The Utility of Quantitative Body Surface Isoarea Mapping for Predicting Ventricular Tachyarrhythmias
10
The Utility of Quantitative Body Surface Isoarea Mapping for Predicting Ventricular Tachyarrhythmias BRUCE G, GOLDNER,* LEORA HORWITZ. NINA KOHN,+ MARTIN LESSER,t JASON EHRLICH, TODD J. COHEN, and RAM JADONATH,t From the ^Department of Mcidicine. Klectrophysiology Section, and the tDepartment of R((search. Division of-Btost ati sties North Shore University Hospital-New York University School of Medicine, Manhass^ONew York) — ^ 1 GOLDNER B., KT AL.: The Utility of Quantitative Body Surface Isoarea Mapping for Predicting Ventricu- lar Tachyarrhythmias, A/on/nvQsive techniques, such as the signal averaged ECG, have heen used to as- sess risk of ventricular tachyarrhythmias (VTj. However, these methods produce false positive and nega- tive results. The purpose of this study was to develop body surface map algorithms which would enhance prediction of susceptibility to VT. Fifty-three patients referred for programmed electrical stimulation were enrolled in this studv. All patients underwent signal averaged ECG. body surface map, programmed elec- trical stimulation. Group I patients had no sustained inducible VT and group II patients had either in- ducible sustained VT at electrophvsiology study or previously documented spontaneous, sustained VT. Eor bodv surface map analysis, the difference between extrema on isoarea maps was calculated and de- fined as the gradient range. An ahnormai body surface map was defined as a QRST gradient range ^ 109 mv-ms. The mean QRST gradient range in group II was significantly < that in group I (P < 0.05). By lo- gistic regression analysis, the presence of coronary artery disease, a QBST gradient range < 109 mv-ms, an EE < 40% and a singal averaged ECG QBS duration > 114 ms predicted VT. The sensitivity, specificity, positive and negative predictive values for predicting VT susceptibility of an algorithm which combines the signal averaged EGG QRS duration and the QRST gradients were 0.93, 0.76, 0.79. and 0.91, respec- tively, while those for the signal averaged ECG alone were 0.52. 0.69. 0.63, and 0.59 for VT susceptibility. A combined bodv surface map-signal averaged EGG algorithm was more sensitive in detecting suscepti- bility to VT than the signal averaged ECC alone. (PAGE 1999:22:453-461} body surface mapping, ventricular tachycardia Introduction Noninvasive methods of testing susceptibility to ventricular tacfiyarrhythmias (VT) and sudden cardiac death have included the signal averaged eleGtrocardiogram (SAECG). left ventricular ejec- tion fraction, Holter monitoring, T wave allernans, and heart rate variability. Time domain SAECG analysis has met with relative success, but its sen- Presuntod in part at tho ()9th Scientific: Session of the American Heart Association in November 1990, New Orleans, Louisiana. Address for reprints: Bruce CJoldner, M.D., Department of Medicine, North Shore University Hospital, New York llniver- .sjty Schoo! of Medicine. 300 Community Drive, Manhasset, NY tlOriOTlFax: (516) 562-2341. r " t ^ '"•, / ^ Received Jannary 13, 1998; revi&pd April 10, 1998; accepted Mayfi,1998. sitivity and specificity are limited. The utility of frequency domain analysis remains unclear,'"** Previously, the body surface map [BSM] has been investigated as a qualitative means for predicting VT susceptibility. However, this method appears both insensitive and subjective," Quantitative analysis of nondipolarity is also in investigational stages, hut requires complex mathematical analy- ses not accessible to the clinician.^""'^ Reentry is generally accepted as a frequent mechanism lor VT. Reentry requires xmidirec- tional block (due to disparity of repolarization) and an area of slow conduction to allow for recov- ery of excitability.'' The SAECG detects late po- tentials that indicate areas of slow conduction, while the BSM-derived QRST area is a marker for disparity of repolarization relatively independent of activation sequence.'^~^" PACE, Vol. 2 March 1999 453
Transcript of The Utility of Quantitative Body Surface Isoarea Mapping for Predicting Ventricular Tachyarrhythmias

The Utility of Quantitative Body Surface IsoareaMapping for Predicting VentricularTachyarrhythmias
BRUCE G, GOLDNER,* LEORA HORWITZ. NINA KOHN,+ MARTIN LESSER,tJASON EHRLICH, TODD J. COHEN, and RAM JADONATH,t
From the ^Department of Mcidicine. Klectrophysiology Section, and the tDepartment of R((search.Division of-Btost ati sties North Shore University Hospital-New York University School of Medicine,Manhass^ONew York) —
^ 1GOLDNER B., KT AL.: The Utility of Quantitative Body Surface Isoarea Mapping for Predicting Ventricu-lar Tachyarrhythmias, A/on/nvQsive techniques, such as the signal averaged ECG, have heen used to as-sess risk of ventricular tachyarrhythmias (VTj. However, these methods produce false positive and nega-tive results. The purpose of this study was to develop body surface map algorithms which would enhanceprediction of susceptibility to VT. Fifty-three patients referred for programmed electrical stimulation wereenrolled in this studv. All patients underwent signal averaged ECG. body surface map, programmed elec-trical stimulation. Group I patients had no sustained inducible VT and group II patients had either in-ducible sustained VT at electrophvsiology study or previously documented spontaneous, sustained VT.Eor bodv surface map analysis, the difference between extrema on isoarea maps was calculated and de-fined as the gradient range. An ahnormai body surface map was defined as a QRST gradient range ^ 109mv-ms. The mean QRST gradient range in group II was significantly < that in group I (P < 0.05). By lo-gistic regression analysis, the presence of coronary artery disease, a QBST gradient range < 109 mv-ms,an EE < 40% and a singal averaged ECG QBS duration > 114 ms predicted VT. The sensitivity, specificity,positive and negative predictive values for predicting VT susceptibility of an algorithm which combinesthe signal averaged EGG QRS duration and the QRST gradients were 0.93, 0.76, 0.79. and 0.91, respec-tively, while those for the signal averaged ECG alone were 0.52. 0.69. 0.63, and 0.59 for VT susceptibility.A combined bodv surface map-signal averaged EGG algorithm was more sensitive in detecting suscepti-bility to VT than the signal averaged ECC alone. (PAGE 1999:22:453-461}
body surface mapping, ventricular tachycardia
Introduction
Noninvasive methods of testing susceptibilityto ventricular tacfiyarrhythmias (VT) and suddencardiac death have included the signal averagedeleGtrocardiogram (SAECG). left ventricular ejec-tion fraction, Holter monitoring, T wave allernans,and heart rate variability. Time domain SAECGanalysis has met with relative success, but its sen-
Presuntod in part at tho ()9th Scientific: Session of the AmericanHeart Association in November 1990, New Orleans, Louisiana.
Address for reprints: Bruce CJoldner, M.D., Department ofMedicine, North Shore University Hospital, New York llniver-.sjty Schoo! of Medicine. 300 Community Drive, Manhasset,NY tlOriOTlFax: (516) 562-2341. r " t ^ '"•, / ^
Received Jannary 13, 1998; revi&pd April 10, 1998; acceptedMay fi, 1998.
sitivity and specificity are limited. The utility offrequency domain analysis remains unclear,'"**Previously, the body surface map [BSM] has beeninvestigated as a qualitative means for predictingVT susceptibility. However, this method appearsboth insensitive and subjective," Quantitativeanalysis of nondipolarity is also in investigationalstages, hut requires complex mathematical analy-ses not accessible to the clinician.^""'^
Reentry is generally accepted as a frequentmechanism lor VT. Reentry requires xmidirec-tional block (due to disparity of repolarization)and an area of slow conduction to allow for recov-ery of excitability.'' The SAECG detects late po-tentials that indicate areas of slow conduction,while the BSM-derived QRST area is a marker fordisparity of repolarization relatively independentof activation sequence.'^~^"
PACE, Vol. 2 March 1999 453
GOLDNER, ET AL.
The purpose of this sfndy was to test the hy-pothesis that a combined BSM-SAECG algorithmwould enhance prediction of VT susceptihility hydetecting hoth components of reentry.
Methods
Study Patients
The BSM protocol was approved by the NorthShore University Hospital's Institutional ReviewBoard and informed written consent was obtainedprior to programmed electrical stimulation (PES).Patients with a history of syncope, nonsustainedVT. or sustained VT referred for PES were en-rolled in this study- Patients in chronic atrial fib-rillation or atrial flutter were excluded because ofthe effect of cycle length variation on ventricularrepolarization. Patients with bundle branch blockor with QRS duration > 120 ms were excluded aswell. None of the patients was receiving antiar-rhythmic drug therapy at the time of BSM,SAECG, or PES.
Patients were divided into two groups. GroupI: nonindncible or stable nonsustained VT [< 30s); group II: spontaneous or inducible sustainedVT > 30 s induced with up to three extrastimuli,or hemodynamically significant VT. The cardiacsubstrate was determined from the history, physi-cal examination, two-dimensional ECG cardiaccatheterization, and/or exercise/pharmacologicalstress test. Patients designated as having coronaryartery disease included patients with a history ofmyocardial infarction, stress test revealing is-chemia and/or infarction, or cardiac catheteriza-tion demonstrating >50% luminal diameter nar-rowing of a coronary artery.
Electrophysiological Study
The stndy was performed on all group I and IIpatients in the fasting state using conscious seda-tion [midazolam 2-6 mg/hour; morphine sulfate2-6 mg/hour). Up to three quadripolar catheterswith 2-10 mm interelectrode spacing were in-serted percutaneously into the right and/or leftfemoral veins and positioned at the high rightatrium, His bundle, and right ventricular apex.Sustained VT was induced by PES using up tothree extrastimuli with two different drive cyclelengths (600 ms and 400 ms) from at least two ven-
tricular sites. Attempts were made to reproducethe arrhythmia at lea,st once.
Body Surface Electrocardiographic Mapping
BSMs were performed on resting, supine pa-tients with a 32-lead system (Predictor Corazonix,Oklahoma Gity, OK USA), Patients' skin was pre-pared with a mild abrasive before application of sil-ver/silver chloride disposable electrodes. Two suc-cessive 20 second recordings were obtainedsimultaneously from 32 unipolar leads with sam-pling rate at 1,000 Hz per lead on the body torsowith Wilson's central terminal as reference. Theelectrodes were placed by Lux's limited lead sys-tem,̂ '-* extending from the sternal notch to the um-bilicus. The 32 leads were then expanded to 192points using a Lux transformation. The electrodearray was linked via a headstage module to an am-phfier and analog-to-digital conversion board. Datawere routed through an electrical isolator to a com-puter based on a 20 MHz Motorola 68030 centralprocessing unit. A representative beat was chosenfrom each recording. Q, S, and T markers werehand placed on a composite beat at the start of theQRS complex, the end of the QRS complex, and theend of the T wave, respectively. QRS area is calcu-lated by time integration from Q to S:
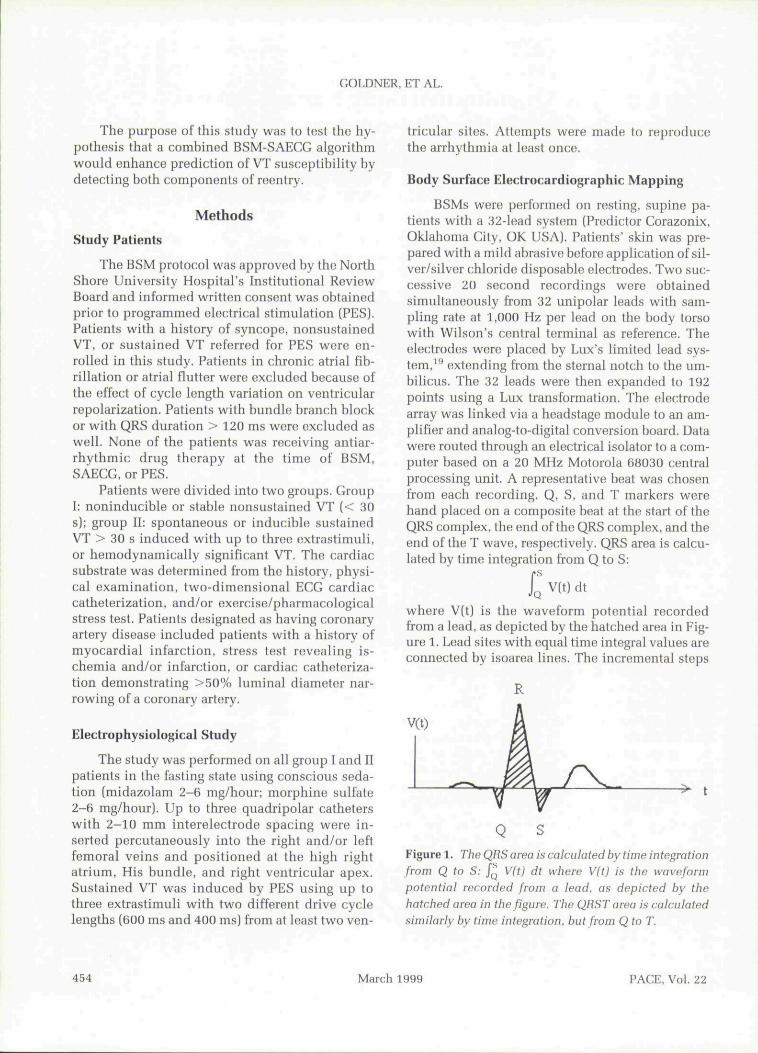
where V(t) is the waveform potential recordedfrom a lead, as depicted by the hatched area in Eig-ure 1. Lead sites with equal time integral values areconnected by isoarea lines. The incremental steps
V(t)
zx.
Figure 1. The QHS area is calculated by time integrationfrom Q to S: /„ V(t) dt where Vft) is the waveformpotential recorded from a lead, as depicted bv thebntcbed area in the figure. The QHST area is caiculatedsimilarly by time integration, but from Q lo T.
454 March 1999 PACE, Vol. 22
BODY SURFACE MAPPING FOR PREDICTING VT
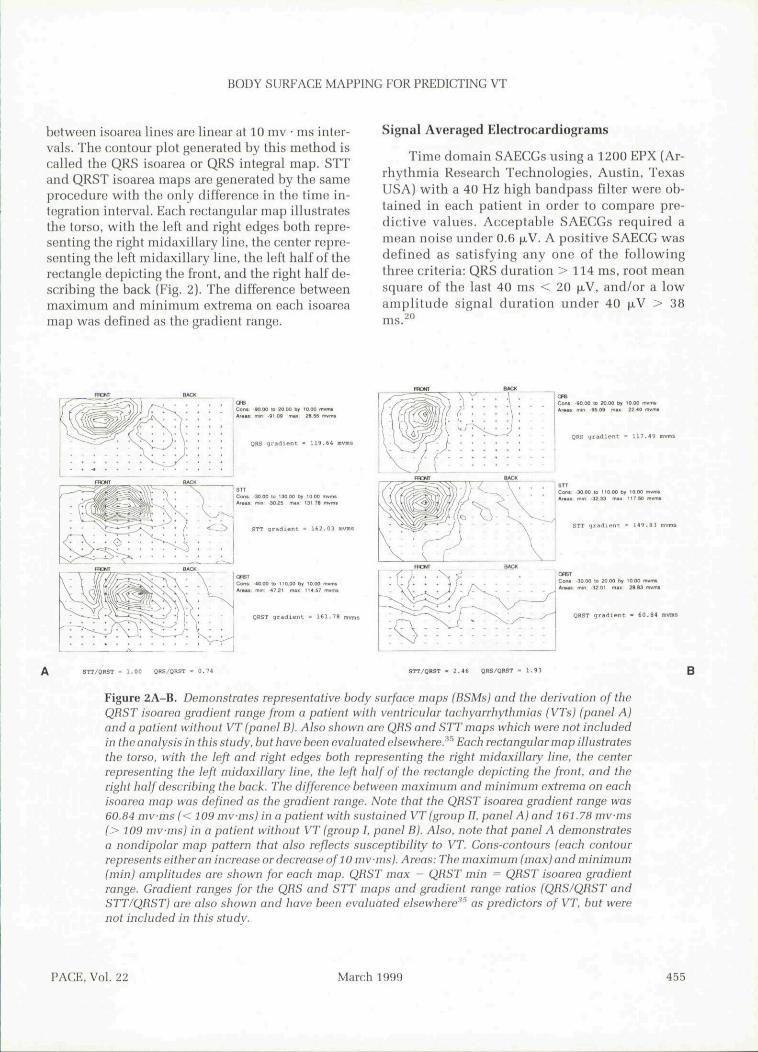
between isoarea lines are linear at 10 mv • ms inter-vals. The contour plot generated by this method iscalled the QRS isoarea or QRS integral map. STTand QRST isoarea maps are generated by the sameprocedure with the only difference in the time in-tegration interval. Each rectangular map illustratesthe torso, with the left and right edges both repre-senting the right midaxillary line, the center repre-senting the left midaxillary line, the left half of therectangle depicting the front, and the right half de-scribing the back (Eig. 2). The difference betweenmaximum and minimum extrema on each isoareamap was defined as the gradient range.
Signal Averaged Electrocardiograms
Time domain SAECCs using a 1200 EPX (Ar-rhythmia Research Technologies, Austin, TexasUSA) with a 40 Hz high bandpass filter were ob-tained in each patient in order to compare pre-dictive values. Acceptahle SAECGs required amean noise under 0.6 \xV. A positive SAEGG wasdefined as satisfying any one of the followingthree criteria: QRS duration > 114 ms, root meansquare of the last 40 ms < 20 .̂V, and/or a lowamplitude signal duration under 40 [xV > 38ms.
OHBTCvw -30 00 lo ?0 00 by 10 CtO TArau mm 32 01 <ni> !»»i i
OBST gradierc ' S0.9i
StT/ORST - l.OD QHS/OHST = B.T* STT/OBST - i.tt QRS/OBST ' 1.93
Figure 2A-B. Demonstrotes representative body surface maps (BSMs) and the derivation of theQRST isoarea gradient range from a patient with ventricular tachyarrhythmias (VTsj (panel A)and a patient without VT (panel B). Also shown are QRS and STT maps which were not includedin the analysis in this study, but have been evaluated elsewhere.^^^ Each rectangular map illustratesthe torso, with the left and right edges both representing the right midaxillary line, the centerrepresenting the left midaxillary line, the left half of the rectangle depicting the front, and theright half describing the back. The difference between maximum and minimum extrema on eachisoarea map was defined as the gradient range. Note that the QRST isoarea gradient range was60.84 mvms (< 109 mv-ms) in a patient with sustained VT (group 11. panel A) and 161.78 mvms(> 109 mv-ms) in a patient without VT (group I, panel B). Also, note that panel A demon.'itratesa nondipoiar map pattern that also reflects susceptibility to VT. Cons-contours (each contourrepresents either an increase or decrease of 10 mvms). Areas: The maximum (max) and minimum(min) amplitudes are shown for each map. QRST max - QRST min ^ QRST isoarea gradientrange. Gradient ranges for the QRS and STT maps and gradient range ratios (QRS/QRST andSTT/QHST) are also shown and have been evaluated elsewhere^^' as predictors of VT, but werenot included in this study.
B
PACE. Vol. 22 March 1999 455
COLDNER, ET AL.
Statistical Methods
Several algorithms were tested to determine apatient's susceptibility to spontaneous or inducedarrhythmias: (1) SAECG-derived filtered QRS du-ration > 114 ms; (2) QRST < 109 mvms; and (3)SAECG QRS > 114 ms and/or QRST < 109mv-ms. Mean isoarea gradient ranges and SAEGGdata (expressed as mean ± SD) were compared us-ing a Student's f-test. A P value < 0.05 was con-sidered statistically significant. Sensitivity, speci-ficity, and positive and negative predictive valueswere determined for each BSM and/or SAEGG al-gorithm using the observed prevalence of 50%. Atrue positive response was defined as an ahnormainoninvasive study in a patient with spontaneousor inducible VT.
Univariate screening of factors predictive ofVT was performed using the Ghi square or Fisher'sexact test, as appropriate. Eactors considered wereejection fraction < 40%, gender, history of is-chemic heart disease, age (< 60, > 60 years),QRST isoarea gradient range (< 109, > 109mvms), low amphtude signal duration (< 38, >38 ms). root mean square vohage (< 20, > 20 |xV).filtered QRS duration (< 114, > 114 ms) andSAEGG. The SAECG was considered ahnormai ifany of the three components were ahnormai, andwas considered normal only if all three compo-nents were normal.
For the BSM, the maximally selected Chi-square test^' was used to determine the optimumcut-off point. This test searches all possible cut-offpoints to identify the most significant cut-off pointwhile maintaining a 5% type I error rate. Factorsthat appeared to be predictive of VT in the uni-variate analysis (P < 0.05) were included in a mul-tivariate logistic regression model. Backward se-lection was used to remove variables that did notcontribute to the model, given other factors in themodel.
Results
Patient Characteristics
A total of 53 patients referred for PES wero en-rolled in this study (Tahle I), Group I included 26patients (20 men; age 11-88 years [mean 58 ± 17years] who either were noninducible or had non-sustained VT, This group consisted of 9 patientswith ischemic disease, 3 with idiopathic dilated
nMean age ± SD
(years)MenNormal heartAbnormal Heart
Ischemic HeartDisease
Dilated CMLVH
Table 1.
Patient Characteristics
Group 1
2658 ± 17
209
179
35
Group II
2766 ± 8
261
2621
41
P
0.04
0.050.0050.0050.002
1.00.1
CM ^ cardiomyopathy; LVH = left ventricular hypertrophy; SDstandard deviation.
cardiomyopathy, 5 with left ventricular hypertro-phy, and 9 with structurally normal hearts. CroupII included 27 patients (26 men; age 55-77 years;mean 66 ± 8 years) who had spontaneous or in-ducible sustained VT. This group consisted of 21patients with ischemic heart disease, 4 with idio-pathic dilated cardiomyopathy, 1 with left ven-tricular hypertrophy, and 1 with a structurallynormal heart.
QRST Isoarea Gradient Range and SAECGParameters (Table II)
The mean QRST isoarea gradient range ingroup II (94.7 ± 63.1 mvms) was significantly <that in group I (166.1 ± 69.5 mvms) (P = 0.0003),The mean filtered QRS duration and low ampli-tude signal duration were significantly greater ingroup II than in group I. Although the mean rootmean square voltage was less in group II than ingroup I, the difference was not statistically signif-icant.
Univariate and Multivariate Analysis
(Table III) The results of the univariate screenand multivariate logistic regression are summarizedin Tahle III. Univariate predictors of VT includedejection fraction < 40%, the presence of coronaryartery disease, age > 60 years, QRST isoarea gradi-ent range < 109 mvms, and an SAEGG filtered QRSduration > 114 ms, Multivariate logistic regressiondemonstrated that the presence of coronary artery
456 March 1999 PACE, Vol. 22

BODY SURFACE MAPPING FOR PREDICTING VT
Mean Isoarea Gradient
Mean QRST Gradient (mv-ms)Filtered QRS Duration (ms)Mean LAS Duration (ms)
Mean RMS40 (|JLV)
Table II.
Ranges and Signal
Group 1
166.1 ± 69.595.7 ± 10.429.5 ±11.6
53.3 ± 46.5
Averaged ECG Parameters
Group II
94.7 ± 63.1113.1 ± 20.039.6 ± 19.9
33.9 ± 28.8
P value
0.00030.00030.030.07
LAS = low amplitude signal duration; ms = milliseconds; mvms = millivolt X milliseconds: RMS40 = root meansquare voltage in the last 40 ms; values are expressed as mean ± SD.
Table III.
Results of Univariate Screen and Multivariate Logistic Regression
Factor NoVT VT
Unadjusted LogisticUnivariate Odds Model Adjusted Odds
P value Ratio (95% Cl) P value Ratio (95% Cl)
NAge
< 6 0> 60
GenderFemaleMale
CADAbsentPresent
EF> 40%
< 40%RMS
>20mV
<20mVLASD
^ 38 ms
> 38 msQRSD
< 114ms> 114ms
SAECGnormalabnormal
QRSTgradient
> 109"s 109"
1313
6
20
17
9
251
188
197
251
18
8
215
26
(72%)(37%)
(86%)(43%)
(74%)
(30%)
(64%)
(7%)
(55%)(40%)
(59%)(33%)
(63%)(8%)
(58%)
(36%)
(81%)(19%)
522
1
26
621
14
13
1512
1314
1512
1314
522
27
(28%)(63%)
(14%)(57%)
(26%)(70%)
(36%)(93%)
(45%)(60%)
(41%)(67%)
(37%)(92%)
(42%)(64%)
(19%)(81%)
< 0.02
N.S.
< 0.01
< 0.005
N.S.
N.S.
< 0.01
N.S.
< 0.0001
1.0 (-)4.4(1.2,15.6)
I.O(-)
7.8 (0.8,73.3)
1.0 (-)6.6(1.9,22.8)
1.0(-)
23.2(2.7,196.f
i.o(-)1.8(0.6,5.7)
I.O(-)
2.9(0.9,9.4)
1.0(-)
20(2.3,177.2;
1.0(-)
2.4 (0.8,7.6)
1.0 (-)18.5(4.5,75.3)
N.S.
N.I.
0.03
0.04
N.I.
N.I.
0.03
N.I.
0.002
9.2(1.2,69.3)
1.0(-)
37.7(1.3,1127)
47.3(1.6,1444)
54.4 (4.5,650)
Factors which were not significant in the univariate screen were not included in the multivariate model, and have N.I. (not included) for thelogistic regression P value in the table. Factors which were included in the model, but eliminated by backwards selection, have N.S. forthe logistic P value, and no adjusted odds ratio, since there was none to compute. CAD = coronary artery disease; Cl ^ confidence in-tervals; EF ejection fraction; LASD = low amplitude signal duration; ms = milliseconds; QRS D - signal averaged ECG tiltered QRSduration; QRST isoarea gradient range expressed in millivolt X milliseconds or mvms." RMS = root mean square voltage in the last 40ms; SAECG = signal average electrocardiogram.
PAGE, Vol. 22 March 1999 457

GOLDNER, ET AL.
disease, ejection fraction < 40%, filtered QRS du-ration, and QRST isoarea gradient range < 109mv-ms were significant predictors of VT.
Estimated Probability of VT (Table IV)
The estimated probability of VT was mea-sured as a function of ejection fraction, presenceor absence of iscbemic boart disease, SAECG QRSduration, and QRST isoarea gradient range. Tbeestimated probability of VT was 97% in tbe ab-sence of iscbemic heart disease if tbe BSM andQRS duration were ahnormai.
BSM QRST and QRS Duration (Table V)
The sensitivity, specificity, aud positive andnegative predictive values of tbe BSM-SAECG al-gorithm for predicting susceptibility to sustainedVT, was 93%, 76%, 79%, and 91%, respectively.
Mean SAECG and BSM Parameters in Patientswith Monomorphic VT Versus Those withPolymorphic VT
The mean LAS (52 ± 16 ms vs 24 ± 10 ms, P< 0.001), RMS40 [19 ± 21 |i.V vs 52 ± 27 jiV, P <0.001), and filtered QRS duration (124 ± 20 ms vs
Table IV.
Estimated Probability of VT as a Function of EjectionFraction, Ischemic Heart Disease, QRST Isoarea
Gradient Range, and SAECG QRS Duration
EF < 40% IHD QRST QRSD EPVT
-t-
30%
38%35%85%96%97%99%
EF = ejection fraction; EPVT = estimated probability of VT; IHD= ischemic heart disease; QRST =• QRST isoarea gradient range(+ indicates QRST < 109mvms); ( indicates ORST > 109mvms); QRSD = SAECG QRS duration (+ indicates QRS D >114ms); (- indicates QRS D < 114ms); + = presence of factor;- = absence of factor.
Table V.
Results of isoarea Gradient Range and SAECGAlgorithms for Predicting Susceptibility to Sustained
Ventricular Tachyarrhythmias
BSM QRST gradientSAECGSAECG QRS DSAECG QRS
D-BSM QRST
SN
0.810.520.440.93
SP
0.810.690.960.76
PPV
0.810.630.920.79
NPV
0.810.590.630.91
SN = sensitivity; SP = specificity; PPV - positive predictivevalue; NPV = negative predictive value. BSM QRST gradient (ab-normal If 5? 109 mv-ms); SAECG = signal averaged electrocar-diogram (abnormal if any of the three SAECG parameters is ab-normal); QRS D - SAECG filtered QRS duration (abnormal if >114 ms); SAECG QRS D-BSM QRST gradient algorithm abnor-mal if either QRS D > 114 ms or QRST ^ 109 mv-ms.
100 ± 11 ms, P < 0.001) were significantly differ-ent for those patients with monomorpbic VT(n=15) compared witb tbose with polymorphicVT (n = 12), respectively. However, there was nosignificant difference in the BSM parameters (89± 67 mvms vs 102 ± 60 mv-ms) for those withmonomorphic VT compared witb tbose witb poly-morpbic VT, respectively.
Comparison of Mean SAECG and BSMParameters for Patients Who Survived Comparedwith Those Who Died
Of tbe 53 patients, 46 survived. 2 died, and 5were lost to follow-up after a mean of 18 ± 1months. The mean LAS duration (34 ± 16 ms vs 50± 36 ms) and filtered QRS duration (104 ± 17 msvs 120 ± 33 ms) were less and the RMS voltage (44± 40 ̂ .V vs 30 ± 39 (xV) was greater in tbe patientswbo survived compared witb those who died, al-tbough the differences were not significantly dif-ferent. The difference between tbe QRST gradientrange (42 ± 27 mv-ms vs 135 ± 77 mvms) was notsignificantly different in tbose wbo died comparedwith tbose who survived (P = 0.09).
Discussion
Tbe QRST isoarea map is a marker for dispar-ity of repolarization.^^'^•' A smaller QRST isoareagradient has been observed in those susceptible to
458 March 1999 PACE. Vol. 22
BODY SURFACE MAPPING FOR PREDICTING VT
ventricular arrhythmias.^^'^^ Diseased my-ocardium does have nonuniform repolarizationcompared with normal myocardium. Therefore,the diminution in QRST isoarea gradient probablyresults from nonuniformity of repolarization indisoasod myocardium creating cancellation of ex-pression of the differences in repolarization.Moreover, differences in extrema [gradient range)are greater with normal myocardium, which repo-larizes in a uniform manner.^''
The QRST isoarea gradient range was predic-tive of VT independent of age, gender, ejectionfraction. SAECG, and cardiac substrate. T wavepotentials alone, by contrast, have been shown tohe lower for females and to decrease witb age.^''
This study demonstrates that quantitative al-gorithms can be developed using the BSM whichcan enhance prediction of VT. Patients with sus-tained or induced VT were found to have signifi-cantly less isoarea gradient ranges than thosewithont sustained VT. Algorithms using the com-bined SAECG QRS duration and BSM QRSTisoarea gradient range predicted VT with a sensi-tivity, specificity, and positive and negative pre-dictive values of 93%, 76%, 79%, and 91%, re-spectively. As demonstrated in previous studies,the SAECG filtered QRS duration was also signifi-cantly higher in those with sustained VT (group II),than in those without (group I).̂ "̂̂ ** We hypothe-sized that a combined BSM-SAEGG algorithmwould account for both disparity of repolarizationand slowed conduction and would improve VT de-tection. There was an improvement in sensitivityand negative predictive value with the combinedalgorithm compared with the SAECG alone for de-tecting VT susceptibility (Table IV).
Previous studies have concentrated on theconcept of nondipolarity or spatial features ofQRST isoarea maps to identify patients at highrisk of VT.'̂ '̂ "^ Tsunakawa and colleagues^' foundthat quantitative assessment of nondipolarity ofQRST area maps was able to identify patients withVT in the chronic phase of myocardial infarctionwithasensitivity of 82% and a specificity of 71%.However, some of the patients were on antiar-rhythmic drugs at the time BSMs were obtained.In addition, the group of patients identified ashaving VT was heterogeneous in that some hadnonsustained VT and others had sustained VT.Hubley-Kozey and coUeagues^^ assessed spatial
features in 204 patients (half with a history of my-ocardial infarction (MI) but no VT and tbe otherhalf with a history of VT with or without prior MI)to identify patients with a history of VT. Theyused an orthogonal-expansion method to identifyprincipal spatial patterns in BSMs of QRST areasand selected those patterns that distinguished pa-tients prone to VT. Patients with VT were identi-fied with a sensitivity, specificity, and positiveand negative predictive accuracy of 90%, 78%,81%, and 89%, respectively. However, theirmethods were complex and not immediately ac-cessible to practicing physicians.
The ability of the SAECG and BSM to predicttotal mortality was evaluated. The number of end-points were too small to make any definitive con-clusions. However, the two patients who dieddemonstrated lower QRST isoarea gradient rangesthan those who survived, although the differencewas not statistically significant. The difference inmean low amplitude signal duration, root meansquare voltage and filtered QRS duration in thosewho died versus who survived also did not reachstatistical significance. However, with a largernumher of endpoints, a significant difference mayhave been observed.
BSM parameters in those with monomorphicVT compared with those with polymorphic VTwere not significantly different. However, all threeSAECG parameters were significantly different forthe patients with monomorphic VT comparedwith those with polymorphic VT.
This study has several limitations. First, a het-erogeneous group of patients referred for PES wasevaluated. Despite this mixed population, theBSM QRST isoarea gradient range < 109 mv mswas capahle of identifying patients with sustainedVT with a high sensitivity and specificity. Appli-cation of the BSM algorithms to individual patientsubsets (i.e., patients with syncope) will be neces-sary before any firm conclusions can be drawnabout its usefulness. In addition, the optimum cut-off values for an ahnormai QRST (< 109 mv-ms)were derived for this heterogenous population us-ing the maximally selected Chi-square test.^^ Thistest searches all possible cut-off points to identifythe most significant cut-off point while maintain-ing a 5% type I error rate. Future studies may iden-tify different optimum values, depending uponthe population.
PACE, Vol. 22 March 1999 459
GOLUNER. ET AL.
Second, SAEGG and BSMs were ohtained atone point in time and reproducihility was not eval-uated. Previously, chauges in BSM isoarea mapshave been observed over time.~*" Therefore, tempo-ral reproducibility of the BSM isoarea gradientrange needs to be evaluated in future studies.
Third, patients with atrial fibrillation/atrialflulter were excluded from primary analysis inthis study. Similarly, these arrhythmias have beenreported to affect detection of late potentials viathe SAECG.'̂ "'̂ Further research is necessary todetermine the true effect of atrial fihrillation/atrialflutter on the BSM.
Fourth. VT susceptibility (the primary end-point) was defined as either previous spontaneousVT or inducibility of VT at PES. Clearly, VT in-ducibility is not equivalent to spontaneous VT,but good correlation exists between inducible andspontaneous VT in patients with coronary arterydisease.•'•''•'•*
Fifth, although the investigators were notblinded as to whether patients previously hadspontaneous VT, the results of PES were not avail-able at the time BSMs were obtained. Finally,there were significantly more patients with is-chemic hearl disease in the group of patients withsustained VT than in the group of patients without
sustained VT. Moreover, there were differences inother baseline parameters such as age and genderthat might have influenced our ultimate findings.Although the presence of ischemic heart diseasecould have accounted for the differences in the re-sults of the BSM, logistic regression analysisdemonstrated that the BSM predicted susceptibil-ity to sustained VT independent of the presence ofischemic heart disease and other baseline charac-teristics. Future studies should address this issueby comparing BSMs in only patients with is-chemic heart disease with and without VT.
In conclusion, the BSM-derived QRST isoarearange is a highly sensitive and specific means foridentifying those at risk for VT, especially whencombined with the SAECXJ QRS duration.Prospective studies of these methods in a largercohort are required to determine the true clinicalutility of the BSM QRST isoarea range combinedwith other noninvasive tests.
Acknowlf^dgnwnts: The authors wish to acknowledge thededicalion and support of the following people in making thismanuscript possible; Anthony Accordino. R.N.. Jennifer Baker,R.N.. Donna Kalondorian, R.N., A.N.P., VVeilun Quan. Ph.D..Kathleen .Sanacore, R.N.. A.N.D., Nitish Badhwar, M.D., MaryFrani.is Ward, R.N.. Stanley Katz, M.D., and Lawrence Scherr,M.D,
References
1. Worley S|, MarkDB. Smith WM, etal. Comparisonof time domain and frequency domain variablesfrom thn signal-averaged electrocardiogram: a miii-tivariate analysis. I Am Goll Gardiol 1988;11:1041-1051.
2. Pierre DC, Easley AR Jr, Windio |R, el al. Fii.stFourier transformation of the entire low amplitudelate QRS potential to predict ventricular tachycar-dia. I Am Coll Cardiol 1989; 14:1731-1740.
3. Kelen GJ. Henkin R, Fontaine JM, et al. Effects ofanalyzed signal duration and phase on the resiiltsof fast Fourier transform analysis of the surfaceelectrocardiogram in subjects with and withoutlate potentials. Am I Cardiol 1987; 60:1282-1289.
4. Machac J, Weiss A, Winters SL, ut al. A compara-tive study of frequency domain and time domainanalysis of signal averaged electrocardiograms inpatients with ventricular tachycardia. J Am CollCardiol 1988; 11:284-296.
5. Lindsay BD. Mardkham J, Schectman KB, et al.Idijntification of patients with sustained ventricu-lar tachycardia by frequency analysis of .signal av-
eraged electrocardiograms despite the presence ofhundlf! branch block. Circulation 1988: 77:122-130.
6. Kinnzln MG. Falcone RA, Simson MB. Alterationsin the initial portion of thn signal-averagod QRScomplex in acute myocardial infarction with ven-tricular tachycardia. Am J C^ardiol 1988; 61:99-103.
7. Malik M. Kulakowski P, Poloniecki J. et al. Fre-quency versus tinu; domain analysis of signal-av-eraged electrocardiograms. 1. Reproducibility ofthe results. J Am Coll C:ardiol 1992; 20:127-134.
8. Kulakowski F, Malik M, Poloniocki I. ot al. Fre-quency versus time domain analysis of signal-av-eraged electrocardiograms. 11. Identification of pa-tients with ventricular tachycardia aftermyocardial infarction. J Am Coll Cardiol 1992:20:135-143.
9. Abildskov lA, Green LS. The recognition of ar-rhythmia vulnerability in body surface electrocar-diographic mapping. Circulation 1987; 75(SupplIII):79-83.
460 March 1999 PACE, Vol. 22
BODY SURFACE MAPPING FOR PREDICTING VT
10. Okamoto Y. Toramachi Y, Musha T, et al. Movingmultiple dipole model for cardiac activity, JpnHeart] 1<JB2; 23:293-330,
11, Tsiinakawa H. Nishiyama G, Kusahana Y, et al.Identification of susceptibility to ventriculartachycardia after myocardial infarction bynondipolarity of QRST area maps, J Am Coll Car-diol 1999: 14:1530-1536,
12. Hubley-Kozey CL, Mitchell LB, Gardner MJ, Ht al.Spatial features in hody-surface potential mapscan identify patients with a history of sustainedventricular tachycardia. Circulation 1995; 1992:1825-1838.
13, MincH CR, On dynamic equilibrium in the heart. JPbysiol 1913:46:349-383,
14, Wilson FN, Mac:Lood AG, Barker PS, et al. Tho de-termination and significance of the areas of theventricular deflections of the electrocardiogram.Am Heart) 1934: 10:46-61,
15. Abildskov JA. Evans AK. Lux RL, et al. Ventricularrecovery properties and QRST defleclion area incardiac ulectrograms. Am | Pbysiol 1980;239:H2Z7-H231.
lG, Lux RL. Urie PM. Burgess MJ, et al. Variability ofthe body surface distributions of QRS. ST-T, andQRST deflection areas with varied activation se-quence in dogs. Cardiovasc Res 1980: 14:607-612.
17, Abildskov JA, Burgess MJ. Urie PM, et al, Tbeunidentified information content of the electrocar-diogram, Circ Res 1977: 40:3-7.
18, Cosma J, Levy B, Pipeberger H, Tbe spatial ven-tricular gradient during alterations in tbe ventric-ular activation pathway. J Electrocardiol 1969:2:101-108,
19, Mirvis DM, Metbods for body surface electrocar-diographic mapping. In Body Surface Electrocar-diographic Mapping. Boston, MA. Kluwer Aca-demic Publishers, 1988. pp, 43-63,
20, Breithardt G. Cain ME, El-Sherif N. et al, Standardsfor analysis of ventricular late potentials usinghigh resolution or signal-averaged electrocardiog-raphy. A statement by a Task Force Committee ofthe European Society of Cardiology, the AmericanHeart A.ssociation and the American College ofCardiology, J Am Coll Cardiol 1991: 17:999-1006.
21, Kozial JA. On maximally selectt'd Chi-squarestatistics. Biometrics 1991: 47:1557-1561,
22, Horacek BM, Montague TJ, Gardner MJ, et al. Ar-rbytbmogenic Clonditions. In DM Mirvis, (ed,):Body Surface Electrocardiographic Mapping,Boston, MA, Kluwer Academic Publishers. 1988.pp. 167-191,
23, Gardner MJ, Montague TJ. Armstrong CS, et al.Vulnerability to ventricular arrbytbmia: Assess-ment by mapping of body surface potentials. Cir-culation 1986: 73:684-692.
24, Green LS. Lux RL, Haws CW, et al. Effects of age,sex, and body babilus on QRS and ST-T potentialmaps of n o b normal subjects. Circulation 1985:71:244-253,
25, Gomes JA. Winters SL, Slewart D. et al, A newnoninvasive index to predict sustained ventriculartachycardia and sudden deatb in the first year af-ter myocardial infarction: Based on signal-aver-aged electrocardiogram, radionuclide ejectionfraction and Holter monitoring, J Am Coll Cardiol1987: 10:349,
26, Gomes JA, Mebra R, Barreca P, et al. Quantitativeanalysi.s of the high-frequency components of thesignal-averaged QRS complex in patients withacute myocardial infarction: A prospective study.Circulation 1985: 72:105-111,
27, Gomes JA. Winters SL. Martinson M, et al, Tbeprognostic significance of quantitative signal-aver-aged variables relative to clinical variables, sites ofmyocardial infarction, (ijection fraction and ven-tricular premature beats, J Am Coll Cardiol 1989:13:377-384.
28, Winters SL, Stewart D, Targonski A, et al. Role ofsignal averaging of the surface QRS complex in se-lecting patients with nonsustained ventriculartachycardia and high grade ventricular arrhyth-mias for programmed stimulation, J Am Coll Car-diol 1987: 12:1481-1487.
29, Winters SL, Stewart D, Gomes JA, Signal averagingof tbe surfac(; QRS complex predicts inducibilityof ventricular tachycardia in patients with syn-cope of unknown origin: A prospective study. JAm Coll Gardiol 1987: 10:775-781.
30, Montague TJ, Smith ER. Cameron DA, et al, Isoin-tegral analysis of body surface maps: Surface dis-tribution and temporal varialjility in normal sub-jects. Circulation 1981: 63:1166-1172,
31, Buckingham RA, Riulin MM, Volgman AS, et al.Does atrial fibrillation cause false-positive late po-tentials? PACE 1993: 16:2222-2226.
32, Scbrem SS. Nachamie M. Weiss E. False positivesignal-averaged electrocardiogram produced byatrial flutter. Am Heart J 1990: 120:698-699,
33, Klein RC, Macbell C, Use of electrophysiologictesting in patients with nonsustiuned ventriculartachycardia: Prognostic and therapeutic implica-tions. J Am Coll Cardiol 1989: 14:155-161.
34, Buxlon AE. Marcblinski FE. Waxman HL, et al.Prognostic factors in nonsustained ventriculartachycardia. Am J Cardiol 1984: 53:1275-1279,
35, Goldner BG. Horwitz L. Quan W, et al, C:omparisonof body surface isoarea mapping with signal aver-aged electrocardiogram for predicting vcmtriculartarhyarrbytbmia susceptibility, (abstract) Circula-tion 1994: 90:1-388.
PACE, Vol, 22 March 1999 461