Overview, survey results and utility algorithms
27
Research Paper 2009 (45) AQoL-7D (Vision) Instrument: Overview, survey results and utility algorithms Jeff Richardson 1 Angelo Iezzi 1 Kompal Sinha 1 Munir Khan 1 Stuart Peacock 2, 3 Graeme Hawthorne 4 Roseanne Misajon 5 Jill Keeffe 6 1 Centre for Health Economics, Monash University, Australia 2 Centre for Health Economics in Cancer, British Columbia Cancer Agency, Canada 3 Department of Health Care and Epidemiology, University of British Columbia, Canada 4 Department of Psychiatry, The University of Melbourne, Australia 5 School of Political and Social Inquiry, Monash University, Australia 6 Centre for Eye Research Australia, The University of Melbourne, Australia December 2009 Centre for Health Economics ISSN 1833-1173 ISBN 1 921187 44 1
-
Upload
independent -
Category
Documents
-
view
3 -
download
0
Transcript of Overview, survey results and utility algorithms
Research Paper 2009 (45)
AQoL-7D (Vision) Instrument:
Overview, survey results and utility algorithms
Jeff Richardson1
Angelo Iezzi1
Kompal Sinha1
Munir Khan1
Stuart Peacock2, 3
Graeme Hawthorne4
Roseanne Misajon5
Jill Keeffe6
1Centre for Health Economics, Monash University, Australia
2Centre for Health Economics in Cancer, British Columbia Cancer Agency, Canada
3Department of Health Care and Epidemiology, University of British Columbia, Canada
4Department of Psychiatry, The University of Melbourne, Australia
5School of Political and Social Inquiry, Monash University, Australia
6Centre for Eye Research Australia, The University of Melbourne, Australia
December 2009
Centre for Health Economics
ISSN 1833-1173
ISBN 1 921187 44 1

AQoL-7D (Vision) Instrument: Overview, survey results and utility algorithms
ACKNOWLEDGEMENTS
The research described in this paper is made possible through National Health and Medical
Research Council (NHMRC) Project Grant ID: 491162 and Professorial Fellowship ID: 284363.
Corresponding author:
Professor Jeff Richardson
Foundation Director
Centre for Health Economics
Faculty of Business and Economics
Monash University
Ph: +61 3 9905 0754
Fax: +61 3 9905 8344
Email: [email protected]

AQoL-7D (Vision) Instrument: Overview, survey results and utility algorithms
ABSTRACT
The AQoL-7D (Vision) is the third of the Assessment of Quality of Life (AQoL) instruments for
measuring health-related quality of life. The full suite, their use, algorithms and the relationship of
different instruments to one another are described on the AQoL website (below).
The construction of the AQoL-7D descriptive system – questionnaire – and the underlying
psychometric analysis are reported in Misajon et al 2005 and the theory behind the derivation of
the utility weights in Peacock et al 2008. The present paper applies the theory to derive the utility
algorithm for the instrument and, separately, for the 7 dimension weights. These may be
accessed and used directly by downloading the algorithm from the AQoL website
http://www.buseco.monash.edu.au/centres/che/aqol/

AQoL-7D (Vision) Instrument: Overview, survey results and utility algorithms
TABLE OF CONTENTS
1 Introduction and Background ........................................................................................................ 1
2 The AQoL-7D descriptive instrument ............................................................................................ 2
3 Deriving the utility algorithm .......................................................................................................... 5
Data ........................................................................................................................................... 6
Results ...................................................................................................................................... 7
Second stage adjustment ....................................................................................................... 10
4 Conclusion ................................................................................................................................... 19
References ..................................................................................................................................... 20
Appendix A. VisQoL instrument (dimension 7 of the AQoL-7D) .................................................... 21
Appendix B. Definition of MA health states and Pseudo states ..................................................... 22
Appendix C. Multiplicative Disutility Equations: AQoL-7D ............................................................. 23
List of Tables
Table 1. Age and gender distribution ............................................................................................... 7
Table 2. SEIFA groups by location (in the Weights Survey) ............................................................ 7
Table 3. VAS scores for the 6 VisQoL items: on item best/worst scale (0-100) .............................. 8
Table 4. VisQoL: Item worst TTO scores on best-death scale (10-0) ............................................. 9
Table 5. Regression of mean TTO on predicted (multiplicative) AQoL ......................................... 12
Table 6. AQoL 7D norms for age groups ....................................................................................... 15
Table 7. Regression results: AQoL-7D on dimension scores ........................................................ 15
List of Figures
Figure 1. Structure of the AQoL-7D ................................................................................................. 5
Figure 2. Frequency distribution of TTO scores (n = 1665) ........................................................... 10
Figure 3. TTO Disutilities vs Mult-AQoL (Pseudo E-type) ............................................................. 11
Figure 4. TTO Disutilities vs Mult-AQoL (all data) ......................................................................... 11
Figure 5. TTO Disutilities Observed vs TTO Predicted (public) ..................................................... 13
Figure 6. TTO Disutilities Observed vs TTO Predicted (patients) ................................................. 13
Figure 7. TTO Disutilities Observed vs TTO Predicted (total) ....................................................... 14
Figure 8. AQoL-7D vs Dimension 1 (independent living)............................................................... 16
Figure 9. AQoL-7D vs Dimension 2 (Relationships) ...................................................................... 16
Figure 10. AQoL-7D vs Dimension 3 (Mental Health) ................................................................... 17
Figure 11. AQoL-7D vs Dimension 4 (Coping) .............................................................................. 17
Figure 12. AQoL-7D vs Dimension 5 (Pain) ................................................................................... 18
Figure 13. AQoL-7D vs Dimension 6 (Senses) .............................................................................. 18
Figure 14. AQoL-7D vs Dimension 7 (Visqol) ................................................................................ 19

AQoL-7D (Vision) Instrument: Overview, survey results and utility algorithms 1
AQoL-7D (Vision) Instrument:
Overview, survey results and utility algorithms
1 Introduction and Background
Around 19 percent of the world’s population or 950 million people are aged 50 or over and in
excess of 82 percent of those who are blind are in this age group. By 2050 the number aged over
60 will exceed 2 billion. The combined effect of an ageing population and the high correlation
between age and vision impairment is an indication that visual impairment is set to increase over
time AIHW (2007).
Vision impairment results in an increased risk of falls, hip fractures, depression, social isolation,
need for community service and greater risk of admission to nursing home (West, Munoz et al.
1997; Taylor, McCarty et al. 2000; Wang , Mitchell et al. 2001; McCarty, Fu et al. 2002). The
consequences of these for an individual’s quality of life (QoL) need to be included in economic
evaluations: their exclusion would result in a systematic bias against the funding of programs to
prevent or cure visual impairment.
Presently economic evaluations attempt to take QoL into account using the Quality Adjusted Life
Year (QALY) as a unique outcome in Cost Utility Analysis (CUA) which estimates and compares
the costs per QALY from competing programs. However to obtain valid measures of QALYs
requires the valid measurement of the QoL of the visually impaired using measurement units
which are suitable for the construction of QALYs. This requires the measurement of QoL using
people’s preferences, or utilities, as the yardstick.
Two approaches can be adopted. With the holistic approach the relevant health states are
described in a series of scenarios. These are then rated using a scaling instrument to obtain
indices of ‘utility’ to calculate QALYs. The Time Trade-off (TTO) and standard gamble (SG) are
the two most popular instruments. Generally, patients who have experienced a health state are
interviewed for the construction of scenarios and randomly selected people from the general
population are surveyed to obtain the utility weights.
With the ‘decomposed’ or multi attribute (MAU) approach a generic instrument is constructed to
describe and pre-calibrate numerous health states. The instrument consists of the ‘descriptive
system’ – a set of questions concerning the multi attributes which have been selected to describe
or define the quality of life – and secondly, an algorithm or scoring system which can convert all
possible combinations of item responses into an index of utility. The model can be derived using

AQoL-7D (Vision) Instrument: Overview, survey results and utility algorithms 2
either econometric or decision analytic techniques to fit a simple additive model or a multiplicative
model.
A number of generic utility instruments exist which, in principle, can measure disparate health
states. These include the 15D, EQ5D, SF6D, HUI 1, 2, 3. One of these, the EQ5D, has been
mandated for use in economic evaluations submitted to the UK National Institute of Clinical
Excellence (NICE). All instruments, however are more or less sensitive in different domains of
health and none of the generic instruments was constructed with the explicit objective of ensuring
sensitivity and validity in the context of visual impairment. The EQ5D, for example, makes no
reference to vision and impaired vision will impact upon this scale only indirectly via an effect
upon mobility, personal care, usual activities or anxiety/depression. However, even these
attributes have only three levels of ‘problem’ (no, moderate, extreme).
The objective of the AQoL program was to achieve a new generation of MAU instruments which
could, if necessary, be supplemented in particular disease areas to achieve a greater sensitivity
to the disease specific health states than would be achieved with the standard AQoL instrument
but which nevertheless produced valid scores for the health states before and after the disease
interventions. To date, supplementation has occurred in the areas of vision and mental health.
The creation of the vision specific dimension of the AQoL is described in Misajon et al. (2005) and
the methods to be used for deriving the utility (weights) algorithm in Peacock et al. (2008). The
present paper summarised these and presents results from the utility (weights) survey. It reports
the final utility algorithm derived from the analysis of these results.
The paper unfolds as follows. Section 2 outlines the objectives and the derivation of the
descriptive system. Section 3 summarises the theory behind utility modelling, the survey results
and the derivation of the utility algorithm. Section 4 presents some results derived from the
algorithms, namely population norms and the relationship between dimension scores and total
AQoL-7D utilities.
2 The AQoL-7D descriptive instrument
The objective of the AQoL-7D project was to create an instrument for assessing vision related
quality of life and which produced utility scores suitable for use in economic evaluation studies
and specifically cost utility analysis.
This required a ‘descriptive system’ set of questions:
With construct validity, ie a descriptive system based upon appropriate psychometric
procedures;
With increased sensitivity to overall quality of life but particularly those states affected by
vision;
With a descriptive system based on the concept of ‘handicap’, (ie problems arising in a
social context) rather than one based on disability or impairment (ie a ‘within the skin’
description); and
Which closely related to the AQoL-6D (Standard) instrument to permit a comparison of
scores.

AQoL-7D (Vision) Instrument: Overview, survey results and utility algorithms 3
The first stage of this process – the construction of the descriptive system for the vision
dimension – is described by Misajon et al. (2005). The AQoL-7D combines 26 items in 7
dimensions. The label ‘VisQoL’ was used to describe the vision dimension (6 items) reflecting the
fact that a supplementary aim was to permit the use of VisQoL as a brief, stand alone (non utility)
instrument for capturing the main effects of visual impairment.
The first step in this stage of the analysis was to create focus groups with people with impaired
vision to determine their perceptions of quality of life. Focus group methodology is a well-
established technique used to canvass a range of views about a topic and is also a useful aid in
the design of questionnaires, including the development of terminology that is appropriate and
understandable for a target population. Participants were recruited from existing self-help groups
at the Vision Australia Foundation so that the sample was representative of the demographic
profile of people with impaired vision. The moderator discussed the purpose of the study with
each group prior to commencement. A semi-structured approach was used to conduct the
groups.
Focus group topics were guided by the Impact of Vision Impairment (IVI)2 questionnaire.
However, group discussion flexibility allowed for exploration of any concepts raised by
participants. The groups probed the effect of vision on self care, mobility in and out of the home,
participation in work and leisure activities, interaction with other people, and their sense of self.
There was also a question on which area of life had been most affected by visual impairment.
Grounded theory techniques were used to analyse transcripts and observer notes from the
discussions. They were examined to identify distinct statements made, which were then coded
into appropriate categories. Using the results from the focus groups and from previous research
an item bank was created for the development of the various dimensions of the VisQoL. The next
step was to determine the suitability and validity of the items in the item bank for inclusion in the
instrument and to optimise the number of items. Participants in this second stage were required
to fill in a questionnaire which contained all of the items which remained in the item bank after
editing and initial triage to eliminate duplicate or obviously inadequate items. Two groups of
participants were recruited:
1. People who were visually impaired, defined as having visual acuity (VA) <20/30 in the
better eye; and
2. Non-visually impaired, defined as VA 20/20 or better in both eyes.
Recruitment: All participants were aged 18 years or over. Participants included people from the
general public and people with vision impairment. People from the general population were
recruited in metropolitan Melbourne and people with impaired vision were recruited from the
Royal Victorian Eye and Ear Hospital (RVEEH). Eligible participants were given the option of
completing the questionnaire in the waiting room or taking it home and returning it via reply-paid
envelopes provided. This enabled participants to seek assistance from the research team or a
family member/friend, if required, to complete the questionnaire. This was important as some
participants had difficulty reading the questionnaire due to their vision impairment.
People examined and found to have normal vision from a population-based study, the Vision
Impairment Project (VIP)1, were sent an invitation letter, explanatory statement, the
questionnaire, a participation consent form and a reply paid envelope via post. Participants who
chose to participate were requested to return the completed questionnaire and signed consent
form in the reply-paid envelope.

AQoL-7D (Vision) Instrument: Overview, survey results and utility algorithms 4
Ethics approval for the study was granted by the Human Research and Ethics committee of the
RVEEH. Informed written consent was obtained from each participant.
Analysis: To reduce the item bank to the final structure, basic psychometric properties were
examined. In addition, exploratory factor (EFA), reliability, item response theory (IRT), and
structural equation modelling (SEM) analyses were conducted. The final step was to confirm the
structural equation model obtained in the pilot study with a second sample group. This second
group was recruited using the same methods as in the pilot study. That is, people with impaired
vision were recruited from the RVEEH, while those with normal vision were recruited from the VIP
study. SEM was used with this sample to confirm the construction sample model. Because there
are known difficulties with SEM ADF (asymptotic distribution free) models constructed in AMOS23
,
which may have provided misleading fit estimates, we pooled the two samples and ran a
confirming analysis.
Results: Results indicated that it was possible to preserve AQoL-6D and achieve a
psychometrically efficient instrument with the addition of one more dimension. The new vision
dimension (‘VisQoL’) consisted of the following six questions:
1. Does my vision make it likely I will injure myself (ie when moving around the house, yard,
neighbourhood or workplace)?
2. Does my vision make it difficult to cope with the demands in my life?
3. Does my vision affect my ability to have friendship?
4. Do I have difficulty organising any assistance I may need?
5. Does my vision make it difficult to fulfil the roles I would like to fulfil in my life (eg family
roles, work roles, community roles)?
6. Does my vision affect my confidence to join in everyday activities?
The questions and response categories are reproduced in an appendix. This dimension was
added to the AQoL-6D to create the AQoL-7D.
The full version of these instruments and the appendix VisQoL instrument (dimension 7, AQoL-
7D) may be found on the website: http://www.buseco.monash.edu.au/centres/che/aqol/.
The dimensions of the AQoL-7D are as follows:
1. Independent living
2. Relationships
3. Mental health
4. Coping
5. Pain
6. Senses
7. VisQoL
The final hierarchical structure of the instrument is shown in Figure 1.
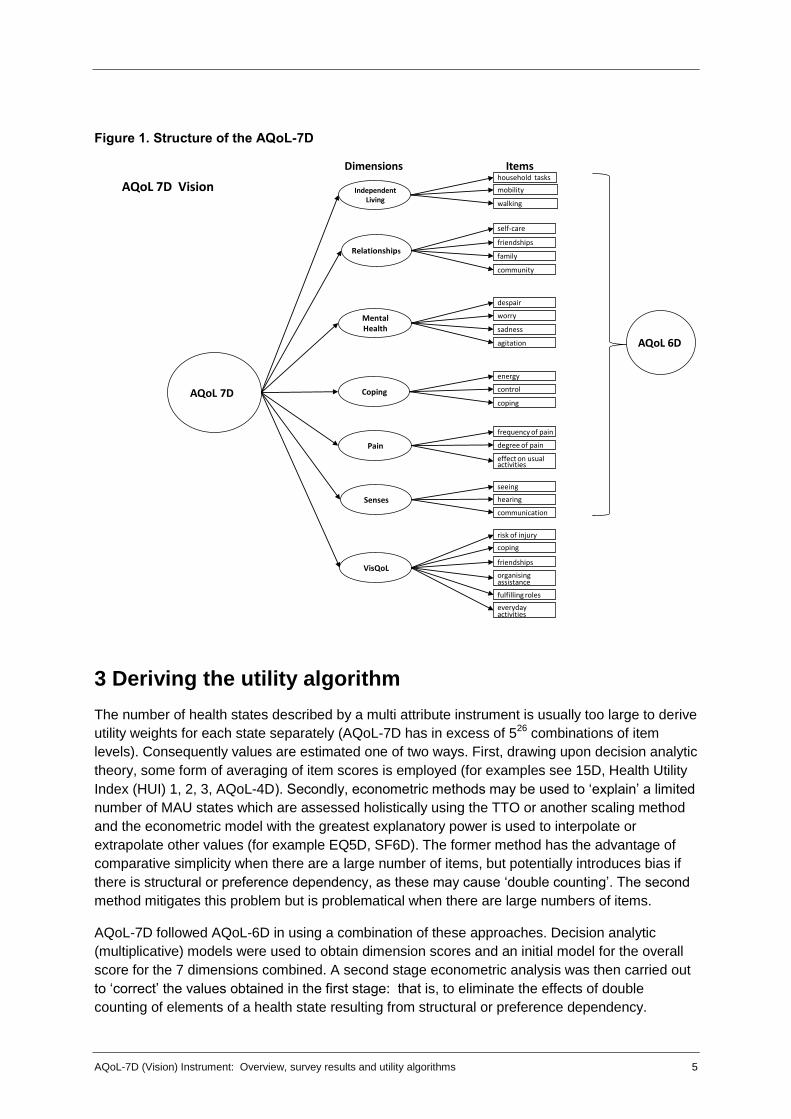
AQoL-7D (Vision) Instrument: Overview, survey results and utility algorithms 5
Figure 1. Structure of the AQoL-7D
3 Deriving the utility algorithm
The number of health states described by a multi attribute instrument is usually too large to derive
utility weights for each state separately (AQoL-7D has in excess of 526
combinations of item
levels). Consequently values are estimated one of two ways. First, drawing upon decision analytic
theory, some form of averaging of item scores is employed (for examples see 15D, Health Utility
Index (HUI) 1, 2, 3, AQoL-4D). Secondly, econometric methods may be used to ‘explain’ a limited
number of MAU states which are assessed holistically using the TTO or another scaling method
and the econometric model with the greatest explanatory power is used to interpolate or
extrapolate other values (for example EQ5D, SF6D). The former method has the advantage of
comparative simplicity when there are a large number of items, but potentially introduces bias if
there is structural or preference dependency, as these may cause ‘double counting’. The second
method mitigates this problem but is problematical when there are large numbers of items.
AQoL-7D followed AQoL-6D in using a combination of these approaches. Decision analytic
(multiplicative) models were used to obtain dimension scores and an initial model for the overall
score for the 7 dimensions combined. A second stage econometric analysis was then carried out
to ‘correct’ the values obtained in the first stage: that is, to eliminate the effects of double
counting of elements of a health state resulting from structural or preference dependency.
AQoL 7D
Independent Living
Relationships
Mental Health
Coping
AQoL 7D Vision
Pain
Senses
VisQoL
risk of injury
coping
friendships
organising assistance
fulfilling roles
everyday activities
household tasks
walking
friendships
family
community
despair
worry
sadness
energy
control
coping
mobility
frequency of pain
degree of pain
effect on usual activities
seeing
hearing
communication
self-care
agitation AQoL 6D
Dimensions Items
AQoL-7D (Vision) Instrument: Overview, survey results and utility algorithms 6
The multiplicative model used in the first step of the estimation procedure is shown in equations 1
and 2. The first equation, despite its apparent complexity is essentially the equation
U = U1.U2.U3.U4.U5.U6.U7 where Ui are the dimension scores and U the overall score. Equation 1
allows additional weights per dimension. Following decision analytic theory these weights are set
equal to the disutility scores of the item worst health states where disutility, DU, is measured on a
0-1 scale and DU = 1-U. Equation 2 produces the scaling constant, k, which serves the same
logical purpose as the requirement that weights add up to 1.00 in an additive model (a weighted
average).
In stage 2, a variety of econometric models were used: double log, linear, quadratic and higher
order. Two criteria were used to select the best fitting model; namely, the conventional R2
coefficient and, secondly, that the final model should give an unbiased prediction of the observed
multi attribute health states.
Since the AQoL-7D is the AQoL-6D plus an additional dimension, data were collected for the new
vision dimension multiplicative model. This was added to the multiplicative equations for AQoL-
6D and an overall multiplicative model for AQoL-7D created using AQoL-6D and VisQoL
dimension weights. MA states were collected which spanned all dimensions.
Data
Population sampling: The sample was drawn from a computer readable phone directory, using
a stratified, clustered two-stage design, similar to Hawthorne et al.’s (1999) procedures in the
AQoL-4D validation study. Based on the Australian Bureau of Statistics Socio-Economic Index for
Areas (SEIFA 2001) scores, postcodes were the primary sampling unit, with probability
proportionate to population size (to reduce the effect of socio-economic confounding). From these
postcode areas, telephone subscribers (18 years+) were randomly sampled (n=184). SEIFA
provides various measures to rank areas based on relative social and economic wellbeing and
was developed by the Australian Bureau of Statistics using data from the 2001 Census of
Population and Housing. Subscribers were contacted by letter and subsequently by telephone.
The use of post-codes as the primary sampling unit meant that informants would be fairly tightly
clustered, minimizing the travel costs. These procedures were also employed in AQoL-4D.
Patient sampling: 182 participants with impaired vision were recruited from hospitals and
rehabilitation agencies. Three levels of impairment were sampled: those with mild (<20/20-20/60);
moderate (<20/60-20/200) and severe (<20/200) impairment. People with vision <20/30 were
recruited from the Royal Victorian Eye and Ear Hospital (RVEEH), Vision Australia (VA) and
Retina Australia. Prior to their next appointments eligible participants from the RVEEH special
eye clinics were sent invitation letters to participate in the study. Peer workers and staff who
were vision impaired from VA were recruited via mail-outs, while clients were recruited directly
from VA day centres, training classes and support groups. Retina Australia included an invitation
letter to their members with their newsletter.
Survey design and field procedure: Prior to their interview, participants were sent a
confirmation letter with details of their interview, as well as a series of questionnaires. The
questionnaires sent to the participants included:
AQoL-4D (12 items) and AQoL-6D (20 items) questionnaires;
VisQoL questionnaire (6 items); and
Questions regarding demographics and health.

AQoL-7D (Vision) Instrument: Overview, survey results and utility algorithms 7
Utility weights were obtained using the TTO technique (as with AQoL-4D and 6D). Participants
were also required to complete rating scales (VAS) for the item responses for the six VisQoL
items and these were subsequently transformed into TTO equivalent scores using the
transformation algorithm produced for AQoL-6D (Richardson et al. 2004).
Results
Table 1 reports the number of respondents by age and gender and Table 2 the distribution of
their postcodes by SEIFA group. The age distribution of patients is heavily skewed towards the
elderly reflecting increasing macular degeneration with age. Public respondents were also
skewed towards the elderly but subsequent analysis found no significant response difference by
age.
Table 1. Age and gender distribution
Age Group Public Patients Grand
total Male Female Total Male Female Total
18 to 34 Years 6 7 13 9 9 18 31
35 to 44 Years 8 10 18 3 6 9 27
45 to 54 years 13 21 34 12 9 21 55
55 to 65 Years 15 39 54 17 16 33 87
66 Years + 22 37 59 35 63 98 157
Total 64 114 178 76 103 179 357
Missing n = 9
Table 2. SEIFA groups by location
SEIFA Group Public Patients Total
1 42 25 67
2 27 19 46
3 42 34 76
4 35 38 73
5 35 66 101
Total 181 182 363
Missing n = 3
Item response scores for each of the items of the vision dimension are reported in Table 3.
Response categories for non-vision dimensions are reported in Richardson et al. (2004).
The VAS scale used to calibrate items set the best and worst item responses at 100 and 0.00
respectively and Table 3 reports the value of intermediate states relative to these endpoints.
Patient and public respondents gave very similar responses. In half of the cases the difference
was significant at the 5 percent level but the absolute differences were very small – the largest
three differences being 8, 6 and 5 points on a 100 point scale.

AQoL-7D (Vision) Instrument: Overview, survey results and utility algorithms 8
Table 3. VAS scores for the 6 VisQoL items – on item best/worst scale (0-100)
Mean VAS score
Public Patient Total
Q1: It is most unlikely I will injure myself because of my vision- rs1a
100.0 100.0 100.0
There is a small chance- rs1b 85.99 83.99 85.00
There is a good chance- rs1c 55.07 55.26 55.16
It is very likely -rs1d 29.70 30.26 29.98
Almost certainly my vision will cause me to injure myself- rs1e
.00 .00 .00
Q2: Has no affect on my ability to cope with the demands in my life- rs2a
100.0 100.0 100.0
Does not make it difficult at all to cope with the demands in my life -rs2b
96.25 96.46 96.35
Makes it a little difficult to cope- rs2c vis dim 79.89 77.29 78.59
Makes it moderately difficult to cope- rs2d 57.77 56.02 56.90
Makes it very difficult to cope- rs2e 26.26 23.05 24.67
Makes me unable to cope at all-rs2f .00 .00 .00
Q3: My vision makes having friendships easier -rs3a 100.0 100.0 100.0
Has no effect on my friendships-rs3b 96.45 97.59 97.02
Makes friendships more difficult- rs3c 72.45 67.63 70.05
Makes friendships a lot more difficult-rs3d 46.83 42.69 44.77
Makes friendships extremely difficult- rs3e 26.08 20.82 23.46
Makes me unable to have friendships-rs3f .00 .00 .00
Q4: I have no difficulty organising any assistance- rs4a
100.0 100.0 100.0
I have a little difficulty organising assistance- rs4b 87.24 83.03 85.14
I have moderate difficulty organising assistance- rs4c vis
65.91 60.21 63.08
I have a lot of difficulty organising assistance- rs4d 34.32 26.13 30.25
I unable to organising assistance at all- rs4e .00 .00 .00
Q5: My vision has no effect on my ability to fulfil these roles- rs5a
100.0 100.0 100.0
Does not make it difficult to fulfil these roles-rs5b 96.66 98.21 97.43
Make it a little difficult to fulfil these roles- rs5c 79.53 77.54 78.54
Make it moderately difficult to fulfil these roles -rs5d
56.24 54.59 55.42
Make it very difficult to fulfil these roles-rs5e 28.85 23.28 26.08
My vision means I am unable to fulfil these roles-rs5f
.00 .00 .00
Q6: My vision makes me more confident to join in everyday activities- rs6a
100.0 100.0 100.0
Has no effect on my confidence to join in everyday activities-rs6b
96.82 98.64 97.72
Makes me feel a little less confident- rs6c 81.63 78.70 80.17
Makes me feel moderately less confident- rs6d 60.69 56.40 58.56
Makes me feel a lot less confident- rs6e 35.53 27.07 31.32
Makes me not confident at all- rs6f .00 .00 .00

AQoL-7D (Vision) Instrument: Overview, survey results and utility algorithms 9
Item worst responses were valued on a scale with endpoints defined by the best and worst health
states. Thus respondents were asked to consider a health state consisting of an item at its worst
level with other items in the dimension at their best level. Evaluation was carried out using the
TTO methodology with 10 years in the intermediate state compared with varying times in the best
and worst states. (For details of the implementation of the TTO see Iezzi and Richardson (2009).
Results are shown in Table 4.)
Table 4. Item worst TTO scores on a 10 point best health-death scale
VisQoL items
Mean TTO SE
Sig
Pu
bli
c
(N=
18
4)
Pa
tie
nts
(N=
18
2)
To
tal
(N=
36
6)
Pu
bli
c
Pa
tie
nts
To
tal
1. Does my vision make it likely I will injure myself? 7.12 7.49 7.30 .17 .17 .12 .120
2. Does my vision make it difficult to cope with the demands in my life?
6.17 6.43 6.30 .20 .18 .14 .335
3. Does my vision affect my ability to have friendships?
6.84 7.00 6.92 .21 .17 .14 .552
4. Do I have difficulty organising any assistance I may need?
6.97 7.09 7.03 .19 .17 .13 .629
5. Does my vision make it difficult to fulfil the roles I would like to fulfil in life?
6.57 6.86 6.71 .20 .18 .13 .276
6. Does my vision affect my confidence to join in everyday activities?
7.18 7.20 7.19 .19 .17 .13 .946
As with item responses, patient and public scores are very similar, differing by an average of 0.2
and a maximum of 0.37 points on a 10 point scale. The result is perhaps unexpected as,
according to the conventional wisdom, patients evaluate states they are familiar with more highly
due to their experience with adaptation. Despite the statistical insignificance of individual
differences, however, every patient’s score is greater than the corresponding public score and
together the 6 results allow a rejection of the null hypothesis that the two populations have
identical scores. However the differences are small.
The item weights (wi) along with the scaling constant (k) in equation 3 results in the dimension
algorithm shown in equation 2.
U = U1 * U2 * U3*…* U7 (1)
111
1
ijii
n
i
xDUkwk
DU
(2)
where
1)1(
1
i
n
ikwk
(3)
DUU 1 (4)

AQoL-7D (Vision) Instrument: Overview, survey results and utility algorithms 10
This multiplicative model was applied at two levels; first to combine items into dimensions and
second to combine dimensions into the overall AQoL-7D score.
Second stage adjustment
Data: In the second stage ‘correction’ independently assessed MA health state utilities were
explained econometrically using the first stage estimate and dimension scores as independent
variables. In principle, MA states could be constructed using experimental design to achieve a
statistically efficient coverage of dimensions. In practice this produces incoherent health states
(bedridden, dead but independent and coping, fully satisfied). Consequently states were
constructed logically using a criteria of (i) coherence; (ii) simplicity; (iii) multi dimensionality.
Simplicity was included to minimise the cognitive load on respondents. States were generally
constructed, therefore, in which several dimensions did not contribute to disutility. The states are
defined in an appendix and were evaluated during the interview using the TTO technique.
Following a procedure developed for AQoL-6D a number of the most serious MA states were
decomposed to create additional MA ‘pseudo’ states. For example, an MA state with dimension
scores (1, a, b, 1, c, 1, 1, d) would be used to define two states (1, 1, b, 1, c, 1, 1, 1) and (1, a, 1,
1, 1, 1, 1, d). The overall MA utility derived from the TTO interview would be divided between the
two new states.
Results: In total, 28 independent health states were employed and 1251 TTO ‘observations’
elicited, an average of 45 observations per health state. Figure 2 is the frequency distribution of
individual TTO scores for the 28 states. An additional 37 pseudo health states were constructed,
giving a total of 65 health states.
Figure 2. Frequency distribution of TTO scores (n = 1665)
Figures 3 and 4 are scatterplots of the mean (MA) TTO utilities for the derived 44 and total 72
health states against the multiplicative values predicted for them (Mult-AQoL). The OLS linear
relationship between these strongly suggests what subsequent analysis revealed, that the best

AQoL-7D (Vision) Instrument: Overview, survey results and utility algorithms 11
statistical fit of the data is linear. The simple plots also indicate the degree of ‘double counting’ of
disutilities in the multiplicative model. If all items and dimensions were orthogonal – elements of
poor health never correlated – then the slope of the linear relationship would be 45 degrees
(TTO = 0.00 + 1.00 Mult-AQoL). Deviation from this indicates the high correlation between
elements of health.
Figure 3. TTO Disutilities vs Mult-AQoL (Pseudo E-type)
Figure 4. TTO Disutilities vs Mult-AQoL (all data)

AQoL-7D (Vision) Instrument: Overview, survey results and utility algorithms 12
The best fitting linear models are reported in Table 5 in which observed disutilities, DU,
(measured by TTO) are explained by the multiplicative AQoL and its dimensions. Mean values of
health states were used as observations to overcome the common problem of extreme non
normality of the data and particularly the number of observations where respondents would not
trade (see TTO score of 10 in Figure 2). As noted, each observation was therefore the result of
an average of 45 individual responses. A logical requirement of models is that the regression line
pass through (0.00, 0.00) – the AQoL all best health state must correspond with a predicted DU
of 0. (One consequence of the suppression of the constant is an inflation of the R2.)
Table 5. Regression of mean TTO on predicted (multiplicative) AQoL
Dependent
mean TTO
Independent
Public Patient Total
b t b t b t
AQoL (Mult) 0.68 (10.8) .65 (11.9) .71 (21.2)
Dim 1
Dim 2 -0.16 (-3.07) -0.08 (-1.5) -0.11 (-4.4)
Dim 3
Dim 4 -0.13 (-2.3) -0.02 ns -0.07 (-2.9)
Dim 5 -0.01 ns -0.12 (-2.1) -0.09 (-2.9)
Dim 6
Dim 7
-0.04 ns -0.10 (-1.76) -0.07 (-2.6)
RMS 116 2.66
R2 (Pseudo) 0.95 0.93 0.95
RMSE 0.06 0.05 0.06
Dependent
mean TTO
Independent
n 30 35 65
TTO Pred 1.00 1.00 0.78 (13.1)
Constant 0.00 0.00 3 0.05 (3.0)
R2 0.73 0.64 0.73
RMSE 0.06 0.07 0.05
F 79 58 171
Non linear models did not fit the data, possibly because there are no observed health states with
an average DU above 0.5. This means that extrapolating beyond this level of DU becomes
increasingly unreliable. However, there are probably few health states which, in practice people
would sacrifice half their remaining life to avoid.
Test of Bias
In the best fitting equations with the total population, total, dimension 2, 4, 5 and 6 were
statistically significant. Consequently these were retained in the equations for the separate public
and patient populations. Both of these were estimated from data obtained exclusively from public
and patient respondents respectively.
The second half of Table 5 reports a second regression for each of the initial regressions. In this
TTO (pred) – the predicted value of the TTO – is itself used to predict the observed TTO. (The
results need not be close, in part because of the suppression of the constant in the derivation of
TTO pred.) As it is this predicted value which is to the outcome of the overall algorithm, it is
important that it represents an unbiased estimate of the observed TTO. Results for the three
datasets are reproduced in Figures 5, 6, and 7.

AQoL-7D (Vision) Instrument: Overview, survey results and utility algorithms 13
Figure 5. TTO Disutilities Observed vs TTO Predicted (public)
TTO (Obs) = 0.00 + 0.999 TTO (Pred)
R2 = 0.74, F = .79
RMSE = 0.06
Figure 6. TTO Disutilities Observed vs TTO Predicted (patients)
TTO (Obs) = -0.002 + 1.000 TTO (Pred)
R2 = 0.63, F = 171
RMSE = 0.05

AQoL-7D (Vision) Instrument: Overview, survey results and utility algorithms 14
Figure 7. TTO Disutilities Observed vs TTO Predicted (total)
TTO (Obs) = 0.05 + 0.78 TTO (Pred)
R2 = 0.73 F = 171
RMSE = 0.05
These show that the models for the two separate populations produce estimates which are
unbiased. The model resulting from combining the two groups produces a good but imperfect
estimate. The root mean error (RME) is only 0.05 but an increase in the predicted TTO of 0.1
corresponds with an increase in the observed TTO of only 0.078; that is, the predicted
overestimates the true increase by about 28 percent (1/0.78). This implies that better estimates
are produced with separate models for the two populations.
Decomposition of utilities
Population norms were constructed from 366 survey respondents. As norms they are limited by
the sample size which in some age cohorts are small (the lowest being 6 males aged above 55 in
the population sample). Results are shown in Table 6. Patients generally had lower utilities than
the public, with anomalies for the two smallest male cohorts. Overall males had higher utilities
except for the oldest cohorts. The pattern with age was similar to other AQoL profiles: an initial
decline in utility was followed by an increase in older age groups, attributable to the improved
social and mental health states of the elderly.

AQoL-7D (Vision) Instrument: Overview, survey results and utility algorithms 15
Table 6. AQoL-7D Norms for Age Groups (n = 8)
Male Female Total
Patient N Utility N Utility N Utility
Age below 24 16 0.748 20 0.728 36 0.737
Age 25-34 16 0.753 12 0.710 28 0.730
Age 35-44 17 0.700 13 0.712 30 0.705
Age 45-54 20 0.728 26 0.715 46 0.720
Age 55 up 9 0.771 33 0.762 42 0.764
Public
Age below 24 20 0.757 24 0.758 44 0.758
Age 25-34 11 0.708 28 0.734 39 0.728
Age 35-44 19 0.749 35 0.736 54 0.741
Age 45-54 11 0.750 20 0.733 31 0.739
Age 55 up 6 0.710 8 0.777 14 0.746
Total
Age below 24 36 0.752 44 0.743 80 0.747
Age 25-34 27 0.730 40 0.722 67 0.729
Age 35-44 36 0.724 48 0.724 84 0.723
Age 45-54 31 0.739 46 0.724 77 0.729
Age 55 up 15 0.740 41 0.769 56 0.755
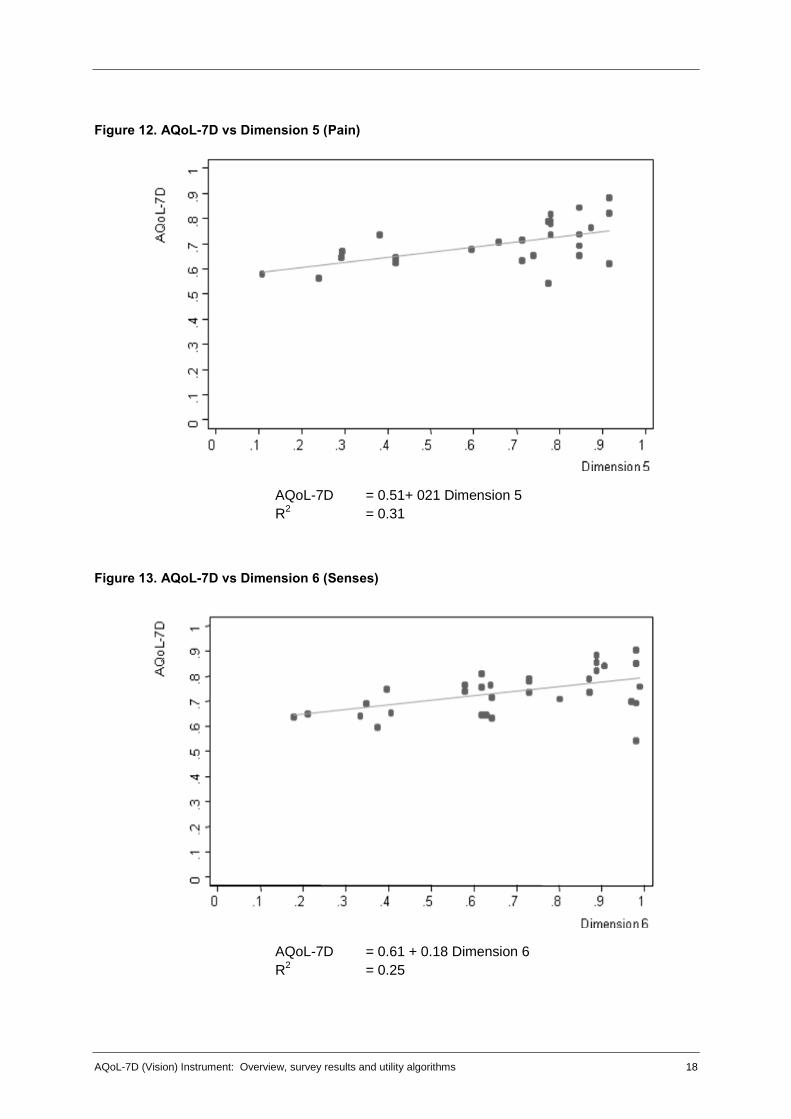
Table 7 reports the association between dimension scores and overall AQoL-7D utility for each of
the 7 dimensions. The association is depicted in Figures 8 to14. An important qualification with
these results is that they are derived from the health states described earlier and are partial
relationships; that is, they are not a ‘pure’ reflection of dimension importance. The health states
are combinations of dimensions and with a relatively small sample of states an increasing
dimension disutility could be offset, by chance, by a reduced disutility in a second dimension.
Table 7. Regression results: AQoL-7D on dimension scores
Dimension n (health states) Constant b R 2
Ind. Living 25 0.59 0.2 0.39
Relationships 27 0.6 0.2 0.24
Mental health 27 0.57 0.26 0.32
Coping 27 0.61 0.21 0.21
Pain 26 0.57 2.1 0.31
Senses 35 0.61 0.18 0.25
Visqol 27 1.44 0.48 0.36
Subject to this qualification the results indicate a similar change in AQoL-7D utilities with a
change in dimension scores. The b coefficient on the dimension score varies from 0.18 to 0.26 for
all dimensions except vision where it is 0.4 indicating, prima facie, a greater contribution of vision
related QoL to a change in AQoL-7D utilities amongst these health states than from other
dimensions. The correlation between dimension and AQoL scores is greatest for independent
living followed by vision (R2 = 0.39; 0.36 respectively) but this is, in part, an artefact of the spread
of the health states.

AQoL-7D (Vision) Instrument: Overview, survey results and utility algorithms 16
Figure 8. AQoL-7D vs Dimension 1 (independent living)
AQoL-7D = 0.59 + 0.20 Dim 1
R2 = 0.39
Figure 9. AQoL-7D vs Dimension 2 (Relationships)
AQoL-7D = 0.60 + 0.19 Dimension 2
R2 = 0.24

AQoL-7D (Vision) Instrument: Overview, survey results and utility algorithms 17
Figure 10. AQoL-7D vs Dimension 3 (Mental Health)
AQoL-7D = 0.57 + 0.27 Dimension 3
R2 = 0.32
Figure 11. AQoL-7D vs Dimension 4 (Coping)
AQoL-7D = 0.61 + Dimension 4
R2
= 0.21
AQoL-7D (Vision) Instrument: Overview, survey results and utility algorithms 18
Figure 12. AQoL-7D vs Dimension 5 (Pain)
AQoL-7D = 0.51+ 021 Dimension 5
R2 = 0.31
Figure 13. AQoL-7D vs Dimension 6 (Senses)
AQoL-7D = 0.61 + 0.18 Dimension 6
R2
= 0.25
AQoL-7D (Vision) Instrument: Overview, survey results and utility algorithms 19
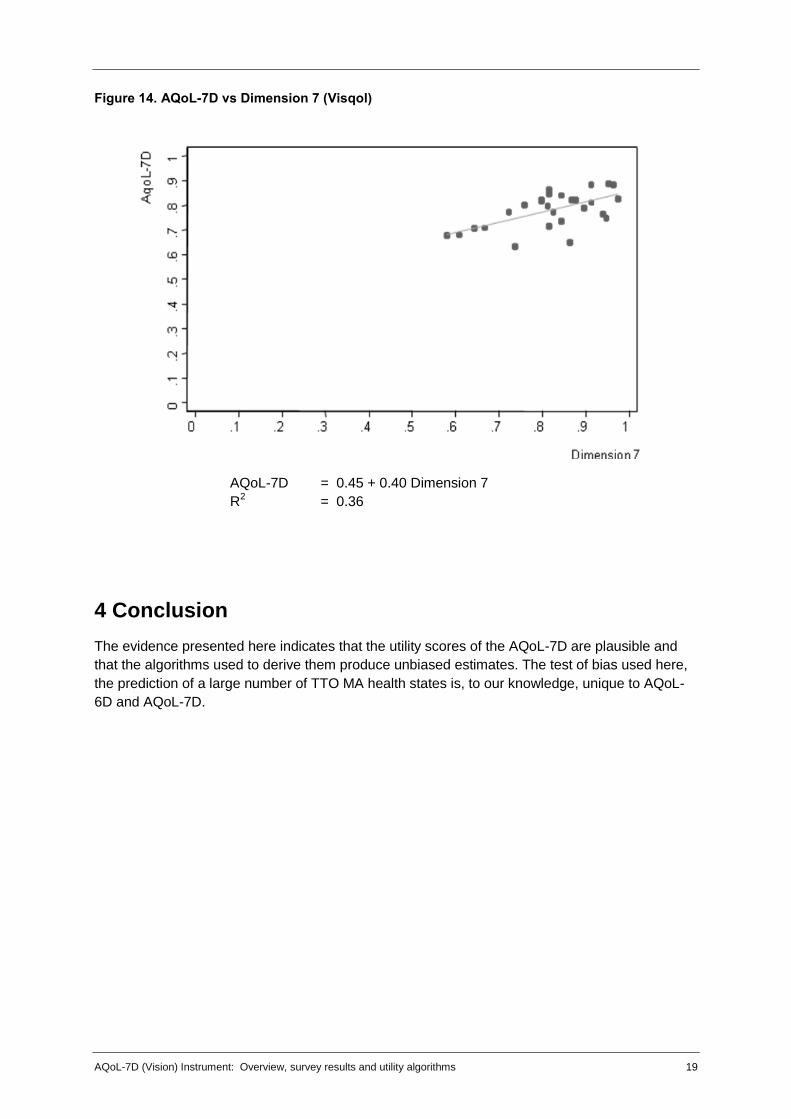
Figure 14. AQoL-7D vs Dimension 7 (Visqol)
AQoL-7D = 0.45 + 0.40 Dimension 7
R2
= 0.36
4 Conclusion
The evidence presented here indicates that the utility scores of the AQoL-7D are plausible and
that the algorithms used to derive them produce unbiased estimates. The test of bias used here,
the prediction of a large number of TTO MA health states is, to our knowledge, unique to AQoL-
6D and AQoL-7D.

AQoL-7D (Vision) Instrument: Overview, survey results and utility algorithms 20
References
AIHW (2007). A guide to Australian eye health data. Canberra, Australian Institute of Health and
Welfare.
Hawthorne, G., J. Richardson, et al. (1999). "The Assessment of Quality of Life (AQoL)
instrument: A psychometric measure of health related quality of life." Quality of Life
Research 8: 209-224.
Iezzi, A. and J. Richardson (2009). Measuring Quality of Life at the CHE: Description of
instruments, interview props and their administration, Research Paper 41. Melbourne,
Centre for Health Ecoomics, Monash University.
McCarty, C. A., C. L. Fu, et al. (2002). "Predictors of falls in the Melbourne Visual Impairment
Project." Aust NZ J Public Health 26(2): 116-119.
Misajon, R., G. Hawthorne, et al. (2005). "Vision and quality of life: The development of a utility
measure." Investigative Ophthalmology & Visual Science 46(11): 4007-4015.
Peacock, S., R. Misajon, et al. (2008). "Vision and quality of life: Development of methods for the
VisQoL vision related utility instrument." Ophthalmic Epidemiology 15(4): 218-223.
Richardson, J., S. Peacock, et al. (2004). The Assessment of Quality of Life (AQoL) 2 instrument:
Derivation of the scaling weights using a multiplicative model and econometric second
stage correction. Working Paper 142. Melbourne, Centre for Health Economics, Monash
University: http://www.buseco.monash.edu.au/centres/che/pubs/wp142.pdf.
Taylor, H. R., C. A. McCarty, et al. (2000). "Vision impairment predicts five year mortality." Trans
Am Ophthalmol Soc 98: 91-96.
Wang , J. J., P. Mitchell, et al. (2001). "Incidence of nurisng home placement in a defined
community." Medical Journal of Australia 174: 271-275.
West, S. K., B. Munoz, et al. (1997). "Function and visual impairment in a population-based study
of older adults." Invest Ophthalmol Vis Sci 38: 72-82.

AQoL-7D (Vision) Instrument: Overview, survey results and utility algorithms 21
Appendix A. VisQoL instrument (dimension 7 of the AQoL-7D)
Q1 Does my vision make it likely I will injure myself (i.e. when moving around the house, yard,
neighbourhood, or workplace)?
It is most unlikely I will injure myself because of my vision
There is a small chance
There is a good chance
It is very likely
Almost certainly my vision will cause me to injure myself Q2 Does my vision make it difficult to cope with the demands in my life? My vision:
has no affect on my ability to cope with the demands in my life
does not make it difficult at all to cope with the demands in my life
makes it a little difficult to cope
makes it moderately difficult to cope
makes it very difficult to cope
makes me unable to cope at all Q3 Does my vision affect my ability to have friendships? My vision:
makes having friendships easier
has no effect on my friendships
makes friendships more difficult
makes friendships a lot more difficult
makes friendships extremely difficult
makes me unable to have friendships
Not applicable; I have no friendships Q4 Do I have difficulty organising any assistance I may need:
I have no difficulty organising any assistance I may need
I have a little difficulty organising assistance
I have moderate difficulty organising assistance
I have a lot of difficulty organising assistance
I am unable to organise assistance at all
Not applicable; I never need to organise assistance Q5 Does my vision make it difficult to fulfil the roles I would like to fulfil in life (e.g. family roles, work
roles, community roles etc)? My vision:
has no effect on my ability to fulfil these roles
does not make it difficult to fulfil these roles
makes it a little difficult to fulfil these roles
makes it moderately difficult to fulfil these roles
makes it very difficult to fulfil these roles
means I am unable to fulfil these roles Q6 Does my vision affect my confidence to join in everyday activities? My vision:
makes me more confident to join in everyday activities
has no effect on my confidence to join in everyday activities
makes me feel a little less confident
makes me feel moderately less confident
makes me feel a lot less confident
makes me not confident at all

AQoL-7D (Vision) Instrument: Overview, survey results and utility algorithms 22
Appendix B. Definition of MA health states and Pseudo states
Key: E = Health states used in TTO interviews;
PS1, PS2 = derivative Pseudo health states
Ind Liv Rel Mental Health Coping Pain Senses Visqol
E4 1 1 1 1 1 1 1 1 1 1 1 1 4 3 2 3 3 3 4 1 1 1 1 1 1 1
E4ps1 1 1 1 1 1 1 1 1 1 1 1 1 1 3 2 3 1 3 1 1 1 1 1 1 1 1
E4ps2 1 1 1 1 1 1 1 1 1 1 1 1 4 1 1 1 3 1 4 1 1 1 1 1 1 1
E5 1 1 1 1 1 2 2 1 1 3 3 1 1 1 1 1 1 2 1 2 1 1 1 1 1 1
E5ps1 1 1 1 1 1 1 2 1 1 3 1 1 1 1 1 1 1 2 1 1 1 1 1 1 1 1
E5ps2 1 1 1 1 1 2 1 1 1 1 3 1 1 1 1 1 1 1 1 2 1 1 1 1 1 1
E6 1 1 1 1 3 3 1 1 4 3 1 4 4 1 3 3 4 1 1 1 1 1 1 1 1 1
E6ps1 1 1 1 1 3 1 1 1 1 3 1 1 4 1 3 1 4 1 1 1 1 1 1 1 1 1
E6ps2 1 1 1 1 1 3 1 1 4 1 1 4 1 1 1 3 1 1 1 1 1 1 1 1 1 1
E7 1 3 3 1 1 1 1 1 1 2 2 1 1 1 2 2 2 1 4 3 1 1 1 1 1 1
E7ps1 1 3 1 1 1 1 1 1 1 2 1 1 1 1 2 1 2 1 1 3 1 1 1 1 1 1
E7ps2 1 1 3 1 1 1 1 1 1 1 2 1 1 1 2 2 1 1 4 1 1 1 1 1 1 1
E8 1 1 5 1 1 1 1 1 3 4 1 4 1 3 1 1 1 1 1 1 1 1 1 1 1 1
E8ps1 1 1 1 1 1 1 1 1 3 1 1 1 1 3 1 1 1 1 1 1 1 1 1 1 1 1
E8ps2 1 1 5 1 1 1 1 1 1 4 1 4 1 1 1 1 1 1 1 1 1 1 1 1 1 1
E10 1 1 5 1 1 3 3 1 1 1 1 1 4 4 1 1 1 4 5 1 1 1 1 1 1 1
E10ps1 1 1 1 1 1 1 3 1 1 1 1 1 4 1 1 1 1 4 1 1 1 1 1 1 1 1
E10ps2 1 1 5 1 1 3 1 1 1 1 1 1 1 4 1 1 1 1 5 1 1 1 1 1 1 1
E12 1 1 1 1 4 1 3 1 4 1 3 1 1 1 1 1 1 2 2 1 1 1 1 1 1 1
E12ps1 1 1 1 1 1 1 3 1 1 1 3 1 1 1 1 1 1 2 1 1 1 1 1 1 1 1
E12ps2 1 1 1 1 4 1 1 1 4 1 1 1 1 1 1 1 1 1 2 1 1 1 1 1 1 1
E13 1 1 1 1 1 2 2 4 1 4 1 1 3 3 1 2 1 1 1 1 1 1 1 1 1 1
E13ps1 1 1 1 1 1 2 1 1 1 4 1 1 3 1 1 1 1 1 1 1 1 1 1 1 1 1
E13ps2 1 1 1 1 1 1 2 4 1 1 1 1 1 3 1 2 1 1 1 1 1 1 1 1 1 1
E14 4 5 5 4 1 1 1 1 4 1 3 1 1 1 2 2 1 2 1 1 1 1 1 1 1 1
E14ps1 1 5 1 4 1 1 1 1 4 1 1 1 1 1 2 1 1 1 1 1 1 1 1 1 1 1
E14ps2 4 1 5 1 1 1 1 1 1 1 3 1 1 1 1 2 1 2 1 1 1 1 1 1 1 1
E16 4 5 5 4 3 2 1 1 1 1 1 1 1 1 3 3 1 1 1 1 1 1 1 1 1 1
E16ps1 4 1 5 1 3 1 1 1 1 1 1 1 1 1 3 1 1 1 1 1 1 1 1 1 1 1
E16ps2 1 5 1 4 1 2 1 1 1 1 1 1 1 1 1 3 1 1 1 1 1 1 1 1 1 1
E17 2 3 2 1 4 1 2 1 1 1 1 3 4 2 1 1 1 1 5 3 1 1 1 1 1 1
E17ps1 1 3 1 1 1 1 2 1 1 1 1 1 4 2 1 1 1 1 1 3 1 1 1 1 1 1
E17ps2 2 1 2 1 4 1 1 1 1 1 1 3 1 2 1 1 1 1 5 1 1 1 1 1 1 1
E18 1 1 1 1 3 3 3 1 1 1 1 1 1 1 1 1 1 4 5 3 1 1 1 1 1 1
E18ps1 1 1 1 1 3 3 1 1 1 1 1 1 1 1 1 1 1 4 1 3 1 1 1 1 1 1
E18ps2 1 1 1 1 1 1 3 1 1 1 1 1 1 1 1 1 1 1 5 1 1 1 1 1 1 1
E19 2 3 2 1 1 1 1 3 1 4 1 4 3 1 1 1 1 1 1 1 1 1 1 1 1 1
E19ps1 2 1 2 1 1 1 1 3 1 1 1 1 3 1 1 1 1 1 1 1 1 1 1 1 1 1
E19ps2 2 3 1 1 1 1 1 1 1 4 1 4 1 1 1 1 1 1 1 1 1 1 1 1 1 1
E20 1 1 1 1 1 1 1 1 1 1 1 1 1 1 2 1 3 1 4 2 3 1 1 3 1 1
E20ps1 1 1 1 1 1 1 1 1 1 1 1 1 1 1 2 1 1 1 1 2 1 1 1 3 1 1
E20ps2 1 1 1 1 1 1 1 1 1 1 1 1 1 1 1 1 3 1 4 1 3 1 1 1 1 1
E21 4 1 5 1 1 1 1 1 1 1 1 1 1 1 1 1 1 1 1 1 2 1 1 1 1 3
E21ps1 4 1 1 1 1 1 1 1 1 1 1 1 1 1 1 1 1 1 1 1 1 1 1 1 1 3
E21ps2 1 1 5 1 1 1 1 1 1 1 1 1 1 1 1 1 1 1 1 1 2 1 1 1 1 1
E22 1 1 1 1 2 3 3 1 1 1 1 1 1 1 1 1 1 1 1 1 1 1 1 1 5 5
E22ps1 1 1 1 1 2 3 1 1 1 1 1 1 1 1 1 1 1 1 1 1 1 1 1 1 1 5
E22ps2 1 1 1 1 2 1 3 1 1 1 1 1 1 1 1 1 1 1 1 1 1 1 1 1 5 1
E23 1 1 1 1 1 1 1 1 1 1 1 1 1 1 1 1 1 1 5 4 1 3 1 3 1 1
E23ps1 1 1 1 1 1 1 1 1 1 1 1 1 1 1 1 1 1 1 1 4 1 3 1 1 1 1
E23ps2 1 1 1 1 1 1 1 1 1 1 1 1 1 1 1 1 1 1 5 1 1 1 1 3 1 1
E24 3 3 1 1 1 1 1 1 1 1 1 1 1 1 2 1 3 1 4 2 1 1 4 1 4 1
E24ps1 3 1 1 1 1 1 1 1 1 1 1 1 1 1 2 1 1 1 1 2 1 1 1 1 4 1
E24ps2 1 3 1 1 1 1 1 1 1 1 1 1 1 1 1 1 3 1 4 1 1 1 4 1 1 1
E25 1 1 1 1 1 1 1 1 1 1 1 3 3 1 1 1 1 1 3 2 1 1 4 4 1 1
E25ps1 1 1 1 1 1 1 1 1 1 1 1 3 1 1 1 1 1 1 1 2 1 1 1 4 1 1
E25ps2 1 1 1 1 1 1 1 1 1 1 1 1 3 1 1 1 1 1 3 1 1 1 4 1 1 1
E26 1 1 1 1 1 1 1 1 2 3 1 1 1 1 1 1 1 1 1 1 4 5 1 1 1 1
E26ps1 1 1 1 1 1 1 1 1 2 1 1 1 1 1 1 1 1 1 1 1 4 1 1 1 1 1
E26ps2 1 1 1 1 1 1 1 1 1 3 1 1 1 1 1 1 1 1 1 1 1 5 1 1 1 1
E27 1 1 1 1 1 1 1 1 1 1 1 1 4 4 1 1 1 1 1 1 1 4 1 1 3 1
E27ps1 1 1 1 1 1 1 1 1 1 1 1 1 1 4 1 1 1 1 1 1 1 4 1 1 1 1
E27ps2 1 1 1 1 1 1 1 1 1 1 1 1 4 1 1 1 1 1 1 1 1 1 1 1 3 1
E28 1 1 1 1 1 1 1 1 1 1 1 1 1 1 1 2 3 1 1 1 4 1 1 4 1 1
E28ps1 1 1 1 1 1 1 1 1 1 1 1 1 1 1 1 2 1 1 1 1 4 1 1 1 1 1
E28ps2 1 1 1 1 1 1 1 1 1 1 1 1 1 1 1 1 3 1 1 1 1 1 1 4 1 1

AQoL-7D (Vision) Instrument: Overview, survey results and utility algorithms 23
Appendix C. Multiplicative Disutility Equations: AQoL-7D
Dimensions
General Formula 0 ; 111
1 dii
n
id kDUkwk
DU
Independent
Living 43211 77.0162.0158.0.138.01102.1 dudududuDU
Social and
Family 7652 47.0165.0.159.01108.1 dududuDU
Mental Health 1110983 70.0164.0166.0.163.01102.1 dudududuDU
Coping 1413214 72.0160.0.139.01108.1 dududuDU
Pain 1716155 57.0157.0169.01108.1 dududuDU
Senses 2019186 51.0139.0149.01118.1 dududuDU
Vision )(1 0.31
1 0.23 )]
AQoL General Formula 0 ; 11 kDUxkwk
WDU iddAQoL
Overall Quality of Life Score for VisQoL