UTILITY OF DOPPLER MYOCARDIAL IMAGING, CARDIAC BIOMARKERS AND CLONAL IMMUNOGLOBULIN GENES TO ASSESS...
23
Utility of Doppler Myocardial Imaging, Cardiac Biomarkers and Clonal Immunoglobulin Genes to Assess Left Ventricular Performance and Stratify Risk Following Peripheral Blood Stem Cell Transplantation in Patients with Systemic Light Chain Amyloidosis (AL) Diego Bellavia, M.D., Ph.D., M.S. 1,* , Roshini S. Abraham, PhD 2,3,5,*,^ , Patricia A. Pellikka, M.D. 1 , Angela Dispenzieri, M.D. 3 , John C. Burnett Jr., M.D. 4 , Ghormallah B. Al-Zahrani, M.B.B.S. 1 , Tammy D. Green 1 , Michelle K. Manske, M.S. 5 , Morie A. Gertz, M.D. 3 , Fletcher A. Miller Jr., M.D. 1 , and Theodore P. Abraham, M.D. 1,6 1 Division of Cardiovascular Diseases, Dept of Medicine, Mayo Clinic, Rochester, MN 2 Division of Clinical Biochemistry and Immunology, Dept of Laboratory Medicine and Pathology, Mayo Clinic, Rochester, MN 3 Division of Hematology, Dept of Medicine, Mayo Clinic, Rochester, MN 4 Cardiorenal Research Laboratory, Division of Cardiovascular Diseases, Mayo Clinic College of Medicine, Rochester, MN 5 Hematology Research Laboratory, Division of Hematology, Mayo Clinic, Rochester, MN 6 Division of Cardiovascular Diseases, John’s Hopkins University, Baltimore, MD Abstract Cardiac dysfunction is a well-recognized complication of light chain amyloidosis (AL). Autologous stem cell transplant (auto-SCT) has emerged as a successful treatment modality for AL patients. In this study, we examined the effect of clonal immunoglobulin light chain genes (VL), which encodes the immunoglobulin light chain protein that ultimately forms amyloid, on cardiac function, in the context of auto-SCT and its impact on overall survival. Longitudinal Doppler myocardial imaging parameters along with cardiac biomarkers were used to assess for cardiac function pre and post auto-SCT. VL gene analysis revealed that Vλ genes, in particular VλVI, were associated with worse cardiac function parameters than Vκ genes. Clonal VL genes appeared to have an impact on left ventricular (LV) function post-transplant and also influenced mortality, with specific VL gene families associated with lower survival. Another key predictor of mortality in this report was change in tricuspid regurgitant flow velocity following auto-SCT. Correlations were also observed between systolic strain rate, systolic strain and VL genes associated with amyloid formation. In summary, clonal VL gene usage influences global cardiac © 2011 American Society of Echocardiography. Published by Mosby, Inc. All rights reserved. ^ Address correspondence to: Dr. Roshini S. Abraham, Dept of Laboratory Medicine and Pathology, Mayo Clinic, 200 1 st St SW, Rochester, MN-55905, Ph: 507-266-9292; Fax: 507-266-4088; [email protected]. * These 2 authors contributed equally to this manuscript This is a PDF file of an unedited manuscript that has been accepted for publication. As a service to our customers we are providing this early version of the manuscript. The manuscript will undergo copyediting, typesetting, and review of the resulting proof before it is published in its final citable form. Please note that during the production process errors may be discovered which could affect the content, and all legal disclaimers that apply to the journal pertain. NIH Public Access Author Manuscript J Am Soc Echocardiogr. Author manuscript; available in PMC 2012 April 1. Published in final edited form as: J Am Soc Echocardiogr. 2011 April ; 24(4): 444–454.e2. doi:10.1016/j.echo.2011.01.003. NIH-PA Author Manuscript NIH-PA Author Manuscript NIH-PA Author Manuscript
Transcript of UTILITY OF DOPPLER MYOCARDIAL IMAGING, CARDIAC BIOMARKERS AND CLONAL IMMUNOGLOBULIN GENES TO ASSESS...
Utility of Doppler Myocardial Imaging, Cardiac Biomarkers andClonal Immunoglobulin Genes to Assess Left VentricularPerformance and Stratify Risk Following Peripheral Blood StemCell Transplantation in Patients with Systemic Light ChainAmyloidosis (AL)
Diego Bellavia, M.D., Ph.D., M.S.1,*, Roshini S. Abraham, PhD2,3,5,*,^, Patricia A. Pellikka,M.D.1, Angela Dispenzieri, M.D.3, John C. Burnett Jr., M.D.4, Ghormallah B. Al-Zahrani,M.B.B.S.1, Tammy D. Green1, Michelle K. Manske, M.S.5, Morie A. Gertz, M.D.3, Fletcher A.Miller Jr., M.D.1, and Theodore P. Abraham, M.D.1,61Division of Cardiovascular Diseases, Dept of Medicine, Mayo Clinic, Rochester, MN2Division of Clinical Biochemistry and Immunology, Dept of Laboratory Medicine and Pathology,Mayo Clinic, Rochester, MN3Division of Hematology, Dept of Medicine, Mayo Clinic, Rochester, MN4Cardiorenal Research Laboratory, Division of Cardiovascular Diseases, Mayo Clinic College ofMedicine, Rochester, MN5Hematology Research Laboratory, Division of Hematology, Mayo Clinic, Rochester, MN6Division of Cardiovascular Diseases, John’s Hopkins University, Baltimore, MD
AbstractCardiac dysfunction is a well-recognized complication of light chain amyloidosis (AL).Autologous stem cell transplant (auto-SCT) has emerged as a successful treatment modality forAL patients. In this study, we examined the effect of clonal immunoglobulin light chain genes(VL), which encodes the immunoglobulin light chain protein that ultimately forms amyloid, oncardiac function, in the context of auto-SCT and its impact on overall survival. LongitudinalDoppler myocardial imaging parameters along with cardiac biomarkers were used to assess forcardiac function pre and post auto-SCT. VL gene analysis revealed that Vλ genes, in particularVλVI, were associated with worse cardiac function parameters than Vκ genes. Clonal VL genesappeared to have an impact on left ventricular (LV) function post-transplant and also influencedmortality, with specific VL gene families associated with lower survival. Another key predictor ofmortality in this report was change in tricuspid regurgitant flow velocity following auto-SCT.Correlations were also observed between systolic strain rate, systolic strain and VL genesassociated with amyloid formation. In summary, clonal VL gene usage influences global cardiac
© 2011 American Society of Echocardiography. Published by Mosby, Inc. All rights reserved.^Address correspondence to: Dr. Roshini S. Abraham, Dept of Laboratory Medicine and Pathology, Mayo Clinic, 200 1st St SW,Rochester, MN-55905, Ph: 507-266-9292; Fax: 507-266-4088; [email protected].*These 2 authors contributed equally to this manuscriptThis is a PDF file of an unedited manuscript that has been accepted for publication. As a service to our customers we are providingthis early version of the manuscript. The manuscript will undergo copyediting, typesetting, and review of the resulting proof before itis published in its final citable form. Please note that during the production process errors may be discovered which could affect thecontent, and all legal disclaimers that apply to the journal pertain.
NIH Public AccessAuthor ManuscriptJ Am Soc Echocardiogr. Author manuscript; available in PMC 2012 April 1.
Published in final edited form as:J Am Soc Echocardiogr. 2011 April ; 24(4): 444–454.e2. doi:10.1016/j.echo.2011.01.003.
NIH
-PA Author Manuscript
NIH
-PA Author Manuscript
NIH
-PA Author Manuscript
function in AL, with patients having VλVI and VλII-III-associated amyloid more severely affectedthan those having Vκ or VλI amyloid. Pulsed wave tissue Doppler imaging along withimmunoglobulin gene analysis offers novel insights into prediction of mortality and cardiacdysfunction in AL after auto-SCT.
INTRODUCTIONLight chain (AL) amyloidosis is the most common systemic amyloidosis with an age-adjusted incidence of 5–13 per million patients per year in the United States. The traditionallow-dose oral melphalan treatment regimen is generally associated with a poor prognosis(median survival of 13 months).1 The recent introduction of autologous peripheral bloodstem cell transplantation (auto-SCT) has dramatically improved median survival in a selectgroup of AL patients.1,2 Both hematological response at Day 100 and cardiac function arekey determinants of post auto-SCT survival.1–4
In earlier studies we reported the high sensitivity of longitudinal Doppler myocardialimaging (DMI) - myocardial velocity, strain and strain rate imaging in detecting leftventricular (LV) impairment in both early and advanced AL.5,6 Because an associationamong particular clonal VL genes, organ tropism of amyloid deposition and outcomes hasbeen observed,7–10 this study had a twofold aim: 1) to evaluate whether clonal light chainVL gene usage influences changes in LV function post-SCT, and its impact on long-termmortality, and 2) to test whether serial measurement of cardiac biomarkers and longitudinalDoppler myocardial imaging (DMI) measures are useful for monitoring cardiac function,and for risk stratification.
METHODSThis study was approved by the Institutional Review Board of the Mayo Clinic. Fifty-threepatients with AL systemic amyloidosis, consecutively selected from patients undergoingevaluation in the Divisions of Cardiovascular Diseases and Hematology at the Mayo Clinic,Rochester, Minnesota, from January 1st 2004 through April 30th 2007, and referred to auto-SCT, were enrolled in a prospective manner. Patients received either standard doseconditioning regimen (Melphalan) at 200 mg/m2 or reduced-dose (<200mg/m2) dependingon patient age, renal function, presence of cardiomyopathy, or 3-organ involvement. Of the53 patients who had immunoglobulin gene analysis performed, 28 received the standarddose, and 25 received the lower dose (see Supplementary Table 1). Follow-up ended Junethe 30th 2009. The diagnosis of AL amyloidosis was made by either subcutaneous fat biopsyor an involved organ biopsy study that demonstrated typical Congo red birefringence underpolarized light. Endomyocardial biopsy was performed in 4 patients, for clinical purposes,and was positive for amyloid infiltration in all the cases. AL amyloidosis was furtherconfirmed by the presence of a monoclonal protein in the serum or urine specimen and/or amonoclonal population of plasma cells in the bone marrow. Clinical, biomarkers andechocardiographic examinations were accomplished at 2 different time points (in a subset of39 patients): the first assessment was performed within a month prior to auto-SCT while thesecond assessment was performed at Day 100 post-SCT.
Exclusion criteria were familial, secondary, or senile amyloidosis (n=2), all other causes ofcardiomyopathy (including other forms of restrictive cardiomyopathy, hypertrophiccardiomyopathy, or any cause of LV hypertrophy, other than AL amyloidosis), diabetesmellitus (n=0), history of moderate or greater systemic or pulmonary hypertension (n=1),more than mild valvular heart disease (n=0), and coronary artery disease or previousmyocardial infarction (n=0). Atrial fibrillation (n=3) was not an exclusion criterion.
Bellavia et al. Page 2
J Am Soc Echocardiogr. Author manuscript; available in PMC 2012 April 1.
NIH
-PA Author Manuscript
NIH
-PA Author Manuscript
NIH
-PA Author Manuscript
Clinical classification of patientsPatients with AL were evaluated for the extent of amyloid-related organ involvement and fordominant organ involvement, integrating standard criteria described elsewhere11 along withinformation provided by the assessment of cardiac biomarkers and diastolic function. Thepatients were categorized according to clinical presentation as having renal, cardiac, hepatic,neurological or other dominant organ involvement. This clinical classification wasperformed independently blind to the clonal VL gene usage, Patients with more than oneorgan involved were categorized according to the most prominent and symptomatic affectedorgan. Since several patients had both cardiac and renal dysfunction due to amyloiddeposition, information on dominant or co-dominant involvement was collected for thesepatients. Dominant gastrointestinal, pulmonary, or soft tissue AL (excluding cardiac, renal,hepatic, or neurological dominant involvement) were all classified in the category “Other”,to simplify analysis.
Dominant cardiac involvement was defined as having a positive endomyocardial biopsy, orabnormally elevated cardiac biomarkers, including brain natriuretic peptide (BNP), andcardiac Troponin T (cTnT), based on our previous observations.3,12 Additionally,echocardiographic parameters, such as mean left ventricular wall thickness (half the sum ofthe antero-septal and posterior wall thickness in the parasternal long-axis view) > 12 mm,and diastolic dysfunction with a grade of 3 or 4 (restrictive pattern) were also used to definedominant cardiac involvement.13,14 Dominant renal involvement was defined as having apositive kidney biopsy and a proteinuria more than 0.5 g/dl, dialysis dependence orcreatinine clearance less than 10 mL/min.
Classification of enrolled patients followed a 3-step algorithm: firstly, patients werecategorized based on clonal VL germline gene usage, and thus two groups were generated:Group Vκ, including patients using Vκ I family genes and Group Vλ, including patientsusing VλI, VλII, VλIII and Vλ VI families. Secondly, group Vλ patients were furthersubdivided based on cardiac function by standard echocardiography (left ventricular wallthickness, mass index, and ejection fraction) at baseline (pre-auto-SCT): Group Vλ I–II–III,and Group Vλ VI. Thirdly, patients of group Vλ I–II–III were sub-divided based onhematologic response;11 all Vλ I patients (n=7) had either partial or complete response atDay 100 and were therefore considered independently from Vλ II–III patients, who hadheterogeneous hematological responses. In summary, 4 different groups were used in theanalysis for comparison: Group Vκ; Group Vλ I; Group Vλ II–III; Group Vλ VI.
Specimen preparation and cloning of Immunoglobulin VL genesBone marrow samples from all 53 AL patients were processed to collect plasma cells andclonal immunoglobulin gene analysis was performed as per protocol (see Appendix formethodological details).
Definition of clonal immunoglobulin gene usageThe term “immunoglobulin gene usage” refers to the concept that antibodies orimmunoglobulin (Ig) molecules are generated in the immune system as a result of selectionand molecular combining of 3–4 individual gene segments (3 for Ig light chain and 4 for Igheavy chain; light and heavy chain being essential for formation of a complete antibodymolecule). This process of selection and molecular recombination is a stochastic eventwhere individual gene segments are apparently randomly “chosen” or “used” out of a largerarray of such gene “families”. In a normal immune response, the diversity of antibodymolecules produced by a terminally differentiated B cell (plasma cell) is large (polyclonalresponse), in contrast, to what is observed during a neoplastic process, such as in AL, wherea single plasma cell undergoes expansion to produce a population of plasma cells
Bellavia et al. Page 3
J Am Soc Echocardiogr. Author manuscript; available in PMC 2012 April 1.
NIH
-PA Author Manuscript
NIH
-PA Author Manuscript
NIH
-PA Author Manuscript
(monoclonal or clonal) all secreting exactly the same antibody (immunoglobulin), fromwhich the light chain forms amyloid fibrils and undergoes tissue deposition.
BiomarkersBNP, NT-proBNP, cTnT, creatinine and glomerular filtration rate (GFR) were measured andcollected at the time of the echocardiographic examination as previously described.6Hematological assessment included percent of bone marrow clonal plasma cells, level ofclonal serum free light chain (FLC),15 serum and urine protein electrophoresis (monoclonalprotein quantitation) with immunofixation (monoclonal protein identification).
Standard Ultrasound ExaminationAll ultrasound examinations were performed with a commercially availableechocardiographic instrument (Vivid 7 System, Vingmed, General electric 3135 EastonTurnpike Fairfield, CT 06828-0001). The thickness of the ventricular septum, and LVposterior wall, and end-systolic and end-diastolic LV diameters, and the left atrial antero-posterior diameter were determined from M-mode or two dimensional (2-D) imaging, whileLV mass and ejection fraction were calculated. Left atrial volume measurement was carriedout as previously described.16 Both LV mass and LA volume were indexed to body surfacearea. Pulsed wave Doppler of mitral inflow, pulmonary veins and LV outflow wasperformed as previously described.16 Pulsed wave tissue Doppler imaging was performedusing a sample volume gate length of 0.17 cm. The sample volume was placed on the medialmitral annulus in the apical four chamber view, and the early (E’) and peak diastolic velocitywere measured. Right index of myocardial performance (RIMP) was measured as previouslydescribed.17 RV systolic pressure (RVSP) was calculated by inserting the tricuspidregurgitation velocity obtained with continuous-wave Doppler, into the simplified Bernoulliequation.13,14
Off-line analysis of standard echocardiographic variables was performed with the use ofdedicated software (ProSolv CV analyzer vers. 3.0 8021 Knue Road Indianapolis, IN46250); three consecutive beats were measured and averaged for each measurement. Allstandard and DMI echocardiographic measures were collected with the two investigatorsobtaining the data (DB and GA) blind to the patients’ clinical status and the time point (pre-or post-SCT) that the images undergoing analysis were acquired.
Strain Imaging Data Acquisition and AnalysisFor DMI, apical 4 chamber, long axis, and 2 chamber views were acquired. DMI was usedto measure longitudinal left ventricular (LV) myocardial strain and strain rate in 2 separateechocardiographic examinations, as mentioned above. In addition, narrow sector views wereacquired for each left ventricular wall from apical views. Color tissue recordings werecollected with a frame rate ≥ 200 frames/sec during brief breath hold. Three consecutivecardiac cycles were recorded as cine loops and the acquired raw data were saved onmagneto-optical disks for off-line analysis (Echopac BT06, GE Vingmed Ultrasound).
Sample volumes were placed on basal, middle and apical LV segments of the anterolateral,inferoseptal, posterior, anteroseptal, inferior and anterior walls to assess longitudinal DMI.Longitudinal systolic peak values were determined for systolic strain rate (sSR) and systolicstrain (sS).18 Analysis was performed for all 16 LV segments individually (data not shown)and in clusters according to the LV level (basal, middle and apical). Specifically, the DMIvalues (sSR and sS) were averaged for the 6 basal segments (basal mean), the 6 middlesegments (middle mean) and the 4 apical segments (apical mean).
Bellavia et al. Page 4
J Am Soc Echocardiogr. Author manuscript; available in PMC 2012 April 1.
NIH
-PA Author Manuscript
NIH
-PA Author Manuscript
NIH
-PA Author Manuscript
Statistical analysisStatistical analyses were performed with a commercially available software program(STATA 10, MP version, Statacorp. Ltd, College Station, Texas). Comparisons betweengroups were made using either the Kruskal-Wallis test or Fisher exact test to determinedifferences among groups at baseline (pre-auto-SCT). The Wilcoxon matched-pairs signedrank sum test was used to compare post-auto-SCT biomarkers and DMI measures to the pre-SCT values. The natural log of BNP and FLC were used in the analysis to meet theassumptions of a normal distribution.
Follow-up of the patients included a median follow-up time of 34 months (range: 0.9 – 64months). Primary end-point was all-cause mortality and this was ascertained in all patients(N = 53), either while they were under medical management, or through the review of deathcertificates, or by querying the National Death index.
Because many of the patients in the study were first referred to Mayo Clinic several monthsafter their initial diagnosis, left truncation was used for the Kaplan-Meier and Coxregression analyses; i.e. no subject was considered to be in the risk set until the time ofechocardiography.19 Kaplan-Meier survival curves for the 4 groups were constructedfollowing, which log-rank test of uniform survival distribution among groups wasperformed. By definition, TRM was excluded in the analysis of this subset. Univariateanalysis of the time to events was performed with use of Cox proportional hazard models,considering the difference (Δ) between pre- and post-SCT of biomarkers, standardechocardiographic, and longitudinal DMI measurements as predictors of primary outcome.Delta (Δ) was computed for all collected variables as follows:
Data is presented as the mean value ± SD or median value ± inter-quartile range(biomarkers) or count (percentage). A difference was considered statistically significantwhen the p-value was <0.05.
Intra- Inter- observer variabilityTo examine intra-observer variability (repeatability), a sample of 10 echocardiographicexaminations was randomly selected for masked review by the same investigator (DB). Toexamine inter-observer variability a co-investigator (GA), blinded to the clinical informationand to the results of the first investigator, examined 10 randomly selected echocardiographicexams. Intraclass correlation coefficients (ICCs) for the same observer and differentobservers were calculated using previously described formulae20 for single segments and forthe global mean of each DMI modality.
RESULTSImmunoglobulin germ line gene usage and clinical characteristics
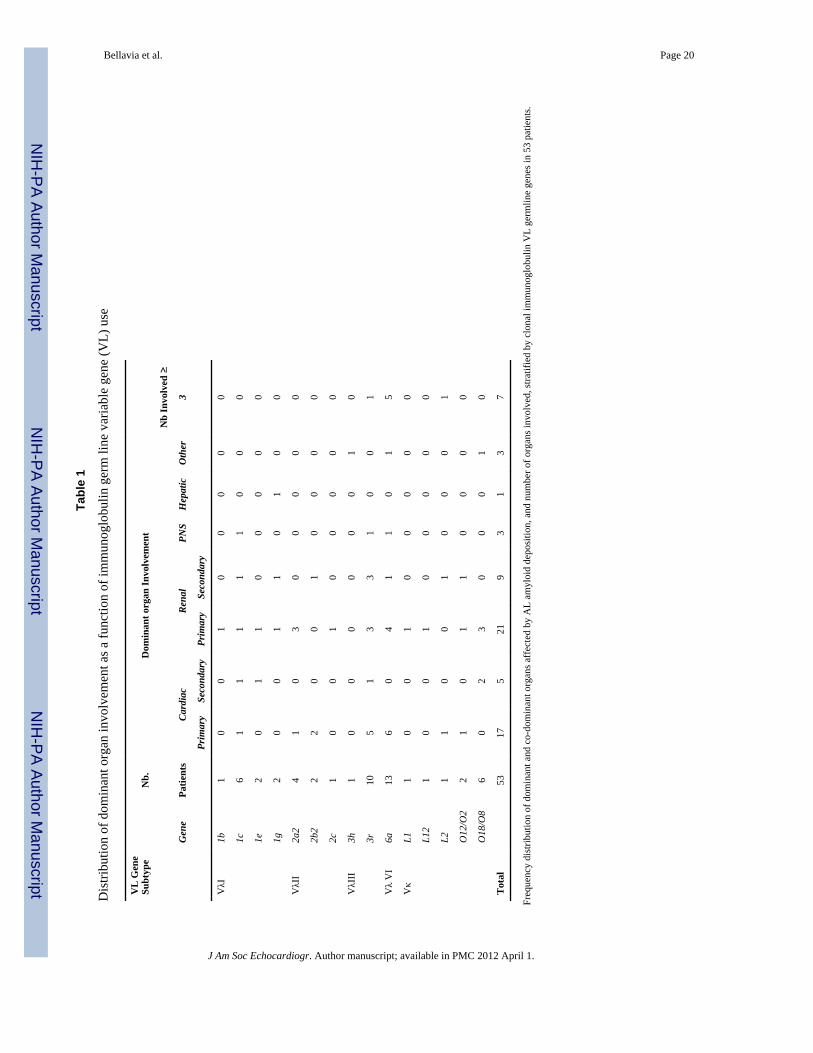
Baseline—The frequency distribution of clonal VL gene usage and dominant organinvolvement are shown in Table 1. The Vλ VI gene −6a, was the most frequently used (n =13; 25%) followed by the Vλ I genes (n=11; 21%), Vλ III genes (n=11, 21%), and Vκ genes(n=11; 21%); Vλ II genes were used the least frequently in this cohort (n =7; 13%). The timebetween diagnosis and enrollment in the study was not significantly different among thegroups (p=0.51).
Amyloid deposition most frequently involved the heart and kidney, and in particular, theheart was the dominant organ affected in patients using Vλ VI, 6a gene (46%) with the Vλ
Bellavia et al. Page 5
J Am Soc Echocardiogr. Author manuscript; available in PMC 2012 April 1.
NIH
-PA Author Manuscript
NIH
-PA Author Manuscript
NIH
-PA Author Manuscript
III family genes coming close behind (45%). Dominant renal involvement was observed in31% of the Vλ VI, 36% of the Vλ I, 57% of Vλ II, 27% of Vλ III, and 54% of the Vκpatients. The Vλ I, Vλ III and Vλ VI genes all had at least 1 patient with dominantperipheral nervous system involvement. Only one patient in the Vλ I group had hepaticinvolvement (Table 1).
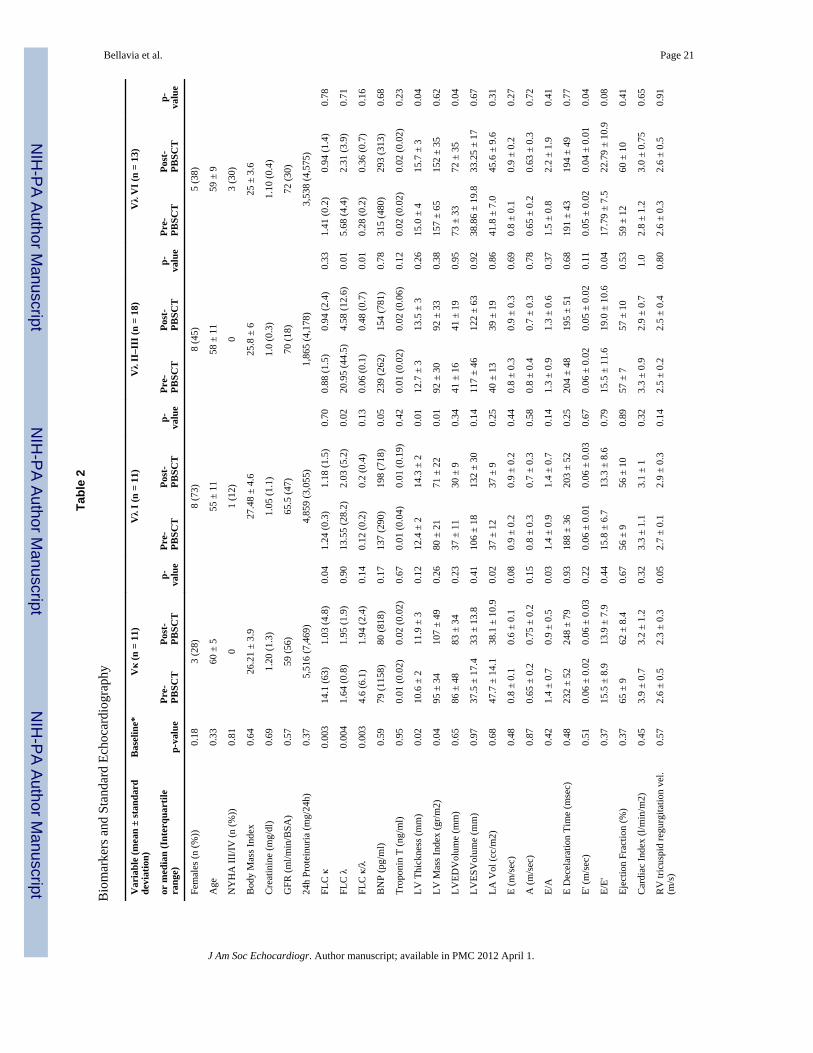
There was no significant difference between the three V λ subgroups and the Vκ grouppatients with regard to age, gender and baseline clinical parameters (Table 2). At baseline,FLC levels were significantly lower in the Vλ VI group compared to the other patients.Furthermore, specific trends could be identified: patients using the Vλ VI gene appeared tohave a higher prevalence of advanced NYHA functional class, and BNP and cTnT levelshad a tendency to be lower in patients using the Vκ gene family and higher in patients usingthe Vλ VI family.
Post-SCT—The changes in BNP, cTnT and FLC κ levels following auto-SCT were notsignificant in any of the 4 groups, but, FLC λ was significantly reduced in both Vλ I and VλII–III groups, while the FLC k/ λ ratio was reduced in only the Vλ II–III group.
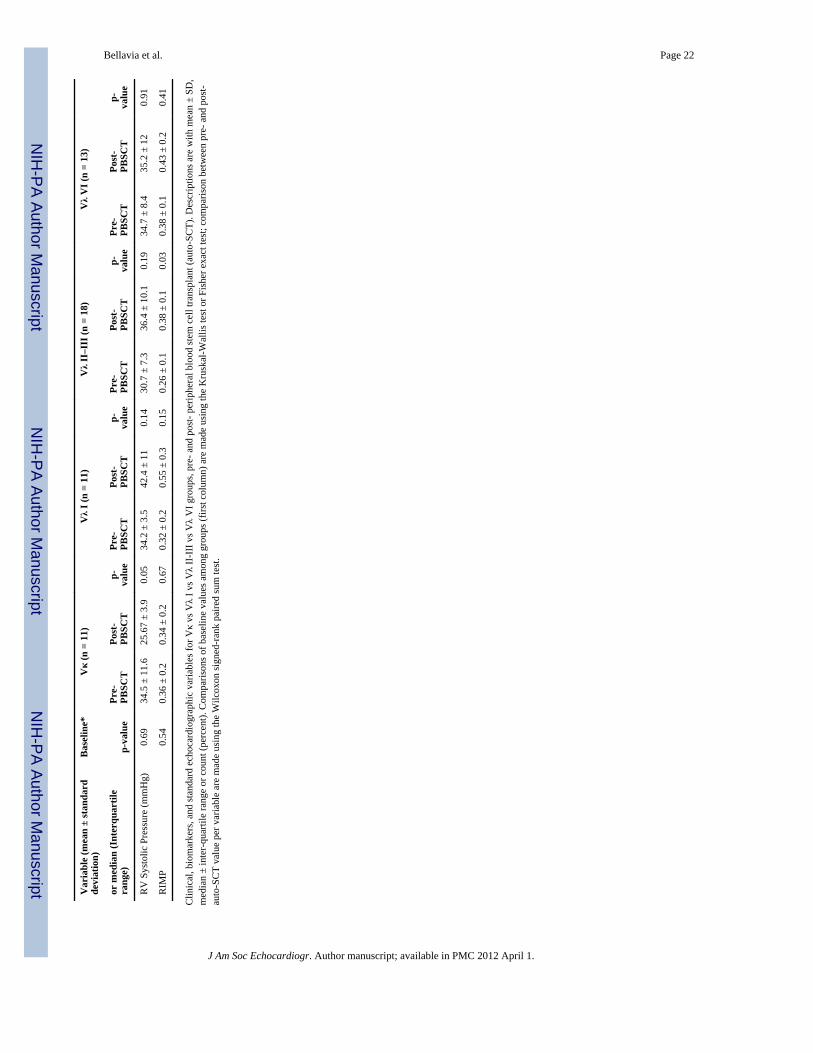
Standard echocardiographyBaseline—LV thickness and LV mass index at baseline was significantly different amongthe groups (Table 2) with the highest value being seen in Vλ VI patients. LV and left atrialvolumes, ejection fraction and cardiac index, along with parameters of diastolic function (Eand A wave velocities, E/A, pulsed wave tissue Doppler E’ velocity of the medial mitralannulus, and E/E’) were similar among all gene groups. Tricuspid regurgitant flow velocity,estimated right ventricular systolic pressure, and right index of myocardial performance(RIMP) were also similar among the groups.
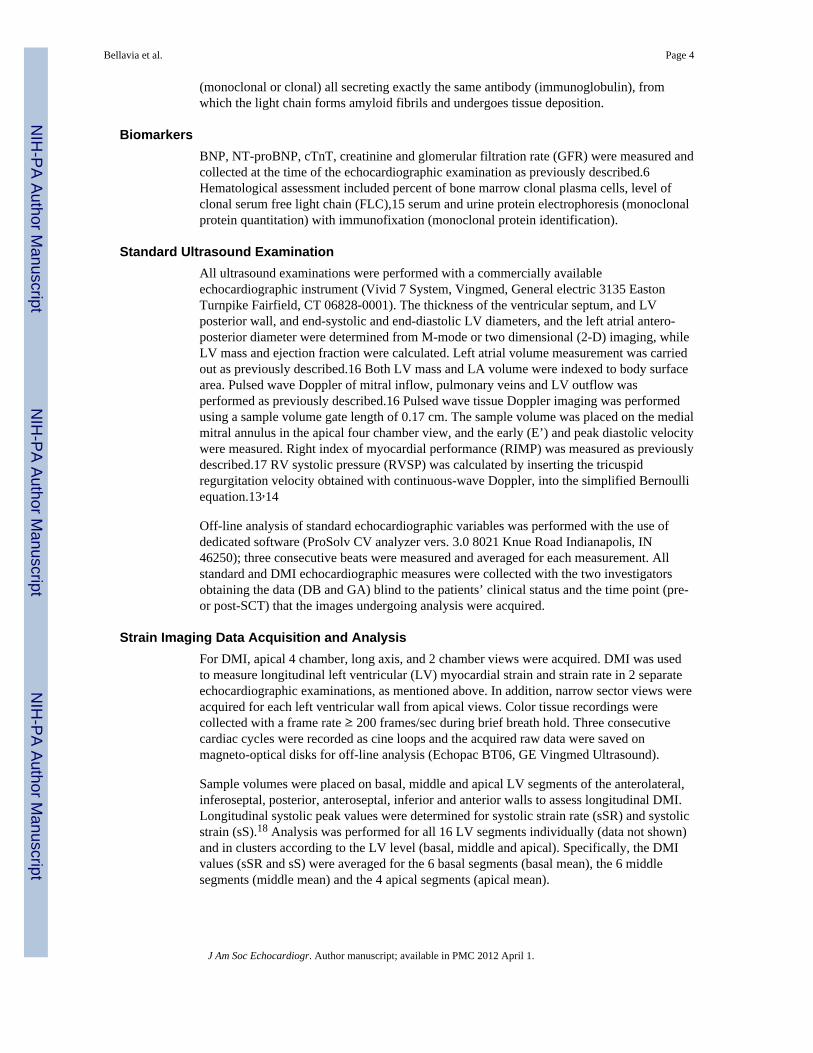
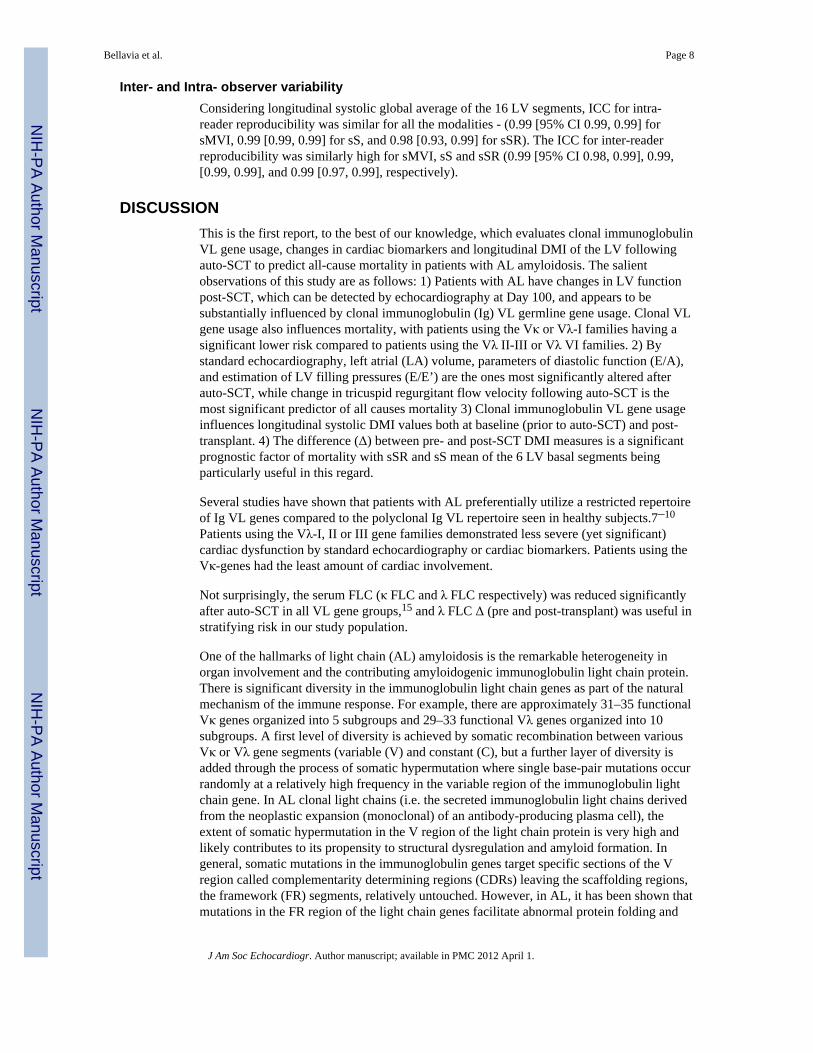
Post-SCT—Post-SCT LV thickness was significantly increased in Vλ I and Vλ VI patients,while LV mass index was increased in Vλ I patients only (Figure 1A). LV end-diastolic andend-systolic volumes were not significantly changed following auto-SCT in any of the 4groups. Left atrial volume was significantly reduced following auto-SCT in patients usingthe Vκ family (Figure 1B). Among diastolic measures, post-SCT trans-mitral E/A ratio wasreduced in the Vκ group, while the difference after auto-SCT was not significant in patientsusing any of the Vλ families. E’ was reduced in Vλ VI patients and E/E’ ratio was increasedin Vλ II–III patients. There were no significant variations in the other groups (Figure 1C),although post-auto-SCT E/E’ was marginally reduced in Vκ and in Vλ I patients. There wasno variation in ejection fraction or cardiac index among groups. Both tricuspid regurgitantflow velocity and right ventricular systolic pressure showed a tendency to decrease only inpatients using the Vκ family. At the same time, RIMP was unchanged in the Vκ group,while it increased in the Vλ II–III patients.
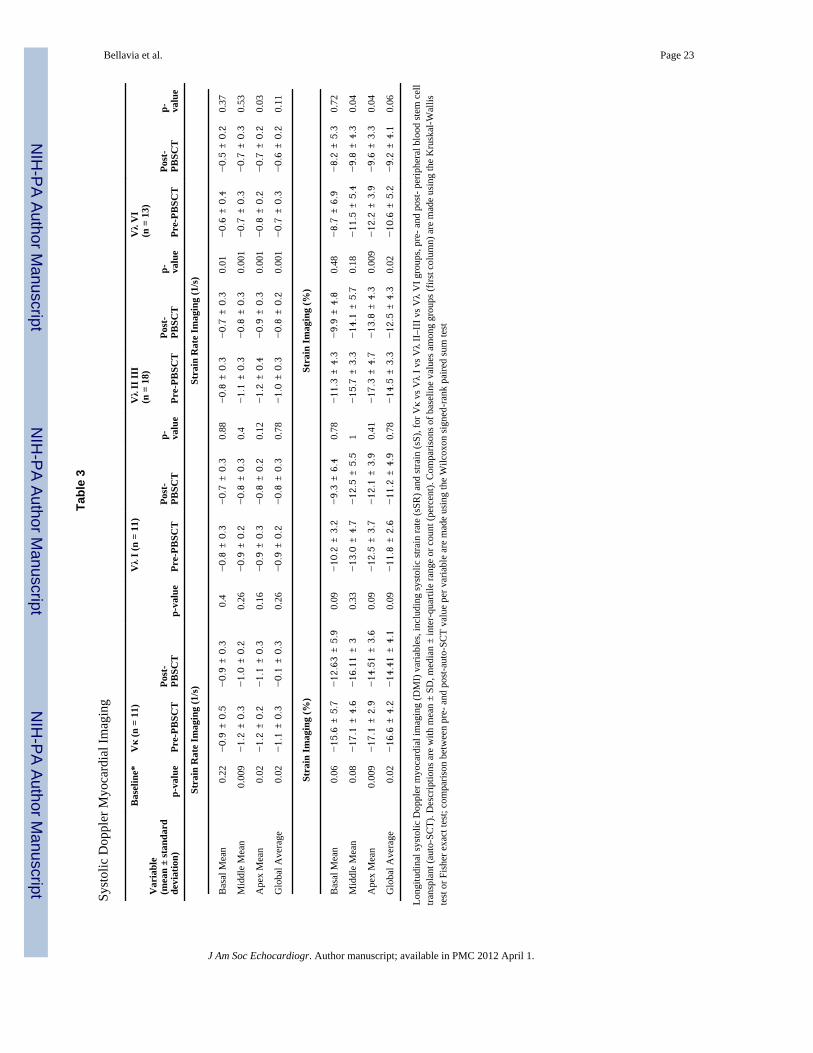
Doppler myocardial imagingBaseline—Longitudinal sSR mean of the 6 middle segments and the mean of the 4 apicalsegments, as well as the mean of 16 LV segments were significantly different among allgroups, with the highest values in patients using the Vκ gene family, intermediate in Vλ II–III groups and least in patients using the Vλ VI and Vλ I gene families (Table 3).
Longitudinal sS mean of the 4 apical segments, and the global mean of 16 LV segmentswere also different among the groups, again with highest values in patients using the Vκgene family and least in patients using the Vλ gene families
Bellavia et al. Page 6
J Am Soc Echocardiogr. Author manuscript; available in PMC 2012 April 1.
NIH
-PA Author Manuscript
NIH
-PA Author Manuscript
NIH
-PA Author Manuscript
Post-SCT—Longitudinal sSR was consistently decreased for all 4 groups and clusters ofsegments, including the global mean of 16 LV segments. In particular, the reduction was notsignificant in patients using the Vκ gene family and in patients using the Vλ I gene family.Patients using the Vλ II–III gene families had a significant reduction post-auto-SCT in thelongitudinal sSR of the mean of the basal, middle and apical segments, as well as the sSRglobal average of 16 LV segments. On the other hand, in patients using the Vλ VI genefamily, sSR appeared to be reduced when considering the mean of the 6 basal, mean of the 6middle, and mean of the 4 apical segments, as well as the global average of all 16 segments.However, this trend reached statistical significance only for the sSR mean of the apicalsegments.
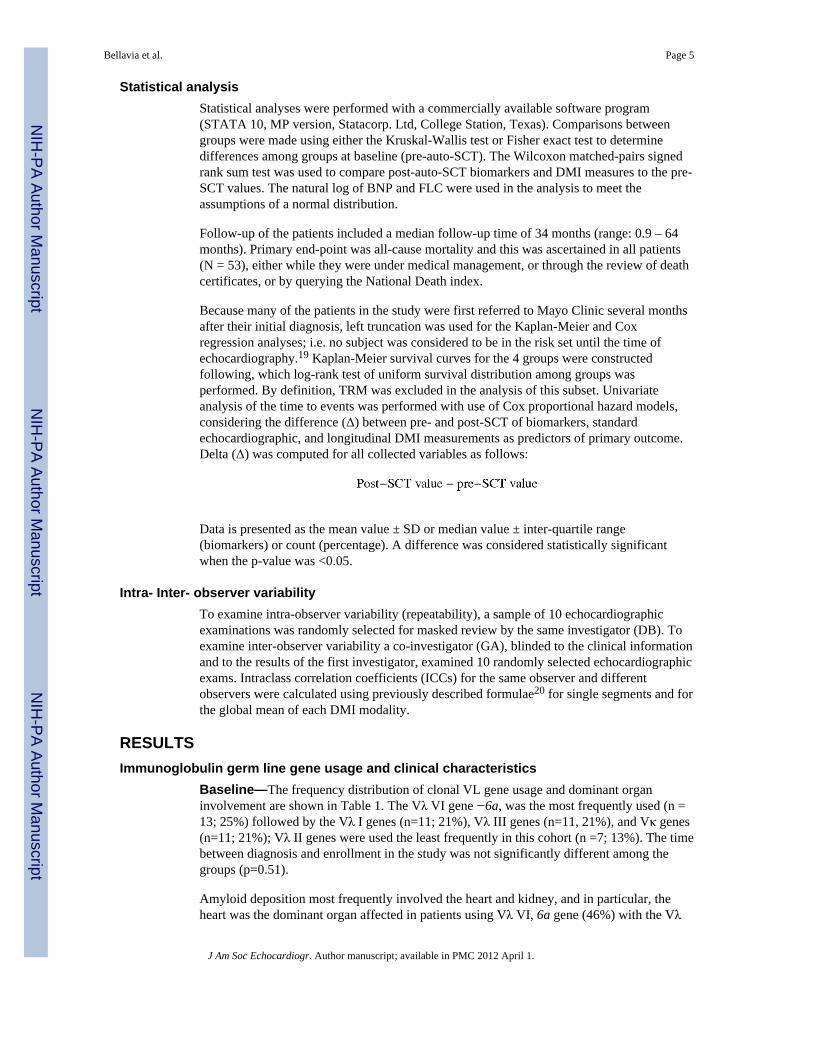
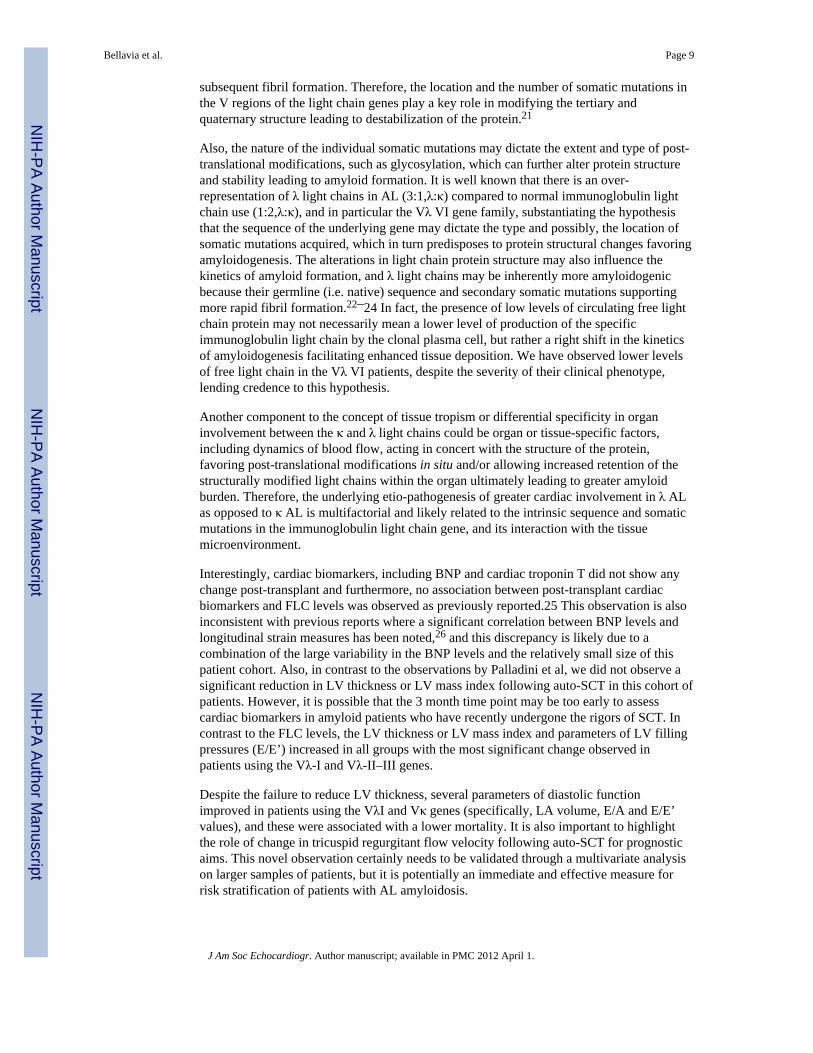
Longitudinal sS had a tendency to be low in all groups (Figure 2), although statisticalsignificance was reached only in the Vλ II–III and Vλ VI groups. Patients using Vλ II–IIIgene families had a reduction post-SCT of the sS mean of the 4 apical segments and globalaverage of 16 LV segments. Patients using the Vλ VI family had a reduction of longitudinalsS measured as mean of the 6 middle and 4 apical segments, as well as global average of 16LV segments.
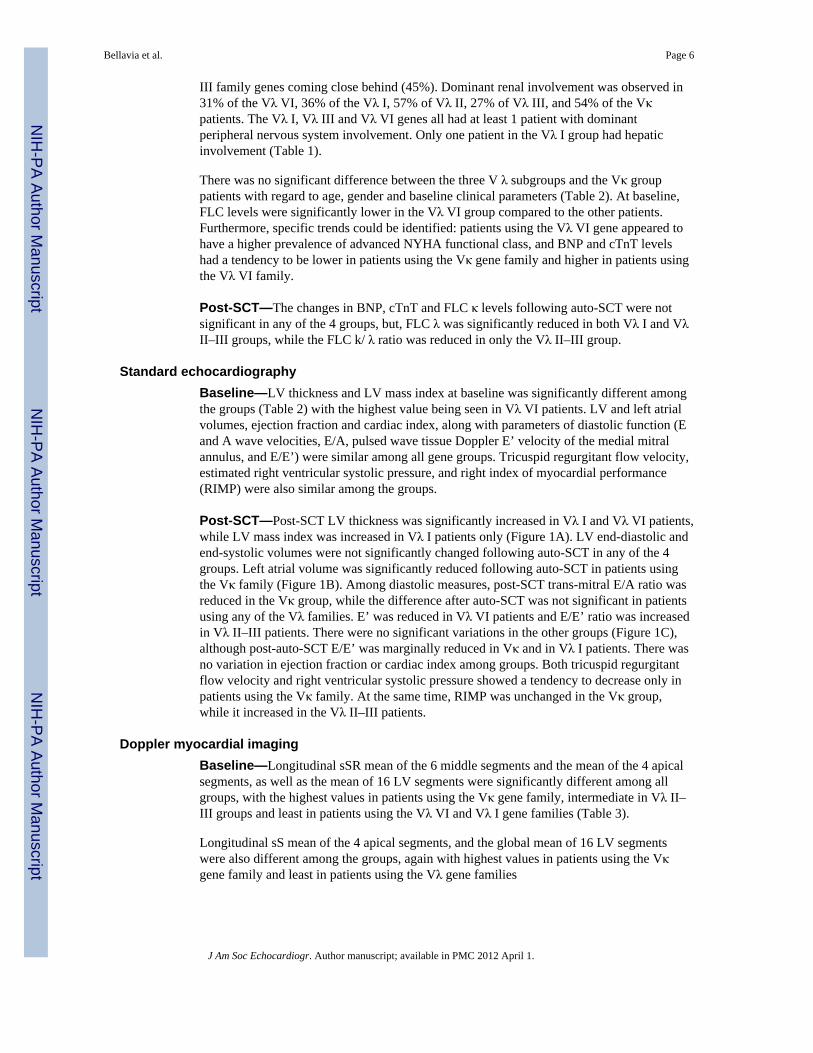
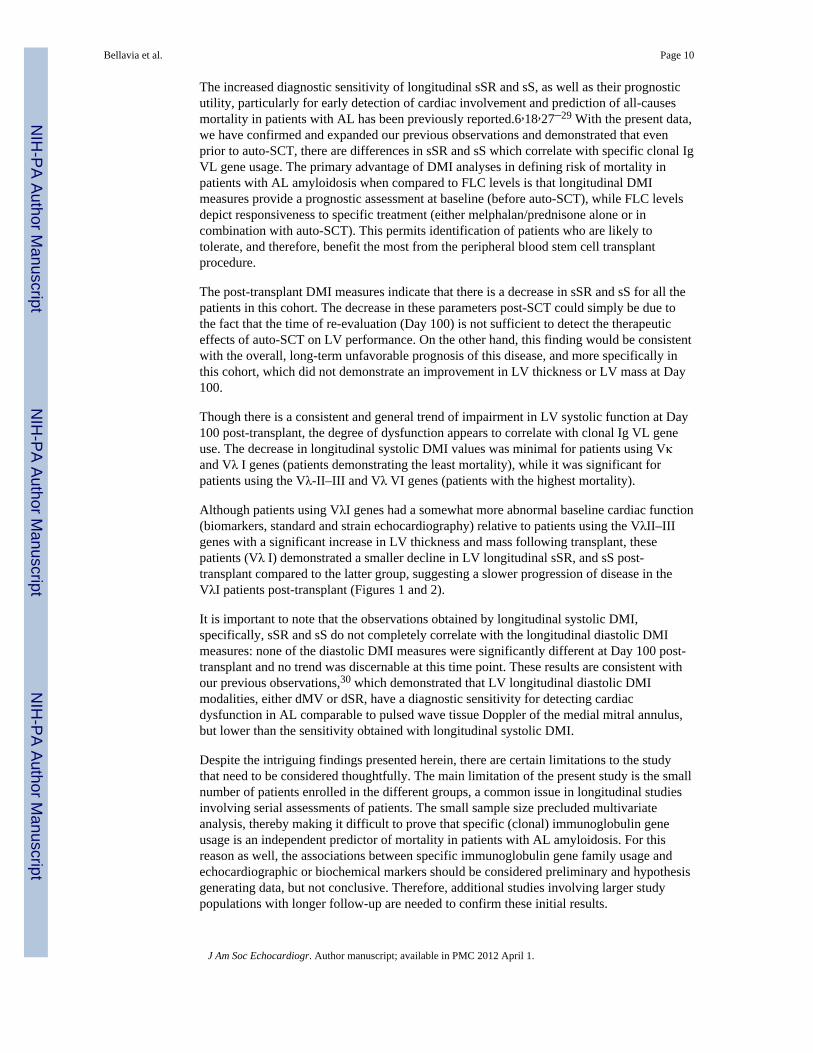
To further demonstrate the differences in longitudinal systolic strain (sS) between patientsusing the Vκ and Vλ gene families, representative images of the inferoseptal wall are shownfor a Vκ and Vλ-II patient pre and post-auto-SCT (Day 100) (Figure 3A–D).
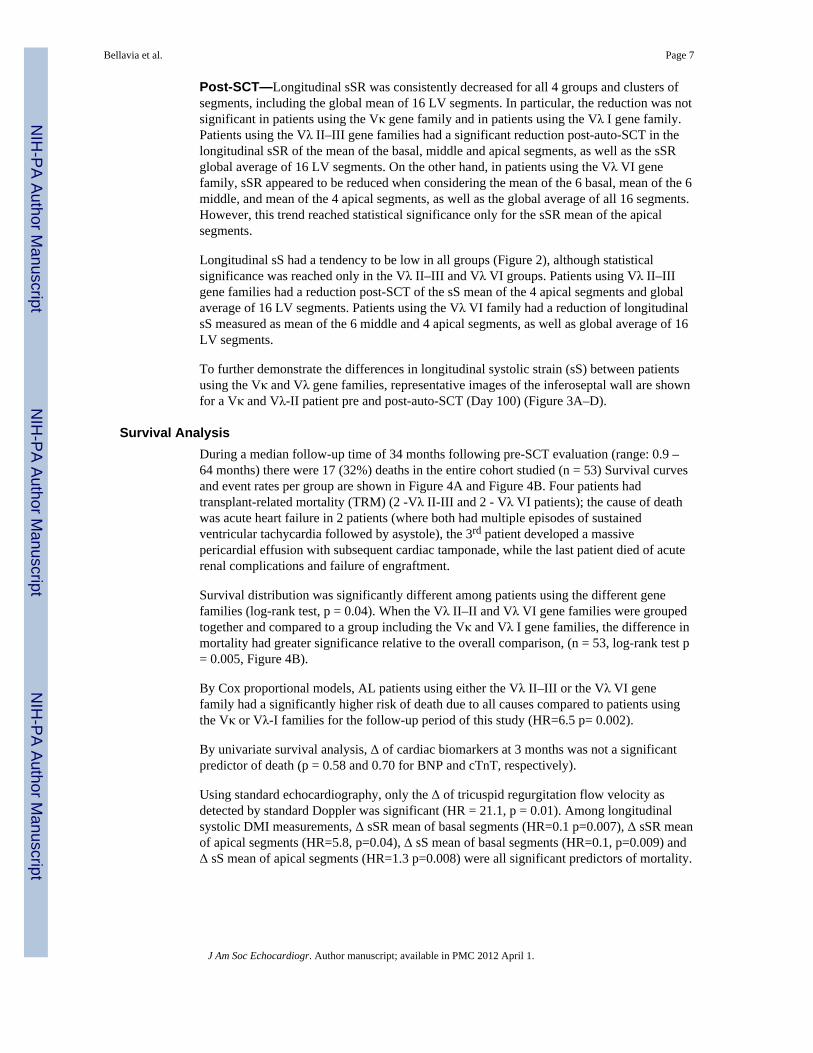
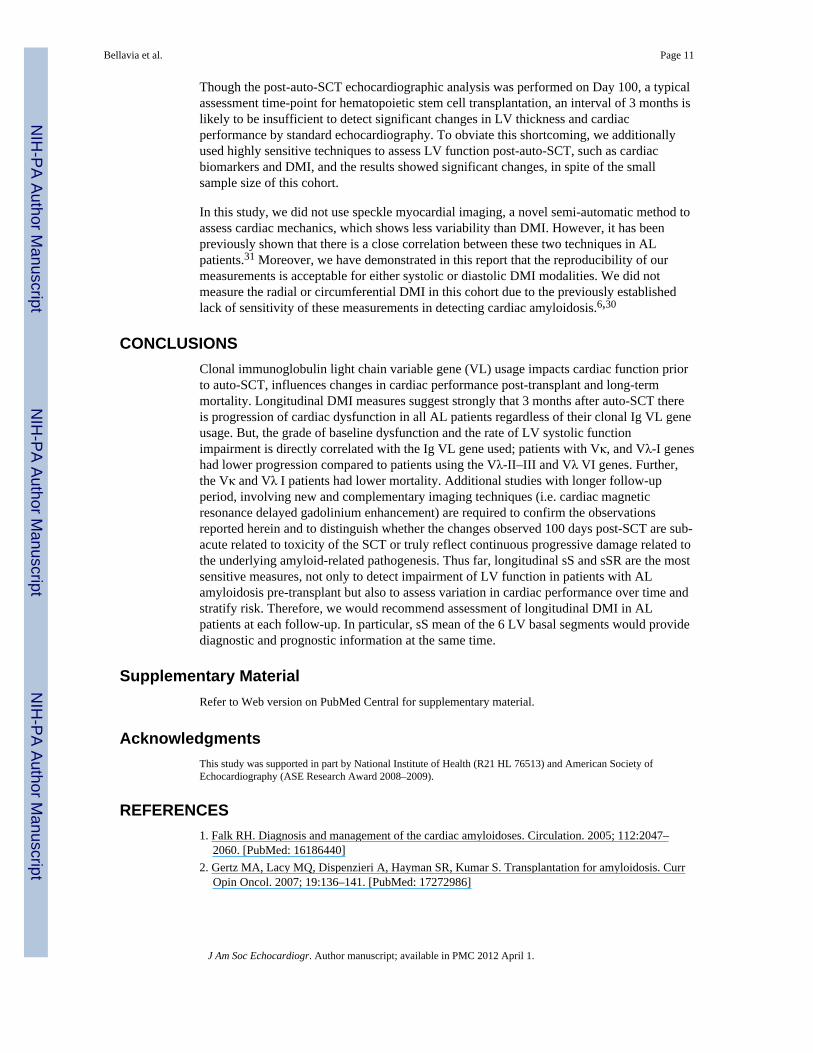
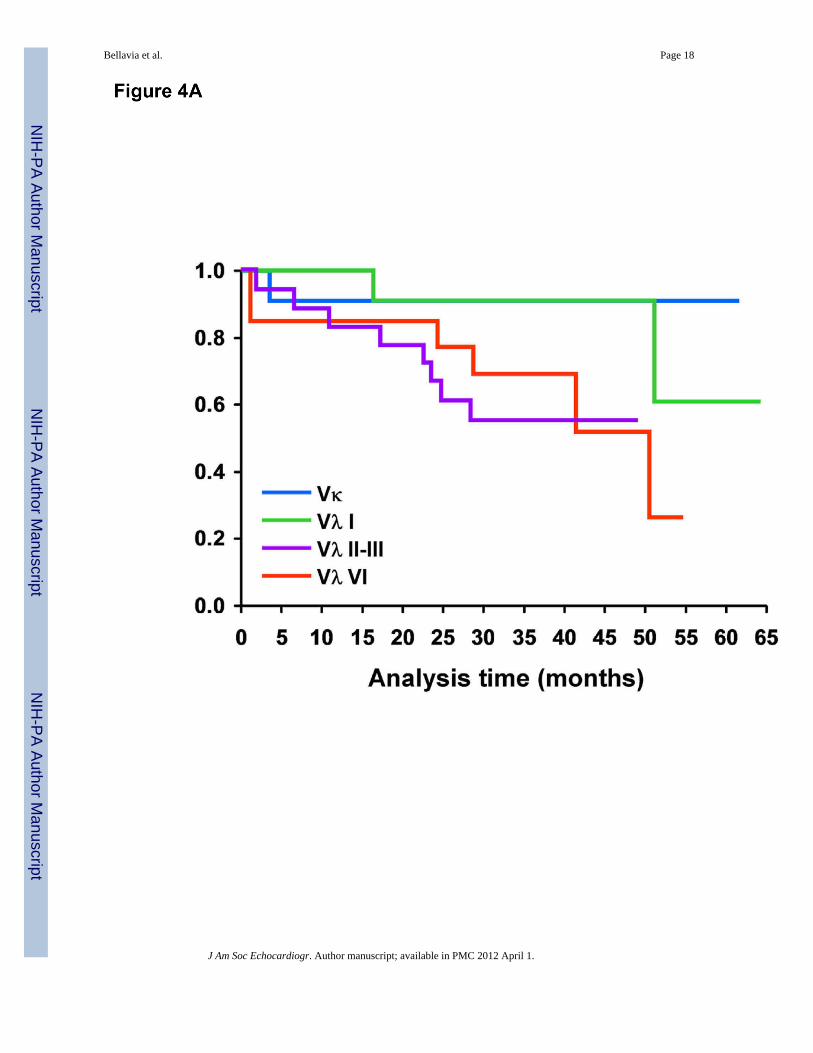
Survival AnalysisDuring a median follow-up time of 34 months following pre-SCT evaluation (range: 0.9 –64 months) there were 17 (32%) deaths in the entire cohort studied (n = 53) Survival curvesand event rates per group are shown in Figure 4A and Figure 4B. Four patients hadtransplant-related mortality (TRM) (2 -Vλ II-III and 2 - Vλ VI patients); the cause of deathwas acute heart failure in 2 patients (where both had multiple episodes of sustainedventricular tachycardia followed by asystole), the 3rd patient developed a massivepericardial effusion with subsequent cardiac tamponade, while the last patient died of acuterenal complications and failure of engraftment.
Survival distribution was significantly different among patients using the different genefamilies (log-rank test, p = 0.04). When the Vλ II–II and Vλ VI gene families were groupedtogether and compared to a group including the Vκ and Vλ I gene families, the difference inmortality had greater significance relative to the overall comparison, (n = 53, log-rank test p= 0.005, Figure 4B).
By Cox proportional models, AL patients using either the Vλ II–III or the Vλ VI genefamily had a significantly higher risk of death due to all causes compared to patients usingthe Vκ or Vλ-I families for the follow-up period of this study (HR=6.5 p= 0.002).
By univariate survival analysis, Δ of cardiac biomarkers at 3 months was not a significantpredictor of death (p = 0.58 and 0.70 for BNP and cTnT, respectively).
Using standard echocardiography, only the Δ of tricuspid regurgitation flow velocity asdetected by standard Doppler was significant (HR = 21.1, p = 0.01). Among longitudinalsystolic DMI measurements, Δ sSR mean of basal segments (HR=0.1 p=0.007), Δ sSR meanof apical segments (HR=5.8, p=0.04), Δ sS mean of basal segments (HR=0.1, p=0.009) andΔ sS mean of apical segments (HR=1.3 p=0.008) were all significant predictors of mortality.
Bellavia et al. Page 7
J Am Soc Echocardiogr. Author manuscript; available in PMC 2012 April 1.
NIH
-PA Author Manuscript
NIH
-PA Author Manuscript
NIH
-PA Author Manuscript
Inter- and Intra- observer variabilityConsidering longitudinal systolic global average of the 16 LV segments, ICC for intra-reader reproducibility was similar for all the modalities - (0.99 [95% CI 0.99, 0.99] forsMVI, 0.99 [0.99, 0.99] for sS, and 0.98 [0.93, 0.99] for sSR). The ICC for inter-readerreproducibility was similarly high for sMVI, sS and sSR (0.99 [95% CI 0.98, 0.99], 0.99,[0.99, 0.99], and 0.99 [0.97, 0.99], respectively).
DISCUSSIONThis is the first report, to the best of our knowledge, which evaluates clonal immunoglobulinVL gene usage, changes in cardiac biomarkers and longitudinal DMI of the LV followingauto-SCT to predict all-cause mortality in patients with AL amyloidosis. The salientobservations of this study are as follows: 1) Patients with AL have changes in LV functionpost-SCT, which can be detected by echocardiography at Day 100, and appears to besubstantially influenced by clonal immunoglobulin (Ig) VL germline gene usage. Clonal VLgene usage also influences mortality, with patients using the Vκ or Vλ-I families having asignificant lower risk compared to patients using the Vλ II-III or Vλ VI families. 2) Bystandard echocardiography, left atrial (LA) volume, parameters of diastolic function (E/A),and estimation of LV filling pressures (E/E’) are the ones most significantly altered afterauto-SCT, while change in tricuspid regurgitant flow velocity following auto-SCT is themost significant predictor of all causes mortality 3) Clonal immunoglobulin VL gene usageinfluences longitudinal systolic DMI values both at baseline (prior to auto-SCT) and post-transplant. 4) The difference (Δ) between pre- and post-SCT DMI measures is a significantprognostic factor of mortality with sSR and sS mean of the 6 LV basal segments beingparticularly useful in this regard.
Several studies have shown that patients with AL preferentially utilize a restricted repertoireof Ig VL genes compared to the polyclonal Ig VL repertoire seen in healthy subjects.7–10
Patients using the Vλ-I, II or III gene families demonstrated less severe (yet significant)cardiac dysfunction by standard echocardiography or cardiac biomarkers. Patients using theVκ-genes had the least amount of cardiac involvement.
Not surprisingly, the serum FLC (κ FLC and λ FLC respectively) was reduced significantlyafter auto-SCT in all VL gene groups,15 and λ FLC Δ (pre and post-transplant) was useful instratifying risk in our study population.
One of the hallmarks of light chain (AL) amyloidosis is the remarkable heterogeneity inorgan involvement and the contributing amyloidogenic immunoglobulin light chain protein.There is significant diversity in the immunoglobulin light chain genes as part of the naturalmechanism of the immune response. For example, there are approximately 31–35 functionalVκ genes organized into 5 subgroups and 29–33 functional Vλ genes organized into 10subgroups. A first level of diversity is achieved by somatic recombination between variousVκ or Vλ gene segments (variable (V) and constant (C), but a further layer of diversity isadded through the process of somatic hypermutation where single base-pair mutations occurrandomly at a relatively high frequency in the variable region of the immunoglobulin lightchain gene. In AL clonal light chains (i.e. the secreted immunoglobulin light chains derivedfrom the neoplastic expansion (monoclonal) of an antibody-producing plasma cell), theextent of somatic hypermutation in the V region of the light chain protein is very high andlikely contributes to its propensity to structural dysregulation and amyloid formation. Ingeneral, somatic mutations in the immunoglobulin genes target specific sections of the Vregion called complementarity determining regions (CDRs) leaving the scaffolding regions,the framework (FR) segments, relatively untouched. However, in AL, it has been shown thatmutations in the FR region of the light chain genes facilitate abnormal protein folding and
Bellavia et al. Page 8
J Am Soc Echocardiogr. Author manuscript; available in PMC 2012 April 1.
NIH
-PA Author Manuscript
NIH
-PA Author Manuscript
NIH
-PA Author Manuscript
subsequent fibril formation. Therefore, the location and the number of somatic mutations inthe V regions of the light chain genes play a key role in modifying the tertiary andquaternary structure leading to destabilization of the protein.21
Also, the nature of the individual somatic mutations may dictate the extent and type of post-translational modifications, such as glycosylation, which can further alter protein structureand stability leading to amyloid formation. It is well known that there is an over-representation of λ light chains in AL (3:1,λ:κ) compared to normal immunoglobulin lightchain use (1:2,λ:κ), and in particular the Vλ VI gene family, substantiating the hypothesisthat the sequence of the underlying gene may dictate the type and possibly, the location ofsomatic mutations acquired, which in turn predisposes to protein structural changes favoringamyloidogenesis. The alterations in light chain protein structure may also influence thekinetics of amyloid formation, and λ light chains may be inherently more amyloidogenicbecause their germline (i.e. native) sequence and secondary somatic mutations supportingmore rapid fibril formation.22–24 In fact, the presence of low levels of circulating free lightchain protein may not necessarily mean a lower level of production of the specificimmunoglobulin light chain by the clonal plasma cell, but rather a right shift in the kineticsof amyloidogenesis facilitating enhanced tissue deposition. We have observed lower levelsof free light chain in the Vλ VI patients, despite the severity of their clinical phenotype,lending credence to this hypothesis.
Another component to the concept of tissue tropism or differential specificity in organinvolvement between the κ and λ light chains could be organ or tissue-specific factors,including dynamics of blood flow, acting in concert with the structure of the protein,favoring post-translational modifications in situ and/or allowing increased retention of thestructurally modified light chains within the organ ultimately leading to greater amyloidburden. Therefore, the underlying etio-pathogenesis of greater cardiac involvement in λ ALas opposed to κ AL is multifactorial and likely related to the intrinsic sequence and somaticmutations in the immunoglobulin light chain gene, and its interaction with the tissuemicroenvironment.
Interestingly, cardiac biomarkers, including BNP and cardiac troponin T did not show anychange post-transplant and furthermore, no association between post-transplant cardiacbiomarkers and FLC levels was observed as previously reported.25 This observation is alsoinconsistent with previous reports where a significant correlation between BNP levels andlongitudinal strain measures has been noted,26 and this discrepancy is likely due to acombination of the large variability in the BNP levels and the relatively small size of thispatient cohort. Also, in contrast to the observations by Palladini et al, we did not observe asignificant reduction in LV thickness or LV mass index following auto-SCT in this cohort ofpatients. However, it is possible that the 3 month time point may be too early to assesscardiac biomarkers in amyloid patients who have recently undergone the rigors of SCT. Incontrast to the FLC levels, the LV thickness or LV mass index and parameters of LV fillingpressures (E/E’) increased in all groups with the most significant change observed inpatients using the Vλ-I and Vλ-II–III genes.
Despite the failure to reduce LV thickness, several parameters of diastolic functionimproved in patients using the VλI and Vκ genes (specifically, LA volume, E/A and E/E’values), and these were associated with a lower mortality. It is also important to highlightthe role of change in tricuspid regurgitant flow velocity following auto-SCT for prognosticaims. This novel observation certainly needs to be validated through a multivariate analysison larger samples of patients, but it is potentially an immediate and effective measure forrisk stratification of patients with AL amyloidosis.
Bellavia et al. Page 9
J Am Soc Echocardiogr. Author manuscript; available in PMC 2012 April 1.
NIH
-PA Author Manuscript
NIH
-PA Author Manuscript
NIH
-PA Author Manuscript
The increased diagnostic sensitivity of longitudinal sSR and sS, as well as their prognosticutility, particularly for early detection of cardiac involvement and prediction of all-causesmortality in patients with AL has been previously reported.6,18,27–29 With the present data,we have confirmed and expanded our previous observations and demonstrated that evenprior to auto-SCT, there are differences in sSR and sS which correlate with specific clonal IgVL gene usage. The primary advantage of DMI analyses in defining risk of mortality inpatients with AL amyloidosis when compared to FLC levels is that longitudinal DMImeasures provide a prognostic assessment at baseline (before auto-SCT), while FLC levelsdepict responsiveness to specific treatment (either melphalan/prednisone alone or incombination with auto-SCT). This permits identification of patients who are likely totolerate, and therefore, benefit the most from the peripheral blood stem cell transplantprocedure.
The post-transplant DMI measures indicate that there is a decrease in sSR and sS for all thepatients in this cohort. The decrease in these parameters post-SCT could simply be due tothe fact that the time of re-evaluation (Day 100) is not sufficient to detect the therapeuticeffects of auto-SCT on LV performance. On the other hand, this finding would be consistentwith the overall, long-term unfavorable prognosis of this disease, and more specifically inthis cohort, which did not demonstrate an improvement in LV thickness or LV mass at Day100.
Though there is a consistent and general trend of impairment in LV systolic function at Day100 post-transplant, the degree of dysfunction appears to correlate with clonal Ig VL geneuse. The decrease in longitudinal systolic DMI values was minimal for patients using Vκand Vλ I genes (patients demonstrating the least mortality), while it was significant forpatients using the Vλ-II–III and Vλ VI genes (patients with the highest mortality).
Although patients using VλI genes had a somewhat more abnormal baseline cardiac function(biomarkers, standard and strain echocardiography) relative to patients using the VλII–IIIgenes with a significant increase in LV thickness and mass following transplant, thesepatients (Vλ I) demonstrated a smaller decline in LV longitudinal sSR, and sS post-transplant compared to the latter group, suggesting a slower progression of disease in theVλI patients post-transplant (Figures 1 and 2).
It is important to note that the observations obtained by longitudinal systolic DMI,specifically, sSR and sS do not completely correlate with the longitudinal diastolic DMImeasures: none of the diastolic DMI measures were significantly different at Day 100 post-transplant and no trend was discernable at this time point. These results are consistent withour previous observations,30 which demonstrated that LV longitudinal diastolic DMImodalities, either dMV or dSR, have a diagnostic sensitivity for detecting cardiacdysfunction in AL comparable to pulsed wave tissue Doppler of the medial mitral annulus,but lower than the sensitivity obtained with longitudinal systolic DMI.
Despite the intriguing findings presented herein, there are certain limitations to the studythat need to be considered thoughtfully. The main limitation of the present study is the smallnumber of patients enrolled in the different groups, a common issue in longitudinal studiesinvolving serial assessments of patients. The small sample size precluded multivariateanalysis, thereby making it difficult to prove that specific (clonal) immunoglobulin geneusage is an independent predictor of mortality in patients with AL amyloidosis. For thisreason as well, the associations between specific immunoglobulin gene family usage andechocardiographic or biochemical markers should be considered preliminary and hypothesisgenerating data, but not conclusive. Therefore, additional studies involving larger studypopulations with longer follow-up are needed to confirm these initial results.
Bellavia et al. Page 10
J Am Soc Echocardiogr. Author manuscript; available in PMC 2012 April 1.
NIH
-PA Author Manuscript
NIH
-PA Author Manuscript
NIH
-PA Author Manuscript
Though the post-auto-SCT echocardiographic analysis was performed on Day 100, a typicalassessment time-point for hematopoietic stem cell transplantation, an interval of 3 months islikely to be insufficient to detect significant changes in LV thickness and cardiacperformance by standard echocardiography. To obviate this shortcoming, we additionallyused highly sensitive techniques to assess LV function post-auto-SCT, such as cardiacbiomarkers and DMI, and the results showed significant changes, in spite of the smallsample size of this cohort.
In this study, we did not use speckle myocardial imaging, a novel semi-automatic method toassess cardiac mechanics, which shows less variability than DMI. However, it has beenpreviously shown that there is a close correlation between these two techniques in ALpatients.31 Moreover, we have demonstrated in this report that the reproducibility of ourmeasurements is acceptable for either systolic or diastolic DMI modalities. We did notmeasure the radial or circumferential DMI in this cohort due to the previously establishedlack of sensitivity of these measurements in detecting cardiac amyloidosis.6,30
CONCLUSIONSClonal immunoglobulin light chain variable gene (VL) usage impacts cardiac function priorto auto-SCT, influences changes in cardiac performance post-transplant and long-termmortality. Longitudinal DMI measures suggest strongly that 3 months after auto-SCT thereis progression of cardiac dysfunction in all AL patients regardless of their clonal Ig VL geneusage. But, the grade of baseline dysfunction and the rate of LV systolic functionimpairment is directly correlated with the Ig VL gene used; patients with Vκ, and Vλ-I geneshad lower progression compared to patients using the Vλ-II–III and Vλ VI genes. Further,the Vκ and Vλ I patients had lower mortality. Additional studies with longer follow-upperiod, involving new and complementary imaging techniques (i.e. cardiac magneticresonance delayed gadolinium enhancement) are required to confirm the observationsreported herein and to distinguish whether the changes observed 100 days post-SCT are sub-acute related to toxicity of the SCT or truly reflect continuous progressive damage related tothe underlying amyloid-related pathogenesis. Thus far, longitudinal sS and sSR are the mostsensitive measures, not only to detect impairment of LV function in patients with ALamyloidosis pre-transplant but also to assess variation in cardiac performance over time andstratify risk. Therefore, we would recommend assessment of longitudinal DMI in ALpatients at each follow-up. In particular, sS mean of the 6 LV basal segments would providediagnostic and prognostic information at the same time.
Supplementary MaterialRefer to Web version on PubMed Central for supplementary material.
AcknowledgmentsThis study was supported in part by National Institute of Health (R21 HL 76513) and American Society ofEchocardiography (ASE Research Award 2008–2009).
REFERENCES1. Falk RH. Diagnosis and management of the cardiac amyloidoses. Circulation. 2005; 112:2047–
2060. [PubMed: 16186440]2. Gertz MA, Lacy MQ, Dispenzieri A, Hayman SR, Kumar S. Transplantation for amyloidosis. Curr
Opin Oncol. 2007; 19:136–141. [PubMed: 17272986]
Bellavia et al. Page 11
J Am Soc Echocardiogr. Author manuscript; available in PMC 2012 April 1.
NIH
-PA Author Manuscript
NIH
-PA Author Manuscript
NIH
-PA Author Manuscript
3. Dispenzieri A, Gertz MA, Kyle RA, Lacy MQ, Burritt MF, Therneau TM, et al. Serum cardiactroponins and N-terminal pro-brain natriuretic peptide: a staging system for primary systemicamyloidosis. J Clin Oncol. 2004; 22:3751–3757. [PubMed: 15365071]
4. Palladini G, Campana C, Klersy C, Balduini A, Vadacca G, Perfetti V, et al. Serum N-terminal pro-brain natriuretic peptide is a sensitive marker of myocardial dysfunction in AL amyloidosis.Circulation. 2003; 107:2440–2445. [PubMed: 12719281]
5. Bellavia D, Abraham TP, Pellikka PA, Al-Zahrani GB, Dispenzieri A, Oh JK, et al. Detection of leftventricular systolic dysfunction in cardiac amyloidosis with strain rate echocardiography. J Am SocEchocardiogr. 2007; 20:1194–1202. [PubMed: 17596912]
6. Bellavia D, Pellikka PA, Abraham TP, Al-Zahrani GB, Dispenzieri A, Oh JK, et al. Evidence ofimpaired left ventricular systolic function by Doppler myocardial imaging in patients with systemicamyloidosis and no evidence of cardiac involvement by standard two-dimensional and Dopplerechocardiography. Am J Cardiol. 2008; 101:1039–1045. [PubMed: 18359328]
7. Abraham RS, Geyer SM, Price-Troska TL, Allmer C, Kyle RA, Gertz MA, et al. Immunoglobulinlight chain variable (V) region genes influence clinical presentation and outcome in light chain-associated amyloidosis (AL). Blood. 2003; 101:3801–3808. [PubMed: 12515719]
8. Comenzo RL, Wally J, Kica G, Murray J, Ericsson T, Skinner M, et al. Clonal immunoglobulinlight chain variable region germline gene use in AL amyloidosis: association with dominantamyloid-related organ involvement and survival after stem cell transplantation. Br J Haematol.1999; 106:744–751. [PubMed: 10468868]
9. Comenzo RL, Zhang Y, Martinez C, Osman K, Herrera GA. The tropism of organ involvement inprimary systemic amyloidosis: contributions of Ig V(L) germ line gene use and clonal plasma cellburden. Blood. 2001; 98:714–720. [PubMed: 11468171]
10. Perfetti V, Casarini S, Palladini G, Vignarelli MC, Klersy C, Diegoli M, et al. Analysis ofV(lambda)-J(lambda) expression in plasma cells from primary (AL) amyloidosis and normal bonemarrow identifies 3r (lambdaIII) as a new amyloid-associated germline gene segment. Blood.2002; 100:948–953. [PubMed: 12130507]
11. Gertz MA, Comenzo R, Falk RH, Fermand JP, Hazenberg BP, Hawkins PN, et al. Definition oforgan involvement and treatment response in immunoglobulin light chain amyloidosis (AL): aconsensus opinion from the 10th International Symposium on Amyloid and Amyloidosis, Tours,France, 18–22 April 2004. Am J Hematol. 2005; 79:319–328. [PubMed: 16044444]
12. Dispenzieri A, Kyle RA, Gertz MA, Therneau TM, Miller WL, Chandrasekaran K, et al. Survivalin patients with primary systemic amyloidosis and raised serum cardiac troponins. Lancet. 2003;361:1787–1789. [PubMed: 12781539]
13. Klein AL, Hatle LK, Burstow DJ, Taliercio CP, Seward JB, Kyle RA, et al. ComprehensiveDoppler assessment of right ventricular diastolic function in cardiac amyloidosis. J Am CollCardiol. 1990; 15:99–108. [PubMed: 2295749]
14. Klein AL, Hatle LK, Taliercio CP, Taylor CL, Kyle RA, Bailey KR, et al. Serial Dopplerechocardiographic follow-up of left ventricular diastolic function in cardiac amyloidosis. J AmColl Cardiol. 1990; 16:1135–1141. [PubMed: 2229760]
15. Dispenzieri A, Lacy MQ, Katzmann JA, Rajkumar SV, Abraham RS, Hayman SR, et al. Absolutevalues of immunoglobulin free light chains are prognostic in patients with primary systemicamyloidosis undergoing peripheral blood stem cell transplantation. Blood. 2006; 107:3378–3383.[PubMed: 16397135]
16. Lang RM, Bierig M, Devereux RB, Flachskampf FA, Foster E, Pellikka PA, et al.Recommendations for chamber quantification: a report from the American Society ofEchocardiography's Guidelines and Standards Committee and the Chamber Quantification WritingGroup, developed in conjunction with the European Association of Echocardiography, a branch ofthe European Society of Cardiology. J Am Soc Echocardiogr. 2005; 18:1440–1463. [PubMed:16376782]
17. Tei C, Dujardin KS, Hodge DO, Kyle RA, Tajik AJ, Seward JB. Doppler index combining systolicand diastolic myocardial performance: clinical value in cardiac amyloidosis. J Am Coll Cardiol.1996; 28:658–664. [PubMed: 8772753]
Bellavia et al. Page 12
J Am Soc Echocardiogr. Author manuscript; available in PMC 2012 April 1.
NIH
-PA Author Manuscript
NIH
-PA Author Manuscript
NIH
-PA Author Manuscript
18. Koyama J, Ray-Sequin PA, Falk RH. Longitudinal myocardial function assessed by tissue velocity,strain, and strain rate tissue Doppler echocardiography in patients with AL (primary) cardiacamyloidosis. Circulation. 2003; 107:2446–2452. [PubMed: 12743000]
19. Andersen PKGR. Cox's regression model for counting processes: a large sample study. Annals ofStatistics. 1982; 10:1100–1120.
20. Shrout PE, Fleiss JL. Intraclass correlations: uses in assessing rater reliability. Psychol Bull. 1979;86:420–428. [PubMed: 18839484]
21. Poshusta TL, Sikkink LA, Leung N, Clark RJ, Dispenzieri A, Ramirez-Alvarado M. Mutations inspecific structural regions of immunoglobulin light chains are associated with free light chainlevels in patients with AL amyloidosis. PLoS One. 2009; 4:e5169. [PubMed: 19365555]
22. Bellotti V, Mangione P, Merlini G. Review: immunoglobulin light chain amyloidosis--thearchetype of structural and pathogenic variability. J Struct Biol. 2000; 130:280–289. [PubMed:10940232]
23. Enqvist S, Sletten K, Stevens FJ, Hellman U, Westermark P. Germ line origin and somaticmutations determine the target tissues in systemic AL-amyloidosis. PLoS One. 2007; 2:e981.[PubMed: 17912358]
24. Randles EG, Thompson JR, Martin DJ, Ramirez-Alvarado M. Structural alterations within nativeamyloidogenic immunoglobulin light chains. J Mol Biol. 2009; 389:199–210. [PubMed:19361523]
25. Palladini G, Lavatelli F, Russo P, Perlini S, Perfetti V, Bosoni T, et al. Circulating amyloidogenicfree light chains and serum N-terminal natriuretic peptide type B decrease simultaneously inassociation with improvement of survival in AL. Blood. 2006; 107:3854–3858. [PubMed:16434487]
26. Yoneyama A, Koyama J, Tomita T, Kumazaki S, Tsutsui H, Watanabe N, et al. Relationship ofplasma brain-type natriuretic peptide levels to left ventricular longitudinal function in patients withcongestive heart failure assessed by strain Doppler imaging. Int J Cardiol. 2008; 130:56–63.[PubMed: 18068244]
27. Bellavia D, Pellikka PA, Al-Zahrani GB, Abraham TP, Dispenzieri A, Miyazaki C, et al.Independent predictors of survival in primary systemic (Al) amyloidosis, including cardiacbiomarkers and left ventricular strain imaging: an observational cohort study. J Am SocEchocardiogr. 2010; 23:643–652. [PubMed: 20434879]
28. Koyama J, Falk RH. Prognostic significance of strain Doppler imaging in light-chain amyloidosis.JACC Cardiovasc Imaging. 2010; 3:333–342. [PubMed: 20394893]
29. Koyama J, Ray-Sequin PA, Falk RH. Prognostic significance of ultrasound myocardial tissuecharacterization in patients with cardiac amyloidosis. Circulation. 2002; 106:556–561. [PubMed:12147536]
30. Al-Zahrani GB, Bellavia D, Pellikka PA, Dispenzieri A, Hayman SR, Oh JK, et al. Dopplermyocardial imaging compared to standard two-dimensional and Doppler echocardiography forassessment of diastolic function in patients with systemic amyloidosis. J Am Soc Echocardiogr.2009; 22:290–298. [PubMed: 19121568]
31. Modesto KM, Cauduro S, Dispenzieri A, Khandheria B, Belohlavek M, Lysyansky P, et al. Two-dimensional acoustic pattern derived strain parameters closely correlate with one-dimensionaltissue Doppler derived strain measurements. Eur J Echocardiogr. 2006; 7:315–321. [PubMed:16154805]
32. Retter I, Althaus HH, Munch R, Muller W. VBASE2, an integrative V gene database. NucleicAcids Res. 2005; 33:D671–D674. [PubMed: 15608286]
Bellavia et al. Page 13
J Am Soc Echocardiogr. Author manuscript; available in PMC 2012 April 1.
NIH
-PA Author Manuscript
NIH
-PA Author Manuscript
NIH
-PA Author Manuscript
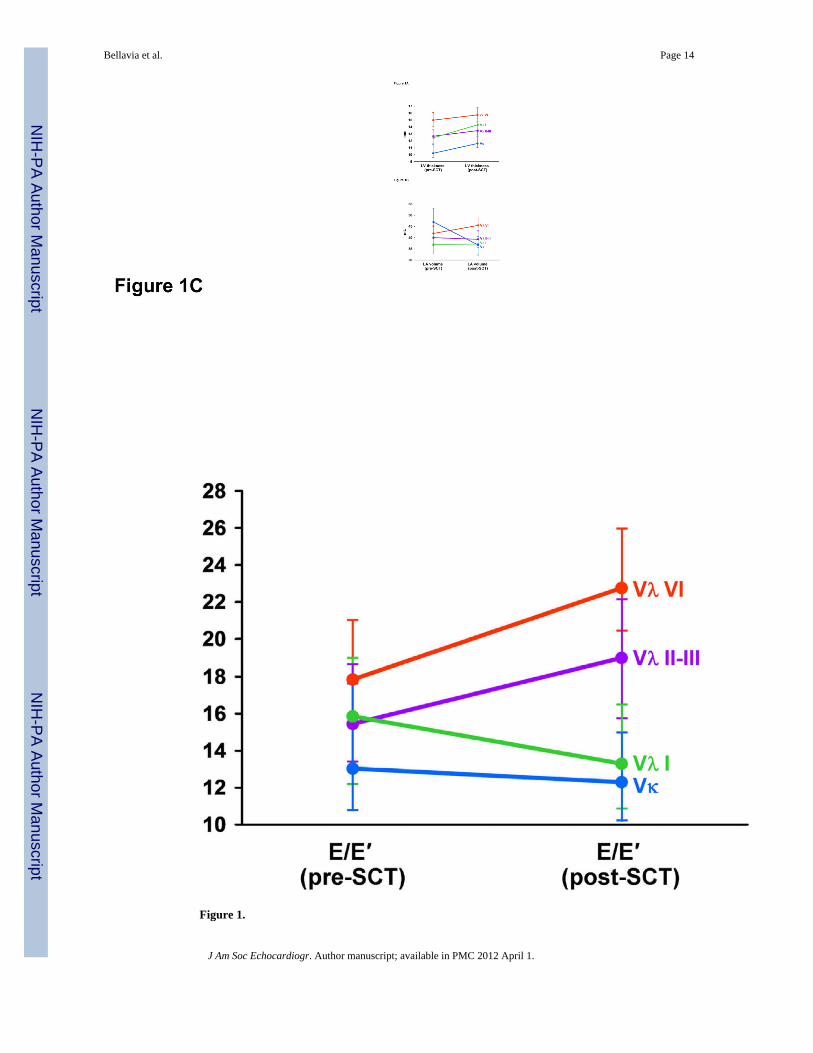
Figure 1.
Bellavia et al. Page 14
J Am Soc Echocardiogr. Author manuscript; available in PMC 2012 April 1.
NIH
-PA Author Manuscript
NIH
-PA Author Manuscript
NIH
-PA Author Manuscript
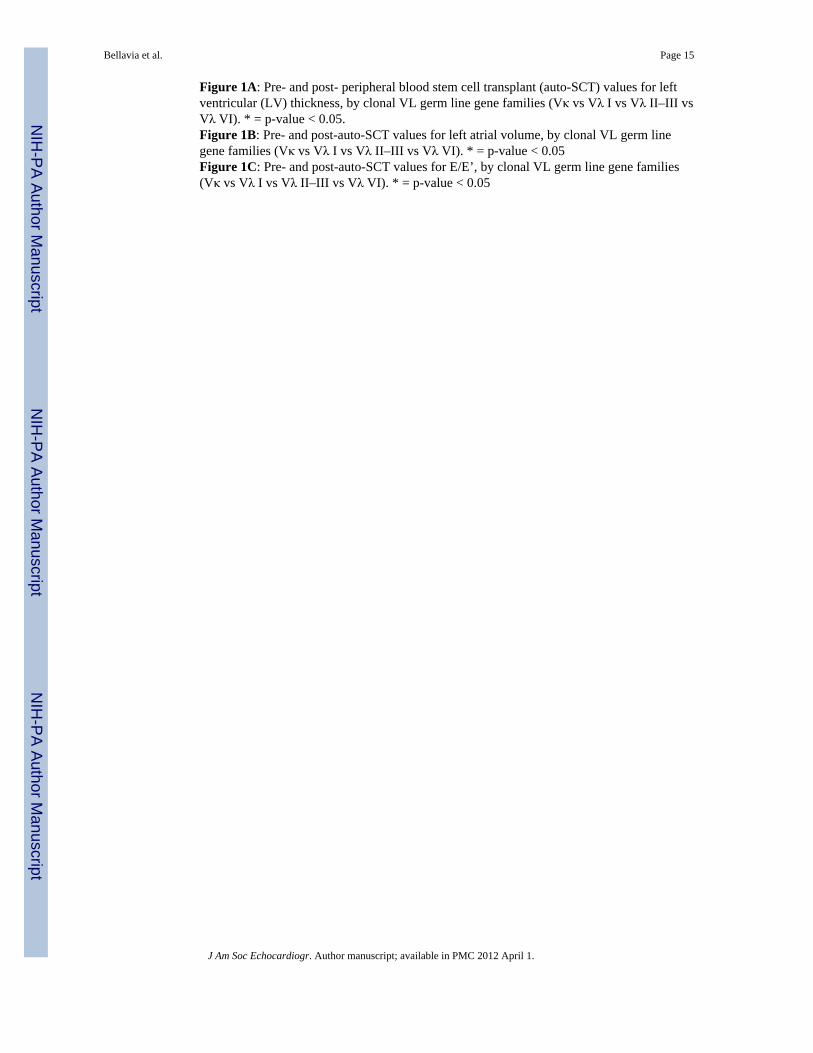
Figure 1A: Pre- and post- peripheral blood stem cell transplant (auto-SCT) values for leftventricular (LV) thickness, by clonal VL germ line gene families (Vκ vs Vλ I vs Vλ II–III vsVλ VI). * = p-value < 0.05.Figure 1B: Pre- and post-auto-SCT values for left atrial volume, by clonal VL germ linegene families (Vκ vs Vλ I vs Vλ II–III vs Vλ VI). * = p-value < 0.05Figure 1C: Pre- and post-auto-SCT values for E/E’, by clonal VL germ line gene families(Vκ vs Vλ I vs Vλ II–III vs Vλ VI). * = p-value < 0.05
Bellavia et al. Page 15
J Am Soc Echocardiogr. Author manuscript; available in PMC 2012 April 1.
NIH
-PA Author Manuscript
NIH
-PA Author Manuscript
NIH
-PA Author Manuscript
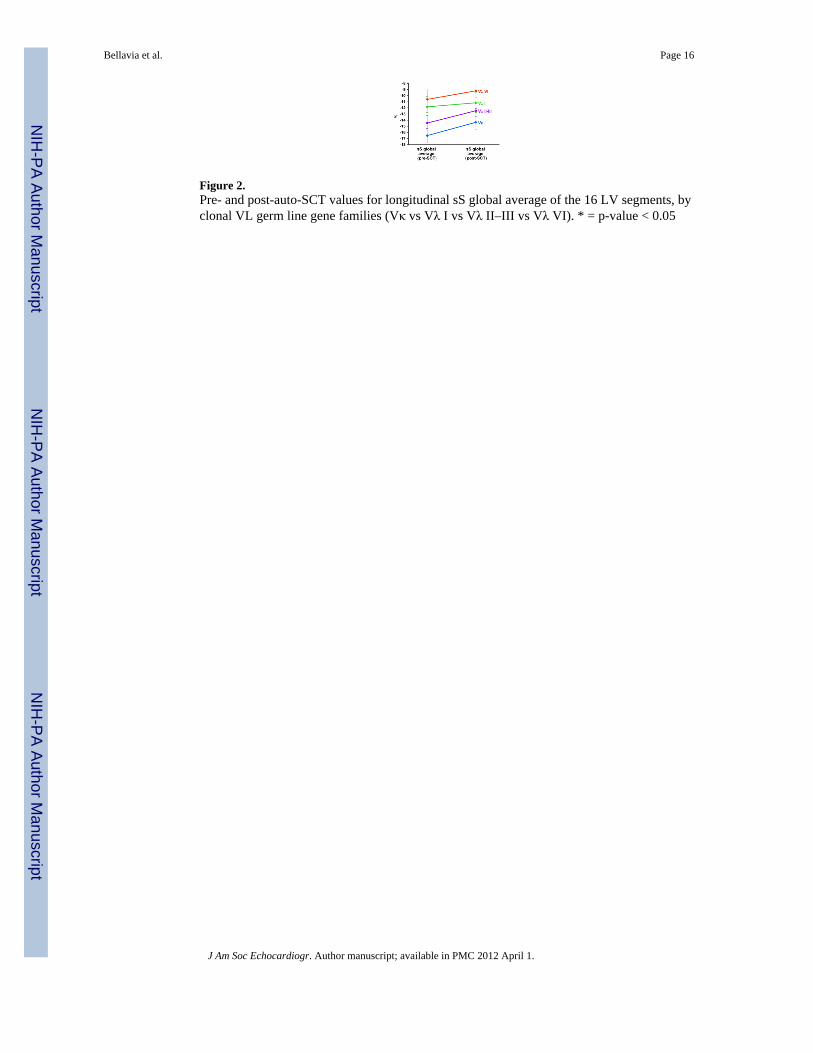
Figure 2.Pre- and post-auto-SCT values for longitudinal sS global average of the 16 LV segments, byclonal VL germ line gene families (Vκ vs Vλ I vs Vλ II–III vs Vλ VI). * = p-value < 0.05
Bellavia et al. Page 16
J Am Soc Echocardiogr. Author manuscript; available in PMC 2012 April 1.
NIH
-PA Author Manuscript
NIH
-PA Author Manuscript
NIH
-PA Author Manuscript
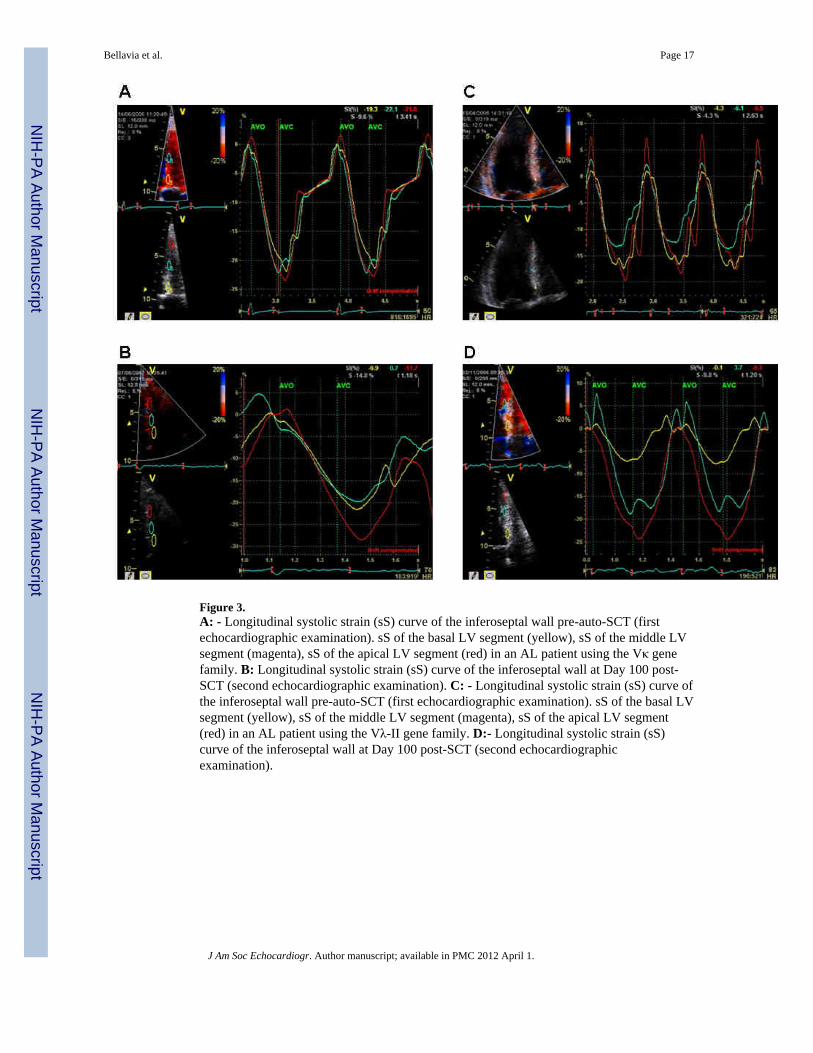
Figure 3.A: - Longitudinal systolic strain (sS) curve of the inferoseptal wall pre-auto-SCT (firstechocardiographic examination). sS of the basal LV segment (yellow), sS of the middle LVsegment (magenta), sS of the apical LV segment (red) in an AL patient using the Vκ genefamily. B: Longitudinal systolic strain (sS) curve of the inferoseptal wall at Day 100 post-SCT (second echocardiographic examination). C: - Longitudinal systolic strain (sS) curve ofthe inferoseptal wall pre-auto-SCT (first echocardiographic examination). sS of the basal LVsegment (yellow), sS of the middle LV segment (magenta), sS of the apical LV segment(red) in an AL patient using the Vλ-II gene family. D:- Longitudinal systolic strain (sS)curve of the inferoseptal wall at Day 100 post-SCT (second echocardiographicexamination).
Bellavia et al. Page 17
J Am Soc Echocardiogr. Author manuscript; available in PMC 2012 April 1.
NIH
-PA Author Manuscript
NIH
-PA Author Manuscript
NIH
-PA Author Manuscript
Bellavia et al. Page 18
J Am Soc Echocardiogr. Author manuscript; available in PMC 2012 April 1.
NIH
-PA Author Manuscript
NIH
-PA Author Manuscript
NIH
-PA Author Manuscript
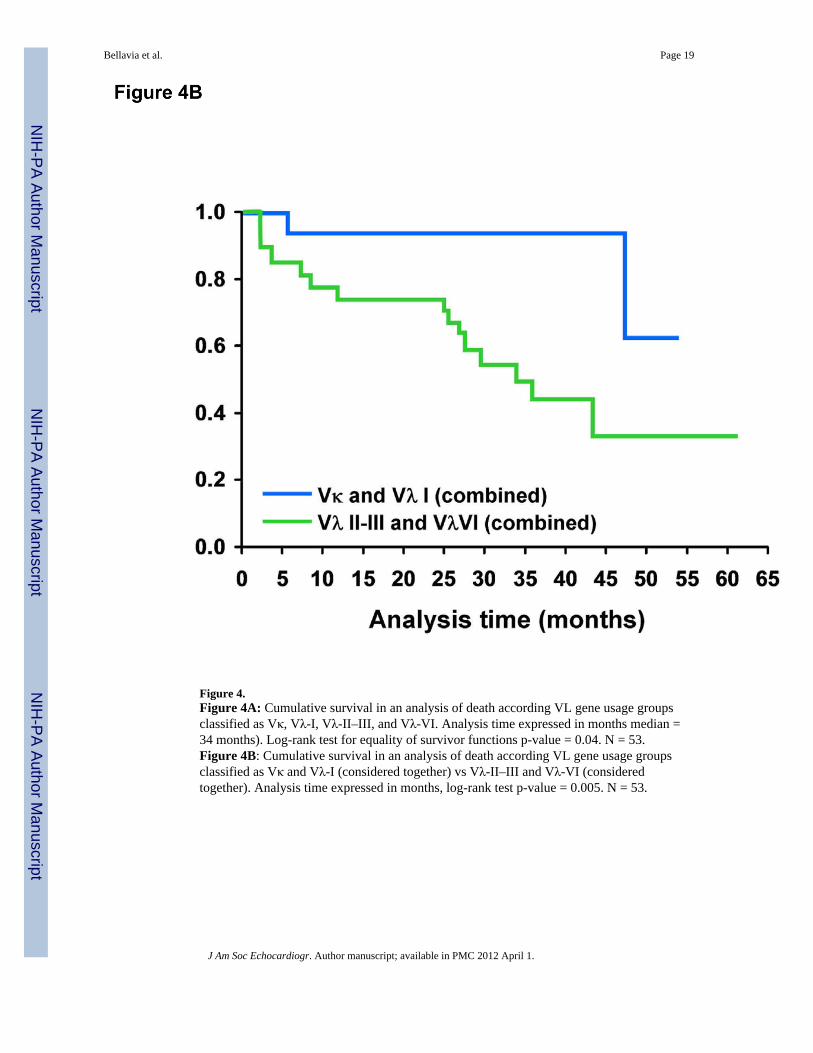
Figure 4.Figure 4A: Cumulative survival in an analysis of death according VL gene usage groupsclassified as Vκ, Vλ-I, Vλ-II–III, and Vλ-VI. Analysis time expressed in months median =34 months). Log-rank test for equality of survivor functions p-value = 0.04. N = 53.Figure 4B: Cumulative survival in an analysis of death according VL gene usage groupsclassified as Vκ and Vλ-I (considered together) vs Vλ-II–III and Vλ-VI (consideredtogether). Analysis time expressed in months, log-rank test p-value = 0.005. N = 53.
Bellavia et al. Page 19
J Am Soc Echocardiogr. Author manuscript; available in PMC 2012 April 1.
NIH
-PA Author Manuscript
NIH
-PA Author Manuscript
NIH
-PA Author Manuscript
NIH
-PA Author Manuscript
NIH
-PA Author Manuscript
NIH
-PA Author Manuscript
Bellavia et al. Page 20
Tabl
e 1
Dis
tribu
tion
of d
omin
ant o
rgan
invo
lvem
ent a
s a fu
nctio
n of
imm
unog
lobu
lin g
erm
line
var
iabl
e ge
ne (V
L) u
se
VL
Gen
eSu
btyp
eN
b.D
omin
ant o
rgan
Invo
lvem
ent
Nb
Invo
lved
≥
Gen
ePa
tient
sCa
rdia
cRe
nal
PNS
Hep
atic
Oth
er3
Prim
ary
Seco
ndar
yPr
imar
ySe
cond
ary
VλI
1b1
00
10
00
00
1c6
11
11
10
00
1e2
01
10
00
00
1g2
00
11
01
00
VλI
I2a
24
10
30
00
00
2b2
22
00
10
00
0
2c1
00
10
00
00
VλI
II3h
10
00
00
01
0
3r10
51
33
10
01
Vλ
VI
6a13
60
41
10
15
Vκ
L11
00
10
00
00
L12
10
01
00
00
0
L21
10
01
00
01
O12
/O2
21
01
10
00
0
O18
/O8
60
23
00
01
0
Tot
al53
175
219
31
37
Freq
uenc
y di
strib
utio
n of
dom
inan
t and
co-
dom
inan
t org
ans a
ffec
ted
by A
L am
yloi
d de
posi
tion,
and
num
ber o
f org
ans i
nvol
ved,
stra
tifie
d by
clo
nal i
mm
unog
lobu
lin V
L ge
rmlin
e ge
nes i
n 53
pat
ient
s.
J Am Soc Echocardiogr. Author manuscript; available in PMC 2012 April 1.
NIH
-PA Author Manuscript
NIH
-PA Author Manuscript
NIH
-PA Author Manuscript
Bellavia et al. Page 21
Tabl
e 2
Bio
mar
kers
and
Sta
ndar
d Ec
hoca
rdio
grap
hy
Var
iabl
e (m
ean
± st
anda
rdde
viat
ion)
Bas
elin
e*Vκ
(n =
11)
Vλ
I (n
= 11
)Vλ
II–I
II (n
= 1
8)Vλ
VI (
n =
13)
or m
edia
n (I
nter
quar
tile
rang
e)p-
valu
ePr
e-PB
SCT
Post
-PB
SCT
p-va
lue
Pre-
PBSC
TPo
st-
PBSC
Tp-
valu
ePr
e-PB
SCT
Post
-PB
SCT
p-va
lue
Pre-
PBSC
TPo
st-
PBSC
Tp-
valu
e
Fem
ales
(n (%
))0.
183
(28)
8 (7
3)8
(45)
5 (3
8)
Age
0.33
60 ±
555
± 1
158
± 1
159
± 9
NY
HA
III/I
V (n
(%))
0.81
01
(12)
03
(30)
Bod
y M
ass I
ndex
0.64
26.2
1 ±
3.9
27.4
8 ±
4.6
25.8
± 6
25 ±
3.6
Cre
atin
ine
(mg/
dl)
0.69
1.20
(1.3
)1.
05 (1
.1)
1.0
(0.3
)1.
10 (0
.4)
GFR
(ml/m
in/B
SA)
0.57
59 (5
6)65
.5 (4
7)70
(18)
72 (3
0)
24h
Prot
einu
ria (m
g/24
h)0.
375,
516
(7,4
69)
4,85
9 (3
,055
)1,
865
(4,1
78)
3,53
8 (4
,575
)
FLC
κ0.
003
14.1
(63)
1.03
(4.8
)0.
041.
24 (0
.3)
1.18
(1.5
)0.
700.
88 (1
.5)
0.94
(2.4
)0.
331.
41 (0
.2)
0.94
(1.4
)0.
78
FLC
λ0.
004
1.64
(0.8
)1.
95 (1
.9)
0.90
13.5
5 (2
8.2)
2.03
(5.2
)0.
0220
.95
(44.
5)4.
58 (1
2.6)
0.01
5.68
(4.4
)2.
31 (3
.9)
0.71
FLC
κ/λ
0.00
34.
6 (6
.1)
1.94
(2.4
)0.
140.
12 (0
.2)
0.2
(0.4
)0.
130.
06 (0
.1)
0.48
(0.7
)0.
010.
28 (0
.2)
0.36
(0.7
)0.
16
BN
P (p
g/m
l)0.
5979
(115
8)80
(818
)0.
1713
7 (2
90)
198
(718
)0.
0523
9 (2
62)
154
(781
)0.
7831
5 (4
80)
293
(313
)0.
68
Trop
onin
T (n
g/m
l)0.
950.
01 (0
.02)
0.02
(0.0
2)0.
670.
01 (0
.04)
0.01
(0.1
9)0.
420.
01 (0
.02)
0.02
(0.0
6)0.
120.
02 (0
.02)
0.02
(0.0
2)0.
23
LV T
hick
ness
(mm
)0.
0210
.6 ±
211
.9 ±
30.
1212
.4 ±
214
.3 ±
20.
0112
.7 ±
313
.5 ±
30.
2615
.0 ±
415
.7 ±
30.
04
LV M
ass I
ndex
(gr/m
2)0.
0495
± 3
410
7 ±
490.
2680
± 2
171
± 2
20.
0192
± 3
092
± 3
30.
3815
7 ±
6515
2 ±
350.
62
LVED
Vol
ume
(mm
)0.
6586
± 4
883
± 3
40.
2337
± 1
130
± 9
0.34
41 ±
16
41 ±
19
0.95
73 ±
33
72 ±
35
0.04
LVES
Vol
ume
(mm
)0.
9737
.5 ±
17.
433
± 1
3.8
0.41
106
± 18
132
± 30
0.14
117
± 46
122
± 63
0.92
38.8
6 ±
19.8
33.2
5 ±
170.
67
LA V
ol (c
c/m
2)0.
6847
.7 ±
14.
138
.1 ±
10.
90.
0237
± 1
237
± 9
0.25
40 ±
13
39 ±
19
0.86
41.8
± 7
.045
.6 ±
9.6
0.31
E (m
/sec
)0.
480.
8 ±
0.1
0.6
± 0.
10.
080.
9 ±
0.2
0.9
± 0.
20.
440.
8 ±
0.3
0.9
± 0.
30.
690.
8 ±
0.1
0.9
± 0.
20.
27
A (m
/sec
)0.
870.
65 ±
0.2
0.75
± 0
.20.
150.
8 ±
0.3
0.7
± 0.
30.
580.
8 ±
0.4
0.7
± 0.
30.
780.
65 ±
0.2
0.63
± 0
.30.
72
E/A
0.42
1.4
± 0.
70.
9 ±
0.5
0.03
1.4
± 0.
91.
4 ±
0.7
0.14
1.3
± 0.
91.
3 ±
0.6
0.37
1.5
± 0.
82.
2 ±
1.9
0.41
E D
ecel
arat
ion
Tim
e (m
sec)
0.48
232
± 52
248
± 79
0.93
188
± 36
203
± 52
0.25
204
± 48
195
± 51
0.68
191
± 43
194
± 49
0.77
E' (m
/sec
)0.
510.
06 ±
0.0
20.
06 ±
0.0
30.
220.
06 ±
0.0
10.
06 ±
0.0
30.
670.
06 ±
0.0
20.
05 ±
0.0
20.
110.
05 ±
0.0
20.
04 ±
0.0
10.
04
E/E'
0.37
15.5
± 8
.913
.9 ±
7.9
0.44
15.8
± 6
.713
.3 ±
8.6
0.79
15.5
± 1
1.6
19.0
± 1
0.6
0.04
17.7
9 ±
7.5
22.7
9 ±
10.9
0.08
Ejec
tion
Frac
tion
(%)
0.37
65 ±
962
± 8
.40.
6756
± 9
56 ±
10
0.89
57 ±
757
± 1
00.
5359
± 1
260
± 1
00.
41
Car
diac
Inde
x (l/
min
/m2)
0.45
3.9
± 0.
73.
2 ±
1.2
0.32
3.3
± 1.
13.
1 ±
10.
323.
3 ±
0.9
2.9
± 0.
71.
02.
8 ±
1.2
3.0
± 0.
750.
65
RV
tric
uspi
d re
gurg
itatio
n ve
l.(m
/s)
0.57
2.6
± 0.
52.
3 ±
0.3
0.05
2.7
± 0.
12.
9 ±
0.3
0.14
2.5
± 0.
22.
5 ±
0.4
0.80
2.6
± 0.
32.
6 ±
0.5
0.91
J Am Soc Echocardiogr. Author manuscript; available in PMC 2012 April 1.
NIH
-PA Author Manuscript
NIH
-PA Author Manuscript
NIH
-PA Author Manuscript
Bellavia et al. Page 22
Var
iabl
e (m
ean
± st
anda
rdde
viat
ion)
Bas
elin
e*Vκ
(n =
11)
Vλ
I (n
= 11
)Vλ
II–I
II (n
= 1
8)Vλ
VI (
n =
13)
or m
edia
n (I
nter
quar
tile
rang
e)p-
valu
ePr
e-PB
SCT
Post
-PB
SCT
p-va
lue
Pre-
PBSC
TPo
st-
PBSC
Tp-
valu
ePr
e-PB
SCT
Post
-PB
SCT
p-va
lue
Pre-
PBSC
TPo
st-
PBSC
Tp-
valu
e
RV
Sys
tolic
Pre
ssur
e (m
mH
g)0.
6934
.5 ±
11.
625
.67
± 3.
90.
0534
.2 ±
3.5
42.4
± 1
10.
1430
.7 ±
7.3
36.4
± 1
0.1
0.19
34.7
± 8
.435
.2 ±
12
0.91
RIM
P0.
540.
36 ±
0.2
0.34
± 0
.20.
670.
32 ±
0.2
0.55
± 0
.30.
150.
26 ±
0.1
0.38
± 0
.10.
030.
38 ±
0.1
0.43
± 0
.20.
41
Clin
ical
, bio
mar
kers
, and
stan
dard
ech
ocar
diog
raph
ic v
aria
bles
for V
κ vs
Vλ
I vs V
λ II
-III
vs V
λ V
I gro
ups,
pre-
and
pos
t- pe
riphe
ral b
lood
stem
cel
l tra
nspl
ant (
auto
-SC
T). D
escr
iptio
ns a
re w
ith m
ean
± SD
,m
edia
n ±
inte
r-qu
artil
e ra
nge
or c
ount
(per
cent
). C
ompa
rison
s of b
asel
ine
valu
es a
mon
g gr
oups
(firs
t col
umn)
are
mad
e us
ing
the
Kru
skal
-Wal
lis te
st o
r Fis
her e
xact
test
; com
paris
on b
etw
een
pre-
and
pos
t-au
to-S
CT
valu
e pe
r var
iabl
e ar
e m
ade
usin
g th
e W
ilcox
on si
gned
-ran
k pa
ired
sum
test
.
J Am Soc Echocardiogr. Author manuscript; available in PMC 2012 April 1.
NIH
-PA Author Manuscript
NIH
-PA Author Manuscript
NIH
-PA Author Manuscript
Bellavia et al. Page 23
Tabl
e 3
Syst
olic
Dop
pler
Myo
card
ial I
mag
ing
Var
iabl
e(m
ean
± st
anda
rdde
viat
ion)
Bas
elin
e*Vκ
(n =
11)
Vλ
I (n
= 11
)Vλ
II II
I(n
= 1
8)Vλ
VI
(n =
13)
p-va
lue
Pre-
PBSC
TPo
st-
PBSC
Tp-
valu
ePr
e-PB
SCT
Post
-PB
SCT
p- valu
ePr
e-PB
SCT
Post
-PB
SCT
p- valu
ePr
e-PB
SCT
Post
-PB
SCT
p- valu
e
Stra
in R
ate
Imag
ing
(1/s
)St
rain
Rat
e Im
agin
g (1
/s)
Bas
al M
ean
0.22
−0.
9 ±
0.5
−0.
9 ±
0.3
0.4
−0.
8 ±
0.3
−0.
7 ±
0.3
0.88
−0.
8 ±
0.3
−0.
7 ±
0.3
0.01
−0.
6 ±
0.4
−0.
5 ±
0.2
0.37
Mid
dle
Mea
n0.
009
−1.
2 ±
0.3
−1.
0 ±
0.2
0.26
−0.
9 ±
0.2
−0.
8 ±
0.3
0.4
−1.
1 ±
0.3
−0.
8 ±
0.3
0.00
1−0.
7 ±
0.3
−0.
7 ±
0.3
0.53
Ape
x M
ean
0.02
−1.
2 ±
0.2
−1.
1 ±
0.3
0.16
−0.
9 ±
0.3
−0.
8 ±
0.2
0.12
−1.
2 ±
0.4
−0.
9 ±
0.3
0.00
1−0.
8 ±
0.2
−0.
7 ±
0.2
0.03
Glo
bal A
vera
ge0.
02−1.
1 ±
0.3
−0.
1 ±
0.3
0.26
−0.
9 ±
0.2
−0.
8 ±
0.3
0.78
−1.
0 ±
0.3
−0.
8 ±
0.2
0.00
1−0.
7 ±
0.3
−0.
6 ±
0.2
0.11
Stra
in Im
agin
g (%
)St
rain
Imag
ing
(%)
Bas
al M
ean
0.06
−15
.6 ±
5.7
−12
.63
± 5.
90.
09−10
.2 ±
3.2
−9.
3 ±
6.4
0.78
−11
.3 ±
4.3
−9.
9 ±
4.8
0.48
−8.
7 ±
6.9
−8.
2 ±
5.3
0.72
Mid
dle
Mea
n0.
08−17
.1 ±
4.6
−16
.11
± 3
0.33
−13
.0 ±
4.7
−12
.5 ±
5.5
1−15
.7 ±
3.3
−14
.1 ±
5.7
0.18
−11
.5 ±
5.4
−9.
8 ±
4.3
0.04
Ape
x M
ean
0.00
9−17
.1 ±
2.9
−14
.51
± 3.
60.
09−12
.5 ±
3.7
−12
.1 ±
3.9
0.41
−17
.3 ±
4.7
−13
.8 ±
4.3
0.00
9−12
.2 ±
3.9
−9.
6 ±
3.3
0.04
Glo
bal A
vera
ge0.
02−16
.6 ±
4.2
−14
.41
± 4.
10.
09−11
.8 ±
2.6
−11
.2 ±
4.9
0.78
−14
.5 ±
3.3
−12
.5 ±
4.3
0.02
−10
.6 ±
5.2
−9.
2 ±
4.1
0.06
Long
itudi
nal s
ysto
lic D
oppl
er m
yoca
rdia
l im
agin
g (D
MI)
var
iabl
es, i
nclu
ding
syst
olic
stra
in ra
te (s
SR) a
nd st
rain
(sS)
, for
Vκ
vs Vλ
I vs V
λ II
–III
vs V
λ V
I gro
ups,
pre-
and
pos
t- pe
riphe
ral b
lood
stem
cel
ltra
nspl
ant (
auto
-SC
T). D
escr
iptio
ns a
re w
ith m
ean
± SD
, med
ian
± in
ter-
quar
tile
rang
e or
cou
nt (p
erce
nt).
Com
paris
ons o
f bas
elin
e va
lues
am
ong
grou
ps (f
irst c
olum
n) a
re m
ade
usin
g th
e K
rusk
al-W
allis
test
or F
ishe
r exa
ct te
st; c
ompa
rison
bet
wee
n pr
e- a
nd p
ost-a
uto-
SCT
valu
e pe
r var
iabl
e ar
e m
ade
usin
g th
e W
ilcox
on si
gned
-ran
k pa
ired
sum
test
J Am Soc Echocardiogr. Author manuscript; available in PMC 2012 April 1.