Predictors of complicated grief: a systematic review of empirical studies

The proxy of renal function that mostaccurately predicts short- and long-termoutcome after acute coronary syndrome
KatiaOrvin,MD,a,b,dAlonEisen,MD,a,b,d IlanGoldenberg,MD,cAteretFarkashcNirShlomo,MPH,cNatalieGevrielov-Yusim,MSc,cZaza Iakobishvili, MD, PhD,a,b andDavid Hasdai, MDa,b Petah Tikva, Tel Aviv, and Tel Hashomer, Israel
Aims The aim of this study is to determine the most accurate renal function formula that predicts short- and long-termmortality in a wide spectrum of acute coronary syndrome (ACS) patients.
Methods and results We analyzed 8,726 consecutive patients (46.3% ST-elevation myocardial infarction [STEMI]and 53.7% non–ST-elevation ACS [NSTE-ACS]) enrolled in the ACS survey in Israel. Renal function, assessed using 5 formulas asproxies of creatinine clearance or estimated glomerular filtration rate (Cockcroft-Gault, modification of diet in renal disease[MDRD], Chronic KidneyDisease Epidemiology Collaboration,Mayo quadratic, and inulin clearance based), varied in applyingthe different formulas. For both STEMI and NSTE-ACS patients, the Mayo formula yielded the highest mean value (88.9 ± 27.7and 81.4±29.2mL/min per 1.73m2, respectively) andChronic KidneyDisease EpidemiologyCollaboration the lowest (73.0 ±23.1 and 67.0 ± 24.1 mL/min per 1.73 m2, respectively). Using multivariate analysis, worse renal function was independentlyassociated with increased mortality risk by 30% to 40% for each decrement of 10 U of creatinine clearance or estimatedglomerular filtration rate in STEMI patients and by 25% to 30% for NSTE-ACS patients, using all 5 formulas. The only formula thatmore accurately predicted 1-year mortality than the MDRD formula was the Mayo quadratic formula with a 1-year netreclassification index of 0.26 and 0.14 for STEMI and NSTE-ACS patients, respectively, after multivariable adjustment.
Conclusion Worse renal function was an independent predictor for short- and long-term mortality using all 5 formulas ina broad spectrum of ACS patients, but only the Mayo quadratic formula had better accuracy in predicting mortality relative tothe MDRD, suggesting that it may be the preferred prognosticator among ACS patients. (Am Heart J 2015;169:702-712.e3.)
Patients with moderate or greater renal dysfunction (RD)have worse outcomes after acute myocardial infarction(AMI), including higher all-cause and cardiac-relatedmortality.1-4 The 2-year mortality rate after AMI in patientswith end-stage renal disease may be 2-fold greater than forthe general population.5 Both serum creatinine (SCr) andestimated glomerular filtration rate (eGFR) on admissionare independent predictors for short- and long-termmortality in patients after AMI.6-11 Indeed, SCr is includedin the Global Registry of Acute Coronary Events score for
rom the aCardiology Department, Rabin Medical Center, Petah Tikva, Israel, bSackleraculty of Medicine, Tel Aviv University, Tel Aviv, Israel, and cThe Israeli Association forardiovascular Trials, Tel Hashomer, Israel.Katia Orvin and Alon Eisen contributed equally to this work and are co-first authors ofis manuscript.isclosure: none declared.ubmitted April 20, 2014; accepted January 15, 2015.eprint requests: Alon Eisen, MD, Cardiology Department, Rabin Medical Center, 39botinsky St, Petah Tikva, Israel 49100.-mail: [email protected] Elsevier Inc. All rights reserved.
ttp://dx.doi.org/10.1016/j.ahj.2015.01.012
FFCd
thDSRJaE0©h
predicting postdischarge outcomes after acute coronarysyndrome (ACS).12 Recently, worsening renal functionduring AMI hospitalization was shown to be an indepen-dent predictor of long-term mortality, beyond renalfunction status upon admission.13
Serum creatinine, used in clinical practice as a proxy ofrenal function, is a relatively poor indicator of renalfunction, particularly among women, African Americans,and the elderly.14,15 Using eGFR provides a better overallmeasure of kidney function.16,17 Traditionally, theCockcroft-Gault (CG) formula was used for calculationof creatinine clearance, but, eventually, due to multipledrawbacks, several other formulas were developed.17,18
The most extensively used alternative formulas are themodification of diet in renal disease (MDRD) and, morerecently, the Chronic Kidney Disease EpidemiologyCollaboration (CKD-EPI) formulas.19-21 The Mayo qua-dratic formula 22 and the inulin clearance–based (IB)eGFR formula21 were developed in an attempt to betterestimate GFR or creatinine clearance in patients withpreserved kidney function.A recent analysis has suggested that the CKD-EPI
formula better predicts outcomes than the popularly

Orvin et al 703American Heart JournalVolume 169, Number 5
used MDRD formula, including patients with vasculardisease.23 Indeed, the US National Kidney Foundation hasdesignated the CKD-EPI formula the formula of choice.16
These findings indicate that prior analyses that examinedthe impact of renal function on outcomes, includingstudies that included patients with ACS, may have beeninfluenced by the choice of formula used to calculatecreatinine clearance or eGFR.The impact of creatinine clearance or eGFR on outcomes
of ACS patients, using these formulas, has been previouslyevaluated in a small study of AMI patients treatedsuccessfully with primary percutaneous coronary interven-tion (PCI)24,25 but comparing only 3 of these formulas.26
There are no data regarding the ability of these 5 formulasto predict outcomes in a large cohort of awide spectrum ofACS patients, including those with ST-elevation myocardialinfarction (STEMI) and non–ST-elevation ACS (NSTE-ACS).We therefore sought to determine the risk implications ofthese 5 different formulas in a contemporary cohort of“real-world,” consecutive ACS patients and to investigatewhich formula better predicts mortality in these patients.
MethodsPatients and data collectionThe present study is a retrospective cohort data analysis
of patients from the ACS Israeli survey between the years2002 and 2010. Details of the registry have beenpreviously reported.27 In brief, this registry is a nationalsurvey performed for 2 consecutive months every 2 yearsamong patients admitted to 26 coronary care units andcardiology wards in all the public hospitals in Israel withthe diagnosis of ACS. All patients with STEMI orNSTE-ACS were included. Patient management was atthe discretion of the attending physicians. Admission anddischarge diagnoses were based on clinical, electrocar-diographic, and biochemical criteria (elevated creatininekinase and/or troponin levels) as used at the time ofsurvey. Follow-up outcomes were ascertained by hospitalchart review, telephone contact, and the Israeli NationalPopulation Register. Patients with any missing data,which were essential for any of the formulas (such asage, sex, weight, or SCr on admission) were excludedfrom the current analysis. We evaluated and comparedbaseline characteristics, hospital course, and outcome forboth STEMI and NSTE-ACS subgroups, based on renalfunction status.
Assessing renal functionWe assessed 5 different eGFR or creatinine clearance
formulas, based on the initial creatinine examinationupon admission. The formulas used, detailed in theAppendix, were as follows: CG, MDRD, CKD-EPI, Mayo,and IB.Patients were categorized into 5 levels of renal function:
no RD (eGFR, N90 mL/min per 1.73 m2), mild RD (eGFR,
60-90 mL/min per 1.73 m2), moderate RD (30-59 mL/minper 1.73 m2), severe RD (15-29 mL/min per 1.73 m2), orkidney failure (b15 mL/min per 1.73 m2).16 The USNational Kidney Foundation criteria were adapted forsignificant RD definition as an eGFR of b60 mL/min per1.73 m2 (for CKD-EPI, MDRD, and Mayo).16
End pointsThe outcomes assessed were 30-day and 1-year
mortality. We evaluated and compared the outcomesfor each category of renal function using all 5 formulas.
Statistical analysisBaseline characteristics including coronary risk factors,
clinical characteristics, laboratory values, and hospitalcourse of the patients were recorded for STEMI andNSTE-ACS patients. Continuous variables are expressed asmean ± SD. The univariate 1-year survival in predefinedRD groups was performed using Kaplan-Meier analysis.To identify the independent association between 1-yearmortality and the predefined RD groups, we used the Coxproportional hazards method. Prespecified covariates inthe multivariable model for STEMI and NSTE-ACS patientsincluded age, gender, hypertension, Killip class ≥2,dyslipidemia, diabetes mellitus, peripheral vascular dis-ease, chronic renal failure (categorically predefined in theserial surveys as SCr of N1.5 mg/dL in a prior examinationor eGFR values of b50 mL/min per 1.73 m2 using the CGor MDRD formulas), aborted sudden cardiac death, priorAMI, and prior heart failure. The results of the multivar-iable analysis are presented as hazard ratio (HR) with 95%confidence limits.In a second set of analyses, we calculated the improved
risk prediction of 30-day and 1-year mortality by thedifferent formulas compared with the MDRD formula,based on the predefined categories (described above),16
using the net reclassification index (NRI) and theintegrated discrimination improvement (IDI) measure.28
The impact of patients' shift into higher and lower levelsof renal function on outcome, using the 4 formulas ascompared with the MDRD formula, was calculated. TheNRI reflects the net reclassification of events (death) withworse renal function and the net reclassification ofnonevents (no death) with better renal function. Anotherway to extend NRI is accomplished by assigning a weightto each movement that is equal to difference ofprobabilities from the old and new models. This measureof accuracy of the prediction model is called the IDI,which is equal to the difference in discrimination slopes.The discrimination slope is the difference in means ofpredicted probabilities for events and nonevents (in otherwords, it is a measure of separation in predictedprobabilities for event and nonevents).We performed a Bland and Altman analysis to assess the
agreement between values derived from each of the

Table I. Baseline characteristics and inhospital, short-, andlong-term course of STEMI and NSTE-ACS patients
STEMI NSTE-ACS
n = 4039 n = 4687
ale gender 78.5 75.2ge (y) 62.2 ± 12.8 64.0 ± 12.7MI (kg/m2) 27.0 ± 4.1 27.5 ± 4.6Cr (mg/dL) 1.2 ± 0.7 1.3 ± 0.9ypertension 48.7 66.5iabetes mellitus 28.3 39.1yslipidemia 55.4 70.7urrent smoker 44.0 28.7hronic medicationsAspirin 33.6 58.2β-blockers 24.2 46.4ACEI/ARB 25.2 45.1Diuretics 10.7 23.8Statins 29.2 52.5Oral antiglycemic 17.1 25.6Insulin 3.9 7.9AD historyPrior MI 20.2 37.6Prior angina 25.7 46.3Prior PCI 17.3 35.3Prior CABG 4.0 16.2Prior CHF 4.0 11.6eperfusionPrimary reperfusion 61.6 2.8
Primary PCI 72.9 2.4Fibrinolysis 27.1 0.4
Total PCI 73.2 51.7CABG 3.7 5.4hospital complicationsCardiogenic shock 4.7 1.8Moderate-severe LV dysfunction 31.5 24.4ortalityInhospital mortality 3.3 1.630-Day mortality 5.2 3.31-Year mortality 9.1 9.5
alues are % or mean ± SD.bbreviations: BMI, Body mass index; ACEI, angiotensin converting enzymehibitor; ARB, angiotensin receptor inhibitor; CAD, coronary artery disease; MI,yocardial infarction; CABG, coronary artery bypass graft; CHF, congestive heartilure; LV, left ventricular.
704 Orvin et alAmerican Heart Journal
May 2015
other formula and the values obtained from the MDRDformula. We also performed receiver operating charac-teristic analyses, as proxies of discrimination; and themodel's ability to separate subjects' outcomes, presentingthe results as the adjusted area under the curve with 95%CIs. Similarly, we applied the Hosmer and Lemeshowgoodness-of-fit test to measure calibration, the ability ofthe model to make unbiased estimates of outcome. AP value N .05 denotes a calibrated model.The statistical software used for the analyses was SAS
version 8.2 (SAS institute, Cary, NC). A 2-sided P value b.05 was used for declaring statistical significance.The authors have no conflict of interest to declare. No
extramural funding was used to support this work. Theauthors are solely responsible for the design and conductof this study, all study analyses, the drafting and editing ofthe paper, and its final contents.
ResultsOf 9,096 patients enrolled during the cohort period,
370 patients were excluded due to lack of relevant data toany of the formulas, leaving 8,726 patients, of whom4,039 presented with STEMI (46.3%) and 4,687 withNSTE-ACS (53.7%). The vast majority of the studypopulation was white, and the appropriate version ofthe formula was thus used.
Baseline characteristics and hospital outcomeST-elevation myocardial infarction patients were mostly
male (78.5%) with multiple risk factors for ischemic heartdisease, yet only aminority had a prior AMI (20.2%, Table I).STEMI patients were treatedmostlywith primary PCI as themode of reperfusion (72.9%).Non–ST-elevation ACS patients were slightly older than
STEMI patients (64.0 ± 12.7 vs 62.2 ± 12.8 years), with ahigher prior history of ischemic heart disease (37.6% withprior AMI; Table I). Before their index admission, theyreceived cardiovascular medications, statins, glucose-lowering therapy, and antiplatelet treatments more com-monly (Table I). A total of 1,782 patients (38.0%) wereadmitted with unstable angina pectoris and the rest withAMI (62.0%). Approximately half of NSTE-ACS patientswere treated with PCI (51.7%). Heart failure complicationswere less frequent among NSTE-ACS patients (Table I).Inhospital and 30-day mortality was low for both groups
(3.3% and 5.2% for STEMI; 1.6% and 3.3% for NSTE-ACS,respectively) with a 2-fold higher rate for STEMI patientsduring the index hospitalization and 1.6-fold greater riskat 30 days (Table I). By 1 year, the mortality rates weresimilar (9.1% for STEMI and 9.5% for NSTE-ACS).
Creatinine clearance/eGFRThe mean creatinine clearance or eGFR values on
admission were in the mild RD range for both STEMI andNSTE-ACS patients but noticeably lower for the NSTE-ACS
MABSHDDCC
C
R
In
M
VAinmfa
patients (P b .001; Figure 1). For both STEMI and NSTE-ACSpatients, the Mayo formula yielded the highest mean value(88.9 ± 27.7 and 81.4 ± 29.2 mL/min per 1.73 m2,respectively) and CKD-EPI the lowest (73.0 ± 23.1 and67.0 ± 24.1 mL/min per 1.73 m2, respectively).Using MDRD as the reference formula, there was a
significant and strong correlation between the 4 formulasand the MDRD formula (r = 0.79 [Mayo]; r = 0.88[CKD-EPI]; r = 0.81 [CG]; r = 0.82 [IB for STEMI]; and r =0.93 [Mayo]; r = 0.98 [CKD-EPI]; r = 0.84 [CG]; r = 0.85[IB for NSTE-ACS]; P b .001, collectively). As evident, thehighest correlation was with the CKD-EPI formula (onlineAppendix Supplementary Figure 1). Bland and Altmananalyses to assess the agreement between values derivedfrom each of the other formula and the values obtained
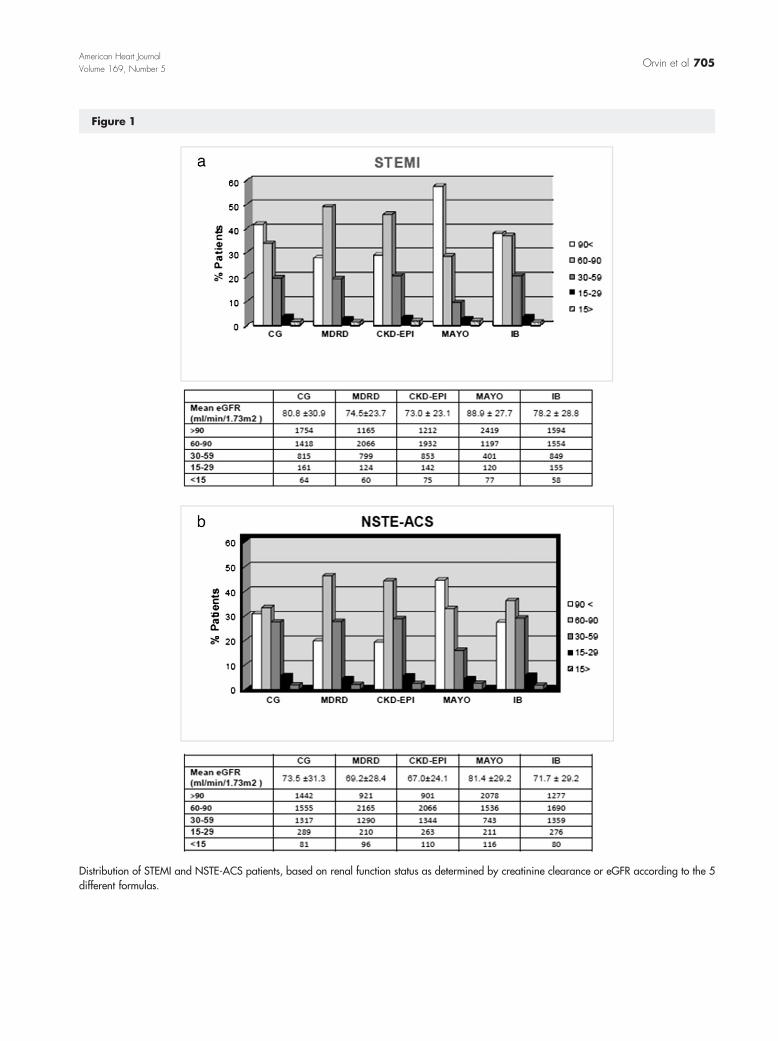
Figure 1
Distribution of STEMI and NSTE-ACS patients, based on renal function status as determined by creatinine clearance or eGFR according to the 5different formulas.
Orvin et al 705American Heart JournalVolume 169, Number 5

Figure 2
Bland and Altman analysis to assess the agreement between values derived from each formula as compared with the MDRD formula (thedifferences between the 2 methods [x-axis] are plotted against the averages of the 2 methods [y-axis]. Red line is for ±1.96 SD).
706 Orvin et alAmerican Heart Journal
May 2015
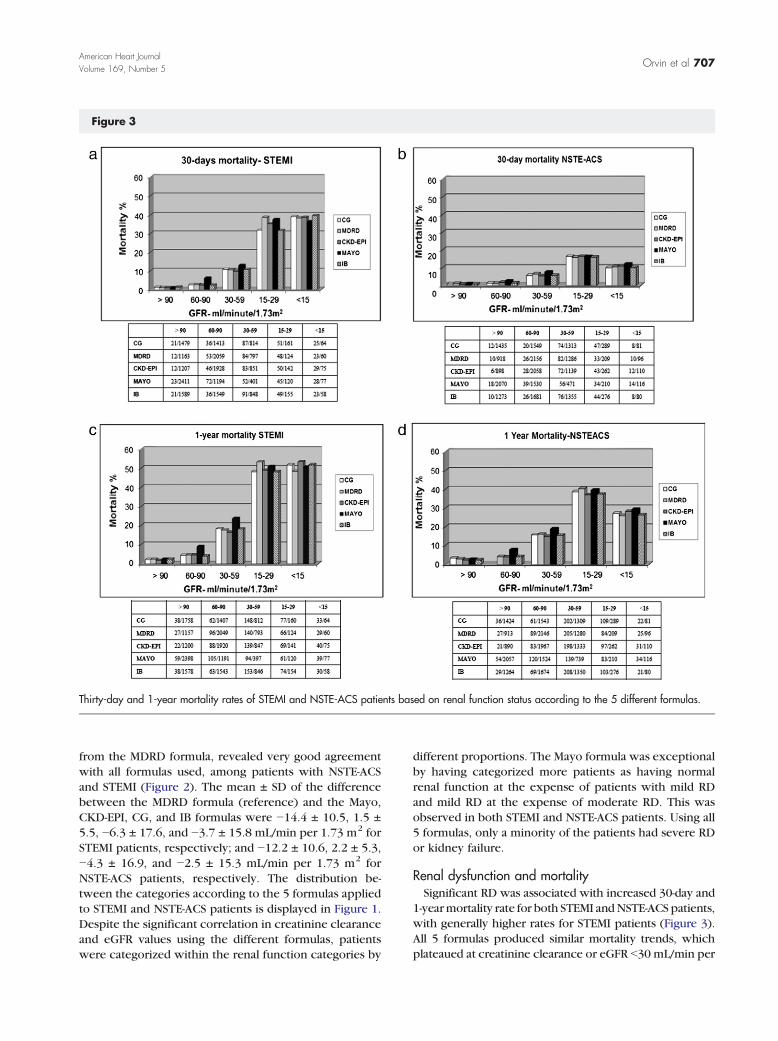
Figure 3
Thirty-day and 1-year mortality rates of STEMI and NSTE-ACS patients based on renal function status according to the 5 different formulas.
Orvin et al 707American Heart JournalVolume 169, Number 5
from the MDRD formula, revealed very good agreementwith all formulas used, among patients with NSTE-ACSand STEMI (Figure 2). The mean ± SD of the differencebetween the MDRD formula (reference) and the Mayo,CKD-EPI, CG, and IB formulas were −14.4 ± 10.5, 1.5 ±5.5, −6.3 ± 17.6, and −3.7 ± 15.8 mL/min per 1.73 m2 forSTEMI patients, respectively; and −12.2 ± 10.6, 2.2 ± 5.3,−4.3 ± 16.9, and −2.5 ± 15.3 mL/min per 1.73 m2 forNSTE-ACS patients, respectively. The distribution be-tween the categories according to the 5 formulas appliedto STEMI and NSTE-ACS patients is displayed in Figure 1.Despite the significant correlation in creatinine clearanceand eGFR values using the different formulas, patientswere categorized within the renal function categories by
different proportions. The Mayo formula was exceptionalby having categorized more patients as having normalrenal function at the expense of patients with mild RDand mild RD at the expense of moderate RD. This wasobserved in both STEMI and NSTE-ACS patients. Using all5 formulas, only a minority of the patients had severe RDor kidney failure.
Renal dysfunction and mortalitySignificant RD was associated with increased 30-day and
1-yearmortality rate for both STEMI andNSTE-ACS patients,with generally higher rates for STEMI patients (Figure 3).All 5 formulas produced similar mortality trends, whichplateaued at creatinine clearance or eGFR b30 mL/min per

Figure 4
Kaplan-Meier survival curves for STEMI and NSTE-ACS patients with significant RD (GFR ≤60 mL/min per 1.73 m2 according to all 5 formulas),nonsignificant RD (GFR N60 mL/min per 1.73 m2 according to all 5 formulas), and those for whom eGFR was discordant and shifted b60 mL/minper 1.73 m2 or N60 mL/min per 1.73 m2 depending on the formula used.
708 Orvin et alAmerican Heart Journal
May 2015
1.73 m2 (Figure 3). However, the cumulative 1-yearsurvival rate for all 5 formulas depicted different mortalitytrends for STEMI versus NSTE-ACS patients (Figure 4);although mortality rates were greater with worse RD forpatients with either STEMI or NSTE-ACS, the mortalitycurves tended to advanceminimally after ~120 days amongSTEMI patients, whereas they tended to gradually increaseover time in the NSTE-ACS group.
We compared the cumulative mortality rate forpatients with significant RD (GFR ≤60 mL/min per1.73 m2 according to all 5 formulas), nonsignificant RD(GFR N60 mL/min per 1.73 m2 according to all 5formulas), and those for whom eGFR was discordantand shifted b60 mL/min per 1.73 m2 or N60 mL/minper 1.73 m2 depending on the formula used. AmongSTEMI patients (Figure 4), the mortality rate was

Table II. Hazard ratios with 95% CIs for 30-day and 1-yearmortality in STEMI and NSTE-ACS patients for 10-U decrements increatinine clearance or eGFR
Formula
30-Day mortality 1-Year mortality
HR (95% CI) P HR (95% CI) P
STEMI patientsCG 1.38 (1.28-1.49) b.001 1.29 (1.20-1.38) b.001MDRD 1.40 (1.30-1.51) b.001 1.32 (1.23-1.41) b.001CKD-EPI 1.44 (1.34-1.56) b.001 1.37 (1.27-1.48) b.001Mayo 1.34 (1.26-1.41) b.001 1.30 (1.23-1.37) b.001IB 1.39 (1.28-1.50) b.001 1.29 (1.21-1.39) b.001
NSTE-ACS patientsCG 1.29 (1.18-1.40) b.001 1.26 (1.19-1.34) b.001MDRD 1.27 (1.17-1.37) b.001 1.26 (1.20-1.33) b.001CKD-EPI 1.30 (1.20-1.42) b.001 1.29 (1.22-1.36) b.001Mayo 1.24 (1.16-1.32) b.001 1.23 (1.18-1.29) b.001IB 1.29 (1.18-1.41) b.001 1.27 (1.20-1.34) b.001
Orvin et al 709American Heart JournalVolume 169, Number 5
highest (34.1%) for those with significant RD andlowest (2.9%) for patients with nonsignificant RD. Ofnote, the cumulative mortality rate was fairly high(11.8%) among patients with discordant RD status.Similar results were obtained for the NSTE-ACS group(24.6%, 2.9%, and 10.5%, respectively) (Figure 4).Using multivariate analysis, worse renal function was
found to be an independent predictor for 30-day and1-year mortality for all formulas used in both STEMI andNSTE-ACS patients (Table II). In general, the risk of dyingincreased by 30% to 40% for each decrement of 10 U ofcreatinine clearance or eGFR in STEMI patients and by25% to 30% for NSTE-ACS patients, using all 5 formulas.To determine which of the 5 formulas most accurately
predicted outcome in our cohort, we performedan analysis of NRI using the MDRD formula as thereference (Table III). The only formula that moreaccurately predicted 1-year mortality as compared withMDRD formula was the Mayo formula with an NRI of 0.26at 1-year for STEMI patients and 0.14 for NSTE-ACSpatients, after multivariable adjustment. Of note, theother 3 formulas (CG, CKD-EPI, and IB) were found to besignificantly less accurate than the MDRD formula forboth STEMI and NSTE-ACS patients at 1 year. The netincreased accuracy of the Mayo formula relative to theMDRD formula reflected its ability to reclassify patients tobetter predict true events at the expense of reducedaccuracy to predict nonevents. The IDI, reflecting theincrement of the predictive accuracy of the model (1-yearmortality) using the Mayo formula instead of the MDRDformula, increased by 0.004 for STEMI and by 0.002for NSTE-ACS.The adjusted area under the curve with 95% CIs for the
MDRD, IB, CG, CKD-EPI, and Mayo formulas was 0.8710
(0.8513; 0.8907), 0.8674 (0.8475; 0.8873), 0.8674(0.8474; 0.8873), 0.8734 (0.8544; 0.8924), and 0.8762(0.8578; 0.8946) for patients with STEMI, respectively;and 0.8313 (0.8113; 0.8513), 0.8292 (0.8090; 0.8494),0.8290 (0.8088; 0.8492), 0.8320 (0.8121; 0.8520), and0.8335 (0.8139; 0.8532), respectively, for patients withNSTE-ACS (online Appendix Supplementary Figure 2).These findings indicate very good ability of the models toseparate the subjects' outcomes using all formulas. Usingthe Hosmer and Lemeshow goodness-of-fit test tomeasure calibration, the ability of the model to makeunbiased estimates of outcome, for the MDRD, IB, CG,CKD-EPI, and Mayo formulas, the P values were .13, .08,.08, .18, and .17 for STEMI patients, respectively; and .24,.70, .85, .58, and .61 for NSTE-ACS patients, respectively.These findings indicate that all models using the differentformulas were calibrated.
DiscussionOur study, which was derived from a contemporary
nationwide ACS database, revealed several cardinalfindings. First, our study complements the findings ofprior studies, demonstrating increased mortality amongACS patients with significant RD. Second, despite thesignificant and strong correlation between creatinineclearance or eGFR values using all 5 formulas, theproportion of patients categorized into the differentrenal function groups varied considerably in our cohort.Third, whereas most prior studies focused on patientswith significant RD, our study included patients in allrenal function categories, clearly demonstrating thatmortality increased, as renal function worsened, with aplateau at creatinine clearance or eGFR b30 mL/min per1.73 m2. Indeed, the risk of dying increased by 30% to40% for each decrement of 10 U of creatinine clearanceor eGFR in STEMI patients and by 25% to 30% forNSTE-ACS patients, using all 5 formulas. Fourth, our studydemonstrates that patient whose RD status shifted fromsignificant to nonsignificant or vice versa using thedifferent formulas had mortality rates that were interme-diate between those with and without significant RD.Last, although creatinine clearance or eGFR was found tobe an independent predictor for short- and long-termmortality using all 5 formulas in a broad spectrum of ACSpatients, only the Mayo formula had better accuracy inpredicting mortality relative to the MDRD, suggesting thatit may be a better prognosticator among ACS patients.It is well established that RD is associated with worse
prognosis among patients with AMI and ACS.1-5 AlthougheGFR is more accurate than SCr for renal functionassessment,16,17 data regarding risk stratification usingeGFR for AMI and ACS remain incomplete. The impact ofeGFR on outcomes in ACS patients has been previouslyevaluated using one of the formulas10,11 or at the mostcomparing 3 of them (MDRD, CG, and CKD-EPI).25,26

Table III. The accuracy of the other formulas relative to MDRD in predicting outcome
Formula
30-Day mortality 1-Year mortality
NRI (95% CI)
% Of eventscorrectly
reclassified
% Ofnoneventscorrectly
reclassified P NRI (95% CI)
% Of eventscorrectly
reclassified
% Ofnoneventscorrectly
reclassified P
STEMI patientsCG −0.44 (−0.57, −0.31) −25% −19% b.001 −0.27 (−0.39, −0.17) −13% −15% b.001CKD-EPI −0.59 (−0.71, −0.48) −53% −7% b.001 −0.18 (−0.28, −0.08) −41% 23% .0009Mayo 0.08 (−0.05, 0.21) 23% −15% .23 0.26 (0.17,0.37) 42% −16% b.001IB −0.55 (−0.68, −0.43) −32% −23% b.001 −0.39 (−0.50, −0.29) −21% −19% b.001
NSTE-ACS patientsCG −0.13 (−0.28, 0.03) −16% 3% .11 −0.26 (−0.36, −0.16) −19% −7% b.001CKD-EPI −0.07 (−0.20, 0.07) −53% 47% .40 −0.52 (−0.59, −0.43) −62% 11% b.001Mayo 0.04 (−0.11, 0.19) 25% −20% .60 0.14 (0.05,0.24) 33% −19% .004IB −0.20 (−0.36, −0.05) −23% 2% .01 −0.31 (−0.41, −0.21) −23% −8% b.001
710 Orvin et alAmerican Heart Journal
May 2015
However, currently, there are no data regarding all 5 eGFRformulas and their ability to predict clinical outcome inpatients admitted with STEMI or NSTE-ACS. In dailyclinical practice, the MDRD and CG formulas are mostcommonly used to calculate eGFR or creatinine clearance,although, more recently, the CKD-EPI formula has beendesignated the formula of choice by the US NationalKidney Foundation.16 According to current guidelines,the MDRD formula is still recommended for assessment ofkidney function in ACS patients because it incorporatesrace and sex in its calculation.29 Our study was unique forevaluating and comparing 5 creatinine clearance or eGFRformulas. We demonstrate that, despite the variability increatinine clearance or eGFR values using the differentformulas, significant RD remained an independent pre-dictor for mortality in a wide spectrum of ACS patients.Nevertheless, we showed that the choice of formula usedinfluences the stratification of patients into the differentrenal function categories, including the dichotomousdistinction of significant versus nonsignificant RD. Al-though the trend for increased mortality with worse renalfunction was demonstrated for all formulas, the absolutemortality rates varied for each renal function categoryusing the different formulas.Applying NRI analysis to examine the influence of the
allocation into the different renal function categories on30-day and 1-year mortality, with the MDRD serving as thereference formula, we found that the Mayo formula wassignificantly more accurate than the MDRD formula inpredicting 1-year mortality, whereas the other formulastended to be less accurate than the MDRD formula. TheMayo formula reclassified a substantial proportion ofpatients with mild RD (according to other formulas) totheno-RD category and similarly reclassified a proportion ofpatients from the moderate RD category to the mild RD
category. Thus, it seems that by reclassifying our ACScohort upward to the better renal function categories, theMayo formula better predicted mortality outcomes. Thesefindings indicate that the Mayo formula may be thepreferred formula for the prediction of mortality in ACSpatients. Alternatively, a correction factor allowing for anupward shift in renal function classmay be needed to bettercalibrate theMDRD formula for risk prognostication in ACS.Our studyhas several limitationsworthmentioning. First,
this study is a retrospective cohort study with thelimitations inherent to such studies. Second, accuratedata regarding renal function during follow-up periodwerenot available. The aim of the present study was to examinethe association of renal function upon admission andsubsequent outcome. As stated above, worsening renalfunction after admission may be an independent andpossibly a more important determinant of outcome.13 Inaddition, we did not evaluate outcomes other thanmortality. We chose mortality as the sole outcome tostrengthen the scientific validity of our analysis because it isan unequivocal, hard end point. Other end points, such asAMI, had evolving definitions over the study period,rendering them less accurate. Nevertheless, the impact ofrenal function on a composite end point, includingmortality and ischemic events, may be different than theimpact on mortality alone. The Mayo formula is known tobetter estimate eGFR in populations with preserved renalfunction or nonsignificant RD.22 In our study, the meaneGFR was within the mild RD range (60-90 mL/min per1.73 m2) using all the formulas. Although in cohorts withworse renal function, the accuracy of the Mayo formulamay be attenuated, it is worth emphasizing that our cohortreflects “real-world,” consecutive ACS patients and istherefore likely to represent general ACS cohorts. Last,data were missing for a small proportion of patients.

Orvin et al 711American Heart JournalVolume 169, Number 5
SummarySignificant RD upon admission, as assessed by different
creatinine clearance or eGFR formulas, is associated withearly and late mortality in patients with STEMI orNSTE-ACS, despite the variability in values using thedifferent formulas. Our data suggest that as comparedwith the other 4 formulas, the Mayo formula may be thepreferred prognosticator among ACS patients.
References1. Herzog CA, Ma JZ, Collins AJ. Poor long-term survival after acute
myocardial infarction among patients on long-term dialysis. N Engl JMed 1998;339:799-850.
2. Weiner DE, Tighiouart H, Amin MG, et al. Chronic kidney disease asa risk factor for cardiovascular disease and all-cause mortality: apooled analysis of community-based studies. J Am Soc Nephrol2004;15:1307-15.
3. Anavekar NS, McMurray JJ, Velazquez EJ, et al. Relation betweenrenal dysfunction and cardiovascular outcomes after myocardialinfarction. N Engl J Med 2004;351:1285-95.
4. Santopinto JJ, Fox KA, Goldberg RJ, et al. Creatinine clearance andadverse hospital outcomes in patients with acute coronary syndromes:findings from the Global Registry of Acute Coronary Events (GRACE).Heart 2003;89:1003-8.
5. Sarnak MJ, Levey AS, Schoolwerth AC, et al. American HeartAssociation Councils on Kidney in Cardiovascular Disease, HighBlood Pressure Research, Clinical Cardiology, and Epidemiology andPrevention. Kidney disease as a risk factor for development ofcardiovascular disease: a statement from the American HeartAssociation Councils on Kidney in Cardiovascular Disease, HighBlood Pressure Research, Clinical Cardiology, and Epidemiology andPrevention. Hypertension 2003;42:1050-65.
6. Hobbach HP, Gibson CM, Giugliano RP, et al. The prognostic value ofserum creatinine on admission in fibrinolytic-eligible patients with acutemyocardial infarction. J Thromb Thrombolysis 2003;16:167-74.
7. Yamaguchi J, Kasanuki H, Ishii Y, et al. HIJC Study Group. Prognosticsignificance of serum creatinine concentration for in-hospital mortalityin patients with acute myocardial infarction who underwent successfulprimary percutaneous coronary intervention (from the Heart Instituteof Japan Acute Myocardial Infarction [HIJAMI] Registry). Am JCardiol 2004;93:1526-8.
8. Yamaguchi J, Kasanuki H, Ishii Y, et al. HIJC investigators. Serumcreatinine on admission predicts long-term mortality in acutemyocardial infarction patients undergoing successful primary angio-plasty: data from the Heart Institute of Japan Acute MyocardialInfarction (HIJAMI) Registry. Circ J 2007;71:1354-9.
9. Pitsavos C, Kourlaba G, Panagiotakos DB, et al. Association ofcreatinine clearance and in hospital mortality in patients with acutecoronary syndromes: the GREECS study. Circ J 2007;71:9-14.
10. Afshinnia F, Ayazi P, Chadow HL. Glomerular filtration rate onadmission independently predicts short-term in-hospital mortalityafter acute myocardial infarction. Am J Nephrol 2006;26:408-14.
11. Nabais S, Rocha S, João C, et al. Prognostic impact of moderate renaldysfunction in acute coronary syndromes. Rev Port Cardiol 2008;27:303-12.
12. Eagle KA, Lim MJ, Dabbous OH, et al. GRACE investigators. Avalidated prediction model for all forms of acute coronary syndrome:estimating the risk of 6-month post discharge death in an internationalregistry. JAMA 2004;291:2727-33.
13. Hsieh MJ, Chen YC, Chen CC, et al. Renal dysfunction on admission,worsening renal function, and severity of acute kidney injury predict2-year mortality in patients with acute myocardial infarction. Circ J2012;77:217-23.
14. Stevens LA, Coresh J, Greene T, et al. Assessing kidney function—-measured and estimated glomerular filtration rate. N Engl J Med2006;354:2473-83.
15. Akbari A, Swedko PJ, Clark HD, et al. Detection of chronic kidneydisease with laboratory reporting of estimated glomerular filtrationrate and an educational program. Arch Intern Med 2004;164:1788-92.
16. Kidney Disease: Improving Global Outcomes (KDIGO) CKD WorkGroup. KDIGO 2012 clinical practice guideline for the evaluationand management of chronic kidney disease. Kidney Int 2013;3:1-150. [Suppl.].
17. Crowe E, Halpin D, Stevens P, et al. Early identification andmanagement of chronic kidney disease. BMJ 2008;337:a1530.
18. Cockroft DW, Gault MH. Prediction of creatinine clearance fromserum creatinine. Nephron 1976;16:31-41.
19. Levey AS, Bosch JP, Lewis JB, et al. for the Modification of Diet in RenalDisease Study Group. A more accurate method to estimate glomerularfiltration rate from serum creatinine: a new prediction equation. AnnIntern Med 1999;130:461-70.
20. Levey AS, Stevens LA, Schmid CH, et al. CKD-EPI (Chronic KidneyDisease Epidemiology Collaboration). A new equation to estimateglomerular filtration rate. Ann Intern Med 2009;150:604-12.
21. Rule AD, Larson TS, Bergstralh EJ, et al. Using serum creatinine toestimate glomerular filtration rate: accuracy in good health and inchronic kidney disease. Ann Intern Med 2004;141:929-37.
22. Rigalleau V, Lasseur C, Raffaitin C, et al. The Mayo Clinic quadraticequation improves the prediction of glomerular filtration rate indiabetic subjects. Nephrol Dial Transplant 2007;22:813-8.
23. Matsushita K, Mahmoodi BK, Woodward M, et al. Chronic KidneyDisease Prognosis Consortium. Comparison of risk prediction usingthe CKD-EPI equation and the MDRD study equation for estimatedglomerular filtration rate. JAMA 2012;307:1941-51.
24. Tsinalis D, Thiel GT. An easy to calculate equation to estimate GFRbased on inulin clearance. Nephrol Dial Transplant 2009;24:3055-61.
25. Szummer K, Lundman P, Jacobson SH, et al. SWEDEHEART.Cockcroft-Gault is better than the Modification of Diet in RenalDisease study formula at predicting outcome after a myocardialinfarction: data from the Swedish Web-system for Enhancement andDevelopment of Evidence-based care in Heart disease EvaluatedAccording to Recommended Therapies (SWEDEHEART). Am Heart J2010;159:979-86.
26. Tomaszuk-Kazberuk A, Kozuch M, Malyszko J, et al. Which methodof GFR estimation has the best prognostic value in patients treatedwith primary PCI: Cockcroft-Gault formula, MDRD, or CKD-EPIequation?—a 6-year follow-up. Ren Fail 2011;33:983-9.
27. Behar S, Battler A, Porath A, et al. Israel Heart and Internal MedicineSocieties. A prospective national survey of management and clinicaloutcome of acute myocardial infarction in Israel, 2000. Isr Med AssocJ 2003;5:249-54.

712 Orvin et alAmerican Heart Journal
May 2015
28. Pencina MJ, D'Agostino Sr RB, D'Agostino Jr RB, et al. Evaluating theadded predictive ability of a new marker: from area under the ROCcurve to reclassification and beyond. Stat Med 2008;27:157-72.
29. Hamm CW, Bassand JP, Agewall S, et al. ESC Committee for PracticeGuidelines. ESC Guidelines for the management of acute coronary
syndromes in patients presenting without persistent ST-segmentelevation: the task force for the management of acute coronarysyndromes (ACS) in patients presenting without persistent ST-segmentelevation of the European Society of Cardiology (ESC). Eur Heart J2011;32:2999-3054.

Orvin et al 712.e1American Heart JournalVolume 169, Number 5
Appendix
eGFR equations in clinical use:1. CKD-EPI formula:CKD-EPI = a × (SCr/b)c × (0.993)age
(SCr in milligrams per deciliter)Where the variable a takes on the following values
based on race and sex:• Black: women = 166; men = 163• White/other: women = 144; men = 141The variable b takes on the following values based on sex:• Women = 0.7• Men = 0.9The variable c takes on the following values based on
sex and creatinine measurement:•Women: 1) SCr≤0.7mg/dL =−0.329; 2) SCrN0.7mg/dL= −1.209
• Men: 1) SCr ≤0.9 mg/dL = −0.411; 2) SCr N0.9 mg/dL= −1.209
2. MDRD formula:MDRD = 186 × SCr−1.154 × Age−0.203 × (1.2010 if black)× (0.742 if female)(SCr in milligrams per deciliter)3. Mayo quadratic formula:Mayo = exp [1.911 + 5.249/SCr − 2.114/SCr2 − 0.00686× Age − (0.205 if female)]If SCr b0.8 mg/dL than SCr = 0.84. IB eGFR formula:IB = [(155 − Age) × Weight (kg)/Scr] × (0.85 if female)(SCr in micromolar)5. Estimated creatinine clearance rate using CG formulaEstimated creatinine clearance rate = [(140 − Age) ×
Weight (kg) × (0.85 if female)]/72 × SCr(SCr in milligrams per deciliter)

Supplementary Figure 1
Locally weighted scatter plot smoothing for each formula versus MDRD in STEMI patients (A) and NSTE-ACS patients (B).
712.e2 Orvin et alAmerican Heart Journal
May 2015
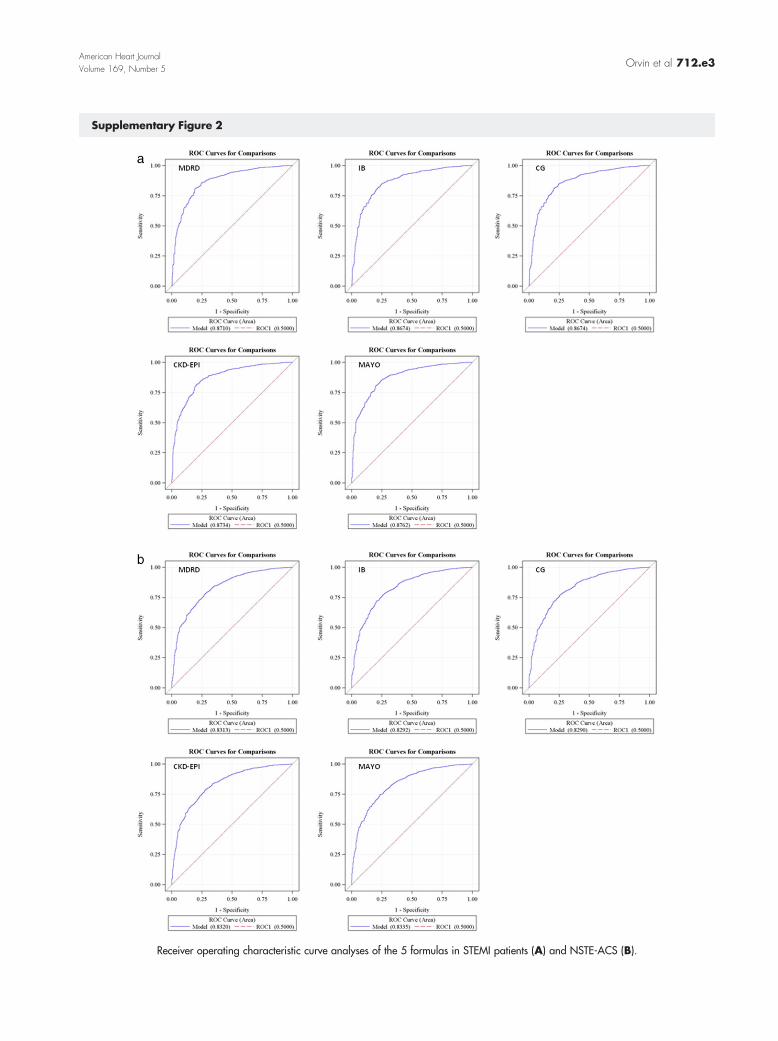
Supplementary Figure 2
Receiver operating characteristic curve analyses of the 5 formulas in STEMI patients (A) and NSTE-ACS (B).
Orvin et al 712.e3American Heart JournalVolume 169, Number 5
Copyright © 2022 FDOKUMEN