Comparison of some chemometric tools for metabonomics biomarker identification

Accepted Manuscript
The use of Vis/NIRS and chemometric analysis to predict fruit defects and post-harvest behaviour of ‘Nules Clementine’ mandarin fruit
Lembe Samukelo Magwaza, Sandra Landahl, Paul J.R. Cronje, Hélène H.Nieuwoudt, Abdul Mounem Mouazen, Bart M. Nicolaï, Leon A. Terry,Umezuruike Linus Opara
PII: S0308-8146(14)00655-4DOI: http://dx.doi.org/10.1016/j.foodchem.2014.04.085Reference: FOCH 15747
To appear in: Food Chemistry
Received Date: 24 August 2013Revised Date: 22 April 2014Accepted Date: 23 April 2014
Please cite this article as: Magwaza, L.S., Landahl, S., Cronje, P.J.R., Nieuwoudt, H.H., Mouazen, A.M., Nicolaï,B.M., Terry, L.A., Opara, U.L., The use of Vis/NIRS and chemometric analysis to predict fruit defects andpostharvest behaviour of ‘Nules Clementine’ mandarin fruit, Food Chemistry (2014), doi: http://dx.doi.org/10.1016/j.foodchem.2014.04.085
This is a PDF file of an unedited manuscript that has been accepted for publication. As a service to our customerswe are providing this early version of the manuscript. The manuscript will undergo copyediting, typesetting, andreview of the resulting proof before it is published in its final form. Please note that during the production processerrors may be discovered which could affect the content, and all legal disclaimers that apply to the journal pertain.

1
The use of Vis/NIRS and chemometric analysis to predict fruit defects and postharvest 1
behaviour of ‘Nules Clementine’ mandarin fruit 2
3
Lembe Samukelo Magwazaa,b*, Sandra Landahlc, Paul J.R. Cronjed, Hélène H. Nieuwoudte, 4
Abdul Mounem Mouazenf, Bart M. Nicolaï g, Leon A. Terryc, Umezuruike Linus Oparab 5
6
a Department of Crop Science, School of Agricultural, Earth and Environmental Sciences, 7
University of KwaZulu-Natal, Private Bag X01, Scottsville, 3209, Pietermaritzburg, South 8
Africa 9
10
b Postharvest Technology Research Laboratory, South African Research Chair in Postharvest 11
Technology, Stellenbosch University, Stellenbosch 7602, South Africa. 12
13
c Plant Science Laboratory, Cranfield University, Bedfordshire MK43 0AL, United Kingdom 14
15
d Citrus Research International, Department of Horticultural Science, Stellenbosch 16
University, Stellenbosch 7602, South Africa. 17
18
e Institute for Wine Biotechnology, Department of Viticulture and Oenology, Stellenbosch 19
University, Stellenbosch, 7602, South Africa. 20
21
f Department of Environmental Science and Technology, Cranfield University, Bedfordshire, 22
MK43 0AL, United Kingdom. 23
24
g MeBioS division, Department of Biosystems, Katholieke Universiteit Leuven, Kasteelpark 25
Arenberg 30, B-3001 Leuven, Belgium. 26
27
28
*Corresponding author: Lembe Samukelo Magwaza, 29
Phone: +27 21 808 4064; Fax: +27 21 808 3743. 30
Email: [email protected] and [email protected] 31
32
33
2
Abstract 34
35
The use of chemometrics to analyse Vis/NIRS signal collected from intact ‘Nules 36
Clementine’ mandarin fruit at harvest, to predict the rind physico-chemical profile after eight 37
weeks postharvest was explored. Vis/NIRS signals of 150 fruit were obtained immediately 38
after harvest. Reference data on the rind were obtained after eight-week storage, including 39
colour index (CI), rind dry matter (DM), and concentration of sugars. Partial least squares 40
(PLS) regression was applied to develop models. Principal component analysis (PCA) 41
followed by PLS-discriminant analysis (PLS-DA) were used to classify fruit according to 42
canopy position. Optimal PLS model performances for DM, sucrose, glucose and fructose 43
were obtained using multiple scatter correction pre-processing, showing respective residual 44
predictive deviation (RPD) of 3.39, 1.75, 2.19 and 3.08. Clusters of sample distribution in the 45
PCA and PLS-DA models based on canopy position were obtained. The results demonstrated 46
the potential applications of Vis/NIRS to predict postharvest behaviour of mandarin fruit. 47
48
Chemical compounds studied in this article: 49
Sucrose (PubChem CID: 5988); Glucose (PubChem CID: 5793); Fructose (PubChem 50
CID: 5984) 51
52
Keywords: 53
Rind breakdown; Visible-NIR spectroscopy; Citrus; Non-destructive; Spectral pre-54
processing; Rind physiological disorder; Postharvest technology. 55
56
57

3
1. INTRODUCTION 58
59
External appearance is the primary parameter used to evaluate quality of citrus fruit and the 60
presence of skin defects is one of the most influential factors in determining the price of fresh 61
fruit. Citrus fruit quality classification is currently based on the evaluation of fruit surface 62
colour, size, shape and freedom from defects. These quality parameters are usually evaluated 63
by humans or by machine vision systems (Xudong, Hailiang, & Yande, 2009). Under most 64
grading systems, fruit with slight external defects are graded and marketed with sound fruit, 65
thereby reducing the quality of the batch. Alternatively, fruit with slight defects are graded 66
out and removed together with seriously damaged fruit, thus causing economic losses 67
(Blasco, Aleixos, & Moltó, 2007). The challenge is significant regarding citrus rind disorders 68
that do not manifest at harvest or during grading, but develop about 1-5 weeks after harvest; 69
such as rind breakdown disorder (RBD) of ‘Nules Clementine’ mandarins (Citrus reticulata 70
Blanco) (Magwaza et al. 2012a; Magwaza et al. 2013a, Magwaza, Opara, Cronje, Nicolaï, 71
Landahl, & Terry, 2013b). The challenge is therefore to develop a non-destructive technology 72
that will determine rind quality in the packing line and assist in pre-symptomatic sorting and 73
segregation of fruit into different quality tiers. 74
75
Non-destructive optical methods based on visible to near-infrared (Vis/NIR) spectroscopy 76
(Vis/NIRS) have been developed and evaluated for non-destructive internal quality 77
assessment of fruit and vegetables, including citrus (Antonucci, Pallottino, Paglia, Palma, 78
D’Aquino, & Menesatti, 2011; Magwaza et al., 2013c). Very limited research work has been 79
conducted to develop a technology that can assess, predict and monitor fruit rind 80
physiological disorders. However, the success of Vis/NIRS to detect oleocellosis and decay 81
in citrus fruit (Zheng et al., 2010; Gómez-Sanchis, Lorente, Soria-Olivas, Aleixos, Cubero, & 82

4
Blasco, 2013), suggests the potential of this technology in determining the sensitivity or 83
propensity of specific citrus fruit consignments to develop non-chilling associated 84
physiological rind disorders. The trend is constantly shifting towards developing more 85
reliable and cost effective technologies to non-destructively screen fruit physiological 86
disorders. 87
88
Vis/NIRS depends on chemometrics which involves multivariate analysis for interpreting 89
large data sets (Wang & Paliwal, 2007; Escuredo, Seijo, Salvador, & González-Martín, 90
2013). Currently, partial least squares (PLS) regression (PLSR) is probably the most widely 91
applied regression method in chemometrics, and the approach has been used to evaluate the 92
potential of Vis/NIRS in measuring the quality characteristics of ‘Satsuma’ mandarin fruit 93
(Gómez, He, & Pereira, 2006). Besides resulting in better prediction models, PLSR results in 94
models which always have the lowest number of latent variables (LVs) since PLSR models 95
exclude LVs that are not important to describe the variance of the quality parameter (Gòmez 96
et al., 2006). 97
98
The spectra of solid and scattering samples such as intact fruit are influenced by physical 99
properties such as shape and size. This creates noise problems when analysing quality 100
parameters for which such physical characteristics are not important (Magwaza, Opara, 101
Nieuwoudt, Cronje, Saeys, & Nicolaï, 2012b). In order to remove these baseline shifts, 102
facilitate handling and to develop more simple and robust models, the complex spectral data 103
are often pre-treated by different statistical procedures (Nicolaï et al., 2007). Thus, the 104
selection of suitable pre-processing or pre-treatment methods is an important step in the 105
process of spectral analysis. 106
107

5
The use of Vis/NIRS and chemometrics to evaluate fruit physiological defects and predict 108
postharvest quality attributes of fruit are topical in postharvest research. In this study, the 109
application of chemometric analysis on spectra of intact ‘Nules Clementine’ mandarin fruit at 110
harvest to predict future rind biochemical profile and to predict susceptibility of fruit rind to 111
develop RBD was investigated. 112
113
2. Materials and methods 114
115
2.1. Fruit samples 116
117
The study was conducted in 2012 using ‘Nules Clementine’ mandarin (Citrus reticulata 118
Blanco) fruit harvested from a commercial orchard located in Paarl area of the Western Cape 119
Province, South Africa (33°43’27.44’’S; 18°57’21.28’’E). A total of 100 fruit (50 from the 120
inside position and 50 from the outside position of the canopy) from 10 trees were selected 121
for non-destructive and destructive measurements. Of the 100 fruit harvested, 60 were used 122
for calibration and the remaining 40 were used for validation set during model development. 123
An independent population of 50 fruit (for validation) was harvested from a commercial 124
orchard in Citrusdal, Western Cape Province, South Africa (32° 35' 18.26'' S, 19° 1' 14.69'' E) 125
using the selection procedure described above. Fruit were harvested at optimum maturity 126
according to industry practice, then received all commercial postharvest practices, including 127
drenching (Thiabenzole, 500 mg/L; Imazalil, 500 mg/L and 2,4-dichlorophenoxyacetic acid, 128
125 mg/L) and waxing (polyethylene citrus wax, Citrushine®, Johannesburg, South Africa). 129
After phytosanitary inspection and export certification, fruit from different canopy positions 130
were packed in separate carton boxes, sent at ambient temperature via a courier service to 131
Cranfield University (CU) in the United Kingdom, where experiments were conducted. Fruit 132

6
arrived at CU after 48 hours and were stored for 24 hours at 20°C and 80% relative humidity 133
to equilibrate, prior to taking NIR measurements. 134
135
2.2. Spectral acquisition 136
137
Upon arrival at CU, spectra of intact fruit samples were acquired using a method described by 138
Magwaza et al. (2012a). Briefly, spectral data was collected using a mobile fibre-optic 139
spectrophotometer (350-2500 nm) (LabSpec2500® Near Infrared Analyzer, Analytical 140
Spectral Devices Inc., USA) in diffuse reflectance mode, equipped with one Si array (350-141
1000 nm) and two Peltier cooled InGaAs detectors (1000-1800 nm and 1800-2500 nm). 142
Reflectance spectra were acquired from 8 positions on the fruit; 4 from equatorial spots, 2 143
from the stem-end and 2 from the stylar-end of the fruit. The first set of spectra was acquired 144
before storage and the second set was acquired from the same fruit (and the same spots within 145
the fruit) after eight weeks of cold storage. 146
147
2.3. Storage and destructive (reference) measurements 148
149
After the first round of spectral acquisition fruit were stored for 8 weeks in a cold room with 150
delivery air temperature of 8±0.5°C which is known to cause the highest degree of RBD 151
incidence (Magwaza et al., 2013b). Destructive data on physico-chemical properties 152
including colour, RBD, DM and non-structural carbohydrates (sucrose, glucose and fructose) 153
of fruit were obtained after 8 weeks of storage. Rind colour components were measured in 154
L*a*b* colour space using a Minolta CR-400 colorimeter (Chroma Meter CR-400, Konica 155
Minolta Sensing Inc., Japan) after calibration using a standard white tile (CR-A43; Y = 93.1, 156

7
x = 0.3138; y = 0.3203). From the L*, a* and b* colour parameters, the colour index (CI) 157
was calculated as follows: (Pathare, Opara, & Al-Said, 2013). 158
159
b x L
a x 1000=CI (1) 160
161
During cold storage, fruit were scored weekly for the incidence of RBD, over eight weeks. 162
RBD incidence was scored on a subjective scale from 0 = no breakdown to 3 = severe 163
breakdown (Fig. S1). RBD was then expressed as RBD index as described by Alférez & 164
Burns (2004) in the following formula: 165
166
fruit ofnumber Total
class}each in fruit No.of ×)30({∑ −=
RBDRBDindex (2) 167
168
After storage, rind was peeled by hand from the rest of fruit, snap frozen in liquid nitrogen 169
and stored at -40°C until further analysis. Frozen samples were then freeze-dried in a 170
Labogene ScanVac CoolSafe Freeze Dryer System (CS55-4, Denmark) for 7 days at 0.015 171
kPA and -55°C. Lyophilized samples were weighed and water content was calculated from 172
freeze dried samples and expressed as a percentage of fresh weight, after which dried samples 173
were ground using a pestle and mortar into fine powder. Non-structural carbohydrates 174
(sucrose, glucose and fructose) were extracted and quantified using a method described 175
elsewhere (Magwaza, Opara, Cronje, Landahl, & Terry, 2013d).
176
177
2.4. Data analysis 178
179

8
Statistical analysis of destructive measurements was carried out using SPSS 20.0 for 180
Windows (SPSS Inc. Chicago, USA). Data were subjected to analysis of variance (ANOVA). 181
Least significant difference values (LSD; p=0.05) were calculated for the comparison of 182
means. 183
184
2.5. Chemometrics 185
186
The reflectance spectra in Indico format (Indico Pro 5.6 software, Analytical Spectral 187
Devices Inc., USA) were transformed to absorbance (log (1/R)). Individual spectra from 8 188
positions within the fruit and the average spectra of 8 spectra from each fruit were tested to 189
develop PLS, PCA and PLD-DA models. Average spectra showed better models than 190
individual spectra (data not shown); and thus results reported herein are based on average 191
spectra. Calculations of the average of 8 spectra obtained from each fruit, pre-processing and 192
calibration methods were executed using The Unscrambler® chemometric software (Version 193
9.2, Camo Process, SA., Norway). 194
195
Different pre-processing methods including MSC, SNV, Savitzky Golay first derivative and 196
second derivative (2nd
order polynomial), were applied to normalise and smooth spectral data 197
prior to regression to correct for light scatter, reduce the changes of light path length. 198
199
Average Vis/NIRS signals were subjected to PCA to determinate effective wavelength, detect 200
outliers and to discriminate fruit from different canopy positions. PLS 1 regression/prediction 201
models were developed using spectral data for each quality attribute. A PLS variant known as 202
partial least squares discriminant analysis (PLS-DA or PLS 2) was also used in order to 203
classify fruit from different canopy positions according to the spectra. A method by Chen, 204

9
Wu, He, & Liu (2011) with slight modifications was used in the application of PLS-DA. Fruit 205
from each of the canopy positions in the calibration set was assigned a dummy variable as a 206
reference value (outside = 1 and inside = 2). In addition, due to discrete nature of RBD 207
scores, samples were assigned a binary dummy variable as a reference value, which was an 208
arbitrary number whether the sample belongs to a particular position or not. RBD affected 209
fruit were set as reference data one (1), while unaffected fruit were assigned to 0. 210
211
During model development, the dataset was subjected to test set validation where fruit were 212
randomly separated into two subsets, 60% for calibration and 40% for validation. Although 213
the sample selection method for calibration and validation was random, validation data sets 214
were scrutinised to ensure that the validation data sets were confined within a range of values 215
of the calibration set. The regression statistics of developed models was described by the 216
value of the root mean square error of calibration (RMSEC), root mean square error of 217
validation or prediction (RMSEP), the correlation coefficient (R), which represents the 218
proportion of explained variance of the response variable in the calibration (Rc) or validation 219
dataset (Rv). The number of LVs, and the residual predictive deviation (RPD), described by 220
Williams & Sobering (1996) as the ratio of the standard deviation of the destructive data for 221
the validation set to the RMSEP. The ideal model should have high R and RPD values as well 222
as low RMSEC and RMSEP values. The optimal number of LVs was determined as the 223
minimum number of LVs corresponding to the first lowest value of the RMSEC or RMSEP 224
from the plot of the RMSEC or RMSEP for increasing number of LVs (Davey, Saeys, Hof, 225
Ramon, Swennen, & Keulemans (2009). 226
227
The spectral variables which contributed the most to the model were determined from the 228
regression coefficients curve. Wavelength bands with high regression coefficient values are 229
10
important to the mode. Outliers were evaluated using the score plots, X-residuals and 230
leverage plots on the PLS and PCA models (Kuang & Mouazen, 2011). Samples that were 231
located far from the zero line of the residual variance plot were identified as outliers and only 232
2 spectral outliers were identified and excluded. 233
234
The stability of the calibration model was tested by interchanging validation and calibration 235
data sets and checking that the differences in the regression statistics obtained were small 236
(Alvarez-Guerra, Ballabio, Amigo, Bro, & Viguri, 2010). Prediction model robustness was 237
tested by external validation with spectra of fruit harvested from a farm in Citrusdal; an 238
orchard located about 100 km from the orchard of fruit used during model development. 239
240
3. Results and discussion 241
242
3.1. Description spectra 243
244
The reflectance spectra presented in Fig. S2 portray the typical spectra obtained from intact 245
‘Nules Clementine’ mandarins harvested from different canopy positions. Each line 246
represents the average spectra acquired from 50 fruit in each canopy position before and after 247
storage, respectively. Spectral features such as reflectance peaks were similar to those 248
obtained by Gómez et al. (2006). The beginning (350–450 nm) of each spectrum was 249
characterised by noise and was removed before calibration. Strong absorption bands around 250
670, 740, 980, 1200, 1450, 1780 and 1930 nm were observed. Absorption at 670 nm is due to 251
red absorbing pigments, particularly chlorophyll (Clément, Dorais, & Vernon, 2008); 740 nm 252
corresponds to third overtone of O-H stretching; 980 nm is associated with second overtone 253
of H-O-H stretching modes of water; 1200 is the combination of second overtones of C-H 254

11
and C-H2 stretching; 1450 belongs to the first overtone of O-H stretching; 1780 nm is a 255
combination of first overtone of C-H and CH2 stretching; and 1930 nm is the combination of 256
O-H, C-H and C-H2 deformations associated with sugar solution (Kawano et al., 1993; Golic, 257
Walsh, & Lawson, 2003; Tewari, Dixit, Chi, & Malik, 2008). It should be noted that before 258
storage, the average spectra of fruit from outside canopy had a distinctly stronger absorbance 259
in the waveband between 590 and 900 nm compared to fruit from inside canopy position. 260
After 8 weeks of storage, the difference between spectral data acquired from fruit outside and 261
inside canopy positions was less pronounced due to loss of chlorophyll (green pigment) 262
during storage. Results observed in this study are similar to those obtained by Zheng et al. 263
(2010) for prediction of oleocellosis disorder, where large variations in absorbance spectra 264
were observed among fruit with different sensitivities in the same waveband between 590 and 265
900 nm. In this current study, fruit harvested from the inside position of the canopy were 266
more susceptible to RBD than outside fruit, a trend that is similar to previous work (Cronje, 267
Barry, & Huysamer, 2011, 2013; Magwaza et al., 2012a; 2013d). Since the intensities of 268
reflectance vary with concentrations of biochemical constituents of the sample, the band may 269
possibly be related to fruit sensitivity to rind physiological disorders such as oleocellosis and 270
RBD. 271
272
3.2. Description of destructive data for Vis/NIRS calibrations 273
274
The distributional statistics of destructive data used in calibration and independent validation 275
are summarized in Table 1. The reference measurements for calibration and validation data 276
sets were normally distributed around the means, covered a wide range and had enough 277
variation, presented by the coefficient of variation (CV%). High variation of the reference 278
data is helpful in developing reliable prediction models for Vis/NIRS (Clément et al., 2008). 279

12
The mean values of the CI for calibration and validation populations were 4.38 and 4.42, 280
respectively, with the corresponding CV% values of 37.81 and 35.75%. The mean 281
concentration of sucrose values used for calibration and validation were 88.19 and 92.68 282
mg/g DW with standard deviation of 41.63 and 42.73 mg/g DW, respectively. The 283
concentration of total non-structural carbohydrates in the rind tissue ranged between 122.03 284
and 501.12 mg/g DW in the calibration population and the range of validation set was from 285
137.66 to 512.01 mg/g DW with corresponding CV% of 34.25 and 32.30, respectively. 286
287
3.3. Spectral pre-processing and wavelength selection 288
289
Similar to our previous study (Magwaza et al., 2012a, Magwaza, Opara, Cronje, Nieuwoudt, 290
Landahl, & Terry, 2013e), the models constructed using individual spectra from 8 positions 291
within the fruit were unacceptably poor (data not presented). In all cases, average spectra 292
showed better model performance than individual spectra from each position. Hence, in the 293
current study, the average spectra were used to develop PLS, PCA and PLS-DA models. Poor 294
performance of individual spectra could be the result of spatial distribution and level of 295
attributes within the fruit. In citrus and other fruit types, chemical composition has been 296
reported to vary from stem to blossom end, from sun to shade sides, and from different 297
canopy positions of the fruit (Peiris, Dull, Leffler, & Kays, 1999). This suggests that Vis/NIR 298
spectra acquisition needs to be repeated at several positions around the fruit in order to 299
minimise the effect of variation within fruit. However, this might not be practically 300
compatible with a typical speed of commercial sorting lines, which may be as high as 10 fruit 301
per second (Nicolaï et al., 2007). Parallel installed spectrometers might overcome this 302
problem. 303
304

13
Spectral data of solid and scattering samples such as intact mandarin fruit are complex as 305
they are influenced by physical properties such as shape, size, etc (Magwaza et al., 2012b). 306
As such, spectral pre-processing facilitates handling and development of simpler and more 307
robust models. After testing several pre-processing methods, prediction models that gave the 308
higher R, lower RMSEC and RMSEP, a small difference between RMSEC and RMSEP and 309
high RPD was selected to predict the quality parameter of interest (Lammertyn, Peirs, De 310
Baerdemaeker, & Nicolaï, 2000). 311
312
Results in Table 2 show that CI was best predicted using raw spectra without spectral pre-313
processing in the visible region (450-750 nm). Since colour parameters are likely to be 314
directly detected in the visible range, it is logical that model performance for CI did not need 315
spectral pre-processing. The CI results demonstrated a classic example of the risk associated 316
with removing useful information from the data by spectral pre-processing. The best stable 317
model for predicting rind DM (RPD = 3.39) was achieved using models developed by MSC 318
pre-processing method. In the case of rind DM, the model based on Savitzky-Golay first 319
derivative (fifth order polynomial) pre-processing also had acceptable prediction potential 320
(RPD = 3.47), but MSC had the smallest difference between Rc and Rv, and was thus more 321
reliable. Although rind DM was best predicted based on spectra treated by MSC, the results 322
obtained using Savitzky Golay first derivative spectral pre-processing were marginally lower, 323
suggesting that both methods could be used for rind DM prediction of ‘Nule Clementine’ 324
mandarin rinds. 325
326
MSC also gave best results for PLS prediction of rind carbohydrates concentration such as 327
sucrose, glucose fructose, and total carbohydrates with RPD values of 1.75, 2.19, 3.08, and 328
3.06, respectively. Savitzky-Golay second derivative with the second order polynomial 329

14
provided the better results for the PCA classification of fruit from different canopy positions 330
(Fig. 1) and PLS model for predicting RBD (Fig. S3). Previous research showed that 331
Savitzky-Golay first and second derivative corrected light scattering properties while MSC 332
corrected for additive, multiplicative effects of the spectra, and pathlength variations (Gómez 333
et al., 2006). It is therefore important to note that the rind DM, fructose, glucose, sucrose and 334
total sugars models developed in the succeeding sections are based on Vis/NIRS after MSC 335
pre-processing while CI models were developed without pre-processing. 336
337
The optimal number of LVs was determined as the minimum number corresponding to the 338
first lowest value of the residual y-variance, from the plot of residual y-variance against 339
number of LVs (Fig. 2A) (Davey et al., 2009). In the rind DM PLS model, the optimum 340
number of LVs was observed as eight. The residual variance did not change after LV 8; 341
hence adding another LV explained very small variance and would have resulted in a 342
complex model. With regard to fructose, the number of LVs (14) used to construct the 343
models were too high and violated the statistical rule of thumb, which states that the ratio of 344
the number of samples for calibration (in this case 100) to the number of LVs should be equal 345
to or larger than 10 (Lammertyn et al., 2000). Despite this large number of LVs used to 346
construct the model, the model seemed to be accurate and stable during the validating 347
exercise. The regression co-efficient curve in Fig. 2B also confirmed that only significant LVs 348
were modelled and noise was not included in the calibration models. 349
350
The contributions of spectral variables to the model were determined from its regression 351
coefficients curve. Wavelength bands with high absolute regression coefficient values are 352
important for the model while regression coefficients with a value close to zero do not 353
contribute to the model (Magwaza et al., 2013c). A typical regression coefficient curve 354

15
obtained during prediction model development for dry matter content in ‘Nules Clementine’ 355
mandarin rinds is portrayed in Fig. 2B. High absolute regression coefficients were observed 356
in the NIR region of the curve at 950, 1200, 1320 and 1700 nm. As mentioned above, these 357
high absolute regression coefficients correspond with the second overtone of H-O-H 358
stretching modes of water, the second overtone of C-H and C-H2 stretching related to sugars 359
molecules as well as second and third overtones of OH and CH stretching vibrations of water 360
hydrogen bonds with sugar molecules related to vibration of water hydrogen bonds with 361
sugars molecules (Kawano et al., 1993). From the regression coefficients results, the 362
informative wavelength bands for all rind carbohydrates and DM were between 900-1700 363
nm, while CI and RBD were best predicted at 450-750 and 450-1000 nm, respectively. 364
365
3.4. Vis/NIRS-based PCA and PLS models 366
367
PCA was performed on Vis/NIRS spectra to compare the characteristics of fruit from 368
different positions on the tree. The PCA was applied to the spectra collected before storage 369
and eight weeks postharvest. The distribution in the PCA score plot of fruit spectra acquired 370
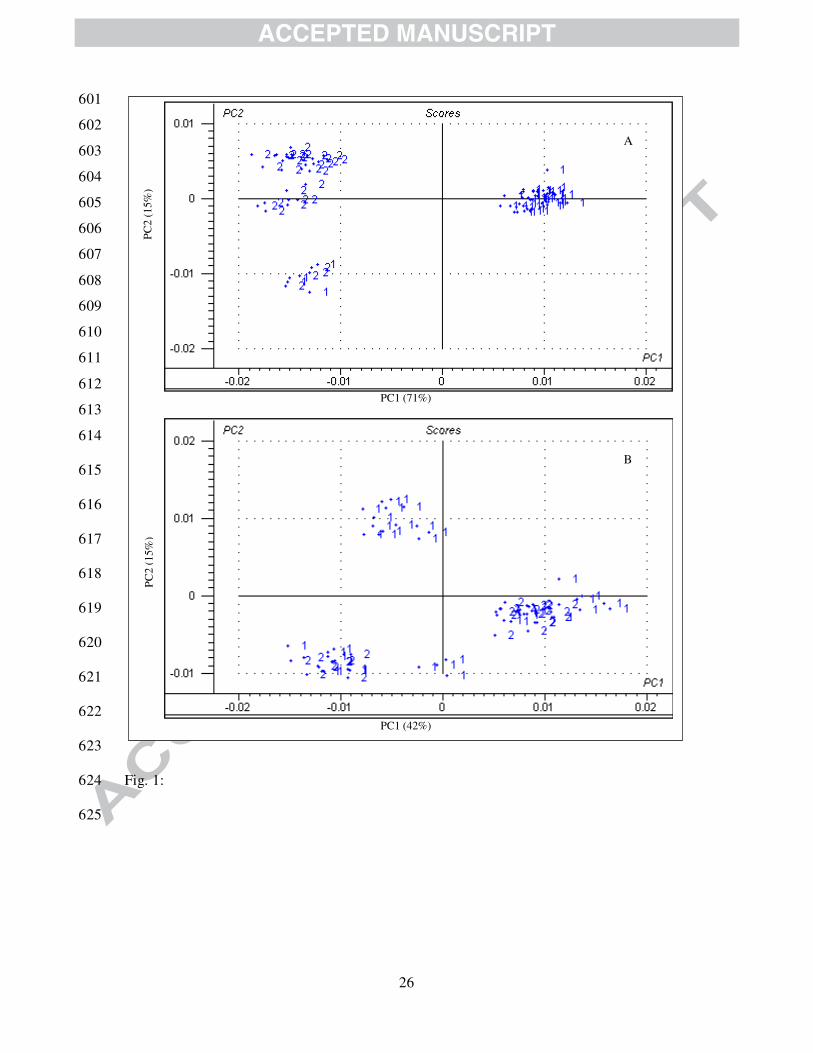
before storage showed two distinctive clusters corresponding to two canopy positions. This 371
grouping was only possible on spectra transformed using Savitzky Golay second derivative 372
pre-processing method (Fig. 1A). These clusters allowed distinction between fruit from 373
different canopy positions with accuracy of 84%, i.e. only 8 fruit were misidentified. The first 374
two PCs accounted for 86.0 % of the total variability (Fig. 1A), PC1 explained the 71.0 % of 375
the variance and PC2 explained 15.0 % of the variance. The effective wavelength band for 376
this classification was from 450 to 1200 nm with a strong absorption at 670 nm influenced by 377
chlorophyll, two bands at 740 and 980 nm corresponding to water (O-H) functional groups 378
and one at 1200 nm associated with C-H stretching for carbohydrates. This confirms that a 379

16
combination of colour, carbohydrates and moisture content of the rind play an important role 380
in discriminating between fruit from different positions of the canopy. As previously reported 381
by Magwaza et al. (2012a), PCA models developed using spectra restricted to either the 382
visible range or to NIR range did not show these clusters demonstrating the importance of the 383
combination of visible and NIR range in the classification of fruit by their canopy position. 384
Spectral data collected after eight weeks of postharvest was also subjected to a similar 385
analysis, but clusters were not easily identifiable (Fig. 1B). In this case, the first two PCs 386
accounted for 57.0 % of the total variability, PC1 explained the 42.0 % of the variance and 387
PC2 explained 15.0 % of the variance. Improved rind colour during storage is one of the 388
possible reasons explaining poor classifications and misidentification observed after 8 weeks 389
of storage. 390
391
To further test the potential of Vis/NIR spectral information to discriminate fruit from 392
different canopy positions, spectral data obtained before storage was subjected to PLS-DA by 393
assigning fruit from each canopy positions to a dummy variable (1, and 2 for outside and 394
inside, respectively). Performance of the PLS-DA model to classify fruit based on their origin 395
within the tree canopy using spectral range between 450 and 2400 nm and MSC spectral pre-396
processing is shown in Fig. 3. The results in this study showed that fruit from inside the 397
canopy had higher susceptibility to the disorder than outside fruit. In practical terms, the 398
ability of Vis/NIRS to non-destructively classify fruit based on their origin within the canopy, 399
suggests the potential of this technology to classify individual fruit in a packing line, for 400
either local (inside fruit) or export market and long term storage (outside fruit). 401
402
Due to discrete nature of RBD scores, correlating it with complicated NIR data was difficult 403
and model statistics were poor (R < 0.10). In terms of predicting RBD, obtained calibration 404

17
and validation statistics were very low with RPD of 0.45. There are standards for RPD values 405
where values below 1.0 are statistically unusable (Kuang & Mouazen, 2013). Therefore, the 406
low RPD values clearly indicate poor accuracy of these models. The complexity of biological 407
factors involved in the development of RBD (Cronje et al., 2011a, b, 2013; Magwaza et al., 408
2012a; 2013d) may also account for the difficulty of developing a reliable prediction model 409
for RBD. Another reason for the poor prediction model for RBD is that calibration and test 410
set also contained a large proportion of samples in which RBD did not develop. In future, it 411
will be necessary to increase sample size and use fruit from different localities in order to 412
increase chances of the disorder. This is to ensure that the distribution of the disorder is wide, 413
normal around the mean and evenly distributed along the entire range to avoid the Dunn 414
effect (Williams & Norris, 2001; Davey et al., 2009). 415
416
Due to poor prediction of RBD, a different approach was applied, where samples were 417
assigned a binary dummy variable (0 and 1), which indicated whether the sample belongs to 418
particular RBD group or not. RBD affected fruit were set as reference data 1 while unaffected 419
fruit were assigned to 0. After this analysis, the model statistical parameters for external 420
prediction were improved to R = 0.61, RMSEP = 0.34 and RPD = 0.45. Considering that 421
RBD was a category binary variable ranging from 0 to 1, the RMSEP of 0.34 was too high 422
(Table 3 and Fig. S3). In addition, the small y-variance explained by this model (18%) also 423
proved this model to be poor and not able to accurately predict RBD. The upper limit for 424
PLS-DA discrimination of fruit without RBD was 0.5, and samples with predicted value of 425
0.5 or higher were classified as having RBD, while samples with predicted values higher than 426
0.5 were not affected by the disorder (Fig. S3). The RBD PLS-DA prediction model had low 427
false positive (6.0%) and relatively high false negatives (20.0%) resulting in the overall 428
accuracy of 74.0%. 429
18
430
The prediction performance of the models developed and validated using Vis/NIRS signals 431
acquired from fruit before storage and eight weeks after storage are summarized in Table 3. 432
PLS model based on spectra acquired before storage was better for predicting CI (R = 0.94, 433
RMSEP = 0.38 and RPD = 4.12) than models based on spectra acquired after 8 weeks of 434
storage (R = 0.89, RMSEP = 0.65 and RPD = 2.43). For RBD, a similar trend was observed, 435
where model prediction statistics was better when using spectra acquired before storage 436
compared to spectra after storage. In ‘Nules Clementine’ mandarins, rind colour of fruit 437
harvested from inside and outside the canopy has been previously reported to improve during 438
storage (Magwaza et al., 2013d). The loss of prediction advantage reported in the current 439
study on rind colour could be attributed to the inclusion of the visible waveband in these 440
models. The prediction performance of rind carbohydrates and DM was slightly higher for 441
the models based on spectra acquired after storage compared to those acquired from fruit 442
before storage. An example of this improved trend of model performance with time is shown 443
on rind DM, where the RPD value of the model with spectra obtained before storage was 3.06 444
while that for spectra acquired after 8 weeks of storage was 3.84. This was also evident for 445
sugars. NIRS is expected to perform well to predict sugar concentration as reported before 446
(Golic et al., 2003).
447
448
4. Conclusions 449
450
This study showed the capability of Vis/NIRS coupled with chemometric analysis of spectra 451
acquired from intact fruit at harvest to predict postharvest rind physico-chemical properties 452
related to rind quality and susceptibility to RBD. Due to the discrete nature of RBD scores, 453
correlating it with complex Vis/NIRS data was difficult and PLS model statistics were poor, 454

19
suggesting that the technique is not able to accurately predict the disorder. The complexity of 455
biological factors involved in the development of RBD may also account for the difficulty of 456
developing a reliable prediction model for RBD. Nevertheless, rind physico-chemical 457
properties such as rind sugars and dry matter content, which have been identified as potential 458
biochemical indicators of fruit susceptibility to RBB (Cronje et al., 2011; Magwaza et al., 459
2013d), were predicted with accuracy for up to eight weeks of fruit storage. Taking into 460
account our previous studies shown that rind carbohydrates concentration and DM can be 461
used as biochemical markers for fruit susceptibility to RBD, the ability of Vis/NIRS to 462
predict these parameters, revealed the capability of Vis/NIRS and chemometrics to predict 463
postharvest behaviour of mandarins and hence susceptibility to RBD disorder. However, 464
there is still no definite upper or lower limit of carbohydrates concentration or DM in which 465
the disorder occurs or does not occur. Hence, further research still needs to be conducted to 466
explain whether Vis/NIR-predicted carbohydrates concentration is useful for determining 467
fruit susceptibility to postharvest RBD. PCA and PLS-DA models based on spectra acquired 468
before harvest were able to discriminate fruit based on their position within the canopy. 469
Given that fruit located inside the canopy are more susceptible to RBD, the accuracy of the 470
two regression methods demonstrated that both methods could be used, individually or in 471
combination, for screening between inside and outside fruit and discriminate fruit based on 472
susceptibility to RBD. This information could be used as an on-line deciding tool, during 473
packing, to decide on fruit destined for long distance export market (outside) and those 474
destined for short distance or local market (inside fruit). 475
476
Acknowledgements 477
478

20
This work is supported by the South African Research Chairs Initiative of the Department of 479
Science and Technology and National Research Foundation. The authors are grateful to the 480
South African Perishable Products Export Control Board (PPECB) and the South 481
Africa/Flanders Research Cooperation Programme (Project UID: 73936) for financial support 482
which made it possible to undertake the study, and to Ms Rosemary Burns, Dr Katherine 483
Cools, Dr Ma Carmen Alamar for technical research support. Dr Lembe Magwaza’s study 484
visit at Cranfield University was partly funded by the Commonwealth Scholarship 485
Commission of the United Kingdom. 486
487
References 488
489
Alférez, F., & Burns. J. (2004). Postharvest peel pitting at non-chilling temperatures in 490
grapefruit is promoted by changes from low to high relative humidity during storage. 491
Postharvest Biology and Technology, 32, 79–87. 492
Alvarez-Guerra, M., Ballabio, D., Amigo, J. M., Bro, R., & Viguri, J. R. (2010). 493
Development of models for predicting toxicity from sediment chemistry by partial least 494
squares-discriminant analysis and counter-propagation artificial neural networks. 495
Environmental Pollution, 158, 607–614. 496
Antonucci, F., Pallottino, F., Paglia, G., Palma, A., D’Aquino, S., & Menesatti, P. (2011). 497
Non-destructive estimation of mandarin maturity status through portable VIS-NIR 498
spectrophotometer. Food and Bioprocess Technology, 4, 809–813. 499
Blasco, J., Aleixos, N., & Moltó. E. (2007). Computer vision detection of peel defects in 500
citrus by means of a region oriented segmentation algorithm. Journal of Food 501
Engineering, 81, 535–543. 502

21
Chen, X., Wu, D., He, Y., & Liu, S. (2011). Nondestructive differentiation of Panax species 503
using visible and shortwave near-infrared spectroscopy. Food and Bioprocess 504
Technology, 4, 753–761. 505
Clément, A., Dorais, M., & Vernon, M. (2008). Nondestructive measurement of fresh tomato 506
lycopene content and other physicochemical characteristics using visible-NIR 507
spectroscopy. Journal of Agricultural and Food Chemistry, 56, 9813–9818. 508
Cronje, P. J. R., Barry, G. H., & Huysamer, M. (2011). Postharvest rind breakdown of ‘Nules 509
Clementine’ mandarin is influenced by ethylene application, storage temperature and 510
storage duration. Postharvest Biology and Technology, 60, 192–201. 511
Cronje, P. J. R., Barry, G. H., & Huysamer, M., 2013. Canopy position affects pigment 512
expression and accumulation of flavedo carbohydrates of ‘Nules Clementine’ mandarin 513
fruit, thereby affecting rind condition. Journal of the American Society for Horticultural 514
Science, 138, 217–244. 515
Davey, M. W., Saeys, W., Hof, E., Ramon, H., Swennen, R.L., & Keulemans, J. (2009). 516
Application of visible and near-infrared reflectance spectroscopy (Vis/NIRS) to 517
determine carotenoid contents in banana (Musa spp.) fruit pulp. Journal of Agricultural 518
and Food Chemistry, 57, 1742–1751. 519
Escuredo, O, Seijo, M.C., Salvador, J., & González-Martín, M. I. (2013). Near infrared 520
spectroscopy for prediction of antioxidant compounds in the honey. Food Chemistry, 521
141, 3409–3414. 522
Golic, M., Walsh, K. W., & Lawson, P. (2003). Short-wavelength near-infrared spectra of 523
sucrose, glucose, and fructose with respect to sugar concentration and temperature. 524
Applied Spectroscopy, 57, 139–145. 525

22
Gómez, A. H., He, Y., & Pereira, A. G. (2006). Non-destructive measurement of acidity, 526
soluble solids and firmness of Satsuma mandarin using Vis-NIR spectroscopy 527
techniques. Journal of Food Engineering, 77, 313–319. 528
Gómez-Sanchis, J., Lorente, D., Soria-Olivas, E., Aleixos, N., Cubero, S., & Blasco, J. 529
(2013). Development of a hyperspectral computer vision system based on two liquid 530
crystal tuneable filters for fruit inspection: application to detect citrus fruits decay. Food 531
and Bioprocess Technology, Doi:10.1007/s11947-013-1158-9. 532
Kawano, S., Fujiwara, T., & Iwamoto, M. (1993). Non-destructive determination of sugar 533
content in ‘Satsuma’ mandarins using NIRS transmittance. Journal of the Japanese 534
Society for Horticultural Science, 62, 465–470. 535
Kuang, B., & Mouazen, A. M. (2011). Calibration of visible and near infrared spectroscopy 536
for soil analysis at the field scale on three European farms. European Journal of Soil 537
Science, 62, 629–636. 538
Kuang, B., & Mouazen, A. M. (2013). Non-biased prediction of soil organic carbon and total 539
nitrogen with vis–NIR spectroscopy, as affected by soil moisture content and texture. 540
Biosystems Engineering, 114, 249–258. 541
Lammertyn, J., Peirs, J., De Baerdemaeker, J., & Nicolaï, B. M. (2000). Light penetration 542
properties of NIR radiation in fruit with respect to non-destructive quality assessment. 543
Postharvest Biology and Technology, 18, 121–132. 544
Magwaza, L. S., Opara, U. L., Terry, L. A., Landahl, S., Cronje, P. J. R., Nieuwoudt, H., 545
Mouazen, A. M., Saeys, W., & Nicolai B. M. (2012a). Prediction of ‘Nules Clementine’ 546
mandarin susceptibility to rind breakdown disorder using Vis/NIR spectroscopy. 547
Postharvest Biology and Technology, 74, 1–10. 548
23
Magwaza, L. S., Opara, U. L., Nieuwoudt, H., Cronje, P. J. R., Saeys, W., & Nicolaï, B. 549
(2012b). NIR spectroscopy applications for internal and external quality analysis of 550
citrus fruit – a review. Food and Bioprocess Technology, 5, 425–444. 551
Magwaza, L. S., Ford, H. D., Cronje, P. J. R., Opara, U. L., Landahl, S., Tatam, R. P., Terry, 552
L. A. (2013a). Application of optical coherence tomography to non-destructively 553
characterise rind breakdown disorder of ‘Nules Clementine’ mandarins. Postharvest 554
Biology and Technology, 84, 16–21. 555
Magwaza, L. S., Opara, U. L., Cronje, P. J. R., Nicolaï, B. M., Landahl, S., & Terry, L. A. 556
(2013b). Non-chilling physiological rind disorders in citrus fruit. Horticultural Reviews, 557
41, 131–176. 558
Magwaza, L. S., Opara, U. L., Terry, L. A., Landahl, S., Cronje, P. J. R., Nieuwoudt, H. H., 559
Hanssens, A., Saeys, W., Nicolaï, B. M. (2013c). Evaluation of Fourier transform-NIR 560
spectroscopy for integrated external and internal quality assessment of Valencia oranges. 561
Journal of Food Composition and Analysis, 31, 144–154. 562
Magwaza, L. S., Opara, U. L., Cronje, P. J. R., Landahl, S., & Terry, L. A. (2013d). Canopy 563
position effect on rind biochemical profile of ‘Nules Clementine’ mandarin fruit during 564
postharvest storage. Postharvest Biology and Technology, 86, 300–308. 565
Magwaza, L. S., Opara, U. L., Cronje, P. J. R., Nieuwoudt, H. H., Landahl, S., & Terry, L. A. 566
(2013e). Quantifying the effects of fruit position in the canopy on physical and 567
biochemical properties and predicting susceptibility to rind breakdown disorder of ‘Nules 568
Clementine’ mandarin (Citrus reticulata Blanco) using Vis/NIR spectroscopy. Acta 569
Horticulturae, (In Press). 570
Nicolaï, B. M., Beullens, K., Bobelyn, E., Peirs, A., Saeys, W., Theron, K. I., & Lammertyn, 571
J. (2007). Non-destructive measurement of fruit and vegetable quality by means of NIR 572
spectroscopy: A review. Postharvest Biology and Technology, 46, 99–118. 573

24
Pathare, P. B., Opara, U. L., & Al-Said, F. A. (2013). Colour measurement and analysis in 574
fresh and processed foods: a review. Food and Bioprocess Technology, 7, 36–60. 575
Peiris, K. H. S., Dull, G. G., Leffler, R. G., & Kays, S. J. (1999). Spatial variability of soluble 576
solids or dry-matter content within individual fruits, bulbs, or tubers: Implications for the 577
development and use of NIR spectrometric techniques. HortScience, 34, 114–118. 578
Tewari, J. C., Dixit, V., Chi, B-K., & Malik, K. A. (2008). Determination of origin and sugars 579
of citrus fruit using genetic algorithm, correspondence analysis and partial least square 580
combined with fiber optic NIR spectroscopy. Spectrochimica Acta A. Molecular and 581
Biomolecular Spectroscopy, 71, 1119–1127. 582
Wang, W., & Paliwal, J. (2007). Near-infrared spectroscopy and imaging in food quality and 583
safety. Sensing and Instrumentation for Food Quality and Safety, 1, 193–207. 584
Williams, P. C., & Sobering, D. C. (1996). “How do we do it: a brief summary of the 585
methods we use in developing near infrared calibrations”. In Proceedings of the 7th 586
International Conference of Near Infrared Spectroscopy: Near Infrared Spectroscopy: 587
The future waves, Davies A. M. C. & Williams P. eds. Montreal, Chichester, UK. Pp. 588
185-188. 589
Williams, P., Norris, K.H., 2001. Variable affecting near infrared spectroscopic analysis. In: 590
Williams, P., Norris, K.H. (eds). Near infrared technology in the agriculture and food 591
industries, 2nd edition. The American Association of Cereal Chemists, St Paul, MNL. 592
Pp. 171–185 593
Xudong, S., Hailiang, Z., & Yande, L. (2009). Nondestructive assessment of quality of 594
‘Nanfeng’ mandarin fruit by a portable near infrared spectroscopy. International Journal 595
of Agricultural and Biological Engineering, 2, 65–71. 596

25
Zheng, Y., He, S., Yi, S., Zhou, Z., Mao, S., Zhao, X., & Deng, L. (2010). Predicting 597
oleocellosis sensitivity in citrus using Vis-NIR reflectance spectroscopy. Scientia 598
Horticulturae, 125, 401–405. 599
600
26
601
602
603
604
605
606
607
608
609
610
611
612
613
614
615
616
617
618
619
620
621
622
623
Fig. 1: 624
625
PC1 (71%)
PC1 (42%)
PC
2 (
15%
) P
C2 (
15%
) A
B

27
626
Fig. 2: 627
628
629
Fig. 3: 630
631
Figure captions: 632 633
634
Fig. 1: Principal component (PC) analysis (PCA) score plot showing the ability of 635
spectra acquired before storage (A) and after 8 weeks of postharvest storage (B), to sort 636
fruit based on their origin within the tree canopy. 1 and 2 represent fruit from outside 637
and inside the canopy, respectively. 638
0.0
0.2
0.4
0.6
0.8
1.0
1.2
0 2 4 6 8 10 12 14 16 18 20
Y-v
ari
ance
Number of latent variables
-1.5
-1.0
-0.5
0.0
0.5
1.0
1.5
35
0
55
0
75
0
95
0
11
50
13
50
15
50
17
50
19
50
21
50
23
50
Reg
ress
ion
coef
fici
ents
Wavelength (nm)
y = 0.92x + 0.11
Rv = 0.96
0.5
1.0
1.5
2.0
2.5
0.5 1.0 1.5 2.0 2.5
Vis
/NIR
pre
dic
ted p
osi
tio
n
Actual position within the canopy
A B

28
639
Fig. 2: Residual y-variance as a function of the number of latent variables (LVs) in the 640
dry matter (DM) model (A), and regression coefficients curve of the DM model of intact 641
‘Nules Clementine’ mandarin fruit with 8 LVs and NIR spectral range of 450–2450 nm 642
(B). 643
644
Fig. 3: PLS-DA models showing the capability of Vis/NIR spectral analysis in predicting 645
fruit origin within the tree canopy. Spectra for this model were acquired before storage. 646
647

29
Table 1: Mean, standard deviation (SD), range and coefficient of variation (CV%) for 648
calibration (n = 100) and independent validation (n = 50) subsets of mandarin fruit physico-649
chemical properties. 650
Quality parameter Calibration data set Validation data set
Mean±SD Range CV% Mean±SD Range CV%
Colour index 4.38±1.66 0.07-7.49 37.81
4.42±1.58 0.07-7.43 35.75
Rind dry matter (%) 28.42±3.07 22.16-35.41 10.82
28.12±3.19 22.84-35.46 11.34
Rind fructose (mg/g DW) 120.12±34.70 53.72-195.88 28.88
120.58±35.09 64.826-195.88 29.10
Rind glucose (mg/g DW) 81.20±30.59 22.19-152.15 37.68
80.70±31.09 36.01-152.16 38.53
Rind sucrose (mg/g DW) 88.19±41.63 35.85-207.95 47.32
92.68±42.73 35.90-206.30 44.47
Rind total carbohydrates (mg/g DW) 289.50±99.14 122.03-501.12 34.25 293.95±94.95 137.66-512.01 32.30

30
Table 2: Results for calibration and prediction of the partial least squares (PLS) models 651
developed and validated using different spectral data pre-processing methods. 652
Quality Calibration Validation Info. Regionn
parameter Pre.Prb LV
h Rc
i RMSEC
j Slope Rv
k RMSEP
l RPD
m Slope (nm)
Colour index Nonec 2 0.95 0.37 0.95 0.94 0.38 4.12 0.94 450-750
SNVd 2 0.94 0.39 0.94 0.94 0.39 4.02 0.93 450-750
1st der
e 2 0.90 0.49 0.90 0.88 0.62 2.56 0.90 450-750
2nd
derf 2 0.90 0.49 0.90 0.88 0.62 2.56 0.88 450-750
MSCg 2 0.95 0.37 0.94 0.94 0.44 3.60 0.93 450-750
Rind DMa None 8 0.95 0.73 0.95 0.91 1.24 2.56 0.96 900-1700
(%) SNV 8 0.91 0.93 0.91 0.91 0.99 3.23 0.91 900-1700
1st der 8 0.96 0.64 0.96 0.92 0.92 3.47 0.93 900-1700
2nd
der 8 0.84 1.28 0.83 0.83 1.35 2.37 0.83 900-1700
MSC 8 0.93 0.68 0.95 0.94 0.94 3.39 0.92 900-1700
Rind fructose None 14 0.87 13.21 0.87 0.85 13.60 2.58 0.85 900-1700
(mg/g DW) SNV 14 0.88 11.96 0.88 0.82 18.20 1.93 0.79 900-1700
1st der 14 0.99 3.99 0.99 0.89 18.43 1.90 0.92 900-1700
2nd
der 14 0.84 14.14 0.84 0.73 23.34 1.50 0.77 900-1700 MSC 14 0.91 9.18 0.90 0.90 11.41 3.08 0.88 900-1700
Rind glucose None 10 0.84 12.53 0.84 0.81 14.90 2.09 0.81 900-1700
(mg/g DW) SNV 10 0.54 20.45 0.54 0.62 16.98 1.83 0.58 900-1700
1st der 10 0.97 5.02 0.98 0.48 20.57 1.51 0.57 900-1700
2nd
der 10 0.69 16.73 0.69 0.59 24.31 1.28 0.62 900-1700
MSC 10 0.89 10.32 0.88 0.88 14.19 2.19 0.86 900-1700
Rind sucrose None 10 0.57 27.46 0.57 0.45 36.81 1.12 0.59 900-1700
(mg/g DW) SNV 10 0.49 29.36 0.49 0.42 34.18 1.21 0.43 900-1700
1st der 10 0.79 18.22 0.79 0.77 25.38 1.62 0.77 900-1700
2nd
der 10 0.72 24.11 0.72 0.63 28.62 1.44 0.71 900-1700
MSC 10 0.92 12.37 0.92 0.83 24.36 1.75 0.90 900-1700
Rind total None 10 0.93 26.06 0.93 0.83 60.03 1.58 0.95 900-1700
carbohydrates SNV 10 0.62 60.42 0.62 0.65 48.70 1.95 0.62 900-1700
(mg/g DW) 1st der 10 0.79 42.71 0.79 0.78 47.29 2.01 0.78 900-1700
2nd
der 10 0.93 26.83 0.93 0.86 47.64 1.99 0.88 900-1700
MSC 10 0.89 30.42 0.89 0.90 31.04 3.06 0.91 900-1700
aDM rind dry matter, b
Pre.Pr pre-processing method, cNone no spectral pre-processing, d
SVN standard vector normalization, e1
st der first 653
derivative, f2
nd der second derivative, g
MSC multiple scatter correction, hLV latent variables, i
Rc correlation coefficient for calibration, 654 jRMSEC root mean square error of calibration, kRv correlation coefficient for validation, lRMESP root mean square error of prediction, mRPD 655
residual predictive deviation, nInfo region, informative region of the spectrum. 656

31
Table 3: Model performance using spectra acquired before storage (week 0) and after 8 weeks of 657
storage. 658
Quality Calibration Validation
parameter Time Pre.Prb LVf Rcg RMSECh Slope Rv
i RMSEPj RPDk Slope
Colour index Week 0 Nonec 2 0.95 0.37 0.95
0.94 0.38 4.12 0.94
Week 8
2 0.91 0.63 0.93
0.89 0.65 2.43 0.90
RBD (binary scores) Week 0 2nd derd 5 0.79 0.27 0.67
0.70 0.34 0.45 0.45
Week 8
5 0.77 0.29 0.59
0.61 0.36 0.42 0.45
Rind DMa (%) Week 0 MSCe 8 0.93 0.94 0.89
0.90 1.04 3.06 0.88
Week 8
8 0.96 0.64 0.96
0.94 0.83 3.84 0.93
Rind fructose (mg/g DW) Week 0 MSC 14 0.91 9.18 0.90
0.90 11.41 3.07 0.88
Week 8
14 0.96 6.33 0.97
0.94 10.01 3.51 0.97
Rind glucose (mg/g DW) Week 0 MSC 10 0.89 10.32 0.88
0.88 14.19 2.19 0.86
Week 8
10 0.91 9.18 0.90
0.90 11.41 2.72 0.88
Rind sucrose (mg/g DW) Week 0 MSC 8 0.89 13.44 0.91
0.75 38.21 1.07 0.59
Week 8
8 0.92 12.38 0.92
0.83 24.36 1.69 0.90
Rind total sugars (mg/g DW) Week 0 MSC 10 0.89 30.42 0.89 0.87 31.35 3.03 0.87 Week 8 10 0.93 25.35 0.91
0.88 31.04 3.05 0.91 aDM rind dry matter, b
Pre.Pr pre-processing method, cNone no spectral pre-processing,d
2nd
der second derivative, eMSC multiple scatter 659
correction, fLV latent variables, g
Rc correlation coefficient for calibration, hRMSEC root mean square error of calibration, i
Rv correlation 660
coefficient for validation, jRMESP root mean square error of prediction, kRPD residual predictive deviation. 661
662
663

32
Highlights 664
665
• Fruit from inside the canopy were more susceptible to RBD disorder than outside fruit 666
• Vis/NIRS PLS models predicted rind fructose, glucose and sucrose with accuracy 667
• Vis/NIRS PCA model was able to non-destructively classify fruit based on tree 668
canopy 669
• Models based on pre-storage spectra gave better prediction of RBD than post-storage 670
671
Copyright © 2022 FDOKUMEN