The use of multivariate curve resolution methods to improve the analysis of muramic acid as...
6
Journal of Chromatography B, 949–950 (2014) 1–6 Contents lists available at ScienceDirect Journal of Chromatography B j ourna l h om epage: www.elsevier.com/locate/chromb The use of multivariate curve resolution methods to improve the analysis of muramic acid as bacterial marker using gas chromatography–mass spectrometry: An alternative method to gas chromatography–tandem mass spectrometry Roudabeh Sadat Moazeni-Pourasil a , Farhad Piri b , Alireza Ghassempour b , Mehdi Jalali-Heravi a,∗ a Department of Chemistry, Sharif University of Technology, P.O. Box 11155-9516, Tehran, Iran b Department of Phytochemistry, Medicinal Plants and Drugs Research Institute, Shahid Beheshti University, Evin, Tehran, Iran a r t i c l e i n f o Article history: Received 18 July 2013 Accepted 27 December 2013 Available online 2 January 2014 Keywords: Multivariate curve resolution Gas chromatography–mass spectrometry Muramic acid a b s t r a c t In analysis of muramic acid (MA) as bacterial marker, two dominant disturbing factors lead the researchers to use gas chromatography–tandem mass spectrometry (GC–MS/MS) technique instead of gas chromatography–mass spectrometry (GC–MS). These factors are the trace concentration of MA and fundamental disturbance of base line mass channels in GC–MS technique. This study aimed to utilize multivariate curve resolution (MCR) methods combined with GC–MS to improve the analysis of MA. First, the background and noise in GC–MS analysis were corrected and reduced using MCR methods. In addition, the MA overlapped peaks were resolved to its pure chromatographic and mass spectral pro- files. Then the two-way response of each component was reconstructed by the outer product of the pure chromatographic and mass spectral profiles. The overall volume integration (OVI) method was used for quantitative determination. The MA peak area was decreased dramatically after the background cor- rection and noise reduction. The findings severely ratify the appropriateness of using MCR techniques combined with GC–MS analysis as a simple, fast and inexpensive method for the analysis of MA in com- plex mixtures. The proposed method may be considered as an alternative method to GC–MS/MS for thorough analysis of the bacterial marker. © 2013 Elsevier B.V. All rights reserved. 1. Introduction Muramic acid (MA), 3-O-lactylglucosamine, has been widely used as a marker for trace determination and quantification of bacteria and bacterial cell wall remnants in complex biologi- cal matrices [1]. The reliability of MA as a bacterial marker is predicated upon its exclusive occurrence in bacterial cell walls [2,3]. Numerous techniques are employed to identify and quantify MA in complex mixtures including spectrophotometry [4,5], high per- formance liquid chromatography (HPLC), where MA is detected by fluorescence as a dansyl derivative [6], or without chemical deriva- tization using pulsed amperometric detection (PAD) system [7], and liquid chromatography–mass spectrometry (LC–MS) [8]. Gas chromatography (GC), gas chromatography–mass spectrometry ∗ Corresponding author. Tel.: +98 21 6616 5329; fax: +98 21 66012983. E-mail addresses: [email protected], [email protected] (M. Jalali-Heravi). (GC–MS) and gas chromatography–tandem mass spectrometry (GC–MS/MS) methods have also been applied for MA analysis including both non-halogenated [9–13] and halogenated deriva- tives [14–16]. Using high resolution chromatographic separations coupled with selective clean-up steps is important in improv- ing the specificity of detection of chemical markers, such as MA in complex matrices [17]. However, chromatographic separation is not adequate to eliminate extraneous peaks when nonselec- tive detectors are employed. The uses of mass spectrometer, as a selective GC detector [i.e. GC–MS analysis in the selected ion monitoring (SIM) mode], significantly diminish the background noise. However, even using SIM mode cannot eliminate extra- neous peaks [18,19]. The tandem mass spectrometer in multiple reaction monitoring (MRM) mode as a GC detector provides even further specificity to the detection of MA at trace levels in complex matrices [20,21]. Capillary-GC–MS/MS has shown a remarkable sensitivity and specificity in analysis of derivatized MA [22,23]. Although, GC–MS is a common method to analyze MA, it suffers from numerous defects. The fundamental problems in the GC–MS 1570-0232/$ – see front matter © 2013 Elsevier B.V. All rights reserved. http://dx.doi.org/10.1016/j.jchromb.2013.12.032
Transcript of The use of multivariate curve resolution methods to improve the analysis of muramic acid as...
Tacc
RMa
b
a
ARAA
KMGM
1
ubcp[
iffltac
(
1h
Journal of Chromatography B, 949– 950 (2014) 1– 6
Contents lists available at ScienceDirect
Journal of Chromatography B
j ourna l h om epage: www.elsev ier .com/ locate /chromb
he use of multivariate curve resolution methods to improve thenalysis of muramic acid as bacterial marker using gashromatography–mass spectrometry: An alternative method to gashromatography–tandem mass spectrometry
oudabeh Sadat Moazeni-Pourasil a, Farhad Pirib, Alireza Ghassempourb,ehdi Jalali-Heravia,∗
Department of Chemistry, Sharif University of Technology, P.O. Box 11155-9516, Tehran, IranDepartment of Phytochemistry, Medicinal Plants and Drugs Research Institute, Shahid Beheshti University, Evin, Tehran, Iran
r t i c l e i n f o
rticle history:eceived 18 July 2013ccepted 27 December 2013vailable online 2 January 2014
eywords:ultivariate curve resolutionas chromatography–mass spectrometryuramic acid
a b s t r a c t
In analysis of muramic acid (MA) as bacterial marker, two dominant disturbing factors lead theresearchers to use gas chromatography–tandem mass spectrometry (GC–MS/MS) technique instead ofgas chromatography–mass spectrometry (GC–MS). These factors are the trace concentration of MA andfundamental disturbance of base line mass channels in GC–MS technique. This study aimed to utilizemultivariate curve resolution (MCR) methods combined with GC–MS to improve the analysis of MA.First, the background and noise in GC–MS analysis were corrected and reduced using MCR methods. Inaddition, the MA overlapped peaks were resolved to its pure chromatographic and mass spectral pro-files. Then the two-way response of each component was reconstructed by the outer product of the pure
chromatographic and mass spectral profiles. The overall volume integration (OVI) method was used forquantitative determination. The MA peak area was decreased dramatically after the background cor-rection and noise reduction. The findings severely ratify the appropriateness of using MCR techniquescombined with GC–MS analysis as a simple, fast and inexpensive method for the analysis of MA in com-plex mixtures. The proposed method may be considered as an alternative method to GC–MS/MS forthorough analysis of the bacterial marker.. Introduction
Muramic acid (MA), 3-O-lactylglucosamine, has been widelysed as a marker for trace determination and quantification ofacteria and bacterial cell wall remnants in complex biologi-al matrices [1]. The reliability of MA as a bacterial marker isredicated upon its exclusive occurrence in bacterial cell walls2,3].
Numerous techniques are employed to identify and quantify MAn complex mixtures including spectrophotometry [4,5], high per-ormance liquid chromatography (HPLC), where MA is detected byuorescence as a dansyl derivative [6], or without chemical deriva-
ization using pulsed amperometric detection (PAD) system [7],nd liquid chromatography–mass spectrometry (LC–MS) [8]. Gashromatography (GC), gas chromatography–mass spectrometry∗ Corresponding author. Tel.: +98 21 6616 5329; fax: +98 21 66012983.E-mail addresses: [email protected], [email protected]
M. Jalali-Heravi).
570-0232/$ – see front matter © 2013 Elsevier B.V. All rights reserved.ttp://dx.doi.org/10.1016/j.jchromb.2013.12.032
© 2013 Elsevier B.V. All rights reserved.
(GC–MS) and gas chromatography–tandem mass spectrometry(GC–MS/MS) methods have also been applied for MA analysisincluding both non-halogenated [9–13] and halogenated deriva-tives [14–16]. Using high resolution chromatographic separationscoupled with selective clean-up steps is important in improv-ing the specificity of detection of chemical markers, such as MAin complex matrices [17]. However, chromatographic separationis not adequate to eliminate extraneous peaks when nonselec-tive detectors are employed. The uses of mass spectrometer, asa selective GC detector [i.e. GC–MS analysis in the selected ionmonitoring (SIM) mode], significantly diminish the backgroundnoise. However, even using SIM mode cannot eliminate extra-neous peaks [18,19]. The tandem mass spectrometer in multiplereaction monitoring (MRM) mode as a GC detector provideseven further specificity to the detection of MA at trace levelsin complex matrices [20,21]. Capillary-GC–MS/MS has shown a
remarkable sensitivity and specificity in analysis of derivatized MA[22,23].Although, GC–MS is a common method to analyze MA, it suffersfrom numerous defects. The fundamental problems in the GC–MS
2 Chrom
aappootiiiiq
ssh(rdleptoa
ubtti[El[ahiisS[t(rfiac
2
tawoshM([citfi
R.S. Moazeni-Pourasil et al. / J.
nalysis are baseline drift, spectral background, homoscedasticnd heteroscedastic noise, peak shape deformation (non-Gaussianeaks), low S/N ratio and co-elution (overlapped and/or embeddedeaks). The main problem in analysis of MA using GC–MS stemsn its low concentration. Its trace concentration prevents the usef ChemStation software to eliminate the large baseline drift. Also,he similarity of spectral background with the MA mass spectrumn the presence of noise and baseline mass channels averts identify-ng the latter. These have compelled researchers to use GC–MS/MSnstead of GC–MS. In addition, the presence of overlapping peaksn MA GC–MS analysis is a serious factor that hinders a thoroughuantitative determination of MA.
Multivariate curve resolution (MCR) methods have been exten-ively used for the analysis of unresolved peaks in chromatographiceparations coupled to multichannel detection systems, such asigh performance liquid chromatography–diode array detectionHPLC–DAD), LC–MS and GC–MS [24–26]. MCR techniques offerobust and reliable data analysis alternatives to handle problemserived from the instability of the GC–MS systems, such as base-
ine drift/spectral background, noise problem, low S/N ratio, orven the co-elution problem. The pure mass spectra and elutionrofiles obtained using the MCR methods remedy incorrect quan-itative analysis. For the aforementioned reasons, the combinationf hyphenated instruments and relevant MCR methods has opened
new window for a quick and accurate analysis of real samples.To the best of our knowledge, MCR methods have not been
sed yet to assist GC–MS in thorough analysis of MA. By com-ining MCR methods with GC–MS technique one may avoid usinghe expensive method of GC–MS/MS to analyze this acid. In addi-ion, the sensitivity and the detection limit of the analysis will bemproved. Various methods, such as evolving factor analysis (EFA)27,28], fixed size moving window-evolving factor analysis (FSMW-FA) [29], window factor analysis (WFA) [30,31], heuristic evolvingatent projection (HELP) [32,33], sub-window factor analysis (SFA)34,35], orthogonal projection regression (OPR) [36] and multivari-te curve resolution-alternating least squares (MCR-ALS) [37–41]ave been developed to provide more information from the chem-
cal analysis, both in chromatographic separations and spectraldentifications [42–46]. In the present work a number of methods,uch as base line correction developed by Kvalheim and Liang [32],avitzky–Golay filter [47], morphological score [48], FSMW-EFA29], EFA [27,28], simple-to use interactive self-modeling mix-ure analysis (SIMPLISMA) [49,50], orthogonal projection approachOPA) [51], MCR-ALS [37–41] and HELP [32,33] were applied toeduce the defects of GC–MS analysis of MA overlapped peaks. Thendings have confirmed the ability of the proposed technique, as
simple and fast method for the analysis of MA in complex matri-es.
. Experimental
All experimental steps including material purchases, cultiva-ion, standard plate count method, bacterial sample preparationnd treatment, bacterial cell wall hydrolysis and MA derivatizationere performed in accordance with the procedure recently devel-
ped and published by Ghassempour and coworkers [52]. For theake of consistency, key experimental descriptions are presentedere. A Varian CP-3800 gas chromatograph equipped with a 4000S ion-trap mass spectrometer and a VF-1ms (CP8924) column
30 m–0.25 mm ID (0.25 mm)) in a split ratio of 1:30 has been used
52]. The temperature program has been set as follows: the initialolumn temperature of 90 ◦C was held for 1 min, which was thenncreased to 250 ◦C at a rate of 5 ◦C min−1. Thereafter, the tempera-ure has been increased again at a rate of 10 ◦C min−1 to 270 ◦C andnally held at this temperature for 5 min.atogr. B 949– 950 (2014) 1– 6
3. Data analysis
In order to export the data matrix, Vx Capture software of AdronSystems LLC [53] was used to convert the data from Varian to Agi-lent format. Afterward an enhanced ChemStation G1701DA versionD.00.01.27 was applied for the data collection and conversion toASCII format. Data analyses were performed using a Pentium-basedHP-Compaq personal computer. All programs of the applied meth-ods were coded in MATLAB 6.5 for Windows by the authors, exceptfor the MCR-ALS that has been downloaded from the website [54].
4. Methodology
The bilinear structure of data set is the main prerequisite forthe MCR approaches [45] and the data acquired from the GC–MSanalysis supplies this demand. A MCR bilinear model allows thedecomposition of the data matrix X into the product of two datamatrices of C and ST (where T stands for transpose of the matrix,i.e. reflecting the matrix over its main diagonal). Each of C andST matrices contains the pure response profiles of the n mixturecomponents associated with the row and the column directions ofthe initial data matrix, respectively. In matrix notation, the generalmodel for the MCR is:
X = CST + E (1)
where X (I × J) is the original GC–MS data matrix, C (I × n) and S(J × n) are the matrices containing the pure chromatograms andmass spectra, respectively. E (I × J) is the error matrix. The variablesI and J represent the number of rows and columns of the originaldata matrix X, respectively, and n is the number of chemical com-ponents in the matrix. The detailed theories behind all methodsused in this paper are given elsewhere. However, to be consistent,they are briefly explained here. On a bilinear data matrix, i.e. a sub-set of the total ion chromatogram (TIC) as a GC–MS peak cluster,the following steps were performed: (1) First, the data matrix wasbaseline corrected using Kvalheim and Liang method [32]. In thismethod, the local rank analysis of zero component regions wouldprovide sufficient information for univariate linear regression withrespect to the retention time and then the baseline would be cor-rected. (2) There are white and heteroscedastic noise in the GC–MSdata which interfere in the identification and quantification of thecomponents. The procedure for heteroscedastic noise correctionwas taken from Savitzky–Golay filter [47]. Moreover, GC–MS dataacquired in full scan mode contains many noisy channels. Thus,deleting the noise channels which consist of random signals wouldresult in a faster computation. In order to avoid accumulation ofthe noise, key spectra instead of full rank matrix were analyzedusing the morphological score method [48] which discriminatesbetween the noise and the signal channels. Channels whose mor-phological scores were below the noise limit were removed. On theother word, the white noise from the data was removed by applyingthis method. (3) Chemical rank was determined by eigenvalues plotresulted from singular value decomposition (SVD) and the morpho-logical score techniques [48]. (4) The peak purity of two-way datawas controlled by the plot of fixed size moving window-evolvingfactor analysis (FSMW-EFA) [29] and evolving latent projectiongraphs (ELPGs) [32]. By using these methods zero componentregions (ZCRs), selective, and overlapped regions of the peak clus-ter were determined. (5) After these steps (data preprocessing,finding the number of chemical components and information oflocal rank analysis) the resolution method was applied. The chro-
matographic and spectral profiles of each component in the peakcluster were recovered using HELP [32,33] or MCR-ALS [37–41]methods. A brief description of the resolution methods is pre-sented to make the article more consistent and understandable.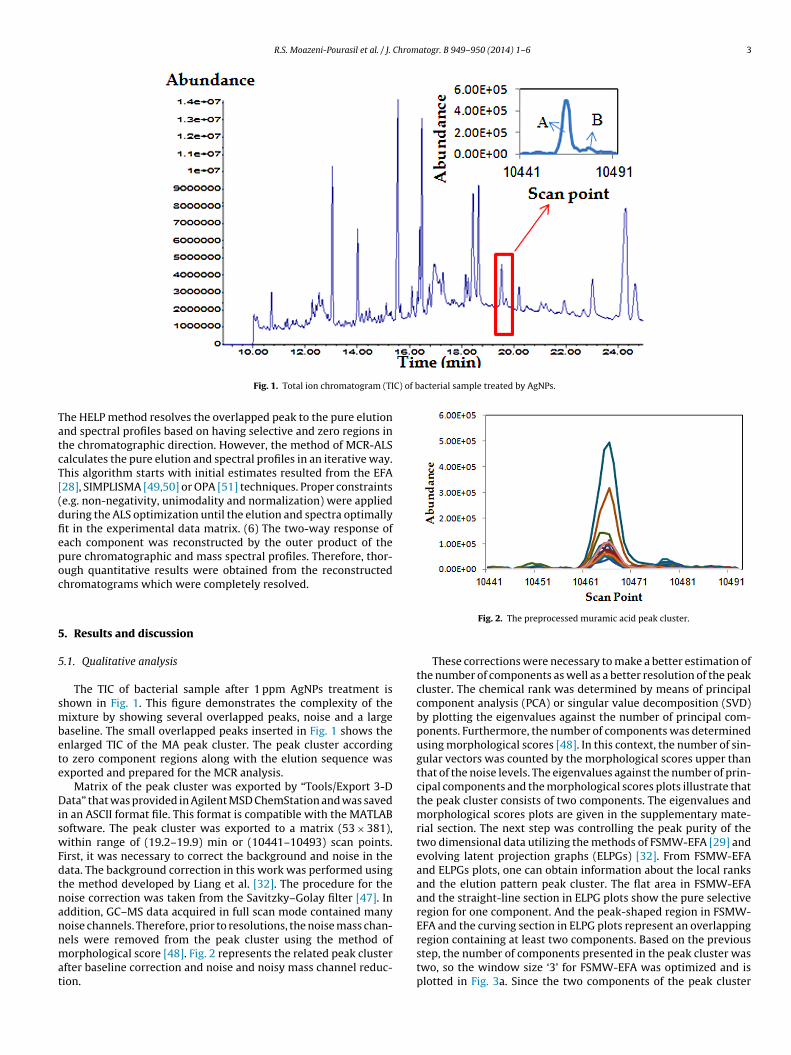
R.S. Moazeni-Pourasil et al. / J. Chromatogr. B 949– 950 (2014) 1– 6 3
C) of bacterial sample treated by AgNPs.
TatcT[(dfiepoc
5
5
smbete
DiswFdtnannmat
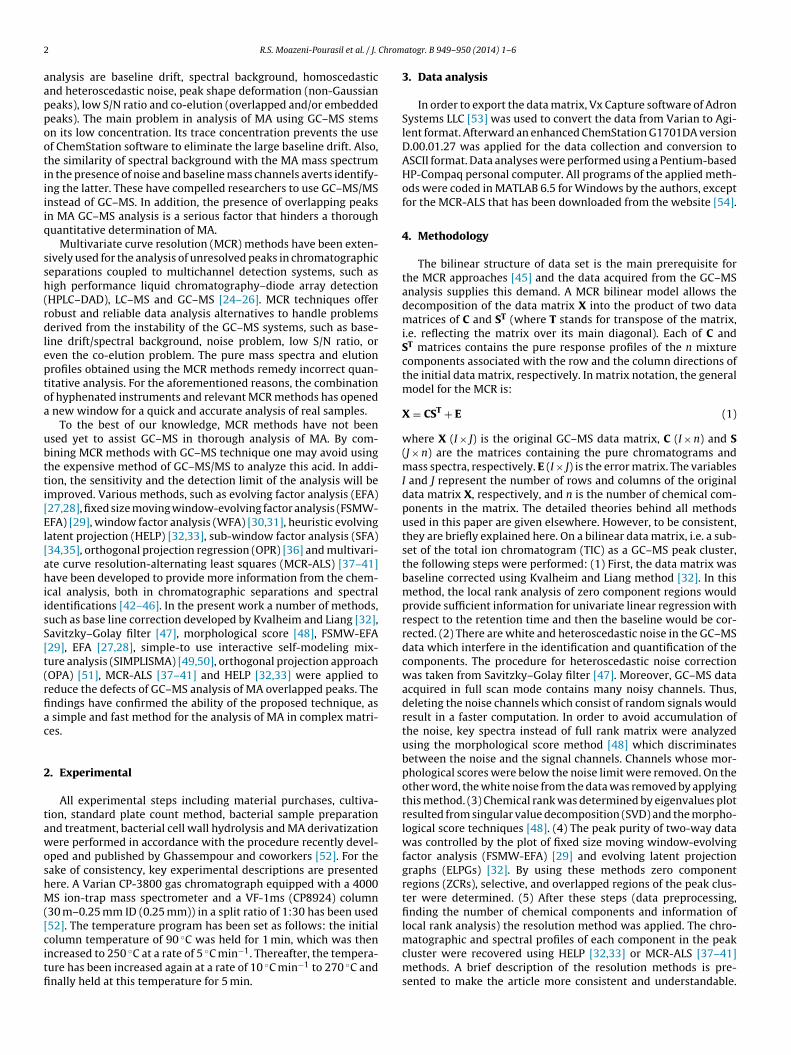
Fig. 1. Total ion chromatogram (TI
he HELP method resolves the overlapped peak to the pure elutionnd spectral profiles based on having selective and zero regions inhe chromatographic direction. However, the method of MCR-ALSalculates the pure elution and spectral profiles in an iterative way.his algorithm starts with initial estimates resulted from the EFA28], SIMPLISMA [49,50] or OPA [51] techniques. Proper constraintse.g. non-negativity, unimodality and normalization) were applieduring the ALS optimization until the elution and spectra optimallyt in the experimental data matrix. (6) The two-way response ofach component was reconstructed by the outer product of theure chromatographic and mass spectral profiles. Therefore, thor-ugh quantitative results were obtained from the reconstructedhromatograms which were completely resolved.
. Results and discussion
.1. Qualitative analysis
The TIC of bacterial sample after 1 ppm AgNPs treatment ishown in Fig. 1. This figure demonstrates the complexity of theixture by showing several overlapped peaks, noise and a large
aseline. The small overlapped peaks inserted in Fig. 1 shows thenlarged TIC of the MA peak cluster. The peak cluster accordingo zero component regions along with the elution sequence wasxported and prepared for the MCR analysis.
Matrix of the peak cluster was exported by “Tools/Export 3-Data” that was provided in Agilent MSD ChemStation and was saved
n an ASCII format file. This format is compatible with the MATLABoftware. The peak cluster was exported to a matrix (53 × 381),ithin range of (19.2–19.9) min or (10441–10493) scan points.
irst, it was necessary to correct the background and noise in theata. The background correction in this work was performed usinghe method developed by Liang et al. [32]. The procedure for theoise correction was taken from the Savitzky–Golay filter [47]. Inddition, GC–MS data acquired in full scan mode contained manyoise channels. Therefore, prior to resolutions, the noise mass chan-
els were removed from the peak cluster using the method oforphological score [48]. Fig. 2 represents the related peak clusterfter baseline correction and noise and noisy mass channel reduc-ion.
Fig. 2. The preprocessed muramic acid peak cluster.
These corrections were necessary to make a better estimation ofthe number of components as well as a better resolution of the peakcluster. The chemical rank was determined by means of principalcomponent analysis (PCA) or singular value decomposition (SVD)by plotting the eigenvalues against the number of principal com-ponents. Furthermore, the number of components was determinedusing morphological scores [48]. In this context, the number of sin-gular vectors was counted by the morphological scores upper thanthat of the noise levels. The eigenvalues against the number of prin-cipal components and the morphological scores plots illustrate thatthe peak cluster consists of two components. The eigenvalues andmorphological scores plots are given in the supplementary mate-rial section. The next step was controlling the peak purity of thetwo dimensional data utilizing the methods of FSMW-EFA [29] andevolving latent projection graphs (ELPGs) [32]. From FSMW-EFAand ELPGs plots, one can obtain information about the local ranksand the elution pattern peak cluster. The flat area in FSMW-EFAand the straight-line section in ELPG plots show the pure selectiveregion for one component. And the peak-shaped region in FSMW-EFA and the curving section in ELPG plots represent an overlappingregion containing at least two components. Based on the previous
step, the number of components presented in the peak cluster wastwo, so the window size ‘3’ for FSMW-EFA was optimized and isplotted in Fig. 3a. Since the two components of the peak cluster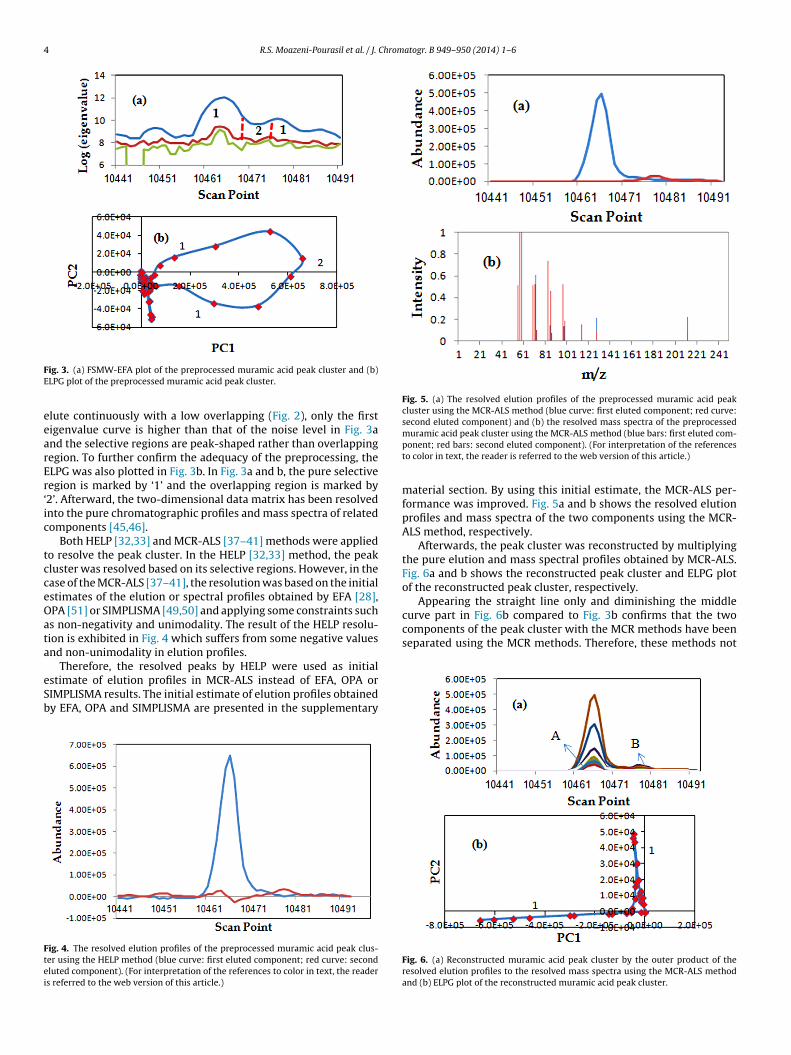
4 R.S. Moazeni-Pourasil et al. / J. Chromatogr. B 949– 950 (2014) 1– 6
FE
eearEr‘ic
tcceOata
eSb
Ftei
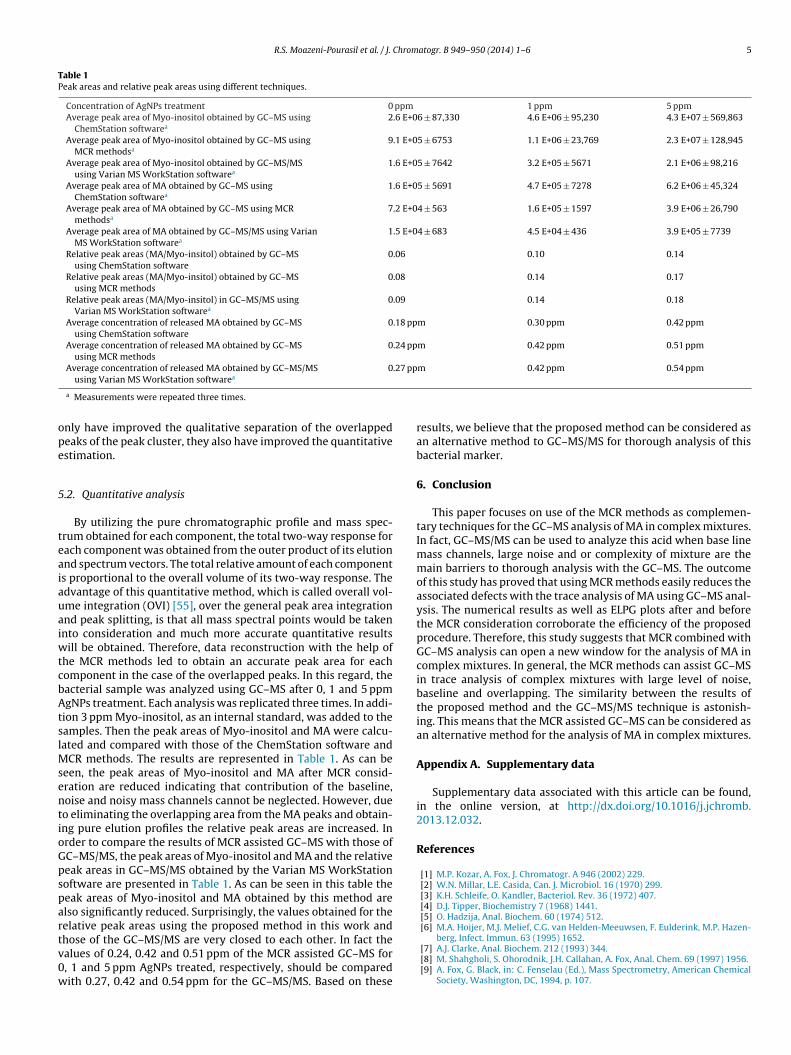
Fig. 5. (a) The resolved elution profiles of the preprocessed muramic acid peakcluster using the MCR-ALS method (blue curve: first eluted component; red curve:second eluted component) and (b) the resolved mass spectra of the preprocessed
curve part in Fig. 6b compared to Fig. 3b confirms that the twocomponents of the peak cluster with the MCR methods have beenseparated using the MCR methods. Therefore, these methods not
ig. 3. (a) FSMW-EFA plot of the preprocessed muramic acid peak cluster and (b)LPG plot of the preprocessed muramic acid peak cluster.
lute continuously with a low overlapping (Fig. 2), only the firstigenvalue curve is higher than that of the noise level in Fig. 3and the selective regions are peak-shaped rather than overlappingegion. To further confirm the adequacy of the preprocessing, theLPG was also plotted in Fig. 3b. In Fig. 3a and b, the pure selectiveegion is marked by ‘1’ and the overlapping region is marked by2’. Afterward, the two-dimensional data matrix has been resolvednto the pure chromatographic profiles and mass spectra of relatedomponents [45,46].
Both HELP [32,33] and MCR-ALS [37–41] methods were appliedo resolve the peak cluster. In the HELP [32,33] method, the peakluster was resolved based on its selective regions. However, in thease of the MCR-ALS [37–41], the resolution was based on the initialstimates of the elution or spectral profiles obtained by EFA [28],PA [51] or SIMPLISMA [49,50] and applying some constraints suchs non-negativity and unimodality. The result of the HELP resolu-ion is exhibited in Fig. 4 which suffers from some negative valuesnd non-unimodality in elution profiles.
Therefore, the resolved peaks by HELP were used as initial
stimate of elution profiles in MCR-ALS instead of EFA, OPA orIMPLISMA results. The initial estimate of elution profiles obtainedy EFA, OPA and SIMPLISMA are presented in the supplementaryig. 4. The resolved elution profiles of the preprocessed muramic acid peak clus-er using the HELP method (blue curve: first eluted component; red curve: secondluted component). (For interpretation of the references to color in text, the readers referred to the web version of this article.)
muramic acid peak cluster using the MCR-ALS method (blue bars: first eluted com-ponent; red bars: second eluted component). (For interpretation of the referencesto color in text, the reader is referred to the web version of this article.)
material section. By using this initial estimate, the MCR-ALS per-formance was improved. Fig. 5a and b shows the resolved elutionprofiles and mass spectra of the two components using the MCR-ALS method, respectively.
Afterwards, the peak cluster was reconstructed by multiplyingthe pure elution and mass spectral profiles obtained by MCR-ALS.Fig. 6a and b shows the reconstructed peak cluster and ELPG plotof the reconstructed peak cluster, respectively.
Appearing the straight line only and diminishing the middle
Fig. 6. (a) Reconstructed muramic acid peak cluster by the outer product of theresolved elution profiles to the resolved mass spectra using the MCR-ALS methodand (b) ELPG plot of the reconstructed muramic acid peak cluster.
R.S. Moazeni-Pourasil et al. / J. Chromatogr. B 949– 950 (2014) 1– 6 5
Table 1Peak areas and relative peak areas using different techniques.
Concentration of AgNPs treatment 0 ppm 1 ppm 5 ppmAverage peak area of Myo-inositol obtained by GC–MS using
ChemStation softwarea2.6 E+06 ± 87,330 4.6 E+06 ± 95,230 4.3 E+07 ± 569,863
Average peak area of Myo-inositol obtained by GC–MS usingMCR methodsa
9.1 E+05 ± 6753 1.1 E+06 ± 23,769 2.3 E+07 ± 128,945
Average peak area of Myo-inositol obtained by GC–MS/MSusing Varian MS WorkStation softwarea
1.6 E+05 ± 7642 3.2 E+05 ± 5671 2.1 E+06 ± 98,216
Average peak area of MA obtained by GC–MS usingChemStation softwarea
1.6 E+05 ± 5691 4.7 E+05 ± 7278 6.2 E+06 ± 45,324
Average peak area of MA obtained by GC–MS using MCRmethodsa
7.2 E+04 ± 563 1.6 E+05 ± 1597 3.9 E+06 ± 26,790
Average peak area of MA obtained by GC–MS/MS using VarianMS WorkStation softwarea
1.5 E+04 ± 683 4.5 E+04 ± 436 3.9 E+05 ± 7739
Relative peak areas (MA/Myo-insitol) obtained by GC–MSusing ChemStation software
0.06 0.10 0.14
Relative peak areas (MA/Myo-insitol) obtained by GC–MSusing MCR methods
0.08 0.14 0.17
Relative peak areas (MA/Myo-insitol) in GC–MS/MS usingVarian MS WorkStation softwarea
0.09 0.14 0.18
Average concentration of released MA obtained by GC–MSusing ChemStation software
0.18 ppm 0.30 ppm 0.42 ppm
Average concentration of released MA obtained by GC–MSusing MCR methods
0.24 ppm 0.42 ppm 0.51 ppm
Average concentration of released MA obtained by GC–MS/MS 0.27 ppm 0.42 ppm 0.54 ppm
ope
5
teaiauaiwtcbAtslMsentioGpspartv0w
using Varian MS WorkStation softwarea
a Measurements were repeated three times.
nly have improved the qualitative separation of the overlappedeaks of the peak cluster, they also have improved the quantitativestimation.
.2. Quantitative analysis
By utilizing the pure chromatographic profile and mass spec-rum obtained for each component, the total two-way response forach component was obtained from the outer product of its elutionnd spectrum vectors. The total relative amount of each components proportional to the overall volume of its two-way response. Thedvantage of this quantitative method, which is called overall vol-me integration (OVI) [55], over the general peak area integrationnd peak splitting, is that all mass spectral points would be takennto consideration and much more accurate quantitative results
ill be obtained. Therefore, data reconstruction with the help ofhe MCR methods led to obtain an accurate peak area for eachomponent in the case of the overlapped peaks. In this regard, theacterial sample was analyzed using GC–MS after 0, 1 and 5 ppmgNPs treatment. Each analysis was replicated three times. In addi-
ion 3 ppm Myo-inositol, as an internal standard, was added to theamples. Then the peak areas of Myo-inositol and MA were calcu-ated and compared with those of the ChemStation software and
CR methods. The results are represented in Table 1. As can beeen, the peak areas of Myo-inositol and MA after MCR consid-ration are reduced indicating that contribution of the baseline,oise and noisy mass channels cannot be neglected. However, dueo eliminating the overlapping area from the MA peaks and obtain-ng pure elution profiles the relative peak areas are increased. Inrder to compare the results of MCR assisted GC–MS with those ofC–MS/MS, the peak areas of Myo-inositol and MA and the relativeeak areas in GC–MS/MS obtained by the Varian MS WorkStationoftware are presented in Table 1. As can be seen in this table theeak areas of Myo-inositol and MA obtained by this method arelso significantly reduced. Surprisingly, the values obtained for theelative peak areas using the proposed method in this work and
hose of the GC–MS/MS are very closed to each other. In fact thealues of 0.24, 0.42 and 0.51 ppm of the MCR assisted GC–MS for, 1 and 5 ppm AgNPs treated, respectively, should be comparedith 0.27, 0.42 and 0.54 ppm for the GC–MS/MS. Based on theseresults, we believe that the proposed method can be considered asan alternative method to GC–MS/MS for thorough analysis of thisbacterial marker.
6. Conclusion
This paper focuses on use of the MCR methods as complemen-tary techniques for the GC–MS analysis of MA in complex mixtures.In fact, GC–MS/MS can be used to analyze this acid when base linemass channels, large noise and or complexity of mixture are themain barriers to thorough analysis with the GC–MS. The outcomeof this study has proved that using MCR methods easily reduces theassociated defects with the trace analysis of MA using GC–MS anal-ysis. The numerical results as well as ELPG plots after and beforethe MCR consideration corroborate the efficiency of the proposedprocedure. Therefore, this study suggests that MCR combined withGC–MS analysis can open a new window for the analysis of MA incomplex mixtures. In general, the MCR methods can assist GC–MSin trace analysis of complex mixtures with large level of noise,baseline and overlapping. The similarity between the results ofthe proposed method and the GC–MS/MS technique is astonish-ing. This means that the MCR assisted GC–MS can be considered asan alternative method for the analysis of MA in complex mixtures.
Appendix A. Supplementary data
Supplementary data associated with this article can be found,in the online version, at http://dx.doi.org/10.1016/j.jchromb.2013.12.032.
References
[1] M.P. Kozar, A. Fox, J. Chromatogr. A 946 (2002) 229.[2] W.N. Millar, L.E. Casida, Can. J. Microbiol. 16 (1970) 299.[3] K.H. Schleife, O. Kandler, Bacteriol. Rev. 36 (1972) 407.[4] D.J. Tipper, Biochemistry 7 (1968) 1441.[5] O. Hadzija, Anal. Biochem. 60 (1974) 512.[6] M.A. Hoijer, M.J. Melief, C.G. van Helden-Meeuwsen, F. Eulderink, M.P. Hazen-
berg, Infect. Immun. 63 (1995) 1652.[7] A.J. Clarke, Anal. Biochem. 212 (1993) 344.[8] M. Shahgholi, S. Ohorodnik, J.H. Callahan, A. Fox, Anal. Chem. 69 (1997) 1956.[9] A. Fox, G. Black, in: C. Fenselau (Ed.), Mass Spectrometry, American Chemical
Society, Washington, DC, 1994, p. 107.
6 Chrom
[[[[[[[[[[[[[[
[
[[
[[[[[[[[
[
[
[[[[[[[[[[[
[
[[
[[
R.S. Moazeni-Pourasil et al. / J.
10] G.D. McGinnis, Carbohydr. Res. 108 (1982) 284.11] G.O. Guerrant, W. Moss, Anal. Chem. 56 (1984) 633.12] K. Bal, L. Larsson, J. Chromatogr. B 738 (2000) 57.13] Z. Mielniczuk, E. Mielniczuk, L. Larsson, J. Chromatogr. B. 670 (1995) 167.14] I. Elmroth, A. Fox, L. Larsson, J. Chromatogr. A. 628 (1993) 93.15] B. Christensson, J. Gilbart, A. Fox, S.L. Morgan, Arthritis Rheum. 32 (1989) 1268.16] A. Tunlid, G. Odham, J. Microbiol. Methods 1 (1983) 63.17] M. Krahmer, K. Fox, A. Fox, Int. J. Mass Spectrom. 190/191 (1999) 321.18] A. Fox, J. Schwab, T. Cochran, Infect. Immun. 29 (1980) 526.19] A. Fox, R.M.T. Rosario, L. Larsson, Appl. Environ. Microbiol. 59 (1993) 4354.20] A. Fox, L. Wright, K. Fox, J. Microbiol. Methods 22 (1995) 11.21] A. Fox, M. Krahmer, D. Harrelson, J. Microbiol. Methods 27 (1996) 129.22] M.P. Kozar, M.T. Krahmer, A. Fox, B.M. Gray, Infect. Immun. 68 (2000) 4688.23] M.P. Kozar, M.T. Krahmer, A. Fox, L. Larsson, J.H. Allton, Geochim. Cosmochim.
Acta 65 (2001) 3307.24] L.W. Hantao, H.G. Aleme, M.P. Pedroso, G.P. Sabin, R.J. Poppi, F. Augusto, Anal.
Chim. Acta 731 (2012) 11.25] R.M. Maggio, P.C. Damiani, A.C. Olivieri, Talanta 83 (2011) 1173.26] H. Parastar, J.R. Radovic, J.M. Bayona, R. Tauler, Anal. Bioanal. Chem. 405 (2013)
6235.27] M. Maeder, Anal. Chem. 59 (1987) 527.28] M. Maeder, A.D. Zuberbuehler, Chemom. Intell. Lab. Syst. 3 (1988) 205.29] H.R. Keller, D.L. Massart, Anal. Chim. Acta 246 (1991) 379.
30] E.R. Malinowski, J. Chemom. 6 (1992) 29.31] W. Den, J. Chemom. 7 (1993) 89.32] Y.Z. Liang, O.M. Kvalheim, Anal. Chem. 64 (1992) 936.33] O.M. Kvalheim, Y.Z. Liang, Anal. Chem. 64 (1992) 946.34] R. Manne, H.L. Shen, Y.Z. Liang, Chemom. Intell. Lab. Syst. 45 (1999) 171.[[[
atogr. B 949– 950 (2014) 1– 6
35] H.L. Shen, R. Manne, Q.S. Xu, D.Z. Chen, Y.Z. Liang, Chemom. Intell. Lab. Syst. 45(1999) 323.
36] F. Cuesta Sanchez, S.C. Rutan, N.D. Gil, D.L. Garcia, Chemom. Intell. Lab. Syst. 36(1997) 153.
37] R. Tauler, A. Smilde, B. Kowalski, J. Chemom. 9 (1995) 31.38] S. Navea, A. de Juan, R. Tauler, Anal. Chim. Acta 446 (2001) 185.39] R. Tauler, J. Chemom. 15 (2001) 627.40] R. Tauler, A. de Juan, Anal. Chim. Acta 500 (2003) 195.41] J. Jaumot, R. Gargallo, A. de Juan, R. Tauler, J. Chemom. 76 (2005) 101.42] M. Jalali-Heravi, M. Vosough, J. Chromatogr. A 1024 (2004) 165.43] M. Jalali-Heravi, B. Zekavat, H. Sereshti, J. Chromatogr. A 1114 (2006) 154.44] M. Jalali-Heravi, B. Zekavat, H. Sereshti, J. Chromatogr. A 1143 (2007) 215.45] M. Jalali-Heravi, H. Parastar, H. Sereshti, Anal. Chim. Acta 623 (2008) 11.46] M. Jalali-Heravi, R.S. Moazeni, H. Sereshti, J. Chromatogr. A 1218 (2011) 2569.47] R.G. Brereton, Chemometrics Data Analysis for the Laboratory and Chemical
Plant, John Wiley & Sons Ltd., New York, 2003.48] H. Shen, L. Stordrange, R. Manne, O.M. Kvalheim, Y.Z. Liang, Chemom. Intell.
Lab. Syst. 51 (2000) 37.49] W. Windig, J. Guilment, Anal. Chem. 63 (1991) 1425.50] W. Windig, C.E. Heckler, F.A. Agblevor, R.J. Evans, Chemom. Intell. Lab. Syst. 14
(1992) 195.51] F.C. Sanchez, J. Toft, B. van den Bogaert, D.L. Massart, Anal. Chem. 68 (1996) 79.52] F. Mirzajani, A. Ghassempour, A. Aliahmadi, M. Esmaeili, Res. Microbiol. 162
(2011) 542.53] http://www.adronsystems.com54] http://www.ub.edu/mcr/web mcr/welcome.html55] F. Gong, Y.Z. Liang, H. Cui, F.T. Chau, B.T.P. Chan, J. Chromatogr. A 909 (2001)
237.