time resolved measurements and - Eindhoven University of ...
Msa
WCa
b
a
ARRAA
KTMPC
1
“lXlRp
iretctu
(
0h
Catalysis Today 229 (2014) 114–122
Contents lists available at ScienceDirect
Catalysis Today
j o ur na l ho me page: www.elsev ier .com/ locate /ca t tod
ultivariate curve resolution analysis applied to time-resolvedynchrotron X-ray Absorption Spectroscopy monitoring of thectivation of copper alumina catalyst
ellington H. Cassinelli a,∗, Leandro Martinsa, Aline R. Passosa,b, Sandra H. Pulcinelli a,elso V. Santilli a, Amélie Rochetb, Valérie Brioisb
Instituto de Química, UNESP - Universidade Estadual Paulista, Rua Professor Francisco Degni, 55, 14800-900 Araraquara, SP, BrazilSynchrotron SOLEIL, L’Orme des Merisiers, BP48, Saint Aubin, 91192 Gif-sur Yvette, France
r t i c l e i n f o
rticle history:eceived 6 July 2013eceived in revised form 14 October 2013ccepted 16 October 2013vailable online 4 December 2013
eywords:ime-resolved XASCR-ALS
a b s t r a c t
The pure X-ray Absorption (XAS) spectral constituents and related concentration profiles characterizingthe reduction of a copper-based catalyst supported on hierarchically porous alumina were disentangledfrom a set of time-resolved Quick-XAS using a Multivariate Curve Resolution-methodology. First, thenumber of components involved in the data set and the range of existence of intermediate species weredetermined by Principal Component Analysis (PCA). Then, a Multivariate Curve Resolution with Alternat-ing Least Squares fitting of the set of time-resolved Quick-XANES was performed using the constraints ofnon-negativity of both absorption and concentration and of closure of concentration. Consideration aboutthe strategy of use of the chemometric methods and robustness regarding the reliability of results for
CAopper speciation
time-resolved XAS data is discussed. The intermediate copper species determined by MCR-ALS is at themonovalent oxidation state and characterized by a local order of 2 oxygen atoms at 1.915 A. Upon isother-mal treatment under 60% H2/He at 250 ◦C for 30 min, the intermediate species appears quite resistant tocomplete copper reduction. Copper speciation obtained using MCR-ALS method leads to very differentresults than those obtained using bulk CuO, Cu2O and metallic Cu as constituents, MCR-ALS concentrationprofile so-determined being fully consistent with the reducibility of the catalyst measured by TPR.
. Introduction
The X-ray Absorption Spectroscopy is a well-knownworkhorse” technique for characterizing in situ catalysts. Theandscape in the field of operando characterization of catalysts by-ray Absorption Spectroscopy has considerably moved since the
ast 10 years due to factors strongly related to new Synchrotronadiation opportunities but also to new strategies for catalystreparation leading to new active phases.
With the advent of third generation synchrotron radiation facil-ties allowing a high time framing in the description of the catalyticeactions by Quick-EXAFS or Energy Dispersive Experiments, thexperimentalist can now access to a deeper and more accurateemporal description of the chemical species involved in the pro-
esses. Sub-seconds [1] or sub-milliseconds [2] XAS snapshotsaken along the activation and reaction of catalysts allows fornraveling transient reactions involving short-lived intermediates.∗ Corresponding author. Tel.: +55 16 33019758; fax: +55 16 33222308.E-mail addresses: [email protected], [email protected]
W.H. Cassinelli).
920-5861/$ – see front matter © 2013 Elsevier B.V. All rights reserved.ttp://dx.doi.org/10.1016/j.cattod.2013.10.077
© 2013 Elsevier B.V. All rights reserved.
Second, dedicated X-ray absorption beamlines worldwide nowprovide infrastructures and tools for handling catalysts in real andsometimes harsh conditions [3], tracking the relationship existingbetween the local order around the active elements of the cata-lyst and its catalytic activity assessed through the measurements ofthe reaction products by combined techniques such as chromatog-raphy, mass spectrometry or more recently Raman spectroscopy[4,5]. With such kind of dedicated beamlines, high quality data rel-evant in terms of catalysis are now collected in a quite routinelyway and are making available not only for expert users who weretechnically involved in the building of cells for the catalysts charac-terization, but also for newcomers who do not need to build theirown cells for assessing to the same knowledge.
For most of the experiments, the bottleneck in the in situ andoperando characterization of catalysts does not lay anymore in thedata collection but in the handling of the huge amount of collecteddata. With typical sub-second time-framing, the monitoring of aheating ramp from Room Temperature (RT) to 500 ◦C at 3 ◦C min−1
can lead to the collection of about 10000 spectra. Automation inthe normalization of XANES and extraction of EXAFS data in a user-friendly data analysis package must be the basic further tool toprovide users a fully treated data in a short time-scale. Up to a
lysis T
rmttottmiP
siptactactbsibdpamsbrcusptwXff2bfo
tici
2
2
odPpwpntd
W.H. Cassinelli et al. / Cata
ecent past, the analysis of a set of time-resolved data was madeost of the time using a feature identification approach. The spec-
ra of known chemical species were used to determine the time orhermal speciation of the active species by linear combination (LC)f the spectra, and these known and identified species were appliedo rebuild the XAS spectra recorded during the time-evolving reac-ion, at any time of the reaction. Sometimes more sophisticated
ethod could be used to determine the number of chemical speciesnvolved in the reaction based on method of linear algebra like therincipal Component Analysis (PCA) [6–9].
The pressing need to have sustainable development and synthe-is strategies for resolving significant energy and environmentalssues changed a lot the materials used as catalysts. In theast decade, nanomaterials have emerged as powerful alterna-ive to conventional materials for various applications in catalysisnd energy storage field [10,11]. The nanometer size of parti-les increases the exposed surface area of the active component,hereby enhancing drastically the contact between reactants andctive component. With the decrease of the size of particles and/orlusters in which are embedded the active species, the identifica-ion of the chemical species involved during the reaction processecomes less straightforward by XAS due to the lack of knownpectral fingerprints for these species. Without these importantnputs for linear combination fitting of the spectroscopic data, itecomes difficult to disentangle the concentration profiles of theifferent species contributing to the spectra. To overcome thisroblem, some pioneering papers reported the use of Multivari-te Curve Resolution with Alternating Least Squares (MCR-ALS)ethodology for the analysis of XAS data of mixtures of con-
tituents during in situ characterizations of catalysts [12–16] oratteries [17]. Despite the robustness of the MCR-ALS chemomet-ic method to simultaneously determine concentration profile ofonstituents and pure constituent spectra, this method is still quitenknown or at least insufficiently used for the interpretation of XASpectra measured as a function of a perturbation (reactive gas, tem-erature, current. . .) to the chemical system under study. Clearlyhe emergence of new materials for catalytic applications togetherith the high time-framing description allowed by time-resolvedAS beamlines dedicated to catalytic study will require in a near
uture a generalization of the use of such chemometric approachor the analysis of the data. Conferences presented in this E-MRS013 symposium are also strongly indicative that the method willecome a new workhorse method for getting more informationrom XAS spectra of mixtures changing of concentrations with timer external perturbation.
After a short introduction about the MCR-ALS method appliedo time-resolved XAS data, we will illustrate its application to thenterpretation of the time-resolved activation of a copper-basedatalyst supported on an alumina support with hierarchical poros-ty.
. Experimental
.1. Sample preparation
Hierarchical porous alumina with macro-mesopores wasbtained by one-pot sol-gel method using surfactants and oilroplets as pore templates [18–20]. Initially, commercial surfactantluronic P123® was dissolved in deionized water at room tem-erature. After complete dissolution, the co-surfactant n-pentanolas added. The sol was obtained by addition of the aluminum iso-
ropoxide and the hydrolysis of the alkoxide was catalyzed by aitric acid solution. The solution was stirred for 5 h. Emulsifica-ion was performed by adding decahydronaphthalene (DHN) oilroplets and the gelation was induced by NH4OH solution. Theoday 229 (2014) 114–122 115
so-formed gel was dried at 50 ◦C for 48 h and calcined at 600 ◦Cfor 4 h in a conventional muffle furnace.
Copper catalyst containing 10 wt.% of copper, was prepared byincipient wetness impregnation of the calcined porous alumina(577 m2/g) using a copper nitrate aqueous solution. The solutionand the support were stirred in a round bottom flask for 3 h at roomtemperature and then water was evaporated in a roto-evaporatorat 60 ◦C. The catalysts were dried at 100 ◦C overnight and calcinedat 500 ◦C for 3 h.
2.2. Quick-XAS measurements and data analysis
Quick-XAS data were recorded in transmission mode at theCu K edge (8979 eV) on the SAMBA beamline of synchrotronSOLEIL (France) according to the assembled system described byLa Fontaine et al. [4]. Fast in situ acquisitions of the copper catalystswere obtained using a Quick-XAS monochromator equipped with aSi (1 1 1) channel-cut crystal whose movement was set as to acquirespectra with an acquisition time of 0.5 s per spectrum [1]. The pow-dered sample was loaded into a dedicated cell located between twoOhken ionization chambers filled with nitrogen for detection of theincident and transmitted X-rays. Energy calibration was ensuredby the simultaneous measurement of the absorption spectrum of aCu metallic foil set between the second and third ionization cham-bers. The cell allows for performing in situ treatments of the catalystunder controlled conditions (temperature and gas flow) all alongthe experiment. After in situ calcination of the catalyst, reductionwas performed by increasing the temperature from 50 to 250 ◦Cwith a heating rate of 10 ◦C min−1 using 60% H2/He at a flow rate of20 mL min−1. A plateau at 250 ◦C under reductive atmosphere wascarried out for 30 min. A collection of 30 spectra recorded in 0.5 swere merged in order to increase the signal to noise ratio leading to105 full XAS scans, from −250 eV to 1000 eV above the Cu K edge.At relevant stages of the reduction, corresponding to strong mod-ifications of XANES spectra, only 10 spectra were merged in orderto better characterize phase transformations. In the latter case, thetemperature change between two consecutive spectra correspondsto ∼1.6 ◦C.
Quick-XAS data were analyzed using the software packageAthena [21]. Data were calibrated in energy using the maximumof the first derivative of the Cu metallic reference foil recordedsimultaneously with the data. For the XANES analysis, a linear back-ground was fitted to the pre-edge region and subtracted from thespectra which were normalized in a consistent way, using a 2nd
order polynomial function defined between 50 and 150 eV abovethe threshold value, E0 defined for all the data to be equal to8991.3 eV. The EXAFS oscillations were extracted from the XASdata by applying a post-edge background defined from 0 to 645 eVabove E0 using the Autobkg algorithm with a cut-off Rbkg = 1 andk weight = 2. Then the EXAFS data were Fourier transformed usinga k3-weigthing Kaiser–Bessel window (dk = 1) over the 3–12 A−1
k-range. EXAFS fitting of distances, coordination numbers andDebye–Waller factors was performed with the Artemis interfaceto IFeFFIT using least-squares refinements [22], firstly checked onCuO, Cu2O and Cu metallic foil references.
3. Chemometric method
This section describes briefly the basic assumptions requiredfor the application of the MCR-ALS method. Then we will discussabout the procedure for applying the method to the analysis of
a set of time-resolved XAS data. The reader interested by a moredetailed description of the method from a theoretical point of viewshould refer to the papers written by Tauler [23,24] who was thefirst to propose the method for the resolution of spectroscopic data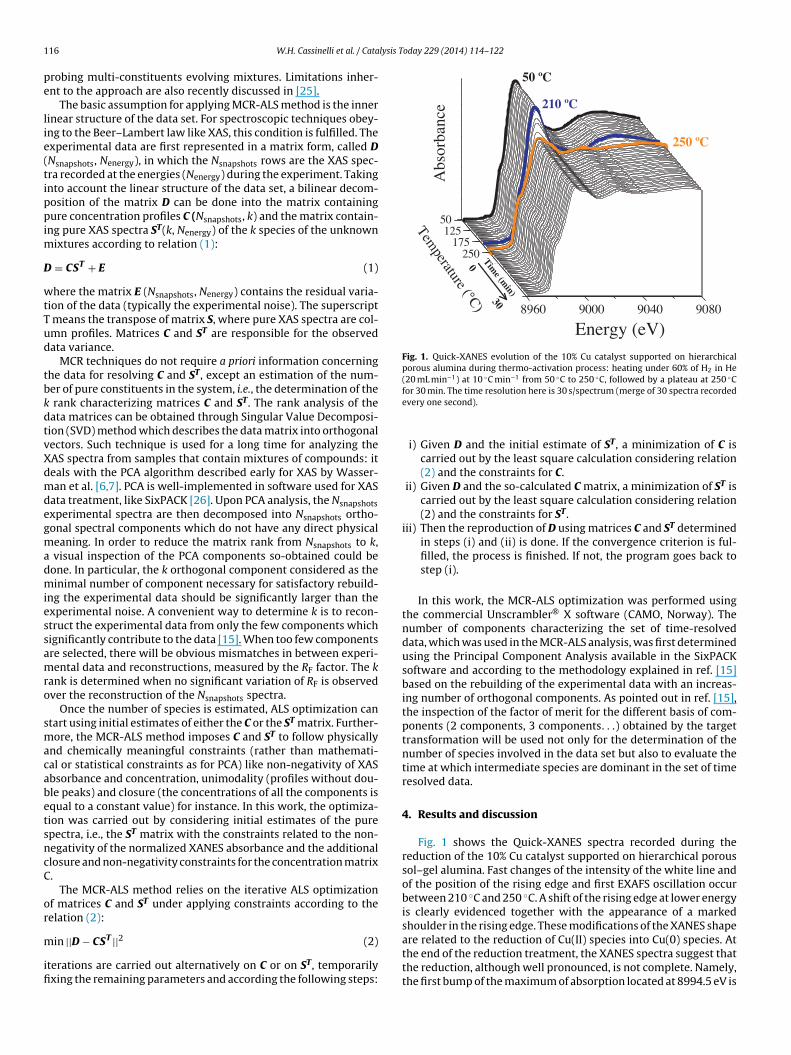
1 lysis Today 229 (2014) 114–122
pe
lie(tippim
D
wtTud
tbkdtvXdmdegmadmiessamro
smacabetsncC
or
m
ifi
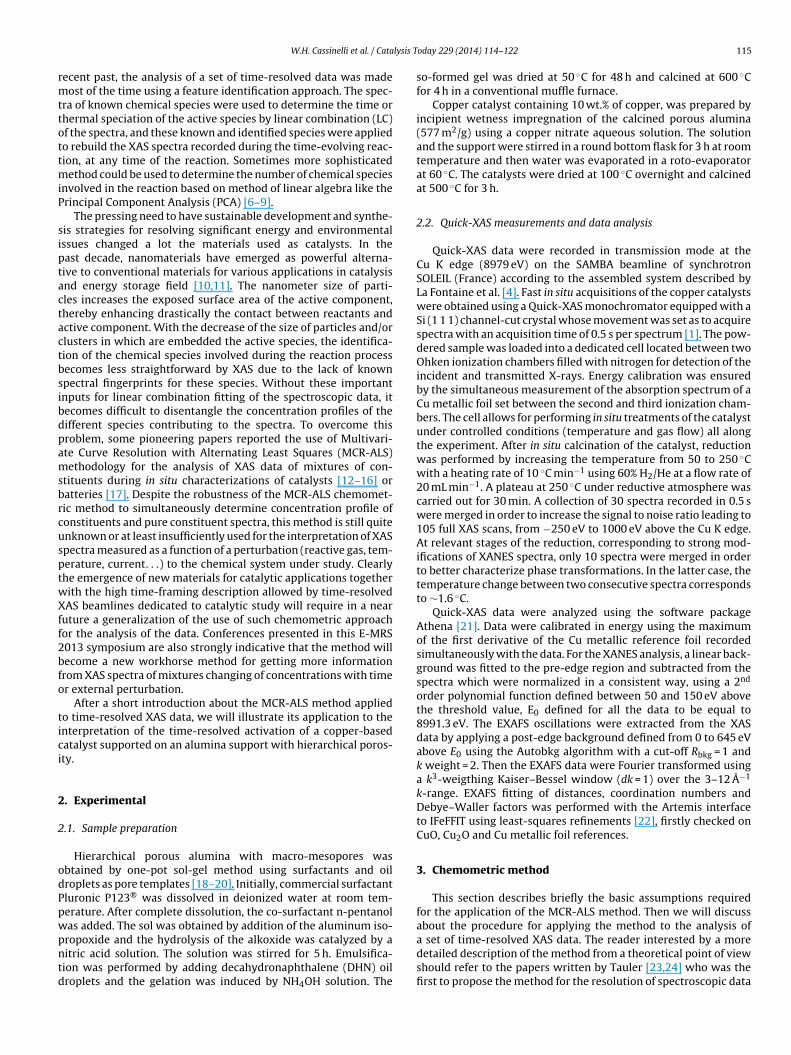
Fig. 1. Quick-XANES evolution of the 10% Cu catalyst supported on hierarchicalporous alumina during thermo-activation process: heating under 60% of H2 in He(20 mL min−1) at 10 ◦C min−1 from 50 ◦C to 250 ◦C, followed by a plateau at 250 ◦C
16 W.H. Cassinelli et al. / Cata
robing multi-constituents evolving mixtures. Limitations inher-nt to the approach are also recently discussed in [25].
The basic assumption for applying MCR-ALS method is the innerinear structure of the data set. For spectroscopic techniques obey-ng to the Beer–Lambert law like XAS, this condition is fulfilled. Thexperimental data are first represented in a matrix form, called DNsnapshots, Nenergy), in which the Nsnapshots rows are the XAS spec-ra recorded at the energies (Nenergy) during the experiment. Takingnto account the linear structure of the data set, a bilinear decom-osition of the matrix D can be done into the matrix containingure concentration profiles C (Nsnapshots, k) and the matrix contain-
ng pure XAS spectra ST(k, Nenergy) of the k species of the unknownixtures according to relation (1):
= CST + E (1)
here the matrix E (Nsnapshots, Nenergy) contains the residual varia-ion of the data (typically the experimental noise). The superscript
means the transpose of matrix S, where pure XAS spectra are col-mn profiles. Matrices C and ST are responsible for the observedata variance.
MCR techniques do not require a priori information concerninghe data for resolving C and ST, except an estimation of the num-er of pure constituents in the system, i.e., the determination of the
rank characterizing matrices C and ST. The rank analysis of theata matrices can be obtained through Singular Value Decomposi-ion (SVD) method which describes the data matrix into orthogonalectors. Such technique is used for a long time for analyzing theAS spectra from samples that contain mixtures of compounds: iteals with the PCA algorithm described early for XAS by Wasser-an et al. [6,7]. PCA is well-implemented in software used for XAS
ata treatment, like SixPACK [26]. Upon PCA analysis, the Nsnapshotsxperimental spectra are then decomposed into Nsnapshots ortho-onal spectral components which do not have any direct physicaleaning. In order to reduce the matrix rank from Nsnapshots to k,
visual inspection of the PCA components so-obtained could beone. In particular, the k orthogonal component considered as theinimal number of component necessary for satisfactory rebuild-
ng the experimental data should be significantly larger than thexperimental noise. A convenient way to determine k is to recon-truct the experimental data from only the few components whichignificantly contribute to the data [15]. When too few componentsre selected, there will be obvious mismatches in between experi-ental data and reconstructions, measured by the RF factor. The k
ank is determined when no significant variation of RF is observedver the reconstruction of the Nsnapshots spectra.
Once the number of species is estimated, ALS optimization cantart using initial estimates of either the C or the ST matrix. Further-ore, the MCR-ALS method imposes C and ST to follow physically
nd chemically meaningful constraints (rather than mathemati-al or statistical constraints as for PCA) like non-negativity of XASbsorbance and concentration, unimodality (profiles without dou-le peaks) and closure (the concentrations of all the components isqual to a constant value) for instance. In this work, the optimiza-ion was carried out by considering initial estimates of the purepectra, i.e., the ST matrix with the constraints related to the non-egativity of the normalized XANES absorbance and the additionallosure and non-negativity constraints for the concentration matrix.
The MCR-ALS method relies on the iterative ALS optimizationf matrices C and ST under applying constraints according to theelation (2):
in ||D − CST ||2 (2)
terations are carried out alternatively on C or on ST, temporarilyxing the remaining parameters and according the following steps:
for 30 min. The time resolution here is 30 s/spectrum (merge of 30 spectra recordedevery one second).
i) Given D and the initial estimate of ST, a minimization of C iscarried out by the least square calculation considering relation(2) and the constraints for C.
ii) Given D and the so-calculated C matrix, a minimization of ST iscarried out by the least square calculation considering relation(2) and the constraints for ST.
iii) Then the reproduction of D using matrices C and ST determinedin steps (i) and (ii) is done. If the convergence criterion is ful-filled, the process is finished. If not, the program goes back tostep (i).
In this work, the MCR-ALS optimization was performed usingthe commercial Unscrambler® X software (CAMO, Norway). Thenumber of components characterizing the set of time-resolveddata, which was used in the MCR-ALS analysis, was first determinedusing the Principal Component Analysis available in the SixPACKsoftware and according to the methodology explained in ref. [15]based on the rebuilding of the experimental data with an increas-ing number of orthogonal components. As pointed out in ref. [15],the inspection of the factor of merit for the different basis of com-ponents (2 components, 3 components. . .) obtained by the targettransformation will be used not only for the determination of thenumber of species involved in the data set but also to evaluate thetime at which intermediate species are dominant in the set of timeresolved data.
4. Results and discussion
Fig. 1 shows the Quick-XANES spectra recorded during thereduction of the 10% Cu catalyst supported on hierarchical poroussol–gel alumina. Fast changes of the intensity of the white line andof the position of the rising edge and first EXAFS oscillation occurbetween 210 ◦C and 250 ◦C. A shift of the rising edge at lower energyis clearly evidenced together with the appearance of a markedshoulder in the rising edge. These modifications of the XANES shape
are related to the reduction of Cu(II) species into Cu(0) species. Atthe end of the reduction treatment, the XANES spectra suggest thatthe reduction, although well pronounced, is not complete. Namely,the first bump of the maximum of absorption located at 8994.5 eV is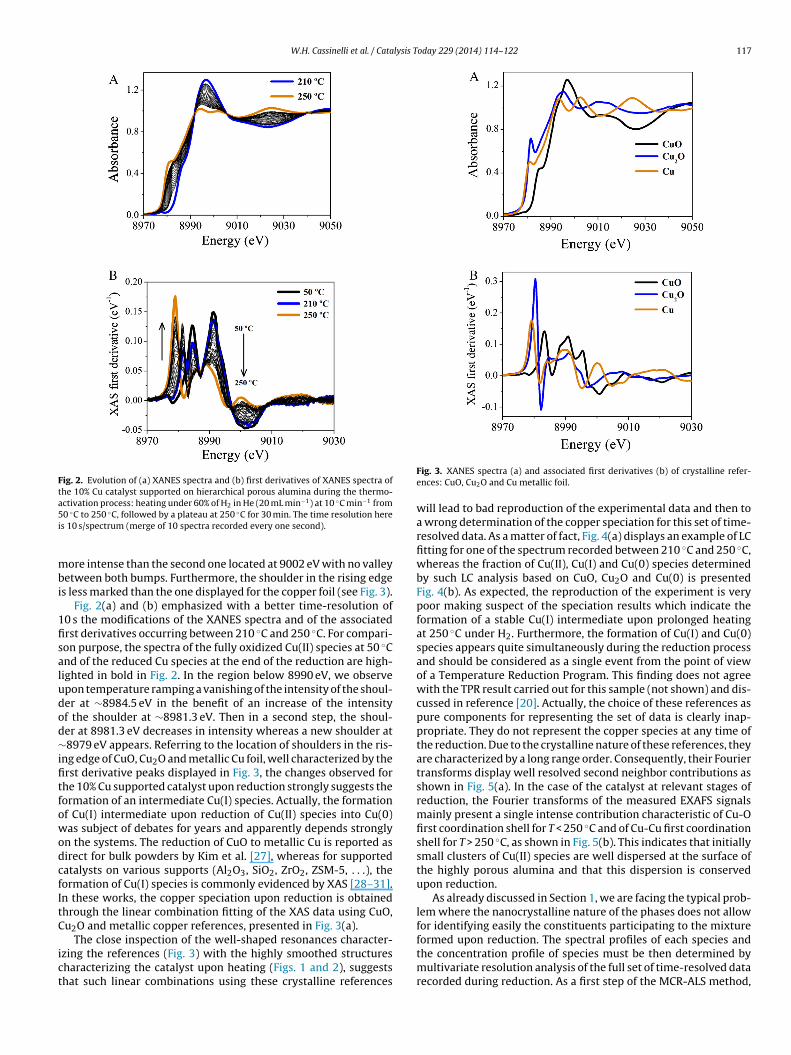
W.H. Cassinelli et al. / Catalysis Today 229 (2014) 114–122 117
Fig. 2. Evolution of (a) XANES spectra and (b) first derivatives of XANES spectra ofthe 10% Cu catalyst supported on hierarchical porous alumina during the thermo-activation process: heating under 60% of H2 in He (20 mL min−1) at 10 ◦C min−1 from5i
mbi
1fisaludod∼ifitfowodcfItC
ict
0 ◦C to 250 ◦C, followed by a plateau at 250 ◦C for 30 min. The time resolution heres 10 s/spectrum (merge of 10 spectra recorded every one second).
ore intense than the second one located at 9002 eV with no valleyetween both bumps. Furthermore, the shoulder in the rising edge
s less marked than the one displayed for the copper foil (see Fig. 3).Fig. 2(a) and (b) emphasized with a better time-resolution of
0 s the modifications of the XANES spectra and of the associatedrst derivatives occurring between 210 ◦C and 250 ◦C. For compari-on purpose, the spectra of the fully oxidized Cu(II) species at 50 ◦Cnd of the reduced Cu species at the end of the reduction are high-ighted in bold in Fig. 2. In the region below 8990 eV, we observepon temperature ramping a vanishing of the intensity of the shoul-er at ∼8984.5 eV in the benefit of an increase of the intensityf the shoulder at ∼8981.3 eV. Then in a second step, the shoul-er at 8981.3 eV decreases in intensity whereas a new shoulder at8979 eV appears. Referring to the location of shoulders in the ris-
ng edge of CuO, Cu2O and metallic Cu foil, well characterized by therst derivative peaks displayed in Fig. 3, the changes observed forhe 10% Cu supported catalyst upon reduction strongly suggests theormation of an intermediate Cu(I) species. Actually, the formationf Cu(I) intermediate upon reduction of Cu(II) species into Cu(0)as subject of debates for years and apparently depends strongly
n the systems. The reduction of CuO to metallic Cu is reported asirect for bulk powders by Kim et al. [27], whereas for supportedatalysts on various supports (Al2O3, SiO2, ZrO2, ZSM-5, . . .), theormation of Cu(I) species is commonly evidenced by XAS [28–31].n these works, the copper speciation upon reduction is obtainedhrough the linear combination fitting of the XAS data using CuO,u2O and metallic copper references, presented in Fig. 3(a).
The close inspection of the well-shaped resonances character-zing the references (Fig. 3) with the highly smoothed structuresharacterizing the catalyst upon heating (Figs. 1 and 2), suggestshat such linear combinations using these crystalline references
Fig. 3. XANES spectra (a) and associated first derivatives (b) of crystalline refer-ences: CuO, Cu2O and Cu metallic foil.
will lead to bad reproduction of the experimental data and then toa wrong determination of the copper speciation for this set of time-resolved data. As a matter of fact, Fig. 4(a) displays an example of LCfitting for one of the spectrum recorded between 210 ◦C and 250 ◦C,whereas the fraction of Cu(II), Cu(I) and Cu(0) species determinedby such LC analysis based on CuO, Cu2O and Cu(0) is presentedFig. 4(b). As expected, the reproduction of the experiment is verypoor making suspect of the speciation results which indicate theformation of a stable Cu(I) intermediate upon prolonged heatingat 250 ◦C under H2. Furthermore, the formation of Cu(I) and Cu(0)species appears quite simultaneously during the reduction processand should be considered as a single event from the point of viewof a Temperature Reduction Program. This finding does not agreewith the TPR result carried out for this sample (not shown) and dis-cussed in reference [20]. Actually, the choice of these references aspure components for representing the set of data is clearly inap-propriate. They do not represent the copper species at any time ofthe reduction. Due to the crystalline nature of these references, theyare characterized by a long range order. Consequently, their Fouriertransforms display well resolved second neighbor contributions asshown in Fig. 5(a). In the case of the catalyst at relevant stages ofreduction, the Fourier transforms of the measured EXAFS signalsmainly present a single intense contribution characteristic of Cu-Ofirst coordination shell for T < 250 ◦C and of Cu-Cu first coordinationshell for T > 250 ◦C, as shown in Fig. 5(b). This indicates that initiallysmall clusters of Cu(II) species are well dispersed at the surface ofthe highly porous alumina and that this dispersion is conservedupon reduction.
As already discussed in Section 1, we are facing the typical prob-lem where the nanocrystalline nature of the phases does not allowfor identifying easily the constituents participating to the mixture
formed upon reduction. The spectral profiles of each species andthe concentration profile of species must be then determined bymultivariate resolution analysis of the full set of time-resolved datarecorded during reduction. As a first step of the MCR-ALS method,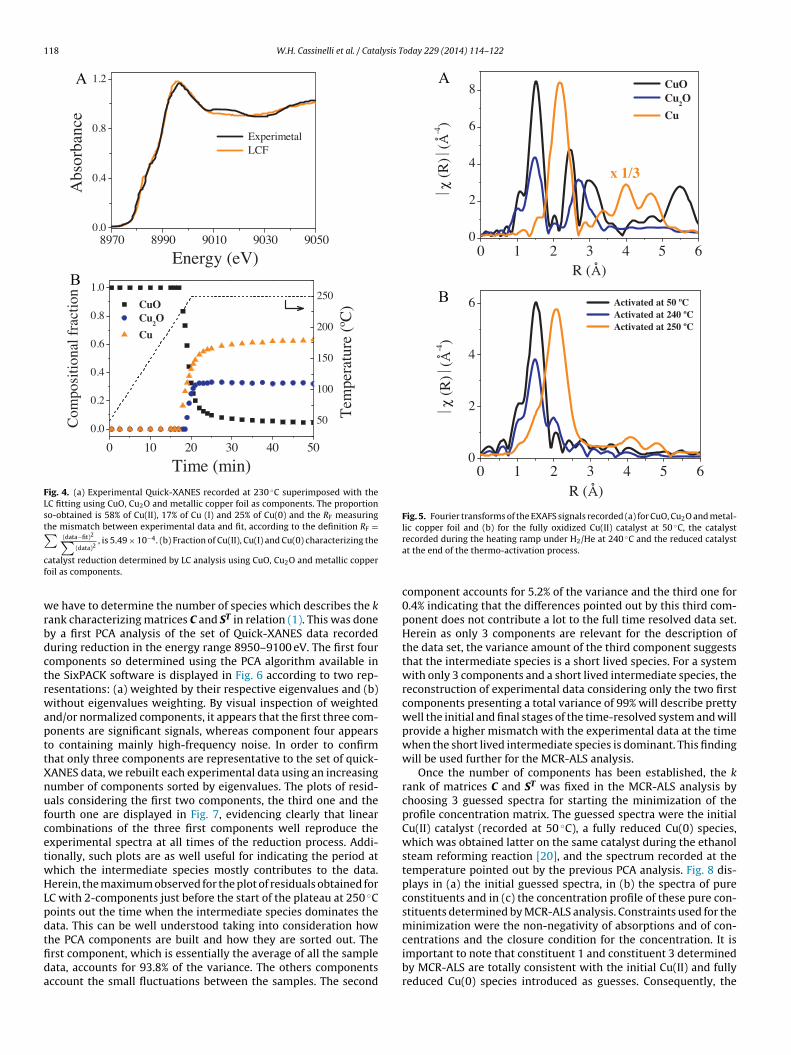
118 W.H. Cassinelli et al. / Catalysis Today 229 (2014) 114–122
Fig. 4. (a) Experimental Quick-XANES recorded at 230 ◦C superimposed with theLC fitting using CuO, Cu2O and metallic copper foil as components. The proportionso-obtained is 58% of Cu(II), 17% of Cu (I) and 25% of Cu(0) and the RF measuringthe mismatch between experimental data and fit, according to the definition RF =∑
(data−fit)2∑2
, is 5.49 × 10⁻⁴. (b) Fraction of Cu(II), Cu(I) and Cu(0) characterizing the
cf
wrbdctrwapttXnufcetwHLpdtfida
Fig. 5. Fourier transforms of the EXAFS signals recorded (a) for CuO, Cu2O and metal-lic copper foil and (b) for the fully oxidized Cu(II) catalyst at 50 ◦C, the catalyst
(data)
atalyst reduction determined by LC analysis using CuO, Cu2O and metallic copperoil as components.
e have to determine the number of species which describes the kank characterizing matrices C and ST in relation (1). This was doney a first PCA analysis of the set of Quick-XANES data recordeduring reduction in the energy range 8950–9100 eV. The first fouromponents so determined using the PCA algorithm available inhe SixPACK software is displayed in Fig. 6 according to two rep-esentations: (a) weighted by their respective eigenvalues and (b)ithout eigenvalues weighting. By visual inspection of weighted
nd/or normalized components, it appears that the first three com-onents are significant signals, whereas component four appearso containing mainly high-frequency noise. In order to confirmhat only three components are representative to the set of quick-ANES data, we rebuilt each experimental data using an increasingumber of components sorted by eigenvalues. The plots of resid-als considering the first two components, the third one and theourth one are displayed in Fig. 7, evidencing clearly that linearombinations of the three first components well reproduce thexperimental spectra at all times of the reduction process. Addi-ionally, such plots are as well useful for indicating the period athich the intermediate species mostly contributes to the data.erein, the maximum observed for the plot of residuals obtained forC with 2-components just before the start of the plateau at 250 ◦Coints out the time when the intermediate species dominates theata. This can be well understood taking into consideration how
he PCA components are built and how they are sorted out. Therst component, which is essentially the average of all the sampleata, accounts for 93.8% of the variance. The others componentsccount the small fluctuations between the samples. The secondrecorded during the heating ramp under H2/He at 240 ◦C and the reduced catalystat the end of the thermo-activation process.
component accounts for 5.2% of the variance and the third one for0.4% indicating that the differences pointed out by this third com-ponent does not contribute a lot to the full time resolved data set.Herein as only 3 components are relevant for the description ofthe data set, the variance amount of the third component suggeststhat the intermediate species is a short lived species. For a systemwith only 3 components and a short lived intermediate species, thereconstruction of experimental data considering only the two firstcomponents presenting a total variance of 99% will describe prettywell the initial and final stages of the time-resolved system and willprovide a higher mismatch with the experimental data at the timewhen the short lived intermediate species is dominant. This findingwill be used further for the MCR-ALS analysis.
Once the number of components has been established, the krank of matrices C and ST was fixed in the MCR-ALS analysis bychoosing 3 guessed spectra for starting the minimization of theprofile concentration matrix. The guessed spectra were the initialCu(II) catalyst (recorded at 50 ◦C), a fully reduced Cu(0) species,which was obtained latter on the same catalyst during the ethanolsteam reforming reaction [20], and the spectrum recorded at thetemperature pointed out by the previous PCA analysis. Fig. 8 dis-plays in (a) the initial guessed spectra, in (b) the spectra of pureconstituents and in (c) the concentration profile of these pure con-stituents determined by MCR-ALS analysis. Constraints used for theminimization were the non-negativity of absorptions and of con-centrations and the closure condition for the concentration. It is
important to note that constituent 1 and constituent 3 determinedby MCR-ALS are totally consistent with the initial Cu(II) and fullyreduced Cu(0) species introduced as guesses. Consequently, the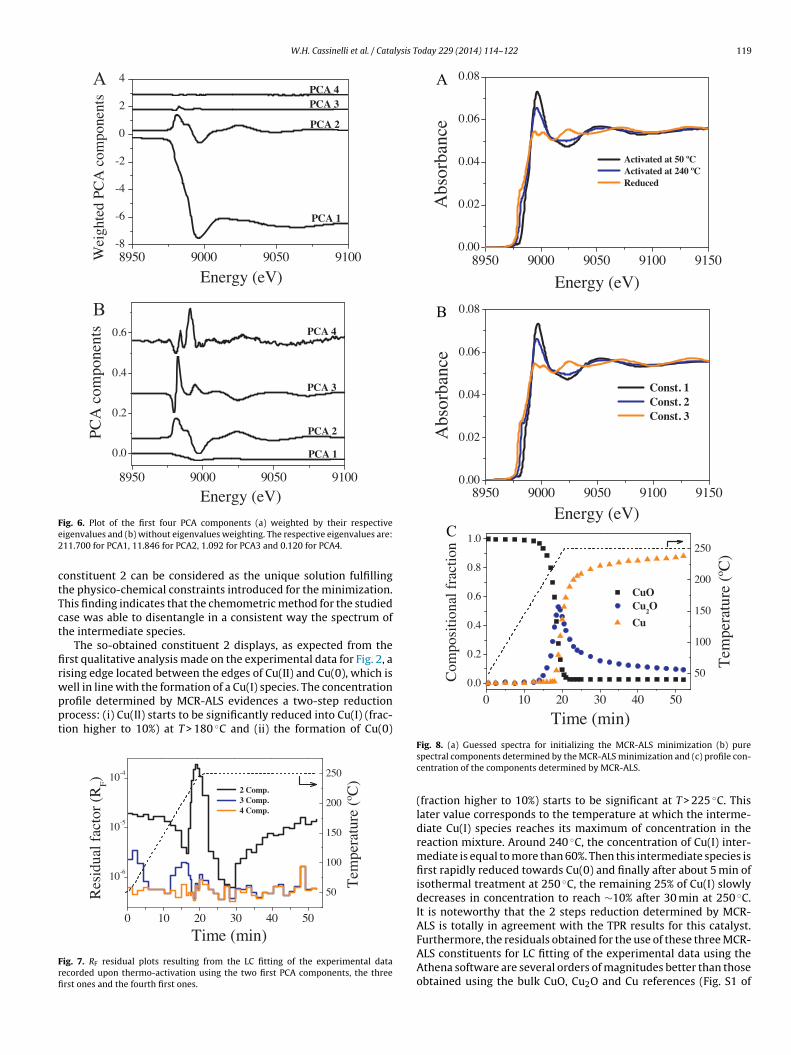
W.H. Cassinelli et al. / Catalysis Today 229 (2014) 114–122 119
Fe2
ctTct
firwppt
Frfi
ig. 6. Plot of the first four PCA components (a) weighted by their respectiveigenvalues and (b) without eigenvalues weighting. The respective eigenvalues are:11.700 for PCA1, 11.846 for PCA2, 1.092 for PCA3 and 0.120 for PCA4.
onstituent 2 can be considered as the unique solution fulfillinghe physico-chemical constraints introduced for the minimization.his finding indicates that the chemometric method for the studiedase was able to disentangle in a consistent way the spectrum ofhe intermediate species.
The so-obtained constituent 2 displays, as expected from therst qualitative analysis made on the experimental data for Fig. 2, aising edge located between the edges of Cu(II) and Cu(0), which is
ell in line with the formation of a Cu(I) species. The concentrationrofile determined by MCR-ALS evidences a two-step reductionrocess: (i) Cu(II) starts to be significantly reduced into Cu(I) (frac-ion higher to 10%) at T > 180 ◦C and (ii) the formation of Cu(0)ig. 7. RF residual plots resulting from the LC fitting of the experimental dataecorded upon thermo-activation using the two first PCA components, the threerst ones and the fourth first ones.
Fig. 8. (a) Guessed spectra for initializing the MCR-ALS minimization (b) purespectral components determined by the MCR-ALS minimization and (c) profile con-centration of the components determined by MCR-ALS.
(fraction higher to 10%) starts to be significant at T > 225 ◦C. Thislater value corresponds to the temperature at which the interme-diate Cu(I) species reaches its maximum of concentration in thereaction mixture. Around 240 ◦C, the concentration of Cu(I) inter-mediate is equal to more than 60%. Then this intermediate species isfirst rapidly reduced towards Cu(0) and finally after about 5 min ofisothermal treatment at 250 ◦C, the remaining 25% of Cu(I) slowlydecreases in concentration to reach ∼10% after 30 min at 250 ◦C.It is noteworthy that the 2 steps reduction determined by MCR-ALS is totally in agreement with the TPR results for this catalyst.
Furthermore, the residuals obtained for the use of these three MCR-ALS constituents for LC fitting of the experimental data using theAthena software are several orders of magnitudes better than thoseobtained using the bulk CuO, Cu2O and Cu references (Fig. S1 of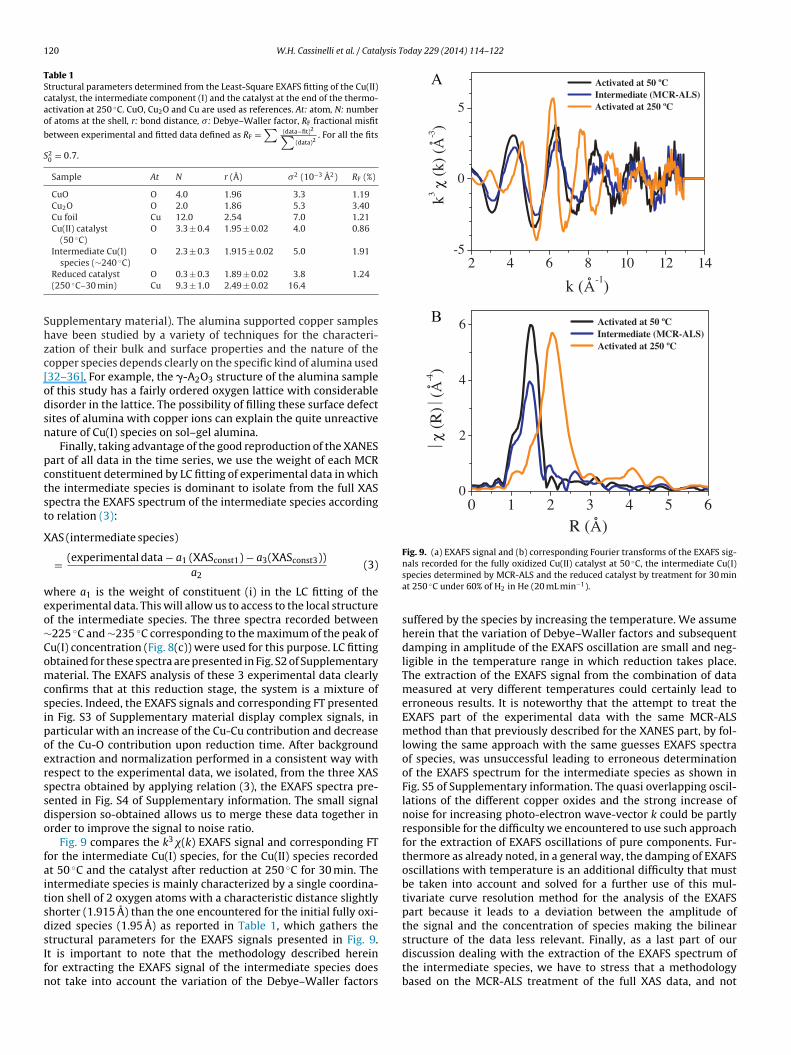
120 W.H. Cassinelli et al. / Catalysis Today 229 (2014) 114–122
Table 1Structural parameters determined from the Least-Square EXAFS fitting of the Cu(II)catalyst, the intermediate component (I) and the catalyst at the end of the thermo-activation at 250 ◦C. CuO, Cu2O and Cu are used as references. At: atom, N: numberof atoms at the shell, r: bond distance, �: Debye–Waller factor, RF fractional misfit
between experimental and fitted data defined as RF =∑
(data−fit)2∑(data)2
. For all the fits
S20 = 0.7.
Sample At N r (Å) �2 (10−3 A2) RF (%)
CuO O 4.0 1.96 3.3 1.19Cu2O O 2.0 1.86 5.3 3.40Cu foil Cu 12.0 2.54 7.0 1.21Cu(II) catalyst
(50 ◦C)O 3.3 ± 0.4 1.95 ± 0.02 4.0 0.86
Intermediate Cu(I)◦
O 2.3 ± 0.3 1.915 ± 0.02 5.0 1.91
Shzc[odsn
pctst
X
weo∼Comcsipoerssdo
faitsdsIfn
Fig. 9. (a) EXAFS signal and (b) corresponding Fourier transforms of the EXAFS sig-
species (∼240 C)Reduced catalyst O 0.3 ± 0.3 1.89 ± 0.02 3.8 1.24(250 ◦C–30 min) Cu 9.3 ± 1.0 2.49 ± 0.02 16.4
upplementary material). The alumina supported copper samplesave been studied by a variety of techniques for the characteri-ation of their bulk and surface properties and the nature of theopper species depends clearly on the specific kind of alumina used32–36]. For example, the �-A2O3 structure of the alumina samplef this study has a fairly ordered oxygen lattice with considerableisorder in the lattice. The possibility of filling these surface defectites of alumina with copper ions can explain the quite unreactiveature of Cu(I) species on sol–gel alumina.
Finally, taking advantage of the good reproduction of the XANESart of all data in the time series, we use the weight of each MCRonstituent determined by LC fitting of experimental data in whichhe intermediate species is dominant to isolate from the full XASpectra the EXAFS spectrum of the intermediate species accordingo relation (3):
AS (intermediate species)
= (experimental data − a1 (XASconst1) − a3(XASconst3))a2
(3)
here a1 is the weight of constituent (i) in the LC fitting of thexperimental data. This will allow us to access to the local structuref the intermediate species. The three spectra recorded between225 ◦C and ∼235 ◦C corresponding to the maximum of the peak ofu(I) concentration (Fig. 8(c)) were used for this purpose. LC fittingbtained for these spectra are presented in Fig. S2 of Supplementaryaterial. The EXAFS analysis of these 3 experimental data clearly
onfirms that at this reduction stage, the system is a mixture ofpecies. Indeed, the EXAFS signals and corresponding FT presentedn Fig. S3 of Supplementary material display complex signals, inarticular with an increase of the Cu-Cu contribution and decreasef the Cu-O contribution upon reduction time. After backgroundxtraction and normalization performed in a consistent way withespect to the experimental data, we isolated, from the three XASpectra obtained by applying relation (3), the EXAFS spectra pre-ented in Fig. S4 of Supplementary information. The small signalispersion so-obtained allows us to merge these data together inrder to improve the signal to noise ratio.
Fig. 9 compares the k3�(k) EXAFS signal and corresponding FTor the intermediate Cu(I) species, for the Cu(II) species recordedt 50 ◦C and the catalyst after reduction at 250 ◦C for 30 min. Thentermediate species is mainly characterized by a single coordina-ion shell of 2 oxygen atoms with a characteristic distance slightlyhorter (1.915 A) than the one encountered for the initial fully oxi-ized species (1.95 A) as reported in Table 1, which gathers the
tructural parameters for the EXAFS signals presented in Fig. 9.t is important to note that the methodology described hereinor extracting the EXAFS signal of the intermediate species doesot take into account the variation of the Debye–Waller factorsnals recorded for the fully oxidized Cu(II) catalyst at 50 ◦C, the intermediate Cu(I)species determined by MCR-ALS and the reduced catalyst by treatment for 30 minat 250 ◦C under 60% of H2 in He (20 mL min−1).
suffered by the species by increasing the temperature. We assumeherein that the variation of Debye–Waller factors and subsequentdamping in amplitude of the EXAFS oscillation are small and neg-ligible in the temperature range in which reduction takes place.The extraction of the EXAFS signal from the combination of datameasured at very different temperatures could certainly lead toerroneous results. It is noteworthy that the attempt to treat theEXAFS part of the experimental data with the same MCR-ALSmethod than that previously described for the XANES part, by fol-lowing the same approach with the same guesses EXAFS spectraof species, was unsuccessful leading to erroneous determinationof the EXAFS spectrum for the intermediate species as shown inFig. S5 of Supplementary information. The quasi overlapping oscil-lations of the different copper oxides and the strong increase ofnoise for increasing photo-electron wave-vector k could be partlyresponsible for the difficulty we encountered to use such approachfor the extraction of EXAFS oscillations of pure components. Fur-thermore as already noted, in a general way, the damping of EXAFSoscillations with temperature is an additional difficulty that mustbe taken into account and solved for a further use of this mul-tivariate curve resolution method for the analysis of the EXAFSpart because it leads to a deviation between the amplitude ofthe signal and the concentration of species making the bilinear
structure of the data less relevant. Finally, as a last part of ourdiscussion dealing with the extraction of the EXAFS spectrum ofthe intermediate species, we have to stress that a methodologybased on the MCR-ALS treatment of the full XAS data, and not
lysis T
odEmaawbittuap
5
ttXTbldwDcmaptASovfirXeao
Qoctwtmoycpr
A
BNtEt
[
[
[
[
[
[
[
[
[
[
[
[
[
[
[
W.H. Cassinelli et al. / Cata
f the data restricted to the XANES range as performed herein,oes not provide good conditions for determining accurately theXAFS signals of the intermediate species. Namely, due to the nor-alization procedure applied to the data, the EXAFS oscillations
bove 9100 eV are quite small, oscillating slowly around the atomicbsorption with a significant increase of the noise comparing tohat it is measured in the XANES part. Using a MCR-ALS analysis
ased on the full XAS spectra can be then uncertain for isolat-ng properly the EXAFS signal. Furthermore, small deviation ofhe EXAFS oscillations extracted from MCR-ALS compared to therue signals will be markedly amplified by thekn weighting schemesed further in the EXAFS analysis for the Fourier Transformationnd then the least-square fitting for determining the structuralarameters.
. Conclusions
This paper reports the strategy for using chemometric tools forhe determination of the spectra of pure constituents and respec-ive concentration profiles characterizing the time evolution of-ray Absorption Spectra recorded during a chemical reaction.his work is a further step to the pioneering works carried outy few research groups already using Multivariate Curve Reso-
ution algorithms [13–17]. Namely herein, we provide a detailedescription of the analytical procedure based on open source soft-ares like SiXPACK and commercial software like Unscrambler X.espite the use of a succession of different softwares which includeonventional data normalization, PCA and finally MCR-ALS mini-ization, this approach is quite easy to be used by non-expert users
nd provides quickly reliable information about the pure speciesresent in the mixture and their time evolution. The implemen-ation of all these tools in a unique software dedicated to X-raybsorption Spectroscopy should guide future software developers.ince Multivariate Curve Resolution was at the heart of severalral presentations of the E-MRS 2013 X symposium, we are con-inced that such software development should have a shininguture in the XAS community. Besides the development of softwarencluding these algorithms, several problems must be addressedegarding the use of MCR-ALS method for the EXAFS part of theAS spectrum, in particular the problem of temperature depend-nce of the signals when the system is studied under temperature,s well as the robustness of the method for overlapping noisyscillations.
Herein the MCR-ALS applied to the XANES part of time-resolveduick-XAS spectra was enabled to study in-depth the speciationf copper species in presence during the reduction of Cu-basedatalyst supported in alumina with hierarchical porosity. In par-icular, we evidence a two-step reduction involving a Cu(I) specieshich is partially transformed into Cu(0) at prolonged reduction
ime at 250 ◦C. Speciation obtained by MCR-ALS analysis is in agree-ent with the TPR measurement for this catalyst contrary to the
nes obtained using bulk CuO, Cu2O and Cu references. The anal-sis provided on this system was essential for the further study ofatalysts loaded with several concentrations of copper and sup-orted on hierarchical alumina and used for the ethanol steameforming [20].
cknowledgements
We acknowledge the financial supports received from therazilian agencies, namely, the CAPES, CNPq, and FAPESP (Projects
umber 07/53073-4, 2013/50023-7 and 2013/05346-2) and fromhe bilateral FAPESP-CNRS cooperation program (Project NumberDC24785). The authors want to thank SOLEIL for providing beam-ime at the SAMBA beamline.
[
oday 229 (2014) 114–122 121
Appendix A. Supplementary data
Supplementary data associated with this article can befound, in the online version, at http://dx.doi.org/10.1016/j.cattod.2013.10.077.
References
[1] E. Fonda, A. Rochet, M. Ribbens, L. Barthe, S. Belin, V. Briois, The SAMBAquick-EXAFS monochromator: XAS with edge jumping, Journal of SynchrotronRadiation 19 (2012) 417–424.
[2] Q. Kong, F. Baudelet, J. Han, S. Chagnot, L. Barthe, J. Headspith, R. Goldsbrough,F.E. Picca, O. Spalla, Microsecond time-resolved energy-dispersive EXAFS mea-surement and its application to film the thermolysis of (NH4)2[PtCl6], ScientificReports 2 (2012).
[3] J.D. Grunwald, A.I. Frenkel, Synchrotron studies of catalysts: from XAFS to QEX-AFS and beyond, Synchrotron Radiation News 22 (2009) 2–4.
[4] C. La Fontaine, L. Barthe, A. Rochet, V. Briois, X-ray absorption spectroscopyand heterogeneous catalysis: performances at the SOLEIL’s SAMBA beamline,Catalysis Today 205 (2013) 148–158.
[5] S. Bordiga, E. Groppo, G. Agostini, J.A. Van Bokhoven, C. Lamberti, Reactivity ofsurface species in heterogeneous catalysts probed by in situ X-ray absorptiontechniques, Chemical Reviews 113 (2013) 1736–1850.
[6] S.R. Wasserman, The analysis of mixtures: application of principal componentanalysis to XAS spectra, Journal De Physique IV: JP 7 (1997), C2-203-C202-205.
[7] S.R. Wasserman, P.G. Allen, K. Shuh, J.J. Bucher, N.M. Edelstein, EXAFS and prin-cipal component analysis: a new shell game, Journal of Synchrotron Radiation6 (1999) 284–286.
[8] P. Haider, J.D. Grunwaldt, R. Seidel, A. Baiker, Gold supported on Cu-Mg-Al andCu-Ce mixed oxides: an in situ XANES study on the state of Au during aerobicalcohol oxidation, Journal of Catalysis 250 (2007) 313–323.
[9] A. Piovano, G. Agostini, A.I. Frenkel, T. Bertier, C. Prestipino, M. Ceretti, W.Paulus, C. Lamberti, Time resolved in situ XAFS study of the electrochemicaloxygen intercalation in SrFeO2.5 brownmillerite structure: comparison withthe homologous SrCoO2.5 system, Journal of Physical Chemistry C 115 (2011)1311–1322.
10] Y. Li, G.A. Somorjai, Nanoscale advances in catalysis and energy applications,Nano Letters 10 (2010) 2289–2295.
11] V. Polshettiwar, R.S. Varma, Green chemistry by nano-catalysis, Green Chem-istry 12 (2010) 743–754.
12] M. Fernández-García, C. Márquez Alvarez, G.L. Haller, XANES-TPR study ofCu-Pd bimetallic catalysts: application of factor analysis, Journal of PhysicalChemistry 99 (1995) 12565–12569.
13] C. Márquez-Alvarez, I. Rodríguez-Ramos, A. Guerrero-Ruiz, G.L. Haller, M.Fernández-García, Selective reduction of NO(x) with propene under oxidativeconditions: nature of the active sites on copper-based catalysts, Journal of theAmerican Chemical Society 119 (1997) 2905–2914.
14] D. Ciuparu, P. Haider, M. Fernández-García, Y. Chen, S. Lim, G.L. Haller, L. Pfef-ferle, X-ray absorption spectroscopic investigation of partially reduced cobaltspecies in Co-MCM-41 catalysts during synthesis of single-wall carbon nano-tubes, Journal of Physical Chemistry B 109 (2005) 16332–16339.
15] Q. Wang, J.C. Hanson, A.I. Frenkel, Solving the structure of reaction interme-diates by time-resolved synchrotron x-ray absorption spectroscopy, Journal ofChemical Physics 129 (2008) 234502.
16] C.A. Nunes, E.C. Resende, I.R. Guimarães, A.S. Anastácio, M.C. Guerreiro, In-situmonitoring of the structure of a goethite-based catalyst during methane oxida-tion by X-ray Absorption Near-Edge Structure (XANES) spectroscopy assistedby chemometric methods, Applied Spectroscopy 65 (2011) 692–697.
17] P. Conti, S. Zamponi, M. Giorgetti, M. Berrettoni, W.H. Smyrl, Multivariate curveresolution analysis for interpretation of dynamic Cu k-edge X-ray absorptionspectroscopy spectra for a Cu doped V2O5 lithium battery, Analytical Chemistry82 (2010) 3629–3635.
18] L. Martins, M.A. Alves Rosa, S.H. Pulcinelli, C.V. Santilli, Preparation of hierarchi-cally structured porous aluminas by a dual soft template method, Microporousand Mesoporous Materials 132 (2010) 268–275.
19] A.R. Passos, L. Martins, S.H. Pulcinelli, C.V. Santilli, Design of hierarchical porousaluminas by using one-pot synthesis and different calcination temperatures,Journal of Sol-Gel Science and Technology 63 (2012) 242–250.
20] W.H. Cassinelli, L. Martins, A.R. Passos, S.H. Pulcinelli, A. Rochet, V. Briois, C.V.Santilli, Correlation between structural and catalytic properties of copper sup-ported on hierarchical porous alumina, Journal of Catalysis, submitted.
21] B. Ravel, M. Newville, ATHENA, ARTEMIS, HEPHAESTUS. Data analysis for X-ray absorption spectroscopy using IFEFFIT, Journal of Synchrotron Radiation12 (2005) 537–541.
22] M. Newville, IFEFFIT: interactive XAFS analysis and FEFF fitting, Journal of Syn-chrotron Radiation 8 (2001) 322–324.
23] R. Tauler, Multivariate curve resolution applied to second order data, Chemo-metrics and Intelligent Laboratory Systems 30 (1995) 133–146.
24] A. De Juan, R. Tauler, Chemometrics applied to unravel multicomponent
processes and mixtures: revisiting latest trends in multivariate resolution, Ana-lytica Chimica Acta 500 (2003) 195–210.25] C. Ruckebusch, L. Blanchet, Multivariate curve resolution: a review of advancedand tailored applications and challenges, Analytica Chimica Acta 765 (2013)28–36.

1 lysis T
[
[
[
[
[
[
[
[
[
[
22 W.H. Cassinelli et al. / Cata
26] S.M. Webb, SIXpack A graphical user interface for XAS analysis using IFEFFIT,Physica Scripta T T115 (2005) 1011–1014.
27] J.Y. Kim, J.A. Rodriguez, J.C. Hanson, A.I. Frenkel, P.L. Lee, Reduction of CuO andCu2O with H2: H embedding and kinetic effects in the formation of suboxides,Journal of the American Chemical Society 125 (2003) 10684–10692.
28] N.B. Muddada, U. Olsbye, L. Caccialupi, F. Cavani, G. Leofanti, D. Gianolio, S.Bordiga, C. Lamberti, Influence of additives in defining the active phase ofthe ethylene oxychlorination catalyst, Physical Chemistry Chemical Physics 12(2010) 5605–5618.
29] A.G. Sato, D.P. Volanti, I.C. de Freitas, E. Longo, J.M.C. Bueno, Site-selectiveethanol conversion over supported copper catalysts, Catalysis Communications26 (2012) 122–126.
30] I. Ritzkopf, S. Vukojevic, C. Weidenthaler, J.D. Grunwaldt, F. Schüth, DecreasedCO production in methanol steam reforming over Cu/ZrO2 catalysts prepared
by the microemulsion technique, Applied Catalysis A: General 302 (2006)215–223.31] M.K. Neylon, C.L. Marshall, A.J. Kropf, In situ EXAFS analysis of the temperature-programmed reduction of Cu-ZSM-5, Journal of the American Chemical Society124 (2002) 5457–5465.
[
oday 229 (2014) 114–122
32] C. Lamberti, A. Zecchina, G. Spoto, S. Bordiga, G.T. Palomino, Alumina-supportedcopper chloride – 1. Characterization of freshly prepared catalyst, Journal ofCatalysis 189 (2000) 91–104.
33] C. Lamberti, A. Zecchina, G. Spoto, S. Bordiga, Alumina-supported copper chlo-ride – 2. Effect of aging and thermal treatments, Journal of Catalysis 189 (2000)105–116.
34] C. Prestipino, S. Bordiga, C. Lamberti, S. Vidotto, M. Garilli, B. Cremaschi, A.Marsella, G. Leofanti, P. Fisicaro, G. Spoto, A. Zecchina, Structural determinationof copper species on the alumina-supported copper chloride catalyst: a detailedEXAFS study, Journal of Physical Chemistry B 107 (2003) 5022–5030.
35] C. Lamberti, C. Prestipino, F. Bonino, L. Capello, S. Bordiga, G. Spoto, A. Zecchina,S.D. Moreno, B. Cremaschi, M. Garilli, A. Marsella, D. Carmello, S. Vidotto,G. Leofanti, The chemistry of the oxychlorination catalyst: an in situ, time-resolved XANES study, Angewandte Chemie International Edition 41 (2002)
2341–2344.36] N.B. Muddada, U. Olsbye, G. Leofanti, D. Gianolio, F. Bonino, S. Bordiga, T.Fuglerud, S. Vidotto, A. Marsella, C. Lamberti, Quantification of copper phases,their reducibility and dispersion in doped-CuCl2/Al2O3 catalysts for ethyleneoxychlorination, Dalton Transactions 39 (2010) 8437–8449.
Copyright © 2022 FDOKUMEN