The United Republic of Tanzania Public Expenditure Review
127
Report No. 23812-TA The United Republic of Tanzania Public Expenditure Review October 2001 Government of Tanzania Tanzania PER Working Group The World Bank PREM 2, Africa Region Document of the World Bank Public Disclosure Authorized Public Disclosure Authorized Public Disclosure Authorized Public Disclosure Authorized
-
Upload
khangminh22 -
Category
Documents
-
view
3 -
download
0
Transcript of The United Republic of Tanzania Public Expenditure Review
Report No. 23812-TA
The United Republic of TanzaniaPublic Expenditure Review
October 2001
Government of TanzaniaTanzania PER Working Group
The World BankPREM 2, Africa Region
Document of the World Bank
Pub
lic D
iscl
osur
e A
utho
rized
Pub
lic D
iscl
osur
e A
utho
rized
Pub
lic D
iscl
osur
e A
utho
rized
Pub
lic D
iscl
osur
e A
utho
rized

GOVERNMENT FISCAL YEAR
FY02 = 2001/02 = July 1, 2001 to June 30, 2002
CURRENCY EQUIVALENTS
Currency Unit = Tanzanian Shilling (T Sh)Interbank Market mid-rate: US$1.00 = T Sh 890 (July 2001)
ABBREVIATIONS AND ACRONYMS
AfDB African Development Bank MOF Ministry of FinanceAIDS Acquired Immune Deficiency Syndrome MOH Ministry of HealthBEMP Basic Education Master Plan MSTHE Ministry of Science, Technology andBOP Balance of Payment Higher EducationBOT Bank of Tanzania MTEF Medium Term Expenditure FrameworkCBMS Cash Budget Management Systems NBC National Bank of CommerceCFAA Country Financial Accountability NFA Net Foreign Assets
Assessment NGO non governmental organizationCG Consultative Group O&E organizational and efficiency (reviews)CSD Civil Service Department O&M operations and maintenanceCSRP Civil Service Reform Programme OC other chargesDANIDA Danish International Development OECD Organization for Economic Cooperation
Agency and DevelopmentDEO District Education Officer PE personnel emolumentsDFID Department for International Development PER Public Expenditure ReviewDMO District Medical Officer PHC Primary Health CareDMT District, Municipal and Town Councils PORALG President's Office - Regional AuthoritiesESP Education Sector Programme and Local GovernmentESRF Economic and Social Research Foundation PRBS Poverty Reduction Budget SupportEU European Union PSWB Public Sector Wage BillFAO Food and Agriculture Organization PRSP Poverty Reduction Strategy PaperFY Fiscal Year RAS Regional Administration SecretariatGDP gross domestic product REPOA Research on Poverty AlleviationGNP gross national product SAC Structural Adjustment CreditGOT Government of Tanzania SASE Selective Accelerated Salary EnhancementHIPC Highly Indebted Poor Countries Debt SASP Structural Adjustment Support Program
Initiative SDC Swiss Development CooperationHIV Human Immuno-deficiency Virus SDP Sector Development ProgramIDA International Development Association SPA Special Program of AssistanceIFEM Inter-bank Foreign Exchange Market SSA Sub-Saharan AfricaIFMS Integrated Financial Management System STD Sexually Transmitted DiseaseIMF International Monetary Fund TANESCO Tanzania Electric Supply CompanyLA Local Authority TAS Tanzania Assistance StrategyLCC Local Cost Compensation TB Treasury BillLGRP Local Government Reform Program TRA Tanzania Revenue AuthorityLPO Local Purchase Order UDSM University of Dar es SalaamMAC Ministry of Agriculture and Cooperatives UNDP United Nations Development ProgramMOEC Ministry of Education and Culture VAT Value Added Tax
Vice President: Callisto MadavoDirector: James W. AdamsSector Manager: Frederick KilbyTask Team Leader: Benno Ndulu
TABLE OF CONTENTS
Executive Summary ........ ..................................................... i
1. Objectives, Methodology and Context ofthe FY01 PER .1
2. Evaluation of the Tanzania PER Process Since FY98 .6
3. Review of Recent Macro Performance .15
4. Review of Budget Performance .18
5. Budget Sustainability and Full Financing of the Priority Sectors .32
6. Revenue Issues in the Longer-Run .36
7. Recommendation .40
8. The Way Forward .51
Postscript .58
Annex 1: Proceedings of the PER FY01 Consultative Meeting 60
Annex 2: Aspects of budget sustainability ............................................................ 74
Annex 3: Fiscal Sustainability ......................................... 77
Annex 4: Data ............................................................ 86
List of Tables:
Table 2.1: Studies and activities carried out under the FYO IPER ........................................... 8
Table 4.1 Government Revenue and External Grants (as % of GDP), FY96 - FY01 ... 19
Table 4.2: Foreign Inflows - Grants and Loans (as % of GDP), FY96 - FY01 .. 19
Table 4.3: Government Expenditures (as % of GDP), FY96 - FY01 . . 20
Table 4.4: Civil Service Employment, FY98-FYOI (December of each year) .. 21
Table 4.5: Civil Service Average Salaries, FY97-FYOO . ....................................................... 21
Table 4.6: Financing of the Fiscal Deficit (% of GDP), FY96 - FY01 . . 22
Table 4.7: Composition of Public Expenditures (as % of GDP), FY96-FYO1 .. 23
Table 4.8: Sectoral Recurrent Expenditures (actuals, as a %age of GDP) . . 23

Table 4.9: Social Sector Recurrent Expenditures (actuals, as a %age of GDP) .................... 24
Table 4.10: Tanzania: Priority Sector Spending - Other Charges ......................................... 25
Table 4.11: Sectoral Development Expenditures (actuals, as a %age of GDP) ..................... 26
Table 4.12: Contingency allocation retained by Ministry of Finance .................................... 27
Table 4.13: Actual Reallocations to PE and OC .................................................................. 28
Table 4.14: Reallocations and Expenditure Outturn, FY00 ................................................... 28
Table 4.15: Development Expenditures by Sector, Actual Expenditures as a Share ofBudgeted Expenditures, FY96-FYOO ................................................................ 29
Table 7.1: Structure of Consolidated Arrears- By Category July 1998 - December 2000 ... 45
Table 7.2: Consolidated Arrears- As a Proportion of Total Arrears July 1998 - December.2000 .................................................................. 46
Table 8.1: Summary of Impact of Public Expenditure Process on Public ExpenditureManagement in Tanzania ...................................... 56
Annex Tables
Table 1: Tanzania Microeconomic Indicators .............................................. 87
Table 2: Balance of Payment .............................................. 88
Table 3: Summary of Central Government Operations ............................................. 89
Table 4: Budget Frame for 1999/2000-2003/04 .............................................. 90
Table 5a: Budget Frame for 1995/96-2003/04 .............................................. 91
Table 5b: Budget Frame for 1995/96-2003/04 % of GDP ....................................... 92
Table 6a: Sectoral-Recurrent Expenditure 1995/1996-2000/01 .................................. 93
Table 6b: Sectoral-Development Expenditure .............................................. 94
Table 6c: Sectoral-Total Expenditure .............................................. 95
Table7a: Actual Recurrent Expenditure by Vote as the Share of Total Recurrent ExpenditureFY96-FYOI ....................................... 96
Table7b: Actual Development Expenditure by Vote as the Share of Total DevelopmentExpenditure FT96-FYO0 ....................................... 97
Table 8a: Actual Recurrent Expenditure as a Percentage of Budgeted Expenditure by VoteFY95-FYO1 ...................................... 98
Table 8b: Actual Development Expenditure as a Percentage of Budgeted Expenditure by VoteFY95-FY0I .............................................. 99
Table 9a: Recurrent Budgeted Expenditure-Regions FY96-FYO0 ............................... 100

Table 9b: Budgeted Development Expenditure-Regions FY96-FYO0 .......................... 101
Table 9c: Budgeted Total Expenditure-Regions ................................................... 102
Table I Oa: Actual Recurrent Expenditure as Percentage of Budgeted Recurrent Expenditure-Regions FY96-FYO I ............................................................... 103
Table I Ob: Actual Development Expenditure as Percentage of Budgeted DevelopmentExpenditure-Region FY96-FYO I ....................................................... 104
Table 1 Oc: Actual Total Expenditure as Percentage of Budgeted Total Expenditure-RegionsFY96-FYO1 ............................................................... 105
Table I 1: Sectoral-Recurrent Expenditure Before and After Reallocation ..................... 106
Table 12: Region-Recurrent Expenditure Reallocations FY00 ................................... 107
List of Figures
Figure 4.1: Development Expenditure as a share of GDP, FY96-FYO I ........ ................ 21
Figure 4.2: External Project Support, Average FY99 and FYOO ................................. 26
Figure 7.1: Monthly Fiscal Deficit / Surplus ........................................................ 42


Preface
Starting in 1997/98, Tanzania has embarked on an annual Public Expenditure Review (PER) processwith the interrelated twin objectives of supporting the budget process and conducting an externalreview of fiscal developments. The Tanzania PER Working Group comprising representatives of theGovernment of Tanzania, the World Bank, other UN agencies, other bilateral and multilateral donors,research and academic institutions, and NGOs determines the agenda for the annual PER process,guides and finances the implementation of the agreed work program, and reviews all outputs. It alsorepresents an important forum for discussion of public expenditure issues between government and awide array of interested stakeholders in Tanzania.
This report intends to fulfill two purposes. Firstly, it puts on record the activities and achievementsof the work of the PER Working Group during FYO. Secondly, it serves as a public record of thefindings of the external review of fiscal developments, which previously have been shared withgovernment and members of the PER working group as well as with a wider audience at the annualPER Consultative Meeting, which was held in May 2001 prior to the finalization of the Tanzaniangovernment budget.
The report is primarily based on the findings of a joint donor mission in November/December 2000which was led by Benno Ndulu (mission leader, AFTP2) and consisted of Robert Utz, Sumana Dhar(AFTP2), Vedasto Rwechungura (AFTPS), Philip Mpango, Hamisi Mwinyimvua (consultants,University of Dar es Salaam), Ben Tarimo (consultant), Frans van Rijn (Netherlands Embassy), ToneTinnes (Norwegian Embassy), Torben Lindqvist (Danish Embassy), Olivier Burki (SwissDevelopment Cooperation), Fiona Shera (DFID) and Amon Manyama (UNDP). A follow-up missionin April/May 2001 was launched to assist the Government in the preparation of the cross-sectorMTEF and to present the findings of the main mission at the Consultative PER meeting held in Dar esSalaam.
In addition to the work undertaken in the context of these two missions, the report also draws onwork commissioned by the PER Working Group on fiscal sustainability carried out by David Bevanand by Emerging Markets Economics Consultants.
The report was written under the supervision of Fred Kilby, Sector Manager, AFTP2, and PenielLyimo, Deputy Permanent Secretary, Ministry of Finance, Government of Tanzania. Allister Moon(ECSPE) and Anand Rajaram (PRMPS) served as peer reviewers. Emmanuel Munganasi providedexcellent research assistance and compiled the statistical appendix. Patrick Mamboleo wasresponsible for the word processing and the physical production of the report.


EXECUTIVE SUMMARY
THE FY01 PER PROCESS
Tanzania has been conducting annual Public Expenditure Reviews (PERs) since FY98. The twoprincipal objectives of the PER process are to support the budget process in Tanzania and to providepeer review on fiscal developments to the Government of Tanzania and to make the findingsavailable to a wide range of stakeholders. The process is government led and benefits from wideparticipation within government, by donor agencies, research institutes, NGOs, and the private sector.
The PER working group, which meets bi-weekly, is the focal point of the PER process. It developsthe annual program of work and supervises the implementation of specific activities. During FY01,these activities included studies on the following issues: expenditure tracking in key poverty sectors,fiscal sustainability and local government indebtedness. The PER working group also supports thepreparation of sectoral PERs and Medium Term Expenditure Frameworks for the priority sectors(education, health, roads, agriculture, justice, water, HIV/AIDS, lands).
The PER macro sub-group provides inputs to the budget guidelines committee on the macroframework, overall prioritization, collects information on donor support as a key element of thegovernment's resource envelope, and contributes to the preparation of the cross-sector medium termexpenditure framework.
As an integral part of the PER process, the World Bank leads the external evaluation of fiscalperformance, covering macro-fiscal development, strategic allocation issues, as well as budgetmanagement issues. This report covers mainly the findings of the extemal evaluation coveringdevelopments during FY00 and the first eight months of FY01, while sectoral issues are covered inindividual sector reports prepared by the sector working groups. The findings of the externalevaluation have been presented at the PER consultative meeting which took place in May 2001 andserved as background to government's presentation of the medium term expenditure framework forthe period FY02-FY04 to a wide range of stakeholders.
BUDGET PERFORMANCE FY00 AND FIRST EIGHT MONTHS OF FY01
During FY00 domestic revenue remained at the same low level as in the previous year, i.e., ataround 11.5 percent of GDP. The first eight months of FY01 saw a slight improvement in therevenue situation with domestic revenue increasing on an annualized basis to 12 %. Theimprovement in the revenue situation is mainly due to increased revenue from VAT on petrolproducts and increased income tax revenue. Aid inflows in the form of grants and concessional loansalso increased in FY00 to 4.8 percent of GDP. The first eight months of FY01 saw a further increaseto 5.5 % of GDP on an annualized basis.
On the expenditure side, expenditures increased in FY00 by one percentage point to 15.9 percentof GDP. Expenditures during the first eight months of FY01 were slightly lower in magnitude duemainly to reduced development expenditure. The increase in expenditures in FY00 was evenlydivided between providing funding for the implementation of the first stage of pay reform andenhancing expenditures on other charges. The first eight months of FY01 saw a decline in the shareof expenditures on wages and salaries, as no pay awards were granted. Expenditures on OC on theother hand increased quite significantly. Despite the significant increases in spending on OC in FY00and FY01, expenditures on OC were below the budgeted amounts, pointing towards the continueddisconnect between budgets and actual expenditures.

Over the past few years, some progress has been made in enhancing funding for priorityactivities in the areas of primary education, health care, roads, and water, with most of theincreased spending going to the districts. Between FY96 and FY99, recurrent expenditures on thesocial sectors increased from 3.5 percent of GDP to 3.7 percent of GDP. Expenditures for the socialsectors declined slightly in FY00 to 3.6% of GDP. This share increased during the first quarter ofFYOI to 4.1 % of GDP. However, spending on administration increased even faster, from 1.4 percentof GDP in FY97 to 2.1 percent of GDP in FY00. Expenditures on defence and security have declinedfrom 2.5% of GDP in FY97 to 2.0% in FY00.
Progress has been made on bringing a greater share of donor financed development spendinginto the budget. Recorded Development expenditures in the appropriation accounts increased from0.9 percent of GDP in FY97 to 1.8 percent of GDP in FY99 and 1.5 percent of GDP in FY00.Correspondingly, actual development expenditures as a share of budgeted development expenditureshave increased from 6.1 percent in FY97 to 52% in FY00. However, further work needs to be doneto improve the capturing of donor flows in the budget.
Deviations between the budget presented to the National Assembly and expenditure outturnsremain significant, especially for non-priority sectors. The analysis in this report decomposesdeviations into (a) deviations due to reallocations and (b) over or under spending by spending units.Reallocations occurred mainly to distribute funds retained at the Ministry of Finance for "specialexpenditures" or for contingencies. These reallocations are of concern because they considerablychange the sectoral allocations approved by Parliament during the budget session. Significantunderspending occurred during FYOI because resource availability from domestic and foreignsources was significantly below the budgeted amounts. Priority sectors were protected from resourceshortfalls and received their full allocations. However, continued efforts to reduce such budgetdeviations will be necessary, including both improvements in budget projections but alsoconsideration of financing options to absorb resource shocks.
Contingency funds retained by the Ministry of Finance are substantial. Although retainingunallocated funds for contingencies is important in an environment of large and unpredictable shocksimpacting on the budget, efforts should be made to enhance ex-ante transparency in determining thesize and allocation of these contingency funds.
The main problem of public expenditure management persists, which is the mismatchbetween available resources and the intended scope of Government activities. Bypreventing access to deficit financing, the cash budget system highlights this mismatch, resultingin permanent under funding of non-priority spending units which renders them virtuallyincapable of providing any services. The mismatch between revenue and intended scope ofactivities also becomes visible in symptoms such as the accumulation of arrears.
Priority sectors are also critically under funded. If the poverty reduction targets laid out in thePRSP are to be achieved, additional resources becoming available will need to be devoted to thepriority sectors.
Possibilities for widening the resource envelope are limited. The structure of the economy makesit difficult to raise more revenue, although the revenue potential of the growth sectors, i.e. mining andtourism, is not yet fully exploited. With Tanzania already being one of the main recipients of foreignaid in the region, the potential for further increases in aid inflows seems limited.
Given the limited prospects for expanding the resource envelope and the huge unmet needs of prioritysectors for poverty reduction and growth, bridging the gap between available resources and fundingrequirements of the current government structure can only be achieved if the scope of government isbrought in line with the medium term resource availability.
ii
Finally, improving access and transparency of information on fiscal developments is important tosupport other efforts to enhance accountability and transparency in the public sector.
MANAGING STRESSES FROM CASH BUDGET SYSTEM
There are three main types of budgetary stresses that have been identified in respect of under-funding of budgets and contributing to pressures for undermining prudent budget management.
The first relates to the overall amount disbursed being far short of requirements for effectivedelivery of services. Frequently this problem has been addressed in terms of enlarging the overallresource envelope and sector as well as sub-sector prioritization. However, the budget stress isaccentuated by the fact that the budget preparation stage has typically overlooked completeness inactivity prioritization (sub-items). Currently statutory payments (CFS) and personal emoluments(PE) are treated as first charge. Two more first-charge type of expenditures, if under-funded, oftenlead to commitments being made outside the budget and build up of arrears. These are utilities(power, water, telecommunications) and "automatic catering" such as food needs of prisons, securityforces, boarding schools and hospitals. This may not be an exhaustive list but together they accountfor about 37 percent of all arrears built up. For the former, until such time as prepaid -servicesystems are installed the commitment is essentially automatic.
Recommendation 1. The report recommends that the Government reviews the classification offirst charge expenditures for completeness and ensure that the guidelines for FY02 includeinstructions for fully funding these. All spending units should provide reasonable estimates of thesein their MTEF and budget submissions. The hierarchy in prioritization then would be: (i) statutoryexpenditures and other first charge sub-items, (ii) Priority sectors and sub-sectors (iii) Other sectorsand sub-items.
The second dimension of the under-funding problem relates to the mismatch between the monthlycash requirements and exchequer releases - amounts and timing. The lumpiness of someexpenditure categories such as road maintenance, pension funds, and examinations present majorstresses in the overall functioning of the Government budget when they occur without provision forcash flow gap smoothing. The pattern of expenditures through the year varies greatly across sectors torender a general rule of releasing 1/12 of the approved budget each month disruptive to the effectiveprovision of public services.
The monthly cash stress is typically accentuated by unforeseen expenditures triggered byemergencies. The main spending units that have to deal with such crises include Health forepidemics, Defense and Home Affairs for security-related emergencies, and Works and Agriculturefor flood disasters entailing emergency repairs of infrastructure and food security. During FY00 itincluded handling of cholera outbreaks, refugee situations, food relief and security in the game parks.While it is possible to preempt some contingencies, such as dealing with tourism protection through aprogram of strengthening security presence in the parks, the bulk of other unforeseen events can onlybe dealt with on a contingency basis.
Exchequer releases are typically issued between the 1 5th and 20th of each month instead of thestipulated date of the 5 th day of each month. This concern was strongly expressed by all spendingunits met. The delay adds to further uncertainty in expenditure planning. Since there is apredetermined rule to base releases on the average of three previous months revenue collection plusprojected external program support, it is hard for spending units to understand the delay. One of thecauses of delay is a process of conforming to the monthly monetary programming necessitatingprotracted exchanges with BOT for finalizing the exchequer issues. It was noted that such exchangescould be programmed in such a way to enable meet the stipulated date for exchequer releases.
iii
Recommendation 2: So as to have a more effective cash management system the report recommendsfour actions:
As a first step to address cash flow gaps, the report recommends that the Budget Guidelinesrequire spending units to present a cash flow plan along with their annual budgets, whichconform to the respective aggregate ceilings but clearly show the time pattern of their cashrequirements. Particular attention should be paid to the typical lumpiness in expenditurepatterns in these units. Currently submissions are being made for some lumpy activities such asfor education and health and the suggestion here would systematically broaden the coverage ofsubmissions to all spending units. Once consolidated the overall budget would also have a cashflow plan to provide a more systematic projection of exchequer releases.The report recommends that the Government considers a cash flow smoothing instrumentthat respects the overall budget ceilings for the year. Two options or their combination werediscussed with the concerned stakeholders. One is a cash reserve operated as a Governmentdeposit that can be drawn down or built up depending on the net cash requirement position versusavailable cash. There were indications of possible contribution to such a reserve by donors,provided it can be protected from becoming a financing instrument. The other option is toestablish a prudent credit line with the BOT as advances subject to the same rule that the netposition as end year be zero. The law allows for such advances with clear limits. The BOTcurrently provides such credit based on the shortfall between projected extemnal program supportand actual disbursement and the credit is repaid when actual flows take place - and applyingagreed automatic adjusters. The recommendation here is to broaden this coverage to includeprojected domestic revenue with specific safeguards against abuse by turning advances into afinancing instrument as it occurred in the past. The previous PERs and this current oneestablished that typically the variance between actual and projected domestic revenue collectionis smaller than that for external resource flows, and that there is a concentration of externalinflows in the last quarter of the year, which could also be used as a safeguard against such abuse.The Government may wish to consider the two options or their combination based oncomparative cost assessment( including the opportunity cost of maintaining a cash reserve) andselect an appropriate instrument for smoothing cash flow gaps beginning in FY02.
* The report recommends that, a separate line item be provided for contingencies under Vote50 to minimize the stress from unforeseen expenditures on the overall functioning of theGovernment. The current provision under vote 50 predominantly provides for salary adjustmentsand regular shortfalls in OC. The current arrangement does not permit to address thesecontingencies on a timely manner. To help speed up responses to emergencies, the Governmentmay wish to have reasonable estimates of emergency requirements based on past experience andto develop and agree on automatic triggers for release based on predetermined criteria.
* The report recommends that exchequer releases be issued on the stipulated date of the 5thof each month so as to minimize uncertainty on available cash. The timing of themeetings/exchanges between Treasury and BOT for ensuring conformity to the monetaryprogram could be set within the stipulated timing target.
The third area of budget management stress relates to payment arrears. There are two dimensionsto this problem - dealing with the accumulated stock of arrears and preventing the building up of newflows of arrears through appropriate incentives. There is currently an initiative funded by theEuropean union to clear up the stock of domestic arrears of the central government. A major problemis the authenticity of the size of the stock. Initially the stock was estimated to be within the range of60-80 billion shillings but to date under SASP IV the stock that has been cleared up is already up to120 billion shillings. An independent audit has rejected a substantial proportion of the stock initiallyverified by CAG. The main problems appeared to be linked to over-pricing of supplies and collusionbetween some officials and suppliers to short change the government.
There is no similar operation of relieving the local governments of their debts, whose stock as of end1998 stood at 8.65 billion shillings (per CAG report). More than half of this stock was due to
iv

councils' creditors and slightly more than 15 percent due to non remission of statutory deductionsfrom employees for contribution to Local Authority Provident Fund. The gravity of the problemvaries across local governments. For some of the poorer authorities, the stock of arrears makes upover 50 percent of their own revenue collection, representing a major potential drag on financingtheir development programs. Most better-to-do and fewer poorer local authorities visited by the PERmission have began, on their own, to reduce the stock of debt and often at the expense of muchneeded funding for public services in the poorer ones.
A major issue in such debt relief programs is the moral hazard problem and preventing the recurrenceof build up of arrears. The report discusses appropriate disincentives to building up new flows andpossible approaches to tightening the financial management system against recurrence ofunsustainable stock.
Recommendation 3: The report recommends that the Government considers a relief program toclear up the stock of debt of poor Local Authorities (Highly Indebted Poor Local Authorities -HIPLA) to give them a fresh chance under the local government reform program. A separatestudy under the PER Working Group has been commissioned for a more in-depth analysis of thisproblem and recommendations for way forward.
Following the central and local government relief operations, the report recommends the followingmeasures to prevent recurrence of the unsustainable stock of debt. New payments arrears should beintegrated into the following year's respective spending unit's budgets as first charge fromtheir allocations. This used to be the practice in the past in order to enforce discipline in budgetmanagement. It would, however, require timely compilation of information on arrears (in thePlatinum system where available) and verification. To prevent abuse of extra-budgetarycommitments will require enforcing the centralized system for issuing LPOs (even where theautomated system is not operative); enhanced enforcement of discipline by the accountingofficers (AOs) to ensure that no invoices are held outside the financial reporting system; andstrengthening the internal audit functions in ministries, regions and local governments. Tominimize collusion with suppliers, it is desirable to publicize/make it very clear to the privatesuppliers that any LPO issued outside the central payment system will not be honored by theMOF. It will raise the risk costs to corrupt suppliers from non-payment for goods and servicessupplied inappropriately.
Rolling out the Integrated Financial Management System (IFMS)
The government has introduced the Integrated Financial Management System (IFMS), which whenfully operational would permit improved transparency of public financial operations through realtime information, and better controls through centralized payments and procurement processing. TheEPICOR (formerly PLATINUM) is the software currently used to operate the IFMS. The ExchequerOrdinance has been revised inter alia to provide a legal basis for operating this new systemeffectively and accepting its reports for fiduciary accountability. To date all ministries in Dar-esSalaam are using the IFMS. However, two are not on line. In practice this means that all expendituretransactions are now being executed through the system. In the case of the two remaining institutions(President's Office and the Ministry of Defense and National Service and agencies under it), althoughnot yet on line, the IFMS and EPICOR software have now been implemented. Central governmentagencies located in regions and districts are served through 19 Sub- Treasuries. Manual operation ofIFMS has been in place since last fiscal year. During the financial year 1999/2000 all payments wereprocessed at the central payment office in the sub-regional treasuries. The structure of the chart ofaccounts in use is the same as that in use at the Central Payments Office but all payments andrevenues are captured manually. Following failure of the first attempt to automate the system, on linelinks are being established in the 19 sub-treasuries from where payments and commitments are beingexecuted for all central government agencies located in the 19 regions. An earlier attempt at
v

automating IFMS in the sub-treasuries using the PLATINUM software suffered technical hitches inhardware and software services making connectivity inoperative. Furthermore, the system used dialup technology for linking with Dar es Salaam. Consequently the links were subject totelecommunication interruptions. The government is in the process of reinstalling equipment andlinking the sub-treasuries with the center via satellite technology. Sub-treasuries connected to theIFMS center can now operate on line and the task to connect all the sub-treasuries is expected to becompleted by end August 2001.
IFMS and the EPICOR software are also being rolled out to 28 local authorities on a pilot basis underphase I of the initiative. 42 more have been targeted for phase II which begun in January, 2001. Thereare only a few amongst the 28 that operate the software effectively.
All ministries, Sub-Treasuries and local authorities visited by the PER mission expressed theirappreciation for improvement in efficiency and controls when the PLATINUM is operative andstrongly urged for its wide use. In the meantime there are some key transitional concerns that need tobe addressed urgently.
Recommendation 4:* As of April 2000, a centralized LPO system became operational in Dar-es- Salaam obviating the
need for continued use of printed LPOs. The presumption was that since many of the Sub-Treasuries had the PLATINUM system, the need for printed LPOs would subside. Due to thefact that the rolled out PLATINUM systems were not operative, a shortage of LPOsemerged endangering the integrity of the procurement system in areas where PLATINJMwas not operative. There is therefore an immediate need for ensuring that adequatesupplies of printed LPOs is availed to all those in need of them.
* The Government needs to quickly review the IFMS roll out program to ensure availabilityof functioning equipment, effective supportive technical services, and adequate training tooperating staff.
LOCAL GOVERNMENT FINANCIAL MANAGEMENT AND OTHER ISSUES
Budgetary stress: There is an apparent difference on budgetary stress between rich and poorer localauthorities (LAs), based on the extent of arrears, own revenue as percentage of total revenue, ownrevenue per capita and underfunding.
Differential treatment of LAs in exchequer releases andfunding: By and large under-funding is stilla problem both in relation to needs and approved allocation. Some districts receive less resourcesthan approved especially those for funding other charges. There is lack of clear consistency vis-a-visunderfunding, with marked variations in the extent of funding between regions and between districtswith some districts receiving far less than their approved allocations. It is not clear what criteria isbeing used in deciding the allocation, timing of actual releases and disbursements since some LAs donot receive releases as expected. There is a need for a study to determine the extent of inequity oftreatment and transparency in the criteria used for differential treatment.
Cash flow plans: There are indications from the LAs that cash flow planning would help ease cashflow problems and reduce uncertainties in budget implementation. Some LAs already prepare cashflow plans while some better to do LAs have been able to use cash reserves to bridge cash flow gapsand smoothen cash flow over time. Generally, councils indicated their agreement to including therequirement for preparing cash flow plans in the Guidelines for the budgeting process.
Financial Management Capacity: The four key positions - Treasurer, ExpenditureAccountant, Revenue Accountant and District Planning Officer are filled by staff with the requisite
vi
professional qualifications. However, the Internal Audit departments are weak in capacity, becausemost of the auditors are new (72 recruited in 2000) and lack job experience to man Internal Auditdepartment, while others are not qualified for the job but only seconded from the Finance Departmentto do the job. Positions below the accountants are also manned by accounts assistants, most of whomhave not gone through a formal training on accounting. The finance management capacity is evenmore worrying and totally lacks at the ward level where, apparently most of the revenue collection inthe Councils takes place. There is a need for further training of accounts clerks and orientationof audit staff to the financial accounting and management of LAs, as well as training of financeand audit staff in computer skills to cope with the introduction of the Platinum System. To helpmore effective supervision by the councilors, there is also a need occasional seminars for thecouncilors to sharpen their understanding of financial statements.
Internal Audit reports and their usefulness: Internal audit reports are essential in uncoveringirregularities and ensuring that regulations are properly followed in the course of performing day today financial management operations. The reports are important not only as a financial managementtool for the management, but also in guiding and simplifying the work of external auditors. It wouldbe important, therefore, that these reports are regularly produced and submitted both to themanagement and the Council. In particular, the Councilors should demand to read suchreports on a quarterly basis and subsequently ensure that the management responds to queriescontained in these reports.
Role of the Regional Secretariat (RAS Office): The RAS office's advisory role is currently verylimited and ambiguous. This has led some to think that the Regional Secretariat is an unnecessaryoverhead to the Government. However, given the distance between ministries and the LAs, there isdefinitely a need for an intermediate body, which will monitor and ensure that the national standardsin service delivery and policies are adhered to. The Regional Secretariat is well placed to performsuch a function. The report recommends that there is need to clarify the role of the RegionalSecretariat vis a vis the sector ministries in monitoring and evaluation, and in enforcingnational standards. The national budget provision for these functions should be shared between thesector ministries and the Regional Secretariats.
Arrears: Most LAs and in particular the poorer LAs have accumulated huge payment arrears.Usually in the preparation of the budget, LAs include repayment of arrears as one of the expenditureitems. In practice, however, it is only the better to do LAs that have been able to spare enoughresources for this item. The inclusion of arrears in the expenditure side of the LA budgets hasinstilled a sense of responsibility to the LAs making them wary to incur more debts. It isrecommended that such practice (integrating debts in their budgets) be formnally adopted in theguidelines for budgeting at all levels of government. The report once again recommends that theGovernment considers a relief program to clear up the stock of debt of poor Local Authorities(Highly Indebted Poor Local Authorities - HIPLA) to give them a fresh chance under the localgovernment reform program.
Frequency and quality of quarterly and annual financial reporting and feed-back fromsupervisors: As noted above monthly, quarterly, and annual financial reports are prepared by the LAmanagement and submitted to the Finance Committee and the full council. Quarterly and annualreports are copied to the RAS and MORALG. However, none of the reports go to the sub-councillevel directly. The assumption is that the contents of the reports would reach the sub-council levelsthrough their representatives. The report recommends that both financial and audit reports(translated into Kiswahili) be displayed /made public at ward and village levels.
The practice existing up to the early 1980s of sending copies of the quarterly reports to Treasury wasvery useful for accountability / feedback. The report recommends that this practice be re-instituted and a desk officer designated in MOF to deal with such reports.
vii
MAJOR EMERGING ISSUES FROM THE PER FY01 CONSULTATIVE MEETING
The theme of the PER FY01 Consultative Meeting focused on realigning the budget and the MTEFwith the PRSP which is now the overarching national framework for implementing poverty reductionmeasures in Tanzania and which has become the benchmark document for prioritizing expendituresin Tanzania. A key feature of the 2001 PER consultative meeting was the broader participation bothin terms of the substantial increase in the number (around 250) and composition of participants,compared to the last two PERs.
Major Emerging Issues
1. PER Process
Mileage Gained under the PER Process: There is a consensus that the PER process has enrichedthe Government budgetary process. Remarkable progress has been made on progressively increasingfunding to priority areas. In addition, the PER has become an increasingly GoT owned and ledprocess as well as highly participatory and transparent. All this needs to be maintained andstrengthened.Adaptation of the PER Process to Poverty Reduction: The PER process has in addition toproviding inputs into the budget process and development of the cross-sector and sector MTEFsadapted to focus more on poverty reduction. The subsequent PER therefore will need to pay greaterattention to the poverty focus.Extending the PER/MTEF Process to the Sub-national Level: Flow of funds to LAs and servicedelivery units is of concern and GoT needs to put appropriate monitoring mechanisms in place withadequate follow-up. This will require, among others, (i) rolling-out the PERIMTEF process to thelower level (Local Government Authorities) as these levels do deliver the primary services. This willimprove planning, execution and control of budget at that level. In addition this will strengthen localownership and local participation. (ii) spending more resources on building capacity at all levels ofgovernment but more so at the sub-national levels.
2. Maintain Macroeconomic Stability: There is a broad consensus that the current success of theGOT in maintaining macroeconomic stability should be maintained.
3. Further Prioritization to Foster Strategic Expenditure Allocation: There is need to continuework on prioritization to foster strategic expenditure allocation using the MTEF instrument, includingrevisiting the priorities, to focus on sectors, such as the transport sector (broadly defined), which canmake a real impact in terms of poverty reduction. It is important that ongoing interventions targeted atrealizing sustainable development in the rural sector and delivery of high quality primary educationare revised and updated to reflect the requirements of Rural Development, Agriculture and PrimaryEducation for poverty reduction.
4. Concern on the Low and Drifting Down of the Revenue Effort: Low and declining revenueeffort remains an important concern. The revenue effort is seen to be driven by taxes on internationaltrade while performance of other taxes does not show much improvement. Efforts are thus needed inimproving compliance and strengthening tax administration.
5. Concern on Continued Channeling of Donor Resources Outside GOT Budget: More attentionneeds to be put on improving the reporting and accounting of donor resources. Administration ofdonor support outside the Government budget creates real problems in budget management andaccountability considering that over 30% of the budget is donor funded (over 80% for developmentbudget). More donor resources need to go through the budget so as to support the poverty reductionstrategy. Addressing this problem requires promoting/enhancing trust and collaboration between the
viii
Government and Donors. It also requires the GOT to continue demonstrating resolve to improvebudget management, transparency and accountability.
6. Need to Harmonize SDPs and PRSP: There is an apparent disconnect between SectorDevelopment Programs (SDP) and the PRSP. There is therefore a need to harmonize theSWAPs/SDPs with the PRSP for orderly implementation of the poverty reduction strategy. Thisimplies that Sector development programs and strategies should be reviewed to ensure consistencywith PRSP to ensure a strategic link between resource allocation and poverty reduction.
7. Options on Full Financing of the PRSP: Full financing of PRSP targets/requirements hasimplications on resource mobilization vis-a-vis attainment of the targets. Various financing optionswill need to be considered if the estimated resource gap of 3% of GDP is to be mobilized. Theoptions include: reducing the PRSP targets or lengthen the period over which targets are to beachieved, or raise more domestic resources or through borrowing (external/internal) but withoutprejudicing macroeconomic stability.
8. Dealing With the Problems Associated with the Cash Budget System: The cash budget systemhas allowed Tanzania to achieve macro stability and increase discipline in budget management.However, the system denies flexibility in terns of informed planning. The cash budget creates aconsiderable level of stress to the budget, taking no account of lumpiness of expenditure or the abilityto implement programs in an environment of uncertain/irregular/delayed funding. Governmentshould explore possible feasible options in dealing with the problem of cash flows. The challengefacing Tanzania is how to move from the cash budget system to a flexible budget system hinged oncredible government institutions. There is a need to address issues of budget management stress fromthe cash-budget system by: (i) revisiting prioritization by type of categories of spending and bringingto fist charge items like utilities and automatic catering and upkeep; (ii) cash flow planning, and (iii)creating a disincentive for accumulation of arrears.
9. Need to Address Weaknesses in the Financial Sector for Poverty Reduction: The financialsystem in Tanzania is not sufficiently deep, even by the standard of developing countries; so that theimpact of financial intermediation on the growth of the economy and poverty reduction is still low.
10. Strengthening Public Financial Management: While the establishment of the IFMS has greatlyenhanced the Treasury's capacity in managing Government finances, lack of ownership of thesystem threatens its sustainability in the long term and makes the system susceptible to potentialbreakdowns and/or sabotage. More training is needed together with the roll-out of IFMS andenhancing staff motivation of staff in Government generally.
11. Monitoring of Expenditure Impact: As progress is being made in sharpening poverty-focusedpriorities and expenditure allocations, increased emphasis will need to be paid to the monitoring ofthe impact of public expenditures. This should include further tracking studies and service deliverysurveys as well as participatory monitoring and evaluation.
12. Enhance Transparency and Information on Expenditure Releases to Recipients andBeneficiaries: A key measure to improve accountability for the use of resources is to provide theintended beneficiaries with information about funds made available from the Central Government forspecific purposes and beneficiaries.
13. Greater Attention to Local Authorities: It should be ensured that the' public expendituremanagement process takes reforms under the Local Government Reform Program adequately intoaccount. Providing some form of debt relief to local authorities who are burdened with high levels ofarrears and debts should be seriously considered.
ix
14. Need to pay Greater Attention to the Close Link Between Poverty and the Environment:There is a realization that poverty and the environment are intricately linked, so that greater attentionto this close link deserves greater attention in the poverty reduction drive.
15. Decisive and Immediate Action Needed Against HIV/AIDS: Decisive and immediate actionagainst HIV/AIDS is necessary and should be fully funded by GOT and donors.
16. Continue Mainstreaming of Gender in the Government Budget
17. Implementation of the Pay Reform Requires More Impetus: Progress is being made regardingthe Public Service Reform Program. Donors were asked to discontinue Local Cost Compensation(LCC) and support the Selective Accelerated Salaty Enhancement (SASE) scheme.
CHALLENGES FOR THE FUTURE
Overall the government has maintained good progress towards the use of the MTEF as a strategicallocation instrument and has this year turned its focus to adapting the MTEF formulation to thePRSP process. The key challenge is to further strengthen links with Sector Development programs,particularly where these were developed prior to the advent of the PRSP and further improving thecosting of realistic requirements (including consistency with absorptive capacity) for achievingpoverty reducing outcomes.
The core pillar for improving public financial accountability remains the implementation of theIntegrated Financial Management System. Very good progress has been made in rolling this out toall central government agencies, which together account for nearly 80 percent of all resourcesmobilized through the Exchequer. Rolling out the IFMS to all LAs would also go a long way inimproving financial management at the sub-national level. This is a challenge that has to be faced byGOT.
Results from the expenditure tracking studies and from the participatory CFAA underline the value ofmaking service delivery surveys and expenditure tracking part of a routine annual assessment of theeffectiveness of public spending. This is particularly important in view of the growing role of sub-national authorities and local communities in delivering/organizing essential services withoutadequate capacity and systems for financial management.
A long step forward has been an agreement and initial steps to address the vexing problem of tightcash budget and its impact on limiting predictability in expenditure planning. GOT began quarterlyreleases and commitments for all priority activities since December 2000 and has committed to staywith this practice. GOT has also embarked on a system of cash flow planning and adopted measuresfor smoothing cash availability. The extension of this practice to non-priority sectors and preventingthe build up of new arrears will reduce pressures on cash flow management.
The PER process and dialogue seems to be paying off in terms of improving both predictability andflexibility of budgets. A larger proportion of recorded loans and grants is now being provided asbudget support and a larger proportion of the external resources are integrated through the Exchequer(including the development budget). There is still a long way to go but progress has been substantialand the dialogue is at least taking place on the same platform. This raises the stakes for improvingthe integrity of financial management and result-orientation to provide the necessary comfort to makefurther strides.
Finally, it is pertinent that the PER working group learns from past experience and continuouslyimproves the PER process, to ensure that the process significantly contributes to enhancing thegovernment's budget process.
x
1. OBJECTIVES, METHODOLOGY AND CONTEXT OF THEFY01 PER
1.1 INTRODUCTION
1.1 This introductory chapter presents the objectives, methodology and context of the Tanzaniapublic expenditure review (PER) FYOI. It highlights the sharper poverty focus adopted under thePER FYO] with the advent of the PRSP process and related sector development programs (SDPs). Italso explains how the PRSP process influenced (i) strategic resource allocation; (ii) budget flexibilityand accountability; and (iii) the development of a poverty focused medium term expenditureframework (MTEF) using the updated and fully costed PRSP targets. The chapter also highlightssome special events that had an important impact on public expenditure including: the second multi-party general elections in October 2000, commitment to intensify the fight against HIV/AIDS,ratification of the East African Cooperation (EAC) treaty in July 2000, Tanzania reaching the HIPCdecision point in April 2000, and conflict in the neighboring DRC.
1.2 In the context of the government-led annual PER process, the Bank provides support to theprocess in terms of strengthening the budget management system and the annual independentassessment of budget performance. Donors and other multilateral institutions provide analyticsupport and some of them routinely join the Bank-led PER main mission to conduct an independentassessment of budget performance and public financial management. In September 2000 the teamcarried out an identification mission to agree with the government on the prospectuses andimplementation schedule of the Economic Sector Work (ESW) program for FYOI as well as actionplans and the supervision program for the adjustment lending program. More specifically, themission consulted with the government and the PER working group (which includes donors, localresearchers and civil society) on the prospectus for FYO1 to determine analytical support from theBank. The objectives and the approach to implementing PER FY01, presented below, were guidedby the findings from this identification mission.
1.2 OBJECTIVES
As in the previous years, the PER FYO had the interrelated twin objectives of (a) providing supportto the budget process in Tanzania and (b) carrying out an external review of budget performance.
(a) Support for strengthening the budget process and public financial management
1.3 The overall objective was to support the government's effort to improve the quality of itsbudget preparation and reflect explicitly the strategic public expenditure issues identified in thePRSP. The specific targets were to (i) engender strategic allocation of public resources throughprioritization, and ensure that the overall spending program is consistent with maintainingmacroeconomic stability; (ii) improve the predictability and integrity of budgets through theconsolidation of the MTEF process; and (iii) adapt the PER process to support the implementation ofthe PRSP and institute pro-poor tracking of expenditure.
(b) Assessment of budget performance and arising issues
1.4 As in the previous years, a traditional task of the PER FY01 was to carry out an independentassessment of budget performance for FYOO and the first quarter of FYOI. The specific aims were (i)to assess the consistency of budget allocations with the objectives of poverty reduction and economicgrowth, (ii) to review the extent to which actual spending corresponds to government plans andbudget in terms of both levels and composition of spending; (iii) assess the efficacy of government
I

spending as evaluated by the Controller and Auditor General and other stakeholders; and (iv) identifythe major concerns and issues arising from the reviews for future action. The findings would formthe basis for recommendations for improving public financial management. For the FYOI PER, theexternal review intended to focus on three specific budget management issues:
Downward drift of domestic revenue
1.5 A frequently mentioned concern is the downward drift of the revenue effort in the past threeyears. Previous analysis has focused on factors related to the efficacy of tax administration. Themission planned to investigate more comprehensively the main causes of this drift and specificallyfocus on the consequences of two phenomena: (i) the impact of past and prospective policy actions (e.g. tariff compressionAiberalization, investment related tax exemptions and privatization); and (ii)the fact that GDP may be expanding faster than the tax base as mining and tourism (enjoying majortax exemptions) dominate the growth process.
Dealing with the negative consequences of the cash budget system
1.6 Previous PERs (based on reports from spending units) and an IMF mission report iin early2001 expressed concerns regarding the negative consequences of the rigidity of the cash budgetsystem under which monthly expenditure releases are based on average revenue collection in thepreceding three months. These consequences were primarily the unpredictability in expenditureplanning and pressures for building up arrears through budget commitments made outside the officialsystem. The FY01 PER set out to (i) explore the desirability and feasibility of integrating cash flowplans into the MTEF process to provide a better basis for overall cash flow projections andmanagement; (ii) explore with the Ministry of Finance, donors and the Bank of Tanzania the feasibleoptions for bridging intra-year cash flow gaps; and (iii) investigate the most effective and 'durableway for dealing with the problem of accumulating arrears focusing on sources of such commitmentsand ways for plugging avenues for making commitments outside the system, whereby emphasiswould be placed on minimizing the moral hazard problem of bail outs.
Financial management at local government level
1.7 The PRSP and a variety of other reports prepared under the Local Government ReformProgram emphasize the need for improving financial management at the local government level, asLocal Authorities increasingly assume the primary responsibility for the delivery of essential publicservices. A World Bank study on decentralization in Tanzania further underscored this concern.Building on these reports, the FY01 PER aimed to make an on the ground assessment of the status ofthe financial management system and review progress in strengthening the system. Morespecifically, it set out to assess (i) the effectiveness and capacity for the use of a bottom-up approachin expenditure planning by reviewing the expenditure prioritization process and the extent andreasons for variance between requirements and approvals of expenditure; (ii) the frequency andquality of quarterly and annual financial reporting and feedback from supervisors; (iii) the efficacy ofthe supervisory functions in budgeting and financial reporting/accountability systems of the localauthorities.
1.3 METHODOLOGY
1.8 Bank support to the Tanzania PER is provided in the context of the annual PER process,which now has been in place for three years. This process has two overlapping main phases. Thefirst phase focuses on technical work for strengthening budget management and feeds into thepreparation of budget frame/MTEF. The second phase combines evaluative work and openconsultation on strategic resource allocation, prioritization and budget management issues.
1.9 During the first phase the Bank's contribution was mainly in the form of providing inputs tothe Budget Guidelines Committee in setting the budget framework, expenditure ceilings, and broad
2
cross-sector prioritization for the Tanzania FY02 - FY04 MTEF and the budget for FY02. In thisrespect the Bank team working with others in the PER Working Group, supported work on resourceand expenditure projections consistent with the macroeconomic frame agreed with the IMF and withindicative external finance. In this task, emphasis was placed on reviewing progress and providingsupport to the costing of programs for meeting poverty reduction targets set out in the PRSP. It isimportant to note that at this analytic stage the PER process leverages substantial professional andfinancial resources from donors and other stakeholders.
1.10 In phase two of the PER process for FYOI, the Bank's main contribution was to lead theindependent external evaluation (PER main mission) to (a) assess the consistency of budgetaryallocations with growth and poverty reduction objectives, (b) review the extent to which actualspending corresponds to government plans and budgets in terms of both levels and the composition ofspending, (c) assess the efficacy of central and local government budget management, (d) review thepoverty-focus of the MTEF in line with the PRSP targets, (e) evaluate the openness of the budgetprocess to consultation with all stakeholders, and (f) identify major concerns and issues (both cross-sectoral and sector-specific) in the area of public expenditure management. The findings from thisreview and other analytic evaluative studies, e.g. expenditure tracking and budget sustainabilityassessment, are coalesced into papers for discussion during the annual PER consultative meetingduring which, the government conducts an open review of past performance and its plans for thefuture. The open review involves a wide range of participants including the press, parliamentarycommittees, civil society, donors, government at all levels, the private sector and researchers.
1.4 THE CONTEXT
Initial poverty reduction efforts
1.11 Poverty reduction has been a key policy objective in Tanzania since Independence. Duringthe 1970s and 1980s, under the socialist regime, poverty eradication was embraced as the main goalof development. The strategy adopted comprised income distribution and high aid intensity tosupport public spending programs on social services. This strategy yielded significant improvementsin human development indicators. However, the strategy did not give due emphasis to economicgrowth. As a result these achievements could not be sustained as requirements for maintenance andoperation of the largely-foreign-funded capacity expansion programs by far exceeded growth in thedomestic resource base.
Pre-PRSP poverty reduction initiatives
1.12 More recent efforts to tackle poverty predate the PRSP. The following initiatives were mostprominent in preparing the ground for the PRSP: (i) The National Development Vision 2025, set thenational aspirations and the way to attain a middle-income status by 2025. (ii) The National PovertyEradication Strategy (NPES) set out objectives, indicators and targets for eradicating abject povertyby 2010. (iii) Sector-wide programs (SWAPs) beginning with one for the health sector, aimed tofacilitate prioritization, improved resource allocation, improved aid coordination and nationalownership of the development programs. (iv) The Tanzania Assistance Strategy (TAS) is a medium-term strategy encompassing joint efforts of the government and the international community, apartnership approach with enhanced Tanzanian ownership of her development agenda, and enhancedtransparency in the conduct and application of aid, with a view to increasing the effectiveness of aidfor poverty reduction. (v) The PER process focused on evaluating and supporting the development ofstrategic public expenditure allocation and monitoring through the medium-term expenditureframework (MTEF). The process emphasized the impact of public expenditures on povertyreduction, bringing the review of the integrity and effectiveness of public spending into the publicdomain, and enhancing the efficacy of public service delivery. (vi) The Local Government ReformProgram (LGRP) devolves the responsibility and the means for the delivery of basic social and
3
infrastructure services to the local level in order to achieve greater efficiency and accountability inservice delivery and to empower local communities.
Advent of the PRSP and sharper poverty focus
1.13 While the PRSP is complementary to the earlier initiatives, it attempts to address the tensionbetween what the sector programs consider to be ideal and what can realistically be achieved. ThePRSP stresses that the policy menu should be limited and priorities should be highly focused onpoverty reduction. While the PRSP is based on a long-term perspective, reflected in the NationalVision 2025 and the National Poverty Eradication Strategy, it has translated long-term goals intoannual monitorable targets covering a three-year horizon in the framework of the MTEF. There areseveral important aspects to the development of this framework in Tanzania:
* First, the MTEF embodies a strategic approach to public expenditure allocation according todefined priorities and ensures consistency with macroeconomic stability necessary for sustainedgrowth. In Tanzania, the MTEF, which predates the PRSP, is the basis for applying the strategicresource allocation approach in the annual budgeting process.
* Second, as limited public resources (both domestic and external) are expected to play a pivotalrole in financing the poverty reduction strategy, the planning framework, notably the sector-wideprograms, are being brought under the discipline of the overall hard budget constraint. Furthermore,the preparation of sector programs takes into account human and institutional capacity limitations.
* Third, the evaluation of the implementation of the PRSP will incorporate an assessment of theimpact of actions taken. This builds on the experience from the past two years when, under theMultilateral Debt Fund facility (MDF), prioritization and protection of social sectors in publicspending was monitored on a quarterly basis. The MTEF and the budget provided the benchmarksfor evaluation. The MDF has now been transformed into Poverty Reduction Budget Support (PRBS),as Tanzania has qualified for debt relief under the enhanced HIPC initiative. However, monitoringmechanisms developed under the MDF will continue to play a central role under new budget supportmechanisms such as the PRBS or the Bank's planned Poverty Reduction Support Credit.
e* Fourth, the existing sector-wide programs will be recast and new ones developed guided bypriorities defined by the national poverty reduction strategy. The PRSP targets serve as a guide in themedium term and the NESP for longer term targets and objectives. In this approach, the PRSP setsthe framework for other development programs, while it is also a product of those plans. Given thehard budget constraint, the most appropriate framework for ensuring consistency between SWAPsand the PRS targets is the MTEF/PER process.
* While the implementation of the PRSP envisages a shift in focus from input to results/impactorientation, the ability to carry out the needed analytical work is uneven across sectors and acrosslevels of government. In this context, strengthening capacity is critical. Judging from the work thathas been carried out on the various sector strategies, the desired financing of the programs farexceeds the levels consistent with the available and projected resource envelope. This underpins thenecessity to make a further distinction between "priority" poverty reducing expenditures, to becovered under the government budget, and "other" expenditures to be funded as additional resourcesbecome available, resources from the private sector and self-generated funds. In this regard, thegovernment of Tanzania has continued to urge development partners to channel most of theirfinancial assistance through the budget to facilitate the planning and prioritization of the povertyreduction program, and simplify aid disbursement procedures and thereby foster government budgetflexibility and accountability.
4

1.5 SPECIAL EVENTS THAT INFLUENCED PUBLIC EXPENDITURE DURING FY01
2000 General elections
1.14 The FY01 PER and budget took into account the government's commitments andexpectations. One major commitment was that of financing the second multi-party general electionswhich combined Presidential, Parliamentary and civic elections in October 2000. The governmentallocated Tshs.45.8 billion to cater for activities like registration of voters, preparation of pollingstations and voting materials, and allowances for election officers.
Interim HIPC relief
1.15 The preparation of the budget for FY01 and the related MTEF took into account theavailability of interim HIPC debt relief following the Tanzania reaching the decision point in April2000. This enabled the government to enhance outlays (in real terms) to the priority sectors so as toimprove the provision of social services which have a direct bearing on the living standard andcapabilities of the poor. In this regard, the exercise of firming up the macro frame under the PERFY01 process involved the development of a high case scenario to take into account additionalresource projections from the enhanced HIPC debt relief.
Full PRSP
1.16 The government prepared a PRSP to address poverty issues in the context of the enhancedHIPC initiative. The process of preparing the PRSP had important expenditure implications duringFY01, considering that the PRSP was to be generated through a participatory process whichnecessitated among others, conducting several zonal and national workshops to canvass views fromall stakeholders including central and local governments, the private sector, NGOs, cooperativesocieties, and faith groups so as to arrive at a national consensus. The PRSP also set targets forpoverty reduction in the medium term, necessitating a re-benchmarking of the MTEF after fullycosting the means for achieving the targets.
Commitment to intensify the fight against HI VIAIDS
1.17 One of the major thrusts of the FY01 budget was to reduce the spread of the HIV/AIDSpandemic. Consequently, in order to give HIV/AIDS the necessary attention in governmentexpenditure programs, each ministry, department and region was required to allocate funds for thisactivity under the MTEF. In addition, the PER working group commissioned a study whose mainobjective was to develop an MTEF for a multi-sectoral HIV/AIDS response.
Other events
1.18 Other events that influenced public expenditure during FY01 include the ratificationof the East African Cooperation (EAC) treaty in July 2000, the preparation of the firstmedium term plan for the implementation of the National Development Vision 2025 andcontinued civil conflict in the neighboring Democratic Republic of Congo (DRC), Burundi andRwanda.
5
2. EVALUATION OF THE TANZANIA PER PROCESS SINCEFY98
2.1 THE PER PROCESS IN RETROSPECT
Introduction
2.1 Since FY98, the government of Tanzania working in partnership with the World Bank, otherdevelopment partners/donors and local stakeholders, has undertaken PERs, which have greatlyinfluenced pertinent public policy formulation and budget management. This chapter outlines theevolution of a participatory PER process in Tanzania adopted since FY98 to assess the usefulness ofthe PER and the associated MTEF process in terms of improving the quality of budget managementand policy making. The assessment begins with an evaluation of the PER process, in the light of thecontext and objectives discussed in Chapter 1, and taking a retrospective look at the previous PER interms of process as well as results. The focus then turns to the FY01 PER, covering the adoption anddeepening of the PER and MTEF process; supportive technical & sector studies (including a synopsisof content); policy pressure from the PER working group (WG) on foreign resources disclosure andinclusion into the GOT budget; poverty focus of PER FY01 taking into account the context and keyevents; and analytic support provided. The evaluation is also cast in terms of issues raised, progressmade to date regarding flexibility, predictability and budget accountability; and with respect totranslating the MTEF into the budget. Finally the chapter draws up some important lessons to informthe future PER process.
2.2 Objectives and Organizational Framework: Prior to 1998 the PER was largely external tothe Tanzanian government and most stakeholders. Besides not being effectively coordinated withgovernment processes, local ownership was also weak and as a result, the whole exercise hadminimal impact. The new PER approach adopted since 1998 in Tanzania has had four main strategicand operational objectives. First, over the past three years the PER process has focused onstrengthening public accountability systems and on entrenching the participatory culture in assessingmanagement and operational efficiency of budgets through primarily opening up the PER process tothe public under the leadership of the government, and retaining the component of "external (togovernment) evaluation of budget performance" as a key feedback/peer review mechanism to thegovernment. The second main purpose has been to encourage the adoption of a strategic approach toallocation of public resources through prioritization, and ensuring that the overall spending programis consistent with maintaining macroeconomic stability. The third objective has been to improve thepredictability and integrity of budgets through the adoption of a medium term horizon in expenditureallocation, and the integration of sector programs as well as external finance into the MTEF. Thefourth major objective has been to strengthen the institutional, legal and personnel capacity forimproved budget management and effectiveness of public spending. More recently (beginning FY01), the PER has evolved a step further to take on board poverty concerns as the overriding objective.
2.3 The Process: In Tanzania the PER has now been adopted as the main routine instrument forannual open review of budget performance and identifying critical strategic issues for improvingefficacy of public spending programs. The medium term approach to strategic allocation, prioritysetting, and integration of sector programs into the overall budget frame have become increasinglyroutine. The two-phase approach to the process that was introduced in 1998 has been retained. Thefirst phase focuses on technical work for strengthening budget management and feeding into the
6
preparation of the budget frame/MTEF. The second phase combines evaluative work and openconsultation on strategic resource allocation, prioritization and budget management issues. The PERWorking Group (WG), chaired by the GoT and involving sector representatives, donors, researchers,civil society and private sector, is the focal organizational point for the process. It meets once everyfortnight and is responsible for managing the whole process.
2.4 The annual process begins with the approval of the prospectus (by the WG) for the year'sPER process (August/September) taking into account lessons from the previous year. The WG thencommissions and organizes finance as well as peer review for the technical studies (September -
February/March); provides inputs to the Budget Guidelines Committee based on studies, analysis byits own Macro Group and external review of performance (conducted in a World Bank-led donormission) (December/January); facilitates the preparation of cross-sector and sector MTEFs usingoutputs from technical studies (February-April); and organizes an open review (PER consultativemeeting) in May to review strategic prioritization and budget management issues. The open reviewinvolves a wide range of participants including the press, parliamentary committees, civil society,donors, government at all levels, the private sector and researchers. The meeting is co-chaired by thePermanent Secretary Ministry of Finance and the World Bank Country Director. The WG then seesto the preparation of the PER report incorporating suggestions/views from the open review meeting.It is important to note that the PER leverages substantial professional and financial resources fromdonors and other stakeholders. The two-phase PER process followed in Tanzania has had theadvantage of providing constant feedback from one phase to another as well as informing decisionmaking throughout the budget cycle.
2.2 FY01 PER
2.5 The PER process for FY01 was initiated in early September with the first meeting of the PERworking group (WG). The WG continued to be chaired by the Deputy Permanent Secretary (DPS),Ministry of Finance (MOF). The composition of the WG expanded compared to the previous PERcycle and now draws members from a broad range of stakeholders including the central and localgovernment, bilateral and multilateral donors, research and academic institutions, private sector, civilsociety and NGOs. The key tasks of the WG included (i) drawing-up the prospectus of PER FY01and MTEF work for the year; (ii) reviewing the terms of reference for the sector PER FY00 updatework and supportive technical studies; (iii) peer-reviewing of all the interim or inception reports; (iv)soliciting and consolidating projected donor disbursements for purposes of firming-up the budgetframe numbers; (v) wider dissemination of the major outputs of the PER process by members of theWG to their constituencies through regular briefings, sector working groups, seminars andworkshops; and (vi) performing the oversight function over the PER process.
2.6 The WG has a macro sub-group and several sector working groups. During FY01, the macrosub-group was chaired by the Deputy Permanent Secretary - Ministry of Finance, while during theprevious PERs it was chaired by a representative from the Netherlands Embassy. Other members ofthe macro sub-group from the government side included the Commissioner for Budget,Commissioner for Policy Analysis, Commissioner for External Finance, a representative from thePresident's Office - Planning and Privatization, and the Bank of Tanzania. Non-governmentmembers are drawn from the World Bank, IMF, European Commission, UNDP, UNICEF, DFID,SDC, CIDA, Norway, Sweden, Denmark, The Netherlands and, JICA/Japan. Key tasks performed bythe macro sub-group during FY01 include preparation of the terms of reference and peer-review oftwo studies on overall budget sustainability; commenting on the draft Budget Guidelines regardingomissions and concerns before Cabinet approval; soliciting indications of external support over theMTEF period (by donor, sector, on/off exchequer, and project/program); developing guidelines forthe full costing of the requirements to meet PRSP targets and checking for consistency of thenumbers with respect to commitments made in the PRSP; and developing the structure andpresentational formats of MTEFs for the PER consultative meeting.
7
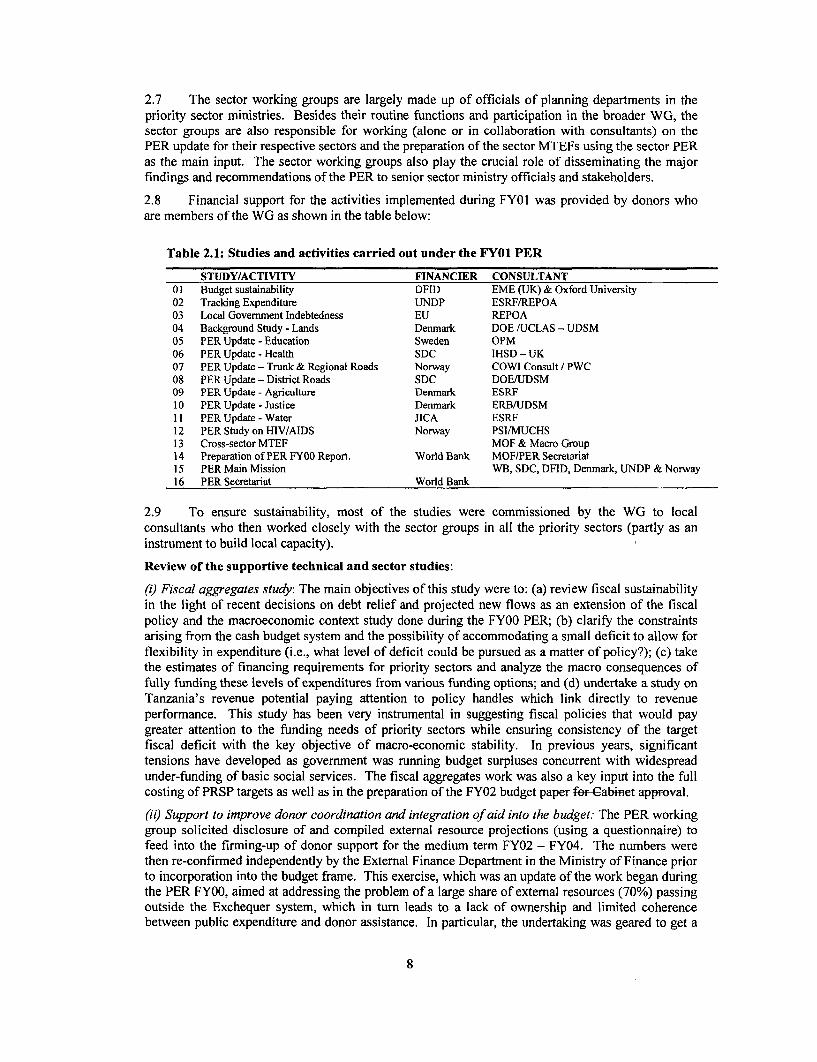
2.7 The sector working groups are largely made up of officials of planning departments in thepriority sector ministries. Besides their routine functions and participation in the broader WG, thesector groups are also responsible for working (alone or in collaboration with consultants) on thePER update for their respective sectors and the preparation of the sector MTEFs using the sector PERas the main input. The sector working groups also play the crucial role of disseminating the majorfindings and recommendations of the PER to senior sector ministry officials and stakeholders.
2.8 Financial support for the activities implemented during FY01 was provided by donors whoare members of the WG as shown in the table below:
Table 2.1: Studies and activities carried out under the FY01 PER
STUDY/ACTIVITY FINANCIER CONSULTANT01 Budget sustainability DFID EME (UK) & Oxford University02 Tracking Expenditure UNDP ESRF/REPOA03 Local Government Indebtedness EU REPOA04 Background Study - Lands Denmark DOE /UCLAS - UDSM05 PER Update - Education Sweden OPM06 PER Update - Health SDC IHSD - UK07 PER Update - Trunk & Regional Roads Norway COWI Consult / PWC08 PER Update - District Roads SDC DOE/UDSM09 PER Update - Agriculture Denmark ESRF1 0 PER Update - Justice Denmark ERB/UDSM11 PER Update - Water JICA ESRF12 PER Study on HIV/AIDS Norway PSI/MUCHS13 Cross-sector MTEF MOF & Macro Group14 Preparation of PER FY00 Report. World Bank MOF/PER Secretariat15 PER Main Mission WB, SDC, DFID, Denmark, UNDP & Norway16 PER Secretariat World Bank
2.9 To ensure sustainability, most of the studies were commissioned by the WG to localconsultants who then worked closely with the sector groups in all the priority sectors (partly as aninstrument to build local capacity).
Review of the supportive technical and sector studies:
(i) Fiscal aggregates study: The main objectives of this study were to: (a) review fiscal sustainabilityin the light of recent decisions on debt relief and projected new flows as an extension of the fiscalpolicy and the macroeconomic context study done during the FY00 PER; (b) clarify the constraintsarising from the cash budget system and the possibility of accommodating a small deficit to allow forflexibility in expenditure (i.e., what level of deficit could be pursued as a matter of policy?); (c) takethe estimates of financing requirements for priority sectors and analyze the macro consequences offully funding these levels of expenditures from various funding options; and (d) undertake a study onTanzania's revenue potential paying attention to policy handles which link directly to revenueperformance. This study has been very instrumental in suggesting fiscal policies that would paygreater attention to the funding needs of priority sectors while ensuring consistency of the targetfiscal deficit with the key objective of macro-economic stability. In previous years, significanttensions have developed as government was running budget surpluses concurrent with widespreadunder-funding of basic social services. The fiscal aggregates work was also a key input into the fullcosting of PRSP targets as well as in the preparation of the FY02 budget paper for-Cabinet approval.
(ii) Support to improve donor coordination and integration of aid into the budget: The PER workinggroup solicited disclosure of and compiled external resource projections (using a questionnaire) tofeed into the firming-up of donor support for the medium term FY02 - FY04. The numbers werethen re-confirmed independently by the External Finance Department in the Ministry of Finance priorto incorporation into the budget frame. This exercise, which was an update of the work began duringthe PER FY00, aimed at addressing the problem of a large share of external resources (70%) passingoutside the Exchequer system, which in turn leads to a lack of ownership and limited coherencebetween public expenditure and donor assistance. In particular, the undertaking was geared to get a
8

better feel of the development resource envelope, in order to integrate the development budget intothe whole resource envelope rather than treating it as a residual.
(iii) Tracking expenditure allocation and its effectiveness in reducing poverty: Considering thatthe government of Tanzania has targeted its allocation of resources to poverty reducingactivities/sectors under the PRSP, under the PER FYOI a study was implemented to track suchexpenditures to ascertain whether they reach service delivery units and have the expected impact interms of improved service delivery and poverty reduction. The cverall aim of the study was to assessthe efficacy of pro-poor budget execution, focussing on primary education and health care. The studyentailed a review of government disbursements and of the flow of materials and supplies, as well asreporting systems. The field survey covered the central government (ministries of finance, education,health, water and regional administration and local government), five local authorities (Babati,Kisarawe and Dodoma rural councils and Mtwara and Kigoma urban councils) and service units.
(iv) PER FYOO update work, costing of PRSP Targets and development of MTEFs: The WGprovided support to the government in preparing seven sector MTEFs for the priority sectors(education, health, water, roads, agriculture, the judiciary, and lands) and the cross-sector MTEF.The work involved oversight and peer review of sector PER update work on priority expenditureneeds and priorities right from the terms of reference to the final reports to feed into the developmentof improved sector MTEFs and the budget for FY02. In addition, the PER FYOI process focusedparticularly on poverty reduction. As part of the PER update work, the WG also prepared genericguidelines to be used by sectors and consultants to prepare full costing of priority sector requirementsin four steps:
Step 1: Identification of targets for the medium term (2001/02 -2003/04) from the PRSP for thepriority sectors and activities (health, education, water, rural roads, agriculture, judiciary andHIV/AIDS).
Step 2: Estimation of the requirements for meeting the targets and costs of implementing the actionprograms identified in the PRSP using projected /updated unit costs.
Step 3: Generation of scenarios for achieving the targets subject to the projected resource constraint(per Budget Guidelines and with additional 10 percent increase in the resource envelope) andimplementation capacity constraints, while pointing out the assumptions and trade-offs (includingefficiency gains) involved in the different scenarios. In assessing the scenarios, sectors were asked tospell out clearly what the government of Tanzania would need in the light of what other players(private sector, NGOs, religious institutions etc.) are doing/providing and, additional resourcesrequired to meet the optimal levels of service provision.
Step 4: Recommendation on the optimum expenditure frame and any suggestions for revisiting timingand phasing of activities; and identify resource and capacity gaps for achieving the most desired longterm scenario. The first round of checking for consistency of the full costing requirements with theoverall resource envelope, and recommendations on any additional financing strategies weresubsequently done at the aggregation stage during the preparation of the cross-sector MTEF.
(v) Study on HIV/AIDS: This study addressed issues related to effective financing of HIV/AIDSactivities by different sectors and organizations in Tanzania. The study covered the experience offinancing HIV/AIDS activities during FYOI with the view to propose improved mechanisms for theeffective financing of HIV/AIDS activities and effective ways of disbursing, utilization andaccounting of resources and funds according to government budgetary standards. The study alsodeveloped an MTEF for the multi-sectoral HIV/AIDS response and made recommendations onstrengthening planning and budgeting of HIV/AIDS in the context of the future MTEF rounds.
(vi) Study on local authorities indebtedness: In many local authorities (LAs) the financialrequirements to meet their operational requirements far exceed the resources available. This hascontributed to the build-up of arrears with private suppliers, staff and statutory bodies. It is believedthat this build up of "debts" militates against the ability of LAs to provide better services to the localpopulation. The objective of this study therefore was to examine the current level of indebtedness of
9
local government authorities and their material effects on councils' operations. The study alsoconsidered the longer term aspects of LAs viability and sustainability, including possibilities of debtrelief, grants for disadvantaged areas, revenue sharing between the center and LAs, and workablemeasures for stimulating and providing enabling conditions for expanded local activity.
(vii) External evaluation of budget performance: This is a yearly exercise which is undertaken bydonors led by the World Bank. It is a standard output of the annual PER. The major objectives of theFYOI external evaluation exercise were to undertake a review of budget performance including: (i) ananalysis of the extent to which actual spending corresponds to government plans and budget in termsof both levels and composition of spending; (ii) an assessment of the efficacy of governmentspending; (iii) the identification of the major concerns and issues in the area of public expendituremanagement; (iv) an review the poverty focus of the MTEF in line with the poverty reduction paper(PRSP) targets; and (v) an assessment of the budget and financial management capacity andconstraints in local governments.
2.3 ACHIEVEMENTS OF THE PER/MTEF PROCESS
2.10 Although it is difficult to establish a direct causal link between improvements in publicfinance management and the PER process, it is nonetheless acknowledged that significantimprovements have taken place in a number of areas which have been a central focus of the PERprocess. In general, the government owned and led PERIMTEF process, which is highlyparticipatory and transparent, has become a key instrument to inform decision making and prioritysetting on important budget issues. Specific achievements include:
* Improved prioritization and progressively increasing funding for the priority sectors:Recommendations derived from the PER work have guided strategic resource allocation.Consequently, the share of total spending on priority sectors (dominated by the socialsectors) as well as allocations to expenditures on operations and maintenance or othercharges (OC) have increased significantly over the last three years compared to before.There has also been a significant re-orientation both in terms of allocation and outturn ofdevelopment spending towards the social sectors, regions and local governments.
• Improved strategic resource allocation through the adoption of an MTEF approach: Thegovernment has maintained good progress towards the use of the MTEF as a strategicallocation instrument over the last two years and is now turning its focus to adapting theMTEF formulation to the PRSP process. Strategic resource allocation has benefited from thefeedback provided through the PER process and the greater transparency and openness in thebudget process that were facilitated through the PER process.
. Strengthening of budget management systems and institutions: Expenditure planning,execution and control has improved significantly through the adoption of the MTEF,implementation of IFMS and enactment of the Public Finance Act 2001 and the PublicProcurement Act 2001. The PER process has been used as one of the instruments to follow-up implementation and roll-out of IFMS to all ministries, regions and local authorities.
* Flexibility, predictability and budget accountability: There has been significant improvementin the predictability and availability of funds for OC and development expenditure comparedto previous years. The discrepancy between budget allocations and actual expenditures hasnarrowed down. This is the result of various factors, including more realistic budgetprojections, better expenditure estimates, and a broader consensus on expenditure prioritieswhich reduced the need for post-budget reallocations. In response to the policy dialogueconducted under the PER, government has commitment and implemented a three monthsexpenditure commitment system and quarterly releases of OC to all priority sectors sinceDecember 2000. In addition government has began to publish all allocations in the newsmedia by ministry, local authority and for the key priority sectors.
10

* Overall fiscal sustainability: The PER process has broadened the discussion on fiscalstability through analytical work that outlines an expanded range of fiscal policies that areconsistent with overall fiscal sustainability. As a consequence, the policy dialogue has nowevolved from focusing on simple deficit targets to a more complex framework that tries toreconcile funding requirements for basic social services under the PRSP with the objective ofmaintaining fiscal stability.
* Poverty focus of public expenditures: Analytical work done under the PER has highlightedthe point that government expenditures have a significant impact on poverty reduction andhence the need to make improvements in the quality of expenditure a government priority. Inthis regard, the PER process has provided important inputs for the design, update andmonitoring of the Tanzania PRSP, which has become the national framework forimplementing poverty reduction measures and a benchmark document for prioritizingexpenditures.
* The PERIMTEF process as a coordinating toolfor various other initiatives: The PER/MTEFprocess is now widely regarded as the main framework for coordinating and harmonizingother initiatives including PRSP, Country Financial Accountability Assessment (CFAA), andSector Development Programs (SDPs). The PER/ MTEF process has also given moreimpetus to the Poverty Reduction Budget Support (PRBS) approach as an instrument toensure that adequate resources are allocated to priority sectors through the budget in supportof the poverty reduction strategy.
* Improved information flow and aid coordination: The opening up of the budget processthrough the PER process has led to improved information flows between Treasury, sectoralministries, donors, and other stakeholders. Furthermore, improvements in foreign resourcedisclosure and reporting on aid flows under the PER process have considerably strengthenedthe information base for government budgeting. The PER process and measures to improvebudget management have also improved donor confidence and motivated a greater share ofdonor assistance provided in the form of budget support or channeled through the budget,thus limiting transaction cost and enhancing government ownership. In that regard, theMTEF process associated with the PER now offers an instrument for aid coordination and forensuring consistency with macroeconomic stability. The influence of the PER in shapingrecent macroeconomic developments is significant. For example, once the foreign resourceprojections were agreed to by the WG, the Ministry of Finance adopted the numbers asindicative resource flows to Tanzania. These were re-confirmed with individual donors aftermaking some corrections for marginal errors based on past experience. The government alsoused the information generated by the PER process to counter-check the authenticity ofdevelopment budget data on donor project finance expected by ministries and localauthorities. Similarly, in firming-up the FY02 budget around May 2001, the governmentmade adjustments to overall sector allocations as per budget guidelines to take into accountnot only the latest information available then but also full costing of PRSP requirements doneunder the PER.
Consolidation and deepening of the PER/MTEF process: The PER has now been adopted asthe main routine instrument for annual open review of budget performance and identifyingcritical strategic issues for improving efficacy of public spending programs. The mediumterm approach to strategic allocation, priority setting, and integration of sector programs intothe overall budget frame have become increasingly routine.
Bringing systemic fiscal issues into the domain of public policy discussions: The analyticwork undertaken under the PER/MTEF process has been instrumental in raising pertinentsystemic fiscal issues for attention by the authorities and suggesting feasible options for theirresolution. Some examples include improvements in cash budget management and tacklingthe problem of arrears as a result of recommendations from the PER process in favor of front-loading of donor budgetary support to ease cash flow constraints, use of bridging finance and
11
preparation of forecasts of cash flow requirements by spending units. The analytic work hasalso been very useful in terms of revealing malpractices and weaknesses in budgetmanagement including short-term borrowing from from the road toll account for other uses;problems with accounting and disbursement of funds from the health basket fund;inadequacy of financing the road program from the Road Fund alone; potential underminingof strategic resource allocation through the mushrooming of earmarking of revenue; theplight of the development budget; and multiplicity of donor financing mechanisms
* Focus on the status of budget andfinancial management in local governments: As part of theexternal evaluative function of the PER FY00 and FY01, an on the ground assessment wasmade of the status of the budgeting process and management in LAs, problems andweaknesses, as well as efforts underway to strengthen them. The findings of this work havebeen instrumental in bringing the local government reform issues on the table for policydiscussion and to help in charting out the way forward. Work was also done to assess thegravity of local authority debts and to come-up with suggestions on how to help highlyindebted LAs while avoiding contraction of new debts.
2.4 OUTSTANDING BUDGET ISSUES AND CHALLENGES FOR FUTURE PERs
* Poor accounting and reporting of donor finance: In spite of the improvements made underthe PER with respect to the reporting of projected donor finance over the last two years, theaccounting and reporting of donor finance remains far from satisfactory. Continued dialogueunder the PER process, together with improvements in financial management, governancemore broadly, and accountability are key in resolving this problem
* Low operational efficiency: The continuing problem of low operational efficiency in publicspending mainly due to: (a) gross under-funding, partly reflected in continued variancebetween budgets and actual expenditures, leading to constraints in prioritized service delivery- the problem is more acute for maintenance as investment programs appear to face a softerfinancing constraint; (b) low predictability of resource availability partly constrainingapplication of the performance budget; (c) personnel incentive problems as civil service payhas declined in real terms over the past three years which underlines the urgency of dealingwith affordability and financing constraints to the implementation of the Medium Term PayReform (MTPR); and (d) continued weakness in financial accountability as brought out in theCAG reports particularly regarding accounts of regions and local authorities.
* Weaknesses in financial management: There remain weaknesses in financial management andthe related institutional frarnework. These include: incomplete roll-out of IFMS particularlyto the regions and LAs which limits coverage, timeliness, and cohesion of financial reporting;disconnect between the central and local government financial reporting system despite largebudget subventions to LAs and major responsibilities for basic service delivery; and the yetto be implemented link between IFMS and MTEF using the multi-year budget module in theEPICOR; as well as poor donor coordination.
* Capacity constraints: Low capacity particularly at the sector level and at the regional anddistrict levels remain as critical constraints in improving budget formulation, implementationand reporting at those levels. Weaknesses in the preparation of full costing of PRSP targetsand sector MTEFs as well as poor budgets of most local authorities were largely the result oflimited capacity and poor work incentives. This requires making an assessment of absorptivecapacity at the relevant levels and working out systematic capacity building / trainingprograms in budget management while revisiting the role of external consultants in theprocess.
* Limited dissemination andfollow-up of PER findings: Although the PER/MTEF process hasproduced a good number of reports/findings and recommendations, the follow-up mechanism
12

is still lacking and needs to be worked out. Possible considerations include MOF issuingdirectives to implementing agencies to provide formal responses and follow-up actionsduring the PER consultations. The PER technical studies could also include a summary ofmain conclusions and policy implications for wider distribution to the general public, policymakers, local authorities, Parliament and civil society.
* Phased-extension of the PER/MTEF process to lower levels of government and Zanzibar: Sofar the PER/MTEF process has not covered Zanzibar and it would be important to explore thefeasibility of expanding the PER process to Zanzibar and work out how this should be done.Aanalogously, a phased-extension of the PER/MTEF process to lower levels of governmentis needed, particularly in view of the government's firm decision to devolve more powers anddecision making to the LAs as the main arm of the government which provides basic socialservices to the population. In the interim, this calls for broader participation of LA officials(District Executive Directors, District Treasurers, Association of Local Authorities ofTanzania (ALAT) etc.) in the PER process.
* Corruption: The fight against corruption needs to be intensified, particularly in infrastructureinvestment and social service delivery.
* Fight against HIV/AIDS: Decisive and immediate action is needed against the HIV/AIDSpandemic.
* Other challenges: Other challenges that need to be addressed include: the continued problemof poor revenue performance; development of improved forecasts of cash requirements byspending units; the need to conduct regular or formalized service delivery and expendituretracking surveys or benefit-incidence studies; and the need to pay greater attention to the linkbetween poverty and the environment.
2.5 SOME LESSONS FOR THE FUTURE
* Maintaining macroeconomic stability is key: Macroeconomic stability is key for increasinggrowth and reducing poverty. Thus it is extremely important that the macro-economic gainsachieved so far in Tanzania are sustained. However, in addition, it needs to be ensured thatsuch gains are translated into poverty reduction. In order to realize growth which benefits thepoor, sustained growth in agriculture and investment in basic social services and ruralinfrastructure is paramount.
* Timing of the PER activities to dovetail well with the budget cycle: The work program of thesubsequent PERs should be developed and discussed early in the PER cycle (July/August) soas to establish clear objectives and facilitate the development of the terms of reference for theanalytic work in support of the process and subsequent preparation of the reports andMTEFs.
* Strong leadership and ownership of the process by the government and participation by allstakeholders: Strong leadership and ownership of a participatory PER process by thegovernment (central & local government and sector working groups) is fundamental for theprocess to have significant impact.
* Stronger role for the civil society: Civil society has a very important role to play, particularlyin monitoring government performance.
* Transparency in resource allocation and disbursements: If resources are to reach the poorand have impact it is necessary to safeguard transparency in both resource allocation anddisbursement. Thus, the intended beneficiaries need to be provided with information aboutfunds made available from the central government.
13

* Monitoring the impact of public expenditure: As progress is being made in sharpeningpoverty focused priorities and expenditure allocations, it becomes imperative to pay greaterattention to monitoring the impact of public expenditure in terms of poverty reduction andsocial service delivery. This calls for the need to make social service delivery surveys andexpenditure tracking part of a routine annual assessment of effectiveness in publicexpenditure.
14
3. REVIEW OF RECENT MACRO PERFORMANCE
3.1 OVERALL ECONOMIC PERFORMANCE
3.1 Tanzania's overall economic performance in recent years has remained robust. The countryis largely on track with regard to meeting macroeconomic objectives and targets of the PovertyReduction and Growth Facility (PRGF). GDP growth in the last three years has been steadily rising,estimated at 4.9 percent in 2000 compared to 4.8 percent in 1999 and 4.0 percent in 1998, led bystrong performance in exports, increased gold production and investment in tourism. The rate ofinflation has fallen significantly, reaching single digit in 1999 driven by a decline in both food andnon-food inflation rates from the last quarter of 2000. In June 2001 the annual headline inflation ratewas recorded at 5.1 percent. Sustained donor support and adherence to the cash budget managementsystem has ensured a modest fiscal surplus (after grants) amounting to about 1% of GDP in FY01.These achievements partly reflect the government's continued efforts at laying the foundation of amodern, diversified economy through accelerated implementation of structural reforms aimed atremoving the remaining constraints for private investors, increasing the efficiency of the economyand creating an environment for private sector led growth. Although private sector growth, beyondmining and tourism, has been slow in responding to the liberalization, and the inflation rate remainsabove that of Tanzania's principal trading partners, the Finance Bill for FY02 has included measuresgeared to support a continuation of Tanzania's strong macroeconomic performance in FY02 andbeyond.
3.2 FISCAL DEVELOPMENTS
3.2 The objective of fiscal discipline and macro economic stability has continued todominate government budgetary developments. In general, fiscal developments have beenencouraging. The fiscal balance improved during FY98 and FY99 recording budget surpluses (0.2 to0.4 percent of GDP, after grants). In FY00 the deficit after grants was estimated to be around 0.5percent of GDP. In FY01 the tax revenue collected have been 6 percent higher than target andexpenditures remained below the target despite the elections of October 2000. The fiscal surplus forFY01 is expected to be about 1 percent of GDP. The budget for FY01 included further steps in theongoing tax reform, including introduction of VAT on petroleum products and the elimination ofgovernment exemptions on VAT. The budget for FY02 also shows that implementation of allpriority spending programs and locally financed development spending will continue as budgeted.However, although there was substantial repayment of budgetary arrears from previous years,continuing weaknesses in public spending control led to some new arrears.
3.3 In the areas of financial management and accountability, government has rolled out thecomputerized integrated financial management system (IFMS) to all ministries and all sub-treasuries.All the ministries are on line in a centralized IFMS using the EPICOR software. Effective July 2001,the central government expenditure controls are being implemented using IFMS, both against theexchequer issues and the budget allocations. All payments and reconciliation by Bank of Tanzaniaare now done centrally. Similarly, 19 sub-treasuries are also using IFMS based on stand aloneservers and the EPICOR software. The national budget for FY02 was also prepared in IFMS.
3.4 During FY00 Tanzania also made significant strides in improving its external debtmanagement and qualified for the HIPC interim assistance and Paris Club VI debt rescheduling. Thegovernment is on track for reaching the Completion Point during the latter part of 2001 under theenhanced HIPC initiative. Significant steps have also been taken to deal with its domestic debtparticularly by reducing government arrears with the private sector and private external commercialdebt. As a result of the HIPC debt relief, the EIU forecasts that Tanzania's total external debt will
15
decline from US$7.4 billion in 2000 to US$5.8 billion in 2002, while the debt-service ratio will fallfrom 18.8% to 12.0% over the same period.
3.3 MONETARY DEVELOPMENTS
3.5 Tanzania's monetary policy has continued to aim at a low rate of inflation, with remarkableachievement in terms of lowering inflation to single-digit level even against a backdrop of higher oilprices. However, data on monetary developments indicate that broad money supply (M3) increasedduring FY00 by 21.7 % compared to FY99 mainly due to a significant increase in net foreign assets(NFA) in the Central Bank and commercial banks. The increase of NFA by 49.8% in FY00compared to only15.1% in FY99 largely reflect an increase in foreign investment activities, donorflows and earnings from tourism as well as purchase of foreign exchange by the Bank of Tanzania onthe Inter-bank Foreign Exchange Market (IFEM). Although the developments in M3 have to someextent contributed to the recent improvements in the balance of payments, higher NFA has not servedto build import capacity except for the component earned from tourism. Furthermore, thisdevelopment has generated an exogenous pressure on monetary expansion which needs to bemanaged to ensure competitiveness of the Tanzania shilling at a time of sustained donor inflows so asto smooth any sharp falls in the exchange rate. A related problem concerns the fact that the ratio ofM3 to GDP has continued to decline, leaving excess liquidity in the banking system when the privatesector remains starved of credit. Trends in interest rates have not changed much over the last twoyears. The spread between lending and deposit rates continue to be high and widening, indicatinglack of competitiveness in the banking sector and high interest risks of repayment/default. As regardsfinancial services in the economy, the rural sector remains deprived of financial services with most ofthe private banks operating only in a few urban centers. During FY00 commercial bank credit tovarious sectors increased by only 10.9 percent compared to 40.3 percent for the preceding year. Themajor beneficiaries of credit included trade, mining and manufacturing sectors. Nevertheless creditextended to the productive sector remains low and declining and thereby acts as an impediment togrowth. In particular, although overall credit to agriculture showed a slight increase during FY00, theamount directed to the purchase of agricultural products continued to decline following theliberalization of crop marketing and the decision by the government to stop providing guarantees oncommercial bank credit to cooperative unions.
3.4 EXTERNAL SECTOR DEVELOPMENTS
3.6 In the external sector the export performance has been strong, specially due to the start of thegold exports and resumption of fish exports to the European Union following lifting of the ban onsuch exports in 2000. Exports of merchandise goods increased by 21.9% in 2000 over the 1999eamings of US$543.3. Exports of services also increased by 2.6% over the same period. Theexchange rate depreciated by about 6 percent during the end of January-February, 2001, mainly amarket corrective response to a strong US$ but has remained stable since then around T.Sh.890 perU.S. dollar. Despite sharply lower international prices for most traditional products, exports grewand the external position improved. By end-2000, gross official reserves had reached the equivalentof 5.3 months of imports of goods and non-factor services. The current account deficit fellsubstantially from an average of about 15% of GDP during the 1990s to about 4% of GDP in 2000mainly because of a fall in the level of imports and a rise in current transfers.
3.5 STRUCTURAL REFORMS
3.7 Substantial progress in structural reforms has been made in the last few years aimed atbolstering market efficiency and private sector led growth and reducing the involvement of the publicsector in commercial activities. A majority of the banking sector now is in private hands with thesale of NBC to ABSA and the increased participation of the international banks in the country, withBarclays Bank being the newest addition to the more than 23 commercial banks now operating in the
16
country. Having divested/liquidated a large number of state owned enterprises in the manufacturingsector, the focus of the privatization program has now moved to the restructuring and divestiture oflarge utilities, especially power and water, and provision of appropriate regulatory framework togovern the operation of these liberalized sectors in a competitive environment.
3.6 Focus ON POVERTY REDUCTION
3.8 Having made significant strides in macro stability, fiscal sustainability and debt management,the government concerns have re-focused on poverty reduction. With 57 percent of the ruralpopulation living below the international poverty line of US$1 a day, poverty is predominantly a ruralphenomenon. GOT has embarked on an aggressive poverty reduction strategy, which emphasizesboth higher growth and more effective public service delivery. The poverty reduction strategyfocuses on four strategic areas, including (i) rural development; (ii) improvement in social services;(iii) private sector and infrastructure development; and, (iv) public sector reform and institutionbuilding. The strategic prioritization areas are reflected in budget for FY01 and the budget for FY02presented to Parliament in June 2001. Both emphasize further increasing public spending in thepriority sectors of primary education, primary health care, agricultural research and extension, ruralroads, the judiciary and HIV/AIDS. In addition, the budget for FY02 contains tax policy measuresthat will provide cost relief for all essential drugs and equipment to treat communicable diseases(including HIV/AIDS), provide incentives for private investment in education and in small scaleenterprise. The latter measure aims at expanding income earning opportunities for the poor.
17
4. REVIEW OF BUDGET PERFORMANCE
4.1. INTRODUCTION
4.1 This chapter presents a review of fiscal developments and expenditure management issuesand covers the fiscal year 1999/00 and the first eight months of fiscal year 2000/01. The analysisfocuses primarily on issues related to aggregate fiscal discipline and strategic allocation. Specificsectoral issues relating to the efficiency of public expenditures have been analyzed in sector specificPER updates and these reports can be obtained from the PER secretariat. Within the framework ofthe PRSP and HIPC, the monitoring of pro-poor expenditures receives increased attention. Toascertain that increased resource allocations and disbursements for pro-poor expenditures, undertakenby the Ministry of Finance lead indeed to increased resource availability at the point of servicedelivery, a pro-poor expenditure tracking study was undertaken in the framework of the PER. Theresults of this expenditure tracking study are presented in section 4 of this chapter. The chapterconcludes with a few observations on accessibility and transparency of information on publicexpenditures in Tanzania.
4.2. AGGREGATE FISCAL PERFORMANCE
Domestic Revenue and Foreign Inflows
4.2 Total revenue as a percentage of GDP continued its decline from the peak of 13.5% of GDPreached in FY97 to 12.0% in FY98 and to 11.3% in FY99 and FY00. In the first eight months ofFYOI revenue collection had slightly recovered to an annualized rate of 12.0% of GDP. Thisimprovement is mainly due to the imposition of VAT on petroleum products as a deliberate taxadministration measure aimed at curbing tax evasion on petroleum products. Underlying the declinein tax revenue over the past few years are substantial reductions in external taxes, relatively large taxincentives for new investments, the continued downsizing of the parastatal sector, and sluggishprivate sector growth which has not yet yielded enough revenue to compensate for lost revenue fromthe shrinking parastatal sector. In FY99, the bulk of the revenue shortfall was accounted for by asharp decline in revenue from other taxes, which declined from 1.8 percent of GDP in FY98 to only1.2 percent of GDP in FY99. This is mainly the result of the streamlining of the tax system and theelimination of a number of nuisance taxes. It may therefore be important to recognize that the taxsystem is still in transition such that there are temporary declines in revenue as nuisance taxes areeliminated. The expectation is that this declining trend will be reversed as the supply side responds,albeit with a lag. However, increasing tax revenue remains an important challenge in the area offiscal management, given the substantial expenditure requirements that arise in connection withgovernment's role of providing infrastructure services and basic social services in support ofeconomic growth and poverty reduction. The program of strengthening tax administration is ongoingand expected to yield tangible results over the next few years. In addition to administrativeimprovements, the streamlining of tax exemptions is another potential source for additional revenuegeneration.
18
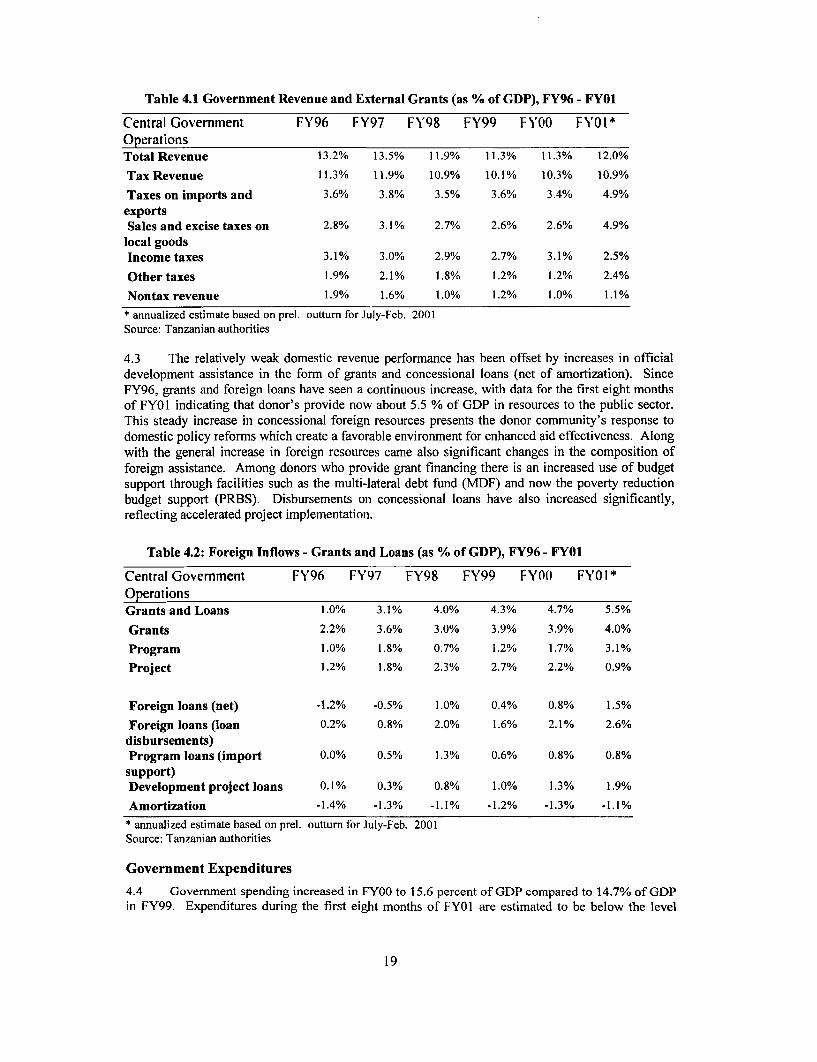
Table 4.1 Government Revenue and External Grants (as % of GDP), FY96 - FY01
Central Government FY96 FY97 FY98 FY99 F Y00 F'0l*OperationsTotal Revenue 13.2% 13.5% 11.9% 11.3% 11.3% 12.0%
TaxRevenue 11.3% 11.9% 10.9% 10.1% 10.3% 10.9%
Taxes on imports and 3.6% 3.8% 3.5% 3.6% 3.4% 4.9%exportsSales and excise taxes on 2.8% 3.1% 2.7% 2.6% 2.6% 4.9%
local goodsIncome taxes 3.1% 3.0% 2.9% 2.7% 3.1% 2.5%
Other taxes 1.9% 2.1% 1.8% 1.2% 1.2% 2.4%
Nontax revenue 1.9% 1.6% 1.0% 1.2% 1.0% 1.1%
* annualized estimate based on prel. outturn for July-Feb. 2001Source: Tanzanian authorities
4.3 The relatively weak domestic revenue performance has been offset by increases in officialdevelopment assistance in the form of grants and concessional loans (net of amortization). SinceFY96, grants and foreign loans have seen a continuous increase, with data for the first eight monthsof FY01 indicating that donor's provide now about 5.5 % of GDP in resources to the public sector.This steady increase in concessional foreign resources presents the donor community's response todomestic policy reforms which create a favorable environment for enhanced aid effectiveness. Alongwith the general increase in foreign resources came also significant changes in the composition offoreign assistance. Among donors who provide grant financing there is an increased use of budgetsupport through facilities such as the multi-lateral debt fund (MDF) and now the poverty reductionbudget support (PRBS). Disbursements on concessional loans have also increased significantly,reflecting accelerated project implementation.
Table 4.2: Foreign Inflows - Grants and Loans (as % of GDP), FY96 - FY01
Central Govemment FY96 FY97 FY98 FY99 FYO0 FY1O*OperationsGrants and Loans 1.0% 3.1% 4.0% 4.3% 4.7% 5.5%
Grants 2.2% 3.6% 3.0% 3.9% 3.9% 4.0%
Program 1.0% 1.8% 0.7% 1.2% 1.7% 3.1%
Project 1.2% 1.8% 2.3% 2.7% 2.2% 0.9%
Foreign loans (net) -1.2% -0.5% 1.0% 0.4% 0.8% 1.5%
Foreign loans (loan 0.2% 0.8% 2.0% 1.6% 2.1% 2.6%disbursements)Program loans (import 0.0% 0.5% 1.3% 0.6% 0.8% 0.8%support)Development project loans 0.1% 0.3% 0.8% 1.0% 1.3% 1.9%
Amortization -1.4% -1.3% -1.1% -1.2% -1.3% -1.1%
* annualized estimate based on prel. outturn for July-Feb. 2001Source: Tanzanian authorities
Government Expenditures
4.4 Government spending increased in FY00 to 15.6 percent of GDP compared to 14.7% of GDPin FY99. Expenditures during the first eight months of FY01 are estimated to be below the level
19
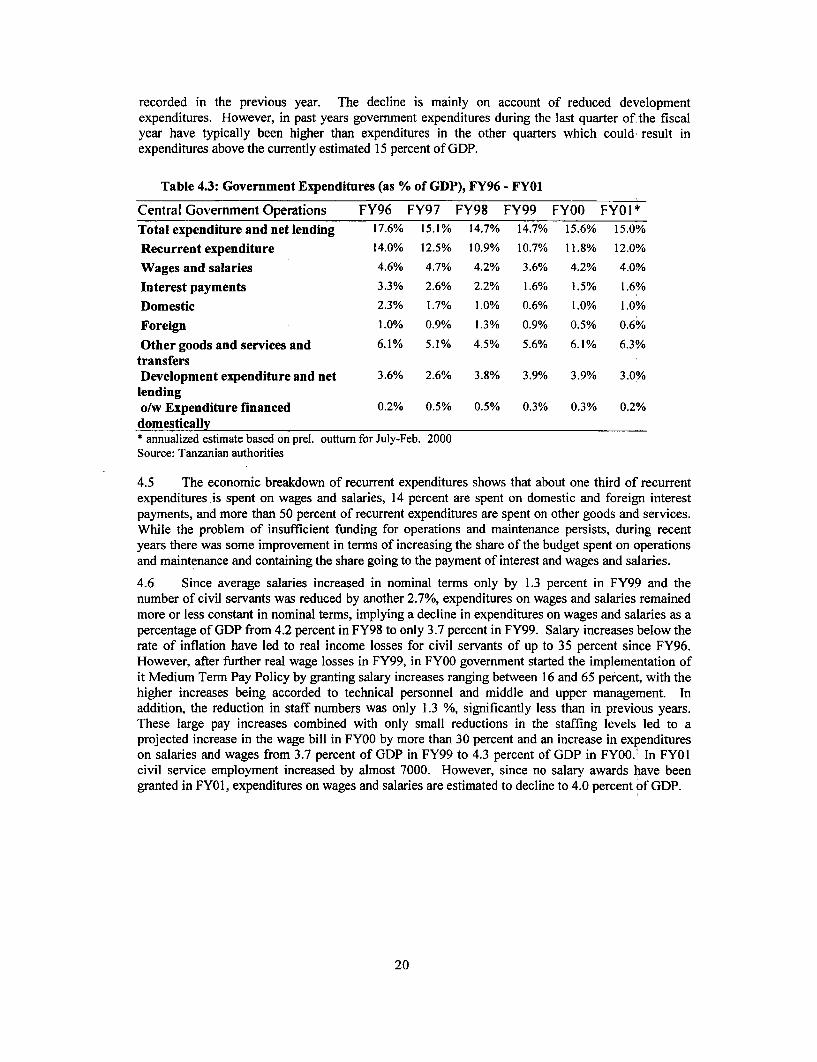
recorded in the previous year. The decline is mainly on account of reduced developmentexpenditures. However, in past years government expenditures during the last quarter of the fiscalyear have typically been higher than expenditures in the other quarters which could result inexpenditures above the currently estimated 15 percent of GDP.
Table 4.3: Government Expenditures (as % of GDP), FY96 - FY01
Central Government Operations FY96 FY97 FY98 FY99 FY00 FY01 *Total expenditure and net lending 17.6% 15.1% 14.7% 14.7% 15.6% 15.0%
Recurrent expenditure 14.0% 12.5% 10.9% 10.7% 11.8% 12.0%
Wages and salaries 4.6% 4.7% 4.2% 3.6% 4.2% 4.0%
Interest payments 3.3% 2.6% 2.2% 1.6% 1.5% 1.6%
Domestic 2.3% 1.7% 1.0% 0.6% 1.0% 1.0%
Foreign 1.0% 0.9% 1.3% 0.9% 0.5% 0.6%
Other goods and services and 6.1% 5.1% 4.5% 5.6% 6.1% 6.3%transfersDevelopment expenditure and net 3.6% 2.6% 3.8% 3.9% 3.9% 3.0%lendingo/w Expenditure financed 0.2% 0.5% 0.5% 0.3% 0.3% 0.2%
domestically* annualized estimate based on prel. outturn for July-Feb. 2000Source: Tanzanian authorities
4.5 The economic breakdown of recurrent expenditures shows that about one third of recurrentexpenditures is spent on wages and salaries, 14 percent are spent on domestic and foreign interestpayments, and more than 50 percent of recurrent expenditures are spent on other goods and services.While the problem of insufficient funding for operations and maintenance persists, during recentyears there was some improvement in terms of increasing the share of the budget spent on operationsand maintenance and containing the share going to the payment of interest and wages and salaries.
4.6 Since average salaries increased in nominal terms only by 1.3 percent in FY99 and thenumber of civil servants was reduced by another 2.7%, expenditures on wages and salaries remainedmore or less constant in nominal terms, implying a decline in expenditures on wages and salaries as apercentage of GDP from 4.2 percent in FY98 to only 3.7 percent in FY99. Salary increases below therate of inflation have led to real income losses for civil servants of up to 35 percent since FY96.However, after further real wage losses in FY99, in FY00 government started the implementation ofit Medium Term Pay Policy by granting salary increases ranging between 16 and 65 percent, with thehigher increases being accorded to technical personnel and middle and upper management. Inaddition, the reduction in staff numbers was only 1.3 %, significantly less than in previous years.These large pay increases combined with only small reductions in the staffing levels led to aprojected increase in the wage bill in FY00 by more than 30 percent and an increase in expenditureson salaries and wages from 3.7 percent of GDP in FY99 to 4.3 percent of GDP in FY00. In FY01civil service employment increased by almost 7000. However, since no salary awards have beengranted in FY01, expenditures on wages and salaries are estimated to decline to 4.0 percent of GDP.
20

Table 4.4: Civil Service Employment, FY98-FY01 (December of each year)
Salary Scale FY98 FY99 FY00 FY01 FY98 FY99 FY00Staff in absolute numbers Percentage change
TGOS 35651 34806 35001 -2.4% 0.6%TGS 63787 63310 59994 -0.7% -5.2%TGTS 122215 118868 119566 -2.7% 0.6%TPSW + TGPSW 36190 34821 36448 -3.8% 4.7%
OTHERS 12785 11381 8837 -11.0% -22.4%TOTAL 270628 263186 259846 266,718 -2.7% -1.3% 3.0%Source: CSD
Table 4.5: Civil Service Average Salaries, 1996-97-FYOO
Salary Scale FY97 FY98 FY99 FY00 FY98 FY99 FY00TGOS 33707 37703 38212 47220 11.9% 1.4% 23.6%TGS 47099 57313 57625 78067 0.5% 35.5%TGTS Included 56314 57073 80162 1.3% 40.5%
in TGSTPSW + TGPSW 65002 60506 61400 70925 -6.9% 1.5% 15.5%
OTHERS 35344 115878 108011 167861 227.9% -6.8% 55.4%TOTAL 47498 54684 55387 74143 15.1% 1.3% 33.9%Source: CSD
4.7 Expenditures on other goods and services have increased continuously from a low of 4.5% ofGDP in FY98 to an estimated 6.3% of GDP during the first eight months of FY01. Expenditures oninterest payments declined from 2.2 percent in FY99 to 1.6 percent in FY00, as a result of a fall inboth domestic and foreign interest payments. During FY00, foreign interest payments fell from Ipercent of GDP to 0.5 percent of GDP. However, this decline in foreign interest payments is offsetby an increase in domestic interest payments to one percent of GDP.
4.8 Central government operations statistics indicate that about four percent of GDP or a littlemore than one fourth of the overall budget is spent on development expenditures, most of which isforeign financed. However, problems with the proper integration of development expenditures in thebudget continue. Data on official development expenditures collected by UNDP indicate that officialdevelopment assistance is about 12 percent of GDP. Although a significant share of ODA goesdirectly to NGOs, the private sector, and the Bank of Tanzania, it is likely that the information ondonor financed projects implemented by sector ministries and local authorities is incomplete. On theother hand, development expenditure in the appropriation accounts is only about one third of the
Development Expenditure as a Share ofGDP, FY96-FY01
7.0%M
6.0'%,-
DCGO
3 4.0% * Budgct Estimate°,3.()"e, l_ - ttU~~ffl4jII~~jjIIft1II~~~4~I1 0 Approp. Amts.
2.0%
FY96 FY97 FY98 FY99 FY00 FY01
21
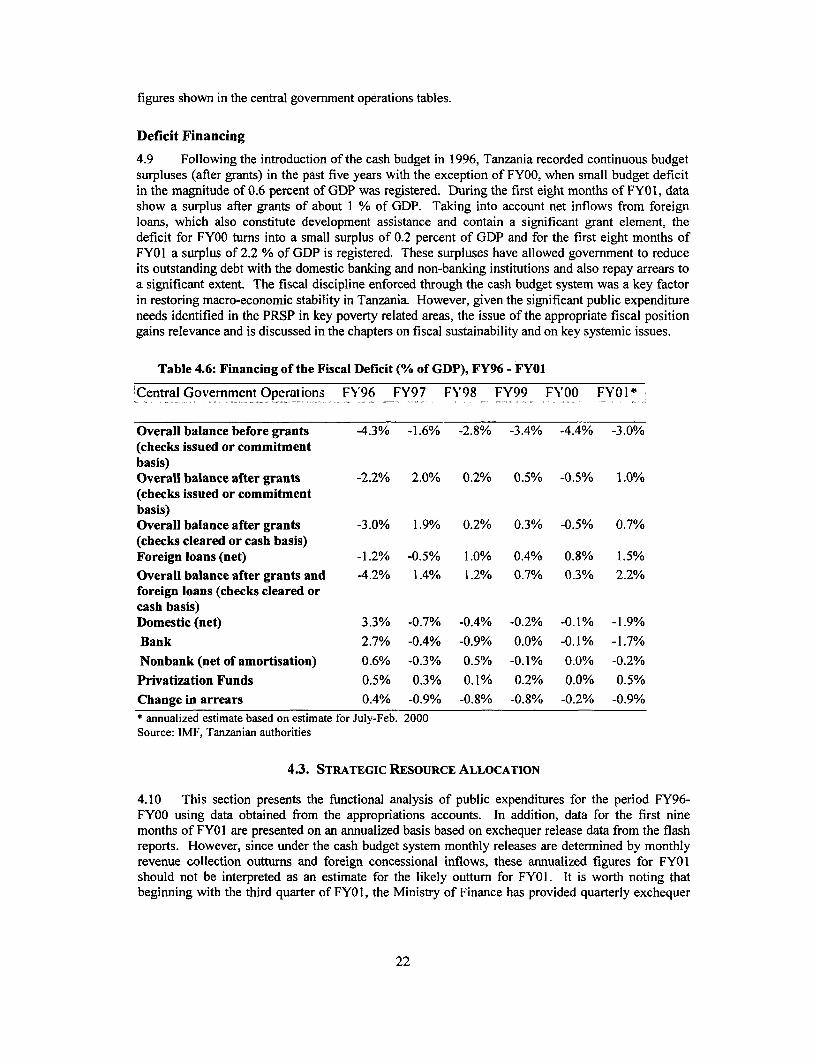
figures shown in the central government operations tables.
Deficit Financing
4.9 Following the introduction of the cash budget in 1996, Tanzania recorded continuous budgetsurpluses (after grants) in the past five years with the exception of FY00, when small budget deficitin the magnitude of 0.6 percent of GDP was registered. During the first eight months of FY01, datashow a surplus after grants of about 1 % of GDP. Taking into account net inflows from foreignloans, which also constitute development assistance and contain a significant grant element, thedeficit for FY00 turns into a small surplus of 0.2 percent of GDP and for the first eight months ofFY01 a surplus of 2.2 % of GDP is registered. These surpluses have allowed government to reduceits outstanding debt with the domestic banking and non-banking institutions and also repay arrears toa significant extent. The fiscal discipline enforced through the cash budget system was a key factorin restoring macro-economic stability in Tanzania. However, given the significant public expenditureneeds identified in the PRSP in key poverty related areas, the issue of the appropriate fiscal positiongains relevance and is discussed in the chapters on fiscal sustainability and on key systemic issues.
Table 4.6: Financing of the Fiscal Deficit (% of GDP), FY96 - FY01
Central Government Operations FY96 FY97 FY98 FY99 FY00 FY01 l
Overall balance before grants -4.3% -1.6% -2.8% -3.4% -4.4% -3.0%(checks issued or commitmentbasis)Overall balance after grants -2.2% 2.0% 0.2% 0.5% -0.5% 1.0%(checks issued or commitmentbasis)Overall balance after grants -3.0% 1.9% 0.2% 0.3% -0.5% 0.7%(checks cleared or cash basis)Foreign loans (net) -1.2% -0.5% 1.0% 0.4% 0.8% 1.5%
Overall balance after grants and -4.2% 1.4% 1.2% 0.7% 0.3% 2.2%foreign loans (checks cleared orcash basis)Domestic (net) 3.3% -0.7% -0.4% -0.2% -0.1% -1.9%
Bank 2.7% -0.4% -0.9% 0.0% -0.1 % -1.7%
Nonbank (net of amortisation) 0.6% -0.3% 0.5% -0.1% 0.0% -0.2%
Privatization Funds 0.5% 0.3% 0.1% 0.2% 0.0% 0.5%
Change in arrears 0.4% -0.9% -0.8% -0.8% -0.2% -0.9%* annualized estimate based on estimate for July-Feb. 2000Source: IMF, Tanzanian authorities
4.3. STRATEGIC RESOURCE ALLOCATION
4.10 This section presents the functional analysis of public expenditures for the period FY96-FY00 using data obtained from the appropriations accounts. In addition, data for the first ninemonths of FY01 are presented on an annualized basis based on exchequer release data from the flashreports. However, since under the cash budget system monthly releases are determined by monthlyrevenue collection outturns and foreign concessional inflows, these annualized figures for FY01should not be interpreted as an estimate for the likely outturn for FY01. It is worth noting thatbeginning with the third quarter of FY01, the Ministry of Finance has provided quarterly exchequer
22
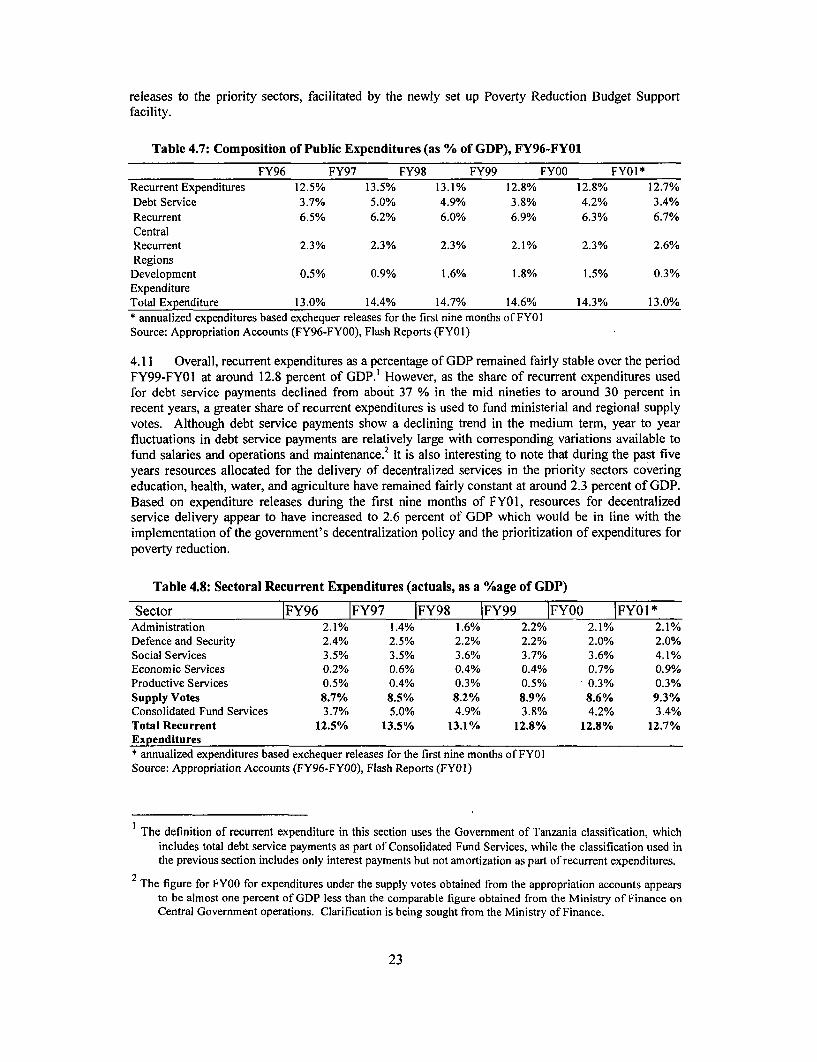
releases to the priority sectors, facilitated by the newly set up Poverty Reduction Budget Supportfacility.
Table 4.7: Composition of Public Expenditures (as % of GDP), FY96-FYO1
FY96 FY97 FY98 FY99 FY00 FY01*Recurrent Expenditures 12.5% 13.5% 13.1% 12.8% 12.8% 12.7%Debt Service 3.7% 5.0% 4.9% 3.8% 4.2% 3.4%Recurrent 6.5% 6.2% 6.0% 6.9% 6.3% 6.7%CentralRecurrent 2.3% 2.3% 2.3% 2.1% 2.3% 2.6%Regions
Development 0.5% 0.9% 1.6% 1.8% 1.5% 0.3%ExpenditureTotal Expenditure 13.0% 14.4% 14.7% 14.6% 14.3% 13.0%* annualized expenditures based exchequer releases for the first nine months of FY01Source: Appropriation Accounts (FY96-FYOO), Flash Reports (FY01)
4.11 Overall, recurrent expenditures as a percentage of GDP remained fairly stable over the periodFY99-FYOI at around 12.8 percent of GDP.' However, as the share of recurrent expenditures usedfor debt service payments declined from about 37 % in the mid nineties to around 30 percent inrecent years, a greater share of recurrent expenditures is used to fund ministerial and regional supplyvotes. Although debt service payments show a declining trend in the medium term, year to yearfluctuations in debt service payments are relatively large with corresponding variations available tofund salaries and operations and maintenance. 2 It is also interesting to note that during the past fiveyears resources allocated for the delivery of decentralized services in the priority sectors coveringeducation, health, water, and agriculture have remained fairly constant at around 2.3 percent of GDP.Based on expenditure releases during the first nine months of FY01, resources for decentralizedservice delivery appear to have increased to 2.6 percent of GDP which would be in line with theimplementation of the government's decentralization policy and the prioritization of expenditures forpoverty reduction.
Table 4.8: Sectoral Recurrent Expenditures (actuals, as a %age of GDP)
Sector IFY96 IFY97 |FY98 |FY99 |FYOO |FYO1*Administration 2.1% 1.4% 1.6% 2.2% 2.1% 2.1%Defence and Security 2.4% 2.5% 2.2% 2.2% 2.0% 2.0%Social Services 3.5% 3.5% 3.6% 3.7% 3.6% 4.1%Economic Services 0.2% 0.6% 0.4% 0.4% 0.7% 0.9%Productive Services 0.5% 0.4% 0.3% 0.5% 0.3% 0.3%Supply Votes 8.7% 8.5% 8.2% 8.9% 8.6% 9.3%Consolidated Fund Services 3.7% 5.0% 4.9% 3.8% 4.2% 3.4%Total Recurrent 12.5% 13.5% 13.1% 12.8% 12.8% 12.7%Expenditures* annualized expenditures based exchequer releases for the first nine months of FY01Source: Appropriation Accounts (FY96-FY00), Flash Reports (FY01)
The definition of recurrent expenditure in this section uses the Government of Tanzania classification, whichincludes total debt service payments as part of Consolidated Fund Services, while the classification used inthe previous section includes only interest payments but not amortization as part of recurrent expenditures.
2 The figure for FY00 for expenditures under the supply votes obtained from the appropriation accounts appearsto be almost one percent of GDP less than the comparable figure obtained from the Ministry of Finance onCentral Government operations. Clarification is being sought from the Ministry of Finance.
23
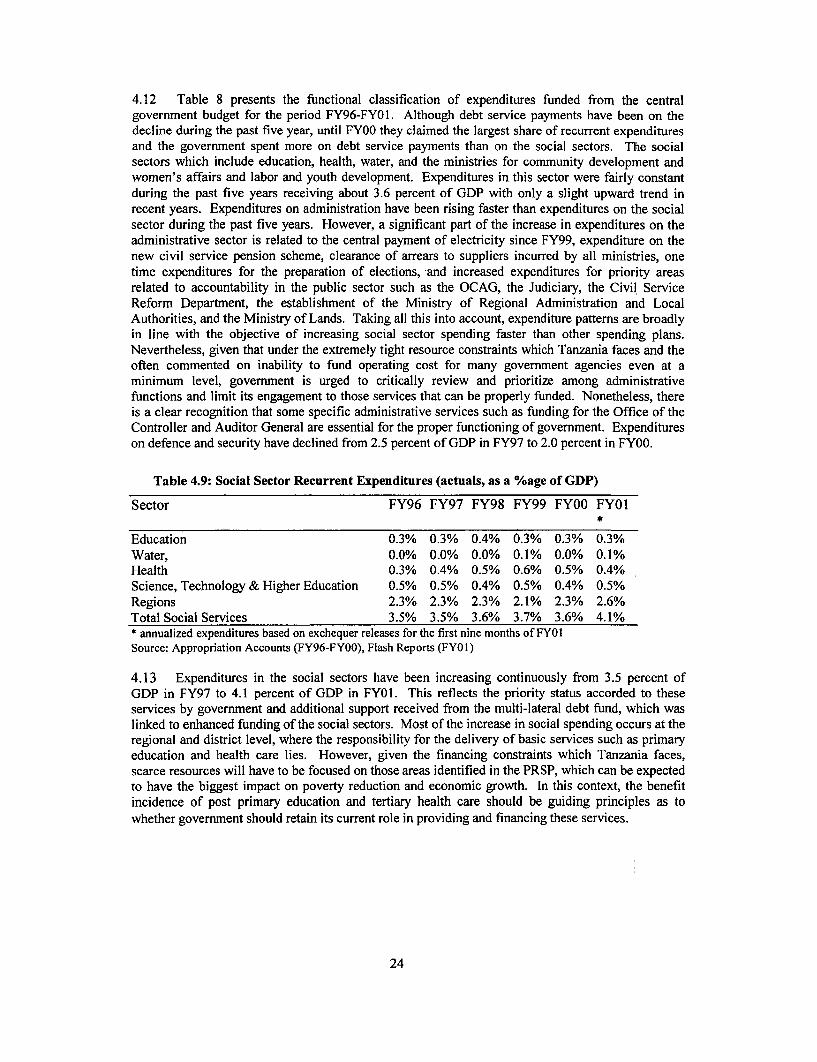
4.12 Table 8 presents the functional classification of expenditures funded from the centralgovernment budget for the period FY96-FYOI. Although debt service payments have been on thedecline during the past five year, until FY00 they claimed the largest share of recurrent expendituresand the government spent more on debt service payments than on the social sectors. The socialsectors which include education, health, water, and the ministries for community development andwomen's affairs and labor and youth development. Expenditures in this sector were fairly constantduring the past five years receiving about 3.6 percent of GDP with only a slight upward trend inrecent years. Expenditures on administration have been rising faster than expenditures on the socialsector during the past five years. However, a significant part of the increase in expenditures on theadministrative sector is related to the central payment of electricity since FY99, expenditure on thenew civil service pension scheme, clearance of arrears to suppliers incurred by all ministries, onetime expenditures for the preparation of elections, 'and increased expenditures for priority areasrelated to accountability in the public sector such as the OCAG, the Judiciary, the Civil ServiceReform Department, the establishment of the Ministry of Regional Administration and LocalAuthorities, and the Ministry of Lands. Taking all this into account, expenditure pattems are broadlyin line with the objective of increasing social sector spending faster than other spending plans.Nevertheless, given that under the extremely tight resource constraints which Tanzania faces and theoften commented on inability to fund operating cost for many government agencies even at aminimum level, government is urged to critically review and prioritize among administrativefunctions and limit its engagement to those services that can be properly funded. Nonetheless, thereis a clear recognition that some specific administrative services such as funding for the Office of theController and Auditor General are essential for the proper functioning of government. Expenditureson defence and security have declined from 2.5 percent of GDP in FY97 to 2.0 percent in FY00.
Table 4.9: Social Sector Recurrent Expenditures (actuals, as a %age of GDP)
Sector FY96 FY97 FY98 FY99 FY00 FY01*
Education 0.3% 0.3% 0.4% 0.3% 0.3% 0.3%Water, 0.0% 0.0% 0.0% 0.1% 0.0% 0.1%Health 0.3% 0.4% 0.5% 0.6% 0.5% 0.4%Science, Technology & Higher Education 0.5% 0.5% 0.4% 0.5% 0.4% 0.5%Regions 2.3% 2.3% 2.3% 2.1% 2.3% 2.6%Total Social Services 3.5% 3.5% 3.6% 3.7% 3.6% 4.1%* annualized expenditures based on exchequer releases for the first nine months of FY01Source: Appropriation Accounts (FY96-FYOO), Flash Reports (FY01)
4.13 Expenditures in the social sectors have been increasing continuously from 3.5 percent ofGDP in FY97 to 4.1 percent of GDP in FY01. This reflects the priority status accorded to theseservices by government and additional support received from the multi-lateral debt fund, which waslinked to enhanced funding of the social sectors. Most of the increase in social spending occurs at theregional and district level, where the responsibility for the delivery of basic services such as primaryeducation and health care lies. However, given the financing constraints which Tanzania faces,scarce resources will have to be focused on those areas identified in the PRSP, which can be expectedto have the biggest impact on poverty reduction and economic growth. In this context, the benefitincidence of post primary education and tertiary health care should be guiding principles as towhether government should retain its current role in providing and financing these services.
24
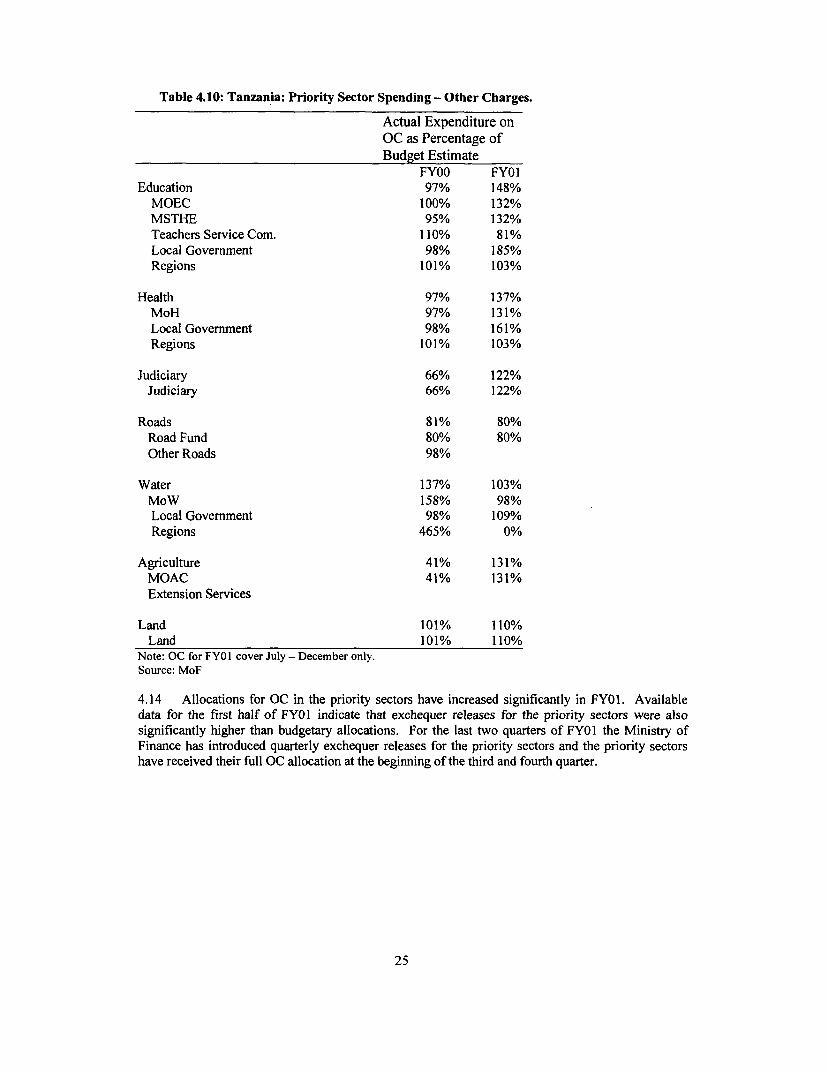
Table 4.10: Tanzania: Priority Sector Spending - Other Charges.
Actual Expenditure onOC as Percentage ofBudget Estimate
FY00 FY01Education 97% 148%
MOEC 100% 132%MSTHE 95% 132%Teachers Service Com. 110% 81%Local Government 98% 185%Regions 101% 103%
Health 97% 137%MoH 97% 131%Local Government 98% 161%Regions 101% 103%
Judiciary 66% 122%Judiciary 66% 122%
Roads 81% 80%Road Fund 80% 80%Other Roads 98%
Water 137% 103%MoW 158% 98%Local Government 98% 109%Regions 465% 0%
Agriculture 41% 131%MOAC 41% 131%Extension Services
Land 101% 110%Land 101% 110%
Note: OC for FYOI cover July - December only.Source: MoF
4.14 Allocations for OC in the priority sectors have increased significantly in FY01. Availabledata for the first half of FY01 indicate that exchequer releases for the priority sectors were alsosignificantly higher than budgetary allocations. For the last two quarters of FY01 the Ministry ofFinance has introduced quarterly exchequer releases for the priority sectors and the priority sectorshave received their full OC allocation at the beginning of the third and fourth quarter.
25
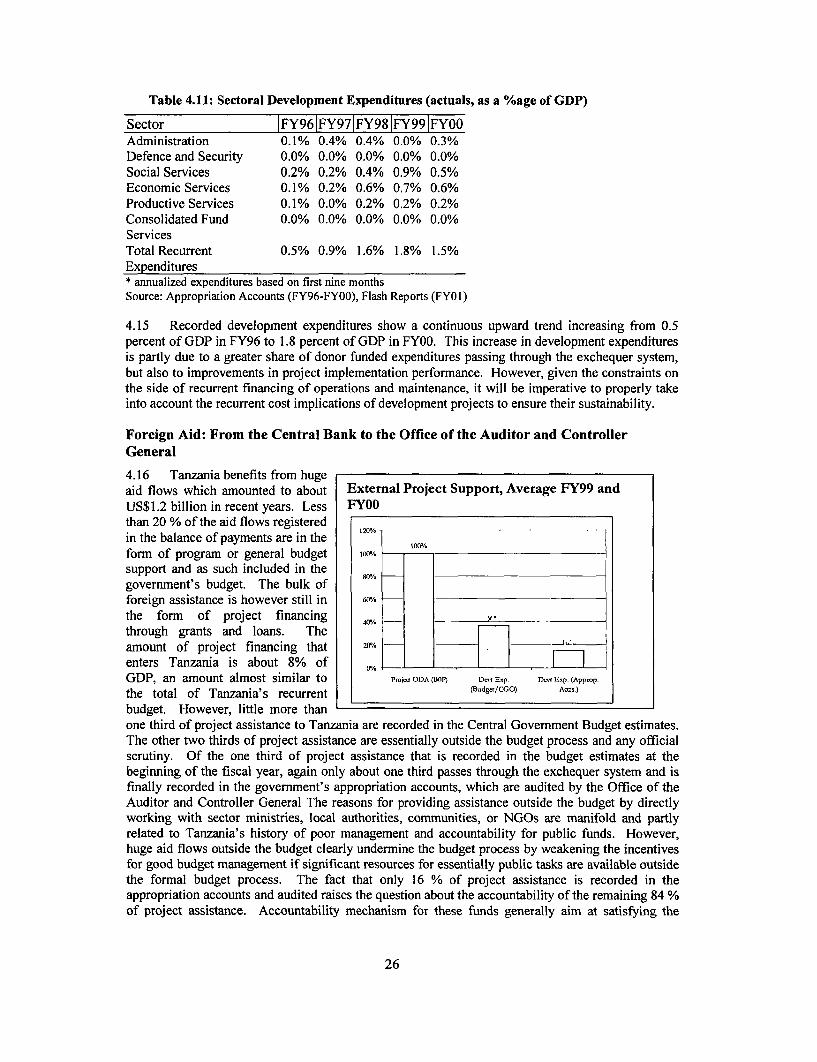
Table 4.11: Sectoral Development Expenditures (actuals, as a %age of GDP)
Sector IFY96 FY97|FY98 FY99 FY00Administration 0.1% 0.4% 0.4% 0.0% 0.3%Defence and Security 0.0% 0.0% 0.0% 0.0% 0.0%Social Services 0.2% 0.2% 0.4% 0.9% 0.5%Economic Services 0.1% 0.2% 0.6% 0.7% 0.6%Productive Services 0.1% 0.0% 0.2% 0.2% 0.2%Consolidated Fund 0.0% 0.0% 0.0% 0.0% 0.0%ServicesTotal Recurrent 0.5% 0.9% 1.6% 1.8% 1.5%Expenditures* annualized expenditures based on first nine monthsSource: Appropriation Accounts (FY96-FYOO), Flash Reports (FYOI)
4.15 Recorded development expenditures show a continuous upward trend increasing from 0.5percent of GDP in FY96 to 1.8 percent of GDP in FY00. This increase in development expendituresis partly due to a greater share of donor funded expenditures passing through the exchequer system,but also to improvements in project implementation performance. However, given the constraints onthe side of recurrent financing of operations and maintenance, it will be imperative to properly takeinto account the recurrent cost implications of development projects to ensure their sustainability.
Foreign Aid: From the Central Bank to the Office of the Auditor and ControllerGeneral
4.16 Tanzania benefits from hugeaid flows which amounted to about External Project Support, Average FY99 andUS$1.2 billion in recent years. Less FY00than 20 % of the aid flows registeredin the balance of payments are in the I- Aform of program or general budget wo, _ -
support and as such included in the _____
government's budget. The bulk offoreign assistance is however still in Or/.
the form of project financing -_ -
through grants and loans. Theamount of project financing that 20%/. _ __
enters Tanzania is about 8% of -. -- _ f iGDP, an amount almost similar to P.im ODA (B0P) D"I UEP. D-
40-p. (Appop.
the total of Tanzania's recurrent (B.dgt/CGO) Aces.)
budget. However, little more thanone third of project assistance to Tanzania are recorded in the Central Government Budget estimates.The other two thirds of project assistance are essentially outside the budget process and any officialscrutiny. Of the one third of project assistance that is recorded in the budget estimates at thebeginning of the fiscal year, again only about one third passes through the exchequer system and isfinally recorded in the government's appropriation accounts, which are audited by the Office of theAuditor and Controller General The reasons for providing assistance outside the budget by directlyworking with sector ministries, local authorities, communities, or NGOs are manifold and partlyrelated to Tanzania's history of poor management and accountability for public funds. However,huge aid flows outside the budget clearly undermine the budget process by weakening the incentivesfor good budget management if significant resources for essentially public tasks are available outsidethe formal budget process. The fact that only 16 % of project assistance is recorded in theappropriation accounts and audited raises the question about the accountability of the remaining 84 %of project assistance. Accountability mechanism for these funds generally aim at satisfying the
26
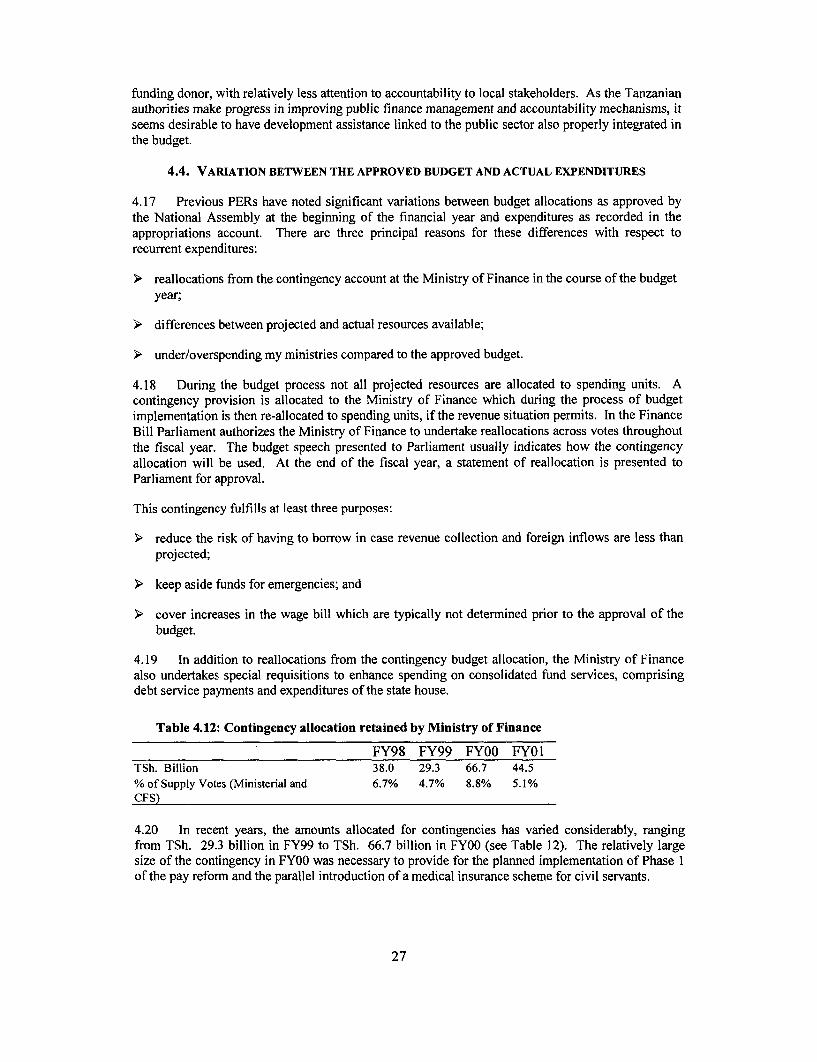
funding donor, with relatively less attention to accountability to local stakeholders. As the Tanzanianauthorities make progress in improving public finance management and accountability mechanisms, itseems desirable to have development assistance linked to the public sector also properly integrated inthe budget.
4.4. VARIATION BETWEEN THE APPROVED BUDGET AND ACTUAL EXPENDITURES
4.17 Previous PERs have noted significant variations between budget allocations as approved bythe National Assembly at the beginning of the financial year and expenditures as recorded in theappropriations account. There are three principal reasons for these differences with respect torecurrent expenditures:
> reallocations from the contingency account at the Ministry of Finance in the course of the budgetyear;
> differences between projected and actual resources available;
> under/overspending my ministries compared to the approved budget.
4.18 During the budget process not all projected resources are allocated to spending units. Acontingency provision is allocated to the Ministry of Finance which during the process of budgetimplementation is then re-allocated to spending units, if the revenue situation permits. In the FinanceBill Parliament authorizes the Ministry of Finance to undertake reallocations across votes throughoutthe fiscal year. The budget speech presented to Parliament usually indicates how the contingencyallocation will be used. At the end of the fiscal year, a statement of reallocation is presented toParliament for approval.
This contingency fulfills at least three purposes:
> reduce the risk of having to borrow in case revenue collection and foreign inflows are less thanprojected;
> keep aside funds for emergencies; and
> cover increases in the wage bill which are typically not determined prior to the approval of thebudget.
4.19 In addition to reallocations from the contingency budget allocation, the Ministry of Financealso undertakes special requisitions to enhance spending on consolidated fund services, comprisingdebt service payments and expenditures of the state house.
Table 4.12: Contingency allocation retained by Ministry of Finance
FY98 FY99 FY00 FYOITSh. Billion 38.0 29.3 66.7 44.5% of Supply Votes (Ministerial and 6.7% 4.7% 8.8% 5.1%CFS)
4.20 In recent years, the amounts allocated for contingencies has varied considerably, rangingfrom TSh. 29.3 billion in FY99 to TSh. 66.7 billion in FY00 (see Table 12). The relatively largesize of the contingency in FY00 was necessary to provide for the planned implementation of Phase 1of the pay reform and the parallel introduction of a medical insurance scheme for civil servants.
27
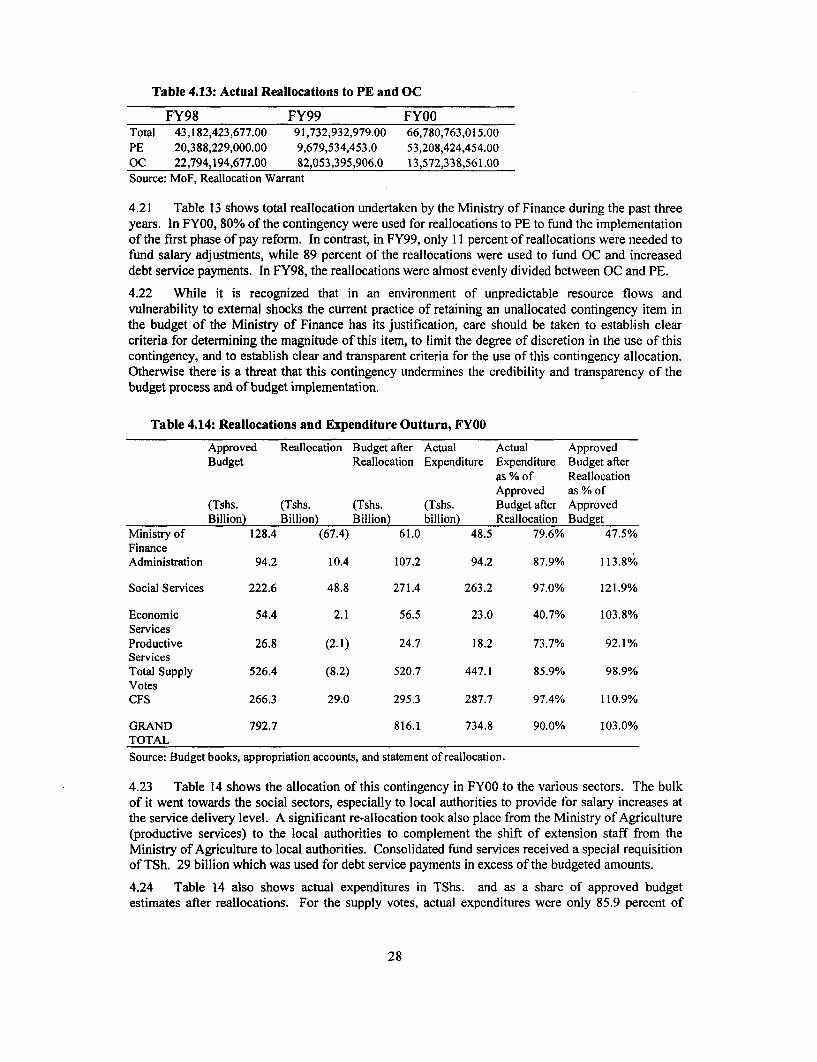
Table 4.13: Actual Reallocations to PE and OC
FY98 FY99 FY00Total 43,182,423,677.00 91,732,932,979.00 66,780,763,015.00PE 20,388,229,000.00 9,679,534,453.0 53,208,424,454.00OC 22,794,194,677.00 82,053,395,906.0 13,572,338,561.00Source: MoF, Reallocation Warrant
4.21 Table 13 shows total reallocation undertaken by the Ministry of Finance during the past threeyears. In FY00, 80% of the contingency were used for reallocations to PE to fund the implementationof the first phase of pay reform. In contrast, in FY99, only 11 percent of reallocations were needed tofund salary adjustments, while 89 percent of the reallocations were used to fund OC and increaseddebt service payments. In FY98, the reallocations were almost evenly divided between OC and PE.
4.22 While it is recognized that in an environment of unpredictable resource flows andvulnerability to external shocks the current practice of retaining an unallocated contingency item inthe budget of the Ministry of Finance has its justification, care should be taken to establish clearcriteria for determnining the magnitude of this item, to limit the degree of discretion in the use of thiscontingency, and to establish clear and transparent criteria for the use of this contingency allocation.Otherwise there is a threat that this contingency undermines the credibility and transparency of thebudget process and of budget implementation.
Table 4.14: Reallocations and Expenditure Outturn, FY00
Approved Reallocation Budget after Actual Actual ApprovedBudget Reallocation Expenditure Expenditure Budget after
as % of ReallocationApproved as % of
(Tshs. (Tshs. (Tshs. (Tshs. Budget after ApprovedBillion) Billion) Billion) billion) Reallocation Budget
Ministry of 128.4 (67.4) 61.0 48.5 79.6% 47.5%FinanceAdministration 94.2 10.4 107.2 94.2 87.9% 113.8%
Social Services 222.6 48.8 271.4 263.2 97.0% 121.9%
Economic 54.4 2.1 56.5 23.0 40.7% 103.8%ServicesProductive 26.8 (2.1) 24.7 18.2 73.7% 92.1%ServicesTotal Supply 526.4 (8.2) 520.7 447.1 85.9% 98.9%VotesCFS 266.3 29.0 295.3 287.7 97.4% 110.9%
GRAND 792.7 816.1 734.8 90.0% 103.0%TOTALSource: Budget books, appropriation accounts, and statement of reallocation.
4.23 Table 14 shows the allocation of this contingency in FY00 to the various sectors. The bulkof it went towards the social sectors, especially to local authorities to provide for salary increases atthe service delivery level. A significant re-allocation took also place from the Ministry of Agriculture(productive services) to the local authorities to complement the shift of extension staff from theMinistry of Agriculture to local authorities. Consolidated fund services received a special requisitionof TSh. 29 billion which was used for debt service payments in excess of the budgeted amounts.
4.24 Table 14 also shows actual expenditures in TShs. and as a share of approved budgetestimates after reallocations. For the supply votes, actual expenditures were only 85.9 percent of
28
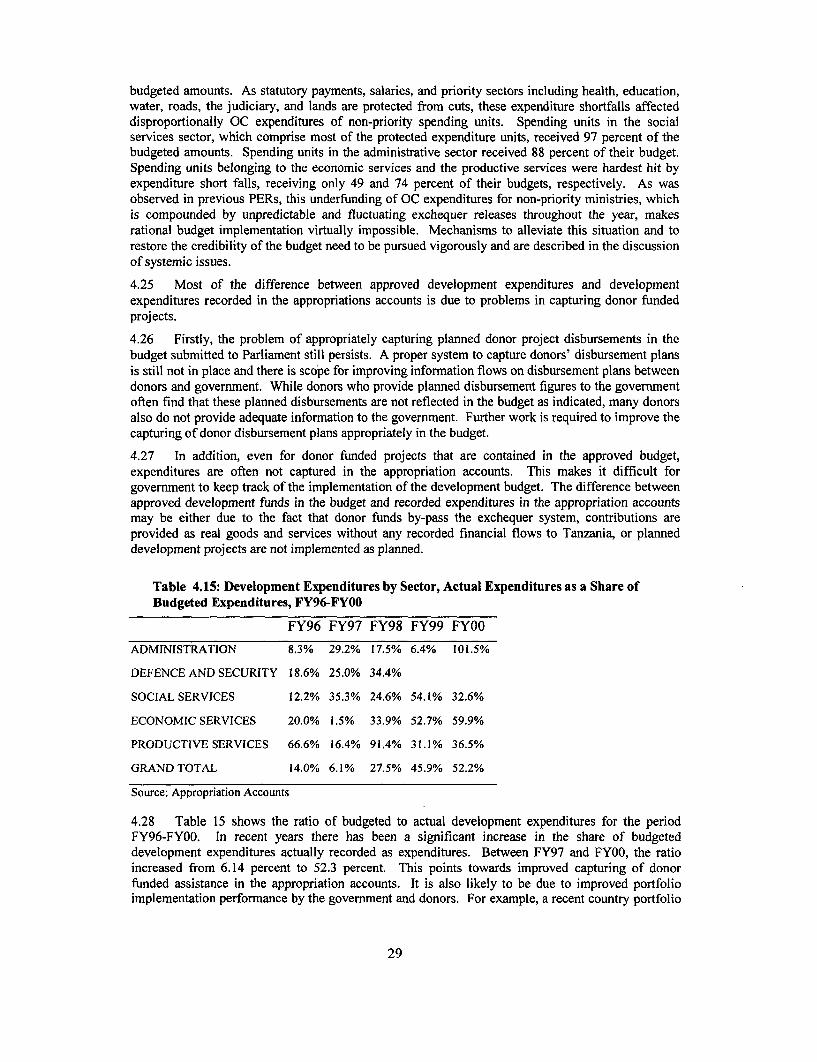
budgeted amounts. As statutory payments, salaries, and priority sectors including health, education,water, roads, the judiciary, and lands are protected from cuts, these expenditure shortfalls affecteddisproportionally OC expenditures of non-priority spending units. Spending units in the socialservices sector, which comprise most of the protected expenditure units, received 97 percent of thebudgeted amounts. Spending units in the administrative sector received 88 percent of their budget.Spending units belonging to the economic services and the productive services were hardest hit byexpenditure short falls, receiving only 49 and 74 percent of their budgets, respectively. As wasobserved in previous PERs, this underfunding of OC expenditures for non-priority ministries, whichis compounded by unpredictable and fluctuating exchequer releases throughout the year, makesrational budget implementation virtually impossible. Mechanisms to alleviate this situation and torestore the credibility of the budget need to be pursued vigorously and are described in the discussionof systemic issues.
4.25 Most of the difference between approved development expenditures and developmentexpenditures recorded in the appropriations accounts is due to problems in capturing donor fundedprojects.
4.26 Firstly, the problem of appropriately capturing planned donor project disbursements in thebudget submitted to Parliament still persists. A proper system to capture donors' disbursement plansis still not in place and there is scope for improving information flows on disbursement plans betweendonors and government. While donors who provide planned disbursement figures to the governmentoften find that these planned disbursements are not reflected in the budget as indicated, many donorsalso do not provide adequate information to the government. Further work is required to improve thecapturing of donor disbursement plans appropriately in the budget.
4.27 In addition, even for donor funded projects that are contained in the approved budget,expenditures are often not captured in the appropriation accounts. This makes it difficult forgovernment to keep track of the implementation of the development budget. The difference betweenapproved development funds in the budget and recorded expenditures in the appropriation accountsmay be either due to the fact that donor funds by-pass the exchequer system, contributions areprovided as real goods and services without any recorded financial flows to Tanzania, or planneddevelopment projects are not implemented as planned.
Table 4.15: Development Expenditures by Sector, Actual Expenditures as a Share ofBudgeted Expenditures, FY96-FYOO
FY96 FY97 FY98 FY99 FYOO
ADMINISTRATION 8.3% 29.2% 17.5% 6.4% 101.5%
DEFENCE AND SECURITY 18.6% 25.0% 34.4%
SOCIAL SERVICES 12.2% 35.3% 24.6% 54.1% 32.6%
ECONOMIC SERVICES 20.0% 1.5% 33.9% 52.7% 59.9%
PRODUCTIVE SERVICES 66.6% 16.4% 91.4% 31.1% 36.5%
GRAND TOTAL 14.0% 6.1% 27.5% 45.9% 52.2%
Source: Appropriation Accounts
4.28 Table 15 shows the ratio of budgeted to actual development expenditures for the periodFY96-FYOO. In recent years there has been a significant increase in the share of budgeteddevelopment expenditures actually recorded as expenditures. Between FY97 and FYOO, the ratioincreased from 6.14 percent to 52.3 percent. This points towards improved capturing of donorfunded assistance in the appropriation accounts. It is also likely to be due to improved portfolioimplementation performance by the government and donors. For example, a recent country portfolio
29

performance review undertaken by the World Bank indicated that the disbursement rate of WorldBank credits almost doubled in the last 2 years increasing from 15% to 28%.
4.29 Provisions for counterpart funds in the amount of TShs. 3.01 billion made in the budget forvarious projects (e.g., the national agricultural extension project, Madibira smallholders rice scheme,rehabilitation of schools and colleges, Lake Victoria, environment management program, etc.) werereallocated for the set up of Television Tanzania. There is concern about the implications of thisreallocation for the implementation of the affected projects.
4.5. PRO-POOR EXPENDITURE TRACKING STUDY
4.30 Allocating resources to pre-identified pro-poor expenditure programs is necessary but notsufficient for guaranteeing that public spending contributes to poverty alleviation. It is also necessarythat allocated funds flow indeed to service delivery units and the intended beneficiaries. Since 1998,various expenditure tracking studies were undertaken to ascertain whether allocated funds reach theintended beneficiaries. With the implementation of the Local government Reform Program theseexpenditure tracking studies gain on importance, as greater responsibility for the delivery of basicservices in priority sectors is being moved from central government ministries to local authorities. Inthe framework of the FY01 PER process another tracking study was carried out by ESRF andREPOA with the objective of assessing the efficacy of budget execution and the intention of drawinglessons that could be used to improve implementation of pro-poor public expenditures. The studyfocused on primary education and health, two of the eight sections/activities that have been identifiedto receive government priority in the fight against poverty. Rural roads and water which were toreceive equal treatment in the study have featured only marginally because they have not establishedinstitutional linkage at the sub-district levels.
4.31 The study reviewed government procedures and channels for disbursing funds, reportingsystems and the flow of funds from one level to the other. In addition to the flow of funds, anassessment was made on the flow of materials and supplies.
4.32 Both desk work and field work were undertaken. In the former a review of documents wasmade. In the latter visits and interviews were made in the relevant government ministries and localauthorities. Five local authorities were visited, three rural and two urban, namely Babati, Kisaraweand Dodoma rural councils and Mtwara and Kigoma urban councils. In the councils documents werereviewed and interviews were made with staff. In addition service centers were visited to provide afeel about supply and availability of materials and supplies. At this level interviews with thebeneficiaries were also held.
4.33 A number of observations have been made in the main report. Below we present the salientones and draw policy implications. Firstly, the cash budget system has in principle relegated OC to aresidual position. This has implications on the timing and level of OC disbursement. Lack ofpredictability on the disbursement of OC has promoted leakages especially at the sub-national levels.Other things being equal, increased predictability would enhance transparency and minimizeleakages.
4.34 Secondly, the existing system of disbursing funds is in principle alright. However, it assumesadequate transparency in information sharing and transmission. The present review has found that insituations of scarce resources ownership of information and misinformation are important forredistributing resources to suit the owners of information. In the case of local authorities informationcontained in the exchequer issue notification has normally not been transmitted to sectoral heads.This has opened room for re-allocations, without the knowledge and consent of sectoral heads. Theintroduction of IFMS at the ministries level has improved albeit marginally the speed of OCdisbursements. However, it has not reduced reallocations at the local authorities because it has notbeen implemented at that level. Since it will take a long time for the IFMS to be implemented atlower levels efforts should be made to build capacity to manage the existing manual system and
30
promote transparency there. On the latter, it is proposed that sectoral heads be given copies of theexchequer issue notification to minimize misinformation.
4.35 Thirdly, perhaps in response to budget cuts, at both the Treasury and the council, sectoralheads have tended to re-allocate the OC they receive in favour of activities that benefit the councilstaff at the headquarters, at the expense of service units. In this case traveling and vehicles have beenfavoured at the expense of school materials and health drugs.
4.36 Fourthly, councils have managed to get away with observations two and three above becausefinancial reporting requirements have accommodated too much aggregation. It is important that anacceptable format be developed that can easily be related to the exchequer issue notification.
4.37 Fifthly, sectoral departments are the last point of cash flow in the disbursement system.There is no flow of cash beyond council departments. Only supplies and services flow to the serviceunits. However, as stated above very little materials and supplies originate from the councils. Mostof the materials distributed by councils originate from sectoral ministries. In this context surveyresults show that the supply of primary materials is limited and ad hoc. The lack of predictabilitymay promote leakages. This is different from the supply of health drugs which is more reliable inboth timing and quality. The perceptions of beneficiaries on availability of school materials andhealth drugs support the above observation. Beneficiaries are more satisfied with availability ofhealth drugs than school materials. A closer look at survey results show that both the quantitysupplied and reliability play an important role in influencing beneficiaries perceptions. It isimportant that the Ministry of Education work on improving both quantity and reliability, i.e. thereshould be a known schedule on the distribution of materials that is followed.
4.6. TRANSPARENCY AND ACCESSIBILITY OF FISCAL INFORMATION
4.38 One of the cornerstones for public accountability in fiscal management is readily available,reliable, and easily understandable information on public expenditures. As government continues toopen up the budget process to various stakeholders inside and outside of government and as moredonors are considering to either provide direct budget support or at least channel their assistancethrough the budget, these issues gain additional importance.
4.39 At present, fiscal information is not easily accessible and often difficult to interpret. Inaddition, there is also the perception that data from various sources are often inconsistent and pubicdebate on fiscal issues often lacks a solid informational foundation.
4.40 With the introduction of the computer based Integrated Financial Management System andthe reclassification of the budget according to the GFS, the transparency of the budget shouldimprove and it is thus important to proceed with this initiative.
4.41 In addition, it is recommended that active efforts are undertaken to make informationaccessible and to provide easily understandable infonnation on key fiscal issues. It is thusrecommended that the PER process in close collaboration with local economic research institutespays greater attention to the dissemination of information generated by the PER process to the public.It is also recommended that in parallel government undertakes to provide information on budgetaryperformance to the public on a quarterly basis.
31
5. BUDGET SUSTAINABILITY AND FULL FINANCING OFTHE PRIORITY SECTORS3
5.1 The main aims of this chapter are (i) to make an assessment of the resource envelopeavailable for the FY 01-02 budget and for the MTEF period. This is approached through a review ofthe prospects for the major sources of resource availability - domestic revenues, external grants andloans and domestic financing; and (ii) to present estimates of the cost of fully financing the PRSPpriority sectors under the 2001/2 to 2003/4 MTEF. The report also comments briefly on someaspects of expenditure control and the budgetary management systems in place to improveexpenditure control (the use of first charges).
5.1. THE RESOURCE ENVELOPE
Domestic Revenue
5.2 Tanzania's revenue performance (measured by the revenue/GDP ratio) is poor in relation tothe average for Sub-Saharan Africa and has declined significantly in recent years, reflecting thesubstantial reduction in external taxes, relatively large tax incentives for new investments, and thecontinued downsizing of the parastatal sector coupled with informalisation of the economy. Therecent decline in revenue performance (1996/97-1998/99) has been attributed to the growth inexemptions (OPM, 2001) and streamlining of the tax system and the elimination of a number ofnuisance taxes.
5.3 There is significant scope for substantially raising domestic revenue in Tanzania. Howeverthe changes required, particularly with respect to necessary improvements in tax administration, areexpected to take time. Thus, unless the government pursues a policy to significantly reduceexemptions in the short term, even with significant tax effort, we do not expect to see any substantialimprovements in domestic revenue during the life of the current MTEF. These observations supportthe cautious revenue projections included in the Budget Guidelines.
External Grants and Loans
5.4 The analysis suggests that the Budget Guidelines are conservative in their estimates of thelikely flow of external grants and loans over the MTEF period. This is resulting primarily from themethodology used by the MOF (and the supporting donor community) which tends to identify onlyfairly firmly confirmed donor financing opportunities. This is not necessarily the appropriatebudgeting practice, which should be based on most likely outcome (with allowance for risk).
Domestic Borrowing
5.5 Prudent budgetary policies in the past 5 years have led to a reduction in the domestic debtburden, measured by domestic debt as a proportion of macro aggregates (govermnent revenue orGDP). Successful inflation control has also led to a potentially sharp reduction in the cost ofservicing the outstanding debt as the yield on Treasury Bills has declined to low nominal and realrates.
3This chapter is the executive summary of a report on "Budget Sustainability and Full Financing of the PrioritySectors" prepared by Emerging Market Economics Ltd. and funded by DFID as a contribution to the PERprocess.
32
5.6 The commercial banking system remains very liquid, with liquid assets accounting for percent of total commercial bank assets, opening up the possibility of some renewed recourse todomestic borrowing, should this be appropriate There are several explanations for the high degree ofcommercial bank liquidity which combine structural and transitory factors. The restrictions onlending by NBC during restructuring and high liquidity arising from expansion of the mining sectorare among the transitory factors, while the limited outreach and lack of experience in private sectorlending are more structural features. The interest rate structure is characterized by a divorce ofcommercial lending rates from the BOT's discount rate or the TB rate.
5.7 In this situation it is implausible to argue that modest net government borrowing wouldcrowd out private sector lending. Equally implausible is the frequently cited view that lowgovernment borrowing can crowd-in private sector lending, given the structural market constraintsand the lack of an integrated interest rate structure.
5.8 However, there are important reasons for continuing to take a cautious approach to renewednet borrowing: any borrowing from the commercial sector would be short-lived as the overall volumeof excess liquidity would be rapidly absorbed by any significant shift in government policy; anysignificant net borrowing is likely to be at a high budgetary cost as a rising TB yield progressivelyaffects both new debt and rolled over debt; until such time as expenditure arrears have been clearedfrom the system, any new borrowing would in effect be financing the build up of arrears.
5.9 There is a need for changes in the reporting of TB market transaction by the BOT to enableresearchers to analyze adequately the determninants of yields in the TB market. BOT should publishinformation that allows the determination of net TB sales on a monthly basis.
5.10 Domestic debt policy should be based on a range of considerations, rather than observance ofa rigid "target" in the form of the ratio of debt or debt service to some macro aggregate. The study'sviews on the main elements to be taken into consideration at present include: cost-effectivemanagement of the outstanding debt stock, private sector crowding-out issues, and the need forexpenditure side controls to be fully in place before there is any renewed recourse to net domesticlending.
33
5.2. THE EXPENDITURE SIDE
Full Financing Costs for the Priority Sectors
5.11 The study attempted to calculate the cost of fully financing the requirements for achieving thePRSP targets in the priority sectors, drawing primarily on the sectoral reports prepared by consultantsduring the first quarter 2001. The main purpose of this exercise was to identify the degree offinancing gap between the full financing requirement and the resource envelope.
5.12 A review of the sectoral consultants' reports revealed several types of obstacle to calculationof the desired type of full financing estimates:
* for some sectors the definition of targets in the PRSP is either unclear, insufficiently detailed oronly loosely linked to sectoral investment or service delivery programmes;
* some sectors have not explicitly adopted the PRSP targets, preferring to continue with their ownsectoral strategies which have not been fully integrated with the PRSP process;
* some sectoral programmes, at least as judged from the sectoral consultants reports, have not yetbeen conceived or detailed to the point where they provide a plausible approach for meetingsectoral PRSP targets either at all or in the timeframe envisaged by the PRSP;
* almost all the sectors have so far failed to define detailed action plans and activities which form abasis for a disaggregated and quantified approach to PRSP target achievement. This is true evenfor the best organized sectors;
* the basis for costing of achievement of PRSP targets remains poor in most sectors, largelybecause of the lack of detailed activity plans, which are a necessary condition for preparation ofscaleable cost estimates;
* there remain important implementation and absorption capacity constraints in most sectors whichmean that the realistic upper bound for effective expenditure in support of the PRSP targetsremains below the level of the proposed full financing level of expenditure;
* per contra, in some sectors the estimate for full financing has been based too closely on thesectors' expectation of likely resource availability as indicated in the Budget Guidelines, leadingto full financing estimates which substantially understate the resources which could and shouldbe made available to meet PRSP targets. This appears to be true of the Judiciary and Watersectors.
5.13 As a result of these problems and shortcomings the full cost estimates need to be interpretedcarefully for each sector on the basis of the stage which the sectoral ministries have reached instrategy and budget formulation and in the light of the pervasive implementation and absorptioncapacity constraints.
5.14 Aggregation of the estimated full financing costs for the 8 priority sectors suggests an under-financing in the Budget Guidelines of Tsh 233bn in 2001/2 and Tsh 166bn in 2002/3. This wouldconstitute roughly 1.5 per cent of GDP and of a magnitude which it might prove possible toaccommodate in the resource envelope.
5.15 However, attention is drawn to the severe implementation constraints which are prominent inmost sectors which will place a ceiling on the effectively utilizable funds in the PRSP priority sectorsat least in the near term. Key implementation constraints arise from:
* Limited procurement capacity (especially in the Roads sector - both MOW and MORLG);* Limited capacity at the district level to administer the roll-out of sectoral service delivery
programs;
34

* Constraints in the staff remuneration and incentive systems which limit the ability of the sectorsto achieve a rational deployment of staff to areas of greatest need for poverty reduction; thisimplies that even if additional funds are provided for Personal Emoluments, the effectiveness ofthe spend for poverty reduction will remain muted;
* Constraints to the release of approved funds arising from the cash budget and expendituremanagement systems (including the regulations in place for the Health Sector Basket).
Specific recommendations arising from the review of full financing costs are:
Recommendation 1: The anticipated revision of the PRSP should be undertaken as a matter ofurgency on completion of the current budgetary cycle, with a view to establishing a firmer basisfor sectoral strategies and plans in the lateryears of the MTEF.
Recommendation 2: In order to permit less tightly constrained growth in the later years of theMTEF high priority should be afforded to measures which address and reduce existing constraintsfor programme roll-out in the PRSP priority sectors.
Recommendation 3: The PER Committee should review the adequacy of the existing andprospective provisions for the sectoral ministries to apply sufficiently remunerative packages toattract key staff required for programme roll-out in remote and poor districts, with a view toensuring that this constraint, which needs a systemic rather than sectoral solution, is adequatelyaddressedt
5.3. ASSESSMENT OF FISCAL SUSTAINABILITY
5.16 Sustainability is treated as a composite and probabilistic concept. At this stage of the PER akey aspect of the assessment of sustainability relates to the confirmation of the plausibility of theprojections set out in the Budget Guidelines, and a substantial part of this report has been concernedto assess and comment on those projections using our own independent estimates of low, medium andhigh scenarios for each of the major aggregates and their principal elements in the resource envelope.
5.17 The overall conclusion drawn at this stage is that the Budget Guidelines (December 2000)provide a robust basis for budgetary planning. However, this result depends on a number of off-setting elements contributing to this conclusion: we believe that the Budget Guidelines areappropriate for domestic revenue, but conservative for contingent liabilities and for external grantsand loans.
5.18 The full financing cost estimates, such as they are, point to some scope for increased PRSPtarget achievement through the allocation of incremental resources in addition to those anticipated inthe PRSP and the December 2000 Budget Guidelines. This scope, is, however, limited by the poorstate of several sector's preparedness to implement the PRSP and the strong implementationconstraints faced in most if not all sectors.
5.19 There is, in principle, scope for the renewal of net borrowing from the commercial sectorgiven the current liquidity of the commercial banks, and the reduction in the burden of domestic debtservice in recent years (which has resulted from GDP growth and falling interest rates). However,this option should probably not be pursued till firm control of arrears and expenditure planning hasbeen achieved.
35

6. REVENUE ISSUES IN THE LONGER-RUN 4
6.1. THE CURRENT POSITION
6.1 The share of domestic revenue in GDP, at around 11.7%, is low in Tanzania relative to that inseveral other Sub-Saharan countries. The Budget Guidelines state that "raising the revenue to GDPratio will be given high priority", but accept that over the next three years the budget share will benearly flat5. The Guidelines thus reflect a tension between a normative approach to the budget (whatwe would like to see happen) and a positive approach (what we actually think will happen).
6.2 In the budgeting context, the positive approach must be right. Building-in implausiblerevenue forecasts would expand the perceived resource envelope and hence the magnitude of plannedexpenditures beyond what was likely to be financeable in practice. Unless there were offsettingerrors, it would therefore lead to a built-in bias so that, in practice, expenditures would have to becurtailed below the budgeted amounts6. Since different components of spending are differentlycompressible, this is not only inefficient, but is also likely to lead to unplanned shifts in composition.
6.3 However, while the normative consideration should not be allowed to disrupt the budgetaryprocess, revenue remains a serious issue. It appears to be an implicit rule of thumb that governmentsin poor countries can usefully deploy resources at least of the order of 20 per cent of GDP, and thisseems now to be accepted as an appropriate broad target for Tanzania. With a revenue share of lessthan 12 per cent, this leaves a very large gap for financing. In view of Tanzania's high currentapproval rating with donors, they seem happy to provide the bulk of the requisite flow. However, it isone thing to do this against a background where the gap is being narrowed albeit slowly by continuedrelative growth in domestic revenue: it is another matter if the gap appears to be stationary and henceindefinite. It does seem important, in consequence, for the government to take a serious look at theissue of stagnant revenue: whether it is desirable to raise it, and if so, how that might beaccomplished; if not, how that can be squared with the longer run issues of size of governmentoperations and aid dependency.
6.4 There have been a number of reforms of the tax regime, and overall, the problem does notseem to rest in the design or rate structure of the system. Also, neighboring countries have verydifferent revenue performances from their somewhat similar systems. Performance in Uganda is verysimilar to that in Tanzania, at around II%-12% of GDP, whereas Kenya's performance is muchstronger, with the tax share averaging roughly twice as much. It is tempting to attribute this toKenya's higher per capita income and more developed manufacturing sector, but it is necessary to becautious about this. Recent cross-country analyses of tax revenue performance tend to suggest thatTanzania should be capable of generating substantially higher revenues, even when her low per capitaincome and disadvantageous economic structure are controlled for. As an illustration, we can feedTanzania's (1999) characteristics into the tax equations estimated for 39 Sub-Saharan Africancountries by Ghura'. Using his base regression, which includes only per capita income and economic
This chapter was prepared by David Bevan as part of his report on "Budget Sustainability and Full Financingof the Priority Sectors."
It is projected to remain at 11.7% over the next two years, and then rise to 11.9% in 20023/04.
6 In practice, there is a potential offsetting error; this is the tendency to underestimate future donor flows becausethey are not yet committed, discussed in the text. However, it does not seem appropriate to budget on thebasis "two wrongs [may] make a right".
7D. Ghura, Tax Revenue in Sub-Saharan Africa: Effects of Economic Policies and Corruption, IMF workingPaper, WP/98/135.
36
structure, Tanzania should apparently be capable of generating a revenue-to-GDP ratio of nearly 18%(or 19.5% if Tanzania's status as a non-oil mineral producer is taken into account). These regressionsshould certainly be taken with a large pinch of salt, but they do suggest that Tanzania's relativelypoor performance cannot be fully attributed to her unfavorable initial conditions.
6.5 Taking the longer view, it is worth noting that the growth in the revenue share would be (inthe Ghura model) only around 3 percentage points even if per capita income were doubled, somethingwhich would require twenty years of growth in real GDP at rates in excess of 6% per annum. Onceagain these estimates should be treated with considerable caution. But they do indicate that growthalone is unlikely to resolve the revenue problem.
6.6 There is also the reverse connection to consider, running from taxation to growth. Tanzaniahas recently succeeded in raising the real GDP growth rate to over 5% and plans to raise it further to(and maintain it at) over 6%. However, the investment share in GDP has been quite low in recentyears (around 15%); to achieve a sustained growth performance without increasing this would implyan incremental capital output ratio of only a little over 2, which is unlikely to be achieved over a longhorizon. The continued high growth of GDP on which the government is relying is therefore likely torequire a substantial increase in private investment. While international evidence suggests that a hightax share is not inimical to rapid growth, this evidence relates to countries where broadly based taxesat moderate rates raise large revenues. It certainly would not sustain a recommendation to raiserevenue share by setting high rates on narrow bases.
6.7 The long-run spending implications of these unresolved domestic revenue issues can hardlybe over-stressed. At present, the government's recent record as a good macroeconomic manager, andevidence of its commitment to a comprehensive reform agenda, mean that donors are prepared tounderwrite something close to a 'normal' spending programme, despite Tanzania's relatively modestrevenue performance. It is of course possible that they will be prepared to do so indefinitely.However, it would not be wise to plan on this eventuality. More immediately, there must be somerisk that a failure to address the revenue issue will begin to tarnish Tanzania's other achievements,and might conceivably lead to an earlier decline in net aid flows than would otherwise occur. Thiswould involve something rather like a 'matching grant' phenomenon; an extra shilling of domesticrevenue would be accompanied by an enhanced aid flow, and vice versa. It should be stressed thatthis argument is both speculative and (probably) long run. But there are real risks nonetheless.
6.2. THE REVENUE PROFILE IN THE MEDUM TERM
6.8 This section discusses considerations that are relevant to the choice (and attemptedimplementation) of the revenue profile in the medium term. Since it utilizes a somewhatidiosyncratic, though quite natural, use of terms, this is spelt out first.
6.9 'Revenue effort' 8 is usually taken in the tax literature to be the number here called 'revenueperformance', typically the share of revenue in GDP. The common usage implicitly assumes that theinput (which is here called effort) is exactly measured by the output - a low level of achieved revenueis taken to reflect a proportionately low level of the effort to raise that revenue. Without wishing todeny that there is a positive relation between the two, it seems implausible that this relationshipshould be linear, as opposed to reflecting some sort of diminishing returns. We make the plausibleassumption, instead, that increased effort would lead to increased revenue, at least over a range9 , but
8 The discussion is equally valid for the closely similar but somewhat narrower concepts of tax effort and taxperformance.
9 Beyond that range, the converse will be true. The idea that there is a revenue-maximizing rate for any tax, sothat any further rate rise actually reduces revenue, has been made familiar in the concept of the 'Laffercurve'.
37

at a diminishing rate. Devoting an extra ten percent of resources to collection, or raising rates by tenper cent, would increase revenue, but by less than ten percent.
6.10 It also seems plausible, and there is some evidence in support, that these diminishing returnsset in more sharply if the attempt to raise performance is rapid rather than gradual, at least if this isattempted by rate rises. Conversely, lowering rates when these had been widely perceived to beunjustifiably high can improve collections by increasing the system's legitimacy and hencecompliance. However, in Tanzania, while there is scope for further design improvements, it does notseem likely that these will of themselves generate substantial gains in revenue, legitimacy orcompliance.
6.11 Even in the literature which presupposes a linear relationship between effort andperformance, it is widely acknowledged that the slope will differ between countries, reflectingdifferences between them in the practical difficulties of collecting taxes. (See the discussion of thepaper by Ghura above.) Once these difficulties have been taken into account (typically by regressionanalysis, using proxies for the various recognized dimensions of "tax-collectability"), a normalizedrevenue performance can be computed for a country, which acknowledges its own idiosyncraticcharacteristics. Any discrepancy between the normalized and actual performance is then ascribed todifferences in its effort relative to the average in the sample. In particular, a low ratio of actual tonormalized revenue is taken to imply a proportionately low level of effort.
6.12 There are two problems with this procedure. The first is that it assumes that the residualcategory "effort" is uncorrelated with the tax-collectability parameters. But this seems very unlikely,and significant correlation would obviously lead to misleading inferences. To illustrate, suppose low-income countries, facing severe difficulties in raising revenues, systematically tried harder than richerones. Then the coefficient on per capita income would be biased downwards; a low-income countrywhose effort was high relative to the overall average but low relative to the low-income group wouldbe categorized as low effort relative to both. If the correlation had the opposite sign, effort levelswould again be biased, and the regression would now exaggerate the benefits of income growth forrevenue.
6.13 The second problem is that the residual category is not really effort at all, but a composite oftax design, tax administration, compliance, and corruption. A low level of "effort" could thereforereflect unduly low tax rates or excessive exemptions; it could reflect lax and inefficient taxadministration; it could reflect a culture of non-compliance; or it could reflect a high level ofcorruption. The latter two difficulties are often treated as two sides of the same coin, but there is amaterial difference between them. Poor compliance will give a tax administration problems even if itis completely free from corruption. Most tax administrations depend on a high degree of voluntarycompliance by taxpayers coupled with a reliable system of enforcement, which itself requires anappropriate culture.
6.14 The effort calculation - for what it is worth - suggests low effort in Tanzania. This poses achoice. It would be possible to discard the calculation, and argue that Tanzania's structure andcircumstances make it appropriate to settle for a low level of revenue generation for the time being.This argument would have to rest not on the proposition that a country in these circumstances couldnot raise substantially more - there are counter examples to show the contrary. It would have to reston the proposition that such a country should not raise more, on the grounds that the damage inflictedto private sector activities, income and growth would be excessive. By extension, other countries insimilar circumstances but with higher revenue collections should be encouraged to reduce theirrevenue effort.
6.15 The alternative is to accept the calculation, and consider ways of improving performance.Since the structure does not seem to be characterized by unduly low rates, the explanation must lie inone or more of the other components, but these imply very different strategies. Particularly difficultto tackle is the issue of a culture of non-compliance. Also, while the perception that revenueperformance is poor seems naturally to imply that revenue effort should be increased, it is far from
38
clear how large an increase in effort would be justified. Indeed, it is unclear how far and how fast therevenue to GDP ratio could be raised, even if the government was to devote all available energies toraising it. In principle, it would be possible to carry out a cost-benefit analysis, weighing themarginal costs (including those borne by the private sector) of increased efforts against the benefits.In practice, the information for such an analysis is lacking.
6.16 In present circumstances, where donors are prepared to fund Tanzania government operationsvery generously, the pressing issue may be one of absorptive capacity, rather than the contribution ofdomestic revenue. In other words, even given the low level of domestic revenue mobilization, donorsupplementation could be carried to the point at which severely diminishing returns to governmentspending would set in. In this context, raising domestic revenue may be a low priority. If it werepossible to raise revenue performance reliably and quickly by adopting certain clear cut measures toincrease effort, then there would be a strong case for leaving the revenue picture alone, andconcentrating on other matters, until such time as absorptive capacity ceased to be a problem, and/ordonor flows began to subside. However, there does not appear to be any quick fix of this type, so thatprudence suggests that the attempt to improve revenue performance should not be delayed untilfunding shortfalls have already become an issue.
39

7. RECOMMENDATIONS
7.1 SYSTEMIC ISSUES IN BUDGET MANAGEMENT
7.1 One of the main objectives of the Tanzania PER process is to support the improvement ofbudget management. This goal goes beyond ensuring sustained fiscal balance consistent withmacroeconomic stability, which Tanzania has achieved in the past five years. This chapter highlightsfour key systemic budget management issues in Tanzania, identifies the key challenges faced, andrecommends actions to deal with them. Some of these recommendations, which were drawn duringFY01 PER missions in December 2000 and May 2001 and presented to the Government of Tanzania,have already been adopted and implemented as shown in Chapter 8.
7.1.1. Strategic Allocation of Scarce Public Resources
7.2 Until FY00, strategic budget allocation primarily targeted the enhancement and protection ofexpenditure in the social sectors. Tanzania being a signatory to the Copenhagen Social Summit(1995) agreed to pursue the international development targets largely focused on raising andprotecting expenditure allocations to the education and health sectors. Development partnerslikewise prioritized their support, including that provided through the Multilateral Debt Fund, to thesame end. Sector development programs were designed without explicit link to overall povertyreduction outcomes or exploiting synergy with other sectors in achieving this goal.
7.3 In FY00, the focus shifted more explicitly to reducing poverty (first with TAS and thenPRSP) in all its dimensions, through actions in a wide range of interrelated sector activities. Thisshift has entailed paying attention to reducing material poverty (income poverty) in addition to theprevious emphasis on increasing social welfare. To this effect, the government's strategicexpenditure allocation through the MTEF was modified to also explicitly target support for growth,particularly in rural areas, and to increase income earning opportunities for the poor. In this regard,expenditures on health and education were to be valued not only for their impact on improving socialwelfare but also for enhancing the capabilities of the poor to earn incomes - the human capitaldimension.
7.4 There are notably three key challenges in enhancing the cohesiveness of strategic resourceallocation under the new approach. One challenge is to harmonize the sector development programs,which were precedent to the PRSP, with sector-specific programming of activities as a means forachieving specific poverty reduction targets. It requires adapting the sector development programs tothe poverty reduction goals in the PRSP and seeking greater cross-sector cohesion in activityprogramming to achieve the desired results. For the health and education sectors, the gap betweenthe sector programs and the requirements for achieving social welfare targets (and human capacitybuilding) in the poverty reduction strategy in broad terms is not wide. However, it will require twotypes of deliberate actions. One is a clearer mapping of inputs to outcomes, and the other is a moredeliberate focus on disadvantaged locations and socio-economic groups. The rest of the sectors cananticipate the need for harmonization as they prepare their development programs. This isparticularly urgent for the agriculture and transportation/roads strategies, currently under preparation.
7.5 Second is the need to resolve the emerging tension between sectoral and central agenciesover responsibilities and authority for strategic expenditure planning. Sector ministries maintained asignificant autonomy in negotiating external financial support with donors, often within a sectordevelopment program but largely outside the overall strategic expenditure allocation framework.Project support to sectors was channeled largely outside the exchequer system, weakening theintegrity of the budget process and management. The process of integrating external resources intothe cross-sector Medium Term Expenditure Frame (MTEF) and budget has changed the relationsbetween the budgetary authorities and spending units with respect to the autonomy of sectors topursue their own ends. The tension can be resolved partly by delineating and specifying the
40
respective roles of sectors and central ministries in the budgeting process to minimize unproductivecompetition and formalize the evolved process in well-documented budgeting procedures. Furthermorean inclusive planning process, involving the budget authorities, sector ministries and donors inter alia, ascurrently being done under the PER Working Group provides a useful mechanism for harmonizingdialogue.
7.6 Third is the need to more explicitly involve the local authorities (LA) in the national budgetingprocess and strategic expenditure allocation decisions. The share of budget allocated to the LAs isapproximately 17 percent (excluding large off-budget donor support). These sub-national entities havethe primary responsibility for delivering basic services (e.g. primary education, primary health care,agricultural extension services and rural infrastructure) involving significant shares of total spending inthe priority areas (e.g. nearly 55 percent of total spending on education). Prior to the inception of theLocal Government Reform Program, the local authority delivery system was essentially adeconcentration of the sector programs under the relevant sector ministry. With more autonomyenvisaged for local authorities under the reform program, there is greater need for integrating theirbudgeting processes into the cross-sector and sector MTEF preparation.
7.7 Two measures are needed in moving towards this direction. One is the harmonization of thefiscal calendars. The LAs operate on a calendar year in contrast to July-June fiscal year for the centralgovernment. This difference leads to some disconnect in the planning process and lack of accurateforesight for expenditure planning for half of the operating year. The uncertainty in budgeting isparticularly acute since LAs largely depend on the central budget subventions (conditional grants, capitaltransfers and shared revenue), accounting on average for about 76 percent of their financing sources.New budget guidelines to LAs provide guidance for expenditure planning in an MTEF approach, buthave still to be implemented. The other measure is devising a mechanism for involving the 113 LAs inthe MTEF process, both in terms of capacity requirements and logistics for participation. To enablegrass root participation in the budgeting process, it would be necessary to begin the process early. Theregional administration secretariats and PORALG would consolidate the inputs from the sub-nationallevels and use these inputs in the preparation of the national budget guidelines (for prioritization) andsubsequently local authority MTEFs. The budgetary authorities at both levels would need to ensureconsistency with both the projected national resource envelope and agreed public service deliverystandards.
7.1.2. Enhancing the predictability of resource flows for improved service delivery
7.8 The cash budget system was introduced in FY96 with the primary aim of instilling fiscaldiscipline in spending units and restoring sustainable budget balance by limiting spending to availablecash. There is no doubt about the success of this policy, having helped the country achieve sustainedmacroeconomic stability. Tanzania has been able to keep its fiscal balance either in surplus orsustainable deficits, since the introduction of the cash budget system. Combined with a tight monetarypolicy, which precluded government borrowing from the central bank to finance its expenditures, itenabled a sharp reduction in inflation over the same period to the current single digit levels. It is worthnoting that the introduction of this system came immediately after Tanzania had gone through three yearsof very poor fiscal performance (FY92-FY95), during which the government lived well beyond itsmeans.
7.9 Five years after the system became operational, all spending units, at national and sub-nationallevels, now express concerns about the stringency of the cash budget system. During the FY01 PERmission in December 2000, concerns were raised by all sector ministries and 14 local authorities visited.The main problems cited revolve around uncertainty faced by implementation units in planning theirspending as monthly disbursements were based on actual revenue collection and disbursement of donor
41

funds, resulting in under-funding of requirements at the time large needs arise. The pressure from suchstringency has led in some cases to commitments outside the official system and the build up of paymentsarrears. A comparison of expenditure on first claim items (debt service and salaries) with other chargesand development expenditure for FY99 showed as expected that first claims have been largely constantand fully funded. On the other hand, development expenditure and operating charges were treated asresidual, whenever there were cash shortfalls. In FY00, problems with the technical operation of the cashbudget system led to a temporary lack of synchronization between the exchequer releases and availabilityof cash (from domestic revenue and external budget support) as illustrated in figure 1. There has been avery significant reduction in the gap in FY01.
7.10 There are three main types of budgetary stresses associated with large variations in theavailability of cash and the associated under-funding of activities, which contribute to pressures forundermining prudence in budget management.
Fig 1: Monthly Fiscal Deficit/Surplus (Tshs billion)
140.0 -
120.0
100.0Monthly
Exchequer Issues.2 80.0
-4-Total ResourcesAvailable
,, 60.0
40.0
20.0-
0.0 a s. H t b s i
o o oa o~ 0 Ca o 0 0 0 .L 0)0 0)0 0) 0) 0 0 0 000
Month
(a) Under-funding of first-charge type expenditures
7.11 The first relates to the overall amount disbursed being far short of requirements for effectivedelivery of services. Frequently, this problem has been addressed in terms of enlarging the overallresource envelope and sector as well as sub-sector prioritization. However, the budget stress isaccentuated by the fact that the budget preparation stage has typically overlooked completeness inactivity prioritization (sub-items). Currently statutory payments (CFS) and personal emoluments (PE)are treated as first charge. There are at least two more first-charge type of expenditures, which if under-funded often lead to pressures for making commitments outside the budget and building up of arrears.These are utilities (power, water, telecommunications) and "automatic catering or upkeep needs" such asfood and upkeep needs of prisons, security forces, boarding schools and hospitals. Although these do notconstitute an exhaustive list, together they account for the largest proportion of all arrears built up. Forexample based on the Controller and Auditor General's Report for FY99 the Police Force, Prison Service
42
Department, Defense (Ngome), and National Service accounted for 75 percent of all outstandingliabilities (43.2 billion T Shs) of the Central and Regional Governments. The bulk of these new arrearsare in the form of suppliers' credit related to procuring these items. Preliminary analysis of arrearsaccumulated since then shows a similar dominance by these votes.
7.12 The government was encouraged to review the classification of first charge expenditures forcompleteness and ensure that budget guidelines for future years include instructions for fully fundingthese. In this regard, all spending units should provide reasonable estimates of these in their MTEF andbudget submissions and be held accountable for staying within limits of the budget.
(b) Cash Flow Gaps
7.13 The second dimension of the budget management problem relates to the mismatch between themonthly cash requirements and exchequer releases - amounts and timing of release. The lumpiness ofsome expenditure categories such as road maintenance after the rain season, pension funds, andexaminations present major stresses in the overall functioning of the government budget when they occurwithout provision for cash flow gap smoothing. The pattern of expenditures through the year variesgreatly across sectors to render a general rule of releasing 1/12 of the -approved budget each monthdisruptive to the effective provision of public services. Generally cash flow gaps have emanated largelyfrom sharper variations in monthly expenditure requirements since the revenue patterns have tended to bemore stable.
7.14 The monthly cash stress is typically accentuated by unforeseen expenditures triggered byemergencies. The main spending units that have to deal with such crises include Health for epidemics,Defense and Home Affairs for security-related emergencies, and Works and Agriculture for flooddisasters entailing emergency repairs of infrastructure and food security. In the last FY it includedhandling of cholera outbreaks, refugee situations, food relief and security in the game parks. While it ispossible to preempt some contingencies, such as dealing with tourism protection through a program ofstrengthening security presence in the parks, the bulk of other unforeseen events can only be dealt withon a contingency basis.
7.15 The delay in exchequer releases adds to further uncertainty in expenditure planning. Since thereis a predetermined rule to base releases on the average of three previous months revenue collection plusprojected external program support, it is hard for spending units to understand the delay. One of thecauses of delay is a process of conforming to the monthly monetary programming necessitatingprotracted exchanges with BOT before finalizing decisions for monthly exchequer allocations. Suchexchanges could be programmed in a way to enable meet the stipulated date for exchequer releases.
7.16 Even though releases for OC to priority sectors (under the quarterly commitment system) aremade a quarter in advance, this does not solve the problem of possible disconnect with the timing ofaccruing resource flow. To deal with the problem of cash flow management the mission put forward fouractions to be considered by the government:
7.17 The Budget Guidelines should require spending units to present a cash flow plan along with theirannual budgets, which conform to the respective aggregate ceilings but clearly show the time pattern oftheir cash requirements. New budget guidelines to LAs now include this requirement. Particularattention needs to be paid to the typical lumpiness in expenditure patterns in the spending units.Currently submissions from some ministries include cash flow needs for some lumpy activities, such asexaminations for education and immunization programs from health. The suggestion here is tosystematize and broaden the coverage of such submissions to all spending units. Once consolidated theoverall budget could also have a cash flow plan to provide a more systematic projection of exchequerreleases.
43
7.18 The government was encouraged to consider a cash flow smoothing instrument that respects theoverall budget ceilings for the year. Two options or their combination, were discussed with theconcerned stakeholders. One is a cash reserve operated as a government deposit that can be drawndown or built up, depending on the net cash requirement position compared with the available cash.There were indications of possible contribution to such a reserve by donors, provided it can be protectedfrom becoming a financing instrument. The other option is to establish a prudent credit line with theBOT, with advances subject to the same rule that the net position as end year be zero. The law allowsfor such advances up to the value of one eighth of the average revenue collection for the past three yearsprovided they are repaid within 180 days. Prior to the recent up-front disbursement of budget support bydonors, the BOT allowed the government to draw down its deposits to pre-finance the shortfall betweenprojected external program support and actual disbursement. The recommendation made here was toallow the use of advances as provided under the law with specific safeguards against potential abuse byturning advances into a financing instrument as it occurred in the past. The previous PERs and thiscurrent one established that typically the variance between actual and projected domestic revenuecollection is smaller than that for external resource flows. Furthermore, there is a concentration ofexternal inflows in the last quarter of the year, which can be exploited as a safeguard against such abuse.Given the cost of advances, it is in the interest of the government to minimize the utilization of thiswindow for financing reversible cash gaps. Upfront disbursement of budget support and indeed betterforesight of aid disbursement plans will help minimize recourse to this avenue. The government wastherefore advised to consider the two options or their combination based on comparative cost assessment,more specifically, the opportunity cost of maintaining a cash reserve and cost of credit.
7.19 There are two minor caveats with regard to these devices, or at least as to the detail of theirdesign. First, while they would both work, as intended, to smooth expenditure against intra-yearfluctuations in government receipts, they would have the undesired consequence of injecting andwithdrawing liquidity via reserve money as they did so. In principle, this would simply enter the BOT'scalculations of how much liquidity paper would be required to offset these movements (as well asmovements in other autonomous factors). However, it might be better to back the government smoothingdeposit by an increase in foreign exchange reserves from the outset. Excess spending in one monthwould then effectively be financed by drawing down foreign exchange reserves, so sterilizing theliquidity impact automatically; and vice versa when receipts exceeded spending.
7.20 The second caveat concerns the end-year position. While it might be believed with certainty thatsome fluctuations in receipts would be reversed within the current fiscal year, there is more usually aproblem of interpretation. Is a downturn a temporary delay, which will be made good within the year? Atemporary delay, which will be made good in a later year? A delay, which will only be made partly goodlater? A loss, which will not be made good at all? In practice, there are bound to be errors ofinterpretation, in both directions. Hence there will need to be some facility for carrying forward a limitedpositive or negative balance, provided there is a mechanism to prevent this process being cumulative.
7.21 A further step along the path of graduation from the strict cash budget is to move away from anannually balanced domestic budget to one in which the government may choose to run a domestic deficit.The prudent and efficient level of deficit would have to be chosen in the light of a number of factors.These would include the circumstances of the private sector, including the domestic credit position, thedemand for real balances, and the saving and investment rates. They would also include thegovernment's own debt position, the inflation, interest and exchange rates, and the value to be attached toadditional government spending. Finally they would include a view of the extent of complementaritybetween public and private activities, and the absorptive capacity of each sector.
10 See Annex 2 for more discussion of this.
44
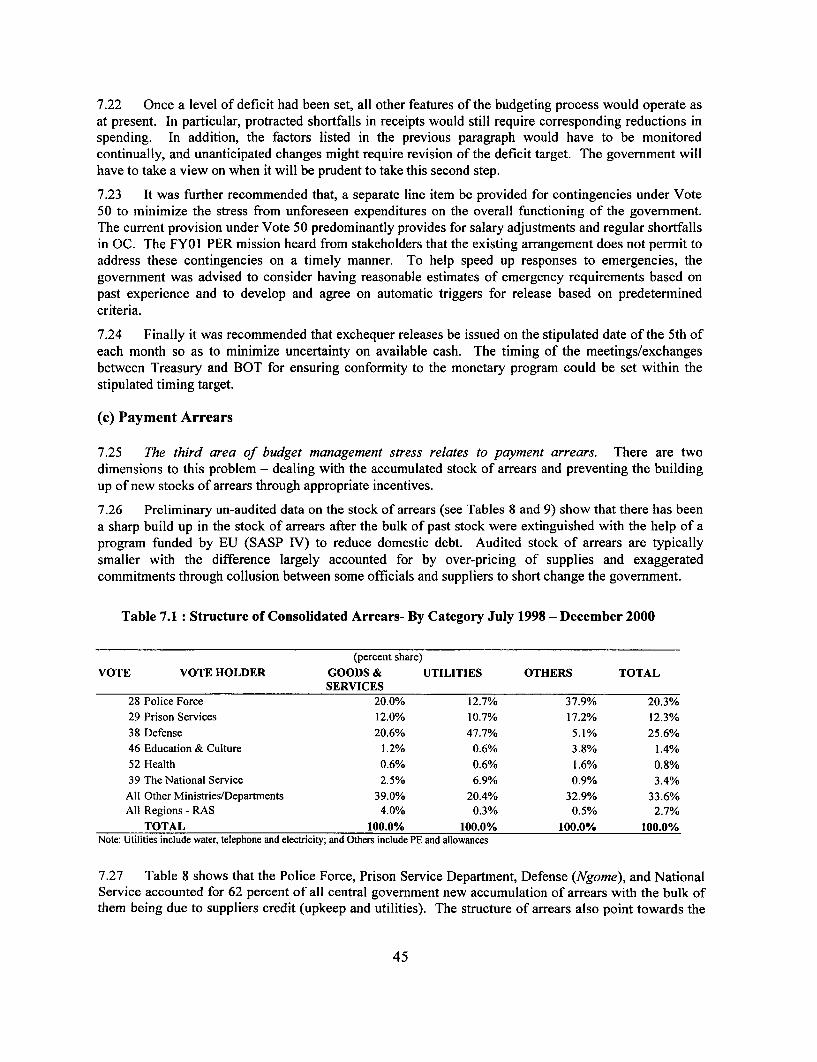
7.22 Once a level of deficit had been set, all other features of the budgeting process would operate asat present. In particular, protracted shortfalls in receipts would still require corresponding reductions inspending. In addition, the factors listed in the previous paragraph would have to be monitoredcontinually, and unanticipated changes might require revision of the deficit target. The government willhave to take a view on when it will be prudent to take this second step.
7.23 It was further recommended that, a separate line item be provided for contingencies under Vote50 to minimize the stress from unforeseen expenditures on the overall functioning of the government.The current provision under Vote 50 predominantly provides for salary adjustments and regular shortfallsin OC. The FY01 PER mission heard from stakeholders that the existing arrangement does not permit toaddress these contingencies on a timely manner. To help speed up responses to emergencies, thegovernment was advised to consider having reasonable estimates of emergency requirements based onpast experience and to develop and agree on automatic triggers for release based on predeterminedcriteria.
7.24 Finally it was recommended that exchequer releases be issued on the stipulated date of the 5th ofeach month so as to minimize uncertainty on available cash. The timing of the meetings/exchangesbetween Treasury and BOT for ensuring conformity to the monetary program could be set within thestipulated timing target.
(c) Payment Arrears
7.25 The third area of budget management stress relates to payment arrears. There are twodimensions to this problem - dealing with the accumulated stock of arrears and preventing the buildingup of new stocks of arrears through appropriate incentives.
7.26 Preliminary un-audited data on the stock of arrears (see Tables 8 and 9) show that there has beena sharp build up in the stock of arrears after the bulk of past stock were extinguished with the help of aprogram funded by EU (SASP IV) to reduce domestic debt. Audited stock of arrears are typicallysmaller with the difference largely accounted for by over-pricing of supplies and exaggeratedcommitments through collusion between some officials and suppliers to short change the government.
Table 7.1: Structure of Consolidated Arrears- By Category July 1998 - December 2000
(percent share)VOTE VOTE HOLDER GOODS & UTILITIES OTHERS TOTAL
SERVICES28 Police Force 20.0% 12.7% 37.9% 20.3%29 Prison Services 12.0% 10.7% 17.2% 12.3%38 Defense 20.6% 47.7% 5.1% 25.6%46 Education & Culture 1.2% 0.6% 3.8% 1.4%52 Health 0.6% 0.6% 1.6% 0.8%39 The National Service 2.5% 6.9% 0.9% 3.4%All Other Ministries/Departments 39.0% 20.4% 32.9% 33.6%All Regions - RAS 4.0% 0.3% 0.5% 2.7%
TOTAL 100.0% 100.0% 100.0% 100.0%Note: Utilities include water, telephone and electricity; and Others include PE and allowances
7.27 Table 8 shows that the Police Force, Prison Service Department, Defense (Ngome), and NationalService accounted for 62 percent of all central government new accumulation of arrears with the bulk ofthem being due to suppliers credit (upkeep and utilities). The structure of arrears also point towards the
45

dominance by suppliers' credit with the combination of goods and services and utilities togetheraccounting for nearly 88 percent of total (Table 9). More than 60 percent of total payment arrears buildup is on account of goods and services and can be controlled through the centralized system of issuinglocal purchase orders (LPO) instituted in early FY01. It is instructive to note that the bulk of new arrearsin this category have occurred in agencies that had not been brought into the Integrated FinancialManagement System (IFMS), through which the centralized commitment system operates. About aquarter of the arrears are on account of utilities, which are outside the purview of the centralizedcommitment system until such time as the prepayment system will become operative. The rest ofpayment arrears (about 12 percent) are debts to employees related to personal emoluments andallowances.
Table 7.2: Consolidated Arrears- As a Proportion of Total Arrears July 1998 - December.2000
(percent share)VOTE VOTE HOLDER GOODS & UTILITIES OTHERS TOTAL
SERVICES28 Police Force 12.6% 3.2% 4.5% 20.3%29 Prison Services 7.5% 2.7% 2.1% 12.3%38 Defense 13.0% 12.0% 0.6% 25.6%46 Education & Culture 0.7% 0.2% 0.5% 1.4%52 Health 0.4% 0.2% 0.2% 0.8%39 The National Service 1.6% 1.7% 0.1% 3.4%All Other Ministries/Departments 24.5% 5.1% 3.9% 33.6%All Regions - RAS 2.5% 0.1% 0.1% 2.7%
TOTAL 62.8% 25.2% 12.0% 100.0%Note: Utilities include water, telephone and electricity; and Others include PE and allowances
7.28 The latest data on payment arrears owed by LAs is for end year 1999 (CAG report). The totalstock of arrears based on the 1999 CAG report amount to Tshs. 5.9 billion. This is made up of 94%suppliers credit and 6% statutory remittance. In 1998 the stock of arrears stood at 6 billion Tshs. Threequarters of this stock was due to councils' creditors and a quarter of it due to non remission of statutorydeductions from employees for contribution to Local Authority Provident Fund. Outstanding imprestsand advances are owed to the LAs, and should therefore be netted out to obtain a net stock of contingentliabilities. Although unpresented checks do not constitute a fresh claim on future budgets, to the extentthat they have to be financed out of inadequate flows of cash in the following year, they do represent astrain on cash management. It is noteworthy that the value of unpresented checks has more than tripledbetween 1998 and 1999.
7.29 The gravity of the problem varies across local governments. For some of the poorer authoritiesthe FY01 PER mission visited, the stock of arrears make up over 50 percent of their own revenuecollection, representing a major potential drag on financing their development programs. Most better-to-do and fewer poorer local authorities visited by the mission have begun, on their own, to reduce the stockof debt and often at the expense of much needed funding for public services in the poorer ones.
7.30 There is no operation for relieving the local governments of their debts. A major issue in suchdebt relief programs is the moral hazard problem and preventing the recurrence of build up of arrears.The mission discussed with those met appropriate disincentives to building up new flows and possibleapproaches to tightening the financial management system against recurrence of unsustainable stock.
46

7.31 It was recommended that the government should consider a relief program to clear up the stockof debt of poor Local Authorities (Highly Indebted Poor Local Authorities - HIPLA) to give them a freshchance under the local government reform program. The PER Working Group commissioned a separatestudy for a more in-depth analysis of this problem and recommendations for way forward.,
7.32 Following the central and local government debt relief operations, it was deemed necessary toprevent recurrence of the unsustainable stock of debt The FY01 PER mission recommended measuresthat would ensure that this is not happening. One of the measures is that new payments arrears shouldbe integrated into the following year's respective spending unit's budgets as first charge from theirallocations. This used to be the practice in the past aimed at enforcing discipline in budget management.It would, however, require timely compilation of information on arrears (in the EPICOR system whereavailable) and verification. To prevent to abuse of extra-budgetary commitments, it was suggested thatthere was need to enforce the centralized system for issuing LPOs. Extended coverage of IFMS sub-treasuries and local governments will facilitate the control of extra-budgetary commitments.Furthermore, it was suggested that there was need to enhance enforcement of discipline by theaccounting officers (AOs) to ensure that no invoices are held outside the financial reporting system.Strengthening the internal audit functions in ministries, regions and local governments would helpminimize collusion with suppliers. It should also be widely publicized that the government would nothonor any commitments made outside the IFMS. Private suppliers that violate this warning should bearthe costs due to non-payment for goods and services supplied inappropriately.
7.1.3. The Integrated Financial Management System
7.33 The government has introduced the Integrated Financial Management System (IFMS), whichwhen fully operational would permit improved transparency of public financial operations through realtime information, and better controls through centralized payments and procurement processing. TheEPICOR (formerly PLATINUM) is the software currently used to operate the IFMS. The ExchequerOrdinance has been revised inter alia to provide a legal basis for operating this new system effectivelyand accepting its reports for fiduciary accountability. To date all ministries in Dar-es Salaam are usingthe IFMS. However, two are not on line. In practice this means that all expenditure transactions are nowbeing executed through the system. In the case of the two remaining institutions (President's Office andthe Ministry of Defense and National Service and agencies under it), although not yet on line, the IFMSand EPICOR software have now been implemented.
7.34 Central government agencies located in regions and districts are served through 19 Sub-Treasuries. Manual operation of IFMS has been in place since last fiscal year. During the financial year1999/2000 all payments were processed at the central payment office in the sub-regional treasuries. Thestructure of the chart of accounts in use is the same as that in use at the Central Payments Office but allpayments and revenues are captured manually. Following failure of the first attempt to automate thesystem, on line links are being established in the 19 sub-treasuries from where payments andcommitments are being executed for all central government agencies located in the 19 regions. Anearlier attempt at automating IFMS in the sub-treasuries using the PLATINUM software sufferedtechnical hitches in hardware and software services making connectivity inoperative. Furthermore, thesystem used dial up technology for linking with Dar es Salaam. Consequently the links were subject totelecommunication interruptions. The government is in the process of reinstalling equipment and linkingthe sub-treasuries with the center via satellite technology. Sub-treasuries connected to the IFMS centercan now operate on line and the task to connect all the sub-treasuries is expected to be completed by endAugust 2001. Training of staff to operate the new system and modules is ongoing. Software serviceswill subsequently be provided on line from the center. Provisions are also being made for stand aloneservers to enable early operation of the EPICOR system in each sub-treasury while connectivity viasatellite is being setup. This provision also caters for managing risk of failure of the central server. The
47

shift to satellite-based communication will avoid operating malfunctions associated with a dial up systemand will enable technical support services on the software from the center. The revamped roll out of theEPICOR system will help resolve the problem of poor technical supportive services encountered in theearlier roll out initiative.
7.35 IFMS and the EPICOR software are also being rolled out to 28 local authorities on a pilot basisunder phase I of the LGRP initiative. About half of the 28 LAs can operate the software effectively. 42more have been targeted for phase II which begun in January, 200 1.
7.36 All ministries, Sub-Treasuries and local authorities visited by the FY01 PER mission expressedtheir appreciation for improvement in efficiency and controls when the EPICOR is operative and stronglyurged for revival and expansion of its operation. However, some key transitional concerns that need tobe addressed urgently were noted.
7.37 As of April 2000, a centralized LPO system became operational in Dar-es- Salaam obviating theneed for continued use of printed LPOs. The presumption was that since many of the Sub-Treasuries hadthe EPICOR system, the need for printed LPOs would subside. Due to the fact that the initial rolling outof the Platinum/EPICOR system to the sub-treasuries was broadly not operative, commitments continuedto be made using the old LPO system. Since these were largely supplied through central agencies, whohad themselves migrated to the automated system, a shortage of LPOs emerged which endangered theintegrity of the procurement system in areas where EPICOR is not operative. It was thereforerecommended that there was an immediate need for ensuring that adequate supplies of printed LPOs wasavailed to all those in need of them prior to the effective migration to the EPICOR system in the sub-Treasuries.
7.38 It was also suggested that the government should also ensure availability of functioningequipment, effective supportive technical services, and adequate training to operating staff. Morefundamentally, however, was the need to enhance the skill profile of the operating and accounting staffand incentives for retaining qualified accountants for whom the government faces stiff competition fromthe private sector and independent public agencies.
7.39 Currently, the OCAG conducts its audits around the computerized system. The new Finance Actenables them now to audit within the computerized system, which will facilitate more timely completionof audits and ongoing monitoring of integrity in the payments system. To do so, however, the OCAGwill require major retraining of its staff to use the automated audit system. It was therefore suggestedthat there was an urgent need for drawing up and implementing an IFMS and EPICOR training program,as well as building up skills for automated audits.
7.1.4. Budget and Financial Management in Local Governments
7.40 The PRSP and a variety of other reports emphasize the need for improving strategic budgetpreparation and financial management at local government level, as Local Authorities increasinglyassume the primary responsibility for the delivery of essential public services. Efforts are also under wayto strengthen the capacity for financial management and accountability at this level of government. TheFY01 PER mission, building on previous reports, visited 14 LAs to undertake an on the groundassessment of status of the budgeting process and financial management, and reviewed progress instrengthening them. More specifically the aims were: (i) to assess the effectiveness and capacity forbottom-up approach in expenditure planning; (ii) the frequency and quality of quarterly and annualfinancial reporting and feedback from supervisors; (iii) the efficacy of the supervisory functions of RAS,PORALG, OCAG and Ministry of Finance in budgeting and financial reporting/accountability systems ofthe local authorities. The following is a synopsis of the main conclusions and recommendations from thedetailed assessment.
48

(a) Budget Processes
7.41 Budgetary stress: It was noted that there is an apparent difference in the extent of budgetarystress between rich and poorer local authorities (LAs). These differences are manifested in the relativesize of payment arrears, own revenue as percentage of total revenue, own revenue per capita and theextent of under-funding of essential services. Deliberate effort was being pursued under the PRSP toidentify and provide higher support to poorer districts. The mission suggested that there was need tomainstream this approach in the annual budgeting process and draw up concrete cross-sector programsthat relatively favors the poorer areas.
7.42 Differential treatment of LAs in exchequer releases and funding: By and large under-funding isstill a problem both in relation to needs and approved allocation. Some districts receive less resourcesthan approved especially for the funding of other charges. There are marked variations in the extent ofunder-funding between regions and between districts with some districts receiving far less than theirapproved allocations. It is not clear what criteria are being used in deciding the allocation, timing ofactual releases and disbursements since some LAs do not receive releases as expected. It was thusrecommended that there was a need for a review to determine the extent of inequity of treatment andtransparency in the criteria used for differential treatment.
7.43 Cash flow plans: There are indications from the LAs that cash flow planning would help easecash flow problems and reduce uncertainties in budget implementation. Some LAs already prepare cashflow plans while some better to do LAs have been able to use cash reserves to bridge cash flow gaps andsmoothen cash flow over time. Generally, councils indicated their agreement to including therequirement for preparing cash flow plans in the Guidelines for the budgeting process. As such it wassuggested that councils should be encouraged to pursue this approach.
7.44 Arrears: Most LAs and in particular the poorer LAs have accumulated huge payment arrears.Usually in the preparation of the budget, LAs include repayment of arrears as one of the expenditureitems. In practice, however, it is only the better to do LAs that have been able to spare enough resourcesfor this item. The inclusion of arrears in the expenditure side of the LA budgets has instilled a sense ofresponsibility to the LAs making them wary to incur more debts. It was recommended that such practice(integrating debts in their budgets) should be formally adopted in the guidelines for budgeting at alllevels of government.
7.45 Role of the Regional Secretariat (RAS Office): The RAS office's advisory role is currently verylimited and ambiguous. This has led some to think that the Regional Secretariat is an unnecessaryoverhead to the government. However, given the distance between ministries and the LAs, there isdefinitely a need for an intermediate body, which will monitor and ensure that the national standards inservice delivery and policies are adhered to. The Regional Secretariat is well placed to perform such afunction. It was suggested that there was need for GOT to clarify the role of the Regional secretariatvis-a-vis the sector ministries in monitoring and evaluation, and in enforcing national standards. Thenational budget provision for these functions, it was also suggested, should be shared between the sectorministries and the Regional Secretariats.
(b) Financial Management
7.46 Capacity for Financial Management: The four key positions - Treasurer, ExpenditureAccountant, Revenue Accountant and District Planning Officer are filled by staff with the requisiteprofessional qualifications. However, the Intemal Audit departments are weak in capacity, because mostof the auditors are new (72 recruited in 2000) and lack job experience to man Internal Audit department,while others are not qualified for the job but only seconded from the Finance Department to do the job.
49
Positions below the accountants are also manned by accounts assistants, most of whom have not gonethrough a formal training on accounting. The finance management capacity is even more worrying andtotally lacks at the ward level where, apparently most of the revenue collection in the Councils takesplace. The mission recommended a need for further training of accounts clerks and orientation of auditstaff to the financial accounting and management of LAs, as well as training of finance and audit staff incomputer skills to cope with the introduction of the Epicor System. To help more effective supervisionby the councilors, it was suggested that there was a need for occasional seminars for the councilors tosharpen their understanding of financial statements. The LGRP and other complementaryinitiatives should pay particular attention to this need.
Internal Audit reports and their usefulness: Internal audit reports are essential in uncoveringirregularities and ensuring that regulations are properly followed in the course of performing day to dayfinancial management operations. The reports are important not only as a financial management tool forthe management, but also in guiding and simplifying the work of external auditors. It was thereforesuggested that these reports should be regularly produced and submitted both to the management andthe Council. In particular, the Councilors should demand to read such reports on a quarterly basis andsubsequently ensure that the management responds to queries contained in these reports.
7.47 Frequency and quality of quarterly and annual financial reporting and feed-back fromsupervisors: Monthly, quarterly, and annual financial reports are prepared by the LA management andsubmitted to the Finance Committee and the full council. Quarterly and annual reports are copied to theRAS and PORALG. However, none of the reports go to the sub-council level directly. The assumptionis that the contents of the reports would reach the sub-council levels through their representatives. Themission recommended that both financial and audit reports (translated into Kiswahili) be displayed /madepublic at ward and village levels.
7.48 The practice existing up to the early 1980s of sending copies of the quarterly reports to Treasurywas very useful for accountability / feedback. This practice, it was suggested, should be re-instituted anda desk officer should be designated in MOF to deal with such reports.
50

8. THE WAY FORWARD
8.1. Government Response to PER Recommendations
8.1 The Government of Tanzania made a substantial effort in addressing various issues that wereidentified during the PER main mission in November/December 2000. Although relatively little time hadpassed by June 2001 since the formulation of the recommendations in December 2000, it was hearteningto learn that in a number of areas steps had already been taken to implement the mission'srecommendations while in other areas the mission's findings had stimulated a debate among the keyparties involved which were likely to lead to concrete steps to implement the recommendations of thePER mission.
8.2 Cash Budget: Although the cash budget system was instrumental in re-establishing fiscaldiscipline, there were rising concerns about the negative effects of the cash budget system on strategicresource allocation and operational efficiency. To soften the negative impacts of the cash budget systemand pave the way for its abandonment in favor of a more orthodox budget management system themission had proposed to incorporate monthly cash requirement plans in the budget process. Thisrecommendation was taken up in the budget guidelines and ministries are now required to submitmonthly cash requirements in addition to overall annual budgetary requirements. A secondrecommendation concerned the synchronization of monthly cash requirements with monthly cashavailability through bridge financing by the Bank of Tanzania or alternatively through a cash reserve.There is now an understanding in principle that the Bank of Tanzania is prepared to provide bridgefinancing in the form of cash advances or through marketable instruments such as treasury bills. Thepreference of the Bank of Tanzania is to use marketable instruments since this would provide a safeguardagainst the possibility that bridge financing would turn into effective long-term Central Bank financing ofgovernment expenditures. government remains concerned about the cost of such financing and wouldprefer to use instruments whose time structure corresponds to the temporary nature of the financingneeds.
8.3 Arrears: With the introduction of the cash budget system, a central payment system, and anintegrated financial management system, government has implemented a system of hard budgetconstraints for spending units. Hard budget constraints increased budgetary stress for many spendingunits and arrears have emerged as an important problem undermining the budget process and fiscaldiscipline. The PER main mission identified several categories of expenditures, in particular utilitypayments and "automatic catering and up-keep needs" as well as expenditures in the purview of sub-treasuries where the LPO/IFMS was not operational as main areas of arrears. The mission recommendedimmediate action to close loopholes at the sub-treasury level by restoring the functionality of theLPO/IFMS system at that level and appropriate action has been taken by the government. With respectto utilities and automatic catering and up-keep needs, the mission recommended that these expendituresshould be given the status of first claim expenditures similar to debt service and salary payments. Thisrecommendation is still under discussion at Treasury.
8.4 Integrated Financial Management System: The PER main mission had noted problems with theimplementation of the IFMS at the level of sub-treasuries and at local authorities. The problem at sub-treasuries was due to the incompatibility of computer hard- and software as well as problems with datatransmission to the Treasury through the telephone network. This problem is being addressed with theOffice of the Accountant General deploying new workstations (and new software - EPICOR) to the sub-treasuries to equip each sub-treasury with 4-5 new workstations. Connectivity with Treasury is being re-established through the use of a wide area network using virtual private network technology. It is
51
expected that the new system will be operational by end August 2001 with all sub-treasuries being onlinewith the central servers at Treasury.
8.5 Problems with the roll-out of the computerized IFMS to local authorities are also beingaddressed by the government also through re-equipping them with a new software. The system wasimplemented to 28 local authorities, but was only operational in half of them. The main constraints at thelevel of local authorities are limited human resources and required expertise, which creates a need forsustained efforts in capacity building.
8.6 Local Authorities: The PER main mission had visited 14 local authorities to gain first handknowledge of financial management issues at the local level and in particular the implications of the localgovernment reform program which involves substantial fiscal decentralization. One of the key problemsaffecting the budgeting process of local authorities is the difference in financial years of the centralgovernment (July-June) and local authorities (January - December). The mission had follow-updiscussion with the LGRP and Treasury on this issue. While there is broad agreement on the desirabilityof synchronizing fiscal years of central and local governments, no steps have as yet been taken to effectthe necessary changes. The mission's recommendation of considering a debt relief scheme for localauthorities has received positive response and a study has been done to establish the actual magnitude ofthe local government debt problem.
8.7 The Budget and MTEF focus on Poverty Reduction: The government more strongly used theMTEF as a strategic allocation instrument during 2001 by adapting its formulation to the PRSP process.Box I summarizes the pro-poor budget measures outlined in the 2001/02 budget speech by the Ministerfor Finance. Other actions taken so far and plans for the future are summarized in the subsequent matrix.
52
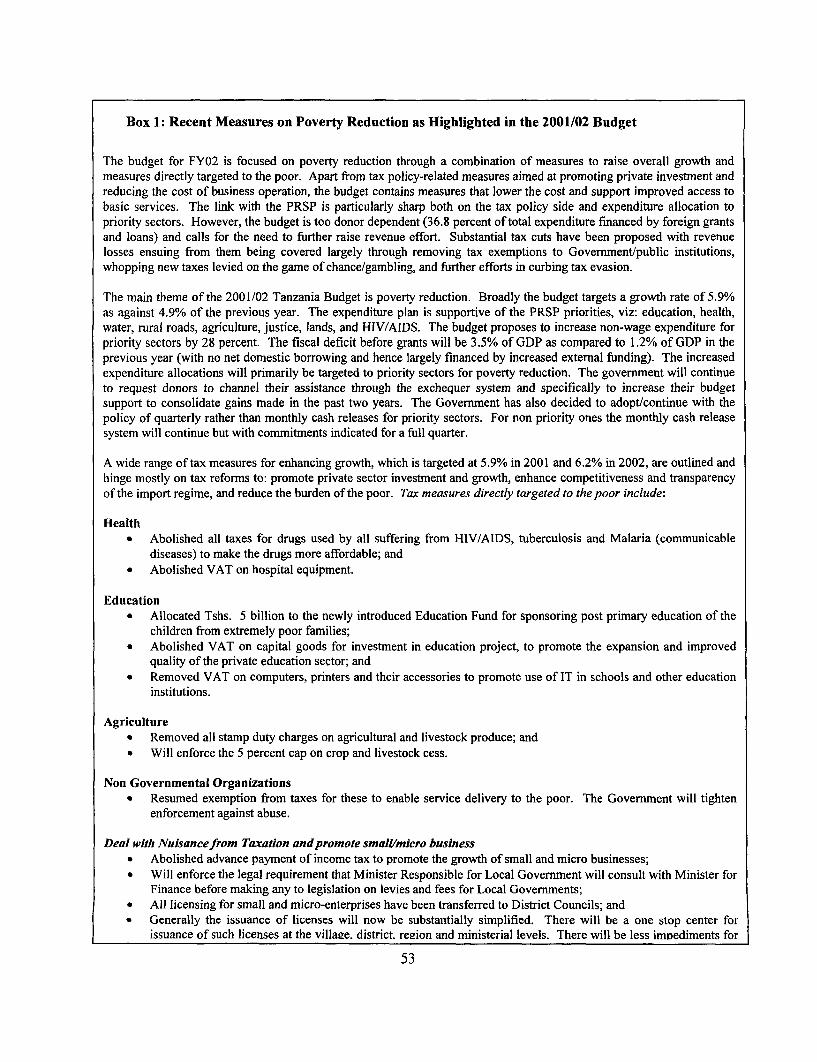
Box 1: Recent Measures on Poverty Reduction as Highlighted in the 2001/02 Budget
The budget for FY02 is focused on poverty reduction through a combination of measures to raise overall growth andmeasures directly targeted to the poor. Apart from tax policy-related measures aimed at promoting private investment andreducing the cost of business operation, the budget contains measures that lower the cost and support improved access tobasic services. The link with the PRSP is particularly sharp both on the tax policy side and expenditure allocation topriority sectors. However, the budget is too donor dependent (36.8 percent of total expenditure financed by foreign grantsand loans) and calls for the need to further raise revenue effort. Substantial tax cuts have been proposed with revenuelosses ensuing from them being covered largely through removing tax exemptions to Government/public institutions,whopping new taxes levied on the game of chance/gambling, and further efforts in curbing tax evasion.
The main theme of the 2001/02 Tanzania Budget is poverty reduction. Broadly the budget targets a growth rate of 5.9%as against 4.9% of the previous year. The expenditure plan is supportive of the PRSP priorities, viz: education, health,water, rural roads, agriculture, justice, lands, and HIV/AIDS. The budget proposes to increase non-wage expenditure forpriority sectors by 28 percent. The fiscal deficit before grants will be 3.5% of GDP as compared to 1.2% of GDP in theprevious year (with no net domestic borrowing and hence largely financed by increased external funding). The increasedexpenditure allocations will primarily be targeted to priority sectors for poverty reduction. The government will continueto request donors to channel their assistance through the exchequer system and specifically to increase their budgetsupport to consolidate gains made in the past two years. The Government has also decided to adopt/continue with thepolicy of quarterly rather than monthly cash releases for priority sectors. For non priority ones the monthly cash releasesystem will continue but with commitments indicated for a full quarter.
A wide range of tax measures for enhancing growth, which is targeted at 5.9% in 2001 and 6.2% in 2002, are outlined andhinge mostly on tax reforms to: promote private sector investment and growth, enhance competitiveness and transparencyof the import regime, and reduce the burden of the poor. Tax measures directly targeted to the poor include:
Health* Abolished all taxes for drugs used by all suffering from HIV/AIDS, tuberculosis and Malaria (communicable
diseases) to make the drugs more affordable; and* Abolished VAT on hospital equipment.
Education* Allocated Tshs. 5 billion to the newly introduced Education Fund for sponsoring post primary education of the
children from extremely poor families;* Abolished VAT on capital goods for investment in education project, to promote the expansion and improved
quality of the private education sector; and* Removed VAT on computers, printers and their accessories to promote use of IT in schools and other education
institutions.
Agriculture* Removed all stamp duty charges on agricultural and livestock produce; and* Will enforce the 5 percent cap on crop and livestock cess.
Non Governmental Organizations* Resumed exemption from taxes for these to enable service delivery to the poor. The Government will tighten
enforcement against abuse.
Deal with Nuisance from Taxation and promote small/micro business* Abolished advance payment of income tax to promote the growth of small and micro businesses;* Will enforce the legal requirement that Minister Responsible for Local Government will consult with Minister for
Finance before making any to legislation on levies and fees for Local Governments;* All licensing for small and micro-enterprises have been transferred to District Councils; and* Generally the issuance of licenses will now be substantially simplified. There will be a one stop center for
issuance of such licenses at the village. district. reeion and ministerial levels. There will be less imoediments for
53
8.2. Impact of the PER Process
50. In addition to the review of fiscal performance and progress in addressing issues identifiedduring the main PER mission, there is also a need to constantly review the effectiveness of the PERprocess, as all involved parties invest substantial amounts of staff time and financial resources in theprocess. Although it is difficult to establish a direct causal link between improvements in public financemanagement and the PER process, it is nonetheless evident that significant improvements have takenplace in a number of areas which have been a central focus of the PER process. They include:
* Improved prioritization and poverty focus of public expenditures;
* Strengthening of budget management systems and institutions;
* The strengthened MTEF produces more realistic budget projections and thus smaller deviationsbetween budgeted and actual expenditures;
* PER analytical work provided important inputs for the design of HIPC and the PRSP;
* Improvements in donor reporting on aid flows under the PER process have considerablystrengthened the information base for GOT budgeting;
* The PER process and measures to improve budget management have improved donor confidenceand a greater share of donor assistance is provided in the form of budget support or channeledthrough the budget thus limiting transaction cost and enhancing government ownership; and
* The opening up of the budget process through the PER process has led to improved informationflows between Treasury, sector ministries, donors, and other stakeholders.
8.3. Challenges for the Future
8.8 Overall the government has maintained good progress towards the use of the MTEF as a strategicallocation instrument and has this year turned its focus to adapting the MTEF formulation to the PRSPprocess. The key challenge is to further strengthen links with Sector Development programs, particularlywhere these were developed prior to the advent of the PRSP and further improving the costing of realisticrequirements (including consistency with absorptive capacity) for achieving poverty reducing outcomes.
8.9 The core pillar for improving public financial accountability remains the implementation of theIntegrated Financial Management System. Very good progress has been made in rolling this out to allcentral government agencies, which together accounts for nearly 80 percent of all resources mobilizedthrough the Exchequer. All central government agencies, including those in the regions should beoperating this facility on real time basis by end of August, 2001. Rolling out the IFMS to all LAs wouldalso go a long way in improving financial management at the sub-national level. This is a challenge thathas to be faced by GOT.
8.10 Results from the expenditure tracking studies and from the participatory CFAA underline thevalue of making service delivery surveys and expenditure tracking part of a routine annual assessment ofthe effectiveness of public spending. This is particularly important in view of the growing role of sub-national authorities and local communities in delivering/organizing essential services without adequatecapacity and systems for financial management.
8.11 A long step forward has been an agreement and initial steps to address the vexing problem oftight cash budget and its impact on limiting predictability in expenditure planning. The government
54

began quarterly releases and commitments for all priority activities since December 2000 and hascommitted to stay with this practice. The government has also embarked on a system of cash flowplanning and adopted measures for smoothing cash availability. The extension of this practice to non-priority sectors and preventing the build up of new arrears will reduce pressures on cash flowmanagement.
8.12 The PER process and dialogue seems to be paying off in terms of improving both predictabilityand flexibility of budgets. A larger proportion of recorded loans and grants is now being provided asbudget support and a larger proportion of the external resources are integrated through the Exchequer(including the development budget). There is still a long way to go but progress has been substantial andthe dialogue is at least taking place on the same platform. This raises the stakes for improving theintegrity of financial management and result-orientation to provide the necessary comfort to make furtherstrides.
8.13 Finally, it would be pertinent that in the future the PER working group undertakes a full reviewof the strengths and weaknesses of the PER process with a view to learn from past experience andcontinuously improve the process. One widely shared view is that it would be useful to start the PERprocess with the drawing up of a plan and identification and commissioning of studies earlier than in thepast to ensure that all inputs are adequately processed during the government's budget cycle.
55
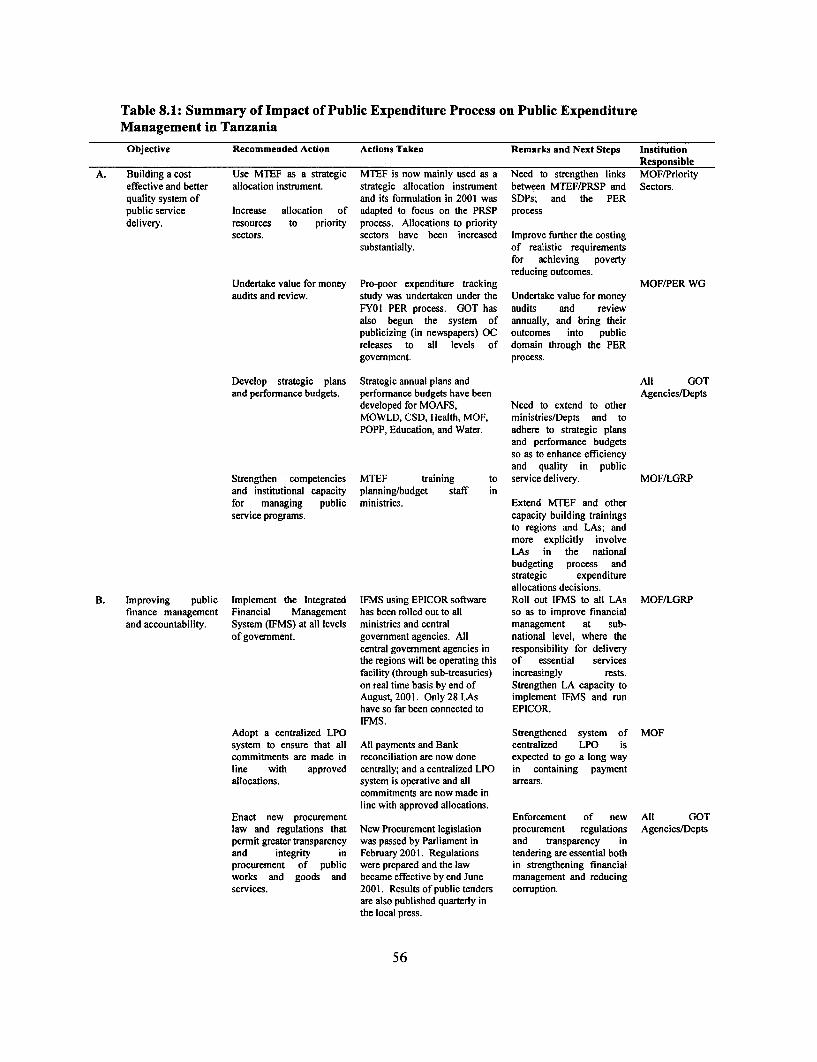
Table 8.1: Summary of Impact of Public Expenditure Process on Public ExpenditureManagement in Tanzania
Objective Recommended Action Actions Taken Remarks and Next Steps InstitutionResponsible
A. Building a cost Use MTEF as a strategic MTEF is now mainly used as a Need to strengthen links MOF/Priorityeffective and better allocation instrument. strategic allocation instrument between MTEF/PRSP and Sectors.quality system of and its formulation in 2001 was SDPs; and the PERpublic service Increase allocation of adapted to focus on the PRSP processdelivery. resources to priority process. Allocations to priority
sectors. sectors have been increased Improve further the costingsubstantially. of realistic requirements
for achieving povertyreducing outcomes.
Undertake value for money Pro-poor expenditure tracking MOF/PER WGaudits and review. study was undertaken under the Undertake value for money
FY01 PER process. GOT has audits and reviewalso begun the system of annually, and bring theirpublicizing (in newspapers) OC outcomes into publicreleases to all levels of domain through the PERgovemment. process.
Develop strategic plans Strategic annual plans and All GOTand performance budgets. performance budgets have been Agencies/Depts
developed for MOAFS, Need to extend to otherMOWLD, CSD, Health, MOF, ministries/Depts and toPOPP, Education, and Water. adhere to strategic plans
and performance budgetsso as to enhance efficiencyand quality in public
Strengthen competencies MTEF training to service delivery. MOF/LGRPand institutional capacity planning/budget staff infor managing public ministries. Extend MTEF and otherservice programs. capacity building trainings
to regions and LAs; andmore explicitly involveLAs in the nationalbudgeting process andstrategic expenditureallocations decisions.
B. Improving public Implement the Integrated IFMS using EPICOR software Roll out IFMS to all LAs MOF/LGRPfinance management Financial Management has been rolled out to all so as to improve financialand accountability. System (IFMS) at all levels ministries and central management at sub-
of government. govemment agencies. All national level, where thecentral government agencies in responsibility for deliverythe regions will be operating this of essential servicesfacility (through sub-treasuries) increasingly rests.on real time basis by end of Strengthen LA capacity toAugust, 2001. Only 28 LAs implement IFMS and runhave so far been connected to EPICOR.IFMS.
Adopt a centralized LPO Strengthened system of MOFsystem to ensure that all All payments and Bank centralized LPO iscommitments are made in reconciliation are now done expected to go a long wayline with approved centrally; and a centralized LPO in containing paymentallocations. system is operative and all arrears.
commitments are now made inline with approved allocations.
Enact new procurement Enforcement of new All GOTlaw and regulations that New Procurement legislation procurement regulations Agencies/Deptspermit greater transparency was passed by Parliament in and transparency inand integrity in February 2001. Regulations tendering are essential bothprocurement of public were prepared and the law in strengthening financialworks and goods and became effective by end June management and reducingservices. 2001. Results ofpublic tenders corruption.
are also published quarterly inthe local press.
56

Objective Recommended Action Actions Taken Remarks and Next Steps InstitutionResponsible
Strengthen reporting There is need for LAsystem for accountability Under IFMS financial reforms reports to be copied to thepurposes. are produced online. Various Treasury; and also made
audit and financial reports accessible (translated in to(quarterly and annual) are Kiswahili and displayed) atproduced at LA level for the sub-council level.management and the council.
C. Addressing the Move to quarterly releases Quarterly releases and Extend this practice to MOFvexing problem of and commitments. For commitments for all priority non-priority sectors andtight cash budgeting this to be possible, embark activities was begun since curb the build up of arrearsand its impact on on a system of cash flow December 2000. so as to facilitate reductionlimiting foresight in planning and measures for of pressures on cash flowexpenditure smoothing cash GOT has also embarked on a management.planning. availability. system of cash flow planning
and adopted measures forsmoothing cash availability.
D. Improving both Request donors to provide Larger proportion ofrecorded More effort needed toward MOFIpredictability assistance through the loans and grants are now being mobilizing resources Ministriesand flexibility of budget (budget support) provided as budget support and through the budget.budgets. rather than through a larger proportion of the Dialogue and bilateral
projects, to avoid external resources are integrated consultations; andduplication of effort and through the Exchequer improved financialfor greater accountability (including the development management,purposes. budget). accountability and
transparency in resourceRequest donors to provide use are essential for this toupfront indications of Donors are more willing to happen.support (budget/project) disclose their indicativewithin the PER and MTEF commitments.framework.
Ministries/Departments nolonger cut their deals withdonors without involving MOF.
57

POSTSCRIPT
8.14 This report serves as a record of the findings of the Bank-led, external (to government)evaluation of fiscal developments. A large number of other reports that were produced during the FY01report and which are listed in Table 2.1 of this report can be obtained from the PER Secretariat. Thecontents of this report have been discussed by the PER Working Group, with Government, and also beenpresented at the consultative PER meeting which took place in May 2001. In order to make the technicalinformation contained in this document accessible to a wider audience, the PER Working Group hascommissioned the production of a "popular" version of the PER,
8.15 The Tanzania PER being an annual exercise, by the time this report appears in print the PERFY02 is well underway. One of the main objectives of the FY02 PER external evaluation exercise willbe to track progress on many of the issues discussed in this report. In addition, the FY02 PER will focuson the following issues:
8.16 General assessment of sources of fiscal risks: One of the key reasons for the continued useof the cash budget system is government's concern about fiscal risks. In consideration of such potentialrisks, deficit targets are typically set at a much more stringent level than would be required on the basisof the fiscal sustainability analysis that has been carried out in previous years. The FY02 external reviewwill focus on identifying specific risks, including macro-economic risks arising from fluctuations ineconomic growth and the fiscal revenue base, risks arising from contingent liabilities, risks from theactivities of agencies, local authorities, parastatals, etc. that are not directly under the commitmentcontrol system of the central government, or risks related to weaknesses in commitment control asidentified under the FY01 PER. In addition to identifying the sources of risks, where data is readilyavailable the mission will undertake preliminary quantification of these, and assess the efficacy of theexisting mechanism to contain risks. The PER FY02 review will also develop an agenda for further workon managing fiscal risk in Tanzania.
8.17 Commitment control and monitoring: Closely related to the issue of fiscal risks is thecapacity of the Ministry of Finance to monitor comprehensively expenditure commitments made byspending units. The FY01 PER had identified a number of expenditure items, such as expenditures onutilities and expenditures for "automatic catering" which were not fully integrated in the commitmentcontrol and monitoring system and which subsequently were frequently the cause for the accumulation ofarrears. The FY02 PER will revisit this issue by assessing the comprehensiveness of the commitmentcontrol and tracking system, issues arising from the move from monthly commitment limits to quarterlycommitment limits, and progress in covering expenditures that cannot be easily managed by commitmentcontrol as first charge expenditures.
8.18 Debt management: With the reaching of the completion point under the enhanced HIPCinitiative, there is now increased urgency to ensure that the fiscal flexibility gained through debt relief isnot eroded through weaknesses in the debt management system. The FY02 PER will review (i) the rolesof MOF, BOT, and other actors such as sectoral ministries in debt contracting, debt servicing andconsolidation of the information in the fiscal accounts, (ii) the adequacy of IFMS and of the provisionsunder the Public Finance and Procurement Acts in tracking and disclosing all investment spendingfinanced through debt, (iii) and government systems in place that ensure that legal provisions in thePublic Finance Act and the Public Procurement Act are adhered to.
8.19 Particular emphasis of this review will be on the integration of debt management with the budgetprocess and the capacity of the Ministry of Finance to adequately monitor new debt commitments. In thepast, there have been concerns that debt financed expenditures that are spread out over several years or
58
implemented by several ministries are not explicitly mapped to funding sources. The recently developedIMF/World Bank guidelines on debt management will provide the framework for carrying out theassessment of debt management.
8.20 Definition and monitoring of poverty reducing expenditures: Previous discussions ofTanzania's definition and monitoring of poverty reducing expenditures have revolved around two, to acertain extent conflicting, objectives. On the one hand, there is the desire to define and monitor a set ofexpenditure items that are clearly identified as "poverty reducing" expenditures in the budget. Inparticular with the expansion of budget support by donors, there is some pressure to clearly define andlabel such "poverty reducing" expenditures that eventually could be matched to donor budget finance. Onthe other hand, the PER and government have adopted a wider concept of poverty reducing expenditures.This approach considers poverty reduction in the broader context of the budget where governmentidentifies pro-poor priority areas which receive priority allocations and whose expenditures are largelyprotected from expenditure cuts in the case of revenue shortfalls. The external review will revisit theseissues taking into account information requirements of the providers of budget support.
8.21 A particular problem with respect to poverty reducing expenditure has been the consolidation ofthematic priorities, such as funding of HIV/AIDS activities, which are implemented by various ministriesand expenditures for which are spread across various ministries, departments and agencies. Additionalconstraints to the reporting on thematic poverty reducing expenditures are that donor support for theseactivities is not fully captured in the budget and government accounts as well as remaining GFSclassification problems in the development budget. The external evaluation will assess to which extentthese constraints limit the usefulness of budgetary reports on poverty reducing expenditures and reviewprogress in overcoming these obstacles for the seven priority areas.
8.22 Internalization of expenditure tracking and service delivery surveys: During past PERs, thePER working group has commissioned expenditure tracking studies which analyzed the flow of resourcesfrom the central government to service delivery units. The government plans to implement anexpenditure tracking system that would internalize this expenditure tracking function in order to providethe Ministry of Finance and sector ministries with timely information on the flow of resources. Theexternal evaluation will review the status of the implementation of the government internal expendituretracking system and make recommendations as to the adequacy of the system and the potential need forcontinued external expenditure tracking as a complement to government internal expenditure tracking.Particular attention will need to be paid to the tracking of transfers in kind, particularly in heath andeducation sectors.
8.23 The expenditure tracking system is to be complemented by service delivery surveys which wouldprovide feedback on the impact and quality of public services. Government has committed toimplementing service delivery surveys on a routine basis as part of the implementation of theperformance budget approach. The external evaluation will assess progress with the implementation ofthe performance budget approach in general and pay particular attention to progress with the roll out ofservice delivery surveys.
59
ANNEX 1: PROCEEDINGS OF THE PER FY01 CONSULTATIVE MEETING,KARIMJEE HALL 7th & 8th MAY 2001
A. OPENING, PRESENTATIONS AND DISCUSSION
DAY ONE
Morning Session:
Welcoming Remarks
Mr. Peter Ngumbullu (Permanent Secretary, Ministry of Finance) welcomed all participants to the 2001PER consultative meeting and thanked them for accepting the Government's invitation. In particular, thePermanent Secretary (PS) thanked the Hon. Daniel Yona (Minister of State, Vice President's Office) foraccepting to come to officially open the consultative meeting. The PS noted that the meeting drawsparticipants from a wide range of stakeholders including Parliament, central and local government,private sector (financial/banking sector; manufacturing, agriculture and trade) civil societyorganizations/NGOs, donors (bilateral and multilateral), academic and research institutions, faithinstitutions and the media. The PS observed that the theme of the 2001 PER consultative meeting is theadaptation of the PER process for poverty reduction and aims at consolidating the partnership approachin implementing the PER process began three years ago. Mr. Ngumbullu also pointed out that the 2001PER consultative meeting is expected to feed into the finalization of the Poverty Status Report towardsthe HIPC completion point as well as the preparation of the 2002/02 budget and the Consultative Group(CG) meeting which will be held later in the year. The PS concluded his opening remarks by recognizingthe co-chair of the consultative meeting Mr. James W. Adams, Country Director for Tanzania andUganda - World Bank, as well as the presence of Mr. Jurgen Reitmaer - Assistant Director, AfricanDepartment of the International Monetary Fund (IMF).
Official Opening
Hon. Daniel Yona - Minister of State, Vice President's Office - opened the meeting on behalf of the Hon.Basil Mramba, Minister for Finance who was on duty abroad.
The Minister expressed gratitude to all the stakeholders and in particular the PER working group whichhas been overseeing the PER work. He also noted that the Government was encouraged by the strongparticipation and support by all the key stakeholders which has greatly enriched the Government budgetprocess. He requested for more ideas from the participants on how the PER process can be improvedfurther.
The Minister highlighted important PER-related developments that have taken place since the last PERconsultative meeting to include (i) The adoption of the PRSP in August 2000 as a national framework forimplementing poverty measures and benchmark document for prioritizing expenditures in Tanzania (ii)formulation of strategies on rural development, agriculture and primary education (iii) initiation of thePoverty Reduction Budget Support (PRBS) as an instrument to ensure that adequate resources areallocated to priority sectors through the Government budget in support of the poverty reductionstrategies. (iv) Further strengthening of budgeting and financial management systems through theIntegrated Financial Management System (IFMS) and enactment of the Public Finance Act, 2001 and the
60
Public procurement Act, 2001. (v) Improving the cash budget system by introducing a quarterlycommitment system to improve expenditure planning as well as release of OC to priority sectors on aquarterly basis since December 2000 and, (vi) carrying out a study on Country Financial AccountabilityAssessment (CFAA) to make an assessment of the strength of financial accountability in both public andprivate sectors in Tanzania.
The Minister mentioned three issues that need further attention in the PER process: (i) the need to reviseand update sector programmes to reflect the requirements of the PRSP to address the apparent disconnectand inconsistencies between the PRSP and sector strategies and programmes. (ii) problems in budgetmanagement and accountability due to the fact that a big part of donor support particularly project typecontinued to be administered by donors outside the Government budget and (iii) need to explore thepossibilities of rolling out the PER process to the local government authorities.
The Minister concluded by informing the participants that Tanzania is largely on track with regard to themacroeconomic objectives and targets of the Poverty Reduction and Growth Facility (PRGF).
Vote of Thanks
Mr. James Adams - Country Director for Tanzania and Uganda, World Bank - thanked Hon MinisterYona for the articulate opening address and also for his work in strengthening the PER process from thetime that he was holding the portfolio of Minister for Finance to his current position as Minister of Statein the VPO responsible for Poverty reduction. Mr. Adams applauded the Government for providingstrong leadership in the PER process which is now transparent and highly participatory.
The Country Director underlined the importance of the annual PER consultative meeting noting that (i)government expenditures have the largest impact on poverty reduction such that we need to keep watchto ensure that the quality of expenditure improves and, (ii) there are many outstanding budget issues andchallenges including the need to address the concern raised by the Government on accounting andreporting of donor resources, as well as continued variance between budgets and actual budget out-turnsetc. Mr. Adams subsequently challenged the participants to use the two days consultative meetingconstructively and productively to among others, discuss how to further improve the PER process andalso address the challenges and other budget issues generally.
Issues Emergingfrom Discussions of Various Papers:
Paper 1: Adaptation of the PER Process to Poverty Reduction
* The Government was congratulated for good attendance in the PER Consultative Meeting.
* There is a need to look into how priorities are set in some sectors. For example, transport as a priorityshould be taken in the broader sense to include other modes of transport (marine, air, railway etc) notjust roads as is currently the case.
Papers 2, 3 and 4: Fiscal Performance & Pro-poor Expenditure, Budget Sustainability andSystemic Fiscal Issues
* Ministry of Finance was urged to ask donors to pass their funds through the exchequer system and tospend their monies according to Tanzania's priorities and not the way they see it fit. Donors were
61

asked to trust the system and pass their funds through the budget. However, the quality of control andmonitoring of public funds needs to be strengthened and improved. Disciplinary measures should betaken against accounting officers who overspend Government funds. Loss of revenue should not beleft to go on unchecked.
* Ministries were asked to revisit their administrative costs as they are seen to consume large shares ofministerial expenditures. Large administrative expenditures within the ministries have been one ofcauses of the donors passing their funds off-exchequer system. For instance when one revisits thefunds utilised at ministerial level for the past few fiscal years, it comes out clearly that billions areused for administrative purposes only.
* The revenue effort is still very low in Tanzania. The Government has to find alternative ways on howto improve revenue flow. However, this can be done through connecting potential tax base to actualtax base, improvements of tax administration and getting rid of unnecessary tax exemptions.
* The Government was urged to improve implementation capacity of the Cash Budget System to fostergrowth and be able to meet the PRSP and Vision 2025 targets.
* Despite the fact that IFMS is operating at both ministries and Government departments, it has beennoticed that the process of releasing funds still takes a long time.
* Utilisation of domestic sources of funds - It was observed that credits from the banking system toprivate investors are still very insignificant despite the fact that Government does not borrow fromthe banking system. Moreover, it is estimated that about 20% of the bank reserves are investedoutside the economy. The Government should therefore continue to set-up a conducive environmentthat will encourage the utilisation of domestic sources of financing such that economic agents canaccess more credits instead of leaving idle funds accumulating within the banking system.
* Following decentralisation policy where service delivery units have been placed under the directresponsibility of the LAs, there is a need for Government to improve capacity within LAs.
* It was noted that there is a great shortfall between budgeted expenditures and actual expenditures(specifically development expenditure) The MoF was urged to disburse public resources as approvedby the Parliament.
* The Government was asked to set a conducive environment for petty traders to obtain credit from thebanks, and also revisit the present tax rates. For instance, the tax rate has to consider the issue oflocation implying that the highly taxable petty traders should be those located in the city centrewhere business is relatively brisk. Analogously, those located in the periphery of the city should bearmuch lower tax rates.
* The current inflation rate is worth preserving. Pushing inflation further down from the current 5%may be harmful to the economy. High and very low rates of inflation are not good for growth.
* There is need to consider issues of risk when addressing the issue of the optimal level of borrowing,otherwise HIPC objectives (to reduce debt ratios) may be eroded.
62
Afternoon Session:
Papers 5 and 6: Financial Accountability
* Participants expressed general satisfaction regarding the Government's efforts to further strengthenbudgeting and financial management systems by implementing the Integrated Financial managementSystem (IFMS) to improve expenditure planning, execution and control and adoption of the Mediumterm Expenditure Framework (MTEF).
* However, participants underlined the need for the Government to fully implement the IFMSincluding rolling over the IFMS and MTEF to local governments to further improve financialmanagement. The rate at which the Government puts the system into use will determine how donorschannel their resources through the Exchequer.
* Participants urged the Government to do more to address the problems in public financialmanagement pointed out by Controller and Auditor General (CAG) the year-in year out.
* Participants also underscored the importance of capacity building to enable the office of theController and Auditor General (CAG) to perform its audit functions around the computer in linewith the IFMS.
* The role of civil society in monitoring Government performance was emphasized
* Donors were asked to route their support through the exchequer system since it allows for trackingdown of expenditures down to service delivery units, something that donors may not be able to do ontheir own.
Papers 7 to 11: MTEF Cross-Cutting Issues
* It was suggested that PRSP Programmes be targeted at community level and the programmes shouldbe owned by communities themselves. Communities should be made aware of what the PRSPprogrammes are and how to go about dealing with the whole issue of poverty reduction.
* The Government was urged to put more effort toward fighting HIV/ AIDS in the country and checkwhat is really missing in the entire drive/war against HIV/ AIDS. The Government should put inplace implementable programmes and also mobilise more resources for fighting the pandemic.
* LGRP was urged to prepare a plan for providing training programmes that will assist the informalsector operators to familiarise themselves with laws and regulations, and cope with the ongoingreforms. LGRP should also design strategic training programmes for councillors to make them awareof their responsibilities given ongoing economic reforms. Furthermore, LG institutions should begiven a mandate to hire and fire the executive officers who misuse the public resources/governmentfunds.
* There is need to put more focus on infrastructure investment, particularly on roads, so as to avertlosses. Loss due to bad roads is estimated at Tshs. 600 billion or 9% of GDP per year.
63

* A lot of work still needs to be done on how the LGRP is going to incorporate local authorities in aharmonized budget process.
+ There is a strong urgency to address the issue of corruption in policy making and investment.
64
DAY TWO
Morning Session:
Paper 12: Cross-Sector MTEF
The Government and Donors work together to improve the predictability of external finance.
As far as the poverty reduction strategy is trying to get rid of poverty it was suggested that everybody andeach household in the country must share this vision and commitment to eradicate poverty. To that effect,PRSP Programmes need to be owned by everyone. Poverty eradication must be seen to be the centralfocus to which people at all levels are aware of. Public education will have to play a vital role to makethe general population aware of what is happening at the national level and on their roles/ responsibilitiesto improve their daily lives.
The Government was advised to ask for debt cancellation and not just to bank on slow-processed debtrelief. This is because debt cancellation is a permanent solution compared to debt relief which is atemporary solution. Debt relief to heavily indebted LAs (HIPLA) was highly supported.
The Government was asked explore the possibility of reserving privatisation funds to pay for retirementbenefits for civil servants.
It was pointed out that the issue of governance has been marginalized in the Cross Sector MTEF. It wasemphasized that governance is a cross cutting issue that needs to be highlighted and evaluated in allsectors. Issues related to corruption and good management of resources need to be seen as an integral partof governance. The Government was asked to scale-up the drive to improve governance in all publicinstitutions and across sectors.
Participants asked the Government to clarify on apparent over funding noted in the case of Trunk andRegional Roads in the cross-sector MTEF numbers considering that under funding was said to be aproblem in the Roads sector PER study.
It was commented that the future of Tanzania lies on education. There is a need to make sure thatTanzania achieves quality education for the betterment of its economy. It was emphasized that althoughthe PRSP has put much emphasis on primary education only, it is also the case that primary educationalone cannot cope with the ongoing technical changes and development issues. In this case, theGovernment emphasis should also be put on higher education.
Government needs to include the growing problem of unemployment, particularly for the youths, amongits priority areas to act upon.
A concern was raised that there was no participant in PER Consultative meeting from the Government ofZanzibar. For the future, an attempt should be made to have representation from Zanzibar so as tofacilitate dissemination of deliberations of the meeting to the people of Zanzibar.
65
Afternoon Session:
Papers 13 and 14: Financing (Indications of Domestic Financing and Donor SupportFY02-FY04, Dealing with Financing Gaps - Domestic & External)
There is a need to find out the actual resource gaps, broken down into recurrent and development, sincedevelopment resources which are largely from foreign sources are not fungible and the aggregate mayblur gaps in recurrent budget.
It was suggested that automatic finances from the Central Bank to the Government should bediscouraged. But auctioning of Government securities by the Central Bank is allowed and encouraged.
It was pointed out that beginning year 2002 about 1.5 million students have to be enrolled in primaryeducation, but the resources available are inadequate for purposes of reaching this target. This suggeststhat borrowing could be one option to achieve the goal.
It was underlined that increasing growth and reducing poverty requires macro stability. The TanzaniaGovernment was therefore cautioned not to ignore macro stability as the country focuses on how tofinance and achieve PRSP targets.
DONOR SUBMISSIONS/REMARKS
Sweden
a) The Ambassador of Sweden to Tanzania expressed his pleasure for being one of the participants inthe FY01 PER Consultative meeting, noting that he had enjoyed the discussions. He commended thePER process and its participatory nature, and the progress that Tanzania has made especially inattaining macroeconomic stability. His other remarks were as follows:
b) There is a need to review the PER process itself to allow for (i) more participation of other nationalstakeholders, and (ii) the Government to run the process itself.
c) The concerns that a significant amount of donor funds are not included/channeled through theexchequer are genuine. Sweden will mobilize efforts toward addressing this issue.
d) Further development hinges on capacity improvement in the Tanzanian institutions and existence ofabsorptive capacity.
e) The existing financial management system lacks transparency and is vulnerable to leakage. There isa need to involve stakeholders by transparently stating to them the amounts of resources that arereleased to the sub-national levels, in order to strengthen accountability at those levels.
f) Supports the idea of strengthening donor resource projections by (donors) providing informationahead of budget.
g) The importance of HIV/AIDS fight is now appreciated - as evidenced by the formation ofTACAIDS. However, much more still needs to be done toward this.
66
h) The bottom-line for continued flow (or increase) of resources is the improvement of general policy ofthe Government, not only financial management but also resolving issues of conflict in Zanzibar andinvolvement of Zanzibar in the PER (or creation of its own mini-PER) process.
European Union (EU)
a) The Representative of EU commended the PER consultative meeting, noting that it was interestingboth in terms of presentations and comments raised. Other remarks were as follows:
b) EU was negotiating a new program of support to Tanzania based on the PRSP framework.
c) Urged that there was a need to convert macro stability and growth into poverty reduction. EU is keenin providing assistance to the key social sectors for both poverty reduction and macro stability.
d) EU is ready to pass more resources through the exchequer. However, this will depend on GOTputting in place good control institutions.
e) Emphasized the importance of putting the correct numbers in the MTEF, especially for the Roadsector. As presented, Road sector MTEF numbers were inconsistent PER study numbers.
f) Stressed the importance of building new roads so as to reduce the transportation cost and time.
g) Stressed the importance of indicators of results and transparency in resource allocation anddisbursement to ensure that resources reach the targeted group at lower level.
h) Capacity at the local level needs to be addressed/enhanced if funds are to be efficiently channelledthere.
i) Tanzania can get a bigger share of the resources based on performance. In this regard the followingneed to be done: (i) corruption has to be controlled, and (ii) clear sector policies have to be put inplace so as to guide decisions on funding, especially through program assistance.
j) The focus of EU will be in supporting local government and civil service reforms.
k) Commitment and Disbursement Forecast by the European Union (2001 -2004) are summarized in thetable below:
67

European Commission: Grants - Commitment and Disbursement Forecast (million EUROs),2001 - 2004.
. Project Aid Budget Support Total2001Commitments 61 75 136Disbursements 40 38 78
2002Commitments 165 165Disbursements 80 37 1172003Commitments 60 110 170Disbursements 119 37 1562004Commitments 20 20Disbursements 96 37 133
United Kingdom (UK)
a) The UK High Commissioner to Tanzania praised the PER consultative meeting for its participatorynature. His other remarks were as follows:
b) UK supports PRSP as a prioritizing tool and MTEF as a vehicle for ensuring the resource allocation.
c) UK will continue to support PRBS (above current support of £ 130 million) if results could be madeexplicit.
d) It is important to ensure a strategic link between PRSP, MTEF and SDPs.
e) More achievements beyond fiscal performance are essential, especially at sector level.
f) Improved management of resources and service delivery is crucial. In this case taking stock of whathas been delivered/achieved (generally and in the context of PRSP targets) is essential.
g) There is a need to ensure great transparency on budgeted resources and how they are intended to beused and how they are ultimately used at local level.
h) UK would like to see growth that benefits the poor. As such there is a need for sustained growth inagriculture, which benefits the majority who depend on it.
Denmark
a) Denmark representative praised the FY01 PER process, noting that it has resulted in very goodfindings that will guide future resource allocations. Other remarks were as follows:
b) Denmark's support will move toward budget support. However, this will depend on improvement inGOT financial management, including predictability and transparency in government spending.
68

c) Denmark will support local government reform. The support will also be directed on (i) Agriculture(ii) Roads (iii) Health (iv) Private sector.
African Development Bank (AfDB)
a) The representative of AfDB commended GOT for attaining macro stability in the country. Noted,however, that there was a need to review various instruments to ensure that a judicious balance ismaintained in the economy. Other remarks include:
b) There is a need to move PRSP and budget processes closer to the people.
c) There is a need to analyze various indicators (e.g. on education) at disaggregate level so as to unearththe diversities between regions and districts. In this case there is a need to consider and give prioritythe most disadvantaged areas of the nation in terms of provision of social services.
d) AfDB have taken note of priorities and are ready to support the (Education) sector. AfDB will alsosupport Roads and Health sectors; and balance of payments (BOP).
UNICEF/UN System
a) UNICEF/UN System representative commended the PER process in Tanzania and Tanzania'stremendous effort and achievements in macro stabilization in the past five years.
b) Focus of UNICEF/UN System support/participation will be on: (i) Maintaining macro stability (ii)Poverty monitoring (iii) HIV/AIDS (iv) Basic Education (v) Primary Health (vi) Food security andlivelihood (vii) Local Government Reform - to help reforms come down to the people.
69
B. CONSENSUS AND SUMMARY OF MAJOR EMERGING ISSUES
The theme of the PER FY0 I Consultative Meeting focused on realigning the budget and the MTEF withthe PRSP which is now the overarching national framework for implementing poverty reductionmeasures in Tanzania and which has become the benchmark document for prioritizing expenditures inTanzania. A two-volume PER report which will contain updated versions of the papers presented at themeeting as well as a summary of the discussions will be prepared after the Government budget for FY02has been finalized.
A key feature of the 2001 PER consultative meeting was the broader participation both in terms of thesubstantial increase in the number (around 250) and composition of participants, compared to the last twoPERs. Participants were drawn from the Government (Ministries, Independent Departments, LocalAuthorities), the Parliament (Public Accounts Committee, Local Authorities Accounts Committee,Parastatal Organizations Committee, Finance and Economic Committee, Social Services Committee), theprivate sector (financial/banking sector, manufacturing, agriculture and trade), donors (bilateral,multilateral, UN System), civil society (NGOs, Association of Local Authorities, gender organization),faith institutions, academic and research institutions, and the media. However, during the course of theconsultations, a need was expressed to extend the PER process and consultations to involve Zanzibar as amechanism both to support and facilitate development and political dialogue.
In previous years, the consultative PER meeting was usually followed by a Consultative Group meeting.Since the 2001 CG meeting has been moved to the second half of the calendar year, the consultative PERmeeting took up some of the issues typically reserved for the CG meeting. In particular, in the lastsession of the meeting several donor representatives expressed their intention to maintain and in severalcases also increase substantially official development assistance to Tanzania (see donor submissionsabove) as long as progress is made in the key areas of:
* Budget management;* Prioritization and focus on poverty reduction in line with the Poverty Reduction Strategy Paper; and* Governance, including issues related to Zanzibar.
Donors also indicated that progress in these areas would also be critical to sustain the shift from projectto program support. In the closing of the meeting, the World Bank Country Director James Adamspresented a summary of the main emerging issues from the meeting.
Major Emerging Issues
1. PER Process
(i) Mileage Gained under the PER Process:
There is a consensus that the PER process has enriched the Government budgetary process. Remarkableprogress has been made on progressively increasing funding to priority areas. In addition, the PER hasbecome an increasingly GoT owned and led process as well as highly participatory and transparent. Allthis needs to be maintained and strengthened.
70
(ii) Adaptation of the PER Process to Poverty Reduction
The PER process has in addition to providing inputs into the budget process and development of thecross-sector and sector MTEFs adapted to focus more on poverty reduction. The subsequent PERtherefore will need to pay greater attention to the poverty focus.
(iii) Extending the PERIMTEF Process to the Sub-national Level:
Flow of funds to LAs and service delivery units is of concern and GoT needs to put appropriatemonitoring mechanisms in place with adequate follow-up. This will require, among others, (i) rolling-outthe PER/MTEF process to the lower level (Local Government Authorities) as these levels do deliver theprimary services. This will improve planning, execution and control of budget at that level. In additionthis will strengthen local ownership and local participation. (ii) spending more resources on buildingcapacity at all levels of government but more so at the sub-national levels.
2. Maintain Macroeconomic Stability
There is a broad consensus that the current success of the GOT in maintaining macroeconomic stabilityshould be maintained.
3. Further Prioritisation to Foster Strategic Expenditure Allocation
There is need to continue work on prioritisation to foster strategic expenditure allocation using theMTEF instrument, including revisiting the priorities, to focus on sectors, such as the transport sector(broadly defined), which can make a real impact in terms of poverty reduction. It is important thatongoing interventions targeted at realising sustainable development in the rural sector and delivery ofhigh quality primary education are revised and updated to reflect the requirements of Rural Development,Agriculture and Primary Education for poverty reduction.
4. Concern on the Low and Drifting Down of the Revenue Effort
Low and declining revenue effort remains an important concern. The revenue effort is seen to be drivenby taxes on international trade while performance of other taxes does not show much improvement.Efforts are thus needed in improving compliance and strengthening tax administration.
5. Concern on Continued Channelling of Donor Resources Outside GOT Budget
More attention needs to be put on improving the reporting and accounting of donor resources.Administration of donor support outside the Government budget creates real problems in budgetmanagement and accountability considering that over 30% of the budget is donor funded (over 80% fordevelopment budget). More donor resources need to go through the budget so as-tosupport the povertyreduction strategy. Addressing this problem requires promoting/enhancing trust and collaborationbetween the Government and Donors. It also requires the GOT to continue demonstrating resolve toimprove budget management, transparency and accountability.
6. Need to Harmonize SDPs and PRSP
There is an apparent disconnect between Sector Development Programs (SDP) and the PRSP. There istherefore a need to harmonise the SWAPs/SDPs with the PRSP for orderly implementation of the povertyreduction strategy. This implies that Sector development programmes and strategies should be reviewedto ensure consistency with PRSP to ensure a strategic link between resource allocation and povertyreduction.
71
7. Options on Full Financing of the PRSP
Full financing of PRSP targets/requirements has implications on resource mobilization vis-A-visattainment of the targets. Various financing options will need to be considered if the estimated resourcegap of 3% of GDP is to be mobilised. The options include: reducing the PRSP targets or lengthen theperiod over which targets are to be achieved, or raise more domestic resources or through borrowing(external/internal) but without prejudicing macroeconomic stability.
8. Dealing With the Problems Associated with the Cash Budget System
The cash budget system has allowed Tanzania to achieve macro stability and increase discipline inbudget management. However, the system denies flexibility in terms of informed planning. The cashbudget creates a considerable level of stress to the budget, taking no account of lumpiness of expenditureor the ability to implement programmes in an environment of uncertain/irregular/delayed funding.Government should explore possible feasible options in dealing with the problem of cash flows. Thechallenge facing Tanzania is how to move from the cash budget system to a flexible budget systemhinged on credible government institutions.
There is a need to address issues of budget management stress from the cash-budget system by: (i)revisiting prioritization by type of categories of spending and bringing to fist charge items like utilitiesand automatic catering and upkeep; (ii) cash flow planning, and (iii) creating a disincentive foraccumulation of arrears.
9. Need to Address Weaknesses in the Financial Sector for Poverty Reduction
The financial system in Tanzania is not sufficiently deep, even by the stand order of developingcountries. So that the impact of financial intermediation on the growth of the economy and povertyreduction is still low.
10. Strengthening Public Financial Management
While the establishment of the IFMS has greatly enhanced the Treasury's capacity in managingGovernment finances, lack of ownership of the system threatens its sustainability in the long term andmakes the system susceptible to potential breakdowns and/or sabotage. More training is needed togetherwith the roll-out of IFMS and enhancing staff motivation of staff in Government generally.
11. Monitoring of Expenditure Impact
As progress is being made in sharpening poverty-focussed priorities and expenditure allocations,increased emphasis will need to be paid to the monitoring of the impact of public expenditures. Thisshould include further tracking studies and service delivery surveys as well as participatory monitoringand evaluation.
12. Enhance Transparency and Information on Expenditure Releases to Recipients andBeneficiaries
A key measure to improve accountability for the use of resources is to provide the intended beneficiarieswith information about funds made available from the Central Government for specific purposes andbeneficiaries.
72
13. Greater Attention to Local Authorities
It should be ensured that the public expenditure management process takes reforms under the LocalGovernment Reform Program adequately into account. Providing some form of debt relief to localauthorities who are burdened with high levels of arrears and debts should be seriously considered.
14. Need to pay Greater Attention to the Close Link Between Poverty and the Environment
There is a realization that poverty and the environment are intricately linked, so that greater attention tothis close link deserves greater attention in the poverty reduction drive.
15. Decisive and Immediate Action Needed Against HIV/AIDS
Decisive and immediate action against HIV/AIDS is necessary and should be fully funded by GOT anddonors.
16. Continue Mainstreaming of Gender in the Government Budget
17. Implementation of the Pay Reform Requires More Impetus
Progress is being made regarding the Public Service Reform Programme. Donors were asked todiscontinue LCC and support the SASE.
73
ANNEX 2: ASPECTS OF BUDGET SUSTAINABILITY1 1
In some respects, budget sustainability is a wider concept than fiscal sustainability, and is subjectto a variety of interpretations. Here, it is helpful to distinguish between three of them.
* The first, which is the most familiar, concerns itself with whether a planned expenditurepath can be sustained without implying infeasible or unacceptable financingconsequences - fiscal sustainability. In effect it asks whether a spending programme isfinanceable, without enquiring whether it is well designed or particularly desirable.
* The second concerns itself with whether a planned expenditure path can be implemented,given available finance; it raises the issue of absorptive capacity as a potentialindependent constraint on spending - absorptive sustainability.
* The third concerns itself with the congruence between planned expenditures and thegovernment's underlying objectives. In the absence of absorptive difficulties, would thebudget suffice to deliver the intended outcomes? This third interpretation is moreconcerned with the sustainability of the objectives, given the level (and composition) ofthe budget, rather than the sustainability of the budget per se - target sustainability'2 .
Full sustainability requires that all three component types hold simultaneously. However, afinding that the government's programme was unsustainable in any one of these three senseswould have very different implications for policy.
If it is sustainable in the fiscal and absorptive senses but not in the target sense, then the firstissue is whether the problem can be resolved by shifting allocations between sectors. If not, can itbe resolved by raising expenditure without violating either fiscal or absorptive sustainability? Ifnot, it will be necessary to adjust aspirations/targets downward until they are sustainable withinexisting constraints
If it is sustainable in the target and absorptive senses but not in the fiscal sense, then the targetsare again infeasible, and downward revision is required until all three constraints are satisfied. Inthis case, it is likely that the downward revision should be reasonably uniformly spread acrosssectors. This assumes that the original targets reflected a relatively uniform degree ofprioritisation, in the sense of the perceived marginal benefit per shilling expended across sectors.
This annex was originally section 2 of a report prepared by David Bevan "The Fiscal Deficit and Sustainability ofFiscal Policy" for the FYO1 PER.
12 Notice that this definition of target sustainability is essentially hypothetical. It asks: "if neither funding norimplementation were a problem, would this level of budget suffice to deliver the planned targets?" It is the levelof "full financing" associated with a given set of targets.
3In practice, policy typically does not imply fixed (undated) target levels, but some path over time to a desiredlevel. "Revising a target downward" is therefore a shorthand for a more complex process which revises the(early) path downward, possibly with a subsequent acceleration to make good the lost ground within anunchanged horizon, or possibly with an extension of the horizon.
74
If it is sustainable in the target and fiscal senses but not in the absorptive sense, then theimplications are rather different. Difficulties of implementation and absorption are likely to besector specific; downward revision of some sectoral spending levels within a financeable totalopens up the possibility of raising targets in other sectors which are constrained by their budgetbut not by absorptive capacity. Absorptive difficulties also require specific policy responses torelax them, and these may involve a different set of expenditures to those already budgeted.
So far, the discussion has presumed that sustainability is problematic in one dimension oranother, so that changes have to be made until all constraints are satisfied, the most stringent ofthem just so. But what if the budgeted programme appears to be sustainable in the target senseand strictly within sustainable limits for the other two? In other words, it would in principle bepossible to finance and implement a more ambitious set of targets than is currently programmed.In an industrialised country with a history of fiscal prudence, a mature tax administration, and adeep financial system, this would be expected to be the norm. The share of government spendingin the economy would not be constrained at a boundary, but (ideally) would be an 'internal'choice reflecting a balance between the marginal cost of public funds (including the distortionary
14 15impact of the tax system) and the marginal benefit of public spending
The case of a country like Tanzania is less clear-cut. While, unlike many other countries inAfrica, it does not have a high level of domestic debt relative to GDP, it does - even by regionalstandards - have a very undeveloped financial system and a low rate of tax collection. It has inconsequence proved very difficult to mobilise additional domestic resources. One interpretationof this might be to say that the marginal cost of public funds is very high - the distortionaryimpact of higher tax collections (or higher domestic borrowing) would be very damaging toprivate sector development, and the gain from lower collections correspondingly high. Inconsequence, even though the marginal benefit of public programs may be very high, it is stillappropriate for them to be very circumscribed' 6 . If the currently programmed targets can befinanced within the available budget, it might be better to lower taxes (or reduce borrowing)rather than to raise targets.
Another interpretation might be to say that the difficulty in raising revenues is primarily anadministrative matter - the marginal cost of these funds is not spectacularly high, but there is - inthe short to medium term - a constraint against increasing them. In that case, it would beappropriate to spend all available resources. Targets should simply be raised until the available
14 To the extent that there are different sources of funds, access to these can be varied so that they each have thesame marginal cost.
5 Of course, views may differ radically as to where this balance should be struck, and systematic mistakes may bemade in where it actually is struck.
16 This is in respect of domestically financed public spending. As regards external grants or concessional loans, themarginal cost of funds will be very low so it is appropriate to make as full a use of these as possible.
75
budget is exhausted. In other words, matters should be arranged so that the fiscal constraintalways binds'7.
In the past, these two beliefs have often both been held simultaneously, one in respect ofdomestic taxes, the other in respect of domestic borrowing. Thus in Tanzania, in recent years, ithas been felt appropriate to maintain the pressure to raise tax revenues as a share of GDP, whilelowering domestic debt as a share of GDP (and indeed in real terms also). This is a perfectlycoherent position to adopt, but it is important to see that it does imply a very specific judgement,namely that the marginal (social) cost of domestic taxes is substantially lower than the marginal(social) cost of domestically borrowed funds. These issues are pursued in more detail in thefollowing section.
17 This assumes that, while absorption constraints may in the short to medium term limit what can be spent inparticular sectors, this is unlikely to be the case across the budget as a whole. Hence, given reallocations, thefiscal constraint will typically bind in aggregate before the absorption constraint.
76
ANNEX 3: FISCAL SUSTAINABILITY"8
The notion of fiscal sustainability offered in annex 2 was the concern whether a plannedexpenditure path could be sustained without implying infeasible or unacceptable financingconsequences. While this may seem a natural starting point, it is worth setting it against a morecomprehensive, if somewhat stylised, approach to budget design. This section begins bysketching this idea, and then returns to why we may be interested in the more limited concept offiscal sustainability.
1. Stylised budget design
In general, the various sources of government funds are not subject to rigid upper limits; in eachcase, it is possible to mobilise increased volume at an increased cost. The government, like othereconomic agents, faces an upward sloping marginal cost of funds. Similarly, we may suppose
19that the marginal benefit from government spending falls as the volume of spending rises
In principle, optimisation of the budget would then involve three steps. First, recourse to differentsources of funds would be governed by their respective cost; low cost sources would beexpanded and high cost ones contracted until the marginal cost of each was equalised. Second,the composition of spending would reflect the differential benefits of different sectors; highbenefit sectors would be expanded and low benefit sectors contracted until the marginal benefitwas equalised. Third, if the common level of benefits exceeded the common level of costs, thebudget would be increased and vice versa, until marginal benefit was equated to marginal cost. Inthis process of optimisation, sustainability is not really an issue. An unsustainable course ofaction would be excluded from consideration because it would have unacceptably high costs(relative to the realisable benefits); the optimum choice would be made from within the set ofsustainable programmes. It would be the best of this set, and would in general lie inside it. Inother words, it would have been possible to programme a bigger budget without this beingunsustainable, but it was preferred not to do so.
This idealised scenario makes a number of strong assumptions:* First, it assumes that it is politically and technically possible to vary all the relevant
magnitudes at will. In practice, it may be a slow process expanding some sectors andcontracting others, for example; then there will be persistent discrepancies between sectoral
8 This annex was originally section 3 of a report prepared for the FYO I PER by David Bevan "The Fiscal Deficitand Sustainability of Fiscal Policy".
19 This is of course an idealised account. In practice, powerful but undeserving interests may pre-empt part of thecore budget, so that higher priorities are further down the queue. In that case, the marginal benefit of publicspending might actually rise with an increase in volume. Similarly, there may be a great deal of waste, whichcould in principle be eliminated with no loss of benefit at all. But the whole thrust of the PRSP, PER, MTEFetc. is to reduce the likelihood of these perverse cases.
77
marginal benefits. Similar considerations apply on the resources side. Thus there may beextended frictional effects; however, this does not undercut the principle involved.
* Second, it assumes that the relevant costs and benefits are susceptible to ready identificationand calculation. In particular, it assumes that this can be done in respect of the same moneymetric on each side of the budget. In practice, a government may be able to prioritise betweendifferent activities, and hence decide on budget composition, without being able to place acash value on the (relatively uniform) benefits.
* Third, it implicitly assumes a rather static type of problem. It fails to do justice to thecomplicated dynamics that are likely to be involved. For example, low domestic debt maymake the marginal cost of domestic borrowing low, but if this results in increased borrowing,
20the marginal cost may rise over time* Fourth, it implicitly assumes that the supply of funds schedule is steadily upward sloping,
rather than being rationed, or otherwise suddenly becoming very steep at some point. If thelatter is a more accurate description, and the marginal benefit schedule meets the cost offunds schedule along this steep section, it is no longer appropriate to think of adjusting thevolume to equate costs and benefits; it is more that the available funds are rationed acrosscompeting uses, and marginal benefit is determined by this rationing process rather than theactual cost21 .
The second, third, and fourth of these points all have the effect of making sustainability an issue.
The second point implies that it may be possible to make progress on getting an efficientfinancing mix and an efficient spending pattern without it being possible confidently to align thetwo, i.e. to decide on how big the budget should be. Given this indeterminacy, a natural startingpoint is to form a view on the location of the practical upper bound, even though it may not beappropriate to utilise all of it. Discussion could then focus on whether it would indeed bedesirable to set spending at this limit or at some lower value. Clearly, this would require anexercise of judgement, in the absence of calculation, as to the respective costs and benefits at thislimit.
The third point emphasises that budget design must be carried out as an inter-temporal exercise,and that - in outline at least - this must be done over a long horizon. Changes to current budgetflows must either envisage offsetting changes in the future, or have cumulative stockconsequences, or usually both. For example, consider a shift in the conventional domesticbudget from balance to a deficit, with revenue stationary, so that expenditure can be raised 22. Ifthis deficit is continuing, it will lead to a continuously rising domestic debt and debt service. Ifinstead the budget returns to balance, domestic debt will stabilise at the new higher level, butdebt service will have risen so that the primary surplus associated with conventional balance will
20 Related issues are discussed more extensively in Annex 2.
21 In the jargon of economics, the "shadow price" of funds is equal to their opportunity cost, which is their value inthe current marginal use, i.e. the marginal cost is determined endogenously to equal the marginal benefit. Thusif a grant of $100 is intended for a use whose benefit is valued at $200, the cost of these funds, if diverted toanother use, is not $100, let alone zero, but the $200 benefit that would be foregone.
22 For simplicity, this illustration considers a stationary economy. In a growing economy, the same issues arise but ina more complex form. See section 3.2.
78
have risen, and expenditure on goods and services will have to fall. If these expenditures are tobe maintained, taxes will have to rise. Alternatively, the conventional budget could be shiftedtemporarily into surplus until the increased debt had been retired; spending could then revert toits original level, but only after a period of more severe contraction. The point of this illustrationis that we cannot shape an informed view on the true cost of a current increase in borrowingwithout knowing something about how the consequences will be handled. In this respect, it isquite unlike, say, the purchase of a good where the cost can be considered in isolation23.
This poses something of a problem. In principle, the earlier paradigm of optimal budget design,given these inter-temporal complications, would require the whole sequence of budgets to besolved forward into the indefinite future. Only when we knew what happening in the future couldwe assure ourselves that what was planned for the present was optimal. Since even economistsacknowledge that this is impractical, we have to find a way of finessing this problem. What wecannot do is to ignore it. This would imply behaving completely myopically and ignoring allfuture consequences of our actions. What is required is some procedure that acknowledges theknock-on effect of present actions, but does not require implausible degrees of sophistication orclairvoyance. This approach brings issues of sustainability to the fore.
2. Fiscal sustainability2 4
One way to implement this requirement for a degree of practicality is to proceed in four stages.
2.1 Steady state calculationsFirst, form a view as to the very long run rate of real growth and inflation that can be anticipatedfor the economy, and what this will generate/require in terms of private savings, privateinvestment and other macroeconomic magnitudes. Then examine a range of 'balanced growth' or(proportionately) 'steady state' scenarios. These assume that the economy grows steadily at theprojected rate, that other key macroeconomic rates (the interest rate, the rate of inflation, the rateof depreciation of the exchange rate) are constant, and that the main fiscal magnitudes arestationary relative to GDP. Thus, for example, the share of revenue in GDP, and the debt incomeratio are assumed constant. Within this structure, a variety of different configurations can beexamined. For example a higher ratio of domestic debt to income implies both proportionatelymore debt to be serviced and also inter alia a higher interest rate at which to service it. The shareof government receipts going to debt service will rise for both reasons. Offsetting this, there willalso be a higher relative contribution of net borrowing to receipts; however, if the domesticinterest rate exceeds the growth rate, this offset will only be partial. Given a realistic view ofrevenues, some idea of the steady state relation between the debt stock and the feasible level of
23 At least it can in the textbook case of competitive markets and a fully employed economy.
24 In the discussion and illustrations in this sub-section, we concentrate on the domestic deficit and on domestic debt.The resources available to government also include external concessional loans (the external deficit) and theassociated external debt. As argued in detail in FPMC the considerations governing these are wholly different.We return to this issue in section 8.
79

expenditures on goods and services can then be obtained25 . For example, if the share of revenuesin income is t, the debt income ratio A, the interest rate r, the growth rate g, then the steady stateratio of spending in income, e26 is constrained to:
e = t - (r - g)A (1)
As already noted, we would normally expect that a higher A would also imply a higher r. Atsome point, this relation may become quite steep, reflecting a very high opportunity cost ofincreased debt. If this involves substantial crowding out of private sector investment, it may alsolower the growth rate g, further lowering e, but having obvious additional costs besides. Therelevance of this point depends on a number of factors, such as how integrated the domesticeconomy is in the world economy, how good is the access of domestic investment tointernational finance2 7, and how credible the government's reputation is for prudent policies. Thestronger the country's performance in these respects, the less sensitive the domestic interest rateis likely to be.
2.2 Convergence to steady statesThe second step is to examine the paths for fiscal magnitudes, especially debt stocks (given theiractual initial value), if certain fiscal flow variables (such as the conventional budget deficit28 ) areset at some level relative to GDP and maintained there. For example, suppose the governmentchose to set and maintain a conventional budget deficit at lOOd%'o of GDP. Then, if the initialdebt income ratio was AO, the future debt income ratio evolves over time (n) as:
A,, = A0 /(l+g)" +[1-l/(I+g gy'd/g (2)
which converges reasonably rapidly towards:
A,C =d/g (3)
as n becomes large29. It is the conventional deficit that usually figures in concerns about fiscalpolicy, i.e. the deficit after nominal interest payments. Hence the growth rate should also be
25 Obviously, if a government could by magic be catapulted into any steady state provided it committed to stayingthere, it would choose the smallest debt possible (or better still to hold the largest asset stock permitted).
26 The symbol e is taken to cover expenditure on goods and services, not including interest payments. For simplicityit will be alluded to in the text by the shorthand 'expenditure'.
27 This might take place through partnerships with transnational firms, via FDI, or via capital account liberalisationand stock market developments.
28 For the remainder of this section, any reference to 'the deficit' can be taken to mean the conventional deficit aftergrants. For simplicity, external borrowing is neglected. Since, currently, net external borrowing and externalinterest are both relatively small and more or less offset each other, this simplification does not greatlymisrepresent the picture.
29 Indeed, equation (2) can be written as a weighted average of the initial and final values,
80
measured in nominal terms. For an economy like Tanzania, the nominal growth rate is in excessof 10% per annum. With a growth rate of 10%, a deficit to GDP ratio (d) of say 2%, ifmaintained, would imply an eventual debt income ratio of 20%. If the initial debt income ratiowas 10%, close to current values in Tanzania, equation (2) shows that it would rise to 15%(halfway to its eventual value of 20%) in a little over 7 years. However, the more interestingquestion concerns the altered path of government spending on goods and services (i.e. net ofinterest payments). This is given by:
e,, =t +d-rA,, (4)
As an illustration, consider a government which has been running a balanced domestic budget, sod = 0. Since the economy is growing, but debt is not, the debt income ratio has been falling. Nowconsider three alternative fiscal strategies, each to be maintained indefinitely30. Strategy I is tomaintain the balanced budget policy; Strategy II is to start running a conventional deficit which isconsistent with a constant debt income ratio. Strategy III is to set some higher deficit, which willsee the debt income ratio rise to a higher level. For concreteness, suppose the initial debt incomeratio is 10%, the nominal growth rate 10%, and the nominal interest rate 12% (substantiallyhigher than the present cost of domestic funds to government, but the right order of magnitude onaverage in recent years31). Suppose that total (non-domestically borrowed) government resourcesare around 18% of GDP (again a typical figure for recent years).
Then:* Strategy I has the spending ratio e rising from an initial value of 16.8%32 gradually to a final
value of 18%. After 5 years of this strategy, the debt income ratio would have fallen toaround 6%, and e would have risen to 17.25%. The reason is that the relative burden of thedebt falls over time, lowering the proportion of resources that has to be diverted to payinterest.
* Strategy II immediately increases e to 17.8% and maintains it there. Since the economy isgrowing, the government can finance a deficit without raising the debt - income ratio,provided the deficit is restricted to (g x A) x 100% of GDP, or 1%. The rest of the interest
A,, = aA0 + (1- a)A. where a = I/(I+g)n
30 There is clearly no particular merit is the assumption of a fixed strategy, and indeed it is unlikely to recommenditself in practice. But it is a helpful device when (i) it is necessary to think ahead, (ii) it is impractical to thinkvery far ahead in detail, and (iii) it is desired to set off on a track that will not lead to enforced radicalsubsequent revision. Such revisions as are subsequently made can then reflect appropriate responses tochanging circumstances, rather than be predictable consequences of poor short run policy.
31 The weighted average yield on Treasury Bills was only 5.7% during 2002. In 1998 and 1999 it was 13.2% and11.0% respectively: Bank of Tanzania, Monthly Economic Review, February-March 2001, Table 7.
32 (.18 + 0 - .12 x .1) x 100. The numbers are being taken to represent all resources and all development spending,not just the local component of the latter.
81
burden (1.2% - 1%) has to be met from other resources. Notice that government spendingwould only reach 17.8% of GDP under strategy I after nearly 20 years!33
* Strategy III is the one sketched earlier, where the deficit is raised to 2% of GDP andmaintained there, implying a rise in the debt income ratio to 20%. Expenditure now jumps to18.8%34 of GDP, then declines steadily toward a final level of 17.6%. Once again, it is nearly20 years before e reaches 17.8%, this time from above.
Two important things to note about these examples are (i) that they all describe sustainabletrajectories for the budget35 ; (ii) that each path for expenditure has the same present value36 as theothers. Hence the choice between them should essentially reflect the government's preference forits operations to be an increasing or declining share of total activity. If it was felt, for example,that growth would be fostered by a relatively heavy initial emphasis on education, health, roads(i.e. the priority sectors) there would be a case for 'front loading' expenditure and adopting astrategy like III. If, on the other hand, it was felt that creating maximum space for privateenterprise was the early key, then a something like Strategy I might be preferred.
The crucial point is that, subject to one important caveat, they are all equally prudent. The caveatconcerns their differential downside risk to an adverse change, for example in the growth or theinterest rates. Since the impact of each is rather different, we consider them separately.
Interest rate changesSuppose the interest rate rose very substantially, to 15%37, and that there was no prospect ofraising revenue relative to GDP. In all three cases, either the strategy must be revised, orexpenditure must be cut.
First, suppose that the change happened just as the new strategy was being adopted, and it wasdecided to maintain it. Then the consequence for initial expenditure would be the same under
More precisely, it is 18.8 years. The cross over between the steady state expenditure strategy and others with aconstant relative conventional deficit takes place after m years where m is given by the condition:(I + g)' = rl(r - g). Caution should be exercised in reviewing these calculations, since they are sensitive to
the specific numbers used. But the general point is clear enough.
34 (.18 + .02 -. 12 x.1) x 100
35 This is conditional on the debt income ratios being feasible: i.e. sustainability really rests on the behaviour of thestocks not the flows, and in particular on there being willing holders for government debt at the postulatedlevel.
36 This follows from the requirement that they must all satisfy the government's inter-temporal budget constraint,and share the same initial debt, revenue profile, and by assumption the same interest rate. The relation would bemodified to the extent that the interest rate was affected by the trajectory of spending. To the extent thatRicardian equivalence holds, (private agents are not fooled by the government re-phasing a given tax burden),the interest rate would indeed be invariant to this trajectory.
37 Note this is the rate that is expected to hold over the future long term. Such a shift would require a massive shift,probably on a worldwide basis, such as did occur in the early 1980s, and was implicated in the following debtcrisis.
82
each strategy; it would require an expenditure cut equivalent to 0.3% of GDP3 8 from the variouspreviously planned initial levels. Of course the long-run outcomes for expenditure are ratherdifferent; however, as can be seen from equation (3), the long-run debt income ratio isunaffected 39. Strategy I still eventually yields a negligible debt income ratio, and e convergesfrom its initial value of 16.5% to 18%. Strategy II continues to maintain the initial debt incomeratio, and e remains at the new reduced level of 17.5% indefinitely. Strategy III continues to yielda long run debt income ratio of 20%, but since this is more costly, the level of e falls over timefrom 18.5% to 17%. The cross over point between the strategies is now somewhat sooner at 11.5years. However, it is possible that the change in the long run projected interest rate might lead toa revision of strategy. For example, suppose the government preferred to font-load itsexpenditure, but still did not wish to contemplate e falling below 17.25% of GDP. Given theupward revision to the interest rate, a strategy like Strategy III is now inconsistent with thegovernment's requirements. In fact, the maximum continued deficit is now only 1.5% of GDP;this sees initial spending rising only to 18% of GDP, and falling eventually to the lower limit17.25% (with the debt income ratio rising to 15%).
Second, suppose the revision only took place some years into the new strategy. It is now possiblethat it would be necessary to reverse the strategy. For example, it was earlier shown in thehypothetical example of Strategy III that the debt income ratio would have risen from 10% to15% after around seven years. If the interest rate revision took place then, the assumed floor tothe expenditure income ratio would require an immediate shift to a strategy of type II; The deficitwould be cut from 2% to 1.5% of GDP and expenditure stabilised at 17.25 %. If the revision tookplace still later, the debt income ratio would have become higher than could be sustained giventhe expenditure floor. However, in the absence of additional sources of revenue, the only way toreduce the debt income ratio would be by temporarily cutting expenditure further below this'floor'. If it were felt that there was a very sharp rise in the marginal benefit of public spendingbelow some threshold, (and hence a correspondingly high and asymmetric cost of falling belowit), then it would obviously pay to be careful to avoid breaching it. However, this does not seemparticularly plausible, and it seems sufficient to deal with this type of adverse change if and whenit arises.
Growth rate changesThe other major form of downside risk in these long run calculations is that it might provenecessary radically to reduce the growth forecast. From equations (2) and (3) it can be seen that,unlike the interest rate change, a growth rate change alters the relation between the deficit and thedebt income ratio. For concreteness, consider the same set of scenarios and initial conditions asbefore, but now suppose that the growth projection has to be revised (dramatically) down from10% to 7%. Strategy I is unaffected, except that the whole process of convergence slows down;
38 I.e. (.15-.12) x .1 x 100
39 The reason for this is that the deficit which controls the level of debt is the primary surplus. If this is fixed, andthere is an increase in the interest rate, then the relation between the primary surplus and debt service isdisrupted, and the growth of debt will accelerate. Targeting the conventional deficit instead provides a built-instabiliser. A rise in interest then requires an offsetting reduction in spending, i.e. an increase in the primarysurplus. The budget reacts to the extra cost of debt immediately and continuously.
83
after 5 years, for example, the debt income ratio will fall to 7% of GDP as opposed to theprevious 6%. Strategy II requires revision. Expenditure has to be cut to 17.5% of GDP (in placeof 17.8%), so the deficit is 0.7% (in place of 1%). If Strategy III is unadjusted (deficit maintainedat 2%), then the debt income ratio will rise to nearly 29% (in place of 20%) and e will eventuallyfall to 16.6%. Thus a 1% deterioration in the projected growth rate has the same consequenceunder the Strategy II approach as a 1% deterioration in the projected interest rate. They havesimilar but not identical effects in the other scenarios, with the difference being mainly a matterof timing.
2.3 Other forms of transitionSo far it has been assumed that the economy in general, and certain key fiscal magnitudes inparticular, have been in steady state. This has permitted attention to be restricted to two main'moving parts', the flow deficit and, given the assumed invariance of the revenue share,spending; and the stock of debt. In practice, many other features of the economy are also likely tobe in some process of transition between states. Two of these are of especial interest in the fiscalcontext.
Resources available to governmentAside from the domestic borrowing considered so far, the two sources of funds available togovernment are domestic tax and non-tax revenues on the one hand, and external grants andconcessional loans on the other. In the situation of Tanzania, both of these are likely to evolveover time. One plausible long run scenario would see the share of domestic revenues rising overtime, from their current low level (see Annex 3); it is conceivable that this increase would beoffset by a tapering of the external inflow. Indeed, if the government succeeds in its aim ofsustaining real growth at 6% per annum or better, then even sustained growth in the aid flowmight see its share in GDP fall steadily. An alternative and more optimistic scenario mightsuppose that this tapering would be long deferred, or be quantitatively less significant than thegrowth in the revenue ratio.
To illustrate the implications of this type of projection, suppose that the initial level of non-domestically borrowed resources available to the government is again 18% of GDP, but that thisis expected to grow steadily to 20% over the next ten years, i.e. at the modest rate of 0.2% ofGDP per annum. The other assumptions are maintained as in the original steady stateillustrations. How might government spending be planned in these circumstances? We examinethree options, two of which are adaptations of the steady state Strategy II.* Strategy IV sets out to preserve one feature of the earlier strategy, the maintenance of the debt
income ratio at its initial value of 10%. Expenditure again jumps in the first year to 17.8%,and the deficit to 1%. However, instead of staying at this level, expenditure can be raised inthe second year to 18.0%, in the third year to 18.2% and so on. The deficit is maintained at1%, and this, together with the margin of 0.2% each year between revenues and expenditure,is sufficient to pay the interest at 1.2% of GDP. The 1% deficit is added to domestic debt,which therefore grows at 10%, the same rate as GDP. Clearly, the sustainable level ofexpenditure is higher than these early values, but it would not be possible to raise expenditurein the early years without breaching the limit on the debt income ratio.
84
* Strategy V preserves the other feature of the earlier strategy, the maintenance of the highestconstant share of expenditure in GDP consistent with overall resources and the initial debt.This turns out, on the illustrative figures given here, to be 19.6% of GDP. Domestic debtbuilds up over the transitional decade to a level equivalent to 19.5% of GDP and thenstabilises there. The deficit initially jumps to 2.8% of GDP, and then tapers over the ten-yearrevenue build-up to a little under 2%, at which it stabilises.
* Strategy VI is a hybrid of the previous two. It sets out to bring expenditure forward, reflectingthe anticipated rise in resources, and this again requires a rise in domestic debt. However, thisrise is designed to be temporary, so that the debt income ratio is again brought back to 10% indue course. This implies that some phased increase in expenditure will be appropriate.Ultimately, expenditure can be raised to 19.8%, since this is consistent with maintenance ofthe debt income ratio at 10%, but it will initially have to be held below this (and indeedbelow the 19.6% of Strategy V). Suppose, for example, that the government decided to raiseexpenditure immediately to 19% and maintain it there until the debt income ratio hadreverted to 10%. Given the present illustrative numbers, this would take 15 years. The debtincome ratio would peak at 14.25% after 7 years. The expenditure path would jump to 19%,be maintained there for 15 years, and then be increased to 19.8% and maintained there. Thedeficit jumps to 2.2%, falls steadily over the 15 year transition (1.7% after 5 years, 0.6% after10, 0.2% after 15), and then reverts to the steady state value of 1%.
FinancialfeaturesThese may also be undergoing transitions from disequilibrium states, and this may alter andpossibly restrict fiscal policy choices. An important example, which is fortunately not relevant inthe Tanzania case, is when there is a very large inherited stock of domestic debt with heavyassociated debt service, which dramatically restricts both expenditure and financing options.Tanzania does of course have very large external debts, and is engaged in a variety of processesto relieve them. From the current perspective, the two key features are that current interest costsare relatively modest, and that net external borrowing is also now modest. Other relevantfeatures are the low levels of demand for real balances and probably for credit. These reflect thepast lack of a private enterprise culture, and historically high inflation rates; they are likely totake a long time to unwind.
85
ANNEX 4: DATA
86

lFable 1: Tanzania Mlacroeconomic Indicators
Indicator nit 199111 19911 19921 19931 19941 19951 19961 19971 19981 19991 2000
PIpiulation/2 Milliolis 23.9 24.6 25.3 26.0 26.7 27.5 28.3 29.1 30.0 30.9 31.91ercupita Income/2 1Us$ 160.9 180.7 167.0 149.2 156.2 176.9 210.3 235.6 220.0 240.0 280.0(il)lD (irowth/2 6.2 2.8 1.8 0.4 1.4 3.6 4.2 3.3 4.0 4.7 4.9Gross )Doiestic Savings/2 Bit. TZS -4.7 -6.6 -32.3 -53.4 -26.6 25.3 202.2 321.8 229.0 314.3 682.4Gross investiments/2 Bil. 'IZS 216.9 286.1 373.0 433.5 566.7 597.8 627.2 700.8 902.6 999.6 1281.0Inflation/2 % 35.8 28.7 21.8 24.0 33.5 27.4 21.0 16.1 12.9 7.8 6.0Exchanige Racl/2 TZS/US$ 197.6 222.6 301.9 414.5 509.6 574.8 580.0 624.6 664.7 720.0 840.0External SectorExports/2 Mil. US$ 470.0 482.2 555.6 747.9 937.6 1265.8 1300.9 1246.4 1141.5 1189.7 1325.8Imports/2 Mil. US$ 1273.6 1336.3 1438.5 1983.6 1812.6 2140.3 2028.5 1948.2 2360.1 2241.4 2094.4Current Accouiii1 Balance/2 Muil. US$ -558.9 -736.1 -800.1 -1022.0 -711.0 -647.6 -455.0 -589.1 -993.0 -793.5 -514.5Balance ofl aynicrtsI2 Mil. US$ -200.0 -260.0 -228.1 -634.4 -446.7 -373.6 -223.9 -355.4 -645.8 -372.8 -336.8Foreign Reserves/2 NMil. US$ 238.9 301.2 458.5 271.9 431.8 288.5 500.6 638.7 599.0 775.6 974.0External Debt/I Uil. US$/I 5.6 6.0 5.9 7.5 8.0 8.4 7.8 8.0 7.9 8.0 7.6Foreign Direct Investmcnt/2 Mil. US$ 0.0 0.0 12.0 20.0 50.0 119.9 150.1 154.7 172.2 183.4 192.8Tourism Eaamings/2 Mil. liJS$ 65.0 94.7 120.0 146.8 192.1 258.1 322.0 392.4 570.0 733.3 739.1Monetary Sector
Average Dcposit Rate/2 % 26.0 26.0 26.0 24.0 25.0 21.0 16.7 10.0 7.0 6.5 6.9Average LcndiigRate/2 % 26.0 26.0 30.0 30.0 31.5 35.5 33.5 26.5 21.4 20.4 19.1Growvth in Money Supply (M3)/2 % 43.3 26.9 42.7 39.3 35.5 32.2 8.7 13.3 10.8 18.6 14.8Government Finance
Total Domestic Rcvenue/l Bil.l7ZS 94.7 137.1 173.6 164.1 242.5 331.2 448.3 572.1 619.1 689.3 777.6Tax Revenie/I 13il. IZS 81.5 118.3 153.4 146.4 220.4 299.9 383.7 505.4 566.1 616.3 685.1Non-Tax Reveinuic/l Bil. TZS 13.2 18.8 20.2 17.7 22.1 31.3 64.6 66.7 53.0 73.0 92.5Total Expenditure/I Bil. T/S 127.9 201.2 223.8 337.9 410.5 453.4 500.1 711.7 856.2 927.7 1168.8Recurrent Expeiiditure/I Bil. IZS 111.6 163.0 191.2 273.2 335.8 386.6 470.0 587.1 669.6 791.2 808.9D)evclopmcnt l xpcndiurrc/Il 13iii. TZS 16.3 38.2 32.6 64.7 74.7 66.8 30.1 124.6 186.6 136.5 359.9Grants/I Blil. I;ZS 27.7 22.9 32.8 58.3 76.9 67.3 46.9 115.4 119.4 169.9 280.3IFiscal l3alance/I 13iI. TZ7S -33.2 -64.1 -50.2 -173.8 -168.0 -122.2 -51.8 -139.6 -237.1 -238.4 -391.1
/1 F:iscal ycar is used. and it ends in mncitionied year June 30th./2 Calcndar year is used. and it ends in mentioned year December 3 Ith.Sources: Tlie Planning Commission. The United Republic of Tanzaniia. Economilci Survey. various issues.
BureauL of Statistics. Planninig Commissionl. National Accouits ol Tanzaniia. various issues.
Ihe Bank of Tanizaniia. Economiic Bulletin. various issues.
88

Table 2: BALANCE OF PAYtMSENTS(in millions of U'S dollars).
Items 1990 1991 11992 1993 1994 1 1995 1 1996 1 199? 1998 1 1999 2000
CURRENT ACCOUNT -559 .736 -704 .1.022 -711 -646 -461 -555 -995 -837 -534
Goods -779 -865 -916 -836 .790 -658 -449 -395 -778 -825 -67?Exports (fob) 408 362 401 439 519 683 764 753 589 5433 663imports (fob) 1,186 1,228 1.317 1.275 1.309 1,341 1.213 1,148 1.366 1.368 1.335
Sersices -157 -158 -169 -390 -85 -217 -279 -306 .443 -227 -96Receipts 1'll 142 168 311 418 583 537 494 553 646 664Paviments 288 300 337 701 503 800 816 800 996 873 760
Inicomie -185 -184 -225 -148 -123 -110 -72 .123 -125 -76 94Receipt-s 6 8 8 21 3 1 32 42 45 48 56 63Payntienits 191 192 234 169 1 53 142 113 168 173 13? 157
Currenit tranisfers 562 471 606 351 287 338 338 270 350 290 328Inflows 593 504 641 381 312 371 371 337 377 413 405
Government 538 480 506 371 215 23 6 236 239 261 25? 257PriNate 54 23 135 1 0 97 135 135s 98 116 162 147
Ottfloss 3 1 33 3 5 30 25 32 3?2 68 27 123 77
CAPITAL ACCOUNT 327 353 298 201 263 191 191 167 300 323 329
Capital trattsfcrs 327 353 298 201 263 191 191 167 300 323 329Ittflows 37 353 298 201 263 191 191 167 300 3 23 329Outflows 0 0 0 0 0 0 0 0 0 0
Acqttsition,disposals of nott-produced 0 0 0 0 0 0 0 0 0 0 0non-ftinattici assets
FINANCIAL ACCOUNT 42 118 107 57 -107 140 0 -136 -18 90 -130
Direct iinsestintent 0 0 12 20 50 ISO 149 158 172 183 193Abroad 0 0 0 0 0 0 0 0 0 0 (It Tateanaii 0 0 12 20 50 150 149 158 171 183 193
Portfolio twvesttmen 0 0 0 0 0 (I 0 0 0 0 (
Othier investtnent 42 118 95 37 -157 -10 -148 -294 -190 -93 -323Inflow of fitnaticial resouirces 237 271 332 615 435 437 319 417 436 423 250
Disbuirsernenit of Govenitnetut loans 224 261 268 372 274 244 225 270 274 336 166Trade credit and otlher finanicial flows 1 3 1 I 64 143 122 142 77 119 1310 83 82Disbursetnent of loans to banks &, otlier sect- 0 0 0 100 38 51 1 7 28 33 4
Ouitflo%s of finiatucial resouirces 195 153 27,7 578 591 448 467 711 626 516 5 73,Repaytenett of govenimettt loans 169 146 237 498 491 273 362 758 479 405 486
Trade credit and other finaticial flows 26 7 0 68 76 163 43 -108 100 57 36Repayment of loans by bank-s & other sector 0 0 0 1 2 24 1 3 62 61 47 54 5 I
Errors attd onmissions 48 33 46 28 94 -70 25 -32 97 96 -69
OVERALL BALANCE -142 -232 -253 -737 -461 -386 -245 -556 -615 -328 -40t4
FINANCING -142 -232 -253 737 461 386 245 556 615 328 404
Net Reserve assets I- ittcrease) -140 -85 -254 157 -77 60 -165 -84 -11 -121 -138Exceptsiontal finanlciute 2891 317 506 579 538 326 410 640 626 450 541
Aricars 100 345 207 199 296 269 31 2 131 1311 147 106Reschediuling 156 0 1319 137 145 0 0 -159 1 751 116 0Delbt IbrgieNcress 11I 0 25 24 24 0 0 194 151 88 131Use of Ftuttd credit 14 -27 136 70 31 -IS -28 77 21 45 1 1Grants borrousing for BOP puirposes - - - 150 74 57 98 156 169 99 304
%letnorantdurn iternts:GI)lntp) Muill. USD) 3.444 3.768 4.042 3.967 4.170 4.866 5.953 6.995 7.594 8.435 8.34CAB GDP -16 -20 -17 -26 -17 -13 -8 -8 -I3: -10 -6CAB GD)P level cttrrcnt official transfers) -3? -3-2 -30 -35 -22 -18 -12 -II -17 -IS .uGross Official Reserves 193 242 394 228 331 271 441 623 599 776 974Weeks of ltnports 7 8 12 6 10 7 II1 1 7 1 3 1 8 24
S.-rc B.Iw,cc ouf P.Y-nets Deparunueun of the Batk of"Tanmi.oj
89
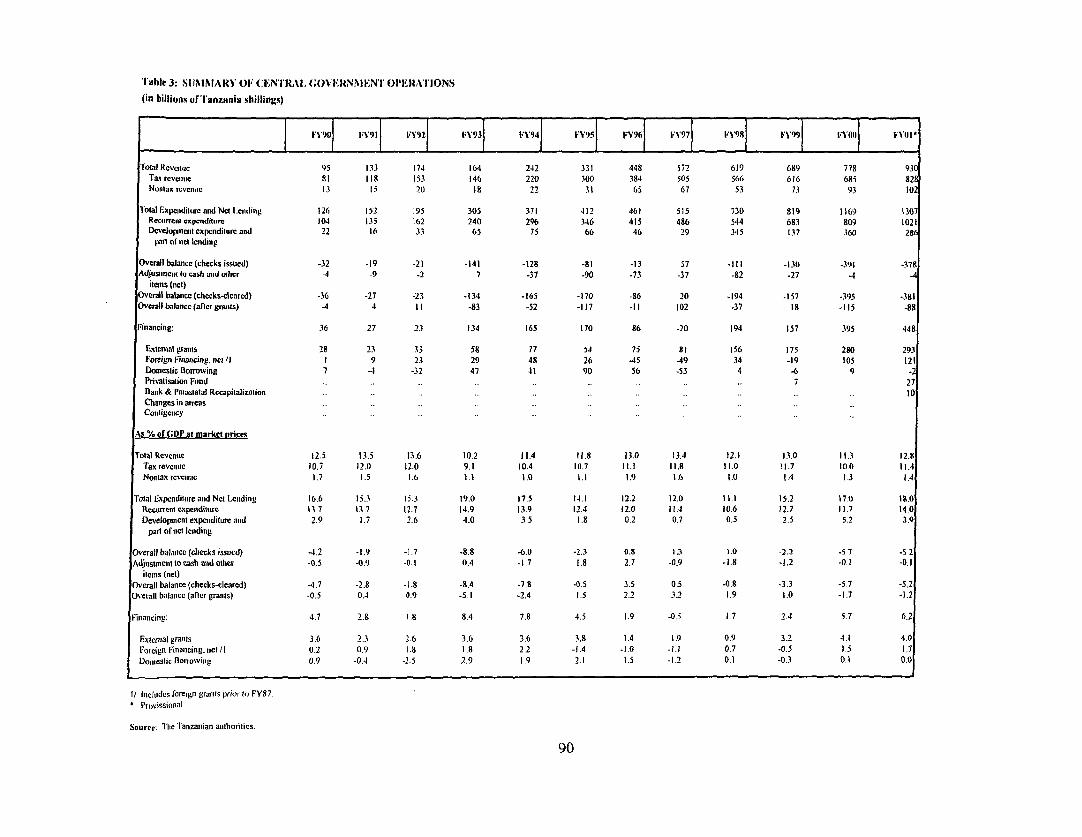
'I'ahle 3: SilUlMlARY ()OF C N'-RAL. (;OV'ERNMN)IEN'1' Ol'ERII'.'IONS
(in billions of 7'anzania shillings)
I F |9] V119l1 F 92^1 VY931 FY941 tY95| FY961 IV971 1X981 [ 991 1; Viii lii.ol
lotal Rcvcweu 95 133 174 164 242 331 448 572 619 689 778 93
Tax rcvcniue 81 118 153 146 220 300 384 505 566 616 685 82
Nontax rCvCIItIC 13 1; 20 18 22 31 65 67 53 73 93 102
lotal lxpeadittire ad Nt L.ending 126 152 195 305 371 412 461 515 730 819 1169 1307
Rccirrent exp,cndirurc 104 135 162 240 296 346 415 486 544 683 809 1021
Developnefitexpendittireanid 22 16 33 65 75 66 46 29 345 137 360 28
patl of net leniding
Overall balanec (checks isstied) -32 -19 -21 -141 -128 -81 -13 57 -111 *130 -3191 -378
Adjustncit th cash and uthicr 4 -9 -2 7 -37 -90 -73 -37 .82 -27 4 -4
items (net)Overall balance (checks-cicarcd) -36 -27 -23 -134 -165 -170 -86 20 -194 .157 -393 -381
Overall balancc(aflcr grants) 4 4 11 -83 -52 -117 -11 102 *37 18 -115 -88
Finanicing: 36 27 23 134 165 170 86 -20 194 157 395 448
Extetnal granms 28 23 33 58 77 54 75 81 156 175 280 293
Foreign Financing, net/I I 9 23 29 48 26 -45 -49 34 -19 105 121
Domestic Borroving 7 -4 -32 47 41 90 56 -53 4 -6 9 -2
Privatisation Frnd . .. . .. .. .. .. .. 7 .. 27
Bank & Parastatal Rccapitalization .. .. .. .. .. .. .. .. .. .. 10
Changes in arreas .. .. .. .
Colitigeelcy .. .. .. .. .. .. . .-.
As % of i'DP at market nrices
Total Revenuc 12.5 13.5 13.6 10.2 11.4 11.8 13.0 13.4 12.1 13.0 11.3 12.8
Tax revetuc 10.7 12.0 12.0 9.1 10.4 10.7 11.1 11.8 11.0 11.7 10.0 11.4
Nontax revenue 1.7 1.5 1.6 1.1 1.0 1.1 1.9 1.6 1.0 1.4 1.3 14
Total Expcndilure and Net Letiding 16.6 15.3 15.3 19.0 17.5 14.1 12.2 12.0 11.1 15.2 17.0 18.0
RecarrTntexpendiltire 13.7 13.7 12.7 14.9 13.9 12.4 12.0 11.4 10.6 12.7 11.7 14.0
Developnient expcnditure aird 2.9 1.7 2.6 4.0 3.5 1.8 0.2 0.7 0.5 2.5 5.2 3.9
part of nct Icnding
Overall balanc (checks issrted) -4.2 -1.9 -1.7 -8.8 -6.0 -2.3 0.8 1.3 1.0 -2.2 -S 7 -5 2
Adjustncnt to rash and other -0.5 -0.9) -0.1 0.4 -1.7 1.8 2.7 -0.9 -1'8 -1.2 -0.1 -0.1
items (net)Overall balance (checks-cleared) -4.7 -2.8 -1.8 -8.4 -7.8 -0.5 3.5 0.5 -0.8 -3.3 -5.7 -5.2
Overall balance (after grants) -0.5 0.4 0.9 -5.1 -2.4 1.5 2.2 3.2 1.9 1.0 -1.7 -1.2
Financing: 4.7 2.8 1.8 8.4 7.8 4.5 1.9 -0,5 1.7 2.4 5.7 6.2
External grants 3.6 2.3 2.6 3.6 3.6 3.8 1.4 1.9 0.9 3.2 4.1 4.0
Foreign Finalicing.net/l 0.2 0.9 1.8 1.8 2.2 -1.4 -1.0 -1.1 0.7 -0.5 1.5 1.7
Domestic Borrowing 0.9 -0.4 -2.5 2.9 1.9 2.1 1.5 -1.2 0.1 -0.3 0.1 0.0
1/ Iicltides foleigil gratlis prior to FY87.I prsvissio55al
Ssurce: The Tanzanian authorities.
90
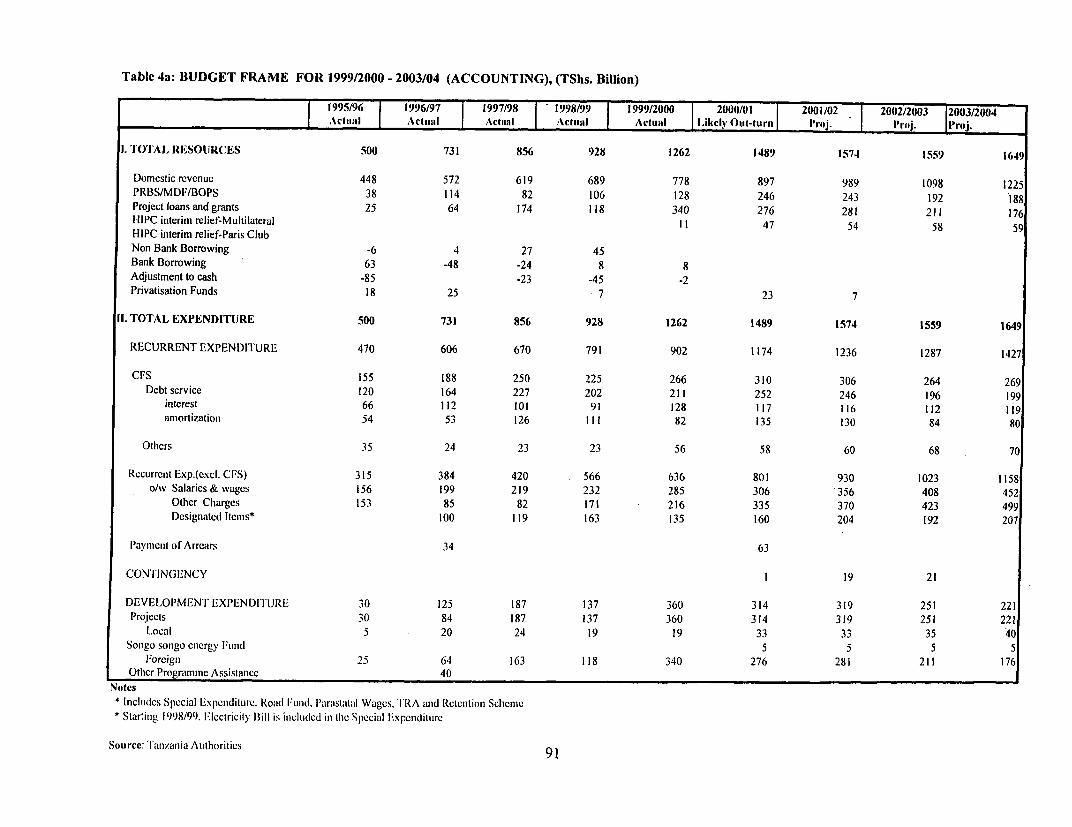
Table 4a: BUDGET FRAME FOR 1999/2000 - 2003/04 (ACCOUNTING), (TShs. Billion)
1995/96 1996/97 1997/98 1998/199 1999/2000 2000/01 2001/02 2002/2003 12004| Atual Atual IActal Acual AItkeal l,ikcly Out-ttirn 1'ro;. 3ruj, r 0j. _
l.lTO'IAL RESOURCES 500 731 856 928 1262 1489 1574 1559 1649
Domcstic revenue 448 572 619 689 778 897 989 1098 1225PRBS/MDF/BOPS 38 114 82 106 128 246 243 192 188Project loans and grants 25 64 174 118 340 276 281 211 176IIIPC interim relief-Multilateral I1 47 54 58 59HIPC interim relief-Paris ClubNon Bank Borrowing -6 4 27 45Bank Borrowing 63 -48 -24 8 8Adjustment to cash -85 -23 -45 -2Privatisation Funds 18 25 - 7 23 7
11. TOTAL EXPENDITURE 500 731 856 928 1262 1489 1574 1559 1649
RECURRENT EXPENDITURE 470 606 670 791 902 1174 1236 1287 1427
CFS 155 188 250 225 266 310 306 264 269Debt service 120 164 227 202 211 252 246 196 199
interest 66 112 101 91 128 117 116 112 119amortization 54 53 126 III 82 135 130 84 80
Otlcrs 35 24 23 23 56 58 60 68 70
Recurreit Exp.(cxcl. CFS) 315 384 420 566 636 801 930 1023 1158o/wv Salarics & wages 156 199 219 232 285 306 356 408 452
Other Charges 153 85 82 171 216 335 370 423 499Designated Items* 100 119 163 135 160 204 192 207
P'aymcint ol Arrears 34 63
CON'I'INGENCY I 19 21
DEVELOI'MENT EXPENDITURE 30 125 187 137 360 314 319 251 221Projects 30 84 187 137 360 314 319 251 221
Local 5 20 24 19 19 33 33 35 40Sonigo songo cnerg Ftind 5 5 5 5
Foreign 25 64 163 118 340 276 281 211 176Otlier Programme Assistanec 40
Notes* Iicltides Special Expenditure. Road Iunlid, l'arastatati Wages, I'RA and Retenition Schemlie* Startinie 1998/99. Electricity 13ill is inci(led in the Special I'xpenditurc
Sourcc:Tanzania Athllorities 91
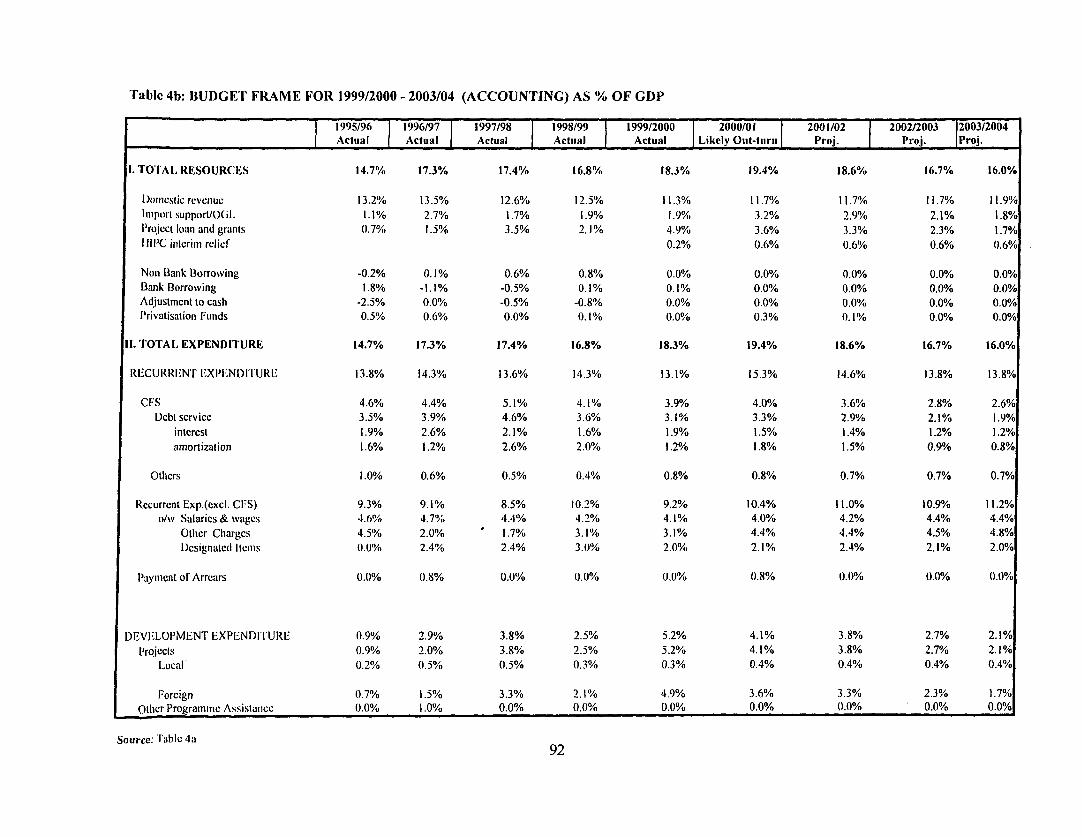
Table 4b: IJUDGET FRAME FOR 1999/2000 - 2003/04 (ACCOUNTING) AS % OF GDP
1995/96 1996/97 1997/98 1998/99 1999/2000 2000/01 2001/02 2002/2003 12003/2004
Aetuial Actual Actual Actial Actual Likely Out-tuiri ProPoj. |Proj.
1. TOIAL RESOURCES 14.7% 17.3% 17.4% 16.8% 18.3% 19.4% 18.6% 16.7% 16.0%
Domestic revenue 13.2% 13.5% 12.6% 12.5% 11.3% 11.7%) 1 1.7%/6 11.7% 11.9%
Importsupport/o(il. 1.1% 2.7% 1.7% 1.9% 1.9% 3.2% 2.9% 2.1% 1.8%
1'roiect loan and grants 0.7% 1.5% 3.5% 2.1% 4.9% 3.6% 3.3% 2.3% 1.7%
IIIPC intierim reliefl 0.2% 0.6% 0.6% 0.6% 0.6%
Non Banik 13orroxving -0.2% 0.1% 0.6% 0.8% 0.0% 0.0% 0.0% 0.0% 0.0%
Bank Borrowing 1.8% -1.1% -0.5% 0.1% 0.1% 0.0% 0.0% 0.0% 0.0%
Adjustment to cash -2.5% 0.0% -0.5% -0.8% 0.0% 0.0% 0.0% 0.0% 0.0%
P'rivatisation Funds 0.5% 0.6% 0.0% 0.1% 0.0% 0.3% 1.1% 0.0% 0.0%
11. TOTAL EXPENDITURE 14.7% 17.3% 17.4% 16.8% 18.3% 19.4% 18.6% 16.7% 16.0%
Rl,ClJRRi.N1I .Xl'l.NDIIURE 13.8% 14.3% 13.6% 14.3% 13.1% 15.3% 14.6% 13.8% 13.8%
CFS 4.6% 4.4% 5.1% 4.1% 3.9% 4.0% 3.6% 2.8% 2.6%
Debt service 3.5% 3.9% 4.6% 3.6% 3.1% 3.3% 2.9% 2.1% 1.9%
interest 1.9% 2.6% 2.1% 1.6% 1.9% 1.5% 1.4% 1.2% i.2%
amortization 1.6% 1.2% 2.6% 2.0% 1.2% 1.8% 1.5% 0.9% 0.8%
Othcrs 1.0% 0.6% 0.5% 0.4% 0.8% 0.8% 0.7% 0.7% 0.7%
RccurrentExp.(excl.CFS) 9.3% 9.1% 8.5% 10.2% 9.2% 10.4% 11.0% 10.9% 11.2%
o/Iv Salaries & wages 4.6% 4.7%X6 4.4% 4.2% 4.1% 4.0% 4.2% 4.4% 4.4%
Other Charges 4.5% 2.0% 1.7% 3.1% 3.1% 4.4% 4.4% 4.5% 4.8%
D)esignated ItIms (0.0% 2.4% 2.4% 3.0% 2.0% 2.1% 2.4% 2.1% 2.0%
PIaymiient ol-Arrears 0.(% 0.8% 0.0% ().tIO 0.0% 0.8% (.0% (.0% 0.0%
DEVELOPMENT EXPENDI'I URE 0.9% 2.9% 3.8% 2.5% 5.2% 4.1% 3.8% 2.7% 2.1%
Proicets 0.9% 2.0% 3.8% 2.5% 5.2% 4.1% 3.8% 2.7% 2.1%
ILocal 0.2% 0.5% 0.5% 0.3% 0.3% 0.4% 0.4% 0.4% 0.4%
Foreign 0.7% 1.5% 3.3% 2.1% 4.9% 3.6% 3.3% 2.3% 1.7%
Othcr Programmc Assistanice (.0% 1.0% 0.0% 0.0% 0.0% 0.0% (.0% 0.0% 0.0%
Source: 1'abIe 4a 92
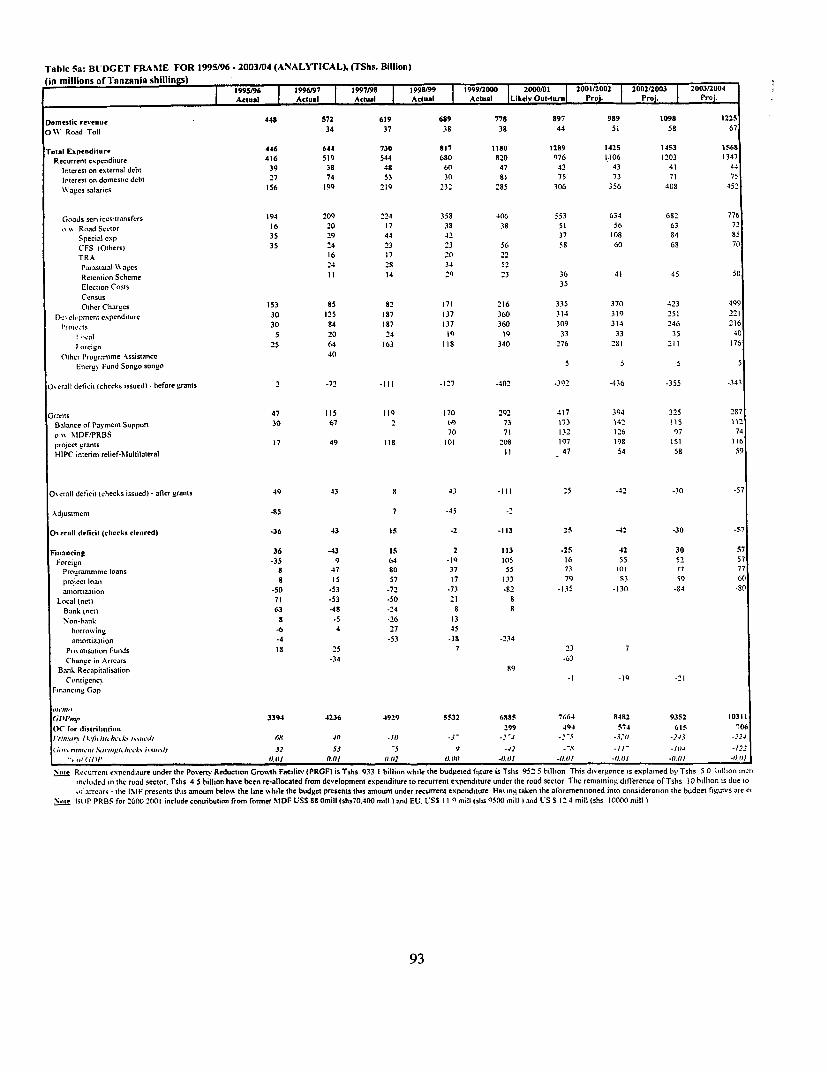
Table 5a: BU'DGET FRAME FOR 1995/96 -2003/04 (ANALVTICAL). (TShs. Billion)(in millions of Tanzania shillings)
1959 19/7 1997/981 1998/9 19920 000 01 02 12002120013 '200312004Acul Ata Actual natual A=ua Liey ttr r. Pro Proj.
Domestic resenue 448 572 619 689 778 897 989 1098 12250O'W Road Toll 34 37 38 38 44 51 55 67
Total Expenditure 446 644 730 817 1180 1289 1425 1453 1568Recurrent espendit.re 416 519 544 680 020 976 1.106 1203 1347
Interest on external debt 39 38 48 60 47 42 43 4 1 44Interest on domestic debt 27 74 53 30 81 75 73 71 75%Vaves salaries 156 199 219 232 285 306 5 6 408 452
Goods scr, ices'transfers 194 209 224 355 406 553 634 682 7 76ssRoad Sector 1 6 20 1 7 38 38 SI 56 63 72Special cxp 35 29 44 42 37 108 84 8SCFS lOthers) 35 24 23 23 56 58 60 68 70TRA 16 17 20 22ra,islatat \\ ages 24 28 34 52Retention Scheme I I 14 29) 23 36 4 1 45 s0Election Costs 3CensusOther Char.es 153 85 82 171 216 335 370 423 499
IThclpm1...ent ex,penditure 30 125 187 1 37 360 314 319 251 221.Pnic~ts 30 84 187 137 360 309 314 246 216
' cal 5 20 24 19 IQ 33 33 35 40t orcian 25 64 163 118 340 276 281 211 176
(tthet Pirogranmme *'%ssistance 40Encrg) Fund Sonco song0 S S 5 5
0jseralIl deficit (checks issued) -before grants 2 -72 -III -1 27 -402 .392 -43,6 -355 -343
Grants 47 115 119 170 292 417 394 325 287Batance of Paymient Suppon 30 67 2 619 73 1713 142 tiS 11os , NDF!PRBS 70 71 132 126 97 74project grants 1 7 49 158 lOt 208 197 198 151 116H-IPC interim relief-?slultilaleral I I 47 54 58 59
Oserall deficit (checks issncdl -after grants 49 43 5 43 -111 25 -42 -30 -57
Adrustnmcnt -85 7 -45 -
Os es-all di,ficit (chseck. cleared) -36 43 15 -2 .113 25 -42 -30 -57
Finanicinig 36 -43 1 5 2 113 -251 42 30 57Foreign -35 9 64 -19 lOS 1 6 5 5 5 2 57
Pro6ramosni loans 5 47 50 37 55 73, tOt 77 77project loan 8 IS5 57 1 7 1 33 79 83 59 60anmortization -50 .53 -72 .73 -82 -135 -1310 -84 -80
Local (nell 7 1 -53 -50 2 1 8Bank (ret) 63 -48 -24 8 8Non-bank 8 -5 -26 1 3
borrosVinc -6 4 27 451mottication -4 -53 -38 -234
Pris atsation Funds 1 8 25 7 23 7Change in Arre-r -34 .63
Bank Recapitalisation 89CuntiLenc., -l -19)-2
Financing Gap
(;/)Pw ~~~~ ~~~~~~3394 4236 49291 5532 6885 7664 8482 9352 10311IO3C fur diitr-ibotlio 299 494 574 615 0Pyiir- I kf,/ ium h/, ,c -,wudI /1 411 -It) -2-4 2 -321) -243 -22-46-,,vriiiii S~iih i,-s iu-b 32 53 -5 9 -42 - ~ -//-- 104 -122
Note Recurrent expencrditure under the Poserr, Reduction Growth Facilitv I PRGFI in Tshs 933 1 billion schile the budgeted figure is Tshs 952 5 billton This divergence is explained by Tshs 5 0 billon ncr,included ini the road sector. Tshs 4 5 billion have been re-allocated from development expetiditure to recuirrent expsettditure under the road sector TIte remaining diff'erence of Tshs 10 billion is due too,f r,rears -tile INIF presents this amount belo%% the line ushile the budget presents this amount under recuirrent expendtture Has ing taken the aforementioned into consideration the budget figurs are ci
Nus-ii IlP PRBS for 2000 2001 includ, contribution from forser %IDF US$S88Omill 1shs7O.400 mill ) and EU. USS 11 c ntiIll slhs Q5O0mill l and US S 12 4 millI(shs lOOOO mill I
93
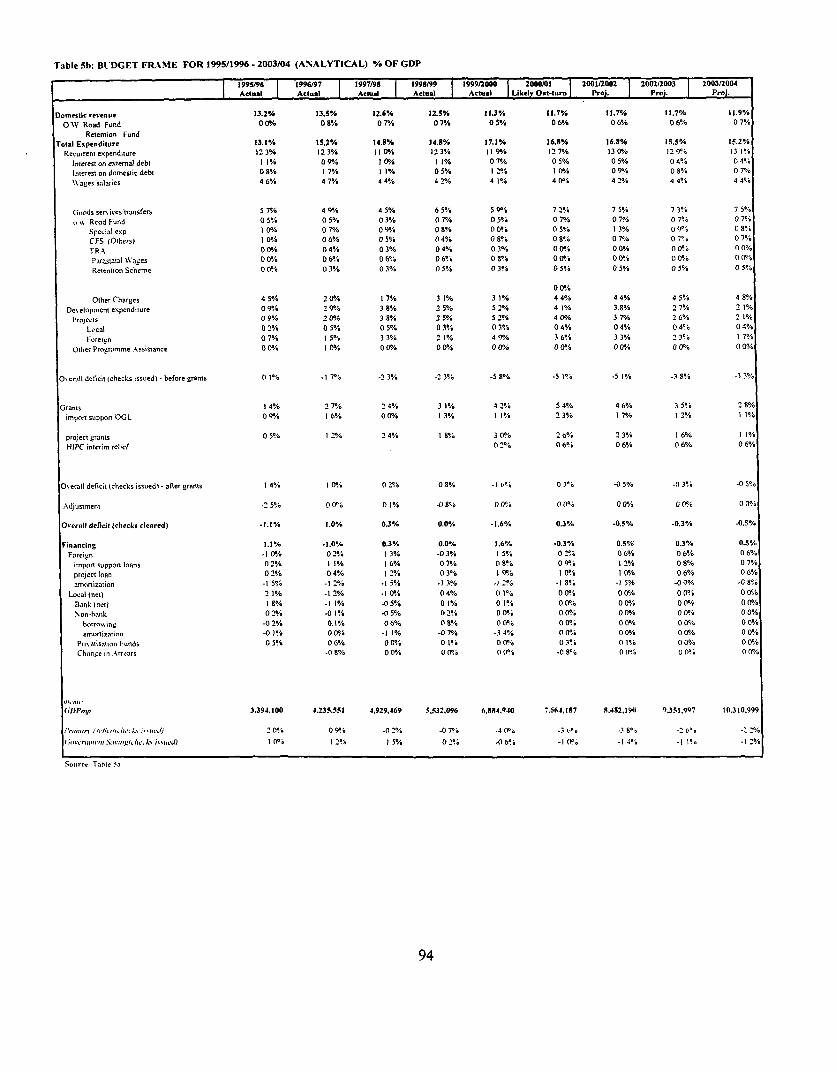
Table 5b: BU'DGET FRANME FOR 1995/1996 -2003/04 (ANALYTICAL) % OF GDP
1995/96 ~~1996/7 197/8 19989 '999200 00/1 01/00 002/2-003 2003/2004Acul A"ta A.tua AlIa I Actual LikelyOa-trn Pro.Ij Proi. Pro.4
Domestic r-nese 13.2% 13.5% 12.6% 12.5% 11.3% 11.7% 11.7% 11.1% 11.9%OW, Road Fund 000/0 08%' 07% 07% 0 5% 0 6%/ 0 6% 0 6% 0 7%Retention FundTotal Expenditure 131% 15.2% 14.8% 14.8% 17.1% 16.5% 16.8h Is.5% 15.2%Recurrent espenclture 12 3% 12 3% 11 0%/ 12 3% 11 00/. 12 7% 130/% 12 9%1 13%Interest on external debt I1% 0 9%/ 1 0% I 1% 0 7% 0 5%1 0 5% 0 4% 0 4%Intrest on donmestic debt 0 8% 1 7% 1% 0 5% I 2 I W9.00. 0 9% /. 0 7%Wages salaries 4 6% 4 7% 4 4% 4 2% 4 I9' 409'.1 4 2% 4 4% 4 4%
Gloods SC, ices'transfers S 7% 4 9%' 4 5% 6 5%, 500' . 7 2% 7 5% 7 3%1 7 5%;ciRood Fond 0 5% 0 5% 0 3% 0 7% 0 5% 0 7% 0 7% 0 7%' 0 7%Spccial e\p I 0/6 0 7% 000/". 0 8% 009'l. 05 il 139' 0 9%' 08%CFS OlOhets) I 0%1 0 6% 035% 0 4% 0 8% 0 8% 0 7% 0 7%. 07%T'RA 0 094. 0 4% 0 3% 0 4% 0 3% 0 0%1 00O% 009".6 00%i/I'aritstalal Wa'.es 0 00/. 0 6% 06%" 0 69'. 089'l. 00% 009'.I.000O/, 00%1Retention Scheme 009'. 0 3% 03% 05% 03%' 0 5%' 0 5% 0 59% 05%I
Other CharLes 4 5% 200/% 17% 3 1% 31% 4 4% 4 4% 459'l. 4 8%De, elopment expenditure 0 9%" 200'. 38% 2 5% 52% 4 1% 3.9% 2 7% 2 1%1"J'rijCS 0 9% 2 00/. 38% 235% 5 2%' 40/% 3 7% 2 69'. 21%Lo'cal 0 2% a05% 0 5% 0 3% 039'. 0 4% 0 4% 049'. 0 4%Fore,0. 0 7% 1 5% 3 3% 2 1% 4 9%, 3 6% 3 3% 2 3%' 1 714Other Procramme Assistance 0 00/. I19/. 0 09/. 0 00/ 0 09' 009' 00/. 0 0% 0 0%1
0. arlI deficit (checks issued).- before grants 019'l. .1 79.'. -2 3%, -2 39'. .58 S. 5 1% .31 -38% -3 3%
Grants 14% 2 7% 24% 3 1% 4 2% 5 4% 4 6% 3 5%' 2 8%import support OGL 0 00/. 1 6% 0 00/. I 3% I 1%l 2 3% I 7% I 2% 1 1%
project irrants 0 59'. I 2%' 2 4% I 8% 300'. . 2 6% 2 3% 1 6% 1 1%H-IPC interim relief 0 2% 0 6% 0 6%4 06%/ 0 6%
Osetrail deficit i checks issued) -after grarnts 14% 10%i 0 2% 0 8% .1 tR6' 0 3. -035% .0 39. -059'.
Adjustment .2 59'. 0 09'. 01% .089'.i 009'. 00%k 00O% 009-i 0 0%
0Oreroll deficit (chtecks cleared) .1.1% 1.0% 0.3% 0.0% -1.6% 0.3% -0.5% .0.3% -0.5%
Financing 1.1% .1.0% 0.3% 0.0% 1.6% -0.3% 8. 5%- 0.3% 0.5%fo'irei -I 010% 0 29' 13% -0 3% 1 5%' 0 29'. 0 6%/ 0 6% 0 6/.inmportsupportloans 0 2% 1 1% 1 6%4 0 7%' 08'. 0 99'. 12% 0 8% 0 7%projectoona 0 2% 0 4% I12% 0 3% 1 9% 09. 1 %I09/. 0 69'. 0 6%anirirization -l 59'. -l 2%1 .1 59' .139' .1 2%1 -l 89% -135% .009% O .08%Local (net) 21% -1 2% -1 00/. 0 49' 01% 0 0'.6 0 00/. 009'. 0 09'.Bank lnetl I8% -1 1% .0 5% 01% 01 009'.OM 0 00/ 0/. 00%00%6Non-batnk 02% .0(9'i. .0 5% 029'l. 00 009' 11. 009/. 009'. 0 0%bo,rni, in. -0 2% 0.19' 0 6%/ 084 009'. 0 09'. 00/. 0 0% 0 0%amortizal-e .01% 00O. -1 1% .0 79'. .3 4%' 009O' 00O% 00% 009/.Prmisatiaio Funds 0 59' 06% 0 09.'. 0 1%' 009'. 0 39' 01% 0 0% 0 0%Change in A rroars .0 8% 009/. 009.. 009'. *0 8".6 00%l 000'. 0 0%
(;I3Im,v 3.394.100 4.235.551 4.929,469 5.532.096 6,884.940 7.664.187 8.482.1911 9-351.997 10.310.999
/ivsi, / fijktrih,,i, /''ii. .... ): 20%' 0 9% .0 2% .0 7%' .4 096 .3 c0, -3 8% -Z ci'. -22
(ue"iiiiiiii wwio/I d) i/itc/ I 00'. I 29'. I 5%' 0 29'. .0 '.9'. .1 0%' .1 4'. -*I . -I 2%
So-rre Table 5.,
94
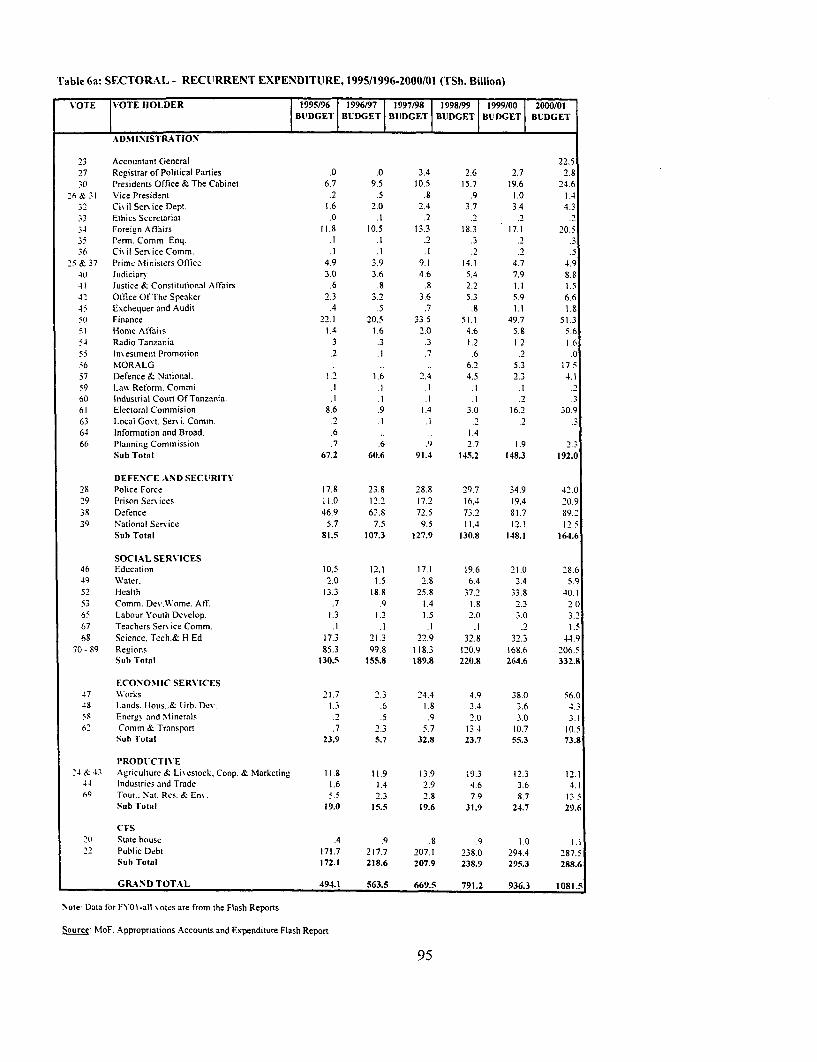
Table 6a: SECTORAL - RECUIRRENT EXPENDITURE, 1995/1996-2000101 (TSh. Billion)
;OTE \OTE HOLDER 1995/96 | 1996/97 | 1997/98 | 1998/99 | 1999/00 | 2000/01BUTDGET BUDGET BUDGET BUDGET BUDGET BUDGET
ADMINISTRATION
23 Accountant General 22.527 Registrar of Political Parties .0 .0 3.4 2.6 2.7 2.830) Presidents Office & The Cabinet 6.7 9.5 10.5 15.7 19.6 24.6
26 ', I Vice President .2 .5 .8 .9 1.0 1.432 Ci% il Ser\ ice Dept. 1.6 2.0 2.4 3.7 3.4 4333 Ethics Secretariat .0 .1 .2 .2 .2 .234 Foreign Aflairs 11.8 10.5 13.3 18.3 17.1 20.535 Perm. Comm. Enq. .1 .1 .2 .3 .2 .336 Cis il Ser ice Comm. .I .I .1 .2 .2 .5
25 & 37 Prim.eMinisters Office 4.9 3.9 9.1 14.1 4.7 4.940 Judiciarv 3.0 3.6 4.6 5.4 7.9 8.84 1 Justice &Constitutional Affairs .6 .8 .8 2.2 1.1 1.542 Olice Ot The Speaker 2.3 3.2 3.6 5.3 5.9 6.645 Exchequer and Audit .4 .5 .7 .8 1.1 1.850 Finance 22.1 20.5 33.5 51.1 49.7 51.35i Home Affairs 1.4 1.6 2.0 4.6 5.8 5.654 Radio Tanzania .3 .3 .3 1.2 1.2 1.655 In\ estment Promotion .2 .1 .7 .6 .2 .056 NORALG .. .. .. 6.2 5.3 17.557 Defence & National. 1.2 1.6 2.4 4.5 2.3 4.159 Iass Reform. Commi. .I .I .1 .I .I .260 Industrial Court Of Tanzania. . .1 .I .1 .261 Electoral Commision 8.6 .9 1.4 3.0 16.2 30.963 Local Govt. Ser\ i. Comm. .2 .1 .1 2 2 .364 Information and Broad. .6 .. ,. 1.466 Planning Commission .7 .6 .9 2.7 1.9 2.3
Sub Total 67.2 60.6 91.4 145.2 148.3 192.0
DEFENCE AND SECU:RITV-28 Police Force 17.8 23.8 28.8 29.7 34.9 42.029 Prison Ser\ices 11.0 12.2 17.2 16.4 19.4 20.938 Defence 46.9 63.8 72.5 73.2 81.7 89.-39 National Service 5.7 7.5 9.5 11.4 12.1 12.5
Sub Total 81.5 107.3 127.9 130.8 148.1 164.6
SOCIAL SERN'ICES46 Education 10.5 12.1 17.1 19.6 21.0 28.649 Water. 2.0 1.5 2.8 6.4 3.4 5.952 Health 13.3 18.8 25.8 37.2 33.8 40.153 Comm. Dev.Wome. Aff. .7 .9 1.4 1.8 2.3 2065 Labour Youth Develop. 1.3 1.3 1.5 2.0 3.0 3.267 Teachers Sers ice Comm. .1 .1 .1 .1 .2 1.568 Science. Tech.& H Ed 17.3 21.3 22.9 32.8 32.3 44.9
70-89 Regions 85.3 99.8 118.3 120.9 168.6 206.5Sub Total 130.5 155.8 189.8 220.8 264.6 332.8
ECONOMIIC SERN'ICES47 Works 21.7 2.3 24.4 4.9 38.(1 56.048 ILands. Hous..& LUrb. Dcv. 1.3 .6 1.8 3.4 3.6 4.358 Energ\ and Minerals .2 .5 .9 2.1) 3.062 Comm & Transport .7 2.3 5.7 13 4 10.7 10.5
Sub Total 23.9 5.7 32.8 23.7 55.3 73.8
PRODUCTIVE24 & 4 3 Agriculture & Li estock. Coop. & Marketing 1 1.8 11.9 13.9 19.3 12.3 12.1
44 Industries and Trade 1.6 1.4 2.9 4.6 3.6 4.169 Tour.. Nat. Res. & Ens. 5.5 2.3 2.8 7.9 8.7 13 5
Sub Total 19.0 15.5 19.6 31.9 24.7 29.6
CFS20 State house .4 .9 .8 .9 1.0 1.122 Public Debt 171.7 217.7 207.1 238.0 294.4 287.5
Suh Total 172.1 218.6 207.9 238.9 295.3 288.6
GRAND TOTAL 494.1 563.5 669.5 791.2 936.3 1081.5
Note Data for FYOI-all \otes are from the Flash Reports
Saurce: NMoF. Appropriations Accounts and Expenditure Flash Report
95
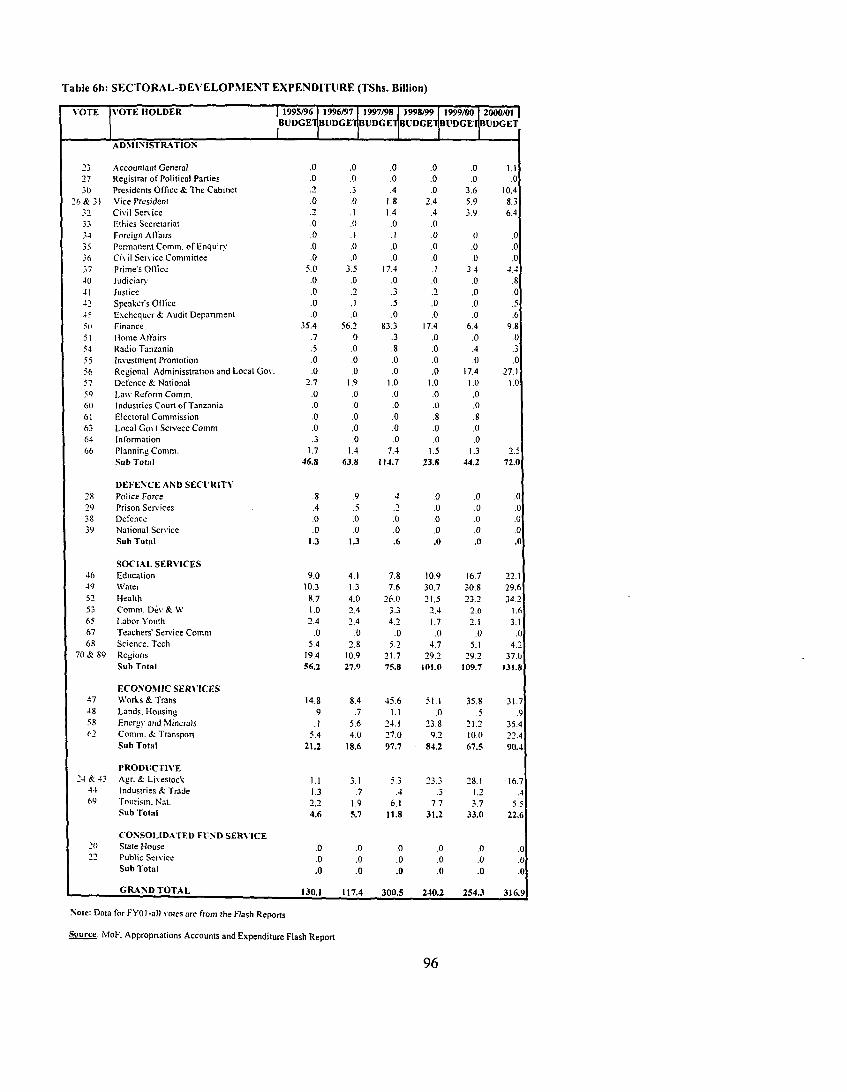
Table 6b: SECTORAL-DEVELOPMENT EXPENDITUTRE (TShs. Billion)
V'OTE _\'OTE HIOLDER J 1995/96 1996/97 1997/98 1998/99 | 1999/00 2000/01 |BUDGE 1 BUDGE1BUDGE1jBUDGE 1 BLUDGElBUDGET
ADMINISTRATION
23 Accountant General .0 .0 .0 .0 .0 1.127 Registrar of Political Parties .0 .0 .0 .0 .0 .030 Presidents Office & The Cabinet .2 .3 .4 .0 3.6 10.4
26& 31 Vice President .0 .0 1.8 2.4 5.9 8.332 Civil Ser% icc .2 .I 1.4 .4 3.9 6.433 Ethics Secretariat .0 .0 .0 .03 Frcien Aflairs .0 .I ,I .0 0 .035 Permanent Comtn. of Enquiry .0 .0 .0 .0 .0 .036 Cis il Serxvice Committee .0 .0 .0 .0 .0 .037 Prime's Ofice 5.0 3.5 17.4 .1 34 4440 Judiciars .0 .0 .0 .0 .0 .84 1 Justice .0 .2 .3 .2 .0 .042 Speakers Office .0 .1 .5 .0 .0 .545 Exchequer & Audit Depanment .0 .0 .0 .0 .0 .650t Finance 35.4 56.2 83.3 17.4 6.4 9.8Sl Hone AffIairs .7 .0 .3 .0 .0 .034 Radio Tanzania .5 .0 .8 .0 .4 .355 Investment Promotion .0 .0 .0 .0 .0 .056 Regional Adminisstration and Local Gov. .0 .0 .0 .0 17.4 27.157 Defence & National 2.7 1.9 1.0 1.0 1.0 1.0sg Law Refortn Comrn. .0 .0 .0 .0 .060 Industries Court of Tanzania .0 .0 .0 .0 .061 Electoral Commission .0 .0 .0 .8 .863 Local Go% t Servece Cotmm .0 .0 .0 .0 .064 Information .3 .0 .0 .0 .066 Planning Conmm. 1.7 1.4 7.4 1.5 1.3 2.5
Sub Total 46.8 63.8 114.7 23.8 44.2 72.0
DEFENCE AND SECt'RITY29 Police Force .8 .9 4 .0 .0 .029 Prison Services .4 .5 .2 .0 .0 .038 Defence .0 .0 .0 .0 .0 .039 National Service .0 .0 .0 .0 .0 .0
Sub Total 1.3 1.3 .6 .0 .11 .0
SOCIAL SERV'ICES46 Education 9.0 4.1 7.8 10.9 16.7 22.149 Water 10.3 1.3 7.6 30.7 30.8 29.652 1-lealth 8.7 4.0 26.0 21.5 23.2 34.253 Comm. Dev & W 1.0 2.4 3.3 2.4 2.6 1.665 Labor Youth 2.4 2.4 4.2 1.7 2.1 3.167 Teachers' Service Comm .0 .0 .0 .0 0 068 Science. Tech 5A4 2.8 5.2 4.7 5.1 4.2
70 & 89 Regions 19.4 10.9 21.7 29.2 29.2 37.0Sub Total 56.2 27.9 75.8 101.0 109.7 131,8
ECONOMIC SERV'ICES47 \Works & Trans 14.8 8.4 45.6 51.1 35.8 31.748 Lands. Hiousing .9 .7 1.1 .0 .5 .958 Energv and Minerals .1 5.6 24.1 23.8 21.2 35.462 Coi11. & Transport 5.4 4.0 27.0 9.2 10.0 22.4
Sub Total 21.2 18.6 97.7 84.2 67.5 90.4
PRODUlCTIV'E24 & 43 Agr. & Livestock 1.1 3.1 5.3 23.3 28.1 16.7
44 Industries & Trade 1.3 .7 .4 .3 1.2 .469 Touristn. Nat. 2.2 1.9 6.1 7.7 3.7 5.5
Sub Total 4.6 5.7 11.8 31.2 33.0 22.6
CONSOLIDATED FUND SERN'ICE20 State House .0 .0 .0 .0 .0 .022 Public Service .0 .0 .0 .0 .0 .0
Sub Total .0 .0 .0 .0 .0 .0
GRAND TOTAL 130.1 117.4 300.5 240.2 254.3 316.
Note: Data for FYI0a11 v otes are from the Flash Reports
Source: MoF. Appropriations Accounts and Expenditure Flash Report
96
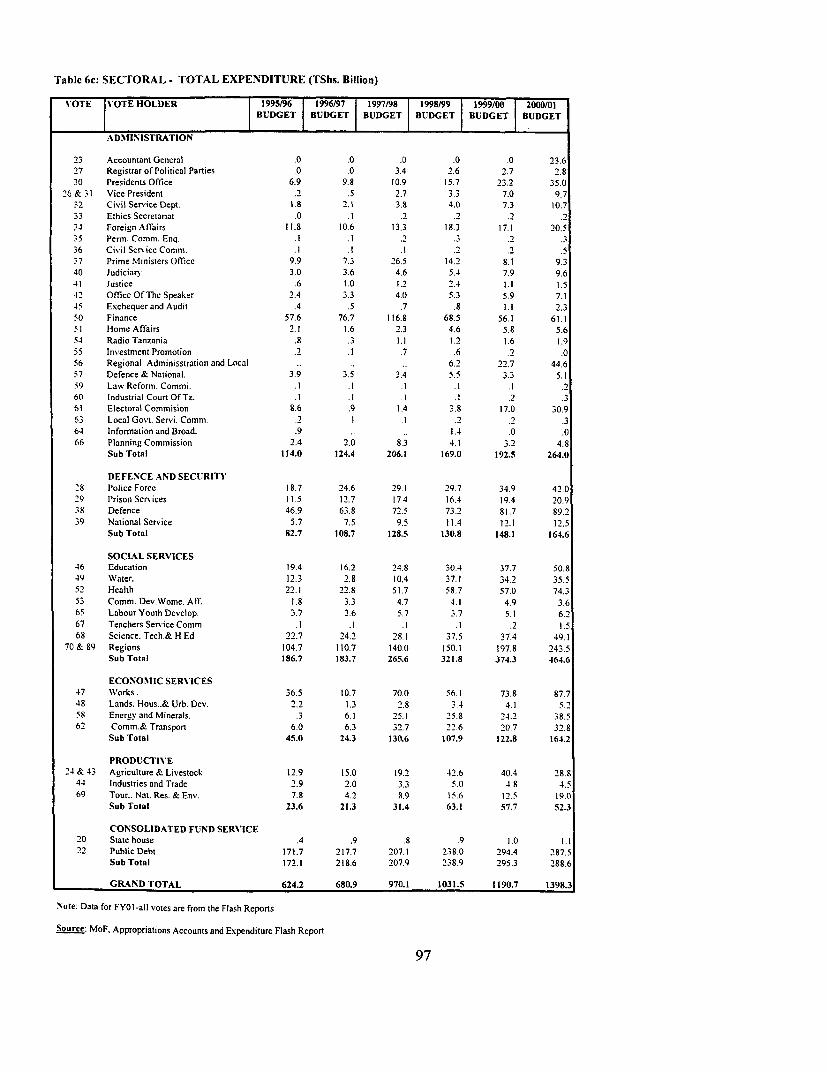
Table 6c: SECTORAL - TOTAL EXPENDITURE (TShs. Billion)
VOVOT OTE HOLDER 1995/96 1996/97 1997/98 | 1998/99 t 1999/00 | 2000/01BUDGET BUDGET BUDGET BUDGET BUDGET BUDGET
ADMINISTRATION
23 Accountant General .0 .0 .0 .0 .0 23.627 Registrar of Political Parties .0 .0 3.4 2.6 2.7 2,830 Presidents Office 6.9 9.8 10.9 15.7 23.2 35.0
26 & 31 Vice President .2 .5 2.7 3.3 7.0 9.732 Civil Service Dept. \.8 2.1 3.8 4.0 7.3 10.733 Ethics Secretariat .0 .1 .2 .2 .2 .234 Foreign Affairs 11.8 10.6 i3.3 18.3 17.1 20.535 Perm. Comm. Enq. .1 .1 .2 .3 236 Civil Scr% ice Comm. .1 .1 .1 .2 .2 .537 Prime Ministers Office 9.9 7.3 26.5 14.2 8.1 9.340 Judiciarn 3.0 3.6 4.6 5.4 7.9 9.641 Justice .6 1.0 1.2 2.4 1.1 1.542 Office Of The Speaker 2.4 3.3 4.0 5.3 5.9 7.145 Exchequer and Audit .4 .5 .7 .8 1.1 2.350 Finance 57.6 76.7 116.8 68.5 56.1 61.15 I Home Affairs 2.1 1.6 2.3 4.6 5.8 5.654 Radio Tanzania .8 .3 1.1 1.2 1.6 1.955 Investment Promotion .2 .1 .7 .6 .2 .056 Regional Adminisstration and Local .. .. ,. 6.2 22.7 44.657 Defence & National. 3.9 3.5 3.4 5.5 3.3 5.159 Lawv Reform. Commi. .I .I .1 .1 .1 .260 Industrial Court Of Tz. .1 .1 .1 .1 .2 .361 Electoral Commision 8.6 .9 1.4 3.8 17.0 30.963 Local Govt. Servi. Comm. .2 1 .1 .2 .2 .364 Information and Broad. .9 .. .. 1.4 .0 .066 Planning Commission 2.4 2.0 8.3 4.1 3.2 4.8
Sub Total 114.0 124.4 206.1 169.0 192.5 264.0
DEFENCE AND SECUiRITV'28 Police Force 18.7 24.6 29.1 29.7 34.9 42.029 Prison Services 11.5 12.7 174 16.4 19.4 20.938 Defence 46.9 63.8 72.5 73.2 81.7 89.239 National Service 5.7 7.5 9.5 11.4 12.1 12.5
Sub Total 82.7 108.7 128.5 130.8 148.1 164.6
SOCIAL SERVICES46 Education 19.4 16.2 24.8 30.4 37.7 50.849 Water. 12.3 2.8 10.4 37.1 34.2 35.552 Health 22.1 22.8 51.7 58.7 57.0 74.353 Comm. Dev.Wome. Aff. 1.8 3.3 4.7 4.1 4.9 3.665 LabourYouthDevelop. 3.7 3.6 5.7 3.7 5.1 6.267 Teachers Service Comm. .1 .1 .1 .1 .2 1.568 Science. Tech.& H Ed 22.7 24.2 28.1 37.5 37.4 49.1
70 & 89 Regions 104.7 110.7 140.0 150.1 197.8 243.5Sub Total 186.7 183.7 265.6 321.8 374.3 464.6
ECONOMIIC SERV'ICES47 Works. 36.5 10.7 70.0 56.1 73.8 87.748 Lands. Hous..& Urb. Dev. 2.2 1.3 2.8 3.4 4.1 5.258 Energy and Minerals. .3 6.1 25.1 25.8 24.2 38,562 Comm.& Transport 6.0 6.3 32.7 22.6 20.7 32.8
Sub Total 45.0 24.3 130.6 107.9 122.8 164.2
PRODUCTIV'E24 & 43 Agriculture & Livestock 12.9 15.0 19.2 42.6 40.4 28.8
44 Industries and Trade 2.9 2.0 3.3 5.0 4 8 4.569 Tour.. Nat. Res. & Env. 7.8 4.2 8.9 15.6 12.5 19.0
Sub Total 23.6 21.3 31.4 63.1 57.7 52.3
CONSOLIDATED FUND SERVICE20 State house .4 .9 .8 .9 1.0 1.122 Public Debt 171.7 217.7 207.1 238.0 294.4 287.5
Sub Total 172.1 218.6 207.9 238.9 295.3 288.6
GRAND TOTAL 624.2 680.9 970.1 1031.5 1190.7 1398.3
Note: Data for FYO1-all votes are from the Flash Reports
Source: MoF. Appropriations Accounts and Expenditure Flash Report
97
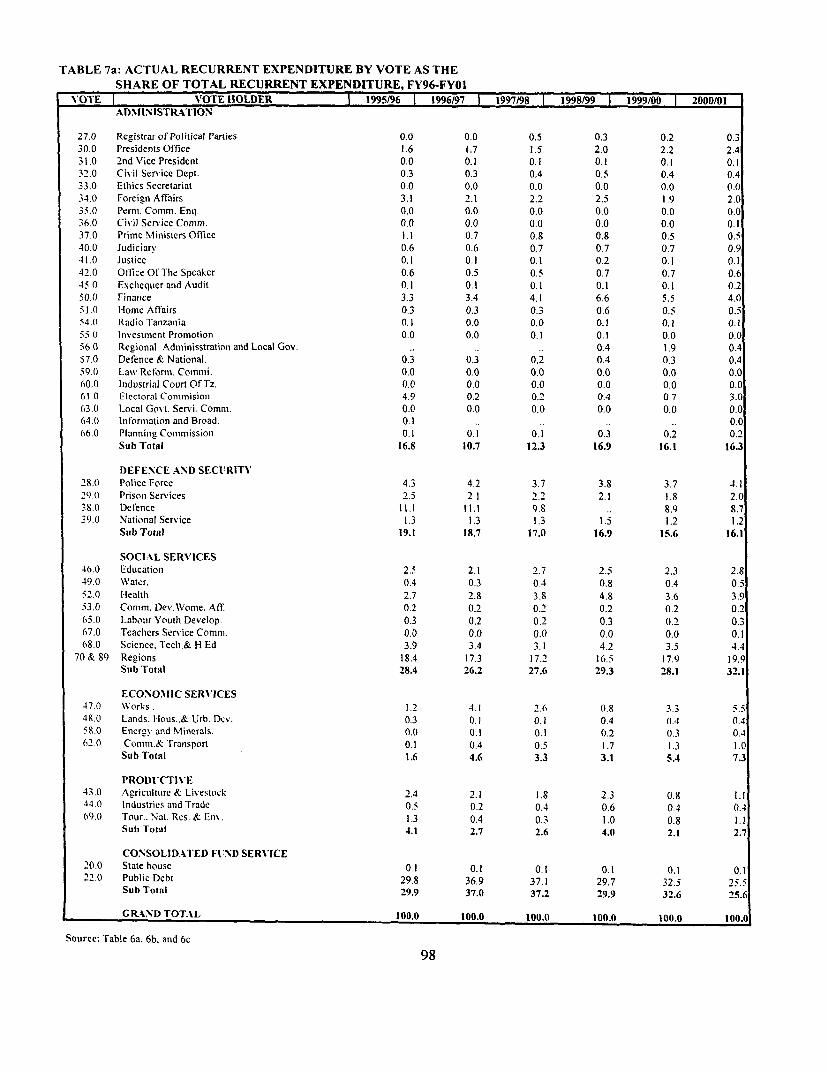
TABLE 7a: ACTUAL RECURRENT EXPENDITURE BY VOTE AS THESHARE OF TOTAL RECURRENT EXPENDITURE, FY96-FYOI
VOTE V'OTE HOLDER 1995196 | 1996/97 | 1997/98 | 1998/99 | 1999/00 | 2000/01ADMINISTRATION
27.0 Registrar of Political Parties 0.0 0.0 0.5 0.3 0.2 0.330.0 Presidents Office 1.6 1.7 1.5 2.0 2.2 2.431.0 2nd Vice President 0.0 0.1 0.1 0.1 0.1 0.132.0 Civil Senrice Dept. 0.3 0.3 0.4 0.5 0.4 0.433.0 Ethics Secretariat 0.0 0.0 0.0 0.0 0.0 0.034.0 Forcien Affairs 3.1 2.1 2.2 2.5 1.9 2.035.0 Perm. Comm. Enq. 0.0 0.0 0.0 0.0 0.0 0.036.0 Civil Service Comil. 0.0 0.0 0.0 0.0 0.0 0.137.0 Prime Ministers Office 1.1 0.7 0.8 0.8 0.5 0.540.0 Judiciarv 0.6 0.6 0.7 0.7 0.7 0.941.0 Justice 0.1 0.1 0.1 0.2 0.1 0.142.0 Office Of The Speaker 0.6 0.5 0.5 0.7 0.7 0.645.0 Exchequer and Audit 0.1 0.1 0.1 0.1 0.1 0.2i0.0 Finance 3.3 3.4 4.1 6.6 5.5 4.051.0 Home Affairs 0.3 0.3 0.3 0.6 0.5 0.554.0 Radio Tanzaniia 0.1 0.0 0.0 0.1 0.1 0.155 ( Investmcnt Promotion 0.0 0.0 0.1 0.1 0.0 0.056.0 Reeional Adminisstration and Local Gov. .. .. .. 0.4 1.9 0.457.0 Def'ence & National. 0.3 0.3 0.2 0.4 0.3 0.459.( Law Reform. Comimii. 0.0 0.0 0.0 0.0 0.0 0.060.0 Industrial Court Of Tz. 0.0 0.0 0.0 0.0 0.0 0.061 0 Electoral Coimmisioni 4.9 0.2 0.2 0.4 0.7 3.063.0 ILocal Gov t. Servi. Comm. 0.0 0.0 0.0 0.0 0.0 0.064.0 Inlforilationi and Broad. 0.1 ., .. .. ., 0.066.0 Plannhig Commission 0.1 0.1 0.1 0.3 0.2 0.2
Sub Total 16.8 10.7 12.3 16.9 16.1 16.3
DEFENCE AND SECItRITY28.0 Police Force 4.3 4.2 3.7 3.8 3.7 4.129.0 Prison Services 2.5 2.1 2.2 2.1 1.8 2.038.0 Defence 11.1 11.1 9.8 .. 8.9 8.739.0 National Service 1.3 1.3 1.3 1.5 1.2 1.2
Sub Total 19.1 18.7 17.0 16.9 15.6 16.1
SOCIAL SERVICES46.0 Education 2.5 2.1 2.7 2.5 2.3 2.849.0 Water. 0.4 0.3 0.4 0.8 0.4 0.552.0 I-lealthi 2.7 2.8 3.8 4.8 3.6 3.953.0 Comm. Dev. Worme. Af'f 0.2 0.2 0.2 0.2 0.2 0.265.0 Labour Y'outh Develop. 0.3 0.2 0.2 0.3 (1.2 0.367.0 Teachers Scrv ice Comm. 0.0 0.0 0.0 0.0 0.0 0.168.0 Science. Tech.& H Ed 3.9 3.4 3.1 4.2 3.5 4.470 & 89 Regions 18.4 17.3 17.2 16.5 17.9 19.9Sub Total 28.4 26.2 27.6 29.3 28.1 32.1
ECON'OMIIC SERVICES47.0 WN'orks. 1.2 4.1 2.6 0.8 3.34R.0 Lands. Illous..& Urb. Dcv. 0.3 0.1 0.1 0.4 0.4 0.458.0 Enerv and Nlinerals. 0.( 0.1 0.1 0.2 0.3 0.462.0 Comnin.& Transport 0.1 0.4 0.5 1.7 1.3 1.0
Sub Total 1.6 4.6 3.3 3.1 5.4 7.3
PRODI'CTIV'E43.(0 Agriculture & Livestock 2.4 2.1 1.8 2.3 0.8 1.144.0 Industries and Trade 0.5 0.2 0.4 0.6 0.4 0.4(9.( Tour.. Nat. Res. & Fitn. 1.3 0.4 0.3 1.0 0.8 1.1Sub Total 4.1 2.7 2.6 4.0 2.1 2.7
CONSOLIDATED FlND SERV'ICE20.0 State house 0.1 0.1 0.1 0.1 0.1 0.122.0 Public Debt 29.8 36.9 37.1 29.7 32.5 25.5Sub Total 29.9 37.0 37.2 29.9 32.6 25.6
GR.AND TOTAL 100.0 100.0 100.0 100.0 100.0 100.
Souree: Table 6a. 6b. and 6c
98

TABLE 7b: ACTUAL DEVELOPMENT EXPENDITURE BY VOTE AS THESHARE OF TOTAL DEVELOPMENT EXPENDITURE, FY96-FYOI
V'OTE VOTE HOLDER 1995/96 11996/97 11997/98 11998/99 119990 20/0DEV'. DEV. DEV. DEV. DEV. DEV.
ADNIINISTRATION'
27 0 Registrar ofPolitical Parties 0 0 0.0 0.0 0 0 0 0 0 030 0 Presidents Office 0.8 0.5 0 1 0.0 3 4 8 231 0 2nid V'ice Plresident 0 0 0 0 0.3 0.7 1 5 0 732 0 Civil Service Dept 0 2 0 2 0.2 0 0 7.8 9 5330( Ethics Secretariat 0.0 0000 0.0 0 0 0 034 0 Foreign Affairs 0 0 0 0 0 0 0.0 0 6 0 0035 0 Penn. Commi. Enq 0 0 0.0 0 0 0 0 0.0 00(36 0 Civ-il Service Comm 0 0 0 0 0.0 0 0 0.0 0.03 70 Primne Mlinisters Off-ice 4 3 8 5 7 3 0.1 2.8 0 6400( Judiciary 0 0 0 0 0.0 0 0 0 0 1.341.0 Justice 0.0 0.5 0.0 0.0 0.0 0 042 0 Office Of The Speaker 0 1 0 2 0 2 0.0 0 0 0.045 0 Exchequer and Audit 0 0 0 0 0 0 0 0 0.0 0.110 0 Finance 3 5 37.7 90 00 I S 1.4
51I0 lomne Af'fairs 0 6 0 0 0 0 0.0 0.0 0 054 0 Radio Tanizaniia 2 7 0.0 0 9 0 0 0.3 0 555 0 Ilnxestmenti Promnotion 0 0 0 0 0 0 0 0 0 0 0 0-56 0 Reizional Adininisstration and Local Gov 0 0 00 00 0.0 00 0457 0 Defence & National 6 4 0.2 4 3 0 0 00 1.659 0 La%\ Reform. Commi 00 0.0 00 00 00 0.060 0 lIndustrial Court Of Tz. 0 0 0.0 0 0 0 0 0 0 0.061 0 Electoral Comninision 0 0 0 0 0.0 0.0 0.063 0 Local Gov t. Serv'i. Commii 0.0 0 0 0.0 0.0 0 0 0.064 0 Inifon-nation and Broad. 0 6 0.0 0 0 0.0 0 066 0 Planning Commnission 2 1 1.2 1 7 0.6 1 4 3 4
Sub Total 21.4 49.0 24.2 1.4 18.8 27.6
DEFENCE AND SECURITY28 0 Police Force 1.0 0 7 0 2 0 0 0.0 0 029 0 Prison Services 0.3 0 2 0 0 0 0 00( 0 038 0 Defence 0.0 0 0 0 0 0 0 0 0 0 039.0 National Serv ice 0 0 0 0 0 0 0 0 0 0 0 0
Sub Total 1.3 0.9 0.2 0.0 0.0 0.0
SOCIAL SERV'ICES46 0 Educationi 4 6 8 7 6 9 9 3 10 8 3 249.0 Water, 0.6 0.5 0 6 17.3 8.l 3.252 0 Hlealthi 0.6 0 9 6 3 lOS 9 6 39.953 0 Commi. Dev.\Vome Aff 0 5 0 0 0.0 1 4 1.3 2.365.0 Labour Youith Develop. 15.6 6.5 I 4 0.3 0 6 0 167(1 Teaclhers Service Commi 00 00 0 0 00 0 0 6 66S 0 Sciencc. Techi& H Ed 2 5 4 2 0 9 1 9 IS5 10 3
70 & 8.9 Reczions 13.0 SI1 6 5 8 9 0 0 10 3Sub Total 37.5i 26.0 2 2. 5 49.6 31. 67.2
ECONOMIIC SERVICES47 0 Works 22 9 8 3 0 0 1 73 19 4 4.148 0 L.ands. IlIOUs.& Urb De\ 0 2 00 0.0 0 0 0 0 0058 0 Enerp\ anid Mlinerals 0 0 3.2 7 7 14.6 9 3 0 262 0 Commn &- Transport 0 0 10.2 32.4 8 3 9 4 0.0
Sub Total 23.1 21.7 40.1 40.2 38.1 4.3
PRODUCTIVE.130 Agriculture &Livestock 5903 6 1 8 6 II I 044 ( Industries and Trade 2 9 0.1 0 3 0 1 0.3 0069)0 T'our.Nat Res & Eniv 7 9 2 I 6 5 0.1 0 0 0.0
Sub Total 16.7 2.5 13.0 8.8 11.3 0.9
CON'SOLIDATED FLUND SERV'ICE20 0 State house o.o 0 0 0 0 0.0, 0 0 0 022 0 Public Debt oo0 0.0 0 0 0.0 0 0 0(1
Sub Total o.o 0.0 0.0 0.0 0.0 0.(I
GRAND TOTAL 100.0 100.0 100.0 100.0 100.0 100.01
Source: Table 6a. 6b. and 6c
99

TABLE 7b: ACTUAL TOTAL EXPENDITURE BY VOTE AS THESHARE OF TOTAL EXPENDITURE, FY96-FYOI
VOTE VOTE HOLDER 1995/96 1996/97 1997/98 1998/99 1999/00 2000/01TOTAL TOTAL TOTAL TOTAL TOTAL TOTAL
ADMINISTRATION
27 0 Registrar of Political Parties 0.0 0.0 04 0 3 0 1 0.330 0 Presidents Office 1.5 16 1.4 1.7 2.3 28310 2nd Vice President 00 0 1 0 1 02 0 3 0 232 0 Civil Service Dept 0 3 0.3 0 3 0 4 1.2 1.033 0 Ethics Secretariat 0 0 0.0 0 0 0.0 0 0 0034 0 Foreign Aflairs 30 2.0 20 2 2 1 7 1.8350 Perm Comm, Enq 00 00 00 00 0.0 0.036 0 Ci% il Service Comm 0 0 0 0 0 0 0 0 0 0 0037 0 Prime Ministers Office 1.3 1 2 I 5 0 7 0 8 0.540 0 Judiciary 0.6 0 6 0 6 0 6 0.6 0.9410 Justice 0.1 0.2 0.1 02 0 1 0 142 0 Office OJ'TheSpeaker 0 5 0.5 05 0.6 0 6 06450 Exchequer and Audit 0.1 0.1 01 01 0.1 0.250 0 Finance 3 3 5 6 4 7 5 8 5.1 3.851 1 Home Affairs 0.3 03 02 05 0.5 0554 0 Radio Tanzania 0 2 0 0 0 1 0.1 0.1 0.155 0 Investment Promotion 0 0 0 0 0 1 0.1 0 0 0.056 0 Regional Adminisstration and Local Gov. . .. 0.3 1.7 0.457 0 Defence & National 0 5 0 3 0 7 0.3 0 2 0 559.0 Law Reform. Commi 0.0 00 00 0.0 00 0.060 0 Industrial Cour Of Tz 0 0 0 0 0 0 0.0 0.0 0.061 0 Electoral Commision 4.7 02 02 .. 06 2.863.0 Local Govt. Servi. Comm 0 0 00 00 00 00 0.064 0 Information and Broad. 0.166 0 Planning Commission 0 2 0 2 0 3 0.4 0.3 0.4Sub Total 17.0 13.1 13.6 15.0 16.4 16.9
DEFENCE AND SECURITN'280 Police Force 4 1 3 9 3 3 3 3 3 3 3 929.0 Prison Services 24 2.0 20 1 8 1.6 1.938 0 Defence 10.7 10.4 8 7 7.9 8.2390 National Service 1 2 1 2 1 2 1.3 1 1 1.2Sub Total 18.4 17.6 15.1 14.8 14.0 15.1
SOCIAL SERV'ICES46 0 Education 2 6 2 5 3 2 3.3 3 3 2 849 0 Water. 0 4 0.3 0 4 2 9 1 2 0.8i2 0 llealth 2 7 2.7 41 5.5 4 3 6 053 0 Comm Dev.Wome. Aff 0.2 0.1 0 2 0 4 0.3 0.365 0 Lahour Youth Develop. 0 9 0 6 0 3 0.3 0 2 0 367.0 Teachers Service Comm 0 0 0 0 0 0 0.0 0 0 0.168.0 Science. Tech.& H Ed 3 9 3 4 2 9 3 9 3 3 4 570 & 89 Regions 18.2 165 160 156 160 193Sub Total 28.8 26.2 27.1 31.8 28.5 34.1
ECONOMIC SERVICES470 Works 2 1 43 23 29 50 54481) Lands. llous.& Urb De% 03 01 01 0.3 04 0458 0 Encrev' and Minerals 00 03 09 2.0 1 3 0 362 0 Comm & Transport 0 1 1 0 4 0 2.5 2 2 1.0Sub Total 2.5 5.7 7.3 7.7 8.9 7.1
PRODI'CTIV'E43 0 Agriculture & Livestock 25 2 0 23 3 1 1.9 i 144 0 Industrics and Trade 0 6 0 2 0 4 0 5 0 4 0 469 0 Tour. Nat Res & En% 1 6 0 5 1 0 0.9 0 8 I ISub Total 4.6 2.7 3.7 4.6 3.1 2.6
CONSOLIDATED FUND SERV'ICE200 State house 0 1 0 1 0 1 0 1 0 1 0 122 0 Public Debt 28 6 34 6 33 1 26 1 29 0 240Sub Total 28.7 34.7 33.2 26.2 29.1 24.1
GRAND TOTAL 100.0 100.0 100.0 100.0 100. 100.0
Source: Table 6a. 6b. and 6c
100
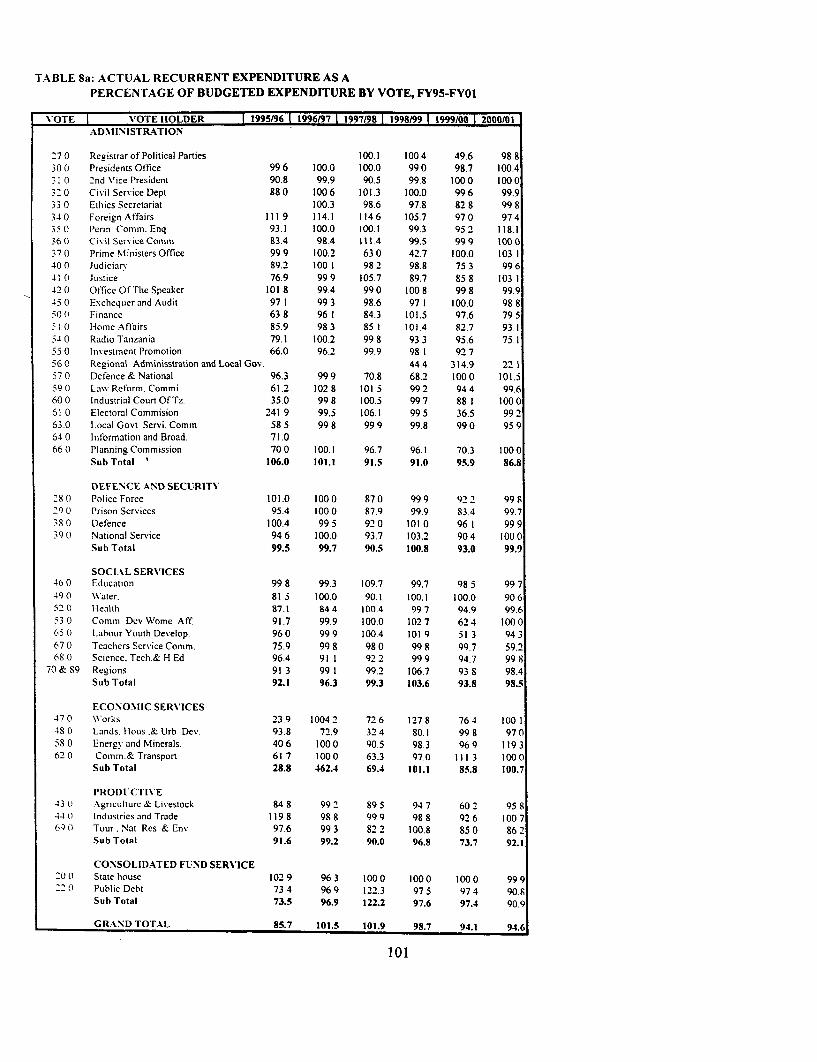
TABLE 8a: ACTUAL RECURRENT EXPENDITURE AS APERCENTAGE OF BUDGETED EXPENDITURE BY VOTE, FY95-FYO1
\OTE VOTE HOLDER 1995(961 1996(97 | 1997(98 | 1998/997 1999/00 | 2000101ADNIINIISTRATION
270 Registrar of Political Parties 100.1 100.4 49.6 98830 0 Presidents Ol'fice 99 6 100.0 100.0 99 0 98.7 100.4.10 2nd Vice President 90.8 99.9 90.5 99.8 1000 1000320 Civil Service Dept 880 1006 101.3 100.0 996 99.933 0 Ethics Secretariat 100.3 98.6 97.8 82 8 99 834 0 Foreign Affairs 111 9 114.1 114 6 105.7 97 0 97 43;5 0 Pernn Comm. Enq 93.1 100.0 100.1 99.3 95 2 118.1360 Civil Service Comm 83.4 98.4 111.4 99.5 999 100037 0 Prime Nlinisters Office 99 9 100.2 63 0 42.7 100.0 103 140 0 Judiciary 89.2 100 1 98 2 98.8 75 3 99641 0 Justice 76.9 999 105.7 89.7 858 103 142.0 Office OfTlle Speaker 101 8 99.4 990 1008 998 99.9450 Exchequer and Audit 971 993 98.6 97 1 100.0 98850 ( Finance 63 8 96 1 84.3 101.5 97.6 79 5:1 0 liome Aftairs 85.9 983 85 1 101.4 82.7 93.1540 Radio Tanzania 79.1 100.2 998 933 95.6 75.155 0 Investmenit Promotion 66.0 96.2 99.9 98 1 92 756 0 Regional Adminisstration and Local Gov. 44.4 314.9 22 157 0 Defence & National 96.3 99 9 70.8 68.2 100 0 101.559 0 Law Reform. Commi. 61.2 102 8 101 5 99 2 94 4 99.6600 Industrial Court OfTz. 35.0 99 8 100.5 997 88 1 100061 0 Electoral Commision 241 9 99.5 106.1 99 5 36.5 99263.0 Local Govt Servi. Comm 58 5 99 8 99 9 99.8 990 95 964 0 Information and Broad. 71.0660 PlanningCommission 700 100.1 96.7 96.1 70.3 1000
Sub Total ' 106.0 101.1 91.5 91.0 95.9 86.8
DEFENCE AND SECURITY'280 PoliceForce 101.0 1000 870 999 922 998290 Prison Services 95.4 1000 87.9 99.9 83.4 99.73S 0 Defence 100.4 99 5 92 0 1010 96 1 999390 National Service 94 6 100.0 93.7 103.2 90 4 1000
Sub Total 99.5 99.7 90.5 100.8 93.0 99.9
SOCIAL SERVICES46 0 Education 99 8 99.3 109.7 99.7 98 5 99 7490 Water. 81 5 100.0 90.1 100.1 100.0 906520 Health 87.1 84 4 100.4 99 7 94.9 99.653 0 Comm Dev Wome Aff. 91.7 99.9 100.0 102 7 62 4 100 0650 I.aboLir Youth Develop. 96 0 99 9 100.4 101 9 51 3 94 367 0 Teachers Service Comm. 75.9 99 8 98 0 99 8 99.7 59.268 0 Science. Tech.& H Ed 96.4 911 92 2 99 9 94.7 99 8
70 & S9 Regions 91 3 99 1 99.2 106.7 93 8 98.4Sub Total 92.1 96.3 99.3 103.6 93.8 98.5
ECONO.MIC SERV'ICES470 \'orks 23.9 10042 726 1278 764 100148 0 Lands. -lous .& Urb Dcv. 93.8 72.9 32 4 80.1 99 8 97 0580 Enerev and Ninerals. 406 1000 90.5 98.3 969 119362 0 Comm.& Transport 61 7 100 0 63.3 97.0 III 3 100 0
Sub Total 28.8 462.4 69.4 101.1 85.8 100.7
PRODt'C'rlT'E43 0 Agricuilture & Livestock 84 8 99 2 895 94 7 60 2 95 844 0 Industries and Trade 119 8 98 8 99 9 98 8 92 6 100 7690 Tour. Nat Res & Env 97.6 99 3 82 2 100.8 850 86 2
Sub Total 91.6 99.2 90.0 96.8 73.7 92.1
CONSOLIDATED FU:ND SERV'ICE200 Statehouse 1029 963 1000 1000 1000 999
0 Public Debt 73 4 96 9 122.3 97 5 97 4 90.8Sub Total 73.5 96.9 122.2 97.6 97.4 90.9
GRAND TOTAL 85.7 101.5 101.9 98.7 94.1 94.6
101
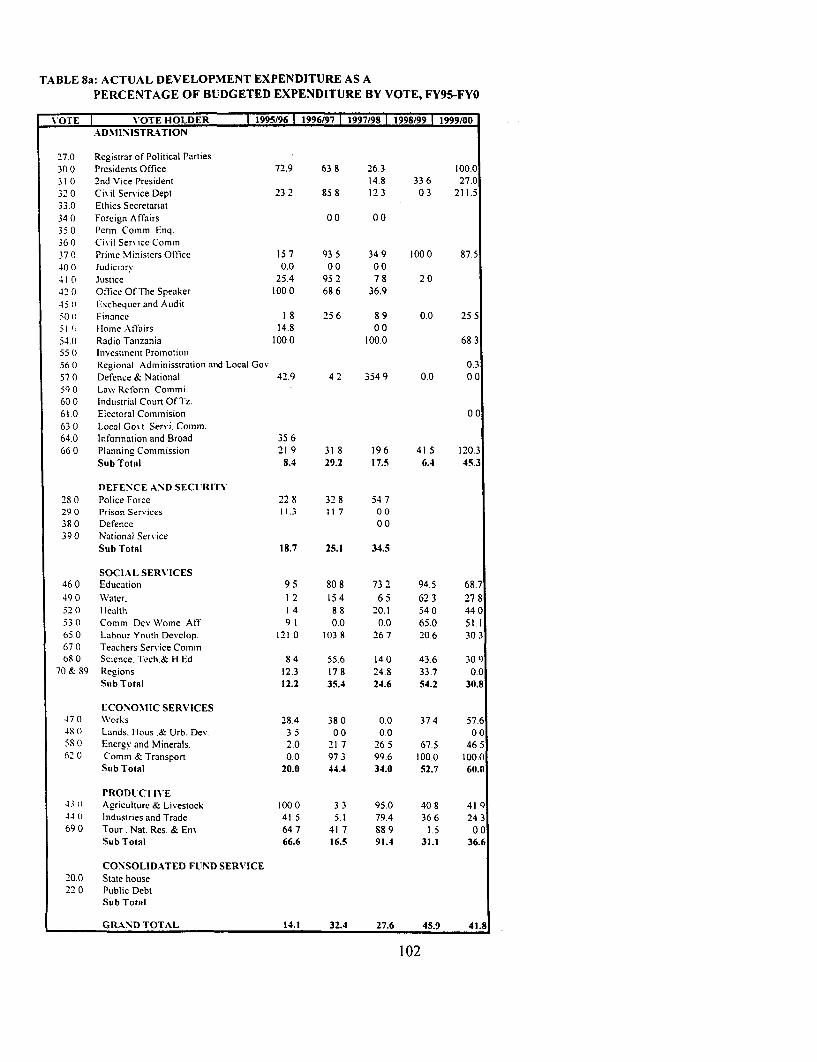
TABLE 8a: ACTUAL DEVELOPMENT EXPENDITURE AS APERCENTAGE OF BUDGETED EXPENDITURE BY VOTE, FY95-FYO
N'OTE N'OTE HOLDER 1995/96 | 1996/97 | 1997/98 | 1998/99 |1999/00ADMINISTRATION
27.0 Registrar of Political Parties30 0 Prcsidents Office 72.9 63 8 26.3 100.031 0 2nd Vice President 14.8 33 6 27.032 0 CiN il Service Dept 23 2 85 8 12 3 0 3 211.533.0 Ethics Secretariat34 0 Foreign Affairs 0 0 0 035 0 Pern Comm Enq.36 0 Civil Ser% icc Comm37 0 Prime Ministers Otlice 15 7 93 5 349 1000 87.540 0 Judiciary 0.0 0° 0 00 41 0 Justice 25.4 95 2 7 8 2 042 0 Off-ice OFlThe Speaker 100 0 68 6 36.945 0 Exchequer and Audit( Rl Financc 1 8 25 6 8 9 0.0 25 5
;1 ( Ilome Affairs 14.8 0054.0 Radio Tanzaniia 100 0 100.0 68 355 0 Investment Promotioni56 0 Regional Adminisstration and Local Gov 0.3570 Defenice & National 42.9 42 3549 0.0 0059 0 Lawv Reformn Commi.60 0 Industrial Court Of Tz.61.0 Electoral Commision 0.063 0 Local Gos t Servi. Comm.64.0 Intfonnation and Broad 35 6660 Planniig Commissioni 21 9 31 8 196 41 S 120.3
Sub Total 8.4 29.2 17.5 6.4 45.3
DEFENCE AND SECURITY28 0 Police Force 22 8 32 8 54.729 0 Prisoni Services 11.3 11 7 0 038 0 Deftence 0 039 0 National Service
Sub Total 18.7 25.1 34.5
SOCIAL SERVICES46 0 Education 9 5 80 8 73.2 94.5 68.7490 Water. 1 2 154 65 62.3 27 8520 I-lealth 1 4 88 20.1 540 440530 Comm Dcv Wome Atf 9 1 0.0 0.0 65.0 51.165 0 ILabotir Youth Develop. 121.0 103 8 26 7 20.6 30 367 0 Teachers Service Comm.o8 0 Science. Tech.& H Ed 8.4 55.6 14 0 43.6 30 9
70 & 89 Regions 12.3 17 8 24.8 33.7 0.0Sub Total 12.2 35.4 24.6 54.2 30.8
ECONO\IIC SERVICES47 0 \orks 28.4 38 0 0.0 37 4 57.648 (1 Lands. Hous .& Urb. Dev. 3.5 00 0.0 005S(1 EnerEv and Minerals. 2.0 21 7 26 5 67.5 46 562 0 Comm & Transport 0.0 97 3 99.6 100.0 100.0
Sub Total 20.0 44.4 34.0 52.7 60.0
PRODUCTIV'E43 1) Agriculture & Livestock 1000 3 3 95.0 40 8 41 944 0 Industries and Trade 41 5 5.1 79.4 366 24 3690 Tour.Nat.Res.&EnN 647 41 7 889 1.5 00
Sub Total 66.6 16.5 91.4 31.1 36.6
CONSOLIDATED FUND SERV'ICE20.0 State house22 0 Public Debt
Sub Total
GRAND TOTAL 14.1 32.4 27.6 45.9 41.8
102

Table 9a: RECURRENT BUDGETED EXPENDITURE - REGIONS, FY96(TShs. Billion)
VOTE rOTE HOLDEJ 1995/96 1996/97 1997/98 1998/99 1999/00| 2000/01 |I BUDGE BUDGE BUDGE BUDGET BUDGE 1BUDGET
70 Arusha 5.5 6.3 7.6 7.7 12.2 15.171 Coast 3.1 3.1 3.7 3.8 5.9 7.172 Dodoma 4.5 5.2 6.1 6.1 8.9 10.573 Iringa 5.2 5.6 6.6 6.8 7.3 11.474 Kigoma 3.4 3.7 4.4 4.7 5.1 7.975 Kilimanjaro 5.6 7.4 8.6 8.8 12.7 15.276 Lindi 2.7 3.0 3.5 3.6 5.1 6.477 Mara 4.6 5.0 6.1 6.1 8.6 11.078 Mbeya 5.5 6.3 8.0 8.2 11.5 13.479 Morogoro 4.9 5.6 6.7 6.8 9.9 11.580 Mtwara 3.3 3.7 4.3 4.4 6.4 7.781 Mwanza 7.1 6.9 8.4 8.4 12.3 13.982 Ruvuma 3.8 4.4 5.2 5.2 7.6 8.883 Shinyanga 5.0 5.4 6.4 6.6 7.3 11.384 Singida 3.1 3.6 4.1 4.2 5.9 7.085 Tabora 3.8 4.4 5.1 5.3 7.1 8.486 Tanga 5.2 5.9 7.0 7.1 10.1 12.087 Kagera .6 5.2 6.2 6.3 9.0 10.888 D'Salaam 5.5 5.6 6.4 6.7 10.0 10.689 Rukwa 2.9 3.2 3.8 4.0 5.6 6.3
Total 85.3 99.4 118.3 120.9 168.6 206.5
Note:Data for FY 01 are from the Expenditure Flash Report.
Source: MoF, Appropriations Accounts and Expenditure Flash Reports
103
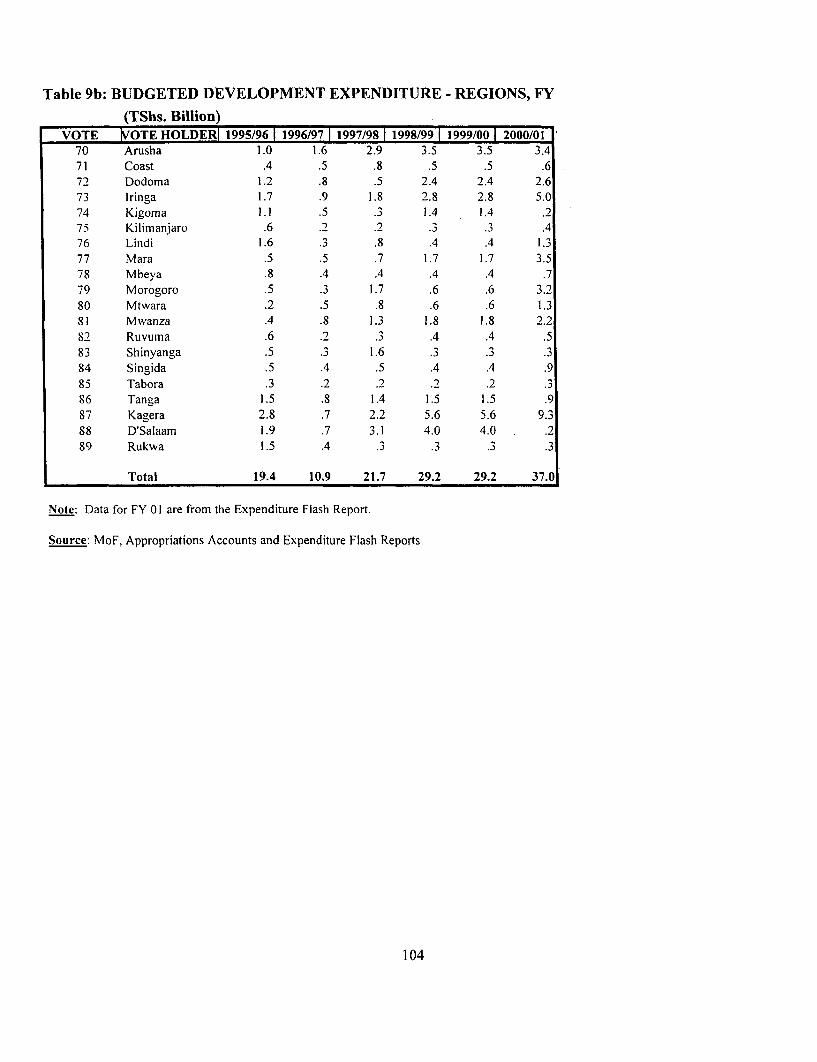
Table 9b: BUDGETED DEVELOPMENT EXPENDITURE - REGIONS, FY
(TShs. Billion)VOTE IVOTE HOLDERI 1995/96 1 1996/97 1997/98 j 1998/99 | 1999/00 | 2000/01
70 Arusha 1.0 1.6 2.9 3.5 3.5 3.471 Coast .4 .5 .8 .5 .5 .672 Dodoma 1.2 .8 .5 2.4 2.4 2.673 Iringa 1.7 .9 1.8 2.8 2.8 5.074 Kigoma 1.1 .5 .3 1.4 1.4 .275 Kilimanjaro .6 .2 .2 .3 .3 .476 Lindi 1.6 .3 .8 .4 .4 1.377 Mara .5 .5 .7 1.7 1.7 3.578 Mbeya .8 .4 .4 .4 .4 .779 Morogoro .5 .3 1.7 .6 .6 3.280 Mtwara .2 .5 .8 .6 .6 1.381 Mwanza .4 .8 1.3 1.8 1.8 2.282 Ruvuma .6 .2 .3 .4 .4 .583 Shinyanga .5 .3 1.6 .3 .3 .384 Singida .5 .4 .5 .4 .4 .985 Tabora .3 .2 .2 .2 .2 .386 Tanga 1.5 .8 1.4 1.5 1.5 .987 Kagera 2.8 .7 2.2 5.6 5.6 9.388 D'Salaam 1.9 .7 3.1 4.0 4.0 .289 Rukwa 1.5 .4 .3 .3 .3 .3
Total 19.4 10.9 21.7 29.2 29.2 37.0
Note: Data for FY 01 are from the Expenditure Flash Report.
Source: MoF, Appropriations Accounts and Expenditure Flash Reports
104
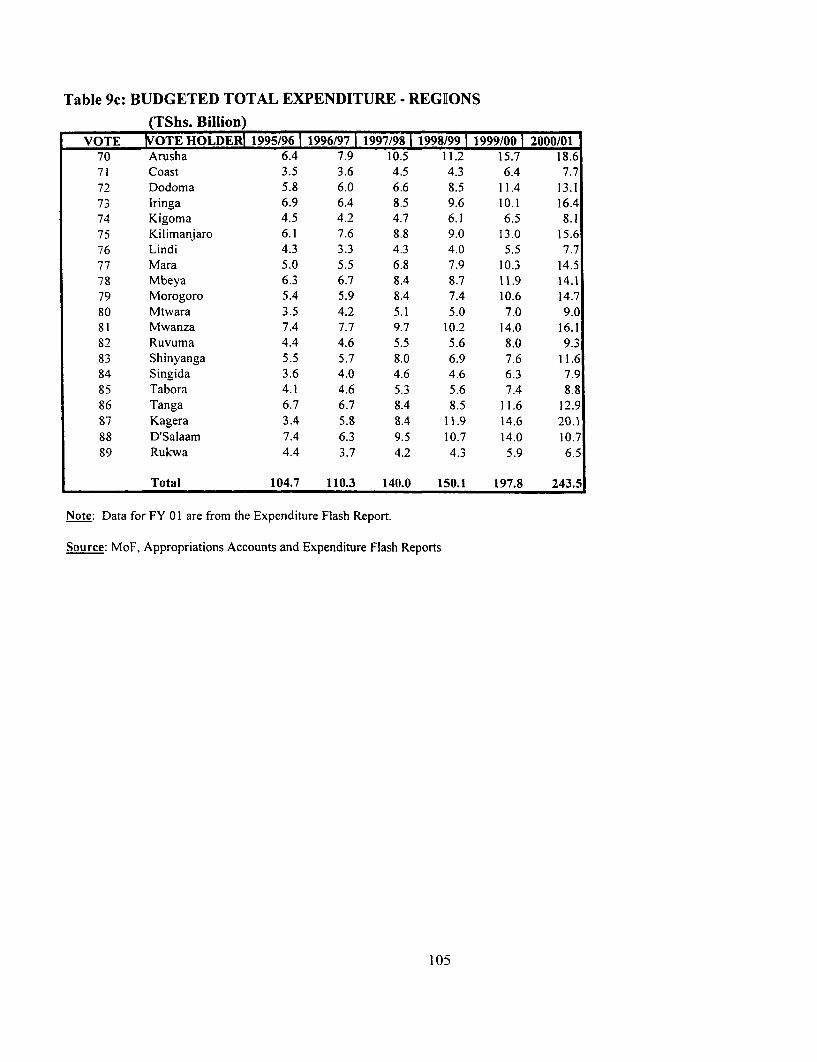
Table 9c: BUDGETED TOTAL EXPENDITURE - REGIONS(TShs. Billion)
VOTE |VOTE HOLDER| 1995/96 | 1996/97 | 1997/981 1998/991 1999/00 | 2000/0170 Arusha 6.4 7.9 10.5 11.2 15.7 18.671 Coast 3.5 3.6 4.5 4.3 6.4 7.772 Dodoma 5.8 6.0 6.6 8.5 11.4 13.173 Iringa 6.9 6.4 8.5 9.6 10.1 16.474 Kigoma 4.5 4.2 4.7 6.1 6.5 8.175 Kilimanjaro 6.1 7.6 8.8 9.0 13.0 15.676 Lindi 4.3 3.3 4.3 4.0 5.5 7.777 Mara 5.0 5.5 6.8 7.9 10.3 14.578 Mbeya 6.3 6.7 8.4 8.7 11.9 14.179 Morogoro 5.4 5.9 8.4 7.4 10.6 14.780 Mtwara 3.5 4.2 5.1 5.0 7.0 9.081 Mwanza 7.4 7.7 9.7 10.2 14.0 16.182 Ruvuma 4.4 4.6 5.5 5.6 8.0 9.383 Shinyanga 5.5 5.7 8.0 6.9 7.6 11.684 Singida 3.6 4.0 4.6 4.6 6.3 7.985 Tabora 4.1 4.6 5.3 5.6 7.4 8.886 Tanga 6.7 6.7 8.4 8.5 11.6 12.987 Kagera 3.4 5.8 8.4 11.9 14.6 20.188 D'Salaam 7.4 6.3 9.5 10.7 14.0 10.789 Rukwa 4.4 3.7 4.2 4.3 5.9 6.5
Total 104.7 110.3 140.0 150.1 197.8 243.5
Note: Data for FY 01 are from the Expenditure Flash Report.
Source: MoF, Appropriations Accounts and Expenditure Flash Reports
105
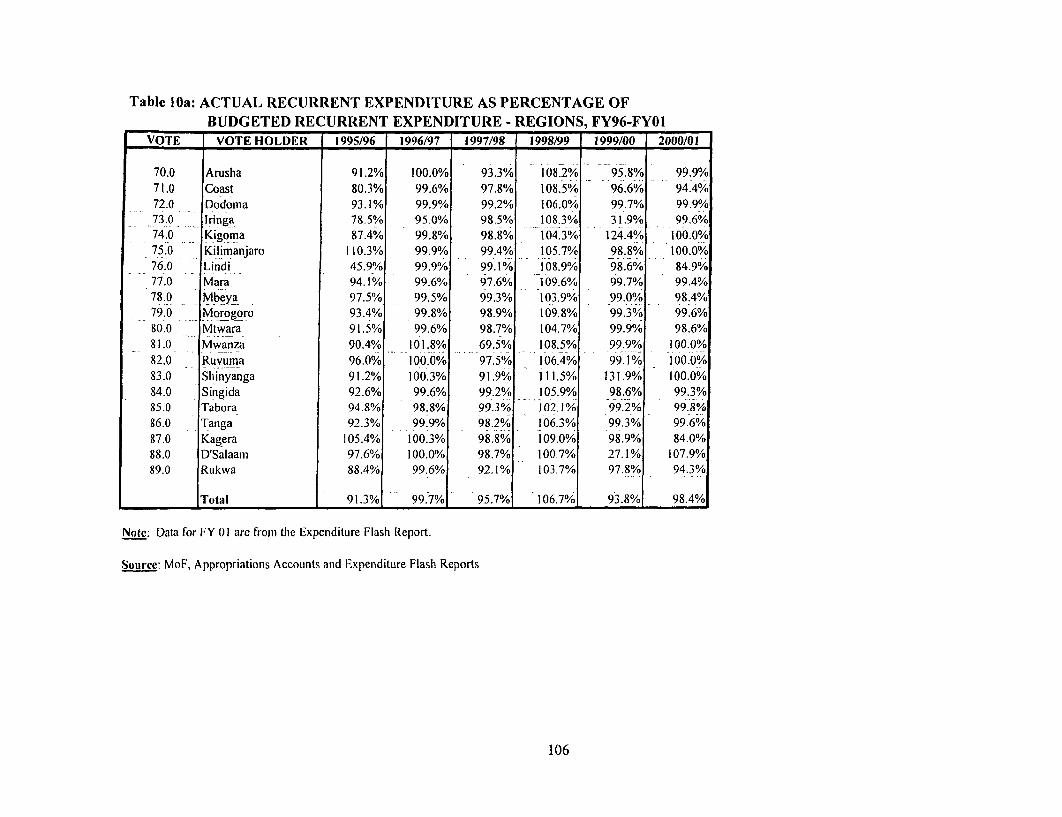
Table 10a: ACTUAL RECURRENT EXPENDITURE AS PERCENTAGE OFBUDGETED RECURRENT EXPENDITURE - REGIONS, FY96-FY01
VOTE VOTE HOLDER 1995/96 1996/97 1997/98 |i998/99 1999/00 2000/01
70.0 Arusha 91.2% 100.0% 93.3% 108.2% 95.8% 99.9%71.0 Coast 80.3% 99.6% 97.8% 108.5% 96.6% 94A4%72.0 Dodoma 93.1% 99.9% 99.2% 106.0% 99.7% 99.9%73.0 Iringa 78.5% 95.,0% 98.5% 108.3% 31.9% 99.6%74.0 Kigoma 87.4% 99.8% 98.8% 104.3% 124.4% 100.0%75.0 Kilimanjaro 110.3% 99.9% 99.4% 105.7% 98.8% 100.0%76.0 Lindi 45.9% 99.9% 99.1% 108.9% 98.6% 84.9%77.0 Mara 94.1% 99.6% 97.6% 109.6% 99.7% 99.4%78.0 Mbeya 97.5% 99.5% 99.3% 103.9% 99.0% 98.4%79.0 _ Morogoro 93.4% 99.8% 98.9% 109.8% 99.3% 99.6%80.0 Mtwara 91.5% 99.6% 98.7% 104.7% 99.9% 98.6%81.0 _ Mwanza 90.4% 101.8% 69.5% 108.5% 99.9% 100.0 %82.0 Ruvuma 96.0% 100.0% 97.5% 106.4% 99.1% 100.0%83.0 Shinyanga 91.2% 100.3% 91.9% 111.5% 131.9% 100.0%84.0 Singida 92.6% 99.6% 99.2% 105.9% 98.6% 99.3%85.0 Tabora 94.8% 98.8% 99.3% 102.1% 99.2% 99.8%86.0 Tanga 92.3% 99.9% 98.2% 106.3% 99.3% 99.6%87.0 Kagera 105.4% 100.3% 98.8% 109.0% 98.9% 84.0%88.0 D'Salaam 97.6% 100.0% 98.7% 100.7% 27.1% 107.9%89.0 Rukwa 88.4% 99.6% 92.1% 103.7% 97.8% 94.3%
_Total 91.3% 99.7% 95.7%1 106.7%/ 93.8% 98.4%
Note: Data for FY 01 are from the lxpcnditure Flash Report.
Source: MoF, Appropriations Accounts and Expenditure Flash Reports
106

Table 1OB: ACTUAL DEVELOPMENT EXPENDITURE AS PERCENTAGE OFBUDGETED DEVELOPMENT EXPENDITURE - REGIONS, FY96-FYO1
VOTE VOTE HOLDER 1995/96 1996/97 1997/98 1998/99 1999100 2000/01
70 Arusha 1.3% 0.6% 4.3% 3.0% 0.6% 14.3%71 Coast 92.8% 17.8% 19.0% 63.8% 56.3% 49.3%72 Dodoma 1.1% 1.3% 23.1% 4.4% 0.2% 10.5%73 Iriniga 1.3% 2.3% 5.0% 47.1% 82.7% 7.0%74 Kigoma 21.1% -13.9% 37.9% 0.0% _ 0.4% 100.0%75 Kilimanjaro 0.5% 17.1%' 58.5% 0.0% 2.0% 100.0%76 Lindi 0.8% -12.5% 13.3% 25.4% 2.4% 22.3%77 Mara 51.8% 65.7% 191.6% 149.3% 85.1% 0.0%78 Mbeya 13.0% 13.8% 25.3% 23.4% 9.1% 71.1%79 Morogoro 15.3% 57.2% 17.6% 17.1% 0.0% 9.5%80 Mtwara 6.7% 4.3% 12.2% 17.6% 0.8% 21.7%81 Mwanza 42.1% 72.7% 56.4% 45.5% 37.0% 18.1%82 Ruvuma 23.8% 66.9% 34.2% 58.0% 41.4% 58.6%83 Shinyaniga 2.6% 9.7% 7.1% 0.0% 0.0% 100.0%84 Singida 2.4% 4.9% 21.2% 25.0% 1.2% 23.3%85 Tabora 4.3% 7.8% 40.9% 44.3% 2.1% 100.0%86 Tanga 0.8% 2.6% 6.9% 7.2% 61.9% 100.0%87 Kagera 8.3% 17.9% 55.5% 61.5% 66.9% 3.6%88 D'Salaam 1.5% 2.8% 2.4% 1.8% 0.1% 100.2%89 Rukwa 46.4% 39.8% 45.6% 36.2% 1.7% 100.0%
Total 12.3% 17.8% 24.8% 33.7% 33.1% 17.8%
Note: Data for FY 01 are from the Expenditure Flash Report.
Source: Mol, Appropriations Accounts and Expenditure Flash Reports
107

Table IOC: ACTUAL TOTAL EXPENDITURE AS PERCENTAGE OFBUDGETED TOTAL EXPENDITURE - REGIONS, FY96-FY01
VOTE VOTE HOLDER 1995/96 1996/97 1997/98 1998/99 1999/00 2000/01
70 Arusha 77.7% 79.5% / , 69.0% 75.4% _, 74.5% 84.2%71 Coast 81.8% 88.4% 84.2% 103.2% 93.5% 90.9%72 Dodoma 73.7% 86.9% 93.4% 77.2% 78.6% 82.4%73 Iringa 59.4% 82.5% 78.4% 90.4% 46.0% _ 71. 1%74 Kigoma 71.9% 90.1% 95.5% 80.0% 97.5% 100.0%75 Kilimanjaro 100.3% 97.6% 98.5% 102.7% 97.0% 100.0%76 Lindi 29.2% 91.2% 83.9% 100.3% 91.4% 74.4%77 Mara 90.1% 96.7% 107.7% 118.3% 97.2% 75.6%78 Mbeya 87.1% 94.8% 95.7% 99.7% 95.6% 97.0%798 Morogoro 85.8% 97.3% - 82.6% 102.1% 93.5% 80.2%so Mtwara 86.8% 89.0% 85.3% 94.4% 91.5% 87.7%81 Mwanza 87.8% 98.8% 67.8% 97.7% 92.0% 88.8%82 Ruvuma 86.5% 98.5% 94.2% 103.0% 96.2% 97.9%83 Shinyanga 82.8% 96.2% 74.9% 106.0% 126.0% 100.0%84_ _ Singida 79.4% 89.9% 91.1% 98.6% 92.1% 91. 1%85 Tabora 88.3% 94.0% 96.6% 99.6% 96.1% 99.8%86 Tanga 71.6% 88.6%i 82.50%- 89.3-%i 94.6 %- , , 99.6i%e87 Kagera 25.6% 90.8% 87.5% 86.5% 86.5% 46.6%88 D'Salaani 73.4% 89.1% 67.7% 64.0% 19.4% 107.7%89 Rukwa 74.4% 92.3% 88.3% 99.1% 93.0% 94.6%
_____ Total 76.793% 91.6%/c 84.7% 92.5% 84.9% 86:2%
Note: Data for FY 01 are from the Expenditure Flash Report.
Source: MoF, Appropriations Accounts and Expenditure Flash Reports
108
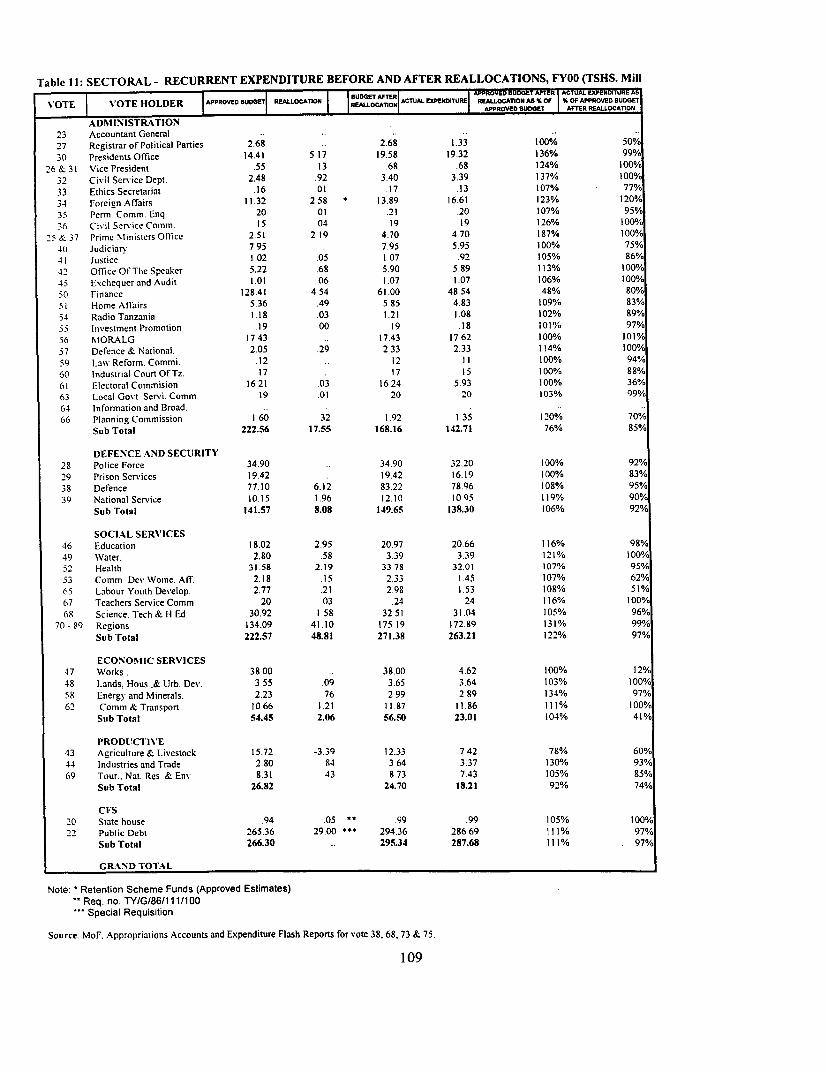
Table 11: SECTORAL - RECURRENT EXPENDITURE BEFORE AND AFTER REALLOCATIONS, FY00 (TSHS. MillBUDGET AFTER "| PROVED BUDGET FTR ACTUAL EltPENDITURE AS
N'OTE \VOTE HOLDER APPROVED BUDOET REALLOCATION ET ACTUAL EXPENDITURE REALLOCATION ASA OE %OF APPROVED BUDGETIOT APPROVED BUDGET AFTER REALLOCAInONADMINISTRATION
23 Accountant General .. .. ..27 Registrar of Political Parties 2.68 .. 2.68 1.33 100% 50%30 Presidents Office 14.41 5 17 19.58 19.32 136% 990
26 & 31 Vice President .55 13 .68 .68 124% 100%,2 Civil Service Dept. 2.48 .92 3.40 3.39 137% 100%33 Ethics Secretariat .16 .01 .17 .13 107% . 77%34 Foreign Affairs 11.32 2 58 ' 13.89 16.61 123% 120%35 Perm Comm. Enq 20 01 .21 .20 107% 95%36 Civil Service Comm. 15 04 19 19 126% 100%
25 & 37 Prime Ministers 03icc 2.51 2 19 4.70 4 70 187% 100%40 Judiciar\ 7 95 . 7.95 5.95 100% 75%41 Justice 1 02 .05 1 07 .92 105% 86%42 Office Of The Speaker 5.22 .68 5.90 5.89 113% 100%45 Exchequer and Audit 1.01 06 1.07 1.07 106% 100%50 Finance 128.41 4 54 61.00 48.54 48% 80%51 Home Affairs 5.36 .49 5 85 4.83 109% 83%54 Radio Tanzania 1.18 .03 1.21 1.08 102% 89%55 iivestment Promotion .19 00 19 .18 101% 97%56 NIORALG 1743 .. 17.43 17.62 100% 101%57 Defence & National. 2.05 .29 233 2.33 114% 100%59 Law Reform. Commi. .12 .. 12 .11 100% 94%60 Industrial Court OfTz. 17 . 17 15 100% 88%61 Electoral Commision 16 21 .03 16 24 5.93 100% 36%63 Local Govt Servi. Comm 19 .01 20 20 103% 99%64 Information and Broad.66 Planning Commission 1 60 32 1.92 1 35 120% 70%
Sub Total 222.56 17.55 168.16 142.71 76% 85%
DEFENCE AND SECUiRIT)'28 Police Force 34.90 .. 34.90 32.20 100% 92%29 Prison Services 19.42 . 19.42 16.19 100% 83%38 Defence 77.10 6.12 83.22 78.96 108% 95%39 National Service 10.15 1.96 12.10 10 95 119% 90%
Sub Total 141.57 8.08 149.65 138.30 106% 92%
SOCIAL SERVICES46 Education 18.02 2.95 20.97 20.66 116% 98%49 Water. 2.80 .58 3.39 3.39 121% 100%52 Health 31.58 2.19 33 78 32.01 107% 95%53 Comm Dev Wome. AIT. 2.18 .15 2.33 1.45 107% 62%65 Labour Youth Develop. 2.77 .21 2.98 1.53 108% 51%67 Teachers Service Comm 20 03 .24 24 116% 100%68 Science. Tech & H Ed 30.92 1 58 32 51 31.04 105% 96%
70 -89 Regions 134.09 41.10 175 19 172.89 131% 99%Sub Total 222.57 48.81 271.38 263.21 122% 97%
ECONOMIIC SERVICES47 W'orks . 38 00 .. 38.00 4.62 100% 12O48 Lands, Hous & Urb. Dev. 355 .09 3.65 3.64 103% 100%58 Energy and Minerals. 2.23 .76 2 99 2 89 134% 97%62 Comm &Transport 1066 1.21 11.87 11.86 111% 100%
Sub Total 54.45 2.06 56.50 23.01 104% 41%
PRODUCTIVE43 Agriculture & Livestock 15.72 -3.39 12.33 7.42 78% 60%44 Industries and Trade 2.80 84 3 64 3.37 130% 93%69 Tour.. Nat. Res & Enm 8.31 43 8 73 7.43 105% 85%
Sub Total 26.82 24.70 18.21 92% 74%
CFS20 State house .94 .05 " .99 .99 105% 100%22 Public Debt 265.36 29.00 " 294.36 286 69 111% 97%
Sub Total 266.30 .. 295.34 287.68 111% . 97%
GRAND TOTAL
Note: ' Retention Scheme Funds (Approved Estimates)Req. no. TYIG/86/111100
- Special Requisition
Source: MoF. Appropriations Accounts and Expenditure Flash Reports for vote 38, 68, 73 & 75.
109
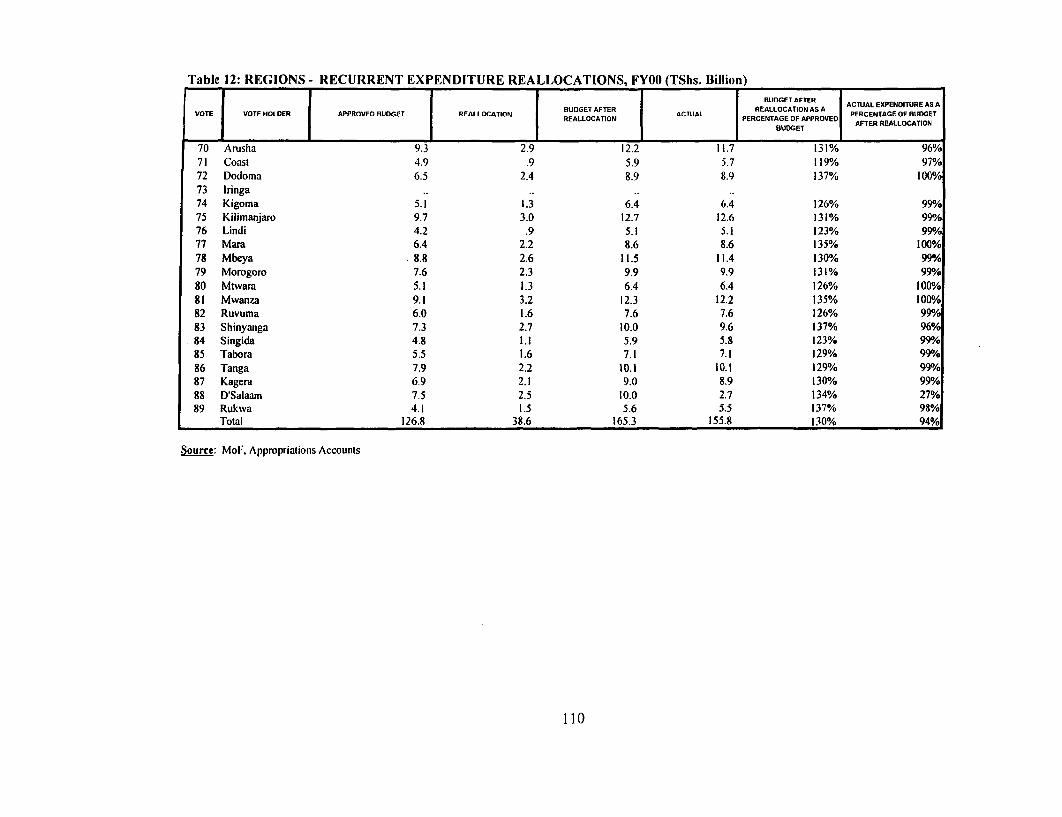
Table 12: IREGIONS - RECURRENT EXPENDITURE REALLOCATIONS, FY00 (TShs. Billion)
BUDGET AFTER RE T A ACTUAL EXPENDITURE AS A
VOTE VOTE HOLDER APPROVED BUDGET REALLOCATION UDGE AFTER ACTUAL PERCENTAGE OF BUOGETREALLOCATION PERCENTAGE OIF APPROVEELLCAIO
BUDGET ATRRALCTO
70 Arusha 9.3 2.9 12.2 11.7 131% 96%71 Coast 4.9 .9 5.9 5.7 119% 97%72 Dodomna 6.5 2.4 8.9 8.9 137% 100%73 Iringa ..
74 Kigoma 5.1 1.3 6.4 6.4 126% 99%75 Kilimanjaro 9.7 3.0 12.7 12.6 131% 99%76 Lindi 4.2 .9 5.1 5.1 123% 99%77 Mara 6.4 2.2 8.6 8.6 135% 100%78 Mbeya 8.8 2.6 11.5 11.4 130% 99%79 Morogoro 7.6 2.3 9.9 9.9 131% 990/080 Mtwara 5.1 1.3 6.4 6.4 126% 100%81 Mwanza 9.1 3.2 12.3 12.2 135% 100%82 Ruvuma 6.0 1.6 7.6 7.6 126% 990/083 Shinyanga 7.3 2.7 10.0 9.6 137% 96%84 Singida 4.8 1.1 5.9 5.8 123% 990%85 Tabora 5.5 1.6 7.1 7.1 129% 990/086 Tanga 7.9 2.2 10.1 10.1 129% 990/087 Kagera 6.9 2.1 9.0 8.9 130% 99%88 D'Salaam 7.5 2.5 10.0 2.7 134% 27%89 Rulkwa 4.1 1.5 5.6 5.5 137% 98%
Total 126.8 38.6 165.3 155.8 130% 94%
Source: MoF, Appropriations Accounts
110