The United Republic of Tanzania
57
The United Republic of Tanzania Tanzania Investment Centre Investment Opportunities in the Livestock Sub-sector, Tanzania
-
Upload
khangminh22 -
Category
Documents
-
view
0 -
download
0
Transcript of The United Republic of Tanzania

The United Republic of Tanzania
Tanzania Investment Centre
Investment Opportunities in the Livestock Sub-sector,
Tanzania

ii
Contents
Contents...................................................................................................................................................................................................... ii Table of Figures ....................................................................................................................................................................................... iv
List of Tables.............................................................................................................................................................................................. v 1 Overview of Tanzania Livestock Sub-sector Analysis .........................................................................................................1
1.1 Livestock Sub-sector Data Collection ........................................................................................................................... 2
2 Livestock Master Plan Commodity Value Chains .................................................................................................................4
2.1 Key Results ............................................................................................................................................................................... 4 2.1.1 Red Meat Value Chain Development....................................................................................................................4
2.2 Poultry Value Chain Development ................................................................................................................................. 5 2.3 Pig/Pork Value Chain Development ............................................................................................................................... 5
2.4 Cow Dairy ................................................................................................................................................................................ 5 2.5 Meat Production - Consumption Balance .................................................................................................................... 6 2.6 Skins & Hides ........................................................................................................................................................................... 6
3 Livestock Production........................................................................................................................................................................7 3.1 Livestock Production in Tanzania.................................................................................................................................... 7
3.2 Meat Imports Quantity into Tanzania............................................................................................................................ 7 3.3 Cattle .......................................................................................................................................................................................... 9
3.3.1 National Cattle Ranches ............................................................................................................................................9 3.3.1.1 The National Ranching Company................................................................................................................9
3.3.1.1.1 Proposed Investment Opportunities for Ranches ....................................................................... 10
3.3.1.2 Livestock Multiplication Units .................................................................................................................... 10
3.3.2 Bovine Meat Imports Quantities into Tanzania ............................................................................................. 11 3.4 Goats Production................................................................................................................................................................ 12
3.4.1 Investment Opportunities into Goats Production ....................................................................................... 12 3.5 Sheep........................................................................................................................................................................................ 13
3.6 Pigs ............................................................................................................................................................................................ 13
3.6.1 Pig Meat Imports Quantities into Tanzania ..................................................................................................... 14 3.7 Investment Opportunities in the Piggery Sub-sector ........................................................................................... 15
3.8 Poultry Production ............................................................................................................................................................. 16 3.9 Poultry Meat Imports quantity ...................................................................................................................................... 17
3.9.1 Investment Opportunities in Poultry Production ......................................................................................... 18
3.10 Other Livestock Species .................................................................................................................................................. 19
4 Improving Performance of the Livestock Sub-sector in Tanzania ............................................................................... 20 4.1 Red and White Meat ......................................................................................................................................................... 20
4.1.1 Tanzania’s Red Meat Systems Roadmap (2016/17 - 2021/22) ................................................................. 20 4.1.1.1 Vision ................................................................................................................................................................... 20
4.1.1.2 Overall Target .................................................................................................................................................. 20 4.1.1.3 Key Challenges and Strategies in Enhancing Red Meat Production in Tanzania .................... 21
4.1.2 Interventions to Achieve Red Meat Targets ................................................................................................... 22 4.1.3 Investment Opportunities in the Red Meat Value Chain........................................................................... 22
4.1.4 Tanzania’s Chicken Development Roadmap (2017/18 - 2021/22) ......................................................... 23
4.1.4.1 Vision ................................................................................................................................................................... 23 4.1.4.2 Overall Target .................................................................................................................................................. 23
4.1.4.3 Improving Traditional Family Chicken and Promoting and Expanding Tropical Improved Chicken Sub-systems ............................................................................................................................................. 23
4.1.4.3.1 Targets........................................................................................................................................................... 23
4.1.4.4 Key Challenges and Strategies Related to Traditional Family Chicken System ..................... 24
4.1.4.5 Interventions to Achieve Chicken Production Targets ................................................................... 25 4.1.4.6 Specialized Commercial Chicken Production...................................................................................... 26
4.1.4.6.1 Targets........................................................................................................................................................... 26 4.1.4.6.2 Key Challenges and Strategies Related to the Specialized Layers and Broilers System 26
4.1.4.6.3 Interventions to Achieve Specialized Layers and Broilers Targets ....................................... 26 4.1.4.7 Investment Opportunities in the White Meat Value Chain ........................................................... 26
4.1.5 Pig/Pork Value Chain Development Roadmap 2017/18 - 2021/22 ........................................................ 26 4.1.5.1 Vision ................................................................................................................................................................... 26

iii
4.1.5.2 Overall Target .................................................................................................................................................. 27 4.1.5.3 Modernizing and Transforming the Traditional Free-Ranging Family Pig Production System.. 27
4.1.5.3.1 Targets........................................................................................................................................................... 27
4.1.5.4 Interventions to Achieve Targets in Family Pig Subsystems .......................................................... 30 4.1.5.5 Expanding the Commercial Specialized Pig Production Sub-system .......................................... 30
4.1.5.5.1 Targets........................................................................................................................................................... 30 4.1.5.6 Key Challenges and Strategies Related to the Commercial Specialized Pig System ............ 31
4.1.5.6.1 Genetics Challenges and Strategies ................................................................................................... 31
4.1.5.6.2 Animal Health Challenges and Strategies ........................................................................................ 31 4.1.5.6.3 Feeds Challenges and Strategies.......................................................................................................... 31
4.1.5.6.4 Marketing and Processing Challenges and Strategies.................................................................. 31 4.1.5.6.5 Policy Challenges and Strategies ......................................................................................................... 31
4.1.5.7 Intervention to Achieve Targets in Commercial Specialized Family Pig Sub-systems ......... 31
4.2 Dairy Development Roadmap 2017/18 - 2021/22................................................................................................. 32
4.2.1 Vision .............................................................................................................................................................................. 32 4.2.2 Overall target .............................................................................................................................................................. 32 4.2.3 Target Production Subsystems for Cow Dairy Improvement Interventions..................................... 32 4.2.4 Improved Family Dairy Production in Coastal, Lake, and Highlands Zones ...................................... 33
4.2.4.1 Interventions to Achieve Dairy Supply Targets .................................................................................. 34
4.2.4.1.1 Main Activities ............................................................................................................................................ 34 4.2.5 Current Status of the Dairy Processing Capacity in Tanzania ................................................................. 36
4.3 Potential Areas of Investment in the Dairy Value Chain .................................................................................... 38
4.3.1 Establishment of Milk Collection Centers ....................................................................................................... 38 4.3.2 Establishment of Milk Processing Plants ........................................................................................................... 38
4.4 Leather and Footwear....................................................................................................................................................... 39
4.4.1 Investment and Production Potentials of the Leather Value Chain....................................................... 39 4.4.1.1 Tanning................................................................................................................................................................ 40 4.4.1.2 Footwear and Leather Goods ................................................................................................................... 40 4.4.1.3 Challenges of the Leather Value Chain .................................................................................................. 42
4.4.1.4 Development Plans......................................................................................................................................... 42 4.5 Animal Feeds......................................................................................................................................................................... 43
4.5.1 Pasture and Fodder Crops ..................................................................................................................................... 43 4.5.2 Compounded Animal Feeds .................................................................................................................................. 43
4.6 Other Livestock By-products ........................................................................................................................................ 46
4.7 Veterinary Laboratories ................................................................................................................................................... 46 4.8 Abattoirs and Meat Processing Plants ........................................................................................................................ 46
5 Livestock Sectoral Analysis Key Findings on Cross-Cutting Issues ............................................................................ 48
5.1 Feed .......................................................................................................................................................................................... 48 5.2 Animal Health ....................................................................................................................................................................... 49
5.3 Animal Genetics .................................................................................................................................................................. 49
6 Conclusion and Recommendations ......................................................................................................................................... 51 6.1 Recommendations .............................................................................................................................................................. 51

iv
Table of Figures
Figure 3-1 Meat Import Quantities into Tanzania............................................................................................................8 Figure 3-2 The Status of Cattle Husbandry in Tanzania ................................................................................................9 Figure 3-3 Bovine Meat Imports Quantities into Tanzania........................................................................................ 11 Figure 3-4 The Status of Goat Farming in Tanzania ..................................................................................................... 12 Figure 3-5 The Status of Sheep Farming in Tanzania ................................................................................................... 13 Figure 3-6 Pig population by region, Tanzania Mainland as at October 1, 2017............................................... 14 Figure 3-7 Pig Meat Import Quantities into Tanzania.................................................................................................. 15 Figure 3-8 Status of Chicken Farming in Tanzania ........................................................................................................ 16 Figure 3-9 Poultry Meat Import Quantities into Tanzania......................................................................................... 17

v
List of Tables
Table 1-1 The Livestock Sub-sector Study Schedule ..........................................................................................................2 Table 3-1 Production of Livestock Products, Tanzania mainland, 2012 - 2016........................................................7 Table 3-2 Meat Imports into Tanzania ......................................................................................................................................8 Table 3-3 NARCO Ranches in Tanzania..................................................................................................................................9 Table 3-4 NARCO Multiplication Units ................................................................................................................................ 10 Table 3-5 Bovine Meat Imports into Tanzania.................................................................................................................... 11 Table 3-6 Pig Meat Imports into Tanzania............................................................................................................................ 15 Table 3-7 Poultry Hatcheries..................................................................................................................................................... 16 Table 3-8 Poultry Meat Imports into Tanzania................................................................................................................... 17 Table 3-9 Number of Other Livestock by Region and Type of Livestock as of 1st October 2017.............. 19 Table 4-1 Key Challenges and Strategies in Enhancing Red Meat Production in Tanzania ............................... 21 Table 4-2 Key Challenges and Strategies Related to Traditional Family Chicken System ................................ 24 Table 4-3 Key Challenges and Strategies Related to the Family Pig Sub-system .................................................. 27 Table 4-4 Key Challenges and Strategies Related to Improved Family Dairy Production ................................ 33 Table 4-5 Dairy Processors in Tanzania................................................................................................................................ 36 Table 4-6 Milk Processing Zones in Tanzania ..................................................................................................................... 38 Table 4-7 Analysis of the Capacity Utilization in Tanneries, 2007 ............................................................................. 39 Table 4-8 Tanneries and their Capacities ............................................................................................................................. 40 Table 4-9 Footwear, leather goods industries and their capacities ........................................................................... 41 Table 4-10 Contacts of Some Footwear & Leather Manufacturers ........................................................................ 41 Table 4-11 Quantitative Targets of Leather Sub-sector (US$’000) ........................................................................ 42 Table 4-12 Animal Feeds Processors .................................................................................................................................. 43 Table 4-13 Other Livestock Products................................................................................................................................. 46 Table 4-14 the State of Abattoirs ......................................................................................................................................... 47

1 Overview of Tanzania Livestock Sub-sector Analysis
According to the livestock sector analysis (LSA)1, Tanzania accounts for about 1.4% of the
global cattle population and 11% of African cattle population2. The main livestock types are
cattle, goats, sheep, pigs, chickens, and donkeys. Based on the 2016/17 LSA baseline Tanzania has about 30.7 million cattle, 19.1 million goats, 5.6 million sheep and 580,238 donkeys. Other
livestock include 2 million pigs, 40.3 million local chicken and 15.6 million improved chicken3.
Goat meat and mutton currently account for 14% and 4% of all red meat respectively - thus,
their improved productivity is unlikely to significantly close the projected meat consumption/demand gap as beef accounts for 82% of the red meat production in Tanzania.
Thus, the development focus has to include cattle.
The national herd is dominated by indigenous cattle - which are currently displaying low
productivity, but they have much potential if feed, health and breed improvements can be
made. The main breeds of beef cattle in the country include: Tanzania Shorthorn Zebu
characterized by small size mature body weight (200 - 350 kg); Longhorn Cattle such as the Ankole which is characterized by large matured body weight (500 - 730 kg); and the Boran
which has a large body weight (500 - 800 kg).
The country has many other outstanding natural resources to support livestock development
including extensive rangelands; diverse natural vegetation and its diversely resilient low
production livestock breeds. Despite these resources, the livestock sector is performing
below its potential.
In recent years therefore, the government of Tanzania prioritized the transformation of the
agricultural sector4. This approach was adopted in the 2007 Agricultural Sector Development
Program (ASDP) and its successor, the 2016 ASDP II.
The country’s agriculture development plan is designed to help meet the objectives set out in a number of existing strategies and policies in the country. Despite accounting for 11% of the
African cattle population, livestock-related activities contribute only 7.4% to Tanzania’s GDP
and growth of the livestock sector at 2.6%, is low. This growth largely reflects increases in
livestock numbers, rather than productivity gains. The absence of a roadmap to develop the
livestock sector has persistently hindered successful implementation of previous investment
plans for the sector.
Though severely constrained by low livestock reproductive rates, high mortality and high
disease prevalence, detailed interdisciplinary by the International Livestock Research Institute
(ILRI) and the Ministry of Livestock and Fisheries (MLF) revealed the potential benefits of a
comprehensive Livestock Master Plan (LMP) for Tanzania.
The LMP sets out livestock-sector investment interventions - better genetics, feed, health
services, and complementary policy support - which could help meet the ASDP II targets by
1 Ministry of Livestock and Fisheries Development Livestock Sector Analysis – done during 2016/17
2 FAO, 2014. FAO: World Agriculture: Towards 2015/2030
3 as also reported in the MLF budget speech, 2016/17
4 LIVESTOCK SECTOR DEVELOPMENT PROGRAMME (August 2011). Ministry of Livestock and Fisheries Development,
Po Box 9152 Dar es Salaam, TANZANIA.

2
improving productivity and total production in the key livestock value chains of poultry, pork,
red meat and milk, leather and dairy5.
1.1 Livestock Sub-sector Data Collection
This study was conducted in partnership between the Tanzania Investment Centre (TIC) and
East Africa Trade & Investment Hub (EATIH) during February - June 2019. Officials from the
regions where sampled National Ranching Company’s (NARCO) Cattle Ranches and Livestock Multiplication Units (LMUs) took the lead to guide the team throughout the
exercise.
Table 1-1 details NARCO’s ranches and LMUs that were visited: -
Table 1-1 The Livestock Sub-Sector Study Schedule
Location Name of Livestock Producer or Processor Date
1 Dodoma Kongwa Ranch March 4, 2019
2 Shinyanga Misungwi Livestock Multiplication Unit (Mabuki) April 15, 2019
Mara Tanzania Dairy Ltd (Utegi Dairy Farm Company Ltd –
UDAFCO)
April 16, 2019
3 Morogoro Mkata and Ngerengere Ranches June 14, 2019
4 Kilimanjaro West Kilimanjaro Ranch June 16, 2019
The following methods were used to generate required data or information: -
i. Desk work/Literature review
ii. Physical site visits - observation
iii. One-to-one or group interviews
iv. Questionnaires
v. Focus Group Discussions
5 Tanzania LivDeveloped by the Tanzania Ministry of Livestock and Fisheries (MLF) and the International Livestock
Research Institute (ILRI) livestock master plan team January 2018estock Master Plan.

3

4
2 Livestock Master Plan Commodity Value Chains
Using the most recently available data, from 2013 to 2015, the MLF supported by ILRI and by
the Bill & Melinda Gates Foundation (BMGF), employed the livestock sector investment and
policy toolkit (LSIPT) to develop the Tanzania Livestock Master Plan (LMP) for 2017 - 2022.
The LMP is a series of five-year development implementation plans or ‘roadmaps’, to be used
to implement the ASDP II.
Based on results of the Livestock Sector Analysis (LSA), to reach the objectives and goals of
the government, the key value chains targeted in the livestock master plan roadmaps are: -
a) Red meat (and milk) from cattle, sheep, and goats
• Improved traditional red meat and milk
• Ranches
• Specialized feedlots
b) Poultry
• Improved family chicken
• Commercial specialized chicken (layers and broilers)
c) Pigs/Pork
• Traditional system (scavenging and semi - scavenging system)
• Commercial specialized pig production systems
d) Cow Dairy
• Improved family dairy
• Commercial specialized dairy
e) Skins & Hides
• Quality of skins & hides
• Processing facilities to produce leather & its products
2.1 Key Results
2.1.1 Red Meat Value Chain Development
The proposed combined interventions for red meat production on traditional family farms
and commercial ranches, as well as feedlot development, would result in a 52% increase in
total red meat production. Production would grow to 742,524 tons between 2017 and 20225.
This would, however, not meet expected consumption growth of 71% by 2022 (to 867,302
tons), leaving a 17% deficit (124,778 tons) in the 2017 - 2022 red meat production and
consumption balance. Given the rapidly growing population, and increasing incomes and
demand for animal-source foods in Tanzania, such projected deficits would put upward
pressure on red meat prices.
The extremely restricted access to land for grazing and feed production and limited ability to
enhance the genetic potential of local ruminant breeds in the medium-term means it is unlikely
that the red meat production gap can be closed in the next five years. Even a substantial
increase in the supply of red meat from small ruminants – with goat meat and mutton currently
accounting for 14% and 4%, respectively - is unlikely to significantly help close the projected
meat consumption/demand gap because beef accounts for 82% of red meat production in
Tanzania.

5
2.2 Poultry Value Chain Development
Successful interventions would allow the poultry subsector to move to improved family
poultry with semi - scavenging crossbreds and enable substantial increases in the scale of
specialized layer and broiler operations. Such a transformation - depending on successful
interventions in breed selection, health services (particularly in treating Newcastle disease),
feed, extension, private investment and trade policies - would contribute considerably to
improving household food and nutrition security and increase the subsector’s contribution to
GDP by 182% from TZS 256 billion to TZS 723 billion; thereby contributing significantly to
closing the production - consumption gap for meat.
Projected annual chicken meat and egg production in Tanzania would rise to 465,600 tons
and 4.2 billion eggs. This would bring the production-consumption deficit for chicken meat
from 130,000 to a surplus of 258,000 tons between 2017 and 2022. The combined
interventions would result in increases of 666% and 40% respectively in chicken meat and egg
production by 2022. Such accomplishments would enable Tanzania to meet the chicken meat
and egg demand for its growing population, and produce a very significant surplus for domestic
industrial use or for export. With the assistance of policies encouraging investment in
processing plants, the surplus eggs could be processed into egg powder and used domestically
for new or additional industrial uses (e.g. in the baking industry), or exported to generate
foreign exchange earnings.
2.3 Pig/Pork Value Chain Development
The proposed combined interventions for improved family and expanded commercial pig
production systems would result in a 69% increase in pork production. Production would
grow from 22,025 to 37,191 tons between 2017 and 2022. The development of a competently
market - oriented farming, processing and a dynamic pig/pork marketing sector, operating in
more sustainable and climate-smart ways, supplying consumers with high-quality and safe pork
would significantly contribute to increased household income, food and nutrition security,
poverty alleviation and would increase sector’s contribution to GDP by 83%, from TZS 44
billion to 80 billion between 2017 and 2022. This would bring the production-consumption
deficit for pork from 8,000 tons to a 1,350-tonne surplus between 2017 and 2022.
Improving pig production requires a focus on controlling African swine fever in pigs. In the
‘without additional investment’ scenario, by year 2032, a deficit of 16,000 tons of pig meat is
estimated, thus resulting in a total ‘all meat’ deficit of 2.0 million tons. However, industrializing
pork production (in large commercial-scale operations and processing for product
transformation) will lower domestic meat prices, and lead to an increase in pig/pork exports
and foreign exchange earnings.
2.4 Cow Dairy
The projected increase in national cow milk production as a result of the proposed
interventions - including artificial insemination and hormone synchronization, combined with
improved feed and health interventions, value addition and complementary policy changes -
during the ASDP II period (2017 - 2022) is 77%. This represents a surplus of 1,002 million
liters over projected domestic consumption requirements. This production increase would

6
make it possible to meet the milk production targets in the ASDP II and exceed the growing
domestic demand for milk by 35%. This surplus of milk could then be substituted for imported
milk products and used domestically for new or additional industrial uses (e.g. in the baking
industry), or exported as milk powder or ultra-heat treated (UHT) milk to raise foreign
exchange earnings. Due to increases in the number of crossbred dairy cows by 281% and milk
production per cow by 26 - 42%, the contribution of the dairy sector to GDP is expected to
rise by 75%.
2.5 Meat Production - Consumption Balance
Perhaps most importantly, the growth of the poultry and pig subsectors would enable
Tanzania to close the projected total national meat production - consumption gap. This
growth would also make it possible to increase the share of white meat in the total meat
consumed from the current 9% to 41% by 2032, but only if chicken is substituted for red
meat. Taking advantage of the benefits of the potential poultry revolution will require
substantial investments in promotional activities to change tastes and preferences from beef,
as well as from local to exotic chicken meat and eggs. The substitution of the surplus chicken
meat for domestic red meat consumption would also lower pressure on domestic meat prices
and enable an increase in the export of live animals (cattle, sheep and goats), potentially raising
foreign exchange earnings.
The huge deficit in projected demand (without investments) for red meat is being driven by
an increasing human population and income growth. Limited access to land for improving feed
production, including grazing lands, and the low genetic potential of local cattle and small
ruminant breeds are the main constraints to increased red meat production. Nevertheless,
red meat from small ruminants will be of little help in closing the meat gap due to their low
numbers, limited feed resources and low genetic potential of indigenous breeds, nor will pork
help because of outbreaks of African swine fever and a lack of demand in the country.
2.6 Skins & Hides
Unfortunately, the LMP didn’t include Skins & Hides as valuable livestock products (value
chain), but the Tanzania Leather Strategy 2016 – 20206 does lay very practical strategies to
improve the leather & footwear sub-sector in the country.
6 UNITED REPUBLIC OF TANZANIA LEATHER SECTOR DEVELOPMENT STRATEGY 2016-2020

7
3 Livestock Production
3.1 Livestock Production in Tanzania
Tanzania is the third amongst countries with largest livestock population in Africa after
Ethiopia and North Sudan. Although during 2016/17 the livestock sector plays a significant
contribution to the economy of Tanzania (whereby the sector growth was 2.8% - contributing
6.9% to GDP), yet there is so much room to improve as the sector performance is way below
its real potential.
The main types of livestock grown in Tanzania are cattle, goats, sheep, pigs, chickens and donkeys. The dominant species are cattle with 30,672,001 heads, followed by goats
(19,055,651 heads), sheep (5,565,986 heads), donkeys (580,238 heads) and indigenous chicken
(40,349,893 birds)2.
Products produced include meat, milk, skins & hides, and eggs. During 2016/17, some 2,127,267 liters of milk were produces; 622,597 Tons of assorted types of meat, and 4,352,182
eggs were produced in Tanzania.
Livestock also contributes to crop and vegetable production by providing draft power for
cultivation and organic manure. It generates a considerable amount of cash income and
determines the household economic and social status in many communities.
According to the Ministry of Livestock and Fisheries, over 70% of livestock is found in the
lake, northern and central zones. Over 98% of cattle are of indigenous breed7, mainly Tanzania
Shorthorn that are known for their ability to survive and are productive even under harsh
environment with poor quality feed resources and disease challenges. These animals are kept
under four farming systems which are: mixed farming, agro-pastoral, pastoral and commercial.
Table 3-1 Production of Livestock Products, Tanzania mainland, 2012 - 2016
Product 2011 2012 2013 2014 2015 2016
Milk Production (‘000 ltr)
Indigenous Cattle 1,135,422 1,255,938 1,297,775 1,339,613 1,381,451 1,423,288 Hybrid cattle 608,800 597,161 623,865 650,570 677,275 703,979
Total 1,744,222 1,853,099 1,921,640 1,990,183 2,058,726 2,127,267 Meat Production (Ton)
Beef 262,606 289,835 299,581 309,086 323,775 319,112 Goat/Sheep 103,709 111,106 115,652 120,199 129,292 124,745 Pork 43,647 47,246 50,814 74,174 54,360 79,200
Chicken 93,534 84,524 87,408 95,292 104,292 99,540
Total 503,496 532,711 553,455 598,751 611,719 622,597 Egg Production (number)
Egg 3,339,566 3,494,584 3,725,200 3,899,569 4,153,800 4,353,182
3.2 Meat Imports Quantity into Tanzania
As shown on Fig. 3-1, in 2016, meat imports quantity for United Republic of Tanzania was
3,737 Tons. Before meat imports quantity of United Republic of Tanzania started to increase
7 Ministry of Livestock and Fisheries Development Report (2018).

8
to reach a level of 3,737 Tons in 2016, it went through a trough reaching a low of 27 Tons in
1993.
Figure 3-1 Meat Import Quantities into Tanzania
Table 3-2 Meat Imports into Tanzania
Year Tons Change, %
2016 3,737 41.50%
2015 2,641 -59.63%
2014 6,542 58.71%
2013 4,122 22.31%
2012 3,370 22.99%
2011 2,740 18.36%
2010 2,315 20.01%
2009 1,929 5.87%
2008 1,822 378.22%
2007 381 -46.94%
2006 718 -46.58%
2005 1,344
0
1,000
2,000
3,000
4,000
5,000
6,000
7,000
2004 2006 2008 2010 2012 2014 2016 2018
To
nn
es
Year
Meat Imports

9
3.3 Cattle
During 2017/18 a total number of 3,065,308 operators were engaged in cattle rearing in
Tanzania Mainland. The total number of cattle was 30,496,687 heads.
The region with highest number of cattle was Tabora with 2,663,395 heads (8.7% of the total
heads in Mainland) followed by Mwanza (2,420,479; 7.9%) and Manyara (2,201,670; 7.2%).
Figure 3-2 The Status of Cattle Husbandry in Tanzania
3.3.1 National Cattle Ranches
Apart from a vast land - suitable for livestock production in Tanzania, there are two main
government resources in the livestock industry in Tanzania for the TIC to consider, while
inviting Foreign Direct Investments (FDIs). They are: National Ranching Company (NARCO)
ranches and Livestock Multiplication Units (LMUs).
3.3.1.1 The National Ranching Company
NARCO owns a total of 519,453 hectares of land. Of these hectares of land, NARCO
operates a total of eight ranches located in seven regions of mainland Tanzania.
Table 3-3 NARCO Ranches in Tanzania
Name of Ranch Area
(Hectares) Location
Livestock Population Full Ranch
Capacity
(Heads of Cattle) Cattle Sheep Goats
1 Kongwa 38,000 Dodoma 8,032 118 768 100,000
2 Mzeri 21,236 Tanga 3,400 200 349 60,000

10
3 Ruvu 43,000 Pwani 3,762 120,000
4 Mkata 19,446 Morogoro 0 35,000
5 Kikulula 42,083 Bukoba 8,730 150,000
6 Missenyi 23,998 Bukoba 7,309 68,466
7 West Kilimanjaro 19,910 Kilimanjaro 967 772 60,000
8 Kalambo 23,588 Rukwa 1,733 25 35 80,000
3.3.1.1.1 Proposed Investment Opportunities for Ranches
All ranches in the country are operating below their respective carrying capacities. Therefore, investment plans aim at increasing livestock population in each of the ranches in order to
attain their maximum carrying capacities8. This would entail: -
a) Purchase of quality breeder animals
b) Purchase of immature animals for feed - lotting c) Infrastructure development
d) Purchase and water facility improvement
3.3.1.2 Livestock Multiplication Units
The profile for each Livestock Multiplication unit (LMU) is as follows:-
Table 3-4 NARCO Multiplication Units
Name of LMU Area (Hectares)
Location Livestock Population Full LMU
Capacity
(Heads of Cattle) Cattle Sheep Goats
1 Mabuki 9,793 Misungwi 2,684 70 6,000
2 Sao Hill 6,500 Iringa 1,759 3,000
3 Nangaramo 6,175 Masasi 441 4,000
4 Kitulo Dairy Farm 5,000 Makete 970 3,500
5 Ngerengere 4,562 Morogoro 574 3,500
The following breeds are available: -
a) Mabuki LMU – mainly Frieshian, Boran, Tanzania Shorthorn Zebu crosses, some 79
buffaloes and 70 goats;
b) Sao Hill LMU – Boran, Ayrshire breeds and their crosses;
c) Nangaramo LMU - Boran, Ayrshire breeds and their crosses;
d) Kitulo Dairy Farm – Friesian dairy cows
e) Ngerengere LMU – Boran cows, Ayrshire bulls and their crosses.
8 Ministry of Livestock and Fisheries Development (2019)
11
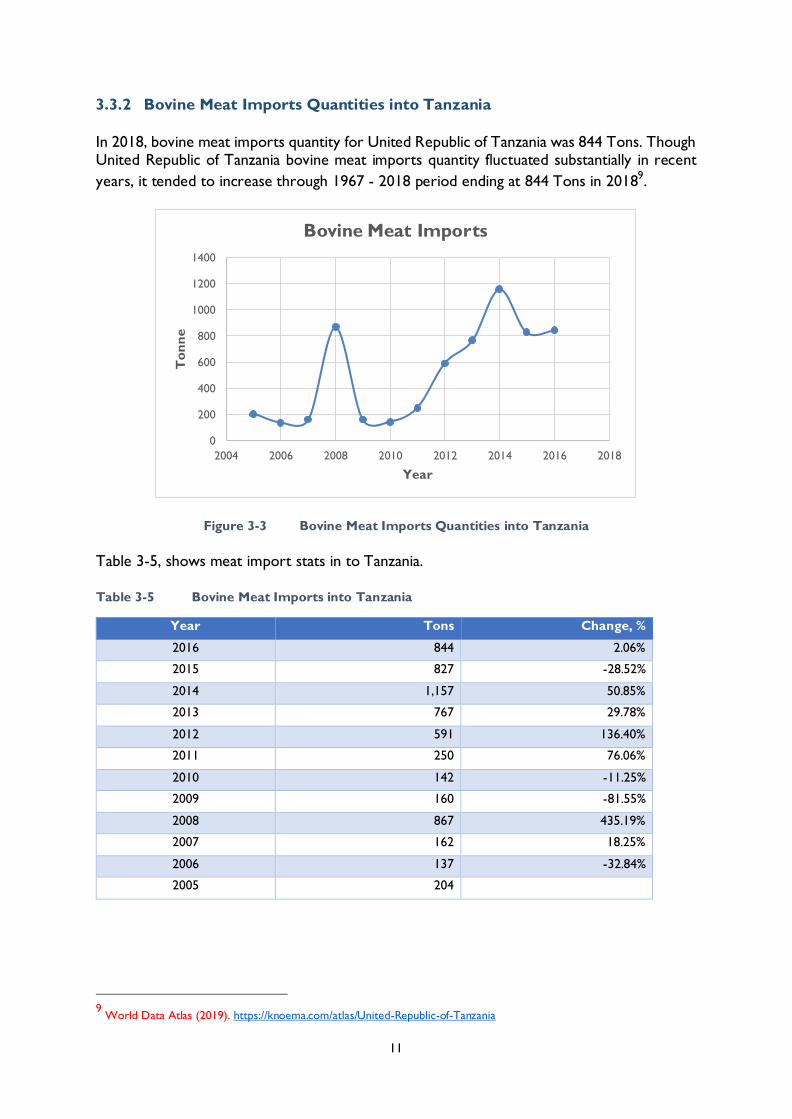
3.3.2 Bovine Meat Imports Quantities into Tanzania
In 2018, bovine meat imports quantity for United Republic of Tanzania was 844 Tons. Though United Republic of Tanzania bovine meat imports quantity fluctuated substantially in recent
years, it tended to increase through 1967 - 2018 period ending at 844 Tons in 20189.
Figure 3-3 Bovine Meat Imports Quantities into Tanzania
Table 3-5, shows meat import stats in to Tanzania.
Table 3-5 Bovine Meat Imports into Tanzania
Year Tons Change, %
2016 844 2.06%
2015 827 -28.52%
2014 1,157 50.85%
2013 767 29.78%
2012 591 136.40%
2011 250 76.06%
2010 142 -11.25%
2009 160 -81.55%
2008 867 435.19%
2007 162 18.25%
2006 137 -32.84%
2005 204
9 World Data Atlas (2019). https://knoema.com/atlas/United-Republic-of-Tanzania
0
200
400
600
800
1000
1200
1400
2004 2006 2008 2010 2012 2014 2016 2018
To
nn
e
Year
Bovine Meat Imports

12
3.4 Goats Production
Goat ranks the second in livestock population after cattle. The number of operators engaged
in goat keeping was 2,746,230. Total number of goats was 18,947,657.
Arusha Region with 2,580,017 heads (13.6%) had the highest number of goats, followed by
Manyara (1,779,423 heads; 9.4%) and Mwanza (1,301,763 heads; 6.9%).
Figure 3-4 The Status of Goat Farming in Tanzania
These animals adapt well in nearly all agroecological zones in the country and are raised mainly
under traditional production system and limited number raised under commercial farming
system.
Goats available are mainly of indigenous types and are kept for meat production. Goat types
include Maasai, Gogo, Newala, Ujiji and Sukuma10.
These types of goats are well adapted to the environment and perform well when raised
under commercial system where management is good – mainly in terms of feed, shelter and
disease control.
3.4.1 Investment Opportunities into Goats Production
The areas for investment in sheep and goats include:
10
Ministry of Livestock and Fisheries Development (2019)

13
a) Partnership with NARCO in the production of goats and sheep;
b) Establishment of large-scale sheep and goats’ farms for meat production; c) Establishment of Dairy Goats Multiplication Units;
d) Contract farming between export agents and goat and sheep farmers.
3.5 Sheep
Sheep is the third livestock type in terms of population after cattle and goat in Tanzania. A
total of 1,070,756 operators were engaged in sheep keeping during 2017/18 period.
The total number of sheep in Tanzania was 5,565,468. Arusha Region with 659,218 sheep (11.8%) had the highest number of sheep, followed by Simiyu (637,269; 11.5%) and Tabora
(548,469; 9.9%).
Figure 3-5 The Status of Sheep Farming in Tanzania
Sheep available are mainly of indigenous types and are kept for meat production. Sheep types
include: - Red Maasai, Sukuma (East African Black Head), Pare and Gogo (Tanzania Long tail).
3.6 Pigs
Pig rearing is mainly practiced in Tanzania Mainland in which there are 449,320 operators who
were engaged in pig rearing. The total number of pigs was 1,952,801 (97.7%) from which Mbeya Region (713,063; 36%) had the highest number of pigs, followed by Tabora (117,178;
6%) and Ruvuma (116,689; 5.9%).

14
Figure 3-6 Pig population by region, Tanzania Mainland as at October 1, 2017
According to the Ministry of Livestock and Fisheries Development10, more than 90% of the
1.9 million pigs are kept by small-scale farmers mostly in Southern and Northern Highlands
under traditional production systems. In addition, pork demand is increasing in urban and peri-
urban areas due to the increasing customers’ preference for delicacy and health reasons.
However, the current demand does not suffice the increasing demand for domestic and
export markets. Therefore, pigs’ production can be improved through proper husbandry
practices, adequate support services, disease control and appropriate slaughter and marketing infrastructure. Intensive pig production for commercial purposes is limited to very few
farmers with regular income, mainly to meet the high cost of concentrate feeds among other
requirements.
The breeds of pigs found in the country are crosses of Large white, Landrace, Saddleback and
Hampshire; while pure breeds are very few. These stocks have been circulating within the
different farms in the country.
3.6.1 Pig Meat Imports Quantities into Tanzania
In 2016, pig meat imports quantity for United Republic of Tanzania was 980 Tons. Though
United Republic of Tanzania pig meat imports quantity fluctuated substantially in recent years,
it tended to increase through 1967 - 2016 period ending at 980 Tons in 2016.
-
100,000
200,000
300,000
400,000
500,000
600,000
700,000
800,000
Dodom
a
Aru
sha
Kili
man
jaro
Tan
ga
Moro
goro
Pw
ani
Dar
es
Sala
am
Lin
di
Mtw
ara
Ruvu
ma
Irin
ga
Mbey
a
Singi
da
Tab
ora
Rukw
a
Kig
om
a
Shin
yanga
Kag
era
Mw
anza
Mar
a
Man
yara
Njo
mbe
Kat
avi
Sim
iyu
Gei
ta
Pig
s

15
Figure 3-7 Pig Meat Import Quantities into Tanzania
Table 3-6 Pig Meat Imports into Tanzania
Year Tons Change, %
2016 980 -18.67%
2015 1,205 -38.30%
2014 1,953 55.00%
2013 1,260 -17.16%
2012 1,521 -3.92%
2011 1,583 -18.11%
2010 1,933 41.82%
2009 1,363 84.44%
2008 739 491.20%
2007 125 -71.78%
2006 443 -19.89%
2005 553
3.7 Investment Opportunities in the Piggery Sub-sector
The areas for investment in the pig industry include:
a) Establishment of breeders’ farms;
b) Establishment of commercial farms;
c) Establishment of slaughter and processing plants.
0
500
1000
1500
2000
2500
2004 2006 2008 2010 2012 2014 2016 2018
To
nn
es
Year
Pig Meat Imports into Tanzania

16
3.8 Poultry Production
In Mainland Tanzania the number of indigenous chickens was 38,595,106. Tabora Region with 2,829,024 birds (7.3%) had the highest number of indigenous chickens, followed by Shinyanga
(2,332,826; 6.0%) and Singida (2,184,743; 5.7%).
Figure 3-8 Status of Chicken Farming in Tanzania
The poultry production system in Tanzania is of two types: traditional and commercial
production. The current production is estimated at 58 million chicken (indigenous 23 million
and commercial 35 million), and 1.2 million ducks.
Poultry production has a lot of opportunities for the private sector investment. The small and
medium enterprises have managed to increase numbers of local chickens from 27 million in
2001 to 30 million in 2006; while commercial stock increased from 20 million to 25 million.
On average 5.5 million hatching eggs and 1 million Day Old Parent Chicks are imported
annually to produce a total of 25 million Day Old Chicks for commercial purposes. This figure
is low compared to the current requirement of 60 million Day Old Chicks per year.
The per capita consumption of eggs has increased from 50 to 75 eggs per person per year in
Tanzania. The rising demand for DOCs, meat and eggs calls for more investments. The
hatcheries and their capacities are as indicated in Table 3-7.
Table 3-7 Poultry Hatcheries
Region Hatchery Capacity (Number of chicks per 3
weeks)

17
1 Arusha Tanzania Poultry farms 180,000
2 Dar es Salaam
Euro Poultry 160,000
Interchick 260,000
Twiga Hatcheries 120,000
Ideal Chicks 120,000
3 Coast
Kibaha E.C 120,000
Ruvu JKT 30,000
Kiluvya Poultry Products 30,000
Mkuza Chicks 360,000
4 Kilimanjaro Kilacha 30,000
Kibo Hatcheries 60,000
5 Mbeya Songwe Hatcheries
3.9 Poultry Meat Imports quantity
In 2016, poultry meat imports quantity for United Republic of Tanzania was 1,805 Tons.
Poultry meat imports quantity of United Republic of Tanzania increased from 193 Tons in
1967 to 1,805 Tons in 2016 growing at an average annual rate of 155.24 %.
Figure 3-9 Poultry Meat Import Quantities into Tanzania
Table 3-8 Poultry Meat Imports into Tanzania
Year Tons Change (%age)
2016 1,805 269.12%
2015 489 -84.11%
2014 3,078 75.68%
2013 1,752 57.41%
2012 1,113 38.43%
2011 804 880.49%
0
500
1,000
1,500
2,000
2,500
3,000
3,500
2004 2006 2008 2010 2012 2014 2016 2018
To
nn
es
Year
Poultry Meat Imports Quantity

18
2010 82 446.67%
2009 15 -16.67%
2008 18 -40.00%
2007 30 -57.75%
2006 71 -86.37%
2005 521
3.9.1 Investment Opportunities in Poultry Production
The areas for investment in the poultry industry include:
a) Establishment of breeders’ farms for grand and parent stock
b) Establishment of commercial layers and broiler farms
c) Establishment of chichen and eggs processing plants. It was learned during this study
that; eggs can be processed into powder – which is used in bakeries.
d) Poultry feeds processing
e) Poultry hatcheries and supply of chicks

19
3.10 Other Livestock Species
Table 3-9 Number of Other Livestock by Region and Type of Livestock as of 1st October
2017
Region Ducks Guinea
Pigs Turkey Rabbits Donkey Dogs
Dodoma 30,236 - - 2,115 31,083 99,411 Arusha 6,858 14,115 6,211 58,992 44,531 Kilimanjaro 31,298 - 12,269 16,160 17,874 53,548
Tanga 201,135 - 641 2,135 18,712 57,615 Morogoro 163,106 - 124,116 2,638 - 37,529
Pwani 89,720 - - - 936 26,224 Dar es Salaam 178,111 - 48,968 1,303 - 7,266
Lindi 4,566 - 189 - 17,080 Mtwara 29,971 - 3,275 - - 3,123 Ruvuma 12,404 3,694 3,913 2,040 - 16,345
Iringa 15,774 312,263 8,005 9,260 4,240 51,297 Mbeya 69,172 59 - 12,914 25,448 59,802 Singida 48,889 1,174 5,222 782 72,644 127,585 Tabora 80,596 - - 1,579 41,262 266,864
Rukwa 39,796 5,660 - 25,113 16,120 45,797
Kigoma 2,234 - - 2,271 - 105,450 Shinyanga 149,786 4,319 3,621 7,140 32,427 174,926 Kagera 53,560 - - 20,069 1,725 39,389
Mwanza 170,800 7,803 2,925 2,555 17,531 516,703 Mara 144,387 - - 10,789 24,653 213,939 Manyara 11,527 208 16,960 1,932 113,623 181,207
Njombe 18,416 210,949 - 19,468 14,415 5,158
Katavi 46,515 4,650 - 1,050 16,720 17,606 Simiyu 81,449 - 989 2,967 31,998 62,214 Geita 151,757 - 1,169 - 21,641 177,519
TOTAL 1,832,064 564,894 216,931 150,681 546,996 2,408,129

20
4 Improving Performance of the Livestock Sub-sector in Tanzania
4.1 Red and White Meat
4.1.1 Tanzania’s Red Meat Systems Roadmap (2016/17 - 2021/22)
Tanzania produced about 493,000 metric tons of red meat (by year 2016/2017) whereby 83%
was beef and the remainder came from sheep and goats. Most of this produce (97%) came
from pastoral and agro-pastoral communities.
The red meat produced is predominately for domestic consumption, with little exports. The
country still has not been able to meet its domestic demand for red meat, and meeting this
demand, as well as exploiting the export potential for red meat, are possible only if the
limitations of unavailable resources, such as animal feeds, are overcome1.
The 2016/22 LMP through the Ministry of Livestock and Fisheries Development, defined the
vision and targets for improving availably of red meat in Tanzania11.
4.1.1.1 Vision
The projected year 2021 domestic demand gap for red meat arising due to rapidly growing
population, increasing urbanization, and rising incomes is reduced; and live animal and meat
exports are increased to generate foreign exchange earnings.
4.1.1.2 Overall Target
To reach production of 742,000 tons of red meat by year 2021, through improvement of
grazing land resources, animal health, and genetics; and use of appropriate feeding technology.
By 2021, a total of 2 million heads of animals passing through the ranch, feedlot and non-
traditional (culled dairy cattle) operations is achieved; and the contribution of the traditional
sector to the overall red meat produced is reduced from the current level of 97% to 10%.
Improved traditional red meat production targets Interventions aimed at increasing traditional
red meat output are expected to bring the following changes: -
a) An increase in the area of the grazing/pasture from 10 - 13%.
b) Promoting allocation and establishment of pasture/fodder production areas from almost
0%, at present, to 5%.
c) Increasing the parturition rate from 4 - 5%.
d) Reducing mortality rate to 25 - 50% for all age and sex categories.
e) An increase in dressing percentage by 2%.
f) Live weight increase by 10% for all age and sex categories.
g) Off-take rate increases from 10 - 16% for small-scale farms; 10 - 14% for medium - scale
farms; and from 18 - 26% in ranches.
11
Tanzania Livestock Master Plan 2016 – 2022. Ministry of Livestock and Fisheries Development

21
h) Increasing the herd size of ranches by a range of 10 - 37% through purchasing of additional
heifers in the first three to four years; and maintain constant herd size, once the carrying
capacity is achieved.
i) The number of ranches increased by 18%.
j) The number of cattle in a fattening cycle, in feedlots, increased by 33%.
k) The number of fattening cycles per year, in a feedlot, increased by 17%.
l) To increase the number of feedlot units by over 100%.
4.1.1.3 Key Challenges and Strategies in Enhancing Red Meat Production in
Tanzania
Table 4-1 Key Challenges and Strategies in Enhancing Red Meat Production in Tanzania
Challenges Strategies
Feed
Lack of sufficient grazing areas to meet the feed needs
of the animals
Rehabilitation of rangeland/grazing land
Poor-quality grazing land resources Acquiring substantial additional area for grazing land
and for pasture/fodder production
Inadequate knowledge on the use of crop residues
and by-products
Training and capacity building and skill development
to increase the use of crop residues and by-products
Limited availability of concentrates and feed
supplements, when needed.
Increased and better use of agro-industrial by-
products from the processing of cereal/grains/oil
seeds/sugarcane as concentrates for animal feeding.
Promote appropriate storage and marketing of
concentrates and feed supplements
Genetics
Low genetic improvement extension coverage Selection within the local breeds
Poor animal data recording system Establishing community-based breeding programs,
which include developing an animal recording scheme
Promoting animal identification and traceability
scheme.
Animal Health
Poor animal health extension services strengthening animal health regulatory capacity under
the coordination of the livestock ministry
Inefficient animal health services
Inadequate supplies and qualities of vaccines and
drugs
Poor control of drugs and supplies
Marketing and processing
Poor market infrastructure Building additional infrastructure.
Poor technical knowledge of value chain actors,
especially processors and technicians
Strategic capacity building spearheaded by the second
phase of the agricultural sector development
program (ASDP II)
Inadequate market information
Poor linkages between producers, processors and
export abattoirs.
Policy
Absence of a breeding policy Developing clearly defined guidelines on land use and
access rights
Loss of land to alternative investments outside
livestock
Implementing appropriate land policies.
A lack of protective trade policies Gazetting grazing land

22
4.1.2 Interventions to Achieve Red Meat Targets
Most of interventions for red meat production are expected to be done in the central, and
coastal and lake production zones. The interventions in these zones do not involve artificial
insemination and genetic progress through improved selection of indigenous breeds is
anticipated to be slow5.
The main proposed technological interventions in the central zone are: -
a) Feed improvement through better range management, over-sowing with grass and
legumes, and the control of invasive species. The intervention to improve rangeland
productivity includes water development and rangeland improvement by shrub clearing,
and the application of thinning technique where major shrub encroachment takes place.
b) Reduction in young and adult stock mortality: The relevant health interventions include
improving access to quality of veterinary services through rationalized use of public/private
veterinary services; parasite control and treatment and vaccinations.
c) Breed improvement through better selection and management of male breeding animals.
d) Introduction of a herd/flock recording scheme for breed improvement.
However, other interventions will target the research, extension, market and value additions
for the red meat products. In the highlands zone, the following interventions will be carried
out: -
a) Breed improvement, involving artificial insemination with semen of exotic breed primarily
for dairy development. However, the culled dairy cattle will be channeled to beef
production.
b) Breed management and improvement through the implementation of a herd/flock
recording scheme.
c) Training/extension to improve the capacity of farmers to select and manage male breeding
animals.
d) The reduction of young and adult stock mortality with vaccines and anti-parasites.
e) The introduction of integrated fodder crops with food crops.
f) The timely harvesting of grass, and storage and conservation of hay from communal
grazing lands.
g) Increased efficiency of crop residue use (proper storage, supplementation, treatment
including physical treatment chopping, and urea).
h) Over-sowing and rotational grazing.
4.1.3 Investment Opportunities in the Red Meat Value Chain
Investment opportunities in the red meat industry exist in the following areas: -
a) Going into joint venture with National Ranching Company (NARCO) and other privately-
owned ranches to modernize the existing ranches. Production of various types of livestock
including beef and dairy cattle, goats, sheep, pigs in partnership with NARCO ranches and

23
with already existing Livestock Multiplication Units – together with establishment of new
farms for the same purpose; b) To invest in the establishment of new ranches (cattle, sheep, goats) and farms (poultry
and piggery);
c) Feed - lot/fattening programs;
d) Slaughtering and processing;
e) Meat and milk processing;
f) Value addition in livestock and other livestock products and byproducts such as hides and skins;
g) Construction and operation of new abattoirs and processing plants;
h) Production of hay, compounded animal feeds and vaccines.
4.1.4 Tanzania’s Chicken Development Roadmap (2017/18 - 2021/22)
The 2016/22 LMP through the Ministry of Livestock and Fisheries Development, defined the
vision and targets to ensure adequate supply of chicken in Tanzania.
4.1.4.1 Vision
By 2022, the chicken industry is to a large extent efficient and commercially run, both in
commercial and household operations, using improved and highly productive breeds to ensure
household food security and higher incomes, and significantly contributes to achieving national
all-meat food security, and higher national income while being resilient to climate change and
conserving the environment.
4.1.4.2 Overall Target
The overall target is to raise annual chicken meat production almost eightfold from about
60,800 to 465,600 tons and egg production from about 3.0 to 4.2 billion by year 2021/22
through improved traditional family chicken (ITFC), tropical improved chicken (TIC) and
expanded specialized/commercial chicken (SCC) - with layers and broilers subsystems.
4.1.4.3 Improving Traditional Family Chicken and Promoting and Expanding
Tropical Improved Chicken Sub-systems
4.1.4.3.1 Targets
a) The number of hens in the ITFC grows from 4.2 million in the base year to 5.7 million in
2021/22, a 37% increase.
b) The number of chickens in the TIC grows from 0.02 million to 2.01 million.
c) Chicken meat production from ITFC increases from 31.8 thousand tons in the year
2016/17 to 48.2 thousand tons in the year 2021/22, a 52% increase.
d) Chicken meat production from the TIC increases from 0.01 thousand tons in the year
2016/17 to 1.7 thousand tons.
e) Total meat from the family system increases from 31.81 thousand tons to 49.9 thousand
tons, a 57% increase.
f) Egg production from ITFC increases from 101.2 million in the year 2016/17 to 229.2
million in the year 2021/22, a 127% increase.

24
g) Egg production from TIC increases from 0.79 million in the year 2016/17 to 129.1 million
in the year 2021/22.
h) Total egg production from the family system increases from 109.99 million in the year
2016/17 to 358.3 million in the year 2021/22, a 350% increase.
Tropical improved chicken is a newly introduced chicken system with a small number of birds
in the base year hence comparing the near non-existent number of TICs in the base year with
those in the fifth-year number does not make sense.
4.1.4.4 Key Challenges and Strategies Related to Traditional Family Chicken
System
Table 4-2 Key Challenges and Strategies Related to Traditional Family Chicken System
Challenges Strategies
Feeds
Limited access to land to produce maize and soybeans
for formulation of chicken feed
Enforce Grazing Land and Animal Feed Resources Act
2010 and related regulations
Low nutritive value of feed ingredients used in feed
formulation such as maize, maize bran, grain sorghum,
rice bran and fish meal in terms of energy, protein,
mineral and amino acid profile
Build capacity for animal feed inspectors in various
levels
Low nutritive value and low quality of commercial
chicken feeds in terms energy, protein, mineral and
amino acid profile and high crude fiber
Prepare guidelines for inspection of processed
chicken feeds
Presence of physical and chemical contaminants such
as charcoal, sand and dust in chicken feed ingredients
and feeds
Create awareness through sensitization on need/
requirements for quality chicken feeds
Low institutional capacity to monitor quality of
chicken feed produced and processed
Build capacity for good processing practices among
animal feed processors
Low incentive for the private sector to invest in
chicken feed processing plants
Regulate the export of oil crops and import of
cooking oils
Strengthen mechanisms to control feed quality
Give tax breaks and other incentives to encourage
private sector in chicken feed processing industries
Animal Health
High prevalence and impact of diseases particularly
Newcastle, salmonellosis, Marek’s disease among
small-scale chicken producers
Strengthen enforcement of Animal Disease Act 2003
and its regulations
Poor handling and poor-quality drugs and vaccines
associated with inadequate human resource for
supervising and monitoring drugs use and unreliable
cold chain supply of chicken vaccines
Formulate biosafety guidelines for disease control and
other relevant guidelines
Enforce stricter disease controls on the importation
of commercial replacement stock
Poor housing and sanitation for chickens Produce Newcastle Disease vaccine with high efficacy
and institute mandatory mass vaccination against the
disease
Create awareness among small producers on best
practices in chicken housing and sanitation

25
Marketing and Processing
Chicken farmers’ marketing organizations are limited
in geographical scope with most operating in Dar-es-
salaam and other urban areas
Promote establishment of Tanzania chicken traders’
associations
Weak chicken farmer’s groups and platforms Existing
farmers marketing organizations are poorly
structured and there is lack of a related apex national
association.
Construct chicken slaughtering and processing
facilities and promote chicken meat and eggs
marketing.
Lack of slaughter facilities for chicken
Lack of chicken meat processing facilities
Weak biosafety facilities and hazard analysis and
critical control points (HACCP)
Institutionalize mandatory biosafety and HACCP
procedures
Weak consumers preference for exotic chicken meat
and eggs
Intensify the promotion and extension work to
change the attitudes of consumers towards
consuming eggs and meat from hybrid and exotic
breeds
Policy
Most of the hatcheries and breeder chicken farms are
not registered, do not have registered veterinarians
and operate within residential areas without standard
operating procedures
Promote registration of hatcheries and breeder farms
Establish standard operating procedures and
guidelines for
operation of hatcheries and breeder farms
There are many complaints from farmers on high
mortality of chicks from some hatcheries due to
salmonellosis and emergence of Marek’s disease in
pullets (layers).
Institutionalize biosafety measures and HACCP
facilities for chicken meat, eggs and feeds
Weak policies related to land acquisition for chicken
feed production.
Create favorable policies for land acquisition for
chicken feed production
4.1.4.5 Interventions to Achieve Chicken Production Targets
The interventions to transform the family chicken system involve improving indigenous
chicken productivity through improved breed selection, importation of high-yielding pure
tropical scavenging brooding breeds and importation of semi-scavenging tropical breeds.
These measures should go along with a reduction of reproductive wastage by introducing
brooding and artificial incubation facilities such as hay box brooders and small-scale
incubators; and health, feed and management interventions.
Adoption and coverage of the intervention at 40% and 30%, respectively, will impact 12% of
the total indigenous ITFC chicken over the five-year project period. Tropical improved
chicken will grow from 15,000 - 2,000,000 chickens in five years, a huge development.
The interventions in the improved traditional family chicken (indigenous and imported pure
breeds) aims at upgrading the flock size from 2 - 8 hens. Eggs laid per year will increase from
50 - 90 and average weight of sold chicken will increase from 1.1 - 1.4 kg. Through the semi-
scavenging tropical crossbreeds such as Kuroiler, holding per family will remain 25 chickens
and it is expected to grow to at least 150 eggs per hen/year with 2.8 kg live weight for mature
chicken. With the additional animal health services, chicken mortality before marketing will

26
dropped down from 50 - 10%. The average number of eggs consumed on-farm/year will
increase from 10 - 20 and chicken consumed from 5 - 10; both 100% increases.
4.1.4.6 Specialized Commercial Chicken Production
4.1.4.6.1 Targets
a) The number of chickens in the specialized chicken layers subsystem grows from 13.3
million in 2016/17 to 17 million in 2021/22, a 28% increase.
b) The number of chickens in the specialized chicken broilers sub-system grows from 3.3
million in 2016/17 to 48.2 million in the year 2021/22, a 1,362% increase.
c) Chicken meat production from specialized chicken increases from 29,047 tons in 2016/17
to 415,745 tons in the year 2021/22, a 1,331% increase.
d) Egg production from specialized layers increases from 2.86 billion in 2016/17 to 3.82 billion
in the year 2021/22, an increase of 33%.
4.1.4.6.2 Key Challenges and Strategies Related to the Specialized Layers and
Broilers System
The specialized layers and broilers systems are facing the challenges as those of the traditional
family chicken system and need similar strategies transforming the system. Refer to Table 4-
2 for the details.
4.1.4.6.3 Interventions to Achieve Specialized Layers and Broilers Targets
The interventions for specialized chicken improvement involve increasing the scale of
operations and volume of production from the specialized chicken farms i.e. specialized
chicken layers and specialized chicken broilers. The major intervention proposed for the
specialized chicken layers and specialized chicken broilers is increasing their number in the
country and the number of specialized farm units. The average number of broilers per
specialized farm/year increases to 1,020 per cycle and the average number of layers stays the
same at 1,300.
4.1.4.7 Investment Opportunities in the White Meat Value Chain
a) Establishment of breeder farms for poultry (grandparent stocks) b) Establishment of commercial layers and broiler farms as well as broiler processing plants;
c) Chicken slaughter abattoirs
d) Chicken feeds processing using locally available materials
4.1.5 Pig/Pork Value Chain Development Roadmap 2017/18 - 2021/22
4.1.5.1 Vision
By 2025 the Tanzania pig industry becomes an efficiently functioning sector with market-
oriented farming, processing and dynamic marketing, operating in more sustainable and
climate-smart ways, supplying consumers with high quality and safe pig meat/pork, and
contributing to household food and nutritional security, income growth, poverty alleviation
and to national economic growth.

27
4.1.5.2 Overall Target
The overall target is to raise pig meat production from the current 22,000 tons (2016/17) to
37,000 tons by 2021/22 through improved family and expanded commercial specialized pig
production systems.
4.1.5.3 Modernizing and Transforming the Traditional Free-Ranging Family Pig
Production System
4.1.5.3.1 Targets
a) The number of sows in traditional (extensive) family (TFPS) systems increases from
207,083 to 300,070 and the number of pigs in the improved semi - intensive family system
increases from 77,778 to 112,703. In both cases the change in number over five years is
45%.
b) Pig meat production from the TFPS subsystem increases from 12.8 thousand tons to 18.
2 thousand tons, a 43% increase.
c) Pig meat from improved (semi-intensive) family pig subsystem (IFPS) increases from 6 tons
to 8.4 tons, a 41% change over five years.
4.1.5.3.1.1 Targeted Productivity Changes
a) The number of sows in the TFPS household sub-system increases from two to four.
b) Mortality of young pigs will decrease from an average of 20% to 18% and 12% to 10% in
TFPS and IFPS, respectively.
c) The age at first calving decreases from an average of 300 - 270 days in TFPS.
d) The proportion of industrial feed included in the pig ration increases from average of 0%
to 4% and from 20% to 40% among TFPS and IFPS, respectively.
e) Age at weaning decreases from an average of 60 - 55 and 45 - 35 days among TFPS and
IFPS, respectively.
f) Age of piglets for marketing decreases from 120 - 112 days and from 60 - 40 days among
TFPS and IFPS, respectively.
Table 4-3 Key Challenges and Strategies Related to the Family Pig Sub-system
Challenges Strategies
Genetics
Limited number of improved pig breeds Establishing public and private sector specialized
commercial pig breeding and multiplication farms
Lack of specialized commercial pig breeding farms The LMP provides opportunities for designing a pig
industry development strategy/program in Tanzania
Low productivity of family-kept pigs partly due to
low genetic potential and inbreeding leading to
poor quality stock supplied to farmers
Importing new lines of improved high-yielding pig
breeds to avoid inbreeding and increase productivity
Inadequate supply of well-bred pig stocks from
pig multiplication and breeding farms
Extension and proper management and husbandry
practices to lower the probability of inbreeding
Supporting the Tanzania Livestock Research Institute
pig breeding and research activities
Animal Health
A weak animal health delivery system Strengthening surveillance, early detection/diagnosis

28
Inadequate health extension staffs Strengthening Strengthening national and local government
authorities’ capacity to recruit additional staff to
respond to outbreaks and provide specialized pig
extension services
The MLF will prepare the national pig biosecurity
policy guidelines for farmers (small and commercial),
feed and meat processors
Widespread pig health and reproductive problems
and major devastating diseases such as African swine
fever, foot-and-mouth disease, erysipelas,
transmissible gastroenteritis and brucellosis that
cause heavy mortality
Supporting immunization measures (for foot-and-
mouth disease, brucellosis)
Improving pig farm management practices to benefit
producers.
Enforcing the Animal Pounds Act, and Animal
Welfare Act, 2008
Extensive pig farmers education and developing
regulations to stop free roaming
Feeds
Unreliable supply of commercial feeds Establishment of private small-scale feed mills and
public-private partnerships multilevel feed processing
plants
Below standard quality of commercial feeds Strengthen surveillance system and the regulatory
capacity of the central veterinary laboratories (CVL)
with MLF involved in monitoring feed quality and
safety
High prices of commercial feeds and premixes such
as amino acids, minerals and vitamins that are
necessary to adhere to standard pig nutritional diets
Organize commercial pig producers for massive
importation of essential feed ingredients e.g. amino
acids, vitamins and trace minerals
Create suitable conditions for land allocation, and
land lease to investors under the provisions of the
current land laws, with major tax incentives on land
use fees and lease time
Severe feed shortages to supply large pig
commercial/specialized pig farms
Develop and implement business models in the
production, transportation, processing and
distribution of pig feeds
Expand private sector-led massive cereals and
legumes production to supply feed processing plants.
Undertake research on alternative pig feeds in terms
of nutritive values, and feed conversion impacts on
weight gain and meat quality that are suitable in each
zone
Unreliable supply of commercial feeds Massive production of cereals (yellow maize, maize,
sorghum etc.) and legumes (soybeans, other oil seed
cakes) to feed commercially farmed pigs
Owners of commercial feeds processing plants, large-
scale cereal and other alternative feed raw materials
are supported to start and run businesses
Marketing and Processing

29
Weak pig marketing arrangements Developing the pig value chain to improve pig
marketing, trading capacity and smallholder pig
production by constructing pig markets, slaughter
facilities/abattoirs and fresh pork marketing outlets
Higher pork price due to marketing inefficiency, high
cost of transportation from producers to urban
markets
Applying good-manufacturing practices (GMP) in
production process, implement HACCP in animal
feed manufacturing, pig slaughtering facilities and
processing
Lack of pig slaughter facilities/abattoirs, absence of
cooling systems (e.g. refrigerators), absence of
standard weights and measures
Strengthening swine producer associations (SPAs) to
provide credit facilities, offer learning opportunities
to farmers’ and actors’ in the value chain through
skills training and joint implementation of biosecurity
measures to control devastating diseases such as
African swine fever
Lack of access to formal credit sources for
investment in pig production
Promote SPAs to innovate and actively participate in
the value chain mainstreaming to maximize installed
feed and meat processing capacities, own and manage
cooperative-owned small-scale feed mills, enforce
formal use of weights in meat sales, and
infrastructural developments in order to increase the
overall volume and values in the market
Lack of quality grading system for pig meat Establish pig meat quality grading standards and
regulatory systems to enforce it
Build capacity of animal and livestock production staff
on pig ante- and postmortem
inspection skills/techniques
Policy
Lack of official pig marketing and pig meat
transportation policies
Ensure policy guidelines/regulations to reorganize pig
marketing/trading system is developed
Ensure linkages to slaughter facilities/abattoirs,
preservation facilities and processing plants
The development, support and implementation of
animal welfare strategic plan
undertaken
Lack of policy for pig holding and slaughtering facilities Create enabling policy environments for the
establishment of rural small-scale and urban large-
scale slaughter facilities
Develop policy guidelines, standard operating
procedures (SOPs) and awareness campaigns on
slaughter facilities’ hygiene and food safety
Lack of policy for land allocation for pig production Ensure policy related to land acquisition or long-term
land leasing
Lack of policy that gives incentives to private sector
to invest in pig production
Develop and seek government approvals on
appropriate policy incentives to encourage foreign
direct investments, organizations and individuals to
invest in commercial pig production, processing and
marketing, building domestic pig auction markets, and
pig products and kiosks consumption outlets
Ensure sufficient infrastructure and access to feed
sources for the production of feed raw materials

30
(cereals, legumes, roots/tubers etc.) to supply large
pig farms
Introduce protective trade policies to encourage
domestic private investment
in pig production
4.1.5.4 Interventions to Achieve Targets in Family Pig Subsystems
The proposed transformation of the traditional family pig production system involves genetic,
health and feeding interventions alongside marketing and policy interventions. The genetic
interventions involve importation of tropically adapted and more productive pig sows and
boars for breeding and crossbreeding and the establishment of pig breeding and multiplication
farms.
The animal health interventions involve strengthening disease control for priority pig diseases
such as African swine fever, transmissible gastro enteritis, erysipelas, worms, and mange;
strengthening biosecurity and allied facilities; surveillance through local government
authorities and zonal veterinary labs; and the building of staff capacity on national mandatory
pig or commodity-based identification and traceability to achieve animal health and safe trade
objectives.
The feed interventions involve strengthening the capacity of private small - scale pig feed
mills/processors to compound and distribute pig feeds to rural smallholder farmers and
strengthening capacity of family pig keeping households to compound and supplement quality
pig feed/home rations with locally available and industrial feed materials.
4.1.5.5 Expanding the Commercial Specialized Pig Production Sub-system
4.1.5.5.1 Targets
The number of sows in the commercial specialized pig subsystem increases by 180% from
57,580 to 161,218 sows.
With each sow having 6 followers, the total number of pigs in this subsystem increases from
403,360 to 1,128,526.
Pig meat production from the specialized pig system increases from 3.3 thousand tons to 10.5
thousand tons over five years which constitutes a 219% growth. This growth is as a result of
the following changes:
a) Delay in weaning: successful service from 15 - 11 days
b) Proportion of industrial feed included in the ration rising from 70 - 79%
c) Age of piglets marketed reducing from 40 - 36 months
d) Daily weight gain of piglets rising from 0.7 - 0.8 kg

31
4.1.5.6 Key Challenges and Strategies Related to the Commercial Specialized Pig
System
4.1.5.6.1 Genetics Challenges and Strategies
The genetic challenges and strategies for addressing them are similar to those in the family pig
sub-system in Table 4-3.
4.1.5.6.2 Animal Health Challenges and Strategies
Apart from the low level of biosafety measures in the commercial specialized pig subsystem,
which can be addressed through implementation of a strict biosafety measures at farm level
and HACCP at feed plants, the animal health problems and strategies to them challenge are
similar to those in the family pig subsystem (refer to Table 4-3).
4.1.5.6.3 Feeds Challenges and Strategies
These are the same as those in the family pig subsystem in Table 4-3. However, to deal with
the serious feed shortage in the specialized system, suitable conditions for land allocation, and
leasing of land to investors under the provisions of the current land laws, with major tax
incentives on land use fees and lease time should be created.
4.1.5.6.4 Marketing and Processing Challenges and Strategies
These are the same as those of the family pig subsystem in Table 4-3.
4.1.5.6.5 Policy Challenges and Strategies
These are the same as those of the family pig sub-system.
4.1.5.7 Intervention to Achieve Targets in Commercial Specialized Family Pig
Sub-systems
The proposed expansion and upscaling of the commercial specialized pig production system
involves genetic, health and feed interventions alongside marketing and policy interventions.
The genetic improvement measures involve importation of 4,000 tropically adapted pig sows
and 200 boars for breeding and crossbreeding and establishment of 10 private and 10 public
pig breeding and multiplication farms.
The animal health interventions involve strengthening disease control for priority pig diseases
such as African swine fever, transmissible gastro enteritis, erysipelas, worms, and mange,
strengthening biosafety facilities, and building staff capacity on national mandatory
identification and traceability to achieve animal health and safe trade objectives.
The feed interventions involve strengthening capacity of private small-, medium- and large-
scale pig feed mills/processors and making land available for pig feed (maize and other cereal)
production. See Table 63 for the detailed investment interventions.

32
4.2 Dairy Development Roadmap 2017/18 - 2021/22
4.2.1 Vision
The overall vision of the dairy development roadmap is increased milk production that meets
the domestic demand and the surplus is exported. This goal will be achieved by increasing
dairy cow productivity through improvements in dairy cow genetics, health and nutrition and
by expanding the national dairy cow herd and improving the processing and marketing of dairy
products.
4.2.2 Overall target
The number of crossbred dairy cattle at the national level will increase by about 3.8 times
from the current 783,000 to 2,985,000 by 2021/22.
The production of milk at the national level will increase from 2,159 million liters in the base
year (2016/17) to 3,816 million liters in 2021/22 - an increase of about 77% over five years.
Though most of this change is expected to come from improvement and increased production
by dairy cows, improvement of cattle for red meat production will also contribute to milk
production.
Productivity improvement interventions in the dairy cow production system will result in 31%
increase in the average annualized milk productivity of a cow in traditional and improved family
dairy subsystem and a 26% increase in commercial specialized dairy. The national average
annualized milk production of a cow will increase from 179 liters to 254 liters over five years
(2016/17 - 2021/22).
Mainly due to dairy but also red meat improvement interventions, the GDP contribution of
milk at the nation level is expected to increase from TZS 808,342 million in 2016/17 to TZS
1,415,671 in 2021/22, a 75% increase.
4.2.3 Target Production Subsystems for Cow Dairy Improvement
Interventions
The dairy production system in Tanzania can be divided into three major categories: traditional cow meat-milk, improved family dairy, and commercial specialized dairy
subsystems2. The traditional cow meat - milk production subsystem is not specialized on a
single commodity and both milk and meat are important products.
However, milk is a priority commodity in improved family dairy and commercial specialized dairy subsystems. Both of these subsystems use crossbred/pure temperate dairy breeds like
Holstein, Jersey and Ayrshire and they differ mainly on the level of intensification and
specialization2.
In the improved family dairy subsystem, the level of input by farmers is lower compared to the commercial specialized dairy subsystem. The input level in improved family dairy
subsystem depends on marketing opportunities and income from sale of milk. Cattle are kept
under semi and zero-grazing settings with cultivated fodder, crop residue and grass cut from
communal land providing most of the feed. Channels for selling milk rely on direct marketing
of milk to the consumer and milk collection centers.

33
The commercial specialized dairy subsystem is more commercialized and specialized and has
higher input of feeds and animal health services compared to the improved family dairy subsystem. This subsystem is divided into small and medium-sized farms, based on herd size.
In small farms, farmers keep between two and three mostly crossbred cows that are not
mixed with indigenous cattle.
Farmers in the medium commercial and specialized dairy subsystem own larger herds of cattle,
often more than 100 cows, with a national average of 450 animals. These farms are
government or privately-owned farms with their own input delivery systems. The milk produced in these farms is sold directly to milk processing plants or processed within the
farms.
The development of the cow dairy system in Tanzania is targeted at improving and expanding
the improved family dairy subsystems in coastal and lake and highlands zones and the
commercial specialized dairy subsystem across the country.
4.2.4 Improved Family Dairy Production in Coastal, Lake, and Highlands Zones
Table 4-4 Key Challenges and Strategies Related to Improved Family Dairy Production
Challenges Strategies
Feed Availability and Quality
Erratic supply of feed quality and quantity Strengthening the extension service and training on
forage production, conservation and feeding
Limited availability and high cost of forage feed and
limited supplementation
Policy interventions to make land available for
investors for forage seed and forage production
Limited access to land for grazing, production of
forage and forage seed due to an unclear land tenure
system
Enforcing feed and forage seed quality standards
Mineral deficiencies in most of the forage Using appropriate fertilizers in forage production.
Low genetic potential of indigenous animals for milk
production Inadequate and inefficient artificial
insemination services
Providing training support and incentives to livestock
farmers to work as artificial insemination technicians
Establishing and strengthening dairy heifer
multiplication farms through private, public and
private-public joint ventures
Promoting, expanding, and strengthening
privatization of
artificial insemination and hormone synchronization
services
Animal Health
High calf mortality
Inefficient animal health services
Inadequate supply of drugs
Poor quality control of drugs and supplies
High prevalence of transboundary diseases and
Trypanosomosis
Rationalizing and strengthening the animal health
regulatory capacity at the national and local
government authorities
(LGAs) levels under the coordination of the MLF
Improving availability and quality control of vaccines
and
drugs

34
Marketing and Processing
Unreliable transport system
Narrow product range which is concentrated on
short shelf-life products i.e. liquid and fermented milk
Poor milk marketing and low price of milk
Fluctuations in milk supply due to seasonality (dry and
wet seasons)
An absence of quality-based pricing incentives
Poor milk quality control and enforcement
mechanisms
Existing informal trade of raw milk which poses threat
tospreading zoonoses
Limited promotion of dairy-product consumption
Promote investment in long shelf-life milk products
such as UHT and powdered milk
Introduction of quality-based standards and pricing to
encourage quality milk supply
Strengthen enforcement of milk and milk products
quality standards
Formalize milk trade by training and licensing milk
traders
Scale up school-milk feeding program to promote
milk consumption
Policy
Pricing policies have disincentive effects on milk
Processing
Overregulation of the dairy industry resulting to
multiple
taxes which is a burden to investors
Introduction of a protective trade policy that includes
increasing import tariffs or bans and/or subsidies for
domestically-produced milk products to enable
competition with imports
Put in place indicative prices for milk products
Reduce bureaucracy and facilitate investment in the
dairy
industry
4.2.4.1 Interventions to Achieve Dairy Supply Targets
All production zones are expected to benefit from the cow dairy improvement interventions.
Expanding and improving the commercial specialized dairy subsystem will be implemented in
all over the country while expanding and improving the improved family dairy subsystem will
target coastal and lake, and highlands zones. The major criteria used to select the production
zones for improved family dairy subsystems include feed availability, climatic condition
(temperature), prevalence of endemic diseases like trypanosomiasis, existing experience in
dairying, product marketing infrastructure, and comparative advantage of each zone for dairy.
4.2.4.1.1 Main Activities
4.2.4.1.1.1 Feed Improvement Interventions
The feed balance estimate in the costal and lake and highlands zones shows significant deficit.
Maintaining moderately high productive crossbred dairy cattle therefore should be
accompanied with a significant increase in amount of feed produced/purchased. In the coastal and lake zone, up to 60% and in highlands zone up to 40% of the feed requirement should be

35
either produced/purchased to keep the crossbred dairy cattle productive. The type of feeds
produced/purchased could be:
a) Improved forage (grass/legumes/fodder trees and shrubs)
b) Concentrate feeds (locally made and industrial by-products)
c) Strengthen the existing forage/forage seed/ quality control laboratories
4.2.4.1.1.2 Genetic Improvement Interventions
Use artificial insemination with and without hormone synchronization and/or proven bulls for
crossbreeding/breeding.
Increase the number of crossbred cattle in the improved family dairy system through
crossbreeding/breeding of indigenous and crossbred cattle using exotic dairy cattle breeds
like Friesian, Ayrshire, Jersey, Brown Swiss and Mpwapwa.
a) Strengthen existing national and zonal artificial insemination centers and establish a new
semen production center.
b) Acquire five new liquid nitrogen plants c) Training and capacity building for 6,650 artificial insemination technicians
d) Encourage establishment of bull centers
e) Encourage establishment of crossbred heifer multiplication farms
f) Purchase and distribute crossbred heifers for under-resourced dairying beginners (2,000
every year)
g) Sensitize farmers on the formation of breed societies
4.2.4.1.1.3 Animal Health Improvement Interventions
a) Set up an East Coastal fever vaccination program to vaccinate of 300,000 dairy cattle
annually.
b) Implement vaccination campaign for foot-and-mouth disease, Rift Valley fever, contagious
bovine pleuropneumonia, brucellosis, East Coastal fever, transboundary diseases and
perform routine internal and external parasite control programs. c) Improve the capacity for livestock disease surveillance and diagnosis.
d) Rehabilitate veterinary centers.
4.2.4.1.1.4 Milk and Dairy Products Improvement Interventions
a) Provide incentives and ease the bureaucracy for investors seeking to establish milk
processing plants.
b) In addition to small- and medium-scale pasteurized milk processing plants; promote establishment of high capacity milk processing plants (at least two processing plants: one
UHT milk and one milk powder).
c) Promote the establishment of and strengthen the dairy cooperative/societies in high
potential areas through training, sensitization, equipping and facilities.
d) Encourage/establish at least 150 milk collection centers/chilling plants (cold chain).
e) Strengthen the Dairy Board (office and laboratory) to improve quality regulation and marketing of milk in milk shed areas
f) Strengthen the capacity of the milk quality assessment and safety control laboratory
g) Strength school-milk feeding programs to benefit 500,000 children in five years - starting
from 100,000 children on the base year and adding new 100,000 children every year.

36
Notice that, Tanzania’s per capita consumption of 40 liters per annum is only one fifth of
FAO recommendation of 200 liters and a half of Kenya consumption level.
4.2.4.1.1.5 Extension Services Improvement Interventions
Training to livestock keepers and improved family dairy farmers on better husbandry, breed
improvement and feeding practices.
4.2.5 Current Status of the Dairy Processing Capacity in Tanzania
There are 22 milk processing plants with the capacity of 700,000 liters of milk per day but
capacity utilization is only 30% (210,000 liters daily or 85 million liters annually). Tanzania
spends TZS 165 billion (US$ 70,434,560) to import milk annually in a bid to fill the gap during.
The dairy industry has a great potential for investment through production, processing and
marketing of milk and milk products. Currently, there are about 600,000 dairy cattle – mainly
crosses of Friesian, Jersey, and Ayrshire breeds with the Tanzania Shorthorn Zebu, which are
kept commercially.
Annual milk production is estimated at 1.65 billion liters, of which 70% comes from the
traditional sector, while the remaining 30% comes from the commercial sector.
Dairy goat farming is gaining popularity all over the country and it is one of the tools for
addressing nutrition insecurity and income among the rural population. It has also become an
alternative source of milk to households that cannot afford to keep large dairy animals either
due to low purchasing power or lack of land to accommodate large animals. It is estimated
that presently there are about 40,000 dairy goats in Tanzania.
Dairy goats’ breeds available in Tanzania include Toggenburg, Saanen, Anglo-Nubian, Alpine,
Norwegian, Mallya goat and their crosses.
The demand for dairy goats is higher than the supply, most of the dairy goats have been
introduced in the country by NGOs such as Heifer International Tanzania and FARM AFRICA;
and institutions such as the Sokoine University of Agriculture and other religious institutions
such as Roman Catholic and Anglican. These are not enough to meet the current demand.
Production of dairy goats within the country is needed.
The general situation with the milk processing industry is as shown on Table 4-5.
Table 4-5 Dairy Processors in Tanzania
Region Name of Processing
Plant
Status Installed
Processing Capacity
(Liters/day)
Current
Processing capacity
(Liters/day)
Percent
Utilization (%)
1 Arusha Brookside (T) Ltd Working 45,000 2,500 6
International Dairy
Products
Working 5,000 3,000 60
Mountain Green Dairy Working 1,500 500 33
Kijimo Dairy Cooperative
Working 1,000 300 30

37
Longido Women Dairy Cooperative
Working 1,000 300 30
Arusha Dairy Company Working 5,000 500 10
2 Dar es Salaam
Azam Dairy Working 3,000 2,000 67
Tommy Dairy Not Working
15,000 0 0
Tan Dairies Working 15,000 6,000 40
3 Dodoma Gonqi Foods Working 600 200 33
Royal Dairy Ltd Not Working
0 0 0
4 Iringa CEFA Njombe Milk Factory
Working 10,000 2,000 20
ASAS Dairy Working 12,00 6,000 50
5 Kilimanjaro Kondiki Small Scale
Dairy
Working 1,200 600 50
Fukeni Mini Dairy Working 3,000 1,000 33
Kalali Women Working 1,000 440 44
Marukeni Working 1,000 450 42
Mpoleni Women Working 1,000 300 30
West Kilimanjaro Working 1,000 300 30
Nlonda Women Working 3,200 1,250 36
Ng’uni Women Working 1,000 350 35
6 Kagera Kagera Milk (KADEFA) Working 3,000 400 13
Kyaka Milk Plant Working 1,000 450 45
Del Food Working 1,000 300 30
Bukoba Market Milk Bar Working 500 300 60
Bukoba Milk Bar – Soko Kuu
Working 500 300 60
Mutungi Milk Bar Working 800 180 23
Salari Milk Bar Working 800 170 21
Kashai Milk Bar Working 800 200 25
Kikulula Milk Processing
Plant
Working 1,000 500 50
MUVIWANYA Working 1,000 350 35
7 Mara New Musoma Dairy Working 120,000 20,000 17
Utegi Plant (Ex TDL) Working 45,000 0 0
Makilagi SSDU Working 1,500 1,000 67
Baraki Sisters Working 3,000 2,100 70
Mara Milk Working 15,000 6,000 40
8 Mbeya Mbeya Maziwa Working 1,000 1,000 100
Vwawa Dairy Cooperative Society
Working 900 600 67
9 Morogoro SUA Working 3,000 200 7
Shambani Graduates Working 1,500 700 47
10 Mwanza Mwanza Mini Dairy (Sengerema)
Working 3,000 500 17
Lake Side Working 5,000 0 0
11 Tabora New Tabora Dairies Working 16,000 200 1
12 Tanga Tanga Fresh Working 30,000 25,000 83
Ammy Brothers Working 2,000 500 25
Morani Not working 0 0 0
Total 384,100 88,940 23

38
4.3 Potential Areas of Investment in the Dairy Value Chain
a) Establishment of dairy farms in order to increase milk production; b) Establishment of milk collection centers;
c) Construction of milk processing plants;
d) Manufacturing of dairy equipment and packaging materials.
4.3.1 Establishment of Milk Collection Centers
Currently, more than 90% of milk is uncollected due to lack of collection centers. The decision
of where to establish milk collection centers will depend on the amount of surplus milk
produced and also availability of power supply, road network and transport facilities.
Therefore, in order to utilize this potential, establishment of a well-coordinated milk
collection network could be a kick-start towards a successful milk processing business.
4.3.2 Establishment of Milk Processing Plants
Currently, only 1.6% of the milk produced is being processed. Establishment of processing
plants is required in order to exploit the remaining amount of milk. The sizes of plants to be established will depend on the availability of surplus milk. Other key determinants of
establishing milk processing factories include processing level (scale), land, buildings, milk
processing equipment/machines, packaging materials, handling, storage, distribution and other
utilities. Potential areas for establishing milk processing plants are as indicated below.
Table 4-6 Milk Processing Zones in Tanzania
Zone Regions Description
1 Central Corridor
Morogoro, Dodoma, Singida,
Manyara, Tabora
• The zone produces about 516 million liters of milk per annum which is about 30% of the national milk production;
• Current installed milk processing capacity is 21,100 litres/day whereas operating capacity is 1,500 litres/day;
• Booming of mining activities in this area (especially
Shinyanga) has created potential market for dairy products;
• The central highway (road) has been improved to the
tarmac level.
2 Northern Zone
Tanga, Arusha, Kilimanjaro
• Estimated milk production: 184 million litres/year – which is about 12% of the national milk production;
• Total installed capacity: 103,200 litres/day – whereas current processing is 37,290 litres/day;
• Favorable climatic condition (temperate sort of climate) for improved dairy cattle;
• Largest tourist corridor in the country, hence existence
of potential market for dairy products such as cheese;
3 Southern
Highlands
Mbeya, Iringa,
Ruvuma, Rukwa)
• Milk production estimate: 178 million litres/year – which is about 13% of the national milk production;
• Installed processing capacity: 33,000 litres/day – and operating capacity is 9,600 litres/day;

39
• No medium and large milk processing plant to absorb the milk produced;
• Favorable climatic condition (temperate sort of climate)
for improved dairy cattle.
4 Eastern Zone Dar es Salaam, Coast
• Milk production estimate: 10 million litres/year – which is
about 0.7% of national milk production;
• Current installed milk processing capacity is 33,000
litres/day, whereas operating capacity is 8,000 litres/day.
5 Lake Zone Kagera, Mwanza,
Mara
• Milk production estimate: 327 million litres/year which is about 23% of the national milk production;
• Current installed milk processing capacity is 202,900
litres/day, whereas operating capacity is 9,600 litres/day.
4.4 Leather and Footwear
4.4.1 Investment and Production Potentials of the Leather Value Chain
Tanzania has the third largest population of livestock in Africa, counting 30.6 million cattle, 19
million goats and 5.5 million sheep. The large number of available livestock resources provides the base for a significant hides and skins production industry with estimated production
potential of about 92 million sq. ft per annum. The availability of hides and skins as raw
materials provides advantageous position for the country for investment setup in the tanning
sub-sector and subsequent leather products manufacturing sub-sectors. It is estimated that
the number of livestock to be slaughtered (off-take rate) is 1.5 million cattle, 2.5 million goats
and 0.5 million sheep per annum while actual collection of hides and skins ranges between 56% - 65% of the potential, which is equivalent to approximated 58 million sq. ft per annum.
Furthermore, poor performance of livestock sub sector, affects the performance of the
tanning sub sector and hence the leather products sub-sector also.
Generally, having an abundant resource base, Tanzania has immense investment opportunities
for the establishment of leather & footwear products manufacturing enterprises which will
further attract investments into tanneries and, therefore, absorb locally available raw
materials.
Huge opportunities for production of quality footwear and wide variety of leather products
including exotic products.
If the process is properly managed as is currently done in Ethiopia, the value addition to dried
hides can jump up many-folds, as many as thirty times of the value of the raw materials.
Table 4-7 Analysis of the Capacity Utilization in Tanneries, 2007
Company Location Installed
Capacity
Capacity Utilization
(ft2) in 2007
Products
1 Moshi Leather Industries Ltd Moshi 10,000,000 2,450,000 Wet blue hides and goat skins, finished leather

40
2 East Hides (T) Ltd Morogoro 24,000,000 19,000,000 Raw and wet blue hides, goat and sheep skins
3 Lake Trading Co. Ltd Kibaha 5,160,000 3,096,000
Raw and wet blue hides,
goat and sheep skins, finished leather
4 Afro Leather Industries Dar es Salaam
3,000,000 1,500,000 Wet blue hides
5 Salex Tanneries Ltd Arusha 4,050,000 3,040,000 Raw hides and skins, wet
blue goat and sheep skins
6 Himo Tanners and Planters Ltd Moshi 4,000,000 4,000,000 Wet blue hides, goat and
sheep skins, finished leather
Sub-Total Capacity 50,210,000 33,086,000
4.4.1.1 Tanning
Tanzania has seven operating tanneries – all of which are privately owned and are tanning to
semi-processed leather (pickled and wet blue) for export and small quantities of finished
leather for domestic consumption.
At full capacity utilization, the seven tanneries can process only 39% of the existing production
potential. This is a clear indication that, there is ample potential for further investment in the
tanning sub-sector. Tanneries and their capacities are shown on Table 4-8.
Table 4-8 Tanneries and their Capacities
Company Location Installed Capacity
(Square Feet) Utilization capacity
(%age)
1 Tanzania Leather Tanneries
(East Hides Tannery Ltd) Morogoro 10,000,000 87
2 Late Trading Co. Ltd Kibaha 4,500,000 56.7
3 Afro Leather Industries Dar es Salaam 4,000,000 82
4 Salex Tanneries Ltd Arusha 4,000,000 54.7
5 Himo Tanneries and Planters Moshi 3,000,000 46.2
6 Moshi Leather Industries Moshi 10,000,000 82
7 JAET Ltd Mwanza 375,000 100
Total Capacity 35,875,000
4.4.1.2 Footwear and Leather Goods
The hides, Skins and Leather industry in Tanzania is one of the most important industries in
the economy of the country. Available statistics (2016/17) indicate that, the country has 30.6 million cattle, 19 million goats and 5.5 million sheep. With an off-take rate of 10 – 15% for
cattle, 28% for goats and 29% for sheep the potential annual production of raw materials is
estimated at 2.8 million hides, 3.8 million goat skins and 1 million sheep skins – equivalent to
91.1 million square feet.
On average, 56% of the total hides and 65% of the total skins produced are collected – out of
which, only 30% are being processed. The remaining 70% of the hides and skins are exported in raw form and therefore, there is a need to invest in value addition industries such as tanning,
footwear and leather goods.

41
Production of footwear and leather goods is dominated by micro-enterprises and a few small
enterprises - focusing on domestic and to some extent, tourist markets.
It is estimated that the current production of shoes is about 720,000 pairs per annum using
mainly imported finished leather - against the current consumption of 20 million pairs of shoes
per year.
There are prospects for further investment in the footwear and leather goods industry for
domestic and export markets. The footwear, leather goods industries and their capacities is
indicated in Table 4-9.
Table 4-9 Footwear, leather goods industries and their capacities
Name of Establishment Location Products (Services)
Capacity (Pairs of bags/annum)
Installed Utilization
1 Noble Footwear and
Accessories Dar es salaam Footwear 52,000 0
2 J.A.E (T) Ltd Mwanza Footwear and leather
goods 39,000 39,000
3 Ok Plast Ltd Dar es salaam Footwear (sandals) 9,360 5,200
4 Peramiho Ltd Ruvuma Footwear (Ladies
footwear) 3,900 2,600
5 Italy Shoe Dar es Salaam Footwear 52,000 39,000
6 DSM Training Production Centre
Dar es Salaam Footwear & Leather products
39,000 5,200
7 Twins Leather Products Moshi Leather products (bags) 2,600 2,600
8 Morogoro Training Production Centre
Morogoro Footwear & Leather products
26,000 2,600
9 Shah Industries Moshi Leather goods (bags) 13,000 7,800
Tanzania has a number of national investors in the leather industry. Some of these are seeking
for joint venture arrangements in leather processing, footwear and leather goods
manufacturing. Their contacts are provided in Table 4-10.
Table 4-10 Contacts of Some Footwear & Leather Manufacturers
Company Current
Occupation Area of
Investment Location e-Mail Address
1 Jaet (T) Ltd
Footwear and
leather goods manufacture
Leather processing,
Footwear and leather goods
Mwanza [email protected]
2 Covenant Exporter of
hides and skins
Leather
processing Mwanza [email protected]
3 Lake
Trading
Tanning of hides
and skins
Footwear and
leather goods Kibaha [email protected]
4 Himo Tanners
Tanning of hides and skins
Leather
processing and manufacture of goods
Moshi [email protected]
5 Salex
Tannery
Tanning of hides
and skins
Expansion up to
finishing Arusha [email protected]
6 Kirobe Investment
Exporter of hides and skins
Leather processing
Dodoma [email protected]

42
4.4.1.3 Challenges of the Leather Value Chain
a) Tanzania’s leather and leather products industry has been influenced by a number of
challenges against further growth which hinders its contribution to the economy in terms
of:
i. Employment and income generation opportunities to address respective
unemployment and income poverty concerns
ii. Increased foreign earnings through exports iii. Increased Government revenues
iv. Increased industrial interlinked business opportunities and hence raise the
subsector’s contribution to industrial sector growth and national economic
development at large.
b) The challenges include the following:
i. Human resources capacity ii. Physical infrastructure and logistics
iii. Incentives for investments
iv. Safeguard measures to domestic industries (particularly MSMEs)
v. Access to financial services
vi. Appropriate and affordable technology and technological transfer
vii. Information networking and integrated market development viii. Products quality, design and diversification
ix. Availability and reliability of quality finished leather for leather products and leather
goods manufacturing.
4.4.1.4 Development Plans
a) On-going implementation of the Integrated Hides, Skins and Leather Sector Development
Strategy b) Formulation and implementation of national programs geared towards development and
promotion of leather products manufacturing in the country
i. Industrial Village Development Support Program – IVSD Program
ii. Product Quality Improvement and Diversification Support Programmed (PQI-
DSP)
iii. Promotional Program on Made in and Buy Tanzanian Leather Products (PP-MTLP) c) Revival and strengthening of Tanzania Institute of Leather Technology (now Mwanza DIT
Campus) for human resource development.
d) Domestic Investment Promotion Initiative Program (DIPI)
e) Initiative on technology, technological transfer and financing.
Table 4-11 Quantitative Targets of Leather Sub-sector (US$’000)
HS Code Unit 2007 2015 2025
Export Import Export Import Export Import
Hides and skins Kg 10,569,076 106,453 0 8,000,000 0 12,000,000
Semi-processed
leather 5,566,405 69,795 500,000 4,000,000 0 7,000,000
Finished Leather Ft2 0 1,200,000 300,000 1,2000,000 900,000 3,000,000
Footwear Pair 1,132,611 31,000,000 8,000,000 15,000,000 15,000,000 13,000,000
Leather goods Kg 17,553 9,313,811 5,500,000 12,000,000 15,000,000 10,000,000

43
4.5 Animal Feeds
Animal feeds are important inputs in livestock production – which accounts for over 70% of
production costs.
The main types of animal feed resources available in Tanzania are pastures, fodder crops, crop
residues and compounded feeds. However, ruminants in the country depend on natural
pastures for about 100%.
4.5.1 Pasture and Fodder Crops
There are several investments in pastures and fodder production in the country. Currently production is in the tune of 303,000 bales of hay while the demand exceeds 1,000,000 bales
per year. However, mostly ruminants’ production in the country depends on natural pastures
and crop residues and little supplementation for the case of dairy animals.
Improved pasture seed production to a greater part is done by government farms. These are
Vikunge and Langwira farms with production capacity of about 40 tons of seeds produced
annually. Improvement in areas of pasture production and conservation for dry season feeding will improve livestock productivity. There is need therefore, for investing in pasture and
pasture seed production and conservation.
4.5.2 Compounded Animal Feeds
Compounded feedstuffs production is estimated at 800,000 tons per annum while the
potential demand stands at 2.5 million tons. There are about 57 animal feed mills/plants in the
country which are not operating to their optimal capacity and most of them are located in Dar es Salaam, Coast, Arusha and Mwanza regions. The production capacity for the different
animal feeds plants is shown in Table 4-11.
Table 4-12 Animal Feeds Processors
Region Name of Plant Type of animal feeds
produces District
Production
(Tons/day)
Capacity Production
1 Arusha
Kijenge Animal Pruction Ltd
Poultry, pig, dairy and horse feeds
Arusha - -
Fammy Poultry Poultry feeds Arusha - -
HAFVET Products Poultry, pig and dairy feeds Arsuha - -
WAPO animal feeds product
Poultry feeds Arusha - -
Ilboru Animal Feed Poultry and dairy feeds Arusha - -
Nane Nane Animal
Feed Poultry and dairy feeds Arusha - -
Dhariwal Trading Company
Poultry and dairy feeds Arusha - -
2 Dar es Salaam
Interchick Co Poultry and dairy feeds Kinondoni
Tausi Animal Feeds Poultry and dairy feeds Kinondoni
Hill Animal Feeds Poultry and dairy feeds Kinondoni
Igo Animal Feeds Poultry and dairy feeds Kinondoni
Lengesia Animal
Feeds Poultry and dairy feeds
Kinondoni
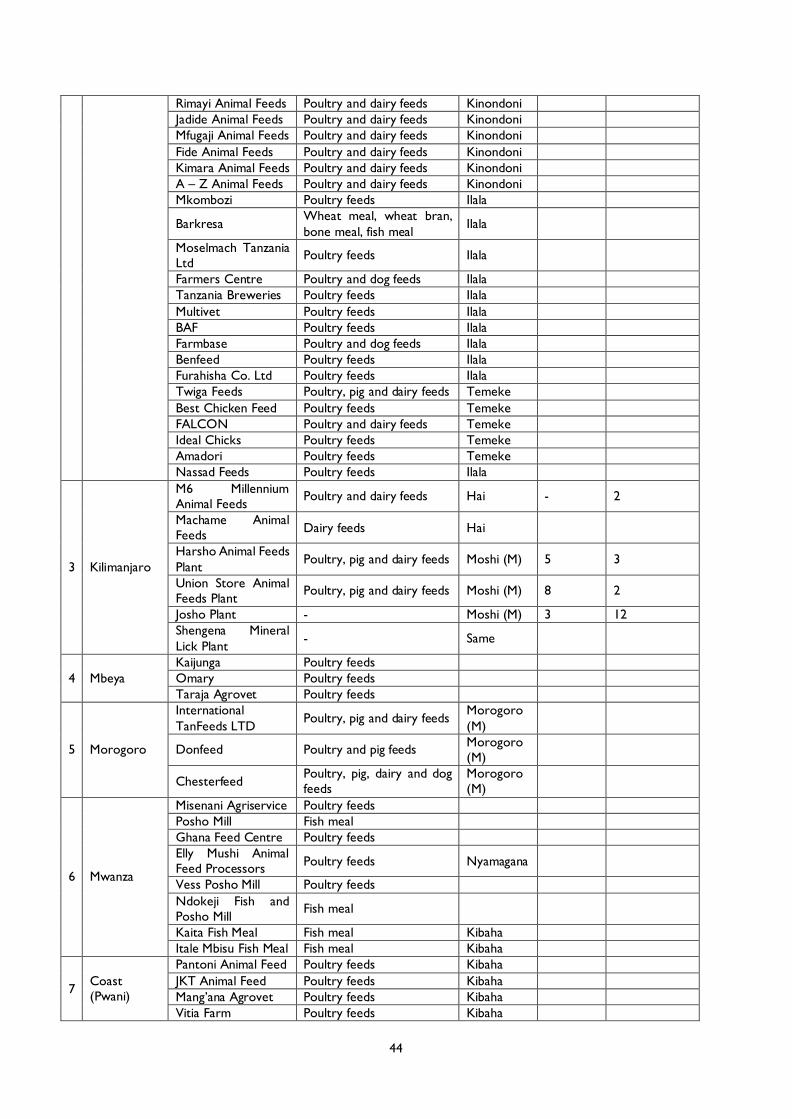
44
Rimayi Animal Feeds Poultry and dairy feeds Kinondoni
Jadide Animal Feeds Poultry and dairy feeds Kinondoni
Mfugaji Animal Feeds Poultry and dairy feeds Kinondoni
Fide Animal Feeds Poultry and dairy feeds Kinondoni
Kimara Animal Feeds Poultry and dairy feeds Kinondoni
A – Z Animal Feeds Poultry and dairy feeds Kinondoni
Mkombozi Poultry feeds Ilala
Barkresa Wheat meal, wheat bran,
bone meal, fish meal Ilala
Moselmach Tanzania
Ltd Poultry feeds Ilala
Farmers Centre Poultry and dog feeds Ilala
Tanzania Breweries Poultry feeds Ilala
Multivet Poultry feeds Ilala
BAF Poultry feeds Ilala
Farmbase Poultry and dog feeds Ilala
Benfeed Poultry feeds Ilala
Furahisha Co. Ltd Poultry feeds Ilala
Twiga Feeds Poultry, pig and dairy feeds Temeke
Best Chicken Feed Poultry feeds Temeke
FALCON Poultry and dairy feeds Temeke
Ideal Chicks Poultry feeds Temeke
Amadori Poultry feeds Temeke
Nassad Feeds Poultry feeds Ilala
3 Kilimanjaro
M6 Millennium Animal Feeds
Poultry and dairy feeds Hai - 2
Machame Animal Feeds
Dairy feeds Hai
Harsho Animal Feeds
Plant Poultry, pig and dairy feeds Moshi (M) 5 3
Union Store Animal Feeds Plant
Poultry, pig and dairy feeds Moshi (M) 8 2
Josho Plant - Moshi (M) 3 12
Shengena Mineral
Lick Plant - Same
4 Mbeya
Kaijunga Poultry feeds
Omary Poultry feeds
Taraja Agrovet Poultry feeds
5 Morogoro
International
TanFeeds LTD Poultry, pig and dairy feeds
Morogoro
(M)
Donfeed Poultry and pig feeds Morogoro (M)
Chesterfeed Poultry, pig, dairy and dog
feeds
Morogoro
(M)
6 Mwanza
Misenani Agriservice Poultry feeds
Posho Mill Fish meal
Ghana Feed Centre Poultry feeds
Elly Mushi Animal Feed Processors
Poultry feeds Nyamagana
Vess Posho Mill Poultry feeds
Ndokeji Fish and Posho Mill
Fish meal
Kaita Fish Meal Fish meal Kibaha
Itale Mbisu Fish Meal Fish meal Kibaha
7 Coast (Pwani)
Pantoni Animal Feed Poultry feeds Kibaha
JKT Animal Feed Poultry feeds Kibaha
Mang’ana Agrovet Poultry feeds Kibaha
Vitia Farm Poultry feeds Kibaha

45
Kongowe Feed and Millers
Poultry feeds Mkuranga
8 Shinyanga
Kaijunga Poultry feeds
Omari Poultry feeds
Taraja Agrovet Poultry feeds
9 Singida VETA Singida Poultry and dairy feeds Singida

46
4.6 Other Livestock By-products
On the average, 70 – 120 cattle are slaughtered daily in Municipal and City abattoirs – apart from those slaughtered in rural areas. This number confirms the availability of large quantities
of livestock by-products (blood, bones, horns, hooves, hair, wool, glands, intestines, stomachs,
feathers and gut contents) produced daily to attract investment.
Currently, Tanzania is lacking industries for processing these by-products. In this regard,
investors are encouraged to invest in this area either in partnership arrangement or as a sole
proprietor. These by-products have various uses which are of economic importance as shown
in Table 4-13.
Table 4-13 Other Livestock Products
Name of by-product Use
1 Blood
• Liquid blood: used as a source of pharmaceuticals as albumin for the glue, textile and dye industries
• Dried blood: used as blood flour, blood meal for animal feed and as fertilizer
2 Bones
• Used as animal feed, fertilizer, gelatin and glue, manufacture of combs,
buttons cutlery handlers, glue, gelatin, tallow and ornaments
3 Hooves and horns
• Used as meal, fertilizer, gelatin and glue, manufacture of combs, buttons,
hairpins and articles of tourists attraction including souvenirs
4 Hair and wool • Used in the manufacture of brushes, yarn, fabrics and fibers
5 Glands and organs • Used for pharmaceuticals
6 Intestines
• Used to make sausage casings, musical instruments/strings and surgical
ligatures
7 Stomachs, other offal, condemned meat
• Used to make tallow for soap and glycerin, lubricants, grease and waxes
8 Got contents, manure • Used to make compost, biogas as fuel for heating and lighting
4.7 Veterinary Laboratories
Laboratories have the mandate to conduct animal disease research, diagnosis and production
of biologicals. Areas of investments include: -
a) Construct and equip the new vaccines production units in Tanzania;
b) Develop new vaccines and expand production of the existing ones.
4.8 Abattoirs and Meat Processing Plants
The government in collaboration with private sector has initiated the establishment of Arusha,
Dodoma, Morogoro and Sumbawanga abattoirs. The slaughter capacity of each of these
abattoirs, range from 150 to 200 animals per day, and therefore, unable to meet the demand
of processed meat for both domestic and export markets.

47
The estimated domestic demand for meat is 449,673 tons/year, while there is also an
increasing demand for the export markets to UAE, Kuwait and Oman. In this respect,
investment in the abattoirs and meat processing plants exist in three categories namely: -
a) Joint venture with the existing abattoirs;
b) Outright purchase of semi-finished abattoirs; and
c) Construction and operation of new abattoirs and processing plants.
Error! Reference source not found.Table 4-14 shows existing or semi-finished abattoirs a
re available for joint venture of purchase: -
Table 4-14 the State of Abattoirs
Name of Abattoir Location
(District) Owner
Land Size
(hectares)
Slaughter Installed Capacity
(animals/day)
Cattle Sheep or
Goats
1 Ruvu Kibaha NARCO 2,000 800 400
2 Dodoma Dodoma NICO and NARCO 11 200 200
3 Mbeya Mbeya 102 25
4 Kyaka Missenyi 700
5 Bunda Bunda 200
6 Themi Arusha 200

48
5 Livestock Sectoral Analysis Key Findings on Cross-Cutting Issues
The productivity enhancing technologies and policy interventions with the greatest potential for contributing to achieving Tanzania’s national agricultural objectives include feed, animal
health, and animal genetics development.
Using the Livestock Sub-sector Investment and Policy Toolkit (LSIPT)11, constraints and
opportunities related to these interventions were analyzed – hence unveiling opportunities
for locals and foreigners to grab!
5.1 Feed
Crop and livestock production are the dominant economic subsectors providing livelihoods,
incomes and employment to more than 80% of Tanzania’s population. The livestock sector
analysis showed feed is the most critical resource constraint to growth and modernization in
the livestock sector. Though endowed with natural resources, a large resource base for the country’s millions of livestock, the utilization of grazing lands for sustainable livestock
production is hampered by seasonal variations in the quality and quantity of forage etc. While
the country also produces substantial amounts of cereals and root crops, whose residues are
valuable feeds for livestock, these crops are produced primarily for human consumption and
some are in short supply.
The livestock feed deficit is aggravated by the effects of climate change on feed quantity and quality. Extended dry seasons, frequent droughts, erratic rainfall manifested by shifts in the
onset and cessation of rainfall, and increased temperatures have drastically reduced the
availability of both roughages and concentrate feeds. Pasture and water shortages have also
led to overgrazing and resource conflicts between livestock keepers and other land users.
The LSIPT was employed to measure the potential supply of forage, fodder and other feed
resources and future requirements for cattle, sheep, goats, poultry and pigs in the three
production zones and the specialized systems.
Results indicated a clear shortage in feed and forage supply in the country, with available
resources making up only 26% of required feed on average (with deficits in all types of rainfall
years). Unless significant action is taken, projected shortages are set to worsen substantially
over the next 15 years with available resources making up only 15% of the feed required.
The central zone is expected to be the most severely affected since the systems there rely most on grazing, leading to increased mortality rates and poorer animal nutritional health.
Interventions in this zone should focus on improving pasture productivity in the grazing lands
and fodder conservation, and reducing the ruminant livestock population. In other systems
and zones, the focus needs to be on intensified on-farm forage production, as well as
commercial-scale feed production through irrigation where possible. The intensification of
feeding programs, where feasible, should also be pursued in tandem with breeding programs
to enhance the genetic potential of livestock.
In order to implement a well-informed investment promotional strategy for the livestock sub-
sector, Tanzania Investment Centre (TIC) partnered with the East Africa Trade and
Investment Hub (EATIH) to conduct a study and identify investment opportunities of the sub-
sector.

49
5.2 Animal Health
More than 85% of Tanzanians live in rural areas, out of which about 37% keep livestock. The livestock population is estimated at 107 million animals, of which an estimated 88% are kept
in smallholder traditional systems. Animal health services - through disease control and
prevention - remain one of the main drivers of livestock production and productivity, along
with feed and genetics. In 2015 alone, the Tanzanian government recorded 329 animal disease
outbreaks involving 32 animal disease conditions and 24,231 clinical cases, causing 5,864
deaths. The control and prevention of animal diseases is a recurring and costly burden to
individual livestock keepers, commercial herd owners and the local and national governments.
Transboundary animal diseases and zoonosis are particularly important constraints to
livestock production in pastoral and agro-pastoral areas and are by and large the most
important constraint to herd health and trade in animals and their products. The main diseases
constraining livestock production in Tanzania are Rift Valley fever, foot-and-mouth disease,
peste des petits ruminants (PPR), African swine fever, Marek’s disease, Newcastle disease,
contagious bovine pleuropneumonia (CBPP), brucellosis and East Coast fever.
Based on expert opinion and data on animal diseases, the toolkit was used to assess qualitative
and quantitative socioeconomic impacts of diseases on household assets, markets/value chains
and intensification of production, develop a priority list of animal diseases, and characterize
the status of veterinary infrastructure in the country. This work sought to determine the
optimal allocation of financial and human resources for surveillance, prevention, control and elimination of selected infectious diseases. The species targeted were food-producing animals:
mainly cattle (beef, dairy), small ruminants (sheep and goats), chicken and pigs. The identified
priority diseases1 hampering:
a) household assets were CBPP for cattle; Rift valley fever for small ruminants, African swine
fever for pigs; and Newcastle disease for poultry;
b) markets and value chains were foot-and-mouth disease for cattle; brucellosis for small ruminants; African swine fever for pigs; and salmonellosis for poultry; and
c) livestock intensification were foot-and-mouth disease for cattle; PPR for small ruminants;
African swine fever for pigs; and salmonellosis for poultry.
Inadequate resources including funds, skilled personnel and logistics have also weakened the
ability of national veterinary services to contribute to reducing the impact of reported
transboundary and zoonotic diseases and pests.
Detecting, controlling and preventing these diseases requires a highly-coordinated public
surveillance and response system at all levels in all areas of the country. The department of
veterinary services needs to strengthen the country’s animal disease surveillance and
reporting system including through empowering livestock communities to detect and report
disease incidents to facilitate prompt responses to outbreaks.
5.3 Animal Genetics
The absence of effective livestock breeding and selection programs in Tanzania has hindered
the supply of improved breeds to farming communities. Better coordination of the
development and protection of animal genetic resources (AnGR) in Tanzania should involve
the establishment of reliable and sustainable germplasm delivery systems and the involvement
of the private sector in animal genetic improvement.

50
Employing the LSIPT, an inventory and characterization of AnGR in Tanzania was undertaken.
Management, conservation and maintenance policies and practices were evaluated for the three production zones in the country and the findings were discussed with key experts and
main stakeholders from the private and public sectors.
Crossbreeding local cattle should focus on the interbreeding of breed-types, taking advantage
of additive gene action.
It is recommended that for dairy, suitable exotic breeds include Friesian, and for dual-purpose
(milk and meat), the best breed is Simmentals. For small ruminants, selection should focus on improving growth rates, crossbreeding indigenous stock with the Boer, Saanen, Dorper and
Malya.
For poultry breeding, there is a need to develop a national recording program to help identify
local breeds and strains for commercial production. Indigenous chickens need to be
characterized and selected, and desirable traits for improvement and conservation established.
Breeds developed elsewhere also need to be tested.
Inbreeding of pigs needs to be controlled and new or improved breeds introduced. The
importation and multiplication of breeds with proven herd performance and track records
should be undertaken by the private sector in line with MLF policy and oversight. This
oversight will require the establishment and enforcement of a legal framework, including the
development of an animal breeding policy and the implementation of the animal breeding bill
currently before parliament.
Livestock selection for genetic improvement needs to focus on:
a) Ensuring effective breeding, selection and conservation programs are in place, including
open nucleus breeding schemes and the renovation of public livestock farms and artificial
insemination centres.
b) The establishment of data recording systems for on-station and on-farm breed evaluation
programs for both locally-adapted and exotic breeds and their crosses. c) The provision of training and support to strengthen animal breeding infrastructure, such
as artificial insemination and minus-one-element-technique laboratories.
Priority and complementary institutional and policy recommendations: -
The review of existing policies, institutions, laws and regulations highlights a lack of
enforcement capacity and the need to modify out-of-date policies are priorities. Land
allocation and tenure regulations particularly need to be revised to encourage private sector investment in feed production to alleviate severe shortages. Key policy priorities in related
areas include:
a) Offering incentives for the private sector involvement in veterinary service provision in
rural areas, including cost sharing for the prevention and control of diseases of economic
importance.
b) Establishing a reporting system for the collection of veterinary drugs/vaccines performance at all levels.
c) Strengthening enforcement of the Animal Disease Act 2003 for poultry and the Grazing
Land and Animal Feed Resources Act 2010, building the capacity of animal feed and meat

51
inspectors, and formulating and enforcing poultry feed inspection guidelines and
biosecurity and other relevant disease control guidelines. d) Taking measures to promote investment in processing facilities for hides and skins, and
ensuring enforcement of relevant trade regulations.
e) Strengthening market price and related information for live animals and products (i.e. hides
and skins).
f) Introducing policies and enforcing laws on rangeland improvement: designating grazing
areas in rangelands owned by livestock farmers; encouraging environmentally friendly tsetse control; mandating dipping and vaccinations; and incentivizing the adoption of
climate change adaptation and mitigation practices.
g) Ensuring the implementation of the draft animal breeding act is accompanied by the
provision of sufficient human resources and infrastructure and the establishment of
livestock breeders’ associations.
h) Enforcing the Grazing Land and Animal Feed Resources Act 2010, and promoting the commercialization of maize and soybean production for livestock feeds, and contract
farming for feed raw materials, such as soybean.
i) Reducing the high costs associated with livestock research by increasing investment in
facilities, infrastructure and human resources, mandating more inclusive associations and
platforms of experts to promote collaboration among researchers and with other
stakeholders, including the private sector. j) Increasing the quantity and quality of extension staff and associated infrastructure and
facilities, and clearly delineating roles and responsibilities between ministry and local
government authorities.
6 Conclusion and Recommendations
As for ranches, all are operating under-capacity, in terms of livestock population. Typically,
Kongwa Ranch (7%), Mkata Ranch (0%), Ngerengere LMU (2%) and West Kilimanjaro Ranch (1%) - all belonging to the National Ranching Company (NARCO). Mismanagement and
carelessness attributes to the poor performance. No practical significant signs (of innovation)
to improve the subsector were seen from the visited livestock ranches and LMUs.
6.1 Recommendations
a) NARCO Ranches & LMUs: The government of Tanzania needs to change the
organization structure of the ranching system in the entire country. Instead of having
animal scientists and veterinary doctors running the ranches, people with demonstrated
business acumen, entrepreneurial spirit and with good project management skills should
be employed to run these ranches. Moreover, these managers should be given annual
performance goals/objectives – against which they will be held accountable (rewarded or
demoted).
b) All ranches should be run as profit generating projects. The government should provide
initial seed money for ranches to use as capital (expand parent stock base), improve
infrastructure etc.
c) Business environment: - the government should protect home-made leather &
footwear products. Amendments of appropriate policies should be done.

52
Overall, it has also been learned that, the government of Tanzania’s weak capacity to conduct
regular monitoring & evaluation (M&E), contributed to the current disappointment – as
periodic M&E could have signaled potential breach of contract or business failure.