Ministry of Transport, The United Republic of Tanzania
114
EI JR 14-068 Ministry of Transport, The United Republic of Tanzania Comprehensive Transport and Trade System Development Master Plan in the United Republic of Tanzania – Building an Integrated Freight Transport System – Final Report Volume 4 Pre-Feasibility Studies March 2014 JAPAN INTERNATIONAL COOPERATION AGENCY PADECO Co., Ltd. Nippon Koei Co. Ltd. International Development Center of Japan Incorporated
-
Upload
khangminh22 -
Category
Documents
-
view
5 -
download
0
Transcript of Ministry of Transport, The United Republic of Tanzania
EI JR
14-068
Ministry of Transport, The United Republic of Tanzania
Comprehensive Transport and Trade System Development Master Plan in the United Republic of Tanzania
– Building an Integrated Freight Transport System –
Final Report
Volume 4
Pre-Feasibility Studies
March 2014
JAPAN INTERNATIONAL COOPERATION AGENCY
PADECO Co., Ltd. Nippon Koei Co. Ltd.
International Development Center of Japan Incorporated

Note: In this study, the work for Master Plan Formulation and Pre-Feasibility Study was completed at the end of 2012 and a Draft Final Report was issued. This final report incorporates comments on the draft final report received from various concerned parties. In accordance with Tanzanian Laws, the process of Strategic Environmental Assessment (SEA) was carried out after the issuance of the Draft Final Report in order to allow for the study to be officially recognized as a Master Plan. The results of the one year SEA have been incorporated in this report. The report contains data and information available at the end of 2012 and does not reflect changes which have taken place since then, except for notable issues and those related to the SEA.
Comprehensive Transport and Trade System Development Final Report Master Plan in the United Republic of Tanzania Volume 4 Pre-Feasibility Studies
i
Contents
Chapter 1 Introduction ......................................................................................................... 1 1.1 Selection of Projects Subject to Pre-Feasibility Study ................................................ 1
1.1.1 Selection Criteria ................................................................................................. 1 1.1.2 Selected Projects ................................................................................................. 1
Chapter 2 Railway Rehabilitation ....................................................................................... 2 2.1 Background ................................................................................................................. 2 2.2 Description of Candidate Projects for Pre-Feasibility Study ...................................... 2
2.2.1 Overhaul and Re-Manufacturing of Diesel-Electric Locomotives ...................... 3 2.2.2 Rehabilitation of Bridges and Culverts on the Central Line between
Tabora and Kigoma ........................................................................................... 12 2.2.3 Re-laying of Track on the Central Line between Tabora and Kigoma in
Heavier Rail....................................................................................................... 12 2.3 Railway Traffic Forecasts for Central Line ............................................................... 12
2.3.1 Forecast Methodology ....................................................................................... 12 2.3.2 Requirements of Locomotives and Wagons ...................................................... 13 2.3.3 Freight Volume Forecast for the Central Line ................................................... 16
2.4 Operating Plan ........................................................................................................... 17 2.4.1 Key Operating Assumptions .............................................................................. 17 2.4.2 Wagon and Train Flow Forecasts ...................................................................... 19 2.4.3 Requirement of Locomotives for Future Services on the Central Line ............. 19 2.4.4 Requirements of Wagons for Future Services on the Central Line ................... 20
2.5 Results of Structure Condition Survey between Tabora and Kigoma ....................... 21 2.5.1 Survey Schedule and Method ............................................................................ 21 2.5.2 Summary of the Structure Condition Survey .................................................... 21
2.6 Project Capital Cost Estimates .................................................................................. 24 2.6.1 Restoration of Diesel Locomotives ................................................................... 24 2.6.2 Rehabilitation of Bridges and Structures ........................................................... 25 2.6.3 Track Rehabilitation .......................................................................................... 47
2.7 Project Operating Cost and Revenue Projections ...................................................... 48 2.7.1 Forecasts of Train Unit Operating Costs Relative to Unit Revenue .................. 48 2.7.2 Forecasts of Annual Revenues and Operating Costs ......................................... 50
2.8 Financial Analysis ..................................................................................................... 52 2.8.1 Purpose and Methodology ................................................................................. 52 2.8.2 Assumptions and Conditions ............................................................................. 53 2.8.3 Analysis ............................................................................................................. 54
2.9 Conclusions and Recommendations .......................................................................... 62 2.9.1 Suggestions for TRL Operation and Management ............................................ 62 2.9.2 Improvements in Morogoro Workshop ............................................................. 63
Chapter 3 Refurbishment of Kigoma Port ........................................................................ 64 3.1 Selection of Short-term Refurbishment Plan ............................................................. 64
3.1.1 Refurbishment of Kigoma Port ......................................................................... 64 3.2 Preliminary Design of Facilities for Kigoma Port ..................................................... 66
3.2.1 Present Situation of Facilities at Kigoma Port .................................................. 66
Comprehensive Transport and Trade System Development Final Report Master Plan in the United Republic of Tanzania Volume 4 Pre-Feasibility Studies
ii
3.2.2 Construction of the Extension of the Quay Facility for the Container Cargo ................................................................................................................. 68
3.2.3 Refurbishment of the Existing Quay for the Container Cargo Marshalling Yard ................................................................................................................... 71
3.2.4 Refurbishment of the Existing Container Cargo Marshalling Yard ................... 71 3.2.5 Others ................................................................................................................ 76
3.3 Provision of Container Handling Equipment ............................................................ 76 3.4 Implementation Schedule .......................................................................................... 76
3.4.1 Overall Implementation Schedule for Kigoma Port Refurbishment ................. 76 3.5 Cost Estimate ............................................................................................................ 76
3.5.1 Total Cost for the Development of Kigoma Port ............................................... 76 3.5.2 Basic Costs of Materials, Equipment, and Labour ............................................ 77 3.5.3 Cost Estimate of Project Components ............................................................... 79
3.6 Financial Analysis ..................................................................................................... 82 3.6.1 Purpose and Methodology ................................................................................. 82 3.6.2 Assumptions and Conditions ............................................................................. 83 3.6.3 Analysis ............................................................................................................. 84
Chapter 4 Result of Scoping Study on Subjected Pre-F/S Projects ................................ 89 4.1 Scoping Result of Kigoma Port Refurbishment Project ............................................ 89 4.2 Scoping Result of Central Line Rehabilitation of Bridges and Culverts; and
Track Relay in Heavier Rail (Kigoma–Tabora) Project ............................................ 94 Appendices Appendix 1 Maintenance Examination and Overhaul Details for the Mainline
Locomotives ...................................................................................................... A-1
Appendix 2 Morogoro Workshop .......................................................................................... A-2
Comprehensive Transport and Trade System Development Final Report Master Plan in the United Republic of Tanzania Volume 4 Pre-Feasibility Studies
iii
Figures Figure 2.1 Effect of Locomotive Restoration on Daily Availability ........................................ 11 Figure 2.2 Forecast of Freight Tonnage Carried on the Central Line between Online
O/Ds .......................................................................................................................16 Figure 2.3 Type of Existing Structures ....................................................................................21 Figure 2.4 Summary of Structure Condition Survey Result ....................................................22 Figure 2.5 Breakdown of Grade D Structures .........................................................................22 Figure 2.6 Type of Reconstructed Bridges/Culverts ................................................................23 Figure 2.7 Train Operation Diagram 2 Trains Per 6 Days (Even Intervals) ............................25 Figure 2.8 Train Operation Diagram: 2 Trains Per 6 Days (Uneven Intervals) .......................26 Figure 2.9 Pipe Culvert (Current Situation).............................................................................33 Figure 2.10 Pipe Culvert (Reconstruction Plan) ........................................................................35 Figure 2.11 Box Culvert (Current Situation) .............................................................................37 Figure 2.12 Box Culvert (Reconstruction Plan) ........................................................................38 Figure 2.13 RC Bridge (Current Situation) ...............................................................................40 Figure 2.14 RC Bridge (Reconstruction Plan) ...........................................................................42 Figure 2.15 Reconstruction Procedure for Rehabilitation Work for Pipe Culvert .....................44 Figure 2.16 Reconstruction Procedure for Rehabilitation Work for Box Culvert .....................44 Figure 2.17 Reconstruction Procedure for Rehabilitation Work for RC Bridge ........................45 Figure 2.18 Project Implementation Schedule ...........................................................................46 Figure 2.19 Container Train Unit Operating Cost vs. Forecast Tonnages and Unit
Revenue, Central Line, 2013–2017 ........................................................................49 Figure 2.20 General Freight Train Unit Operating Cost vs. Forecast Tonnages and Unit
Revenue ..................................................................................................................50 Figure 2.21 Forecast of Annual Revenues (On-Line Traffic, Central Line) ..............................51 Figure 2.22 Forecast of Annual Operating Costs (On-Line Traffic, Central Line) ....................52 Figure 2.23 Forecast of Annual Revenue vs. Operating Cost (On-Line Traffic, Central
Line) .......................................................................................................................52 Figure 3.1 General Layout of Short-Term Development Plan for Kigoma Port ......................65 Figure 3.2 Present Situation of Kigoma Port ...........................................................................66 Figure 3.3 Location of Container Berth Extension ..................................................................68 Figure 3.4 Typical Cross Section of the Extension for the Gantry Crane Berth ......................70 Figure 3.5 Container Stacking Yard .........................................................................................71 Figure 3.6 Design Curves of Base Course Thickness ..............................................................73 Figure 3.7 Section of the Apron Pavement ..............................................................................74 Figure 3.8 Apron Joints ...........................................................................................................74 Figure 3.9 Pavement of Yard ...................................................................................................75 Figure 3.10 Construction Procedure for the Rehabilitation Work for Kigoma Port ..................79
Comprehensive Transport and Trade System Development Final Report Master Plan in the United Republic of Tanzania Volume 4 Pre-Feasibility Studies
iv
Tables Table 2.1 Proposed Schedule .................................................................................................10 Table 2.2 Average Daily Available Number of Locomotives ................................................. 11 Table 2.3 Effect of Locomotive Rehabilitation and Re-Railing on Schedule Speed on
Central Line ............................................................................................................14 Table 2.4 Annual Freight Haulage Capability per Locomotive (Freight Net Tonnes) ...........14 Table 2.5 Locomotive Availability for Freight Service ..........................................................15 Table 2.6 Freight Tonnage Forecast for TRL Network, 2013–2017 ......................................15 Table 2.7 Central Line – Traffic To/From On-Line ODs .......................................................16 Table 2.8 Central Line – Traffic To/From Off-Line ODs .......................................................17 Table 2.9 Train Cycle Times and Annual Trip Capacity – Central Line ................................19 Table 2.10 Forecast of Westbound Wagon and Train Flows on Central Line ..........................19 Table 2.11 Forecast of Locomotive Requirements for Operation of Central Line
Services ..................................................................................................................20 Table 2.12 Forecast of Wagon Requirements for Operation of Central Line Services ............20 Table 2.13 Type and Number of Bridges/Cuverts ....................................................................21 Table 2.14 Summary of Structure Condition Survey Result ....................................................22 Table 2.15 Breakdown of Grade D Structures .........................................................................22 Table 2.16 Types of Reconstructed Bridges/Culverts ..............................................................23 Table 2.17 Details of Reconstructed Bridges and Culverts ......................................................24 Table 2.18 Estimated Capital Cost and Disbursement Schedule for Locomotive
Rehabilitation .........................................................................................................25 Table 2.19 Quantities of Reconstruction Work ........................................................................26 Table 2.20 List of Field Survey Results and Refurbishment Method ......................................27 Table 2.21 Inspection Sheet Samples (for Pipe Culverts) ........................................................31 Table 2.22 Inspection Sheet Samples (for Box Culverts) ........................................................31 Table 2.23 Inspection Sheet Samples (for Reinfoced Concrete Bridges) ................................32 Table 2.24 Summary of Reconstruction Quantities .................................................................45 Table 2.25 Cost Estimate for Reconstruction Work between Tabora and Kigoma ..................47 Table 2.26 Cost Estimate for Track Re-laying Work between Tabora and Kigoma .................48 Table 2.27 Summary of Tonne-Km Forecasts, for On-Line Traffic, Central Line ...................51 Table 2.28 Initial Cost for Locomotive Rehabilitation ............................................................54 Table 2.29 Summary Results of the Cash Flow Analysis ........................................................55 Table 2.30 Cash Flow Analysis (Case 1)..................................................................................57 Table 2.31 Cash Flow Analysis (Case 13)................................................................................58 Table 2.32 Cash Flow Analysis (Case 25)................................................................................59 Table 2.33 Cash Flow Analysis (Case 37)................................................................................60 Table 2.34 Cash Flow Analysis (Case 49)................................................................................61 Table 3.1 Table Comparing the Quay Structure Types for the Extension Area ...................69 Table 3.2 Table of Quantitites for the Container Berth Extension .........................................70 Table 3.3 Table of Quantities for Refurbishment of the Existing Berth .................................71 Table 3.4 Load Conditions for the Container Stacking Area .................................................72 Table 3.5 Thickness of Sub-Base Course ...............................................................................73 Table 3.6 Reference Values for Concrete Slab Thickness ......................................................74 Table 3.7 Calculation of Apron Quantities .............................................................................75 Table 3.8 Quantities for Container Stacking Yard ..................................................................75 Table 3.9 Equipment List for Container Handling .................................................................76
Comprehensive Transport and Trade System Development Final Report Master Plan in the United Republic of Tanzania Volume 4 Pre-Feasibility Studies
v
Table 3.10 Construction Costs for Project Refurbishment Component ...................................77 Table 3.11 Cost of Materials to be Used in the Kigoma Port Project ......................................77 Table 3.12 Equipment Costs to be Used for Kigoma Port Project ...........................................78 Table 3.13 Costs of Labour for the Kigoma Port Project .........................................................78 Table 3.14 Costs of Execution Works in the Kigoma Port Area ..............................................78 Table 3.15 Construction Cost for the Extension of the Quay Facility for Container
Cargo ......................................................................................................................80 Table 3.16 Cost of Refurbishment of the Existing Quay of the Container Marshalling
Yard ........................................................................................................................81 Table 3.17 Rehabilitation Cost of the Concrete Pavement for the Container Marshalling
Yard ........................................................................................................................81 Table 3.18 Refurbishment Cost of the Concrete Block Pavement for the Container
Marshalling Yard ....................................................................................................82 Table 3.19 Procurement Cost for Container Handling Equipment ..........................................82 Table 3.20 Revenue Sources for the Port Operator ..................................................................83 Table 3.21 Summary of the Results of the Cash Flow Analysis ..............................................85 Table 3.22 Cash Flow Analysis (Case 1)..................................................................................86 Table 3.23 Cash Flow Analysis (Case 2)..................................................................................86 Table 3.24 Cash Flow Analysis (Case 3)..................................................................................87 Table 3.25 Cash Flow Analysis (Case 4)..................................................................................87 Table 3.26 Cash Flow Analysis (Case 5)..................................................................................88 Table 3.27 Cash Flow Analysis (Case 6)..................................................................................88 Table 4.1 Scoping Result of Kigoma Port Refurbishment Project .........................................90 Table 4.2 Scoping Result of Central Line Rehabilitation of Bridges and Culverts; and
Track Relay in Heavier Rail (Kigoma–Tabora) Project .........................................95
Photos Photo 2.1 Pipe Culvert ............................................................................................................33 Photo 2.2 Box Culvert ............................................................................................................36 Photo 2.3 RC Bridge 1 ............................................................................................................40 Photo 2.4 RC Bridge 2 ............................................................................................................42 Photo 3.1 Existing Container Berth ........................................................................................66 Photo 3.2 Extension of the Container Berth ...........................................................................67 Photo 3.3 Present Situation of the Area of Marshalling Yard .................................................67
Comprehensive Transport and Trade System Development Final Report Master Plan in the United Republic of Tanzania Volume 4 Pre-Feasibility Studies
vi
Abbreviations and Acronyms FIRR Financial International Rate of Return
GDP Gross Domestic Product
ICD Inland Container Depot
JICA Japan International Cooperation Agency
OEM Original Equipment Manufacturer
SUMATRA Surface and Marine Transport Regulatory Authority
TAZARA Tanzania Zambia Railway Authority
TEU Twenty Equivalent Unit
TPA Tanzania Ports Authority
TRA Tanzania Revenue Authority
TRL Tanzania Railway Limited
Comprehensive Transport and Trade System Development Volume 4 Chapter 1 Master Plan in the United Republic of Tanzania Introduction
1
Chapter 1 Introduction
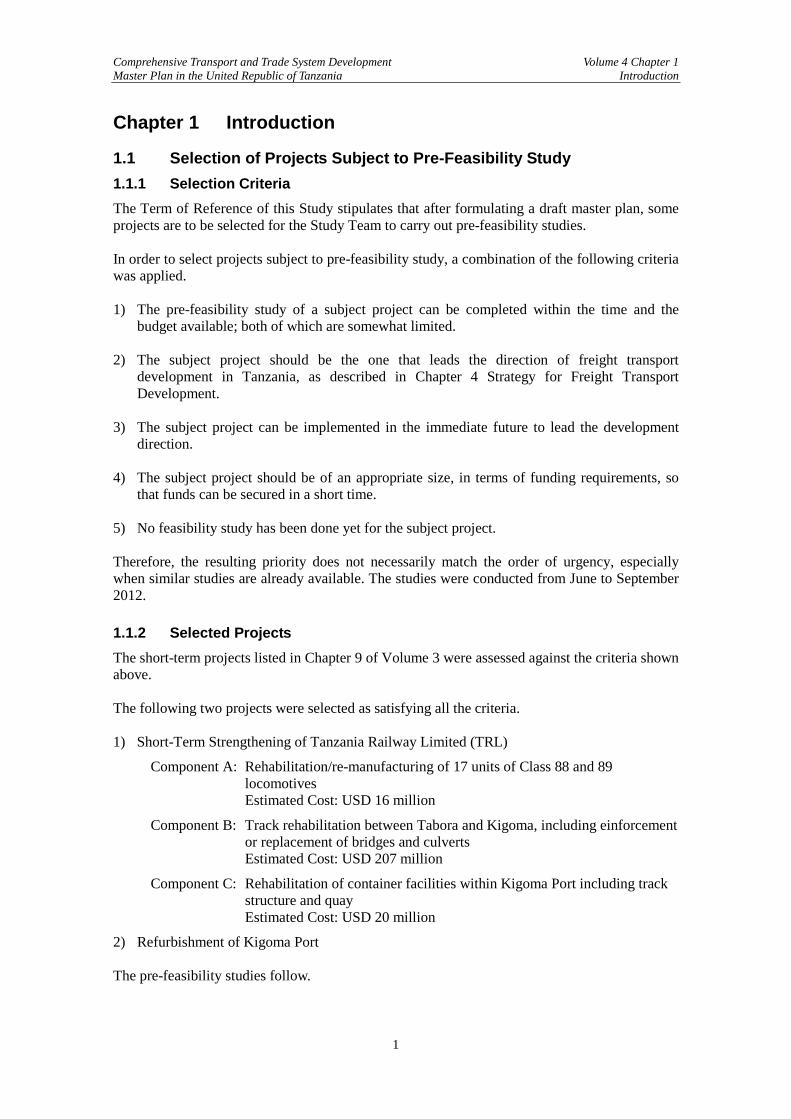
1.1 Selection of Projects Subject to Pre-Feasibility Study 1.1.1 Selection Criteria The Term of Reference of this Study stipulates that after formulating a draft master plan, some projects are to be selected for the Study Team to carry out pre-feasibility studies. In order to select projects subject to pre-feasibility study, a combination of the following criteria was applied. 1) The pre-feasibility study of a subject project can be completed within the time and the
budget available; both of which are somewhat limited. 2) The subject project should be the one that leads the direction of freight transport
development in Tanzania, as described in Chapter 4 Strategy for Freight Transport Development.
3) The subject project can be implemented in the immediate future to lead the development
direction. 4) The subject project should be of an appropriate size, in terms of funding requirements, so
that funds can be secured in a short time. 5) No feasibility study has been done yet for the subject project. Therefore, the resulting priority does not necessarily match the order of urgency, especially when similar studies are already available. The studies were conducted from June to September 2012. 1.1.2 Selected Projects The short-term projects listed in Chapter 9 of Volume 3 were assessed against the criteria shown above. The following two projects were selected as satisfying all the criteria. 1) Short-Term Strengthening of Tanzania Railway Limited (TRL)
Component A: Rehabilitation/re-manufacturing of 17 units of Class 88 and 89 locomotives
Estimated Cost: USD 16 million
Component B: Track rehabilitation between Tabora and Kigoma, including einforcement or replacement of bridges and culverts
Estimated Cost: USD 207 million
Component C: Rehabilitation of container facilities within Kigoma Port including track structure and quay
Estimated Cost: USD 20 million
2) Refurbishment of Kigoma Port The pre-feasibility studies follow.
Comprehensive Transport and Trade System Development Volume 4 Chapter 2 Master Plan in the United Republic of Tanzania Railway Rehabilitation
2
Chapter 2 Railway Rehabilitation
2.1 Background Based on the results of the Comprehensive Transport and Trade System Development Master Plan (hereinafter called the Master Plan) prepared by the JICA Study Team, it was acknowledged that revitalization and restoration of the railway system will be one of the major key prerequisites for the development of the transport and trade system in Tanzania. The freight tonnage handled by TRL sharply declined from 1.56 million tonnes in 2003, its peak year, to 0.26 million tonnes in 2010. The main reason for this sharp decline has been the severe shortage of locomotives due to TRL’s having inadequate funds to purchase the spare parts needed to carry out major overhauls of its main line and shunting locomotives. A decrease in the scheduled speed of trains has been another reason for the decline of freight tonnage. Due to the shortage of funds for track maintenance and the change in maintenance methods by RITES (the former concessionaire, a Government of India enterprise), track conditions became worse and the scheduled speed of trains decreased accordingly. (1) Purpose of This Study Among the projects planned for the revitalization of the TRL railway system, the following three were selected as urgent projects that were recommended to be carried out in the short term:1
• Restoration of the mainline diesel locomotives; • Rehabilitation of the track structure between Tabora and Kigoma; and • Rehabilitation of bridges and structures between Tabora and Kigoma.
In order to assess these projects, the following data collection, survey, and investigation were carried out as part of the pre-feasibility study of the railway sector by the JICA Study Team:
• Assessment of the requirements for mainline locomotive restoration; • Data collection on the track structure between Tabora and Kigoma; and • Structure condition survey between Tabora and Kigoma.
2.2 Description of Candidate Projects for Pre-Feasibility Study In accordance with the Terms of Reference for this study, three railway sector projects were identified for pre-feasibility study. They were:
• Restoration of the mainline diesel-electric locomotives; • Rehabilitation of bridges and culverts on the Central Line between Tabora and Kigoma;
and • Re-laying of track on the Central Line between Tabora and Kigoma using heavier rail.
All three are intended for implementation in the short-term timeframe identified for the Master Plan, i.e., 2013–2017. Since these projects are critical for the restoration of freight transport services on the Central Line (following the failure of the RITES operating concession and the
1 The following distance are excluded from the pre-feasibility study as urgent projects because of the each reason above. 1) Dar es Salaam–Tabora: the rehabilitation has been completed. 2) Tabora–Isaka: the rehabilitation has been planned by World Bank.
Comprehensive Transport and Trade System Development Volume 4 Chapter 2 Master Plan in the United Republic of Tanzania Railway Rehabilitation
3
sharp decline in railway transport volume on the TRL network), their implementation is considered urgent. The following subsections describe these projects in detail and outline a proposed implementation schedule. 2.2.1 Overhaul and Re-Manufacturing of Diesel-Electric Locomotives The short supply of locomotives on the TRL system was identified in the Interim Report as the predominant reason for the sharp decline in rail freight transport volume, from the peak of 1.56 million tonnes in 2003 to a low of 256,200 tonnes in 2010. It is clear that by far the major contributor is the severe shortage of locomotives, which was the result of TRL’s being deprived of adequate funds to purchase the spare parts needed to carry out major overhauls and rehabilitation of its mainline locomotives. These overhauls are typically deferred for up to three years. Details of the mainline Locomotives Major Overhauls are listed below:
• Class 88: “F” overhauls are scheduled every eight years; • Class 89: “W6/E” overhauls are scheduled every 12,000 engine-running hours; and • Class 73: “D” overhauls are scheduled every four years.
(For details of maintenance and overhauls, see Appendix 1 on the Maintenance Examination and Overhaul Details for the Mainline Locomotives). This situation of “overdue overhauls” is also prevalent in the shunting locomotive fleet, meaning that many of these locomotives are not available for service (e.g., on 11 September 2012 only 5 of 11 were available).This deferral of overhauls leads to low reliability resulting in unacceptably high rates of in-service failure and hence poor rates of availability. Another factor that could also be contributing to locomotive unreliability is the lack of defined and visible overhaul processes on the Morogoro Workshop floor, together with the lack of a complementary quality system to verify the process and product integrity. Additionally, the situation regarding personnel and workshop floor safety requires improvement (see Appendix 2 – Morogoro Workshop). In order to ascertain what level of process control is in place, it is recommended that a very quick snapshot audit be carried out on the overhaul of two or so different major locomotive components. This audit would have to be carried out with some level of sensitivity, so as not to expose and embarrass anyone in the process if deficiencies are found. Nevertheless, it is important to do; it could probably start with by interviewing the manager(s) and then other staff. The following questions could form the basis of the audit (the list is not exhaustive and should be more discussed with TRL senior managers before implementing);
1) What specification(s) are applicable to the overhaul of each component, traction motor?
2) Do these specifications exist at Morogoro? 3) Where are they kept? 4) Are there copies on the workshop floor? 5) Who controls the distribution list and ensures that only controlled copies are in use? 6) Who issues them and keeps them up-to-date? 7) Are they up-to-date?
Comprehensive Transport and Trade System Development Volume 4 Chapter 2 Master Plan in the United Republic of Tanzania Railway Rehabilitation
4
8) How are the contents of the specifications communicated to the workforce? 9) How is it verified that the workforce is following the instructions? 10) Are there any special tools specified? 11) Are these tools available? 12) Is there a calibration system for tooling/equipment? 13) How is material managed? 14) Are kits delivered to the working area or do operators go to the stores/elsewhere and
pick up their material when required? 15) Do they pick up material all at once or have to make repeated journeys2? 16) Is there some sort of quality system in place, supporting product integrity.
Depending on the outcome based on discussions with the manager(s) and other staff plus observations and questions, this audit could give an indication on whether it is worthwhile to launch a process definition exercise for the overhaul of some/all of the locomotive components including the locomotive themselves. The reasons behind this suggestion of redefinition of processes are as follows. Morogoro Workshop usually does repeated work carried out by personnel who have had (i) many years of service, (ii) developed expertise over those years, and (iii) in whom the workshop management has faith can to carry out a good job. However, it would be a good practice for them to visibly demonstrate that they are following a defined overhaul process in line with Original Equipment Manufacturer (OEM) requirements. This could be done with the use of some sort of process sheet that defines what needs to be done and captures what was found and what was done, recording qualitative and quantitative data, and demonstrating product compliance with specification. Each process sheet should be uniquely numbered and referenced in a system and should list all of the sequential overhaul operations/activities that need to be undertaken – some of these will be qualitative (e.g., observations of conditions) while others will be quantitative recording of data. The sheet should record the serial number of the component it refers to and have space for the operator to record (i) any qualitative observations and (ii) any measurements carried out, demonstrating compliance of these measurements with the required parameters/acceptable tolerances for good and safe functionality of the component. Each entry would be initialled by the operator and the whole sheet signed by the supervisor, with the sheet then being stored and available for subsequent scrutiny, should there be an unexpected incident and/or failure of the component. Also, to aid this process, this process sheet should be protected by plastic and attached to the component as it passes through the overhaul stages, so that at any time its overhaul status/progress can be ascertained. This is particularly important if multiple operators, possibly in different areas, are involved in the completion of the overhaul. This is to make sure that nothing is missed and the component is overhauled to the required specification. The process sheet should stay attached to the component until its fitment, at which point, fully completed, it is withdrawn and filed for historical reference. For new recruits, such a system would be an essential requirement because it is unlikely that they will have the same level of knowledge and expertise as their long-serving workshop colleagues. The use of the process sheets would be a fundamental part of their training. Due to the high average age of the workforce (no one is below the age of 40), recruitment is inevitable and the introduction of such a system needs to be addressed fairly urgently (age profiles are discussed below).
2 Operators’ time is valuable when a locomotive is standing awaiting attention, more so than the extra effort by warehouse personnel to make sure material is available and delivered line-side
Comprehensive Transport and Trade System Development Volume 4 Chapter 2 Master Plan in the United Republic of Tanzania Railway Rehabilitation
5
Regarding the complementary quality system, once the process sheet system is operational, it will be possible to introduce both system and product audit regimes, whereby the quality of completion of the process sheets and the quality of the component could both be ascertained by a sampled inspection on an ongoing basis with targets for continuous improvement. This could then be rolled out to all of the locomotive systems and products (including work directly on the locomotive itself). Another potential problem observed at the Morogoro Workshop is that there is little evidence of any calibration system for tools and equipment. Even if the operator is recording required measurements, these measurements might be inaccurate and this inaccuracy could be significant, particularly where safety-critical work is being carried out, such as on brake systems. The next potential problem at the Morogoro Workshop is the lack of training. Even if there are knowledgeable operators as described above, there is concern about or what may happen if a new recruit joins the team. New recruits will undoubtedly be supervised by someone with more knowledge, but there is no guarantee of the level of knowledge that this supervisor has and their ability to pass on knowledge satisfactorily. Also, there is a risk that what will be done to the component may have deviate significantly from the original OEM specifications due to the ongoing inaccuracy of this word-of-mouth process over time. Missing activities, for instance, which may have come about due to material shortages in the past, may not have been reinstated, and the process without them may have become the new norm for that part of the overhaul. Any omissions such as this could affect the component and ultimately the reliability and safety of the locomotive. (In Europe, where safety-critical work is being undertaken, training is not the end of the story; it is also necessary by law to establish a competency framework for staff, whereby ongoing checks and records are made of their competencies on the different safety-critical systems on the locomotives (this is particularly so, where passengers are being hauled). If staff members fail these competency checks, they are nominated for urgent retraining and ultimately could be barred from doing that particular job if they cannot demonstrate the required competency.) (Once OEM process standards have been re-established, it is of course possible to consider relaxing them under controlled conditions, but this would be a future consideration. Such relaxation would be to investigate the opportunity of extending repair periodicities and reduceng the cost of overhauls where components have not deteriorated as much as expected against the OEM standard. However, this would have to be done at the correct time, once it was certain that the OEM standards were embedded again in the ways of working and via a carefully controlled engineering exercise, to ensure that locomotive safety, reliability and quality were not compromised as changes were made.) The next concern from not having documented process sheets is the relatively high age profile of the operators at Morogoro Workshop. This means there is a risk of their leaving due to illness or retirement, potentially leading to the accumulated overhaul knowledge getting lost over time. This risk was discussed and acknowledged with Morogoro staff. It was confirmed that the operators with the knowledge were happy to share it, but they did not know how. Therefore, it was accepted that it would be a good idea if the process redefinition above was launched, whereby someone worked alongside them during the overhaul activity, talking to them, listening, and observing their actions in addition to taking photographs. This could be carried out with the various knowledgeable persons in turn. The prioritization of which component process to do first would be directly related to the perceived risk of the loss of the relevant expert, for example it could be done in the order of retirement. This would allow draft process sheets to be produced, which could be discussed, refined, and then published for ongoing use.
Comprehensive Transport and Trade System Development Volume 4 Chapter 2 Master Plan in the United Republic of Tanzania Railway Rehabilitation
6
Interviewing, observing, recording, and photographing what the knowledgeable operator is currently doing will give a snapshot of what process is being followed. In the short term, this will yield first-generation process sheets available to all, in particular to less knowledgeable colleagues, so that depending on the delivery of overhaul kits, there will be some level of process control in place. At some point following and probably subject to a level of organizational change, this first-generation process sheet initiative would need to be replaced with a proper training and competency framework system. This report has not developed the logic for this initiative nor any cost estimates as it is seen to be outside the current scope. The first-generation process sheets would be a good start to this more substantive training/ competency framework exercise in which they could be discussed and ratified against the overhaul manuals in more detail, refined and, then published for ongoing training and use. In summary, in support of sustainable and increasing locomotive fleet reliability, the following “Option A baseline” plan is recommended for potential development partner funding: (i) support for the existing five locomotives being overhauled within the TRL 2012/2013 budget, (ii) delivery of 4 major “F” Class 88 overhaul kits in order to catch-up with the deferred overhauls, and (iii) the re-manufacturing of 6 Class 88 locomotives. However, preceding (ii), it is recommended that an audit be carried out on two major locomotive components. If this audit indicates a lack of proper process control, another exercise is recommended to restore the OEM-intended overhaul standard. This would entail a process mapping exercise on the locomotive components and the locomotive itself to be carried out by observing and recording the current processes followed by the workshop-floor experts (highlighting and discussing any perceived weaknesses) and documenting the results and producing first-generation process sheets, ensuring that in turn the operators (particularly less knowledgeable/inexperienced staff) work according to these sheets. There would be benefits in launching this process sheet initiative. Although it would be subject to funding (but is relatively inexpensive compared to material costs), it should be launched sooner rather than later so that when the major overhaul material kits arrive, they would be delivered into a working environment that has already been optimized (as much as possible) as a focused, well-defined, effective, and compliant overhaul environment. It would be unfortunate if the planned locomotive fleet reliability growth/sustainability that should be expected from a considerable investment in major overhaul kits is negated somewhat due to suboptimal/uncontrolled shop floor working processes. It appears that staff members at the Morogoro Workshop have little idea of what reliability is being achieved by the locomotives they have released to traffic. In Appendix 2 on the Morogoro Workshop, the point is highlighted about the apparent lack of appropriate and visible key performance indicators (KPIs) on the Morogoro Workshop floor for indicating targets that are planned to be achieved versus what is actually achieved and recovery programmes, if appropriate. The locomotive fleet reliability data could be part of this issue. Trend charts showing that planned reliability growth is on target could be placed on notice boards at the Morogoro Workshop allowing staff to recognize and commend a locomotive’s sustained reliability success or alternatively for the management to investigate why a locomotive they have released to traffic has suboptimal reliability. This could be achieved by checking back on the process and quality paperwork to see what was done or not done to the locomotive and who was responsible. Running maintenance will also have an effect, It is surprising that such “Morogoro reliability awareness” is not insisted upon by the operator, who would want the Morogoro management and staff to continuously strive to maximize the reliability of their products in line with the best-in-class they had ever achieved, per locomotive
Comprehensive Transport and Trade System Development Volume 4 Chapter 2 Master Plan in the United Republic of Tanzania Railway Rehabilitation
7
type. This objective would require Morogoro management and staff to have feedback data on reliability trends, which could be part of the general KPI approach discussed above. The lack of locomotives for revenue earning service has resulted in train cancellations and a loss of customers, many of which have had to invest in trucks in order to meet their transport needs. The actual number of running mainline locomotives and immobile frames is over 100, but it has been decided that the effective maximum fleet size that can realistically be restored to full service in reasonable is 46, as follows:
• 28 Class 88 • 8 Class 89 • 10 Class 73
Total 46 Currently, the number of mainline locomotives fully available3 for traffic each day falls far below 46, averaging only 12 units or less (e.g., on 11 September 2012 only 10 mainline locomotives were in service – 8 Class 88s and 2 Class 73s) compared to the envisaged maximum combined fleet size of 44 (27%). In addition to this poor availability, there is an excessive rate of in-service mechanical and electrical failures, which frequently cause trains to become stranded in the middle of block sections. This then causes delays of other traffic, thereby reducing the prevailing schedule speed4 to a level at which freight haulage capacity is severely reduced. The current schedule speed on the TRL system is only 14 km per hour, consistent with an annual freight haulage volume of no more than about 285,000 tonnes. To address problem, a number of locomotive improvement initiatives are proposed and the first is underway. Locomotive Improvement Initiatives to be Supported by the Government of Tanzania
In 2012/2013’s budget for TRL, the Government of Tanzania (GOT) committed to the overhaul of 5 locomotives (2 Class 88 and 3 Class 89) via the procurement of major overhaul kits (however, as of this writing funds had been released to cover the procurement of only four kits, which had been received). Details follow: • 8818 – since overhauled and released to traffic (materials did not arrive in time for the full
eight-year major “F” Overhaul, a 4 year “D” overhaul was carried out; the spare “F” overhaul components will be retained for 8818 or used on another locomotive
• 8825 – overhauled and released to traffic having undergone a full eight-year major “F” overhaul;
• 8906 – a full W6/E (12,000 engine hours) overhaul was underway (reported as 95% complete on 11 September 2012)
• 8909 – a full W6/E (12,000 engine hours) overhaul was underway (reported as 10% complete on 11 September 2012)
3 “Fully available” means that locomotives may be assigned to traffic 75% of the time, with the balance (25%) for maintenance. In addition, there are currently on the register six Class 88 locomotives, which are estimated to be available only 44% of the time due to their poor condition resulting from deferred maintenance. If it is assumed that these locomotives are equivalent to four fully available locomotives, the current number available on a daily basis would be 16. 4 “Schedule speed” is the ratio of distance covered between two stops and total running time including the time at all stops. The schedule speed of a given train, when running on a given service (i.e., with a given distance between stations) is affected by: (i) acceleration and braking retardation; (ii) maximum or crest speed; and (iii) duration of stops.
Comprehensive Transport and Trade System Development Volume 4 Chapter 2 Master Plan in the United Republic of Tanzania Railway Rehabilitation
8
• 8908 – this locomotive had been cleaned and was ready for a full W6/E (12,000 engine hours) overhaul (funds were committed in the TRL 2012/2013 Budget, but had not yet been released for purchase of the overhaul kit)
Also in 2012/2013’s TRL budget, the GOT committed to a 40% down payment for the re-manufacturing of 6 Class 88 locomotives. (Re-manufacturing refers to the locomotive and bogie being stripped back to their frames and rebuilt. This work is proposed to be sent abroad, as discussed later). It is reported that a total of 12 Class 88s are defective and out of service for potential re-manufacturing so 6 Class 88 locomotives are available to be funded by TRL (with development partner donor funding for the remaining 6 – see the next section). Locomotive Improvement Initiatives Requested and Proposed for Development Partner Funding Assistance
1. It is being requested to channel investment into restoration of the Class 88 and 89 fleets as follows: • (2.1.1) Purchasing 4 of Class 88 major (“F”) overhaul kits for the following
locomotives: 8820 8823 8827 8829
2. Purchasing rehabilitation kits for 9 Class 88 locomotives (vehicle numbers to be identified)
[rehabilitation is work that is usually carried out over and above the second major “F” overhaul (16 years)] and 3 Class 89 locomotives, as below. This improves areas that are at risk of failing before the next overhaul: Class 89
8901 8902 8903
3. Making arrangements for 6 Class 88 locomotives to be remanufactured (rebuilt) abroad. It
is reported that there are 12 Class 88 Locomotives that are defective and out of use. The GOT had committed a down payment of 40% in the 2012/2013 budget for “6 Class 88 Locomotives” and development partner funding for a further six.
The GOT and proposed development partner support should restore the supply of serviceable locomotives allowing freight levels to reach previously achieved levels. It is expected that all overhaul and rehabilitation work will be undertaken by TRL at its Morogoro Locomotive Workshops as at present. (However, note the points above regarding restoration of some visible process control at this workshop far in advance of further material deliveries, so as to benefit from the combined synergy of improved processes and new overhaul material leading to maximization of locomotive reliability.) It is planned to send abroad for re-manufacturing the 6 TRL budget-supported Class 88 locomotives, followed by another 6 that will be supported by development partner funding since TRL lacks the facilities and capacity for this work. It is reported that tenders went out to four companies at the end of September 2012. Recent work has been undertaken to identify a further
Comprehensive Transport and Trade System Development Volume 4 Chapter 2 Master Plan in the United Republic of Tanzania Railway Rehabilitation
9
company, UGL in Hong Kong,5 which is bidding on a separate contract with another third party, to re-manufacture 56 diesel locomotives in Bangkok. It is possible that if they secure this work, the TRL re-manufacturing work can be “slotted” into the back of this programme, taking advantage of economies of scale. Initial indications from UGL suggest that the price could be about USD 1.5 million if economies of scale could be achieved, but this would be established with more accuracy if TRL wishes to invite UGL to tender and they wish to participate. The proposed schedule for the following is shown in Table 2.1:
• The GOT-supported overhaul of 2 Class 88 and 3 Class 89 locomotives (work had already commenced);
• The GOT-supported re-manufacturing of 6 Class 88 locomotives; • The proposed overhaul of 4 Class 88 locomotives by supplying overhaul kits • The proposed rehabilitation of 9 Class 88 and 3 Class 89 locomotives; and • The proposed re-manufacturing of 6 Class 88 locomotives.
As stated, the GOT had committed funding for the overhaul programme for 5 locomotives (and funds had already been released for major overhaul kits for 4, and the first two of these Class 88 locomotives are in traffic – 8818 and 8825). It was assumed that the next two locomotives 8906 and 8909 would be released into traffic in 2012 but the 5th locomotive under the GOT funding programme would likely not be completed until 2013. Regarding the purchase of 4 additional Class 88 Major “F” overhaul kits and 13 rehabilitation kits plus the re-manufacture of 6 Class 88 locomotives, it was assumed that the loan and contract approval process will take place in 2013 with the kits delivered in 2014. The current Class 88 and 89 major overhaul kit suppliers are known, but TRL is considering nine other potential suppliers. More recent investigations have identified two further potential supply bases for all TRL locomotive types described below: • Unipart Rail6 (part of the Unipart Group) offers a “one-stop-shop” for parts, and specializes
in sourcing or re-engineering parts that are becoming obsolete; and • Sovereign Trains Limited7 specializes in re-engineering parts that are becoming obsolete
and taking cost out. These two additional potential suppliers could be included in the tendering process; they are historically very competitive and are particularly good at taking cost out of parts when re-engineering them, but all of this can be ascertained at the tender stage. Regarding the remanufacturing of the 12 Class 88 locomotives, for the purpose of the pre-feasibility study it was assumed that three locomotives can be re-built within the span of a year – thus a period of two years would be needed for re-building of the proposed initial six units, but this is the worst case scenario. UGL has tentatively indicated that it could improve on this scenario (if it already has its Bangkok production line running, as mentioned above) plus it is
5 Contact: Neil Heaton General Manager, 804-805A, 8/F, Nanyang Plaza, 57 Hung To Road Kwun Tong, Kowloon Hong Kong Telephone: +852 2796 2681 Facsimile: +852 2375 2461 Mobile/Cell:+852 9385 6383, email: [email protected], www.ugllimited.com. 6 Contact: Steve Nicks, Business Development Manager, email: [email protected] Mobile +44 (0) 7810 053410, Telephone +44 (0) 1302 731541 , www.unipartrail.com. Registered Office: Unipart Rail Limited, Unipart House, Cowley, Oxford, OX4 2PG Registered in England and Wales: Registered No. 3038418. 7 78 York Street, London W1H 1DP UK, Contact: Mr. David Shipley, Engineering Director Tel: +44 (0) 207 193 7351, Fax: +44 (0) 203 514 2989, email: [email protected].
Comprehensive Transport and Trade System Development Volume 4 Chapter 2 Master Plan in the United Republic of Tanzania Railway Rehabilitation
10
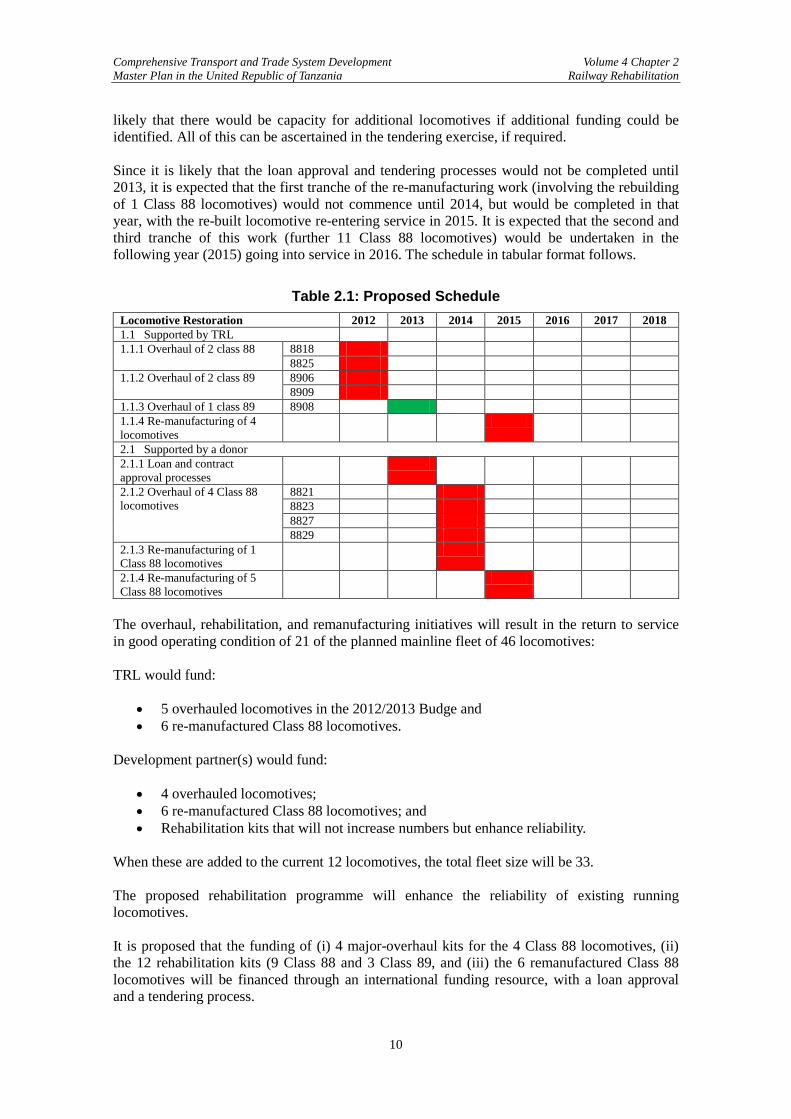
likely that there would be capacity for additional locomotives if additional funding could be identified. All of this can be ascertained in the tendering exercise, if required. Since it is likely that the loan approval and tendering processes would not be completed until 2013, it is expected that the first tranche of the re-manufacturing work (involving the rebuilding of 1 Class 88 locomotives) would not commence until 2014, but would be completed in that year, with the re-built locomotive re-entering service in 2015. It is expected that the second and third tranche of this work (further 11 Class 88 locomotives) would be undertaken in the following year (2015) going into service in 2016. The schedule in tabular format follows.
Table 2.1: Proposed Schedule Locomotive Restoration 2012 2013 2014 2015 2016 2017 2018 1.1 Supported by TRL 1.1.1 Overhaul of 2 class 88 8818
8825 1.1.2 Overhaul of 2 class 89 8906
8909 1.1.3 Overhaul of 1 class 89 8908 1.1.4 Re-manufacturing of 4 locomotives
2.1 Supported by a donor 2.1.1 Loan and contract approval processes
2.1.2 Overhaul of 4 Class 88 locomotives
8821 8823 8827 8829
2.1.3 Re-manufacturing of 1 Class 88 locomotives
2.1.4 Re-manufacturing of 5 Class 88 locomotives
The overhaul, rehabilitation, and remanufacturing initiatives will result in the return to service in good operating condition of 21 of the planned mainline fleet of 46 locomotives: TRL would fund:
• 5 overhauled locomotives in the 2012/2013 Budge and • 6 re-manufactured Class 88 locomotives.
Development partner(s) would fund:
• 4 overhauled locomotives; • 6 re-manufactured Class 88 locomotives; and • Rehabilitation kits that will not increase numbers but enhance reliability.
When these are added to the current 12 locomotives, the total fleet size will be 33. The proposed rehabilitation programme will enhance the reliability of existing running locomotives. It is proposed that the funding of (i) 4 major-overhaul kits for the 4 Class 88 locomotives, (ii) the 12 rehabilitation kits (9 Class 88 and 3 Class 89, and (iii) the 6 remanufactured Class 88 locomotives will be financed through an international funding resource, with a loan approval and a tendering process.
Comprehensive Transport and Trade System Development Volume 4 Chapter 2 Master Plan in the United Republic of Tanzania Railway Rehabilitation
11
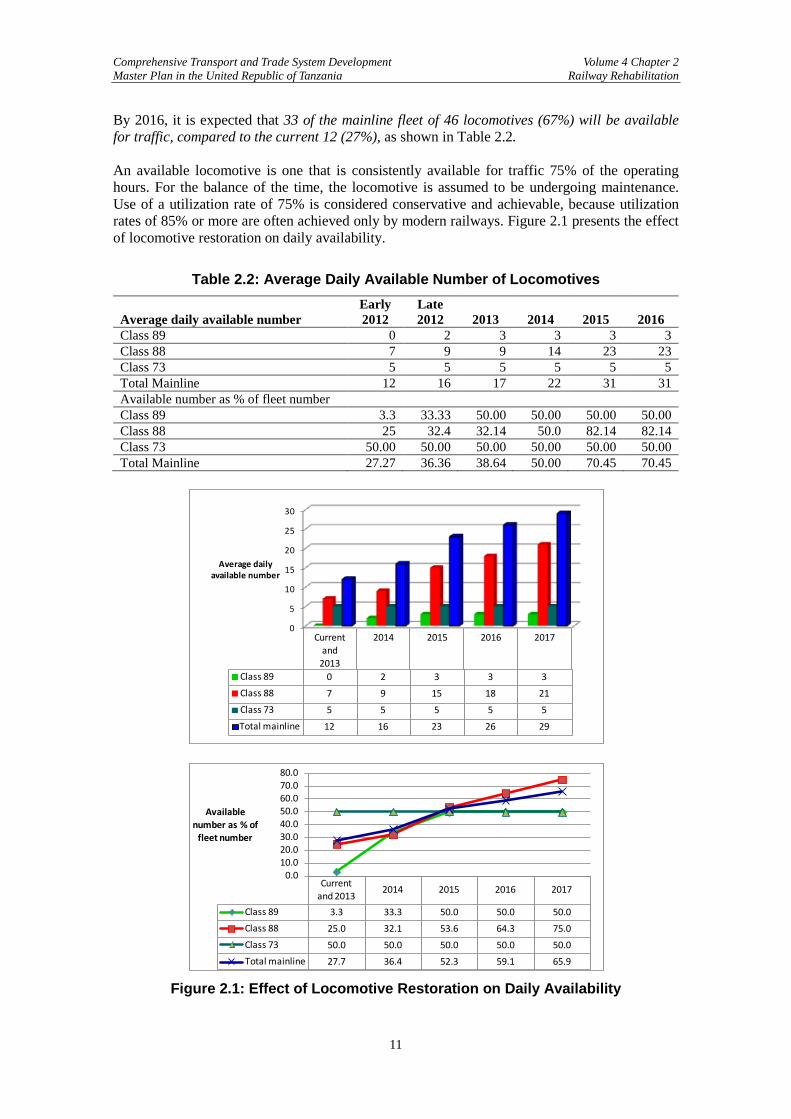
By 2016, it is expected that 33 of the mainline fleet of 46 locomotives (67%) will be available for traffic, compared to the current 12 (27%), as shown in Table 2.2. An available locomotive is one that is consistently available for traffic 75% of the operating hours. For the balance of the time, the locomotive is assumed to be undergoing maintenance. Use of a utilization rate of 75% is considered conservative and achievable, because utilization rates of 85% or more are often achieved only by modern railways. Figure 2.1 presents the effect of locomotive restoration on daily availability.
Table 2.2: Average Daily Available Number of Locomotives
Average daily available number Early 2012
Late 2012 2013 2014 2015 2016
Class 89 0 2 3 3 3 3 Class 88 7 9 9 14 23 23 Class 73 5 5 5 5 5 5 Total Mainline 12 16 17 22 31 31 Available number as % of fleet number Class 89 3.3 33.33 50.00 50.00 50.00 50.00 Class 88 25 32.4 32.14 50.0 82.14 82.14 Class 73 50.00 50.00 50.00 50.00 50.00 50.00 Total Mainline 27.27 36.36 38.64 50.00 70.45 70.45
0
5
10
15
20
25
30
Current and
2013
2014 2015 2016 2017
Class 89 0 2 3 3 3Class 88 7 9 15 18 21Class 73 5 5 5 5 5Total mainline 12 16 23 26 29
Average daily available number
Current and 2013
2014 2015 2016 2017
Class 89 3.3 33.3 50.0 50.0 50.0Class 88 25.0 32.1 53.6 64.3 75.0Class 73 50.0 50.0 50.0 50.0 50.0Total mainline 27.7 36.4 52.3 59.1 65.9
0.010.020.030.040.050.060.070.080.0
Available number as % of
fleet number
Figure 2.1: Effect of Locomotive Restoration on Daily Availability
Comprehensive Transport and Trade System Development Volume 4 Chapter 2 Master Plan in the United Republic of Tanzania Railway Rehabilitation
12
The importance of coordinating, to the maximum extent possible, the work on track improvement with that on locomotive rehabilitation cannot be overemphasized. While additions of serviceable locomotives to the fleet will have the greatest impact in terms of increasing schedule speeds and hence expanding the freight haulage capacity of TRL, track re-laying will allow the lifting of speed restrictions on the re-laid sections, which will further increase schedule speeds. 2.2.2 Rehabilitation of Bridges and Culverts on the Central Line between
Tabora and Kigoma About 90% of bridges and culverts between Tabora and Kigoma were constructed 100 years ago by the German colonial administration with a designed axle load of 10 tonnes or 12 tonnes. The structure condition survey carried out from 29 June to 10 July 2012 found that many structures are severely weathered and have already deteriorated. In the case of the “rolled beams encased in concrete” type of small bridge, encased steel beams are exposed and severely corroded. Those structures judged in class D are proposed for replacement. Prior to the rehabilitation of the track structure, bridges and culverts are preferred to be rehabilitated or re-constructed because the construction will be difficult and more costly after new continuous welded rail (CWR) is placed. (Tanzanian Railway Corporation (TRC) had constructed bridges and culverts from 1990 to 2007 with a design axle load of 25 tonnes for new bridges and structures. However, considering the demand forecast, and planned locomotives and wagons, a design axle load of 25 tonnes will not be required. 2.2.3 Re-laying of Track on the Central Line between Tabora and Kigoma in
Heavier Rail The existing track between Tabora and Kigoma was built from 1912 to 1914 by the German colonial administration using 56.12 lb/yard rail, steel sleepers, and fish-plated rail joints. Because of usage over a long time, the rail head is worn out and many of the fish-bolted joints are already loose. Rehabilitation of the track in this section requires the replacement of the existing track structure with 80 lb/yard rail with new steel sleepers. The new 80 lb/yard rail will be welded to form CWR. 2.3 Railway Traffic Forecasts for Central Line 2.3.1 Forecast Methodology A forecast of the railway freight volume carried on the Central Line was prepared as a basis for appraising the economic and financial viability of short-term investments in the rehabilitation of the TRL mainline locomotive fleet, as well as of track, bridges, and culverts on the Central Line between Tabora and Kigoma. This forecast was prepared for the timeframe 2013–2017, i.e., the short-term period adopted for the Transport Sector Master Plan for Tanzania. During this period, the volume of freight carried by rail will be constrained primarily by the freight haulage capacity of the mainline locomotive fleet. Plans to rehabilitate this fleet progressively (as described in the following sections) will result in restoration by 2017 to the TRL freight tonnage level at or near its peak in 2003. Subsequently, the rail freight volume can be expected to grow in proportion to the country’s main economic indicators, unconstrained by the capacity of railway infrastructure and operating assets, which may be expanded with new investment. In the short term, however, when the
Comprehensive Transport and Trade System Development Volume 4 Chapter 2 Master Plan in the United Republic of Tanzania Railway Rehabilitation
13
focus of investment is on the rehabilitation of railway assets, new investments will not be necessary. The first step in the preparation of the freight volume forecast was to determine the freight haulage capacity of the fleet of mainline locomotives. Increases in the typical schedule speed on the TRL network need to be taken into consideration, as extra serviceable locomotives are added to the fleet and as sections of the Central Line are re-laid in 80 lb per yard rail to permit increased maximum speeds. This gave the system-wide freight volumes that may be expected over the period of 2013–2017. The freight volumes to be carried on the Central Line over this period were then determined by applying to the system-wide volumes the latest available traffic shares (by commodity) for traffic between origins and destinations along the Central Line. For the purposes of traffic costing, origin-destination (OD) data were also used to determine the shares of traffic that only partly use the Central Line (i.e., would have an off-line origin or destination). In each case, the OD data were used to indicate also the direction of travel. Also, for costing purposes, OD data were used to provide for both on-line and off-line traffic the average length of haulage in km on the Central Line. The steep decline in railway transport demand by shippers has been a reflection of loss of confidence in railway operation on the part of shippers. One may argue that without recovering punctuality by better management railway cannot recapture the lost shippers. However, the Study Team found that the main reason of uncertainty in railway operation was not managerial practice but the lack of available rolling stock and the weak track. With the rehabilitation and renewal of rolling stock, particularly locomotives, and the rehabilitation of parts of the track, punctuality of operation would be restored and consequently shippers’ confidence. 2.3.2 Requirements of Locomotives and Wagons System-wide freight volume was calculated as the annual freight haulage capacity per locomotive multiplied by the net number of locomotives per day available for freight haulage. (1) Calculation of Locomotive Annual Freight Haulage Capacity The productivity of a mainline locomotive allocated to freight service may be calculated in terms of its annual net tonnage capacity, based on assumptions about average length of haul, average train payload, schedule speed, and terminal time. For the TRL system, rehabilitation of the mainline locomotive fleet will increase the number of serviceable locomotives available on a daily basis and will significantly reduce delays due to in-section failures. In addition, the proposed re-railing of the Central Line will permit significant progressive improvement in operating speeds. Thus both initiatives will have the effect of increasing the schedule, or average running speeds, on the Central Line. For this reason, it will be essential for the locomotive and track rehabilitation programs to be coordinated. The speed on the Central Line over the period 2013-2017 has been estimated to increase from the current 14 km per hour to 36 km per hour, as shown in Table 2.3.
Comprehensive Transport and Trade System Development Volume 4 Chapter 2 Master Plan in the United Republic of Tanzania Railway Rehabilitation
14
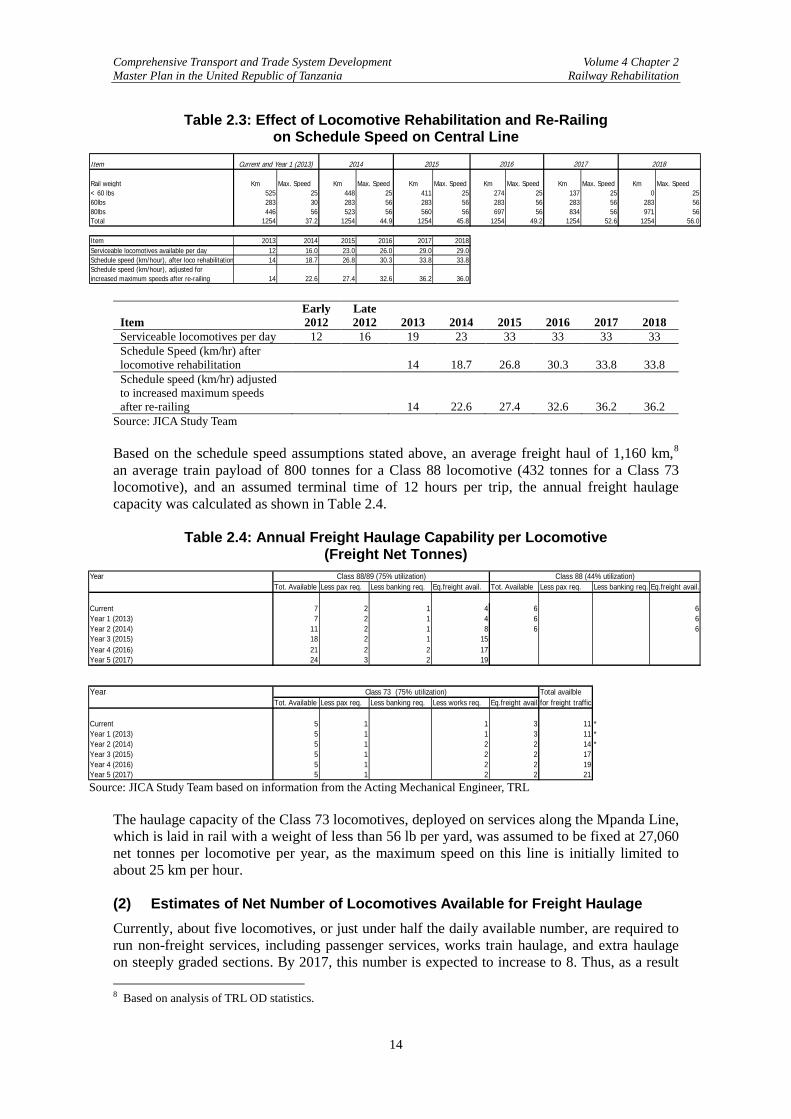
Table 2.3: Effect of Locomotive Rehabilitation and Re-Railing on Schedule Speed on Central Line
Item
Rail weight Km Max. Speed Km Max. Speed Km Max. Speed Km Max. Speed Km Max. Speed Km Max. Speed< 60 lbs 525 25 448 25 411 25 274 25 137 25 0 2560lbs 283 30 283 56 283 56 283 56 283 56 283 5680lbs 446 56 523 56 560 56 697 56 834 56 971 56Total 1254 37.2 1254 44.9 1254 45.8 1254 49.2 1254 52.6 1254 56.0
Item 2013 2014 2015 2016 2017 2018Serviceable locomotives available per day 12 16.0 23.0 26.0 29.0 29.0Schedule speed (km/hour), after loco rehabilitation 14 18.7 26.8 30.3 33.8 33.8Schedule speed (km/hour), adjusted for increased maximum speeds after re-railing 14 22.6 27.4 32.6 36.2 36.0
2017 2018Current and Year 1 (2013) 2014 2015 2016
Item Early 2012
Late 2012 2013 2014 2015 2016 2017 2018
Serviceable locomotives per day 12 16 19 23 33 33 33 33 Schedule Speed (km/hr) after locomotive rehabilitation 14 18.7 26.8 30.3 33.8 33.8 Schedule speed (km/hr) adjusted to increased maximum speeds after re-railing 14 22.6 27.4 32.6 36.2 36.2
Source: JICA Study Team Based on the schedule speed assumptions stated above, an average freight haul of 1,160 km,8 an average train payload of 800 tonnes for a Class 88 locomotive (432 tonnes for a Class 73 locomotive), and an assumed terminal time of 12 hours per trip, the annual freight haulage capacity was calculated as shown in Table 2.4.
Table 2.4: Annual Freight Haulage Capability per Locomotive (Freight Net Tonnes)
YearTot. Available Less pax req. Less banking req. Eq.freight avail. Tot. Available Less pax req. Less banking req. Eq.freight avail.
Current 7 2 1 4 6 6Year 1 (2013) 7 2 1 4 6 6Year 2 (2014) 11 2 1 8 6 6Year 3 (2015) 18 2 1 15Year 4 (2016) 21 2 2 17Year 5 (2017) 24 3 2 19
Year Total availble Tot. Available Less pax req. Less banking req. Less works req. Eq.freight avail.for freight traffic
Current 5 1 1 3 11 *Year 1 (2013) 5 1 1 3 11 *Year 2 (2014) 5 1 2 2 14 *Year 3 (2015) 5 1 2 2 17Year 4 (2016) 5 1 2 2 19Year 5 (2017) 5 1 2 2 21
Class 88/89 (75% utilization) Class 88 (44% utilization)
Class 73 (75% utilization)
Source: JICA Study Team based on information from the Acting Mechanical Engineer, TRL
The haulage capacity of the Class 73 locomotives, deployed on services along the Mpanda Line, which is laid in rail with a weight of less than 56 lb per yard, was assumed to be fixed at 27,060 net tonnes per locomotive per year, as the maximum speed on this line is initially limited to about 25 km per hour. (2) Estimates of Net Number of Locomotives Available for Freight Haulage Currently, about five locomotives, or just under half the daily available number, are required to run non-freight services, including passenger services, works train haulage, and extra haulage on steeply graded sections. By 2017, this number is expected to increase to 8. Thus, as a result 8 Based on analysis of TRL OD statistics.
Comprehensive Transport and Trade System Development Volume 4 Chapter 2 Master Plan in the United Republic of Tanzania Railway Rehabilitation
15
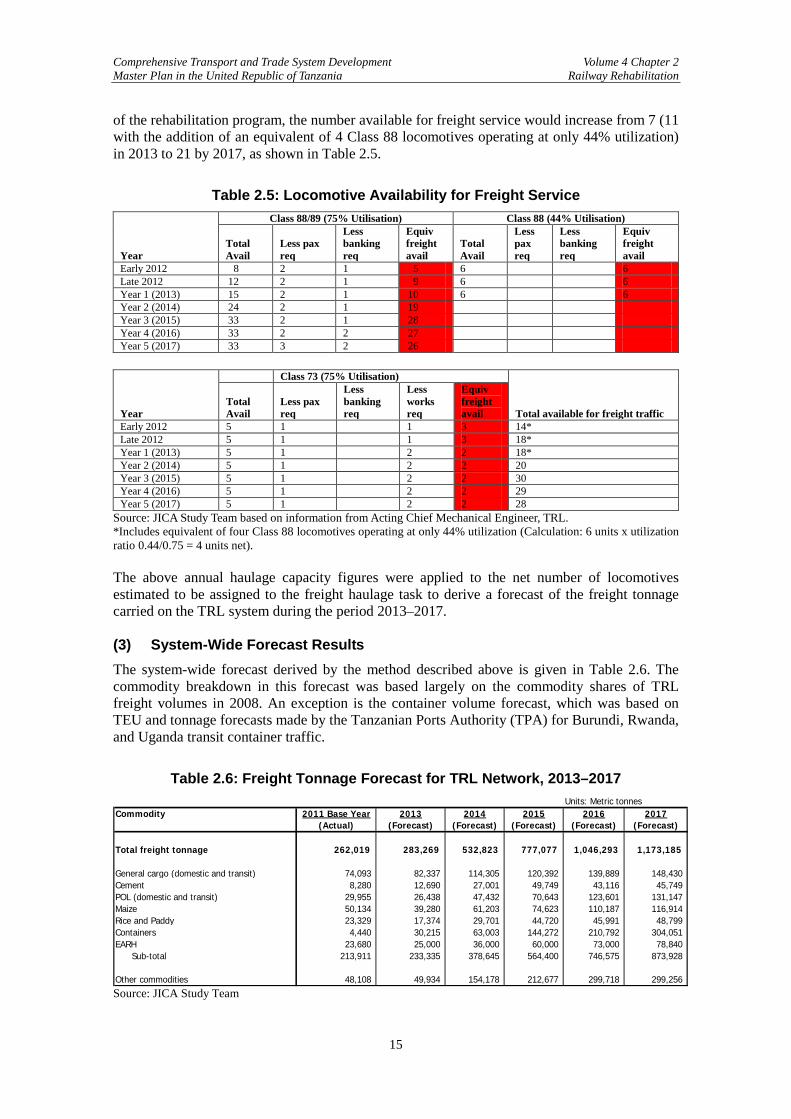
of the rehabilitation program, the number available for freight service would increase from 7 (11 with the addition of an equivalent of 4 Class 88 locomotives operating at only 44% utilization) in 2013 to 21 by 2017, as shown in Table 2.5.
Table 2.5: Locomotive Availability for Freight Service
Year
Class 88/89 (75% Utilisation) Class 88 (44% Utilisation)
Total Avail
Less pax req
Less banking req
Equiv freight avail
Total Avail
Less pax req
Less banking req
Equiv freight avail
Early 2012 8 2 1 5 6 6 Late 2012 12 2 1 9 6 6 Year 1 (2013) 15 2 1 10 6 6 Year 2 (2014) 24 2 1 19 Year 3 (2015) 33 2 1 28 Year 4 (2016) 33 2 2 27 Year 5 (2017) 33 3 2 26
Year
Class 73 (75% Utilisation)
Total available for freight traffic Total Avail
Less pax req
Less banking req
Less works req
Equiv freight avail
Early 2012 5 1 1 3 14* Late 2012 5 1 1 3 18* Year 1 (2013) 5 1 2 2 18* Year 2 (2014) 5 1 2 2 20 Year 3 (2015) 5 1 2 2 30 Year 4 (2016) 5 1 2 2 29 Year 5 (2017) 5 1 2 2 28
Source: JICA Study Team based on information from Acting Chief Mechanical Engineer, TRL. *Includes equivalent of four Class 88 locomotives operating at only 44% utilization (Calculation: 6 units x utilization ratio 0.44/0.75 = 4 units net). The above annual haulage capacity figures were applied to the net number of locomotives estimated to be assigned to the freight haulage task to derive a forecast of the freight tonnage carried on the TRL system during the period 2013–2017. (3) System-Wide Forecast Results The system-wide forecast derived by the method described above is given in Table 2.6. The commodity breakdown in this forecast was based largely on the commodity shares of TRL freight volumes in 2008. An exception is the container volume forecast, which was based on TEU and tonnage forecasts made by the Tanzanian Ports Authority (TPA) for Burundi, Rwanda, and Uganda transit container traffic.
Table 2.6: Freight Tonnage Forecast for TRL Network, 2013–2017 Units: Metric tonnes
Commodity 2011 Base Year 2013 2014 2015 2016 2017(Actual) (Forecast) (Forecast) (Forecast) (Forecast) (Forecast)
Total freight tonnage 262,019 283,269 532,823 777,077 1,046,293 1,173,185
General cargo (domestic and transit) 74,093 82,337 114,305 120,392 139,889 148,430 Cement 8,280 12,690 27,001 49,749 43,116 45,749 POL (domestic and transit) 29,955 26,438 47,432 70,643 123,601 131,147 Maize 50,134 39,280 61,203 74,623 110,187 116,914 Rice and Paddy 23,329 17,374 29,701 44,720 45,991 48,799 Containers 4,440 30,215 63,003 144,272 210,792 304,051 EARH 23,680 25,000 36,000 60,000 73,000 78,840 Sub-total 213,911 233,335 378,645 564,400 746,575 873,928
Other commodities 48,108 49,934 154,178 212,677 299,718 299,256 Source: JICA Study Team
Comprehensive Transport and Trade System Development Volume 4 Chapter 2 Master Plan in the United Republic of Tanzania Railway Rehabilitation
16
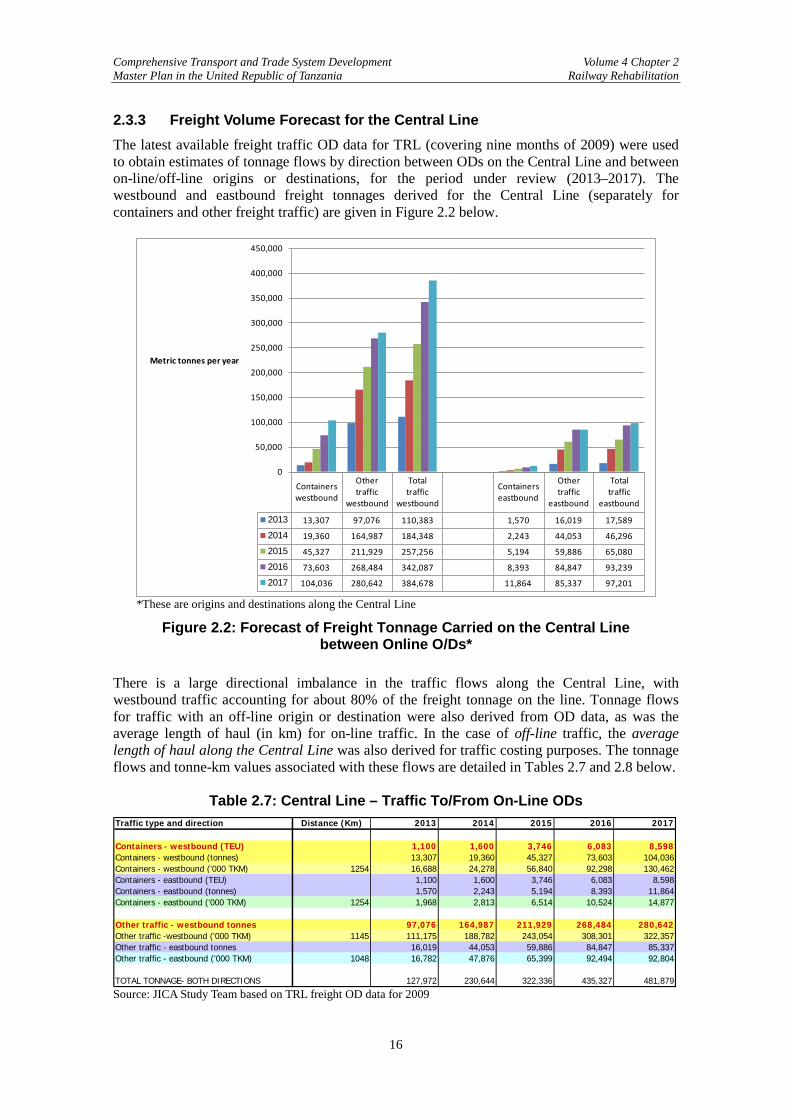
2.3.3 Freight Volume Forecast for the Central Line The latest available freight traffic OD data for TRL (covering nine months of 2009) were used to obtain estimates of tonnage flows by direction between ODs on the Central Line and between on-line/off-line origins or destinations, for the period under review (2013–2017). The westbound and eastbound freight tonnages derived for the Central Line (separately for containers and other freight traffic) are given in Figure 2.2 below.
Containers westbound
Other traffic
westbound
Total traffic
westbound
Containers eastbound
Other traffic
eastbound
Total traffic
eastbound
2013 13,307 97,076 110,383 1,570 16,019 17,589
2014 19,360 164,987 184,348 2,243 44,053 46,296
2015 45,327 211,929 257,256 5,194 59,886 65,080
2016 73,603 268,484 342,087 8,393 84,847 93,239
2017 104,036 280,642 384,678 11,864 85,337 97,201
0
50,000
100,000
150,000
200,000
250,000
300,000
350,000
400,000
450,000
Metric tonnes per year
*These are origins and destinations along the Central Line
Figure 2.2: Forecast of Freight Tonnage Carried on the Central Line between Online O/Ds*
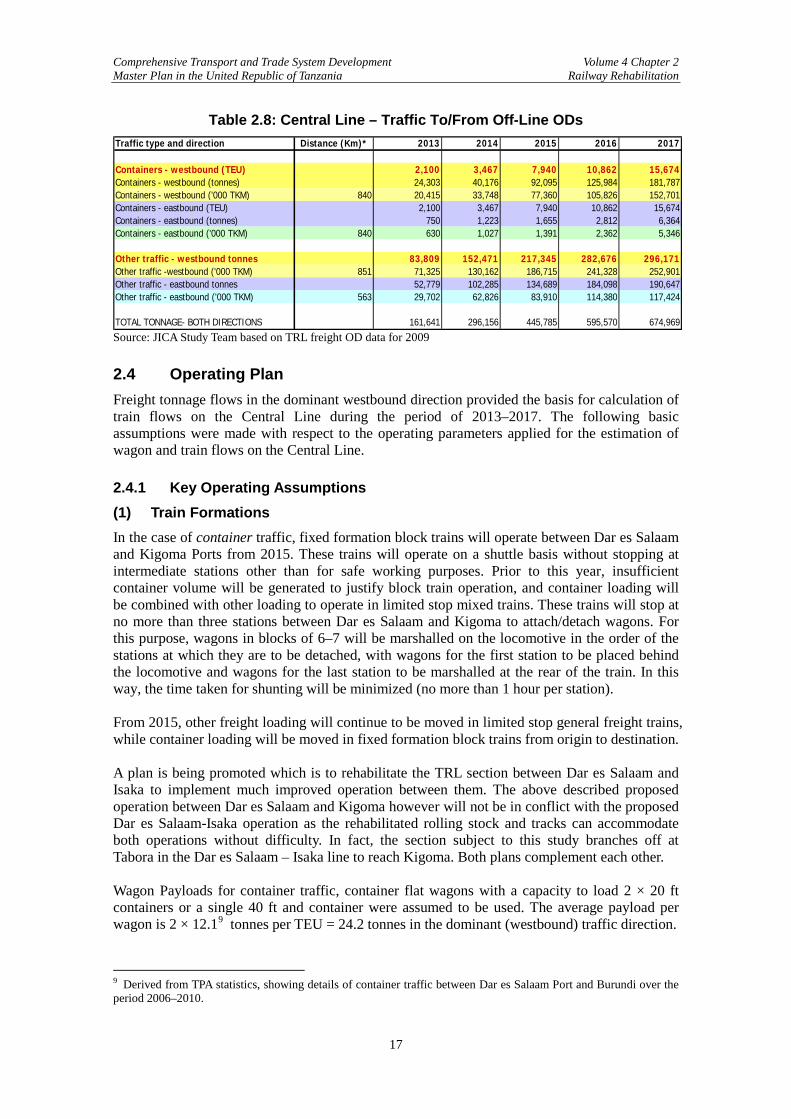
There is a large directional imbalance in the traffic flows along the Central Line, with westbound traffic accounting for about 80% of the freight tonnage on the line. Tonnage flows for traffic with an off-line origin or destination were also derived from OD data, as was the average length of haul (in km) for on-line traffic. In the case of off-line traffic, the average length of haul along the Central Line was also derived for traffic costing purposes. The tonnage flows and tonne-km values associated with these flows are detailed in Tables 2.7 and 2.8 below.
Table 2.7: Central Line – Traffic To/From On-Line ODs Traffic type and direction Distance (Km) 2013 2014 2015 2016 2017
Containers - westbound (TEU) 1,100 1,600 3,746 6,083 8,598Containers - westbound (tonnes) 13,307 19,360 45,327 73,603 104,036Containers - westbound ('000 TKM) 1254 16,688 24,278 56,840 92,298 130,462Containers - eastbound (TEU) 1,100 1,600 3,746 6,083 8,598Containers - eastbound (tonnes) 1,570 2,243 5,194 8,393 11,864Containers - eastbound ('000 TKM) 1254 1,968 2,813 6,514 10,524 14,877
Other traffic - westbound tonnes 97,076 164,987 211,929 268,484 280,642Other traffic -westbound ('000 TKM) 1145 111,175 188,782 243,054 308,301 322,357Other traffic - eastbound tonnes 16,019 44,053 59,886 84,847 85,337Other traffic - eastbound ('000 TKM) 1048 16,782 47,876 65,399 92,494 92,804
TOTAL TONNAGE- BOTH DIRECTIONS 127,972 230,644 322,336 435,327 481,879 Source: JICA Study Team based on TRL freight OD data for 2009
Comprehensive Transport and Trade System Development Volume 4 Chapter 2 Master Plan in the United Republic of Tanzania Railway Rehabilitation
17
Table 2.8: Central Line – Traffic To/From Off-Line ODs Traffic type and direction Distance (Km)* 2013 2014 2015 2016 2017
Containers - westbound (TEU) 2,100 3,467 7,940 10,862 15,674Containers - westbound (tonnes) 24,303 40,176 92,095 125,984 181,787Containers - westbound ('000 TKM) 840 20,415 33,748 77,360 105,826 152,701Containers - eastbound (TEU) 2,100 3,467 7,940 10,862 15,674Containers - eastbound (tonnes) 750 1,223 1,655 2,812 6,364Containers - eastbound ('000 TKM) 840 630 1,027 1,391 2,362 5,346
Other traffic - westbound tonnes 83,809 152,471 217,345 282,676 296,171Other traffic -westbound ('000 TKM) 851 71,325 130,162 186,715 241,328 252,901Other traffic - eastbound tonnes 52,779 102,285 134,689 184,098 190,647Other traffic - eastbound ('000 TKM) 563 29,702 62,826 83,910 114,380 117,424
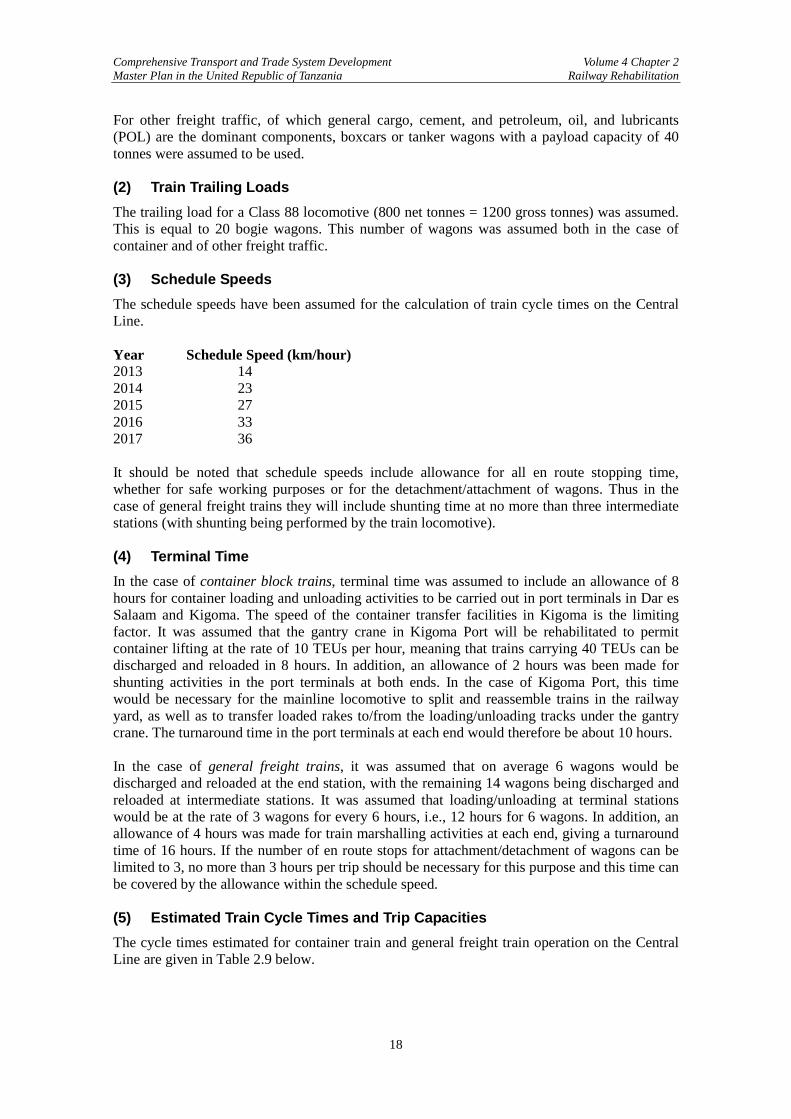
TOTAL TONNAGE- BOTH DIRECTIONS 161,641 296,156 445,785 595,570 674,969 Source: JICA Study Team based on TRL freight OD data for 2009 2.4 Operating Plan Freight tonnage flows in the dominant westbound direction provided the basis for calculation of train flows on the Central Line during the period of 2013–2017. The following basic assumptions were made with respect to the operating parameters applied for the estimation of wagon and train flows on the Central Line. 2.4.1 Key Operating Assumptions (1) Train Formations In the case of container traffic, fixed formation block trains will operate between Dar es Salaam and Kigoma Ports from 2015. These trains will operate on a shuttle basis without stopping at intermediate stations other than for safe working purposes. Prior to this year, insufficient container volume will be generated to justify block train operation, and container loading will be combined with other loading to operate in limited stop mixed trains. These trains will stop at no more than three stations between Dar es Salaam and Kigoma to attach/detach wagons. For this purpose, wagons in blocks of 6–7 will be marshalled on the locomotive in the order of the stations at which they are to be detached, with wagons for the first station to be placed behind the locomotive and wagons for the last station to be marshalled at the rear of the train. In this way, the time taken for shunting will be minimized (no more than 1 hour per station). From 2015, other freight loading will continue to be moved in limited stop general freight trains, while container loading will be moved in fixed formation block trains from origin to destination. A plan is being promoted which is to rehabilitate the TRL section between Dar es Salaam and Isaka to implement much improved operation between them. The above described proposed operation between Dar es Salaam and Kigoma however will not be in conflict with the proposed Dar es Salaam-Isaka operation as the rehabilitated rolling stock and tracks can accommodate both operations without difficulty. In fact, the section subject to this study branches off at Tabora in the Dar es Salaam – Isaka line to reach Kigoma. Both plans complement each other. Wagon Payloads for container traffic, container flat wagons with a capacity to load 2 × 20 ft containers or a single 40 ft and container were assumed to be used. The average payload per wagon is 2 × 12.19 tonnes per TEU = 24.2 tonnes in the dominant (westbound) traffic direction.
9 Derived from TPA statistics, showing details of container traffic between Dar es Salaam Port and Burundi over the period 2006–2010.
Comprehensive Transport and Trade System Development Volume 4 Chapter 2 Master Plan in the United Republic of Tanzania Railway Rehabilitation
18
For other freight traffic, of which general cargo, cement, and petroleum, oil, and lubricants (POL) are the dominant components, boxcars or tanker wagons with a payload capacity of 40 tonnes were assumed to be used. (2) Train Trailing Loads The trailing load for a Class 88 locomotive (800 net tonnes = 1200 gross tonnes) was assumed. This is equal to 20 bogie wagons. This number of wagons was assumed both in the case of container and of other freight traffic. (3) Schedule Speeds The schedule speeds have been assumed for the calculation of train cycle times on the Central Line. Year Schedule Speed (km/hour) 2013 14 2014 23 2015 27 2016 33 2017 36 It should be noted that schedule speeds include allowance for all en route stopping time, whether for safe working purposes or for the detachment/attachment of wagons. Thus in the case of general freight trains they will include shunting time at no more than three intermediate stations (with shunting being performed by the train locomotive). (4) Terminal Time In the case of container block trains, terminal time was assumed to include an allowance of 8 hours for container loading and unloading activities to be carried out in port terminals in Dar es Salaam and Kigoma. The speed of the container transfer facilities in Kigoma is the limiting factor. It was assumed that the gantry crane in Kigoma Port will be rehabilitated to permit container lifting at the rate of 10 TEUs per hour, meaning that trains carrying 40 TEUs can be discharged and reloaded in 8 hours. In addition, an allowance of 2 hours was been made for shunting activities in the port terminals at both ends. In the case of Kigoma Port, this time would be necessary for the mainline locomotive to split and reassemble trains in the railway yard, as well as to transfer loaded rakes to/from the loading/unloading tracks under the gantry crane. The turnaround time in the port terminals at each end would therefore be about 10 hours. In the case of general freight trains, it was assumed that on average 6 wagons would be discharged and reloaded at the end station, with the remaining 14 wagons being discharged and reloaded at intermediate stations. It was assumed that loading/unloading at terminal stations would be at the rate of 3 wagons for every 6 hours, i.e., 12 hours for 6 wagons. In addition, an allowance of 4 hours was made for train marshalling activities at each end, giving a turnaround time of 16 hours. If the number of en route stops for attachment/detachment of wagons can be limited to 3, no more than 3 hours per trip should be necessary for this purpose and this time can be covered by the allowance within the schedule speed. (5) Estimated Train Cycle Times and Trip Capacities The cycle times estimated for container train and general freight train operation on the Central Line are given in Table 2.9 below.
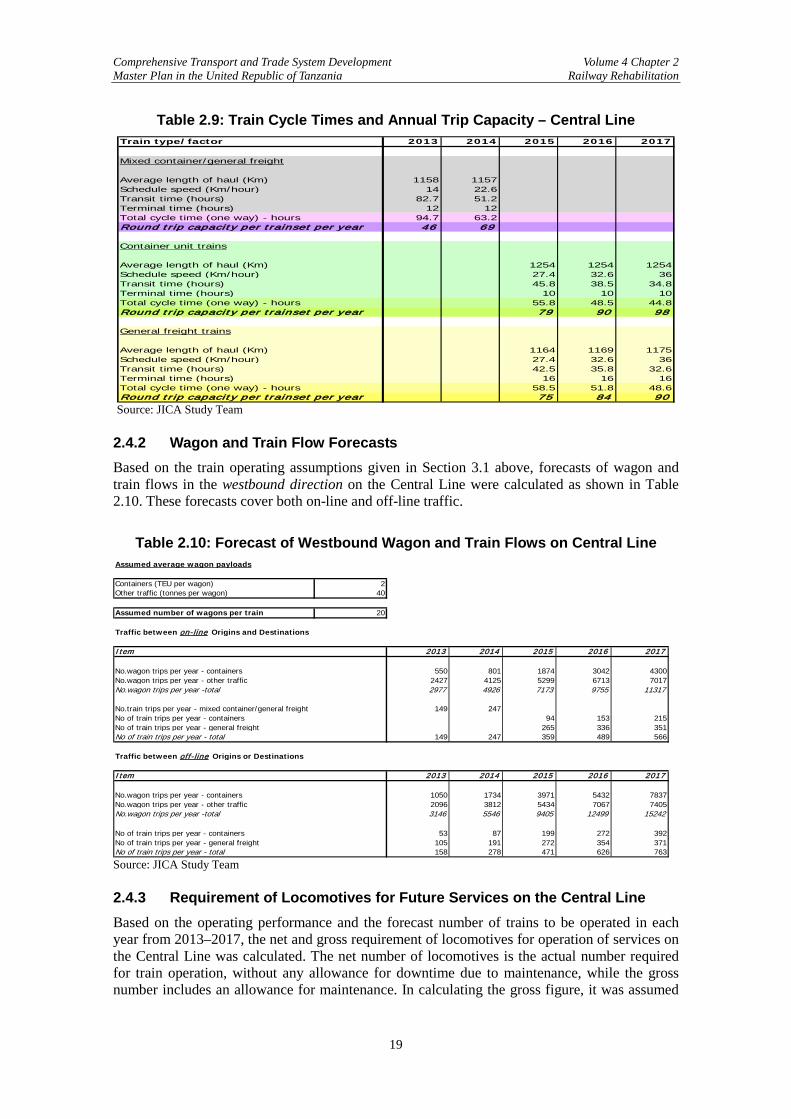
Comprehensive Transport and Trade System Development Volume 4 Chapter 2 Master Plan in the United Republic of Tanzania Railway Rehabilitation
19
Table 2.9: Train Cycle Times and Annual Trip Capacity – Central Line Train type/factor 2013 2014 2015 2016 2017
Mixed container/general freight
Average length of haul (Km) 1158 1157Schedule speed (Km/hour) 14 22.6Transit time (hours) 82.7 51.2Terminal time (hours) 12 12Total cycle time (one way) - hours 94.7 63.2Round trip capacity per trainset per year 46 69
Container unit trains
Average length of haul (Km) 1254 1254 1254Schedule speed (Km/hour) 27.4 32.6 36Transit time (hours) 45.8 38.5 34.8Terminal time (hours) 10 10 10Total cycle time (one way) - hours 55.8 48.5 44.8Round trip capacity per trainset per year 79 90 98
General freight trains
Average length of haul (Km) 1164 1169 1175Schedule speed (Km/hour) 27.4 32.6 36Transit time (hours) 42.5 35.8 32.6Terminal time (hours) 16 16 16Total cycle time (one way) - hours 58.5 51.8 48.6Round trip capacity per trainset per year 75 84 90
Source: JICA Study Team
2.4.2 Wagon and Train Flow Forecasts Based on the train operating assumptions given in Section 3.1 above, forecasts of wagon and train flows in the westbound direction on the Central Line were calculated as shown in Table 2.10. These forecasts cover both on-line and off-line traffic.
Table 2.10: Forecast of Westbound Wagon and Train Flows on Central Line Assumed average wagon payloads
Containers (TEU per wagon) 2Other traffic (tonnes per wagon) 40
Assumed number of wagons per train 20
Traffic between on-line Origins and Destinations
Item 2013 2014 2015 2016 2017
No.wagon trips per year - containers 550 801 1874 3042 4300No.wagon trips per year - other traffic 2427 4125 5299 6713 7017No.wagon trips per year -total 2977 4926 7173 9755 11317
No.train trips per year - mixed container/general freight 149 247No of train trips per year - containers 94 153 215No of train trips per year - general freight 265 336 351No of train trips per year - total 149 247 359 489 566
Traffic between off-line Origins or Destinations
Item 2013 2014 2015 2016 2017
No.wagon trips per year - containers 1050 1734 3971 5432 7837No.wagon trips per year - other traffic 2096 3812 5434 7067 7405No.wagon trips per year -total 3146 5546 9405 12499 15242
No of train trips per year - containers 53 87 199 272 392No of train trips per year - general freight 105 191 272 354 371No of train trips per year - total 158 278 471 626 763 Source: JICA Study Team
2.4.3 Requirement of Locomotives for Future Services on the Central Line Based on the operating performance and the forecast number of trains to be operated in each year from 2013–2017, the net and gross requirement of locomotives for operation of services on the Central Line was calculated. The net number of locomotives is the actual number required for train operation, without any allowance for downtime due to maintenance, while the gross number includes an allowance for maintenance. In calculating the gross figure, it was assumed
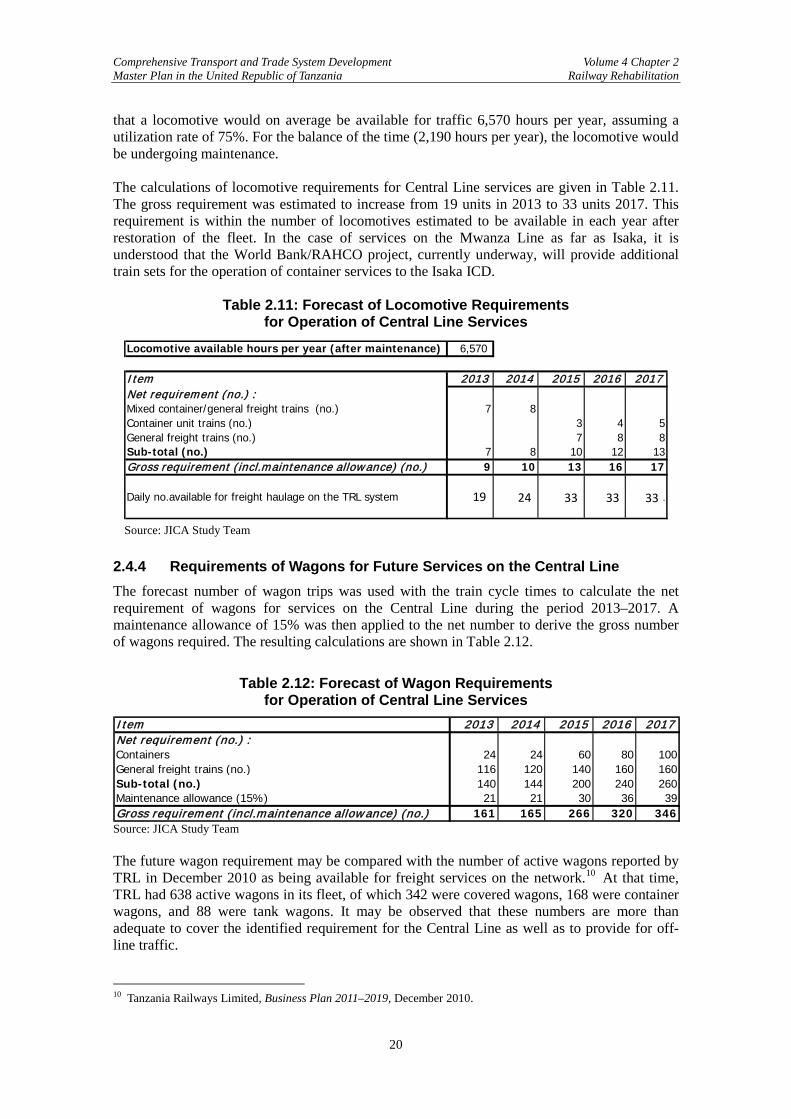
Comprehensive Transport and Trade System Development Volume 4 Chapter 2 Master Plan in the United Republic of Tanzania Railway Rehabilitation
20
that a locomotive would on average be available for traffic 6,570 hours per year, assuming a utilization rate of 75%. For the balance of the time (2,190 hours per year), the locomotive would be undergoing maintenance. The calculations of locomotive requirements for Central Line services are given in Table 2.11. The gross requirement was estimated to increase from 19 units in 2013 to 33 units 2017. This requirement is within the number of locomotives estimated to be available in each year after restoration of the fleet. In the case of services on the Mwanza Line as far as Isaka, it is understood that the World Bank/RAHCO project, currently underway, will provide additional train sets for the operation of container services to the Isaka ICD.
Table 2.11: Forecast of Locomotive Requirements for Operation of Central Line Services
Source: JICA Study Team
2.4.4 Requirements of Wagons for Future Services on the Central Line The forecast number of wagon trips was used with the train cycle times to calculate the net requirement of wagons for services on the Central Line during the period 2013–2017. A maintenance allowance of 15% was then applied to the net number to derive the gross number of wagons required. The resulting calculations are shown in Table 2.12.
Table 2.12: Forecast of Wagon Requirements for Operation of Central Line Services
Item 2013 2014 2015 2016 2017Net requirement (no.) :Containers 24 24 60 80 100General freight trains (no.) 116 120 140 160 160Sub-total (no.) 140 144 200 240 260Maintenance allowance (15%) 21 21 30 36 39Gross requirement (incl.maintenance allowance) (no.) 161 165 266 320 346 Source: JICA Study Team The future wagon requirement may be compared with the number of active wagons reported by TRL in December 2010 as being available for freight services on the network.10 At that time, TRL had 638 active wagons in its fleet, of which 342 were covered wagons, 168 were container wagons, and 88 were tank wagons. It may be observed that these numbers are more than adequate to cover the identified requirement for the Central Line as well as to provide for off-line traffic. 10 Tanzania Railways Limited, Business Plan 2011–2019, December 2010.
Locomotive available hours per year (after maintenance) 6,570
I tem 2013 2014 2015 2016 2017Net requirement (no.) :Mixed container/general freight trains (no.) 7 8Container unit trains (no.) 3 4 5General freight trains (no.) 7 8 8Sub-total (no.) 7 8 10 12 13Gross requirement (incl.maintenance allowance) (no.) 9 10 13 16 17
Daily no.available for freight haulage on the TRL system 11 14 17 19 2119 24 33 33 33
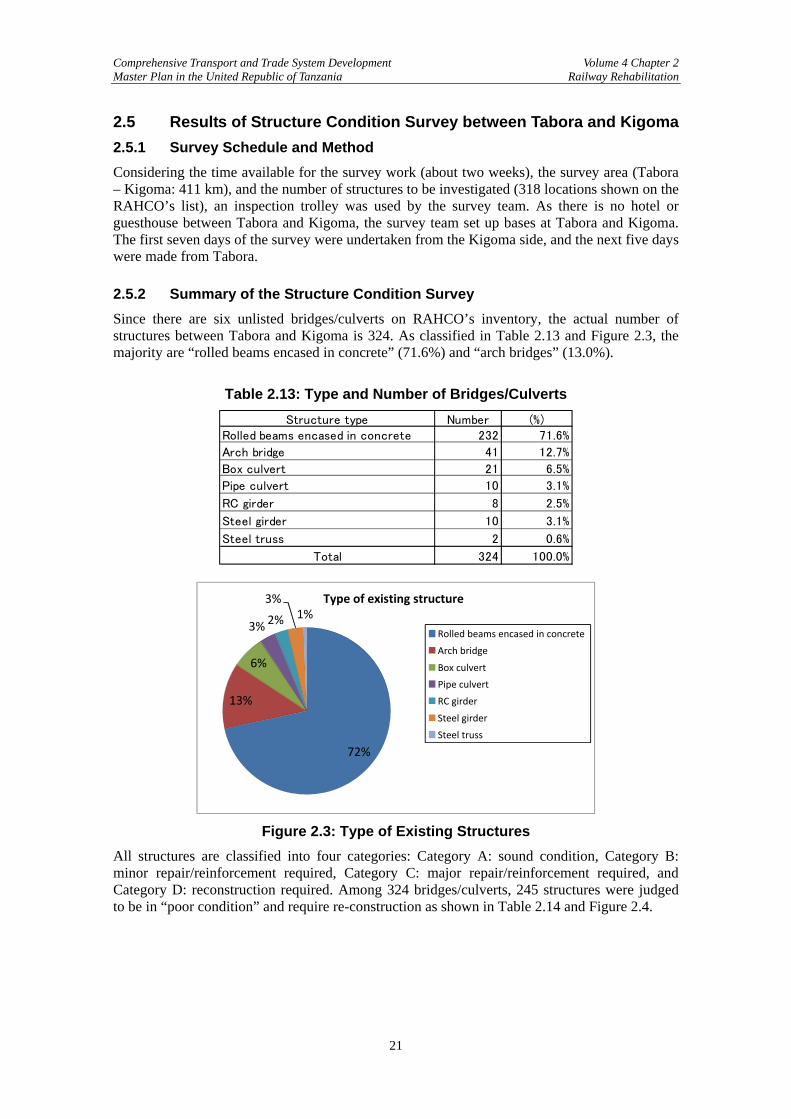
Comprehensive Transport and Trade System Development Volume 4 Chapter 2 Master Plan in the United Republic of Tanzania Railway Rehabilitation
21
2.5 Results of Structure Condition Survey between Tabora and Kigoma 2.5.1 Survey Schedule and Method Considering the time available for the survey work (about two weeks), the survey area (Tabora – Kigoma: 411 km), and the number of structures to be investigated (318 locations shown on the RAHCO’s list), an inspection trolley was used by the survey team. As there is no hotel or guesthouse between Tabora and Kigoma, the survey team set up bases at Tabora and Kigoma. The first seven days of the survey were undertaken from the Kigoma side, and the next five days were made from Tabora. 2.5.2 Summary of the Structure Condition Survey Since there are six unlisted bridges/culverts on RAHCO’s inventory, the actual number of structures between Tabora and Kigoma is 324. As classified in Table 2.13 and Figure 2.3, the majority are “rolled beams encased in concrete” (71.6%) and “arch bridges” (13.0%).
Table 2.13: Type and Number of Bridges/Culverts Structure type Number (%)
Rolled beams encased in concrete 232 71.6%
Arch bridge 41 12.7%
Box culvert 21 6.5%
Pipe culvert 10 3.1%
RC girder 8 2.5%
Steel girder 10 3.1%
Steel truss 2 0.6%
Total 324 100.0%
Figure 2.3: Type of Existing Structures
All structures are classified into four categories: Category A: sound condition, Category B: minor repair/reinforcement required, Category C: major repair/reinforcement required, and Category D: reconstruction required. Among 324 bridges/culverts, 245 structures were judged to be in “poor condition” and require re-construction as shown in Table 2.14 and Figure 2.4.
72%
13%
6%
3% 2%
3%1%
Type of existing structure
Rolled beams encased in concrete Arch bridge
Box culvert
Pipe culvert
RC girder
Steel girder
Steel truss
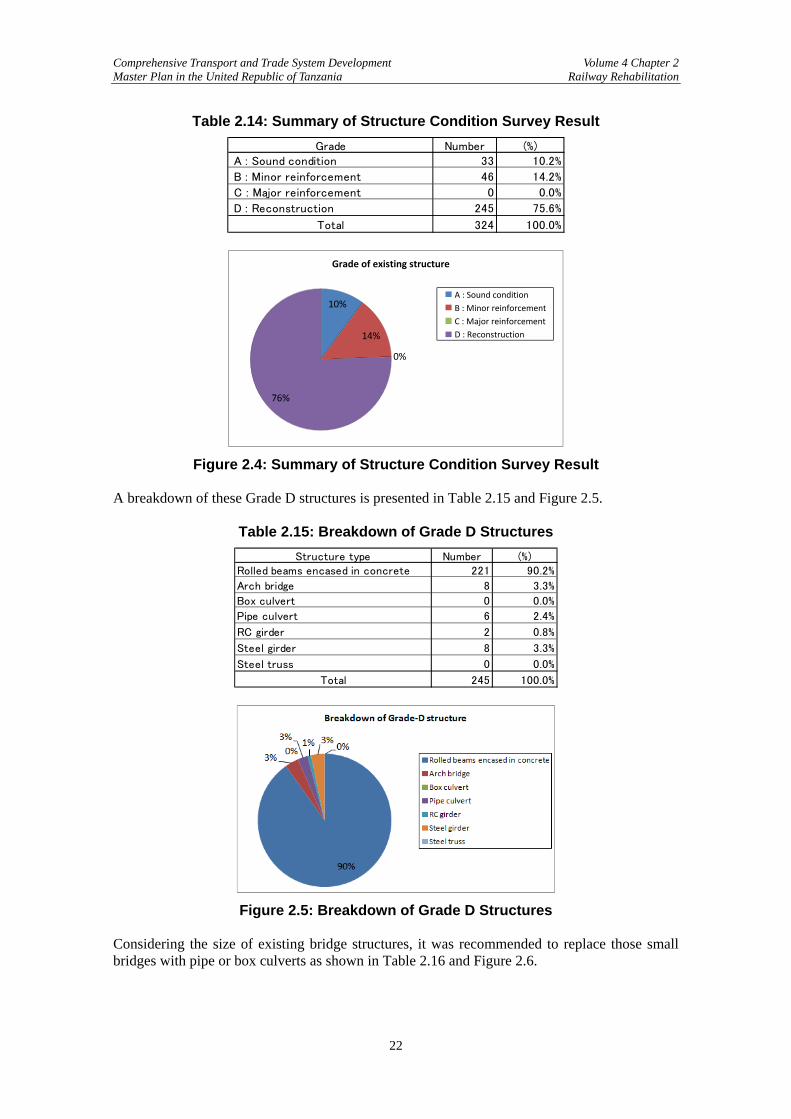
Comprehensive Transport and Trade System Development Volume 4 Chapter 2 Master Plan in the United Republic of Tanzania Railway Rehabilitation
22
Table 2.14: Summary of Structure Condition Survey Result Grade Number (%)
A : Sound condition 33 10.2%
B : Minor reinforcement 46 14.2%
C : Major reinforcement 0 0.0%
D : Reconstruction 245 75.6%
Total 324 100.0%
Figure 2.4: Summary of Structure Condition Survey Result
A breakdown of these Grade D structures is presented in Table 2.15 and Figure 2.5.
Table 2.15: Breakdown of Grade D Structures Structure type Number (%)
Rolled beams encased in concrete 221 90.2%
Arch bridge 8 3.3%
Box culvert 0 0.0%
Pipe culvert 6 2.4%
RC girder 2 0.8%
Steel girder 8 3.3%
Steel truss 0 0.0%
Total 245 100.0%
Figure 2.5: Breakdown of Grade D Structures
Considering the size of existing bridge structures, it was recommended to replace those small bridges with pipe or box culverts as shown in Table 2.16 and Figure 2.6.
10%
14%
0%
76%
Grade of existing structure
A : Sound condition
B : Minor reinforcement
C : Major reinforcement
D : Reconstruction
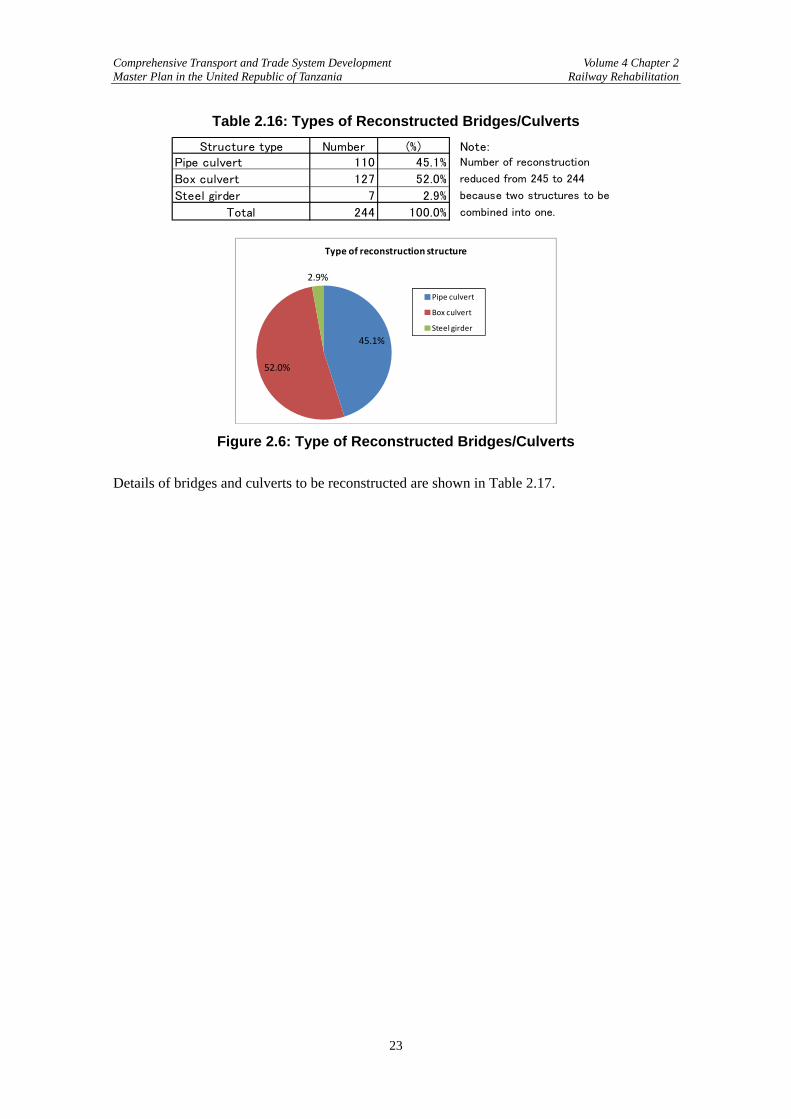
Comprehensive Transport and Trade System Development Volume 4 Chapter 2 Master Plan in the United Republic of Tanzania Railway Rehabilitation
23
Table 2.16: Types of Reconstructed Bridges/Culverts Structure type Number (%) Note:
Pipe culvert 110 45.1% Number of reconstruction
Box culvert 127 52.0% reduced from 245 to 244
Steel girder 7 2.9% because two structures to be
Total 244 100.0% combined into one.
45.1%
52.0%
2.9%
Type of reconstruction structure
Pipe culvert
Box culvert
Steel girder
Figure 2.6: Type of Reconstructed Bridges/Culverts
Details of bridges and culverts to be reconstructed are shown in Table 2.17.
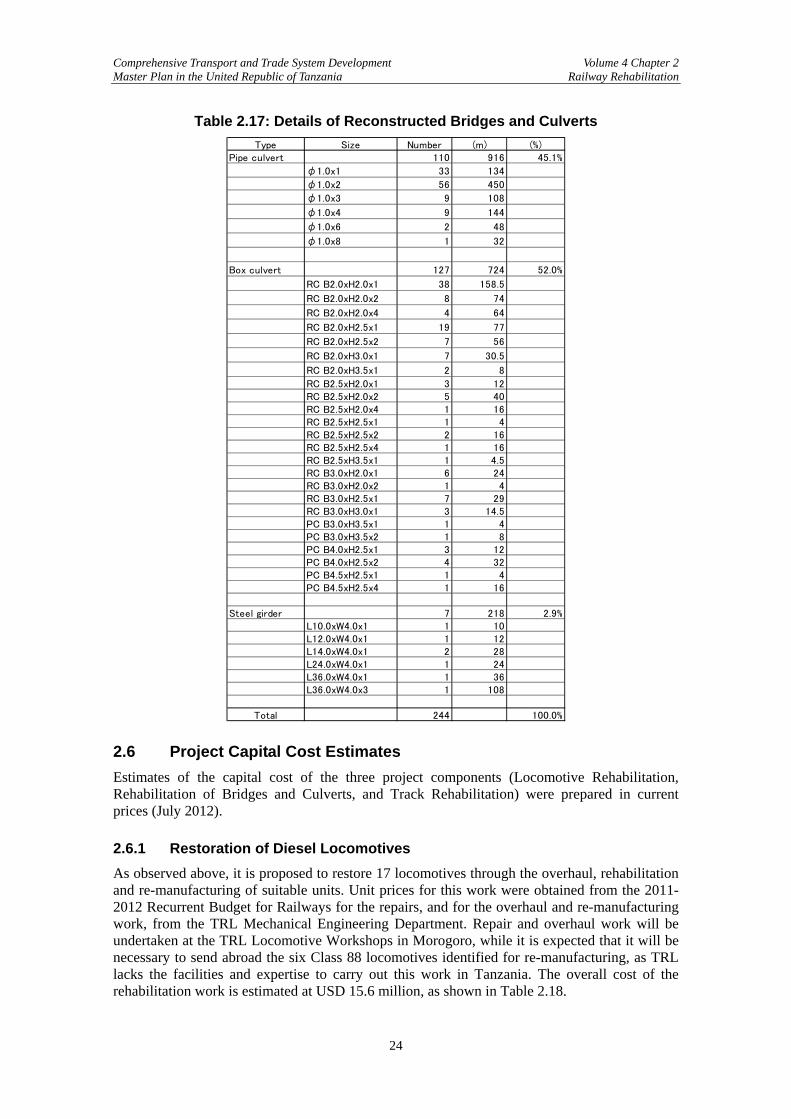
Comprehensive Transport and Trade System Development Volume 4 Chapter 2 Master Plan in the United Republic of Tanzania Railway Rehabilitation
24
Table 2.17: Details of Reconstructed Bridges and Culverts Type Size Number (m) (%)
Pipe culvert 110 916 45.1%
φ1.0x1 33 134
φ1.0x2 56 450
φ1.0x3 9 108
φ1.0x4 9 144
φ1.0x6 2 48
φ1.0x8 1 32
Box culvert 127 724 52.0%
RC B2.0xH2.0x1 38 158.5
RC B2.0xH2.0x2 8 74
RC B2.0xH2.0x4 4 64
RC B2.0xH2.5x1 19 77
RC B2.0xH2.5x2 7 56
RC B2.0xH3.0x1 7 30.5
RC B2.0xH3.5x1 2 8
RC B2.5xH2.0x1 3 12RC B2.5xH2.0x2 5 40RC B2.5xH2.0x4 1 16RC B2.5xH2.5x1 1 4RC B2.5xH2.5x2 2 16RC B2.5xH2.5x4 1 16RC B2.5xH3.5x1 1 4.5RC B3.0xH2.0x1 6 24RC B3.0xH2.0x2 1 4RC B3.0xH2.5x1 7 29RC B3.0xH3.0x1 3 14.5PC B3.0xH3.5x1 1 4PC B3.0xH3.5x2 1 8PC B4.0xH2.5x1 3 12PC B4.0xH2.5x2 4 32PC B4.5xH2.5x1 1 4PC B4.5xH2.5x4 1 16
Steel girder 7 218 2.9%L10.0xW4.0x1 1 10L12.0xW4.0x1 1 12L14.0xW4.0x1 2 28L24.0xW4.0x1 1 24L36.0xW4.0x1 1 36L36.0xW4.0x3 1 108
Total 244 100.0% 2.6 Project Capital Cost Estimates Estimates of the capital cost of the three project components (Locomotive Rehabilitation, Rehabilitation of Bridges and Culverts, and Track Rehabilitation) were prepared in current prices (July 2012). 2.6.1 Restoration of Diesel Locomotives As observed above, it is proposed to restore 17 locomotives through the overhaul, rehabilitation and re-manufacturing of suitable units. Unit prices for this work were obtained from the 2011-2012 Recurrent Budget for Railways for the repairs, and for the overhaul and re-manufacturing work, from the TRL Mechanical Engineering Department. Repair and overhaul work will be undertaken at the TRL Locomotive Workshops in Morogoro, while it is expected that it will be necessary to send abroad the six Class 88 locomotives identified for re-manufacturing, as TRL lacks the facilities and expertise to carry out this work in Tanzania. The overall cost of the rehabilitation work is estimated at USD 15.6 million, as shown in Table 2.18.
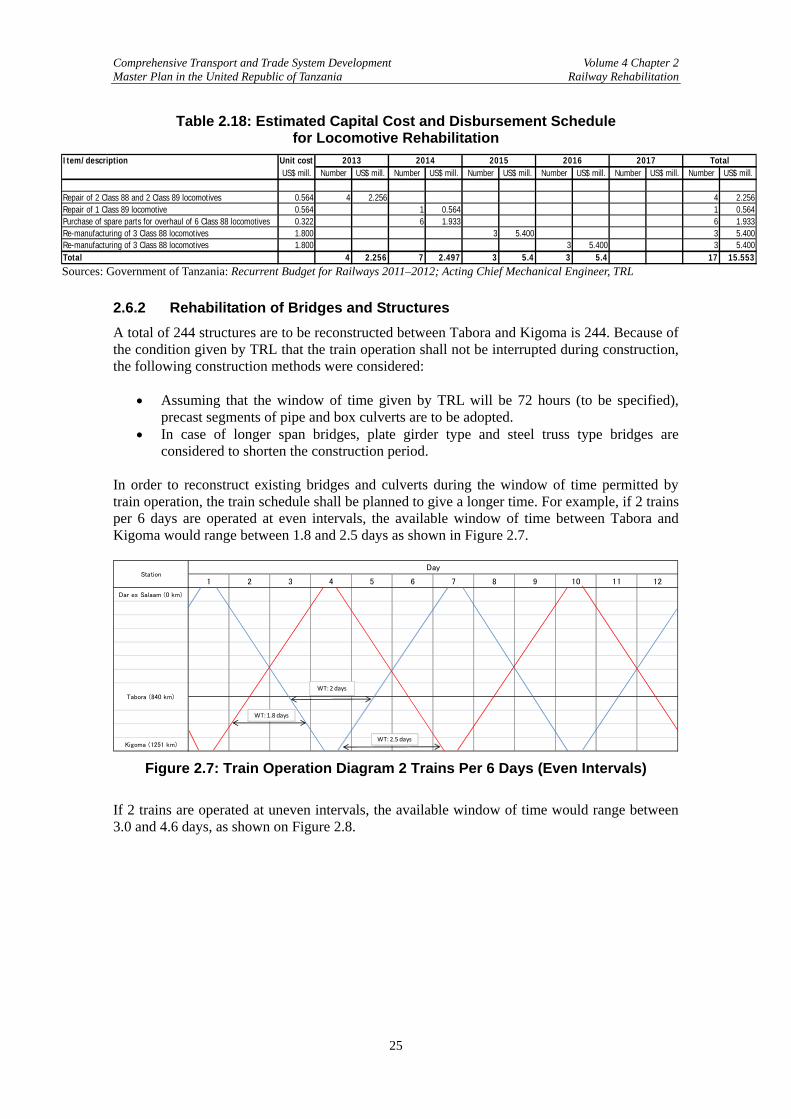
Comprehensive Transport and Trade System Development Volume 4 Chapter 2 Master Plan in the United Republic of Tanzania Railway Rehabilitation
25
Table 2.18: Estimated Capital Cost and Disbursement Schedule for Locomotive Rehabilitation
Item/description Unit cost US$ mill. Number US$ mill. Number US$ mill. Number US$ mill. Number US$ mill. Number US$ mill. Number US$ mill.
Repair of 2 Class 88 and 2 Class 89 locomotives 0.564 4 2.256 4 2.256Repair of 1 Class 89 locomotive 0.564 1 0.564 1 0.564Purchase of spare parts for overhaul of 6 Class 88 locomotives 0.322 6 1.933 6 1.933Re-manufacturing of 3 Class 88 locomotives 1.800 3 5.400 3 5.400Re-manufacturing of 3 Class 88 locomotives 1.800 3 5.400 3 5.400Total 4 2.256 7 2.497 3 5.4 3 5.4 17 15.553
Total2013 2014 2015 2016 2017
Sources: Government of Tanzania: Recurrent Budget for Railways 2011–2012; Acting Chief Mechanical Engineer, TRL
2.6.2 Rehabilitation of Bridges and Structures A total of 244 structures are to be reconstructed between Tabora and Kigoma is 244. Because of the condition given by TRL that the train operation shall not be interrupted during construction, the following construction methods were considered:
Assuming that the window of time given by TRL will be 72 hours (to be specified), precast segments of pipe and box culverts are to be adopted.
In case of longer span bridges, plate girder type and steel truss type bridges are considered to shorten the construction period.
In order to reconstruct existing bridges and culverts during the window of time permitted by train operation, the train schedule shall be planned to give a longer time. For example, if 2 trains per 6 days are operated at even intervals, the available window of time between Tabora and Kigoma would range between 1.8 and 2.5 days as shown in Figure 2.7.
1 2 3 4 5 6 7 8 9 10 11 12
Dar es Salaam (0 km)
Kigoma (1251 km)
Tabora (840 km)
StationDay
WT: 2 days
WT: 2.5 days
WT: 1.8 days
Figure 2.7: Train Operation Diagram 2 Trains Per 6 Days (Even Intervals)
If 2 trains are operated at uneven intervals, the available window of time would range between 3.0 and 4.6 days, as shown on Figure 2.8.

Comprehensive Transport and Trade System Development Volume 4 Chapter 2 Master Plan in the United Republic of Tanzania Railway Rehabilitation
26
1 2 3 4 5 6 7 8 9 10 11 12
Dar es Sal aam (0 km)
Ki goma (1251 km)
Tabora (840 km)
StationDay
WT: 3.0 days
WT: 4.6 days
Figure 2.8: Train Operation Diagram: 2 Trains Per 6 Days (Uneven Intervals)
(1) Scope of Study A field survey was carried out between Tabora and Kigoma. The refurbishment study was for the entire structure. Reference was made to the repair track record of TRL, and Pipe Culvert, Box Culvert, and Reinforced Concrete (RC) Bridge structures were considered. Structures subject to reconstruction (Bridge No. 1011–No. 1328) are shown in Table 2.19, which summarizes the classification of reinforcement or replacement. The table also shows reconstruction quantities. In addition, Table 2.20 presents a list of field survey results and refurbishment methods, and Tables 2.21 to 2.23 present inspection sheet samples for each type of structure.
Table 2.19: Quantities of Reconstruction Work
a)Pipe Culvert Nos b)Box Culvert Nos c)RC Bridge Nos
Span 4.0m 29.0 Span 4.0m 86.0 Span 12.0m 1.0
Span 4.5m 1.0 Span 4.5m 2.0 Span 14.0m 2.0
Span 5.5m 1.0 Span 5.0m 3.0 Span 12.0m*9span=108m 1.0
Span 8.0m 55.0 Span 6.5m 2.0 Span 11.8m*2span=23.6m 1.0
Span 10.0m 1.0 Span 8.0m 27.0 Span 12.0m*3span=6m 1.0
Span 12.0m 9.0 Span 9.0m 1.0 Span 13.0m 1.0
Span 16.0m 10.0 Span 16.0m 8.0
Span 24.0m 2.0 Span 18.0m 1.0
Span 32.0m 1.0
Total 109.0 130.0 7.0
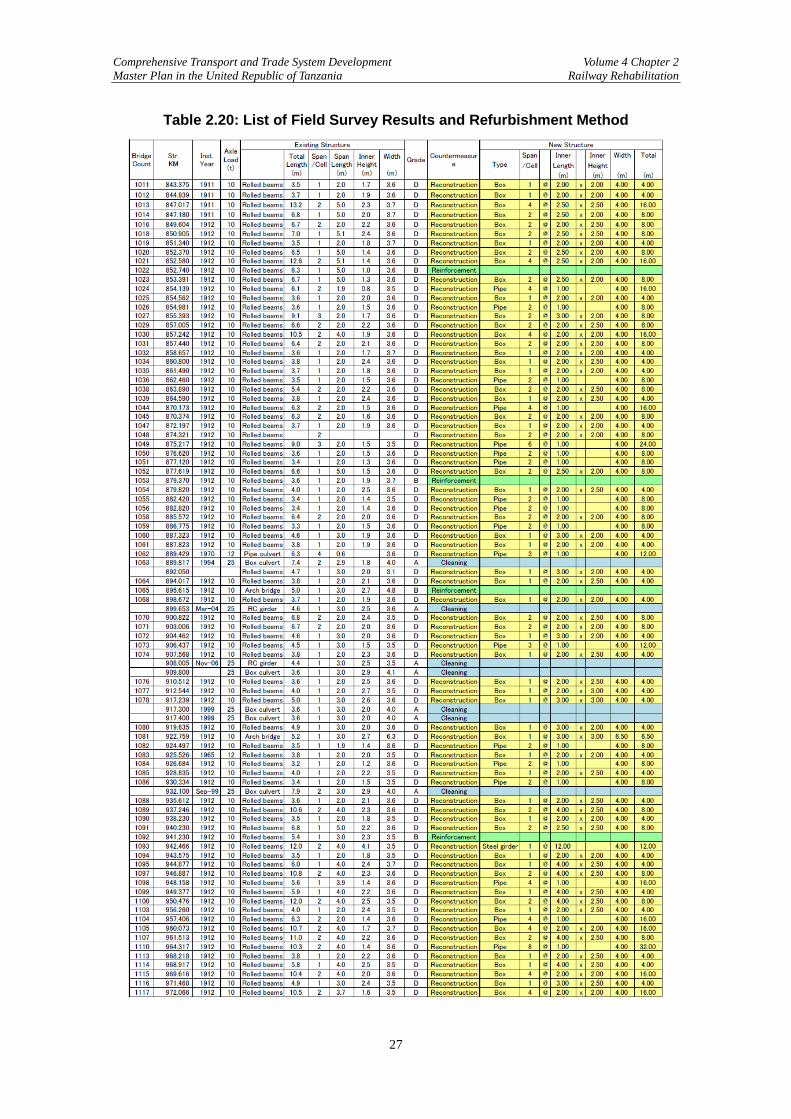
Comprehensive Transport and Trade System Development Volume 4 Chapter 2 Master Plan in the United Republic of Tanzania Railway Rehabilitation
27
Table 2.20: List of Field Survey Results and Refurbishment Method
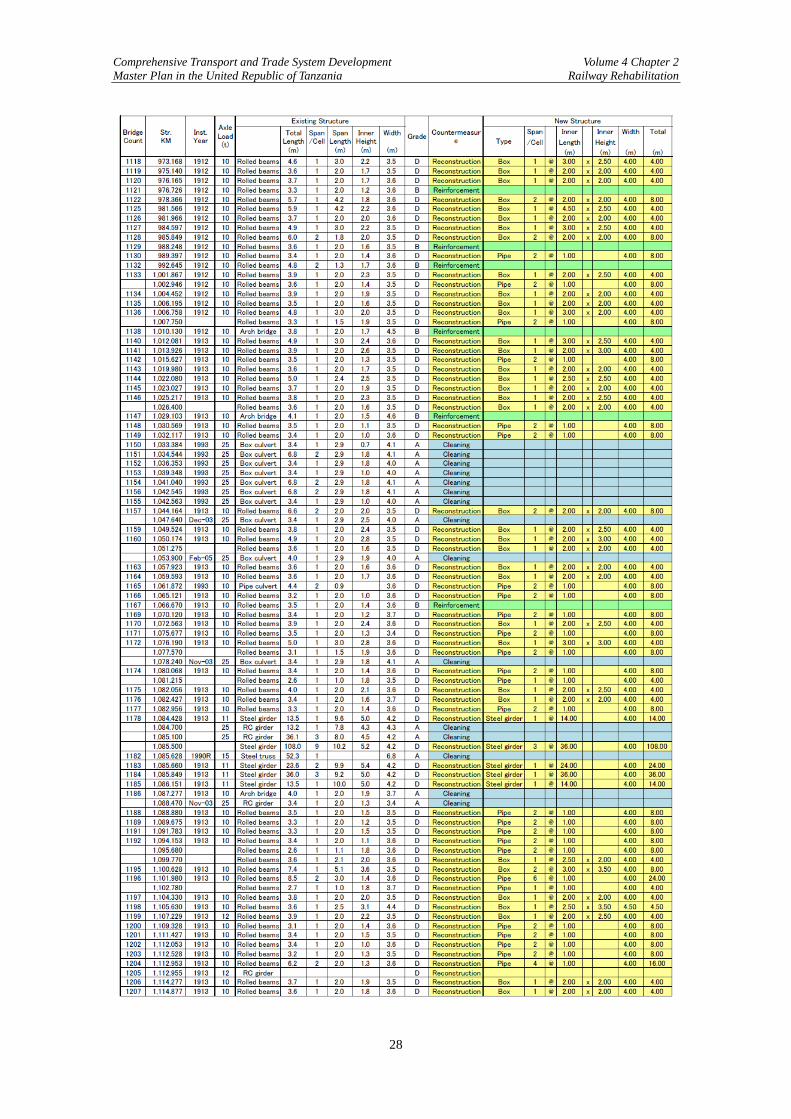
Comprehensive Transport and Trade System Development Volume 4 Chapter 2 Master Plan in the United Republic of Tanzania Railway Rehabilitation
28
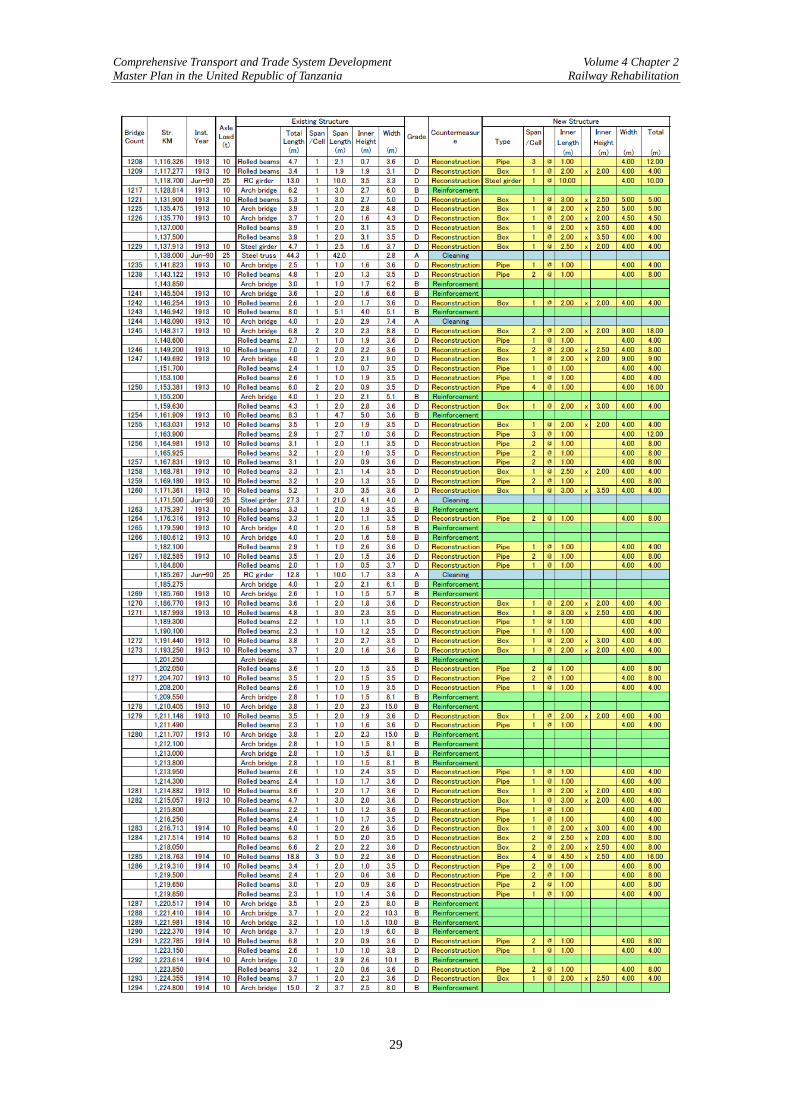
Comprehensive Transport and Trade System Development Volume 4 Chapter 2 Master Plan in the United Republic of Tanzania Railway Rehabilitation
29
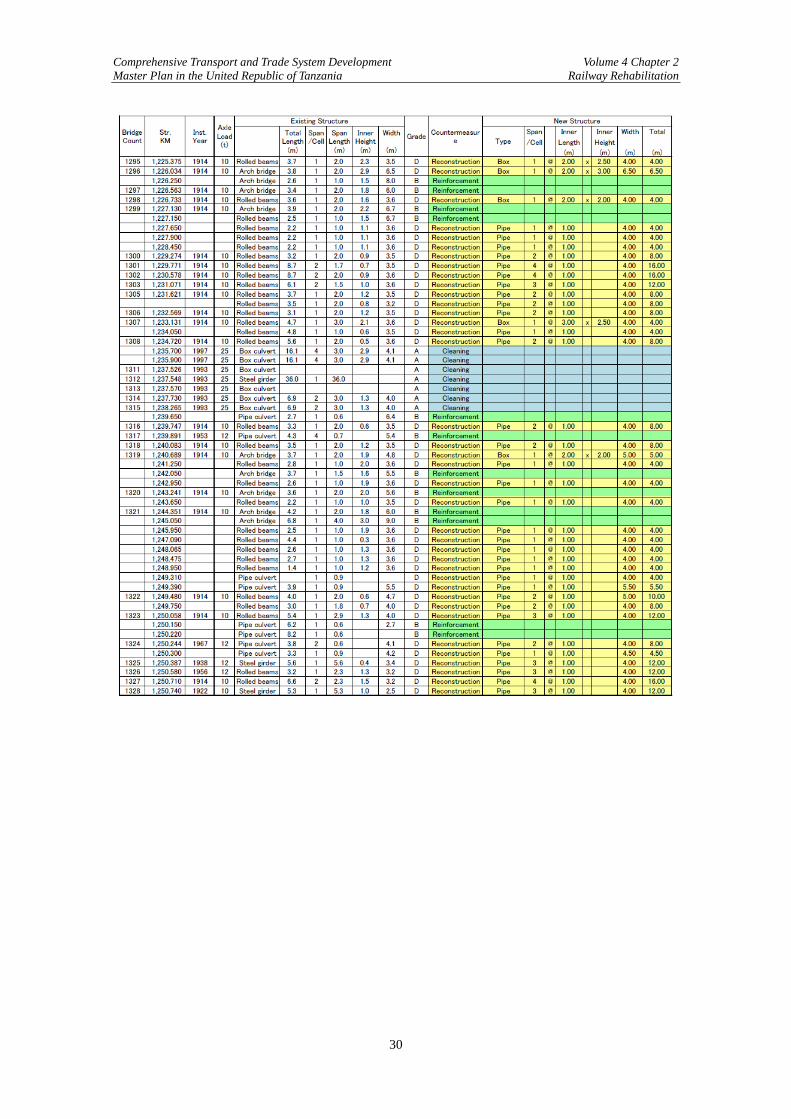
Comprehensive Transport and Trade System Development Volume 4 Chapter 2 Master Plan in the United Republic of Tanzania Railway Rehabilitation
30
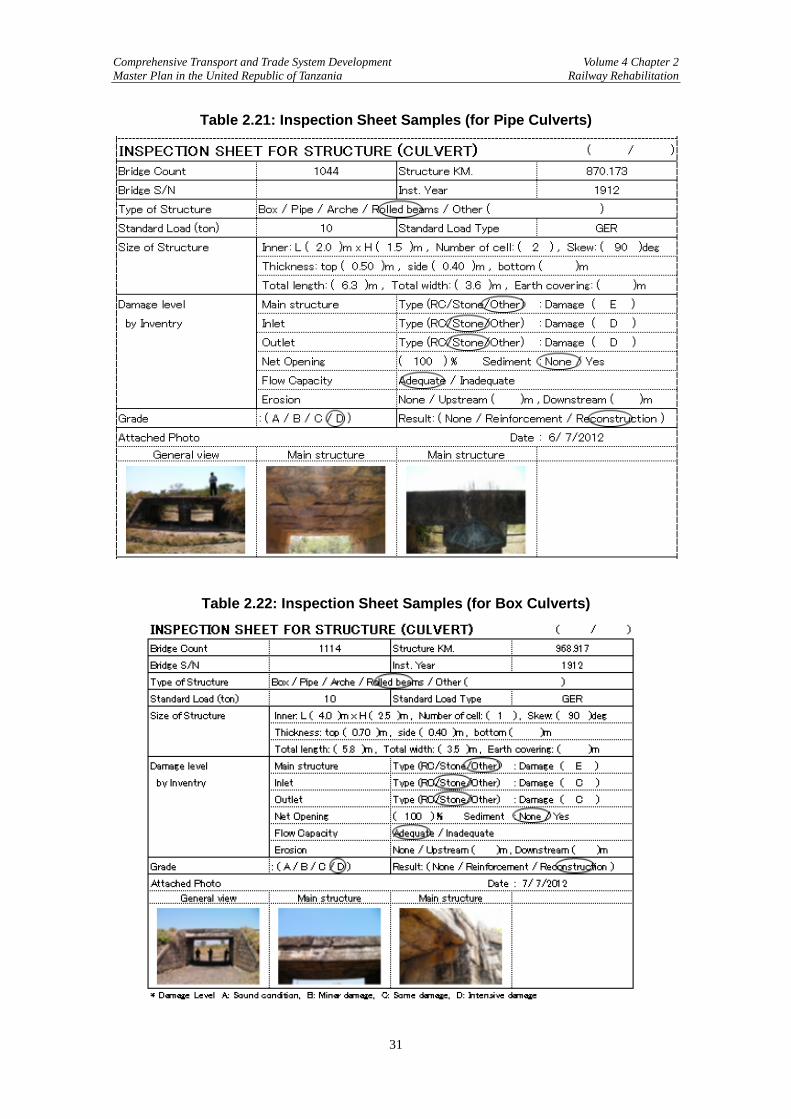
Comprehensive Transport and Trade System Development Volume 4 Chapter 2 Master Plan in the United Republic of Tanzania Railway Rehabilitation
31
Table 2.21: Inspection Sheet Samples (for Pipe Culverts)
Table 2.22: Inspection Sheet Samples (for Box Culverts)
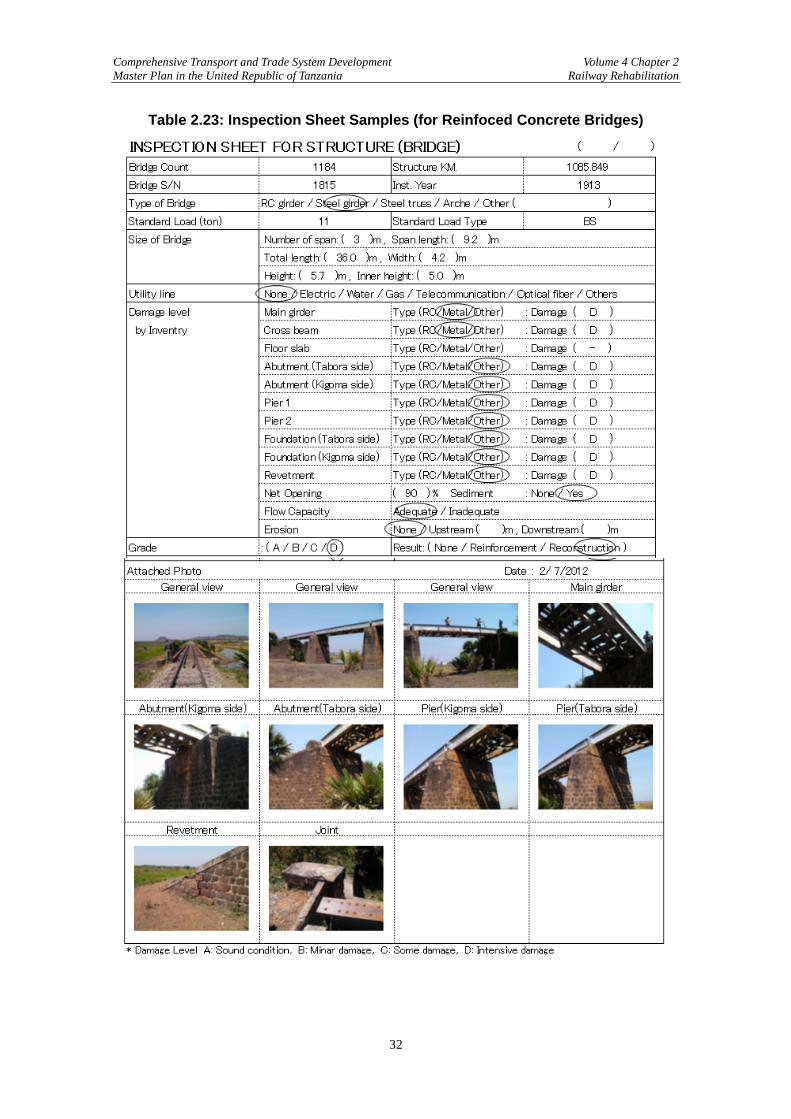
Comprehensive Transport and Trade System Development Volume 4 Chapter 2 Master Plan in the United Republic of Tanzania Railway Rehabilitation
32
Table 2.23: Inspection Sheet Samples (for Reinfoced Concrete Bridges)
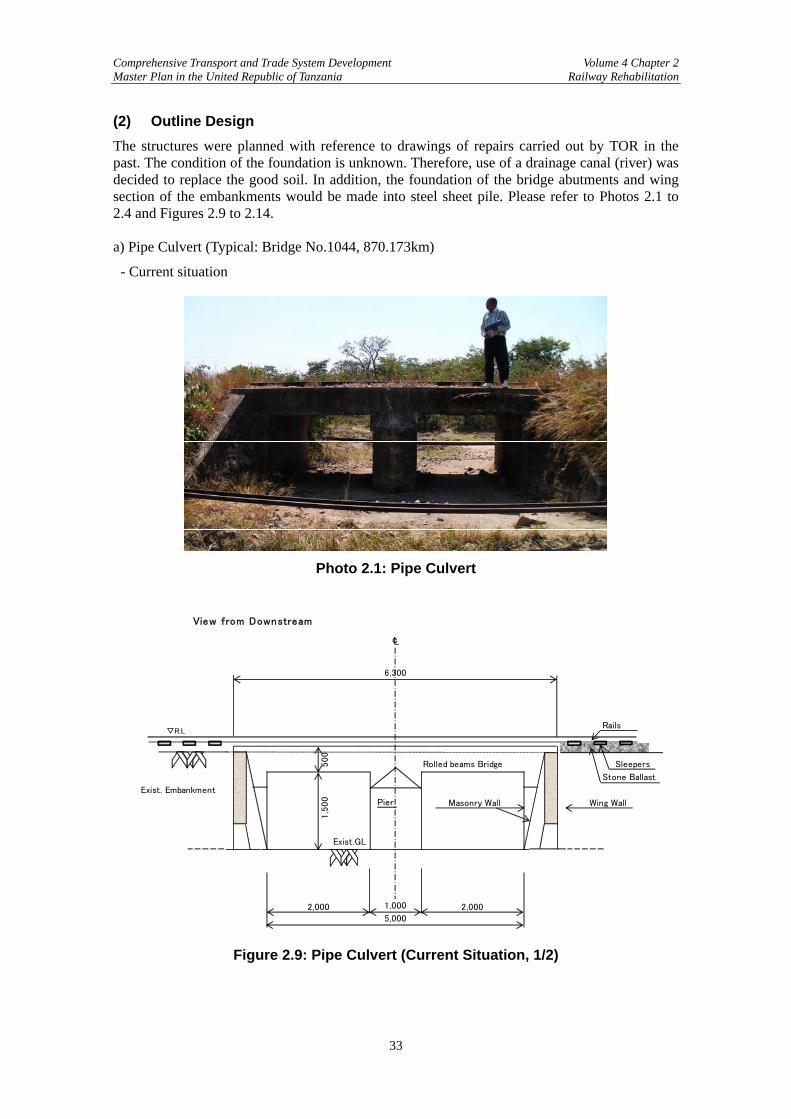
Comprehensive Transport and Trade System Development Volume 4 Chapter 2 Master Plan in the United Republic of Tanzania Railway Rehabilitation
33
(2) Outline Design The structures were planned with reference to drawings of repairs carried out by TOR in the past. The condition of the foundation is unknown. Therefore, use of a drainage canal (river) was decided to replace the good soil. In addition, the foundation of the bridge abutments and wing section of the embankments would be made into steel sheet pile. Please refer to Photos 2.1 to 2.4 and Figures 2.9 to 2.14. a) Pipe Culvert (Typical: Bridge No.1044, 870.173km)
- Current situation
Photo 2.1: Pipe Culvert
Rails
Rolled beams Bridge Sleepers
Stone Ballast
Exist. Embankment
Masonry Wall Wing Wall
Exist.GL
500
1,5
00
5,0002,000 2,0001,000
Pier
6,300
℄
View from Downstream
▽R.L
Figure 2.9: Pipe Culvert (Current Situation, 1/2)
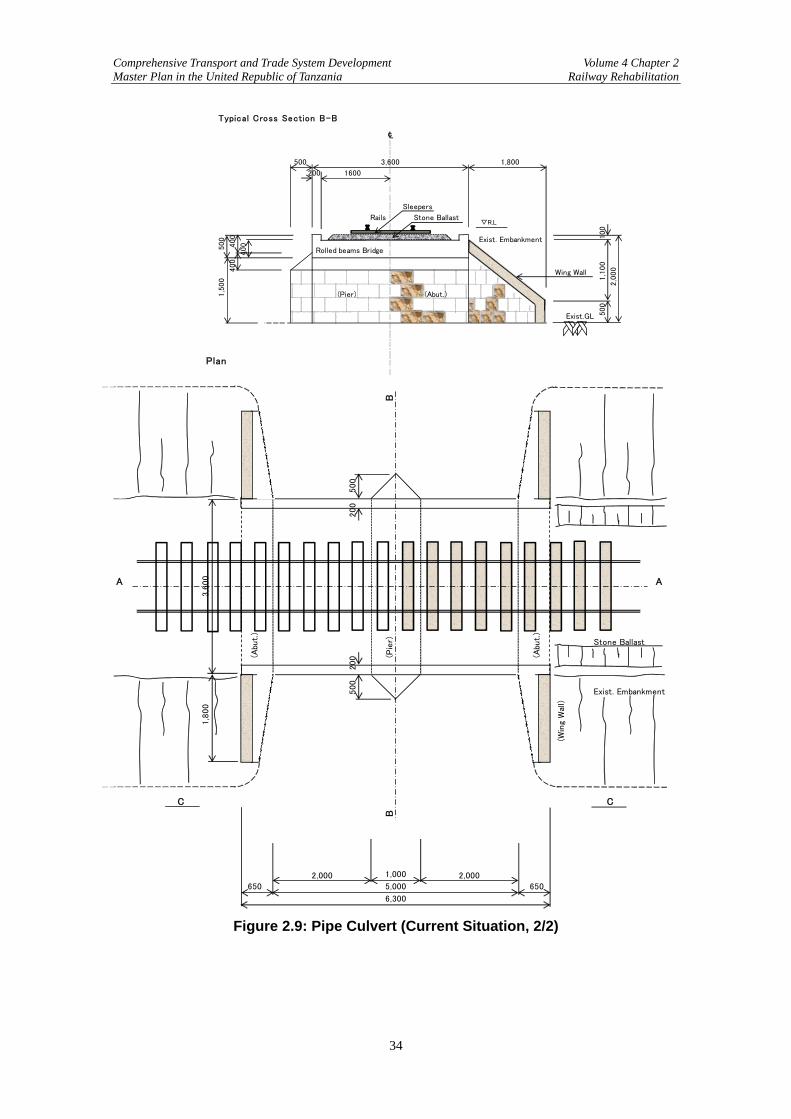
Comprehensive Transport and Trade System Development Volume 4 Chapter 2 Master Plan in the United Republic of Tanzania Railway Rehabilitation
34
Sleepers
Rails Stone Ballast
Exist. Embankment
Rolled beams Bridge
Wing Wall
(Pier) (Abut.)
Exist.GL
2,0
00
▽R.L
500
100
1,1
00
1,800
Typical Cross Section B-B
℄
3,600
500
1,5
00
500
400
400
200 1600
400
B
A A
Stone Ballast
Exist. Embankment
C C
B
6505,000
(Win
g W
all)
(Abu
t.)
(Pie
r)
2,000
6,300
Plan
2,000 1,000
500
500
(Abu
t.)
650
1,8
00
3,6
00
200
200
Figure 2.9: Pipe Culvert (Current Situation, 2/2)
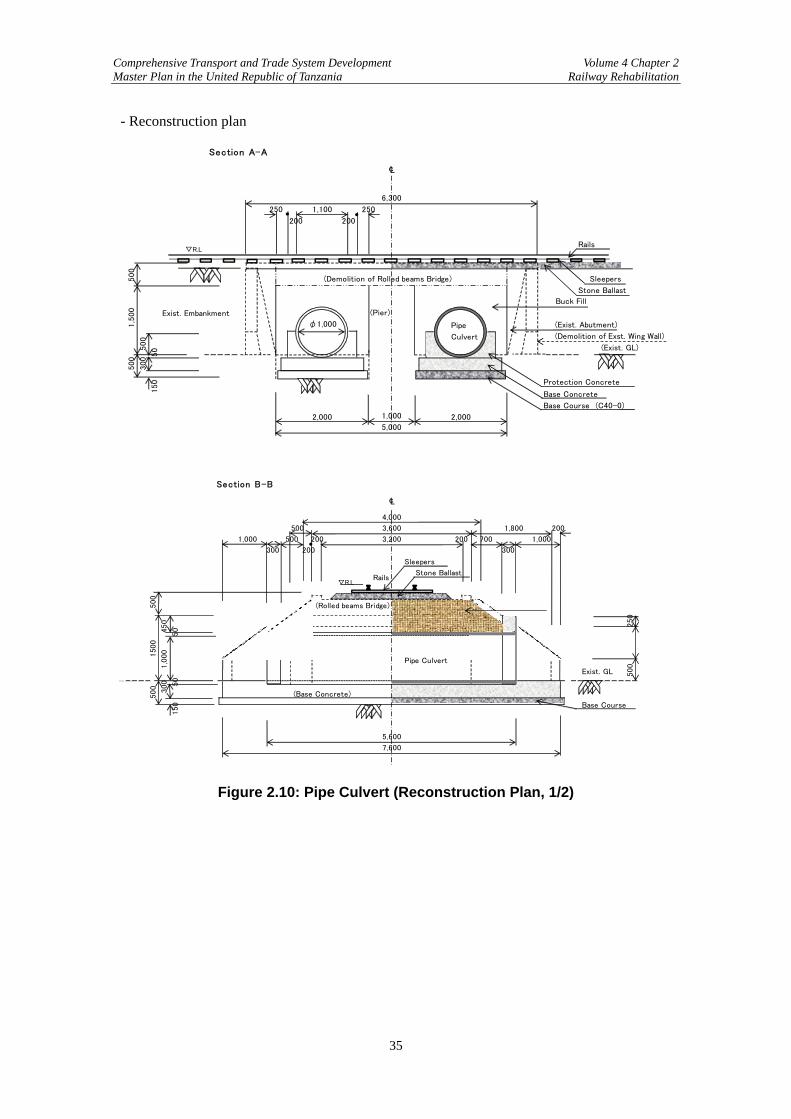
Comprehensive Transport and Trade System Development Volume 4 Chapter 2 Master Plan in the United Republic of Tanzania Railway Rehabilitation
35
- Reconstruction plan
Rails
(Demolition of Rolled beams Bridge) Sleepers
Stone Ballast
Exist. Embankment
Pipe (Exist. Abutment)
Culvert (Demolition of Exst. Wing Wall)
(Exist. GL)
Protection Concrete
Base Concrete
Base Course (C40-0)
500
500
1,5
00
300
150
500
50
Section A-A
℄
1,100250 250
200 200
6,300
▽R.L
(Pier)
2,000 1,000 2,0005,000
φ1,000
Buck Fill
Sleepers
Stone Ballast▽R.L
(Rolled beams Bridge)
Pipe Culvert
Exist. GL
(Base Concrete)
Base Course
500
500
250
200
500
4,000
Buck Fill
1,800
1,000200 700
200
300
3,200200
Rails
500
Section B-B
℄
500
450
1500
50
1,0
00
50
300
150
3,600
300
1,000
7,600
5,600
Figure 2.10: Pipe Culvert (Reconstruction Plan, 1/2)
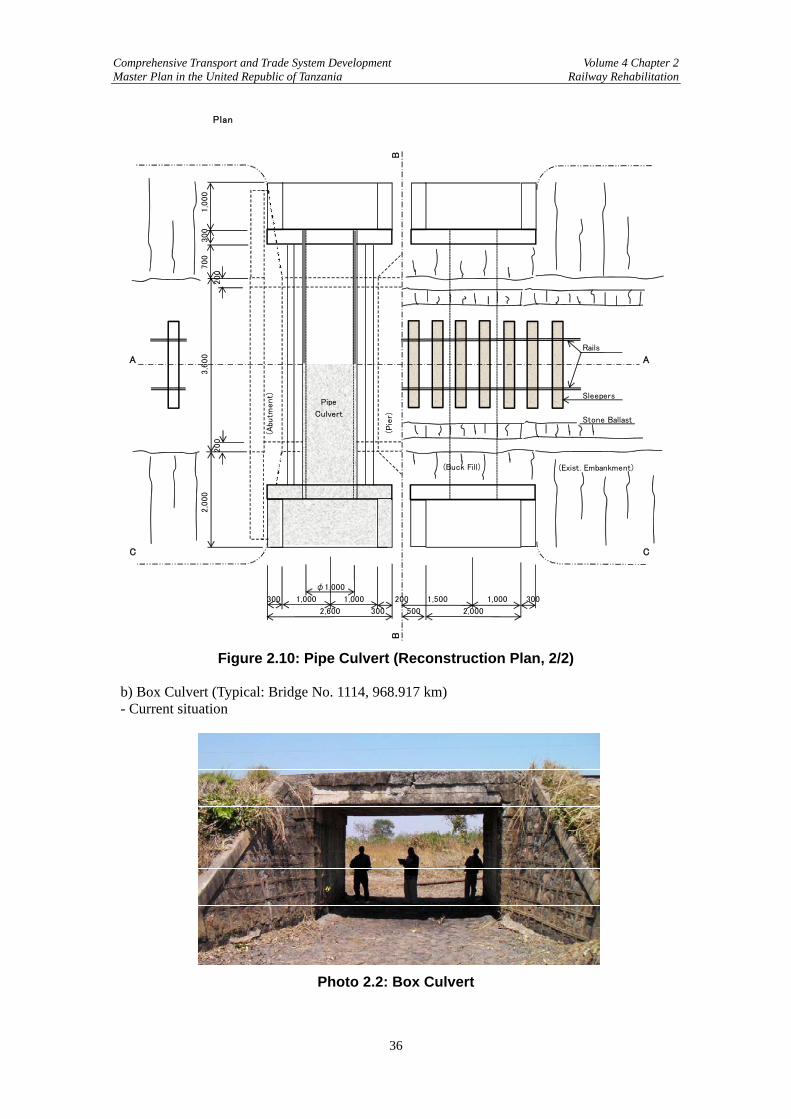
Comprehensive Transport and Trade System Development Volume 4 Chapter 2 Master Plan in the United Republic of Tanzania Railway Rehabilitation
36
B
Rails
A A
Sleepers
Stone Ballast
(Exist. Embankment)
C C
B
300
500
Plan
200
300
200
1,0
00
3,6
00
300
700
2,0
00
(Pie
r)
(Abu
tment)
1,500
2,600
1,000 1,000
2,000
φ1,000
(Buck Fill)
2001,000
300
Pipe
Culvert
Figure 2.10: Pipe Culvert (Reconstruction Plan, 2/2)
b) Box Culvert (Typical: Bridge No. 1114, 968.917 km) - Current situation
Photo 2.2: Box Culvert
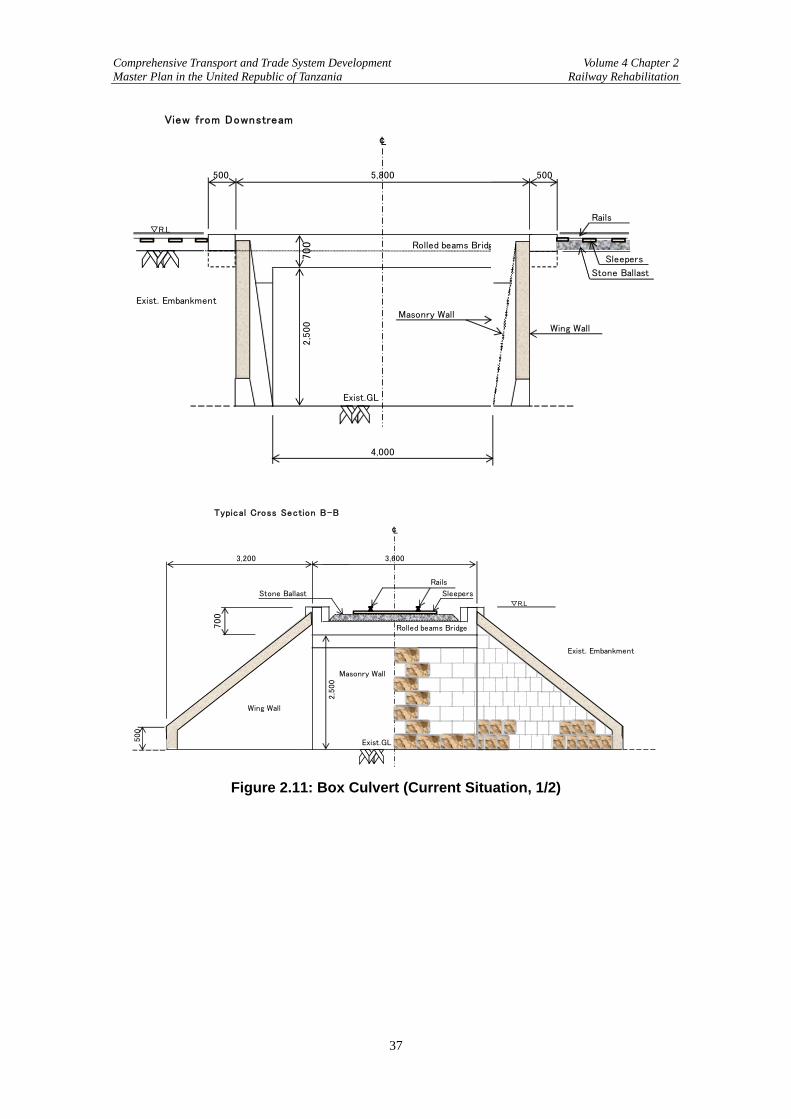
Comprehensive Transport and Trade System Development Volume 4 Chapter 2 Master Plan in the United Republic of Tanzania Railway Rehabilitation
37
Rails
Rolled beams Bridge
Sleepers
Stone Ballast
Exist. Embankment
Masonry Wall
Wing Wall
Exist.GL
View from Downstream
2,5
00
4,000
▽R.L
500500 5,800
℄
700
Rails
Stone Ballast Sleepers
Rolled beams Bridge
Exist. Embankment
Masonry Wall
Wing Wall
Exist.GL500
3,200
▽R.L
700
2,5
00
Typical Cross Section B-B
℄
3,600
Figure 2.11: Box Culvert (Current Situation, 1/2)
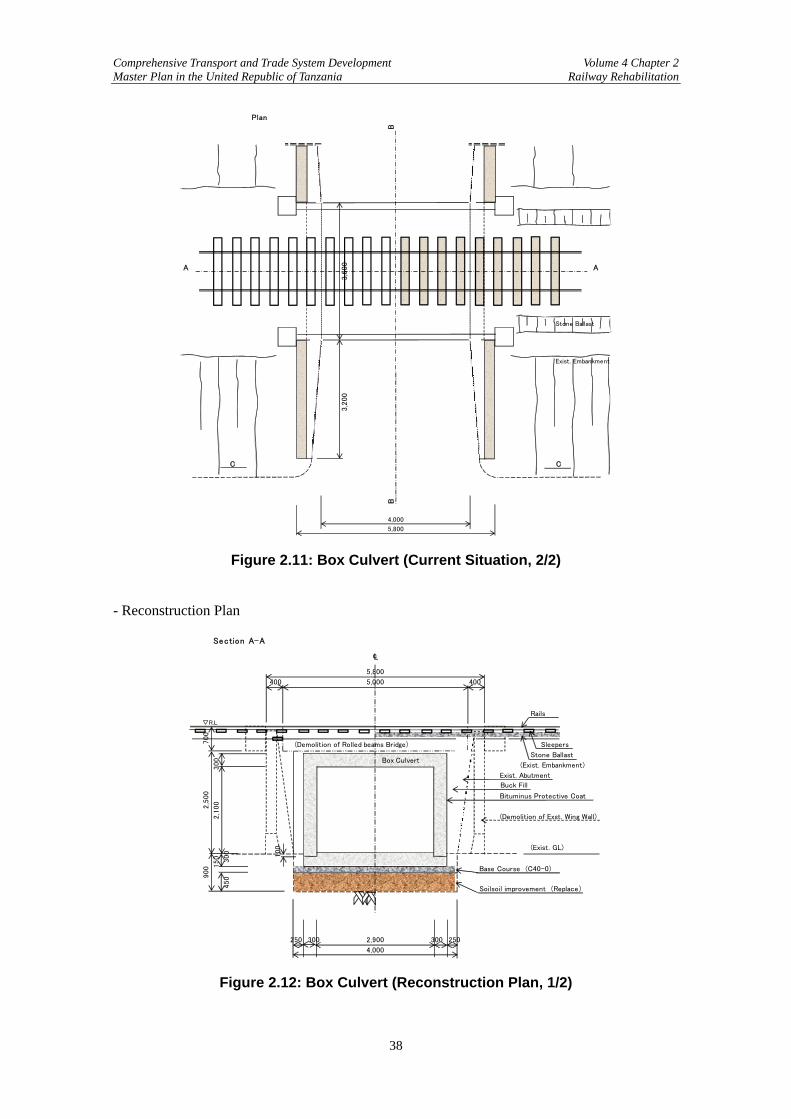
Comprehensive Transport and Trade System Development Volume 4 Chapter 2 Master Plan in the United Republic of Tanzania Railway Rehabilitation
38
B
A A
Stone Ballast
Exist. Embankment
C C
B
4,000
5,800
Plan
3,6
00
3,2
00
Figure 2.11: Box Culvert (Current Situation, 2/2)
- Reconstruction Plan
Rails
(Demolition of Rolled beams Bridge) Sleepers
Stone Ballast
(Exist. Embankment)
Exist. Abutment
Bituminus Protective Coat
(Demolition of Exst. Wing Wall)
(Exist. GL)
Base Course (C40-0)
Soilsoil improvement (Replace)
Section A-A
℄
400
5,800
▽R.L
700
150
900
2,5
00
2,1
00
450
300 100
4,000
300 3002,900250 250
300
5,000
Buck Fill
400
Box Culvert
Figure 2.12: Box Culvert (Reconstruction Plan, 1/2)
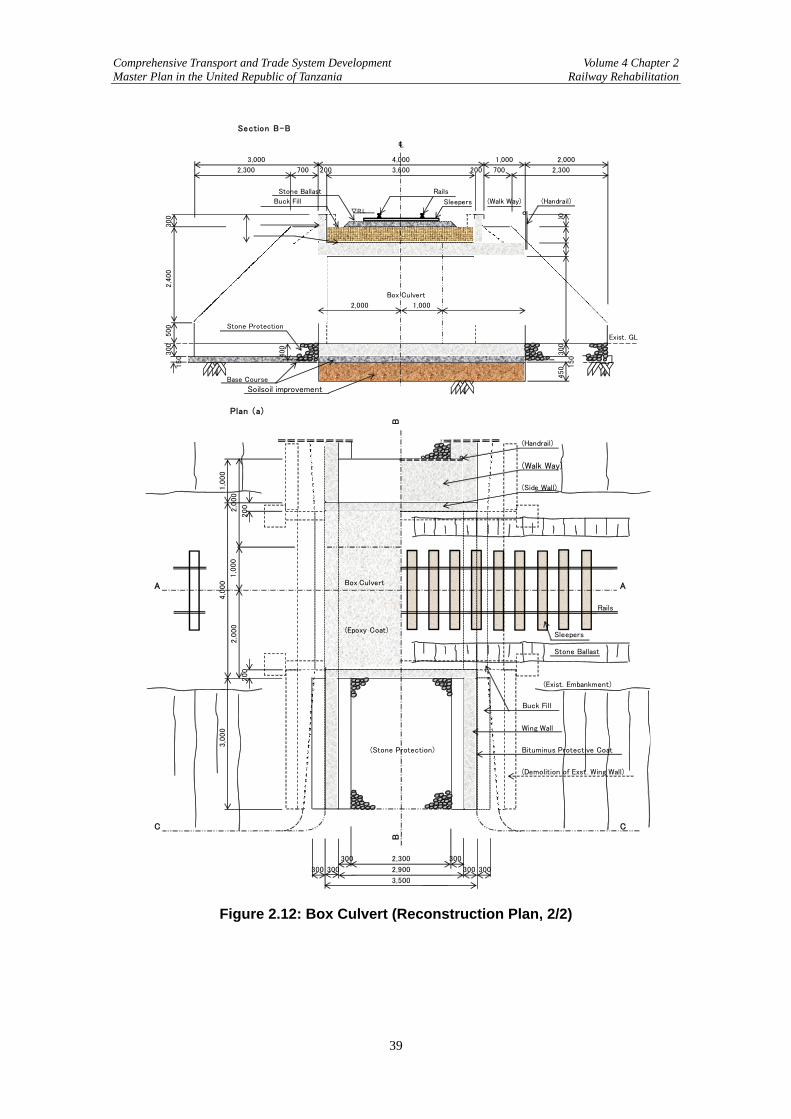
Comprehensive Transport and Trade System Development Volume 4 Chapter 2 Master Plan in the United Republic of Tanzania Railway Rehabilitation
39
Stone Ballast Rails
Sleepers▽R.L
(Side Wall)
Epoxy Coat
Wing Wall
Stone Protection
Exist. GL
Base Course
Soilsoil improvement
(Handrail)Buck Fill
150
300
300
500
2,1
00
150 4
00
Box Culvert
300
450
800
500
3,6002007002,300
1,0002,000
2,4
00
300
300
Section B-B
℄
2,000
(Walk Way)
4,0003,000
700
1,000
200 2,300
2,000
B
(Walk Way)
(Side Wall)
A A
Rails
Stone Ballast
(Exist. Embankment)
Wing Wall
(Stone Protection) Bituminus Protective Coat
(Demolition of Exst. Wing Wall)
C C
B
Sleepers
(Handrail)
Buck Fill
300 300
2,300 300
300 2,900 300
Plan (a)
2,0
00
2,0
00
4,0
00
1,0
00
1,0
00
200
3,500
300
200
3,0
00
Box Culvert
(Epoxy Coat)
Figure 2.12: Box Culvert (Reconstruction Plan, 2/2)
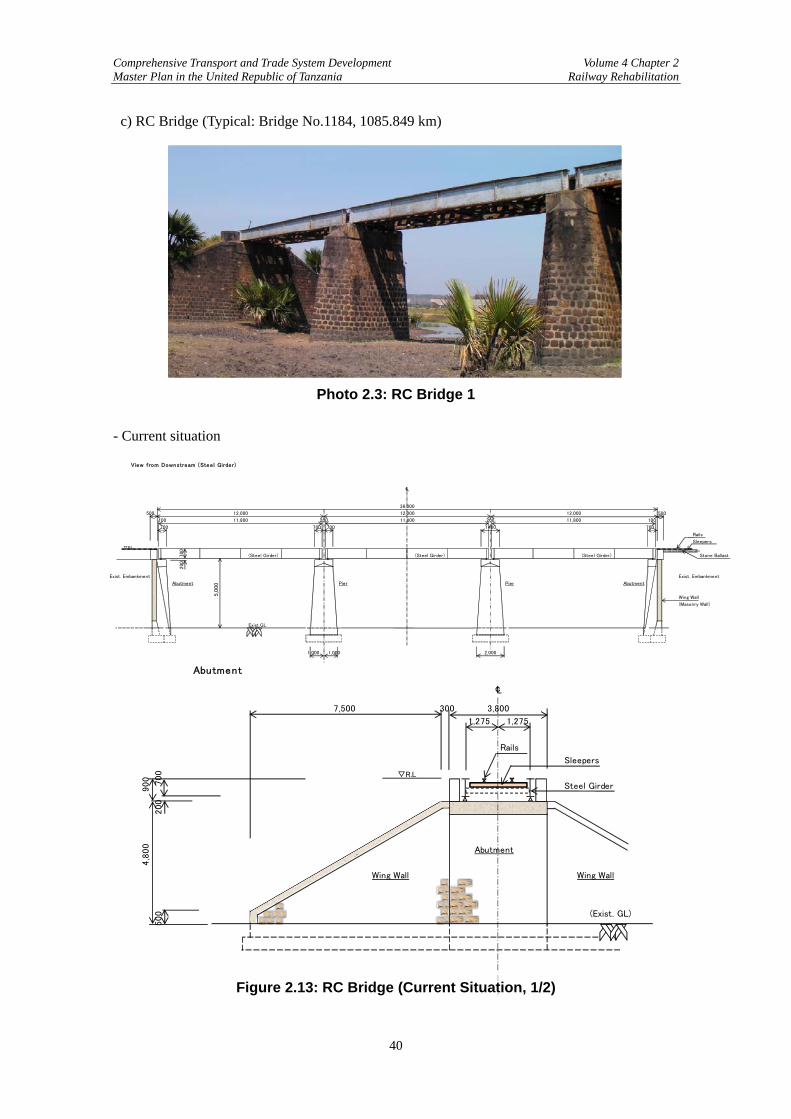
Comprehensive Transport and Trade System Development Volume 4 Chapter 2 Master Plan in the United Republic of Tanzania Railway Rehabilitation
40
c) RC Bridge (Typical: Bridge No.1184, 1085.849 km)
Photo 2.3: RC Bridge 1
- Current situation
View from Downstream (Steel Girder)
Rails
Sleepers
(Steel Girder) (Steel Girder) (Steel Girder) Stone Ballast
Exist. Embankment Exist. Embankment
Abutment Pier Pier Abutment
Wing Wall
(Masonry Wall)
Exist.GL
200
5,0
00
1,000 1,000 2,000
700 700 700 1400 700
▽R.L
700
12,000 500
100 11,800 200 11,800 200 11,800 100
℄
36,000
500 12,000 12,000
Rails
Sleepers
▽R.L
Steel Girder
Abutment
Wing Wall Wing Wall
(Exist. GL)
℄
Abutment
900
4,8
00
500
1,275
7,500 300 3,800
1,275
200
700
Figure 2.13: RC Bridge (Current Situation, 1/2)
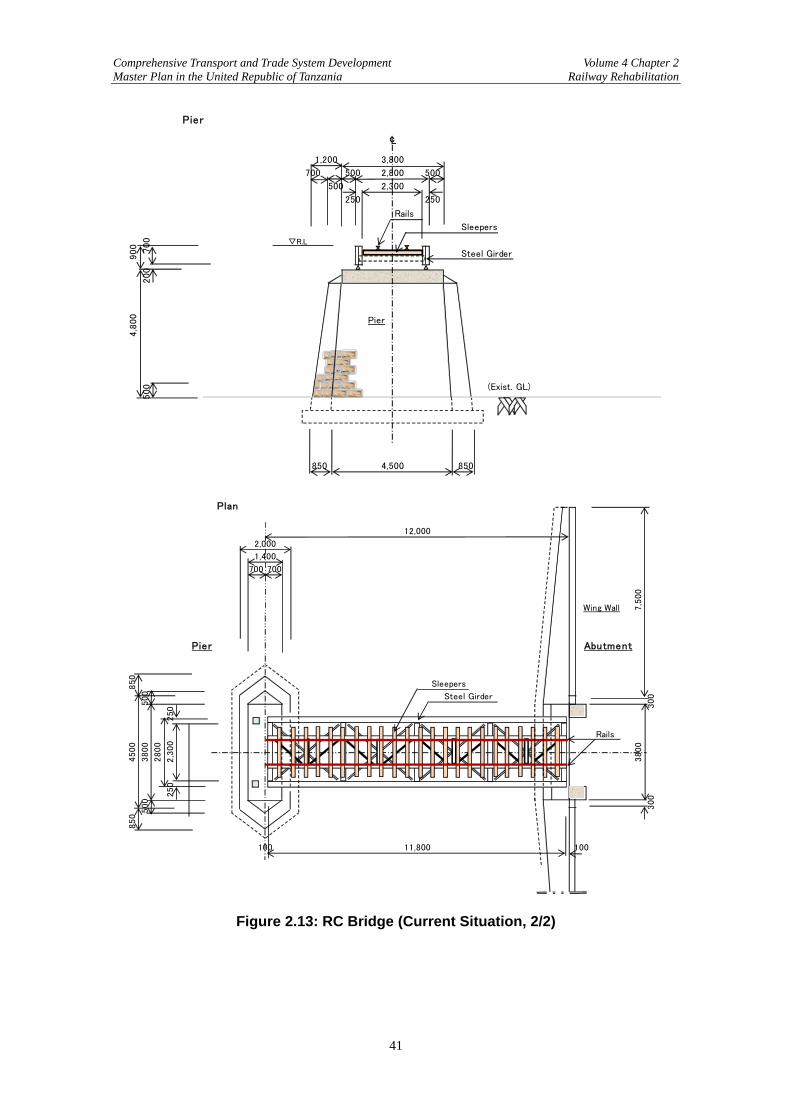
Comprehensive Transport and Trade System Development Volume 4 Chapter 2 Master Plan in the United Republic of Tanzania Railway Rehabilitation
41
Rails
Sleepers
▽R.L
Steel Girder
Pier
(Exist. GL)
700 500 2,800 500
500 2,300
Pier
℄
1,200 3,800
4,8
00
500
850 4,500 850
250 250
900 700
200
Wing Wall
Abutment
Sleepers
Steel Girder
Rails
1,400
Plan
2,000
12,000
700 700
11,800
Pier
4500
850
850
100100
3800
300
300
2800
2,3
00
250
250
7,5
00
3800
500
500
Figure 2.13: RC Bridge (Current Situation, 2/2)
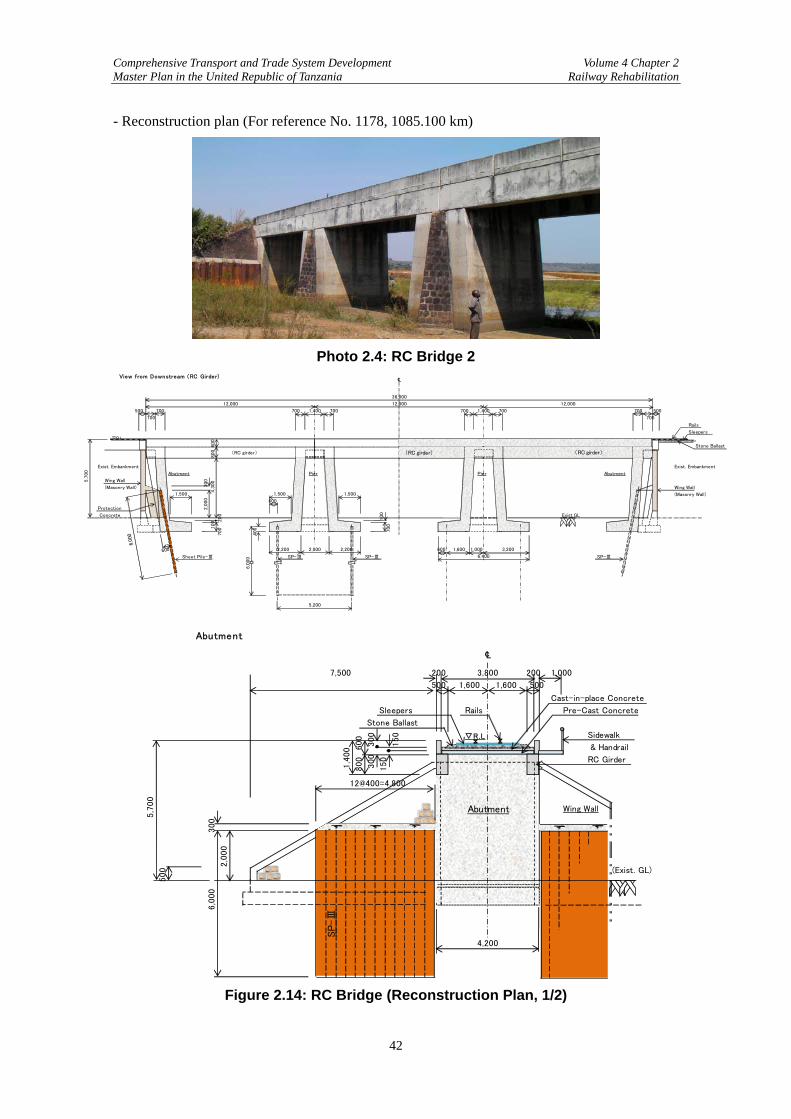
Comprehensive Transport and Trade System Development Volume 4 Chapter 2 Master Plan in the United Republic of Tanzania Railway Rehabilitation
42
- Reconstruction plan (For reference No. 1178, 1085.100 km)
Photo 2.4: RC Bridge 2 View from Downstream (RC Girder)
Rails
Sleepers
Stone Ballast
(RC girder)
Exist. Embankment Exist. Embankment
Abutment Pier Pier Abutment
Wing Wall
(Masonry Wall) Wing Wall
(Masonry Wall)
Protection
Concrete Exist.GL
Sheet Pile-Ⅲ SP-Ⅲ SP-Ⅲ SP-Ⅲ
5,200
600 1,600 1,000 3,200
6,0
00 6,400
700
700
400
2,200 2,000 2,200
1,500 1,500
600
200
100
100
▽R.L
600
800
5,7
00
300
4,3
00
1,500
2,0
00
1,400 700 700 500
700 700
36,000
12,000 12,000 12,000
500 700 700 1,400 700 700
℄
(RC girder) (RC girder)
Cast-in-place Concrete
Sleepers Rails Pre-Cast Concrete
Stone Ballast
Sidewalk
& Handrail
RC Girder
Wing Wall
(Exist. GL)
Abutment
℄
7,500 200 3,800
600
300
200 1,000
500 1,600 1,600 500
5,7
00
12@400=4,800
300
2,0
00
500
6,0
00
150 ▽R.L
1,4
00
800
300
150
4,200
Abutment
SP-Ⅲ
Figure 2.14: RC Bridge (Reconstruction Plan, 1/2)
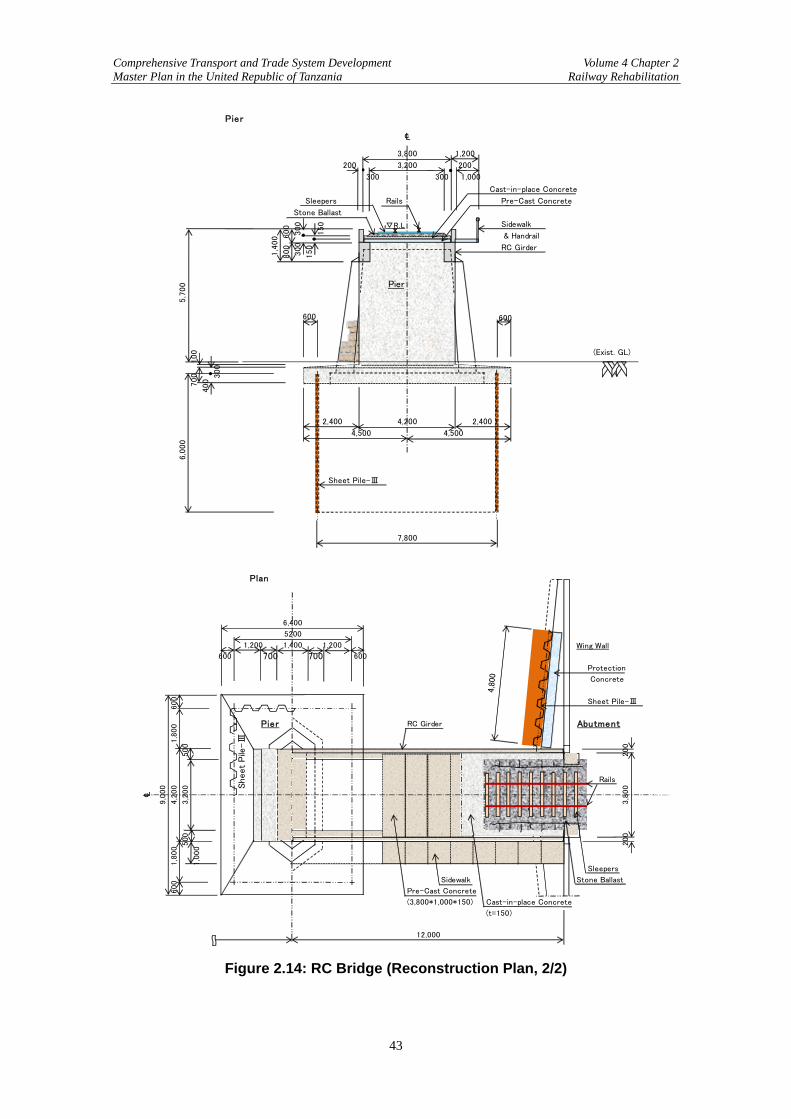
Comprehensive Transport and Trade System Development Volume 4 Chapter 2 Master Plan in the United Republic of Tanzania Railway Rehabilitation
43
Cast-in-place Concrete
Sleepers Rails Pre-Cast Concrete
Stone Ballast
Sidewalk
& Handrail
RC Girder
(Exist. GL)
Sheet Pile-Ⅲ
600
300
150 ▽R.L
5,7
00
1,200
200
300 300
200
1,000
1,4
00
800
300
150
600
6,0
00
700
100
400
300
3,200
Pier
℄
3,800
7,800
2,400 2,4004,200
4,500 4,500
600
Pier
Wing Wall
Protection
Concrete
Sheet Pile-Ⅲ
RC Girder Abutment
Rails
Sleepers
Sidewalk Stone Ballast
Pre-Cast Concrete
(3,800*1,000*150) Cast-in-place Concrete
(t=150)
Plan
12,000
6,400
1,400
700 700
1,200 1,200
600
5200
500
3,2
00
Pier
500
600
℄
Sheet
Pile
-Ⅲ
3,8
00
200
200
9,0
00
600
600
1,0
00
1,8
00
4,2
00
1,8
00
Figure 2.14: RC Bridge (Reconstruction Plan, 2/2)
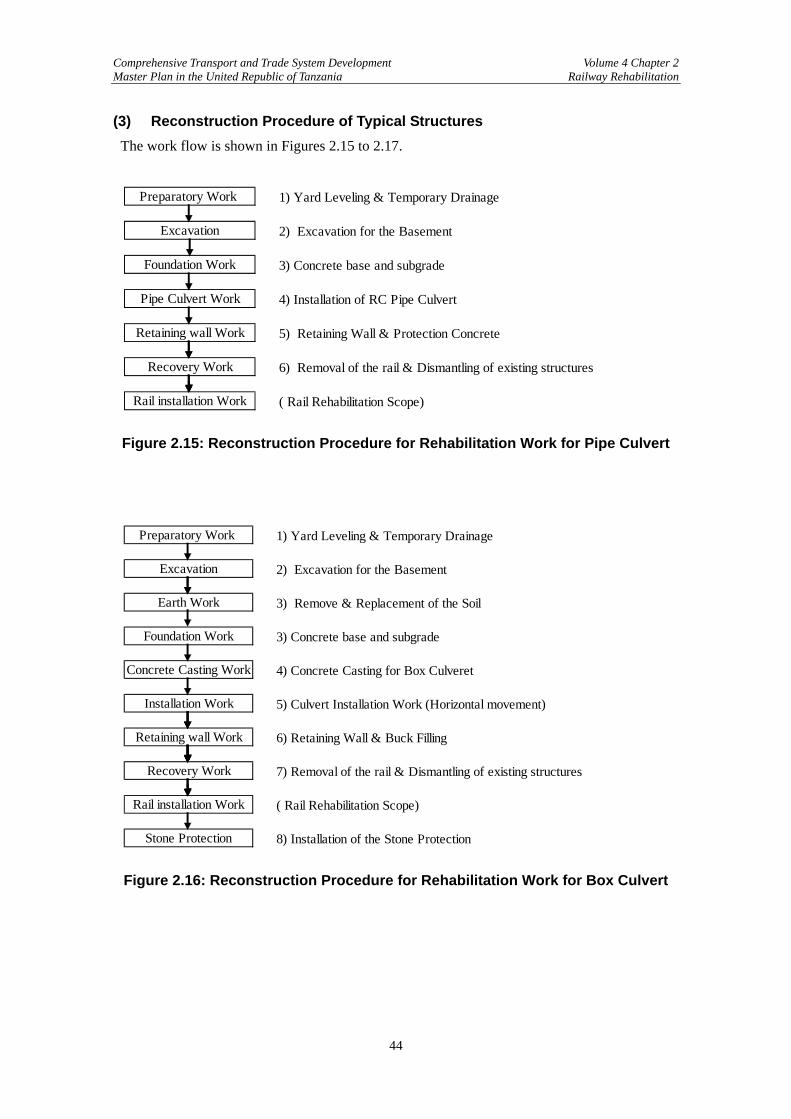
Comprehensive Transport and Trade System Development Volume 4 Chapter 2 Master Plan in the United Republic of Tanzania Railway Rehabilitation
44
(3) Reconstruction Procedure of Typical Structures The work flow is shown in Figures 2.15 to 2.17.
1) Yard Leveling & Temporary Drainage
2) Excavation for the Basement
3) Concrete base and subgrade
4) Installation of RC Pipe Culvert
5) Retaining Wall & Protection Concrete
6) Removal of the rail & Dismantling of existing structures
( Rail Rehabilitation Scope)
Retaining wall Work
Recovery Work
Rail installation Work
Preparatory Work
Excavation
Foundation Work
Pipe Culvert Work
Figure 2.15: Reconstruction Procedure for Rehabilitation Work for Pipe Culvert
1) Yard Leveling & Temporary Drainage
2) Excavation for the Basement
3) Remove & Replacement of the Soil
3) Concrete base and subgrade
4) Concrete Casting for Box Culveret
5) Culvert Installation Work (Horizontal movement)
6) Retaining Wall & Buck Filling
7) Removal of the rail & Dismantling of existing structures
( Rail Rehabilitation Scope)
8) Installation of the Stone Protection
Rail installation Work
Stone Protection
Retaining wall Work
Recovery Work
Earth Work
Preparatory Work
Excavation
Foundation Work
Concrete Casting Work
Installation Work
Figure 2.16: Reconstruction Procedure for Rehabilitation Work for Box Culvert
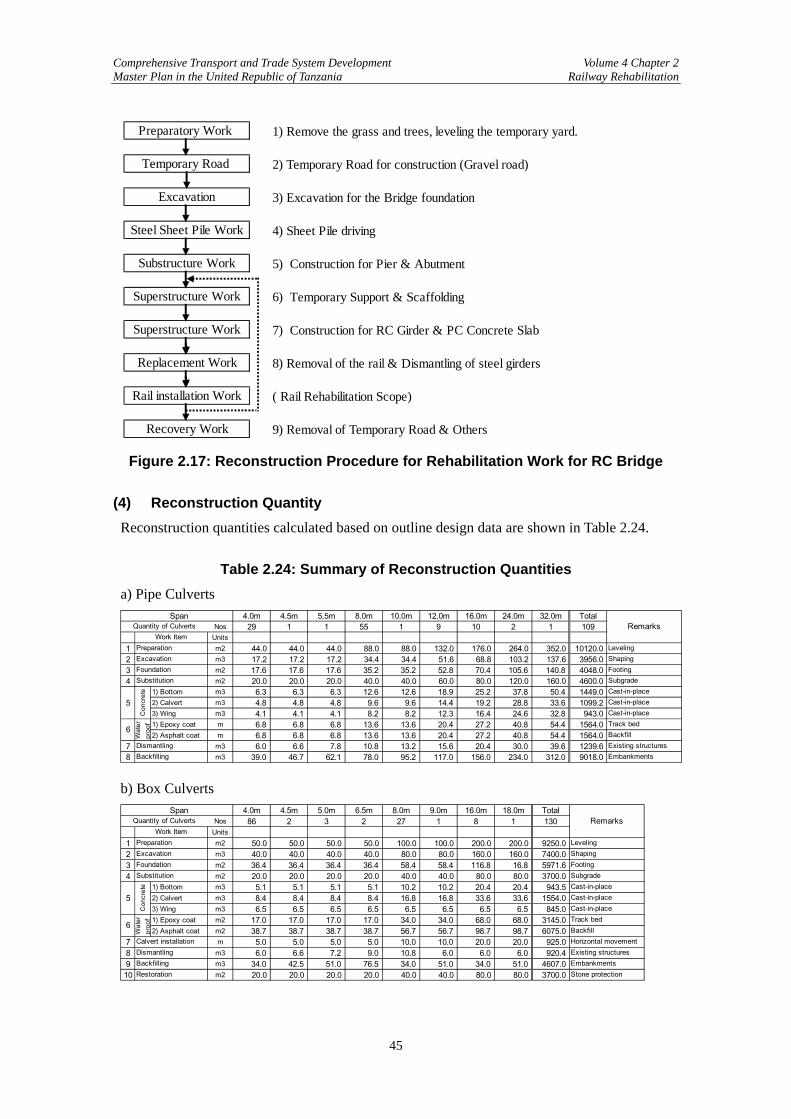
Comprehensive Transport and Trade System Development Volume 4 Chapter 2 Master Plan in the United Republic of Tanzania Railway Rehabilitation
45
1) Remove the grass and trees, leveling the temporary yard.
2) Temporary Road for construction (Gravel road)
3) Excavation for the Bridge foundation
4) Sheet Pile driving
5) Construction for Pier & Abutment
6) Temporary Support & Scaffolding
7) Construction for RC Girder & PC Concrete Slab
8) Removal of the rail & Dismantling of steel girders
( Rail Rehabilitation Scope)
9) Removal of Temporary Road & Others
Replacement Work
Rail installation Work
Recovery Work
Substructure Work
Superstructure Work
Superstructure Work
Preparatory Work
Temporary Road
Excavation
Steel Sheet Pile Work
Figure 2.17: Reconstruction Procedure for Rehabilitation Work for RC Bridge
(4) Reconstruction Quantity
Reconstruction quantities calculated based on outline design data are shown in Table 2.24.
Table 2.24: Summary of Reconstruction Quantities a) Pipe Culverts
Span 4.0m 4.5m 5.5m 8.0m 10.0m 12.0m 16.0m 24.0m 32.0m TotalNos 29 1 1 55 1 9 10 2 1 109
Units1 m2 44.0 44.0 44.0 88.0 88.0 132.0 176.0 264.0 352.0 10120.02 m3 17.2 17.2 17.2 34.4 34.4 51.6 68.8 103.2 137.6 3956.03 m2 17.6 17.6 17.6 35.2 35.2 52.8 70.4 105.6 140.8 4048.04 m2 20.0 20.0 20.0 40.0 40.0 60.0 80.0 120.0 160.0 4600.0
1) Bottom m3 6.3 6.3 6.3 12.6 12.6 18.9 25.2 37.8 50.4 1449.05 2) Calvert m3 4.8 4.8 4.8 9.6 9.6 14.4 19.2 28.8 33.6 1099.2
3) Wing m3 4.1 4.1 4.1 8.2 8.2 12.3 16.4 24.6 32.8 943.01) Epoxy coat m 6.8 6.8 6.8 13.6 13.6 20.4 27.2 40.8 54.4 1564.02) Asphalt coat m 6.8 6.8 6.8 13.6 13.6 20.4 27.2 40.8 54.4 1564.0
7 m3 6.0 6.6 7.8 10.8 13.2 15.6 20.4 30.0 39.6 1239.68 m3 39.0 46.7 62.1 78.0 95.2 117.0 156.0 234.0 312.0 9018.0Backfilling Embankments
6
Wat
erpr
oof Track bed
BackfillDismantling Existing structures
Foundation FootingSubstitution Subgrade
Con
cret
e Cast-in-placeCast-in-placeCast-in-place
Quantity of Culverts RemarksWork Item
Preparation LevelingExcavation Shaping
b) Box Culverts Span 4.0m 4.5m 5.0m 6.5m 8.0m 9.0m 16.0m 18.0m Total
Nos 86 2 3 2 27 1 8 1 130Units
1 m2 50.0 50.0 50.0 50.0 100.0 100.0 200.0 200.0 9250.02 m3 40.0 40.0 40.0 40.0 80.0 80.0 160.0 160.0 7400.03 m2 36.4 36.4 36.4 36.4 58.4 58.4 116.8 16.8 5971.64 m2 20.0 20.0 20.0 20.0 40.0 40.0 80.0 80.0 3700.0
1) Bottom m3 5.1 5.1 5.1 5.1 10.2 10.2 20.4 20.4 943.55 2) Calvert m3 8.4 8.4 8.4 8.4 16.8 16.8 33.6 33.6 1554.0
3) Wing m3 6.5 6.5 6.5 6.5 6.5 6.5 6.5 6.5 845.01) Epoxy coat m2 17.0 17.0 17.0 17.0 34.0 34.0 68.0 68.0 3145.02) Asphalt coat m2 38.7 38.7 38.7 38.7 56.7 56.7 98.7 98.7 6075.0
7 m 5.0 5.0 5.0 5.0 10.0 10.0 20.0 20.0 925.08 m3 6.0 6.6 7.2 9.0 10.8 6.0 6.0 6.0 920.49 m3 34.0 42.5 51.0 76.5 34.0 51.0 34.0 51.0 4607.010 m2 20.0 20.0 20.0 20.0 40.0 40.0 80.0 80.0 3700.0
Dismantling Existing structuresBackfilling EmbankmentsRestoration Stone protection
6
Wat
erpr
oof Track bed
BackfillCalvert installation Horizontal movement
Foundation FootingSubstitution Subgrade
Con
cret
e Cast-in-placeCast-in-placeCast-in-place
Quantity of Culverts RemarksWork Item
Preparation LevelingExcavation Shaping
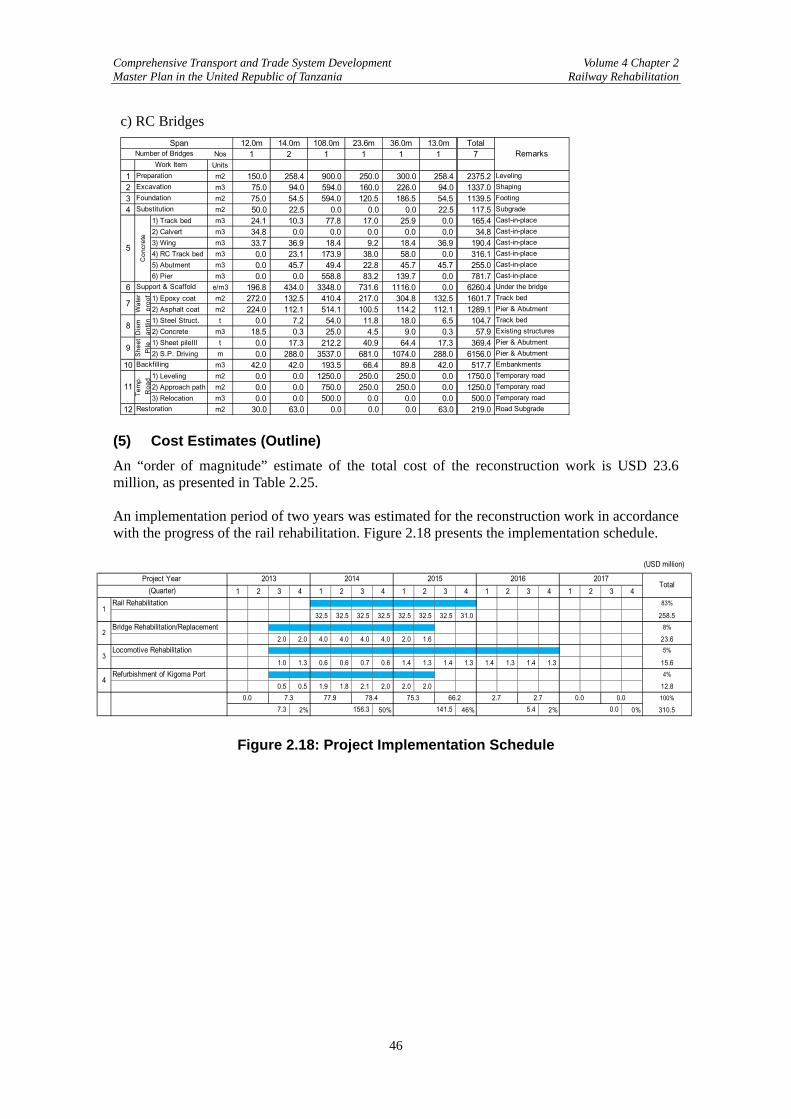
Comprehensive Transport and Trade System Development Volume 4 Chapter 2 Master Plan in the United Republic of Tanzania Railway Rehabilitation
46
c) RC Bridges Span 12.0m 14.0m 108.0m 23.6m 36.0m 13.0m Total
Nos 1 2 1 1 1 1 7Units
1 m2 150.0 258.4 900.0 250.0 300.0 258.4 2375.22 m3 75.0 94.0 594.0 160.0 226.0 94.0 1337.03 m2 75.0 54.5 594.0 120.5 186.5 54.5 1139.54 m2 50.0 22.5 0.0 0.0 0.0 22.5 117.5
1) Track bed m3 24.1 10.3 77.8 17.0 25.9 0.0 165.42) Calvert m3 34.8 0.0 0.0 0.0 0.0 0.0 34.83) Wing m3 33.7 36.9 18.4 9.2 18.4 36.9 190.44) RC Track bed m3 0.0 23.1 173.9 38.0 58.0 0.0 316.15) Abutment m3 0.0 45.7 49.4 22.8 45.7 45.7 255.06) Pier m3 0.0 0.0 558.8 83.2 139.7 0.0 781.7
6 e/m3 196.8 434.0 3348.0 731.6 1116.0 0.0 6260.41) Epoxy coat m2 272.0 132.5 410.4 217.0 304.8 132.5 1601.72) Asphalt coat m2 224.0 112.1 514.1 100.5 114.2 112.1 1289.11) Steel Struct. t 0.0 7.2 54.0 11.8 18.0 6.5 104.72) Concrete m3 18.5 0.3 25.0 4.5 9.0 0.3 57.91) Sheet pileⅢ t 0.0 17.3 212.2 40.9 64.4 17.3 369.42) S.P. Driving m 0.0 288.0 3537.0 681.0 1074.0 288.0 6156.0
10 m3 42.0 42.0 193.5 66.4 89.8 42.0 517.71) Leveling m2 0.0 0.0 1250.0 250.0 250.0 0.0 1750.02) Approach path m2 0.0 0.0 750.0 250.0 250.0 0.0 1250.03) Relocation m3 0.0 0.0 500.0 0.0 0.0 0.0 500.0
12 m2 30.0 63.0 0.0 0.0 0.0 63.0 219.0Restoration Road Subgrade
Backfilling Embankments
11
Tem
p.R
oad Temporary road
Temporary roadTemporary road
8
Dis
man
tlin Track bed
Existing structures
9
Shee
tPi
le Pier & AbutmentPier & Abutment
Support & Scaffold Under the bridge
7
Wat
erpr
oof Track bed
Pier & Abutment
5
Con
cret
e
Cast-in-placeCast-in-placeCast-in-placeCast-in-placeCast-in-placeCast-in-place
Excavation ShapingFoundation FootingSubstitution Subgrade
Number of Bridges RemarksWork Item
Preparation Leveling
(5) Cost Estimates (Outline) An “order of magnitude” estimate of the total cost of the reconstruction work is USD 23.6 million, as presented in Table 2.25. An implementation period of two years was estimated for the reconstruction work in accordance with the progress of the rail rehabilitation. Figure 2.18 presents the implementation schedule.
(USD million)
1 2 3 4 1 2 3 4 1 2 3 4 1 2 3 4 1 2 3 4
32.5 32.5 32.5 32.5 32.5 32.5 32.5 31.0 258.5
2.0 2.0 4.0 4.0 4.0 4.0 2.0 1.6 23.6
1.0 1.3 0.6 0.6 0.7 0.6 1.4 1.3 1.4 1.3 1.4 1.3 1.4 1.3 15.6
0.5 0.5 1.9 1.8 2.1 2.0 2.0 2.0 12.8100%
2% 50% 46% 2% 0% 310.5
Project Year (Quarter)
2013Total
20172014 2015 2016
Rail Rehabilitation1
2
3
Bridge Rehabilitation/Replacement
Locomotive Rehabilitation
4
0.0 7.3 77.9 78.4
Refurbishment of Kigoma Port
83%
8%
5%
4%
7.3 156.3 141.5 5.4 0.02.7 2.7 0.0 0.075.3 66.2
Figure 2.18: Project Implementation Schedule
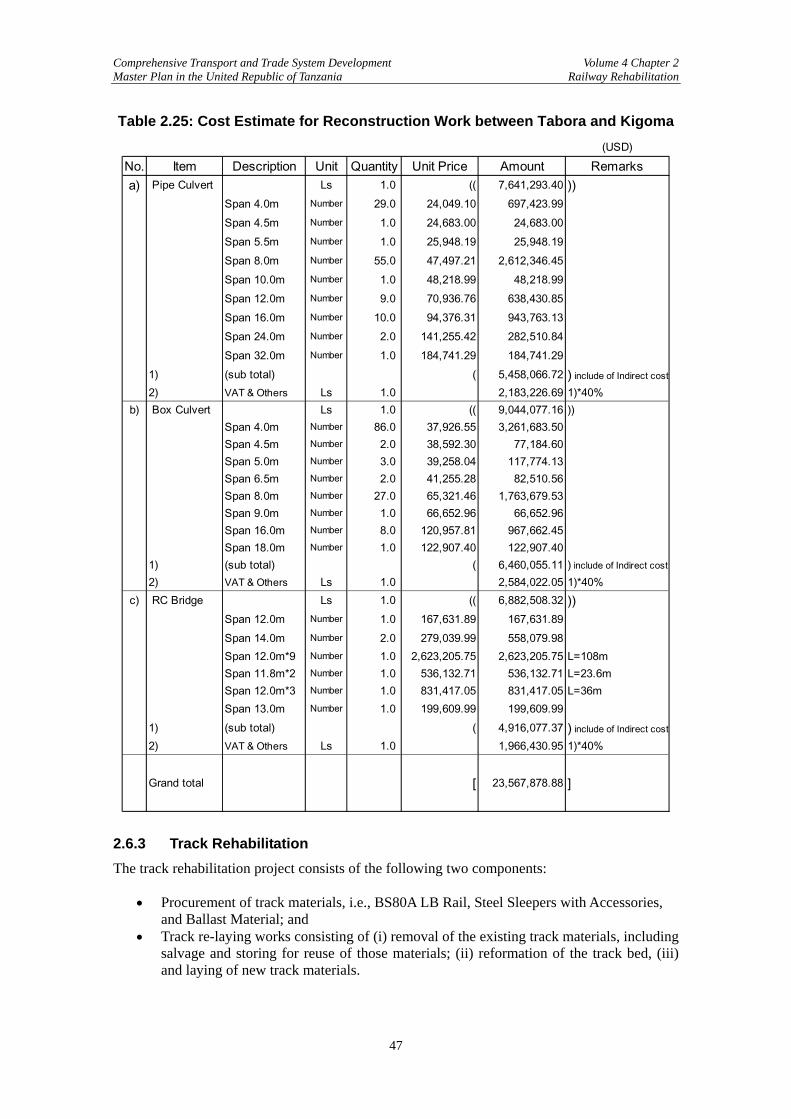
Comprehensive Transport and Trade System Development Volume 4 Chapter 2 Master Plan in the United Republic of Tanzania Railway Rehabilitation
47
Table 2.25: Cost Estimate for Reconstruction Work between Tabora and Kigoma (USD)
No. Item Description Unit Quantity Unit Price Amount Remarksa) Pipe Culvert Ls 1.0 (( 7,641,293.40 ))
Span 4.0m Number 29.0 24,049.10 697,423.99Span 4.5m Number 1.0 24,683.00 24,683.00Span 5.5m Number 1.0 25,948.19 25,948.19Span 8.0m Number 55.0 47,497.21 2,612,346.45Span 10.0m Number 1.0 48,218.99 48,218.99Span 12.0m Number 9.0 70,936.76 638,430.85Span 16.0m Number 10.0 94,376.31 943,763.13Span 24.0m Number 2.0 141,255.42 282,510.84Span 32.0m Number 1.0 184,741.29 184,741.29
1) (sub total) ( 5,458,066.72 ) include of Indirect cost
2) VAT & Others Ls 1.0 2,183,226.69 1)*40%b) Box Culvert Ls 1.0 (( 9,044,077.16 ))
Span 4.0m Number 86.0 37,926.55 3,261,683.50Span 4.5m Number 2.0 38,592.30 77,184.60Span 5.0m Number 3.0 39,258.04 117,774.13Span 6.5m Number 2.0 41,255.28 82,510.56Span 8.0m Number 27.0 65,321.46 1,763,679.53Span 9.0m Number 1.0 66,652.96 66,652.96Span 16.0m Number 8.0 120,957.81 967,662.45Span 18.0m Number 1.0 122,907.40 122,907.40
1) (sub total) ( 6,460,055.11 ) include of Indirect cost
2) VAT & Others Ls 1.0 2,584,022.05 1)*40%c) RC Bridge Ls 1.0 (( 6,882,508.32 ))
Span 12.0m Number 1.0 167,631.89 167,631.89Span 14.0m Number 2.0 279,039.99 558,079.98Span 12.0m*9 Number 1.0 2,623,205.75 2,623,205.75 L=108mSpan 11.8m*2 Number 1.0 536,132.71 536,132.71 L=23.6mSpan 12.0m*3 Number 1.0 831,417.05 831,417.05 L=36mSpan 13.0m Number 1.0 199,609.99 199,609.99
1) (sub total) ( 4,916,077.37 ) include of Indirect cost
2) VAT & Others Ls 1.0 1,966,430.95 1)*40%
Grand total [ 23,567,878.88 ]
2.6.3 Track Rehabilitation The track rehabilitation project consists of the following two components:
Procurement of track materials, i.e., BS80A LB Rail, Steel Sleepers with Accessories, and Ballast Material; and
Track re-laying works consisting of (i) removal of the existing track materials, including salvage and storing for reuse of those materials; (ii) reformation of the track bed, (iii) and laying of new track materials.
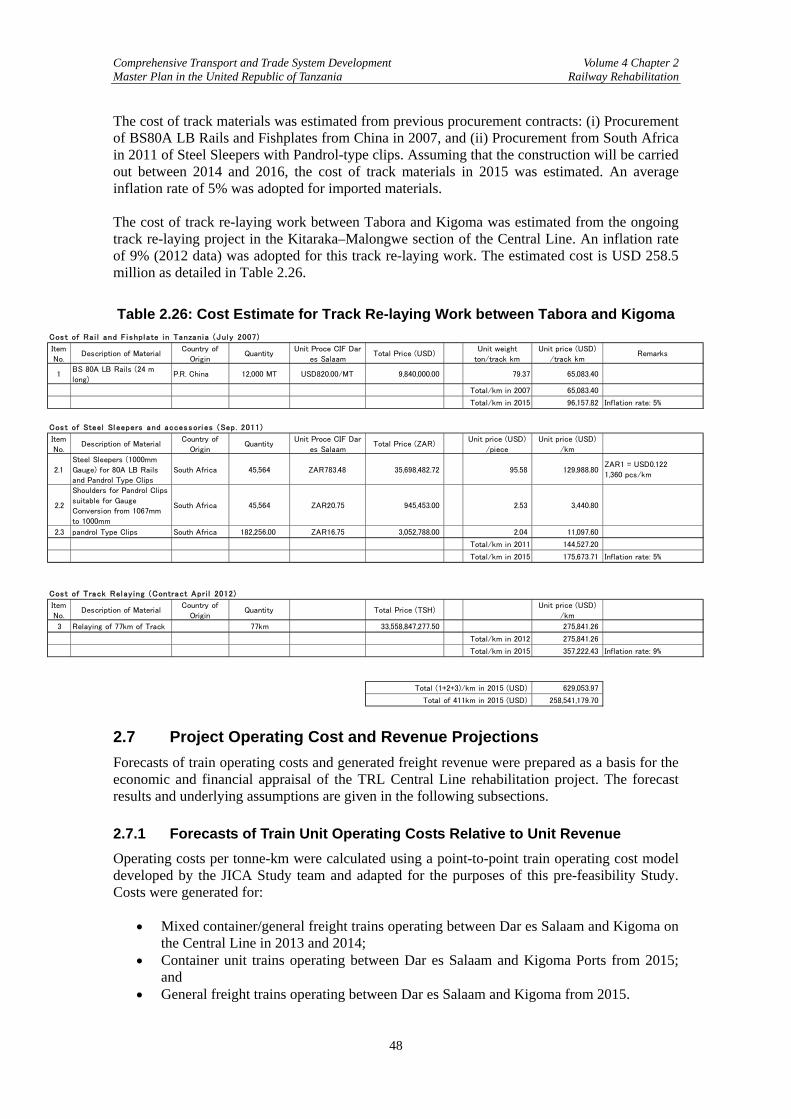
Comprehensive Transport and Trade System Development Volume 4 Chapter 2 Master Plan in the United Republic of Tanzania Railway Rehabilitation
48
The cost of track materials was estimated from previous procurement contracts: (i) Procurement of BS80A LB Rails and Fishplates from China in 2007, and (ii) Procurement from South Africa in 2011 of Steel Sleepers with Pandrol-type clips. Assuming that the construction will be carried out between 2014 and 2016, the cost of track materials in 2015 was estimated. An average inflation rate of 5% was adopted for imported materials. The cost of track re-laying work between Tabora and Kigoma was estimated from the ongoing track re-laying project in the Kitaraka–Malongwe section of the Central Line. An inflation rate of 9% (2012 data) was adopted for this track re-laying work. The estimated cost is USD 258.5 million as detailed in Table 2.26.
Table 2.26: Cost Estimate for Track Re-laying Work between Tabora and Kigoma Cost of Ra i l and F i shplate i n Tanzania (July 2007)
Item
No.Description of Material
Country of
OriginQuantity
Unit Proce CIF Dar
es SalaamTotal Price (USD)
Unit weight
ton/track km
Unit price (USD)
/track kmRemarks
1BS 80A LB Rails (24 m
long)P.R. China 12,000 MT USD820.00/MT 9,840,000.00 79.37 65,083.40
Total/km in 2007 65,083.40
Total/km in 2015 96,157.82 Inflation rate: 5%
Cost of Steel Sl eepers and accessories (Sep. 2011)
Item
No.Description of Material
Country of
OriginQuantity
Unit Proce CIF Dar
es SalaamTotal Price (ZAR)
Unit price (USD)
/piece
Unit price (USD)
/km
2.1
Steel Sleepers (1000mm
Gauge) for 80A LB Railsand Pandrol Type Clips
South Africa 45,564 ZAR783.48 35,698,482.72 95.58 129,988.80ZAR1 = USD0.122
1,360 pcs/km
2.2
Shoulders for Pandrol Clips
suitable for GaugeConversion from 1067mm
to 1000mm
South Africa 45,564 ZAR20.75 945,453.00 2.53 3,440.80
2.3 pandrol Type Clips South Africa 182,256.00 ZAR16.75 3,052,788.00 2.04 11,097.60
Total/km in 2011 144,527.20
Total/km in 2015 175,673.71 Inflation rate: 5%
Cost of Track Rel ay ing (Contract Apri l 2012)
Item
No.Description of Material
Country of
OriginQuantity Total Price (TSH)
Unit price (USD)
/km
3 Relaying of 77km of Track 77km 33,558,847,277.50 275,841.26
Total/km in 2012 275,841.26
Total/km in 2015 357,222.43 Inflation rate: 9%
Total (1+2+3)/km in 2015 (USD) 629,053.97
Total of 411km in 2015 (USD) 258,541,179.70 2.7 Project Operating Cost and Revenue Projections Forecasts of train operating costs and generated freight revenue were prepared as a basis for the economic and financial appraisal of the TRL Central Line rehabilitation project. The forecast results and underlying assumptions are given in the following subsections. 2.7.1 Forecasts of Train Unit Operating Costs Relative to Unit Revenue Operating costs per tonne-km were calculated using a point-to-point train operating cost model developed by the JICA Study team and adapted for the purposes of this pre-feasibility Study. Costs were generated for:
Mixed container/general freight trains operating between Dar es Salaam and Kigoma on the Central Line in 2013 and 2014;
Container unit trains operating between Dar es Salaam and Kigoma Ports from 2015; and
General freight trains operating between Dar es Salaam and Kigoma from 2015.
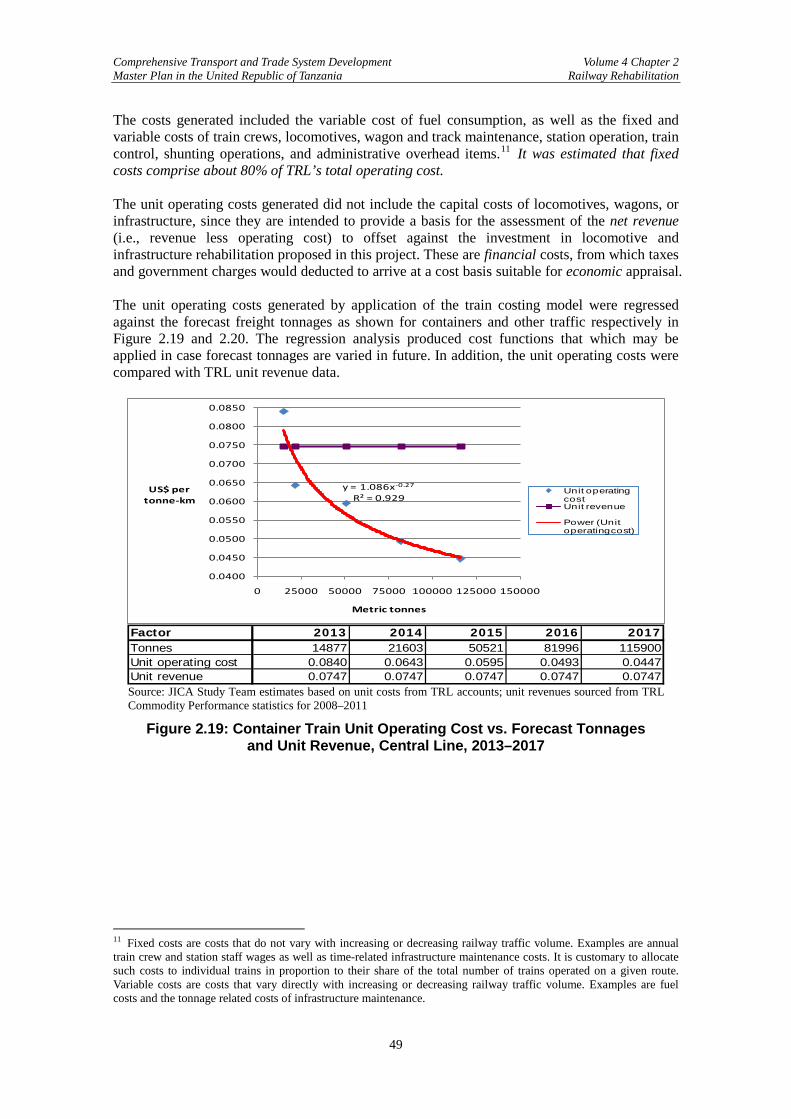
Comprehensive Transport and Trade System Development Volume 4 Chapter 2 Master Plan in the United Republic of Tanzania Railway Rehabilitation
49
The costs generated included the variable cost of fuel consumption, as well as the fixed and variable costs of train crews, locomotives, wagon and track maintenance, station operation, train control, shunting operations, and administrative overhead items.11 It was estimated that fixed costs comprise about 80% of TRL’s total operating cost. The unit operating costs generated did not include the capital costs of locomotives, wagons, or infrastructure, since they are intended to provide a basis for the assessment of the net revenue (i.e., revenue less operating cost) to offset against the investment in locomotive and infrastructure rehabilitation proposed in this project. These are financial costs, from which taxes and government charges would deducted to arrive at a cost basis suitable for economic appraisal. The unit operating costs generated by application of the train costing model were regressed against the forecast freight tonnages as shown for containers and other traffic respectively in Figure 2.19 and 2.20. The regression analysis produced cost functions that which may be applied in case forecast tonnages are varied in future. In addition, the unit operating costs were compared with TRL unit revenue data.
y = 1.086x-0.27
R² = 0.929
0.0400
0.0450
0.0500
0.0550
0.0600
0.0650
0.0700
0.0750
0.0800
0.0850
0 25000 50000 75000 100000 125000 150000
US$ per tonne-km
Metric tonnes
Unit operating costUnit revenue
Power (Unit operating cost)
Factor 2013 2014 2015 2016 2017Tonnes 14877 21603 50521 81996 115900Unit operating cost 0.0840 0.0643 0.0595 0.0493 0.0447Unit revenue 0.0747 0.0747 0.0747 0.0747 0.0747 Source: JICA Study Team estimates based on unit costs from TRL accounts; unit revenues sourced from TRL Commodity Performance statistics for 2008–2011
Figure 2.19: Container Train Unit Operating Cost vs. Forecast Tonnages and Unit Revenue, Central Line, 2013–2017
11 Fixed costs are costs that do not vary with increasing or decreasing railway traffic volume. Examples are annual train crew and station staff wages as well as time-related infrastructure maintenance costs. It is customary to allocate such costs to individual trains in proportion to their share of the total number of trains operated on a given route. Variable costs are costs that vary directly with increasing or decreasing railway traffic volume. Examples are fuel costs and the tonnage related costs of infrastructure maintenance.
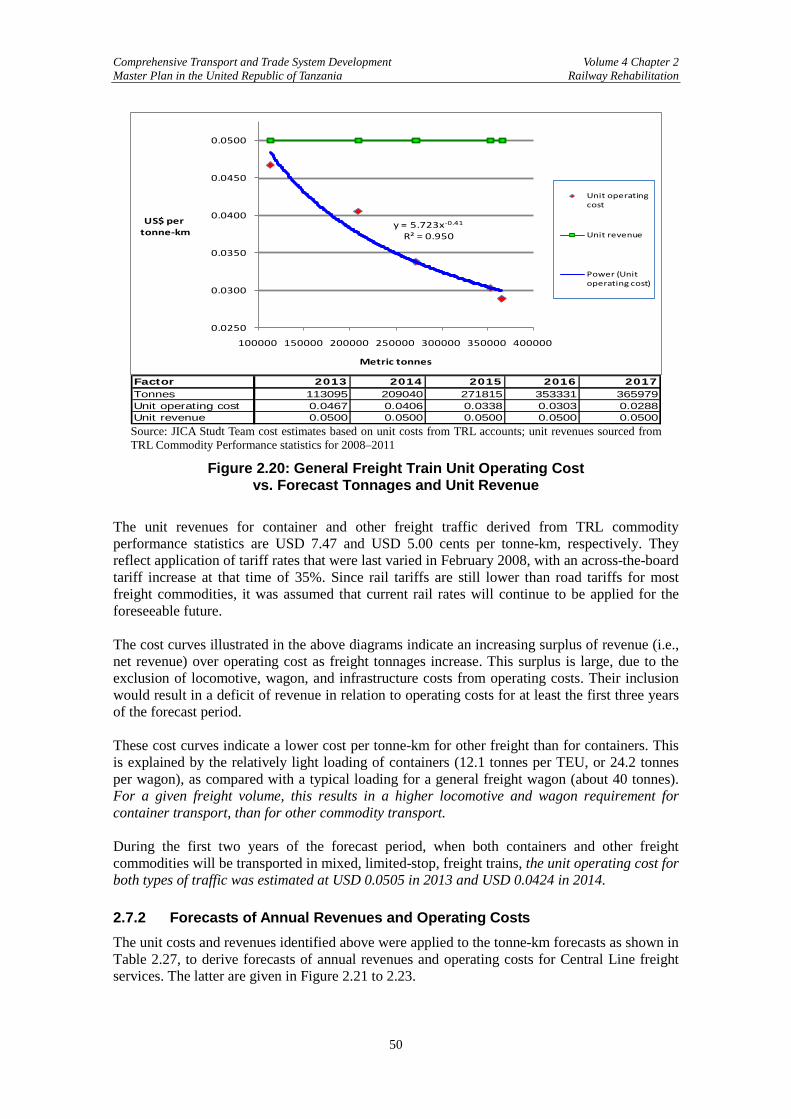
Comprehensive Transport and Trade System Development Volume 4 Chapter 2 Master Plan in the United Republic of Tanzania Railway Rehabilitation
50
y = 5.723x-0.41
R² = 0.950
0.0250
0.0300
0.0350
0.0400
0.0450
0.0500
100000 150000 200000 250000 300000 350000 400000
US$ pertonne-km
Metric tonnes
Unit operating cost
Unit revenue
Power (Unit operating cost)
Factor 2013 2014 2015 2016 2017Tonnes 113095 209040 271815 353331 365979Unit operating cost 0.0467 0.0406 0.0338 0.0303 0.0288Unit revenue 0.0500 0.0500 0.0500 0.0500 0.0500
Source: JICA Studt Team cost estimates based on unit costs from TRL accounts; unit revenues sourced from TRL Commodity Performance statistics for 2008–2011
Figure 2.20: General Freight Train Unit Operating Cost vs. Forecast Tonnages and Unit Revenue
The unit revenues for container and other freight traffic derived from TRL commodity performance statistics are USD 7.47 and USD 5.00 cents per tonne-km, respectively. They reflect application of tariff rates that were last varied in February 2008, with an across-the-board tariff increase at that time of 35%. Since rail tariffs are still lower than road tariffs for most freight commodities, it was assumed that current rail rates will continue to be applied for the foreseeable future. The cost curves illustrated in the above diagrams indicate an increasing surplus of revenue (i.e., net revenue) over operating cost as freight tonnages increase. This surplus is large, due to the exclusion of locomotive, wagon, and infrastructure costs from operating costs. Their inclusion would result in a deficit of revenue in relation to operating costs for at least the first three years of the forecast period. These cost curves indicate a lower cost per tonne-km for other freight than for containers. This is explained by the relatively light loading of containers (12.1 tonnes per TEU, or 24.2 tonnes per wagon), as compared with a typical loading for a general freight wagon (about 40 tonnes). For a given freight volume, this results in a higher locomotive and wagon requirement for container transport, than for other commodity transport. During the first two years of the forecast period, when both containers and other freight commodities will be transported in mixed, limited-stop, freight trains, the unit operating cost for both types of traffic was estimated at USD 0.0505 in 2013 and USD 0.0424 in 2014. 2.7.2 Forecasts of Annual Revenues and Operating Costs The unit costs and revenues identified above were applied to the tonne-km forecasts as shown in Table 2.27, to derive forecasts of annual revenues and operating costs for Central Line freight services. The latter are given in Figure 2.21 to 2.23.
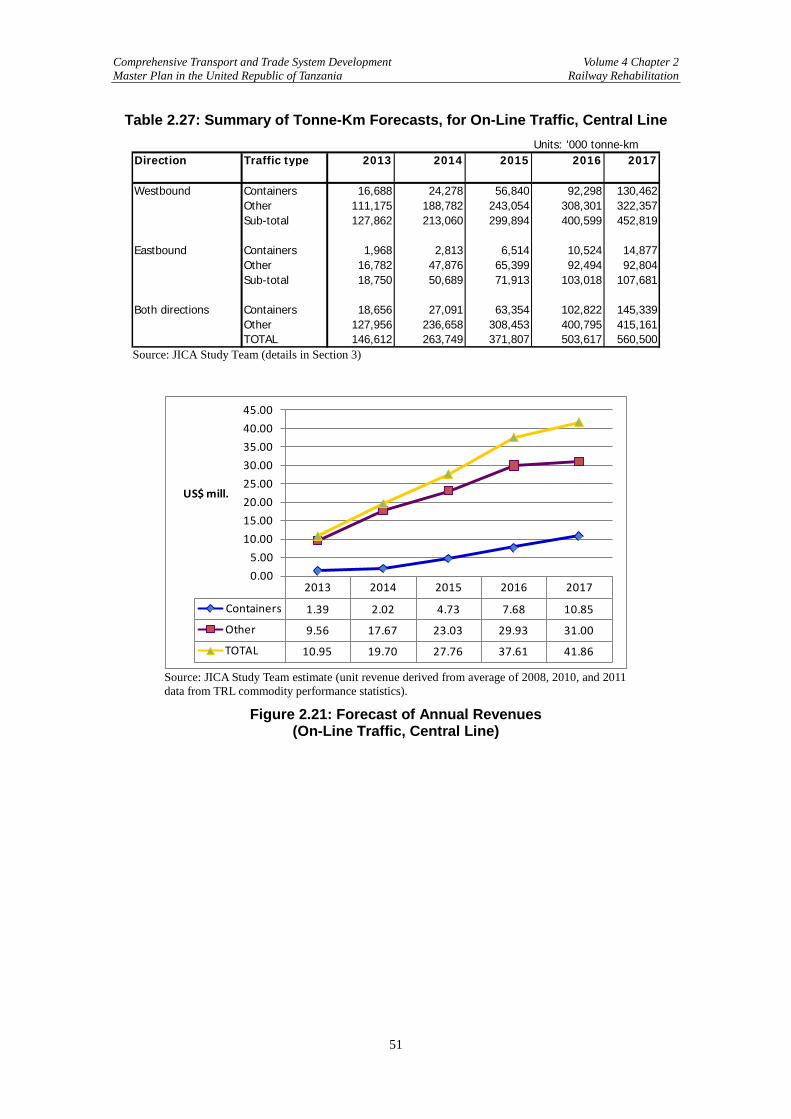
Comprehensive Transport and Trade System Development Volume 4 Chapter 2 Master Plan in the United Republic of Tanzania Railway Rehabilitation
51
Table 2.27: Summary of Tonne-Km Forecasts, for On-Line Traffic, Central Line Units: '000 tonne-km
Direction Traffic type 2013 2014 2015 2016 2017
Westbound Containers 16,688 24,278 56,840 92,298 130,462Other 111,175 188,782 243,054 308,301 322,357Sub-total 127,862 213,060 299,894 400,599 452,819
Eastbound Containers 1,968 2,813 6,514 10,524 14,877Other 16,782 47,876 65,399 92,494 92,804Sub-total 18,750 50,689 71,913 103,018 107,681
Both directions Containers 18,656 27,091 63,354 102,822 145,339Other 127,956 236,658 308,453 400,795 415,161TOTAL 146,612 263,749 371,807 503,617 560,500
Source: JICA Study Team (details in Section 3)
2013 2014 2015 2016 2017
Containers 1.39 2.02 4.73 7.68 10.85
Other 9.56 17.67 23.03 29.93 31.00
TOTAL 10.95 19.70 27.76 37.61 41.86
0.005.00
10.0015.0020.0025.0030.0035.0040.0045.00
US$ mill.
Source: JICA Study Team estimate (unit revenue derived from average of 2008, 2010, and 2011 data from TRL commodity performance statistics).
Figure 2.21: Forecast of Annual Revenues (On-Line Traffic, Central Line)
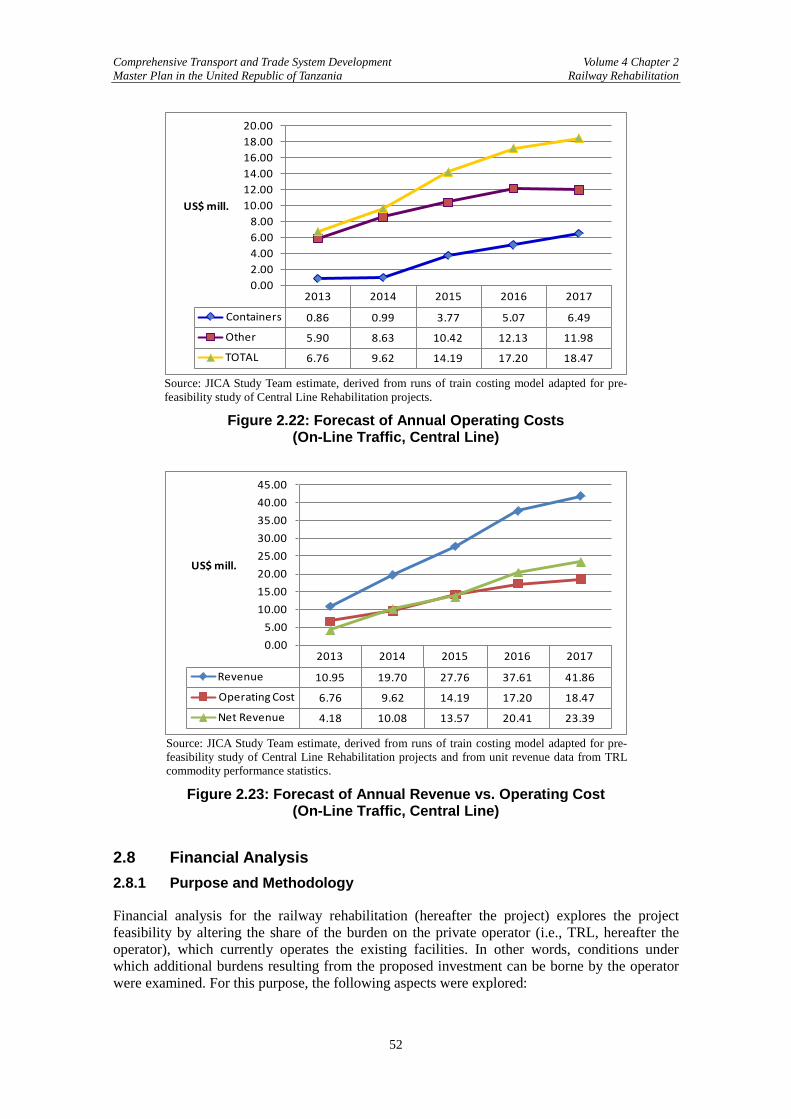
Comprehensive Transport and Trade System Development Volume 4 Chapter 2 Master Plan in the United Republic of Tanzania Railway Rehabilitation
52
2013 2014 2015 2016 2017
Containers 0.86 0.99 3.77 5.07 6.49
Other 5.90 8.63 10.42 12.13 11.98
TOTAL 6.76 9.62 14.19 17.20 18.47
0.002.004.006.008.00
10.0012.0014.0016.0018.0020.00
US$ mill.
Source: JICA Study Team estimate, derived from runs of train costing model adapted for pre-feasibility study of Central Line Rehabilitation projects.
Figure 2.22: Forecast of Annual Operating Costs (On-Line Traffic, Central Line)
2013 2014 2015 2016 2017
Revenue 10.95 19.70 27.76 37.61 41.86
Operating Cost 6.76 9.62 14.19 17.20 18.47
Net Revenue 4.18 10.08 13.57 20.41 23.39
0.005.00
10.0015.0020.0025.0030.0035.0040.0045.00
US$ mill.
Source: JICA Study Team estimate, derived from runs of train costing model adapted for pre-feasibility study of Central Line Rehabilitation projects and from unit revenue data from TRL commodity performance statistics.
Figure 2.23: Forecast of Annual Revenue vs. Operating Cost (On-Line Traffic, Central Line)
2.8 Financial Analysis 2.8.1 Purpose and Methodology
Financial analysis for the railway rehabilitation (hereafter the project) explores the project feasibility by altering the share of the burden on the private operator (i.e., TRL, hereafter the operator), which currently operates the existing facilities. In other words, conditions under which additional burdens resulting from the proposed investment can be borne by the operator were examined. For this purpose, the following aspects were explored:
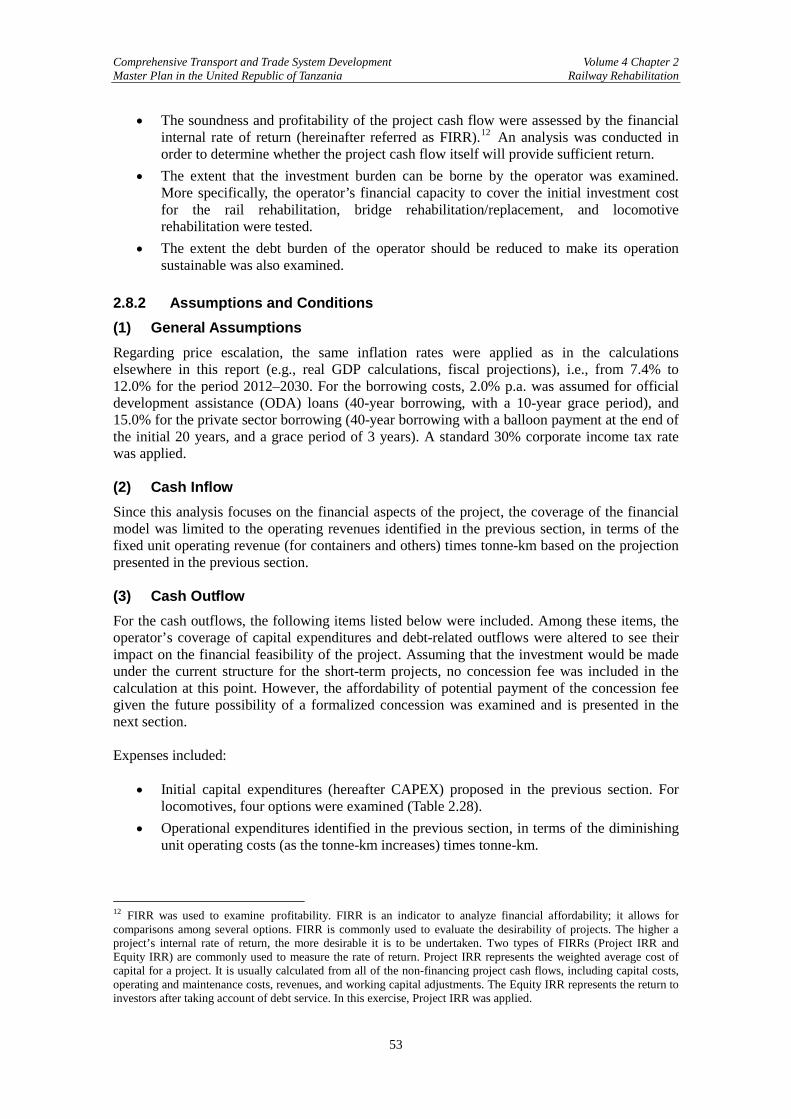
Comprehensive Transport and Trade System Development Volume 4 Chapter 2 Master Plan in the United Republic of Tanzania Railway Rehabilitation
53
• The soundness and profitability of the project cash flow were assessed by the financial internal rate of return (hereinafter referred as FIRR).12 An analysis was conducted in order to determine whether the project cash flow itself will provide sufficient return.
• The extent that the investment burden can be borne by the operator was examined. More specifically, the operator’s financial capacity to cover the initial investment cost for the rail rehabilitation, bridge rehabilitation/replacement, and locomotive rehabilitation were tested.
• The extent the debt burden of the operator should be reduced to make its operation sustainable was also examined.
2.8.2 Assumptions and Conditions (1) General Assumptions Regarding price escalation, the same inflation rates were applied as in the calculations elsewhere in this report (e.g., real GDP calculations, fiscal projections), i.e., from 7.4% to 12.0% for the period 2012–2030. For the borrowing costs, 2.0% p.a. was assumed for official development assistance (ODA) loans (40-year borrowing, with a 10-year grace period), and 15.0% for the private sector borrowing (40-year borrowing with a balloon payment at the end of the initial 20 years, and a grace period of 3 years). A standard 30% corporate income tax rate was applied. (2) Cash Inflow Since this analysis focuses on the financial aspects of the project, the coverage of the financial model was limited to the operating revenues identified in the previous section, in terms of the fixed unit operating revenue (for containers and others) times tonne-km based on the projection presented in the previous section. (3) Cash Outflow For the cash outflows, the following items listed below were included. Among these items, the operator’s coverage of capital expenditures and debt-related outflows were altered to see their impact on the financial feasibility of the project. Assuming that the investment would be made under the current structure for the short-term projects, no concession fee was included in the calculation at this point. However, the affordability of potential payment of the concession fee given the future possibility of a formalized concession was examined and is presented in the next section. Expenses included:
• Initial capital expenditures (hereafter CAPEX) proposed in the previous section. For locomotives, four options were examined (Table 2.28).
• Operational expenditures identified in the previous section, in terms of the diminishing unit operating costs (as the tonne-km increases) times tonne-km.
12 FIRR was used to examine profitability. FIRR is an indicator to analyze financial affordability; it allows for comparisons among several options. FIRR is commonly used to evaluate the desirability of projects. The higher a project’s internal rate of return, the more desirable it is to be undertaken. Two types of FIRRs (Project IRR and Equity IRR) are commonly used to measure the rate of return. Project IRR represents the weighted average cost of capital for a project. It is usually calculated from all of the non-financing project cash flows, including capital costs, operating and maintenance costs, revenues, and working capital adjustments. The Equity IRR represents the return to investors after taking account of debt service. In this exercise, Project IRR was applied.
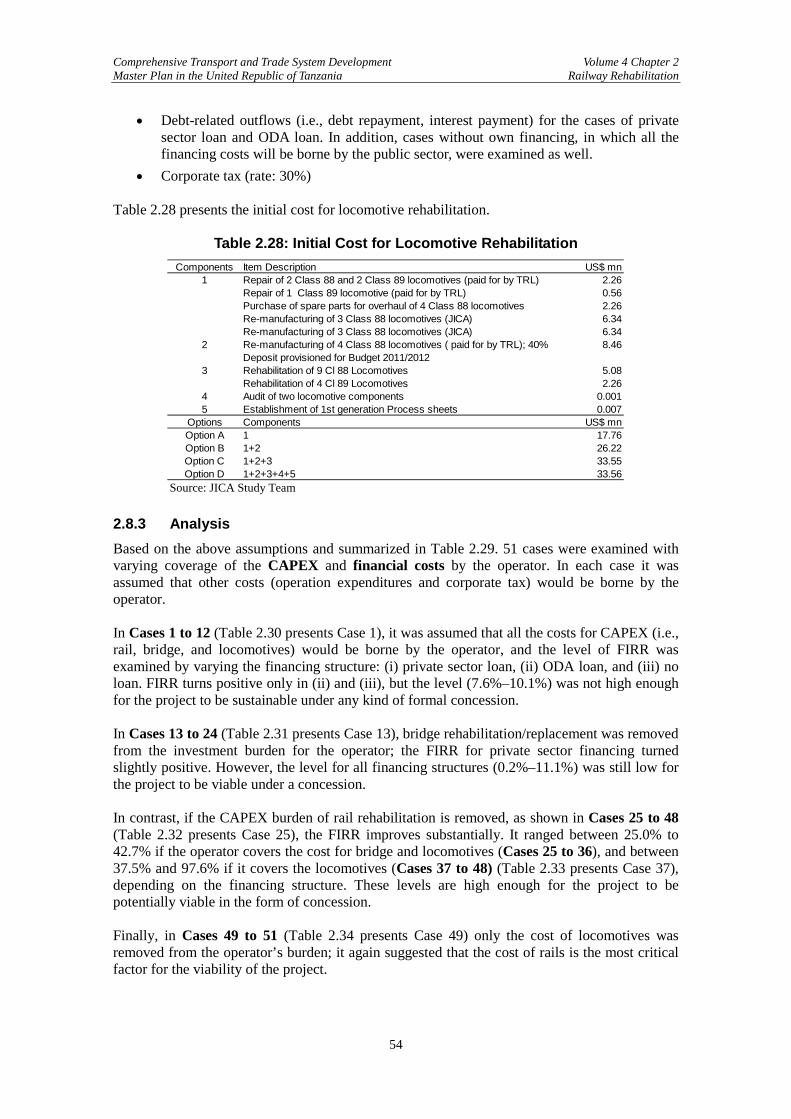
Comprehensive Transport and Trade System Development Volume 4 Chapter 2 Master Plan in the United Republic of Tanzania Railway Rehabilitation
54
• Debt-related outflows (i.e., debt repayment, interest payment) for the cases of private sector loan and ODA loan. In addition, cases without own financing, in which all the financing costs will be borne by the public sector, were examined as well.
• Corporate tax (rate: 30%) Table 2.28 presents the initial cost for locomotive rehabilitation.
Table 2.28: Initial Cost for Locomotive Rehabilitation Components Item Description US$ mn
1 Repair of 2 Class 88 and 2 Class 89 locomotives (paid for by TRL) 2.26Repair of 1 Class 89 locomotive (paid for by TRL) 0.56Purchase of spare parts for overhaul of 4 Class 88 locomotives 2.26Re-manufacturing of 3 Class 88 locomotives (JICA) 6.34Re-manufacturing of 3 Class 88 locomotives (JICA) 6.34
2 Re-manufacturing of 4 Class 88 locomotives ( paid for by TRL); 40%Deposit provisioned for Budget 2011/2012
8.46
3 Rehabilitation of 9 Cl 88 Locomotives 5.08Rehabilitation of 4 Cl 89 Locomotives 2.26
4 Audit of two locomotive components 0.0015 Establishment of 1st generation Process sheets 0.007
Options Components US$ mnOption A 1 17.76Option B 1+2 26.22Option C 1+2+3 33.55Option D 1+2+3+4+5 33.56
Source: JICA Study Team 2.8.3 Analysis Based on the above assumptions and summarized in Table 2.29. 51 cases were examined with varying coverage of the CAPEX and financial costs by the operator. In each case it was assumed that other costs (operation expenditures and corporate tax) would be borne by the operator. In Cases 1 to 12 (Table 2.30 presents Case 1), it was assumed that all the costs for CAPEX (i.e., rail, bridge, and locomotives) would be borne by the operator, and the level of FIRR was examined by varying the financing structure: (i) private sector loan, (ii) ODA loan, and (iii) no loan. FIRR turns positive only in (ii) and (iii), but the level (7.6%–10.1%) was not high enough for the project to be sustainable under any kind of formal concession. In Cases 13 to 24 (Table 2.31 presents Case 13), bridge rehabilitation/replacement was removed from the investment burden for the operator; the FIRR for private sector financing turned slightly positive. However, the level for all financing structures (0.2%–11.1%) was still low for the project to be viable under a concession. In contrast, if the CAPEX burden of rail rehabilitation is removed, as shown in Cases 25 to 48 (Table 2.32 presents Case 25), the FIRR improves substantially. It ranged between 25.0% to 42.7% if the operator covers the cost for bridge and locomotives (Cases 25 to 36), and between 37.5% and 97.6% if it covers the locomotives (Cases 37 to 48) (Table 2.33 presents Case 37), depending on the financing structure. These levels are high enough for the project to be potentially viable in the form of concession. Finally, in Cases 49 to 51 (Table 2.34 presents Case 49) only the cost of locomotives was removed from the operator’s burden; it again suggested that the cost of rails is the most critical factor for the viability of the project.
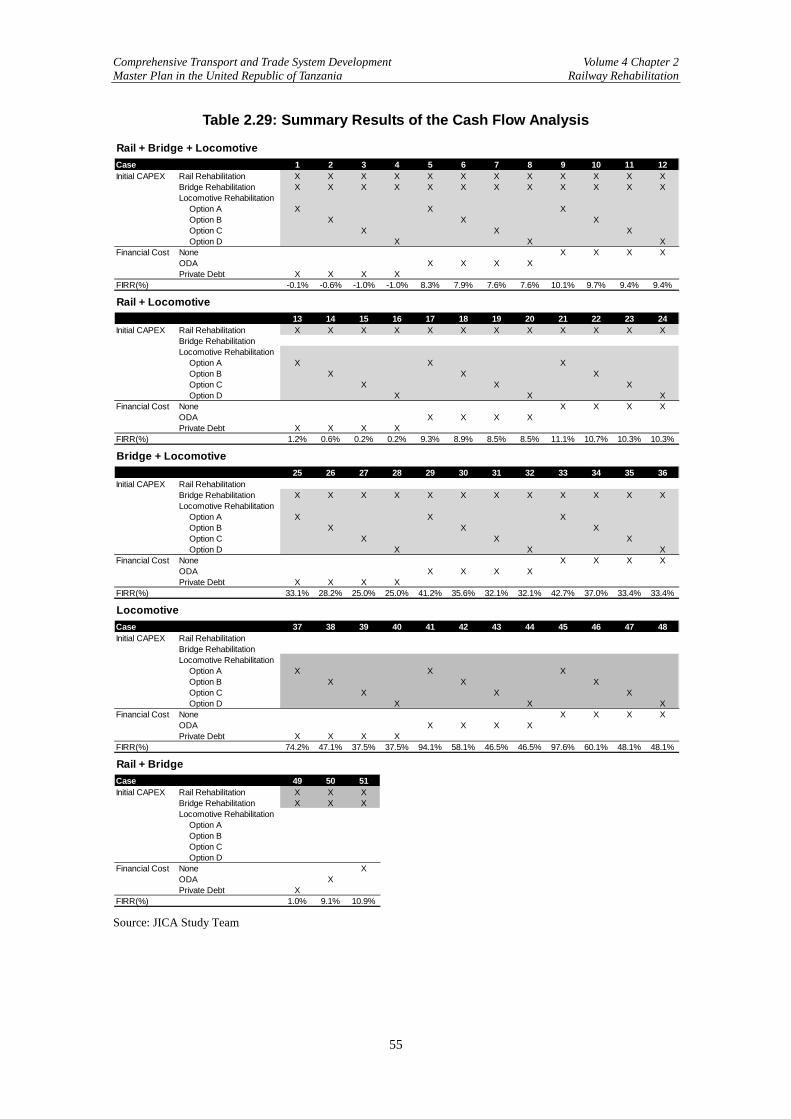
Comprehensive Transport and Trade System Development Volume 4 Chapter 2 Master Plan in the United Republic of Tanzania Railway Rehabilitation
55
Table 2.29: Summary Results of the Cash Flow Analysis
Source: JICA Study Team
Rail + Bridge + LocomotiveCase 1 2 3 4 5 6 7 8 9 10 11 12Initial CAPEX Rail Rehabilitation X X X X X X X X X X X X
Bridge Rehabilitation X X X X X X X X X X X XLocomotive Rehabilitation
Option A X X XOption B X X XOption C X X XOption D X X X
Financial Cost None X X X XODA X X X XPrivate Debt X X X X
FIRR(%) -0.1% -0.6% -1.0% -1.0% 8.3% 7.9% 7.6% 7.6% 10.1% 9.7% 9.4% 9.4%
Rail + Locomotive13 14 15 16 17 18 19 20 21 22 23 24
Initial CAPEX Rail Rehabilitation X X X X X X X X X X X XBridge RehabilitationLocomotive Rehabilitation
Option A X X XOption B X X XOption C X X XOption D X X X
Financial Cost None X X X XODA X X X XPrivate Debt X X X X
FIRR(%) 1.2% 0.6% 0.2% 0.2% 9.3% 8.9% 8.5% 8.5% 11.1% 10.7% 10.3% 10.3%
Bridge + Locomotive25 26 27 28 29 30 31 32 33 34 35 36
Initial CAPEX Rail RehabilitationBridge Rehabilitation X X X X X X X X X X X XLocomotive Rehabilitation
Option A X X XOption B X X XOption C X X XOption D X X X
Financial Cost None X X X XODA X X X XPrivate Debt X X X X
FIRR(%) 33.1% 28.2% 25.0% 25.0% 41.2% 35.6% 32.1% 32.1% 42.7% 37.0% 33.4% 33.4%
LocomotiveCase 37 38 39 40 41 42 43 44 45 46 47 48Initial CAPEX Rail Rehabilitation
Bridge RehabilitationLocomotive Rehabilitation
Option A X X XOption B X X XOption C X X XOption D X X X
Financial Cost None X X X XODA X X X XPrivate Debt X X X X
FIRR(%) 74.2% 47.1% 37.5% 37.5% 94.1% 58.1% 46.5% 46.5% 97.6% 60.1% 48.1% 48.1%
Rail + BridgeCase 49 50 51Initial CAPEX Rail Rehabilitation X X X
Bridge Rehabilitation X X XLocomotive Rehabilitation
Option AOption BOption COption D
Financial Cost None XODA XPrivate Debt X
FIRR(%) 1.0% 9.1% 10.9%

Comprehensive Transport and Trade System Development Volume 4 Chapter 2 Master Plan in the United Republic of Tanzania Railway Rehabilitation
56
Conclusions that can be drawn from observation of these cases include the following.
• The most critical factor for the financial viability of the project (from the operator’s viewpoint) is whether the initial cost for the railway rehabilitation is borne by the public or not.
• If so, the project nay be regarded as financially viable in most of the cases, regardless of the financing structure, or the coverage of other components of the projects.
• As long as the cost of rails is fully included in the operator’s burden, the project cannot provide an FIRR high enough to make a concession viable.
• These observations suggest that at the very least the burden of rail rehabilitation needs to be separated from the operator, and most likely financed with concessionary funds from international development partners.
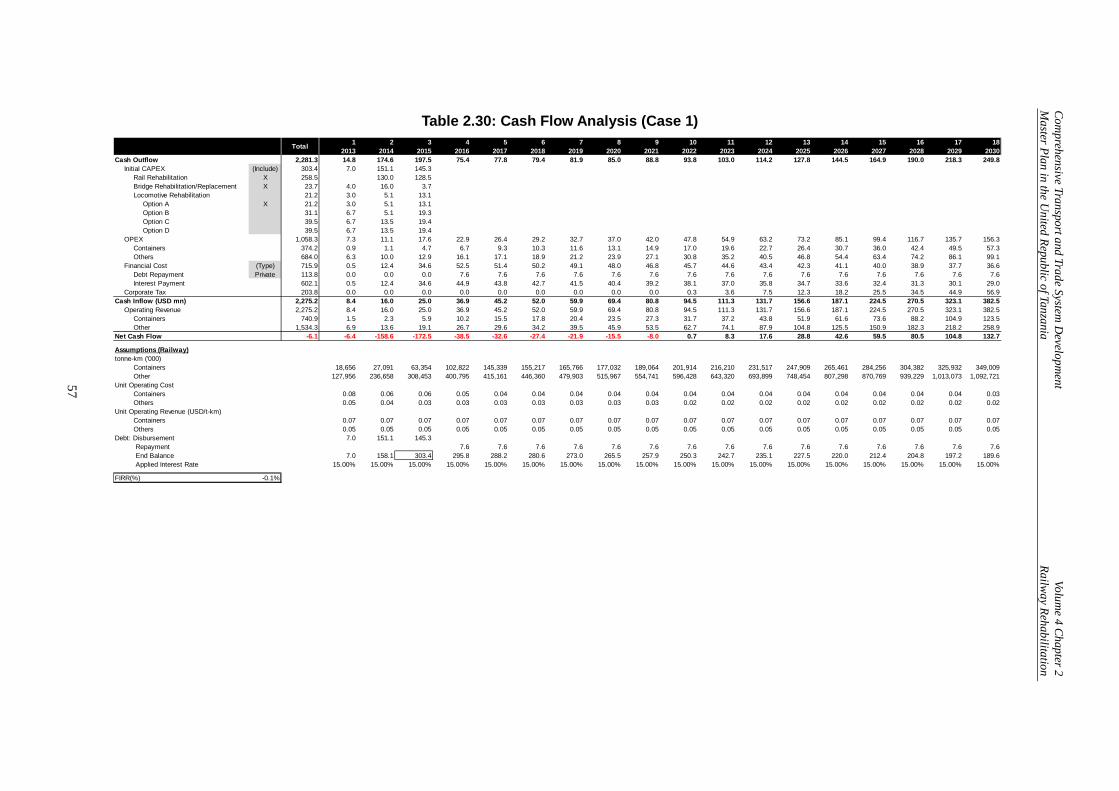
Com
prehensive Transport and Trade System D
evelopment
Volume 4 Chapter 2
Master Plan in the U
nited Republic of Tanzania Railw
ay Rehabilitation
57
Table 2.30: Cash Flow Analysis (Case 1) 1 2 3 4 5 6 7 8 9 10 11 12 13 14 15 16 17 18
2013 2014 2015 2016 2017 2018 2019 2020 2021 2022 2023 2024 2025 2026 2027 2028 2029 2030Cash Outflow 2,281.3 14.8 174.6 197.5 75.4 77.8 79.4 81.9 85.0 88.8 93.8 103.0 114.2 127.8 144.5 164.9 190.0 218.3 249.8
Initial CAPEX (Include) 303.4 7.0 151.1 145.3Rail Rehabilitation X 258.5 130.0 128.5Bridge Rehabilitation/Replacement X 23.7 4.0 16.0 3.7Locomotive Rehabilitation 21.2 3.0 5.1 13.1
Option A X 21.2 3.0 5.1 13.1Option B 31.1 6.7 5.1 19.3Option C 39.5 6.7 13.5 19.4Option D 39.5 6.7 13.5 19.4
OPEX 1,058.3 7.3 11.1 17.6 22.9 26.4 29.2 32.7 37.0 42.0 47.8 54.9 63.2 73.2 85.1 99.4 116.7 135.7 156.3Containers 374.2 0.9 1.1 4.7 6.7 9.3 10.3 11.6 13.1 14.9 17.0 19.6 22.7 26.4 30.7 36.0 42.4 49.5 57.3Others 684.0 6.3 10.0 12.9 16.1 17.1 18.9 21.2 23.9 27.1 30.8 35.2 40.5 46.8 54.4 63.4 74.2 86.1 99.1
Financial Cost (Type) 715.9 0.5 12.4 34.6 52.5 51.4 50.2 49.1 48.0 46.8 45.7 44.6 43.4 42.3 41.1 40.0 38.9 37.7 36.6Debt Repayment Private 113.8 0.0 0.0 0.0 7.6 7.6 7.6 7.6 7.6 7.6 7.6 7.6 7.6 7.6 7.6 7.6 7.6 7.6 7.6Interest Payment 602.1 0.5 12.4 34.6 44.9 43.8 42.7 41.5 40.4 39.2 38.1 37.0 35.8 34.7 33.6 32.4 31.3 30.1 29.0
Corporate Tax 203.8 0.0 0.0 0.0 0.0 0.0 0.0 0.0 0.0 0.0 0.3 3.6 7.5 12.3 18.2 25.5 34.5 44.9 56.9Cash Inflow (USD mn) 2,275.2 8.4 16.0 25.0 36.9 45.2 52.0 59.9 69.4 80.8 94.5 111.3 131.7 156.6 187.1 224.5 270.5 323.1 382.5
Operating Revenue 2,275.2 8.4 16.0 25.0 36.9 45.2 52.0 59.9 69.4 80.8 94.5 111.3 131.7 156.6 187.1 224.5 270.5 323.1 382.5Containers 740.9 1.5 2.3 5.9 10.2 15.5 17.8 20.4 23.5 27.3 31.7 37.2 43.8 51.9 61.6 73.6 88.2 104.9 123.5Other 1,534.3 6.9 13.6 19.1 26.7 29.6 34.2 39.5 45.9 53.5 62.7 74.1 87.9 104.8 125.5 150.9 182.3 218.2 258.9
Net Cash Flow -6.1 -6.4 -158.6 -172.5 -38.5 -32.6 -27.4 -21.9 -15.5 -8.0 0.7 8.3 17.6 28.8 42.6 59.5 80.5 104.8 132.7
Assumptions (Railway)tonne-km ('000)
Containers 18,656 27,091 63,354 102,822 145,339 155,217 165,766 177,032 189,064 201,914 216,210 231,517 247,909 265,461 284,256 304,382 325,932 349,009Other 127,956 236,658 308,453 400,795 415,161 446,360 479,903 515,967 554,741 596,428 643,320 693,899 748,454 807,298 870,769 939,229 1,013,073 1,092,721
Unit Operating CostContainers 0.08 0.06 0.06 0.05 0.04 0.04 0.04 0.04 0.04 0.04 0.04 0.04 0.04 0.04 0.04 0.04 0.04 0.03Others 0.05 0.04 0.03 0.03 0.03 0.03 0.03 0.03 0.03 0.02 0.02 0.02 0.02 0.02 0.02 0.02 0.02 0.02
Unit Operating Revenue (USD/t-km)Containers 0.07 0.07 0.07 0.07 0.07 0.07 0.07 0.07 0.07 0.07 0.07 0.07 0.07 0.07 0.07 0.07 0.07 0.07Others 0.05 0.05 0.05 0.05 0.05 0.05 0.05 0.05 0.05 0.05 0.05 0.05 0.05 0.05 0.05 0.05 0.05 0.05
Debt: Disbursement 7.0 151.1 145.3 Repayment 7.6 7.6 7.6 7.6 7.6 7.6 7.6 7.6 7.6 7.6 7.6 7.6 7.6 7.6 7.6 End Balance 7.0 158.1 303.4 295.8 288.2 280.6 273.0 265.5 257.9 250.3 242.7 235.1 227.5 220.0 212.4 204.8 197.2 189.6 Applied Interest Rate 15.00% 15.00% 15.00% 15.00% 15.00% 15.00% 15.00% 15.00% 15.00% 15.00% 15.00% 15.00% 15.00% 15.00% 15.00% 15.00% 15.00% 15.00%
FIRR(%) -0.1%
Total
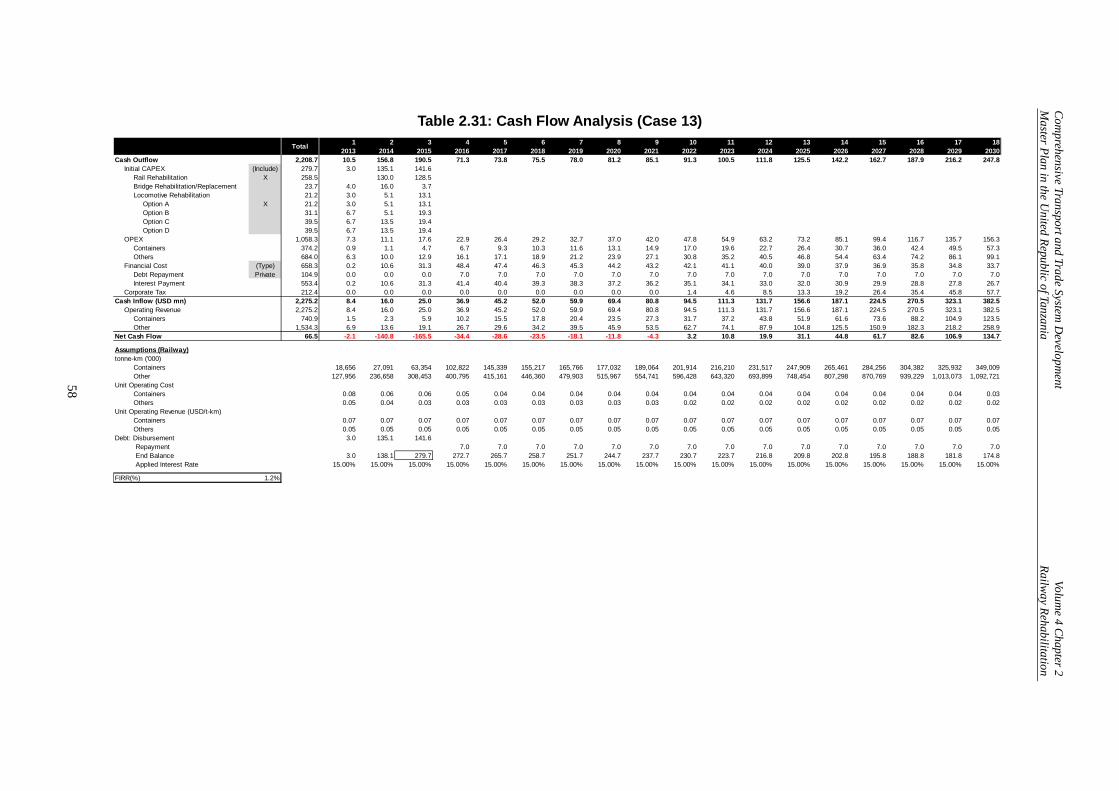
Com
prehensive Transport and Trade System D
evelopment
Volume 4 Chapter 2
Master Plan in the U
nited Republic of Tanzania Railw
ay Rehabilitation
58
Table 2.31: Cash Flow Analysis (Case 13) 1 2 3 4 5 6 7 8 9 10 11 12 13 14 15 16 17 18
2013 2014 2015 2016 2017 2018 2019 2020 2021 2022 2023 2024 2025 2026 2027 2028 2029 2030Cash Outflow 2,208.7 10.5 156.8 190.5 71.3 73.8 75.5 78.0 81.2 85.1 91.3 100.5 111.8 125.5 142.2 162.7 187.9 216.2 247.8
Initial CAPEX (Include) 279.7 3.0 135.1 141.6Rail Rehabilitation X 258.5 130.0 128.5Bridge Rehabilitation/Replacement 23.7 4.0 16.0 3.7Locomotive Rehabilitation 21.2 3.0 5.1 13.1
Option A X 21.2 3.0 5.1 13.1Option B 31.1 6.7 5.1 19.3Option C 39.5 6.7 13.5 19.4Option D 39.5 6.7 13.5 19.4
OPEX 1,058.3 7.3 11.1 17.6 22.9 26.4 29.2 32.7 37.0 42.0 47.8 54.9 63.2 73.2 85.1 99.4 116.7 135.7 156.3Containers 374.2 0.9 1.1 4.7 6.7 9.3 10.3 11.6 13.1 14.9 17.0 19.6 22.7 26.4 30.7 36.0 42.4 49.5 57.3Others 684.0 6.3 10.0 12.9 16.1 17.1 18.9 21.2 23.9 27.1 30.8 35.2 40.5 46.8 54.4 63.4 74.2 86.1 99.1
Financial Cost (Type) 658.3 0.2 10.6 31.3 48.4 47.4 46.3 45.3 44.2 43.2 42.1 41.1 40.0 39.0 37.9 36.9 35.8 34.8 33.7Debt Repayment Private 104.9 0.0 0.0 0.0 7.0 7.0 7.0 7.0 7.0 7.0 7.0 7.0 7.0 7.0 7.0 7.0 7.0 7.0 7.0Interest Payment 553.4 0.2 10.6 31.3 41.4 40.4 39.3 38.3 37.2 36.2 35.1 34.1 33.0 32.0 30.9 29.9 28.8 27.8 26.7
Corporate Tax 212.4 0.0 0.0 0.0 0.0 0.0 0.0 0.0 0.0 0.0 1.4 4.6 8.5 13.3 19.2 26.4 35.4 45.8 57.7Cash Inflow (USD mn) 2,275.2 8.4 16.0 25.0 36.9 45.2 52.0 59.9 69.4 80.8 94.5 111.3 131.7 156.6 187.1 224.5 270.5 323.1 382.5
Operating Revenue 2,275.2 8.4 16.0 25.0 36.9 45.2 52.0 59.9 69.4 80.8 94.5 111.3 131.7 156.6 187.1 224.5 270.5 323.1 382.5Containers 740.9 1.5 2.3 5.9 10.2 15.5 17.8 20.4 23.5 27.3 31.7 37.2 43.8 51.9 61.6 73.6 88.2 104.9 123.5Other 1,534.3 6.9 13.6 19.1 26.7 29.6 34.2 39.5 45.9 53.5 62.7 74.1 87.9 104.8 125.5 150.9 182.3 218.2 258.9
Net Cash Flow 66.5 -2.1 -140.8 -165.5 -34.4 -28.6 -23.5 -18.1 -11.8 -4.3 3.2 10.8 19.9 31.1 44.8 61.7 82.6 106.9 134.7
Assumptions (Railway)tonne-km ('000)
Containers 18,656 27,091 63,354 102,822 145,339 155,217 165,766 177,032 189,064 201,914 216,210 231,517 247,909 265,461 284,256 304,382 325,932 349,009Other 127,956 236,658 308,453 400,795 415,161 446,360 479,903 515,967 554,741 596,428 643,320 693,899 748,454 807,298 870,769 939,229 1,013,073 1,092,721
Unit Operating CostContainers 0.08 0.06 0.06 0.05 0.04 0.04 0.04 0.04 0.04 0.04 0.04 0.04 0.04 0.04 0.04 0.04 0.04 0.03Others 0.05 0.04 0.03 0.03 0.03 0.03 0.03 0.03 0.03 0.02 0.02 0.02 0.02 0.02 0.02 0.02 0.02 0.02
Unit Operating Revenue (USD/t-km)Containers 0.07 0.07 0.07 0.07 0.07 0.07 0.07 0.07 0.07 0.07 0.07 0.07 0.07 0.07 0.07 0.07 0.07 0.07Others 0.05 0.05 0.05 0.05 0.05 0.05 0.05 0.05 0.05 0.05 0.05 0.05 0.05 0.05 0.05 0.05 0.05 0.05
Debt: Disbursement 3.0 135.1 141.6 Repayment 7.0 7.0 7.0 7.0 7.0 7.0 7.0 7.0 7.0 7.0 7.0 7.0 7.0 7.0 7.0 End Balance 3.0 138.1 279.7 272.7 265.7 258.7 251.7 244.7 237.7 230.7 223.7 216.8 209.8 202.8 195.8 188.8 181.8 174.8 Applied Interest Rate 15.00% 15.00% 15.00% 15.00% 15.00% 15.00% 15.00% 15.00% 15.00% 15.00% 15.00% 15.00% 15.00% 15.00% 15.00% 15.00% 15.00% 15.00%
FIRR(%) 1.2%
Total
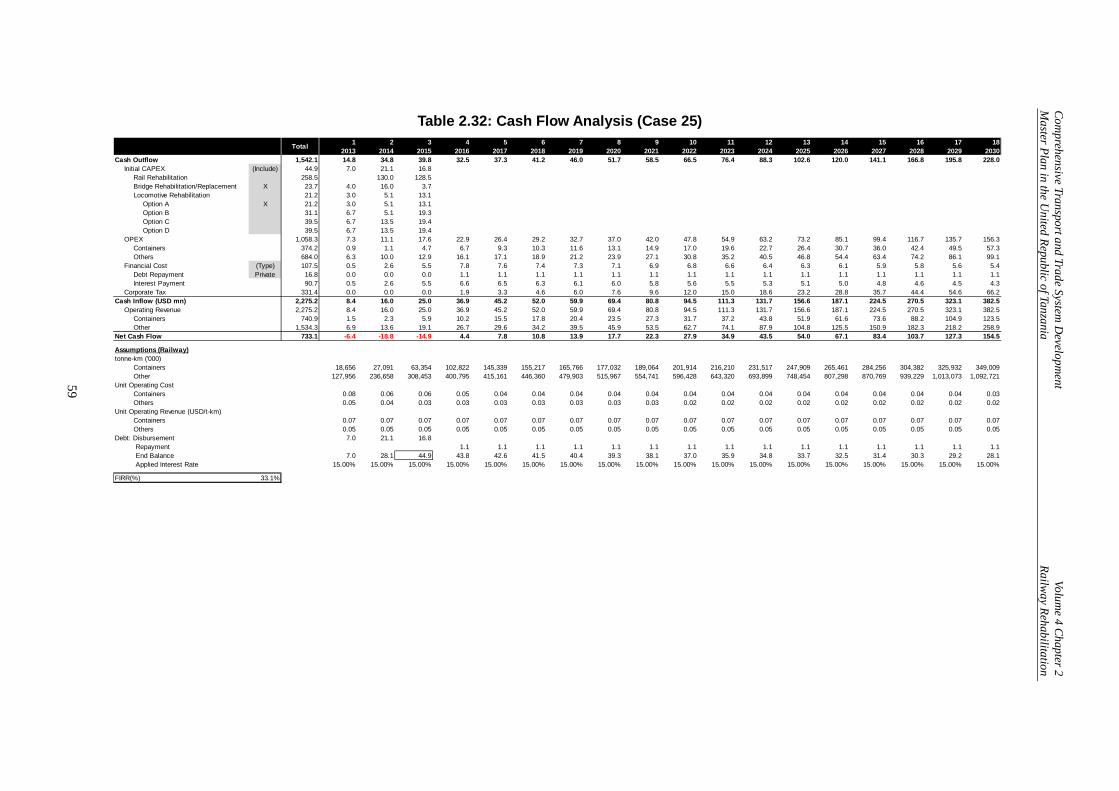
Com
prehensive Transport and Trade System D
evelopment
Volume 4 Chapter 2
Master Plan in the U
nited Republic of Tanzania Railw
ay Rehabilitation
59
Table 2.32: Cash Flow Analysis (Case 25) 1 2 3 4 5 6 7 8 9 10 11 12 13 14 15 16 17 18
2013 2014 2015 2016 2017 2018 2019 2020 2021 2022 2023 2024 2025 2026 2027 2028 2029 2030Cash Outflow 1,542.1 14.8 34.8 39.8 32.5 37.3 41.2 46.0 51.7 58.5 66.5 76.4 88.3 102.6 120.0 141.1 166.8 195.8 228.0
Initial CAPEX (Include) 44.9 7.0 21.1 16.8Rail Rehabilitation 258.5 130.0 128.5Bridge Rehabilitation/Replacement X 23.7 4.0 16.0 3.7Locomotive Rehabilitation 21.2 3.0 5.1 13.1
Option A X 21.2 3.0 5.1 13.1Option B 31.1 6.7 5.1 19.3Option C 39.5 6.7 13.5 19.4Option D 39.5 6.7 13.5 19.4
OPEX 1,058.3 7.3 11.1 17.6 22.9 26.4 29.2 32.7 37.0 42.0 47.8 54.9 63.2 73.2 85.1 99.4 116.7 135.7 156.3Containers 374.2 0.9 1.1 4.7 6.7 9.3 10.3 11.6 13.1 14.9 17.0 19.6 22.7 26.4 30.7 36.0 42.4 49.5 57.3Others 684.0 6.3 10.0 12.9 16.1 17.1 18.9 21.2 23.9 27.1 30.8 35.2 40.5 46.8 54.4 63.4 74.2 86.1 99.1
Financial Cost (Type) 107.5 0.5 2.6 5.5 7.8 7.6 7.4 7.3 7.1 6.9 6.8 6.6 6.4 6.3 6.1 5.9 5.8 5.6 5.4Debt Repayment Private 16.8 0.0 0.0 0.0 1.1 1.1 1.1 1.1 1.1 1.1 1.1 1.1 1.1 1.1 1.1 1.1 1.1 1.1 1.1Interest Payment 90.7 0.5 2.6 5.5 6.6 6.5 6.3 6.1 6.0 5.8 5.6 5.5 5.3 5.1 5.0 4.8 4.6 4.5 4.3
Corporate Tax 331.4 0.0 0.0 0.0 1.9 3.3 4.6 6.0 7.6 9.6 12.0 15.0 18.6 23.2 28.8 35.7 44.4 54.6 66.2Cash Inflow (USD mn) 2,275.2 8.4 16.0 25.0 36.9 45.2 52.0 59.9 69.4 80.8 94.5 111.3 131.7 156.6 187.1 224.5 270.5 323.1 382.5
Operating Revenue 2,275.2 8.4 16.0 25.0 36.9 45.2 52.0 59.9 69.4 80.8 94.5 111.3 131.7 156.6 187.1 224.5 270.5 323.1 382.5Containers 740.9 1.5 2.3 5.9 10.2 15.5 17.8 20.4 23.5 27.3 31.7 37.2 43.8 51.9 61.6 73.6 88.2 104.9 123.5Other 1,534.3 6.9 13.6 19.1 26.7 29.6 34.2 39.5 45.9 53.5 62.7 74.1 87.9 104.8 125.5 150.9 182.3 218.2 258.9
Net Cash Flow 733.1 -6.4 -18.8 -14.9 4.4 7.8 10.8 13.9 17.7 22.3 27.9 34.9 43.5 54.0 67.1 83.4 103.7 127.3 154.5
Assumptions (Railway)tonne-km ('000)
Containers 18,656 27,091 63,354 102,822 145,339 155,217 165,766 177,032 189,064 201,914 216,210 231,517 247,909 265,461 284,256 304,382 325,932 349,009Other 127,956 236,658 308,453 400,795 415,161 446,360 479,903 515,967 554,741 596,428 643,320 693,899 748,454 807,298 870,769 939,229 1,013,073 1,092,721
Unit Operating CostContainers 0.08 0.06 0.06 0.05 0.04 0.04 0.04 0.04 0.04 0.04 0.04 0.04 0.04 0.04 0.04 0.04 0.04 0.03Others 0.05 0.04 0.03 0.03 0.03 0.03 0.03 0.03 0.03 0.02 0.02 0.02 0.02 0.02 0.02 0.02 0.02 0.02
Unit Operating Revenue (USD/t-km)Containers 0.07 0.07 0.07 0.07 0.07 0.07 0.07 0.07 0.07 0.07 0.07 0.07 0.07 0.07 0.07 0.07 0.07 0.07Others 0.05 0.05 0.05 0.05 0.05 0.05 0.05 0.05 0.05 0.05 0.05 0.05 0.05 0.05 0.05 0.05 0.05 0.05
Debt: Disbursement 7.0 21.1 16.8 Repayment 1.1 1.1 1.1 1.1 1.1 1.1 1.1 1.1 1.1 1.1 1.1 1.1 1.1 1.1 1.1 End Balance 7.0 28.1 44.9 43.8 42.6 41.5 40.4 39.3 38.1 37.0 35.9 34.8 33.7 32.5 31.4 30.3 29.2 28.1 Applied Interest Rate 15.00% 15.00% 15.00% 15.00% 15.00% 15.00% 15.00% 15.00% 15.00% 15.00% 15.00% 15.00% 15.00% 15.00% 15.00% 15.00% 15.00% 15.00%
FIRR(%) 33.1%
Total
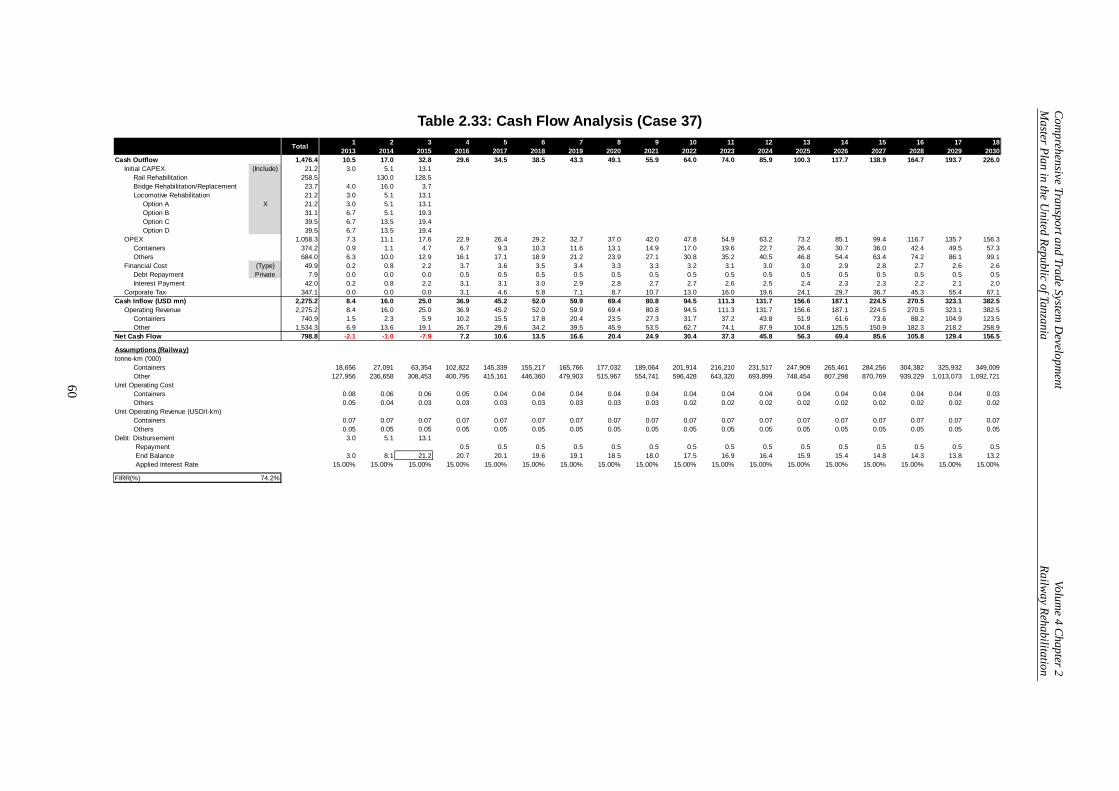
Com
prehensive Transport and Trade System D
evelopment
Volume 4 Chapter 2
Master Plan in the U
nited Republic of Tanzania Railw
ay Rehabilitation
60
Table 2.33: Cash Flow Analysis (Case 37) 1 2 3 4 5 6 7 8 9 10 11 12 13 14 15 16 17 18
2013 2014 2015 2016 2017 2018 2019 2020 2021 2022 2023 2024 2025 2026 2027 2028 2029 2030Cash Outflow 1,476.4 10.5 17.0 32.8 29.6 34.5 38.5 43.3 49.1 55.9 64.0 74.0 85.9 100.3 117.7 138.9 164.7 193.7 226.0
Initial CAPEX (Include) 21.2 3.0 5.1 13.1Rail Rehabilitation 258.5 130.0 128.5Bridge Rehabilitation/Replacement 23.7 4.0 16.0 3.7Locomotive Rehabilitation 21.2 3.0 5.1 13.1
Option A X 21.2 3.0 5.1 13.1Option B 31.1 6.7 5.1 19.3Option C 39.5 6.7 13.5 19.4Option D 39.5 6.7 13.5 19.4
OPEX 1,058.3 7.3 11.1 17.6 22.9 26.4 29.2 32.7 37.0 42.0 47.8 54.9 63.2 73.2 85.1 99.4 116.7 135.7 156.3Containers 374.2 0.9 1.1 4.7 6.7 9.3 10.3 11.6 13.1 14.9 17.0 19.6 22.7 26.4 30.7 36.0 42.4 49.5 57.3Others 684.0 6.3 10.0 12.9 16.1 17.1 18.9 21.2 23.9 27.1 30.8 35.2 40.5 46.8 54.4 63.4 74.2 86.1 99.1
Financial Cost (Type) 49.9 0.2 0.8 2.2 3.7 3.6 3.5 3.4 3.3 3.3 3.2 3.1 3.0 3.0 2.9 2.8 2.7 2.6 2.6Debt Repayment Private 7.9 0.0 0.0 0.0 0.5 0.5 0.5 0.5 0.5 0.5 0.5 0.5 0.5 0.5 0.5 0.5 0.5 0.5 0.5Interest Payment 42.0 0.2 0.8 2.2 3.1 3.1 3.0 2.9 2.8 2.7 2.7 2.6 2.5 2.4 2.3 2.3 2.2 2.1 2.0
Corporate Tax 347.1 0.0 0.0 0.0 3.1 4.6 5.8 7.1 8.7 10.7 13.0 16.0 19.6 24.1 29.7 36.7 45.3 55.4 67.1Cash Inflow (USD mn) 2,275.2 8.4 16.0 25.0 36.9 45.2 52.0 59.9 69.4 80.8 94.5 111.3 131.7 156.6 187.1 224.5 270.5 323.1 382.5
Operating Revenue 2,275.2 8.4 16.0 25.0 36.9 45.2 52.0 59.9 69.4 80.8 94.5 111.3 131.7 156.6 187.1 224.5 270.5 323.1 382.5Containers 740.9 1.5 2.3 5.9 10.2 15.5 17.8 20.4 23.5 27.3 31.7 37.2 43.8 51.9 61.6 73.6 88.2 104.9 123.5Other 1,534.3 6.9 13.6 19.1 26.7 29.6 34.2 39.5 45.9 53.5 62.7 74.1 87.9 104.8 125.5 150.9 182.3 218.2 258.9
Net Cash Flow 798.8 -2.1 -1.0 -7.9 7.2 10.6 13.5 16.6 20.4 24.9 30.4 37.3 45.8 56.3 69.4 85.6 105.8 129.4 156.5
Assumptions (Railway)tonne-km ('000)
Containers 18,656 27,091 63,354 102,822 145,339 155,217 165,766 177,032 189,064 201,914 216,210 231,517 247,909 265,461 284,256 304,382 325,932 349,009Other 127,956 236,658 308,453 400,795 415,161 446,360 479,903 515,967 554,741 596,428 643,320 693,899 748,454 807,298 870,769 939,229 1,013,073 1,092,721
Unit Operating CostContainers 0.08 0.06 0.06 0.05 0.04 0.04 0.04 0.04 0.04 0.04 0.04 0.04 0.04 0.04 0.04 0.04 0.04 0.03Others 0.05 0.04 0.03 0.03 0.03 0.03 0.03 0.03 0.03 0.02 0.02 0.02 0.02 0.02 0.02 0.02 0.02 0.02
Unit Operating Revenue (USD/t-km)Containers 0.07 0.07 0.07 0.07 0.07 0.07 0.07 0.07 0.07 0.07 0.07 0.07 0.07 0.07 0.07 0.07 0.07 0.07Others 0.05 0.05 0.05 0.05 0.05 0.05 0.05 0.05 0.05 0.05 0.05 0.05 0.05 0.05 0.05 0.05 0.05 0.05
Debt: Disbursement 3.0 5.1 13.1 Repayment 0.5 0.5 0.5 0.5 0.5 0.5 0.5 0.5 0.5 0.5 0.5 0.5 0.5 0.5 0.5 End Balance 3.0 8.1 21.2 20.7 20.1 19.6 19.1 18.5 18.0 17.5 16.9 16.4 15.9 15.4 14.8 14.3 13.8 13.2 Applied Interest Rate 15.00% 15.00% 15.00% 15.00% 15.00% 15.00% 15.00% 15.00% 15.00% 15.00% 15.00% 15.00% 15.00% 15.00% 15.00% 15.00% 15.00% 15.00%
FIRR(%) 74.2%
Total
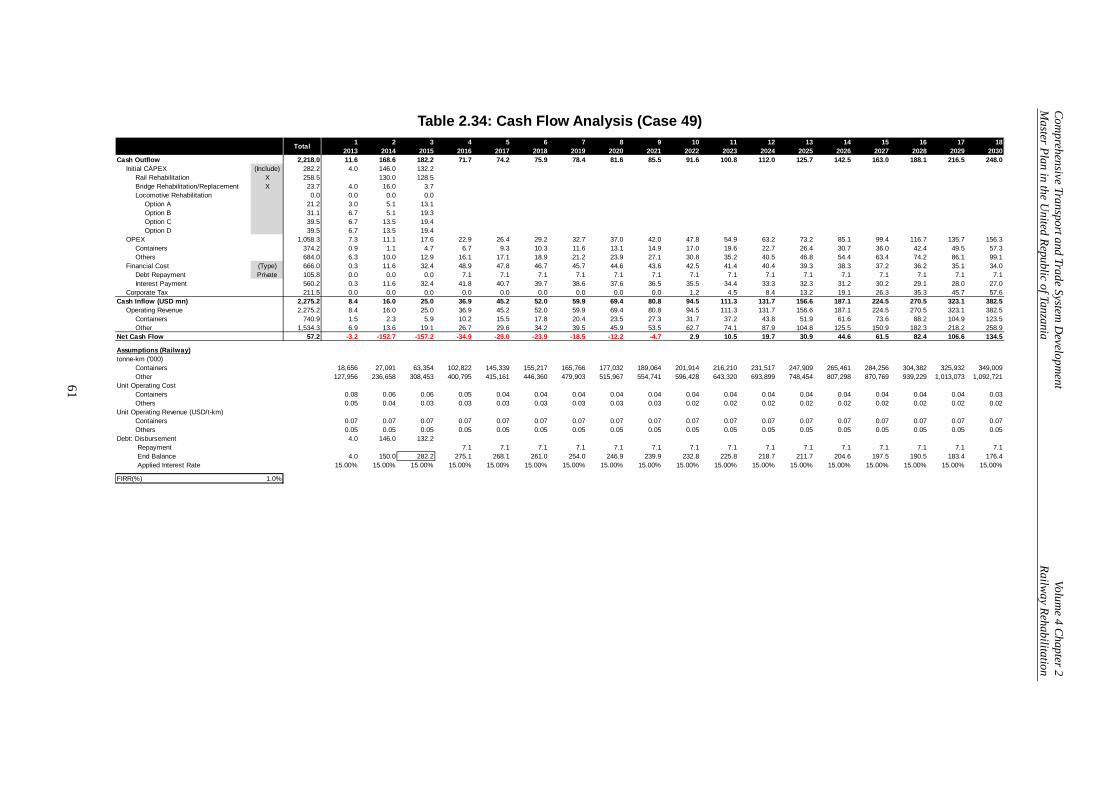
Com
prehensive Transport and Trade System D
evelopment
Volume 4 Chapter 2
Master Plan in the U
nited Republic of Tanzania Railw
ay Rehabilitation
61
Table 2.34: Cash Flow Analysis (Case 49)
1 2 3 4 5 6 7 8 9 10 11 12 13 14 15 16 17 182013 2014 2015 2016 2017 2018 2019 2020 2021 2022 2023 2024 2025 2026 2027 2028 2029 2030
Cash Outflow 2,218.0 11.6 168.6 182.2 71.7 74.2 75.9 78.4 81.6 85.5 91.6 100.8 112.0 125.7 142.5 163.0 188.1 216.5 248.0Initial CAPEX (Include) 282.2 4.0 146.0 132.2
Rail Rehabilitation X 258.5 130.0 128.5Bridge Rehabilitation/Replacement X 23.7 4.0 16.0 3.7Locomotive Rehabilitation 0.0 0.0 0.0 0.0
Option A 21.2 3.0 5.1 13.1Option B 31.1 6.7 5.1 19.3Option C 39.5 6.7 13.5 19.4Option D 39.5 6.7 13.5 19.4
OPEX 1,058.3 7.3 11.1 17.6 22.9 26.4 29.2 32.7 37.0 42.0 47.8 54.9 63.2 73.2 85.1 99.4 116.7 135.7 156.3Containers 374.2 0.9 1.1 4.7 6.7 9.3 10.3 11.6 13.1 14.9 17.0 19.6 22.7 26.4 30.7 36.0 42.4 49.5 57.3Others 684.0 6.3 10.0 12.9 16.1 17.1 18.9 21.2 23.9 27.1 30.8 35.2 40.5 46.8 54.4 63.4 74.2 86.1 99.1
Financial Cost (Type) 666.0 0.3 11.6 32.4 48.9 47.8 46.7 45.7 44.6 43.6 42.5 41.4 40.4 39.3 38.3 37.2 36.2 35.1 34.0Debt Repayment Private 105.8 0.0 0.0 0.0 7.1 7.1 7.1 7.1 7.1 7.1 7.1 7.1 7.1 7.1 7.1 7.1 7.1 7.1 7.1Interest Payment 560.2 0.3 11.6 32.4 41.8 40.7 39.7 38.6 37.6 36.5 35.5 34.4 33.3 32.3 31.2 30.2 29.1 28.0 27.0
Corporate Tax 211.5 0.0 0.0 0.0 0.0 0.0 0.0 0.0 0.0 0.0 1.2 4.5 8.4 13.2 19.1 26.3 35.3 45.7 57.6Cash Inflow (USD mn) 2,275.2 8.4 16.0 25.0 36.9 45.2 52.0 59.9 69.4 80.8 94.5 111.3 131.7 156.6 187.1 224.5 270.5 323.1 382.5
Operating Revenue 2,275.2 8.4 16.0 25.0 36.9 45.2 52.0 59.9 69.4 80.8 94.5 111.3 131.7 156.6 187.1 224.5 270.5 323.1 382.5Containers 740.9 1.5 2.3 5.9 10.2 15.5 17.8 20.4 23.5 27.3 31.7 37.2 43.8 51.9 61.6 73.6 88.2 104.9 123.5Other 1,534.3 6.9 13.6 19.1 26.7 29.6 34.2 39.5 45.9 53.5 62.7 74.1 87.9 104.8 125.5 150.9 182.3 218.2 258.9
Net Cash Flow 57.2 -3.2 -152.7 -157.2 -34.9 -29.0 -23.9 -18.5 -12.2 -4.7 2.9 10.5 19.7 30.9 44.6 61.5 82.4 106.6 134.5
Assumptions (Railway)tonne-km ('000)
Containers 18,656 27,091 63,354 102,822 145,339 155,217 165,766 177,032 189,064 201,914 216,210 231,517 247,909 265,461 284,256 304,382 325,932 349,009Other 127,956 236,658 308,453 400,795 415,161 446,360 479,903 515,967 554,741 596,428 643,320 693,899 748,454 807,298 870,769 939,229 1,013,073 1,092,721
Unit Operating CostContainers 0.08 0.06 0.06 0.05 0.04 0.04 0.04 0.04 0.04 0.04 0.04 0.04 0.04 0.04 0.04 0.04 0.04 0.03Others 0.05 0.04 0.03 0.03 0.03 0.03 0.03 0.03 0.03 0.02 0.02 0.02 0.02 0.02 0.02 0.02 0.02 0.02
Unit Operating Revenue (USD/t-km)Containers 0.07 0.07 0.07 0.07 0.07 0.07 0.07 0.07 0.07 0.07 0.07 0.07 0.07 0.07 0.07 0.07 0.07 0.07Others 0.05 0.05 0.05 0.05 0.05 0.05 0.05 0.05 0.05 0.05 0.05 0.05 0.05 0.05 0.05 0.05 0.05 0.05
Debt: Disbursement 4.0 146.0 132.2 Repayment 7.1 7.1 7.1 7.1 7.1 7.1 7.1 7.1 7.1 7.1 7.1 7.1 7.1 7.1 7.1 End Balance 4.0 150.0 282.2 275.1 268.1 261.0 254.0 246.9 239.9 232.8 225.8 218.7 211.7 204.6 197.5 190.5 183.4 176.4 Applied Interest Rate 15.00% 15.00% 15.00% 15.00% 15.00% 15.00% 15.00% 15.00% 15.00% 15.00% 15.00% 15.00% 15.00% 15.00% 15.00% 15.00% 15.00% 15.00%
FIRR(%) 1.0%
Total
Comprehensive Transport and Trade System Development Volume 4 Chapter 2 Master Plan in the United Republic of Tanzania Railway Rehabilitation
62
2.9 Conclusions and Recommendations 2.9.1 Suggestions for TRL Operation and Management Even after cancellation of the RITES operating concession in August 2011, the structure for the railway operation introduced by RITES still remains. It seems that the GOT has not formed any clear view of how to revitalize the railway operation. Discussions with TRL operating staff about the changes before and after the concession contract identified the following issues:
• RITES tried to reduce labour cost by decreasing the number of track maintenance staff. RITES planned to utilize maintenance vehicles to maintain longer track sections with less staff. However, this method failed because no mechanical equipment was provided to widen the working area. Consequently, the track condition became worse than before and train speed decreased accordingly.
• RITES tried to use leased locomotives from Indian Railways and minimize investment for the maintenance of locomotives owned by RAHCO. When the plan was rejected by the GOT, the number of locomotives available for operation decreased gradually and volumes transported decreased accordingly.
• RITES eliminated decentralized management authority within TRL, with the result that even authority to purchase small items of spare parts was centralized and local staff members were denied any opportunity or incentive for innovation and initiative.
• RITES abandoned the Management Information System established by the former TRC administration. For example, the Railtracker wagon control and reporting system, which provided operations and marketing staff with the means of monitoring the utilization, productivity, and cost-effectiveness of the locomotive and wagon fleets, was abandoned during RITES era.
It may be argued that wherever railway privatization has been introduced, it has had mixed success at best. In several countries, attempts were made initially to lift the profitability of railway services by reducing O&M costs. However, this had the reverse effect, because in many instances (e.g., in the United Kingdom), it compromised safety and governments were forced to make increased investments to restoring maintenance to levels that would ensure safe operation. It is not clear why the GOT is maintaining the present separation between ownership and operation of the railway, with RAHCO as the asset holding company and TRL as the operator. If the government is hoping to appoint another concessionaire, the reason why RITES failed should be studied carefully. If no new concession is planned, the existing system should be modified in such a way that it can function efficiently. The past record of freight tonnage indicates that the Tanzania Railways Company (TRC) achieved a tonnage record of 1.56 million tonnes in 2003. Since then, the volume kept declining even after the advent of RITES in 2007. It is clear that the reason for this decline is the shortage of locomotives due to lack of adequate funds for maintenance. If the GOT provides sufficient funds for locomotive maintenance work, recovering transport capacity will not be difficult. Considering the above, it is recommended to put extra emphasis on the following issues for improving the operation:
• The track maintenance gang system should be reinstated in remote areas. • Track maintenance equipment, such as, multiple tie tampers, ballast regulators, and the
like, should be rehabilitated.
Comprehensive Transport and Trade System Development Volume 4 Chapter 2 Master Plan in the United Republic of Tanzania Railway Rehabilitation
63
2.9.2 Improvements in Morogoro Workshop Conclusions
• A special exercise for the delivery of a number of major overhaul kits is underway and more are proposed.
• Fitment of these kits may not maximise reliability in the locomotive fleets if the Morogoro Workshop process continues to be sub-optimal.
• The brief visit to Morogoro did not show any indication of the existence of defined and visible processes as there was no paperwork to be seen; as the operators overhaul components, they do not complete process sheets.
• An audit should be carried out on two major locomotive components.
• If necessary, resulting from the audit findings, process sheets should be reinstated for locomotive/component overhauls as soon as possible so that the accumulated knowledge by older workers’ is captured before they retire.
• Someone should be assigned to work with the various workshop experts, recording and photographing what they do, to produce a process for each component overhaul, so that the knowledge is transferred from people’s heads to paper/electronic format.
• This approach will also allow new recruits to acquire necessary knowledge sooner because they will have a defined process sheet to follow and on which they can be trained.
• These process sheets can then be further improved over time
• In the worst case the special exercise to deliver additional major “F” overhaul kits may not produce the intended outcome – that is, reliable locomotives in a timely manner.
Recommendations
• Carry out an exercise as soon as possible to audit two major locomotive components to establish the level of process control.
• If this audit indicates a problem, launch an exercise as soon as possible to debrief the workshop experts and capture the processes that are currently in their heads, recording and photographing what they do, in order for a process sheet to be produced for each component overhaul, so that the knowledge can be transferred from people’s heads to paper/electronic format and is not lost when they leave/retire.
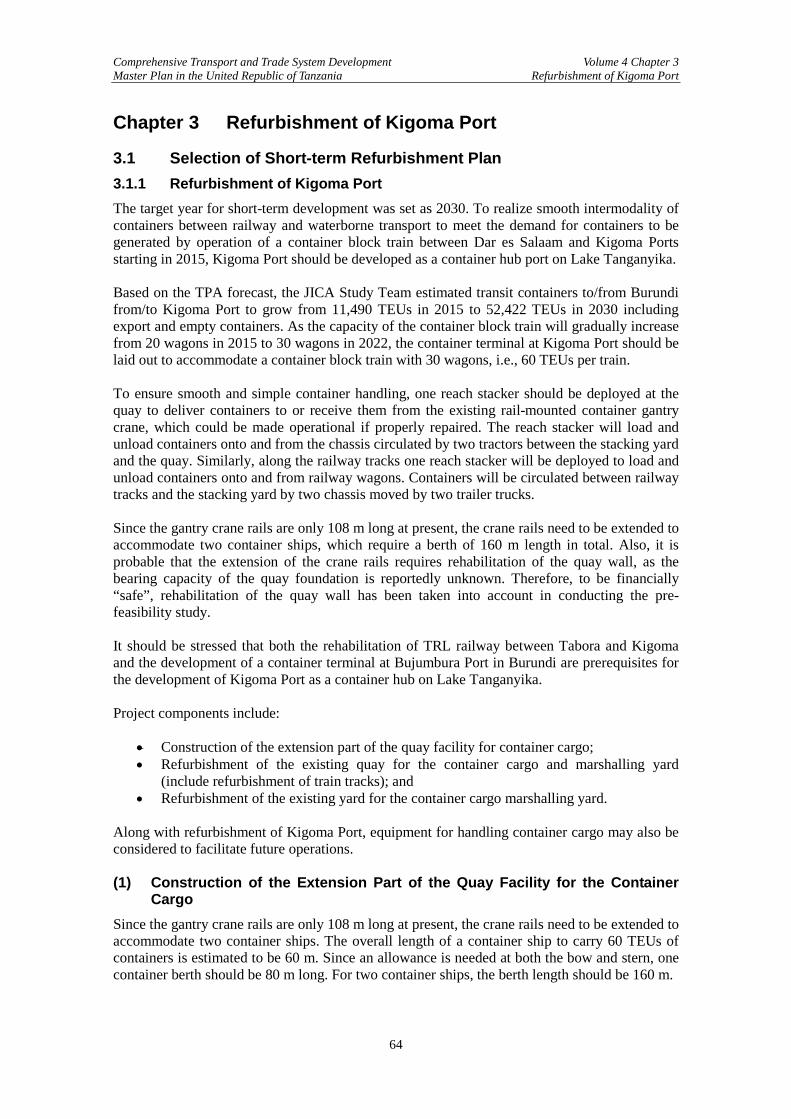
Comprehensive Transport and Trade System Development Volume 4 Chapter 3 Master Plan in the United Republic of Tanzania Refurbishment of Kigoma Port
64
Chapter 3 Refurbishment of Kigoma Port
3.1 Selection of Short-term Refurbishment Plan 3.1.1 Refurbishment of Kigoma Port The target year for short-term development was set as 2030. To realize smooth intermodality of containers between railway and waterborne transport to meet the demand for containers to be generated by operation of a container block train between Dar es Salaam and Kigoma Ports starting in 2015, Kigoma Port should be developed as a container hub port on Lake Tanganyika. Based on the TPA forecast, the JICA Study Team estimated transit containers to/from Burundi from/to Kigoma Port to grow from 11,490 TEUs in 2015 to 52,422 TEUs in 2030 including export and empty containers. As the capacity of the container block train will gradually increase from 20 wagons in 2015 to 30 wagons in 2022, the container terminal at Kigoma Port should be laid out to accommodate a container block train with 30 wagons, i.e., 60 TEUs per train. To ensure smooth and simple container handling, one reach stacker should be deployed at the quay to deliver containers to or receive them from the existing rail-mounted container gantry crane, which could be made operational if properly repaired. The reach stacker will load and unload containers onto and from the chassis circulated by two tractors between the stacking yard and the quay. Similarly, along the railway tracks one reach stacker will be deployed to load and unload containers onto and from railway wagons. Containers will be circulated between railway tracks and the stacking yard by two chassis moved by two trailer trucks. Since the gantry crane rails are only 108 m long at present, the crane rails need to be extended to accommodate two container ships, which require a berth of 160 m length in total. Also, it is probable that the extension of the crane rails requires rehabilitation of the quay wall, as the bearing capacity of the quay foundation is reportedly unknown. Therefore, to be financially “safe”, rehabilitation of the quay wall has been taken into account in conducting the pre-feasibility study. It should be stressed that both the rehabilitation of TRL railway between Tabora and Kigoma and the development of a container terminal at Bujumbura Port in Burundi are prerequisites for the development of Kigoma Port as a container hub on Lake Tanganyika. Project components include:
• Construction of the extension part of the quay facility for container cargo; • Refurbishment of the existing quay for the container cargo and marshalling yard
(include refurbishment of train tracks); and • Refurbishment of the existing yard for the container cargo marshalling yard.
Along with refurbishment of Kigoma Port, equipment for handling container cargo may also be considered to facilitate future operations.
(1) Construction of the Extension Part of the Quay Facility for the Container
Cargo Since the gantry crane rails are only 108 m long at present, the crane rails need to be extended to accommodate two container ships. The overall length of a container ship to carry 60 TEUs of containers is estimated to be 60 m. Since an allowance is needed at both the bow and stern, one container berth should be 80 m long. For two container ships, the berth length should be 160 m.
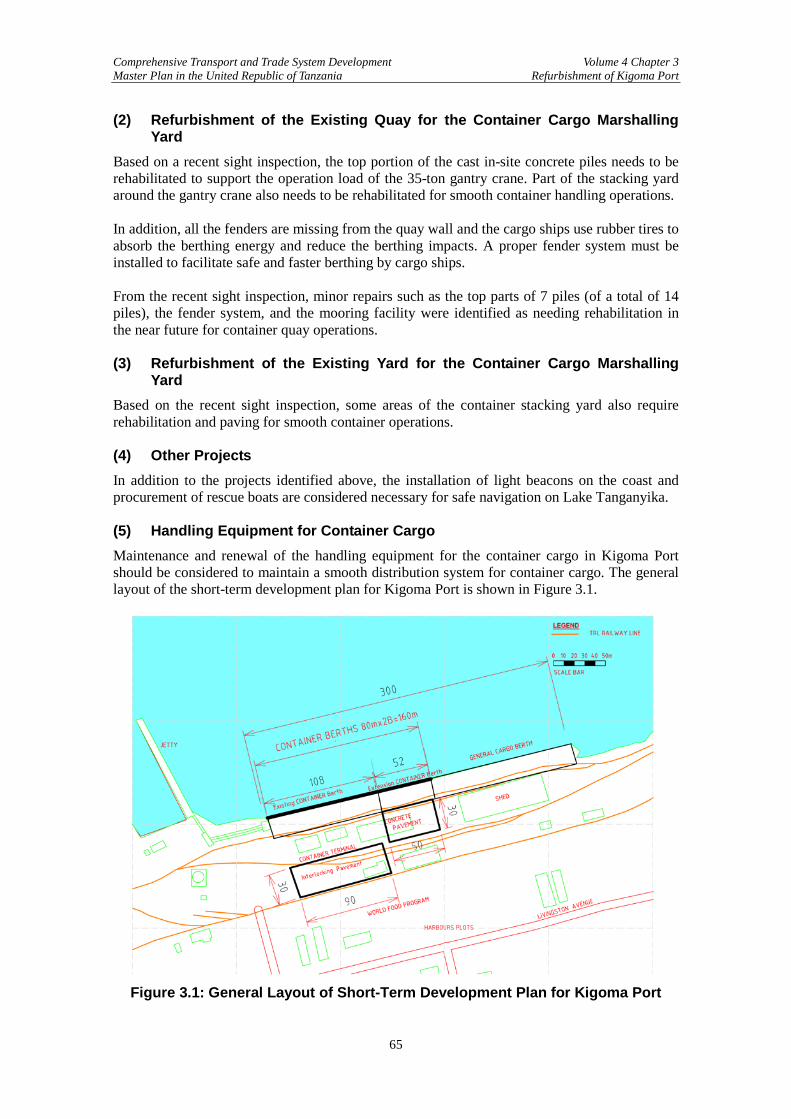
Comprehensive Transport and Trade System Development Volume 4 Chapter 3 Master Plan in the United Republic of Tanzania Refurbishment of Kigoma Port
65
(2) Refurbishment of the Existing Quay for the Container Cargo Marshalling Yard
Based on a recent sight inspection, the top portion of the cast in-site concrete piles needs to be rehabilitated to support the operation load of the 35-ton gantry crane. Part of the stacking yard around the gantry crane also needs to be rehabilitated for smooth container handling operations. In addition, all the fenders are missing from the quay wall and the cargo ships use rubber tires to absorb the berthing energy and reduce the berthing impacts. A proper fender system must be installed to facilitate safe and faster berthing by cargo ships. From the recent sight inspection, minor repairs such as the top parts of 7 piles (of a total of 14 piles), the fender system, and the mooring facility were identified as needing rehabilitation in the near future for container quay operations. (3) Refurbishment of the Existing Yard for the Container Cargo Marshalling
Yard Based on the recent sight inspection, some areas of the container stacking yard also require rehabilitation and paving for smooth container operations. (4) Other Projects In addition to the projects identified above, the installation of light beacons on the coast and procurement of rescue boats are considered necessary for safe navigation on Lake Tanganyika. (5) Handling Equipment for Container Cargo Maintenance and renewal of the handling equipment for the container cargo in Kigoma Port should be considered to maintain a smooth distribution system for container cargo. The general layout of the short-term development plan for Kigoma Port is shown in Figure 3.1.
Figure 3.1: General Layout of Short-Term Development Plan for Kigoma Port
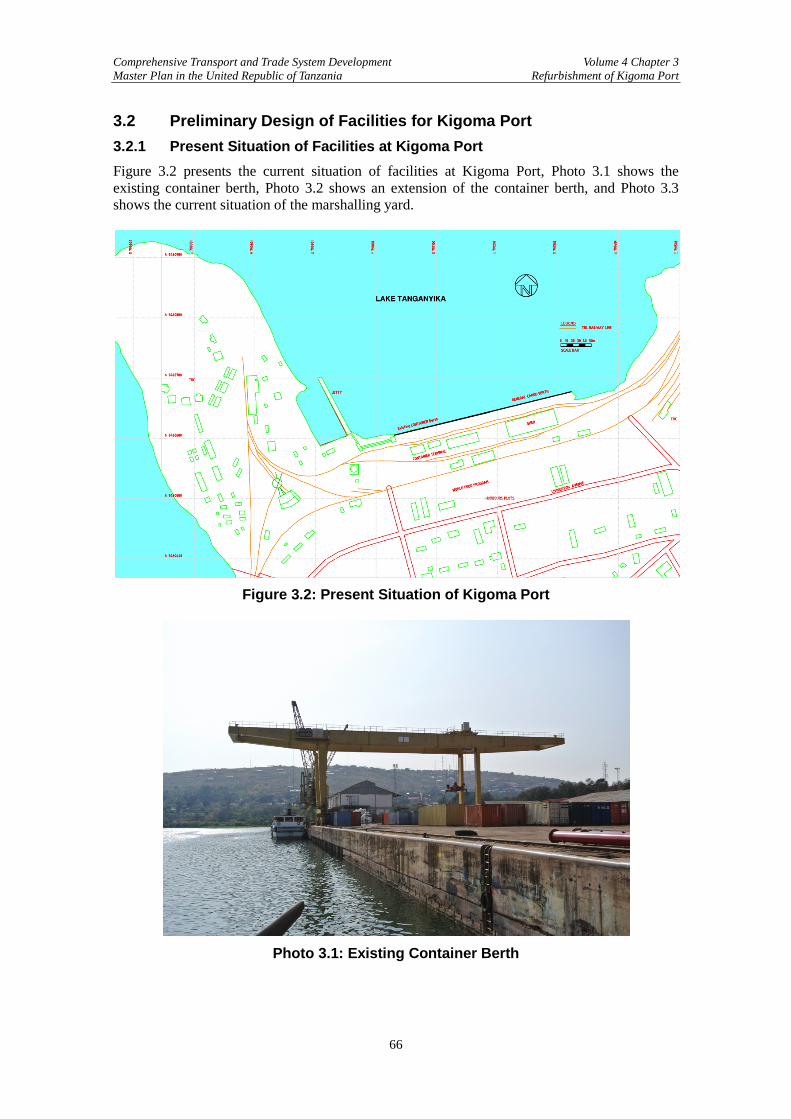
Comprehensive Transport and Trade System Development Volume 4 Chapter 3 Master Plan in the United Republic of Tanzania Refurbishment of Kigoma Port
66
3.2 Preliminary Design of Facilities for Kigoma Port 3.2.1 Present Situation of Facilities at Kigoma Port Figure 3.2 presents the current situation of facilities at Kigoma Port, Photo 3.1 shows the existing container berth, Photo 3.2 shows an extension of the container berth, and Photo 3.3 shows the current situation of the marshalling yard.
Figure 3.2: Present Situation of Kigoma Port
Photo 3.1: Existing Container Berth
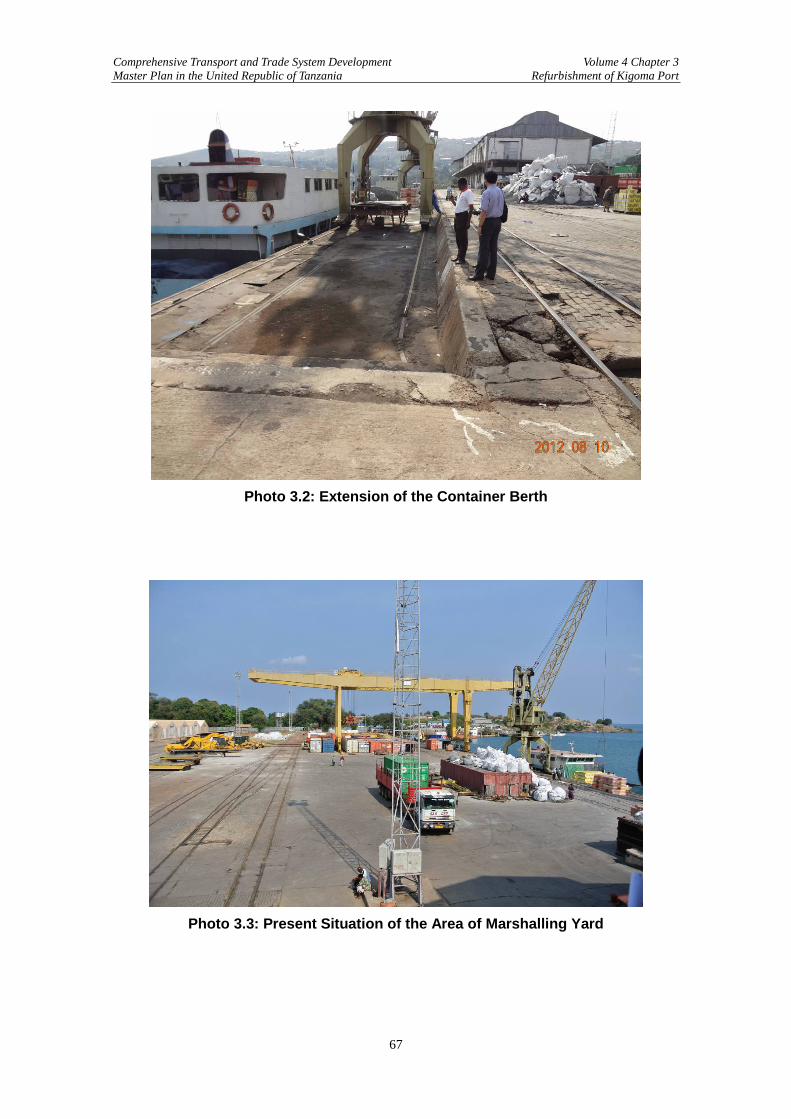
Comprehensive Transport and Trade System Development Volume 4 Chapter 3 Master Plan in the United Republic of Tanzania Refurbishment of Kigoma Port
67
Photo 3.2: Extension of the Container Berth
Photo 3.3: Present Situation of the Area of Marshalling Yard
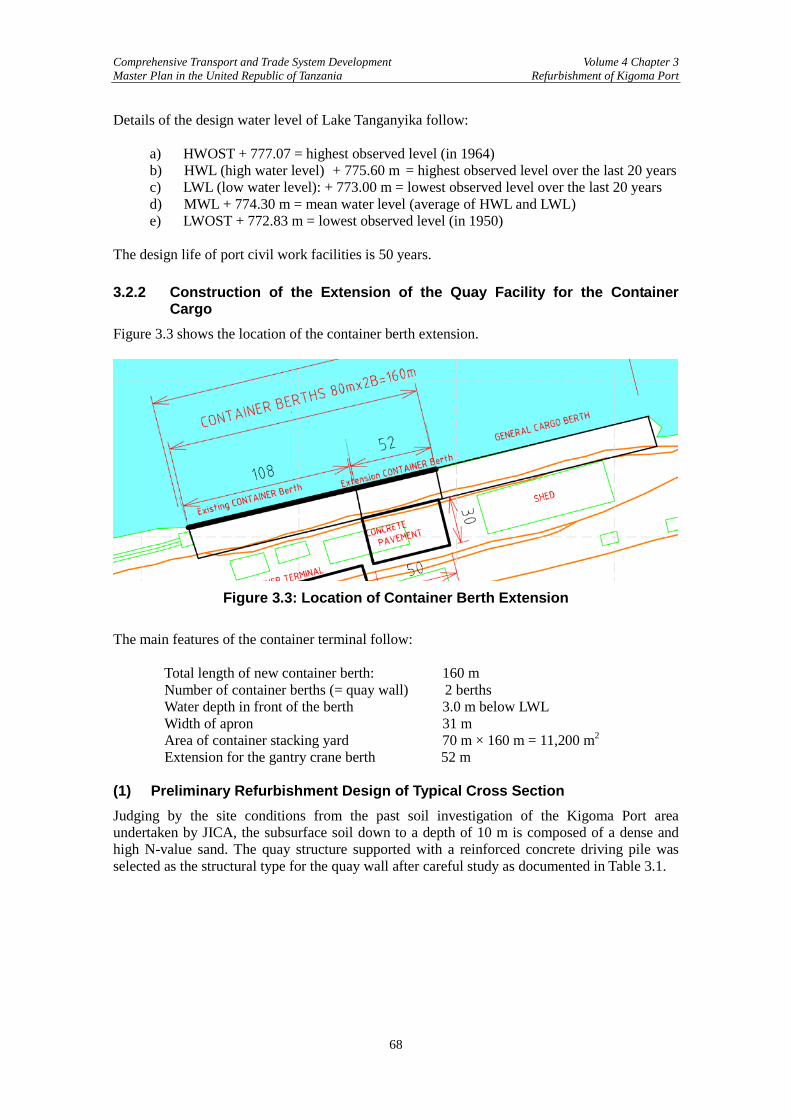
Comprehensive Transport and Trade System Development Volume 4 Chapter 3 Master Plan in the United Republic of Tanzania Refurbishment of Kigoma Port
68
Details of the design water level of Lake Tanganyika follow: a) HWOST + 777.07 = highest observed level (in 1964) b) HWL (high water level) + 775.60 m = highest observed level over the last 20 years c) LWL (low water level): + 773.00 m = lowest observed level over the last 20 years d) MWL + 774.30 m = mean water level (average of HWL and LWL) e) LWOST + 772.83 m = lowest observed level (in 1950) The design life of port civil work facilities is 50 years. 3.2.2 Construction of the Extension of the Quay Facility for the Container
Cargo Figure 3.3 shows the location of the container berth extension.
Figure 3.3: Location of Container Berth Extension
The main features of the container terminal follow: Total length of new container berth: 160 m Number of container berths (= quay wall) 2 berths Water depth in front of the berth 3.0 m below LWL Width of apron 31 m Area of container stacking yard 70 m × 160 m = 11,200 m2
Extension for the gantry crane berth 52 m (1) Preliminary Refurbishment Design of Typical Cross Section Judging by the site conditions from the past soil investigation of the Kigoma Port area undertaken by JICA, the subsurface soil down to a depth of 10 m is composed of a dense and high N-value sand. The quay structure supported with a reinforced concrete driving pile was selected as the structural type for the quay wall after careful study as documented in Table 3.1.
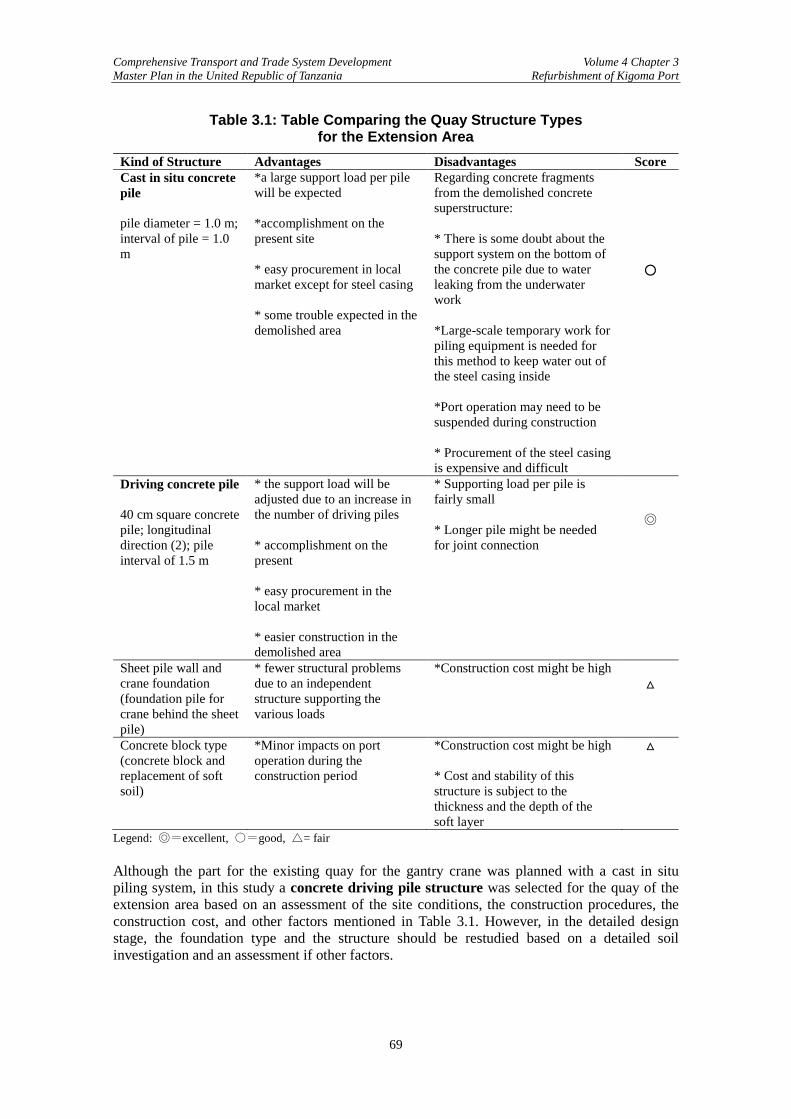
Comprehensive Transport and Trade System Development Volume 4 Chapter 3 Master Plan in the United Republic of Tanzania Refurbishment of Kigoma Port
69
Table 3.1: Table Comparing the Quay Structure Types for the Extension Area
Kind of Structure Advantages Disadvantages Score Cast in situ concrete pile pile diameter = 1.0 m; interval of pile = 1.0 m
*a large support load per pile will be expected *accomplishment on the present site * easy procurement in local market except for steel casing * some trouble expected in the demolished area
Regarding concrete fragments from the demolished concrete superstructure: * There is some doubt about the support system on the bottom of the concrete pile due to water leaking from the underwater work *Large-scale temporary work for piling equipment is needed for this method to keep water out of the steel casing inside *Port operation may need to be suspended during construction * Procurement of the steel casing is expensive and difficult
○
Driving concrete pile 40 cm square concrete pile; longitudinal direction (2); pile interval of 1.5 m
* the support load will be adjusted due to an increase in the number of driving piles * accomplishment on the present * easy procurement in the local market * easier construction in the demolished area
* Supporting load per pile is fairly small * Longer pile might be needed for joint connection
◎
Sheet pile wall and crane foundation (foundation pile for crane behind the sheet pile)
* fewer structural problems due to an independent structure supporting the various loads
*Construction cost might be high △
Concrete block type (concrete block and replacement of soft soil)
*Minor impacts on port operation during the construction period
*Construction cost might be high * Cost and stability of this structure is subject to the thickness and the depth of the soft layer
△
Legend: ◎=excellent, ○=good, △= fair Although the part for the existing quay for the gantry crane was planned with a cast in situ piling system, in this study a concrete driving pile structure was selected for the quay of the extension area based on an assessment of the site conditions, the construction procedures, the construction cost, and other factors mentioned in Table 3.1. However, in the detailed design stage, the foundation type and the structure should be restudied based on a detailed soil investigation and an assessment if other factors.
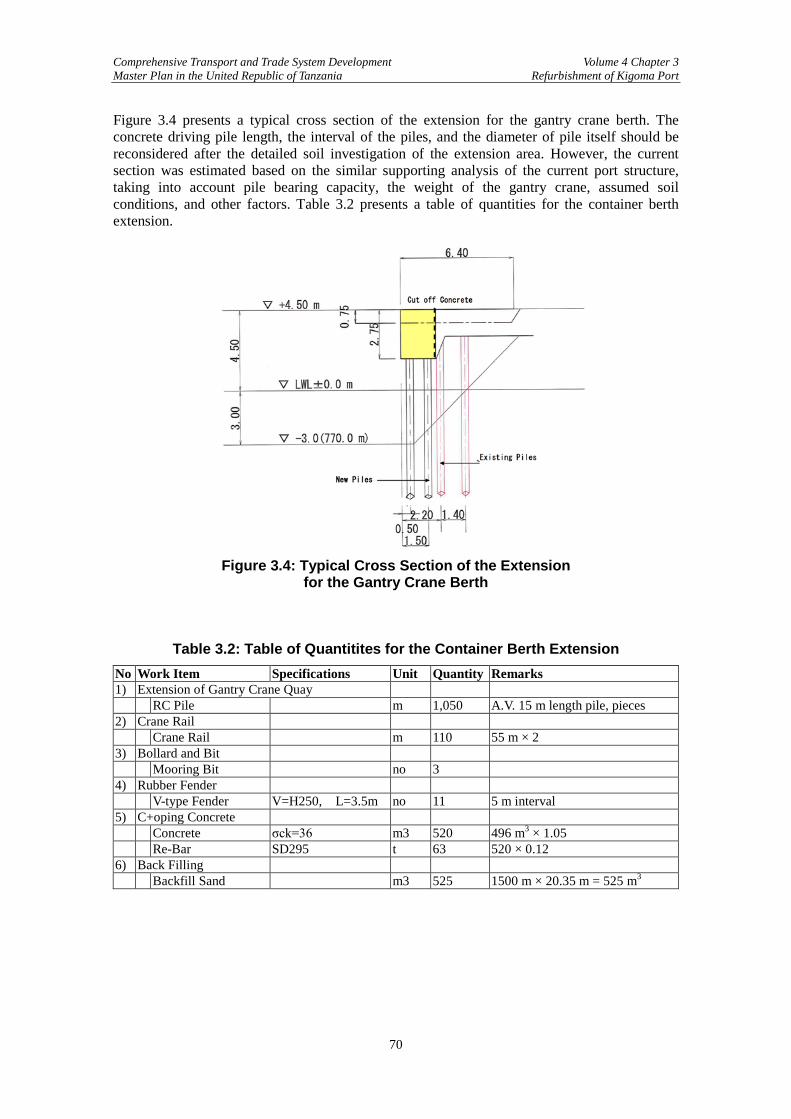
Comprehensive Transport and Trade System Development Volume 4 Chapter 3 Master Plan in the United Republic of Tanzania Refurbishment of Kigoma Port
70
Figure 3.4 presents a typical cross section of the extension for the gantry crane berth. The concrete driving pile length, the interval of the piles, and the diameter of pile itself should be reconsidered after the detailed soil investigation of the extension area. However, the current section was estimated based on the similar supporting analysis of the current port structure, taking into account pile bearing capacity, the weight of the gantry crane, assumed soil conditions, and other factors. Table 3.2 presents a table of quantities for the container berth extension.
Figure 3.4: Typical Cross Section of the Extension
for the Gantry Crane Berth
Table 3.2: Table of Quantitites for the Container Berth Extension No Work Item Specifications Unit Quantity Remarks 1) Extension of Gantry Crane Quay RC Pile m 1,050 A.V. 15 m length pile, pieces 2) Crane Rail Crane Rail m 110 55 m × 2 3) Bollard and Bit Mooring Bit no 3 4) Rubber Fender V-type Fender V=H250, L=3.5m no 11 5 m interval 5) C+oping Concrete Concrete σck=36 m3 520 496 m3 × 1.05 Re-Bar SD295 t 63 520 × 0.12 6) Back Filling Backfill Sand m3 525 1500 m × 20.35 m = 525 m3
Comprehensive Transport and Trade System Development Volume 4 Chapter 3 Master Plan in the United Republic of Tanzania Refurbishment of Kigoma Port
71
3.2.3 Refurbishment of the Existing Quay for the Container Cargo Marshalling Yard
The top part of the cast in site pile needs to be rehabilitated to support the weight of the gantry crane and the operation load of the container cargo. The repair method will be undertaken in a way similar to that for the work that was previously undertaken on the site. The new train track in the container yard area needs to be utilized across the yard; its length is 800 m with two lines. Table 3.3 presents a table of quantities for refurbishment of the existing berth.
Table 3.3: Table of Quantities for Refurbishment of the Existing Berth No Work Item Specs Unit Quantities Remarks 1) Existing concrete pile repair work
Filling concrete at the top part of the concrete pile
45Nspecial m3 3.3 V= π × 1.0 m × 0.15 m × 1.5 mH × 7 = 3.3 m3
Cleaning the surface of the concrete pile Ls 1 Scaffolding around the concrete pile Ls 1
2) Crane rail Crane Rail M 216 108 m × 2
2) Bollard & Bit Mooring Bit No 6
4) Rubber Fender V-type Fender V = H250,
L = 3.5 m No. 22 5 m interval
5) Train rail rail for container train M 800 B= 1067 mm
3.2.4 Refurbishment of the Existing Container Cargo Marshalling Yard Figure 3.5 presents a drawing of the container stacking yard.
Figure 3.5: Container Stacking Yard
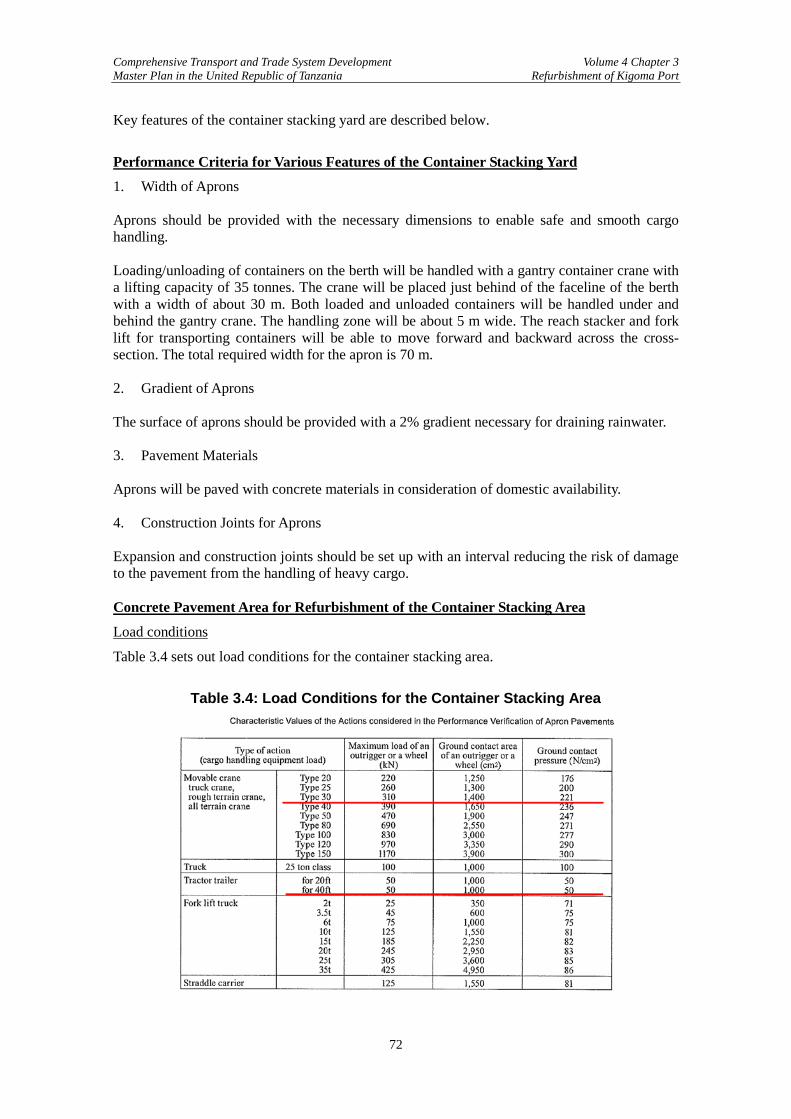
Comprehensive Transport and Trade System Development Volume 4 Chapter 3 Master Plan in the United Republic of Tanzania Refurbishment of Kigoma Port
72
Key features of the container stacking yard are described below.
Performance Criteria for Various Features of the Container Stacking Yard
1. Width of Aprons Aprons should be provided with the necessary dimensions to enable safe and smooth cargo handling. Loading/unloading of containers on the berth will be handled with a gantry container crane with a lifting capacity of 35 tonnes. The crane will be placed just behind of the faceline of the berth with a width of about 30 m. Both loaded and unloaded containers will be handled under and behind the gantry crane. The handling zone will be about 5 m wide. The reach stacker and fork lift for transporting containers will be able to move forward and backward across the cross-section. The total required width for the apron is 70 m. 2. Gradient of Aprons The surface of aprons should be provided with a 2% gradient necessary for draining rainwater. 3. Pavement Materials Aprons will be paved with concrete materials in consideration of domestic availability. 4. Construction Joints for Aprons Expansion and construction joints should be set up with an interval reducing the risk of damage to the pavement from the handling of heavy cargo. Concrete Pavement Area for Refurbishment of the Container Stacking Area
Load conditions
Table 3.4 sets out load conditions for the container stacking area.
Table 3.4: Load Conditions for the Container Stacking Area
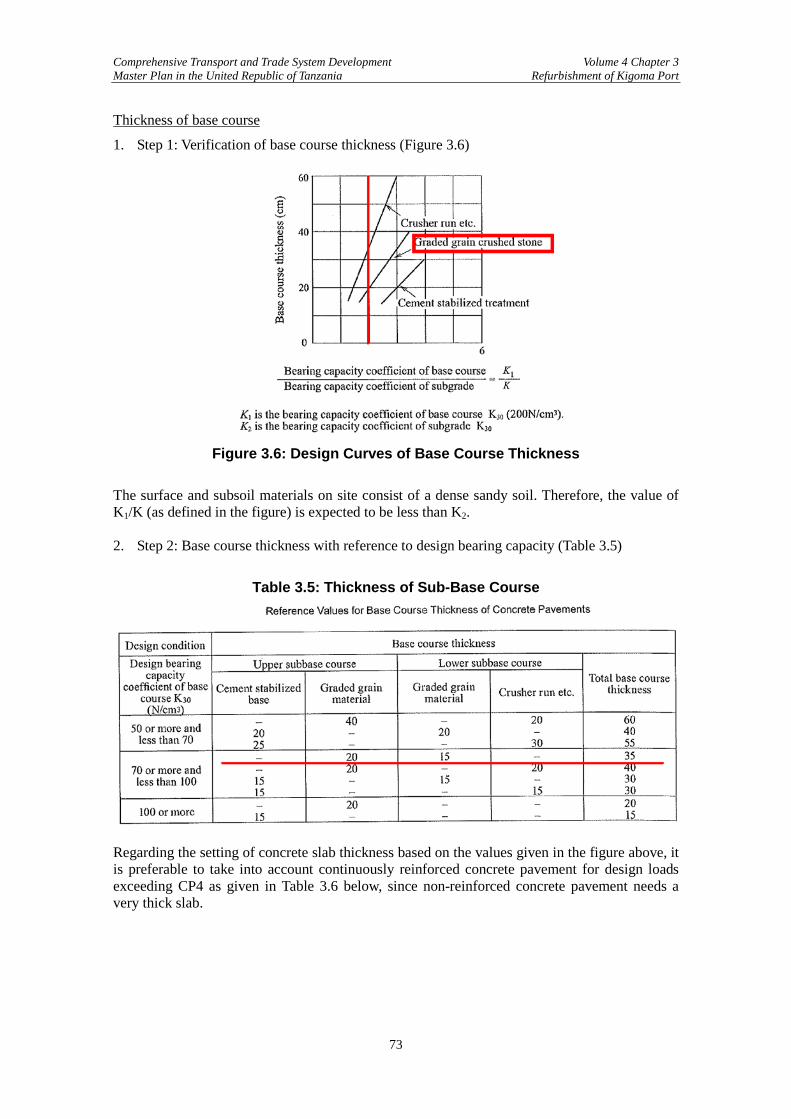
Comprehensive Transport and Trade System Development Volume 4 Chapter 3 Master Plan in the United Republic of Tanzania Refurbishment of Kigoma Port
73
Thickness of base course
1. Step 1: Verification of base course thickness (Figure 3.6)
Figure 3.6: Design Curves of Base Course Thickness
The surface and subsoil materials on site consist of a dense sandy soil. Therefore, the value of K1/K (as defined in the figure) is expected to be less than K2. 2. Step 2: Base course thickness with reference to design bearing capacity (Table 3.5)
Table 3.5: Thickness of Sub-Base Course
Regarding the setting of concrete slab thickness based on the values given in the figure above, it is preferable to take into account continuously reinforced concrete pavement for design loads exceeding CP4 as given in Table 3.6 below, since non-reinforced concrete pavement needs a very thick slab.
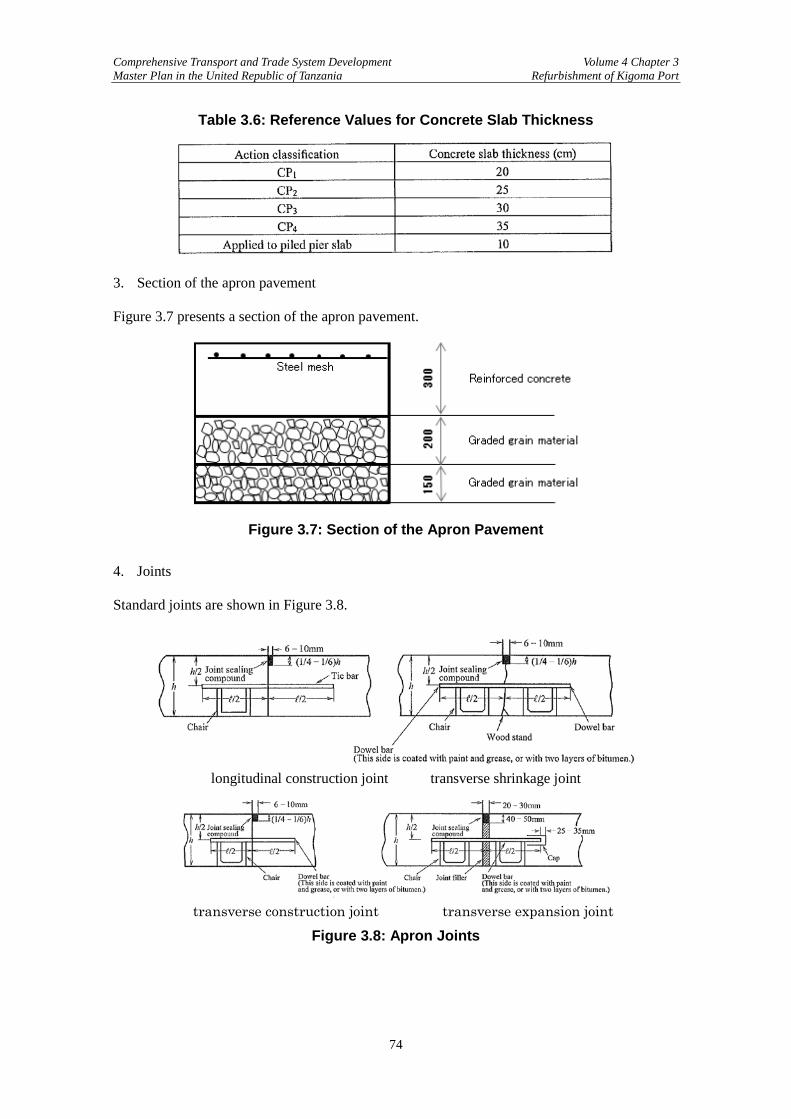
Comprehensive Transport and Trade System Development Volume 4 Chapter 3 Master Plan in the United Republic of Tanzania Refurbishment of Kigoma Port
74
Table 3.6: Reference Values for Concrete Slab Thickness
3. Section of the apron pavement Figure 3.7 presents a section of the apron pavement.
Figure 3.7: Section of the Apron Pavement
4. Joints Standard joints are shown in Figure 3.8.
longitudinal construction joint transverse shrinkage joint
transverse construction joint transverse expansion joint
Figure 3.8: Apron Joints
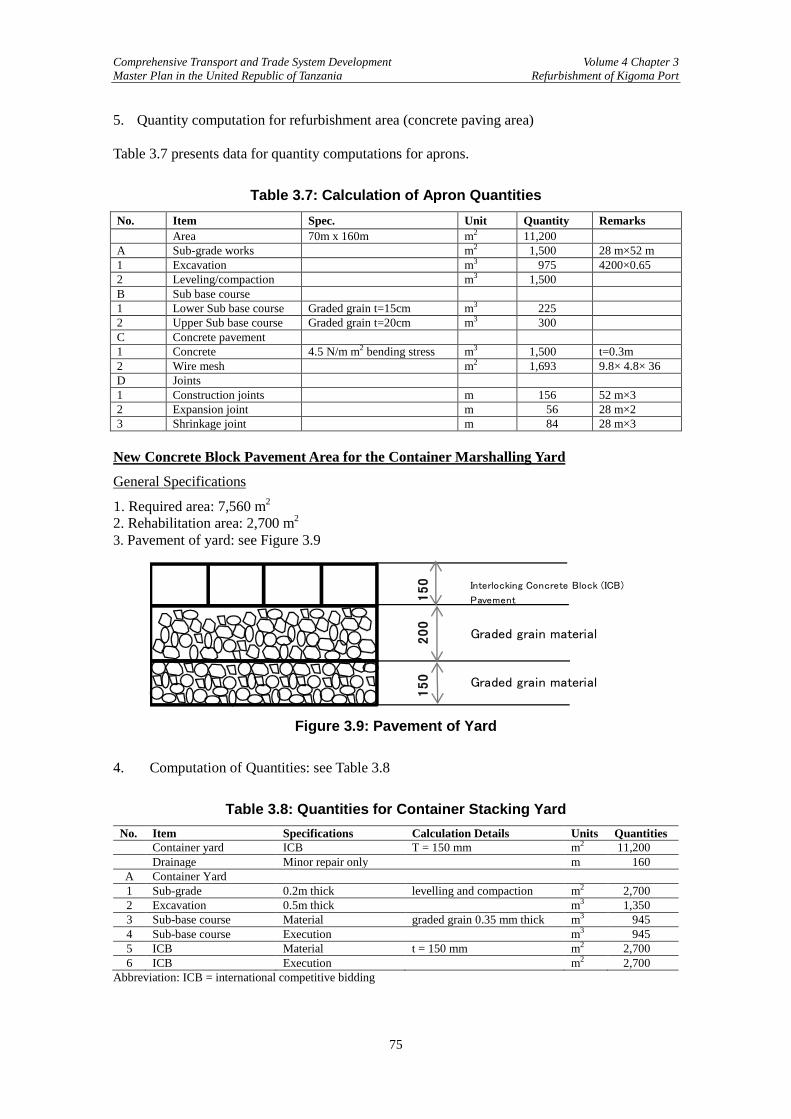
Comprehensive Transport and Trade System Development Volume 4 Chapter 3 Master Plan in the United Republic of Tanzania Refurbishment of Kigoma Port
75
5. Quantity computation for refurbishment area (concrete paving area) Table 3.7 presents data for quantity computations for aprons.
Table 3.7: Calculation of Apron Quantities No. Item Spec. Unit Quantity Remarks Area 70m x 160m m2 11,200 A Sub-grade works m2 1,500 28 m×52 m 1 Excavation m3 975 4200×0.65 2 Leveling/compaction m3 1,500 B Sub base course 1 Lower Sub base course Graded grain t=15cm m3 225 2 Upper Sub base course Graded grain t=20cm m3 300 C Concrete pavement 1 Concrete 4.5 N/m m2 bending stress m3 1,500 t=0.3m 2 Wire mesh m2 1,693 9.8× 4.8× 36 D Joints 1 Construction joints m 156 52 m×3 2 Expansion joint m 56 28 m×2 3 Shrinkage joint m 84 28 m×3 New Concrete Block Pavement Area for the Container Marshalling Yard
General Specifications
1. Required area: 7,560 m2 2. Rehabilitation area: 2,700 m2 3. Pavement of yard: see Figure 3.9
150 Graded grain material
150
200
Graded grain material
Interlocking Concrete Block (ICB)
Pavement
Figure 3.9: Pavement of Yard
4. Computation of Quantities: see Table 3.8
Table 3.8: Quantities for Container Stacking Yard No. Item Specifications Calculation Details Units Quantities Container yard ICB T = 150 mm m2 11,200 Drainage Minor repair only m 160 A Container Yard 1 Sub-grade 0.2m thick levelling and compaction m2 2,700 2 Excavation 0.5m thick m3 1,350 3 Sub-base course Material graded grain 0.35 mm thick m3 945 4 Sub-base course Execution m3 945 5 ICB Material t = 150 mm m2 2,700 6 ICB Execution m2 2,700
Abbreviation: ICB = international competitive bidding
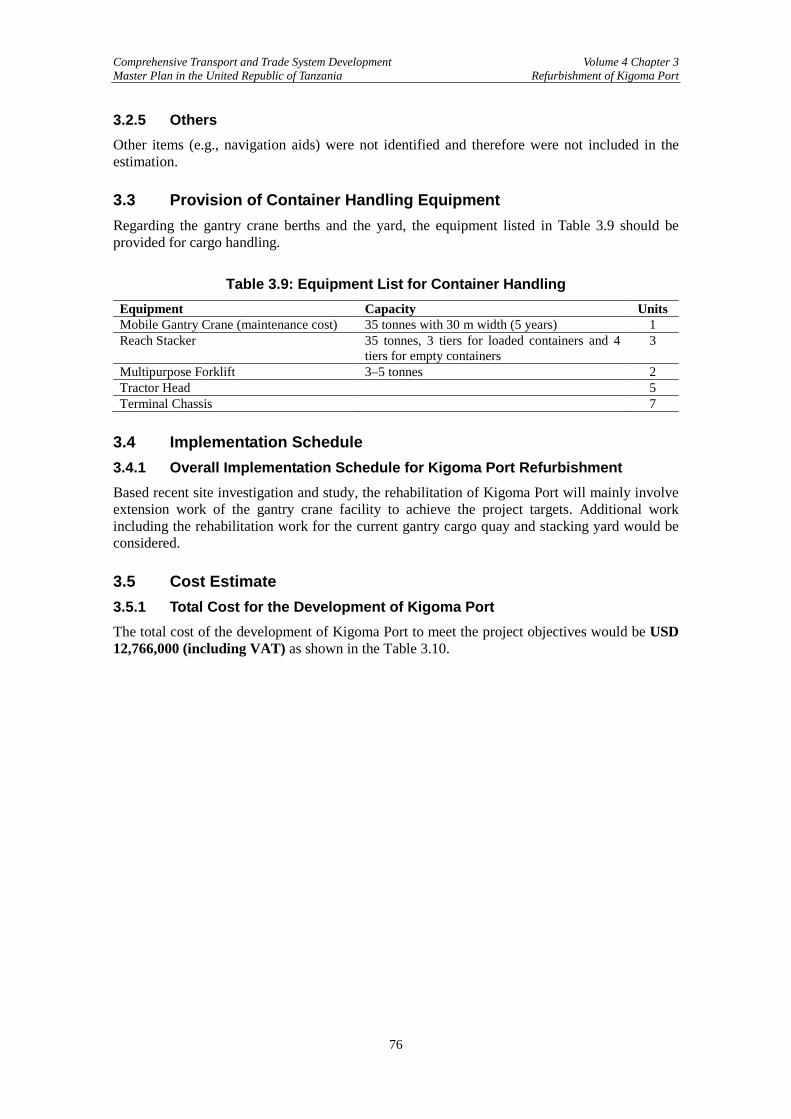
Comprehensive Transport and Trade System Development Volume 4 Chapter 3 Master Plan in the United Republic of Tanzania Refurbishment of Kigoma Port
76
3.2.5 Others Other items (e.g., navigation aids) were not identified and therefore were not included in the estimation. 3.3 Provision of Container Handling Equipment Regarding the gantry crane berths and the yard, the equipment listed in Table 3.9 should be provided for cargo handling.
Table 3.9: Equipment List for Container Handling Equipment Capacity Units Mobile Gantry Crane (maintenance cost) 35 tonnes with 30 m width (5 years) 1 Reach Stacker 35 tonnes, 3 tiers for loaded containers and 4
tiers for empty containers 3
Multipurpose Forklift 3–5 tonnes 2 Tractor Head 5 Terminal Chassis 7
3.4 Implementation Schedule 3.4.1 Overall Implementation Schedule for Kigoma Port Refurbishment Based recent site investigation and study, the rehabilitation of Kigoma Port will mainly involve extension work of the gantry crane facility to achieve the project targets. Additional work including the rehabilitation work for the current gantry cargo quay and stacking yard would be considered. 3.5 Cost Estimate 3.5.1 Total Cost for the Development of Kigoma Port The total cost of the development of Kigoma Port to meet the project objectives would be USD 12,766,000 (including VAT) as shown in the Table 3.10.
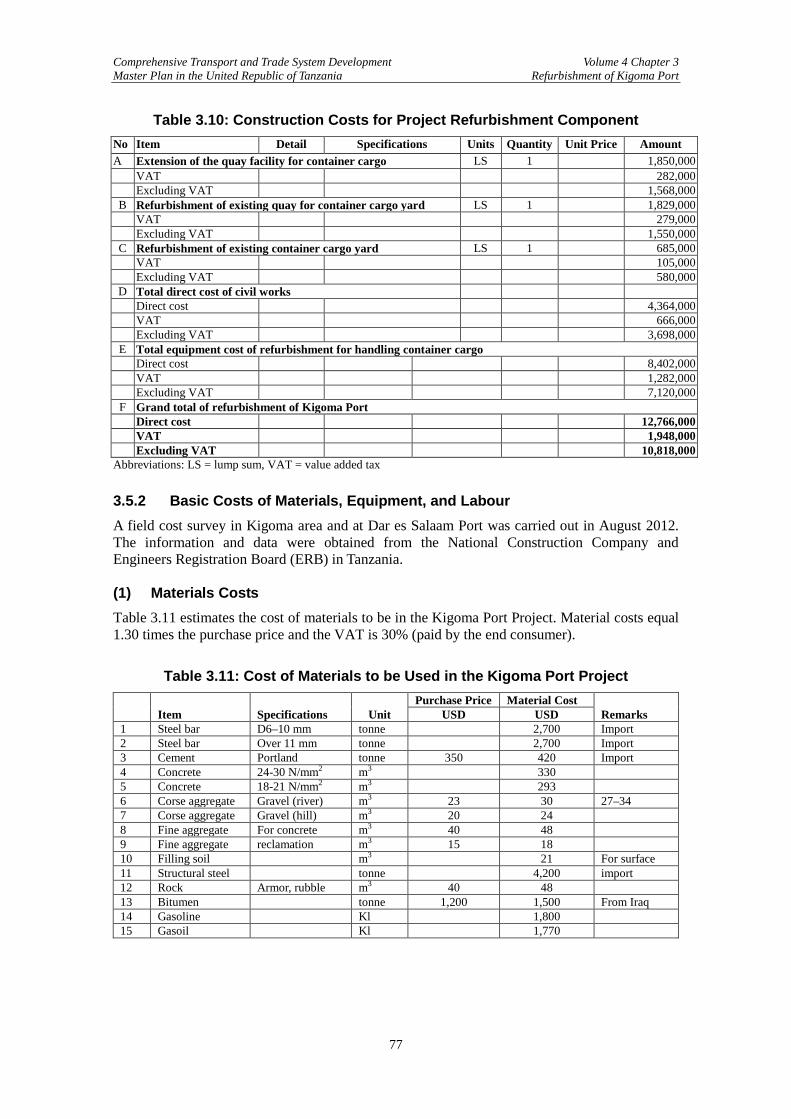
Comprehensive Transport and Trade System Development Volume 4 Chapter 3 Master Plan in the United Republic of Tanzania Refurbishment of Kigoma Port
77
Table 3.10: Construction Costs for Project Refurbishment Component No Item Detail Specifications Units Quantity Unit Price Amount A Extension of the quay facility for container cargo LS 1 1,850,000
VAT 282,000 Excluding VAT 1,568,000
B Refurbishment of existing quay for container cargo yard LS 1 1,829,000 VAT 279,000 Excluding VAT 1,550,000
C Refurbishment of existing container cargo yard LS 1 685,000 VAT 105,000 Excluding VAT 580,000
D Total direct cost of civil works Direct cost 4,364,000 VAT 666,000 Excluding VAT 3,698,000
E Total equipment cost of refurbishment for handling container cargo Direct cost 8,402,000 VAT 1,282,000 Excluding VAT 7,120,000
F Grand total of refurbishment of Kigoma Port Direct cost 12,766,000 VAT 1,948,000 Excluding VAT 10,818,000
Abbreviations: LS = lump sum, VAT = value added tax 3.5.2 Basic Costs of Materials, Equipment, and Labour A field cost survey in Kigoma area and at Dar es Salaam Port was carried out in August 2012. The information and data were obtained from the National Construction Company and Engineers Registration Board (ERB) in Tanzania. (1) Materials Costs Table 3.11 estimates the cost of materials to be in the Kigoma Port Project. Material costs equal 1.30 times the purchase price and the VAT is 30% (paid by the end consumer).
Table 3.11: Cost of Materials to be Used in the Kigoma Port Project
Item Specifications Unit Purchase Price Material Cost
Remarks USD USD 1 Steel bar D6–10 mm tonne 2,700 Import 2 Steel bar Over 11 mm tonne 2,700 Import 3 Cement Portland tonne 350 420 Import 4 Concrete 24-30 N/mm2 m3 330 5 Concrete 18-21 N/mm2 m3 293 6 Corse aggregate Gravel (river) m3 23 30 27–34 7 Corse aggregate Gravel (hill) m3 20 24 8 Fine aggregate For concrete m3 40 48 9 Fine aggregate reclamation m3 15 18 10 Filling soil m3 21 For surface 11 Structural steel tonne 4,200 import 12 Rock Armor, rubble m3 40 48 13 Bitumen tonne 1,200 1,500 From Iraq 14 Gasoline Kl 1,800 15 Gasoil Kl 1,770
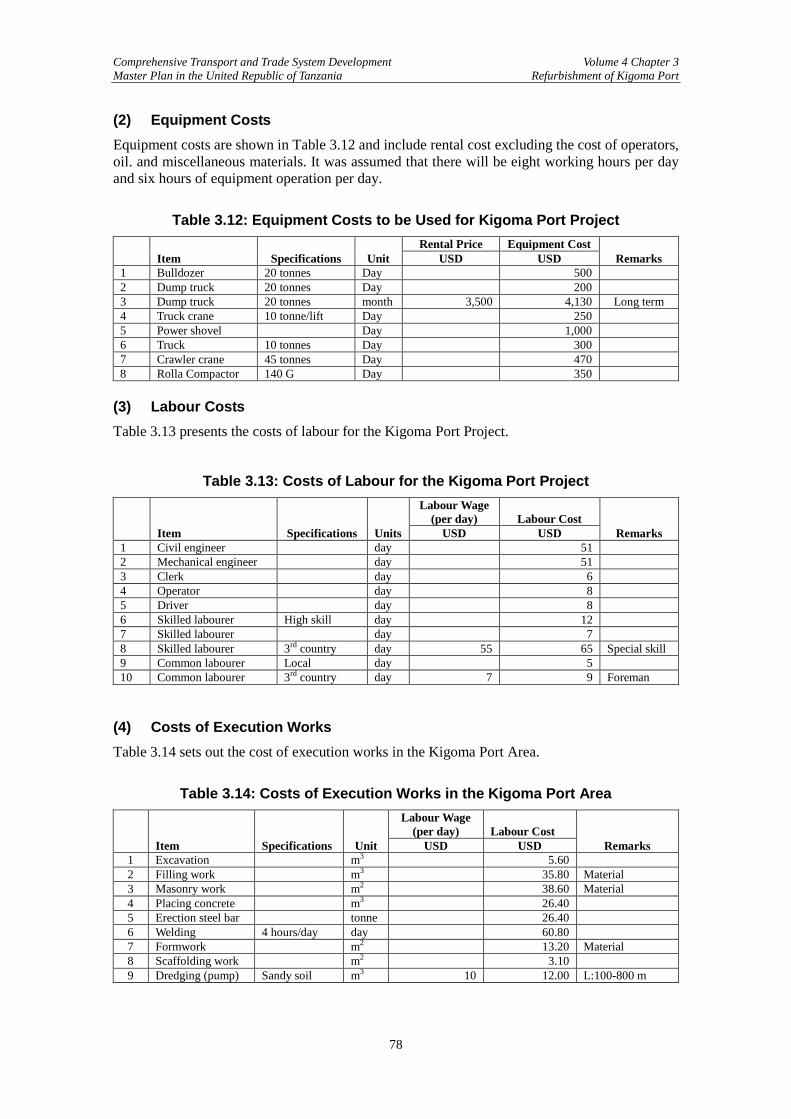
Comprehensive Transport and Trade System Development Volume 4 Chapter 3 Master Plan in the United Republic of Tanzania Refurbishment of Kigoma Port
78
(2) Equipment Costs Equipment costs are shown in Table 3.12 and include rental cost excluding the cost of operators, oil. and miscellaneous materials. It was assumed that there will be eight working hours per day and six hours of equipment operation per day.
Table 3.12: Equipment Costs to be Used for Kigoma Port Project
Item Specifications Unit Rental Price Equipment Cost
Remarks USD USD 1 Bulldozer 20 tonnes Day 500 2 Dump truck 20 tonnes Day 200 3 Dump truck 20 tonnes month 3,500 4,130 Long term 4 Truck crane 10 tonne/lift Day 250 5 Power shovel Day 1,000 6 Truck 10 tonnes Day 300 7 Crawler crane 45 tonnes Day 470 8 Rolla Compactor 140 G Day 350
(3) Labour Costs Table 3.13 presents the costs of labour for the Kigoma Port Project.
Table 3.13: Costs of Labour for the Kigoma Port Project
Item Specifications Units
Labour Wage (per day) Labour Cost
Remarks USD USD 1 Civil engineer day 51 2 Mechanical engineer day 51 3 Clerk day 6 4 Operator day 8 5 Driver day 8 6 Skilled labourer High skill day 12 7 Skilled labourer day 7 8 Skilled labourer 3rd country day 55 65 Special skill 9 Common labourer Local day 5 10 Common labourer 3rd country day 7 9 Foreman
(4) Costs of Execution Works Table 3.14 sets out the cost of execution works in the Kigoma Port Area.
Table 3.14: Costs of Execution Works in the Kigoma Port Area
Item Specifications Unit
Labour Wage (per day) Labour Cost
Remarks USD USD 1 Excavation m3 5.60 2 Filling work m3 35.80 Material 3 Masonry work m2 38.60 Material 4 Placing concrete m3 26.40 5 Erection steel bar tonne 26.40 6 Welding 4 hours/day day 60.80 7 Formwork m2 13.20 Material 8 Scaffolding work m2 3.10 9 Dredging (pump) Sandy soil m3 10 12.00 L:100-800 m
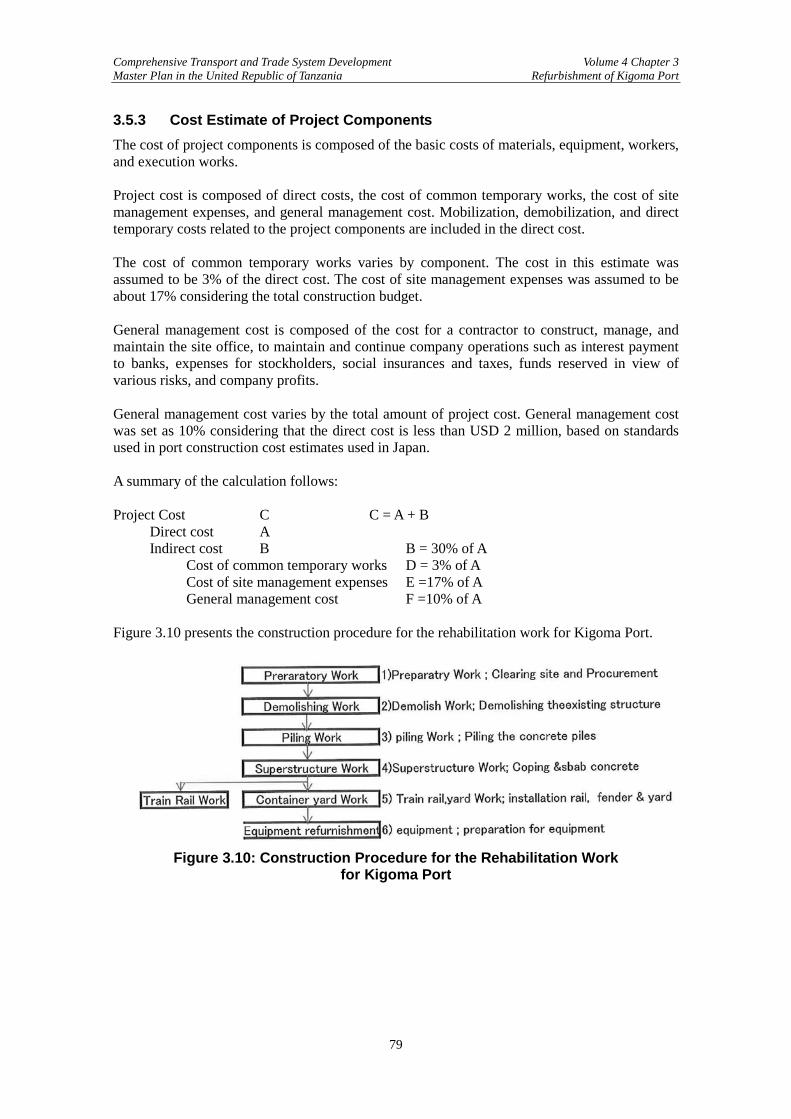
Comprehensive Transport and Trade System Development Volume 4 Chapter 3 Master Plan in the United Republic of Tanzania Refurbishment of Kigoma Port
79
3.5.3 Cost Estimate of Project Components The cost of project components is composed of the basic costs of materials, equipment, workers, and execution works. Project cost is composed of direct costs, the cost of common temporary works, the cost of site management expenses, and general management cost. Mobilization, demobilization, and direct temporary costs related to the project components are included in the direct cost. The cost of common temporary works varies by component. The cost in this estimate was assumed to be 3% of the direct cost. The cost of site management expenses was assumed to be about 17% considering the total construction budget. General management cost is composed of the cost for a contractor to construct, manage, and maintain the site office, to maintain and continue company operations such as interest payment to banks, expenses for stockholders, social insurances and taxes, funds reserved in view of various risks, and company profits. General management cost varies by the total amount of project cost. General management cost was set as 10% considering that the direct cost is less than USD 2 million, based on standards used in port construction cost estimates used in Japan. A summary of the calculation follows: Project Cost C C = A + B Direct cost A Indirect cost B B = 30% of A Cost of common temporary works D = 3% of A Cost of site management expenses E =17% of A General management cost F =10% of A Figure 3.10 presents the construction procedure for the rehabilitation work for Kigoma Port.
Figure 3.10: Construction Procedure for the Rehabilitation Work
for Kigoma Port
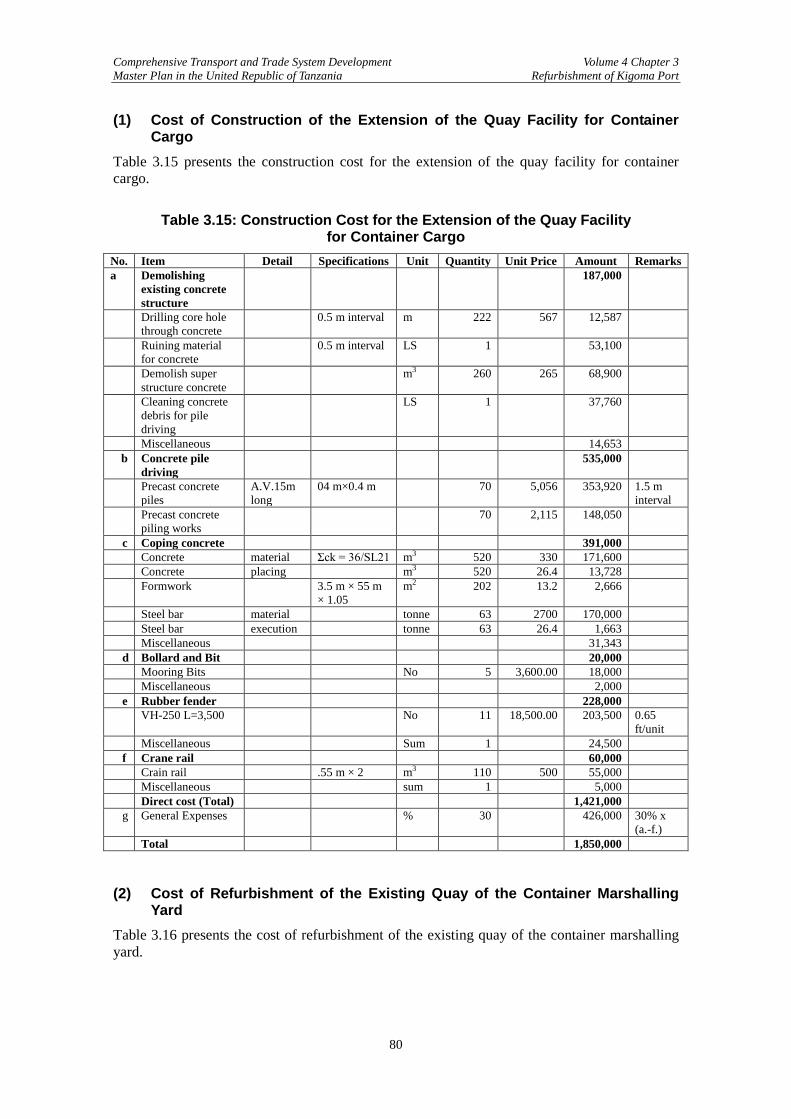
Comprehensive Transport and Trade System Development Volume 4 Chapter 3 Master Plan in the United Republic of Tanzania Refurbishment of Kigoma Port
80
(1) Cost of Construction of the Extension of the Quay Facility for Container Cargo
Table 3.15 presents the construction cost for the extension of the quay facility for container cargo.
Table 3.15: Construction Cost for the Extension of the Quay Facility for Container Cargo
No. Item Detail Specifications Unit Quantity Unit Price Amount Remarks a Demolishing
existing concrete structure
187,000
Drilling core hole through concrete
0.5 m interval m 222 567 12,587
Ruining material for concrete
0.5 m interval LS 1 53,100
Demolish super structure concrete
m3 260 265 68,900
Cleaning concrete debris for pile driving
LS 1 37,760
Miscellaneous 14,653 b Concrete pile
driving 535,000
Precast concrete piles
A.V.15m long
04 m×0.4 m 70 5,056 353,920 1.5 m interval
Precast concrete piling works
70 2,115 148,050
c Coping concrete 391,000 Concrete material Σck = 36/SL21 m3 520 330 171,600 Concrete placing m3 520 26.4 13,728 Formwork 3.5 m × 55 m
× 1.05 m2 202 13.2 2,666
Steel bar material tonne 63 2700 170,000 Steel bar execution tonne 63 26.4 1,663 Miscellaneous 31,343
d Bollard and Bit 20,000 Mooring Bits No 5 3,600.00 18,000 Miscellaneous 2,000
e Rubber fender 228,000 VH-250 L=3,500 No 11 18,500.00 203,500 0.65
ft/unit Miscellaneous Sum 1 24,500
f Crane rail 60,000 Crain rail .55 m × 2 m3 110 500 55,000 Miscellaneous sum 1 5,000
Direct cost (Total) 1,421,000 g General Expenses % 30 426,000 30% x
(a.-f.) Total 1,850,000 (2) Cost of Refurbishment of the Existing Quay of the Container Marshalling
Yard Table 3.16 presents the cost of refurbishment of the existing quay of the container marshalling yard.
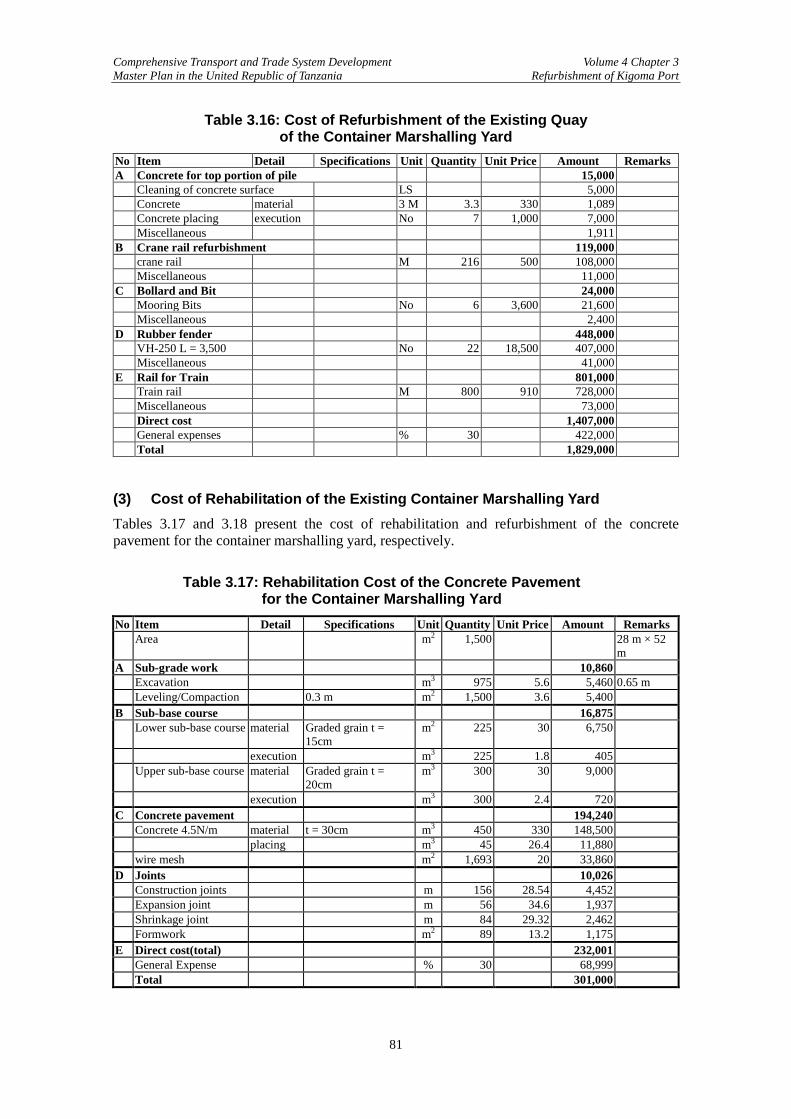
Comprehensive Transport and Trade System Development Volume 4 Chapter 3 Master Plan in the United Republic of Tanzania Refurbishment of Kigoma Port
81
Table 3.16: Cost of Refurbishment of the Existing Quay of the Container Marshalling Yard
No Item Detail Specifications Unit Quantity Unit Price Amount Remarks A Concrete for top portion of pile 15,000
Cleaning of concrete surface LS 5,000 Concrete material 3 M 3.3 330 1,089 Concrete placing execution No 7 1,000 7,000 Miscellaneous 1,911
B Crane rail refurbishment 119,000 crane rail M 216 500 108,000 Miscellaneous 11,000
C Bollard and Bit 24,000 Mooring Bits No 6 3,600 21,600 Miscellaneous 2,400
D Rubber fender 448,000 VH-250 L = 3,500 No 22 18,500 407,000 Miscellaneous 41,000
E Rail for Train 801,000 Train rail M 800 910 728,000 Miscellaneous 73,000 Direct cost 1,407,000 General expenses % 30 422,000 Total 1,829,000
(3) Cost of Rehabilitation of the Existing Container Marshalling Yard Tables 3.17 and 3.18 present the cost of rehabilitation and refurbishment of the concrete pavement for the container marshalling yard, respectively.
Table 3.17: Rehabilitation Cost of the Concrete Pavement for the Container Marshalling Yard
No Item Detail Specifications Unit Quantity Unit Price Amount Remarks Area m2 1,500 28 m × 52
m A Sub-grade work 10,860
Excavation m3 975 5.6 5,460 0.65 m Leveling/Compaction 0.3 m m2 1,500 3.6 5,400
B Sub-base course 16,875 Lower sub-base course material Graded grain t =
15cm m2 225 30 6,750
execution m3 225 1.8 405 Upper sub-base course material Graded grain t =
20cm m3 300 30 9,000
execution m3 300 2.4 720 C Concrete pavement 194,240
Concrete 4.5N/m material t = 30cm m3 450 330 148,500 placing m3 45 26.4 11,880 wire mesh m2 1,693 20 33,860
D Joints 10,026 Construction joints m 156 28.54 4,452 Expansion joint m 56 34.6 1,937 Shrinkage joint m 84 29.32 2,462 Formwork m2 89 13.2 1,175
E Direct cost(total) 232,001 General Expense % 30 68,999 Total 301,000
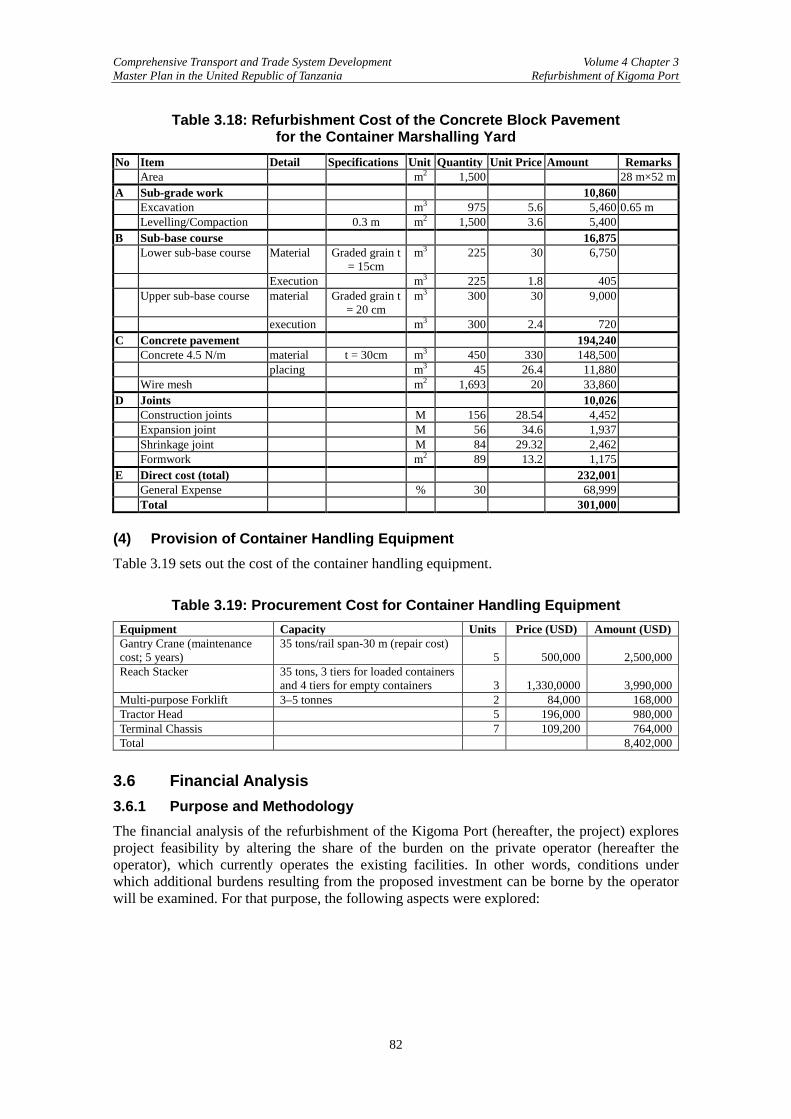
Comprehensive Transport and Trade System Development Volume 4 Chapter 3 Master Plan in the United Republic of Tanzania Refurbishment of Kigoma Port
82
Table 3.18: Refurbishment Cost of the Concrete Block Pavement for the Container Marshalling Yard
No Item Detail Specifications Unit Quantity Unit Price Amount Remarks Area m2 1,500 28 m×52 m
A Sub-grade work 10,860 Excavation m3 975 5.6 5,460 0.65 m Levelling/Compaction 0.3 m m2 1,500 3.6 5,400
B Sub-base course 16,875 Lower sub-base course Material Graded grain t
= 15cm m3 225 30 6,750
Execution m3 225 1.8 405 Upper sub-base course material Graded grain t
= 20 cm m3 300 30 9,000
execution m3 300 2.4 720 C Concrete pavement 194,240
Concrete 4.5 N/m material t = 30cm m3 450 330 148,500 placing m3 45 26.4 11,880 Wire mesh m2 1,693 20 33,860
D Joints 10,026 Construction joints M 156 28.54 4,452 Expansion joint M 56 34.6 1,937 Shrinkage joint M 84 29.32 2,462 Formwork m2 89 13.2 1,175
E Direct cost (total) 232,001 General Expense % 30 68,999 Total 301,000
(4) Provision of Container Handling Equipment Table 3.19 sets out the cost of the container handling equipment.
Table 3.19: Procurement Cost for Container Handling Equipment Equipment Capacity Units Price (USD) Amount (USD) Gantry Crane (maintenance cost; 5 years)
35 tons/rail span-30 m (repair cost) 5 500,000 2,500,000
Reach Stacker 35 tons, 3 tiers for loaded containers and 4 tiers for empty containers 3 1,330,0000 3,990,000
Multi-purpose Forklift 3–5 tonnes 2 84,000 168,000 Tractor Head 5 196,000 980,000 Terminal Chassis 7 109,200 764,000 Total 8,402,000
3.6 Financial Analysis 3.6.1 Purpose and Methodology The financial analysis of the refurbishment of the Kigoma Port (hereafter, the project) explores project feasibility by altering the share of the burden on the private operator (hereafter the operator), which currently operates the existing facilities. In other words, conditions under which additional burdens resulting from the proposed investment can be borne by the operator will be examined. For that purpose, the following aspects were explored:
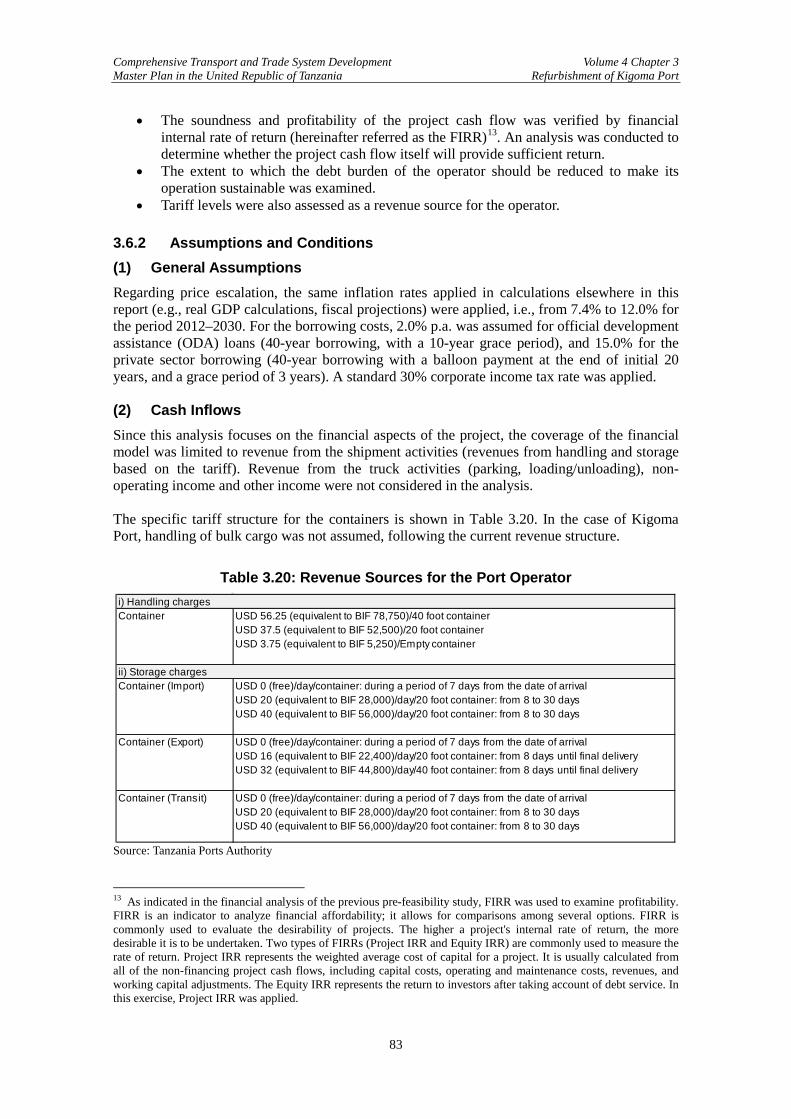
Comprehensive Transport and Trade System Development Volume 4 Chapter 3 Master Plan in the United Republic of Tanzania Refurbishment of Kigoma Port
83
• The soundness and profitability of the project cash flow was verified by financial internal rate of return (hereinafter referred as the FIRR)13. An analysis was conducted to determine whether the project cash flow itself will provide sufficient return.
• The extent to which the debt burden of the operator should be reduced to make its operation sustainable was examined.
• Tariff levels were also assessed as a revenue source for the operator. 3.6.2 Assumptions and Conditions (1) General Assumptions Regarding price escalation, the same inflation rates applied in calculations elsewhere in this report (e.g., real GDP calculations, fiscal projections) were applied, i.e., from 7.4% to 12.0% for the period 2012–2030. For the borrowing costs, 2.0% p.a. was assumed for official development assistance (ODA) loans (40-year borrowing, with a 10-year grace period), and 15.0% for the private sector borrowing (40-year borrowing with a balloon payment at the end of initial 20 years, and a grace period of 3 years). A standard 30% corporate income tax rate was applied. (2) Cash Inflows Since this analysis focuses on the financial aspects of the project, the coverage of the financial model was limited to revenue from the shipment activities (revenues from handling and storage based on the tariff). Revenue from the truck activities (parking, loading/unloading), non-operating income and other income were not considered in the analysis. The specific tariff structure for the containers is shown in Table 3.20. In the case of Kigoma Port, handling of bulk cargo was not assumed, following the current revenue structure.
Table 3.20: Revenue Sources for the Port Operator i) Handling chargesContainer USD 56.25 (equivalent to BIF 78,750)/40 foot container
USD 37.5 (equivalent to BIF 52,500)/20 foot containerUSD 3.75 (equivalent to BIF 5,250)/Empty container
ii) Storage chargesContainer (Import) USD 0 (free)/day/container: during a period of 7 days from the date of arrival
USD 20 (equivalent to BIF 28,000)/day/20 foot container: from 8 to 30 daysUSD 40 (equivalent to BIF 56,000)/day/20 foot container: from 8 to 30 days
Container (Export) USD 0 (free)/day/container: during a period of 7 days from the date of arrivalUSD 16 (equivalent to BIF 22,400)/day/20 foot container: from 8 days until final deliveryUSD 32 (equivalent to BIF 44,800)/day/40 foot container: from 8 days until final delivery
Container (Transit) USD 0 (free)/day/container: during a period of 7 days from the date of arrivalUSD 20 (equivalent to BIF 28,000)/day/20 foot container: from 8 to 30 daysUSD 40 (equivalent to BIF 56,000)/day/20 foot container: from 8 to 30 days
Source: Tanzania Ports Authority 13 As indicated in the financial analysis of the previous pre-feasibility study, FIRR was used to examine profitability. FIRR is an indicator to analyze financial affordability; it allows for comparisons among several options. FIRR is commonly used to evaluate the desirability of projects. The higher a project's internal rate of return, the more desirable it is to be undertaken. Two types of FIRRs (Project IRR and Equity IRR) are commonly used to measure the rate of return. Project IRR represents the weighted average cost of capital for a project. It is usually calculated from all of the non-financing project cash flows, including capital costs, operating and maintenance costs, revenues, and working capital adjustments. The Equity IRR represents the return to investors after taking account of debt service. In this exercise, Project IRR was applied.
Comprehensive Transport and Trade System Development Volume 4 Chapter 3 Master Plan in the United Republic of Tanzania Refurbishment of Kigoma Port
84
(3) Cash Outflows The items listed below were included as cash outflows:
• Initial capital expenditures (hereafter CAPEX) proposed in the previous section; • Operational expenditures related to the shipment activities; • Debt-related outflows (i.e., debt repayment, interest payment); • Concession fee (if payable); and • Corporate tax (tax rate: 30%).
Among these, the operator’s coverage of capital expenditures, debt-related outflows, and concession fee were altered to assess impact on the financial feasibility of the project. 3.6.3 Analysis Based on the above assumptions, five cases (summarized in Table 3.21) were examined with varying coverage of the CAPEX and financial costs by the operator. In all cases it was assumed that other costs (operation expenditures and corporate tax) would be borne by the operator, while a concession fee may or may not be charged, depending on the viability of the operation. In Case 1 (Table 3.22), it was assumed that both the CAPEX and the financial cost for private borrowing would be borne by the operator, which receives the tariff at the current level but does not pay any concession fees. In this case, the FIRR is negative, suggesting that the project is not financially viable, even if the operator is free from the obligation of paying any concession fees. Case 2 (Table 3.23) was examined by altering the financing option from private borrowing to ODA. But the FIRR remains negative, suggesting that the financing cost alone cannot improve the viability. Even in Case 3 (Table 3.24), where financial constraints were further loosened, assuming that all the financing cost would be borne by the public sector, the FIRR did not turn positive. To improve FIRR from the condition in Case 3, it was assumed that the tariff level would be increased from the current level, which is shown in Case 4 (Table 3.25), Case 5 (Table 3.26), and Case 6 (Table 3.27). In Case 4, the level of tariff increase to achieve an FIRR of 0.0% was sought, which was calculated as 54.2% (i.e., an increase of all tariffs by 54.2% for the entire period). In Case 5, the same exercise was undertaken to achieve an FIRR of 15% (i.e., the prevailing level perceived to be “viable” for this type of infrastructure project), which turned out to be 95.0%. Finally, in Case 6 the burden of equipment cost, which is generally borne by the operator, was removed, meaning that this part would also be covered by the public sector. Although there was no solution for the FIRR calculation for the cash flows in this case (i.e., the FIRR could not be calculated), the result should be better than for Case 5 assuming the same increase in tariff as in Case 5 (95.0%). Cases 1 to 5 do not assume the payment of any concession fees since the cash flow is too tight. A concession fee is payable only in Case 6 assuming that it requires an FIRR that meets or exceeds the financially viable level (i.e., 15%). However, this level of financial viability can be achieved only at the expense of discharging the operator from the initial cost of equipment.
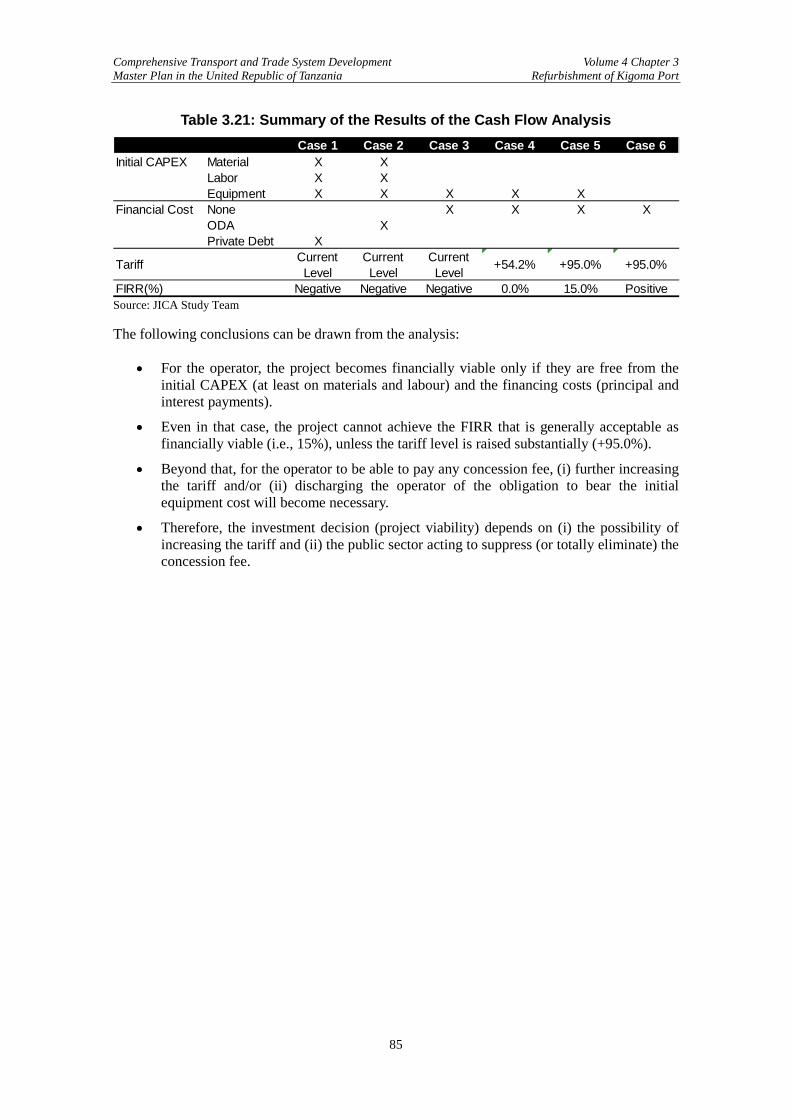
Comprehensive Transport and Trade System Development Volume 4 Chapter 3 Master Plan in the United Republic of Tanzania Refurbishment of Kigoma Port
85
Table 3.21: Summary of the Results of the Cash Flow Analysis Case 1 Case 2 Case 3 Case 4 Case 5 Case 6
Initial CAPEX Material X XLabor X XEquipment X X X X X
Financial Cost None X X X XODA XPrivate Debt X
Tariff CurrentLevel
CurrentLevel
CurrentLevel
+54.2% +95.0% +95.0%
FIRR(%) Negative Negative Negative 0.0% 15.0% Positive Source: JICA Study Team The following conclusions can be drawn from the analysis:
• For the operator, the project becomes financially viable only if they are free from the initial CAPEX (at least on materials and labour) and the financing costs (principal and interest payments).
• Even in that case, the project cannot achieve the FIRR that is generally acceptable as financially viable (i.e., 15%), unless the tariff level is raised substantially (+95.0%).
• Beyond that, for the operator to be able to pay any concession fee, (i) further increasing the tariff and/or (ii) discharging the operator of the obligation to bear the initial equipment cost will become necessary.
• Therefore, the investment decision (project viability) depends on (i) the possibility of increasing the tariff and (ii) the public sector acting to suppress (or totally eliminate) the concession fee.
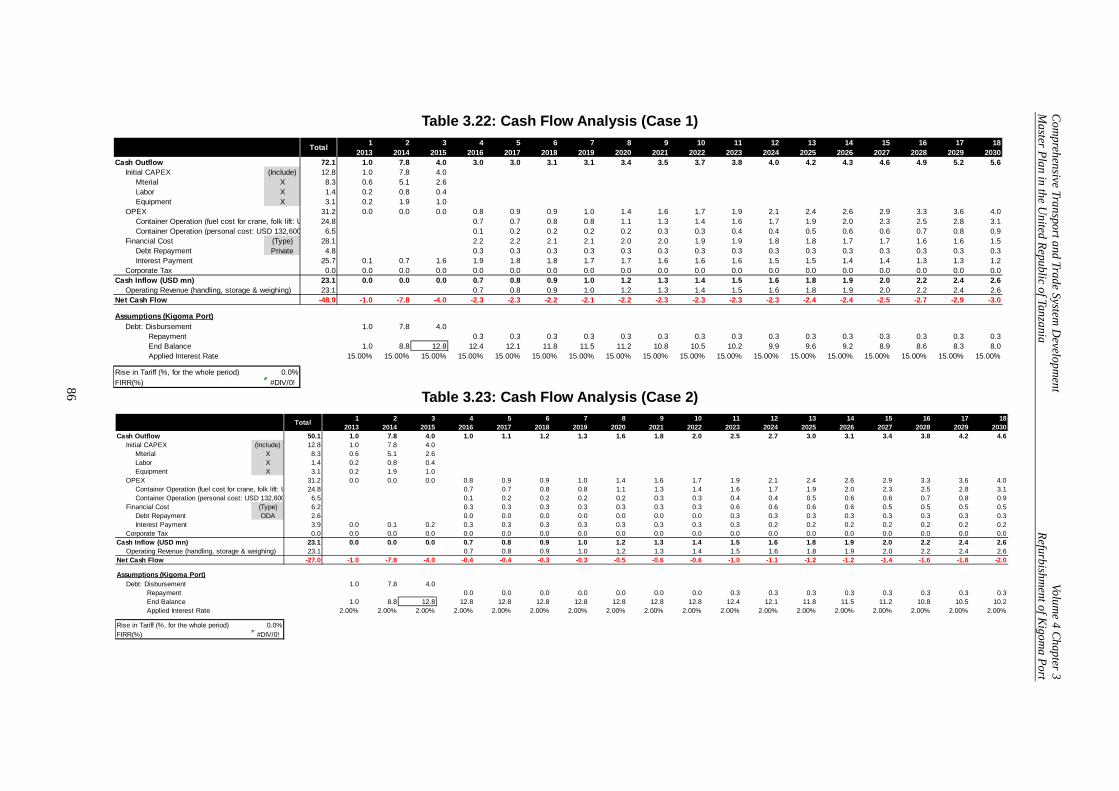
Com
prehensive Transport and Trade System D
evelopment
Volume 4 Chapter 3
Master Plan in the U
nited Republic of Tanzania Refurbishm
ent of Kigom
a Port
86
Table 3.22: Cash Flow Analysis (Case 1) 1 2 3 4 5 6 7 8 9 10 11 12 13 14 15 16 17 18
2013 2014 2015 2016 2017 2018 2019 2020 2021 2022 2023 2024 2025 2026 2027 2028 2029 2030Cash Outflow 72.1 1.0 7.8 4.0 3.0 3.0 3.1 3.1 3.4 3.5 3.7 3.8 4.0 4.2 4.3 4.6 4.9 5.2 5.6
Initial CAPEX (Include) 12.8 1.0 7.8 4.0Mterial X 8.3 0.6 5.1 2.6Labor X 1.4 0.2 0.8 0.4Equipment X 3.1 0.2 1.9 1.0
OPEX 31.2 0.0 0.0 0.0 0.8 0.9 0.9 1.0 1.4 1.6 1.7 1.9 2.1 2.4 2.6 2.9 3.3 3.6 4.0Container Operation (fuel cost for crane, folk lift: U 24.8 0.7 0.7 0.8 0.8 1.1 1.3 1.4 1.6 1.7 1.9 2.0 2.3 2.5 2.8 3.1Container Operation (personal cost: USD 132,600 6.5 0.1 0.2 0.2 0.2 0.2 0.3 0.3 0.4 0.4 0.5 0.6 0.6 0.7 0.8 0.9
Financial Cost (Type) 28.1 2.2 2.2 2.1 2.1 2.0 2.0 1.9 1.9 1.8 1.8 1.7 1.7 1.6 1.6 1.5Debt Repayment Private 4.8 0.3 0.3 0.3 0.3 0.3 0.3 0.3 0.3 0.3 0.3 0.3 0.3 0.3 0.3 0.3Interest Payment 25.7 0.1 0.7 1.6 1.9 1.8 1.8 1.7 1.7 1.6 1.6 1.6 1.5 1.5 1.4 1.4 1.3 1.3 1.2
Corporate Tax 0.0 0.0 0.0 0.0 0.0 0.0 0.0 0.0 0.0 0.0 0.0 0.0 0.0 0.0 0.0 0.0 0.0 0.0 0.0Cash Inflow (USD mn) 23.1 0.0 0.0 0.0 0.7 0.8 0.9 1.0 1.2 1.3 1.4 1.5 1.6 1.8 1.9 2.0 2.2 2.4 2.6
Operating Revenue (handling, storage & weighing) 23.1 0.7 0.8 0.9 1.0 1.2 1.3 1.4 1.5 1.6 1.8 1.9 2.0 2.2 2.4 2.6Net Cash Flow -48.9 -1.0 -7.8 -4.0 -2.3 -2.3 -2.2 -2.1 -2.2 -2.3 -2.3 -2.3 -2.3 -2.4 -2.4 -2.5 -2.7 -2.9 -3.0
Assumptions (Kigoma Port)Debt: Disbursement 1.0 7.8 4.0 Repayment 0.3 0.3 0.3 0.3 0.3 0.3 0.3 0.3 0.3 0.3 0.3 0.3 0.3 0.3 0.3 End Balance 1.0 8.8 12.8 12.4 12.1 11.8 11.5 11.2 10.8 10.5 10.2 9.9 9.6 9.2 8.9 8.6 8.3 8.0 Applied Interest Rate 15.00% 15.00% 15.00% 15.00% 15.00% 15.00% 15.00% 15.00% 15.00% 15.00% 15.00% 15.00% 15.00% 15.00% 15.00% 15.00% 15.00% 15.00%
Rise in Tariff (%, for the whole period) 0.0%FIRR(%) #DIV/0!
Total
Table 3.23: Cash Flow Analysis (Case 2)
1 2 3 4 5 6 7 8 9 10 11 12 13 14 15 16 17 182013 2014 2015 2016 2017 2018 2019 2020 2021 2022 2023 2024 2025 2026 2027 2028 2029 2030
Cash Outflow 50.1 1.0 7.8 4.0 1.0 1.1 1.2 1.3 1.6 1.8 2.0 2.5 2.7 3.0 3.1 3.4 3.8 4.2 4.6Initial CAPEX (Include) 12.8 1.0 7.8 4.0
Mterial X 8.3 0.6 5.1 2.6Labor X 1.4 0.2 0.8 0.4Equipment X 3.1 0.2 1.9 1.0
OPEX 31.2 0.0 0.0 0.0 0.8 0.9 0.9 1.0 1.4 1.6 1.7 1.9 2.1 2.4 2.6 2.9 3.3 3.6 4.0Container Operation (fuel cost for crane, folk lift: U 24.8 0.7 0.7 0.8 0.8 1.1 1.3 1.4 1.6 1.7 1.9 2.0 2.3 2.5 2.8 3.1Container Operation (personal cost: USD 132,600 6.5 0.1 0.2 0.2 0.2 0.2 0.3 0.3 0.4 0.4 0.5 0.6 0.6 0.7 0.8 0.9
Financial Cost (Type) 6.2 0.3 0.3 0.3 0.3 0.3 0.3 0.3 0.6 0.6 0.6 0.6 0.5 0.5 0.5 0.5Debt Repayment ODA 2.6 0.0 0.0 0.0 0.0 0.0 0.0 0.0 0.3 0.3 0.3 0.3 0.3 0.3 0.3 0.3Interest Payment 3.9 0.0 0.1 0.2 0.3 0.3 0.3 0.3 0.3 0.3 0.3 0.3 0.2 0.2 0.2 0.2 0.2 0.2 0.2
Corporate Tax 0.0 0.0 0.0 0.0 0.0 0.0 0.0 0.0 0.0 0.0 0.0 0.0 0.0 0.0 0.0 0.0 0.0 0.0 0.0Cash Inflow (USD mn) 23.1 0.0 0.0 0.0 0.7 0.8 0.9 1.0 1.2 1.3 1.4 1.5 1.6 1.8 1.9 2.0 2.2 2.4 2.6
Operating Revenue (handling, storage & weighing) 23.1 0.7 0.8 0.9 1.0 1.2 1.3 1.4 1.5 1.6 1.8 1.9 2.0 2.2 2.4 2.6Net Cash Flow -27.0 -1.0 -7.8 -4.0 -0.4 -0.4 -0.3 -0.3 -0.5 -0.6 -0.6 -1.0 -1.1 -1.2 -1.2 -1.4 -1.6 -1.8 -2.0
Assumptions (Kigoma Port)Debt: Disbursement 1.0 7.8 4.0 Repayment 0.0 0.0 0.0 0.0 0.0 0.0 0.0 0.3 0.3 0.3 0.3 0.3 0.3 0.3 0.3 End Balance 1.0 8.8 12.8 12.8 12.8 12.8 12.8 12.8 12.8 12.8 12.4 12.1 11.8 11.5 11.2 10.8 10.5 10.2 Applied Interest Rate 2.00% 2.00% 2.00% 2.00% 2.00% 2.00% 2.00% 2.00% 2.00% 2.00% 2.00% 2.00% 2.00% 2.00% 2.00% 2.00% 2.00% 2.00%
Rise in Tariff (%, for the whole period) 0.0%FIRR(%) #DIV/0!
Total
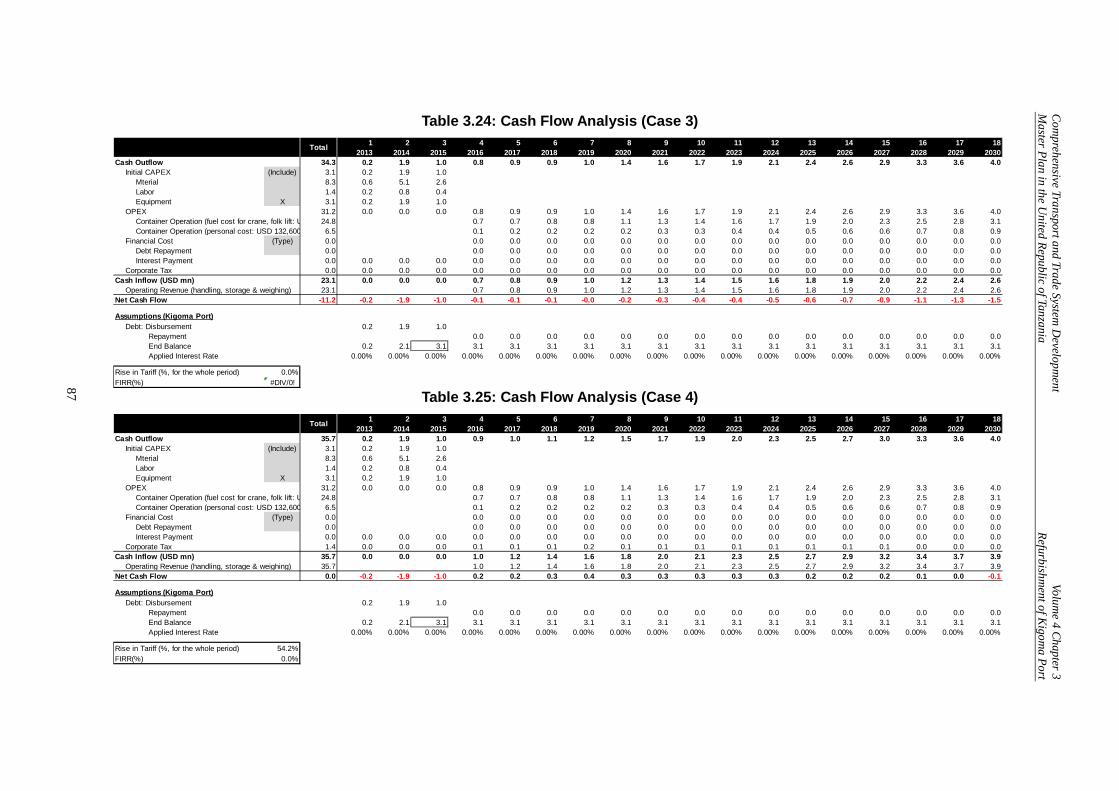
Com
prehensive Transport and Trade System D
evelopment
Volume 4 Chapter 3
Master Plan in the U
nited Republic of Tanzania Refurbishm
ent of Kigom
a Port
87
Table 3.24: Cash Flow Analysis (Case 3) 1 2 3 4 5 6 7 8 9 10 11 12 13 14 15 16 17 18
2013 2014 2015 2016 2017 2018 2019 2020 2021 2022 2023 2024 2025 2026 2027 2028 2029 2030Cash Outflow 34.3 0.2 1.9 1.0 0.8 0.9 0.9 1.0 1.4 1.6 1.7 1.9 2.1 2.4 2.6 2.9 3.3 3.6 4.0
Initial CAPEX (Include) 3.1 0.2 1.9 1.0Mterial 8.3 0.6 5.1 2.6Labor 1.4 0.2 0.8 0.4Equipment X 3.1 0.2 1.9 1.0
OPEX 31.2 0.0 0.0 0.0 0.8 0.9 0.9 1.0 1.4 1.6 1.7 1.9 2.1 2.4 2.6 2.9 3.3 3.6 4.0Container Operation (fuel cost for crane, folk lift: U 24.8 0.7 0.7 0.8 0.8 1.1 1.3 1.4 1.6 1.7 1.9 2.0 2.3 2.5 2.8 3.1Container Operation (personal cost: USD 132,600 6.5 0.1 0.2 0.2 0.2 0.2 0.3 0.3 0.4 0.4 0.5 0.6 0.6 0.7 0.8 0.9
Financial Cost (Type) 0.0 0.0 0.0 0.0 0.0 0.0 0.0 0.0 0.0 0.0 0.0 0.0 0.0 0.0 0.0 0.0Debt Repayment 0.0 0.0 0.0 0.0 0.0 0.0 0.0 0.0 0.0 0.0 0.0 0.0 0.0 0.0 0.0 0.0Interest Payment 0.0 0.0 0.0 0.0 0.0 0.0 0.0 0.0 0.0 0.0 0.0 0.0 0.0 0.0 0.0 0.0 0.0 0.0 0.0
Corporate Tax 0.0 0.0 0.0 0.0 0.0 0.0 0.0 0.0 0.0 0.0 0.0 0.0 0.0 0.0 0.0 0.0 0.0 0.0 0.0Cash Inflow (USD mn) 23.1 0.0 0.0 0.0 0.7 0.8 0.9 1.0 1.2 1.3 1.4 1.5 1.6 1.8 1.9 2.0 2.2 2.4 2.6
Operating Revenue (handling, storage & weighing) 23.1 0.7 0.8 0.9 1.0 1.2 1.3 1.4 1.5 1.6 1.8 1.9 2.0 2.2 2.4 2.6Net Cash Flow -11.2 -0.2 -1.9 -1.0 -0.1 -0.1 -0.1 -0.0 -0.2 -0.3 -0.4 -0.4 -0.5 -0.6 -0.7 -0.9 -1.1 -1.3 -1.5
Assumptions (Kigoma Port)Debt: Disbursement 0.2 1.9 1.0 Repayment 0.0 0.0 0.0 0.0 0.0 0.0 0.0 0.0 0.0 0.0 0.0 0.0 0.0 0.0 0.0 End Balance 0.2 2.1 3.1 3.1 3.1 3.1 3.1 3.1 3.1 3.1 3.1 3.1 3.1 3.1 3.1 3.1 3.1 3.1 Applied Interest Rate 0.00% 0.00% 0.00% 0.00% 0.00% 0.00% 0.00% 0.00% 0.00% 0.00% 0.00% 0.00% 0.00% 0.00% 0.00% 0.00% 0.00% 0.00%
Rise in Tariff (%, for the whole period) 0.0%FIRR(%) #DIV/0!
Total
Table 3.25: Cash Flow Analysis (Case 4)
1 2 3 4 5 6 7 8 9 10 11 12 13 14 15 16 17 182013 2014 2015 2016 2017 2018 2019 2020 2021 2022 2023 2024 2025 2026 2027 2028 2029 2030
Cash Outflow 35.7 0.2 1.9 1.0 0.9 1.0 1.1 1.2 1.5 1.7 1.9 2.0 2.3 2.5 2.7 3.0 3.3 3.6 4.0Initial CAPEX (Include) 3.1 0.2 1.9 1.0
Mterial 8.3 0.6 5.1 2.6Labor 1.4 0.2 0.8 0.4Equipment X 3.1 0.2 1.9 1.0
OPEX 31.2 0.0 0.0 0.0 0.8 0.9 0.9 1.0 1.4 1.6 1.7 1.9 2.1 2.4 2.6 2.9 3.3 3.6 4.0Container Operation (fuel cost for crane, folk lift: U 24.8 0.7 0.7 0.8 0.8 1.1 1.3 1.4 1.6 1.7 1.9 2.0 2.3 2.5 2.8 3.1Container Operation (personal cost: USD 132,600 6.5 0.1 0.2 0.2 0.2 0.2 0.3 0.3 0.4 0.4 0.5 0.6 0.6 0.7 0.8 0.9
Financial Cost (Type) 0.0 0.0 0.0 0.0 0.0 0.0 0.0 0.0 0.0 0.0 0.0 0.0 0.0 0.0 0.0 0.0Debt Repayment 0.0 0.0 0.0 0.0 0.0 0.0 0.0 0.0 0.0 0.0 0.0 0.0 0.0 0.0 0.0 0.0Interest Payment 0.0 0.0 0.0 0.0 0.0 0.0 0.0 0.0 0.0 0.0 0.0 0.0 0.0 0.0 0.0 0.0 0.0 0.0 0.0
Corporate Tax 1.4 0.0 0.0 0.0 0.1 0.1 0.1 0.2 0.1 0.1 0.1 0.1 0.1 0.1 0.1 0.1 0.0 0.0 0.0Cash Inflow (USD mn) 35.7 0.0 0.0 0.0 1.0 1.2 1.4 1.6 1.8 2.0 2.1 2.3 2.5 2.7 2.9 3.2 3.4 3.7 3.9
Operating Revenue (handling, storage & weighing) 35.7 1.0 1.2 1.4 1.6 1.8 2.0 2.1 2.3 2.5 2.7 2.9 3.2 3.4 3.7 3.9Net Cash Flow 0.0 -0.2 -1.9 -1.0 0.2 0.2 0.3 0.4 0.3 0.3 0.3 0.3 0.3 0.2 0.2 0.2 0.1 0.0 -0.1
Assumptions (Kigoma Port)Debt: Disbursement 0.2 1.9 1.0 Repayment 0.0 0.0 0.0 0.0 0.0 0.0 0.0 0.0 0.0 0.0 0.0 0.0 0.0 0.0 0.0 End Balance 0.2 2.1 3.1 3.1 3.1 3.1 3.1 3.1 3.1 3.1 3.1 3.1 3.1 3.1 3.1 3.1 3.1 3.1 Applied Interest Rate 0.00% 0.00% 0.00% 0.00% 0.00% 0.00% 0.00% 0.00% 0.00% 0.00% 0.00% 0.00% 0.00% 0.00% 0.00% 0.00% 0.00% 0.00%
Rise in Tariff (%, for the whole period) 54.2%FIRR(%) 0.0%
Total
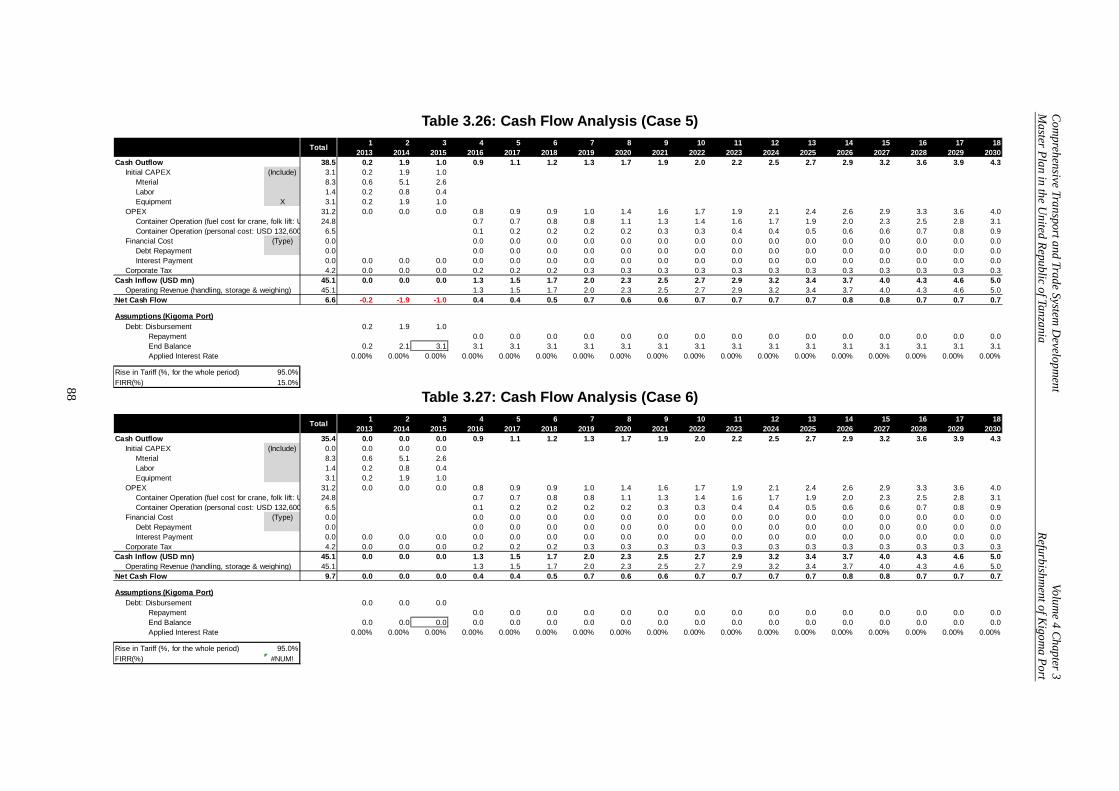
Com
prehensive Transport and Trade System D
evelopment
Volume 4 Chapter 3
Master Plan in the U
nited Republic of Tanzania Refurbishm
ent of Kigom
a Port
88
Table 3.26: Cash Flow Analysis (Case 5) 1 2 3 4 5 6 7 8 9 10 11 12 13 14 15 16 17 18
2013 2014 2015 2016 2017 2018 2019 2020 2021 2022 2023 2024 2025 2026 2027 2028 2029 2030Cash Outflow 38.5 0.2 1.9 1.0 0.9 1.1 1.2 1.3 1.7 1.9 2.0 2.2 2.5 2.7 2.9 3.2 3.6 3.9 4.3
Initial CAPEX (Include) 3.1 0.2 1.9 1.0Mterial 8.3 0.6 5.1 2.6Labor 1.4 0.2 0.8 0.4Equipment X 3.1 0.2 1.9 1.0
OPEX 31.2 0.0 0.0 0.0 0.8 0.9 0.9 1.0 1.4 1.6 1.7 1.9 2.1 2.4 2.6 2.9 3.3 3.6 4.0Container Operation (fuel cost for crane, folk lift: U 24.8 0.7 0.7 0.8 0.8 1.1 1.3 1.4 1.6 1.7 1.9 2.0 2.3 2.5 2.8 3.1Container Operation (personal cost: USD 132,600 6.5 0.1 0.2 0.2 0.2 0.2 0.3 0.3 0.4 0.4 0.5 0.6 0.6 0.7 0.8 0.9
Financial Cost (Type) 0.0 0.0 0.0 0.0 0.0 0.0 0.0 0.0 0.0 0.0 0.0 0.0 0.0 0.0 0.0 0.0Debt Repayment 0.0 0.0 0.0 0.0 0.0 0.0 0.0 0.0 0.0 0.0 0.0 0.0 0.0 0.0 0.0 0.0Interest Payment 0.0 0.0 0.0 0.0 0.0 0.0 0.0 0.0 0.0 0.0 0.0 0.0 0.0 0.0 0.0 0.0 0.0 0.0 0.0
Corporate Tax 4.2 0.0 0.0 0.0 0.2 0.2 0.2 0.3 0.3 0.3 0.3 0.3 0.3 0.3 0.3 0.3 0.3 0.3 0.3Cash Inflow (USD mn) 45.1 0.0 0.0 0.0 1.3 1.5 1.7 2.0 2.3 2.5 2.7 2.9 3.2 3.4 3.7 4.0 4.3 4.6 5.0
Operating Revenue (handling, storage & weighing) 45.1 1.3 1.5 1.7 2.0 2.3 2.5 2.7 2.9 3.2 3.4 3.7 4.0 4.3 4.6 5.0Net Cash Flow 6.6 -0.2 -1.9 -1.0 0.4 0.4 0.5 0.7 0.6 0.6 0.7 0.7 0.7 0.7 0.8 0.8 0.7 0.7 0.7
Assumptions (Kigoma Port)Debt: Disbursement 0.2 1.9 1.0 Repayment 0.0 0.0 0.0 0.0 0.0 0.0 0.0 0.0 0.0 0.0 0.0 0.0 0.0 0.0 0.0 End Balance 0.2 2.1 3.1 3.1 3.1 3.1 3.1 3.1 3.1 3.1 3.1 3.1 3.1 3.1 3.1 3.1 3.1 3.1 Applied Interest Rate 0.00% 0.00% 0.00% 0.00% 0.00% 0.00% 0.00% 0.00% 0.00% 0.00% 0.00% 0.00% 0.00% 0.00% 0.00% 0.00% 0.00% 0.00%
Rise in Tariff (%, for the whole period) 95.0%FIRR(%) 15.0%
Total
Table 3.27: Cash Flow Analysis (Case 6)
1 2 3 4 5 6 7 8 9 10 11 12 13 14 15 16 17 182013 2014 2015 2016 2017 2018 2019 2020 2021 2022 2023 2024 2025 2026 2027 2028 2029 2030
Cash Outflow 35.4 0.0 0.0 0.0 0.9 1.1 1.2 1.3 1.7 1.9 2.0 2.2 2.5 2.7 2.9 3.2 3.6 3.9 4.3Initial CAPEX (Include) 0.0 0.0 0.0 0.0
Mterial 8.3 0.6 5.1 2.6Labor 1.4 0.2 0.8 0.4Equipment 3.1 0.2 1.9 1.0
OPEX 31.2 0.0 0.0 0.0 0.8 0.9 0.9 1.0 1.4 1.6 1.7 1.9 2.1 2.4 2.6 2.9 3.3 3.6 4.0Container Operation (fuel cost for crane, folk lift: U 24.8 0.7 0.7 0.8 0.8 1.1 1.3 1.4 1.6 1.7 1.9 2.0 2.3 2.5 2.8 3.1Container Operation (personal cost: USD 132,600 6.5 0.1 0.2 0.2 0.2 0.2 0.3 0.3 0.4 0.4 0.5 0.6 0.6 0.7 0.8 0.9
Financial Cost (Type) 0.0 0.0 0.0 0.0 0.0 0.0 0.0 0.0 0.0 0.0 0.0 0.0 0.0 0.0 0.0 0.0Debt Repayment 0.0 0.0 0.0 0.0 0.0 0.0 0.0 0.0 0.0 0.0 0.0 0.0 0.0 0.0 0.0 0.0Interest Payment 0.0 0.0 0.0 0.0 0.0 0.0 0.0 0.0 0.0 0.0 0.0 0.0 0.0 0.0 0.0 0.0 0.0 0.0 0.0
Corporate Tax 4.2 0.0 0.0 0.0 0.2 0.2 0.2 0.3 0.3 0.3 0.3 0.3 0.3 0.3 0.3 0.3 0.3 0.3 0.3Cash Inflow (USD mn) 45.1 0.0 0.0 0.0 1.3 1.5 1.7 2.0 2.3 2.5 2.7 2.9 3.2 3.4 3.7 4.0 4.3 4.6 5.0
Operating Revenue (handling, storage & weighing) 45.1 1.3 1.5 1.7 2.0 2.3 2.5 2.7 2.9 3.2 3.4 3.7 4.0 4.3 4.6 5.0Net Cash Flow 9.7 0.0 0.0 0.0 0.4 0.4 0.5 0.7 0.6 0.6 0.7 0.7 0.7 0.7 0.8 0.8 0.7 0.7 0.7
Assumptions (Kigoma Port)Debt: Disbursement 0.0 0.0 0.0 Repayment 0.0 0.0 0.0 0.0 0.0 0.0 0.0 0.0 0.0 0.0 0.0 0.0 0.0 0.0 0.0 End Balance 0.0 0.0 0.0 0.0 0.0 0.0 0.0 0.0 0.0 0.0 0.0 0.0 0.0 0.0 0.0 0.0 0.0 0.0 Applied Interest Rate 0.00% 0.00% 0.00% 0.00% 0.00% 0.00% 0.00% 0.00% 0.00% 0.00% 0.00% 0.00% 0.00% 0.00% 0.00% 0.00% 0.00% 0.00%
Rise in Tariff (%, for the whole period) 95.0%FIRR(%) #NUM!
Total
Comprehensive Transport and Trade System Development Volume 4 Chapter 4 Master Plan in the United Republic of Tanzania Result of Scoping Study
89
Chapter 4 Result of Scoping Study on Subjected Pre-F/S Projects
The scoping study on the following subjected pre-F/S projects that were assumed to a cause certain extent of environmental and social negative impact were conducted during the JICA Environmental and Social Consideration Expert’s stay in Kigoma, from April 18 to April 22, 2013. This study was conducted based on the requirement of all Master Plan Studies, in compliance to the New JICA Environmental and Social Consideration Guideline 2010, and in cooperation with the Kigoma Port Master’s Office (Kigoma, Tanzania Port Authority: TPA) and Tanzania Railway Limited (TRL) office of Kigoma Station associated with actual site investigation guided by both of these authorities. 4.1 Scoping Result of Kigoma Port Refurbishment Project With regard to the Kigoma Port Refurbishment Project, the following points were taken into consideration with the scoping result and TOR as presented in the following Table 4.1. 1. Lake Tanganyika is a cradle to various rare endemic species and existing habitats along the
coast of the Lake are limited; thus, appropriate measures to avoid, mitigate or compensate impact on their habitat should be taken into consideration. When doing so, such precautions should be made, taking into account issues such as; (a) Tanzania is a country that has already ratified the Convention on Biological Diversity and therefore must make appropriate measures to not violate it, (b) although development activities are not restricted, appropriate measures to preserve sustainability of the environment need to be reported to the Secretariat Office as a requirement stipulated under the Convention on Sustainable Management of Lake Tanganyika (which has been already ratified by the Lake coast countries including Tanzania) (c) the Environmental Officer of the Vice President’s Office in Kigoma is in charge of (a) and (b) above, and therefore, his opinion regarding the matter at hand must be respected, (d) Lake Tanganyika, is a well known, second oldest Lake in the world with various rare endemic species, and therefore is subjected and famous for academic studies throughout the world. Bearing this in mind, opinions of related scholars, and governmental institutions such as TAFIRI (Tanzania Fisheries Research Institute) should be taken into respect.
2. Lake Tanganyika is a source of drinking water for the Kigoma community (extracted from a pumping station near Lake Tanganyika Hotel, neighboring the Kigoma Port), and therefore, impact on water and bottom sediment quality should be taken into consideration with caution (especially if dredging works are planned as part of refurbishment works).
3. Currently, the east end of the cargo berth is demolished, however, the demolished end, currently under water has become a habitat to endemic species, which can be confirmed even from above the water. If the refurbishment works include restoration of this east end of the cargo berth, it may have some extent of impact on this area. Appropriate measures to mitigate impact should be taken into account.
4. Although the refurbishment project seems to not cause much negative impact (much rather positive impact is expected) towards the Kigoma community, such concerns should always be kept in mind.
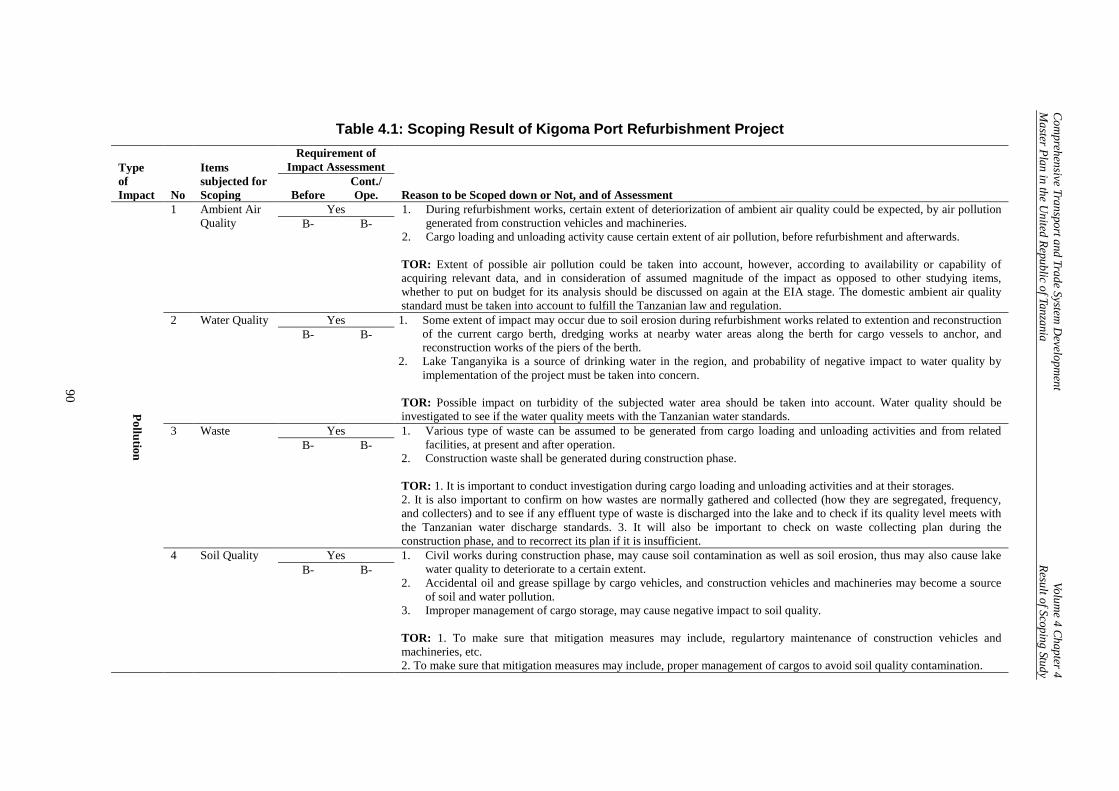
Com
prehensive Transport and Trade System D
evelopment
Volume 4 Chapter 4
Master Plan in the U
nited Republic of Tanzania Result of Scoping Study
90
Table 4.1: Scoping Result of Kigoma Port Refurbishment Project
Type of Impact No
Items subjected for Scoping
Requirement of Impact Assessment
Reason to be Scoped down or Not, and of Assessment Before Cont./ Ope.
Pollution
1 Ambient Air Quality
Yes 1. During refurbishment works, certain extent of deteriorization of ambient air quality could be expected, by air pollution generated from construction vehicles and machineries.
2. Cargo loading and unloading activity cause certain extent of air pollution, before refurbishment and afterwards. TOR: Extent of possible air pollution could be taken into account, however, according to availability or capability of acquiring relevant data, and in consideration of assumed magnitude of the impact as opposed to other studying items, whether to put on budget for its analysis should be discussed on again at the EIA stage. The domestic ambient air quality standard must be taken into account to fulfill the Tanzanian law and regulation.
B- B-
2 Water Quality Yes 1. Some extent of impact may occur due to soil erosion during refurbishment works related to extention and reconstruction of the current cargo berth, dredging works at nearby water areas along the berth for cargo vessels to anchor, and reconstruction works of the piers of the berth.
2. Lake Tanganyika is a source of drinking water in the region, and probability of negative impact to water quality by implementation of the project must be taken into concern.
TOR: Possible impact on turbidity of the subjected water area should be taken into account. Water quality should be investigated to see if the water quality meets with the Tanzanian water standards.
B- B-
3
Waste Yes 1. Various type of waste can be assumed to be generated from cargo loading and unloading activities and from related facilities, at present and after operation.
2. Construction waste shall be generated during construction phase. TOR: 1. It is important to conduct investigation during cargo loading and unloading activities and at their storages. 2. It is also important to confirm on how wastes are normally gathered and collected (how they are segregated, frequency, and collecters) and to see if any effluent type of waste is discharged into the lake and to check if its quality level meets with the Tanzanian water discharge standards. 3. It will also be important to check on waste collecting plan during the construction phase, and to recorrect its plan if it is insufficient.
B- B-
4
Soil Quality Yes 1. Civil works during construction phase, may cause soil contamination as well as soil erosion, thus may also cause lake water quality to deteriorate to a certain extent.
2. Accidental oil and grease spillage by cargo vehicles, and construction vehicles and machineries may become a source of soil and water pollution.
3. Improper management of cargo storage, may cause negative impact to soil quality. TOR: 1. To make sure that mitigation measures may include, regulartory maintenance of construction vehicles and machineries, etc. 2. To make sure that mitigation measures may include, proper management of cargos to avoid soil quality contamination.
B- B-
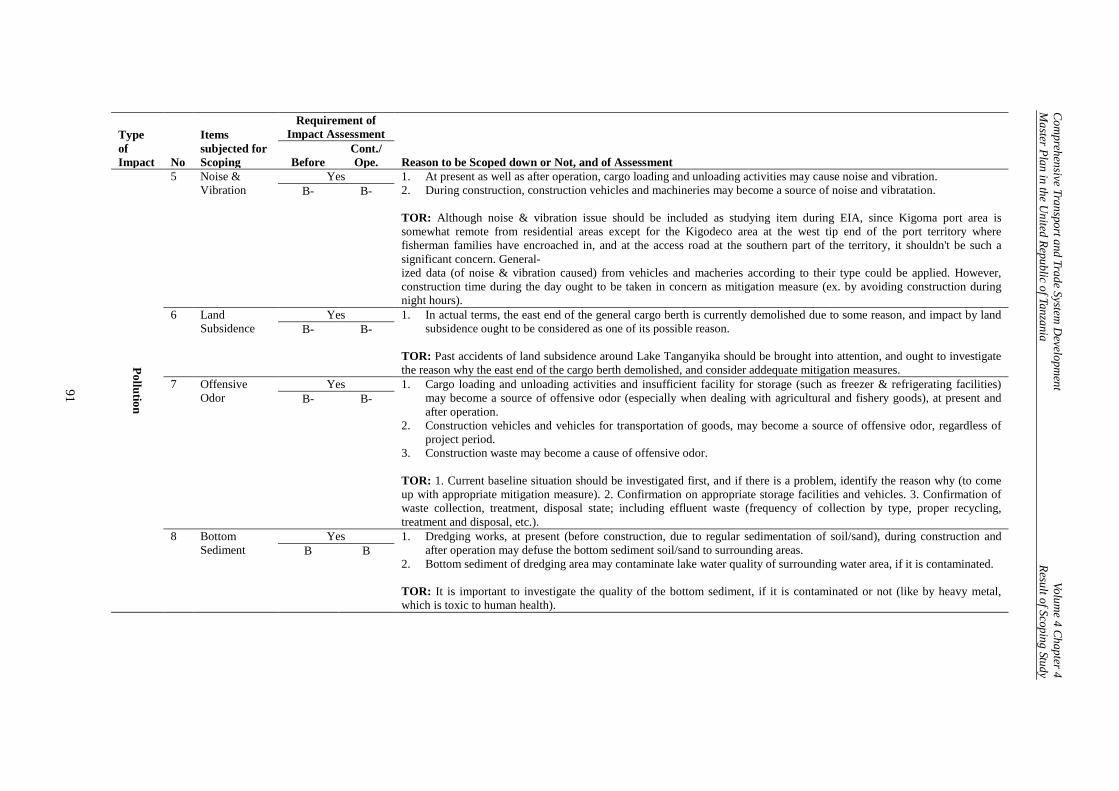
Com
prehensive Transport and Trade System D
evelopment
Volume 4 Chapter 4
Master Plan in the U
nited Republic of Tanzania Result of Scoping Study
91
Type of Impact No
Items subjected for Scoping
Requirement of Impact Assessment
Reason to be Scoped down or Not, and of Assessment Before Cont./ Ope.
Pollution
5
Noise & Vibration
Yes 1. At present as well as after operation, cargo loading and unloading activities may cause noise and vibration. 2. During construction, construction vehicles and machineries may become a source of noise and vibratation. TOR: Although noise & vibration issue should be included as studying item during EIA, since Kigoma port area is somewhat remote from residential areas except for the Kigodeco area at the west tip end of the port territory where fisherman families have encroached in, and at the access road at the southern part of the territory, it shouldn't be such a significant concern. General- ized data (of noise & vibration caused) from vehicles and macheries according to their type could be applied. However, construction time during the day ought to be taken in concern as mitigation measure (ex. by avoiding construction during night hours).
B- B-
6
Land Subsidence
Yes 1. In actual terms, the east end of the general cargo berth is currently demolished due to some reason, and impact by land subsidence ought to be considered as one of its possible reason.
TOR: Past accidents of land subsidence around Lake Tanganyika should be brought into attention, and ought to investigate the reason why the east end of the cargo berth demolished, and consider addequate mitigation measures.
B- B-
7 Offensive Odor
Yes 1. Cargo loading and unloading activities and insufficient facility for storage (such as freezer & refrigerating facilities) may become a source of offensive odor (especially when dealing with agricultural and fishery goods), at present and after operation.
2. Construction vehicles and vehicles for transportation of goods, may become a source of offensive odor, regardless of project period.
3. Construction waste may become a cause of offensive odor. TOR: 1. Current baseline situation should be investigated first, and if there is a problem, identify the reason why (to come up with appropriate mitigation measure). 2. Confirmation on appropriate storage facilities and vehicles. 3. Confirmation of waste collection, treatment, disposal state; including effluent waste (frequency of collection by type, proper recycling, treatment and disposal, etc.).
B- B-
8
Bottom Sediment
Yes 1. Dredging works, at present (before construction, due to regular sedimentation of soil/sand), during construction and after operation may defuse the bottom sediment soil/sand to surrounding areas.
2. Bottom sediment of dredging area may contaminate lake water quality of surrounding water area, if it is contaminated. TOR: It is important to investigate the quality of the bottom sediment, if it is contaminated or not (like by heavy metal, which is toxic to human health).
B B
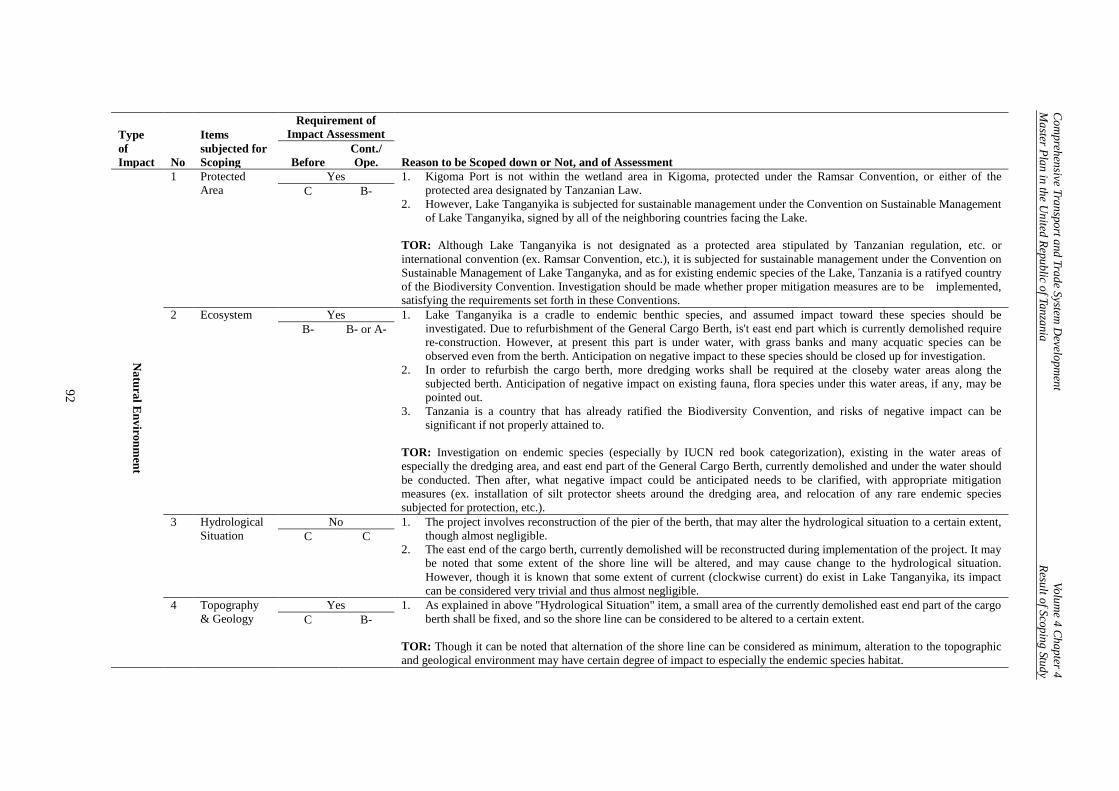
Com
prehensive Transport and Trade System D
evelopment
Volume 4 Chapter 4
Master Plan in the U
nited Republic of Tanzania Result of Scoping Study
92
Type of Impact No
Items subjected for Scoping
Requirement of Impact Assessment
Reason to be Scoped down or Not, and of Assessment Before Cont./ Ope.
Natural Environm
ent
1
Protected Area
Yes 1. Kigoma Port is not within the wetland area in Kigoma, protected under the Ramsar Convention, or either of the protected area designated by Tanzanian Law.
2. However, Lake Tanganyika is subjected for sustainable management under the Convention on Sustainable Management of Lake Tanganyika, signed by all of the neighboring countries facing the Lake.
TOR: Although Lake Tanganyika is not designated as a protected area stipulated by Tanzanian regulation, etc. or international convention (ex. Ramsar Convention, etc.), it is subjected for sustainable management under the Convention on Sustainable Management of Lake Tanganyka, and as for existing endemic species of the Lake, Tanzania is a ratifyed country of the Biodiversity Convention. Investigation should be made whether proper mitigation measures are to be implemented, satisfying the requirements set forth in these Conventions.
C B-
2
Ecosystem Yes 1. Lake Tanganyika is a cradle to endemic benthic species, and assumed impact toward these species should be investigated. Due to refurbishment of the General Cargo Berth, is't east end part which is currently demolished require re-construction. However, at present this part is under water, with grass banks and many acquatic species can be observed even from the berth. Anticipation on negative impact to these species should be closed up for investigation.
2. In order to refurbish the cargo berth, more dredging works shall be required at the closeby water areas along the subjected berth. Anticipation of negative impact on existing fauna, flora species under this water areas, if any, may be pointed out.
3. Tanzania is a country that has already ratified the Biodiversity Convention, and risks of negative impact can be significant if not properly attained to.
TOR: Investigation on endemic species (especially by IUCN red book categorization), existing in the water areas of especially the dredging area, and east end part of the General Cargo Berth, currently demolished and under the water should be conducted. Then after, what negative impact could be anticipated needs to be clarified, with appropriate mitigation measures (ex. installation of silt protector sheets around the dredging area, and relocation of any rare endemic species subjected for protection, etc.).
B- B- or A-
3
Hydrological Situation
No 1. The project involves reconstruction of the pier of the berth, that may alter the hydrological situation to a certain extent, though almost negligible.
2. The east end of the cargo berth, currently demolished will be reconstructed during implementation of the project. It may be noted that some extent of the shore line will be altered, and may cause change to the hydrological situation. However, though it is known that some extent of current (clockwise current) do exist in Lake Tanganyika, its impact can be considered very trivial and thus almost negligible.
C C
4
Topography & Geology
Yes 1. As explained in above "Hydrological Situation" item, a small area of the currently demolished east end part of the cargo berth shall be fixed, and so the shore line can be considered to be altered to a certain extent.
TOR: Though it can be noted that alternation of the shore line can be considered as minimum, alteration to the topographic and geological environment may have certain degree of impact to especially the endemic species habitat.
C B-
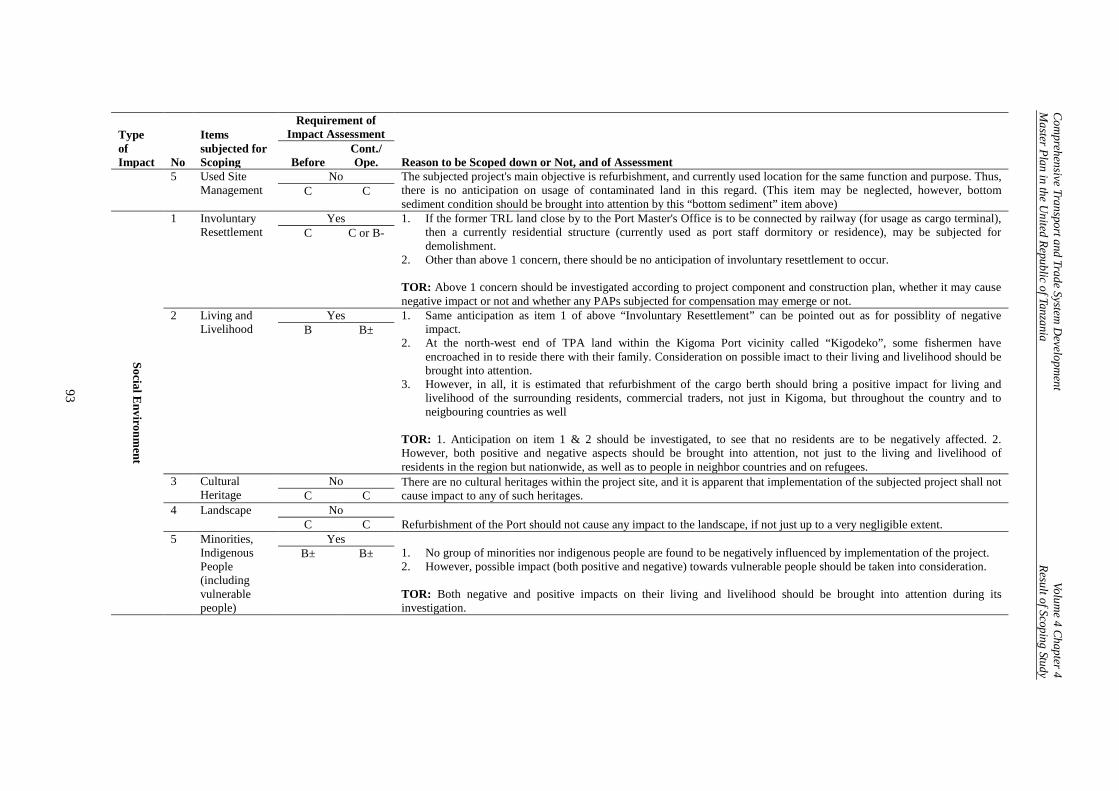
Com
prehensive Transport and Trade System D
evelopment
Volume 4 Chapter 4
Master Plan in the U
nited Republic of Tanzania Result of Scoping Study
93
Type of Impact No
Items subjected for Scoping
Requirement of Impact Assessment
Reason to be Scoped down or Not, and of Assessment Before Cont./ Ope.
5
Used Site Management
No The subjected project's main objective is refurbishment, and currently used location for the same function and purpose. Thus, there is no anticipation on usage of contaminated land in this regard. (This item may be neglected, however, bottom sediment condition should be brought into attention by this “bottom sediment” item above)
C C
Social Environm
ent
1
Involuntary Resettlement
Yes 1. If the former TRL land close by to the Port Master's Office is to be connected by railway (for usage as cargo terminal), then a currently residential structure (currently used as port staff dormitory or residence), may be subjected for demolishment.
2. Other than above 1 concern, there should be no anticipation of involuntary resettlement to occur. TOR: Above 1 concern should be investigated according to project component and construction plan, whether it may cause negative impact or not and whether any PAPs subjected for compensation may emerge or not.
C C or B-
2
Living and Livelihood
Yes 1. Same anticipation as item 1 of above “Involuntary Resettlement” can be pointed out as for possiblity of negative impact.
2. At the north-west end of TPA land within the Kigoma Port vicinity called “Kigodeko”, some fishermen have encroached in to reside there with their family. Consideration on possible imact to their living and livelihood should be brought into attention.
3. However, in all, it is estimated that refurbishment of the cargo berth should bring a positive impact for living and livelihood of the surrounding residents, commercial traders, not just in Kigoma, but throughout the country and to neigbouring countries as well
TOR: 1. Anticipation on item 1 & 2 should be investigated, to see that no residents are to be negatively affected. 2. However, both positive and negative aspects should be brought into attention, not just to the living and livelihood of residents in the region but nationwide, as well as to people in neighbor countries and on refugees.
B B±
3 Cultural Heritage
No There are no cultural heritages within the project site, and it is apparent that implementation of the subjected project shall not cause impact to any of such heritages. C C
4
Landscape No Refurbishment of the Port should not cause any impact to the landscape, if not just up to a very negligible extent. C C
5
Minorities, Indigenous People (including vulnerable people)
Yes 1. No group of minorities nor indigenous people are found to be negatively influenced by implementation of the project. 2. However, possible impact (both positive and negative) towards vulnerable people should be taken into consideration. TOR: Both negative and positive impacts on their living and livelihood should be brought into attention during its investigation.
B± B±
Comprehensive Transport and Trade System Development Volume 4 Chapter 4 Master Plan in the United Republic of Tanzania Result of Scoping Study
94
4.2 Scoping Result of Central Line Rehabilitation of Bridges and Culverts; and Track Relay in Heavier Rail (Kigoma–Tabora) Project
With regard to the Central Line Rehabilitation of Bridges and Culverts; and Track Relay in Heavier Rail (Kigoma–Tabora) Project, the following points were taken into consideration, with the scoping result and TOR as presented in the following Table 4.2. 1. According to TRL, it is said that the subjected railway reserve is not within the vicinity of
any protected area, though close to Moyowosi and Kigosi Game Reserves. Even so, it is advised that during the EIA stage, any possibility of negative impact towards the nearby protected area should be taken into consideration (for avoidance, mitigation and compensation of impacts, etc.).
2. By site observation of the Central Line track half way towards Tabora from Kigoma, there
are no fences installed to avoid pedestrians trespassing into the railway reserve, and that according to TRL, has caused many accidents leading to human injury or death (by trains colliding with pedestrians walking along the rail tracks). Such situation resulting in fatal accidents should be avoided in every way possible, firstly by installing fences around the railway reserve.
3. Also through site observation, it was confirmed that for railroad crossings, no gates, alarms
or fences were installed. At some parts of the railway sections, the railway was passing through the middle of a village (with the state of railroad crossing as mentioned above), or very close by to a primary school, etc. This was found extremely dangerous for pedestrians and so appropriate measures to avoid accidents from happening should be taken into consideration, otherwise, fatal accidents may rise since rehabilitation and improvements will make the trains go faster, making it more difficult to slow down to avoid accidents.
4. On the other hand, it should be noted that some vast amount of encroached farmlands at
both sides of the railway were sited within the railway reserve. If fences are to be installed for pedestrians to prevent trespassing within the railway reserve, loss of farmlands will be inevitable (it is one of the requirements for the recipient country to make compensations for even illegal settlers, small-scale businesses, and farmlands, etc., as one of the conditions stipulated in the JICA Environmental and Social Consideration Guideline 2010). Appropriate measures for compensation must be taken as it shall be one of JICA’s project appraisal requirements.
5. Other minor issue is that approximately around 30 km from Kigoma to Tabora, a famous
grave called “Mama Katumbo” was confirmed as one of the surrounding cultural heritages. Since this project is only a rehabilitation project, it can be said that this specific issue would not develop into a big issue; however, it will no doubt be important to avoid causing impact towards such cultural heritages.
As a result, both subjected Pre-F/S projects can be defined as Environmental Category “B” projects, with certain extent of environmental and social impacts expected, but without any anticipation of significant negative impacts in reference to Appendix 3 (Illustrative List of Sensitive Sectors, Characteristics, and Areas) of the JICA Environmental and Social Consideration Guideline 2010, as criteria for determination of significance of such impacts.
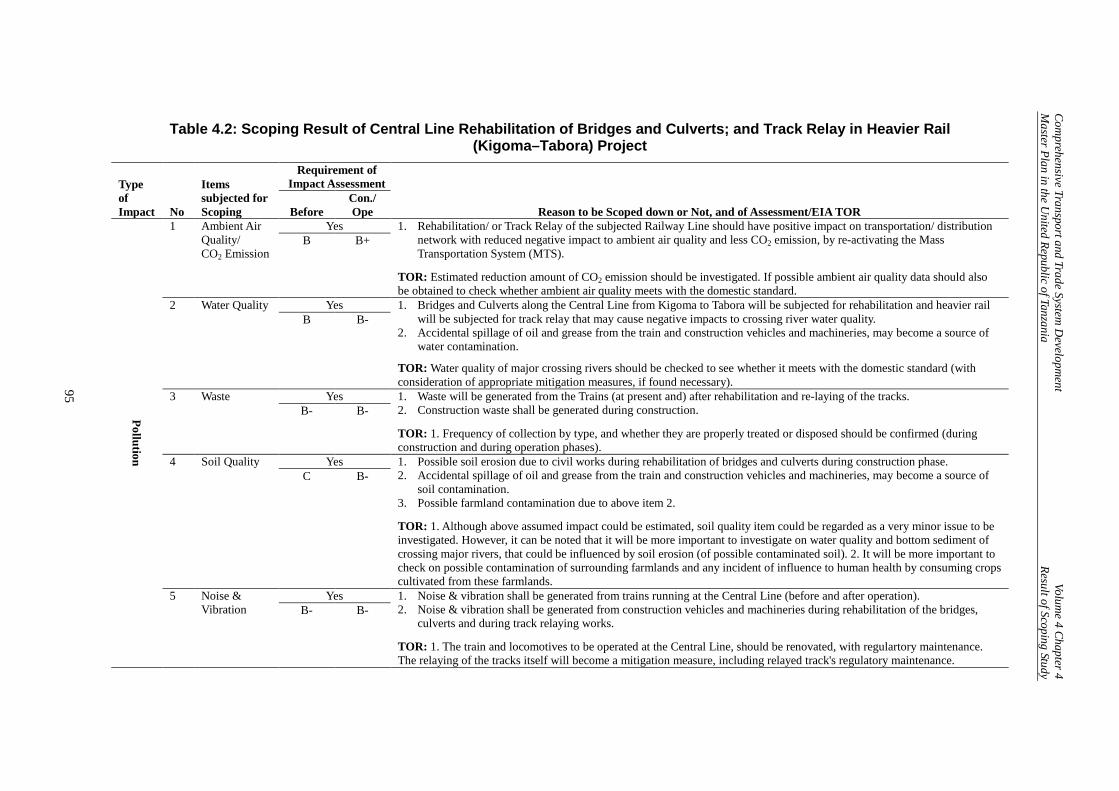
Com
prehensive Transport and Trade System D
evelopment
Volume 4 Chapter 4
Master Plan in the U
nited Republic of Tanzania Result of Scoping Study
95
Table 4.2: Scoping Result of Central Line Rehabilitation of Bridges and Culverts; and Track Relay in Heavier Rail (Kigoma–Tabora) Project
Type of Impact No
Items subjected for Scoping
Requirement of Impact Assessment
Reason to be Scoped down or Not, and of Assessment/EIA TOR Before Con./ Ope
Pollution
1
Ambient Air Quality/ CO2 Emission
Yes 1. Rehabilitation/ or Track Relay of the subjected Railway Line should have positive impact on transportation/ distribution network with reduced negative impact to ambient air quality and less CO2 emission, by re-activating the Mass Transportation System (MTS).
TOR: Estimated reduction amount of CO2 emission should be investigated. If possible ambient air quality data should also be obtained to check whether ambient air quality meets with the domestic standard.
B B+
2
Water Quality Yes 1. Bridges and Culverts along the Central Line from Kigoma to Tabora will be subjected for rehabilitation and heavier rail will be subjected for track relay that may cause negative impacts to crossing river water quality.
2. Accidental spillage of oil and grease from the train and construction vehicles and machineries, may become a source of water contamination.
TOR: Water quality of major crossing rivers should be checked to see whether it meets with the domestic standard (with consideration of appropriate mitigation measures, if found necessary).
B B-
3
Waste Yes 1. Waste will be generated from the Trains (at present and) after rehabilitation and re-laying of the tracks. 2. Construction waste shall be generated during construction.
TOR: 1. Frequency of collection by type, and whether they are properly treated or disposed should be confirmed (during construction and during operation phases).
B- B-
4
Soil Quality Yes 1. Possible soil erosion due to civil works during rehabilitation of bridges and culverts during construction phase. 2. Accidental spillage of oil and grease from the train and construction vehicles and machineries, may become a source of
soil contamination. 3. Possible farmland contamination due to above item 2.
TOR: 1. Although above assumed impact could be estimated, soil quality item could be regarded as a very minor issue to be investigated. However, it can be noted that it will be more important to investigate on water quality and bottom sediment of crossing major rivers, that could be influenced by soil erosion (of possible contaminated soil). 2. It will be more important to check on possible contamination of surrounding farmlands and any incident of influence to human health by consuming crops cultivated from these farmlands.
C B-
5
Noise & Vibration
Yes 1. Noise & vibration shall be generated from trains running at the Central Line (before and after operation). 2. Noise & vibration shall be generated from construction vehicles and machineries during rehabilitation of the bridges,
culverts and during track relaying works.
TOR: 1. The train and locomotives to be operated at the Central Line, should be renovated, with regulartory maintenance. The relaying of the tracks itself will become a mitigation measure, including relayed track's regulatory maintenance.
B- B-
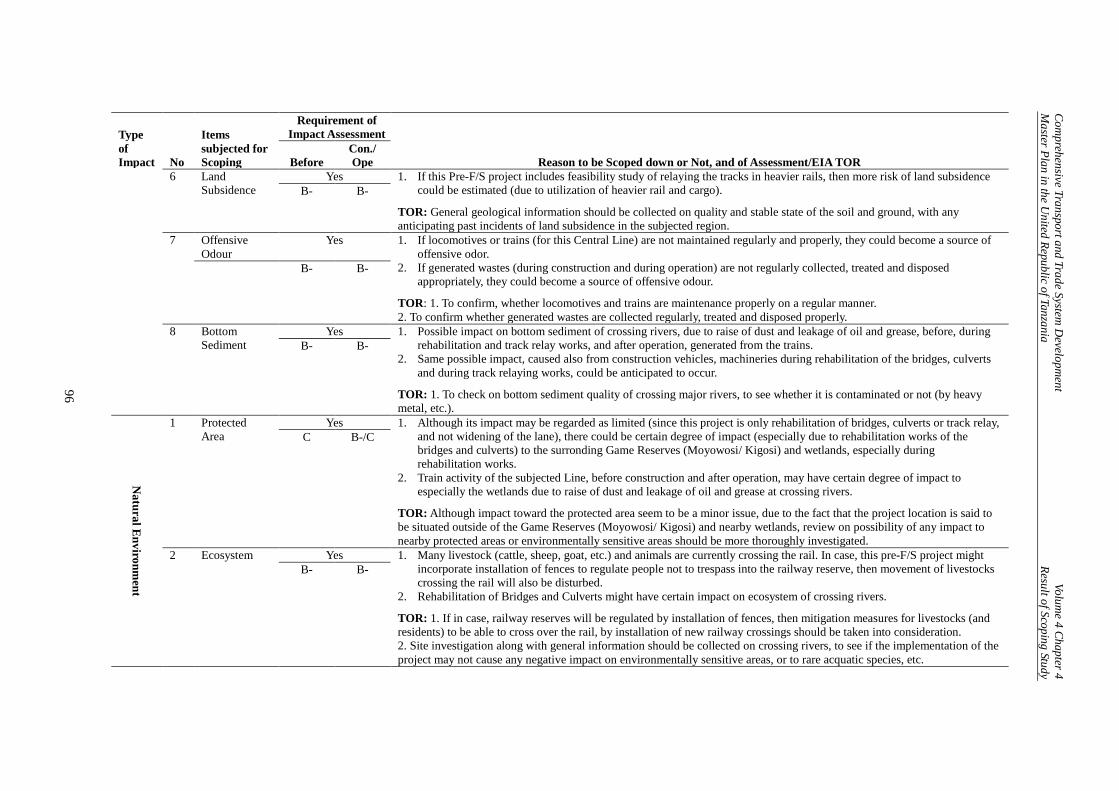
Com
prehensive Transport and Trade System D
evelopment
Volume 4 Chapter 4
Master Plan in the U
nited Republic of Tanzania Result of Scoping Study
96
Type of Impact No
Items subjected for Scoping
Requirement of Impact Assessment
Reason to be Scoped down or Not, and of Assessment/EIA TOR Before Con./ Ope
6
Land Subsidence
Yes 1. If this Pre-F/S project includes feasibility study of relaying the tracks in heavier rails, then more risk of land subsidence could be estimated (due to utilization of heavier rail and cargo).
TOR: General geological information should be collected on quality and stable state of the soil and ground, with any anticipating past incidents of land subsidence in the subjected region.
B- B-
7
Offensive Odour
Yes 1. If locomotives or trains (for this Central Line) are not maintained regularly and properly, they could become a source of offensive odor.
2. If generated wastes (during construction and during operation) are not regularly collected, treated and disposed appropriately, they could become a source of offensive odour.
TOR: 1. To confirm, whether locomotives and trains are maintenance properly on a regular manner. 2. To confirm whether generated wastes are collected regularly, treated and disposed properly.
B- B-
8
Bottom Sediment
Yes 1. Possible impact on bottom sediment of crossing rivers, due to raise of dust and leakage of oil and grease, before, during rehabilitation and track relay works, and after operation, generated from the trains.
2. Same possible impact, caused also from construction vehicles, machineries during rehabilitation of the bridges, culverts and during track relaying works, could be anticipated to occur.
TOR: 1. To check on bottom sediment quality of crossing major rivers, to see whether it is contaminated or not (by heavy metal, etc.).
B- B-
Natural Environm
ent
1
Protected Area
Yes 1. Although its impact may be regarded as limited (since this project is only rehabilitation of bridges, culverts or track relay, and not widening of the lane), there could be certain degree of impact (especially due to rehabilitation works of the bridges and culverts) to the surronding Game Reserves (Moyowosi/ Kigosi) and wetlands, especially during rehabilitation works.
2. Train activity of the subjected Line, before construction and after operation, may have certain degree of impact to especially the wetlands due to raise of dust and leakage of oil and grease at crossing rivers.
TOR: Although impact toward the protected area seem to be a minor issue, due to the fact that the project location is said to be situated outside of the Game Reserves (Moyowosi/ Kigosi) and nearby wetlands, review on possibility of any impact to nearby protected areas or environmentally sensitive areas should be more thoroughly investigated.
C B-/C
2
Ecosystem Yes 1. Many livestock (cattle, sheep, goat, etc.) and animals are currently crossing the rail. In case, this pre-F/S project might incorporate installation of fences to regulate people not to trespass into the railway reserve, then movement of livestocks crossing the rail will also be disturbed.
2. Rehabilitation of Bridges and Culverts might have certain impact on ecosystem of crossing rivers.
TOR: 1. If in case, railway reserves will be regulated by installation of fences, then mitigation measures for livestocks (and residents) to be able to cross over the rail, by installation of new railway crossings should be taken into consideration. 2. Site investigation along with general information should be collected on crossing rivers, to see if the implementation of the project may not cause any negative impact on environmentally sensitive areas, or to rare acquatic species, etc.
B- B-
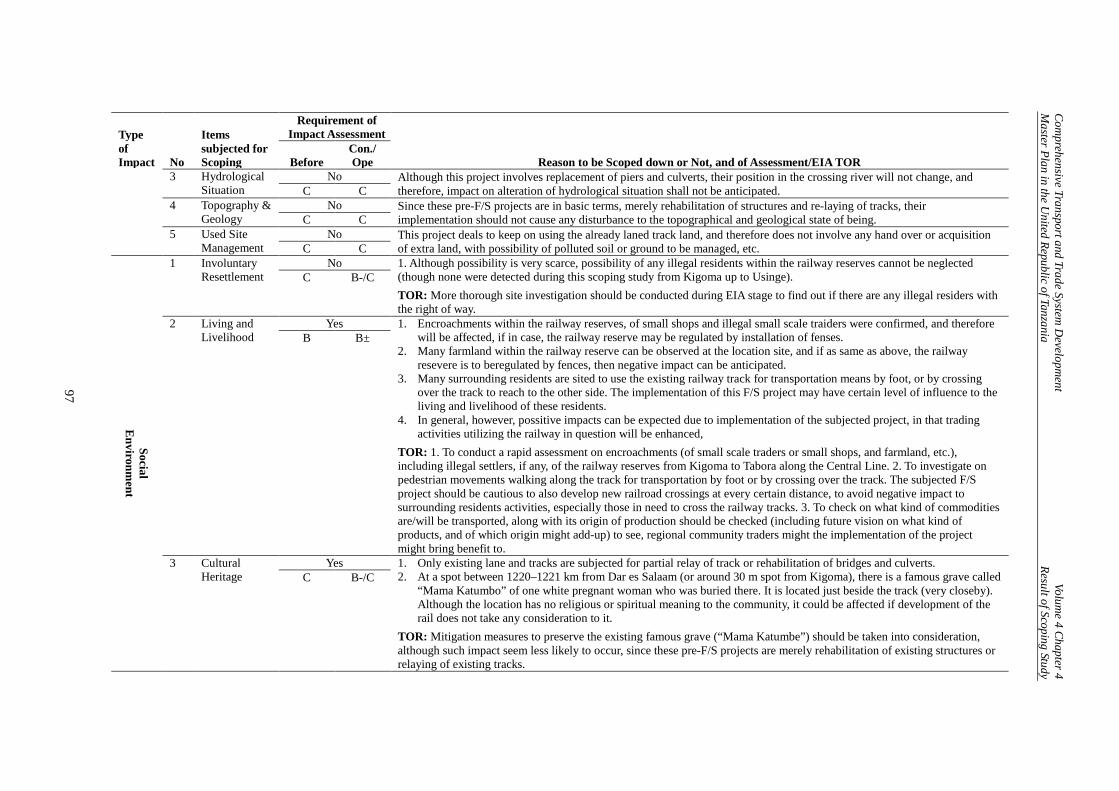
Com
prehensive Transport and Trade System D
evelopment
Volume 4 Chapter 4
Master Plan in the U
nited Republic of Tanzania Result of Scoping Study
97
Type of Impact No
Items subjected for Scoping
Requirement of Impact Assessment
Reason to be Scoped down or Not, and of Assessment/EIA TOR Before Con./ Ope
3
Hydrological Situation
No Although this project involves replacement of piers and culverts, their position in the crossing river will not change, and therefore, impact on alteration of hydrological situation shall not be anticipated. C C
4
Topography & Geology
No Since these pre-F/S projects are in basic terms, merely rehabilitation of structures and re-laying of tracks, their implementation should not cause any disturbance to the topographical and geological state of being. C C
5
Used Site Management
No This project deals to keep on using the already laned track land, and therefore does not involve any hand over or acquisition of extra land, with possibility of polluted soil or ground to be managed, etc. C C
Social E
nvironment
1
Involuntary Resettlement
No 1. Although possibility is very scarce, possibility of any illegal residents within the railway reserves cannot be neglected (though none were detected during this scoping study from Kigoma up to Usinge). TOR: More thorough site investigation should be conducted during EIA stage to find out if there are any illegal residers with the right of way.
C B-/C
2
Living and Livelihood
Yes 1. Encroachments within the railway reserves, of small shops and illegal small scale traiders were confirmed, and therefore will be affected, if in case, the railway reserve may be regulated by installation of fenses.
2. Many farmland within the railway reserve can be observed at the location site, and if as same as above, the railway resevere is to beregulated by fences, then negative impact can be anticipated.
3. Many surrounding residents are sited to use the existing railway track for transportation means by foot, or by crossing over the track to reach to the other side. The implementation of this F/S project may have certain level of influence to the living and livelihood of these residents.
4. In general, however, possitive impacts can be expected due to implementation of the subjected project, in that trading activities utilizing the railway in question will be enhanced,
TOR: 1. To conduct a rapid assessment on encroachments (of small scale traders or small shops, and farmland, etc.), including illegal settlers, if any, of the railway reserves from Kigoma to Tabora along the Central Line. 2. To investigate on pedestrian movements walking along the track for transportation by foot or by crossing over the track. The subjected F/S project should be cautious to also develop new railroad crossings at every certain distance, to avoid negative impact to surrounding residents activities, especially those in need to cross the railway tracks. 3. To check on what kind of commodities are/will be transported, along with its origin of production should be checked (including future vision on what kind of products, and of which origin might add-up) to see, regional community traders might the implementation of the project might bring benefit to.
B B±
3
Cultural Heritage
Yes 1. Only existing lane and tracks are subjected for partial relay of track or rehabilitation of bridges and culverts. 2. At a spot between 1220–1221 km from Dar es Salaam (or around 30 m spot from Kigoma), there is a famous grave called
“Mama Katumbo” of one white pregnant woman who was buried there. It is located just beside the track (very closeby). Although the location has no religious or spiritual meaning to the community, it could be affected if development of the rail does not take any consideration to it.
TOR: Mitigation measures to preserve the existing famous grave (“Mama Katumbe”) should be taken into consideration, although such impact seem less likely to occur, since these pre-F/S projects are merely rehabilitation of existing structures or relaying of existing tracks.
C B-/C
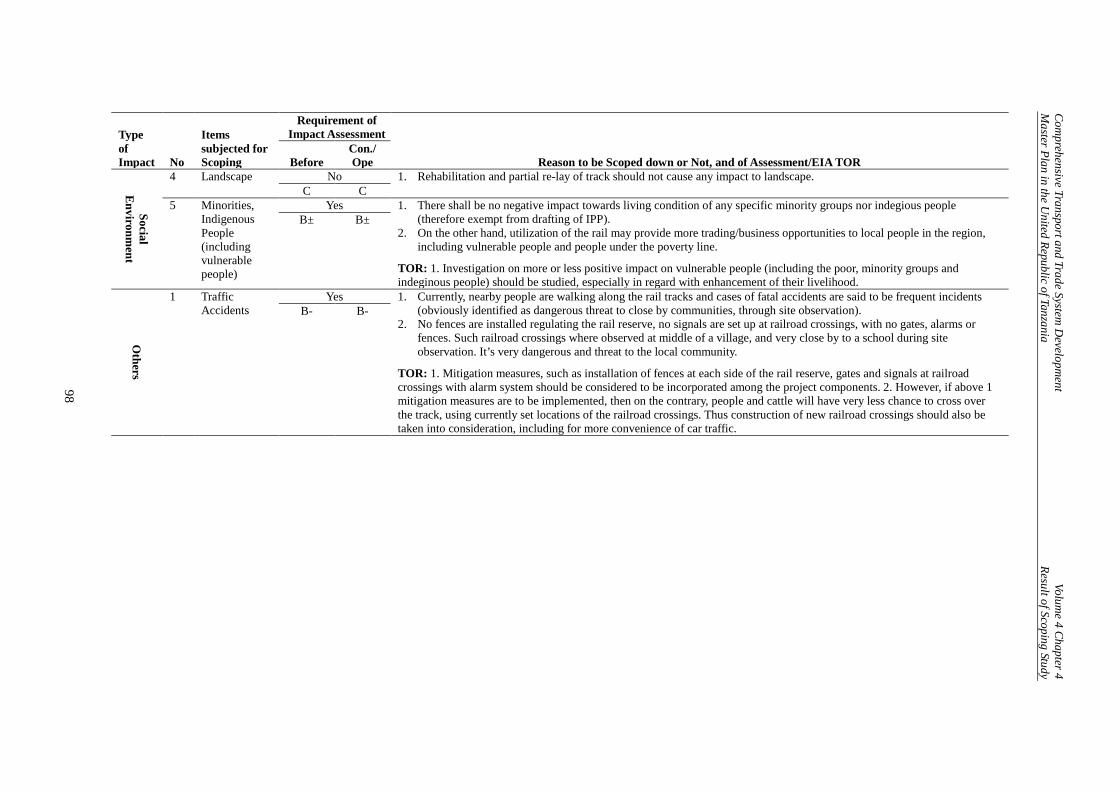
Com
prehensive Transport and Trade System D
evelopment
Volume 4 Chapter 4
Master Plan in the U
nited Republic of Tanzania Result of Scoping Study
98
Type of Impact No
Items subjected for Scoping
Requirement of Impact Assessment
Reason to be Scoped down or Not, and of Assessment/EIA TOR Before Con./ Ope
Social E
nvironment
4 Landscape No 1. Rehabilitation and partial re-lay of track should not cause any impact to landscape. C C
5 Minorities, Indigenous People (including vulnerable people)
Yes 1. There shall be no negative impact towards living condition of any specific minority groups nor indegious people (therefore exempt from drafting of IPP).
2. On the other hand, utilization of the rail may provide more trading/business opportunities to local people in the region, including vulnerable people and people under the poverty line.
TOR: 1. Investigation on more or less positive impact on vulnerable people (including the poor, minority groups and indeginous people) should be studied, especially in regard with enhancement of their livelihood.
B± B±
Others
1
Traffic Accidents
Yes 1. Currently, nearby people are walking along the rail tracks and cases of fatal accidents are said to be frequent incidents (obviously identified as dangerous threat to close by communities, through site observation).
2. No fences are installed regulating the rail reserve, no signals are set up at railroad crossings, with no gates, alarms or fences. Such railroad crossings where observed at middle of a village, and very close by to a school during site observation. It’s very dangerous and threat to the local community.
TOR: 1. Mitigation measures, such as installation of fences at each side of the rail reserve, gates and signals at railroad crossings with alarm system should be considered to be incorporated among the project components. 2. However, if above 1 mitigation measures are to be implemented, then on the contrary, people and cattle will have very less chance to cross over the track, using currently set locations of the railroad crossings. Thus construction of new railroad crossings should also be taken into consideration, including for more convenience of car traffic.
B- B-

Appendices

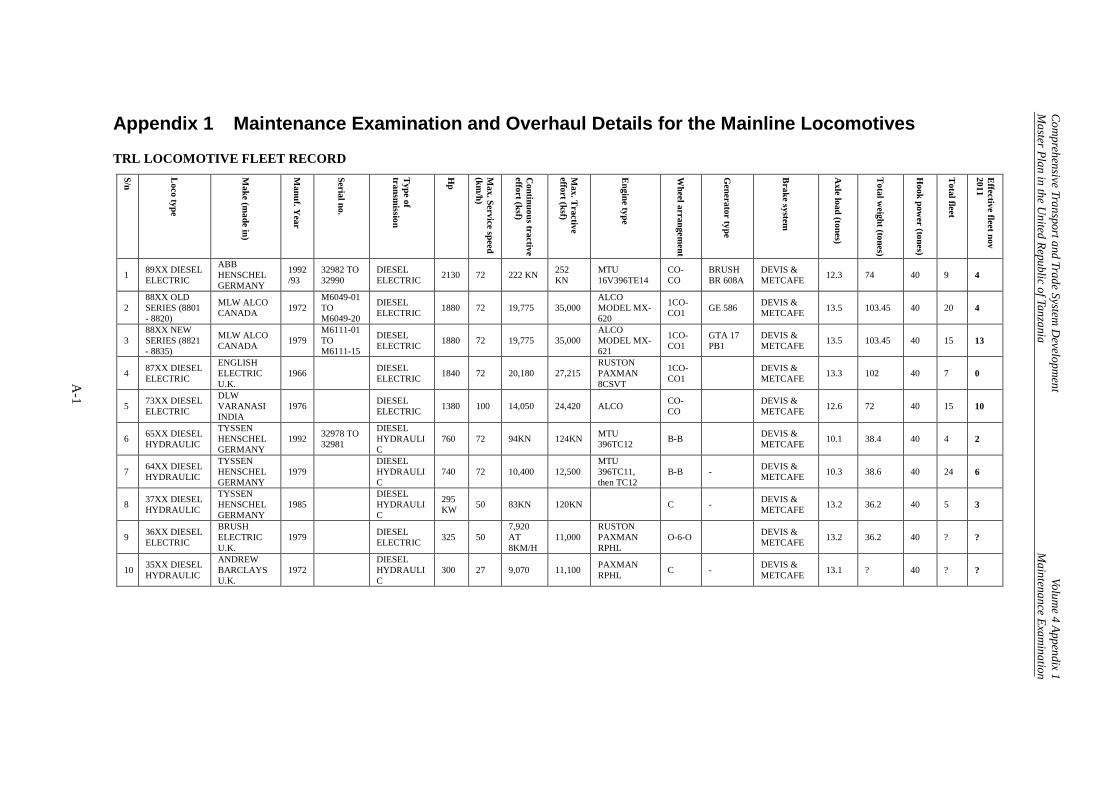
Com
prehensive Transport and Trade System D
evelopment
Volume 4 Appendix 1
Master Plan in the U
nited Republic of Tanzania M
aintenance Examination
A-1
Appendix 1 Maintenance Examination and Overhaul Details for the Mainline Locomotives TRL LOCOMOTIVE FLEET RECORD
S/n
Loco type
Make (m
ade in)
Manuf. Y
ear
Serial no.
Type of
transmission
Hp
Max. Service speed
(km/h)
Continuous tractive
effort (ksf)
Max. T
ractive effort (ksf)
Engine type
Wheel arrangem
ent
Generator type
Brake system
Axle load (tones)
Total w
eight (tones)
Hook pow
er (tones)
Total fleet
Effective fleet nov
2011
1 89XX DIESEL ELECTRIC
ABB HENSCHEL GERMANY
1992/93
32982 TO 32990
DIESEL ELECTRIC 2130 72 222 KN 252
KN MTU 16V396TE14
CO-CO
BRUSH BR 608A
DEVIS & METCAFE 12.3 74 40 9 4
2 88XX OLD SERIES (8801 - 8820)
MLW ALCO CANADA 1972
M6049-01 TO M6049-20
DIESEL ELECTRIC 1880 72 19,775 35,000
ALCO MODEL MX- 620
1CO-CO1 GE 586 DEVIS &
METCAFE 13.5 103.45 40 20 4
3 88XX NEW SERIES (8821 - 8835)
MLW ALCO CANADA 1979
M6111-01 TO M6111-15
DIESEL ELECTRIC 1880 72 19,775 35,000
ALCO MODEL MX- 621
1CO-CO1
GTA 17 PB1
DEVIS & METCAFE 13.5 103.45 40 15 13
4 87XX DIESEL ELECTRIC
ENGLISH ELECTRIC U.K.
1966 DIESEL ELECTRIC 1840 72 20,180 27,215
RUSTON PAXMAN 8CSVT
1CO-CO1 DEVIS &
METCAFE 13.3 102 40 7 0
5 73XX DIESEL ELECTRIC
DLW VARANASI INDIA
1976 DIESEL ELECTRIC 1380 100 14,050 24,420 ALCO CO-
CO DEVIS & METCAFE 12.6 72 40 15 10
6 65XX DIESEL HYDRAULIC
TYSSEN HENSCHEL GERMANY
1992 32978 TO 32981
DIESEL HYDRAULIC
760 72 94KN 124KN MTU 396TC12 B-B DEVIS &
METCAFE 10.1 38.4 40 4 2
7 64XX DIESEL HYDRAULIC
TYSSEN HENSCHEL GERMANY
1979 DIESEL HYDRAULIC
740 72 10,400 12,500 MTU 396TC11, then TC12
B-B - DEVIS & METCAFE 10.3 38.6 40 24 6
8 37XX DIESEL HYDRAULIC
TYSSEN HENSCHEL GERMANY
1985 DIESEL HYDRAULIC
295 KW 50 83KN 120KN C - DEVIS &
METCAFE 13.2 36.2 40 5 3
9 36XX DIESEL ELECTRIC
BRUSH ELECTRIC U.K.
1979 DIESEL ELECTRIC 325 50
7,920 AT 8KM/H
11,000 RUSTON PAXMAN RPHL
O-6-O DEVIS & METCAFE 13.2 36.2 40 ? ?
10 35XX DIESEL HYDRAULIC
ANDREW BARCLAYS U.K.
1972 DIESEL HYDRAULIC
300 27 9,070 11,100 PAXMAN RPHL C - DEVIS &
METCAFE 13.1 ? 40 ? ?
Comprehensive Transport and Trade System Development Volume 4 Appendix 2 Master Plan in the United Republic of Tanzania Morogoro Workshop
A-2
Appendix 2 Morogoro Workshop TRL’s Morogoro Locomotive Overhaul Workshop plus Running Shed were visited on Friday, 31 August 2012 Attendees: TRL: Mr. Nejon Goso, Mr. Joseph Kaiziagi, and Mr C Mgweno JICA: Mr. Shin Maruo JICA Study Team: Mr. Norifumo Yamamoto, Mr. Mortone Leo, and Mr. Eamonn Flaherty Mr. Mgweno joined at the end of the tour in the planning area. Mr. Maruo summarised why the background to the visit Mr. Ngoso, the Workshop Manager, described the history of Morogoro and provided a chronology of locomotive deliveries since 1972. He accounted for more than 100 locomotives. Mr. Ngoso then led a tour of the Overhaul Workshop and the Running Shed (where the scheduled maintenance plus any repairs are carried out). Mr. Ngoso was a knowledgeable and experienced person – he was aware of what was going on in the running shed, which can be a bit of a “transient” environment, with locomotives coming and going, sometimes quite quickly. One concern was that Mr. Ngoso stated that he had suffered recently from a stroke and as a result could not walk for a while. At the time of the visit, he was able to walk but his gait was unusual. The worry is that Mr Ngoso may be the “magic formula” for the site to work and operations might be seriously compromised if he were unable to carry on working. He stated that they conducted no training whatsoever (the most knowledgeable person in each area “trained” others). Mr. Ngoso introduced his assistant, but there did not appear to be a sufficiently robust succession plan overall, particularly on the workshop floor. There was not a single piece of paper in evidence anywhere that could be seen – no drawings, procedures, processes, or quality documentation. Thus, if most of the knowledge is in peoples’ heads, this knowledge could be easily lost through illness or retirement. Analysis • The following provides a snapshot summary (there was not much time at Morogoro) of
what was observed or elicited by questions and is by no means exhaustive. • The examples quoted are used to show what may be underlying systemic problems. • In order to make comparisons, a benchmark is needed to identify the standard of operations
directly related to locomotive reliability because the key is the capability to grasp reliability issues and produce high-quality locomotives.
o For instance, if one says that a Japanese/European workshop is at a “platinum-level”, the Morogoro workshop may be considered to be at the “bronze-level”. Therefore, the question is what level do they need to be at – stay at the bronze level or progress up the scale?
o This is important because each level will require increased investment in money and time. When each higher level is reached, the payback will be safer and more environmentally friendly processes and systems, in turn contributing to increased
Comprehensive Transport and Trade System Development Volume 4 Appendix 2 Master Plan in the United Republic of Tanzania Morogoro Workshop
A-3
speed of throughput of correct quality locomotives, leading to good reliability of the fleets.
o The analysis was carried out under three headings – Men, Machines, and Materials, but as stated above this is just a quick snapshot and is not exhaustive, and may not be fully representative.
• One thing that was clear from the outset was that safety and environmental issues seem to be well below standard.
o For instance, Mr. Ngoso conducted the tour of the workshops wearing open-toed sandals and the workers in the workshop were also wearing sandals or normal shoes (no steel toe-caps), so their feet would be completely crushed if the heavy items they were dealing with fell onto them.
o The workers were not wearing overalls either, just their normal everyday clothes; it would not be good if they return home to their families in these.
o Mr. Leo had discussions directly with workers in their own language and they endorsed the point that working conditions were not good in the workshop.
• One serious safety issue is how personnel work on locomotive roofs and ensure that they do not fall to their death; this has been a recent issue in Transnet Workshops in South Africa
o Often a “fall-arrest” system is used (wire and harness). o Mr. Ngoso was asked how his personnel worked on locomotive roofs as there were
deep pits with raised rails. o Mr. Ngoso said they used ladders (which are not allowed in UK rail depots for
instance; staging must be used).
• There were a number of health and safety issues observed, e.g., a locomotive was being lifted on four screw jacks and personnel were still allowed to work underneath. If a jack fails, the men would be seriously injured or killed.
• An introduction was made to the “planning person” who also seemed very capable – Mr. Mgweno - who showed his white boards, listing all locomotives (but not the ones outside that has been vandalized).
• Mr. Maruo stated that he had been told that if the major overhaul kits were delivered, the Workshop could produce locomotives.
• Based on the “snapshot” observations, there were no visible processes/drawings, and considering the complexity of diesel traction compared to electric, there was a concern that perhaps the locomotives could be built, but their reliability may not be sustained once they left the workshop. This would be a concern if money had been spent on new overhaul kits.
• Workers in many workshops often say “get me the material and I can do the job for you”, but often this is not true. If there is a general material shortage, staff become accustomed to this situation and there is no urgency in keeping other complementary systems in good working condition, so that when the material arrives, which staff do not expect to ever happen, they get caught unprepared and other systems around it fail.
o If the material arrives, other issues (e.g., capability/competency, engineering, tooling) surface.
o These other issues are hidden behind the lack of material. If the lack of materials continues over an extended period of time, personnel do not bother to address them with any urgency, since they become used to having no material and when material arrives they are unprepared.
Comprehensive Transport and Trade System Development Volume 4 Appendix 2 Master Plan in the United Republic of Tanzania Morogoro Workshop
A-4
Men (meant to cover both men and women) • A dayshift only is worked – 07:00 to 17:00.
• There is a need to understand how failed locomotives are attended to outside of these times. o Possibly they are managed exclusively by Control, but what if there is need to carry
out a bigger repair on the locomotive? o Possibly the “ethos” is to have enough spare locomotives to substitute for failed
locomotives, but this is an expensive solution and does not encourage the search for better reliability.
• The workers are paid a salary and there are six salary bands, but most personnel (having been there a long time) are near the top and there is effectively no pay incentive for these people.
o The concern here is that where straight salary is paid, there is usually significant sub-optimal productivity
o Mr. Ngoso explained that they used to have a “piecework system” (which usually refers to reward for volume of output), but this was not being suggested; the suggestion was more of an incentive scheme for locomotive speed of throughput, linked to defined acceptable quality, safe operations, ongoing reliability.
• Mr. Ngoso explained briefly that there were smaller depots at Tabora and Dar es Salaam and much smaller turnaround depots.
• Mr. Ngoso explained about the “exam regime” that is applied to locomotives. There appeared to no evidence of schedules being followed as work was undertaken; one would expect to see at least a checklist with a sheet signed off by the supervisor.
• The process was for locomotive throughput was not evident since there were no planning or key performance indicator (KPI) data exhibited other than on the planning whiteboard and this was upstairs away from the Workshop and showed only “high-level” detail on locomotive quantities and status.
o It would be good to see each work section (cell) have a “communication board” showing the relevant KPIs for that area/cell, showing the plan, targets, and achievement against these targets, accident statistics, and the like.
o It would be expected that the area/cell supervisor would hold their meetings at this location at the start of their shifts.
• There was “sub-assembly” activity in various closed rooms, e.g., relays, turbo-blowers, and the staff could not be seen. Whenever staff are out of sight, it is often the case that there is low productivity; but segregation is sometimes required for cleanliness e.g. fuel injectors of course. Perhaps perspex (plastic) windows could be installed in this case.
• Since there were no KPI boards in these annexes, it was unclear what the subassembly plans
were and how this related to the overall locomotive throughput.
• Mr. Ngoso explained that there is no training carried out at present on site but there is a training room.
o He further explained that apprentices are trained in Tabora but leave after they are trained.
o He stated that his assistant is a trainer. o He stated that trainers had to be degree-qualified and workshop-experienced. It was
observed that possibly this was somewhat over-ambitious, certainly initially. o The question was raised about allocating time to senior personnel to at least do
some training; a strong business case should be demonstrated.
Comprehensive Transport and Trade System Development Volume 4 Appendix 2 Master Plan in the United Republic of Tanzania Morogoro Workshop
A-5
o Mr. Ngoso stated that it was their intention to get accredited by the National Council. A question came as to how this could be achieved, certainly in the short term, since they were not conducting training.
• Mr. Ngoso estimated that the average age of the workforce is 45, but Mr. Maruo made the observation that there are relatively old workers so when the older ones retire this could be a problem, particularly with no training or succession plan.
o Subsequent to the visit the following staff numbers were established: Age 20-30: 0 Age 30 – 40: 0 Age 40 – 50: 59 Age 50 – 60: 61 Total: 120 Retirement Age: 60
• The observation was made that this situation has been seen in other organisations. If there is
a serious lack of drawings, procedures, and documented processes, the knowledge is mostly held in the heads of the older workers and notebooks in their pockets. When they leave, this is a serious problem as the knowledge is lost
• Mr. Ngoso stated that the staff turnover was “effectively zero”.
• A logbook of one of the drivers in the running shed was seen and it was very well written and very comprehensive, indicating that the driver had been very diligent in recording as much detail as possible.
• In addition to closed-room annexes, there were a number of cells out in the open workshop, but again, there was no KPI board and no labelling of items, so it was not obvious which were repairables and which were serviceable. There appeared to be no quality system in place.
• There was a bogie cell with a number of frames standing.
o There was evidence of dye penetrant crack testing. o It was asked if there were repair procedures for cracked areas. o Mr. Ngoso replied that if cracks were detected the frame was scrapped. o This could be unnecessarily expensive.
• There were a number of wheel sets around.
o There was an inquiry about how axles were tested for cracks. o Mr. Ngoso said there was an ultrasonic testing kit upstairs. o There was little evidence of ultrasonic testing, and if it is not carried out on axles,
there is a risk of fatigue cracking going unnoticed until the axle possibly fails by shearing. If a derailment of a freight train occurs this is bad enough, but if the axle shears on passenger service, this would be catastrophic.
Machines There were a great number of different machines used in the workshop.
o There appeared to be no obvious calibration system in place (e.g., there were no stickers on instruments).
o This was particularly concerning for the 80 degrees Celsisus water pressure tester, from a safety perspective.
Comprehensive Transport and Trade System Development Volume 4 Appendix 2 Master Plan in the United Republic of Tanzania Morogoro Workshop
A-6
Material • Mr. Ngoso explained that there was a third area on the site, the Warehouse, but this was not
toured. It would have been good to see this area and understand the awareness of supplying kits of material just in time (JIT) with the delivery to specially allocated storage areas close to the working areas (kanbans).
• Mr. Ngoso explained very briefly that there were smaller depots at Tabora and Dar es
Salaam and much smaller turnaround depots.
• It would be good to understand what material is held at each site plus the procurement strategy, e.g., is re-ordering triggered by usage? What proportion of stock is very slow-moving and is money spent on material prioritised by usage?
• If identical items are stored on different sites, what is the mechanism to prioritise the greatest needs?
o Previous experience in other organisations suggests that on different sites, if you are not careful, material will be retained that is not immediately needed and not freely sent to another site with the greater need. Disciplined intervention is required.
o Experience also suggests that if there is a lack of discipline in the materials system, spending will not be optimally directed
• Mr. Ngoso stated that some pumps had been sent to Dubai for repair. This further raises questions about their procurement strategy as there may be closer suppliers, e.g.. in South Africa.
• There was a suggestion that RITES personnel had removed locomotive components from
the site and took them to India and never returned them
• In the workshop there was a traction motor location pin being reduced in size on a shaping machine. It looked like it would take three hours to complete the task..
o This triggered the question of what the “make-buy” philosophy is. o While that pin was being made, a required traction motor was standing on the floor
and no doubt a locomotive was standing too. o It is possible that things are being made that could be bought less expensively (but
procurement and contracting skills would be required). o This would allow stock to be held and be immediately available, minimising
locomotive output delays.
• The relay bank being worked on in one of the closed rooms/annexes had been removed from the locomotive and the locomotive was standing waiting for it to be refurbished and refitted. This was obviously a concern as ideally there should have been a spare part on the shelf, ready to fit.
• The question was raised about whether there could be a 2-bin issuing system for fixtures
and fasteners adjacent to working areas and not part of any kit delivery.