farmingsystems.pdf - Tanzania Online Gateway
90
Sustainable Management of Usangu Wetland and its Catchment March 2001 Final report - Farming systems Page No. i TABLE OF CONTENTS 1. INTRODUCTION......................................................................................... 1 1.1 Background Information ......................................................................................................... 1 1.2 The farming systems study ...................................................................................................... 2 1.3 Objectives of the study ............................................................................................................ 2 1.3.1 Main objective .................................................................................................................... 2 1.3.2 Specific objectives .............................................................................................................. 2 2. METHODOLOGY........................................................................................ 3 2.1 Review of secondary information............................................................................................ 3 2.2 Reconnaissance survey ............................................................................................................ 3 2.2.1 Key informant interviews ................................................................................................... 3 2.2.2 Dialogue with farmers ........................................................................................................ 3 2.2.3 Participants observation .................................................................................................... 3 2.2.4 Areas visited during the reconnaissance survey ................................................................. 4 2.3 The formal survey.................................................................................................................... 4 2.3.1 Selection of study villages .................................................................................................. 4 2.3.2 Farmer selection ................................................................................................................. 5 2.3.3 Questionnaire survey ........................................................................................................... 5 2.3.4 Data analysis....................................................................................................................... 5 3. THE STUDY AREA ..................................................................................... 6 3.1 Biophysical environment and infrastructure............................................................................ 6 3.1.1 Location and land area........................................................................................................ 6 3.1.2 The people .......................................................................................................................... 6 3.1.3 Physiography, climate and soils ......................................................................................... 7 3.1.4 Infrastructure .................................................................................................................... 12 3.1.5 Village leadership, social groups and institutions ............................................................ 13 3.2 Households composition and characteristics ......................................................................... 13 3.2.1 Household size and composition ...................................................................................... 13 3.2.2 Age and marital status ...................................................................................................... 13 3.2.3 Education level ................................................................................................................. 14 3.2.4 Ethnic composition ........................................................................................................... 14 3.2.6 Land ownership, acreage and distribution ....................................................................... 15 4. DESCRIPTION OF THE FARMING SYSTEMS .................................. 17 4.1 Potato-based farming system (FS1) ....................................................................................... 19 4.2. Maize-potato farming system (FS2) ...................................................................................... 21 4.3. Maize-Beans Farming System (FS3) .................................................................................... 23 4.4. Maize-based farming system (FS4) ....................................................................................... 24 4.6. Pastoral farming system......................................................................................................... 27 4.7 Tobacco-pastoral farming system.......................................................................................... 27 4.8. Maize - potato - tea farming system ...................................................................................... 27 4.9. Changes in the farming systems ........................................................................................... 28 5. CROP PRODUCTION ............................................................................... 30 5.1. Types of crops grown ............................................................................................................ 30
-
Upload
khangminh22 -
Category
Documents
-
view
4 -
download
0
Transcript of farmingsystems.pdf - Tanzania Online Gateway

Sustainable Management of Usangu Wetland and its Catchment March 2001
Final report - Farming systems Page No. i
TABLE OF CONTENTS
1. INTRODUCTION......................................................................................... 11.1 Background Information .........................................................................................................11.2 The farming systems study......................................................................................................21.3 Objectives of the study ............................................................................................................2
1.3.1 Main objective....................................................................................................................21.3.2 Specific objectives..............................................................................................................2
2. METHODOLOGY........................................................................................ 32.1 Review of secondary information............................................................................................32.2 Reconnaissance survey ............................................................................................................3
2.2.1 Key informant interviews ...................................................................................................32.2.2 Dialogue with farmers ........................................................................................................32.2.3 Participant�s observation ....................................................................................................32.2.4 Areas visited during the reconnaissance survey .................................................................4
2.3 The formal survey....................................................................................................................42.3.1 Selection of study villages..................................................................................................42.3.2 Farmer selection .................................................................................................................52.3.3 Questionnaire survey ...........................................................................................................52.3.4 Data analysis.......................................................................................................................5
3. THE STUDY AREA ..................................................................................... 63.1 Biophysical environment and infrastructure............................................................................6
3.1.1 Location and land area........................................................................................................63.1.2 The people ..........................................................................................................................63.1.3 Physiography, climate and soils .........................................................................................73.1.4 Infrastructure ....................................................................................................................123.1.5 Village leadership, social groups and institutions ............................................................13
3.2 Households composition and characteristics .........................................................................133.2.1 Household size and composition ......................................................................................133.2.2 Age and marital status ......................................................................................................133.2.3 Education level .................................................................................................................143.2.4 Ethnic composition...........................................................................................................143.2.6 Land ownership, acreage and distribution.......................................................................15
4. DESCRIPTION OF THE FARMING SYSTEMS .................................. 174.1 Potato-based farming system (FS1).......................................................................................194.2. Maize-potato farming system (FS2) ......................................................................................214.3. Maize-Beans Farming System (FS3)....................................................................................234.4. Maize-based farming system (FS4) .......................................................................................244.6. Pastoral farming system.........................................................................................................274.7 Tobacco-pastoral farming system..........................................................................................274.8. Maize - potato - tea farming system ......................................................................................274.9. Changes in the farming systems ...........................................................................................28
5. CROP PRODUCTION............................................................................... 305.1. Types of crops grown ............................................................................................................30

Sustainable Management of Usangu Wetland and its Catchment March 2001
Final report - Farming systems Page No. ii
5.2. Crop production operations and cropping calendar .............................................................. 355.2.1 Land preparation and ploughing ...................................................................................... 355.2.2 Sowing ............................................................................................................................. 365.2.3 Weeding ........................................................................................................................... 365.2.4 Soil fertility management................................................................................................. 375.2.5 Crop protection ................................................................................................................ 385.2.6 Harvesting and storage..................................................................................................... 385.2.7 Land conservation practices............................................................................................. 395.2.8. Cropping Seasons and Calendar ...................................................................................... 39
5.3 Labour use and division in crop production.......................................................................... 445.4. Crop production trends.......................................................................................................... 455.5. Crop production constraints .................................................................................................. 45
5.5.1. Labour availability ........................................................................................................... 465.5.2 Declining soil fertility ...................................................................................................... 485.5.3 Unreliable rainfall ............................................................................................................ 495.5.4 Marketing of produce....................................................................................................... 505.5.5 Fertiliser availability and fertiliser prices ........................................................................ 505.5.6 Pesticide availability and pesticide prices........................................................................ 515.5.7 Extension services............................................................................................................ 52
6. LIVESTOCK PRODUCTION................................................................... 536.1 Livestock types, herd sizes and ownership ........................................................................... 536.2 Uses of livestock ................................................................................................................... 536.3 Livestock management ......................................................................................................... 556.4 Labour use and division in livestock management .............................................................. 566.5 Constraints to livestock production...................................................................................... 56
7. THE HOUSEHOLD SOCIO-ECONOMY............................................... 597.1 Off-farm sources of income .................................................................................................. 597.2 Household food security ....................................................................................................... 607.3 Source of fuel wood .............................................................................................................. 617.4 Perception of farmers on villages level institutions .............................................................. 62
8. SUMMARY OF MAIN FINDINGS AND RECOMMENDATIONS .... 648.1 Summary of main findings.................................................................................................... 648.2 Recommendations................................................................................................................. 65
REFERENCES ................................................................................................. 67
APPENDIX I..................................................................................................... 68Terms of Reference for the Farming Systems (rainfed) Study........................................................ 68
APPENDIX II:.................................................................................................. 69Itinerary for the formal survey ........................................................................................................ 69
APPENDIX III.................................................................................................. 70A checklist for semi-structured interviews of key informants during formal survey...................... 70D. Integration of livestock............................................................................................................... 71

Sustainable Management of Usangu Wetland and its Catchment March 2001
Final report - Farming systems Page No. iii
APPENDIX IV������������������������..72 Mean annual rainfall over 21, 10, and 5 years at Uyole Station������������...�72
APPENDIX V ................................................................................................... 73Villages visited during the formal survey........................................................................................73
APPENDIX VI.................................................................................................. 74List of Key Informants Contacted During the Farming Systems Survey ........................................74
APPENDIX VII ................................................................................................ 79Summary of Farming Systems Zonation in Usangu Wetlands and Its Catchment..........................79
APPENDIX VIII............................................................................................... 84Surveyed Village Profile in the Usangu Wetlands and its Catchment..................................................................84
APPENDIX IX������������������������..85 Average Rainfall (mm) for Rujewa Station � 1985/86 �99/00��������������.84
LIST OF TABLES
Table 2.1 Composition of farmers interviewed by district ....................................................................5Table 3.1 Administrative areas and breakdown of the Usangu catchment ............................................6Table 3.2 Household size and composition in the study area ..............................................................13Table 3.3 Proportion of respondents by types and level of education .................................................14Table 3.4 Ethnic groups composition by district (% of respondents)..................................................14Table 3.5 Average number of farm plots and acreage per farming system .........................................15Table 3.6 Percentage of respondents having farms on valley bottoms, sloping and flat lands............16Table 4.1 Types of crops grown by farmers in different farming systems (percentage of respondentsgrowing the crops)��������������������������������.19Table 5.1 Average acreage under crop production in different farming systems (range)....................31Table 5.2 Percentage of farmers using draft animals in different farm operations by farming system���������������������������������������...36Table 5.3 Use of soil fertility improvement methods by farming systems (in % of respondents).......37Table 5.4 Average amount of fertiliser used in maize, beans and round potatoes...............................38Table 5.5 Use of erosion control methods in the farms by farming system (% of respondents) .........39Table 5.6 Household members� involvement in crop production operations (% of respondents).......44Table 5.7 Percentage of farmers indicating declining in production of major crops by farmingsystem�������.. .....................................................................................................................45Table 5.8 Percentage of farmers indicating reason for the decline in production of major crops byfarming system���..........................................................................................................................46Table 5.9a Extent of labour shortage and hire of labour for different crops by district (% ofrespondents)����..........................................................................................................................47Table 5.9b Crops and activities that use hired labour (% of respondents)...........................................48Table 6.1 Number of livestock kept by respondents in different farming systems..............................53Table 6.2 Condition of feed resources in grazing lands as assessed by farmers (% of respondents) ..55

Sustainable Management of Usangu Wetland and its Catchment March 2001
Final report - Farming systems Page No. iv
Table 6.3a Percentage of respondents on division of labour and decision making for the managementof non-ruminant animals in the household ........................................................................................... 57Table 6.4 Livestock production problems in different farming systems (% of respondents).............. 57Table 7.1 Sources of income for rural livelihood by farming system (% of respondents).................. 60Table 7.2 Sources of fuel wood used by farmers (% of respondents) ................................................. 62Table 7.3a Presence of services of village level institutions by farming system (% of respondents) . 62Table 7.3b Rating of services of village level institutions (% of respondents) ................................... 63
LIST OF FIGURES
Figure.3.1 Agro-ecological map of the Usangu wetland and its catchment��������.10Figure 4.1 Farming systems map������������������������..18Figure 5.1 Seasonal calendar: potato-pyrethrum based farming system���������..40Figure 5.2 Seasonal calendar: maize-potato based farming system�����������.40Figure 5.3 Seasonal calendar: maize � beans farming system�������������..41Figure 5.4 Seasonal calendar: maize - based farming system�������������..42Figure 5.5 Seasonal calendar: rice based farming system���������������43
LIST OF CHARTS
Chart 4.1 Important cash crops in potato based farming system������������19Chart 4.2 Important food crops in potato based farming system������������20Chart 4.3 Important cash crops in maize-potato farming system������������21Chart 4.4 Important food crops in maize-potato farming system�����������...22Chart 4.5 Important food crops in maize-beans farming system������������23Chart 4.6 Important cash crops in maize-beans farming system������������.24Chart 4.7 Important food crops in maize based farming system������������.24Chart 4.8 Important cash crops in maize based farming system������������.25Chart 4.9 Important food crops in rice-pastoral farming system������������25Chart 4.10 Important cash crops in rice-pastoral farming systems�����������...26Chart 5.1 Regular family labour working in the farms����..�����������.44Chart 5.2 Extent of labour problems in different farming systems�����������.47Chart 5.3 Declining soil fertility as ranked by farmers in different farming systems����.49Chart 5.4 Ranking of the problem of unreliable rainfall in order of importance���...��.49Chart 5.5 Marketing problems as ranked by farmers in different farming systems�����50Chart 5.6 Farmers response on problems of fertiliser availability�����������..51Chart 5.7 Response of farmers on problems of pesticide availability and price������.51Chart 5.8 Ranking of problem of extension services by farmers in the study area�����.52Chart 7.1 Major sources of income�����������������������.59Chart 7.2 Rating of household food security in different farming systems��������59Chart 7.3 Time on walking to fuelwood collecting points��������������..61
Sustainable Management of Usangu Wetland and its Catchment March 2001
Final report - Farming systems Page No. 1
1. INTRODUCTION
1.1 Background Information
The project Sustainable Management of the Usangu Wetlands and its Catchment (SMUWC) is aproject for the Government of Tanzania, funded by the United Kingdom (UK) Government�sDepartment for International Development. The project was conceived in response to perceivedreductions in water flows in the Great Ruaha river in the dry season. In particular, low flows from theGreat Ruaha to the Mtera/Kidatu hydropower schemes were blamed for power shortages in the mid-1990�s. The continuous reduction of water flowing through the Ruaha National Parks was also aconcern. Competition for water between cultivators and pastoralists, and amongst irrigators was alsosaid to be leading to increased conflicts and sometimes violence. The general concern also was onthe diminution and degradation of the wetlands, leading to loss of a valuable natural resource(SMUWC Inception Report, 1999).
The development of a sustainable management of the Usangu wetland and its catchment depends onthe clear understanding of the past and present situation of the area. In the Usangu wetland and itscatchment, farmers practice both irrigated and rainfed agriculture. Most of the farm households,however, depend on rainfed agriculture and the farming system is characterised by small landholdings, low input (except labour), low productivity and low household income. Furthermore, thelow production level is achieved in an environmentally unsustainable way. This is because increasesin production to match the population increase, have usually been realized by expansion ofagricultural land as opposed to intensification (Qaraeen, 1997).
Farmers in the high potential highland areas (normally densely populated, with reliable rainfall) nowintensify production or move to marginal lands. Often they employ traditional farming practices thatproduce short-term benefits and lead to continued depletion of organic matter. Continuous cultivationcoupled with the slash and burn system that is usually practised, leads to loss of bio-diversity. Thishas adversely affected supply of food, fuel wood, fodder and timber and more importantly, water(Dumea, 1997). In the lowland, which is characterised by low and unreliable rainfall, rainfedagriculture is mostly applied to upland crops in areas where irrigation is not suitable or not developed.Traditional and improved irrigation systems are common in paddy-cultivated areas, and off-seasonproduction of crops.
The Sustainable Management of the Usangu Wetland and its Catchment (SMUWC) project wasinitiated in 1998. One of the project objectives is to increase knowledge and understanding of thetechnical and physical processes underlying natural resource availability and use in the project area.The project is investigating the nature and causes of recent changes in natural resource availability.The knowledge developed will assist the Government of Tanzania and key stakeholders in thedevelopment of a sustainable environmental management strategy. This will also enable localcommunities to develop and implement their own strategies for sustainable management of naturalresources (SMUWC Interim Report, 1999).
The project has already developed a body of knowledge on a number of hypotheses developed duringthe implementation. These include hydrological processes in the sub-catchments and irrigationdemands. Studies have been conducted to understand the farming systems under irrigated agricultureand the pastoralists systems. This study addresses the farming systems issues in rainfed agriculture.

Sustainable Management of Usangu Wetland and its Catchment March 2001
Final report - Farming systems Page No. 2
1.2 The farming systems study
The existing farming systems in the study area are a result of interaction between their exogenous,natural, economic and cultural circumstances of their own priorities and resource capabilities. Afarming system is defined as a unique and reasonably stable management of farming enterprises thatthe household manages and practices in response to physical, biological and socio-economicenvironments, in accordance with the household goals, preferences and resources (Shanner et al,1992). The farming system analysis gives a detailed description of the farmers� circumstances andcurrent production systems. A clear definition of priority problems limiting the farmers in meetinghousehold objectives and productivity of available resources is established. The farming systemsstudy also creates an understanding of the interdependencies of the components under the control ofthe farm household and on the interaction of their components with physical, biological and socio-economic factors beyond the household control.
In watershed management the central theme is the recognition of linkages of upland and downstreamareas by land use factors and the processes within the drainage (Msolla, 1997). It is thereforeimportant to create a clear understanding of the farming practices used in the area, reasons as to whythese practices have been adopted and their impact on land and water conservation and thecommunity. This will give more insight of the problems associated with use of land resources in thearea.
1.3 Objectives of the study
1.3.1 Main objective
The overall objective of the study is to provide a clear description of the farming systems in therainfed agriculture of the Usangu wetland and its catchment. This will provide information neededtowards the development of a strategy for the sustainable utilisation of the natural resources in thecatchment for the maintenance and improvement of rural livelihoods.
1.3.2 Specific objectives
i) To identify all major farming systems components and describe their roles andinteractions
ii) To identify types of crops grown, cultivation practices and perceived problems that limitoptimum productivity in the study area
iii) To study the integration of livestock in the farming systems described iv) To establish other sources of income (forests products � lumbering, charcoal making,
firewood collection, beekeeping, handicrafts, etc) v) To establish the relative importance of different activities for household survival/income vi) To investigate changes over time (20 years ago, 40 years ago) in cropped area, crop type,
yields, etc.

Sustainable Management of Usangu Wetland and its Catchment March 2001
Final report - Farming systems Page No. 3
2. METHODOLOGY
A combination of data collection methods was used in this study. This include the following:
2.1 Review of secondary information
A review of the secondary information and data from the project documents and other existingliterature from previous studies was carried out. This enabled the researcher to gather relevantinformation about the Usangu wetland and its catchment in general.
2.2 Reconnaissance survey
A reconnaissance survey was conducted in the study area to become acquainted, in particular, withthe farming systems, geographical characteristics and the size (magnitude) of the project area. Duringthe reconnaissance survey, information and data from the district, division, ward and village levelswere collected to give an insight on the current status on the demographic situation, currentproduction enterprises, constraints and opportunities of the farming community in the different agro-ecological zones. Six districts in the project area, namely Mbarali, Mbeya, Makete, Njombe, Mufindiand Iringa, were visited as per Terms of Reference (Appendix I). Participants� observations, keyinformants� consultations and group discussions using a checklist (Appendix III) were used as toolsfor information gathering.
2.2.1 Key informant interviews
During the reconnaissance survey, interviews with key informants (Appendix VI) in the district,division, ward and village levels enabled the researcher to collect important information regarding thecrops grown, farming practices and major events and changes that occurred in the past years.
2.2.2 Dialogue with farmers
Dialogue with groups of farmers in some villages was carried out in order to collect qualitativeinformation on the farming systems observed by the researcher in the transect drive through the studyarea. The dialogue particularly focused on the major farm enterprises farmers are engaged on, majorchanges, events over time and trends in productivity for various crops.
2.2.3 Participant�s observation
Direct observation of land use was made from the standing crop, and other associations for crops thatwere still in the field, and for livestock grazing lands. The extent of soil fertility and crop allocationon various lands depending on altitude and soil structure and fertility was also observed. Valleybottom cultivation locally known as �vinyungu� and dry season irrigation practices were observed inrelation to farmers� off-season engagement.

Sustainable Management of Usangu Wetland and its Catchment March 2001
Final report - Farming systems Page No. 4
2.2.4 Areas visited during the reconnaissance survey
The following villages were visited during the reconnaissance survey:
(i) Mbarali districta) Madibira ward - Nyamakuyu villageb) Mawindi ward � Mawindi and Manienga villagesc) Mahongole ward � Mahongole villaged) Chimala ward � Igumbilo villagee) Utengule ward � Utengule Usangu, Luhanga and Simike villages
(ii) Mbeya districta) Tembela ward: Simambwe villageb) Ulenje ward: Nyalwela and Ulenje villages. The two wards are located in the
subcatchment where Patagwa and Mwambali rivers originate to join the Gwiri Riverdownstream.
(iii) Makete districta) Matamba wards: Igenge and Magoye villages situated in the Numbe subcatchment that
feeds the Chimala river.b) Njombe district: Wanging�ombe division and particularly Malangali village located in the
Balali subcatchment that feeds the Mbarali river.
(iv) Mufindi district: Malangali division: Mwilavila village
(v) Iringa district: Ifunda ward � Lumuli village that lies in the Lyandemberacatchment.
(vi) Njombe District: Mlangali and Mambegu villages.
2.3 The formal survey
2.3.1 Selection of study villages
The study villages were selected to represent different Agro Ecological Zones (AEZs) found in thestudy area. Initially 20 villages were selected for the formal survey, but only 19 villages wereinvolved in the formal survey. Saja village in Wanging�ombe division was dropped because thevillage chairman and Village Executive Officer were not present to facilitate farmers� selection on theday planned. It was also found that the village lies in the same agro-ecological zones withIdumulavanu in Mufindi district.
The studied villages were Lumuli in Iringa district; Maduma and Idumulavanu in Mufindi district;Imalilo, Itunduma and Malangali in Njombe district; Nyamakuyu, Ikoga, Nyeregete, Itamba, Mhwelaand Simike in Mbarali district; Kimani, Ng�onde and Igenge in Makete district and Kikondo,Galijembe, Ulenje and Iyawaya in Mbeya district (Appendix V). An itinerary for formal survey(Appendix II) was implemented.

Sustainable Management of Usangu Wetland and its Catchment March 2001
Final report - Farming systems Page No. 5
2.3.2 Farmer selection
A procedure for random sampling of respondents was employed using existing village household listsprepared by the Child Survival and Development Programme (CSPD). In villages where a householdlist was not available, a taxpayer list was used. In areas where women were exempted from taxpaying, efforts were made to get a household list, to make sure that women headed household wererepresented. On average, 10 farmers were selected in each village for the interviews.
2.3.3 Questionnaire survey
The formal questionnaire survey was carried out in all villages selected. The questionnaire was firstpre-tested in Ifiga and Ilongo villages in Mbeya district. Necessary corrections were made before themain survey started. The formal survey enabled quantification of some important informationgathered during the informal survey. The questionnaire was administered on an individual householdbasis. Farmer�s interviews took place at their homesteads to facilitate observation by researchers andto build rapport with the farmers interviewed. It also helped to get data on livestock because farmerswere very reluctant to admit that they had livestock for fear of taxes. Where possible, husband andwife participated in responding to questions asked to the main respondent.
A total of 187 farm-households were interviewed in the project area. Of these, 104 (56%) were menand 83 (44%) were women farmers. The distribution per district is shown on the table below.
Table 2.1 Composition of farmers interviewed by district
District Men Percentage(%)
Women Percentage(%)
Total Percentage(%)
Iringa 4 3.8 5 6.0 9 4.8Mufindi 9 8.7 12 14.5 21 11.2Njombe 12 11.5 17 20.5 29 15.5Mbarali 42 40.4 17 20.5 59 31.6Makete 14 13.5 14 16.9 28 15.0Mbeya 23 22.1 18 21.6 41 21.9Total 104 55.6 83 44.4 187 100
2.3.4 Data analysis
Data from the formal questionnaire was analysed using the Statistical Package for Social Science(SPSS). Pre-coding of the questionnaire enabled data entry in the field.

Sustainable Management of Usangu Wetland and its Catchment March 2001
Final report - Farming systems Page No. 6
3. THE STUDY AREA
3.1 Biophysical environment and infrastructure
3.1.1 Location and land area
The Usangu wetland and its catchment covers an area of about 21 000 km2, with 60% of the arealying in Mbeya region and the remaining 40% lying in Iringa region. Administratively, the projectarea involves seven districts namely: Mbarali, Mbeya Rural and Chunya districts in Mbeya region;Iringa Rural, Mufindi, Njombe and Makete districts in Iringa region. The administrative areas andthe relative breakdown (coverage) are given in table 3.1 below.
The farming systems study was carried out both in the highlands and lowlands of the project area.The major rain fed cultivated areas studied include the area south and south east of Mbeya, along thesouthern watershed between Mbeya and Matamba, Matamba area, the Njombe area south to theUsangu plains, the northern-eastern highlands (Makambako-Iringa); and the southern Usangu plainsfrom the Chunya escarpment to Madibira. The area falls within six districts of Mbarali, Mbeya Rural,Makete, Njombe, Mufindi, and Iringa Rural.
Table 3.1 Administrative areas and breakdown of the Usangu catchment
Region District % of the CatchmentMbeya (60%) Mbarali 54.69
Mbeya Rural 3.17Chunya 2.30
Iringa (40%) Iringa Rural 5.35Mufindi 11.27Njombe 15.22Makete 7.98
Source: SMUWC-Interim report, 1999
3.1.2 The people
The Usangu Catchment is occupied by a number of ethnic groups. In Mbeya district, the major ethnicgroups are Wasafwa, Wakinga and Wanyakyusa, while in Chunya there are Wakimbu, Wasafwa,Nyakyusa. Pastoralists groups from the northern regions including Wasukuma, Wataturu, andWagogo are also found in Chunya district. In Mbarali District there are more diverse ethnic groupsdue to the immigration of people for various reasons. The natives are the Wasangu. There are alsoWabena and Hehe who moved from Iringa region (Njombe and Iringa districts) in search ofemployment on large farms and later decided to settle in the plains to cultivate paddy. Another groupis the Nyakyusa from Kyela, Rungwe and Ileje. Wasukuma, Maasais, Barbaig, Taturu and Gogosform the group of pastoralists who moved to the plains in search of grazing pastures for theirlivestock. Many opted to settle, especially the Sukumas who are engaged in crop production as well.Another group is that of Baluchis who came to Usangu as early 1940�s, and engaged themselves inpaddy cultivation and business. In Iringa and Mufindi districts, the major ethnic group is the Waheheand in Njombe district are the Wabena and Wakinga. In Makete district (Matamba area) majority areWawanji and Wakinga.

Sustainable Management of Usangu Wetland and its Catchment March 2001
Final report - Farming systems Page No. 7
The multi-ethnicity in the area has an implication for the farming practices as one group may adoptsome different aspects of cultivation from the other. A case in point is the use of water harvesting(water bunds) techniques in the cultivation of rice, introduced in the area by Baluchis and now acommon practice in the whole of Usangu.
3.1.3 Physiography, climate and soils
The physiography of Usangu wetland and its catchment is viewed from the agro-ecological zonesclassification of Samki and Harrop (1982) as reported by URT/EEC (1986a) for Iringa Region, that is,Makete, Iringa, Njombe and Mufindi districts. In Mbeya Region the classification described bySamki and Harrop (1982) and reviewed by Mussei et al (1999) is adopted. Based on this, six mainagro-ecological zones are identified � AEZ 3, 8, 11, 14, 16 and 18. These are shown in figure 3.1.
(a) Agro-ecological zones in Iringa Region
In Iringa Region the Usangu wetland and its catchment falls within three main agro-ecological zones,that is, AEZ 3, AEZ8 and AEZ 14. The areas are further divided into land units as described in theIringa agro-ecological zonation by URT/EEC (1986a) as follows:
Agro-ecological zone 3
(i) The Njombe Plateau falls in the AEZ 3, land unit 3iii. It covers most of the Igosi ward, thesouthern part of Imalinyi ward and the area west of Wangama ward. The plateau is mostlyundulating with some parts of rolling to hilly. Flat top slopes occur commonly with broadbottomlands. The plateau becomes more dissected in topography on transition towards theKipengere ranges. The mean altitude increases from 1 800 m in the eastern parts of the unitto 2 200 m in the western and southern parts, and likewise the climate becomes wetter. Themean annual rainfall is 1 200 mm. The soils are highly leached red clays of low fertility,mainly with humic topsoils influenced by volcanic ash at the almost flat or gently slopinghilltops. On the steeper slopes of unit 3iiib, the soils are often shallow and stony.
(ii) The Gofio plateau lies in the AEZ 3 land unit 3iv. It constitutes the northern extension ofthe Kipengere Mountains, with the eastern and southern boundaries sharply marked by asteep escarpment, while the elongated ridges with decreasing elevations from 2 700 m to1 800 m a.s.l. stretch in the western and northern direction. The topography is undulating torolling on the plateau, and the area is accessible and sparsely populated only on its westernand southern borders. The greater part remains inaccessible and uninhabited. The soils areshallow, stony and rocky, and have often humic/volcanic ash topsoils.
The Gofio plateau belongs to the most humid areas of Iringa regions, and the mean annualrainfall is 1 500 mm. Short grasses of low nutritive value cover the ridges and the Gofioplateau. Humid forests occupy the valleys as the most common vegetation. Scatteredcultivation of crops such as wheat, potatoes and green peas occurs on the borders of theplateau.
(iii) The Kipengere Range lies in land unit 3v extends in a roughly northwest/southeastdirection from the Kitulo plateau to the Gofio plateau. It refers to a chain of hills, whichrises abruptly from 2 000 m to 2 600/2 900 m. The land unit is uninhabited, having a verypoor accessibility. The hilltops have generally flatter slopes, with gradients of 2-8%, whilethe hill slopes are very steep, with gradients mostly over 30%. The drainage system is

Sustainable Management of Usangu Wetland and its Catchment March 2001
Final report - Farming systems Page No. 8
narrow in-filled. The soils are shallow, mostly stony and rocky on the steep slopes, andslightly deeper on the gentler hill tops and lower slopes. The humic topsoil influenced byvolcanic ash is common also on the steep slopes.
The most common vegetation is short to medium grassland with low nutritional value andhumid forests in the valleys. Scattered cultivation occurs on the gentler and more accessiblelower slopes.
(iv) The Matamba-Ikuwo basins lie in land unit 3vi. These are two plains located in thenorthern part of Makete District and separated by the Numbe valley and the northwardextension of the Kipengere range. Both plateaux are bordered in the south, west and east ofthe plains by the surrounding Kipengere ranges; and in the north and northeast by the steepChimala escarpment. The altitudes decreases from 2 300 m at the foot slopes of theKipengere ranges to 2 000 m near the Chimala escarpment. The topography is undulating torolling with a more dissected landscape in some places.
The mean annual rainfall is 1 200 mm, and the unit is also the warmest inside AEZ 3 withmean annual temperature of 18.70C, reflecting the transition to the drier AEZ 14. Thedominant soils are red leached clays, often with humic topsoil, influenced by volcanic ashand pumice. The soil fertility is moderate to fairly high. The area is mostly cultivated, wheremaize, wheat, peas and potatoes grow and it has the remnants of upland forest.
(v) The Kitulo plateau lies in land Unit 3vii, bounded on the east by the Kipengere ranges andon the west by the crest of the Livingstone Mountains. The area is undulating over thegreater parts of the plateau and the altitude ranges from 2 200 to 2 900 m. The unit is thecoldest and wettest of AEZ 3. The mean annual rainfall is 1 600 mm exceeding largely theannual evapotranspiration that is 800 mm.
The soils are derived from volcanic ash overlying pumice material, with thick and blackhumic topsoil. The growing period is very long, with duration of 280 days. The meantemperature is 10.80C, minimum temperatures occur between months of May and October at4.10C. Frost may occur during the driest months of June to August. The dominant vegetationis short grassland of low nutritional value, which is mostly used for sheep and cattle grazing.Scattered cultivation of pyrethrum, barley, round potatoes and wheat occurs.
Agroecological zone 8
(vi) Rocky Mountains (AEZ 8v) comprise of rocky areas and have an elevation of 1 100 to 1800m a.s.l. Rainfall is 750 to 900 mm annually; and evapotranspiration is 1 500 mm.Commiphora and Combretum species are common in the lower more arid parts. Miombooccurs in the higher elevations. The soils are shallow and stony. These areas arerecommended for extensive grazing due to low rainfall and the rocky nature of land.
Agroecological zone 14
(vii) The Mufindi Plateau lies in the AEZ 14i, and it is mostly undulating with slopes of 2-8%,with scattered steeper areas with slopes of 8-16% with in-filled drainage lines. The altituderanges between 1 600-2 000 m. The annual precipitation is 950 mm, with growing period of175 days starting from end of November. The soils are uniform yellow highly leached clays,

Sustainable Management of Usangu Wetland and its Catchment March 2001
Final report - Farming systems Page No. 9
although red clays also occur. The fertility of this unit is lower than in most parts of Iringaregion due to the high degree of chemical leaching and the absence of humic or dark topsoil.Most organic matter has already mineralised due to the relatively dry and warm conditions.Vegetation is wooded grassland and grassland. There are scattered trees and clumps ofTerminalia, but Parinari and Uapaca are typical species. Most of the area is cultivated,although there is are still large areas under grassland of low nutritive value.
(viii) The Northern Ubena Plateau, AEZ 14ii, is a small unit that covers the main Makambako-Njombe road. It is mostly undulating, scattered areas with hilly land slopes and gullyerosion. The altitude ranges between 1600-2000 m and the annual precipitation is 950 mm.The vegetation comprises of miombo woodland and wooded grassland. The area is highlypopulated and mostly cultivated. The soils are mostly highly leached yellow clays with lowfertility with small inclusions of more fertile red clays.
(ix) The Kidugala Plateau lies in AEZ 14iii located between the Gofio Plateau escarpment andnorthern border of Njombe Plateau. The common land form is undulating to rolling plateauwith a broad bottomland and in-filled drainage system. The landscape decreases in elevationin a northeasterly direction from more than 2 000 m around Wangama to 1 500 m in theKidugala area. Extensive undulating grasslands, characterised by short shrubs of miombo,mikusu (Combretum species), Uapaca kirkiana and Misaulwa (Parinari species), typify thezone. Hyparrhenia species dominate the natural grasses. The soils are red clays, sometimeswith a sandy topsoil, with moderate fertility. The unit is mostly cultivated and it is suitablefor maize, beans, sunflower, wheat and potatoes.
(x) The Lower Mufindi Plateau (Malangali-Saja-Wanging�ombe stretch) is a transition to theUsangu flats and it lies in AEZ 14iv. The lower Mufindi Plateau is mostly flat to undulatingland. The mean elevation decreases from 1500 m in the west to 1 200 m in the east. In theundulating to rolling landscape, the dominant soils are red and yellow leached sands withvery poor fertility, sometimes associated with red and yellow loams with sandy topsoil.Shallow and stony soils are common in the eroded areas. Large areas in this zone areaffected by severe sheet and gully erosion, with an incised drainage. The vegetation iswooded grassland with Combretum thicket on sandy soils and miombo woodlands in someplaces. Cultivation is common in the area.
(xi) Usangu Flats border (Chimala-Mbuyuni-Igawa) is located on the northern side of Maketeand Njombe districts along the boundary with Mbeya region. It lies in the AEZ 14v and isalso a transitional zone to the flat and dry Usangu plains. The landform is mostly rolling,hilly with an incised drainage system. The elevation decreases from 1 500 m in the south to1 000m in the north. The area receives little rainfall, an average of 900 mm per annum. Thesoils are predominantly shallow or moderately deep red clays, mostly stony with poorfertility. The dominant vegetation is Miombo and Acacia woodland with grasses of lownutritional value.
(xii) Chimala scarp, Numbe Mountains and Northern Gofio Plateau is a small unit located inMakete district that lies in AEZ 14vi. It differs from the preceding unit in elevation andlandform as it is steeply dissected and there is mountainous area in the north bordering theMatamba-Ikuwo basins. The main elevation decreases from 1 800 m to 1 300 masl, and theunit is almost uninhabited and suffers from very poor access possibilities. On the shallow,rocky and stony soils, in the western parts miombo woodland is very common, whilegrassland or wooded grassland is more common on the Gofio Plateau border. The area issuitable for afforestation and grazing.

Sustainable Management of Usangu Wetland and its Catchment March 2001
Final report - Farming systems Page No. 10
Figure3.1 Agro-ecological map of the Usangu wetland and its catchment

Sustainable Management of Usangu Wetland and its Catchment March 2001
Final report - Farming systems Page No. 11
(b) Agro-ecological zones in Mbeya region
The area of the Usangu catchment that falls in Mbeya region is divided into four main AEZs namelyzone AEZ 3, AEZ 14, AEZ 16 and AEZ 18 (Samki & Harrop, 1982) and are hereby summarised.
(xiii) Uporoto Highlands lie in the AEZ 3il (Samki and Harrop, 1982). The area comprise ofsteeply dissected mountains with gentle slopes and down valleys, and a hilly plateau withbroad convex interfluves. The altitude ranges from 1 500 m to 2 500 masl, and the rainfall isbetween 1 000-2 000 mm per annum. The area comprises deep brown sandy clay loams(Mollic, Andosol, Vitric, Haplic Andosol). More than 90% of the area is under cultivation.Remnants exist of natural forests consisting of Hagenia sterculea and bamboo with scatteredFicus tree species. The common natural grasses in the area are Kikuyu grass. As you movedown towards Mbeya stepped plains, grass species dominating the area are Themeda andHyparrhenia. Scattered Acacia kigalia and Erythrina tree species constitute the naturalvegetation.
(xiv) The Mbeya Stepped Plains lie in the AEZ 3io (Samki & Harrop, 1982). It consists of agently undulating lava plateau, which has been partly buried by undulating and rolling lavaflows. There are also alluvial and debris fans beneath the surrounding hills. The resultingsoils are brownish to deep red clay loams of low fertility and highly prone to soil erosion(Haplic Andosols). Altitude ranges between 1 200 m to 1 900 m above sea level. Therainfall decrease from 1 500 mm, in areas bordering Uporoto Mountains to 600 mm towardsShamwengo. Miombo woodlands consisting of Brachystegia and Combretum tree species aswell as scattered Acacia are common. Hyparrhenia grass species are also common.
(xv) Rocky Mountains East of Madibira fall under AEZ 8v (Samki and Harrop, 1982). Theseare mostly steep, with altitude ranging from 1 000 m to 1 800 masl and mean annual rainfallis 750-900 mm. The soils are rocky and shallow (Cambic arenosol) and sandy with highlysodic and relatively clay rich hardpan in the upper soils towards Mapogoro plains. Thevegetation is mainly of Acacia kirkii, A. stuhlmanii, Commiphora, with bushes of Cynodonshort grassland or barren land. The land is much eroded in the higher elevations leavingrocky out crop.
(xvi) The Chunya Dissected Plateau (AEZ 11i) is an undulating and rolling plateau with altituderanging from 1 200 m to 1 800 masl. Mean annual rainfall is 700-1 300 mm, and thegrowing season extends from December to April. The soils are shallow, stony sand (CambicArenosols). Vegetation is mainly Brachystegia julbernardia woodland, bush land or bushedgrassland with scattered cultivation. Above 1 700 m, scattered Parinari curatellifolia treesoccur on the gentler slopes, which are often chosen for cultivation.
(xvii) The Chunya Plains lie in AEZ 11ii that is a gently undulating plain with inselbergs. Thealtitude ranges between 1 000 m-1 500 masl with the mean annual rainfall of 750-900 mm.The soils are deep sands, sandy clay over sandy loam (Albic Arenosol, Fine sodic, EutricGleysol). The growing season starts from December to April; and mainly grazing ispractised. Miombo woodlands and Hyparrhenia species dominate.
(xviii) The Middle Ruaha Valley lies in the AEZ16i (Samki & Harrop 1982). It is mostly flatwith riverine plains, surrounded by foot slopes of hills and mountains. The altitude rangesbetween 1 000 m � 1 500 masl and mean annual rainfall is 550 mm. The soils are young,fertile and alluvial, characterised by dark brown to yellow brown loams that are calcareousand saline (Calcic Cambisol, Eutric). The land use is basically grazing of beef and small
Sustainable Management of Usangu Wetland and its Catchment March 2001
Final report - Farming systems Page No. 12
ruminants, with scattered cultivation of sorghum, rice and groundnuts by pastoralists. Thegrowing period is between December and March (Mussei, et al, 1999).
(xix) The Usangu Plains lie in the AEZ 18 (Samki and Harrop, 1982). They consist of lacustrineplains with fans, bajada and piedmonts. The altitude ranges from 1 000m to 1 050 masl ingeneral, rising to 1 200 masl in the west in the vicinity of Ruiwa. The soils are mainly darkgrey clays and the prismatic cracking clays; and are generally slightly sodic. They can bevery sodic on levees or raised ground as are indicated by A. kirkii or A. stuhlmanii. Theyoung alluvial fans and bajada are moderately fertile and are favourably affected by groundwater. On the piedmonts above Rujewa, moderately deep reddish profiles with darkmoderately fertile topsoils have developed over a mixture of acid and basic rocks. NearMadibira, the soils are moderately deep and coarse in texture in the vicinity of granites. Thebeach sands are deep course quartz that may be moderately shallow, overlying a hardpan orpoorly drained soils. The mean annual rainfall is 600 mm decreasing north eastwards. Thegrowing season is four months from December to March.
3.1.4 Infrastructure
The two highways, Dar-es-salaam-Tunduma and Uyole-Kasumulu, and the Tanzania-ZambiaRailway line, pass in the project area. The rural road network is good although the road condition inmost of the districts is not good. Most of the villages visited have all-weather feeder roads. The roadconnecting Matamba division from the District Headquarters is not passable during the wet season,making it very difficult for farmers to get administrative support. Farmers in Matamba divisionsometimes have to walk long distances to Chimala for hospital services, market their crops and buyother household items. Bicycles are very common and many people use them to transport theirproduce to the marketing centre.
There is at least one primary school in each village. There are secondary schools in almost everyward either owned/managed by religious institutions or the Tanzania Parent�s Association. There arealso health centres in most of the wards, though they are poorly equipped with personnel as well asmedical facilities.
Water supply status is moderate to good, as some of the villages have piped water distributed by theWater Project funded by DANIDA. In other areas, they have shallow wells. However, other villageslike Malangali and Imalilo depend on streams and traditional wells.
There are organised open markets in almost all wards for marketing of crops as well as livestock.Dipping facilities are found in some villages, but most of them are not functional due to problems ofavailability of acaricides. Appendix VIII summarises some infrastructural facilities existing in thesurveyed villages.
A number of donor-funded projects are operating in the area. In Iringa, Hifadhi ya Mazingira(HIMA), a DANIDA/GOT supported project is operating in all three districts. There was also supportof the Southern Highlands Dairy Development Project, a Swiss Government funded project, which iscurrently phasing out. Heifer Project International (HPI) is also supporting dairy farmers. Most ofthese projects are operating in Iringa Region and the highlands areas of Mbeya.

Sustainable Management of Usangu Wetland and its Catchment March 2001
Final report - Farming systems Page No. 13
3.1.5 Village leadership, social groups and institutions
Village leadership is in the hands of village governments, headed by village chairmen. The VillageExecutive Officers assist the Chairmen on day-to-day activities. The village government comprisesalso various committees and there are also sub-village leaders.
3.2 Households composition and characteristics
3.2.1 Household size and composition
The mean household size of the respondents is 6 with a minimum of 1 person and maximum of 33(standard deviation=4.42). Highest numbers were recorded in Mbarali, Iringa and Mufindi districtsdue to polygamy and extended family ties. Extended family ties were more pronounced amongst thepastoralists, especially the Wasukuma. Sometimes it was very difficult to define a household in theSukuma context, because sons continued to stay in the parent�s homesteads and were counted as onehousehold.
Table 3.2 Household size and composition in the study area
Farming System Household size Household CompositionMin. Max. Mean Female
(mean)Male(mean)
Children(below 16)
No. of Householdmembers involved in
Agriculture(Range)
Potato based (FS1) 1 8 3.73 2.00 2.18 2.10 2.09 (1-3)Maize-Potato (FS2) 1 11 4.91 2.57 2.48 2.45 2.51 (1-7)Maize-Beans (FS3) 1 7 4.95 2.40 2.35 2.45 2.35 (1-5)Maize based (FS4) 1 23 6.19 3.12 2.83 3.55 2.4 (1-9)Rice Pastoralist (FS5) 1 33 6.81 3.29 3.21 3.41 3.47 (1-11)Total 1 33 5.90 2.94 2.82 3.10 2.79Source: Questionnaire survey, 2000
The average number of female and male members of the household is 2.94 and 2.82 respectively.The number of children under 16 years old is on average 3.1 (standard deviation = 3.08). The numberof people engaged in agriculture ranged from 1 in singles to 11 in large households, with an averageof 2.79 (std. 1.89). Table 3.2 summarises the household size and composition of the interviewees inthe different farming systems identified in the study area.
3.2.2 Age and marital status
The average age of the household elders is 39 years, minimum age was 18 years and maximum was76 years old. The average age of men was 41.6 years while the average age of women was 36.5years.
About ninety (89.8) percent of respondents were married, 4% were single, 5.9% widows, while 1.1%divorced and 1.2% temporarily separated from their spouses. About 80.7% of the respondents areChristians, Moslems are 3.2% and traditionalists are 16.0%.

Sustainable Management of Usangu Wetland and its Catchment March 2001
Final report - Farming systems Page No. 14
3.2.3 Education level
As shown in table 3.3, about 50 percent have complete primary education, 27.8 percent attendedprimary education but did not complete standard seven. Few (3.2 percent) attended secondary leveleducation, but half of them did not finish school due to various reasons. Some parents could notcontinue paying school fees for their children, and mostly the girls dropped out to get married.
Table 3.3 Proportion of respondents by types and level of education
Level of Education Frequency (n=187) PercentageNo formal education 34 18.1Adult education 7 3.8Complete primary education 88 47.1Incomplete primary education 52 27.8Secondary education 3 1.6Incomplete secondary education 3 1.6Source: Questionnaire survey, 2000.
3.2.4 Ethnic composition
Looking at the ethnic composition in the project area (table 3.4), it was found out that, in Iringa andMufindi the major ethic groups are Wahehe (88.9% and 76.2% respectively) and Wabena (11.1% and23.8% respectively). In Njombe, Wabena are the majority and few Wakinga (96.6% and 3.4%respectively). In Makete, Wawanji are the majority (71.4%) especially in the highlands, with fewWabena and Wakinga (10.7% each). Wasangu are found in the lowland areas of Kimani (7.1%). InMbeya district, majority are Wasafwa (85.4%), with few Wakingas (9.8%) especially in the UporotoMountains, and Wanyakyusa (4.9%). In Mbarali, as stated earlier, there are more diverse ethnicgroups. It was found that Wasangu who are the natives forms about 23.7%, followed by Nyakyusa(20.3%). Another big groups are the Wahehe (16.9%), especially in Madibira area, and Wasukuma(11.9%). Others are Wabena and Wakinga (6.8% respectively), Wasafwa, Wawanji and Wagogo(3.4% respectively), Wandali and Walambya (1.7% respectively).
Table 3.4 Ethnic groups composition by district (% of respondents)
Tribe Iringa Mufindi Njombe Makete Mbeya MbaraliWahehe 88.9 76.2 16.9Wabena 11.1 23.8 96.6 10.7 6.8Wakinga 3.4 10.7 9.8 6.8Wawanji 71.4 3.4Wasangu 7.1 23.7Wasafwa 85.4 3.4Wanyakyusa 4.9 20.3Wasukuma 11.9Source: Questionnaire survey, 2000.

Sustainable Management of Usangu Wetland and its Catchment March 2001
Final report - Farming systems Page No. 15
3.2.5 Source of income for rural livelihood
The major source of household income is agriculture and livestock. About 94.7% of the farmersranked agriculture as their first income source, and 38% indicated livestock as their second source.Agriculture formed the main occupation of rural people, where 100% are engaged in crop production.Eighty six percent (86%) of farmers keep different types of livestock. Farmers are also engaged inoff-farm activities as discussed in Chapter 8.
3.2.6 Land ownership, acreage and distribution
On average, farmers manage 5 different agricultural plots. ranging between 1 and 25. The highestnumber of agricultural plots was recorded in maize-potato farming system. This is due to landfragmentation in the highlands. In the maize-potato growing areas, particularly Mbeya District,husbands and wives customarily own farm plots. Therefore land is divided into smaller plots andallocated between parents, sons and daughters soon after the latter are able to work. Daughtersmaintain their plots even after they are married. Coupled with population pressure, this system ofland allocation has resulted into increased land fragmentation such that the size of the plots iscurrently very small. Husbands may also allocate some land to their wives so that there is guaranteeof food for their household and excess for sale. In the rice-pastoral farming system number of plotsare few but the acreage are large. In most of the villages, men own land (65%), while 25% of thefarmers indicated that both husbands and wives owned land. Only 10% of women owned land in theproject area. Farmers have an average of 8.5 acres, with a minimum of 0.5 and a maximum of 261acres. Table 3.5 shows the average number of farm plots and acreage per farming system.
Table 3.5 Average number of farm plots and acreage per farming system
Farming SystemsZones
No. ofrespondents
Number of Agricultural Plots Acreage
Ave. Min. Max. Ave. Min. Max.1. Potato-based 12 5.4 4 7 6.1 2.5 10.52. Maize-Potato 35 8.6 2 25 7.9 0.75 80.03. Maize-Beans 20 8.0 1 24 4.9 1.0 10.54. Maize-based 52 3.7 1 20 4.9 1.0 15.05. Rice-Pastoralism 68 3.1 1 10 13.2 0.5 261.0Project area 187 4.9 1 25 8.5 0.5 261.0Source: Questionnaire survey, 2000
Large land holdings were recorded in Mbarali and especially amongst the agro-pastoralist householdswho have opened large land areas for crop production. There is a difference between genders in landownership. Men headed households have more land, the average is 10.45 acres, ranging from 0.5 to261. Women headed household have on the average 6.14 acres ranging between 0.75 to 80 acres.
About 79 percent of the farmers acquired their land through inheritance. Fourteen percent (14%) ofthe farmers were allocated land by village governments and 7% got land through hiring or boughtland. About 36% of farmers hire land from other individuals. Hiring of land is very common inMbarali (28.8%), Makete (35.7%) and Mbeya (46.3%) districts. Land is hired for the production ofcash crops like paddy and potatoes. Also many farmers hired land in the valley bottoms locallyknown as �vinyungu� for the production of high value crops like green maize, tomatoes andvegetables.

Sustainable Management of Usangu Wetland and its Catchment March 2001
Final report - Farming systems Page No. 16
It was also found out that farmers have moved back to their land, locally known as �malungulu�, dueto a shortage of land in areas where they were moved to during the villagization programme of 1974.Farmers keeping livestock also had to walk long distances in search of grazing lands; thus theydecided to go back to their �malungulu�. This has increased the number of village hamlets, and someof them are allocated more than 10 km from the village centre, creating problems to childrenattending school, as was the case in Maduma and Malangali villages in Mufindi and Njombe districtsrespectively.
About 48% of the respondents have land in the valley bottoms locally known as �vinyungu�. InIringa district 100% of farmers have land in the �vinyungu�. The utilisation of bottom valley�vinyungu� under different farming systems is shown on table 3.6 below.
Table 3.6 Percentage of respondents having farms on valley bottoms, sloping and flatlands
Farming System Having farms on Valleybottom land (vinyungu)
Having Farms onSloping Land
Having Farms on Flatland
Potato-based (FS 1) 0 90.9 27.3Maize-Potato (FS 2) 34.3 100.0 40.0Maize-Beans (FS 3) 50.0 85.0 75.0Maize-based (FS 4) 79.2 69.8 69.3Rice-Pastoralist (FS 5) 36.8 5.9 91.2Project (study) area 47.6 55.1 70.1Source: Questionnaire survey, 2000.
This indicates that, valley bottom cultivation is very common in almost all farming systems, except inthe potato-based farming system and some parts of Uporoto (maize-potato farming system), where itis very hilly and valley bottoms are narrow. Cultivation in the �vinyungu� is done as an incomegeneration activity, but to a large extent it supplements the low production in the main season. In therice-pastoralist farming system most farmers cultivate along river-banks when they have access towater. Apparently due to shortage of water in the past two seasons, most farmers could not cultivatetheir vinyungu. Some farmers have to hire from neighbouring farmers or villages. Otherwisevinyungu cultivation is very important for food security as well as income generation.
Fifty five percent (55.1%) of the farmers indicated having land on steep slopes, while 70.1% havetheir farms on the flat land. Except for few farmers in areas where there is intervention by projectslike HIMA in Matamba, EEC in Galijembe, and ARI Uyole in Iyawaya, farmers did not use anyconservation methods to protect land from erosion. Most farmers in the highlands construct divergingchannels to allow water flow out of their fields. During group discussions with farmers, it wasrevealed that farmers did not practice land conservation, claiming that contour construction, forexample, is laborious. Other claimed that contours reduced areas for cultivation.

Sustainable Management of Usangu Wetland and its Catchment March 2001
Final report - Farming systems Page No. 17
4. DESCRIPTION OF THE FARMING SYSTEMS
Rainfed agriculture is mainly subsistence and is practiced by all households in the study area. It is themost important source of living. The different farming systems found in the project area can beexplained by the variation in physical and biological circumstances and by variation in economic andsocial realities. Natural circumstances influence farmer�s decisions on the type of crops to be grown.Altitude and rainfall impose restrictions on growing seasons and create uncertainties in farming.Differences in soils and topography are other factors of major importance in crop production.External socio-economic circumstances including farmer�s access to inputs, produce markets, prices,availability of consumer goods, credits and extension services also influence their decisions.
Resource constraints in terms of labour, cash and capital limit farmers capacity to make substantialchanges in their farming systems. Also large and rapidly expanding villages have resulted in localland shortages. In areas where farmers cultivate with oxen and land is not limiting, increases inproduction are a result of increases in acreage as opposed to intensification. Most of the potentialfarmland is under continuous cultivation. In areas where there is land pressure, cultivation is nowspreading to steeper slopes with serious erosion susceptibility.
The farming system in the rainfed agriculture is very dynamic and in most cases crops and cropmixtures grown reflect the dietary preferences and the market opportunities of the farmers and riskavoiding strategies. The highlands and plateau have good soils, reliable and plentiful rainfall and areof high agricultural potential for smallholder farmers.
In the highlands and medium plateau, crops grown include maize, beans, round potatoes, green peas,sweet potatoes, wheat, pyrethrum, coffee, sunflower, finger millet, vegetables and fruits. In someareas, sugarcane is becoming an important cash crop and its production is on the increase in villagesbordering Usangu plains. In the lowlands, the main crops produced are maize, cowpeas, pigeon peas,groundnuts, millets, sorghum, sweet potatoes and cassava. Paddy is mostly grown under irrigationeither in traditional or improved schemes. Table 4.1 shows percentage of farmers growing differenttypes of crops in the farming systems studied.
Livestock is practised both in the highlands and lowlands, where cattle, small ruminants, and non-ruminants are kept in varying degrees. There is high population of ruminants in the lowlands, and inthe highlands dairying and pig production is common.
The farming systems (FS) are classified based on AEZs and other socio-economic factors. Althoughthe soils, climate and altitude define the land-use pattern within any AEZ, different farming systemsoccur along side each other, sometimes correlated with infrastructure (figure 4.1). The farmingsystem zonation is summarised in Appendix VII and detailed information is given in the proceedingsections.

Sustainable Management of Usangu Wetland and its Catchment March 2001
Final report - Farming systems Page No. 18
Figure 4.1. Farming systems map.

Sustainable Management of Usangu Wetland and its Catchment March 2001
Final report - Farming systems Page No. 19
Table 4.1 Types of crops grown by farmers in different farming systems (percentage ofrespondents growing the crops)
Crop FS1 FS2 FS3 FS4 FS5 TotalMaize - 97.1 100.0 98.1 100.0 98.4Beans - 77.1 95.0 98.1 36.8 67.9Wheat - 100.0 50.0 9.4 - 31.0Paddy - - - - 60.3 21.9Pyrethrum 18.2 62.9 20.0 - - 15.1Finger millet - - 5.0 13.2 7.4 7.0Sorghum - - 65.0 11.3 17.6 7.0Round potatoes 100.0 88.6 68.8 32.1 - 38.3Sweet Potatoes - 14.3 55.0 43.4 30.9 32.1Sunflower - 5.7 5.0 79.2 1.5 24.6Sugarcane - 5.7 5.0 7.7 4.4 4.8Cowpeas - - - 30.2 22.1 16.6Tomatoes - 20.0 70.0 28.3 8.8 22.5Cabbages 27.3 17.1 20.0 18.9 - 12.3Onions 9.1 22.9 30.0 9.4 2.9 11.8Green peas 54.5 64.7 60.0 5.7 - 23.1Coffee - 37.1 35.0 - - 10.7Bananas - 20.6 30.0 1.9 4.4 9.1Fruits - 42.9 10.0 1.9 1.5 10.2Groundnuts - - 20.0 13.2 38.2 19.8Vegetables (leafy) 9.1 11.4 30.0 9.4 10.3 12.3Note: FS1=Potatoes based. FS; FS2=Maize-Potatoes FS; FS3=Maize-beans FS; FS4=Maize basedFS; FS5=Rice-Pastoralism.
4.1 Potato-based farming system (FS1)
The potato based FS lies in the high areas of Kikondo in Kitulo plateau in AEZ 3. The altitude rangesfrom 2000 to 2900 m and has a montane temperate farming system. The soils are rather variable but
the altitude and temperatures areof overriding importance. Thedominant vegetation is shortgrassland of low nutritive value,which is mostly used for grazing.There are remnants of the naturalforests consisting of Hageniasterculea and bamboos withscattered Ficus species. Kikuyugrass is the common natural grassin the area. Bamboo is usedprimarily as a building materialand especially for roofing.
The soils are mostly dark incolour with free pumice gravel.Rainfall is generally high and the
0102030405060708090
100
% o
f Res
pond
ents
1st Priority 2nd Priority 3rd Priority 4th Priority
Ranking in order of importance
Chart 4.1: Important Cash Crops in Potato based Farming System
Round Potatoes Cabbages Onions Green peas

Sustainable Management of Usangu Wetland and its Catchment March 2001
Final report - Farming systems Page No. 20
mean annual rainfall is 1 600 mm. The growing period is consequently very long, with duration of280 days. The mean temperature is 10.80C, and frost can occur in the driest months of June, July andAugust. Climatically the area is suitable for pyrethrum, and it used to be a major cash crop before1991. Round potatoes replaced it (chart 4.1) due to marketing problems experienced after thecollapse of co-operative unions, which were sole buyer of pyrethrum flowers.
Good markets in Dar-es-salaam and neighbouringcountries such as Malawi andZambia also motivated farmersto expand potato production.Potatoes are grown as the maincash and food crop. Althoughthe area under potatoproduction is on the increase,poor road conditions leading tolow prices are discouragingfarmers. With liberalisation ofmarketing of cash crops inrecent years, some farmershave started to replantpyrethrum. The pace ofgrowing pyrethrum is,however, very slow becausethe prices offered in the lasttwo seasons were not very
attractive and the farmers still lack confidence on the market opportunities. It was reported thatfarmers are discouraged to grow pyrethrum in this area, as it takes too long to harvest (6 months), ascompared to potatoes (3 months). In addition, during the wet season drying of pyrethrum is laboriousand there are a lot of post harvest losses.
Wheat, green peas and maize are grown mainly for food (chart 4.2). However, the growing season istoo long in this zone, therefore farmers cultivate these crops in the neighbouring villages that arelocated at lower altitudes. Farm size is on average 6.1 acres per household, ranging between 2.5 to10.5 acres (table 3.5). Area under cultivation of round potatoes, which is a major cash crop, is onaverage 2.68 acres per household ranging from 1.0-5.0 acres. Use of chemical fertilisers in roundpotato production is medium, where most farmers apply 2 bags of 50 kg each of Triple SuperPhosphate (TSP) plus 1 bag (50 kg) of Calcium Ammonium Nitrate (CAN 26% N) mix in one acre,as basal application. The recommended rates for potatoes in these areas are 3 bags of TSP plus 3bags of Urea (46% N) per acre. Top dressing is not common, and use of organic manure was notmentioned. Cultivation is done by hand hoe, and use of donkeys for haulage is on the increase.Labour is one of the constraints in crop production, but terrain limits mechanisation especially forland preparation, weeding and harvesting. Farmers use hired labour and labour parties for theactivities.
On average, yield for crops grown in potato based farming systems are very low. The average yieldfor round potatoes is 5 409 kg/acre, while the potential yield ranges from 17 tons to 30 tonsdepending on the variety and fertiliser use. The average yields for other crops recorded are cabbage(2 533 kg/acre); green peas (196.7 kg/acre) and onions (200 kg/acre).
0102030405060708090
100
% o
f res
pond
ents
1st Priority 2nd Priority 3rd Priority 4th PriorityRanking in order of importance
Chart 4.2: Important Food crops in Potato-based farming system
Maize Wheat Beans Round potatoes Green peas

Sustainable Management of Usangu Wetland and its Catchment March 2001
Final report - Farming systems Page No. 21
About 72.7 percent of farmers interviewed reported that they keep various types of livestock,including cattle, sheep, and donkeys. Local Zebus and sheep are common, although the population ofsheep has declined due to high mortality rates caused by diseases. Pig production is also verycommon. Livestock keeping is mostly extensive where animals are kept far from homesteads, andone member of the family goes there once a day to check in case of sick animals. Under this systemanimals are not milked. The average number of animals kept, by category, are presented in table 6.1.
4.2. Maize-potato farming system (FS2)
The maize-potato (MP) farming system is found in the high altitude areas of Uporoto particularlyTembela and Matamba divisions, and some parts of Njombe plateau. Mussei et al (1999) referred tothis as farming system zone 4 (FS 4). The soils are mostly highly leached. The area comprises ofdeep brown sandy clay loams (Mollic Andosol, Vitric, Haplic Andosols) in Uporoto Mountains. In
the Njombe plateau the soils arehighly leached red clays of lowfertility, mainly with humic topsoilsinfluenced by volcanic ash on thealmost flat or gently sloping hilltops.
Remnants of natural forestconsisting of Hagenia sterculea andBamboo, Kikuyu grass at higherelevation and Hyparrhenia grass isdominating in the lower altitude.More than 75 percent of land isunder continuous cultivation. Landfragmentation is common and accessto more land for expansion isdifficult. The growing period israther long extending from Augustto July the following year, thusinter-cropping or double cropping isvery common.
Agriculture is both for subsistence and cash income. The predominant crop is maize followed bypotatoes and pyrethrum, wheat, beans and peas (table 4.1). Round potatoes, pyrethrum and maize arethe major cash crops, while maize is the major food crop, followed by wheat and round potatoes,beans and green peas. Low prices offered by private buyers and poor road condition to villages inthis farming system are becoming major hindering factors to increased production.
In this area pyrethrum used to be a major cash crop, but market problems caused farmers to abandonthe crop in favour of round potatoes. Unlike in Kikondo area, farmers interviewed at Igenge, Ulenjeand Nyalwela villages claimed that there is increased demand of pyrethrum seeds this season as manyfarmers are increasingly gaining confidence in the private sector involved in the buying of pyrethrumflowers in the villages. Charts 4.3 and 4.4 summarises the ranking by respondents on the importanceof different crops grown. Pyrethrum is ranked as first priority as a cash crop, followed by roundpotatoes and maize. Maize is ranked as first priority food crop followed by wheat, round potatoes,beans and green peas.
Chart 4.3: Important Cash crops in Maize Potatoes Farming System
0
5
10
15
20
25
30
35
40
45
1st Priority 2nd Priority 3rd Priority 4th Priority
Ranking in order of importance
% o
f Res
pond
ents
Pyrethrum Round potatoes Maize Wheat Coffee Beans Green peas

Sustainable Management of Usangu Wetland and its Catchment March 2001
Final report - Farming systems Page No. 22
Vegetables like cabbages,onions and tomatoes arebecoming important cashcrop earners wherecommunication is goodsuch as Njombe, Tembelaand Uyole areas that haveaccess to market areas ofMbeya town and Dar-es-salaam. Other cropsinclude high altitudesorghum and finger millet,although the production offinger millet has declined asareas under forest used forslash and burn system arediminishing. Sorghum andfinger millet are basically
used for brewing. Temperate fruits, mostly peaches are common around the homesteads in this area.Bamboo for wine production is also an important cash crop in some areas. All cultivation is done byhand hoe, as hilly terrain limits mechanisation.
Average farm size is 7.9 acres per household, and allocation of land to a particular crop depends verymuch on its importance as a cash or food crop. On average, farmers cultivate 2 acres of maize; 1.24acres of round potatoes; 1.1 acres of beans, 1.2 acres of wheat, 1.1 acres of pyrethrum and 0.9 acres ofgreen peas. Sometimes these crops are mixed, and it is common to find mixtures of maize with roundpotatoes and peas or wheat with peas. Pyrethrum is grown as a mono-crop. Few farmers buy seeds,while the majority select own seeds from previous crop. Varieties of maize grown include H6302 andH614.
Use of chemical fertiliser is common for cash crops and farmers are using TSP or DAP for basalapplication and UREA or CAN for top dressing. On average 36.3 kg/acre is applied at planting and30 kg/acre is applied as top dressing in maize. In round potatoes 51.4 kg and 33.1 kg per acre areapplied during planting and top dressed respectively. Use of organic manure was reported, but ratesare very low (270 kg/acre). The recommended rates for maize and round potatoes are 2 bags of TSPper acre and 7 bags of Urea per acre for Njombe plateau and Uyole plains respectively. Averageyield in kg per acre for crops grown in this farming system as reported by respondents are very low asfollows: maize (522.9); round potatoes (1,696.9), beans (140.7); wheat (295.6), onion (468.6) andtomatoes (1011.4). Farmers mentioned soil fertility and labour as major constraints. There is alsohigh diseases and pest pressure in this farming system as compared to potato-based farming system.Many farmers in the MP-FS reported use of pesticides in control of diseases and pests.
Over 80 percent of farmers indicated problems of labour shortage in the FS for various cropoperations; out of which 42.4 percent hired labour for especially land preparation. Other activitiessuch as planting, weeding and harvesting, though experienced labour shortage, there are few farmersthat indicated hiring labour.
About 88.6 percent of farmers interviewed keep livestock in the MP farming system. The livestockkept include cattle, goats, sheep, pigs, guinea pigs, rabbits and poultry (table 6.1). The number ofdairy animals under smallholder is increasing as a result of intervention by projects and NGOs like
Chart 4.4: Important Food Crops in Maize-Potato Farming System.
0102030405060708090
100
1st Priority 2nd Priority 3rd Priority 4th PriorityRanking in order of importance
% o
f res
pond
ents
Maize Wheat R/potatoes Beans G/peas

Sustainable Management of Usangu Wetland and its Catchment March 2001
Final report - Farming systems Page No. 23
Southern Highlands Dairy Development Programme, HPI, and CARITAS Tanzania. Most of theseanimals are managed under the extensive system of grazing (60.9%), while dairy animals are eitherzero grazed (8.7%) or tethered (30.4%). Milk marketing is a common problem in these areas, despitethe efforts by some projects to mobilise groups cum associations to promote group marketing. Milkprocessing is only limited to fermentation into sour milk. There is low use of draft power in this zone(8.6% of respondents) because of the terrain that limit mechanisation; moreover donkeys are used forhaulage.
4.3. Maize-Beans Farming System (FS3)
The maize-beans (MB) FS is predominantly practised in the middle altitude. The FS is common inthe Uyole plains and it extends to Inyala area. It is also found in some parts of the highlands such asthe Njombe plateau, where it is located in the foot-slopes of the mountains. The soils are mostlyhighly leached red clays with low fertility. In the Mbeya stepped plains soils are brownish and deep
red clay loam of low fertility. Thesesoils are prone to erosion. Miombowoodland and Hyparrhenia grassesare the dominating natural vegetation.Rainfall decreases from 1 500 mm inhigher altitudes, to 600 mm in thelower altitudes. The growing periodis between December and June. Themain crops grown are maize, beans,tomatoes, onion, wheat, roundpotatoes, sweet potatoes, sunflower,sorghum and finger millet. Theirimportance as food and cash crops isshown by the percentage ofrespondents (charts 4.5 and 4.6). Thecropping system is either mono-cropor mixed. Cultivation is on small tomedium farms. Farmers cultivate onaverage 2.8 acres of maize, 2.1 acres
of beans, 0.8 acres of pyrethrum, and 0.5 acres of round potatoes and wheat respectively. Other cropsare groundnuts (1.7 acres); onion (1.0 acres); sorghum (0.6 acres); sunflower (0.5 acres) and fingermillet (0.5 acres).
There is high use of draft power (52.6% of respondents) for land preparation. All other operations aredone by hand. However, farmers who owned oxen are only 20%. Other farmers using oxen eitherborrowed (10%) or hired from fellow farmers (70%). Use of fertilisers is relatively low, and ismainly used in maize and round potato fields. Interviewed farmers who indicated use of fertilisers inmaize, apply on average 30.6 kg/acre as basal application, and 52.9 kg/acre for top dressing. Therecommended rates for maize is 50 kg/acre of TSP or DAP and 100 kg/acre of CAN for basal andtop-dressing respectively. Most farmers reported use of own selected seeds from previous crop, andreasons given are that prices of seeds are high and quality of seeds is poor as experienced in the lasttwo seasons.
0102030405060708090
100
% o
f res
pond
ents
1st Priority 2nd Priority 3rd Priority 4th PriorityRanking in order of importance
Chart 4.5: Importanf Food Crops in Maize-Beans Farming System
Maize Beans R/potatoes S/potatoes Wheat

Sustainable Management of Usangu Wetland and its Catchment March 2001
Final report - Farming systems Page No. 24
About 95 percent of respondents keeplivestock in this farming system.Thirty nine percent (38.9%) keepcattle for draught power, milkproduction and supply of manure.More than 88.9 percent keep chickenand 61.1 percent keep goats. About16.7%, 11.1%, and 16.7% also keeppigs, guinea pigs and rabbitsrespectively. Table 6.1 shows theaverage number of livestock kept inthe FS. Livestock keeping is mostlyextensive, except for pigs and guineapigs that are raised in-door. Farmersinterviewed indicated that feedresources are adequate.
4.4. Maize-based farming system (FS4)
The maize-based (M) FS covers areas of Mufindi and Kidugala plateau, Northern Ubena plateau(Makambako-Njombe road), lower Mufindi plateau (Malangali-Saja-Wanging�ombe stretch) andUsangu Flats border (Chimala-Mbuyuni-Igawa area). The altitude ranges between 1 200 - 2 000 m.The annual precipitation varies between 900 mm to 1 000 mm, and the growing period is 175 daysstarting from end of November. The soils are uniform yellow highly leached clays, and red clay soilswith moderate fertility sometimes having a sandy topsoil. In the Usangu Flats border, soils arepredominantly shallow or moderately deep red clays, mostly stony with poor fertility.
The dominant vegetation isMiombo and Acacia woodlandwith grasses of low nutritionalvalue. Extensive undulatinggrasslands characterised byshort shrubs of miombo,mikusu (Combretum species),Uapaca kirkiana andMisaulwa (Parinari species)typify the zone. Hyparrheniaand Cynodon speciesdominate the natural grasses.Most of the area is cultivated,although there is still a largearea under grassland.
Chart 4.6: Important Cash Crops in Maize-Beans Farming System
0
10
20
30
40
50
1st Priority 2nd Priority 3rd Priority 4th Priority
Ranking in order of importance
% o
f res
pond
ents
Maize Beans Tomatoes R/potatoesOnions Sorghum Coffee
Chart 4.7: Important Food Crops in Maize based Farming System
0
20
40
60
80
100
120
1st Priority 2nd Priority 3rd Priority 4th Priority
Ranking in order of importance
% o
f res
pond
ents
Maize Beans R/potatoes S/potatoes Sunflower Cowpeas

Sustainable Management of Usangu Wetland and its Catchment March 2001
Final report - Farming systems Page No. 25
The basic FS does not varysignificantly throughout thesystem, concentrating mainly onmaize production followed byoilseeds such as sunflower andgroundnuts. Other crops ofimportance are beans, cowpeas,pigeon peas, sorghum, sweetpotatoes, cassava, wheat,tomatoes, onion, vegetables andbamboo. Charts 4.7 and 4.8summarise the importance offood and cash crops as indicatedby respondents. Maize issometimes planted under Acaciatrees, a practice commonly seenalong Chimala-Mbuyuni andMadibira areas. Soils underAcacia trees are fertile and moistfavouring growth.
In this area, farmers use oxen (73.6%), mostly for ploughing and transportation. Weeding and ridgingimplements are not very common despite the fact that these farm operations seem to be an importantbottleneck in increasing productivity. Use of chemical fertilisers is very low, due to low incomesleading to low capital investment in crop production. Very few farmers use chemical fertilisers, butfarm yard manure is used by many farmers who keep livestock. On average farmers use fertilisers inmaize at rates of 26.2 kg/acre of TSP and 30.9 kg/acre of CAN for basal and top-dressingrespectively. Farmers mostly use own selected seeds.
About 94 percent of respondents keep livestock. Animals kept include cattle, goats, sheep, pigs andpoultry. Fifty percent of respondents keep cattle while 84.3% keep poultry. Few farmers keep goats,
sheep and donkeys. Like in other FSs,livestock are extensively grazed inrangelands, and farmers reported thatfeed resources are adequate.
4.5 Rice-Pastoral FarmingSystem (FS5)
The Rice-Pastoral (RP) FS occupies theUsangu plains (AEZ 18) and ischaracterised by cultivation of paddy,and is referred to as FS 10 by Mussei etal (1999). Under this system, theconcept of land use planning along thecatena is very well developed and cropsare located to land componentsaccording to their capabilities (Hatibu
Chart 4.8: Important Cash Crops in Maize-based Farming System
0
10
20
30
40
50
1st Priority 2nd Priority 3rd Priority 4th Priority
Ranking in order of importance
% o
f res
pond
ents
Maize Beans Sunflower Tomatoes Cabbages
Chart 4.9: Important Food Crops in Rice-Pastoral Farming System
0102030405060708090
100
1st Priority 2nd Priority 3rd Priority 4th Priority
Ranking in order of importance
% o
f res
pond
ents
Maize Beans Paddy S/potatoesGroundnuts Cowpeas Vegetables Sorghum
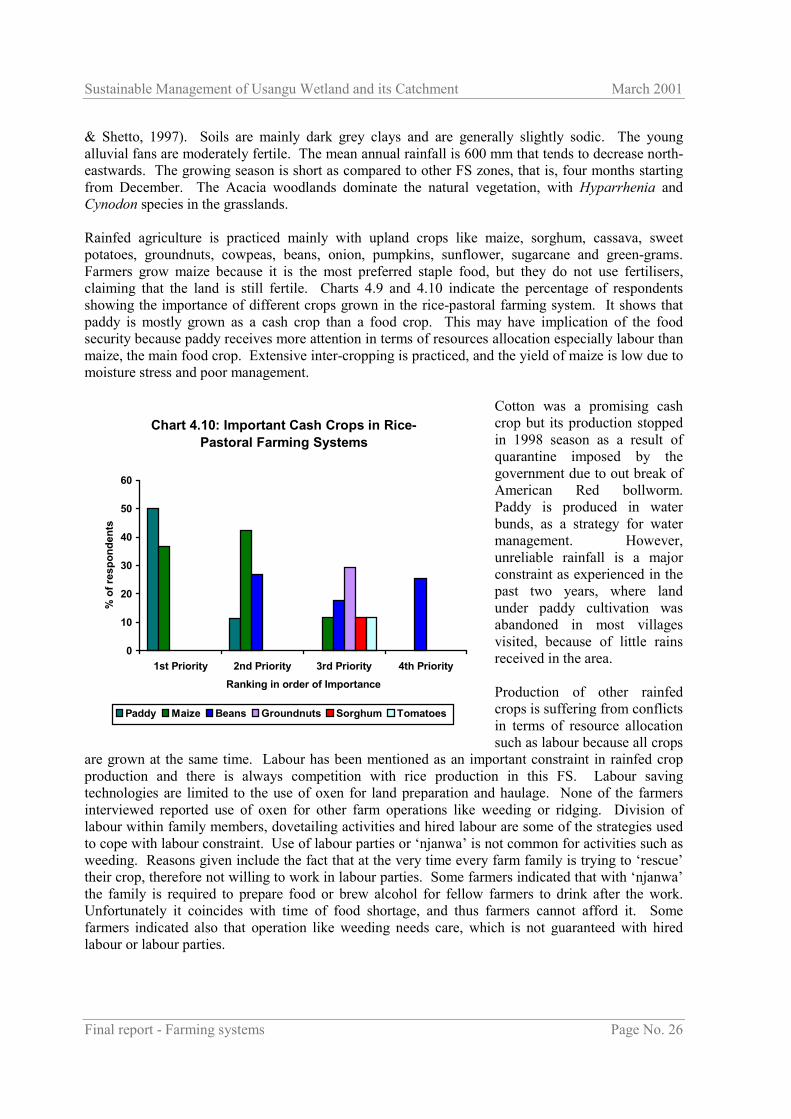
Sustainable Management of Usangu Wetland and its Catchment March 2001
Final report - Farming systems Page No. 26
& Shetto, 1997). Soils are mainly dark grey clays and are generally slightly sodic. The youngalluvial fans are moderately fertile. The mean annual rainfall is 600 mm that tends to decrease north-eastwards. The growing season is short as compared to other FS zones, that is, four months startingfrom December. The Acacia woodlands dominate the natural vegetation, with Hyparrhenia andCynodon species in the grasslands.
Rainfed agriculture is practiced mainly with upland crops like maize, sorghum, cassava, sweetpotatoes, groundnuts, cowpeas, beans, onion, pumpkins, sunflower, sugarcane and green-grams.Farmers grow maize because it is the most preferred staple food, but they do not use fertilisers,claiming that the land is still fertile. Charts 4.9 and 4.10 indicate the percentage of respondentsshowing the importance of different crops grown in the rice-pastoral farming system. It shows thatpaddy is mostly grown as a cash crop than a food crop. This may have implication of the foodsecurity because paddy receives more attention in terms of resources allocation especially labour thanmaize, the main food crop. Extensive inter-cropping is practiced, and the yield of maize is low due tomoisture stress and poor management.
Cotton was a promising cashcrop but its production stoppedin 1998 season as a result ofquarantine imposed by thegovernment due to out break ofAmerican Red bollworm.Paddy is produced in waterbunds, as a strategy for watermanagement. However,unreliable rainfall is a majorconstraint as experienced in thepast two years, where landunder paddy cultivation wasabandoned in most villagesvisited, because of little rainsreceived in the area.
Production of other rainfedcrops is suffering from conflictsin terms of resource allocationsuch as labour because all crops
are grown at the same time. Labour has been mentioned as an important constraint in rainfed cropproduction and there is always competition with rice production in this FS. Labour savingtechnologies are limited to the use of oxen for land preparation and haulage. None of the farmersinterviewed reported use of oxen for other farm operations like weeding or ridging. Division oflabour within family members, dovetailing activities and hired labour are some of the strategies usedto cope with labour constraint. Use of labour parties or �njanwa� is not common for activities such asweeding. Reasons given include the fact that at the very time every farm family is trying to �rescue�their crop, therefore not willing to work in labour parties. Some farmers indicated that with �njanwa�the family is required to prepare food or brew alcohol for fellow farmers to drink after the work.Unfortunately it coincides with time of food shortage, and thus farmers cannot afford it. Somefarmers indicated also that operation like weeding needs care, which is not guaranteed with hiredlabour or labour parties.
Chart 4.10: Important Cash Crops in Rice-Pastoral Farming Systems
0
10
20
30
40
50
60
1st Priority 2nd Priority 3rd Priority 4th PriorityRanking in order of Importance
% o
f res
pond
ents
Paddy Maize Beans Groundnuts Sorghum Tomatoes

Sustainable Management of Usangu Wetland and its Catchment March 2001
Final report - Farming systems Page No. 27
Improved crop husbandry like planting in recommended spacing is not practised. Ridging is commonfor maize and groundnuts. Sorghum is planted on flat seedbeds and mostly is broadcast. Farmersselect own seeds from previous crop, and most common maize varieties grown include Katumbili,Katumani and Mwendambio. Few farmers purchase seeds and Cargil 4141 is preferred due to itsearly maturity. Sorghum varieties grown are known by different names in different places, but inIkoga farmers mentioned Piligi (an early maturing variety), Mawilu (late maturing variety but highyielder). Other sorghum varieties are Gumi and Msale believed to originate from the northern regionor Kenya.
Farmers cultivate large land areas. On average farmers own 13.2 acres, ranging from 0.5 to 261acres. Large land holdings are reported amongst the agro-pastoralists groups who opened large areasto cater for large families. Land scarcity was reported at Kimani where farmers hired land forespecially paddy cultivation. Yield for crops grown is generally low because of poor crop husbandryin almost all crops grown in addition to other problems mentioned above. Mean yield for paddy is1228 kg/acre; for maize is 572 kg/acre; groundnut (225 kg/acre); sorghum (415.8 kg/acre); sweetpotatoes (1482 kg/acre); cowpeas (67 kg/acre); finger millet (252 kg/acre).
More than 77 percent keep livestock. Large groups of ruminants, sheep and goats are mainly kept byagro-pastoralists, especially the Sukumas, Maasais and other ethnic groups from the northern regions(table 6.1). Increased theft incidences by pastoralists have reduced the number of animals kept bysmall farmers in the Usangu area. Most farmers (88.7%) keep chicken, but numbers are reduced byhigh incidences of diseases like Newcastle and coccidiosis.
4.6. Pastoral farming system
The pastoral (P) FS covers the area north of the Usangu plains known as Middle Ruaha valley. In thissystem the principal production enterprise is livestock. The system is characterised by stock keepingthat is sometimes supplemented by a little crop production (mainly sorghum and millet). There isvery low off-take of animals but with high sales of milk and gee in exchange for food grains. Theoutput levels are low and there is limited commercialisation (Hatibu & Shetto, 1997). This area wasnot visited during the study.
4.7 Tobacco-pastoral farming system
The tobacco-pastoral (TP) farming system lies in the northwest parts of the project area in Chunyadistrict. Most farmers grow flue-cured tobacco as their main cash crop. Bee keeping is a traditionalactivity in the farming system. The majority of farmers keep large herds of cattle. The climate, soilsand poor road communications are a serious constraint to development in this system. The area wasnot visited during the survey.
4.8. Maize - potato - tea farming system
The maize-potato-tea (MPT) farming system covers the central Njombe area. Main crops grown inthis FS are maize, potatoes and tea. Other crops include wheat, peas, temperate fruits, beans, barley,pyrethrum, sunflower and coffee. The livestock kept include cattle, goats, sheep, pigs and poultry.Forests are a common component of the system and are dominated by wattle trees. The FS was notvisited during the formal survey.

Sustainable Management of Usangu Wetland and its Catchment March 2001
Final report - Farming systems Page No. 28
4.9. Changes in the farming systems
As discussed earlier, the existing farming systems are a result of interaction between the exogenous,natural, economic and cultural circumstances of farmers and their own priorities and resourcecapabilities. Farm households manage and practice production roles in response to physical,biological and socio-economic environments, and in accordance with the household goals,preferences and resources. In rural areas many activities are geared towards ensuring enoughhousehold food supply and earn cash to meet other household obligations. Observation shows thatthe farming systems found in the study area are very dynamic. Discussion with farmers reveals thathousehold preferences on the type of crops to be grown for food and cash earning and level ofproductivity have been changing over time. The changes may be in terms of changes in croppingpatterns, crop-livestock interactions, and particularly changes towards a market economy.
In the maize-beans and maize based farming systems where maize is a main staple food, farmersindicated that finger millet used to be the main staple food. Finger millet was produced under a slashand burn system. Increase in population resulted in opening up of more land for production of foodcrops. This reduced areas under forestry to support this type of farming system. After theintroduction of maize improved technologies under the maize improvement programme of the 1970s,maize replaced finger millet. Promotion of use of fertilisers that were highly subsidised made it moreprofitable to produce maize at that time and there was a ready market for the crop. Therefore maizebecame a major food crop as well as a cash crop. In addition, the availability of input credit facilitiesin the rural areas at the time of maize improvement programme increased the adoption of improvedpractices. Increase in maize production in the southern highlands, hence nicknamed �the big four� or�the grain basket of the country�.
Recent campaigns by the government and other pressure groups to stop deforestation have alsocontributed to reduced number of farmers producing finger millet and area under cultivation. Only 7percent of farmers indicated that they grow finger millet. The number might be higher as manyfarmers feared to state that they grow finger millet due to by-laws on deforestation. In Idumulavanu,for example, farmers needed a permit to clear a new farm, and that is where they plant finger millet.Farmers also reported that finger millet post-harvest processing is very laborious and thusdiscouraging them especially young farmers.
In the rice-pastoral farming systems we observed that land that is currently under maize could beconverted to rice production when water is available, thus changing cropping patterns. For example,in Itamba village farmers are producing maize on land that was formally under rice cultivation. Theriver that was providing water to these farms had shifted its course during the el nino rains, leavingabout 2 000 acres without water for rice production. Farmers who want to continue cultivating ricehave to walk long distances to other villages like Kimani to hire land. This creates more competitionof resources available especially family labour. There are many similar examples in villages in thisFS like Simike and Mhwela villages.
There is persistence of growing maize in marginal areas due to food preferences as it was observed inthe high altitudes. These areas have long growing season causing maize to occupy land for almost 10months.
Improvements in the infrastructure to markets in major towns has recently increased production ofhorticultural crops. Most of the horticultural crops are produced in the off-season, under irrigation.Land that used to lay idle after harvesting allowing cattle to graze is immediately cleared forhorticultural crops as observed in Iyawaya village. This has also created competition on resourceallocation in terms of labour for off-farm activities and water.

Sustainable Management of Usangu Wetland and its Catchment March 2001
Final report - Farming systems Page No. 29
It was also observed that in the potato based FS and maize-potato FS, round potato replacedpyrethrum when there was a problem of marketing the crop. This shows that farmers are respondingto market opportunities whenever possible.
The migration of agro-pastoralists in the Usangu plains also has an influence on the type of farmingsystems. They introduced keeping of large herds of animals, creating more demand on grazing lands.Pastoralists from the Sukuma ethnic group also promoted cultivation of crops like sorghum,groundnuts and sweet potatoes causing opening up of more land.
Changes in government policies may also influence changes in the farming systems. The recentquarantine caused farmers to drop cultivation of cotton that was a promising cash crop in the Usanguplains.
Introduction of dairy animals under zero grazing also makes a lot of changes in resource allocationespecially labour. Women get more involved in dairy management as observed in maize-potatoes andmaize-beans farming systems. In same FSs land fragmentation and utilisation of marginal lands dueto population pressure caused farmers to cultivate high value crops like tomatoes and onions. Due toland shortage in these areas, time for fallowing that was practised for soil conservation and fertilityimprovement is reduced from 5-10 years to 1-3 years.

Sustainable Management of Usangu Wetland and its Catchment March 2001
Final report - Farming systems Page No. 30
5.0. CROP PRODUCTION
5.1. Types of crops grown
The major crops grown in the Usangu wetland and its catchment are maize, beans, paddy, wheat,round potatoes, sweet potatoes, sunflower, groundnuts, cowpeas, finger millet, and vegetables likepumpkin leaves, spinach, cabbages, green peas, onions, and tomatoes. The choice and intensity of acrop grown depends very much on the agro-ecological zone and the farming system. The main foodand cash crops in different farming systems and land allocation is presented in table 5.1. It isapparent that maize is an important crop in the farming systems as it is a food and cash crop. Theimportance of maize varies from one farming system to another.
(a) Maize
Maize is grown in almost all AEZs except the Kitulo Plateau. Both wet season and dry seasonplanting are practiced. The latter is planted on valley bottom locally known as �vinyungu�. About98% of the respondents grow maize in the main season.
The main season for maize production is the wet season that starts in November. In higher altitudeslike Uporoto Mountains planting is done in August using residual moisture. Sixty eight percent of thefarmers interviewed grew maize mixed with other crops. In the medium and low altitudes, maize ismixed with other crops such as beans, cowpeas, sunflower, sorghum, groundnuts and pumpkins. Inhigh altitude areas of Uporoto maize is mixed with round potatoes and green peas. The averageacreage under maize is 3.89 acres ranging between 0.5 and 42.0 acres. In the Usangu plains, maize isgrown on land that is not suitable for rice. Maize cultivation in Usangu is mainly done on ridges.The intensity of cultivation appears to be directly related to the distance from the settlements, withland near the village being more intensely cropped than the land further away.
Low soil fertility and declining moisture, especially in the last two seasons, mainly account for lowproduction. Use of chemical fertilisers in maize production is also very low. Only 16.8% of farmersreported using TSP or DAP during planting, 23.8% use organic fertiliser mainly farm yard manureand compost for planting. Moreover the fertiliser rates applied are well below the recommended onesas discussed earlier in chapter 4. In the lowland farmers do not use fertilisers claiming that their soilsare still fertile.
About 83% of farmers select seeds from the previous crop. Most of them indicated that theycontinued selecting from the Hybrid seeds planted in the 1970s during the maize improvementprogramme. Few farmers (11%) buy new seeds from either stockists in villages or open markets.Others get seed from fellow farmers when they see that it has performed better. Varieties grown inhigh and medium altitude include H 6302, H 614, TMV2, CG4141. In the lowland, composite werepreferred most and Katumani, Kilima, Staha, UCA, CG4142 and 4141 were mentioned in manyvillages. Local varieties used were mostly from the reselected seeds and farmers prefer Katumbiliand Mwendambio because they mature early. Important criteria for selection of varieties are highyielding, early maturity and milling quality.

Sustainable Management of Usangu Wetland and its Catchment March 2001
Final report - Farming systems Page No. 31
Table 5.1 Average acreage under crop production in different farming systems (range)
Crop FS1 FS2 FS3 FS4 FS5 TotalMaize - 1.99 (0.5-6.0) 2.8 (0.5-7.0) 3.5 (0.5-10) 3.8 (0.5-42.0) 3.16 (0.5-42)Beans - 1.08 (0.1-6.0) 2.1 (0.25-7.0) 2.5 (0.25-8.0) 1.8 (0.25-13.0) 1.96 (0.1-13.0)Wheat - 1.2 (0.25-3.0) 0.5 (0.25-1.0) 0.5 ((0.25-1.0) - 0.95 (0.25-3.0)Paddy - - - - 4.1 (0.5-21.5) 4.1 (0.5-21.5)Pyrethrum 1.13 (.75-1.5) 1.14 (0.25-5.0) 0.8 (0.25-1.0) - - 1.09 (0.25-5.0)Finger millet - - 0.5 0.2 (0.2-0.5) 0.6 (0.25-1.0) 0.37 (0.21.0)Sorghum - - 0.6 (0.25-2.0) 2.4 (0.5-4.0) 26.5 (1.0-240) 10.99 (0.25-240)Round potatoes 2.68 (1.00-5.00) 1.24 (0.25-7.0) 0.5 (0.25-1.0) 0.8 (0.13-6.0) - 1.25 (0.13-7.0)Sweet Potatoes - 0.3 (0.25-0.5) 0.3 (0.25-1.25) 0.3 (0.2-1.0) 0.8 (0.2-6.0) 0.48 (0.13-6.0)Sunflower - 0.25 0.5 2.1 (0.2-6.0) 1.5 2.01 (0.13-6.0)Sugarcane - - - 1.4 (0.24-3.0) 2.7 (0.13-9.0) 2/02 (0.13-9.0)Cowpeas - - - 1.9 (0.25-7.0) 1.7 (0.2-6.0) 1.81 (0.13-7.0)Tomatoes - 0.26 (0.1-0.5) 0.3 (0.1-0.5) 0.4 (0.1-2.0) 0.28 (0.2-0.5) 0.3 (0.1-2.0)Cabbages 0.33 (0.25-0.5) 0.18 (0.1-0.25) 0.4 (0.1-1.0) 0.3 (0.1-1.0) - 0.3 (0.1-1.0)Onions 0.5 0.28 (0.1-0.5) 1.0 (0.5-2.0) 0.24 (0.2-0.3) 0.25 0.44 (0.2-2.0)Green peas 0.68 (0.1-2.0) 0.89 (0.2-3.0) 0.5 (0.25-2.0) 0.5 (0.25-1.0) - 0.7 (0.1-3.0)Coffee - 0.6 (0.25-1.5) 0.3 (0.25-0.5) - - 0.46 (0.25-1.5)Bananas - 0.3 (0.1-0.5) 0.2 (0.1-0.25) - 3.8 (0.5-9.0) 1.44 (0.1-9.0)Fruits - 0.23 (0.2-0.25) - - - 0.23 (0.2-0.25)Groundnuts - - 1.7 (0.25-5.0) 1.4 (0.25-3.0) 2.2 (0.25-13.0) 2.01 (0.25-13.0)Vegetables (leafy) 0.25 0.33 (0.25-0.5) 0.2 (0.1-0.25) - 0.5 (0.25-1.0) 0.35 (0.1-2.0)

Sustainable Management of Usangu Wetland and its Catchment March 2001
Final report - Farming systems Page No. 32
Harvesting time for maize varies depending on the AEZ. In the medium and low lands maize plantedin November-December is harvested starting June to August. At higher altitude maize takes 10 to 12months to harvest, as is the case in potato-based farming system. The average production of maize is543 kg per acre, ranging from 50kg to 2 500 kg (Std. deviation is 383.9). This variation is mainlyattributed to location, soil fertility, and amount of rainfall and husbandry practices. In the high andmedium plateau where maize is grown for food as well as a cash crop, improved husbandry ispractised. This includes planting in recommended spacing, use of fertilisers, plant protection andweeding twice. The pest of economic importance is stalk borer, and most farmers control it by usingnatural botanicals such as �utupa� (Tephrosia species) and �Lidupala� (Neurotanania species, alegume found in the bush lands).
On average, fifty percent of the maize produced is left for household consumption and the rest is soldto earn income. Maize is sold to private buyers, and the price ranging from 4 000/ per bag of 100 kgat harvesting time to 10 000/- in February when there is scarcity. However, most farmers sell theirmaize immediately after harvesting to earn money for other household needs such as medicalexpenses, school fees and clothing.
Many farmers indicated that they produce maize in the dry seasons (vinyungu) under irrigation tosupplement the low production of maize in the main season.
(b) Beans
Beans is a second crop grown by many farmers in the study area. About 129 (68%) of therespondents are producing beans as a food crop as well as for cash. On average, 1.9 acres perhousehold is under beans. There are three seasons for bean production. Beans planted inNovember/December are grown in mixtures with maize. The second season is February/Marchwhere beans are planted as a mono-crop. A third season is under the vinyungu system and in thelowlands where beans are grown under irrigation that is planted in July/August. The majority offarmers in Usangu plains produce beans in the third season. Use of fertilisers is very low. In manycases beans are fertilised when planted with maize or where it is planted in the second season inplaces like Njombe, Makete and Mbeya where beans is mostly produced as a cash crop.
Bean varieties grown in the area are mostly local varieties including Kablanketi, Mwasipenjele,Nyamhanga, Masusu and Msafiri. There are also improved varieties that were released at the UyoleAgricultural Research Institute such as Kabanima and Uyole 84. Currently three new varietiesnamely Uyole 94, Uyole 96 and Uyole 98 were tested on-farm especially in Wanging�ombe area.Farmers� assessment of these varieties is still on going.
Average production is 154 kg/acre, ranging from 20kg/acre to 1 000 kg/acre (std. Deviation = 170.6).Low production is caused by use of local varieties and low soil fertility in the highlands. In thelowlands, low soil moisture is the major constraint and sometimes the crop fails completely in badyears. Pests also caused decline in bean production especially in the second and third season.Disease is a problem in the first season due to high moisture.
(c) Wheat
Wheat is mainly grown in Njombe, Makete and Mbeya districts, and in some areas in Iringa andMufindi districts. About 31% of farmers plant wheat in the study area, and the average area underproduction is 1 acre, ranging from 0.25 to 3 acres. In Makete, wheat is produced mainly as food cropas well as cash crop, while in Mbeya most farmers produced it for cash. Use of fertiliser is very low,only 3.6% of farmers indicated using fertilisers during planting of wheat.
Sustainable Management of Usangu Wetland and its Catchment March 2001
Final report - Farming systems Page No. 33
A number of varieties are grown in the area and it is common to find the same variety identified bydifferent names from one place to another. The local varieties mentioned by farmers includeMagunila, Kadala-kasupi, Madihani and Sikalino. Improved variety found in farmers� fields, inMatamba division especially, is Juhudi that was released at Uyole in 1980s. Wheat production is alsovery low, with an average of 276.9 kg/acre, ranging from 60 kg/acre to 334 kg/acre. The potentialyields recorded in Galijembe in Mbeya district under farmers� condition are 1 000 kg/acre (ARIUyole Progress Report, 2000). Low soil fertility, late planting and diseases account for poorproduction in most of the areas visited.
(d) Paddy
Although the crop is not produced under rain-fed agriculture, it is very important in the rurallivelihoods of Usangu people. Paddy is produced in the Usangu plains and is under irrigation. Bothtraditional and improved irrigation systems are used. The crop is produced mainly as a cash crop;where about 80% percent of the farmers in Mbarali district (the main producer) indicated that it istheir first important cash crop. Average acreage under paddy production is 4 acres per household,ranging between 0.5 to 21.5 acres. The average production of paddy is 1 228.1 kg/acre.
Most farmers are not using improved crop husbandry practices, such as planting at the recommendedspacing and use of inputs. Farmers using recommended spacing and high yielding varieties atIgomelo village recorded higher yields of up to 34 bag/acre. Varieties commonly planted by farmersare Supa, Subarimati, India rangi, Faya, Mahia, Pijo and Zambia. Supa is the mostly preferred varietydue to its grain quality and differential price, but it is low yielding. As with other crops, use offertilisers is very low, only 2.4% of farmers indicated using fertilisers during planting and topdressing. The majority of the farmers claimed that land under paddy is still fertile. The majorproblem causing low production, as reported by farmers, is inadequate water for irrigation. In somevillages like Itamba, Simike, Luhanga, Utengule and Mhwela farmers could not produce paddy thisseason because of water problems. Some farmers associated this with poor designs of improvedirrigation channel that denied them water that used to flow in rivers. However, current research foundout that the main problem is expansion of area under production outside the designed irrigationschemes by the people surrounding the project (Machibya, 2000: personal communication).
Labour and bird scaring are also important production constraints in paddy cultivation.
(e) Pyrethrum
Pyrethrum is produced in Njombe, Mbeya and Makete districts. The crop as mentioned earlier, usedto be an important cash crop before 1990 when the Cooperatives Union responsible for marketing wasoperating. Currently, with market liberalisation, the area under pyrethrum is increasing though at aslow pace. About 15% of the farmers interviewed grow pyrethrum. More farmers growingpyrethrum were found in Mbeya district (60.7%), followed by Makete (21.4%) and Njombe is 17%.
Harvesting of pyrethrum flower is done by hand and dried on mats or special areas prepared for thepurpose. Average production of pyrethrum is 136 kg/acre, ranging from 30 to 350 kg/acre. No use ofchemical fertiliser was recorded during interviews. Farmers in Imalilo villages informed that theygrow pyrethrum in their old farms (malungulu) where it is fertile.
(f) Ground potatoes

Sustainable Management of Usangu Wetland and its Catchment March 2001
Final report - Farming systems Page No. 34
This is an important cash crop in the Kitulo Plateau, Njombe Plateau and Uporoto Mountains. Onaverage, acreage under round potato production is 1.2 acres, ranging between 0.13 to 7.0 acres. InIringa, Mufindi and some parts of Mbeya, round potatoes is mixed with maize, green peas or wheat;and in this farming system, yields are very low. In Kikondo and Njombe plateau where potato ismostly grown as cash crop, the cropping system is mono-crop and the production is high. It rangesfrom 30 bags to 60 bags/acre (weight of one bag is between 110 to 130kg). The average productionin the project area is 2 000 kg/acre (about 16 bags/acre).
Use of chemical fertilisers is common in Njombe and Mbeya. Mostly farmers apply basal fertilisersand the most common is Triple Super Phosphate, NPK and Di-Ammonium Phosphate (DAP).Farmers in Kikondo reported that they use three bags of fertilisers, a mixture of TSP and CAN at aration of 2:1 at planting, and top dressing with Urea at a rate of one bag per acre.
The most important problems indicated by farmers are soil fertility and diseases, and the use ofpesticides in Mbeya and Njombe is high. Diseases of economic importance are potato blight andbacterial wilt. Potato blight is controlled using fungicides and most farmers apply them. The controlof bacterial wilt is mostly by cultural practices like crop rotation, but most farmers are not aware ofthe problem. The disease, if not controlled can spread very fast and may threaten production ofpotato in the area (Gondwe, 2000 in ARI Uyole progress report).
(g) Vegetable crops
Many farmers, especially young farmers, produce vegetables in the rain-fed as well as in the vinyunguor under irrigation during dry season. Tomatoes are grown by 22.5% of the farmers interviewed, andare an important cash crop especially in areas with good access to markets in towns. Most of thefarmers, however, depend on the Dar-es-salaam markets.
Farmers produce tomatoes on small plots, average is 0.3 acres and it ranges between 0.1 to 2 acres.Large plots were found in Njombe, especially Itunduma/Mtwango and Mbeya areas, enjoying goodaccess to roads which makes marketing easy. Average production is 2 500 kg/acre. It was difficultfor most farmers to estimate their production per acre as most of them produce in very small plots.Also very few kept records of number of buckets harvested as the crop is sold in small quantities.During the reconnaissance survey, some key producers (through discussion) claimed that somefarmers could produce up to 1 000 buckets each of 20kg, which was estimated to about 40 000kg/acre.
Other vegetable crops produced are cabbages mostly in Mbeya and Makete districts where it ismainly produced as cash crop. Onions is another important cash crop produced in Mbeya, Mbaraliand Makete districts. Green peas are also an important cash crop in the Uporoto villages as they haveaccess to market links through the Kasumulu-Mbeya-Dar-es-salaam road. Women mostly grow thecrop in small plots mixed with potatoes, maize or wheat. In villages surrounding Kipengere rangesand in Matamba, green peas are mostly grown for food, prepared as relish.
(h) Other crops
Other crops include sunflower, sorghum, cowpeas, finger millet, sweet potatoes, sugarcane,groundnuts, bananas, coffee, and fruits.
Sunflower is an important cash crop in Malangali-Wangingombe-Saja areas. Farmers growsunflower in mixtures. On average farmers produce 175.8 kg/acre, ranging between 100 to 1 200kg/acre. When sold as seeds, farmers get very low prices (Tsh. 6 400/- per bag), but they fetch good

Sustainable Management of Usangu Wetland and its Catchment March 2001
Final report - Farming systems Page No. 35
returns when sold as processed oil as commonly done by farmers around Makambako town. It wasfound out that farmers get 16 000/- to 20 000/- per bag when sunflower is processed into oil that givesabout 25 litres of vegetable oil.
Sweet potatoes are usually grown in small plots, solely by women. The farm field sizes vary between0.1 to 1 acres. Wasukuma in Usangu recorded higher acreage up to 12 acres, thus bringing theaverage of 2.5 acres per household. It is mostly grown after land preparation and sowing of othercrops is finished, indicating labour competition and increasing workload of women. The crop ismainly grown on the more sandy soils, and it is an important food security crop utilised during foodscarcity in March. The Sukuma women dry potatoes for storage as matobolwa or michembe. Theyield varies from 50 to 2 000 kg/acre.
Groundnuts are also becoming an important cash crop in the Lower Mufindi Plateau and Usanguplains in areas of Madibira division. Discussion with farmers at Idumulavanu and Saja villagesrevealed that it is becoming second to maize as a cash crop. The crop is grown on sandy soils,sometimes mixed with maize or sorghum. Average production is however low, 292 kg/acre, rangingfrom 50 kg/acre to 1 000 kg/acre.
Sorghum is grown in Njombe and Mbarali districts. In Njombe it is mostly grown for brewing, whilein Mbarali it is an important food crop especially amongst the Wasukuma ethnic group. Averageacreage is 11 acres, ranging between 0.25 to 240 acres (highest acreage recorded in Mbarali byWasukuma). Production is also very low ranging between 20kg/acre to 2 500 kg/acre (meanproduction is 360.3 kg/acre).
Coffee is an important cash crop in the highlands, but only 9% percent of farmers interviewed growcoffee. Average acreage is 0.5 acres, and production is very low ranging between 20 to 200 kg/acre.The crop is mostly mixed with bananas or Grevillia.
Many farmers grow some fruit trees especially around their homesteads. In the highland, peaches andavocado are common, while in the lowlands mangoes were found. Farmers although appreciated theproduce from fruit trees, it was very difficult to estimate production as mostly, fruits are consumed athome.
In most of the villages visited bamboo farming was common for production of bamboo wine. Thewine is mostly harvested starting from December at the on set of the rains up to May. In some placeswhere the crop is grown in the wetter parts, harvesting may continue up to August. Bamboo winemakes an important source of income in many households near the main road for the markets inMbeya, Makambako, Mufindi, and Iringa towns. Farmers in Matamba division in Makete districtreported that they might also transport bamboo wine to Chimala where they market it to businessmenfrom Mbeya town. HIMA (1994) reported that up to 17% of farmers in Makete engage in bamboowine business and it contributes about 19% of average cash earning per annum in the household.
5.2. Crop production operations and cropping calendar
5.2.1 Land preparation and ploughing
Land preparation involves slashing and burning of forest, in case of new land, or clearing and burningof crop residues. Ploughing is mostly done by hand hoe and oxen. On average 54.1 percent offarmers indicated use of draft animals for land preparation. The use of draught animals is morepronounced in the maize-beans FS, maize FS and rice-pastoral FS (table 5.2). Use of tractors was

Sustainable Management of Usangu Wetland and its Catchment March 2001
Final report - Farming systems Page No. 36
reported in Mbarali district. Land preparation and ploughing for different crops is done at differenttime depending on the cropping calendar as shown in figures 5.1 to 5.5.
Table 5.2 Percentage of farmers using draft animals in different farm operations byfarming system
PotatoFS
Maize-Potato FS
Maize-Beans FS
Maize FS Rice-PastoralFS
Total
Draft animal use(%)
11.1 8.6 52.6 73.6 69.2 54.1
Ownership ofdraft animals (%)
100 33.3 20 50.0 37.8 43.4
Hired draftanimals (%)
66.7 70.0 32.5 57.8 48.5
Borrow draftanimals (%)
10.0 12.5 4.4 8.1
ACTIVITIES USING DRAFT POWERLand preparation(%)
15.0 71.4 86.7 93.6 73.3
Weeding (%) 17.8 4.3 7.6Puddling (%) 27.3 11.4Ridging (%) 22.2 7.6Haulage (%) 20.0 7.1 31.1 44.7 28.2Source: Questionnaire survey, 2000
Where tillage is done by hand hoe, farmers prefer planting on ridges as they claimed that it was easierto prepare land and weed on ridges. Flat seedbeds are common when oxen are used for ploughing astillage is mainly done by using the single furrow mouldboard plough. In the potato based FS farmersowned and used donkeys for haulage only.
In the highlands, crop residues are ploughed under to improve soil fertility, while in lowland farmersburn crop residues to avoid pest infestation of their crops.
5.2.2 Sowing
There is great variation in planting time for various crops. This is influenced more by the agro-ecological zone and labour availability. Planting time for various crops in the farming systemsidentified is indicated in the cropping calendar (figs. 5.1-5.5). Sowing is done by hand eitherrandomly or in furrows behind the plough when oxen are used in ploughing. Broadcasting of smallcereals like wheat and sorghum is also common.
5.2.3 Weeding
Weeding is invariably done by hand hoes in all farming system zones. Weeding using draft animalsis not common with the exception of the Mtwango/Makambako area where the mouldboard plough isused (table 5.2).

Sustainable Management of Usangu Wetland and its Catchment March 2001
Final report - Farming systems Page No. 37
Frequency of weeding depends on the importance of a crop. In maize and round potatoes it is usuallydone twice. Cash crops mostly receive more attention in terms of management. For example,farmers producing paddy reported that the crop is given priority in terms of labour allocation duringpeak time.
5.2.4 Soil fertility management
The productivity of the soils very much depends not only on the physiography of land but also on itsnutrient supplying power. Crop production is directly related to the level of both macro andmicronutrient elements. The levels of these nutrients are in turn influenced by both landforms, inputs(e.g. crop residues, inorganic and organic fertilisers, etc), cropping system and agronomic practices(Msaky, 1998). Soils in the highland areas are acidic in nature, low in nitrogen and phosphorus andother micronutrients to support crop production. Farmers have for a long time adopted various waysof managing soil fertility such as fallowing, incorporation of crop residues, ridging, composting, croprotation, agro-forestry, and use of organic manures. Table 5.3 below summarises response of farmerson various soil fertility improvement methods used by farmers other than application of fertilisers.
With increased population, suitable land for crop production has been continuously cultivated.Fallowing though still practised, the time for fallowing has been reduced from 5-10 years to 1-3years, and in many cases farmers reported only one year of fallowing.
Farmers practice inter-cropping, but in most cases is used as a risk aversion strategy rather than soilfertility improvement strategy. Farmers are intercropping in order to ensure that they produce manycrops in a small piece of land.
Table 5.3 Use of soil fertility improvement methods by farming systems (in % ofrespondents)
Method PotatoFS
Maize-potato FS
Maize-Beans FS
Maize FS Rice-pastoralistFS
Total
Fallowing 81.8 60.0 45.0 28.3 33.8 41.2Nitrogen fixingplants
8.6 5.0 7.5 16.2 10.2
Intercropping 9.1 20.0 65.0 66.0 17.6 36.4Marejea 5.7 1.6Burying cropresdues
22.9 20.0 30.2 1.5 15.5
Crop rotation 45.7 70.0 18.9 13.2 26.2Source: Questionnaire survey, 2000
Agro-forestry in Mbarali district was observed in relation to incorporation of Acacia trees in thefarming system. This was very common in Madibira, in the lower Mufindi plateau, especially in theborder to Usangu and Chimala-Mbuyuni areas. Soils under the Acacia tree are reported to be veryfertile, hence these trees are retained on the farm to fertilise the land.
The use of fertilisers, both organic and inorganic, was mentioned in all farming system zones exceptthe rice�pastoralism farming system zone where farmers reported that land is still fertile (see table5.4).

Sustainable Management of Usangu Wetland and its Catchment March 2001
Final report - Farming systems Page No. 38
Use of fertiliser was reported mostly for crops produced as cash crops such as maize, round potatoes,beans and horticultural crops such as tomatoes. Farmers did not report use of fertilisers in othercrops. Use of organic fertiliser is becoming popular in areas where there is project intervention suchas HIMA, and CONCERN. Farmers however reported that use of manure is limited to farms aroundhomesteads because of transportation problems.
Table 5.4 Average amount of fertiliser used in maize, beans and round potatoes
FS1 FS2 FS3 FS4 FS5MAIZE
Basal Application (kg/acre) 0 36.3 30.6 26.2 0Top dressing (kg/acre) 0 29.5 52.9 30.9 0Organic manure (kg/acre) 0 270.3 310.0 360 0
BEANSBasal Application (kg/acre) 0 29.2 41.6 31.1 0Top dressing (kg/acre) 0 0 0 0 0Organic manure (kg/acre) 0 0 0 0 0
ROUND POTATOESBasal Application (kg/acre) 143.0 51.4 45.0 50.0 -Top dressing (kg/acre) 16.7 33.1 53.8 50.0 -Organic manure (kg/acre) 0 383.3 0 500.0 -Note: Amount are kilograms of TSP, CAN (26%N), DAP, Urea applied per acre.
5.2.5 Crop protection
Practices of controlling crop pests and diseases are reported mostly in the highlands and mediumplateau. Stalk borer, aphids, bean beetle and army-worms were mostly mentioned. Natural botanicalmaterials such as Utupa (Tephrosia species) and Lidupala (Neurotanania species) are commonly usedin controlling stalk borer in maize.
5.2.6 Harvesting and storage
Harvesting of all crops is done manually, and farmers harvest crops as they mature in the farm. Inmost cases, harvesting is done using family labour. Hiring of labour or labour parties may be used incase of crops such as round potatoes that have to be harvested in one day.
Cash crops are normally sold immediately after harvesting; therefore it is mostly food crops that arestored for a long time. Farmers in the study area use traditional storage structures locally known as�vihenge�. These are built outside the homestead and they are of different capacity ranging from 3 to10 bags of maize. Some households may have more than one structure depending on the harvest andsize of the household. In some areas especially where there is influence of township, farmers arediscouraged to store their grains in such structures because of incidences of theft. Sometimes farmersare storing their produce in gunny bags. The most common storage pest is the grain weevils(Sitophilus species) and sometimes the large grain borer was found. Farmers are advised to mix

Sustainable Management of Usangu Wetland and its Catchment March 2001
Final report - Farming systems Page No. 39
shelled maize with Actellic Super Dust as a way of controlling LGB. However most farmers arereluctant to shell their maize, claiming that it is easy to misuse the grain.
5.2.7 Land conservation practices
Soil degradation in most cases was expressed in terms of declining soils fertility. Soil erosion thoughevidenced in some parts was not revealed as a major problem contributing to declining soil fertility.Few farmers consciously practiced soil erosion control methods, except in areas where there isawareness through projects such as HIMA and CONCERN (table 5.5).Table 5.5. Use of erosion control methods in the farms by farming system (% ofrespondents)
Method Potato FS Maize-Potato FS
Maize-Beans FS
Maize FS Rice-PastoralistFS
Total
Ridging 18.2 20.0 25.0 32.7 21.2 24.5Contours 27.3 57.1 55.0 21.2 3.0 25.5Perennial grassplanted oncontours
14.3 15.0 1.9 4.9
Crop strawbarriers
5.0 9.6 3.3
Fallowing 54.5 48.6 25.0 26.9 12.1 27.2Tree planting 5.7 10.0 15.4 1.5 7.1Intercropping 20.0 50.0 53.8 6.1 26.6Agro-forestry 9.1 14.3 10.0 13.6 9.2Source: Questionnaire survey, 2000
The construction ditches to drain out excess water in the fields is a common practice in areas wherethey cultivation on very steep slopes. Use of ridges is also common in high and medium plateau.Contour farming is rarely practised and in most cases is influenced by project interventions.
5.2.8. Cropping Seasons and Calendar
There is great diversity in terms of time of operations for various crop productions in the project areadue to variation in agro-ecological zones. The cropping season runs throughout the year. In someareas land preparation starts immediately after harvesting, as growing seasons are very longespecially in the high altitudes. With increased use of �vinyungu� or irrigation to supplement cropproduction for household food security as well as cash, most farmers are involved in agriculture fortwelve months. Crop calendars for crops grown in different farming systems are shown in figures 5.1to 5.5. Most farmers indicated that December to March is the labour peak period, where landpreparation, planting and weeding is done. In maize-bean FS and maize FS harvesting coincides withland preparation in the valley bottom, thus is another time with high labour demands.

Sustainable Management of Usangu Wetland and its Catchment March 2001
Final report - Farming systems Page No. 40
Figure 5.1 Seasonal calendar: potato-pyrethrum based farming system
Crop 1 2 3 4 5 6 7 8 9 10 11 12R/potatoes LP LP LP LP
PL PL PL PL WD WD WDWD HVHV HV
Cabbage LP LPPL PL WD HV HV
G/peas LP LPPL PL HV HV
Note: LP = Land preparation; PL = planting; WD = weeding; HV = harvesting.
Figure 5.2 Seasonal calendar: maize-potato based farming system
CROP 1 2 3 4 5 6 7 8 9 10 11 12Maize LP LP LP LP
PL PLWD WD WD HV HV HV HV
Beans: first crop LP LP LP LPPL PL
WD WD HV HV HV
second crop LP LPPL WD HV HV
R/potatoes LP LP LP LPPL PL PL PL
WD WD HV HV HV HV
Wheat LP LP LP LPPL PL PL PL HV HV HV
Pyrethrum LPPL PL PL PL PL
WD WD WD WDHV HV HV HV HV HV
G/peas LP LPPL PL HV
Maize LP LP(off- season) PL PL WD WD
HV HV
Vegetables LPPL PL WD HV
Note: LP = Land preparation; PL = planting; WD = weeding; HV = harvesting.

Sustainable Management of Usangu Wetland and its Catchment March 2001
Final report - Farming systems Page No. 41
Figure 5.3 Seasonal calendar: maize � beans farming system
CROPS 1 2 3 4 5 6 7 8 9 10 11 12Maize LP LP LP LP
PL PLWD WD WD HV HV HV
Beans LP LP LP LPPL PL
PL PLWD WD HV HV HV
Wheat LP LPPL PL PL HV HV
Pyrethrum LP LPPL PL WD HV HV HV HV HV
Sorghum LP LP LPPL PL
WD WD WD HV
R/potatoes LP LP LP LPPL PL
PLWD WD WD HV HV
S/potatoes LP LP LP LP LPPL PL PL HV HV HV HV
S/flower LP LPPL PL
WD WD WD HV HV
Coffee LP LP LPPL
PL PLWD WD HV HV HV
Note: LP = Land preparation; PL = planting; WD = weeding; HV = harvesting.

Sustainable Management of Usangu Wetland and its Catchment March 2001
Final report - Farming systems Page No. 42
Figure 5.4 Seasonal calendar: maize - based farming system
CROPS 1 2 3 4 5 6 7 8 9 10 11 12Maize LP LP LP
PL PLWD WD WD HV HV HV HV
Beans LP LP LPPL PL
WD WD HV HV HV
S/flower LP LP LPPL PL
LP LPWD WD HV HV
S/potatoes LP LPPL PL
WD WD WD HV HV HV HV HV HV
S/cane LP PL PLHV HV
Tomatoes LP PL HV HV
Onions LP PL WD HV
G/nuts LPPL WD HV
R/potatoes LPPL WD HV
F/millet LP LP LPPL PL
WD WD HVNote: LP = Land preparation; PL = planting; WD = weeding; HV = harvesting.

Sustainable Management of Usangu Wetland and its Catchment March 2001
Final report - Farming systems Page No. 43
Figure 5.5 Seasonal calendar: rice based farming system
CROP 1 2 3 4 5 6 7 8 9 10 11 12Maize LP LP
PLPLWD WD WD HV HV
Beans: Firstcrop
LP
LP PL WDHV HV
Second crop LP LP WD HV HVPL PL
Paddy LP LPPL PL PL
WD WD HV HV
Sorghum LPPL
WD HV
Sweet potatoes LP LP LPPL PL PL HV HV HVHV HV HV HV HV
Cowpeas LPPL
PL WD WD HV HV
Groundnuts LP PLPLWD WD WD HV HV
Note: LP = Land preparation; PL = planting; WD = weeding; HV = harvesting.

Sustainable Management of Usangu Wetland and its Catchment March 2001
Final report - Farming systems Page No. 44
5.3 Labour use and division in crop production
Family labour that is regularly available for crop production is on average 2 people as reported by57.2 percent of respondents. The number ranges from 1 to 11 as shown in the chart 5.1 below.
Households with more people working on the farm were recorded amongst the pastoralists in Mbaralidistrict, and Iringa and Mufindi due to polygamy and extended family relationship.
Table 5.6 Household members� involvement in crop production operations (% ofrespondents)
Responsible member of the familyActivityMen Women Both adults Children
Land preparation 16.9 14.8 63.4 6.5Ploughing 11.4 10.3 73.4 4.8Puddling 25.5 6.4 66.0 2.1Planting/transplanting 5.0 21.0 68.5 11.0Weeding 5.5 15.9 73.6 4.9Spraying 37.5 9.1 51.1 2.2Harvesting 6.0 13.1 76.0 4.9Transportation 7.6 12.0 74.5 6.0
Both men and women almost on equal basis participate in crop production in the study area as shownin the table 5.6. Farmers� response on involvement of household members revealed that in menheaded household both adults participate in all farm operations. In female-headed household womendo all the activities. Where there are children they also participate in some operations when out ofschool. Despite the involvement of both men and women in all field activities, the men are moreinvolved in puddling and spraying, while women participated in weeding, harvesting and
Chart 5.1: Regular Family labour working in the farms
12
57.2
12.38.6
2.7 1.1 1.6 0.5 1.1 1.6 1.10
10
20
30
40
50
60
70
1 2 3 4 5 6 7 8 9 10 11Number of people available in Interviewed Household
Perc
enta
ge
Percentage of respondents

Sustainable Management of Usangu Wetland and its Catchment March 2001
Final report - Farming systems Page No. 45
transportation. The women are also involved in other reproductive chores such as fetching water andfire wood collection.
5.4. Crop production trends
The study reviewed trends of production for major crops produced in the Usangu wetland and itscatchment. Farmers interviewed reported that there is a general trend of decline in crop production inall farming systems visited. Table 5.7 below summarises the response from farmers.
Table 5.7 Percentage of farmers indicating declining in production of major crops byfarming system
Crop FS1 FS2 FS3 FS4 FS5 TotalMaize 80.0 70.0 75.5 97.1 84.1Beans 69.6 70.0 86.5 100 83.5Wheat 80.0 50.0 100.0 76.6Paddy 100.0 100.0R/potatoes 80.0 74.2 50.0 55.6 69.0S/potatoes 50.0 71.4 72.2 94.1 78.3Finger millet 80.0 80.0 80.0Sunflower 80.0 72.7Sorghum 62.5 100.0 100.0 85.7Tomatoes 80.0 41.7 75.0 100.0 67.6Onion 100.0 33.3 100.0 100.0 75.0Source: Questionnaire survey, 2000
The decline in crop production is associated with many reasons, but the main reasons are: (i) declinein soil fertility, (ii) unreliable rainfall, (iii) diseases and pests and (iv) frost damage (table 5.8). In thecase of pyrethrum, farmers reported that production is increasing because the area under production isalso increasing as many farmers are replanting the crop after improvement in the market situation.An increase was also reported for sugarcane especially in villages bordering Usangu plains likeLower Mufindi plateau as many farmers are opening up new farms. New crops like sugarcane arereplacing maize that used to be a cash crop in these areas. Groundnut production is also on theincrease.
5.5. Crop production constraints
During group discussion farmers mentioned a number of problems. These are:(i) Labour availability(ii) Declining soils fertility(iii) Unreliable rainfall(iv) Marketing of produce(v) Fertiliser availability(vi) High fertiliser prices(vii) Pesticides availability(viii) High pesticides prices(ix) Extension services

Sustainable Management of Usangu Wetland and its Catchment March 2001
Final report - Farming systems Page No. 46
Some of these problems have been highlighted in the previous sections. Farmers ranked the problemsin order of importance as discussed hereunder.
Table 5.8 Percentage of farmers indicating reason for the decline in production of majorcrops by farming system
Crop Reason for the decline FS1 FS2 FS3 FS4 FS5 TotalMaize Decline in soil fertility
Unreliable rainfallDiseases and pestsFrost damage
60.026.73.33.3
78.621.4
70.525.0
11.985.11.5
43.951.0
1.3
Beans Decline in soil fertilityUnreliable rainfallDiseases and pestsFrost damage
52.929.45.95.9
64.328.6
7.1
47.826.123.9
96.238.844.711.7
1.9Wheat Decline in soil fertility
Unreliable rainfallDiseases and pestsFrost damage
62.117.26.93.4
50.050.0
100.0 64.918.9
5.42.7
Paddy Decline in soil fertilityUnreliable rainfallDiseases and pestsFrost damage
12.587.5
12.587.5
R/potatoes Decline in soil fertilityUnreliable rainfallDiseases and pestsFrost damage
37.525.0
25.0
64.020.012.0
25.050.025.0
80.0
20.0
57.121.4
9.57.1
Source: Questionnaire survey, 2000.
5.5.1. Labour availability
Cultivation of various crops for food and cash needs, coupled with dependence on the hand hoe,resulted in labour shortage at peak period in most of the farming systems. Many farmers especiallyfor priority crops like maize, beans and paddy experience labour shortage. Chart 5.2 summarises theresponse of farmers on the extent of labour problem in different farming systems.

Sustainable Management of Usangu Wetland and its Catchment March 2001
Final report - Farming systems Page No. 47
0
10
20
30
40
50
60
70
80
90
% o
f res
pond
ents
First Priority Second Priority Third riorityRanking in order of importance
Chart 5.2: Extent of Labour problem in different farming systems
FS1FS2FS3FS4FS5
In FS1, 2, and 3 labour was mentioned as an important limitation but there was also high use oflabour parties than in FS 4 and 5. Farmers in the latter zones claimed that labour parties, or locallyknown as �Mgowe� in Iringa, Njombe, Mbarali and Makete or �Nyanwa� in Mbeya, are becomingless popular and farmers are not responding when invited. There are many reasons given on this stateof affair. Some farmers claimed that due to unreliable rainfall, the growing season is short.Therefore, there is a tendency of farmers rushing in their fields to ensure that they perform theoperations in time. Those with big families have advantage of coping with the situation. A fewfarmers can afford hired labour and the majority end up in late completion of farm operations.
It was also noted that the time of peak labour demand coincides with payment of school fees. It wasalso reported that at this time of the year many people suffer from diseases such as malaria, hencereducing the work force and more money is spent on hospital bills. Some operations like weedingneeded great care. In some areas it was found out that during this time of labour peak, many familieshave also food shortage, and hence sell their labour to earn food in kind or in cash. As a result theyattend late to their farms. Labour shortage is experienced in areas where there are many cropenterprises like maize-potato FSs and maize-beans FSs.
Crop operations that use hired labour most are land preparation and weeding. This reflectsinadequacy in mechanisation in the study area, despite the indication of high use of draft animals(54.1%) in land preparation in the study area. Tables 5.9a and 5.9b show the extent of labourshortage and hire and activities that use hired labour by crops.
Table 5.9a Extent of labour shortage and hire of labour for different crops by district (% ofrespondents)
Crop LabourShortage/hire
Potato FS Maize-Potato FS
Maize-Beans FS
Maize FS Rice-Pastoral FS
Total
Maize LS 70.0 88.6 100.0 86.8 76.1 83.8LH 50 44.4 57.9 36.7 40.3 42.2
Beans LS 25.0 63.6 84.2 79.2 52.5 70.2LH 100.0 16.7 62.5 35.4 31.6 36.9

Sustainable Management of Usangu Wetland and its Catchment March 2001
Final report - Farming systems Page No. 48
Wheat LS 71.4 81.8 57.1 66.7 76.0LH 33.3 21.4 20.0 22.0
Paddy LS 85.4 85.4LH 65.8 65.8
Pyrethrum LS 76.2 50.0 73.9LH 11.1 11.5
R/potatoes LS 90.9 75.0 57.1 23.1 64.4LH 81.8 32.0 40.0 11.1 40.0
S/potatoes LS 33.3 42.9 33.3 38.5 36.2LH 20.0 11.8 12.5 12.1
Sunflower LS 100.0 65.8 100.0 65.9LH 33.3 30.6
Tomatoes LS 46.2 36.4 25.0 33.3LH 50.0 22.2 50.0 34.8
Note: LS = Labour shortage; LH = Labour hired
Table 5.9b Crops and activities that use hired labour (% of respondents)
Crop Activity PotatoFS
Maize-Potato FS
Maize-Beans FS
MaizeFS
Rice-Pastoral FS
Total
Maize Land preparation 75.0 80.0 30.8 5.6 19.2 32.9Planting 6.7 1.3Weeding 6.7 69.2 88.9 80.8 61.8Harvesting 25.0 6.7 5.6 3.9
Beans Land preparation 50.0 100 30.0 23.5 16.7 31.6Weeding 60.0 76.5 83.3 63.2Harvesting 50.0 10.0 5.3
R/potatoes Land preparation 22.2 37.5 50.0 30.0Planting 33.3 12.5 20.0Weeding 25.0 50.0 20.0Harvesting 44.4 25.0 30.0
Wheat Land preparation 83.3 100.0 66.7Weeding 16.7 11.1Harvesting 22.2
Paddy Land preparation 12.5 12.5Puddling 33.3 33.3Transplanting 12.5 12.5Weeding 33.3 33.3
Source: Questionnaire survey, 2000
5.5.2 Declining soil fertility
Low productivity due to declining soil fertility is another problem, which was frequently mentioned.The problem is felt more in the high and medium altitude and particularly in areas where soils arefragile, and prone to soil erosion like lower Mufindi plateau. Chart 5.3 below depicts the picture asper farmers� response. Generally the problem of declining soil fertility as first priority cuts across allthe farming system.

Sustainable Management of Usangu Wetland and its Catchment March 2001
Final report - Farming systems Page No. 49
0
10
20
30
40
50
60
70
80
90
% o
f Res
pond
ents
First Priority Second Priority Third PriorityRanking in order of importance
Chart 5.3: Declining Soil fertility as ranked by Farmers in different Farming Systems
FS1FS2FS3FS4FS5
5.5.3 Unreliable rainfall
Unreliable rainfall was mentioned as a big problem in varying magnitude. In the highlandssometimes too much rains increase the incidences of diseases, causing low production. This wasparticularly mentioned in the FS1 and FS2 as a problem in round potatoes production. For the pasttwo years, however, the problem has been late start of rains and the rains stopped early. In thelowlands, the problem is declining moisture content to support growth of crops. The problem alsowas experienced more in the last two seasons. Farmers with irrigation facilities supplement with dryseason production of food crops to ensure food security. Chart 5.4 below shows percentage offarmers responding to unreliable rainfall in order of importance.
0
10
20
30
40
50
60
70
80
90
100
% o
f res
ponn
dent
s
1st Priority 2nd Priority 3rd PriorityRanking in order of importance
Chart 5.4: Ranking of the Problem of Unreliable Rainfall in order of importance
FS1FS2FS3FS4FS5

Sustainable Management of Usangu Wetland and its Catchment March 2001
Final report - Farming systems Page No. 50
5.5.4 Marketing of produce
With trade liberalisation, 96.8 percent of farmers indicated that they have access to market. Themain problem was therefore, low farm gate prices offered by private buyers. Farmers would like tosell their produce immediately after harvesting, but the prices given at that time are very lowcompared to cost of production. For example, the price of one bag of paddy sold at harvesting timein June/July ranges from 6 000/- to 8 000/-. The same bag of paddy will sell at 18 000/- to 20 000/-in January/March when there is shortage. Very few farmers could manage to keep their produce thatlong. One strategy used by farmers who have good access to water is to plant very early and harvestwhen there is high demand for rice, in March/April. Chart 5.5 give the picture of marketingproblems as ranked by respondents in the farming systems studied.
0
10
20
30
40
50
60
70
80
% o
f res
pond
ents
1st Priority 2nd Priority 3rd PriorityRanking in order of importance
Chart 5.5: Marketing problem as ranked by farmers in different farming systems
FS1FS2FS3FS4FS5
5.5.5 Fertiliser availability and fertiliser prices
Farmers related the problem of low productivity with decreased use of fertilisers. Most farmersreported that they no longer use chemical fertilisers because of its non-availability and high prices(see chart 5.6).

Sustainable Management of Usangu Wetland and its Catchment March 2001
Final report - Farming systems Page No. 51
0102030405060708090
% o
f res
pond
ents
FS1 FS2 FS3 FS4 FS5
Chart 5.6: Farmers response on problems of Fertiliser availability and prices
Fertiliser Availability Fetiliser Prices
In ranking the two problems farmers felt that the prices of fertilisers were high as indicated in thecharts 5.6 above. The problem was reported mainly in the high and medium altitudes due to low soilfertility as discussed in section 5.4.2. Farmers increasingly use organic fertilisers to cope with theproblem, although the problem of transportation hinders its extensive use.
5.5.6 Pesticide availability and pesticide prices
The problem of pesticide availability and high prices was mentioned more in horticultural crops andround potatoes. Farmers reported that there is a problem of pests such as aphids in dry seasonvegetables and beans. As with the case of fertilisers, farmers complained more on pesticides pricesand their efficacy. There is a lot of adulteration of chemicals sold especially in open markets wheremost farmers go to buy their supplies. Chart 5.7 shows the response of farmers in the pesticides
0
10
20
30
40
50
60
% o
f res
pond
ents
FS1 FS2 FS3 FS4 FS5
Chart 5.7: Response of Farmers on Problems of Pesticides Availability and prices
Pesticide availability Pesticide prices

Sustainable Management of Usangu Wetland and its Catchment March 2001
Final report - Farming systems Page No. 52
availability and prices. Use of pesticides in potato based farming system is low due to low diseasepressure; while in rice-pastoral FS use of inputs is generally low in paddy production.
5.5.7 Extension services
Some farmers related the problem of low production with lack of adequate knowledge on goodhusbandry practices and new technologies to address production constraints. However, unlike otherproblems, this was ranked low. Maybe this is due to the fact that there are few extension officers invarious fields of rural development especially agriculture and livestock. Farmers learn more fromtheir fellow farmers as one way of knowledge uptake pathways. Although most of the villages visitedhad Village Extension Officers, most of them serve more than one village, and do not have transportto enable them visit the villages more frequently. This to a large extent reduces their efficiency.Chart 5.8 shows the ranking of extension services in the study area.
0
10
20
30
40
50
60
% o
f res
pond
ents
1st Priority 2nd Priority 3rd Priority
Ranking in order of importance
Chart 5.8: Ranking of problem of Extension Services by Farmers in the study area
FS1FS2FS3FS4FS5
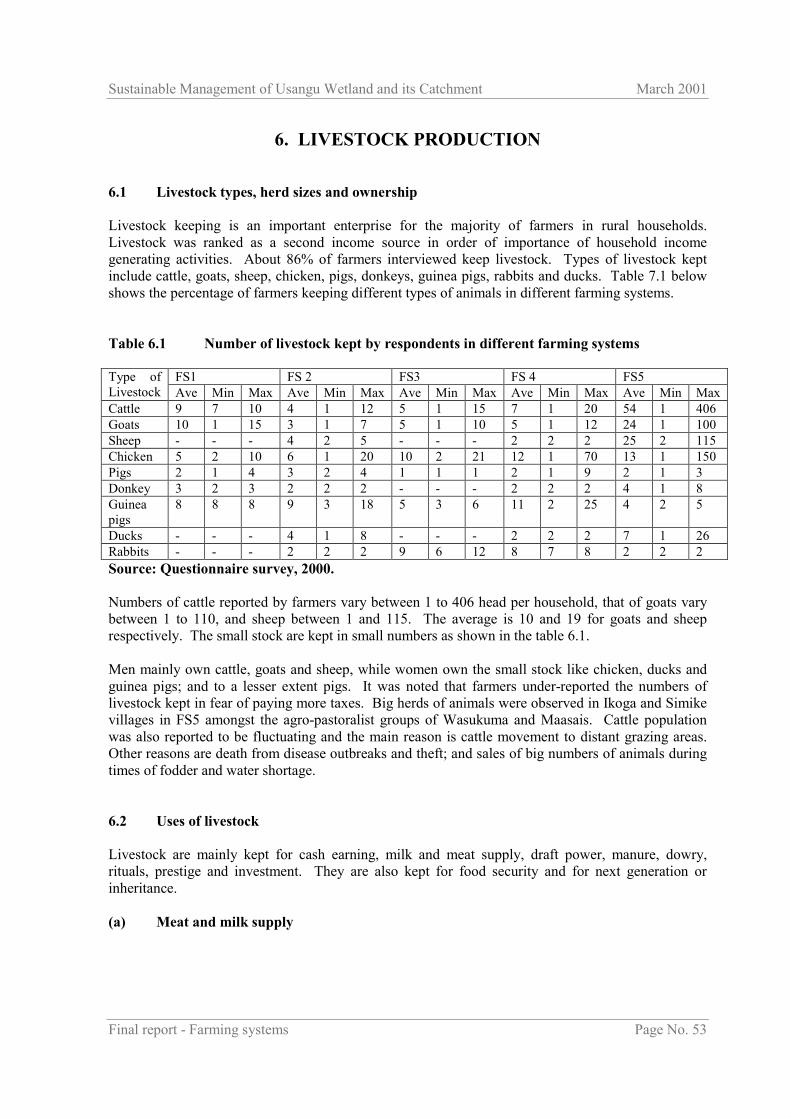
Sustainable Management of Usangu Wetland and its Catchment March 2001
Final report - Farming systems Page No. 53
6. LIVESTOCK PRODUCTION
6.1 Livestock types, herd sizes and ownership
Livestock keeping is an important enterprise for the majority of farmers in rural households.Livestock was ranked as a second income source in order of importance of household incomegenerating activities. About 86% of farmers interviewed keep livestock. Types of livestock keptinclude cattle, goats, sheep, chicken, pigs, donkeys, guinea pigs, rabbits and ducks. Table 7.1 belowshows the percentage of farmers keeping different types of animals in different farming systems.
Table 6.1 Number of livestock kept by respondents in different farming systems
FS1 FS 2 FS3 FS 4 FS5Type ofLivestock Ave Min Max Ave Min Max Ave Min Max Ave Min Max Ave Min MaxCattle 9 7 10 4 1 12 5 1 15 7 1 20 54 1 406Goats 10 1 15 3 1 7 5 1 10 5 1 12 24 1 100Sheep - - - 4 2 5 - - - 2 2 2 25 2 115Chicken 5 2 10 6 1 20 10 2 21 12 1 70 13 1 150Pigs 2 1 4 3 2 4 1 1 1 2 1 9 2 1 3Donkey 3 2 3 2 2 2 - - - 2 2 2 4 1 8Guineapigs
8 8 8 9 3 18 5 3 6 11 2 25 4 2 5
Ducks - - - 4 1 8 - - - 2 2 2 7 1 26Rabbits - - - 2 2 2 9 6 12 8 7 8 2 2 2Source: Questionnaire survey, 2000.
Numbers of cattle reported by farmers vary between 1 to 406 head per household, that of goats varybetween 1 to 110, and sheep between 1 and 115. The average is 10 and 19 for goats and sheeprespectively. The small stock are kept in small numbers as shown in the table 6.1.
Men mainly own cattle, goats and sheep, while women own the small stock like chicken, ducks andguinea pigs; and to a lesser extent pigs. It was noted that farmers under-reported the numbers oflivestock kept in fear of paying more taxes. Big herds of animals were observed in Ikoga and Simikevillages in FS5 amongst the agro-pastoralist groups of Wasukuma and Maasais. Cattle populationwas also reported to be fluctuating and the main reason is cattle movement to distant grazing areas.Other reasons are death from disease outbreaks and theft; and sales of big numbers of animals duringtimes of fodder and water shortage.
6.2 Uses of livestock
Livestock are mainly kept for cash earning, milk and meat supply, draft power, manure, dowry,rituals, prestige and investment. They are also kept for food security and for next generation orinheritance.
(a) Meat and milk supply

Sustainable Management of Usangu Wetland and its Catchment March 2001
Final report - Farming systems Page No. 54
Cattle are rarely slaughtered for meat for household consumption except when they are sick or onspecial occasions. The animals mostly slaughtered are small stock. Goat and chicken meat ispreferred most.
Milk production is very low, ranging between 1.0 to 1.5 litres/cow/day from local zebus. This ismostly consumed at home in case of few animals. Farmers with large herds like the agro-pastoralistsmay have excess milk for sale especially in the wet season. However the marketing of milk is a bigproblem in the Southern Highlands, because people do not have the habit of drinking milk.
There are few farmers with dairy animals, mainly crossbred cattle and goats in some villages inMakete (Matamba division), Njombe, Mbeya and Mufindi districts. The production of milk of thedairy cattle ranges between 5 to 10 litres. These animals were acquired mostly through projects likethe Southern Highlands Dairy Development Project (SHDDP), Heifer International Project (HPI) andCARITAS. Institutions like ARI Uyole, Kitulo Dairy farms and SAO Hills Livestock MultiplicationCentre were mentioned as sources of dairy animals.
(b) Cash income
Cattle, goats, chicken and pigs are important for income generation. The respondents reported that itis easier to sell goats and chickens than other stocks like sheep. Sheep play an insignificant role, asmost people do not like its meat. Some farmers reported that they sell sheep to fellow farmers forrituals. Women preferred keeping chicken and pigs as an important source of income. These couldbe sold in events of sickness or payment of school fees for their children.
(c) Draft power and manure
Oxen are very important for crop production almost in all farming systems except Kikondo andUporoto areas. On average, 54% of the farmers in the study area used draft animals for cropproduction. Donkeys are mostly used for haulage, and were very common in the Usangu plains,Matamba and Kikondo areas. Oxen are mainly used for land preparation using the mouldboardplough, ridging and for transportation. Weeding by using draught animals is not common withexception of the Mtwango/Makambako area where the mouldboard plough is used (table 7.2). Manyfarmers were unaware of draught animal weeding technologies. Organic fertilisers especially farmyard manure or kraal manure is used to improve soil fertility.
(d) Dowry, rituals, and food security
Cattle used to be important animals for dowry purposes. With time, this is changing as farmersclaimed that due to high monetary value of cattle, people would rather sell the animals and pay dowryin cash. In agro-pastoralists, in particular the Sukuma, payment of dowry in terms of cattle is stillvery common. When a family has more boys, dowry could be a reason for decreased cattle herd.
Goats and sheep are mostly used for rituals purposes, although this is becoming less important withChristianity and amongst young farmers. Farmers also sell their animals in events of crop failure tobuy food, as is the case this season in most agro-pastoralists families.
(e) Investment and inheritance
The role of cattle as a store of wealth in rural livelihood is very significant, and farmers claimed thatit is more reliable than other alternatives like banking. Most of the banks are very far from rural

Sustainable Management of Usangu Wetland and its Catchment March 2001
Final report - Farming systems Page No. 55
areas, and it becomes very expensive for them to bank. Cattle and goats also play a major role inprestige and inheritance as compared to other stock.
6.3 Livestock management
Livestock are traditionally managed by extensive systems. The most important aspects ofmanagement are feeding, watering, housing, milking and disease control are briefly described below.King and Ole-Lengisugi (2000) in their study of Livestock in the Usangu Plains give a more detaileddescription of livestock management in the pastoralists system.
(i) Feeding
Cattle, goats, sheep and donkeys graze or browse in the rangelands. Rangelands are uncropped areaswithin designated village lands. The animals are taken to graze during the day and kept in bomas inthe night. Only 5.3 and 7.4 percent of respondents practice zero grazing and tethering respectively.Tethering is common in some parts of Matamba and Mbeya districts where grazing lands are scarceas land is continuously under cultivation. Farmers keeping dairy animals mostly practice zerograzing. In Mbarali and Njombe districts about 50% or more of the respondents reported that feedswere inadequate (table 6.2).
Table 6.2 Condition of feed resources in grazing lands as assessed by farmers (% ofrespondents)
Assessment level Potato FS Maize-Potato FS
Maize-Beans FS
Maize FS Rice-Pastoralist FS
Total
Very plenty 33.3 4.3 20.0 25.9 12.0 16.1Adequate 33.3 34.8 73.3 29.6 44.0 41.9Scarce 33.3 56.5 6.7 29.0 40.0 35.5Very scarce 0.0 4.3 14.8 4.0 6.5Source: Questionnaire survey, 2000
(ii) Watering
Watering of ruminants is done along the streams and rivers in the grazing lands. During the dryseason, water is a big problem. This has been a cause for conflicts between pastoralists and cropproducers who cultivate in the valley bottoms (vinyungu) as witnessed in Simike village.Alternatively livestock keepers dig holes/wells to get water for animals. Women and female childrenfetch water for animals kept under zero grazing system and non-ruminants. This adds womenworkload especially during the labour peak period and the dry season when they walk long distances.
(iii) Housing
Cattle, goats, sheep and donkeys are kept in open enclosures (kraals) commonly called bomas or �zizila ng�ombe�. Sometimes sheep and goats are kept in raised huts. In Imalilo, Matamba and some partsof Uporoto areas, animals are kept in remote areas away from the normal village grazing areas. Inmost cases these are their old settlements known as �mahame� where farmers claim that there arebetter and adequate pastures. One member of the family will visit once or twice per week to checkthe health of the animals and in case of new borne. In this system animals are not milked.

Sustainable Management of Usangu Wetland and its Catchment March 2001
Final report - Farming systems Page No. 56
(iv) Milking and cleaning of shed
In pastoralist areas, adult women and male children milk the animals. In areas where they did nothave cattle culture and dairy animals were introduced recently, women are not used to milking. Inthis case adult men milk the animals. Cleaning of sheds is common in zero grazing systems, and fornon-ruminants like pigs and chicken, and is mostly done by women and female children.
(v) Disease control and treatment
There is a wide range of animal diseases in the Usangu wetlands and its catchment. Men spray or dipthe animals and they play a major role in disease control for cattle, sheep and goats. Womennormally treat small stocks like chicken and ducks using local herbs.
6.4 Labour use and division in livestock management
In livestock management, involvement of household members depends much on the type of animaland production systems used. With ruminants managed under extensive system of keeping animals,mostly men and male children are responsible for grazing, watering, dipping/spraying, care of sickanimals, cleaning sheds and stock marketing.
When management is under zero grazing the involvement of women is increased especially infeeding, cleaning of shed, milking and milk marketing. Tables 6.3 a and b show the involvement ofmembers of the household in management of ruminant and non-ruminant animals as reported byrespondents.
6.5 Constraints to livestock production
(a) Livestock diseases
There is high prevalence of livestock diseases and respondents ranked this as number one problemcausing high mortality rates in livestock (table 6.4). Farmers reported tick borne diseases namely:East Coast Fever and Anaplasmosis as a big problem. In most villages it was reported that dippingfacilities are either lacking or not functional. Contagious Bovine Pleuro Pneumonia (CBPP), Blackquarter, lumpy skin and calf scours are other diseases claiming cattle deaths. New Castle Disease(NCD), Salmonellosis and Coccidiosis are causing deaths in poultry especially chicken to the extentof almost wiping the flocks in most households.
(b) Inadequate veterinary services
Inadequate and sometimes lack of veterinary services in terms of drugs and advisory services wasranked second by respondents. Extension staff are very few and in most cases live far from thelivestock keepers. In Madibira ward, for example, there is only one extension staff for the wholeward and he is staying at Mkunywa village. This Livestock Extension Officer has to serve farmers inIkoga village that is situated more than 50 km away. Pastoralists therefore have learned to treat theiranimals. Farmers complained of high cost of drugs required for treating their animals. Livestockkeepers also use different indigenous strategies in coping with livestock diseases. Use of herbs iscommon but not very effective.

Sustainable Management of Usangu Wetland and its Catchment March 2001
Final report - Farming systems Page No. 57
With trade liberalisation, there have been a lot of drugs with different trade names. It would be ofhelp for the livestock department to plan for short-term para-professional training to these groups inorder to up-date their knowledge on these new medicines in the market.
Table 6.3a Percentage of respondents on division of labour and decision making for themanagement of non-ruminant animals in the household
Activity AdultMen
AdultWomen
ChildrenMen
ChildrenFemale
BothAdults
BothChildren
Indoor feeding 4.3 52.2 8.7 0.0 30.4 4.3Fetching of water 5.2 65.2 3.4 3.4 12.1 10.3Care of young stock 7.7 74.4 1.3 0.0 14.1 2.6Dipping/spraying 25.0 50.0 0.0 0.0 25.0 0.0Cleaning shed 8.2 75.3 1.4 4.1 9.6 1.4Care of sick animals 21.4 60 1.4 1.4 15.7 0.0Stock marketing 25.3 45.3 0.0 0.0 29.3 0.0Decision when to sale 19.5 42.7 0.0 0.0 37.8 0.0Source: Questionnaire survey, 2000.
Table 6.3b Percentage of respondents on division of labour and decision making for themanagement of ruminant animals in the household
Activity AdultMen
AdultWomen
ChildrenMen
ChildrenFemale
BothAdults
BothChildren
Grazing and watering 27.8 7.8 43.3 3.3 8.9 6.7Care of young stock 47.7 14.0 26.7 2.3 8.1 1.2Cutting of grasses 46.7 26.7 6.7 0.0 20.0 0.0Indoor feeding 33.3 33.3 6.7 0.0 26.7 0.0Fetching water 15.0 29.5 31.8 0.0 18.2 4.5Dipping 68.4 10.5 15.8 0.0 5.3 0.0Spraying 88.0 8.0 4.0 0.0 0.0 0.0Cleaning shed 27.9 42.3 14.8 1.6 13.1 1.4Milking 31.5 35.2 18.5 0.0 7.4 7.4Care of sick animals 74.4 8.1 4.7 0.0 12.8 0.0Milk marketing 38.2 41.2 5.9 2.9 11.8 0.0Stock marketing 85.4 4.5 2.2 0.0 7.9 0.0Decision where to graze 91.7 0.0 0.0 0.0 8.3 0.0Decision when to sale 77.3 4.5 1.1 0.0 17.0 0.0Source: Questionnaire survey, 2000.
Table 6.4 Livestock production problems in different farming systems (% of respondents)
Problem FS1 FS2 FS3 FS4 FS5 TotalInadequate grazing lands 18.2 40.0 45.0 45.3 30.9 37.4Poor quality forage 9.1 37.1 35.0 43.4 25.0 32.6Dry season forage 18.2 40.0 45.0 45.3 26.5 35.8

Sustainable Management of Usangu Wetland and its Catchment March 2001
Final report - Farming systems Page No. 58
Unreliable rainfall pattern 27.3 42.9 45.0 43.4 26.5 36.4High incidences of livestock diseases 72.7 77.1 85.0 79.2 69.1 75.4Lack of veterinary services 72.7 65.7 65.0 73.6 63.2 67.4Source: Questionnaire survey, 2000.
(c) Conflicting interest in the livestock department
During discussions with farmers it was revealed that sometimes campaigns for vaccination arecombined with tax collection and therefore farmers tend to hide some of their animals. This wasreported almost in all villages and might be a root cause of spreading of diseases that could becontrolled by vaccination like CBPP.
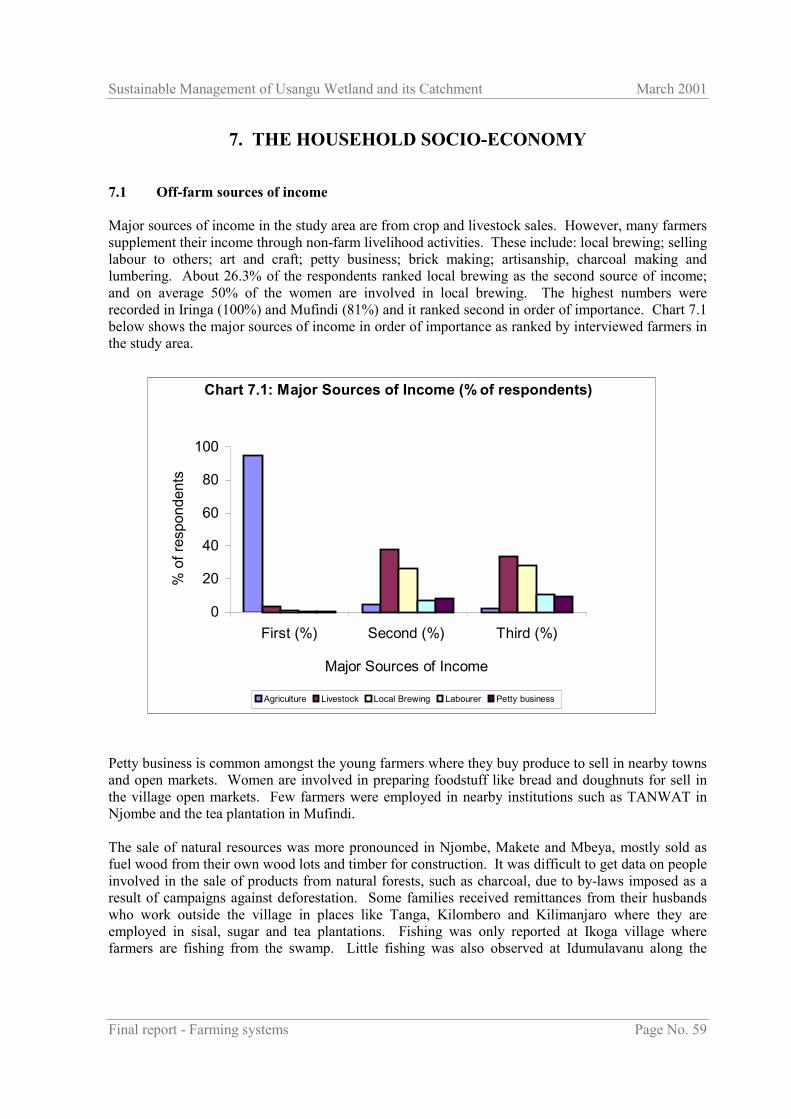
Sustainable Management of Usangu Wetland and its Catchment March 2001
Final report - Farming systems Page No. 59
7. THE HOUSEHOLD SOCIO-ECONOMY
7.1 Off-farm sources of income
Major sources of income in the study area are from crop and livestock sales. However, many farmerssupplement their income through non-farm livelihood activities. These include: local brewing; sellinglabour to others; art and craft; petty business; brick making; artisanship, charcoal making andlumbering. About 26.3% of the respondents ranked local brewing as the second source of income;and on average 50% of the women are involved in local brewing. The highest numbers wererecorded in Iringa (100%) and Mufindi (81%) and it ranked second in order of importance. Chart 7.1below shows the major sources of income in order of importance as ranked by interviewed farmers inthe study area.
Petty business is common amongst the young farmers where they buy produce to sell in nearby townsand open markets. Women are involved in preparing foodstuff like bread and doughnuts for sell inthe village open markets. Few farmers were employed in nearby institutions such as TANWAT inNjombe and the tea plantation in Mufindi.
The sale of natural resources was more pronounced in Njombe, Makete and Mbeya, mostly sold asfuel wood from their own wood lots and timber for construction. It was difficult to get data on peopleinvolved in the sale of products from natural forests, such as charcoal, due to by-laws imposed as aresult of campaigns against deforestation. Some families received remittances from their husbandswho work outside the village in places like Tanga, Kilombero and Kilimanjaro where they areemployed in sisal, sugar and tea plantations. Fishing was only reported at Ikoga village wherefarmers are fishing from the swamp. Little fishing was also observed at Idumulavanu along the
Chart 7.1: Major Sources of Income (% of respondents)
0
20
40
60
80
100
First (%) Second (%) Third (%)
Major Sources of Income
% o
f res
pond
ents
Agriculture Livestock Local Brewing Labourer Petty business

Sustainable Management of Usangu Wetland and its Catchment March 2001
Final report - Farming systems Page No. 60
rivers. This implies that non-farm activities provide opportunity for diversification and contributes tothe household economy. The variation between farming systems is summarised in table 7.1 below.
Table 7.1 Sources of income for rural livelihood by farming system (% of respondents)
Farming system AG LIV LB NR AC ART PET TRD LABPotato FSFirst 100Second 10 50 20 10Third 55.6 22.2 11.1 11.1Maize-Potatoes FSFirst 100Second 33.3 33.3 9.1 55.5 6.1 3.0Third 38.5 38.5 3.8 5.3 15.4Maize-Beans FSFirst 100Second 55 10 5 5 5 20Third 30.8 38.5 15.4 7.7 7.7Maize FSFirst 94.3 3.8 1.9Second 3.8 37.7 26.4 1.9 3.8 9.4 3.8 3.8Third 4.3 23.9 28.3 2.2 4.3 6.5 8.7 2.2 17.4Rice-pastoralist FSFirst 89.7 8.8 1.5Second 9.5 39.7 23.8 3.2 1.6 7.9 3.2 9.5Third 2.9 38.2 17.6 11.8 14.7 2.9 11.8Source: Questionnaire survey, 2000 (AG=Agriculture; LV=Livestock; LB=Local brewing; NR=Naturalresources; AC=Arts & Craft; ART=Artisan; PET=petty business; TRD=Trading & Business;EMP=Employment; LAB=Labourer)
7.2 Household food security
Many activities in the rural areas are geared towards securing a household food supply. A variety offood crops are grown in different farming systems for the purposes. Mixing of crops such as maize,beans and vegetable like pumpkins, cowpeas is a way of ensuring that household get enough food tosustain the family for the whole year.
The rating of household food security indicates that 56.7 percent of the respondents are havingenough food for the whole year. About 31.6 percent of the respondents are not secured and 11.8 areon the edge of food security. Chart 7.2 shows the extent of household food security in the differentfarming systems.

Sustainable Management of Usangu Wetland and its Catchment March 2001
Final report - Farming systems Page No. 61
Chart 7.3: Time on walking to the fuel wood collecting points
54.9
26.5
6.2 7.74.4
0
10
20
30
40
50
60
0-30 31-60 61-90 91-120 121-240Time intervals (minutes)
% o
f res
pond
ents
7.3 Source of fuel wood
Fuel wood is the main source of energy used in the rural areas in the Usangu wetlands and itscatchment. The major source of fuel wood is the natural forest as reported by 69.9 percent ofrespondents. Only 18.6 percent of respondents indicated that they get fuel wood from own wood lotsespecially in Njombe, Makete and Mbeya district. Table 7.2 below shows different sources of fuelwood as reported in the study area.
Collection of fuel wood is done by women (85.8%) and sometimes assisted by their female children.Men are involved in cutting trees when the household is using fuel wood from own wood lot orbought from neighbours. Men were also involved in cases of use of oxen for transportation. Timetaken to walk to fuel wood collection points is shown in chart 7.3.
01020304050607080
% o
f res
pond
ents
FS1 FS2 FS3 FS4 FS5 Total
Farming systems
Chart 7.2: Rating of Household Food Security in different Farming systems (% of respondents)
Secured
Not secured
On the edge of Hhfood security

Sustainable Management of Usangu Wetland and its Catchment March 2001
Final report - Farming systems Page No. 62
Table 7.2 Sources of fuel wood used by farmers (% of respondents)
Source of fuel wood PotatoFS
Maize-Potato FS
Maize-BeansFS
Maize FS Rice-PastoralistFS
Total
Own wood lot 10.0 48.6 27.8 17.0 3.0 18.6Village wood lot - - - 5.7 - 1.6Neighbouring village - 2.9 - 1.9 1.5 1.6Natural forest 90.0 20.0 61.1 69.8 95.5 69.9Buying trees fromneighbour
- 28.6 11.1 1.9 - 7.1
Institutional forest - - - 3.8 - 1.1Source: Questionnaire survey, 2000.
7.4 Perception of farmers on villages level institutions
The village-level institutions present in the study area include village government, representatives ofgovernment extension services, religious institutions and non-governmental organisations. All thevillages visited have a village government, sub-village leaders, and a number of committees tooversee the implementation of development goals. The Village Executive Officers are LocalGovernment employees who assist the Village Chairmen in implementing local government activitiesat village level, like tax collection and maintaining order in the villages.
The presence of village level institutions and rating of perception of farmers on the performance ofthe institutions present in the villages is summarised on tables 7.3 a and b. The role of CommunityDevelopment Officers was perceived more of a mobilisation rather than developmental. ForestryExtension Officers are regarded more on policing of forestry reserves rather than extension services.Although farmers reported the presence of Agricultural Extension Officers in some of the villages,there was no regular contact and their visiting schedules were not known to farmers. In some casesfarmers perceive farming is �business as usual� and an extension officer is needed when there areproblems. As discussed earlier, extension staff are few and those present did not have facilities suchas transport to enable them move in the villages allocated to them. Some Village Extension Officerssave more than three villages.
Table 7.3a Presence of services of village level institutions by farming system (% ofrespondents)
Institution PotatoFS
Maize-Potato FS
Maize-BeansFS
Maize FS Rice-Pastoralist FS
Total
Village Government 100 100 100 100 100 100Religious institutions 45.5 88.6 90.0 96.2 82.4 86.1Informal Groups 36.4 65.7 65.0 30.3 17.6 36.6Agricultural Extension 0 94.3 85.0 64.2 52.9 59.1Community Dev.Officers
0 28.6 40.0 11.5 13.2 17.7
Forest Extension 0 42.9 60.0 15.1 8.8 22.0NGOs 0 40.0 42.1 7.5 4.4 15.7Source: Questionnaire survey, 2000

Sustainable Management of Usangu Wetland and its Catchment March 2001
Final report - Farming systems Page No. 63
Table 7.3b Rating of services of village level institutions (% of respondents)
Institution Excellent Good Average BadVillage Government 19.0 42.4 31.0 7.6Religious institutions 7.5 40.3 45.9 6.3Informal Groups 11.9 41.8 32.8 13.4Agricultural Extension 10.1 39.4 40.4 10.1Community Dev. Officers 6.3 28.1 59.4 6.3Forest Extension 2.5 55.0 3.0 12.5NGOs 25.0 64.3 10.7 -Source: Questionnaire survey, 2000

Sustainable Management of Usangu Wetland and its Catchment March 2001
Final report - Farming systems Page No. 64
8. SUMMARY OF MAIN FINDINGS AND RECOMMENDATIONS
8.1 Summary of main findings
Rainfed agriculture is mainly subsistence and is practiced by all rural households in the study area.There is a great variation in the study areas within and between the highlands and the lowlands. Thestudy identified the eight farming systems existing in the Usangu wetlands and its catchment based onthe agro-ecological and geo-morphological characteristics, economic and social realities. Five ofthese were studied and described in detail.
The current farming systems are a result of interactions and interdependencies between natural,economic and socio-cultural of farmers� own priorities, resource availability and capabilities. Naturalcircumstances such as altitude, rainfall, soils, and topography influence farmer�s decision on the typeof crops to be grown. External socio-economic circumstances including farmer�s access to inputs,produce markets, prices, availability of consumer goods and extension services also influence theirdecisions. Resource constraints in terms of land, water, labour, cash and capital limit farmerscapacity to make substantial changes in their farming systems.
The rural livelihoods of people in the Usangu wetlands and its catchment depend on agriculture andlivestock keeping as major sources of income. Men and women were found to participate equally inagricultural activities. In many cases men were more involved in land preparation, while womenplayed a big role in planting and weeding. Many farmers supplement their income through non-farmlivelihood activities that include: local brewing, selling labour to others, art and craft, petty business,brick making, artisanship, charcoal making and lumbering.
The crop production systems in the rainfed agriculture are very dynamic and in most cases crop andcrop mixtures grown reflect the dietary preferences and the market opportunities of the farmers andrisk avoiding strategies. In the highlands and medium plateau, crops grown include maize, beans,round potatoes, green peas, sweet potatoes, wheat, pyrethrum, coffee, sunflower, finger millet,vegetables and fruits. In the lowlands, the main crops produced are maize, cowpeas, pigeon peas,groundnuts, millets, sorghum, sweet potatoes, cassava and sugarcane. Paddy is mostly grown underirrigation either in traditional or improved schemes.
Livestock is practised both in the highlands and lowlands, where cattle, goats, sheep, donkeys,chicken, rabbits, ducks, pigs and guinea pigs are kept. There is high population of local zebu cattleand small ruminants in the lowlands, and in the highlands, dairying and pig production is common.Chickens are kept by almost all rural households.
Farmers, especially young farmers, are engaged in production of high value crops such ashorticultural crops, but lack of processing industries and handling facilities for the produce leads tohigh post harvest losses and low farm gate prices.
Most of the farmers in rural areas lack working capital due to an absence of rural financial services topromote savings and credit. Financial capital limits farmers� capacity to make substantial changes intheir farming systems and livelihood diversification.
There is great potential in all farming systems for crop production, but currently productivity is verylow. Increase in production is a result of increase in acreage as opposed to intensification. Productionof rainfed crops is suffering from conflicts in terms of resource allocation such as labour because all

Sustainable Management of Usangu Wetland and its Catchment March 2001
Final report - Farming systems Page No. 65
crops are grown at the same time and there is always competition. Other important productionconstraints mentioned include low soil fertility, unreliable rainfall, diseases and pests. In additionlack of markets for their produce, low farm gate prices, high costs of inputs such as fertilisers andpesticides, low levels of mechanisation of farm operations and inadequate extension services limit theutilisation of the potential available in the study area.
Most of the potential farmland is under continuous cultivation. In areas where there is land pressurecultivation is now spreading to steeper slopes with serious erosion susceptibility, as observed inUlenje, Galijembe, Imalilo and Malangali villages and Matamba area. In the lowlands, more clearingof land is experienced. Most of the villages lack clear land use plans for the natural resourcesmanagement. Farmers are aware of the global concern on environmental degradation, as by laws fordeforestation control exist and in some villages there are environmental committees. There is,however, lack of knowledge on appropriate land husbandry for the sustainable utilisation of thenatural resources, maintenance and improvement of rural livelihoods.
Livestock keeping is an important enterprise for the majority of farmers in rural households.Livestock was ranked as a second income source in order of importance of household incomegenerating activities. However, there is very low off-take of animals, the output levels are low andthere is limited commercialisation. Dairying though promising in integration of crops and livestockproduction, is facing the problems of marketing of products such as milk and low productivity ofanimals due to low capital investment. High incidences of diseases coupled with inadequateveterinary services are the major limiting factors.
Recommendations are made towards the development of a strategy for the sustainable utilisation ofthe natural resources, maintenance and improvement of rural livelihoods in the study area.
8.2 Recommendations
Based on the findings of the study a number of intervention measures with regard to sustainableutilisation of the natural resources, maintenance and improvement of rural livelihoods in thecatchment are needed. Possible areas of intervention are as follows:
i. Rainfed agriculture will remain the major source of income for the rural people, and landresources are important factors in achieving increased productivity. There is a need to identify,develop and implement sustainable land husbandry practices for both the highlands andlowlands. In the highlands, practices such as crop rotation and fallowing should be encouraged.In the lowlands soil and water management practices such as use of water bunds in ricecultivation and ridging in rainfed crops should be encouraged.
ii. The introduction of high value crops should accompany land conservation practices to optimisebenefits or return to land and labour.
iii. Diversification of crop enterprises into non-traditional crops like pepper production underirrigation in the off-season production should be encouraged.
iv. Establish and understanding of indigenous technologies existing in different farming systemsand knowledge of uptake pathways in land husbandry. The role of community leaders in landhusbandry should be well established and integrated in the village development teams (TMV)that are currently promoted by SMUWC.

Sustainable Management of Usangu Wetland and its Catchment March 2001
Final report - Farming systems Page No. 66
v. Promotion of uses of organic fertilisers that is currently done by extension departments andresearch should continue as a strategy for organic matter amendment in the farming systems.Studies to determine optimal level of organic fertilisers and combinations of organic andinorganic fertilisers required under different farming systems. The problem of transportationshould be addressed by introducing simple carts.
vi. Food security strategy should focus on development of early maturing and drought resistantvarieties of maize, sorghum and pulses in order to address the problems of unreliable rainfallespecially in the medium and low altitudes.
vii. Promotion of value adding technologies like oil extraction in sunflower and processing ofhorticultural crops would increase farmers� income, and hence rural livelihood.
viii. The extension departments of the district councils, in collaboration with research institutions,should develop and demonstrate labour saving technologies in paddy and other rainfed crops toreduce the competition in labour allocation.
ix. Integration of crop-livestock production systems, particularly in the high and medium altitudes,should consider introduction of high yielding livestock and zero grazing.
xi. Valley bottom cultivation (�vinyungu�) is important for food security, but in some areas farmersare cultivating in areas too close to river banks, which may create problems of sedimentation.Proper cultivation practices should be looked at to ensure better utilisation of �vinyungu�.
x. Empowering farmers through promotion of farmers� organisation in order to address problemsof accessibility of extension services and marketing of crop and livestock produce isrecommended.
xii. Empowering farmers by promoting rural financial services such as savings and creditassociations will enable farmers have more opportunities and capacity to make changes in theirfarming systems through livelihood diversification.

Sustainable Management of Usangu Wetland and its Catchment March 2001
Final report - Farming systems Page No. 67
REFERENCES
Agricultural Research Institute Uyole, Progress Reports, 2000
Dumea, H.A. Watershed Management Relevance, Strategies and Approaches to Farmers. In Power,S., Makungu, P. and Quaraeen, A. (eds) 1997. Watershed Management, Participatory andSustainable Development. Proceedings of DANIDA�s 2nd International workshop onWatershed Management held in Iringa region Tanzania, from 26 May to 5 June 1997.
HIMA 1994. The Livestock/Farming System Study of Matamba Division.
King, A and Ole-Lengisugi. 2000. Livestock on the Usangu Plains. Report submitted to SMUWCProject.
Msolla, M., J. Hansen and A. Bjoernshave-Hansen, 1977. Sustainable Management as a Componentof Watershed Management. Power, S., Makungu, P. and Quaraeen, A. (eds) 1997.Watershed Management, Participatory and Sustainable Development. Proceedings ofDANIDA�s 2nd International workshop on Watershed Management held in Iringa regionTanzania, from 26May to 5 June, 1997.
Mussei, A.N., R.P. Mbwile, J.K. Kamasho, C.M. Mayona, G.J. Ley and R.M. Mghogho. 1999. Agro-ecological zones and farming systems of the Southern Highlands of Tanzania. ARI Uyole,Mbeya, Tanzania.
Qaraeen, A. 1997. HIMA�s Conformity with Tanzania�s National Policies and Strategies forSustainable Development. In Power, S., Makungu, P. and Quaraeen, A. (eds) 1997.Watershed Management, Participatory and Sustainable Development. Proceedings ofDANIDA�s 2nd International workshop on Watershed Management held in Iringa regionTanzania, from 26May to 5 June,1997.
Samki, J.K. and Harrop, J.F. 1982. Fertiliser Recommendations Related to Ecological Zones inTanzania. Mlingano.
Shanner, W.W., Phillip, P.F. and Schmehl, W.R. 1992. Farming Systems Research in Development:Guidelines for Developing Countries. Boulder: West View Press.
Sustainable Management of Usangu Wetlands and its Catchment, Interim Report, 2000.
URT/EEC. 1987. United Republic of Tanzania/European Development Fund. Regional AgriculturalDevelopment Plan, Iringa Region Final Report Annex 1, Agrar-Und HydrotechnikGMBH. Germany.

Sustainable Management of Usangu Wetland and its Catchment March 2001
Final report - Farming systems Page No. 68
APPENDIX I
Terms of Reference for the Farming Systems (rainfed) Study
The Consultant will undertake an extended rainfed farming systems survey within the Usangucatchment. This includes both highland and lowland farming systems, but excludes the pastoralsystems of the Usangu plain. Likewise, while the integration of irrigation needs to be assessed,detailed information on irrigation practices has already been collected and does not form part of thepresent assignment.
The major rainfed cultivated areas to be assessed are thought to be the area south and south-east ofMbeya; along the southern watershed between Mbeya and Matamba; Matamba area, Njombe south tothe Usangu plain; the north-eastern highlands (Makambako to Iringa); and the southern Usangu plainfrom the Chunya escarpment to Madibira. The area falls within two regions (Iringa and Mbeya) andsix districts � Mbarali, Mbeya rural, Makete, Njombe, Mufindi, and Iringa rural.
The objective is to prepare an overview of the rainfed farming systems of the catchments. Expectedoutputs include a map showing location and area of different farming systems, and a report describingeach farming system. It is expected that most of the information will be obtained from secondarysources (National agricultural statistics, Regional, district and ward data, documented sources; otherprojects e.g. HIMA; etc.), with verification and elaboration through primary data collection at villageand farmer levels. An extensive farmer/participatory process is not envisaged.
Specific topics to be covered by the survey include:
Cultivation - area- crops �annual cropped area; crops grown (perennial, annual)- fallow � area; rotation- seeds � traditional/improved, sources,- fertiliser � type, amount, sources, etc.- yields- use/division of family labour (gender, adult/child)- other inputs � labour sources, mechanisation, etc.- cultivation practices (hoe, animal traction, tractor, etc.)- input costs (seeds, fertilisers, labour, etc.)- constraints � access to inputs, credit, labour, etc.- seasonal calendar- marketing (amounts, location, prices)- perceived problems � fertility, erosion, rainfall, etc.
Integration of livestock - types of livestock - numbers - uses (traction, milk, meat, fertilisation, etc. - amount and sources of pasture - labour (for herding)
Other income � forest products, bees, handcrafts, etc.
Relative importance of different activities re. Household survival/income.
Changes over time (20 years ago, 40 year ago) � crop area, crop type, yields, etc.

Sustainable Management of Usangu Wetland and its Catchment March 2001
Final report - Farming systems Page No. 69
APPENDIX II:
Itinerary for the formal survey
Date Activity21/8/2000, Monday Travel to Mbarali. Make logistic arrangement at SMUWC office and travel to
Iringa22/8/2000, Tuesday Selection of farmers for interviews at Lumuli village23/8/2000, Wednesday Interviewed farmers at Lumuli village and travel to Mafinga24/8/2000, Thursday Selection of farmers for interviews at Maduma and Idumulavanu villages25/8/2000, Friday Interviewed farmers at Maduma village26/8/2000, Saturday Interviewed farmers at Idumulavanu village and travel to Njombe27/8/2000, Sunday Break28/8/2000, Monday Selected and Interviewed farmers at Imalilo village29/8/2000, Tuesday Selection of farmers at Itunduma village30/8/2000, Wednesday Interviewed farmers at Itunduma village31/8/2000, Thursday Selection of farmers at Malangali village1/9/2000, Friday Interviewed farmers at Malangali villages2/9/2000, Saturday Travelled to Mbeya, weekend break3/9/2000, Sunday Break4/9/2000, Monday Selection of farmers at Ikoga and Nyamakuyu villages5/9/2000, Tuesday Interviewed farmers at Nyamakuyu and Ikoga villages, travel to Rujewa6/9/2000, Wednesday Selection of farmers at Nyeregete and Itamba villages7/9/2000, Thursday Interviewed farmers at Nyeregete village8/9/2000, Friday Cancelled interviews at Itamba village (car breakdown)9-10/9/2000, Sat & Sun Break11/9/2000, Monday Interviewed farmers at Itamba village and selected farmers for interviews at Kimani
village12/9/2000, Tuesday Interviewed farmers at Kimani villages, omitted Usalimwani village due to problem
of cattle theft and funeral13/9/2000, Wednesday Travel to Matamba, selected farmers at Ng�onde and Igenge villages14/9/2000, Thursday Interviewed farmers at Ng�onde and Igenge villages, travelled to Igurusi15/9/2000, Friday Farmers selection at Iyawaya village16/9/2000, Saturday Farmers interviews at Iyawaya village, travelled to Mbeya17/9/2000, Sunday Break18/9/2000, Monday Data entry at Uyole19/9/2000, Tuesday Farmers selection at Mhwela village20/9/2000, Wednesday Farmers interviews at Mhwela village, farmers selection at Simike village21/9/2000, Thursday Farmers interviews at Simike village22/9/2000, Friday Farmers selection at Kikondo village23/9/2000, Saturday Farmers interviews at Kikondo village, selection of farmers at Ulenje village23/9/2000, Saturday Farmers interviews at Kikondo village, selection of farmers at Ulenje village24/9/2000, Sunday Break25/9/2000, Monday Farmers interviews at Ulenje village and farmers selection at Galijembe village26/9/2000, Tuesday Farmers� interviews at Galijembe village.27-29/9/2000, Wednesday toFriday
Data entry and cleaning
30/9/2000 to 14/10/2000 Data analysis and Report writing at Uyole

Sustainable Management of Usangu Wetland and its Catchment March 2001
Final report - Farming systems Page No. 70
APPENDIX III
A checklist for semi-structured interviews of key informants during formal survey.
A. Background Information
1. The history of the village and a chronological account of major events e.g. occurrence of drought,famine and family coping strategies, migration, epidemics, collectivisation and its effects,introduction of new crops and technologies and their impact to people and management of naturalresources.2. Identify types/categories of agriculturalists and their relevant attributes (examples of categories:semi-permanent, permanent, temporary, absentees, labourers, etc) and relationship that are developedas a result of their existence. In what way categories are linked with resource use, change indistribution, conservation, conflicts, etc.3. Understand the history of different ethnic groups that have lived in the village.Which areas do they occupy, which activities do they undertake, on what scale and under whichmanagement leadership?4. Ethnic inter-relations following the series of major events in the village (e.g. during traditionalsociety, villagisation, and present, since liberalization of the economy).How is resource use regulated to ensure sustainable management of natural resources?
B. Land, its use and managemnent
1. Land tenure, land availability, allocation or distribution, land transfer and inheritance in the pastand present.
2. Types of farming systems/practices, their history, requirements, advantages and problems,institutional organisations and management aspects in the farming system.
3. What farming system practices are considered good and needs to be maintained/promoted? Whyand how?
4. How was resources distributed within the family, lineages, community, etc.5. How are resources owned, managed e.g. land, water, trees of special values, rivers, valleys,springs, wild animals, etc. Are there any changes in the present situation, what are they and why didthey occur? Who uses what and the level of dependency?
6. Information regarding major traditional institutions that existed, still existing, their role inmanagement of resources, organizations, strength and weaknesses.
7. Characteristics of families/individuals who use or control certain important resources (e.g. largepieces of land, small forests, wild resources such as foraging areas, malungulu area).
8. How do people perceive ecological changes? How are the changes linked to agriculture andresource utilisation processes?
9. Socio-economic categories of families in the village? Wealth ranking? What are the developmentneeds of the different socio-economic categories?
C. Cultivation of crops
1. Area under cultivation (by village, district, by crops);2. Crops grown (annual cropped area � perennial, annual; cash and food crops);3. Productivity (yield) levels of various crops grown, general production trends, causes for
undesired situation in the production of crops;4. Fallow practices � area, lengths, rotation practices;5. Seeds used � traditional/improved, sources, costs, etc.

Sustainable Management of Usangu Wetland and its Catchment March 2001
Final report - Farming systems Page No. 71
6. Fertilisers � types, amounts, sources, costs, etc.7. Use/division of labour � gender/adult/child, strategies for coping with peak period labour
requirement; hired labour (types, sources, costs, etc.);8. Cultivation practices (hoe, animal traction, tractors � indicating operations done under each and
costs, etc.);9. Conservation practices (if any) � types, impact, etc.10. Seasonal calendars11. Storage of crops � structures, post harvest processing, farm transportation, etc.12. Marketing � amounts, location, prices13. Constraints � access to inputs, credit, labour, etc.14. Problems of production � fertility, rainfall
D. Integration of livestock
1. Types of livestock kept2. Numbers3. Uses (traction, milk, meat, FYM, dowry, etc)4. Amount and sources of pastures5. Division of labour (in herding and other husbandry practices).
E. Household food security
1. What were the traditional staple food crops in the past?2. What traditional crops are no longer produced or eaten, and reasons.3. Investigate on famine occurrence in the past, reasons, what coping strategies used, howsuccessful.
F. Other sources of income
1. Opportunity for farmers to be engaged in off-farm activities as a source of income2. What are the other sources of income (e.g. from forest products, bees, handicrafts, social welfare,etc.)
G. Community and general trends in natural resource utilisation
1. What was the forest like when the village was formed, in relation to how it is now? What majorchanges and how have they come about? What do they foresee as a future trend?2. How do people perceive changes in availability of resources such as land, firewood, wild fruitsand vegetables, decrease in fallow land, protected forests and increase in cultivated land area?3. What major changes (rainfall, occurrence of certain diseases, pests, etc) and how do they perceiveit?4. What impact do people think their activities have on the environment? What desires are there forchange of negative effects? What types of changes do they intend to make?5. Strategies for cope with changing environmental situation: Are people planting or conservingtrees in their farming systems, what species of trees and why? What are the characteristics of peopleplanting trees, how are they planted, approximate hectares with planted trees, source of seedlings,usage of trees. What other conservation practices in use?

Sustainable Management of Usangu Wetland and its Catchment March 2001
Final report - Farming systems Page No. 72
Appendix IV: Mean Annual Rainfall over 20, 10, and 5 years at Uyole Station
0
50
100
150
200
250
JAN
FEB
MAR APR
MAY
JUNE
JULY AU
GSEP
OCTNOV
DEC
Months
Amou
nt o
f rai
nfal
l in
mm
Mean Rainfall of 20 years Mean Rainfall of 10 years Mean Rainfall of 5 years

Sustainable Management of Usangu Wetland and its Catchment March 2001
Final report - Farming systems Page No. 73
APPENDIX V
Villages visited during the formal survey
Village District Farming System1. Lumuli Iringa 42. Maduma Mufindi 43. Idumulavanu Mufindi 44. Imalilo Njombe 25. Itunduma Njombe 46. Malangali Njombe 47. Nyamakuyu Mbarali 58. Ikoga Mbarali 59. Nyeregete Mbarali 510. Itamba Mbarali 511. Mhwela Mbarali 512. Simike Mbarali 513. Kimani Makete 514. Ng�onde Makete 315. Igenge Makete 216. Kikondo Mbeya 117. Galijembe Mbeya 218. Ulenje Mbeya 219. Iyawaya Mbeya 3

Sustainable Management of Usangu Wetland and its Catchment March 2001
Final report - Farming systems Page No. 74
APPENDIX VI
List of Key Informants Contacted During the Farming Systems Survey
District/Place Village/Town Name of Contact person TitleSMUWCOffice
Mr. Tom FranksMr. Geoff KingMr. MnzavaMr. MlingaMs. VivianMr. MtaroniMr. Mbuya
Iringa DALDO�s office Mr. MwakyembeMrs. Natai
DALDODEO
Iringa Lumuli Zawadi muyinga VEOCamillius Simba Village Executive OfficerHamida Mukasa DIVEORaphael Kimbunga Committee member of the
Primary cooperativesDaudi Ngesi Village ChairmanNyakunga FarmerSamwel Nywage Farmer
Mufindi Mafinga Nnko Ag. DALDO MufindiN.B. Mbaga DSMS
Maduma B.K. Kimaryo DIVEOYotam Kihwela FarmerRaphael Chafumbwe FarmerSalesi Msumule FarmerJeremia Silimo FarmerDominicus Mkisi FarmerChelson Mbakiko FarmerAtanus Chasumbwe FarmerSamwel Mwanga FarmerRaphael Msumule FarmerIsdori Chipangule FarmerRaphael Mkisi FarmerEnok Ngoli FarmerObadia Emmanuel FarmerAtilio Silino FarmerJoseph Msumule FarmerJamanus Lalika FarmerObedi Kiswaga FarmerJanet Chawala FarmerChristina Mkisi Farmer

Sustainable Management of Usangu Wetland and its Catchment March 2001
Final report - Farming systems Page No. 75
Idumulavanu Dodi H.H VEOMartin Kihanga FarmerVetus Pogo FarmerEmilio Mvevere FarmerBosco Mganda FarmerTitus Msule FarmerE. Mgaya FarmerB. Nzwalila FarmerElla Kiloko FarmerMlehwa Kilohoko FarmerAnita Myale FarmerChristina Msungu FarmerRukia Kihoza FarmerCristina Msovela FarmerPatricia Mwigani FarmerMaria Msovella FarmerAgnes Msovella FarmerAnamaria Myinga FarmerSikujua Kalamba FarmerJoseph Msamagilo Farmer
Njombe Njombe Mtama L.Y. Project Manager HIMANjombe
DALDO Office Dr. Mwakitosi Ag. DALDO NjombeM.Kombe DSMS small stockC.M. Ngoda DSMS PyrethrumMtelewe D. District Information Officer
Imalilo H.Mahava VEOFausta Mbilinyi FarmerSabela Chaula FarmerEmi Mbwilo FarmerAnet Mbilinyi FarmerVeronika Chengula FarmerAlifa Sanga FarmerUpendo Mbilinyi FarmerSadru Sanga FarmerBertha Mdete Farmer
Itunduma Mollel G. VEOYohana Mgindo Village chairmanJuma Athmani FarmerElina Kinyunyu FarmerKiwanga Luter FarmerDurxon S. Nywage Village Executive OfficerMuhema M. Sihoman Farmer
Malangali R.Makafu DIVEOK.Mawona VEO

Sustainable Management of Usangu Wetland and its Catchment March 2001
Final report - Farming systems Page No. 76
B. Ngogomi Village ChairmanB. Mbewa Village Executive officerJacktan Luponemo FarmerFuraha Mbangule FarmerLazaro Kinywafu Farmer
Mbarali Rujewa Dr. Mapunda DALDO MbaraliMr. Mlinga District Extension officerMr. Salu Range Management Officer
Nyeregete Kasim Sawani VEOH. Ngande FarmerM. Msagila FarmerA. Mjengwa FarmerJ. Kilala FarmerB. Badanga Farmer
Ikoga Mvamba Henry Village ChairmanIsdori Mhumba Village Executive officerFidelis Lusuva FarmerBenitho Kasila FarmerSikitu Mhomole FarmerSiprian Lyawa FarmerBundala Gung�u FarmerThobias Lalika FarmerMartin Kkigwamupi FarmerJoseph Kawuya Farmer
Nyamakuyu Hamisi Ginga FarmerJulius Uhagile FarmerFlorance Chalamila FarmerRamadhani Ginga Farmer
Itamba Guni S. VEOAnyesi Mbenelo FarmerCharles singu FarmerJulius wambali FarmerRogathia Goliama FarmerAkile Shomari FarmerSauda Shilunda Farmer
Makete Matamba Kessy D. Team Leader HIMAMatamba
Mbogela F. HIMA officerLupembe VEO
Kimani Josia Kiumbe Village ChairmanNuhu Makwesa Village Executive officerElifrida Pilla FarmerGodfrey Mbwilo Farmer
Igenge Ibrahim Mbwilo Village ChairmanErnest sanga Village Executive officer

Sustainable Management of Usangu Wetland and its Catchment March 2001
Final report - Farming systems Page No. 77
Lupembe D. VEOJosephat Nkwama FarmerRobert B. Chawe FarmerLekinald B. Chawe FarmerAgnes L. Mahenge FarmerEustina O. Sanga FarmerNicolas O. sanga FarmerAfloni Chawe FarmerTubuni Mgaya FarmerAtusungukile Ngogo FarmerAtuvonokisye Mbwilo Farmer
Mbarali Simike Kassim Malise VEOE. Monga FarmerA. Mwaikambo FarmerD. Gambi FarmerM. Kisyombe FarmerS. Luhela FarmerJuma Mwampike Farmer
Mhwela Issa Samson FarmerGileki Mbilamu FarmerNewton Mwakalobo FarmerJane Sheyo FarmerBetelina Mwangosi FarmerJoseph Mwashitete FarmerJohn Mwakosi Farmer
Mbeya Mbeya Muliahela.L DALDO MbeyaMatovu C. DIVEO Tembela Division
Galijembe Nsiya Mwanyonga FarmerJoesph Sakupina FarmerMbwiga Gristauni FarmerYasini sayota FarmerNsallu Ngalle FarmerElina Mwalyego FarmerJamhuri John Farmer
Ulenje Anjelina Shonga FarmerFlora Mwamboneke FarmerAtilio Mwajojo FarmerShimba Mathew FarmerDionisia Mahinya FarmerYilongo Winga FarmerAron Mwandimbo Farmer
Iyawaya Oscar Nassor FarmerSalum Nsagaje FarmerMajaliwa Mwakama FarmerZadok Mbuja Farmer

Sustainable Management of Usangu Wetland and its Catchment March 2001
Final report - Farming systems Page No. 78
Juma Simwahenda FarmerJackson Mwampalanya FarmerOmari Mbwiga FarmerAron Mwaibole FarmerSaja Mwakanyamale FarmerShida Samwel Farmer
Kikondo Atanas Mbanga FarmerEmmanuel Feni FarmerMichael Mashaka FarmerGandesi Nelson FarmerSadaka Bida FarmerJeni Binamu FarmerErasto Njelwa FarmerJulius Swallo Farmer

Sustainable Management of Usangu Wetland and its Catchment March 2001
Final report - Farming systems Page No. 79
APPENDIX VII
Summary of Farming Systems Zonation in Usangu Wetlands and Its Catchment
(a) Farming System 1
Name of the Farming System: Potato Zone
Legend abbreviation: PotLocation: High area of Kikondo in the Kitulo plateauTowns and Wards: KikondoEstimated area: Altitude: 2000-2900 maslMean annual rainfall: 1600 mmRainfall pattern: Mono modalLandscape: Undulated and some dissected landscapeParent material:Soil: Humic AndosolsNatural vegetation: Dominantly short grassland (mostly kikuyu) and remnants of
natural forests consisting of Hagenia sterculea, bamboo andscattered Ficus species.
Estimated population:Population density:Ethnic groups: Wasafwa, Wawanji and wanyakyusaAverage household size: 3.73Average farm size: 6.1 acresHouseholds with Livestock: 72.7%Major types of livestock kept: cattle and pigsAverage cattle herd size: 9 (7-10) herds/householdType of livestock keeping: ExtensiveType of cultivation: Flat cultivationMajor food crops: Wheat, beans, green peas, round potatoes.Major cash crops: Round potatoesCommon cropping patterns: Mono croppingImportant off-farm activities: Local brewingConstraints: Decline soil fertility, frost damage, High fertiliser prices and
inavailability.
Opportunities: Increased production with improved communications andmarket opportunities.
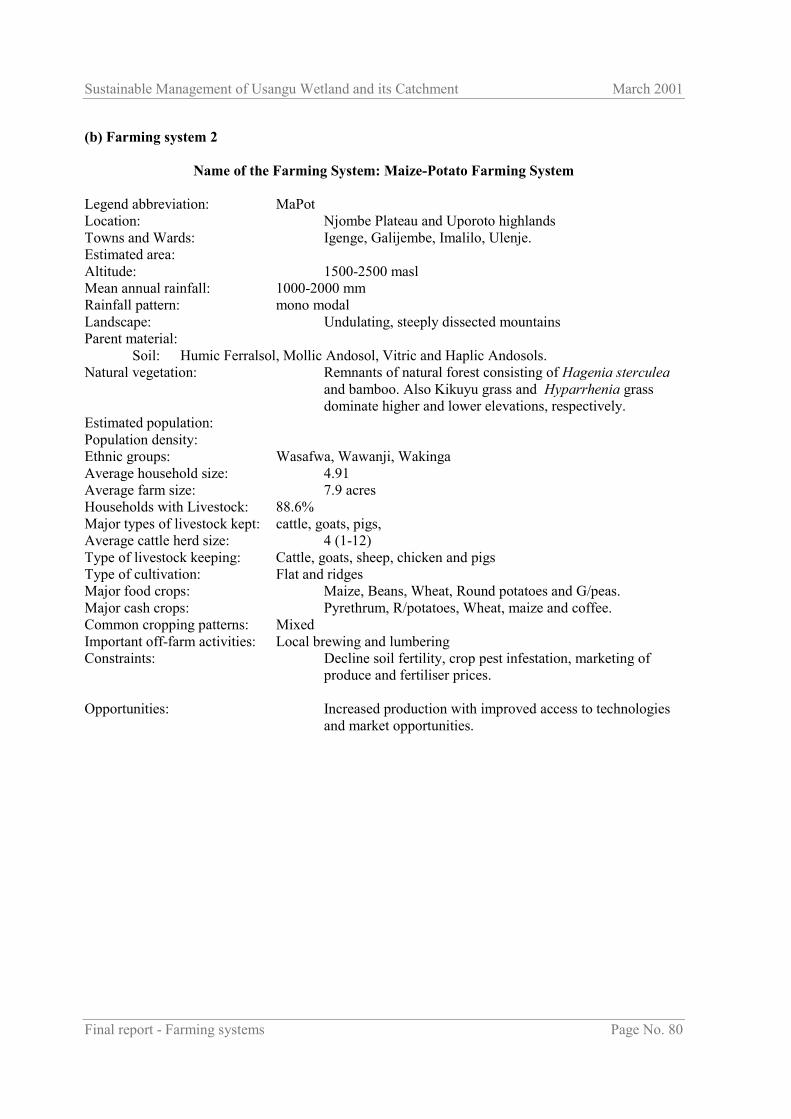
Sustainable Management of Usangu Wetland and its Catchment March 2001
Final report - Farming systems Page No. 80
(b) Farming system 2
Name of the Farming System: Maize-Potato Farming System
Legend abbreviation: MaPotLocation: Njombe Plateau and Uporoto highlandsTowns and Wards: Igenge, Galijembe, Imalilo, Ulenje.Estimated area:Altitude: 1500-2500 maslMean annual rainfall: 1000-2000 mmRainfall pattern: mono modalLandscape: Undulating, steeply dissected mountainsParent material:
Soil: Humic Ferralsol, Mollic Andosol, Vitric and Haplic Andosols.Natural vegetation: Remnants of natural forest consisting of Hagenia sterculea
and bamboo. Also Kikuyu grass and Hyparrhenia grassdominate higher and lower elevations, respectively.
Estimated population:Population density:Ethnic groups: Wasafwa, Wawanji, WakingaAverage household size: 4.91Average farm size: 7.9 acresHouseholds with Livestock: 88.6%Major types of livestock kept: cattle, goats, pigs,Average cattle herd size: 4 (1-12)Type of livestock keeping: Cattle, goats, sheep, chicken and pigsType of cultivation: Flat and ridgesMajor food crops: Maize, Beans, Wheat, Round potatoes and G/peas.Major cash crops: Pyrethrum, R/potatoes, Wheat, maize and coffee.Common cropping patterns: MixedImportant off-farm activities: Local brewing and lumberingConstraints: Decline soil fertility, crop pest infestation, marketing of
produce and fertiliser prices.
Opportunities: Increased production with improved access to technologiesand market opportunities.

Sustainable Management of Usangu Wetland and its Catchment March 2001
Final report - Farming systems Page No. 81
(c) Farming system 3
Name of the Farming System: Maize-Beans Farming System
Legend abbreviation: MaBeLocation: Mbeya stepped plains and North Ubena plateauTowns and Wards: Iyawaya, Inyala, Ng`ondeEstimated area:Altitude: 1600-1800 maslMean annual rainfall: 900mmRainfall pattern: Mono modalLandscape: UndulatingParent material: Alluvial and debril fansSoil: Xanthic ferralsol, Ferralic cambisolNatural vegetation: Miyombo woodland and wooded grasslandEstimated population:Population density:Ethnic groups: Wabena and WasafwaAverage household size: 4.95Average farm size: 5 acresHouseholds with Livestock: 95%Major types of livestock kept: Cattle, goats, chicken, pigs, guinea pigs, rabbitsAverage cattle herd size: 5 (1-15) herds/householdType of livestock keeping: Extensive (93.3%), zero grazing (6.7%)Type of cultivation: Flat and ridge cultivationMajor food crops: Maize, beans, r/potatoes, s/potatoes and wheat.Major cash crops: Maize, beans, tomatoes and onionsCommon cropping patterns: Mixed.Important off-farm activities: Lumbering and local brewing, bamboo wine harvesting.Constraints: Decline soil fertility, high fertiliser prices, frost and
unreliable rainfall.Opportunities: Increased production with improved access to technologies
and market opportunities.

Sustainable Management of Usangu Wetland and its Catchment March 2001
Final report - Farming systems Page No. 82
(d) Farming system 4
Name of the Farming System: Maize-based Farming System
Legend abbreviation: MaLocation: Mufindi and Kidugala plateau, lower Mufindi, Usangu flats border.
Towns and Wards: Makambako, Malangali, Wanging`ombe, Chimala andIgawa
Estimated area:Altitude: 1000-2000 maslMean annual rainfall: 900-1200 mmRainfall pattern: mono-modalLandscape: UndulatingSoil: Humic Andosols, chromic cambisol, xanthic
ferralsol,ferralic cambisol and cambic arenosolNatural vegetation: wooded grassland, Miyombo woodland and extensive
undulating grasslandEstimated population:Population density:Ethnic groups: Wabena, Wahehe, WasanguAverage household size: 6.19Average farm size: 5 acres/householdHouseholds with Livestock: 94.3%Major types of livestock kept: cattle, goats, chicken and pigsAverage cattle herd size: 7(1-20) heads/householdType of livestock keeping: ExtensiveType of cultivation: Flat seedbed and some ridging.
Major food crops: Maize, beans, r/potatoes, s/potatoes, s/flower and cowpeasMajor cash crops: Maize, Beans, s/flower, tomatoes, cabbagesCommon cropping patterns: Mixed.Important off-farm activities: Local brewingConstraints: Decline in soil fertility, unreliable rainfall, and fertiliser
prices
Opportunities: Land conservation would improve soil properties hence,increased production and income to farmers. Promotion ofprocessing industry would improve farm gate prices ofproduce such as oil seeds.

Sustainable Management of Usangu Wetland and its Catchment March 2001
Final report - Farming systems Page No. 83
(e) Farming System 5
Name of the Farming System: Rice-Pastoral Farming System
Legend abbreviation: Rc-PalLocation: Usangu plainsTowns and Wards: Nyamakuyu, Ikoga, Mhwela, Simike, Kimani, ItambaEstimated area:Altitude: 750-1000 maslMean annual rainfall: 400-600mmRainfall pattern: mono-modalLandscape: Lacustrine plain, bajada and piedmontsParent material: Alluvial fansSoil: Chromic vertisol and Eutric fluvusolNatural vegetation: wooded grassland consisting of A. kirkii and A. stuhlmaniiEstimated population:Population density:Ethnic groups: Wasangu, Wasukuma, Wahehe, Wabena, WanyakyusaPopulation mobility:Average household size: 6.81Average farm size: 13.2 acresHouseholds with Livestock: 77.6%Major types of livestock kept: cattle, goats, sheep, chicken, ducks, donkeysAverage cattle herd size: 54 (1-406) heads/householdType of livestock keeping: Agro-pastoralismType of cultivation: Flat and ridgingMajor food crops: Maize, paddy, beans, s/potatoes, g/nuts, cowpeasMajor cash crops: Maize, paddy, beans, g/nutsCommon cropping patterns: Mixed, monocropping in paddyImportant off-farm activities: Local brewing and petty businessConstraints: Unreliable rainfall, marketing of produce, low prices of livestock products, marketingof milk.
Opportunities: Expanded paddy production with efficient use ofirrigation water, leather and other livestock products, ethno-botanicals for livestock diseases and tickcontrol, improving livestock management and develop into local ranching enterprises.

Sustainable Management of Usangu Wetland and its Catchment March 2001
Final report - Farming systems Page No. 84
APPENDIX VIII
Surveyed Village Profile in the Usangu Wetlands and its Catchment
Potato-Pyrethrum
Maize-Potato Maize-Beans Maize-based Farming systemSocio EconomicProfile
Kikondo Galijembe Imalilo Ulenje Igenge Iyawaya Ng�onde Malangali Itunduma Lumuli Maduma IdumulavanuNo. of sub-villages 6 5 6 10 3 5 3 3 5 7 10 6No. of Households 306 418 308 389 209 174 390 499 580 502 850 352Primary School v v v v v V v v V v v VDispensary v V v VExtension Officer VEO VEO VEO VEO VEO VEO VEOWater SupplyTape(T), Wells (W),Natural springs (N)
N T W T T W
Road condition Good(G), Bad (B),Average (A)
G G A A G G G A G A A A
Transport ConditionGood (G), Bad (B),Average (A)
G G B B A G A B G A A A
Shops/kiosk serviceGood (G), Bad (B),Some (S)
G G G G S S S S G S S G
Storage FacilitiesPresent (P), None (N)
N P P P P P P P P P P P
Milling MachinePresent (P), None (N)
P P P P P P P P P P P P

Sustainable Management of Usangu Wetland and its Catchment March 2001
Final report - Farming systems Page No. 85
Rice-Pastoralist Farming SystemSocio EconomicProfile Nyamakuyu Ikoga Nyeregete Itamba Kimani Simike MhwelaNo. of sub-villages 5 6 9 6 3 8 9No. of Households 614 354 354 266 264 646Primary School v v v v V v vDispensary vExtension Officer VEO VEO VEO VEO VEO VEOWater SupplyTape(T), Wells(W), Naturalsprings (N)
N N N N N N N
Road conditionGood (G), Bad(B), Average (A)
A B A A G A G
TransportCondition Good(G), Bad (B),Average (A)
A B A G G B A
Shops/kioskserviceGood (G), Bad(B), Some (S)
G S G G S B S
Storage FacilitiesPresent (P), None(N)
P P P P P P P
Milling MachinePresent (P), None(N)
P P P P P P P

Sustainable Management of Usangu Wetland and its Catchment March 2001
Final report - Farming systems Page No. 86
Appendix IX Average rainfall (mm) for Rujewa Station -1985/86-99/00
0
20
40
60
80100
120
140
160
180
Rainfall in mm
Months
Amountofrainfall(mm)
JulAugSepOctNovDecJanFebMarAprMayJun