The Transformation of Cluster Galaxies at Intermediate Redshift
19
arXiv:astro-ph/0412083v1 3 Dec 2004 Draft version February 2, 2008 Preprint typeset using L A T E X style emulateapj v. 6/22/04 THE TRANSFORMATION OF CLUSTER GALAXIES AT INTERMEDIATE REDSHIFT N. L. Homeier 1 R. Demarco 1 , P. Rosati 12 , M. Postman 1 , J. P. Blakeslee 1 , R. J. Bouwens 3 , L. D. Bradley 1 , H. C. Ford 1 , T. Goto 1 , C. Gronwall 9 , B. Holden 3 , G. D. Illingworth 3 , M. J. Jee 1 , A. R. Martel 1 , S. Mei 1 , F. Menanteau 1 , A. Zirm 8 , M. Clampin 7 , G. F. Hartig 2 , D. R. Ardila 1 , F. Bartko 4 , N. Ben´ ıtez 1 , T. J. Broadhurst 5 , R. A. Brown 2 , C. J. Burrows 2 , E. S. Cheng 6 , N.J.G. Cross 1 , P.D. Feldman 1 , M. Franx 8 , D. A. Golimowski 1 , L. Infante 10 R. A. Kimble 7 , J. E. Krist 2 , M. P. Lesser 11 , G. R. Meurer 1 , G. K. Miley 8 , V. Motta 10 , M. Sirianni 2 , W. B. Sparks 2 , H. D. Tran 13 , Z. I. Tsvetanov 1 , R. L. White 2 , & W. Zheng 1 Draft version February 2, 2008 ABSTRACT We combine imaging data from the Advanced Camera for Surveys (ACS) with VLT/FORS optical spectroscopy to study the properties of star-forming galaxies in the z =0.837 cluster CL0152-1357. We have morphological information for 24 star-forming cluster galaxies, which range in morphology from late-type and irregular to compact early-type galaxies. We find that while most star-forming galaxies have r 625 - i 775 colors bluer than 1.0, eight are in the red cluster sequence. Among the star- forming cluster population we find five compact early-type galaxies which have properties consistent with their identification as progenitors of dwarf elliptical galaxies. The spatial distribution of the star-forming cluster members is nonuniform. We find none within R ∼ 500 Mpc of the cluster center, which is highly suggestive of an intracluster medium interaction. We derive star formation rates from [OII] λλ3727 line fluxes, and use these to compare the global star formation rate of CL0152-1357 to other clusters at low and intermediate redshifts. We find a tentative correlation between integrated star formation rates and T X , in the sense that hotter clusters have lower integrated star formation rates. Additional data from clusters with low X-ray temperatures is needed to confirm this trend. We do not find a significant correlation with redshift, suggesting that evolution is either weak or absent between z =0.2 - 0.8. Subject headings: galaxies: clusters: general, galaxies: clusters: individual (CL0152-1357), galaxies: evolution, galaxies: interactions, galaxies: high-redshift 1. INTRODUCTION Galaxy morphology is influenced by environment. This is illustrated at the most basic level by the dif- ference in the morphological mix of galaxies in high density galaxy clusters and low density groups, or the field. In the local universe, the highest density envi- ronments of massive cluster cores are composed almost exclusively of early-type galaxies, i.e. ellipticals and lenticulars (S0s), while in the field, gas-rich disks and 1 Department of Physics and Astronomy, Johns Hopkins Uni- versity, 3400 North Charles Street, Baltimore, MD 21218. 2 STScI, 3700 San Martin Drive, Baltimore, MD 21218. 3 UCO/Lick Observatory, University of California, Santa Cruz, CA 95064. 4 Bartko Science & Technology, 14520 Akron Street, Brighton, CO 80602. 5 Racah Institute of Physics, The Hebrew University, Jerusalem, Israel 91904. 6 Conceptual Analytics, LLC, 8209 Woburn Abbey Road, Glenn Dale, MD 20769 7 NASA Goddard Space Flight Center, Code 681, Greenbelt, MD 20771. 8 Leiden Observatory, Postbus 9513, 2300 RA Leiden, Nether- lands. 9 Department of Astronomy and Astrophysics, The Pennsylva- nia State University, 525 Davey Lab, University Park, PA 16802. 10 Departmento de Astronom´ ıa y Astrof´ ısica, Pontificia Univer- sidad Cat´ olica de Chile, Casilla 306, Santiago 22, Chile. 11 Steward Observatory, University of Arizona, Tucson, AZ 85721. 12 European Southern Observatory, Karl-Schwarzschild-Strasse 2, D-85748 Garching, Germany. 13 W. M. Keck Observatory, 65-1120 Mamalahoa Hwy., Ka- muela, HI 96743 8 Leiden Observatory, Postbus 9513, 2300 RA Leiden, Nether- lands. irregular galaxies dominate. In the lower density field and in low-mass groups, interactions and mergers are linked to enhanced star formation rates and starbursts (Schweizer 1987; Sanders & Mirabel 1996; Johnson et al. 1999; Conselice, Bershady, & Gallagher 2000; Barton, Geller, & Kenyon 2000; Pustilnik et al. 2001; Homeier, Gallagher, & Pasquali 2002; Struck & Smith 2003). It might be expected that ram pressure from a dense intracluster medium (ICM) compresses molecular clouds and triggers a starburst (Bekki & Couch 2003). Therefore, it is not intuitively clear if gas-rich galaxies infalling into high density clusters would have increased or decreased star formation rates relative to the field. In intermediate redshift cluster samples, the star formation rates of cluster galaxies are suppressed relative to the field, even when the different morphological mix is ac- counted for (Balogh et al. 1997, 1998; Hashimoto et al. 1998). While the star formation rates in clusters increase as a function of redshift, they are still lower than the star formation rates in the field population at that redshift. The mechanism by which star formation in cluster galaxies is suppressed is still unclear, but there is substantial evidence that suppression, not enhancement, is the dominant outcome (Couch et al. 2001; Ellingson et al. 2001; Postman, Lubin, & Oke 2001; Lewis et al. 2002; Mart ´ inez et al. 2002). Two of the most widely discussed mechanisms for star formation suppression are ram pressure stripping (Gunn & Gott 1972), and a more gentle form of galaxy-ICM interaction termed ’starvation’ (Larson, Tinsley, & Caldwell 1980). Both of these mech-
Transcript of The Transformation of Cluster Galaxies at Intermediate Redshift

arX
iv:a
stro
-ph/
0412
083v
1 3
Dec
200
4Draft version February 2, 2008Preprint typeset using LATEX style emulateapj v. 6/22/04
THE TRANSFORMATION OF CLUSTER GALAXIES AT INTERMEDIATE REDSHIFT
N. L. Homeier1 R. Demarco1, P. Rosati12, M. Postman1, J. P. Blakeslee1, R. J. Bouwens3, L. D. Bradley1, H. C.Ford1, T. Goto1, C. Gronwall9, B. Holden3, G. D. Illingworth3, M. J. Jee1, A. R. Martel1, S. Mei1, F.
Menanteau1, A. Zirm8, M. Clampin7, G. F. Hartig2, D. R. Ardila1, F. Bartko4, N. Benıtez1, T. J. Broadhurst5,R. A. Brown2, C. J. Burrows2, E. S. Cheng6, N.J.G. Cross1, P.D. Feldman1, M. Franx8, D. A. Golimowski1, L.Infante10 R. A. Kimble7, J. E. Krist2, M. P. Lesser11, G. R. Meurer1, G. K. Miley8, V. Motta10, M. Sirianni2,
W. B. Sparks2, H. D. Tran13, Z. I. Tsvetanov1, R. L. White2, & W. Zheng1
Draft version February 2, 2008
ABSTRACT
We combine imaging data from the Advanced Camera for Surveys (ACS) with VLT/FORS opticalspectroscopy to study the properties of star-forming galaxies in the z = 0.837 cluster CL0152-1357.We have morphological information for 24 star-forming cluster galaxies, which range in morphologyfrom late-type and irregular to compact early-type galaxies. We find that while most star-forminggalaxies have r625 − i775 colors bluer than 1.0, eight are in the red cluster sequence. Among the star-forming cluster population we find five compact early-type galaxies which have properties consistentwith their identification as progenitors of dwarf elliptical galaxies. The spatial distribution of thestar-forming cluster members is nonuniform. We find none within R ∼ 500 Mpc of the cluster center,which is highly suggestive of an intracluster medium interaction. We derive star formation rates from[OII] λλ3727 line fluxes, and use these to compare the global star formation rate of CL0152-1357 toother clusters at low and intermediate redshifts. We find a tentative correlation between integratedstar formation rates and TX , in the sense that hotter clusters have lower integrated star formationrates. Additional data from clusters with low X-ray temperatures is needed to confirm this trend. Wedo not find a significant correlation with redshift, suggesting that evolution is either weak or absentbetween z = 0.2 − 0.8.Subject headings: galaxies: clusters: general, galaxies: clusters: individual (CL0152-1357), galaxies:
evolution, galaxies: interactions, galaxies: high-redshift
1. INTRODUCTION
Galaxy morphology is influenced by environment.This is illustrated at the most basic level by the dif-ference in the morphological mix of galaxies in highdensity galaxy clusters and low density groups, or thefield. In the local universe, the highest density envi-ronments of massive cluster cores are composed almostexclusively of early-type galaxies, i.e. ellipticals andlenticulars (S0s), while in the field, gas-rich disks and
1 Department of Physics and Astronomy, Johns Hopkins Uni-versity, 3400 North Charles Street, Baltimore, MD 21218.
2 STScI, 3700 San Martin Drive, Baltimore, MD 21218.3 UCO/Lick Observatory, University of California, Santa Cruz,
CA 95064.4 Bartko Science & Technology, 14520 Akron Street, Brighton,
CO 80602.5 Racah Institute of Physics, The Hebrew University, Jerusalem,
Israel 91904.6 Conceptual Analytics, LLC, 8209 Woburn Abbey Road, Glenn
Dale, MD 207697 NASA Goddard Space Flight Center, Code 681, Greenbelt,
MD 20771.8 Leiden Observatory, Postbus 9513, 2300 RA Leiden, Nether-
lands.9 Department of Astronomy and Astrophysics, The Pennsylva-
nia State University, 525 Davey Lab, University Park, PA 16802.10 Departmento de Astronomıa y Astrofısica, Pontificia Univer-
sidad Catolica de Chile, Casilla 306, Santiago 22, Chile.11 Steward Observatory, University of Arizona, Tucson, AZ
85721.12 European Southern Observatory, Karl-Schwarzschild-Strasse
2, D-85748 Garching, Germany.13 W. M. Keck Observatory, 65-1120 Mamalahoa Hwy., Ka-
muela, HI 967438 Leiden Observatory, Postbus 9513, 2300 RA Leiden, Nether-
lands.
irregular galaxies dominate. In the lower density fieldand in low-mass groups, interactions and mergers arelinked to enhanced star formation rates and starbursts(Schweizer 1987; Sanders & Mirabel 1996; Johnson et al.1999; Conselice, Bershady, & Gallagher 2000;Barton, Geller, & Kenyon 2000; Pustilnik et al. 2001;Homeier, Gallagher, & Pasquali 2002; Struck & Smith2003). It might be expected that ram pressure from adense intracluster medium (ICM) compresses molecularclouds and triggers a starburst (Bekki & Couch 2003).Therefore, it is not intuitively clear if gas-rich galaxiesinfalling into high density clusters would have increasedor decreased star formation rates relative to the field. Inintermediate redshift cluster samples, the star formationrates of cluster galaxies are suppressed relative to thefield, even when the different morphological mix is ac-counted for (Balogh et al. 1997, 1998; Hashimoto et al.1998). While the star formation rates in clustersincrease as a function of redshift, they are still lowerthan the star formation rates in the field population atthat redshift. The mechanism by which star formationin cluster galaxies is suppressed is still unclear, butthere is substantial evidence that suppression, notenhancement, is the dominant outcome (Couch et al.2001; Ellingson et al. 2001; Postman, Lubin, & Oke2001; Lewis et al. 2002; Martinez et al. 2002).
Two of the most widely discussed mechanismsfor star formation suppression are ram pressurestripping (Gunn & Gott 1972), and a more gentleform of galaxy-ICM interaction termed ’starvation’(Larson, Tinsley, & Caldwell 1980). Both of these mech-

2
anisms may operate with varying degrees of impor-tance, but stripping is expected to quench star formationrapidly (∼ 50 Myr; e.g. Quilis, Moore, & Bower 2000),whereas starvation leads to a decline in the star forma-tion rate over a longer timescale (> 1 Gyr; e.g. Bekki,Couch, & Shioya 2002). The other mechanism of noteis galaxy harassment, where galaxy-galaxy interactionscombined with the tidal field of the cluster are expectedto lead to strong mass loss and a drastic change in mor-phology (Moore, Lake, & Katz 1998).
In the Virgo cluster, ram pressure stripping is theleading explanation for the observation that gas-deficientdwarf galaxies are found in regions of higher X-ray sur-face brightness (Lee, Richer, & McCall 2000). Also inVirgo, there is direct evidence for ram pressure strip-ping of spiral galaxies in the form of HI and Hα “bow-shock” morphology (Vollmer et al. 2004; Kenney et al.2004). Further evidence for the importance of galaxy-ICM interactions comes from a study by Smith (2003),who found that the hot X-ray halos of cluster early-typegalaxies are missing, showing that stripping of gas ha-los occurs in dense environments. Also, the existence ofcluster passive spirals, galaxies with spiral structure butno detected star formation, can also be interpreted asevidence for ram pressure strippping (Goto et al. 2003;Yamauchi & Goto 2004; Kodama et al. 2004). How-ever, the importance of ram pressure stripping and star-vation on the morphology-density relation as a wholehas yet to be determined. Due to degenerate outcomesin color-morphology space of vastly different formationscenarios, we must observe at higher redshifts to probethe dominant processes in producing the morphology-environment correlations seen in the present day uni-verse.
CL0152-1357 (z = 0.837) was observed as part of anongoing project with the Advanced Camera for Surveys(ACS) to obtain imaging of intermediate redshift clustergalaxies, with the goal of tracing the evolution of clus-ter galaxy properties. In this paper we combine mor-phological information from ACS imaging with ground-based spectroscopy to characterize the population ofstar-forming cluster galaxies, and to provide constraintson the mechanisms which influence the evolution of thestar-forming population in clusters.
We begin our investigation of how the properties ofstar-forming galaxies depend on environment in § 3 byestablishing the morphologies, colors, and locations ofour sample galaxies. In § 4 we calculate star formationrates for individual galaxies, and use these to derive anintegrated star formation rate for the cluster. We com-pare this to other clusters at low to intermediate redshiftin § 5, and explore relationships with redshift, LX , andTX . In § 6 we discuss the possibility that ram pressurestripping is responsible for extinguishing star formationin CL0152-1357, and in § 7 we discuss the likely fate ofthe star-forming galaxies. In § 8, we present our conclu-sions.
We use Ωm = 0.3, ΩΛ = 0.7, and H0 = 70 km s−1.
2. OBSERVATIONS AND REDUCTIONS
CL0152 − 1357 was discovered in three cluster sur-veys: the Wide Angle ROSAT Pointed Survey (WARPS;Ebeling et al. 2000), the ROSAT Deep Cluster Sur-vey (RDCS, Rosati et al. 1998) and the Serendipitous
High-redshift Archival ROSAT Cluster Survey (SHARC;Romer et al. 2000). It is not dynamically relaxed, andcontains two massive clusters in the process of merg-ing, both at redshifts of z ∼ 0.837 (Demarco 2003;Demarco et al. 2004). The mass within 1 Mpc is 4.9 ±0.4 × 10¹⁴M⊙ from a weak-lensing analysis (Jee et al.2004). There also appears to be structure in additionto the two massive components. An example of this isa group of red cluster sequence galaxies to the east ofthe northern component; this structure is also detectedin the weak-lensing mass map as well as diffuse X-rayemission.
CL0152-1357 was observed in the F625W, F775W,and F850LP bandpasses (hereafter r625, i775, and z850)with the ACS (Ford et al. 2002) Wide Field Channelas part of the guaranteed time observation program(proposal 9290). The observations were taken in a2 × 2 mosaic pattern, with 2 orbits of integration inthe r625, i775, and z850 filters at each of the four point-ings. Due to the 1′ of overlap between the pointings,the core of the cluster was imaged for a total of 8 or-bits in each filter. The data were processed with theApsis pipeline (Blakeslee et al. 2003a,b). Our photome-try is calibrated to the AB magnitude system using ze-ropoints of 25.90 ± 0.04 (r625), 25.66 ± 0.03 (i775), and24.86 ± 0.02 (z850) (Sirianni et al., in preparation). Ob-ject detection and photometry was performed by SEx-tractor (Bertin & Arnouts 1996) incorporated within theApsis pipeline. A more detailed description can be foundin Benıtez et al. (2004). We use isophotal magnitudes(MAGISO) for colors and total magnitudes (MAGA-UTO) from Sextractor (Bertin & Arnouts 1996).
The spectroscopic data were taken with the FORS1and FORS2 instruments on the VLT, and are fullydescribed in Demarco et al. The pixel scale rangesfrom 0.20 − 0.25′′ pixel−1, the spectral resolution from2.6 − 6.9 A pixel−1, the slit widths from 1 − 1.4′′, andthe seeing was < 0.8′′ (Demarco et al. 2005). The wave-length coverage was 4000 − 10000 Aor 6000 − 10000 A.S/N ranged from less than 1 in cases where no contin-uum was detected, to ∼ 50 at 4000 A rest-frame. Red-shift completeness fractions were determined by count-ing the number of galaxies in the field of view withinthe specified magnitude (color, morphology) limits com-pared to the fraction of those with redshifts. The sampleof 100 field galaxies used in § 3.1 is from the spectroscopicsample of confirmed non-cluster members with redshiftsand ACS coverage. This field sample covers the red-shift range 0.2 < z < 1.3. Galaxies for spectroscopicfollow-up were selected as having photometric redshifts0.7 < zphot < 0.9. The redshift selection was not uniformwith color, but was biased towards red galaxies. There-fore, the completeness as a function of color, shown inFigure 1, varies by a factor of 2 for blue and red galaxiesbrighter than i = 23.
3. RESULTS
The spectroscopic sample contains 102 cluster mem-bers, 33 of which have emission lines indicative of starformation, and 2 are AGN. Emission lines were iden-tified by eye on the 2D spectral images. The weakest[OII] line identified is 12 A EW. Table 1 lists informa-tion for the star-forming galaxies (excluding AGN). Wehave morphological information for 24 of the star-forming

3
galaxies that overlap with our ACS field. Figure 2 showsr625, i775, z850 color cutouts of the star-forming clustermembers.
3.1. Morphology
Morphologies were determined by visual classificationson the T-type system (de Vaucouleurs et al. 1991). Allgalaxies in the field with i775 ≤ 24 magnitude were clas-sified by MP (Postman et al., in preparation). 20% ofthe galaxies were also classified by MF, NC, and BHto estimate the classification errors. Unanimous or ma-jority agreement was achieved for 75% of objects withi775 ≤ 23.5. There was no significant offset between themean classification from the independent classifiers.
Visual morphologies of the cluster members with ev-idence for ongoing star formation, indicated by the de-tection of [OII] emission, fall into three categories: redcluster sequence spiral galaxies (Sa and earlier), com-pact (re < 3 kpc) early-type galaxies (T ≤ 0), andirregular/late-type spiral galaxies ( T ≥ 3) that are typ-ically expected to have star formation. Only one of thegalaxies (2016) is highly disturbed, indicative of a majormerger.
In Figure 3 we present histograms of the visually classi-fied morphologies for galaxies with and without emissionlines. For the cluster galaxies, we see a clear correlationof morphology with star formation, which is absent inthe field sample. Also, the distribution of morphologicaltypes is different between cluster and field, with a signif-icant number of disky galaxies in the field sample, andearly-type morphologies in the cluster sample.
Five of the star-forming cluster members have early-type morphologies and compact appearances. We fit2D light profiles to the PSF-convolved z850 images usingGALFIT (Peng et al. 2002). The results are shown inTable 2. We fit a single Sersic profile where the surfacebrightness varies as r1/n (Sersic 1968; Ciotti & Bertin1999). A profile with n = 4 is a de Vaucouleurs profile,and one with n = 1 describes an exponential disk. Wefind that these compact early-type cluster members haveeffective radii ranging from ∼ 1 − 2.7 kpc. This is lowerthan the mean of 3.4 kpc from 53 early-type (T ≤ 0)cluster member galaxies. Thus, we are able to confirmtheir visually compact appearance. The low measuredn values for these compact early-type galaxies is consis-tent the trend of magnitude and surface brightness pro-file found for E and dE galaxies in the nearby Universe(Graham & Guzman 2003).
None of the early-type galaxies with [OII] is a luminouspoint source in the 37ks Chandra image. These galaxieshave narrow [OII] λ3727 emission lines, and none has[NeIII] λ3869; broad lines and [NeIII] λ3869 are typicalof active nuclei. For galaxy 1006=10871, we also detect[OIII] λ5007 and Hβ, and we can apply a diagnostic cri-teria from Rola, Terlevich, & Terlevich (1997). We findlog([OIII]λ5007/Hβ)=0.3 and log([OII]λ3727/Hβ)=0.6,locating it within the HII galaxy regime, but in a regionalso populated by LINERs. Thus we cannot rule outan active nucleus origin for the [OII] emission. This ap-plies to all galaxies in our sample, however, these com-pact early-type galaxies lack properties typical of star-forming galaxies, such as a patchy appearance (indicat-ing the presence of gas and dust).
3.2. Colors of Star-forming Galaxies
In Figure 5 we present a histogram of the r625 − i775values for cluster member galaxies with and without de-tected star formation. There is a strong segregation inthe r625−i775 colors of star-forming and non-star-forminggalaxies. While the star-forming galaxies range in colorfrom blue to red, galaxies without detected star forma-tion are almost exclusively red. This leads to the con-clusion that with reliable photometric redshifts, a sim-ple color selection to separate the star-forming and pas-sive cluster populations is fairly robust (e.g. Gray et al.2004). However, such a selection is not well suited tostudy the overall properties of the star-forming clustermembers; there is a small but significant fraction of redstar-forming galaxies.
3.2.1. Fraction of Star-forming Red Cluster SequenceGalaxies
The red cluster sequence (RCS) is the prominent redridge in color magnitude diagrams of large galaxy sam-ples. In low redshift clusters, it is composed exclusivelyof ellipticals and S0s. However in this galaxy samplewe have RCS members with current star formation asindicated by the presence of [OII] emission, also notedin Demarco et al. (2004). To calculate the fraction ofRCS galaxies with ongoing star formation, we need thecompleteness of our spectroscopic survey as a functionof magnitude, and the magnitude distribution of the redcluster sequence (RCS) galaxies. The redshift complete-ness as a function of color is shown in Figure 1. Galaxyselection was biased towards red galaxies. After correct-ing for color, there was also a ∼ 5% bias towards early-type morphologies, but we will neglect this correction asit is much smaller than the color bias.
To define the red cluster sequence we take all non-stellar objects with 0.8 < r625 − i775 < 1.4 and 20 <i775 < 24. We iteratively fit a linear relation to thissample with 2.2σ clipping. The color-magnitude relationdefining the red cluster sequence for CL0152-1357 is thus
(r − i) = (−0.037± 0.006)× i + 1.900 ± 0.132
The standard deviation about this relation is 0.07 mag-nitudes, and we define an object as an RCS member ifits deviation is less than 2σ, or 0.15 magnitudes, fromthis relation. A more detailed explanation of the redcluster sequence will be presented in Blakeslee et al. (inpreparation).
The deviation in magnitudes from the RCS, ∆ RCS, isgiven in column 8 of Table ??. There are 8 galaxies withcolors placing them in the RCS. Of the RCS galaxies withspectra, how many show evidence for star formation?There are spectra for 73 RCS cluster member galaxies.Of these 73, 44 are brighter than i775 = 22.5, and 6 ofthe 44 have evidence for star formation (∼ 14%). If wechoose a slightly fainter magnitude limit of i775 = 23.0,then the number of RCS cluster member galaxies withspectra is 65, and 8 have detected [OII] (∼ 12%).
After correcting for color bias in the redshift incom-pleteness fractions, there is a slight bias against galaxieswith late-type morphologies (T≥ 0). We conclude thatthe fraction of RCS galaxies with ongoing star formationin CL0152 − 1357 is > 0.15. We note that this is an

4
underestimate, because we have access only to [OII] inemission as our star formation indicator.
3.3. Segregation of Star-forming Galaxies
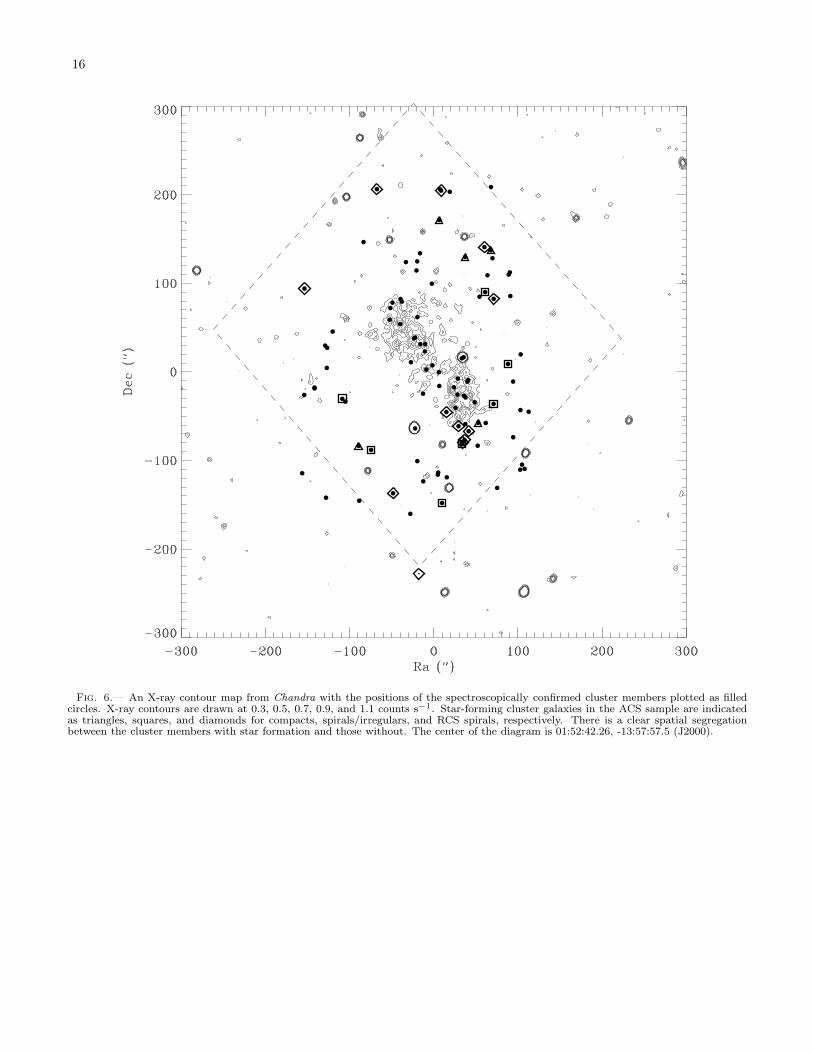
In Figure 6 we show the Chandra contour map withthe positions of the cluster members indicated as soliddots, and the edges of the ACS mosaic as dotted lines.The star-forming galaxies are marked according to theirmorphology: triangles, squares, and diamonds representcompact galaxies, spirals/irregulars, and RCS spirals. Asimilar figure without the morphological imformation canbe found in Demarco et al. (2004). We find no star-forming galaxies within the main X-ray peaks, that is,within a contour value of 0.3 counts s−1. Consider-ing the area between the two main X-ray peaks as thecenter, there appears to be a sharp transition aroundR ∼ 500 kpc (R ∼ 300 − 400 kpc from the center ofthe southern cluster), within which we find almost nostar-forming galaxies. We note that if the distribution ofcluster galaxies is spherically symmetric, a few might beexpected simply from projection effects. However, thereare also few spectroscopically confirmed cluster memberswithin ∼ 500 kpc to the northwest and southeast of thenorthern cluster. Therefore, the radius at which thistransition occurs is not well constrained by our obser-vations.
4. STAR FORMATION RATES
Star formation rates are derived from [O II] emissionline luminosities. There are a few prescriptions for con-verting [OII] line fluxes to star formation rates (Gal-lagher, Hunter, & Bushouse 1989, Kennicut 1992, Kew-ley, Geller, & Jansen 2004). We will use the prescriptionof Kewley et al. (2004),
SFR[OII](M⊙ yr−1) =
(6.58 ± 1.65)× 10−42L[OII](ergs s−1)
This relation was derived using the mean reddeningcorrected [OII]/Hα ratio (1.2 ± 0.3) from the NearbyField Galaxies Survey (Jansen et al. 2000). Systematicerrors in [OII] derived SFRs arise from metallicity andextinction effects. For field galaxies in the nearby Uni-verse, both of these quantities have been shown to cor-relate with B-band luminosity (e.g. Jansen, Franx, &Fabricant 2001). Because we have no information aboutmetallicity or dust extinction, and how these might scalewith luminosity for our sample, we have not includedthese corrections. They should therefore be consideredlower limits on the true SFRs. In the next section weassume an average internal extinction of 1 magnitude atHα for comparison with other studies. We convert ourline fluxes to luminosities by assuming all galaxies are atthe cluster distance (z = 0.84).
The emission-line fluxes were measured by fitting sin-gle Gaussian profiles interactively using SPLOT in IRAF.We fit several spectra on five separate occasions to esti-mate errors on our flux measurements due to continuumselection. For the highest line fluxes, the errors were< 5%, while for the lowest, errors approached 20%. Com-bining this error with the error on the SF prescription,errors on our SFRs range from 13 − 50%. A representa-tive L[OII] error of 10% results in a SFR error of ∼ 27%.EWs were also measured interactively with SPLOT in
IRAF on background-subtracted but non-flux calibratedspectra. EWs were estimated as the mean of 5 separatemeasurements, and the quoted errors are the maximumdeviation from the mean measurement.
We can set a 2σ limit on the SFR for those galaxieswhere the [OII] line was not detected. A typical [OII]emission line width for the star-forming galaxies in oursample is 11A. We set the 2σ limit as twice the standarddeviation in counts within ±2.5× 11A of the wavelengthof the redshifted [OII]. We then relate the mean counts tothe mean flux to arrive at upper limits for SFRs. Theseare below 1.0 M⊙ yr−1 for all galaxies (with two ex-ceptions). For comparison, the lowest measured SFR is0.12 M⊙ yr−1. This reflects the widely varying quality ofthe spectroscopic sample. The distribution of our SFRlimits is shown in Figure 8.
The smallest slit width for the spectroscopic observa-tions is 1′′. With the exception of 3 galaxies, the effec-tive radii of all identified star-forming cluster membersare less than 1′′, and the seeing was < 0.8′′, so we do notapply an aperture correction.
4.1. Integrated Star Formation Rate
Due to the small number of galaxies in our sample andredshift completeness effects with color, we choose not tocompute the fraction of SF galaxies with density or ra-dius as it is fraught with uncertainty due to selection ef-fects. To minimize discrepancies due to differences in sur-vey characteristics, Finn, Zaritsky, & McCarthy (2004)compared integrated SFRs, which are dominated bygalaxies with the largest star formation rates. A compar-ison of integrated SFRs is more accurate than a fractionalcomparison. Here we compare the overall star-formingproperties of CL0152-1357 to that of other clusters at lowto intermediate redshift. The spatial limits of the lowerredshift cluster studies determine a limit of 0.5R200 forcomparison. R200 is the radius where the mean clusterdensity is 200 times the critical density of the universe,ρc, at that redshift. We write the expression for R200 as
R200(kpc) = [Mcl
4/3π200ρc]1/3
We take Mcl as the total projected mass within 1 Mpc:Mcl = 4.92 ± 0.44 × 10¹⁴ M⊙ (Jee et al. 2004). ForCL0152 at z = 0.84, R200 = 1192 kpc, or ∼ 2.5′.
In comparing our results we must include correctionsfor completeness and extinction. Also, because this isa merging cluster, it is not straightforward to choose acluster center. We discuss these issues in the followingsections.
4.1.1. Incompleteness Correction
Compared to an imaging survey, a spectroscopic sur-vey suffers significantly more from incompleteness. Wewill correct for this using the redshift completeness asa function of color and magnitude, but first we estimatethe validity of our incompleteness correction by consider-ing the cluster CL0023, which has spectroscopic narrow-band imaging data. 70% of the star forming galaxiesand 65% of the star formation was missed in the spec-troscopic survey versus the imaging survey covering thesame area (Finn, Zaritsky, & McCarthy 2004). Correct-ing for this incompleteness should be the same as correct-ing for incompleteness in the redshift survey (Lubin et al.

5
1998). Of the 23 galaxies in the Finn et al. (2004) sam-ple with SFRs ≥ 0.2 M⊙ yr−1 that are matched withspectroscopically confirmed cluster members in the Lu-bin et al. (1998) sample, 21 are brighter than R = 24.0.The cumulative completeness of the spectroscopic sur-vey is 0.187 ± 0.006 at R = 24.0, and 0.240 ± 0.076 atR = 23.75. Therefore the incompleteness is 76− 82%, ingood agreement with the narrow-band imaging results.Thus, when we compute the normalized integrated starformation rate below, we correct for incompleteness usingthe redshift completeness function presented in Figure 1.
4.1.2. Extinction Correction
For the galaxies where we detect [OII], our star forma-tion rates are underestimated due to reddening. Fromthe Nearby Galaxies Survey, Jansen et al. (2000) es-tablished that there is a luminosity-extinction relation,in the sense that more luminous galaxies have largerE(B − V ). However, the scatter in this relation is large,and it is unclear if intermediate redshift cluster galaxiesfollow the same relation as the local star-forming popula-tion. Therefore, to correct for extinction, we follow con-vention and assume 1 magnitude of internal extinctionat Hα, λ6563 (e.g. Balogh & Morris 2000, Couch et al.2001; Balogh et al. 2002, Finn et al. 2003). This corre-sponds to ∼ 1.8 magnitudes at λ3727 using the Galac-tic extinction law of Cardelli, Clayton, & Mathis (1989).We thus correct our fluxes by a factor of 5.25.
4.1.3. Integrated SFR for CL0152
If we restrict ourselves to 0.5R200, then the choice ofa cluster center is an important one. The distributionof cluster galaxies and the X-ray emission are elongated.In the spectroscopic survey, more star-forming galaxiesare detected at the southern end of the cluster. In fact,if we choose the center of the northern clump as R = 0,then we have no star-forming galaxies within 0.5R200.Our integrated SFR changes from 4.5 M⊙ yr−1 with 5galaxies, to 5.3 M⊙ yr−1 with 8 galaxies if R = 0 isbetween the clumps or on the southern clump. If wewere to take R200 instead of 0.5R200, the integrated SFRwould not depend significantly on the choice of clustercenter, changing at most from 19.1 to 19.9 M⊙ yr−1.
We choose a point between the two massive clustersas the cluster center: 01:52:41.55, −13:57:56.7. Ourobserved, uncorrected integrated star formation rate is4.5 M⊙ yr−1. Next we correct this for incompletenessand extinction. Four of these galaxies have r − i < 1.0,are brighter than i775 = 22.8, and have a mean SFR of1.1 M⊙ yr−1. We measure a cumulative completeness of0.17 for galaxies with i775 ≤ 23.0, and 0.23 for galaxieswith i775 ≤ 22.5, so we will use a cumulative complete-ness of 0.20 for this sample. Then we should have roughly20 galaxies with a mean SFR of 0.9 M⊙ yr−1. The fifthgalaxy has r − i = 1.03 and SFR=0.2 M⊙ yr−1. Thecumulative completeness for red galaxies is 0.53, and wedo not apply a correction. Thus, the completeness cor-rected total SFR is 18.2 M⊙ yr−1. We then apply anextinction correction corresponding to 1.8 magnitudes ofextinction at [OII]. We thus correct our total SFR by afactor of 5.25, for a total of 96 M⊙ yr−1. The error onthis estimate is unlikely to be lower than 20%.
5. A COMPARISON OF CLUSTER SFRS
To investigate what dominates the star-forming prop-erties of cluster galaxies, evolution or cluster character-istics, in Figure 9 we plot integrated SFRs and the mass-normalized integrated SFRs versus redshift, LX , and TX .Cluster parameters are listed in Table 3.
Finn, Zaritsky, & McCarthy (2004) plotted mass-normalized integrated cluster SFRs versus redshift andvelocity dispersion, which was intended as a proxyfor mass. Kodama et al. (2004) added the clusterCL0024+17 at z = 0.395 to this plot. Here we addCL0152 at z = 0.837, and also plot the integrated SFRand the mass-normalized cluster SFR against two quan-tities that describe the state of the ICM: the X-ray lu-minosity and the X-ray gas temperature.
We take integrated star formation rates and errors fromFinn, Zaritsky, & McCarthy (2004) and Kodama et al.(2004). The integrated star formation rates for A1689,AC114, A2390, CL0024, CL0023, and CL0152 are 61±19(Balogh et al. 2002), 39 ± 15 (Couch et al. 2001), 96 ±34 (Balogh & Morris 2000), 253 ± 34. (Kodama et al.2004), 78 ± 7 (Finn, Zaritsky, & McCarthy 2004), and96 ± 24 M⊙ yr−1, respectively. These numbers werederived from Hα spectroscopy for A1689 and AC114,and Hα narrow-band imaging for A2390, CL0024,and CL0023. Here we include an incompleteness cor-rection of 2.5 for AC114 from the values presentedin Finn, Zaritsky, & McCarthy (2004), and for A1689adopt the incompleteness and a slit aperture correctionof 2.8 from Kodama et al. (2004). Where errors on LX
are not listed, we assume a 10% error.In the right-hand panels, we divide the integrated
SFRs by cluster mass in units of 1014 M⊙. We re-fer to these values as mass-normalized cluster SFRs.For CL0152, CL0024, and AC114 we use the lens-ing masses of 4.9 × 10¹⁴ M⊙ (Jee et al. 2004), 5.7 ×10¹⁴ M⊙ (Kneib et al. 2003), and 7.3 × 10¹⁴ M⊙
(Natarajan, Kneib, Smail, & Ellis 1998). For consis-tency with Kodama et al. (2004) we use 8.1 × 10¹⁴ M⊙
for A1689 (King, Clowe, & Schneider 2002), but wenote that recent work by Broadhurst et al. (2005) andZekser et al. (2005) indicate a value of 1.8 × 10¹⁵ M⊙.This also illustrates the typical uncertanties in mass esti-mates from lensing analyses. For CL0023 we use the esti-mate of 2.3× 10¹⁴ M⊙ in Kodama et al. (2004). Whereerrors on mass are not listed, we assume a 10% error.
We find a possible inverse correlation of integrated SFRand TX , but also note that the scatter is large. Usingthe non-parametric Spearman rank correlation test, wefind a 70%, or 1σ, inverse correlation between integratedSFR and TX . However, this disappears when CL0024 isexcluded. For the mass-normalized cluster SFR and TX ,it is more significant, 94%. The trend remains even whenCL0024 is excluded. We find no significant correlationbetween either the integrated SFR and redshift or themass-normalized integrated SFR and redshift.
CL0024 has the highest integrated SFR of the clusterssurveyed so far. It also has the lowest X-ray temperatureand X-ray luminosity, but its weak-lensing mass (withinM200) is similar to CL0152 (within 1 Mpc) and AC114,and it is at a similar redshift to AC114. Considering onlythese 3 clusters, it appears that it is the ICM that hasthe dominant effect on star formation in cluster galaxies.However, we caution that until more clusters with lowTX and LX are observed, such a conclusion is tentative.

6
In fact, it may be that TX is a more accurate measure ofcluster mass than the values derived from lensing analy-ses, in which case the fundamental correlation is betweencluster SFR and cluster mass, with either no or weakevolution between z = 0.2 − 0.8. One possible compli-cation is additional ICM heating from AGN, which may
introduce some scatter in the expected T3/2X ∝Mclus cor-
relation for a virialized system. There is some evidencefor a significant AGN population in the z = 0.83 clusterMS1054 (Johnson, Best, & Almaini 2003), and CL0152has two confirmed AGN associated with the southernclump (Demarco et al. 2004).
Let us briefly review what is qualitatively expectedfrom hierarchical models. Borgani et al. (2002) (seeFig. 6) predict a trend of a rising SFR with redshift un-til z ∼ 2 − 3, and a decline thereafter. More massivehalos have larger SFRs at high redshift which rise moreslowly, peak at higher redshift, and decline more sharply.Around z ∼ 2 the trend of SFR with halo mass has re-versed, with lower mass halos having higher SFRs. Thereis also a prediction of a larger spread of integrated clus-ter SFRs with decreasing redshift for clusters that differin mass, but an overall trend of decreasing cluster SFRwith redshift. We do not find evidence for this in ourdata. We note that if CL0024 is excluded, then there isa tentative correlation of mass-normalized cluster SFRwith redshift, however, this arises because in this sam-ple more massive clusters are at lower redshift. Also,“normalizing” the model halos by mass exaggerates thedifferences in cluster SFRs at these redshifts, and wouldnot give such a correlation. Testing such models mustinvolve observations of many clusters at z = 0− 1 over arange of cluster masses to look for similarity at interme-diate redshifts and strong diversity at low redshifts.
6. STAR FORMATION EXTINGUISHMENT MECHANISM
The segregation of star-forming and passive galaxies inthis cluster is striking. That no star-forming galaxies arefound within the regions of high ICM density points to agalaxy/ICM interaction as the cause. There are two ma-jor contenders in the galaxy/ICM interaction category:ram pressure stripping and starvation. The two are dis-tinguished by the timescale over which they are expectedto operate. Ram pressure stripping affects the entire gassupply of a galaxy, disk and halo, whereas starvation onlyconcerns the more loosely bound halo of gas, commonlytermed the ’reservoir’, which if left undisturbed, will set-tle to the disk and participate in star formation. Rampressure stripping is expected to occur on timescales ofa few tens of Myr, and starvation & 1 Gyr.
For a comparison with Treu et al. (2003), we estimate,using standard assumptions, the radius at which rampressure stripping becomes important for a typical in-falling spiral galaxy into the southern cluster. We assumea smooth ICM and a density profile of the form
ρgas = ρ0 × [1 + (r/rc)2](−3/2)β
We use the virial radius rv = 1.4 Mpc, the gas masswithin the virial radius 4.5 × 10¹³ M⊙, the core radius,rc=122+28
−20 kpc, and β = 0.66 ± 0.08 (Maughan et al.
2003). to find ρ0 = 2 × 10¹⁴M⊙ Mpc−3. Following
Fujita & Nagashima (1999), we write the condition forram pressure stripping as
ρgasv2 > 3.1 × 10¹⁹M⊙ km2 Mpc−3 s−2
(vrot
220kms−1)2(
rh
10kpc)−1(
ΣHI
8 × 10²⁰mH)
where ρ is in M⊙ Mpc−3, v is in km s−1, and mH is incm−2.
With these parameters, the stripping radius for a MilkyWay-type galaxy moving at a velocity of 1000 km s−1
relative to the ICM is ∼ 0.3 Mpc. The closest pro-jected star-forming galaxies to the southern clusters are∼ 0.3 − 0.4 Mpc. Although this is a crude estimate, thesegregation of star-forming and non-star-forming galax-ies in CL0152 − 1357 is consistent with an ICM inter-action as the dominant mechanism. The crucial distin-guishing observation is the time for star formation to beextinguished, which we cannot make here.
7. EVOLUTION OF STAR-FORMING GALAXIES IN CL0152
Each of the red sequence spirals has evidence for acentral stellar concentration above an exponential disk,which we will refer to as a bulge. This contrasts with theblue late-type star-forming galaxies, about half of whichshow no evidence for a bulge. Their red colors cannotbe due solely to dust, as they appear smooth while theblue spirals have patchy appearances, a clear indicationof a larger amount of dust extinction. The fact that thesered spirals are in the red cluster sequence means that thebulk of their stellar population was formed at a similarredshift as the ellipticals that make up the majority of theRCS in this cluster. Given their red color, the presenceof a bulge, and their relatively low star formation rates,it is probable that these red sequence spirals will becomeS0s.
The compact early-type galaxies have rest-frameMB values from −19 to −20.5. A minimum fadingof −1.2 magnitudes from z = 0.84 to 0 is expectedassuming a single burst population with an age of3 Gyr at z = 0.84. Adding even a 1% burst with anage of 10 Myr increases the fading to −2.2 magni-tudes, and a burst of 10% to −4.1 magnitudes. Wetherefore expect these galaxies to fade to MB = −19to −15. This is consistent with an identification asprogenitors of dwarf elliptical galaxies that are populousin present day clusters (Conselice, Gallagher, & Wyse2001; Geha, Guhathakurta, & van der Marel 2003;Jerjen, Binggeli, & Barazza 2004; Rakos & Schombert2004).
These compact early-type galaxies may also be relatedto “harassed” low surface brightness disk galaxies. Thesimulations of Moore et al. (1999) explore the effects ofgalaxy harassment on high and low surface brightness(LSB) disk galaxies, and indicate that the outcome issignificantly different for the two types of objects. LSBgalaxies lose between 50 − 90% of their stars, and rem-nants are well-fitted by exponential disks with scale-lengths between 1.5 − 2.5 kpc, which is consistent withthe scale-lengths of the compact early-type galaxies dis-covered in CL0152. To match the absolute B magnitudesof these compact galaxies, infalling field LSB disk galax-ies would have to have absolute B magnitudes of −21 to

7
−23 before the effects of harassment, assuming the youngand old stellar populations are equally stripped.
We also note a possible connection to the ”missing”faint red galaxy population in the luminosity functionsof intermediate redshift clusters (Kodama et al. 2004;Goto et al. 2005). Perhaps the faint red population isstill forming at z = 0.8, and the descendants of thesestar-forming compact galaxies will make up the missingfaint red galaxies.
8. CONCLUSIONS
We have identified a population of star-forminggalaxies in the cluster CL0152-1357 at z = 0.837(Demarco et al. 2004), and we investigate their mor-phologies, colors, and spatial distribution. We derivestar-formation rates from [OII] fluxes, and use these tocompare the integrated SFR within 0.5R200 with otherclusters between z = 0.2 − 0.8. Our conclusions are asfollows.
• The 24 star-forming galaxies with ACS morpho-logical information range from compact early-typesto spirals, with only one highly disturbed galaxy.The colors of the star-forming galaxies range fromblue to red, and 8 out of 24 have r625 − i775 col-ors placing them on the red cluster sequence. Wefind that the fraction of red cluster sequence galax-ies with [OII] emission is likely to be > 0.15. Sixof these galaxies have obvious spiral morphologies,and presuming an absence of major mergers, willmost likely evolve into red sequence S0s. Thus,> 15% of red cluster sequence S0s in massive clus-ters at z=0 are still forming stars at a low level atz = 0.84. However, their overall red colors indi-cate that they formed most of their stars duringthe epoch of massive cluster ellipticals.
• We find no massive early-type galaxies with [OII]emission lines down to a 12 A observed limit, cor-responding to approximately 7 A rest-frame EW.All galaxies with [OII] are spiral, irregular, or com-pact, low-to-intermediate mass early-type galaxies.
These compact early-type galaxies have rest-frameB magnitudes of −19 to −20.5. Assuming a mod-erate amount of 1.5−4 magnitudes of B-band fad-ing, this overlaps with present-day dwarf ellipticalmagnitudes, and we identify them as possible dwarfelliptical progenitors. We also note that these maybe the ”missing” faint red galaxy population in in-termediate redshift clusters (Kodama et al. 2004;Goto et al. 2005).
• We find a paucity of star-forming galaxies within∼ 500 kpc of the projected cluster center, and nonewithin the main X-ray peaks. Using simple, stan-dard assumptions about the density profile of theICM, this radius is consistent with the expectedeffect of ram pressure stripping.
• We measure the integrated star formation ratewithin 0.5R200 for CL0152-1357, and find a valuesimilar to that of the z = 0.8 cluster CL0023+0423,although these clusters differ by at a least a fac-tor of 2 in mass. We find an inverse correlationof the mass-normalized integrated star formationrate and TX , and no trend with redshift. How-ever, a larger cluster sample is needed to reach adefinitive conclusion, and additional data on clus-ters with low X-ray temperatures will be pivotal.
ACS was developed under NASA contract NAS 5-32865, and this research has been supported by NASAgrant NAG5-7697 and by an equipment grant from SunMicrosystems, Inc. The Space Telescope Science Insti-tute is operated by AURA Inc., under NASA contractNAS5-26555. We are grateful to K. Anderson, J. Mc-Cann, S. Busching, A. Framarini, S. Barkhouser, andT. Allen for their invaluable contributions to the ACSproject at JHU. We thank W. J. McCann for the use ofthe FITSCUT routine for our color images.
REFERENCES
Allen, S. W., Ettori, S., & Fabian, A. C. 2001, MNRAS, 324, 877Balogh, M. L., Morris, S. L., Yee, H. K. C., Carlberg, R. G., &
Ellingson, E. 1997, ApJ, 488, L75Balogh, M. L., Schade, D., Morris, S. L., Yee, H. K. C., Carlberg,
R. G., & Ellingson, E. 1998, ApJ, 504, L75Balogh, M. L. & Morris, S. L. 2000, MNRAS, 318, 703Balogh, M. L., et al. 2002, ApJ, 566, 123Barton, E. J., Geller, M. J., & Kenyon, S. J. 2000, ApJ, 530, 660Bekki, K., Couch, W. J., & Shioya, Y. 2002, ApJ, 577, 651Bekki, K. & Couch, W. J. 2003, ApJ, 596, L13Benıtez, N., et al. 2004, ApJS, 150, 1Bertin, E. & Arnouts, S. 1996, A&AS, 117, 393Blakeslee, J. P., Anderson, K. R., Meurer, G. R., Benitez, N., &
Magee, D. 2003a, in ASP Conf. Ser. 295, Astronomical DataAnalysis Software and Systems XII, ed. G. Piotto, G. Meylan,S. G. Djorgovski, & M. Riello (San Francisco: ASP), 257
Blakeslee, J. P., et al. 2003b, ApJ, 596, 143Borgani, S., Governato, F., Wadsley, J., Menci, N., Tozzi, P.,
Quinn, T., Stadel, J., & Lake, G. 2002, MNRAS, 336, 409Broadhurst, T., et al., 2005, ApJ, in pressCardelli, J. A., Clayton, G. C., & Mathis, J. S. 1989, ApJ, 345, 245Ciotti, L. & Bertin, G. 1999, A&A, 352, 447Conselice, C. J., Bershady, M. A., & Gallagher, J. S. 2000, A&A,
354, L21
Conselice, C. J., Gallagher, J. S., & Wyse, R. F. G. 2001, ApJ,559, 791
Couch, W. J., Balogh, M. L., Bower, R. G., Smail, I., Glazebrook,K., & Taylor, M. 2001, ApJ, 549, 820
de Vaucouleurs, G., de Vaucouleurs, A., Corwin, H. G., Buta, R. J.,Paturel, G., & Fouque, P. 1991, Volume 1-3, XII, 2069 pp. 7figs.. Springer-Verlag Berlin Heidelberg New York,
Demarco, R. 2003, PhDTDemarco, R. et al., A&A, submittedEbeling, H., et al. 2000, ApJ, 534, 133Ellingson, E., Lin, H., Yee, H. K. C., & Carlberg, R. G. 2001, ApJ,
547, 609Finn, R. A., Zaritsky, D., & McCarthy, D. W. 2004, ApJ, 604, 141Ford, H., et al. 2002, SPIE, 4854, 81Fujita, Y. & Nagashima, M. 1999, ApJ, 516, 619Gallagher, J. S., Hunter, D. A., & Bushouse, H. 1989, AJ, 97, 700Geha, M., Guhathakurta, P., & van der Marel, R. P. 2003, AJ, 126,
1794Goto, T., et al. 2003, PASJ, 55, 757Goto, T. et al., 2005, submittedGraham, A. W. & Guzman, R. 2003, AJ, 125, 2936Gray, M. E., Wolf, C., Meisenheimer, K., Taylor, A., Dye, S., Borch,
A., & Kleinheinrich, M. 2004, MNRAS, 347, L73Gunn, J. E. & Gott, J. R. I. 1972, ApJ, 176, 1

8
Hashimoto, Y., Oemler, A., Jr., Lin, H., Tucker, D. L. 1998, ApJ,499, 589
Homeier, N., Gallagher, J. S., & Pasquali, A. 2002, A&A, 391, 857Jansen, R. A., Franx, M., Fabricant, D., Caldwell, N. 2000, ApJS,
126, 271Jansen, R. A., Franx, M., & Fabricant, D. 2001, ApJ, 551, 825Jee, M., et al. 2005, ApJ, in press (astro-ph/0409304)Jerjen, H., Binggeli, B., & Barazza, F. D. 2004, AJ, 127, 771Johnson, K. E., Vacca, W. D., Leitherer, C., Conti, P. S., & Lipscy,
S. J. 1999, AJ, 117, 1708Johnson, O., Best, P. N., & Almaini, O. 2003, MNRAS, 343, 924Kenney, J. D. P., van Gorkom, J. H., & Vollmer, B. 2004, AJ, in
pressKennicutt, R. C., Jr. 1992, ApJ, 388, 310Kewley, L. J., Geller, M. J., & Jansen, R. A. 2004, AJ, 127, 2002King, L. J., Clowe, D. I., & Schneider, P. 2002, A&A, 383, 118Kneib, J., et al. 2003, ApJ, 598, 804Kodama, T., Balogh, M. L., Smail, I., Bower, R. G., Nakata, F.
2004, MNRAS, in pressLarson, R. B., Tinsley, B. M., & Caldwell, C. N. 1980, ApJ, 237,
692Lee, H., Richer, M. G., & McCall, M. L. 2000, ApJ, 530, L17Lewis, I., et al. 2002, MNRAS, 334, 673Lotz, J. M., Martin, C. L., & Ferguson, H. C. 2003, ApJ, 596, 143Lubin, L. M., Postman, M., Oke, J. B., Ratnatunga, K. U., Gunn,
J. E., Hoessel, J. G., & Schneider, D. P. 1998, AJ, 116, 584Mahdavi, A. & Geller, M. J. 2001, ApJ, 554, L129Martin, C. L., Lotz, J., & Ferguson, H. C. 2000, ApJ, 543, 97Martinez, H. J., Zandivarez, A., Dominguez, M., Merchan, M. E.,
Lambas, D. G. 2002, MNRAS, 333, 31Maughan, B. J., Jones, L. R., Ebeling, H., Perlman, E., Rosati, P.,
Frye, C., & Mullis, C. R. 2003, ApJ, 587, 589Moore, B., Lake, G., & Katz, N. 1998, ApJ, 495, 139Moore, B., Lake, G., Quinn, T., & Stadel, J. 1999, MNRAS, 304,
465
Natarajan, P., Kneib, J., Smail, I., & Ellis, R. S. 1998, ApJ, 499,600
Ota, N., Pointecouteau, E., Hattori, M., & Mitsuda, K. 2004, ApJ,601, 120
Peng, C. Y., Ho, L. C., Impey, C. D., & Rix, H. 2002, AJ, 124, 266Postman, M., Lubin, L. M., & Oke, J. B. 2001, AJ, 122, 1125Pustilnik, S. A., Kniazev, A. Y., Lipovetsky, V. A., & Ugryumov,
A. V. 2001, A&A, 373, 24Quilis, V., Moore, B., & Bower, R. 2000, Science, 288, 1617Rakos, K. & Schombert, J. 2004, AJ, 127, 1502Rola, C. S., Terlevich, E., & Terlevich, R. J. 1997, MNRAS, 289,
419Romer, A. K., et al. 2000, ApJS, 126, 209Rosati, P., della Ceca, R., Norman, C., Giacconi, R. 1998, ApJ,
492, 21Sanders, D. B. & Mirabel, I. F. 1996, ARA&A, 34, 749Scharf, C. A., Jones, L. R., Ebeling, H., Perlman, E., Malkan, M.,
& Wegner, G. 1997, ApJ, 477, 79Schweizer, F. 1987, Nearly Normal Galaxies. From the Planck Time
to the Present, 18Sersic, J. L. 1968, Atlas de Galaxes Australes; Vol. Book; Page 1,
0Smith, R. J. 2003, MNRAS, 344, L17Struck, C. & Smith, B. J. 2003, ApJ, 589, 157Treu, T., Ellis, R. S., Kneib, J., Dressler, A., Smail, I., Czoske, O.,
Oemler, A., & Natarajan, P. 2003, ApJ, 591, 53Vollmer, B., Beck, R., Kenney, J. D. P., & van Gorkom, J. H. 2004,
AJ, in pressWu, X., Xue, Y., & Fang, L. 1999, ApJ, 524, 22Yamauchi, C. & Goto, T. 2004, MNRAS, 352, 815Zekser, K. C., et al., 2005, ApJ, in press

9
TABLE 1Properties of the Star-Forming Cluster Members
ID ID z r625 − i775 i775 − z850 i775 ∆ RCS Flux[OII] SFR EW [OII] (A)VLT ACS MAGISO MAGISO MAGAUTO mag erg s−1 cm−2 M⊙ yr−1 A
1290 8671 0.8416 0.715 ± 0.011 0.305 ± 0.010 21.411 ± 0.008 −0.49 1.51E-16 3.4 −59.9 ± 6.0650 3927 0.8671 0.839 ± 0.013 0.333 ± 0.011 21.574 ± 0.009 −0.36 1.32E-16 2.9 −55.2 ± 14.7125 · · · 0.8376 · · · · · · · · · · · · 1.23E-16 2.7 −167 ± 30144 · · · 0.8442 · · · · · · · · · · · · 1.05E-16 2.3 −31.9 ± 6.71006 10871 0.8485 0.440 ± 0.032 0.186 ± 0.038 24.028 ± 0.026 −0.66 1.01E-16 2.2 −579 ± 422347 1676 0.8463 0.897 ± 0.014 0.424 ± 0.012 22.725 ± 0.007 −0.25 9.24E-17 2.0 −64.8 ± 13.11530 · · · 0.8367 · · · · · · · · · · · · 8.20E-17 1.8 −185 ± 281146 5111 0.8641 0.762 ± 0.015 0.289 ± 0.013 23.016 ± 0.008 −0.38 7.09E-17 1.6 −67.7 ± 11.0306 5481 0.8539 1.036 ± 0.015 0.634 ± 0.009 22.019 ± 0.008 −0.14 6.55E-17 1.4 −51.9 ± 35.03014 · · · 0.8474 · · · · · · · · · · · · 4.72E-17 1.0 −29.6 ± 8.9295 1652 0.8370 0.803 ± 0.012 0.279 ± 0.011 21.633 ± 0.009 −0.39 4.72E-17 1.0 −31.2 ± 4.9327 2016 0.8247 0.261 ± 0.014 0.120 ± 0.017 22.277 ± 0.011 −0.91 4.24E-17 0.9 −273 ± 165161 · · · 0.8447 · · · · · · · · · · · · 4.18E-17 0.9 −85.6 ± 13.01131 5846 0.8237 0.403 ± 0.020 0.342 ± 0.021 23.842 ± 0.014 −0.71 3.72E-17 0.8 −646 ± 522868 8708 0.8297 0.573 ± 0.030 0.263 ± 0.031 23.444 ± 0.025 −0.55 3.09E-17 0.7 −89.1 ± 40.647 2027 0.8436 0.884 ± 0.019 0.417 ± 0.015 22.134 ± 0.013 −0.29 2.71E-17 0.6 −17.2 ± 10.3270 1562 0.8450 0.984 ± 0.019 0.505 ± 0.013 21.613 ± 0.014 −0.21 2.21E-17 0.5 −31.4 ± 4.8851 5410 0.8360 1.022 ± 0.012 0.485 ± 0.008 21.592 ± 0.006 −0.17 1.98E-17 0.4 −12.3 ± 6.2898 10148 0.8300 0.711 ± 0.023 0.296 ± 0.021 22.774 ± 0.013 −0.44 1.71E-17 0.4 −205 ± 1071532 1146 0.8413 0.740 ± 0.024 0.316 ± 0.022 22.584 ± 0.017 −0.42 1.95E-17 0.4 −19.5 ± 2.9377 2597 0.8379 0.971 ± 0.022 0.465 ± 0.016 22.404 ± 0.014 −0.19 1.67E-17 0.4 −47.4 ± 7.41238b · · · 0.8456 · · · · · · · · · · · · 1.55E-17 0.3 −150 ± 301258 7017 0.8394 1.136 ± 0.010 0.570 ± 0.008 21.250 ± 0.005 −0.07 1.50E-17 0.3 −13.4 ± 2.2184 · · · 0.8397 · · · · · · · · · · · · 1.36E-17 0.3 −73.8 ± 25.0204 3390 0.8386 1.247 ± 0.016 0.701 ± 0.008 21.118 ± 0.008 0.04 1.15E-17 0.3 −20.7 ± 19.5248 4076 0.8472 1.111 ± 0.022 0.733 ± 0.013 22.479 ± 0.011 −0.05 1.47E-17 0.3 −30.9 ± 16.1551 2235 0.8362 1.235 ± 0.018 0.604 ± 0.010 21.705 ± 0.009 0.05 1.45E-17 0.3 −10.6 ± 5.018 717 0.8248 1.263 ± 0.031 0.597 ± 0.017 22.435 ± 0.016 0.10 8.63E-18 0.2 −94.6 ± 58.1234 1564 0.8474 0.784 ± 0.024 0.329 ± 0.021 22.661 ± 0.017 −0.37 7.07E-18 0.2 −32.6+37.6
−16.3
267 1575 0.8443 1.057 ± 0.039 0.704 ± 0.023 22.876 ± 0.024 −0.09 8.38E-18 0.2 −139 ± 126394 1737 0.8329 1.029 ± 0.023 0.415 ± 0.016 22.789 ± 0.014 −0.12 6.88E-18 0.2 −20.7 ± 9.73013 · · · 0.8224 · · · · · · · · · · · · 5.50E-18 0.1 −27.0 ± 11.026b1 · · · 0.8372 · · · · · · · · · · · · · · · · · · · · ·
Note. — Notes: Colors are computed with MAGISO; total i775 is MAGAUTO. ∆ RCS is deviation in magnitudes of r − i from thered cluster sequence. Errors on Flux[OII] ranges from 5-20% from the highest to the lowest luminosities. Combining this with the errorin the L[OII]-SFR relation (Kewley, Geller, & Jansen 2004), errors on SFRs range from ∼ 13 − 50%. EWs are the mean of 5 interactivemeasurements in SPLOT. EW errors are taken as the largest deviation from the mean. EWs are observed EWs; to transform to rest-frame,divide by (1+z).
1The blue wavelength coverage was not sufficient to detect [OII] λ 3727; only [OIII] λ 4959,5007 was detected.

10
TABLE 2
Structural Parameters of Compact Early-type Star-forming Galaxies
ACS ID re, pixels re, kpc n T type
4076 7.1 2.7 4.7 −45111 4.3 1.7 1.4 −110871 3.8 1.4 0.8 01676 3.1 1.2 5.4 −55846 2.8 1.1 1.8 −1

11
TABLE 3
Cluster Redshift 1014 M⊙ LX 1044 erg s−1 TX (keV) Ref
A1689 0.183 8.1 55.73 ± 8.92 9.02+0.4
−0.31
A2390 0.228 13.6 ± 0.7 63.49 ± 14.87 11.5 ± 1.5 2AC114 0.32 7.3+4.4
−1.938.10 9.76+1.04
−0.853
CL0024 0.395 5.7 ± 1.1 3.4 4.47+0.83−0.54
4
CL0152 0.837 4.9 ± 0.4 16.0 ± 2.0 7.7 ± 2.0 5CL0023 0.845 2.3 · · · · · · 6
References. — (1) King, Clowe, & Schneider (2002); Wu, Xue, & Fang (1999), (2) Allen, Ettori, & Fabian (2001), (3) Wu, Xue, & Fang(1999); Natarajan, Kneib, Smail, & Ellis (1998) (4)Kneib et al. (2003); Ota et al. (2004), (5) Demarco et al. (2004); Jee et al. (2004);Maughan et al. (2003), Balestra et al., in preparation, (6) Finn, Zaritsky, & McCarthy (2004); Kodama et al. (2004)

12
Fig. 1.— Cumulative redshift completeness for blue (r − i < 1.0) and red (r − i > 1.0) galaxies.

13
3390 717 1575 1737
2235 5481 7017 1676
2016
4076 5111 5846 10871
165239278671
20278708 1562 5410
10148 1146 2597 1564
Fig. 2.— ACS r625, i775, z850 color cutouts of the spectroscopically confirmed star-forming cluster members. Top two rows: red clustersequence members, middle three rows: spirals and irregulars, bottom row: compact early-type galaxies. Galaxy 1676 is a compact early-type,but also in the red sequence. ACS IDs corresponding to Table 1 are given below each cutout. Image sizes are 5′′ × 5′′.

14
Fig. 3.— The distribution of visually classified morphologies for galaxies with and without emission lines. There is a clear trend forcluster galaxies without [OII] to have early-type morphologies, while the star-forming cluster galaxies range from early to late-type. Thistrend is absent in the field sample.
Fig. 4.— Histogram of r625 − i775 values for cluster members with and without detected star formation. Some of the red galaxies havestar formation, but the color distribution of passive galaxies is more peaked than for the star-forming galaxies.

15
Fig. 5.— Color magnitude diagram for galaxies in the Cl0152 field. Cluster member with star formation are marked with triangles,squares, and diamonds for compact early-type galaxies, blue spirals/irregulars, and RCS spirals, respectively.
16
Fig. 6.— An X-ray contour map from Chandra with the positions of the spectroscopically confirmed cluster members plotted as filledcircles. X-ray contours are drawn at 0.3, 0.5, 0.7, 0.9, and 1.1 counts s−1. Star-forming cluster galaxies in the ACS sample are indicatedas triangles, squares, and diamonds for compacts, spirals/irregulars, and RCS spirals, respectively. There is a clear spatial segregationbetween the cluster members with star formation and those without. The center of the diagram is 01:52:42.26, -13:57:57.5 (J2000).

17
Fig. 7.— Examples of spectra. ACS ID is listed above each spectrum.

18
Fig. 8.— Histogram of the 2σ limits on the star formation rates for galaxies without detected [OII] emission. All are below 1 M⊙ yr−1,with the exception of two galaxies.

19
Fig. 9.— Integrated cluster SFRs and mass-normalized integrated cluster SFRs plotted against LX , TX , and redshift. See text fordetails.