The Redshift Search Receiver 3 mm Wavelength Spectra of 10 Galaxies
32
arXiv:1101.0132v1 [astro-ph.GA] 30 Dec 2010 Draft version January 4, 2011 Preprint typeset using L A T E X style emulateapj v. 11/10/09 THE REDSHIFT SEARCH RECEIVER 3 MM WAVELENGTH SPECTRA OF 10 GALAXIES Ronald L. Snell 1 , Gopal Narayanan 1 , Min S. Yun 1 , Mark Heyer 1 , Aeree Chung 1,2 , William M. Irvine 1,3 , Neal R. Erickson 1 , and Guilin Liu 1 Draft version January 4, 2011 ABSTRACT The 3 mm wavelength spectra of 10 galaxies have been obtained at the Five College Radio As- tronomy Observatory using a new, very broadband receiver and spectrometer, called the Redshift Search Receiver (RSR). The RSR has an instantaneous bandwidth of 37 GHz covering frequencies from 74 to 111 GHz, and has a spectral resolution of 31 MHz (∼100 km s −1 ). During tests of the RSR on the FCRAO 14 m telescope the complete 3 mm spectra of the central regions of NGC 253, Maffei 2, NGC1068, IC 342, M82, NGC 3079, NGC 3690, NGC 4258, Arp 220 and NGC 6240 were obtained. Within the wavelength band covered by the RSR, 20 spectral lines from 14 different atomic and molecular species were detected. Based on simultaneous fits to the spectrum of each galaxy, a number of key molecular line ratios are derived. A simple model which assumes the emission arises from an ensemble of Milky Way-like Giant Nolecular Cloud cores can adequately fit the observed line ratios using molecular abundances based on Galactic molecular cloud cores. Variations seen in some line ratios, such as 13 CO/HCN and HCO + /HCN, can be explained if the mean density of the molecular gas varies from galaxy to galaxy. However, NGC 3690, NGC 4258 and NGC 6240 show very large HCO + /HCN ratios and require significant abundance enhancement of HCO + over HCN, possible due to the proximity to active galactic nucleus activity. Finally, the mass of dense molecular gas is estimated and we infer that 25-85% of the total molecular gas in the central regions of these galaxies must have densities greater than 10 4 cm −3 . Subject headings: galaxies: ISM —ISM: Molecules — ISM: Abundances — Radio Lines: galaxies 1. INTRODUCTION The molecular emission lines observed in galaxies are powerful probes of the physical and chemical properties of the gas most directly connected to the star forma- tion process. Over the past several decades there have been many studies of the molecular line emission from galaxies, and these studies have provided invaluable in- formation on the molecular gas content, star formation efficiency and molecular abundances (Young & Scoville 1991; Omont 2007). Although CO emission has been the primary means of deriving the molecular gas content in galaxies, emission from other less abundant molecular species, is much better in determining the physical and chemical properties of the gas. As the chemistry of the molecular gas is affected by the local radiation field, these trace molecular constituents may also provide informa- tion on local environments of this gas. More frequently observations of molecular species such as HCN, HCO + , HNC, and CS are being obtained (Omont 2007) and in a few cases mapped in nearby galaxies (Meier & Turner 2005). Since these molecules have much larger per- manent electric dipole moments than CO, they require considerable higher densities to collisionally excite, and thus, in general, trace denser molecular gas than the gas probed by CO. Emissions from these dense gas tracers, 1 Department of Astronomy, LGRT 619, University of Massachusetts, 710 North Pleasant Street, Amherst, MA 01003; emails: [email protected], [email protected] [email protected], [email protected], [email protected], [email protected], [email protected] 2 Harvard-Smithsonian Astrophysical Observatory, 60 Garden Street, Cambridge, MA, 02138; email: [email protected] 3 Goddard Center for Astrobiology such as HCN, have been argued to be a much better probe of the star-forming molecular gas than emission from CO (Gao & Solomon 2004). The utility of emission from these ‘high dipole moment molecules’ to probe the properties of the nuclear regions of galaxies is well established, and there have been nu- merous papers on this subject in recent years (see re- view by Omont (2007)). In addition, several emission line ratios, such as those for the low-lying transitions of HCN/CO, HCO + /HCN, and HNC/HCN, have been suggested as good diagnostics of the properties of the dense star-forming gas in galaxies (Aalto 2008). Nearly all studies of the molecular emission in galaxies have been limited to just a few targeted molecular lines. However, Mart´ ın et al. (2006) recently presented the first spectral scan of a galaxy providing an inventory of the molecu- lar lines in NGC 253 within the 2 mm wavelength band. Such spectral scans can provide a much more complete description of the chemical complexities of the molecular gas in galaxies. The 3 mm wavelength band is equally well suited, and past spectral surveys have provided im- portant information on the chemical and physical prop- erties of Giant Molecular Clouds (GMCs) in the Milky Way (Johansson et al. 1984, 1985; Cummins et al. 1986; Turner 1989). One major disadvantage of most spectral line surveys is that the data are assembled from many ob- servations with varying pointing accuracy and with po- tentially systematic calibration problems. The observa- tions described here have been obtained simultaneously over the full spectral band for each galaxy, and hence many systematic problems are eliminated. In this paper we present the first 3 mm spectral scans of the central regions of 10 galaxies.
-
Upload
johnshopkins -
Category
Documents
-
view
0 -
download
0
Transcript of The Redshift Search Receiver 3 mm Wavelength Spectra of 10 Galaxies

arX
iv:1
101.
0132
v1 [
astr
o-ph
.GA
] 3
0 D
ec 2
010
Draft version January 4, 2011Preprint typeset using LATEX style emulateapj v. 11/10/09
THE REDSHIFT SEARCH RECEIVER 3 MM WAVELENGTH SPECTRA OF 10 GALAXIES
Ronald L. Snell1, Gopal Narayanan1, Min S. Yun1, Mark Heyer1, Aeree Chung1,2, William M. Irvine1,3, Neal R.Erickson1, and Guilin Liu1
Draft version January 4, 2011
ABSTRACT
The 3 mm wavelength spectra of 10 galaxies have been obtained at the Five College Radio As-tronomy Observatory using a new, very broadband receiver and spectrometer, called the RedshiftSearch Receiver (RSR). The RSR has an instantaneous bandwidth of 37 GHz covering frequenciesfrom 74 to 111 GHz, and has a spectral resolution of 31 MHz (∼100 km s−1). During tests of theRSR on the FCRAO 14 m telescope the complete 3 mm spectra of the central regions of NGC 253,Maffei 2, NGC1068, IC 342, M82, NGC 3079, NGC 3690, NGC 4258, Arp 220 and NGC 6240 wereobtained. Within the wavelength band covered by the RSR, 20 spectral lines from 14 different atomicand molecular species were detected. Based on simultaneous fits to the spectrum of each galaxy, anumber of key molecular line ratios are derived. A simple model which assumes the emission arisesfrom an ensemble of Milky Way-like Giant Nolecular Cloud cores can adequately fit the observedline ratios using molecular abundances based on Galactic molecular cloud cores. Variations seen insome line ratios, such as 13CO/HCN and HCO+/HCN, can be explained if the mean density of themolecular gas varies from galaxy to galaxy. However, NGC 3690, NGC 4258 and NGC 6240 showvery large HCO+/HCN ratios and require significant abundance enhancement of HCO+ over HCN,possible due to the proximity to active galactic nucleus activity. Finally, the mass of dense moleculargas is estimated and we infer that 25-85% of the total molecular gas in the central regions of thesegalaxies must have densities greater than 104 cm−3.Subject headings: galaxies: ISM —ISM: Molecules — ISM: Abundances — Radio Lines: galaxies
1. INTRODUCTION
The molecular emission lines observed in galaxies arepowerful probes of the physical and chemical propertiesof the gas most directly connected to the star forma-tion process. Over the past several decades there havebeen many studies of the molecular line emission fromgalaxies, and these studies have provided invaluable in-formation on the molecular gas content, star formationefficiency and molecular abundances (Young & Scoville1991; Omont 2007). Although CO emission has beenthe primary means of deriving the molecular gas contentin galaxies, emission from other less abundant molecularspecies, is much better in determining the physical andchemical properties of the gas. As the chemistry of themolecular gas is affected by the local radiation field, thesetrace molecular constituents may also provide informa-tion on local environments of this gas. More frequentlyobservations of molecular species such as HCN, HCO+,HNC, and CS are being obtained (Omont 2007) and in afew cases mapped in nearby galaxies (Meier & Turner2005). Since these molecules have much larger per-manent electric dipole moments than CO, they requireconsiderable higher densities to collisionally excite, andthus, in general, trace denser molecular gas than the gasprobed by CO. Emissions from these dense gas tracers,
1 Department of Astronomy, LGRT 619, University ofMassachusetts, 710 North Pleasant Street, Amherst, MA01003; emails: [email protected], [email protected]@astro.umass.edu, [email protected],[email protected], [email protected],[email protected]
2 Harvard-Smithsonian Astrophysical Observatory, 60 GardenStreet, Cambridge, MA, 02138; email: [email protected]
3 Goddard Center for Astrobiology
such as HCN, have been argued to be a much betterprobe of the star-forming molecular gas than emissionfrom CO (Gao & Solomon 2004).The utility of emission from these ‘high dipole moment
molecules’ to probe the properties of the nuclear regionsof galaxies is well established, and there have been nu-merous papers on this subject in recent years (see re-view by Omont (2007)). In addition, several emissionline ratios, such as those for the low-lying transitionsof HCN/CO, HCO+/HCN, and HNC/HCN, have beensuggested as good diagnostics of the properties of thedense star-forming gas in galaxies (Aalto 2008). Nearlyall studies of the molecular emission in galaxies have beenlimited to just a few targeted molecular lines. However,Martın et al. (2006) recently presented the first spectralscan of a galaxy providing an inventory of the molecu-lar lines in NGC 253 within the 2 mm wavelength band.Such spectral scans can provide a much more completedescription of the chemical complexities of the moleculargas in galaxies. The 3 mm wavelength band is equallywell suited, and past spectral surveys have provided im-portant information on the chemical and physical prop-erties of Giant Molecular Clouds (GMCs) in the MilkyWay (Johansson et al. 1984, 1985; Cummins et al. 1986;Turner 1989). One major disadvantage of most spectralline surveys is that the data are assembled from many ob-servations with varying pointing accuracy and with po-tentially systematic calibration problems. The observa-tions described here have been obtained simultaneouslyover the full spectral band for each galaxy, and hencemany systematic problems are eliminated. In this paperwe present the first 3 mm spectral scans of the centralregions of 10 galaxies.

2 Snell et al.
2. OBSERVATIONS AND DATA REDUCTION
The observations reported in this paper were ob-tained in spring 2008 using the Redshift Search Re-ceiver (RSR) on the Five College Radio Astronomy Ob-servatory (FCRAO) 14-m telescope. The RSR is asensitive, ultra-broad bandwidth receiver/spectrometer(Erickson et al. 2007) developed at the University ofMassachusetts as a facility instrument for the 50-m di-ameter Large Millimeter Telescope (Schloerb 2008). Thisinstrument was designed primarily to measure the red-shift of distant, dust-obscured galaxies. The RSR is adual polarization and dual beam instrument. The fourbroadband receivers cover instantaneously the frequencyrange 74-111 GHz. A high speed Faraday rotation beamswitch, operating at 1 kilohertz, is used to overcomethe 1/f noise originating in the front-end monolithic mi-crowave integrated circuit (MMIC) amplifiers. Followingthe MMIC amplifiers, two wideband mixers convert eachreceiver band to two intermediate frequency (IF) chan-nels. After further conversion and amplification, the IFsignal is passed into an analog auto-correlation spectrom-eter. Each analog correlator has a bandwidth of 6.5 GHzand there are six correlators for each receiver polariza-tion. To obtain the best frequency resolution, we do notapodize the lag domain signal before transforming to thefrequency domain. Without this apodization, as withother auto-correlation based spectrometers, a ringing ef-fect can be seen in the baselines around strong, narrowlines. The RSR has been designed to detect weak rel-atively broad lines, in which case this ringing is not aproblem. In several of the spectra presented here, the13CO line is sufficiently strong, that this ringing addsadditional baseline noise near the line. The RSR has aninstantaneous bandwidth of 37 GHz with a resolution of31 MHz, or a velocity resolution of approximately 100km s−1 in the 3 mm wavelength band.The RSR was commissioned on the FCRAO 14-m tele-
scope in 2007 and 2008 and used for several initial sci-ence projects. During the time of the observations re-ported here, 12 of the final 24 spectrometers were avail-able, which permitted beam switching with the full 37GHz bandwidth in a single polarization. During commis-sioning observations, there was a small hardware issue(which has since been diagnosed and fixed) which pro-duced anomalous noise at approximately 92 GHz, and asmall region around this frequency has been blanked inmany of the spectra presented here.Observations were obtained at the positions of the 10
galaxies listed in Table 1. Distances in Table 1 for thenearby galaxies, NGC 253, Maffei 2, IC342 and M82,are from Karachentsev (2005) and distances for the moredistant galaxies are from the NASA/IPAC ExtragalacticDatabase. The galaxies were selected primarily becausethey were well studied and had relatively bright molec-ular emission lines, important for verifying the perfor-mance of the RSR. Since our observations cover the en-tire 3 mm wavelength window with uniform sensitivity,we can study the previously detected lines and all otherlines within frequency range of the RSR. We added tothe list of bright line galaxies some additional weak-linegalaxies to further test the performance of the RSR andmany of these additional galaxies are known to host anactive galactic nucleus (AGN). Also included in the table
is the total integration time spent on each galaxy. Theobservations were taken over varying atmospheric con-ditions, so our broad aims were to achieve a relativelyuniform sensitivity of about 1 mK or to achieve a signalto noise in the 13CO line of 10. NGC 3079 and NGC6240 did not show strong lines, so we spent additionaltime on these sources to lower the noise to better than0.5 mK. The observations for each galaxy were obtainedover several observing sessions and combined together.The pointing and calibration was repeatedly checked byobservations of the continuum emission from planets andquasars. Pointing offsets were never more than a few arc-seconds, a small fraction of the beam size, and the overallflux calibration is repeatable to be better than 10 %.Also included in Table 1 are some brief notes regarding
the properties of the central regions of the galaxies in oursample. The molecular emission in many of these galax-ies is dominated by their nuclear starburst. Both NGC6240 and Arp 220 are ultra luminous infrared galaxies(ULIRGS). NGC 1068, NGC 4258 and NGC 6240 allhave Seyfert 2 nuclei; however, the emission we observein NGC 1068 is likely dominated by the surrounding nu-clear starburst ring (Schinnerer et al. 2000). NGC 4258is a weak AGN, but has a pair of radio jets that may beinfluencing the molecular emission (Krause et al. 2007).NGC 6240 is the merger of two Seyfert 2 host galax-ies where the two AGNs are separated by less than 2′′
and the molecular emission is concentrated in a smallregion centered on the Seyfert nuclei (Iono et al. 2007).Finally we note that NGC 3690 is in the process of merg-ing with IC 694 (the system is called Arp 299 or Mrk171). The nuclei of NGC 3690 and IC 694 are separatedby only ∽ 20 arcseconds and both nuclei have an AGN(Garcıa-Marın et al. 2006). The 13CO and HCN emis-sion from the IC 694 nucleus is much stronger than thatfrom the NGC 3690 nucleus (Aalto et al. 1997); thus,although we are centered on NGC 3690, the emissionmay have a contribution from IC 694. Unfortunately,the emission from both nuclei is at approximately thesame velocity, so velocity cannot be used to separate theemissions within our telescope beam.One limitation of the RSR for the observations pre-
sented in this paper is the relatively small throw of thebeam switch. The reference beam is only offset by 4.34arcmin in azimuth. Thus, for the largest galaxies, suchas IC 342 or NGC 253, the reference beam may con-tain weak emission from molecular clouds in the galacticdisk. However, the 12CO emission falls off sharply fromthe central regions, and even in the largest galaxies, theemission in the reference beam is more than 10 timesweaker than that at the center of the galaxy (Young et al.1995). As a check on line fluxes we compared the inte-grated intensity of the 13CO emission, which of the lineswe observe has the greatest potential for disk contam-ination, in the four galaxies (IC 342, NGC 253, NGC1068 and NGC 3079) that were in common with thestudy of Paglione et al. (2001). Paglione et al. (2001)also used the FCRAO 14 m telescope; however they ob-tained their observations by position switching well offthe galaxy. We find in all five galaxies that the integratedintensity we measure is in good agreement with that ofPaglione et al. (2001); thus, we believe that the line inte-grated intensities that we report have not been strongly

3 mm Spectra of Galaxies 3
affected by our beam switching observation mode.The data have been analyzed using software developed
by G. Narayanan specifically for RSR data reduction,and this software is a complete data reduction packagewith interactive graphics implemented using the Pythonprogramming language. For the data for each galaxy,linear baselines were subtracted from each of six spec-tral segments independently. The six segments were thencombined together to form a spectrum covering 74 - 111GHz. The complete spectrum of each of the 10 galaxiesis presented in Figure 1. Note that due to the problemsmentioned earlier, in many of the galaxies a small spec-tral window around 92 GHz has no usable data.The RSR does not have Doppler tracking ability; thus,
the spectra have a frequency axis in the local rest frameof the telescope. Due to changes in the Earth’s motionrelative to the sources, observations made at differenttimes and on different days have slightly different fre-quency offsets, but these offsets are less than 5 MHz,much smaller than the 31 MHz resolution of the spec-trometer. The intensity scales of all spectra shown areT∗
A(antenna temperature corrected only for atmospheric
losses). The main beam efficiency of the 14-m telescopeusing the RSR has been measured to vary from 0.63 at 89GHz to 0.51 at 107 GHz. The decline in efficiency at highfrequencies is due to the increased amount of power lostto the error pattern of the telescope. The beam size alsovaried with frequency, with a HPBW of approximately70′′ at 74 GHz decreasing to 47′′ at 111 GHz.Since the galaxies observed vary enormously in dis-
tance, the regions probed by our RSR observations varyfrom spatial scales of approximately 1 kpc for the nearestgalaxy to 18 kpc for the most distant galaxy. However, inmany of these galaxies the molecular emission is centrallyconcentrated (Young et al. 1995), so that the observedemission is likely dominated by gas in the central ∼1Kpc region. It is worthwhile noting that the beam sizevariations over the RSR bandpass could distort line ra-tios if the emission were extended. However, if the bulkof the emission arises from a nearly unresolved source,then the line ratios will not be affected.
3. RESULTS
3.1. Line-integrated Intensities
The spectra shown in Figure 1 display a number ofstrong lines that are in common to almost all of the galax-ies observed. In addition to the strong lines of 13CO,HCN, HCO+, HNC and CS, many additional muchweaker lines are also detected. The spectral scans ofOrion KL and Sgr B2 (Turner 1989) were used as a guideto compile a list of spectral lines and line blends thatare likely to be detectable in these galaxies and from thiscompilation we have identified all of the spectral featuresin the 10 galaxies. Lines from CO, CS, HCN, HCO+,HNC, N2H
+, C2H, HNCO, CH3OH, HC3N, C3H3, SOand CH3C2H are detected in one or more of these galax-ies. In addition, at least one of the hydrogen recombi-nation lines was detected in M82, NGC 1068 and NGC4258.One of the most important advantages of obtaining
each 3 mm wavelength spectrum simultaneously with theRSR is the perfect pointing registration in all spectrallines. These galaxies all have complex small-scale struc-
ture, so even small pointing errors can seriously affectline ratios. In addition, because the lines were obtainedsimultaneously with a single instrument, the relative cal-ibration of the spectral line intensities is very good.The intensities of the spectral features were determined
by fitting each spectrum with a template of spectral linesassuming a common line width and redshift. The listof lines was developed from the strong lines seen in thespectral scans of Orion and Sgr B2 (Turner 1989), andinclude all plausible lines, even if the chemistry is differ-ent than these Galactic sources. The benefit of such asimultaneous fit is that the line width and redshift can bewell constrained by the stronger spectral lines, permit-ting more accurate determination of the intensities of theweaker lines. Of course this assumes that the emissionfrom the various molecular species are distributed simi-larly so they share a common line width and line velocity.Examination of the residuals to the template fits findsthem consistent with the baseline noise, thus, we believethat these assumptions are satisfied. The 33 spectral fea-tures that were fit are listed in Table 2, which include theisotopic lines of H13CN, H13CO+, HN13C, and C34S. Al-though these isotopic lines were not detected in any ofthe galaxies, they were included in the simultaneous fitsto provide upper limits on the isotopic emission. Sincehydrogen recombination lines were possibly detected inthree of these galaxies, the entire series of hydrogen re-combination lines were included in the fits. In severalcases a single spectral feature was fit to a blend of lines(marked blend in Table 2) when the line separation infrequency was much smaller than the 31 MHz spectralresolution of the RSR. In most cases these were blendsof lines from the same molecular species.Fits to the 33 spectra features are shown superimposed
on the spectra in Figure 1. All features with any signifi-cance are well fit by this line template. Features detectedat a significance of 3σ or greater are labeled in Figure 1.The results of our template fitting procedure for all ofthe galaxies are summarized in Table 3. For featuresdetected at a significance of 3σ or greater, the table pro-vides the peak intensity and the 1σ uncertainty on theseintensities (in parentheses). For features not detected atthe 3σ significance level, the table provides the 3σ up-per limit to the intensity of the spectral transition orblend. Only one of the six hydrogen recombination lineswas detected in M82, however, two other recombinationlines were just slightly below the detection threshold andremaining two recombination lines were present at the2σ level. Thus, the presence of hydrogen recombinationlines is probably secure. In NGC 1068 and NGC 4258only the H41α recombination line was detected and inNGC 4258 this was only one of the three lines detected.In both of these galaxies there is no evidence for any ofthe other recombination lines at comparable strengths asthe H41α line as would be expected, therefore, the iden-tification of this feature at 92.035 GHz as a hydrogenrecombinations line is suspect. The only other plausibleidentification for this feature is a blend of CH3CN linesfrom the J = 5-4 transition, however if correct, CH3CNwould be surprisingly strong in these two galaxies.The only spectral line detected in all 10 galaxies is
HCO+. 13CO was detected in nine galaxies, HCN, HNCand CS were detected in seven galaxies and C18O wasdetected in six galaxies. Because our sample of galaxies

4 Snell et al.
vary in distance from 2.9 to 101 Mpc, the absolute de-tection threshold is not the same for these galaxies, how-ever, in all subsequent analysis we utilize line ratios. Therichest spectrum is that for NGC 253, where 16 of the 33spectral features listed in Table 2 were detected. We notethat there have been many spectroscopic observations ofthese same galaxies, and a number of the spectral linesin Table 2, not detected in our survey, were detected inmore sensitive measurements focused on single spectrallines. In only six galaxies, Arp 220, NGC 1068, NGC 253,M82, IC 342, and Maffei 2, five or more spectral featuresare detected. In NGC 6240 the only line detectable isHCO+, and in two other galaxies, NGC 3690 and NGC4258, we detect HCO+ but not HCN. In the followingsection the template fits are used to examine several lineintensity ratios and investigate variations in these ratiosfrom galaxy to galaxy.
3.2. Measured Line Ratios
3.2.1. Isotopic Ratios
We first examine the CO isotopic ratios. In the sixgalaxies where both 13CO and C18O were detected, theaverage ratio 13CO/C18O was 4.5. The spread in thisratio was relatively small, ranging from 3.3 in NGC3079 to 7.8 in Maffei 2. These measured ratios aresimilar to those found for massive GMCs in the diskof the Milky Way (Penzias et al. 1972) and for Sgr B2(Cummins et al. 1986). A survey of luminous star-forming regions in the Milky Way (Loenen 2009) found13CO/C18O ratios between 3 and 16, with the averageregion having a ratio of about 6, again very similar tothe values measured in our galaxy sample. This ratiocan be affected by optical depth; however, this lowesttransition of CO is intrinsically weak, so it is expectedthat these isotopic lines are optically thin. Thus, thisratio likely reflects the abundance ratio of the isotopesof atomic carbon and oxygen. In the Milky Way boththe 12C/13C ratio and the 16O/18O ratio have a strongdependence on galactic radius (Wilson 1999), both in-creasing with increasing galactic radius. Wilson & Rood(1994) suggest that both 13C and 18O are secondary nu-clear products, while 12C and 16O are primary nuclearproducts. Ratios of primary to secondary products, suchas 12C/13C, are expected to be a good indicator of thechemical evolution of the Galaxy. However ratios of sec-ondary products, such as 13CO/C18O, should not varygreatly as is observed.We did not detect the J=1-0 transitions of H13CN,
H13CO+, or HN13C or the J=2-1 transition of C34S inany of the galaxies in our sample, however, these limitsprovide information on the optical depth of the mainlines. The most sensitive limits on the isotopic linestrengths were set in NGC 253 and M82. In NGC 253the 3-σ lower limits on the isotopic intensity ratios wereHCN/H13CN > 19, HCO+/H13CO+ > 16, and CS/C34S> 8. In M82 the 3-σ lower limits were HCN/H13CN > 12,HCO+/H13CO+ > 19, and CS/C34S > 5. If we assumeisotopic abundances measured or NGC 253 summarizedby Omont (2007), we conclude that the main isotopiclines of HCN, HCO+, HNC and CS have optical depths< 3.
3.2.2. HCN/13CO Ratio
Both CO and HCN emission are often used as tracersof the molecular gas in galaxies (Omont 2007). Since thetransitions of CO and HCN have quite disparate crit-ical densities, they may be expected to trace differentdensity molecular gas, and thus their ratio is a measureof the dense gas fraction (Paglione et al. 1998). 12COis outside the frequency range of the RSR for these verylow redshift galaxies; however, we believe that 13CO maybe a much better probe of the gas. The 13CO emissionlikely arises from higher column density molecular gasthan CO, and much of the 13CO emission may be pro-duced in the same gas responsible for the HCN emission.Thus, the HCN/13CO ratio may be a good diagnostic ofthe density of the molecular gas most directly connectedto the star formation activity in the nuclear starburstregions of these galaxies. We find that the HCN/13COratio varies significantly from galaxy to galaxy, with thelargest ratio of 2.2 found in Arp 220 and the smallestratio found in NGC 4258, where the 3-σ upper limit wasonly 0.30. We discuss later how this ratio can provide animportant constraint on the mean gas density.
3.2.3. HCO+/HCN Ratio
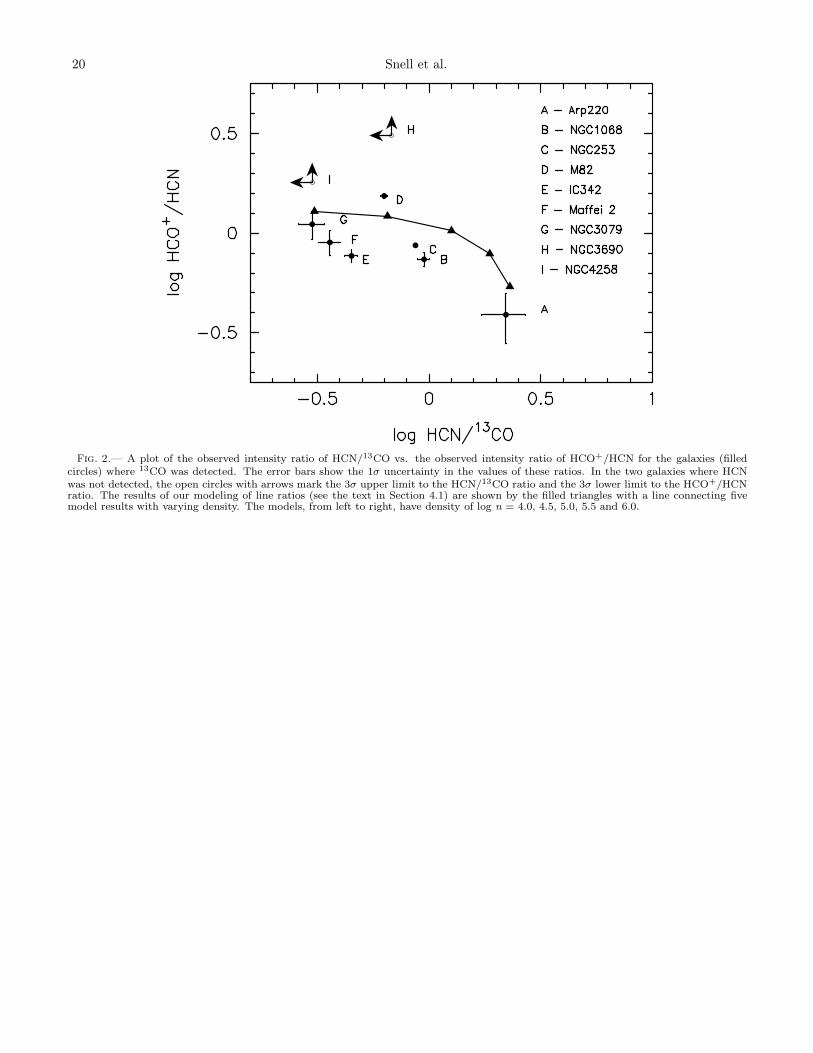
Early models of the chemistry of X-ray irradiatedgas suggested that HCO+ would be under-abundant ingas near a hard X-ray source (Lepp & Dalgarno 1996;Maloney et al. 1996). These results led to the sugges-tion that the HCO+/HCN ratio may distinguish be-tween PDR and XDR dominated gas and thus betweencentral regions of galaxies dominated by either star-bursts or AGNs. Subsequent observations (Kohno et al.2001; Gracia-Carpio et al. 2006; Imanishi et al. 2007;Baan et al. 2008) seemed to confirm this prediction.These observations also showed an anti-correlation be-tween the observed HCN/CO ratio and the HCO+/HCNratio. However, the more recent theoretical work ofMeijerink & Spaans (2005) and Meijerink et al. (2007)places this interpretation in question. Meijerink et al.(2007) showed that in the high density gas, theHCO+/HCN ratio is larger in XDR regions than inPDR regions, just the opposite of that suggested byLepp & Dalgarno (1996). They also noted a strong den-sity dependence for this ratio in both PDR and XDRgas.In Figure 2 we plot the HCO+/HCN ratio versus
the HCN/13CO ratio. We find a similar trend tothat found in previous observational papers, that is,the HCO+/HCN ratio is inversely correlated with theHCN/13CO ratio. The agreement of our result with pastpapers is not surprising, since there is considerable over-lap between our galaxy sample and those in the previousstudies. We will address the role density plays in theseratio trends later, however, NGC 3690, NGC 4258 andNGC 6240 are quite anomalous in having unusually largeratios of HCO+/HCN, and variations in chemistry arealmost certainly needed to explain these ratios. NGC6240 is not plotted in Figure 2 because we did not de-tect either HCN or 13CO, but the ratio of HCO+/HCNis greater than 2.3 (3 sigma limit). NGC 3690 and NGC6240 were both part of the Juneau et al. (2009) study ofULIRGS, and these galaxies were among those with thelargest HCO+/HCN ratio.

3 mm Spectra of Galaxies 5
3.2.4. HNC/HCN Ratio
The HNC/HCN ratio is a tracer of gas temperature(Aalto 2008). It is well known that in cold clouds thecolumn density ratio of HNC/HCN can be as large as 3to 10 (Churchwell et al. 1984), while in warm GMCs, thecolumn density ratio is less than 1, and can be as smallas 0.015 (Goldsmith et al. 1981). The strong dependenceof this ratio on temperature is a prediction of molec-ular cloud chemistry (Schilke et al. 1992). Since theselines are similarly excited and have similar A-coefficients,when they are optically thin the observed emission ra-tio is proportional to the column density ratio. For thegalaxies in our sample with detections in both lines, theobserved ratio of HNC/HCN is confined to a narrowrange of values between 0.43 and 0.69, narrower thanthat the galaxies observed by Aalto et al. (2002). Theratios are consistent with the emission arising from warmmolecular gas.
3.3. Comparison of M82 and NGC 253
The two galaxies with the strongest emission lines areM82 and NGC 253 which enable a comparison of emis-sion from other molecular species, such as C2H, N2H
+,HNCO, CH3OH, HC3N, C3H2, SO and CH3C2H, thathad only a limited number of detections in our galaxysample as a whole. In both of these galaxies the emis-sions observed are likely dominated by molecular cloudsassociated with their nuclear starbursts. However thereare differences, Aladro et al. (2011) suggested that thestarburst in M82 is more evolved and the chemistry isdominated by PDR regions, while the chemistry in theyounger starburst, NGC 253, is dominated by shocks.Notable differences between these two galaxies are
the detection of HNCO, CH3OH, N2H+ and HC3N in
NGC 253 but not in M82, although these lines wouldhave been readily detected if they had the same linestrength relative to HCN as they have in NGC 253. BothHNCO and CH3OH are thought to have a shock ori-gin, as these molecules are believed to form on grainsurfaces (Tideswell et al. 2010) and then ejected fromthe grains by low velocity shocks (Martın et al. 2008).Thus, the presence of these lines in NGC 253 agreeswith the idea that shocks are an important componentto the chemistry in the nuclear regions of this galaxy.Omont (2007) also noted that SiO and CH3CN, boththought to have a shock origin, are more abundant inNGC 253 than M82. We note that HNCO and CH3OHare even stronger relative to HCN in IC 342 and Maffei 2,both whose chemistry may also be dominated by shocks(Aladro et al. 2011). A similar conclusion concerning IC342 was reached by Meier & Turner (2005). The largestCH3OH/HCN ratio was measured in NGC 3079, andthus the chemistry in NGC 253, IC 342, Maffei 2 andNGC 3079 may all be strongly influenced by shocks.HC3N was also detected in NGC 253 and not in M82.The only other galaxy where HC3N was detected wasArp 220, where the ratio of HC3N/HCN was about threetimes larger than in NGC 253. Based on the strong emis-sion in Arp 220 (Aalto et al. 2002), Aalto et al. (2007)speculated that strong HC3N emission might be indica-tive of young starbursts and this perhaps may explainthe stronger emission in NGC 253 relative to the olderstarburst M82.
The other notable difference is the detection ofCH3C2H in M82 but not in NGC 253, and theCH3C2H/HCN ratio measured in M82 is three timeslarger than the 3σ upper limit established in NGC 253.In fact, other hydrocarbon molecules, such as C2H,C3H2 and CH3C2H, have strengths relative to HCNmuch larger in M82 than in NGC 253. The enhance-ment of these hydrocarbon molecules in M82 is discussedin Fuente et al (2005) and they suggested that photon-dominated chemistry was important for the productionof hydrocarbons in the central region of M82. Thus thepattern of lines seen in M82 and NGC 253 supports thesuggestion of Aladro et al. (2011) that the chemistry inNGC 253 is influenced by shocks, while the chemistry inM82 is more PDR dominated.
3.4. Starburst Versus AGNs
From our sample of galaxies, we can also examinethe differences between the starburst and AGN galax-ies. We have already noted that NGC 3690, NGC 4258and NGC 6240, all with AGNs, have anomalously largeHCO+/HCN ratio. We have formed composite spectraof a sample of starburst galaxies (NGC 253, Maffei 2, IC342, M82 and Arp 220) and galaxies with AGNs (NGC1068, NGC 3690, NGC 4258 and NGC 6240). The emis-sion in each spectra was first normalized to the strengthof the HCO+ line (the only line seen in all the galaxies),then the frequency axis was adjusted by a factor of 1+z,and finally the spectra were averaged using equal weights.Equal weighting was used so that no galaxy dominatedthe composite spectrum, although this meant that theweaker line galaxies added more noise than the strongline galaxies to the composite spectra. The compositespectra were fit using the same procedure described ear-lier for the individual galaxies and, as before, a 3σ cutoffwas used to define line detections. Unfortunately, theAGN composite consisted primarily of weak-line galax-ies, so fewer lines were detected in the composite spec-trum relative to the starburst composite. The most in-teresting ratio is the HCO+/HCN ratio and in the star-burst galaxies this ratio has a value of 0.71±0.06, whilein the AGN galaxies, the ratio was 1.9±0.3, significantlylarger. We can also compare the HCN/13CO ratio, whichfor the starbursts was 1.11±0.07 and for the AGNs was0.64±0.09. Ratios of HNC/HCN and CS/HCN were sim-ilar in the two samples.In the AGN galaxies, NGC 1068 has the strongest lines.
Earlier we noted that none of the observed line ratiosdistinguishes NGC 1068 from the sample of starburstgalaxies. The emission observed in NGC 1068 may bedominated by the starburst ring and not gas closely as-sociated with the Seyfert nucleus. Removing NGC 1068,we can form a new AGN composite spectrum from theremaining three AGN galaxies. Although HCN was notdetected in any of the individual galaxies, it is readilydetected in their composite spectrum. In this new com-posite AGN spectrum, we find ratios of HCO+/HCN =3.4±0.9 and HCN/13CO = 0.45±0.12. Not surprising,these ratios are even more extreme relative to the star-burst sample than the AGN composite including NGC1068.
4. MOLECULAR GAS MODELS

6 Snell et al.
4.1. Modeled Line Ratios
The line ratios discussed in the previous section de-pend on both the physical (density, column density, andtemperature) and chemical (molecular abundance) prop-erties of the gas. The information available in our spectrais inadequate to constrain all the needed gas properties.We have consequently modeled the line ratios with a verysimplistic approach in which we assume that the emis-sion arises from a collection of identical molecular cloudcores which are characterized by a single temperatureand density, with equal abundances of the various molec-ular species. Molecular abundances were taken fromthe well studied Galactic GMC cores M17 and Ceph Asummarized by Bergin et al. (1997). We further assumeabundance ratios of CO/H2 = 1×10⁻⁴ and 13CO/CO =2×10⁻²; the resulting molecular abundances relative toH2 are given in Table 4. An E/A ratio of 1 for CH3OHand an ortho/para ratio of 3 for C3H2 were also assumed.The assumed molecular abundances are very similar tothose derived by Martın et al. (2006) for NGC 253 basedon their 2 mm wavelength spectral survey (see compari-son in Table 4).The emission from an ensemble of GMC cores was
modeled with the RADEX code (Van der Tak et al.2007) using the Einstein A-coefficients and collisionrate coefficients from the Leiden Atomic and MolecularDatabase (Schoier et al. 2005). To compute the line in-tensities, besides the molecular abundances, the gas den-sity, n, gas temperature, T , and the H2 column densityper unit line width, N(H2)/∆v, need to be specified. Ourstandard GMC core model assumes T = 35 K, n = 1×10⁵
cm−3, and N(H2)/∆v = 1×1022 cm−2 (km s−1)−1. Linewidths for GMCs in the Galactic disk are around 3 kms−1 (Snell et al. 1984), leading to a H2 column densityof 3×1022 cm−2. Molecular clouds near the center of ourGalaxy, such as Sgr B2, have line widths around 20 kms−1 (Cummins et al. 1986), and for this line width themodeled H2 column density is 2×1023 cm−2.The line ratios computed from our standard model
are compared with the observations of NGC 253, thegalaxy with the richest spectrum, in Figure 3. SinceHCN usually has the strongest emission of any of the’high dipole moment’ molecules, all intensity ratios arecomputed relative to HCN. Multiple lines were observedfor several molecular species and for the line ratio analy-sis the 87.9252 GHz line for HNCO, the 96.7414 GHz linefor CH3OH and the 99.2999 GHz line for SO were usedin forming the intensity ratios. For HC3N, the two linesat 81.8815 and 100.0764 GHz, which were in the leastline confused regions of the spectrum, were summed to-gether. The line ratios for our standard core model agreewell with those observed for NGC 253. The largest dis-crepancies between the observed and modeled line ratiosis less than a factor of two. The observed ratios in thisgalaxy are well fit using this simple model.Our model can also be used to address the sensitivity of
the various line ratios to density and temperature. Theline ratios were computed from the standard model fordensities of 1×10⁴ and 1×106 cm−3 and the resulting lineratios shown in Figure 3. For our assumed abundances,a density of 1×105 cm−3 is the better fit to the observedline ratios in NGC 253. Figure 3 illustrates that severalof the line ratios, due to differences in the critical density
of the lines forming the ratio, are highly sensitive to den-sity. As expected, one of the values most affected is theHCN/13CO ratio; however, in addition, the line ratiosCH3OH/HCN and HNCO/HCN are also density sensi-tive. The temperature sensitivity of these ratios can alsobe explored, and in Figure 4 the observed line ratios inNGC 253 are compared to those derived from our stan-dard model with density 1×105 cm−3 and with varyingtemperatures. Temperature has a much smaller effecton the line ratios than does density, largely because themolecular transitions we observed all arise from similarenergy levels above the ground rotational state.NGC 253 has been widely studied and there are a
number of estimates of the density of the molecular gas.Based on fitting multiple lines of CS, HCN and HCO+
led Martın et al. (2005) and Knudsen et al. (2007) to es-timate a density of approximately 2×105 cm−3, higherthan an earlier estimate based on H2CO emission(Huttemeister et al. 1997). Recently, Bayet et al. (2009)fit the CS emission from NGC 253 with a two-componentmodel consisting of a cool, lower density component anda warm, higher density component. For the two veloc-ity features in NGC 253, they found densities for thecooler component of order 2×10⁴ and for the warmercomponent of order 2×106 cm−3. The density in ourstandard model agrees well with the single density fitsof Martın et al. (2005) and Knudsen et al. (2007) andis consistent with the average of the components fit byBayet et al. (2009). Based on this density, the abun-dances we assumed in our standard model, includingthose molecules (HNCO and CH3OH) that may be pro-duced in shocks, are consistent with the observations inNGC 253. A better determination of the physical prop-erties of the molecular gas is needed to refine the abun-dance estimates.Our model can be used to examine the anti-correlation
between the HCO+/HCN and 13CO/HCN ratios shownin Figure 2. Overlaid on the data in Figure 2 is showna line connecting the results for five models in whichonly the density is varied, from 1×10⁴ to 1×106 cm−3.The comparison between data and models suggests thatmuch of the variation observed in the 13CO/HCN ratiocan be explained if the average density of the molecu-lar gas varies among these galaxies. For densities below1×104 cm−3, it is difficult to produce detectable HCN or13CO emission without having unrealistically large col-umn densities of these molecular species. Although theHCO+/HCN ratio is not strongly affected by density,some of the anti-correlation found between this ratio andthe 13CO/HCN ratio can be explained by variations inthe average density. Juneau et al. (2009) came to simi-lar conclusion and the sensitivity of these line ratios todensity is also apparent in the modeling presented byMeijerink et al. (2007). Based on the line ratios, and ig-noring any chemical differences, the data suggest that themolecular gas in Arp 220 is the densest and the molec-ular gas in NGC 3079 the least dense. However, densityalone cannot explain the large HCO+/HCN line ratiosmeasured in NGC 3690, NGC 4258 and NGC 6240, allwith AGNs. In the models of Meijerink et al. (2007),only the XDR models predict HCO+/HCN ratios greaterthan one, thus, if these XDR models are correct, it ispossible that the AGN has an influence on the chemistry

3 mm Spectra of Galaxies 7
and is responsible for the enhanced HCO+ abundancein the central regions of these three galaxies. However,the large sample of ULIRGS presented by Juneau et al.(2009) show no correlation between the HCO+/HCN ra-tio and whether these galaxies are believed to be AGNor star formation dominated, putting some doubt in thisAGN hypothesis for the enhanced HCO+ emission.The comparison between models and observations can
be extended to the line ratios measured for IC342, M82,Arp 220, Maffei 2, NGC 1068 and NGC 3079. These com-parisons are shown in Figure 4. Since density has thegreatest influence on the line ratios, only models withvarying density at a fixed temperature of 35 K are in-cluded in this figure. Based on model comparisons shownin Figures 2 and 4, IC 342, Maffei 2 and NGC 3079 wouldbe expected to have the lowest average gas density of∼104 cm−3. This low average density is borne out bythe other density sensitive ratios. With this density, wefind the abundances from our standard core model repro-duce well the measured line ratios in these three galaxies.Similarly, the average density for M82 is expected to besomewhat larger (∼3×104 cm−3) and assuming this den-sity we confirm that the abundances of HC3N, CH3OH,N2H
+, and HNCO relative to HCN are smaller than inour standard model and for those found in NGC 253.Again based on the result shown in Figures 2 and 4, NGC1068 is expected to have a somewhat larger average den-sity (∼105 cm−3), while Arp 220 is expected to have thehighest average density (∼106 cm−3). As suggested ear-lier, we find an overabundance of HC3N relative to HCNin Arp 220 for any of the modeled densities. Thus if weallow for the average molecular gas density to vary fromgalaxy to galaxy, our standard model with fixed abun-dances provides a reasonable good fit to the measuredratios in these galaxies.There have been a number of estimates of the av-
erage molecular gas density for galaxies in our sam-ple. Most of these estimates utilize multiple transi-tions of a single molecular species, thus they are in-dependent of derived abundances. However, despitethis, estimates for a single galaxy can still differ byorder of magnitude. Density estimates for IC 342(Huttemeister et al. 1997; Meijerink & Spaans 2005),Maffei 2 (Huttemeister et al. 1997), M82 (Naylor et al.2010), and Arp 220 (Greve et al. 2009) are in reason-able agreement with our estimates. The HCN line SEDSshown in Knudsen et al. (2007) are also consistent withthe trend in density variations for the galaxies M82, NGC253 and Arp 220. Fitting the gas in the central regionsof these galaxies with a single density is an oversimpli-fication and Bayet et al. (2009) and Aladro et al. (2011)have fit multiple-density components for NGC 253, M82,IC 342, Maffei 2 and NGC 1068. With the exceptionof M82, their column density weighted average densityis consistent with our findings. For M82, both find acolumn density weighted density about an order of mag-nitude higher than that of Naylor et al. (2010).
4.2. Molecular Mass and Beam Filling Factor
The simple model we presented in the previous sec-tion, in which the molecular emission observed arisesfrom an ensemble of identical cloud cores, can be used toestimate the beam filling factor and mass of moleculargas, independent of the XCO-factor. Since the distances
of the galaxies in our sample vary enormously, the re-gion probed ranges from just the central starburst coreto nearly the entire galaxy. The linear diameter of theFCRAO beam at the frequency of the 13CO line for thedistance of these galaxies (DB) is given in Table 5.The beam surface area filling factor (farea) is related to
the observed antenna temperature of the line correctedfor the main beam efficiency (TMB), the line intensityfrom our model (Tmodel), the assumed core line width inthe model (∆vmodel), and the observed line width of thegalaxy (∆vobs), which is dominated by galactic rotation,by the following equation:
farea =TMB
Tmodel
∆vobs
∆vmodel
. (1)
The observed 13CO emission is used to estimate the beamfilling factor from the above relation. The modeled in-tensity ratios, discussed previously, did not depend onthe line width, however, the total integrated intensity,and hence the beam surface filling factor, does. We haveno information on the line widths of cloud cores in thesegalaxies, so we assume a line width of 10 km s−1 for ourmodel cores, which corresponds to an H2 column densityof 1×1023 cm−2. Although a density of 1×105 cm−3 wasassumed, the emission from 13CO has very little den-sity dependence as long as n ≥ 1×104 cm−3. Based onthe observed line intensities and line widths presented inTable 3, the computed beam area filling factor is summa-rized in Table 5. Not surprising, the beam filling factoris strongly dependent on galaxy distance. For the nearergalaxies, the beam area filling factor can be as large as0.26, implying that one-fourth of the FCRAO ∼50′′ beamis covered with gas with a total gas column density of1×1023 cm−2, corresponding to an Av of approximately100 mag. Similar beam area filling factors would havebeen found if we had used other molecular species, suchas HCN or HCO+. However, the results would have beenmore sensitive to the assumed density of the cloud cores.The molecular gas mass can also be estimated from our
model. The mass is given by:
M = mH2Nmodel farea d
2 ΩB, (2)
wheremH2is the mass of a molecular hydrogen molecule,
Nmodel is the gas column density in the core model, d isthe distance to the galaxy, and ΩB is the main beamsolid angle. As long as the 13CO emission is opticallythin, the mass determination is independent of many ofthe assumed core model parameters. However, two im-portant parameters in deriving masses are (1) the as-sumed core gas temperature, as this affects the partitionfunction, and (2) the assumed 13CO/H2 ratio of 2×10⁻⁶.The mass of molecular hydrogen derived from the aboveequation is summarized in Table 5. Because of the vary-ing distance of these galaxies, the mass of the nearbygalaxies (NGC 253, Maffei 2, IC 342 and M82) includesonly the gas in the central 1 kpc regions, whereas forthe most distant galaxies (NGC 3690 and Arp 220) itincludes the entire molecular mass of the galaxy.These mass estimates can be compared with those de-
rived from CO using an assumed XCO-factor. To makecertain that we are comparing the mass from comparableregions of these galaxies, we have used CO observations
8 Snell et al.
also obtained with the FCRAO 14-m telescope as partof the FCRAO Extragalactic CO Survey (Young et al.1995). Observations of all of the galaxies except Maffei2 are covered in this survey, and these observations wereobtained with nearly an identical beam size as our ob-servations of 13CO. The CO fluxes from the survey aresummarized in Table 5, where the integrated intensityto flux conversion factor provided in Young et al. (1995)was used.To estimate the mass from the CO fluxes, an XCO-
factor of 1.8×1020 cm−2 (K km s−1)−1, was used whichis representative of Galactic molecular clouds (Omont2007). The molecular hydrogen gas mass can then bewritten (Kenney & Young 1989) as:
M(H2) = 7.1× 10³d2SCO, (3)
where d is the distance in Mpc and SCO is CO flux inunits of Jy km s−1. The masses derived from this expres-sion are presented in Table 5. Mass estimates from COare 1.2 - 4.3 times larger than that derived from 13CO. Itis possible to reconcile these masses if we either lower the13CO abundance, increase the gas temperature assumedin our core model, or decrease the XCO-factor used. Wecannot rule out any of these possibilities; however, a morelikely scenario is that some of the CO emission is arisingfrom lower density and lower column density gas thatdoes not produce significant 13CO emission. No matterwhat the reason for the mass difference, we can concludethat the mass of dense gas must represent a significantfraction of the total molecular gas in these galaxy centers.We find that between about 25 and 85 % of the total
molecular mass in these galaxies must have high densityand column density. These properties are likely asso-ciated with the molecular clouds in the central ∼1 kpcregions of these galaxies. Bally et al. (1987) estimatedthe mean density of the molecular gas in the inner 500pc radius region of the Milky Way to be 2×104 cm−3,similar to the average density estimated for several ofthe galaxies in our survey. However, the properties ofthe molecular clouds in the disk of the Milky Way arequite different. Lee et al. (1990) mapped a 3 deg2 re-gion around ℓ = 24 in both 13CO and CS. Although,no estimate was made of the mean density of the gas,the quoted emission ratio of CS/13CO of 0.008 is sub-stantially lower than the range of ratios, 0.12 - 1.0, wemeasured for our galaxy sample. The largest CS/13COratio was observed in Arp 220, which is also modeled tohave the highest mean molecular gas density. Since thisratio is sensitive to the mean gas density, this compari-son suggests that a large fraction of the molecular gas inthe central regions of the galaxies in our sample, and theMilky Way, must be dense, while molecular clouds in theMilky Way disk have a much smaller fraction of densegas. Studies of individual molecular clouds in the disk ofthe Milky Way (Carpenter et al. 1995) confirm this andshow that high density and high column density coresrepresent only a small fraction of the area and mass ofthe molecular cloud.
5. SUMMARY
We have presented the 3 mm wavelength spectra ofthe central regions of ten relatively nearby galaxies. Thespectra of each galaxy were obtained simultaneously with
the RSR. The important advantages of obtaining the 3mm wavelength spectra simultaneously are the perfectpointing registration in all spectral lines and the verygood relative calibration of the spectral line intensities.The only uncertainty in relative line intensities comesfrom the small variations of beam efficiency and beamsize with frequency. Most of the lines that we detectedarise from high-dipole moment molecules, which allowsus to examine the physical and chemical properties ofthe dense gas in these galaxies. Although the galaxiesin our survey are far from being a homogeneous sample,their differences can be exploited to study the extent towhich various line ratios are found to vary and to whatextent they require differences in the physical or chemicalproperties of the molecular gas.The spectra were fit with a template with 33 spec-
tral features to determine the line intensities. We de-tected 20 of the 33 spectral features in our template,and these features arose from 14 different atomic andmolecular species. Based on the fitted line intensities,a number of line intensity ratios were examined. The13CO/C18O and HNC/HCN line ratios are insensitive todensity. The 13CO/C18O ratio was found to have a verynarrow range of values, from 3.3 to 7.8, supporting theidea that both 13C and 18O are secondary nucleosynthe-sis products. The HNC/HCN ratio also was relativelyconstant from galaxy to galaxy, varying between 0.4 -0.7 and consistent with the emission arising in relativelywarm gas.The emission from these galaxies was modeled with an
ensemble of molecular cloud cores, each with a temper-ature of 35 K and a molecular hydrogen column den-sity per unit line width of 1×1022 cm−2 (km s−1)−1.The molecular abundances were taken from well-studiedGalactic clouds, although these abundances are consis-tent with those found in NGC 253 (Martın et al. 2006).The sensitivity of various line ratios to density and tem-perature was examined and it was found that densityhas the greatest affect. The HCN/13CO ratio is partic-ularly density sensitive, and we believe that the largevariation observed for this ratio may be due to differ-ences in the mean gas density in these galaxies. Varyingthe density from 104 to 106 cm−3 can explain the rangeof HCN/13CO ratios observed and provide consistent re-sults with the other density sensitive line intensity ratios.Varying the density can also help explain much of the ob-served variations in the HCO+/HCN ratio. Thus, a sim-ple model with fixed molecular abundances and varyingdensity, fits well the 3 mm spectra of most of these galax-ies. One of the most notable exceptions is the anoma-lously large HCO+/HCN ratios detected in NGC 3690,NGC 4258 and NGC 6240, which cannot be fit with-out increasing the abundance of HCO+ relative to HCNrelative. Based on the XDR model of Meijerink et al.(2007), a plausible explanation is that the AGN activ-ity in these galaxies is responsible altering the chemistryin these galaxies and producing the large HCO+/HCNratio.The cloud core model was used to estimate the filling
factor of dense, high column density gas in our beamand to estimate the mass of dense molecular gas. Thederived beam filling factors are strongly correlated withdistance, as our beam varies in linear size from about

3 mm Spectra of Galaxies 9
0.8 Kpc in the nearest galaxies to over 17 Kpc in themost distant galaxies. In the nearby galaxies, beam fill-ing factors as great as 0.26 are found, suggesting thatthe central regions of these galaxies have a high fillingfactor of dense, high column density gas. We comparedour mass of dense gas with estimates based on CO andan assumed XCO-factor and find that the dense gas rep-resents approximately 25-85 % of the total molecular gas
in the central regions of these galaxies.
This work was supported by NSF grants AST 0096854,AST 0704966 and AST 0838222 and by NASA grantNNG04G155A. We thank Hugh Crowl and Bing Jiangwho assisted in data collection and Lauren Harley whoassisted in some of the data reduction and spectral linefitting.
REFERENCES
Aalto, S., Radford, S. J. E., Scoville, N.Z. & Sargent, A. I. 1997,ApJ, 475, L107
Aalto, S., Polatidis, A.G., Huttemeister, S. & Curran, S.J., 2002,A&A, 381, 783
Aalto, S., Monje, R. & Martın, S. 2007, A&A, 475, 479Aalto, S. 2008, Ap&SS, 313, 273Aladro, R., Martın-Pintado, J., Martın, S., Mauersberger, R. &
Bayet, E. 2011, A&A, 525, 89Baan, W. A., Henkel, C., Loenen, A. F., Baudry, A. & Wiklind,
T., 2008, A&A, 477, 747Bally, J., Stark, A., Wilson, W. & Henkel, C. 1987, ApJS, 65, 13Bergin, E. A., Ungerechts, H., Goldsmith, P.F., Snell, R.L.,
Irvine, W.M. & Schloerb, F.P., 1997, ApJ, 482, 267Bayet, E., Aladro, R., Martın, S., Viti, S., & Martın-Pintado, J.
2009, ApJ, 707, 126Carpenter, J.M., Snell, R.L. & Schloerb, F.P. 1995, ApJ, 445, 246Churchwell, E., Nash, A.G. & Walmsley, C. M., 1984, ApJ, 287,
681Cummins, S. E., Linke, R. A., & Thaddeus, P. 1986, ApJS, 60,
819Erickson, N., Narayanan, G., Goeller, R., & Grosslein, R. 2007,
ASP Conf. Ser. 375, From Z-Machines to ALMA:(Sub)millimeter Spectroscopy of Galaxies, ed. A. J. Baker, J.Glenn, A. I. Harris, J.G. Mangum, M.S. Yun (San Francisco,CA: ASP), 71
Fuente, A., Garcıa-Burillo, S., Gerin,M., Teyssier, D., Usero, A.,Rizzo, J.R. & De Vicente, P. 2005 ApJ, 619, L155
Gao, Y. & Solomon, P. M., 2004, ApJ, 606, 271Goldsmith, P.F., Langer, W.D., Ellder, J., Irvine, W. & Kollberg,
E., 1981, ApJ, 249, 524Gracia-Carpio, J., Garcıa-Burillo, S., Planesas, P., & Colina, L.,
2006 ApJ, 640, L135Garcıa-Marın, M., Colina, L., Arribas, S., Alonso-Herrero, A. &
Mediavilla, E. 2006, ApJ, 650, 850Greve, T. R., Papadopoulos, P. P., Gao, R. & Radford, S. J. E.
2009, ApJ, 692, 1432Huttemeister, S., Mauersberger, R. & Henkel, C. 1997, A&A, 326,
59Imanishi, M., Nakanishi, K., Tamura, Y., Oi, Nagisa, & Kohno,
Kotaro, 2007, AJ, 134, 2366Iono, D., Wilson, C.D., Takakuwa, S., Yun, M. S., Petitpas, G.R.,
Peck, A. B., Ho, P.T.P., Matsushita, S., Pihlstrom, Y. M. &Wang, Z. 2007, ApJ, 659, 283
Johansson, L. E. B., Andersson, C., Ellder, J., Friberg, P.,Hjalmarson, A., Hoglund, B., Irvine, W. M., Olofsson, H. &Rydbeck, G. 1984, A&A, 130, 227
Johansson, L. E. B., Andersson, C., Elder, J., Friberg, P.,Hjalmarson, A., Hoglund, B., Olofsson, H., Rydbeck, G. &Irvine, W. M. 1985, A&AS, 60, 135
Juneau, S., Narayanan, D. T., Moustakas, J., Shirley, Y. L.,Bussman, R. S., Kennicutt, R. C., Vanden Bout, P. A. 2009,ApJ, 707, 1217
Karachentsev, I, D. 2005, ApJ, 129, 178
Kenney, J.D.P., Young, J.S. 1989, ApJ, 344, 171Kohno, K., Matsushita, S., Vila-Vilaro, B., Okumura, S. K.,
Shibatsuka, T., Okiura, M., Ishizuki, S., Kawabe, R., 2001, ASPConf. Ser. 249, The Central Kiloparsec of Starbursts and AGN:The La Palma Connection, ed. J. H. Knapen, J. E. Beckman, I.Shlosman, & T. J. Mahoney (San Francisco, CA: ASP), 672
Knudsen, K. K., Walter, F., Weiss, A., Bollatto, A., Riechers, D.A. & Menten, K. 2007, ApJ, 666, 156
Krause, M, Fendt, C. & Neininger, N. 2007, A&A, 467, 1037Lee, Y., Snell, R. & Dickman, R. 1990, ApJ, 355, 536Lepp, S, & Dalgarno, A., 1996, A&A, 306, L21
Loenen, E., 2009, Ph.D. thesis, Univ. of GroningenMaloney, R.R., Hollenbach, D.J. & Tielens, A.G.G.M. 1996, ApJ,
466, 561Martın, S., Martın-Pintado, J., Mauersberger, R., Henkel, C. &
Garcıa-Burillo, S. 2005, ApJ, 620, 210Martın, S., Mauersberger, R., Martın-Pintado, J., Henkel, C., &
Garcıa-Burillo, S. 2006, ApJS, 164, 450Martın, S., Requena-Torres, M.A., Martın-Pintado, J. &
Mauersberger, R. 2008, ApJ, 678, 245Meier, D. S. & Turner, J. L. 2005, ApJ, 618, 259Meijerink, R. & Spaans, M., 2005, A&A, 436, 397Meijerink, R., Spaans, M. & Israel, F., 2007, A&A, 461, 793Naylor, B.J., Bradford, C.M., Aquirre, J.E., Bock, J.J., Earle, L.,
Glenn, J., Inami, H., Kamenetzky, J., Maloney, P.R.,Matsuhara, H., Nguyen, H.T., & Zmuidzinas, J. 2010, ApJ,722, 558
Omant, A., 2007, Rep. Prog. Phys., 70, 1099Paglione, T., Jackson, J., Bolatto, A., & Heyer, M. 1998, ApJ,
493, 680Paglione, T., Wall, W., Young, J., Heyer, M., Richard, M.,
Goldstein, M., Kaufman, Z., Nantais, J., & Perry. G. 2001,ApJS, 135, 183.
Penzias, A. A., Jefferts, K. B., Wilson, R. W., Liszt, H. S., &Solomon, P. M., 1972, ApJ, 178, L35
Schilke, P., Walmsley, C.M., Pineau Des Forets. G., Roueff, E.,Flower, D.R. & Guilloteau, S., 1992, A&A, 256, 595
Schinnerer, E., Eckart, A., Tacconi, L.J., Genzel, R. & Downes,D., 2000, ApJ, 533 850
Schloerb, F. P. 2008, Proc. SPIE, 7012Schoier, F.L., Van der Tak, F.F.S., van Dishoeck, E.F. & Blaqck,
J. H., 2005, A&A, 432, 369Snell, R. L., Goldsmith, P. F., Erickson, N. R., Mundy, L. G. &
Evans, N. J. II 1984, ApJ, 276 625Tideswell, D.M., Fuller, G.A., Millar, T.J. & Markwick, A.J.,
2010, A&A, 510, 85Turner, B. 1989, ApJS, 70, 539Van der Tak, F.F.S., Black, J.H., Schoier, F.L., Jansen, D.J. &
van Dishoeck, E.F., 2007,A&A, 468, 627Wilson, T.L., 1999, Rep. Prog. Phys., 62, 143Wilson, T.L. & Rood, R. 1994, ARA&A, 32, 191Young, J.S. & Scoville, N.Z. 1991, ARA&A, 29, 581Young, J.S. et al. 1995, ApJS, 98, 219

10 Snell et al.
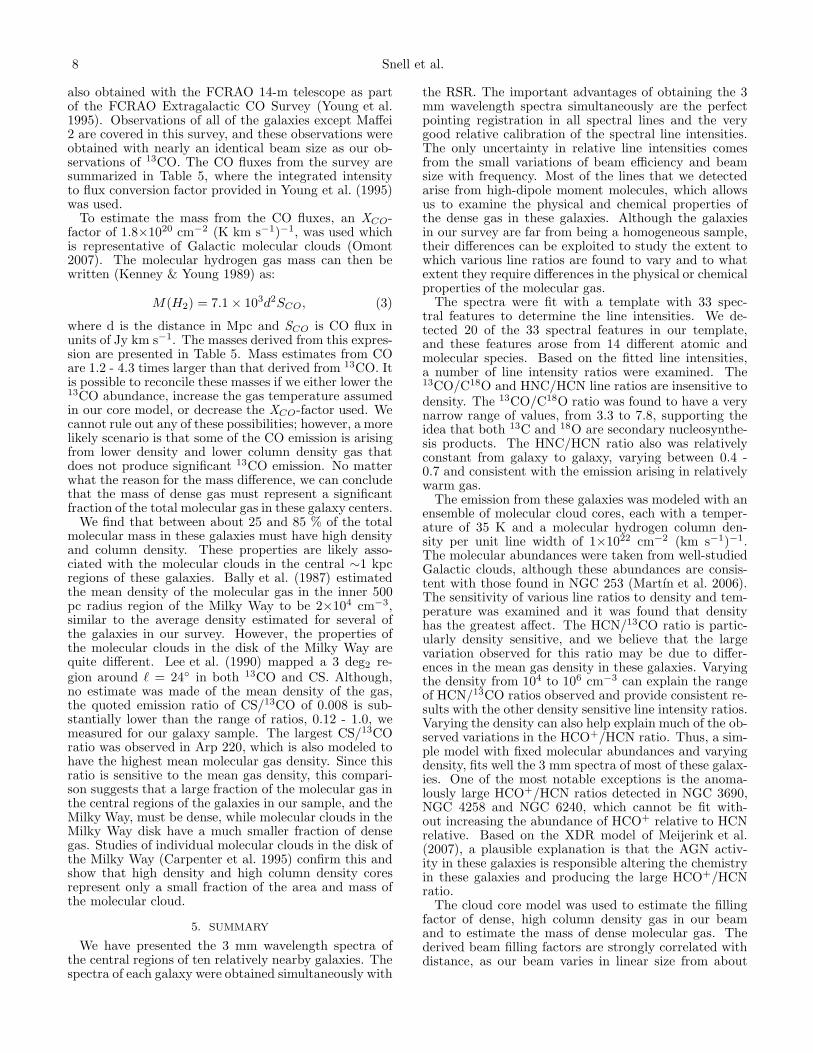
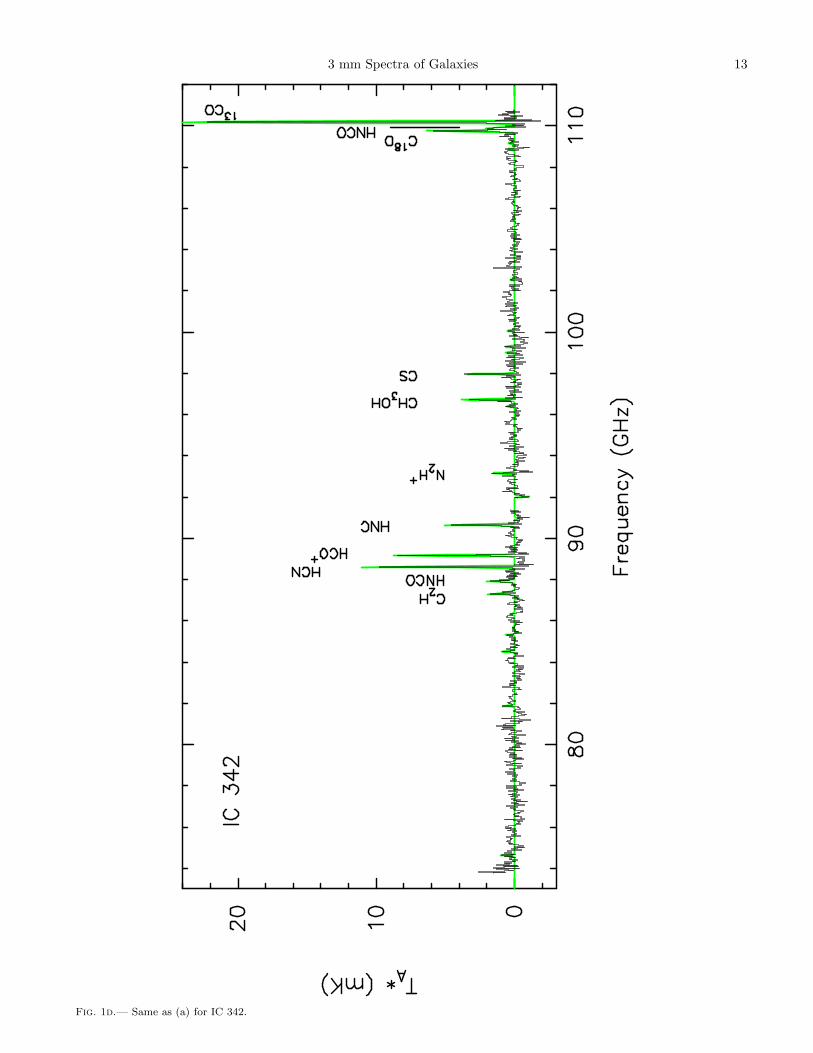
Fig. 1a.— Three-millimeter spectra for NGC 253 are presented by the binned points. The frequency axis is measured relative to thelocal rest frame of the telescope with no corrections for the Earth’s motion. The continuous line (continuous green line in the electronicversion of the paper) shows the fit of our 33-spectral feature template discussed in the text.

3 mm Spectra of Galaxies 11
Fig. 1b.— Same as (a) for Maffei 2.

12 Snell et al.
Fig. 1c.— Same as (a) for NGC 1068.
3 mm Spectra of Galaxies 13
Fig. 1d.— Same as (a) for IC 342.

14 Snell et al.
Fig. 1e.— Same as (a) for M82.

3 mm Spectra of Galaxies 15
Fig. 1f.— Same as (a) for NGC 3079.

16 Snell et al.
Fig. 1g.— Same as (a) for NGC 3690.

3 mm Spectra of Galaxies 17
Fig. 1h.— Same as (a) for NGC 4258.
18 Snell et al.
Fig. 1i.— Same as (a) for Arp 220.

3 mm Spectra of Galaxies 19
Fig. 1j.— Same as (a) for NGC 6240.
20 Snell et al.
Fig. 2.— A plot of the observed intensity ratio of HCN/13CO vs. the observed intensity ratio of HCO+/HCN for the galaxies (filledcircles) where 13CO was detected. The error bars show the 1σ uncertainty in the values of these ratios. In the two galaxies where HCNwas not detected, the open circles with arrows mark the 3σ upper limit to the HCN/13CO ratio and the 3σ lower limit to the HCO+/HCNratio. The results of our modeling of line ratios (see the text in Section 4.1) are shown by the filled triangles with a line connecting fivemodel results with varying density. The models, from left to right, have density of log n = 4.0, 4.5, 5.0, 5.5 and 6.0.

3 mm Spectra of Galaxies 21
Fig. 3a.— The observed intensity ratios (shown as filled circles) for a number of key molecular species is shown for NGC 253. The errorbars show the 1σ uncertainty in the values of the line ratios. Where the molecular species was not detected, the 3σ upper limit on the ratiois shown. Accompanying the observed intensity ratios, are ratios computed from our standard core model, see the text; the modeled lineintensity ratios are connected by a dashed line for log n = 4.0, a solid line for log n = 5.0 and a dotted line for log n = 6.0.

22 Snell et al.
Fig. 3b.— Same as (a), except showing models of the line intensity ratios for fixed density of log n = 5.0, and temperatures of 15 K(dashed line), 35 K (solid line), and 75 K (dotted line).

3 mm Spectra of Galaxies 23
Fig. 4a.— Same as Figure 3(a) for Maffei 2.

24 Snell et al.
Fig. 4b.— Same as Figure 3(a) for NGC 1068.

3 mm Spectra of Galaxies 25
Fig. 4c.— Same as Figure 3(a) for IC 342.

26 Snell et al.
Fig. 4d.— Same as Figure 3(a) for M82.

3 mm Spectra of Galaxies 27
Fig. 4e.— Same as Figure 3(a) for NGC 3079.

28 Snell et al.
Fig. 4f.— Same as Figure 3(a) for Arp 220.

3 mm Spectra of Galaxies 29
TABLE 1Galaxy Sample and Observing Times
Galaxy α(2000)1 δ(2000)1 Distance tint NotesMpc hr
NGC 253 00 47 33 -25 17 18 3.9 3.2 StarburstMaffei 2 02 41 55 +59 36 01 2.8 1.8 StarburstNGC 1068 02 42 40 -00 00 48 14.4 3.5 Starburst, Seyfert 2IC 342 03 46 48 +68 05 45 3.3 8.3 StarburstM82 09 55 52 +69 40 47 3.5 4.3 StarburstNGC 3079 10 01 57 +55 40 46 19.7 7.5 LINERNGC 3690 11 28 32 +58 33 43 45 9.0 LIRG, AGNNGC 4258 12 18 57 +47 18 13 7.9 3.5 Seyfert 2Arp 220 15 34 57 +23 30 09 76 6.0 ULIRGNGC 6240 16 52 58 +02 24 03 101 9.7 LIRG, Seyfert 2
1 Units of right ascension are hours, minutes, and seconds, and units of declination are degrees, arcminutes, and arcseconds.

30 Snell et al.
TABLE 2Fitted Spectral Lines
Line Number Frequency (GHz) Identification
1 74.6446 H44 α
2 79.9127 H43 α
3 81.8815 HC3N 9 - 84 84.5211 CH3OH 5(-1) - 4(0) E5 85.3389 C3H2 2(1,2) - 1(0,1)6 85.4557 CH3C2H blend7 85.6884 H42 α
8 86.3402 H13CN 1 - 09 86.7543 H13CO+ 1 - 010 87.0909 HN13C 1 - 011 87.3169 C2H blend12 87.4020 C2H blend13 87.9252 HNCO 4(1,3) - 3(1,2)14 88.6318 HCN 1-015 89.1885 HCO+ 1 - 016 90.6635 HNC 1-017 90.9790 HC3N 10 - 918 92.0345 H41 α
19 93.1738 N2H+ 1 - 020 96.4129 C34S 1 - 021 96.7414 CH3OH blend22 97.9810 CS 1 - 023 99.0230 H40 α
24 99.2999 SO 3(2) - 2(1)25 100.0764 HC3N 11 - 10 (SO 4(5) - 4(4) blended)26 102.5470 CH3C2H blend27 106.7374 H39 α
28 108.8939 CH3OH 0(0) - 1(-1) E29 109.1736 HC3N 12 - 1130 109.2522 SO 2(3) - 1(2)31 109.7822 C18O 1 - 032 109.9057 HNCO 5(0,5) - 4(0,4)33 110.2014 13CO 1 - 0

3 mm Spectra of Galaxies 31
TABLE 3Fitted Line Intensities and Line Widths
Line Intensities1
Line Number NGC253 Maffei 2 NGC1068 IC342 M82 NGC3079 NGC3690 NGC4258 Arp220 NGC6240
1 <2.2 <2.6 <1.5 <1.9 <1.8 <0.6 <0.9 <1.1 <0.9 <0.62 <2.1 <2.5 <1.4 <1.7 <1.7 <0.6 <0.9 <1.0 <0.9 <0.63 4.7(0.7) <2.5 <1.4 <1.7 <1.7 <0.6 <0.9 <1.0 <0.9 <0.64 <2.0 <2.4 <1.4 <1.7 <1.6 <0.6 <0.8 <1.0 <0.9 <0.65 2.9(0.7) <2.4 <1.4 <1.6 2.7(0.5) <0.7 <0.8 <1.0 <0.9 <0.66 <2.0 <2.4 <1.4 <1.8 <1.6 <0.7 <0.8 <1.0 <0.9 <0.67 <2.0 <2.4 <1.4 <1.6 <1.6 <0.6 <0.8 <1.0 <0.9 <0.58 <2.0 <2.4 <1.4 <1.6 <1.6 <0.6 <0.8 <1.0 <0.9 <0.59 <2.0 <2.4 <1.4 <1.6 <1.6 <0.6 <0.8 <1.0 <0.9 <0.510 <2.0 <2.4 <1.4 <1.6 <1.6 <0.6 <0.8 <1.0 <0.9 <0.511 9.0(0.7) <2.4 2.4(0.5) 2.0(0.5) 9.5(0.6) <0.8 <0.9 <1.0 <0.9 <0.712 4.3(0.7) <2.4 <1.4 <1.6 4.6(0.6) <0.8 <0.9 <1.0 <0.9 <0.713 4.6(0.7) 2.8(0.8) <1.4 2.2(0.6) <1.6 <0.6 <0.9 <1.0 <0.8 <0.514 37.5(0.7) 8.2(0.8) 10.8(0.5) 11.4(0.6) 20.1(0.6) 1.6(0.2) <0.8 <1.0 2.9(0.3) <0.515 32.6(0.7) 7.4(0.8) 8.0(0.5) 8.7(0.5) 31.0(0.6) 1.8(0.2) 2.5(0.3) 1.8(0.3) 1.1(0.3) 1.2(0.2)16 19.4(0.7) 5.2(0.8) 4.7(0.5) 5.2(0.5) 8.6(0.5) <0.6 1.2(0.3) <1.0 2.0(0.3) <0.517 3.3(0.7) <2.3 <1.5 <1.7 <1.6 <0.6 <0.8 <1.0 <0.8 <0.518 <2.0 <2.3 1.5(0.5) <1.5 <1.6 <0.6 <0.8 2.4(0.3) <0.8 <0.519 5.5(0.6) <2.3 <1.3 1.7(0.5) <1.6 <0.6 <0.8 <1.0 <0.8 <0.520 <1.9 <2.3 <1.3 <1.6 <1.5 <0.6 <0.8 <0.9 <0.9 <0.521 7.4(0.6) 3.0(0.8) <1.3 4.0(0.5) <1.5 0.6(0.2) <0.8 <0.9 <0.9 <0.522 14.4(0.6) 5.4(0.8) 2.0(0.4) 3.6(0.5) 7.1(0.5) 0.6(0.2) <0.8 <0.9 1.3(0.3) <0.523 <1.9 <2.2 <1.3 <1.6 <1.5 <0.5 <0.8 <0.9 <0.9 <0.524 <1.9 <2.2 <1.3 <1.6 1.8(0.5) <0.5 <0.8 <0.9 <0.8 <0.525 4.4(0.6) <2.2 <1.3 <1.6 <1.5 <0.5 <0.8 <0.9 1.1(0.3) <0.526 <1.8 <2.2 <1.3 <1.6 2.9(0.5) <0.5 <0.8 <0.9 <0.8 <0.527 <1.8 <2.2 <1.3 <1.5 1.7(0.5) <0.5 <0.7 <0.9 <0.8 <0.528 <1.8 <2.1 <1.2 <1.5 <1.4 <0.6 <0.7 <0.9 <0.8 <0.529 <1.9 <2.2 <1.4 <1.5 <1.6 <0.9 <0.9 <1.0 1.2(0.3) <0.830 <1.9 <2.2 <1.4 <1.5 <1.6 <0.9 <0.9 <1.0 <1.0 <0.831 9.5(0.6) 2.9(0.7) 2.2(0.4) 6.4(0.5) 7.1(0.5) 1.6(0.2) <0.8 <0.9 <0.8 <0.632 2.7(0.6) <2.1 <1.2 2.1(0.5) <1.4 <0.7 <0.8 <0.9 <0.8 <0.633 43.2(0.7) 22.7(0.8) 11.4(0.5) 25.6(0.6) 31.8(0.5) 5.3(0.2) 1.2(0.3) 3.3(0.3) 1.3(0.3) <0.5
Line Width2 235(3) 202(8) 277(9) 132(4) 253(4) 546(22) 357(37) 305(27) 361(30) 551(75)
1 Intensities given are the peak T∗
Ain mK. The format is intensity with the 1 sigma uncertainty in paratheses. For for non-detections, the 3 sigma
upper limit on the line intensity is given.2 Line widths are in km s−1. The format is line width with the 1 sigma uncertainty in paratheses.
TABLE 4Assumed Molecular Abundance Relative to H2
Molecular Species Ratio - GMCs1 Ratio - NGC 2532
13CO 2×10⁻⁶ -HCN 9×10⁻⁹ 5.0×10⁻⁹
HCO+ 2×10⁻⁹ 1.6×10⁻⁹
HNC 2×10⁻⁹ 1.0×10⁻⁹
CS 6×10⁻⁹ 6.2×10⁻⁹
N2H+ 3×10⁻¹⁰ -HC3N 4×10⁻¹⁰ 6.3×10⁻⁹
SO 1×10⁻⁹ 1.3×10⁻⁹
CH3OH 8×10⁻⁹ 1.3×10⁻⁹
C3H2 5×10⁻¹⁰ 5.0×10⁻¹⁰
HNCO 1×10⁻⁹ 1.6×10⁻⁹
1 Abundances from Bergin et al. (1997)1 Abundances from Martın et al. (2006)

32 Snell et al.
TABLE 5Mass and Beam Filling Fraction
Galaxy DB farea Mass from 13CO SCO1 Mass from CO Dense Gas Fraction
kpc M⊙ Jy km s−1 M⊙
NGC 253 0.9 0.26 2.7×10⁸ 1.1×10⁴ 1.2×10⁹ 0.23Maffei 2 0.6 0.11 6.2×10⁷ - - -NGC 1068 3.3 0.08 1.1×10⁹ 2.3×10³ 1.8×10⁹ 0.61IC 342 0.8 0.08 6.2×10⁷ 1.5×10³ 1.2×10⁸ 0.52M82 0.8 0.19 1.7×10⁸ 6.7×10³ 5.8×10⁸ 0.29NGC 3079 4.5 0.07 2.0×10⁹ 1.6×10³ 4.4×10⁹ 0.45NGC 3690 10.4 0.01 1.5×10⁹ 4.5×10² 6.5×10⁹ 0.23NGC 4258 1.8 0.02 1.1×10⁸ 3.0×10² 1.3×10⁸ 0.85Arp 220 17.5 0.01 4.7×10⁹ 4.0×10² 1.6×10¹⁰ 0.29NGC 6240 23.2 <0.01 <4.9×10⁹ 2.4×10² 1.7×10¹⁰ <0.29
1 From Young et al. (1995)