
The thylakoid proton motive force in vivo. Quantitative, non-invasive probes, energetics, and...
12
The thylakoid proton motive force in vivo. Quantitative, non-invasive probes, energetics, and regulatory consequences of light-induced pmf Kenji Takizawa, Jeffrey A. Cruz, Atsuko Kanazawa, David M. Kramer ⁎ Institute of Biological Chemistry, 289 Clark Hall, Washington State University, Pullman, WA 99164-6340, USA Received 29 March 2007; received in revised form 26 June 2007; accepted 3 July 2007 Available online 24 July 2007 Abstract Endogenous probes of light-induced transthylakoid proton motive force ( pmf ), membrane potential (Δψ) and ΔpH were used in vivo to assess in Arabidopsis the lumen pH responses of regulatory components of photosynthesis. The accumulation of zeaxanthin and protonation of PsbS were found to have similar pK a values, but quite distinct Hill coefficients, a feature allowing high antenna efficiency at low pmf and fine adjustment at higher pmf. The onset of “energy-dependent’ exciton quenching (q E ) occurred at higher lumen pH than slowing of plastoquinol oxidation at the cytochrome b 6 f complex, presumably to prevent buildup of reduced electron carriers that can lead to photodamage. Quantitative comparison of intrinsic probes with the electrochromic shift signal in situ allowed quantitative estimates of pmf and lumen pH. Within a degree of uncertainly of ∼ 0.5 pH units, the lumen pH was estimated to range from ∼ 7.5 (under weak light at ambient CO 2 ) to ∼ 5.7 (under 50 ppm CO 2 and saturating light), consistent with a ‘moderate pH’ model, allowing antenna regulation but preventing acid-induced photodamage. The apparent pK a values for accumulation of zeaxanthin and PsbS protonation were found to be ∼ 6.8, with Hill coefficients of about 4 and 1 respectively. The apparent shift between in vitro violaxanthin deepoxidase protonation and zeaxanthin accumulation in vivo is explained by steady-state competition between zeaxanthin formation and its subsequent epoxidation by zeaxanthin epoxidase. In contrast to tobacco, Arabidopsis showed substantial variations in the fraction of pmf (0.1–0.7) stored as Δψ, allowing a more sensitive qE response, possible as an adaptation to life at lower light levels. © 2007 Elsevier B.V. All rights reserved. Keywords: Chloroplast; Cytochrome b6f complex; Electrochromic shift; In vivo spectroscopy; Non-photochemical quenching; Regulation of photosynthesis 1. Introduction In higher plant photosynthesis, light-driven electron transfer stores energy in an electrochemical gradient of protons, termed the proton motive force ( pmf ). The total pmf, consisting of the sum of membrane potential (Δψ) and proton diffusion potential (ΔpH), is used to drive ATP synthesis at the CF O -CF 1 -ATP synthase (ATP synthase) [1], while acidification of the thylakoid lumen caused by the ΔpH component acts as a key signaling component, regulating light capturing, via the ‘energy-depen- dent’ quenching (q E ) mechanism, which dissipates ‘excess’ light energy harmlessly as heat (reviewed in [2]). q E is dis- tinguished from other non-photochemical quenching processes by its distinctive mode of activation (i.e. by acidification of the lumen), its relaxation behavior in the dark and its strict cor- relation to the appearance of absorbance changes at 535 nm. The initiation of q E involves two lumen pH-dependent pro- cesses, the activation of violaxanthin deepoxidase (VDE) which converts violaxanthin (V) to antheraxanthin (A) and A to zea- xanthin (Z) and the protonation of PsbS, a protein component of the photosystem II antenna complex. In addition, acidification of the lumen slows the oxidation of plastoquinol (PQH 2 ) at the cytochrome (cyt) b 6 f complex, thus regulating overall electron transfer [3]. Currently, there is a great deal of interest in understanding photosynthesis as a complete “system” in order to predict the responses of photosynthesis to environmental changes. It is clear that the light reactions and downstream biochemical pro- cesses are tightly integrated to balance photochemical efficiency with avoidance of photodamage and that the pmf plays a central role in this integration (reviewed in [4]). In this context, given the central importance of thylakoid pmf in sustaining and Biochimica et Biophysica Acta 1767 (2007) 1233 – 1244 www.elsevier.com/locate/bbabio ⁎ Corresponding author. Fax: +1 509 335 7643. E-mail address: [email protected] (D.M. Kramer). 0005-2728/$ - see front matter © 2007 Elsevier B.V. All rights reserved. doi:10.1016/j.bbabio.2007.07.006
-
Upload
michiganstate -
Category
Documents
-
view
2 -
download
0
Transcript of The thylakoid proton motive force in vivo. Quantitative, non-invasive probes, energetics, and...

1767 (2007) 1233–1244www.elsevier.com/locate/bbabio
Biochimica et Biophysica Acta
The thylakoid proton motive force in vivo. Quantitative, non-invasive probes,energetics, and regulatory consequences of light-induced pmf
Kenji Takizawa, Jeffrey A. Cruz, Atsuko Kanazawa, David M. Kramer ⁎
Institute of Biological Chemistry, 289 Clark Hall, Washington State University, Pullman, WA 99164-6340, USA
Received 29 March 2007; received in revised form 26 June 2007; accepted 3 July 2007Available online 24 July 2007
Abstract
Endogenous probes of light-induced transthylakoid proton motive force ( pmf ), membrane potential (Δψ) and ΔpH were used in vivo to assessin Arabidopsis the lumen pH responses of regulatory components of photosynthesis. The accumulation of zeaxanthin and protonation of PsbSwere found to have similar pKa values, but quite distinct Hill coefficients, a feature allowing high antenna efficiency at low pmf and fineadjustment at higher pmf. The onset of “energy-dependent’ exciton quenching (qE) occurred at higher lumen pH than slowing of plastoquinoloxidation at the cytochrome b6 f complex, presumably to prevent buildup of reduced electron carriers that can lead to photodamage. Quantitativecomparison of intrinsic probes with the electrochromic shift signal in situ allowed quantitative estimates of pmf and lumen pH. Within a degree ofuncertainly of ∼0.5 pH units, the lumen pH was estimated to range from ∼7.5 (under weak light at ambient CO2) to ∼5.7 (under 50 ppm CO2 andsaturating light), consistent with a ‘moderate pH’ model, allowing antenna regulation but preventing acid-induced photodamage. The apparent pKa
values for accumulation of zeaxanthin and PsbS protonation were found to be ∼6.8, with Hill coefficients of about 4 and 1 respectively. Theapparent shift between in vitro violaxanthin deepoxidase protonation and zeaxanthin accumulation in vivo is explained by steady-state competitionbetween zeaxanthin formation and its subsequent epoxidation by zeaxanthin epoxidase. In contrast to tobacco, Arabidopsis showed substantialvariations in the fraction of pmf (0.1–0.7) stored asΔψ, allowing a more sensitive qE response, possible as an adaptation to life at lower light levels.© 2007 Elsevier B.V. All rights reserved.
Keywords: Chloroplast; Cytochrome b6f complex; Electrochromic shift; In vivo spectroscopy; Non-photochemical quenching; Regulation of photosynthesis
1. Introduction
In higher plant photosynthesis, light-driven electron transferstores energy in an electrochemical gradient of protons, termedthe proton motive force ( pmf ). The total pmf, consisting of thesum of membrane potential (Δψ) and proton diffusion potential(ΔpH), is used to drive ATP synthesis at the CFO-CF1-ATPsynthase (ATP synthase) [1], while acidification of the thylakoidlumen caused by the ΔpH component acts as a key signalingcomponent, regulating light capturing, via the ‘energy-depen-dent’ quenching (qE) mechanism, which dissipates ‘excess’light energy harmlessly as heat (reviewed in [2]). qE is dis-tinguished from other non-photochemical quenching processesby its distinctive mode of activation (i.e. by acidification of the
⁎ Corresponding author. Fax: +1 509 335 7643.E-mail address: [email protected] (D.M. Kramer).
0005-2728/$ - see front matter © 2007 Elsevier B.V. All rights reserved.doi:10.1016/j.bbabio.2007.07.006
lumen), its relaxation behavior in the dark and its strict cor-relation to the appearance of absorbance changes at 535 nm.
The initiation of qE involves two lumen pH-dependent pro-cesses, the activation of violaxanthin deepoxidase (VDE) whichconverts violaxanthin (V) to antheraxanthin (A) and A to zea-xanthin (Z) and the protonation of PsbS, a protein component ofthe photosystem II antenna complex. In addition, acidificationof the lumen slows the oxidation of plastoquinol (PQH2) at thecytochrome (cyt) b6 f complex, thus regulating overall electrontransfer [3].
Currently, there is a great deal of interest in understandingphotosynthesis as a complete “system” in order to predict theresponses of photosynthesis to environmental changes. It isclear that the light reactions and downstream biochemical pro-cesses are tightly integrated to balance photochemical efficiencywith avoidance of photodamage and that the pmf plays a centralrole in this integration (reviewed in [4]). In this context, giventhe central importance of thylakoid pmf in sustaining and

1234 K. Takizawa et al. / Biochimica et Biophysica Acta 1767 (2007) 1233–1244
regulating photosynthesis, it is critical that we have the ability toprobe it in vivo. Extrapolating from in vitro studies is risky, asillustrated by early work suggesting that all pmf is stored asΔpH, implying a highly acidic lumen (ΔpH ∼3.5, reviewed in[5]). More recent work has argued that such an acidic lumen isincompatible with the known properties of the photosyntheticmachinery (reviewed in [4,5]). Low lumen pH can severelyslow key electron transfer processes, particularly plastoquinoloxidation at the cyt b6 f complex [6,7], and sensitizephotosystem (PS) II to photodamage [8]. Instead, we suggestedthat lumen pH remains moderate, above about 6.0 under optimalconditions, decreasing lower only under stress, e.g. under lowCO2 [5]. To maintain sufficient driving force for ATP synthesis,it was hypothesized that light-driven trans-thylakoid Δψconstituted a substantial portion of pmf. Later in vitro and invivo measurements of the light-driven electrochromic shift(ECS) confirmed contributions of about 50%Δψ to pmf, at leastunder the experimental conditions used in these studies [9,10].
Establishing quantitative relationships among light-drivenelectron and proton transfer, the resulting pmf, lumen pH andregulation of light capture is essential for understanding theplants responses to environmental changes. In this work, weattempt to address these issues by estimating total pmf andlumen pH in vivo from ECS and complementary measurements.
2. Materials and methods
2.1. Plant materials
Arabidopsis thaliana (ecotype Columbia) wild type (Wt) and npq2 [11]were grown either in a green house (∼25 °C, maximum light intensity 600 μmolphotons m−2 s−1) or growth chamber (23 °C, light intensity 130 μmol photonsm−2 s−1). Three- to 4-week-old plants were dark-adapted and acclimated toroom temperature (23 °C) overnight before measurements. During assays,detached leaves with petioles dipped in water were placed in the spectropho-tometer leaf chamber under flowing ambient air (∼372 ppm CO2, 21% O2), lowCO2 air (50 ppm CO2, 21% O2), or CO2-free air (0 ppm CO2, 21% O2). To avoiddehydration, flowing air was humidified by bubbling in distilled water.
2.2. Spectroscopic measurement of electrochromic shift
Spectroscopic assays were performed using a custom-made spectrophotom-eter, based on those described previously [10,12]. The pulsed measuring beamfor absorbance measurements consisted of green light-emitting diodes filteredthrough interference filters. The pulsed measuring beam for fluorescencemeasurements was a 535-nm light-emitting diode, with fluorescence beingdetected at N720 nm from the side of the leaf illuminated by the actinic andmeasuring lights. These wavelength ranges were chosen to allow even samplingof fluorescence responses from different layers of the leaf since green and infra-red light passes relatively unobstructed through the leaf. Key measurementswere repeated on a modified instrument in which the fluorescence was detectedfrom the opposite side. Essentially identical responses comparing ECS andfluorescence signals were found, indicating that differential sampling fromdifferent leaf depths did not interfere with our measurements.
All ECS signals were normalized to the rapid (microseconds) rise in 520 nmabsorbance upon a saturating, single-turnover xenon flash, independentlymeasured on dark-adapted leaves [13,14]. This normalization accounted forchanges in leaf thickness and chloroplast density between leaves which variedby about 5%, e.g. between Wt and npq2. We also used the flash-induced ECS totest whether illumination caused large scale changes in the optical pathlengths ofthe leaves, e.g. by chloroplast movements. Neither red nor blue light causedsignificant changes in the extent of flash-induced ECS changes as long as the
illumination was not intense enough to cause photodamage (data not shown),leading us to conclude that illumination did not induce significant changes in theoptical properties of the leaves.
Dark interval relaxation kinetics (DIRK) of ECS was measured duringsteady-state photosynthetic conditions, after 15 min actinic illumination by redLEDs (650 nm) at intensity from 55 to 794 μmol photon m−2 s−1. The total rapidchange in ECS, termed ECSt, was measured as the absorbance change at 520 nm(ΔA520) during brief (320 ms) dark intervals. For measuring ΔpH proportion inpmf (θ), the ‘inverted’ ECS signal at 520 nm, termed ECSinv, during 1 min dark-interval was deconvoluted using a base line between 505 and 535 nm asdescribed in [12,14].
2.3. Chlorophyll fluorescence measurements
The extents of LEF and qE were calculated from saturation pulse-inducedchlorophyll fluorescence yields. Chlorophyll fluorescence was excited by weakpulses of 520 nm light and fluorescence emission was detected in the near infra-red region (N720 nm). LEF was calculated from quantum efficiency of PSII(ΦPSII) [15,16], photosynthetically active radiation (i) and fractional capturing ofphoton by PSII (approximated to 0.5) [17]; LEF=ΦPSII
⁎i⁎0.5. qE was calculatedfrom a maximum fluorescence yield after 15 min actinic illumination (FM′ ) andits recovery after 10 min dark period (FM″ ) as in [10,14]; qE=FM″ /FM′ −1. Theestimates of excitation quenching derived in this way and under the presentconditions were proportional to changes in absorbance at 535 nm, and thusattributable to qE [18].
2.4. Spectroscopic measurement of cytochrome f reduction
Cyt f reduction was measured from ΔA554 after subtracting a baselinebetween ΔA545 and ΔA563 as described previously [7,19]. Steady-state oxi-dation–reduction rates were estimated by DIRK analysis as in [19]. After 10 to15 min actinic illumination, ΔA554, ΔA545 and ΔA563 measurements during500 ms dark-interval were averaged 16 to 30 times, with 5 s actinic intervalsseparating each collected trace. Measurements of cyt f reduction were made onboth green house and growth chamber grown plants, with essentially super-imposable results. However, data from growth chamber grown plants gave bettersignal-to-noise ratios and thus are shown here.
2.5. Spectroscopic measurement of xanthophyll conversion
Deepoxidation of xanthophyll was estimated from ΔA505 using ΔA535 as areference, after an appropriate dark time (10 min.) to allow for relaxation of qE,as described earlier [20,21]. The ΔA505 was measured over a 10-min actinicillumination period (reaching steady-state) followed by a 1-min dark relaxationto distinguish xanthophyll conversion from ECS and light scattering changes(deepoxidized xanthophylls remains for tens of minutes in the dark [22]).Relatively large noise caused by chloroplast movement during illumination wasmostly eliminated by using ΔA535 as a reference.
2.6. Data analysis and computer simulation of a kinetic model
Experimental data were plotted and fitted by the model equations (seeDiscussion) using Origin 6.0. Computer simulations of xanthophyll conversionwere performed by a program written in-house using Microsoft Visual Basic 6.0.
3. Results
3.1. Response of the dark interval relaxation kinetics ofelectrochromic shift to changing CO2 levels and light intensity
The relative changes in steady-state light-induced pmf andlumen pH in vivo were measured spectroscopically using darkinterval relaxation kinetics (DIRK) analysis of ECS as dis-cussed in detail in [4,23] and briefly as follows. The ECS signalmeasured at around 520 nm has been shown to respond linearly

1235K. Takizawa et al. / Biochimica et Biophysica Acta 1767 (2007) 1233–1244
to changes in transthylakoid Δψ [24], making it a useful probeof the electrogenic reactions of photosynthesis, including trans-membrane proton flux through the ATP synthase. To probe pmf,we start from steady-state conditions, where proton influx intothe lumen is precisely balanced by efflux, thus simplifying theanalyses. The actinic light is then switched off for ∼2 minintervals, inhibiting the proton influx associated with the lightreactions while allowing proton efflux to continue. Therelaxation kinetics of the ECS during the dark interval (seeFig. 1A inset) are analyzed to yield estimates of pmfcomponents [9,10,25]. Light-induced pmf (pmf in light minuspmf in dark, pmfl-d, pmf in light minus that in dark) should beproportional to total amplitude of ECS or ECSt, the rapid (tensof ms) light–dark change in ECS. The light-induced ΔpH(ΔpHl-d) should be proportional to inverted ECS or ECSinv, theslowly-reversible (tens of s) phase of ECS decay. The difference
Fig. 1. Response of ECS parameters to changing CO2 levels and light intensity.ECSt (Panel A), ECSinv (Panel B), and θ, ECSinv/ECSt (Panel C) were measuredin Wt leaves at a range of steady-state light intensities, 55, 233, 445, 794 μmolphotons m−2 s−1 under ambient air (■, n=4±se) and 50 ppm CO2 (●, n=4±se). ECS parameters were normalized by a saturation pulse-induced potentialrise for compensating a difference in the reaction center density. Panel A insetshows typical ECS measurement sequence after light-to-dark transition. Actinicillumination was turned of at time 0. The amplitude of ECS drop at time 0 isECSt and the subsequent recovery phase is ECSinv.
Fig. 2. Response of the LEF and cyt f reduction to changing CO2 levels and lightintensity. LEF (Panel A) and effective rate constant (keff) of cyt f reduction(Panel B) were measured in Wt leaves at a range of steady-state light intensities,55, 233, 445, 794 μmol photons m−2 s−1 under ambient air (■, n=4±se) and50 ppm CO2 (●, n=4±se).
between ECSt and ECSinv should reflect theΔψ portion of light-induced pmf (Δψ in light minus Δψ in dark, Δψl-d).
ECS parameters (normalized as described in Materials andMethods) were measured under steady-state illuminated condi-tions in leaves of Arabidopsis wild type (Wt). Under ambientCO2 (∼372 ppm) and O2 (21%), ECSt increased with increasinglight intensity from 55 to 794 μmol photons m−2 s−1 (Fig. 1A).Lowering CO2 to 50 ppm (maintaining O2 at 21%) enhanced theresponse of ECSt to light intensity, an effect predominantlyattributable to a decrease in the proton conductivity of the ATPsynthase (data not shown), as previously observed in tobacco[10,26] and in Arabidopsis [14].
Responses of ECSinv, reflecting the ΔpH component of pmf,were qualitatively similar to those of ECSt but with highersensitivity at low CO2 (Fig. 1B). The fraction of pmf stored asΔpH, a parameter we term θ, estimated by ECSinv/ECSt,changed from 0.1 to 0.5 as the light intensity increased tosaturation (Fig. 1C). A similar effect was previously observedin Arabidopsis [14] and in intact tobacco plants [10] whenboth CO2 and O2 were lowered and attributed to a regulatory

Fig. 3. Response of qE to changing CO2 levels and light intensity. qE and ΔA505
were measured under varied steady-state illumination, 55, 120, 216, 390,620 μmol photons m−2 s−1, and CO2 level. Panel A: qE was measured in Wtleaves under ambient air (■, n=6±se), 50 ppm CO2 (●, n=3±se), and CO2-free air (▲, n=5±se). Panel B: qE in npq2 was measured under ambient air (■,n=8±se), 50 ppm CO2 (●, n=4±se), and CO2-free air (▲, n=4±se). Panel C:ΔA505 in Wt leaves was measured under ambient air (■, n=6±se) CO2-free air(▲, n=5±se).
1236 K. Takizawa et al. / Biochimica et Biophysica Acta 1767 (2007) 1233–1244
response, where increases in θ result in more sensitive qEresponses.
3.2. Response of the effective rate constant for plastoquinoloxidation at cyt b6 f complex to changing CO2 levels and lightintensity
Fig. 2A shows the light response of linear electron flow(LEF) in Wt leaves, estimated using saturation pulse-inducedchlorophyll fluorescence changes (see [15,17]). At 372 ppmCO2 and 20% O2, LEF was half-saturated at ∼300 μmolphotons m−2 s−1 and reached a maximal rate of ∼130 μmolelectrons m−2 s−1. Decreasing the CO2 levels to 50 ppm causeda decrease in the maximal LEF rate to ∼70 μmol electronsm−2 s−1 and in the half-saturating light intensity to ∼120 μmolphotons m−2 s−1.
Fig. 2B shows the effective rate constant (keff) for plasto-quinol oxidation monitored by cyt f reduction upon rapid light–dark transitions from steady-state illumination (see Materialsand methods and [6,7,19]). (We note that keff cannot, by itself,be directly compared to LEF; estimates of flux using cyt fkinetics would require consideration of the extent of cyt foxidation as well as electron sharing between cyt f, plastocyaninand P700 [19]). Under 372 ppm CO2 and 20% O2, keff slowedfrom 147 to 59 s−1 from low to saturating light. When the CO2
was lowered to 50 ppm, cyt f keff ranged from ∼45 to ∼15 s−1,reflecting increased restriction in plastoquinol oxidation uponlumen acidification, as observed previously [27]. In contrast, intobacco, cyt f reduction remained constant from low tosaturating light decreasing only upon lowering CO2 levels(reviewed in [5]).
3.3. Response of the qE to changing CO2 levels and lightintensity
In vivo activation of qE and its two lumen pH-dependentcomponents, xanthophyll cycle conversion and protonation ofPsbS, were estimated in Arabidopsis Wt and npq2, whichcontinuously accumulates deepoxidized xanthophyll [11]. Asmeasured from chlorophyll fluorescence, qE was alwaysproportional to absorbance changes at 535 nm (data notshown), in accord with the previously reported strict interde-pendence of these two signals [28,29]. Parameters weremeasured under a range of light intensities and under ambientCO2, 50 ppm CO2 or CO2-free air.
In Wt under ambient air (Fig. 3A), qE increased sigmoidallywith a distinct, insensitive phase at low light intensity. In earlierwork (e.g. [22]), this lag phase was likely obscured bycontributions from other NPQ processes, mostly photoinhibitoryquenching or qI [30]. Lowering the CO2 level to 50 or 0 ppmdramatically increased the qE response to light intensity, aspreviously observed [26]. In contrast to Wt, npq2 did not showan initial lag (insensitive) phase in qE response to light intensity(Fig. 3B, cf. Fig. 6 in ref. [11]). Light saturation curves of LEFwere indistinguishable between Wt and npq2 (data not shown).
Fig. 3C shows the extents of steady-state light-induceddeepoxidation of xanthophylls in Wt leaves, estimated byΔA505

Fig. 4. The profile of pH dependent reactions plotted as a function of ECSinv, usedas an approximate indicator of change in lumen pH. Logarithm of keff (Panel A),ΔA505 (Panel B), qE in npq2 (Panel C) and Wt (Panel D) measured as Figs. 2B,3C, B and A respectively were plotted against simultaneously measured ECSinv.The logarithm of keff was plotted in Panel A because these values should beproportional to lumen pH below the effective pKa for PQH2 oxidation.
1237K. Takizawa et al. / Biochimica et Biophysica Acta 1767 (2007) 1233–1244
[20–22]. With 372 ppm CO2, 20% O2, the light saturation curveof ΔA505 was sharply sigmoidal, with a lag phase at lightintensities below about 120 μmol photons m−2 s−1. Uponlowering CO2 to 50 ppm, the response of ΔA505 became moresensitive to light intensity. No ΔA505 signals attributable to qEwere observed in npq2 (data not shown), as expected fromprevious work [11], showing that xanthophyll is maintained inits deepoxidized state in this mutant.
4. Discussion
4.1. Investigations intrinsic pH-dependent processes by ECSinv
In this section, we explore the relationships between variouslumen pH-dependent processes and our (at this point qualita-tive) estimate of light-induced ΔpH (ECSinv). Fig. 4A–D showthe dependences of four processes on ECSinv (proportional tothe ΔpH component of pmf), 1) the logarithm of effective rateconstant for cyt f reduction, reflecting the pH-dependence ofplastoquinol oxidation at the cyt b6f complex (Fig. 4A); 2) theconversion of violaxanthin (V) to zeaxanthin (Z) via antherax-anthin (A) measured by the ΔA505 change, reflecting the pH-dependent activation of V deepoxidase (VDE) (Fig. 4B); 3) qEin npq2, reflecting changes in lumen pH when Z is saturated,most likely reflecting PsbS protonation (Fig. 4C); and 4) qE inWt, reflecting both VDE activation and (likely) PsbS proton-ation (Fig. 4D). The data were fit, rather arbitrarily at this point(but see below), to Hill equations. The noise level largelyreflects the difficulty in measuring ECSinv, which requiresdeconvolution of ECS signal using three separate wavelengthsover extended periods (many seconds).
Even without calibration of the signals, these data allow us tomake some important conclusions about the nature and roles ofthe thylakoid pmf. Most strikingly, the responses appear to becontinuous (smooth) functions of estimated light-induced ΔpH,despite the fact that the ΔpH was varied both by changing lightintensity and CO2 levels. In other words, no apparent deviationswere observed that might indicate that these processes ‘feel’different extents of ΔpH, as one would expect for altering theirmodes of action or switching between localized versus de-localized proton gradients [20] since such processes should haveyielded strongly scattered or discontinuous relationships in Fig. 4.
The differences in the dependencies of Z accumulation andPsbS protonation are also striking. These responses arise fromdifferences in the cooperativity (Hill coefficient or nH) forprotonation of VDE and PsbS, the former being reported asaround 5 [31] and the latter probably being 1 or 2 (see below).The response of qE lies somewhere between that of Z accumu-lation and PsbS protonation, supportive of models where bothprocesses are required for activation of qE [32] (see also below).
4.2. Quantitative estimates of pmf
As discussed previously [4,23,33], calibrating the ECSresponse should allow us to make quantitative estimates ofpmf, Δψ and ΔpH. Since the ECS signal is a linear indicatorof Δψ, we need only to determine the slope of the relationship

1238 K. Takizawa et al. / Biochimica et Biophysica Acta 1767 (2007) 1233–1244
between ECS and Δψ, a factor we term C, which should bepossible by comparing ECS to intrinsic lumen pH-dependentsignals. The calibrating signals do not need to be linearindicators of lumen pH, but at least must exhibit reproducibletransitions that follow defined pH-responses. Here we used nHand the pKa of plastoquinol oxidation at cyt b6 f complex asprimary constraints, since their behavior has been wellcharacterized in vitro, and follow this up by several externalvalidity checks (see below).
One complication is that calculating pH in thylakoid lumen(pHlumen) also requires estimates of dark-sustained pmf ( pmfd)and stromal pH (pHstroma). However, previous observations giveus estimates of pmfd and pHstroma within relatively small ranges(as discussed below). We conclude that the pmfd and pHstroma
are relatively constant under our experimental conditions sincesubstantial changes in these parameters should measurably alterthe relationships between ECSinv and qE, which previouslyhave not been observed (see [10,26]).
The relationships between light-induced pmf ( pmfl-d), light-induced Δψ (Δψl-d) and light-induced ΔpH (ΔpHl-d) and thecorresponding ESC parameters can be written in the followingsimple equations:
pmf1Qd ¼ Cd ECSt; ð1aÞ
Dw1Qd ¼ Cd ECSss; ð1bÞ
and
DpH1Qd ¼F
2:3RTd Cd ECSinvc
159 mV
d Cd ECSinv: ð1cÞ
It is important to note that pmf is maintained across thethylakoid membrane in vivo even in the dark and that the signalswe measure will reflect pmf components offset by valuesreflecting ‘dark’ pmf or pmfd [9,13,34,35]. In vascular plants,pmfd is probably the result of ATP hydrolysis at the ATPsynthase, but substantial contributions from ‘chlororespiration’or related processes are seen in algae [35,36]. In our experi-ments on vascular plants [10,14,26], the decay of the ECSduring short dark interval in light-adapted leaves was mono-exponential, reflecting an apparent single pseudo-first or-der process, indicating that under these conditions pmfd issufficient to maintain the ATP synthase in an active state whenits γ-subunit is in its reduced form. Thus, at least in light-adapted leaves we expect pmfd to come into equilibrium withΔGATP during dark intervals [9,26] and remain so over the tensof minutes required to oxidize the ATP synthase γ-subunit [13].ΔGATP measured in the dark and the light is estimated to rangebetween 40 and 50 kJ/mol [37,38], corresponding to 90–112mVin pmfd, assuming that the proton ATP ratio is 4.67 [39]; theupper estimate of 112 mVagrees well with other independent invitro measurements of threshold pmf required to maintain theATP synthase in its active state [1,40].
The total pmf under steady-state illumination ( pmfss) will bethe sum of pmfd (dark-stable component, in equilibrium withΔGATP) and pmfl-d (light-induced component, which is out of
equilibrium with ΔGATP because of the substantial light-drivenproton flux),
pmfss ¼ pmf1Qd þ pmfd: ð2ÞCombining with Eq. (1a) yields,
pmfsscCd ECSt þ pmfd: ð3ÞWe next assess the lumen pH imposed by pmf. In earlier
work, (see [9,10]) we showed that θ (the fraction of pmf storedas ΔpH) for light-induced pmf can be estimated by ECSinv/ECSt. Here we assume that the same θ can be applied to bothlight-induced and dark pmf. This should be true as long as theproton buffering capacity of the lumen is reasonably constantover the pH range experienced by the lumen (see discussion in[9,41]). The estimated ΔpH under steady-state illumination,termed ΔpHss, can thus be expressed as,
2:3RTF
DpHss ¼ hd pmfss; ð4Þ
And at room temperature,
DpHssc1
59 mVd hd Cd ECSt þ pmfdð Þ: ð5Þ
The lumen pH (pHlumen) in the light can thus be estimated as
pHlumen ¼ pHstroma � DpHss
cpHstroma �1
59 mVd hd Cd ECSt þ pmfdð Þ: ð6Þ
4.3. The oxidation of plastoquinol by the cyt b6 f complex
It is well known that the kinetics of plastoquinol oxidation atthe Qo site of the cyt b6 f complex are pH-dependent [6,7]. Here,we used the inverse of the lifetime for cyt f reduction, as aphenomenological (or empirical) indicator of the keff forplastoquinol oxidation [7]. The logarithm of the keff is observedto be proportional to pH below its apparent pKa, as follows
keffkeff MAX
¼ 1
10nHd ðpKa�pHlumenÞ þ 1; ð7aÞ
and
logðkeff Þ ¼ logðkeff MAXÞ � logð10nHd ðpKa�pHstromaþDpHssÞ þ 1Þð7bÞ
where keff MAX is the maximum value of the keff (above the pKa)and nH and pKa are the apparent Hill coefficient and pKa forplastoquinol oxidation. Experiments on uncoupled thylakoids[7] and isolated cyt b6 f complexes [6] showed an apparent pKa
of ∼6.1 and nH of ∼1.2. The physical basis of the observednHN1 is unclear (see [6]) but probably reflects protonation ofmultiple residues on the b6 f complex.
Fig. 5 shows a plot of the data in Fig. 4A, but with the ‘upper’x-axis set to estimated ‘ΔpH’ using Eq. (5). The calculation ofΔpH from the ECSinv data in Fig. 4A takes into considerationthe partitioning of total pmf into Δψ and ΔpH, thus resulting in
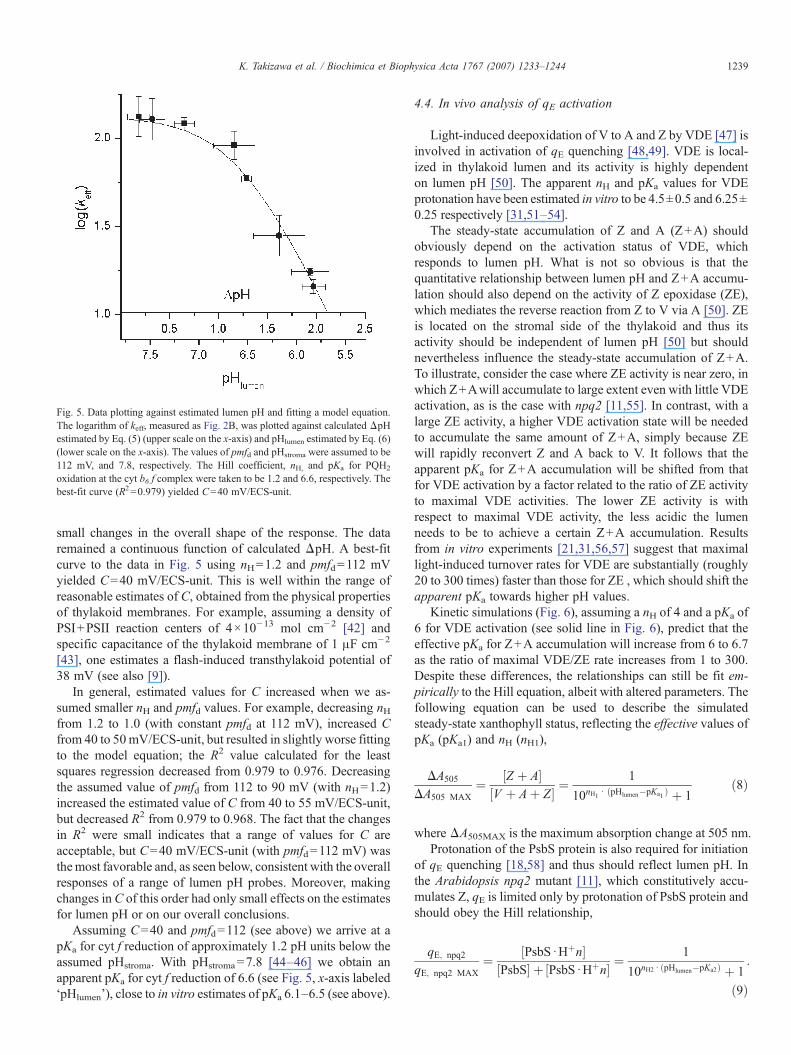
Fig. 5. Data plotting against estimated lumen pH and fitting a model equation.The logarithm of keff, measured as Fig. 2B, was plotted against calculated ΔpHestimated by Eq. (5) (upper scale on the x-axis) and pHlumen estimated by Eq. (6)(lower scale on the x-axis). The values of pmfd and pHstroma were assumed to be112 mV, and 7.8, respectively. The Hill coefficient, nH, and pKa for PQH2
oxidation at the cyt b6 f complex were taken to be 1.2 and 6.6, respectively. Thebest-fit curve (R2=0.979) yielded C=40 mV/ECS-unit.
1239K. Takizawa et al. / Biochimica et Biophysica Acta 1767 (2007) 1233–1244
small changes in the overall shape of the response. The dataremained a continuous function of calculated ΔpH. A best-fitcurve to the data in Fig. 5 using nH=1.2 and pmfd=112 mVyielded C=40 mV/ECS-unit. This is well within the range ofreasonable estimates of C, obtained from the physical propertiesof thylakoid membranes. For example, assuming a density ofPSI+PSII reaction centers of 4×10⁻¹³ mol cm−2 [42] andspecific capacitance of the thylakoid membrane of 1 μF cm−2
[43], one estimates a flash-induced transthylakoid potential of38 mV (see also [9]).
In general, estimated values for C increased when we as-sumed smaller nH and pmfd values. For example, decreasing nHfrom 1.2 to 1.0 (with constant pmfd at 112 mV), increased Cfrom 40 to 50mV/ECS-unit, but resulted in slightly worse fittingto the model equation; the R2 value calculated for the leastsquares regression decreased from 0.979 to 0.976. Decreasingthe assumed value of pmfd from 112 to 90 mV (with nH=1.2)increased the estimated value of C from 40 to 55 mV/ECS-unit,but decreased R2 from 0.979 to 0.968. The fact that the changesin R2 were small indicates that a range of values for C areacceptable, but C=40 mV/ECS-unit (with pmfd=112 mV) wasthemost favorable and, as seen below, consistent with the overallresponses of a range of lumen pH probes. Moreover, makingchanges inC of this order had only small effects on the estimatesfor lumen pH or on our overall conclusions.
Assuming C=40 and pmfd=112 (see above) we arrive at apKa for cyt f reduction of approximately 1.2 pH units below theassumed pHstroma. With pHstroma=7.8 [44–46] we obtain anapparent pKa for cyt f reduction of 6.6 (see Fig. 5, x-axis labeled‘pHlumen’), close to in vitro estimates of pKa 6.1–6.5 (see above).
4.4. In vivo analysis of qE activation
Light-induced deepoxidation of V to A and Z by VDE [47] isinvolved in activation of qE quenching [48,49]. VDE is local-ized in thylakoid lumen and its activity is highly dependenton lumen pH [50]. The apparent nH and pKa values for VDEprotonation have been estimated in vitro to be 4.5±0.5 and 6.25±0.25 respectively [31,51–54].
The steady-state accumulation of Z and A (Z+A) shouldobviously depend on the activation status of VDE, whichresponds to lumen pH. What is not so obvious is that thequantitative relationship between lumen pH and Z+A accumu-lation should also depend on the activity of Z epoxidase (ZE),which mediates the reverse reaction from Z to V via A [50]. ZEis located on the stromal side of the thylakoid and thus itsactivity should be independent of lumen pH [50] but shouldnevertheless influence the steady-state accumulation of Z+A.To illustrate, consider the case where ZE activity is near zero, inwhich Z+Awill accumulate to large extent even with little VDEactivation, as is the case with npq2 [11,55]. In contrast, with alarge ZE activity, a higher VDE activation state will be neededto accumulate the same amount of Z+A, simply because ZEwill rapidly reconvert Z and A back to V. It follows that theapparent pKa for Z+A accumulation will be shifted from thatfor VDE activation by a factor related to the ratio of ZE activityto maximal VDE activities. The lower ZE activity is withrespect to maximal VDE activity, the less acidic the lumenneeds to be to achieve a certain Z+A accumulation. Resultsfrom in vitro experiments [21,31,56,57] suggest that maximallight-induced turnover rates for VDE are substantially (roughly20 to 300 times) faster than those for ZE , which should shift theapparent pKa towards higher pH values.
Kinetic simulations (Fig. 6), assuming a nH of 4 and a pKa of6 for VDE activation (see solid line in Fig. 6), predict that theeffective pKa for Z+A accumulation will increase from 6 to 6.7as the ratio of maximal VDE/ZE rate increases from 1 to 300.Despite these differences, the relationships can still be fit em-pirically to the Hill equation, albeit with altered parameters. Thefollowing equation can be used to describe the simulatedsteady-state xanthophyll status, reflecting the effective values ofpKa (pKa1) and nH (nH1),
DA505
DA505 MAX¼ ½Z þ A�
½V þ Aþ Z� ¼1
10nH1 d ðpHlumen�pKa1 Þ þ 1ð8Þ
where ΔA505MAX is the maximum absorption change at 505 nm.Protonation of the PsbS protein is also required for initiation
of qE quenching [18,58] and thus should reflect lumen pH. Inthe Arabidopsis npq2 mutant [11], which constitutively accu-mulates Z, qE is limited only by protonation of PsbS protein andshould obey the Hill relationship,
qE; npq2
qE; npq2 MAX¼ ½PsbSd Hþn�
½PsbS� þ ½PsbSd Hþn� ¼1
10nH2d ðpHlumen�pKa2Þ þ 1:
ð9Þ

Fig. 7. qE activation model. A working model was constructed based on ourobservations and those of others [2,29,59]. Conversion of light harvesting complexII from the qE inactive to qE active form requires both protonation of PsbS andaccumulation of Z+A. These processes are regulated by pH with specific equilib-rium constants (pKa and pKa2) and Hill coefficients (nH and nH2). Steady-stateconcentration of Z+A is determined by the relative activities of VDE to ZE, witheffective pKa (pKa1 ) and Hill coefficient (nH1) as described in Fig. 6 and the text.
Fig. 6. Kinetic simulations of Z+A accumulation. pH dependency of steady-state Z+A accumulation was simulated under different maximum activity ofVDE comparing to ZE as described in the text, with the maximal rates of VDE/ZE=1 (□), 10 (○), 50 (▵), 300 (∇), whose effective pKa were 6.1, 6.3, 6.5, 6.7,respectively. A solid line shows pH-dependent VDE activation curve (nH=4 andpKa=6) used for the simulations.
1240 K. Takizawa et al. / Biochimica et Biophysica Acta 1767 (2007) 1233–1244
where qE,npq2MAX is the maximal qE in npq2 mutant observedunder saturating lumen acidity (where PsbS is fully protonated).PsbS and PsbS·H+
n are the deprotonated and protonated formsof PsbS; pKa2 and nH2 are the effective values of pKa and nH forPsbS protonation. Since protonation of two Glu residues ofPsbS protein are involved in the qE response [29], nH1 willprobably be between one and two, depending upon whether theprotonation of the two residues is cooperative. Site-directedmutants lacking one of the two Glu residues on PsbS showeddiminished qE, but the half-time for onset of qE was essentiallyidentical to those of Wt [29], suggesting that each Glu residueacts additively but non-cooperatively, and thus we suggest thatnH1 is unity.
In current models for antenna regulation, the extent of qE iscontrolled by both Z+A accumulation and PsbS protonation[2,29,59], as diagramed in Fig. 7. A straightforward formulation ofthis model, where the extent of qE is dependent on the product ofZ+A accumulation and PsbS protonation, can be expressed asfollows,
qEqE MAX
¼ ½Z þ A�½V þ Aþ Z� d
½PsbSd Hþn�½PsbS� þ ½PsbSd Hþn�
¼ 1
10nH1d ðpHlumen�pKa1Þ þ 1d
1
10nH2d ðpHlumen�pKa2Þ þ 1ð10Þ
where the nH and pKa parameters are the effective protonationparameters for PsbS protonation and Z+A accumulation, asdescribed above. Implicit in Eq. (10) is a linear response of qEwith[Z+A] at a constant PsbS protonation, as shown by Gilmore et al.[59]. This nonsaturating response implies that either multiple Z
and A molecules can associate with a given antenna or that theassociation is weak.
Fig. 8A–C show Z+A accumulation (ΔA505), PsbS proton-ation (qE in npq2) and qE plotted against lumen pH estimatedby our calibrated ECS assay. Using C=40 mV/ECS-unit,pmfd=112 mV and pH stroma=7.8 yielded good agreementwith the model (using Eqs. (8), (9) and (10) for Z+A, PsbSprotonation and qE gave R2 =0.975, 0.911 and 0.936 respec-tively). Z+A accumulation and PsbS protonation predicted verysimilar effective pKa values (∼6.8), but very different nH values(∼4.3 vs. ∼1.0 respectively). These fits conform to the ex-pected relative Hill coefficients for the two processes [31,51–53], partially validating our estimates.
The pKa of protonation of VDE determined in vitro isbetween 6.0 and 6.5 [31,51–53]. The apparent pKa for Z+Aaccumulation from our fit to Fig. 8A is shifted upwards from invitro estimates by 0.3 to 0.8 units. Within the context of themodel presented in Fig. 6, this shift implies that the maximal ZEturnover rate is between 10 and 300 times slower than that ofVDE, consistent with published data [21,57]. These resultsindicate that the chloroplast might adjust the pH range of thexanthophyll cycle responses by regulating ZE activity. In thiscontext, it is interesting to note that VDE and ZE could bedifferentially regulated during stress or development, suggest-ing that the responses of Z+A accumulaton to lumen pH mightbe adjusted as an acclimatization response [60–63].
4.5. Quantitative estimates of lumen pH in vivo
Fig. 9A shows estimates of total steady-state pmf (termedpmfss) using Eq. (3) with C=40 mV/ECS unit, pmfd=112 mV.The amplitudes of pmfss (steady-state pmf, ΔpH and Δψ)ranged from 116 to 160 mV under 372 ppm CO2, 20% O2. At50 ppm and 20% O2, we estimated a maximal pmf of 175 mVathigh light (N445 μmol photons m−2 s−1). All pmf values werewithin the linear force-flux range for ATP synthesis at the ATPsynthase [1,64].
Fig. 9B shows predicted pHlumen (lumen pH under steady-stateillumination), based on Eq. (6), C=40 mV/ECS unit, pmfd=112 mV. These estimates are probably only accurate to ±0.5 pH

Fig. 9. Estimates of in vivo steady-state lumen pmf ( pmfss) and pH. Panel Aestimated in vivo steady-state pmf ( pmfss); Panel B estimated lumen pH. Mea-surements were made under ambient air (■ and □, n=4±se) and 50 ppm CO2
(● and○, n=4±se). pmfss and lumen pH were calculated from Eqs. (3) and (6)using ECS parameters as in Fig. 1. C and pmfd were assumed to be 40 mV/ECS-unit and 112 mVrespectively. A range of lumen pHwas calculated depending onthe range of stromal pH between 7.6 (closed symbols) and 8.0 (open symbols).
Fig. 8. In vivo pH response of xanthophyll cycle status, PsbS protonation andonset of qE. Panel A, ΔA505 reflecting accumulation of Z+A; Panel B,protonation of PsbS as reflected by measurements of qE in npq2; and Panel C,onset of qE in Wt. Measurements were made as described in Fig. 3 and Materialsand methods, and plotted against lumen pH calculated from Eq. (6) withC=40 mV/ECS-unit, pmfd=112 mVand pHstroma=7.8. Solid curves show fits tomodel equations; Eq. (8) for Z+A accumulation gave R2=0.975 with nH1=4.3and pKa=6.8, Eq. (9) for PsbS protonation gave R2=0.911 with nH1=1.0 andpKa=6.8, Eq. (8) for qE activation gave R
2=0.936 with nH and pKa values as inZ+A accumulation and PsbS protonation.
1241K. Takizawa et al. / Biochimica et Biophysica Acta 1767 (2007) 1233–1244
units, owing mainly to ambiguities in estimates of pmfd andpHstroma. The upper and lower data sets in Fig. 9B illustrate therange with pHstroma between 7.6 and 8.0 [44–46]. Under ambientair and low light, pHlumen is predicted to be about 7.5. Increasinglight intensity lowered pHlumen to between 6.3 and 6.7, just aroundthe apparent pKa for plastoquinol oxidation at the cyt b6 f complex(see Fig. 5, squares). In tobacco, there is no restriction of the b6 fcomplex, even at high light, at unstressed plants at ambient CO2,but plastoquinol oxidation slows when CO2 is lowered [5,27,65].In Arabidopsis, on the other hand, keff for the b6 f complex slowswith increasing light intensity even at ambient CO2 (Fig. 5,squares, see also [14]), possibly as an adaptation to growth at lowlight. When CO2 was decreased to 50 ppm, estimated lumen pHdecreased to as low as 5.7 to 6.1 at high light, where plastoquinoloxidation was substantially slowed (see Fig. 5, circles).
We emphasize the importance of θ, the fraction of pmf storedas ΔpH, in maintaining this range of pHlumen in Arabidopsis.Our ECS assays (Fig. 1C) suggest that ΔpH constitutes a scant

1242 K. Takizawa et al. / Biochimica et Biophysica Acta 1767 (2007) 1233–1244
10–20% of pmf at low light, but that this increased between40% at high light intensity, and at 70% at both high light andlow CO2. As discussed previously [10,25], such changes in θare critical for understanding the relationship between light-driven pmf and antenna regulation. How θ is regulated remainsunknown, but we have suggested that alterations in stromal ionbalance might differentially dissipate Δψ, allowing ΔpH tobuild up to varying extents [9]. There appears to be significantspecies differences in θ responses. In tobacco [10,26], wepreviously observed constant θ values under changing CO2 andlight, but substantial changes in θ only when O2 was lowered.Arabidopsis appears to have a much more sensitive control of θ,resulting in a higher range of responses to changing CO2 andlight. This makes it essential to measure θ to obtain evenrelative estimates of ΔpH. In addition, we speculate that thedifferences θ responses to physiological status represent adapta-tions to the plants growth light.
4.6. The regulation of electron transport by lumen pH
It has been proposed for some time that photosyntheticelectron transfer can be regulated (or controlled) by lumen pH atthe level of plastoquinol oxidation at the cyt b6 f complex[6,66]. This behavior could have evolved to prevent excessivereduction of PSI electron acceptors, which can lead to super-oxide generation and photodamage [67]. On the other hand,slowing electron transfer at the cyt b6 f complex can lead tobuildup of reduced plastoquinone and subsequently QA
− in PSII,also resulting in photodamage [68]. Clearly, any regulation ofthe cyt b6 f complex must be well balanced to prevent eithertype of photodamage.
Our data demonstrate that the onset of qE occurs at a lumenpH somewhat higher than that which slows the cyt b6 fcomplex. Accordingly, we observe half-activation of qE atabout pH 6.5 (Fig. 8C), just where the cyt b6 f complex is be-ginning to slow (Fig. 5). Thus, we propose that the chloroplast‘tunes’ the pH-response of the xanthophyll cycle with respect tothat of the cyt b6 f complex to lower excitation pressure at PSIIbefore electron transfer is slowed, preventing buildup of QA
−.The pH-profile of qE is clearly triphasic, as a result of the
interplay of Z+A accumulation and PsbS protonation (Fig. 8C).We suggest that this complex response has a regulatory role. The‘lag’ phase at high lumen pH allows high efficiency lightcapture, required for growth at low light intensity [69]. The steepincrease as VDE becomes activated allows for precise transitionbetween ‘high efficiency’ and ‘photoprotective’ modes, wheresubstantial QA
− buildup must be avoided to prevent photodamage(see discussion in [70]). Finally, a gradual increase at lowerlumen pH allows for fine tuning at high light/low CO2.
Our simulations (Fig. 6) suggest a likely mechanism for‘tuning’ the qE response, involving differential expression ofVDE and ZE, which will result in a shift in the apparent pKa forZ+A accumulation. Overexpressing ZE should shift the ap-parent pKa for Z+A accumulation to lower lumen pH, belowthat of the cyt b6f complex kinetics. This should result in theinability to fully activate qE (since electron transfer is slowed bylow lumen pH before accumulation of Z+A) and subsequent
photodamage. Indeed, Shikanai and coworkers [71] found thatsuch effects for the complementary situation. In the Arabidopsismutant pgr1, the cyt b6f complex was found to be more pH-dependent, so much so that electron flow was slowed sub-stantially before qE was fully engaged, resulting in predomi-nantly reduced QA and increased photoinhibition.
5. Conclusions
Using non-invasive probes of intrinsic pH-indicators asconstraints, we were able to estimate the relative lumen pH-responses of the light reactions in vivo. Our results are in generalagreement with the ‘moderate’ lumen pH hypothesis [5], inwhich lumen pH is maintained, under normal conditions, in arange where it can regulate light capture while not damaging thephotosynthetic apparatus. The predicted lumen pH (Fig. 9)ranged 7.8 to 5.7 should activate pH dependent antenna down-regulation (qE), but not damage the photosynthetic machinery,particularly the oxygen evolving complex of photosystem II andplastocyanin, which are pH sensitive [5,8,72,73] below aboutpH=5.5 (cf. Scheme I in [5]). We suggest that mutations ofconditions which prevent this pH regulation will lead toincreased photodamage [5]. Substantial and variable contribu-tions of Δψ to pmf appear to be needed to sustain sufficientΔGATP while maintaining a moderate lumen pH in the range thatproperly regulates the antenna and electron transfer [4].
The relative responses of qE and the cyt b6 f complex tolumen pH, governed by their respective pKa and nH values,appear to be tuned to minimize buildup of reactive intermediatesas electron flow is down-regulated under suboptimal conditions.We propose that the ‘lag’ in accumulation of Z+A at low ΔpHhelps to maximize the efficiency of light capture when photo-synthesis is light limited. The sharp increase in Z+A when pHdecreases around its apparent pKa coincides with an increase inqE, under conditions where light input begins to exceed capacityfor LEF or NADPH and ATP consumption. At higher ΔpH,when Z+A accumulation is saturated, the qE response becomeslimited by PsbS protonation. The more gradual PsbS response,due to its lower nH, allows for fine-tuning of the qE responseover the lower pH range. The onset of qE appears at a slightlyhigher lumen pH than down-regulation of the cyt b6 f complex,dissipating excess light energy when the capacity for LEF isslowed.
Finally, we provide reasonable ranges for values of C (therelationship between ECS and Δψ), allowing for the first time,quantitative estimates of pmf and lumen pH in vivo. Ourapproach is strongly supported by the consistency of responsesof Z+A accumulation, PsbS protonation and cyt b6 f turnover asa function of predicted lumen pH, over a wide range ofconditions, even with large changes in LEF, proton conductivityat the ATP synthase and partitioning of pmf into ΔpH and Δψ.
Acknowledgements
The authors would like to thank Drs. Gerald Edwards, ThomasAvenson and John Nishio for stimulating discussions, andMasaaki Komatsu, Fred Henderson, and Willow Foster for
1243K. Takizawa et al. / Biochimica et Biophysica Acta 1767 (2007) 1233–1244
contributions to construction of instrumentation, and Dr. KrishnaNiyogi for providing seeds of Arabidopsis npq2. The authorswould also like to thank the anonymous reviewers for theirinsightful comments. This work was supported by the U.S.Department of Energy (DE-FG02-04ERl5559).
References
[1] U. Junesch, P. Gräber, The rate of ATP-synthesis as a function of ΔpH andΔψ catalyzed by the active, reduced H+-ATPase from chloroplasts, FEBSLett. 294 (1991) 275–278.
[2] P. Müller, X.P. Li, K.K. Niyogi, Non-photochemical quenching. Aresponse to excess light energy, Plant Physiol. 125 (2001) 1558–1566.
[3] D.M. Kramer, T.J. Avenson, G.E. Edwards, Dynamic flexibility in the lightreactions of photosynthesis governed by both electron and proton transferreactions, Trends Plant Sci. 9 (2004) 349–357.
[4] D.M. Kramer, J.A. Cruz, A. Kanazawa, Balancing the central roles of thethylakoid proton gradient, Trends Plant Sci. 8 (2003) 27–32.
[5] D.M. Kramer, C.A. Sacksteder, J.A. Cruz, How acidic is the lumen?Photosynth. Res. 60 (1999) 151–163.
[6] A.B. Hope, P. Valente, D.B. Matthews, Effects of pH on the kinetics ofredox reactions in and around the cytochrome bf complex in an isolatedsystem, Photosynth. Res. 42 (1994) 111–120.
[7] J.N. Nishio, J. Whitmarsh, Dissipation of the proton electrochemicalpotential in intact chloroplasts (II. The pH gradient monitored bycytochrome f reduction kinetics), Plant Physiol. 101 (1993) 89–96.
[8] A. Krieger, E. Weis, The role of calcium in the pH-dependent control ofphotosystem-II, Photosynth. Res. 37 (1993) 117–130.
[9] J.A. Cruz, C.A. Sacksteder, A. Kanazawa, D.M. Kramer, Contribution ofelectric field (Δψ) to steady-state transthylakoid proton motive force (pmf)in vitro and in vivo. control of pmf parsing into Δψ and ΔpH by ionicstrength, Biochemistry 40 (2001) 1226–1237.
[10] T.J. Avenson, J.A. Cruz, D.M. Kramer, Modulation of energy-dependentquenching of excitons in antennae of higher plants, Proc. Natl. Acad. Sci.U. S. A. 101 (2004) 5530–5535.
[11] K.K. Niyogi, A.R. Grossman, O. Björkman, Arabidopsis mutants define acentral role for the xanthophyll cycle in the regulation of photosyntheticenergy conversion, Plant Cell 10 (1998) 1121–1134.
[12] C.A. Sacksteder, M.E. Jacoby, D.M. Kramer, A portable, non-focusingoptics spectrometer (NoFOSpec) for measurements of steady-stateabsorbance changes in intact plants, Photosynth. Res. 70 (2001) 231–240.
[13] D.M. Kramer, A.R. Crofts, Activation of the chloroplast ATPase measuredby the electrochromic change in leaves of intact plants, Biochim. Biophys.Acta 976 (1989) 28–41.
[14] T.J. Avenson, J.A. Cruz, A. Kanazawa, D.M. Kramer, Regulating theproton budget of higher plant photosynthesis, Proc. Natl. Acad. Sci. U. S. A.102 (2005) 9709–9713.
[15] B. Genty, J.-M. Briantais, N.R. Baker, The relationship between thequantum yield of photosynthetic electron transport and quenching ofchlorophyll fluorescence, Biochim. Biophys. Acta 990 (1989) 87–92.
[16] D.M. Kramer, G. Johnson, O. Kiirats, G.E. Edwards, New fluorescenceparameters for the determination of QA redox state and excitation energyfluxes, Photosynth. Res. 79 (2004) 209–218.
[17] J.P. Krall, G.E. Edwards, Relationship between photosystem-II activityand CO2 fixation in leaves, Physiol. Plant. 86 (1992) 180–187.
[18] X.P. Li, O. Björkman, C. Shih, A.R. Grossman, M. Rosenquist, S. Jansson,K.K. Niyogi, A pigment-binding protein essential for regulation ofphotosynthetic light harvesting, Nature 403 (2000) 391–395.
[19] C.A. Sacksteder, D.M. Kramer, Dark interval relaxation kinetics of absor-bance changes as a quantitative probe of steady-state electron transfer,Photosynth. Res. 66 (2000) 145–158.
[20] E.E. Pfündel, M. Renganathan, A.M. Gilmore, H.Y. Yamamoto, R.A.Dilley, Intrathylakoid pH in isolated pea chloroplasts as probed byviolaxanthin deepoxidation, Plant Physiol. 106 (1994) 1647–1658.
[21] D. Siefermann, H.Y. Yamamoto, Light-induced de-epoxidation ofviolaxanthin in lettuce chloroplasts. III. Reaction kinetics and effect of
light intensity on de-epoxidase activity and substrate availability, Biochim.Biophys. Acta 357 (1974) 144–150.
[22] O. Björkman, B. Demmig-Adams, Regulation of photosynthetic lightenergy capture, conversion, and dissipation in leaves of higher plants, in:E.D. Schulze, M.M. Caldwell (Eds.), Ecophysiology of Photosynthesis,Springer-Verlag, Berlin, 1994, pp. 17–47.
[23] J.A. Cruz, T.J. Avenson, A. Kanazawa, K. Takizawa, G.E. Edwards, D.M.Kramer, Plasticity in light reactions of photosynthesis for energyproduction and photoprotection, J. Exp. Bot. 56 (2005) 395–406.
[24] H.T. Witt, Energy conversion in the functional membrane of photosyn-thesis. Analysis by light pulse and electric pulse methods. The central roleof the electric field, Biochim. Biophys. Acta 505 (1979) 355–427.
[25] T.J. Avenson, A. Kanazawa, J.A. Cruz, K. Takizawa, W.E. Ettinger, D.M.Kramer, Integrating the proton circuit into photosynthesis: progress andchallenges, Plant Cell Environ. 28 (2005) 97–109.
[26] A. Kanazawa, D.M. Kramer, In vivo modulation of nonphotochemicalexciton quenching (NPQ) by regulation of the chloroplast ATP synthase,Proc. Natl. Acad. Sci. U. S. A. 99 (2002) 12789–12794.
[27] J. Harbinson, C. Hedley, The kinetics of P-700+ reduction in leaves: anovel in situ probe of thylakoid functioning, Plant Cell Environ. 12 (1989)357–369.
[28] P. Horton, A.V. Ruban, D. Rees, A.A. Pascal, G. Noctor, A.J. Young, Controlof the light-harvesting function of chloroplast membranes by aggregation ofthe LHCII chlorophyll–protein complex, FEBS Lett. 292 (1991) 1–4.
[29] X.P. Li, A.M. Gilmore, S. Caffarri, R. Bassi, T. Golan, D. Kramer, K.K.Niyogi, Regulation of photosynthetic light harvesting involves intrathy-lakoid lumen pH sensing by the PsbS protein, J. Biol. Chem. 279 (2004)22866–22874.
[30] N. Keren, A. Berg, P.J. van Kan, H. Levanon, I.I. Ohad, Mechanism ofphotosystem II photoinactivation and D1 protein degradation at low light:the role of back electron flow, Proc. Natl. Acad. Sci. U. S. A. 94 (1997)1579–1584.
[31] E.E. Pfündel, R.A. Dilley, The pH dependence of violaxanthindeepoxidation in isolated pea chloroplasts, Plant Physiol. 101 (1993)65–71.
[32] N.E. Holt, G.R. Fleming, K.K. Niyogi, Toward an understanding of themechanism of nonphotochemical quenching in green plants, Biochemistry43 (2004) 8281–8289.
[33] D.M. Kramer, A.R. Crofts, Control of photosynthesis and measurement ofphotosynthetic reactions in intact plants, in: N. Baker (Ed.), Photosynthesisand the Environment. Advances in Photosynthesis, Kluwer AcademicPublishers, Dordrecht, The Netherlands, 1996, pp. 25–66.
[34] G. Finazzi, F. Rappaport, In vivo characterization of the electrochemicalproton gradient generated in darkness in green algae and its kinetic effectson cytochrome b6 f turnover, Biochemistry 37 (1998) 9999–10005.
[35] P. Joliot, A. Joliot, Characterization of linear and quadratic electrochromicprobes in Chlorella sorokiniana and Chlamydomonas reinhardtii,Biochim. Biophys. Acta 975 (1989) 355–360.
[36] P. Bennoun, The present model for chlororespiration, Photosynth. Res.73 (2002) 273–277.
[37] C. Giersch, U. Heber, Y. Kobayashi, Y. Inoue, K. Shibata, H.W. Heldt,Energy charge, phosphorylation potential and proton motive force in[spinach] chloroplasts, Biochim. Biophys. Acta 590 (1980) 59–73.
[38] G. Noctor, C.H. Foyer, Homeostasis of adenylate status during photo-synthesis in a fluctuating environment, J. Exp. Bot. 51 (2000) 347–356(Special Issue).
[39] H. Seelert, A. Poetsch, N.A. Dencher, A. Engel, H. Stahlberg, D.J.Müller, Structural biology. Proton-powered turbine of a plant motor,Nature 405 (2000) 418–419.
[40] A.R. Portis Jr., R.E. McCarty, Effects of adenine nucleotides and ofphotophosphorylation on H+ uptake and the magnitude of the H+ gradientin illuminated chloroplasts, J. Biol. Chem. 249 (1974) 6250–6254.
[41] W. Junge, W. Ausländer, A.J. McGeer, T. Runge, The buffering capacityof the internal phase of thylakoids and the magnitude of the pH changesinside under flashing light, Biochim. Biophys. Acta 546 (1979)121–141.
[42] L.A. Staehelin, Chloroplast structure and supramolecular organization ofphotosynthetic membranes, in: L.A. Staehelin, C.J. Arntzen (Eds.),

1244 K. Takizawa et al. / Biochimica et Biophysica Acta 1767 (2007) 1233–1244
Photosynthesis III Photosynthetic Membranes and Light HarvestingSystems, Springer-Verlag, Berlin, 1986, pp. 1–84.
[43] B. Hille, Ionic channels of excitable membranes, Sunderland, Massachu-setts, 1984.
[44] M. Hauser, H. Eichelmann, V. Oja, U. Heber, A. Laisk, Stimulation bylight of rapid pH regulation in the chloroplast stroma in vivo asIndicated by CO2 solubilization in leaves, Plant Physiol. 108 (1995)1059–1066.
[45] K.Werdan, H.W. Heldt, M. Milovancev, The role of pH in the regulation ofcarbon fixation in the chloroplast stroma. Studies on CO2 fixation in thelight and dark, Biochim. Biophys. Acta 396 (1975) 276–292.
[46] D. Heineke, M. Stitt, H.W. Heldt, Effects of inorganic phosphate on thelight dependent thylakoid energization of intact spinach chloroplasts, PlantPhysiol. 91 (1989) 221–226.
[47] H.Y. Yamamoto, T.O.M. Nakayama, C.O. Chichester, Studies on the lightand dark interconversions of leaf xanthophylls, Arch. Biochem. Biophys.97 (1962) 168–173.
[48] M. Havaux, K.K. Niyogi, The violaxanthin cycle protects plants fromphotooxidative damage by more than one mechanism, Proc. Natl. Acad.Sci. U. S. A. 96 (1999) 8762–8767.
[49] B. Demmig-Adams, A.M. Gilmore, W.W. Adams 3rd, Carotenoids 3: invivo function of carotenoids in higher plants, Faseb J. 10 (1996) 403–412.
[50] H.Y. Yamamoto, Biochemistry of the violaxanthin cycle in higher plants,Pure Appl. Chem. 51 (1979) 639–648.
[51] M.J. Delrieu, Regulation of thermal dissipation of absorbed excitationenergy and violaxanthin deepoxidation in the thylakoids of lactuca sativa.Photoprotective mechanism of a population of photosystem II centers,Biochim. Biophys. Acta 1363 (1998) 157–173.
[52] C.E. Bratt, P.-O. Arvidsson, M. Carlsson, H.-E. Akerlund, Regulation ofviolaxanthin de-epoxidase activity by pH and ascorbate concentration,Photosynth. Res. 45 (1995) 169–175.
[53] A. Gisselsson, A. Szilagyi, H.E. Akerlund, Role of histidines in thebinding of violaxanthin de-epoxidase to the thylakoid membrane asstudied by site-directed mutagenesis, Physiol. Plant. 122 (2004) 337–343.
[54] A. Emanuelsson, M. Eskling, H.E. Akerlund, Chemical and mutationalmodification of histidines in violaxanthin de-epoxidase from Spinaciaoleracea, Physiol. Plant. 119 (2003) 97–104.
[55] K.K. Niyogi, O. Björkman, A.R. Grossman, Chlamydomonas xanthophyllcycle mutants identified by video imaging of chlorophyll fluorescencequenching, Plant Cell 9 (1997) 1369–1380.
[56] D. Siefermann, H.Y. Yamamoto, NADPH and oxygen-dependent epoxi-dation of zeaxanthin in isolated chloroplasts, Biochem. Biophys. Res.Commun. 62 (1975) 456–461.
[57] A.M. Gilmore, N. Mohanty, H.Y. Yamamoto, Epoxidation of zeaxanthinand antheraxanthin reverses non-photochemical quenching of photosystemII chlorophyll a fluorescence in the presence of trans-thylakoid delta pH,FEBS Lett. 350 (1994) 271–274.
[58] K.K. Niyogi, X.P. Li, V. Rosenberg, H.S. Jung, Is PsbS the site of non-
photochemical quenching in photosynthesis? J. Exp. Bot. 56 (2005)375–382.
[59] A.M. Gilmore, V.P. Shinkarev, T.L. Hazlett, G. Govindjee, Quantitativeanalysis of the effects of intrathylakoid pH and xanthophyll cycle pigmentson chlorophyll a fluorescence lifetime distributions and intensity inthylakoids, Biochemistry 37 (1998) 13582–13593.
[60] S.Woitsch, S. Romer, Expression of xanthophyll biosynthetic genes duringlight-dependent chloroplast differentiation, Plant Physiol. 132 (2003)1508–1517.
[61] J.B.F. Charron, F. Ouellet, M. Pelletier, J. Danyluk, C. Chauve, F. Sarhan,Identification, expression, and evolutionary analyses of plant lipocalins,Plant Physiol. 139 (2005) 2017–2028.
[62] R.C. Bugos, S.H. Chang, H.Y. Yamamoto, Developmental expression ofviolaxanthin de-epoxidase in leaves of tobacco growing under high andlow light, Plant Physiol. 121 (1999) 207–213.
[63] R.C. Bugos, S.W. Chang, H.Y. Yamamoto, Distribution of violaxanthin de-epoxidase during leaf development in tobacco. Plant Physiol. 114 (1997)415–415.
[64] R.P. Hangarter, N.E. Good, Energy thresholds for ATP synthesis inchloroplasts, Biochim. Biophys. Acta 681 (1982) 397–404.
[65] B. Genty, J. Harbinson, Regulation of light utilization for photosyntheticelectron transport, in: N.R. Baker (Ed.), Photosynthesis and theEnvironment, Kluwer Academic Publishers, Dordrecht, The Netherlands,1996, pp. 67–99.
[66] W. Haehnel, Photosynthetic electron transport in higher plants, Annu. Rev.Plant Physiol. 35 (1984) 659–693.
[67] K. Asada, The water–water cycle in chloroplasts: scavenging of activeoxygens and dissipation of excess photons, Annu. Rev. Plant Physiol. PlantMol. Biol. 50 (1999) 601–639.
[68] E.M. Aro, I. Virgin, B. Andersson, Photoinhibition of photosystem II.Inactivation, protein damage and turnover, Biochim. Biophys. Acta1143 (1993) 113–134.
[69] X.G. Zhu, D.R. Ort, J. Whitmarsh, S.P. Long, The slow reversibility ofphotosystem II thermal energy dissipation on transfer from high to lowlight may cause large losses in carbon gain by crop canopies: a theoreticalanalysis, J. Exp. Bot. 55 (2004) 1167–1175.
[70] X.P. Li, P. Müller-Moulé, A.M. Gilmore, K.K. Niyogi, PsbS-dependentenhancement of feedback de-excitation protects photosystem II fromphotoinhibition, Proc. Natl. Acad. Sci. U. S. A. 99 (2002) 15222–15227.
[71] Y. Munekage, S. Takeda, T. Endo, P. Jahns, T. Hashimoto, T. Shikanai,Cytochrome b6 f mutation specifically affects thermal dissipation ofabsorbed light energy in Arabidopsis, Plant J. 28 (2001) 351–359.
[72] J.D. Sinclair-Day, M.J. Sisley, A.G. Sykes, G.C. King, P.E. Wright, Aciddissociation constants for plastocyanin in the CuI state, J. Chem. Soc.,Chem. Commun. (1985) 505–507.
[73] J.M. Guss, P.R. Harrowell, M. Murata, V.A. Norris, H.C. Freeman, Crystalstructure analyses of reduced (CuI) poplar plastocyanin at six pH values,J. Mol. Biol. 192 (1986) 361–387.