the tanzania national multisectoral nutrition action plan (nmnap)
203
DRAFT-2 UNITED REPUBLIC OF TANZANIA PRIME MINISTER’S OFFICE THE TANZANIA NATIONAL MULTISECTORAL NUTRITION ACTION PLAN (NMNAP) JULY 2016 - JUNE 2021 STRATEGIC PLAN From Evidence to Policy to Action Dar Es Salaam July 2016
-
Upload
khangminh22 -
Category
Documents
-
view
1 -
download
0
Transcript of the tanzania national multisectoral nutrition action plan (nmnap)
DRAFT-2
UNITED REPUBLIC OF TANZANIA
PRIME MINISTER’S OFFICE
THE TANZANIA NATIONAL MULTISECTORAL
NUTRITION ACTION PLAN (NMNAP)
JULY 2016 - JUNE 2021
STRATEGIC PLAN
From Evidence to Policy to Action
Dar Es Salaam July 2016
DRAFT-2
- 2 -
THE TANZANIA NATIONAL
MULTISECTORAL NUTRITION ACTION PLAN (NMNAP)
JULY 2016-JUNE 2021
STRATEGIC PLAN From Evidence to Policy to Action
First edition published September 2016
“Great things are done by a series of small things put together”
Suggested citation: United Republic of Tanzania (2016): Tanzania National Multisectoral Nutrition Action Plan (NMNAP) for the period July 2016 – June 2021: STRATEGIC PLAN: From Evidence to Policy to Action
Dar Es Salaam July 2016
DRAFT-2
- 3 -
Keynote This National Multisectoral Nutrition Action Plan (NMNAP) reflects Tanzania’s commitment to addressing the unacceptably high levels of malnutrition. Tanzania’s political will and Government commitment for nutrition is longstanding. Since independence in 1961, the first phase Government under President, Mwalimu Julius Nyerere, declared that the country faced three major enemies: poverty, disease and ignorance, all of which are the manifestations and causative factors of malnutrition. To show commitment, the Government established the Tanzania Food and Nutrition Centre (TFNC) in 1973 to coordinate nutrition activities in the country. With the support of development partners, Government developed various nutrition relevant policies, strategies and programmes with a specific Food and Nutrition Policy approved in 1992. Despite much progress made since independence, under-nutrition in children is still a major contributor to the persistence of all the three enemies, and a double burden of malnutrition is emerging with increasing levels of overweight/ obesity and diet related non-communicable diseases including, type-2 diabetes, hypertension, chronic respiratory diseases and several types of diet related cancers. Recognizing that malnutrition in all its forms, is a developmental challenge, and a national threat to achieving our national socio-economic objectives, especially of being an industrial, knowledge driven Middle Income Country by 2025, the fifth phase Government formulated the 2016 Food and Nutrition Policy. This National Multisectoral Nutrition Action Plan (NMNAP) which complements the policy within the Government’s Five Year Development Plan II (FYDP II) 2016/17-2020/21 is a “double action” plan that addresses malnutrition in all its forms. The theme of FYDPII is Nurturing an industrial economy and Human Development seen within the context of the long term National Development Vision 2025 on Economic and Social Growth (MKUKUTA). The main aim of MKUKUTA is to transform Tanzania into a Middle Income Country by 2025. Nutrition is prioritized within the Human Development general area with an ambitious target of reducing the prevalence of stunting from the current 34 percent to 15 percent by 2025. The NMNAP target is to reduce stunting to 28 percent by 2021. The long-term desired change expected from scaling-up nutrition interventions within the NMNAP is that “Children, adolescents, women and men in Tanzania are better nourished leading to healthier and more productive lives that contribute to economic growth and sustainable development”. Our target is to eliminate malnutrition as a problem of public health significance by 2030, also a key target for the Global Sustainable Development Goals (SDGs). This NMNAP translates into a single comprehensive national plan the nutrition relevant national, regional and international commitments that Tanzania has made. I would like to reiterate the Government’s commitment to addressing malnutrition with the same vigour to route-out corruption and collecting taxes for national development; same energy as we build our physical infrastructure. In particular, eliminating undernutrition is a great way to develop the “grey matter infrastructure”. In doing this, we shall leave no one behind, and provide every citizen with the potential to lead a healthy and productive life. While we will emphasize domestic resource allocation for nutrition, we ask our development partners, Civil Society Organizations and the private sector to join us to make financial investments in those areas where domestic resources are not adequate. I am confident that together we can eliminate the scourge of malnutrition in all its forms by 2030 if we put our efforts in doing so. Hon. Kassim Majaliwa Prime Minister
DRAFT-2
- 4 -
Foreword Although Tanzania has made some good progress in addressing the problem of undernutrition in children, the pace of improvement, especially for stunting has been slow, with data showing that the prevalence of stunting reduced from about 50 percent in 1992 to about 34 percent in 2015/16. This current level of stunting is categorized as “severe” in terms of its public health significance and is above the 30 percent average observed for Africa. Moreover, a double burden of malnutrition has emerged where undernutrition exists together with a rapidly increasing problem of diet-related non-communicable diseases (DRNCDs), especially overweight, obesity, hypertension and type -2 diabetes that have doubled in adults during the last decade. This is despite the existence of evidence based high impact nutrition interventions, a strong political commitment to address undernutrition and a robust economic growth of about 7 percent for the last decade. One of the key challenges in the slow progress in reducing malnutrition has been national capacity at all levels to translate the political will and commitment into evidence-based, effective, impactful and sustainable policies, strategies and actions that are at scale, multisectoral, well-coordinated, integrated, resourced and monitored. To address this challenge, the Government strengthened its leadership in nutrition and took several steps in recent years. This included the launching of the National Nutrition Strategy (NNS) 2011/12-2015/16, the inclusion of nutrition in national planning and budgeting and the formation of a Multisectoral High-Level Steering Committee on Nutrition (HLSCN) to ensure participation of key nutrition stakeholders. The HLSCN is chaired by the Permanent Secretary in the Prime Minister’s Office with members being the Permanent Secretaries of several key nutrition sensitive ministries, Development Partners, Civil Society Organizations and representatives from the private sector. Nutrition Steering Committees at the Regional and Local Government Authorities have also been formed to facilitate nutrition planning, budgeting and participation of key stakeholders at those levels. While this has been an important step towards building leadership and strategic guidance at the national level, the lack of capacity for implementation at ‘all levels’ remains an impediment. Recently, the Government, with the support of partners, developed the 2016 Food and Nutrition Policy. This National Multisectoral Nutrition Action Plan (NMNAP) is the Policy’s strategic implementation action plan for the period 2016/17-2020/2. The NMNAP is evidence-informed, results-oriented, consistent with the theory of change and based on the three ONES principle of the Scaling-up of Nutrition (SUN) Movement at all levels: one plan, one coordinating mechanism and one monitoring and evaluation framework. It also provides for an effective framework for common results, resources and accountability for nutrition. The NMNAP has identified the following seven key results areas: (i) scaling-up maternal, infant, young child and adolescent nutrition (ii) scaling up prevention and control of micronutrient deficiencies, (iii) scaling up integrated management of acute malnutrition (iv) scaling up prevention and management of diet related non-communicable diseases (DRNCDs), (v) integration of multisectoral nutrition sensitive interventions, (vi) improving nutrition governance, and (vii) establishing a multisectoral nutrition information system. The NMNAP’s objectives are to meet the World Health Assembly nutrition targets on undernutrition, the UN targets on Diet Related Non-Communicable Diseases (DRNCDs) and localizing the global nutrition-relevant Sustainable Development Goals (SDGs) towards eliminating malnutrition as a problem of public health significance by 2030. I call upon all internal and external stakeholder to support Tanzania in the implementation of this NMNAP. Hon. Ummy Mwalimu Minister for Health, Community Development, Gender, Elderly and Children.

DRAFT-2
- 5 -
Statement of commitment We, the Permanent Secretaries from the Line Ministries forming the High Level Steering Committee on Nutrition (HLSCN): Recognizing that the current levels of chronic malnutrition in children under the age of five years are unacceptably high; Aware that despite the good progress made in addressing malnutrition in Tanzania, undernutrition continues to affect the most vulnerable population groups especially children, pregnant and lactating women and adolescents; Concerned that a double burden of malnutrition is emerging with diet-related non-communicable diseases (DRNCDs) increasing at a fast pace along-side high levels of undernutrition; Acknowledging the grave consequences of malnutrition on national social and economic development, which will impede our aspiration of transiting into a middle income country by 2025; Understanding that there is adequate national and global scientific evidence and experience in scaling-up high impact nutrition specific and nutrition sensitive interventions; Confident that this National Multisectoral Nutrition Action Plan (NMNAP) translates well the 2016 National Food and Nutrition Policy into an evidence-based strategic action plan that also contextualizes adaption of the global Sustainable Development Goals (SDGs) and regional nutrition relevant strategies that Tanzania is a state party to; Accepting that it is possible to make significant progress in addressing malnutrition during the Five-Year Development Plan II of 2016/17 – 2020/21 as an important step towards making Tanzania a middle income country by 2025 and the national goal of eliminating malnutrition as a problem of public health significance by 2030; THEREFORE, WE COMMIT OURSELVES TO THE FOLLOWING: We shall take practical steps to ensure our sector policies, strategies, programmes and budgets are nutrition sensitive; We shall actively participate in the implementation of the NMNAP through the High Level Steering Committee on Nutrition; and We shall take the necessary leadership in the implementation of the areas that our sectors have been assigned by the Food and Nutrition Policy and this NMNAP. Names and signatures of the PS of the HLSCN Ministries.
DRAFT-2
- 6 -
Acknowledgements Steered by the Prime Minister’s Office (Mr. Obey Ansery Nkya and Ms Sarah Mshiu) and coordinated by the Tanzania Food and Nutrition Centre, the development of this National Multisectoral Action Plan (NMNAP) involved an extensive consultation process of many nutrition stakeholders. Those who made significant contributions are listed in appendix 4. Since we cannot mention them all by name here, we would like to acknowledge their inputs. As in all big things, there have been movers of the NMNAP, whom we would like to mention in person. Dr. Joyceline Kaganda, Acting Managing Director of TFNC was instrumental in coordinating all aspects of the process. Dr. Festo P. Kavishe1 an Independent Human Development Consultant was the Lead Technical Facilitator and synthesizer writer. Dr. Biram Ndiaye, Nutrition Manager at UNICEF Tanzania and Mauro Brero, Nutrition specialist at UNICEF, Tanzania, not only facilitated the two key result areas on Maternal, Infant, Young Child and Adolescent Nutrition (MIYCAN) and Integrated Management of Acute Malnutrition (IMAM), but also the overall analysis of costs and the Common Results, Resources and Accountability Framework. The UNICEF Tanzania Country Office also provided additional support with Rikke le Kirkegaard, Nutrition Officer who supported drafting of the IMAM scale up plan and Elizabeth Macha, Nutrition Specialist supported the development of the MIYCAN scale up action plans. Ms Neema Joshua and Ms Maria Msangi both from TFNC chaired these two Key Result Areas. The Micronutrients Key Result Area was chaired by Dr. Fatma Abdallah of TFNC and facilitated by Prof. Jonathan Gorstein of the University of Washington and Executive Director of the Iodine Global Network. Prof. Andrew Swai of the Tanzania Diabetic Association facilitated the Diet Related Non-Communicable Diseases (DRNCDs) Key Result Area with Ms Julieth Kitali of TFNC as the chair. The Key Result Areas of Nutrition Sensitive Interventions and Nutrition Governance were chaired by Mr. Geoffrey Chiduo of TFNC and facilitated by David Katsube, Benedict Jeje and Tumaini Charles all from Fhi360-FANTA. Mr. Adam Hancy chaired the Key Result Area of Nutrition Information System, which was facilitated by Cletus Mkai, an Independent Consultant. Giulio Ghirardo, Lead Consultant and Strategy Advisor of IMA International led the theory of change workshop. Enock Musinguzi, Country Representative and SUN Business Network Coordinator for the Global Alliance for Improved Nutrition (GAIN) organized the consultation with the private sector. Many thanks are also due to David Charles, USAID for the technical guidance, Dr Deborah Ash, FHI 360/FANTA for technical guidance and review of the Nutrition Sensitive (NSI) and Multisectoral Nutrition Governance (MNG) thematic areas, and Caroline Mshanga, FHI360/FANTA for review of the NSI and MNG thematic areas. UNICEF provided additional support as follows: Dr France Begin, Senior Nutrition Adviser, UNICEF New York, supported the development of MIYCAN scale up plan and coordinated global UNICEF review of the draft NMNAP; UNICEF ESARO: Ms. Juliawati Untoro, Nutrition Specialist, supported the Bottle Neck Analysis (BNA) for Vitamin A and Iron-Folic Acid supplementation; Mr. Patrick Codjia, Nutrition Specialist supported the BNA for Integrated Management of Acute Malnutrition (IMAM) and development of IMAM scale up plan; Eric Ribaira, Health Specialist supported the BNA for Infant and Young Child Nutrition (IYCN) and Micronutrients scale-up plan; Yu Shibui, Health Officer, supported the BNA for IYCN and Micronutrients; and Dr. Joan Matji, Regional Nutrition Adviser, provided cross cutting support to all components of the NMNAP. UNICEF Niger Country Office provided Fatoumata Lankoande, Nutrition Specialist to assist in costing of the IMAM scale up plan; UNICEF Somalia Country Office provided James Hedges, Monitoring and Evaluation Specialist who assisted in the BNA for IMAM and development of IMAM Logframe.
1 Dr. Festo Kavishe was a former Managing Director of TFNC, District Medical Officer in Mufindi and former UNICEF’s Deputy Regional Director for East Asia and Pacific, Representative in Zimbabwe and Eritrea, Programme Chief on Community Action for Social Development in Cambodia and Regional Nutrition Adviser for Eastern and Southern Africa (ESARO)
DRAFT-2
- 7 -
UNICEF funded the overall process and facilitation including of four Key Result Areas and the workshop on the “Theory of Change”. Fhi360-FANTA supported the facilitation of the two Key Result Areas on NSI and MNG, while the Micronutrient Initiative (MI) funded the facilitation of the Key Result Area on Micronutrients. We would like to thank them all.
DRAFT-2
CONTENTS Keynote ............................................................................................................................................................. - 3 - Foreword .......................................................................................................................................................... - 4 - Statement of commitment......................................................................................................................... - 5 - Acknowledgements ...................................................................................................................................... - 6 - EXECUTIVE SUMMARY .................................................................................................................................. 11
Purpose of the NMNAP ............................................................................................................................. 11 Process for developing the NMNAP .................................................................................................... 12 Key Result Areas of the NMNAP ........................................................................................................... 12 Key expected results of the NMNAP ................................................................................................... 12 Planned NMNAP targets ........................................................................................................................... 12 Key strategies of the NMNAP ................................................................................................................. 14 Leadership and management structure of the NMNAP ............................................................. 15 Monitoring and Evaluation of the NMNAP ....................................................................................... 16 The NMNAP to adhere to the THREE ONEs principle ................................................................. 16 Cost of implementing the NMNAP ....................................................................................................... 16 Prioritized interventions in case of resource constraints ......................................................... 17 A call to stakeholders to support the NMNAP ................................................................................ 17
CHAPTER 1: INTRODUCTION ..................................................................................................................... 18 1.1 Overview .......................................................................................................................................... 18 1.2 Political Will and Government Commitment to addressing malnutrition ........... 18 1.3 The evidence base for the NMNAP ........................................................................................ 19 1.4 The NMNAP and the National Development Agenda .................................................... 20 1.5 The NMNAP and the international development agenda .......................................... 21 1.6 Why invest in nutrition? ............................................................................................................ 23 1.6 Who are the main audience for the NMNAP? ................................................................... 24 1.7 The process for developing the NMNAP ............................................................................. 25 1.8 How is the NMNAP document organized? ......................................................................... 25
CHAPTER 2: SITUATION ANALYSIS AND STRATEGIC CONTEXT ............................................... 27 2.1 Tanzania’s development context ........................................................................................... 27 2.2 Tanzania’s Vital Nutrition Trends ...................................................................... 28 2.2.1 Who are those with suboptimal nutritional status? ................................... 29 2.2.2 Under-nutrition improving but levels still unacceptably high ............... 29 2.2.3 Rapid progress in reducing childhood mortality. ............................................. 33 2.2.4 Slow progress in neonatal and maternal mortality .................................... 34 2.2.3 The double burden of malnutrition ................................................................... 34 2.2.4 The pattern of malnutrition in Tanzania: Where are the malnourished?36 2.3 Major causes of malnutrition in Tanzania ......................................................................... 40 2.4 The impact of malnutrition on national development in Tanzania ........................ 41 2.5 Why is progress in reducing malnutrition relatively slow in Tanzania? ............. 42 2.6.1 Contextual factors ...................................................................................................... 43 2.6.2 Programmatic factors .............................................................................................. 44 2.7 The 2016 National Food and Nutrition Policy ................................................................. 44
CHAPTER 3: CONCEPTUAL FRAMEWORK FOR THE NMNAP ...................................................... 48 3.1 The conceptual basis ................................................................................................................... 48 3.2 The NMNAP Theory of Change ............................................................................................... 51 3.3 Desired change and key assumptions ................................................................................. 51
DRAFT-2
9
3.4 The NMNAP pathway of change ............................................................................................. 53 3.4.1 The hierarchy of results .......................................................................................... 53 3.4.2 Desired change for the NMNAP ........................................................................... 53 3.4.3 Stakeholder engagement and Analysis ............................................................ 53
CHAPTER 4: EXPECTED RESULTS AND KEY STRATEGIES ........................................................... 57 4.1 Guiding principles ........................................................................................................................ 57 4.2 Seven Priority Key Result Areas ............................................................................................ 57 4.3 Expected Results and targets .................................................................................................. 57 4.4 Expected impact and outcomes.............................................................................................. 58 4.5 Expected outputs per outcome .............................................................................................. 60 4.5.1 Key outputs and targets for MIYCAN outcome ............................................. 60 4.5.2 Key outputs and targets for Micronutrients outcome ............................... 60 4.5.3 Key outputs and targets for IMAM outcome .................................................. 60 4.5.4 Key outputs and targets for DRNCDs outcome ............................................. 61 4.5.5 Key outputs and targets for Nutrition sensitive interventions outcome61 4.5.6 Key outputs and targets for Nutrition Governance outcome ................. 61 4.5.7 Key outputs and targets for multisectoral nutrition information system outcome .......................................................................................................................................... 61 4.6 Key strategies ................................................................................................................................. 61 4.6.1 Integrated multisectoral nutrition strategy as overarching ................................. 61 4.6.2 Supportive cross-cutting strategies ................................................................................. 62
CHAPTER 5: ACTION PLANS TO SCALE UP NUTRITION INTERVENTIONS IN THE KEY RESULT AREAS OF THE NMNAP ............................................................................................................... 65
5.1 Overview .......................................................................................................................................... 65 5.2 Action plans to scale-up nutrition specific interventions ........................................... 65 5.2.1 Actions to scale-up Maternal, Infant, Young Child and Adolescent Nutrition (MIYCAN): Detailed Action Plan in Annex 1 ................................................................... 65 5.2.2 Action Plan to Promote Optimal Intake of Essential Micronutrients - Detailed Action Plan in Annex 2 ............................................................................................................. 70 5.2.3 Action Plan to scale-up the Integrated Management of Acute Malnutrition (IMAM): Detailed Action Plan in Annex 3 ........................................................................ 75 5.2.4 Action Plan to Prevent and Manage Diet Related Non-Communicable Diseases (DRNCDs) – Detailed plan available as Annex 4. .......................................................... 81 5.3 Action plan to strengthen Nutrition Sensitive Interventions (Detailed Action Plan in Annex 5) ..................................................................................................................................................... 84 5.3.1 Actions to strengthen Agriculture and Food Security through nutrition sensitive interventions ............................................................................................................ 84 5.3.2 Actions to integrate nutrition in the management of broad health objectives, including HIV and AIDS through Nutrition Sensitive Interventions .................... 88 5.3.3 Actions to strengthen the linkage and synergy between nutrition and Water, Sanitation and Hygiene (WASH) .......................................................................................... 89 5.3.4 Actions to strengthen the linkage between Nutrition, Education and Early Childhood Development .......................................................................................................... 91 5.3.5 Actions to strengthen the links between nutrition and Social Protection activities ......................................................................................................................................... 93 5.3.6 Action plan to strengthen the links between the Environment, Climate Change and Nutrition ................................................................................................................................ 94
CHAPTER 6: GOVERNANCE AND MANAGEMENT OF THE NMNAP .......................................... 97 6.1 Overview .......................................................................................................................................... 97
DRAFT-2
10
6.2 Leadership and management structure ............................................................................. 99 6.3 Key actors, their roles and responsibilities ....................................................................... 99 6.4 Multisectoral coordination system .................................................................................... 108 6.3 Human Resources and Institutional Capacity requirements ................................. 111 6.4 Action plan for Multisectoral Nutrition Governance (Detailed Action Plan in Annex 6) ....................................................................................................................................................... 112
CHAPTER 7: MONITORING, LEARNING AND EVALUATION ...................................................... 118 7.1 Overview .............................................................................................................................................. 118 7.2 Common Results, Resources and Accountability Framework (CRRAF) ............ 120 7.3 Monitoring, Reviews and Evaluation ................................................................................ 120 7.4 Learning and Operational Research .................................................................................. 120 7.5 Action plan for Multisectoral Nutrition Information System (Detailed Action Plan in Annex 7) ........................................................................................................................................ 121
CHAPTER 8: STRATEGIC INVESTMENT PLAN FOR THE NMNAP ........................................... 127 8.1 Overview ....................................................................................................................................... 127 8.2 Financial requirements of the NMNAP ............................................................................ 127 8.2.1 The NMNAP overall budget overview .................................................................. 127 8.3 Financial resources available and the funding gap .................................................... 133 8.5 Resources mobilization plan ....................................................................................................... 134 8.6 Strategic prioritization of proposed action plans ....................................................... 136
CHAPTER 9: RISK ANALYSIS AND MANAGEMENT (RAM) ......................................................... 137 9.1 Risks analysis ..................................................................................................................................... 137 9.2 Risks mitigation ................................................................................................................................. 137
BIBLIOGRAPHY .............................................................................................................................................. 139 APPENDIXES ................................................................................................................................................... 141
Appendix 1: Visual Representations of NMNAP Theory of change ................................. 141 Appendix 2: Integrated Common Results, Resources and Accountability Framework (ICRRAF) for the National Multisectoral Nutrition Action Plan (2016-2021) 145 Appendix 3: Methodology used in developing the NMNAP ................................................... 152 Appendix 4: Membership of Task Teams ...................................................................................... 155 Appendix 5: Abbreviations ............................................................................................................... 160
ANNEXES (available as separate documents) .................................................................................. 164 Annex 1: Action Plan to Scale Up Maternal, Infant, Young Child and Adolescent Nutrition (MIYCAN) ................................................................................................................................ 164 Annex 2: Action Plan to Promote Optimal Intake of Essential Micronutrients ........ 164 Annex 3: Action Plan to Scale Up Integrated Management of Acute Malnutrition (IMAM) 164 Annex 4: Action Plan to Scale Up Prevention and Management of Diet Related Non-Communicable Diseases (DRNCDs) ................................................................................................. 164 Annex 5: Action Plan to Promote Multisectoral Nutrition Sensitive Interventions 164 Annex 6: Action Plan to Strengthen Multisectoral Nutrition Governance ................. 164 Annex 7: Action Plan to Establish a Multisectoral Nutrition Information System . 164
DRAFT-2
11
EXECUTIVE SUMMARY
Purpose of the NMNAP 1. This National Multisectoral Nutrition Action Plan (NMNAP) covering the five-year
period 2016/17-2020/21 is the implementation plan for the 2016 National Food and Nutrition Policy (FNP) and its ten-year Implementation Strategy (2015/16-2025/26). It is an evidence-based “double action” MULTISECTORAL ACTION PLAN to address the unacceptably high levels of malnutrition in Tanzania in all its forms –both under-nutrition and the prevention and control of the increasing burden of Diet Related Non-Communicable Diseases (DRNCDs) such as overweight, obesity, type-2 diabetes and other diet related conditions including cancers.
2. Anchored within Government’s Five-Year Development Plan II (2016/17 – 2020/21) the NMNAP’s broad goal is to accelerate scaling up of high impact multisectoral nutrition specific 2 and nutrition sensitive interventions 3 and creating an enabling environment for improved nutrition, for a healthy and wealthy nation. Though all population groups are considered, the focus is on the most vulnerable groups – infants, children under-five years, adolescent girls, pregnant and lactating women and other women of reproductive age (15-49 years). By developing a productive human capital that focuses on the most vulnerable groups in society, the NMNAP will contribute significantly to the nation’s aspiration of attaining and sustaining a Middle Income Country (MIC)4 status by 2025 in conditions of peace, stability, equality, opportunity and social justice. Moreover, a well-nourished population will have the productive and learning capacity necessary to compete in a knowledge based MIC economy.
3. The NMNAP builds on the successes already made in tackling the malnutrition problem in Tanzania, fills the gaps identified and addresses emerging challenges and priorities. The conceptual framework used in the process facilitates the incorporation of global and national nutrition evidence and experience (Adaptive Planning) into the NMNAP. In its essence, the NMNAP translates current scientific knowledge and evidence on nutrition into concrete actions; and above all political will and Government commitment into tangible delivery of services.
4. The NMNAP is planned as a flexible living document that is able to respond to the dynamic environment expected during its period of implementation. If well resourced, the NMNAP is likely to contribute significantly towards Tanzania’s vision of eliminating malnutrition as a problem of public health significance by 2030 as adopted by the UN General Assembly’s Agenda 2030 on the Sustainable Development Goals (SDGs).
2 Nutrition specific interventions address the immediate causes of undernutrition, like inadequate dietary intake, disease management and some of the underlying causes like feeding and care practices and access to food. They are usually done through the Ministry responsible for health. 3 Nutrition sensitive interventions address some of the underlying and basic causes of malnutrition by incorporating nutrition goals and actions from a wide range of sectors. They can also serve as delivery platforms for nutrition specific interventions. 4 The World Bank’s cut-off GNI per capita defining a MIC as of 1st July 2015 is US$1045 from 2014. On the basis of the new definition, the GNI per capita for Tanzania in 2014 was US$920 and the country wants to attain MIC status of GNI/capita of US$3,000 by 2025.

DRAFT-2
12
Process for developing the NMNAP 5. The process for developing this NMNAP ensured participation of all key players in
the multisectoral nutrition system through extensive stake-holder consultations and scientific evidence reviews (see hyperlinks in relevant sections and bibliography). It was initiated by a steering sub-committee of the High Level Steering Committee on Nutrition (HLSCN) that was chaired by the Prime Minister’s Office (PMO), specifically by the Director of Government Business Coordination, who is also the Scaling Up Nutrition (SUN) focal point. The NMNAP was coordinated and led by the Tanzania Food and Nutrition Centre (TFNC), which followed the guidance of a road map (see appendix 3 on methodology) and facilitated by a Lead Facilitator who provided technical coordination for the six task teams which developed operational action plans in seven Key Result Areas.
Key Result Areas of the NMNAP 6. The NMNAP is organized in seven Key Result Areas (KRAs) to reflect both life-
course and multisectoral approaches. Six task teams led by subject matter experts developed operational action plans for each of the seven KRAs. Task team five covered the two KRAs of Nutrition Sensitive Interventions and Multisectoral Nutrition Governance. The seven Key Result Areas operational action plans are summarized in chapter 5 and available separately as annexes 1-7. The prioritized Key Result Areas of the NMNAP and the task teams responsible are:
1) Scaling up Maternal, Infant, Young Child and Adolescent Nutrition (MIYCAN) (task team 1);
2) Scaling-up Prevention and Management of Micronutrient Deficiencies (task team 2);
3) Scaling up Integrated Management of Acute Malnutrition (IMAM) (task team 3);
4) Scaling-up Prevention and Management of Diet Related Non-Communicable Diseases (DRNCDs) (task team 4);
5) Promoting Multisectoral Nutrition Sensitive Interventions (MNSI) (task team 5);
6) Strengthening Multisectoral Nutrition Governance (MNG) (task team 5); 7) Establishing Multisectoral Nutrition Information System (MNIS) (task
team 6).
Key expected results of the NMNAP 7. The expected long-term impact of the NMNAP is that “Children, adolescents,
women and men in Tanzania are better nourished leading to healthier and more productive lives that contribute to economic growth and sustainable development”. The NMNAP seeks to achieve the desired change and key results through scaling up of evidence-based multisectoral nutrition specific and nutrition sensitive interventions to all segments of the population and providing a conducive enabling environment.
Planned NMNAP targets 8. The planned key targets are adapted from the globally agreed World Health
Assembly (WHA) nutrition targets by 20255, the Sustainable Development Goals 5 The six global targets to be achieved by the year 2025 are (1) 40% reduction of the global number of children under five who are stunted (2) 50% reduction of anaemia in women of reproductive age (3) 30% reduction of low birth weight (4) no increase in childhood overweight (5) increase the rate of exclusive breastfeeding in the first six months up to at least 50% and (6) reduce and
DRAFT-2
13
(SDGs) by 2030 and the global voluntary Non-Communicable Diseases (NCDs) targets by 2025 that Tanzania will be required to report upon.
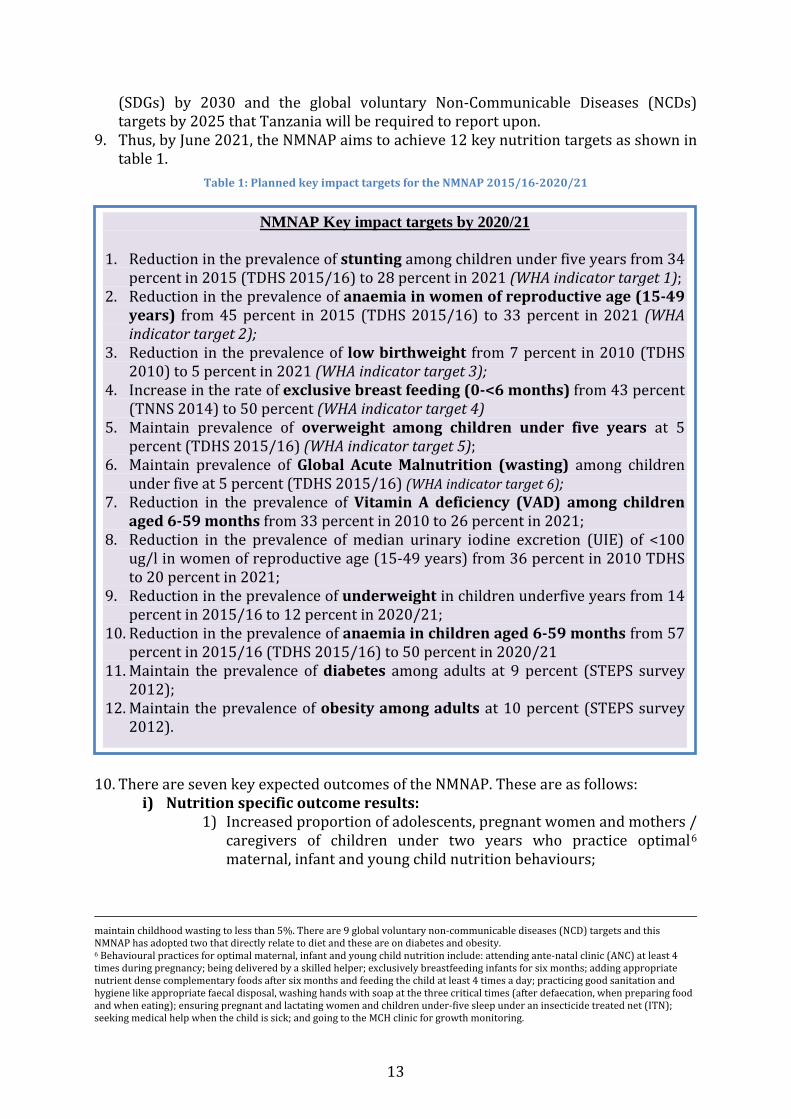
9. Thus, by June 2021, the NMNAP aims to achieve 12 key nutrition targets as shown in table 1.
Table 1: Planned key impact targets for the NMNAP 2015/16-2020/21
10. There are seven key expected outcomes of the NMNAP. These are as follows:
i) Nutrition specific outcome results: 1) Increased proportion of adolescents, pregnant women and mothers /
caregivers of children under two years who practice optimal6 maternal, infant and young child nutrition behaviours;
maintain childhood wasting to less than 5%. There are 9 global voluntary non-communicable diseases (NCD) targets and this NMNAP has adopted two that directly relate to diet and these are on diabetes and obesity. 6 Behavioural practices for optimal maternal, infant and young child nutrition include: attending ante-natal clinic (ANC) at least 4 times during pregnancy; being delivered by a skilled helper; exclusively breastfeeding infants for six months; adding appropriate nutrient dense complementary foods after six months and feeding the child at least 4 times a day; practicing good sanitation and hygiene like appropriate faecal disposal, washing hands with soap at the three critical times (after defaecation, when preparing food and when eating); ensuring pregnant and lactating women and children under-five sleep under an insecticide treated net (ITN); seeking medical help when the child is sick; and going to the MCH clinic for growth monitoring.
NMNAP Key impact targets by 2020/21
1. Reduction in the prevalence of stunting among children under five years from 34 percent in 2015 (TDHS 2015/16) to 28 percent in 2021 (WHA indicator target 1);
2. Reduction in the prevalence of anaemia in women of reproductive age (15-49 years) from 45 percent in 2015 (TDHS 2015/16) to 33 percent in 2021 (WHA indicator target 2);
3. Reduction in the prevalence of low birthweight from 7 percent in 2010 (TDHS 2010) to 5 percent in 2021 (WHA indicator target 3);
4. Increase in the rate of exclusive breast feeding (0-<6 months) from 43 percent (TNNS 2014) to 50 percent (WHA indicator target 4)
5. Maintain prevalence of overweight among children under five years at 5 percent (TDHS 2015/16) (WHA indicator target 5);
6. Maintain prevalence of Global Acute Malnutrition (wasting) among children under five at 5 percent (TDHS 2015/16) (WHA indicator target 6);
7. Reduction in the prevalence of Vitamin A deficiency (VAD) among children aged 6-59 months from 33 percent in 2010 to 26 percent in 2021;
8. Reduction in the prevalence of median urinary iodine excretion (UIE) of <100 ug/l in women of reproductive age (15-49 years) from 36 percent in 2010 TDHS to 20 percent in 2021;
9. Reduction in the prevalence of underweight in children underfive years from 14 percent in 2015/16 to 12 percent in 2020/21;
10. Reduction in the prevalence of anaemia in children aged 6-59 months from 57 percent in 2015/16 (TDHS 2015/16) to 50 percent in 2020/21
11. Maintain the prevalence of diabetes among adults at 9 percent (STEPS survey 2012);
12. Maintain the prevalence of obesity among adults at 10 percent (STEPS survey 2012).

DRAFT-2
14
2) Optimal intake of essential vitamins and minerals to meet physiological requirements and prevent deficiency (focus on Vitamin A, Iron, Iodine, Zinc, Folic Acid and vitamin B12);
3) Increased coverage of Integrated Management of Acute Malnutrition (IMAM); and
4) Improved healthy lifestyles of the Tanzanian community to address the problem of overweight and obesity.
ii) Nutrition sensitive outcome results: 1) Increased coverage of nutrition sensitive interventions from key
development sectors: Agriculture and Food Security; Health and HIV; Water, Sanitation and Hygiene; Education; Social Protection and Environment and Climate Change.
iii) Enabling environment outcome results: 1) Improved Nutrition Governance (including coordination and
leadership) and response across all sectors, actors and administrative levels; and
2) Increased access to quality nutrition related information to allow Government of Tanzania and other stakeholders to make timely and effective evidence based decisions.
Key strategies of the NMNAP 11. The overarching strategy for the NMNAP is a community-centred 7
multisectoral nutrition system that explicitly embraces simultaneous actions for nutrition specific interventions at the level of immediate causes and nutrition sensitive interventions at the levels of underlying and basic causes of malnutrition. A multisectoral nutrition system is composed of multiple sectors (e.g. Agriculture, Health, WASH (Water, Sanitation and Hygiene), Education, Social Protection, Environment); multiple levels (National, Regional/District, Local Government Authorities and importantly the Community) and multiple partners (Government, Development Partners – UN/multi-laterals, Bilaterals, NGOs, CSOs, academia and private sector). The multisectoral community-centred strategy is based on the overwhelming scientific evidence that achieving high coverage of the evidence-based high impact nutrition interventions (Lancet Series 2008 and 2013) requires multisectoral harmonization and collaboration with key nutrition stakeholders.
12. The overarching multisectoral approach will be supported by ten key cross-cutting strategies:
i) Social and behaviour change communication (SBCC) to promote adoption of appropriated behaviours and practices and commitment to achieving common nutrition results for everyone and everywhere in the country.
ii) Advocacy and Social mobilization to sustain political will and commitment for nutrition at all levels.
iii) Community-centred Capacity Development (CCCD) to improve human, institutional and organizational functional capacity for nutrition to ensure efficient and effective multisectoral and multistakeholder collaboration focusing at the community level;
7 A community can be defined as an organized group of people who share a sense of belonging, beliefs, norms and leadership and who usually interact within a common geographical area. Some communities share common goals and interests and usually are supportive of each other and distinguished by what they do (Source: Urban Jonsson, 2003: Human Rights Approach to Development Programming, Pg 64).
DRAFT-2
15
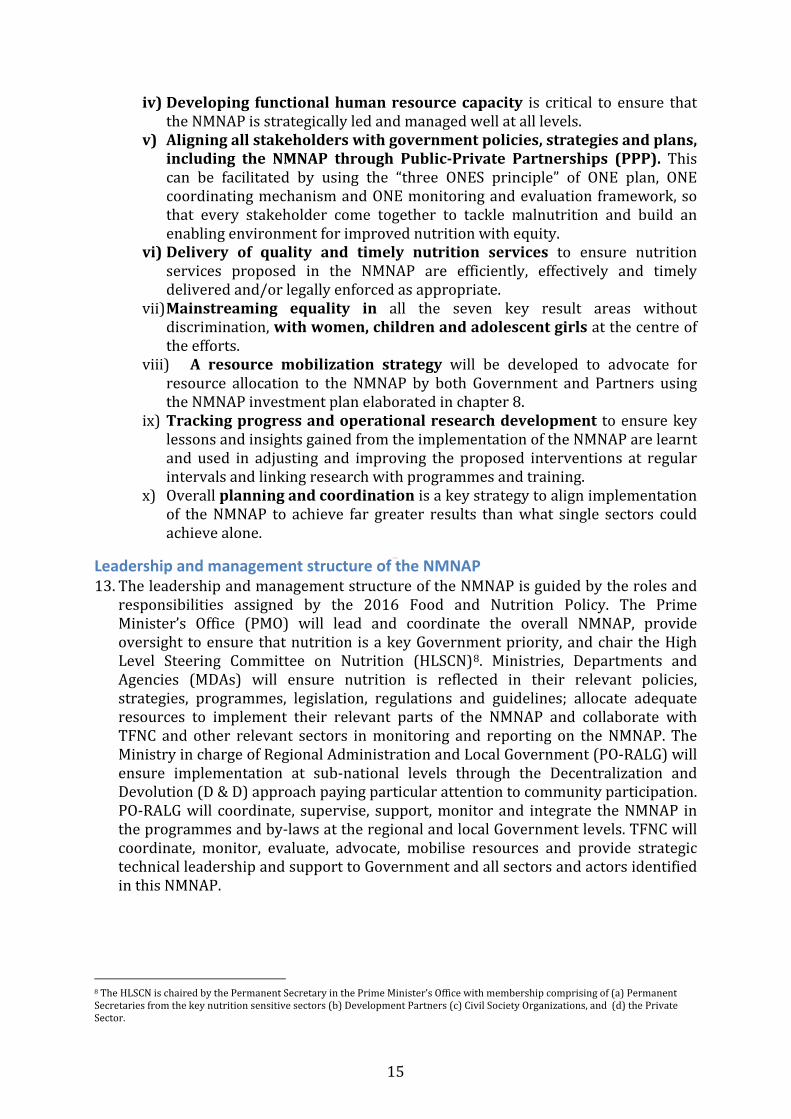
iv) Developing functional human resource capacity is critical to ensure that the NMNAP is strategically led and managed well at all levels.
v) Aligning all stakeholders with government policies, strategies and plans, including the NMNAP through Public-Private Partnerships (PPP). This can be facilitated by using the “three ONES principle” of ONE plan, ONE coordinating mechanism and ONE monitoring and evaluation framework, so that every stakeholder come together to tackle malnutrition and build an enabling environment for improved nutrition with equity.
vi) Delivery of quality and timely nutrition services to ensure nutrition services proposed in the NMNAP are efficiently, effectively and timely delivered and/or legally enforced as appropriate.
vii) Mainstreaming equality in all the seven key result areas without discrimination, with women, children and adolescent girls at the centre of the efforts.
viii) A resource mobilization strategy will be developed to advocate for resource allocation to the NMNAP by both Government and Partners using the NMNAP investment plan elaborated in chapter 8.
ix) Tracking progress and operational research development to ensure key lessons and insights gained from the implementation of the NMNAP are learnt and used in adjusting and improving the proposed interventions at regular intervals and linking research with programmes and training.
x) Overall planning and coordination is a key strategy to align implementation of the NMNAP to achieve far greater results than what single sectors could achieve alone.
Leadership and management structure of the NMNAP 13. The leadership and management structure of the NMNAP is guided by the roles and
responsibilities assigned by the 2016 Food and Nutrition Policy. The Prime Minister’s Office (PMO) will lead and coordinate the overall NMNAP, provide oversight to ensure that nutrition is a key Government priority, and chair the High Level Steering Committee on Nutrition (HLSCN)8. Ministries, Departments and Agencies (MDAs) will ensure nutrition is reflected in their relevant policies, strategies, programmes, legislation, regulations and guidelines; allocate adequate resources to implement their relevant parts of the NMNAP and collaborate with TFNC and other relevant sectors in monitoring and reporting on the NMNAP. The Ministry in charge of Regional Administration and Local Government (PO-RALG) will ensure implementation at sub-national levels through the Decentralization and Devolution (D & D) approach paying particular attention to community participation. PO-RALG will coordinate, supervise, support, monitor and integrate the NMNAP in the programmes and by-laws at the regional and local Government levels. TFNC will coordinate, monitor, evaluate, advocate, mobilise resources and provide strategic technical leadership and support to Government and all sectors and actors identified in this NMNAP.
8 The HLSCN is chaired by the Permanent Secretary in the Prime Minister’s Office with membership comprising of (a) Permanent Secretaries from the key nutrition sensitive sectors (b) Development Partners (c) Civil Society Organizations, and (d) the Private Sector.
DRAFT-2
16
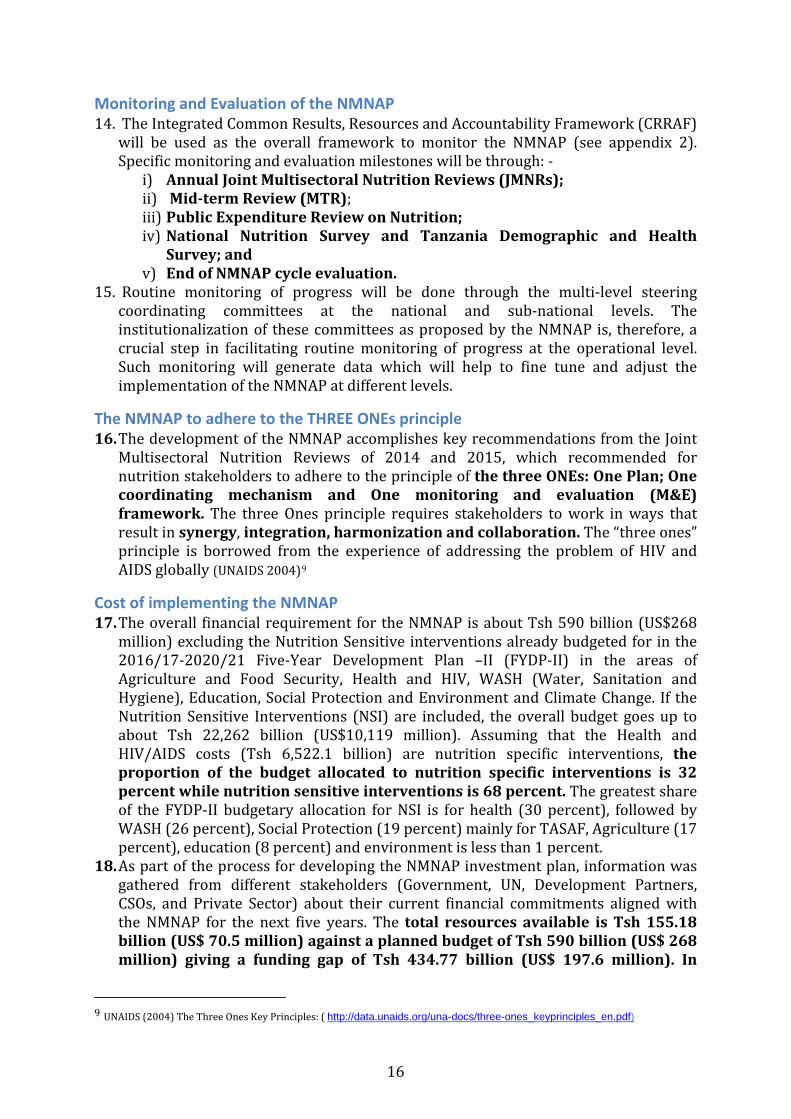
Monitoring and Evaluation of the NMNAP 14. The Integrated Common Results, Resources and Accountability Framework (CRRAF)
will be used as the overall framework to monitor the NMNAP (see appendix 2). Specific monitoring and evaluation milestones will be through: -
i) Annual Joint Multisectoral Nutrition Reviews (JMNRs); ii) Mid-term Review (MTR); iii) Public Expenditure Review on Nutrition; iv) National Nutrition Survey and Tanzania Demographic and Health
Survey; and v) End of NMNAP cycle evaluation.
15. Routine monitoring of progress will be done through the multi-level steering coordinating committees at the national and sub-national levels. The institutionalization of these committees as proposed by the NMNAP is, therefore, a crucial step in facilitating routine monitoring of progress at the operational level. Such monitoring will generate data which will help to fine tune and adjust the implementation of the NMNAP at different levels.
The NMNAP to adhere to the THREE ONEs principle 16. The development of the NMNAP accomplishes key recommendations from the Joint
Multisectoral Nutrition Reviews of 2014 and 2015, which recommended for nutrition stakeholders to adhere to the principle of the three ONEs: One Plan; One coordinating mechanism and One monitoring and evaluation (M&E) framework. The three Ones principle requires stakeholders to work in ways that result in synergy, integration, harmonization and collaboration. The “three ones” principle is borrowed from the experience of addressing the problem of HIV and AIDS globally (UNAIDS 2004)9
Cost of implementing the NMNAP 17. The overall financial requirement for the NMNAP is about Tsh 590 billion (US$268
million) excluding the Nutrition Sensitive interventions already budgeted for in the 2016/17-2020/21 Five-Year Development Plan –II (FYDP-II) in the areas of Agriculture and Food Security, Health and HIV, WASH (Water, Sanitation and Hygiene), Education, Social Protection and Environment and Climate Change. If the Nutrition Sensitive Interventions (NSI) are included, the overall budget goes up to about Tsh 22,262 billion (US$10,119 million). Assuming that the Health and HIV/AIDS costs (Tsh 6,522.1 billion) are nutrition specific interventions, the proportion of the budget allocated to nutrition specific interventions is 32 percent while nutrition sensitive interventions is 68 percent. The greatest share of the FYDP-II budgetary allocation for NSI is for health (30 percent), followed by WASH (26 percent), Social Protection (19 percent) mainly for TASAF, Agriculture (17 percent), education (8 percent) and environment is less than 1 percent.
18. As part of the process for developing the NMNAP investment plan, information was gathered from different stakeholders (Government, UN, Development Partners, CSOs, and Private Sector) about their current financial commitments aligned with the NMNAP for the next five years. The total resources available is Tsh 155.18 billion (US$ 70.5 million) against a planned budget of Tsh 590 billion (US$ 268 million) giving a funding gap of Tsh 434.77 billion (US$ 197.6 million). In
9 UNAIDS (2004) The Three Ones Key Principles: ( http://data.unaids.org/una-docs/three-ones_keyprinciples_en.pdf)

DRAFT-2
17
proportional terms, about 26.3 percent of the NMNAP funds is available leaving a gap of 73.7 percent to be mobilized. The biggest funding gaps are seen in the Key Result Areas of Maternal, Infant, Young Child and Adolescent Nutrition (US$ -54.97 million), Micronutrients (US$ -43.81 million), Integrated Management of Acute Malnutrition (US$ -40.45 million), Diet Related Non-Communicable Diseases (US& -32.48 million) and Multisectoral Nutrition Information System (US$ -21.87 million).
Prioritized interventions in case of resource constraints 19. Since the NMNAP is results-based, the interventions proposed are necessary to
achieve the articulated results. If further prioritization is done, it also means that the planned results will also have to be reduced. However, given the high funding gap of about 74 percent, the NMNAP prioritized the following intervention areas in case of resource constraints:
i) Increase coverage of Maternal Infant, Young Child and Adolescent Nutrition (MIYCAN) activities;
ii) Scale up of Integrated Management of Acute Malnutrition (IMAM) among children under five; and
iii) Prevention of anaemia among women. 20. The main reason for prioritizing the above areas is to quickly scale up high impact
interventions that are able to significantly address the high levels of stunting, the big burden of severe acute malnutrition in children under five and anaemia in women of reproductive age. Progress in these areas has been slow in the past, and ensuring they are funded is likely to result in quick gains in child survival, growth and improved human capital formation and productivity.
A call to stakeholders to support the NMNAP 21. Having adopted the Food and Nutrition Policy; developed this NMNAP with wide
stakeholder consultation and made modest secure financial commitment for investing in nutrition, the Government pledges continued political leadership and accountability in the fight against malnutrition and calls upon partners, including the private sector to support this NMNAP. The resource mobilization plan calls for about 30 percent of the resource gap to be provided by the Government of Tanzania, 60 percent from Development Partners and 10 percent from the Private Sector. With this support, the NMNAP will be fully funded, which will enable implementation and its targets hopefully achieved and even exceeded.

DRAFT-2
18
CHAPTER 1: INTRODUCTION
1.1 Overview 1. This document articulates the Tanzania National Multisectoral Nutrition
Action Plan (NMNAP) for the period 2016/17-2020/2021. The period coincides with the First Five-Year Development Plan of the Fifth Phase Government and provides a logical continuation of the five-year National Nutrition Strategy (NNS) 2010/2011-2015/2016. The NMNAP was developed to implement the basic principles included in the 2016 Tanzania National Food and Nutrition Policy to address the unacceptably high levels of malnutrition.
2. The term malnutrition is used here to refer to both undernutrition and overnutrition. Undernutrition manifests itself mainly as stunting (low height-for-age or chronic malnutrition); wasting (low weight-for-height or acute malnutrition); underweight (low weight-for age, a combination of stunting and wasting); and low birth weight (of less than 2.5kg). Micronutrient deficiencies (often called hidden hunger) caused by deficiencies of essential vitamins and minerals also fall in the category of undernutrition. The main essential vitamins and mineral deficiencies in Tanzania are: vitamin A, folic acid, vitamin B12 and iodine, iron and zinc. Overnutrition manifests mainly as overweight and obesity, which lead to the development of diet related non-communicable diseases (DRNCDs) including type-2 diabetes, high blood pressure, cardio-vascular diseases, weight related joint pains and several types of cancer.
3. The NMNAP is a “double duty action” plan that for the first time in Tanzania integrates actions to combat undernutrition with those which aim to prevent and control overweight/obesity and related non-communicable diseases into one plan. “Double duty-actions” have the potential for greater impact on malnutrition in all its forms, than actions addressing specific types of malnutrition in isolation. The NMNAP galvanizes recent scientific evidence and national and global political attention on nutrition into integrated cross-sectoral actions and multi-stakeholder collaboration for improved nutrition.
1.2 Political Will and Government Commitment to addressing malnutrition 4. Tanzania’s commitment for nutrition is longstanding. Since independence in
1961 the declared major enemies of Tanzania were Poverty, Disease and Ignorance, all major causes of malnutrition. Despite progress made, under-nutrition still is a major impediment to the alleviation of all the three enemies. The key challenge has been translation of the political will and state commitment into evidence-based, effective, impactful and sustainable policies, strategies and actions that are implemented at scale, well-coordinated, resourced and monitored.
5. Committed to providing leadership in nutrition in recent years, the Government formally adopted a multisectoral approach and increased its commitment to improve nutrition by:
i. Launching the National Nutrition Strategy (NNS) 2011/12-2015/16 and its Implementation Plan;
ii. Developing a National Action Plan for NCDs 2008-2015;

DRAFT-2
19
iii. Reviewing and updating the 1992 into a 2016 National Food and Nutrition Policy;
iv. Actively participating in the Global SUN Movement at Presidential level after joining in 2011 as one of the 26 Early Riser Countries;
v. Creating a Multisectoral High-Level Steering Committee for Nutrition (HLSCN) coordinated by the Prime Minister’s Office and multisectoral steering committees for nutrition at regional and district levels;
vi. Establishing and funding the posts of Regional and District Nutrition Officers (RNuO and DNuOs) and recruiting qualified people in these positions for all regions and districts.
vii. Creating a Nutrition Section in the Ministry of Regional Administration and Local Government (RALG) initially in the Prime Minister’s Office and from 2016 in the President’s Office to ensure effective decentralization of nutrition actions and resources.
viii. Developing tools to track progress towards scaling-up nutrition by tracking both results and financial expenditures: e.g. the Public Expenditure Review (PER) of the Nutrition Sector in 2013 expected to be repeated every two 2-3 years, developing and adoption of the Nutrition Scorecard in 2015 and organizing annual Joint Multisectoral Nutrition Reviews (JMNRs) since 2014.
ix. Developing guidelines for nutrition planning and budgeting by regional and district/council nutrition officers for inclusion in the council's comprehensive plans since 2012.
6. The Government’s efforts to decentralize public financing for nutrition to the Local Government Authorities resulted in a steady increase in funds for nutrition at the District/Council level with financial allocations for nutrition per district/municipal council increasing from Tsh 58 million in Financial Year 2011/12 to Tsh 217 million in Financial Year 2014/15.
1.3 The evidence base for the NMNAP 7. Although no formal evaluation of the implementation of the National Nutrition
Strategy (NNS) of 2010/11-2015/16 was done, there were several reviews, surveys or studies undertaken that together with global studies provide the evidence-base for the NMNAP. These included the TFNC landscape analysis to asses Tanzania’s readiness to scale-up nutrition (TFNC 2012)10 ; the 2014 and 2015 Joint Multisectoral Nutrition Reviews11; the 2014 Technical Review Paper (Vision 2025) on “Towards Eliminating Malnutrition in Tanzania” by 203012; the 2014 National Nutrition Survey (SMART Survey); the 2015/16 Tanzania Demographic and Health Survey and Malaria Survey (TDHS-MS) and the 2016 Scaling Up Nutrition (SUN) Movement Joint Assessment for Tanzania. Moreover, as part of the process for developing the NMNAP, several bottleneck analyses (BNA) were done to assess the operational challenges to effective
10 TFNC (2012): Landscape Analysis of country’s readiness to accelerate action in nutrition: Tanzania assessment for scaling up nutrition 2012 http://apps.who.int/nutrition/landscape_analysis/TanzaniaLandscapeAnalysisFinalReport.pdf?ua=1 11Kavishe F.P (2014 & 2015): https://www.researchgate.net/publication/267252935_Report_on_the_First_Tanzania_Multisectoral_Nutrition_Review_August_19-21_2014 and https://www.researchgate.net/publication/283122986_Report_on_the_2015_and_Second_Tanzania_Joint_Multisectoral_Nutrition_Review 12Kavishe F.P (2014): https://www.researchgate.net/publication/267309649_Towards_Eliminating_Malnutrition_in_Tanzania_Vision_2025
DRAFT-2
20
delivery and of scaling-up nutrition interventions at the Local Government Authority (LGA) Council level. Additionally, extensive global literature reviews provided the scientific evidence. Desk reviews of the National Nutrition Multisectoral Plans for Ethiopia, Nepal and Sri Lanka provided global experience in developing such plans.
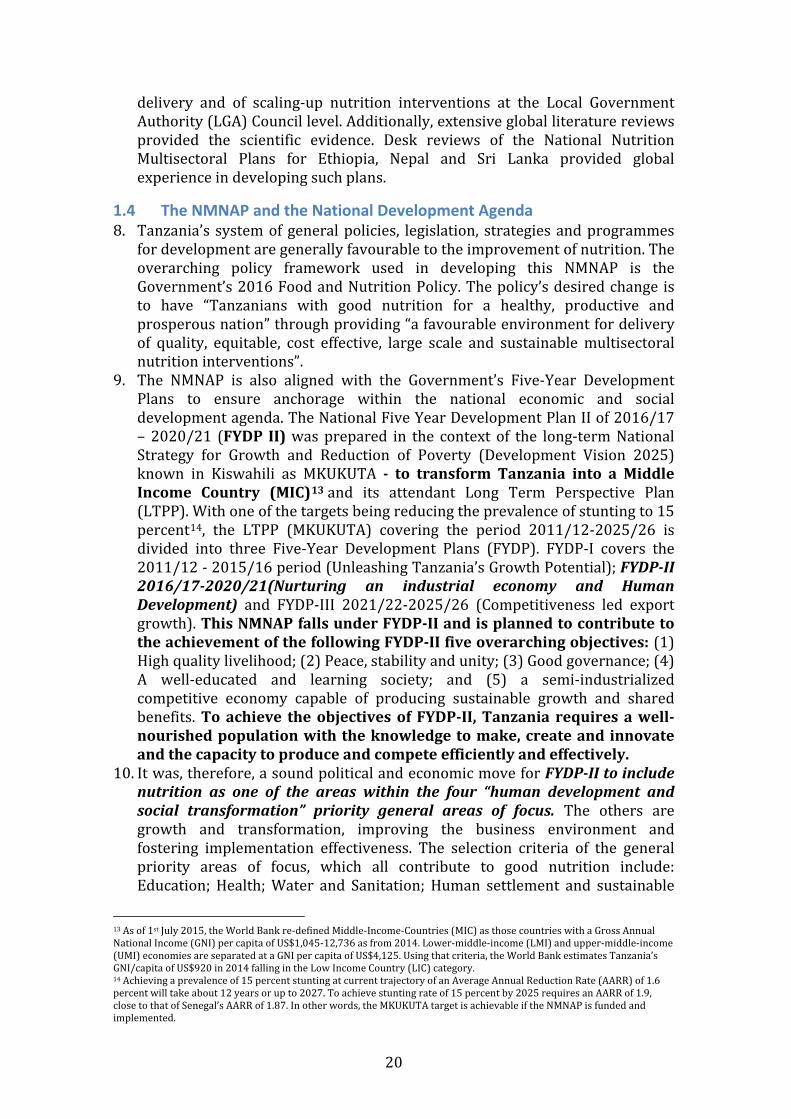
1.4 The NMNAP and the National Development Agenda 8. Tanzania’s system of general policies, legislation, strategies and programmes
for development are generally favourable to the improvement of nutrition. The overarching policy framework used in developing this NMNAP is the Government’s 2016 Food and Nutrition Policy. The policy’s desired change is to have “Tanzanians with good nutrition for a healthy, productive and prosperous nation” through providing “a favourable environment for delivery of quality, equitable, cost effective, large scale and sustainable multisectoral nutrition interventions”.
9. The NMNAP is also aligned with the Government’s Five-Year Development Plans to ensure anchorage within the national economic and social development agenda. The National Five Year Development Plan II of 2016/17 – 2020/21 (FYDP II) was prepared in the context of the long-term National Strategy for Growth and Reduction of Poverty (Development Vision 2025) known in Kiswahili as MKUKUTA - to transform Tanzania into a Middle Income Country (MIC)13 and its attendant Long Term Perspective Plan (LTPP). With one of the targets being reducing the prevalence of stunting to 15 percent14, the LTPP (MKUKUTA) covering the period 2011/12-2025/26 is divided into three Five-Year Development Plans (FYDP). FYDP-I covers the 2011/12 - 2015/16 period (Unleashing Tanzania’s Growth Potential); FYDP-II 2016/17-2020/21(Nurturing an industrial economy and Human Development) and FYDP-III 2021/22-2025/26 (Competitiveness led export growth). This NMNAP falls under FYDP-II and is planned to contribute to the achievement of the following FYDP-II five overarching objectives: (1) High quality livelihood; (2) Peace, stability and unity; (3) Good governance; (4) A well-educated and learning society; and (5) a semi-industrialized competitive economy capable of producing sustainable growth and shared benefits. To achieve the objectives of FYDP-II, Tanzania requires a well-nourished population with the knowledge to make, create and innovate and the capacity to produce and compete efficiently and effectively.
10. It was, therefore, a sound political and economic move for FYDP-II to include nutrition as one of the areas within the four “human development and social transformation” priority general areas of focus. The others are growth and transformation, improving the business environment and fostering implementation effectiveness. The selection criteria of the general priority areas of focus, which all contribute to good nutrition include: Education; Health; Water and Sanitation; Human settlement and sustainable
13 As of 1st July 2015, the World Bank re-defined Middle-Income-Countries (MIC) as those countries with a Gross Annual National Income (GNI) per capita of US$1,045-12,736 as from 2014. Lower-middle-income (LMI) and upper-middle-income (UMI) economies are separated at a GNI per capita of US$4,125. Using that criteria, the World Bank estimates Tanzania’s GNI/capita of US$920 in 2014 falling in the Low Income Country (LIC) category. 14 Achieving a prevalence of 15 percent stunting at current trajectory of an Average Annual Reduction Rate (AARR) of 1.6 percent will take about 12 years or up to 2027. To achieve stunting rate of 15 percent by 2025 requires an AARR of 1.9, close to that of Senegal’s AARR of 1.87. In other words, the MKUKUTA target is achievable if the NMNAP is funded and implemented.
DRAFT-2
21
urban management; and strengthening capability and social protection. The selection of these human development priority areas was based on their potential to contribute to the realization of the national development aspirations and the need for sustaining and consolidating current social development achievements, including nutrition and social protection. The high priority given to the role of the private sector in FYDP-II is also reflected in the process for the development of this NMNAP that included private sector consultation15.
11. Poverty, malnutrition, diseases and inequality are intricately linked, and if not addressed are often transferred from one generation to the next. Thus, effectively addressing the challenge of malnutrition may help to interrupt the vicious cycle of malnutrition-disease-poverty-inequality now and for future generations. In conjunction with efforts to reduce poverty and inequality, eliminating malnutrition can accelerate Tanzania’s accession to MIC status, promote and foster political stability, reduce the chances of social conflict, accelerate the achievement of the objectives of FYDP-II, MKUKUTA and promote fairness, social justice and social mobility.
12. Moreover, a well-nourished and healthy population contributes to all of the five overarching objectives of FYDP-II because good health and nutrition (1) improves the quality of livelihoods by increasing their educability, employability, creativity and innovation; (2) increases the likelihood of peace, stability and unity by reducing poverty and inequalities, thus enhancing human dignity and self-worth; (3) improves good governance because well- nourished people are more likely to participate in the system of governance; (4) improves the chances of creating a well-educated and learning society by improving school performance and capacity to learn; and lastly (5) enhances the development of a knowledge-based economy, which is critical for economic competitiveness by improving the intelligent quotient (IQ) of the population and the productivity of adults.
1.5 The NMNAP and the international development agenda 13. Every nation is affected by malnutrition, some more so by undernutrition,
others by overnutrition (overweight, obesity and diet related non-communicable disease) and still others, like Tanzania, by a double burden of both under-and overnutrition. Given that malnutrition is a serious barrier to the development of full human potential and equitable and sustainable social and economic development the international development agenda has rightly given high priority to addressing the malnutrition challenge.
14. At the global level, the burden of malnutrition is enormous. The Global Nutrition Report 201616 recognized that the numbers of people affected by the different types of malnutrition cannot simply be added because a person may suffer from more than one type of malnutrition at the same time. The report sums up the global scale of malnutrition in 2016 as follows: (1) out of a world population of 7 billion, about 2 billion suffer from micronutrient malnutrition
15 Kavishe F.P (2016): Report on the Private Sector Consultation on the Development of the Tanzania National Multisectoral Nutrition Action Plan (NMNAP) for 2016/17-2020/21 16 International Food Policy Research Institute. 2016. Global Nutrition Report 2016: From Promise to Impact: Ending Malnutrition by 2030. Washington, DC.. http://ebrary.ifpri.org/utils/getfile/collection/p15738coll2/id/130354/filename/130565.pdf
DRAFT-2
22
and nearly 800 million suffer from calorie deficiency; (2) out of 667 million children under the age of five years worldwide, 159 million are stunted (too short for their age), 50 million are wasted (too thin for their height), and 41 million are overweight; and (3) out of 5 billion adults worldwide, nearly 2 billion are overweight or obese and one in 12 has type 2 diabetes. Moreover, undernutrition is responsible for about 45 percent of deaths of children under-five years (3 million deaths per annum). The economic burden is also huge: up to 11 percent of GDP is lost to maternal and child undernutrition and 2.8 percent of GDP is lost to obesity. However, the benefits of good nutrition are also huge: 33 percent of well-nourished children are more likely to escape poverty and the benefit-cost returns on investing in nutrition is 16-to-1 and often, even higher.
15. Thus, while the NMNAP implements the national development agenda, it is heavily informed by the regional and global nutrition-relevant development agenda and translate this into a national action plan. The key regional ones are: The East African Food and Nutrition Policy, the SADC Food and Nutrition Security and the African Union (AU) Food and Nutrition Strategy. Globally, they include inter alia: Agenda 2030 on Sustainable Development Goals (SDGs); the 2012 World Health Assembly nutrition targets for 2025; the UN Network for Scaling Up Nutrition (SUN) Strategy (2016-2020)17; the UN Decade (2016-2025) of Action on Nutrition; the second International Conference on Nutrition (ICN2) Plan of Action; the 2011 UN Political Declaration and 2014 UN Outcome Document on Non Communicable Diseases (NCDs). At the global level, key policies and strategic targets include the WHO comprehensive implementation plan on maternal, infant and young child nutrition (http://www.who.int/nutrition/publications/CIP_document/en/) and the WHO global strategy for women’s, children’s and adolescent health 2016-2030 (http://www.who.int/life-course/partners/global-strategy/en/).
16. The United Nations Agenda 2030 (SDGs) challenged countries to end all forms of malnutrition by 2030 by including as the second SDG,” End hunger, achieve food security and improved nutrition and promote sustainable agriculture”. Clearly, nutrition is central to the SDGs with at least 12 of the 17 SDGs containing indicators vital for nutrition improvement. These are SDGs 1, 2, 3,4,5,6,8,10,13,15,16 &17, which reflect an appreciation of the importance of nutrition in sustainable development.
17. The Global Nutrition Report of 2016 calls on countries to take five critical actions to address the problem of malnutrition: (1) Make the political choice to end all forms of malnutrition (2) Invest more and allocate better for nutrition (3) Collect the right data to maximize investments in nutrition (4) Invest in carrying out proven and evidence informed solutions – and identify new ones; and (5) Tackle malnutrition in all its forms. This NMNAP recognizes and incorporates all five of these critical actions.
18. Moreover, the NMNAP is aligned with the SUN Movements Vision of a “world free from malnutrition in all its forms by 2030, to be led by governments and supported by organizations and individuals to take collective action to ensure every child, adolescent, mother and family can realise their right to food and nutrition, reach their full potential and shape sustainable and prosperous societies”. The proposed actions of the NMNAP also align with the SUN
17 SUN Movement (2016): Strategy and Roadmap (2016-2020)
DRAFT-2
23
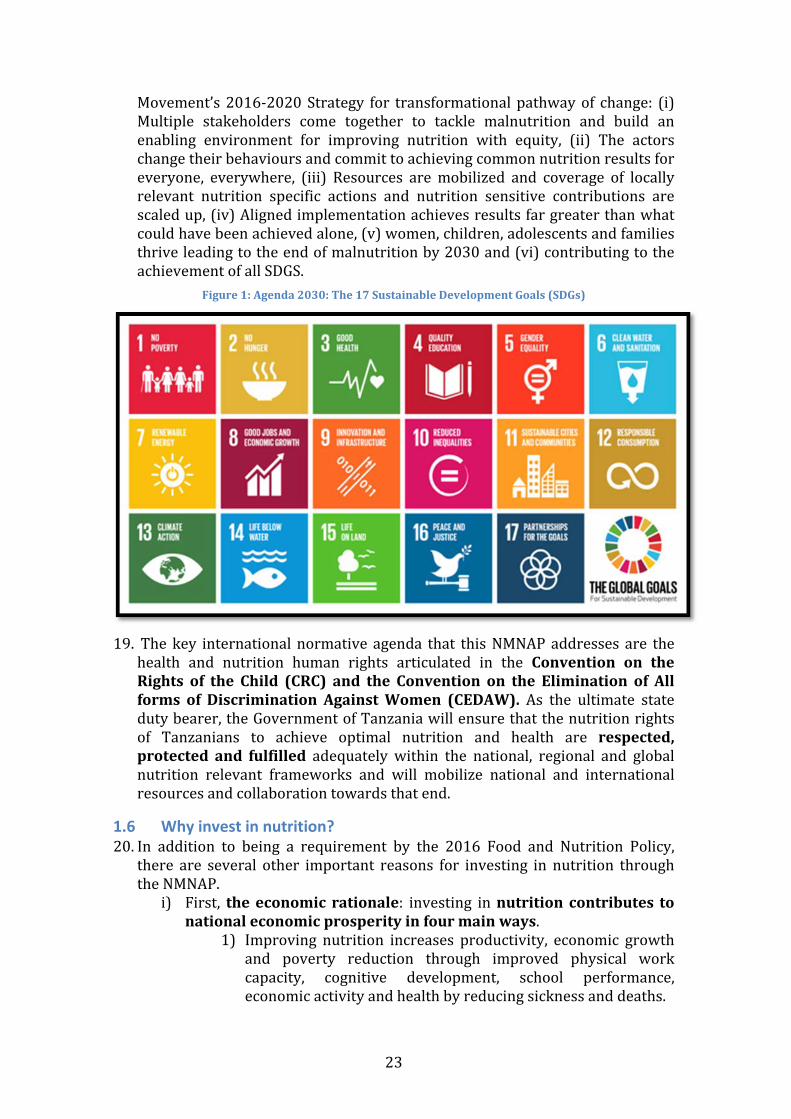
Movement’s 2016-2020 Strategy for transformational pathway of change: (i) Multiple stakeholders come together to tackle malnutrition and build an enabling environment for improving nutrition with equity, (ii) The actors change their behaviours and commit to achieving common nutrition results for everyone, everywhere, (iii) Resources are mobilized and coverage of locally relevant nutrition specific actions and nutrition sensitive contributions are scaled up, (iv) Aligned implementation achieves results far greater than what could have been achieved alone, (v) women, children, adolescents and families thrive leading to the end of malnutrition by 2030 and (vi) contributing to the achievement of all SDGS.
Figure 1: Agenda 2030: The 17 Sustainable Development Goals (SDGs)
19. The key international normative agenda that this NMNAP addresses are the health and nutrition human rights articulated in the Convention on the Rights of the Child (CRC) and the Convention on the Elimination of All forms of Discrimination Against Women (CEDAW). As the ultimate state duty bearer, the Government of Tanzania will ensure that the nutrition rights of Tanzanians to achieve optimal nutrition and health are respected, protected and fulfilled adequately within the national, regional and global nutrition relevant frameworks and will mobilize national and international resources and collaboration towards that end.
1.6 Why invest in nutrition? 20. In addition to being a requirement by the 2016 Food and Nutrition Policy,
there are several other important reasons for investing in nutrition through the NMNAP.
i) First, the economic rationale: investing in nutrition contributes to national economic prosperity in four main ways.
1) Improving nutrition increases productivity, economic growth and poverty reduction through improved physical work capacity, cognitive development, school performance, economic activity and health by reducing sickness and deaths.

DRAFT-2
24
2) Addressing malnutrition increases GDP growth and reduces national budgetary costs for custodian care and malnutrition-related lost lives. According to WHO, in 2012, nutritional deficiencies (protein-energy deficiency and deficiencies of iron, vitamin A and iodine) were responsible for as much as 5 percent of the total DALYS (disability-adjusted life years) losses in the low income WHO African region countries18. The proportion of DALYS lost is higher if DRNCDs are included.
3) Investing in nutrition is the “best” buy for economic development. The 2012 Copenhagen Consensus 19 concluded that undernutrition should be a top priority for policy makers because it is the best buy for development. Three types of key investments were proposed to impact on nutrition: (1) Accelerating yield enhancements, (2) Market innovations that reduce hunger, and (3) Interventions that reduce micronutrient malnutrition and reduce the prevalence of stunting.
4) Interventions to improve nutrition have cost-benefit ratios of around 1:20, comparable for example to investments in roads, irrigation, and health, and generate growth that directly benefits the poor and reduce inequality. Investing in nutrition also help businesses and assist in social mobility, through a more productive workforce and a more affluent consumer base.
ii) Second, nutrition is a human right. The 2016 Food and Nutrition Policy makes frequent reference to nutrition as a fundamental human right in the identification of the strategic policy issues to address. Moreover, Tanzania is a state party to a number of human rights instruments that explicitly mention the right to health and nutrition. These include among others the Convention on the Rights of the Child (CRC), the Convention on the Elimination of All forms of Discrimination Against Women (CEDAW) and the African Charter on Human Rights.
iii) Third, addressing malnutrition is a national and global political choice for security, peace and stability. Nationally, it will greatly contribute to Tanzania’s political agenda of peace and stability and propelling the country into middle income country (MIC) status by 2025. Globally, it contributes to global security and peace and provides national anchor for the implementation of the global development and normative agendas.
1.6 Who are the main audience for the NMNAP? 21. The NMNAP main audience is policy makers (and their technical staff) at all
levels (national & sub-national), who are involved in the design of policies for, and allocation of resources towards improving the health and wellbeing of the population. At the operational level, the NMNAP provides strategic direction to those responsible for programme implementation and service delivery at all levels. Furthermore, donors, development partners and other state and no-state actors in nutrition, including Civil Society Organizations and the private
18 WHO (2014): Global Health Estimates 2014 Summary Tables: DALY by Cause, Age, and Sex by World Bank Income Category and WHO Region, 2000 and 2012. http://www.who.int/healthinfo/global_burden_disease/estimates/en/index2.html 19 Copenhagen Consensus, 2012. Challenge Paper, Hunger and Malnutrition, Available from: http://copenhagenconsensus.com/sites/default/files/Hunger%2Band%2BMalnutrition.pdf

DRAFT-2
25
sector, who finance nutrition improvement initiatives and projects will find this Action Plan useful in setting priority investments and implementing their Country strategies. The NMNAP facilitates all stakeholders in nutrition to act in a harmonized, constructive and collaborative way.
1.7 The process for developing the NMNAP 22. The process was initiated by a NMNAP steering committee, which was formed
as a sub-committee of the High Level Steering Committee on Nutrition (HLSCN). Led by the Prime Minister’s Office (PMO), specifically by the Director of Government Business Coordination, who is also the Scaling Up Nutrition (SUN) focal point and with the Executive Coordination by the Tanzania Food and Nutrition Centre (TFNC), the process was informed by extensive stake-holder consultations – Government Ministries, Departments and Agencies (MDA), UN, Development Partners, Civil Society Organizations, Academia, Research Institutions and the Private Sector. It drew on lessons from most current scientific evidence, bottleneck analysis for the Key Result Areas and experience, lessons and insights from the 2014 and 2015 Joint Multisectoral Nutrition Reviews (JMNR) of the five-year National Nutrition Strategy (NNS) covering the period 2010/2011 to 2015/2016.
23. After developing a roadmap that provided the foundation for establishing seven Key Result Areas (KRA), each KRA was steered by task teams that were led by an expert facilitator and chaired by a TFNC subject area expert. A Lead Facilitator who is a senior nutrition expert with extensive national and international experience in nutrition provided technical quality assurance, coordination and synthesized the task teams’ outputs into this coherent NMNAP. The TFNC Acting Managing Director provided administrative coordination and chaired multi-task team strategic forums.
24. A great amount of dynamic flexibility was built into the process to allow for incorporation of new and emerging ideas including doing a consultation with the private sector and holding two workshops on the “Theory of Change and Complexity”. The flexibility helped to widen stakeholder participation, sharpened the capacity for articulating results-based planning and budgeting and allowed for reflective contributions by stakeholders. The NMNAP document finalization process included a consolidation workshop, a validation workshop and peer review of the drafts.
1.8 How is the NMNAP document organized? 25. This NMNAP document provides a synthesized high-level strategic overview of
the action plans developed by the Key Result Areas task teams. The detailed operational plans are available separately as Annexes 1-7 to this NMNAP. The NMNAP document is organized in nine chapters with a bibliography, six appendices and 7 annexes as follows: -
1) Chapter 1 introduces the NMNAP with a brief overview of what
the action plan is about, why it was developed and leveraged the context of the Five-Year Development Plan 11 (FYDP-II), the process for its development, the main audiences and how the document is organized.

DRAFT-2
26
2) Chapter 2 provides a situation analysis looking at Tanzania’s development context, the evidence base used, the nutrition trends as well as the policy basis for NMNAP.
3) Chapter 3 provides the theory of change describing the rationale and pathways for the different proposed activities to reach the desired change.
4) Chapter 4 indicates expected results of the NMNAP, the key targets and the key strategies.
5) Chapter 5 is a synthesized summary of the action plans for the first five of the seven Key Result Areas indicating the key actions, timelines and budget.
6) Chapter 6 describe the governance of NMNAP and proposes a framework for coordinating, leading and managing the NMNAP from a strategic perspective. It includes the key actions, timelines and budget for the Multisectoral Nutrition Governance action plan.
7) Chapter 7 is on Monitoring, Evaluation, Learning and Reporting and is derived from Key Result Area seven on Multisectoral Nutrition Information Systems with its action plan, timelines and proposed budget.
8) Chapter 8 lays out the investment plan for the NMNAP and analyses the financial, human and organizational resource requirements and gaps with a view to develop a resources mobilization plan.
9) Chapter 9 provides a risk analysis and mitigation measures. 26. After a bibliography and appendixes, there is a list of the seven Annexes
(1-7), which are the separate “operational action plans” for the seven Key Result Areas (KRAs). These Annexes, which are available separately are: -
Annex 1: Scaling up maternal, infant, young child and adolescent nutrition (MIYCAN); Annex 2: Scaling up the prevention and management of micronutrient deficiencies Annex 3: Scaling up of Integrated Management of Acute Malnutrition (IMAM)- includes during emergency situations and people affected by HIV and AIDS; Annex 4: Scaling up Prevention and Management of Diet Related Non-Communicable Diseases (DRNCDs); Annex 5: Multisectoral Nutrition Sensitive Interventions Annex 6: Nutrition Governance; and Annex 7: Establishing a Multisectoral Nutrition Information System.
27. While the overall NMNAP is meant to be a strategic guide, each of the costed Key Result Area Action Plans (Annexes 1-7) can serve the following objectives (a) as a guiding tool for developing operational plans at all levels by lead and collaborating institutions as indicated in the specific accountability frameworks (b) as a framework for coordinating the actions of various sectors and partners; (c) as an integrated framework for common results, resources and accountability that will help tracking progress; and (d) as a basis to mobilize resources for the individual Key Result Areas.

DRAFT-2
27
CHAPTER 2: SITUATION ANALYSIS AND STRATEGIC CONTEXT
2.1 Tanzania’s development context 28. The planning and implementation of this NMNAP should be seen within
Tanzania’s development context. The World Bank categorizes Tanzania as a low-income country (LIC). In 2015 the Gross National Income (GNI) per capita was estimated to be US$ 920, the population was 53.47 million and life expectancy at birth was 65 years. The World Bank also forecasts Tanzania’s decade Gross Domestic Product (GDP) growth of about 7 percent to continue and even grow higher between 2014-2018 if economic volatility and inflation are controlled. This trajectory is consistent with Tanzania’s decade of economic growth and aspiration of becoming a low-middle-income country by 2025 with an anticipated GNI per capita of $3,000. In May 2016, the Ministry of Finance and Planning estimated a GDP growth of 7.2 percent for 2015 and projected the GNI per capita to grow from an estimated US Dollars 1,006 in 2015 to US Dollars 1,500 in 2020, an indication that Tanzania is likely to graduate into a Low Middle Income Country (LMIC) status, crossing the US$ 1045 GNI per capita threshold, during the period of this NMNAP.
29. In its 2016 Eighth Tanzania Economic Update20, the World Bank estimated that in 2015 around 12 million Tanzanians (23 percent of the population) live in poverty as compared to 28.2 percent in 2012 and 34 percent in 2007. Although this represents an improvement, the majority of the non-poor are only marginally above the poverty line with the risk of sliding back into poverty in the event of even the slightest shock. Moreover, the World Bank estimates that about 44 percent of the population lives on less than US$1.25 per day (much higher if the new cut-off point for poverty of US$1.90 is used) and 90 percent of the population lives on less than US$3 per day. The slow progress in poverty reduction despite a robust GDP growth for over a decade can be explained by the slow pace of employable human capital formation and lack of growth in the labour intensive sectors like in agriculture in rural areas where about 80 percent of the population live. Most of Tanzania’s GDP growth has been driven by increased private consumption and public investment, together with the rapidly growing sectors of communication, construction, financial services, the service industry and mining (including gas and oil).
30. Typically, low-income countries become middle-income when their economies shift away from agriculture and informal services and begin relying on low-wage and low-tech manufacturing. This can create new challenges, such as an increase in inequalities and subsequent difficulties to translate economic growth into poverty reduction, an issue already apparent in Tanzania. Unemployment is high, with about 800,000 youth entering the job market every year finding it difficult to get jobs because employment opportunities
20 The World Bank, 20 May 2016: The eighth Tanzania Economic Update (TEU): The Road Less Traveled: Unleashing Public Private Partnerships in Tanzania

DRAFT-2
28
remain scarce and rare. Moreover, inequality is increasing and the gini-coefficient21 (a measure of equality) was at 0.35 in 2011 and rising.
31. The 2014 UNDP Human Development Report shows some progress in the Human Development Index (HDI)22, which increased from below 0.4 in the 1990s to 0.521 in 2014, but still ranks Tanzania very low at 151 out of over 190 countries. The Gender Development Index (GDI) is, however, good at 0.938 an indication of good progress in the empowerment of women. The average expected years of schooling was 9.2 years in 2014 and the gross primary school enrolment ratio was 87 percent in 2015 and expected to rise with the Government’s commitment to provide free schooling for 11 years (up to Form 4). Studies show a strong correlation between the level of education starting at 5 years of schooling, especially of women and the levels of malnutrition and childhood and adult mortality. Moreover, despite a robust economic growth for over a decade some key metrics of development like reduction of poverty, inequality, stunting and uptake of critical services like family planning have not progressed as well as would have been expected. In addition, institutional capacity, including for nutrition, which is vital for sustaining MIC status, is low.
32. Of concern is that Tanzania is currently on track to become a MIC without the shifts that characterize middle income countries like – reaching an advanced stage in the demographic shift (fertility and population growth lower than the world average); technological indicators being close to the world average; intermediate positioning of the human development index (HDI); and an exhibition of greater equality and institutional quality. The fact that the nature of Official Development Assistance (ODA) changes when a country attains MIC status could mean a sliding back of social indicators in Tanzania including for nutrition, given that the aid architecture favours investments in human development like health, nutrition, education and water and sanitation. Recognizing this potential development challenge, this NMNAP attempts to contribute to ensuring that Tanzania enters MIC status by making critical pro-active investments in its human capital development. It contributes to the investment in skilled human resources necessary for Tanzania to design, implement and monitor programmes which aim to improve life expectancy, accelerate economic growth and improve not only the productive capacity of its population, but also to reduce poverty, inequality, improve social mobility and the employability of the young Tanzanians entering the job market.
2.2 Tanzania’s Vital Nutrition Trends 33. The extent, causes, impact, trends, patterns and challenges of the problem of
malnutrition in Tanzania are already captured in the Food and Nutrition Policy and more elaborately in “Nutrition Vision 2025 on Towards Eliminating Malnutrition in Tanzania by 203023; so only the key trends will be summarized here. Taking a long-term 30-year perspective, through Government-led
21 The Gini-coefficient or index is a measure of inequality. As a coefficient the values are on the scale 0-1 with 0 indicating complete equality and 1 complete inequality. Stated as an index the values are from 0-100 with 0 indicating complete equality and 100 complete inequality. No country has ever attained either extreme. 22 The Human Development Index (HDI) is published annually by the UN. It measures the average achievement in a country of three composite basic human development dimensions: life expectancy at birth, adult literacy and GDP per capita (PPP in US$). The values range from 0 -1 with 0 being the lowest and 1 the highest. 23 Kavishe F.P (2014): Towards Eliminating Malnutrition in Tanzania: Nutrition Vision 2025, September 2014. TFNC Monograph Series Number 2.

DRAFT-2
29
partner supported nutrition programmes, Tanzania’s under-nutrition trends have greatly improved, though the level of those with suboptimal nutritional status is still unacceptably high both in terms of prevalence rates and in absolute numbers. Of concern is that like most other low-income countries (LIC) transiting into Middle Income Country (MIC) status, Tanzania has entered an epidemiological and nutritional transition with a double burden of malnutrition where under-nutrition exists in tandem with high levels of overweight, obesity and diet related non-communicable disease (DRNCDs).
2.2.1 Who are those with suboptimal nutritional status? 34. Children under five, women of reproductive age especially pregnant and
lactating women and adolescent girls are the most affected by undernutrition due to their physiological needs for growth and reproduction. There is not much information on the nutrition status of school age children, adolescents and the elderly. In pregnant women and children, the 1,000 day-period, from conception to two years, is crucial and offers a critical window for actions that result in high impact. Poor nutrition often begins in the womb and extends, particularly for girls and women, well into adolescent and adult life. It also spans interminably into future generations. These intergenerational effects are cyclical, reinforcing and often devastating. If improvements in nutrition of women and adolescent girls could be accelerated, multiple impacts and positive feedback linkages could be achieved, including: avoidance of early pregnancies at a young age (teenage pregnancies), better birth outcomes for both mother and newborn, declines in low birth weight, and improvements in child growth.
2.2.2 Under-nutrition improving but levels still unacceptably high 35. Taking a long-term perspective, the undernutrition situation could best be
described as (i) very high and constant over time and in all regions of the country during the 1960s, 1970s and early 1980s; (ii) responding to specific interventions during the mid-1980s and 1990s; (iii) progressing too slowly despite good economic progress in the early 2000s; and (iv) improving but still unacceptably high with a double burden of undernutrition and overnutrition during the 2010s.
36. A review of the nutrition status trends based on anthropometric measurements confirms that there have been some significant declines in the prevalence of undernutrition during the last two decades (see figure 3). The levels of stunting in children 6-59 reduced from a prevalence of 50 percent in the 1990s to 34 percent in the 2015/16 TDHS, but still above the average of 30 percent for Africa and falls within the category of “severe” in public health significance. However, due to the rate of population growth outstripping the rate of reduction, the absolute numbers of stunted children increased from below 2.0 million in the early 2000’s to about 2.7 million in 2015. Reduction in stunting is the main indicator that this NMNAP will use to measure its impact although targets have been set for several other nutrition indicators based on the World Health Assembly (WHA) targets for 2025. During the same period, the prevalence of underweight declined from 25 percent to 14 percent close to meeting the MDG1 target of halving underweight by 2015.

DRAFT-2
30
Figure 2: Prevalence trends of stunting, wasting and underweight in children under
five years in Tanzania (1992-2015/16
37. In the same vein, wasting an indicator of acute malnutrition in children 6-59 months, declined from 8 percent in 1992 to 4.5 percent in 2015/16 reaching the WHA 2025 target of below 5 percent (see figure 4). However, due to the huge population and rapid population increase, the absolute numbers of those acutely malnourished are high and also increasing with some 600,000 children under five years of age estimated to be acutely malnourished in 2015 of whom 100,00 were categorized as severe. The risk of death is much higher amongst children with severe acute undernutrition, and as such require concomitant efforts as part of a comprehensive program which focuses on the alleviation of chronic undernutrition.
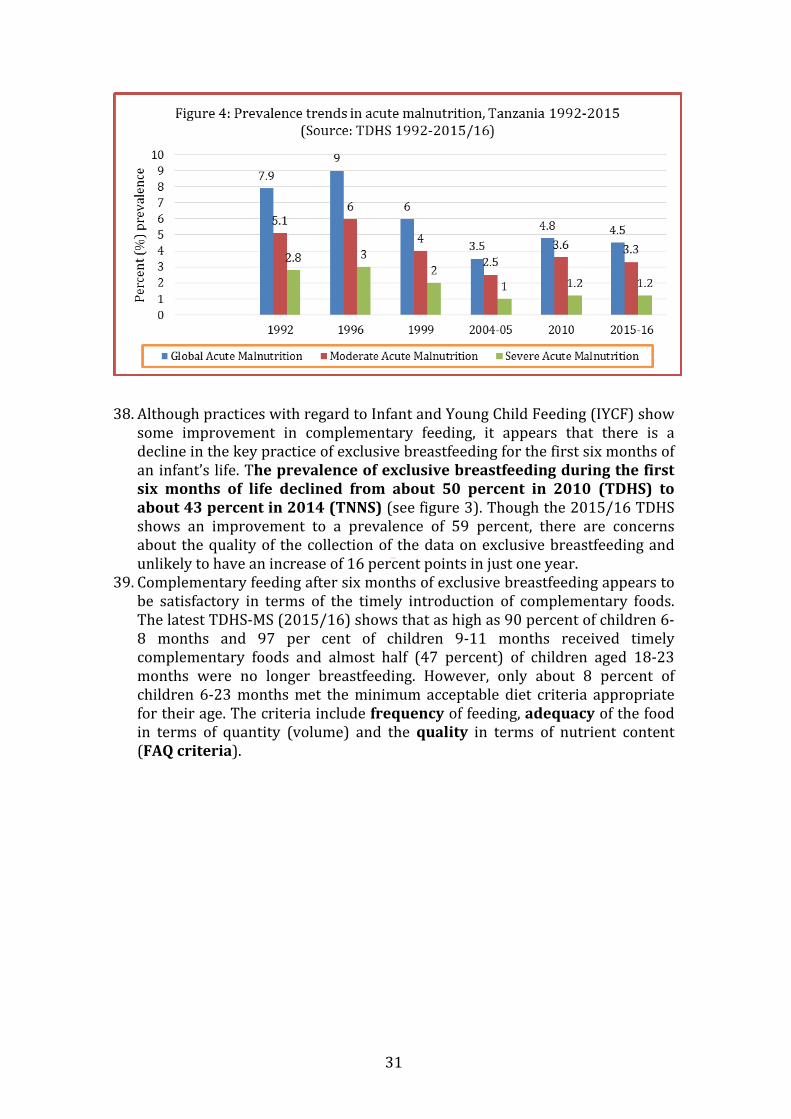
DRAFT-2
31
38. Although practices with regard to Infant and Young Child Feeding (IYCF) show some improvement in complementary feeding, it appears that there is a decline in the key practice of exclusive breastfeeding for the first six months of an infant’s life. The prevalence of exclusive breastfeeding during the first six months of life declined from about 50 percent in 2010 (TDHS) to about 43 percent in 2014 (TNNS) (see figure 3). Though the 2015/16 TDHS shows an improvement to a prevalence of 59 percent, there are concerns about the quality of the collection of the data on exclusive breastfeeding and unlikely to have an increase of 16 percent points in just one year.
39. Complementary feeding after six months of exclusive breastfeeding appears to be satisfactory in terms of the timely introduction of complementary foods. The latest TDHS-MS (2015/16) shows that as high as 90 percent of children 6-8 months and 97 per cent of children 9-11 months received timely complementary foods and almost half (47 percent) of children aged 18-23 months were no longer breastfeeding. However, only about 8 percent of children 6-23 months met the minimum acceptable diet criteria appropriate for their age. The criteria include frequency of feeding, adequacy of the food in terms of quantity (volume) and the quality in terms of nutrient content (FAQ criteria).

DRAFT-2
32
Figure 3: Trends in exclusive breastfeeding in Tanzania 2004/05, 2010 and 2014
40. National programmes to prevent and control micronutrient deficiencies have
had a profound impact, resulting in the reduction of the prevalence of micronutrient deficiencies especially of the severe clinical forms, through the achievement of optimal intakes. Cretinism due to iodine deficiency and nutritional blindness due to vitamin A deficiency, commonly seen during the 1980s, are now rare. Moreover, the severe forms of nutritional anaemia in children and pregnant women (mainly due to iron deficiency) common in the 1970s and 1980s necessitating hospitals to have special “anaemia” wards are also rare. However, improvement in the prevalence of moderate anaemia has been slow.
41. As of 2015, the trends in the three main micronutrient deficiencies could be summarized as follows: -
IODINE • The median urinary iodine concentration for women of reproductive age
(15-49 years) increased from 160 µg/L (TDHS 2010) to 180 µg/L (TDHS-MIS 2015-16). The desirable range is 100-200 uGu/L.
• Using Rapid Test Kits to measure presence of iodine in salt, the proportion of households with iodized salt increased from 73 percent in 2005 (TDHS 2004-05) to 82 percent in 2010 (TDHS 2010) where it has remained the same (81 percent) in the TDHS-MIS 2015-16.
• Data from laboratory analysis indicated that the proportion of households with iodized salt increased from 90 percent in the 2010 TDHS to 96 percent in 2015 TDHS. During the same period, households with adequately iodised salt (15+ ppm) increased from 47 percent in 2010 to 61 percent in 2015.
ANAEMIA (IRON AND FOLIC ACID) • The proportion of women who gave birth in the 5 years before the survey
who took iron supplements or syrup for 90 days or more as recommended during pregnancy increased from 5 percent in 2010 to 21 percent in the 2015-16 TDHS – MIS .
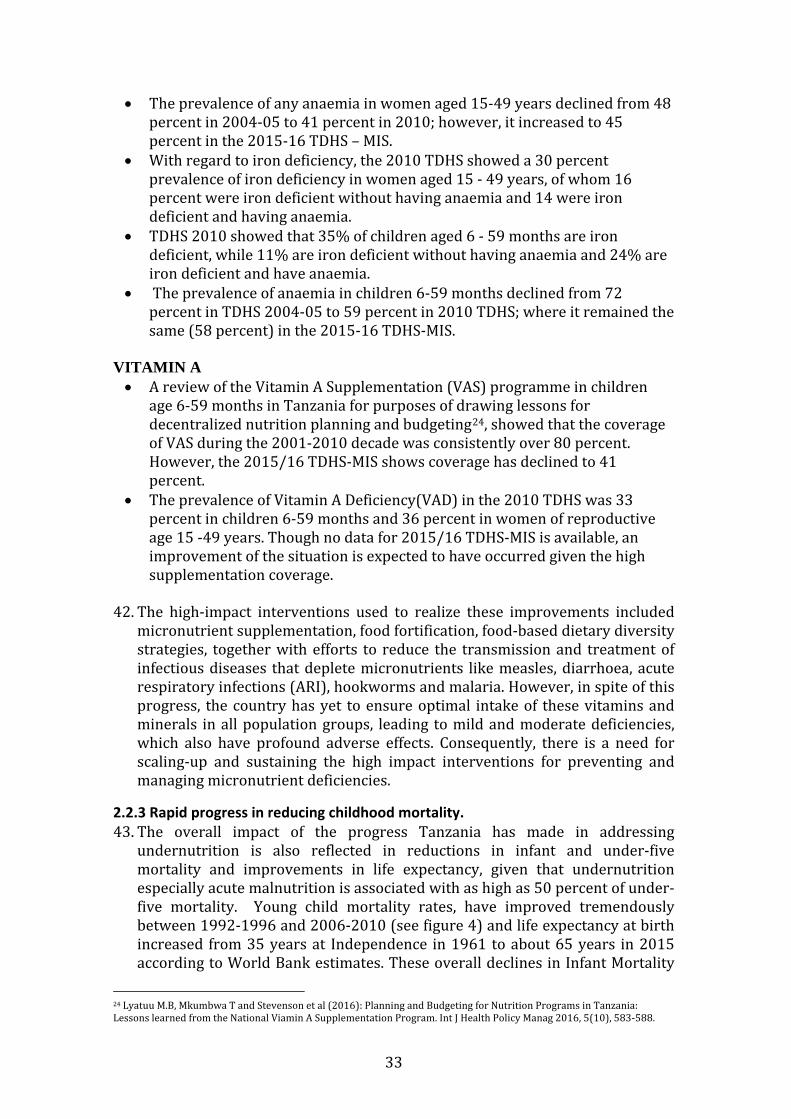
DRAFT-2
33
• The prevalence of any anaemia in women aged 15-49 years declined from 48 percent in 2004-05 to 41 percent in 2010; however, it increased to 45 percent in the 2015-16 TDHS – MIS.
• With regard to iron deficiency, the 2010 TDHS showed a 30 percent prevalence of iron deficiency in women aged 15 - 49 years, of whom 16 percent were iron deficient without having anaemia and 14 were iron deficient and having anaemia.
• TDHS 2010 showed that 35% of children aged 6 - 59 months are iron deficient, while 11% are iron deficient without having anaemia and 24% are iron deficient and have anaemia.
• The prevalence of anaemia in children 6-59 months declined from 72 percent in TDHS 2004-05 to 59 percent in 2010 TDHS; where it remained the same (58 percent) in the 2015-16 TDHS-MIS.
VITAMIN A • A review of the Vitamin A Supplementation (VAS) programme in children
age 6-59 months in Tanzania for purposes of drawing lessons for decentralized nutrition planning and budgeting24, showed that the coverage of VAS during the 2001-2010 decade was consistently over 80 percent. However, the 2015/16 TDHS-MIS shows coverage has declined to 41 percent.
• The prevalence of Vitamin A Deficiency(VAD) in the 2010 TDHS was 33 percent in children 6-59 months and 36 percent in women of reproductive age 15 -49 years. Though no data for 2015/16 TDHS-MIS is available, an improvement of the situation is expected to have occurred given the high supplementation coverage.
42. The high-impact interventions used to realize these improvements included
micronutrient supplementation, food fortification, food-based dietary diversity strategies, together with efforts to reduce the transmission and treatment of infectious diseases that deplete micronutrients like measles, diarrhoea, acute respiratory infections (ARI), hookworms and malaria. However, in spite of this progress, the country has yet to ensure optimal intake of these vitamins and minerals in all population groups, leading to mild and moderate deficiencies, which also have profound adverse effects. Consequently, there is a need for scaling-up and sustaining the high impact interventions for preventing and managing micronutrient deficiencies.
2.2.3 Rapid progress in reducing childhood mortality. 43. The overall impact of the progress Tanzania has made in addressing
undernutrition is also reflected in reductions in infant and under-five mortality and improvements in life expectancy, given that undernutrition especially acute malnutrition is associated with as high as 50 percent of under-five mortality. Young child mortality rates, have improved tremendously between 1992-1996 and 2006-2010 (see figure 4) and life expectancy at birth increased from 35 years at Independence in 1961 to about 65 years in 2015 according to World Bank estimates. These overall declines in Infant Mortality
24 Lyatuu M.B, Mkumbwa T and Stevenson et al (2016): Planning and Budgeting for Nutrition Programs in Tanzania: Lessons learned from the National Viamin A Supplementation Program. Int J Health Policy Manag 2016, 5(10), 583-588.
DRAFT-2
34
Rate (IMR) and Under-five Mortality Rate (U5MR) reflect progress in the reach and penetration of maternal and child public health measures, especially progress in immunization, undernutrition, control of communicable diseases (like measles, diarrhoea, ARI, malaria, worms), improvements in medical care, which have taken place parallel to overall social and economic development.
Figure 4: Trends in Infant, Child and Under-five Mortality Rates 1999-2015
2.2.4 Slow progress in neonatal and maternal mortality 44. Of great concern is that the maternal mortality ratio (MMR) per 100,000 live
births has stagnated at about 450/100,000 for the past decade and neonatal mortality (NMR) has declined slightly from about 40 per 1,000 live births in 1999 to 25/1,000 live births in 2015/16 against a backdrop of an increasing trend of teenage pregnancies and low coverage of health facility deliveries and family planning. The proportion of adolescent girls 15-19 years who have begun childbearing rose from 23 percent in 2010 TDHS to 27 percent in 2015 TDHS. Overall, the proportion of teenagers who have begun childbearing rises rapidly with age from 4 percent at 15 years to 57 percent at 19 years (TDHS 2015/16). The fertility of adolescents is important on both health and social grounds. In addition to constraining their opportunities to purse education, adolescent mothers are at greater risk of experiencing adverse pregnancy outcomes for both mother and child, including maternal and neonatal deaths and sicknesses than adult women. Moreover, children of teenagers are more likely to be undernourished than those of adult women of similar social status.
2.2.3 The double burden of malnutrition 45. While there has been some progress towards reduction in the burden of
undernutrition, the problem of overweight, obesity and other diet related non-communicable diseases (DRNCDs) has been increasing in children and adults, especially women of reproductive age. Overweight in children under five years increased from a prevalence of below 1 percent in the 1990s to about 4-5 percent in the 2010-2015 according to the TDHS. This current level is at the cut-off WHA target for 2025 of keeping overweight in children to a prevalence

DRAFT-2
35
of below 5 percent. However, while the prevalence of under-nutrition in women of reproductive age as measured by Body Mass Index (BMI) of below 18.5 declined from 11.4 percent (TDHS 2010) to 5.9 percent (TNNS 2014). During the same period overweight (BMI>25) remained at the same level of about 20 percent and obesity (BMI>30) increased from 6.2 percent to 9.7 percent. The 2012 National STEPS survey that covered both sexes showed the prevalence of obesity in men to be 2.5 percent while that of women was 15 percent. The overweight prevalence was 15 percent in men and 37 percent in women, an indication of future higher levels of obesity. Figure 6 shows the resultant BMI changes in Tanzania between 2005 and 2010: there is an increase in BMI in almost all regions.
46. Thus, Tanzania is clearly undergoing a “nutrition transition” which is likely to accelerate as the country develops into a Middle-Income Country (MIC) a trend that the NMNAP aims to prevent and control. A nutrition transition occurs when the epidemiological health scenario shifts from one dominated by undernutrition and communicable diseases (e.g. malaria, measles, diarrhoea, ARI, intestinal worms) to one increasingly dominated by overweight/obesity and other diet related non-communicable diseases (DRNCDs).
47. The four major DRNCDs are diabetes (mainly adult onset type 2-diabetes) cardiovascular diseases, several types of cancer and chronic respiratory diseases. These diseases take long to develop and may be related to childhood undernutrition experiences and the unhealthy lifestyles “liked” by many people, many of whom are at the prime of their productive lives. Other problems caused by overweight and obesity include pain in weight bearing joints, difficulties in breathing when asleep, and low fertility both in women and men. Moreover, obese women, especially those who were stunted in childhood are at a higher risk of poor birth outcomes for both the mother and newborn that may include maternal and newborn deaths.
Figure 5: Regional trends in BMI in women of reproductive age, Tanzania, 2005 and 2010
(Source: STEPS surveys)

DRAFT-2
36
48. Non-communicable diseases (NCDs) usually have no symptoms until well advanced and the systems for health-care delivery in many low-income countries including Tanzania are not well oriented towards dealing with them. Evidence-based strategies to decrease energy intake and increase physical activity are now well established 25 and their urgent adoption by the population is essential. Education starting from childhood is an important component of any strategy to prevent and control DRNCDs.
49. Globally, overweight and obesity have reached epidemic proportions prompting the UN to hold two High Level Meetings on NCDs with a third consultation planned for 2018. The UN set four time bound commitments in its 2014 UN Outcome Document on NCDs which this NMNAP will implement; (i) consider setting up national NCD targets for 2025 (ii) consider developing national multisectoral policies and plans to achieve the national targets by 2025; (iii) Reduce risk factors for NCDs, building on guidance set out by WHO Global NCD Action Plan and (iv) Strengthen health systems to address NCDs through people oriented primary health care and universal health coverage, building on guidance set out in the WHO Global Action Plan.
50. The most important contributors to the rise in diet related non-communicable diseases are an increase in the mean food energy intake and a decrease in physical activity in households, communities and populations that have reached abundant food security and developed unhealthy dietary practices like eating too much foods rich in fats, sugar and carbohydrates. In such environments, food is used not only to meet nutrition needs, but also for social reasons like relaxing, reducing stress and socialization accompanied by sedentary lifestyles. In the Tanzanian context, there is the additional cultural perception that being obese is sexy, a sign of being wealthy and healthy, and of being taken good care of by the spouse.
2.2.4 The pattern of malnutrition in Tanzania: Where are the malnourished? 51. All regions of Tanzania suffer from all types of malnutrition, though the
severity of the problems differ. There are three key drivers of the pattern of malnutrition in Tanzania. These are geographical location, level of education and income disparity. Gender does not seem to be a major determinant, although boys show slightly higher prevalence rates of all forms of undernutrition than girls. These three drivers and their role in the aetiology of undernutrition is described in the next sections.
52. Geographical location: In general, rural areas are more affected by undernutrition than urban areas, while urban areas are more affected by overweight and obesity than rural areas. According to the 2015/16 TDHS, the prevalence of stunting among children living in urban areas was 24.7 percent compared to 37.8 percent for children living in rural residences. Very high prevalence of stunting (of above 40 percent) were seen in five mainly rural regions: Rukwa (56.3 percent), Njombe (49.4 percent), Kagera (41.7 percent), Iringa (41.6 percent) and Geita (40.5 percent). Ironically, Rukwa, Njombe, and Iringa are known to be the food basket regions in Tanzania. As such the implication is that factors other than food are responsible for these high
25 Popkin, BM. Now and Then: Nutrition Transition: The Pandemic of Obesity in Developing Countries. Nutrition Reviews (2012) 70(10: 3-21

DRAFT-2
37
prevalence of stunting. Stunting prevalence of above 30 percent are categorized as severe in terms of public health significance.
Table 2: The geographical pattern of malnutrition, Tanzania (Source: TDHS-MS 2015/16)
Geographical Category
Prevalence of stunting in percent (%) (Source: TDHS 2015/16) 50 and above
40 - <50 30 - <40 <30
Zones None Southern Highlands (44.7); South West Highlands (43.1)
Western (32.2); Northern (36.2); Central (34), Southern (36.6); Lake (35.6);
Eastern (23.2)
Regions Rukwa (56.3)
Ruvuma (44.4); Iringa (41.6); Kagera (41.7); Njombe (49.4); Geita (40.5);
Tanga (39.4); Dodoma (36.5) Arusha (36.0); Mtwara (37.7); Mbeya (37.7); Lindi (35.2); Morogoro (33.4), Kigoma (37.9); Pwani (30); Mwanza (38.6); Manyara (36.0); Katavi (38.8); Simiyu (33.3)
Dar es Salaam (14); Kilimanjaro (29); Singida (29.2); Tabora (27.9) Mara (29.2);
53. The geographical distribution of the burden of stunting could be categorized
by zones and regions as per table 2. Only the Eastern zone (out of 7 zones) and five regions (out of 24 excluding the new regions) have stunting prevalence of below 30 percent. With a stunting prevalence of 14 percent, Dar es Salaam is the only region that has achieved the MKUKUTA target of a stunting prevalence of 15 percent.
54. In terms of the geographical distribution of the numbers of malnourished children, 58 percent of the 2.7 million stunted children live in only 10 of Tanzania’s 30 regions (Dodoma, Morogoro, Dar es Salaam, Ruvuma, Mbeya, Tabora, Kigoma, Kagera, Mwanza and Geita -see figs 6 and 7). Half of the children suffering from severe acute malnutrition live in only five regions (Dar es Salaam, Rukwa, Mwanza, Simiyu and Kilimanjaro).
Figure 6: Under –five stunting prevalence and burden by region
Source: TNNS 2014 and Census 2012
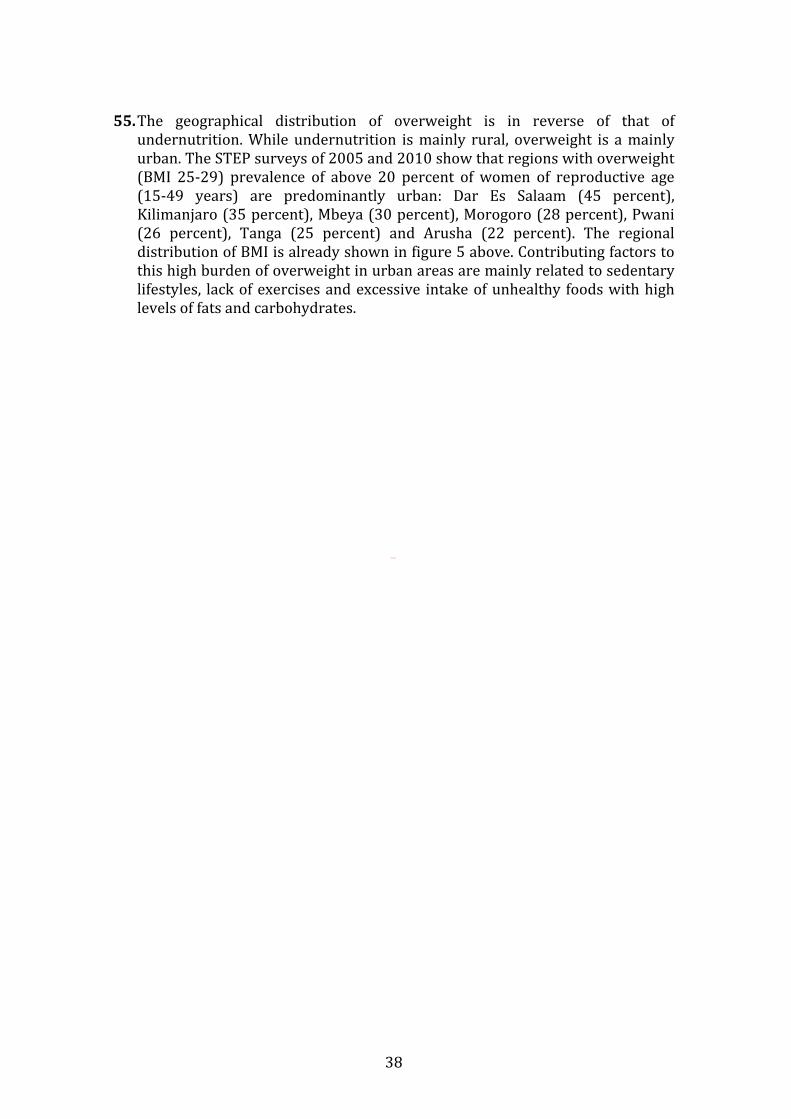
DRAFT-2
38
55. The geographical distribution of overweight is in reverse of that of
undernutrition. While undernutrition is mainly rural, overweight is a mainly urban. The STEP surveys of 2005 and 2010 show that regions with overweight (BMI 25-29) prevalence of above 20 percent of women of reproductive age (15-49 years) are predominantly urban: Dar Es Salaam (45 percent), Kilimanjaro (35 percent), Mbeya (30 percent), Morogoro (28 percent), Pwani (26 percent), Tanga (25 percent) and Arusha (22 percent). The regional distribution of BMI is already shown in figure 5 above. Contributing factors to this high burden of overweight in urban areas are mainly related to sedentary lifestyles, lack of exercises and excessive intake of unhealthy foods with high levels of fats and carbohydrates.
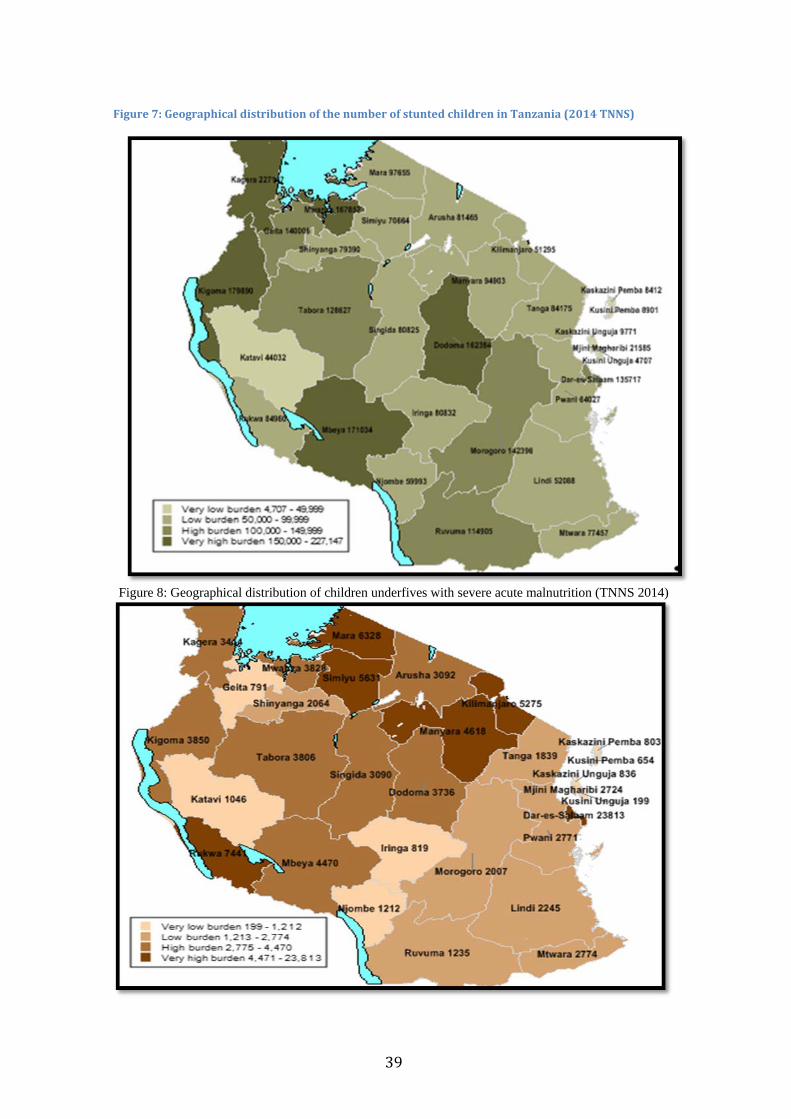
DRAFT-2
39
Figure 7: Geographical distribution of the number of stunted children in Tanzania (2014 TNNS)
Figure 8: Geographical distribution of children underfives with severe acute malnutrition (TNNS 2014)

DRAFT-2
40
56. Income disparity is the second critical driver for malnutrition. As seen in figure 9, the 2015/16 TDHS shows that while the highest income quintile had 19.2 percent of their children stunted, the lowest income quintile prevalence of stunting was more than twice as high (39.2 percent). Thus, addressing poverty and inequality are very important in improving nutrition. The corollary, is also true: that addressing malnutrition reduces poverty and inequality. Overall, higher wealth income sections of population have higher prevalence rates of overweight and obesity than lower income sections. As seen in figure 9, gender does not seem to be an important factor though boys are slightly more undernourished than girls.
Figure 9: Prevalence of stunting by wealth quintile and gender (TDHS 2015/16)
57. Education of the mother or caregiver is the third major driver. The stunting prevalence of children whose mothers have no education was 39.2 percent as compared to 34.7 percent of mothers with primary education and 23.1 percent of mothers with secondary education. It has been well established that mothers with higher education are more likely to have high income, knowledge about the importance of nutrition and the key factors to ensure optimal intakes and disease prevention, hence are less likely to have undernourished children.
2.3 Major causes of malnutrition in Tanzania 58. Malnutrition is the biological manifestation of various social processes in
society. UNICEF developed a useful model which categorizes the key determinants of poor nutrition according to three distinct levels of causality: immediate, underlying and basic. While the immediate factors act at the

DRAFT-2
41
individual/household level, the underlying and basic factors operate predominantly at the higher levels of society starting with the community and extending to the political and economic structures at the district, regional, national and international levels. According to the conceptual framework used in developing this NMNAP, interventions at the level of immediate causes are referred to as nutrition specific; while those targeting the underlying causes are nutrition sensitive interventions; and finally, those that focus on the basic causes as enabling environment interventions. To have high and sustainable impact, simultaneous actions must be taken at all levels of causality (immediate, underlying and basic) and levels of society (household, community, national and international) as done in this NMNAP.
59. In Tanzania, the immediate causes of malnutrition can be categorized into two: Dietary causes and diseases which reinforce each other. Dietary causes relate to low or excessive frequency of feeding, dietary diversity and adequacy of the food taken in relation to physiological and physical needs. Frequent clinical and sub-clinical diseases like diarrhoea, environmental enteropathy, helminths, pneumonia, malaria, AIDS, etc. influence food intake and utilization by the body. Excessive feeding, especially of fats and carbohydrates leads to development of dietary related non-communicable diseases (DRNCDs).
60. The underlying causes of malnutrition can be clustered into three determinants: food security, caring capacity and access to basic services like health, education, and safe water, sanitation and hygiene (WASH). While each category is a necessary causative factor, none acts entirely independently. Food security refers to diversified food availability throughout the year, its economic and cultural accessibility and its biological utilization to meet nutritional needs. The care of children, pregnant and lactating women, the elderly and those suffering from diseases including AIDS and tuberculosis is important to improve nutrition in those population groups. Recent studies show that inadequate access to safe water and sanitation and poor hygiene practices increase the burden of infectious pathogens and lead to growth retardation and stunting.
61. Basic causes of malnutrition in Tanzania are predominantly in the area of enabling environment. They include among others: income disparity, poverty, inadequate nutrition and general political governance, ignorance due to low education, nutrition unfriendly customs and traditions, and inadequate functional institutional capacity at all levels for nutrition. Others are inadequate linkages with nutrition of sectoral policies, strategies and programmes especially in the key nutrition sensitive sectors of agriculture, education, WASH, social protection and climate change and environment. Moreover, enforcement of nutrition relevant laws and regulations is inadequate and tracking of both nutrition specific and sensitive interventions for results and investments is not systematized and institutionalized.
2.4 The impact of malnutrition on national development in Tanzania 62. Malnutrition constrains all aspects of national development. By contributing
to child and maternal illnesses and deaths, it reduces the rates of survival and, therefore, reduces overall life expectancy of the population. Secondly, malnutrition impairs physical and mental growth leading to poor performance

DRAFT-2
42
in school and the ability to develop essential survival and development skills due to poor cognitive development. Thirdly, for those who survive to adulthood, they become small in stature and are unable to reach their productive potential. They earn less than their counterparts, their limited skills development make it difficult to be employed and many remain in abject poverty. Of the multidimensional causes of child poverty26, malnutrition stands out as one of the most serious dimensions.
63. Moreover, malnutrition in childhood has a cumulative impact along the life course. For women who were stunted in childhood, their short stature can result in poor birth outcomes including a higher risk for maternal and neonatal mortality. Malnutrition in pregnant women explains to a large extent the slow progress in the reduction of the high levels of maternal mortality ratio (MMR) and neonatal mortality in the country.
64. Stunting in childhood is also related to overweight and obesity later in life. People who were stunted in childhood, have a higher risk of developing obesity and non-communicable diseases (NCDs). The cumulative effect of malnutrition during the life course leads to intergenerational cycles of malnutrition, poverty and inequality and thus drags down national development.
65. The economic burden of malnutrition in Tanzania is significant. It is estimated that malnutrition annually reduces Tanzania’s GDP growth by about 2.5 percent, and if the impact of poor sanitation and hygiene on stunting is added, the effect may reach up to 10 percent reduction of GDP growth. This is further illustrated by the 2014 PROFILES27 data for Tanzania. PROFILES consist of a set of computer-based models that generate estimates of the benefits of improved (or compromised) nutrition on health and development outcomes. Taking 2025 as the target date and an improving nutrition scenario (as is anticipated through the NMNAP), about 900,000 children would have been saved from mild to severe brain damage due to maternal iodine deficiency and over 120,000 children saved from death due to the impact of stunting. Again using an improved nutrition scenario, the estimated future economic gain is a total of about US$4.8 billions of which $3.9 billion is the result of reduction in stunting; US$382 million in reduction due to improvements in anaemia among no-pregnant women and $479 million gained as a consequence of improvements in iodine nutrition. The figures underscore the fact that investing in nutrition is not only a health investment, but an economic investment with huge economic returns.
2.5 Why is progress in reducing malnutrition relatively slow in Tanzania? 66. Based on evidence, it is clear what works and what does not. In spite of this
evidence, high political will and robust economic growth, progress on reducing malnutrition in Tanzania has remained slow. To address this discrepancy, the NMNAP specifically acknowledges the key factors that have been identified by recent analyses, and develops concrete actions to remove these bottlenecks.
26 UNICEF (February 2011): A Multidimensional Approach to Measuring Child Poverty. Social and Economic Policy Working Briefs. UNICEF Policy and Practice (http://www.unicef.org/socialpolicy/files/A_Multidimensional_Approach_to_Measuring_Child_Poverty(2).pdf) 27 PROFILES is an evidence-based tool that was developed by USAID in the 1990s for the purpose of nutrition advocacy. The USAID-funded Food and Nutrition Technical Assistance (FANTA) project III developed the 2014 PROFILES for Tanzania on request by the Government of Tanzania and in collaboration with the Prime Minister’s Office (PMO) and TFNC, aiming at developing a national nutrition advocacy strategy and related materials.
DRAFT-2
43
The main factors could be could be divided into two categories: (a) contextual factors; and (b) programmatic factors: -
2.6.1 Contextual factors 67. The main contextual factors include: -
1) Low awareness of the problem of malnutrition by policy makers, the media and the public at large (e.g. stunting and micronutrient deficiencies largely not recognized as problems).
2) Low investment in nutrition: currently nutrition is not adequately prioritized in the allocation of financial resources. The 2013 Public Expenditure Review on Nutrition (PE-N) showed that only about 23 percent of expenditure on nutrition is from public funds, the rest is from donors. A Government review of nutrition funding for the FY 2011/12 - FY 2015/16 (Nutrition Budget Brief 2016) concludes that although resources for nutrition-related activities increased and even doubled during the period reviewed, spending on nutrition accounted for only 0.03 percent of GDP and 0.13 percent of total public spending. Moreover, only 12 percent of the National Nutrition Strategy (NNS) for 2011/12-2015/16 total budget of about Tsh 825 billion (US$520 million) was funded and mostly by donors. Over reliance on donor funds for nutrition introduces a large amount of uncertainty into nutrition planning given the sometimes erratic nature of donor funding. A robust resource mobilization strategy that emphasizes increased domestic resources will be developed in the implementation of the NMNAP.
3) Inadequate nutrition governance: e.g. inadequate multisectoral coordination of interventions at all levels, lack of common results, resources and accountability framework for nutrition, poor enforcement of relevant laws, low use of technology for nutrition;
4) Inadequate focus on the Community and life course: reaching communities with large scale nutrition interventions has been slow and some vulnerable groups like adolescent girls were not covered;
5) Low functional institutional capacity for nutrition at all levels. Although institutions for nutrition have satisfactory technical capacity, functional capacity is low at all levels.
6) Inadequate attention to the social determinants of malnutrition to effect social change for nutrition improvement. Social determinants are the conditions into which people are born, live, work and age. They include behaviour, practices, formal and informal structures and systems some of which are good and others bad for nutrition. Some examples include social protection measures and systems; practices related to child rearing; sanitation and hygiene practices; lifestyles and food preferences;
7) Distorted application of the conceptual framework with an overemphasis on nutrition specific interventions and the food security sector without adequate attention to other important nutrition sensitive sectors. Key nutrition sensitive sectors addressed in this NMNAP include (a) Agriculture and Food Security, (b) Education and Early Childhood Development, (c) Health and HIV, (d) Water, Sanitation and Hygiene (WASH) and (e) Climate

DRAFT-2
44
Change and Environment. Enabling environment interventions have progressed in recent years, but are not adequately institutionalized or enforced.
2.6.2 Programmatic factors 68. The 2014 and 2015 Joint Multisectoral Reviews reviewed in depth the
operational challenges that faced the implementation of the eight strategic objectives of the National Nutrition Strategy (2011/12-2015/26) using a bottleneck analysis (BNA) approach for selected nutrition specific interventions covering both Tanzania mainland and Zanzibar. The four selected interventions submitted to BNA were coverage or implementation status of (i) Infant and Young Child Feeding (IYCF) practices, (ii) Integrated Management of Acute Malnutrition (IMAM) (iii) Vitamin A distribution (VAD) and (iv) distribution of Iron and Folic Acid (IFA) to pregnant women.
69. The bottleneck analysis used the Tanahashi model28 applicable for identifying key constraints in the effective delivery of interventions, especially for health and looked at five bottlenecks: (a) commodity availability, (b) human resources capacity, (c) geographical access to interventions (d) utilization of interventions by targeted groups and (e) the quality of interventions provided. Data was collected by District and Regional Nutrition Officers from 148 districts (86 percent, out of 186 districts) and analysed by a team of experts from TFNC, Ministries responsible for Health (mainland and Zanzibar), selected Regions/Districts, UNICEF and UN-REACH. The 2012 Census, the 2014 Tanzania National Nutrition Survey (TNNS) and the 2015/16 TDHS Key Indicators provided the population reference points for purposes of calculating coverage.
70. The results of the bottleneck analysis provide a clue to the major operational challenges that the NMNAP has tried to address. These were: -
1) Low coverage of high impact interventions, both nutrition specific and nutrition sensitive;
2) Inadequate alignment of the level of implementation with the geographical burden of the problem of malnutrition for stunting and acute malnutrition; and
3) Inadequate skilled human resource capacity affecting the quality of interventions for all the five areas subjected to BNA.
4) Commodities, utilization by the target groups and the quality of interventions provided did not appear to be major bottlenecks.
2.7 The 2016 National Food and Nutrition Policy 71. The 2016 National Food and Nutrition Policy addresses the major challenges
that emerged during the implementation of the 1992 Policy and the major changes that have taken place on the national and international nutrition landscape. These include advances in scientific knowledge, lessons learned in combating malnutrition, the emergence of the double burden of malnutrition and, perhaps most importantly, the emerging recognition of nutrition as a multisectoral development issue. Thus, the policy provides for a broader framework for increased multisectoral collaboration and coordination towards better nutrition.
28 Tanahashi T (1978): Health service coverage and its evaluation. Bull World Health Organ. 1978; 56(2) 295-303.
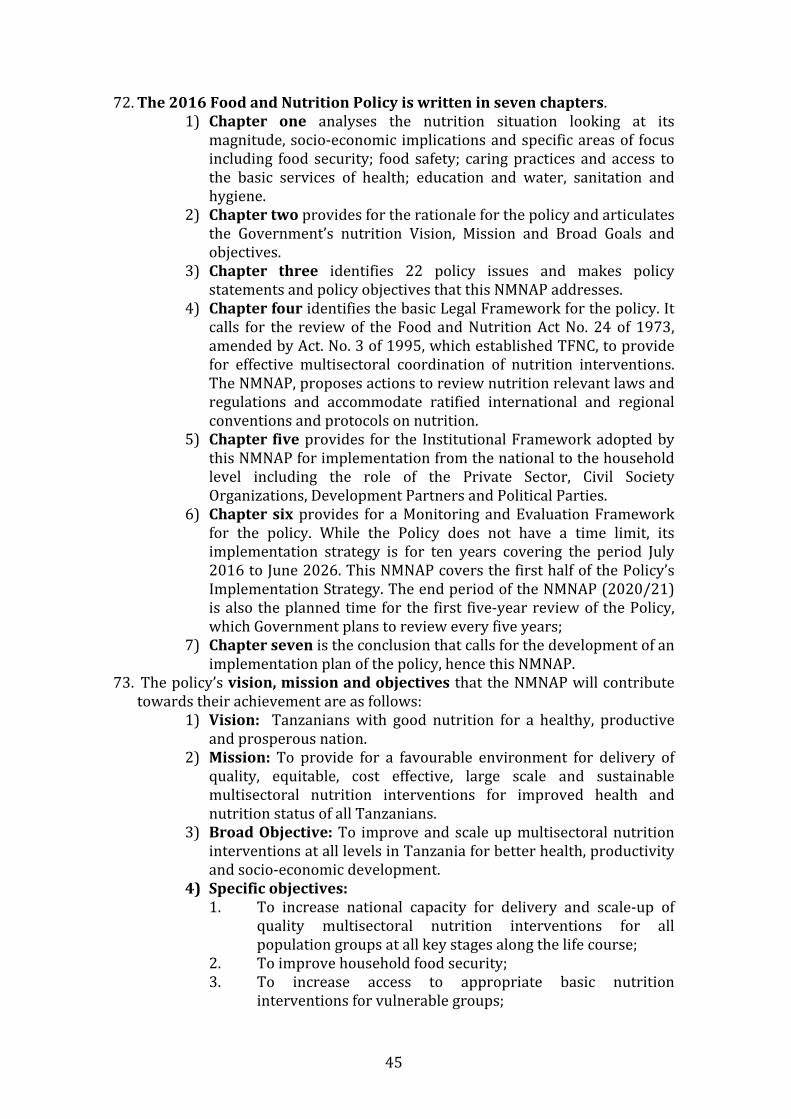
DRAFT-2
45
72. The 2016 Food and Nutrition Policy is written in seven chapters. 1) Chapter one analyses the nutrition situation looking at its
magnitude, socio-economic implications and specific areas of focus including food security; food safety; caring practices and access to the basic services of health; education and water, sanitation and hygiene.
2) Chapter two provides for the rationale for the policy and articulates the Government’s nutrition Vision, Mission and Broad Goals and objectives.
3) Chapter three identifies 22 policy issues and makes policy statements and policy objectives that this NMNAP addresses.
4) Chapter four identifies the basic Legal Framework for the policy. It calls for the review of the Food and Nutrition Act No. 24 of 1973, amended by Act. No. 3 of 1995, which established TFNC, to provide for effective multisectoral coordination of nutrition interventions. The NMNAP, proposes actions to review nutrition relevant laws and regulations and accommodate ratified international and regional conventions and protocols on nutrition.
5) Chapter five provides for the Institutional Framework adopted by this NMNAP for implementation from the national to the household level including the role of the Private Sector, Civil Society Organizations, Development Partners and Political Parties.
6) Chapter six provides for a Monitoring and Evaluation Framework for the policy. While the Policy does not have a time limit, its implementation strategy is for ten years covering the period July 2016 to June 2026. This NMNAP covers the first half of the Policy’s Implementation Strategy. The end period of the NMNAP (2020/21) is also the planned time for the first five-year review of the Policy, which Government plans to review every five years;
7) Chapter seven is the conclusion that calls for the development of an implementation plan of the policy, hence this NMNAP.
73. The policy’s vision, mission and objectives that the NMNAP will contribute towards their achievement are as follows:
1) Vision: Tanzanians with good nutrition for a healthy, productive and prosperous nation.
2) Mission: To provide for a favourable environment for delivery of quality, equitable, cost effective, large scale and sustainable multisectoral nutrition interventions for improved health and nutrition status of all Tanzanians.
3) Broad Objective: To improve and scale up multisectoral nutrition interventions at all levels in Tanzania for better health, productivity and socio-economic development.
4) Specific objectives: 1. To increase national capacity for delivery and scale-up of
quality multisectoral nutrition interventions for all population groups at all key stages along the life course;
2. To improve household food security; 3. To increase access to appropriate basic nutrition
interventions for vulnerable groups;

DRAFT-2
46
4. To strengthen mechanisms for multisectoral coordination of nutrition interventions at all levels;
5. To increase availability of nutrition data and information for planning, programming and decision making;
6. To strengthen regional and international cooperation for improvement of nutrition; and
7. To strengthen integration of crosscutting issues in nutrition interventions for optimal impact.
74. The 22 policy objectives of the Policy that this NMNAP has adopted and aims to address are: - 1) To improve household food security 2) To improve food safety and quality for enhancement of nutrition status at
individual, household and community level. 3) To improve and scale up access to quality nutrition interventions along the
life course; 4) To improve adolescent and maternal nutritional care and support; 5) To improve infants’ and young child nutrition. 6) To reduce the prevalence of micronutrient deficiencies in the population. 7) To improve the nutrition status of vulnerable groups 8) To strengthen prevention and management of Diet Related Non-
Communicable Diseases (DRNCDs) 9) To provide appropriate nutritional care and support to communities
during emergencies and disasters; 10) To enhance national capacity for improvement of nutrition; 11) To strengthen multisectoral coordination of nutrition interventions in the
country; 12) To strengthen private sector contribution to improve nutrition in the
country; 13) To increase the availability and accessibility of reliable, timely and
sustainable data on the nutrition situation in the country at all levels; 14) To improve nutrition knowledge, behaviours, attitudes and practices in the
country; 15) To promote regional and international cooperation for improvement of
nutrition; 16) To enhance national capacity for generation of new knowledge and
solutions to nutritional needs in the country; 17) To promote safe water, sanitation, and hygiene practices as key strategies
for improved nutrition. 18) To ensure that nutrition interventions at all levels are gender sensitive; 19) To enhance sustainable use and management of the environment for
improvement of food and nutrition security; 20) To improve nutritional care and support for people living with HIV and
AIDS and their households; 21) To decentralize planning, management and coordination of nutrition
services to local Governments; and 22) To strengthen good governance in nutrition at all levels.
75. The NMNAP addresses all of the 22 policy objectives through action plans in seven Key Result Areas. Each thematic key results Action Plan starts with an

DRAFT-2
47
indication of the policy objectives of the Food and Nutrition Policy that the plan addresses.

DRAFT-2
48
CHAPTER 3: CONCEPTUAL FRAMEWORK FOR THE NMNAP
3.1 The conceptual basis 76. A comprehensive conceptual framework describing the key determinants of
malnutrition in children and women was first developed in Tanzania during the mid-1980s in the Iringa Joint Government UNICEF/WHO Nutrition Programme (JNSP). The framework saw malnutrition as the manifestation of various individual, community and social processes in society with multiple determinants classified as immediate, underlying and basic. The causality framework was used as the lens through which determinants of malnutrition in any specific context can be analysed, and was accompanied by a programming approach of a cyclic process of assessment of the extent of the nutrition challenge, analysis of the causes in that specific context, and actions to address the causes. The cycling triple A process makes it possible to adjust course as new evidence is captured and experience gained so called “Adaptive Programming”. The conceptual framework was first globally outlined in UNICEF’s conceptual framework on maternal and child undernutrition in 1990. The framework has since been extended and evolved to encompass new evidence and knowledge on the causes, as well as the short- and long-term consequences, impacts, and intervention approaches (see figure 11).
Figure 10: The 2015 UNICEF Conceptual Framework of the Determinants of Maternal and Child Undernutrition

DRAFT-2
49
77. The UNICEF conceptual framework clearly identifies the social determinants of
undernutrition at the different levels of depth of analysis (immediate, underlying and basic) with the implication that addressing these determinants will lead to improved maternal and child nutrition. Based on this framework, the 2013 Lancet Nutrition Series developed it further for purposes of developing a specific framework for addressing malnutrition (see fig 12) categorizing interventions into: -
1) Nutrition specific interventions 2) Nutrition sensitive interventions; and 3) Enabling environment interventions.
Figure 11: The Conceptual Framework adopted by the NMNAP for developing the action plan

DRAFT-2
50
78. A key lesson learned in using the “Conceptual Framework” in previous policies, strategies and programmes in Tanzania is that, given the complex nature of the nutrition challenge, there is no single magic bullet or single intervention that will address all the problems of malnutrition. Instead, the most successful actions that will lead to large-scale high impact are evidence-based, use an explicit conceptual framework, are multisectoral, multi-disciplinary and multi-level. They use the cyclic triple A process of Assessment, Analysis and Action with nutritional status as the key outcome. Given the dynamic socio-economic changes expected during the period for implementation of the NMNAP, it will be important to use the triple A process to re-assess, re-analyse and adjust actions, which are responsive to the changing landscape. Since malnutrition occurs at individual/household/community level, focusing actions and encouraging participatory triple A processes at the community level results in the greatest impact. The approach is greatly enhanced by decentralized and multisectoral coordinating structures, and a human rights perspective, which are all in place in Tanzania. Key strategies should include developing the functional capacities related to human, institutional and financial resources; advocacy and communication to ensure accountability of results and social responsibility; gender mainstreaming and

DRAFT-2
51
Results-Based Planning and Management. Thus, the NMNAP is not a static blue print, but a dynamic strategic guide that can be contextually modified and adapted by the various actors in their own nutrition plans as conditions evolve and changes are warranted.
3.2 The NMNAP Theory of Change 79. In articulating results, the NMNAP relied heavily on the adoption of methods
to define the “Theory of Change (TOC)” for all activities and program elements. The TOC is not only a tool but a way of understanding and learning about social change. The TOC helps describe the challenge of addressing malnutrition through “adaptive” social change processes, given that malnutrition is an emergent manifestation of social processes, complex in its causation and interventions, and manifests in dynamic and often uncertain contexts.
80. The use of a Theory of Change approach29 enabled us to organize our thoughts and convert our knowledge and experience into those conditions needed to achieve the desired change in a given context around a thinking-action planning logic. This is partly done by making assumptions explicit and by analysing them critically. The conceptual framework used in this NMNAP to address malnutrition provides not only the theoretical framework, but also an explicit indication of how the TOC can be translated into practice. Table 3 provides the definition of the main terms used in Theory of Change. Table 3: Definition of key components of the Theory of Change
Key definitions of the components of the Theory of Change
Desired change This is the long-term change expected from doing an intervention (called Impact in the NMNAP)
Assumptions Assumptions are the rationale of our interventions and they sit between Desired Change and Conditions for change answering the question: “Why do you think this condition is necessary in order for the Desired Change to happen?
Conditions for Change
These are events and phenomenon that need to be in place in order for the Desired Change to happen – also called “outcomes” in the NMNAP
Contribution to Condition
Is the contribution in terms of individuals and organisations that is provided in order to influence the Condition for Change. Called “output” in the NMNAP.
81. In developing the NMNAP Theory of Change, a multi-stakeholder’s workshop
was designed with the participation of the majority of key stakeholders involved in the thinking process around a draft NMNAP. During the process a Desired Change was identified, validated and agreed as well as key Conditions and key Assumptions.
3.3 Desired change and key assumptions 82. The desired change which emerged from the TOC workshop is that “Children,
adolescents, women and men in Tanzania are better nourished leading to healthier and more productive lives that contribute to economic growth and sustainable development”. For each of the seven Key Result Areas there
29 The theory of change (2016): A journey to understand complexity and our role in social change processes: Adapted from http://www.theory-of-change.com/the-approach

DRAFT-2
52
are several assumptions for the outcomes to lead to the desired change. These assumptions include: -
1) Key assumptions for scaling up MIYCAN: practicing optimal nutrition behaviours lead to better nourishment, health and improved economic productivity; there is a standard set of behaviours which improve nutrition; high awareness and adequate support to target groups will lead to adoption of optimal nutrition behaviours.
2) Key assumptions for prevention and management of Micronutrient deficiencies: Adequate micronutrient intake is essential for optimal growth and development; micronutrients improve health and economic productivity.
3) Key assumptions for scaling up Integrated Management of Acute Malnutrition (IMAM): Treatment of acute malnutrition benefits children’s development and survival in the short and long term; Scaling-up treatment of acute malnutrition will save children’s lives.
4) Key assumptions in scaling up prevention and management of Diet Related Non-Communicable Diseases (DRNCDs): physical and mental health are associated with good health and nutrition; healthy eating and lifestyles are associated with better health and nutrition and improved economic productivity.
5) Key assumptions for Nutrition Sensitive Interventions: interventions in health and HIV, WASH, food security, social protection and education sectors have a strong impact in improving nutrition; reaching all communities with nutrition sensitive interventions will lead to improvements in nutrition.
6) Key assumption for good nutrition governance: Good governance improves efficiency, equity and coverage of nutrition interventions; Good nutrition governance has an indirect impact on improving the nutrition status of Tanzanians.
7) Key assumptions for Multisectoral Nutrition Information Systems: Access to quality and timely nutrition information contributes to designing effective nutrition interventions including targeting of vulnerable groups and mobilization and targeting of resources.
83. During the implementation of the plan a key operational strategy will be to consistently track the assumptions described in the Theory of Change. This will allow the plan to remain dynamic, and use data from ongoing implementation to guide whether or not the implicit expectations are being realized, or whether there is a need to adjust and modify activities to improve program performance. Table 4 below illustrates an example of one Monitoring template for the Key Result Area of Maternal, Infant, Young Child and Adolescent Nutrition which will help confirm assumptions throughout the implementation phase.
Table 4: Monitoring template for the NMNAP based on the theory of change using the MIYCAN example
Condition (Outcome)
Assumption Inquiry questions Methods and tools
Informants

DRAFT-2
53
Adolescents, pregnant women and mothers / care givers of children under five years are supported to practice optimal nutrition behaviors
Practicing optimal nutrition behaviours leads to better health and improved economic productivity
i) To what extent optimal nutritious behaviours has led to improved health and economic productivity? ii) To what extent adolescents, pregnant women and mothers / care givers are better nourished?
i) Reality check approaches ii) Critical stories of Change iii) Participatory video iv) KAP surveys v) Focus Group Discussions
Mothers, Children, School teachers, Employers, Districts Nutrition Officers
3.4 The NMNAP pathway of change
3.4.1 The hierarchy of results 84. An additional dimension to the development of the NMNAP is a pathway of
change which is envisaged along the life course as a hierarchy of results which have to be in place in order for the desired change to be realized. This pathway is based on the notion that activities contribute to the necessary conditions which support and make possible the desired change to happen. Given that the NMNAP strategic actions are planned in seven Key Result Areas, each of the seven different conditions are envisaged to contribute towards the NMNAP’s desired change.
3.4.2 Desired change for the NMNAP 85. The NMNAP has defined only one desired change (impact), which is the
highest level result expected from implementing the NMNAP: that “Children, adolescents, women and men in Tanzania are better nourished leading to healthier and more productive lives that contribute to economic growth and sustainable development”.
86. Unpacking the desired change from a population-based perspective and using the Lancet 2013 Nutrition Series conceptual framework to address malnutrition, we can elaborate on the expected NMNAP impacts which will be associated with the desired change: -
1) Being well nourished means significant reductions in the prevalence rates of undernutrition (stunting, wasting, underweight, low birth weight, micronutrient deficiencies) and improved adult stature. It also means reductions in the prevalence rates of overweight, obesity and diet/weight related non-communicable diseases (NCDs).
2) Healthy lives mean that in addition to being well-nourished, reductions in the prevalence of morbidity (illnesses) and mortality (IMR, U5MR, NMR, MMR) and improvements in life expectancy.
3) Productive lives that contribute to economic growth and sustainable development means improved mental and cognitive development, improved school performance and learning capacity, improved production capacity, productivity, earning capacity and consequently, reductions in poverty and inequality.
3.4.3 Stakeholder engagement and Analysis 87. Table 5 illustrates the results of the stakeholder analysis for the NMNAP
Theory of Change. It is divided into a specific stakeholder analysis for each
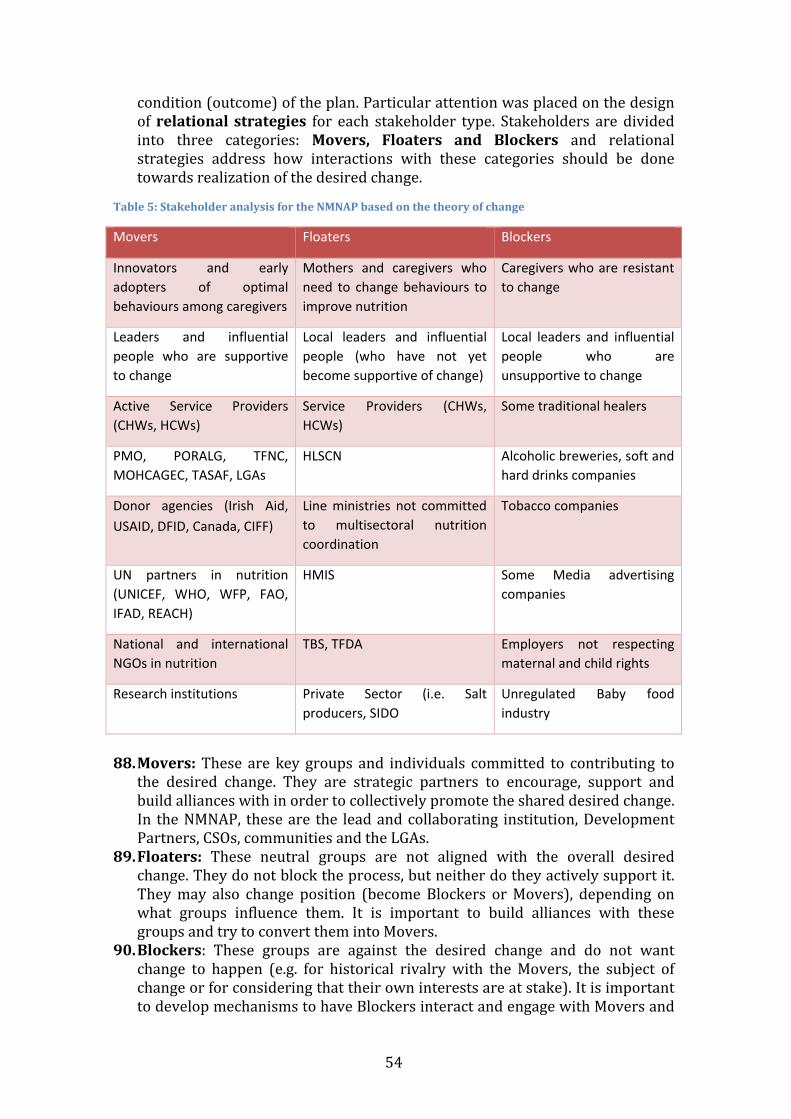
DRAFT-2
54
condition (outcome) of the plan. Particular attention was placed on the design of relational strategies for each stakeholder type. Stakeholders are divided into three categories: Movers, Floaters and Blockers and relational strategies address how interactions with these categories should be done towards realization of the desired change.
Table 5: Stakeholder analysis for the NMNAP based on the theory of change
Movers Floaters Blockers
Innovators and early adopters of optimal behaviours among caregivers
Mothers and caregivers who need to change behaviours to improve nutrition
Caregivers who are resistant to change
Leaders and influential people who are supportive to change
Local leaders and influential people (who have not yet become supportive of change)
Local leaders and influential people who are unsupportive to change
Active Service Providers (CHWs, HCWs)
Service Providers (CHWs, HCWs)
Some traditional healers
PMO, PORALG, TFNC, MOHCAGEC, TASAF, LGAs
HLSCN Alcoholic breweries, soft and hard drinks companies
Donor agencies (Irish Aid, USAID, DFID, Canada, CIFF)
Line ministries not committed to multisectoral nutrition coordination
Tobacco companies
UN partners in nutrition (UNICEF, WHO, WFP, FAO, IFAD, REACH)
HMIS Some Media advertising companies
National and international NGOs in nutrition
TBS, TFDA Employers not respecting maternal and child rights
Research institutions Private Sector (i.e. Salt producers, SIDO
Unregulated Baby food industry
88. Movers: These are key groups and individuals committed to contributing to
the desired change. They are strategic partners to encourage, support and build alliances with in order to collectively promote the shared desired change. In the NMNAP, these are the lead and collaborating institution, Development Partners, CSOs, communities and the LGAs.
89. Floaters: These neutral groups are not aligned with the overall desired change. They do not block the process, but neither do they actively support it. They may also change position (become Blockers or Movers), depending on what groups influence them. It is important to build alliances with these groups and try to convert them into Movers.
90. Blockers: These groups are against the desired change and do not want change to happen (e.g. for historical rivalry with the Movers, the subject of change or for considering that their own interests are at stake). It is important to develop mechanisms to have Blockers interact and engage with Movers and

DRAFT-2
55
Floaters in order to prevent and counter-balance their impact on the program, as well as trying to dilute their influence.
91. The stakeholders’ analysis helps to guide implementers on how to engage different groups of stakeholders, and leverage their potential to contribute to the NMNAP desired change. It is an ongoing process driven by relational strategies at all levels of the Theory of Change.
92. Figure 13 summarizes the theory of change for the NMNAP and incorporates several change elements into one. First, it shows the linkage between outputs, outcomes and the overall program impact/desired change. These linkages are based on sets of assumptions, which the implementation of the plan will make sure are tested and verified. Second, although there may be several outputs and outcomes, they all are seen as complementary and necessary in order to contribute to a single summary impact measure, or desired change. Finally, the figure underscores the fact that there are several activities/interventions that can produce such linkages and are nutrition specific and/or nutrition sensitive and require an enabling environment. These activities are detailed for each of the seven thematic area in the action plans in chapter 5.
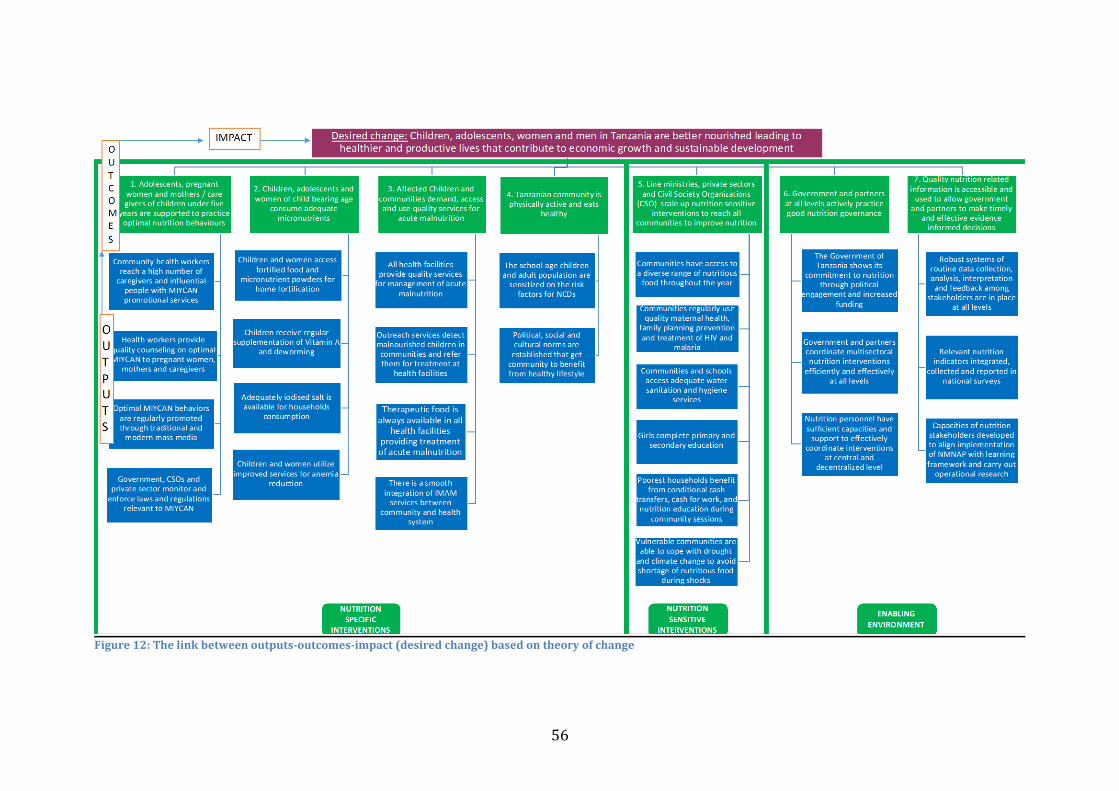
DRAFT-2
56
Figure 12: The link between outputs-outcomes-impact (desired change) based on theory of change
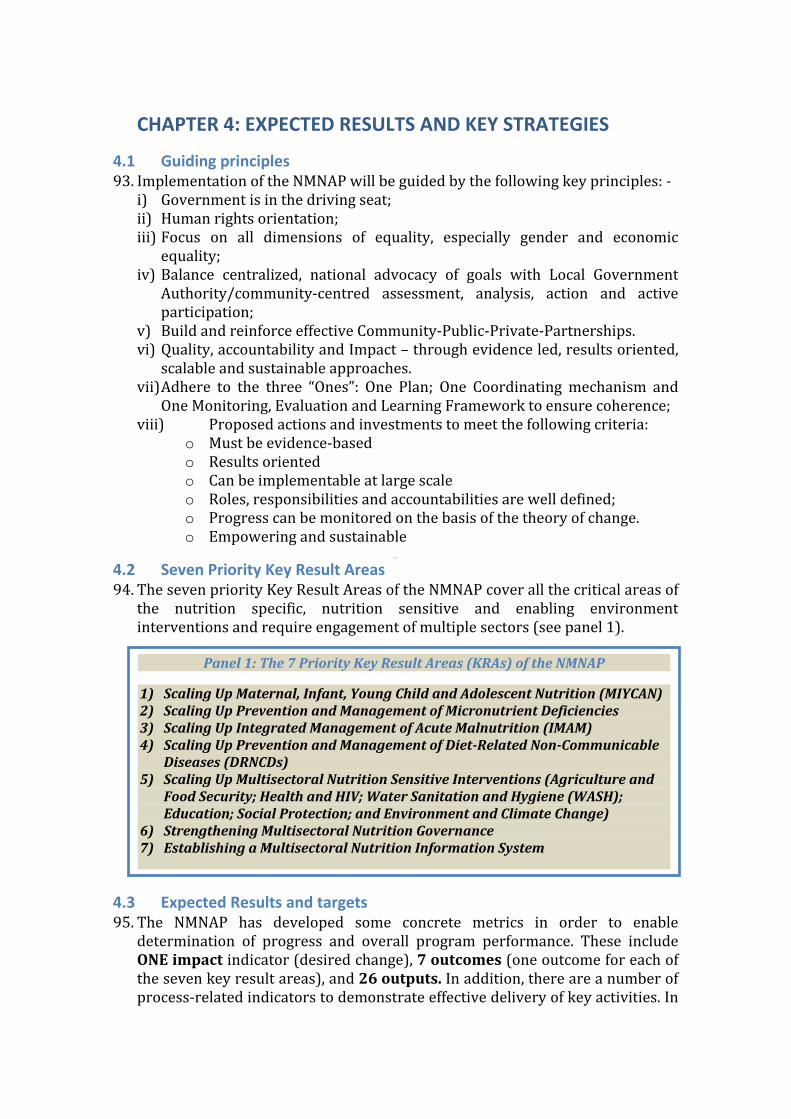
DRAFT-2
CHAPTER 4: EXPECTED RESULTS AND KEY STRATEGIES
4.1 Guiding principles 93. Implementation of the NMNAP will be guided by the following key principles: -
i) Government is in the driving seat; ii) Human rights orientation; iii) Focus on all dimensions of equality, especially gender and economic
equality; iv) Balance centralized, national advocacy of goals with Local Government
Authority/community-centred assessment, analysis, action and active participation;
v) Build and reinforce effective Community-Public-Private-Partnerships. vi) Quality, accountability and Impact – through evidence led, results oriented,
scalable and sustainable approaches. vii) Adhere to the three “Ones”: One Plan; One Coordinating mechanism and
One Monitoring, Evaluation and Learning Framework to ensure coherence; viii) Proposed actions and investments to meet the following criteria:
o Must be evidence-based o Results oriented o Can be implementable at large scale o Roles, responsibilities and accountabilities are well defined; o Progress can be monitored on the basis of the theory of change. o Empowering and sustainable
4.2 Seven Priority Key Result Areas 94. The seven priority Key Result Areas of the NMNAP cover all the critical areas of
the nutrition specific, nutrition sensitive and enabling environment interventions and require engagement of multiple sectors (see panel 1).
4.3 Expected Results and targets 95. The NMNAP has developed some concrete metrics in order to enable
determination of progress and overall program performance. These include ONE impact indicator (desired change), 7 outcomes (one outcome for each of the seven key result areas), and 26 outputs. In addition, there are a number of process-related indicators to demonstrate effective delivery of key activities. In
Panel 1: The 7 Priority Key Result Areas (KRAs) of the NMNAP
1) Scaling Up Maternal, Infant, Young Child and Adolescent Nutrition (MIYCAN) 2) Scaling Up Prevention and Management of Micronutrient Deficiencies 3) Scaling Up Integrated Management of Acute Malnutrition (IMAM) 4) Scaling Up Prevention and Management of Diet-Related Non-Communicable
Diseases (DRNCDs) 5) Scaling Up Multisectoral Nutrition Sensitive Interventions (Agriculture and
Food Security; Health and HIV; Water Sanitation and Hygiene (WASH); Education; Social Protection; and Environment and Climate Change)
6) Strengthening Multisectoral Nutrition Governance 7) Establishing a Multisectoral Nutrition Information System

DRAFT-2
58
articulating results, the NMNAP adopted a number of different criteria normally used in designing monitoring and evaluation (M&E) systems for large-scale programmes:
1) Appropriate level of results (Impact, Outcome, output) 2) Appropriate ratio of outputs per outcome 3) Appropriate ratio of indicators to output-outcome-impact 4) The quality of results 5) The SMART (specific, measurable attributable, replicable and time-
bound) principle 6) Formulation of indicators: Neutral and specific 7) Soundness of horizontal logic (baseline, milestones, reliable source)
96. Key targets were proposed for each of the outcome and output indicators based on several criteria including:
1) Baseline data from population based surveys (TDHS 2015/16, Tanzania National Nutrition Survey (TNNS) of 2014, Population Census and Household Survey 2012),
2) Target for stunting reduction is based on the calculation of the annual average reduction rate (AARR)30 of 3.4 percent for 2015-2020 using the 2015/16 TDHS as baseline and the NMNAP 2020/21 prevalence target of 28 percent. The NMNAP did not use the WHA 2025 global nutrition target of reducing the numbers of children under five who are stunted by 40 percent given the high population growth for Tanzania.
3) Continued political will and Government commitment to nutrition and 4) The consensus reached during the consultations in developing the
NMNAP on coordination, harmonization and collaboration by various stakeholders using the three ONES principle of ONE plan, One Coordinating Mechanism and ONE M&E framework at all levels.
4.4 Expected impact and outcomes 97. The main expected impact or desired change is that “Children, adolescents,
women and men in Tanzania are better nourished leading to healthier and more productive lives that contribute to economic growth and sustainable development”.
98. The 12 key indicators associated targets to demonstrate progress towards the achievement of the desired change for 2021 are shown in table 6.
30 The Annual Average Rate of Reduction (AARR) is the average relative percent decrease per year in prevalence or rate. Thus, a positive sign indicates reduction or downward trend, while a negative sign indicates increase, or upward trend. The AARR for stunting is calculated based on available survey data. When there are available data beyond the baseline year, the current AARR is calculated only considering two points, the baseline and the latest survey estimates using the formula AARR = 1- (Pt+n / Pt )(1/n), where Pt+n is the latest prevalence, Pt is the baseline prevalence, and n is the number of years between them.
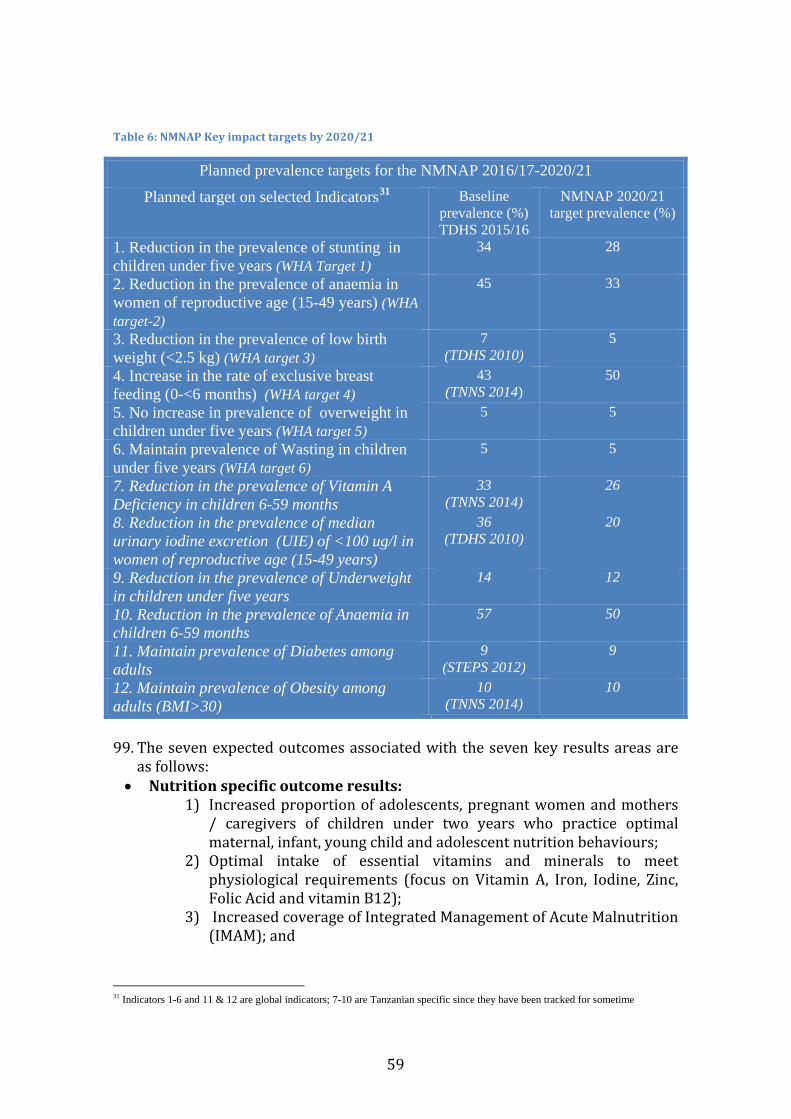
DRAFT-2
59
Table 6: NMNAP Key impact targets by 2020/21
Planned prevalence targets for the NMNAP 2016/17-2020/21
Planned target on selected Indicators31
Baseline prevalence (%) TDHS 2015/16
NMNAP 2020/21 target prevalence (%)
1. Reduction in the prevalence of stunting in children under five years (WHA Target 1)
34 28
2. Reduction in the prevalence of anaemia in women of reproductive age (15-49 years) (WHA target-2)
45 33
3. Reduction in the prevalence of low birth weight (<2.5 kg) (WHA target 3)
7 (TDHS 2010)
5
4. Increase in the rate of exclusive breast feeding (0-<6 months) (WHA target 4)
43 (TNNS 2014)
50
5. No increase in prevalence of overweight in children under five years (WHA target 5)
5 5
6. Maintain prevalence of Wasting in children under five years (WHA target 6)
5 5
7. Reduction in the prevalence of Vitamin A Deficiency in children 6-59 months
33 (TNNS 2014)
26
8. Reduction in the prevalence of median urinary iodine excretion (UIE) of <100 ug/l in women of reproductive age (15-49 years)
36 (TDHS 2010)
20
9. Reduction in the prevalence of Underweight in children under five years
14 12
10. Reduction in the prevalence of Anaemia in children 6-59 months
57 50
11. Maintain prevalence of Diabetes among adults
9 (STEPS 2012)
9
12. Maintain prevalence of Obesity among adults (BMI>30)
10 (TNNS 2014)
10
99. The seven expected outcomes associated with the seven key results areas are
as follows: • Nutrition specific outcome results:
1) Increased proportion of adolescents, pregnant women and mothers / caregivers of children under two years who practice optimal maternal, infant, young child and adolescent nutrition behaviours;
2) Optimal intake of essential vitamins and minerals to meet physiological requirements (focus on Vitamin A, Iron, Iodine, Zinc, Folic Acid and vitamin B12);
3) Increased coverage of Integrated Management of Acute Malnutrition (IMAM); and
31 Indicators 1-6 and 11 & 12 are global indicators; 7-10 are Tanzanian specific since they have been tracked for sometime
DRAFT-2
60
4) Improved healthy lifestyles of the Tanzanian community to address the problem of overweight and obesity.
• Nutrition sensitive outcome results:
1) Increased coverage of nutrition sensitive interventions from key development sectors (Agriculture and Food Security; Health and HIV; Water, Sanitation and Hygiene; Education; Social Protection and Environment and Climate Change;).
• Enabling environment outcome results:
1) Improved Nutrition Governance and response across all sectors, actors and implementation levels;
2) Increased access to quality nutrition related information to allow Government of Tanzania to make timely and effective evidence based decisions.
4.5 Expected outputs per outcome 100. This section presents key outputs and targets for each of the seven
outcomes listed above: -
4.5.1 Key outputs and targets for MIYCAN outcome Output 1: Increased coverage and quality of MIYCAN services at the community level to reach 65 percent coverage by June 2021 from a baseline of 15 percent. Output 2: Improved quality of MIYCAN services at the health facilities level to reach 65 percent by June 2021 from a baseline of 20 percent. Output 3: MIYCAN is promoted at all levels through mass-media and the use of new technologies to reach at least 50 percent of the population by June 2021. Output 4: Improved MIYCAN law enforcement through advocacy and capacity building of key institutions. The target by 2021 is to have at least 50 percent of employers providing minimum requirement of maternity benefits (maternity leaves, breastfeeding breaks, breastfeeding corners at workplaces)
4.5.2 Key outputs and targets for Micronutrients outcome Output 1: Children and women access fortified food and micronutrient powders for home fortification. Increase in the percentage of districts with Micronutrient Powders (MNPs) from 10% to 35% by 2012 and increase in the proportion of flour produced in Tanzania which is fortified with iron from 36% to 50% by 2021. Output 2: Children receive regular supplementation of Vitamin A and deworming, with percentage of children receiving vitamin A supplementation increasing from 89% and being sustained at 90% by 2021. Output 3: Adequately iodised salt is available for households’ consumption with an increased percentage of the edible salt produced in Tanzania which is adequately iodized from 36% to 63% by 2021. Output 4: Children and women utilize improved services for anaemia reduction, reflected by an increase in the coverage of women with IFA from 17% to 58% by 2021.
4.5.3 Key outputs and targets for IMAM outcome Output 1: Improved quality of services for management of severe and moderate acute malnutrition in at least 75 percent of health facilities by 2021 Output 2: At least 75 percent of children under five years old are reached through screening for severe and moderate acute malnutrition at community level by 2021

DRAFT-2
61
Output 3: Essential therapeutic nutrition supplies and equipment are available in at least 90 percent of health facilities providing services for management of severe and moderate acute malnutrition by June 2021 Output 4: Strengthened coordination of integrated management of severe and moderate acute malnutrition at the national and subnational level by June 2021 Output 5: Functional Management Information System for severe and moderate acute malnutrition is available in at least 90 percent of districts by June 2021
4.5.4 Key outputs and targets for DRNCDs outcome Output 1: At least 50 percent of the school-age children and adult population are sensitized on the risk factors for NCDs by 2021. Output 2: Policies, social, cultural and structural norms are established to enable at least 75 percent of the community to engage in healthy lifestyles by 2021
4.5.5 Key outputs and targets for Nutrition sensitive interventions outcome Output 1: Communities have access to a diverse range of nutritious food throughout the year Output 2: Communities regularly use quality maternal health, family planning prevention services and treatment of HIV and malaria Output 3: Communities and schools access adequate water sanitation and hygiene services Output 4: Girls complete primary and secondary education Output 5: Poorest households benefit from conditional cash transfers, cash for work, and nutrition education during community sessions Output 6: Vulnerable communities are able to cope with drought and climate change to avoid shortage of nutritious food during shocks
4.5.6 Key outputs and targets for Nutrition Governance outcome Output 1: The Government of Tanzania shows its commitment to nutrition through political engagement and increased funding Output 2: Government and partners coordinate multisectoral nutrition interventions efficiently and effectively at all levels Output 3: Nutrition personnel have sufficient capacities and support to effectively coordinate interventions at central and decentralized level
4.5.7 Key outputs and targets for multisectoral nutrition information system outcome Output 1: Robust systems of routine data collection, analysis, interpretation and feedback among stakeholders are in place at all levels Output 2: Relevant nutrition indicators integrated, collected and reported in national surveys Output 3: Capacities of nutrition stakeholders developed to align implementation of NMNAP with learning framework and carry out operational research
4.6 Key strategies
4.6.1 Integrated multisectoral nutrition strategy as overarching 101. The NMNAP uses an explicit Multisectoral Nutrition Strategy that is based
on global and national learning and evidence as per the section on the conceptual basis for this NMNAP. Given the complex nature of the determinants
DRAFT-2
62
which influence nutritional status and requiring a broad set of inputs and actors to address these, a multisectoral approach is ideally suitable.
102. The multisectoral strategy is based on the overwhelming scientific evidence that achieving high coverage of the evidence-based high impact nutrition interventions requires multisectoral synergy and collaboration including community-public-private partnerships (C-PPP). Indeed, both nutrition specific and nutrition sensitive interventions require multisectoral approaches. The idea is to ensure that actions taken address the multiple causative factors at all levels of the nutrition system: immediate, underlying and basic and achieve synergistic results.
4.6.2 Supportive cross-cutting strategies 103. Acknowledging that nutrition is a crosscutting issue that requires the
effective contribution of multiple actors, sectors and administrative levels, the NMNAP is based on a national multisectoral strategic nutrition framework for planning, implementation and coordination. The overarching multisectoral approach used in this NMNAP is complemented by several supportive strategies which are relevant and applicable to each of the seven key results based areas. These include: -
1) Social and Behaviour Change Communication (SBCC) for nutrition through interpersonal communication and mass media to promote adoption of appropriated behaviours and practices and commitment to achieving common results for everyone and everywhere in the country for improved nutrition. The NMNAP will use the National Nutrition Social and Behavioural Change Communication Strategy for 2013-2018.
2) Advocacy and Social mobilization to sustain political will and Government commitment for nutrition and to mobilise adequate resources for nutrition. Social mobilisation activities are important to create awareness of the problems of malnutrition among decision makers and community members to improve nutrition. For example, a 2013 landscape analysis by TFNC found that policy makers and communities do not perceive stunting and micronutrient deficiencies as problems to be addressed. Since many of the actions in advocacy and social mobilization require behavioural, attitude and practice changes by policy makers and communities for overall societal change all types of media need to be involved. Social mobilization will also increase the participation of communities in the implementation of the NMNAP. Since the key actors for improved nutrition are households and communities ensuring their active participation of communities is a critical success factor for the NMNAP.
3) Community-Centred Capacity Development (CCCD): The development of human, institutional and organizational capacity is critical in the implementation of the NMNAP especially at the community level. Community participation in doing their own triple A processes of assessment, analysis and action can be greatly enhanced by developing the capacity of the community and that of community-based organisations to support social accountability

DRAFT-2
63
mechanisms (see chapter on nutrition governance for definition of social accountability). Recognizing that communities constitute the greater whole of society and that they exist in relationship with society as a whole, development of capacity of communities should go hand in hand with developing capacity at the higher levels – council, district, region, national.
4) Developing functional human resource capacity: Although human resource technical capacity in nutrition is fairly adequate, functional capacity in communication skills, coordination and strategic leadership and management requires further development. System-wide development of nutrition relevant institutions, especially for TFNC as the institutional Leader in the implementation of this NMNAP will be given priority. Institutionalization of the nutrition steering committees at all levels and developing their functional capacity will be further explored.
5) Aligning all stakeholders with the NMNAP through Community-Public-Private Partnerships (C-PPP) using the “three ONES principle” of ONE plan, ONE coordinating mechanism and ONE monitoring and evaluation framework, so that every stakeholder come together to tackle malnutrition and build an enabling environment for improved nutrition with equity. Capacities will be developed to conduct and manage C-PPPs as part of a collaborative leadership strategy. Forming strategic partnerships at all levels of the nutrition system will enhance coordination and accountability. Strategic collaboration, including the engagement of the private sector through implementation of appropriate principles of social and corporate responsibility, is likely to result in cost-efficiency and effectiveness and promote ownership and sustainability.
6) Delivery of quality and timely nutrition services: This NMNAP will promote the delivery of nutrition and nutrition-relevant services that are timely and of high quality. Tools will be put in place to assess the effective implementation and delivery of services, and where bottlenecks are identified, remedial and corrective measures will be adopted including legal enforcement as appropriate.
7) Mainstream equality in all the seven Key Result Areas of the NMNAP without discrimination, focusing on women, children and adolescent girls. Although generally Tanzania has made good progress in empowering women, traditional patriarchal practices remain, that favour men, including in nutrition relevant practices, and are often reflected in both formal and informal systems and institutions especially in the rural areas.
8) A resource mobilization strategy will be developed to advocate for resource allocation to the NMNAP by both Government and Partners.
9) Tracking progress and operational Research and development will be promoted to ensure key lessons and insights gained from the implementation of the NMNAP are learnt and used in adjusting and improving the proposed interventions at regular intervals and linking research with programmes and training. Research will also provide quality assurance, robust data on program performance and

DRAFT-2
64
support learning. Linking research to the programmes and to training will assure evidence-based sharing of experience and intergenerational transfer of knowledge. Efforts will be made to link the implementation of the NMNAP with nutrition-relevant centres of excellence both nationally and internationally.
10) Overall planning and coordination is a key strategy to align implementation of the NMNAP to achieve far greater results than what single sectors could achieve alone.

DRAFT-2
65
CHAPTER 5: ACTION PLANS TO SCALE UP NUTRITION INTERVENTIONS IN THE KEY RESULT AREAS OF THE NMNAP
5.1 Overview 104. This chapter summarizes the action plans for the first five of the seven Key
Result Areas (KRAs) categorized into “nutrition specific interventions” and “nutrition sensitive interventions”. The nutrition specific intervention action plans are for (i) Maternal, Infant, Young Child and Adolescent Nutrition (MIYCAN), (ii) Micronutrients, (iii) Integrated Management of Acute Malnutrition (IMAM), and (iv) Diet Related Non-Communicable Diseases (DRNCDs). The Nutrition Sensitive Interventions (NSI) are for Agriculture and Food Security; Health and HIV; Water, Sanitation and Hygiene (WASH); Education; Social Protection; and Environment and Climate Change. Enabling environment intervention action plans are in chapter 6 - action plan for Multisectoral Nutrition Governance (MNG), and chapter 7 - action plan for the Multisectoral Nutrition Information System (MNIS). Each action plan starts with the policy objectives that the plan aims to achieve. All of the 22 policy objectives of the 2016 Food and Nutrition Policy are covered in the seven KRAs.
5.2 Action plans to scale-up nutrition specific interventions
5.2.1 Actions to scale-up Maternal, Infant, Young Child and Adolescent Nutrition (MIYCAN): Detailed Action Plan in Annex 1 105. The proposed MIYCAN action plan is expected to address the following
Food and Nutrition Policy objectives: 1) To improve and scale up access to quality nutrition interventions
along the life course; 2) To improve adolescent and maternal nutritional care and support; 3) To improve infants’ and young child nutrition. 4) To improve the nutrition status of vulnerable groups 5) To improve nutrition knowledge, behaviours, attitudes and practices
for improved nutrition. 106. The MIYCAN action plan is based on the previous National Infant and
Young Child Feeding (IYCF) strategy with the following important additions: promotion of optimal maternal and adolescent nutrition in key practices; an explicit multisectoral approach which will incorporate elements of Health, WASH, Early childhood development and adds new strategic stakeholders like local leaders, grandmothers, mothers-in-law and husbands. The actions are prioritized and will be systematically scaled-up geographically using two main criteria: (i) the burden of stunting in the regions; and (ii) the availability of funding and partners to support the regions.
107. As a result, the following groups of regions will be progressively covered by the Plan:

DRAFT-2
66
1) First year (2015/16): Dodoma, Morogoro, Mbeya, Iringa and Njombe;
2) Second year (2016/17): Geita, Kagera, Kigoma, Mwanza, Ruvuma, Shinyanga, Simiyu;
3) Third year (2017/18): Dar Es Salaam, Arusha, Manyara, Mara, Rukwa, Tabora, Tanga;
4) Fourth year (2018/19): Katavi, Kilimanjaro, Lindi, Mtwara, Pwani, Singida. By fourth year all regions will be covered.
108. The MIYCAN key actions and timeline are shown in table 7, budget in table 8 and annual budget trend in figure 14 below.
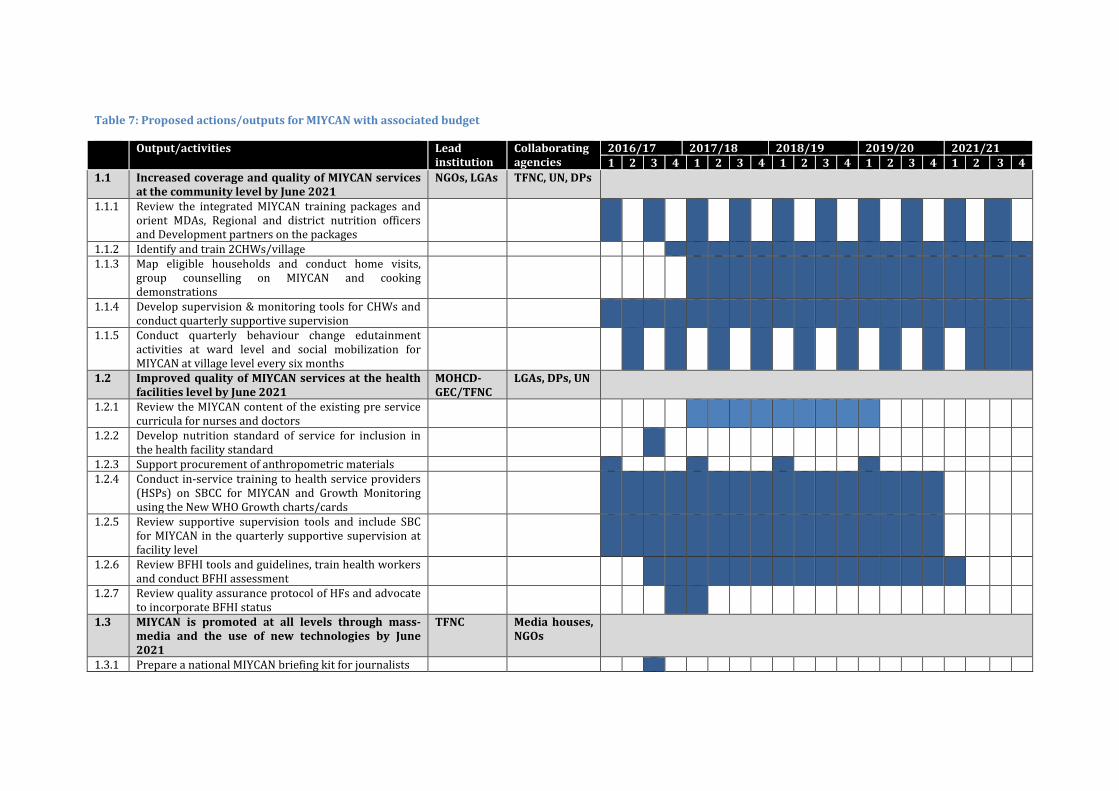
Table 7: Proposed actions/outputs for MIYCAN with associated budget
Output/activities Lead institution
Collaborating agencies
2016/17 2017/18 2018/19 2019/20 2021/21 1 2 3 4 1 2 3 4 1 2 3 4 1 2 3 4 1 2 3 4
1.1 Increased coverage and quality of MIYCAN services at the community level by June 2021
NGOs, LGAs TFNC, UN, DPs
1.1.1 Review the integrated MIYCAN training packages and orient MDAs, Regional and district nutrition officers and Development partners on the packages
1.1.2 Identify and train 2CHWs/village 1.1.3 Map eligible households and conduct home visits,
group counselling on MIYCAN and cooking demonstrations
1.1.4 Develop supervision & monitoring tools for CHWs and conduct quarterly supportive supervision
1.1.5 Conduct quarterly behaviour change edutainment activities at ward level and social mobilization for MIYCAN at village level every six months
1.2 Improved quality of MIYCAN services at the health facilities level by June 2021
MOHCD-GEC/TFNC
LGAs, DPs, UN
1.2.1 Review the MIYCAN content of the existing pre service curricula for nurses and doctors
1.2.2 Develop nutrition standard of service for inclusion in the health facility standard
1.2.3 Support procurement of anthropometric materials 1.2.4 Conduct in-service training to health service providers
(HSPs) on SBCC for MIYCAN and Growth Monitoring using the New WHO Growth charts/cards
1.2.5 Review supportive supervision tools and include SBC for MIYCAN in the quarterly supportive supervision at facility level
1.2.6 Review BFHI tools and guidelines, train health workers and conduct BFHI assessment
1.2.7 Review quality assurance protocol of HFs and advocate to incorporate BFHI status
1.3 MIYCAN is promoted at all levels through mass-media and the use of new technologies by June 2021
TFNC Media houses, NGOs
1.3.1 Prepare a national MIYCAN briefing kit for journalists

TANZANIA NATIONAL MULTISECTORAL NUTRITION ACTION PLAN (NMNAP) JULY 2016-2021
68
Output/activities Lead institution
Collaborating agencies
2016/17 2017/18 2018/19 2019/20 2021/21 1 2 3 4 1 2 3 4 1 2 3 4 1 2 3 4 1 2 3 4
1.3.2 Conduct press conference and media seminar MIYCAN and other relevant nutrition issues for journalists and editors
1.3.3 Advocate for nutrition through ambassadors / celebrities
1.3.4 Support the World Breastfeeding Week every year to advocate appropriate child feeding practices
1.3.5 Design and broadcast MIYCAN programs and messages through TV, radios, cell phones, social medias and gathering (busses, football games, concerts)
1.3.6 Conduct quarterly network meetings with private media and communication companies to strengthen synergies at national and regional level
1.4 Improved MIYCAN law enforcement through advocacy and capacity building of key institutions
TFNC TFDA, UN, MoLED, NGOs, ATE
1.4.1 Establish status of implementation, prepare a business case and advocate for enforcement of the three months maternity leave; create awareness on maternity protection in formal/informal sectors
1.4.2 Sensitize commercial partners on compliance with regulations and standards for IYCF products
1.4.3 Develop a Swahili booklet of BMS regulations; Create awareness and advocate for monitoring of the regulations at all levels.
Table 8: Financial requirements of the MIYCAN action plan disaggregated by expected results (Outcome and outputs)
Expected Results Budget in Billion TZS Total
Million USD** 2016/17 2017/18 2018/19 2019/20 2020/21 Total
Expected Outcome 1:
Increased proportion of adolescents, pregnant women and mothers / caregivers of children under two years who practice optimal maternal, infant and young child nutrition behaviours 34.9 49.9 60.9 36.1 14.0 195.8 89.0
Output 1.1: Increased coverage and quality of MIYCAN services at the community level by June 2021 23.8 38.1 46.7 26.1 10.6 145.4 66.10 Output 1.2: Improved quality of MIYCAN services at the health facilities level by June 2021 10.2 10.7 13.2 9.2 2.5 45.8 20.83 Output 1.3: MIYCAN is promoted at all levels through mass-media and the use of new technologies by June 2021 0.6 0.6 0.6 0.6 0.6 2.9 1.30
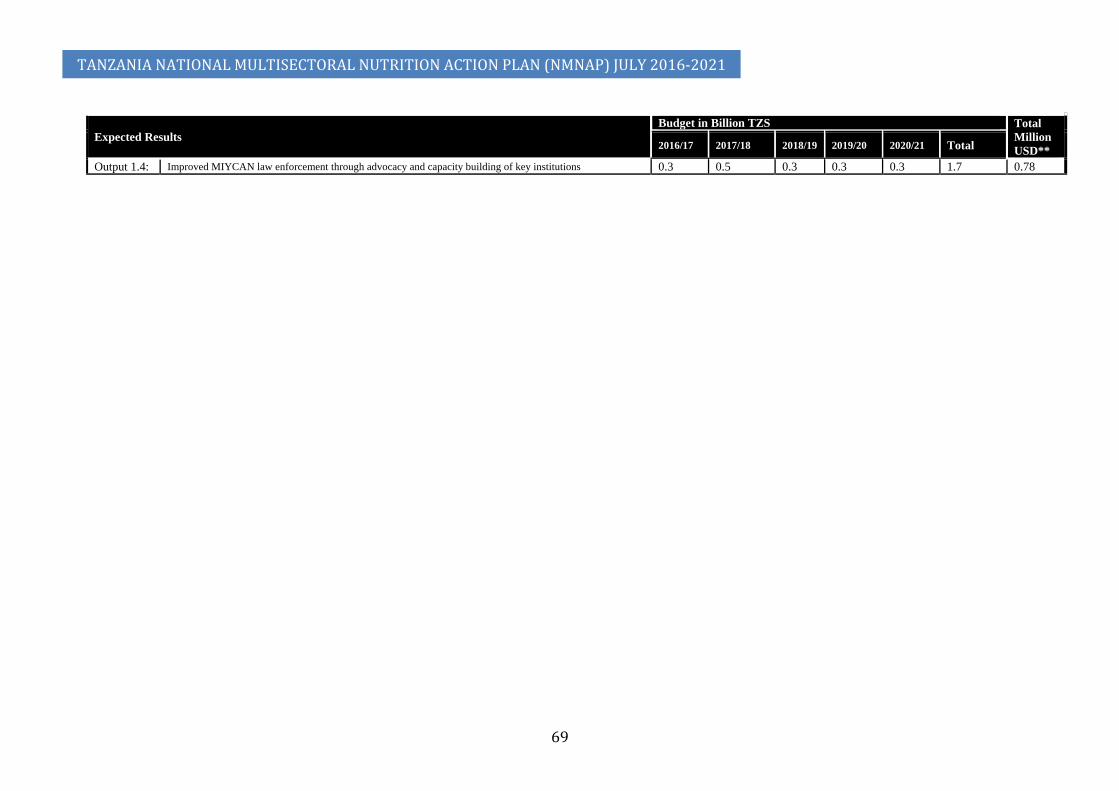
TANZANIA NATIONAL MULTISECTORAL NUTRITION ACTION PLAN (NMNAP) JULY 2016-2021
69
Expected Results Budget in Billion TZS Total
Million USD** 2016/17 2017/18 2018/19 2019/20 2020/21 Total
Output 1.4: Improved MIYCAN law enforcement through advocacy and capacity building of key institutions 0.3 0.5 0.3 0.3 0.3 1.7 0.78
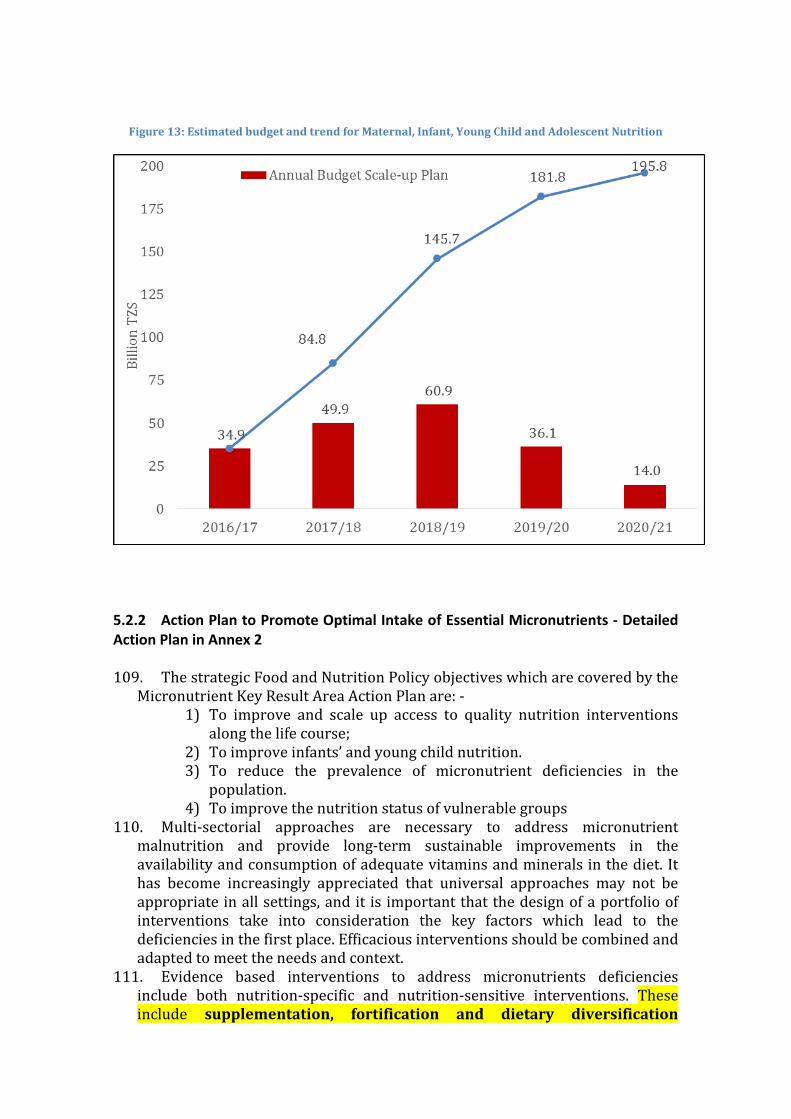
Figure 13: Estimated budget and trend for Maternal, Infant, Young Child and Adolescent Nutrition
5.2.2 Action Plan to Promote Optimal Intake of Essential Micronutrients - Detailed Action Plan in Annex 2 109. The strategic Food and Nutrition Policy objectives which are covered by the
Micronutrient Key Result Area Action Plan are: - 1) To improve and scale up access to quality nutrition interventions
along the life course; 2) To improve infants’ and young child nutrition. 3) To reduce the prevalence of micronutrient deficiencies in the
population. 4) To improve the nutrition status of vulnerable groups
110. Multi-sectorial approaches are necessary to address micronutrient malnutrition and provide long-term sustainable improvements in the availability and consumption of adequate vitamins and minerals in the diet. It has become increasingly appreciated that universal approaches may not be appropriate in all settings, and it is important that the design of a portfolio of interventions take into consideration the key factors which lead to the deficiencies in the first place. Efficacious interventions should be combined and adapted to meet the needs and context.
111. Evidence based interventions to address micronutrients deficiencies include both nutrition-specific and nutrition-sensitive interventions. These include supplementation, fortification and dietary diversification

TANZANIA NATIONAL MULTISECTORAL NUTRITION ACTION PLAN (NMNAP) JULY 2016-2021
71
enhancements which focus on increasing the supply, availability and utilization of foods rich in vitamins and minerals, biodiversification, improved dietary behaviours and care, emphasizing infant and young child feeding practices. Public health measures such as deworming, immunization especially for measles and control of diarrhoea through safe water, sanitation and hygiene reduce the risk of micronutrient losses from the body and increase the bioavailability and absorption of the nutrients consumed. Such activities need to be complimented by a strong enabling environment with robust political commitment, policies and regulatory mechanisms as well as an awareness amongst policy makers, health care providers, caregivers and the public at large about the importance of micronutrients and strategies available to ensure optimal intake.
112. In order to arrest the intergenerational vicious cycle of micronutrient deficiency, there is a need for particular attention on adolescent girls, both in terms of encouraging their participation in schools as well as to target communications to increase their knowledge and adopt appropriate positive dietary behaviours. These will increase their intake of vitamins and minerals, building stores as they get older, married and increase the likelihood of a positive pregnancy outcome.
113. The Micronutrients Action Plan has been developed with five complementary components, three of which focus on individual nutrients, one which aims to foster better alignment and one to improve dietary diversity and filling the gap for multiple vitamins and minerals. These components are: -
1) Improved program coordination 2) Filling the micronutrient gap 3) Improved vitamin A status 4) Improved iodine status 5) Improved iron and folate status and overall prevention of anaemia
114. Taken together, these five components aim to scale-up and increase the reach of interventions which have been in place, recognizing and addressing constraints in their effective delivery, as well as broadening the landscape to include emerging approaches. For the former, comprehensive situation analyses will be carried out to identify and inform specific opportunities for program improvement. For the latter, the NMNAP will explore the feasibility of innovative and novel strategies, such as multiple-crop bio-fortification and activities to reach adolescent girls, initially through pilot studies to define implementation guidance and then slowly expanding to other regions of the country.
115. The key actions and timeline for preventing and managing micronutrient deficiencies are shown by output in table 9, the budget in table 10 and the annual budget trend in figure 15 below. Figure 16 shows the proportional budget planned for the five components of the Micronutrient action plan.
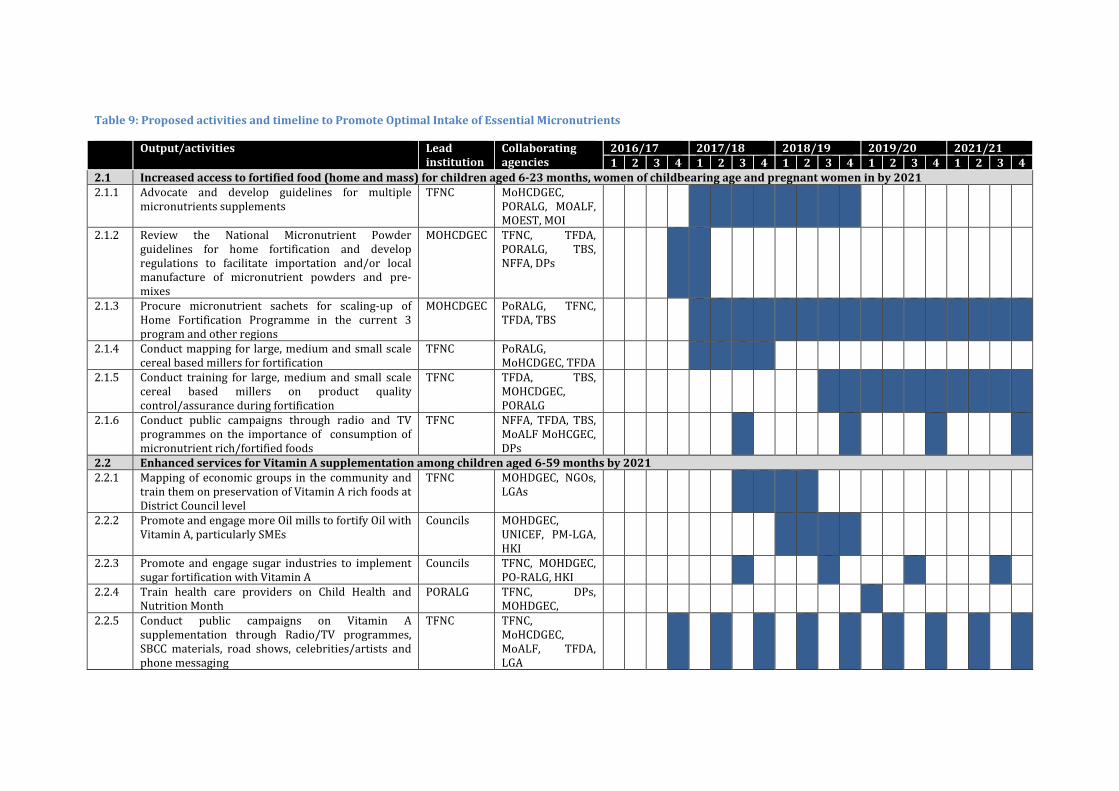
Table 9: Proposed activities and timeline to Promote Optimal Intake of Essential Micronutrients
Output/activities Lead institution
Collaborating agencies
2016/17 2017/18 2018/19 2019/20 2021/21 1 2 3 4 1 2 3 4 1 2 3 4 1 2 3 4 1 2 3 4
2.1 Increased access to fortified food (home and mass) for children aged 6-23 months, women of childbearing age and pregnant women in by 2021 2.1.1 Advocate and develop guidelines for multiple
micronutrients supplements TFNC MoHCDGEC,
PORALG, MOALF, MOEST, MOI
2.1.2 Review the National Micronutrient Powder guidelines for home fortification and develop regulations to facilitate importation and/or local manufacture of micronutrient powders and pre-mixes
MOHCDGEC TFNC, TFDA, PORALG, TBS, NFFA, DPs
2.1.3 Procure micronutrient sachets for scaling-up of Home Fortification Programme in the current 3 program and other regions
MOHCDGEC PoRALG, TFNC, TFDA, TBS
2.1.4 Conduct mapping for large, medium and small scale cereal based millers for fortification
TFNC PoRALG, MoHCDGEC, TFDA
2.1.5 Conduct training for large, medium and small scale cereal based millers on product quality control/assurance during fortification
TFNC TFDA, TBS, MOHCDGEC, PORALG
2.1.6 Conduct public campaigns through radio and TV programmes on the importance of consumption of micronutrient rich/fortified foods
TFNC NFFA, TFDA, TBS, MoALF MoHCGEC, DPs
2.2 Enhanced services for Vitamin A supplementation among children aged 6-59 months by 2021 2.2.1 Mapping of economic groups in the community and
train them on preservation of Vitamin A rich foods at District Council level
TFNC MOHDGEC, NGOs, LGAs
2.2.2 Promote and engage more Oil mills to fortify Oil with Vitamin A, particularly SMEs
Councils MOHDGEC, UNICEF, PM-LGA, HKI
2.2.3 Promote and engage sugar industries to implement sugar fortification with Vitamin A
Councils TFNC, MOHDGEC, PO-RALG, HKI
2.2.4 Train health care providers on Child Health and Nutrition Month
PORALG TFNC, DPs, MOHDGEC,
2.2.5 Conduct public campaigns on Vitamin A supplementation through Radio/TV programmes, SBCC materials, road shows, celebrities/artists and phone messaging
TFNC TFNC, MoHCDGEC, MoALF, TFDA, LGA

TANZANIA NATIONAL MULTISECTORAL NUTRITION ACTION PLAN (NMNAP) JULY 2016-2021
73
Output/activities Lead institution
Collaborating agencies
2016/17 2017/18 2018/19 2019/20 2021/21 1 2 3 4 1 2 3 4 1 2 3 4 1 2 3 4 1 2 3 4
2.2.6 Conduct media seminars on Vitamin A and its prevention to journalist and editors and media owners.
Councils TFNC, MOHSW, PO-RALG
2.3 Increased availability of adequately iodized salt by 2021 2.3.1 Sensitize LGAs including members of regional
defence and security on the importance of community consumption of iodized salt and enforcement of the salt law and regulations
TFNC MOHCDGEC, TASPA, PO-RALG, DPs, TBS, TFDA
2.3.2 Register salt producing sites, whole sellers and vendor groups in all districts
TFNC MOHCDGEC, DPs, MEM, TASPA, TBS, TFDA, MITI
2.3.3 Undertake a salt situation analysis including production of iodized salt/food
TFNC MOHCDGEC, DPs, MEM, TASPA, TBS, TFDA, MITI
2.3.4 Support and strengthen existing TASPA's KIO3 cost-recovery model
TFNC MOHCDGEC, DPs, MEM, TASPA, TBS, TFDA, MITI
2.3.5 Support and strengthen the formation of small scale salt producer (SSSP) groups
TFNC MOHCDGEC, DPs, MEM, TASPA, TBS, TFDA, MITI
2.3.6 Sensitize Local Government officials (DNuOs, DHOs, Ward Health Officers and CHW/VHWs) to support salt monitoring and law enforcement
TFDA MOHCDGEC, PORALG, TASPA, TBS, TFDA, TFNC
2.3.7 Conduct regular salt monitoring and inspections in all salt producing/processing sites, importers, wholesalers, retailers, and salt vendors according to the Act and salt regulations
PORALG MOHCDGEC, TASPA, TBS, TFDA, TFNC
2.3.8 Procure and distribute test kits, WYD machines and reagents in all councils country wide
TFNC MOHCDGEC, DPs, TASPA, TFDA
2.3.9 Train council health staff including laboratory technicians in the use of WYD iodine checker machines in district hospitals
TFNC MOHCDGEC, TASPA, TBS, TFDA
2.3.10 Undertake formative research to identify barriers and motivating factors that influence behaviours which increase demand for iodized salt
TFNC PORALG, MOHCDGEC, MEM, TASPA, TBS, TFDA, MITI
2.3.11 Sensitize community on importance of consuming TFNC PORALG,
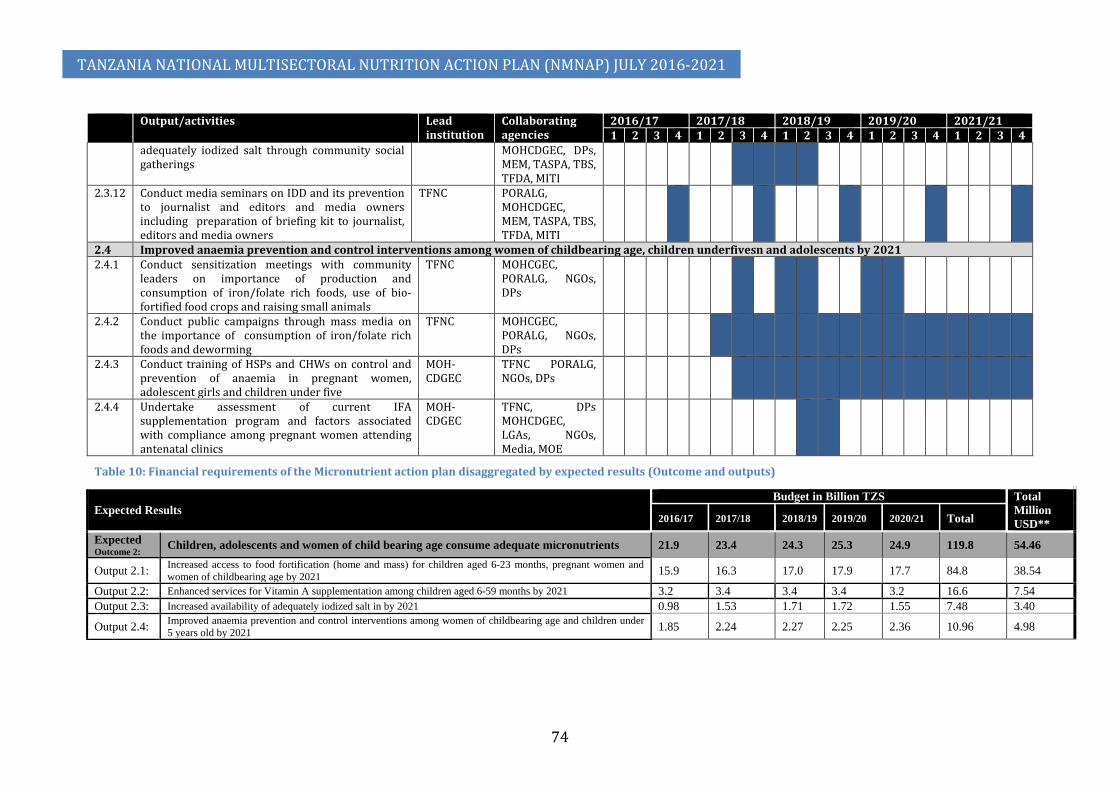
TANZANIA NATIONAL MULTISECTORAL NUTRITION ACTION PLAN (NMNAP) JULY 2016-2021
74
Output/activities Lead institution
Collaborating agencies
2016/17 2017/18 2018/19 2019/20 2021/21 1 2 3 4 1 2 3 4 1 2 3 4 1 2 3 4 1 2 3 4
adequately iodized salt through community social gatherings
MOHCDGEC, DPs, MEM, TASPA, TBS, TFDA, MITI
2.3.12 Conduct media seminars on IDD and its prevention to journalist and editors and media owners including preparation of briefing kit to journalist, editors and media owners
TFNC PORALG, MOHCDGEC, MEM, TASPA, TBS, TFDA, MITI
2.4 Improved anaemia prevention and control interventions among women of childbearing age, children underfivesn and adolescents by 2021 2.4.1 Conduct sensitization meetings with community
leaders on importance of production and consumption of iron/folate rich foods, use of bio-fortified food crops and raising small animals
TFNC MOHCGEC, PORALG, NGOs, DPs
2.4.2 Conduct public campaigns through mass media on the importance of consumption of iron/folate rich foods and deworming
TFNC MOHCGEC, PORALG, NGOs, DPs
2.4.3 Conduct training of HSPs and CHWs on control and prevention of anaemia in pregnant women, adolescent girls and children under five
MOH-CDGEC
TFNC PORALG, NGOs, DPs
2.4.4 Undertake assessment of current IFA supplementation program and factors associated with compliance among pregnant women attending antenatal clinics
MOH-CDGEC
TFNC, DPs MOHCDGEC, LGAs, NGOs, Media, MOE
Table 10: Financial requirements of the Micronutrient action plan disaggregated by expected results (Outcome and outputs)
Expected Results Budget in Billion TZS Total
Million USD** 2016/17 2017/18 2018/19 2019/20 2020/21 Total
Expected Outcome 2: Children, adolescents and women of child bearing age consume adequate micronutrients 21.9 23.4 24.3 25.3 24.9 119.8 54.46
Output 2.1: Increased access to food fortification (home and mass) for children aged 6-23 months, pregnant women and women of childbearing age by 2021 15.9 16.3 17.0 17.9 17.7 84.8 38.54
Output 2.2: Enhanced services for Vitamin A supplementation among children aged 6-59 months by 2021 3.2 3.4 3.4 3.4 3.2 16.6 7.54 Output 2.3: Increased availability of adequately iodized salt in by 2021 0.98 1.53 1.71 1.72 1.55 7.48 3.40
Output 2.4: Improved anaemia prevention and control interventions among women of childbearing age and children under 5 years old by 2021 1.85 2.24 2.27 2.25 2.36 10.96 4.98

Figure 14: Annual distribution of budget for Micronutrient action plan
Figure 15: Proportional budget distribution for the micronutrient plan components
5.2.3 Action Plan to scale-up the Integrated Management of Acute Malnutrition (IMAM): Detailed Action Plan in Annex 3 116. The IMAM action plan will address the following policy objectives of the
Food and Nutrition Policy: - 1) To improve the nutrition status of vulnerable groups 2) To improve infants’ and young child nutrition. 3) To provide appropriate nutritional care and support to communities
during emergencies and disasters;

TANZANIA NATIONAL MULTISECTORAL NUTRITION ACTION PLAN (NMNAP) JULY 2016-2021
76
117. This scale-up action plan aims to institutionalise quality IMAM services in Tanzania and strengthening the links between communities and health facilities across the continuum of care. By simultaneously targeting severe and acute malnutrition, life-saving interventions for the treatment of acute malnutrition will be implemented whilst broadening efforts to prevent moderate acute malnutrition (MAM) from progressing into the more serious condition of severe acute malnutrition (SAM). All outputs and activities – apart from procurement and distribution of supplies for IMAM – will be developed and jointly delivered to manage severe and moderate acute malnutrition.
118. The key actions and timelines are shown in table 11; the planned budget in table 12 and the annual budget distribution in figure 17 below: -
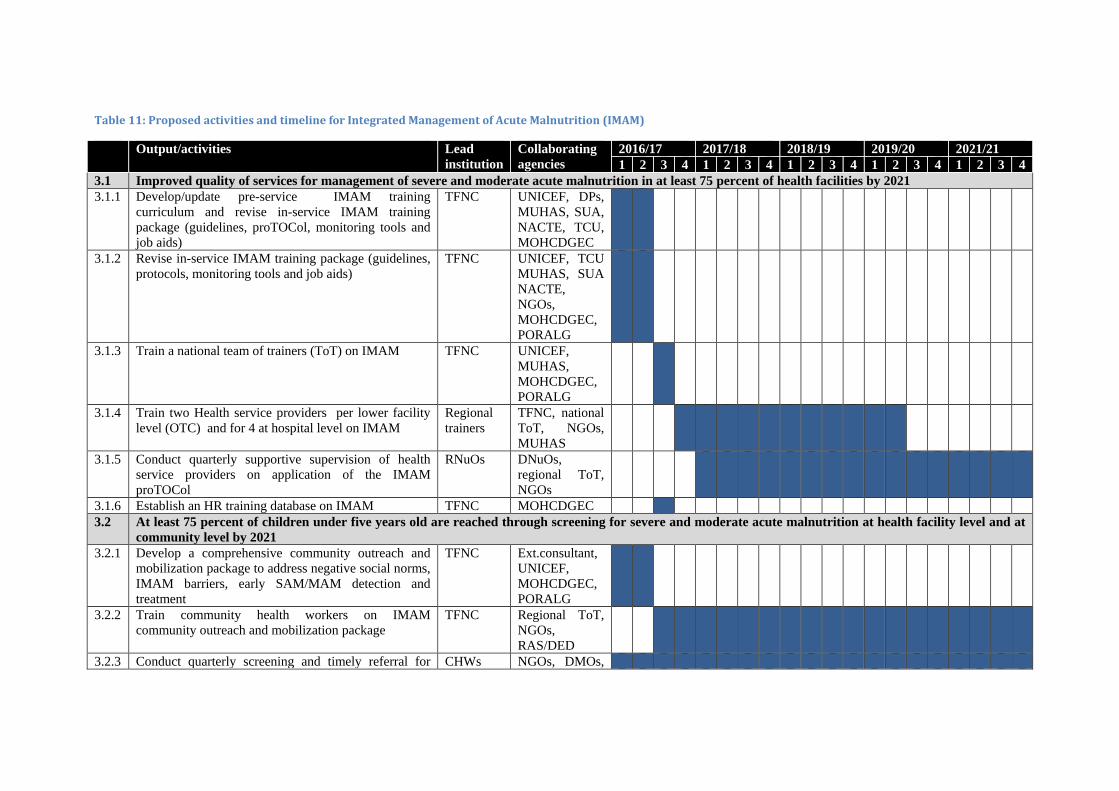
Table 11: Proposed activities and timeline for Integrated Management of Acute Malnutrition (IMAM)
Output/activities Lead institution
Collaborating agencies
2016/17 2017/18 2018/19 2019/20 2021/21 1 2 3 4 1 2 3 4 1 2 3 4 1 2 3 4 1 2 3 4
3.1 Improved quality of services for management of severe and moderate acute malnutrition in at least 75 percent of health facilities by 2021 3.1.1 Develop/update pre-service IMAM training
curriculum and revise in-service IMAM training package (guidelines, proTOCol, monitoring tools and job aids)
TFNC UNICEF, DPs, MUHAS, SUA, NACTE, TCU, MOHCDGEC
3.1.2 Revise in-service IMAM training package (guidelines, protocols, monitoring tools and job aids)
TFNC UNICEF, TCU MUHAS, SUA NACTE, NGOs, MOHCDGEC, PORALG
3.1.3 Train a national team of trainers (ToT) on IMAM TFNC UNICEF, MUHAS, MOHCDGEC, PORALG
3.1.4 Train two Health service providers per lower facility level (OTC) and for 4 at hospital level on IMAM
Regional trainers
TFNC, national ToT, NGOs, MUHAS
3.1.5 Conduct quarterly supportive supervision of health service providers on application of the IMAM proTOCol
RNuOs DNuOs, regional ToT, NGOs
3.1.6 Establish an HR training database on IMAM TFNC MOHCDGEC 3.2 At least 75 percent of children under five years old are reached through screening for severe and moderate acute malnutrition at health facility level and at
community level by 2021 3.2.1 Develop a comprehensive community outreach and
mobilization package to address negative social norms, IMAM barriers, early SAM/MAM detection and treatment
TFNC Ext.consultant, UNICEF, MOHCDGEC, PORALG
3.2.2 Train community health workers on IMAM community outreach and mobilization package
TFNC Regional ToT, NGOs, RAS/DED
3.2.3 Conduct quarterly screening and timely referral for CHWs NGOs, DMOs,

TANZANIA NATIONAL MULTISECTORAL NUTRITION ACTION PLAN (NMNAP) JULY 2016-2021
78
Output/activities Lead institution
Collaborating agencies
2016/17 2017/18 2018/19 2019/20 2021/21 1 2 3 4 1 2 3 4 1 2 3 4 1 2 3 4 1 2 3 4
eligible SAM and MAM children at all levels DNuOs 3.2.4 Support referral of SAM and MAM cases to relevant
health facilities via cell phones CHWs NGOs, HSPs
DNuOs, SWOs
3.2.5 Conduct quarterly supervision of trained community health workers
Health service providers
DNuOs, NGOs, DCDO, DED, DMO
3.3 Essential therapeutic nutrition supplies and equipment are available in at least 90 percent of health facilities providing services for management of severe and moderate acute malnutrition by June 2021
3.3.1 Integrate IMAM therapeutic nutrition supplies into central procurement logistics system (ILS)
TFNC MOHCDGEC, TFNC, MSD, PORALG, DPs
3.3.2 Harmonize clearance procedures for IMAM therapeutic commodities amongst the different regulatory bodies and revise the existing MoU on supplies
TFNC Regulatory boards, DPs, UNICEF, TFDA TFNC, MSD
3.3.3 Procure RUTF, therapeutic milk, medicines, anthropometric material, tools and equipment for IMAM annually
UNICEF TFNC, MSD, MOHCDGEC, TFDA
3.3.4 Purchase commodities for outreach services (cell phones, badges, rain coats and bicycles) annually
TFNC Development Partners
3.3.5 Train regional and district supply officers / pharmacists / pharmaceutical technicians on IMAM supply chain management annually
TFNC National ToT, MSD, UNICEF & DPs, NGOs
3.4 Strengthened integration of management of severe and moderate acute malnutrition at the national and subnational level by June 2021 3.4.1 Conduct advocacy with the Government and
Development Partners to ensure adequate funding and prioritization of IMAM in Tanzania
TFNC PORALG, MOHCDGEC, DPs
3.4.2 Support the National Consultative Group on IMAM TFNC UNICEF 3.4.3 Support Zonal meeting on IMAM annually TFNC UNICEF &
DPs, PORALG
3.4.4 Integrate IMAM into the agenda of the District Nutrition Steering Committee (within CHMT)
RNSC TFNC, PORALG
3.4.5 Integrate IMAM in health facilities package TFNC MOHCDGEC
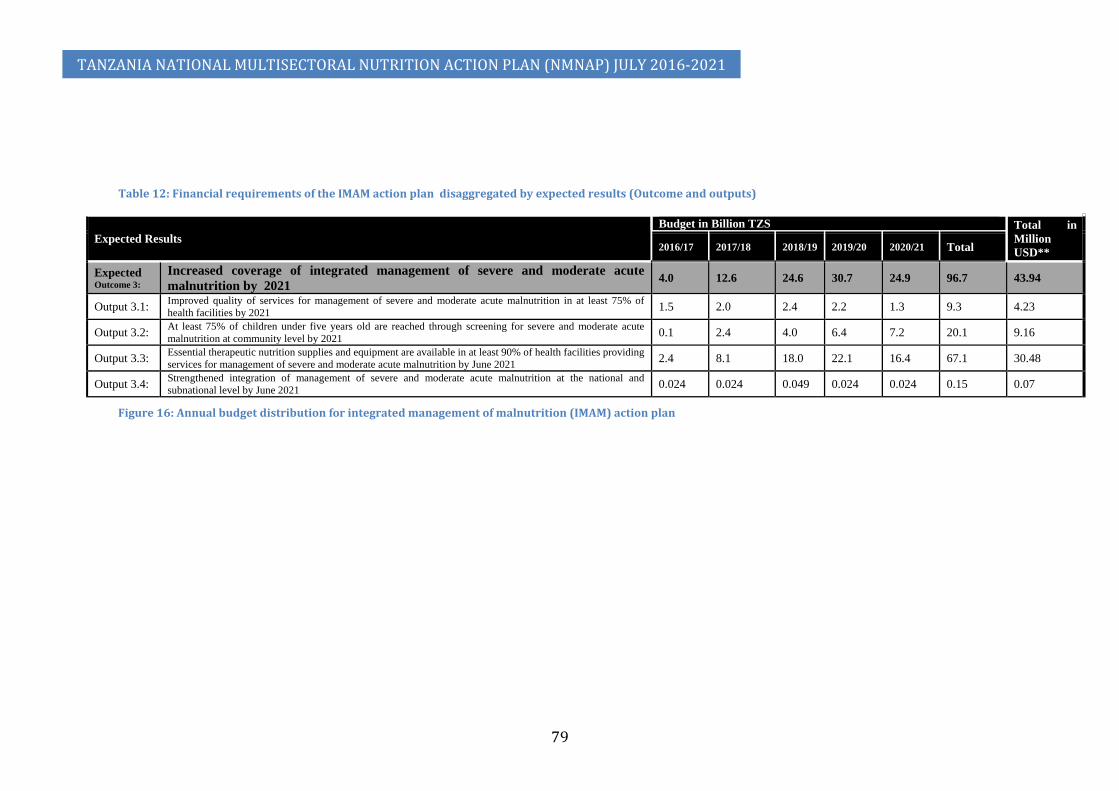
TANZANIA NATIONAL MULTISECTORAL NUTRITION ACTION PLAN (NMNAP) JULY 2016-2021
79
Table 12: Financial requirements of the IMAM action plan disaggregated by expected results (Outcome and outputs)
Expected Results Budget in Billion TZS Total in
Million USD** 2016/17 2017/18 2018/19 2019/20 2020/21 Total
Expected Outcome 3:
Increased coverage of integrated management of severe and moderate acute malnutrition by 2021
4.0 12.6 24.6 30.7 24.9 96.7 43.94
Output 3.1: Improved quality of services for management of severe and moderate acute malnutrition in at least 75% of health facilities by 2021 1.5 2.0 2.4 2.2 1.3 9.3 4.23
Output 3.2: At least 75% of children under five years old are reached through screening for severe and moderate acute malnutrition at community level by 2021 0.1 2.4 4.0 6.4 7.2 20.1 9.16
Output 3.3: Essential therapeutic nutrition supplies and equipment are available in at least 90% of health facilities providing services for management of severe and moderate acute malnutrition by June 2021 2.4 8.1 18.0 22.1 16.4 67.1 30.48
Output 3.4: Strengthened integration of management of severe and moderate acute malnutrition at the national and subnational level by June 2021 0.024 0.024 0.049 0.024 0.024 0.15 0.07
Figure 16: Annual budget distribution for integrated management of malnutrition (IMAM) action plan

TANZANIA NATIONAL MULTISECTORAL NUTRITION ACTION PLAN (NMNAP) JULY 2016-2021
80

5.2.4 Action Plan to Prevent and Manage Diet Related Non-Communicable Diseases (DRNCDs) – Detailed plan available as Annex 4. 119. The DRNCDs action plan aims to achieve the following policy objectives of
the Food and Nutrition Policy: - 1) To strengthen prevention and management of Diet Related Non-
Communicable Diseases (DRNCDs) 2) To improve and scale up access to quality nutrition interventions
along the life course; 3) To improve the nutrition status of vulnerable groups
120. The DRNCDs action plan proposes a series of feasible and cost-effective interventions aimed at contributing to achieving the voluntary global World Health Assembly (WHA) NCD targets in Tanzania, including addressing unhealthy diets, physical inactivity, harmful use of alcohol and tobacco use. The interventions include:
1) Increasing community awareness on preventive measures and early diagnosis of NCDs;
2) Creating an enabling environment for healthy lifestyles including incentives for producing and buying healthier food and building and organizing cities to encourage physical activity;
3) Fiscal measures and incentives to ensure compliance with policy interventions for discouraging the production and use of unhealthy commodities e.g. tobacco;
4) Improvement of the health system for early detection and to better manage NCDs; and
5) Research to inform policy. 121. The plan will promote the notion that being physically active for at least
30 minutes a day, in any way, in addition to reducing weight, decreases the risk of several diet related non-communicable diseases including diabetes, hypertension, heart diseases and several types of cancers. Activity helps prevent the build-up of fat, a risk factor for obesity. It increases blood flow, thus preventing the build-up of blood clogging cholesterol in the blood vessels, and therefore, reducing the risk to hypertension and heart diseases. By regulating blood levels of hormones that contribute to the development of diabetes and cancer risk; and by speeding up food through the colon, physical activity reduces exposure risk to dietary carcinogens (cancer causing agents). Physical activity and many of the other actions that prevent DRNCDs like stopping smoking and drinking alcohol in moderation also increase longevity. These actions need to be adopted by individuals themselves, while population level actions are mainly done to create an enabling environment.
122. The key activities identified for the DRNCDs action plan at the population level and their timeline are shown in table 13, the planned budget in table 14 and the annual budget distribution in figure 18 below: -

Table 13: Proposed activities and timeline to Prevent and Manage Diet Related Non-Communicable Diseases (DRNCDs)
Output/activities Lead institution Collaborating agencies
2016/17 2017/18 2018/19 2019/20 2021/21 1 2 3 4 1 2 3 4 1 2 3 4 1 2 3 4 1 2 3 4
4.1 At least 50 percent of the school-age children and adult population are sensitized on the risk factors for NCDs by 2021 4.1.1 Review/develop and validate and print
comprehensive guidelines (for community, clinical and e-learning) on healthy lifestyles for Tanzania
TFNC MoHCDGEC, MUHAS, SUA, MoESTVT, MALF, PORALG
4.1.2 Train Health Care Providers on Diet and Nutrition Related Noncommunicable Diseases at all levels
TANCDA TFNC, MUHAS, LGAs, APHFTA, NGOs
4.1.3 Conduct sensitization seminars on healthy lifestyles to journalists, editors and media owners
MOHCDGEC MUHAS, SUA, MoESTVT, MALF, PO-RALG, TANCDA
4.1.4 Conduct public awareness campaigns to inform the community about healthy lifestyles for all ages including pregnancy (Advertising and publication) at national and 30 regions
MOHCDGEC MUHAS, SUA, TBS, TFDA, MoESTVT, MALF, PORALG, TANCDA
4.1.5 Sensitize food vendors/hoteliers, school children and employees in work places on healthy lifestyles
TFNC MoHCDGEC, MEDIA, LGAs, MoESTVT, TANCDA
4.2 Policies, social, cultural and structural norms are established to enable at least 75 percent of the community to engage in healthy lifestyles by 2021 4.2.1 Sensitize policy makers, urban planners and
highway and road designers on healthy lifestyles
MoHCDGEC TFNC, MoLHS, MoWTC LGAs, TFDA, PARLIAMENT, PO-RALG, TANCDA
4.2.2 Develop/review standards and bylaws and sensitize law enforcers on issues related to healthy lifestyles
MoHCDGEC TBS, TANCDA, TFNC, TFDA, TPHA
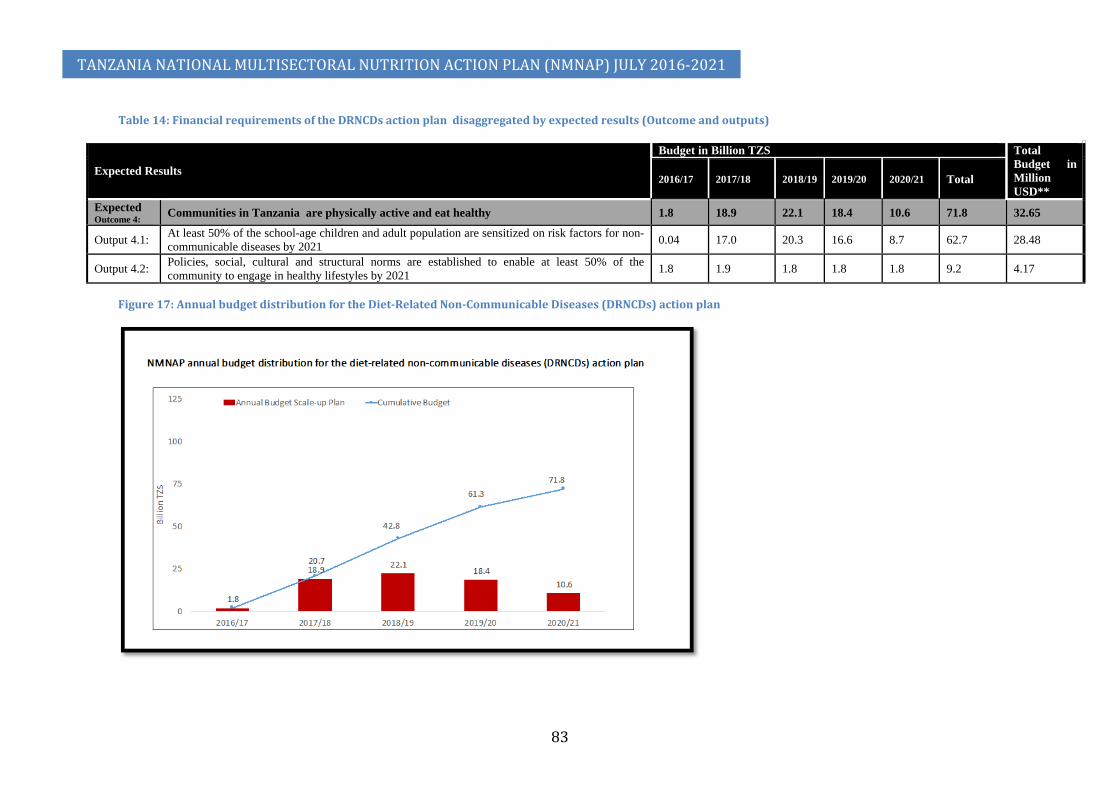
TANZANIA NATIONAL MULTISECTORAL NUTRITION ACTION PLAN (NMNAP) JULY 2016-2021
83
Table 14: Financial requirements of the DRNCDs action plan disaggregated by expected results (Outcome and outputs)
Expected Results
Budget in Billion TZS Total Budget in Million USD**
2016/17 2017/18 2018/19 2019/20 2020/21 Total
Expected Outcome 4: Communities in Tanzania are physically active and eat healthy 1.8 18.9 22.1 18.4 10.6 71.8 32.65
Output 4.1: At least 50% of the school-age children and adult population are sensitized on risk factors for non-communicable diseases by 2021 0.04 17.0 20.3 16.6 8.7 62.7 28.48
Output 4.2: Policies, social, cultural and structural norms are established to enable at least 50% of the community to engage in healthy lifestyles by 2021 1.8 1.9 1.8 1.8 1.8 9.2 4.17
Figure 17: Annual budget distribution for the Diet-Related Non-Communicable Diseases (DRNCDs) action plan

5.3 Action plan to strengthen Nutrition Sensitive Interventions (Detailed Action Plan in Annex 5) 123. Nutrition-sensitive interventions can help enhance the penetration and
impact of nutrition-specific interventions by creating a stimulating environment in which young children can grow and develop to their full potential and adults become more productive. Different sectors can take practical steps to develop nutrition sensitive policies, strategies and programmes. To make them nutrition-sensitive, sectors should:
1) Strengthen their nutrition focused goals, design, and encourage greater integration in implementation. For example, food security programmes can explicitly articulate their nutrition goals, adopt agricultural practices that diversify nutrient content and integrate their work with micronutrient programmes.
2) Improve targeting, timing, and duration of exposure to interventions. For example, integrating nutrition into safe water and sanitation programmes that reach families with pregnant and lactating women and children between 0 and 24 months of age will reduce the risk of diarrhoea.
3) Use conditions to stimulate demand for human capital development, while ensuring delivery of quality services. For example, cash transfer programmes provide cash to extremely poor households to ensure access to health, education services and food security like the TASAF’s Productive Social Safety Net (PSSN) programme.
4) Optimise focus on women’s nutrition and empowerment. For example, when programmes are designed from the outset to increase women’s decision-making power, it can increase investments in better nutrition for the whole family. Education of girls, enforcement of laws against teenage marriages are other examples.
124. The NMNAP identified nutrition sensitive actions in the following sectors: Agriculture and Food Security; Health and HIV; Water, Sanitation and Hygiene (WASH); Education; Social Protection; and Environment and Climate change. The NMNAP recognizes that there are already ongoing activities being implemented by these sectors which are nutrition sensitive and these are encouraged to continue. In order to support these sectors to strengthen the alignment of these activities with the NMNAP, the NMNAP proposes holding of sector-specific workshops that will impart knowledge and skills in nutrition sensitive programming for sector planners and decision makers. Such an activity is planned under the Multisectoral Nutrition Governance (MNG) action plan that will “review sector policies and plans to make them more nutrition sensitive.”
5.3.1 Actions to strengthen Agriculture and Food Security through nutrition sensitive interventions 125. The proposed actions aim to address the following Food and Nutrition
Policy objectives: - 1) To improve household food security. 2) To improve food safety and quality for enhancement of nutrition
status at individual, household and community level.

TANZANIA NATIONAL MULTISECTORAL NUTRITION ACTION PLAN (NMNAP) JULY 2016-2021
85
126. The key actions in Agriculture and Food security aim to ensure communities have access to a diverse range of nutritious food throughout the year. It involves increased production of diversified nutritious foods using modern technological methods, bio-diversification, post-harvest prevention of losses and quality (e.g. addressing issue of mycotoxin contamination especially of aflatoxins), promotion of agro-industries to add value and finding easy access to markets. Other complementary measures include the promotion of consumption of these foods, agriculture extension training and improving food safety. All these are already included in the Agriculture and Food Security sector in the 5-Year Development Plan 2016/17-2020/21 and this NMNAP will promote linkages with its objectives.
127. The key action and timelines are shown for the first output in this Action Plan in table 15 below:
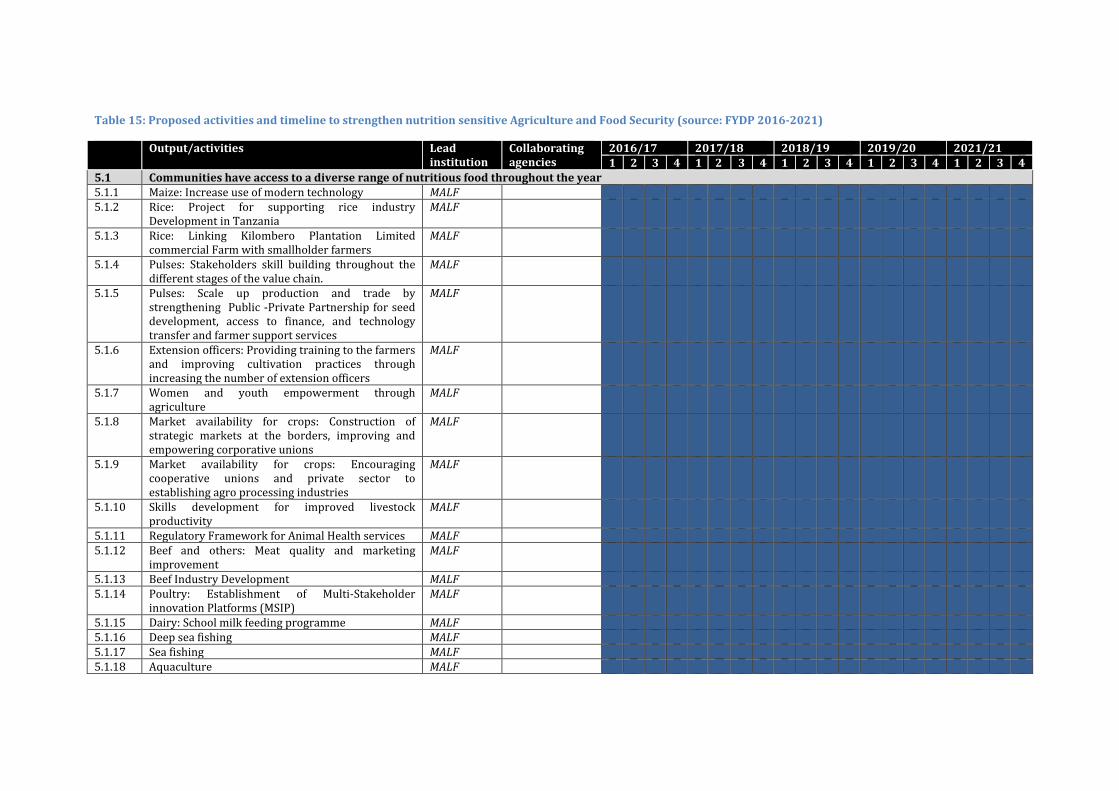
Table 15: Proposed activities and timeline to strengthen nutrition sensitive Agriculture and Food Security (source: FYDP 2016-2021)
Output/activities Lead institution
Collaborating agencies
2016/17 2017/18 2018/19 2019/20 2021/21 1 2 3 4 1 2 3 4 1 2 3 4 1 2 3 4 1 2 3 4
5.1 Communities have access to a diverse range of nutritious food throughout the year 5.1.1 Maize: Increase use of modern technology MALF 5.1.2 Rice: Project for supporting rice industry
Development in Tanzania MALF
5.1.3 Rice: Linking Kilombero Plantation Limited commercial Farm with smallholder farmers
MALF
5.1.4 Pulses: Stakeholders skill building throughout the different stages of the value chain.
MALF
5.1.5 Pulses: Scale up production and trade by strengthening Public -Private Partnership for seed development, access to finance, and technology transfer and farmer support services
MALF
5.1.6 Extension officers: Providing training to the farmers and improving cultivation practices through increasing the number of extension officers
MALF
5.1.7 Women and youth empowerment through agriculture
MALF
5.1.8 Market availability for crops: Construction of strategic markets at the borders, improving and empowering corporative unions
MALF
5.1.9 Market availability for crops: Encouraging cooperative unions and private sector to establishing agro processing industries
MALF
5.1.10 Skills development for improved livestock productivity
MALF
5.1.11 Regulatory Framework for Animal Health services MALF 5.1.12 Beef and others: Meat quality and marketing
improvement MALF
5.1.13 Beef Industry Development MALF 5.1.14 Poultry: Establishment of Multi-Stakeholder
innovation Platforms (MSIP) MALF
5.1.15 Dairy: School milk feeding programme MALF 5.1.16 Deep sea fishing MALF 5.1.17 Sea fishing MALF 5.1.18 Aquaculture MALF
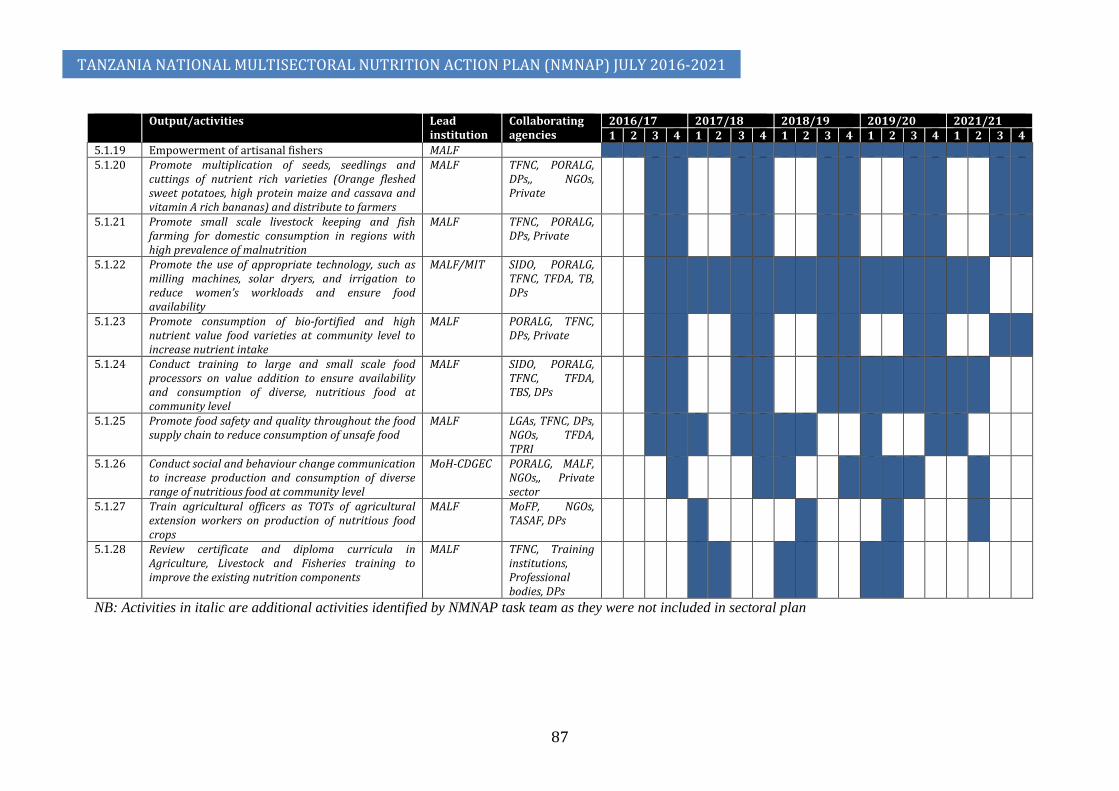
TANZANIA NATIONAL MULTISECTORAL NUTRITION ACTION PLAN (NMNAP) JULY 2016-2021
87
Output/activities Lead institution
Collaborating agencies
2016/17 2017/18 2018/19 2019/20 2021/21 1 2 3 4 1 2 3 4 1 2 3 4 1 2 3 4 1 2 3 4
5.1.19 Empowerment of artisanal fishers MALF 5.1.20 Promote multiplication of seeds, seedlings and
cuttings of nutrient rich varieties (Orange fleshed sweet potatoes, high protein maize and cassava and vitamin A rich bananas) and distribute to farmers
MALF TFNC, PORALG, DPs,, NGOs, Private
5.1.21 Promote small scale livestock keeping and fish farming for domestic consumption in regions with high prevalence of malnutrition
MALF TFNC, PORALG, DPs, Private
5.1.22 Promote the use of appropriate technology, such as milling machines, solar dryers, and irrigation to reduce women’s workloads and ensure food availability
MALF/MIT SIDO, PORALG, TFNC, TFDA, TB, DPs
5.1.23 Promote consumption of bio-fortified and high nutrient value food varieties at community level to increase nutrient intake
MALF PORALG, TFNC, DPs, Private
5.1.24 Conduct training to large and small scale food processors on value addition to ensure availability and consumption of diverse, nutritious food at community level
MALF SIDO, PORALG, TFNC, TFDA, TBS, DPs
5.1.25 Promote food safety and quality throughout the food supply chain to reduce consumption of unsafe food
MALF LGAs, TFNC, DPs, NGOs, TFDA, TPRI
5.1.26 Conduct social and behaviour change communication to increase production and consumption of diverse range of nutritious food at community level
MoH-CDGEC PORALG, MALF, NGOs,, Private sector
5.1.27 Train agricultural officers as TOTs of agricultural extension workers on production of nutritious food crops
MALF MoFP, NGOs, TASAF, DPs
5.1.28 Review certificate and diploma curricula in Agriculture, Livestock and Fisheries training to improve the existing nutrition components
MALF TFNC, Training institutions, Professional bodies, DPs
NB: Activities in italic are additional activities identified by NMNAP task team as they were not included in sectoral plan
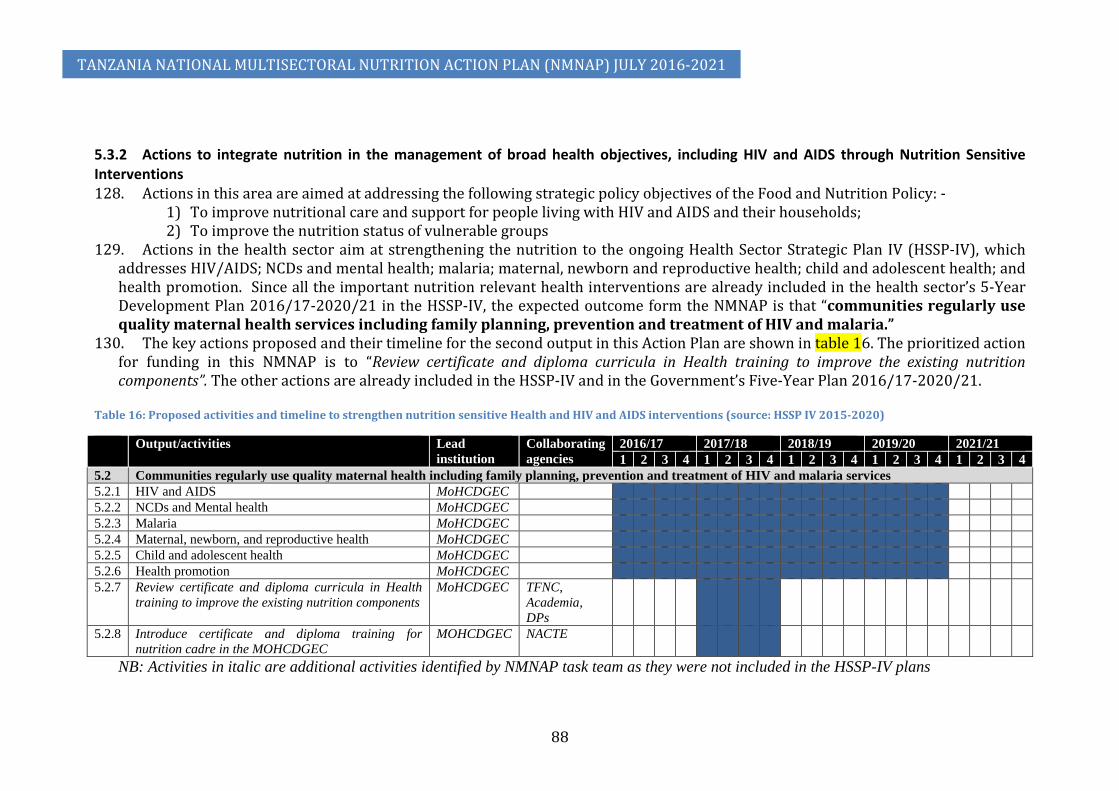
TANZANIA NATIONAL MULTISECTORAL NUTRITION ACTION PLAN (NMNAP) JULY 2016-2021
88
5.3.2 Actions to integrate nutrition in the management of broad health objectives, including HIV and AIDS through Nutrition Sensitive Interventions 128. Actions in this area are aimed at addressing the following strategic policy objectives of the Food and Nutrition Policy: -
1) To improve nutritional care and support for people living with HIV and AIDS and their households; 2) To improve the nutrition status of vulnerable groups
129. Actions in the health sector aim at strengthening the nutrition to the ongoing Health Sector Strategic Plan IV (HSSP-IV), which addresses HIV/AIDS; NCDs and mental health; malaria; maternal, newborn and reproductive health; child and adolescent health; and health promotion. Since all the important nutrition relevant health interventions are already included in the health sector’s 5-Year Development Plan 2016/17-2020/21 in the HSSP-IV, the expected outcome form the NMNAP is that “communities regularly use quality maternal health services including family planning, prevention and treatment of HIV and malaria.”
130. The key actions proposed and their timeline for the second output in this Action Plan are shown in table 16. The prioritized action for funding in this NMNAP is to “Review certificate and diploma curricula in Health training to improve the existing nutrition components”. The other actions are already included in the HSSP-IV and in the Government’s Five-Year Plan 2016/17-2020/21.
Table 16: Proposed activities and timeline to strengthen nutrition sensitive Health and HIV and AIDS interventions (source: HSSP IV 2015-2020)
Output/activities Lead institution
Collaborating agencies
2016/17 2017/18 2018/19 2019/20 2021/21 1 2 3 4 1 2 3 4 1 2 3 4 1 2 3 4 1 2 3 4
5.2 Communities regularly use quality maternal health including family planning, prevention and treatment of HIV and malaria services 5.2.1 HIV and AIDS MoHCDGEC 5.2.2 NCDs and Mental health MoHCDGEC 5.2.3 Malaria MoHCDGEC 5.2.4 Maternal, newborn, and reproductive health MoHCDGEC 5.2.5 Child and adolescent health MoHCDGEC 5.2.6 Health promotion MoHCDGEC 5.2.7 Review certificate and diploma curricula in Health
training to improve the existing nutrition components MoHCDGEC TFNC,
Academia, DPs
5.2.8 Introduce certificate and diploma training for nutrition cadre in the MOHCDGEC
MOHCDGEC NACTE
NB: Activities in italic are additional activities identified by NMNAP task team as they were not included in the HSSP-IV plans

5.3.3 Actions to strengthen the linkage and synergy between nutrition and Water, Sanitation and Hygiene (WASH) 131. Proposed actions in WASH aim to address the following strategic policy objectives of the Food and Nutrition Policy: -
1) To promote safe water, sanitation, and hygiene practices as key strategies for improved nutrition. 2) To improve food safety and quality for enhancement of nutrition status at individual, household and community level. 3) To improve nutrition knowledge, behaviours, attitudes and practices for improved nutrition
132. Actions directed towards WASH aim to ensure that communities have sufficient access to adequate safe water, sanitation and hygiene services as these will decrease the proliferation and transmission of infectious pathogens which have adverse effects on nutrition through a number of mechanisms. The key action and timeline for funding by this NMNAP is for the Ministry of Water and Irrigation (MOWI) with assistance of TFNC, professional bodies and Development Partners (DPs) to review Certificate and Diploma curricula in Water Resource Management training to improve and include nutrition components during the third quarter of 2018/19 as seen in table 17. Some other key activities will include campaigns for zero open defaecation and to promote key sanitation and hygiene practices like proper faeces disposal and handwashing with soap during the three critical periods (after defaecation, during food preparation and before eating with hands).
Table 17: Proposed activities and timeline to strengthen nutrition sensitive Water, Sanitation and Hygiene (WASH) (source: FYDP 2016-2021)
Output/activities Lead institution
Collaborating organizations
2016/17 2017/18 2018/19 2019/20 2021/21 1 2 3 4 1 2 3 4 1 2 3 4 1 2 3 4 1 2 3 4
5.3 Communities access adequate safe water sanitation and hygiene services 5.3.1 Improvement of water supply and sanitation
services in Regional centres MOWI MOHCDGEC,
PORALG
5.3.2 Water quality management and pollution control MOWI MOHCDGEC, PORALG
5.3.3 Scale up water supply in Rural areas MOWI PORALG, WATER AUTHORITIES
5.3.4 Urban water supply Strategic Choices MOWI MOHCDGEC, PORALG, WATER AUTHORITIES
5.3.5 Advocacy and orientation of key government and non-government stakeholders for sanitation and hygiene
MOHCDGEC MOWI, PORALG, WATER
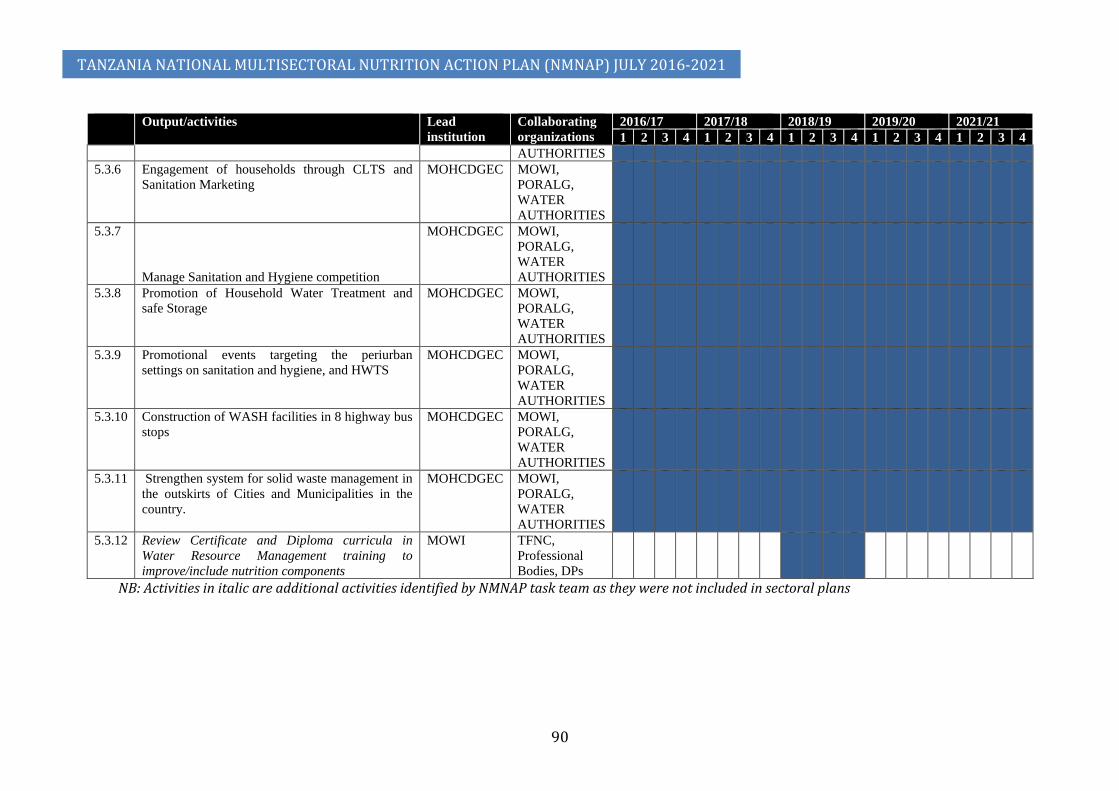
TANZANIA NATIONAL MULTISECTORAL NUTRITION ACTION PLAN (NMNAP) JULY 2016-2021
90
Output/activities Lead institution
Collaborating organizations
2016/17 2017/18 2018/19 2019/20 2021/21 1 2 3 4 1 2 3 4 1 2 3 4 1 2 3 4 1 2 3 4
AUTHORITIES 5.3.6 Engagement of households through CLTS and
Sanitation Marketing MOHCDGEC MOWI,
PORALG, WATER AUTHORITIES
5.3.7
Manage Sanitation and Hygiene competition
MOHCDGEC MOWI, PORALG, WATER AUTHORITIES
5.3.8 Promotion of Household Water Treatment and safe Storage
MOHCDGEC MOWI, PORALG, WATER AUTHORITIES
5.3.9 Promotional events targeting the periurban settings on sanitation and hygiene, and HWTS
MOHCDGEC MOWI, PORALG, WATER AUTHORITIES
5.3.10 Construction of WASH facilities in 8 highway bus stops
MOHCDGEC MOWI, PORALG, WATER AUTHORITIES
5.3.11 Strengthen system for solid waste management in the outskirts of Cities and Municipalities in the country.
MOHCDGEC MOWI, PORALG, WATER AUTHORITIES
5.3.12 Review Certificate and Diploma curricula in Water Resource Management training to improve/include nutrition components
MOWI TFNC, Professional Bodies, DPs
NB: Activities in italic are additional activities identified by NMNAP task team as they were not included in sectoral plans

5.3.4 Actions to strengthen the linkage between Nutrition, Education and Early Childhood Development 133. Nutrition sensitive Education and early childhood development aims to
address the following strategic objectives of the Food and Nutrition Policy: - 1) To improve nutrition knowledge, behaviours, attitudes and practices
in the country; 2) To enhance national capacity for improved nutrition;
134. The nutrition sensitive education component in the FYDP-II aims at improving early education and child development, literacy and numeracy strategy in primary education; construction of class rooms and latrines and improve availability of safe water and electricity in primary and secondary schools; and implement comprehensive plan for free basic education up to form IV. Early child education and development develops cognitive and learning abilities critical for future learning and educational performance.
135. Many of the key nutrition sensitive actions in Education are already included in the Education FYPD-II sector plans. However, the Multisectoral Nutrition Sensitive Interventions task team identified three key actions that this NMNAP will need to prioritize and fund to achieve a truly nutrition sensitive education sector. These are: (a) Promote girl-friendly water and sanitation facilities in primary and secondary schools (b) Build capacity of school health and nutrition program coordinators of primary and secondary school on effective implementation of nutrition sensitive activities in the schools, and (c) Promote physical activities in primary and secondary schools to reduce the risk of diet related non-communicable diseases among school children and teachers and later in adulthood.
136. The key activities and timelines for the fourth output of the Nutrition Sensitive Action Plan are shown in table 18 below.
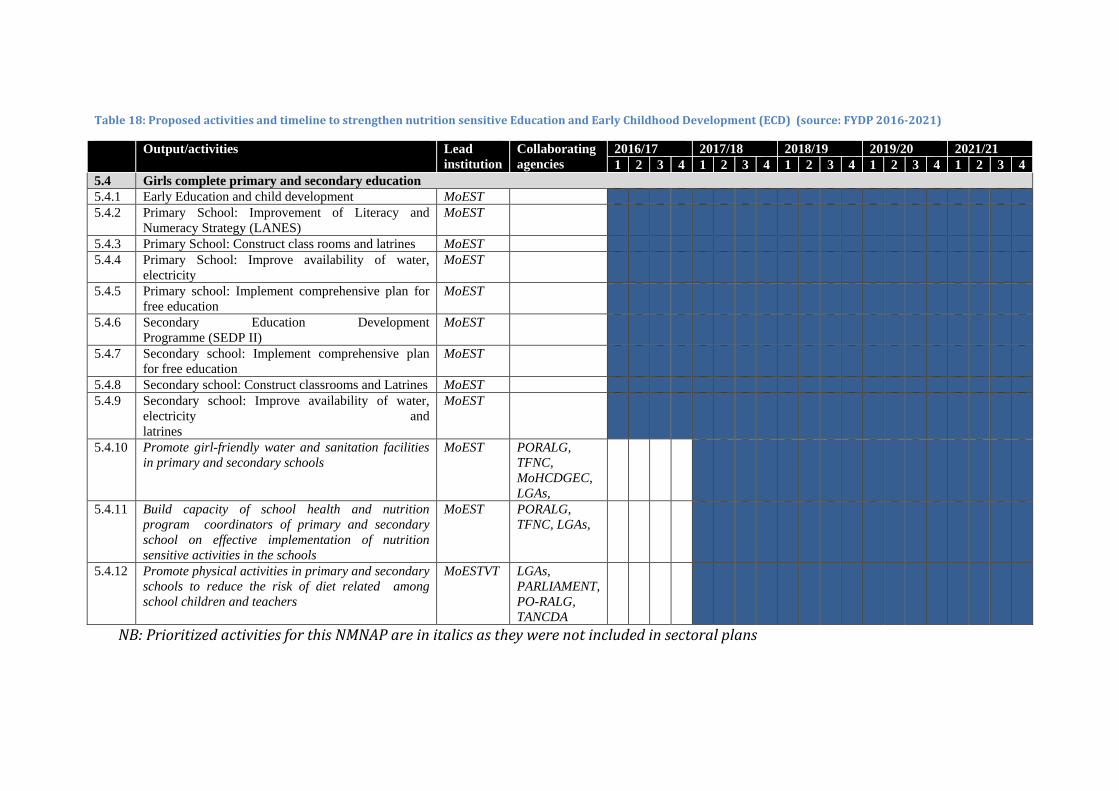
Table 18: Proposed activities and timeline to strengthen nutrition sensitive Education and Early Childhood Development (ECD) (source: FYDP 2016-2021)
Output/activities Lead institution
Collaborating agencies
2016/17 2017/18 2018/19 2019/20 2021/21 1 2 3 4 1 2 3 4 1 2 3 4 1 2 3 4 1 2 3 4
5.4 Girls complete primary and secondary education 5.4.1 Early Education and child development MoEST 5.4.2 Primary School: Improvement of Literacy and
Numeracy Strategy (LANES) MoEST
5.4.3 Primary School: Construct class rooms and latrines MoEST 5.4.4 Primary School: Improve availability of water,
electricity MoEST
5.4.5 Primary school: Implement comprehensive plan for free education
MoEST
5.4.6 Secondary Education Development Programme (SEDP II)
MoEST
5.4.7 Secondary school: Implement comprehensive plan for free education
MoEST
5.4.8 Secondary school: Construct classrooms and Latrines MoEST 5.4.9 Secondary school: Improve availability of water,
electricity and latrines
MoEST
5.4.10 Promote girl-friendly water and sanitation facilities in primary and secondary schools
MoEST PORALG, TFNC, MoHCDGEC, LGAs,
5.4.11 Build capacity of school health and nutrition program coordinators of primary and secondary school on effective implementation of nutrition sensitive activities in the schools
MoEST PORALG, TFNC, LGAs,
5.4.12 Promote physical activities in primary and secondary schools to reduce the risk of diet related among school children and teachers
MoESTVT LGAs, PARLIAMENT, PO-RALG, TANCDA
NB: Prioritized activities for this NMNAP are in italics as they were not included in sectoral plans

5.3.5 Actions to strengthen the links between nutrition and Social Protection activities 137. The Food and Nutrition Policy objectives that actions in Social Protection aim to address is “To improve the nutrition status of
vulnerable groups.” The main vulnerable group that the Social Protection component addresses is the extremely poor households that live below the food poverty line, which is about 9.7 percent of households according to the 2012 Household Budget Survey.
138. The key nutrition sensitive actions already included in the FYDP II on social protection include the economic empowerment of women, ending child marriages and early child pregnancies, livelihood and capacity enhancements and the Tanzania Social Action Fund’s (TASAF) conditional cash transfers and cash for work through the Productive Social Safety Net (PSSN) program. The NMNAP has identified two additional key activities to be prioritized to assure synergy. These are (i) Review Certificate and Diploma curricula in Community development training to improve/include nutrition components and (ii) Review Certificate and Diploma curricula in social Welfare training to improve/include nutrition components.
139. The key actions and timelines for the fifth output of the Nutrition Sensitive Action Plan are shown in table 19 below: Table 19: Proposed activities and timeline to strengthen nutrition sensitive Social Protection (source: FYDP 2016-2021)
Output/activities Lead institution
Collaborating agencies
2016/17 2017/18 2018/19 2019/20 2021/21 1 2 3 4 1 2 3 4 1 2 3 4 1 2 3 4 1 2 3 4
5.5 Poorest households benefit from social protection programmes (conditional cash transfers, cash for work, and nutrition education during community sessions)
5.5.1 Women Economic Empowerment MoHCDGEC 5.5.2 End Child Marriage and Early Pregnancies MoHCDGEC 5.5.3 Develop and implementation of Local Economic
Development (LED) initiatives MoHCDGEC
5.5.4 TASAF - Cash Transfer TASAF 5.5.5 TASAF - Cash for Work TASAF 5.5.6 Review Certificate and Diploma curricula in
Community development training to improve/include nutrition components.
MoHCDGEC TFNC, Professional Bodies, DPs
5.5.7 Review Certificate and Diploma curricula in social Welfare training to improve/include nutrition components
MoHCDGEC TFNC, Professional Bodies, DPs
NB: Activities in italic are additional activities identified by NMNAP task team as they were not included in sectoral plan

TANZANIA NATIONAL MULTISECTORAL NUTRITION ACTION PLAN (NMNAP) JULY 2016-2021
94
5.3.6 Action plan to strengthen the links between the Environment, Climate Change and Nutrition 140. The Food and Nutrition Policy objective addressed by this action plan is “To enhance sustainable use and management of the
environment for improvement of food and nutrition security.” 141. The main nutrition sensitive action included in the FYDP-II with regard to climate change is “Implementation of concrete
adaptation measures to reduce vulnerability of livelihoods and Economy of the coast communities of Tanzania”. To cover the whole country and link actions taken with improved nutrition, the NMNAP has prioritized an additional activity which is “Develop a nutrition contingency plan for addressing nutrition needs of populations that are prone to climate change hazards”.
142. The key actions and timelines for the sixth output of the Nutrition Sensitive Action Plan are shown in table 20 below.
Table 20: Proposed activities and timeline to strengthen nutrition sensitive Environment (source: FYDP 2016-2021) Output/activities Lead
institution Collaborating agencies
2016/17 2017/18 2018/19 2019/20 2021/21 1 2 3 4 1 2 3 4 1 2 3 4 1 2 3 4 1 2 3 4
5.6 Vulnerable communities are able to cope with draught and climate change to avoid shortage of nutritious food during shocks 5.6.1 Implementation of concrete adaptation measures to
reduce vulnerability of livelihoods and Economy of the coast communities of Tanzania
VPO
5.6.2 Develop a nutrition contingency plan for addressing nutrition needs of populations that are prone to climate change hazards
PMO VPO, NEMC, MALF, PORALG, DPs, TMA, LGAs
NB: Activities in italic are additional activities identified by NMNAP task team as they were not included in sectoral plan
143. The link between climate change and nutrition is an area where research may be particularly helpful. There is scope to undertake operations research to better understand the link between climate change, temperature, rainfall and agriculture output. By extension what is the impact of climate change on food security, food availability and intakes which then contribute to nutritional status? Empirical evidence suggests that climate change impacts on nutrition in four main ways: First, it affects food security through reducing food production; hampering transportation, storage, marketing systems and increase price volatilities. Second, it impacts on health through changes in the vector environment (e.g. increased breeding of mosquitoes that transmit malaria), increased risk of water borne diseases (e.g. diarrhoea) or airborne diseases (e.g. respiratory infections including tuberculosis). Third, it reduces the caring capacity for children and women through increased workload of women (e.g. going long distances to fetch water or firewood). Fourth, climate change affects mainly those at greatest risk of poverty and malnutrition: those dependent on climate-sensitive

TANZANIA NATIONAL MULTISECTORAL NUTRITION ACTION PLAN (NMNAP) JULY 2016-2021
95
resources and livelihoods (e.g. subsistence farmers, pastoralists, fisheries, forest-based livelihoods, agricultural labour); those who lack the capacity to cope (e.g. with few assets) further depleting their resilience necessitating resorting to negative adaptive and coping mechanism like deforestation and transactional sex increasing the risk of contracting HIV (World Bank 2004).
Budget for nutrition sensitive outputs 144. The overall budget for the six outputs of the Nutrition Sensitive Key Result Area is shown in table 21 and the annualized
budget distribution plan in figure 19.
Table 21: Budget for Action Plan to strengthen Nutrition Sensitive Interventions (NSI): Agriculture and Food Security, Health and HIV, WASH, Education, Social Protection and Environment and Climate Change
Expected Results Budget in Billion TZS Total budget in
Million USD** 2016/17 2017/18 2018/19 2019/20 2020/21 Total Expected Outcome 5:
Line sectors, private sector and CSOs scale-up nutrition sensitive interventions to reach all communities to improve nutrition 4,128.4 4,287.0 4,950.9 5,058.2 3,247.2 21,671.7 9,850.78
Output 5.1: * Communities have access to a diverse range of nutritious food throughout the year 728.1 737.0 723.5 720.5 713.1 3,622.3 1,646.48
Output 5.2: *
Communities regularly use quality maternal health including family planning, prevention and treatment of HIV and malaria services 1,461.0 1,556.0 1,704.0 1,801.0 NA 6,522.1 2,964.59
Output 5.3: * Communities access adequate water sanitation and hygiene services 1,149.0 1,149.0 1,149.0 1,148.8 1,148.0 5,743.9 2,610.86
Output 5.4: * Girls complete primary and secondary education 351.8 351.8 351.4 353.1 351.3 1,759.4 799.73
Output 5.5: *
Poorest households benefit from conditional cash transfers, cash for work, and nutrition education during community sessions 436.9 491.5 1,021.3 1,033.2 1,033.2 4,016.2 1,825.56
Output 5.6: *
Vulnerable communities are able to cope with draught and climate change to avoid shortage of nutritious food during shocks 1.56 1.56 1.56 1.58 1.56 7.82 3.55
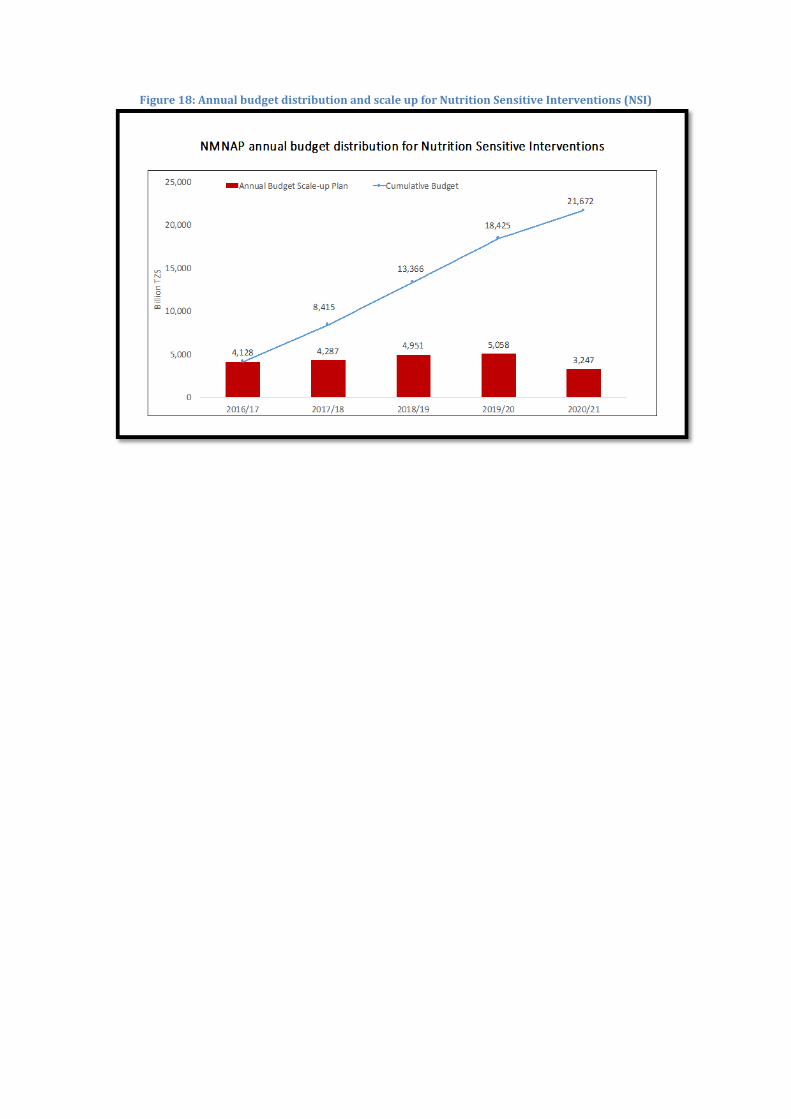
Figure 18: Annual budget distribution and scale up for Nutrition Sensitive Interventions (NSI)
CHAPTER 6: GOVERNANCE AND MANAGEMENT OF THE NMNAP
6.1 Overview 145. Good nutrition governance is a critical component of nutrition
improvement as it creates the necessary enabling environment for scale-up, empowerment and sustainability of interventions. Although in nutrition we understand what works and in many ways how it should work, the challenge is to ensure interventions are delivered in governance systems that are efficient, cost-effective and adheres to the principles of good governance. Human rights (HR) principles inform the content of good governance efforts including for nutrition. The HR framework addresses all the key dimensions of good governance, including public participation, access to information, and accountability. A critical aspect of good nutrition governance is the Government’s capacity to respect, protect, and fulfil human rights, and in this context nutrition rights. Ultimately, it is the simultaneous realization of all civil, political, economic, social and cultural rights that contributes most to good governance including for nutrition.
146. Good governance sustains political will and Government commitment, increases allocation of financial and human resources, develops institutional response capacity, ensures accountability and coalesces advocacy and communication efforts around a common narrative to reduce malnutrition. Moreover, strong attention to nutrition governance ensures the multiple determinants of malnutrition (biological, social, cultural, economic, political) are addressed, increases the understanding of policy makers on the impact of malnutrition on national development and links improved nutrition to policy and implementation action plans.
147. Ensuring accountability is an important component of this NMNAP. While the state and other stakeholder accountability for results and resources is included in the integrated “Common Results, Resources and Accountability Framework (CRRAF – see appendix 2) good governance should also ensure social accountability. This will assist in responding to the emerging contours of a new social contract where citizens are seeking a relationship with their government based on transparency, accountability, and participation.
148. The World Bank (2013)32 defines “Social accountability” as an approach towards building accountability that relies on civic engagement, i.e., in which it is ordinary citizens and/or civil society organizations who participate directly or indirectly in exacting accountability”. The aim of civic engagement is to stimulate demand from citizens and thus put pressure on the state or private sector to meet their obligations to provide quality services. The supply side of this equation is about building state capability and responsiveness, which in this case is for nutrition improvement. Social accountability mechanisms for nutrition could include the use of the “Nutrition Score Card” at the community level and participation of communities in monitoring implementation of the NMNAP (e.g. through the TASAF nutrition community sessions). Lessons from the experiences gained in the use of social
32 World Bank (2013): Social Accountability and Demand for Good Governance. August 15, 2013 (http://www.worldbank.org/en/topic/socialdevelopment/brief/social-accountability)

TANZANIA NATIONAL MULTISECTORAL NUTRITION ACTION PLAN (NMNAP) JULY 2016-2021
98
accountability mechanisms in Tanzania by some stakeholders like Care’s Community Score Card33, CUAMM’s Beneficiary Feedback mechanism and Irish Aid support to CSO on social accountability, could provide opportunities to adapt social accountability for nutrition in the implementation of the NMNAP.
149. The nutrition governance framework used in developing governance actions in this NMNAP is adapted from that developed by the U.K’s Institute of Development Studies (IDS) at Sussex34 synthesizing studies from 4 countries: Brazil, Peru, Bangladesh, Ethiopia and Zambia. The evidence shows how governance is key to progress on reduction of undernutrition. The framework focuses on four key factors:
1) intersectoral cooperation, of Government and non-Government sectors;
2) Vertical coordination between the different levels of Government from local to national levels
3) Sustainable funding from all levels of Government and well managed and transparently tracked. Donor support can increase sustained Government commitment
4) Monitoring and Advocacy: To maintain political will and commitment to nutrition, Government and civil society organizations must advocate. To ensure evidence-informed advocacy, there is need for timely and quality nutrition information.
150. The IDS research findings made 10 recommendations that have been adopted by the NMNAP. These are: -
1) Involve the executive branch of Government in nutrition polices: For Tanzania, both the Office of the President (PO-RALG) and that of the Prime Minister (PMO) have taken active leadership role in developing the NMNAP and will do the same in its implementation;
2) Establish effective bodies to coordinate actions: Though they need functional capacitation, there are multisectoral coordinating steering committees on nutrition from the national to the LGA levels
3) Frame nutrition as an integral part of the national development agenda: Nutrition is in development vision 2025 (MKUKUTA) and in the Five-Year Development Plan II (2016/17-2020/21). This NMNAP 2016/17-2020/21 is anchored in the corresponding Five-Year Development Plan.
4) Develop a single narrative about the severity of the malnutrition problem: The narrative in this NMNAP with its Common Results, Resources and Accountability Framework (CRRAF) and consensus nutrition targets updates and, therefore, super-cedes the 2011/12-205/16 National Nutrition Strategy (NNS) narrative.
5) Ensure that local Governments have the capacity to deliver nutrition services: the decentralization of nutrition interventions through PO-RALG with regional and council nutrition steering committees, nutrition officers and annual planning and budgeting
33 Care: http://governance.care2share.wikispaces.net/Social+Accountability 34 Institute of Development Studies (IDS)-UK (2012): Accelerating Reductions in Undernutrition: What can nutrition governance tell us? In: IDS in Focus, Policy Briefs, Research and analysis from the Institute of Development Studies, Issue 22 April 2012.
TANZANIA NATIONAL MULTISECTORAL NUTRITION ACTION PLAN (NMNAP) JULY 2016-2021
99
cycles provides a good basis for the decentralized implementation of the NMNAP.
6) Encourage local ownership of nutrition programme and their outcomes: this will continue to be implemented through the decentralized PO-RALG structure.
7) Support Civil society groups to develop social accountability. The area of social accountability will require to be developed during the implementation of the NMNAP as it is not well understood.
8) Collect nutrition outcome data at regular intervals: This is already being collected by the TDHS, SMART Surveys and PER-Nutrition, though at long intervals. The national multisectoral nutrition information system (MNIS) to be established under the NMNAP will ensure better quality and timely collection and dissemination for evidence informed advocacy, communication and adaptive management of the NMNAP.
9) Use centralised funding mechanisms to generate greater incentives to cooperate in the design, implementation and monitoring of nutrition interventions. Government allocation of resources is both centralized for national resources and decentralized for LGA resources.
10) Governments should create financial mechanisms to protect (earmark) nutrition funding and use it in a transparent way. The Government has already created a nutrition code for budgeting at the LGA levels which earmarks funds for nutrition and should assist also in tracking of those funds. The issue of developing a nutrition basket fund and ring-fencing the nutrition budget will be considered as part of nutrition governance.
6.2 Leadership and management structure 151. The leadership and management structure for the NMNAP derive from the
accountability framework articulated in the Food and Nutrition Policy. At the national level, the chair of the HLSCN (PS in the PMO) will provide overall policy and coordination leadership for the NMNAP. At the operational level, PO-RALG will lead the Regional and Council level response with the support of the chairs of the nutrition steering committees at the regional and council levels. As the technical arm of Government, TFNC will provide overall technical coordination and leadership and management of the NMNAP at all levels including being the secretariat to the HLSCN and chairing the Thematic Working Groups (TWGs). Thus, it is critical to develop TFNC’s capacity to take on this task.
6.3 Key actors, their roles and responsibilities 152. The Food and Nutrition Policy already identified the key actors and their
roles in the policy implementation. These roles and responsibilities are divided into 4 broad categories: oversight and coordination; nutrition services delivery; food production; and provision of basic services and supportive services for nutrition improvement. The key implementers include Government Ministries, Departments and Agencies (MDA); Regional Administrations and Local Government Authorities (LGAs); Development Partners; NGOs, the Private Sector; Civil Society Organisations (CSO) including NGOs and Faith-Based

TANZANIA NATIONAL MULTISECTORAL NUTRITION ACTION PLAN (NMNAP) JULY 2016-2021
100
Organizations (FBO); the Private Sector, political parties and communities. Since this NMNAP is the implementation plan for the policy, the same actors and roles identified in the policy apply in the governance and management of the NMNAP as shown below: - (i) The Prime Minister’s Office (PMO)
• Coordinate the overall national response to nutrition including ensuring effective contribution by Ministries, Departments and Agencies (MDAs) to the NMNAP;
• Support the multisectoral response to nutrition and ensuring that Nutrition is adequately mainstreamed in policies and strategies of the key line ministries;
• Provide oversight for governance and accountability of all sectors and actors in nutrition; and
• Chair and host the High Level National Steering Committee for Nutrition (HLSCN).
(ii) Ministries, Departments and Agencies (MDA) General responsibilities for all MDA
• Ensure that nutrition is adequately reflected in MDA policies, strategic plans, programs, legislation, regulations and guidelines;
• Identify, mobilize and allocate human, financial and organizational resources to the NMNAP in the discharge of their responsibilities under the Food and Nutrition Policy;
• Report on the implementation of their nutrition interventions done in the context of the NMNAP to the ministry responsible for coordination Government business (PMO) and to TFNC; and
• Collaborate with TFNC, other key sector line ministries and actors to realize the NMNAP goals, objectives and targets.
Specific responsibilities for MDA in line with their mandates: 1. President’s Office - Ministry responsible for Regional Administration and Local Government Authorities (PO-RALG)
• Guide and monitor the integration of nutrition interventions in regional and local Government authorities plans and by laws;
• Coordinate and facilitate capacity development of regional and local Government administrations to plan and implement nutrition improvement programs at the community level; and
• Coordinate and monitor nutrition interventions by all actors in regional and local Government authorities using the principle of the three ones: One Plan, One Coordinating Mechanism and One Monitoring and Evaluation Framework.
TANZANIA NATIONAL MULTISECTORAL NUTRITION ACTION PLAN (NMNAP) JULY 2016-2021
101
2. President’s Office – Ministry responsible for public service and good governance • Facilitate establishment, recruitment and development of nutrition cadres at all
levels. • Prioritize nutrition in the ongoing government structural/institutional reforms 3. Ministry Responsible for Health, Community Development, Gender, Elders and Children
• Scale-up quality basic health services (health promotion, prevention, curative and rehabilitation services) essential for improvement of nutrition in the country up to the health facility at community level;
• Implement, monitor and coordinate the essential health interventions for improving the nutritional status at all levels;
• Develop legislation, regulations and guidelines relevant to health and nutrition in line with the Food and Nutrition Policy and its implementation plan (NMNAP);
• Integrate nutrition components in school health, reproductive health and other relevant programs;
• Strengthen food and nutrition services for vulnerable groups, including children with multiple vulnerabilities (MVC), People with Disability (PWD) and the elderly;
• Promote integration of nutrition objectives in social protection programs;
• Promoting household-based strategies to increase food and nutrition security;
• Promote nutrition supportive behaviours and discouraging behaviours that are barriers to improving nutrition; and
• Advocate for mainstreaming nutrition issues in community development.
4. Ministry Responsible for Agriculture, Livestock and Fisheries
• Ensure that national food security plans and programs have explicit objectives to improve household food and nutrition security;
• Promote and support increased production and consumption of diverse high nutrient dense food crops;
• Promote increased agro-processing, preservation and storage of food crops to reduce post-harvest losses and contamination and preserve nutrition quality;
• Enhance research on food crops with high nutrient value; • Ensure mainstreaming of nutrition in agriculture training programmes; • Ensure good agricultural practices and food safety along the production
chain;
TANZANIA NATIONAL MULTISECTORAL NUTRITION ACTION PLAN (NMNAP) JULY 2016-2021
102
• Promote increased production and consumption of high nutrient value livestock, dairy and fisheries products;
• Enhance training and research for small scale production and processing of livestock, dairy and fisheries products to increase nutritional outcomes in households;
• Facilitate good marketing of livestock, dairy and fisheries products across the country; and
• Ensure the safety of livestock and fisheries food products along the production chain.
5. Ministry Responsible for Water and Irrigation
• Ensure sustainable supply of adequate safe and clean water up to household level; and
• Promote safe water, sanitation and Hygiene (WASH) practices for improved nutrition outcomes.
6. Ministry Responsible for Education, Science, Technology and Vocational Training
• Integrate nutrition education in school and college curricula; • Promote nutritious feeding programs in schools, colleges and other
Educational institutions; • Promote innovation and optimal application of communication, science and
technology at all levels to improve food and nutrition in the country; and • Strengthen the monitoring of food and nutrition services in day and
Boarding schools, colleges and other educational institutions.
7. Ministry Responsible for Energy and Minerals • Promote better and cheaper energy in both rural and urban areas to reduce
women’s workload and increase nutritional outcomes in households; • Ensure increased production of quality salt and adherence to the mining
regulation on salt iodation; and • Ensure safe mining practices to reduce the risk of contamination of food and
nutrition resources.
8. The Ministry Responsible for Natural Resources Management • Ensure integration of the nutritional rights of communities surrounding
wildlife and forest reserves in their resources sustainable management plans; and
• Promote increased small-scale production and processing of quality honey, fruits and animal products to enhance nutritional outcomes at household level.
9. Ministry Responsible for Industry and Trade

TANZANIA NATIONAL MULTISECTORAL NUTRITION ACTION PLAN (NMNAP) JULY 2016-2021
103
• Promote increased processing, storage and marketing of agricultural, livestock and fisheries products;
• Promote fortification of commonly eaten foods; • Promote increased nutrition-relevant small and medium enterprise (SME)
participation in the food industry subsector; and • Promote consumer protection and traceability.
10. Ministry Responsible for Finance and Planning • Mobilize and allocate funds for the implementation of the NMNAP; • Expedite timely disbursement of allocated funds to the responsible sectors
and institutions; • Monitor public expenditure on food and nutrition with specific reference to
the NMNAP; and • Promote harmonization and alignment of sector financing to ensure optimal
impact of nutrition in national development.
11. The Ministry responsible for Labour • Sensitize employers and the national labour force on the importance of good
nutrition to good health and high productivity; • Monitor the nutrition situation in the labour force ad take appropriate
actions; • Promote work-place based nutritional improvement initiatives including safe
water for drinking, sanitation, breastfeeding and other feeding programs; and • Promote the right to maternity and paternity leave.
12. Ministry Responsible for Home Affairs • Strengthen enforcement of laws and regulations that facilitate food and
nutrition security in the country; • Ensure that the food and nutrition rights of people under incarceration,
including prisoners are met. These rights include adequate access to health services, healthy nutritious diets and safe water for drinking, hygiene and sanitation;
• Enhance training in production of high value nutritious products through prison farming systems.
13. Ministry Responsible for Information, Culture and Sports
• Promote increased media coverage of the NMNAP and overall nutrition issues across the country;
• Promote traditions and customs that positively impact on nutrition, including production and consumption of indigenous nutritious foods;
• Identify traditions and customs that undermine nutrition and support interventions and actions to address them;
TANZANIA NATIONAL MULTISECTORAL NUTRITION ACTION PLAN (NMNAP) JULY 2016-2021
104
• Promote sports for healthy living for the prevention of overweight, obesity and other Diet Related Non-Communicable Diseases (DRNCDs) at all levels in the country; and
• Integrate nutrition in sports development programmes.
14. Ministries Responsible for Infrastructure Development The main responsibilities of this sector ministry will include ensuring that a functional road network, railway and water transport services (where applicable) are in place to facilitate access and food transportation between producing areas and markets across the country throughout the year. This will provide an effective link between food producing and consumption areas, reduce seasonal variations in food availability and improve food security. Additionally, infrastructure development, especially in urban settings should facilitate people to do physical exercises like walking, jogging and cycling.
Government Agencies A. Tanzania Food and Nutrition Centre (TFNC)
TFNC coordinated the development of the NMNAP, thus its leadership role will continue during its implementation. Moreover, the 2016 Food and Nutrition Policy and in particular Act 24 of 1973 that established TFNC and its 1995 amendment provides TFNC with a critical mandate in the implementation of the Food and Nutrition Policy and its associated NMNAP. The mandate includes: -
• To regulate all matters relating to nutrition in the country; • In collaboration with the producer, manufacturers and distributors of articles
of food, to ensure proper nutritional value of the food marketed in the United Republic or exported to foreign countries;
• To provide strategic and technical leadership and support on nutrition to all sectors and actors;
• To coordinate, monitor and evaluate all nutrition interventions and resources in the country;
• To provide the secretariat to High Level Steering Committee on Nutrition (HLSCN);
• To coordinate, advocate and mobilize resources for nutrition; • To coordinate nutrition research in the country; • To promote integration of nutrition objectives in relevant sectors; and • To advise the Government and other stakeholders on all key matters relating
to nutrition in the country including training, human resources deployment and accreditation of nutritionists.
B. Tanzania Food and Drugs Authority (TFDA)
• Ensure the right of consumers to adequate nutritional information on all pre-packaged food products; and

TANZANIA NATIONAL MULTISECTORAL NUTRITION ACTION PLAN (NMNAP) JULY 2016-2021
105
• Monitor the safety of all food imports and exports, and food products in markets and other outlets in the country to reduce nutritional risks and take legal action as appropriate.
C. Tanzania Bureau of Standards (TBS)
Ensure nutritional concerns are addressed in the development and monitoring of quality and standards for food products.
Regional Administration and Local Government Authorities (LGAs) a. Regional Secretariats • Identify nutrition problems, challenges and solutions in the Region; • Integrate food and nutrition objectives in Regional Secretariat plans and
strategies; • Interpret policies and policy guidelines on nutrition; • Provide technical guidance and supportive supervision on nutrition to LGAs;
and • Coordinate, monitor and evaluate the implementation of NMNAP by
different stakeholders at regional level. b. Local Government Authorities (LGAs) • Strengthen Multisectoral Coordination Committee for Nutrition at LGA
level. • Establish and facilitate a Nutrition Unit in the Council to provide technical
support; • Facilitate identification of nutrition problems, challenges and solutions in the
LGA; • Integrate nutrition activities into the Comprehensive Council Development
Plans; • Mobilize, allocate and ‘ring fence’ resources for implementation of nutrition
activities in the council; • Strengthen community-based activities to fight malnutrition; • Support ward, village/mtaa levels to integrate nutrition into their
development plans and implement and monitor nutrition activities at their respective levels; and
• Coordinate the implementation, monitoring and evaluation of nutrition interventions in the council in the context of the NMNAP.
c. Ward and Village/Mtaa Levels • Identify food and nutrition opportunities and challenges at the respective
level; • Ensure the integration of food and nutrition issues in ward/village/mtaa
plans and strategies; • Ensure adequate community sensitization to increase demand for and uptake
of nutrition services;
TANZANIA NATIONAL MULTISECTORAL NUTRITION ACTION PLAN (NMNAP) JULY 2016-2021
106
• Initiate appropriate community-based food and nutrition interventions and mobilize resources for implementation; and
• Coordinate monitoring and evaluation of nutrition improvement activities at the respective level in the context of the NMNAP.
Higher Learning, Training and specialized Research Institutions
• Review and update curricula for pre-service, in-service and continuing education to ensure that nutrition is adequately integrated;
• Increase opportunities for training in nutrition; • Mobilise funding for research in nutrition, undertaking research and
dissemination of research findings to stakeholders; • Participate in monitoring and evaluation of food and nutrition interventions
in the country; and • Provide technical advice and consultancy on implementation of the
NMNAP.
Civil Society Organizations (CSO) NGOs, CBOs, FBOs Civil Society include national and international NGOs, CBOs, FBOs and political parties. In addition to providing financial and technical support, CSO will: -
• Advocate for the prioritisation of nutrition in national, regional, LGA and community development plans;
• Support community mobilization and implementation of nutrition interventions up to household level;
• Support capacity development for improvement of food and nutrition at all levels in the LGAs;
• Integrate nutrition issues in their programs, projects and activities targeting communities and households; and
• Align their nutritional plans with the Government plans at the respective level within the context of the NMNAP.
Professional Bodies Professional bodies and associations such as Paediatrics, Nurses, Food and Nutrition, Public Health, Medical Association, will include promoting the NMNAP among their members. They will issue professional guidance in nutrition, conduct research, set professional standards and participate in the development of nutrition curricula for pre-service, in-service and continuing education; and supporting outreach activities on nutrition in communities.
Political Parties
Political parties are in a unique position to promote nutrition improvement, given their reach and influence in mobilizing for social goals. In implementing the NMNAP, political parties will: -
TANZANIA NATIONAL MULTISECTORAL NUTRITION ACTION PLAN (NMNAP) JULY 2016-2021
107
• Incorporate food and nutrition improvement issues in their election manifestos and campaigns;
• Support mobilization for improved food and nutrition security: • Support initiatives for improvement of food and nutrition especially in
vulnerable groups; and • Advocate for the prioritisation of nutrition in national, regional, LGA and
community development plans.
Private Sector Institutions The private sector will partner with Government in the provision of nutrition-relevant services at all levels in the implementation of the NMNAP. Specific contributions could include: -
• Increase investments in production, processing, storage and marketing of high-value nutritious and healthy products and in the provision of essential basic social services (food, health, water, sanitation and hygiene) for nutrition improvement;
• Invest in production and marketing of appropriate low cost-labour saving technologies that enhance food and nutrition improvement at community level;
• Integrate nutritional support in corporate social responsibility plans and activities;
• Make available appropriate technologies for nutrition improvement including for advocacy, creation of public awareness and for tracking progress;
• Initiate and improve workplace nutrition programmes for their labour force; and
• Ensure compliance with all national laws, regulations, guidelines and international protocols for protection of consumer rights, health and the environment.
The Media
In line with National Social and Behavioural Change Communication (SBCC) Strategy, the mass media will be responsible for advocating and conveying accurate information to the public and create awareness so as to influence positive behavioural changes for nutrition improvement. Mass media includes the print, radio, TV and computer networks (websites, emails and e-social forums).
Households
• Ensure availability of adequate and diverse nutritious food to meet the basic needs of all household members;
• Distribute equitably nutritious food among family members and address the specific needs of infants, young children, pregnant and lactating mothers;
• Ensure proper handling and management of food to avoid contamination and wastage;
TANZANIA NATIONAL MULTISECTORAL NUTRITION ACTION PLAN (NMNAP) JULY 2016-2021
108
• Ensure safe water, sanitation and hygiene practices in the household to reduce the risk of related diseases;
• Demand for information, education and essential basic social services to improve Nutritional care in their households and communities; and
• Participate in nutrition improvement activities implemented by different actors in the ward/villages/mitaas.
Development Partners
Development Partners, including the UN agencies, multilateral and bilateral organizations will advocate for, promote and place implementation of the NMNAP high on their global and national agenda. Their role will include mobilizing for technical and financial resources for implementation, capacity development, monitoring and evaluating the NMNAP. Development partners can also bring in international experience, norms and standards, evidence-based guidance and insights to adjust strategy and promote international cooperation in the implementation of the NMNAP including global reporting.
6.4 Multisectoral coordination system 153. Ensuring functional, efficient, effective and strategic multisectoral
coordination system that adequately supports implementation of the NMNAP is critical to its success. A strategic coordination system will help put in place a proper “Three ones” for nutrition in Tanzania (One Plan, One coordination system and One M&E mechanism). The NMNAP (2016-21) will be the “one plan”; a revised coordination system as the “One Coordinating mechanism and the Common Results, Resources and Accountability Framework (Appendix 2) can be used as the “one M&E” System. Government has already established good multisectoral and multi-stakeholder coordination mechanisms at the different levels, which facilitate Public-Private-Partnerships if used well. Government will need to institutionalize the proposed structures for accountability purposes.
154. Since 2013, the national level coordinating structures were composed of: -
1. A High Level Steering Committee on Nutrition (HLSCN) composed of the Permanent Secretaries (PS) from nine key nutrition relevant Ministries and chaired by the PS, Prime Minister’s Office (PMO) with TFNC as Secretariat;
2. Multisectoral Nutrition Technical Working Group (MN-TWG) which was more linked to Health Sector Strategic Plan (HSSP) III and chaired by TFNC; and
3. Nine National Consultative groups: (i) Infant and Young Child Feeding, (ii) Nutrition surveillance, (iii) Iodine Deficiency Disorders, (iv) Anaemia, (v) Vitamin A Supplementation, (vi) Food Fortification Alliance, (vii) Household food security, (viii) Integrated Management of Acute Malnutrition, and (ix) Emergency nutrition.
155. Some of these structures were put in place before the finalization of the National Nutrition Strategy (NNS) of 2011-2016 with no clear link between those structures and its implementation. While the 2013-2016 coordinating mechanism of having nutrition steering committees at the LGA and Regional levels are adequate for those levels for the NMNAP, the national coordinating

TANZANIA NATIONAL MULTISECTORAL NUTRITION ACTION PLAN (NMNAP) JULY 2016-2021
109
structure will need to be reviewed to align with the 2016 Food and Nutrition Policy and the NMNAP.
156. In order to effectively align the coordinating structures with the implementation of the NMNAP 2016/17-2020/21, the system will be restructured and institutionalized as follows: -
1) Sub-national level: the nutrition steering committees at regional and Council levels will be institutionalized and their composition and terms of reference reviewed to support implementation of the NMNAP;
2) At the national level: The HLSCN chaired by the Permanent Secretary in the Prime Minister’s Office (PMO) will be institutionalized for intersectoral coordination of the Food and Nutrition Policy and the NMNAP. The role of the High Level Steering Committee on Nutrition (HLSCN) will be: - 1) To serve as the inter-ministerial monitoring body for implementation of
the National Food and Nutrition Policy and, therefore, the NMNAP; 2) Develop consensus among ministries and other actors on the key
NMNAP milestones and monitor their achievement; 3) Advise the Government on appropriate response and actions to address
challenges identified in the course of implementing the NMNAP; and 4) Promote the multisectoral approach and coordination of the NMNAP 5) The HLSCN will meet twice a year, in October-November and in April-
May. The first meeting of the HLSCN in October – November will be an opportunity to share the results of the Joint Multisectoral Nutrition Review for the previous year (N-1) and validate the recommendations for planning the next Fiscal Year (N+1). The second meeting, in April-May can be used to review progress on implementation of Annual Work Plans (AWP) for first semester of year N and present the consolidated AWP for the next Fiscal Year (N+1). These points will be the core issues of the HLSCN agenda, but additional points can be integrated in the agenda.
The HLSCN will set up a sub-committee that will be in charge of monitoring implementation of large scale nutrition programs like Mwanzo Bora, ASTUTE, ASRP etc. The composition and terms of reference for the sub-committee will be developed. This sub-committee that will be chaired by the Director of Government Business on Coordination who is also the Scaling Up Nutrition (SUN) focal point in the PMO will meet twice a year and feed into the agenda of the HLSCN.
3) A NMNAP Main Technical Working Group (Main TWG) chaired by the TFNC Managing Director will meet twice a year and will support the work of the “NMNAP Steering Committee and coordinate the work of the thematic technical working groups of the NMNAP as described below.
4) NMNAP Thematic Technical Working Groups chaired by TFNC: Seven Technical Working Groups based on the seven Key Result Areas of the NMNAP will be established. They will incorporate the work of the current consultative groups. To cover all critical components of the NMNAP, it will be necessary to create an additional technical working group on “resource mobilization”.

TANZANIA NATIONAL MULTISECTORAL NUTRITION ACTION PLAN (NMNAP) JULY 2016-2021
110
The composition and TOR for the technical groups will need to be developed under the coordination of TFNC.
5) Thus, there will be eight thematic technical groups as follows: I. TWG on maternal, infant, young child and adolescent nutrition
(MIYCAN): The group will review progress on the implementation of the operations plans of the NMNAP bearing the same name. Current technical consultative groups to be incorporated will include Infant and Young Child Feeding,
II. TWG on Prevention and Control of Micronutrients. This will incorporate the following current consultative groups: IDD, Vitamin A supplementation, Anaemia and Food Fortification Alliance. The group will review progress on the implementation of the operational plans of the NMNAP bearing the same name.
III. TWG on Integrated Management of Acute Malnutrition (IMAM): to incorporate current consultative groups on Emergency nutrition and Integrated Management of Acute Malnutrition (IMAM). The group will review progress on the implementation of the operational plans of the NMNAP bearing the same name.
IV. TWG on Prevention and Management of Diet Related Non-Communicable Diseases (DRNCDs): The group will review progress on the implementation of the operational plans of the NMNAP bearing the same name.
V. TWG on Nutrition Sensitive interventions. The group will review progress on the implementation of the operational plans of the NMNAP bearing the same name.
VI. TWG on Multisectoral nutrition governance: The group will review progress on the implementation of the operational plans of the NMNAP bearing the same name.
VII. TWG on Multisectoral nutrition information systems. The group will review progress on the implementation of the operational plans of the NMNAP bearing the same name.
VIII. TWG on Resource mobilization. Although no task team was formed for resource mobilization in the development of the NMNAP, this technical group will develop a resource mobilization strategy and track utilization of resources to ensure good value for money.
157. During the process for institutionalizing the various coordinating structures, it will be important to review the terms of reference of those structures that remain and develop new ones for the new structures. Fig. 20 shows the current (2013-2016) coordinating structure, while fig. 21 shows the proposed coordinating structure for the NMNAP 2016/17 – 2020/21.

Figure 19: NNS Coordinating structures 2013-2016
Figure 20: Proposed NMNAP Coordination Structures 2016-2021
6.3 Human Resources and Institutional Capacity requirements 158. In recent years, Government has established a cadre of Nutrition Officers at
the Regional and LGA levels with commensurate allocation of resources for their salaries. With the direction of the Ministry of Finance and Planning, and through these Nutrition Officers, nutrition has been systematically included in
TANZANIA NATIONAL MULTISECTORAL NUTRITION ACTION PLAN (NMNAP) JULY 2016-2021
112
the Government planning and budgeting process, for the first time at all levels. The key issue for the implementation of the NMNAP is for Government to ensure that all regions and LGAs have skilled Nutrition Officers. As of August 2016, about 70 percent of the 185 LGAs have Nutrition Officers/Focal Points. Pre-service and in-service training on nutrition is included in the action plan of the nutrition governance section. For purposes of quality assurance of human resources, TFNC, which has the legal mandate, should consider establishing a system of accreditation for Nutrition Officers, similar to that of South Africa.
159. In addition to human resources, institutional capacity for leading and managing the NMNAP in a dynamic context, especially as the country transits into a middle-income country, is very important. It will thus be critical for the coordinating structures at all levels (HLSCN, regional/LGA steering committees on nutrition) to be institutionalized a move that will recognize them as doing priority Government work. This should include the urgent development of TFNC capacity and institutionalization of the SUN focal point in the Prime Minister’s Office. It also implies that institutional and individual capacities across governance structures will strive for a collective effort of social innovation, by including the development of nutrition collaborative leadership capacities of the nutrition community through action-learning, soft skills development, upholding of quality and accountability and capturing the impact of the NMNAP coordination space.
6.4 Action plan for Multisectoral Nutrition Governance (Detailed Action Plan in Annex 6) 160. The nutrition governance action plan addresses the following objectives of
the Food and Nutrition Policy: - 1) To enhance National capacity for improvement of nutrition. 2) To strengthen multisectoral coordination of nutrition services and
interventions in the country 3) To improve regional and international collaboration for nutrition
improvement 4) To ensure that nutrition services at all levels in the country are
gender sensitive 5) To decentralize planning, management and coordination of nutrition
services to the local Government level 6) To strengthen good governance in nutrition at all levels
161. The Multisectoral Nutrition Governance (MNG) Action Plan addresses the core governance needs for implementation of the NMNAP. They include: efficient leadership and management, policy guidance, enabling legislations and regulations, appropriate structures for coordination and service delivery, sufficient resources (human and financial) for implementation of interventions, and good governance at all levels. The MNG action plan also addresses the need for more political commitment and national response to prioritize nutrition and create better enabling environment for improved nutrition, through advocacy and social mobilisation.
162. The proposed activities and timeline for multisectoral nutrition governance is shown in table 22, the output based budget in table 23 and budget the annualized budget distribution in figure 22 below.

Table 22: Proposed activities and timeline for Multisectoral Nutrition Governance
Output/activities Lead institution
Collaborating agencies
2016/17 2017/18 2018/19 2019/20 2021/21 1 2 3 4 1 2 3 4 1 2 3 4 1 2 3 4 1 2 3 4
6.1 Increased Government political and financial commitment to Nutrition and enforcement of nutrition-relevant laws and regulations 6.1.1 Disseminate the 2016 Food and Nutrition Policy,
Policy Implementation Strategy and NMNAP to all levels
TFNC PORALG, Key ministries, DPs
6.1.2 Review key line sectoral policies, strategies and guidelines to make them more nutrition sensitive
PMO PORALG, MDAs, DPs, TFNC
6.1.3 Conduct sensitization campaigns to the public and community on laws and regulations related to food and nutrition
TFNC PMO, TFDA, TBS, Media agencies, MoI
6.1.4 Prepare and disseminate policy briefs on key nutrition issues to guide policy makers and other actors
PMO MOHCDGEC, MDAS
6.1.5 Review Nutrition Advocacy strategy and develop materials and tools (Radio programs, TV documentaries, printed materials, power point presentations)
TFNC PMO, PORALG, DPs
6.1.6 Conduct capacity building among MP nutrition champions on nutrition specific and sensitive interventions (meetings, trainings, field visits)
TFNC PMO, PORALG, DPs
6.1.7 Support the MP nutrition champion group to review their nutrition strategic plan
PMO TFNC, CSOs, DPs
6.1.8 Conduct advocacy meetings on nutrition for RCs, DCs, Counsellors, RAS, DEDs and other influential people
PO-RALG TFNC, CSOs, DPs,
6.1.9 Orient nutrition focal points and key decision makers in line ministries and at regional and district levels on multisectoral planning and budgeting of nutrition sensitive activities.
PMO PORALG, Key Ministries, TFNC, DPs
6.1.10 Conduct annual zonal planning and budgeting meetings with regional and LGA multisectoral teams
PORALG RS, LGAs, TFNC, DPs, NGOs

TANZANIA NATIONAL MULTISECTORAL NUTRITION ACTION PLAN (NMNAP) JULY 2016-2021
114
Output/activities Lead institution
Collaborating agencies
2016/17 2017/18 2018/19 2019/20 2021/21 1 2 3 4 1 2 3 4 1 2 3 4 1 2 3 4 1 2 3 4
6.1.11 Establish a Joint National NMNAP Resource Mobilisation Committee (JNRMC) and conduct quarterly working sessions
PMO MOHCDGEC, DPs MOFP, MDAs, TFNC, PORALG,
6.1.12 Facilitate JNRMC to organize fundraising events for resource mobilisation to implement NMNAP
PMO MOHCDGEC, MDAs, TFNC, PORALG, DPs
6.1.13 Consult with the Government budget preparatory committee to advocate for integration of nutrition priorities into budget guideline
PO-RALG MOFP, PMO, RS, LGAs, TFNC
6.1.14 Support representation of Tanzania nutrition teams in relevant regional, international and global cooperation frameworks to enhance scaling up of nutrition in the country
MFAECRIC PMO, TFNC, MOHCDGEC
6.1.15 Develop operational guidelines on good governance for effective implementation of NMNAP
PMO TFNC, PORALG, DPs
6.2 Functional multisectoral coordination at all levels 6.2.1 Review composition and terms of reference
for HLSCN PMO PORALG, MDA,
TFNC, DPs
6.2.2 Establish and operationalise HLSCN Secretariat (Full time staff, office set up, equipment)
PMO MDAs, TFNC, DPs
6.2.3 Conduct HLSCN meetings every six months PMO PORALG, MDAs, TFNC, NGOs, DPs
6.2.4 Review the composition and ToR of the Multi Sectoral Nutrition Technical Working Group (MNTWG) and its Consultative Groups based on the NMNAP's structure
PMO PORALG, MDAs, TFNC, DPs, NGOs
6.2.5 Conduct MNTWG and Consultative Groups meetings every six months
TFNC MDAs, DPs
6.2.6 Review ToR for Regional and Council Nutrition Steering Committees (R/CNSCs)
PORALG PMO, TFNC, RS, LGAs
6.2.7 Establish and conduct R/CNSC meetings in PORALG PMO, TFNC, RS
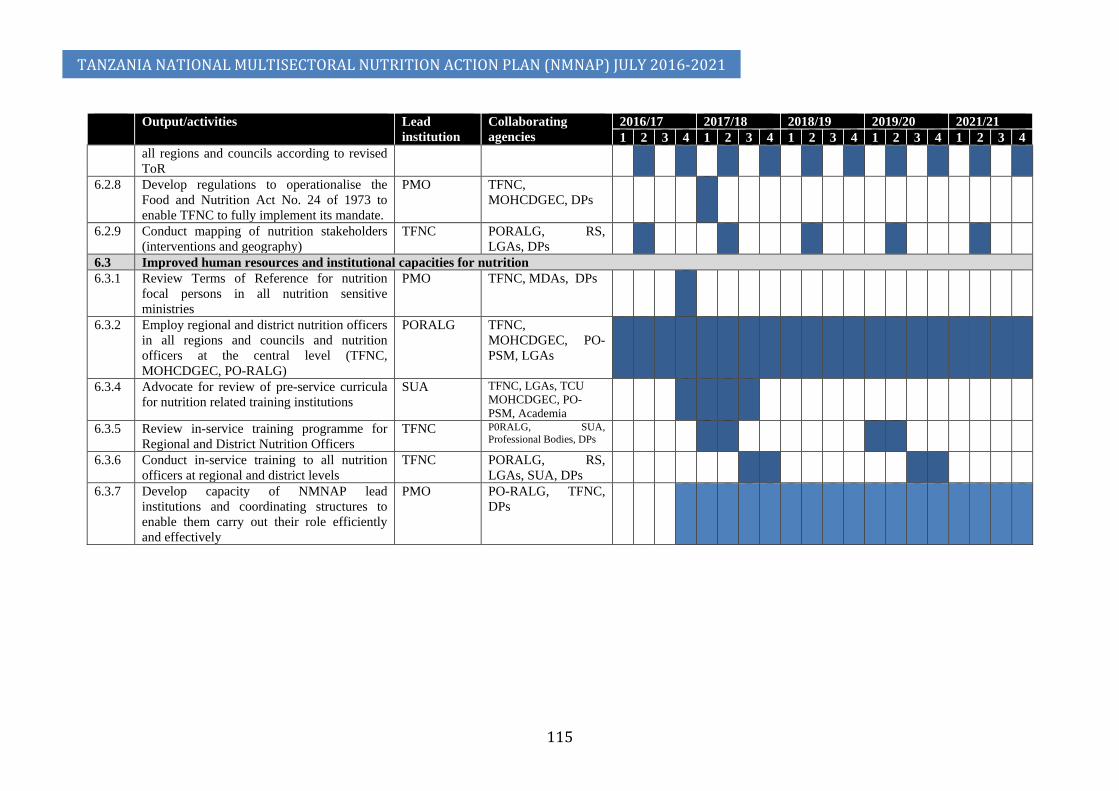
TANZANIA NATIONAL MULTISECTORAL NUTRITION ACTION PLAN (NMNAP) JULY 2016-2021
115
Output/activities Lead institution
Collaborating agencies
2016/17 2017/18 2018/19 2019/20 2021/21 1 2 3 4 1 2 3 4 1 2 3 4 1 2 3 4 1 2 3 4
all regions and councils according to revised ToR
6.2.8 Develop regulations to operationalise the Food and Nutrition Act No. 24 of 1973 to enable TFNC to fully implement its mandate.
PMO TFNC, MOHCDGEC, DPs
6.2.9 Conduct mapping of nutrition stakeholders (interventions and geography)
TFNC PORALG, RS, LGAs, DPs
6.3 Improved human resources and institutional capacities for nutrition 6.3.1 Review Terms of Reference for nutrition
focal persons in all nutrition sensitive ministries
PMO TFNC, MDAs, DPs
6.3.2 Employ regional and district nutrition officers in all regions and councils and nutrition officers at the central level (TFNC, MOHCDGEC, PO-RALG)
PORALG TFNC, MOHCDGEC, PO-PSM, LGAs
6.3.4 Advocate for review of pre-service curricula for nutrition related training institutions
SUA TFNC, LGAs, TCU MOHCDGEC, PO-PSM, Academia
6.3.5 Review in-service training programme for Regional and District Nutrition Officers
TFNC P0RALG, SUA, Professional Bodies, DPs
6.3.6 Conduct in-service training to all nutrition officers at regional and district levels
TFNC PORALG, RS, LGAs, SUA, DPs
6.3.7 Develop capacity of NMNAP lead institutions and coordinating structures to enable them carry out their role efficiently and effectively
PMO PO-RALG, TFNC, DPs

TANZANIA NATIONAL MULTISECTORAL NUTRITION ACTION PLAN (NMNAP) JULY 2016-2021
116
Table 23: Output based budget for Nutrition Governance
Expected Results Budget in Billion TZS Total USD
(million) 2016/17 2017/18 2018/19 2019/20 2020/21 Total Expected Outcome 6: Efficient and effective nutrition governance 6.3 8.8 7.4 8.0 7.4 37.8 17.18
Output 6.1: Increased Government political and financial commitment to Nutrition 0.65 2.24 1.70 1.70 1.70 7.98 3.63 Output 6.2: Functional multisectoral coordination at all levels 0.47 0.76 0.52 0.52 0.52 2.78 1.26 Output 6.3: Improved human resources and capacities for nutrition 5.15 5.81 5.15 5.78 5.15 27.04 12.29 Expected Outcome 7:
Quality nutrition related information is accessible and used to allow Government and partners to make timely and effective evidence informed decisions 8.5 16.3 20.4 16.3 6.6 68.0 30.91
Output 7.1: Robust systems of data collection, analysis, interpretation and feedback among stakeholders are in place at all levels 5.44 12.59 16.32 14.55 2.53 51.43 23.38
Output 7.2: Relevant nutrition indicators integrated, collected and reported in national surveys 1.52 0.39 2.51 0.27 2.59 7.28 3.31
Output 7.3: Capacity of nutrition stakeholders developed to align implementation of NMNAP with learning framework and carry out operational research 1.53 3.32 1.57 1.44 1.43 9.29 4.22

Figure 21: Annual budget distribution for multisectoral nutrition governance
CHAPTER 7: MONITORING, LEARNING AND EVALUATION
7.1 Overview 163. The Government recognizes the importance of monitoring and evaluation not
only for tracking results but also for tracking financial resources and build an evidence base for decision making. Thus, this NMNAP proposes a harmonized Nutrition Information System reflecting the multisectoral approach to nutrition, embracing the national, regional, district and community levels.
164. To a considerable extent, a regular multisectoral nutrition information system (MNIS) does exist in Tanzania as exemplified by the five-year Tanzania Demographic and Health Surveys (TDHS) started in 1992, the four-year STEP surveys started in 2009, the four-year Nutrition Public Expenditure Review (N-PER) started in 2013 and the four-year National Nutrition Surveys (NNS) started in 2014. However, many of these nutrition specific information systems are evaluative in nature given the long moments between the surveys and are best used for policy and strategy development and not for tracking operational progress. Moreover, these data systems provide information that can be analysed only at the regional and national levels with districts/Councils and communities left out of the system making it difficult to track progress at these crucial levels. For operational monitoring, there are several nutrition-relevant information systems that collect nutrition-relevant routine data like the Food Security Information systems, the Health Management Information System (HIMS), Growth Monitoring, the Education Information Management System (EIMS) and TACAIDS information system among others, which are rarely analysed from a nutrition perspective.
165. The full potential of a nutrition information system can be harnessed if the system covers all levels, from national to council and community levels; if the data can be used at the point of collection and if the timeliness and quality of the information collected is good. Capacity to do usable analyses and interpretation is critical in order to provide feedback in ways that can impact positively on the problem of malnutrition in terms of improved decisions and practices.
166. The use of mobile phone technology may offer innovative opportunities to strengthen the quality, timeliness and response of the system, especially at the community. The rapid expansion of mobile network coverage, growing mobile phone penetration and decreasing service costs in Tanzania make community-based monitoring more effective and valuable for caregivers, communities, Governments and other stakeholders. As of 2016, there were about 27 million mobile phones (53 percent of the population of 51 million) and a third of the population (about 17 million people) are connected to the internet. It is in this respect that a key action in the MNIS is to develop a strategy on technology for nutrition (T4N) taking advantage of the extensive mobile phone connectivity.
167. Establishing an effective nutrition information system requires an institutional base. Currently, there are two key national institutions that collect specific nutrition data: The Tanzania Food and Nutrition Centre (TFNC) and the National Bureau of Statistics (NBS). However, to ensure accountability for a Multisectoral Nutrition Information System as required by this NMNAP, there is need to have a nationally recognized institutional base for nutrition information in order to ensure data ownership and quality analysis. Other issues to address include frequency of
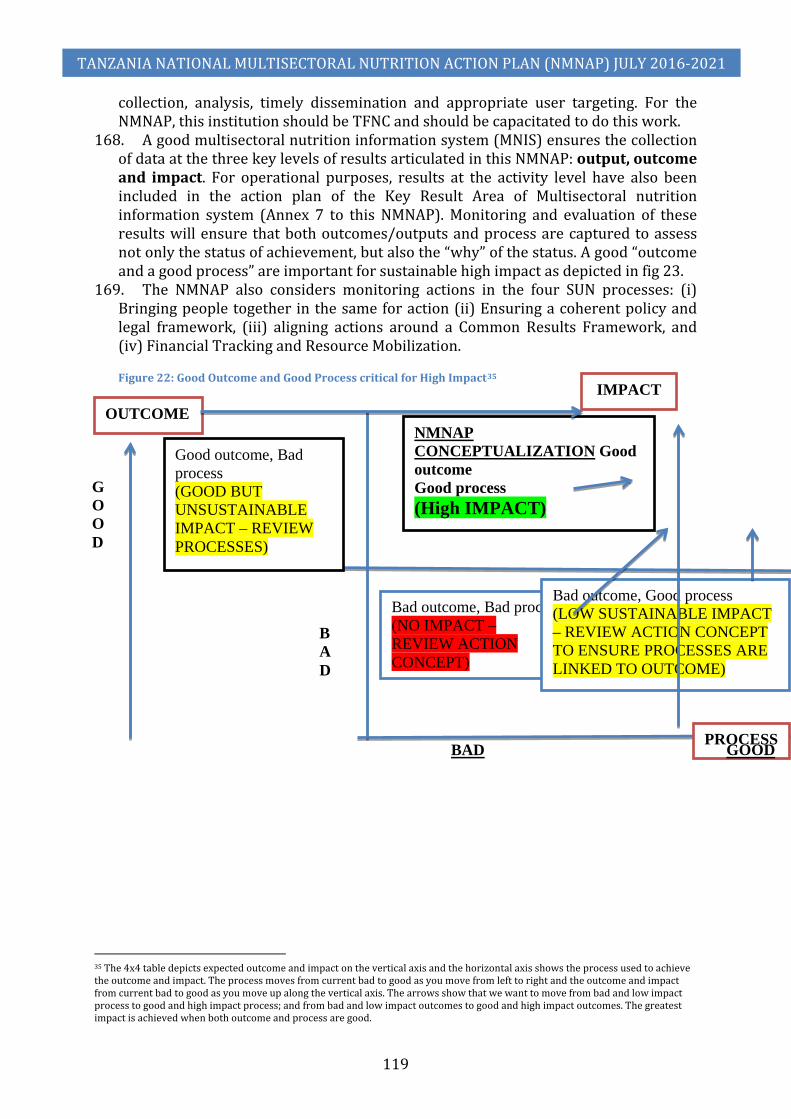
TANZANIA NATIONAL MULTISECTORAL NUTRITION ACTION PLAN (NMNAP) JULY 2016-2021
119
collection, analysis, timely dissemination and appropriate user targeting. For the NMNAP, this institution should be TFNC and should be capacitated to do this work.
168. A good multisectoral nutrition information system (MNIS) ensures the collection of data at the three key levels of results articulated in this NMNAP: output, outcome and impact. For operational purposes, results at the activity level have also been included in the action plan of the Key Result Area of Multisectoral nutrition information system (Annex 7 to this NMNAP). Monitoring and evaluation of these results will ensure that both outcomes/outputs and process are captured to assess not only the status of achievement, but also the “why” of the status. A good “outcome and a good process” are important for sustainable high impact as depicted in fig 23.
169. The NMNAP also considers monitoring actions in the four SUN processes: (i) Bringing people together in the same for action (ii) Ensuring a coherent policy and legal framework, (iii) aligning actions around a Common Results Framework, and (iv) Financial Tracking and Resource Mobilization.
Figure 22: Good Outcome and Good Process critical for High Impact35
35 The 4x4 table depicts expected outcome and impact on the vertical axis and the horizontal axis shows the process used to achieve the outcome and impact. The process moves from current bad to good as you move from left to right and the outcome and impact from current bad to good as you move up along the vertical axis. The arrows show that we want to move from bad and low impact process to good and high impact process; and from bad and low impact outcomes to good and high impact outcomes. The greatest impact is achieved when both outcome and process are good.
Good outcome, Bad process (GOOD BUT UNSUSTAINABLE IMPACT – REVIEW PROCESSES)
NMNAP CONCEPTUALIZATION Good outcome Good process (High IMPACT)
Bad outcome, Bad process (NO IMPACT – REVIEW ACTION CONCEPT)
Bad outcome, Good process (LOW SUSTAINABLE IMPACT – REVIEW ACTION CONCEPT TO ENSURE PROCESSES ARE LINKED TO OUTCOME)
GOOD
BAD
OUTCOME
PROCESS
IMPACT
BAD GOOD

TANZANIA NATIONAL MULTISECTORAL NUTRITION ACTION PLAN (NMNAP) JULY 2016-2021
120
7.2 Common Results, Resources and Accountability Framework (CRRAF) 170. In developing the NMNAP, an agreement was reached around a single set of
nutrition results – a Common Results, Resources and Accountability Framework (CRRAF) – which serves as the basis for developing, aligning and securing consensus for nutrition-relevant plans which cover different sectors. According to the Scaling Up Nutrition (SUN) Movement, a CRRAF should ideally have the following features:
1) Expected results for improvement of nutritional status; 2) Defined populations in which these improvements will be seen; 3) Interventions necessary to achieve the results and clear indications on the
current coverage level and on the goal coverage; 4) Identified responsibilities of line ministries and sectors within
Government for implementing the interventions; 5) The roles and responsibilities of non-Government partners; 6) A shared framework for performance monitoring and evaluation; and 7) A matrix of costs which identifies the contribution of Government
(including human resources) and of other implementers. 171. Appendix 2 summarizes the Integrated Common Results, Resources, and
Accountability Framework for the NMNAP, which fulfils all the features identified as ideal by the SUN Movement.
7.3 Monitoring, Reviews and Evaluation 172. The NMNAP will be monitored and evaluated through several mechanisms as
follows: 1) Annual Joint Multisectoral Nutrition Reviews (JMNRs) will be used to
review operational progress, challenges and opportunities and recommend way forward.
2) The JMNR 2019 will serve as the Mid-term Review (MTR) of the NMNAP. This JMNR/MTR will review progress after implementation of FY2016/17, FY2017/18, and FY 2018/19 and will be preceded by a Public Expenditure Review on Nutrition (PER-N) for FY 2016/17 and 2017/18 and the National Nutrition Survey (SMART survey) in 2018. These two key studies will provide the necessary evidence for any adjustments in strategy and articulated results including targets. The preparation of NMNAP (2021-2026) will be initiated following the JMNR 2019 and finalized June 2021.
3) The JMNR 2021 will be used to evaluate the NMNAP (2016-21). It is expected that this JMNR will be preceded by the Tanzania Demographic and Health Survey (TDHS) or a National Nutrition Survey in 2020.
173. Routine monitoring of progress will be done through the multi-level steering coordinating committees at the national and sub-national levels. The institutionalization of these committees as proposed by the NMNAP is, therefore, a crucial step in facilitating routine monitoring of progress at the operational level.
7.4 Learning and Operational Research 174. The monitoring and evaluation mechanisms including the annual reviews, mid-
term review and end-of term evaluation together with their associated surveys will provide critical learning moments. Lessons learnt will be used to address operational challenges and adjustments of strategy as appropriate.

TANZANIA NATIONAL MULTISECTORAL NUTRITION ACTION PLAN (NMNAP) JULY 2016-2021
121
175. Operational research focusing on identified challenges in implementing the NMNAP will be linked to relevant national and international academic institutions. Students doing their theses will be encouraged to identify specific areas of research that will help in getting solutions to particular challenges in the implementation of the NMNAP. A critical component of the annual JMNRs will be to identify any areas that require operational research to be taken up during the succeeding years. Learning will be enhanced by linking implementation not only to research, but also to pre-service and in-service training.
176. Figure 24 summarizes the monitoring, evaluation and learning framework Figure 23: Monitoring, Evaluation and Learning Framework
7.5 Action plan for Multisectoral Nutrition Information System (Detailed Action Plan in Annex 7) 177. The Food and Nutrition Policy objective that the multisectoral nutrition
information system will address is: “To enhance national capacity for generation of new knowledge and solutions to nutritional needs in the country.” To achieve this, the NMNAP proposes several strategic actions:
1) To establish and capacitate TFNC as the institutional base for the Multisectoral Nutrition Information System;
2) To strengthen routine data collection, analysis and interpretation capacity as well as feedback on multisectoral nutrition information in Government and among stakeholders at national, regional, district and LGAs;
3) To integrate, collect and report relevant nutrition indicators in the appropriate national surveys;

TANZANIA NATIONAL MULTISECTORAL NUTRITION ACTION PLAN (NMNAP) JULY 2016-2021
122
4) To align implementation of the NMNAP with a learning framework that guides monitoring and evaluation for continuous improvement of the nutrition response; and
5) To strengthen the capacity of nutrition stakeholders to carry out operational research to improve nutrition programming and training.
178. Table 24 shows the proposed activities and timelines; table 25 the planned budget and figure 25 the annualized distribution of the budget.
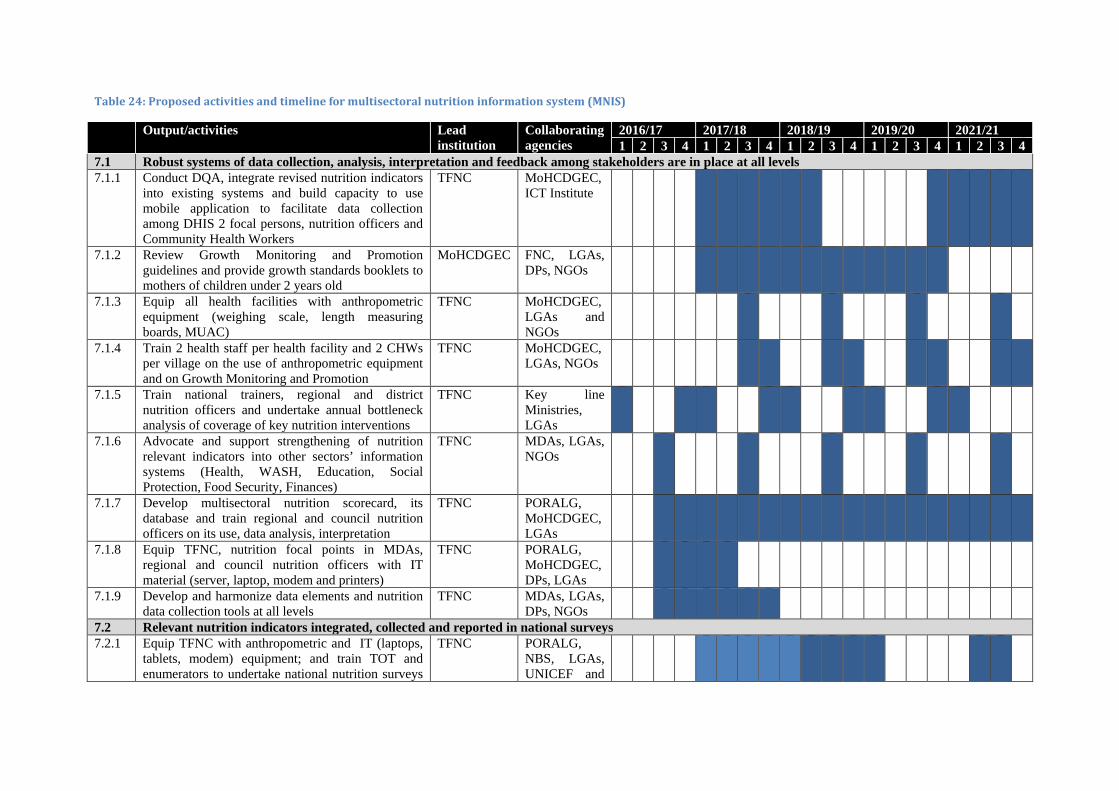
Table 24: Proposed activities and timeline for multisectoral nutrition information system (MNIS)
Output/activities Lead institution
Collaborating agencies
2016/17 2017/18 2018/19 2019/20 2021/21 1 2 3 4 1 2 3 4 1 2 3 4 1 2 3 4 1 2 3 4
7.1 Robust systems of data collection, analysis, interpretation and feedback among stakeholders are in place at all levels 7.1.1 Conduct DQA, integrate revised nutrition indicators
into existing systems and build capacity to use mobile application to facilitate data collection among DHIS 2 focal persons, nutrition officers and Community Health Workers
TFNC MoHCDGEC, ICT Institute
7.1.2 Review Growth Monitoring and Promotion guidelines and provide growth standards booklets to mothers of children under 2 years old
MoHCDGEC FNC, LGAs, DPs, NGOs
7.1.3 Equip all health facilities with anthropometric equipment (weighing scale, length measuring boards, MUAC)
TFNC MoHCDGEC, LGAs and NGOs
7.1.4 Train 2 health staff per health facility and 2 CHWs per village on the use of anthropometric equipment and on Growth Monitoring and Promotion
TFNC MoHCDGEC, LGAs, NGOs
7.1.5 Train national trainers, regional and district nutrition officers and undertake annual bottleneck analysis of coverage of key nutrition interventions
TFNC Key line Ministries, LGAs
7.1.6 Advocate and support strengthening of nutrition relevant indicators into other sectors’ information systems (Health, WASH, Education, Social Protection, Food Security, Finances)
TFNC MDAs, LGAs, NGOs
7.1.7 Develop multisectoral nutrition scorecard, its database and train regional and council nutrition officers on its use, data analysis, interpretation
TFNC PORALG, MoHCDGEC, LGAs
7.1.8 Equip TFNC, nutrition focal points in MDAs, regional and council nutrition officers with IT material (server, laptop, modem and printers)
TFNC PORALG, MoHCDGEC, DPs, LGAs
7.1.9 Develop and harmonize data elements and nutrition data collection tools at all levels
TFNC MDAs, LGAs, DPs, NGOs
7.2 Relevant nutrition indicators integrated, collected and reported in national surveys 7.2.1 Equip TFNC with anthropometric and IT (laptops,
tablets, modem) equipment; and train TOT and enumerators to undertake national nutrition surveys
TFNC PORALG, NBS, LGAs, UNICEF and
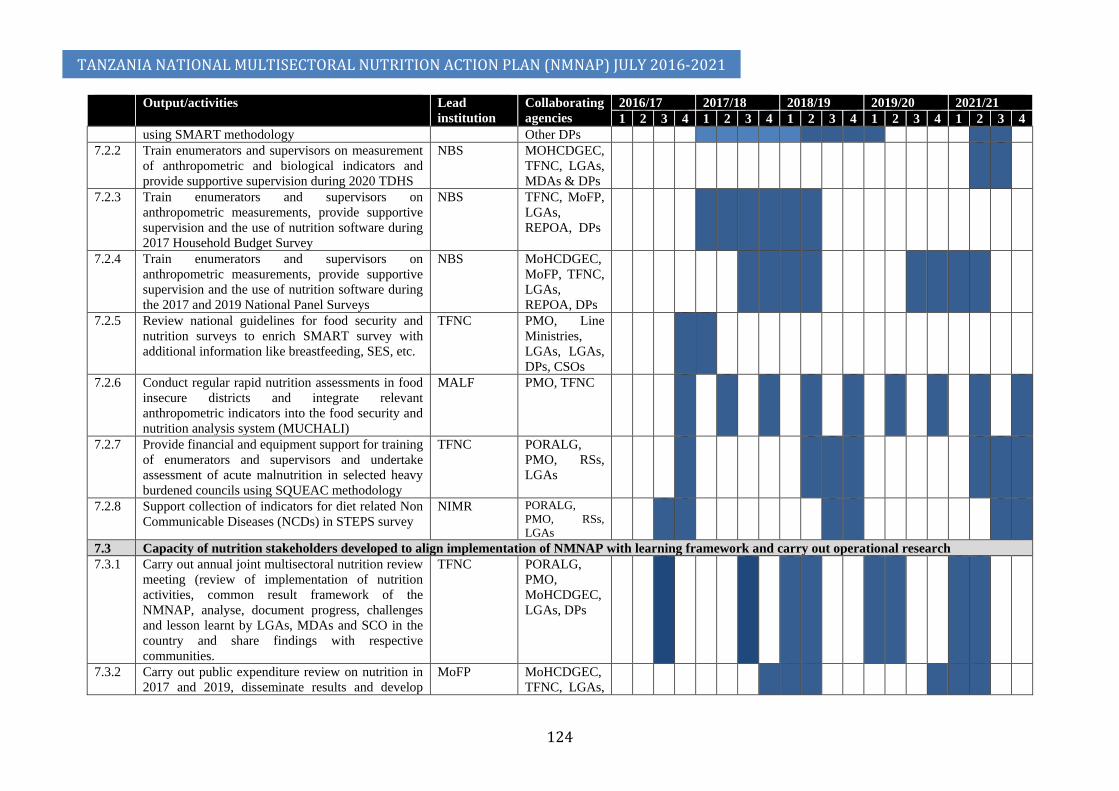
TANZANIA NATIONAL MULTISECTORAL NUTRITION ACTION PLAN (NMNAP) JULY 2016-2021
124
Output/activities Lead institution
Collaborating agencies
2016/17 2017/18 2018/19 2019/20 2021/21 1 2 3 4 1 2 3 4 1 2 3 4 1 2 3 4 1 2 3 4
using SMART methodology Other DPs 7.2.2 Train enumerators and supervisors on measurement
of anthropometric and biological indicators and provide supportive supervision during 2020 TDHS
NBS MOHCDGEC, TFNC, LGAs, MDAs & DPs
7.2.3 Train enumerators and supervisors on anthropometric measurements, provide supportive supervision and the use of nutrition software during 2017 Household Budget Survey
NBS TFNC, MoFP, LGAs, REPOA, DPs
7.2.4 Train enumerators and supervisors on anthropometric measurements, provide supportive supervision and the use of nutrition software during the 2017 and 2019 National Panel Surveys
NBS MoHCDGEC, MoFP, TFNC, LGAs, REPOA, DPs
7.2.5 Review national guidelines for food security and nutrition surveys to enrich SMART survey with additional information like breastfeeding, SES, etc.
TFNC PMO, Line Ministries, LGAs, LGAs, DPs, CSOs
7.2.6 Conduct regular rapid nutrition assessments in food insecure districts and integrate relevant anthropometric indicators into the food security and nutrition analysis system (MUCHALI)
MALF PMO, TFNC
7.2.7 Provide financial and equipment support for training of enumerators and supervisors and undertake assessment of acute malnutrition in selected heavy burdened councils using SQUEAC methodology
TFNC PORALG, PMO, RSs, LGAs
7.2.8 Support collection of indicators for diet related Non Communicable Diseases (NCDs) in STEPS survey
NIMR PORALG, PMO, RSs, LGAs
7.3 Capacity of nutrition stakeholders developed to align implementation of NMNAP with learning framework and carry out operational research 7.3.1 Carry out annual joint multisectoral nutrition review
meeting (review of implementation of nutrition activities, common result framework of the NMNAP, analyse, document progress, challenges and lesson learnt by LGAs, MDAs and SCO in the country and share findings with respective communities.
TFNC PORALG, PMO, MoHCDGEC, LGAs, DPs
7.3.2 Carry out public expenditure review on nutrition in 2017 and 2019, disseminate results and develop
MoFP MoHCDGEC, TFNC, LGAs,

TANZANIA NATIONAL MULTISECTORAL NUTRITION ACTION PLAN (NMNAP) JULY 2016-2021
125
Output/activities Lead institution
Collaborating agencies
2016/17 2017/18 2018/19 2019/20 2021/21 1 2 3 4 1 2 3 4 1 2 3 4 1 2 3 4 1 2 3 4
policy brief CSOs 7.3.3 Undertake mid-term and end-line review of the
NMNAP (2016-21); and formulate recommendations for the preparation of NMNAP (2021 - 2016)
PMO PO-RALG, MoHCDGEC, TFNC, LGAs, DPs
7.3.4 Develop and maintain an integrated platform for multisectoral nutrition management information system for knowledge sharing
TFNC PORALG, PMO, MoHCDGEC, LGAs, DPs
7.3.5 Develop, implement, monitor and evaluate the implementation of the learning framework and improve learning along the course of implementation of the NMNAP
TFNC PO-RALG, PMO, MoHCDGEC, LGAs, DPs
7.3.6 Develop nutrition research priorities list, conduct formative research, share research findings and best practises for nutrition in Tanzania
TFNC LGAs, NIMR, COSTECH, DPs
7.3.7 Strengthen statistical analysis capacity across sectors and carry out studies to identify drivers of stunting in Tanzania using various datasets
NBS TFNC, NIMR, COSTECH, DPs
7.3.8 Strengthen capacities (human resource, equipment and supplies) of nutrition laboratories (TFNC, SUA) as per needs assessment
TFNC SUA
Table 25: Annualized budget to Key Result Area of Nutrition Information System per output
Expected Results
Budget in Billion TZS Total Budget in Million USD**
2016/17 2017/18 2018/19 2019/20 2020/21 Total
Expected Outcome 7:
Quality nutrition related information is accessible and used to allow Government and partners to make timely and effective evidence informed decisions 8.5 16.3 20.4 16.3 6.6 68.0 30.91
Output 7.1: Robust systems of data collection, analysis, interpretation and feedback among stakeholders are in place at all levels 5.44 12.59 16.32 14.55 2.53 51.43 23.38
Output 7.2: Relevant nutrition indicators integrated, collected and reported in national surveys 1.52 0.39 2.51 0.27 2.59 7.28 3.31
Output 7.3: Capacity of nutrition stakeholders developed to align implementation of NMNAP with learning framework and carry out operational research 1.53 3.32 1.57 1.44 1.43 9.29 4.22
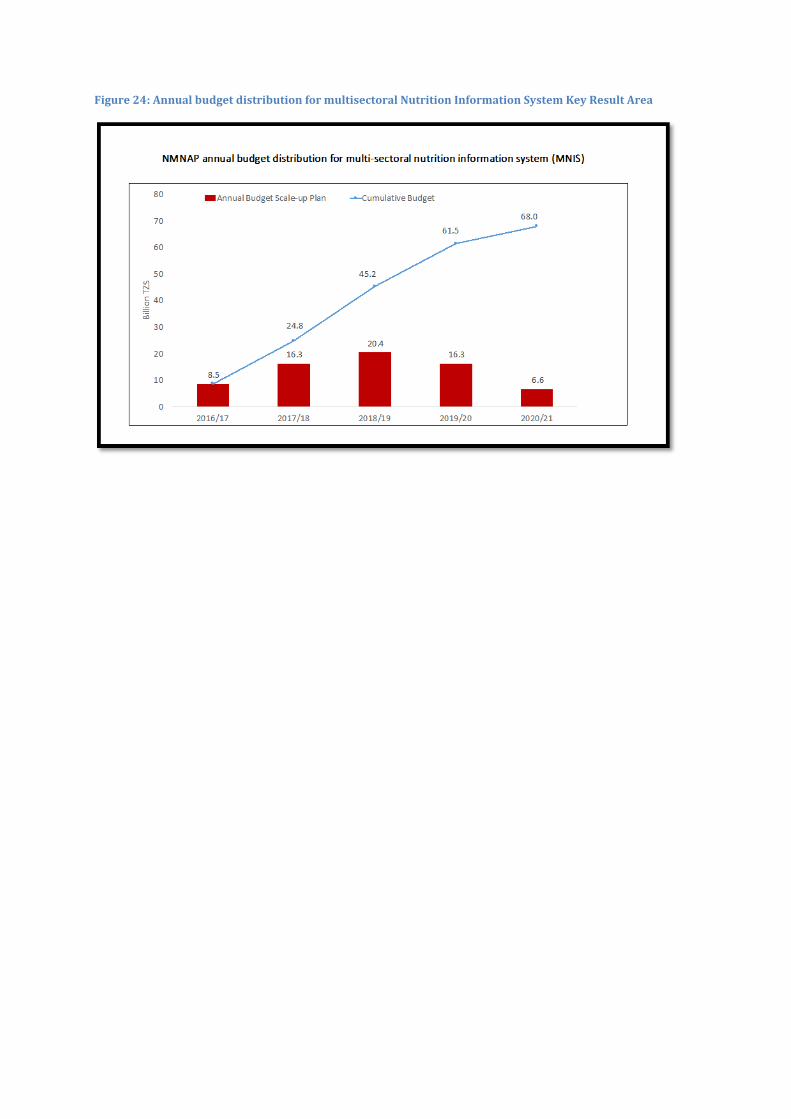
Figure 24: Annual budget distribution for multisectoral Nutrition Information System Key Result Area

TANZANIA NATIONAL MULTISECTORAL NUTRITION ACTION PLAN (NMNAP) JULY 2016-2021
127
CHAPTER 8: STRATEGIC INVESTMENT PLAN FOR THE NMNAP
8.1 Overview 179. Financing the NMNAP has to take into account the changing global context that
has resulted into a more complex aid architecture: e.g. 1) the emergence of new actors in the donor community like the global
funds, private foundations; non-DAC bilateral donors; 2) the development of new financing instruments e.g. budget support,
domestic financing; and 3) new forms of dialogues that require improved donor coordination,
harmonization and alignment with national priorities. 180. The new aid architecture requires a new framework that should be strategically
focused, results-oriented, inclusive of all actors and one that enhances national ownership, leadership and participation. To impact positively on this NMNAP, the framework should ensure that nutrition is a Government priority included in strategic discussions and is part and parcel of the monitoring, reporting and evaluation of the FYDP-II. It should also be noted that when Tanzania transits from a Low Income Country (LIC) into a Middle Income Country (MIC) expected to be during the period of this NMNAP, the aid structure is likely to shift from grants normally targeted at human development programmes, to physical infrastructure loans. This aspect needs to be part of the strategic discussions.
8.2 Financial requirements of the NMNAP
8.2.1 The NMNAP overall budget overview 181. Table 26 provides a summary of the minimum financial requirements to
implement the NMNAP disaggregated by key results (outcomes and outputs) and table 27 shows the same by type of interventions and Key Result Areas using the adopted nutrition conceptual framework. Excluding the nutrition sensitive interventions (NSI) already budgeted for in the Governments Five-Year Development Plan 2016/17-2020/21, the overall financial requirement for the NMNAP is about Tsh 590 billion (US$268 million). The budget spread (figure 26) follows the Gauss curve (normal distribution) indicating that costing was done more or less realistically.
182. If the Nutrition Sensitive Interventions (NSI) are included, the overall budget goes up to about Tsh 22,262billion (US$10,119). Assuming that the Health and HIV/AIDS costs (Tsh 6,522.1billion) are nutrition specific interventions, the proportion of the budget allocated to nutrition specific interventions is 32 percent while nutrition sensitive interventions is 68 percent. The sector distribution of the NSI (including health) is shown in figure 28. The greatest share of the allocation is for health (30 percent), followed by WASH (26 percent), Social Protection (19 percent) mainly for TASAF, Agriculture (17 percent), education (8 percent) and environment is less than 1 percent.
183. Looking at the budget from the perspective of the thematic Key Result Areas, the highest allocation is to maternal, infant, young child and adolescent nutrition (33 percent), followed by micronutrient malnutrition (20 percent) and integrated
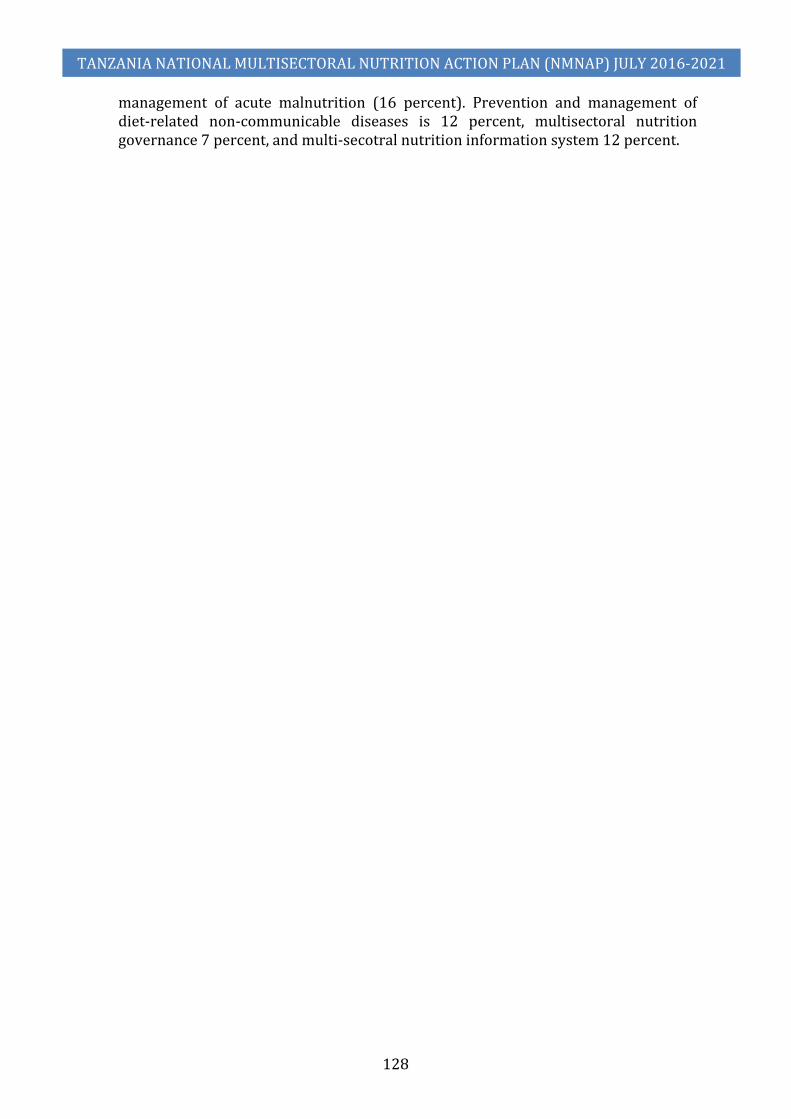
TANZANIA NATIONAL MULTISECTORAL NUTRITION ACTION PLAN (NMNAP) JULY 2016-2021
128
management of acute malnutrition (16 percent). Prevention and management of diet-related non-communicable diseases is 12 percent, multisectoral nutrition governance 7 percent, and multi-secotral nutrition information system 12 percent.

Table 26: Financial requirements of the NMNAP disaggregated by expected results (Outcome and outputs)
Expected Results
Budget in Billion TZS Total Budget in Million USD**
2016/17 2017/18 2018/19 2019/20 2020/21 Total
Expected Outcome 1:
Increased proportion of adolescents, pregnant women and mothers / caregivers of children under two years who practice optimal maternal, infant and young child nutrition behaviours 34.9 49.9 60.9 36.1 14.0 195.8 89.0
Output 1.1: Increased coverage and quality of MIYCAN services at the community level by June 2021 23.8 38.1 46.7 26.1 10.6 145.4 66.10
Output 1.2: Improved quality of MIYCAN services at the health facilities level by June 2021 10.2 10.7 13.2 9.2 2.5 45.8 20.83
Output 1.3: MIYCAN is promoted at all levels through mass-media and the use of new technologies by June 2021 0.6 0.6 0.6 0.6 0.6 2.9 1.30 Output 1.4: Improved MIYCAN law enforcement through advocacy and capacity building of key institutions 0.3 0.5 0.3 0.3 0.3 1.7 0.78 Expected Outcome 2: Children, adolescents and women of child bearing age consume adequate micronutrients 21.9 23.4 24.3 25.3 24.9 119.8 54.46
Output 2.1: Increased access to food fortification (home and mass) for children aged 6-23 months, pregnant women and women of childbearing age by 2021 15.9 16.3 17.0 17.9 17.7 84.8 38.54
Output 2.2: Enhanced services for Vitamin A supplementation among children aged 6-59 months by 2021 3.2 3.4 3.4 3.4 3.2 16.6 7.54 Output 2.3: Increased availability of adequately iodized salt in by 2021 0.98 1.53 1.71 1.72 1.55 7.48 3.40
Output 2.4: Improved anaemia prevention and control interventions among women of childbearing age and children under 5 years old by 2021 1.85 2.24 2.27 2.25 2.36 10.96 4.98
Expected Outcome 3:
Increased coverage of integrated management of severe and moderate acute malnutrition by 2021
4.0 12.6 24.6 30.7 24.9 96.7 43.94
Output 3.1: Improved quality of services for management of severe and moderate acute malnutrition in at least 75% of health facilities by 2021 1.5 2.0 2.4 2.2 1.3 9.3 4.23
Output 3.2: At least 75% of children under five years old are reached through screening for severe and moderate acute malnutrition at community level by 2021 0.1 2.4 4.0 6.4 7.2 20.1 9.16
Output 3.3: Essential therapeutic nutrition supplies and equipment are available in at least 90% of health facilities providing services for management of severe and moderate acute malnutrition by June 2021 2.4 8.1 18.0 22.1 16.4 67.1 30.48
Output 3.4: Strengthened integration of management of severe and moderate acute malnutrition at the national and subnational level by June 2021 0.024 0.024 0.049 0.024 0.024 0.15 0.07
Expected Outcome 4: Communities in Tanzania are physically active and eat healthy 1.8 18.9 22.1 18.4 10.6 71.8 32.65
Output 4.1: At least 50% of the school-age children and adult population are sensitized on risk factors for non-communicable diseases by 2021 0.04 17.0 20.3 16.6 8.7 62.7 28.48
Output 4.2: Policies, social, cultural and structural norms are established to enable at least 50% of the community to engage in healthy lifestyles by 2021 1.8 1.9 1.8 1.8 1.8 9.2 4.17
Expected Outcome 5:
Line sectors, private sector and CSOs scale-up nutrition sensitive interventions to reach all communities to improve nutrition 4,128.4 4,287.0 4,950.
9 5,058.2 3,247.2 21,671.7 9,850.78
Output 5.1: Communities have access to a diverse range of nutritious food throughout the year 728.1 737.0 723.5 720.5 713.1 3,622.3 1,646.48

TANZANIA NATIONAL MULTISECTORAL NUTRITION ACTION PLAN (NMNAP) JULY 2016-2021
130
Expected Results
Budget in Billion TZS Total Budget in Million USD**
2016/17 2017/18 2018/19 2019/20 2020/21 Total
* Output 5.2: *
Communities regularly use quality maternal health including family planning, prevention and treatment of HIV and malaria services 1,461.0 1,556.0 1,704.
0 1,801.0 NA 6,522.1 2,964.59
Output 5.3: * Communities access adequate water sanitation and hygiene services 1,149.0 1,149.0 1,149.
0 1,148.8 1,148.0 5,743.9 2,610.86
Output 5.4: * Girls complete primary and secondary education 351.8 351.8 351.4 353.1 351.3 1,759.4 799.73
Output 5.5: *
Poorest households benefit from conditional cash transfers, cash for work, and nutrition education during community sessions 436.9 491.5 1,021.
3 1,033.2 1,033.2 4,016.2 1,825.56
Output 5.6: *
Vulnerable communities are able to cope with draught and climate change to avoid shortage of nutritious food during shocks 1.56 1.56 1.56 1.58 1.56 7.82 3.55
Expected Outcome 6: Efficient and effective nutrition governance 6.3 8.8 7.4 8.0 7.4 37.8 17.18
Output 6.1: Increased Government political and financial commitment to Nutrition 0.65 2.24 1.70 1.70 1.70 7.98 3.63 Output 6.2: Functional multisectoral coordination at all levels 0.47 0.76 0.52 0.52 0.52 2.78 1.26 Output 6.3: Improved human resources and capacities for nutrition 5.15 5.81 5.15 5.78 5.15 27.04 12.29 Expected Outcome 7:
Quality nutrition related information is accessible and used to allow Government and partners to make timely and effective evidence informed decisions 8.5 16.3 20.4 16.3 6.6 68.0 30.91
Output 7.1: Robust systems of data collection, analysis, interpretation and feedback among stakeholders are in place at all levels 5.44 12.59 16.32 14.55 2.53 51.43 23.38
Output 7.2: Relevant nutrition indicators integrated, collected and reported in national surveys 1.52 0.39 2.51 0.27 2.59 7.28 3.31
Output 7.3: Capacity of nutrition stakeholders developed to align implementation of NMNAP with learning framework and carry out operational research 1.53 3.32 1.57 1.44 1.43 9.29 4.22
TOTAL WITHOUT NUTRITION SENSITIVE INTERVENTIONS 77.4 129.9 159.6 134.7 88.3 589.9 268.16
TOTAL WITH NUTRITION SENSITIVE INTERVENTIONS 4,205.8 4,416.9 5,110.5 5,193.0 3,335.5 22,261.7 10,118.93
*: Data were extracted from Five Year Development Plan (FYDP 2016-21) and sectoral plans (e.g. HSSP IV, TASAF) plus additional nutrition sensitive activities identified by NMNAP task team as they were not included in sectoral plans
**: Exchange rate 1 USD = 2200 TZS
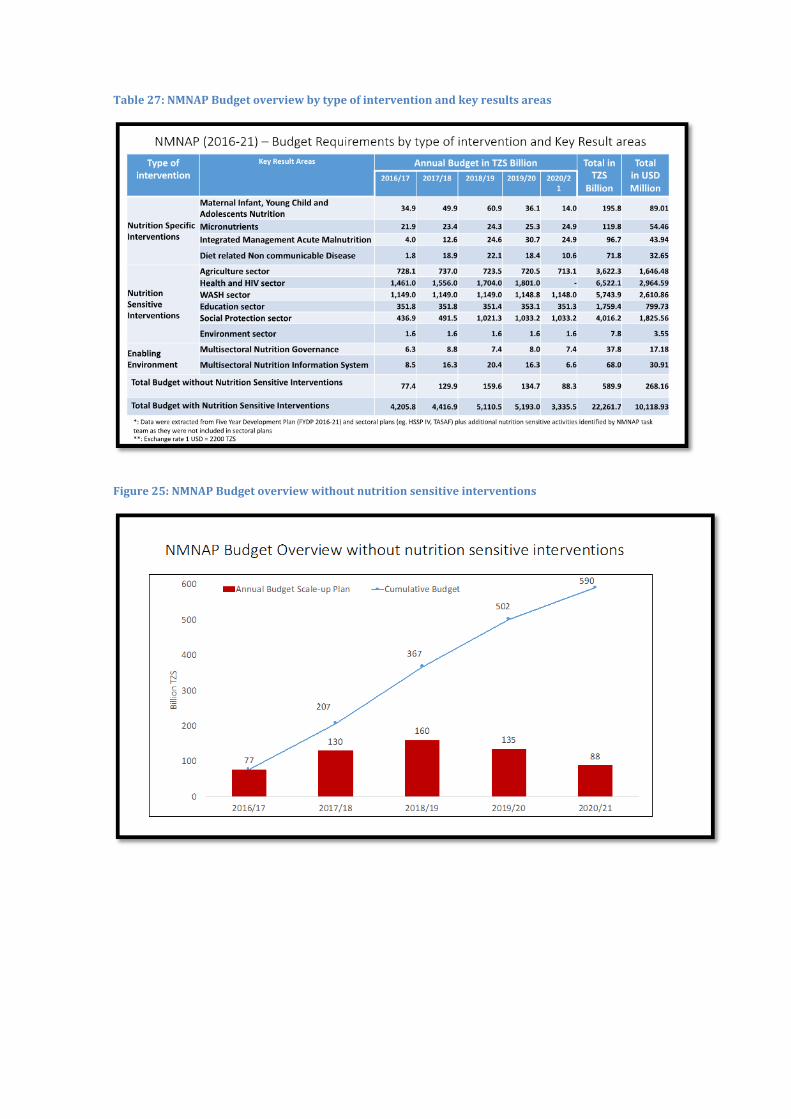
Table 27: NMNAP Budget overview by type of intervention and key results areas
Figure 25: NMNAP Budget overview without nutrition sensitive interventions
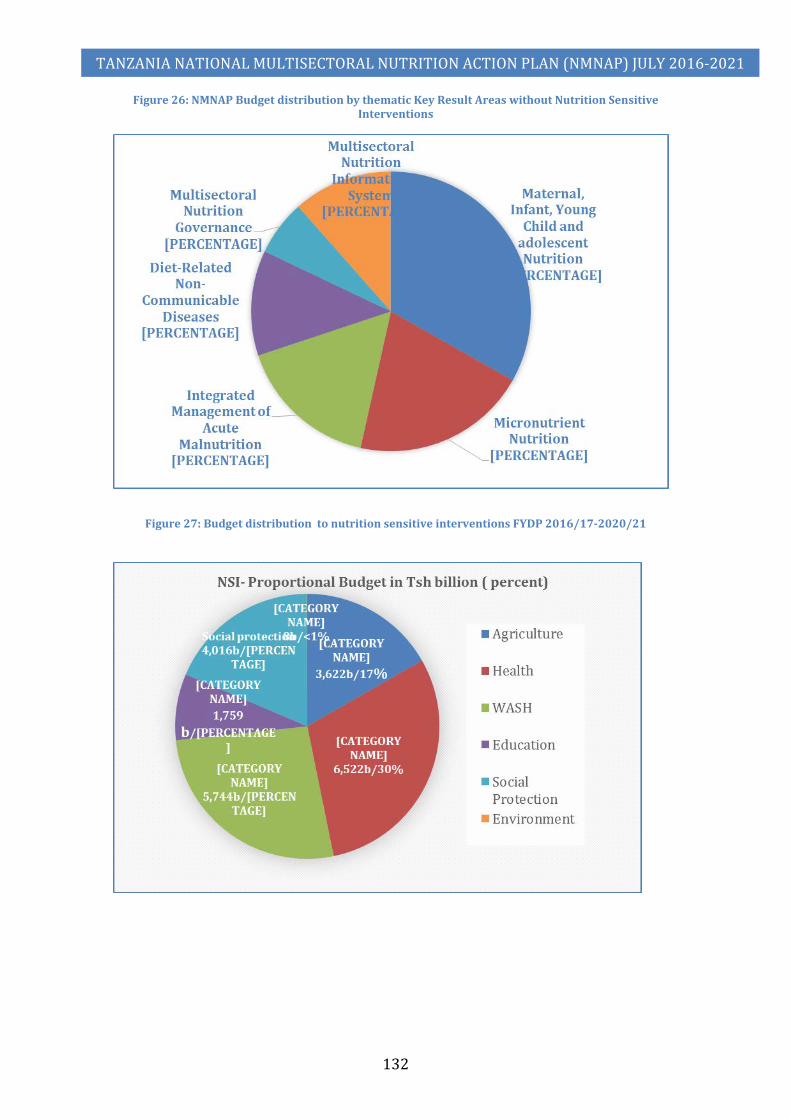
TANZANIA NATIONAL MULTISECTORAL NUTRITION ACTION PLAN (NMNAP) JULY 2016-2021
132
Figure 26: NMNAP Budget distribution by thematic Key Result Areas without Nutrition Sensitive Interventions
Figure 27: Budget distribution to nutrition sensitive interventions FYDP 2016/17-2020/21

TANZANIA NATIONAL MULTISECTORAL NUTRITION ACTION PLAN (NMNAP) JULY 2016-2021
133
8.3 Financial resources available and the funding gap 184. The process of developing the NMNAP also estimated the resources
available from Government, Development Partners, Civil Society Organizations and the private sector, through sharing of a dummy table of the Key Result Areas and requesting stakeholders to show their estimated financial commitments for the period of the NMNAP (2016/17-2020/21). Full responses were received from Government (for TFNC and LGAs), UN Agencies (FAO, WHO, WFP, UNICEF and IAEA), and the Private Sector (GAIN for Flour and oil fortification premixes, Micronutrient Powders and the salt iodation alliance comprising of MOH/TFNC/TASAP). Responses from CSOs included IMA World health, CUAMM, Feed the Children, the International Potato Centre, Save the Children, COUNSENUTH and Mwanzo Bora (estimated by USAID).
185. The main reason for comparing the financial requirements against available resources was to estimate the funding gap required to be mobilized to assure full implementation of the NMNAP. Table 28 shows the total resources available from the Government, Development Partners and the Private Sector is Tsh 155.18 billion (US$ 70.5 million) against a planned budget of Tsh 590 billion (US$ 268 million) giving a funding gap of Tsh 434.77 billion (US$ 197.6 million). In proportionate terms, about 26.3 percent of the NMNAP funds is available leaving a gap of 73.7 percent to be mobilized.
186. The biggest funding gaps are seen in the Key Result Areas of Maternal, Infant, Young Child and Adolescent Nutrition (US$ -54.97 million), Micronutrients (US$ -43.81 million), Integrated Management of Acute Malnutrition (US$ -40.45 million), Diet Related Non-Communicable Diseases (US& -32.48 million) and Multisectoral Nutrition Information System (US$ -21.87 million).

Table 28: National Multisectoral Nutrition Action Plan (2016-2021) – Resources available and funding gap
Areas Key Result Areas NMNAP Financial
Requirements
Resources Available for NMNAP Funding Gap
NMNAP
Funding Gap
NMNAP
Proportion of
Resources Available
(%)
Proportion of Funding Gap (%)
Government of Tanzania
Development Partners
Private Sector
Total Available
TZS billion USD million
Nutrition Specific Interventions
Maternal Infant, Young Child and Adolescents Nutrition
196
2.54 72.35
- 74.90 -120.93
-54.97 38% -62%
Micronutrients 120 0.51 10.69 12.23 23.43 -96.38 -43.81 20% -80% Food Fortification (MNP,
Flour and Oil) 85 0.36 0.77 12.17 13.30 -71.48 -32.49 16% -84%
Vitamin A Supplementation
17 0.07 10.31 - 10.38 -6.21 -2.82 63% -37%
Salt Iodization 8 0.03 2.25 0.06 2.34 -5.14 -2.34 31% -69% Anaemia Prevention 11 0.05 6.49 - 6.53 -4.43 -2.01 60% -40%
Integrated Management Acute Malnutrition
97 1.24 6.43 - 7.67 -89.00 -40.45 8% -92%
Diet related Non communicable Disease
72 - 0.37 - 0.37 -71.46 -32.48 0.5% -99.5%
Nutrition Sensitive Interventions
Agriculture sector
NA
Health and HIV sector WASH sector Education sector Social Protection sector Environment sector
Enabling Environment
Multisectoral Nutrition Governance
38
15.12
13.81
-
28.93
-8.87
-4.03
77%
-23%
Multisectoral Nutrition Information System
68 0.85 19.04 - 19.88 -48.12 -21.87 29% -71%
TOTAL 590 20.3 122.70 12.23 155.18 -434.77 -197.62 26.3% 73.7% PROPORTION (%) 100% 3.4% 20.8% 2.1% 26.3% 73.7%
**: Exchange rate 1 USD = 2200 TZS
8.5 Resources mobilization plan 187. Table 29 shows the resources mobilization plan. About 30 percent of the resources are planned to be mobilized from the
Government of Tanzania, 60 percent from Development Partners and 10 percent from the Private Sector. A key strategy for resource
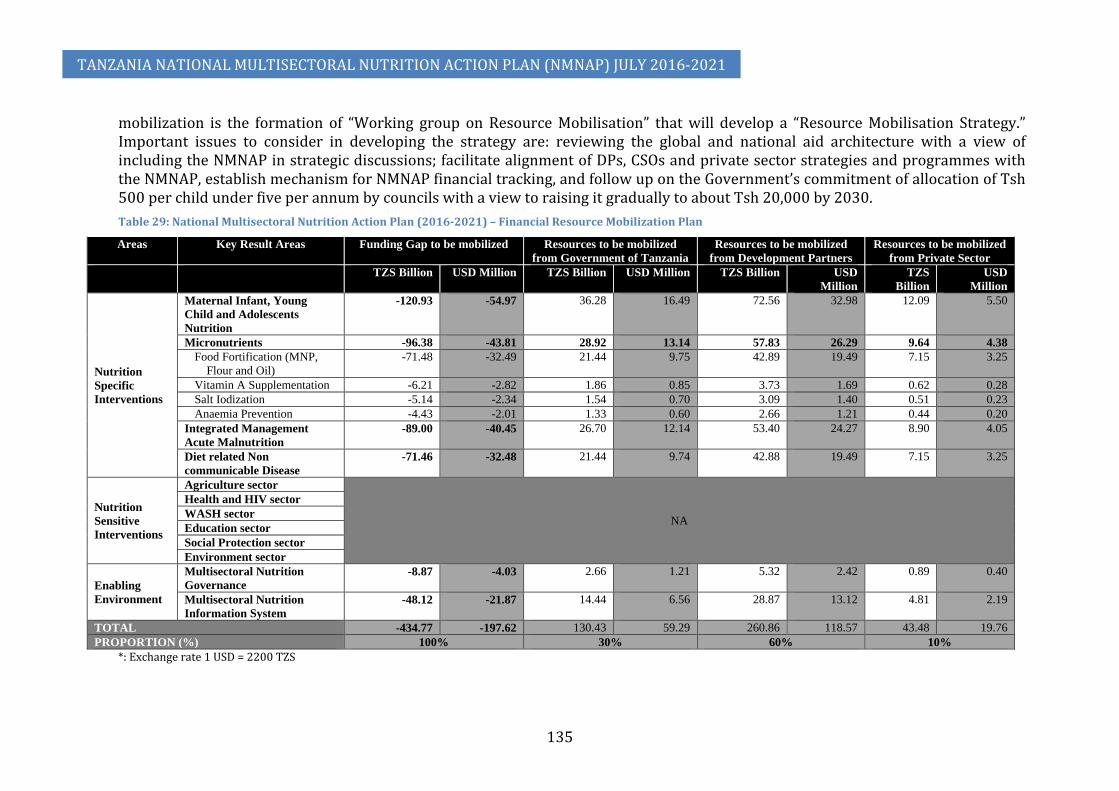
TANZANIA NATIONAL MULTISECTORAL NUTRITION ACTION PLAN (NMNAP) JULY 2016-2021
135
mobilization is the formation of “Working group on Resource Mobilisation” that will develop a “Resource Mobilisation Strategy.” Important issues to consider in developing the strategy are: reviewing the global and national aid architecture with a view of including the NMNAP in strategic discussions; facilitate alignment of DPs, CSOs and private sector strategies and programmes with the NMNAP, establish mechanism for NMNAP financial tracking, and follow up on the Government’s commitment of allocation of Tsh 500 per child under five per annum by councils with a view to raising it gradually to about Tsh 20,000 by 2030. Table 29: National Multisectoral Nutrition Action Plan (2016-2021) – Financial Resource Mobilization Plan
Areas Key Result Areas Funding Gap to be mobilized Resources to be mobilized from Government of Tanzania
Resources to be mobilized from Development Partners
Resources to be mobilized from Private Sector
TZS Billion USD Million TZS Billion USD Million TZS Billion USD Million
TZS Billion
USD Million
Nutrition Specific Interventions
Maternal Infant, Young Child and Adolescents Nutrition
-120.93 -54.97 36.28 16.49 72.56 32.98 12.09 5.50
Micronutrients -96.38 -43.81 28.92 13.14 57.83 26.29 9.64 4.38 Food Fortification (MNP,
Flour and Oil) -71.48 -32.49 21.44 9.75 42.89 19.49 7.15 3.25
Vitamin A Supplementation -6.21 -2.82 1.86 0.85 3.73 1.69 0.62 0.28 Salt Iodization -5.14 -2.34 1.54 0.70 3.09 1.40 0.51 0.23 Anaemia Prevention -4.43 -2.01 1.33 0.60 2.66 1.21 0.44 0.20
Integrated Management Acute Malnutrition
-89.00 -40.45 26.70 12.14 53.40 24.27 8.90 4.05
Diet related Non communicable Disease
-71.46 -32.48 21.44 9.74 42.88 19.49 7.15 3.25
Nutrition Sensitive Interventions
Agriculture sector
NA
Health and HIV sector WASH sector Education sector Social Protection sector Environment sector
Enabling Environment
Multisectoral Nutrition Governance
-8.87 -4.03 2.66 1.21 5.32 2.42 0.89 0.40
Multisectoral Nutrition Information System
-48.12 -21.87 14.44 6.56 28.87 13.12 4.81 2.19
TOTAL -434.77 -197.62 130.43 59.29 260.86 118.57 43.48 19.76 PROPORTION (%) 100% 30% 60% 10%
*: Exchange rate 1 USD = 2200 TZS
8.6 Strategic prioritization of proposed action plans 188. Given the large funding gap of about US$ 198 million (74 percent of the US$268
million required), there will be need to prioritize interventions and activities in case of funding constraints. Because of the high burden of stunting, anaemia and the large number of children with severe acute malnutrition, these areas will be prioritized. Activities that will be prioritized are those that contribute to: (1) increased coverage of maternal infant, young child and adolescent nutrition activities; (2) scale-up of integrated management of acute malnutrition among children under five; and (3) those that prevent anaemia among women of reproductive age (15-49 years). The funding for these three result areas represents about 97 million USD over the 5-year period of the NMNAP. Prioritized interventions will be those that are most cost-effective with proven evidence on reducing stunting and are easy to implement at large scale (quick wins). Other activities to prioritize will be those that contribute to removal of bottlenecks on availability of trained human resources at health facility and community level and availability of critical supplies.
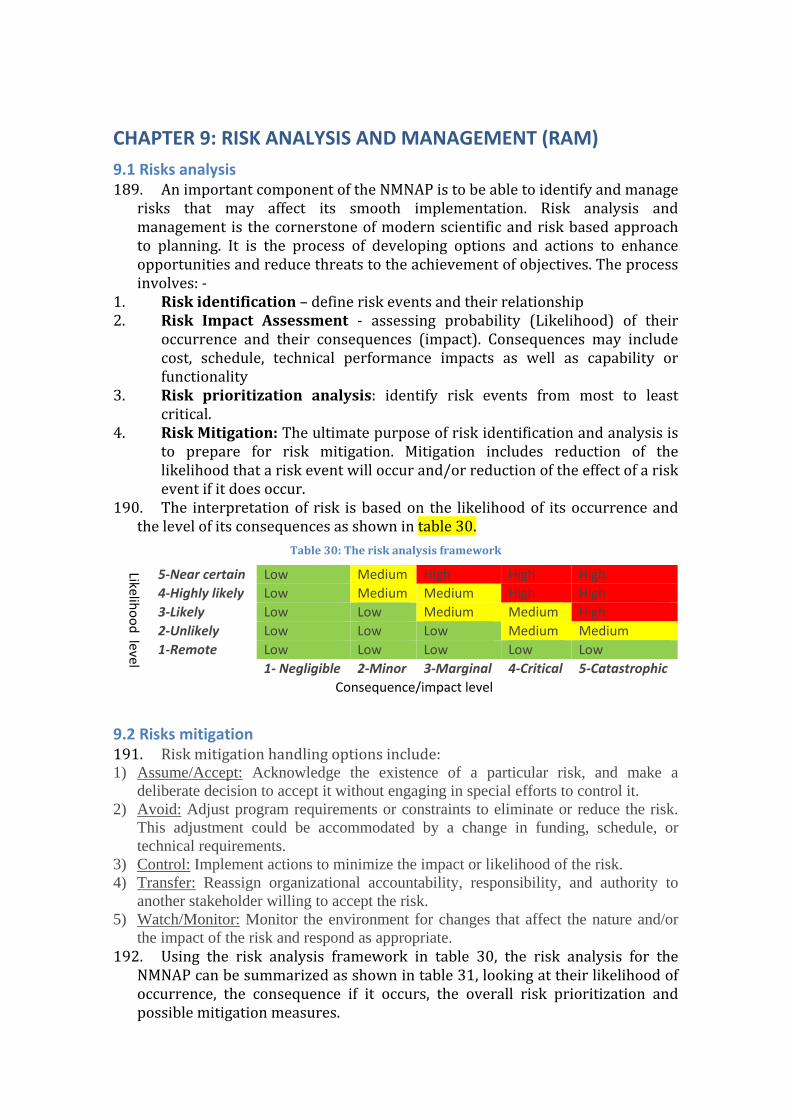
CHAPTER 9: RISK ANALYSIS AND MANAGEMENT (RAM) 9.1 Risks analysis 189. An important component of the NMNAP is to be able to identify and manage
risks that may affect its smooth implementation. Risk analysis and management is the cornerstone of modern scientific and risk based approach to planning. It is the process of developing options and actions to enhance opportunities and reduce threats to the achievement of objectives. The process involves: -
1. Risk identification – define risk events and their relationship 2. Risk Impact Assessment - assessing probability (Likelihood) of their
occurrence and their consequences (impact). Consequences may include cost, schedule, technical performance impacts as well as capability or functionality
3. Risk prioritization analysis: identify risk events from most to least critical.
4. Risk Mitigation: The ultimate purpose of risk identification and analysis is to prepare for risk mitigation. Mitigation includes reduction of the likelihood that a risk event will occur and/or reduction of the effect of a risk event if it does occur.
190. The interpretation of risk is based on the likelihood of its occurrence and the level of its consequences as shown in table 30.
Table 30: The risk analysis framework
Likelihood level
5-Near certain Low Medium High High High 4-Highly likely Low Medium Medium High High 3-Likely Low Low Medium Medium High 2-Unlikely Low Low Low Medium Medium 1-Remote Low Low Low Low Low 1- Negligible 2-Minor 3-Marginal 4-Critical 5-Catastrophic
Consequence/impact level
9.2 Risks mitigation 191. Risk mitigation handling options include: 1) Assume/Accept: Acknowledge the existence of a particular risk, and make a
deliberate decision to accept it without engaging in special efforts to control it. 2) Avoid: Adjust program requirements or constraints to eliminate or reduce the risk.
This adjustment could be accommodated by a change in funding, schedule, or technical requirements.
3) Control: Implement actions to minimize the impact or likelihood of the risk. 4) Transfer: Reassign organizational accountability, responsibility, and authority to
another stakeholder willing to accept the risk. 5) Watch/Monitor: Monitor the environment for changes that affect the nature and/or
the impact of the risk and respond as appropriate. 192. Using the risk analysis framework in table 30, the risk analysis for the
NMNAP can be summarized as shown in table 31, looking at their likelihood of occurrence, the consequence if it occurs, the overall risk prioritization and possible mitigation measures.
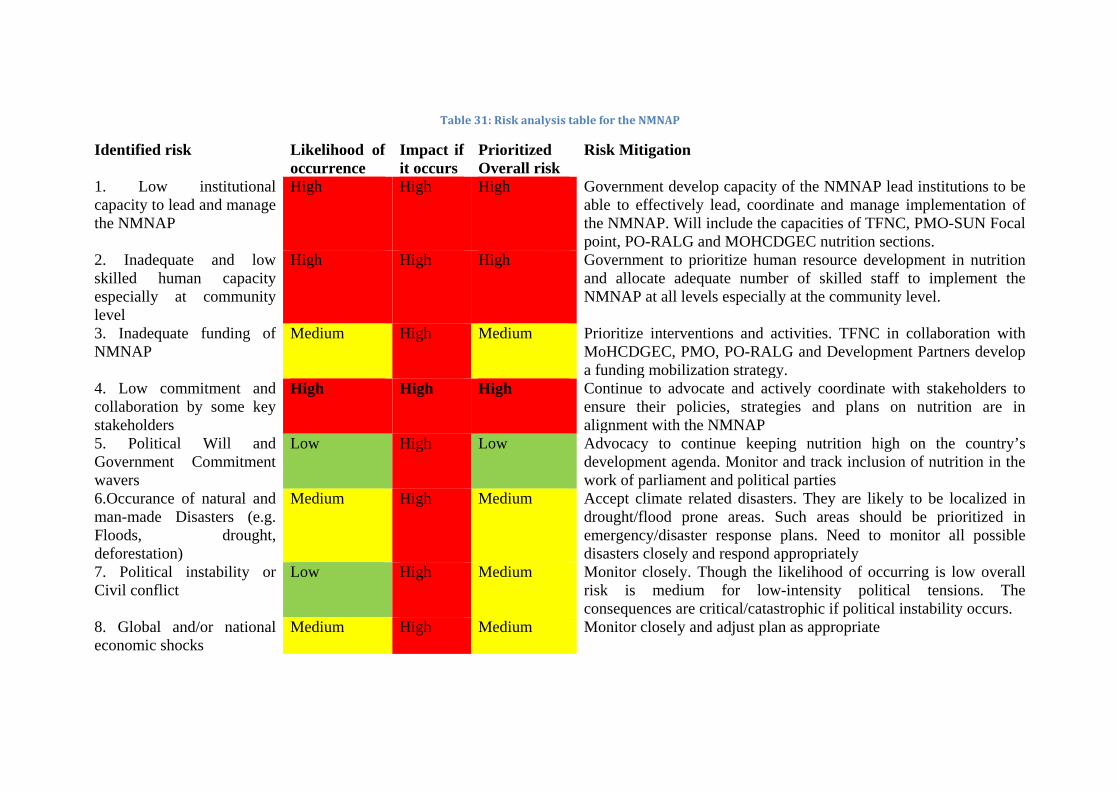
Table 31: Risk analysis table for the NMNAP
Identified risk Likelihood of occurrence
Impact if it occurs
Prioritized Overall risk
Risk Mitigation
1. Low institutional capacity to lead and manage the NMNAP
High High High Government develop capacity of the NMNAP lead institutions to be able to effectively lead, coordinate and manage implementation of the NMNAP. Will include the capacities of TFNC, PMO-SUN Focal point, PO-RALG and MOHCDGEC nutrition sections.
2. Inadequate and low skilled human capacity especially at community level
High High High Government to prioritize human resource development in nutrition and allocate adequate number of skilled staff to implement the NMNAP at all levels especially at the community level.
3. Inadequate funding of NMNAP
Medium High Medium Prioritize interventions and activities. TFNC in collaboration with MoHCDGEC, PMO, PO-RALG and Development Partners develop a funding mobilization strategy.
4. Low commitment and collaboration by some key stakeholders
High High High Continue to advocate and actively coordinate with stakeholders to ensure their policies, strategies and plans on nutrition are in alignment with the NMNAP
5. Political Will and Government Commitment wavers
Low High Low Advocacy to continue keeping nutrition high on the country’s development agenda. Monitor and track inclusion of nutrition in the work of parliament and political parties
6.Occurance of natural and man-made Disasters (e.g. Floods, drought, deforestation)
Medium High Medium Accept climate related disasters. They are likely to be localized in drought/flood prone areas. Such areas should be prioritized in emergency/disaster response plans. Need to monitor all possible disasters closely and respond appropriately
7. Political instability or Civil conflict
Low High Medium Monitor closely. Though the likelihood of occurring is low overall risk is medium for low-intensity political tensions. The consequences are critical/catastrophic if political instability occurs.
8. Global and/or national economic shocks
Medium High Medium Monitor closely and adjust plan as appropriate
BIBLIOGRAPHY
1. Bhutta ZA, Ahmad T, Black RE, et al. Maternal and child undernutrition-3: What works? Interventions for maternal and child undernutrition and survival. Lancet 2008; www.thelancet.com Vol. 371 February 2, 2008pg. 417-439.
2. Bhutta, Zulfiqar A, Jai K Das, Arjumand Rizvi et al (2013); Evidence-based improvement of maternal and child nutrition: what can be done and at what cost? The Lancet, Nutrition Interventions Review Group, the Maternal and Child Nutrition Study Group. The Lancet, Annex 382, Issue 9890, Pages 452 - 477, 3 August 2013
3. Black R, Allen L, Bhutta Z, et al. Maternal and child undernutrition-1: global and regional exposures and health consequences. Lancet 2008; www.thelancet.com Vol. 371 January 19, 2008pg. 243-259
4. British Medical Journal (BMJ) Suppl (2015): Towards a new Global Strategy for Women’s, Children’s and Adolescent Health. BMJ 2015;351. (All papers in supplement reviewed)
5. Bryce J, Coitinho D, Darnton-Hill I, Pelletier D, Pinstrup-Andersen P (2008). Maternal and childundernutrition-4: effective action at national level: Lancet 2008; www.thelancet.com Vol. 371 February 9, 2008pg. 510-526.
6. Global Nutrition Report 2016: From Promise to Impact. Ending Malnutrition by 2030. 7. Inka Barnett, Yosellina, Sigit Sulistyo, Barbara Befani, Kencana KariSari, Shumona Sharmin
and Devianna Dewi (July 2016): Mixed-Method Impact Evaluation of a Mobile Phone Application for Nutrition Monitoring in Indonesia: Evidence Report No 200: Reducing Hunger and Undernutrition. Institute of Development Studies, Sussex, UK (2016).
8. Kavishe F.P (2014): Towards Eliminating Malnutrition in Tanzania by 2030: Nutrition Vision 2025. Technical Working Paper, TFNC Monograph Series Number 2. TFNC and UN-REACH, Dar Es Salaam, 7 October 2014.
9. Kavishe F.P, Mushi SS (1993): Nutrition-relevant actions in Tanzania. United Nations, Administrative Committee on Coordination, Subcommittee on Nutrition, 1993. Geneva, Switzerland: Monograph series /Tanzania Food and Nutrition Centre; no. 1 (AHH2072)
10. Mercedes de Onis, Kathryn G. Dewey, Elaine Borghi, Adelheid W. Onyango, Monika Blössner, Bernadette Daelmans, Ellen Piwoz and Francesco Branca (2013: World Health Organization's global target for reducing childhood stunting by 2025: rationale and proposed actions (pages 6–26). Article first published online: 18 SEP 2013 | DOI: 10.1111/mcn.12075. http://onlinelibrary.wiley.com/doi/10.1111/mcn.12075/abstract
11. Ministry of Health, Community Development, Gender, Elderly and Children (MoHCDGEC) [Tanzania Mainland], Ministry of Health [Zanzibar], National Bureau of Statistics (NBS), Office of the Chief Government Statistics (OCGS), and ICF International. Tanzania Demographic and Health Survey and Malaria Indicator Survey (TDHS – MS) 2015-16. Dar Es Salaam, Tanzania, and Rockville, Maryland, USA
12. Tanahashi T (1978): Health service coverage and its evaluation. Bull World Health Organization 1978; 56(2): 295-303. (http://www.ncbi.nlm.nih.gov/pmc/articles/PMC2395571/).
13. Tanzania Food and Nutrition Centre (TFNC), 2012: Landscape analysis of the country’s readiness to accelerate action in nutrition. Tanzania Assessment for Scaling Up Nutrition 2012. Dar Es Salaam, Tanzania.
14. UNICEF (2015): UNICEF Global Nutrition Strategy. UNICEF’s approach to scaling up nutrition programming for mothers and their children. UNICEF, NYHQ
15. UNICEF (2016): Strategy for Water, Sanitation and Hygiene 2016-2030. Programme Division, UNICEF NYHQ.
16. United Republic of Tanzania (2016): Draft Food and Nutrition Policy Tanzania. June 2016 17. United Republic of Tanzania (2015): Food and Nutrition Policy Tanzania: Implementation
Strategy July 2016 - June 2026. Draft. Dar Es Salaam, March 2015. 18. United Republic of Tanzania (National Bureau of Statistics) and ICF MACRO (2010): Tanzania
Demographic and Health Survey (TDHS) 2010. Dar Es Salaam, Tanzania 19. United Republic of Tanzania (URT) (1992): The Food and Nutrition Policy for Tanzania.
www.tzonline.org/pdf/thefoodandnutritionpolicy.pdf . Ministry of Health, July 1992, Dar Es Salaam, Tanzania.
TANZANIA NATIONAL MULTISECTORAL NUTRITION ACTION PLAN (NMNAP) JULY 2016-2021
140
20. United Republic of Tanzania (URT) Ministry of Finance (2014): Public Expenditure Review of the Nutrition Sector. Main Report, Plan of Action and Policy Brief. Innovex, UNICEF and Irish Aid, April 2014, Dar Es Salaam, Tanzania.
21. United Republic of Tanzania (URT) Ministry of Finance (2014): Public Expenditure Review of the Nutrition Sector. Main Report, Plan of Action and Policy Brief. Innovex, UNICEF and Irish Aid, April 2014, Dar Es Salaam, Tanzania.
22. Victoria CG, Adair L, Fall C, et al. Maternal and child undernutrition-2: consequences for adult health and human capital. Lancet 2008; www.thelancet.com Vol. 371 January 26, 2008 pg. 340-357.World Bank (2013). Improving Nutrition through Multisectoral Approaches. The World Bank, Washington, January 2013.
23. WHO (2016): Comprehensive implementation plan on maternal, infant and young child nutrition. (http://www.who.int/nutrition/publications/CIP_document/en/ )
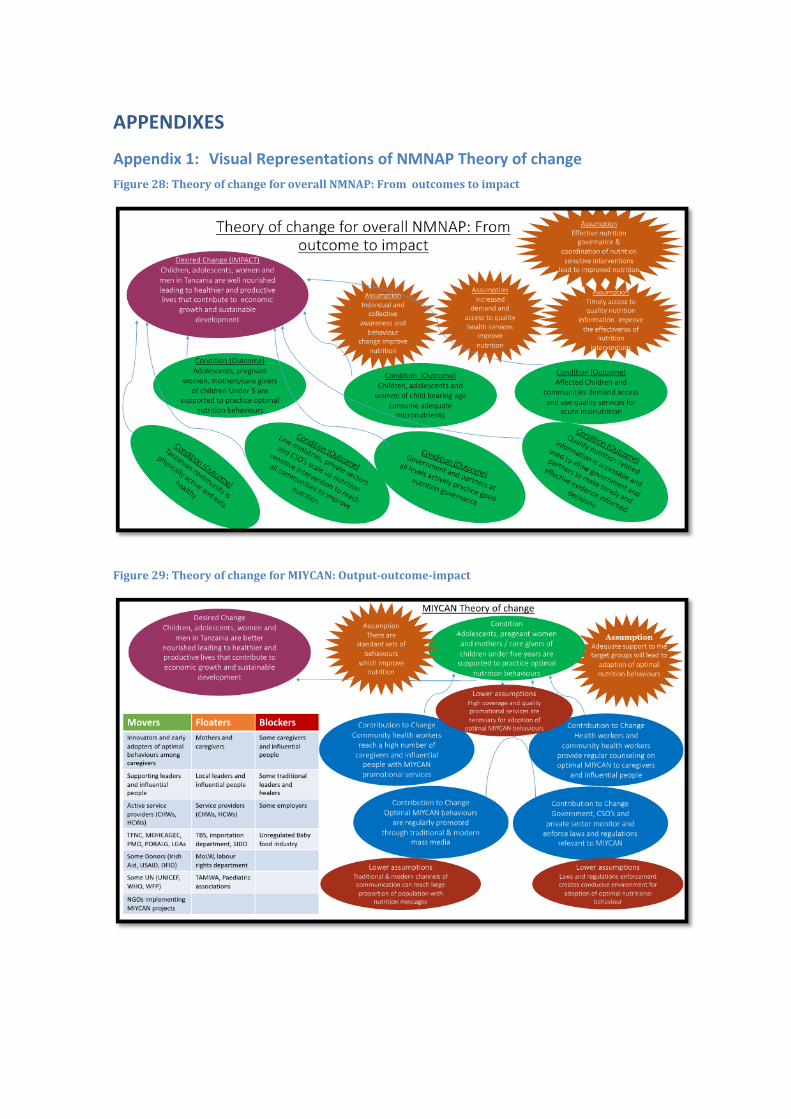
APPENDIXES
Appendix 1: Visual Representations of NMNAP Theory of change Figure 28: Theory of change for overall NMNAP: From outcomes to impact
Figure 29: Theory of change for MIYCAN: Output-outcome-impact
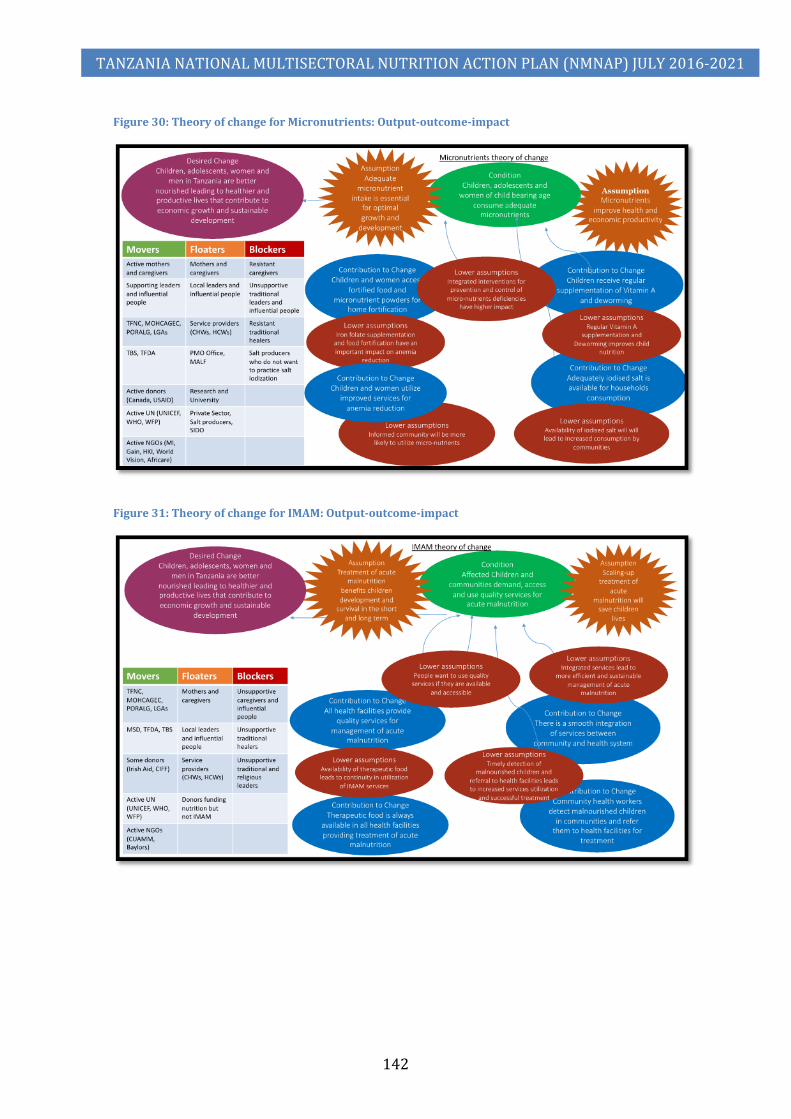
TANZANIA NATIONAL MULTISECTORAL NUTRITION ACTION PLAN (NMNAP) JULY 2016-2021
142
Figure 30: Theory of change for Micronutrients: Output-outcome-impact
Figure 31: Theory of change for IMAM: Output-outcome-impact
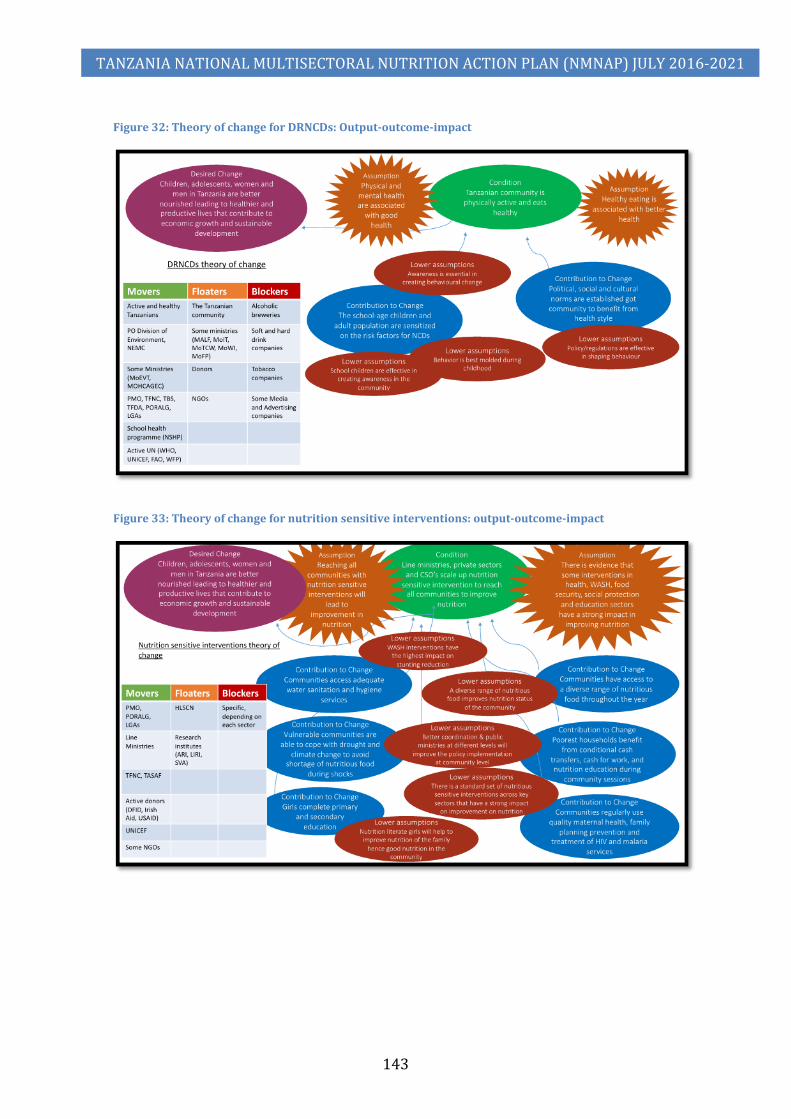
TANZANIA NATIONAL MULTISECTORAL NUTRITION ACTION PLAN (NMNAP) JULY 2016-2021
143
Figure 32: Theory of change for DRNCDs: Output-outcome-impact
Figure 33: Theory of change for nutrition sensitive interventions: output-outcome-impact
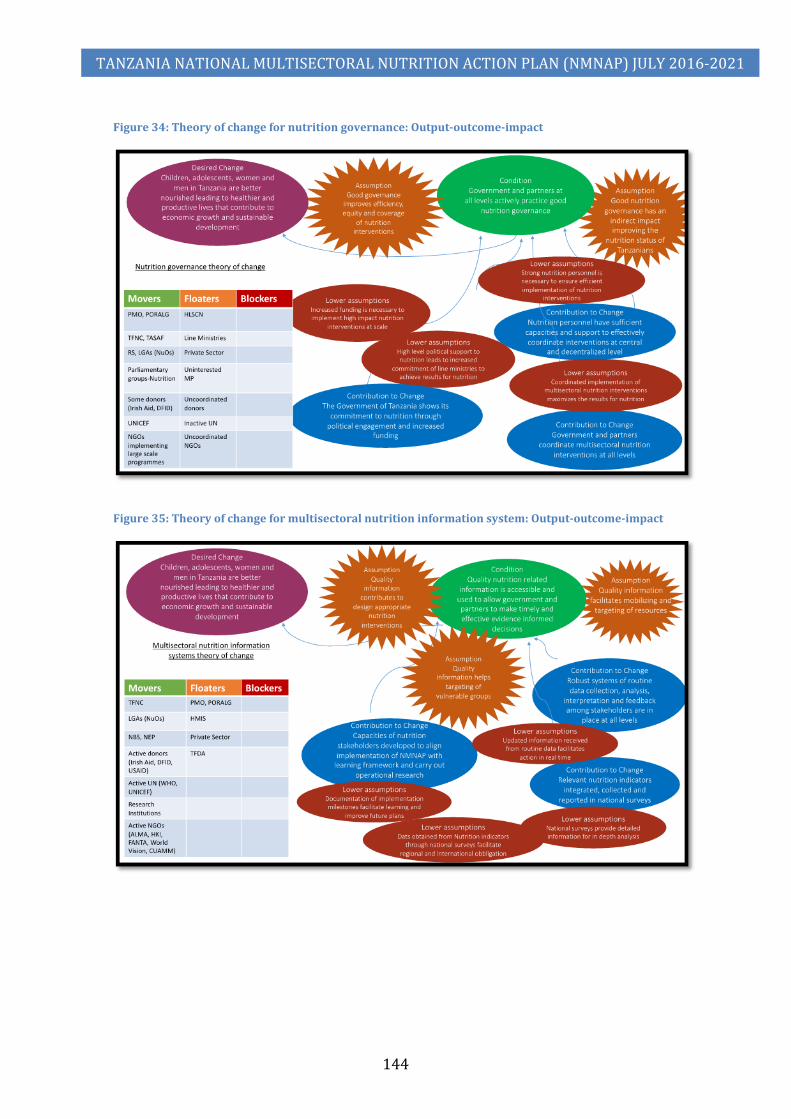
TANZANIA NATIONAL MULTISECTORAL NUTRITION ACTION PLAN (NMNAP) JULY 2016-2021
144
Figure 34: Theory of change for nutrition governance: Output-outcome-impact
Figure 35: Theory of change for multisectoral nutrition information system: Output-outcome-impact
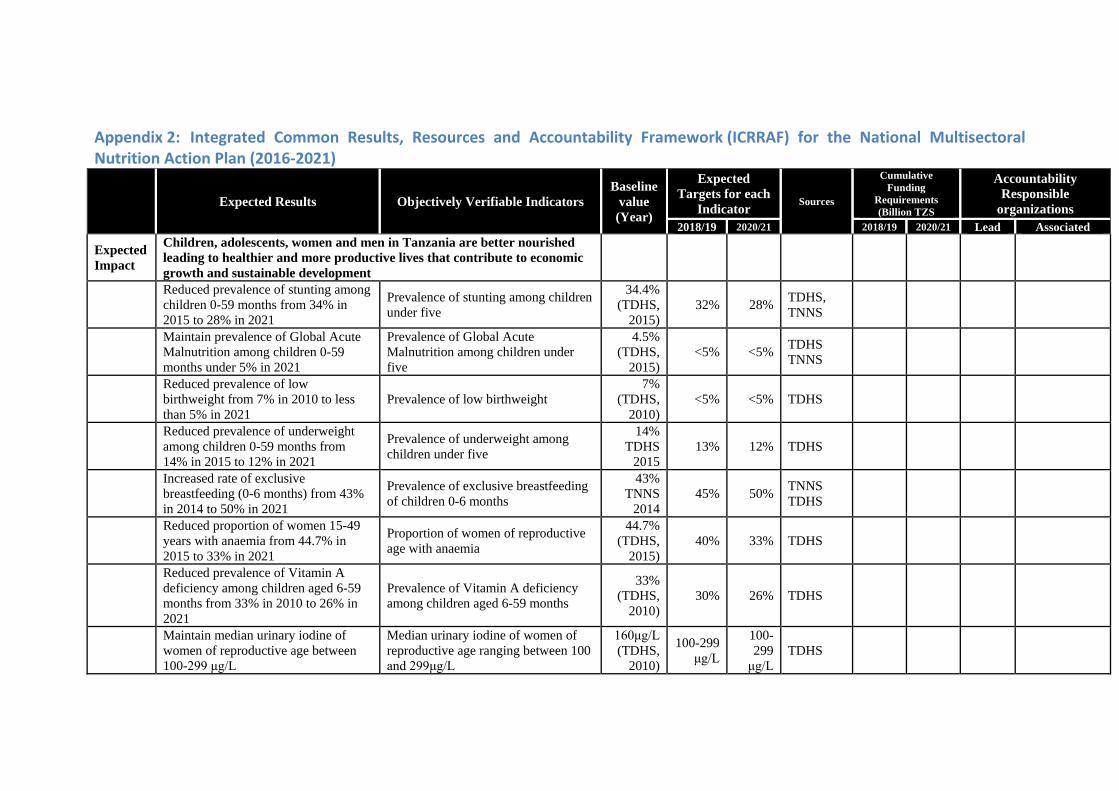
Appendix 2: Integrated Common Results, Resources and Accountability Framework (ICRRAF) for the National Multisectoral Nutrition Action Plan (2016-2021)
Expected Results Objectively Verifiable Indicators Baseline
value (Year)
Expected Targets for each
Indicator Sources
Cumulative Funding
Requirements (Billion TZS
Accountability Responsible
organizations 2018/19 2020/21 2018/19 2020/21 Lead Associated
Expected Impact
Children, adolescents, women and men in Tanzania are better nourished leading to healthier and more productive lives that contribute to economic growth and sustainable development
Reduced prevalence of stunting among children 0-59 months from 34% in 2015 to 28% in 2021
Prevalence of stunting among children under five
34.4% (TDHS,
2015) 32% 28% TDHS,
TNNS
Maintain prevalence of Global Acute Malnutrition among children 0-59 months under 5% in 2021
Prevalence of Global Acute Malnutrition among children under five
4.5% (TDHS,
2015) <5% <5% TDHS
TNNS
Reduced prevalence of low birthweight from 7% in 2010 to less than 5% in 2021
Prevalence of low birthweight 7%
(TDHS, 2010)
<5% <5% TDHS
Reduced prevalence of underweight among children 0-59 months from 14% in 2015 to 12% in 2021
Prevalence of underweight among children under five
14% TDHS
2015 13% 12% TDHS
Increased rate of exclusive breastfeeding (0-6 months) from 43% in 2014 to 50% in 2021
Prevalence of exclusive breastfeeding of children 0-6 months
43% TNNS
2014 45% 50% TNNS
TDHS
Reduced proportion of women 15-49 years with anaemia from 44.7% in 2015 to 33% in 2021
Proportion of women of reproductive age with anaemia
44.7% (TDHS,
2015) 40% 33% TDHS
Reduced prevalence of Vitamin A deficiency among children aged 6-59 months from 33% in 2010 to 26% in 2021
Prevalence of Vitamin A deficiency among children aged 6-59 months
33% (TDHS,
2010) 30% 26% TDHS
Maintain median urinary iodine of women of reproductive age between 100-299 μg/L
Median urinary iodine of women of reproductive age ranging between 100 and 299μg/L
160μg/L (TDHS,
2010)
100-299 μg/L
100-299
μg/L TDHS

TANZANIA NATIONAL MULTISECTORAL NUTRITION ACTION PLAN (NMNAP) JULY 2016-2021
146
Expected Results Objectively Verifiable Indicators Baseline
value (Year)
Expected Targets for each
Indicator Sources
Cumulative Funding
Requirements (Billion TZS
Accountability Responsible
organizations 2018/19 2020/21 2018/19 2020/21 Lead Associated
Maintain prevalence of Diabetes among adults under 10%
Prevalence of Diabetes among adults 25-69 years of age
9.1% (STEPS,
2012) <10% <10% STEPS
Survey
Maintain prevalence of overweight among children under five under 5%
Prevalence of Overweight among children under five
3.6 (TDHS,
2015) <5% <5% TDHS,
TNNS
Maintain prevalence of overweight among adults under 30%
Prevalence of overweight in adults aged 25-69 years
29% (STEPS,
2012) <29% <29%
DHS, STEPS Survey
Expected Outcome 1:
Increased proportion of adolescents, pregnant women and mothers / caregivers of children under two years who practice optimal maternal, infant and young child nutrition behaviours
Proportion of children aged 0-5 months who are exclusively breastfed
41% (TNNS,
2014) 45% 50% TDHS
TNNS
Proportion of children aged 6-23 months who receive a minimum acceptable diet
20% (TNNS
2014) 25% 30% TDHS
TNNS 146 196
Output 1.1:
Increased coverage and quality of MIYCAN services at the community level by June 2021
% mothers / caregivers of children under two years who received counselling on optimal feeding from CHWs
15% (BNA, 2015)
33% 65%
Annual BNA reports on nutrition
109 145 NGOs, LGAs
TFNC UN, DPs
Output 1.2:
Improved quality of MIYCAN services at the health facilities level by June 2021
% of pregnant women who have received counselling on exclusive breastfeeding from a health worker during the last fiscal year
20% (BNA, 2015)
36% 65%
Annual BNA reports on nutrition
34 46 MOH/TFNC
LGAs, DPs UN
Output 1.3:
MIYCAN is promoted at all levels through mass-media and the use of new technologies by June 2021
% of Tanzania population reached with relevant MIYCAN promotional messages through mass media and social media
0% (IMA/
ASTUTE Baseline)
25% 50%
Media program transmis-sion reports /surveys
1.73 2.86 TFNC Media Houses NGOs
Output 1.4:
Improved MIYCAN law enforcement through advocacy and capacity building of key institutions
% of employers providing minimum requirement of maternity benefits (maternity leave, bf breaks, bf corners)
0% (IMA/
ASTUTE Baseline)
25% 50%
Periodic assessment reports (MOHCDGEC, ATE)
1.10 1.71 TFNC
TFDA, MoLED NGOs, ATE, UN

TANZANIA NATIONAL MULTISECTORAL NUTRITION ACTION PLAN (NMNAP) JULY 2016-2021
147
Expected Results Objectively Verifiable Indicators Baseline
value (Year)
Expected Targets for each
Indicator Sources
Cumulative Funding
Requirements (Billion TZS
Accountability Responsible
organizations 2018/19 2020/21 2018/19 2020/21 Lead Associated
Expected Outcome 2:
Children, adolescents and women of child bearing age consume adequate micronutrients
Proportion of children aged 6-59 months who received Vitamin A Supplement during the last 6 months
72% (TNNS,
2014) 80% 90% TDHS,
TNNS
Proportional of households consuming iodized salt
64.2% (TNNS,
2014) 70% 85% TDHS,
TNNS
Proportion of pregnant women taking iron and folic acid (IFA) for 90+ days during pregnancy
8% (TNNS,
2014) 20% 50% TDHS,
TNNS 70 120
Output 2.1:
Increased access to food fortification (home and mass) for children aged 6-23 months, pregnant women and women of childbearing age by 2021
% of districts with MNP supplementation programme
10% (TFNC
2015 AR ) 25% 35% TFNC
Reports 49 85 TFNC
MOHCDGEC LGAs, MoALF, MoIT, DP
% of flour produced in Tanzania that is fortified with iron
36% (TFNC
2015 AR)
42% 50% TFNC Annual Reports
Output 2.2:
Enhanced services for Vitamin A supplementation among children aged 6-59 months in by 2021
Proportion of children 6-59 months who have received Vitamin A supplementation during the previous 6 months
89% (CHNM campaign report
2015)
95% 95% CHNM campaign report
9.96 16.59 TFNC PORALG, MOHDGEC, DPs
Output 2.3:
Increased availability of adequately iodized salt by 2021
Proportion of household with iodized salt
64% (TNNS
2014) 70% 80% TNNS,
TDHS 4.21 7.48
TFNC MOHCDGEC, PORALG, TBS, TFDA, TASPA
Output 2.4:
Improved anaemia prevention and control interventions among women of childbearing age and children under 5 years old by 2021
Proportion of women 15-49 years of age with children under five years of age who took an IFA supplementation during pregnancy for past birth
9% (TNNS
2014) 15% 20% TNNS,
TDHS 6.36 10.96
TFNC PORALG, MoALF, MoEVET, MOHCGEC, DPs, Private
Expected Increased coverage of integrated Proportion of children under five in 9% 35% 75% Annual

TANZANIA NATIONAL MULTISECTORAL NUTRITION ACTION PLAN (NMNAP) JULY 2016-2021
148
Expected Results Objectively Verifiable Indicators Baseline
value (Year)
Expected Targets for each
Indicator Sources
Cumulative Funding
Requirements (Billion TZS
Accountability Responsible
organizations 2018/19 2020/21 2018/19 2020/21 Lead Associated
Outcome 3: management of severe and moderate acute malnutrition
need of SAM treatment who are admitted in the program annually
(BNA/ SAM,
2015/16)
BNA reports on nutrition
Proportion of children under five in need of MAM treatment who are admitted in the program annually
<1% (WFP
Project Report,
2015)
35% 75% WFP Annual Reports
41 97
Output 3.1:
Improved quality of services for management of severe and moderate acute malnutrition in at least 75% of health facilities by 2021
Proportion of health facilities providing out-patient treatment (OTP) of SAM
25% (BNA/ SAM,
2015/16)
50% 90%
Annual BNA reports on nutrition
5.90 9.31 TFNC
MOHCDGEC, TFDA, MSD, PORALG, TCU, MUHAS, SUA, NACTE, DPs
Proportion of health facilities food insecure districts providing integrated management of MAM
<5% (WFP
PR, 2015)
20% 50% WFP Annual Reports
Output 3.2:
At least 75% of children under five years old are reached through screening for severe and moderate acute malnutrition at community level by 2021
Proportion of children with SAM who are identified through screening annually
19% (BNA/ SAM, 2015)
35% 75% HMIS 6.59 20.15 TFNC
MOHCDGEC, PORALG, UN, DPs/NGOs
Output 3.3:
Essential therapeutic nutrition supplies and equipment are available in at least 90% of health facilities providing services for management of severe and moderate acute malnutrition by June 2021
Proportion of health facilities with no stock-out of RUTF lasting more than one month during last fiscal year
46% (BNA/ SAM,
2015/16)
60% 90%
Annual BNA reports on IMSAM interventions
28.55 67.06 TFNC
MOHCDGEC (NU, RCH, PHU, TFDA, MSD), PORALG, DPs
Output 3.4:
Strengthened integration of management of severe and moderate acute malnutrition at the national and
Proportion of Councils implementing at least two IMAM key activities (training, screening, supervision)
0% (2015) >50% >75%
District annual plan CCHP activity
0.10 0.15 TFNC MOHCDGEC, PORALG, UN,

TANZANIA NATIONAL MULTISECTORAL NUTRITION ACTION PLAN (NMNAP) JULY 2016-2021
149
Expected Results Objectively Verifiable Indicators Baseline
value (Year)
Expected Targets for each
Indicator Sources
Cumulative Funding
Requirements (Billion TZS
Accountability Responsible
organizations 2018/19 2020/21 2018/19 2020/21 Lead Associated
subnational level by June 2021 annually report DPs/NGOs
Expected Outcome 4:
Communities in Tanzania are physically active and eat healthy
Proportion of people who drink alcohol among adults 25-69 years of age
14% (2012) <14% <14% STEPS
Survey
Prevalence of tobacco use in adults 25-69 years of age
18% (2012) <18% <18% STEPS
Survey 43 72
Output 4.1:
At least 50% of the school-age children and adult population are sensitized on the risk factors for non-communicable diseases by 2021
Proportion of school-age children and adults reached with information on healthy lifestyles through mass media
5% (2012) 30% 50%
Mass media reports
37 63 TFNC
MoEVT, MOHCDGEC, MoICAS, TANCDA, Media
Output 4.2:
Policies, social, cultural and structural norms are established to enable at least 50% of the community to engage in healthy lifestyles by 2021
Proportion of school-age children and adult population that are physically inactive
7.5% (2012) 7.1% 6.8% Yearly
reports 5.52 9.18 MOH-CDGEC
MoLHS, TFDA, TBS, TANCDA, PO-RALG, TPHA, ATE
Expected Outcome 5:
Line sectors, private sector and CSOs scale-up nutrition sensitive interventions to reach all communities to improve nutrition
Proportion of planned budget spent on nutrition sensitive interventions between 2016/17 and 2020/21
0% 40% 60%
PER Nutrition JMNR Annual Sector reports
13,366 21,672
Output 5.1:*
Communities have access to a diverse range of nutritious food throughout the year
Proportion of households with low dietary diversity
Rural: 21.4% Urban:
8.6% (2012)
Rural: 20%
Urban: 8%
Rural: 15%
Urban: 6%
CFSVA reports HHBS
2,189 3,622 MALF DP Food Security
Output 5.2: *
Communities regularly use quality maternal health including family planning, prevention and treatment of HIV and malaria services
Proportion of women (15-49 years of age) attending at least 4 ante-natal care (ANC) visits
51% (TDHS,
2015) 55% 60% HMIS,
TDHS 4,721 6,522 MOH-CDGEC
DP Health
Proportion of women of reproductive age who are using (or whose partner is
32% (2015/16) 40% 50% HMIS,
TDHS

TANZANIA NATIONAL MULTISECTORAL NUTRITION ACTION PLAN (NMNAP) JULY 2016-2021
150
Expected Results Objectively Verifiable Indicators Baseline
value (Year)
Expected Targets for each
Indicator Sources
Cumulative Funding
Requirements (Billion TZS
Accountability Responsible
organizations 2018/19 2020/21 2018/19 2020/21 Lead Associated
using) a modern family planning method
Proportion of pregnant women using IPT for malaria prevention
35% (2015/16) 42% 50% HMIS,
TDHS
Output 5.3: *
Communities access adequate water sanitation and hygiene services
Rural population with access to piped or protected water as their main source (%)
72% (2014/15) 80% 85% TDHS,
HBS, 3,447 5,744
MoH-CDGEC, MoWI
DP WASH
Proportion of the households with improved sanitation facilities (latrines) in rural areas
25% (2014/15) 60% 75% TDHS,
HBS
Output 5.4: *
Girls complete primary and secondary education
Net enrolment ratio for Girls at higher secondary education (% of eligible)
0.9 % (2014/15) 1.6% 2% MoEVT 1,055 1,759 MoES
T DP Education
Output 5.5: *
Poorest households benefit from conditional cash transfers, cash for work, and nutrition education during community sessions
Proportion of vulnerable households benefiting from social protection programmes (conditional cash transfers, cash for work, and nutrition education during community sessions)
83% (5,011,335
out of 6,000,000)
95% 100% PSSN Results Framework Reports
1,950 4,016 TASAF
DP Social Protection
Output 5.6: *
Vulnerable communities are able to cope with draught and climate change to avoid shortage of nutritious food during shocks
Poor dietary intake prevalence (rural and urban)
Rural: 10.5% Urban:
3.4% (2012)
Rural: 8.5%
Urban: 2.8%
Rural: 7%
Urban: 2.5%
CFSVA reports 4.68 7.82 MALF
DP Food Security and Environment
Expected Outcome 6:
Efficient and effective nutrition governance
Proportion of districts implementing the minimum budget allocation to nutrition
NA (2015/
16)
30% increase from baseline
50% increase from baseline
PER Nutrition JMNR
22 38
Output 6.1:
Increased Government political and financial commitment to Nutrition
Average nutrition spending on nutrition at council level
TZS 128 million
(2014/15)
TZS 250 million
TZS 400 million
PER Nutrition JMNR
4.58 7.98 TFNC PMO, LGAs, DP PORALG,
Output 6.2:
Functional multisectoral coordination at all levels
Proportion of councils that hold at least two council nutrition steering
<10% (2015/1) 35% 60% District
quarterly 1.74 2.78 TFNC PMO, PORALG, MDAs, LGAs,
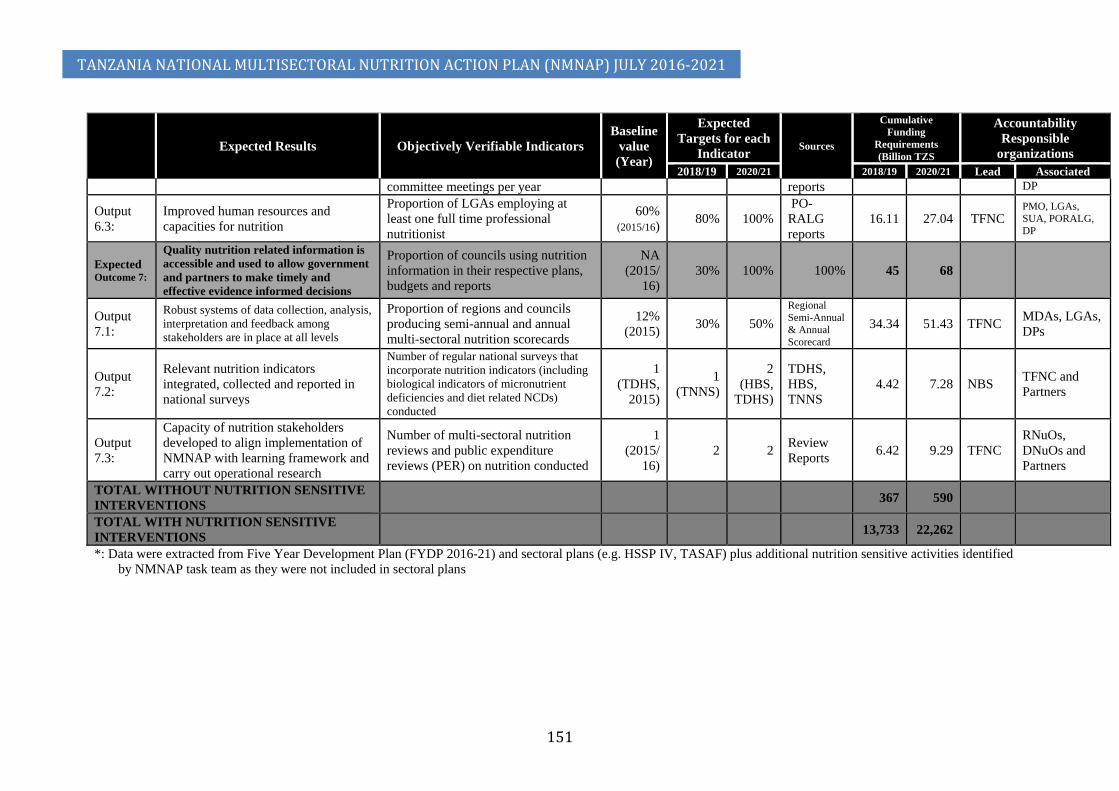
TANZANIA NATIONAL MULTISECTORAL NUTRITION ACTION PLAN (NMNAP) JULY 2016-2021
151
Expected Results Objectively Verifiable Indicators Baseline
value (Year)
Expected Targets for each
Indicator Sources
Cumulative Funding
Requirements (Billion TZS
Accountability Responsible
organizations 2018/19 2020/21 2018/19 2020/21 Lead Associated
committee meetings per year reports DP
Output 6.3:
Improved human resources and capacities for nutrition
Proportion of LGAs employing at least one full time professional nutritionist
60% (2015/16)
80% 100% PO-RALG reports
16.11 27.04 TFNC PMO, LGAs, SUA, PORALG, DP
Expected Outcome 7:
Quality nutrition related information is accessible and used to allow government and partners to make timely and effective evidence informed decisions
Proportion of councils using nutrition information in their respective plans, budgets and reports
NA (2015/
16) 30% 100% 100% 45 68
Output 7.1:
Robust systems of data collection, analysis, interpretation and feedback among stakeholders are in place at all levels
Proportion of regions and councils producing semi-annual and annual multi-sectoral nutrition scorecards
12% (2015) 30% 50%
Regional Semi-Annual & Annual Scorecard
34.34 51.43 TFNC MDAs, LGAs, DPs
Output 7.2:
Relevant nutrition indicators integrated, collected and reported in national surveys
Number of regular national surveys that incorporate nutrition indicators (including biological indicators of micronutrient deficiencies and diet related NCDs) conducted
1 (TDHS,
2015)
1 (TNNS)
2 (HBS,
TDHS)
TDHS, HBS, TNNS
4.42 7.28 NBS TFNC and Partners
Output 7.3:
Capacity of nutrition stakeholders developed to align implementation of NMNAP with learning framework and carry out operational research
Number of multi-sectoral nutrition reviews and public expenditure reviews (PER) on nutrition conducted
1 (2015/
16) 2 2 Review
Reports 6.42 9.29 TFNC RNuOs, DNuOs and Partners
TOTAL WITHOUT NUTRITION SENSITIVE INTERVENTIONS 367 590
TOTAL WITH NUTRITION SENSITIVE INTERVENTIONS 13,733 22,262
*: Data were extracted from Five Year Development Plan (FYDP 2016-21) and sectoral plans (e.g. HSSP IV, TASAF) plus additional nutrition sensitive activities identified by NMNAP task team as they were not included in sectoral plans

Appendix 3: Methodology used in developing the NMNAP The roadmap for the preparation of the NMNAP The 2015 Joint Multisectoral Nutrition Review (JMNR) adopted a roadmap for the development of the NMNAP that was adjusted during the course of NMNAP process to address challenges and issues identified (see figure 39 below for final roadmap). The objective of the Roadmap was to provide a clear working structure, workplan and budget. Figure 36: Roadmap for the preparation of the multisectoral nutrition action plan (NMNAP)
Formation of thematic Task Teams The roadmap provided for a “Steering Structure” for policy guidance, sectoral and partner coordination, strategic decisions and quality assurance. Structurally, the NMNAP Steering Committee was formed as a sub-committee of the High Level Steering Committee on Nutrition (HLSCN) and chaired by the Prime Minister Office (PMO), specifically the Scaling Up Nutrition (SUN) focal point. Members included TFNC (as Secretariat), representatives from nutrition sensitive sectors (ministries and departments) in Mainland and key partners in nutrition (UN Agencies, Development Partners, NGOs, Academia). To ensure key areas for nutrition intervention are adequately covered by the NMNAP, the Steering Committee established six Task Teams with the mandate to develop costed implementation plans for actions in the seven Key Result Areas. Common Terms of Reference (TOR) were developed for the Task Teams with their formation and work overseen by TFNC. In forming the Task Teams, the Steering Committee used the Lancet Conceptual Framework for addressing malnutrition and categorized the Key Result Areas into three: Nutrition Specific, Nutrition Sensitive and Enabling Environment interventions.
1) Nutrition specific interventions Key Result Areas: Four Task Teams were formed to develop costed action plans to scale-up high impact nutrition specific interventions. These were

TANZANIA NATIONAL MULTISECTORAL NUTRITION ACTION PLAN (NMNAP) JULY 2016-2021
153
i. Maternal Infant, Young Child and Adolescent Nutrition (MIYCAN) - task team 1;
ii. Micronutrient Deficiencies - task team 2; iii. Integrated Management of Acute Malnutrition (IMAM) – task team 3; iv. Diet Related Non-Communicable Diseases (DRNCDs) – task team 4.
2) Nutrition sensitive interventions Key Result Area: i. Task team 5 was tasked to develop Multisectoral Nutrition Sensitive
Interventions in six key sectors: (a) Agriculture and Food Security; (b) Health and HIV; (c) Water, Sanitation and Hygiene (WASH); (d) Education; (e) Social Protection and (f) Environment and Climate Change.
3) Enabling environment interventions i. Multisectoral Nutrition Governance - task team 5; and
ii. Multisectoral Nutrition Information System - task team 6. Each Task Team was composed of at least eight (8) core members drawn from key stakeholders, a chair from TFNC and an expert Task Team Facilitator. The Task Team Expert Facilitators and Chairs ensured all key stakeholders were consulted and that proposed actions were evidence-based. Appendix 4 provides a list of participants in the task teams.
Coordination of the Task Teams The Acting Managing Director of TFNC chaired frequent meetings of the Facilitators and the Chairs of the Task Teams to discuss progress and address any emerging issues in order to build consensus on issues and strategize on key milestones. A senior level nutrition expert Lead Facilitator provided technical harmonization, coordination, quality assurance and cross-theme conceptual standardization. The collection of evidence A key approach in the development of the NMNAP was the emphasis given to evidence-based actions. Evidence was collected using desk reviews and where appropriate new operational evidence was collected through bottleneck analysis. A bottleneck analysis was carried out nationally in January-February 2016 looking specifically at (i) promotion of exclusive breastfeeding for children 0-5 months (ii) promotion of appropriate complementary feeding for children 6-23 months (iii) supplementation of children 6-59 months with vitamin A and (iv) supplementation of pregnant women with iron-folic acid. The results of the bottleneck analysis were discussed with other evidence in a workshop that was held on 23-24 February 2016 as part of the development of this NMNAP. A desk review on the global scientific evidence on appropriate interventions for child and maternal nutrition and on DRNCDs was done. Particular attention was paid to the Lancet Nutrition Series of 2008, 2013 and 2016 and UN, Development Partner and other nutrition relevant research organizations. Examples of other Multisectoral Nutrition Action Plans like the ones in Ethiopia, Nepal and Sri Lanka were consulted. Stakeholder participation The process engaged all key actors in the multisectoral, multi-layer and multi-stakeholder nutrition system at all levels. The SUN stakeholder platforms (MDAs-national/regional/ district/LGAs), the UN System (UNICEF, WHO, UN-REACH, WFP and FAO), key Development partners (Fhi360, Irish Aid, DFID, USAID ), NGOs (PANITA, HKI, COUNSENUTH), Civil Society Organizations (Tanzania Public Health Association - TPHA,
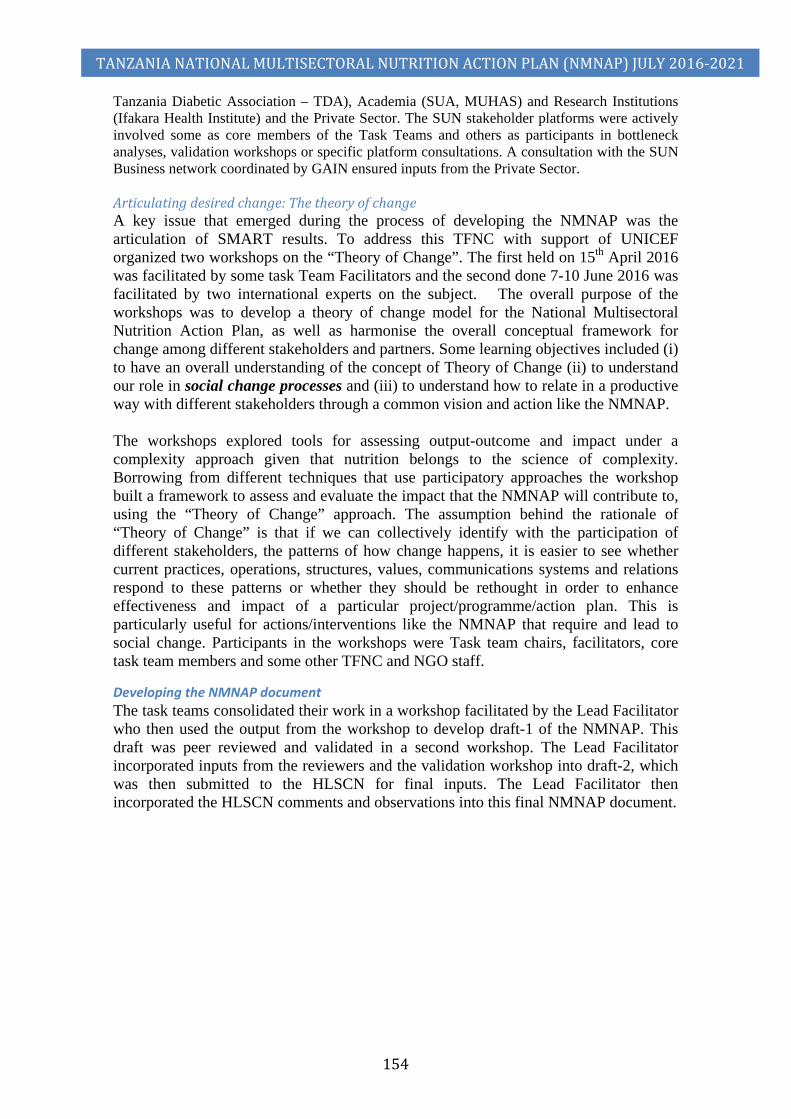
TANZANIA NATIONAL MULTISECTORAL NUTRITION ACTION PLAN (NMNAP) JULY 2016-2021
154
Tanzania Diabetic Association – TDA), Academia (SUA, MUHAS) and Research Institutions (Ifakara Health Institute) and the Private Sector. The SUN stakeholder platforms were actively involved some as core members of the Task Teams and others as participants in bottleneck analyses, validation workshops or specific platform consultations. A consultation with the SUN Business network coordinated by GAIN ensured inputs from the Private Sector. Articulating desired change: The theory of change A key issue that emerged during the process of developing the NMNAP was the articulation of SMART results. To address this TFNC with support of UNICEF organized two workshops on the “Theory of Change”. The first held on 15th April 2016 was facilitated by some task Team Facilitators and the second done 7-10 June 2016 was facilitated by two international experts on the subject. The overall purpose of the workshops was to develop a theory of change model for the National Multisectoral Nutrition Action Plan, as well as harmonise the overall conceptual framework for change among different stakeholders and partners. Some learning objectives included (i) to have an overall understanding of the concept of Theory of Change (ii) to understand our role in social change processes and (iii) to understand how to relate in a productive way with different stakeholders through a common vision and action like the NMNAP. The workshops explored tools for assessing output-outcome and impact under a complexity approach given that nutrition belongs to the science of complexity. Borrowing from different techniques that use participatory approaches the workshop built a framework to assess and evaluate the impact that the NMNAP will contribute to, using the “Theory of Change” approach. The assumption behind the rationale of “Theory of Change” is that if we can collectively identify with the participation of different stakeholders, the patterns of how change happens, it is easier to see whether current practices, operations, structures, values, communications systems and relations respond to these patterns or whether they should be rethought in order to enhance effectiveness and impact of a particular project/programme/action plan. This is particularly useful for actions/interventions like the NMNAP that require and lead to social change. Participants in the workshops were Task team chairs, facilitators, core task team members and some other TFNC and NGO staff.
Developing the NMNAP document The task teams consolidated their work in a workshop facilitated by the Lead Facilitator who then used the output from the workshop to develop draft-1 of the NMNAP. This draft was peer reviewed and validated in a second workshop. The Lead Facilitator incorporated inputs from the reviewers and the validation workshop into draft-2, which was then submitted to the HLSCN for final inputs. The Lead Facilitator then incorporated the HLSCN comments and observations into this final NMNAP document.

TANZANIA NATIONAL MULTISECTORAL NUTRITION ACTION PLAN (NMNAP) JULY 2016-2021
155
Appendix 4: Membership of Task Teams
Overall NMNAP coordinating Committee No. Name Organization Function 1. Joyceline Kaganda TFNC Ag. Managing Director, Chair 2. Dr Festo P. Kavishe Independent Human
Development Consultant NMNAP Lead Facilitator
3. Sarah Mshiu PMO Representing HLSCN 4. Biram Ndiaye UNICEF UNICEF Focal point for NMNAP 5. Neema Joshua TFNC Chair, MIYCAN 6. Mauro Brero UNICEF Facilitator, MIYCAN 7. Dr Fatima Abdallah TFNC Chair, Micronutrients 8. Prof Jonathan Gorstein Washington University
& Global IDD Network Facilitator, Micronutrients
9. Mary Msangi TFNC Chair, IMAM 10. Rikkle UNICEF Facilitator, IMAM 11. Julieth Kitali TFNC Chair, DRNCDs 12. Prof. Andrew Swai Tanzania Diabetes
Association (TDA) Facilitator, DRNCDs
13. Jeoffrey Chiduo TFNC Chair, Nutrition sensitive interventions and governance
14. David Katusabe Fhi360 Facilitator, Nutrition sensitive interventions and governance
15. Benedict Jeje Fhi360 Co-Facilitator, Nutrition sensitive interventions and governance
16. Tumaini Charles Fhi360 Fhi360 focal point for Nutrition sensitive interventions and governance
17. Adam Hancy TFNC Chair, Multisectoral Nutrition Information Systems
18. Cletus Mkai Independent Consultant Facilitator, Multisectoral Nutrition Information Systems
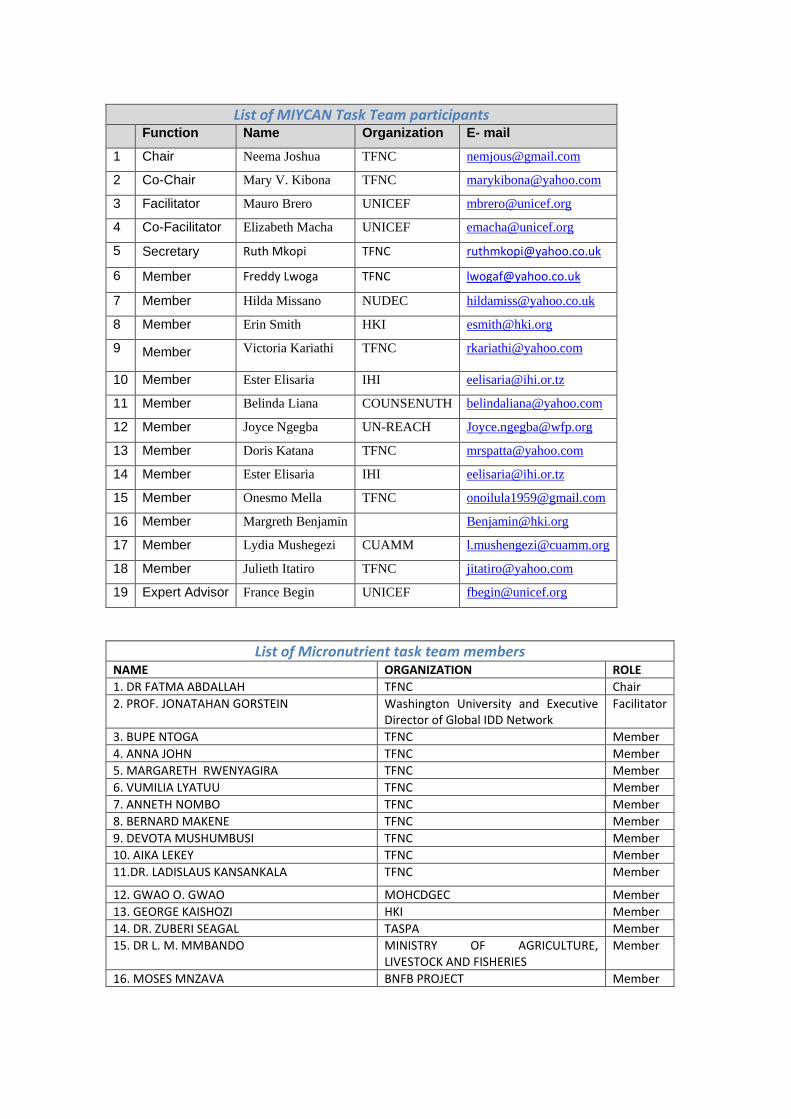
List of MIYCAN Task Team participants Function Name Organization E- mail
1 Chair Neema Joshua TFNC [email protected]
2 Co-Chair Mary V. Kibona TFNC [email protected]
3 Facilitator Mauro Brero UNICEF [email protected]
4 Co-Facilitator Elizabeth Macha UNICEF [email protected]
5 Secretary Ruth Mkopi TFNC [email protected]
6 Member Freddy Lwoga TFNC [email protected]
7 Member Hilda Missano NUDEC [email protected]
8 Member Erin Smith HKI [email protected]
9 Member Victoria Kariathi TFNC [email protected]
10 Member Ester Elisaria IHI [email protected]
11 Member Belinda Liana COUNSENUTH [email protected]
12 Member Joyce Ngegba UN-REACH [email protected]
13 Member Doris Katana TFNC [email protected]
14 Member Ester Elisaria IHI [email protected]
15 Member Onesmo Mella TFNC [email protected]
16 Member Margreth Benjamin [email protected]
17 Member Lydia Mushegezi CUAMM [email protected]
18 Member Julieth Itatiro TFNC [email protected]
19 Expert Advisor France Begin UNICEF [email protected]
List of Micronutrient task team members
NAME ORGANIZATION ROLE 1. DR FATMA ABDALLAH TFNC Chair 2. PROF. JONATAHAN GORSTEIN Washington University and Executive
Director of Global IDD Network Facilitator
3. BUPE NTOGA TFNC Member 4. ANNA JOHN TFNC Member 5. MARGARETH RWENYAGIRA TFNC Member 6. VUMILIA LYATUU TFNC Member 7. ANNETH NOMBO TFNC Member 8. BERNARD MAKENE TFNC Member 9. DEVOTA MUSHUMBUSI TFNC Member 10. AIKA LEKEY TFNC Member 11.DR. LADISLAUS KANSANKALA TFNC Member
12. GWAO O. GWAO MOHCDGEC Member 13. GEORGE KAISHOZI HKI Member 14. DR. ZUBERI SEAGAL TASPA Member 15. DR L. M. MMBANDO MINISTRY OF AGRICULTURE,
LIVESTOCK AND FISHERIES Member
16. MOSES MNZAVA BNFB PROJECT Member
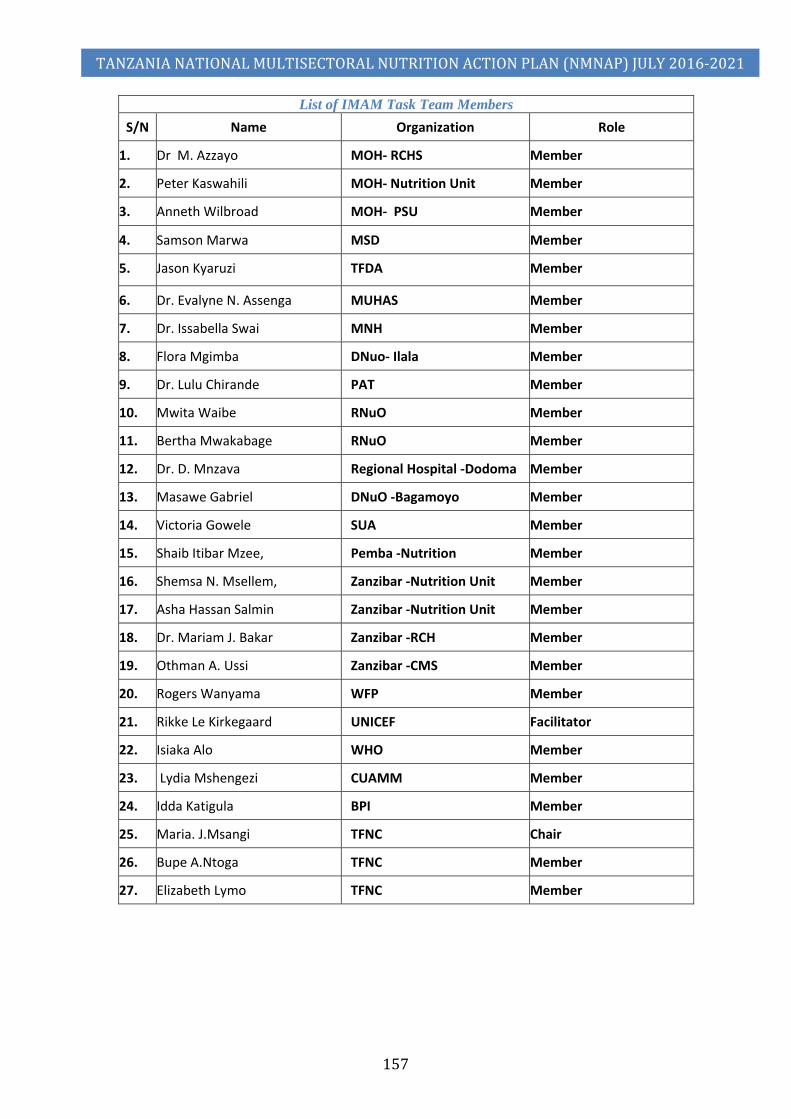
TANZANIA NATIONAL MULTISECTORAL NUTRITION ACTION PLAN (NMNAP) JULY 2016-2021
157
List of IMAM Task Team Members S/N Name Organization Role
1. Dr M. Azzayo MOH- RCHS Member
2. Peter Kaswahili MOH- Nutrition Unit Member
3. Anneth Wilbroad MOH- PSU Member
4. Samson Marwa MSD Member
5. Jason Kyaruzi TFDA Member
6. Dr. Evalyne N. Assenga MUHAS Member
7. Dr. Issabella Swai MNH Member
8. Flora Mgimba DNuo- Ilala Member
9. Dr. Lulu Chirande PAT Member
10. Mwita Waibe RNuO Member
11. Bertha Mwakabage RNuO Member
12. Dr. D. Mnzava Regional Hospital -Dodoma Member
13. Masawe Gabriel DNuO -Bagamoyo Member
14. Victoria Gowele SUA Member
15. Shaib Itibar Mzee, Pemba -Nutrition Member
16. Shemsa N. Msellem, Zanzibar -Nutrition Unit Member
17. Asha Hassan Salmin Zanzibar -Nutrition Unit Member
18. Dr. Mariam J. Bakar Zanzibar -RCH Member
19. Othman A. Ussi Zanzibar -CMS Member
20. Rogers Wanyama WFP Member
21. Rikke Le Kirkegaard UNICEF Facilitator
22. Isiaka Alo WHO Member
23. Lydia Mshengezi CUAMM Member
24. Idda Katigula BPI Member
25. Maria. J.Msangi TFNC Chair
26. Bupe A.Ntoga TFNC Member
27. Elizabeth Lymo TFNC Member

TANZANIA NATIONAL MULTISECTORAL NUTRITION ACTION PLAN (NMNAP) JULY 2016-2021
158
List of participants of Diet Related Non-Communicable Diseases( DRNCDs) Name Institution Role 1. Abela Twin’Omujuni Tanzania Food and Nutrition Centre (TFNC) Participant 2, Adeline Munuo Tanzania Food and Nutrition Centre Participant 3. Aika S Lekey Tanzania Food and Nutrition Centre Participant 4.. Akwilina Mwanri Sokoine University of Agriculture Participant 5. Andrew Swai (Prof.) Tanzania Diabetes Association & Tanzania NCD
Alliance Facilitator, DRNCDs
6. Anneth J Nombo Tanzania Food and Nutrition Centre Participant 7. Beatrice Lyimo Ministry of Information Participant 8. Bertha Maega Tanzania Public Health Association (TPHA) Participant 9. Chibole Manumbu Ministry of Industry Trade & Investment Participant 10. Cypriana Cyprian Tanzania Food and Nutrition Centre Participant 11. E. M. Urio TFNC Participant 12. Elifatio Towo Tanzania Food and Nutrition Centre Participant 13. Elizabeth J Lyimo Tanzania Food and Nutrition Centre Participant 14. Fatma Abdalla Tanzania Food and Nutrition Centre Participant 15. Faustin Njau Tanzania Public Health Association Participant 16. Festo Kavishe, Dr. Independent Human Development Consultant NMNAP Lead
Facilitator 17. Freddy Lwoga Tanzania Food and Nutrition Centre Participant 18. Fredirick Mashili Muhimbili University of Health and Allied Sciences Participant 19. Grace J Munhambo Tanzania Socail Action Fund (TASAF) Participant 20. Helen Semu Ministry of Health, Community Development, Gender,
elderly and Children (MOHCDGEC) Participant
21. Herbert Gowelle TFNC Participant 22. Hindu M Augossy Ministry of Works Participant 23. Jasson Joel Kyaruzi TFDA Participant 24. Jasson Ndanguzi Ministry of Works, Transport and Communications Participant 25. Judith Njau APHFTA Participant 26. Julieth J Shine Tanzania Food and Nutrition Centre Chair, DRNCDs 27.
Kaushik Ramaiya Tanzania Diabetes Association, Tanzania NCD Alliance, Association of Private Health Facilities in Tanzania
Participant
28. Laureta Lucas CONSENUTH Participant 29. Marai J Msangi TFNC Participant 30. Maria Ngilisho TFNC Participant 31. Mariam Kalomo Ministry of Health, Community Development, Gender,
elderly and Children Participant
32. Mtawajibu Athumani Elimu - Msingi Participant 33. Neema Joshua TFNC Participant 34. Samson Marwa MSD Participant 35. Sara Mahena Mbise MOHCDGEC Participant 36. Sara Simba Health promotion Unit Participant 37. Stephen Motambi President’s Office, Regional Administration and Local
Government Participant
38. Suzana Godwin Mwangoka Ministry of Lands, Housing & Human Settlement Development
Participant
39. Tatizo Waane
Jakaya Mrisho Heart Institute, Tanzania Heart Foundation, Tanzania NCD Alliance
Participant
40. Tumaini Kiyola ATE Participant
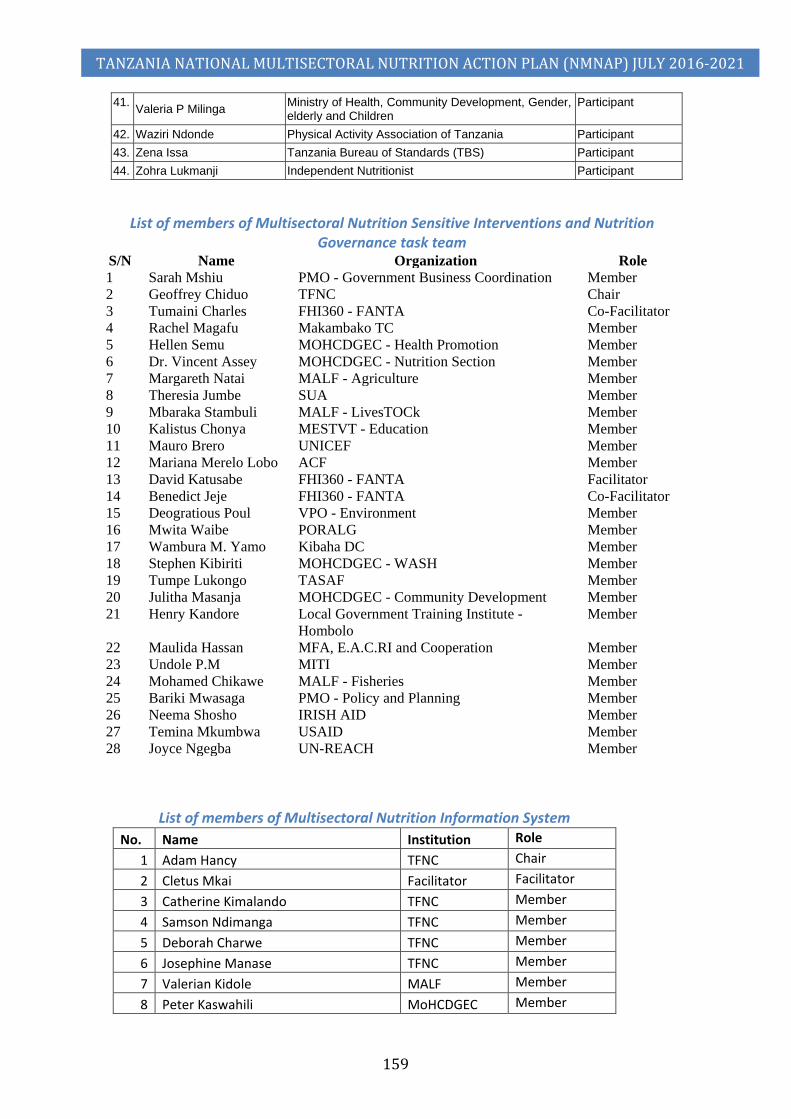
TANZANIA NATIONAL MULTISECTORAL NUTRITION ACTION PLAN (NMNAP) JULY 2016-2021
159
41. Valeria P Milinga Ministry of Health, Community Development, Gender, elderly and Children
Participant
42. Waziri Ndonde Physical Activity Association of Tanzania Participant 43. Zena Issa Tanzania Bureau of Standards (TBS) Participant 44. Zohra Lukmanji Independent Nutritionist Participant
List of members of Multisectoral Nutrition Sensitive Interventions and Nutrition
Governance task team S/N Name Organization Role 1 Sarah Mshiu PMO - Government Business Coordination Member 2 Geoffrey Chiduo TFNC Chair 3 Tumaini Charles FHI360 - FANTA Co-Facilitator 4 Rachel Magafu Makambako TC Member 5 Hellen Semu MOHCDGEC - Health Promotion Member 6 Dr. Vincent Assey MOHCDGEC - Nutrition Section Member 7 Margareth Natai MALF - Agriculture Member 8 Theresia Jumbe SUA Member 9 Mbaraka Stambuli MALF - LivesTOCk Member 10 Kalistus Chonya MESTVT - Education Member 11 Mauro Brero UNICEF Member 12 Mariana Merelo Lobo ACF Member 13 David Katusabe FHI360 - FANTA Facilitator 14 Benedict Jeje FHI360 - FANTA Co-Facilitator 15 Deogratious Poul VPO - Environment Member 16 Mwita Waibe PORALG Member 17 Wambura M. Yamo Kibaha DC Member 18 Stephen Kibiriti MOHCDGEC - WASH Member 19 Tumpe Lukongo TASAF Member 20 Julitha Masanja MOHCDGEC - Community Development Member 21 Henry Kandore Local Government Training Institute -
Hombolo Member
22 Maulida Hassan MFA, E.A.C.RI and Cooperation Member 23 Undole P.M MITI Member 24 Mohamed Chikawe MALF - Fisheries Member 25 Bariki Mwasaga PMO - Policy and Planning Member 26 Neema Shosho IRISH AID Member 27 Temina Mkumbwa USAID Member 28 Joyce Ngegba UN-REACH Member
List of members of Multisectoral Nutrition Information System
No. Name Institution Role 1 Adam Hancy TFNC Chair 2 Cletus Mkai Facilitator Facilitator 3 Catherine Kimalando TFNC Member 4 Samson Ndimanga TFNC Member 5 Deborah Charwe TFNC Member 6 Josephine Manase TFNC Member 7 Valerian Kidole MALF Member 8 Peter Kaswahili MoHCDGEC Member

TANZANIA NATIONAL MULTISECTORAL NUTRITION ACTION PLAN (NMNAP) JULY 2016-2021
160
9 Mary Manzawa TACAIDS Member 10 Angela Shija NIMR Member 11 Evelyne Assenga MUHAS Member 12 Theresia Jumbe SUA Member 13 Biram Ndiaye UNICEF Member 14 Domina Kambarangwe WFP Member 15 Joyce Ngegba REACH Member 16 Touma Ngwanakilala CUAMM Member 17 Magreth Paul PANITA Member 18 Mariana Merelo Lobo ACF Member 19 Caroline Shayo IHI Member
Additional List of people who made significant contributions
Office Name and Position Contribution UNICEF Tanzania Country Office
Rikke le Kirkegaard, Nutrition Officer
Supported on drafting the IMAM scale up plan
Elizabeth Macha, Nutrition Specialist
Supported the development of MIYCAN scale up plan and Micronutrient scale up plan
UNICEF New York
Dr France Begin, Senior Nutrition Advisor
Supported development of MIYCAN scale up plan
UNICEF ESARO Nairobi
Ms. Juliawati Untoro, Nutrition Specialist
Supported the BNA for Vitamin A and Iron Folic Acid supplementation
M. Patrick Codjia, Nutrition Specialist
Supported the BNA for IMAM and development of IMAM scale up plan
Eric Ribaira, Health Specialist
Supported the BNA for IYCN and Micronutrient
Yu Shibui, Health Officer, Supported the BNA for IYCN and Micronutrient Dr. Joan Matji, Regional Nutrition Adviser,
Cross cutting support to all components of the NMNAP
UNICEF Niger Country Office
Fatoumata Lankoande, Nutrition Specialist
Supported costing of IMAM scale up plan
UNICEF Somalia Country Office
James Hedges, Monitoring and Evaluation Specialist
Supported the BNA for IMAM and development of IMAM Logframe
USAID David Charles Technical guidance on NSI and MNG Key Result Areas
FHI 360/FANTA Dr. Deborah Ash Technical review of NSI and MNG Key Result Areas
Caroline Mshanga Technical review of NSI and MNG Key Result Areas
Appendix 5: Abbreviations Abbreviation Full name
AARR Average Annual Reduction Rate ACF Action Contra Le Femme (Action Against Hunger) AIDS Acquired Immunological Deficiency Syndrome APHFTA ATE Association of Tanzania Employers

TANZANIA NATIONAL MULTISECTORAL NUTRITION ACTION PLAN (NMNAP) JULY 2016-2021
161
BFHI Baby Friendly Hospital Initiative BNFP Project BNA Bottle-Neck Analysis BPI CCCD Community-Centred Capacity Development CCHP CFSVA CMS (Zanzibar) CSO Civil Society Organizations CHWs Community Health Workers C-PPP Community-Public-Private Partnership COSTECH Commission of Science and Technology CRC Convention on the Rights of the Child CEDAW Convention on the Elimination of All forms of Discrimination
Against Women CRRAF Common Results, Resources and Accountability Framework COUNSENUTH Centre for Counselling on Nutrition and Health CUAMM DCDO District Community Development Officer DED District Executive Director DfID Department for International Development (UK) DMO District Medical Officer DNuO District Nutrition Officer DP Development Partners DPG Development Partners Group DPG-N Development Partners’ Group on Nutrition FAO Food and Agricultural organization (of the United Nations) FBOs Faith Based Organizations Fhi360-FANTA FY Financial Year GAIN Global Alliance In Nutrition FYDP Five-Year Development Plan GDI Gender Development Index GNI Gross National Income IMAM Integrated Management of Acute Malnutrition LGAs Local Government Authorities HCWs HDI Human Development Index HIV Human Immunodeficiency Virus HKI Helen Keller International HLSCN High Level Steering Committee on Nutrition HMIS Health Management Information System HBS Household Budget Survey HSP Health Strategic Plan IFAD International Food and Agriculture Development (of UN) IHI Ifakara Health Institute IMSAM Integrated Management of Severe Acute Malnutrition IMA/ASTUTE
TANZANIA NATIONAL MULTISECTORAL NUTRITION ACTION PLAN (NMNAP) JULY 2016-2021
162
IMR Infant Mortality Rate IYCF Infant and Young Child Feeding JMNR Joint Multisectoral Nutrition Review LGA Local Government Authority MALF Ministry of Agriculture, Livestock and Fisheries MAM Moderate Acute Malnutrition MDAs Ministries, Departments and Agencies MEM MIYCAN Maternal, Infant, Young Child and Adolescent Nutrition MDGs Millennium Development Goals M&E Monitoring and Evaluation MFAECRIC MIC Middle Income Country MIT MITI MKUKUTA MN Micronutrients MNG Multisectoral Nutrition Governance MNIS Multisectoral Nutrition Information System MNSI Multisectoral Nutrition Sensitive Interventions MMR Maternal Mortality Ratio (Rate) MOAFSF Ministry of Agriculture, Food Security and Fisheries MOESTVT Ministry of Education, Science and Technology and Vocational
Training MOFP Ministry of Finance and Planning MOHCDGEC Ministry of Health, Community Development, Gender, Elderly and
Children MOI Ministry of Information (Sports and Culture) MoLED MOWI Ministry of Water and Irrigation MSD Medical Supplies Department MUHAS Muhimbili University of Health and Allied Sciences NACTE NBS National Bureau of Statistics NEMC NGOs Non-Governmental Organizations NIMR National Institute for Medical Research NMNAP National Multisectoral Nutrition Action Plan NNS National Nutrition Strategy NSI Nutrition Sensitive Interventions NUDEC PANITA PER-N Public Expenditure Review on Nutrition PAT PMO Prime Minister’s Office PO-RALG President Office – Regional Administration and Local Government
(Ministry)
TANZANIA NATIONAL MULTISECTORAL NUTRITION ACTION PLAN (NMNAP) JULY 2016-2021
163
PSSN Productive Social Safety Net PSU Planning Support Unit RAS Regional Administrative Secretary RCH Reproductive and Child Health RS Regional Secretary SAM Severe Acute Malnutrition SBBC Social and Behavioural Change Communication SIDO Small Industries Development Organization SME Small and Medium Enterprises STEPS SUA Sokoine University of Agriculture SDGs Sustainable Development Goals SUN Scaling Up Nutrition SWO TACAIDS Tanzania Commission on AIDS TAHEA Tanzania Home Economics Association TANCDA TASAF Tanzania Social Action Fund TASPA Tanzania Salt Producers Association TBS Tanzania Bureau of Standards TCU Tanzania Commission of Universities TDA Tanzania Diabetes Association TDHS Tanzania Demographic and Health Survey TFDA Tanzania Food and Drug Administration TFNC Tanzania Food and Nutrition Centre TMA Tanzania Medical Association TNNS Tanzania National Nutrition Survey TPHA Tanzania Public Health Association TOT Training of Trainers Tsh Tanzanian Shilling TWG Thematic Working Group RAM Risk Assessment and Mitigation RBB Results Based Budgeting RBM Results-Based Management RCHS Reproductive Child Health Services U5MR Under-five Mortality Rate VPO Vice President’s Office UN United Nations UN-REACH United Nations – Reaching All Children against Hunger UNICEF United Nations Children’s Fund USAID United States Agency for International Development VAD Vitamin A Deficiency VPO Voluntary Private Organizations WASH Water, Sanitation and Hygiene WHA World Health Assembly WFP World Food Programme WHO World Health Organization

TANZANIA NATIONAL MULTISECTORAL NUTRITION ACTION PLAN (NMNAP) JULY 2016-2021
164
ANNEXES (available as separate documents)
Annex 1: Action Plan to Scale Up Maternal, Infant, Young Child and Adolescent Nutrition (MIYCAN)
Annex 2: Action Plan to Promote Optimal Intake of Essential Micronutrients
Annex 3: Action Plan to Scale Up Integrated Management of Acute Malnutrition (IMAM)
Annex 4: Action Plan to Scale Up Prevention and Management of Diet Related Non-Communicable Diseases (DRNCDs)
Annex 5: Action Plan to Promote Multisectoral Nutrition Sensitive Interventions
Annex 6: Action Plan to Strengthen Multisectoral Nutrition Governance
Annex 7: Action Plan to Establish a Multisectoral Nutrition Information System
i
Building Nutritious Food Baskets Project
MONITORING, EVALUATION AND LEARNING PLAN
AUGUST 1, 2016

ii
TABLE OF CONTENTS INTRODUCTION………………………………………………………………………………………………………………………………………………………..1
BNFB RESULTS FRAMEWORK…………………………………………………………………………………………………………………………………… 2
INDICATOR AND OUTPUTS………………………………………………………………………………………………………………………………………. 3
BNFB’S MONITORING, EVALUATION AND LEARNING MECHANISMS……………………………………………………….. 6
1. Monitoring and Learning Mechanisms……………………………………………………………………………………………………….. 6
2. Evaluation Mechanisms……………………………………………………………………………………………………………………………… 8
3. Data, Information, and Knowledge Management Mechanisms………………………………………………………………….. 8
Data Quality Assessment Plan……………………………………………………………………………………………………………….. 9
Project Reporting………………………………………………………………………………………………………………………………….. 10
Bi-weekly Progress Updates………………………………………………………………………………………………………………….. 10
Quarterly Progress Reports…………………………………………………………………………………………………………………… 10
Bi-annual Progress Reports…………………………………………………………………………………………………………………… 10
Annual Progress Reports…………………………………………………………………………………………………………………………10
Final Project Report……………………………………………………………………………………………………………………………… 11
4. Annual Project Review and Planning Meeting (APRPM)…………………………………………………………………………… 14
APPENDICES: ……………………………………………………………………………………………………………………………………………………….. 15
Appendix 1: The MEL Matrix ………………………………………………………………………………………………………………… 15
Appendix 2. Bi-weekly reporting template …………………………………………………………………………………………… 24
Appendix 3: Quarterly Reporting Template …………………………………………………………………………………………. 25
Appendix 4: Bi-annual/annual reporting templates ……………………………………………………………………………… 27
Appendix 5: Activity Attendance Register ……………………………………………………………………………………………. 35
Appendix 6: Resource Mobilization Tracking Tool (Indicator #4, appendix 1) ……………………………………….. 36
Appendix 7: Individuals Accessing Biofortified Crops Tracking Form……………………………………………………….37

1
INTRODUCTION
This document highlights the Monitoring, Evaluation and Learning (MEL) plan of the Building Nutritious
Food Baskets (BNFB) project for the 2016-2018 period. The plan provides a framework for collecting
accurate, relevant and timely information to enable the project meet information needs for learning
purposes. The plan further articulates performance indicators designed to track results in order to realise
the overarching goal. The MEL plan supplements the project document in terms of articulating the project
data collection demands as well as performance measurement along the set objectives.
The Plan consists of the M&E Framework, a list of key outputs and outcome indicators and a 3-year
performance tracking table/matrix. A set of monitoring and reporting tools is also included.
BNFB is a three year, USD 5 Million project that builds on the achievements, success, and scaling up
approaches of the Reaching Agents of Change (RAC) project and draws on complementary CGIAR
expertise for scaling up biofortified crops. The project broadens its focus from orange-fleshed
Sweetpotato (OFSP) to a multi-crop (“food basket”) approach. The project engages a range of partners,
including five core CGIAR centers and programs working on nutritious staple crops. These partners and
their focus on the project are the International Center for Tropical Agriculture (CIAT): iron/zinc beans; the
International Maize and Wheat Improvement Center (CIMMYT): biofortified pro-vitamin A (PVA) (orange)
maize, quality protein maize (QPM); the International Potato Center (CIP): OFSP; the International
Institute of Tropical Agriculture (IITA): yellow cassava and pro-vitamin A (orange) maize; HarvestPlus:
country-level promotion of bio fortification; and Forum for Agricultural Research in Africa (FARA): policy
engagement and advocacy at regional level.
The goal of the BNFB project is to help reduce hidden hunger by catalysing sustainable investment for the
utilization of biofortified crops at scale in Nigeria and Tanzania. Its specific purpose is to demonstrate how
scaling up can be achieved through a concerted effort by a range of CGIAR centers and programs along
with community, national, regional, and international stakeholders. These partners will work together on
advocacy, policy development, nutrition education, and behavior change communication (BCC) for
demand creation, capacity strengthening, and institutional learning to support the scaling up of multiple
bio fortified crops.
The project has two specific objectives:
(1) Strengthen the enabling environment for investments in bio fortified crops;
(2) Strengthen institutional and community capabilities to produce and consume bio fortified crops.
The project offers a unique opportunity for the centers, together with HarvestPlus (a CGIAR program) and
FARA to collaborate towards achieving this common goal. The project allows these organizations to work
collectively with the NARS to create meaningful linkages with the local private sector and to accelerate
release of seed varieties and multiplication of seeds/vines to fulfil consumer demand. The project focuses
on Nigeria and Tanzania, where the current momentum for bio fortification is strong.
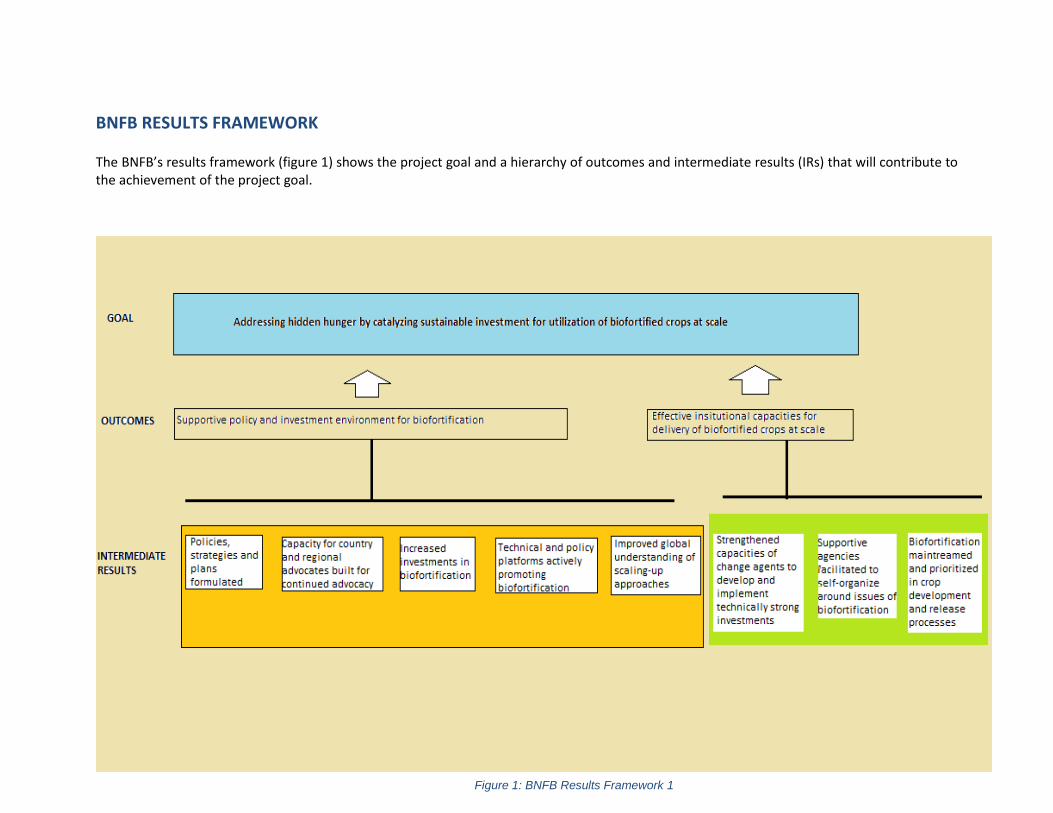
2
BNFB RESULTS FRAMEWORK
The BNFB’s results framework (figure 1) shows the project goal and a hierarchy of outcomes and intermediate results (IRs) that will contribute to the achievement of the project goal.
Figure 1: BNFB Results Framework 1

3
INDICATOR AND OUTPUTS
The project has 12 performance indicators as shown in tables 1 and 2. The outputs contributing to each indicator are also presented. Each outcome has a total of six indicators. The definition of and data collection plan for each indicator is provided in appendix 1.
Table 1: Outcome 1 Indicators and Outputs
Outcome Indicators Outputs
1. Supportive policy and
investment environments
for biofortification in
Nigeria and Tanzania, and
at regional level
Number of policy documents and strategic
plans that include/prioritize biofortification
within the agricultural and nutrition sectors
a) in Nigeria and Tanzania
b) at the regional level
a) Country and regional advocacy strategies and plans
b) Country multisectoral policy platforms
c) Value chains for biofortified crops included as priority in national and
regional agricultural / nutrition strategies and plans
Number of advocates and champions with
capacity for advocating for biofortification a)
in Nigeria and Tanzania b) at the regional
level
Number of new programs on biofortification
initiated by change agents in Nigeria and
Tanzania
Projects and programs that are gender sensitive mainstreamed at all levels of
the project cycle
Amount of resources ($) mobilized in
support of biofortification
a) Gender aware pro-poor, youth friendly and environmentally sensitive
country resource mobilization strategy/plans
b) Linkages and strategic alliances built and policy platforms
c) Engendered project proposals to mobilize resources
d) Promotion and advocacy materials in favor of biofortification
e) Nutrition education for BCC programs

4
Outcome Indicators Outputs
Number and type of key issues discussed
and prioritized for inclusion in policies
through the multisectoral technical and
policy platforms
Multisectoral technical and policy meetings on biofortified crops
Key elements of the scaling up model
documented and published
a) Joint MEL system to support learning and adaptive management by all
project partners
b) Processes, successes, and lessons learned white papers
c) Journal publications on scaling-up biofortified crops
Table 2: Outcome 2 Indicators and Outputs
Outcome Indicators Outputs
2. Effective institutional capacities (public, NGO and private) for delivery of biofortified crops at scale in Nigeria and Tanzania
Number of change agents with capacity to scale up biofortified crops
a) Targeted and gender mainstreamed ToT learning modules on priority areas for biofortified crops developed
b) capacities for institutions built to deliver these modules
c) Critical mass of service providers trained through the step-down cascading model
Number of agencies/institutions with capacity to design and implement projects and programs in support of biofortification
Change agents trained and have designed projects in support of biofortification

5
Number of households growing biofortified crops
a) Crop specific strategies to accelerate the up-take of biofortified crops
b) Crop specific champion platforms
c) National seed agencies, the private sector and farmer/ women/youth groups involved in large scale production of seeds of the biofortified crops
d) Study on effectiveness and sustainability of the three models of seed production systems
Percentage of national crop varieties in development that include biofortified traits
Pipeline varieties of biofortified crops officially released
Number of commercial processors processing biofortified food products
Commercial processors processing biofortified food products
Number of national crop programs and extension services (private and public) integrating / prioritizing biofortification and biofortified varieties of staple crops
Relevant varietal release committees include release criteria that give higher consideration to new crop varieties with enhanced micronutrient content.
6
BNFB’S MONITORING, EVALUATION AND LEARNING MECHANISMS
1. Monitoring and Learning Mechanisms
The Project monitoring will consist of 4 interrelated levels: at activity/process level, output level, outcome
level, and at the project’s goal level as described below;
I. Day to day activity/process monitoring – This will be done to determine whether the activities
as outlined in the work plans are implemented as designed (specification, quantity and quality)
and in time. Activity monitoring will involve simple methods such as recording participants in
respective functions and observing and recording processes. Activity/process monitoring will
seek to answer questions such as how many change agents attended training, how many cassava
cuttings were distributed, stage of implementation of the advocacy strategies, what type of
technologies for each commodity crop were inventoried etc. Implementing partners will be
responsible for managing activity/process data while Thematic Leaders1 will verify the
implementation through spot checks. Activity monitoring will be reported on a biweekly basis
(see project reporting section for details).
II. Output monitoring – Reporting on progress at the output level will be done on quarterly basis to
determine whether or not planned interventions and implemented activities are generating
anticipated outputs. For each output (e.g. engendered project proposals to mobilize resources,
commercial processors processing biofortified food products, pipeline varieties of biofortified
crops officially released), specified deliverables will act as the means of verification (such as
samples of the proposals, the commercial processor, the variety released). Thematic Leaders will
supervise the execution of outputs to enforce and verify quality (e.g. the quality of proposals
written, the quantity and quality of the processing of the products and the bio-chemical
composition of the varieties in trails/released). The M&E Specialist and the Project Manager will
backstop verification efforts of the Thematic Leaders through spot checks. Quarterly reporting
template (see appendix 3) and the Results Tracker will be adopted as key reporting tools.
III. Outcome monitoring –This will be reported 6 monthly and annually (where relevant) and will
provide important information regarding the extent to which delivered outputs are contributing
to expected outcomes. Table 3 shows the reporting schedule and responsibility for the 6
monthly and report.
Objective 1
BNFB will track progress in implementing the advocacy strategies with emphasis on monitoring
key outcomes (policy changes, resources mobilized, project/programs initiated). For policy
change, BNFB will track the number of supportive policies, strategy documents and plans at
country and regional levels that incorporate biofortification as the deliverables. Moreover, the
system will track funds mobilized (appendix 6) and how these funds are translating into
1 The PIs of the respective CGIAR centers, Seed System Consultant, Country Coordinators and the Capacity Development and Communications Specialist
7
programs and projects. It is understood that advocacy for policy change and investment can take
time to bear tangible deliverables. BNFB will develop milestones to monitor as a key indicator of
progress. These milestones will be described in the country and regional advocacy strategies.
Moreover, an online database will be designed to track the policy engagement processes and
key advocacy contacts.
Objective 2
BNFB will track outputs (change agents trained) and how they are generating the anticipated
outcomes (sustained investments that drive the uptake of the biofortified technologies).
Moreover, BNFB will track the number of households adopting biofortified varieties / crops
(appendix 7 for an example of the tool), working closely with ongoing projects by CGIAR and
other agencies that promote specific biofortified crops. With respect to the adoption indicators,
BNFB will align its MEL tools and process to be able build on the MEL systems in use by these
projects2. BNFB will monitor adoption figures over 5 years3, rather than the 3-year project
duration, for two reasons: (I) BNFB supported institutional and policy activities will take effect
with a lag-time due to prevailing cycles of policy implementation, planning, and agricultural
seasons, and (ii) The project seeks to track whether capacities are sustained for at least 2 years
beyond the project duration.
The Project Manager, backstopped by the Project Steering Committee will lead on outcome
monitoring. The M&E Specialist will backstop the verification efforts at this level and maintain
an up-to-date database.
Based on this, the Project Management Team will discuss and share observations with Bill &
Melinda Gates Foundation and partners regarding progress of implementation. The Project
Management Team will discuss notable delays or challenges and will provide appropriate support
advice to institute corrective measures. These reviews will be done mostly quarterly (outputs)
and bi-annually (outcomes) to reflect on the progress of implementation of the project
interventions.
IV. Goal level- This is discussed under the evaluation mechanisms section below.
2 BNFB partners could already be using different tools (especially for attendance and individuals obtaining biofortified crops). The tools presented in appendix 4-6 are CIP specific and only serve to show the important information that BNFB intends to capture whatever tool the partner may opt to use. 3 BNFB will build the capacity of national partners to continue collecting and managing indicator data even after the project comes to an end. Moreover, The BNFB consortium partners will still be active in these two countries and will be able to continue to monitor progress in this respect.

8
2. Evaluation Mechanisms
Knowing that evaluation is most effective when driven by specific questions, evaluation findings will
determine the need to revise planning assumptions or how the plans are to be implemented based on
new evidence and changing conditions. Evaluation thus forms the basis for adapting the BNFB
implementation plan to reflect the changing program context. The program will be subjected to various
internal studies to document the progress of the project. BNFB will also commission a data quality
assessment (DQA) at mid-term (18 months after project implementation) to review the veracity of the
data as reported by implementing partners.
Baseline and Target values
As a foundation for effective evaluation mechanisms, BNFB will conduct a situation analysis in Tanzania
and Nigeria at the onset of project implementation. This information will establish initial conditions
against which the progress of the project will be compared. The baseline values will also inform the setting
and/or refinement of performance targets. Based on the baseline figures, the project will establish
appropriate progress targets to pursue and upon which the results tracker will be completed.
3. Data, Information, and Knowledge Management Mechanisms
The project’s data collection approach for output deliverables and outcome indicators will be two
pronged; through project monitoring and periodic field surveys (baseline and end-line). Figure 2 shows
how the data emanating from the project monitoring will be collected, processed and utilized:
Figure 2: Data Flow and Management 1

9
BNFB will use an online automated database available at http://52.37.140.82. Each implementing
partner/staff will be provided with an operational manual for this system. The database also provides a
functionality to record/attach all evidences/means of verifications.
Information generated from the monitoring and evaluation system will be disseminated through case
stories and other information sharing mechanisms. The advocacy and seed system specific platforms,
knowledge fairs and diverse publications will provide important avenues to share lessons learned that
might be beneficial in both facilitating wider adoption of the most promising strategies and innovations
by value chain stakeholders and in the design and implementation of similar scaling-up projects. Other
channels for sharing information will include seminars, workshops, conferences, knowledge fairs, print,
social networking and electronic channels such as blogs and web sites. The Communications Specialist will
lead on these activities.
Identifying and analysing
lessons learned will be an on-
going process, and the need to
communicate such lessons is
one of the project's key
objectives. Partners will be
encouraged to document and
report lessons learned to
project management so that
appropriate compilation and
documentation is undertaken.
Data Quality Assessment Plan
All reported data will be subject to periodic data quality assessment. The M&E Specialist will ensure that
the data is properly documented, managed and updated on regular basis. It is essential that any data
collected and reported is of the best possible quality. If resources allow, in order to ensure data quality, a
Data Quality Audit (DQA) will be conducted by an independent M&E expert to verify data submitted from
all thematic areas. Each Thematic leader will be responsible for maintaining accurate and factual data for
his/her objective. Data audit will focus on critical elements of data quality, namely: validity, reliability,
timeliness, precision and integrity. The BNFB M&E Specialist will lead the process to ensure that
recommendations made by the data quality assessor are implemented. Also, since the project will be
implementing its project activities through partners, the project M&E specialist will ensure that the
implementing partners are well trained and briefed on data quality issues.
To analyse lessons, BNFB will adopt the definition framework of Mbabu et.al, (2014)
Experience: an encounter or practical contact with something, event or observation
Challenge: a difficulty in a task or undertaking that is stimulating to the one engaged in it
Findings: information discovered as a result of an inquiry, an act of discovery
Analysis: an examination of learning points by distilling the root causes of success or of a problem
Lesson learnt: change in process, behaviour or performance as a result of an experience
Recommendations: a prescription on what should be done in a specific circumstance

10
Project Reporting
Since the project is implemented in collaboration with other partners, it is imperative that a robust
reporting mechanism is put in place to track progress and mitigate delays in taking corrective action as
required. The following are the progress reports (appendix 2-4 are the reporting templates) under this
project:
Bi-weekly Progress Updates
The bi-weekly reports will be submitted by all project staff and will focus on the link between resource
utilization and activities executed. Thematic Leaders will in turn provide necessary feedback or corrective
action (copied to the Project Manager). An online report submission and collation system has been
developed (available at: http://52.37.140.82). Staff will be trained and a manual provided on how to use
this online platform.
Quarterly Progress Reports
The quarterly reports will link activities to respective outputs. The quarterly reports will provide an
opportunity to interrogate quality and timeliness of the delivery of expected outputs. Implementing
partners will submit the quarterly reports to the Country Coordinators in their respective countries who
will then consolidate country quarterly reports and submit the same to the Project Manager. These
reports will also highlight any implementation challenges so that appropriate strategy can be sought with
relevant key stakeholders.
Bi-annual Progress Reports
Thematic leaders will submit bi-annual progress reports to the Project Manager focusing on project
outputs under each objective every six months. These reports will be collated and synthesized
(translating project activities into outputs) by the thematic leaders who will share the reports with the
M&E Specialist for consolidation and verification of performance data. Similar to the quarterly reports,
these reports will also highlight any implementation challenges experienced so that appropriate strategy
can be sought with relevant key stakeholders. Though not a requirement, the bi-annual reports will be
shared with BMGF for information.
Annual Progress Reports
Two annual Technical Progress Reports will be prepared in the life of the project for submission to the
donor. These reports will comprehensively present project outputs and outcomes emerging during the
implementation period, significant achievements, observations, challenges encountered and
recommended strategies to address them. The reports will present an analysis of what will have been
found to be working well or not and attendant reasons. Specifically, the technical reports will capture
lessons learned for purposes of improving action. The information generated from the technical reports
will also be shared with key stakeholders.

11
Final Project Report
The project will prepare a final end-of-project report and submit it to the donor two months after the
project end date. This report will comprehensively summarize all the activities, outputs and outcomes of
the project, lessons learnt, objectives met, or not met and why. The report will also lay out
recommendations for any further steps that may need to be taken to ensure sustainability and
mainstreaming of project results into relevant national research and development organizations and
private sector initiatives.
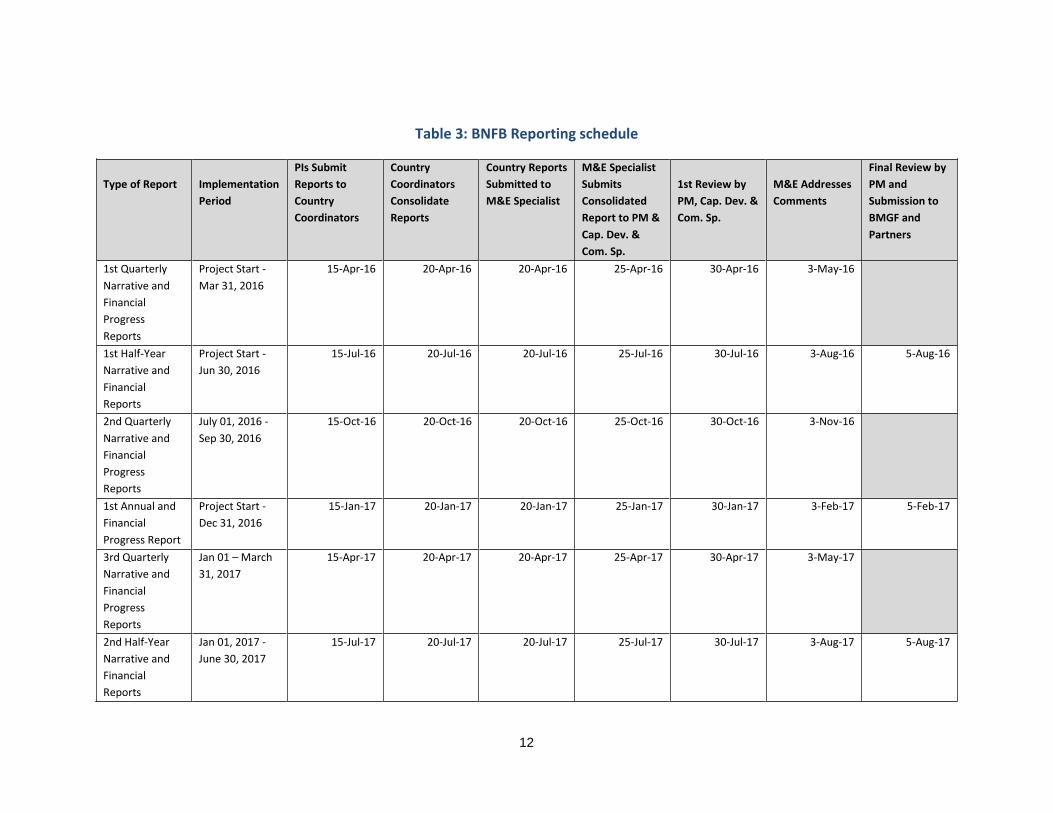
12
Table 3: BNFB Reporting schedule
Type of Report
Implementation
Period
PIs Submit
Reports to
Country
Coordinators
Country
Coordinators
Consolidate
Reports
Country Reports
Submitted to
M&E Specialist
M&E Specialist
Submits
Consolidated
Report to PM &
Cap. Dev. &
Com. Sp.
1st Review by
PM, Cap. Dev. &
Com. Sp.
M&E Addresses
Comments
Final Review by
PM and
Submission to
BMGF and
Partners
1st Quarterly
Narrative and
Financial
Progress
Reports
Project Start -
Mar 31, 2016
15-Apr-16 20-Apr-16 20-Apr-16 25-Apr-16 30-Apr-16 3-May-16
1st Half-Year
Narrative and
Financial
Reports
Project Start -
Jun 30, 2016
15-Jul-16 20-Jul-16 20-Jul-16 25-Jul-16 30-Jul-16 3-Aug-16 5-Aug-16
2nd Quarterly
Narrative and
Financial
Progress
Reports
July 01, 2016 -
Sep 30, 2016
15-Oct-16 20-Oct-16 20-Oct-16 25-Oct-16 30-Oct-16 3-Nov-16
1st Annual and
Financial
Progress Report
Project Start -
Dec 31, 2016
15-Jan-17 20-Jan-17 20-Jan-17 25-Jan-17 30-Jan-17 3-Feb-17 5-Feb-17
3rd Quarterly
Narrative and
Financial
Progress
Reports
Jan 01 – March
31, 2017
15-Apr-17 20-Apr-17 20-Apr-17 25-Apr-17 30-Apr-17 3-May-17
2nd Half-Year
Narrative and
Financial
Reports
Jan 01, 2017 -
June 30, 2017
15-Jul-17 20-Jul-17 20-Jul-17 25-Jul-17 30-Jul-17 3-Aug-17 5-Aug-17
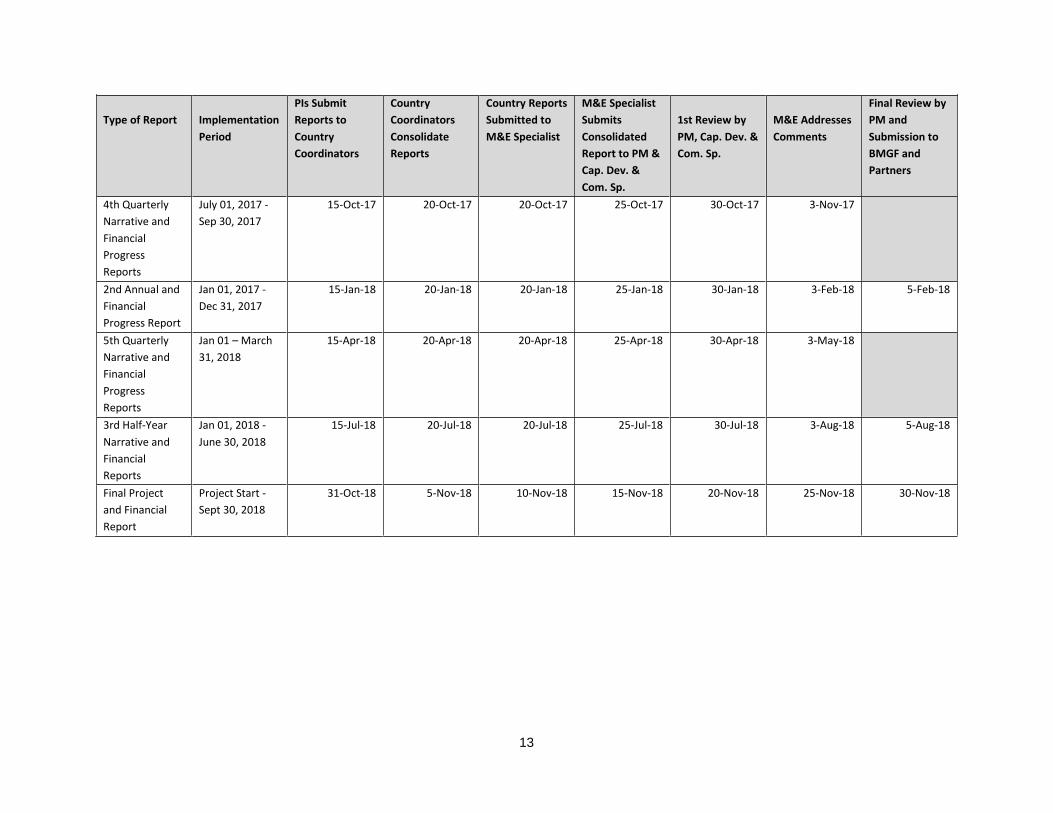
13
Type of Report
Implementation
Period
PIs Submit
Reports to
Country
Coordinators
Country
Coordinators
Consolidate
Reports
Country Reports
Submitted to
M&E Specialist
M&E Specialist
Submits
Consolidated
Report to PM &
Cap. Dev. &
Com. Sp.
1st Review by
PM, Cap. Dev. &
Com. Sp.
M&E Addresses
Comments
Final Review by
PM and
Submission to
BMGF and
Partners
4th Quarterly
Narrative and
Financial
Progress
Reports
July 01, 2017 -
Sep 30, 2017
15-Oct-17 20-Oct-17 20-Oct-17 25-Oct-17 30-Oct-17 3-Nov-17
2nd Annual and
Financial
Progress Report
Jan 01, 2017 -
Dec 31, 2017
15-Jan-18 20-Jan-18 20-Jan-18 25-Jan-18 30-Jan-18 3-Feb-18 5-Feb-18
5th Quarterly
Narrative and
Financial
Progress
Reports
Jan 01 – March
31, 2018
15-Apr-18 20-Apr-18 20-Apr-18 25-Apr-18 30-Apr-18 3-May-18
3rd Half-Year
Narrative and
Financial
Reports
Jan 01, 2018 -
June 30, 2018
15-Jul-18 20-Jul-18 20-Jul-18 25-Jul-18 30-Jul-18 3-Aug-18 5-Aug-18
Final Project
and Financial
Report
Project Start -
Sept 30, 2018
31-Oct-18 5-Nov-18 10-Nov-18 15-Nov-18 20-Nov-18 25-Nov-18 30-Nov-18

14
4. Annual Project Review and Planning Meeting (APRPM)
APRPM meetings will be held annually, preferably in October or November (at the end of the financial
year). The meetings will bring together the project team, advocates, representative(s) from Bill & Melinda
Gates Foundation, representatives from the governments of the two countries, regional champions, the
Project Steering Committee members and representatives from the platforms. These meetings will serve
as mechanisms for annual assessment of implementation progress, and will serve as an essential project
management tool to help highlight areas of critical reflections and extracting lessons learned for overall
improvement of project implementation. The APRPMs will inform development of the Annual Progress
Reports. The outcome of the APRPMs will also feed into the annual planning and will allow strategy
realignments. Project indicators will also be reviewed and updated as necessary during the APRs because
the M&E process will be maintained as a dynamic system. Additionally, the meeting will be used as a
forum for team building amongst key actors of the project and as a forum to share experiences and
exchange strategies.

15
APPENDICES:
Appendix 1: The MEL Matrix
Goal: To Reduce Hidden Hunger by Catalyzing Sustainable Investment for The Utilization of Biofortified Crops at Scale in Tanzania and Nigeria
Objective Indicator Definition of
Indicator
Disaggregati
on
Target
(2016)
Baseline
value
Means of
verification/ Source
of data
Frequen
cy of
Data
Collectio
n
Responsibility
Stre
ngt
he
n t
he
en
ablin
g e
nvi
ron
me
nt
for
inve
stm
en
ts
in b
io f
ort
ifie
d c
rop
s
1. Number of
policy documents
and strategic
plans that
include/prioritize
biofortification
within the
agricultural and
nutrition sectors
These are policy and
strategic technical
documents that
officially incorporate
issues of
biofortification as a
direct consequence
of BNFB's advocacy
and capacity
building initiatives.
This will be
computed by
looking at the new
policy and technical
documents that
incorporate
biofortification or
biofortified crops
compared with
By country
and at the
regional level
10 policy
strategic
documents
(7 by CIP, 3
FARA)
2 in Nigeria
(the National
Guideline on
Micronutrient
deficiency
control in
Nigeria in
2013;
Agriculture
Transformatio
n Agenda
2011) and 3 in
Tanzania (the
agricultural
strategy; the
nutrition
strategy
implementati
on plan; the
Published
government and
regional policy and
strategy documents
Bi-
annually
Country
Coordinators
(CIP) and
Regional
Advocacy
Advisor (FARA)
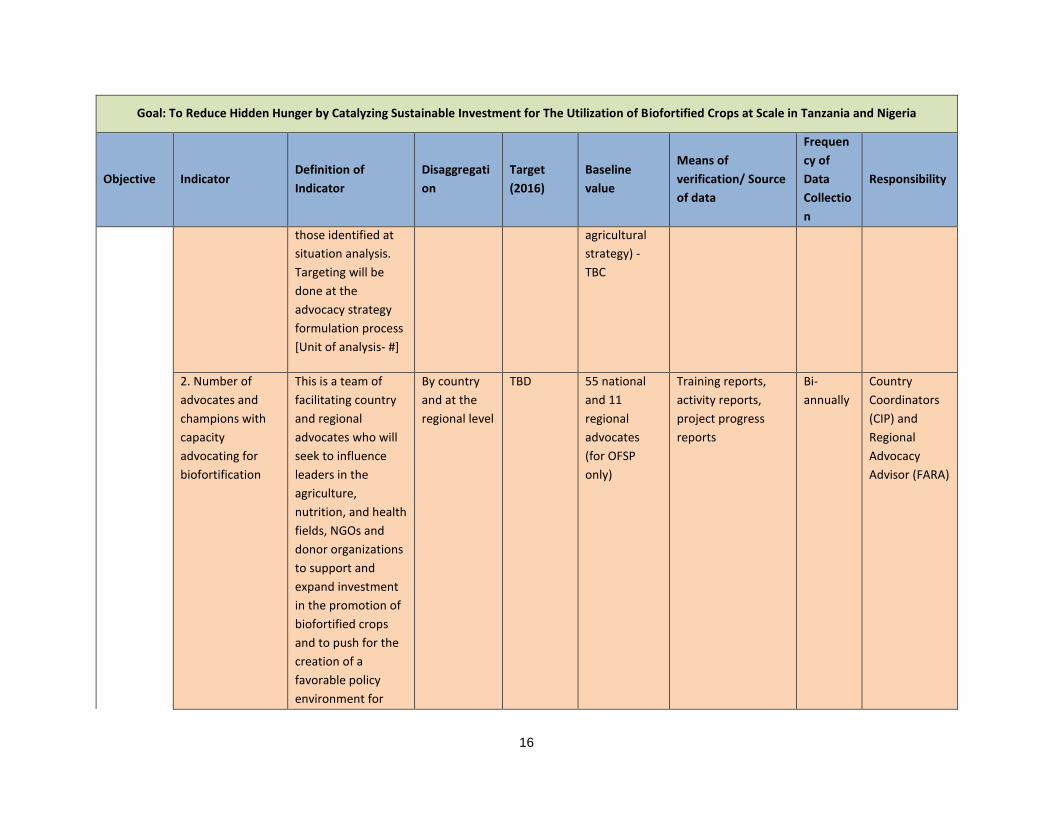
16
Goal: To Reduce Hidden Hunger by Catalyzing Sustainable Investment for The Utilization of Biofortified Crops at Scale in Tanzania and Nigeria
Objective Indicator Definition of
Indicator
Disaggregati
on
Target
(2016)
Baseline
value
Means of
verification/ Source
of data
Frequen
cy of
Data
Collectio
n
Responsibility
those identified at
situation analysis.
Targeting will be
done at the
advocacy strategy
formulation process
[Unit of analysis- #]
agricultural
strategy) -
TBC
2. Number of
advocates and
champions with
capacity
advocating for
biofortification
This is a team of
facilitating country
and regional
advocates who will
seek to influence
leaders in the
agriculture,
nutrition, and health
fields, NGOs and
donor organizations
to support and
expand investment
in the promotion of
biofortified crops
and to push for the
creation of a
favorable policy
environment for
By country
and at the
regional level
TBD 55 national
and 11
regional
advocates
(for OFSP
only)
Training reports,
activity reports,
project progress
reports
Bi-
annually
Country
Coordinators
(CIP) and
Regional
Advocacy
Advisor (FARA)
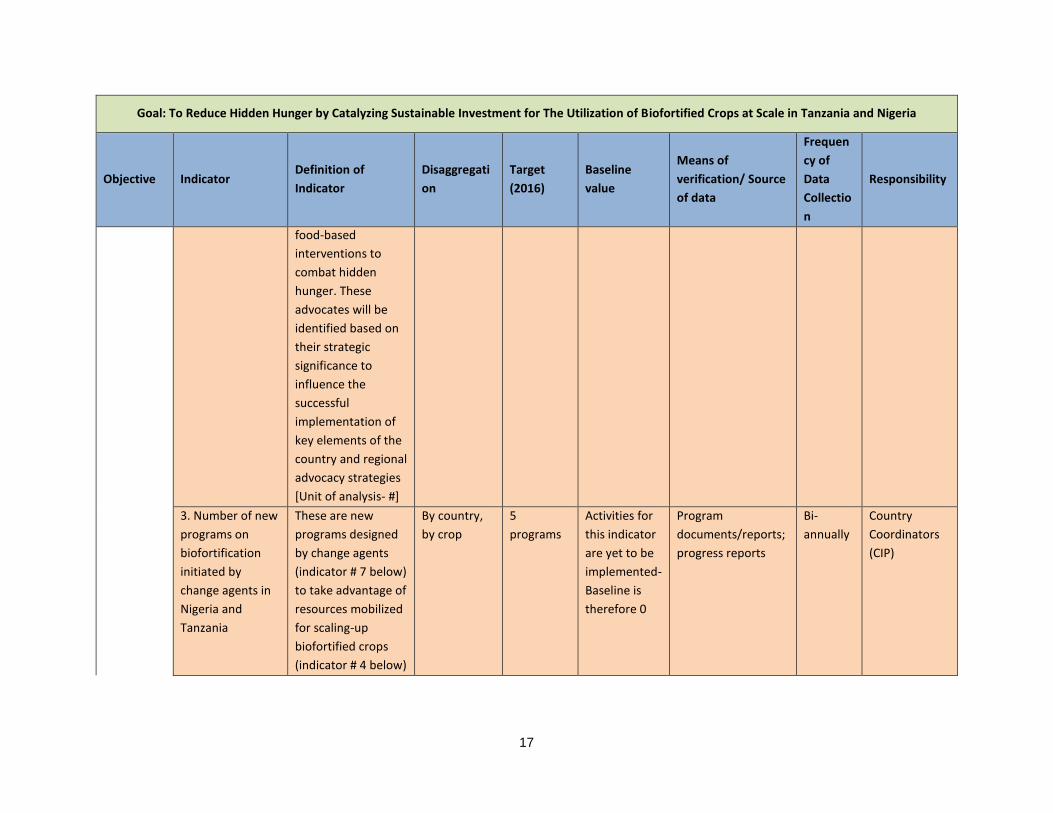
17
Goal: To Reduce Hidden Hunger by Catalyzing Sustainable Investment for The Utilization of Biofortified Crops at Scale in Tanzania and Nigeria
Objective Indicator Definition of
Indicator
Disaggregati
on
Target
(2016)
Baseline
value
Means of
verification/ Source
of data
Frequen
cy of
Data
Collectio
n
Responsibility
food-based
interventions to
combat hidden
hunger. These
advocates will be
identified based on
their strategic
significance to
influence the
successful
implementation of
key elements of the
country and regional
advocacy strategies
[Unit of analysis- #]
3. Number of new
programs on
biofortification
initiated by
change agents in
Nigeria and
Tanzania
These are new
programs designed
by change agents
(indicator # 7 below)
to take advantage of
resources mobilized
for scaling-up
biofortified crops
(indicator # 4 below)
By country,
by crop
5
programs
Activities for
this indicator
are yet to be
implemented-
Baseline is
therefore 0
Program
documents/reports;
progress reports
Bi-
annually
Country
Coordinators
(CIP)

18
Goal: To Reduce Hidden Hunger by Catalyzing Sustainable Investment for The Utilization of Biofortified Crops at Scale in Tanzania and Nigeria
Objective Indicator Definition of
Indicator
Disaggregati
on
Target
(2016)
Baseline
value
Means of
verification/ Source
of data
Frequen
cy of
Data
Collectio
n
Responsibility
4. Amount of
resources (in $)
mobilized in
support of
biofortification
This is the amount
of new resources
(not counting those
raised under RAC 1)
in US $ mobilized for
production,
dissemination and
use of biofortified
crops to combat
hidden hunger.
These will include
in-kind
contributions
specifically made
towards the
promotion of crops
e.g. value of salaries
of government staff
that are allocated to
promote biofortified
crops in their
regions
By country USD 10
million
Tanzania
(USD
4,033,501.5),
Nigeria (USD
1,262,479.42)
- Raised
under RAC
Funded project
proposals, award
letters
Bi-
annually
Country
Coordinators
(CIP)

19
Goal: To Reduce Hidden Hunger by Catalyzing Sustainable Investment for The Utilization of Biofortified Crops at Scale in Tanzania and Nigeria
Objective Indicator Definition of
Indicator
Disaggregati
on
Target
(2016)
Baseline
value
Means of
verification/ Source
of data
Frequen
cy of
Data
Collectio
n
Responsibility
5. Number and
type of key issues
discussed and
prioritized for
inclusion in
policies through
the multisectoral
technical and
policy platforms
These are key issues
discussed and
documented during
the annual
multisectoral
technical and policy
platform meetings
to address issues
related to indicators
# 1, 2, 4 above
By country TBD TBD Platform meeting
minutes, activity
reports
Quarterl
y
Country
Coordinators
(CIP)
6. Key elements of
the scaling up
model
documented and
published
BNFB is scaling-up
model. The project
will document and
publish at least
papers highlighting
key features of
scaling-up and
lessons learned
during the process
of implementation.
By topic, by
crop, by
partner
3 papers Activities for
this indicator
are yet to be
implemented-
Baseline is
therefore 0
Published articles,
activity reports
Bi-
annually
Project
Manager,
Capacity
Development
Specialist,
Partners and
M&E Specialist
Stre
ngt
he
n
inst
itu
tio
nal
an
d
com
mu
nit
y
cap
abili
tie
s to
pro
du
ce a
nd
con
sum
e b
io
fort
ifie
d c
rop
s
7. Number of
change agents
with capacity to
scale up
biofortified crops
BNFB will select
strategic individuals
(ToTs) on specific
content along the
crops value chain to
accelerate the
By country,
by crop
10,000
agents
Activities for
this indicator
are yet to be
implemented-
Baseline is
therefore 0
Training reports,
project progress
reports
Bi-
annually
Capacity
Development
and
Communicatio
ns Specialist
(CIP)
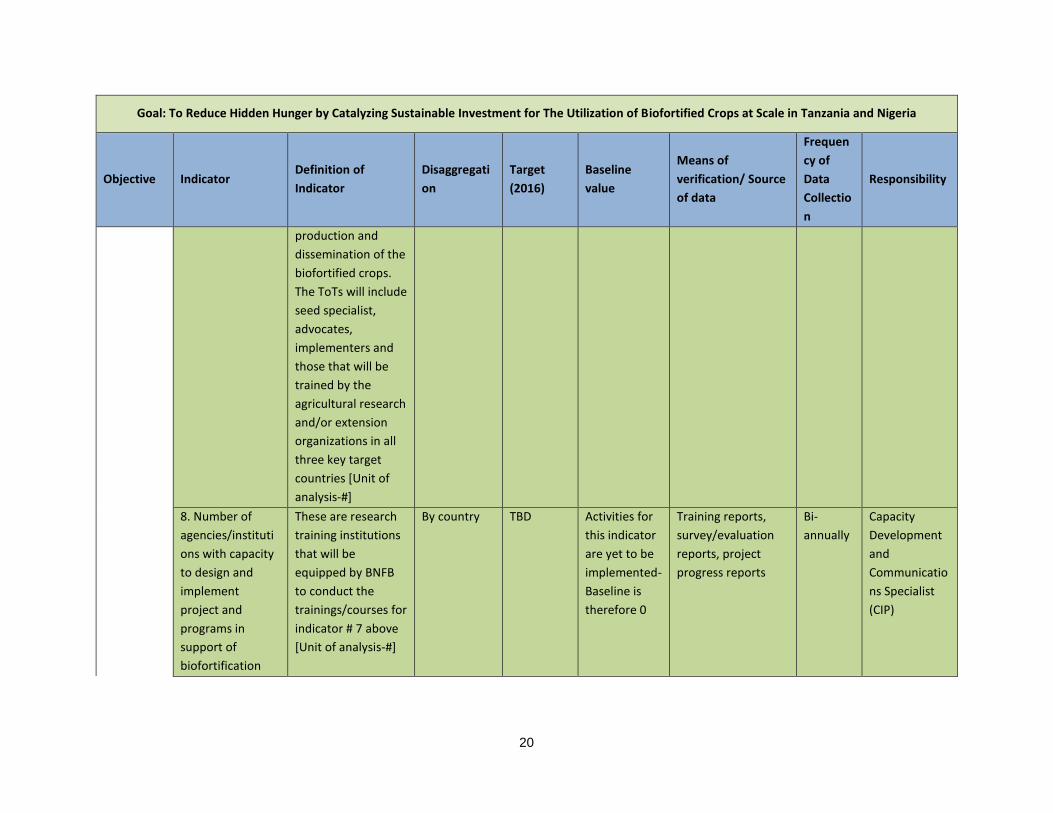
20
Goal: To Reduce Hidden Hunger by Catalyzing Sustainable Investment for The Utilization of Biofortified Crops at Scale in Tanzania and Nigeria
Objective Indicator Definition of
Indicator
Disaggregati
on
Target
(2016)
Baseline
value
Means of
verification/ Source
of data
Frequen
cy of
Data
Collectio
n
Responsibility
production and
dissemination of the
biofortified crops.
The ToTs will include
seed specialist,
advocates,
implementers and
those that will be
trained by the
agricultural research
and/or extension
organizations in all
three key target
countries [Unit of
analysis-#]
8. Number of
agencies/instituti
ons with capacity
to design and
implement
project and
programs in
support of
biofortification
These are research
training institutions
that will be
equipped by BNFB
to conduct the
trainings/courses for
indicator # 7 above
[Unit of analysis-#]
By country TBD Activities for
this indicator
are yet to be
implemented-
Baseline is
therefore 0
Training reports,
survey/evaluation
reports, project
progress reports
Bi-
annually
Capacity
Development
and
Communicatio
ns Specialist
(CIP)
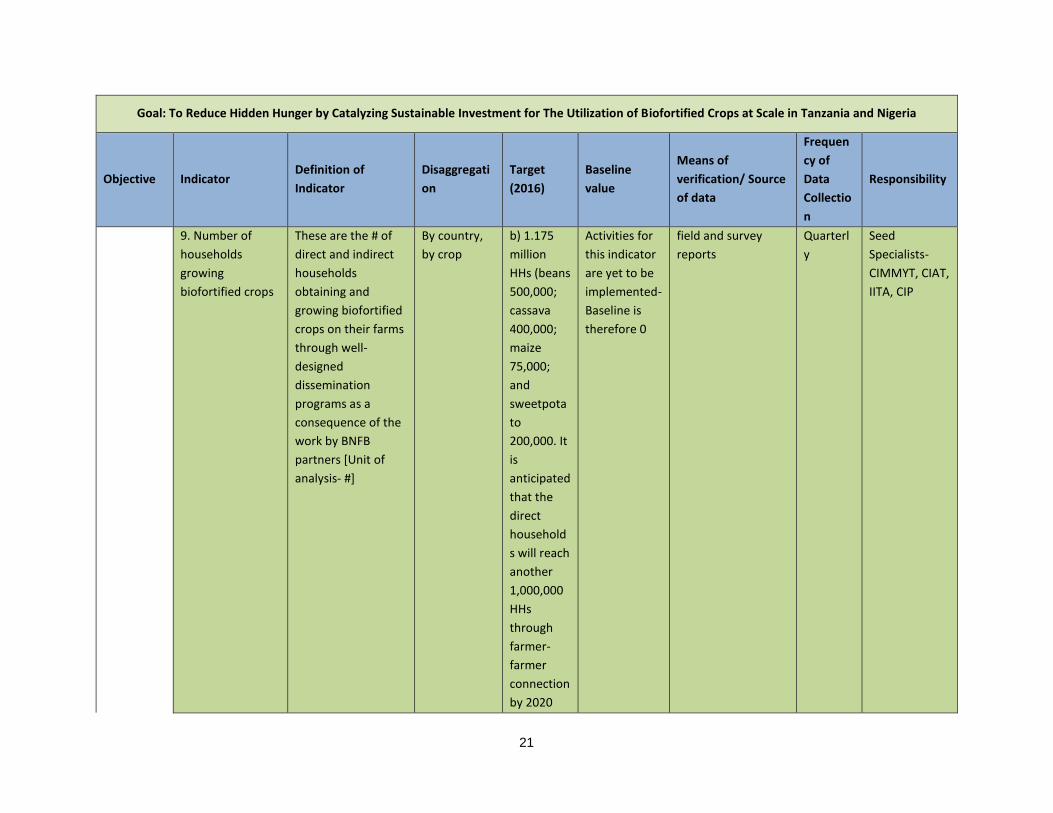
21
Goal: To Reduce Hidden Hunger by Catalyzing Sustainable Investment for The Utilization of Biofortified Crops at Scale in Tanzania and Nigeria
Objective Indicator Definition of
Indicator
Disaggregati
on
Target
(2016)
Baseline
value
Means of
verification/ Source
of data
Frequen
cy of
Data
Collectio
n
Responsibility
9. Number of
households
growing
biofortified crops
These are the # of
direct and indirect
households
obtaining and
growing biofortified
crops on their farms
through well-
designed
dissemination
programs as a
consequence of the
work by BNFB
partners [Unit of
analysis- #]
By country,
by crop
b) 1.175
million
HHs (beans
500,000;
cassava
400,000;
maize
75,000;
and
sweetpota
to
200,000. It
is
anticipated
that the
direct
household
s will reach
another
1,000,000
HHs
through
farmer-
farmer
connection
by 2020
Activities for
this indicator
are yet to be
implemented-
Baseline is
therefore 0
field and survey
reports
Quarterl
y
Seed
Specialists-
CIMMYT, CIAT,
IITA, CIP

22
Goal: To Reduce Hidden Hunger by Catalyzing Sustainable Investment for The Utilization of Biofortified Crops at Scale in Tanzania and Nigeria
Objective Indicator Definition of
Indicator
Disaggregati
on
Target
(2016)
Baseline
value
Means of
verification/ Source
of data
Frequen
cy of
Data
Collectio
n
Responsibility
10. Percentage of
crop varieties in
development that
include
biofortified traits
During the situation
analysis, BNFB will
analyze the maize,
beans, sweetpotato,
cassava varieties at
advanced stages of
release and which
among these are
biofortified. The
project will then
target to catalyze
the release of at
least 12 varieties of
the biofortified
advanced materials
[Unit of analysis- #]
By country,
by crop
12
varieties in
the
pipeline-To
be
confirmed
(3 CIAT, 4
CIP, 3
CIMMYT, 2
IITA
12 varieties in
the pipeline-
To be
confirmed
Technical and
variety release, field
and survey reports
Bi-
annually
Seed
Specialists-
CIMMYT, CIAT,
IITA, CIP
11. Number of
commercial
processors
processing
biofortified food
products
These are the new
commercial
processors
processing
biofortified food
products as a
consequence of
BNFB's advocacy
efforts (linking
farmers with
By country,
by crop
4
commercia
l
processors
(1 CIP, 1
CIMMYT, 2
IITA)
This will be
new
processors.
Activities for
this indicator
are yet to be
implemented-
Baseline is
therefore 0
field and survey
reports
Bi-
annually
Seed
Specialists-
CIMMYT, IITA,
CIP + Country
Coordinators

23
Goal: To Reduce Hidden Hunger by Catalyzing Sustainable Investment for The Utilization of Biofortified Crops at Scale in Tanzania and Nigeria
Objective Indicator Definition of
Indicator
Disaggregati
on
Target
(2016)
Baseline
value
Means of
verification/ Source
of data
Frequen
cy of
Data
Collectio
n
Responsibility
processors for
scaled-up
processing of
biofortified crops)-
[Unit of analysis- #]
12. Number of
national crop
programs and
extension services
(private and
public) integrating
/ prioritizing
biofortification
and biofortified
varieties of staple
crops
Through advocacy,
BNFB will influence
the mainstreaming
of biofortification in
the national crop
breeding programs
of Tanzania and
Nigeria - and
biofortified varieties
of staple crops
prioritized in the
development and
release process of
these two countries.
These will be
included in the
national crop
legislations/laws/pol
icy documents [Unit
of analysis- #]
By country 2 national
programs,
1 each for
Tanzania
and
Nigeria
Activities for
this indicator
are yet to be
implemented-
Baseline is
therefore 0
Field, project
progress reports,
specific national
crop
legislations/laws/pol
icy documents
Bi-
annually
Seed
Specialists-
CIMMYT, CIAT,
IITA, CIP +
Country
Coordinators

24
Appendix 2. Bi-weekly reporting template
NAME:
PERIOD:
1. Accomplishments Last Two Weeks
No. Output/Milestone Activities Last Two Weeks
1
2
2. What are the major challenges you are facing (bold things that you need action on as soon as possible)?
3. Any major events planned for the next two months
No. Output/Milestone Activities Planned for the Next Two Months
1
2
4. What are the five major things your team will undertake in the next 2 weeks?
No. Output/Milestone Activities to be Undertaken in the Next Two Weeks
1
2
5. Any upcoming events, visitors or mission the team should know about?
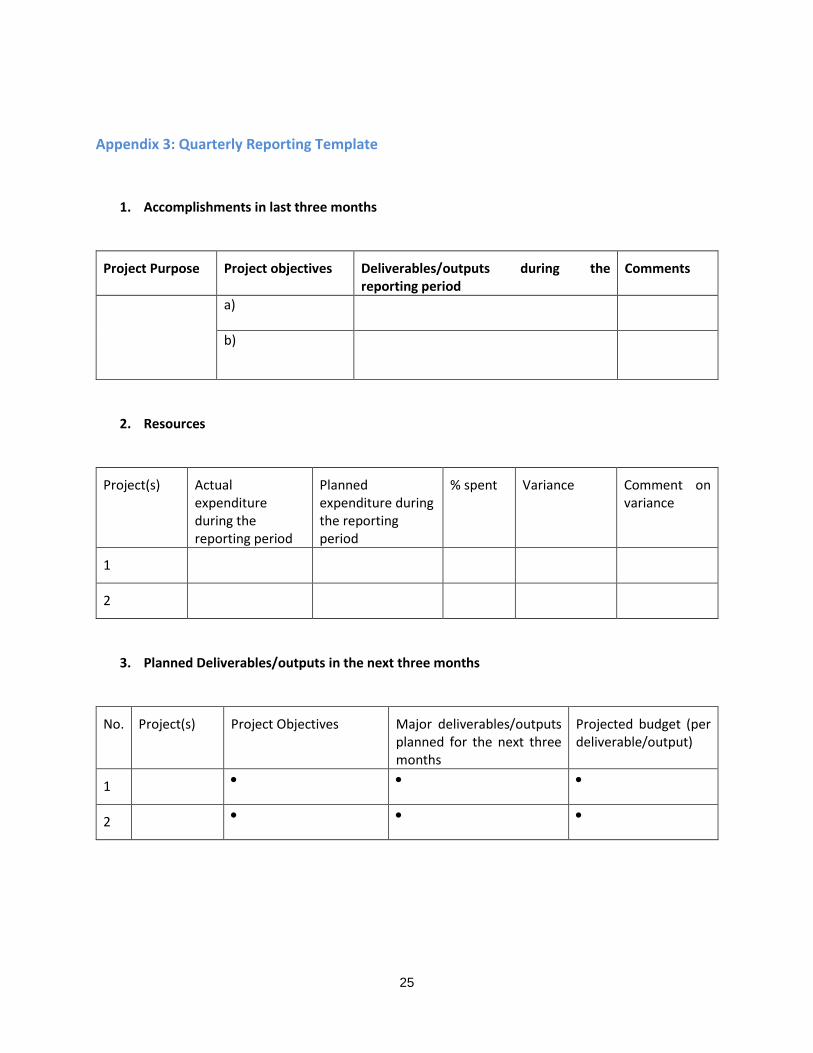
25
Appendix 3: Quarterly Reporting Template
1. Accomplishments in last three months
Project Purpose Project objectives Deliverables/outputs during the reporting period
Comments
a)
b)
2. Resources
Project(s) Actual expenditure during the reporting period
Planned expenditure during the reporting period
% spent Variance Comment on variance
1
2
3. Planned Deliverables/outputs in the next three months
No. Project(s) Project Objectives Major deliverables/outputs planned for the next three months
Projected budget (per deliverable/output)
1
2

26
Management Issues
State key challenges encountered in the last three months; steps taken to overcome the respective
challenges; and pending matters for resolution
Key Management Issues and Challenges
Action(s) Taken Recommendation or Pending matters for resolution
I. Management & governance
II. Partners
III. Donors
IV. Host government
V. Other (Specify)
5. Strategic Outlook
a. State of the national strategy – articulation of expected outcomes and impact at scale
b. Gaps between current project portfolio and expected outcomes and impact at scale
c. Opportunities to fill the gaps between expected outcomes and impact at scale
27
Appendix 4: Bi-annual/annual reporting templates
Period: (e.g. January-June 2016)
Report by: (indicate your organization)

28
Table of Contents
List of Acronyms and Abbreviations
II. Project Progress and Results
Executive Summary
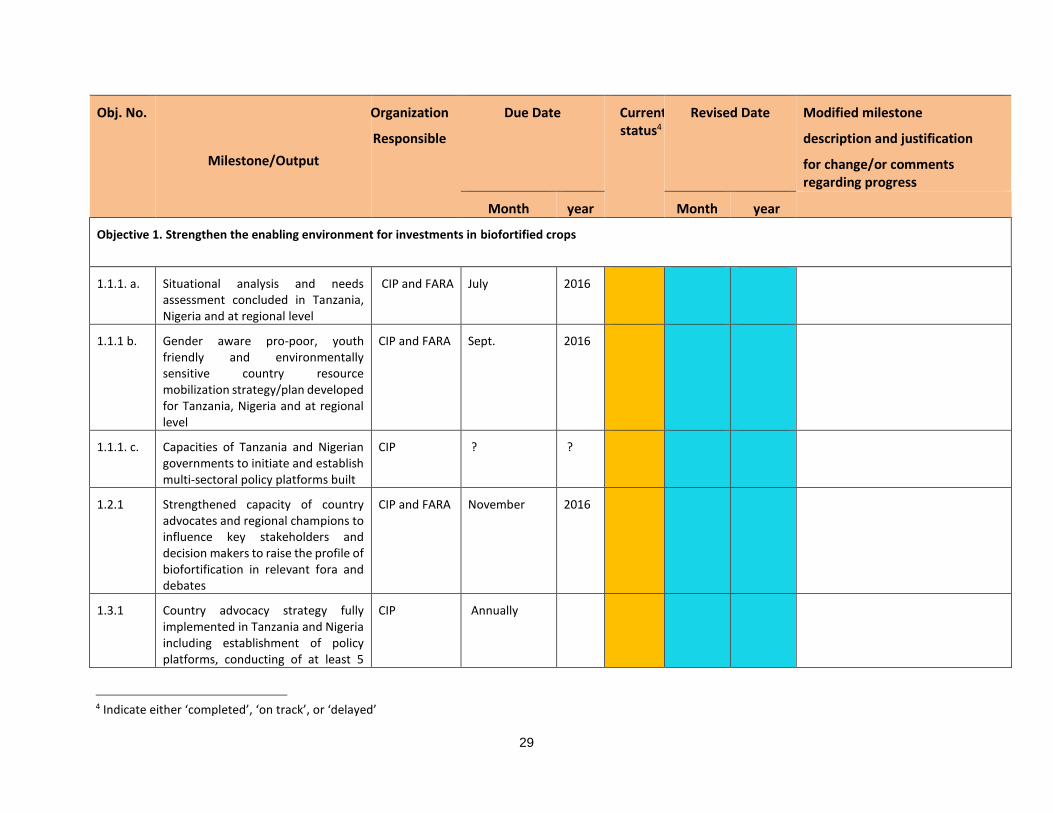
29
Obj. No.
Milestone/Output
Organization
Responsible
Due Date Current status4
Revised Date Modified milestone
description and justification
for change/or comments regarding progress
Month year Month year
Objective 1. Strengthen the enabling environment for investments in biofortified crops
1.1.1. a. Situational analysis and needs assessment concluded in Tanzania, Nigeria and at regional level
CIP and FARA July
2016
1.1.1 b. Gender aware pro-poor, youth friendly and environmentally sensitive country resource mobilization strategy/plan developed for Tanzania, Nigeria and at regional level
CIP and FARA Sept. 2016
1.1.1. c. Capacities of Tanzania and Nigerian governments to initiate and establish multi-sectoral policy platforms built
CIP ? ?
1.2.1 Strengthened capacity of country advocates and regional champions to influence key stakeholders and decision makers to raise the profile of biofortification in relevant fora and debates
CIP and FARA November 2016
1.3.1 Country advocacy strategy fully implemented in Tanzania and Nigeria including establishment of policy platforms, conducting of at least 5
CIP Annually
4 Indicate either ‘completed’, ‘on track’, or ‘delayed’

30
Obj. No.
Milestone/Output
Organization
Responsible
Due Date Current status4
Revised Date Modified milestone
description and justification
for change/or comments regarding progress
Month year Month year advocacy campaigns or events per year
1.3.2 Regional advocacy strategy fully implemented leading to biofortification included in regional agricultural strategies and plans
FARA December 2017
1.3.3 Advocacy/ Promotion/ BCC Materials & Supplies & Visibility (Branding and Marketing) and media engagement developed/conducted
CIP and FARA Sept. 2016
1.4. At least 10 million US$ committed by donor, philanthropists, private sector or government for biofortification
CIP Oct. 2018
1.5. MEL system to support learning and adaptive management by all project partners designed and processes, successes, and lessons learned white papers documented
CIP, CIMMYT, CIAT
June
November
June
2017
2017
2018
Objective 2. Strengthen institutional and community capabilities to produce and consume biofortified crops
2.1.1 Targeted and gender mainstreamed ToT learning modules on priority areas for biofortified crops
CIAT, CIMMYT, IITA, CIP, Kibaha Research Institute (KRI)
June
December
December
2018
2016
2016
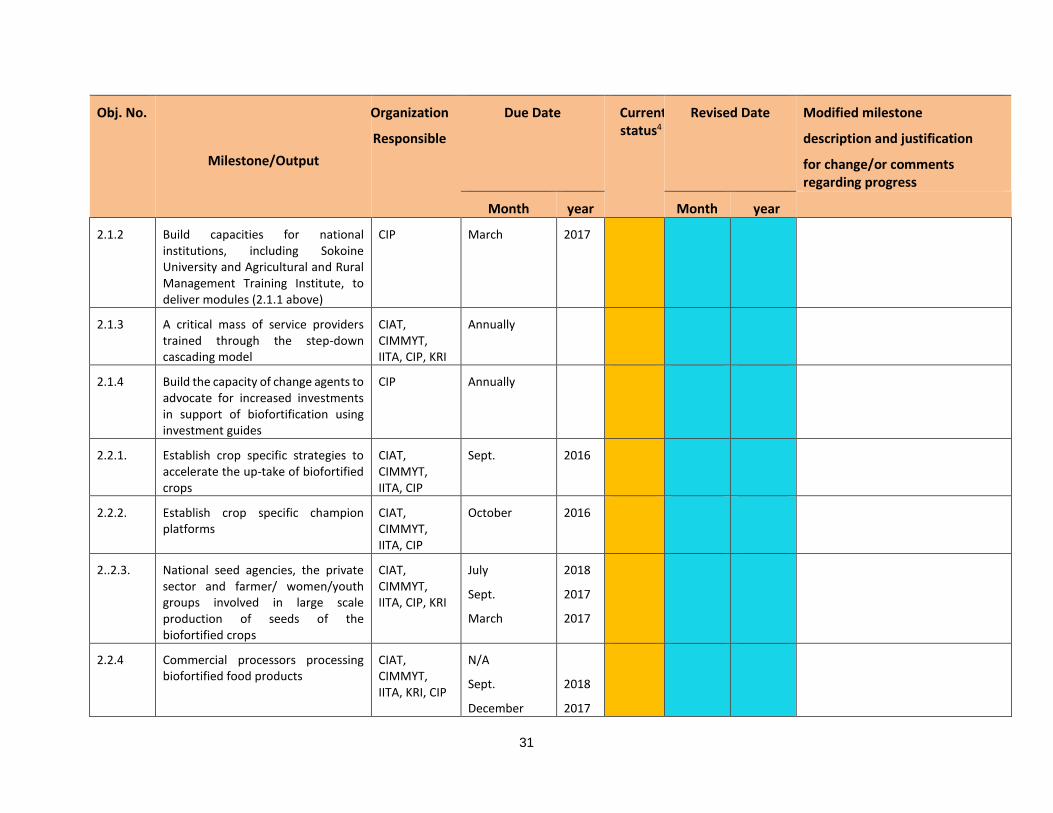
31
Obj. No.
Milestone/Output
Organization
Responsible
Due Date Current status4
Revised Date Modified milestone
description and justification
for change/or comments regarding progress
Month year Month year
2.1.2 Build capacities for national institutions, including Sokoine University and Agricultural and Rural Management Training Institute, to deliver modules (2.1.1 above)
CIP March 2017
2.1.3 A critical mass of service providers trained through the step-down cascading model
CIAT, CIMMYT, IITA, CIP, KRI
Annually
2.1.4 Build the capacity of change agents to advocate for increased investments in support of biofortification using investment guides
CIP Annually
2.2.1. Establish crop specific strategies to accelerate the up-take of biofortified crops
CIAT, CIMMYT, IITA, CIP
Sept. 2016
2.2.2. Establish crop specific champion platforms
CIAT, CIMMYT, IITA, CIP
October 2016
2..2.3. National seed agencies, the private sector and farmer/ women/youth groups involved in large scale production of seeds of the biofortified crops
CIAT, CIMMYT, IITA, CIP, KRI
July
Sept.
March
2018
2017
2017
2.2.4 Commercial processors processing biofortified food products
CIAT, CIMMYT, IITA, KRI, CIP
N/A
Sept.
December
2018
2017
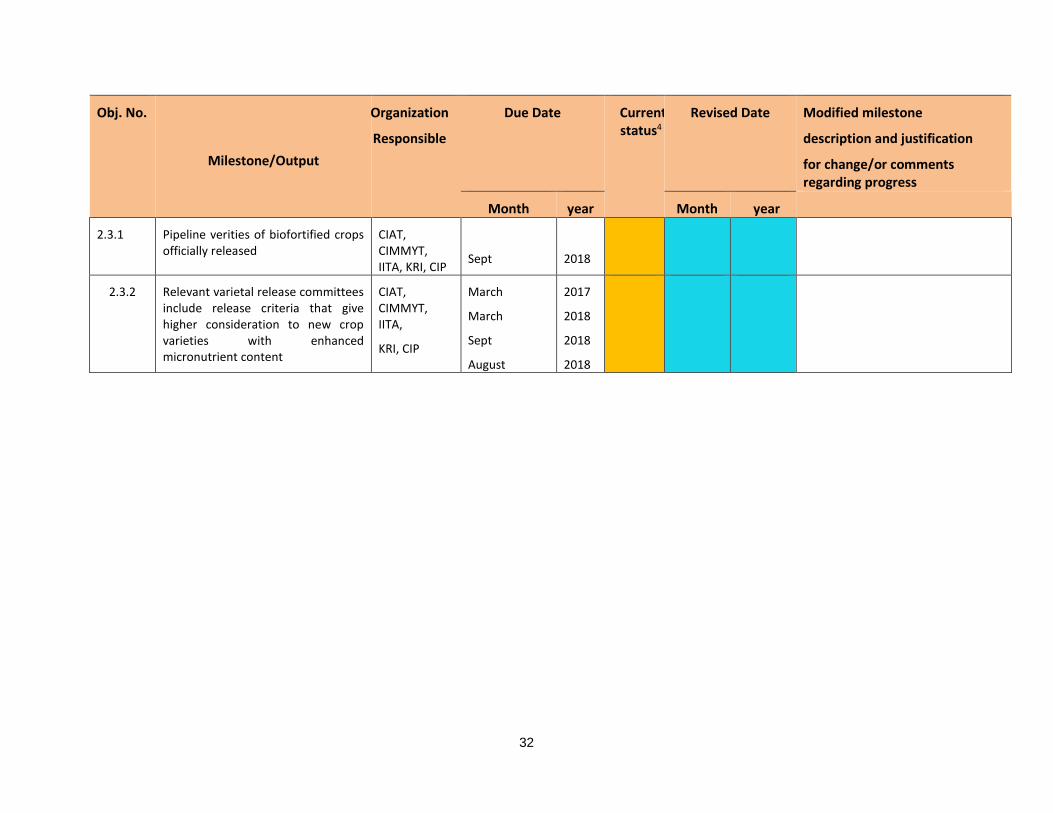
32
Obj. No.
Milestone/Output
Organization
Responsible
Due Date Current status4
Revised Date Modified milestone
description and justification
for change/or comments regarding progress
Month year Month year
2.3.1 Pipeline verities of biofortified crops officially released
CIAT, CIMMYT, IITA, KRI, CIP
Sept
2018
2.3.2 Relevant varietal release committees include release criteria that give higher consideration to new crop varieties with enhanced micronutrient content
CIAT, CIMMYT, IITA,
KRI, CIP
March
March
Sept
August
2017
2018
2018
2018
33
Progress Narrative
Objective 1. Strengthen the enabling environment for investments in biofortified crops
IR 1.1. Policies, strategies, and plans developed/formulated and implemented that prioritize support
to biofortification to accelerate the scaling of biofortified crops within wider agricultural and
nutrition/health sectors
IR 1.2. Capacity for advocates and champions built for continued advocacy for biofortification in
Tanzania and Nigeria
IR 1.3. Increased investments by public, private, and NGO sectors in support of biofortification
IR 1.4. Technical and policy platforms actively promoting evidence-based support for biofortification
IR 1.5. Improved global understanding of scaling-up approaches
Objective 2. Strengthen institutional and community capabilities to produce and consume biofortified crops
IR 2.1. Strengthened capacities and competencies of investors and executing institutions to design and
implement technically strong, cost-effective, and gender-sensitive investments that drive uptake of
biofortified crops
IR 2.2. Enhanced awareness of and increased organizational action for biofortification among key
stakeholder groups (farmer organizations, marketers, processors, consumer groups)
IR 2.3. Biofortification increasingly mainstreamed in national nutrition programs and NARS crop
programs, and biofortified varieties of staple crops prioritized in development, release, and utilization
B. Key Milestone Deviation
C. Course Correction.
D. Plans for Next Reporting Period.
E. Risks.
F. Sustainability.
G. Lessons Learned.

34
III. Budget Progress and Results
1. Summary
Briefly describe how total project spending to date compares against the budget and how your assumptions may have changed as the project progressed.
2. Latest Period Variance
Provide explanation for any cost category variances outside the allowable range. Explain causes, consequences for the project, and mitigation plans if relevant. Report whether or not approval for the variance has been obtained from your Program Officer. Note: “Latest period variance” compares actuals to previous projections for the period
3. Total Grant Variance
Provide explanation for any cost category variances outside the allowable range. Explain causes, consequences for the project, and mitigation plans if relevant. Report whether or not approval for the variance has been obtained from your Program Officer. Note: “Total grant variance” compares actuals plus current projections to the budget
4. Interest Earned
Describe how interest earned and/or currency gains were used to support the project
IV. Annexes

35
Appendix 5: Activity Attendance Register
PARTICIPANTS ATTENDANCE REGISTER
ACTIVITY: ______________________________________________________________
DATE: _______________
No. NAME GENDER ORGANIZATION DESIGNATION MOBILE.
No
E-mail ADDRESS

36
Appendix 6: Resource Mobilization Tracking Tool (Indicator #4, appendix 1)
Resource Mobilization Monitoring tool
Country:
Implementing Institution
Category of implementing Institution5
Donor Project Focus
Budget (US$)
Location of Project
Status of Project
Duration of Project/
Evidence of Investment
e.g. OFSP Total Activity
e.g. HKI, “Enhancing Agriculture for Better Nutrition6”
e.g. NGO e.g. Irish Aid
e.g. Vine multiplication, dissemination, nutrition education
$1.5M Tete Province
Completed
Two years, 2012–2014
Award letter
Total
5 Use the following categories: NGO, INGO, Federal/central government, State/Local government, Private, CBO/FBO
6 This first row is for illustration purposes

37
Appendix 7: Individuals Accessing Biofortified Crops Tracking Form