A Search for Extended Ultraviolet Disk (XUV‐Disk) Galaxies in the Local Universe
Upload
independentCategory
view
1download
0
The Astrophysical Journal, 717:289–322, 2010 July 1 doi:10.1088/0004-637X/717/1/289C© 2010. The American Astronomical Society. All rights reserved. Printed in the U.S.A.
THE STRUCTURE AND KINEMATICS OF THE CIRCUMGALACTIC MEDIUM FROM FAR-ULTRAVIOLETSPECTRA OF z � 2–3 GALAXIES∗
Charles C. Steidel1, Dawn K. Erb
2,8, Alice E. Shapley
3,9,10, Max Pettini
4,5, Naveen Reddy
6,11, Milan Bogosavljevic
1,
Gwen C. Rudie1, and Olivera Rakic
71 California Institute of Technology, MS 249-17, Pasadena, CA 91125, USA
2 Department of Physics, University of California Santa Barbara, Santa Barbara, CA 93106, USA3 Department of Physics and Astronomy, University of California Los Angeles, 430 Portola Plaza, Box 951547, Los Angeles, CA 90095, USA
4 Institute of Astronomy, Madingley Road, Cambridge CB3 OHA, UK5 International Centre for Radio Astronomy Research, University of Western Australia, 35 Stirling Highway, Crawley, WA 6009, Australia
6 National Optical Astronomy Observatories, 950 North Cherry Avenue, Tucson, AZ 85258, USA7 Leiden Observatory, Leiden University, P.O. Box 9513, 2300 RA Leiden, The Netherlands
Received 2010 February 22; accepted 2010 May 11; published 2010 June 10
ABSTRACT
We present new results on the kinematics and spatial distribution of metal-enriched gas within ∼125 kpc ofstar-forming (“Lyman break”) galaxies at redshifts 2 � z � 3. In particular, we focus on constraints providedby the rest-frame far-ultraviolet (far-UV) spectra of faint galaxies, and demonstrate how galaxy spectra can beused to obtain key spatial and spectral information more efficiently than possible with QSO sightlines. Using asample of 89 galaxies with 〈z〉 = 2.3 ± 0.3 and with both rest-frame far-UV and Hα spectra, we re-calibratethe measurement of accurate galaxy systemic redshifts using only survey-quality rest-UV spectra. We use thevelocity-calibrated sample to investigate the kinematics of the galaxy-scale outflows via the strong interstellar(IS) absorption lines and Lyα emission (when present), as well as their dependence on other physical propertiesof the galaxies. We construct a sample of 512 close (1′′–15′′) angular pairs of z ∼ 2–3 galaxies with redshiftdifferences indicating a lack of physical association. Sightlines to the background galaxies provide new informationon the spatial distribution of circumgalactic gas surrounding the foreground galaxies. The close pairs samplegalactocentric impact parameters 3–125 kpc (physical) at 〈z〉 = 2.2, providing for the first time a robust map ofcool gas as a function of galactocentric distance for a well-characterized population of galaxies. We propose asimple model of circumgalactic gas that simultaneously matches the kinematics, depth, and profile shape of ISabsorption and Lyα emission lines, as well as the observed variation of absorption line strength (H i and severalmetallic species) versus galactocentric impact parameter. Within the model, cool gas is distributed symmetricallyaround every galaxy, accelerating radially outward with vout(r) increasing with r (i.e., the highest velocities arelocated at the largest galactocentric distances r). The inferred radial dependence of the covering fraction of coolgas (which modulates the absorption line strength) is fc(r) ∝ r−γ with 0.2 � γ � 0.6 depending on transition.We discuss the results of the observations in the context of “cold accretion,” in which cool gas is accretingvia filamentary streams directly onto the central regions of galaxies. At present, we find little observationalevidence for cool infalling material, while evidence supporting the large-scale effects of superwind outflowsis strong. This “pilot” study using faint galaxy spectra demonstrates the potential of using galaxies to tracebaryons within galaxies, in the circumgalactic medium, and ultimately throughout the intergalactic medium.
Key words: cosmology: observations – galaxies: evolution – galaxies: high-redshift
Online-only material: color figures
1. INTRODUCTION
Observational studies of the galaxy formation process arereaching a critical juncture, where the accumulation rate ofnew data may be overtaking our ability to reach new under-standing. There are now many large surveys designed to studygalaxy formation and evolution over ever-increasing volumesand redshift ranges, backed by the unquestionable power ofmultiwavelength observations from X-rays to the far-infrared(far-IR)/submillimeter and radio. Interpretation of survey data
∗ Based on data obtained at the W. M. Keck Observatory, which is operated asa scientific partnership among the California Institute of Technology, theUniversity of California, and NASA, and was made possible by the generousfinancial support of the W. M. Keck Foundation.8 Spitzer Fellow.9 Alfred P. Sloan Fellow.10 Packard Fellow.11 Hubble Fellow.
is aided by a multitude of theoretical results based on simula-tions and/or semi-analytic calculations. However, many of themost fundamental remaining questions in galaxy formation in-volve complex baryonic processes that are difficult to model, arenot well constrained by current observations, or involve physicsthat are not yet well understood.
While there is general agreement about the development ofstructure in the dark matter component on scales larger thanthat of galaxies, the astrophysics of the baryonic response tothe dark matter structure, the subsequent feedback of energyfrom star formation, supernova explosions, and accretion energyfrom the growth of supermassive black holes, and the flow ofgas into and out of galaxies, remain largely unconstrained—andthus subject to substantial debate. “Feedback” has become abuzzword, universally acknowledged as something importantto understand, but there is little agreement about what itreally means and how it affects the “big picture.” Nevertheless,some kind of feedback is invoked to explain many otherwise-
289
290 STEIDEL ET AL. Vol. 717
inexplicable observations: the cessation of star formation inmassive galaxies at high redshift; the small number of low-mass galaxies relative to the dark matter halo mass functionpredicted by the otherwise successful ΛCDM cosmology; thecorrelation between galaxy spheroid mass and the mass ofcentral supermassive black holes; the general absence of coolingflows in clusters of galaxies; and the metal enrichment ofintracluster gas, just to name a few. The most obvious sourcesof the energy and/or momentum required to explain thesephenomena are massive stars, supernovae, and active galacticnucleus (AGN) activity, all of which must have exerted most oftheir influence in the distant past, when these processes were attheir peak intensity.
One route to understanding the relevant baryonic processesis via simultaneous study of galaxies and the intergalacticmedium (IGM), in the same cosmic volumes during the epochwhen they were arguably exerting the greatest influence onone another—near the peak of both universal star formationand supermassive black hole growth in the redshift range3 � z � 1.5. Combining two powerful lines of investigationprovides complementary information on the state of baryons,both those collapsed into galaxies and those residing outsideof galaxies. The IGM and “circumgalactic medium” (CGM; bywhich we mean the gas-phase structures found within �300 kpc(physical) of galaxies) together present a laboratory in which theeffects of galaxy formation and AGN accretion (e.g., radiativeand hydrodynamical “feedback” and its recent history) canbe measured on scales that are not accessible using directobservations of galaxies. Similarly, galaxy distribution relativeto the lines of sight to background objects tells us more abouthow the physical information garnered from the absorption linestudies should be interpreted. These ambitious science goals—toobserve both diffuse gas and galaxies/AGNs in the same surveyvolume at high fidelity and down to small scales—require adifferent approach compared to most spectroscopic surveys ofthe distant universe. Whereas the movement of most galaxysurveys has been toward larger and larger scales, the most vexingremaining uncertainties are related to phenomena occurring on∼1–10 Mpc scales, where the figure of merit is informationdensity and not total survey volume.
It has been known for some time that galactic-scale outflowswith velocities of several hundred km s−1 are ubiquitous instar-forming galaxies at all redshifts for which interstellar (IS)absorption features are accessible (e.g., Steidel et al. 1996;Franx et al. 1997; Pettini et al. 2000, 2001; Shapley et al.2003; Martin 2005; Rupke et al. 2005; Tremonti et al. 2007;Weiner et al. 2009). Evidence is found in the offsets betweenthe redshifts of the nebular emission lines, IS absorption lines,and Lyα emission (Pettini et al. 2001), in the relative velocitiesof stellar, IS, and nebular lines in composite ultraviolet (UV)spectra (Shapley et al. 2003), and in the correlation of C iv
systems seen in absorption in QSO spectra with the positionsof the galaxies themselves (Adelberger et al. 2003, 2005a). Theoutflowing gas has been observed in detail for only a handfulof lensed galaxies (Pettini et al. 2002; Quider et al. 2009,2010); in the best observed of these, MS1512-cB58, the ISabsorption is distributed over a very wide range of velocities,−800 km s−1 � v � +200 km s−1, with a centroid velocity of−255 km s−1 (Pettini et al. 2002). Such outflows are also ageneral feature of starburst galaxies in the local universe, whererest-UV spectroscopic studies reveal similarly complex velocitystructure and gas in multiple phases (e.g., Heckman et al. 1990;Lehnert & Heckman 1996; Martin 1999; Strickland et al. 2004;
Schwartz et al. 2006; Grimes et al. 2009; Chen et al. 2010).However, the outflow phenomenon is so much more widespreadat high redshifts that it is influencing essentially every galaxy,and potentially every galaxy’s local environment. It must havean influence on both the chemical evolution of the galaxies andof the IGM, it may well regulate the maximum star formationrate (SFR) attainable by a galaxy, and without doubt it is anessential ingredient to basic understanding of the circulation ofbaryons as galaxies are forming.
In spite of the substantial observational evidence for galaxy-scale outflows, most of the recent theoretical work has focusedinstead on the infall of cool gas (“Cold Accretion” or “ColdFlows”) via filaments, directly onto the central regions offorming galaxies. According to much of the recent work, thismode of gas accretion is what feeds (and regulates) high SFRsin high-redshift galaxies until they attain a particular massthreshold (Mtot � 1012 M) at which point virial shocks developand accretion of cold material is suppressed (Keres et al. 2005,2009; Dekel et al. 2009; Brooks et al. 2009; Ceverino et al. 2010).This transition is believed to be at least partially responsible forproducing massive “red and dead” galaxies as early as z ∼ 2.5.Similarly, the phenomenon of spatially extended Lyα emission,including giant Lyα “blobs” (Steidel et al. 2000) has beenascribed to cooling radiation from the denser portions of the coldstreams as they are accreting directly onto the galaxy’s centralregions (e.g., Haiman et al. 2000; Furlanetto et al. 2005; Dijkstra& Loeb 2009; Goerdt et al. 2009). Although the cold accretionpicture may be attractive, the predictions of the observationalconsequences for CGM gas are rather model-dependent forboth absorption lines and Lyα emission. The simulations whichpredict cold accretion generally do not account for IS gasthat may have been carried to large galactocentric radii byoutflows, nor for Lyα photons produced by photoionizationin a galaxy’s H ii regions which then scatter their way inspace through CGM gas before escaping. It may well bethat the observational signatures of infall by cold accretionand outflows via supernova-driven winds are very subtle, andperhaps indistinguishable. Possibly the most telling differenceswould be kinematic—absorption line signatures of infallingmaterial in galaxy spectra would be expected to be primarilyredshifted, while outflowing material would be blueshifted andcould reach much higher velocities with respect to the galaxysystemic redshift. Thus, accurate determination of the galaxysystemic redshift is an essential part of understanding the natureof the CGM.
The spatial distribution of the blueshifted high-velocitymaterial seen in absorption against the galaxy continuum isnot yet established. We know that virtually every z > 2 galaxybright enough to be observed spectroscopically is driving outmaterial at velocities of at least several hundred km s−1, butwe do not know how far this material travels, or even where itis with respect to the galaxy as we observe it. The mass fluxassociated with such flows has been measured in only one caseat high redshift, MS1512-cB58 (Pettini et al. 2000), and evenin this case the result depends very sensitively on the assumedphysical location of the absorbing material responsible for thebulk of the observed absorption. The best hope for constrainingthe location of outflowing gas is by observing objects lyingin the background, but at small angular separation, relativeto the galaxy of interest. In this case, the challenge is to findbackground objects bright enough in the rest-frame far-UV butclose enough to the foreground galaxy to provide interestingconstraints. A great deal of effort, over a large range of redshifts,

No. 1, 2010 STRUCTURE AND KINEMATICS OF THE CIRCUMGALACTIC MEDIUM 291
has been invested using QSOs as background sources, whereabsorption by metallic ions or H i in the spectrum of the QSOis compared with galaxies with known redshifts and projectedseparations (e.g., Bergeron & Boisse 1991; Steidel et al. 1994,2002; Chen et al. 2001; Lanzetta et al. 1995; Danforth & Shull2008; Bowen et al. 1995; Bouche et al. 2007; Kacprzak et al.2010); most of this work has focused on redshifts z < 1 becauseof the increasing difficulty obtaining spectra of the foregroundgalaxies at higher redshifts. Even if galaxies are identified andhave redshifts that correspond closely with observed absorption,the association of particular absorption systems with identifiedgalaxies is almost always ambiguous, since the dynamic rangefor identifying faint galaxies is limited, and often the brightbackground QSOs make it challenging to observe galaxieswithin a few arcsec of the QSO sightline. Finally, there is thecontroversial issue of whether metals seen near, but outside of,galaxies are a direct result of recent star formation or AGNactivity, or are simply tracing out regions of the universe inwhich some galaxies, perhaps in the distant past, polluted thegas with metals (e.g., Madau et al. 2001; Scannapieco et al.2002; Mori et al. 2002; Ferrara 2003; cf. Adelberger et al. 2003,2005a).
In this paper, our goal is to try to understand the spatialdistribution of cool gas seen in absorption against the stellarcontinuum of every galaxy observed at high redshift. The ob-jective is to empirically track the kinematics and structure inthe CGM from the central parts of galaxies all the way to largegalactocentric radii. In this work, we use only galaxy spectra,primarily in the rest-frame far-UV, but we calibrate the veloc-ity zero-point using a set of nearly 100 Hα measurements inthe observed-frame near-IR for galaxies in the redshift range1.9 � z � 2.6. The near-IR measurements are drawn primarilyfrom the sample of Erb et al. (2006c), after which we use amuch more extensive set of rest-UV spectra from a nearly com-pleted UV-selected galaxy survey targeting the same range ofredshifts.
The paper is organized as follows: in Section 2 we examinethe statistics of the kinematics of the outflows using a subsampleof galaxies for which both near-IR nebular Hα spectroscopy andreasonably high-quality optical (rest-UV) spectra are available.We also present new empirical formulae for estimating galaxysystemic redshifts for the typical case in which only low signal-to-noise ratio (S/N) rest-UV spectra are available. In Section 3,we seek correlations between the IS absorption line kinematics,in particular the bulk velocities measured from strong low-ionization transitions, and other measured galaxy properties.Section 4 describes further inferences on the structure andkinematics of outflowing material from high S/N composite far-UV spectra, while Section 5 examines the observed behavior ofLyα emission and its relationship to the IS absorption features,and attempts to understand the observations with simple models.We introduce in Section 6 the use of close angular pairs ofgalaxies at different redshifts for mapping the spatial distributionof the circumgalactic gas around the foreground galaxies,while Section 7 develops a simple geometrical and kinematicmodel for outflows consistent with both the line profiles ingalaxy spectra and the larger-scale distribution of gas in theCGM. Section 8 discusses the observational results and theirinterpretation in the context of the models, and Section 9summarizes the conclusions and discusses the prospects forimprovement in the future.
We assume a ΛCDM cosmology with Ωm = 0.3, ΩΛ = 0.7,and h = 0.7 throughout, unless specified otherwise.
2. BULK OUTFLOW VELOCITIES ASSOCIATED WITHz ∼ 2–3 GALAXIES
2.1. Spectra in the Hα Galaxy Sample
The rest-frame far-UV spectra of star-forming galaxies in-clude numerous absorption features which (in principle) pro-vide detailed information on the young OB stars responsiblefor the bright continuum, as well as the IS and circumgalacticatomic and ionized gas associated with the galaxy (see, e.g.,Pettini et al. 2000, 2002). The strongest stellar features are dueto stellar winds from massive stars, producing broad P-Cygniprofiles in higher-ionization lines such as N v λλ1238,1242, C iv
λλ1548,1550, and Si iv λλ1393, 1402. The absorption is broad(Δv � 2000 km s−1) and shallow, with depth dependent on themetallicity of the O-stars. Photospheric lines from the same OBstars are also present, but the lines are generally much weakerthan the wind features, and so can be difficult to discern in thespectra of individual high-redshift galaxies. The IS lines are su-perposed on the integrated stellar spectrum, where absorptionfeatures of abundant species (e.g., H i, O i, C ii, C iv, Si ii, Si iii,Si iv, Fe ii, Al ii) can be extremely strong—strong enough to beuseful for redshift identification in low S/N spectra. Unfortu-nately, the most accessible absorption features—the IS and windfeatures—are not useful for accurate measurements of galaxyredshifts because of the non-gravitational origin of their kine-matics. Similarly, Lyα emission, which is observed in �50%of a continuum-selected sample at z ∼ 2–3 (e.g., Shapley et al.2003; Steidel et al. 2004; Kornei et al. 2010) is resonantly scat-tered, altering the emergent kinematics in a manner that dependson both the optical depth and velocity distribution of the gas do-ing the scattering.
Fortunately, nebular emission lines originating in a galaxy’sH ii regions are also relatively accessible observationally, withthe strongest lines (e.g., Hα, Hβ, [O iii]) found in the observed-frame near-IR at the redshifts of interest. The Hα line, whichis not resonantly scattered and whose strength is stronglydependent on both the ionizing UV radiation field and thedensity, is likely to provide a reasonable estimate of the systemicredshift of the stars, as well as a measure of gravitationallyinduced motion within the galaxy (Pettini et al. 2001; Erb et al.2006c). The only disadvantage of the nebular spectra is that theirnumbers are currently small in comparison with the availablerest-UV spectra.
The quality of rest-UV survey spectra for typical high-redshiftgalaxies is generally not sufficient for detailed spectral analysis,and so much of what we know about general trends betweenspectral properties and other physical parameters of galaxies isbased on composites (e.g., Steidel et al. 2001; Shapley et al.2003; Erb et al. 2006a). In order to form these composites forthe far-UV spectra, one must assume a relationship betweenthe velocities of measured spectral features and the object’ssystemic redshift zsys; as discussed above, this task is madedifficult by the fact that the strong lines of resonance transitionsin the far-UV are seldom closer than a few hundred km s−1 tothe objects’ true redshifts.
With the current, enlarged sample of z ∼ 2 galaxies, includinggenerally higher-quality UV spectra than available in the past,we revisit the measurement of galaxy systemic redshifts usingfar-UV spectral features, building on previous results (Pettiniet al. 2001; Adelberger et al. 2003, 2005a). In this section, weexamine in detail the relationship between observed far-UV ISlines, Lyα emission, and the redshifts defined by the Hα line

292 STEIDEL ET AL. Vol. 717
in the rest-frame optical, including careful attention to possiblesystematic errors.
The redshifts (both Hα and UV-based) for all but eight ofthe galaxies have been presented in Erb et al. (2006c), wherethe observations are described in detail. The new Hα spectrawere obtained in the same manner using NIRSPEC (McLeanet al. 1998) in 2005 June. Using a 0′′. 76 entrance slit, the typicalspectral resolution achieved with NIRSPEC is R � 1400, orFWHM � 215 km s−1, so that the typical Hα line widths ofσv ∼ 100 km s−1 (FWHM � 240 km s−1) are marginally re-solved. The rest-UV spectra were obtained with the LRIS-Bspectrograph on the Keck 1 telescope, primarily using a400 line mm−1 grism blazed at 3400 Å with a dichroic beamsplitter sending all wavelengths λ < 6800 Å into the blue chan-nel, as described in Steidel et al. (2004). As discussed in detailbelow, the typical effective spectral resolution achieved in thismode is �370 km s−1 (FWHM), or σres � 160 km s−1.
For objects whose UV spectra show detectable IS absorptionlines, we have included only those measurements deemed to beof sufficient quality to yield reasonably precise measurements.We have also excluded the handful of objects from the Erbet al. (2006c) sample with z < 1.9 in order to avoid systematicbiases caused by differential atmospheric refraction (discussedbelow), and to focus on the redshift range for which we havethe highest-quality ancillary data.
The resulting Hα sample consists of a total of 89 galaxieswith 〈z〉 = 2.27 ± 0.16, of which 48 (54%) have UV spectrain which only an IS absorption line redshift was measured,38 (43%) have measurements of both Lyα emission and ISabsorption, and 3 (3.5%) have only Lyα emission redshiftsmeasured. These fractions are comparable to those obtainedfrom the full spectroscopic sample of �1600 galaxies in thesame range of redshifts, 1.9 � z � 2.6 (see Steidel et al. 2004).Most (87%) of the galaxies in the parent sample satisfy the“BX” photometric selection criteria (Adelberger et al. 2004;Steidel et al. 2004), with the remainder satisfying the “MD”color criteria defined in Steidel et al. (2003). These galaxiesselected on the basis of their UV color have been shown toinclude all but the dustiest star-forming galaxies in the redshiftrange of interest (Adelberger & Steidel 2000; Reddy et al. 2008).
2.2. Redshift Uncertainties
As discussed in detail by Shapley et al. (2003), a large numberof IS absorption lines is commonly observed in far-UV spectraof star-forming galaxies. In general, all of the detected linesare used to verify that the assigned redshift is correct, but thepositions of only three lines, C ii λ1334.53, Si iv λ1393.76, andSi ii λ1526.72, have been used to measure zIS. Of the strongresonance lines in the rest-wavelength range 1000–1600 Å (therange in common for almost all of the spectra discussed inthis paper), these lines are the least likely to be blendedwith other strong lines and most likely to yield a consistentmeasure of zIS. Clearly, the accuracy of each measurementof zIS depends on the strength and width of the lines, andon the quality of the spectra. The S/N of the spectra usedfor the current study varies considerably. Empirically, frominternal agreement of different absorption lines in the samespectrum, and from repeated measurements of the same galaxyon different slitmasks, we estimate that the typical measurementuncertainties are ∼100 km s−1 for zIS redshifts and ∼50 km s−1
for zLyα .Unfortunately, systematic uncertainties can be more difficult
to quantify. For example, the measured wavelengths of fea-
tures depend on the illumination of the spectrograph slit bythe object, whereas the wavelength solutions are determinedfrom calibration lamps and night sky spectra which illumi-nate the 1′′. 2 slits uniformly. This source of error can also bewavelength-dependent due to the effects of differential atmo-spheric refraction. The features used for redshift measurementgenerally fall in the observed wavelength range ∼3750–5200 Åfor the Hα sample considered here, with 〈zHα〉 = 2.27 ± 0.16.Over this wavelength range, the differential refraction12 wouldbe ∼0.′′7 at an airmass of sec z = 1.3. Slitmasks were almostalways observed within ∼10◦–15◦ of the parallactic angle whenthe airmass was significantly different from 1.0, but even so,the amplitude of differential refraction perpendicular to the slitcould be as large as ∼0.′′2, which could map into a velocity shiftof up to ∼ ±75 km s−1 depending on the seeing and the spatialprofile of the galaxy.
The measurements of zHα are subject to a different set ofsystematic uncertainties. Differential refraction in the near-IR isnegligible for our purposes, but the observations were obtainedusing a 0′′. 76 slit after applying a blind offset from a nearby starto the position of the galaxy measured from either an optical ornear-IR continuum image (see Erb et al. 2003, 2006c). Whilethe observations were taken in a way that should minimizeany systematic offsets in the resulting zHα due to pointing orastrometric inaccuracies, they of course measure the velocity ofonly the flux that entered the slit. Empirically, we found thatrepeated observations of the same galaxy (using different slitposition angles) suggest an accuracy of ±60 km s−1 for zHα
(rms), with the largest excursions from consistency applyingto objects known to be spatially extended. Another directcomparison of the redshifts for 14 objects from the NIRSPECsample of Erb et al. (2006c) is provided by observations ofthe same objects with the integral-field spectrometer SINFONIat the Very Large Telescope (Forster Schreiber et al. 2006).The SINFONI redshifts are based on the velocity centroid ofall detected Hα flux from the object, and are not affectedsignificantly by pointing errors or by slit losses. This comparisonshows a level of agreement similar to our estimate from multipleobservations with NIRSPEC: 〈zN − zS〉 = −34 ± 59 km s−1
(rms), where zN is the NIRSPEC redshift and zS is the SINFONIredshift. The average offset is marginally significant (�2σ ), butthe scatter is consistent with our NIRSPEC experience. Elevenof the galaxies in the present Hα sample were also observedusing OSIRIS with Laser Guide Star Adaptive Optics (LGSAO)on the Keck 2 telescope (Law et al. 2009); the average redshiftdifference zN − zO = 8 ± 41 km s−1, indicating no evidencefor a systematic difference.
In summary, adopting an uncertainty in zHα of 60 km s−1,the typical uncertainties in the measured values of ΔvIS =c(zIS − zHα)/(1 + zHα) and ΔvLyα = c(zLyα − zHα)/(1 + zHα) fora given galaxy are ∼130 km s−1 and ∼90 km s−1, respectively.
2.3. Sample Statistics
Figure 1 shows a histogram of the IS and Lyα emissionvelocities with respect to the systemic redshift defined byzHα . The distributions have 〈ΔvIS〉 = −164 ± 16 km s−1 and〈ΔvLyα〉 = 445 ± 27 km s−1, where the quoted uncertainties areerrors in the mean. Figure 2 illustrates the same sample as in
12 All of the spectroscopic observations of the Hα sample were obtainedbefore the commissioning of the Cassegrain ADC on Keck 1. We areexcluding for the moment galaxies at redshifts where key features fall atwavelengths shorter than 3750 Å due to the rapidly increasing amplitude ofdifferential refraction.

No. 1, 2010 STRUCTURE AND KINEMATICS OF THE CIRCUMGALACTIC MEDIUM 293
Figure 1. Histogram of the measured (centroid) velocities of IS absorption lines(blue) and Lyα emission (red) with respect to the galaxy nebular redshift asdefined by the centroid of the Hα emission line, for a sample of 89 galaxies with〈z〉 = 2.27±0.16. The sample includes only those galaxies having both nebularline redshifts and rest-UV spectra of adequate quality to measure absorptionline centroids. In this sample, 86 of the 89 galaxies have measured values of zIS,3 have only zLyα , and 39 have both. The mean values of the velocity offsets areindicated.
Figure 1, where different symbols are used depending on theUV spectral morphology of the galaxies.
In light of the current Hα sample of z ∼ 2.3 galaxies, it isworth re-examining the “rules” that one would use to estimatethe true systemic redshift of the galaxies given only informationcontained in their rest-UV spectra, and assuming that zHα definesthe rest frame. Using a linear regression form similar to that usedby Adelberger et al. (2005a), for galaxies with both zLyα and zISmeasurements,
zHα = zIS + 0.00289 − 0.0026(2.7 − zIS); σz = 0.00127, (1)
zHα = zLyα −0.0054 + 0.0001(2.7−zLyα); σz = 0.00193, (2)
corresponding to velocity offsets of ΔvIS = −170±115 km s−1
and ΔvLyα = +485 ± 175 km s−1, respectively, at the meanredshift of zHα = 2.27. For objects with a measurement of zISonly,
zHα = zIS + 0.00303 − 0.0031(2.7 − zIS); σz = 0.00145, (3)
or ΔvIS = −165 ± 140 km s−1 (error is the standard deviation)at the mean redshift of the sample.
Using all 86 Hα galaxies with measured zIS, the best-fit singlerelation of the form in Equations (1)–(3) is
zHα = zIS + 0.00299 − 0.00291(2.7 − zIS); σz = 0.00138 (4)
or ΔvIS = −166 ± 125 km s−1 at 〈zHα〉 = 2.27. We find thatincluding zLyα in the above regression formulae increases therms redshift uncertainty over that obtained using only zIS, incontrast to similar estimates at somewhat higher redshift byAdelberger et al. (2005a). One possible explanation for thedifference could be the generally weaker Lyα lines in the z � 2.3
Figure 2. Plot showing the IS absorption line centroid velocities (blue) andcentroid Lyα emission velocities relative to the redshift defined by Hα for thesame sample as in Figure 1. Galaxies for which both IS absorption redshiftsand Lyα emission redshifts are available are indicated with blue (absorption)and red (emission) solid dots; open triangles show systems for which one orthe other measurements are not available. The circled objects are ones whichexhibited measurable velocity shear in the sample of Erb et al. (2006c; see thetext for discussion).
sample compared to that at z � 3 (Reddy et al. 2008). Wereturn in Section 5 to a discussion of the kinematics of the Lyαemission line. In any case, using only the absorption redshift,with a constant offset of �+165 km s−1, would provide anestimate of zHα accurate to ∼125 km s−1 (rms).
There are too few objects (3 of 89) in the Hα sample havingonly zLyα to define a significant relationship for such objects(which are also quite rare in the full z � 2 spectroscopicsample), although these three objects have 〈ΔvLyα〉 = 400±183,consistent with Equation (2) above. For this reason, we useEquation (2) for subsequent estimates of zHα when only Lyαemission is available.
Figures 1 and 2 show that a significant fraction of the galaxieshave an IS absorption line centroid velocity shift ΔvIS consistentwith zero. Given the uncertainties in ΔvIS, this is not particularlysignificant for individual objects, but we discuss the issue furtherbecause of the intriguing behavior of ΔvIS and ΔvLyα with respectto one another and because of the greater significance of theresult in higher S/N composite spectra discussed below. Threeof the eleven galaxies with measured ΔvIS � 0 also have Lyαemission, and have 〈ΔvLyα〉 = +708 ± 50 km s−1, ∼250 km s−1
higher than the average of the full sample; however, the average〈ΔvLyα−ΔvIS〉 = 622±40 km s−1 for this set of objects is nearlyidentical to that of the full sample. The relative consistency of thedifference ΔvLyα − ΔvIS in the Hα sample, as well as in muchlarger samples without the benefit of Hα spectroscopy (e.g.,Shapley et al. 2003; Steidel et al. 2004), suggests a situation inwhich ΔvLyα moves in concert with ΔvIS irrespective of whetherthe centroid of the absorption line velocities are blueshifted withrespect to systemic.
Interestingly, three other galaxies out of the eleven (seeFigure 2) with ΔvIS � 0 are among those with spatially resolvedvelocity shear in the Hα emission line, meaning that the Hαspectrum exhibits a significant velocity offset as a functionof spatial position; see Erb et al. (2006c) for details. Giventhe overall detection rate of shear in the sample of Erb et al.(2006c), we would expect to find ∼1 such object in a sampleof 11. Furthermore, of the 14 objects with tilted Hα emissionlines in the Erb et al. (2006c) sample, 8 have high-quality
294 STEIDEL ET AL. Vol. 717
absorption redshifts with 〈ΔvIS〉 = −47 ± 35 km s−1; 6 of8 have ΔvIS > −60 km s−1.
The apparent connection between decreased |ΔvIS| and ob-servation of measurable velocity shear in Hα can be interpretedin at least two ways. If the velocity shear indicates an unre-solved merger, infalling gas (or an unusual amount of gas nearzero velocity) could significantly reduce the average blueshiftof the IS lines. The IS and nebular redshifts could also arisefrom different pieces of a merger, or even from different galax-ies altogether (see Quider et al. 2010 for a possible example).Alternatively, if the tilted emission lines are caused by rotationthat is most easily detected in nearly edge-on configurations, theoutflows in these objects may be loosely collimated perpendic-ular to the disk as for many local starburst galaxies. If this werethe case, one might expect to observe lower outflow velocitiesand perhaps stronger IS absorption near the galaxy systemicredshift for objects with smaller inclination angles to the lineof sight. Both of these effects appear to play a role in the NaD IS line kinematics observed in a large sample of nearby star-forming galaxies (Chen et al. 2010). While possible inclinationeffects would not naturally account for highly redshifted Lyαemission, none of the objects with velocity shear identified fromtheir Hα spectra happen to have Lyα in emission. Inclinationeffects could be present in our sample, although the significantbulk outflows observed in the vast majority of the sample argueagainst collimation and projection effects being a major factorin most cases.
As we will show in Section 4 below, we favor an explanationfor many of the observed trends discussed in this section thathinges on the quantity of gas at or near zero velocity (and noton the overall outflow speed).
3. THE RELATION BETWEEN BULK OUTFLOWS ANDOTHER GALAXY PROPERTIES
One of the advantages of the sample of z ∼ 2 galaxiesdiscussed in this paper is that a large number of other galaxyproperties are available to look for trends with respect to thebulk outflow properties. Most of the measurements and inferredquantities used here are tabulated in Erb et al. (2006b, 2006c).Among the parameters available are the Hα line widths σv , theSFRs inferred from the Hα line fluxes (corrected for extinctionaccording to the method outlined in Erb et al. 2006b), thesurface density of star formation ΣSFR, the dynamical mass Mdynmeasured from a combination of σv and the observed physicalsize of the Hα emitting region, and the stellar mass M∗ inferredfrom spectral energy distribution (SED) fitting from the rest-UVto the rest optical/IR. The cold gas mass Mgas is estimated byusing the measured Hα surface brightness and galaxy size andassuming that the local Schmidt–Kennicutt (Kennicutt 1998)relation between gas surface density and SFR applies. Finally,the total baryonic mass Mbar = M∗ +Mgas and the fraction of theinferred baryonic mass in the form of cold gas, μ = Mgas/Mbar,have been utilized.
Table 1 summarizes the results of Spearman correlation testsbetween ΔvIS, ΔvLyα , ΔvLyα − ΔvIS, and these other physicalquantities. The number of galaxies available in the sample foreach test, which is also given in Table 1, varies depending on thequantity being evaluated. The tests have been conducted againstthe absolute value of the quantities ΔvIS and ΔvLyα so that thesense of any correlations is positive when the bulk velocitydifferences increase with the other physical characteristic. Noneof the quantities considered is significantly correlated withΔvLyα or ΔvLyα − ΔvIS at more than the 95% (2σ ) confidence
Table 1Correlations of Bulk Outflow Velocity and Galaxy Propertiesa
Quantity −ΔvIS ΔvLyα ΔvLyα − ΔvIS
σvb −2.08 (65) +1.81 (29) +0.74 (29)
SFRc −1.52 (87) −0.04 (42) −0.08 (39)ΣSFR
d +0.95 (81) +0.82 (37) +0.49 (35)Mdyn
e −2.24 (57) +1.02 (24) +0.14 (24)Mgas
f −1.68 (73) +0.71 (36) +0.85 (34)M∗g −1.93 (73) −0.37 (36) −0.48 (34)Mbar
h −2.66 (73) −0.10 (36) −0.10 (34)μi +1.72 (73) +0.64 (36) +0.93 (34)
Notes.a All values are the number of standard deviations from the null hypothesisthat the quantities are uncorrelated, based on a Spearman rank correlation test.Negative values indicate anti-correlations between the quantities. The numberin parentheses following each value is the number of galaxies in the sampleused to evaluate the correlation.b Velocity dispersion measured from the Hα emission line.c Star formation rate, in M yr−1, measured from the intensity of the Hα
emission line, and corrected for extinction as in Erb et al. (2006b).d Average star formation surface density, as in Erb et al. (2006b).e Dynamical mass, as tabulated in Erb et al. (2006a).f Cold gas mass, estimated from the star formation surface density and theobserved Hα size, as in Erb et al. (2006a, 2006b).g Stellar mass, estimated from SED fitting, from Erb et al. (2006c).h Total baryonic mass, M∗ + Mgas.i Gas fraction, Mgas/Mbar, as in Erb et al. (2006a, 2006c).
level, although the measured Hα velocity dispersion σv maybe marginally correlated, in the sense that ΔvLyα is larger forobjects with larger σv .
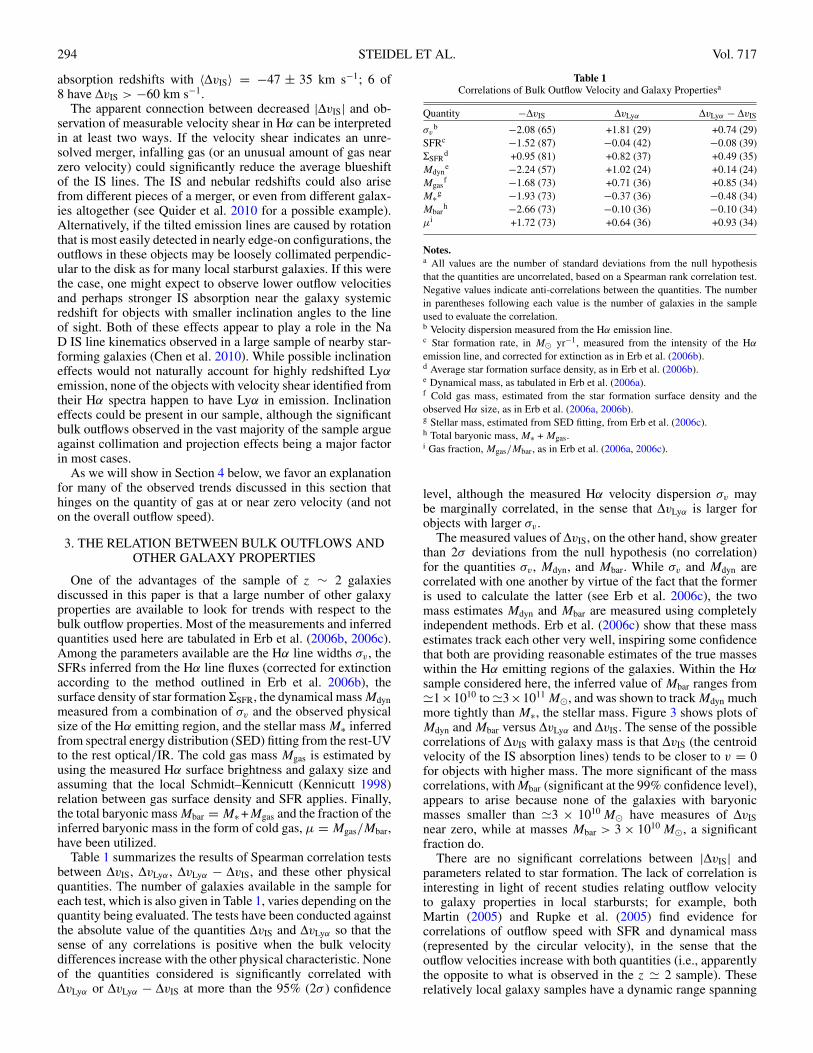
The measured values of ΔvIS, on the other hand, show greaterthan 2σ deviations from the null hypothesis (no correlation)for the quantities σv , Mdyn, and Mbar. While σv and Mdyn arecorrelated with one another by virtue of the fact that the formeris used to calculate the latter (see Erb et al. 2006c), the twomass estimates Mdyn and Mbar are measured using completelyindependent methods. Erb et al. (2006c) show that these massestimates track each other very well, inspiring some confidencethat both are providing reasonable estimates of the true masseswithin the Hα emitting regions of the galaxies. Within the Hαsample considered here, the inferred value of Mbar ranges from�1×10¹⁰ to �3×10¹¹ M, and was shown to track Mdyn muchmore tightly than M∗, the stellar mass. Figure 3 shows plots ofMdyn and Mbar versus ΔvLyα and ΔvIS. The sense of the possiblecorrelations of ΔvIS with galaxy mass is that ΔvIS (the centroidvelocity of the IS absorption lines) tends to be closer to v = 0for objects with higher mass. The more significant of the masscorrelations, with Mbar (significant at the 99% confidence level),appears to arise because none of the galaxies with baryonicmasses smaller than �3 × 10¹⁰ M have measures of ΔvISnear zero, while at masses Mbar > 3 × 10¹⁰ M, a significantfraction do.
There are no significant correlations between |ΔvIS| andparameters related to star formation. The lack of correlation isinteresting in light of recent studies relating outflow velocityto galaxy properties in local starbursts; for example, bothMartin (2005) and Rupke et al. (2005) find evidence forcorrelations of outflow speed with SFR and dynamical mass(represented by the circular velocity), in the sense that theoutflow velocities increase with both quantities (i.e., apparentlythe opposite to what is observed in the z � 2 sample). Theserelatively local galaxy samples have a dynamic range spanning
No. 1, 2010 STRUCTURE AND KINEMATICS OF THE CIRCUMGALACTIC MEDIUM 295
Figure 3. Plots showing the dependence of bulk outflow velocities on dynamicalmass estimated from Hα line widths and observed sizes (top panels) and totalbaryonic mass (i.e., the sum of inferred stellar and cold gas masses; bottompanels).
(A color version of this figure is available in the online journal.)
∼4 orders of magnitude in SFR, and include dwarf starburstswith vc ∼ 30 km s−1 and SFR < 1 M yr−1, i.e., a muchlarger range than present in our z ∼ 2.3 sample. The observedcorrelations in the local sample flatten for galaxies with SFR �10–100 M yr−1 (Rupke et al. 2005), the approximate range ofSFRs in our current sample. In other words, no trends are presentin the low-redshift samples when only galaxies with parameterscharacteristic of our z ∼ 2 galaxies are considered. Also, as wediscuss below, other effects on the kinematics measured fromcentroid velocities would likely mask the presence of a weakcorrelation if it were present.
At higher redshift, Weiner et al. (2009) also found that theinferred outflow velocity in composite spectra of z � 1.4star-forming galaxies is a slowly increasing function of SFR,vout ∝ SFR0.3. However, because their composite spectra are ofrelatively high spectral resolution, Weiner et al. (2009) measureΔvIS as the velocity at which the IS absorption reaches 90%of the continuum value, i.e., close to the maximum blueshiftedvelocity rather than the centroid. They decompose the Mg ii ISline into a “symmetric” and “outflowing” component, and findthat the strength of the symmetric component is very steeplydependent on stellar mass—in fact, it is much steeper than thevariation of the outflowing component. As in our sample, thelowest-mass galaxies are consistent with having zero symmetriccomponent (see their Figure 13 and Table 1).
Clearly, the centroid velocity of strongly saturated IS absorp-tion lines is in many ways a blunt tool for characterizing thevelocity of outflowing gas. First, the lines may include a sig-nificant amount of IS gas at or near zero velocity with respectto the galaxy systemic redshift, which would have the effect ofdecreasing the measured value of |ΔvIS| even if outflow veloci-ties were substantial. While Martin (2005), Rupke et al. (2005),and Weiner et al. (2009) removed a component of IS absorp-tion centered at zero velocity before evaluating the velocity ofoutflowing material, it is generally not possible to do this forindividual spectra in our z � 2 sample because of more limited
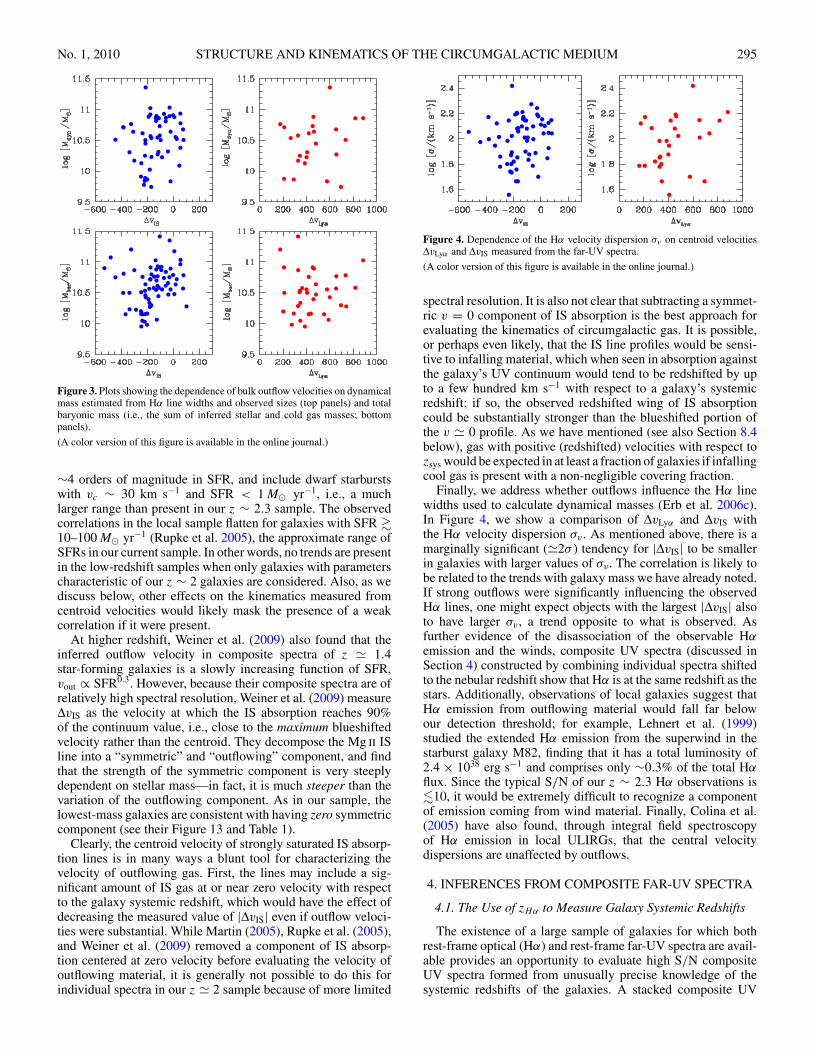
Figure 4. Dependence of the Hα velocity dispersion σv on centroid velocitiesΔvLyα and ΔvIS measured from the far-UV spectra.
(A color version of this figure is available in the online journal.)
spectral resolution. It is also not clear that subtracting a symmet-ric v = 0 component of IS absorption is the best approach forevaluating the kinematics of circumgalactic gas. It is possible,or perhaps even likely, that the IS line profiles would be sensi-tive to infalling material, which when seen in absorption againstthe galaxy’s UV continuum would tend to be redshifted by upto a few hundred km s−1 with respect to a galaxy’s systemicredshift; if so, the observed redshifted wing of IS absorptioncould be substantially stronger than the blueshifted portion ofthe v � 0 profile. As we have mentioned (see also Section 8.4below), gas with positive (redshifted) velocities with respect tozsys would be expected in at least a fraction of galaxies if infallingcool gas is present with a non-negligible covering fraction.
Finally, we address whether outflows influence the Hα linewidths used to calculate dynamical masses (Erb et al. 2006c).In Figure 4, we show a comparison of ΔvLyα and ΔvIS withthe Hα velocity dispersion σv . As mentioned above, there is amarginally significant (�2σ ) tendency for |ΔvIS| to be smallerin galaxies with larger values of σv . The correlation is likely tobe related to the trends with galaxy mass we have already noted.If strong outflows were significantly influencing the observedHα lines, one might expect objects with the largest |ΔvIS| alsoto have larger σv , a trend opposite to what is observed. Asfurther evidence of the disassociation of the observable Hαemission and the winds, composite UV spectra (discussed inSection 4) constructed by combining individual spectra shiftedto the nebular redshift show that Hα is at the same redshift as thestars. Additionally, observations of local galaxies suggest thatHα emission from outflowing material would fall far belowour detection threshold; for example, Lehnert et al. (1999)studied the extended Hα emission from the superwind in thestarburst galaxy M82, finding that it has a total luminosity of2.4 × 1038 erg s−1 and comprises only ∼0.3% of the total Hαflux. Since the typical S/N of our z ∼ 2.3 Hα observations is�10, it would be extremely difficult to recognize a componentof emission coming from wind material. Finally, Colina et al.(2005) have also found, through integral field spectroscopyof Hα emission in local ULIRGs, that the central velocitydispersions are unaffected by outflows.
4. INFERENCES FROM COMPOSITE FAR-UV SPECTRA
4.1. The Use of zHα to Measure Galaxy Systemic Redshifts
The existence of a large sample of galaxies for which bothrest-frame optical (Hα) and rest-frame far-UV spectra are avail-able provides an opportunity to evaluate high S/N compositeUV spectra formed from unusually precise knowledge of thesystemic redshifts of the galaxies. A stacked composite UV

296 STEIDEL ET AL. Vol. 717
Figure 5. Composite rest-frame far-UV spectra for two independent samples of z ∼ 2.3 galaxies. The top panel is an average of the 89 spectra in the Hα sample, withR = 800, after normalizing each to the same relative intensity in the range 1300–1500 Å. The bottom panel is a composite of 102 galaxy spectra obtained with higherspectral resolution (R = 1330), shifted into the rest frame using Equations (2) and (4), and scaled as the first sample before averaging.
spectrum was formed by shifting each spectrum into the restframe using zHα , scaling based on the flux density in the range1300–1500 Å, re-sampling onto a common wavelength scale of0.33 Å per pixel, and averaging at each dispersion point, withoutlier rejection. Thus, the composite is an unweighted averageof all 89 galaxies having both Hα spectra from NIRSPEC andhigh-quality UV spectra from LRIS-B; the result is shown inFigure 5. A measurement of the centroids of weak stellar photo-spheric absorption features (S vλ1501.76, O iv λ1343.354, andC iii λ1171.76 were used for this purpose; see Shapley et al.2003; Pettini et al. 2000) in the rest-frame composite spectrumverifies that the Hα redshifts are very close to the systemicredshifts of the stars in the galaxies, with a mean velocity ofv∗ = 13 ± 24 km s−1. Composites formed from various sub-sets of the data yield a similar level of agreement: for example,a composite formed from the subset of 28 galaxies with sig-nificantly deeper LRIS-B spectra (with total integration timesranging from 5 to 20 hr compared to the typical 1.5 hr) hasv∗ = 2 ± 36 km s−1.
4.2. Velocity Widths of IS Lines and the Maximum OutflowVelocity
One of the quantities that can be evaluated with increasedconfidence using the new sample is the velocity extent of the ISabsorption lines and Lyα emission, in addition to the centroidvelocities discussed in the previous section. Of particular interestare ηIS, the FWHM of the IS absorption lines, and ηLyα , theFWHM of the Lyα emission line, corrected for the instrumental
resolution. Unfortunately, as discussed above, the instrumentalresolution is not always known precisely because it depends onthe seeing-convolved size of the galaxy compared to the 1′′. 2 slitsused for all of the LRIS-B spectroscopy. For objects illuminatingthe slit uniformly, the spectral resolution is measured to be450 km s−1 (FWHM) for the 400 line mm−1 grism used foralmost all of the optical spectra of galaxies in the Hα sample;however, for typical seeing of �0.′′6–0.′′8, galaxies in our samplehave FWHM � 1.′′0. Given this, we would expect that the actualspectral resolution is FWHM � 370 km s−1 (R = 800). Wehave verified this for both the composite spectrum of all Hαgalaxies, and for a smaller subset of galaxies with very deepspectroscopic integrations, by measuring the spatial size ofeach object in the slit direction. Assuming that the Hα redshiftuncertainties are σz � 60 km s−1 and that individual spectrahave σres � 160 km s−1 (i.e., FWHM/2.355), the estimatedintrinsic FWHM of IS absorption features and Lyα emissionin the composite spectrum are ηIS � 540–570 km s−1 andηLyα � 620–650 km s−1, respectively.
We have recently obtained LRIS-B spectra of galaxies se-lected in the same way as the Hα sample, but observed usingthe 600 line mm−1 grism instead of the 400 line mm−1 grismused for the vast majority of the Hα sample. These observationsprovide spectral resolution 1.68 times higher for the same slitwidth and object size. As a test of our ability to measure lineprofiles with marginally resolved data, we assembled a sampleof 102 spectra all obtained on the same observing run and withconsistent observing conditions (seeing of �0.′′6–0.′′7 FWHM

No. 1, 2010 STRUCTURE AND KINEMATICS OF THE CIRCUMGALACTIC MEDIUM 297
Figure 6. Comparison of the Lyα and IS line profiles for the full Hα sample(red) and the composite of 102 identically selected objects observed with higherspectral resolution (blue), where the latter have been shifted into the rest frameusing the rules defined in Section 2. For blended features such as O i λ1302/Si ii
λ1304 and C iv λλ1548, 1550, a separate panel is given for each; in both cases,one should look at the longer of the two components for the profile near v ∼ 0and the shorter one to gauge the extent of the most blueshifted velocities, due tothe line blending. Note the very similar velocity profiles for the two independentsamples, for both the minimum and maximum velocities.
(A color version of this figure is available in the online journal.)
evaluated at 4800 Å) in a field which remained very close tothe zenith at the Keck Observatory, thus minimizing issues ofdifferential atmospheric refraction. We applied the rules givenin Equation (4) above to shift the spectra into the rest frame,and produced a composite spectrum, shown in the bottom panelof Figure 5, with an effective spectral resolution of FWHM �225 km s−1 (R � 1330). The stellar photospheric absorptionfeatures in the stacked spectrum have v∗ = −2 ± 10 km s−1,illustrating that the rules for estimating the systemic velocityfrom the UV spectra work very well on average, and that thehigher resolution spectra are advantageous for producing moreaccurate wavelengths for weak (stellar and IS) features.
The line profiles of the R = 800 and R = 1330 compositespectra are remarkably similar for both Lyα emission and thestrong IS absorption features, as shown in Figure 6. The spectrayield the same value of ηLyα and ηIS after accounting for thedifference in spectral resolution. We are particularly interestedin the asymmetry of the line profiles and the value of themaximum blueshifted velocity vmax, which we define as thevelocity at which the blue wing of the IS absorption lines meetsthe continuum. We find that vmax, although difficult to measurefor typical spectra of individual galaxies due to limited S/N, isnot strongly dependent on spectral resolution; Figure 6 showsthat |vmax| � 700–800 km s−1 for both composite spectra.As discussed above, the C iv and (to a lesser extent) Si iv
doublets in galaxy spectra have contributions from both theIS lines and from the P-Cygni stellar wind lines from massivestars, and thus the IS component must be separated from thestellar feature in the process of fitting the local continuum. Anexample of a continuum fit near the Si iv and C iv features is
Figure 7. Portion of the composite spectrum shown in the lower panel of Figure 5in the vicinity of the Si iv and C iv doublets. The dashed red curve is an examplecontinuum fit used to normalize the spectrum for measuring the strength ofthe IS component of these lines. Note that the continuum has been adjustedto remove the broad absorption due to the stellar wind component of C iv; asimilar adjustment was made to remove the stellar component of Si iv, thoughit is much weaker than the C iv feature. The weak emission line within thebroad C iv wind absorption feature is nebular Si ii* λ1533, one of several weakexcited fine-structure emission lines observed in the spectra of z � 2–3 galaxies(Shapley et al. 2003). The weak absorption line near 1501 Å is photosphericS v.
(A color version of this figure is available in the online journal.)
shown in Figure 7. Fortunately, the P Cygni feature is generallyboth broader and shallower than the IS components of theselines, so that while the continuum uncertainties are largerthan for unblended features, they do not prevent an accuratemeasurement in relatively high S/N composite spectra.
The velocity profiles of some of the strongest spectral featuresin the stacked spectrum of the galaxies observed with R = 1330are overplotted in Figure 8. Evidently, |vmax| � 700–800 km s−1
is a generic feature of the spectra of these rapidly star-forminggalaxies, in spite of the fact that the average centroid of the ISline profiles is more modest, with ΔvIS ∼ −165 km s−1 fromthe previous section. The apparent values of |vmax| are relativelyinsensitive to spectral resolution.
The line profiles in the spectra of individual galaxies can,of course, vary considerably. Figure 9 shows the spectra oftwo individual galaxies to illustrate the point: one is MS1512-cB58, the z = 2.729 lensed Lyman break galaxy (LBG) whosespectrum has been analyzed in detail by Pettini et al. (2000,2002); the other is Q0000-D6 (Shapley et al. 2003), a brightLBG at z = 2.966 observed at a comparable spectral resolutionof �1500. These spectra show clear differences in the detailsof the profiles and with the apparent covering fraction of thecontinuum, particularly for the low-ionization species whichdiffer in apparent optical depth by a factor of �2. Clearly, Lyαemission is prominent in D6, but very weak in the spectrum ofcB58 (see also Quider et al. 2009). The spectrum of Q0000-D6also has an unusual high-ionization component that producesclear Lyα absorption in the apparent blue wing of the Lyαemission line, as well as in the high ions (but is less prominent

298 STEIDEL ET AL. Vol. 717
Figure 8. Velocity profiles of strong IS lines and Lyα emission features relativeto systemic for the composite UV spectrum of the R = 1330 sample. The C iv
profile is a solid blue histogram for the λ1548 component and dashed for λ1550.
in the lower ions) near v = 0. Still, the velocity envelopefor the blueshifted material is remarkably consistent with thatseen in the composites presented above: maximum blueshiftedvelocities of |vmax| � 800 km s−1, roughly independent ofionization level.
4.3. Trends with Baryonic Mass
Returning to the trends in the centroid velocities of the ISlines noted in the previous section, it is instructive to examinethe mean line profiles of composite spectra selected by impliedbaryonic mass Mbar, the parameter most significantly linked tothe observed kinematics of the IS absorption features. Figure 10shows the comparison between the halves of the Hα sample thatare above and below an inferred Mbar = 3.7 × 10¹⁰ M, thesample median. There are clear differences in the Lyα emissionline strength, which is similar to that seen for subsamples ofdifferent metallicity as in Erb et al. (2006a). The peak of theLyα emission line profile is shifted by � + 200 km s−1 (from� + 400 to � + 600 km s−1) for the higher-mass subsamplerelative to that of the lower-mass subsample.13 The profilesof the low-ionization IS lines (C ii λ1334 is in the cleanestspectral region and illustrates it best) may be indicating theroot cause of the kinematic trends discussed in Section 3: thehigher-mass sample exhibits stronger IS absorption at or nearv ∼ 0, while the profiles are nearly identical in their behaviornear v = −|vmax|. This “excess” low-velocity material in thehigher-mass subsample—a shift of �200 km s−1 in the red wingof the IS line profiles—systematically shifts the centroid of theIS velocity distribution by � + 100 km s−1 relative to the lower-mass subsample, while the blue wing of the profile exhibits noclear trend with Mbar. The excess low-velocity material in the
13 No significant correlation was found between Mbar and ΔvLyα in Section 3,but many of the galaxies in the higher-mass subsample had Lyα emission thatwas too weak to measure, resulting in a very small sample.
Figure 9. As for Figure 6, comparing the spectra of two individual objects havingparticularly high-quality UV spectra as well as accurate systemic redshifts fromstellar absorption features. The spectrum of MS1512-cB58 (the R � 1600spectrum from Pettini et al. 2000) is in red, while the spectrum of Q0000-D6, obtained with R � 1300, is in blue. Despite significant differences inspectral “morphology” (e.g., D6 has strong Lyα line emission, while cB58has strong absorption, and the ratio of the strengths of high-ionization linesto low-ionization lines is quite different), the range of velocities spanned bythe outflows is quite similar in both cases, with the maximum velocities ofv � 800 km s−1. Note that the Si ii λ1526 line of D6 is affected by absorptionfrom another system in the blue wing of the profile. Both of these galaxies wouldbe in the Mbar < 3.7 × 10¹⁰ M (i.e., lower baryonic mass) subsample.
higher-mass subsample is not obvious in the C iv absorptionprofile, for which the two profiles appear to be nearly identicalfor v � 0 (note that C iv was not used to measure ΔvIS for anyof the galaxies in the sample because of the dependence of therest wavelength for the blend on the relative strength of the linesof the doublet).
Figure 11 shows the residual apparent optical depth Δτ (v)for three relatively isolated low-ionization transitions for thehigh- and low-Mbar subsamples. By this we mean the additionaloptical depth as a function of velocity that when added to the lineprofiles of the low-Mbar subsample would produce line profilesidentical to those of the high-Mbar subsample, i.e.,
Ihm(v) = Ilm(v)e−Δτ (v), (5)
where Ihm and Ilm are the spectral intensity of the high-Mbar andlow-Mbar subsamples, respectively. The spectrum Δτ (v) has apeak at v � 0, a centroid at v = +154 km s−1, and a velocitywidth of σv � 120 km s−1 after correcting for the effectiveinstrumental resolution. The excess apparent optical depth Δτin these transitions accounts for �25% of the equivalent widthof the full low-ion profiles of the high-Mbar subsample. Theadditional component of absorption in the high-Mbar subsamplealso changes the average IS line width from ηIS = 540 km s−1 forthe lower-mass subsample to ηIS = 660 km s−1 for the higher-mass subsample.
We will return to a discussion of the possible implicationsof the baryonic mass dependence of the IS line kinematics inSection 8.

No. 1, 2010 STRUCTURE AND KINEMATICS OF THE CIRCUMGALACTIC MEDIUM 299
Figure 10. As for Figure 6, comparing the composites of subsets of the Hα sample depending on their inferred baryonic mass Mbar. The composite from objects withMbar > 3.7 × 10¹⁰ M is plotted in red, and that from objects with Mbar < 3.7 × 10¹⁰ M in blue. Note the differences in the profiles of the low ions (e.g., Si ii, O i,C ii) for v � 0, where the high baryonic mass objects appear to have stronger low-ion absorption at velocities closer to systemic. These differences do not seem to bepresent for the higher-ionization lines (e.g., see the C iv λ1550 panel), nor are there differences in the maximum blueshifted velocities.
(A color version of this figure is available in the online journal.)
5. LYα EMISSION
5.1. Observed Trends
We have shown in Section 2 that the centroid velocity ofLyα emission ΔvLyα exhibits larger scatter than ΔvIS relativeto the systemic redshift defined by Hα emission, but thatthe relative consistency of ΔvLyα − ΔvIS suggests a causallink between the two kinematic measures. In this section, weattempt to understand the nature of this relationship in greaterdetail.
In Section 4, we presented evidence that the kinematicprofiles of strong IS lines in the spectra of rapidly star-forminggalaxies exhibit greater variation near v = 0 than at largeblueshifted velocities. Moreover, the presence of significantlow-ion absorption at v � 0 strongly affects both the apparentvelocity of Lyα emission and the centroid velocity ΔvIS of the ISlines, though vmax, the maximum blueshift, remains essentiallyunchanged.
A commonly adopted “toy model” (see, e.g., Pettini et al.2002; Adelberger et al. 2003) used to interpret the kinematics ofLyα emission and IS absorption lines in starburst galaxy spectrainvolves a roughly spherically symmetric outflow resulting in
generally blueshifted absorption as seen from Earth. BecauseLyα photons resonantly scatter, they escape from the nebulaonly when they acquire a velocity such that the optical depthto scattering in the material which lies (physically) between theobserver and the emitted Lyα photon becomes small. Perhapsthe easiest way for an Lyα photon to reach Earth is to acquirethe velocity of an outflowing material on the far side of thegalaxy, but to be emitted in the observer’s direction, so that thephoton has been redshifted by several hundred km s−1 relativeto the bulk of the material through which it must pass to reachus. This picture would explain qualitatively why the dominantcomponent of Lyα emission always appears redshifted relativeto the galaxy systemic velocity. Neglecting radiative transfereffects for the moment, if the range of velocities of outflowinggas is similar on the “far” side of the galaxy to what we observe(through the IS absorption lines) on the “near” side, then onewould expect the maximum blueshifted velocity |vmax| to becomparable to the maximum velocity observed in the red wing ofthe Lyα emission line. One could then explain different spectralmorphology near the Lyα line by altering the distribution of Lyαoptical depth as a function of velocity for the material betweenthe observer and the far side of the outflow.

300 STEIDEL ET AL. Vol. 717
Figure 11. Relative optical depth τhigh–τlow for selected low-ionization absorp-tion lines, vs. velocity relative to systemic, where these quantities refer to thecomposite spectra of the high-Mbar and low-Mbar subsamples. The histogramsare for Si ii λ1260 (green), C ii λ1334 (red), and Si ii λ1526 (magenta) IS lineprofiles, where the heavy black curve is the average residual optical depth forthe three transitions. Note the absence of significant residuals at blueshiftedvelocities (with the possible exception of local “peak” near v = −300, whichrepresents slightly deeper absorption in the spectrum of the low-Mbar subsam-ple). The excess absorption in the Mbar-high subsample has its centroid atv = +154 km s−1 and its peak near v � 0.
(A color version of this figure is available in the online journal.)
For example, in the simplest possible scenario, one couldimagine that the difference in the Lyα line profiles shown inFigure 12 (or any other set of Lyα profiles) could be explainedby altering the distribution of τLyα(v) such that only the most-redshifted photons have an appreciable chance of making itthrough the intervening H i. It is then easy to see that increasingτLyα(v) near v = 0 will shift the apparent peak and centroidof Lyα emission toward the red, since Lyα photons emittedfrom material with line-of-sight velocities near v = 0 will haveno chance to reach the observer—only those with the mostextreme redshifted velocities will find τLyα low enough to makeit through in our direction. Figure 12 shows the Lyα profiles forthe two samples split by Mbar as in the previous section—thegreen histogram shows 1 + ΔτLyα(v) with ΔτLyα defined so asto produce the red profile (high Mbar) from the blue one (lowMbar), i.e.,
Ihm(v) = Ilm(v)e−ΔτLyα(v). (6)
Here, ΔτLyα is the excess optical depth, over and above thatalready present for the low-Mbar subsample; the effective opticaldepth, including both scattering and dust opacity, must be verysignificant even for the latter, since the equivalent width of theobserved Lyα emission line is ∼20–40 times smaller than thatexpected for Case-B recombination and a normal population ofhigh-mass stars (e.g., Charlot & Fall 1991).
Figure 12 also reproduces the excess optical depth Δτ (C ii,Si ii) in the low-ionization metallic species from Figure 11for comparison to Δτ (Lyα). While both have centroids withv > 0, Δτ (Lyα) peaks at v ∼ +270 km s−1, close to thevelocity at which Δτ (C ii, Si ii) begins to decrease going toward
Figure 12. Comparison of the composite Lyα emission profiles of the samesamples as in Figure 10. Also shown (green histogram) is the inferred function1 + ΔτLyα(v), where ΔτLyα(v) is the excess apparent optical depth in Lyα (asa function of velocity) required to produce the weaker of the two Lyα profilesfrom the stronger. The black histogram reproduces the low-ion residuals fromFigure 11.
(A color version of this figure is available in the online journal.)
higher positive velocity. The differences are probably due toa combination of generally much higher optical depths in theLyα transition than for the low-ion metals (Lyα photons canonly escape from regions having the lowest τ (Lyα)), as well asgeometric effects relating to the possible location of gas seenin absorption (which must lie in front of the continuum source)versus emission (which may lie either in front of or behind thecontinuum source).
5.2. Understanding Lyα Emission Line Kinematics
The real situation is undoubtedly far more complicated.There have been several recent theoretical treatments of Lyαradiative transfer in the context of galactic outflows (Verhammeet al. 2006, 2008; Schaerer & Verhamme 2008; Hansen &Oh 2006; Dijkstra et al. 2006a, 2006b; Zheng & Miralda-Escude 2002), and even in the highly idealized geometricconfigurations considered in these papers, a given line profiledoes not uniquely specify the combination of velocity field, H i
column density, covering fraction, and dust opacity that appliesto a given observation. For example, both bulk velocity fieldsand photon diffusion are capable of accounting for Lyα photonsthat acquire large redshifts before escaping from a model galaxy.The profiles of IS absorption lines, particularly in the highest-quality spectra of individual objects, indicate that material withvelocities ranging from ∼+200 to ∼−800 km s−1 exists inmost observed ions for most galaxies (as discussed above).Essentially all of the ions observed in spectra of the qualitypresented here are strongly saturated, so that line profiles arebest thought of as maps of covering fraction (hereinafter fc)versus velocity. The simultaneous presence of neutral and singlyionized species along with higher-ionization species like C iv,with similar overall velocity envelopes, reinforces the idea that

No. 1, 2010 STRUCTURE AND KINEMATICS OF THE CIRCUMGALACTIC MEDIUM 301
the interstellar medium (ISM) is a complex multiphase medium.To make matters worse, we do not know where, in physicalspace, IS absorption at a given observed velocity actually arises.Since Lyα photons must traverse this medium, experiencingtypically thousands of scattering events, it is therefore extremelydifficult to predict in detail what the emergent Lyα profile willlook like.
Verhamme et al. (2006, 2008) consider a wide range ofparameters, examining the effect on emergent Lyα line profiles,for models of central (monochromatic) point sources surroundedby an expanding shell of gas with varying H i column density andDoppler parameter (b). A generic prediction, as discussed above,is that Lyα emission (when present) will be very asymmetric,with the details of the line shape depending on the assumedshell velocity, Doppler parameter, and H i column density in theshell. For the expanding shell models, these authors predict thatthe peak of the Lyα emission line should appear near velocityv � −2 × Vexp, where vexp is the shell velocity, due to thecombined effects of radiative transfer and the bulk velocity of thescattering medium. The red wings of the Lyα line are expectedto be produced by photons scattering multiple times from thereceding side of the expanding shell (as seen by an observeron Earth); most of the migration of Lyα photons toward largeredshifted velocities arises from absorption in the Lorentzianwings associated with high values of N(H i). Larger values ofvexp and higher assumed values of N(H i) also accentuate the redwing of the Lyα line and suppress regions close to the systemicredshift, moving both the peak and the centroid of Lyα emissionto higher velocities. A further prediction of the shell models isthe presence of additional Lyα peaks that correspond to photonsescaping in either the blue or the red wing of Lyα associatedwith the approaching side of the shell; photons emitted from thered wing of the Lyα line in the approaching side would then lieclose to v = 0, while the blue wing would tend to form a peakwith v � −Vexp.
In a less-idealized situation, where the bulk velocity of theoutflowing gas is not single-valued, but spans a more-or-lesscontinuous velocity range of at least 800 km s−1, the dominantmechanism for the migration of Lyα photons in both frequencyspace and real space becomes simpler, in some respects.14 Ina scenario with more gradual velocity gradients and a clumpymedium spread over a large range in galactocentric distance r(rather than a “shell”) associated with an outflow, photons canachieve velocities off-resonance by scattering their way throughgas with a range of v; when they escape the nebula and areobserved as redshifted Lyα photons by the observer, they wouldgenerally exhibit Doppler shifts that directly reflect the velocitywith respect to the systemic velocity of the gas from which theywere last scattered. Since the medium is clumpy, the columndensity N(H i) for individual “clumps” becomes less relevantthan their velocity distribution and covering fraction, since mostLyα photons will scatter off the “surfaces” of clumps, rarelyencountering regions where absorption or emission in the broadwings of a line is important (see Neufeld 1991 for a discussionof this type of situation). Note that the clumpy geometry isqualitatively different from, e.g., the “Hubble expansion” modelconsidered by Verhamme et al. (2006), which has v increasingsmoothly with r. In this case, the radiative transfer is stillimportant because the scattering medium is continuous and hasassociated with it a particular N(H i) through which all Lyαphotons must pass on their way to larger r. The picture we are
14 More general implications of this type of model are discussed in Section 7.
Figure 13. Comparison of two independent galaxy sample composites illus-trating the presence of a weak blueshifted component of Lyα centered atv = −520 km s−1 (indicated with a solid vertical line). The blue and greenhistograms are the velocity profiles of Lyα and C ii λ1334 for the R = 1330sample, while the red and magenta histograms are the same lines for the R = 800Hα sample. The position of the secondary Lyα peak corresponds to the maxi-mum blueshifted wing of the IS line profiles.
(A color version of this figure is available in the online journal.)
advocating has photons scattering from the τ (Lyα) ∼ 1 surfacesof discrete clumps; this causes most Lyα photons to emergefrom scattering events near the line center, and thus to acquirea Doppler shift characteristic of the velocity (with respect tosystemic) of the most recent clump. In other words, bulk-motion-induced velocity shifts, rather than radiative transfereffects, may be most responsible for the kinematics of theobserved Lyα emission line.
In this context, the IS absorption lines provide a reasonableproxy for the velocity distribution of gas that will comprise themedium through which the Lyα photons must scatter in orderto escape in the observer’s direction.15 If the flows are roughlyspherically symmetric, it should be possible to seek consistencybetween the kinematics of Lyα emission (which would probe thekinematics of gas on the receding side of the flow) and that of theIS absorption, which samples the blueshifted, or approaching,side. The Lyα photons will be most successful in escaping thegalaxy when they acquire velocity shifts well off resonance ofwhatever material lies between the last scattering surface andthe observer. This effect would tend to produce emission fromboth the redshifted and blueshifted gas.
Figure 13 compares the velocity profiles of Lyα emission andC ii λ1334 absorption for the same R = 800 and R = 1330composite spectra shown in Figure 5. First, it does appearthat both spectra exhibit a secondary blue peak in the Lyαemission line, with centroid velocity at v � −520 km s−1
(although it is more evident in the spectrum with higherspectral resolution), close to a “mirror image” (in velocity)of the dominant redshifted emission. While the strength ofthis secondary feature in the composites is only ∼5% of the
15 Note that the velocity field information provided by the IS lines has notbeen exploited in any of the models mentioned above.

302 STEIDEL ET AL. Vol. 717
Figure 14. Examples of model spectra in which the velocity field of optically thick gas in the galaxy is assumed to be comprised of two Gaussian (in optical depth τ )components, both having a covering fraction of 0.6 (dashed profiles in each panel). The top two panels show the results for a model with one component outflowingwith v1 = −450 ± 150 km s−1, and an additional component with v2 = 0 ± 120 km s−1; the bottom panels show a second example with v2 = 150 ± 200 km s−1, withthe velocity v1 and optical depth of the outflowing component held fixed. Note how the kinematics of the material near v = 0 influences the measured centroids of thenet absorption lines (heavy blue curve). If the same gas kinematics are assumed for H i, the predicted Lyα emission profiles as seen by an observer would resemblethe red curves; the Lyα centroid is redshifted by an additional �100 km s−1 in the bottom model as compared to the top.
(A color version of this figure is available in the online journal.)
primary redshifted component, it corresponds closely to therange of velocities seen in the most blueshifted portion of theIS C ii profile, with −350 km s−1 � v � −750 km s−1. Thisrange also corresponds to that over which the apparent opticaldepth of the IS absorption is decreasing from its maximum,which extends in both composites over the velocity range−350 km s−1 � v � 0 km s−1.
5.3. A Simple Kinematic Model for IS Absorption and LyαEmission
In an attempt to produce simultaneously the salient featuresof the observed IS lines and Lyα emission lines, we haveconstructed a very schematic kinematic model following theline of reasoning outlined above, for the purposes of illustration.In the models, we assume that optically thick gas (for eitherlow-ionization metallic species or Lyα) is present in twokinematic components, each of which is Gaussian in opticaldepth τ for a given transition: one component is centered nearv = 0 and the other is outflowing with a velocity distribution〈v〉 = −450 ± 150 km s−1. We choose 450 km s−1 for thecentroid of the outflowing component somewhat arbitrarily,but (in addition to producing line profiles that resemble the
real ones) it is approximately equal to the escape velocityvesc at the virial radius of a dark matter halo of total mass∼9 × 10¹¹ M at z � 2.5, believed to be typical of the galaxiesin our spectroscopic sample (Adelberger et al. 2005b; Conroyet al. 2008; see Section 8). For the gas near the galaxy systemicredshift, we assume that the velocity distribution of the opticallythick gas is similar to that of the H ii regions traced by Hαemission, i.e., σv(Hα) ∼ 100 km s−1 (Erb et al. 2006b). Allprofiles have been convolved with an instrumental resolution ofR = 1330.
Figure 14 shows example model line profiles for both ISabsorption and Lyα emission, as seen by an observer onEarth (note that the right-hand panel in each case is just azoomed-out view). One needs to provide the normalizationof the τ distribution (i.e., the maximum optical depth τ0) forboth components; in the first example, the v = 0 componenthas a central optical depth of τ � 20, and the outflowingcomponent has a peak at τ � 5.16 The dark blue solidcurve shows the expected absorption line profile (assumingthat the covering fraction fc = 0.6, for both components)
16 The result is relatively insensitive to these numbers, so long as the lines aresaturated.

No. 1, 2010 STRUCTURE AND KINEMATICS OF THE CIRCUMGALACTIC MEDIUM 303
for a saturated low-ion transition. The combination of the twoassumed velocity components produces an absorption featurewith a centroid 〈ΔvIS〉 = −184 km s−1 and a rest equivalentwidth W0 � 2.2 Å—close to the typical values measured forthe real galaxies. A second example, in the bottom panels ofFigure 14, has an identical outflowing component, but the v � 0component has been shifted to +150 km s−1 (to approximatelymimic the “excess” optical depth observed in the high-Mbarsample discussed above; see Figure 11), and broadened toσv = 200 km s−1. The centroid of the resulting absorptionfeature is 〈ΔvIS〉 = −22 km s−1, in spite of the fact thatthe outflowing component is identical by construction, withmaximum blueshifts of vmax � −800 km s−1.
The predicted Lyα emission from the same galaxies is slightlymore complex; for the moment we adopt a simple model inwhich the τ (|v|) distribution is assumed to be the same as forthe IS absorption lines. The probability of a scattering eventin which an Lyα photon is emitted by one atom and thenabsorbed by another with the same velocity (alternatively, onecan think of it as the relative fraction of time an Lyα photonspends resonantly trapped in gas with optical depth τ (v)) isroughly ε ∝ τ 2(v), since τ (v) ∝ nH (v), where nH (v) is thedensity of neutral H atoms with velocity between v and v + dv).The probability that a resonantly trapped Lyα photon escapeswithout being immediately scattered at or near the same velocityis ∝ exp[−τ (v)]. Crudely, the probability that an Lyα photonis scattered by an atom with velocity v and is able to escape inthe direction of an observer without additional scattering, as afunction of v, is the Lyα emission profile I (v),
I (v) � Cτ 2(v)exp [−τ (v)] , (7)
where C is a scale factor that can be adjusted to roughly accountfor the destruction of Lyα photons due to dust, which we assumeis proportional to the total path length traversed by a photon as itworks its way out of the nebula. Finally, we assume that the Lyαphotons reaching an observer who sees IS absorption profilesas in Figure 14 have been scattered toward the observer withprobability of “escape” according to Equation (7). To be clear,we do not concern ourselves with how Lyα photons made it fromthe central H ii regions to any part of the outflow—instead wesimply assume that at any given moment, the relative probabilityfor emission of an Lyα photon is proportional to τ 2(v). Wedo not know the spatial distribution of the outflowing gason the redshifted side of the flow as a function of velocity,but we assume that it is spatially distinct (i.e., farther awayfrom the observer) than the component of ISM near the galaxysystemic redshift, and that the blueshifted component is closer.Further, we assume that the outflow velocity |vout| is a monotonicfunction of the galactocentric distance r on both the redshiftedand blueshifted sides of the flow. We found this assumptionto be necessary to obtain kinematics and spectral morphologyconsistent with observations; it would also follow from theassumption that the line depth at a given velocity is directlyrelated to fc, so that the highest-velocity material is farthestfrom the continuum source; see also Section 7 and Weiner et al.(2009) and Martin & Bouche (2009).
The red curves in the panels of Figure 14 were producedin this way and show the predicted Lyα emission profile for agalaxy whose absorption profile (Lyα or low-ionization metallines) is given by the blue curve, as seen by the observer. Itis worth noting that (to first order, in the absence of dust) theLyα emission profile is not strongly dependent on gas coveringfraction, since (as seen by an observer) the outflowing material
is both the “source” and the “sink” for Lyα photons, both ofwhich would be reduced by the same geometric factor. We note anumber of interesting features of the predicted profiles: first, thecentroids of Lyα emission and IS absorption nicely reproducethose typically observed in the galaxy sample; second, theextreme velocities of redshifted Lyα emission and blueshifted ISabsorption reach 800 km s−1, as for the observed galaxies; third,the model in the top panel produces a blueshifted component ofLyα emission near v � −500 km s−1—similar in both relativeintensity and velocity relative to the redshifted component asin the composite spectra (see Figure 13). In the model, thesecondary feature arises from photons scattered toward theobserver from gas in the approaching part of the outflow; itis generally weaker than the redshifted component if thereis any dust in the galaxy because photons coming from thenear side of the outflow do not appear as redshifted relative tothe scattering medium because they are moving in the samedirection. As a consequence, blueshifted Lyα photons havegenerally experienced a larger number of scatterings in orderto escape in the direction of the observer, thereby increasing theprobability of being absorbed by dust. Finally, the apparent peakof Lyα emission is modulated primarily by the component ofgas near v = 0—Lyα emission is more redshifted, and weaker,when the velocity range spanned by the ISM in the galaxy isbroader (see also Mas-Hesse et al. 2003).
In summary, the apparent velocity of Lyα emission dependsprimarily on gas near the systemic redshift of the galaxy, whilethe extent of the red wing depends on the maximum velocityof material with appreciable column density and/or coveringfraction fc. The extent of the red wing of Lyα appears to be ratherconsistent over subsamples examined. The relative consistencyof ΔvLyα − ΔvIS reflects this dependency: as IS absorption linesshift toward more positive velocities, only the Lyα photons thatscatter off very high velocity material on the far side of thegalaxy can penetrate the H i gas in the foreground. In any case,it appears that the spectral morphology of Lyα and IS lines inrapidly star-forming galaxies may be more easily explained bythe (observed) bulk velocities of outflowing IS gas, as comparedto more subtle radiative transfer effects.
We return to a more physically motivated outflow model inSection 7.
6. WHERE IS THE ABSORBING GAS?
6.1. Mapping the Circumgalactic Medium
Lines-of-sight to star-forming galaxies can provide a greatdeal of information on the overall kinematics, chemical abun-dances, and (in some cases) estimates of the mass flux of coolmaterial entrained in an outflow (e.g., Pettini et al. 2000, 2002;Quider et al. 2009, 2010). However, such observations containlittle or no direct information about where the gas is locatedrelative to the galaxy. A full appreciation for the physics ofthe outflows, and their effects on both the “host” galaxies andthe local IGM, requires probing them along lines of sight fromwhich the physical location of gas as a function of ionizationlevel and velocity can be disentangled. In practice, this is verydifficult.
In the absence of spatially resolved spectroscopy, each galaxyspectrum provides only a surface-brightness-weighted absorp-tion profile in each observed transition, integrated along theentire line of sight from the “center” of the galaxy. Althoughions of differing excitation appear to have similar velocity pro-files when integrated along the line of sight, we do not have
304 STEIDEL ET AL. Vol. 717
any way of knowing, e.g., whether the bulk of the C iv ions at aparticular v are distributed in the same general regions as thosegiving rise to C II absorption at the same velocity. The informa-tion available from the galaxy spectra themselves is necessar-ily crude given the relatively low S/N and spectral resolutionof all but a handful of high-redshift galaxy spectra. The fewhigh-quality spectra, of which MS1512-cB58 (Pettini et al.2002) is perhaps the best example, show that the velocity pro-files are complex, and that most of the lines accessible in lower-quality spectra are strongly saturated. If so, then interpretationof crude measures of line strength such as equivalent width (orapparent optical depth versus v) is ambiguous. The absorptionarises in gas which may not be uniform across the entire con-tinuum source. The absorbing gas may be close to the galaxy,which is typically several kiloparsecs across, and some linesof sight through the (outflowing) material may be completelyabsorbed, while others may be altogether free of absorption. Asdiscussed by Shapley et al. (2003), the equivalent width of astrong line is modulated primarily by the fraction of the contin-uum source covered by gas giving rise to the particular transition(which controls the depth of the lines relative to the continuum)and the velocity range in the foreground gas.
Since the absorbing gas is almost certainly clumpy (e.g., therange of ionization level seen in absorption cannot coexist inthe same gas, and yet they share a comparable overall velocity“envelope”), the apparent optical depth for saturated lines (asseen by an observer on Earth) arising from material at a givengalactocentric radius r will depend on the characteristic physicalscale of the “clumps” σc(r), and their number density nc(r). Theobserved line strength (in the present case, the rest equivalentwidth W0) will also depend on the distribution of line-of-sight velocity—large values of W0 require a large line-of-sightvelocity dispersion, the width of which depends on the sampleddistribution of covering fraction. Clearly, any model for theoutflows is underconstrained by the spectrum of the galaxyitself, even for high-quality spectra (e.g., Pettini et al. 2002;Quider et al. 2009).
However, high-resolution spectra of very closely spacedsightlines toward gravitationally lensed QSOs have providedconstraints on the characteristic physical scales over whichcolumn densities of various transitions such as Lyα, C iv, andlower-ionization species vary significantly (Rauch et al. 1999,2001; Ellison et al. 2004). These scales appear to be �0.5–1 kpcfor C iv (thus, comparable to the “beam footprint” of the galaxy)and �50–100 pc for low-ionization metallic species (muchsmaller than the typical beam footprint). If it is assumed thatthe QSO spectra are sampling metal-enriched gas similar to thatfound near galaxies like the ones in the current sample, thesescales, together with measures of covering fraction, providesome useful information on the structure of the gas in the flows.Information on the distribution of gas transverse to the lineof sight breaks some of the remaining degeneracies hinderinga full phase-space (velocity, position) understanding of thecircumgalactic gas.
6.2. Galaxy–Galaxy Pair Samples
One method for probing the geometry of outflows is toobserve foreground galaxies found near the lines of sight tobackground QSOs, and to compare the kinematics of absorbinggas in the galaxy spectrum with that seen in the QSO spectrum.A picture of the structure of the gaseous envelope surroundinggalaxies can then be built up statistically, by observing a sampleof galaxies with a range of projected galactocentric distances
from the background QSOs (e.g., Adelberger et al. 2005a,2003). This method has the advantage that one can choose thebackground QSOs to be very bright, so that very high S/N andspectral resolution is possible, but the disadvantage is that suchQSOs are rare, and one is “stuck” with whatever galaxies happento lie within �1′ of the QSO. Of course, the smallest separations(e.g., θ � 15′′, or a projected physical galactocentric radius of�120 kpc) will be especially rare. Ultimately, one is also limitedby the quality of the (faint) galaxy spectrum if one is interestedin a kinematic comparison using two different lines of sightthrough the galaxy.
An alternative and complementary method is to use closeangular pairs of galaxies at discrepant redshifts to vastly increasethe sample sizes, at the expense of information quality (becauseboth the foreground and the background objects are faint). Aninitial attempt to use this method was presented by Adelbergeret al. (2005a); here we investigate it using a significantly larger,higher-quality, sample of galaxy pairs drawn from an ongoingdensely sampled spectroscopic survey (see Steidel et al. 2004for early results; the full survey will be described in detailelsewhere).
The survey has been conducted over a total of 18 independentfields, 15 of which are centered on bright QSOs with zQ �2.6–2.8 (high-resolution spectra of the bright QSOs are usedin Section 6.5). The spectroscopic sample includes �2500galaxy spectra in the redshift range 1.5 � z � 3.6, with〈z〉 = 2.28 ± 0.42. We used this galaxy survey catalog toidentify pairs of spectroscopically confirmed galaxies in eachof three bins in angular separation: θ < 5′′, 5′′ < θ �10′′,and 10′′ < θ � 15′′, which will be identified as samples P1,P2, and P3, respectively (see Table 2). At the mean redshiftof the foreground galaxies of 〈z〉 = 2.2, the angular binscorrespond to projected physical distances of b � 41 kpc,41 kpc < b � 83 kpc, and 83 kpc < b � 124 kpc for samplesP1, P2, and P3, respectively (see Table 2). The conversion fromangular separation to physical impact parameter changes byonly ±2% over the full redshift range of the foreground galaxysamples, so that we will use angular separation and impactparameter interchangeably.
Within each pair sample, a number of additional criteria wereimposed: (1) both galaxy spectra within the pair must haveaccurately determined redshifts; the redshift-space separation ofthe two galaxies in each pair must be >3000 km s−1 to ensurethat their geometry is unambiguous (i.e., so that we know whichgalaxy is “behind” the other); and (2) the redshift separationzbg − zfg � 1.0 to ensure that the spectra contain a significantrest-wavelength interval in common after both are shifted to therest frame of the foreground object. Redshifts were assigned toeach galaxy using their Hα redshift if available, and otherwiseusing Equations (2) or (4), depending on spectral morphology.As discussed in Section 2.3, the uncertainty in the redshiftsfor the bulk of the galaxies in the samples is expected to be�125 km s−1. After culling, the final pair samples include 42,164, and 306 pairs for samples P1, P2, and P3, respectively. Theproperties of these three angular pair samples are summarizedin Table 2.
6.3. A Case Study: GWS-BX201 and GWS-BM115
Among these pair samples, there is a handful for which thespectra were of sufficient quality to be analyzed individually.One example, illustrated in Figures 15 and 16 (see also Figure4 of Adelberger et al. 2005a), allows us to compare the ISabsorption lines in the spectrum of the z = 1.6065 galaxy

No. 1, 2010 STRUCTURE AND KINEMATICS OF THE CIRCUMGALACTIC MEDIUM 305
Figure 15. HST/ACS image of the GWS-BM115/BX201 galaxy pair, in the F814W filter. BM115 has zsys = 1.6065, based on the Hα line observed with Keck/
NIRSPEC. BX201 lies 1′′. 9 away on the plane of the sky, corresponding to an impact parameter at z = 1.6065 of �16.1 kpc (physical). Figure 16 and Table 3 comparethe IS lines observed in the spectrum of the foreground galaxy BM115 and those observed in the spectrum of BX201 at the redshift of BM115.
(A color version of this figure is available in the online journal.)
Table 2Foreground/Background Galaxy Pair Statisticsa
Sample θ Rangeb b Rangec (kpc) Number 〈θ〉 〈b〉 (kpc) 〈zfg〉d 〈zbg〉e
P1 < 5′′ 10–41 42 3′′. 8 ± 0′′. 8 31 ± 7 2.21 ± 0.32 2.64 ± 0.36P2 5′′–10′′ 41–82 164 7′′. 6 ± 1′′. 5 63 ± 12 2.18 ± 0.36 2.64 ± 0.41P3 10′′–15′′ 82–125 306 12′′. 5 ± 1′′. 5 103 ± 12 2.14 ± 0.33 2.65 ± 0.39
Notes.a Galaxy pairs in the spectroscopic sample for which both the foreground and background galaxies have unambiguously measuredredshifts which differ by > 3000 km s−1.b Range of angular separation of the galaxies, in arcseconds.c Range of impact parameter, in physical kpc.d Mean redshift for the foreground galaxies in pairs with the specified range of θ .e Mean redshift for the background galaxies in pairs with the specified range of θ .
GWS-BM115 with the same features observed in the spectrumof a background galaxy projected only 1′′. 9 away on the planeof the sky, GWS-BX201 (z = 2.173). In this case, the systemicredshift of GWS-BM115 is known from Hα spectroscopy (Erbet al. 2006b), and the optical spectra of both objects wereobtained with spectral resolution R � 1500 (i.e., �2 timeshigher than most of the other spectra in the sample). Thesegalaxies have apparent magnitudes g′ = 23.5 (BX201) andg′ = 23.7 (BM115), �1 mag brighter than typical galaxies inour sample. Using the systemic redshift of the foreground galaxy(GWS-BM115) measured from its Hα line, both spectra wereshifted into the foreground galaxy’s rest frame, and continuumnormalized, to produce the comparison in Figure 16 whichshows the Al ii λ1670 and C iv λλ1548,1550 transitions.17 Asummary of relevant measurements is given in Table 3.
17 Because of the low redshift of BM115, there are fewer lines in common forthese two galaxies than for most of the pairs in the three samples; thetransitions shown are representative of low-ionization and high-ionizationlines, respectively.
There are several points worth making for this particular case:first, the lines seen in the spectrum of the foreground galaxyhave blueshifted centroids, with ΔvIS � −192 km s−1, whichwe have shown is typical of the objects in the Hα sample.Although the C iv lines are very broad (FWHM � 400 km s−1
after correcting for the instrumental resolution), one can stilldiscern a separation of the two components of the doublet. Theline of sight to the background galaxy (GWS-BX201) passes theforeground galaxy at a projected physical distance (hereinafter“impact parameter,” b) of b = 16.1 kpc. Along this line of sight,the centroids of Al ii and C iv are consistent with ΔvIS = 0relative to the foreground galaxy GWS-BM115—fitting thetwo lines of the C iv doublet and the Al ii feature yields avelocity offset ΔvIS = 0 ± 15 km s−1 and velocity width FWHM� 300 km s−1 after accounting for the instrumental resolution.For both transitions, the “offset” line of sight produces lineswhich are significantly stronger (in terms of equivalent width)than those seen directly toward BM115 itself (see Table 3)!Of course, the path length through the galaxy is different inthe two cases; one line of sight passes through only the “front

306 STEIDEL ET AL. Vol. 717
Table 3Absorption Lines at zfg in GWS-BX201/BM115 Paira
Spectrum 〈b〉 W0(C iv 1549)b W0(Al ii 1670) ΔvISc FWHMd
(kpc) (Å) (Å) (km s−1) (km s−1)
GWS-BM115 (z = 1.6065) 0.0 2.78 1.11 −192 ± 15 400GWS-BX201 (@z = 1.6065) 16.1 3.53 2.20 0 ± 18 270
Notes.a For this galaxy pair, the spectra were both shifted to the rest frame of the foreground galaxy (BM115) and then evaluated withrespect to z = 1.6065.b Values include both components of the C iv doublet; the doublet ratios are 1.20 and 1.05, respectively.c Velocity of IS line centroids relative to z = 1.6065.d Velocity widths of IS lines, corrected for instrumental resolution.
Figure 16. Comparison of the kinematics of representative IS absorption linesin the spectrum of the z = 1.6065 galaxy BM115 (red) to the absorption inthe spectrum of the background galaxy BX201 (z = 2.173, 1′′. 9 on the planeof the sky, or a projected transverse separation of �16 kpc at z = 1.607),shifted into the rest frame of BM115 using the same systemic redshift (blue).The rest wavelengths of the transitions shown are indicated (the C iv profilesare plotted with respect to v = 0 for the λ1548.20 line). Note that in both casesthe absorption in the background galaxy spectrum is stronger and shifted by� + 190 km s−1 compared to the features in the foreground galaxy spectrum,placing the centroid very close to the foreground galaxy systemic redshift.
(A color version of this figure is available in the online journal.)
half” of whatever gas is associated with the foreground galaxy,while the sightline to the background object, although spatiallyoffset, samples material both “behind” and “in front of” BM115as seen by an observer on Earth. The fact that the centroid ofthe absorption has ΔvIS � 0 is consistent with any picture inwhich material is distributed reasonably symmetrically aroundBM115; e.g., this would be expected for axisymmetric radial
outflow from (or infall onto) BM115, reaching a galactocentricdistance of at least rg � 16.1 kpc.
As mentioned above, strong lines such as Al ii λ1670 andC iv are very likely to be saturated; they clearly exhibit saturationalong the b = 16 kpc line of sight, but the lines in the foregroundgalaxy spectrum itself do not reach zero intensity. Al ii λ1670and both components of the C iv doublet have approximatelythe same residual intensity of �0.5 (Figure 16). The inferenceof fc < 1 for cool outflowing material is not unusual, and infact a covering fraction of ∼50% is quite typical of z ∼ 2–3galaxies (see, e.g., Shapley et al. 2003; Quider et al. 2009).
Based on the Hubble Space Telescope (HST)/AdvancedCamera for Surveys (ACS) image (I band) shown in Figure 15,although the two galaxies have similar apparent magnitudesthey have quite different surface brightness distributions: BX201has FWHM � 0.′′22 (�1.8 kpc, physical), while the UV lightof BM115 has FWHM � 0.′′40 (∼3.4 kpc, physical). Thus,the spectrum of BM115 itself indicates that, averaged overan area of �10 kpc2 centered at b = 0 (assuming that theintensity-weighted diameter of the light distribution is givenapproximately by the FWHM), but through only “half” of theoutflow, only � 50% of the “beam” area intercepts appreciableoutflowing low- and intermediate-ionization gas. The “offset”line of sight (b = 16.1 kpc) produces absorption reaching zerointensity in both relatively low (Al ii) and relatively high (C iv)ionization gas, indicating fc � 1 when averaged on a scale of�2.5 kpc2, at a galactocentric radius of �16.1 kpc.
It is difficult to know from observations of a single galaxy pairwhether differences in the kinematics and/or depth of absorptionlines arise from averaging over a smaller spatial region (e.g., amore compact background source might subtend a region withinwhich the gas is optically thick everywhere) or from a changinggas-phase covering fraction with impact parameter b (such thatthe coherence scale of absorbing gas may be physically largeror smaller). This degeneracy is one of the disadvantages ofresolved background sources. However, as we now demonstrate,it is possible to use a large ensemble of pairs to construct aphysical picture of the size and structure of an average galaxy’scircumgalactic gas distribution, again using stacked compositespectra.
6.4. Composite Spectra of Galaxy–Galaxy Pairs
Unfortunately, most of the galaxy pairs in the current spec-troscopic sample are considerably fainter than the GWS-BX201/BM115 pair and were observed with somewhat lowerspectral resolution. Nevertheless, the large size of the pair sam-ples, coupled with the improved accuracy of systemic red-shifts estimated from far-UV spectral features (most of thegalaxies in pairs do not have Hα measurements), allow for

No. 1, 2010 STRUCTURE AND KINEMATICS OF THE CIRCUMGALACTIC MEDIUM 307
Figure 17. Comparison of the absorption lines in composite spectra formed from galaxy–galaxy pairs. The top spectrum is the composite of all foreground galaxiesin pairs from sample P3 with redshift differences > 3000 km s−1. The second spectrum is the composite of all background galaxies in pairs with angular separationΔθ � 5′′ (sample P1(bg)), formed by shifting each to the redshift of the foreground galaxy and averaging, as described in the text. The third and fourth spectra wereformed the same way, for the background galaxies in pairs with 5′′–10′′ and 10′′–15′′ angular separations (samples P2(bg) and P3(bg)), respectively.
(A color version of this figure is available in the online journal.)
interesting measurements from composite spectra. For each an-gular pair of galaxies, the spectrum of the foreground galaxy ineach pair was shifted to its own rest frame using the measuredvalues of ΔvIS and the rules given in Equations (2) or (4), andcontinuum-normalized. The resulting foreground spectra werethen averaged within each pair sample, producing stacked spec-tra which we refer to as P1(fg), P2(fg), and P3(fg), respectively.A similar approach was used to produce stacked spectra of thebackground galaxies: each individual background galaxy spec-trum was shifted into the foreground galaxy’s rest frame usingthe same systemic redshift applied to the foreground galaxyspectrum, and continuum normalized. The strong IS absorptionfeatures at the redshift of each background galaxy constitute asource of noise that can affect the composite spectrum of thebackground galaxies (after shifting the spectra to zfg, the lineswill appear at different wavelengths for each spectrum). To mini-mize this effect, the strongest IS lines in each background galaxyspectrum (at the galaxy redshift, zbg) were masked when pro-ducing the average spectrum at zfg. The resulting compositesP1(bg), P2(bg), and P3(bg) are shown in Figure 17, togetherwith (for display purposes only; in the analysis below we use adistinct stack of the foreground spectra within each pair sample)the spectrum of the average of all foreground galaxy spectra insample P3.
Figures 18, 19, and 20 show line profile comparisons ofP1(bg) and P1(fg), P2(bg) and P2(fg), and P3(bg) and P3(fg),respectively, for selected transitions. Table 4 summarizes themeasured rest-frame line equivalent widths for the same stackedspectra. The quoted errors on the equivalent widths in Table 4account for sample variance, continuum uncertainties, and
measurement errors based on repeated measurements withspectra formed from subsets of the data.
As might be expected, the composites P1(fg), P2(fg), andP3(fg) are very similar, since they are averages of galaxy spectrafor three sets of galaxies selected using identical criteria, withvery similar redshift ranges (see Table 2). Nevertheless, they arecompletely independent, having been formed from the spectraof distinct samples of galaxies. The differences in measuredline strength for the foreground galaxy composites indicate theapproximate level of sample variance (< 10% for the strongestabsorption lines). It is of interest to predict what the absorptionline profiles of the spectra of the foreground galaxies would looklike if the line of sight were to probe the full galaxy rather thanonly the part in the foreground. If one assumes that the stronglines are saturated, and that the kinematics of outflowing gas aresimilar on the far side of the galaxy as observed on the near side,the full line profile should include a reflection of the portion ofthe line profile with v < 0 about v = 0. Generally, accountingfor this effect increases the equivalent widths by a factor of1.45 for low-ionization species (e.g., C ii, Si ii), 1.70 for Si iv,and �2 for C iv. These factors vary because of the differingstrength of the absorption near v = 0—typically low-ionizationspecies have stronger v � 0 absorption, while for C iv thereis very little. The corrected values of the line strengths for theforeground galaxy spectra are also indicated in Table 4; in thediscussion below, we adopt the corrected values for the b � 0sightlines.
The comparison in Figure 18 thus shows the differencein absorption line profiles for lines of sight at b = 0, andthose offset by 1.′′5–5′′ (〈θ〉 = 3′′. 8, or 〈b〉 � 30 kpc), for

308 STEIDEL ET AL. Vol. 717
Table 4Absorption Line Strengths at zfg in Galaxy Pairsa
Sample 〈b〉 Lyα Si ii 1260 C ii 1334 Si iv 1393 Si ii 1526 C iv 1549b Al ii 1670
P1(fg) 0 · · · 1.38 ± 0.12 1.79 ± 0.15 1.20 ± 0.12 1.34 ± 0.12 1.95 ± 0.15 0.97 ± 0.100c (4.7 ± 1.0)d (2.01 ± 0.18) (2.61 ± 0.22) (2.04 ± 0.20) (1.96 ± 0.18) (3.90 ± 0.30) (1.42 ± 0.15)
P1(bg) 31 2.01 ± 0.15 0.42 ± 0.06 0.90 ± 0.08 0.39 ± 0.08 0.37 ± 0.06 2.13 ± 0.15 0.40 ± 0.08P2(fg) 0 · · · 1.42 ± 0.10 1.74 ± 0.15 1.12 ± 0.12 1.52 ± 0.12 1.90 ± 0.10 1.10 ± 0.12
0c (4.8 ± 1.0)d (2.07 ± 0.15) (2.54 ± 0.22) (1.90 ± 0.20) (2.22 ± 0.18) (3.80 ± 0.20) (1.61 ± 0.18)P2(bg) 63 1.23 ± 0.20 0.41 ± 0.09 0.67 ± 0.12 0.19 ± 0.08 < 0.15 1.18 ± 0.15 < 0.20P3(fg) 0 · · · 1.40 ± 0.10 1.62 ± 0.10 1.10 ± 0.12 1.41 ± 0.10 1.90 ± 0.10 1.01 ± 0.11
0c (4.9 ± 1.0)d (2.04 ± 0.15) (2.37 ± 0.15) (1.87 ± 0.20) (2.06 ± 0.18) (3.80 ± 0.20) (1.47 ± 0.22)P3(bg) 103 0.92 ± 0.12 < 0.05 < 0.12 0.12 ± 0.06 < 0.04 0.13 ± 0.05 < 0.10
Notes.a For each pair sample, the rest-frame equivalent width (in Å) for the stack of the foreground galaxy spectra are given in the first row; the results from thecomposite of the background spectra, shifted to rest frame of the foreground galaxy, are in the second row.b Values include both components of the C iv doublet.c Rest equivalent widths after applying corrections (see the text) to represent sightlines through the entire galaxy at b = 0.d Values for Lyα at b = 0 are estimated from the observed strength of Lyβ absorption.
Figure 18. Comparison of the absorption profiles in the composite spectra ofsample P1(fg) (red) and P1(bg) (blue). For each of the 42 pairs, the sameforeground galaxy systemic redshift was used to shift both the foregroundand background galaxy spectra to zfg. Thus, the red curve represents theaverage galaxy absorption line spectrum (i.e., b = 0), while the blue curveis the average spectrum of the same ensemble of galaxies at mean impactparameter of 〈b〉 = 31 kpc. (See Tables 2 and 4 for sample descriptions andstatistics. Note that the rest wavelength of the C iv doublet blend has assumedW0(1548)/W0(1550) = 1.4.)
(A color version of this figure is available in the online journal.)
precisely the same set of 42 galaxies. As in the example ofGWS-BM115/BX201 above, the absorption line centroids inthe 〈b〉 � 30 kpc line of sight are close to the foreground galaxysystemic redshift. For instance, the observed Lyα absorptionline in the P1(bg) spectrum has a measured wavelength of1215.62 Å, only 12 km s−1 from v = 0; the estimated errorin the line centroid from propagation of the uncertainties inzsys for individual objects is σ (Δv) ≈ 20–25 km s−1. Theother lines in the P1(bg) spectrum show similar behavior, inthe sense that their centroids are much closer to v = 0 than thesame lines in the P1(fg) spectrum, which have v � −150 to
Figure 19. Same as for Figure 18, for samples P2(fg) (red) and P2(bg) (blue).In this case, the blue spectrum represents the average absorption profile atimpact parameters b = 41–82 kpc, for the same 162 galaxies which comprisethe mean galaxy spectrum in red. (See Tables 2 and 4 for sample descriptionsand statistics.)
(A color version of this figure is available in the online journal.)
−200 km s−1. It is also clear from Table 4 and Figure 18 that thestrength of low- and intermediate-ionization absorption lines issignificantly weaker for lines of sight with an average impactparameter of 〈b〉 = 31 kpc (physical). Specifically, the strengthof C ii λ1334 is reduced by a factor of ∼3, and Si iv λ1393 bymore than a factor of 5, for sample P1(bg) (〈b〉 = 31 kpc) relativeto P1(fg). Interestingly, the strength of the C iv absorption fallsmuch less steeply in P1(bg) versus P1(fg), declining by only afactor of �1.8.
The same general trend continues in the comparison of P2(fg)and P2(bg) (Figure 19 and Table 4), where P2(bg) representsan average spectrum for impact parameters b = 41–82 kpcwith 〈b〉 = 63 kpc. P3(bg), sensitive to absorption from gaswith b = 82–125 kpc (〈b〉 = 103 kpc), has reached the pointwhere the composite spectra formed from the low-resolution,

No. 1, 2010 STRUCTURE AND KINEMATICS OF THE CIRCUMGALACTIC MEDIUM 309
Figure 20. Same as Figure 18, for samples P3(fg) (red) and P3(bg) (blue). Inthis case, the blue spectrum represents the average absorption profile at impactparameters b = 82–125 kpc, for the same 306 galaxies which comprise themean galaxy spectrum in red. (See Tables 2 and 4 for sample descriptions andstatistics.)
(A color version of this figure is available in the online journal.)
low-S/N galaxy spectra are just barely sensitive enough to detectabsorption lines other than Lyα. C iv absorption is detected withonly marginal significance, and the low-ionization metal linesfall below the threshold of detectability. Interestingly, there is nosignificant change in the equivalent width for the Lyα absorptionline between sample P2 and P3: both have W0(Lyα) reduced byonly a factor of �2 relative to sample P1(bg). We will discusspossible explanations for this behavior in Section 7 below.
A graphical summary of the contents of Table 4 is shown inFigure 21. Points representing lines of sight with b � 0 (i.e.,P1(fg), P2(fg), and P3(fg)) have been averaged, the result ofwhich is plotted near b = 0. The small error bars show thatthe scatter among the independent subsamples of foregroundgalaxy spectra is small. Lyβ has been used in lieu of Lyα fora measure of the strength of H i absorption in the foregroundgalaxy spectra, because of the contamination of Lyα absorptionby Lyα emission. Because both lines probably fall on the flatpart of the curve of growth, the strength of Lyα absorption islikely to be comparable to that of Lyβ.
In spite of the limited sensitivity to weak absorption linesin the composite spectra, there are several trends worth noting.The strength of Si iv and both Si ii lines track each other veryclosely out to b ∼ 40 kpc. This is noteworthy because it is to beexpected when all three lines are strongly saturated and samplethe same range of velocities; in particular, the two measured linesof Si ii (λ1260, λ1526) have oscillator strengths f = 1.18 andf = 0.133, respectively. For a given column density N(Si ii), theratio of λ2f for the two lines would differ by a factor of �6.1;the fact that the equivalent widths of these two lines are equal outto ∼40 kpc indeed supports strong saturation. This suggests thetrend toward weaker absorption with increasing b is dominatedby either a decreasing velocity spread or a decreasing fc; thegalaxy spectra are not of high enough resolution to distinguishbetween the two. By 〈b〉 � 63 kpc, however, the measured Si ii
λ1526 line strength has decreased significantly with respect toSi ii λ1260 (it is at least three times weaker) indicating that theλ1526 line is becoming unsaturated. The equivalent width ratioW0(λ1526)/W0(λ1260) implies an average total Si ii columndensity at 〈b〉 � 63 kpc of log N(Si ii) �13.3 cm−2. In principle,the two lines of the Si iv doublet should allow an assessmentof the degree of saturation, but the Si iv λ1402 absorption lineis sufficiently weak in the composite spectra that it cannot bemeasured with useful precision.
The other lines in Figure 21 exhibit trends similar to thatof the Si lines, albeit with a shallower decline in line strengthwith increasing impact parameter. The equivalent widths for allof the ions in Figure 21 fall precipitously somewhere betweenb � 60 and b � 90 kpc, with the exception of Lyα. All of thespecies decline with galactocentric radius (or impact parameter)as W0 ∝ b−β with 0.2 � β � 0.6 out to b ∼ 50 kpc,whereas β � 1 at larger b (again, Lyα excepted). Becauseof line saturation, and the fact that only relatively strong linescan be detected using low-resolution spectra of faint galaxies,we know that the trends seen in Figure 21 are dominated bya declining value of fc with galactocentric radius, along witha smaller range of line-of-sight velocities with increasing b.Schematic models which reproduce the curves in Figure 21 arediscussed in Section 7.1.
6.5. Lyα Absorption at Larger Impact Parameter
In order to trace the average Lyα absorption line strengthto larger galactocentric radii (b > 125 kpc), we made use ofthe S/N � 40–100, high-resolution (R � 30, 000) spectra ofbright QSOs lying in 15 of the galaxy survey fields introducedin Section 6.2. The QSO spectra were obtained using the HIRESspectrograph on the Keck 1 telescope, with the UV cross-disperser providing simultaneous wavelength coverage from3100–6000 Å with very high throughput. For the time being,we degrade these QSO spectra (using only their high S/N) inorder to obtain absorption line measurements analogous to thoseusing the galaxy pairs above. As for the galaxy pairs, foregroundgalaxy redshifts were assigned based on Equations (2) or (4),and the spectral regions of the QSO spectra correspondingto the Lyα transition at the redshift of the foreground galaxywere extracted. The foreground galaxies were chosen to liein two impact parameter bins: 125 kpc � b � 200 kpc and200 kpc � b � 280 kpc. Within each bin, 21 QSO spectralregions were shifted into the rest frame of 21 distinct foregroundgalaxies, i.e., so that v = 0 lies at the galaxy redshift. Thespectra within each bin were then averaged to obtain the meanLyα absorption profile. The resulting composites were thencontinuum normalized18 and averaged to obtain the mean Lyαabsorption profile. Although the background QSOs are pointsources, and therefore not suitable for measuring gas coveringfraction in a single line of sight, the ensemble of QSO sightlinesshould provide an average absorption profile equivalent to whatwould be obtained using resolved background galaxies. Thetwo new points have been added to Figure 21 to extend themeasurement to b = 280 kpc, or an angular separation of �34′′at 〈z〉 = 2.2. The averaged spectra in the galaxy rest frame forthe two bins are shown in Figure 22; the centroids of the resultingLyα absorption features are remarkably close to v = 0, anotherindication that the estimated galaxy redshifts are relatively freeof systematics (Adelberger et al. 2003).
18 The strength of the absorption associated with the galaxies is measuredrelative to a new effective continuum level reduced by �20%, the average Lyαforest decrement at z ∼ 2.2.

310 STEIDEL ET AL. Vol. 717
Figure 21. Dependence of IS absorption line strengths on the galactocentric impact parameter in physical kpc, for the galaxy–galaxy pair samples outlined in Tables 2and 4. The values near b � 0 are an average of the points for the three distinct foreground galaxy samples P1(fg), P2(fg), and P3(fg). These values have each beencorrected upward to account for the estimated contribution to the line strength from the “far side” of the gas distribution, assuming symmetric kinematics of outflowingmaterial. Each color (for points and connecting line segments) represents a different ISM transition as indicated in the box legend; downward arrows on points indicateupper limits. The dashed curves using the same color coding are predictions for W0(b) using the model described in the text (summarized in Table 5). The two pointsfor Lyα represented by open squares were measured from HIRES spectra, as described in the text. The corresponding spectra are plotted in Figure 22.
Returning to Figure 21, the high-quality HIRES spectra haveallowed us to extend the W0 versus b relation for Lyα to seethe point where the line strength decreases rapidly, evidentlyb � 250 kpc. It seems likely that the rapid falloff in W0indicates that Lyα is becoming optically thin. Indeed, underthis assumption, the line strength in the bin with the largest bis W0 = 0.31 ± 0.05 Å, which would correspond roughly tolog N(H i) � 13.25. Thus, as for the metal line transitions, acombination of decreasing covering fraction and linear curve ofgrowth effects steepens the W0 versus b relation.
We now explore the possibility that a simple schematicoutflow model might reasonably reproduce the observations ofboth the b = 0 constraints (line strength and line shape in galaxyspectra) and the observed variation of absorption line strengthwith impact parameter.
7. A SIMPLE MODEL FOR OUTFLOWS ANDCIRCUMGALACTIC GAS
7.1. Line Strength and the Spatial Extent of CircumgalacticGas
Assuming a spherically symmetric gas flow with (galacto-centric) radial velocity outward, vout(r) (note that this is not a“shell”), the strength of absorption lines produced by materialalong an observer’s line of sight at impact parameter b will de-pend on the line-of-sight component of vout and on the radialand velocity dependence of the covering fraction, fc(r, v). Forthe moment, we characterize the rapid falloff at some galacto-centric radius Reff (which may differ for each ionic species) asan “edge” beyond which no absorption would be detected.
Figure 22. Average spectrum near Lyα in regions of HIRES spectra centeredon the systemic redshifts of galaxies with QSO line-of-sight impact parametersof 120 kpc � b � 200 kpc (blue; 〈b〉 = 170 kpc) and 200 kpc < b � 280 kpc(red; 〈b〉 = 240 kpc). Each spectrum represents an average of 21 galaxy–QSOsightline angular pairs. The centroid velocities are very close to v = 0, indicatingthat our estimates of the galaxy systemic redshifts are accurate. The equivalentwidths fall on an extrapolation to larger b of the relationship obtained fromgalaxy pairs.

No. 1, 2010 STRUCTURE AND KINEMATICS OF THE CIRCUMGALACTIC MEDIUM 311
Figure 23. Diagram illustrating the simple model for estimating the relativeIS absorption line strength W0 as a function of impact parameter b used toproduce the model curves in Figure 21. Reff is the characteristic size of the gasdistribution producing saturated lines of a particular transition. Any systematicdependence of vout on radius has not been included in this model, but thecovering fraction fc of gas giving rise to the transition of interest is assumed tohave a radial dependence fc(r) ∝ r−γ (see the text for additional details).
(A color version of this figure is available in the online journal.)
Modeling the effective value of the covering fraction (and theresulting line equivalent width) for gas along an observed line ofsight must include an assumption about the radial dependence ofthe outflow velocity of absorbing material vout(r) and fc(r, v),where the radial coordinate r takes on values between b andReff , as illustrated in Figure 23. For a saturated transition, theobserved line profile (normalized intensity I versus velocity) isgiven by
I (v) = 1 −∫
fc(r, v)dl, (8)
where v is the line-of-sight component of vout(r) relative to thegalaxy systemic redshift, and the integral is evaluated along theline of sight (shaded region in Figure 23). If the form of vout(r)is assumed, one can then associate a line-of-sight componentof velocity (v) with each value of r along the sightline sothat fc(r, v) becomes a function of only one variable (eitherr or v). The line strength is then given by the integral of I (v)evaluated between the minimum and maximum line-of-sightvelocity expected. For a velocity field which has vout increasingwith r, the extreme velocities expected would be
|Δvmax(b)| = vout(Reff)[1 − b2/R2
eff
]1/2(9)
and the associated equivalent width (with continuum normalizedto unity) is just
W0(v) = 2∫ Δvmax
0fc(v)dv (10)
which can be integrated over the wavelength to give the expectedabsorption line equivalent width. Assuming for the moment that
Table 5W0 versus b Model Parametersa
Line γ b Reff (kpc) vout fc,maxc
Lyα(1216) 0.37 250 820 0.80C iv(1549) 0.23 80 800 0.35/0.25d
C ii(1334) 0.35 90 650 0.52Si ii(1526) 0.60 70 750 0.40Si iv(1393) 0.60 80 820 0.33
Notes.a Parameters used to produce the model curves shown in Figure 21.b Power-law exponent in the expression fc(r) = fc,maxr
−γ .c Maximum value of the covering fraction for each transition, measured fromthe composite spectrum (see Figure 8).d Includes contributions from C iv λ1548 and C iv λ1550 of 0.35 and 0.25,respectively.
fc(r) = fc,maxr−γ , and that vout(r) is constant, one can adjust
the values of vout, γ , and Reff in order to reproduce the observedW0(b) for each species. The maximum covering fraction fc,maxcan be measured from the stacked spectra of the foregroundgalaxies—it is just the maximum depth of the absorptionlines relative to the continuum for each species. These havebeen measured from an average of all three foreground galaxysamples, P1(fg), P2(fg), and P3(fg), and collected in Table 5.Table 5 also contains the parameter values used to produce themodel curves shown in Figure 21 for each species.
The examples plotted using dashed lines in Figure 21 showthat the model does a reasonable job reproducing the relativelyshallow dependence of W0 on b, and the steep decline atb � 70–250 kpc (depending on the transition). The best valuesof γ are in the range 0.2 � γ � 0.6, depending on the transition(Table 5); note that the assumption of fc(r) ∝ r−2, which wouldapply if the absorbing clouds retained the same characteristicphysical size as they move to larger r, appears strongly ruledout by the relatively shallow observed dependence of W0 onb.19 Obviously, a distinct “edge” to the gas distribution at someradius Reff is not physical; however, this radius could, e.g., markthe point at which a transition is becoming optically thin, so thatboth declining covering fraction and decreasing optical depthlead to a rapid diminution of W0 with b. This explanation couldalso account for the fact that Lyα does not exhibit a break inthe near-power-law dependence of W0 on b until b ∼ 250 kpc:Lyα remains strongly saturated as long as log N(H i) � 14.5, sothat geometric dilution dominates over changes in optical depthto radii beyond the limit of sensitivity for the galaxy–galaxypair samples; even with unity covering fraction a rest equivalentwidth of �0.9 Å would correspond to a saturated Lyα line.
For this particular model in which vout is independent ofgalactocentric radius r, the combination of the measured fc,maxand vout control the overall normalization, while the slope ofthe W0 versus b function is dictated entirely by the choice of γ .As shown in Table 5, Lyα, C iv, and Si iv are best matched ifvout = 800 km s−1, while Si ii and C ii suggest vout = 750 km s−1
and vout = 650 km s−1, respectively. The fact that the latter twovalues are somewhat lower may be related to the influence of(non-outflowing) absorption near v = 0 on the measurement offc,max (see discussion in Section 4); for example, changing the
19 It turns out (perhaps counter-intuitively) that the power-law slopes relatingW0 and b in the model curves in Figure 21 are very close to the power-lawindex γ assumed in the expression for fc(r) because of the relationshipbetween impact parameter b and the line-of-sight dependence of the sampledvelocity range.

312 STEIDEL ET AL. Vol. 717
value of fc,max for C ii from 0.52 to 0.42 (i.e., by less than 20%)favors vout = 800 km s−1 rather than vout = 650 km s−1.
So far, the model has made a number of idealized assump-tions: spherical symmetry, uniform outflowing velocity field(we will assess the validity of this assumption in Section 7.3),radial dependence of the covering fraction fc(r) ∝ r−γ , andsaturated lines whose equivalent widths are controlled by thecovering fraction coupled with the range of velocities expectedto be sampled along the line of sight. It is worth a cautionary re-minder at this point that W0(b) for a particular transition cannotbe converted unambiguously into a map of total column densityversus b so long as the lines remain optically thick. Instead, onemeasures the average covering fraction of gas hosting that par-ticular ion; conversely, when the optical depths become of orderunity it becomes feasible to measure total column density, butat that point the constraints on covering fraction are diminished.
As mentioned above, C iv, with γ � 0.20, has a much moregradual decline with b than Si ii and Si iv. This behavior mightbe attributed to a changing ionization state of more diffuse gasentrained in the outward flow, so that “new” pockets of gasbecome more likely to absorb in C iv as the flow becomes morediffuse at larger radii (i.e., it is not just the same “clouds”with larger cross section). The strength of C iv absorptionoften appears “de-coupled” from the strength and depth ofthe lower-ionization species in galaxy spectra (see Shapleyet al. 2003), which may be related to the very different radialdistribution of absorbing gas inferred above, as well as to themuch larger physical coherence scale of C iv-absorbing gascompared to gas giving rise to lower-ionization species observedin high-resolution studies of very small separation lines ofsight. Nevertheless, C iv absorption usually spans a very similarrange of blueshifted velocities in the galaxy spectra, stronglysuggesting that it is being carried in the same outflow. Thequality of the present data does not justify a more detailedanalysis.
7.2. Total Absorption Cross Section
A very simple (and model-independent) calculation that canbe made using the information collected in Figure 21 is theexpected incidence of absorption lines exceeding a particularthreshold in W0 associated with extended gas around galaxiessimilar to those in the current sample. This exercise is theconverse of one undertaken many times in the past for varioustypes of QSO absorbers; typically, one takes an observed valueof dN/dz, the number of systems observed per unit redshift,and calculates the galaxy cross section and number densityrequired to account for the rate of incidence, assuming thecross section is all contributed by galaxies. In the presentcase, we have a well-defined population of galaxies, uniformlyselected, with a well-established far-UV luminosity function.Reddy & Steidel (2009) have produced the most up-to-dateluminosity function, determined from the same data set andusing the same selection criteria as the galaxies used in thegalaxy–galaxy pair analysis. They found that a Schechterfunction with φ∗ = (2.75±0.54)×10−3 Mpc−3, M∗ = −20.7,and α = −1.73 ± 0.07 is a good description of the rest-frame 1700 Å luminosity function of UV-selected galaxies in theredshift range 1.9 � z � 2.7. Integrating this function only overthe luminosity range of the actual spectroscopic sample (i.e., toR � 25.5, which corresponds to L ∼ 0.3L∗ at 〈z〉 = 2.3), thenumber density is ngal � 3.7×10⁻³ Mpc−3. Taking b � 90 kpcas the point where W0(C iv λ1548) � 0.15 Å (see Figure 21),at the mean redshift of the foreground galaxies, the co-moving
cross section for absorption per galaxy is σgal � 0.26 Mpc2. Therelevant co-moving path length per unit redshift at 〈z〉 = 2.20is l � 1320 Mpc, so that the expected number of W0(C iv)> 0.15 Å absorption systems20 per unit redshift is
dN
dz(C iv, pred) � (3.7 × 10⁻³)lσgal � 1.1. (11)
The observed incidence of C iv systems at the same equivalentwidth threshold at z � 2.2 is dN/dz(obs) = 2.44 ± 0.29(Sargent et al. 1988; Steidel 1990a), so that galaxies in thecurrent spectroscopic sample alone account for ∼45% of strongC iv systems at z ∼ 2. Although the statistics for the incidence ofother lines are not as well established, Steidel & Sargent (1992)found that, for the C ii λ1334 absorption with W0 � 0.15 Å and〈z〉 = 2.35,
dN
dz(C ii, obs) � 0.94 ± 0.33. (12)
At face value, since the extent of C ii is approximately the sameas C iv (Table 5 and Figure 21), comparison with Equation (12)suggests that essentially all C iiλ1334 absorption with W0 >0.15 Å is within �90 kpc (physical) of a galaxy similar to thosein the sample used here. The presence of strong C ii absorptiongenerally depends on the self-shielding provided by H i withlog N � 17.2 (e.g., Steidel 1990b), so that although we cannotmeasure N(H i) from the galaxy pair spectra, one might expect asimilar cross section for Lyman limit system (LLS) absorption.According to Steidel (1992),
dN
dz(LLS, obs) � 1.4 (13)
at z � 2, suggesting that the total absorption cross sectionof these galaxies accounts for as much as ∼70% of all LLSabsorption at similar redshifts.
It is important to emphasize that the absorption line statis-tics obtained using galaxies as background sources should beidentical to what would be obtained using QSOs, in the limitof a suitably large number of QSO sightlines. In other words,a given average rest-frame equivalent width would be obtainedat the same characteristic impact parameter from a galaxy, in-dependent of the morphology of the background probes. It fol-lows from the above discussion that most of the cross sectionfor strong low-ionization metal-line absorption (and by exten-sion, LLSs) is provided by rapidly star-forming galaxies, atleast at z � 2.2. A very similar connection between strongQSO absorbers and rapid star formation has been observed re-cently by Menard et al. (2009), who used a very large sampleof W0 > 0.7Å Mg ii absorbers (in Sloan Digital Sky Survey(SDSS) QSO spectra) over the redshift range 0.4 � z � 1.2,and compared with the stacked [O ii] λ3727 emission signaturedetected within the SDSS fibers. These authors conclude thatthe strong absorption is tightly correlated with the presence of arapidly star-forming galaxy within �50 kpc of the QSO sight-line. By way of comparison, the statistical impact parameterfor producing C ii absorption with W0 � 0.7 Å at 〈z〉 = 2.2 isb � 60 kpc.
We now turn to additional consistency checks by combiningthe spatial information from the preceding discussion withinformation extracted from the profiles of the IS absorptionlines in the b = 0 spectra of typical LBGs.
20 This equivalent width threshold is roughly equivalent to systems havinglog N(C iv) � 13.5 cm−2.

No. 1, 2010 STRUCTURE AND KINEMATICS OF THE CIRCUMGALACTIC MEDIUM 313
7.3. Constraints from IS Absorption Line Profiles
From the previous section, the galaxy pair data indicate acovering fraction of absorbing gas with a radial dependencefc(r) ∝ r−γ , with 0.2 � γ � 0.6. All measured lines exceptLyα have dropped below the current detection limit for W0by b � 100 kpc; for larger impact parameters, spectra ofhigher resolution and S/N are required—these measurementsare being made using the bright QSO sightlines in each ofthe survey fields (e.g., O. Rakic et al. 2010, in preparation;G. C. Rudie et al. 2010, in preparation). If we focus for themoment on scales r � 125 kpc, the dominant importance of thecovering fraction in modulating absorption line strength meansthat there are only weak constraints on changes in total columndensity with radius. However, the kinematics of the absorptionlines observed along sightlines at b = 0—the spectra of thegalaxies themselves—provide a means of checking the modelsfor consistency. Ideally, one should be able to reproduce theabsorption line shape (i.e., covering fraction as a function ofvelocity) using a model for vout(r) and fc(r) consistent with theobservations of both direct and offset lines of sight.
The boundary conditions provided by the direct line-of-sight(b = 0) observations are that the maximum observed |ΔvIS|should be �800 km s−1, the maximum covering fraction istypically smaller than unity, and the line shapes generally implythat larger blueshifted velocities are associated with gas havingsmaller covering fraction. As we have shown, the simplest(although probably not unique) physical explanation would bethat the higher-velocity gas is located predominantly at largerradii21 (see also Weiner et al. 2009; Martin & Bouche 2009).Since the outflows are believed to be driven by energy and/or momentum originating in the inner regions of the galaxy, aplausible model might have the acceleration experienced by agas cloud depend on the galactocentric distance r. The detailsof this dependence are likely to be complex, since the forceexperienced by cool gas clouds would depend on the energyand/or momentum acquired by the gas, the ambient pressuregradient, the radial dependence of the clouds’ physical sizes,22
and the entrainment of ambient gas in the flow (sometimesreferred to as “mass-loading”) as it moves outward.
In an idealized picture of a multiphase outflow, gas clouds,perhaps pressure confined by a hotter, more diffuse gaseousmedium, are accelerated by thermal and/or radiation pressure tolarger radii and higher velocities. The fact that the inferred radialdependence of the absorbing gas covering fraction remainsat fc(r) ∝ r−γ with γ � 0.6 (at least for radii r < Reff)implies that the clouds must expand as they move out (otherwisefc(r) ∝ r−2). Even the most steeply declining species, withγ � 0.6, requires that the total cross section for absorptionper cloud increases as σc ∝ r4/3, or that the characteristic cloudsize Rc(r) ∝ r2/3. For clouds of constant mass Mc = 4/3πR3
c ρc
and assumed pressure gradient p(r) ∝ r−2, maintaining localpressure equilibrium leads to the same dependence, Rc ∝ r2/3;thus, the behavior of fc(r) for Si ii and Si iv is very close to whatone might expect for cooler, denser “cloudlets” confined by ahotter medium whose pressure decreases with galactocentricradius. One might think of the clouds giving rise to low-ionization absorption as “expanding bullets,” surviving as long
21 Note that the simple models presented in Section 5 assumed a monotonicrelationship between physical location and velocity to simultaneously explainthe kinematics of observed Lyα emission and IS absorption.22 Recall that the radial dependence of the covering fraction is inconsistentwith clouds maintaining the same size; we show below that the clouddimensions Rc must increase with r.
as there is sufficient ambient pressure to confine them, or untilthey expand to the point that they no longer produce significantlow-ionization absorption (see Schaye et al. 2007 for additionalobservational evidence of such phenomena).
D.K. Strickland (2009, private communication) has suggestedthat the force experienced by cool clouds in a wind model obey-ing local pressure equilibrium would have radial dependenceF (r) ∝ r−4/3; this is precisely what would be expected under thecircumstances described above (i.e., Rc ∝ r2/3 and p(r) ∝ r−2).For clouds of constant mass, the radial dependence of cloud ac-celeration a(r) would have the same form as F (r); if additionalmass (e.g., ambient ISM) is entrained in the wind, then a(r)would decrease more rapidly with increasing radius. Once theradial dependence of cloud acceleration is specified, one obtainsvout(r), and thus fc(v), the expected velocity dependence of thecovering fraction.
Rather than develop a more detailed model for the physics ofthe multiphase outflowing material (which is beyond the scopeof the current work), for simplicity we parameterize the cloudacceleration a(r) as
a(r) = Ar−α, (14)
where A is a constant, and seek the value of α that can reproducethe IS line profiles given fc(r) inferred from the galaxy–galaxypair data (Figure 21 and Table 5). Using this parameterizationof a(r),
a(r) = Ar−α = dv(r)
dt=
[dv(r)
dr
](dr
dt
)= v(r)
(dv
dr
).
(15)
Assuming the clouds are “launched” from r = rmin, Equa-tion (15) can be rearranged and integrated to provide an expres-sion for vout(r):
vout(r) =(
2A
α − 1
)0.5 (r1−α
min − r1−α)0.5
. (16)
The constant A can be obtained by using the boundary condi-tion provided by |vmax|, which is the velocity at which fc(r)approaches zero23 and the value of Reff estimated for the transi-tion of interest (Table 5).
We are now in a position to attempt to match observedIS absorption line profiles while simultaneously adhering tothe observationally inferred form of fc(r). For simplicity, weassume that the spectra of galaxies sample their own outflowkinematics at b = 0 (i.e., we ignore the spatial extent of thegalaxy continuum and treat observed spectra as a spatial averageover a region typically 2–3 kpc in diameter).
For demonstration purposes, an absorption component isadded to the outflow profile at v = 0 with a maximum coveringfraction varied to reproduce the v > 0 portion of the line profile.The width assigned to this component is taken to be the same asthe nebular line width associated with the H ii regions in a typicalgalaxy (σ � 100 km s−1). Figure 24 shows a comparison of thepredicted velocity profiles for an IS line given the above model(assuming that rmin = 1 kpc), compared to the observed velocityprofile of the C ii 1334.53 line in the composite spectrum ofz ∼ 2–3 LBGs with R � 1330. Also shown in Figure 24 are the
23 In other words, this is the maximum velocity beyond which the coveringfraction is too small to produce absorption that can be distinguished from thecontinuum.

314 STEIDEL ET AL. Vol. 717
Figure 24. Top: model line profiles (convolved with the appropriate instrumental resolution) for an IS absorption line with radial covering fraction fc(r) ∝ r−γ ,maximum covering fraction for outflowing material fc,max = 0.59, and radial cloud acceleration a(r) ∝ r−α , compared to the C ii λ1334.53 profile from a compositeof R = 1330 galaxy spectra. Two models are plotted, both of which include an absorption component with v = 0, σv = 80 km s−1, and fc,max = 0.4: the dark blueprofile assumes γ = 0.35 as inferred from the galaxy pair measurements for the C ii line, and α = 1.15, which provides a good match to the observed line shape. Theorange curve represents the model line profile if γ = 0.2 and all other parameters are held fixed. Note that the relatively small change in γ produces a line profileinconsistent with the data, with a high-velocity wing that is too strong. Both are constrained to have vmax = −700 km s−1 at the point where the line profile becomesindistinguishable from the continuum. The covering fraction of outflowing material is assumed to go to zero at r = Reff = 90 kpc. Bottom: dependence of the coveringfraction (purple, right-hand axis) fc(v) and the relation between vout and galactocentric radius r (cyan, left-hand axis). The solid curves correspond to the dark blueprofile, with the dashed curves indicating values for the orange profile. Note that the velocity profiles are identical for the two models, since they use the same valueof α. The red curve shows the estimated escape velocity as a function of galactocentric radius r for an NFW halo of mass 9 × 10¹¹ M; the green dotted line is thevirial radius rvir for the same halo. Note that at r = rvir (in the context of this model) the outflow velocity exceeds vesc(rvir).
resulting relationships between r and v and between fc and v.The values of γ were chosen based on the models (Table 5) thatadequately describe how W0 varies with b for the relevant ion: aself-consistent kinematic model may be obtained for γ = 0.35(the value inferred for C ii λ1334; see Table 5) if α = 1.15.To provide some intuition on how the line profile would bealtered with different parameter values, the predicted profilewith α held fixed and γ = 0.20 instead of γ = 0.35 is alsoplotted. It shows that assuming an incorrect value for the radialdependence of fc leads (in this case) to an absorption featurethat has too much apparent optical depth at high values of |v|and therefore significantly overpredicts the values of |〈vout〉|and W0.
By altering the maximum covering fraction of the outflowinggas and the optical depth and covering fraction of the v = 0component, it is possible to reproduce a wide range of observedline profiles. Figure 25 (dark blue model profile) shows anotherexample with α chosen to produce a very strong line with a largeblueshifted centroid such as those observed in the spectrum ofthe lensed LBG MS1512-cB58 (Pettini et al. 2002). In this case,it was necessary to change fc,max to unity and to adjust thefunction a(r) to be steeper than for the example in Figure 24.Since the line is again C ii λ1334.53, once again γ = 0.35.The orange model profile is that obtained when all parametersare held fixed but α is reduced to the value that provideda good fit to the profile in Figure 24. Qualitatively, as thefunction a(r) becomes steeper, the covering fraction at high
velocity increases along with the line equivalent width (giventhe imposed boundary conditions); the physical meaning of asteeper a(r) is that material is accelerated more rapidly, suchthat it reaches high velocity before it becomes geometricallydiluted.
The bottom panels of Figures 24 and 25 are also interestingto consider. They show that, at least in the context of thecurrent models, the outflowing gas attains close to its maximumvelocity within ∼3–10 kpc (depending on the model) of thecenter of the galaxy, where whatever mechanism is at work inaccelerating the clouds is most effective. At larger radii, theoutflow velocities change slowly with increasing radius. Recallthat our simple model for inferring fc(r) from W0 versus bassumed that vout is independent of r. Since the current modelrequires a(r) = dvout(r)/dt ∝ r−α with 1.15 � α � 1.95, mostof the acceleration up to the maximum observed velocity occurswhen r 10 kpc. Thus, we conclude that having assumed afixed vout as in Section 7.1 was justified, given other sources ofuncertainty.
We caution that in the particular family of models describedabove, the parameters γ and α are covariant and combinationsof the two can usually be found that will adequately reproduceobserved IS line profiles. It is only because we have informationon the radial dependence of f (r) from the galaxy–galaxy pairs(constraining γ ) that anything like a unique solution results.Since the value of γ is statistical (and so may not apply forparticular individual galaxies) it would be unwise to read too

No. 1, 2010 STRUCTURE AND KINEMATICS OF THE CIRCUMGALACTIC MEDIUM 315
Figure 25. Same as Figure 24, but with increased maximum covering fraction of the outflowing gas fc,max = 1, and a slightly larger covering fraction fc,max = 0.5for the component at v = 0. The cyan and magenta dashed curves in the lower panel refer to the model parameters listed in the upper right of the top panel, while thesolid curves of the same colors refer to the model parameters in the upper left. The dark blue model profile shows that for γ = 0.35, a good match to the observed C ii
line in the spectrum of the lensed LBG MS1512-cB58 (R � 1500, to match Figure 24; see Pettini et al. 2000) is obtained if α = 1.95. The orange curve illustratesthe change in the model line profile if α = 1.15 is assumed instead, with all other parameters held fixed. Clearly, the latter model fails to produce the depth of theabsorption at high values of |v|. As for the example in Figure 24, the outflow velocity is significantly higher than vesc at the virial radius of the assumed halo.
much physical significance into the inferred values of α neededto fit a particular line profile. For example, the C ii line profilein Figure 24 can be well fit a model with the parameters(α, γ ) = (1.33, 0.60), and that shown in Figure 25 can beequally well fit by the combination (α, γ ) = (1.25, 0.20).
8. DISCUSSION
8.1. Connection between b = 0 and b � 0 Sightlines
The models discussed above are schematic only, and prob-ably not unique in adequately describing the relatively crudeobservations. Nevertheless, we have seen that a reasonablysuccessful model for the kinematics and overall geometry ofthe outflows includes a characteristic asymptotic velocity of�700–800 km s−1. Such high velocities are required to explainthe shapes of IS absorption line profiles “down the barrel” forb = 0 sightlines, as well as the strength of the IS absorptionand its relatively shallow dependence on impact parameter forsightlines with b � 10 kpc. This suggests that the absorption atlarge b is causally related to the outflowing material observed atb = 0, in which case the gas at large r would most naturally beidentified with cool gas carried out in an earlier phase of the cur-rent episode of star formation. If this were the case, one mightexpect the geometry of the metal-enriched gaseous envelope ofa galaxy to be time-dependent.
For example, galaxies with spectral morphology similar tothat of MS1512-cB58 (and represented by the model shown inFigure 25) tend to be those with estimated stellar populationages (star formation episodes) of tsf < 100 Myr (Shapley et al.2001; Kornei et al. 2010). Even for gas moving at 800 km s−1,reaching r ∼ 100 kpc requires ∼120 Myr, i.e., longer thanthe inferred duration of the current star formation episode and
�20% of tsf typical of UV-selected galaxies at z � 2–3 (Shapleyet al. 2005). Since the inferences about the CGM geometry fromthe galaxy–galaxy pairs are statistical, and the subset of the pairsample having ancillary information on stellar populations issmall, we are not in a position at present for a definitive test.Significant variations in SFR or of the mass flux of outflowingmaterial might also be expected; if star formation were to shutdown completely, the corresponding diminution of outflowinggas might eventually be recognized as “gaps” in the CGMnear to the galaxy, but lingering high-velocity material at largerradii. Such remnant wind material may have been observed inthe spectra of massive post-starburst galaxies at intermediateredshift (Tremonti et al. 2007). At z � 2–3, our sample does notcurrently include galaxies without significant star formation,though it does include some galaxies with small inferred gasfractions and low specific star formation rate SFR/M∗ (Erbet al. 2006b). Unfortunately, these, too, do not have highenough surface density to have contributed significantly to ourgalaxy–galaxy pair samples.
One of the expectations of the simple kinematic modeloutlined above is that most of the absorption seen in the spectrumof a LBG is due to gas located within �10 kpc, while most ofthe absorption observed in offset lines of sight is due to gasthat makes a relatively small contribution to the line profilein the b = 0 spectra. At large r, because gas giving rise to aparticular absorption line transition has lower fc, the constraintson its velocity from the b = 0 line profiles become progressivelyweaker. This means that there could be lower- or higher-velocitymaterial at large radii and small covering fraction that mightgo unnoticed compared to material with the same velocity butmuch smaller galactocentric radius (because it would have aless-diluted fc).

316 STEIDEL ET AL. Vol. 717
In this context, it is interesting to consider what is responsiblefor the “extra” IS absorption in the higher baryonic masssubsample discussed in Section 4 above. It is intriguing thatthe strength of the v ∼ 0 components of IS absorption is such astrong function of galaxy mass in both the current sample andin the z ∼ 1.4 sample of Weiner et al. (2009). A comparisonof the highest and lowest stellar mass bins in Table 1 of Weineret al. (2009) shows that the line strength of the symmetriccomponent increases with stellar mass by a factor of at least16.6. Weiner et al. (2009) argue that the absorption near v = 0 isdue primarily to stellar photospheric Mg ii absorption. However,the set of far-UV transitions used for our z ∼ 2.3 sample arenot contaminated by significant stellar photospheric absorption,and yet the line profiles exhibit a very similar trend with galaxymass. We therefore conclude that the “excess” absorption nearv = 0 arises from IS gas, at least in our z ∼ 2–3 sample.
There is generally little evidence for infalling (redshifted)gas in the far-UV spectra of the galaxies, and even less evidencethat v(r) could be decreasing with increasing r (the line shapeswould be very different if this were the case). It would also bedifficult to explain the spectral morphology of Lyα emission (seeSection 5) if the relationship between vout and r were inverted, asmight be expected if stalling winds and/or infall dominated thegas flows. The expected signature of infall as seen in the galaxyspectra is IS absorption velocities redshifted with respect to thegalaxy systemic velocity. Such absorption would be expectedif gas were prevented from escaping the galaxy potential andeventually began to fall back onto the central regions; a similarsignature could also result from “fresh” (rather than recycled)infalling cool gas that is expected to have physical conditions(T � 104–105 K; e.g., Goerdt et al. 2009) very similar to thecool outflowing gas. The absorption line strength for the metallicspecies we have been able to measure would be relativelyinsensitive to the metal abundance of infalling material, onceagain due to the high degree of saturation in the strong IS lines.In other words, the presence of infalling gas should be easilydetected in the galaxy spectra (both at b = 0 and at largegalactocentric radii). Redshifted absorption should be observedin the velocity range 0 km s−1 � v � +300 km s−1 as long asthe covering fraction is within a factor of a few of that inferredfor outflowing gas. Under the current model, infalling gas shouldhave increasingly redshifted velocities as its covering fractionincreases (i.e., as r becomes smaller); the expected line profileswould then be inverted with respect to the observations, in thesense that line profiles would be deepest at the high-velocity endof the distribution.
We have discussed evidence from the composite spectra inSection 4 that galaxies with higher baryonic mass are more likelyto have stronger absorption at v � 0, which could possibly bea signature of stalled outflowing material and/or infalling gas.This possibility is discussed further in Section 8.4 below.
8.2. The CGM and Dark Matter Halos
Figure 21 shows that among the strong lines we can measurefrom the composite galaxy spectra, all except Lyα appear tobecome much weaker at impact parameters of b � 70–100physical kpc even though the rate of decline of W0(b) (at smallervalues of b) varies among the observed lines. It is interestingto ask whether this particular scale has physical significance(as opposed to being an artifact of the limited sensitivity of thedata) given that we know something about the properties of thegalaxies associated with the extended gas. The particular objectsin the present sample, drawn from a spectroscopic survey of
“BX” UV-color-selected galaxies, have been well characterizedin terms of their spatial clustering (Adelberger et al. 2005b) andstellar population parameters (Erb et al. 2006c; Shapley et al.2005; Reddy et al. 2005). Conroy et al. (2008) have used theobservational results of Adelberger et al. (2005b) to match thesez � 1.9–2.6 galaxies to dark matter halos in the Millenniumsimulation (Springel et al. 2005). They find a good match toboth the clustering strength and the space density of the “BX”galaxies with dark matter halos having Mhalo > 4.2 × 10¹¹ Mand 〈Mhalo〉 = 9.0×10¹¹ M. If we assume that the dark matterhalos “formed” several hundred million years prior to the epochof their observation (e.g., a galaxy observed at z ∼ 2.4 mighthave formed at z ∼ 2.8 for a typical inferred stellar populationage of �500 Myr), one can estimate the corresponding virialradius,24 which is ∼64 kpc for the minimum halo mass of4.2 × 1011 M and �82 kpc for a halo with the expectedaverage mass of 9 × 10¹¹. These values of rvir would increaseby �10%–15% if the “formation” redshift were assumed to bez = 2.3 instead. It is possible that the similarity of rvir and theradius at which the W0 versus b curve begins to steepen for someof the low-ionization absorption lines is not a coincidence. Ifthe clouds are confined by the pressure of a hotter, more diffusemedium, then rvir may be approximately the radius at whichthe clouds become too diffuse and highly ionized to producesignificant columns of low-ionization metals.
By assuming a radial density profile for the characteristic darkmatter halo, we can estimate the “escape velocity” vesc(r) froma point at radius r relative to the center of mass. Assuming aNavarro et al. (1997) (NFW) dark matter density profile,
ρDM(r) ∝ 1
(1 + cr/rvir)2 cr/rvir, (17)
the corresponding escape velocity from radius r is given by
v2esc(r) = 2GMvir
r
ln(1 + cr/rvir)
ln(1 + c) − c/(1 + c), (18)
where c is the NFW concentration parameter. Assuming a“formation” redshift of z = 2.8, Mvir = 4.2 × 10¹¹ M, andr = 1 kpc, vesc � 561 km s−1, while for the expected averagehalo mass from above, vesc � 730 km s−1, both assumingc = 7.25 Perhaps more relevant, the escape velocity for materialat r = rvir is significantly lower, vesc � 310 km s−1 for theminimum mass halo (rvir = 64 kpc) and vesc � 400 km s−1
for the average mass halo (rvir = 82 kpc). The lower panelsof Figures 24 and 25 show the estimated vesc as a functionof r; note that in the context of the model both cases havevout(rvir) > vesc(rvir).
8.3. Comparison to Observations at Lower Redshifts
The observed value |vmax| ∼ 800 km s−1 so commonamong the galaxies in the UV-selected samples discussed abovesuggests that much of the outflowing gas is destined to becomeunbound from the parent galaxy. One might naturally ask whyvmax seems to be so consistent within the current z ∼ 2–3spectroscopic samples. For halos forming at a given redshift,
24 Here we are assuming that the virial radius is the radius within which theaverage halo matter density is �178 times higher than the mean density of theuniverse at the time of initial collapse.25 vesc is relatively insensitive to c, changing by < 10% as c goes from 5 to 9,but is somewhat more sensitive to the value assumed for zf (e.g., assumingzf = 4 changes the velocities for the same halos above tovesc(r = 1) � 640 km s−1 and 830 km s−1, respectively).
No. 1, 2010 STRUCTURE AND KINEMATICS OF THE CIRCUMGALACTIC MEDIUM 317
the expected dependence of vesc on mass is fairly shallow,vesc(rvir) ∝ M0.3
vir . The inferred range of baryonic mass Mbar(stars + cold gas) among the “BX” sample at z � 2–2.6is reasonably described by a log-normal distribution withlog Mbar = 10.61±0.34 (Erb et al. 2006c); assuming the cosmicbaryon-to-dark matter ratio for all of the galaxies, the expectedrange in vesc among the sample would then be ±25%, whichis marginally compatible with the observed consistency of vmaxamong the BX sample of galaxies. Similarly, the range of SFRsamong the NIRSPEC Hα sample is SFR � 30 ± 15 M yr−1
(Erb et al. 2006b) meaning that if the correlation of vmax ∝SFR0.25 (found by Weiner et al. 2009 for galaxies at z ∼ 1.4)applied to the z ∼ 2–3 galaxies, the expected variation ofvmax would be ±6%, which is indistinguishable from “constant”given the uncertainties in the measurement.
Strickland & Heckman (2009) have emphasized that outflowvelocities observed in cool gas entrained in superwind-drivenoutflows will be significantly smaller than that of the hot “windfluid,” which for M82 they infer to have characteristic velocityof 1400–2200 km s−1 based on hard-X-ray observations. Thehighest velocity observed in cool material (via Hα filaments) inM82 is vout � 500–600 km s−1. The typical galaxy in our samplehas a bolometric luminosity of �3×10¹¹ L, roughly five timeshigher than that of M82 (cf. Reddy et al. 2006; Sanders et al.2003). Applying the scaling expected for momentum-drivenwinds26 (Murray et al. 2005), vmax ∝ L0.25, by analogy withM82 one would expect the cool component of the outflows for atypical z ∼ 2–3 galaxy in our sample to reach 750–900 km s−1.This range is clearly consistent with the observations.
8.4. Evidence for “Cold Accretion”?
It is clearly of interest to understand the expected obser-vational signature of the accretion of gas in the context ofthe proposed schematic model of the CGM. The current mod-els of cold accretion predict characteristic gas temperatures of∼(1–5) × 104 K (e.g., Goerdt et al. 2009), which is the samerange of temperatures expected for the cool outflowing mate-rial seen in absorption against the galaxy far-UV continuum.The bulk of the cool accreting gas is predicted to lie within�100 kpc for halos of mass 1012 M. According to Dekel et al.(2009), absorption due to cold stream accretion should have acovering fraction as seen by background sources of �25% for20 kpc � r � 100 kpc with N(H i) > 1020 cm−2, with in-fall velocities ∼200 km s−1. Along lines of sight with b � 0,one might expect absorption centered near vlos � 0 relative tothe galaxy systemic redshift (because on average the sightlinesshould intersect both blueshifted and redshifted IS material),with velocity range of perhaps ±150 km s−1. Sightlines withb � 0 (i.e., in the spectra of the galaxies themselves) shouldintersect inflowing gas with 0 � vlos � +200 km s−1.
As mentioned in Section 4.3 above (and illustrated inFigure 11), the “excess” absorption in the composite spectrum ofgalaxies with Mbar � 4 × 10¹⁰ M may be consistent with boththe expected kinematics and optical depth (or covering fraction)for infalling gas. It is notable that the vlos � 0 component ofabsorption is seen in low-ionization species, but not in morehighly ionized species such as C iv that are otherwise presentover all velocities vlos < 0 km s−1. This may imply that thegas in the vlos > 0 kinematic component is more self-shielded
26 Murray et al. (2005) point out that cool clouds entrained in a hot flowbehave like momentum-driven winds whether the source of the flow isprimarily momentum-driven or energy-driven.
than the IS material that contributes most of the observed lineequivalent width, suggesting it lies primarily at small r. In anycase, even when it is present, a putative infalling IS compo-nent cannot account for the observation of strong absorption inboth Lyα and metal lines whose strength requires high-velocitydispersion and covering fraction. Nor can accretion explain theobserved kinematics of Lyα emission discussed extensively inSection 5. Nevertheless, we know that galaxies with halo massesof �1012 M must accrete material in some form over the typ-ical star formation timescale of ∼500 Myr in any reasonablehierarchical model; infall of low-metallicity gas may also benecessary for producing the observed mass–metallicity relationat z � 2 (e.g., Erb 2008).
Possibly more intriguing than the dominance of outflowing ISmaterial is the observation (both in the present 〈z〉 = 2.3 sampleand in the z ∼ 1.4 sample of Weiner et al. 2009) that galaxiesbelow a threshold in baryonic mass appear to lack the vlos > 0 ISabsorption component. In the z ∼ 2.3 sample the mass thresholdappears to be near Mbar � 4×10¹⁰ M, below which essentiallyall IS absorption is blueshifted. We have seen that the probablerange in dark matter halo mass (assuming correspondencebetween baryonic mass and halo mass) for the lower-Mbar halfof the Hα sample is 4 × 10¹¹ M � Mhalo � 9 × 10¹¹ M—arange in mass over which cold accretion is believed to benear its peak at z � 2. Paradoxically, the subsample showingpossible evidence for an accreting component of cool gas is thehalf with Mhalo � 1012 M, i.e., close to the critical mass atwhich virial shocks begin to prevent cold gas from streamingto the central regions of the galaxy (e.g., Dekel & Birnboim2006; Ceverino et al. 2010, but see Keres et al. 2009). Lowerbaryonic mass galaxies with similar SFRs show no evidencefor an infalling component with significant covering fraction, atleast as compared to that of outflowing material. The extendednature of the galaxies in whose spectra the IS lines are measuredprovides a spatially averaged IS absorption profile to detect boththe coolest regions of inflowing material as well as more highlyionized gas (i.e., having N(H i) as low as 1014 cm−2) that wouldpresent a larger covering fraction. It would be very hard to missinfalling cool gas, which would appear as redshifted absorptionfor b = 0 sightlines. Moreover, sightlines at b � 0 wouldproduce lines too weak to be consistent with the W0 versus bresults from Section 6 due to the quieter velocity fields expectedfor infalling material; see Dekel et al. (2009).
With the possible exception of the v > 0 absorption inthe more massive half of the current sample (which couldhave alternative explanations; see discussion in Section 2), theobservations reveal an absence of evidence supporting cold flowaccretion as currently envisioned. It is possible that the streamscover a much smaller fraction of 4π sr than the ∼20%–25%estimated from simulations (Goerdt et al. 2009; Dekel &Birnboim 2008) in order to remain undetected by the absorptionprobes; however, since the absorption line probes are sensitiveto H i column densities as low as N(H i) � 1015 cm−2, theywould be sensitive to much more than the coolest, most highlycollimated regions of the accretion flow. In any case, there seemsto be no way to reconcile the observed CGM absorption linestrength and kinematics with the results of simulations whichseem consistently to predict that accretion of cool gas shouldbe dominant over outflow for galaxies with Mtot ∼ 1012 M.Taken at face value, it seems that the importance of coldaccretion has been significantly overestimated—or at least thatits observational signature must be more subtle than suggestedby the early predictions. Of equal concern is that the influence

318 STEIDEL ET AL. Vol. 717
of outflows, affecting large regions of the CGM of relativelymassive galaxies, seems to have been seriously underestimated;in many cases, outflowing material has been completely ignoredor deemed negligible for galaxies in the same mass range as inour sample. There is strong empirical evidence for high-velocityoutflows whose influence extends to galactocentric radii of atleast 125 kpc around an average galaxy in our sample—roughlythe same range of r over which cold accretion is supposed to bemost observable. It would clearly be interesting to understandhow high-velocity outflows would interact with cool accretinggas in the case where both are occurring simultaneously in thesame galaxies and where the relevant physics of both processeshave been realistically modeled. At present, the bulk of theobservational results do not support the direction in which thetheory has been moving—a situation which clearly needs to beresolved.
8.5. Lyα Emission Revisited
In Section 5, we presented a simple one-dimensional modelin an effort to understand the kinematics of Lyα emissionin the galaxy spectra. The model assumed that the observedblueshifted IS absorption is providing information on the rele-vant gas-phase kinematics on the “far side” of the galaxy. Weshowed that the scattering of Lyα photons in circumgalactic gashaving large bulk velocities and steep velocity gradients wouldproduce redshifted Lyα emission similar to that observed. Asomewhat more physically motivated CGM model was pre-sented in Section 7. The outflowing material is multiphase,where the covering fraction of gas giving rise to a particulartransition (rather than the optical depth) versus velocity andgalactocentric radius modulates the line profile shapes and theline strength as a function of impact parameter. A more sophis-ticated model for Lyα emission, including photon diffusion inthree-dimensional physical space as well as velocity space (e.g.,Laursen & Sommer-Larsen 2007; Verhamme et al. 2008), wouldbe needed for a detailed understanding of the Lyα morphology.Such modeling is beyond the scope of the present work; how-ever, the multiphase gas involved in galaxy-scale outflows islikely to lead, qualitatively, to Lyα kinematics similar to theobservations.
As discussed in Section 5, the high velocity and (moreimportantly) the large velocity range evident from the observedIS absorption lines allow Lyα photons initially produced byrecombination in the galaxy H ii regions to work their wayoutward in both real space and velocity space via multiplescattering events. Rather than a shell or a continuous mediumof high H i optical depth, the velocity gradient due to theacceleration of the clumpy outflowing gas allows Lyα photonsto migrate to larger radii and higher velocities until they aresufficiently redshifted that photons emitted toward an observercan escape the galaxy and its circumgalactic gas. Since weknow that the clouds giving rise to low-ionization absorptionlines typically extend to at least r � 70 kpc, the model wehave proposed implies that there should be a diffuse Lyα haloon the same physical scales. The total luminosity in the diffusehalo may, in some cases, represent a significant fraction of thegalaxy’s production of Lyα, albeit distributed over a projectedsurface area as much as �1000 times larger than the galaxycontinuum light. Of course, most of this Lyα emission wouldnot be included in the narrow slit typically used for galaxyspectroscopy. It is possible that the diffuse emission has alreadybeen observed in very deep Lyα images in the form of Lyα“Blobs” (Steidel et al. 2000; Matsuda et al. 2004)—the most
extreme examples—or as diffuse emission evident only afterstacking spatial regions surrounding normal LBGs (Hayashinoet al. 2004; C. C. Steidel et al. 2010, in preparation).
The main point is that the structure and kinematics of theCGM ultimately control the morphology of escaping Lyαemission, and the Lyα “photosphere” of a galaxy is expected tobe roughly coincident with the distribution of gas responsible forthe observed IS absorption features. This “prediction” of veryextended Lyα halos on scales of ∼50–100 kpc is remarkablysimilar to recent predictions of cooling Lyα emission associatedwith cold accretion onto galaxies of very similar mass scale tothose in the current sample (Goerdt et al. 2009; Dijkstra &Loeb 2009). Lyα emission is expected to be both redshiftedand relatively axisymmetric for Lyα originating in the galaxyand scattering through the CGM, whereas Lyα emission fromaccreting gas should favor blueshifts and will be concentratedin a few dense filaments. However, it remains unclear howobservationally distinct the extended Lyα emission arising fromthese two very different processes will be.
We intend to address these issues in greater detail in a separatepaper.
8.6. Outflow Mass Flux and the Gas Content of the CGM
In principle, the type of outflow model described above can beused to estimate the outward mass flux Mout as well as the total(cool) gas content of the CGM, MCGM. Mass outflow rates ofcool gas have been estimated for nearby starbursts (e.g., Martin2005), for rare individual examples of high-redshift galaxies(e.g., Pettini et al. 2000), and for composite spectra of star-forming galaxies at intermediate redshifts (Weiner et al. 2009).In all cases, the mass flux is estimated to be Mout � M∗ whereM∗ is the galaxy SFR. The calculations generally assume that theoutflowing material is in a thin shell located at a galactocentricradius r just beyond the observed stars, traveling with outwardvelocity given by the centroid of the outflowing component ofthe IS absorption lines, where the total gas column densitieshave been estimated from the strength of low-ionization metalabsorption lines (for z < 1.6) or from the observed N(H i)measured from the Lyα absorption, in the case of MS1512-cB58. The uncertainties in these calculations are very large evenin the context of the simple shell model, since they depend on theassumed shell radius as r2 and the total gas columns are poorlyconstrained even when N(H i) has been directly measured, dueto unknown ionization corrections.
Unfortunately, the less-idealized model introduced abovedoes not necessarily improve the situation; the IS absorption isproduced by gas with a large range of both radius and velocity,rather than a shell at a single radius. This means that a galaxyspectrum contains information on the integral absorption alongits line of sight, and therefore includes material deposited byboth current and past winds. Since the depth of absorption linesis significant out to Reff ∼ 100 kpc in our outflow model, gasthat was launched up to �100 Myr ago may still contribute tothe line profiles, albeit diluted by a decreasing covering fractionwith increasing r.
In the context our model, cool gas deposited by outflows tor ∼ 100 kpc represents an appreciable fraction of the expectedMbar,tot � 1.5 × 10¹¹ M associated with a typical dark matterhalo mass of �9 × 10¹¹ M. If we assume for definitenessthat Reff � 80 kpc and that the asymptotic outflow velocityis vout � 750 km s−1, a packet of cool gas launched fromrmin ∼ 1–2 kpc will reach r � 80 kpc after t80 ∼ 1.3×10⁸ yr. Ifthere is a steady-state flow with mass flux Mout, the total cool gas

No. 1, 2010 STRUCTURE AND KINEMATICS OF THE CIRCUMGALACTIC MEDIUM 319
content within Reff = 80 kpc deposited by the outflow wouldbe given approximately by
〈MCGM〉 = 〈Mout〉t80. (19)
The model that best reproduces the radial behavior of fcfor low-ionization species in the CGM of typical galaxiesimplies cloud densities that increase with galactocentric radiusas ρc ∝ r−2 (Section 7.3). If we assume that the initial numberdensity of atoms in a typical cloud is n0 cm−3 at the base of theflow rmin, then the total cool gas mass between rmin ∼ 1 kpc andr = 80 kpc is
MCGM(r < 80) � 3 × 10¹⁰n0 M, (20)
〈Mout〉 � 〈MCGM〉t80
� 230n0 M yr−1. (21)
Note that this estimate does not attempt to account for hotor highly ionized gas that is also likely to be associated withsupernova-driven outflows (e.g., Strickland & Heckman 2009).
An estimate of n0 follows from our earlier assertion that Refffor low-ion species likely corresponds to a threshold N(H i) �1017 cm−2 (i.e., an LLS). The neutral fraction for such H i
column density gas ionized by the metagalactic radiation field isestimated to be ∼10−3 (e.g., Steidel 1990b), so that the total Hcolumn will be ∼1020 cm−2. For a line of sight with b ∼ 80 kpc,the corresponding average density nH (80) ∼ 4×10⁻⁴ cm−3. Inthe case of the aforementioned r−2 density dependence,
n0 ∼[Reff
rmin
]2
nH (80) ∼ 1 cm−3. (22)
Adopting n0 = 1 cm−3, cool gas in the CGM would account forat least 20% of the total baryons associated with a typical galaxy,with mass comparable to the total Mbar (cold gas plus stars) inthe central few kiloparsecs, which has 〈Mbar〉 � 4 × 10¹⁰ M atz = 2.3 (Erb et al. 2006c). If one assumes that the typical stellarmass M∗ � 2 × 10¹⁰ M was formed over the same timescale(i.e., t80 � 1.3 × 10⁸ yr), then 〈SFR〉 � 150 M yr−1. Thus,a crude (but largely independent) calculation yields the samequalitative result obtained with shell models in previous work,i.e., Mout � M∗.
In any case, it is difficult to escape the conclusion that theCGM contains a substantial fraction of galactic baryons atz ∼ 2–3, and that the gas-phase kinematics and geometry pointsto a causal connection between rapid star formation and thepresence of large amounts of gas at large galactocentric radius.27
9. SUMMARY AND CONCLUSIONS
We have used a relatively large sample of 1.9 � z �2.6 galaxies with accurate measurements of systemic redshiftzsys and reasonably high-quality rest-frame far-UV spectrato examine the relationship between galaxy properties andUV spectral morphology. Our main focus has been on thekinematics and strength of IS absorption and Lyα emissionand their implications for the galaxy-scale outflows observedin all rapidly star-forming galaxies at high redshifts. Using thiswell-observed subset as a calibration, we then combined the restfar-UV galaxy spectra drawn from a much larger parent samplewith additional spatial information for the same ensemble ofgalaxies provided by the spectra of background galaxies with
27 See Menard et al. (2009) for additional support for this causal connection.
small angular separations. Using these joint constraints, weconstructed simple models of the kinematics and geometry ofthe “CGM”—the interface between star-forming galaxies andthe IGM. Our principal conclusions are as follows.
1. We have used the Hα sample of z � 2–2.6 galaxies togetherwith their far-UV spectra to produce a revised calibrationthat allows deriving systemic redshifts for star-forminggalaxies from their far-UV spectral features (strong IS linesand Lyα emission). In the absence of stellar photosphericabsorption lines or nebular emission lines in the rest-frameoptical, the most accurate estimates of the systemic redshiftare derived from the centroids of strong IS absorption lines.Applying a shift of Δv = +165 km s−1 (Δz = +0.0018)at z = 2.3 to a measured absorption redshift providesan estimate of a galaxy’s systemic redshift accurate to±125 km s−1; redshifts measured from the Hα emissionline (when available) have a precision of ±60 km s−1.Both methods for estimating redshifts have no significantsystematic offset relative to the redshift defined by stellar(photospheric) absorption features.
2. Using only the Hα sample of BX galaxies, we found meanvelocity offsets for the centroids of the strong IS lines andLyα emission line of ΔvIS = −164±16 km s−1 and ΔvLyα =+445±27 km s−1, respectively. We searched for significantcorrelations between the kinematics defined by the centroidvelocities of IS and Lyα lines and other measured orinferred galaxy properties. Within the Hα sample, theonly significant correlations found were between ΔvIS andgalaxy mass estimated from the sum of inferred stellar andgas mass (Mbar) as well as the independently estimatedMdyn. The sense of the correlation is that ΔvIS is smaller(i.e., less blueshifted) in galaxies with larger masses.
3. Despite the trend described in point (2) above, the velocity|vmax| of the maximum blueshift observed in the absorptionprofiles is essentially identical for the subsamples of galax-ies with Mbar > 3.7 × 10¹⁰ M and Mbar < 3.7 × 10¹⁰ M,with |vmax| � 800 km s−1. However, the higher-mass subsethas both ΔvIS and ΔvLyα shifted toward positive velocities(i.e., more redshifted) by ∼200 km s−1. The differences inthe composite IS and Lyα profiles can be explained by anadditional component of absorption at v � 0 that appears tobe absent in the lower-mass subsample. The extra absorp-tion, which has a peak near v = 0 and a centroid velocityof v � +150 km s−1, could conceivably be a signature ofinfalling gas or stalled winds falling back on the galaxy,but is most likely to be gas at small galactocentric radiibased on the line profiles. In any case, the velocity cen-troids of the IS lines, which are commonly used as a proxyfor the “wind velocity” for high-redshift galaxy samples,are actually modulated almost entirely by gas that is notoutflowing.
4. The Lyα emission profile, like 〈ΔvIS〉, is modulated by thecovering fraction (or apparent optical depth) of materialnear v � 0. We show that, by using the informationon the covering fraction near v � 0, the kinematics ofblueshifted gas, and assuming spherical symmetry, thebehavior of Lyα emission with respect to IS absorptioncan be reproduced using simple models. In general, the redwing of Lyα emission is produced by Lyα photons scatteredfrom outflowing gas on the opposite side of the galaxy. Theapparent redshift of the Lyα centroid is a manifestation ofthe fact that only photons scattering from material having a(redshifted) velocity large enough to take the photons off the
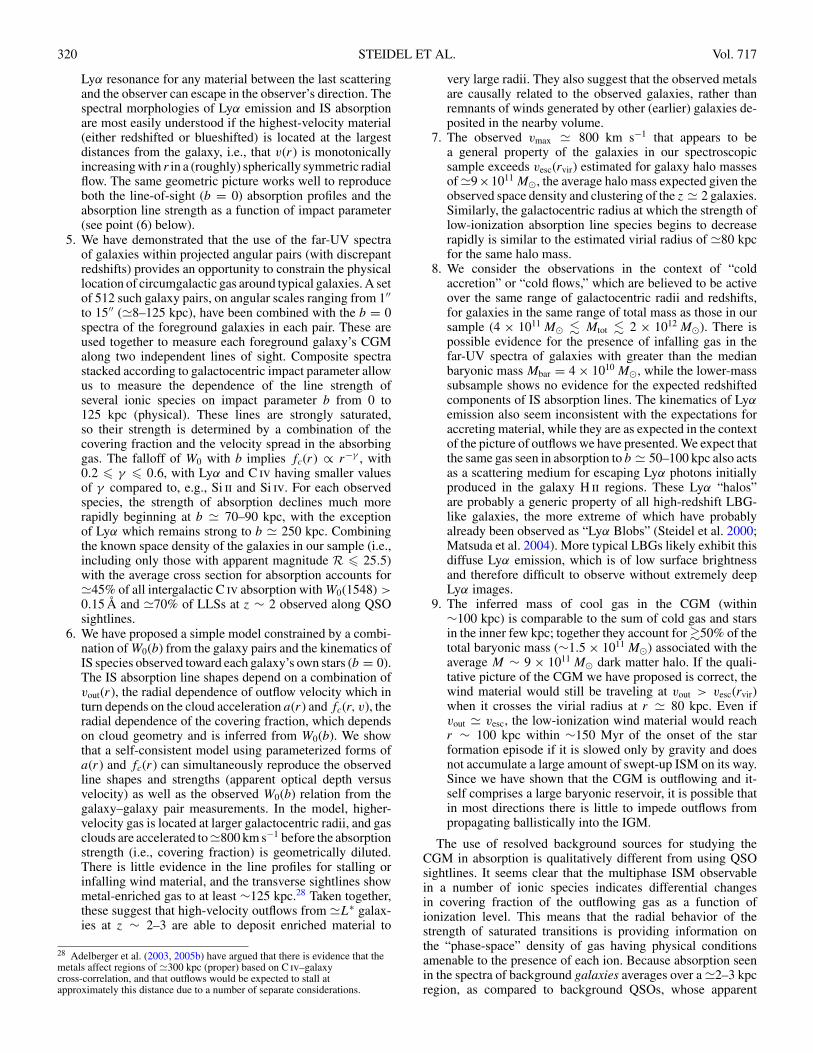
320 STEIDEL ET AL. Vol. 717
Lyα resonance for any material between the last scatteringand the observer can escape in the observer’s direction. Thespectral morphologies of Lyα emission and IS absorptionare most easily understood if the highest-velocity material(either redshifted or blueshifted) is located at the largestdistances from the galaxy, i.e., that v(r) is monotonicallyincreasing with r in a (roughly) spherically symmetric radialflow. The same geometric picture works well to reproduceboth the line-of-sight (b = 0) absorption profiles and theabsorption line strength as a function of impact parameter(see point (6) below).
5. We have demonstrated that the use of the far-UV spectraof galaxies within projected angular pairs (with discrepantredshifts) provides an opportunity to constrain the physicallocation of circumgalactic gas around typical galaxies. A setof 512 such galaxy pairs, on angular scales ranging from 1′′to 15′′ (�8–125 kpc), have been combined with the b = 0spectra of the foreground galaxies in each pair. These areused together to measure each foreground galaxy’s CGMalong two independent lines of sight. Composite spectrastacked according to galactocentric impact parameter allowus to measure the dependence of the line strength ofseveral ionic species on impact parameter b from 0 to125 kpc (physical). These lines are strongly saturated,so their strength is determined by a combination of thecovering fraction and the velocity spread in the absorbinggas. The falloff of W0 with b implies fc(r) ∝ r−γ , with0.2 � γ � 0.6, with Lyα and C iv having smaller valuesof γ compared to, e.g., Si ii and Si iv. For each observedspecies, the strength of absorption declines much morerapidly beginning at b � 70–90 kpc, with the exceptionof Lyα which remains strong to b � 250 kpc. Combiningthe known space density of the galaxies in our sample (i.e.,including only those with apparent magnitude R � 25.5)with the average cross section for absorption accounts for�45% of all intergalactic C iv absorption with W0(1548) >0.15 Å and �70% of LLSs at z ∼ 2 observed along QSOsightlines.
6. We have proposed a simple model constrained by a combi-nation of W0(b) from the galaxy pairs and the kinematics ofIS species observed toward each galaxy’s own stars (b = 0).The IS absorption line shapes depend on a combination ofvout(r), the radial dependence of outflow velocity which inturn depends on the cloud acceleration a(r) and fc(r, v), theradial dependence of the covering fraction, which dependson cloud geometry and is inferred from W0(b). We showthat a self-consistent model using parameterized forms ofa(r) and fc(r) can simultaneously reproduce the observedline shapes and strengths (apparent optical depth versusvelocity) as well as the observed W0(b) relation from thegalaxy–galaxy pair measurements. In the model, higher-velocity gas is located at larger galactocentric radii, and gasclouds are accelerated to �800 km s−1 before the absorptionstrength (i.e., covering fraction) is geometrically diluted.There is little evidence in the line profiles for stalling orinfalling wind material, and the transverse sightlines showmetal-enriched gas to at least ∼125 kpc.28 Taken together,these suggest that high-velocity outflows from �L∗ galax-ies at z ∼ 2–3 are able to deposit enriched material to
28 Adelberger et al. (2003, 2005b) have argued that there is evidence that themetals affect regions of �300 kpc (proper) based on C iv–galaxycross-correlation, and that outflows would be expected to stall atapproximately this distance due to a number of separate considerations.
very large radii. They also suggest that the observed metalsare causally related to the observed galaxies, rather thanremnants of winds generated by other (earlier) galaxies de-posited in the nearby volume.
7. The observed vmax � 800 km s−1 that appears to bea general property of the galaxies in our spectroscopicsample exceeds vesc(rvir) estimated for galaxy halo massesof �9×10¹¹ M, the average halo mass expected given theobserved space density and clustering of the z � 2 galaxies.Similarly, the galactocentric radius at which the strength oflow-ionization absorption line species begins to decreaserapidly is similar to the estimated virial radius of �80 kpcfor the same halo mass.
8. We consider the observations in the context of “coldaccretion” or “cold flows,” which are believed to be activeover the same range of galactocentric radii and redshifts,for galaxies in the same range of total mass as those in oursample (4 × 10¹¹ M � Mtot � 2 × 10¹² M). There ispossible evidence for the presence of infalling gas in thefar-UV spectra of galaxies with greater than the medianbaryonic mass Mbar = 4 × 10¹⁰ M, while the lower-masssubsample shows no evidence for the expected redshiftedcomponents of IS absorption lines. The kinematics of Lyαemission also seem inconsistent with the expectations foraccreting material, while they are as expected in the contextof the picture of outflows we have presented. We expect thatthe same gas seen in absorption to b � 50–100 kpc also actsas a scattering medium for escaping Lyα photons initiallyproduced in the galaxy H ii regions. These Lyα “halos”are probably a generic property of all high-redshift LBG-like galaxies, the more extreme of which have probablyalready been observed as “Lyα Blobs” (Steidel et al. 2000;Matsuda et al. 2004). More typical LBGs likely exhibit thisdiffuse Lyα emission, which is of low surface brightnessand therefore difficult to observe without extremely deepLyα images.
9. The inferred mass of cool gas in the CGM (within∼100 kpc) is comparable to the sum of cold gas and starsin the inner few kpc; together they account for �50% of thetotal baryonic mass (∼1.5 × 10¹¹ M) associated with theaverage M ∼ 9 × 10¹¹ M dark matter halo. If the quali-tative picture of the CGM we have proposed is correct, thewind material would still be traveling at vout > vesc(rvir)when it crosses the virial radius at r � 80 kpc. Even ifvout � vesc, the low-ionization wind material would reachr ∼ 100 kpc within ∼150 Myr of the onset of the starformation episode if it is slowed only by gravity and doesnot accumulate a large amount of swept-up ISM on its way.Since we have shown that the CGM is outflowing and it-self comprises a large baryonic reservoir, it is possible thatin most directions there is little to impede outflows frompropagating ballistically into the IGM.
The use of resolved background sources for studying theCGM in absorption is qualitatively different from using QSOsightlines. It seems clear that the multiphase ISM observablein a number of ionic species indicates differential changesin covering fraction of the outflowing gas as a function ofionization level. This means that the radial behavior of thestrength of saturated transitions is providing information onthe “phase-space” density of gas having physical conditionsamenable to the presence of each ion. Because absorption seenin the spectra of background galaxies averages over a �2–3 kpcregion, as compared to background QSOs, whose apparent
No. 1, 2010 STRUCTURE AND KINEMATICS OF THE CIRCUMGALACTIC MEDIUM 321
angular sizes are �5 orders of magnitude smaller, statistics suchas IS line strength, covering fraction, and velocity range versusimpact parameter, are much less subject to large variance alonga single sightline.
All of the galaxy spectra used in this paper were obtainedas part of large surveys, and therefore have low-to-moderatespectral resolution and S/N. It is possible with current gener-ation telescopes and instruments to obtain spectra of relativelyhigh S/N and moderate resolution (e.g., Shapley et al. 2006)in 10–20 hr integration time (i.e., ∼10 times longer than mostin the current samples). However, spectra similar to those cur-rently possible only for strongly lensed galaxies (R ∼ 5000,S/N � 30) will be routine at R � 24–24.5 using future 30 mclass telescopes equipped with state of the art multiobject spec-trometers (Steidel et al. 2009). When such capability is realized,full observational access to the three-dimensional distributionof gas near to and between galaxies will revolutionize the studyof baryonic processes in the context of galaxy formation. Theresults described above are intended as an illustration of theapplication of rest-far-UV galaxy spectra toward a better un-derstanding of feedback processes and the CGM/IGM interfacewith the sites of galaxy formation. The feasibility of sharpeningour understanding and interpretation with higher-quality data inthe future is very encouraging.
This work has been supported by the US National ScienceFoundation through grants AST-0606912 and AST-0908805(C.C.S.), and by the David and Lucile Packard Foundation(A.E.S., C.C.S.). C.C.S. acknowledges additional support fromthe John D. and Catherine T. MacArthur Foundation. D.K.E. issupported by the National Aeronautics and Space Administra-tion under Award No. NAS7-03001 and the California Instituteof Technology. We thank Juna Kollmeier and Joop Schaye forinteresting and useful conversations, and Patrick Hall, MartinHaehnelt, and the referee for comments that significantly im-proved the final version of the paper. Kurt Adelberger playeda major role in the early days of the survey used in this pa-per; his intellectual contributions have remained crucial thoughhe has moved on to new challenges in the “real” world. MarcKassis and the rest of the W. M. Keck Observatory staff keepthe instruments and telescopes running effectively, for whichwe are extremely grateful. We extend thanks to those of Hawai-ian ancestry on whose sacred mountain we are privileged to beguests.
REFERENCES
Adelberger, K. L., Shapley, A. E., Steidel, C. C., Pettini, M., Erb, D. K., &Reddy, N. A. 2005a, ApJ, 629, 636
Adelberger, K. L., & Steidel, C. C. 2000, ApJ, 544, 218Adelberger, K. L., Steidel, C. C., Pettini, M., Shapley, A. E., Reddy, N. A., &
Erb, D. K. 2005b, ApJ, 619, 697Adelberger, K. L., Steidel, C. C., Shapley, A. E., Hunt, M. P., Erb, D. K., Reddy,
N. A., & Pettini, M. 2004, ApJ, 607, 226Adelberger, K. L., Steidel, C. C., Shapley, A. E., & Pettini, M. 2003, ApJ, 584,
45Bergeron, J., & Boisse, P. 1991, A&A, 243, 344Bouche, N., Murphy, M. T., Peroux, C., Davies, R., Eisenhauer, F., Forster
Schreiber, N. M., & Tacconi, L. 2007, ApJ, 669, L5Bowen, D. V., Blades, J. C., & Pettini, M. 1995, ApJ, 448, 634Brooks, A. M., Governato, F., Quinn, T., Brook, C. B., & Wadsley, J. 2009, ApJ,
694, 396Ceverino, D., Dekel, A., & Bournaud, F. 2010, MNRAS, 404, 2151Charlot, S., & Fall, S. M. 1991, ApJ, 378, 471Chen, H., Lanzetta, K. M., Webb, J. K., & Barcons, X. 2001, ApJ, 559, 654Chen, Y., Tremonti, C. A., Heckman, T. M., Kauffmann, G., Weiner, B. J.,
Brinchmann, J., & Wang, J. 2010, arXiv:1003.5425
Colina, L., Arribas, S., & Monreal-Ibero, A. 2005, ApJ, 621, 725Conroy, C., Shapley, A. E., Tinker, J. L., Santos, M. R., & Lemson, G. 2008, ApJ,
679, 1192Danforth, C. W., & Shull, J. M. 2008, ApJ, 679, 194Dekel, A., & Birnboim, Y. 2006, MNRAS, 368, 2Dekel, A., & Birnboim, Y. 2008, MNRAS, 383, 119Dekel, A., et al. 2009, Nature, 457, 451Dijkstra, M., Haiman, Z., & Spaans, M. 2006a, ApJ, 649, 14Dijkstra, M., Haiman, Z., & Spaans, M. 2006b, ApJ, 649, 37Dijkstra, M., & Loeb, A. 2009, MNRAS, 400, 1109Ellison, S. L., Ibata, R., Pettini, M., Lewis, G. F., Aracil, B., Petitjean, P., &
Srianand, R. 2004, A&A, 414, 79Erb, D. K. 2008, ApJ, 674, 151Erb, D. K., Shapley, A. E., Pettini, M., Steidel, C. C., Reddy, N. A., & Adelberger,
K. L. 2006a, ApJ, 644, 813Erb, D. K., Shapley, A. E., Steidel, C. C., Pettini, M., Adelberger, K. L., Hunt,
M. P., Moorwood, A. F. M., & Cuby, J. 2003, ApJ, 591, 101Erb, D. K., Steidel, C. C., Shapley, A. E., Pettini, M., Reddy, N. A., & Adelberger,
K. L. 2006b, ApJ, 647, 128Erb, D. K., Steidel, C. C., Shapley, A. E., Pettini, M., Reddy, N. A., & Adelberger,
K. L. 2006c, ApJ, 646, 107Ferrara, A. 2003, Ap&SS, 284, 415Forster Schreiber, N. M., et al. 2006, ApJ, 645, 1062Franx, M., Illingworth, G. D., Kelson, D. D., van Dokkum, P. G., & Tran, K.-V.
1997, ApJ, 486, L75Furlanetto, S. R., Schaye, J., Springel, V., & Hernquist, L. 2005, ApJ, 622, 7Goerdt, T., Dekel, A., Sternberg, A., Ceverino, D., Teyssier, R., & Primack, J.
R. 2009, arXiv:0911.5566Grimes, J. P., et al. 2009, ApJS, 181, 272Haiman, Z., Spaans, M., & Quataert, E. 2000, ApJ, 537, L5Hansen, M., & Oh, S. P. 2006, MNRAS, 367, 979Hayashino, T., et al. 2004, AJ, 128, 2073Heckman, T. M., Armus, L., & Miley, G. K. 1990, ApJS, 74, 833Kacprzak, G. G., Churchill, C. W., Ceverino, D., Steidel, C. C., Klypin, A., &
Murphy, M. T. 2010, ApJ, 711, 533Kennicutt, R. C. 1998, ApJ, 498, 541Keres, D., Katz, N., Fardal, M., Dave, R., & Weinberg, D. H. 2009, MNRAS,
395, 160Keres, D., Katz, N., Weinberg, D. H., & Dave, R. 2005, MNRAS, 363, 2Kornei, K. A., Shapley, A. E., Erb, D. K., Steidel, C. C., Reddy, N. A., Pettini,
M., & Bogosavljevic, M. 2010, ApJ, 711, 693Lanzetta, K. M., Bowen, D. V., Tytler, D., & Webb, J. K. 1995, ApJ, 442, 538Laursen, P., & Sommer-Larsen, J. 2007, ApJ, 657, L69Law, D. R., Steidel, C. C., Erb, D. K., Larkin, J. E., Pettini, M., Shapley, A. E.,
& Wright, S. A. 2009, ApJ, 697, 2057Lehnert, M. D., & Heckman, T. M. 1996, ApJ, 472, 546Lehnert, M. D., Heckman, T. M., & Weaver, K. A. 1999, ApJ, 523, 575Madau, P., Ferrara, A., & Rees, M. J. 2001, ApJ, 555, 92Martin, C. L. 1999, ApJ, 513, 156Martin, C. L. 2005, ApJ, 621, 227Martin, C. L., & Bouche, N. 2009, ApJ, 703, 1394Mas-Hesse, J. M., Kunth, D., Tenorio-Tagle, G., Leitherer, C., Terlevich, R. J.,
& Terlevich, E. 2003, ApJ, 598, 858Matsuda, Y., et al. 2004, AJ, 128, 569McLean, I. S., et al. 1998, Proc. SPIE, 3354, 566Menard, B., Wild, V., Nestor, D., Quider, A., & Zibetti, S. 2009,
arXiv:0912.3263Mori, M., Ferrara, A., & Madau, P. 2002, ApJ, 571, 40Murray, N., Quataert, E., & Thompson, T. A. 2005, ApJ, 618, 569Navarro, J. F., Frenk, C. S., & White, S. D. M. 1997, ApJ, 490, 493Neufeld, D. A. 1991, ApJ, 370, L85Pettini, M., Rix, S. A., Steidel, C. C., Adelberger, K. L., Hunt, M. P., & Shapley,
A. E. 2002, ApJ, 569, 742Pettini, M., Shapley, A. E., Steidel, C. C., Cuby, J., Dickinson, M., Moorwood,
A. F. M., Adelberger, K. L., & Giavalisco, M. 2001, ApJ, 554, 981Pettini, M., Steidel, C. C., Adelberger, K. L., Dickinson, M., & Giavalisco, M.
2000, ApJ, 528, 96Quider, A. M., Pettini, M., Shapley, A. E., & Steidel, C. C. 2009, MNRAS, 398,
1263Quider, A. M., Shapley, A. E., Pettini, M., Steidel, C. C., & Stark, D. P.
2010, MNRAS, 402, 1467Rauch, M., Sargent, W. L. W., & Barlow, T. A. 1999, ApJ, 515, 500Rauch, M., Sargent, W. L. W., & Barlow, T. A. 2001, ApJ, 554, 823Reddy, N. A., Erb, D. K., Steidel, C. C., Shapley, A. E., Adelberger, K. L., &
Pettini, M. 2005, ApJ, 633, 748Reddy, N. A., & Steidel, C. C. 2009, ApJ, 692, 778

322 STEIDEL ET AL. Vol. 717
Reddy, N. A., Steidel, C. C., Fadda, D., Yan, L., Pettini, M., Shapley, A. E., Erb,D. K., & Adelberger, K. L. 2006, ApJ, 644, 792
Reddy, N. A., Steidel, C. C., Pettini, M., Adelberger, K. L., Shapley, A. E., Erb,D. K., & Dickinson, M. 2008, ApJS, 175, 48
Rupke, D. S., Veilleux, S., & Sanders, D. B. 2005, ApJS, 160, 115Sanders, D. B., Mazzarella, J. M., Kim, D., Surace, J. A., & Soifer, B. T.
2003, AJ, 126, 1607Sargent, W. L. W., Boksenberg, A., & Steidel, C. C. 1988, ApJS, 68, 539Scannapieco, E., Ferrara, A., & Madau, P. 2002, ApJ, 574, 590Schaerer, D., & Verhamme, A. 2008, A&A, 480, 369Schaye, J., Carswell, R. F., & Kim, T. 2007, MNRAS, 379, 1169Schwartz, C. M., Martin, C. L., Chandar, R., Leitherer, C., Heckman, T. M., &
Oey, M. S. 2006, ApJ, 646, 858Shapley, A. E., Steidel, C. C., Adelberger, K. L., Dickinson, M., Giavalisco, M.,
& Pettini, M. 2001, ApJ, 562, 95Shapley, A. E., Steidel, C. C., Erb, D. K., Reddy, N. A., Adelberger, K. L.,
Pettini, M., Barmby, P., & Huang, J. 2005, ApJ, 626, 698Shapley, A. E., Steidel, C. C., Pettini, M., & Adelberger, K. L. 2003, ApJ, 588,
65Shapley, A. E., Steidel, C. C., Pettini, M., Adelberger, K. L., & Erb, D. K.
2006, ApJ, 651, 688Springel, V., et al. 2005, Nature, 435, 629Steidel, C. C. 1990a, ApJS, 72, 1Steidel, C. C. 1990b, ApJS, 74, 37
Steidel, C. C. 1992, PASP, 104, 843Steidel, C. C., Adelberger, K. L., Shapley, A. E., Pettini, M., Dickinson, M., &
Giavalisco, M. 2000, ApJ, 532, 170Steidel, C. C., Adelberger, K. L., Shapley, A. E., Pettini, M., Dickinson, M., &
Giavalisco, M. 2003, ApJ, 592, 728Steidel, C. C., Dickinson, M., & Persson, S. E. 1994, ApJ, 437, L75Steidel, C. C., Giavalisco, M., Pettini, M., Dickinson, M., & Adelberger, K. L.
1996, ApJ, 462, L17Steidel, C. C., Kollmeier, J. A., Shapley, A. E., Churchill, C. W., Dickinson, M.,
& Pettini, M. 2002, ApJ, 570, 526Steidel, C. C., Martin, C., Prochaska, J. X., Pettini, M., Schaye, J., & Rakic, O.
2009, Astro2010: Astron. Astrophys. Decadal Survey, 286Steidel, C. C., Pettini, M., & Adelberger, K. L. 2001, ApJ, 546, 665Steidel, C. C., & Sargent, W. L. W. 1992, ApJS, 80, 1Steidel, C. C., Shapley, A. E., Pettini, M., Adelberger, K. L., Erb, D. K., Reddy,
N. A., & Hunt, M. P. 2004, ApJ, 604, 534Strickland, D. K., & Heckman, T. M. 2009, ApJ, 697, 2030Strickland, D. K., Heckman, T. M., Colbert, E. J. M., Hoopes, C. G., & Weaver,
K. A. 2004, ApJ, 606, 829Tremonti, C. A., Moustakas, J., & Diamond-Stanic, A. M. 2007, ApJ, 663, L77Verhamme, A., Schaerer, D., Atek, H., & Tapken, C. 2008, A&A, 491, 89Verhamme, A., Schaerer, D., & Maselli, A. 2006, A&A, 460, 397Weiner, B. J., et al. 2009, ApJ, 692, 187Zheng, Z., & Miralda-Escude, J. 2002, ApJ, 578, 33
Copyright © 2022 FDOKUMEN