The Extreme‐Ultraviolet Emission in the Coma Cluster of Galaxies and the Underlying Source of this...
17
arXiv:astro-ph/0403081v1 3 Mar 2004 The EUV Emission in the Coma Cluster of Galaxies and the Underlying Source of this Radiation Stuart Bowyer, Eric J. Korpela & Michael Lampton Space Sciences Laboratory, Univ. of Calif. T. W. Jones Astronomy Dept. Univ. of Minn. ABSTRACT Observations with the Extreme Ultraviolet Explorer (EUVE) have shown the Coma Cluster to be a source of EUV emission in excess of that produced by X-ray gas in the cluster. We have re-examined the EUVE data on this cluster in an attempt to obtain clues as to the origin of this emission. We find two important new results. First, the ratio between the azimuthally averaged EUV excess emission and the ROSAT hard X-ray flux is constant as a function of distance from the cluster center outward. Second, a correlation analysis between the EUV excess emission and the X-ray emission shows that on a detailed level the EUV excess is spatially closely related to the X-ray emission. These findings contradict previous suggestions as to the underlying source of the diffuse EUV emission in Coma and provide important information in regards to the true source of this emission. We propose a new explanation for the source of this emission: inverse Compton scattering of microwave background photons by secondary electrons and positrons. We explore this possibility in some detail and show that it is consistent with all of the available observational evidence. The parent cosmic ray protons may have been produced by any of a number of sources, including supernovae, active galaxies, galactic winds, and cluster formation shocks, but we believe that the most likely source is cluster formation shocks. If the EUV emission in the Coma Cluster is, in fact, the result of secondary electrons, this may be the only direct evidence for secondary electrons in the intracluster medium of a cluster of galaxies, since recent work suggests that secondary electrons may not be the cause of radio halos. 1. Introduction Observations with the Extreme Ultraviolet Ex- plorer (EUVE) provided evidence that a number of clusters of galaxies emit excess EUV emission in the cores of the clusters. The first clusters re- ported to have EUV excesses were the Virgo clus- ter (Lieu et al. 1996a; Bowyer et al. 1996) and the Coma Cluster (Lieu et al. 1996b). Thereafter EUV emission was reported for Abell 1795 (Mit- taz, Lieu & Lockman, 1998) and Abell 2199 (Lieu et al. 1999a). These early works employed a vari- ety of data analysis schemes that were later found to be incorrect (Bowyer, Bergh¨ ofer, & Korpela, 1999), primarily because incorrect methods were used to account for the sensitivity profile, or expo- sure map, of the telescope. The only clusters that have been determined to have an EUV excess us- ing uncontested data analysis procedures are the Virgo cluster (Bergh¨ofer et al. 2000) and the Coma Cluster (Bowyer et al. 1999). Subsequent to the analysis of Bowyer et al. (1999) additional EUV data on the Coma Cluster were obtained with EUVE. In this paper we re-examine the excess EUV emission in the Coma Cluster us- ing all the EUVE data available on this cluster. We obtain important new information on the char- acter of the EUV emission in this cluster. Given 1
-
Upload
universityofcalifornia -
Category
Documents
-
view
2 -
download
0
Transcript of The Extreme‐Ultraviolet Emission in the Coma Cluster of Galaxies and the Underlying Source of this...
arX
iv:a
stro
-ph/
0403
081v
1 3
Mar
200
4
The EUV Emission in the Coma Cluster of Galaxies and the
Underlying Source of this Radiation
Stuart Bowyer, Eric J. Korpela & Michael LamptonSpace Sciences Laboratory, Univ. of Calif.
T. W. JonesAstronomy Dept. Univ. of Minn.
ABSTRACT
Observations with the Extreme Ultraviolet Explorer (EUVE) have shown the Coma Clusterto be a source of EUV emission in excess of that produced by X-ray gas in the cluster. We havere-examined the EUVE data on this cluster in an attempt to obtain clues as to the origin of thisemission. We find two important new results. First, the ratio between the azimuthally averagedEUV excess emission and the ROSAT hard X-ray flux is constant as a function of distance fromthe cluster center outward. Second, a correlation analysis between the EUV excess emission andthe X-ray emission shows that on a detailed level the EUV excess is spatially closely related tothe X-ray emission. These findings contradict previous suggestions as to the underlying sourceof the diffuse EUV emission in Coma and provide important information in regards to the truesource of this emission. We propose a new explanation for the source of this emission: inverseCompton scattering of microwave background photons by secondary electrons and positrons.We explore this possibility in some detail and show that it is consistent with all of the availableobservational evidence. The parent cosmic ray protons may have been produced by any of anumber of sources, including supernovae, active galaxies, galactic winds, and cluster formationshocks, but we believe that the most likely source is cluster formation shocks. If the EUVemission in the Coma Cluster is, in fact, the result of secondary electrons, this may be the onlydirect evidence for secondary electrons in the intracluster medium of a cluster of galaxies, sincerecent work suggests that secondary electrons may not be the cause of radio halos.
1. Introduction
Observations with the Extreme Ultraviolet Ex-plorer (EUVE) provided evidence that a numberof clusters of galaxies emit excess EUV emissionin the cores of the clusters. The first clusters re-ported to have EUV excesses were the Virgo clus-ter (Lieu et al. 1996a; Bowyer et al. 1996) andthe Coma Cluster (Lieu et al. 1996b). ThereafterEUV emission was reported for Abell 1795 (Mit-taz, Lieu & Lockman, 1998) and Abell 2199 (Lieuet al. 1999a). These early works employed a vari-ety of data analysis schemes that were later foundto be incorrect (Bowyer, Berghofer, & Korpela,
1999), primarily because incorrect methods wereused to account for the sensitivity profile, or expo-sure map, of the telescope. The only clusters thathave been determined to have an EUV excess us-ing uncontested data analysis procedures are theVirgo cluster (Berghofer et al. 2000) and the ComaCluster (Bowyer et al. 1999).
Subsequent to the analysis of Bowyer et al. (1999)additional EUV data on the Coma Cluster wereobtained with EUVE. In this paper we re-examinethe excess EUV emission in the Coma Cluster us-ing all the EUVE data available on this cluster.We obtain important new information on the char-acter of the EUV emission in this cluster. Given
1
these new results, we provide strong evidence thatthe EUV emission is produced by secondary elec-trons and positrons in the intracluster medium(ICM). This finding may well be the only secureevidence of the presence of secondary electronsand positrons in an intracluster medium.
2. Data and Data Analysis
All of the data employed were obtained with theDeep Survey (DS) telescope of EUVE (Bowyer &Malina 1991). In Table 1 we provide an observinglog of the observations. The total observing timewas 390 ks.
Various authors have used a number of data re-duction procedures in searches for EUV emissionfrom clusters. Because of the misconceptions cre-ated by the use of incorrect analysis procedures,we describe the data reduction approach used herein some detail. These procedures were developedand documented in Bowyer et al. 1999. The valid-ity of this approach was examined and tested byBerghofer, Bowyer, & Korpela 2000 and its appro-priateness verified.
First, the Coma data sets were screened to ex-clude noisy data. The pulse height distribution ofeach set was then examined and low energy countsproduced by random noise were excluded by re-jecting counts below a low energy threshold. Sincea low energy threshold is applied to the data by theonboard satellite data processing system, this stepwas not crucial. Indeed, Berghofer et al. 2000 haveshown that changing the low energy threshold byas much as a factor of two has no effect on the endresult. Nonetheless, this approach can improve thequality of the data set in at least some cases. Cos-mic rays interacting with the spacecraft and thedetector produce a few high energy counts in thedata which we removed by upper level threshold-ing. These counts are only a small fraction of the
Date Duration (ks)
12/25/95-12/28/95 5006/11/96-06/12/96 3901/12/99-01/14/99 5302/04/99-02/07/99 7603/15/99-03/21/99 172
Table 1: Log of Observations
total data set and ignoring this step does not sig-nificantly affect the end result. Nonetheless, thesecounts were easy to remove and we did so. Cor-rections were then made to account for telemetrylimitations and detector dead time effects on thetotal observing time; these were ∼ 10%.
The next step in our analysis is quite important.A background was obtained from regions of the de-tector that do not view photons from the sky. Thisbackground arises from energetic charged parti-cles interacting with the satellite; these producecharged particles within the instrument that trig-ger counts in the detector. This background variesover time scales of weeks to months and dependsupon geophysical conditions. Berghofer et al. 2000have shown that this background differs by only afactor of two over the course of the EUVE mission,but given the low counting rates from clusters ofgalaxies it is important that this background levelbe identified in order to establish the zero level foreach particular observation. Accordingly, we es-tablished this background independently for eachof the data sets we employed.
Most importantly, the correct telescope sensi-tivity profile, or exposure map, was used in con-nection with the analysis of the data. We note sim-ilar corrections for the instrument sensitivity overthe field of view are routinely applied in the reduc-tion of most observations of diffuse X-ray emission.For example, observations of diffuse sources withthe ROSAT PSPC are routinely corrected using aneffective area exposure map (Snowden et al. 1994).Bowyer et al. 1999 have provided a map of theEUVE DS sensitivity profile using 363 ks of datafrom a variety of blank fields. The use of a sen-sitivity profile composed of a large number of in-dividual blank field data sets could, in principle,be questioned. Indeed, Lieu et al. 1999a claimedthe EUVE DS sensitivity profile varies with time,but no analysis validating this claim was provided.Berghofer et al. 2000 carried out a detailed investi-gation of this possibility. They compared the 363ks data set referred to above with an assemblage of425 ks of data from a different set of blank fieldsobtained at different times. The two data setswere correlated at the 97% level, consistent withthe statistical uncertainties in the counts in theindividual cells in the two data sets. This demon-strated the stability of the EUVE DS telescope’ssensitivity profile over time scales of years. In our
2
work on the Coma Cluster we used a sensitivityprofile composed of 788 ks of data obtained bycombining the two blank field data sets describedabove.
Because of the different orientations of each ofthe different Coma observations, it was necessaryto carry out the above steps on each of the individ-ual data sets separately. The results of each obser-vation were then summed. This required a knowl-edge of the absolute pointing of the spacecraft. Be-cause there are no obvious point sources that arepresent in all of the EUV images, it is non-trivialto confirm the pointing coordinates provided bythe satellite. A comparison of the location of themaximum of the cluster emission in the imagesshows the relative pointing error in the nominalspacecraft pointing to be ∼ 0′.28. Since this un-certainty is <∼ the estimated point spread func-tion of the telescope, we simply added the imagesusing the nominal spacecraft pointing. We note,however, that any conclusions based on the EUVEdata will be uncertain at this, or smaller, scales.
Next, the effects of absorption by the Galac-tic interstellar medium (ISM) on the EUV fluxwere determined. There are a number of programsavailable to determine the effects of the ISM on theX-ray flux from Galactic and extragalactic sourcesand any of these will provide a result that is es-sentially valid in the X-ray regime. However inthe EUV, the situation is entirely different. Inthis band absorption is due only to hydrogen, neu-tral helium, and singly ionized helium. Metals canbe ignored because they produce insignificant ab-sorption in comparison to these species, and thereduction of He I and He II due to the presenceof He III can be ignored because there is virtuallyno He III in the ISM (Heiles et al. 1996). The ap-propriate EUV cross sections must be used for HI, He I, and He II, and equally importantly, cor-rect columns are needed for each of these compo-nents. In particular, the amount of H II in theline of sight must be established in order to de-termine the true He I and He II columns. A fulldiscussion of these issues and a comparison of thediffering outcomes with the use of different com-pilations of cross-sections are provided in Bowyeret al. 1999. In this case we used a hydrogen columnof 8.95×1019 cm−2 (Dickey & Lockman 1990) withionization fractions and cross sections for GalacticISM absorption as described in detail in Bowyer
et al. 1999. We note that Bregman et al. 2003 haveshown that small scale variations in the GalacticISM can be as large as factor of 3 in some 1 degreefields containing clusters of galaxies and this canaffect the magnitude of the EUV excess in thesecases. However, this is not a factor in regard tothe Coma Cluster where there is near spatial uni-formity of the Galactic Hi column as manifestedin the NRAO map of this region with a spatialresolution of 21′, and the finer scale IRAS 100 µmmap.
We then derived the EUV emission producedby the high temperature X-ray emitting gas usingComa ROSAT PSPC archival data. We used atemperature of 9 keV (Briel et al. 1992). We notethat a variety of temperatures, typically varyingfrom 8 to 9 keV have been reported for the thermalgas in Coma by various authors. This variationhas only a small effect on the ratio of the X-ray toEUV flux. This ratio for an 8 keV plasma is within10% of that for a 9 keV plasma. We used a factorof 128 to convert counts in the 0.5-2.4 keV band ofthe ROSAT PSPC to the EUVE DS-band counts.The PSPC conversion factor was derived from theMEKAL plasma code with abundances of 0.3 solarand a temperature of 9 keV. We corrected for theGalactic ISM as described above.
The next task was to align the X-ray and EUVimages. A source well away from the cluster cen-ter was detected at the same sky location in boththe EUVE DS image and the ROSAT soft X-rayimage. In both of these images the source was<∼ the point- spread functions of the respective
detectors. A UV source, A 2305, is located withinthe central portion of the point-spread functionsin both the EUVE and the ROSAT images. AQSO would typically produce a UV, EUV, andsoft X-ray signature of this character. With thissource as a fiducial, the images were aligned to<∼ 0′.43. We note that any comparisons between
the EUV and X-ray data are uncertain at, or lessthan, scales of 0′.43. We then subtracted the EUVemission due to the X-ray gas from the total EUVemission detected by EUVE.
The identification of diffuse emission in a skymap is difficult because of the low signal to noiseratio of data in individual cells of the map. Thisproblem was identified early in the study of diffuseX-ray emission in clusters of galaxies. A solutionuniverally employed in studies of diffuse emission
3
0 5 10 15 20 25Radius (arcmin)
0.0010
0.0012
0.0014
0.0016
0.0018
0.0020
EU
V c
ount
rat
e (c
ount
s/se
c/ar
cmin
2 )
0 5 10 15 20 25Radius (arcmin)
−1.0•10−4
0
1.0•10−4
2.0•10−4
3.0•10−4
4.0•10−4
5.0•10−4
6.0•10−4
EU
V e
xces
s (c
ount
s/se
c/ar
cmin
2 )
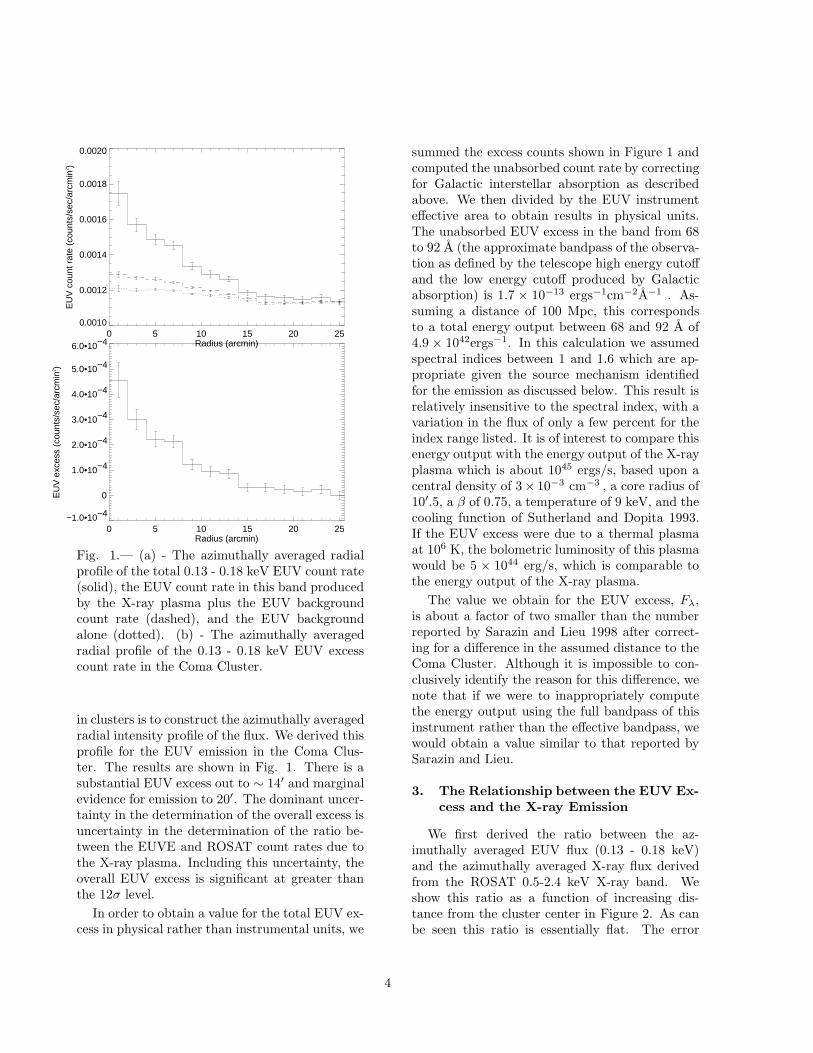
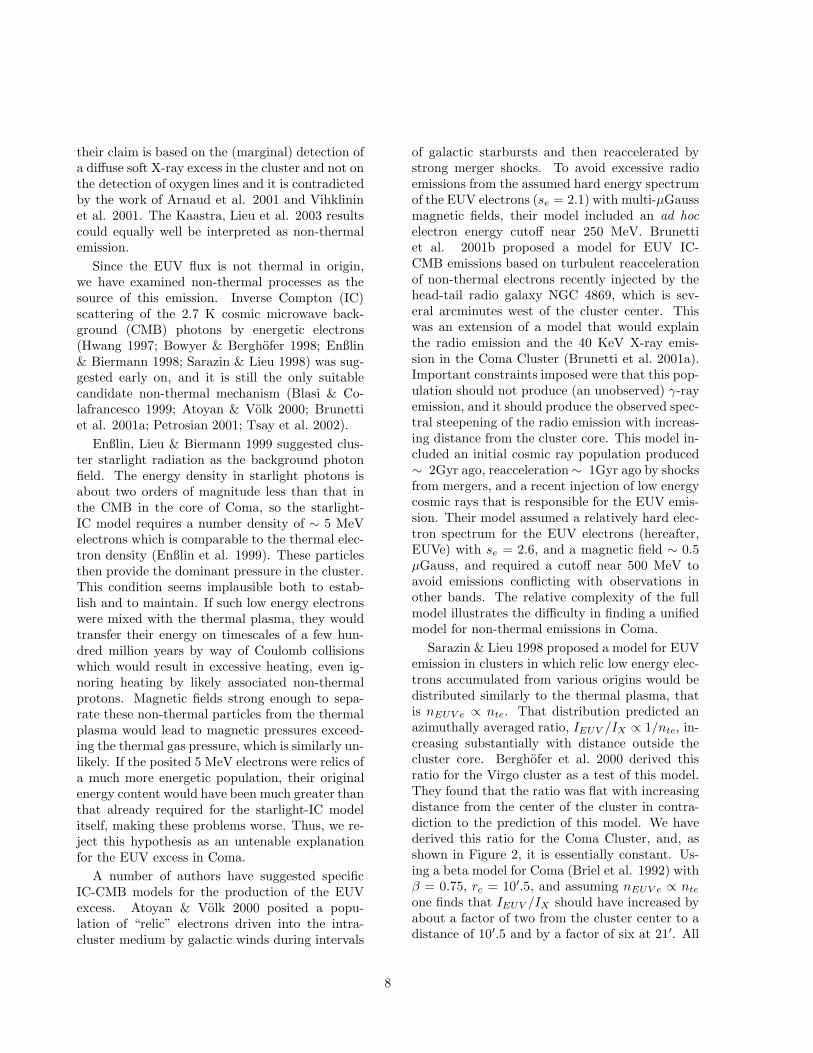
Fig. 1.— (a) - The azimuthally averaged radialprofile of the total 0.13 - 0.18 keV EUV count rate(solid), the EUV count rate in this band producedby the X-ray plasma plus the EUV backgroundcount rate (dashed), and the EUV backgroundalone (dotted). (b) - The azimuthally averagedradial profile of the 0.13 - 0.18 keV EUV excesscount rate in the Coma Cluster.
in clusters is to construct the azimuthally averagedradial intensity profile of the flux. We derived thisprofile for the EUV emission in the Coma Clus-ter. The results are shown in Fig. 1. There is asubstantial EUV excess out to ∼ 14′ and marginalevidence for emission to 20′. The dominant uncer-tainty in the determination of the overall excess isuncertainty in the determination of the ratio be-tween the EUVE and ROSAT count rates due tothe X-ray plasma. Including this uncertainty, theoverall EUV excess is significant at greater thanthe 12σ level.
In order to obtain a value for the total EUV ex-cess in physical rather than instrumental units, we
summed the excess counts shown in Figure 1 andcomputed the unabsorbed count rate by correctingfor Galactic interstellar absorption as describedabove. We then divided by the EUV instrumenteffective area to obtain results in physical units.The unabsorbed EUV excess in the band from 68to 92 A (the approximate bandpass of the observa-tion as defined by the telescope high energy cutoffand the low energy cutoff produced by Galacticabsorption) is 1.7 × 10⁻¹³ ergs−1cm−2A−1 . As-suming a distance of 100 Mpc, this correspondsto a total energy output between 68 and 92 A of4.9 × 1042ergs−1. In this calculation we assumedspectral indices between 1 and 1.6 which are ap-propriate given the source mechanism identifiedfor the emission as discussed below. This result isrelatively insensitive to the spectral index, with avariation in the flux of only a few percent for theindex range listed. It is of interest to compare thisenergy output with the energy output of the X-rayplasma which is about 1045 ergs/s, based upon acentral density of 3× 10⁻³ cm−3 , a core radius of10′.5, a β of 0.75, a temperature of 9 keV, and thecooling function of Sutherland and Dopita 1993.If the EUV excess were due to a thermal plasmaat 106 K, the bolometric luminosity of this plasmawould be 5 × 1044 erg/s, which is comparable tothe energy output of the X-ray plasma.
The value we obtain for the EUV excess, Fλ,is about a factor of two smaller than the numberreported by Sarazin and Lieu 1998 after correct-ing for a difference in the assumed distance to theComa Cluster. Although it is impossible to con-clusively identify the reason for this difference, wenote that if we were to inappropriately computethe energy output using the full bandpass of thisinstrument rather than the effective bandpass, wewould obtain a value similar to that reported bySarazin and Lieu.
3. The Relationship between the EUV Ex-
cess and the X-ray Emission
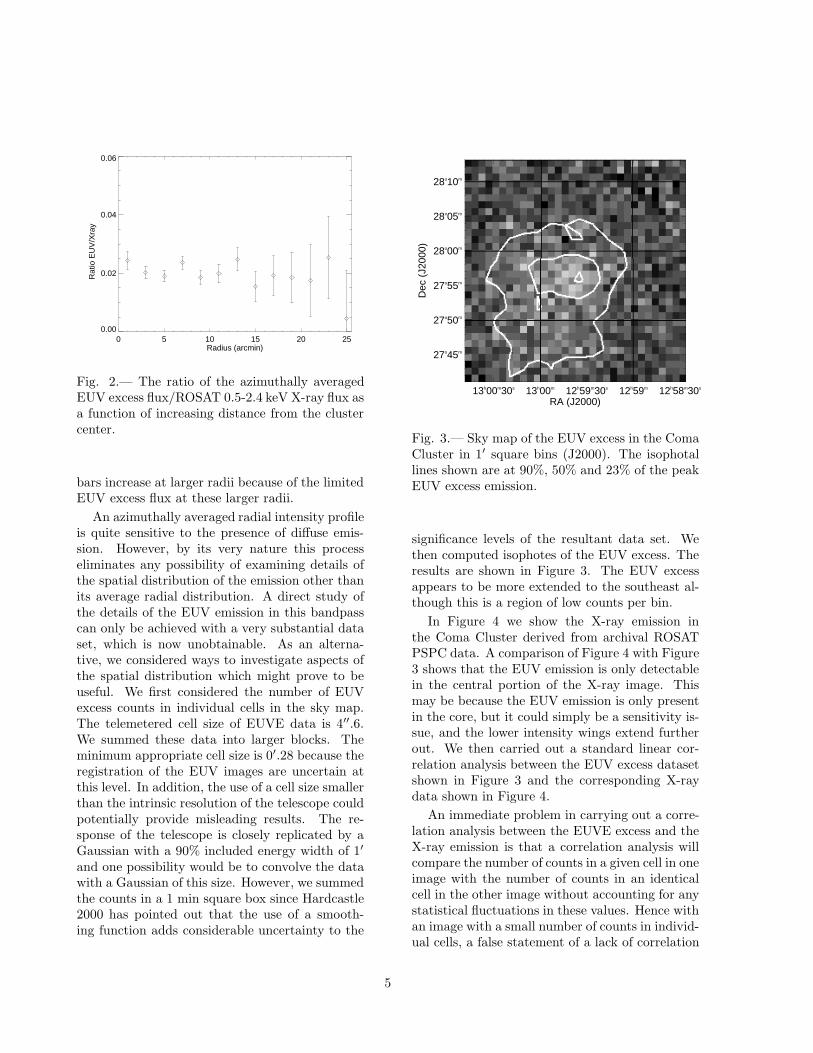
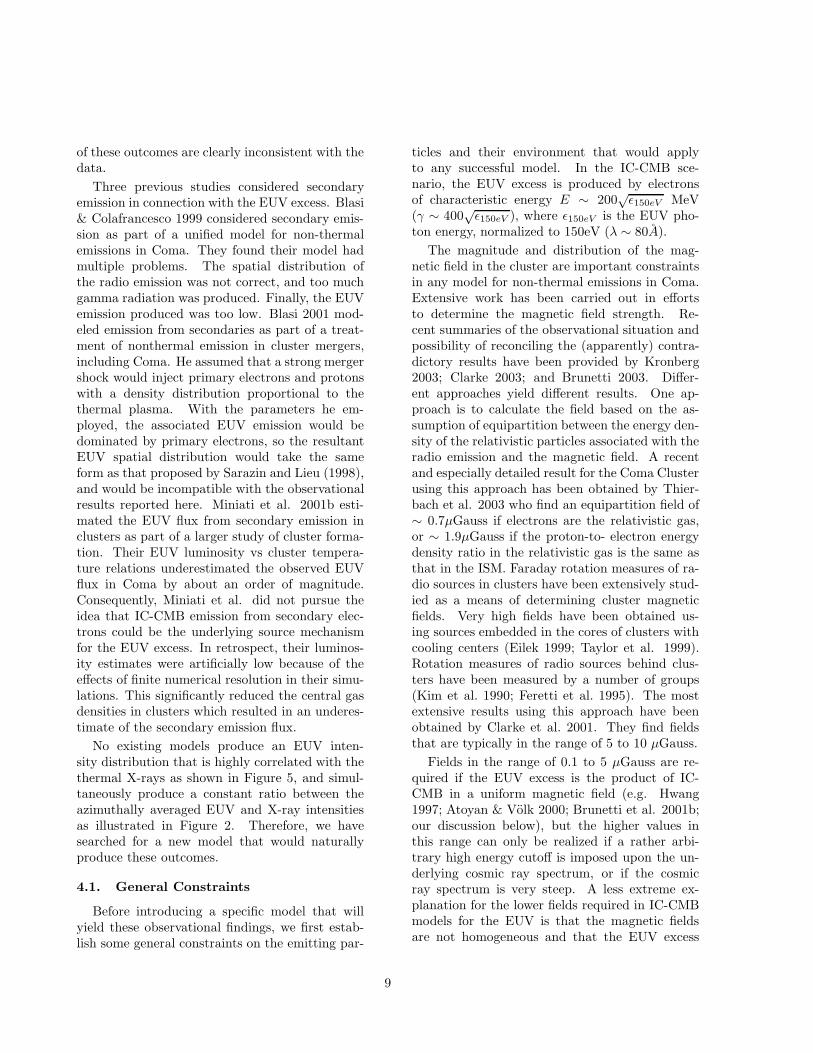
We first derived the ratio between the az-imuthally averaged EUV flux (0.13 - 0.18 keV)and the azimuthally averaged X-ray flux derivedfrom the ROSAT 0.5-2.4 keV X-ray band. Weshow this ratio as a function of increasing dis-tance from the cluster center in Figure 2. As canbe seen this ratio is essentially flat. The error
4
0 5 10 15 20 25Radius (arcmin)
0.00
0.02
0.04
0.06
Rat
io E
UV
/Xra
y
Fig. 2.— The ratio of the azimuthally averagedEUV excess flux/ROSAT 0.5-2.4 keV X-ray flux asa function of increasing distance from the clustercenter.
bars increase at larger radii because of the limitedEUV excess flux at these larger radii.
An azimuthally averaged radial intensity profileis quite sensitive to the presence of diffuse emis-sion. However, by its very nature this processeliminates any possibility of examining details ofthe spatial distribution of the emission other thanits average radial distribution. A direct study ofthe details of the EUV emission in this bandpasscan only be achieved with a very substantial dataset, which is now unobtainable. As an alterna-tive, we considered ways to investigate aspects ofthe spatial distribution which might prove to beuseful. We first considered the number of EUVexcess counts in individual cells in the sky map.The telemetered cell size of EUVE data is 4′′.6.We summed these data into larger blocks. Theminimum appropriate cell size is 0′.28 because theregistration of the EUV images are uncertain atthis level. In addition, the use of a cell size smallerthan the intrinsic resolution of the telescope couldpotentially provide misleading results. The re-sponse of the telescope is closely replicated by aGaussian with a 90% included energy width of 1′
and one possibility would be to convolve the datawith a Gaussian of this size. However, we summedthe counts in a 1 min square box since Hardcastle2000 has pointed out that the use of a smooth-ing function adds considerable uncertainty to the
13h00m30s 13h00m 12h59m30s 12h59m 12h58m30s
RA (J2000)
27o45m
27o50m
27o55m
28o00m
28o05m
28o10m
Dec
(J2
000)
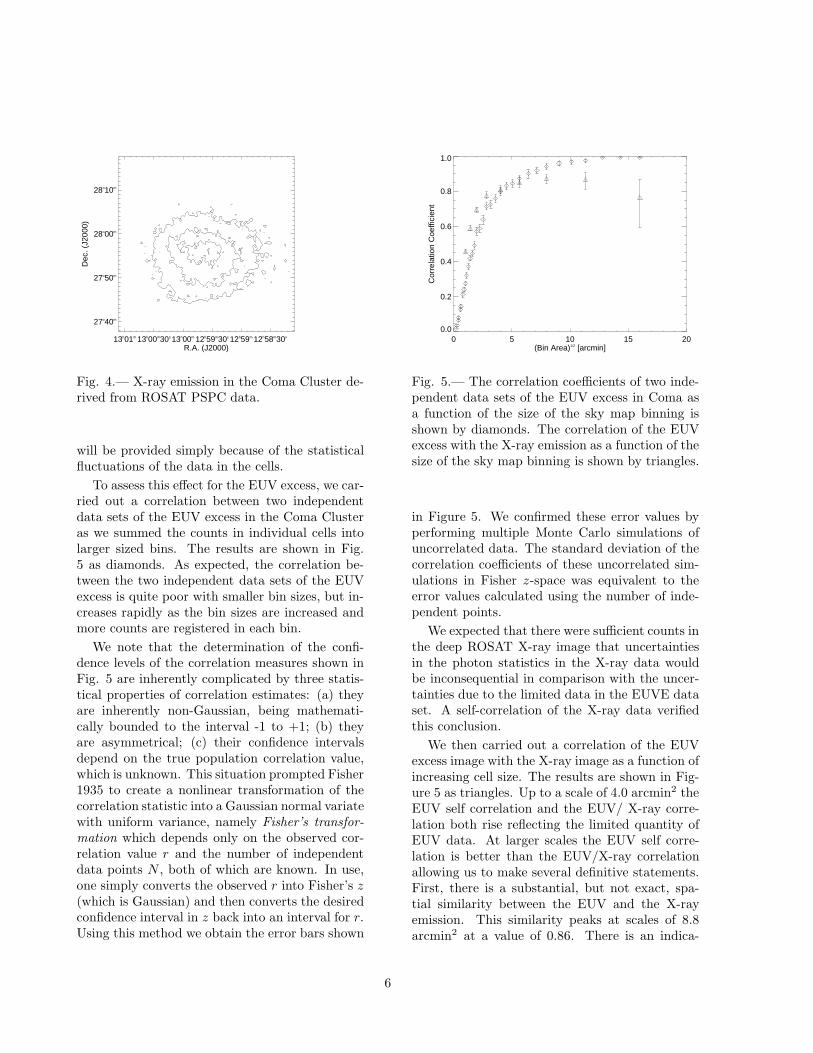
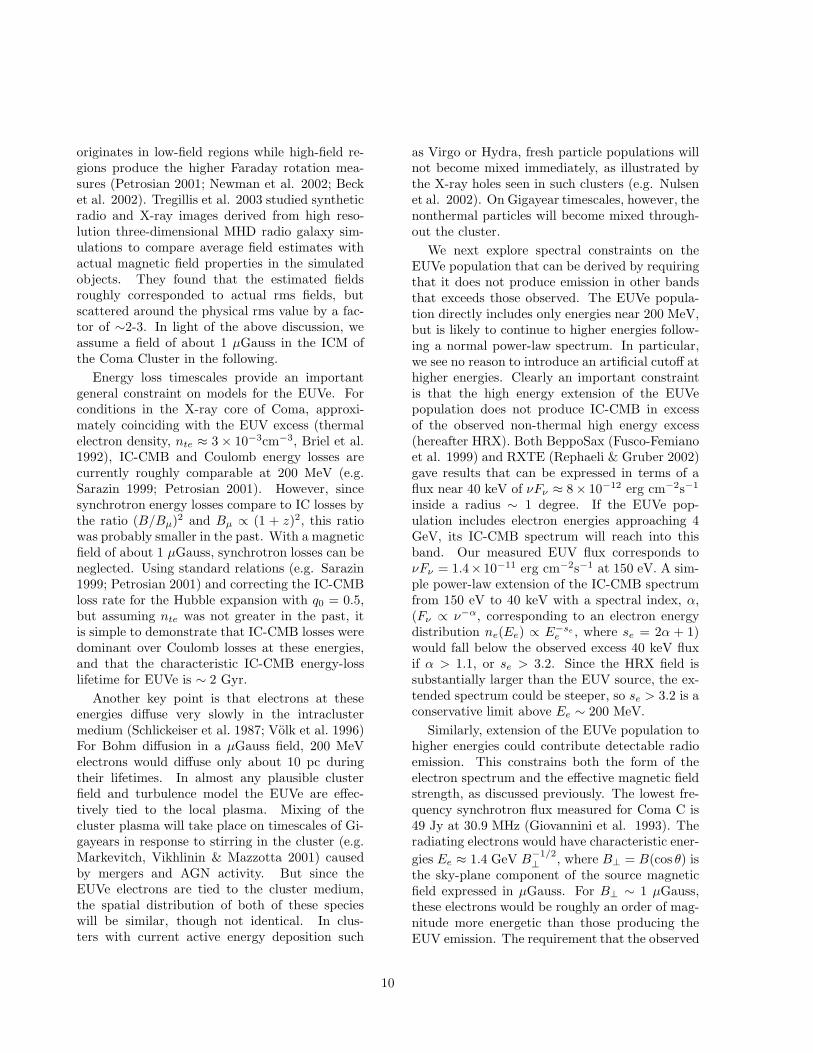
Fig. 3.— Sky map of the EUV excess in the ComaCluster in 1′ square bins (J2000). The isophotallines shown are at 90%, 50% and 23% of the peakEUV excess emission.
significance levels of the resultant data set. Wethen computed isophotes of the EUV excess. Theresults are shown in Figure 3. The EUV excessappears to be more extended to the southeast al-though this is a region of low counts per bin.
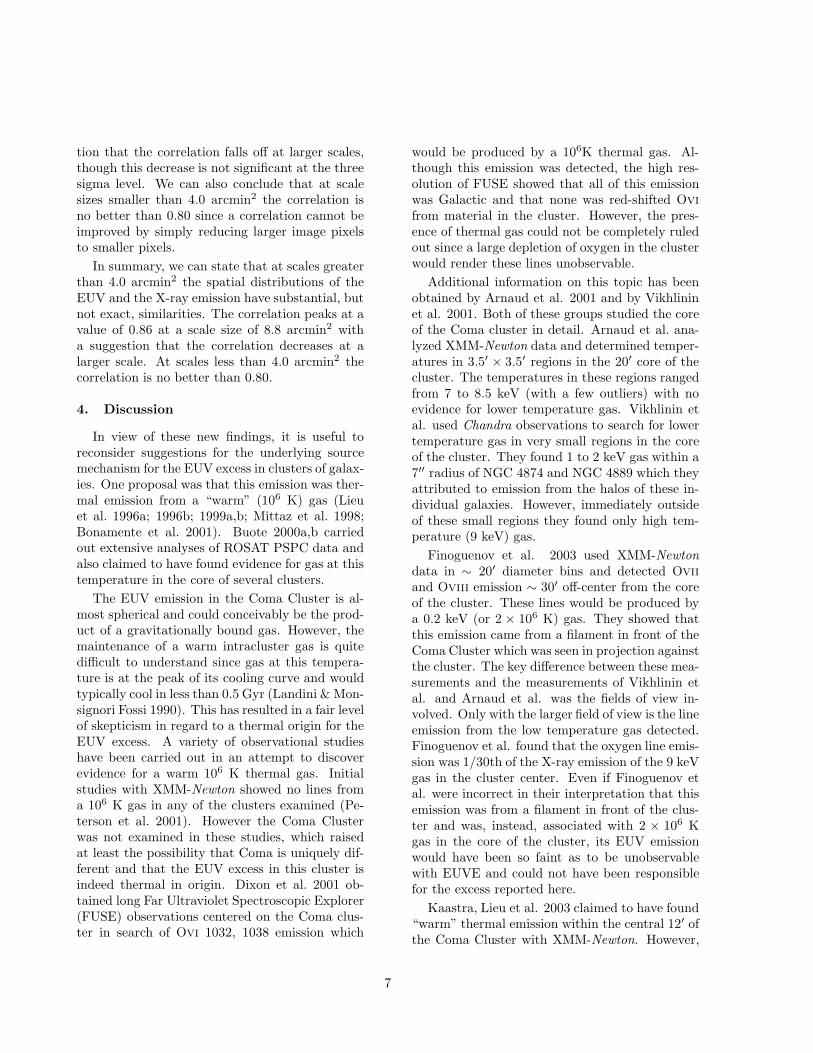
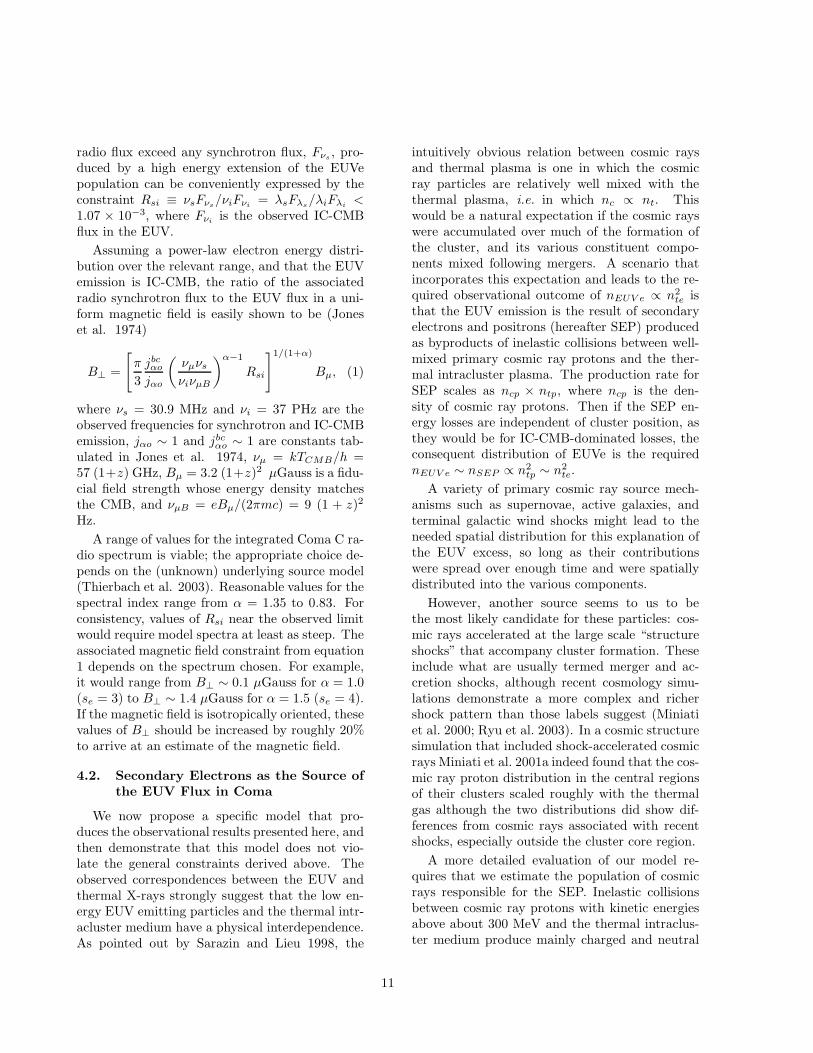
In Figure 4 we show the X-ray emission inthe Coma Cluster derived from archival ROSATPSPC data. A comparison of Figure 4 with Figure3 shows that the EUV emission is only detectablein the central portion of the X-ray image. Thismay be because the EUV emission is only presentin the core, but it could simply be a sensitivity is-sue, and the lower intensity wings extend furtherout. We then carried out a standard linear cor-relation analysis between the EUV excess datasetshown in Figure 3 and the corresponding X-raydata shown in Figure 4.
An immediate problem in carrying out a corre-lation analysis between the EUVE excess and theX-ray emission is that a correlation analysis willcompare the number of counts in a given cell in oneimage with the number of counts in an identicalcell in the other image without accounting for anystatistical fluctuations in these values. Hence withan image with a small number of counts in individ-ual cells, a false statement of a lack of correlation
5
13h01m 13h00m30s 13h00m 12h59m30s 12h59m 12h58m30s
R.A. (J2000)
27o40m
27o50m
28o00m
28o10m
Dec
. (J2
000)
Fig. 4.— X-ray emission in the Coma Cluster de-rived from ROSAT PSPC data.
will be provided simply because of the statisticalfluctuations of the data in the cells.
To assess this effect for the EUV excess, we car-ried out a correlation between two independentdata sets of the EUV excess in the Coma Clusteras we summed the counts in individual cells intolarger sized bins. The results are shown in Fig.5 as diamonds. As expected, the correlation be-tween the two independent data sets of the EUVexcess is quite poor with smaller bin sizes, but in-creases rapidly as the bin sizes are increased andmore counts are registered in each bin.
We note that the determination of the confi-dence levels of the correlation measures shown inFig. 5 are inherently complicated by three statis-tical properties of correlation estimates: (a) theyare inherently non-Gaussian, being mathemati-cally bounded to the interval -1 to +1; (b) theyare asymmetrical; (c) their confidence intervalsdepend on the true population correlation value,which is unknown. This situation prompted Fisher1935 to create a nonlinear transformation of thecorrelation statistic into a Gaussian normal variatewith uniform variance, namely Fisher’s transfor-
mation which depends only on the observed cor-relation value r and the number of independentdata points N , both of which are known. In use,one simply converts the observed r into Fisher’s z(which is Gaussian) and then converts the desiredconfidence interval in z back into an interval for r.Using this method we obtain the error bars shown
0 5 10 15 20(Bin Area)1/2 [arcmin]
0.0
0.2
0.4
0.6
0.8
1.0
Cor
rela
tion
Coe
ffici
ent
Fig. 5.— The correlation coefficients of two inde-pendent data sets of the EUV excess in Coma asa function of the size of the sky map binning isshown by diamonds. The correlation of the EUVexcess with the X-ray emission as a function of thesize of the sky map binning is shown by triangles.
in Figure 5. We confirmed these error values byperforming multiple Monte Carlo simulations ofuncorrelated data. The standard deviation of thecorrelation coefficients of these uncorrelated sim-ulations in Fisher z-space was equivalent to theerror values calculated using the number of inde-pendent points.
We expected that there were sufficient counts inthe deep ROSAT X-ray image that uncertaintiesin the photon statistics in the X-ray data wouldbe inconsequential in comparison with the uncer-tainties due to the limited data in the EUVE dataset. A self-correlation of the X-ray data verifiedthis conclusion.
We then carried out a correlation of the EUVexcess image with the X-ray image as a function ofincreasing cell size. The results are shown in Fig-ure 5 as triangles. Up to a scale of 4.0 arcmin2 theEUV self correlation and the EUV/ X-ray corre-lation both rise reflecting the limited quantity ofEUV data. At larger scales the EUV self corre-lation is better than the EUV/X-ray correlationallowing us to make several definitive statements.First, there is a substantial, but not exact, spa-tial similarity between the EUV and the X-rayemission. This similarity peaks at scales of 8.8arcmin2 at a value of 0.86. There is an indica-
6
tion that the correlation falls off at larger scales,though this decrease is not significant at the threesigma level. We can also conclude that at scalesizes smaller than 4.0 arcmin2 the correlation isno better than 0.80 since a correlation cannot beimproved by simply reducing larger image pixelsto smaller pixels.
In summary, we can state that at scales greaterthan 4.0 arcmin2 the spatial distributions of theEUV and the X-ray emission have substantial, butnot exact, similarities. The correlation peaks at avalue of 0.86 at a scale size of 8.8 arcmin2 witha suggestion that the correlation decreases at alarger scale. At scales less than 4.0 arcmin2 thecorrelation is no better than 0.80.
4. Discussion
In view of these new findings, it is useful toreconsider suggestions for the underlying sourcemechanism for the EUV excess in clusters of galax-ies. One proposal was that this emission was ther-mal emission from a “warm” (106 K) gas (Lieuet al. 1996a; 1996b; 1999a,b; Mittaz et al. 1998;Bonamente et al. 2001). Buote 2000a,b carriedout extensive analyses of ROSAT PSPC data andalso claimed to have found evidence for gas at thistemperature in the core of several clusters.
The EUV emission in the Coma Cluster is al-most spherical and could conceivably be the prod-uct of a gravitationally bound gas. However, themaintenance of a warm intracluster gas is quitedifficult to understand since gas at this tempera-ture is at the peak of its cooling curve and wouldtypically cool in less than 0.5 Gyr (Landini & Mon-signori Fossi 1990). This has resulted in a fair levelof skepticism in regard to a thermal origin for theEUV excess. A variety of observational studieshave been carried out in an attempt to discoverevidence for a warm 106 K thermal gas. Initialstudies with XMM-Newton showed no lines froma 106 K gas in any of the clusters examined (Pe-terson et al. 2001). However the Coma Clusterwas not examined in these studies, which raisedat least the possibility that Coma is uniquely dif-ferent and that the EUV excess in this cluster isindeed thermal in origin. Dixon et al. 2001 ob-tained long Far Ultraviolet Spectroscopic Explorer(FUSE) observations centered on the Coma clus-ter in search of Ovi 1032, 1038 emission which
would be produced by a 106K thermal gas. Al-though this emission was detected, the high res-olution of FUSE showed that all of this emissionwas Galactic and that none was red-shifted Ovi
from material in the cluster. However, the pres-ence of thermal gas could not be completely ruledout since a large depletion of oxygen in the clusterwould render these lines unobservable.
Additional information on this topic has beenobtained by Arnaud et al. 2001 and by Vikhlininet al. 2001. Both of these groups studied the coreof the Coma cluster in detail. Arnaud et al. ana-lyzed XMM-Newton data and determined temper-atures in 3.5′ × 3.5′ regions in the 20′ core of thecluster. The temperatures in these regions rangedfrom 7 to 8.5 keV (with a few outliers) with noevidence for lower temperature gas. Vikhlinin etal. used Chandra observations to search for lowertemperature gas in very small regions in the coreof the cluster. They found 1 to 2 keV gas within a7′′ radius of NGC 4874 and NGC 4889 which theyattributed to emission from the halos of these in-dividual galaxies. However, immediately outsideof these small regions they found only high tem-perature (9 keV) gas.
Finoguenov et al. 2003 used XMM-Newton
data in ∼ 20′ diameter bins and detected Ovii
and Oviii emission ∼ 30′ off-center from the coreof the cluster. These lines would be produced bya 0.2 keV (or 2 × 10⁶ K) gas. They showed thatthis emission came from a filament in front of theComa Cluster which was seen in projection againstthe cluster. The key difference between these mea-surements and the measurements of Vikhlinin etal. and Arnaud et al. was the fields of view in-volved. Only with the larger field of view is the lineemission from the low temperature gas detected.Finoguenov et al. found that the oxygen line emis-sion was 1/30th of the X-ray emission of the 9 keVgas in the cluster center. Even if Finoguenov etal. were incorrect in their interpretation that thisemission was from a filament in front of the clus-ter and was, instead, associated with 2 × 10⁶ Kgas in the core of the cluster, its EUV emissionwould have been so faint as to be unobservablewith EUVE and could not have been responsiblefor the excess reported here.
Kaastra, Lieu et al. 2003 claimed to have found“warm” thermal emission within the central 12′ ofthe Coma Cluster with XMM-Newton. However,
7
their claim is based on the (marginal) detection ofa diffuse soft X-ray excess in the cluster and not onthe detection of oxygen lines and it is contradictedby the work of Arnaud et al. 2001 and Vihklininet al. 2001. The Kaastra, Lieu et al. 2003 resultscould equally well be interpreted as non-thermalemission.
Since the EUV flux is not thermal in origin,we have examined non-thermal processes as thesource of this emission. Inverse Compton (IC)scattering of the 2.7 K cosmic microwave back-ground (CMB) photons by energetic electrons(Hwang 1997; Bowyer & Berghofer 1998; Enßlin& Biermann 1998; Sarazin & Lieu 1998) was sug-gested early on, and it is still the only suitablecandidate non-thermal mechanism (Blasi & Co-lafrancesco 1999; Atoyan & Volk 2000; Brunettiet al. 2001a; Petrosian 2001; Tsay et al. 2002).
Enßlin, Lieu & Biermann 1999 suggested clus-ter starlight radiation as the background photonfield. The energy density in starlight photons isabout two orders of magnitude less than that inthe CMB in the core of Coma, so the starlight-IC model requires a number density of ∼ 5 MeVelectrons which is comparable to the thermal elec-tron density (Enßlin et al. 1999). These particlesthen provide the dominant pressure in the cluster.This condition seems implausible both to estab-lish and to maintain. If such low energy electronswere mixed with the thermal plasma, they wouldtransfer their energy on timescales of a few hun-dred million years by way of Coulomb collisionswhich would result in excessive heating, even ig-noring heating by likely associated non-thermalprotons. Magnetic fields strong enough to sepa-rate these non-thermal particles from the thermalplasma would lead to magnetic pressures exceed-ing the thermal gas pressure, which is similarly un-likely. If the posited 5 MeV electrons were relics ofa much more energetic population, their originalenergy content would have been much greater thanthat already required for the starlight-IC modelitself, making these problems worse. Thus, we re-ject this hypothesis as an untenable explanationfor the EUV excess in Coma.
A number of authors have suggested specificIC-CMB models for the production of the EUVexcess. Atoyan & Volk 2000 posited a popu-lation of “relic” electrons driven into the intra-cluster medium by galactic winds during intervals
of galactic starbursts and then reaccelerated bystrong merger shocks. To avoid excessive radioemissions from the assumed hard energy spectrumof the EUV electrons (se = 2.1) with multi-µGaussmagnetic fields, their model included an ad hoc
electron energy cutoff near 250 MeV. Brunettiet al. 2001b proposed a model for EUV IC-CMB emissions based on turbulent reaccelerationof non-thermal electrons recently injected by thehead-tail radio galaxy NGC 4869, which is sev-eral arcminutes west of the cluster center. Thiswas an extension of a model that would explainthe radio emission and the 40 KeV X-ray emis-sion in the Coma Cluster (Brunetti et al. 2001a).Important constraints imposed were that this pop-ulation should not produce (an unobserved) γ-rayemission, and it should produce the observed spec-tral steepening of the radio emission with increas-ing distance from the cluster core. This model in-cluded an initial cosmic ray population produced∼ 2Gyr ago, reacceleration ∼ 1Gyr ago by shocksfrom mergers, and a recent injection of low energycosmic rays that is responsible for the EUV emis-sion. Their model assumed a relatively hard elec-tron spectrum for the EUV electrons (hereafter,EUVe) with se = 2.6, and a magnetic field ∼ 0.5µGauss, and required a cutoff near 500 MeV toavoid emissions conflicting with observations inother bands. The relative complexity of the fullmodel illustrates the difficulty in finding a unifiedmodel for non-thermal emissions in Coma.
Sarazin & Lieu 1998 proposed a model for EUVemission in clusters in which relic low energy elec-trons accumulated from various origins would bedistributed similarly to the thermal plasma, thatis nEUV e ∝ nte. That distribution predicted anazimuthally averaged ratio, IEUV /IX ∝ 1/nte, in-creasing substantially with distance outside thecluster core. Berghofer et al. 2000 derived thisratio for the Virgo cluster as a test of this model.They found that the ratio was flat with increasingdistance from the center of the cluster in contra-diction to the prediction of this model. We havederived this ratio for the Coma Cluster, and, asshown in Figure 2, it is essentially constant. Us-ing a beta model for Coma (Briel et al. 1992) withβ = 0.75, rc = 10′.5, and assuming nEUV e ∝ nte
one finds that IEUV /IX should have increased byabout a factor of two from the cluster center to adistance of 10′.5 and by a factor of six at 21′. All
8
of these outcomes are clearly inconsistent with thedata.
Three previous studies considered secondaryemission in connection with the EUV excess. Blasi& Colafrancesco 1999 considered secondary emis-sion as part of a unified model for non-thermalemissions in Coma. They found their model hadmultiple problems. The spatial distribution ofthe radio emission was not correct, and too muchgamma radiation was produced. Finally, the EUVemission produced was too low. Blasi 2001 mod-eled emission from secondaries as part of a treat-ment of nonthermal emission in cluster mergers,including Coma. He assumed that a strong mergershock would inject primary electrons and protonswith a density distribution proportional to thethermal plasma. With the parameters he em-ployed, the associated EUV emission would bedominated by primary electrons, so the resultantEUV spatial distribution would take the sameform as that proposed by Sarazin and Lieu (1998),and would be incompatible with the observationalresults reported here. Miniati et al. 2001b esti-mated the EUV flux from secondary emission inclusters as part of a larger study of cluster forma-tion. Their EUV luminosity vs cluster tempera-ture relations underestimated the observed EUVflux in Coma by about an order of magnitude.Consequently, Miniati et al. did not pursue theidea that IC-CMB emission from secondary elec-trons could be the underlying source mechanismfor the EUV excess. In retrospect, their luminos-ity estimates were artificially low because of theeffects of finite numerical resolution in their simu-lations. This significantly reduced the central gasdensities in clusters which resulted in an underes-timate of the secondary emission flux.
No existing models produce an EUV inten-sity distribution that is highly correlated with thethermal X-rays as shown in Figure 5, and simul-taneously produce a constant ratio between theazimuthally averaged EUV and X-ray intensitiesas illustrated in Figure 2. Therefore, we havesearched for a new model that would naturallyproduce these outcomes.
4.1. General Constraints
Before introducing a specific model that willyield these observational findings, we first estab-lish some general constraints on the emitting par-
ticles and their environment that would applyto any successful model. In the IC-CMB sce-nario, the EUV excess is produced by electronsof characteristic energy E ∼ 200
√ǫ150eV MeV
(γ ∼ 400√
ǫ150eV ), where ǫ150eV is the EUV pho-ton energy, normalized to 150eV (λ ∼ 80A).
The magnitude and distribution of the mag-netic field in the cluster are important constraintsin any model for non-thermal emissions in Coma.Extensive work has been carried out in effortsto determine the magnetic field strength. Re-cent summaries of the observational situation andpossibility of reconciling the (apparently) contra-dictory results have been provided by Kronberg2003; Clarke 2003; and Brunetti 2003. Differ-ent approaches yield different results. One ap-proach is to calculate the field based on the as-sumption of equipartition between the energy den-sity of the relativistic particles associated with theradio emission and the magnetic field. A recentand especially detailed result for the Coma Clusterusing this approach has been obtained by Thier-bach et al. 2003 who find an equipartition field of∼ 0.7µGauss if electrons are the relativistic gas,or ∼ 1.9µGauss if the proton-to- electron energydensity ratio in the relativistic gas is the same asthat in the ISM. Faraday rotation measures of ra-dio sources in clusters have been extensively stud-ied as a means of determining cluster magneticfields. Very high fields have been obtained us-ing sources embedded in the cores of clusters withcooling centers (Eilek 1999; Taylor et al. 1999).Rotation measures of radio sources behind clus-ters have been measured by a number of groups(Kim et al. 1990; Feretti et al. 1995). The mostextensive results using this approach have beenobtained by Clarke et al. 2001. They find fieldsthat are typically in the range of 5 to 10 µGauss.
Fields in the range of 0.1 to 5 µGauss are re-quired if the EUV excess is the product of IC-CMB in a uniform magnetic field (e.g. Hwang1997; Atoyan & Volk 2000; Brunetti et al. 2001b;our discussion below), but the higher values inthis range can only be realized if a rather arbi-trary high energy cutoff is imposed upon the un-derlying cosmic ray spectrum, or if the cosmicray spectrum is very steep. A less extreme ex-planation for the lower fields required in IC-CMBmodels for the EUV is that the magnetic fieldsare not homogeneous and that the EUV excess
9
originates in low-field regions while high-field re-gions produce the higher Faraday rotation mea-sures (Petrosian 2001; Newman et al. 2002; Becket al. 2002). Tregillis et al. 2003 studied syntheticradio and X-ray images derived from high reso-lution three-dimensional MHD radio galaxy sim-ulations to compare average field estimates withactual magnetic field properties in the simulatedobjects. They found that the estimated fieldsroughly corresponded to actual rms fields, butscattered around the physical rms value by a fac-tor of ∼2-3. In light of the above discussion, weassume a field of about 1 µGauss in the ICM ofthe Coma Cluster in the following.
Energy loss timescales provide an importantgeneral constraint on models for the EUVe. Forconditions in the X-ray core of Coma, approxi-mately coinciding with the EUV excess (thermalelectron density, nte ≈ 3 × 10⁻³cm−3, Briel et al.1992), IC-CMB and Coulomb energy losses arecurrently roughly comparable at 200 MeV (e.g.Sarazin 1999; Petrosian 2001). However, sincesynchrotron energy losses compare to IC losses bythe ratio (B/Bµ)2 and Bµ ∝ (1 + z)2, this ratiowas probably smaller in the past. With a magneticfield of about 1 µGauss, synchrotron losses can beneglected. Using standard relations (e.g. Sarazin1999; Petrosian 2001) and correcting the IC-CMBloss rate for the Hubble expansion with q0 = 0.5,but assuming nte was not greater in the past, itis simple to demonstrate that IC-CMB losses weredominant over Coulomb losses at these energies,and that the characteristic IC-CMB energy-losslifetime for EUVe is ∼ 2 Gyr.
Another key point is that electrons at theseenergies diffuse very slowly in the intraclustermedium (Schlickeiser et al. 1987; Volk et al. 1996)For Bohm diffusion in a µGauss field, 200 MeVelectrons would diffuse only about 10 pc duringtheir lifetimes. In almost any plausible clusterfield and turbulence model the EUVe are effec-tively tied to the local plasma. Mixing of thecluster plasma will take place on timescales of Gi-gayears in response to stirring in the cluster (e.g.Markevitch, Vikhlinin & Mazzotta 2001) causedby mergers and AGN activity. But since theEUVe electrons are tied to the cluster medium,the spatial distribution of both of these specieswill be similar, though not identical. In clus-ters with current active energy deposition such
as Virgo or Hydra, fresh particle populations willnot become mixed immediately, as illustrated bythe X-ray holes seen in such clusters (e.g. Nulsenet al. 2002). On Gigayear timescales, however, thenonthermal particles will become mixed through-out the cluster.
We next explore spectral constraints on theEUVe population that can be derived by requiringthat it does not produce emission in other bandsthat exceeds those observed. The EUVe popula-tion directly includes only energies near 200 MeV,but is likely to continue to higher energies follow-ing a normal power-law spectrum. In particular,we see no reason to introduce an artificial cutoff athigher energies. Clearly an important constraintis that the high energy extension of the EUVepopulation does not produce IC-CMB in excessof the observed non-thermal high energy excess(hereafter HRX). Both BeppoSax (Fusco-Femianoet al. 1999) and RXTE (Rephaeli & Gruber 2002)gave results that can be expressed in terms of aflux near 40 keV of νFν ≈ 8 × 10⁻¹² erg cm−2s−1
inside a radius ∼ 1 degree. If the EUVe pop-ulation includes electron energies approaching 4GeV, its IC-CMB spectrum will reach into thisband. Our measured EUV flux corresponds toνFν = 1.4× 10⁻¹¹ erg cm−2s−1 at 150 eV. A sim-ple power-law extension of the IC-CMB spectrumfrom 150 eV to 40 keV with a spectral index, α,(Fν ∝ ν−α, corresponding to an electron energydistribution ne(Ee) ∝ E−se
e , where se = 2α + 1)would fall below the observed excess 40 keV fluxif α > 1.1, or se > 3.2. Since the HRX field issubstantially larger than the EUV source, the ex-tended spectrum could be steeper, so se > 3.2 is aconservative limit above Ee ∼ 200 MeV.
Similarly, extension of the EUVe population tohigher energies could contribute detectable radioemission. This constrains both the form of theelectron spectrum and the effective magnetic fieldstrength, as discussed previously. The lowest fre-quency synchrotron flux measured for Coma C is49 Jy at 30.9 MHz (Giovannini et al. 1993). Theradiating electrons would have characteristic ener-
gies Ee ≈ 1.4 GeV B−1/2⊥
, where B⊥ = B(cos θ) isthe sky-plane component of the source magneticfield expressed in µGauss. For B⊥ ∼ 1 µGauss,these electrons would be roughly an order of mag-nitude more energetic than those producing theEUV emission. The requirement that the observed
10
radio flux exceed any synchrotron flux, Fνs, pro-
duced by a high energy extension of the EUVepopulation can be conveniently expressed by theconstraint Rsi ≡ νsFνs
/νiFνi= λsFλs
/λiFλi<
1.07 × 10⁻³, where Fνiis the observed IC-CMB
flux in the EUV.
Assuming a power-law electron energy distri-bution over the relevant range, and that the EUVemission is IC-CMB, the ratio of the associatedradio synchrotron flux to the EUV flux in a uni-form magnetic field is easily shown to be (Joneset al. 1974)
B⊥ =
[
π
3
jbcαo
jαo
(
νµνs
νiνµB
)α−1
Rsi
]1/(1+α)
Bµ, (1)
where νs = 30.9 MHz and νi = 37 PHz are theobserved frequencies for synchrotron and IC-CMBemission, jαo ∼ 1 and jbc
αo ∼ 1 are constants tab-ulated in Jones et al. 1974, νµ = kTCMB/h =57 (1+z) GHz, Bµ = 3.2 (1+z)2 µGauss is a fidu-cial field strength whose energy density matchesthe CMB, and νµB = eBµ/(2πmc) = 9 (1 + z)2
Hz.
A range of values for the integrated Coma C ra-dio spectrum is viable; the appropriate choice de-pends on the (unknown) underlying source model(Thierbach et al. 2003). Reasonable values for thespectral index range from α = 1.35 to 0.83. Forconsistency, values of Rsi near the observed limitwould require model spectra at least as steep. Theassociated magnetic field constraint from equation1 depends on the spectrum chosen. For example,it would range from B⊥ ∼ 0.1 µGauss for α = 1.0(se = 3) to B⊥ ∼ 1.4 µGauss for α = 1.5 (se = 4).If the magnetic field is isotropically oriented, thesevalues of B⊥ should be increased by roughly 20%to arrive at an estimate of the magnetic field.
4.2. Secondary Electrons as the Source of
the EUV Flux in Coma
We now propose a specific model that pro-duces the observational results presented here, andthen demonstrate that this model does not vio-late the general constraints derived above. Theobserved correspondences between the EUV andthermal X-rays strongly suggest that the low en-ergy EUV emitting particles and the thermal intr-acluster medium have a physical interdependence.As pointed out by Sarazin and Lieu 1998, the
intuitively obvious relation between cosmic raysand thermal plasma is one in which the cosmicray particles are relatively well mixed with thethermal plasma, i.e. in which nc ∝ nt. Thiswould be a natural expectation if the cosmic rayswere accumulated over much of the formation ofthe cluster, and its various constituent compo-nents mixed following mergers. A scenario thatincorporates this expectation and leads to the re-quired observational outcome of nEUV e ∝ n2
te isthat the EUV emission is the result of secondaryelectrons and positrons (hereafter SEP) producedas byproducts of inelastic collisions between well-mixed primary cosmic ray protons and the ther-mal intracluster plasma. The production rate forSEP scales as ncp × ntp, where ncp is the den-sity of cosmic ray protons. Then if the SEP en-ergy losses are independent of cluster position, asthey would be for IC-CMB-dominated losses, theconsequent distribution of EUVe is the requirednEUV e ∼ nSEP ∝ n2
tp ∼ n2te.
A variety of primary cosmic ray source mech-anisms such as supernovae, active galaxies, andterminal galactic wind shocks might lead to theneeded spatial distribution for this explanation ofthe EUV excess, so long as their contributionswere spread over enough time and were spatiallydistributed into the various components.
However, another source seems to us to bethe most likely candidate for these particles: cos-mic rays accelerated at the large scale “structureshocks” that accompany cluster formation. Theseinclude what are usually termed merger and ac-cretion shocks, although recent cosmology simu-lations demonstrate a more complex and richershock pattern than those labels suggest (Miniatiet al. 2000; Ryu et al. 2003). In a cosmic structuresimulation that included shock-accelerated cosmicrays Miniati et al. 2001a indeed found that the cos-mic ray proton distribution in the central regionsof their clusters scaled roughly with the thermalgas although the two distributions did show dif-ferences from cosmic rays associated with recentshocks, especially outside the cluster core region.
A more detailed evaluation of our model re-quires that we estimate the population of cosmicrays responsible for the SEP. Inelastic collisionsbetween cosmic ray protons with kinetic energiesabove about 300 MeV and the thermal intraclus-ter medium produce mainly charged and neutral
11
pions. The charged pions decay into muons andneutrinos, and the muons into the SEP that areresponsible for the EUV emission. We express thecosmic ray proton density distribution as a power-law of the form
n(γp) = np0γ−sp
p , (2)
where Ep = γpMpc2 is the proton energy.
The approximate formalism given in Mannheimand Schlickeiser 1994 gives us a simple expressionfor the net omnidirectional SEP production rate,qe, with energies γmec
2 >> 35 MeV from p-p col-lisions. In particular, for a power law proton en-ergy distribution we have
qe ≈13
12σppcntpnp0
(
Mp
24me
)se0−1
γ−se0 cm−3s−1,
(3)where σpp ≈ 3.2×10⁻²⁶cm−2, se0 = 4
3 (sp− 12 ), and
q+e ≈ q−e . At low energies this expression overes-
timates SEP production, so we have compared itwith a numerical calculation for q±e based on themore accurate pion production described in asso-ciation with equation 5 (following) and the SEPdistribution given by Moskalenko & Strong 1998.For electron energies of 150 MeV the two resultsagree to better than about 50% so in what followswe use the simpler expression in equation 3. Weargued above that the lifetimes of the EUVe at∼ 200 MeV SEP are determined by their energylosses against IC-CMB. We can reasonably assumethat the SEP density is set by a balance between p-p production and IC-CMB losses. Since the EUVemission is the same IC-CMB, it is straightforwardto derive the expected omnidirectional EUV vol-ume emissivity directly in terms of the cosmic rayproton density. The result using equation 3 is
νiǫνi≈ jBC
αo
26
12(sp − 5/4)
(
Mp
24me
)se−2
× (4)
σppcntpnp0mec2
(
νµ
νi
)α−1
erg cm−3 s−1,
where νi, νµ and jBCαo were identified in relation to
equation 1, se = 43 (sp + 1
4 ) = se0 +1 is the spectralindex of the steady-state SEP energy distibution,and, once again, α = (se − 1)/2. With a con-stant cosmic ray density fraction, fp = np0/ntp,the EUV emissivity scales with n2
tp, as requiredby the EUVE data for Coma.
Using this result we can integrate over the clus-ter to compute an EUV luminosity, which can thenbe compared with the observational result. Theresult will depend on an assumed cosmic ray en-ergy spectral index as well as on the intraclustermedium density distribution. If the cosmic rayproton flux is due to structure formation shocks,the cosmic ray spectrum represents an averagefrom the shocks dissipated in the local gas overcosmic time. In the test particle limit for diffusiveshock acceleration, which is a reasonable approx-imation for relatively weak shocks, the standardrelation is sp = 2(M2 + 1)/(M2 − 1), where M isthe shock Mach number. Strictly speaking, thisindex applies to the momentum spectrum, n(pp),of cosmic ray protons accelerated at shocks, ratherthan the energy spectrum, n(γp), that we definedin equation 2 in order to apply analytic expres-sions for our simple model estimates. The twospectra compare as n(γp)/n(pp) = (1 − 1/γ2
p)sp/2.At relativistic energies the two forms converge;at the threshold for pion production, γp ≈ 1.3,n(γp)/n(pp) ≈ 1/3, which roughly compensatesfor the overestimate in SEP production from equa-tion 3.
In a recent detailed analysis of shocks formed ina high resolution cosmic structure formation simu-lation, Ryu et al. 2003 found that the most impor-tant shocks for cosmic ray acceleration were thosewith M ∼ 2 − 4, corresponding to sp ∼ 2.3 − 3.To be specific in our estimates below we choosesp = 2.5, which leads to se = 11/3 and α = 4/3which will be consistent with the radio halo andHXR constraints. Then assuming a beta law dis-tribution for the intracluster medium, ntp(r) =nt0/(1 + (r/a)2)3β/2, with nt0 = 3 × 10⁻³ cm−3,β = 0.75, (Briel et al. 1992) and a = 300 kpc(corresponding to 10′.5 at 100 Mpc), we computethe spatially integrated EUV flux to be νiFνi
≈1×10⁻⁴fp erg cm−2s−1. Comparing this result tothe observed νiFνi
≈ 1.4×10⁻¹¹ erg cm−2s−1, weobtain fp ≈ 1.4 × 10⁻⁷.
A test of the reasonableness of this result canbe made by determining its consistency with up-per limits on the γ-ray flux in the Coma cluster. Inaddition to charged pions, inelastic p-p collisionswill produce neutral pions, which will quickly de-cay to γ-rays. The resultant γ-ray spectrum peaksnear 70 MeV, but extends to higher energies and,in particular, into the ≥ 100 MeV EGRET band.
12
The γ-ray emissivity due to a power-law cos-mic ray spectrum approaches a power-law at highenergies, making it relatively straightforward tocompute an analytical estimate of the high energyflux. However, the EGRET band is too close tothe 70 MeV peak for that approximation to be ad-equate for our needs. Fortunately, semi-empiricalrelations for our range of interest are available inthe literature. We have followed the formulationlaid out conveniently in Schlickeiser 2002. Theomnidirectional γ-ray emissivity can be written as
qγ(Eγ) = 2
∫ ∞
Eγ+(mπc2)2/(4Eγ)
qπ0(Eπ)√
E2π − (mπc2)2
dEπ,
(5)where qπ0(Eπ) ∝ σppcntpnp0 is the neutral pionproduction rate. That rate asymptotes to a power-law at high energies with spectral index se0, just asfor the SEP, but drops sharply as the pions becomenonrelativistic. Using the full expressions givenby Schlickeiser, assuming sp = 2.5 and integratingequation 5 over photon energy, we obtain qγ(Eγ ≥100MeV) ≈ 0.32σppcntenp0 photons cm−3 s−1.From the values established above for Coma, in-cluding the required cosmic ray density fraction,fp, we obtain an estimated γ-ray flux Fγ(Eγ ≥100MeV) ≈ 1.4 × 10⁻⁹ photons cm−2 s−1.Sreekumar et al. 1996 give a 2 σ upper flux limitin this band of 4× 10⁻⁸ photons cm−2 s−1 for theComa cluster. This is well above the γ-ray fluxproduced by our required SEP population.
Simulations such as those of Miniati et al. 2000,2001a,b and Ryu et al. 2003 have suggested thatstructure formation shocks might lead to cosmicray energy pressures approaching as much as 1/3the total intracluster medium pressure. Accord-ingly, we have estimated the cosmic ray energydensity in the core of Coma that would be neces-sary under the SEP model we have proposed. Forthe proton spectra of immediate interest (sp ∼2.5), most of the kinetic energy resides in mildlyrelativistic particles, independent of whether weuse the energy power law of equation 2 or theanalogous momentum power law. We can writeapproximately ucp ∼ np0Mpc
2, which gives ucp ∼10−12erg cm−3 for the nonrelativistic cosmic rayproton distribution. This compares to the ther-mal energy density, 3ntpkT ≈ 4× 10⁻¹¹erg cm−3.This rough estimate can be compared to estimatesfrom cosmology simulations which range upwardsof tens of percent (e.g. Miniati et al. 2001a; Ryu
et al. 2003).
We can summarize the constraints on our modelas follows. The electron energy spectrum musthave a power law slope steeper than se ≈ 3.2, inorder to avoid excess inverse-Compton hard X-rayemission. Constraints set by the observed radiosynchrotron flux depend on the spectral index ofthe radio emission and the cluster magnetic field.An electron spectrum with se = 3, requires thecluster magnetic field be ∼ 0.1µGauss. If se =4 the cluster field must be ∼ 1.4µGauss. Theseoutcomes are shown graphically in Figure 6.
5. Conclusions
We have analyzed archival data obtained withEUVE on the core of the Coma cluster. We findthe ratio of the azimuthally averaged EUV andX-ray intensities is essentially constant with in-creasing cluster radius. In addition, a correlationof the diffuse EUV emission with the diffuse X-rayemission shows that the detailed spatial distribu-tions of these emissions are quite similar, but notidentical.
XMM-Newton and Chandra observations showthat there is no intracluster 106 K gas in thecore of the cluster and hence that the EUV emis-sion must be non-thermal. The only viable non-thermal source for the EUV excess is photons in-verse Compton scattered by 200 MeV electronsfrom the cosmic microwave background. To ac-count for the observed EUV intensity distribu-tion, the scattering electrons must be distributedwith a spatial density roughly in proportion to thesquare of the thermal plasma density. A scenariothat naturally produces these results is that theEUV emitting particles are electron/positron sec-ondaries produced by inelastic collisions betweenprimary cosmic ray protons and thermal protonswith similar spatial distributions. This type of dis-tribution would be a natural outcome if the cosmicrays had been produced over the past several Gyrand had become well-mixed with the intraclustermedium.
This model accounts naturally for the averagespatial distribution of the EUV emission in rela-tion to the X-ray emission. It accounts for the sim-ilar, but imperfect, pixel-to-pixel correspondenceof the EUV and X-ray emission. Finally, it accom-plishes this without violating observational limits
13
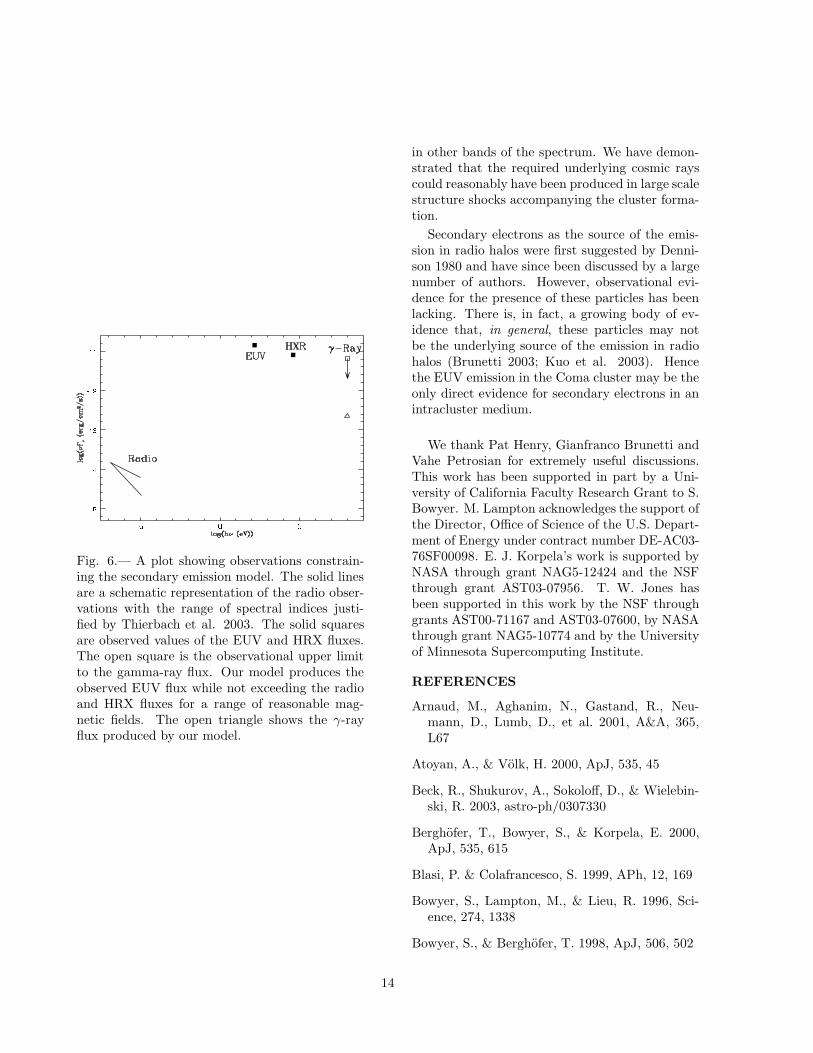
Fig. 6.— A plot showing observations constrain-ing the secondary emission model. The solid linesare a schematic representation of the radio obser-vations with the range of spectral indices justi-fied by Thierbach et al. 2003. The solid squaresare observed values of the EUV and HRX fluxes.The open square is the observational upper limitto the gamma-ray flux. Our model produces theobserved EUV flux while not exceeding the radioand HRX fluxes for a range of reasonable mag-netic fields. The open triangle shows the γ-rayflux produced by our model.
in other bands of the spectrum. We have demon-strated that the required underlying cosmic rayscould reasonably have been produced in large scalestructure shocks accompanying the cluster forma-tion.
Secondary electrons as the source of the emis-sion in radio halos were first suggested by Denni-son 1980 and have since been discussed by a largenumber of authors. However, observational evi-dence for the presence of these particles has beenlacking. There is, in fact, a growing body of ev-idence that, in general, these particles may notbe the underlying source of the emission in radiohalos (Brunetti 2003; Kuo et al. 2003). Hencethe EUV emission in the Coma cluster may be theonly direct evidence for secondary electrons in anintracluster medium.
We thank Pat Henry, Gianfranco Brunetti andVahe Petrosian for extremely useful discussions.This work has been supported in part by a Uni-versity of California Faculty Research Grant to S.Bowyer. M. Lampton acknowledges the support ofthe Director, Office of Science of the U.S. Depart-ment of Energy under contract number DE-AC03-76SF00098. E. J. Korpela’s work is supported byNASA through grant NAG5-12424 and the NSFthrough grant AST03-07956. T. W. Jones hasbeen supported in this work by the NSF throughgrants AST00-71167 and AST03-07600, by NASAthrough grant NAG5-10774 and by the Universityof Minnesota Supercomputing Institute.
REFERENCES
Arnaud, M., Aghanim, N., Gastand, R., Neu-mann, D., Lumb, D., et al. 2001, A&A, 365,L67
Atoyan, A., & Volk, H. 2000, ApJ, 535, 45
Beck, R., Shukurov, A., Sokoloff, D., & Wielebin-ski, R. 2003, astro-ph/0307330
Berghofer, T., Bowyer, S., & Korpela, E. 2000,ApJ, 535, 615
Blasi, P. & Colafrancesco, S. 1999, APh, 12, 169
Bowyer, S., Lampton, M., & Lieu, R. 1996, Sci-ence, 274, 1338
Bowyer, S., & Berghofer, T. 1998, ApJ, 506, 502
14
Bowyer, S., Berghofer, T., & Korpela, E. 1999,ApJ, 526, 592
Bowyer, S., & Malina, R. 1991, in Extreme Ultra-violet Astronomy, ed. R. Malina & S. Bowyer(New York: Pergamon), 397
Bonamente, M., Lieu, R., & Mittaz, P. 2001, ApJ,547, L7
Bregman, J., Novicki, M., Krick, J., & Arabadjis,J. 2003, ApJ, 597, in press.
Briel, U., Henry, J. P., & Bohringer, H. 1992,A&A, 259, L31
Brunetti, G., Setti, G., Feretti, L., & Giovannini,G. 2001a, MNRAS, 320, 365
Brunetti, G., Setti, G., Feretti, L., & Giovannini,G. 2001b, New Astronomy 6, 1
Brunetti, G. 2003, in ASP Conf. Ser. 301, Mat-ter and Energy in Clusters of Galaxies, ed. S.Bowyer & C.-Y. Hwang (San Francisco: ASP),349
Buote, D. 2000a, ApJ, 532, L113
Buote, D. 2000b, ApJ, 544, 242
Clarke, T. E., Kronberg, P. P., & Bohringer, H.2001, ApJ, 547, L111
Clarke, T. E. 2003, in ASP Conf. Ser. 301, Mat-ter and Energy in Clusters of Galaxies, ed. S.Bowyer & C.-Y. Hwang (San Francisco: ASP),185
Dennison, B. 1980, ApJ, 239, 93
Dixon, W., Sallmen, S., Hurwitz, M., & Lieu, R.2001, ApJ, 552, L69
Dickey, J. M., & Lockman, F. J. 1990, ARA&A,28, 215
Dolag, K., & Enßlin, T. 2000, A&A, 362, 151
Eilek, J. 1999, in Proceedings of Diffuse Thermaland Relativistic Plasma in Galaxy Clusters, ed.H. Bhringer, L. Feretti, & P. Schuecker (Garch-ing: MPE Report 271), 71
Enßlin, T. & Biermann, P. 1998, A&A, 330, 90
Enßlin, T., Lieu, R., & Biermann, P. 1999, A&A,344, 409
Feretti, L., Dallacasa, D., Giovannini, G., &Tagliani, A. 1995, A&A, 302, 680
Finoguenov, A., Briel, U. G., & Henry, J. P. 2003,submitted to A&A, astro-ph/0309019.
Fisher, R. A. 1935 in “Statistical Methods for Re-search Workers,” (Oliver & Boyd: Edinburgh)
Fusco-Femiano, R., dal Fiume, D., Feretti, L.,Giovannini, G., Grandi, P., et al. 1999, ApJ,513, 21
Giovannini, G., Feretti, L., Venturi, T., Kim, K.-T., & Kronberg, P. 1993, ApJ, 406, 399.
Govoni, F. Enßlin, T., Feretti, L., & Giovannini,G. 2001, A&A, 369, 441
Hardcastle, M. J. 2000, A & A, 357, 884
Hwang, C.-Y. 1997, Science, 278, 1971
Heiles, C., Koo, B. C., Levenson, N., & Reach, W.1996, ApJ, 462, 326
Jones, T. W., O’Dell, L. S., & Stein, W. A. 1974,ApJ, 188, 353
Kaastra, J. S., Lieu, R., Tamura, T., Paerels, F.,& den Herder, J. W. 2003, A&A, 397, 445
Kang, H., Jones, T. W., & Gieseler, U. D. J. 2002,ApJ, 579, 337
Kim, K.-T., Kronberg, P. P., Dewdney, P. E., &Landecker, T. L. 1990, ApJ, 355, 29
Kronberg, P. P. 2003 in ASP Conf. Ser. 301, Mat-ter and Energy in Clusters of Galaxies, ed. S.Bowyer & C.-Y. Hwang (San Francisco: ASP),169
Kuo, P.-H., Hwang, C.-Y., & Ip, W.-H. 2004, ApJ,in press
Landini, M., & Monsignori Fossi, B. C. 1990,A&AS, 82, 229.
Lieu, R., Ip, W.-H., Axford, W.-I., & Bonamente,M. 1999, ApJ, 510, L25
Lieu, R., Mittaz, J., Bowyer, S., Lockman, F.,Hwang, C.-Y., & Schmitt, J. 1996a, ApJ, 458,L5
15
Lieu, R., Mittaz, J., Bowyer, S., Breen, J., Lock-man, F., Murphy, E, & Hwang, C.-Y. 1996b,Science, 274, 1335
Lieu, R., Bonamente, M., & Mittaz, J. 1999a, ApJ,517, L91
Lieu, R., Bonamente, M., Mittaz, J., Durret, F.,Santos, S., & Kaastra, J. 1999b, ApJ, 527, L77
Lieu, R., Ip, W.-H., Axford, W. I., & Bonamente,M. 1999c, ApJ, 510, L25
Mannheim, K., & Schlickeiser, R. 1994, A&A, 286,983
Markevitch, M., Vikhlinin, A., & Mazzotta, P.2001, ApJ, 562, L153
Miniati, F., Ryu, D., Kang, H., Jones, T. W., Cen,R., & Ostriker, J. P. 2000, ApJ, 542, 608
Miniati, F., Ryu, D., Kang, H., & Jones, T. W.2001a, ApJ, 559, 59
Miniati, F., Jones, T. W., Kang, H., & Ryu, D.,2001b, ApJ, 562, 233
Mittaz, J., Lieu, R., & Lockman, F. 1998, ApJ,498, L17
Moskalenko, I. V. & Strong, A. W. 1998, ApJ, 493,694
Newman, W. I., Newman, A. L., & Rephaeli, Y.2002, ApJ, 575, 755
Nulsen, P. E. J., David, L. P., McNamara, B. R.,Jones, C., Forman, W. R., & Wise, M. 2002,ApJ, 568, 163
Peterson, J.R., Paerels, F.B.S., Kaastra, J.S.,et al. 2001, A&A, 365, L104
Petrosian, V. 2001, ApJ, 557, 560.
Rephaeli, Y. & Gruber, D. 2002, ApJ, 579, 587
Ryu, D., Kang, H., Hallman, E., & Jones, T. W.2003, ApJ, in press
Sarazin, C., & Lieu, R. 1998, ApJ, 494, L177
Sarazin, C. L. 1999, ApJ, 520, 529
Snowden, S., McCammon, D., Burrows, D., &Mendenhall, J. 1994, ApJ, 424, 714
Schlickeiser, R., Sievers, A., and Thieman, H.1987, A&A, 182, 21
Schlickeiser, R. 2002, Cosmic Ray Astrophysics(Springer-Verlag, Berlin), Ch 5.
Sreekumar, P., Bertsch, D. L., Dingus, B. L.et al. 1996, ApJ, 464, 628
Sutherland, R. S. & Dopita, M. A. 1993, ApJS,88, 253
Taylor, G. B., Allen, S. W., & Fabian, A. C.1999, in Proceedings of Diffuse Thermal andRelativistic Plasma in Galaxy Clusters, ed. H.Bhringer, L. Feretti, & P. Schuecker (Garching:MPE Report 271), 77
Tregillis, I. L., Jones, T. W., & Ryu, D. 2003, ApJ,submitted, astro-ph/10719
Thierbach, M., Klein, U., & Wielebinski, R. 2003,A&A, 397, 53
Tsay, M., Hwang, C.-Y., & Bowyer, S. 2002, ApJ,566, 794.
Vikhlinin, A., Markevitch, M., Forman, W., &Jones, C. 2001, ApJ, 555, L87
Volk, H., Aharonian, F. & Breitschwerdt, D. 1996SSR 75, 279
This 2-column preprint was prepared with the AAS LATEX
macros v5.2.
16
Note added in proof.- Miniati has recently remodeled the nonthermal emission from clusters with animproved treatment (F. Miniati, MNRAS, 342, 1009 [2003]). In his published work, he shows results onlyabove 10 keV. However, he has now extended his work to lower energies and has calculated the EUV fluxwith the specific parameters of the Coma Cluster (F. Miniati, 2004, private communication). He finds thatthe IC EUV emission from SEPs is consistent at the 20% nominal level with the measured EUV flux reportedhere. Further the spatial distribution for this emission is concentrated in the inner Mpc of the cluster. Theseresults provide additional support for the ideas presented here.
17