Food Security, Energy Security, and Inclusive Growth in India
Upload
khangminh22Category
view
2download
0
FOOD SECURITY AND NUTRITION
IN THE WORLD
THE STATE OF
REPURPOSING FOOD AND AGRICULTURAL POLICIES TO MAKE
HEALTHY DIETS MORE AFFORDABLE
2022
SPAIN. Burlap bag filled with vegetables and fruits in a crop field – healthy eating and ecological agriculture.
COVER PHOTOGRAPH ©Shutterstock.com/Raul Mellado Ortiz
This flagship publication is part of The State of the World series of the Food and Agriculture Organization of the United Nations.
Required citation:FAO, IFAD, UNICEF, WFP and WHO. 2022. The State of Food Security and Nutrition in the World 2022. Repurposing food and agricultural policies to make healthy diets more affordable. Rome, FAO.https://doi.org/10.4060/cc0639en
The designations employed and the presentation of material in this information product do not imply the expression of any opinion whatsoever on the part of the Food and Agriculture Organization of the United Nations (FAO), the International Fund for Agricultural Development (IFAD), the United Nations Children’s Fund (UNICEF), the World Food Programme (WFP) or the World Health Organization (WHO) concerning the legal or development status of any country, territory, city or area or of its authorities, or concerning the delimitation of its frontiers or boundaries. The mention of specific companies or products of manufacturers, whether or not these have been patented, does not imply that these have been endorsed or recommended by FAO, IFAD, UNICEF, WFP or WHO in preference to others of a similar nature that are not mentioned. The designations employed and the presentation of material in the maps do not imply the expression of any opinion whatsoever on the part of FAO, IFAD, UNICEF, WFP or WHO concerning the legal or constitutional status of any country, territory or sea area, or concerning the delimitation of frontiers. All reasonable precautions have been taken by FAO, IFAD, UNICEF, WFP and WHO to verify the information contained in this publication. However, the published material is being distributed without warranty of any kind, either expressed or implied. The responsibility for the interpretation and use of the material lies with the reader. In no event shall FAO, IFAD, UNICEF, WFP and WHO be liable for damages arising from its use.
ISSN 2663-8061 (print)ISSN 2663-807X (online)ISBN 978-92-5-136499-4© FAO 2022
Some rights reserved. This work is made available under the Creative Commons Attribution-NonCommercial-ShareAlike 3.0 IGO licence (CC BY-NC-SA 3.0 IGO; https://creativecommons.org/licenses/by-nc-sa/3.0/igo).
Under the terms of this licence, this work may be copied, redistributed and adapted for non-commercial purposes, provided that The Work is appropriately cited. In any use of this work, there should be no suggestion that FAO, IFAD, UNICEF, WFP and WHO endorses any specific organization, products or services. The use of the FAO logo is not permitted. If The Work is adapted, then it must be licensed under the same or equivalent Creative Commons license. If a translation of this work is created, it must include the following disclaimer along with the required citation: “This translation was not created by the Food and Agriculture Organization of the United Nations (FAO), International Fund for Agricultural Development (IFAD), United Nations Children’s Fund (UNICEF), World Food Programme (WFP) or World Health Organization (WHO). FAO, IFAD, UNICEF and WHO are not responsible for the content or accuracy of this translation. The original English edition shall be the authoritative edition.”
Disputes arising under the licence that cannot be settled amicably will be resolved by mediation and arbitration as described in Article 8 of the licence except as otherwise provided herein. The applicable mediation rules will be the mediation rules of the World Intellectual Property Organization http://www.wipo.int/amc/en/mediation/rules and any arbitration will be conducted in accordance with the Arbitration Rules of the United Nations Commission on International Trade Law (UNCITRAL).
Third-party materials. Users wishing to reuse material from this work that is attributed to a third party, such as tables, figures or images, are responsible for determining whether permission is needed for that reuse and for obtaining permission from the copyright holder. The risk of claims resulting from infringement of any third-party-owned component in the work rests solely with the user.
Sales, rights and licensing. FAO information products are available on the FAO website (www.fao.org/publications) and can be purchased through [email protected]. Requests for commercial use should be submitted via: www.fao.org/contact-us/licence-request. Queries regarding rights and licensing should be submitted to: [email protected].
FOOD SECURITY AND NUTRITION
IN THE WORLD
THE STATE OF
REPURPOSING FOOD AND AGRICULTURAL POLICIES TO MAKE
HEALTHY DIETS MORE AFFORDABLE
ISSN
266
3-80
61
Food and Agriculture Organization of the United NationsInternational Fund for Agricultural Development | United Nations Children’s Fund
United Nations World Food Programme | World Health Organization
Rome, 2022
CONTENTS
FOREWORD viMETHODOLOGY viiiACKNOWLEDGEMENTS ixACRONYMS AND ABBREVIATIONS xiiKEY MESSAGES xivEXECUTIVE SUMMARY xvi
CHAPTER 1INTRODUCTION 1
CHAPTER 2FOOD SECURITY AND NUTRITION AROUND THE WORLD 92.1 Food security indicators – latest updates and progress towards ending hunger and ensuring food security 10
2.2 The state of nutrition: progress towards global nutrition targets 30
2.3 Cost and affordability of a healthy diet: an update 47
CHAPTER 3FOOD AND AGRICULTURAL POLICY SUPPORT IN THE WORLD: HOW MUCH DOES IT COST AND AFFECT DIETS? 553.1 Stocktaking: what policy support is currently provided to food and agriculture? 56
3.2 How are food and agricultural policies affecting diets? 70
CHAPTER 4POTENTIAL OPTIONS TO REPURPOSE POLICY SUPPORT TO FOOD AND AGRICULTURE FOR IMPROVING AFFORDABILITY OF A HEALTHY DIET 874.1 What are the potential impacts of reallocating food and agricultural policy support differently to reduce the cost of nutritious foods? 88
4.2 Complementing policies within and outside agrifood systems that are needed to ensure repurposing efforts are impactful 109
4.3 The political economy and governance dynamics that influence repurposing policy support 119
CHAPTER 5CONCLUSION 129
ANNEXES 135
ANNEX 1AStatistical tables to Chapter 2 136
ANNEX 1BMethodological notes for the food security and nutrition indicators 162
ANNEX 2Methodologies used in Chapter 2 176
ANNEX 3Updated data series of the cost and affordability of a healthy diet, 2017–2020 184
ANNEX 4Policy support indicators: sources, coverage and methodology 191
ANNEX 5Tariff data and food group definitions 195
ANNEX 6Results from selected global model-based scenarios 196
ANNEX 7Glossary 200
NOTES 207
| ii |
TABLES
1 Prevalence of undernourishment (PoU), 2005–2021 14
2 Number of undernourished people (NoU), 2005–2021 15
3 Prevalence of food insecurity at severe level only, and at moderate or severe level, based on the Food Insecurity Experience Scale, 2014–2021 25
4 Number of people experiencing food insecurity at severe level only, and at moderate or severe level, based on the Food Insecurity Experience Scale, 2014–2021 26
5 Almost 3.1 billion people could not afford a healthy diet in 2020 due to the increased cost 51
6 Support to the food and agricultural sector as a share of value of production, by country income group, average 2013–2018 64
7 Business-as-usual, elimination and repurposing of support to food and agriculture scenarios 91
8 Impact of repurposing border measures to support healthy diets, 2030 (change with respect to the baseline) 96
9 Impact of repurposing border measures to support healthy diets on diet cost and per capita consumption, 2030 (percentage change with respect to the baseline) 97
10 Impact of repurposing fiscal subsidies to producers to support healthy diets, 2030 (change with respect to the baseline) 98
11 Impact of repurposing fiscal subsidies to producers to support healthy diets on diet cost and per capita consumption, 2030 (percentage change with respect to the baseline) 99
12 Impact of repurposing fiscal subsidies from producers to consumers to support healthy diets, 2030 (change with respect to the baseline) 100
13 Impact of repurposing fiscal subsidies from producers to consumers to support healthy diets on diet cost and per capita consumption, 2030 (percentage change with respect to the baseline) 101
A1.1 Progress towards the Sustainable Development Goals (SDGs) and global nutrition targets: prevalence of undernourishment, moderate or severe food insecurity, selected forms of malnutrition, exclusive breastfeeding and low birthweight 136
A1.2 Progress towards the Sustainable Development Goals (SDGs) and global nutrition targets: number of people who are affected by undernourishment, moderate or severe food insecurity and selected forms of malnutrition; number of infants exclusively breastfed and number of babies born with low birthweight 149
A2.1 Ranges of PoU and NoU nowcasted in 2020 and 2021 177
A2.2 Regression coefficients from three models estimated on historic CV|y values (2000–2019) 178
A2.3 Countries with nutrition outcome data from national surveys between 2015 and 2021 that contributed to the inequality analysis 180
A3.1 The cost and affordability of a healthy diet by region, subregion, country and country income group, 2017–2020 185
A3.2 Lower- and upper-bound estimates of the percentage and number of people (in millions) who cannot afford the cost of a healthy diet, by region and country income group in 2020 190
A4.1 Countries covered in the Ag-Incentives database by the country income group classification used in the stocktaking analysis 192
A4.2 Policy instruments for supporting food and agriculture and related indicators 193
A6.1 Countries covered in the Ag-Incentives database by the country income group classification used in the model simulations 197
A6.2 Impact of removing border measures, 2030 (change with respect to the baseline) 198
A6.3 Impact of removing fiscal support to producers, 2030 (change with respect to the baseline) 198
| iii |
CONTENTS
FIGURES
1 An agrifood systems approach is essential to repurpose food and agricultural policy support 5
2 Between 702 and 828 million people in the world faced hunger in 2021. Considering the middle of the projected range (768 million), hunger affected 46 million more people in 2021 compared to 2020, and a total of 150 million more people since 2019, before the COVID-19 pandemic 13
3 More than half (425 million) of the people in the world affected by hunger in 2021 were in Asia and more than one-third (278 million) in Africa 16
4 After increasing from 2019 to 2020 in most of Africa, Asia and Latin America and the Caribbean, the PoU continued to rise in 2021 in most subregions, but at a slower pace 17
5 Comparison of percent of income loss by global income quintile due to the COVID-19 pandemic in 2020 and 2021 shows large disparities in income recovery 18
6 The COVID-19 scenario projects a decrease in global hunger to around 670 million in 2030, far from the zero hunger target. This is 78 million more undernourished people in 2030 than in a scenario in which the pandemic had not occurred 19
7 Moderate or severe food insecurity remained stable at the global level despite increases in every region except Asia, whereas severe food insecurity increased globally and in every region 23
8 The concentration and distribution of food insecurity by severity differs greatly across the regions of the world 28
9 As the country income level falls, the total prevalence of food insecurity and the proportion of severe food insecurity tends to increase 28
10 Globally and in every region, the prevalence of food insecurity is higher among women than men 29
11 Global trends in prevalence and absolute numbers indicate that overweight among children under five years of age, anaemia among women, and obesity among adults are increasing, while low birthweight, stunting among children under five years of age and exclusive breastfeeding have steadily improved since 2000 33
12 Low- and lower-middle-income countries bear the greatest burden of stunting, wasting, low birthweight, and anaemia cases while upper-middle- and high-income countries have the greatest burden of obesity cases 35
13 Inequality analyses using the latest available data per country (2015 to 2021) indicate that globally, stunted children under five years of age are more likely to be residing in rural settings, in poorer households, with mothers who received no formal education, and to be male while obesity among women is most common in urban settings and wealthier households 40
14 Reaching the 2030 global nutrition targets will require immense efforts. Only exclusive breastfeeding among infants under six months of age (37.1 to 43.8 percent) and stunting among children under five years of age (26.2 to 22.0 percent) have notably improved since 2012, yet even these indicators will require accelerated progress to meet the 2030 targets 44
15 Regional progress towards nutrition targets indicates worsening anaemia among women and overweight among children under five years of age, while many regions are making progress in the reduction of wasting and stunting among children under five years of age 45
16 The cost of a heathy diet increased, and the diet was more unaffordable in every region of the world in 2020 52
A6.4 Impact of redistributing fiscal subsidies to producers equally across food products, 2030 (change with respect to the baseline) 199
A6.5 Impact of redistributing fiscal subsidies to producers equally across food products on diet cost and per capita consumption, 2030 (percentage change with respect to the baseline) 199
| iv |
17 Food and agricultural policy support instruments and indicators 57
18 Level and composition of global support to food and agriculture (USD billion, average 2013–2018) 62
19 Nominal rate of assistance as a share of production value, by instrument and income group 63
20 Composition of general services support as a share of value of production, by income group and type of service, average 2015–2018 65
21 Nominal rate of assistance as a share of the value of production by income and food group, average 2013–2018 67
22 Nominal rate of assistance as a share of the value of production for selected most targeted food products by income group, average 2013–2018 68
23 Impact of changes on GDP in the repurposing scenarios, 2030 (percentage change with respect to the baseline) 102
24 Complementing policies, both inside and outside agrifood systems, are critical to support repurposing support efforts 110
25 Political economy and governance dynamics related to the repurposing of food and agricultural policy support 121
BOXES
1 Definitions of repurposing, and food and agricultural policy support 3
2 Updates to the prevalence of undernourishment (PoU) and accounting for the COVID-19 pandemic in estimates of hunger in the world in 2021 12
3 The war in Ukraine: potential risks for international agricultural markets and global food security 20
4 COVID-19 case study: country examples of the impact of the pandemic on child wasting and overweight through context-specific pathways 37
5 The war in Ukraine threatens to increase the number of malnourished people, especially women and children globally 38
6 Updated information and refinement in methodology improves the accuracy of the global estimates of the cost and affordability of a healthy diet 49
7 Standard indicators of support to food and agriculture 58
8 WTO rules that apply to price incentives and fiscal support 60
9 The importance of fish and fishery products for healthy diets and the role of fisheries subsidies in policy repurposing efforts 69
10 Description of nutritious foods and healthy diets 71
11 Higher support to producers through price incentives correlates with a higher cost of a healthy diet 72
12 Tariffs on highly processed foods, sugar and confectionery and fruits and vegetables 74
13 Classification of food products as low, medium and high priority for increasing their availability and consumption to meet recommended dietary levels 94
14 Optimizing public budgets to align agricultural transformation and healthy diets’ affordability objectives: evidence for Ethiopia 104
15 Implications of repurposing agricultural subsidies for countries’ WTO commitments 108
16 Social protection is essential in the face of shocks to livelihoods 114
17 Investment in climate adaptation practices to support affordable healthy diets and inclusive supply chains 116
18 Value chain development as an effective tool to transform unequal power distribution 124
| v |
FOREWORD
The challenges to ending hunger, food insecurity and all forms of malnutrition keep growing. The COVID-19 pandemic has further highlighted the fragilities in our agrifood systems and the inequalities in our societies, driving further increases in world hunger and severe food insecurity. Despite global progress, trends in child undernutrition – including stunting and wasting, deficiencies in essential micronutrients and overweight and obesity in children, continue to be of great concern. Further, maternal anaemia and obesity among adults continue to be alarming.
The most recent evidence available suggests that the number of people unable to afford a healthy diet around the world rose by 112 million to almost 3.1 billion, reflecting the impacts of rising consumer food prices during the pandemic. This number could even be greater once data are available to account for income losses in 2020. The ongoing war in Ukraine is disrupting supply chains and further affecting prices of grain, fertilizer and energy. In the first half of 2022, this resulted in further food price increases. At the same time, more frequent and severe extreme climate events are disrupting supply chains, especially in low-income countries.
Looking forward, the gains we made in reducing the prevalence of child stunting by one-third in the previous two decades – translating into 55 million fewer children with stunting – are under threat by the triple crises of climate, conflict and the COVID-19 pandemic. Without intensified efforts, the number of children with wasting will only increase.
This report repeatedly highlights the intensification of these major drivers of food insecurity and malnutrition: conflict, climate extremes and economic shocks, combined with growing inequalities. The issue at stake is not whether adversities will continue to occur or not, but how we must take bolder action to build resilience against future shocks.
While last year’s report highlighted the pathways to transform agrifood systems, the reality is that it is easier said than done. Global economic growth
prospects for 2022 have been revised downward significantly; hence, more limited financial resources are available to invest in agrifood systems. Public-private partnerships will be extremely important for investments in agrifood systems. Robust governance will also be important to ensure that such partnerships ultimately benefit communities and people in greatest need, not powerful industry players.
This report shows that governments can invest in agrifood systems equitably and sustainably, even with the same level of public resources. Governments’ support to food and agriculture accounts for almost USD 630 billion per year globally. However, a significant proportion of this support distorts market prices, is environmentally destructive, and hurts small-scale producers and Indigenous Peoples, while failing to deliver healthy diets to children and others who need them the most.
Food-importing countries have often provided stronger policy support, especially for cereals, with the aim of shielding their farming sector from international competition. In doing so, they may have been disproportionately fostering production of cereals relative to production of pulses, seeds, fruits, vegetables and other nutritious foods. These policies have contributed to food security in terms of sufficient quantity of calories, but they are not effective in improving nutrition and health outcomes, including among children.
The evidence suggests that if governments repurpose the resources to prioritize food consumers, and to incentivize sustainable production, supply and consumption of nutritious foods, they will help make healthy diets less costly and more affordable for all.
Governments must take this important transformational step, but the multilateral architecture under the United Nations Decade of Action on Nutrition must support it. As well, the repurposing of trade measures and fiscal subsidies will have to consider countries’ commitments and flexibilities under the rules of the World Trade Organization.
| vi |
This evidence-based report builds on the momentum of last year’s United Nations Food Systems Summit and the Tokyo Nutrition for Growth Summit, as well as the expected outcomes from the COP26 negotiations for building climate resilience for food security and nutrition.
We recognize that countries with lower incomes will have scarce public resources and need international development finance support. These are countries where agriculture is key to the economy, jobs and rural livelihoods, and where millions of people are hungry, food insecure, or malnourished. We are committed to working with these countries to find avenues for increasing the provision of public services that supports agrifood systems’ actors collectively, with the involvement of local institutions and civil society, while forging public-private partnerships.
In all contexts, reforms to repurpose support to food and agriculture must also be accompanied by policies that promote shifts in consumer behaviours along with social protection policies to mitigate unintended consequences of reforms for vulnerable populations. Finally, these reforms must be multisectoral, encompassing health, environment, transport and energy policies.
Our organizations stand firmly committed and ready to support governments and bring additional allies to achieve such policy coherence at the global and national levels. Everyone has a right to access safe nutritious foods and affordable healthy diets. Investing in healthy and sustainable agrifood systems is an investment in the future, and in future generations.
Qu DongyuFAO Director-General
David BeasleyWFP Executive Director
Gilbert F. HoungboIFAD President
Tedros Adhanom GhebreyesusWHO Director-General
Catherine RussellUNICEF Executive Director
| vii |
METHODOLOGY
The State of Food Security and Nutrition in the World 2022 has been prepared by the FAO Agrifood Economics Division in collaboration with the Statistics Division of the Economic and Social Development Stream and a team of technical experts from the Food and Agriculture Organization of the United Nations (FAO), the International Fund for Agricultural Development (IFAD), the United Nations Children’s Fund (UNICEF), the World Food Programme (WFP) and the World Health Organization (WHO).
A senior advisory team consisting of designated senior managers of the five UN publishing partners guided the production of the report. Led by FAO, this team decided on the outline of the report and defined its thematic focus. Further, it gave oversight to the technical writing team composed of experts from each of the five co-publishing agencies. Background technical papers were prepared to support the research and data analysis undertaken by the members of the writing team.
The writing team produced a number of interim outputs, including an annotated outline, first draft and final draft of the report. These were reviewed, validated and cleared by the senior advisory team at each stage in the preparation process. The final report underwent a rigorous technical review by senior management and technical experts from different divisions and departments within each of the five UN agencies, both at headquarters and decentralized offices. Finally, the report underwent executive review and clearance by the heads of agency of the five co-publishing partners.
| viii |
ACKNOWLEDGEMENTS
The State of Food Security and Nutrition in the World 2022 was jointly prepared by the Food and Agriculture Organization of the United Nations (FAO), the International Fund for Agricultural Development (IFAD), the United Nations Children’s Fund (UNICEF), the World Food Programme (WFP) and the World Health Organization (WHO).
The publication was carried out under the direction of Marco V. Sánchez Cantillo and José Rosero Moncayo, with the overall coordination of Cindy Holleman, the Editor of the publication, and the overall guidance of Máximo Torero Cullen, all of whom are from the FAO Economic and Social Development Stream (ES). The development of the report was guided by a Steering Committee consisting of agency representatives from the five co-publishing partners: Marco V. Sánchez Cantillo (Chair), Sara Savastano (IFAD), Victor Aguayo (UNICEF), Arif Husain (WFP) and Francesco Branca (WHO). Tisorn Songsermsawas (IFAD), Chika Hayashi, Jo Jewell and Vilma Tyler (UNICEF), Eric Branckaert and Saskia de Pee (WFP) and Marzella Wüstefeld (WHO) contributed to the coordination and provided technical support. Valuable comments and final approval of the report were provided by the executive heads and senior staff of the five co-authoring agencies.
Chapter 1 of the report was written by Cindy Holleman with inputs from Marco V. Sánchez Cantillo, Lynnette Neufeld, Anne Kepple, Jakob Rauschendorfer, José Rosero Moncayo and Trudy Wijnhoven (FAO), Caterina Ruggeri Laderchi and Tisorn Songsermsawas (IFAD), Jo Jewell and Rizwan Yusfali (UNICEF), Sabrina Kuri (WFP), and Karen McColl and Marzella Wüstefeld (WHO).
Chapter 2 of the report was coordinated by Anne Kepple (FAO). Section 2.1 was written by Carlo Cafiero, Anne Kepple and José Rosero Moncayo with inputs from Piero Conforti, Alejandro Grinspun, Marco Knowles, Vanya Slavchevska, Sara Viviani and Firas Yassin (FAO). Box 3 was written by Boubaker Ben Belhassen, Aikaterini Kavallari and Holger Matthey (FAO). Olivier Lavagne d’Ortigue (FAO) provided data visualization and editorial support. Section 2.2 was written by Elaine Borghi, Giovanna Gatica Domínguez and Alexandra Humphreys (WHO), with inputs from Chika Hayashi, Julia Krasevec, Richard Kumapley and Vrinda Mehra (UNICEF), Anne Kepple (FAO), and Monica Flores, Katrina Lundberg, Lisa Rogers, Gretchen Stevens and Marzella Wüstefeld (WHO). The International Center for Equity in Health (ICEH), Pelotas, Brazil provided some of the data and code used for the inequality analysis. Section 2.3 was written by Cindy Holleman with inputs from Valentina Conti, Anne Kepple, Lynnette Neufeld and Trudy Wijnhoven (FAO) and Saskia de Pee (WFP). José Rosero Moncayo (FAO) provided technical editorial support to the sections of this chapter.
Chapter 3 of the report was coordinated by Cindy Holleman (FAO). Section 3.1 was written by Valentina Pernechele with Ekaterina Krivonos and Audum Lem (FAO), with inputs from Cosimo Avesani, Catherine Bessy, Valentina Conti, Diana Fernández de la Reguera, Jessie Lin, Markus Lipp, Lynnette Neufeld, George Rapsomanikis, Jakob Rauschendorfer, Carla Vaca Eyzaguirre and Trudy Wijnhoven (FAO), Saskia de Pee (WFP), and Karen McColl, Benn McGrady, Kathryn Robertson and Marzella Wüstefeld (WHO). The estimation of indicators of policy support to food and agriculture were provided by David Laborde with Joseph Glauber (International Food Policy Research Institute [IFPRI]). Section 3.2 was written by Carla Vaca Eyzaquirre with Valentina Conti, Diana Fernández de la Reguera, Cindy Holleman, Ekaterina Krivonos and Jakob Rauschendorfer and Trudy Wijnhoven (FAO), with inputs from Giovanni Carrasco Azzini, Chaterine Bessy, Markus Lipp, Valentina Pernechele and George Rapsomanikis (FAO), Ole Boysen (University College Dublin), Joyce Njoro, Jyotsna Puri, Caterina Ruggeri Laderchi, Tisorn Songsermsawas and Victoria Wise (IFAD), Jo Jewell and Rizwan Yusfali (UNICEF), Sabrina Kuri (WFP), and Hyun Jin, Karen McColl, Benn McGrady, Kathryn Robertson and Marzella Wüstefeld (WHO). Marco V. Sánchez Cantillo provided technical editorial support to the sections of this chapter.
| ix |
ACKNOWLEDGEMENTS
Chapter 4 of the report was coordinated by Cindy Holleman (FAO). Section 4.1 was written by Marco V. Sánchez Cantillo with Cindy Holleman and Ekaterina Krivonos (FAO), with input from Martin Cicowiez, Valentina Conti, Valentina Pernechele, Jakob Rauschendorfer and Carla Vaca Eyzaguirre (FAO), Caterina Ruggeri Laderchi (IFAD), Sabrina Kuri (WFP), and Karen McColl and Marzella Wüstefeld (WHO). The results of simulating global policy support changes using the Modelling International Relations under Applied General Equilibrium (MIRAGRODEP) models were provided by David Laborde with Joseph Glauber (International Food Policy Research Institute [IFPRI]). Section 4.2 was written by Giovanni Carrasco Azzini and Cindy Holleman (FAO), Caterina Ruggeri Laderchi (IFAD), Sabrina Kuri (WFP), and Karen McColl and Marzella Wüstefeld (WHO), with inputs from Cosimo Avesani, Diana Fernández de la Reguera, Jessie Lin, Lynette Neufeld, Ekaterina Krivonos, Valentina Pernechele, Jakob Rauschendorfer, Carla Vaca Eyzaguirre and Trudy Wijnhoven (FAO), Daniel Anavitarte, Samir Bejaoui, Romina Cavatassi, Sinafikeh Gemessa, Daniel Higgins, Mikael Kauttu, Giuseppe Maggio, Anni Mandelin, Thanh Tung Nguyen, Rasha Omar and Tisorn Songsermsawas (IFAD), Saskia de Pee (WFP), Jo Jewell and Rizwan Yusfali (UNICEF) and Kaia Engesveen, Hyun Jin, Katrina Lundberg, Simone Moraes Raszl, Jessica Pullar, Manasi Shukla Trivedi and Camilla Haugstveit Warren (WHO). Section 4.3 was written by Jessie Lin and Giovanni Carrasco Azzini (FAO), with inputs from Carla Vaca Eyzaguirre, Cindy Holleman, Ekaterina Krivonos, Pascal Liu and Jakob Rauschendorfer (FAO), Aslihan Arslan, Cristina Chiarella, Tawfiq El-Zabri, Athur Mabiso, Michele Pennella, Caterina Ruggeri Laderchi, Tisorn Songermsawas, Nicolas Syed, Sakiusa Tubuna and Emanuele Zucchini (IFAD), Jo Jewell and Rizwan Yusfali (UNICEF), Lina Mahy, Karen McColl, Jessica Pullar and Marzella Wüstefeld (WHO). Marco V. Sánchez Cantillo provided technical editorial support to the sections of this chapter.
Chapter 5 of the report was written by Cindy Holleman and Marco V. Sánchez Cantillo, with inputs from Anne Kepple and José Rosero Moncayo (FAO).
Numerous colleagues from different technical units and departments across the five co-publishing agencies provided valuable technical comments and input to the report. An agency-wide technical clearance process facilitated a comprehensive review by many technical experts from the five co- authoring agencies. Listing each of the contributions would be challenging and furthermore increase the risk of important omissions.
Abdul Sattar, Sara Viviani and Firas Yassin were responsible for preparing undernourishment and food security data in Section 2.1 and Annex 1A, with inputs from Marinella Cirillo, Filippo Gheri, Gabriela Interlenghi, Adeeba Ishaq, Talent Manyani, Ana Moltedo and María Rodríguez, under the supervision of Carlo Cafiero (FAO). Supporting data were provided by the Food Balance Sheets (FBS) team, led by Salar Tayyib of the FAO Statistics Division (ESS). Carlo Cafiero prepared the 2030 projections of undernourishment with input from Adeeba Ishaq, Abdul Sattar and Firas Yassin (FAO), with key input provided by David Laborde as part of a research collaboration with IFPRI. Giovanna Gatica Domínguez, Elaine Borghi and Alexandra Humphreys (WHO), and Richard Kumapley and Vrinda Mehra (UNICEF) were responsible for consolidating the nutrition data in Section 2.2, with input from Julia Krasevec (UNICEF). Giovanna Gatica Dominguez and Elaine Borghi (WHO) and Richard Kumapley and Vrinda Mehra (UNICEF) were responsible for the analyses in Section 2.2 and Annex 2. Giovanna Gatica Domínguez and Alexandra Humphreys (WHO) were responsible for the development of the COVID-19 pandemic case studies included in Box 4 of Section 2.2, with inputs from Elaine Borghi (WHO) and Chika Hayashi and Richard Kumapley (UNICEF). Elisa Dominguez and Giovanna Gatica Domínguez (WHO) and Julia Krasevec and Richard Kumapley (UNICEF) contributed to the analyses of national surveys used in the development of the case studies, as part of the UNICEF-WHO-WB Joint Child
| x |
Malnutrition Estimates (JME) work. Valentina Conti and Cindy Holleman (FAO) were responsible for preparing the analysis of the cost and affordability of a healthy diet in Section 2.3 and Annex 3, with input from Veronica Boero, Jean Marie Vianney Munyeshyaka, Lynnette Neufeld, Michele Vollaro and Trudy Wijnhoven (FAO), Leah Costlow, Anna Herforth and William A. Masters (Tufts University), and Yan Bai, Nada Hamadeh and Marko Olavi Rissanen (World Bank). Juan José Egas Yerovi carried out revisions of the data and figures in Section 3.1.
Support for report production came from Christin Campbell (consulting editor), Giovanni Carrasco Azzini and Daniela Verona in the FAO Economic and Social Development Stream.
The FAO Meeting Branch and Language Services Branch of Governing Bodies Servicing Division (CSG) carried out the translations, in addition to the contributors mentioned above.
The Publishing Group (OCCP) of the FAO’s Office of Communications provided editorial support, design and layout, as well as production coordination, for editions in all six official languages.
| xi |
ACRONYMS AND ABBREVIATIONS
AARR Average annual rate of reduction
ACT-NM UNICEF-USAID-WHO Agile Core Team for Nutrition Monitoring
ADER Average dietary energy requirement
AoA Agreement on Agriculture
BMI Body mass index
CGE Computable general equilibrium
CoAHD Cost and affordability of a healthy diet
CPI Consumer price index
CV Coefficient of variation
CV|r CV due to energy requirements
CV|y CV due to income
DEC Dietary energy consumption
DES Dietary energy supply
FAO Food and Agriculture Organization of the United Nations
FBDGs Food-based dietary guidelines
FBS Food Balance Sheets
FIES Food Insecurity Experience Scale
FImod+sev Prevalence of moderate or severe food insecurity
FIsev Prevalence of severe food insecurity
GDP Gross domestic product
GHG Greenhouse gas
GSS General services support
GWP Gallup World Poll
HICs High-income countries
ICN2 Second International Conference on Nutrition
ICP World Bank International Comparison Programme
IDB Inter-American Development Bank
IFAD International Fund for Agricultural Development
IFPRI International Food Policy Research Institute
IMF International Monetary Fund
JME Joint Malnutrition Estimates
LDCs Least developed countries
LICs Low-income countries
LMICs Lower-middle-income countries
MDER Minimum dietary energy requirement
MICs Middle-income countries
MIRAGRODEP Modelling International Relations under Applied General Equilibrium
NCD Non-communicable disease
NoU Number of undernourished people
NRA Nominal rate of assistance
NRP Nominal rate of protection
NTMs Non-tariff measures
OECD Organisation for Economic Co-operation and Development
PIP Poverty and Inequality Platform
PoU Prevalence of undernourishment
PPP Purchasing power parity
R&D Research and development
SD Standard deviation
SDGs Sustainable Development Goals
SMEs Small- and medium-sized enterprises
SPS Sanitary and phytosanitary measures
SUN Scaling Up Nutrition Movement
TBT Technical barriers to trade
| xii |
TFA Transfatty acids
UMICs Upper-middle-income countries
UNDP United Nations Development Programme
UNEP United Nations Environment Programme
UNICEF United Nations Children's Fund
USD United States dollar
VAT Value-added tax
WFP World Food Programme
WHA World Health Assembly
WHO World Health Organization
WTO World Trade Organization
| xiii |
KEY MESSAGES
è Despite hopes that the world would emerge from the COVID-19 pandemic in 2021 and food security would begin to improve, world hunger rose further in 2021. The increase in global hunger in 2021 reflects exacerbated inequalities across and within countries due to an unequal pattern of economic recovery among countries and unrecovered income losses among those most affected by the COVID-19 pandemic.
è After remaining relatively unchanged since 2015, the prevalence of undernourishment jumped from 8.0 to 9.3 percent from 2019 to 2020 and rose at a slower pace in 2021 to 9.8 percent. Between 702 and 828 million people were affected by hunger in 2021. The number has grown by about 150 million since the outbreak of the COVID-19 pandemic – 103 million more people between 2019 and 2020 and 46 million more in 2021.
è Projections are that nearly 670 million people will still be facing hunger in 2030 – 8 percent of the world population, which is the same as in 2015 when the 2030 Agenda was launched.
è After increasing sharply in 2020, the global prevalence of moderate or severe food insecurity remained mostly unchanged in 2021, but severe food insecurity rose higher, reflecting a deteriorating situation for people already facing serious hardships. Around 2.3 billion people in the world were moderately or severely food insecure in 2021, and 11.7 percent of the global population faced food insecurity at severe levels.
è Globally in 2020, an estimated 22 percent of children under five years of age were stunted, 6.7 percent were wasted, and 5.7 percent were overweight. Children in rural settings and poorer households, whose mothers received no formal education, were more vulnerable to stunting and wasting. Children in urban areas and wealthier households were at higher risk of overweight.
è Steady progress has been made on exclusive breastfeeding, with 43.8 percent of infants under six months of age exclusively breastfed worldwide in 2020, up from 37.1 percent in 2012, but improvement must be accelerated to meet the 2030 target. Infants residing in rural areas, in poorer households, who are female and whose mothers received no formal education are more likely to be breastfed.
è Globally in 2019, nearly one in three women aged 15 to 49 years (571 million) were affected by anaemia, with no progress since 2012. Anaemia affects more women in rural settings, in poorer households and who have received no formal education.
è Almost 3.1 billion people could not afford a healthy diet in 2020. This is 112 million more than in 2019, reflecting the inflation in consumer food prices stemming from the economic impacts of the COVID-19 pandemic and the measures put in place to contain it.
è The recent setbacks indicate that policies are no longer delivering increasing marginal returns in reducing hunger, food insecurity and malnutrition in all its forms. Governments where the economy is fragile are also facing fiscal constraints to transform agrifood systems. This is the time for governments to start examining their current support to food and agriculture.
è Worldwide support to food and agriculture accounted for almost USD 630 billion per year on average over 2013–2018. The lion share of it is targeted to farmers individually, through trade and market policies and fiscal subsidies largely tied to production or unconstrained use of variable production inputs. Not only is much of this support market distorting, but it is not reaching many farmers, hurts the environment and does not promote the production of nutritious foods.
| xiv |
è Support to agricultural production largely concentrates on staple foods, dairy and other animal source protein-rich foods, especially in high- and upper-middle-income countries. Rice, sugar and meats of various types are the foods most incentivized worldwide, while fruits and vegetables are less supported overall, or even penalized in some low-income countries.
è Trade and market interventions can act as trade barriers for nutritious foods undermining the availability and affordability of healthy diets. In many countries, fiscal subsidies have increased the availability and reduced the price of staple foods and their derivatives, discouraging and making relatively more expensive the consumption of unsubsidized or less subsidized commodities such as fruits, vegetables and pulses.
è Done smartly and informed by evidence, involving all stakeholders, keeping in mind countries’ political economies and institutional capabilities, and considering commitments and flexibilities under World Trade Organization rules, repurposing existing public support can help increase the availability of nutritious foods to the consumer. It can contribute to making healthy diets less costly and more affordable all over the world, a necessary – albeit insufficient – for condition for healthy diets to be consumed.
è When repurposing public support to make healthy diets less costly, policymakers have to avoid potential inequality trade-offs that may emerge if farmers are not in a position to specialize in the production of nutritious foods due to resource constraints. To avoid trade-offs in terms of greenhouse gas emissions, low-emission intensity technologies have to be adopted to produce nutritious foods, and overproduction and overconsumption of emission-intensive commodities need to be reduced in high- and upper-middle-income countries in line with dietary guidelines.
è In low-income countries but also in some lower-middle-income countries where agriculture is key for the economy, jobs and livelihoods, governments need to increase and prioritize expenditure for the provision of services that support food and agriculture more collectively. This is crucial to bridge productivity gaps in the production of nutritious foods and enable income generation to improve the affordability of healthy diets, although it will require significant development financing.
è Repurposing current public support to food and agriculture will not be enough alone. Healthy food environments and empowering consumers to choose healthy diets must be promoted through complementing agrifood systems policies. Social protection and health system policies will be needed to mitigate unintended consequences of repurposing support on the most vulnerable, particularly women and children. Environmental, health, transportation and energy systems policies will be needed to enhance the positive outcomes of repurposing support in the realms of efficiency, equality, nutrition, health, climate mitigation and the environment.
è The success of repurposing efforts will also be influenced by the political and social context, governance, (im)balances of power, and differences in interests, ideas and influence of stakeholders. Given the diversity of each country’s context, repurposing efforts will need strong institutions on a local, national and global level, as well as engaging and incentivizing stakeholders from the public sector, the private sector and international organizations.
| xv |
EXECUTIVE SUMMARY
With eight years remaining to end hunger, food insecurity and all forms of malnutrition (Sustainable Development Goals [SDGs] Targets 2.1 and 2.2), the world is moving in the wrong direction. As argued in the last two editions of this report, to meet the targets of SDG 2 by 2030, healthy diets must be delivered at lower cost to contribute to people’s ability to afford them. This implies both an expansion in the supply of the nutritious foods that constitute a healthy diet and a shift in consumption towards them.
Most of the food and agricultural policy support currently implemented is not aligned with the objective of promoting healthy diets and in many cases is actually inadvertently undermining food security and nutrition outcomes. Furthermore, much of the support is not equitably distributed, is market distortive and environmentally harmful.
It is possible to allocate public budgets more cost-effectively and efficiently to help reduce the cost of healthy diets, thus improving their affordability, sustainably and inclusively, ensuring no one is left behind.
This year’s report first presents the latest updates of the food security and nutrition situation around the world, including updated estimates on the cost and affordability of a healthy diet. The report then takes a deep dive into “repurposing food and agricultural policy support to make healthy diets more affordable” through reducing the cost of nutritious foods relative to other foods and people’s income, which, in turn, helps countries make more efficient and effective use of – in many cases – limited public resources.
FOOD SECURITY AND NUTRITION AROUND THE WORLDFood security indicators – latest updates and progress towards ending hunger and ensuring food security Despite hopes that the world would emerge more quickly from the crisis and food security would begin to recover from the pandemic in 2021, world hunger rose further in 2021, following a sharp upturn in 2020 in the midst of the COVID-19 pandemic. Disparities in the impact of the pandemic and the recovery, together with the limited coverage and duration of the social protection measures, led to widening inequalities that have contributed to further setbacks in 2021 towards achievement of the Zero Hunger target by 2030.
After remaining relatively unchanged since 2015, the prevalence of undernourishment (SDG Indicator 2.1.1) jumped from 8.0 in 2019 to around 9.3 percent in 2020 and continued to rise in 2021 – though at a slower pace – to around 9.8 percent. It is estimated that between 702 and 828 million people in the world (corresponding to 8.9 and 10.5 percent of the world population, respectively) faced hunger in 2021. Considering the middle points of the projected ranges (which reflect the added uncertainty induced by the lingering consequences of the COVID-19 pandemic), hunger affected 46 million more people in 2021 compared to 2020, and a total of 150 million more people since 2019, prior to the COVID-19 pandemic.
The numbers show persistent regional disparities, with Africa bearing the heaviest burden. One in five people in Africa (20.2 percent of the population) was facing hunger in 2021, compared to 9.1 percent in Asia, 8.6 percent in Latin America and the Caribbean, 5.8 percent in Oceania, and less than 2.5 percent in Northern America and Europe. After increasing from 2019 to 2020 in
| xvi |
most of Africa, Asia and Latin America and the Caribbean, the PoU continued to rise in 2021 in most subregions, but more slowly.
Updated projections of the number of undernourished people suggest that nearly 670 million people will still be undernourished in 2030 – 78 million more than in a scenario in which the pandemic had not occurred. Another crisis now looms that is likely to impact the trajectory of food security globally. The war in Ukraine will have multiple implications for global agricultural markets through the channels of trade, production and prices, casting a shadow over the state of food security and nutrition for many countries in the near future.
SDG Target 2.1 challenges the world to go beyond ending hunger by ensuring access for all to safe, nutritious and sufficient food all year round. SDG Indicator 2.1.2 – the prevalence of moderate or severe food insecurity in the population, based on the Food Insecurity Experience Scale – is used to monitor progress towards the ambitious goal of ensuring access to adequate food for all.
Moderate or severe food insecurity at the global level has been increasing since FAO first started collecting Food Insecurity Experience Scale data in 2014. In 2020, the year the COVID-19 pandemic spread across the globe, it rose nearly as much as in the previous five years combined. New estimates for 2021 suggest that the prevalence of moderate or severe food insecurity has remained relatively unchanged compared with 2020, whereas that of severe food insecurity has increased, providing further evidence of a deteriorating situation mainly for those already facing serious hardships. In 2021, an estimated 29.3 percent of the global population – 2.3 billion people – were moderately or severely food insecure, and 11.7 percent (923.7 million people) faced severe food insecurity.
There is also a growing gender gap in food insecurity. In 2021, 31.9 percent of women in the world were moderately or severely food insecure compared to 27.6 percent of men – a gap of more than 4 percentage points, compared with 3 percentage points in 2020.
The state of nutrition: progress towards global nutrition targetsThis report also assesses global and regional levels and trends for the seven global nutrition targets. The estimates presented are based primarily on data collected prior to 2020 and do not fully account for the impact of the COVID-19 pandemic.
The latest estimate for low birthweight revealed that 14.6 percent of newborns (20.5 million) were born with a low birthweight in 2015, a modest decrease from the 17.5 percent (22.9 million) in 2000. Optimal breastfeeding practices, including exclusive breastfeeding for the first six months of life, are critical for child survival and the promotion of health and cognitive development. Globally, the prevalence has risen from 37.1 percent (49.9 million) in 2012 to 43.8 percent (59.4 million) in 2020. Still, more than half of all infants under six months of age globally did not receive the protective benefits of exclusive breastfeeding.
Stunting, the condition of being too short for one’s age, undermines the physical and cognitive development of children, increases their risk of dying from common infections and predisposes them to overweight and non-communicable diseases later in life. Globally, the prevalence of stunting among children under five years of age has declined steadily, from an estimated 33.1 percent (201.6 million) in 2000 to 22.0 percent (149.2 million) in 2020.
| xvii |
EXECUTIVE SUMMARY
Child wasting is a life-threatening condition caused by insufficient nutrient intake, poor nutrient absorption, and/or frequent or prolonged illness. Affected children are dangerously thin with weakened immunity and a higher risk of mortality. The prevalence of wasting among children under five years of age was 6.7 percent (45.4 million) in 2020.
Children who are overweight or obese face both immediate and potentially long-term health impacts, including a higher risk of non-communicable diseases later in life. Globally, the prevalence of overweight among children under five years of age increased slightly from 5.4 percent (33.3 million) in 2000 to 5.7 percent (38.9 million) in 2020. Rising trends are seen in around half of the countries worldwide.
The prevalence of anaemia among women aged 15 to 49 years was estimated to be 29.9 percent in 2019. The absolute number of women with anaemia has risen steadily from 493 million in 2000 to 570.8 million in 2019, which has implications for female morbidity and mortality and can lead to adverse pregnancy and newborn outcomes. Globally, adult obesity nearly doubled in absolute value from 8.7 percent (343.1 million) in 2000 to 13.1 percent (675.7 million) in 2016. Updated global estimates are poised to be released before the end of 2022.
Children in rural settings and poorer households are more vulnerable to stunting and wasting. Children and adults, particularly women, in urban areas and wealthier households are at higher risk of overweight and obesity, respectively. Infants residing in rural areas, in poorer households, with mothers who received no formal education and female infants are more likely to be breastfed. Women with no formal education are more vulnerable to anaemia and their children to stunting and wasting. Addressing inequalities will be essential to achieving the 2030 targets.
Although progress is being made in some regions, malnutrition persists in many forms across all regions and may in fact be worse than these findings suggest as the impact of the COVID-19 pandemic on nutritional outcomes is still unfolding. Reaching the 2030 global nutrition targets will require immense efforts to counteract severe global setbacks. Global trends in anaemia among women aged 15 to 49 years, overweight in children, and obesity among adults especially, will need to be reversed to achieve the progress needed to reach the SDGs.
Cost and affordability of a healthy diet: an updateThe 2020 edition of this report included, for the first time, global estimates of the cost and affordability of a healthy diet. These are useful indicators of people’s economic access to nutritious foods and healthy diets.
The effects of inflation in consumer food prices stemming from the economic impacts of the COVID-19 pandemic and the measures put in place to contain it, are clear and significant. Global consumer food prices were higher by the end of 2020 than they were during any month in the previous six years. This translated directly into an increased average cost of a healthy diet in 2020 for all regions and almost all subregions in the world.
The affordability of a healthy diet measures the average cost of the diet relative to income; therefore, changes over time can be the result of changes in the cost of the diet, people’s income, or both. In 2020, the measures put in place to contain COVID-19 sent the world and most countries into economic recession, with per capita incomes contracting in more countries than at any time in the recent past. However, while affordability estimates in 2020 reflect food price shocks, the income shocks are not yet captured due to the unavailability of 2020 income distribution data. The estimated number of people who could not
| xviii |
afford a healthy diet, therefore, might increase further once income distribution data become available that will allow to account for the combined effects of inflation in consumer food prices and income losses.
It is estimated that the number of people who could not afford a healthy diet in 2020 increased globally and in every region in the world. Almost 3.1 billion people could not afford a healthy diet in 2020, an increase of 112 million more people than in 2019. This increase was mainly driven by Asia, where 78 million more people were unable to afford this diet in 2020, followed by Africa (25 million more people), while Latin America and the Caribbean and Northern America and Europe had 8 and 1 million more people, respectively.
FOOD AND AGRICULTURAL POLICY SUPPORT IN THE WORLD: HOW MUCH DOES IT COST AND AFFECT DIETS?Stocktaking: What policy support is currently provided to food and agriculture?Governments support food and agriculture through various policies, including trade and market interventions (e.g. border measures and market price control) that generate price incentives or disincentives, fiscal subsidies to producers and consumers, and general services support. These policies impact all stakeholders, part of the food environment and can affect the availability and affordability of healthy diets.
Worldwide support for the food and agricultural sector accounted for almost USD 630 billion a year on average over 2013–2018. Support targeting agricultural producers individually averaged almost USD 446 billion a year in net terms (i.e. accounting for both price incentives and disincentives for farmers), which corresponds to about 70 percent of the total sector support and about 13 percent of the global value of production,
on average. About USD 111 billion were spent yearly by governments for the provision of general services to the sector, while food consumers received USD 72 billion on average every year.
Policy support to food and agriculture differs across country income groups and across time. Overall, price incentive measures and fiscal subsidies have been the most widely used in high-income countries and are becoming increasingly popular across some middle-income countries, in particular those at the upper level of income. Low-income countries have historically implemented policies that generate price disincentives for farmers to facilitate consumers’ access to food at a lower price. These countries have limited resources to provide fiscal subsidies to producers and consumers as well as to fund general services that benefit the whole of the food and agricultural sector.
In middle-income countries, fiscal subsidies to agricultural producers accounted for just 5 percent of total value of production – versus almost 13 percent in high-income countries. General services support, expressed as share of value of production, is lower in low-income countries (2 percent) compared to high-income countries (4 percent). Two-thirds of the world’s fiscal subsidies to consumers (either final or intermediary, such as processors) were disbursed in high-income countries.
Policy support differs across food groups and commodities. Countries with higher levels of income provide support to all food groups, and particularly to staple foods, including cereals, roots and tubers, followed by dairy and other protein-rich foods. In high-income countries, support within these three food groups is equally provided in the form of price incentives and fiscal subsidies to producers. On the contrary, for fruits and vegetables, and fats and oils, fiscal subsidies (accounting for about 11 percent of the value of production) were substantially larger than price incentives on average during 2013–2018.
| xix |
EXECUTIVE SUMMARY
Lower-middle-income countries consistently penalized production of most products through policies that depress farm gate prices, but these countries provided fiscal subsidies to farmers, especially for staple foods, fruits and vegetables, as well as fats and oils. Price incentives were negative for most food groups in low-income countries, ranging from a minus 7 percent on staple foods (mainly cereals) to 1 percent for other crops (e.g. sugar, tea, coffee).
How are food and agricultural policies affecting diets? In many countries, the amount of public support is significant and depending on how it is allocated, it can either support or hinder efforts to lower the cost of nutritious foods and make healthy diets affordable for everyone.
Border measures affect the availability, diversity and prices of food in domestic markets. While some of these measures target important policy objectives including food safety, governments could do more to reduce trade barriers for nutritious foods, such as fruits, vegetables and pulses, in order to increase the availability and affordability of such foods to reduce the cost of healthy diets.
In low- and middle-income countries, market price controls such as minimum or fixed price policy overwhelmingly target commodities like wheat, maize, rice, as well as sugar, with the objective of stabilizing or raising farm incomes while ensuring supplies of staple foods for food security purposes. However, these policies could be contributing to the unhealthy diets that one observes all over the world.
Fiscal subsidies allocated to some specific commodities or factors of production have significantly contributed to growing production and reducing the prices of cereals (especially maize, wheat and rice), but also beef and milk. This has positively impacted food security,
farm incomes and indirectly supported the development and use of better technology and of new agricultural inputs. On the other hand, these subsidies have de facto created (relative) disincentives towards producing nutritious foods, encouraged monocultures in some countries, ceased the farming of certain nutritious products, and discouraged the production of some foods that do not receive the same level of support.
Public support through the funding and provision of general services benefits actors of the food and agricultural sector collectively, which is in principle good for small-scale farmers, women and youth. But this type of support is significantly lower than the support provided to individual producers through price incentives and fiscal subsidies, and it is more widely funded in high-income countries. In some cases, services such as research and development are biased towards producers of staple foods.
POTENTIAL OPTIONS TO REPURPOSE POLICY SUPPORT TO FOOD AND AGRICULTURE FOR IMPROVING AFFORDABILITY OF A HEALTHY DIET What are the potential impacts of reallocating food and agricultural policy support differently to reduce the cost of nutritious foods? A new analysis of model-based scenarios of repurposed food and agricultural policy support, specially developed for this report, points to potential options by which all countries in the world can repurpose existing public support to food and agriculture to increase the affordability of a healthy diet.
These scenarios simulate the reallocation of current budgets supporting agricultural producers using different policy instruments. This is done for all countries from all geographical regions, in order to reduce the cost and increase the
| xx |
affordability of a healthy diet. This reallocation is implemented linearly between 2023 and 2028, and impacts are examined for 2030.
In these scenarios, the reallocation of budgets targets “high-priority” foods for a healthy diet. These are food groups whose level of current per capita consumption in each country/region does not yet match the recommended levels for that country/region, as defined by the food-based dietary guidelines used for the computation of the cost of a healthy diet.
A general empirically grounded observation is that repurposing existing public support to agriculture in all regions of the world, with the objective of promoting the production of nutritious foods (whose consumption is low relative to the dietary requirements) would contribute to make a healthy diet less costly and more affordable, globally and particularly in middle-income countries.
Removing or reducing border support and market price controls for commodities that are priorities for a healthy diet reduces their prices, particularly in markets with high border protection. As a result, the percent of the global population for which a healthy diet is affordable increases (by 0.64 percentage point in 2030 compared with the baseline), while the cost of a healthy diet falls relatively more than that of the average diet (by 1.7 vs 0.4 percent, respectively).
The move towards a less costly and more affordable healthy diet is accompanied by a decline in global agricultural production that, in turn, is reflected in lower greenhouse gas emissions in agriculture. Greenhouse gas emissions fall in all income groups, except for the high-income countries (where agricultural production is found to increase).
Other effects include a small increase of global farm income (up 0.03 percent), although for low- and lower-middle-income countries, where border measures and market price controls account for a
high share of total food and agricultural support, the farm income effects are negative and greater than the global average change. The impact on extreme poverty is minimal at the global level; small increases in lower-middle-income countries are offset by declines in the other income groups.
On the other hand, the simulated repurposing of fiscal subsidies to producers increases the affordability of a healthy diet more than the simulated repurposing of border measures and market price controls (by 0.81 vs 0.64 percentage point). It also reduces the percent of the global population in extreme poverty and experiencing undernourishment. However, an important trade-off – not seen in the previous repurposing scenario – is that total greenhouse gas emissions from agriculture increase (by 1.5 percent) reflecting the higher agricultural production, including protein-rich foods such as dairy products whose consumption increases to meet the recommended dietary levels particularly in lower-middle-income countries.
Instead, with fiscal subsidies going to consumers albeit still targeting “high-priority” foods, the cost of a healthy diet falls more notably than in the two previous repurposing scenarios, both in absolute terms (by 3.34 percent in 2030 compared with the baseline) and relative to the average diet. The percent of the population that can afford a healthy diet increases (by almost 0.8 percentage point), but slightly less than in the fiscal subsidies to producers' scenario due to the income effect.
Important positive synergies in this scenario include a reduction in extreme poverty and undernourishment levels, due in part to increased farm income in low-income countries. Moreover, world greenhouse gas emissions fall due to a reduction in agricultural production. In contrast, this scenario is found to hit producers hard in the absence of their subsidies. Globally, farm income and agricultural production fall (respectively, by 3.7 and 0.2 percent in 2030 relative to the baseline).
| xxi |
EXECUTIVE SUMMARY
Whether through border measures and market controls or fiscal subsidies, policymakers will have to repurpose their support considering the potential inequality trade-offs that may emerge if small-scale farmers (including women and youth) are not in a position to specialize in the production of nutritious foods due to resource constraints.
A key challenge for policymakers in low-income countries, and perhaps some lower-middle-income countries, will not only be to reach compromises in repurposing food and agricultural support to achieve several inclusive agricultural transformation objectives that are well aligned with reducing the cost of nutritious foods. Considering their low budgets, governments of these countries will also have to mobilize significant financing to step up the provision of: i) general services support where it has to be prioritized to effectively bridge productivity gaps in the production of nutritious foods with inclusivity and sustainability; and ii) fiscal subsidies to consumers to increase affordability. In this regard, international public investment support will be key to ease the transition towards higher general services support, especially in low-income countries.
To take advantage of the opportunities that repurposing support offers, countries will have to get together at the multilateral table. The repurposing of border measures, market price controls and fiscal subsidies will have to consider countries’ commitments and flexibilities under current World Trade Organization rules, as well as issues in the ongoing negotiations.
In sum, repurposing support that targets the “high-priority” foods for a healthy diet would support economic recovery globally, provided this is realized through the reduction of border measures and market price controls or the shifting of fiscal subsidies from producers to consumers, but there are potential trade-offs to consider. Therefore, the results will differ by country income group and geographical region.
Complementing policies within and outside agrifood systems that are needed to ensure repurposing efforts are impactful For repurposing to be most effective, contributing to making healthy diets less costly and more affordable, other agrifood systems policies, and policies and incentives outside agrifood systems, will be needed. If aligned and put in place, these complementing policies can offer support in two ways.
First, they can provide incentives (or disincentives) that can support shifts in food supply chains, food environments and consumer behaviour towards healthy eating patterns. Second, they can ease or mitigate the unintended consequences or trade-offs from repurposing support, particularly if these include a reduction in the access to nutritious foods and healthy diets for vulnerable and disadvantaged population groups.
Making nutritious foods more widely accessible and affordable is a necessary, albeit insufficient condition, for consumers to be able to choose, prefer and consume healthy diets. Thus, complementary policies that promote shifts in food environments and consumer behaviour towards healthy eating patterns will be critical. These could include implementing mandatory limits or voluntary targets to improve the nutritional quality of processed foods and drink products, enacting legislation on food marketing, and implementing nutrition labelling policies and healthy procurement policies. Combining land- use policies with other complementing policies to address food deserts and swamps can also be very important.
Given repurposing can lead to trade-offs that may negatively affect some stakeholders, in these cases, social protection policies may be necessary to mitigate possible trade-offs, particularly short-term income losses or negative effects on livelihoods, especially among the most vulnerable populations.
| xxii |
Environmental, health, transportation and energy systems policies will be absolutely necessary to enhance the positive outcomes of repurposing support in the realms of efficiency, equality, nutrition, health, climate mitigation and the environment. Health services that protect poor and vulnerable groups whose diets do not provide all the nutrients are particularly relevant. Not adequately addressing inefficiencies and problems in transportation would also undermine and render ineffective repurposing efforts.
The political economy and governance dynamics that influence repurposing policy support The extent to which efforts to repurpose food and agricultural support will be successful will depend on the political economy, governance and the incentives of relevant stakeholders in a local, national and global context. Broadly speaking, the political economy refers to the social, economic, cultural and political factors that structure, sustain and transform constellations of public and private actors, and their interests and relations, over time. This includes institutional set-ups, “the rules of the game” that affect the everyday policymaking agenda and its structuring. Institutions, interests and ideas are dynamic factors at play that influence agricultural and food policy support. Governance refers to formal and informal rules, organizations and processes through which public and private actors articulate their interests and make and implement decisions.
There are three broad political economy elements that need to be considered and effectively managed when repurposing food and agricultural policy support: i) political context, stakeholder perspectives and the will of governments; ii) power relations, interests and the influence of different actors; and iii) governance mechanisms and regulatory frameworks needed for the facilitation and implementation of
repurposing support efforts. The dynamics and the mechanisms for managing these elements are explored in detail in the report.
Given the diversity of each country’s political context, strong institutions on a local, national and global level will be crucial, as well as engaging and incentivizing stakeholders from the public sector, the private sector and international organizations to support the repurposing support efforts. For many countries, agrifood systems transformation pathways provide a framework through which to channel the repurposing efforts. The engagement of small- and medium-sized enterprises and civil society groups – as well as transparent governance and safeguards to prevent and manage conflicts of interest – will be key to balancing out unequal powers within agrifood systems.
CONCLUSIONThis year’s report should dispel any lingering doubts that the world is moving backwards in its efforts to end hunger, food insecurity and malnutrition in all its forms. We are now only eight years away from 2030, the SDG target year. The distance to reach many of the SDG 2 targets is growing wider each year, while the time to 2030 is narrowing. There are efforts to make progress towards SDG 2, yet they are proving insufficient in the face of a more challenging and uncertain context.
The current recessionary context makes it even more challenging for many governments to increase their budgets to invest in agrifood systems transformation. At the same time, much can and needs to be done with existing resources. A key recommendation of this report is that governments start rethinking how they can reallocate their existing public budgets to make them more cost-effective and efficient in reducing the cost of nutritious foods and increasing the availability and affordability of healthy diets, with sustainability and leaving no one behind. n
| xxiii |
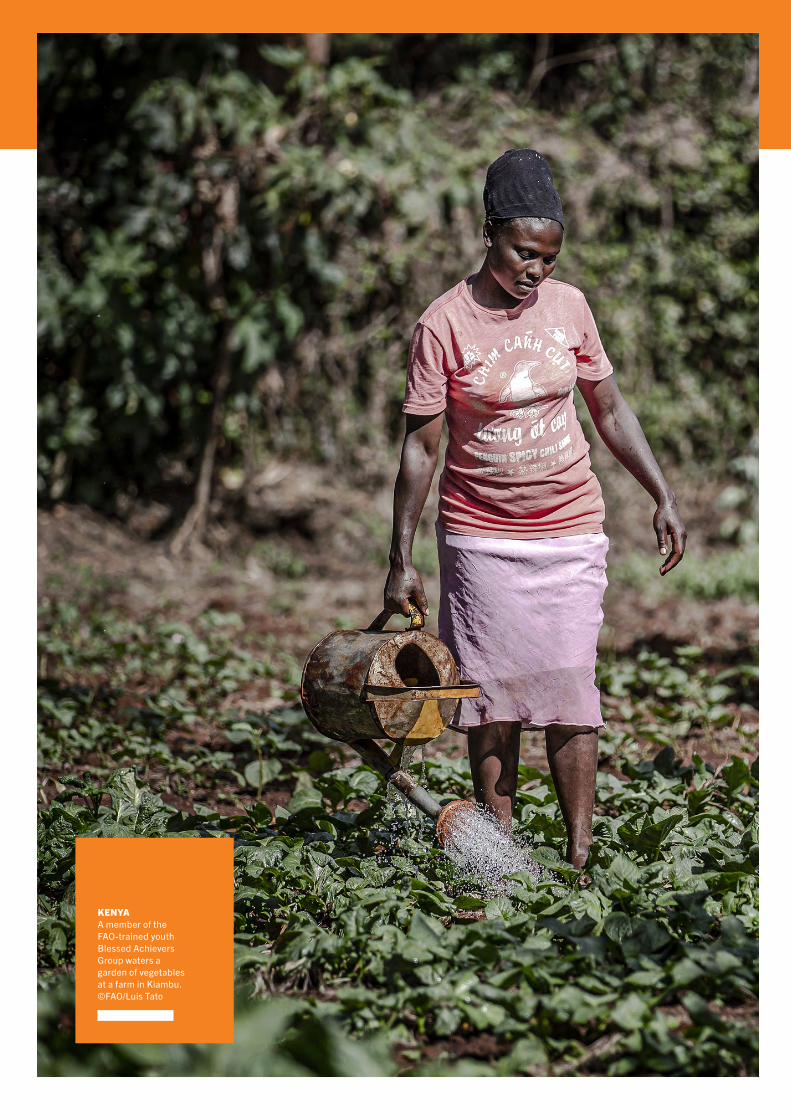
KENYAA member of the FAO-trained youth Blessed Achievers Group waters a garden of vegetables at a farm in Kiambu.©FAO/Luis Tato
CHAPTER 1 INTRODUCTION
W ith eight years remaining to end hunger, food insecurity and all forms of malnutrition
(SDG Targets 2.1 and 2.2), the world is moving in the wrong direction. As this report reveals, food insecurity further deteriorated in 2021, and the only progress made towards the 2030 global nutrition targets was for exclusive breastfeeding among infants under six months of age and child stunting, while anaemia among women and adult obesity are actually worsening. To help prevent rising levels of malnutrition and realize the human right to food, everyone must have access to healthy diets, but updated estimates suggest they are unaffordable for almost 3.1 billion people around the world.
The lingering effects of the COVID-19 pandemic and their consequences continue to impede progress towards the achievement of SDG 2 by
2030. The unequal pattern of economic recovery in 2021 among countries and the unrecovered income losses among those most affected by the pandemic have exacerbated existing inequalities and have worsened the food security situation for the populations already struggling the most to feed their families. Food prices have also increased in the past year due to bottlenecks in supply chains, soaring transport costs and other disruptions caused by the COVID-19 pandemic. Furthermore, the war in Ukraine, two of the biggest producers in agriculture and staple cereals globally, is disrupting supply chains and further affecting global grain, fertilizer and energy prices, leading to shortages and fuelling even higher food price inflation. On top of this, the growing frequency and intensity of extreme climate events are proving to be a major disrupter of supply chains, especially in low-income countries (LICs).
| 1 |
CHAPTER 1 INTRODUCTION
more conducive for private investment that helps accelerate recovery with improved food security and nutrition of their inhabitants.
Repurposing policy support to make healthy diets more affordable, sustainably and inclusivelyAgainst this backdrop, allocating existing public budgets and price incentives in a different manner becomes more an urgent necessity; it must indeed be the primary step, even for countries that need and can increase these budgets. It is possible to allocate public budgets more cost-effectively and efficiently for achieving development objectives, including reducing the cost of healthy diets, thus improving affordability, sustainably and inclusively, ensuring no one is left behind.a In this regard, many countries can repurpose their food and agricultural policies towards these objectives, while ensuring that other agrifood systems policies and complementing policies in other sectors – such as health, social protection and the environment – are there to create incentives that are coherent to this end (see Box 1 for definitions of repurposing, and food and agricultural policy support).
Unfortunately, very little food and agricultural policy support has been explicitly designed to meet the objectives related to all dimensions of food security and nutrition, and environmental objectives, simultaneously and coherently. Furthermore, the majority of the policy support measures have been designed and implemented in isolation, for a specific purpose, without considering the unintended consequences that they might generate in other dimensions.
As a result, existing policies have provided incentives for modern agrifood systems to evolve in such a way where the cost of a healthy diet is five times greater than the cost of diets
a The ICN2 Framework for Action enumerates recommended actions for sustainable agrifood systems promoting healthy diets, including to review national policies and investments and integrate nutrition objectives into food and agriculture policy, programme design and implementation (Recommendation 8). The work programme of the UN Decade of Action for Nutrition, which includes related action under Action Area 1: Sustainable, resilient agrifood systems for healthy diets, is based on the recommendations of the ICN2 Framework for Action.
Altogether, the intensification of the major drivers of food insecurity and malnutrition – conflict, climate extremes, economic shocks, combined with growing inequality – often occurring in combination, continues to challenge the quantity and quality of foods people can access, while making the fiscal situation of many countries more challenging for governments trying to mitigate the effects of these drivers.
As emphasized in the last two editions of this report, to meet the targets of SDG 2 by 2030, agrifood systems must be transformed in ways that ensure they deliver lower cost and safe nutritious foods that make healthy diets more affordable for all, sustainably and inclusively. In this report, it is argued that healthy diets must be delivered at lower costs to contribute to people’s ability to afford them, which implies both an expansion in the supply of the nutritious and safe foods that constitute a healthy diet and a shift in consumption towards them. From both a policy and advocacy perspective, this also implies that healthy diets need to be more affordable relative to unhealthy diets. There are several entry points to do this, but the current context of economic recession, reduced household income (at least for the lowest deciles of the income distribution), erratic tax revenues, and inflation pressures is not one in which many countries – certainly not many middle-income countries (MICs) and LICs – could massively invest in agrifood systems to enable a recovery with improved food security and nutrition of their inhabitants.
Thus, the options available to transform agrifood systems need to be carefully considered, aiming at the most cost-effective and efficient use of limited resources in ways that contribute to making healthy diets more affordable for all. In the current recessionary context, public spending and investments become particularly important, because many private investors (including agrifood systems actors) are more risk averse in terms of investments within the agrifood systems sphere as they tend to be more on the high-risk, low-reward spectrum in terms of monetary reward, especially in the short term. To this end, governments must wield public policy to support delivery of affordable healthy diets in order to create an environment
| 2 |
THE STATE OF FOOD SECURITY AND NUTRITION IN THE WORLD 2022
that meet dietary energy requirements only through a staple cereal.3 These policies have also triggered the rise of low-priced foods of high energy density and minimal nutritional value. The health costs of unhealthy diets are also high – with diet-related health costs linked to mortality and non-communicable diseases (NCDs) projected to exceed USD 1.3 trillion per year by 2030.3 At the same time, agrifood systems have become a major source of global greenhouse gas (GHG) emissions and are placing excessive pressures on land, water and other
natural resource systems. The diet-related social costs of GHG emissions associated with current agrifood systems and the dietary patterns they support are projected to exceed USD 1.7 trillion per year by 2030. Switching to plant-based dietary patterns would reduce the social costs of GHG emissions by 41–74 percent by 2030.3
There is a long history of food and agricultural policy support, mostly motivated by the need to promote agricultural productivity, particularly for staple cereals, protect farm
BOX 1 DEFINITIONS OF REPURPOSING, AND FOOD AND AGRICULTURAL POLICY SUPPORT
Repurposing policy support – as defined recently in a joint report published by the Food and Agriculture Organization of the United Nations (FAO), United Nations Development Programme (UNDP) and United Nations Environment Programme (UNEP) (2021),1 is the reduction of support measures that are inefficient, unsustainable and/or inequitable, to replace them with support measures that are the opposite. In other words, support is not eliminated but reconfigured. In this way, repurposing will always imply reforming.*
Policy support to food and agriculture, in this report, refers to any form of government financial support to these sectors or government policy that directly or indirectly impacts the production and trade of food and agriculture goods throughout the food value chain.
� Agricultural policy support typically consists of various types of measures that implicitly or explicitly affect farm gate prices or profitability or provide monetary transfers to farmers or public expenditure and investment in general services and public goods** that benefit the agricultural sector. This includes, for example, price (dis)incentives (mainly border measures and domestic price interventions), which implicitly represent transfers from consumers and taxpayers to farmers (or vice versa).
� Food policy support is generally broader in scope covering not only how food is produced but also how it is processed, distributed, purchased, or provided, and how these policies are designed to ensure human health and nutrition needs. Unfortunately, the availability of globally comparable data on this support to the food part of the agrifood system as a whole is limited, as opposed to the policy support to agriculture only, which is less limited.
Governments use policies to create either incentives and/or disincentives to induce a behavioural change among agrifood systems actors, the population and agrifood sector outcomes.*** Governments are also subject to policies of other countries; as such, it is not only countries’ own policies that matter.
Because this report’s theme focuses on repurposing both food and agricultural policies, the term “agrifood systems” is used instead of the term “food systems” used in previous editions. The reason is that the term “agrifood systems” is increasingly used in the context of transforming food systems for sustainability and inclusivity and is broader in its definition as it encompasses both food and agricultural systems and focuses on both food and non-food agricultural products, with clear overlaps.****
* The definition of policy reform adopted in this report is aligned with the Organisation for Economic Co-operation and Development (OECD) definition. Accordingly, policy reform is a process in which changes are made to the “rules of the game” – including laws, regulations and institutions – to address a problem or achieve a goal.2 ** This refers to general services and support to public goods such as public investments to research and development (R&D), marketing services and infrastructure (e.g. irrigation, roads and electrification). *** Incentives (or disincentives) in this context are the result of policies that influence change in behaviour for a desired sector outcome. They are broader than (but include) more specific technical definitions of price incentives that reflect the effect of agricultural trade and market policy measures. **** See Annex 7 Glossary for the definition of the agrifood systems and the difference between this term and food systems.
| 3 |
CHAPTER 1 INTRODUCTION
incomes and/or ensure national food security.4 Historically, national food security policies were designed with the aim of ensuring national food availability, particularly for cereals (e.g. maize, wheat or rice). As a result, agrifood systems worldwide have been successful in supplying foods that provide dietary energy in the form of low-cost cereals. The majority of the poor in every region and country around the world can afford cereals to meet their daily dietary energy requirement.3 This, however, is insufficient for meeting other dietary requirements, including adequate macronutrients and micronutrients and a diverse intake of foods that help prevent malnutrition in all its forms, as well as diet-related (NCDs).3 The share of the total cost of staple foods in a healthy diet is, on average, only 15 percent of its total cost.
Most of the agricultural policy support that is currently implemented is not aligned with the national objective of promoting healthy diets and in many cases is actually inadvertently undermining food security and nutrition outcomes and contributing to the rise in overweight and obesity and diet-related NCDs. For example, as shown in Section 3.1, sugar or emission-intensive commodities (e.g. beef, milk) receive the most support worldwide despite the potentially negative impacts on health of high sugar intakes, and on climate change adaptation and mitigation due to the high carbon emissions from the livestock sector. This support also creates (relative) disincentives towards producing higher amounts of nutritious foods, such as fruits, vegetables and leguminous crops. The detailed evidence on what the impact of these policies means in terms of the cost of nutritious foods and the affordability of healthy diets remains scarce, nonetheless.
Furthermore, much of the current food and agricultural policy support is not equitably distributed, particularly support that is conditional (or coupled) to specific volumes of production for some commodities or to the use of certain inputs, requirements that some small farmers in particular cannot meet. In other words, much of the existing food and agricultural policy support is market
distortive in terms of the absence of free and open competition, and as is particularly the case of coupled support, tends to benefit larger producers who can meet requirements to access it (i.e. production volumes for specific products, inputs use, etc.).
For these reasons, rethinking the allocation of public spending in order to repurpose food and agricultural policies is urgently needed. Repurposing options need to be looked at carefully, not only in terms of agricultural production (both its quantity and its diversity), but also all along the food supply chains, in food environments, as well as with regard to consumer behaviour. This rethinking is crucial because the factors driving the high cost of nutritious foods are found throughout agrifood systems, as shown in the 2020 edition of this report.b In addition, possible trade-offs triggered by repurposing food and agricultural support need to be carefully evaluated. For example, rice is a high emission-intensive commodity that provides calories but few micronutrients, and yet it receives significant support worldwide as it is also the staple food for more than 3 billion people (Section 3.1). Environmental sustainability considerations, nutrition outcomes and affordability of healthy diets need all be part of a carefully considered strategy to repurpose rice support.
These considerations highlight how an agrifood systems approach is essential for repurposing food and agricultural policy support (Figure 1). This approach will entail considering the nexus between policies and the availability and cost of nutritious foods relative to the foods of high energy density and minimal nutritional value, which are often low priced, people’s incomes, and the nutritional and environmental impact of agrifood systems. This consideration implies both an expansion of the supply of nutritious foods that constitute a healthy diet while reducing their absolute cost, and a reduction in the relative cost of healthy diets. To shift current
b See Section 2.3 in FAO, IFAD, UNICEF, WFP and WHO (2020).3 Cost drivers are found across agrifood systems in realms of production, food supply chains, consumer behaviour, and the food environment. Note that in FAO, IFAD, UNICEF, WFP and WHO (2020),3 the term "food systems" is used while the term "agrifood systems" is used in this report to emphasize the need for repurposing food and agricultural policies.
| 4 |
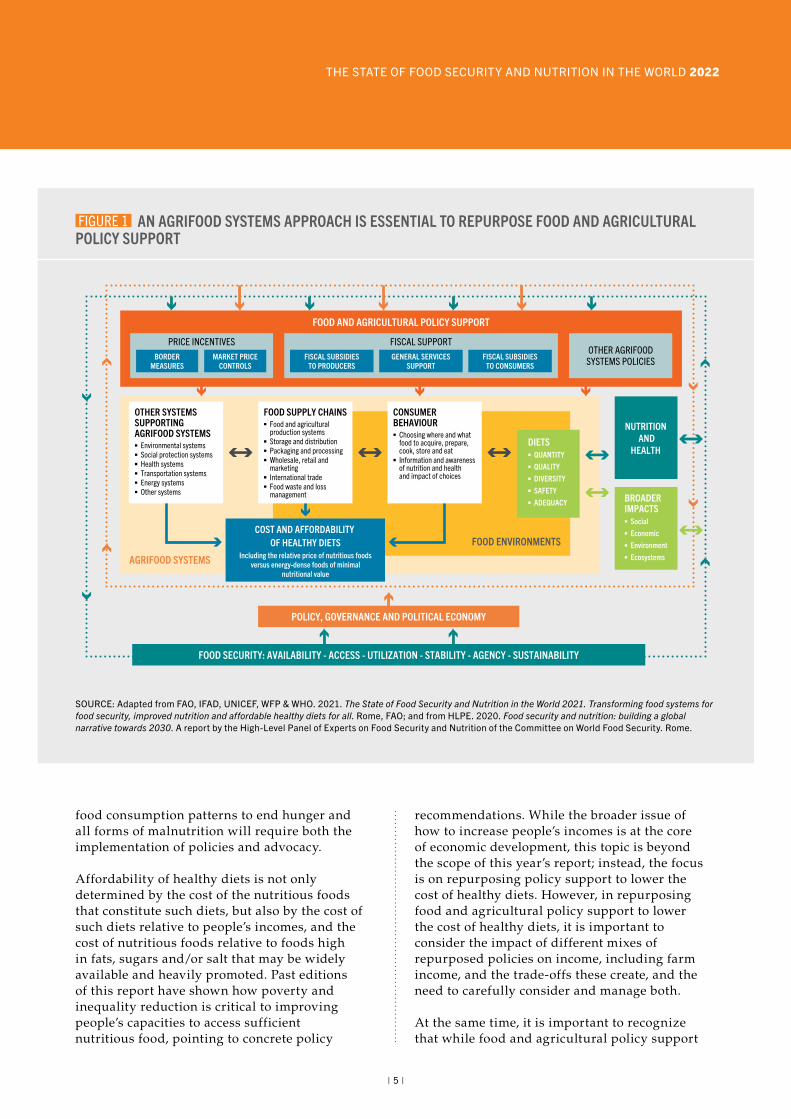
THE STATE OF FOOD SECURITY AND NUTRITION IN THE WORLD 2022
food consumption patterns to end hunger and all forms of malnutrition will require both the implementation of policies and advocacy.
Affordability of healthy diets is not only determined by the cost of the nutritious foods that constitute such diets, but also by the cost of such diets relative to people’s incomes, and the cost of nutritious foods relative to foods high in fats, sugars and/or salt that may be widely available and heavily promoted. Past editions of this report have shown how poverty and inequality reduction is critical to improving people’s capacities to access sufficient nutritious food, pointing to concrete policy
recommendations. While the broader issue of how to increase people’s incomes is at the core of economic development, this topic is beyond the scope of this year’s report; instead, the focus is on repurposing policy support to lower the cost of healthy diets. However, in repurposing food and agricultural policy support to lower the cost of healthy diets, it is important to consider the impact of different mixes of repurposed policies on income, including farm income, and the trade-offs these create, and the need to carefully consider and manage both.
At the same time, it is important to recognize that while food and agricultural policy support
FIGURE 1 AN AGRIFOOD SYSTEMS APPROACH IS ESSENTIAL TO REPURPOSE FOOD AND AGRICULTURAL POLICY SUPPORT
FOOD AND AGRICULTURAL POLICY SUPPORT
AGRIFOOD SYSTEMS
FOOD ENVIRONMENTS
PRICE INCENTIVES FISCAL SUPPORTFISCAL SUBSIDIES
TO PRODUCERSBORDER
MEASURESMARKET PRICE
CONTROLSGENERAL SERVICES
SUPPORTFISCAL SUBSIDIES
TO CONSUMERS
OTHER AGRIFOODSYSTEMS POLICIES
DIETS QUANTITY QUALITY DIVERSITY SAFETY ADEQUACY
NUTRITION AND
HEALTH
BROADERIMPACTS Social Economic Environment Ecosystems
COST AND AFFORDABILITY OF HEALTHY DIETS
Including the relative price of nutritious foodsversus energy-dense foods of minimal
nutritional value
FOOD SUPPLY CHAINS Food and agricultural production systems Storage and distribution Packaging and processing Wholesale, retail and marketing International trade Food waste and loss management
FOOD SECURITY: AVAILABILITY - ACCESS - UTILIZATION - STABILITY - AGENCY - SUSTAINABILITY
POLICY, GOVERNANCE AND POLITICAL ECONOMY
OTHER SYSTEMSSUPPORTINGAGRIFOOD SYSTEMS Environmental systems Social protection systems Health systems Transportation systems Energy systems Other systems
CONSUMERBEHAVIOUR Choosing where and what food to acquire, prepare, cook, store and eat Information and awareness of nutrition and health and impact of choices
SOURCE: Adapted from FAO, IFAD, UNICEF, WFP & WHO. 2021. The State of Food Security and Nutrition in the World 2021. Transforming food systems for food security, improved nutrition and affordable healthy diets for all. Rome, FAO; and from HLPE. 2020. Food security and nutrition: building a global narrative towards 2030. A report by the High-Level Panel of Experts on Food Security and Nutrition of the Committee on World Food Security. Rome.
| 5 |
CHAPTER 1 INTRODUCTION
may eventually create the right incentives and leading to the intended effects within agrifood systems, what happens elsewhere may be resulting in the opposite. Thus, complementing policies within agrifood systems and in other sectors outside agrifood systems need to be considered in the interim and in terms of synergies and trade-offs to achieve the policy coherence that will be needed to make the most of available resources, including those in the health and environmental sectors.
Nonetheless, repurposing food and agricultural policy support may take time to bear fruit in terms of reducing the cost of nutritious foods or could lead to short-term livelihood insecurity and loss of income. In other words, it will not be fully free of trade-offs; therefore, mitigation measures such as social protection may be needed to avoid unintended consequences, especially for those most vulnerable to the changes during the transition. Repurposing food and agricultural policy support, and complementing policies within and outside agrifood systems, will need to be devised differently depending on the structural characteristics of the countries including their income status, production structure, natural resource endowments, net trade position, and food security and nutrition situation, as well as political economy considerations.
Repurposing existing food and agricultural policy support is a critical first step on which this report provides evidence and policy guidance. However, for many countries, this alone will not be enough to ensure the affordability of healthy diets for all, and they will need to scale up investments in the food and agriculture sectors. Some countries will actually not be in a position to repurpose anything, given the limited amounts of public resources they currently devote to food and agricultural policy support. For these countries in particular, it will be necessary to scale up spending, both public expenditure and private investment, including through blended financing options. Identifying these countries is another key contribution of this report.
Links between food and agricultural policy support and the cost of nutritious foods Repurposing food and agricultural policy support with an objective to lower the cost of nutritious foods to make healthy diets more affordable for all will be a critical move for many countries to reach the SDG 2 targets by 2030, including those targets related to sustainable agriculture, as well as other SDGs. Currently, almost 3.1 billion people (Section 2.3) in the world cannot afford even the cheapest healthy diet even though this diet is essential to good health and well-being. Therefore, making healthy diets more economically accessible for everyone will also contribute to the achievement of SDG 3 (Good Health and Well-Being) and will create more equitable access to nutritious foods and enhance health, food security and nutrition, contributing to the achievement of SDG 10 (Reduced Inequalities). Furthermore, shifting to healthy diets can contribute to reductions in GHG emissions as shown in previous editions of this report;3 therefore, they are not only good for the health of the population, but also for the health of the planet and thus can be a win-win solution contributing to both SDG 12 (Responsible Consumption and Production) and SDG 13 (Climate Action).
This year’s report first presents the latest updates of the food security and nutrition situation around the world, including updated estimates on the cost and affordability of a healthy diet (Chapter 2). The report then takes a deep dive into “repurposing food and agricultural policy support to make healthy diets more affordable” through reducing the cost of nutritious foods relative to other foods and people’s incomes, which, in turn, helps countries make more efficient and effective use of – in many cases – limited public resources.
First, a stocktaking exercise is undertaken to explore the most predominant food and agricultural policy support currently in place around the world, the amount of support provided, the activities and actors mostly supported (or, on the contrary, penalized), and the pathways through which this support is pushing up the relative cost of nutritious foods
| 6 |
THE STATE OF FOOD SECURITY AND NUTRITION IN THE WORLD 2022
and promoting unhealthy diets (Chapter 3). Second, guidance – grounded in analysis and evidence – is provided on alternative food and agricultural policy support mixes that help reduce the cost of nutritious foods, as well as on how the resulting trade-offs need to be managed to ensure agrifood systems are not only
more efficient, but also more sustainable and inclusive. Lastly, the report takes a close look at complementing policies, within and outside agrifood systems that are important to support repurposing efforts and at the political economy factors and dynamics that hamper or facilitate repurposing efforts (Chapter 4). n
| 7 |
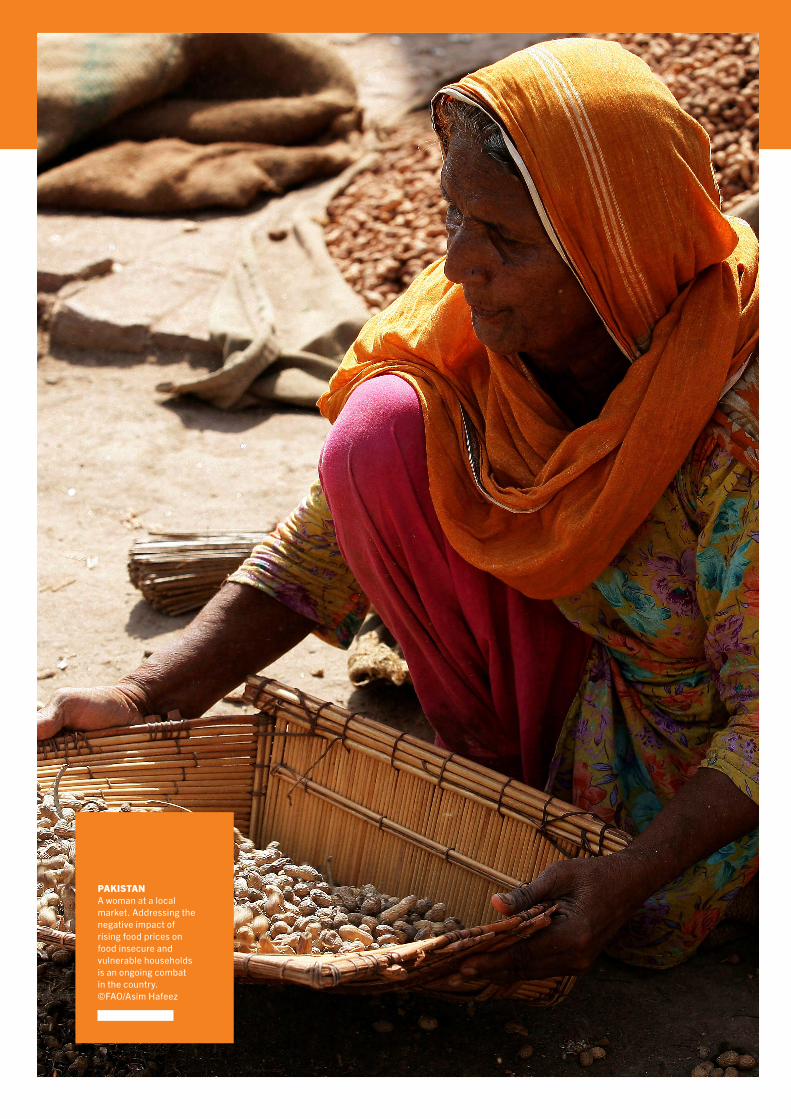
PAKISTANA woman at a local market. Addressing the negative impact of rising food prices on food insecure and vulnerable households is an ongoing combat in the country.©FAO/Asim Hafeez
CHAPTER 2 FOOD SECURITY AND NUTRITION AROUND THE WORLD
T his chapter presents an updated global assessment of food insecurity and nutrition for up to the year 2021 and a
report on progress towards meeting SDG Targets 2.1 and 2.2: ending hunger and ensuring access to safe, nutritious and sufficient food for all people all year round; and eradicating all forms of malnutrition.
The assessment in last year’s report of the situation in 2020 – the year the COVID-19 pandemic spread rapidly across the globe – revealed major setbacks, with growing numbers of people facing hunger and food insecurity as the unprecedented crisis exacerbated inequalities that were already stalling progress prior to the pandemic. It also highlighted that malnutrition in all its forms remains a challenge and that child malnutrition, in particular, is expected to be higher due to the effects of the pandemic.
Despite hopes that the world would emerge more quickly from the crisis and food security would begin to recover from the pandemic in 2021, the pandemic held its grip and even tightened it in some parts of the world. The rebound of gross domestic product (GDP) growth observed in most countries in 2021 did not translate into gains in food security in the same year. Enormous challenges are still faced by those who continue to be the most affected: those with less wealth, lower and more unstable incomes and poorer access to critical basic services. The COVID-19 pandemic increased inequalities between countries and within
countries that the economic recovery has not yet been able to reverse.
Another crisis is unfolding as this report is being written with potentially sobering implications for global food security and nutrition: the war in Ukraine. Although the statistics presented in this report represent the state of food security and nutrition up until 2021, the direct and indirect effects of the conflict in 2022 will have multiple implications for global agricultural markets through the channels of trade, production and prices. Ultimately, this casts a shadow over the state of food security and nutrition for many countries, in particular those that are already facing hunger and food crisis situations, and poses an additional challenge for achieving the SDG 2 targets of ending hunger and ensuring access to adequate food for all (SDG Target 2.1) and of eliminating all forms of malnutrition (SDG Target 2.2).
Section 2.1 of this chapter presents an updated assessment of the state of food security and progress towards achieving the hunger and food insecurity targets (SDG 2.1). It includes global, regional and subregional assessments of the two SDG Target 2.1 indicators: the prevalence of undernourishment (PoU) and the prevalence of moderate or severe food insecurity based on the Food Insecurity Experience Scale (FIES), revised up to 2021 based on the most recent data available to FAO at the time of closing the production of this report. Updated projections of what the PoU may be in 2030 are also provided.
| 9 |
CHAPTER 2 FOOD SECURITY AND NUTRITION AROUND THE WORLD
the COVID-19 pandemic – 103 million more people between 2019 and 2020 and 46 million more in 2021, considering the middle of the projected range.
è The further increase in global hunger in 2021 reflects exacerbated inequalities across and within countries due to an unequal pattern of economic recovery among countries and unrecovered income losses among those most affected by the COVID-19 pandemic, all in a context of diminishing social protection measures that had been implemented in 2020.
è In 2021, hunger affected 278 million people in Africa, 425 million in Asia and 56.5 million in Latin America and the Caribbean – 20.2, 9.1 and 8.6 percent of the population, respectively. While most of the world’s undernourished people live in Asia, Africa is the region where the prevalence is highest.
è After increasing from 2019 to 2020 in most of Africa, Asia and Latin America and the Caribbean, hunger continued to rise in most subregions in 2021, but at a slower pace. Compared with 2019, the largest increase was observed in Africa, both in terms of percentage and number of people.
è It is estimated that nearly 670 million people will still be undernourished in 2030 – 8 percent of the world population, which is the same percentage as in 2015 when the 2030 Agenda was launched. This is 78 million more undernourished people in 2030 compared to a scenario in which the pandemic had not occurred.
è After increasing sharply in 2020, the global prevalence of moderate or severe food insecurity remained mostly unchanged in 2021, whereas that of severe food insecurity rose higher, providing additional evidence of a deteriorating situation mainly for people already facing serious hardships.
è Around 2.3 billion people in the world were moderately or severely food insecure in 2021, or nearly 30 percent of the global population – more than 350 million more people than in 2019, the year before the COVID-19 pandemic unfolded.
è Close to 40 percent of people affected by moderate or severe food insecurity in the world were facing food insecurity at severe levels. The prevalence of severe food insecurity increased from 9.3 percent in 2019 to 11.7 percent in 2021 – the equivalent of 207 million more people in two years.
Section 2.2 presents analyses of the state of nutrition and progress towards the global nutrition targets defined by the World Health Assembly (WHA) in 2012 and the 2030 Agenda for Sustainable Development (SDG 2.2). While the COVID-19 pandemic interfered with the collection of data needed to update most of the nutrition indicators, the section sheds new light on the unequal distribution of malnutrition in the population and the groups most affected, based on the most recent estimates available. An analytical framework showing the pathways through which the COVID-19 pandemic may impact various forms of malnutrition is described, with two country-level analyses that provide clues as to what the new nutrition data may reveal about the consequences of the pandemic when they become available.
Section 2.3 presents updated estimates of the cost and affordability of a healthy diet, based on an improved methodology. These indicators shed light on one critical aspect of achieving healthy diets: access to diverse, nutritious foods. n
2.1FOOD SECURITY INDICATORS – LATEST UPDATES AND PROGRESS TOWARDS ENDING HUNGER AND ENSURING FOOD SECURITY KEY MESSAGES
è Despite hopes that the world would emerge from the COVID-19 pandemic in 2021 and food security would begin to improve, world hunger rose further in 2021. After remaining relatively unchanged since 2015, the prevalence of undernourishment (PoU) jumped from 8.0 to 9.3 percent from 2019 to 2020 and rose at a slower pace in 2021 to 9.8 percent.
è It is estimated that between 702 and 828 million people were affected by hunger in 2021. The number has grown by about 150 million since the outbreak of
| 10 |
THE STATE OF FOOD SECURITY AND NUTRITION IN THE WORLD 2022
è In the last year, moderate or severe food insecurity increased the most in Africa, the region with the highest prevalence at both levels of severity. Food security also continued to worsen in Latin America and the Caribbean, although at a slower pace compared to the year before. In Asia, the prevalence of moderate or severe food insecurity showed a slight decrease between 2020 and 2021, in spite of a small increase in severe food insecurity.
è The gender gap in food insecurity – which had grown in 2020 under the shadow of the COVID-19 pandemic – widened even further in 2021, driven largely by the widening differences in Latin America and the Caribbean, as well as in Asia. In 2021, the gap reached 4.3 percentage points, with 31.9 percent of women in the world being moderately or severely food insecure compared to 27.6 percent of men.
è Although this report profiles the state of food security and nutrition up to 2021, the ongoing war in Ukraine poses an additional challenge for achieving the SDG 2 targets of ending hunger and casts a shadow over the state of food security and nutrition for many countries, in particular those that are already facing hunger and food crisis situations.
Persisting uncertainty The unprecedented COVID-19 pandemic in 2020, and its continuing impacts in 2021, pose a significant challenge for the assessment of the state of food insecurity in the world. The physical distancing measures taken to contain the spread of the pandemic disrupted normal data collection activities in 2020. Although some activities were resumed in 2021, resurgent waves of the pandemic continued to impede normal statistical operations around the world. As a result, the uncertainty that always characterizes estimates of how many people are suffering from hunger and food insecurity has been further amplified.
For this reason, in this edition of the report, the 2020 and 2021 estimates of the global PoU (SDG Indicator 2.1.1) are presented as ranges to reflect the added uncertainty induced by the lingering consequences of the COVID-19 pandemic. It is important to note that, as usual, the PoU estimates corresponding to the most recent year reported (i.e. 2021 in this edition) are not based on data reported directly
by countries. Rather, they are obtained by nowcasting the parameters needed to estimate the PoU (Annex 2A). Parameters were updated using the most recent information available to FAO regarding the food supply and reasonable assumptions on the extent of inequality in access to food (Box 2). For the 63 countries with the highest numbers of undernourished people, PoU estimates for 2020 have been substantially revised compared to last year’s assessment, benefiting from official data on food production, trade and utilization reported by these countries. For the rest of the countries, the 2020 food supply values used to estimate the PoU are still nowcasts. Most importantly, uncertainty remains on the extent of inequality in access to food in both 2020 and 2021 due to the lack of up-to-date household food consumption data for all countries.
The assessments of the prevalence of moderate or severe food insecurity based on the FIES (SDG Indicator 2.1.2), also presented in this section, are informed by survey data collected annually by FAO mainly through the Gallup© World Poll (GWP) in over 140 different countries. Contrary to 2020, when data were collected mostly via telephone interviews due to the restrictions imposed by the pandemic, face-to-face interviews resumed in 2021 in most of the countries, making the assessment for 2021 somewhat more reliable (Annex 1B).
SDG Indicator 2.1.1 Prevalence of undernourishment (PoU)World hunger rose further in 2021, following a sharp upturn in 2020 in the midst of the COVID-19 pandemic. The persistence of the pandemic and its enduring consequences, which exacerbated existing inequalities, have contributed to further setbacks in 2021 towards achievement of the Zero Hunger target by 2030. After remaining relatively unchanged since 2015, the PoU jumped from 8.0 in 2019 to around 9.3 percent in 2020 and continued to rise in 2021 – though at a slower pace – to around 9.8 percent (Figure 2). It is estimated that between 702 and 828 million people in the world (corresponding to 8.9 and 10.5 percent of the world population, respectively) faced hunger in 2021. Considering the middle points of the projected ranges (722 and 768 million), hunger affected 46 million more people in 2021 compared
| 11 |
CHAPTER 2 FOOD SECURITY AND NUTRITION AROUND THE WORLD BOX 2 UPDATES TO THE PREVALENCE OF UNDERNOURISHMENT (PoU) AND ACCOUNTING FOR THE COVID-19 PANDEMIC IN ESTIMATES OF HUNGER IN THE WORLD IN 2021
The entire series of PoU values is carefully revised with each new edition of this report to reflect new data and information that FAO has obtained since the release of the previous edition. As this process usually implies backward revisions of the entire PoU series, readers are advised to refrain from comparing series across different editions of this report and should always refer to the current edition of the report, including for values in past years.
ROUTINE REVISIONS OF SERIES UP TO 2019 AND 2020All new information obtained by FAO is used to conduct careful revisions of the series of the three parameters that inform the calculation of the PoU: the average dietary energy consumption (DEC), the measure of inequality in dietary energy consumption (CV), and the minimum dietary energy requirement (MDER) for the national population, in each of the covered countries (see Annex 1B for details on the methodology). This year, important revisions have been made in the DEC and CV series.
First, in preparation for this edition of the report, the Food Balance Sheets (FBS) series produced by FAO with the new methodology launched in 2020 have been updated for all monitored countries. This entailed a revision of the series from 2010 up to 2019 for all countries, and up to 2020 for the 63 countries with the largest number of undernourished people. The revision reflects a backward revision of the FBS for the period 2010–2019, using the same method to treat stocks and non-food utilization that was introduced last year and benefiting from additional new data on food commodity stocks obtained from external sources. This is part of a continuing effort to revise the historical series of FBS in order to increase their consistency over time. These new FBS series were used to revise the series of the average DEC at country level, implying revisions of the full series of PoU estimates. Of particular note is the upward correction of the estimated average DEC in Iraq, needed to reflect the fact that the total food supply reported in the FBS for Iraq does not include production and trade for the Iraqi Kurdistan region. The correction implies a significantly lower estimate of the PoU and NoU for Iraq and, consequently, for the entire Western Asia subregion, compared with past reports.
Second, micro data from 18 household consumption and expenditure surveys covering 15 countries and various years* that became available to FAO last year were used to revise the parameter referring to inequality in dietary energy consumption due to income (CV|y). As the values of CV|y are interpolated between the years of available surveys, this new information induced a revision of the entire series for the involved countries. For some of them, such as Myanmar, the Philippines and Sri Lanka, this has meant a significant, downward reduction of the CV|y – and hence of the PoU – over
several years, up to 2018–2019. The impact of the revision is detectable in the lower level of the whole series of the PoU and NoU for South-eastern Asia.
NOWCAST OF THE PoU IN 2020 AND 2021As already noted in last year’s edition of this report, the exceptional nature of the COVID-19 pandemic makes it particularly challenging to produce reliable nowcasts of key parameters, which cannot be based on observed historical trends. This continues to be true this year, as information on actual food availability and consumption in 2020 and 2021 remains scarce and imprecise. For this reason, the values of the PoU and NoU in 2020 and 2021 are presented as ranges.
The following specific data and procedures were used to project DEC and CV parameters for 2020 and 2021:
� Current estimates of per capita, average dietary energy supply (DES), compiled on the basis of the short-run market outlook exercises conducted by FAO to inform the World Food Situation,5 were used to nowcast the value of the DEC for each country, starting from the last available year in the FBS series. This meant nowcasting values of DEC for 2021 for the 63 countries that contribute the most to the global NoU, and for both 2020 and 2021 for the rest of the countries in the world.
� FIES data collected by FAO (see section on SDG 2.1.2 below) were used to nowcast the values of CV|y up to 2021. As in previous editions of this report, FIES data collected by FAO from 2014 to 2019 were used to project the changes in the CV|y either from 2015 or from the year of the last food consumption survey available, and up to 2019. Normally, the projections would be based on a smoothed (three-year moving average) trend in severe food insecurity. However, recognizing that reliance on three-year moving averages would very likely underestimate the actual change in CV|y in 2020 and 2021, nowcasts for these last two years were based on the actual, unsmoothed change in the prevalence of severe food insecurity from 2019 to 2020 and from 2020 to 2021. In addition, as the COVID-19 pandemic may have exacerbated inequalities in the ability of people to access food, it may no longer be appropriate to refer to the historically observed contribution of the change in CV|y to the change in PoU (one of the parameters used in the projections). For this reason, ranges of values for the nowcasted 2020 and 2021 CV|y are obtained by varying the corresponding parameter from one-third to 100 percent of the observed change in the prevalence of severe food insecurity captured by FIES data. Further details and the ranges of the PoU at the regional and subregional levels can be found in Annex 2.
* Côte d’Ivoire (2018), Ethiopia (2019), Iraq (2018), Kyrgyzstan (2018), Malawi (2019), Mali (2018), Myanmar (2017), Niger (2018), the Philippines (2018), Senegal (2018), Sri Lanka (2016, 2019), Togo (2018), Uganda (2018), United Republic of Tanzania (2001, 2007, 2017) and Vanuatu (2019).
| 12 |
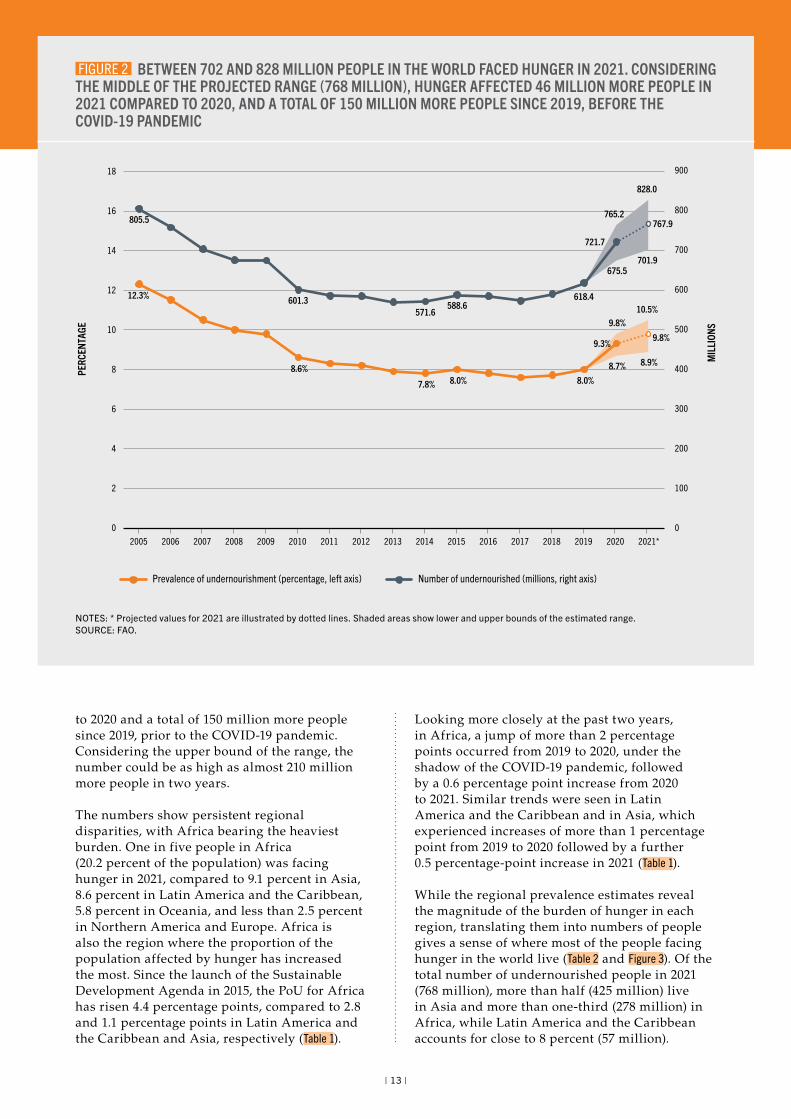
THE STATE OF FOOD SECURITY AND NUTRITION IN THE WORLD 2022
to 2020 and a total of 150 million more people since 2019, prior to the COVID-19 pandemic. Considering the upper bound of the range, the number could be as high as almost 210 million more people in two years.
The numbers show persistent regional disparities, with Africa bearing the heaviest burden. One in five people in Africa (20.2 percent of the population) was facing hunger in 2021, compared to 9.1 percent in Asia, 8.6 percent in Latin America and the Caribbean, 5.8 percent in Oceania, and less than 2.5 percent in Northern America and Europe. Africa is also the region where the proportion of the population affected by hunger has increased the most. Since the launch of the Sustainable Development Agenda in 2015, the PoU for Africa has risen 4.4 percentage points, compared to 2.8 and 1.1 percentage points in Latin America and the Caribbean and Asia, respectively (Table 1).
Looking more closely at the past two years, in Africa, a jump of more than 2 percentage points occurred from 2019 to 2020, under the shadow of the COVID-19 pandemic, followed by a 0.6 percentage point increase from 2020 to 2021. Similar trends were seen in Latin America and the Caribbean and in Asia, which experienced increases of more than 1 percentage point from 2019 to 2020 followed by a further 0.5 percentage-point increase in 2021 (Table 1).
While the regional prevalence estimates reveal the magnitude of the burden of hunger in each region, translating them into numbers of people gives a sense of where most of the people facing hunger in the world live (Table 2 and Figure 3). Of the total number of undernourished people in 2021 (768 million), more than half (425 million) live in Asia and more than one-third (278 million) in Africa, while Latin America and the Caribbean accounts for close to 8 percent (57 million).
FIGURE 2 BETWEEN 702 AND 828 MILLION PEOPLE IN THE WORLD FACED HUNGER IN 2021. CONSIDERING THE MIDDLE OF THE PROJECTED RANGE (768 MILLION), HUNGER AFFECTED 46 MILLION MORE PEOPLE IN 2021 COMPARED TO 2020, AND A TOTAL OF 150 MILLION MORE PEOPLE SINCE 2019, BEFORE THE COVID-19 PANDEMIC
0
100
200
300
400
500
600
700
800
900
0
6
8
2
4
10
12
14
16
18
2005 2006 2007 2008 2009 2010 2011 2012 2013 2014 2015 2016 2017 2018 2019 2020 2021*
MIL
LION
S
PERC
ENTA
GE
Prevalence of undernourishment (percentage, left axis) Number of undernourished (millions, right axis)
12.3%
8.6%
7.8% 8.0% 8.0%
9.3%9.8%
8.7% 8.9%
9.8%10.5%
805.5
601.3571.6
588.6618.4
721.7
767.9
675.5701.9
765.2
828.0
NOTES: * Projected values for 2021 are illustrated by dotted lines. Shaded areas show lower and upper bounds of the estimated range.SOURCE: FAO.
| 13 |
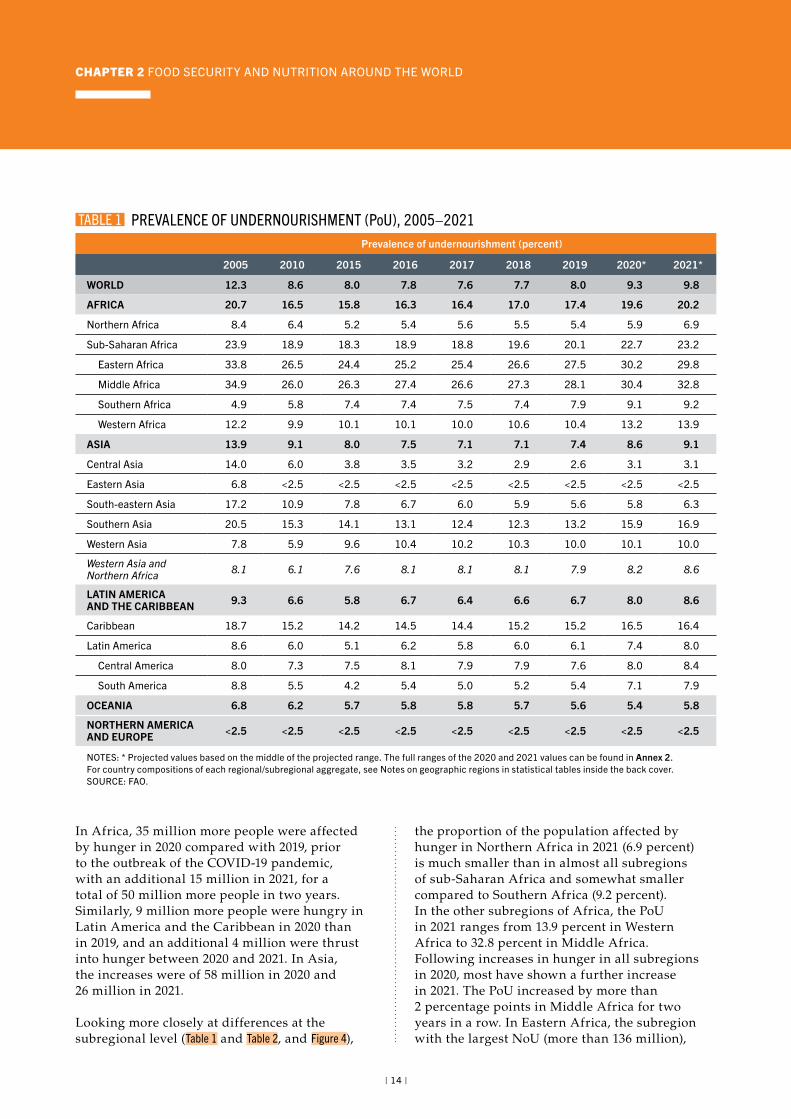
CHAPTER 2 FOOD SECURITY AND NUTRITION AROUND THE WORLD
In Africa, 35 million more people were affected by hunger in 2020 compared with 2019, prior to the outbreak of the COVID-19 pandemic, with an additional 15 million in 2021, for a total of 50 million more people in two years. Similarly, 9 million more people were hungry in Latin America and the Caribbean in 2020 than in 2019, and an additional 4 million were thrust into hunger between 2020 and 2021. In Asia, the increases were of 58 million in 2020 and 26 million in 2021.
Looking more closely at differences at the subregional level (Table 1 and Table 2, and Figure 4),
the proportion of the population affected by hunger in Northern Africa in 2021 (6.9 percent) is much smaller than in almost all subregions of sub-Saharan Africa and somewhat smaller compared to Southern Africa (9.2 percent). In the other subregions of Africa, the PoU in 2021 ranges from 13.9 percent in Western Africa to 32.8 percent in Middle Africa. Following increases in hunger in all subregions in 2020, most have shown a further increase in 2021. The PoU increased by more than 2 percentage points in Middle Africa for two years in a row. In Eastern Africa, the subregion with the largest NoU (more than 136 million),
Prevalence of undernourishment (percent)
2005 2010 2015 2016 2017 2018 2019 2020* 2021*
WORLD 12.3 8.6 8.0 7.8 7.6 7.7 8.0 9.3 9.8
AFRICA 20.7 16.5 15.8 16.3 16.4 17.0 17.4 19.6 20.2
Northern Africa 8.4 6.4 5.2 5.4 5.6 5.5 5.4 5.9 6.9
Sub-Saharan Africa 23.9 18.9 18.3 18.9 18.8 19.6 20.1 22.7 23.2
Eastern Africa 33.8 26.5 24.4 25.2 25.4 26.6 27.5 30.2 29.8
Middle Africa 34.9 26.0 26.3 27.4 26.6 27.3 28.1 30.4 32.8
Southern Africa 4.9 5.8 7.4 7.4 7.5 7.4 7.9 9.1 9.2
Western Africa 12.2 9.9 10.1 10.1 10.0 10.6 10.4 13.2 13.9
ASIA 13.9 9.1 8.0 7.5 7.1 7.1 7.4 8.6 9.1
Central Asia 14.0 6.0 3.8 3.5 3.2 2.9 2.6 3.1 3.1
Eastern Asia 6.8 <2.5 <2.5 <2.5 <2.5 <2.5 <2.5 <2.5 <2.5
South-eastern Asia 17.2 10.9 7.8 6.7 6.0 5.9 5.6 5.8 6.3
Southern Asia 20.5 15.3 14.1 13.1 12.4 12.3 13.2 15.9 16.9
Western Asia 7.8 5.9 9.6 10.4 10.2 10.3 10.0 10.1 10.0
Western Asia and Northern Africa 8.1 6.1 7.6 8.1 8.1 8.1 7.9 8.2 8.6
LATIN AMERICA AND THE CARIBBEAN 9.3 6.6 5.8 6.7 6.4 6.6 6.7 8.0 8.6
Caribbean 18.7 15.2 14.2 14.5 14.4 15.2 15.2 16.5 16.4
Latin America 8.6 6.0 5.1 6.2 5.8 6.0 6.1 7.4 8.0
Central America 8.0 7.3 7.5 8.1 7.9 7.9 7.6 8.0 8.4
South America 8.8 5.5 4.2 5.4 5.0 5.2 5.4 7.1 7.9
OCEANIA 6.8 6.2 5.7 5.8 5.8 5.7 5.6 5.4 5.8
NORTHERN AMERICA AND EUROPE <2.5 <2.5 <2.5 <2.5 <2.5 <2.5 <2.5 <2.5 <2.5
NOTES: * Projected values based on the middle of the projected range. The full ranges of the 2020 and 2021 values can be found in Annex 2. For country compositions of each regional/subregional aggregate, see Notes on geographic regions in statistical tables inside the back cover.SOURCE: FAO.
TABLE 1 PREVALENCE OF UNDERNOURISHMENT (PoU), 2005–2021
| 14 |
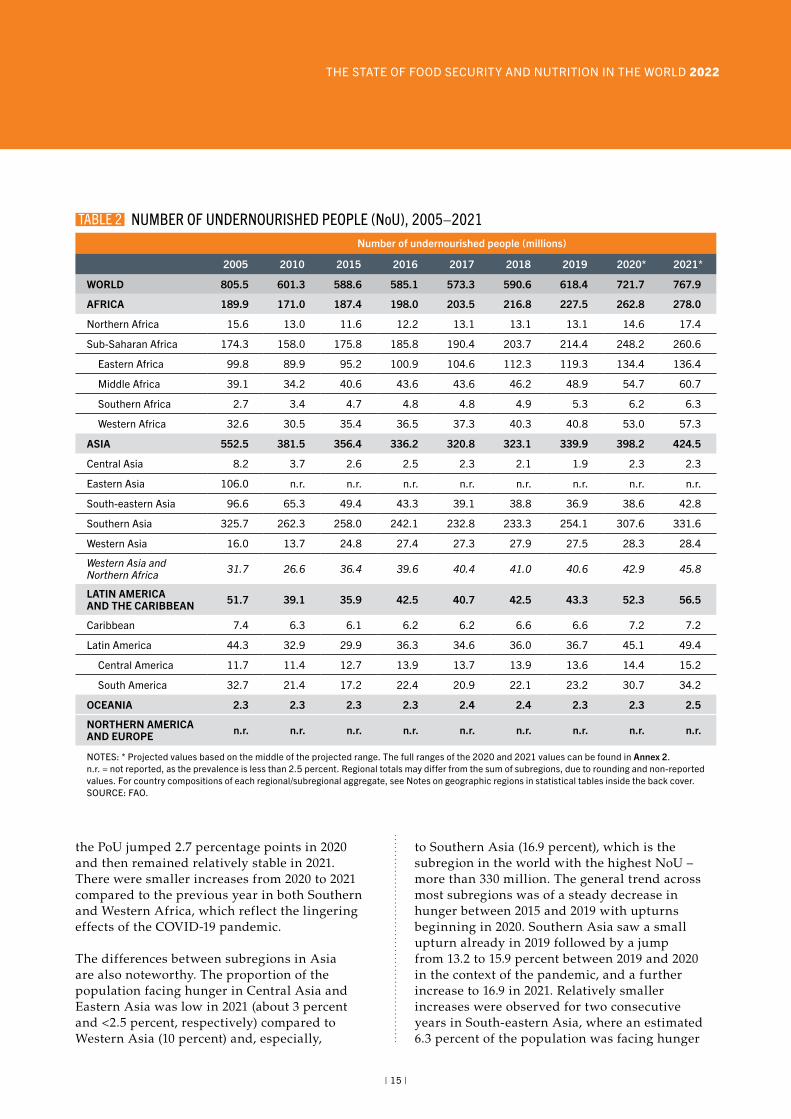
THE STATE OF FOOD SECURITY AND NUTRITION IN THE WORLD 2022
the PoU jumped 2.7 percentage points in 2020 and then remained relatively stable in 2021. There were smaller increases from 2020 to 2021 compared to the previous year in both Southern and Western Africa, which reflect the lingering effects of the COVID-19 pandemic.
The differences between subregions in Asia are also noteworthy. The proportion of the population facing hunger in Central Asia and Eastern Asia was low in 2021 (about 3 percent and <2.5 percent, respectively) compared to Western Asia (10 percent) and, especially,
to Southern Asia (16.9 percent), which is the subregion in the world with the highest NoU – more than 330 million. The general trend across most subregions was of a steady decrease in hunger between 2015 and 2019 with upturns beginning in 2020. Southern Asia saw a small upturn already in 2019 followed by a jump from 13.2 to 15.9 percent between 2019 and 2020 in the context of the pandemic, and a further increase to 16.9 in 2021. Relatively smaller increases were observed for two consecutive years in South-eastern Asia, where an estimated 6.3 percent of the population was facing hunger
Number of undernourished people (millions)
2005 2010 2015 2016 2017 2018 2019 2020* 2021*
WORLD 805.5 601.3 588.6 585.1 573.3 590.6 618.4 721.7 767.9
AFRICA 189.9 171.0 187.4 198.0 203.5 216.8 227.5 262.8 278.0
Northern Africa 15.6 13.0 11.6 12.2 13.1 13.1 13.1 14.6 17.4
Sub-Saharan Africa 174.3 158.0 175.8 185.8 190.4 203.7 214.4 248.2 260.6
Eastern Africa 99.8 89.9 95.2 100.9 104.6 112.3 119.3 134.4 136.4
Middle Africa 39.1 34.2 40.6 43.6 43.6 46.2 48.9 54.7 60.7
Southern Africa 2.7 3.4 4.7 4.8 4.8 4.9 5.3 6.2 6.3
Western Africa 32.6 30.5 35.4 36.5 37.3 40.3 40.8 53.0 57.3
ASIA 552.5 381.5 356.4 336.2 320.8 323.1 339.9 398.2 424.5
Central Asia 8.2 3.7 2.6 2.5 2.3 2.1 1.9 2.3 2.3
Eastern Asia 106.0 n.r. n.r. n.r. n.r. n.r. n.r. n.r. n.r.
South-eastern Asia 96.6 65.3 49.4 43.3 39.1 38.8 36.9 38.6 42.8
Southern Asia 325.7 262.3 258.0 242.1 232.8 233.3 254.1 307.6 331.6
Western Asia 16.0 13.7 24.8 27.4 27.3 27.9 27.5 28.3 28.4
Western Asia and Northern Africa 31.7 26.6 36.4 39.6 40.4 41.0 40.6 42.9 45.8
LATIN AMERICA AND THE CARIBBEAN 51.7 39.1 35.9 42.5 40.7 42.5 43.3 52.3 56.5
Caribbean 7.4 6.3 6.1 6.2 6.2 6.6 6.6 7.2 7.2
Latin America 44.3 32.9 29.9 36.3 34.6 36.0 36.7 45.1 49.4
Central America 11.7 11.4 12.7 13.9 13.7 13.9 13.6 14.4 15.2
South America 32.7 21.4 17.2 22.4 20.9 22.1 23.2 30.7 34.2
OCEANIA 2.3 2.3 2.3 2.3 2.4 2.4 2.3 2.3 2.5
NORTHERN AMERICA AND EUROPE n.r. n.r. n.r. n.r. n.r. n.r. n.r. n.r. n.r.
NOTES: * Projected values based on the middle of the projected range. The full ranges of the 2020 and 2021 values can be found in Annex 2. n.r. = not reported, as the prevalence is less than 2.5 percent. Regional totals may differ from the sum of subregions, due to rounding and non-reported values. For country compositions of each regional/subregional aggregate, see Notes on geographic regions in statistical tables inside the back cover.SOURCE: FAO.
TABLE 2 NUMBER OF UNDERNOURISHED PEOPLE (NoU), 2005–2021
| 15 |
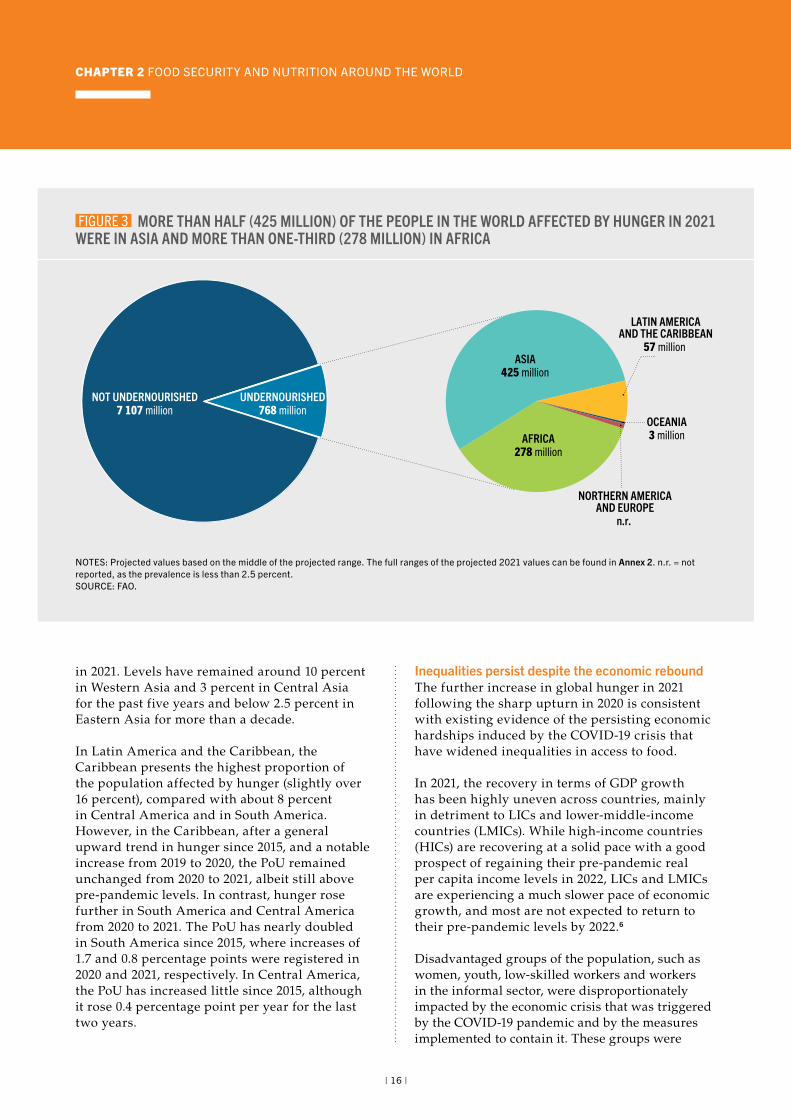
CHAPTER 2 FOOD SECURITY AND NUTRITION AROUND THE WORLD
in 2021. Levels have remained around 10 percent in Western Asia and 3 percent in Central Asia for the past five years and below 2.5 percent in Eastern Asia for more than a decade.
In Latin America and the Caribbean, the Caribbean presents the highest proportion of the population affected by hunger (slightly over 16 percent), compared with about 8 percent in Central America and in South America. However, in the Caribbean, after a general upward trend in hunger since 2015, and a notable increase from 2019 to 2020, the PoU remained unchanged from 2020 to 2021, albeit still above pre-pandemic levels. In contrast, hunger rose further in South America and Central America from 2020 to 2021. The PoU has nearly doubled in South America since 2015, where increases of 1.7 and 0.8 percentage points were registered in 2020 and 2021, respectively. In Central America, the PoU has increased little since 2015, although it rose 0.4 percentage point per year for the last two years.
Inequalities persist despite the economic rebound The further increase in global hunger in 2021 following the sharp upturn in 2020 is consistent with existing evidence of the persisting economic hardships induced by the COVID-19 crisis that have widened inequalities in access to food.
In 2021, the recovery in terms of GDP growth has been highly uneven across countries, mainly in detriment to LICs and lower-middle-income countries (LMICs). While high-income countries (HICs) are recovering at a solid pace with a good prospect of regaining their pre-pandemic real per capita income levels in 2022, LICs and LMICs are experiencing a much slower pace of economic growth, and most are not expected to return to their pre-pandemic levels by 2022.6
Disadvantaged groups of the population, such as women, youth, low-skilled workers and workers in the informal sector, were disproportionately impacted by the economic crisis that was triggered by the COVID-19 pandemic and by the measures implemented to contain it. These groups were
FIGURE 3 MORE THAN HALF (425 MILLION) OF THE PEOPLE IN THE WORLD AFFECTED BY HUNGER IN 2021 WERE IN ASIA AND MORE THAN ONE-THIRD (278 MILLION) IN AFRICA
NOT UNDERNOURISHED7 107 million
AFRICA278 million
ASIA425 million
LATIN AMERICAAND THE CARIBBEAN
57 million
OCEANIA3 million
NORTHERN AMERICAAND EUROPE
n.r.
UNDERNOURISHED768 million
NOTES: Projected values based on the middle of the projected range. The full ranges of the projected 2021 values can be found in Annex 2. n.r. = not reported, as the prevalence is less than 2.5 percent.SOURCE: FAO.
| 16 |
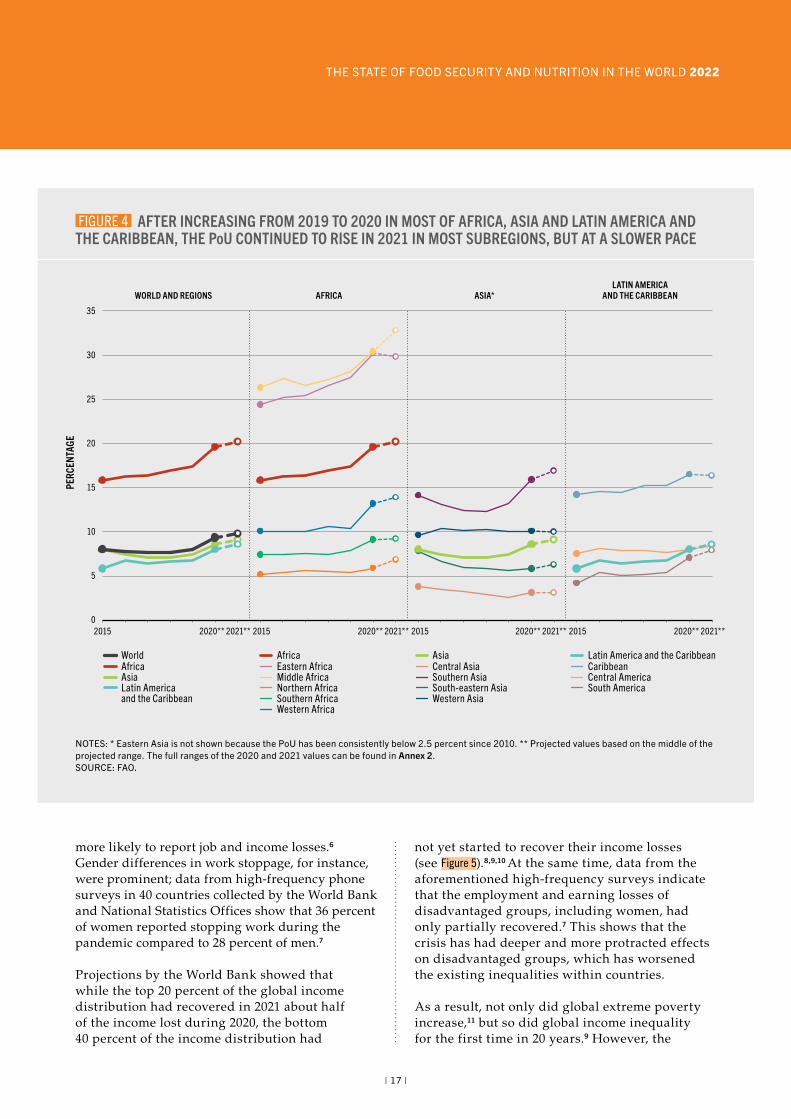
THE STATE OF FOOD SECURITY AND NUTRITION IN THE WORLD 2022
more likely to report job and income losses.6 Gender differences in work stoppage, for instance, were prominent; data from high-frequency phone surveys in 40 countries collected by the World Bank and National Statistics Offices show that 36 percent of women reported stopping work during the pandemic compared to 28 percent of men.7
Projections by the World Bank showed that while the top 20 percent of the global income distribution had recovered in 2021 about half of the income lost during 2020, the bottom 40 percent of the income distribution had
not yet started to recover their income losses (see Figure 5).8,9,10 At the same time, data from the aforementioned high-frequency surveys indicate that the employment and earning losses of disadvantaged groups, including women, had only partially recovered.7 This shows that the crisis has had deeper and more protracted effects on disadvantaged groups, which has worsened the existing inequalities within countries.
As a result, not only did global extreme poverty increase,11 but so did global income inequality for the first time in 20 years.9 However, the
FIGURE 4 AFTER INCREASING FROM 2019 TO 2020 IN MOST OF AFRICA, ASIA AND LATIN AMERICA AND THE CARIBBEAN, THE PoU CONTINUED TO RISE IN 2021 IN MOST SUBREGIONS, BUT AT A SLOWER PACE
WORLD AND REGIONS AFRICA ASIA*LATIN AMERICA
AND THE CARIBBEAN
0
5
10
15
20
25
30
35
PERC
ENTA
GE
2015 20152020** 2021** 20152020** 2021** 20152020** 2021** 2020** 2021**
AfricaAsiaLatin Americaand the Caribbean
WorldEastern AfricaMiddle AfricaNorthern AfricaSouthern AfricaWestern Africa
AfricaCentral AsiaSouthern AsiaSouth-eastern AsiaWestern Asia
AsiaCaribbeanCentral AmericaSouth America
Latin America and the Caribbean
NOTES: * Eastern Asia is not shown because the PoU has been consistently below 2.5 percent since 2010. ** Projected values based on the middle of the projected range. The full ranges of the 2020 and 2021 values can be found in Annex 2.SOURCE: FAO.
| 17 |
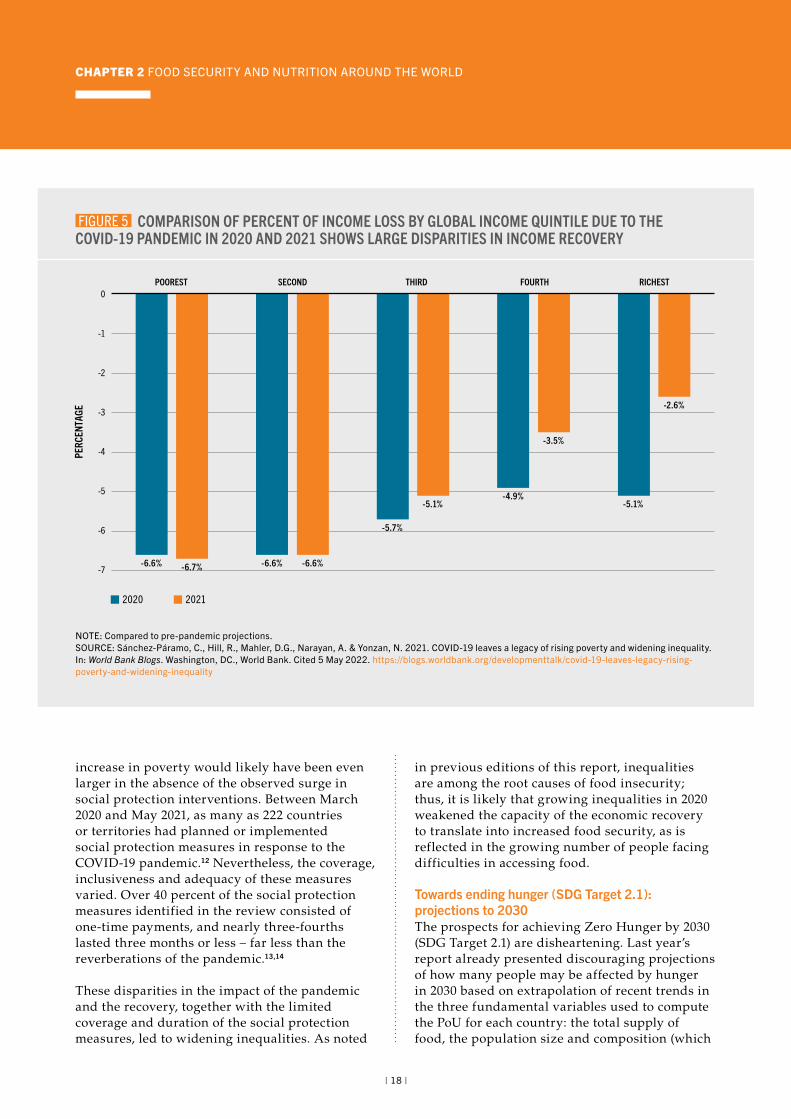
CHAPTER 2 FOOD SECURITY AND NUTRITION AROUND THE WORLD
increase in poverty would likely have been even larger in the absence of the observed surge in social protection interventions. Between March 2020 and May 2021, as many as 222 countries or territories had planned or implemented social protection measures in response to the COVID-19 pandemic.12 Nevertheless, the coverage, inclusiveness and adequacy of these measures varied. Over 40 percent of the social protection measures identified in the review consisted of one-time payments, and nearly three-fourths lasted three months or less – far less than the reverberations of the pandemic.13,14
These disparities in the impact of the pandemic and the recovery, together with the limited coverage and duration of the social protection measures, led to widening inequalities. As noted
in previous editions of this report, inequalities are among the root causes of food insecurity; thus, it is likely that growing inequalities in 2020 weakened the capacity of the economic recovery to translate into increased food security, as is reflected in the growing number of people facing difficulties in accessing food.
Towards ending hunger (SDG Target 2.1): projections to 2030 The prospects for achieving Zero Hunger by 2030 (SDG Target 2.1) are disheartening. Last year’s report already presented discouraging projections of how many people may be affected by hunger in 2030 based on extrapolation of recent trends in the three fundamental variables used to compute the PoU for each country: the total supply of food, the population size and composition (which
FIGURE 5 COMPARISON OF PERCENT OF INCOME LOSS BY GLOBAL INCOME QUINTILE DUE TO THE COVID-19 PANDEMIC IN 2020 AND 2021 SHOWS LARGE DISPARITIES IN INCOME RECOVERY
2020 2021
PERC
ENTA
GE
-5
-6
-7
-4
-3
-2
-1
0
-6.6% -6.6%
-5.7%
-4.9%-5.1%
-6.7% -6.6%
-5.1%
-3.5%
-2.6%
POOREST SECOND THIRD FOURTH RICHEST
NOTE: Compared to pre-pandemic projections.SOURCE: Sánchez-Páramo, C., Hill, R., Mahler, D.G., Narayan, A. & Yonzan, N. 2021. COVID-19 leaves a legacy of rising poverty and widening inequality. In: World Bank Blogs. Washington, DC., World Bank. Cited 5 May 2022. https://blogs.worldbank.org/developmenttalk/covid-19-leaves-legacy-rising-poverty-and-widening-inequality
| 18 |
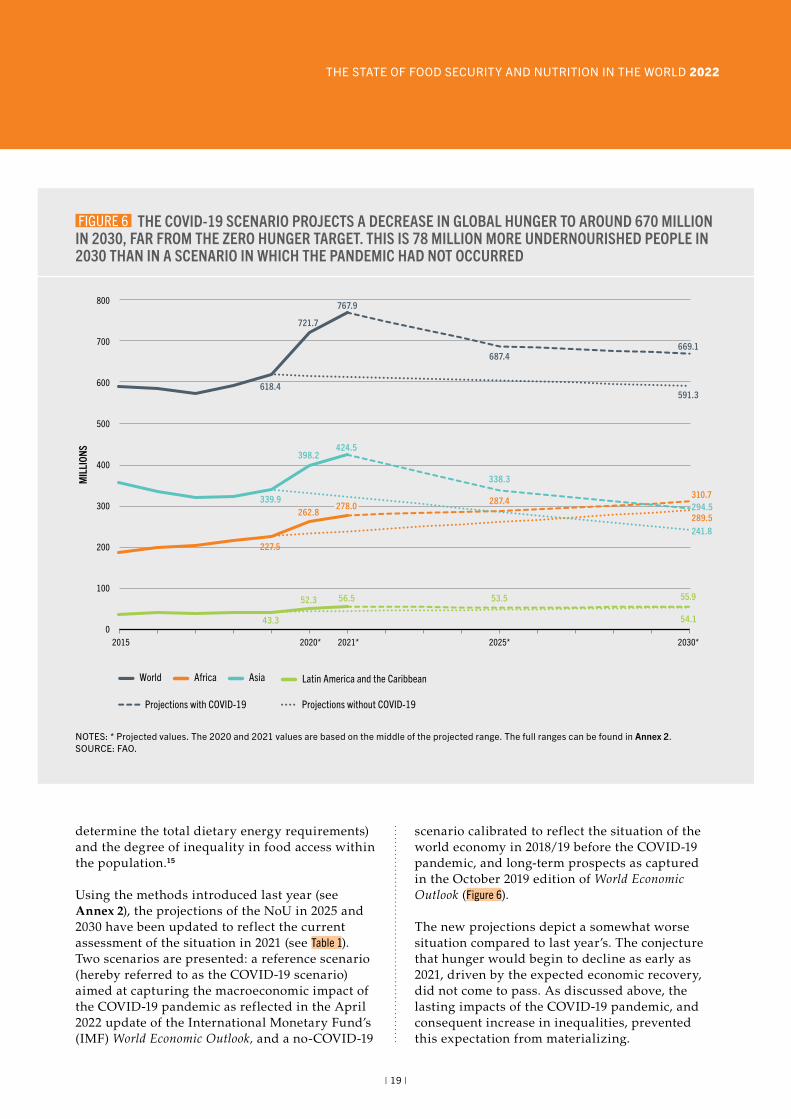
THE STATE OF FOOD SECURITY AND NUTRITION IN THE WORLD 2022
determine the total dietary energy requirements) and the degree of inequality in food access within the population.15
Using the methods introduced last year (see Annex 2), the projections of the NoU in 2025 and 2030 have been updated to reflect the current assessment of the situation in 2021 (see Table 1). Two scenarios are presented: a reference scenario (hereby referred to as the COVID-19 scenario) aimed at capturing the macroeconomic impact of the COVID-19 pandemic as reflected in the April 2022 update of the International Monetary Fund’s (IMF) World Economic Outlook, and a no-COVID-19
scenario calibrated to reflect the situation of the world economy in 2018/19 before the COVID-19 pandemic, and long-term prospects as captured in the October 2019 edition of World Economic Outlook (Figure 6).
The new projections depict a somewhat worse situation compared to last year’s. The conjecture that hunger would begin to decline as early as 2021, driven by the expected economic recovery, did not come to pass. As discussed above, the lasting impacts of the COVID-19 pandemic, and consequent increase in inequalities, prevented this expectation from materializing.
FIGURE 6 THE COVID-19 SCENARIO PROJECTS A DECREASE IN GLOBAL HUNGER TO AROUND 670 MILLION IN 2030, FAR FROM THE ZERO HUNGER TARGET. THIS IS 78 MILLION MORE UNDERNOURISHED PEOPLE IN 2030 THAN IN A SCENARIO IN WHICH THE PANDEMIC HAD NOT OCCURRED
World Africa Asia Latin America and the Caribbean
Projections without COVID-19
0
100
200
300
400
500
600
700
800
2015 2020* 2021* 2025* 2030*
MIL
LION
S
721.7
669.1
618.4591.3
262.8
310.7
227.5
289.5
398.2424.5
294.5339.9
241.8
52.3 56.5 55.9
43.3 54.1
767.9
687.4
338.3
287.4
53.5
Projections with COVID-19
278.0
NOTES: * Projected values. The 2020 and 2021 values are based on the middle of the projected range. The full ranges can be found in Annex 2.SOURCE: FAO.
| 19 |
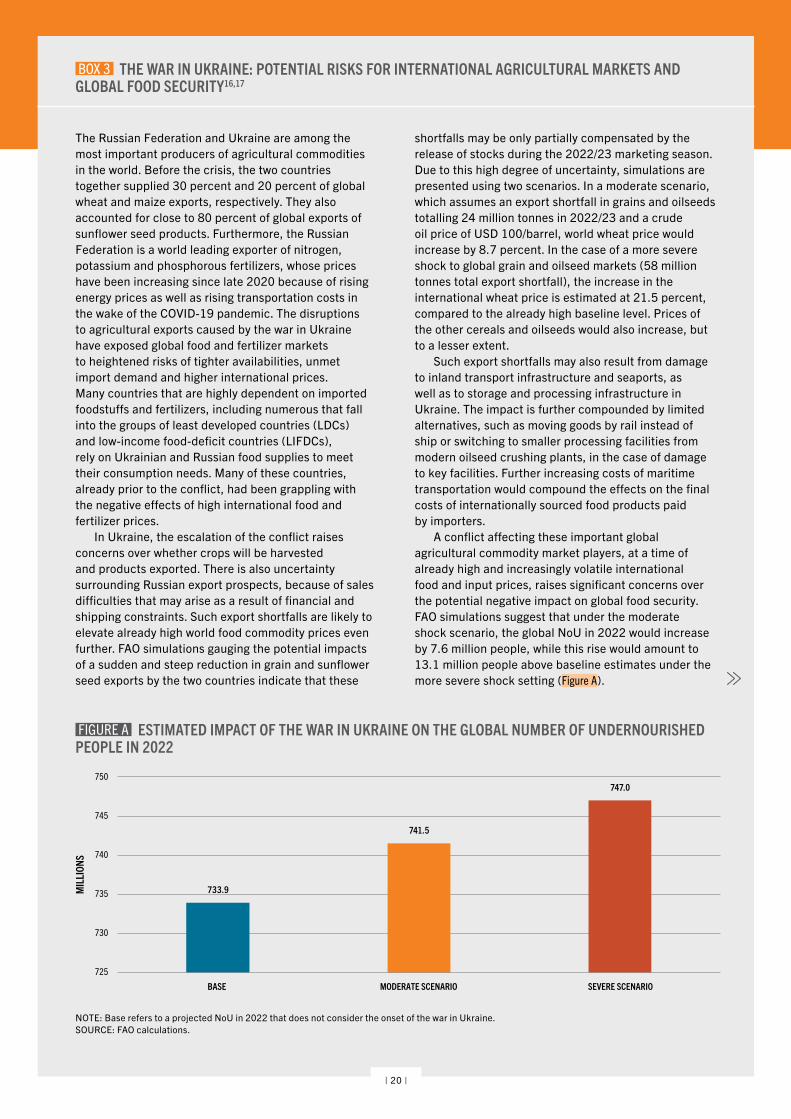
CHAPTER 2 FOOD SECURITY AND NUTRITION AROUND THE WORLD BOX 3 THE WAR IN UKRAINE: POTENTIAL RISKS FOR INTERNATIONAL AGRICULTURAL MARKETS AND GLOBAL FOOD SECURITY16,17
The Russian Federation and Ukraine are among the most important producers of agricultural commodities in the world. Before the crisis, the two countries together supplied 30 percent and 20 percent of global wheat and maize exports, respectively. They also accounted for close to 80 percent of global exports of sunflower seed products. Furthermore, the Russian Federation is a world leading exporter of nitrogen, potassium and phosphorous fertilizers, whose prices have been increasing since late 2020 because of rising energy prices as well as rising transportation costs in the wake of the COVID-19 pandemic. The disruptions to agricultural exports caused by the war in Ukraine have exposed global food and fertilizer markets to heightened risks of tighter availabilities, unmet import demand and higher international prices. Many countries that are highly dependent on imported foodstuffs and fertilizers, including numerous that fall into the groups of least developed countries (LDCs) and low-income food-deficit countries (LIFDCs), rely on Ukrainian and Russian food supplies to meet their consumption needs. Many of these countries, already prior to the conflict, had been grappling with the negative effects of high international food and fertilizer prices.
In Ukraine, the escalation of the conflict raises concerns over whether crops will be harvested and products exported. There is also uncertainty surrounding Russian export prospects, because of sales difficulties that may arise as a result of financial and shipping constraints. Such export shortfalls are likely to elevate already high world food commodity prices even further. FAO simulations gauging the potential impacts of a sudden and steep reduction in grain and sunflower seed exports by the two countries indicate that these
shortfalls may be only partially compensated by the release of stocks during the 2022/23 marketing season. Due to this high degree of uncertainty, simulations are presented using two scenarios. In a moderate scenario, which assumes an export shortfall in grains and oilseeds totalling 24 million tonnes in 2022/23 and a crude oil price of USD 100/barrel, world wheat price would increase by 8.7 percent. In the case of a more severe shock to global grain and oilseed markets (58 million tonnes total export shortfall), the increase in the international wheat price is estimated at 21.5 percent, compared to the already high baseline level. Prices of the other cereals and oilseeds would also increase, but to a lesser extent.
Such export shortfalls may also result from damage to inland transport infrastructure and seaports, as well as to storage and processing infrastructure in Ukraine. The impact is further compounded by limited alternatives, such as moving goods by rail instead of ship or switching to smaller processing facilities from modern oilseed crushing plants, in the case of damage to key facilities. Further increasing costs of maritime transportation would compound the effects on the final costs of internationally sourced food products paid by importers.
A conflict affecting these important global agricultural commodity market players, at a time of already high and increasingly volatile international food and input prices, raises significant concerns over the potential negative impact on global food security. FAO simulations suggest that under the moderate shock scenario, the global NoU in 2022 would increase by 7.6 million people, while this rise would amount to 13.1 million people above baseline estimates under the more severe shock setting (Figure A).
FIGURE A ESTIMATED IMPACT OF THE WAR IN UKRAINE ON THE GLOBAL NUMBER OF UNDERNOURISHED PEOPLE IN 2022
725
735
730
740
745
750
MIL
LION
S
733.9
741.5
747.0
BASE MODERATE SCENARIO SEVERE SCENARIO
NOTE: Base refers to a projected NoU in 2022 that does not consider the onset of the war in Ukraine. SOURCE: FAO calculations.
| 20 |
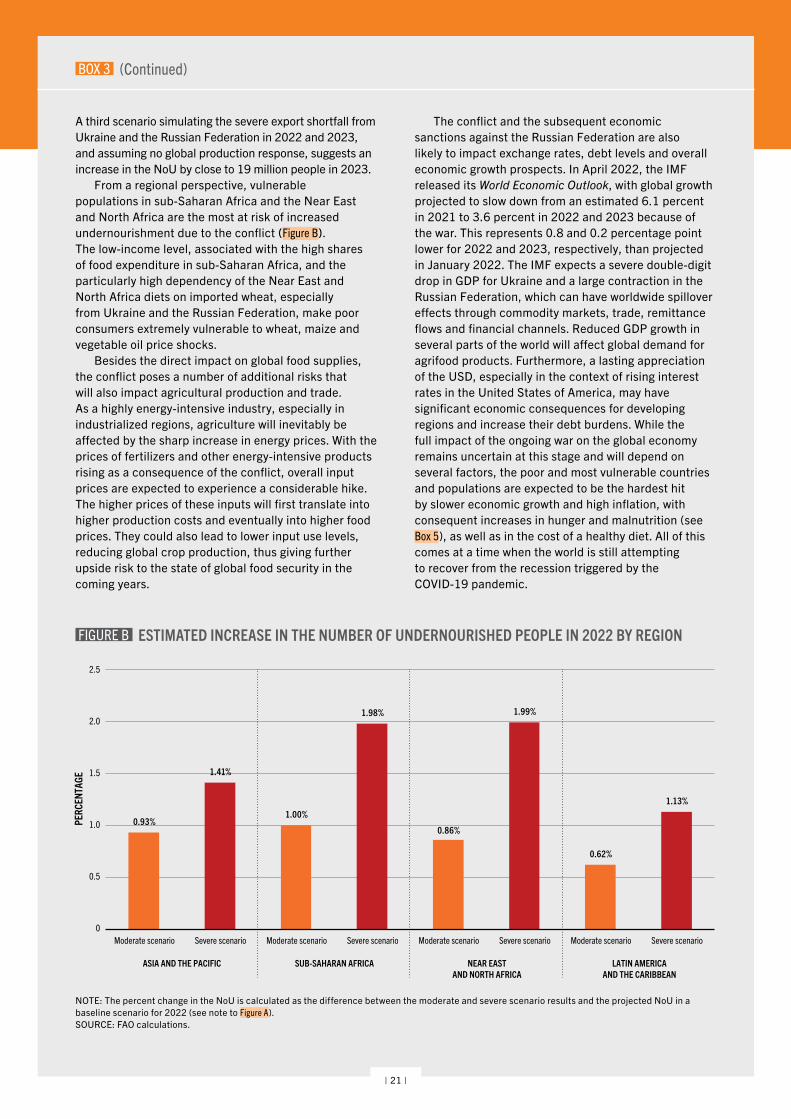
THE STATE OF FOOD SECURITY AND NUTRITION IN THE WORLD 2022 BOX 3 (Continued)
FIGURE B ESTIMATED INCREASE IN THE NUMBER OF UNDERNOURISHED PEOPLE IN 2022 BY REGION
PERC
ENTA
GE
0
0.5
1.0
1.5
2.0
2.5
0.93%1.00%
0.86%
0.62%
1.41%
1.98% 1.99%
1.13%
Moderate scenario Severe scenario Moderate scenario Severe scenario Moderate scenario Severe scenario Moderate scenario Severe scenario
ASIA AND THE PACIFIC SUB-SAHARAN AFRICA NEAR EASTAND NORTH AFRICA
LATIN AMERICAAND THE CARIBBEAN
A third scenario simulating the severe export shortfall from Ukraine and the Russian Federation in 2022 and 2023, and assuming no global production response, suggests an increase in the NoU by close to 19 million people in 2023.
From a regional perspective, vulnerable populations in sub-Saharan Africa and the Near East and North Africa are the most at risk of increased undernourishment due to the conflict (Figure B). The low-income level, associated with the high shares of food expenditure in sub-Saharan Africa, and the particularly high dependency of the Near East and North Africa diets on imported wheat, especially from Ukraine and the Russian Federation, make poor consumers extremely vulnerable to wheat, maize and vegetable oil price shocks.
Besides the direct impact on global food supplies, the conflict poses a number of additional risks that will also impact agricultural production and trade. As a highly energy-intensive industry, especially in industrialized regions, agriculture will inevitably be affected by the sharp increase in energy prices. With the prices of fertilizers and other energy-intensive products rising as a consequence of the conflict, overall input prices are expected to experience a considerable hike. The higher prices of these inputs will first translate into higher production costs and eventually into higher food prices. They could also lead to lower input use levels, reducing global crop production, thus giving further upside risk to the state of global food security in the coming years.
The conflict and the subsequent economic sanctions against the Russian Federation are also likely to impact exchange rates, debt levels and overall economic growth prospects. In April 2022, the IMF released its World Economic Outlook, with global growth projected to slow down from an estimated 6.1 percent in 2021 to 3.6 percent in 2022 and 2023 because of the war. This represents 0.8 and 0.2 percentage point lower for 2022 and 2023, respectively, than projected in January 2022. The IMF expects a severe double-digit drop in GDP for Ukraine and a large contraction in the Russian Federation, which can have worldwide spillover effects through commodity markets, trade, remittance flows and financial channels. Reduced GDP growth in several parts of the world will affect global demand for agrifood products. Furthermore, a lasting appreciation of the USD, especially in the context of rising interest rates in the United States of America, may have significant economic consequences for developing regions and increase their debt burdens. While the full impact of the ongoing war on the global economy remains uncertain at this stage and will depend on several factors, the poor and most vulnerable countries and populations are expected to be the hardest hit by slower economic growth and high inflation, with consequent increases in hunger and malnutrition (see Box 5), as well as in the cost of a healthy diet. All of this comes at a time when the world is still attempting to recover from the recession triggered by the COVID-19 pandemic.
NOTE: The percent change in the NoU is calculated as the difference between the moderate and severe scenario results and the projected NoU in a baseline scenario for 2022 (see note to Figure A). SOURCE: FAO calculations.
| 21 |
CHAPTER 2 FOOD SECURITY AND NUTRITION AROUND THE WORLD
It is projected that nearly 670 million people will still be undernourished in 2030 – 8 percent of the world population, which is the same proportion as in 2015 when the 2030 Agenda was launched. This is 78 million more undernourished people in 2030 compared to a scenario in which the pandemic had not occurred. The projected gradual reduction in global hunger by 2030 is largely due to the significant improvements foreseen for Asia, where the NoU is projected to fall from the current 425 million to around 295 million (equivalent to about 6 percent of the population), and to a simultaneous worsening in Africa, where the NoU is projected to grow from almost 280 to more than 310 million (corresponding to slightly above 18 percent of the population). For Latin America and the Caribbean, the number of people affected by undernourishment is projected to remain stable until 2030 at around 56 million (which correspond to about 8 percent of the population).
At the time of writing this report, another crisis looms that is likely to impact the trajectory of food security globally: the war in Ukraine. As explained in more detail in Box 3, the Russian Federation and Ukraine are prominent players in the global trade of food and agricultural products, in particular of wheat, maize, sunflower, sunflower oils and fertilizers in markets characterized by exportable supplies concentrated in a handful of countries. This concentration makes these markets, in particular, vulnerable to shocks such as the one that the current war represents. Several risks emanate from the conflict that will directly and indirectly impact global supply. Among them, the risk of disruptions in trade flows, and the resulting risk of soaring prices, are among the first to consider. In addition, the potential risk of reduced production levels of the next harvest and logistical risks like those posed by damage of transport, storage and processing infrastructure are also to be considered. Taken together, they cast a looming shadow over the prospect of food insecurity in the short and medium term, especially in impoverished countries, and constitute a challenge to the achievement of the SDG 2 target of Zero Hunger.
The unfolding crisis adds additional uncertainty to the projections of global hunger levels in 2030, which may well affect the projected scenarios
in Figure 6. While it is still premature to try to quantify the impact of the conflict, given the many different pathways through which it could impact global food insecurity, Box 3 presents simulations of the potential impact of the war in 2022 that take into account two of the risks induced by the conflict: the trade risk (reflected in interrupted wheat and maize exports from Ukraine) and the price risk (reflected in the rise in prices of commodities and energy).
SDG Indicator 2.1.2 Prevalence of moderate or severe food insecurity in the population, based on the FIESEnding hunger is an urgent imperative for the preservation of life and human dignity. SDG Target 2.1 challenges the world to go further by ensuring access for all to safe, nutritious and sufficient food all year round. SDG Indicator 2.1.2 – the prevalence of moderate or severe food insecurity in the population, based on the FIES – is used to monitor progress towards the ambitious goal of ensuring access to adequate food for all.
The FIES also enables the estimation of the prevalence of food insecurity at severe levels only, which provides a supplementary lens for monitoring hunger. Although obtained using very different data and methods (see Annex 1B), the prevalence of severe food insecurity is expected to correlate with the PoU across populations. This is because people experiencing severe food insecurity are unlikely to be able to acquire enough food to continuously fulfil their dietary energy requirements, which is the concept of chronic undernourishment measured by the PoU.3,18
FIES data are increasingly available from official national sources as a growing number of countries have adopted the FIES as a standard food security assessment tool. FIES or equivalent experience-based food security data collected by national institutions were used to inform the estimates in this year’s edition of this report for more than 59 countries, covering more than a quarter of the world population. For the remaining countries, estimates are based on FIES data collected by FAO, mainly through the GWP (see Annex 1B). Additionally, this year’s report is also informed by FIES data collected by FAO
| 22 |
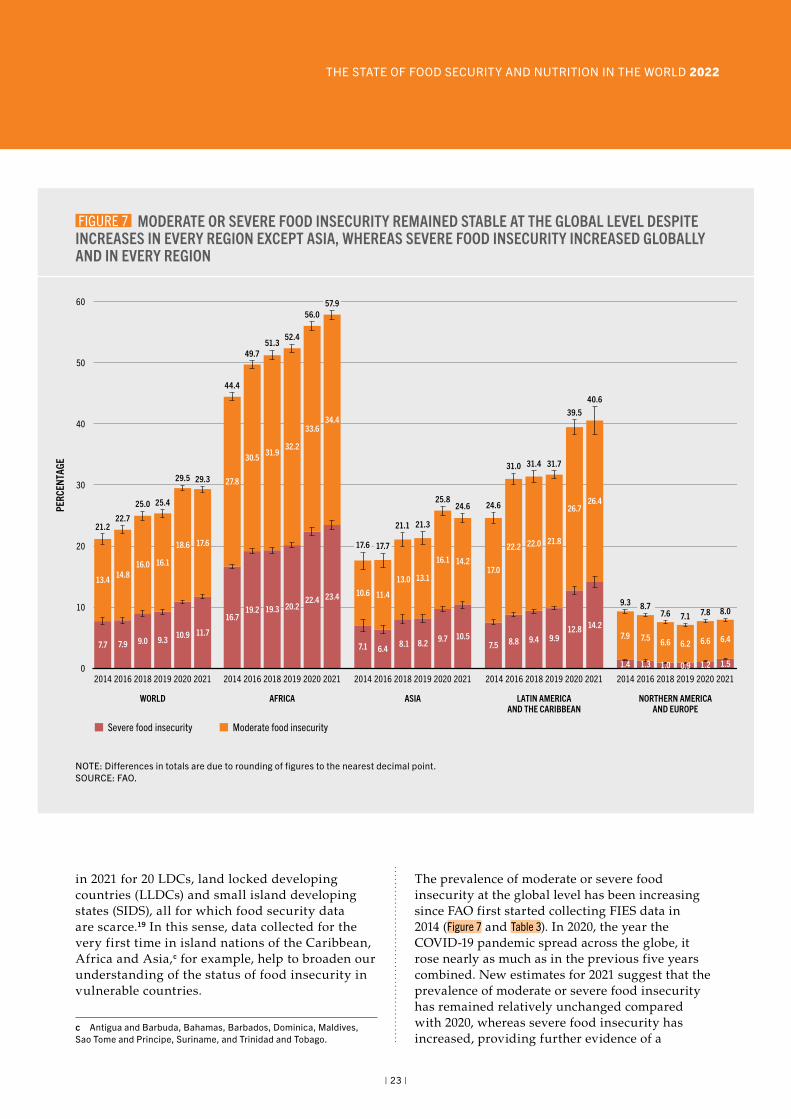
THE STATE OF FOOD SECURITY AND NUTRITION IN THE WORLD 2022
in 2021 for 20 LDCs, land locked developing countries (LLDCs) and small island developing states (SIDS), all for which food security data are scarce.19 In this sense, data collected for the very first time in island nations of the Caribbean, Africa and Asia,c for example, help to broaden our understanding of the status of food insecurity in vulnerable countries.
c Antigua and Barbuda, Bahamas, Barbados, Dominica, Maldives, Sao Tome and Principe, Suriname, and Trinidad and Tobago.
The prevalence of moderate or severe food insecurity at the global level has been increasing since FAO first started collecting FIES data in 2014 (Figure 7 and Table 3). In 2020, the year the COVID-19 pandemic spread across the globe, it rose nearly as much as in the previous five years combined. New estimates for 2021 suggest that the prevalence of moderate or severe food insecurity has remained relatively unchanged compared with 2020, whereas severe food insecurity has increased, providing further evidence of a
FIGURE 7 MODERATE OR SEVERE FOOD INSECURITY REMAINED STABLE AT THE GLOBAL LEVEL DESPITE INCREASES IN EVERY REGION EXCEPT ASIA, WHEREAS SEVERE FOOD INSECURITY INCREASED GLOBALLY AND IN EVERY REGION
0
10
20
30
40
50
60
PERC
ENTA
GE
Severe food insecurity Moderate food insecurity
7.7
13.4
7.9
14.8
9.0
16.0
9.3
16.1
10.9
18.6
11.7
17.6
16.719.2 19.3 20.2
22.4 23.4
27.8
30.5 31.932.2
33.634.4
7.1 6.4 8.1 8.2 9.7 10.5
10.6 11.4
13.0 13.1
16.1 14.2
7.5 8.8 9.4 9.912.8 14.2
17.0
22.2 22.0 21.8
26.726.4
1.4 1.3 1.0 0.9 1.2 1.5
7.9 7.5 6.6 6.2 6.6 6.4
2014 2016 2018 2019 2020 2021
WORLD
2014 2016 2018 2019 2020 2021
AFRICA
44.4
49.751.3
52.4
56.057.9
2014 2016 2018 2019 2020 2021
ASIA
17.6 17.7
21.1 21.3
25.824.6
2014 2016 2018 2019 2020 2021
LATIN AMERICAAND THE CARIBBEAN
24.6
31.0 31.4 31.7
39.540.6
2014 2016 2018 2019 2020 2021
NORTHERN AMERICAAND EUROPE
9.3 8.77.6 7.1 7.8 8.0
21.222.7
25.0 25.4
29.5 29.3
NOTE: Differences in totals are due to rounding of figures to the nearest decimal point.SOURCE: FAO.
| 23 |
CHAPTER 2 FOOD SECURITY AND NUTRITION AROUND THE WORLD
deteriorating situation mainly for those already facing serious hardships.
In 2021, an estimated 29.3 percent of the global population – 2.3 billion people – were moderately or severely food insecure, meaning they did not have access to adequate food (Table 3 and Table 4). Although the number remained relatively stable between 2020 and 2021, more than 350 million more people were affected by moderate or severe food insecurity in 2021 compared to 2019, the year before the COVID-19 pandemic unfolded.
Of those people affected by moderate or severe food insecurity, close to 40 percent of them were facing food insecurity at severe levels, indicating they had run out of food and, at worst, gone a day without eating. The global prevalence of severe food insecurity rose from 9.3 to 10.9 percent between 2019 and 2020, and to 11.7 percent in 2021. An estimated 923.7 million people faced severe food insecurity in 2021 – 73.6 million more than in 2020 and 207 million more people compared to 2019.
The estimated numbers of severely food insecure people presented in Table 4 and of undernourished people presented in Table 2 show similar trends. However, the number of severely food insecure people in the world in 2021, as well as the increase in the number of severely food insecure people from 2020 to 2021, are somewhat greater compared to the estimates of undernourished people presented in the preceding section, based on the middle range estimate in Table 2. This is because the indicators are based on very different methodologies and sources of data. As explained, the FIES data were collected directly from respondents in surveys, providing timely and robust estimates, while the 2021 PoU estimates are nowcasts based on data on food availability and access to food at the country level.
While levels of moderate or severe food insecurity remained stable at the global level, differing trends were seen at the regional level. The largest increase in moderate or severe food insecurity between 2020 and 2021 was seen in Africa, which also has the highest prevalence at both levels of severity. Moderate or severe food insecurity increased 1.9 percentage
points in one year to 57.9 percent, and severe food insecurity increased 1 percentage point, affecting nearly one in four people in the region in 2021. An estimated 322 million Africans were facing severe food insecurity – 21.5 million more than in 2020 and 58 million more than in 2019 prior to the COVID-19 pandemic. Globally, more than one-third of the total number of people facing severe food insecurity in 2021 live in Africa.
Differences at the subregional level in Africa are noteworthy. The prevalence of food insecurity in Northern Africa is roughly half that of sub-Saharan Africa; however, the food security situation appeared to worsen more in Northern Africa from 2020 to 2021. Within sub-Saharan Africa, Middle Africa is the subregion facing the highest levels of food insecurity and is also where the largest increases occurred from 2020 to 2021.
Food security also continued to worsen in Latin America and the Caribbean, although the deterioration has slowed following a relatively sharp rise in food insecurity in 2020. In 2021, 40.6 percent of the population was facing moderate or severe food insecurity – an increase of 1.1 percentage points since 2020, which is within the margins of error. Severe food insecurity rose 1.4 percentage points to reach 14.2 percent – an increase of nearly 10 million more people in one year and almost 30 million more when compared with 2019. The prevalence of severe food insecurity in the region has nearly doubled since FIES data were first collected in 2014.
The rise in food insecurity in Latin America and the Caribbean is driven largely by an increase in South America. The prevalence of moderate or severe food insecurity in South America increased sharply from 2019 to 2020 (nearly 9 percentage points) and then rose at a slower pace from 2020 to 2021 to about 41 percent. However, there was a more notable rise in severe food insecurity in South America from 2020 to 2021, bringing the level to over 15 percent. In Central America, food insecurity levels have remained relatively stable since 2020 following a sharp increase from 2019 to 2020. The estimated prevalence of moderate or severe food insecurity
| 24 |
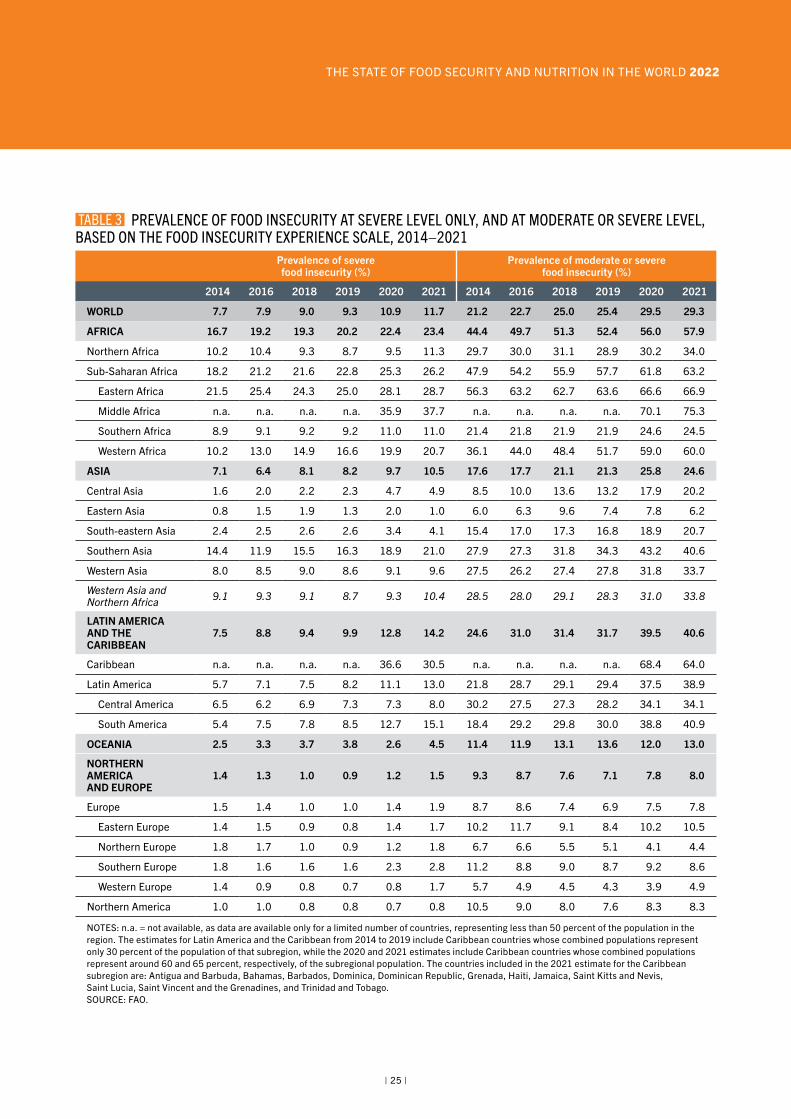
THE STATE OF FOOD SECURITY AND NUTRITION IN THE WORLD 2022
Prevalence of severe food insecurity (%)
Prevalence of moderate or severe food insecurity (%)
2014 2016 2018 2019 2020 2021 2014 2016 2018 2019 2020 2021
WORLD 7.7 7.9 9.0 9.3 10.9 11.7 21.2 22.7 25.0 25.4 29.5 29.3
AFRICA 16.7 19.2 19.3 20.2 22.4 23.4 44.4 49.7 51.3 52.4 56.0 57.9
Northern Africa 10.2 10.4 9.3 8.7 9.5 11.3 29.7 30.0 31.1 28.9 30.2 34.0
Sub-Saharan Africa 18.2 21.2 21.6 22.8 25.3 26.2 47.9 54.2 55.9 57.7 61.8 63.2
Eastern Africa 21.5 25.4 24.3 25.0 28.1 28.7 56.3 63.2 62.7 63.6 66.6 66.9
Middle Africa n.a. n.a. n.a. n.a. 35.9 37.7 n.a. n.a. n.a. n.a. 70.1 75.3
Southern Africa 8.9 9.1 9.2 9.2 11.0 11.0 21.4 21.8 21.9 21.9 24.6 24.5
Western Africa 10.2 13.0 14.9 16.6 19.9 20.7 36.1 44.0 48.4 51.7 59.0 60.0
ASIA 7.1 6.4 8.1 8.2 9.7 10.5 17.6 17.7 21.1 21.3 25.8 24.6
Central Asia 1.6 2.0 2.2 2.3 4.7 4.9 8.5 10.0 13.6 13.2 17.9 20.2
Eastern Asia 0.8 1.5 1.9 1.3 2.0 1.0 6.0 6.3 9.6 7.4 7.8 6.2
South-eastern Asia 2.4 2.5 2.6 2.6 3.4 4.1 15.4 17.0 17.3 16.8 18.9 20.7
Southern Asia 14.4 11.9 15.5 16.3 18.9 21.0 27.9 27.3 31.8 34.3 43.2 40.6
Western Asia 8.0 8.5 9.0 8.6 9.1 9.6 27.5 26.2 27.4 27.8 31.8 33.7
Western Asia and Northern Africa 9.1 9.3 9.1 8.7 9.3 10.4 28.5 28.0 29.1 28.3 31.0 33.8
LATIN AMERICA AND THE CARIBBEAN
7.5 8.8 9.4 9.9 12.8 14.2 24.6 31.0 31.4 31.7 39.5 40.6
Caribbean n.a. n.a. n.a. n.a. 36.6 30.5 n.a. n.a. n.a. n.a. 68.4 64.0
Latin America 5.7 7.1 7.5 8.2 11.1 13.0 21.8 28.7 29.1 29.4 37.5 38.9
Central America 6.5 6.2 6.9 7.3 7.3 8.0 30.2 27.5 27.3 28.2 34.1 34.1
South America 5.4 7.5 7.8 8.5 12.7 15.1 18.4 29.2 29.8 30.0 38.8 40.9
OCEANIA 2.5 3.3 3.7 3.8 2.6 4.5 11.4 11.9 13.1 13.6 12.0 13.0
NORTHERN AMERICA AND EUROPE
1.4 1.3 1.0 0.9 1.2 1.5 9.3 8.7 7.6 7.1 7.8 8.0
Europe 1.5 1.4 1.0 1.0 1.4 1.9 8.7 8.6 7.4 6.9 7.5 7.8
Eastern Europe 1.4 1.5 0.9 0.8 1.4 1.7 10.2 11.7 9.1 8.4 10.2 10.5
Northern Europe 1.8 1.7 1.0 0.9 1.2 1.8 6.7 6.6 5.5 5.1 4.1 4.4
Southern Europe 1.8 1.6 1.6 1.6 2.3 2.8 11.2 8.8 9.0 8.7 9.2 8.6
Western Europe 1.4 0.9 0.8 0.7 0.8 1.7 5.7 4.9 4.5 4.3 3.9 4.9
Northern America 1.0 1.0 0.8 0.8 0.7 0.8 10.5 9.0 8.0 7.6 8.3 8.3
NOTES: n.a. = not available, as data are available only for a limited number of countries, representing less than 50 percent of the population in the region. The estimates for Latin America and the Caribbean from 2014 to 2019 include Caribbean countries whose combined populations represent only 30 percent of the population of that subregion, while the 2020 and 2021 estimates include Caribbean countries whose combined populations represent around 60 and 65 percent, respectively, of the subregional population. The countries included in the 2021 estimate for the Caribbean subregion are: Antigua and Barbuda, Bahamas, Barbados, Dominica, Dominican Republic, Grenada, Haiti, Jamaica, Saint Kitts and Nevis, Saint Lucia, Saint Vincent and the Grenadines, and Trinidad and Tobago. SOURCE: FAO.
TABLE 3 PREVALENCE OF FOOD INSECURITY AT SEVERE LEVEL ONLY, AND AT MODERATE OR SEVERE LEVEL, BASED ON THE FOOD INSECURITY EXPERIENCE SCALE, 2014–2021
| 25 |
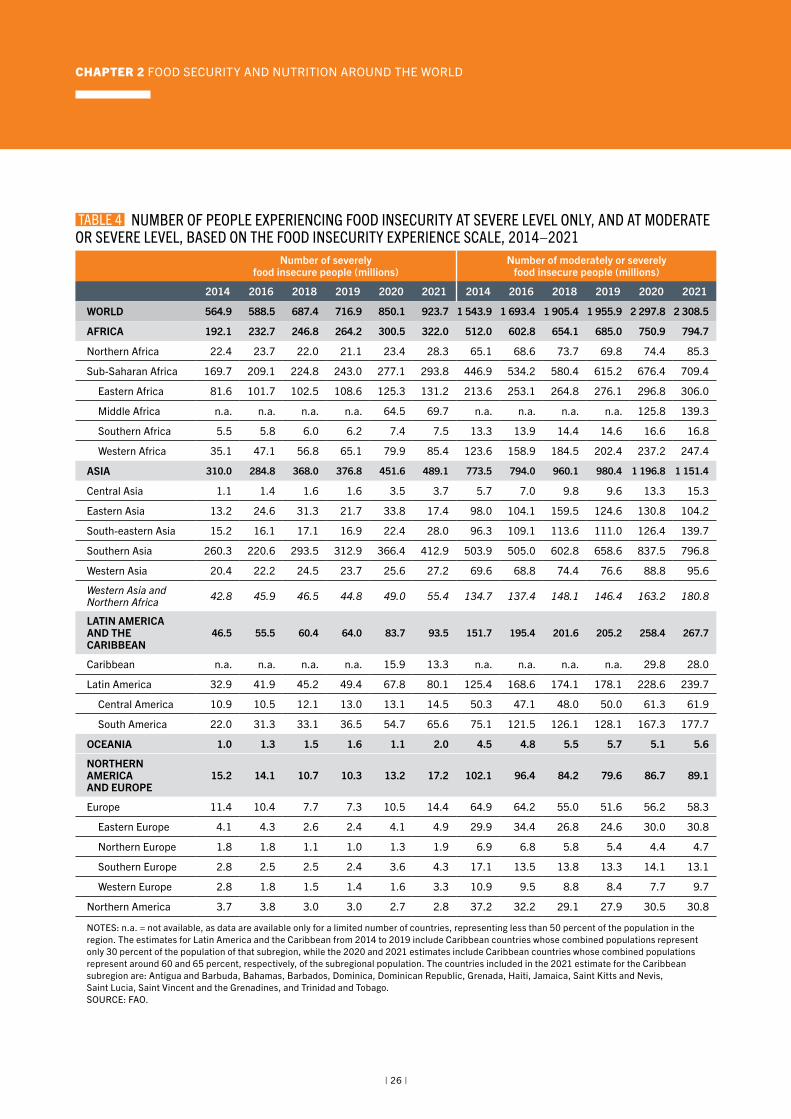
CHAPTER 2 FOOD SECURITY AND NUTRITION AROUND THE WORLD
Number of severely food insecure people (millions)
Number of moderately or severely food insecure people (millions)
2014 2016 2018 2019 2020 2021 2014 2016 2018 2019 2020 2021
WORLD 564.9 588.5 687.4 716.9 850.1 923.7 1 543.9 1 693.4 1 905.4 1 955.9 2 297.8 2 308.5
AFRICA 192.1 232.7 246.8 264.2 300.5 322.0 512.0 602.8 654.1 685.0 750.9 794.7
Northern Africa 22.4 23.7 22.0 21.1 23.4 28.3 65.1 68.6 73.7 69.8 74.4 85.3
Sub-Saharan Africa 169.7 209.1 224.8 243.0 277.1 293.8 446.9 534.2 580.4 615.2 676.4 709.4
Eastern Africa 81.6 101.7 102.5 108.6 125.3 131.2 213.6 253.1 264.8 276.1 296.8 306.0
Middle Africa n.a. n.a. n.a. n.a. 64.5 69.7 n.a. n.a. n.a. n.a. 125.8 139.3
Southern Africa 5.5 5.8 6.0 6.2 7.4 7.5 13.3 13.9 14.4 14.6 16.6 16.8
Western Africa 35.1 47.1 56.8 65.1 79.9 85.4 123.6 158.9 184.5 202.4 237.2 247.4
ASIA 310.0 284.8 368.0 376.8 451.6 489.1 773.5 794.0 960.1 980.4 1 196.8 1 151.4
Central Asia 1.1 1.4 1.6 1.6 3.5 3.7 5.7 7.0 9.8 9.6 13.3 15.3
Eastern Asia 13.2 24.6 31.3 21.7 33.8 17.4 98.0 104.1 159.5 124.6 130.8 104.2
South-eastern Asia 15.2 16.1 17.1 16.9 22.4 28.0 96.3 109.1 113.6 111.0 126.4 139.7
Southern Asia 260.3 220.6 293.5 312.9 366.4 412.9 503.9 505.0 602.8 658.6 837.5 796.8
Western Asia 20.4 22.2 24.5 23.7 25.6 27.2 69.6 68.8 74.4 76.6 88.8 95.6
Western Asia and Northern Africa 42.8 45.9 46.5 44.8 49.0 55.4 134.7 137.4 148.1 146.4 163.2 180.8
LATIN AMERICA AND THE CARIBBEAN
46.5 55.5 60.4 64.0 83.7 93.5 151.7 195.4 201.6 205.2 258.4 267.7
Caribbean n.a. n.a. n.a. n.a. 15.9 13.3 n.a. n.a. n.a. n.a. 29.8 28.0
Latin America 32.9 41.9 45.2 49.4 67.8 80.1 125.4 168.6 174.1 178.1 228.6 239.7
Central America 10.9 10.5 12.1 13.0 13.1 14.5 50.3 47.1 48.0 50.0 61.3 61.9
South America 22.0 31.3 33.1 36.5 54.7 65.6 75.1 121.5 126.1 128.1 167.3 177.7
OCEANIA 1.0 1.3 1.5 1.6 1.1 2.0 4.5 4.8 5.5 5.7 5.1 5.6
NORTHERN AMERICA AND EUROPE
15.2 14.1 10.7 10.3 13.2 17.2 102.1 96.4 84.2 79.6 86.7 89.1
Europe 11.4 10.4 7.7 7.3 10.5 14.4 64.9 64.2 55.0 51.6 56.2 58.3
Eastern Europe 4.1 4.3 2.6 2.4 4.1 4.9 29.9 34.4 26.8 24.6 30.0 30.8
Northern Europe 1.8 1.8 1.1 1.0 1.3 1.9 6.9 6.8 5.8 5.4 4.4 4.7
Southern Europe 2.8 2.5 2.5 2.4 3.6 4.3 17.1 13.5 13.8 13.3 14.1 13.1
Western Europe 2.8 1.8 1.5 1.4 1.6 3.3 10.9 9.5 8.8 8.4 7.7 9.7
Northern America 3.7 3.8 3.0 3.0 2.7 2.8 37.2 32.2 29.1 27.9 30.5 30.8
NOTES: n.a. = not available, as data are available only for a limited number of countries, representing less than 50 percent of the population in the region. The estimates for Latin America and the Caribbean from 2014 to 2019 include Caribbean countries whose combined populations represent only 30 percent of the population of that subregion, while the 2020 and 2021 estimates include Caribbean countries whose combined populations represent around 60 and 65 percent, respectively, of the subregional population. The countries included in the 2021 estimate for the Caribbean subregion are: Antigua and Barbuda, Bahamas, Barbados, Dominica, Dominican Republic, Grenada, Haiti, Jamaica, Saint Kitts and Nevis, Saint Lucia, Saint Vincent and the Grenadines, and Trinidad and Tobago. SOURCE: FAO.
TABLE 4 NUMBER OF PEOPLE EXPERIENCING FOOD INSECURITY AT SEVERE LEVEL ONLY, AND AT MODERATE OR SEVERE LEVEL, BASED ON THE FOOD INSECURITY EXPERIENCE SCALE, 2014–2021
| 26 |
THE STATE OF FOOD SECURITY AND NUTRITION IN THE WORLD 2022
in 2020 and 2021 for this subregion was slightly over 34 percent. The Caribbean is the subregion with the highest prevalence of food insecurity (64 percent moderate or severe food insecurity and 30.5 percent severe food insecurity), but an encouraging downward trend was observed from 2020 to 2021.d
The food insecurity situation was comparatively better in Asia, where the combined prevalence of moderate and severe food insecurity decreased slightly from 25.8 percent in 2020 to 24.6 percent in 2021. Nevertheless, given the size of its population, Asia accounts for half the people facing moderate or severe food insecurity in the world – more than 1.15 billion. Furthermore, the prevalence of severe food insecurity actually increased to 10.5 percent. An estimated 37.5 million more people faced severe food insecurity in Asia in 2021 compared to 2020 – a larger increase in terms of absolute numbers than in Africa. When compared with 2019, 112.3 million more people were facing food insecurity at severe levels in 2021.
The subregion of Asia with the highest levels of food insecurity is Southern Asia, where 40.6 percent of the population was moderately or severely food insecure in 2021. This represents an increase of about 6 percentage points since 2019 and more than 13 percentage points in five years, despite a 2.6 point decrease from 2020 to 2021. Of the people affected by moderate or severe food insecurity, half were facing severe food insecurity (21 percent of the population). In Western Asia, more than one-third of the population faced moderate or severe food insecurity in 2021 (an increase of 1.9 percentage points in one year, 5.9 points in two years and 7.5 points in five years), and nearly one in ten suffered from severe food insecurity. Central Asia and South-eastern Asia show similar trends and levels of food insecurity, although the increases have been steeper in Central Asia in recent years.
d Estimates are available for this subregion only for 2020 and 2021 when data became available for Caribbean countries whose combined populations represent around 60 and 65 percent, respectively, of the subregional population. The countries included in the 2021 estimate for the Caribbean subregion are: Antigua and Barbuda, Bahamas, Barbados, Dominica, Dominican Republic, Grenada, Haiti, Jamaica, Saint Kitts and Nevis, Saint Lucia, Saint Vincent and the Grenadines, and Trinidad and Tobago.
Eastern Asia is the subregion with the lowest levels of food insecurity and also appears to be one of the few subregions in the world where progress was made and food insecurity fell below pre-pandemic levels in 2021. The prevalence of moderate or severe food insecurity decreased 1.6 percentage points to 6.2 percent, and severe food insecurity fell by half to 1.0 percent, levels similar to many subregions of Northern America and Europe.
In Northern America and Europe, the region where the lowest rates of food insecurity are found, the prevalence of severe food insecurity increased for the second consecutive year since the beginning of FIES data collection in 2014. In 2021, 8.0 percent of the population of Northern America and Europe was moderately or severely food insecure, and 1.5 percent was severely food insecure. The rates were slightly higher in Oceania: 13.0 and 4.5 percent, respectively.
Small increases in food insecurity in Northern America and Europe from 2020 to 2021 were driven mainly by increases in Europe. Within Europe, a rise in food insecurity was observed in almost all subregions, at both levels of severity. The exception is Southern Europe, where the combined prevalence of moderate and severe food insecurity appears to have decreased slightly, even as severe food insecurity increased.
Figure 8 shows that, of a total of 2.3 billion suffering from food insecurity in 2021, half (1.15 billion) are in Asia; more than one-third (795 million) are in Africa; about 12 percent (268 million) live in Latin America and the Caribbean; and nearly 4 percent (89 million) are in Northern America and Europe. The figure also illustrates the difference across regions in the distribution of the population by food-insecurity severity level. Africa and Asia are the regions where severe levels represent the largest share of the combined total of moderate plus severe food insecurity – 41.0 percent and 42.5 percent, respectively – compared to 35 percent in Latin America and the Caribbean and 19 percent in Northern America and Europe.
Different patterns in food-insecurity severity also emerge when countries are grouped by income level. Figure 9 shows that, as the income level falls, not only does the prevalence of food
| 27 |
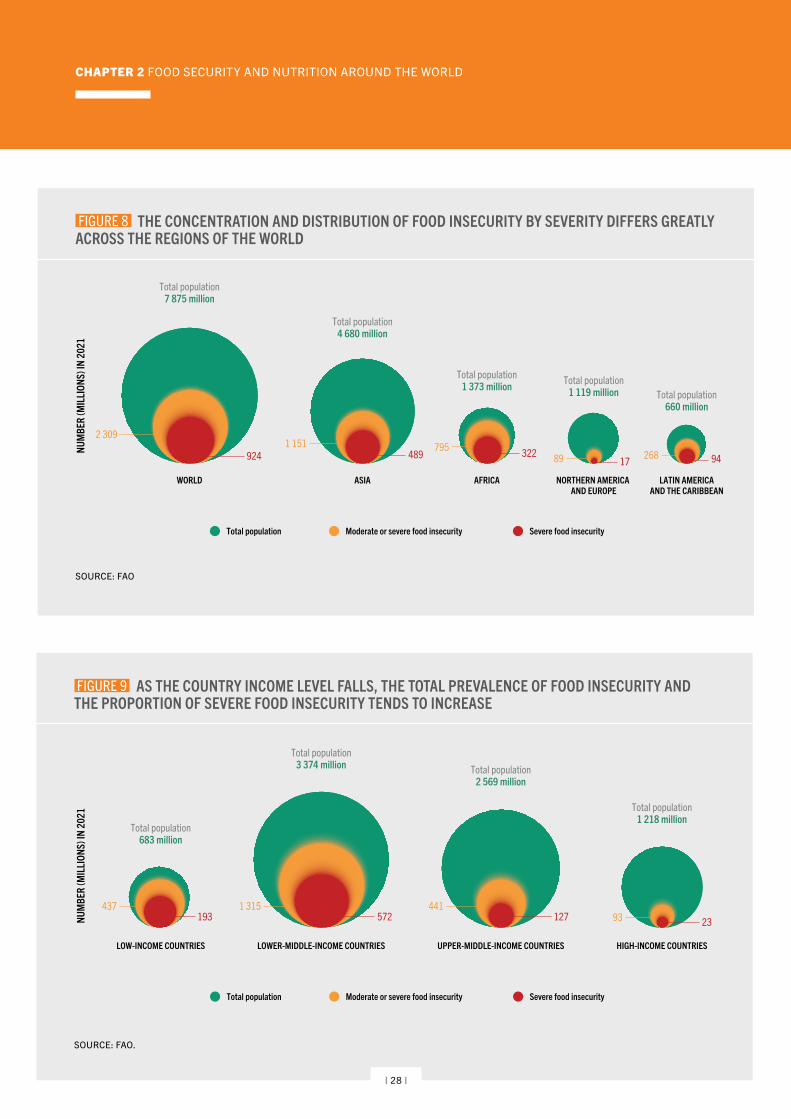
CHAPTER 2 FOOD SECURITY AND NUTRITION AROUND THE WORLD
FIGURE 8 THE CONCENTRATION AND DISTRIBUTION OF FOOD INSECURITY BY SEVERITY DIFFERS GREATLY ACROSS THE REGIONS OF THE WORLD
Total population7 875 million
Total population4 680 million
Total population1 373 million Total population
1 119 million Total population660 million
322795489
1 151924
2 309
94268NUM
BER
(MIL
LION
S) IN
202
1
WORLD ASIA AFRICA NORTHERN AMERICA AND EUROPE
LATIN AMERICAAND THE CARIBBEAN
1789
Total population Moderate or severe food insecurity Severe food insecurity
SOURCE: FAO
FIGURE 9 AS THE COUNTRY INCOME LEVEL FALLS, THE TOTAL PREVALENCE OF FOOD INSECURITY AND THE PROPORTION OF SEVERE FOOD INSECURITY TENDS TO INCREASE
Total population683 million
Total population3 374 million Total population
2 569 million
Total population1 218 million
127441
5721 315
193437
NUM
BER
(MIL
LION
S) IN
202
1
LOW-INCOME COUNTRIES LOWER-MIDDLE-INCOME COUNTRIES UPPER-MIDDLE-INCOME COUNTRIES HIGH-INCOME COUNTRIES
2393
Total population Moderate or severe food insecurity Severe food insecurity
SOURCE: FAO.
| 28 |
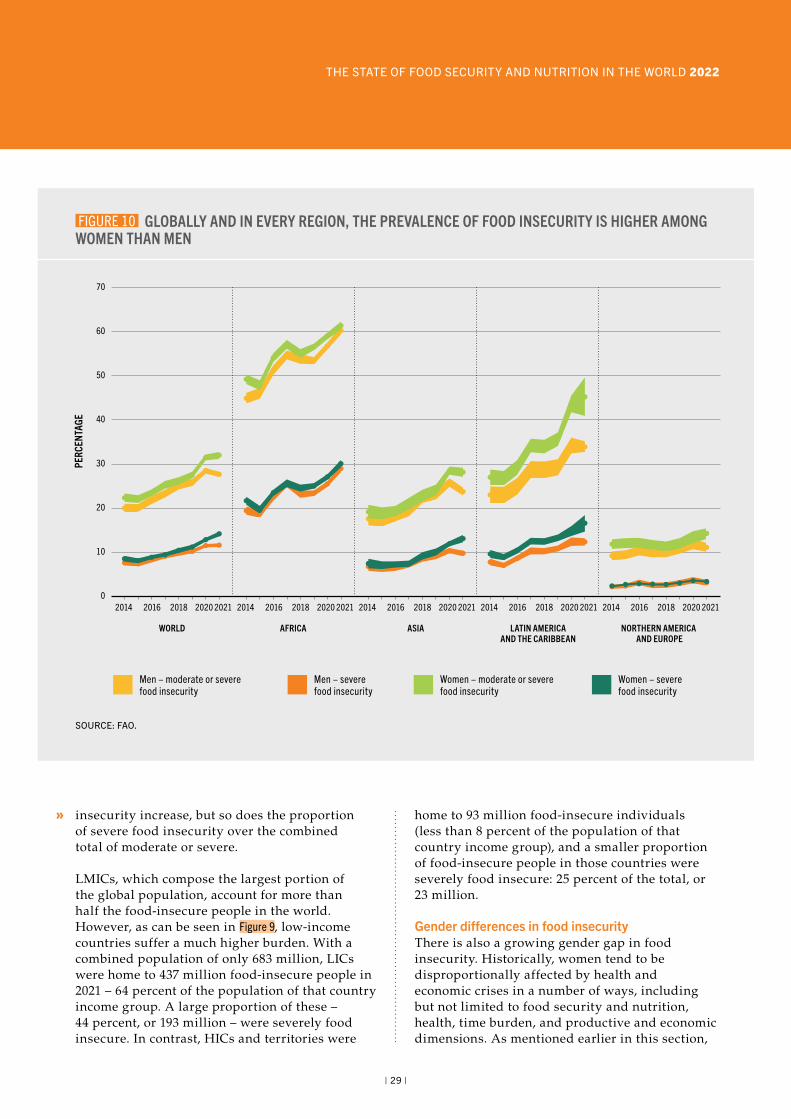
THE STATE OF FOOD SECURITY AND NUTRITION IN THE WORLD 2022
insecurity increase, but so does the proportion of severe food insecurity over the combined total of moderate or severe.
LMICs, which compose the largest portion of the global population, account for more than half the food-insecure people in the world. However, as can be seen in Figure 9, low-income countries suffer a much higher burden. With a combined population of only 683 million, LICs were home to 437 million food-insecure people in 2021 – 64 percent of the population of that country income group. A large proportion of these – 44 percent, or 193 million – were severely food insecure. In contrast, HICs and territories were
home to 93 million food-insecure individuals (less than 8 percent of the population of that country income group), and a smaller proportion of food-insecure people in those countries were severely food insecure: 25 percent of the total, or 23 million.
Gender differences in food insecurityThere is also a growing gender gap in food insecurity. Historically, women tend to be disproportionally affected by health and economic crises in a number of ways, including but not limited to food security and nutrition, health, time burden, and productive and economic dimensions. As mentioned earlier in this section,
FIGURE 10 GLOBALLY AND IN EVERY REGION, THE PREVALENCE OF FOOD INSECURITY IS HIGHER AMONG WOMEN THAN MEN
0
10
20
30
40
50
70
60
Men − moderate or severefood insecurity
Men − severefood insecurity
Women − moderate or severefood insecurity
Women − severefood insecurity
PERC
ENTA
GE
LATIN AMERICAAND THE CARIBBEAN
2014 2016 2018 2020 2021
ASIA
2014 2016 2018 2020 2021
AFRICA
2014 2016 2018 2020 2021
WORLD
2014 2016 2018 2020 2021
NORTHERN AMERICA AND EUROPE
2014 2016 2018 2020 2021
SOURCE: FAO.
| 29 |
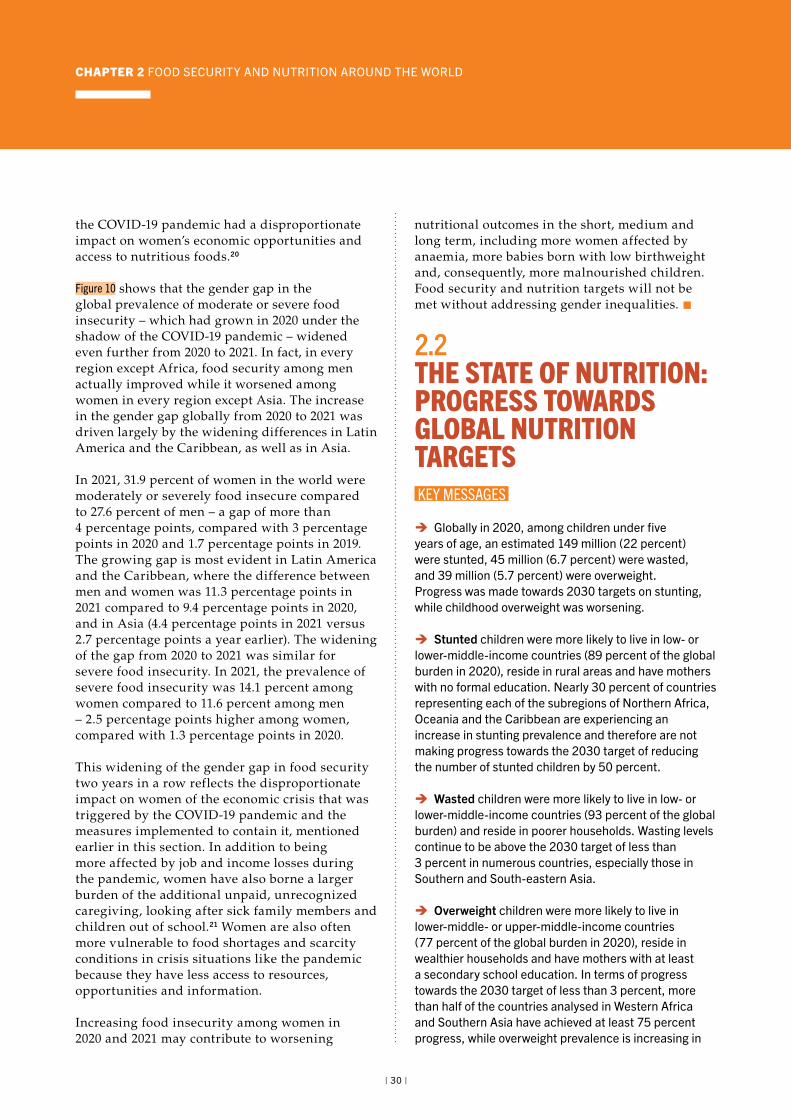
CHAPTER 2 FOOD SECURITY AND NUTRITION AROUND THE WORLD
the COVID-19 pandemic had a disproportionate impact on women’s economic opportunities and access to nutritious foods.20
Figure 10 shows that the gender gap in the global prevalence of moderate or severe food insecurity – which had grown in 2020 under the shadow of the COVID-19 pandemic – widened even further from 2020 to 2021. In fact, in every region except Africa, food security among men actually improved while it worsened among women in every region except Asia. The increase in the gender gap globally from 2020 to 2021 was driven largely by the widening differences in Latin America and the Caribbean, as well as in Asia.
In 2021, 31.9 percent of women in the world were moderately or severely food insecure compared to 27.6 percent of men – a gap of more than 4 percentage points, compared with 3 percentage points in 2020 and 1.7 percentage points in 2019. The growing gap is most evident in Latin America and the Caribbean, where the difference between men and women was 11.3 percentage points in 2021 compared to 9.4 percentage points in 2020, and in Asia (4.4 percentage points in 2021 versus 2.7 percentage points a year earlier). The widening of the gap from 2020 to 2021 was similar for severe food insecurity. In 2021, the prevalence of severe food insecurity was 14.1 percent among women compared to 11.6 percent among men – 2.5 percentage points higher among women, compared with 1.3 percentage points in 2020.
This widening of the gender gap in food security two years in a row reflects the disproportionate impact on women of the economic crisis that was triggered by the COVID-19 pandemic and the measures implemented to contain it, mentioned earlier in this section. In addition to being more affected by job and income losses during the pandemic, women have also borne a larger burden of the additional unpaid, unrecognized caregiving, looking after sick family members and children out of school.21 Women are also often more vulnerable to food shortages and scarcity conditions in crisis situations like the pandemic because they have less access to resources, opportunities and information.
Increasing food insecurity among women in 2020 and 2021 may contribute to worsening
nutritional outcomes in the short, medium and long term, including more women affected by anaemia, more babies born with low birthweight and, consequently, more malnourished children. Food security and nutrition targets will not be met without addressing gender inequalities. n
2.2THE STATE OF NUTRITION: PROGRESS TOWARDS GLOBAL NUTRITION TARGETS KEY MESSAGES
è Globally in 2020, among children under five years of age, an estimated 149 million (22 percent) were stunted, 45 million (6.7 percent) were wasted, and 39 million (5.7 percent) were overweight. Progress was made towards 2030 targets on stunting, while childhood overweight was worsening.
è Stunted children were more likely to live in low- or lower-middle-income countries (89 percent of the global burden in 2020), reside in rural areas and have mothers with no formal education. Nearly 30 percent of countries representing each of the subregions of Northern Africa, Oceania and the Caribbean are experiencing an increase in stunting prevalence and therefore are not making progress towards the 2030 target of reducing the number of stunted children by 50 percent.
è Wasted children were more likely to live in low- or lower-middle-income countries (93 percent of the global burden) and reside in poorer households. Wasting levels continue to be above the 2030 target of less than 3 percent in numerous countries, especially those in Southern and South-eastern Asia.
è Overweight children were more likely to live in lower-middle- or upper-middle-income countries (77 percent of the global burden in 2020), reside in wealthier households and have mothers with at least a secondary school education. In terms of progress towards the 2030 target of less than 3 percent, more than half of the countries analysed in Western Africa and Southern Asia have achieved at least 75 percent progress, while overweight prevalence is increasing in
| 30 |
THE STATE OF FOOD SECURITY AND NUTRITION IN THE WORLD 2022
the majority of countries analysed in Southern Africa, Oceania, South-eastern Asia, South America and the Caribbean.
è Globally, low birthweight decreased from 17.5 percent in 2000 to 14.6 percent in 2015, with progress made in most regions. However, data gaps are a challenge to global monitoring of this indicator, as nearly one in three newborns in the world are not weighed at birth.
è Steady progress has been made on exclusive breastfeeding, with 43.8 percent of infants under six months of age exclusively breastfed worldwide in 2020, up from 37.1 percent in 2012. Infants who are exclusively breastfed are more likely to live in low- or lower-middle-income countries (84 percent of the global number of exclusively breastfed infants in 2020), in rural areas, in poorer households, with mothers who had no formal education, and are more likely to be female. Most regions have achieved between 25 and 50 percent of the progress needed to reach the 2030 exclusive breastfeeding target of at least 70 percent.
è Globally in 2019, nearly one in three women aged 15 to 49 years (29.9 percent) were affected by anaemia, with stagnant, if not slightly reversed, progress since 2012 (28.5 percent). This translates into 571 million anaemic women worldwide, who were more likely to reside in rural settings, in poorer households and to have received no formal education. Progress towards the 2030 target for anaemia of a 30 percent reduction is worsening across the great majority of countries in almost all regions, particularly in Northern America, Europe, Australia and New Zealand, Oceania and South-eastern Asia.
è Adult obesity is on the rise in all regions, having increased worldwide from 11.8 percent in 2012 to 13.1 percent in 2016 – the last year for which data are available. Adults affected by obesity are more likely to live in upper-middle- or high-income countries (73 percent of the global burden in 2016), and the prevalence is higher among women. Women with obesity are more likely to reside in urban areas and in wealthier households. More efficient efforts are needed to reverse this trend.
è The persistence of the COVID-19 pandemic and other emergencies such as the war in Ukraine threaten progress towards ending all forms of malnutrition. The number of malnourished people,
especially women and children, may further increase and impede the progress in achieving the 2030 global nutrition targets. This calls for concerted efforts to mitigate the effects on malnutrition.
Nutrition is central to the 2030 Agenda for Sustainable Development. This report assesses global and regional levels and trends for the seven global nutrition targets. These include the six nutrition targets endorsed by the WHA in 2012 to be achieved by 2025, for which extended 2030 targets22 were subsequently proposed by the World Health Organization (WHO) and the United Nations Children’s Fund (UNICEF). Four out of the six indicators were also selected to monitor progress towards SDG Target 2.2, namely stunting, wasting and overweight in children under 5 years of age and anaemia in women aged 15 to 49 years.23 The seventh target is to halt the rise in adult obesity, which the WHA adopted as part of the Global Action Plan for the Prevention and Control of Noncommunicable Diseases (NCDs) in 2013.24
This edition innovates on previous reports by providing a more detailed characterization of the population groups most affected by malnutrition. The global burden of malnutrition is disaggregated by World Bank income groups. Additionally, the inequality analysis examines disparities across urban and rural residence, household wealth, maternal and women’s education, and gender. In this way, this report unmasks inequalities that exist within and between countries and sociodemographic groups. These analyses and disaggregations aim to shed light on the question: What population groups are most affected by malnutrition? This is a key aspect to inform the targeting of interventions for inequalities that seem to persist in the face of policies and programmes that are ineffective or too small for the challenge.
Progress towards the 2030 targets will be presented by looking into the summary of progress made by countries or territories, henceforth referred to as “countries”, for which estimates are available within regions and subregions up to the latest year.
The estimates of the prevalence and absolute numbers for the seven nutrition indicators
| 31 |
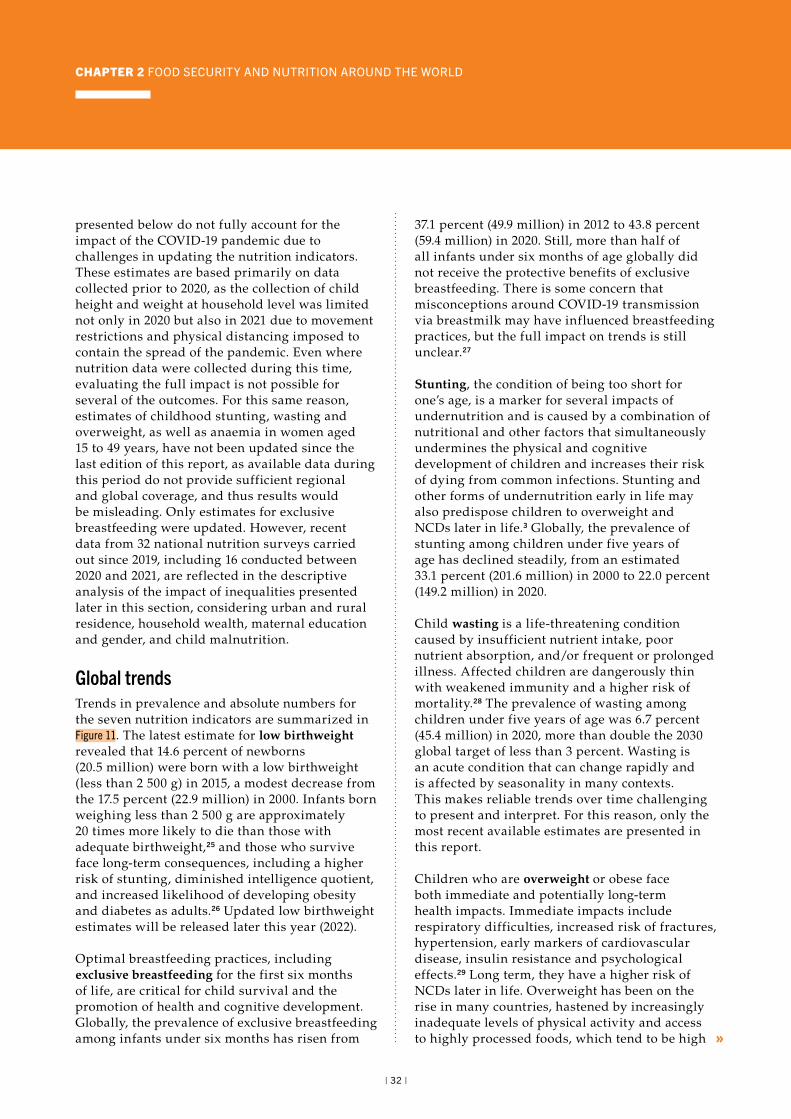
CHAPTER 2 FOOD SECURITY AND NUTRITION AROUND THE WORLD
presented below do not fully account for the impact of the COVID-19 pandemic due to challenges in updating the nutrition indicators. These estimates are based primarily on data collected prior to 2020, as the collection of child height and weight at household level was limited not only in 2020 but also in 2021 due to movement restrictions and physical distancing imposed to contain the spread of the pandemic. Even where nutrition data were collected during this time, evaluating the full impact is not possible for several of the outcomes. For this same reason, estimates of childhood stunting, wasting and overweight, as well as anaemia in women aged 15 to 49 years, have not been updated since the last edition of this report, as available data during this period do not provide sufficient regional and global coverage, and thus results would be misleading. Only estimates for exclusive breastfeeding were updated. However, recent data from 32 national nutrition surveys carried out since 2019, including 16 conducted between 2020 and 2021, are reflected in the descriptive analysis of the impact of inequalities presented later in this section, considering urban and rural residence, household wealth, maternal education and gender, and child malnutrition.
Global trendsTrends in prevalence and absolute numbers for the seven nutrition indicators are summarized in Figure 11. The latest estimate for low birthweight revealed that 14.6 percent of newborns (20.5 million) were born with a low birthweight (less than 2 500 g) in 2015, a modest decrease from the 17.5 percent (22.9 million) in 2000. Infants born weighing less than 2 500 g are approximately 20 times more likely to die than those with adequate birthweight,25 and those who survive face long-term consequences, including a higher risk of stunting, diminished intelligence quotient, and increased likelihood of developing obesity and diabetes as adults.26 Updated low birthweight estimates will be released later this year (2022).
Optimal breastfeeding practices, including exclusive breastfeeding for the first six months of life, are critical for child survival and the promotion of health and cognitive development. Globally, the prevalence of exclusive breastfeeding among infants under six months has risen from
37.1 percent (49.9 million) in 2012 to 43.8 percent (59.4 million) in 2020. Still, more than half of all infants under six months of age globally did not receive the protective benefits of exclusive breastfeeding. There is some concern that misconceptions around COVID-19 transmission via breastmilk may have influenced breastfeeding practices, but the full impact on trends is still unclear.27
Stunting, the condition of being too short for one’s age, is a marker for several impacts of undernutrition and is caused by a combination of nutritional and other factors that simultaneously undermines the physical and cognitive development of children and increases their risk of dying from common infections. Stunting and other forms of undernutrition early in life may also predispose children to overweight and NCDs later in life.3 Globally, the prevalence of stunting among children under five years of age has declined steadily, from an estimated 33.1 percent (201.6 million) in 2000 to 22.0 percent (149.2 million) in 2020.
Child wasting is a life-threatening condition caused by insufficient nutrient intake, poor nutrient absorption, and/or frequent or prolonged illness. Affected children are dangerously thin with weakened immunity and a higher risk of mortality.28 The prevalence of wasting among children under five years of age was 6.7 percent (45.4 million) in 2020, more than double the 2030 global target of less than 3 percent. Wasting is an acute condition that can change rapidly and is affected by seasonality in many contexts. This makes reliable trends over time challenging to present and interpret. For this reason, only the most recent available estimates are presented in this report.
Children who are overweight or obese face both immediate and potentially long-term health impacts. Immediate impacts include respiratory difficulties, increased risk of fractures, hypertension, early markers of cardiovascular disease, insulin resistance and psychological effects.29 Long term, they have a higher risk of NCDs later in life. Overweight has been on the rise in many countries, hastened by increasingly inadequate levels of physical activity and access to highly processed foods, which tend to be high
| 32 |
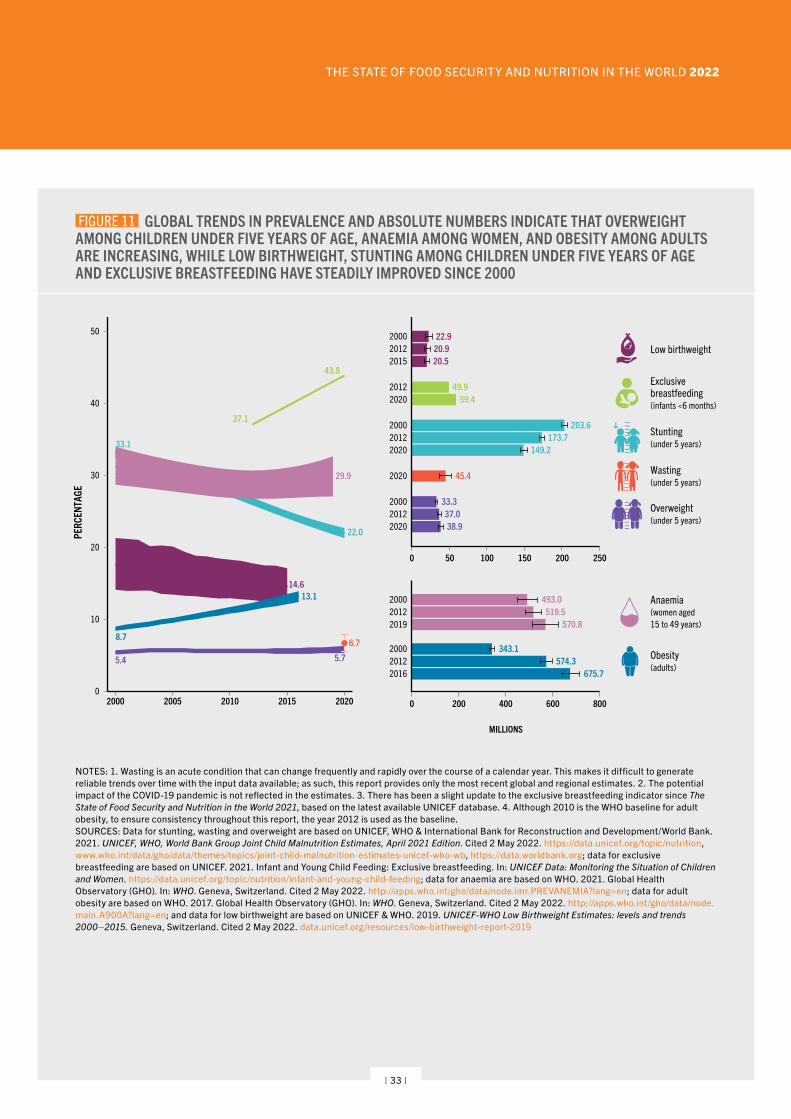
THE STATE OF FOOD SECURITY AND NUTRITION IN THE WORLD 2022
FIGURE 11 GLOBAL TRENDS IN PREVALENCE AND ABSOLUTE NUMBERS INDICATE THAT OVERWEIGHT AMONG CHILDREN UNDER FIVE YEARS OF AGE, ANAEMIA AMONG WOMEN, AND OBESITY AMONG ADULTS ARE INCREASING, WHILE LOW BIRTHWEIGHT, STUNTING AMONG CHILDREN UNDER FIVE YEARS OF AGE AND EXCLUSIVE BREASTFEEDING HAVE STEADILY IMPROVED SINCE 2000
Low birthweight
Anaemia(women aged15 to 49 years)
Exclusivebreastfeeding(infants <6 months)
Overweight(under 5 years)
Wasting(under 5 years)
Stunting(under 5 years)
Obesity(adults)
33.1
22.0
31.2 29.9
17.5
14.6
5.4 5.7
37.1
43.8
6.78.7
13.1
0
10
20
30
40
50
PERC
ENTA
GE
2000 2005 2010 2015 2020
38.9202037.02012
33.32000
45.42020
149.22020173.72012
203.62000
59.4202049.92012
20.5201520.9201222.92000
0 50 100 150 200 250
675.72016574.32012
343.12000
570.82019519.52012
493.02000
0 200 400 600 800
MILLIONS
NOTES: 1. Wasting is an acute condition that can change frequently and rapidly over the course of a calendar year. This makes it difficult to generate reliable trends over time with the input data available; as such, this report provides only the most recent global and regional estimates. 2. The potential impact of the COVID-19 pandemic is not reflected in the estimates. 3. There has been a slight update to the exclusive breastfeeding indicator since The State of Food Security and Nutrition in the World 2021, based on the latest available UNICEF database. 4. Although 2010 is the WHO baseline for adult obesity, to ensure consistency throughout this report, the year 2012 is used as the baseline.SOURCES: Data for stunting, wasting and overweight are based on UNICEF, WHO & International Bank for Reconstruction and Development/World Bank. 2021. UNICEF, WHO, World Bank Group Joint Child Malnutrition Estimates, April 2021 Edition. Cited 2 May 2022. https://data.unicef.org/topic/nutrition, www.who.int/data/gho/data/themes/topics/joint-child-malnutrition-estimates-unicef-who-wb, https://data.worldbank.org; data for exclusive breastfeeding are based on UNICEF. 2021. Infant and Young Child Feeding: Exclusive breastfeeding. In: UNICEF Data: Monitoring the Situation of Children and Women. https://data.unicef.org/topic/nutrition/infant-and-young-child-feeding; data for anaemia are based on WHO. 2021. Global Health Observatory (GHO). In: WHO. Geneva, Switzerland. Cited 2 May 2022. http://apps.who.int/gho/data/node.imr.PREVANEMIA?lang=en; data for adult obesity are based on WHO. 2017. Global Health Observatory (GHO). In: WHO. Geneva, Switzerland. Cited 2 May 2022. http://apps.who.int/gho/data/node.main.A900A?lang=en; and data for low birthweight are based on UNICEF & WHO. 2019. UNICEF-WHO Low Birthweight Estimates: levels and trends 2000–2015. Geneva, Switzerland. Cited 2 May 2022. data.unicef.org/resources/low-birthweight-report-2019
| 33 |
CHAPTER 2 FOOD SECURITY AND NUTRITION AROUND THE WORLD
in energy, fats, free sugars and/or salt.30 Globally, the prevalence of overweight among children under five years of age increased slightly from 5.4 percent (33.3 million) in 2000 to 5.7 percent (38.9 million) in 2020. Although not statistically significant, rising trends are seen in around half of the countries worldwide. Based on this, and given the associated risks, this should be interpreted with concern.
The prevalence of anaemia among women aged 15 to 49 years, which was estimated to be 31.2 percent in 2000, signalled a slight downward trend until around 2012, but then rose again to 29.9 percent in 2019. Meanwhile, the absolute number of women with anaemia has risen steadily from 493 million in 2000 to 570.8 million in 2019, which has implications for female morbidity and mortality and can lead to adverse pregnancy and newborn outcomes.31
Globally, adult obesity nearly doubled in absolute value from 8.7 percent (343.1 million) in 2000 to 13.1 percent (675.7 million) in 2016. Updated global estimates are poised to be released before the end of 2022. However, it is not yet clear if there will be sufficient data to reflect how the COVID-19 pandemic has impacted this outcome. It is possible that movement restrictions imposed to contain the spread of the virus may have increased physical inactivity and sedentary behaviours, which together with shifting dietary practices towards unhealthy eating habits, may have resulted in increased adult body mass index (BMI) globally.32
The global burden of malnutrition varies across country income groups,33 and in some cases, over time. The burden per income group depends on the prevalence of the nutrition outcome as well as the population size of that income group; thus, both aspects are key to interpret disparities. Although the income group classification for a given country can shift over time, the analysis presented here considers the distribution of burden based on the latest classification, looking at shifts that happened across countries as per the income group they are currently classified under.
The distribution of the global burden for the seven nutrition indicators by income group are
presented in Figure 12. For each indicator, the distribution in 2012 and in the year for which the most recent data are available are presented to show changes over time.
LICs and LMICs together carried the brunt of the low birthweight burden among newborns both in 2012 and in 2015 (83 percent of the global burden in 2020). Overall, the distribution of the burden remained similar between the two years.
Globally, most exclusively breastfed infants lived in LICs or LMICs, with the combined portion of the global number increasing from 78 percent in 2012 to 84 percent in 2020. However, there were insufficient data to examine the portion of exclusively breastfed infants in high-income countries, and therefore this group is not represented in Figure 12 for this indicator.
Part of the burden of stunting among children under five years of age shifted from LMICs to LICs between 2012 and 2020; namely, from 21 percent to 24 percent in the latter. Overall, stunted children are more likely to reside in LICs or LMICs.
LICs and LMICs bear the greatest burden of wasting among children under five years of age, totalling 93 percent of children affected by wasting globally.
The distribution across income groups of the burden of overweight among children under five years of age remained unchanged between 2012 and 2020, with a similar number of overweight children residing in LMICs and upper-middle-income countries (UMICs).
There were no significant shifts in the distribution of the global burden of anaemia among women aged 15 to 49 years between 2012 and 2019 across income groups. In 2019, 74 percent of women suffering from anaemia resided in LICs or LMICs, while one in five resided in UMICs.
The distribution of the global burden of obesity among adults across country income groups remained largely unchanged between 2012 and 2016, with the largest proportion (73 percent) residing in UMICs and HICs.
| 34 |
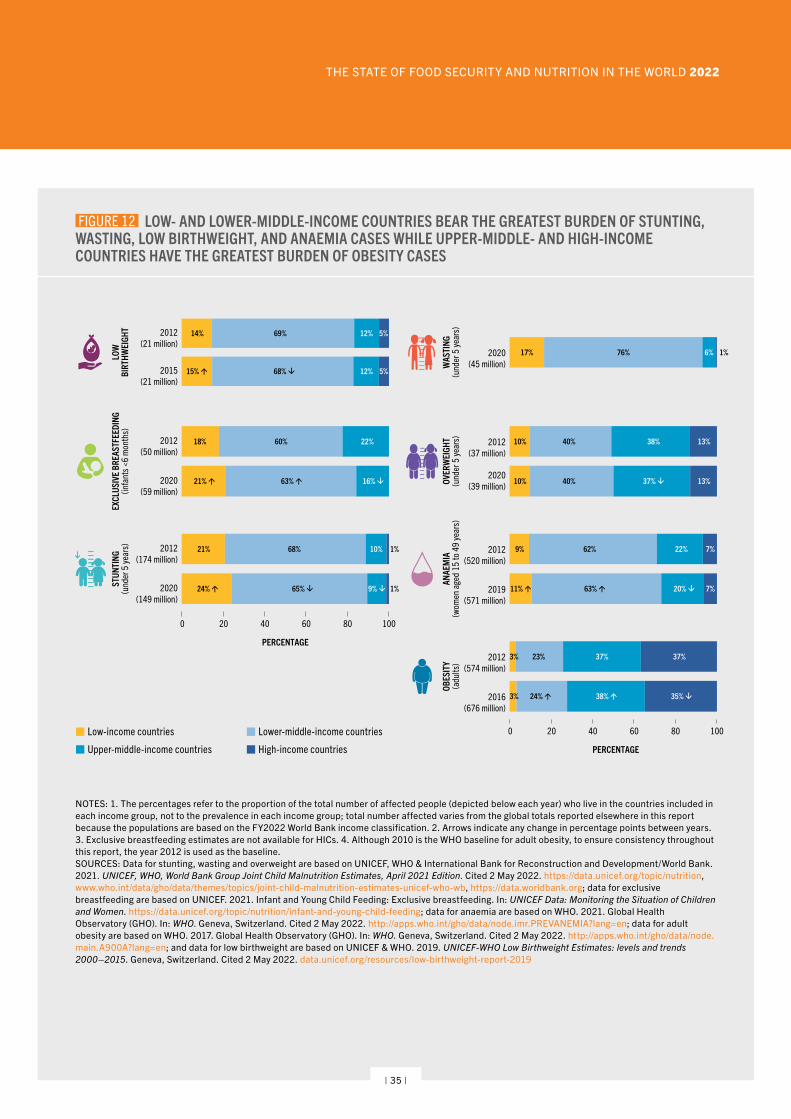
THE STATE OF FOOD SECURITY AND NUTRITION IN THE WORLD 2022
FIGURE 12 LOW- AND LOWER-MIDDLE-INCOME COUNTRIES BEAR THE GREATEST BURDEN OF STUNTING, WASTING, LOW BIRTHWEIGHT, AND ANAEMIA CASES WHILE UPPER-MIDDLE- AND HIGH-INCOME COUNTRIES HAVE THE GREATEST BURDEN OF OBESITY CASES
LOW
BIRT
HWEI
GHT
EXCL
USIV
E BR
EAST
FEED
ING
(infa
nts <
6 m
onth
s)ST
UNTI
NG(u
nder
5 ye
ars)
WAS
TING
(und
er 5
year
s)OV
ERW
EIGH
T(u
nder
5 ye
ars)
ANAE
MIA
(wom
en a
ged
15 to
49
year
s)OB
ESIT
Y(a
dults
)
14%
15%
69%
68%
12%
12%
5%
5%
2012(21 million)
2015(21 million)
18%
21%
60%
63%
22%
16%
2012(50 million)
2020(59 million)
21%
24%
68%
65% 1%
10% 1%
9%
2012(174 million)
2020(149 million)
3%
3%
23%
24%
37%
38%
37%
35%
2012(574 million)
2016(676 million)
9%
11%
62%
63%
22%
20%
7%
7%
2012(520 million)
2019(571 million)
10%
10%
40%
40%
38%
37%
13%
13%
2012(37 million)
2020(39 million)
17% 76% 1%6%2020(45 million)
PERCENTAGE
PERCENTAGE
Upper-middle-income countries
Low-income countries
High-income countries
Lower-middle-income countries 0 20 40 60 80 100
0 20 40 60 80 100
NOTES: 1. The percentages refer to the proportion of the total number of affected people (depicted below each year) who live in the countries included in each income group, not to the prevalence in each income group; total number affected varies from the global totals reported elsewhere in this report because the populations are based on the FY2022 World Bank income classification. 2. Arrows indicate any change in percentage points between years. 3. Exclusive breastfeeding estimates are not available for HICs. 4. Although 2010 is the WHO baseline for adult obesity, to ensure consistency throughout this report, the year 2012 is used as the baseline.SOURCES: Data for stunting, wasting and overweight are based on UNICEF, WHO & International Bank for Reconstruction and Development/World Bank. 2021. UNICEF, WHO, World Bank Group Joint Child Malnutrition Estimates, April 2021 Edition. Cited 2 May 2022. https://data.unicef.org/topic/nutrition, www.who.int/data/gho/data/themes/topics/joint-child-malnutrition-estimates-unicef-who-wb, https://data.worldbank.org; data for exclusive breastfeeding are based on UNICEF. 2021. Infant and Young Child Feeding: Exclusive breastfeeding. In: UNICEF Data: Monitoring the Situation of Children and Women. https://data.unicef.org/topic/nutrition/infant-and-young-child-feeding; data for anaemia are based on WHO. 2021. Global Health Observatory (GHO). In: WHO. Geneva, Switzerland. Cited 2 May 2022. http://apps.who.int/gho/data/node.imr.PREVANEMIA?lang=en; data for adult obesity are based on WHO. 2017. Global Health Observatory (GHO). In: WHO. Geneva, Switzerland. Cited 2 May 2022. http://apps.who.int/gho/data/node.main.A900A?lang=en; and data for low birthweight are based on UNICEF & WHO. 2019. UNICEF-WHO Low Birthweight Estimates: levels and trends 2000–2015. Geneva, Switzerland. Cited 2 May 2022. data.unicef.org/resources/low-birthweight-report-2019
| 35 |
CHAPTER 2 FOOD SECURITY AND NUTRITION AROUND THE WORLD
This analysis highlights that LICs and LMICs combined bear the greatest burden of low birthweight newborns, stunted and wasted children, and women with anaemia, keeping in mind the fact that these countries are home to a greater proportion of the global population.
Potential impacts of current crises on global nutritionGlobal trends will likely be affected by recent and ongoing crises, especially those with global implications. Although the effects of the COVID-19 pandemic on malnutrition are not fully revealed yet, either due to data sparsity or the long-term impact for some of the nutritional outcomes, negative impacts on various forms of malnutrition are expected at the global level. More recently, the war in Ukraine has the potential to impact malnutrition on a global scale.34
Despite uncertainty around the impact of COVID-19 on global nutrition, there have been some simulation exercises based on different scenarios to evaluate the impact of the pandemic on child malnutrition using a limited set of covariates and estimates based on historical data.35 The 2021 edition of this report provided some projections based on these simulations for child stunting and wasting.15 It showed that between 11.2 and 16.3 million more children under five years of age in LICs and MICs may be affected by wasting from 2020 to 2022 as a consequence of the COVID-19 pandemic, compared to a scenario in which the pandemic had not occurred. For child stunting, it was predicted that between 3.4 and 4.5 million more children may be stunted in 2022 due to the impacts of the COVID-19 pandemic.
More recently, a comprehensive analytical framework36 was developed by the UNICEF-USAID-WHO Agile Core Team for Nutrition Monitoring (ACT-NM) which focuses on public-health pathways linking the pandemic to nutrition outcomes related to the six nutrition targets endorsed by the WHA. The framework is built around five categories of factors relevant to the intersection of the COVID-19 pandemic and nutrition: i) enabling determinants, ii) underlying determinants, iii) immediate determinants, iv) outcomes and v) impact. Each category of
determinant has an overall theme with various subcategories. Enabling determinants include subcategories for governance, resource and sociocultural context; underlying determinants include subcategories for food, health, social protection, education, water and sanitation, while immediate determinants include ten subcategories of behavioural and nutritional status. The framework’s left-to-right axis enables users to identify, explore and assess numerous context-specific public-health pathways and consider inequalities at all levels.
Two country case studies attempt to illustrate potential context-specific pathways of the impact of the pandemic on child malnutrition specifically in Chad for wasting and Peru for overweight (Box 4). Although data to provide evidence of this impact is very limited, the exercise is useful to explore the different pathways through which the COVID-19 pandemic can impact nutrition.
The ongoing war in Ukraine risks increasing the number of malnourished people, especially women and children globally. This conflict is intrinsically related to the impact on the global food supply and hunger as mentioned in Section 2.1 (Box 3). A recent article published in Nature aims to raise awareness about these potential risks and makes a global call for urgent action.34 A summary of this work is presented in Box 5.
Spotlight on inequalitiesIn this section, we explore six nutrition indicators through the lens of inequalities. This is an important addition, as global and regional patterns in malnutrition can mask disparities that exist within and between countries, including characteristics such as urban and rural residence, household wealth, education and gender. In an inequality analysis, these are the population groups that are most commonly analysed for comparisons between countries and regions, due to their strong associations with nutrition outcomes. The results from these analyses help to identify the most vulnerable population groups, contributing to evidence that can inform decision-making and effective action through the appropriate targeting and design of policies and
| 36 |
THE STATE OF FOOD SECURITY AND NUTRITION IN THE WORLD 2022
BOX 4 COVID-19 CASE STUDY: COUNTRY EXAMPLES OF THE IMPACT OF THE PANDEMIC ON CHILD WASTING AND OVERWEIGHT THROUGH CONTEXT-SPECIFIC PATHWAYS
Based on the ACT-NM comprehensive analytical framework, the case studies below trace potential pathways connecting multiple determinants and factors that may impact wasting and overweight among children under five years of age. However, interpretations of potential impact should be made with caution due to information gaps resulting from the stringency measures implemented by countries to control the pandemic.
A PATHWAY TO CHILDHOOD WASTING – AN EXAMPLEChad* began implementing COVID-19 measures in March of 2020, with its strictest in place from April to May 2020 (Stringency Index [SI] = 88.9**). In May and June 2020, 58 percent of communities reported a deterioration in their ability to meet basic needs – 11 percent of households reported a loss of income, and 13 percent of households were unable to perform farming activities due to COVID-19 measures.37 Meanwhile, the increased prices of major food items impacted 68.7 percent of households, and many relied on coping strategies including reduced food consumption (35 percent), reliance on savings (22 percent), the sale of assets (13.8 percent), or reliance on less preferred foods (10.8 percent).37,38 An estimated 2.4 million people had insufficient food consumption in early November 2020.39 Among infants under six months of age, exclusive breastfeeding rates declined from the already very low 16.4 percent (2020) to 11.4 percent (2021), possibly influenced by the fear of mother-to-child transmission of SARSCoV-2.40 Many households were unable to access necessary medical treatment in 2020 due to lack of money, fear of transmission, and the lack of available health workers.37,40 Wasting treatment programmes were scaled up in late 2020 with a 10–24 percent increase in admissions observed from the first quarter of 2020 to the first quarter of 2021,
likely mitigating a higher impact on child wasting in Chad.41 Nevertheless, wasting among children under five years of age at national level appeared to be on a downward trend from 13.5 (95% confidence interval [CI]; 12.6–14.5) percent in 2018 to 12.0 (95% CI; 11.3–12.7) percent in 2019 to 9.5 (95% CI; 8.9–10.1) percent in 2020 before reversing and increasing slightly to 10.2 (95% CI; 9.5–10.8) percent in 2021.42 The observed dip in wasting in 2020 was likely influenced by efforts to mitigate the COVID-19 impact as well as the fact that the data collection period was outside of the lean season (unlike the other surveys). However, the observed reversal of the downward trend in 2021 may indicate the degradation of the nutrition-related environment.
A PATHWAY TO CHILDHOOD OVERWEIGHT – AN EXAMPLEPeru implemented some of the strictest COVID-19 measures in Latin America with the most stringent from May to October 2020 (SI = 96.3). These were not substantially eased until December 2020 (SI = 59.3). The measures led to an increase in online food purchases and delivery services of pre-packaged foods as well as greater exposure to the marketing of highly processed foods. This shifted consumption patterns, notably towards an increased reliance on unhealthy diets, often containing processed foods high in energy, fat, free sugars and salt. This negatively affected the quantity, quality and diversity of diets in Peru. At the same time, the stringent measures may have contributed to reduced physical activity and increased sedentary lifestyle practices including excessive time spent viewing mobile phone, computer and television screens. Nationally, overweight among children under five years of age increased from 8.1 (95% CI; 7.6–8.6) percent in 2019 to 10.6 (95% CI; 9.8–11.5) percent in 2020.42
* In 2020, Chad was classified as a LIFDC by the World Bank, but the COVID-19 pandemic worsened the situation as evidenced by the INSEED and World Bank National Socio-Economic Impacts of COVID-19 studies at the household level. ** Stringency index (SI) from the Oxford Coronavirus Government Response Tracker (OxCGRT). The stringency index is a composite measure based on the mean score of nine response indicators (i.e. school closures, workplace closures, cancellation of public events, restrictions on public gatherings, closures of public transport, stay-at-home requirements, public information campaigns, restrictions on internal movements, and international travel controls) rescaled to a value from 0 to 100 (100 = strictest).
| 37 |
CHAPTER 2 FOOD SECURITY AND NUTRITION AROUND THE WORLD
programmes. Stakeholders can then tackle these important gaps between population groups so that no one is left behind.
An inequality analysis according to urban and rural residence, household wealth, education level and gender as applied to six nutrition indicators is presented using Equiplots in Figure 13. Equiplots depict mean prevalences for subpopulations within each category of the respective inequity dimension (i.e. type of residence, wealth, maternal education, gender). They allow visual interpretation of prevalence levels and distance between groups, which represents absolute inequality. The analysis was performed across United Nations regional classification based on data
availability for countries within each region. Unweighted analysis was applied using the latest available data from national surveys between 2015 and 2021. The list of countries contributing to each region is presented in Annex 2C Table A2.3. Despite the limitations regarding lack of data in many countries, as highlighted in the figure, this inequality analysis presents important information aiming to answer the question, “Who is most affected by malnutrition?”
Inequality analyses for low birthweight are not presented in this section due to data limitations. Globally, a large proportion of newborns are not weighed at birth, and there are disparities across regions. In 2020, for example, more than one quarter (27.2 percent) of newborns were
BOX 5 THE WAR IN UKRAINE THREATENS TO INCREASE THE NUMBER OF MALNOURISHED PEOPLE, ESPECIALLY WOMEN AND CHILDREN GLOBALLY
The Russian Federation and Ukraine are among the most important producers of key agricultural products and inputs (fertilizers and crude oil). The bearings of the war in Ukraine are uncertain, but its threat to global food security is quickly surfacing. The number of malnourished people, especially women and children, is poised to increase steeply if concerted efforts are not made to mitigate the conflict’s effects on malnutrition. A recent comment published in Nature outlines potential risks and also includes a list of urgent actions to mitigate its impact.34 They are described below.
Potential risks imposed by the crisis:
1. Direct impacts on food security and quality of the diet through increased food prices and reduced food availability and access.
2. Reduced reach of humanitarian assistance and services for prevention and treatment of acute malnutrition.
3. Reallocations of nutrition budgets to other priorities.
Call to six urgent actions to safeguard access to nutrition services and safe, nutritious foods for women and children:
1. Support call to minimizing restrictions on global food and fertilizer trade, and disruptions to supply chains to mitigate food price crisis.
2. Shield access to nutritious food for the most vulnerable with nutrition-sensitive social safety net measures.
3. Mobilize needed resources for humanitarian assistance.
4. Follow through on Tokyo Nutrition for Growth Summit (N4G) financing commitments to scale up nutrition services for the poor.
5. Protect nutrition budgets and continue services of proven nutrition interventions for women and children.
6. Invest in timely standardized nutrition data to guide policy and funding.
The effect of this crisis has the potential to be long term, affecting a generation of women and children who are already vulnerable to malnutrition – with implications for the human capital of communities and nations spanning generations.
| 38 |
THE STATE OF FOOD SECURITY AND NUTRITION IN THE WORLD 2022
not weighed globally, while 61.9 percent of low birthweight data were missing in Western Africa compared to just 1.4 percent in Europe.42 Furthermore, low birthweight estimates disaggregated by background characteristics such as wealth, mother’s education and gender are not currently available in global databases. This is due to many factors, including discrepancies in the availability and quality of data among groups. For example, in LICs and MICs, in most cases, a much lower percentage of newborns in the poorest quintile are weighed at birth, and birthweight data are often recorded in multiples of 100 g and 500 g (data heaping), leading to less reliable estimates and potentially biased and misleading comparisons between these groups. Lastly, more research is needed to evaluate whether the current non-sex-specific cut-off for low birthweight (<2 500 g) will bias results for gender inequality analyses.
The proportion of infants under six months of age benefiting from exclusive breastfeeding is higher in rural areas across most regions, with the exception of Northern America, Europe, Australia and New Zealand, where the practice is more common in urban areas. It also tends to be higher among infants whose mothers were less educated, especially in Latin America and the Caribbean. Although exclusive breastfeeding was generally higher among households in lower wealth quintiles, Oceania excluding Australia and New Zealand (henceforth referred to as “Oceania”) had the highest prevalence among the second and fifth wealth quintiles. Northern America, Europe, Australia and New Zealand also lacked a clear pattern. Slightly more girls than boys were breastfed across most regions. Overall, infants under six months of age who are benefiting from exclusive breastfeeding are more likely to be residing in rural areas, in poorer households, have mothers who received no formal education and to be female (Figure 13A).
In most regions presented, the prevalence of stunting among children under five years of age is highest in rural residences, with the exception of Northern America, Europe, Australia and New Zealand. This difference is most pronounced in Africa. The highest prevalence was among households of the lowest wealth quintile.
In Africa, the wealthiest quintile presents a substantially lower prevalence compared with the other four quintiles. In contrast, in Latin America and the Caribbean, the poorest quintile is lagging behind compared to the other four quintiles, which means that interventions must be targeted to this specific subgroup. Analyses by maternal education showed a clear pattern across all regions, with the prevalence of stunting being highest among children whose mothers had no formal education and lowest among children whose mothers received a secondary or higher education. Boys were more affected by stunting than girls in most regions. Overall, stunted children under five years of age are more likely to be residing in rural settings, in poorer households, with mothers who received no formal education, and to be male.
The prevalence of wasting among children under five years of age does not vary greatly based on urban or rural setting, household wealth or gender, with the exception of Oceania where children of mothers who received no formal education are more likely to be wasted. Overall, wasted children under five years of age may be more likely to be living in a poorer household and have a mother who received no formal education.
Comparisons of overweight among children under five years of age living in rural versus urban areas do not reveal a clear pattern across regions, while the wealthiest households have a higher prevalence of overweight in most regions. Children whose mothers received at least a secondary education seem to be more affected by overweight, with the exception of the more developed regions – Northern America, Europe, Australia and New Zealand – where children with mothers who received only primary education have the highest prevalence. Boys may be more affected by overweight than girls. Overall, overweight children under five years of age are more likely to be living in wealthier households and with mothers who received at least a secondary school education.
The prevalence of anaemia among women aged 15 to 49 years by place of residence varies by region. In Africa, the prevalence is
| 39 |
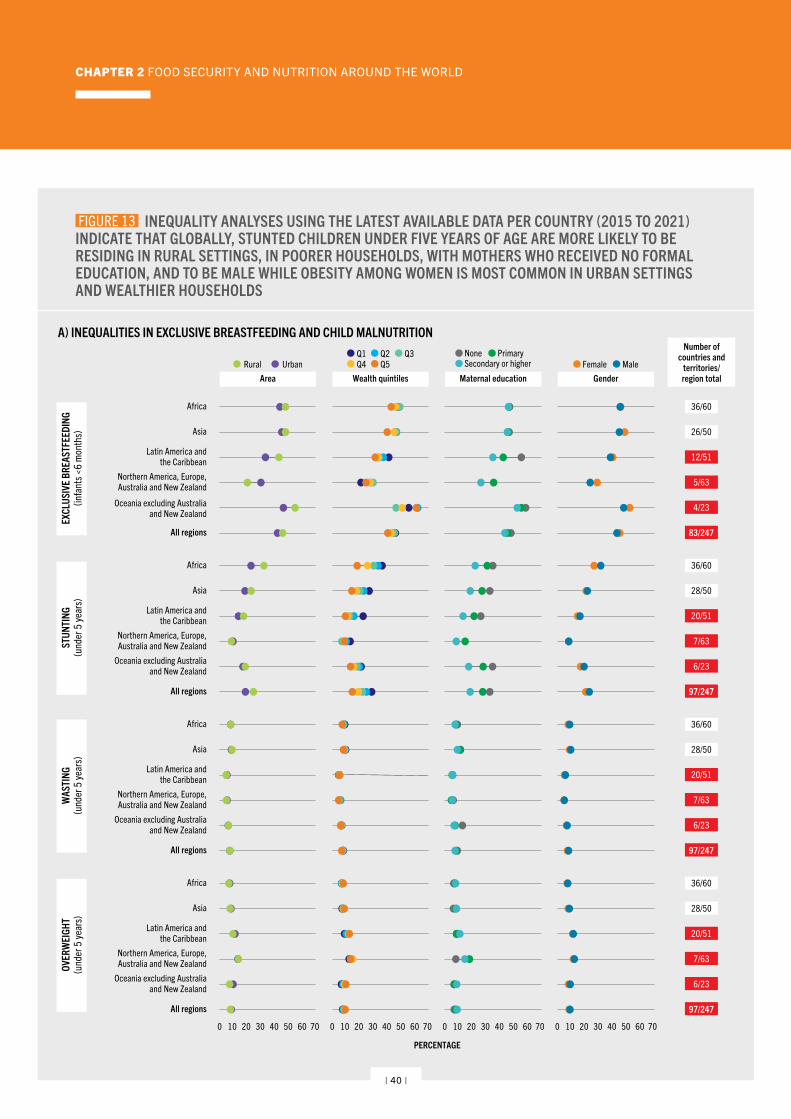
CHAPTER 2 FOOD SECURITY AND NUTRITION AROUND THE WORLD
FIGURE 13 INEQUALITY ANALYSES USING THE LATEST AVAILABLE DATA PER COUNTRY (2015 TO 2021) INDICATE THAT GLOBALLY, STUNTED CHILDREN UNDER FIVE YEARS OF AGE ARE MORE LIKELY TO BE RESIDING IN RURAL SETTINGS, IN POORER HOUSEHOLDS, WITH MOTHERS WHO RECEIVED NO FORMAL EDUCATION, AND TO BE MALE WHILE OBESITY AMONG WOMEN IS MOST COMMON IN URBAN SETTINGS AND WEALTHIER HOUSEHOLDS
All regions
Oceania excluding Australiaand New Zealand
Northern America, Europe,Australia and New Zealand
Latin America andthe Caribbean
Asia
Africa
All regions
Oceania excluding Australiaand New Zealand
Northern America, Europe,Australia and New Zealand
Latin America andthe Caribbean
Asia
Africa
All regions
Oceania excluding Australiaand New Zealand
Northern America, Europe,Australia and New Zealand
Latin America andthe Caribbean
Asia
Africa
All regions
Oceania excluding Australiaand New Zealand
Northern America, Europe,Australia and New Zealand
Latin America andthe Caribbean
Asia
Africa
PERCENTAGE
0 10 20 30 40 50 60 70
Rural UrbanArea
0 10 20 30 40 50 60 70
Q1 Q2 Q3Q4 Q5
Wealth quintiles
0 10 20 30 40 50 60 70
None PrimarySecondary or higher
Maternal education
0 10 20 30 40 50 60 70
Female MaleGender
83/247
4/23
5/63
12/51
26/50
36/60
97/247
6/23
7/63
20/51
28/50
36/60
97/247
6/23
7/63
20/51
28/50
36/60
97/247
6/23
7/63
20/51
28/50
36/60
Number ofcountries and
territories/region total
EXCL
USIV
E BR
EAST
FEED
ING
(infa
nts <
6 m
onth
s)ST
UNTI
NG(u
nder
5 ye
ars)
WAS
TING
(und
er 5
year
s)OV
ERW
EIGH
T(u
nder
5 ye
ars)
A) INEQUALITIES IN EXCLUSIVE BREASTFEEDING AND CHILD MALNUTRITION
| 40 |
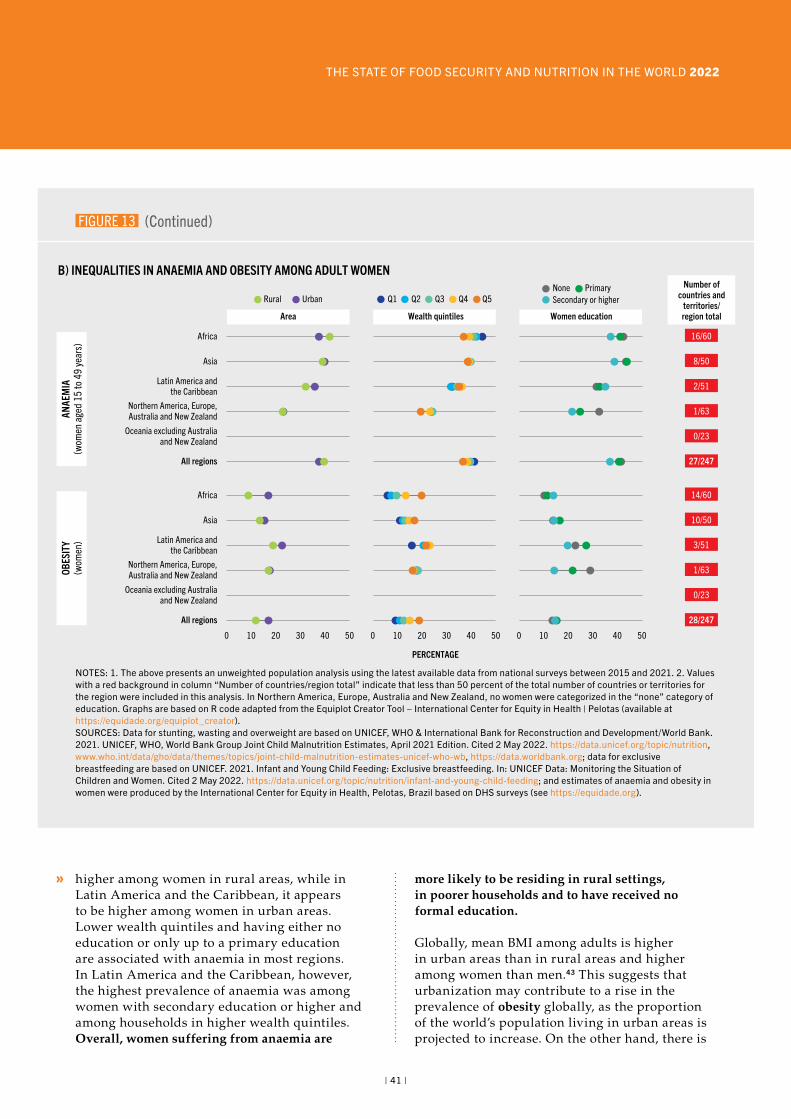
THE STATE OF FOOD SECURITY AND NUTRITION IN THE WORLD 2022
higher among women in rural areas, while in Latin America and the Caribbean, it appears to be higher among women in urban areas. Lower wealth quintiles and having either no education or only up to a primary education are associated with anaemia in most regions. In Latin America and the Caribbean, however, the highest prevalence of anaemia was among women with secondary education or higher and among households in higher wealth quintiles. Overall, women suffering from anaemia are
more likely to be residing in rural settings, in poorer households and to have received no formal education.
Globally, mean BMI among adults is higher in urban areas than in rural areas and higher among women than men.43 This suggests that urbanization may contribute to a rise in the prevalence of obesity globally, as the proportion of the world’s population living in urban areas is projected to increase. On the other hand, there is
FIGURE 13 (Continued)
ANAE
MIA
(wom
en a
ged
15 to
49
year
s)OB
ESIT
Y(w
omen
)
Number ofcountries and
territories/region total
27/247
0/23
1/63
2/51
8/50
16/60
28/247
0/23
1/63
3/51
10/50
14/60
Rural Urban
Area
0 10 20 30 40 50
Q1 Q2 Q3 Q4 Q5
Wealth quintiles
0 10 20 30 40 50
None PrimarySecondary or higher
Women education
0 10 20 30 40 50
All regions
Oceania excluding Australiaand New Zealand
Northern America, Europe,Australia and New Zealand
Latin America andthe Caribbean
Asia
Africa
All regions
Oceania excluding Australiaand New Zealand
Northern America, Europe,Australia and New Zealand
Latin America andthe Caribbean
Asia
Africa
PERCENTAGE
B) INEQUALITIES IN ANAEMIA AND OBESITY AMONG ADULT WOMEN
NOTES: 1. The above presents an unweighted population analysis using the latest available data from national surveys between 2015 and 2021. 2. Values with a red background in column “Number of countries/region total” indicate that less than 50 percent of the total number of countries or territories for the region were included in this analysis. In Northern America, Europe, Australia and New Zealand, no women were categorized in the “none” category of education. Graphs are based on R code adapted from the Equiplot Creator Tool − International Center for Equity in Health | Pelotas (available at https://equidade.org/equiplot_creator). SOURCES: Data for stunting, wasting and overweight are based on UNICEF, WHO & International Bank for Reconstruction and Development/World Bank. 2021. UNICEF, WHO, World Bank Group Joint Child Malnutrition Estimates, April 2021 Edition. Cited 2 May 2022. https://data.unicef.org/topic/nutrition, www.who.int/data/gho/data/themes/topics/joint-child-malnutrition-estimates-unicef-who-wb, https://data.worldbank.org; data for exclusive breastfeeding are based on UNICEF. 2021. Infant and Young Child Feeding: Exclusive breastfeeding. In: UNICEF Data: Monitoring the Situation of Children and Women. Cited 2 May 2022. https://data.unicef.org/topic/nutrition/infant-and-young-child-feeding; and estimates of anaemia and obesity in women were produced by the International Center for Equity in Health, Pelotas, Brazil based on DHS surveys (see https://equidade.org).
| 41 |
CHAPTER 2 FOOD SECURITY AND NUTRITION AROUND THE WORLD
evidence that the obesity prevalence has increased faster in rural than in urban areas, likely due to the lack of access to healthy foods in LICs and MICs.44 Figure 13B presents results of inequality analyses of the prevalence of obesity exclusively among women due to the lack of primary data at individual level for men with same coverage, which would allow similar analysis. Of the 28 Demographic and Health Surveys (DHS) conducted since 2015 included in this analysis, only 10 surveys also collected anthropometric data for men (a men-to-women data availability ratio of approximately 1:4). Based on this analysis, more women 15–49 years of age suffer from obesity in urban than in rural settings across regions. The relationship between level of education and obesity varies greatly, with women with no formal education having the highest prevalence of obesity in Northern America, Europe, Australia and New Zealand, while in Africa, substantially more women with obesity had a secondary or higher education. In most regions, obesity was higher among women from wealthier households. Overall, women with obesity are more likely to reside in urban areas and in wealthier households.
A subanalysis was conducted using the 10 DHS surveys with data for men and women 20–49 years of age, highlighting substantial differences in the prevalence of obesity between men and women. Among the 10 countries located primarily in Africa and Asia,e the mean prevalence of obesity was 13.8 percent among women and 4.9 percent among men. The prevalence of obesity was higher for women in all countries, regardless of urban or rural setting or household wealth quintile.
Many regions and countries are increasingly facing multiple forms of malnutrition simultaneously at the population, household and individual levels,45 and this double burden of malnutrition can be associated with the inequalities described above. For example, results of one recent analysis in LMICs showed that the double burden of malnutrition at the household level (in this case, overweight mother
e The subanalysis included surveys from 10 countries: Albania, Bangladesh, India, Maldives, Nepal, Sierra Leone, South Africa, Timor-Leste, Uganda and Zimbabwe.
with stunted child) was higher among richer households in the poorer countries, while in the richer countries, the risk was higher among poorer households.46 Effective double-duty actions to address these burdens will be those that are context-specific and that target those subpopulations most affected.
In summary, this spotlight on inequalities reveals that children in rural settings and poorer households are more vulnerable to stunting and wasting, while boys may be more affected by stunting. Children and adults, particularly women, in urban areas and wealthier households are at higher risk of overweight and obesity, respectively. Infants residing in rural areas, in poorer households, with mothers who received no formal education and female infants are more likely to be breastfed. Women with no formal education are more vulnerable to anaemia and their children to stunting and wasting. The aim of such analyses is to highlight how global progress is hindered by the specific challenges of different groups. Stakeholders can then identify more contextualized inequalities to redesign and target national policies and programmes aimed at reaching the most vulnerable groups. Addressing inequalities will be essential to achieving the 2030 targets.
Progress towards ending all forms of malnutrition by 2030This section presents an assessment of the progress towards the 2030 global nutrition targets. Like the projections for hunger, estimates regarding levels of malnutrition towards the 2030 targets are characterized by a high level of uncertainty. The same approach applied in the last two editions of this report was used to assess the progress of the nutritional indicators, which is based on the rate of change observed from trends before the pandemic. Hence, this analysis does not reflect the potential effect of COVID-19 on malnutrition, which will likely affect progress assessment towards the 2030 targets, as already indicated through projection exercises in the 2021 edition of this report showing potential effects of the COVID-19 pandemic on stunting and wasting.15
| 42 |
THE STATE OF FOOD SECURITY AND NUTRITION IN THE WORLD 2022
Global progressGlobal progress towards each of the seven nutrition 2030 targets is summarized in Figure 14. Although the 2015 prevalence of 14.6 percent among newborns suffering from low birthweight was not far from the 14.1 percent required to be on track for the 2030 target of a 30 percent reduction since the baseline of 2012, available data suffer from the limitations discussed earlier in this chapter. Improvements in low birthweight data quality and representativeness are needed to reliably assess the severity and magnitude of the problem.
The proportion of exclusively breastfed infants under six months of age increased from 37.1 percent in 2012 to 43.8 percent in 2020; however, this falls well below the 54.7 percent that would indicate the world was on track to achieving the 2030 target of at least 70 percent globally. Achieving this target will require investments in effective and context-specific interventions that promote the adoption and sustained implementation of exclusive breastfeeding. Enactment and enforcement of the International Code of Marketing of Breast-milk Substitutes, institutionalization of the Baby-friendly Hospital Initiative, and scaling-up of antenatal and postnatal breastfeeding counselling are critically needed.
Although stunting among children under five years of age has decreased from 26.2 percent in 2012 to 22.0 percent in 2020, it would need to have been reduced to 19.1 percent in 2020 to be on track to reach the 50 percent reduction in the number of stunted children by the 2030 target, which translates to a prevalence of 12.8 percent. Larger investments in both nutrition-specific and nutrition-sensitive actions will be required to ensure greater strides are made in stunting reduction.
The prevalence of wasting among children under five years of age was estimated to be 6.7 percent in 2020, more than double the 2030 target of less than 3 percent. This estimate signals that investments in the prevention, early detection and treatment of wasting must be increased substantially.
While the 2030 target calls for a substantial reduction in overweight among children under five years to just 3 percent, the prevalence has
increased slightly from 5.6 percent in 2012 to 5.7 percent in 2020, albeit without statistical significance. A reversal in this trend will be required to achieve the 2030 target. As with obesity among all age groups, this will require increased investments into effective interventions to improve diet and nutrition as well as other lifestyle factors such as physical activity.
The prevalence of anaemia among women aged 15 to 49 years increased from 28.5 percent in 2012 to 29.9 percent in 2019. Thus, the world is moving further away from reaching the 2030 target of a 50 percent reduction in the number of women with anaemia, which would translate into a prevalence of 14.3 percent. Reversing this trend will require an integrated, multisectoral approach to determine and address all causes and risk factors of anaemia in women, including but not limited to those related to poor nutritional status, gynaecological conditions, malaria and other parasitic infections, and low socioeconomic status. Increased awareness and support are needed at the global, regional and national levels to facilitate these comprehensive approaches, in contrast with isolated interventions which may not have a sufficient impact on trends.
Adult obesity continued on the rise from 11.8 percent in 2012 to 13.1 percent in 2016. This trend will need to be reversed in order to return to the 11.8 percent prevalence of 2012, in alignment with the 2025 target to halt the rise in obesity. In addition to improved diet and nutrition, investments will be required to support public health actions that promote healthier lifestyles.
Regional progressThe progress achieved since the baseline year of 2012 up to the latest year for which estimates are available were compared with the progress required using the Average Annual Rate of Reduction (AARR)47,f for countries with sufficient data and summarized within regions they belong to (Figure 15). This level of granularity is useful to show that countries are in a different status of progress within regions, as within each region and subregion we can
f See technical note on how to calculate AARR (available at UNICEF [2007]).47
| 43 |
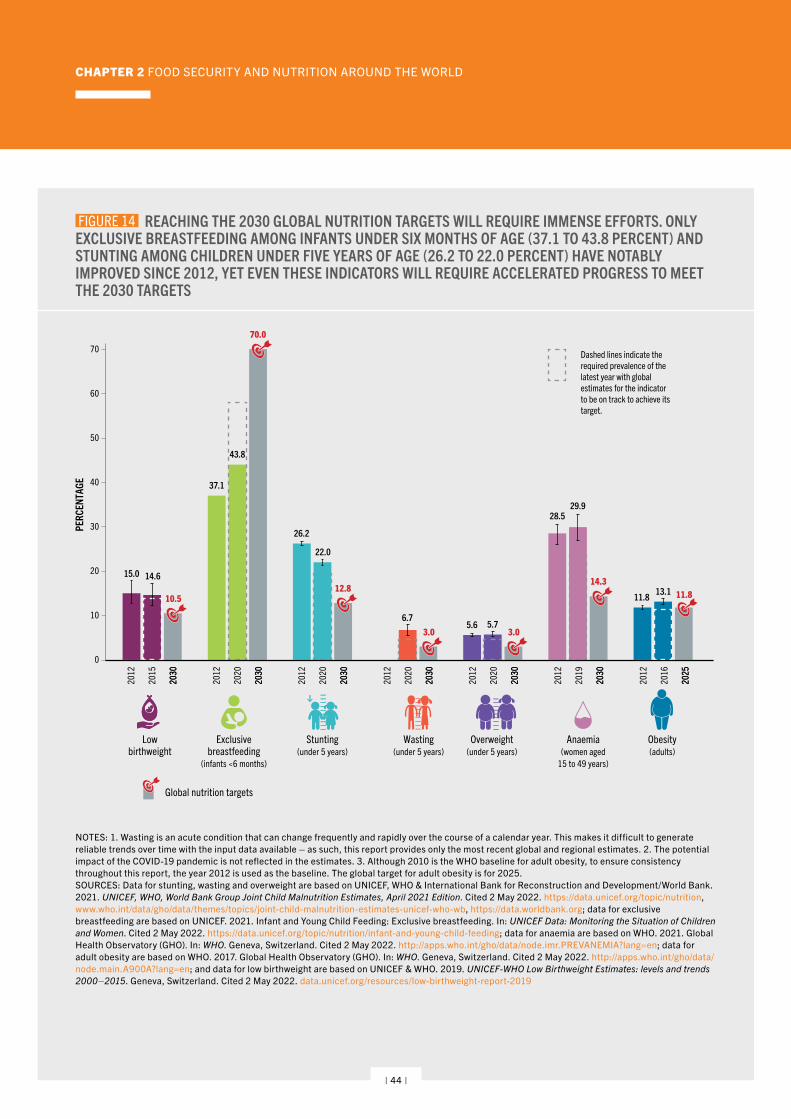
CHAPTER 2 FOOD SECURITY AND NUTRITION AROUND THE WORLD
FIGURE 14 REACHING THE 2030 GLOBAL NUTRITION TARGETS WILL REQUIRE IMMENSE EFFORTS. ONLY EXCLUSIVE BREASTFEEDING AMONG INFANTS UNDER SIX MONTHS OF AGE (37.1 TO 43.8 PERCENT) AND STUNTING AMONG CHILDREN UNDER FIVE YEARS OF AGE (26.2 TO 22.0 PERCENT) HAVE NOTABLY IMPROVED SINCE 2012, YET EVEN THESE INDICATORS WILL REQUIRE ACCELERATED PROGRESS TO MEET THE 2030 TARGETS
0
10
20
30
40
50
60
70
2015
2030
2030
2012
2020
2030
2030
2012
2020
2030
2030
2012
2020
2030
2030
2012
2020
2030
2030
2012
2019
2030
2030
2012
2016
2025
2025
2012
Lowbirthweight
Anaemia(women aged
15 to 49 years)
Exclusivebreastfeeding
(infants <6 months)
Overweight(under 5 years)
Wasting(under 5 years)
Stunting(under 5 years)
Obesity(adults)
PERC
ENTA
GE
10.5
70.0
12.8
3.0 3.0
14.311.8
15.0
37.1
26.2
5.6
28.5
11.8
14.6
43.8
22.0
6.75.7
29.9
13.1
Dashed lines indicate therequired prevalence of thelatest year with globalestimates for the indicatorto be on track to achieve itstarget.
Global nutrition targets
NOTES: 1. Wasting is an acute condition that can change frequently and rapidly over the course of a calendar year. This makes it difficult to generate reliable trends over time with the input data available – as such, this report provides only the most recent global and regional estimates. 2. The potential impact of the COVID-19 pandemic is not reflected in the estimates. 3. Although 2010 is the WHO baseline for adult obesity, to ensure consistency throughout this report, the year 2012 is used as the baseline. The global target for adult obesity is for 2025.SOURCES: Data for stunting, wasting and overweight are based on UNICEF, WHO & International Bank for Reconstruction and Development/World Bank. 2021. UNICEF, WHO, World Bank Group Joint Child Malnutrition Estimates, April 2021 Edition. Cited 2 May 2022. https://data.unicef.org/topic/nutrition, www.who.int/data/gho/data/themes/topics/joint-child-malnutrition-estimates-unicef-who-wb, https://data.worldbank.org; data for exclusive breastfeeding are based on UNICEF. 2021. Infant and Young Child Feeding: Exclusive breastfeeding. In: UNICEF Data: Monitoring the Situation of Children and Women. Cited 2 May 2022. https://data.unicef.org/topic/nutrition/infant-and-young-child-feeding; data for anaemia are based on WHO. 2021. Global Health Observatory (GHO). In: WHO. Geneva, Switzerland. Cited 2 May 2022. http://apps.who.int/gho/data/node.imr.PREVANEMIA?lang=en; data for adult obesity are based on WHO. 2017. Global Health Observatory (GHO). In: WHO. Geneva, Switzerland. Cited 2 May 2022. http://apps.who.int/gho/data/node.main.A900A?lang=en; and data for low birthweight are based on UNICEF & WHO. 2019. UNICEF-WHO Low Birthweight Estimates: levels and trends 2000–2015. Geneva, Switzerland. Cited 2 May 2022. data.unicef.org/resources/low-birthweight-report-2019
| 44 |
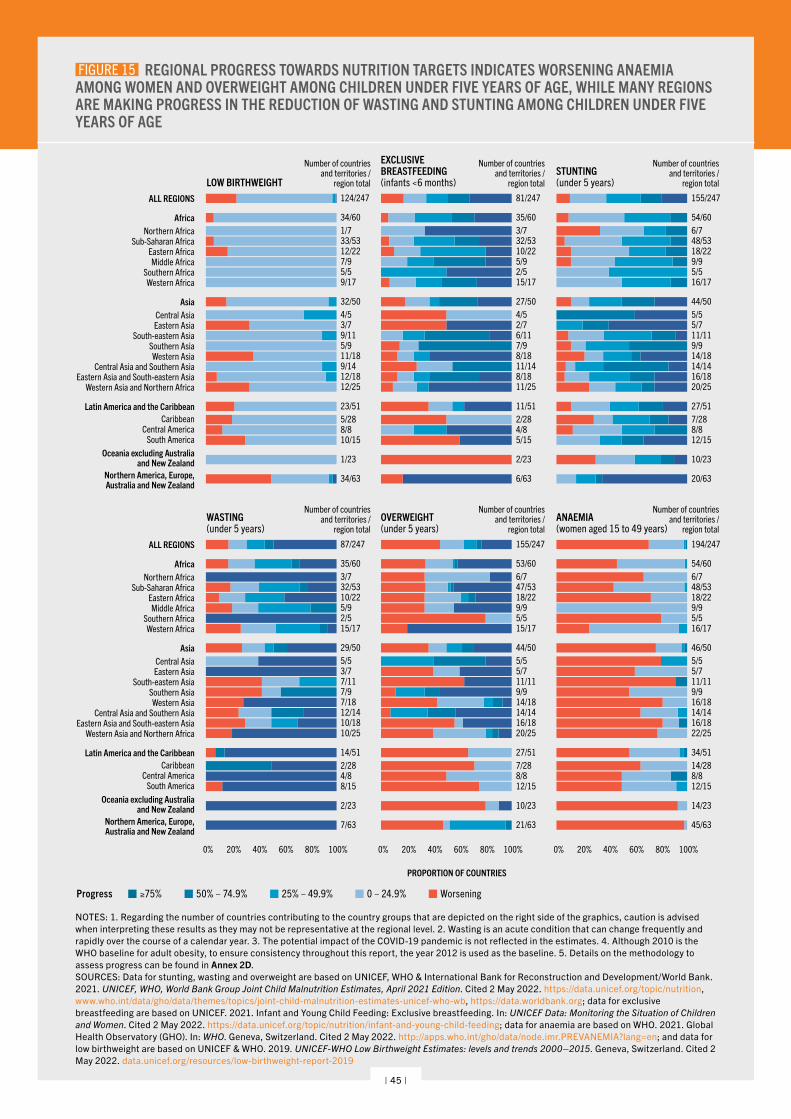
THE STATE OF FOOD SECURITY AND NUTRITION IN THE WORLD 2022 FIGURE 15 REGIONAL PROGRESS TOWARDS NUTRITION TARGETS INDICATES WORSENING ANAEMIA AMONG WOMEN AND OVERWEIGHT AMONG CHILDREN UNDER FIVE YEARS OF AGE, WHILE MANY REGIONS ARE MAKING PROGRESS IN THE REDUCTION OF WASTING AND STUNTING AMONG CHILDREN UNDER FIVE YEARS OF AGE
34/63
1/23
10/158/85/2823/51
12/2512/189/1411/185/99/113/74/532/50
9/175/57/912/2233/531/734/60
124/247
7/63
2/23
8/154/82/2814/51
10/2510/1812/147/187/97/113/75/529/50
15/172/55/910/2232/533/735/60
87/247
0% 20% 40% 60% 80% 100%
20/63
10/23
12/158/87/2827/51
20/2516/1814/1414/189/911/115/75/544/50
16/175/59/918/2248/536/754/60
155/247
45/63
14/23
12/158/814/2834/51
22/2516/1814/1416/189/911/115/75/546/50
16/175/59/918/2248/536/754/60
194/247
0% 20% 40% 60% 80% 100%
Northern America, Europe,Australia and New Zealand
Oceania excluding Australiaand New Zealand
South AmericaCentral America
CaribbeanLatin America and the Caribbean
Western Asia and Northern AfricaEastern Asia and South-eastern Asia
Central Asia and Southern AsiaWestern Asia
Southern AsiaSouth-eastern Asia
Eastern AsiaCentral Asia
Asia
Western AfricaSouthern Africa
Middle AfricaEastern Africa
Sub-Saharan AfricaNorthern Africa
Africa
ALL REGIONS
0%
6/63
2/23
5/154/82/2811/51
11/258/1811/148/187/96/112/74/527/50
15/172/55/910/2232/533/735/60
81/247
21/63
10/23
12/158/87/2827/51
20/2516/1814/1414/189/911/115/75/544/50
15/175/59/918/2247/536/753/60
155/247
Number of countriesand territories /
region total
Number of countriesand territories /
region total
Number of countriesand territories /
region totalWASTING(under 5 years)
ANAEMIA(women aged 15 to 49 years)
OVERWEIGHT(under 5 years)
Number of countriesand territories /
region total
Number of countriesand territories /
region total
Number of countriesand territories /
region totalLOW BIRTHWEIGHTSTUNTING(under 5 years)
EXCLUSIVEBREASTFEEDING(infants <6 months)
20% 40% 60% 80% 100%
Progress ≥75% 50% − 74.9% 25% − 49.9% 0 − 24.9% Worsening
PROPORTION OF COUNTRIES
NOTES: 1. Regarding the number of countries contributing to the country groups that are depicted on the right side of the graphics, caution is advised when interpreting these results as they may not be representative at the regional level. 2. Wasting is an acute condition that can change frequently and rapidly over the course of a calendar year. 3. The potential impact of the COVID-19 pandemic is not reflected in the estimates. 4. Although 2010 is the WHO baseline for adult obesity, to ensure consistency throughout this report, the year 2012 is used as the baseline. 5. Details on the methodology to assess progress can be found in Annex 2D.SOURCES: Data for stunting, wasting and overweight are based on UNICEF, WHO & International Bank for Reconstruction and Development/World Bank. 2021. UNICEF, WHO, World Bank Group Joint Child Malnutrition Estimates, April 2021 Edition. Cited 2 May 2022. https://data.unicef.org/topic/nutrition, www.who.int/data/gho/data/themes/topics/joint-child-malnutrition-estimates-unicef-who-wb, https://data.worldbank.org; data for exclusive breastfeeding are based on UNICEF. 2021. Infant and Young Child Feeding: Exclusive breastfeeding. In: UNICEF Data: Monitoring the Situation of Children and Women. Cited 2 May 2022. https://data.unicef.org/topic/nutrition/infant-and-young-child-feeding; data for anaemia are based on WHO. 2021. Global Health Observatory (GHO). In: WHO. Geneva, Switzerland. Cited 2 May 2022. http://apps.who.int/gho/data/node.imr.PREVANEMIA?lang=en; and data for low birthweight are based on UNICEF & WHO. 2019. UNICEF-WHO Low Birthweight Estimates: levels and trends 2000–2015. Geneva, Switzerland. Cited 2 May 2022. data.unicef.org/resources/low-birthweight-report-2019
| 45 |
CHAPTER 2 FOOD SECURITY AND NUTRITION AROUND THE WORLD
see the proportion of the respective countries in each category indicating progress achieved: ≥75 percent, 50–74.9 percent, 25–49.9 percent, 0–24.9 percent, or worsening.g However, regional estimates should be interpreted with caution as not all countries are included in the calculations (see Annex 2D).
The great majority of countries across most regions have made modest progress (0–24.9 percent of the progress required) towards the goal of a 30 percent reduction in the prevalence of low birthweight by 2030 among newborns. In contrast, approximately half of countries representing Northern America, Europe, Australia and New Zealand are experiencing a worsening situation.
Notable progress has been made towards increasing the percentage of exclusively breastfed infants under six months of age. In the majority of regions, between 20 and 70 percent of countries fall into the ≥75 percent category, that is, reaching at least 75 percent of the total progress required. In contrast, the situation is worsening in Oceania excluding Australia and New Zealand, followed by South America, the Caribbean, Central Asia and Eastern Asia.
The majority of regions are making progress in the reduction of stunting among children under five years of age. Progress is notable in Central Asia, Eastern Asia, Northern America, Europe, Australia and New Zealand, and South America, where more than 50 percent of the countries included in this analysis had achieved at least 50 percent of the progress required to reach the 2030 target. However, nearly 30 percent of countries in Northern Africa, Oceania and the Caribbean are worsening, experiencing an increase in stunting prevalence.
All countries representing Northern Africa, Southern Africa, Eastern Asia, Central America, Oceania, Northern America, Europe, Australia and New Zealand have achieved at least 75 percent progress in reducing the prevalence of wasting to meet the 2030
g For wasting and exclusive breastfeeding, progress assessment is included only for countries or territories where the latest survey year is 2015 or more recent.
target. However, nearly half of the countries representing Southern Asia and South-eastern Asia are experiencing a worsening situation.
Progress in lowering the prevalence of overweight to meet the 2030 target varies by region, with more than half of countries representing Western Africa and Southern Asia achieving at least 75 percent progress. In turn, overweight is notably worsening among most countries representing Southern Africa, Oceania, South-eastern Asia, South America and the Caribbean.
Progress towards the 2030 target for anaemia is worsening across the great majority of countries in almost all regions, particularly in Northern America, Europe, Australia and New Zealand, Oceania and South-eastern Asia. Meanwhile, all 9 countries representing Middle Africa in this analysis have achieved up to 25 percent of the progress required.
The progress in curbing the rise of obesity among adults is not presented in this figure, as the situation is worsening across all countries where data are available. No progress is being made.
In summary, although progress is being made in some regions, malnutrition persists in many forms across all regions and may in fact be worse than these findings suggest as the impact of the COVID-19 pandemic on nutritional outcomes is still unfolding, and the full impact is yet to be revealed. Reaching the 2030 global nutrition targets will require immense efforts to counteract severe global setbacks. Global trends in anaemia among women aged 15 to 49 years, overweight in children, and obesity among adults especially, will need to be reversed to achieve the progress needed to reach the Sustainable Development Goals (SDGs).
Two high-level events took place in 2021 for advancing the global nutrition agenda, the UN Food Systems Summit (UNFSS) and the Tokyo Nutrition for Growth (N4G) Summit. Both summits served as a catalytic global moment for agrifood systems transformation aimed at delivering healthy diets for all sustainably and inclusively.
| 46 |
THE STATE OF FOOD SECURITY AND NUTRITION IN THE WORLD 2022
The key outcomes of the UNFSS include national food system pathways developed by more than 100 countries, which detail a roadmap for transformative action and within which the number one priority echoed by many Member States is the need to deliver healthy diets from sustainable agrifood systems.48 This is also supported by the Coalitions of Action such as those focused on healthy diets from sustainable agrifood systems, blue foods and school meals which unite global actors and countries behind common visions.
Moreover, the N4G outcomes support this action through pledges to enhance political and financial commitments that address food, health and social protection system drivers to enable healthy diets and end malnutrition in all its forms.49 More than half of the 396 commitments made by 181 stakeholders across 78 countries address food (63 percent). The commitments recognize the need for coherent multisectoral policies, linking the food and health sectors, and for an increase in actions and investment, for agrifood systems to support the shift to dietary patterns that benefit nutrition, human health and the environment. Integrating nutrition into Universal Health Coverage (UHC) was one pillar, where country governments and multiple stakeholders committed to take actions aiming at strengthening health systems with a view to providing quality and affordable nutrition services.
Now it is important that Member States implement their nutrition-related commitments made at the United Nations Food Systems Summit and the Tokyo Nutrition for Growth Summit 2021 by intensifying their efforts and scaling up their activities as appropriate under the Nutrition Decade’s work programme.50 n
2.3COST AND AFFORDABILITY OF A HEALTHY DIET: AN UPDATE KEY MESSAGES
è Diet quality is a critical link between food security and nutrition. Poor diet quality can lead to different forms of malnutrition, including undernutrition and micronutrient deficiencies, as well as overweight and obesity.
è The effects of inflation in consumer food prices stemming from the economic impacts of the COVID-19 pandemic and the measures put in place to contain it, have increased the costs and the unaffordability of a healthy diet around the world.
è In 2020, the sharp increase in global consumer food prices in the second half of the year translated directly into an increased average cost of a healthy diet at the global level, and for all regions and almost all subregions in the world. The average cost of a healthy diet globally in 2020 was USD 3.54 per person per day; 3.3 and 6.7 percent more than in 2019 and 2017, respectively.
è Latin America and the Caribbean had the highest cost of a healthy diet compared to other regions, at USD 3.89 per person per day in 2020, followed by Asia (USD 3.72), Africa (USD 3.46), Northern America and Europe (USD 3.19) and Oceania (USD 3.07).
è Between 2019 and 2020, Asia witnessed the highest surge in the cost of a healthy diet (4.0 percent), followed by Oceania (3.6 percent), Latin America and the Caribbean (3.4 percent), Northern America and Europe (3.2 percent) and Africa (2.5 percent).
è Almost 3.1 billion people could not afford a healthy diet in 2020 – an increase of 112 million more people than in 2019, reflecting the higher costs of a healthy diet in 2020. This was mainly driven by Asia, where 78 million more people were unable to afford this diet, followed by Africa (25 million more people), and to a lesser extent by Latin America and the Caribbean and Northern America and Europe (8 and 1 million more people, respectively).
| 47 |
CHAPTER 2 FOOD SECURITY AND NUTRITION AROUND THE WORLD
è The cost of a healthy diet will likely continue to rise as food prices have surged in 2021, and into 2022, but data are not fully available to provide updated estimates in this regard. The likely trend in the affordability of a healthy diet in 2021 and into 2022 is less clear due to differences in income growth.
Diet quality is a critical link between food security and nutrition. Poor diet quality can lead to different forms of malnutrition, including undernutrition, micronutrient deficiencies, overweight and obesity.3,15 The 2020 edition of this report included, for the first time, global estimates of the cost and affordability of a healthy diet. These are useful indicators of economic access to nutritious foods and healthy diets, which is one of the core principles embedded in the definition of food security.
Reporting on the cost and affordability of a healthy diet has brought global attention to the fact that, in countries both rich and poor, low disposable income relative to the high cost of food is one of the most serious impediments to accessing nutritious foods essential for a healthy, active life. In the 2020 edition of this report, the analysis showed that more than 3 billion people cannot afford even the average cost of the cheapest healthy diet.3
The cost and affordability of a healthy diet (CoAHD) indicators provide useful information for national governments, international agencies, civil society and the private sector to work together towards improving people’s economic access to a healthy diet and achieving longstanding goals for global food security and good nutrition. As mentioned in Section 2.2, attention to ensuring access to healthy diets has been increasing over the last decade, in particular after the Second International Conference on Nutrition (ICN2) in 2014 and during the United Nations Decade of Action on Nutrition (2016–2025).
FAO is continuing to systematically monitor and report on these new indicators annually in this report. Estimates in this year’s report are updated up to year 2020 (see Annex 2E). In addition, periodic revisions to the entire data series will be carried out to refine and improve its accuracy as new data become available and as methodologies
advance, as is common practice for all the food security and nutrition indicators regularly monitored in this report. Revision to the cost and affordability of the healthy diet data series this year includes the updates to account for new income distributions, revised average percentage of income that can be credibly reserved for food, and a methodological refinement in the average cost of the diet that is more robust, provides greater transparency, and supports long-term monitoring utilizing annually reported price data. Box 6 provides a brief summary of these revisions and implications (see Herforth et al. [forthcoming]54 for a full description of data sources and methodology).
The cost and affordability of a healthy diet in 2020Table 5 presents the latest estimates of the cost and affordability of a healthy diet updated to 2020, representing the first global assessment since the year the COVID-19 pandemic spread rapidly across the globe. However, while affordability estimates in 2020 reflect food price shocks induced by COVID-19, the income shocks are not yet captured due to the unavailability of 2020 income distribution data in the World Bank's Poverty and Inequality Platform (PIP). Therefore, the estimated number of people who could not afford a healthy diet might increase further once the availability of 2020 income distributions will allow accounting for the combined effects of inflation in consumer food prices and income losses, stemming from the economic impacts of the COVID-19 pandemic and the measures put in place to contain it.
While global consumer food prices only began to increase in May 2020, by the end of the year they were higher than in any month in the previous six years. This sharp increase in the second half of 2020 translated directly into an increased average cost of a healthy diet in 2020 for all regions and almost all subregions in the world (Table 5). At the global level, the average cost of a healthy diet in 2020 was USD 3.54 per person per day, which represents a 3.3 percent increase from 2019, and a 6.7 percent increase from 2017.
Between 2019 and 2020, Asia had the highest increase in the cost of a healthy diet at 4.0 percent, followed by Oceania at 3.6 percent
| 48 |
THE STATE OF FOOD SECURITY AND NUTRITION IN THE WORLD 2022
BOX 6 UPDATED INFORMATION AND REFINEMENT IN METHODOLOGY IMPROVES THE ACCURACY OF THE GLOBAL ESTIMATES OF THE COST AND AFFORDABILITY OF A HEALTHY DIET54
The CoAHD series are updated this year to account for new information that FAO has received since the release of the previous editions, as well as a refinement in the methodological approach that supports long-term monitoring objectives. These updates apply to the entire CoAHD series, replacing the data reported in previous editions of this report; therefore, readers are advised to refrain from comparing series across different editions of this report. Readers should always refer to the most current edition of the report, including for values in the previous years to the most recent year for which data are being presented. See Annex 3 (Table A3.1) for the updated data series of the CoAHD indicators by country for 2017–2020.
REVISIONS BASED ON NEW UPDATED DATAThe new data used to conduct the revisions to the data series are reflected in two variables that inform the affordability of a healthy diet: the country-specific income distributions and the percentage of income that can be credibly reserved for food.
For this edition of the report, updated country-specific income distributions that are derived from the World Bank’s PIP were used to revise the 2017 affordability of a healthy diet indicator.51 This affordability indicator compares the average least cost of a healthy diet with the estimated income distribution in a given country, using income distributions from the World Bank’s PIP. It is used to count the number of people with insufficient income to purchase a healthy diet and also non-food items. Income distributions for 2017 are now available for all countries and were used to update the 2017 estimate of the number and percentage of people who cannot afford a healthy diet in each country. As the affordability of a healthy diet indicators were first presented in the 2020 edition of this report, specifically for the year 2017, this year naturally became the first (or base) year of the series.
The 2017 to 2020 series are also revised with updated data for the percentage of income that can be credibly reserved for food, considering that people must be able to afford food as well as non-food items. In the 2020 edition of this report, using the data from the World Bank Global Consumption Database,52 this was estimated at 63 percent based on the observation that this is the average percent of income the poorest quintile of people in LICs spend on food. In consultation with the World Bank, it has become
apparent that this database will not be updated on a regular basis. The best alternative is the national accounts expenditure data from the World Bank International Comparison Programme (ICP) database.53 The ICP reports each country’s expenditure aggregates alongside the item prices used for other CoAHD calculations in a way that readily allows computing the national-average share of household income that is spent on food. Based on this database, the average percent of income spent on food in LICs is now estimated at 52 percent.54
REFINEMENT IN METHODOLOGICAL APPROACH FOR MORE ROBUST ANNUAL MONITORINGA new methodological refinement is applied in the estimation of the average cost of a healthy diet that is more robust, provides greater transparency and supports long-term systematic monitoring utilizing annually updated price data.54 In the 2020 and 2021 edition of this report, the cost of a healthy diet indicator was calculated based on the cost of meeting each of ten country food-based dietary guidelines (FBDGs) in diverse regions, representing a majority of the world population, taking the median cost across all ten healthy diets.3,54 This method was employed to ensure that diet cost calculations were directly based on FBDGs adopted by national governments, incorporating countries’ individual characteristics, cultural context, locally available foods and dietary customs. This method resulted in an average cost, but not a tangible basket of food groups and items.
Clarification of the amounts and types of food represented in the cost of a healthy diet indicator is important for transparency and better comprehension of the indicator by users and is important for simplifying the task of monitoring the cost of a healthy diet over time. As an update to the original method, therefore, rather than calculating the average cost of each guideline, the cost of the average food group quantities recommended in each guideline is calculated.54 This refinement in the method of the cost calculation is important because it is more transparent and tangible as to what the cost of the diet contains (i.e. which food groups and the amounts of foods in each), simplifies the calculation while making it more robust (approximating a larger range of FBDGs rather than only ten) and minimizes the price data needs for monitoring the indicator over time.
| 49 |
CHAPTER 2 FOOD SECURITY AND NUTRITION AROUND THE WORLD
(Figure 16a). In Asia, this surge pushed up the average cost of a healthy diet to USD 3.72 per person per day. Two subregions in Asia had even higher single-year increases between 2019 and 2020: Eastern Asia (6.0 percent), and South-eastern Asia (4.2 percent).
Latin America and the Caribbean had the third highest increase (3.4 percent) in the average cost of a healthy diet in the same period, reporting the highest cost in 2020 (USD 3.89 per person per day). Northern America and Europe saw a cost increase of 3.2 percent and an average cost of a healthy diet at USD 3.19 per person per day. Africa had the lowest increase in the cost of a healthy diet between 2019 and 2020 (2.5 percent), reaching an average cost of USD 3.46 per person per day in 2020. The increase was highest in two subregions of sub-Saharan Africa: Eastern Africa and Southern Africa (3.4 and 3.3 percent increase, respectively).
The affordability of a healthy diet measures the average cost of the diet relative to income; therefore, changes over time can be the result of changes in the cost of the diet, people’s income, or both. Rising food costs, if not matched by rising income, will render more people unable to afford a healthy diet. If food costs rise at the same time incomes fall, this has a compounding effect that can result in even more people finding healthy diets unaffordable.
In 2020, the number of people who could not afford a healthy diet in 2020 increased globally and in every region in the world (Table 5). Similarly, the number increased in all subregions, with the exception of Northern Africa and Western Asia.
Between 2019 and 2020, the number of people in the world who could not afford a healthy diet increased by 3.8 percent (Table 5). Two regions registered the highest increases: Latin America and the Caribbean (6.5 percent) and Northern America and Europe (5.4 percent). However, the percent of the population who could not afford a healthy diet was around 22 percent for the former, and only 2 percent for the latter. This compares to 80 percent in Africa and almost 44 percent in Asia (Table 5).
As a result of the single-year increases in 2020, almost 3.1 billion people could not afford a healthy diet, an increase of 112 million more people than in 2019 (Figure 16b). Asia, where improvements in the affordability are observed between 2017 and 2019 (Figure 16b), accounts for the highest increase in the absolute number of people for whom a healthy diet is out of reach (78 million). All subregions except Western Asia show an increase: Southern Asia (35 million), Eastern Asia (27 million),h South-eastern Asia (16 million), and Central
h This increase is largely attributable to China, which had a 7 percent increase in the cost of a healthy diet between 2019 and 2020.
BOX 6 (Continued)
IMPLICATIONS OF THREE UPDATES ON THE DATA SERIES When only the updated cost method is applied, the number of people who cannot afford a healthy diet declines. However, the two other updates affecting income have the opposite effect, pushing up the number of people who cannot afford a healthy diet. Applying both the new cost method and the updated income distribution and household expenditure share data from national accounts, the revised estimate for
2017 is that 3.05 billion people were unable to afford a healthy diet, which is only slightly higher than the 2017 estimate reported in the 2020 edition of this report (3.02 billion people in 2017).
Ranges of the affordability indicators shown in Table 5, with lower and upper bounds that reflect different assumptions about the share of income reserved for food by country income group, are presented in Annex 3 (Table A3.2).
| 50 |
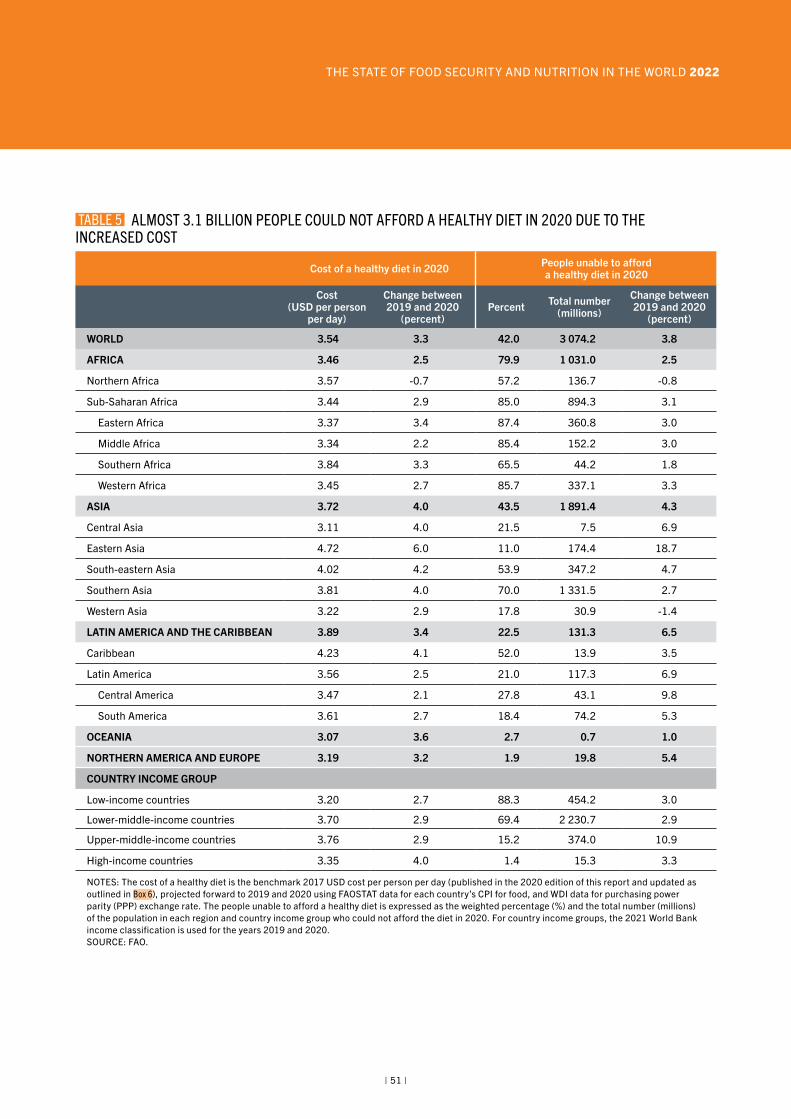
THE STATE OF FOOD SECURITY AND NUTRITION IN THE WORLD 2022
Cost of a healthy diet in 2020 People unable to afford a healthy diet in 2020
Cost
(USD per person per day)
Change between 2019 and 2020
(percent)Percent Total number
(millions)
Change between 2019 and 2020
(percent)
WORLD 3.54 3.3 42.0 3 074.2 3.8
AFRICA 3.46 2.5 79.9 1 031.0 2.5
Northern Africa 3.57 -0.7 57.2 136.7 -0.8
Sub-Saharan Africa 3.44 2.9 85.0 894.3 3.1
Eastern Africa 3.37 3.4 87.4 360.8 3.0
Middle Africa 3.34 2.2 85.4 152.2 3.0
Southern Africa 3.84 3.3 65.5 44.2 1.8
Western Africa 3.45 2.7 85.7 337.1 3.3
ASIA 3.72 4.0 43.5 1 891.4 4.3
Central Asia 3.11 4.0 21.5 7.5 6.9
Eastern Asia 4.72 6.0 11.0 174.4 18.7
South-eastern Asia 4.02 4.2 53.9 347.2 4.7
Southern Asia 3.81 4.0 70.0 1 331.5 2.7
Western Asia 3.22 2.9 17.8 30.9 -1.4
LATIN AMERICA AND THE CARIBBEAN 3.89 3.4 22.5 131.3 6.5
Caribbean 4.23 4.1 52.0 13.9 3.5
Latin America 3.56 2.5 21.0 117.3 6.9
Central America 3.47 2.1 27.8 43.1 9.8
South America 3.61 2.7 18.4 74.2 5.3
OCEANIA 3.07 3.6 2.7 0.7 1.0
NORTHERN AMERICA AND EUROPE 3.19 3.2 1.9 19.8 5.4
COUNTRY INCOME GROUP
Low-income countries 3.20 2.7 88.3 454.2 3.0
Lower-middle-income countries 3.70 2.9 69.4 2 230.7 2.9
Upper-middle-income countries 3.76 2.9 15.2 374.0 10.9
High-income countries 3.35 4.0 1.4 15.3 3.3
NOTES: The cost of a healthy diet is the benchmark 2017 USD cost per person per day (published in the 2020 edition of this report and updated as outlined in Box 6), projected forward to 2019 and 2020 using FAOSTAT data for each country’s CPI for food, and WDI data for purchasing power parity (PPP) exchange rate. The people unable to afford a healthy diet is expressed as the weighted percentage (%) and the total number (millions) of the population in each region and country income group who could not afford the diet in 2020. For country income groups, the 2021 World Bank income classification is used for the years 2019 and 2020. SOURCE: FAO.
TABLE 5 ALMOST 3.1 BILLION PEOPLE COULD NOT AFFORD A HEALTHY DIET IN 2020 DUE TO THE INCREASED COST
| 51 |
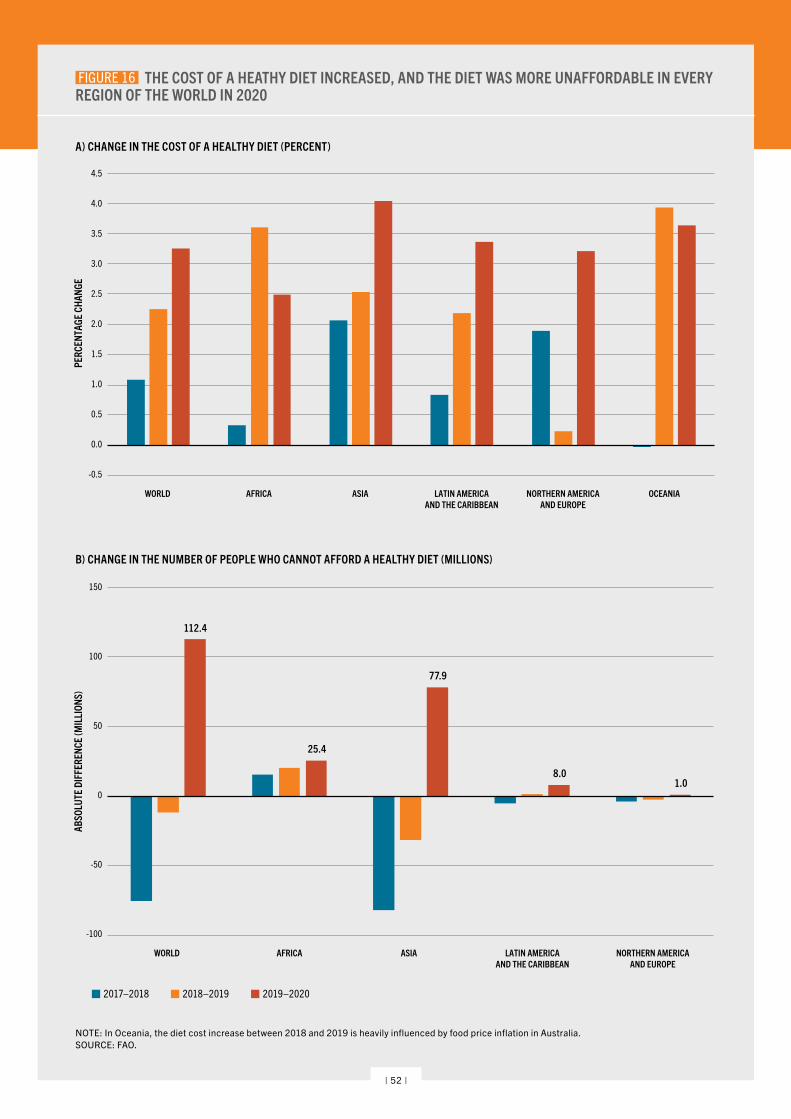
CHAPTER 2 FOOD SECURITY AND NUTRITION AROUND THE WORLD FIGURE 16 THE COST OF A HEATHY DIET INCREASED, AND THE DIET WAS MORE UNAFFORDABLE IN EVERY REGION OF THE WORLD IN 2020
NOTE: In Oceania, the diet cost increase between 2018 and 2019 is heavily influenced by food price inflation in Australia. SOURCE: FAO.
4.5
4.0
3.5
3.0
2.5
2.0
1.5
1.0
0.5
0.0
-0.5
PERC
ENTA
GE C
HANG
E
WORLD AFRICA ASIA LATIN AMERICAAND THE CARIBBEAN
NORTHERN AMERICAAND EUROPE
OCEANIA
2017–2018 2018–2019 2019–2020
A) CHANGE IN THE COST OF A HEALTHY DIET (PERCENT)
150
100
50
0
-50
-100
ABSO
LUTE
DIF
FERE
NCE
(MIL
LION
S)
WORLD AFRICA ASIA LATIN AMERICAAND THE CARIBBEAN
NORTHERN AMERICAAND EUROPE
2017–2018 2018–2019 2019–2020
112.4
25.4
77.9
8.01.0
B) CHANGE IN THE NUMBER OF PEOPLE WHO CANNOT AFFORD A HEALTHY DIET (MILLIONS)
| 52 |
THE STATE OF FOOD SECURITY AND NUTRITION IN THE WORLD 2022
Asia (0.5 million). In Western Asia, the number decreased by 0.4 million. An average of 25 million more people in Africa could not afford a healthy diet in 2020. Specifically, this diet was out of reach for 27 million more people in sub-Saharan Africa – of which 21 million live in Eastern and Western Africa – while improvements occurred in Northern Africa with 1 million more people able to afford a healthy diet. In Latin America and the Caribbean, where 8 million more people could not afford a healthy diet in 2020, the increase was almost entirely driven by Latin American countries compared to Caribbean countries that reported a 0.5 million increase. The affordability remained stable in Oceania while it worsened in Northern America and Europe where 1 million more people were unable to afford a healthy diet.
Affordability of a healthy diet in 2021 and 2022 The lingering effects of the COVID-19 pandemic continue to exert inflationary pressure on foods and are contributing to a mixed picture of economic recovery among countries. At the same time, the war in Ukraine is now adding pressure by disrupting supply chains and affecting global grain, fertilizer and energy prices leading to shortages and fuelling even higher rates of inflation. Global food and energy prices are soaring and have reached levels that have not been seen in decades. Global economic growth prospects in 2022 have already been slashed.
While it is not possible to update estimates beyond 2020 at this time given that the core data required are not yet available, the cost of a healthy diet is likely to have continued to rise as food prices continued to increase in 2021 and are increasing into 2022. By December 2021, the latest available global consumer food price index (food CPI), which is the most relevant food price measure for the cost of a diet, was 11 percent higher compared to December 2020. Assuming the prices of nutritious foods follow the same general trend as food prices overall, a healthy diet may have already been pushed further out of reach for many.
It is expected that the upward inflationary trend will continue through 2022. However, notable
regional differences in consumer food price surges are expected due to their different production and trade structures, as well as the speed of economic recovery. For example, the Latin America and the Caribbean food CPI shows the highest increase, at 23.5 percent between December 2020 and December 2021, while in Africa it was 15.5 percent and 14.8 percent in Asia. In contrast, it was 6.4 percent in North America, 4.4 percent in Europe and 2.5 percent in Oceania.
The likely trend in the affordability of a healthy diet is relatively less clear, as this depends not only on the cost of a healthy diet, but also on changes in incomes. While the economic recession that started in 2020 extended into early 2021 for many countries, others turned their economies around. As described in Section 2.1, the economic recovery has been highly uneven across countries, with LMICs and LICs experiencing a much slower pace of economic growth than HICs. For vulnerable populations within countries, the COVID-19 pandemic has had deeper and more protracted effects, aggravating existing inequalities within countries. Global extreme poverty has increased,11 as well as global income inequality.9 Among those populations who were already unable to afford a healthy diet, increased prices, together with reductions of income, will have deepened their affordability gap, putting a healthy diet, and among many even just meeting basic food needs, further out of reach.
The comparison of cost and affordability over time points to the important roles of changes in income as well as prices in determining affordability. The rise or fall of the number of people who can afford a healthy diet in 2021 and 2022 will depend largely on the magnitude of the increases in the average cost of a healthy diet, whether incomes improve or decline and by how much, and whether income inequalities increase or fall. However, it is worth remembering that many other factors can contribute to improving access to healthy diets. There is much that governments can do to promote better, more stable incomes, protect non-market sources of food provisioning, and decrease the effective cost of nutritious foods. n
| 53 |
INDIAFemale farmer collecting bundles of wheat stalk.©Shutterstock.com/greenaperture
CHAPTER 3 FOOD AND AGRICULTURAL POLICY SUPPORT IN THE WORLD: HOW MUCH DOES IT COST AND AFFECT DIETS?
KEY MESSAGES
è Given the setbacks in hunger, food security and nutrition, and given the economic, health and environmental challenges that the world is facing, making healthy diets more economically accessible for everyone is critical. To move towards this target, it is important to examine the current policy support to the food and agriculture sector in order to identify the most needed policy reforms.
è Governments support food and agriculture through various policies, including trade and market interventions (e.g. border measures and market price controls) that generate price incentives or disincentives, fiscal subsidies to producers and consumers, and general services support (GSS). These policies may impact every stakeholder within the food environment and, hence, can affect the availability and affordability of healthy diets.
è Worldwide support to food and agriculture accounted for almost USD 630 billion per year on average over 2013–2018. About 70 percent of this support targeted farmers individually through trade and market policies and fiscal subsidies largely tied (i.e. coupled) to production or unconstrained use of variable inputs.
è HICs and UMICs largely support agricultural producers both through border measures and fiscal
subsidies increasingly decoupled from production. In contrast, in LMICs and LICs, fiscal space to provide subsidies is more limited; moreover, these countries commonly use trade policies to protect consumers rather than producers.
è Overall, support to agricultural production largely concentrates on staple foods, dairy and other protein-rich foods, especially in HICs and UMICs. Rice, sugar and meats of various types are the foods most incentivized worldwide, while producers of fruits and vegetables are less supported overall or are even penalized in some LICs.
è Border measures affect the availability, diversity and prices of foods in domestic markets. While some of these measures target important policy objectives (e.g. public revenue generation or ensuring food safety), they can sometimes act as trade barriers for nutritious foods undermining the availability and affordability of healthy diets.
è Market price controls (e.g. minimum or administered prices) mostly target staple foods like wheat, maize, rice, as well as sugar. While their key objective is to stabilize or raise farm income and ensure enough supplies of staple foods, they may also implicitly discourage the production of other foods that are necessary for healthy diets.
| 55 |
CHAPTER 3 FOOD AND AGRICULTURAL POLICY SUPPORT IN THE WORLD: HOW MUCH DOES IT COST AND AFFECT DIETS?
In the specific case of SDG 2, it is important that public support to food and agriculture starts showing increasing marginal returns, including in reducing the cost of nutritious foods and increasing the availability and affordability of healthy diets, sustainably and inclusively. n
3.1STOCKTAKING: WHAT POLICY SUPPORT IS CURRENTLY PROVIDED TO FOOD AND AGRICULTURE?How do governments support food and agriculture?Governments support food and agriculture in different forms and using different types of instruments that affect agrifood systems, as presented in Figure 1 in Chapter 1. This third chapter takes stock of this support, using indicators available for some of the most common policies, which are summarized in Figure 17. These indicators reflect whether the support provided is influencing domestic prices or actors of agrifood systems are benefiting from a direct public budgetary transfer. Other policies explored further below (Section 4.2), including land regulations, food standards and labelling policies, can be part of a government’s policy toolkit for repurposing food and agricultural support to deliver affordable healthy diets.
Trade and market interventions in this chapter include mainly: i) border measures on imports (e.g. tariffs, tariff-rate quotas and non-tariff measures [NTMs]) and exports (e.g. export taxes, bans or licensing, or export subsidies or credits) and ii) market price control measures, such as administered prices (at which governments procure food from farmers) and minimum producer price policies. These interventions increase or depress domestic prices relative to the border price; as such, they can generate price incentives (or disincentives) for farmers. In this report, price incentives are quantified through the nominal rate of protection (NRP) indicator (Box 7).
è In many countries, fiscal subsidies to agricultural producers have increased the availability and reduced the price of staple foods and their derivates (e.g. low-cost foods of minimal or no nutritional value). As a result, the consumption and diversity of unsubsidized or less subsidized commodities such as fruits, vegetables and pulses, have been discouraged as they are relatively more expensive.
è General services are public goods that can boost productivity in the long term and could contribute to food safety and food availability, and to lower food prices, including for nutritious foods. Unfortunately, expenditures on general services are just a small share of the total support to food and agriculture. These are still lagging behind the actual needs of the sector, especially in LICs and LMICs and are often biased towards staple foods.
è While subsidies to consumers take a very small share of public support to food and agriculture, nutrition-sensitive policies and programmes supporting consumers have the potential to contribute to increasing consumption of nutritious foods, especially when they target the poorest or the most nutritionally vulnerable people and are accompanied by food and nutrition education.
As shown in the previous chapter, the world is facing major setbacks, with growing numbers of people facing hunger and food insecurity and increasing challenges to malnutrition in all its forms. Many countries are not on track or are even moving further away from reaching their SDG 2 targets. Governments must take actions to reverse this situation. There are many policy options available to this end, but the current recessionary context makes it even more challenging for many governments to increase their budgets and support to the sector. Even under such a tough economic context, however, much can and needs to be done.
Governments will need to be ingenious and start by looking at the current food and agricultural support they provide to evaluate whether this money can be reallocated more cost-effectively and efficiently to achieve development objectives. For governments all over the world, the starting point is to take stock of their support and then assess its cost-effectiveness.
| 56 |
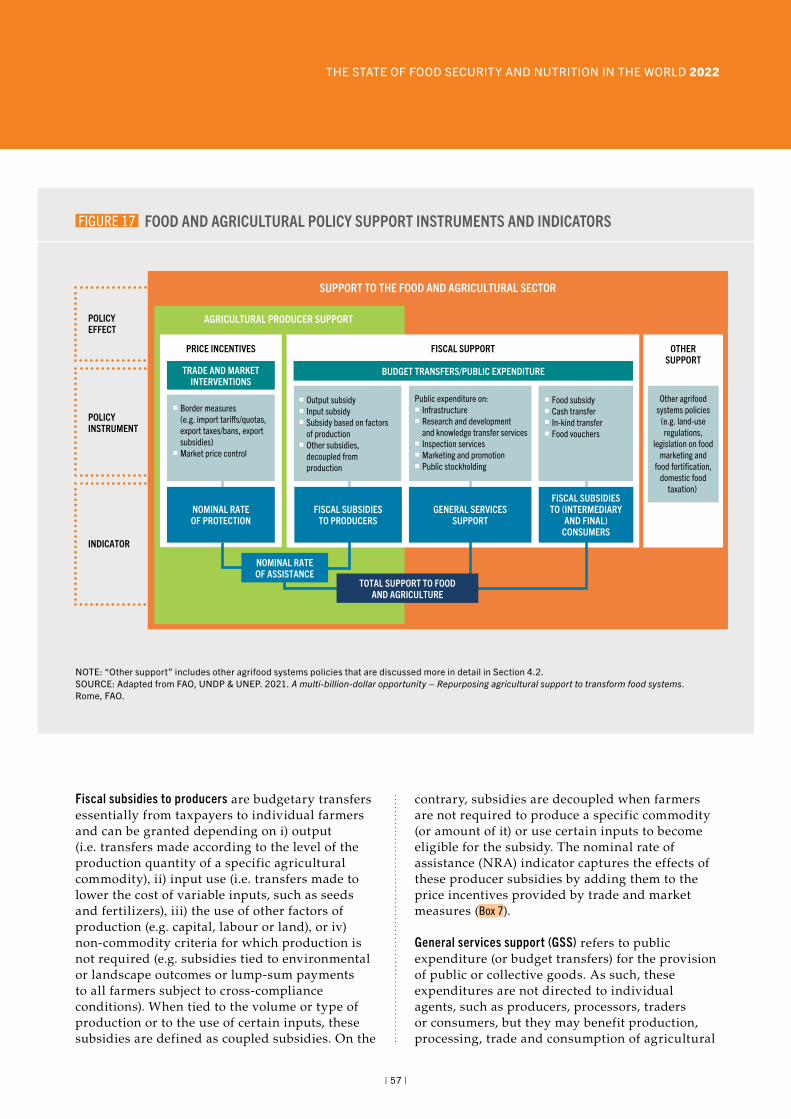
THE STATE OF FOOD SECURITY AND NUTRITION IN THE WORLD 2022
Fiscal subsidies to producers are budgetary transfers essentially from taxpayers to individual farmers and can be granted depending on i) output (i.e. transfers made according to the level of the production quantity of a specific agricultural commodity), ii) input use (i.e. transfers made to lower the cost of variable inputs, such as seeds and fertilizers), iii) the use of other factors of production (e.g. capital, labour or land), or iv) non-commodity criteria for which production is not required (e.g. subsidies tied to environmental or landscape outcomes or lump-sum payments to all farmers subject to cross-compliance conditions). When tied to the volume or type of production or to the use of certain inputs, these subsidies are defined as coupled subsidies. On the
contrary, subsidies are decoupled when farmers are not required to produce a specific commodity (or amount of it) or use certain inputs to become eligible for the subsidy. The nominal rate of assistance (NRA) indicator captures the effects of these producer subsidies by adding them to the price incentives provided by trade and market measures (Box 7).
General services support (GSS) refers to public expenditure (or budget transfers) for the provision of public or collective goods. As such, these expenditures are not directed to individual agents, such as producers, processors, traders or consumers, but they may benefit production, processing, trade and consumption of agricultural
FIGURE 17 FOOD AND AGRICULTURAL POLICY SUPPORT INSTRUMENTS AND INDICATORS
POLICY EFFECT
POLICY INSTRUMENT
INDICATOR
SUPPORT TO THE FOOD AND AGRICULTURAL SECTOR
AGRICULTURAL PRODUCER SUPPORT
FISCAL SUPPORTPRICE INCENTIVES
BUDGET TRANSFERS/PUBLIC EXPENDITURETRADE AND MARKETINTERVENTIONS
NOMINAL RATEOF ASSISTANCE
Border measures (e.g. import tari�s/quotas, export taxes/bans, export subsidies) Market price control
OTHERSUPPORT
TOTAL SUPPORT TO FOODAND AGRICULTURE
NOMINAL RATEOF PROTECTION
Output subsidy Input subsidy Subsidy based on factors of production Other subsidies, decoupled from production
FISCAL SUBSIDIESTO PRODUCERS
Food subsidy Cash transfer In-kind transfer Food vouchers
FISCAL SUBSIDIESTO (INTERMEDIARY
AND FINAL)CONSUMERS
Public expenditure on: Infrastructure Research and development and knowledge transfer services Inspection services Marketing and promotion Public stockholding
GENERAL SERVICESSUPPORT
Other agrifoodsystems policies
(e.g. land-useregulations,
legislation on foodmarketing and
food fortification,domestic food
taxation)
NOTE: “Other support” includes other agrifood systems policies that are discussed more in detail in Section 4.2. SOURCE: Adapted from FAO, UNDP & UNEP. 2021. A multi-billion-dollar opportunity – Repurposing agricultural support to transform food systems. Rome, FAO.
| 57 |
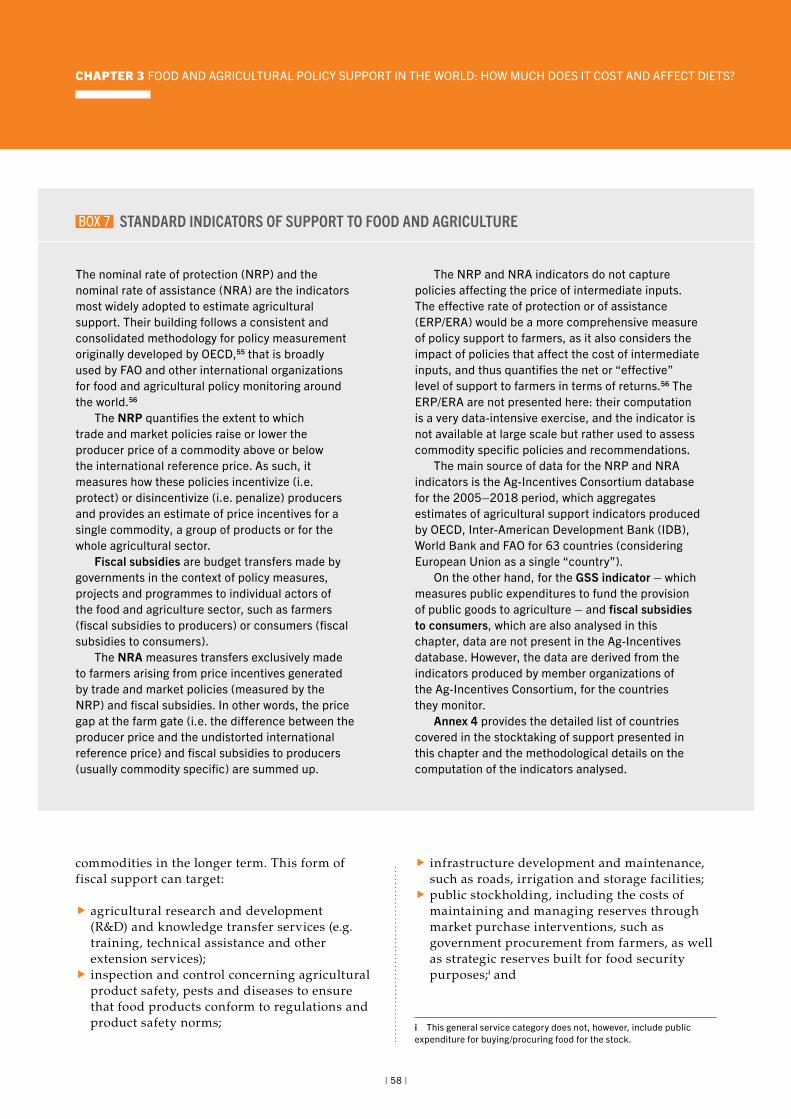
CHAPTER 3 FOOD AND AGRICULTURAL POLICY SUPPORT IN THE WORLD: HOW MUCH DOES IT COST AND AFFECT DIETS?
commodities in the longer term. This form of fiscal support can target:
� agricultural research and development (R&D) and knowledge transfer services (e.g. training, technical assistance and other extension services);
� inspection and control concerning agricultural product safety, pests and diseases to ensure that food products conform to regulations and product safety norms;
� infrastructure development and maintenance, such as roads, irrigation and storage facilities;
� public stockholding, including the costs of maintaining and managing reserves through market purchase interventions, such as government procurement from farmers, as well as strategic reserves built for food security purposes;i and
i This general service category does not, however, include public expenditure for buying/procuring food for the stock.
BOX 7 STANDARD INDICATORS OF SUPPORT TO FOOD AND AGRICULTURE
The nominal rate of protection (NRP) and the nominal rate of assistance (NRA) are the indicators most widely adopted to estimate agricultural support. Their building follows a consistent and consolidated methodology for policy measurement originally developed by OECD,55 that is broadly used by FAO and other international organizations for food and agricultural policy monitoring around the world.56
The NRP quantifies the extent to which trade and market policies raise or lower the producer price of a commodity above or below the international reference price. As such, it measures how these policies incentivize (i.e. protect) or disincentivize (i.e. penalize) producers and provides an estimate of price incentives for a single commodity, a group of products or for the whole agricultural sector.
Fiscal subsidies are budget transfers made by governments in the context of policy measures, projects and programmes to individual actors of the food and agriculture sector, such as farmers (fiscal subsidies to producers) or consumers (fiscal subsidies to consumers).
The NRA measures transfers exclusively made to farmers arising from price incentives generated by trade and market policies (measured by the NRP) and fiscal subsidies. In other words, the price gap at the farm gate (i.e. the difference between the producer price and the undistorted international reference price) and fiscal subsidies to producers (usually commodity specific) are summed up.
The NRP and NRA indicators do not capture policies affecting the price of intermediate inputs. The effective rate of protection or of assistance (ERP/ERA) would be a more comprehensive measure of policy support to farmers, as it also considers the impact of policies that affect the cost of intermediate inputs, and thus quantifies the net or “effective” level of support to farmers in terms of returns.56 The ERP/ERA are not presented here: their computation is a very data-intensive exercise, and the indicator is not available at large scale but rather used to assess commodity specific policies and recommendations.
The main source of data for the NRP and NRA indicators is the Ag-Incentives Consortium database for the 2005–2018 period, which aggregates estimates of agricultural support indicators produced by OECD, Inter-American Development Bank (IDB), World Bank and FAO for 63 countries (considering European Union as a single “country”).
On the other hand, for the GSS indicator – which measures public expenditures to fund the provision of public goods to agriculture – and fiscal subsidies to consumers, which are also analysed in this chapter, data are not present in the Ag-Incentives database. However, the data are derived from the indicators produced by member organizations of the Ag-Incentives Consortium, for the countries they monitor.
Annex 4 provides the detailed list of countries covered in the stocktaking of support presented in this chapter and the methodological details on the computation of the indicators analysed.
| 58 |
THE STATE OF FOOD SECURITY AND NUTRITION IN THE WORLD 2022
� food and agricultural marketing services and promotion, including collective schemes for post-production facilities and other services designed to improve the marketing environment for agriculture, promote as well as reduce post-harvest losses and to promote market exchange and trade (e.g. promotional campaigns, participation in international fairs). The food and agricultural marketing discussed in this chapter is different from “marketing” that promotes branded products to consumers as defined by the WHA; the latter is part of what is referred to in this chapter as “promotion”.j
The GSS indicator accounts for all the public expenditures funding public goods in the food and agricultural sector (Box 7).
Fiscal subsidies to consumers are budgetary transfers from the government (and more specifically taxpayers) to intermediary (e.g. processors, traders, etc.) or final consumers of food. These transfers are meant to lower the cost of acquiring food (food subsidies), to increase consumer income (e.g. cash transfers) or to provide direct access to food (e.g. in-kind food transfers and school feeding programmes).
Some of the policy instruments described above, particularly border measures and subsidies on output and inputs, have the potential to distort trade. For this reason, multilateral trade rules play a crucial role in setting the global framework that determines the policy space for national agricultural policies. The World Trade Organization (WTO) Agreement on Agriculture (AoA), which resulted from the Uruguay Round of multilateral trade negotiations, produced a comprehensive set of disciplines on member countries’ trade and agricultural policies, seeking to reduce distortions in agricultural markets. The AoA contains binding commitments that place limits on the use of tariffs and subsidies to agricultural producers (Box 8).
j The 2010 WHA set of recommendations on the marketing of foods and non-alcoholic beverages to children states that marketing refers to “any form of commercial communication or message that is designed to increase, or has the effect of increasing, the recognition, appeal and/or consumption of particular products and services. It comprises anything that acts to advertise or otherwise promote a product or service“ (WHO [2010], p. 94).201
How does support to food and agriculture affect agrifood systems?Governments may support food and agriculture through the policy instruments introduced above to pursue multifaceted objectives of agrifood systems in the economic, social and health realms. Among these, food and agricultural support has the potential to affect the cost and affordability of healthy diets, by shaping production and consumption choices as well as affecting food supply chain dynamics and food environments, as summarized in Figure 1 in Chapter 1. Both its objectives and the ultimate impact of this policy support will largely depend on the country-specific context, i.e. income and development level, production structure and volume, agricultural sector performance and relevance for the economy, consumption patterns, political economy considerations, impact of climate change on agriculture, and the occurrence of emergencies (e.g. humanitarian crises, conflicts) that can affect safety and livelihood of the population.
Trade and market interventions, for instance, are usually adopted in a bid to support producer prices and thus farm income (e.g. import tariffs), or to keep prices low for consumers (e.g. export bans). LICs and MICs often use some of these measures to protect their farming sector against import competition, or to influence domestic prices for ensuring adequate supplies and access to foods for consumers. However, border measures, beyond affecting trade flows, also influence domestic food production practices and diversity of available foods (or lack thereof) and can therefore imply important trade-offs. By generating a gap between the domestic producer price and the border price of a specific agricultural commodity, these measures can, for example, favour producers of certain crops and potentially discourage production of others. Measures such as tariffs also affect consumption decisions as they raise the price of imported foods, as well as their domestic substitutes to consumers.
Fiscal subsidies to producers are generally provided to boost agricultural production and productivity and support farm income by reducing production costs. In MICs and LICs, these transfers are often »
| 59 |
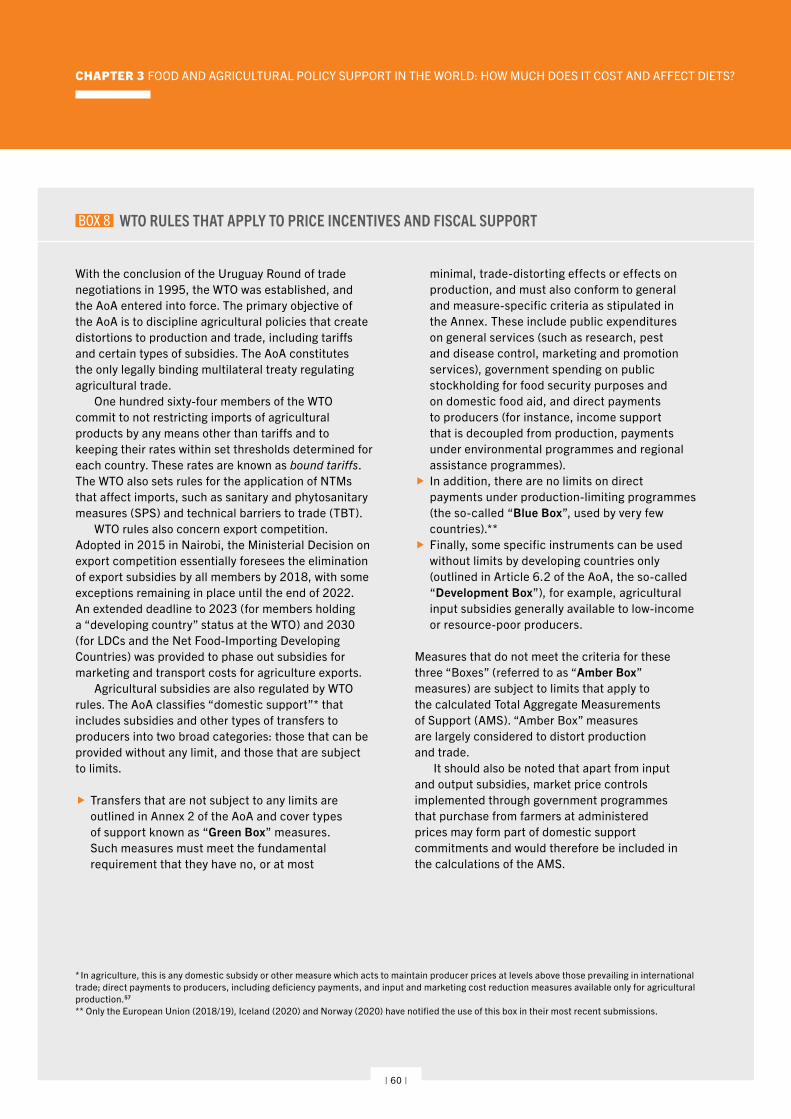
CHAPTER 3 FOOD AND AGRICULTURAL POLICY SUPPORT IN THE WORLD: HOW MUCH DOES IT COST AND AFFECT DIETS?
BOX 8 WTO RULES THAT APPLY TO PRICE INCENTIVES AND FISCAL SUPPORT
With the conclusion of the Uruguay Round of trade negotiations in 1995, the WTO was established, and the AoA entered into force. The primary objective of the AoA is to discipline agricultural policies that create distortions to production and trade, including tariffs and certain types of subsidies. The AoA constitutes the only legally binding multilateral treaty regulating agricultural trade.
One hundred sixty-four members of the WTO commit to not restricting imports of agricultural products by any means other than tariffs and to keeping their rates within set thresholds determined for each country. These rates are known as bound tariffs. The WTO also sets rules for the application of NTMs that affect imports, such as sanitary and phytosanitary measures (SPS) and technical barriers to trade (TBT).
WTO rules also concern export competition. Adopted in 2015 in Nairobi, the Ministerial Decision on export competition essentially foresees the elimination of export subsidies by all members by 2018, with some exceptions remaining in place until the end of 2022. An extended deadline to 2023 (for members holding a “developing country” status at the WTO) and 2030 (for LDCs and the Net Food-Importing Developing Countries) was provided to phase out subsidies for marketing and transport costs for agriculture exports.
Agricultural subsidies are also regulated by WTO rules. The AoA classifies “domestic support”* that includes subsidies and other types of transfers to producers into two broad categories: those that can be provided without any limit, and those that are subject to limits.
� Transfers that are not subject to any limits are outlined in Annex 2 of the AoA and cover types of support known as “Green Box” measures. Such measures must meet the fundamental requirement that they have no, or at most
minimal, trade-distorting effects or effects on production, and must also conform to general and measure-specific criteria as stipulated in the Annex. These include public expenditures on general services (such as research, pest and disease control, marketing and promotion services), government spending on public stockholding for food security purposes and on domestic food aid, and direct payments to producers (for instance, income support that is decoupled from production, payments under environmental programmes and regional assistance programmes).
� In addition, there are no limits on direct payments under production-limiting programmes (the so-called “Blue Box”, used by very few countries).**
� Finally, some specific instruments can be used without limits by developing countries only (outlined in Article 6.2 of the AoA, the so-called “Development Box”), for example, agricultural input subsidies generally available to low-income or resource-poor producers.
Measures that do not meet the criteria for these three “Boxes” (referred to as “Amber Box” measures) are subject to limits that apply to the calculated Total Aggregate Measurements of Support (AMS). “Amber Box” measures are largely considered to distort production and trade.
It should also be noted that apart from input and output subsidies, market price controls implemented through government programmes that purchase from farmers at administered prices may form part of domestic support commitments and would therefore be included in the calculations of the AMS.
* In agriculture, this is any domestic subsidy or other measure which acts to maintain producer prices at levels above those prevailing in international trade; direct payments to producers, including deficiency payments, and input and marketing cost reduction measures available only for agricultural production.57
** Only the European Union (2018/19), Iceland (2020) and Norway (2020) have notified the use of this box in their most recent submissions.
| 60 |
THE STATE OF FOOD SECURITY AND NUTRITION IN THE WORLD 2022
used to correct for certain market failures, such as the limited availability of inputs, capital, or credit. However, when these subsidies are coupled to the use of inputs or to the volume of production, like border measures, they can greatly influence which commodities are produced and marketed and/or the type and use of inputs with important implications beyond the farm sector for the climate, food security and nutrition, equity and efficiency.
If provided without any condition, input subsidies may, for example, lead to overuse of agrochemicals and natural resources, and promote monoculture, with negative consequences on the environment and the sustainability of agrifood systems.58,59 As discussed in more detail in Section 3.2, such subsidies can also hinder positive nutritional outcomes, in some cases by disproportionately fostering the production of cereals in the long term at the expense of other foods that contribute to healthy diets, such as fruits and vegetables.3 Moreover, these subsidies can be regressive if larger farms are more capable than smallholders of meeting requirements necessary to accessing them. These potentially negative implications are aggravated by the fact that, since these policies bring about immediate and often very tangible effects, they are politically difficult to remove, once in place.
Contrary to most types of border measures, fiscal subsidies can also drain public resources that could instead be invested in areas where returns may be higher and benefits are longer lasting, for example, in general services such as R&D, infrastructure, or marketing facilities – thus hindering efficient and more sustainable use of often-limited public funds.60,61 However, it should be recognized that if designed with sustainability objectives in mind, fiscal subsidies may contribute to better production and livelihoods.62
Subsidies decoupled from production and public expenditure on general services, especially in countries where they are low and significant productivity gaps persist, are less likely to hinder sustainability and can even promote it. These forms of support can promote production and productivity enhancements, food safety, connectivity between farmers, markets
and consumers and can contribute to food security and improved nutrition in the longer term. They may also affect farm revenues or consumption expenditure indirectly. Though the positive impacts of many general services take longer to materialize compared to, for example, border measures, price control policies or input subsidies, returns of general services investments on agricultural growth and poverty reduction are recognized to be higher.63,64,65 Properly designed, inclusive and sustainable investments in R&D, marketing services and infrastructure can also be effective in lowering the cost of nutritious foods and improving access to healthy diets, as discussed in detail in Section 3.2.66
Subsidies to consumers, including food subsidies to processors or traders, and those provided through social protection programmes that include cash transfers, food vouchers and in-kind food transfers including school feeding programmes, can have positive effects on different outcomes.k These subsidies, if carefully designed, can increase total household food consumption, improve dietary diversity and nutritional outcomes, as well as decrease poverty rates (see Section 3.2 for more analysis).67 They can also affect agricultural performance, since they have the potential to alleviate liquidity and credit constraints affecting investment and production decisions.67,68
Policy support to food and agriculture is significant but differs by policy instrumentWorldwide support for the food and agricultural sector accounted for almost USD 630 billion a year on average over 2013–2018.l Support targeting agricultural producers individually averaged almost USD 446 billion a year in net terms (i.e. accounting for both price incentives and disincentives for farmers), which corresponds to about 70 percent of the total sector support and
k Contrary to fiscal subsidies to producers, these measures are not disciplined under the WTO AoA and are therefore not bound by multilateral commitments.
l These estimates are based on data for about 63 countries (considering European Union members as a single one) that together account for close to 90 percent of the global value of agricultural production in the years with the greatest coverage. For a detailed list of countries covered and their income classification, please refer to Annex 4.
»
| 61 |
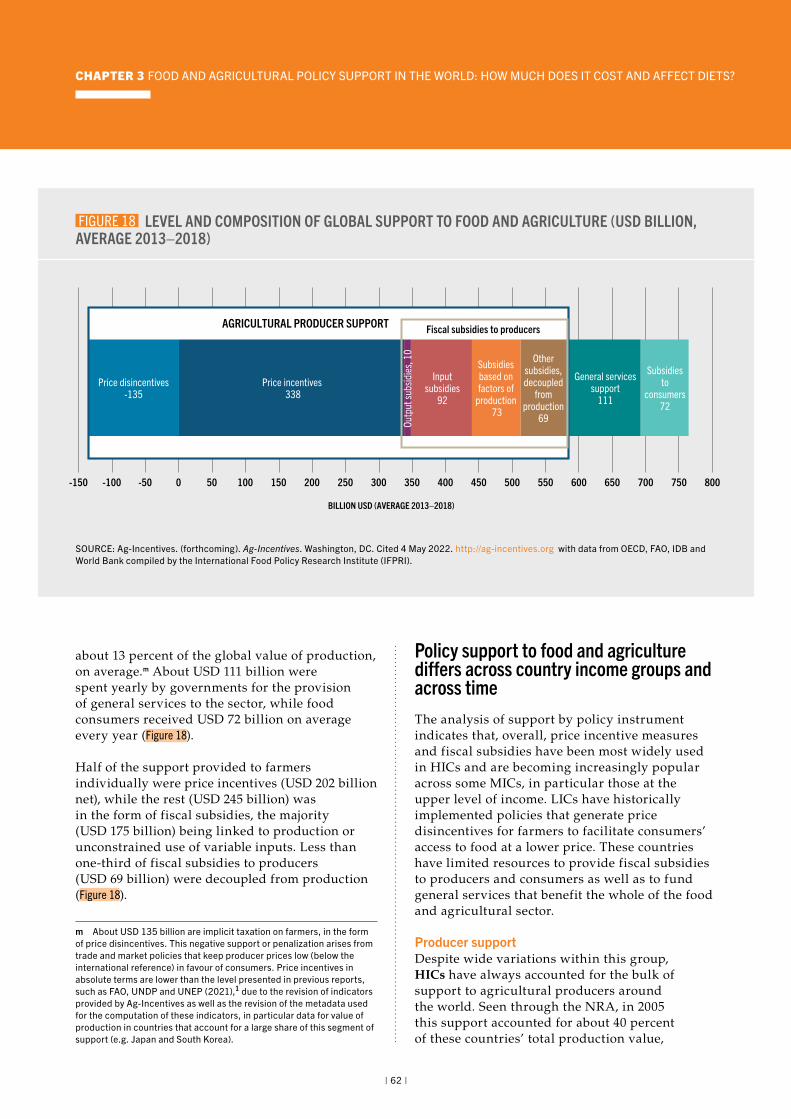
CHAPTER 3 FOOD AND AGRICULTURAL POLICY SUPPORT IN THE WORLD: HOW MUCH DOES IT COST AND AFFECT DIETS?
about 13 percent of the global value of production, on average.m About USD 111 billion were spent yearly by governments for the provision of general services to the sector, while food consumers received USD 72 billion on average every year (Figure 18).
Half of the support provided to farmers individually were price incentives (USD 202 billion net), while the rest (USD 245 billion) was in the form of fiscal subsidies, the majority (USD 175 billion) being linked to production or unconstrained use of variable inputs. Less than one-third of fiscal subsidies to producers (USD 69 billion) were decoupled from production (Figure 18).
m About USD 135 billion are implicit taxation on farmers, in the form of price disincentives. This negative support or penalization arises from trade and market policies that keep producer prices low (below the international reference) in favour of consumers. Price incentives in absolute terms are lower than the level presented in previous reports, such as FAO, UNDP and UNEP (2021),1 due to the revision of indicators provided by Ag-Incentives as well as the revision of the metadata used for the computation of these indicators, in particular data for value of production in countries that account for a large share of this segment of support (e.g. Japan and South Korea).
Policy support to food and agriculture differs across country income groups and across timeThe analysis of support by policy instrument indicates that, overall, price incentive measures and fiscal subsidies have been most widely used in HICs and are becoming increasingly popular across some MICs, in particular those at the upper level of income. LICs have historically implemented policies that generate price disincentives for farmers to facilitate consumers’ access to food at a lower price. These countries have limited resources to provide fiscal subsidies to producers and consumers as well as to fund general services that benefit the whole of the food and agricultural sector.
Producer supportDespite wide variations within this group, HICs have always accounted for the bulk of support to agricultural producers around the world. Seen through the NRA, in 2005 this support accounted for about 40 percent of these countries’ total production value,
FIGURE 18 LEVEL AND COMPOSITION OF GLOBAL SUPPORT TO FOOD AND AGRICULTURE (USD BILLION, AVERAGE 2013–2018)
-150 -100 -50 0 50 100 150 200 250 300 350 400 450 500 550 600 650 700 750 800
AGRICULTURAL PRODUCER SUPPORT Fiscal subsidies to producers
Price disincentives-135
Price incentives 338
Outp
ut su
bsid
ies,
10
Inputsubsidies
92
General servicessupport
111
Subsidiesto
consumers72
Subsidiesbased onfactors of
production 73
Othersubsidies,decoupled
fromproduction
69
BILLION USD (AVERAGE 2013–2018)
SOURCE: Ag-Incentives. (forthcoming). Ag-Incentives. Washington, DC. Cited 4 May 2022. http://ag-incentives.org with data from OECD, FAO, IDB and World Bank compiled by the International Food Policy Research Institute (IFPRI).
| 62 |
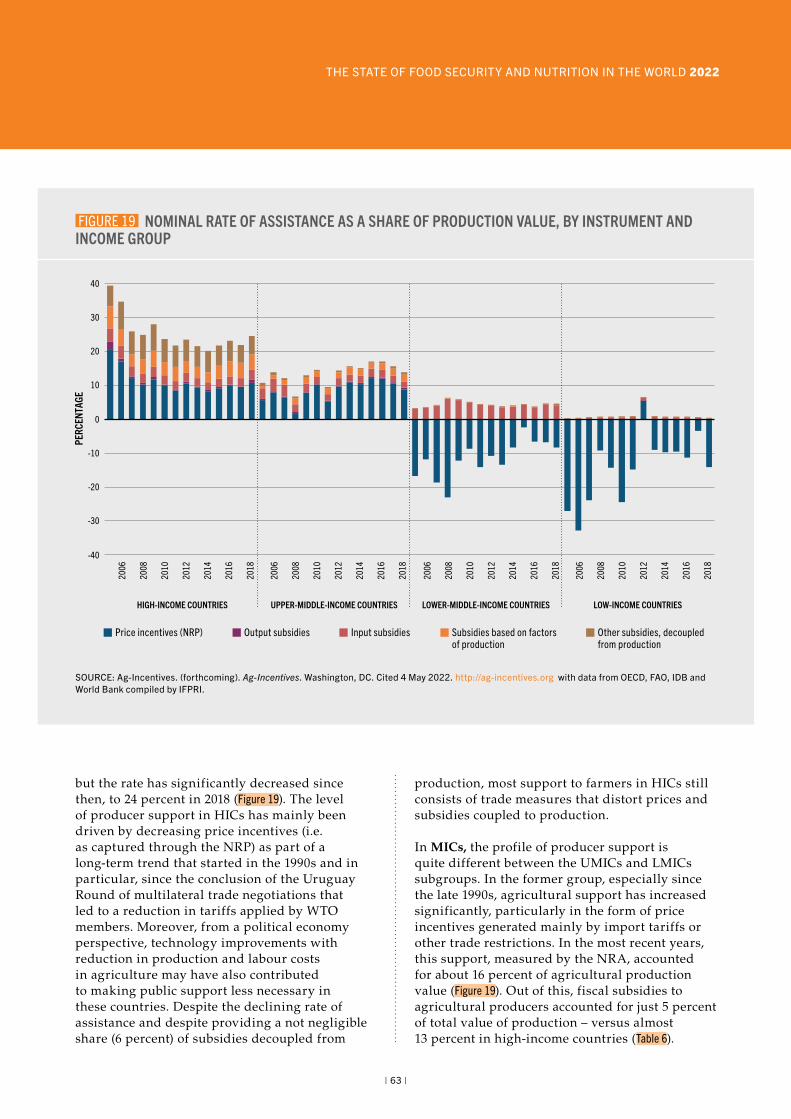
THE STATE OF FOOD SECURITY AND NUTRITION IN THE WORLD 2022
but the rate has significantly decreased since then, to 24 percent in 2018 (Figure 19). The level of producer support in HICs has mainly been driven by decreasing price incentives (i.e. as captured through the NRP) as part of a long-term trend that started in the 1990s and in particular, since the conclusion of the Uruguay Round of multilateral trade negotiations that led to a reduction in tariffs applied by WTO members. Moreover, from a political economy perspective, technology improvements with reduction in production and labour costs in agriculture may have also contributed to making public support less necessary in these countries. Despite the declining rate of assistance and despite providing a not negligible share (6 percent) of subsidies decoupled from
production, most support to farmers in HICs still consists of trade measures that distort prices and subsidies coupled to production.
In MICs, the profile of producer support is quite different between the UMICs and LMICs subgroups. In the former group, especially since the late 1990s, agricultural support has increased significantly, particularly in the form of price incentives generated mainly by import tariffs or other trade restrictions. In the most recent years, this support, measured by the NRA, accounted for about 16 percent of agricultural production value (Figure 19). Out of this, fiscal subsidies to agricultural producers accounted for just 5 percent of total value of production – versus almost 13 percent in high-income countries (Table 6).
FIGURE 19 NOMINAL RATE OF ASSISTANCE AS A SHARE OF PRODUCTION VALUE, BY INSTRUMENT AND INCOME GROUP
-40
-30
-20
-10
0
10
20
30
40
2006
2008
2010
2012
2014
2016
2018
2006
2008
2010
2012
2014
2016
2018
2006
2008
2010
2012
2014
2016
2018
2006
2008
2010
2012
2014
2016
2018
HIGH-INCOME COUNTRIES UPPER-MIDDLE-INCOME COUNTRIES LOWER-MIDDLE-INCOME COUNTRIES LOW-INCOME COUNTRIES
Price incentives (NRP) Output subsidies Input subsidies Subsidies based on factorsof production
Other subsidies, decoupledfrom production
PERC
ENTA
GE
SOURCE: Ag-Incentives. (forthcoming). Ag-Incentives. Washington, DC. Cited 4 May 2022. http://ag-incentives.org with data from OECD, FAO, IDB and World Bank compiled by IFPRI.
| 63 |
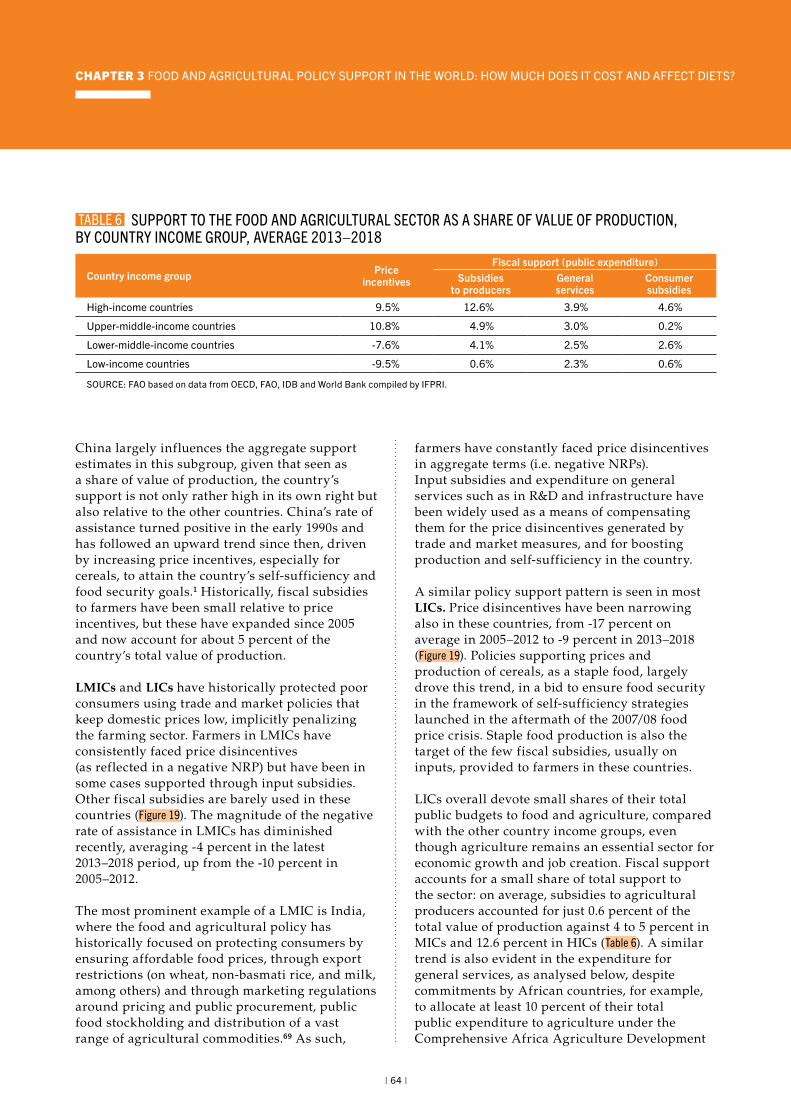
CHAPTER 3 FOOD AND AGRICULTURAL POLICY SUPPORT IN THE WORLD: HOW MUCH DOES IT COST AND AFFECT DIETS?
China largely influences the aggregate support estimates in this subgroup, given that seen as a share of value of production, the country’s support is not only rather high in its own right but also relative to the other countries. China’s rate of assistance turned positive in the early 1990s and has followed an upward trend since then, driven by increasing price incentives, especially for cereals, to attain the country’s self-sufficiency and food security goals.1 Historically, fiscal subsidies to farmers have been small relative to price incentives, but these have expanded since 2005 and now account for about 5 percent of the country’s total value of production.
LMICs and LICs have historically protected poor consumers using trade and market policies that keep domestic prices low, implicitly penalizing the farming sector. Farmers in LMICs have consistently faced price disincentives (as reflected in a negative NRP) but have been in some cases supported through input subsidies. Other fiscal subsidies are barely used in these countries (Figure 19). The magnitude of the negative rate of assistance in LMICs has diminished recently, averaging -4 percent in the latest 2013–2018 period, up from the -10 percent in 2005–2012.
The most prominent example of a LMIC is India, where the food and agricultural policy has historically focused on protecting consumers by ensuring affordable food prices, through export restrictions (on wheat, non-basmati rice, and milk, among others) and through marketing regulations around pricing and public procurement, public food stockholding and distribution of a vast range of agricultural commodities.69 As such,
farmers have constantly faced price disincentives in aggregate terms (i.e. negative NRPs). Input subsidies and expenditure on general services such as in R&D and infrastructure have been widely used as a means of compensating them for the price disincentives generated by trade and market measures, and for boosting production and self-sufficiency in the country.
A similar policy support pattern is seen in most LICs. Price disincentives have been narrowing also in these countries, from -17 percent on average in 2005–2012 to -9 percent in 2013–2018 (Figure 19). Policies supporting prices and production of cereals, as a staple food, largely drove this trend, in a bid to ensure food security in the framework of self-sufficiency strategies launched in the aftermath of the 2007/08 food price crisis. Staple food production is also the target of the few fiscal subsidies, usually on inputs, provided to farmers in these countries.
LICs overall devote small shares of their total public budgets to food and agriculture, compared with the other country income groups, even though agriculture remains an essential sector for economic growth and job creation. Fiscal support accounts for a small share of total support to the sector: on average, subsidies to agricultural producers accounted for just 0.6 percent of the total value of production against 4 to 5 percent in MICs and 12.6 percent in HICs (Table 6). A similar trend is also evident in the expenditure for general services, as analysed below, despite commitments by African countries, for example, to allocate at least 10 percent of their total public expenditure to agriculture under the Comprehensive Africa Agriculture Development
Country income group Priceincentives
Fiscal support (public expenditure)Subsidies
to producersGeneralservices
Consumersubsidies
High-income countries 9.5% 12.6% 3.9% 4.6%
Upper-middle-income countries 10.8% 4.9% 3.0% 0.2%
Lower-middle-income countries -7.6% 4.1% 2.5% 2.6%
Low-income countries -9.5% 0.6% 2.3% 0.6%
SOURCE: FAO based on data from OECD, FAO, IDB and World Bank compiled by IFPRI.
TABLE 6 SUPPORT TO THE FOOD AND AGRICULTURAL SECTOR AS A SHARE OF VALUE OF PRODUCTION, BY COUNTRY INCOME GROUP, AVERAGE 2013–2018
| 64 |
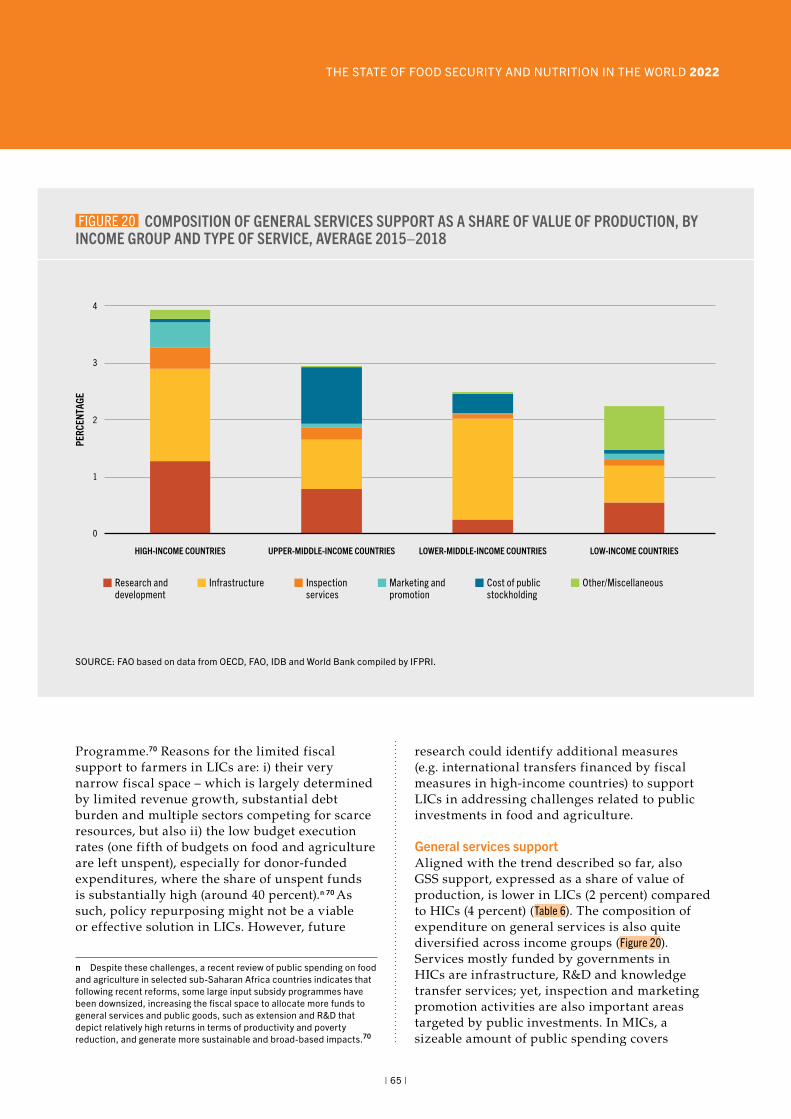
THE STATE OF FOOD SECURITY AND NUTRITION IN THE WORLD 2022
Programme.70 Reasons for the limited fiscal support to farmers in LICs are: i) their very narrow fiscal space – which is largely determined by limited revenue growth, substantial debt burden and multiple sectors competing for scarce resources, but also ii) the low budget execution rates (one fifth of budgets on food and agriculture are left unspent), especially for donor-funded expenditures, where the share of unspent funds is substantially high (around 40 percent).n 70 As such, policy repurposing might not be a viable or effective solution in LICs. However, future
n Despite these challenges, a recent review of public spending on food and agriculture in selected sub-Saharan Africa countries indicates that following recent reforms, some large input subsidy programmes have been downsized, increasing the fiscal space to allocate more funds to general services and public goods, such as extension and R&D that depict relatively high returns in terms of productivity and poverty reduction, and generate more sustainable and broad-based impacts.70
research could identify additional measures (e.g. international transfers financed by fiscal measures in high-income countries) to support LICs in addressing challenges related to public investments in food and agriculture.
General services supportAligned with the trend described so far, also GSS support, expressed as a share of value of production, is lower in LICs (2 percent) compared to HICs (4 percent) (Table 6). The composition of expenditure on general services is also quite diversified across income groups (Figure 20). Services mostly funded by governments in HICs are infrastructure, R&D and knowledge transfer services; yet, inspection and marketing promotion activities are also important areas targeted by public investments. In MICs, a sizeable amount of public spending covers
FIGURE 20 COMPOSITION OF GENERAL SERVICES SUPPORT AS A SHARE OF VALUE OF PRODUCTION, BY INCOME GROUP AND TYPE OF SERVICE, AVERAGE 2015–2018
Research anddevelopment
Infrastructure Inspectionservices
Marketing andpromotion
Cost of publicstockholding
Other/Miscellaneous
0
1
2
3
4
HIGH-INCOME COUNTRIES UPPER-MIDDLE-INCOME COUNTRIES LOWER-MIDDLE-INCOME COUNTRIES LOW-INCOME COUNTRIES
PERC
ENTA
GE
SOURCE: FAO based on data from OECD, FAO, IDB and World Bank compiled by IFPRI.
| 65 |
CHAPTER 3 FOOD AND AGRICULTURAL POLICY SUPPORT IN THE WORLD: HOW MUCH DOES IT COST AND AFFECT DIETS?
costs of public stockholding programmes. These are very common in Asia and the Pacific (e.g. China, India, Indonesia, Pakistan and the Philippines) and, though their implementation mechanisms may differ, they are overall aimed at providing remunerative prices to farmers, stabilizing markets, and ensuring food security for consumers.71 Amounts spent in GSS are relatively lower in LICs; support is concentrated on funding agricultural infrastructure construction and maintenance (with a special focus on irrigation), on R&D services, as well as on expenditures earmarked for forestry, land management and environmental protection (mapped in the miscellaneous category) (Figure 20).70
Consumer supportIn line with the fiscal support described above, two-thirds of the world’s fiscal subsidies to consumers (either final or intermediary, such as that of processors) were disbursed in HICs. On average in 2013–2018, these accounted for 4.6 percent of the value of production in HICs, while in LICs they were less than 1 percent of the total value of production (Table 6). Again, this is an indication that HICs have more means and resources to financially support agrifood systems actors than LICs do. On the contrary, LICs tend to opt more for trade and market interventions to keep domestic prices low in favour of consumers, as discussed above. Subsidies to intermediary consumers are usually provided only in HICs and UMICs, notably in Norway, Iceland, the United States of America and Kazakhstan.
Subsidies to consumers provided in LICs and MICs most often take the form of in-kind or cash transfers under social protection programmes. India and Indonesia, for example, provide substantial subsidies to final consumers under the Targeted Public Distribution System for grains in India, and the food assistance programme (BPNT) based on electronic vouchers for rice, in Indonesia. In some sub-Saharan Africa countries, subsidies to consumers have recently increased, in some cases to the detriment of producers, who have received less financial support under existing budget constraints; cash transfers, in-kind transfers and school meal programmes have instead been expanded.70
Policy support differs across food groups and commoditiesIn line with the discussion above, countries with higher levels of income provide support to all food groups, and particularly to staple foods, including cereals, roots and tubers, followed by dairy and other protein-rich foods.o In HICs, support within these three food groups is equally provided in the form of price incentives and fiscal subsidies to producers. On the contrary, for fruits and vegetables and fats and oils, fiscal subsidies (accounting for about 11 percent of the value of production) were substantially larger than price incentives, on average, during 2013–2018 (Figure 21).p
The persistence of the staple cereals focus in the food and agricultural policy in most countries around the world is not a new trend. Policies that promoted staple crop productivity, including price incentives, crop specific input subsidies, and grain procurement for food security stocks, have been common since the Green Revolution period.72 Historically, these measures have contributed to hampering farmer incentives for the diversification of their production systems, as analysed more in detail in Section 3.2.73,74
o For the specific analyses done for Figure 21 and Box 11, “staple foods” refer to cereals (rice, maize, wheat, sorghum, millet, etc.) and roots and tubers such as cassava and potatoes of different types. The “dairy” food group mainly includes milk, while “protein-rich foods” include other animal source food such as meat of various types (bovine, pig, poultry, sheep, etc.) and eggs, as well as pulses (e.g. beans and peas). “Fruits and vegetables” include commonly grown fresh products like onion, tomato, avocado, banana, pineapple, mango, among many others. In the “fats and oils” group, soybean, palm oil and the most common oilseeds are included. The “other” food group contains important food crops such as sugar, tea, cocoa and coffee, as well as non-food crops such as cotton, wool and tobacco.
p Based on data availability, the NRA indicator is analysed only for these food groups in this report. However, it is recognized that further data and disaggregation within these food groups (for example for protein-rich foods and fats and oils) would be essential to strengthen findings and recommendations around food and agriculture policy support related to healthy diets.
| 66 |
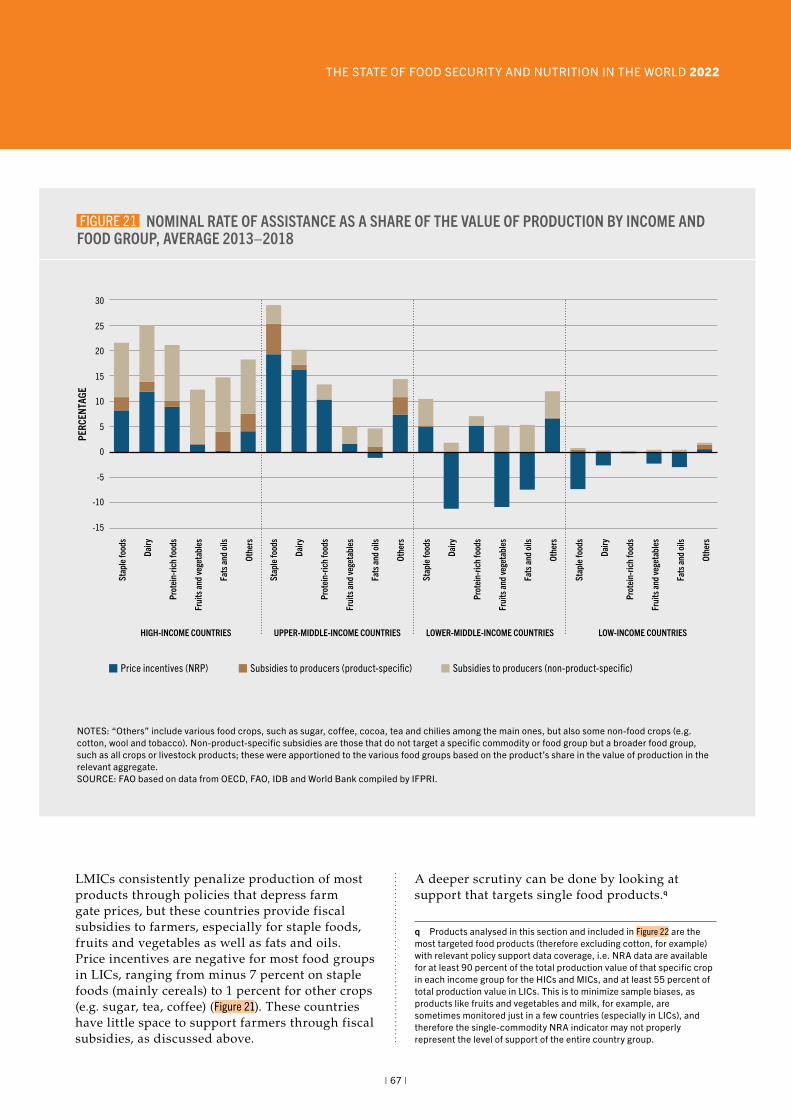
THE STATE OF FOOD SECURITY AND NUTRITION IN THE WORLD 2022
LMICs consistently penalize production of most products through policies that depress farm gate prices, but these countries provide fiscal subsidies to farmers, especially for staple foods, fruits and vegetables as well as fats and oils. Price incentives are negative for most food groups in LICs, ranging from minus 7 percent on staple foods (mainly cereals) to 1 percent for other crops (e.g. sugar, tea, coffee) (Figure 21). These countries have little space to support farmers through fiscal subsidies, as discussed above.
A deeper scrutiny can be done by looking at support that targets single food products.q
q Products analysed in this section and included in Figure 22 are the most targeted food products (therefore excluding cotton, for example) with relevant policy support data coverage, i.e. NRA data are available for at least 90 percent of the total production value of that specific crop in each income group for the HICs and MICs, and at least 55 percent of total production value in LICs. This is to minimize sample biases, as products like fruits and vegetables and milk, for example, are sometimes monitored just in a few countries (especially in LICs), and therefore the single-commodity NRA indicator may not properly represent the level of support of the entire country group.
FIGURE 21 NOMINAL RATE OF ASSISTANCE AS A SHARE OF THE VALUE OF PRODUCTION BY INCOME AND FOOD GROUP, AVERAGE 2013–2018
HIGH-INCOME COUNTRIES UPPER-MIDDLE-INCOME COUNTRIES LOWER-MIDDLE-INCOME COUNTRIES LOW-INCOME COUNTRIES
Price incentives (NRP) Subsidies to producers (product-specific) Subsidies to producers (non-product-specific)
-15
-10
-5
0
5
10
15
20
25
30
Stap
le fo
ods
Dairy
Prot
ein-
rich
food
s
Frui
ts an
d ve
geta
bles
Fats
and
oils
Othe
rs
Stap
le fo
ods
Dairy
Prot
ein-
rich
food
s
Frui
ts an
d ve
geta
bles
Fats
and
oils
Othe
rs
Stap
le fo
ods
Dairy
Prot
ein-
rich
food
s
Frui
ts an
d ve
geta
bles
Fats
and
oils
Othe
rs
Stap
le fo
ods
Dairy
Prot
ein-
rich
food
s
Frui
ts an
d ve
geta
bles
Fats
and
oils
Othe
rs
PERC
ENTA
GE
NOTES: “Others” include various food crops, such as sugar, coffee, cocoa, tea and chilies among the main ones, but also some non-food crops (e.g. cotton, wool and tobacco). Non-product-specific subsidies are those that do not target a specific commodity or food group but a broader food group, such as all crops or livestock products; these were apportioned to the various food groups based on the product’s share in the value of production in the relevant aggregate. SOURCE: FAO based on data from OECD, FAO, IDB and World Bank compiled by IFPRI.
| 67 |
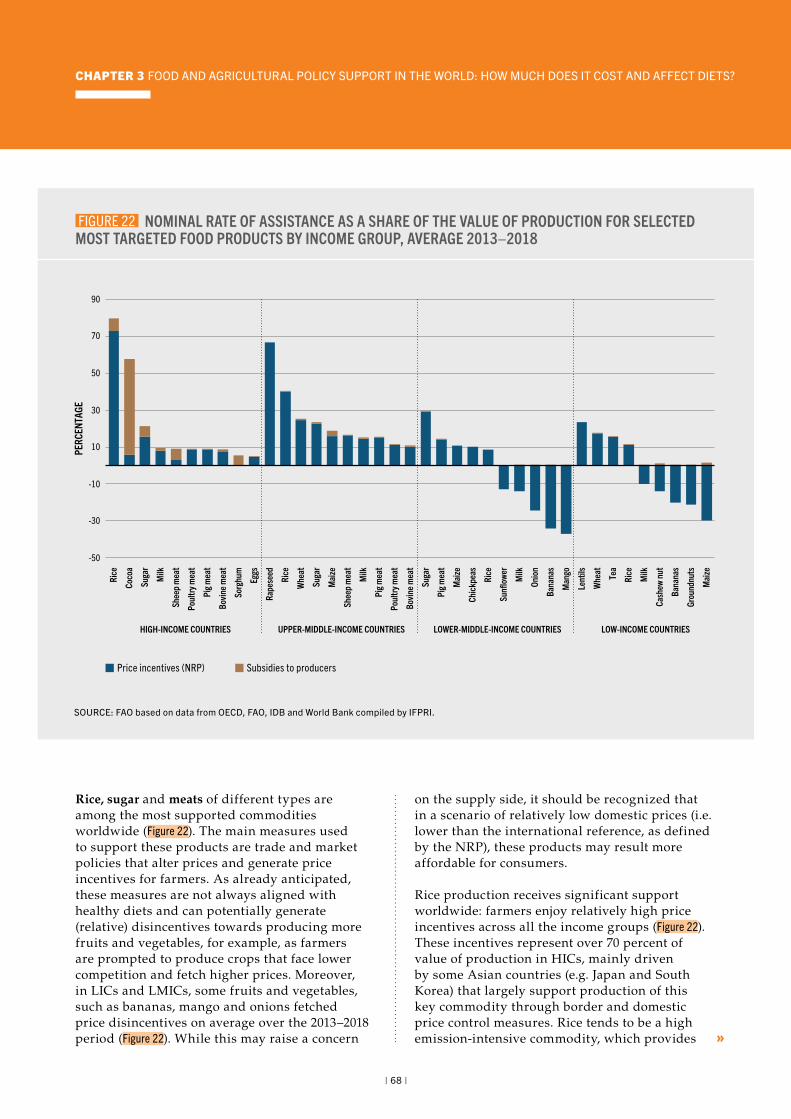
CHAPTER 3 FOOD AND AGRICULTURAL POLICY SUPPORT IN THE WORLD: HOW MUCH DOES IT COST AND AFFECT DIETS?
Rice, sugar and meats of different types are among the most supported commodities worldwide (Figure 22). The main measures used to support these products are trade and market policies that alter prices and generate price incentives for farmers. As already anticipated, these measures are not always aligned with healthy diets and can potentially generate (relative) disincentives towards producing more fruits and vegetables, for example, as farmers are prompted to produce crops that face lower competition and fetch higher prices. Moreover, in LICs and LMICs, some fruits and vegetables, such as bananas, mango and onions fetched price disincentives on average over the 2013–2018 period (Figure 22). While this may raise a concern
on the supply side, it should be recognized that in a scenario of relatively low domestic prices (i.e. lower than the international reference, as defined by the NRP), these products may result more affordable for consumers.
Rice production receives significant support worldwide: farmers enjoy relatively high price incentives across all the income groups (Figure 22). These incentives represent over 70 percent of value of production in HICs, mainly driven by some Asian countries (e.g. Japan and South Korea) that largely support production of this key commodity through border and domestic price control measures. Rice tends to be a high emission-intensive commodity, which provides
FIGURE 22 NOMINAL RATE OF ASSISTANCE AS A SHARE OF THE VALUE OF PRODUCTION FOR SELECTED MOST TARGETED FOOD PRODUCTS BY INCOME GROUP, AVERAGE 2013–2018
HIGH-INCOME COUNTRIES UPPER-MIDDLE-INCOME COUNTRIES LOWER-MIDDLE-INCOME COUNTRIES LOW-INCOME COUNTRIES
Price incentives (NRP) Subsidies to producers
PERC
ENTA
GE
-50
-30
-10
10
30
50
70
90
Rice
Coco
a
Suga
r
Milk
Shee
p m
eat
Poul
try m
eat
Pig m
eat
Bovin
e mea
t
Sorg
hum
Eggs
Rape
seed
Rice
Whe
at
Suga
r
Mai
ze
Shee
p m
eat
Milk
Pig m
eat
Poul
try m
eat
Bovin
e mea
t
Suga
r
Pig m
eat
Mai
ze
Chic
kpea
s
Rice
Sunfl
ower
Milk
Onio
n
Bana
nas
Man
go
Lent
ils
Whe
at Tea
Rice
Milk
Cash
ew n
ut
Bana
nas
Grou
ndnu
ts
Mai
zeSOURCE: FAO based on data from OECD, FAO, IDB and World Bank compiled by IFPRI.
»
| 68 |
THE STATE OF FOOD SECURITY AND NUTRITION IN THE WORLD 2022
BOX 9 THE IMPORTANCE OF FISH AND FISHERY PRODUCTS FOR HEALTHY DIETS AND THE ROLE OF FISHERIES SUBSIDIES IN POLICY REPURPOSING EFFORTS
Fish and other aquatic foods are a unique source of essential omega-3 fatty acids, as well as being rich in vitamins, minerals and animal high-quality proteins. Moreover, consumption of aquatic animals with plant-source foods increases the absorption of nutrients such as zinc and iron.75,76 Despite reductions in the use of small fish in animal feeds, there is still competing use of these fish for fishmeal and fish oil, which may in some regions impact nutritionally vulnerable populations. In many areas of the world, small indigenous fish species are consumed entirely (including head, eyes, bones and viscera) and are an essential source of micronutrients. In comparison, species such as tilapia, tuna or salmon, are often consumed only for their fillets, which represent from 30–70 percent of the fish, with the remainder being discarded.77,78 Simple processing technologies can convert heads and bones into nutritious and delicious products, for example, tuna frame powder, which was found to be highly acceptable to schoolchildren in Ghana when added to traditional recipes in school meals.79
SMALL IN SCALE, BUT BIG IN VALUE: SMALL-SCALE FISHERIES CONTRIBUTION TO HEALTHY AGRIFOOD SYSTEMSAt least 40 percent of global fisheries catch is estimated to originate from small-scale fisheries, and about one-third of this comes from inland fisheries.80 Small pelagics, such as sardines, herrings and anchovies, and other pelagic fish such as mackerels, scads and tunas account for almost 50 percent of the total marine small-scale fisheries catch. Small-scale fisheries play a critical role in the realization of the right to adequate food: over 95 percent of all small-scale landings are destined for local consumption.81 Consumption of fish from small-scale fisheries landings could provide 50 percent of the recommended daily intake of omega-3 fatty acids to 150 million women in Africa and 773 million women in Asia.*80
The livelihood of about 492 million people in the world depends – at least partially – on small-scale fisheries. Small-scale fisheries account for 90 percent of all of those employed in capture fisheries along the value chain, and 53 million people engage in subsistence fishing with a significant share being women. As such, small-scale fishers and fish workers hold enormous potential to promote transformative
changes in how, by whom and for whom fish and fishery products are produced, processed and distributed – with positive ripple effects felt throughout the global food system. The International Year of Artisanal Fisheries and Aquaculture 2022 will be a unique opportunity to showcase the implementation of the Voluntary Guidelines for Securing Sustainable Small-Scale Fisheries in the context of Food and Poverty Eradication.81
FISHERIES SUBSIDIES NEGOTIATIONS AT THE WORLD TRADE ORGANIZATION (WTO) Overfishing is a pressing challenge for sustainable development, as it can harm the aquatic environment through, for example, species’ extinctions and variations in oceans’ biomass levels and can prejudice vulnerable communities who depend on fish and fish products for nutrition, food security and livelihoods. Fisheries’ subsidies that increase fishing capacity and potentially incentivize overfishing contribute significantly to this problem. These may also fuel unfair competition between large fleets and individual artisanal fishermen, fostering inequality.
Fisheries’ subsidies discipline has been the subject of the WTO Negotiating Group on Rules since the Doha Development Agenda in 2001, with an agreed negotiating mandate in 2005, during the WTO Hong Kong Ministerial Conference. This mandate calls to eliminate subsidies for illegal, unreported and unregulated (IUU) fishing and prohibit certain forms of fisheries’ subsidies that contribute to overcapacity and overfishing, stating that special and differential treatment for developing and LDCs is an integral part of the negotiations. After the WTO mandate was established, the global call on the 2030 Agenda set the SDGs, with SDG 14.6 targeting prohibition and elimination of fisheries’ subsidies, based on the same pillars negotiated at the WTO and even reinforcing its mandate.
The associated benefits of having multilateral rules on fisheries’ subsidies dealing with IUU fishing, overcapacity and overfishing go beyond trade and the environment. Repurposing fisheries’ subsidies through a holistic approach based on scientific evidence can increase the availability of sustainable and nutritious food, as well as reduce the unfair competition that some small-scale fisheries often face.
* The Global Action Network on Sustainable Food from the Oceans and Inland Waters for Food Security and Nutrition has been convened under the UN Decade of Action on Nutrition, with a holistic approach of “from healthy waters to healthy people”, to improve food security and nutrition with sustainable food from the oceans and inland waters and leave no one behind.
| 69 |
CHAPTER 3 FOOD AND AGRICULTURAL POLICY SUPPORT IN THE WORLD: HOW MUCH DOES IT COST AND AFFECT DIETS?
» calories but few micronutrients. However, being a staple food for more than 3 billion people in the world, it requires careful and special consideration when policymakers assess the most appropriate policy reform and repurposing options, in order to avert trade-offs with food security. The same consideration applies to animal source foods products like milk and beef, which can contribute to improving the diet quality and nutrition in some LICs and LMICs contexts but are often overconsumed in HICs with negative health implications. It is precisely in HICs and UMICs that production of these livestock-derived products is relatively more supported, as indicated by an average NRA of about 11 percent across these two income groups during 2013–2018.
Some LICs have provided price incentives to selected staple foods, i.e. wheat and rice but disincentives for others, like maize (Figure 22). In some cases, input subsidies schemes were also implemented, notably for maize (mostly in Malawi) and wheat (in Rwanda) production. Price incentives for rice were particularly high in Eastern African countries (e.g. Burundi, Rwanda and Uganda) in the 2013–2018 period. Milk, cashew nut and bananas were instead among the most penalized products (Figure 22).
Other commodities of critical importance for the livelihoods, food security and nutrition of billions of people around the world are fishery and aquaculture products, for which, unfortunately, there are no consistent policy support indicators. Fish and other aquatic foods play a pivotal role in healthy diets; in many countries, indeed, they provide the animal protein required to consume the least costly healthy diet. Small-scale artisanal fishers and fish workers produce a large portion of these foods and represent a large proportion of the workforce in many countries (Box 9). Overfishing is a pressing challenge for agrifood systems and the environment. Fishery subsidies could exacerbate overfishing as well as illegal and unequal practices. There is an urgent need for gathering and developing data to understand the level and type of public support directed to these products important for healthy diets, as repurposing strategies in many countries must account for these considerations (Box 9). n
3.2HOW ARE FOOD AND AGRICULTURAL POLICIES AFFECTING DIETS? Towards an understanding of the differences between healthy diets and unhealthy diets To understand how existing food and agricultural policy support is affecting diets, it is first necessary to understand the differences between what is meant by healthy diets and unhealthy diets. The 2020 edition of this report looked closely at what constitutes a healthy diet through its examination of the evolving view of diet in the food security and nutrition debate, which is summarized in this section.
The exact make-up of a healthy diet varies depending on individual characteristics, cultural context, local availability of food, climatic and ecological conditions, dietary customs and preferences. The basic principles of what constitutes a healthy diet, however, are common across context and are clearly agreed upon and outlined (Box 10). One key element of diet quality is dietary diversity, or the variety of foods from different food groups that make up the diet. Eating a larger variety of foods across food groups is associated with decreased risk of insufficient intake of several micronutrients and related deficiencies.30 Consuming a healthy diet throughout the life-course helps to prevent against all forms of malnutrition, favours child growth and development, and protects against diet-related NCDs such as diabetes, heart disease, stroke and cancer.30 Prevention of all forms of malnutrition is linked with adult productivity and is vital, therefore, for the development of nations.82
Unhealthy diets – those that do not meet the basic principles outlined in Box 10 – tend to be low in a variety of essential nutrients and often high in fat (especially trans or saturated fats), sugars and/or salt. Consumption of unhealthy diets may be due to constrained access to a variety of nutritious foods due to economic or other factors, and/or to knowledge, preferences, motivations, traditions
| 70 |
THE STATE OF FOOD SECURITY AND NUTRITION IN THE WORLD 2022
and similar factors. Progressing from unhealthy to healthy diets, therefore, requires concerted and simultaneous efforts to address supply and access considerations, enabling healthy food environments as well as the promotion of healthy diets through education, behaviour change and enabling healthy food environments.
Food and agricultural policies that affect the availability and affordability of healthy diets Food and agricultural policies affect agrifood systems (Figure 1) through various and complex pathways, including through their effects on production, trade, relative food prices, variety
of foods, producer’s incomes, and consumption decisions, among others. Hence, any support to food and agriculture through these policies can potentially trigger shifts in the availability of different foods and in the affordability of healthy diets, which in turn can affect dietary patterns.3,15
The empirical literature reveals that policy support to food and agricultural production, e.g. in the form of fiscal subsidies or border and market measures to protect producers from price volatility or competition, may bring positive effects on beneficiary producers, such as on their incomes.85 These policies, however, may have negative implications on the ability of consumers, in particular the poor, to access healthy diets and
BOX 10 DESCRIPTION OF NUTRITIOUS FOODS AND HEALTHY DIETS
In this report, nutritious foods are referred to as safe foods that contribute essential nutrients such as vitamins and minerals (micronutrients), fibre and other components to healthy diets that are beneficial for growth, and health and development, guarding against malnutrition. In nutritious foods, the presence of nutrients of public health concern including saturated fats, free sugars, and salt/sodium is minimized, industrially produced transfats are eliminated, and salt is iodized.83
GUIDING PRINCIPLES OF HEALTHY DIETS:3,84
� start early in life with early initiation of breastfeeding, exclusive breastfeeding until six months of age, and continued breastfeeding until two years of age and beyond combined with appropriate complementary feeding;
� are based on a great variety of unprocessed or minimally processed foods, balanced across food groups, while restricting highly processed food and drink products;*
� include wholegrains, legumes, nuts and an abundance and variety of fruits and vegetables;**
� can include moderate amounts of eggs, dairy, poultry and fish, and small amounts of red meat;
� include safe and clean drinking water as the fluid of choice;
� are adequate (i.e. reaching but not exceeding needs) in energy and nutrients for growth and development and meet the needs for an active and healthy life across the life cycle;
� are consistent with WHO guidelines to reduce the risk of diet-related NCDs and ensure health and well-being for the general population; and
� contain minimal levels or none, if possible, of pathogens, toxins and other agents that can cause food-borne disease.
According to WHO, healthy diets include less than 30 percent of total energy intake from fats, with a shift in fat consumption away from saturated fats to unsaturated fats and the elimination of industrial transfats; less than 10 percent of total energy intake from free sugars (preferably less than 5 percent); consumption of at least 400 g of fruits and vegetables per day; and not more than 5 g per day of salt (to be iodized).30
* Food processing can be beneficial for the promotion of high-quality diets; it can make food more available as well as safer. However, highly processed foods can contain very high densities of salt, free sugars and saturated or transfats, and these products, when consumed in high amounts, can undermine diet quality. Free sugars are all sugars added to foods or drinks by the manufacturer, cook or consumer, as well as sugars naturally present in honey, syrups, fruit juices and fruit juice concentrates.30 ** Potatoes, sweet potatoes, cassava, and other starchy roots are not classified as fruits or vegetables.
»
| 71 |
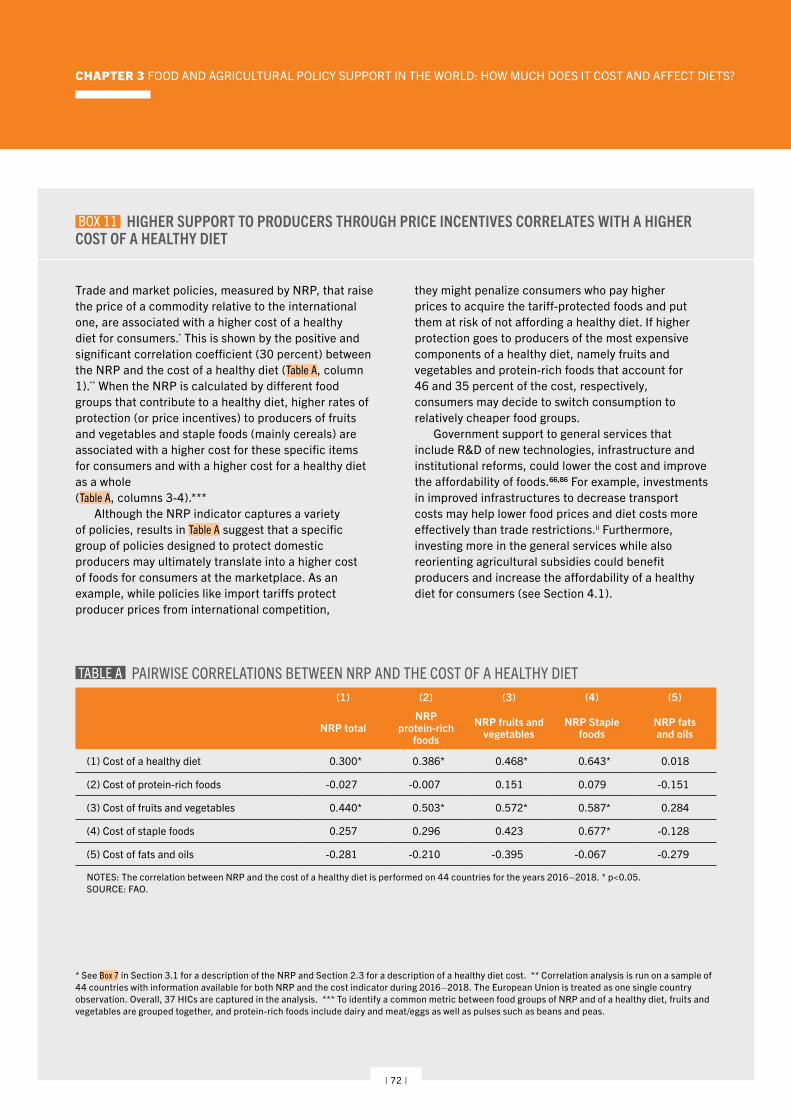
CHAPTER 3 FOOD AND AGRICULTURAL POLICY SUPPORT IN THE WORLD: HOW MUCH DOES IT COST AND AFFECT DIETS?
BOX 11 HIGHER SUPPORT TO PRODUCERS THROUGH PRICE INCENTIVES CORRELATES WITH A HIGHER COST OF A HEALTHY DIET
Trade and market policies, measured by NRP, that raise the price of a commodity relative to the international one, are associated with a higher cost of a healthy diet for consumers.* This is shown by the positive and significant correlation coefficient (30 percent) between the NRP and the cost of a healthy diet (Table A, column 1).** When the NRP is calculated by different food groups that contribute to a healthy diet, higher rates of protection (or price incentives) to producers of fruits and vegetables and staple foods (mainly cereals) are associated with a higher cost for these specific items for consumers and with a higher cost for a healthy diet as a whole (Table A, columns 3-4).***
Although the NRP indicator captures a variety of policies, results in Table A suggest that a specific group of policies designed to protect domestic producers may ultimately translate into a higher cost of foods for consumers at the marketplace. As an example, while policies like import tariffs protect producer prices from international competition,
they might penalize consumers who pay higher prices to acquire the tariff-protected foods and put them at risk of not affording a healthy diet. If higher protection goes to producers of the most expensive components of a healthy diet, namely fruits and vegetables and protein-rich foods that account for 46 and 35 percent of the cost, respectively, consumers may decide to switch consumption to relatively cheaper food groups.
Government support to general services that include R&D of new technologies, infrastructure and institutional reforms, could lower the cost and improve the affordability of foods.66,86 For example, investments in improved infrastructures to decrease transport costs may help lower food prices and diet costs more effectively than trade restrictions.ii Furthermore, investing more in the general services while also reorienting agricultural subsidies could benefit producers and increase the affordability of a healthy diet for consumers (see Section 4.1).
(1) (2) (3) (4) (5)
NRP totalNRP
protein-rich foods
NRP fruits and vegetables
NRP Staple foods
NRP fats and oils
(1) Cost of a healthy diet 0.300* 0.386* 0.468* 0.643* 0.018
(2) Cost of protein-rich foods -0.027 -0.007 0.151 0.079 -0.151
(3) Cost of fruits and vegetables 0.440* 0.503* 0.572* 0.587* 0.284
(4) Cost of staple foods 0.257 0.296 0.423 0.677* -0.128
(5) Cost of fats and oils -0.281 -0.210 -0.395 -0.067 -0.279
NOTES: The correlation between NRP and the cost of a healthy diet is performed on 44 countries for the years 2016–2018. * p<0.05. SOURCE: FAO.
TABLE A PAIRWISE CORRELATIONS BETWEEN NRP AND THE COST OF A HEALTHY DIET
* See Box 7 in Section 3.1 for a description of the NRP and Section 2.3 for a description of a healthy diet cost. ** Correlation analysis is run on a sample of 44 countries with information available for both NRP and the cost indicator during 2016–2018. The European Union is treated as one single country observation. Overall, 37 HICs are captured in the analysis. *** To identify a common metric between food groups of NRP and of a healthy diet, fruits and vegetables are grouped together, and protein-rich foods include dairy and meat/eggs as well as pulses such as beans and peas.
| 72 |
THE STATE OF FOOD SECURITY AND NUTRITION IN THE WORLD 2022
dietary diversity, since they affect the relative prices of different foods. For example, increasing price incentives to farmers, as measured by the NRP, is associated with a higher cost of a healthy diet (Box 11).
Repurposing food and agricultural policy support across the food supply chain, if carefully designed and targeted to achieve better nutrition outcomes (see Figure 1), has the potential to help reduce the cost and increase the access of foods that form a healthy diet, hence, contributing to improving their relative affordability and availability. This entails increasing incentives (and decreasing disincentives) for the production and consumption of diverse, nutritious and safe foods through environmentally sustainable practices at all stages of the food supply chain (Figure 1).87 This also implies taking due consideration of all stakeholders, including women and youth, as they often find themselves in a disadvantaged position compared to their adult male counterparts when it comes to the access to, and use of, food and agricultural resources and markets. For example, access to subsidies, inputs, storage facilities, technology, extension services, all would improve the efficiency of women and youth’s activities, food safety and the reduction of post-harvest losses.88 It is also important to keep in mind that inclusive and healthy environmental systems are needed to ensure the sustained and long-term supply of sufficient nutritious food,15 thus contributing to address the trends of and prevent all forms of malnutrition (see Chapter 2), and support all other efforts to ensure food security and good nutrition for all.
Before examining potential policy paths for repurposing food and agricultural policy support, the next sections briefly discuss the nexus between food and agricultural policy support (Figure 17) and the availability and affordability of healthy diets. For the purpose of clarity, the discussion hereafter follows the categorization of policies presented in Section 3.1.
Trade and market interventions: border measuresTrade can improve the availability and affordability of different foods, thereby broadening consumer choices and supporting
more diversified diets, including the access to fresh foods.89 For example, countries like Denmark, the Maldives and Mauritania imported more than three-quarters of the quantity of fruits and vegetables available for domestic consumption in 2019.90 At the same time, food trade is often also associated with increased availability of highly processed, energy-dense foods that are high in fats, sugars and/or salt.89 Similarly, while trade can help with climate adaptation by stabilizing markets and reallocating food from surplus to deficit regions,91 production for exports can generate negative environmental externalities, such as unsustainable freshwater withdrawals, pollution, biodiversity loss, deforestation and GHG emissions (including from shipment of food). Trade policies in food and agriculture should therefore tackle the trade-offs between economic, environmental and social objectives and strengthen the resilience of the global agrifood system to shocks.
Border measures, as defined in Section 3.1, affect the availability and relative prices of food and can therefore impact consumer choices, dietary patterns and diet-related health outcomes. Import tariffs are the most commonly used border measure, often employed to shield domestic producers from competition, with tariffs typically varying for different products and across countries (Box 12).
Besides tariffs, NTMs can impact agrifood trade and diet affordability and diversity, because producers and traders may have to comply with standards and other regulatory requirements that increase trade costs.r 3 Crucially – and while tariffs in agrifood trade have declined since the Uruguay Round of trade negotiations – NTMs are widespread.3,99,100
To illustrate, recent results on the prevalence of NTMs by product group show that in 2019 close to 80 percent of the total import value of 100 countries with available data were subject to NTMs, with agrifood trade being impacted disproportionally.100 Additionally, estimates of
r NTMs have been broadly defined as “(…) policy measures, other than ordinary customs tariffs, that can potentially have an economic effect on international trade in goods, changing quantities traded, or prices or both”.434
»
»
| 73 |
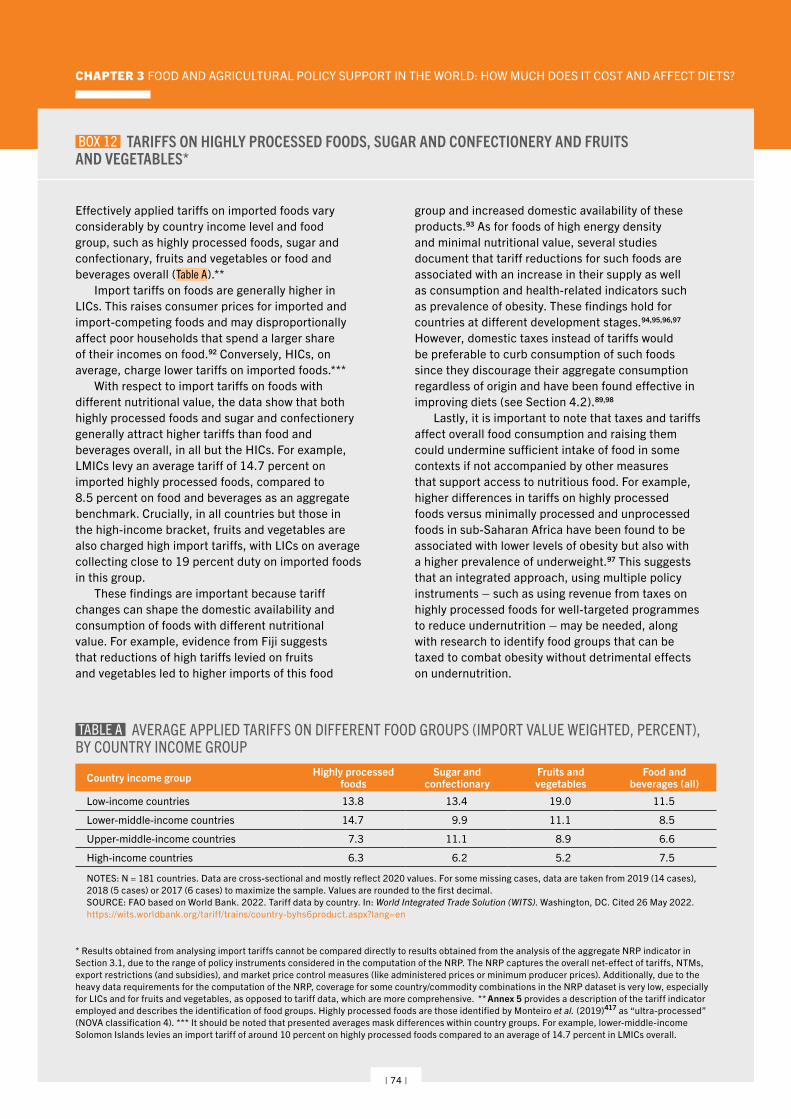
CHAPTER 3 FOOD AND AGRICULTURAL POLICY SUPPORT IN THE WORLD: HOW MUCH DOES IT COST AND AFFECT DIETS?
BOX 12 TARIFFS ON HIGHLY PROCESSED FOODS, SUGAR AND CONFECTIONERY AND FRUITS AND VEGETABLES*
Effectively applied tariffs on imported foods vary considerably by country income level and food group, such as highly processed foods, sugar and confectionary, fruits and vegetables or food and beverages overall (Table A).**
Import tariffs on foods are generally higher in LICs. This raises consumer prices for imported and import-competing foods and may disproportionally affect poor households that spend a larger share of their incomes on food.92 Conversely, HICs, on average, charge lower tariffs on imported foods.***
With respect to import tariffs on foods with different nutritional value, the data show that both highly processed foods and sugar and confectionery generally attract higher tariffs than food and beverages overall, in all but the HICs. For example, LMICs levy an average tariff of 14.7 percent on imported highly processed foods, compared to 8.5 percent on food and beverages as an aggregate benchmark. Crucially, in all countries but those in the high-income bracket, fruits and vegetables are also charged high import tariffs, with LICs on average collecting close to 19 percent duty on imported foods in this group.
These findings are important because tariff changes can shape the domestic availability and consumption of foods with different nutritional value. For example, evidence from Fiji suggests that reductions of high tariffs levied on fruits and vegetables led to higher imports of this food
group and increased domestic availability of these products.93 As for foods of high energy density and minimal nutritional value, several studies document that tariff reductions for such foods are associated with an increase in their supply as well as consumption and health-related indicators such as prevalence of obesity. These findings hold for countries at different development stages.94,95,96,97 However, domestic taxes instead of tariffs would be preferable to curb consumption of such foods since they discourage their aggregate consumption regardless of origin and have been found effective in improving diets (see Section 4.2).89,98
Lastly, it is important to note that taxes and tariffs affect overall food consumption and raising them could undermine sufficient intake of food in some contexts if not accompanied by other measures that support access to nutritious food. For example, higher differences in tariffs on highly processed foods versus minimally processed and unprocessed foods in sub-Saharan Africa have been found to be associated with lower levels of obesity but also with a higher prevalence of underweight.97 This suggests that an integrated approach, using multiple policy instruments – such as using revenue from taxes on highly processed foods for well-targeted programmes to reduce undernutrition – may be needed, along with research to identify food groups that can be taxed to combat obesity without detrimental effects on undernutrition.
Country income group Highly processed foods
Sugar and confectionary
Fruits and vegetables
Food and beverages (all)
Low-income countries 13.8 13.4 19.0 11.5
Lower-middle-income countries 14.7 9.9 11.1 8.5
Upper-middle-income countries 7.3 11.1 8.9 6.6
High-income countries 6.3 6.2 5.2 7.5
NOTES: N = 181 countries. Data are cross-sectional and mostly reflect 2020 values. For some missing cases, data are taken from 2019 (14 cases), 2018 (5 cases) or 2017 (6 cases) to maximize the sample. Values are rounded to the first decimal. SOURCE: FAO based on World Bank. 2022. Tariff data by country. In: World Integrated Trade Solution (WITS). Washington, DC. Cited 26 May 2022. https://wits.worldbank.org/tariff/trains/country-byhs6product.aspx?lang=en
TABLE A AVERAGE APPLIED TARIFFS ON DIFFERENT FOOD GROUPS (IMPORT VALUE WEIGHTED, PERCENT), BY COUNTRY INCOME GROUP
* Results obtained from analysing import tariffs cannot be compared directly to results obtained from the analysis of the aggregate NRP indicator in Section 3.1, due to the range of policy instruments considered in the computation of the NRP. The NRP captures the overall net-effect of tariffs, NTMs, export restrictions (and subsidies), and market price control measures (like administered prices or minimum producer prices). Additionally, due to the heavy data requirements for the computation of the NRP, coverage for some country/commodity combinations in the NRP dataset is very low, especially for LICs and for fruits and vegetables, as opposed to tariff data, which are more comprehensive. ** Annex 5 provides a description of the tariff indicator employed and describes the identification of food groups. Highly processed foods are those identified by Monteiro et al. (2019)417 as “ultra-processed” (NOVA classification 4). *** It should be noted that presented averages mask differences within country groups. For example, lower-middle-income Solomon Islands levies an import tariff of around 10 percent on highly processed foods compared to an average of 14.7 percent in LMICs overall.
| 74 |
THE STATE OF FOOD SECURITY AND NUTRITION IN THE WORLD 2022
tariff equivalents of NTMs in agrifood trade are often found to be higher than import tariffs. The global average of the tariff equivalent of SPS and TBT – key measures affecting agrifood imports – is estimated at around 15 percent.101,102,103 As for individual food groups of interest in the context of healthy diets, tariff equivalents for SPS and TBT measures combined have been estimated at about 8 percent for broadly defined vegetable products and at almost 14 percent for processed foods (including sugar and confectionary).103
Taken together, these results suggest that NTMs are likely to increase the cost of food to consumers, but it is not clear whether nutritious foods are more severely affected. Additionally, SPS measures are in place for the protection of human, animal, or plant life or health.104 Food safety measures, for example, are implemented to ensure that traded food is safe for consumers, for instance, by imposing maximum residue levels for pesticides or veterinary drugs.3,102
It has also been documented that some NTMs can expand agrifood trade, for example, by boosting consumer confidence through labelling and packaging requirements.102,103
Maintaining and strengthening measures to protect human, animal and plant health, while making their application transparent and based on evidence, is therefore important for safety and predictability of agrifood trade and healthy diets.
Export restrictions mostly target staple foods that are considered important for food security, such as rice, wheat, maize or pulses, and are only seldom applied to fruits or vegetables. For example, in the context of the war in Ukraine and unprecedented high food prices, in mid-March of 2022, Egypt banned the export of wheat, flour, lentils and beans amid growing concerns over food reserves.105 Among 33 countries that implemented export restrictions over 2007–2011, only Jordan imposed an export ban on “fresh vegetables and eggs,”106 with another exemption being Uzbekistan, which introduced an export ban on fruits and vegetables in 2015, but lifted it in 2016.107 Few countries also implemented short-lived export restrictions during the first wave of the COVID-19 pandemic, with Türkiye putting an
export ban on lemons for five months, while Kazakhstan first banned exports of different vegetable items before converting the ban into an export quota.108 Given their overarching focus of making staple foods more affordable, export restrictions could lead to lower relative prices of staple foods and therefore a high proportion of such foods in the overall calorie intake of poor households in particular. However, evidence suggests that in the past these measures were not successful at limiting domestic price increases of targeted products.109
Trade and market interventions: market price controlsAs outlined in Section 3.1, market price controls include policies such as administered prices used for direct government procurement from farmers. If interventions through public food procurement increase or reduce domestic prices relative to the border price, these generate incentives or disincentives for producers.
Often governments procure food directly from farmers at administered prices for public food stockholding purposes, social protection programmes or meals served in public institutions (see Box 16 in Section 4.2). Policies that establish administered prices are common in LICs and MICs, including major agricultural producers like China and India, but have been largely abandoned by HICs such as the United States of America and the European Union member states.69,110 In the past, public support provided through high guaranteed prices, for example in the European Union, led to excessive public stocks and friction with the European Union’s main trading partners.111
Price controls are frequently accompanied by border measures to sustain prices above world market prices for domestic producers. For example, the price support programme for rice farmers in the Dominican Republic entails maintaining a floor price paid to producers, implemented through a combination of market regulation and tariff rate quotas, with high out-of-quota tariffs.112
If they exceed world prices, such minimum or administered prices would provide incentives
»
| 75 |
CHAPTER 3 FOOD AND AGRICULTURAL POLICY SUPPORT IN THE WORLD: HOW MUCH DOES IT COST AND AFFECT DIETS?
to farmers to produce larger quantities than they otherwise would. In many LICs and MICs governments use this instrument with the policy objective of ensuring sufficient supplies of strategic commodities, for food security purposes, and to improve incomes of poor farmers. At the same time, as other trade and market measures that generate price incentives, they distort domestic markets and potentially global trade, affecting the cost of foods. As price controls are predominantly implemented on grains, in particular rice, maize and wheat,71 and also on sugar,110 they often result in a higher supply of these products relative to foods such as fruits, vegetables or legumes.
In many LICs and MICs, these measures are still widespread. Some evidence suggests this may have detrimental effects on dietary diversity. For example, in Egypt, the high domestic wheat procurement price provides strong incentives to farmers to cultivate wheat. This, combined with bread subsidies to bakeries and consumers led to a significant increase in per capita consumption of bread and a higher share of wheat-based products in the overall food supply.113 Similar to other Northern African countries, Egypt’s per capita food supply of wheat products is among the highest in the world: at 146 kg per capita annually, it is more than double the world average, constituting roughly one-third of the overall food supply in calorie terms.90
Fiscal subsidies to producers The mix of products that is supported through different types of fiscal subsidies to producers (Figure 17), and the process by which policies are implemented, can directly and/or indirectly affect the diversity and quantity of food produced, trade flows and the relative prices that consumers face. These will, therefore, affect the access and affordability of healthy diets (Box 10). The specific impact of a fiscal subsidies is country (context) specific. However, each of these policy instruments have some common positive and negative impacts on healthy diets.
Subsidies on output and (on) factors of production Subsidies on output and based on factors of production have a direct bearing on farmers’
production decisions. As such, they can impact the quantity, diversity and price of commodities – whether these are for final consumption or are inputs to the food processing and livestock farming industry. Over the past decades, the application of these subsidies has been different across countries; however, in most countries the focus has been – and continues to be – on a handful of commodities (Section 3.1). In fact, the most subsidized commodities, since the 1970s, include staple foods – especially maize, wheat and rice – followed by beef and milk.s
These subsidies have significantly contributed to increasing production and lowering prices of the subsidized staple foods, mainly cereals.85,114 The most significant positive impact of these subsidies has been their contribution to improving food security through higher caloric intake across the world.73,115 Further, by supporting farm incomes, output subsidies and factors of production indirectly supported the development and use of better technology and of new agricultural inputs which enhanced the productivity of the subsidized commodities.116
These subsidies, however, also caused important market distortionst within and across borders.62,117,118 Market distortions affected production, trade and prices of subsidized commodities in ways that would have not usually existed in a competitive market, and have created (relative) disincentives towards producing nutritious foods.74,119 Output subsidies and factors of production have encouraged monocultures in some countries, ceased the farming of certain nutritious products,u and have reduced production of some foods that do not receive the same level of government support (commodities and its derivatesv).73,120,121 These changes in production have direct implications on the price and availability of unsubsidized or less subsidized commodities and their derivatives,
s For more on this, see Section 3.1 and OECD (2022).451
t Market distortions in this context refers to government policies that significantly affects prices or market behaviour in magnitudes that would not usually exist in a competitive market.439,440
u For example, intensive rice monoculture systems led to the loss of wild leafy vegetables and fish that the poor had previously harvested from rice paddies in the Philippines.118
v Derivates refer to processed food that use the subsidized crops as an input or ingredient, for example, high-fructose corn (maize) syrup.
| 76 |
THE STATE OF FOOD SECURITY AND NUTRITION IN THE WORLD 2022
which in turn can create negative incentives for people to diversify their diets – especially for the most economically vulnerable.120 The production levels and lower prices of subsidized commodities have also impacted the food industry, which has developed the low-cost, unhealthy inputs that it widely uses (e.g. high-fructose corn [maize] syrup, oils containing saturated fats, etc.).96,122
The most subsidized crops are highly prevalent in most countries’ food supply, are low-priced, and in some countries are consumed at rates well above recommendations (Box 10).123,124,125
When the share of these subsidized commodities, along with food ingredients derived from them, are considered in individuals’ total food consumption, these represent an important portion of people’s diets – especially among the most vulnerable people, including in HICs.120,126,127 For example, a study assessing the impact of the United States of America’s output subsidies and factors of production (covering maize, wheat, soy, rice, sorghum, dairy and livestock) on its population’s consumption found that 56 percent of calories consumed were from the subsidized food commodities, with the share being between 66 percent and 100 percent among those who are less educated, poorer and less food secure.122
Input subsidiesInput subsidies usually aim to fill the gaps of underdeveloped or poorly functioning markets, to increase profitability of farming and to diversify and/or to increase the production and consumption of agricultural commodities.128,129
Input subsidies could, therefore, contribute to the availability and affordability of healthy diets, enhancing food security and nutrition.126
Empirical studies show, however, mixed results. On the one hand, some country case studies disclose that large input subsidies for some commodities – e.g. for rice seeds and fertilizer purchases – encouraged higher production, consumption and private investment, which in turn played an important role in transforming the value chain.130
On the other hand, other country case studies show that input subsidies’ policy objectives are not always met, and/or their cost outweighs
their benefits, and that the policy instrument is difficult to phase out, and in some cases, it may have inhibited the development of input markets.128,131 The underpinning reasons for these outcomes are related to the process by which these subsidies are provided.132 In certain countries – often in LMICs – input subsidies’ objectives regarding productivity and diversity were not met when the process by which input subsidies were implemented was deficient (e.g. subsidies did not reach the intended beneficiaries or were not accompanied with extension services),131 or when input subsidies had suboptimal funding, encouraged monocultures, or were not nutrition-sensitive.96,130
As for countries where the costs of input subsidies exceeded benefits – notably in MICs and HICs – the mechanism for their implementation (e.g. subsidy coupled to level of production that covers a limited number of products) together with the high amount subsidized, were not only costly and difficult to phase out but also distorted markets or gave an “unfair” advantage to some commodities (e.g. cereals).62,133,134 In this case, the negative impact on diets are similar to those discussed above with regard to output subsidies and factors of production.
The negative impacts of input subsidies may also outweigh their benefits when these subsidies compete for scarce government funds that could be directed to other investments (e.g. infrastructure, R&D, and so on) that, in the long term, may enable rural households to diversify their livelihoods from staple foods and move towards a more diversified healthy diet,120,135 may contribute to boost productivity, and reduce the price and increase the availability of nutritious foods.69
On a positive note, recent studies found that countries that move towards hybrid policies that support market creation for inputs131 have been able to reach a greater number of farmers, while developing a sustainable inputs market, which could facilitate access to quality inputs for all agricultural produce.136,137 This is the case, for example, of input subsidies that use vouchers and private traders,128 or hybrid policies using cash transfers.96
| 77 |
CHAPTER 3 FOOD AND AGRICULTURAL POLICY SUPPORT IN THE WORLD: HOW MUCH DOES IT COST AND AFFECT DIETS?
Other subsidies for which non-commodity criteria or production appliesIn addition to the subsidies discussed above are lump-sum payments to all farmers, which may include subsidies tied to environmental or landscape outcomes. These subsidies are usually subject to cross-compliance conditions but not linked to the production of specific commodities or livestock numbers or the use of specific factors of production; these are known as decoupled subsidies (Section 3.1). These subsidies can include transfers that contribute to soil regeneration, whose impact on healthy diets will depend on how the subsidy is implemented.138 For example, it can encourage the planting of native species,139 but, in the short to medium term, it may reduce production of some commodities and hence increase their price.140 The impact on healthy diets will also depend on later land-use decisions and the existing agricultural production structure – outcomes will therefore be country specific.141
Decoupled subsidies may also include support to producers to overcome challenges such as compliance with new regulations and to encourage environmentally sustainable production. Empirical studies show that these subsidies increase the level of production but do not significantly change the variety of foods produced by a country.142 In what concerns a healthy diet, the studies gathered suggest that countries that have adopted decoupled subsidies have not been able to meet the demand of nutritious food. For example, in Southern Asia, the movement towards high value fruit and vegetable production systems has been slow relative to the growth in demand.143 In France, despite increase in decoupled subsidies in 2005 and 2014, the performance of the legumes sector has not significantly changed.144 In both cases, lack of infrastructure investments and high transaction costs associated with fruit and vegetable value chains are cited among the primary reasons for the slow supply response. Subsidies with sustainability objectives have, however, contributed to positive environmental outcomes and the availability of safer food. Discussion on policy repurposing towards nutritious and sustainable agrifood systems are part of Chapter 4.
General services support GSS are public expenditures for the provision of public goods and services that can be designed to create enabling and environmentally sustainable conditions for the food and agricultural sector (Section 3.1). These services connect all economic actors of agrifood systems (Figure 1), support the nexus between producers and consumers, and can be an excellent booster of productivity where levels are low and productivity gaps are significant, which is the case in many LICs. These services include R&D and knowledge transfer, inspection services, agricultural related infrastructure, public stockholding, and food and agricultural marketing and promotion. GSS is critical for the well-functioning of agrifood systems, essential for ensuring food safety and food availability, and can significantly contribute to food price reduction – including for nutritious foods.69 It is important to remember that due to the inadequacy and poor interest given to some nutritious foods over several decades (e.g. indigenous commodities, legumes in France), private sector investment in those foods has been low.144 As for the impact of GSS on production, it is different across services, is highly context specific (Section 3.1), and may present trade-offs. For instance, a service (e.g. inspection) can have a positive impact on food security and food safety, but it might imply a higher food price (e.g. oversight fees) that could threaten affordability of healthy diets, or vice versa. Because of the importance of each of the general services for healthy diets, and for clarity purpose, these are discussed separately hereafter.
Research and development (R&D) and knowledge transfersPublic investment in food and agricultural R&D is essential for global food security, improved nutrition, delivery of affordable healthy diets and environmental sustainability. R&D is one of the drivers of productivity gains, declining commodity prices and the related fall of retail food prices achieved since 1950.145,146 For example, in the case of fruits and vegetables, a study found that without the knowledge acquired through public R&D, the consumption of this food group would have been reduced by more than 27 percent due to higher prices.145
Furthermore, R&D has significantly contributed
| 78 |
THE STATE OF FOOD SECURITY AND NUTRITION IN THE WORLD 2022
to the development of farm inputs, new food products, farm technology, improved product information among traders, processors and retailers, and product traceability from farm-to-fork (e.g. block chain technology operated by value chain agents), which increased transparency and trust.147,148,149
Although the benefits of R&D are many,w
the impact of R&D on diets depends on the conditionalities that apply to R&D support, the means of implementation and the targeted commodity.150 R&D is generally a joint effort of the private and public sectors,x 151 provided to long-established institutions, most of which are highly concentrated in industries related to cereals (including the most subsidized commodities discussed above under fiscal subsidies to producers).150,152 For example, the World Vegetable Center (covering a wide basket of crops) has a budget of about USD 20 million,153
while the International Rice Research Institute has a grant portfolio of USD 67.464 million.154
Closely associated with R&D are knowledge transfers that are core services for increasing productivity, food safety and the nutritional value of products – specially needed in contexts where it is challenging to meet populations’ micronutrient requirements.146 Knowledge transfer services are critical for the diffusion and adoption of R&D products (e.g. new seeds) and technologies (e.g. satellite data to monitor crop growth).148,155,156 They can also be key to providing generic training and extension advice to farmers (e.g. on sustainable farming techniques, post-harvest loss management, nutrition-sensitive agriculture) and high education on agricultural programmes (e.g. market-oriented services).148,157 For example, in the case of nutrition-sensitive agriculture, these services increasingly involve multiple types of interventions, such as the adoption of biofortified crops along with agriculture-nutrition education,158 fortification of cereals and products together with training
w Public R&D expenditure is estimated to yield a return on investments between 6.5 percent and 15.2 percent in Europe441 and a return of 42.3 percent in sub-Saharan Africa.442
x For example, in Argentina, soybean seeds were developed by the plant breeding industry and public institutions to increase country exports.150
to scale up production, which have proven to reduce micronutrient deficiencies (e.g. vitamin A) while increasing household incomes.120,130 These developments, however, are not reaching all producers due to still important gaps in funds, knowledge, technology, means of implementation, coordination of R&D and knowledge transfer service providers, and limited partnerships across stakeholders.159 For example, in the case of fortification, technology gaps are too wide to be effectively applied in small-scale industrial processing.160,161
Inspection service Inspection service is the enforcement arm of Food Safety Risk Management. This includes ensuring that food products conform to regulations and product safety and quality norms of the entire food chain (inputs and outputs).162 Inspection service is fundamental for healthy diets (Box 10), for food security and food safety, i.e. to reduce the risks of food contamination by, for example, harmful toxins, chemicals, bacteria and other pathogens. Furthermore, inspection can contribute to enhancing the quality of food (including the nutritional value of products), productivity (e.g. rules affecting production losses), and to enhancing consumer trust and awareness.163 In recent years, countries have been investing in tools for communication of good practices, in digital risk-based approaches to improve control for food safety, and in cooperation and collaboration among competent authorities.164,165
That said, significant gaps exist in the adoption of new technologies and in investment of inspection equipment required to access quality scientific services (e.g. capacity to monitor, sample and analyse food products for specific contaminants, and process data for the purpose of risk analysis). Also, in many countries inspection procedures remain cumbersome, costly, and their implementation lack transparency and coherence between different government bodies (e.g. different requirements made by the Ministry of Agriculture and Ministry of Health).164,165 Moreover, in some countries the private sector’s food safety systems are weak,166 and some countries privilege official control of food for export while
| 79 |
CHAPTER 3 FOOD AND AGRICULTURAL POLICY SUPPORT IN THE WORLD: HOW MUCH DOES IT COST AND AFFECT DIETS?
food for domestic markets is neglected (e.g. food sold in East Africa local markets contained aflatoxin).167
It is important to bear in mind that lack of trust in inspection for local products, or lack of trust in the private sector’s food safety management systems, can deter consumption of nutritious and less expensive local products in favour of imported products (this was the case, for example, of infant foods in Western Africa).168 Coping with those challenges may not come without trade-offs. Compliance with new rules or processes may mean that the food industry will need to bear additional costs for ensuring the safety of their products, which will be passed on to consumer prices. This can reduce the affordability of nutritious foods – affecting poor producers and poor consumers disproportionately. Governments are, therefore, challenged to find the right balance between these two concurrent objectives. A first step to meeting those challenges could be to implement instruments such as FAO-WHO’s Food Control System Assessment Tool, which helps assess the effectiveness of, and better targets limited resources to strengthen, national food control systems – including modernization of inspection service.169
Infrastructure Infrastructure is essential to fostering dietary diversity, food availability, affordability and food safety. Appropriate infrastructure can increase both the quantity and quality of foods available in markets – especially for perishable foods such as fruits144 and fresh fish.170 This is needed to diminish food loss and waste, to reduce economic losses and pressure on the environment, and to build resilience in the face of climate change.y 75,171 Increasing infrastructure at all stages of the value chain also plays a central role in food safety. For example, proper and reliable drying and storage infrastructure is key to reducing carcinogenic mycotoxins (e.g. aflatoxins) in grain, nuts and related dry staple foods; capital-intensive cold chains that meet food safety standards are needed for the distribution of perishable aquatic food.172
y It has been estimated that LICs and MICs have a USD 1 trillion gap between current and needed investments in infrastructure.443
Infrastructure is particularly important in countries that depend on access to markets, as well as for countries where the diversity of their food supply depends on their own production,
and where post-harvest losses are very high.126,155,171 For example, in the case of food loss and waste, while in sub-Saharan Africa fruits and vegetables loss and waste during post-harvest, processing and distribution have been estimated at 35 percent, in Europe the same figure was estimated at 15 percent.173
Investing in irrigation, roads, technology for storage, low-input food preservation (such as solar drying) and sustainable cooling and electricity have proven to contribute to addressing those challenges and are becoming increasingly necessary due to erratic rain patterns and increasing temperatures.120,135,174
These investments, however, do not necessarily guarantee success in improving dietary diversity, affordability or access to healthy diets. For example, small-scale irrigation in Ethiopia and Tanzania did not improve nutrition,151 and although support to the fruit and vegetable value chains in seven African and Asian countriesz increased exports of those produce, it did not expand fruit and vegetable supply in informal markets.175
Therefore, infrastructure investment needs to be designed to reach rural and remote areas,155,156 growing urban areas, and needs to be adapted to the commodity and the context. For example, food loss and waste varies across products – especially perishable and non-perishable food (e.g. in Africa, losses for non-perishable crops typically range between 1.3 and 7.3 percent, while post-harvest losses for tomatoes, in Kenya, were around 28 percent).176 In terms of products, aquatic food may need the most attention in relation to reducing food loss, as about 35 percent of global harvest in capture fisheries and aquaculture is either lost or wasted every year.78 Furthermore, infrastructure investment may need to be accompanied by other measures such as extension services, support for food and agricultural marketing and promotion of nutritious foods, for rural financial services
z Bangladesh, Burkina Faso, Ethiopia, India, Nepal, Nigeria and the United Republic of Tanzania.
| 80 |
THE STATE OF FOOD SECURITY AND NUTRITION IN THE WORLD 2022
and, in some countries, subsidies to consumers to increase consumption of healthy diets.135,151
For example, interventions not only require infrastructure and advocacy about the benefits of reducing food loss and waste, but they should be accompanied by investments along food supply chains to ensure behavioural change.177
Public stockholding Public stockholding programmes include the costs of maintaining and managing reserves resulting from market purchase interventions, such as public procurement from farmers and reserves built for food security purposes (Section 3.1). This category does not, however, include public expenditure for buying food stocks. In some countries, these services are part of national food reserves for coping with food emergencies (e.g. food crises in 2007/08) and are considered by some an essential element of a prudent national security policy – particularly in countries facing famines or frequent exposure to shocks (e.g. droughts, floods and conflicts).71 These programmes, however, in some countries are also used to target price behaviour.178 Furthermore, product coverage has largely focused on staple foods, notably rice, wheat, or maize,179 which may skew production away from higher-value products and could be detrimental to diversifying domestic diets towards foods with higher nutritional value.71
Public stockholding success, on ensuring a country’s food security, has been found to rely on programme design. This includes organizational structure and reserve management, the procurement and release of food so it has minimal disruption to regular market functioning,178 and adoption of healthy public food procurement and services policies which support increasing the availability of nutritious foods and developing standards related to foods (e.g. regarding food high in fat, salt and/or sugar, etc.) 180 (see Section 4.2). Some countries are also looking into alternative market-neutral instruments to meet national food security objectives while being less costly and enabling diet diversity. For example, by developing the value chain of indigenous crops such as roots and tubers,178 or by providing cash to the food insecure.71
Food and agricultural marketing and promotion Food and agricultural marketing (as defined in Section 3.1)aa includes services that are at the core of food environments (Figure 1), encompassing public and private participants involved in all the stages of a product value chain – from supply of inputs of farms to retail markets.181,182,183 For example, these services may include commodity grading schemes or agricultural machinery services. They may be services related to post-harvest losses, lowering transaction costs, facilitating market exchange and trade, and strengthening or expanding supply networks.151,183 Moreover, they can include services to facilitate the sale of nutritious foods in underserved areas,184 or the conservation, processing and other determinant factors for the profitability of products with special requirements such as perishable, bulky or indigenous commodities, among many others.
Food and agricultural marketing services can have an impact on healthy diets through several channels. These can enhance efficiency across the value chain and increase the number of suppliers but also the demand, a combined effect that can trigger competition without decreasing suppliers’ incomes, while providing lower prices for consumers.153,185 For instance, over the past decades cooperatives and producers’ organizations have been cornerstones on the production and sales of farm products.182,186 This has been the case for milk processing through farmers’ cooperatives in Nepal and Uganda which improved milk processing capacity and safety.187,188 In Ecuador, a platform of cooperation helped farmers to achieve higher yields and gross margins, while reducing the use of toxic pesticides, hence increasing supply of sustainably produced food.189
More recently, the food and agricultural sector has witnessed the rise of innovative channels of support adapted to the commodity, the systems of production, the culture and traditions of
aa “Food and agricultural marketing” services as discussed in this chapter is different from commercial “marketing” as referred to in Section 4.2; commercial “marketing” is part of what is referred to in this chapter as promotion. Refer to Section 3.1 for comprehensive information about the differences between the two terms.
| 81 |
CHAPTER 3 FOOD AND AGRICULTURAL POLICY SUPPORT IN THE WORLD: HOW MUCH DOES IT COST AND AFFECT DIETS?
the producers, and the level of development of the country and the sector.189,190 For example, governments are enabling producers (including small farmers) to meet demand by funding digital innovations that help farmers find vehicles to move their fruits and vegetables to markets (India), and that help farmers add value to products otherwise lost, e.g. tomatoes into tomato paste in Malawi.191 In the European Union, producer organizations channel government support to fruits and vegetables and enable the development of short-food supply chains which, by easing the relation between producers, processors and consumers, are increasing food availability and reducing the price for consumers.192,193
Complementing these services is promotion, which includes activities to inform and reach consumers (e.g. promotion campaigns, participation in international fairs, activities promoting food quality). Services that promote nutritious food, including those that empower consumers to choose healthy diets, are important because the intake of foods that make up a healthy diet (Box 10), or changing consumption patterns, not only depends on price, physical accessibility and availability. Consumption decisions also depend on consumers’ preferences, on their knowledge about nutritious foods and the impact of unhealthy diets on long-term health, and on trust of products in the market 194,195 (not least, trust in the quality [food safety] of traditional/indigenous products). Empirical studies show a strong link between knowledge of nutrition and health (e.g. food-based information through social mass media) and nutritional outcomes.126,130 Furthermore, studies have found a strong association between an individual’s health status and the product promoted.196
For example, promotion of energy-dense foods high in fats, sugars and/or salt significantly increases consumption of these products, and this could led to deteriorating health.197 Although most studies about the effect of the promotion of products’ role in unhealthy diets on consumption have been conducted in HICs and MICs, similar results are predicted for LICs where the consumption of these foods is growing.198,199,200 In fact, in response to the
harmful impact of such promotion, countries at the WHA agreed, in 2010, on recommendations to restrict the commercial marketing of foods and beverages of high energy density and minimal nutritional value to children.201 Policies that can create healthy food environments and help achieve healthy consumption patterns are discussed in Section 4.2.
Fiscal subsidies to consumersFiscal subsidies to consumers to enable access to food include instruments under social protection programmes (for end consumers) and food subsidies to lower the cost of food (provided to intermediaries). The latter includes transfers to commercial buyers (e.g. millers, processors) and other food value chain actors (e.g. transporters, storage service providers).202 Depending on their design and implementation, these transfers can contribute to food security and nutrition, and have the potential to improve access to healthy diets. These policy instruments are often implemented in the face of crises, economic shocks, policy reforms (e.g. repurposing), and can be part of the broader food and agricultural policy setting.
Food subsidies, unlike the output or input subsidies discussed in the sections above, have the primary objective of making food more affordable and available to consumers. These usually target certain population groups and comprise specific food items.203 For instance, Canada provides food subsidies to wholesale distributors sending perishable foods by air to remote communities, which has reduced the cost and increased the availability of nutritious foods for families in the beneficiary communities.204
Evidence shows that food subsidies that target specific nutrients and nutritious foods in HICs can improve the nutritional status of beneficiaries, but only during the period the subsidy is implemented and the beneficiaries are effectively receiving the subsidy.204 The same study suggests that if the subsidy is designed to have long-term impacts (e.g. by implementing this over long periods), it would allow for sustained changes in dietary patterns and could potentially reduce the prevalence of
| 82 |
THE STATE OF FOOD SECURITY AND NUTRITION IN THE WORLD 2022
NCDs in adults.126 In the case of LICs and MICs, studies find that in most countries large-scale food subsidies are directed towards staple foods;96,205,206 this is the case, for example, of the food subsidy that targets rice consumption in India.207 The same studies also revealed that these subsidies have a limited contribution, or no contribution, to improving access to nutritious foods and healthy diets.
Transfers under social protection programmes, which are intended and designed to improve the affordability of food, include in-kind food transfers, food vouchers and cash transfers, and are implemented alone or through a mixed modality. While the impact of these transfers in reducing malnutrition and increasing access to healthy diets are context specific, an increasing amount of evidence reveals several common patterns, namely:
Transfers to consumers that are explicitly designed to have nutritional impacts – i.e. through nutrition-sensitive social protection programmes208 – can increase the consumption of nutritious foods.209 Hence, nutrition considerations must be at the core of the design of any transfer aimed for food security and improved nutrition. This can be accomplished, for example, by ensuring that in-kind food transfers – or other transfers – include nutritious foods and/or fortified staple foods.210 Transfers could also be accompanied with food and nutrition education129,211 which has been the common success factor that helped increase the consumption of nutritious food. For example, Cabo Verde’s in-kind transfer part of its school feeding programme includes diverse nutritious foods (fruits, vegetables, beans and fish) for schoolchildren, and nutrition education for teachers, school staff and cooks.208
Subsidies targeting specific population groups, or the consumption of specific foods that are associated with a specific health policy target (e.g. anaemia reduction), yield better outcomes. Targeting subsidies towards vulnerable households or individuals, such as the lowest income earners or the nutritionally vulnerable, for example, nutrition-specific interventions such as micronutrient supplements (e.g. iron, folic-acid), can enhance the health state
of a population as it can improve the nutrition of those who may only have access to healthy diets through social protection programmes, and thus expand the number of individuals with adequate nutritional status.208,212 Thus, targeting subsidies can contribute to reducing fundamental social inequities between low- and high-income consumers which often prevent families from adopting healthy diets and accessing basic services such as health. On the contrary, subsidies to everyone can leave behind the most in need and widen health inequality gaps.129,208 Furthermore, transfers with the specific objective of increasing access to nutritious food (e.g. equivalent to a price reduction of 10–30 percent in fruits and vegetables),180 and especially when accompanied by a food tax (e.g. for sugar-sweetened beverages),213 are expected to bring health benefits such as reduction of deaths from cardiovascular diseases and cancer.214
The implementation of these transfers can be challenging. This is the case when the subsidy does not reach all eligible households, reaches households outside the criteria for inclusion, and has insufficient availability of product variety – especially in LICs that rely heavily on cereals,127 suffer shop closings, or where the programme is affected by corruption (e.g. public officials charged with distributing subsidized grain sell it instead).130,165,215 Tackling these issues is not only important to meet the objectives and ensure sustainability and cost effectiveness of social protection programmes, but also to ensure that these programmes are strong enough to be expanded or adapted – in a timely manner – in the face of shocks and crises.208
Appraisals on the impact and cost of social protection instruments suggest that in areas where there is adequate market functionality, cash transfers could be delivering dietary diversity, and thus micronutrients, more efficiently than in-kind transfers could. 202,211 Evidence also shows that household savings resulting from in-kind transfers are often not used to buy food,209 and in-kind transfers cost nearly three times more to implement than other programmes.211,216 However, in-kind transfers remain essential in remote areas where markets do not function
| 83 |
CHAPTER 3 FOOD AND AGRICULTURAL POLICY SUPPORT IN THE WORLD: HOW MUCH DOES IT COST AND AFFECT DIETS?
well, have proven to have positive impacts on children’s nutrition through school-feeding programmes, and can also be designed to fill a population’s existing nutrient gaps through, for example, delivery of nutritious foods or of fortified foods.217 For these reasons, in many cases, a mixed approach may bring better outcomes.202 For example, Pakistan’s programme for pregnant and breastfeeding women and children 6–23 months of age provides cash transfer and nutritious foods conditional on their utilization of health and nutrition services.218
Countries are currently exploring multifaceted and innovative approaches in order to enhance the efficiency of subsidies. Specifically, they seek to increase access to nutritious foods and improve dietary diversity in combination with: i) enhancing knowledge, skills and practices; ii) facilitating access to services (health, nutrition, water, etc.); and iii) linking the intervention with an economic activity.219 For instance, in Chile the government developed a digital application to facilitate access to nutritious foods for vulnerable populations, while supporting small local producers and markets.220 These and other new approaches need to be considered in repurposing food and agricultural policy support strategies as further discussed in Section 4.2.
In summary – the challenges and potential policy pathways Food and agricultural policies affect consumer and food-industry decisions by affecting the availability and affordability of food across all stages of the value chain, from primary production to final consumption, and are interlinked with other systems, such as the health system and the environmental system (see Figure 1). Policies can lead to unbalanced diets that contribute to NCDs when they directly or indirectly encourage production of energy-dense, nutrient-poor monocultures, discourage consumption of nutritious foods (Box 10) or make energy-dense foods high in fats, sugars and/or salt more affordable.199,221
To shift consumption patterns towards healthy diets, and for the food industry to
replace harmful inputs such as transfats with nutritious inputs, it is necessary to increase the supply of nutritious foods, to lower their costs to competitive levels, and to implement nutrition-sensitive strategies targeted at both consumers and producers. Thus, fiscal subsidies, trade and market interventions, and GSS need to be analysed for their effects on food supply, prices and consumer choices, and to be tailored to country-specific contexts in order to inform necessary reforms and to ensure well-coordinated multilateral actions (see Chapter 4).
Over the past decades, to improve national food security and support farmers, public support has been highly concentrated on the production of and access to the world’s most consumed staple foods, like rice and wheat, but also sugar, oil, meat and milk (Figure 22). Less support has been provided to foods with higher nutritional value, such as vegetables, fruits and pulses, or indigenous commodities providing the much needed nutrients particularly important in underserved areas. In terms of border measures, governments should strive to reduce barriers and facilitate trade in order to foster the diversity and affordability of nutritious foods, while ensuring that safety of traded food is not undermined. Such changes in border measures could be accompanied by fiscal measures, such as domestic taxes on products high in fats, sugars and/or salt, which are preferable to import tariffs because they affect the overall consumption of a food, not only imported food, and are consistent with WTO rules. Similarly, some forms of market price controls are subject to multilateral trade rules and their implications for affordability of healthy diets need to be analysed carefully before undertaking any policy changes, considering country specificity.
Fiscal subsidies to producers and GSS must include carefully designed mechanisms for implementation and targeting if these are to enhance greater diversity and increase supply of nutritious foods, especially in LICs and LMICs where productivity is still lagging behind and where important gaps exist in the provision of such services. These mechanisms must also ensure that nutritious foods and inputs
| 84 |
THE STATE OF FOOD SECURITY AND NUTRITION IN THE WORLD 2022
– whether these are sourced from domestic or international markets – can reach all population groups, especially the most vulnerable, among which are women (Chapter 2). For example, support to producers of nutritious food can be accompanied by nutrient-sensitive social
protection programmes and support of food safety and commercialization of neglected and underutilized species that are closer to remote areas. The potential pathways that countries can adopt to make the most of repurposing their policies are discussed in Chapter 4. n
| 85 |
NICARAGUAWoman selling fruits and vegetables at Huembes Market, Managua.©FAO/Saul Palma
CHAPTER 4 POTENTIAL OPTIONS TO REPURPOSE POLICY SUPPORT TO FOOD AND AGRICULTURE FOR IMPROVING AFFORDABILITY OF A HEALTHY DIET
KEY MESSAGES
è Repurposing current public support to food and agriculture to increase the availability of nutritious foods to the consumer can contribute to the objective of making a healthy diet less costly and more affordable, globally and particularly in MICs.
è Repurposing existing fiscal subsides is found to provide the largest improvement in the affordability of a healthy diet, particularly if they are shifted from producers to consumers. In this case, agriculture’s GHG emissions are found to fall, but there are potential trade-offs in poverty reduction, farm incomes, total agricultural output and economic recovery.
è Shifting price incentives globally by repurposing border measures and market price controls can also make a healthy diet less costly and more affordable, albeit less than when fiscal subsidies are shifted from producers to consumers. With this option, GHG emissions from agriculture would fall, while potential trade-offs would also generally be avoided.
è When repurposing public support to make a healthy diet less costly, policymakers will have to avoid potential inequality trade-offs that may emerge if farmers are not in a position to specialize in the production of nutritious foods due to resource constraints. This could be particularly the case with small-scale farmers, women and youth.
è To take advantage of the opportunities that a global repurposing of border measures, market price controls and fiscal subsidies may offer in practice, countries will have to consider their commitments and flexibilities under WTO rules.
è Where agriculture is still a key sector for the economy, jobs and livelihoods, mainly in LICs but also in some LMICs, it will be crucial to increase and prioritize public expenditure for the provision of GSS. This is an effective way to bridge productivity gaps for producing nutritious foods and enabling income generation to improve the affordability of a healthy diet. However, stepping up this type of support in these countries will require significant development financing.
è Other key agrifood systems policies will be needed to complement repurposing efforts to ensure shifts in food supply chains, food environments and consumer behaviour towards healthy eating patterns. These include, for example, policies on food reformulation and fortification, regulation of food labelling and marketing, taxation of energy-dense foods and healthy public food procurement.
è In addition, social protection policies may be necessary to mitigate possible trade-offs from repurposing, particularly short-term income losses or negative effects on livelihoods, especially among the most vulnerable populations. Health system policies will also be key to ensure access to essential nutrition services for protecting the health of vulnerable groups,
| 87 |
CHAPTER 4 POTENTIAL OPTIONS TO REPURPOSE POLICY SUPPORT TO FOOD AND AGRICULTURE <...>
incentives to reduce GHG emissions, adapt to climate change and manage natural resources sustainably under planetary boundaries.
To take advantage of these possibilities, though, a systems approach will be needed. In other words, other policies and incentives, some of which may pertain to other systems, will have to coherently complement repurposing support efforts in food and agriculture. Altogether, the policy mix will succeed depending on country context where food insecurity and malnutrition can be the result of several drivers (i.e. conflict, climate extremes and variability and economic swings), structural characteristics (e.g. income status, degree of inequality, natural resource endowments, net trade position, and so forth) and political economy considerations and feasibility. n
4.1WHAT ARE THE POTENTIAL IMPACTS OF REALLOCATING FOOD AND AGRICULTURAL POLICY SUPPORT DIFFERENTLY TO REDUCE THE COST OF NUTRITIOUS FOODS? Recent studies show that reallocating public support to food and agriculture differently can lead to improved outcomes, but with potential trade-offs in several important domains for sustainable development that need to be carefully understood.222 Due to the issues at stake, most of these studies have relied on model-based simulations and because most public support is given to farmers, they focus mostly on agricultural support rather than food and agricultural support.
Repurposing policy support implies an understanding of what would happen if, for example, this support were allocated differently, which would trigger direct but also indirect economy-wide effects. For example, a reallocation of public expenditure into investments that boost
and the food and agricultural workforce, as well as to ensure food safety.
è Environmental, transportation and energy policies will be absolutely necessary to enhance the positive outcomes of the repurposing support efforts in the realms of efficiency, equality, nutrition, health, climate mitigation and the environment.
è The success of repurposing food and agricultural policy will also be influenced by the political and social context, governance, (im)balances of power, differences in interests, ideas and influence of stakeholders, market power concentration, and the governance mechanisms and regulatory frameworks in place to facilitate the reform process and prevent and manage conflicts.
è Given the diversity of each country’s political context, the repurposing support efforts will need strong institutions on a local, national and global level, as well as engaging and incentivizing stakeholders from the public sector, the private sector and international organizations. The engagement of SMEs and civil society groups will be key to balancing out unequal powers within agrifood systems.
è Monitoring and evaluation mechanisms will be particularly important to ensure accountability and to identify areas of improvement in repurposing support, provided they can be supported through data development and maintenance as well as model-based scrutiny.
Deciding on what food and agricultural policy support should be reformed and how, in order to improve the affordability of healthy diets, requires careful examination of the potential effects and trade-offs implied by different policy mixes. This is key to inform policy decisions and strike a proper balance across all dimensions of sustainable development.
Governments may find that repurposing some of their support to food and agriculture can be a means to: i) improve agrifood systems efficiency, with fairness and inclusiveness for all agrifood systems actors that want to benefit from such reconfigured policies (equity); ii) increase the availability and reduce the cost of nutritious foods, thus increasing people’s affordability and access to healthy diets; and iii) provide strong
| 88 |
THE STATE OF FOOD SECURITY AND NUTRITION IN THE WORLD 2022
productivity in agriculture sectors will have effects on these sectors’ production directly. Yet, it will also have indirect impacts through the productive linkages between these sectors and other sectors of the economy, not least the food industry. Some agriculture sectors also trade internationally. Farmers in sectors promoted by such investments will also increase their demand for agricultural inputs as well as their final demand for food since they are also consumers. These interlinkages justify analysing repurposing food and agricultural support options using simulations from computable general equilibrium (CGE) models.223
Most existing studies that rely on such models have also focused on reforming or repurposing agricultural support to achieve better climate-related and environmental outcomes. In these studies, global model-based simulations not only point to the link between agricultural support and GHG emissions, but also find that repurposing such support can lead to reductions in GHG emissions. However, these global model-based analyses also highlight important trade-offs; for example, in terms of agriculture production, farm income and economic efficiency. Although these studies point to several important insights on the affordability of healthy diets,4,224,225,226 this issue has not been at the core of their analyses.
Eliminating agricultural support is not a feasible optionGlobal model-based analyses warn that removing all agricultural support alone is not an option.1,227 Such a drastic scenario could lead to some reductions in GHG emissions from agriculture, and efficiency and net-global economic gains, but it would come at a high socioeconomic and human cost to society. Trade-offs may include significant reductions in crop production, livestock farming production and farm employment.
One of the studies227 analysed the ensuing impact of globally removing support on consumption, diet-related mortality and overweight and obesity by 2030. The changes in consumption followed the changes in production but were also mediated by changes in trade and commodity prices. The per capita availability of fruits, vegetables and other
horticultural products for consumption decreased in all regions, as did total energy intake. Associated with these changes was a projected net increase in diet-related mortality, most of which was associated with the reductions in availability of fruits and vegetables for consumption but was slightly compensated for by reductions in overweight and obesity. Further, the same study points to the resulting increases in mortality which would negatively affect the labour supply and economic welfare.
Allocating agricultural support differently is an optionAnother key finding from recent studies is that changing the composition of agricultural support with repurposing can ensure beneficial outcomes while minimizing trade-offs. For example, one study examines4 the model-based scenario where all countries concertedly repurpose current coupled subsidies into conditional payments to farmers who are achieving higher productivity and adopting lower emission-intensity technologies, while supplementing this with additional government support for R&D in such technologies and infrastructure improvements. Not only would such a scenario significantly help reduce GHG emissions from both agricultural production and land-use change, but it would also help increase yields globally, contribute to reducing food prices, improve farm incomes in developing countries, reduce poverty and hunger, and incidentally, reduce the cost of a healthy diet for poor people.
Another study,227 using a similar modelling framework, found that on a global scale, several reform options could lead to reductions in GHGs and improvements in population health without reductions in economic welfare. Those reform options include a repurposing of up to half of those agricultural subsidies that support the production of foods with beneficial health and environmental characteristics, including fruits, vegetables and other horticultural products.
These findings show that smart repurposing of current agricultural support has the potential to contribute to the environmental sustainability of agriculture, while also contributing (moderately) to poverty reduction, food security and better
| 89 |
CHAPTER 4 POTENTIAL OPTIONS TO REPURPOSE POLICY SUPPORT TO FOOD AND AGRICULTURE <...>
nutrition. The key to these outcomes is ensuring that the reorientation of support leads to significant efficiency improvements – both in terms of higher yields and lower emission intensities. It is also clear that reorienting agricultural incentives in this way will not address all agrifood system challenges in full.
Recent studies that also rely on modelling find that repurposing domestic agricultural subsidies – particularly those that are coupled to production as defined in Chapter 3 – to pursue better nutrition, health and environmental outcomes, can be beneficial to transitions towards healthy diets that include sustainability considerations.227,228
For example, positive gains could be made in terms of human health through increased consumption of nutritious foods, including fruits and vegetables, nuts, seeds and pulses.228 Repurposing half or all subsidies to nutritious foods is found to lead to hundreds of thousands of fewer diet-related deaths and reductions in GHG emissions. Modelling also shows that the resulting shifts in resource demand for water, land, nitrogen and phosphorus are generally modest, and changes in management practices may arguably be more effective in moderating water and land use (e.g. subsidy reforms include incentives for adopting sustainable management practices, in addition to encouraging changes in the mix of production). These studies focus on subsidies, though, thus leaving out other instruments of policy support.
Bridging current knowledge gaps in understanding repurposing with a lens on healthy dietsWhile the global model-based analyses described above have provided important policy insights for repurposing support efforts, they fall short in helping us more thoroughly understand what repurposing scenarios mean if they were to include lowering the cost of nutritious foods and increasing the affordability of healthy diets for all as a key policy objective. Bridging these knowledge gaps is critical to inform decision-making in repurposing support to ensure it contributes to ending hunger, food insecurity and all forms of malnutrition with
synergies for other development goals. It is also important for governments to understand ways in which in times of economic sluggishness, as is the case nowadays, public resources can be spent wisely with the highest cost-effectiveness possible to improve people’s lives while respecting the planet.
The remainder of this section presents new analysis of model-based scenarios of repurposed food and agricultural policy support specially developed for this report, mostly at the global level, but adding country examples. It tackles a number of key questions: What could be the impacts of allocating current public support to food and agriculture differently on both food production and consumption patterns, in ways that affect the cost of nutritious foods (relative to other foods and people’s incomes) and thus change people’s affordability of healthy diets? Are results from repurposing different for specific groups of countries? What trade-offs could arise between multiple sustainable development objectives and mixes of policies, and what alternative policy mixes exist to avoid them?
Repurposing may not be feasible for some countries, especially for LICs but also for some LMICs that are barely spending on food and agriculture while still undergoing agricultural transformation. For these countries, the question then becomes: “how far” could repurposing take them? While there may be little potential for repurposing (or reallocating) resources in these countries, there is potential to reform policies and to use these resources more efficiently and effectively. How can these countries ensure that agricultural transformation and increasing access to healthy diets are synergic through policy support?
Scenarios of repurposing support to lower the cost and improve the affordability of a healthy diet, sustainably and inclusivelySome of the studies discussed above used the Modelling International Relations under Applied General Equilibrium (MIRAGRODEP) model to gauge the potential impacts of eliminating and reallocating agricultural support differently. This is a global, recursive-dynamic CGE model with multiregions and multisectors, which links
| 90 |
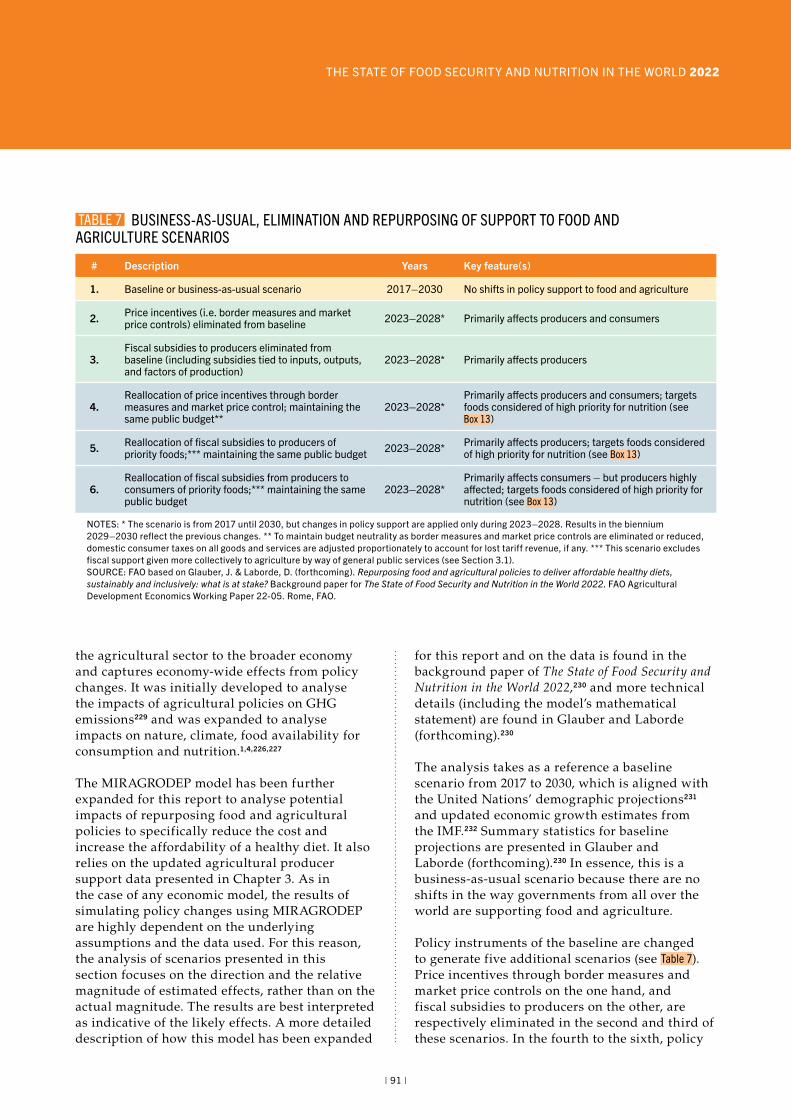
THE STATE OF FOOD SECURITY AND NUTRITION IN THE WORLD 2022
the agricultural sector to the broader economy and captures economy-wide effects from policy changes. It was initially developed to analyse the impacts of agricultural policies on GHG emissions229 and was expanded to analyse impacts on nature, climate, food availability for consumption and nutrition.1,4,226,227
The MIRAGRODEP model has been further expanded for this report to analyse potential impacts of repurposing food and agricultural policies to specifically reduce the cost and increase the affordability of a healthy diet. It also relies on the updated agricultural producer support data presented in Chapter 3. As in the case of any economic model, the results of simulating policy changes using MIRAGRODEP are highly dependent on the underlying assumptions and the data used. For this reason, the analysis of scenarios presented in this section focuses on the direction and the relative magnitude of estimated effects, rather than on the actual magnitude. The results are best interpreted as indicative of the likely effects. A more detailed description of how this model has been expanded
for this report and on the data is found in the background paper of The State of Food Security and Nutrition in the World 2022,230 and more technical details (including the model’s mathematical statement) are found in Glauber and Laborde (forthcoming).230
The analysis takes as a reference a baseline scenario from 2017 to 2030, which is aligned with the United Nations’ demographic projections231 and updated economic growth estimates from the IMF.232 Summary statistics for baseline projections are presented in Glauber and Laborde (forthcoming).230 In essence, this is a business-as-usual scenario because there are no shifts in the way governments from all over the world are supporting food and agriculture.
Policy instruments of the baseline are changed to generate five additional scenarios (see Table 7). Price incentives through border measures and market price controls on the one hand, and fiscal subsidies to producers on the other, are respectively eliminated in the second and third of these scenarios. In the fourth to the sixth, policy
# Description Years Key feature(s)
1. Baseline or business-as-usual scenario 2017–2030 No shifts in policy support to food and agriculture
2. Price incentives (i.e. border measures and market price controls) eliminated from baseline 2023–2028* Primarily affects producers and consumers
3.Fiscal subsidies to producers eliminated from baseline (including subsidies tied to inputs, outputs, and factors of production)
2023–2028* Primarily affects producers
4.Reallocation of price incentives through border measures and market price control; maintaining the same public budget**
2023–2028*Primarily affects producers and consumers; targets foods considered of high priority for nutrition (see Box 13)
5. Reallocation of fiscal subsidies to producers of priority foods;*** maintaining the same public budget 2023–2028* Primarily affects producers; targets foods considered
of high priority for nutrition (see Box 13)
6.Reallocation of fiscal subsidies from producers to consumers of priority foods;*** maintaining the same public budget
2023–2028*Primarily affects consumers – but producers highly affected; targets foods considered of high priority for nutrition (see Box 13)
NOTES: * The scenario is from 2017 until 2030, but changes in policy support are applied only during 2023–2028. Results in the biennium 2029–2030 reflect the previous changes. ** To maintain budget neutrality as border measures and market price controls are eliminated or reduced, domestic consumer taxes on all goods and services are adjusted proportionately to account for lost tariff revenue, if any. *** This scenario excludes fiscal support given more collectively to agriculture by way of general public services (see Section 3.1).SOURCE: FAO based on Glauber, J. & Laborde, D. (forthcoming). Repurposing food and agricultural policies to deliver affordable healthy diets, sustainably and inclusively: what is at stake? Background paper for The State of Food Security and Nutrition in the World 2022. FAO Agricultural Development Economics Working Paper 22-05. Rome, FAO.
TABLE 7 BUSINESS-AS-USUAL, ELIMINATION AND REPURPOSING OF SUPPORT TO FOOD AND AGRICULTURE SCENARIOS
| 91 |
CHAPTER 4 POTENTIAL OPTIONS TO REPURPOSE POLICY SUPPORT TO FOOD AND AGRICULTURE <...>
support is reallocated in different ways with the purpose of reducing the cost and increasing the affordability of a healthy diet. All five policy scenarios assume that all countries of the world simultaneously implement the same policy change – even if all countries do not have the same development levels, economic structures, policy systems and priorities, and, importantly, do not have the same level and structure of policy support.
Following definitions in Glauber and Laborde (forthcoming),230 key food security, nutrition, equity and climate variables for which results are presented include:
� Affordability of a healthy diet – This measures the percent of the population that can afford a healthy diet as defined in this report (see Section 2.3 and Annex 3).
� Income gap in the affordability of a healthy diet – This measures the average gap between the cost of a healthy diet and the food expenditures of the population that could not afford it.
� Prevalence of undernourishment (PoU) – This measures the percent of the population that is undernourished (see Section 2.1 and Annex 1B).
� Population in extreme poverty (less than USD 1.90 per day) – This measures the percent of the population living in extreme poverty.
� Farm income – This measures the real value added of the farm sector.
� Agricultural production (volume) – This measures agricultural production measured on a volume basis.
� Total GHG emissions from agriculture including land-use changes (cumulated during the period 2025–2030) – This measures the total value, both production and land emisssions cumulated over five years 2025–2030.ab
Results for the five policy scenarios are reported as percentage point change from the baseline scenario in 2030 for the affordability of a healthy diet, the income gap in the affordability of a healthy diet, the PoU and the population in
ab Glauber and Laborde (forthcoming)230 report additional results for GHG emissions due to agricultural production (2030) and emissions due to land-use changes (cumulated during the period 2025–2030).
extreme poverty. The results are reported as percentage change from the baseline scenario in 2030 for farm income, agricultural production and total GHG emissions from agriculture including land-use changes.
Reinforcing the case for repurposing supportResults from the second and third scenarios whereby, respectively, border support and market price control or fiscal subsidies to producers are removed from the baseline scenario help reinforce the case that eliminating such support altogether would not be a feasible option.
When all border support and market price control measures affecting agricultural products – both positively and negatively – are removed globally, agricultural imports increase, and this lowers prices for consumers and producers in food-importing countries, although food prices go up for food exporting countries whose products are in higher demand. In turn, an overall reduction in agricultural prices help reduce undernourishment, increase the affordability of a healthy diet and shrink the income gap towards affording a healthy diet, particularly in LICs (Table A6.2 in Annex 6).
Total GHG emissions from agriculture fall as well, but these benefits are not free of trade-offs. Global extreme poverty essentially does not change – and actually increases in LMICs. There is a clear reduction in global agricultural production in all but HICs, and farm income falls in LMICs and LICs where border support is more typically provided than fiscal subsidies (Table A6.2 in Annex 6). The reduction in total GHG emissions in agriculture results from less agricultural production in MICs and LICs.
Trade-offs are even more apparent when all fiscal subsidies given to producers individually – mostly in HICs and UMICs – are removed, keeping all other support including border measures and market price controls in place (Table A6.3 in Annex 6). Effects are particularly adverse in terms of farm income and agricultural production particularly in HICs, although global food security and nutrition may also deteriorate. The drop in global agricultural production pushes agricultural prices up, which in the context of LICs is somewhat favourable to agricultural
| 92 |
THE STATE OF FOOD SECURITY AND NUTRITION IN THE WORLD 2022
production, farm income and poverty reduction. Even so, poverty increases globally, and both the decline in farm income in some LMICs in Asia and the aforementioned increased prices push up the PoU and the cost of nutritious foods, thus leaving a healthy diet less affordable, particularly in LMICs. There is a reduction in GHG emissions from agriculture given the decrease in global agricultural production, but the trade-offs in food security, nutrition and equity reinforce the case that eliminating fiscal subsidies to producers is not a feasible option.
On the basis of these results, policymakers may see in repurposing support to food and agriculture a better option than eliminating such support. Policymakers will need to consider the potential options to repurpose policy support to food and agriculture for improving affordability of healthy diets. This includes the consideration of different scenarios that can inform decisions for policy reforms.
Repurposing scenariosThese scenarios simulate the reallocation of current budgets supporting agricultural producers using different policy instruments. This is done for all countries from all geographical regions, in order to reduce the cost and increase the affordability of a healthy diet (see Table 7). This reallocation is implemented linearly between 2023 and 2028, and impacts are examined for 2030, a year by which sufficient time will have elapsed for policy changes to have been implemented and for markets and investments to have adjusted.
The policy instruments under consideration are price incentives through border measures and market price controls, fiscal subsidies given to producers individually, and fiscal subsidies to consumers (as defined in Section 3.1). Because the policy objective is to reduce the cost and increase the affordability of a healthy diet – sustainably and inclusively, the repurposing scenarios are such that food products whose current consumption levels are low relative to recommended dietary levels are subsidized at a higher rate than all other food products. Food products are classified in terms of such suboptimal intake, and the targeted level of support is defined based on how this
deficiency earmarks them as “high-priority”, “medium-priority” or “low-priority” foods. High-priority foods include fruits and vegetables, fisheries and dairy products in most regions (see Box 13).
In addition to the seven indicators introduced earlier, six more indicators are added to examine the impacts of repurposing on the cost and affordability of a healthy diet and per capita consumption of broad food groups adjusted for food loss and waste (see Glauber and Laborde [forthcoming]230 for definitions) – all expressed as a percentage change relative to the baseline in 2030:
� Cost of actual diet – which measures the cost of the average diet based on the average national food expenditure that is currently observed in the data – and is thus reflected in the baseline scenario
� Cost of a healthy diet � Per capita consumption of dairy products (i.e. raw milk, processed milk, cheese)
� Per capita consumption of animal fats and vegetable oils
� Per capita consumption of sugar and sweeteners � Per capita consumption of fruits and vegetables
Per capita consumption focuses on the food groups whose level of current per capita consumption in each country/region does not yet match the recommended levels for that country/region, as defined by the FBDGs used for the computation of the cost of a healthy diet (see Section 2.3, Box 13 and Annex 2E). In the policy scenarios, any increase in the production and availability of these food groups as a result of a policy change will increase their consumption so that markets clear.ac The assumption is that consumers will be readily available to fully absorb the increased food availability. Of course, for this to occur in practice, other policies that target consumer behaviour will simultaneously be needed, as further explained in Section 4.2.
ac This process takes into consideration key structural parameters of countries, including their income-expenditure elasticities, commodities’ shares of food baskets, food price elasticities, etc.
»
| 93 |
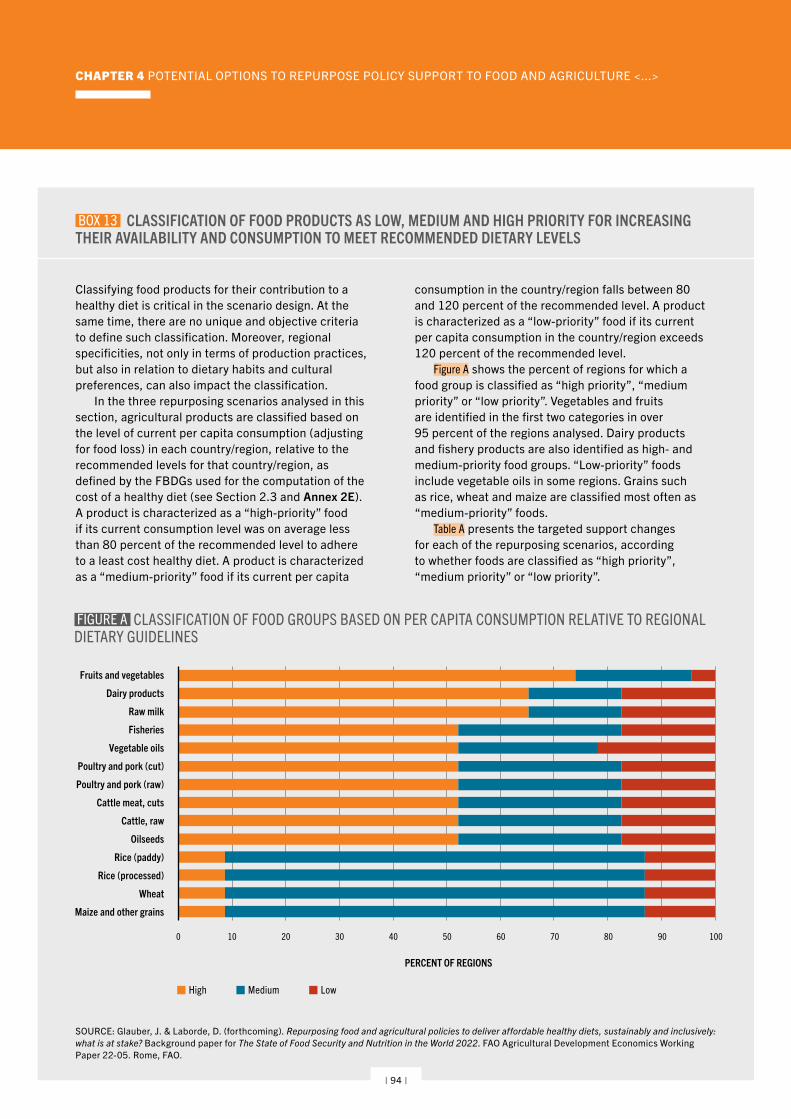
CHAPTER 4 POTENTIAL OPTIONS TO REPURPOSE POLICY SUPPORT TO FOOD AND AGRICULTURE <...>
BOX 13 CLASSIFICATION OF FOOD PRODUCTS AS LOW, MEDIUM AND HIGH PRIORITY FOR INCREASING THEIR AVAILABILITY AND CONSUMPTION TO MEET RECOMMENDED DIETARY LEVELS
Classifying food products for their contribution to a healthy diet is critical in the scenario design. At the same time, there are no unique and objective criteria to define such classification. Moreover, regional specificities, not only in terms of production practices, but also in relation to dietary habits and cultural preferences, can also impact the classification.
In the three repurposing scenarios analysed in this section, agricultural products are classified based on the level of current per capita consumption (adjusting for food loss) in each country/region, relative to the recommended levels for that country/region, as defined by the FBDGs used for the computation of the cost of a healthy diet (see Section 2.3 and Annex 2E). A product is characterized as a “high-priority” food if its current consumption level was on average less than 80 percent of the recommended level to adhere to a least cost healthy diet. A product is characterized as a “medium-priority” food if its current per capita
consumption in the country/region falls between 80 and 120 percent of the recommended level. A product is characterized as a “low-priority” food if its current per capita consumption in the country/region exceeds 120 percent of the recommended level.
Figure A shows the percent of regions for which a food group is classified as “high priority”, “medium priority” or “low priority”. Vegetables and fruits are identified in the first two categories in over 95 percent of the regions analysed. Dairy products and fishery products are also identified as high- and medium-priority food groups. “Low-priority” foods include vegetable oils in some regions. Grains such as rice, wheat and maize are classified most often as “medium-priority” foods.
Table A presents the targeted support changes for each of the repurposing scenarios, according to whether foods are classified as “high priority”, “medium priority” or “low priority”.
FIGURE A CLASSIFICATION OF FOOD GROUPS BASED ON PER CAPITA CONSUMPTION RELATIVE TO REGIONAL DIETARY GUIDELINES
PERCENT OF REGIONS
0 10 20 30 40 50 60 70 80 90 100
Fruits and vegetables
Dairy products
Raw milk
Fisheries
Vegetable oils
Poultry and pork (cut)
Poultry and pork (raw)
Cattle meat, cuts
Cattle, raw
Oilseeds
Rice (paddy)
Rice (processed)
Wheat
Maize and other grains
High Medium Low
SOURCE: Glauber, J. & Laborde, D. (forthcoming). Repurposing food and agricultural policies to deliver affordable healthy diets, sustainably and inclusively: what is at stake? Background paper for The State of Food Security and Nutrition in the World 2022. FAO Agricultural Development Economics Working Paper 22-05. Rome, FAO.
| 94 |
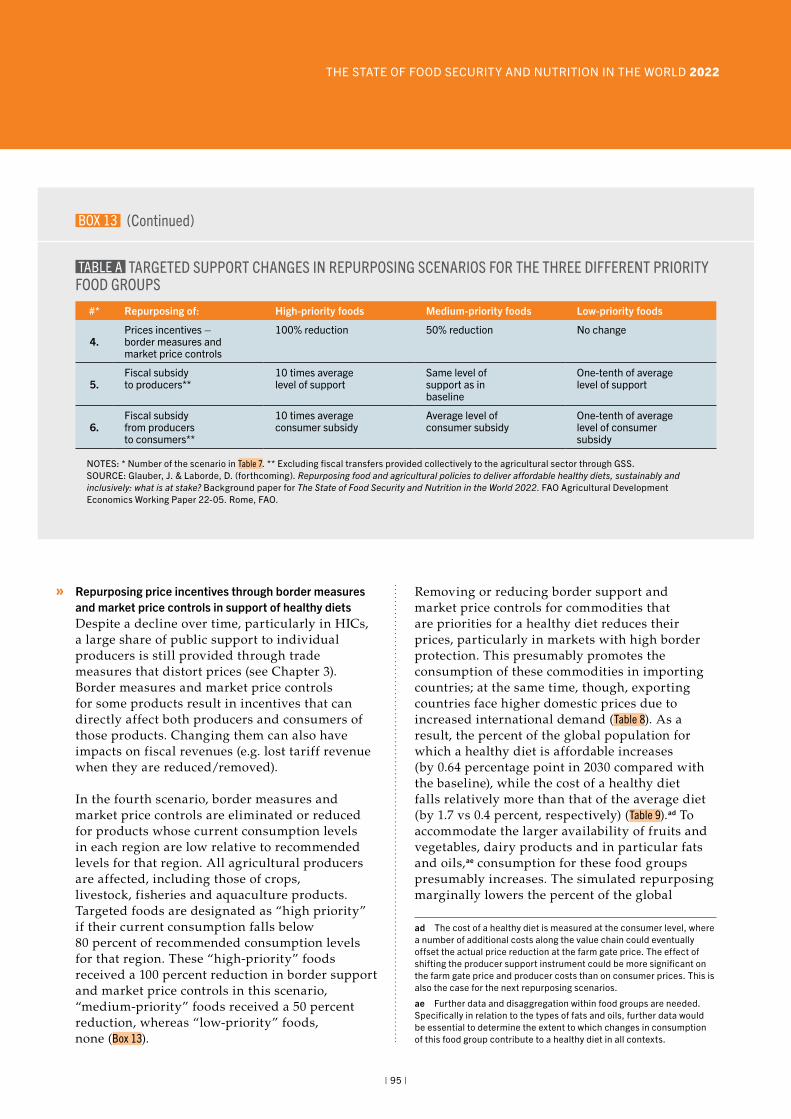
THE STATE OF FOOD SECURITY AND NUTRITION IN THE WORLD 2022
Repurposing price incentives through border measures and market price controls in support of healthy dietsDespite a decline over time, particularly in HICs, a large share of public support to individual producers is still provided through trade measures that distort prices (see Chapter 3). Border measures and market price controls for some products result in incentives that can directly affect both producers and consumers of those products. Changing them can also have impacts on fiscal revenues (e.g. lost tariff revenue when they are reduced/removed).
In the fourth scenario, border measures and market price controls are eliminated or reduced for products whose current consumption levels in each region are low relative to recommended levels for that region. All agricultural producers are affected, including those of crops, livestock, fisheries and aquaculture products. Targeted foods are designated as “high priority” if their current consumption falls below 80 percent of recommended consumption levels for that region. These “high-priority” foods received a 100 percent reduction in border support and market price controls in this scenario, “medium-priority” foods received a 50 percent reduction, whereas “low-priority” foods, none (Box 13).
Removing or reducing border support and market price controls for commodities that are priorities for a healthy diet reduces their prices, particularly in markets with high border protection. This presumably promotes the consumption of these commodities in importing countries; at the same time, though, exporting countries face higher domestic prices due to increased international demand (Table 8). As a result, the percent of the global population for which a healthy diet is affordable increases (by 0.64 percentage point in 2030 compared with the baseline), while the cost of a healthy diet falls relatively more than that of the average diet (by 1.7 vs 0.4 percent, respectively) (Table 9).ad To accommodate the larger availability of fruits and vegetables, dairy products and in particular fats and oils,ae consumption for these food groups presumably increases. The simulated repurposing marginally lowers the percent of the global
ad The cost of a healthy diet is measured at the consumer level, where a number of additional costs along the value chain could eventually offset the actual price reduction at the farm gate price. The effect of shifting the producer support instrument could be more significant on the farm gate price and producer costs than on consumer prices. This is also the case for the next repurposing scenarios.
ae Further data and disaggregation within food groups are needed. Specifically in relation to the types of fats and oils, further data would be essential to determine the extent to which changes in consumption of this food group contribute to a healthy diet in all contexts.
BOX 13 (Continued)
#* Repurposing of: High-priority foods Medium-priority foods Low-priority foods
4.Prices incentives – border measures and market price controls
100% reduction 50% reduction No change
5.Fiscal subsidy to producers**
10 times average level of support
Same level of support as in baseline
One-tenth of average level of support
6.Fiscal subsidy from producers to consumers**
10 times average consumer subsidy
Average level of consumer subsidy
One-tenth of average level of consumer subsidy
NOTES: * Number of the scenario in Table 7. ** Excluding fiscal transfers provided collectively to the agricultural sector through GSS.SOURCE: Glauber, J. & Laborde, D. (forthcoming). Repurposing food and agricultural policies to deliver affordable healthy diets, sustainably and inclusively: what is at stake? Background paper for The State of Food Security and Nutrition in the World 2022. FAO Agricultural Development Economics Working Paper 22-05. Rome, FAO.
TABLE A TARGETED SUPPORT CHANGES IN REPURPOSING SCENARIOS FOR THE THREE DIFFERENT PRIORITY FOOD GROUPS
»
| 95 |
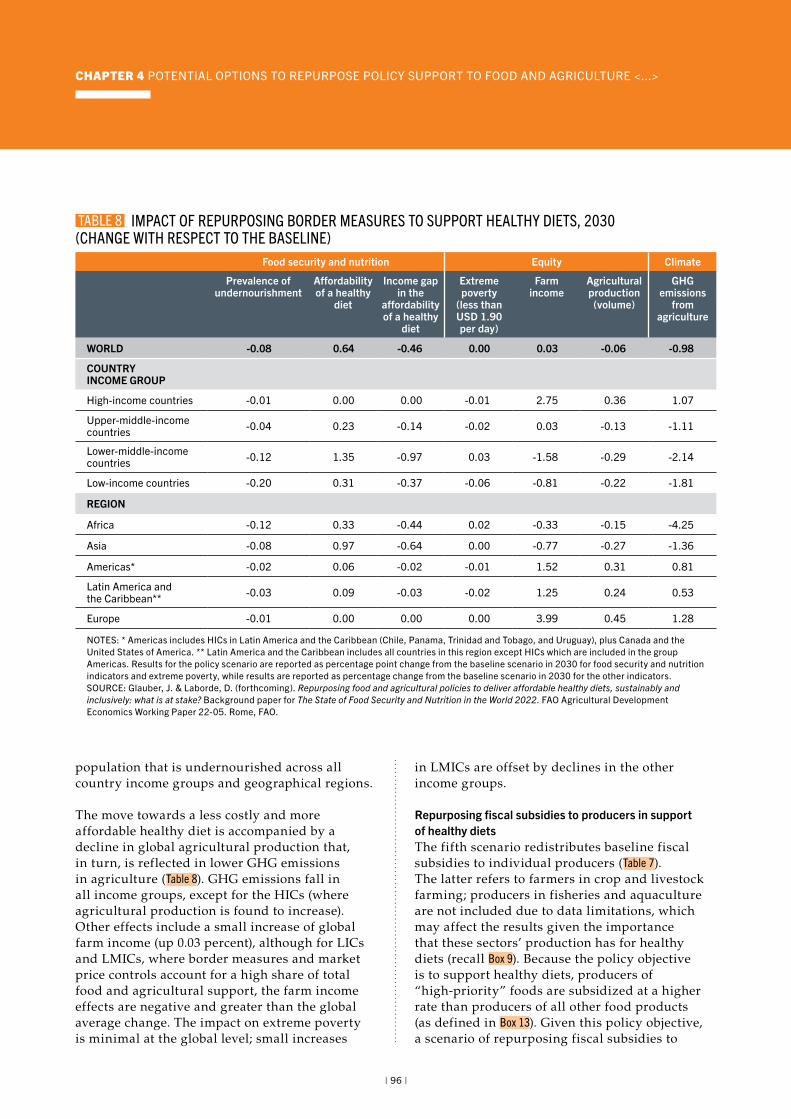
CHAPTER 4 POTENTIAL OPTIONS TO REPURPOSE POLICY SUPPORT TO FOOD AND AGRICULTURE <...>
population that is undernourished across all country income groups and geographical regions.
The move towards a less costly and more affordable healthy diet is accompanied by a decline in global agricultural production that, in turn, is reflected in lower GHG emissions in agriculture (Table 8). GHG emissions fall in all income groups, except for the HICs (where agricultural production is found to increase). Other effects include a small increase of global farm income (up 0.03 percent), although for LICs and LMICs, where border measures and market price controls account for a high share of total food and agricultural support, the farm income effects are negative and greater than the global average change. The impact on extreme poverty is minimal at the global level; small increases
in LMICs are offset by declines in the other income groups.
Repurposing fiscal subsidies to producers in support of healthy dietsThe fifth scenario redistributes baseline fiscal subsidies to individual producers (Table 7). The latter refers to farmers in crop and livestock farming; producers in fisheries and aquaculture are not included due to data limitations, which may affect the results given the importance that these sectors’ production has for healthy diets (recall Box 9). Because the policy objective is to support healthy diets, producers of “high-priority” foods are subsidized at a higher rate than producers of all other food products (as defined in Box 13). Given this policy objective, a scenario of repurposing fiscal subsidies to
Food security and nutrition Equity Climate
Prevalence of undernourishment
Affordability of a healthy
diet
Income gap in the
affordability of a healthy
diet
Extreme poverty
(less than USD 1.90 per day)
Farm income
Agricultural production
(volume)
GHG emissions
from agriculture
WORLD -0.08 0.64 -0.46 0.00 0.03 -0.06 -0.98
COUNTRY INCOME GROUP
High-income countries -0.01 0.00 0.00 -0.01 2.75 0.36 1.07
Upper-middle-income countries -0.04 0.23 -0.14 -0.02 0.03 -0.13 -1.11
Lower-middle-income countries -0.12 1.35 -0.97 0.03 -1.58 -0.29 -2.14
Low-income countries -0.20 0.31 -0.37 -0.06 -0.81 -0.22 -1.81
REGION
Africa -0.12 0.33 -0.44 0.02 -0.33 -0.15 -4.25
Asia -0.08 0.97 -0.64 0.00 -0.77 -0.27 -1.36
Americas* -0.02 0.06 -0.02 -0.01 1.52 0.31 0.81
Latin America and the Caribbean** -0.03 0.09 -0.03 -0.02 1.25 0.24 0.53
Europe -0.01 0.00 0.00 0.00 3.99 0.45 1.28
NOTES: * Americas includes HICs in Latin America and the Caribbean (Chile, Panama, Trinidad and Tobago, and Uruguay), plus Canada and the United States of America. ** Latin America and the Caribbean includes all countries in this region except HICs which are included in the group Americas. Results for the policy scenario are reported as percentage point change from the baseline scenario in 2030 for food security and nutrition indicators and extreme poverty, while results are reported as percentage change from the baseline scenario in 2030 for the other indicators.SOURCE: Glauber, J. & Laborde, D. (forthcoming). Repurposing food and agricultural policies to deliver affordable healthy diets, sustainably and inclusively: what is at stake? Background paper for The State of Food Security and Nutrition in the World 2022. FAO Agricultural Development Economics Working Paper 22-05. Rome, FAO.
TABLE 8 IMPACT OF REPURPOSING BORDER MEASURES TO SUPPORT HEALTHY DIETS, 2030 (CHANGE WITH RESPECT TO THE BASELINE)
| 96 |
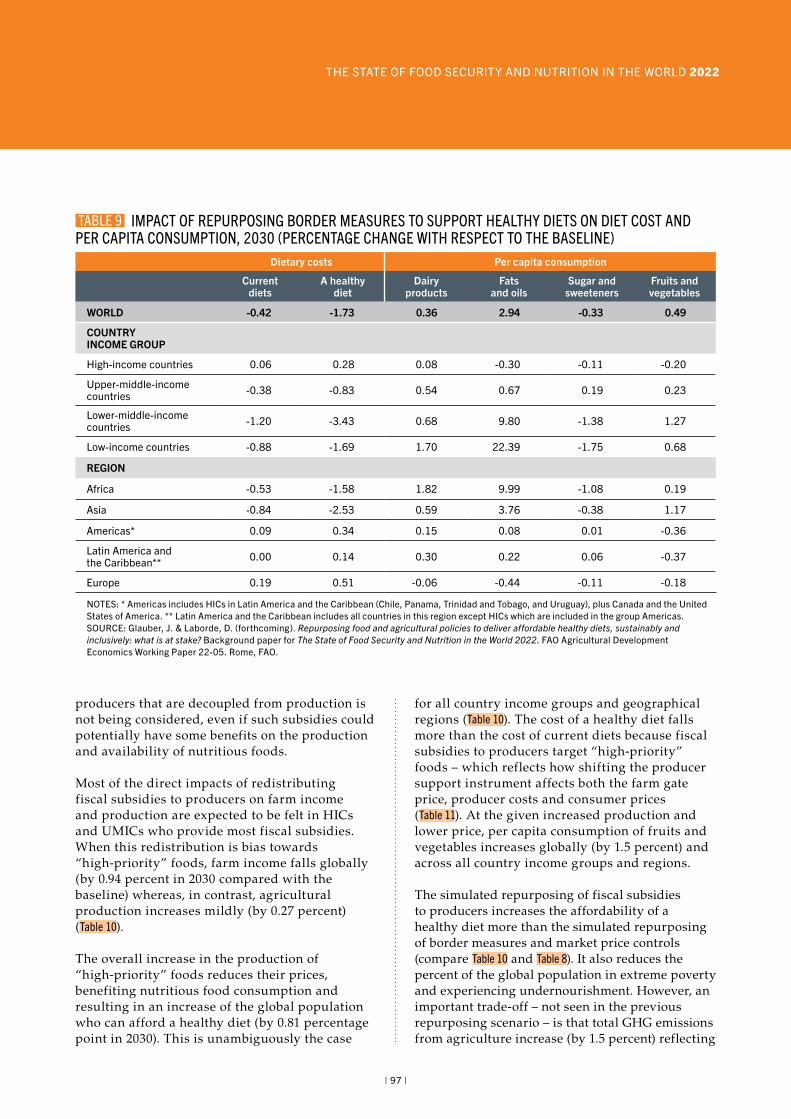
THE STATE OF FOOD SECURITY AND NUTRITION IN THE WORLD 2022
producers that are decoupled from production is not being considered, even if such subsidies could potentially have some benefits on the production and availability of nutritious foods.
Most of the direct impacts of redistributing fiscal subsidies to producers on farm income and production are expected to be felt in HICs and UMICs who provide most fiscal subsidies. When this redistribution is bias towards “high-priority” foods, farm income falls globally (by 0.94 percent in 2030 compared with the baseline) whereas, in contrast, agricultural production increases mildly (by 0.27 percent) (Table 10).
The overall increase in the production of “high-priority” foods reduces their prices, benefiting nutritious food consumption and resulting in an increase of the global population who can afford a healthy diet (by 0.81 percentage point in 2030). This is unambiguously the case
for all country income groups and geographical regions (Table 10). The cost of a healthy diet falls more than the cost of current diets because fiscal subsidies to producers target “high-priority” foods – which reflects how shifting the producer support instrument affects both the farm gate price, producer costs and consumer prices (Table 11). At the given increased production and lower price, per capita consumption of fruits and vegetables increases globally (by 1.5 percent) and across all country income groups and regions.
The simulated repurposing of fiscal subsidies to producers increases the affordability of a healthy diet more than the simulated repurposing of border measures and market price controls (compare Table 10 and Table 8). It also reduces the percent of the global population in extreme poverty and experiencing undernourishment. However, an important trade-off – not seen in the previous repurposing scenario – is that total GHG emissions from agriculture increase (by 1.5 percent) reflecting
Dietary costs Per capita consumption
Current diets
A healthy diet
Dairy products
Fats and oils
Sugar and sweeteners
Fruits and vegetables
WORLD -0.42 -1.73 0.36 2.94 -0.33 0.49
COUNTRY INCOME GROUP
High-income countries 0.06 0.28 0.08 -0.30 -0.11 -0.20
Upper-middle-income countries -0.38 -0.83 0.54 0.67 0.19 0.23
Lower-middle-income countries -1.20 -3.43 0.68 9.80 -1.38 1.27
Low-income countries -0.88 -1.69 1.70 22.39 -1.75 0.68
REGION
Africa -0.53 -1.58 1.82 9.99 -1.08 0.19
Asia -0.84 -2.53 0.59 3.76 -0.38 1.17
Americas* 0.09 0.34 0.15 0.08 0.01 -0.36
Latin America and the Caribbean** 0.00 0.14 0.30 0.22 0.06 -0.37
Europe 0.19 0.51 -0.06 -0.44 -0.11 -0.18
NOTES: * Americas includes HICs in Latin America and the Caribbean (Chile, Panama, Trinidad and Tobago, and Uruguay), plus Canada and the United States of America. ** Latin America and the Caribbean includes all countries in this region except HICs which are included in the group Americas.SOURCE: Glauber, J. & Laborde, D. (forthcoming). Repurposing food and agricultural policies to deliver affordable healthy diets, sustainably and inclusively: what is at stake? Background paper for The State of Food Security and Nutrition in the World 2022. FAO Agricultural Development Economics Working Paper 22-05. Rome, FAO.
TABLE 9 IMPACT OF REPURPOSING BORDER MEASURES TO SUPPORT HEALTHY DIETS ON DIET COST AND PER CAPITA CONSUMPTION, 2030 (PERCENTAGE CHANGE WITH RESPECT TO THE BASELINE)
| 97 |
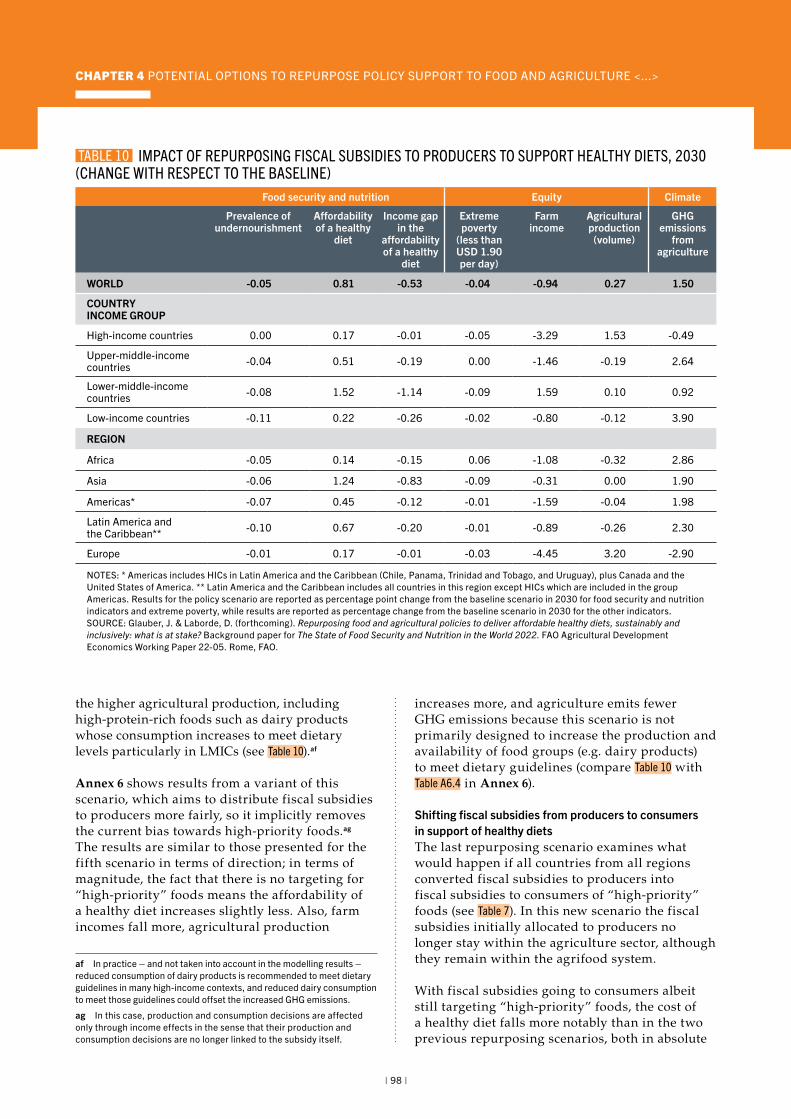
CHAPTER 4 POTENTIAL OPTIONS TO REPURPOSE POLICY SUPPORT TO FOOD AND AGRICULTURE <...>
the higher agricultural production, including high-protein-rich foods such as dairy products whose consumption increases to meet dietary levels particularly in LMICs (see Table 10).af
Annex 6 shows results from a variant of this scenario, which aims to distribute fiscal subsidies to producers more fairly, so it implicitly removes the current bias towards high-priority foods.ag The results are similar to those presented for the fifth scenario in terms of direction; in terms of magnitude, the fact that there is no targeting for “high-priority” foods means the affordability of a healthy diet increases slightly less. Also, farm incomes fall more, agricultural production
af In practice – and not taken into account in the modelling results – reduced consumption of dairy products is recommended to meet dietary guidelines in many high-income contexts, and reduced dairy consumption to meet those guidelines could offset the increased GHG emissions.
ag In this case, production and consumption decisions are affected only through income effects in the sense that their production and consumption decisions are no longer linked to the subsidy itself.
increases more, and agriculture emits fewer GHG emissions because this scenario is not primarily designed to increase the production and availability of food groups (e.g. dairy products) to meet dietary guidelines (compare Table 10 with Table A6.4 in Annex 6).
Shifting fiscal subsidies from producers to consumers in support of healthy dietsThe last repurposing scenario examines what would happen if all countries from all regions converted fiscal subsidies to producers into fiscal subsidies to consumers of “high-priority” foods (see Table 7). In this new scenario the fiscal subsidies initially allocated to producers no longer stay within the agriculture sector, although they remain within the agrifood system.
With fiscal subsidies going to consumers albeit still targeting “high-priority” foods, the cost of a healthy diet falls more notably than in the two previous repurposing scenarios, both in absolute
Food security and nutrition Equity Climate
Prevalence of undernourishment
Affordability of a healthy
diet
Income gap in the
affordability of a healthy
diet
Extreme poverty
(less than USD 1.90 per day)
Farm income
Agricultural production
(volume)
GHG emissions
from agriculture
WORLD -0.05 0.81 -0.53 -0.04 -0.94 0.27 1.50
COUNTRY INCOME GROUP
High-income countries 0.00 0.17 -0.01 -0.05 -3.29 1.53 -0.49
Upper-middle-income countries -0.04 0.51 -0.19 0.00 -1.46 -0.19 2.64
Lower-middle-income countries -0.08 1.52 -1.14 -0.09 1.59 0.10 0.92
Low-income countries -0.11 0.22 -0.26 -0.02 -0.80 -0.12 3.90
REGION
Africa -0.05 0.14 -0.15 0.06 -1.08 -0.32 2.86
Asia -0.06 1.24 -0.83 -0.09 -0.31 0.00 1.90
Americas* -0.07 0.45 -0.12 -0.01 -1.59 -0.04 1.98
Latin America and the Caribbean** -0.10 0.67 -0.20 -0.01 -0.89 -0.26 2.30
Europe -0.01 0.17 -0.01 -0.03 -4.45 3.20 -2.90
NOTES: * Americas includes HICs in Latin America and the Caribbean (Chile, Panama, Trinidad and Tobago, and Uruguay), plus Canada and the United States of America. ** Latin America and the Caribbean includes all countries in this region except HICs which are included in the group Americas. Results for the policy scenario are reported as percentage point change from the baseline scenario in 2030 for food security and nutrition indicators and extreme poverty, while results are reported as percentage change from the baseline scenario in 2030 for the other indicators.SOURCE: Glauber, J. & Laborde, D. (forthcoming). Repurposing food and agricultural policies to deliver affordable healthy diets, sustainably and inclusively: what is at stake? Background paper for The State of Food Security and Nutrition in the World 2022. FAO Agricultural Development Economics Working Paper 22-05. Rome, FAO.
TABLE 10 IMPACT OF REPURPOSING FISCAL SUBSIDIES TO PRODUCERS TO SUPPORT HEALTHY DIETS, 2030 (CHANGE WITH RESPECT TO THE BASELINE)
| 98 |
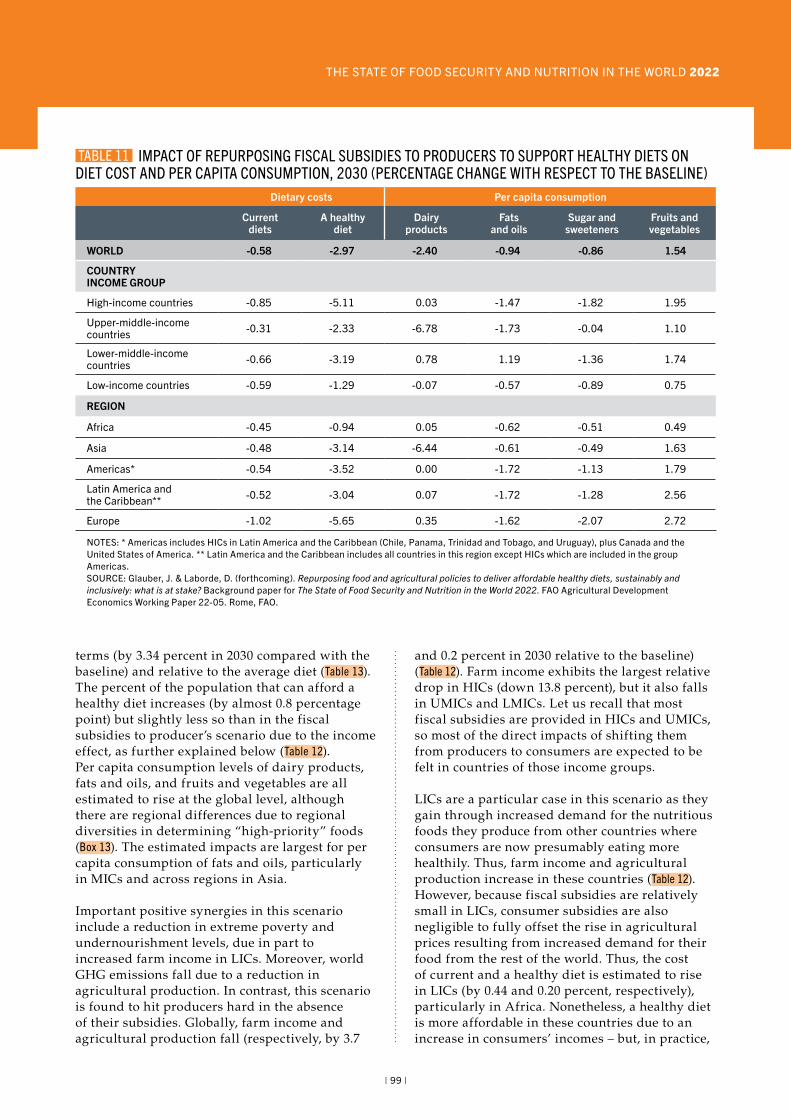
THE STATE OF FOOD SECURITY AND NUTRITION IN THE WORLD 2022
terms (by 3.34 percent in 2030 compared with the baseline) and relative to the average diet (Table 13). The percent of the population that can afford a healthy diet increases (by almost 0.8 percentage point) but slightly less so than in the fiscal subsidies to producer’s scenario due to the income effect, as further explained below (Table 12). Per capita consumption levels of dairy products, fats and oils, and fruits and vegetables are all estimated to rise at the global level, although there are regional differences due to regional diversities in determining “high-priority” foods (Box 13). The estimated impacts are largest for per capita consumption of fats and oils, particularly in MICs and across regions in Asia.
Important positive synergies in this scenario include a reduction in extreme poverty and undernourishment levels, due in part to increased farm income in LICs. Moreover, world GHG emissions fall due to a reduction in agricultural production. In contrast, this scenario is found to hit producers hard in the absence of their subsidies. Globally, farm income and agricultural production fall (respectively, by 3.7
and 0.2 percent in 2030 relative to the baseline) (Table 12). Farm income exhibits the largest relative drop in HICs (down 13.8 percent), but it also falls in UMICs and LMICs. Let us recall that most fiscal subsidies are provided in HICs and UMICs, so most of the direct impacts of shifting them from producers to consumers are expected to be felt in countries of those income groups.
LICs are a particular case in this scenario as they gain through increased demand for the nutritious foods they produce from other countries where consumers are now presumably eating more healthily. Thus, farm income and agricultural production increase in these countries (Table 12). However, because fiscal subsidies are relatively small in LICs, consumer subsidies are also negligible to fully offset the rise in agricultural prices resulting from increased demand for their food from the rest of the world. Thus, the cost of current and a healthy diet is estimated to rise in LICs (by 0.44 and 0.20 percent, respectively), particularly in Africa. Nonetheless, a healthy diet is more affordable in these countries due to an increase in consumers’ incomes – but, in practice,
Dietary costs Per capita consumption
Current diets
A healthy diet
Dairy products
Fats and oils
Sugar and sweeteners
Fruits and vegetables
WORLD -0.58 -2.97 -2.40 -0.94 -0.86 1.54
COUNTRY INCOME GROUP
High-income countries -0.85 -5.11 0.03 -1.47 -1.82 1.95
Upper-middle-income countries -0.31 -2.33 -6.78 -1.73 -0.04 1.10
Lower-middle-income countries -0.66 -3.19 0.78 1.19 -1.36 1.74
Low-income countries -0.59 -1.29 -0.07 -0.57 -0.89 0.75
REGION
Africa -0.45 -0.94 0.05 -0.62 -0.51 0.49
Asia -0.48 -3.14 -6.44 -0.61 -0.49 1.63
Americas* -0.54 -3.52 0.00 -1.72 -1.13 1.79
Latin America and the Caribbean** -0.52 -3.04 0.07 -1.72 -1.28 2.56
Europe -1.02 -5.65 0.35 -1.62 -2.07 2.72
NOTES: * Americas includes HICs in Latin America and the Caribbean (Chile, Panama, Trinidad and Tobago, and Uruguay), plus Canada and the United States of America. ** Latin America and the Caribbean includes all countries in this region except HICs which are included in the group Americas.SOURCE: Glauber, J. & Laborde, D. (forthcoming). Repurposing food and agricultural policies to deliver affordable healthy diets, sustainably and inclusively: what is at stake? Background paper for The State of Food Security and Nutrition in the World 2022. FAO Agricultural Development Economics Working Paper 22-05. Rome, FAO.
TABLE 11 IMPACT OF REPURPOSING FISCAL SUBSIDIES TO PRODUCERS TO SUPPORT HEALTHY DIETS ON DIET COST AND PER CAPITA CONSUMPTION, 2030 (PERCENTAGE CHANGE WITH RESPECT TO THE BASELINE)
| 99 |
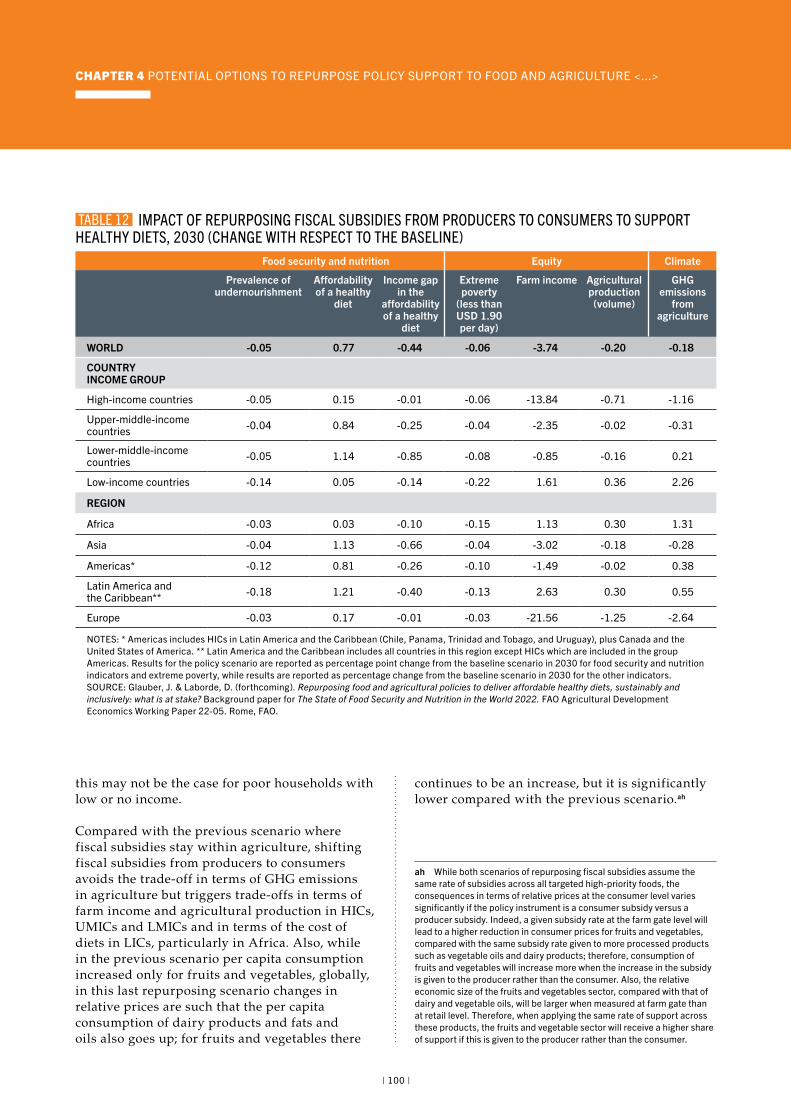
CHAPTER 4 POTENTIAL OPTIONS TO REPURPOSE POLICY SUPPORT TO FOOD AND AGRICULTURE <...>
this may not be the case for poor households with low or no income.
Compared with the previous scenario where fiscal subsidies stay within agriculture, shifting fiscal subsidies from producers to consumers avoids the trade-off in terms of GHG emissions in agriculture but triggers trade-offs in terms of farm income and agricultural production in HICs, UMICs and LMICs and in terms of the cost of diets in LICs, particularly in Africa. Also, while in the previous scenario per capita consumption increased only for fruits and vegetables, globally, in this last repurposing scenario changes in relative prices are such that the per capita consumption of dairy products and fats and oils also goes up; for fruits and vegetables there
continues to be an increase, but it is significantly lower compared with the previous scenario.ah
ah While both scenarios of repurposing fiscal subsidies assume the same rate of subsidies across all targeted high-priority foods, the consequences in terms of relative prices at the consumer level varies significantly if the policy instrument is a consumer subsidy versus a producer subsidy. Indeed, a given subsidy rate at the farm gate level will lead to a higher reduction in consumer prices for fruits and vegetables, compared with the same subsidy rate given to more processed products such as vegetable oils and dairy products; therefore, consumption of fruits and vegetables will increase more when the increase in the subsidy is given to the producer rather than the consumer. Also, the relative economic size of the fruits and vegetables sector, compared with that of dairy and vegetable oils, will be larger when measured at farm gate than at retail level. Therefore, when applying the same rate of support across these products, the fruits and vegetable sector will receive a higher share of support if this is given to the producer rather than the consumer.
Food security and nutrition Equity Climate
Prevalence of undernourishment
Affordability of a healthy
diet
Income gap in the
affordability of a healthy
diet
Extreme poverty
(less than USD 1.90 per day)
Farm income Agricultural production
(volume)
GHG emissions
from agriculture
WORLD -0.05 0.77 -0.44 -0.06 -3.74 -0.20 -0.18
COUNTRY INCOME GROUP
High-income countries -0.05 0.15 -0.01 -0.06 -13.84 -0.71 -1.16
Upper-middle-income countries -0.04 0.84 -0.25 -0.04 -2.35 -0.02 -0.31
Lower-middle-income countries -0.05 1.14 -0.85 -0.08 -0.85 -0.16 0.21
Low-income countries -0.14 0.05 -0.14 -0.22 1.61 0.36 2.26
REGION
Africa -0.03 0.03 -0.10 -0.15 1.13 0.30 1.31
Asia -0.04 1.13 -0.66 -0.04 -3.02 -0.18 -0.28
Americas* -0.12 0.81 -0.26 -0.10 -1.49 -0.02 0.38
Latin America and the Caribbean** -0.18 1.21 -0.40 -0.13 2.63 0.30 0.55
Europe -0.03 0.17 -0.01 -0.03 -21.56 -1.25 -2.64
NOTES: * Americas includes HICs in Latin America and the Caribbean (Chile, Panama, Trinidad and Tobago, and Uruguay), plus Canada and the United States of America. ** Latin America and the Caribbean includes all countries in this region except HICs which are included in the group Americas. Results for the policy scenario are reported as percentage point change from the baseline scenario in 2030 for food security and nutrition indicators and extreme poverty, while results are reported as percentage change from the baseline scenario in 2030 for the other indicators.SOURCE: Glauber, J. & Laborde, D. (forthcoming). Repurposing food and agricultural policies to deliver affordable healthy diets, sustainably and inclusively: what is at stake? Background paper for The State of Food Security and Nutrition in the World 2022. FAO Agricultural Development Economics Working Paper 22-05. Rome, FAO.
TABLE 12 IMPACT OF REPURPOSING FISCAL SUBSIDIES FROM PRODUCERS TO CONSUMERS TO SUPPORT HEALTHY DIETS, 2030 (CHANGE WITH RESPECT TO THE BASELINE)
| 100 |
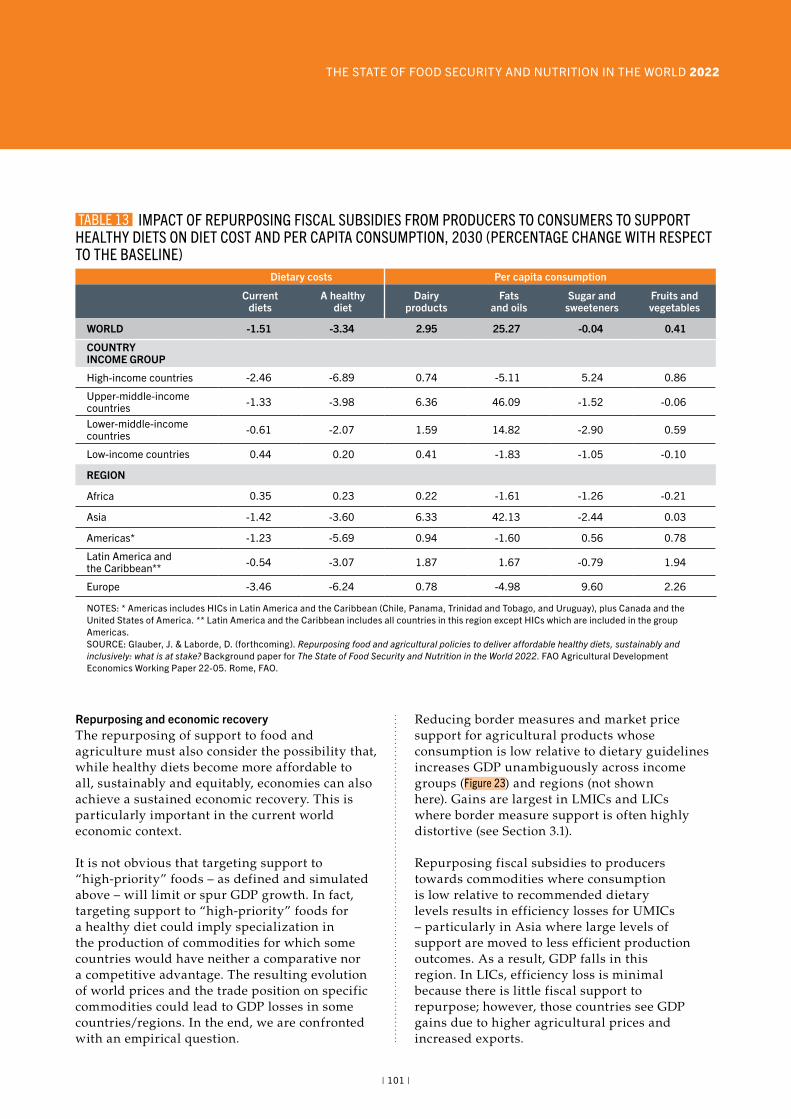
THE STATE OF FOOD SECURITY AND NUTRITION IN THE WORLD 2022
Repurposing and economic recoveryThe repurposing of support to food and agriculture must also consider the possibility that, while healthy diets become more affordable to all, sustainably and equitably, economies can also achieve a sustained economic recovery. This is particularly important in the current world economic context.
It is not obvious that targeting support to “high-priority” foods – as defined and simulated above – will limit or spur GDP growth. In fact, targeting support to “high-priority” foods for a healthy diet could imply specialization in the production of commodities for which some countries would have neither a comparative nor a competitive advantage. The resulting evolution of world prices and the trade position on specific commodities could lead to GDP losses in some countries/regions. In the end, we are confronted with an empirical question.
Reducing border measures and market price support for agricultural products whose consumption is low relative to dietary guidelines increases GDP unambiguously across income groups (Figure 23) and regions (not shown here). Gains are largest in LMICs and LICs where border measure support is often highly distortive (see Section 3.1).
Repurposing fiscal subsidies to producers towards commodities where consumption is low relative to recommended dietary levels results in efficiency losses for UMICs – particularly in Asia where large levels of support are moved to less efficient production outcomes. As a result, GDP falls in this region. In LICs, efficiency loss is minimal because there is little fiscal support to repurpose; however, those countries see GDP gains due to higher agricultural prices and increased exports.
Dietary costs Per capita consumption
Current diets
A healthy diet
Dairy products
Fats and oils
Sugar and sweeteners
Fruits and vegetables
WORLD -1.51 -3.34 2.95 25.27 -0.04 0.41
COUNTRY INCOME GROUP
High-income countries -2.46 -6.89 0.74 -5.11 5.24 0.86
Upper-middle-income countries -1.33 -3.98 6.36 46.09 -1.52 -0.06
Lower-middle-income countries -0.61 -2.07 1.59 14.82 -2.90 0.59
Low-income countries 0.44 0.20 0.41 -1.83 -1.05 -0.10
REGION
Africa 0.35 0.23 0.22 -1.61 -1.26 -0.21
Asia -1.42 -3.60 6.33 42.13 -2.44 0.03
Americas* -1.23 -5.69 0.94 -1.60 0.56 0.78
Latin America and the Caribbean** -0.54 -3.07 1.87 1.67 -0.79 1.94
Europe -3.46 -6.24 0.78 -4.98 9.60 2.26
NOTES: * Americas includes HICs in Latin America and the Caribbean (Chile, Panama, Trinidad and Tobago, and Uruguay), plus Canada and the United States of America. ** Latin America and the Caribbean includes all countries in this region except HICs which are included in the group Americas.SOURCE: Glauber, J. & Laborde, D. (forthcoming). Repurposing food and agricultural policies to deliver affordable healthy diets, sustainably and inclusively: what is at stake? Background paper for The State of Food Security and Nutrition in the World 2022. FAO Agricultural Development Economics Working Paper 22-05. Rome, FAO.
TABLE 13 IMPACT OF REPURPOSING FISCAL SUBSIDIES FROM PRODUCERS TO CONSUMERS TO SUPPORT HEALTHY DIETS ON DIET COST AND PER CAPITA CONSUMPTION, 2030 (PERCENTAGE CHANGE WITH RESPECT TO THE BASELINE)
| 101 |
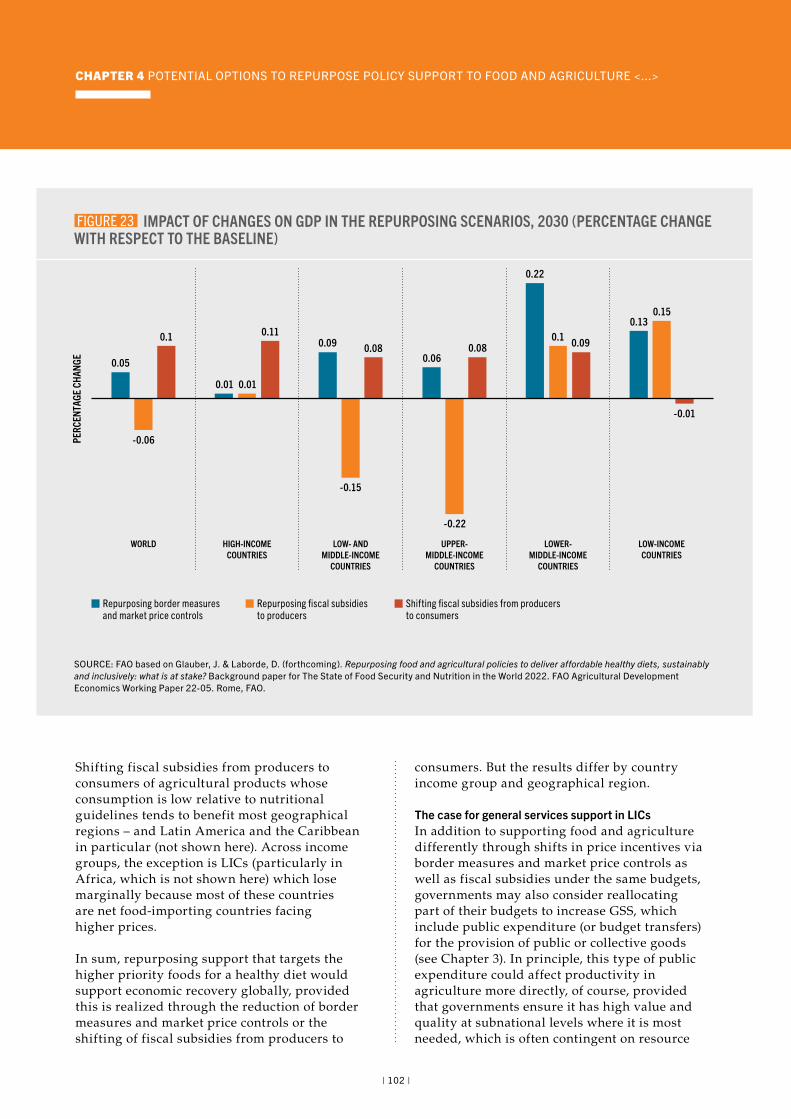
CHAPTER 4 POTENTIAL OPTIONS TO REPURPOSE POLICY SUPPORT TO FOOD AND AGRICULTURE <...>
Shifting fiscal subsidies from producers to consumers of agricultural products whose consumption is low relative to nutritional guidelines tends to benefit most geographical regions – and Latin America and the Caribbean in particular (not shown here). Across income groups, the exception is LICs (particularly in Africa, which is not shown here) which lose marginally because most of these countries are net food-importing countries facing higher prices.
In sum, repurposing support that targets the higher priority foods for a healthy diet would support economic recovery globally, provided this is realized through the reduction of border measures and market price controls or the shifting of fiscal subsidies from producers to
consumers. But the results differ by country income group and geographical region.
The case for general services support in LICsIn addition to supporting food and agriculture differently through shifts in price incentives via border measures and market price controls as well as fiscal subsidies under the same budgets, governments may also consider reallocating part of their budgets to increase GSS, which include public expenditure (or budget transfers) for the provision of public or collective goods (see Chapter 3). In principle, this type of public expenditure could affect productivity in agriculture more directly, of course, provided that governments ensure it has high value and quality at subnational levels where it is most needed, which is often contingent on resource
FIGURE 23 IMPACT OF CHANGES ON GDP IN THE REPURPOSING SCENARIOS, 2030 (PERCENTAGE CHANGE WITH RESPECT TO THE BASELINE)
WORLD HIGH-INCOMECOUNTRIES
PERC
ENTA
GE C
HANG
E
LOW- ANDMIDDLE-INCOME
COUNTRIES
UPPER-MIDDLE-INCOME
COUNTRIES
LOWER-MIDDLE-INCOME
COUNTRIES
LOW-INCOMECOUNTRIES
Repurposing border measuresand market price controls
Repurposing fiscal subsidiesto producers
Shifting fiscal subsidies from producersto consumers
0.05
0.1
-0.06
0.01
0.11
0.01
0.09 0.08
-0.15
0.060.08
-0.22
0.22
0.090.10.13
-0.01
0.15
SOURCE: FAO based on Glauber, J. & Laborde, D. (forthcoming). Repurposing food and agricultural policies to deliver affordable healthy diets, sustainably and inclusively: what is at stake? Background paper for The State of Food Security and Nutrition in the World 2022. FAO Agricultural Development Economics Working Paper 22-05. Rome, FAO.
| 102 |
THE STATE OF FOOD SECURITY AND NUTRITION IN THE WORLD 2022
transfers from central to provincial, district or municipal levels and relevant capacities to carry this out.
GSS has not been included in the global scenarios analysed above for several reasons, an important one being a lack of unambiguous evidence of the extent to which different types of these expenditures can actually affect productivity across countries/regions. The effect of GSS on productivity will be different across individual countries, whereas in the global scenarios several countries are aggregated together in a single region, which makes any GSS-related scenario and its impact on productivity more difficult to interpret. In this regard, country-specific analysis may be more meaningful.
General government services will not benefit producers all the time at country level, because, inter alia, a large number of farmers already benefit from their provision; they only affect some aspects of the food value chain; they are earmarked to programmes with design and implementation problems; or because of political economy considerations. In HICs, which have generally reached the “frontier” on several general government services expenditures, adding new lab facilities or sanitary inspectors or new rural infrastructure, for example, may not result in significant productivity gains compared to less advanced economies. On the contrary, GSS expenditures could make a difference in LICs that are pursuing agricultural transformation but still exhibit a deficit of public services and productivity gaps.
Studies that rely on country-specific CGE models for a LIC like Uganda,233 or even a MIC like Mexico,223 have analysed the impacts of a modest public investment to increase the provision of GSS (e.g. improving rural roads, irrigation systems, storage infrastructure, etc.), which is targeted at agricultural sectors one at a time. Results include total factor productivity gains over time and private capital accumulation, resulting in increases in GDP, agrifood output, private consumption and rural poverty reduction. However, these studies recommend that such public investments should prioritize some sectors over others to reap the highest economic and social benefits.
The study of Mexico, in particular, calls for prioritizing public investments in agriculture also taking nutrition into consideration.223 A key recommendation is to invest in the sugar cane sector as it provides the highest output growth, welfare and poverty reduction gains compared to other agricultural sectors. Instead of using sugar cane for producing sugar-sweetened beverages and confectionery for final consumption (which the study recommends taxing), the recommendation of the study is to take advantage of the sector potential as a major feedstock for biofuel.
The idea that GSS expenditures should be prioritized to make the most economic and social gains is key for countries at very low levels of public support for agriculture but that still exhibit significant productivity gaps. How to optimize the low public budgets allocated to agriculture in LICs becomes of upmost importance to ensure that these countries’ agricultural transformation objectives are well aligned with the objective of reducing the cost and increasing the affordability of healthy diets. It is not so obvious that these multiple objectives can be met without trade-offs, unless budgets for agriculture are repurposed very carefully to ensure they can benefit all actors collectively, including women and youth.
A study for Ethiopia confirms it is possible to achieve policy coherence across multiple objectives if the public budget allocated for agriculture is repurposed optimally. Optimality refers to reaching a compromise in policymaking to reallocate the same budget in a unique way whereby it is not possible to improve in at least one policy objective without worsening any of the other policy objectives (Box 14).
Policy discussion and implicationsThe scenario analysis points to potential options by which all countries in the world can repurpose existing public support to food and agriculture to increase the affordability of a healthy diet, a necessary – albeit insufficient – condition for healthy diets to be consumed. Undernourishment and extreme poverty are generally found to decrease (sometimes very mildly) at the global level when the affordability
| 103 |
CHAPTER 4 POTENTIAL OPTIONS TO REPURPOSE POLICY SUPPORT TO FOOD AND AGRICULTURE <...>
BOX 14 OPTIMIZING PUBLIC BUDGETS TO ALIGN AGRICULTURAL TRANSFORMATION AND HEALTHY DIETS’ AFFORDABILITY OBJECTIVES: EVIDENCE FOR ETHIOPIA
FAO has developed an innovative policy optimization tool to help policymakers address their most common problem: i.e. to seek multiple objectives that can be conflicting under a budget constraint. Sánchez and Cicowiez (2022)234 proposed the approach and applied it with data for Ethiopia. They show how inclusive agricultural transformation objectives can be simultaneously pursued while minimizing trade-offs if a compromise is reached through optimal policies.* The tool originally considered three policy objectives: maximizing agrifood GDP, maximizing off-farm rural employment and minimizing rural poverty. Sánchez and Cicowiez (forthcoming)235 have expanded the tool to include a fourth policy objective of upmost importance: minimizing the cost of the nutritious foods that form a least cost healthy diet in the context of Ethiopia, as defined in this report (see Section 2.3 and Annex 2E).
It is thus now possible to understand what the current budget allocated to all fiscal transfers to producers (through subsidies and GSS) would look like relative to an optimal budget that would allow countries to move towards the four objectives. The budget is much disaggregated as it considers the type of expenditure and the commodities whose production this expenditure is supposed to promote. In order to facilitate the presentation of results, two graphs instead of only one are presented.**
Two repurposing scenarios are compared with a base scenario. The latter starts in fiscal year 2015/2016 and runs through a future year (e.g.
2025). It is a business-as-usual scenario as it shows what the budget will look like by 2025 if its composition remains unchanged. The two repurposing scenarios pursue the inclusive agricultural transformation objectives (i.e. maximizing agrifood GDP, maximizing off-farm rural employment and minimizing rural poverty) between 2022 and 2025. Only in one of these scenarios is the objective of minimizing the cost of the nutritious foods that form a least cost healthy diet (i.e. healthy diets’ affordability objective) also pursued.
Figure A shows that improving on all of these objectives will require prioritizing the budget differently. When only inclusive agricultural transformation objectives are pursued, for example, extension services in both cereals and livestock farming, as well as fertilizers – though to a lower extent – would receive a relatively larger budget allocation at the cost of other budget lines. When the healthy diets’ affordability objective is added to the policymaking problem, it becomes optimal to step up expenditures in irrigation, for example, notably because there will be more production and consumption of nutritious foods, such as fruits and vegetables, which are relatively more water intensive. In this case, irrigation expenditure can be targeted to specific commodities (i.e. nutritious ones), whereas investing in rural roads will have a positive impact on all commodities.
Because the reallocation of the budget is optimal, Figure B shows there is improvement on all the objectives (relative to the base), indicating that
of healthy diets increases as a result of the repurposing support options.
An important finding is that, among the different policy instruments available to provide public support, repurposing fiscal subsidies to increase the availability of “priority foods” for healthy diets globally may have the largest impacts on the affordability of healthy diets, particularly if it targets the consumer. This option, however, also shows some potential synergies but also trade-offs in the realms of GHG emissions, farm income, total agricultural output and global economic recovery.
Repurposing support through border measures and market price controls to incentivize
production, availability and consumption of “high-priority” foods for healthy diets, on the other hand, is found to be most effective amongst the options for reducing undernourishment in LICs, simply because these countries have very little fiscal support to repurpose.
Repurposing support towards healthy diets by targeting “high-priority” foods, whether through border measures and market price controls or fiscal subsidies, introduces an element of equality in supporting agricultural products compared with the current support situation. However, it could also introduce biases if some farmers – especially small-scale ones as well as women – who may be willing to take advantage of the support, ultimately face resource constraints »
| 104 |

THE STATE OF FOOD SECURITY AND NUTRITION IN THE WORLD 2022
»
BOX 14 (Continued)
FIGURE A ETHIOPIA’S DOMESTIC BUDGET ALLOCATION TO AGRICULTURE BY 2025: PROJECTION OF CURRENT BUDGET VS SCENARIOS OF OPTIMAL BUDGET REALLOCATIONS
PERC
ENTA
GE
100
90
80
70
60
50
40
30
20
10
0
A) BUDGET ALLOCATION BY TYPE OF EXPENDITURE
BASE WITHOUT HEALTHY DIET AFFORDABILITY OBJECTIVE WITH HEALTHY DIET AFFORDABILITY OBJECTIVE
Rural roads
Mechanizationcereal
Fertilizers
R&D cereal
Mechanizationnon-cereal
Irrigation non-cereal
Extension livestockExtension cereal
R&D non-cereal
Mechanizationlivestock
Extension non-cereal
Irrigation cereal
Cash transfers
PERC
ENTA
GE
100
90
80
70
60
50
40
30
20
10
0
B) BUDGET ALLOCATION BY COMMODITY
BASE WITHOUT HEALTHY DIET AFFORDABILITY OBJECTIVE WITH HEALTHY DIET AFFORDABILITY OBJECTIVE
Te� Pulses
Fruit crops
Barley
Other vegetables Co�ee
Wheat
Oilseeds
Enset
Maize
Sugar cane
Other crops Cattle Poultry
Other animals
Flowers
SOURCE: Sánchez, M.V. & Cicowiez, M. (forthcoming). Repurposing agriculture’s public budget to align healthy diets affordability and agricultural transformation objectives in Ethiopia. Background paper for The State of Food Security and Nutrition in the World 2022. FAO Agricultural Development Economics Working Paper 22-04. Rome, FAO.
| 105 |
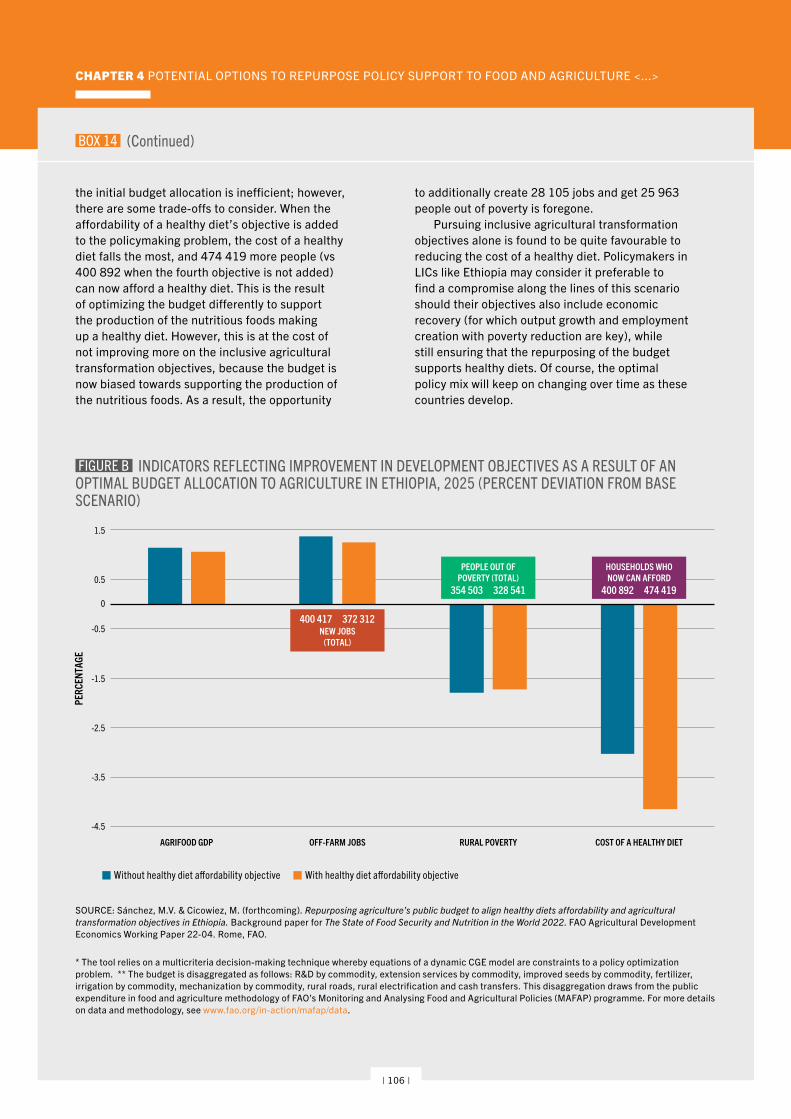
CHAPTER 4 POTENTIAL OPTIONS TO REPURPOSE POLICY SUPPORT TO FOOD AND AGRICULTURE <...>
BOX 14 (Continued)
the initial budget allocation is inefficient; however, there are some trade-offs to consider. When the affordability of a healthy diet’s objective is added to the policymaking problem, the cost of a healthy diet falls the most, and 474 419 more people (vs 400 892 when the fourth objective is not added) can now afford a healthy diet. This is the result of optimizing the budget differently to support the production of the nutritious foods making up a healthy diet. However, this is at the cost of not improving more on the inclusive agricultural transformation objectives, because the budget is now biased towards supporting the production of the nutritious foods. As a result, the opportunity
to additionally create 28 105 jobs and get 25 963 people out of poverty is foregone.
Pursuing inclusive agricultural transformation objectives alone is found to be quite favourable to reducing the cost of a healthy diet. Policymakers in LICs like Ethiopia may consider it preferable to find a compromise along the lines of this scenario should their objectives also include economic recovery (for which output growth and employment creation with poverty reduction are key), while still ensuring that the repurposing of the budget supports healthy diets. Of course, the optimal policy mix will keep on changing over time as these countries develop.
FIGURE B INDICATORS REFLECTING IMPROVEMENT IN DEVELOPMENT OBJECTIVES AS A RESULT OF AN OPTIMAL BUDGET ALLOCATION TO AGRICULTURE IN ETHIOPIA, 2025 (PERCENT DEVIATION FROM BASE SCENARIO)
Without healthy diet a�ordability objective With healthy diet a�ordability objective
PERC
ENTA
GE
-4.5
-3.5
-2.5
-1.5
-0.5
0.5
0
1.5
AGRIFOOD GDP OFF-FARM JOBS RURAL POVERTY COST OF A HEALTHY DIET
400 417 372 312NEW JOBS
(TOTAL)
354 503 328 541
PEOPLE OUT OFPOVERTY (TOTAL)
400 892 474 419
HOUSEHOLDS WHONOW CAN AFFORD
SOURCE: Sánchez, M.V. & Cicowiez, M. (forthcoming). Repurposing agriculture’s public budget to align healthy diets affordability and agricultural transformation objectives in Ethiopia. Background paper for The State of Food Security and Nutrition in the World 2022. FAO Agricultural Development Economics Working Paper 22-04. Rome, FAO.
* The tool relies on a multicriteria decision-making technique whereby equations of a dynamic CGE model are constraints to a policy optimization problem. ** The budget is disaggregated as follows: R&D by commodity, extension services by commodity, improved seeds by commodity, fertilizer, irrigation by commodity, mechanization by commodity, rural roads, rural electrification and cash transfers. This disaggregation draws from the public expenditure in food and agriculture methodology of FAO’s Monitoring and Analysing Food and Agricultural Policies (MAFAP) programme. For more details on data and methodology, see www.fao.org/in-action/mafap/data.
| 106 |
THE STATE OF FOOD SECURITY AND NUTRITION IN THE WORLD 2022
and are thus not in a position to specialize in the production of “high-priority” foods for healthy diets.
The most important trade-offs are observed when fiscal subsidies are repurposed, particularly in terms of lower farm income across country income groups (and more notably so in HICs) and agricultural production. These trade-offs are more pronounced when fiscal subsidies are shifted from producers to consumers. The trade-off between increasing the affordability of healthy diets and GHG emissions in agriculture (and even economic recovery) is seen globally when fiscal subsidies are repurposed but continue to be allocated to producers within agriculture, particularly in LICs and MICs. On the other hand, there are far fewer trade-offs when repurposing support only makes its way through border measures and market price controls.
Of course, it is important to understand the limitations of model-based scenarios. The scenarios discussed up until now do not consider the fact that some production technologies generate more or less GHG emissions (or environmental damage) than others. For example, changes in the pattern of policy support in the scenarios, with more or fewer fertilizers for instance, could change – at the margins – the emission intensity of some products. But the scenarios do not explicitly consider a shift towards technologies that are relatively lower in emission intensity (e.g. new feed technologies for cattle, improved bio-control approaches for pest managements, new crop rotation practices for improving soil health and reduce fertilizer uses, and so forth). In practice, repurposing support need not be at the cost of higher GHG emissions if, at the same time, low-emission intensity technologies are adopted to produce the nutritious foods, and if current overproduction and overconsumption of foods, including meat and dairy products, in HICs and UMICs are reduced in line with healthy eating guidelines. Another issue is the broad nature of the food categories for the high-priority foods used in the scenarios because, for example, the extent to which increased consumption of fats and oils contributes to healthy diets is not clear in all contexts, at least not without more specific data on the types of fats and oils.
The results of the scenarios also suggest that providing fiscal subsidies to consumers tends to generate more diversified healthy food consumption patterns with GHG emission reduction, compared with providing fiscal subsidies to producers, even if both policies target the same nutritious foods. This is expected because reducing the cost and increasing the affordability of healthy diets is a consumer-side objective, rather than a producer-side objective. But then, again, the policy of subsidizing consumers of “high-priority” foods for healthy diets does not come free of trade-offs in farm income, agricultural production and even the cost of a healthy diet in the case of LICs, which policymakers may like to avoid in practice.
In the case of LICs, for example, the cost of healthy and current diets is found to increase marginally when fiscal subsidies are shifted from producers to consumers for two reasons: i) increased import demand for LICs’ food in the rest of the world raises food prices, and ii) there are limited fiscal subsidies in LICs to reallocate for meaningfully incentivizing the demand for nutritious foods. This is an important trade-off to consider, particularly in the context of Africa, where healthy diets are found to become more affordable generally when consumers’ incomes increase, because reducing the cost of healthy diets presents more challenges in these countries. However, the poorer households with low- or no-income generation capacity may not be in a position to benefit under this type of scenario.
To avoid trade-offs, policymakers may not try to reduce the cost and increase the affordability of healthy diets by shifting fiscal subsidies from producers (agriculture) to consumers. They may consider phasing out fiscal subsidies to producers that are tied to the production of a specific commodity and are proven distorting, environmentally harmful and not promoting the production of nutritious foods. In this case, the resources may be redirected to fiscal subsidies to producers that are decoupled from production but whose design is nutrition-sensitive, promotes the adoption of low-emission intensity technologies and includes other environmental conditionalities. At the same time, policymakers may want to take advantage of the evidence
»
| 107 |
CHAPTER 4 POTENTIAL OPTIONS TO REPURPOSE POLICY SUPPORT TO FOOD AND AGRICULTURE <...>
emerging from this report, which indicates that a fiscal subsidy to commodities whose consumption needs to increase to follow dietary guidelines is a very efficient policy. Unfortunately, subsidies to consumers form the tiniest share of all the support being provided to food and agriculture in the world (see Figure 18 in Chapter 3). To make the most of such fiscal subsidies, it is important to step up
consumer support.
To take advantage of the opportunities that repurposing support may offer in practice, countries will have to get together at the multilateral table; unilateral action may be useful but insufficient in some cases, and in others it could have damaging consequences. The repurposing of border measures and market
BOX 15 IMPLICATIONS OF REPURPOSING AGRICULTURAL SUBSIDIES FOR COUNTRIES’ WTO COMMITMENTS
Box 8 in Chapter 3 outlined how price incentives and fiscal support measures are disciplined by the WTO rules. In this context, it is important to consider that repurposing agricultural subsidies would have implications for countries’ commitments as WTO members.
For example, if a country raises fiscal subsidies to producers on nutritious foods with the objective of lowering their final cost to consumers, these would still be considered trade-distorting in the context of the WTO AoA, as product-specific subsidies are included in the Aggregate Measurement of Support (AMS), which is subject to limits. All WTO members have the right to provide subsidies to specific products – regardless of their nutritional value – if their AMS ceiling (which differs depending on country-specific WTO commitments) is not exceeded.* It would therefore be important to consider these limits if a country opts for shifting subsidies from one product to another.
If, on the other hand, countries choose to reduce trade-distorting subsidies, they have the option of providing direct income support to farmers instead. Income support that is decoupled from production levels can be used without any limits as part of “Green Box” measures (Box 8). Likewise, countries could increase GSS for which no limits are imposed under the WTO rules, provided that the criteria set in the AoA are met.
In essence, countries could reduce or eliminate product-specific subsidies for products with lower
nutritional value or which do not contribute to healthy diets and introduce alternative measures that include the expansion of public funding to infrastructure services, research programmes for nutritious foods, and agricultural extension services without jeopardizing compliance with the WTO rules. This means that repurposing does not need to imply a reduction in the overall level of food and agricultural support, but rather a shifting to less trade-distorting measures.
Countries could also opt for a reduction of border measures (including high tariffs and in-quota tariffs) on nutritious foods such as fruits and vegetables, while not changing or even increasing trade protection for products high in fats, sugars or salt. Under WTO rules, countries are allowed to do so up to a certain limit (the bound level of tariffs).**
Repurposing agricultural subsidies, if undertaken by many countries, could even open a new chapter for agricultural trade negotiations at the WTO. Countries could find new ground for discussion on how to discipline trade-distorting domestic support. One option would be increasing the flexibility for providing product-specific subsidies to producers of nutritious foods. Likewise, in the context of the negotiations on market access that includes tariffs, countries could consider reducing the bound level of tariffs on fruits, vegetables, legumes and other products important to healthy diets, fostering trade in such products.
* In providing trade-distorting support, LICs and MICs enjoy additional flexibilities under the “Special and Differential Treatment” provisions of the WTO. This includes agricultural input subsidies, which can be provided without any limits. ** Actual tariffs that the countries apply (applied tariffs) on agricultural and food products can be at any level below or equal to the bound level for each product.
| 108 |
THE STATE OF FOOD SECURITY AND NUTRITION IN THE WORLD 2022
price controls and fiscal subsidies will have to consider countries’ commitments and flexibilities under current WTO rules, as well as issues in the ongoing negotiations (Box 15).
The issue of GSS to improve the affordability of healthy diets is a special case. It is mostly relevant for countries where the current level of this type of support is low, agricultural transformation is still underway, and existing productivity gaps in agriculture remain large, which is generally the case of LICs and LMICs. In the context of healthy diets, GSS can be a critical component of public support to address issues such as, for example, Post-Harvest handling and Post-Harvest Loss (PHL), which can particularly affect perishable nutritious foods. When in line with the provisions of the relevant WTO agreements, this type of public expenditure can be provided without limits (Box 15).
Stepping up GSS for reducing the cost of nutritious foods so healthy diets become more affordable should not slow down inclusive agricultural transformation in LICs and LMICs. Moreover, by definition, GSS will collectively support agriculture, without excluding small farmers, women and youth. However, the way in which GSS expenditures are repurposed or scaled up in practice needs to take into account that productivity gaps are larger for some of these agrifood systems actors, particularly women who generally exhibit limited access to and control of productive resources and livelihood assets such as land and credit, inadequate agricultural extension and other services and rural infrastructure.236
A key challenge for policymakers in LICs, and perhaps also some LMICs, will not only be to reach compromises in repurposing food and agricultural support to achieve several inclusive agricultural transformation objectives that are well aligned with reducing the cost of nutritious foods. Considering their low budgets, governments of these countries will also have to mobilize significant financing to step up the provision of: i) GSS where it has to be mostly prioritized to effectively bridge productivity gaps in the production of nutritious foods with inclusivity and sustainability; and ii) fiscal subsidies to consumers to increase affordability.
In this regard, international public investment support (e.g. from International Financial Organizations [IFIs], regional development banks, the Global Agriculture and Food Security Programme [GAFSP], and so forth) will be key to ease the transition towards higher GSS, especially in LICs. n
4.2COMPLEMENTING POLICIES WITHIN AND OUTSIDE AGRIFOOD SYSTEMS THAT ARE NEEDED TO ENSURE REPURPOSING EFFORTS ARE IMPACTFUL For repurposing scenarios such as those discussed in the preceding section to materialize, thus effectively contributing to making a healthy diet less costly and more affordable, other agrifood systems policies, and policies and incentives outside agrifood systems, will be needed (see Figure 1 in Chapter 1). If aligned and put in place, these complementing policies can offer support in two ways (Figure 24). First, they can provide incentives (or disincentives) that can support shifts in food supply chains, food environments and consumer behaviour towards healthy eating patterns. Second, they can ease or mitigate the unintended consequences or trade-offs from repurposing support, particularly if these include a reduction in the access to nutritious foods and healthy diets for vulnerable and disadvantaged population groups.
Attention must also be given to the private sector, not just farmers but agribusiness and also enterprises in other sectors that constitute the food industry, as their actions can enable or go against the intended objectives of repurposing support in practice. Ignoring the interlinkages between agrifood systems and other systems can produce unintended and uncompensated costs and consequences.
| 109 |
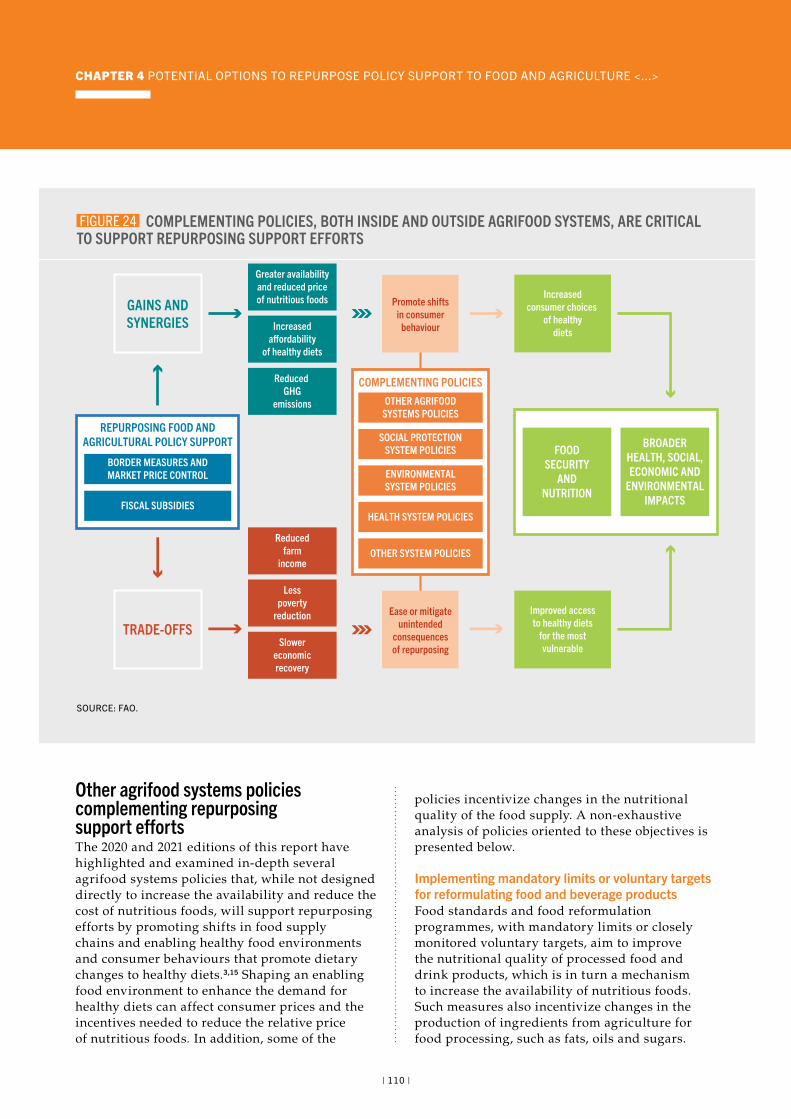
CHAPTER 4 POTENTIAL OPTIONS TO REPURPOSE POLICY SUPPORT TO FOOD AND AGRICULTURE <...>
Other agrifood systems policies complementing repurposing support effortsThe 2020 and 2021 editions of this report have highlighted and examined in-depth several agrifood systems policies that, while not designed directly to increase the availability and reduce the cost of nutritious foods, will support repurposing efforts by promoting shifts in food supply chains and enabling healthy food environments and consumer behaviours that promote dietary changes to healthy diets.3,15 Shaping an enabling food environment to enhance the demand for healthy diets can affect consumer prices and the incentives needed to reduce the relative price of nutritious foods. In addition, some of the
policies incentivize changes in the nutritional quality of the food supply. A non-exhaustive analysis of policies oriented to these objectives is presented below.
Implementing mandatory limits or voluntary targets for reformulating food and beverage productsFood standards and food reformulation programmes, with mandatory limits or closely monitored voluntary targets, aim to improve the nutritional quality of processed food and drink products, which is in turn a mechanism to increase the availability of nutritious foods. Such measures also incentivize changes in the production of ingredients from agriculture for food processing, such as fats, oils and sugars.
FIGURE 24 COMPLEMENTING POLICIES, BOTH INSIDE AND OUTSIDE AGRIFOOD SYSTEMS, ARE CRITICAL TO SUPPORT REPURPOSING SUPPORT EFFORTS
Greater availabilityand reduced priceof nutritious foods
Increaseda�ordability
of healthy diets
Reduced GHG
emissions
Reducedfarm
income
Lesspoverty
reduction
Slowereconomicrecovery
BORDER MEASURES ANDMARKET PRICE CONTROL
FISCAL SUBSIDIES
REPURPOSING FOOD ANDAGRICULTURAL POLICY SUPPORT
Improved accessto healthy diets
for the mostvulnerable
GAINS ANDSYNERGIES
TRADE-OFFS
COMPLEMENTING POLICIES
OTHER SYSTEM POLICIES
OTHER AGRIFOODSYSTEMS POLICIES
SOCIAL PROTECTIONSYSTEM POLICIES
ENVIRONMENTALSYSTEM POLICIES
HEALTH SYSTEM POLICIES
Increasedconsumer choices
of healthydiets
BROADERHEALTH, SOCIAL,ECONOMIC AND
ENVIRONMENTALIMPACTS
FOODSECURITY
ANDNUTRITION
Promote shiftsin consumer
behaviour
Ease or mitigateunintended
consequencesof repurposing
SOURCE: FAO.
| 110 |
THE STATE OF FOOD SECURITY AND NUTRITION IN THE WORLD 2022
Although reformulation programmes promote products with a healthier nutrition profile so they can be well aligned with repurposing policy support, reformulated foods should not replace the consumption of fresh and home-prepared nutritious foods.
A comprehensive policy approach to promote reformulation includes regulatory action to eliminate transfatty acids (TFA); government-led reformulation programmes to progressively reduce saturated fats, free sugars, salt/sodium and energy covering all major categories of highly processed food and beverages; and, adoption of evidence-based nutrient profile models to inform policies that encourage reformulation.237 Food product reformulation programmes are now in place in 82 countries.238 National or local policies to eliminate TFA have succeeded in reducing TFA intakes and have been followed by favourable changes in health outcomes.239,240,241,242,243 Countries that have been able to shift their production towards crops producing oils with higher levels of mono- or polyunsaturated fatty acids achieved more easily the transition to “healthier” oils than those that rely heavily on imports and have been driven to replace the supply of oils rich in TFA with products with a high content of saturated fat.244,245 By 2021, mandatory TFA policies were in effect for 3.2 billion people in 57 countries.246
Similarly, well-designed reformulation targets can lead to reductions in sodium levels in food and population sodium intakes. Both voluntary or mandatory sodium reduction policies have shown to be effective in reducing salt levels in processed foods, depending on the products and the population.247 The cooperation of the food industry is vital to the success of such interventions.247,248 In order to help realize the full potential of salt reduction, the WHO global sodium benchmarks provide guidance to countries and industries to reduce the sodium content in a wide range of processed food categories.249
Improving nutritional value through fortification and biofortificationFood fortification refers to the post-harvest addition of micronutrients to food, through a form of processing to increase the content of
one or more essential micronutrients to improve the nutritional quality of the food supply and provide a public health benefit with minimal risk to health. Biofortification, on the other hand, adds those micronutrients through techniques of crop cross-breeding with varieties of higher concentration of desired micronutrient(s) or genetic modification.250 These are among the most cost-effective measures to help prevent micronutrient deficiencies,251 as these can supply essential micronutrients to large segments of the population without requiring radical changes in food consumption patterns nor individual decision for compliance.252,253,254
These are not aimed at replacing a balanced and diverse diet, but at preventing the long-term consequences and public health impacts of micronutrient deficiencies, while efforts to bring healthy diets within reach continue to move forward, as might be the case of policy support reform processes. Decisions on which micronutrients to add, to which foods and in what amounts should be based on evidence of micronutrient intake gaps, consumption patterns, feasibility of the selected food vehicle to be fortified, and, if available, biochemical indicators of micronutrient status of the population.252,253,254,255 To achieve policy coherence, these decisions also need to consider the foods promoted by the repurposing policy support, as well as the resulting potential changes in consumption patterns. In addition to the micronutrient deficiencies, fortification and biofortification policies need to consider an alignment with policies for the reduction of diet-related NCDs, e.g. salt iodization.256,257
Enacting legislation on marketing of food and beverages, and the implementation of nutrition labelling policiesRepurposing support efforts can also be supported by enacting legislation (or regulations, standards and/or other legal instruments) restricting marketing of food and beverages and implementing nutrition labelling policies, including interpretive front-of-pack nutrition labelling.258,259,260 Policies to protect people from the harmful impacts of marketing of food and beverages,261 particularly children from birth to 18 years of age, are designed to influence consumer behaviour and help to shift demand
| 111 |
CHAPTER 4 POTENTIAL OPTIONS TO REPURPOSE POLICY SUPPORT TO FOOD AND AGRICULTURE <...>
towards nutritious foods.262,263,264 Implementation of policy action in this area is growing, with 52 countries having implemented restrictions on the marketing of food and non-alcoholic beverages to children238 and 144 countries having adopted legal measures on marketing of breastmilk substitutes.265
Nutrition labelling can also help increase demand for nutritious foods. For example, research shows that the use of nutrition labels is associated with choosing healthy diets,266,267,268,269,270 although many people still do not read nutrient declarations on the back of food packages – where such declarations exist – and understanding of such labels remains a challenge.266,267,271,272,273 Simplified nutrition information in a prominent place on the front of food packages (front-of-pack labelling) can guide consumers towards healthier food choices and can encourage food manufacturers and retailers to reformulate their products, being an important complement to the repurposing support efforts. For instance, a recent systematic review found that food labelling not only led to changes in consumers choices, but also to significant reductions of TFA and sodium content in processed foods.269 Forty-two countries are now implementing front-of-pack labelling initiatives.238
Taxation of energy-dense foods high in fats, sugars and/or saltTaxation of energy-dense foods and foods high in fats, sugars and/or salt can complement repurposing support efforts towards subsidizing and stimulating the supply and consumption of nutritious foods. This type of taxation helps to curb the demand for such foods and, by influencing the relative affordability of healthier food options, helps shift demand towards nutritious foods.274 Twenty-six countries have now implemented taxes on foods typically high in fats, sugars and/or salt.238 There is clear evidence from countries that this type of taxation reduces purchases of these taxed foods.275 Individuals that prefer to continue paying high prices for such taxed foods become a source of revenues for the government that can be effectively reinvested in agrifood systems, or in health initiatives to help tackle the impact of unhealthy diets (which can also build public support for taxation measures).276
On the other hand, value-added tax (VAT) reductions for nutritious foods may lead to a reduction in their prices, but the transmission of this change will depend on factors such as market structure and the seasonality of fresh foods, etc. For example, in Latvia, a reduction of the VAT for several fruits and vegetables from the standard rate of 21 percent to 5 percent led to a considerable decrease of retail prices of these foods. However, the retail price reduction only corresponded to 88 percent of the reduction of the VAT, which means that not the entire tax reduction was passed on to consumers.277
Combining land-use policies with other complementing policies to address food deserts and swamps Physical access to affordable nutritious foods, which any repurposing support strategy should aim to increase, can be undermined because of the absence or low density of food shops, markets or outlets – particularly fresh foods of short self-life or requiring refrigeration – within a practical travelling distance (referred to as food deserts)184 or in the case of shops and outlets offering an overabundance of energy-dense foods high in fats, sugars and/or salt and few nutritious foods (food swamps).184 Food deserts and food swamps are often found in LICs, underserved areas in HICs and are an increasing problem in LICs and MICs.184
To overcome the challenges of food deserts or swamps, land-use policies – including zoning, regulations and taxation – become very important. National and local governments have, for example, applied zoning laws and planning regulations: i) to restrict food retail and food service outlets which mainly offer energy-dense foods high in fats, sugars or salt in certain areas; and ii) to introduce support and incentives for the sale of nutritious foods.184,278 Similarly, regulatory authorities can use licensing processes to influence what types of food premises are permitted or what types of food that outlets are allowed to sell. Several authorities use these powers to avoid food swamps around schools by limiting, for example, hot food takeaway outlets close to school premises.278,279,280,281 Moreover, tax credits and exemptions can be used to incentivize retailers to sell more fresh produce and healthier drink options. The use of a combination of zoning
| 112 |
THE STATE OF FOOD SECURITY AND NUTRITION IN THE WORLD 2022
laws and financial incentives has successfully increased the availability of affordable, fresh produce in some low-income neighbourhoods and boosted the purchase of fruits and vegetables.282
Implementing healthy public food procurement and service policies One area of policy that has an untapped potential to support repurposing of food and agricultural policy support is the implementation of public food procurement and service policies.ai By setting nutrition and sustainability criteria for meals or snacks and drinks sold or served in public settings, or bought with public funds, these policies can put nutritious foods on people’s plates in the places where they study, work, or live, while helping to shape eating habits and shift demand towards healthier diets that include sustainability considerations. They can also stimulate increased production of perishable, nutritious foods such as fruits, vegetables and dairy products, and help mitigate any unintended consequences of repurposing, particularly targeting those most vulnerable to these changes during the transition.
The scale of institutional demand and the structured nature of public sector purchasing processes can create large-scale, predictable demand for nutritious foods (both perishable foods and foods that are low in unhealthy fats, sugars and salt), thereby increasing the economic viability of producing such foods, reducing the risks and creating an accessible, guaranteed market. The financial scale of government buying – representing between 12 and 20 percent of countries’ GDP with a significant proportion of those funds being spent on food – shows the potential of this policy measure to influence wider agrifood systems.
The European cities of Copenhagen and Vienna, for example, found that implementation of procurement policies requiring a given percentage of food to be organic stimulated increased supply of organic fruits, vegetables and other products.283,284,285 In a similar way, the introduction of nutrition or sustainability criteria that increase the plant-based portion of meals served in public settings could stimulate
ai Defined according to WHO (2021).180
production of fruits, vegetables, legumes and nuts and other nutritious foods. Experience in other countries or cities has shown that public food procurement policies can prompt diversification by both farmers and food manufacturers.286
Healthy public procurement and service policies are most commonly implemented in schools (reported in 91 countries).238 There remains a great deal of scope to expand implementation into other sectors including nurseries, universities, hospitals, residential care facilities, prisons, military, government offices and food aid programmes. Only 16 countries have policies covering other settings, of which only four countries have policies covering all food procured by the government.238
In one example of procurement policies with a wider scope, in the Philippines, in 2021, the Quezon City Healthy Public Food Procurement Policy introduced mandatory nutrition standards for all food supplies in city-run hospitals, offices, departments and institutions. A programme to source nutritious foods and healthy ingredients from micro-, small- and medium-sized enterprises (SMEs), supports the policy.287
Social protection system policies to mitigate possible trade-offsAs analysed in the previous section, the repurposing of food and agriculture policy support can lead, in some scenarios, to trade-offs that may negatively affect some population groups: it includes reduction of farm incomes and slower patterns in poverty reduction and economic recovery. In this regard, social protection policies can play a key role in facilitating the transition of population segments or stakeholders that may be negatively affected by the repurposing of policy support.
Counting on programmes formulated with a shock-responsive social protectionaj approach, taking advantage of their orientation towards identifying risks to livelihoods and scaling them up to effectively respond to risks,288
aj Its aim is to extend the types of risks covered by social protection, anticipating recurrent, protracted or severe shocks that may have critical effects on individuals and households’ livelihoods.444
| 113 |
CHAPTER 4 POTENTIAL OPTIONS TO REPURPOSE POLICY SUPPORT TO FOOD AND AGRICULTURE <...>
can be an effective way to mitigate potential negative effects of the repurposing of food and agriculture polices in countries where the extension of social insurance schemes have still not reached wide segments of the population. During the current COVID-19 pandemic, for example, several countries around the world have increased the value and duration of benefits of existing programmes (i.e. vertical expansion), as well as included new beneficiaries into their social protection schemes (i.e. horizontal expansion).289,290 In Sierra Leone, for example, the unconditional cash transfer known as the Et Fet Po programme implemented
a top-up benefit for households with people with disabilities and was expanded to add 65 000 new recipients/households, mostly coming from vulnerable rural areas291,292 (see Box 16 for more examples).
In addition to expanding existing programmes, new social protection initiatives can be created to support households’ livelihoods in case of shocks, including from policy shifts. The PROCAMPO (and later Proagro) programme in Mexico, for example, was implemented after the liberalization of trade due the implementation of the North American Free Trade Agreement
BOX 16 SOCIAL PROTECTION IS ESSENTIAL IN THE FACE OF SHOCKS TO LIVELIHOODS
To mitigate the effects of the COVID-19 pandemic on the population, some governments set in motion their shock-responsive social protection (SRSP) systems, helping vulnerable households cope with shocks through the vertical (i.e. value and duration of benefits) and horizontal (i.e. adding more beneficiaries) expansion of programmes or other strategies. Examples are:
� In the Caribbean, a region affected by hurricanes and other natural hazards, countries have increasingly used SRSP systems to respond to natural disasters. Leveraging on existing programmes or introducing new ones, by mid-2020 all Caribbean countries had introduced measures to mitigate the socioeconomic impacts of the COVID-19 pandemic.296 The Dominican Republic, for example, set up a temporary vertical and horizontal expansion (called Quédate en Casa or Stay Home) of its flagship social protection programme. The explicit objective of this expansion was to maintain the household’s food purchasing power. In May 2021, leveraging on this expansion, the Government launched the transformation and expansion of the flagship programme into Supérate, which aims to reach over 1 million households in the country.297
� The Government of Lesotho, with the support of WFP, has a school feeding programme that reached all schools throughout the country.298
During the COVID-19 pandemic, the Government and WFP were able to ensure that learners continued to have access to this support despite school closures, by providing school meals in the form of take-home rations.296
� Mauritania, a country recurringly affected by cycles of drought, established the Tekavoul social assistance programme in 2015 to provide regular support to the most vulnerable households, and the Maouna programme in 2017, to provide seasonal cash transfers to households affected by drought and other shocks. Building on these platforms, in May 2020 the Mauritanian government was able to rapidly set up a vertical expansion of Tekavoul’s cash transfer, as well as a rapid scale-up of El Maouna’s seasonal cash transfer as part of its national response plan to address the socioeconomic impacts of the COVID-19 pandemic.296
Capitalizing on these advances on social protection during the COVID-19 pandemic, the Universal Social Protection 2030 (USP2030) Working Group on Social Protection for Food Systems Transformation was established. This Working Group, stemming from the 2021 United Nations Food Systems Summit, aims to support countries and coordinate efforts to forge and enhance linkages and synergies between national social protection and agrifood systems for better poverty reduction, food security, nutrition and decent work outcomes.299
| 114 |
THE STATE OF FOOD SECURITY AND NUTRITION IN THE WORLD 2022
(NAFTA) in 1994, as a compensatory income transfer targeted to producers in front of the anticipated decrease in domestic prices of basic crop formerly protected by border prices.293 After 25 years of operation (it was replaced by a new initiative in 2019), the programme showed mixed results: it had positive effects in reducing poverty and inequality, but it also benefitted more the richest and largest producers rather than the poorest and smallest, as the transfer was mostly linked to the production area owned by beneficiaries.294
While countries are strengthening their national social protection systems (consisting in social insurance, social assistance and labour market interventions), the design of new programmes or the expansion of existing programmes with a shock-responsive approach might be an important part of the complementary interventions to address the possible trade-offs of the repurposing of food and agricultural policy support. Effective targeting and adequate benefits of these complementing interventions will be key for reducing the impact of possible negative income effects due to policy reform.295
Environmental and climate-related policies and incentives Promoting affordable healthy diets and pursuing environmental and climate goals can offer important synergies with the repurposing of food and agricultural support. For example, supporting adaptation and mitigation can help enhance the production of a variety of nutritious foods that constitute healthy diets while also improving the livelihoods of farmers and employees operating along the value chains (Box 17). Additionally, the production of fruits and vegetables can contribute to increasing biodiversity and supporting environmental sustainability.300 Investments promoting and marketing neglected and underutilized species could ensure meeting dietary requirements of the population, particularly in LICs, while diversifying production and supporting biodiversity.301
Similarly, seeking to limit reliance on chemical fertilizers by promoting intercropping or rotations with legumes not only contributes to soil health but also promotes production
of safe nutritious foods by limiting chemical contamination and increasing availability of pulses. Preliminary evidence suggests that forms of regenerative agriculture, which improve environmental sustainability, might increase the nutritional content of produce.302
Because of these synergies, environmental and climate policies can provide incentives for the production of nutritious foods that contribute to healthy diets. Yet, trade-offs are pervasive and can contribute to significantly undermining the affordability of healthy diets. A clear example is provided by policies that aim to address the environmental externalities of unhealthy diets (for instance, transportation, packaging, and emissions of volatile organic compounds required to produce and market highly processed food items) – as those externalities are staggering.3 Internalizing those costs through pricing (e.g. carbon taxes, or cap and trade systems) could contribute to significantly altering the relative prices of nutritious foods and foods of high energy density and minimal nutritional value, but this is not easy to implement in practice and might require global agreements.
Health system policies to complement repurposing Food and health systems are intrinsically interconnected in multiple ways.310 Effective health systems are vital to provide needed care including essential nutrition actions for the treatment and prevention of different forms of malnutrition and diet-related NCDs.311 This will continue to be the case until agrifood systems are able to sustainably deliver affordable healthy diets. Furthermore, accessible health services are essential to face the potential trade-offs with regard to income loss or reduction that can reduce utilization of basic social services, including health services, by the poor. Therefore, any strategy to repurpose support to food and agriculture to deliver affordable healthy diets will have to look at the health system as well.
Health services that protect poor and vulnerable groups whose diets do not provide all the nutrients they need are particularly relevant in the context of repurposing support efforts. Examples include mother and child nutritional
| 115 |
CHAPTER 4 POTENTIAL OPTIONS TO REPURPOSE POLICY SUPPORT TO FOOD AND AGRICULTURE <...>
BOX 17 INVESTMENT IN CLIMATE ADAPTATION PRACTICES TO SUPPORT AFFORDABLE HEALTHY DIETS AND INCLUSIVE SUPPLY CHAINS
By placing increasing pressure on ecosystems, climate change poses the greatest threat to rural smallscale producers, particularly poor and most vulnerable communities. This pressure comes through increasingly frequent extreme weather events, such as droughts, storms and floods, as well as gradual changes such as shorter rainy seasons, delayed onset of rain, rising sea levels and melting glaciers. Based on this, climate adaptation is receiving increasing attention and becoming central to the future of food.
Climate adaptation refers to changes in processes, practices and structures to moderate potential damages or to benefit from opportunities associated with climate change. Investments in climate adaptation solutions take many shapes and forms, depending on the unique context of a community, business, organization, country, or region. Interventions prioritizing the adaptation needs of smallscale producers and micro-, small- and medium-sized enterprises (MSMEs) along food supply chains can help ensure the affordability of healthy diets going forward, while bolstering the resilience and inclusiveness of agrifood systems. Innovative governance mechanisms give a real voice and influence to poor rural people, including small-scale producers.303
Small-scale producers remain underserved by global climate finance. They bear the devastating consequences of changing climate, degraded soils, food insecurity and irregular migration. So far only about 1.7 percent of the money invested globally in climate finance is reaching small-scale producers,304 and it is mostly going to mitigation objectives compared to adaptation. The Adaptation for Smallholder Agriculture Programme (ASAP) supports farmers to adapt to climate change. Between 2019 and 2021, ASAP invested about USD 897 million in climate finance across LMICs. Most of this finance, around 91 percent, went to climate adaptation interventions for small-scale producers. Successful examples of such investments include the following:
� Bolivia (Plurinational State of): The Economic Inclusion Programme for Families and Rural Communities in the Territory of the Plurinational State of Bolivia promoted climate adaptation to shocks such as droughts and floods and supported the implementation of farming systems adapted to the widely varying conditions of high plateau, inter-Andean valleys and some lowland areas. The project increased participants’ income by 13 percent and the ability to recover from climatic shocks by 4 percent.305
� Djibouti: The Programme to Reduce Vulnerability in Coastal Fishing Areas, led by the Ministry of Agriculture, aimed at reducing climate vulnerability of small-scale fishers by promoting comanagement of marine resources. While protecting marine resources, the project was also able to increase the value of fish sold by 25 percent, the share of value of fish sold from total catch by 8 percent, and productive assets including fishing gears by 7 percent. Also, food security increased by 29 percent.306
� Mozambique: The Pro-Poor Value Chain Development in the Maputo and Limpopo Corridors aimed at promoting production practices of cassava, meat and horticulture while also investing in inclusive agribusiness value chains and farmers’ organizations. Through sustainable practices promoted by the project, cassava productivity increased by 36 percent, and the number of meals consumed also increased by 4 percent. The project also helped to increase resilience by diversifying incomes, thereby increasing the number of beneficiaries’ income sources 15 percent.307
� Tajikistan: The Livestock and Pasture Development Project II aimed at enhancing livestock productivity and rural livelihoods while reducing the ecological footprint of livestock herds on pastures. The project established rotational pasture plans, water points, veterinary services, breeding techniques and fodder production, alongside capacity building and strengthening of social capital implemented through Pasture Users’ Unions. The project increased livestock weight by 30 percent, milk production by 99 percent, and generated higher income from livestock by 110 percent. Meanwhile, through awareness raising about the adverse effects of overgrazing on productivity and the environment, the project convinced the villagers to reduce their herd size on average by 29 percent.308
� Viet Nam: The Project for Adaption to Climate Change in the Mekong Delta in Ben Tre and Tra Vinh Provinces supported rural livelihoods against salinity intrusion, strengthening the adaptive capacity of target communities and institutions to better contend with climate change. The project successfully increased crop income by 28 percent and productive asset accumulation by 11 percent.309 Food security increased by 14 percent, whereas shrimp, coconut and rice producers who suffered salt intrusion had better yields and revenues than their counterparts.
| 116 |
THE STATE OF FOOD SECURITY AND NUTRITION IN THE WORLD 2022
services and the provision of vitamin or mineral supplements in settings where micronutrient deficiencies are prevalent.311 Moreover, health promotion and education activities of health professionals, who are particularly trusted sources of advice for promoting dietary behaviour change, potentially increase demand for affordable healthy diets.
The health system has a critical role in protecting and promoting the health of the food and agricultural workforce. Agriculture employs 27 percent of the world’s labour force312 and workers along the entire food chain can be exposed to different hazards in their workplace. For example, an estimated 385 million agricultural workers are affected every year by unintentional acute pesticide poisoning.313 Hazards can affect the physical and mental health of workers, and adequate health and safety standards are, therefore, essential.310
Important threats that cross the health and agrifood system nexus include zoonoses, antimicrobial resistance (AMR) and food-borne hazards. Healthier diets – such as those any repurposing support strategy should promote – often constitute fresh, more perishable foods,30 which are more susceptible to contamination and spoilage during production, transportation and storage. Policies and systems must ensure that these foods are safe to eat according to their intended use. Food-borne diseases have significant economic consequences for those affected and for the health care system. Efforts by just one sector cannot, therefore, fully address these issues, and complementary actions within the health sector are required.
A One Health approach helps multiple sectors (including agrifood, environment and health systems) communicate and work together to achieve better outcomes for human, ecosystem and animal health.314 The COVID-19 pandemic underlined the links between health and agrifood systems, and the relevance of the One Health approach. The Africa One Health University Network (AFROHUN), for example, provided a platform for learning and exchange among stakeholders in diverse fields including public health, veterinary medicine, pathobiology and environmental health in eight African countries
(Cameroon, Democratic Republic of the Congo, Ethiopia, Kenya, Rwanda, Senegal, Uganda and the United Republic of Tanzania).315
To address food safety concerns, FAO and WHO established the Codex Alimentarius,316 an international food safety code that includes guidelines, standards and regulations established to protect the health of the consumers and to ensure fair practices in the food trade for potential food safety hazards. For example, for aquatic food the Codex sets specific regulations on food hygiene, sampling and analysis, inspection, certification and labelling; however, for example for aquatic food, the Codex tends to be applied, for the most part, for international trade and rarely used in domestic marketing, creating different standards for food safety at local and international levels.75 To fully support the repurposing agenda, governments will need to harmonize national legislations with these same standards for all levels, including at local levels.ak
Finally, robust health, food and nutrition monitoring and surveillance systems are needed to be able to track the impact, both positive and negative, of repurposed food and agricultural policies.
Other system policies and incentives: transportation and energyIn the 2020 edition of this report, inefficiencies along the food value chain were identified as drivers of the cost of nutritious foods.3 The efficiency of food transportation is an important area that governments should consider during the repurposing of food and agricultural support. Targeted policies and incentives to the transportation sectoral will be important for reducing the costs of nutritious foods. Even if food and agricultural policies are repurposed, if the inefficiencies and problems in
ak The WHO Global Strategy for Food Safety, released in 2022, also serves as a blueprint and guidance for Member States in their efforts to strengthen their national food safety systems and promote regional and global cooperation.445
al For the purpose of this section, the transportation sector refers to the modes by which food is transported at the domestic and international level, including four means of transport: water, rail, truck and air.446
| 117 |
THAILANDOrganic vegetables, edible flowers and fruits from local farmers’ market.©AbobeStock.com/Nungning20
THE STATE OF FOOD SECURITY AND NUTRITION IN THE WORLD 2022
transportationam are not adequately addressed, repurposing support efforts could be undermined and may not be effective in reducing the cost of healthy diets.
Many governments that implemented lockdowns all over the world in the face of the COVID-19 pandemic considered the food and agriculture sector as “essential” so as to be exempt from those kinds of restrictions. This allowed food value chains to continue working and supplying food even in the hardest periods of lockdowns. However, the lack of transportation was one of the most serious threats to maintaining the food supply active in several countries.317 For example, in Nigeria, harbours continued their operations, while internal transportation by traders and truckers faced limitations that affected the regular supply of food or agricultural inputs. To facilitate food transportation, governments should not only invest in infrastructure but also support the development of transportation and logistics services for domestic traders, which are in most cases SMEs, and are crucial for the functioning of the food supply chain, though they are not often recognized as part of it.318
It is also important to consider the linkages with energy systems. Agrifood systems are becoming more energy intensive, and this has implications for food prices, as well as for the environment. On the one hand, several studies have highlighted the relationship between energy and food prices,319 and the recent hikes in food prices have been pushed also by increases in energy prices.320 On the other hand, it has been estimated that almost a third of the emissions of the global agrifood system comes from energy-related activities.321 Moreover, about one-third of the world population relied on traditional fuels such as wood, charcoal and agricultural residues for household cooking in 2019, with a demand that in some areas exceeded the sustainable capacity of forests and trees.322 The environmental outcomes of more sustainably boosting economic activity in agrifood systems through better use of policy support can be enhanced with policies that support more efficient use of energy in agrifood systems.
am Please see the 2020 edition of this report for a more in-depth analysis of the role of the transport sector in the cost of nutritious foods.
To this end, investments in renewable energy sources at the farm level or the introduction of freight truck fuel economy standards at the transportation stage can be very coherent.323 In addition, the lack of cold chains is a key determinant of food losses of perishable foods, such as fruits and vegetables, and its availability in LICs and LMICs is much lower than in HICs,324 making more challenging the improvement of the cold chains situation with environmental considerations in LICs and LMICs. As cold chains are energy intensive, reducing their carbon footprint is a main topic of research, and improvements in technology as well as in operation and management of cold chains can play a key role in increasing the availability of cold chains logistics in LICs and LMICs while also taking into account the environment.325 Taking advantage of the potential efficiencies in sustainable energy use of local agrifood systems, considering the restoration of degraded forests and the establishment of fast-growing tree plantations, improving the use of residues from wood harvesting and processing, and the recovery of post-consumer wood through its cascading use within a more circular economic framework326 should also be considered as part of a policy portfolio complementing the food and agriculture policy reform. n
4.3THE POLITICAL ECONOMY AND GOVERNANCE DYNAMICS THAT INFLUENCE REPURPOSING POLICY SUPPORTThe extent to which efforts to repurpose food and agricultural support will be successful will depend on the political economy, governance and the incentives of relevant stakeholders in a local, national and global context. Broadly speaking, the political economy refers to the social, economic, cultural and political factors that structure, sustain and transform constellations of public and private actors, and their interests and relations, over time. This includes institutional set-ups, “the rules of the game” that affect the everyday policymaking agenda and its structuring.327,328
| 119 |
CHAPTER 4 POTENTIAL OPTIONS TO REPURPOSE POLICY SUPPORT TO FOOD AND AGRICULTURE <...>
Governance refers to formal and informal rules, organizations and processes through which public and private actors articulate their interests and make and implement decisions.329,330
The political economy affects the type of political and institutional reforms and the forms of governance that are needed to enable and facilitate the repurposing of food and agricultural policy support. At the same time, the political economy dynamics can hamper repurposing support efforts and outcomes for improved affordability of healthy diets.331 It is, therefore, critical to understand the political economy dynamics and factors at play and to take action and put in place mechanisms to ensure repurposing support efforts achieve their intended purpose.
Governance, institutions, interests and ideas are dynamic factors at play that influence food and agricultural policy support.332,333 There are three broad elements that need to be considered and effectively managed as part of repurposing food and agricultural policy support:
i. political context, stakeholder perspectives and the will of governments;
ii. power relations, interests and the influence of different actors; and
iii. the governance mechanisms and regulatory frameworks needed for the facilitation and implementation of repurposing support efforts.
In addition, to ensure that the repurposed policy has achieved its intended purposes, monitoring and evaluation of the repurposed policy support is key. It promotes transparency and accountability throughout the process and can be a positive driver for sustaining policy reforms in the long term.
The dynamics and the mechanisms for managing these elements are presented in Figure 25 and are explored in detail in the following sections.
Political context, stakeholder perspectives and the will of governmentsThe extent to which food and agricultural support can be repurposed depends on each country’s local context, including its political regime, interests, ideologies and incentives, among other
factors. For instance, the degree of agricultural protection often depends on the level of political and economic competition within a country.334
Without political incentives and feasibility to support this process, any policy change will be challenging to implement and sustain in practice.335 Furthermore, in many country contexts, bottlenecks within governance structures can lead to a gap between policy expectations and outcomes.
Recent global discussions, such as those under the auspices of the United Nations Food Systems Summit and the COP26 on climate change in 2021, and the increased awareness of the importance of public health and environmental sustainability, provide a unique opportunity for greater feasibility of repurposing support.227
Recent discussions of agricultural policy reform in the European Union (“Farm to Fork” strategy) and the United Kingdom of Great Britain and Northern Ireland (new agriculture bill) have stressed the importance of considering the health and environmental sustainability of food production as desirable public goods that are to be supported. A “public money for public goods” approach could render subsidies to nutritious foods that are important for public health and environmental sustainability politically more feasible than past production-centred approaches.227
Of course, the political context differs among countries. In HICs, food and agricultural support has become high compared to the relatively small proportions of the upstream agriculture sector in their GDP and employment rates. For example, the European Union’s Common Agricultural Policy took up around 35 percent of the European Union’s budget in 2020.336 Many LICs often lack the financial capacity to provide food and agricultural support in the form of subsidies, thus, producer support in these countries often entails border and trade controls, which as explained in Chapter 3, do not require government outlays. On the contrary, reshaping border controls might come at the cost of lost trade-related revenues for governments. The differences in political priorities and challenges in each context are likely to affect whether governments will promote repurposing efforts and their extents.
| 120 |
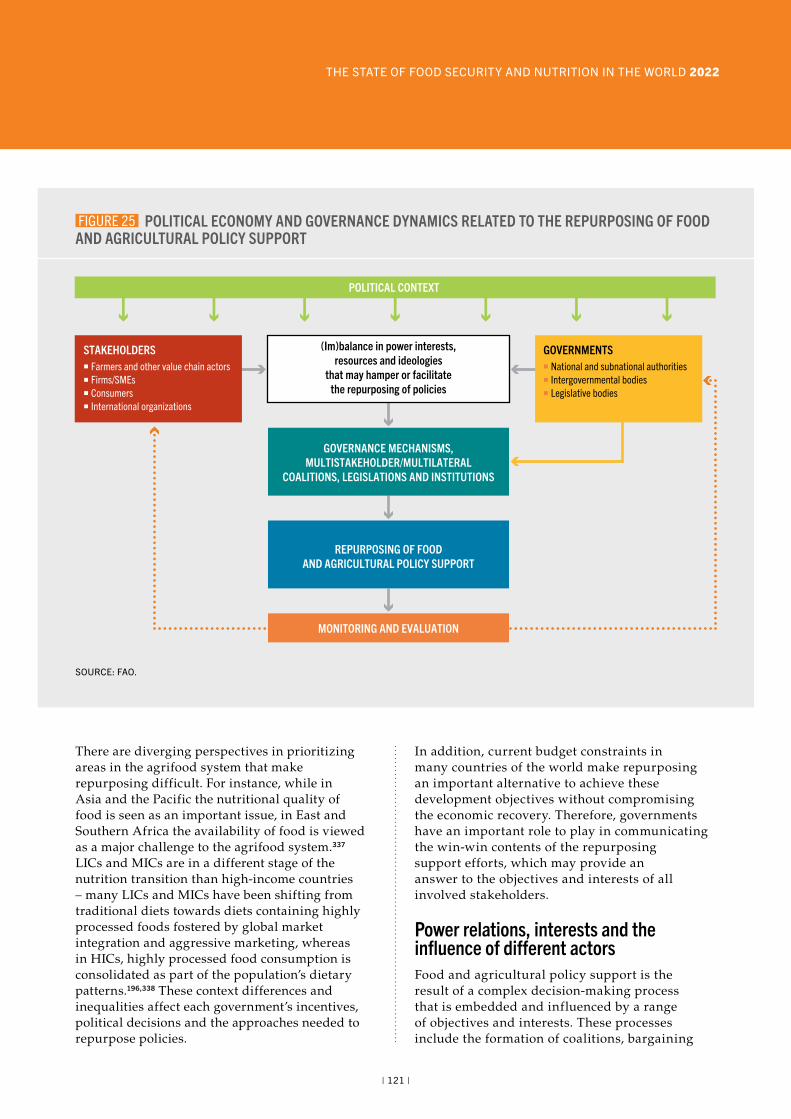
THE STATE OF FOOD SECURITY AND NUTRITION IN THE WORLD 2022
There are diverging perspectives in prioritizing areas in the agrifood system that make repurposing difficult. For instance, while in Asia and the Pacific the nutritional quality of food is seen as an important issue, in East and Southern Africa the availability of food is viewed as a major challenge to the agrifood system.337 LICs and MICs are in a different stage of the nutrition transition than high-income countries – many LICs and MICs have been shifting from traditional diets towards diets containing highly processed foods fostered by global market integration and aggressive marketing, whereas in HICs, highly processed food consumption is consolidated as part of the population’s dietary patterns.196,338 These context differences and inequalities affect each government’s incentives, political decisions and the approaches needed to repurpose policies.
In addition, current budget constraints in many countries of the world make repurposing an important alternative to achieve these development objectives without compromising the economic recovery. Therefore, governments have an important role to play in communicating the win-win contents of the repurposing support efforts, which may provide an answer to the objectives and interests of all involved stakeholders.
Power relations, interests and the influence of different actorsFood and agricultural policy support is the result of a complex decision-making process that is embedded and influenced by a range of objectives and interests. These processes include the formation of coalitions, bargaining
FIGURE 25 POLITICAL ECONOMY AND GOVERNANCE DYNAMICS RELATED TO THE REPURPOSING OF FOOD AND AGRICULTURAL POLICY SUPPORT
MONITORING AND EVALUATION
(Im)balance in power interests,resources and ideologies
that may hamper or facilitatethe repurposing of policies
STAKEHOLDERS Farmers and other value chain actors Firms/SMEs Consumers International organizations
GOVERNMENTS National and subnational authorities Intergovernmental bodies Legislative bodies
GOVERNANCE MECHANISMS,MULTISTAKEHOLDER/MULTILATERAL
COALITIONS, LEGISLATIONS AND INSTITUTIONS
REPURPOSING OF FOODAND AGRICULTURAL POLICY SUPPORT
POLITICAL CONTEXT
SOURCE: FAO.
| 121 |
CHAPTER 4 POTENTIAL OPTIONS TO REPURPOSE POLICY SUPPORT TO FOOD AND AGRICULTURE <...>
among interests, altering or preventing changes to decision-making rules, finding ways and means, or defeating policy choices by restricting the means available, enabling or preventing policy implementation, and ensuring voice or discriminating among actors and groups. Their success will thus depend on the relative power of different groups of stakeholders in favour of or against the reforms.
The data gaps on policy support that relates to food processing, distribution and provision often hinder the analysis of how the structure of support itself may be contributing to existing power structures along supply chains. In addition, different sectors within a country or region often have different priorities and potential trade-offs. These differences between the aims of different sectors could turn into a lack of policy coherence that is needed to make efficient use of available resources339,340 and achieve affordable healthy diets for all while at the same time ensuring sustainable use of natural resources and resilience to climate change.
For example, a study in the Pacific Islands shows that there are opposing views on policy framing when addressing diet-related NCDs due to conflicts of interest. Though governments have identified policy intervention options, implementation has been slow due to diverging perceptions and priorities. For instance, there are disagreements between the need to prioritize public health and decrease imports of highly processed foods versus support for increased trade,341 underlying the need for policy coherence across sectors.
Repurposing support efforts towards an increase in the production and trade of nutritious foods can be challenged by the agrifood industry’s dominance at the food supply chain level. Companies and corporations play a significant role in producing, processing and distributing food commodities. For example, in the mid-2000s, it was estimated that four large companies dominated 70 to 90 percent of the global grain trade. This concentration was observed jointly with an increasing trend in the production of major agricultural inputs for the food industry, such as raw sugar and vegetable oil crops.196 In fact, food industry actors often influence and
interfere in public policymaking or bias the science that underpins this process,342 as they lobby policymakers, make political donations, frame policy debates, adopt self-regulation to pre-empt and delay government action (policy substitution), implement public relations campaigns, and so forth.343
For example, the amount of money that the United States of America’s beverage industry has spent on lobbying activities increased to USD 60 million in 2009, the same year when a federal soda tax was proposed. The figure has stayed continuously high ever since.344 In South Africa, there is evidence that the private sector influences legal challenges or trade-related complaints relating to nutrition and alcohol regulation policies.345
Similarly in other countries, governments’ efforts to introduce regulatory measures could face challenges on the grounds that the proposed measures could conflict with binding trade commitments. For example, 245 interventions were made at WTO by exporting Member States between 1995 and 2019 for the marketing of breastmilk substitutes.346,347 In other cases, sometimes the food industry partnered with other public agencies, as in the case of Colombia during the discussion of the food labelling regulation, when some ministries and agencies argued in alignment with the industry’s position during the discussion of the initiative in the congress.348 Such challenges contribute to policy inertia and generate a “regulatory chill” that impedes national governments from taking action to repurpose food and agricultural policies.347,349
The influence of food industries extends to global governance, for example, the setting of international food standards by the Codex Alimentarius Commission (Section 4.2). Food industry actors exerted influence on the Codex process on the front-of-pack nutrition labelling350 and on setting the Codex standard for follow-up formula.347 Food industry responses to WHO consultations on diet-related NCD policies have tended to promote voluntary or non-statutory approaches instead of legislative measures.351
| 122 |
THE STATE OF FOOD SECURITY AND NUTRITION IN THE WORLD 2022
Retail is another sector in which power can be exerted and could affect the repurposing support efforts. In many countries, highly concentrated power in the retail sector is growing rapidly in the form of large chains of supermarkets and grocery stores.352 These developments are also driven by other structural factors such as income growth, urbanization and foreign direct investment (FDI) inflows.353
A review of studies regarding supermarket power in Australia observed that supermarkets exerted power by setting the terms of trade for suppliers, shaping societal values regarding food through discursive power, lobbying and establishing relationships with policymakers. This can affect several fields such as the governance of the agrifood system, the availability and affordability of healthy diets, public health and nutrition outcomes.354 Supermarket concentration within limited geographical areas could also enable the creation of food deserts, isolating populations who reside outside the retailers’ locations and limiting their access to nutritious foods.355
At the same time, supermarket chains have the power to enforce certain food quality and safety standards on their supply.352 In many LICs and MICs, the modern retail sector could become an important driver of changes within the agrifood system and could contribute to making healthy diets more affordable and accessible.356 The engagement and actions of the private sector includes also SMEs, and the provision of incentives to these actors can be key to supporting repurposing support efforts. SMEs can be empowered and mobilized to the transformation and repurposing support efforts by “equilibrating” the unequal relations of the observed powers (see Box 18) if the political climate facilitates responsible business practices along the entire value chain.357,358
Civil society groups are important for agrifood systems367 and levelling the playing field for them can also play a significant role in addressing the equity aspect of policy support. For example, farmer cooperatives could allow small-scale producers to strengthen their bargaining position in front of other agrifood systems stakeholders.368 In Guatemala, a farmers’ organizations network improved the agency capacities of producers
of the rural municipality of Huehuetenango and allowed them to implement innovative climate-resilient development plans at the local level.369 Consumer associative initiatives, such as community organizations or producer-consumer partnerships, are currently important actors in the transformation of local agrifood systems370 and can also influence and support policy reform processes.
The governance mechanisms and regulatory frameworks needed for the facilitation and implementation of repurposing support efforts Vested interests may hamper efforts to repurpose food and agricultural policy support when not managed properly. To this aim, the presence of strong public institutions,371 and particularly participatory governance mechanisms, free from conflict of interest, can positively influence policy reform processes as they create a positive enabling environment for reforms, as well as increase their efficiency and effectiveness. Similarly, policy reform processes can create and reinforce governance mechanisms and improve the capacities and social capital of involved stakeholders, creating a two-way relationship in which the institutions, and the reforms themselves, are promoted and reinforced.372
Multistakeholder and multisectoral platforms are common and interesting examples of governance mechanisms. They can be successful when there are: i) active and long-term engagement from the government, ii) public resources to facilitate the process, iii) a neutral facilitator to serve as checks and balances and iv) the implementation of strict accountability mechanisms. The facilitation of the coordination among involved stakeholders and groups and ensuring that all voices are heard in transparent decision-making processes can facilitate and ease the pressure from powerful actors.327,373,374
At the global level, an interesting multilateral example is the Scaling Up Nutrition (SUN) Movement, a global platform with 65 member countries working in collaboration to end all forms of malnutrition with an external independent evaluation to assess SUN’s efforts. The multilateral SUN Movement is supported
| 123 |
CHAPTER 4 POTENTIAL OPTIONS TO REPURPOSE POLICY SUPPORT TO FOOD AND AGRICULTURE <...>
BOX 18 VALUE CHAIN DEVELOPMENT AS AN EFFECTIVE TOOL TO TRANSFORM UNEQUAL POWER DISTRIBUTION
Value chain development can be an effective tool to transform the unequal power distribution currently observed between small-scale producers, processors, sellers and other stakeholders within agricultural value chains.
Small-scale producers in LICs and MICs often face high transaction costs when accessing markets to sell their products.359,360,361 Market imperfections and frictions related to limited access to credit, insurance and information might further constrain access to markets. Implementing policies to address these constraints has been politically difficult, as small-scale producers often face several obstacles to engage in collective action, including to add their demands in the political agenda. These constraints are often greater for women, youth and Indigenous Peoples. Access to the markets for small-scale producers is typically provided by mid-stream SMEs involved in processing, packaging, transport and final sales. This type of value chain has been estimated to provide more than half of the food consumed in Africa.362
Well-designed investments can reduce transaction costs as well as market imperfections and frictions by improving access to market information, providing access to credit and productivity-enhancing inputs, and potentially increasing small-scale producers and downstream SMEs’ bargaining power in front of traders and off-takers. In particular, agricultural value chain investments operating through producer organizations or agricultural cooperatives have been shown to be an effective means to engage small-scale producers and SMEs in value chains and to improve their market access. Such investments can also help in “levelling the playing field” for populations such as women, youth and Indigenous Peoples, who face even more constraints in accessing the agricultural value chain in equal conditions. Greater market access among small-scale producers, particularly in rural areas, can contribute to a higher degree of competition in local markets and higher prices received by producers.
Notable success stories of value chain development have emerged even in difficult settings in Latin America and the Pacific Islands, where access to the market might be particularly challenging in remote and mountainous areas. In Peru, the Strengthening Local
Development in the Highlands and High Rainforest Areas Project provided small-scale producers with access to financial and nonfinancial services, including technical assistance, market linkages and leadership skills to develop business plans. Small-scale producer’s market participation in crop and animal source foods increased by 7 and 13 percent, while women’s participation in local groups and decision-making of income by 27 and 45 percent.363 In Argentina, the Inclusive Rural Development Programme provided funding to producer organizations and Indigenous Peoples to engage in product development projects and to invest in community needs. Project participants were able to increase values of crop and livestock production by 92 percent and 72 percent driven by financial services provided to producer organizations to allow investments in heavy agricultural machinery for improving production practices, resulting in a 15 percent increase in household income. Further, female participation in leadership positions of producer organizations increased by 10 percent.364
In Papua New Guinea, the Productive Partnerships in Agriculture Project focused on forging direct linkages between producers and off-takers. It supported cocoa and coffee producers by providing market linkages with agribusiness enterprises and training in more efficient, market-responsive and sustainable production practices between 2012 and 2019.365 Asset ownership by women increased by 3 percent and decision-making by women in crop production increased by 4 percent. In the Solomon Islands, the Rural Development Programme – Phase II focused on agribusiness partnerships. It engaged cocoa and coconut producers to sell their commodities in value chains by linking them with enterprises through agribusiness partnerships between 2015 and 2021. The project resulted in higher cocoa prices paid to producers and higher volumes of cocoa sold, as well as more workers hired by agribusinesses supported by the project.366 These increases are mainly driven by an increase in the total value of production (38 percent increase), and in particular in crop production (62 percent increase). Further, female participation in decision-making on self-employment income use increased by 6 percent.
| 124 |
THE STATE OF FOOD SECURITY AND NUTRITION IN THE WORLD 2022
by civil society networks of more than 4 000 organizations, a business network including SMEs, large enterprises, a SUN donor network and a UN Network for SUN. With the platform, member states can align actions around common results with sectors and stakeholders working at the subnational level.375
There have been criticisms, however, that the involvement of multinational companies in the SUN business network undermines the network’s efforts, for example, by contributing to the increased influence of the private sector on policymaking and redefining legal concepts to accommodate the multi-stakeholder model.376
On a national and local level, instruments that support policy repurposing should be coordinated between several ministries or departmental agencies. For example, the Childhood Obesity Plan in England consists of several components, the implementation of each of which involved coordination across different departments. To support the development of healthy food environments in the National Planning Policy Framework, the coordination involved the Department of Health and Social Care (DHSC) to develop health policies and the Ministry of Housing, Communities and Local Government (MHCLG) to specify the decisions to support the access to nutritious foods. In addition, the Nutrient Profiling Model was set up with the leadership of the national public health body at the time, Public Health England (PHE).377
Another well-known multisectoral case was Brazil’s former National Food Security and Nutrition Council (CONSEA), an advisory body to the Brazilian presidency composed of representatives of the government and civil society, which during its years of existence (1993–2019) served as a space of dialogue and articulation among different stakeholders, and turned into a key facilitator for the formulation of policies as the National Policy and Plan for Food Security and Nutrition, the Food Acquisition Programme, the National School Food Programme and Brazil’s Dietary Guidelines.378
Nevertheless, while participatory governance mechanisms are key to developing and implementing policy reforms, they are not “silver bullets” for implementing them. It has been observed in some cases when implementing regulations in the food industry to promote healthy diets, that the power of the most important industry stakeholders has been enhanced in the context of multistakeholder governance arrangements, including public-private partnerships. This is the result of expanded corporate influence in policy decision-making. For example, by procuring in-house expertise, food companies have expanded their capacity to engage in these activities and thereby influence food policy and regulation-setting processes. As a result, some structural policy changes have been omitted from the policy agenda.196 It is important to safeguard against conflicts of interest in policy development and decision-making, and tools are available to help countries prevent and manage such conflicts of interest.an
On the other hand, participatory governance arrangements can give voice and influence to the often marginalized groups of the population, such as people in rural areas, to raise awareness and sensitize everyone involved and build coalitions in favour of more inclusive repurposing support efforts. Strengthening collective action, capacities, voice and bargaining power of rural populations, including smallholder farmers, can contribute to policy reforms and facilitate their formulation and implementation, as well as strengthen the legitimacy of the reforms among all stakeholders.303 In addition, identifying key stakeholders in favour of the policy reform that may act as “champions of change” in coordination with the leading government agency can facilitate the dialogue among actors.371 For example, countries such as Brazil, Peru, Thailand and Viet Nam have national nutrition leaders, which ensure strong coordination among actors in government, civil society and the private sector. In addition, they
an To help national policymakers, WHO has developed a draft approach to prevent and manage conflicts of interest in the development and implementation of nutrition programmes on a country level. A roadmap for implementing this draft approach in the Americas was recently launched.374
| 125 |
CHAPTER 4 POTENTIAL OPTIONS TO REPURPOSE POLICY SUPPORT TO FOOD AND AGRICULTURE <...>
are responsible for taking action and being subjected to accountability during the policy repurposing process.379
Finally, governments should carefully identify the trade-offs of the repurposing of food and agricultural policy support and anticipate the challenges that may arise during implementation, including scenarios based on evidence and potential. Governance mechanisms allow for different actors to consider the trade-offs of the policy changes and correctly address them.380 To this aim, as analysed in the previous section, governments should implement mitigation policies directed at the “losers” of the policy reform, or those who are more vulnerable to being negatively affected by it. At the same time, repurposing policy support may threaten power interest groups, who may resist the reform or prevent its implementation. As noted before, the impacts of current policy support on the availability and cost of nutritious foods and the affordability of healthy diets are complex and, thus, need to be determined through a systemic approach that relies on historical data and/or model-based scenarios.
Developing and validating model-based scenarios should not be purely desk work. The engagement of key stakeholders is essential, not only for transparency and accountability but also to improve the modelling itself given data uncertainties. In integrated climate impact assessments, for example, researchers have interacted with stakeholders such as farmers to explore and design alternative sets of plausible future scenarios and climate change adaptation packages for integrated modelling, to improve the accuracy and transparency of the results, compared to similar exercises without farmers’ engagement.381
However, model-based scenarios need to be designed and validated by government experts using official data. Several recent studies showcase this practice, in which the government advises how much it is willing to invest and finance agriculture to enable recovery. Modelers then use that information to determine the agricultural sectors that must be prioritized given the results on GDP growth, agrifood output growth, household welfare and rural poverty reduction223,233 in order
to increase access to affordable healthy diets and achieve nutritional objectives. The key issue is to rely on multisectoral and multilateral policy dialogues with all relevant stakeholders informed by evidence on the potential impacts of alternative policy support options.
Monitoring and evaluation of the repurposed policy supportRepurposing food and agricultural policy support does not end after policy formulation and implementation. The assessment of agrifood systems interventions has been increasingly recognized as a key element for the success of transformation processes;382 it ensures accountability and points to the need to adapt.383 For instance, in 2011 the New York City Council in the United States of America established the obligation to monitor and report the initiatives related to the Food Local Law.384 To this aim, the Food Metrics report has been published since 2012, following five policy goals with a total of 37 indicators, providing useful information to monitor the progress of the city’s agrifood policies for both policymakers and citizens.385
Commitments made by governments and other stakeholders during the high-level discussions on agrifood systems and nutrition can be used to monitor and support the implementation of repurposing support strategies. Following the Food Systems Summit, convened by the UN Secretary General in September 2021, 110 countries have published details of their strategy towards food system transformation within national shaping pathways, 92 percent of which featured healthy diets from sustainable agrifood systems as a priority topic.386
This priority issue was also taken up by Coalition of Action on Healthy Diets from Sustainable Food Systems For All which unites global actors and countries to align, mobilize and support action towards this shared vision.387 At the Tokyo Nutrition for Growth Summit in 2021, 181 stakeholders in 78 countries made 396 new nutrition commitments.388 Going forward, the development of solid databases that inform us about system transformation action including food and agricultural support in regions around the world will be essential to see if
| 126 |
THE STATE OF FOOD SECURITY AND NUTRITION IN THE WORLD 2022
commitments have translated into policy actions. Closing the data and research gaps in the areas of the current policy support estimates and the evidence of the impact of food and agricultural support1 is crucial to enable a monitoring framework to better track the progress of these commitments and to ensure accountability. For example, WHO’s Global database on the Implementation of Nutrition Actions (GINA) monitors and publishes updates on policy actions on nutrition.238
Developing the needed database infrastructure will require collaborating with relevant stakeholders in international organizations, governments and research think tanks. The data collection process of tracking repurposed policies should be institutionalized389 with defined objectives.
To start with, it is key to promote the adoption of a set of consistent definitions that are internationally recognized to allow precise measurement of support to food and agriculture. This should go along with the strengthening of the database developed by the Consortium for Measuring the Policy Environment for Agriculture (or Ag-Incentives Consortium, which was introduced in Chapter 3) in several ways: i) first by closing the data gap on policy support estimates by improving data on consumer subsidies, collecting data on subsidies and expenditures targeting climate-smart practices, as well as natural resource conservation and resilience to have a better picture of the public expenditures and investments that are the most conducive to agrifood systems transformation; and ii) second, by expanding the country coverage of policy support estimates to countries, which have a specific profile of policy support and/or regional agrifood systems challenges.
Other databases and networks can be important for monitoring and evaluation purposes. The International Network for Food and Obesity/Non-communicable Diseases Research, Monitoring and Action Support (INFORMAS) is a global platform set up to monitor and benchmark food environments, government policies and private sector actions across countries.390
Having comparable indicators of the effectiveness of repurposing support efforts on the different actors and stakeholders that are involved throughout the value chain also increases transparency and enables comparisons of reforms across countries.391 On the community level, tracking can take the forms of participatory monitoring, evaluation, reflection and learning (PMERL). This method enables the voices of the more disadvantaged groups in communities to be heard to take part in the process.392 Policies that promote open data access enable transparency and accountability when evaluating the performance and impact of repurposed policies and reduce the potential of dominant agrifood industries’ influence over the reshaping policy process.393
For example, the Agricultural Science and Technology Indicators (ASTI) has an online interactive data platform that tracks key data and information on agricultural R&D across LICs and MICs. This tool provides transparent and accessible mechanisms to track the impacts of repurposed measures.389 Finally, communicating the impacts of the repurposed changes to agricultural producers and consumers and relevant stakeholders throughout the value chain is important to ensure that the changes have support and can be sustained. This can be done by developing a shared understanding and knowledge through networks and communications among the stakeholder groups. This is seen as an important aspect in the process of development and spreading change in the agrifood system.367
Data development and maintenance will be key for monitoring and evaluation purposes. Furthermore, model-based scrutiny helps to identify whether the repurposed support has the intended consequences. In this regard, model-based monitoring should show whether the cost of nutritious foods and unaffordability of healthy diets were reduced during implementation, in a sustainable and inclusive manner. Synergies with other development planning processes and related investments, particularly SDGs (e.g. 1, 2, 3, 5, 10, 12 and 13) should also become evident. The evidence generated should be the basis through which evaluation helps identify potential areas for improvement delivered to governments. n
| 127 |
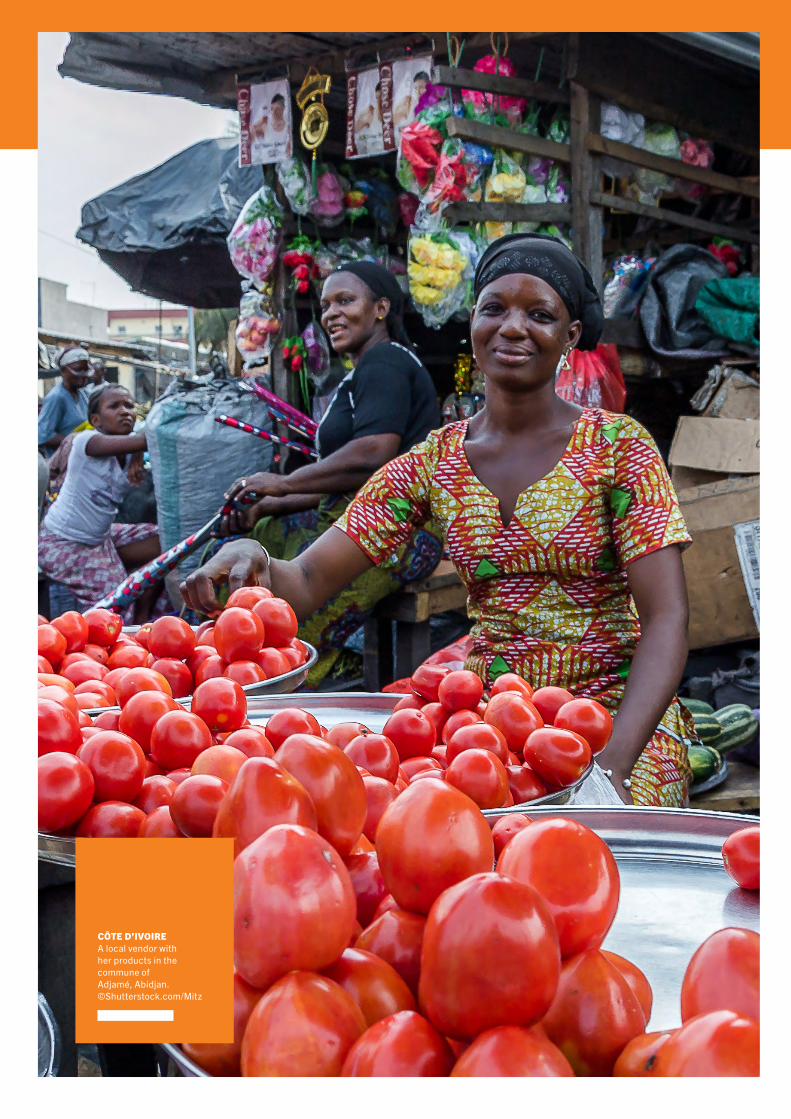
CÔTE D’IVOIREA local vendor with her products in the commune of Adjamé, Abidjan.©Shutterstock.com/Mitz
CHAPTER 5 CONCLUSION
T his year’s report should dispel any lingering doubts that the world is moving backwards in its efforts to end
hunger, food insecurity and malnutrition in all its forms. We are now only eight years away from 2030, the SDG target year. The distance to reach many of the SDG 2 targets is growing wider each year, while the time to 2030 is narrowing. There are efforts to make progress towards SDG 2, yet they are proving insufficient in the face of a more challenging and uncertain context.
As shown in Chapter 2, between 702 and 828 million people in the world faced hunger in 2021. This is about 180 million more people since the beginning of the 2030 Agenda, with much of the increase (150 million) since 2019, before the COVID-19 pandemic. Furthermore, nearly one in three people in the world, around 2.31 billion people, were moderately or severely food insecure in 2021. This is around 350 million more people than in 2019, the year before the COVID-19 pandemic unfolded. Healthy diets, crucial for enhancing food security and preventing all forms of malnutrition, are also now further out of reach for people in every region in the world. In 2020 – the most recent year for which data are available, almost 3.1 billion people could not afford a healthy diet, which is 112 million more people compared to 2019.
Of the seven 2030 global nutrition targets, only exclusive breastfeeding and stunting among children under five years of age have improved since 2012. No region has exhibited progress in lowering the prevalence of adult obesity, and overweight prevalence in children under five years of age is increasing in more than half of countries representing Southern Africa, Oceania, South-eastern Asia, South America, and the
Caribbean. Furthermore, the latest available nutrition estimates are based primarily on data collected prior to 2020 and do not fully account for the anticipated global setbacks due to the effects of the COVID-19 pandemic.
Things did not improve much in the first half of 2022. The lingering effects of the COVID-19 pandemic continue to impede progress and create setbacks, contributing to a slow and mixed picture of economic recovery among countries that also weakens efforts to end hunger, food insecurity and malnutrition in all its forms. The war in Ukraine is also disrupting supply chains and affecting global grain, fertilizer and energy prices. Global food and energy prices are soaring and have reached levels not seen in decades. Global economic growth prospects for 2022 have been revised downward significantly. The growing frequency and intensity of extreme climate events continue to be major disrupters of agricultural production and supply chains, affecting food security, nutrition, health and livelihoods in many countries.
The intensification of the major drivers behind recent food insecurity and malnutrition trends (i.e. conflict, climate extremes and economic shocks) combined with the high cost of nutritious foods and growing inequalities will continue to challenge food security and nutrition. This will be the case until agrifood systems are transformed, become more resilient and are delivering lower cost nutritious foods and affordable healthy diets for all, sustainably and inclusively.
This year’s report is cognizant of the fact that the current recessionary context makes it even more challenging for many governments to increase their budgets to invest in agrifood systems
| 129 |
CHAPTER 5 CONCLUSIONS
in Section 3.2. The distortions that border measures, market interventions and fiscal subsidies generate affect trade, production and consumption decisions, with repercussions for the environment, food security and nutrition.
Border measures affect the availability, diversity and prices of food in domestic markets. While some of these measures target important policy objectives including food safety, governments could do more to reduce trade barriers for nutritious foods, such as fruits, vegetables and pulses, in order to increase the availability and affordability of such foods to reduce the cost of healthy diets.
In LICs and MICs, market price controls such as minimum or fixed price policy to consumers overwhelmingly target commodities like wheat, maize, rice, as well as sugar, with the objective of stabilizing or raising farm incomes while ensuring supplies of staple foods for food security purposes. However, these policies could be contributing to the unhealthy diets that one observes all over the world.
Fiscal subsidies allocated to some specific commodities or factors of production have significantly contributed to increasing production and reducing the prices of cereals (especially maize, wheat and rice), but also of beef and milk. This has positively impacted food security and farm incomes. They have also indirectly supported the development and use of better technology and of new agricultural inputs, which enhance the productivity of the subsidized commodities. On the other hand, these types of subsidies have also resulted in important market distortions within and across borders that do not usually exist in a competitive market. In a way, they have de facto created (relative) disincentives towards producing nutritious foods. They have also encouraged monocultures in some countries, ceased the farming of certain nutritious products, and discouraged the production of some foods that do not receive the same level of support. The resulting changes in production have had direct implications for the price and availability of unsubsidized or less subsidized commodities and their derivatives, creating negative incentives for people to diversify their diets.
transformation. At the same time, the report has argued that much can and needs to be done with existing resources. A key recommendation is that governments start rethinking how they can reallocate their existing public budgets to make them more cost-effective and efficient in reducing the cost of nutritious foods and increasing the availability and affordability of healthy diets, from sustainable agrifood systems and leaving no one behind.
Chapter 3 shows that worldwide governments allocated almost USD 630 billion a year on average over 2013–2018 to the food and agriculture sector. Support targeting agricultural producers averaged almost USD 446 billion a year in net terms, accounting for both price incentives and disincentives to farmers. About USD 111 billion were spent yearly by governments for the provision of general services to the sector, while food consumers received USD 72 billion on average every year through fiscal subsidies. Altogether, the USD 630 billion a year is not a small amount if one compares it with other important sources of finance. For example, as measured in the Global Landscape of Climate Finance 2021 report, total climate finance – which has been growing considerably – reached USD 632 billion in 2019–2020,394 which is close to this report’s estimate of support to food and agriculture. While governments are spending similar amounts of public resources to support food and agriculture, agrifood systems are not delivering on what is needed to achieve food security and nutrition objectives.
Agricultural producers take the lion’s share of all this support globally – about 70 percent. Governments, particularly in HICs and UMICs, are providing price incentives to farmers through border measures (i.e. import tariffs and NTMs) and market price controls as well as fiscal subsidies (often tied to the production of a specific commodity or the use of a specific input). In contrast, LMICs and LICs have more limited fiscal space and tend to use trade policies to protect consumers, rather than producers.
Not only is the amount of public support significant but depending on how it is allocated, it can either support or hinder efforts towards sustainable development – as highlighted
| 130 |
THE STATE OF FOOD SECURITY AND NUTRITION IN THE WORLD 2022
Public support through general services benefits actors of the food and agricultural sector more collectively, which is in principle good for small-scale farmers, women and youth. But as noted, this type of support is significantly lower than the support provided to individual producers through price incentives and fiscal subsidies, and it is more widely funded in HICs. In some cases, services such as R&D are biased towards producers of staple foods. Nonetheless, this alternative form of support, if allocated for example to research, development and knowledge transfer, infrastructure, inspection, food and agricultural marketing services, and so forth, can be strategic to bridge productivity gaps in countries at lower-income levels. More expenditure on general services and more support decoupled from production is essential for ensuring food safety and food availability and can significantly contribute to lower food prices – including for nutritious foods. Yet, important gaps exist in the provision, implementation, design and coherence of such types of support in many countries.
This report, while acknowledging data limitations, has also shown that subsidies to consumers represent the lowest share of all the support to food and agriculture. The evidence also shows that policies and programmes supporting consumers have the potential to contribute to increasing consumption of nutritious foods. This is especially the case of interventions that are well targeted (e.g. to the poorest households or the most nutritionally vulnerable people), explicitly designed to have nutritional impacts (i.e. nutrition-sensitive programmes) and are accompanied by nutritional education.
Having taken stock of support to food and agriculture worldwide and by regions, and on how the evidence suggests this support affects agrifood systems and diets, another significant contribution is Chapter 4. It provides evidence that repurposing existing food and agricultural support has the potential to play an important role in delivering healthy diets at lower costs and more generally contribute to people’s ability to afford them.
While governments will need to develop tailored repurposing strategies based on their country context and evidence, the need for such
reforms will be found in most countries, given the internationally agreed SDG 2, and in some cases, well-coordinated multilateral actions will be needed to enable reforms. Thus, analysing the effects of potential options for repurposing support to food and agriculture is also of strategic importance at the global level. In this regard, an analysis of model-based scenarios developed in Section 4.1 provides some important insights to keep in mind:
� A general empirically grounded observation is that repurposing existing public support to agriculture in all regions of the world, with the objective of promoting the production of nutritious foods (whose production and consumption is low relative to the dietary requirements) would contribute to make a healthy diet less costly and more affordable, globally and particularly in LMICs and UMICs.
� Most improvement towards this specific objective would be seen through repurposing fiscal subsidies, particularly if these were to be shifted from producers to consumers. Fiscal subsidies to products whose consumption must increase to bridge dietary gaps can result in the most diversified healthy diet consumption pattern with GHG emission reductions, especially when targeted at consumption rather than production level. However, the benefits could be at the cost of poverty reduction, farm incomes, total agricultural output and economic recovery, particularly if the reallocation of these subsidies were to be targeted at production level.
� Repurposing support through border measures and market price controls would also help to move towards the objective of making a healthy diet less costly and more affordable, although relatively less so than in the case of fiscal subsidies. This alternative policy shift would however contribute to cutting GHG emissions in agriculture without the trade-offs seen with the repurposing of fiscal subsidies.
� Globally, the trade-off between increasing the affordability of a healthy diet and reducing GHG emissions in agriculture would be more apparent should fiscal subsidies to producers be repurposed to target nutritious foods. This is because, in this case, dairy production in particular would have to increase to enable meeting certain dietary requirements,
| 131 |
CHAPTER 5 CONCLUSIONS
particularly in LICs and MICs. More generally, such type of trade-off may be offset if countries shift towards technologies that are relatively lower in emission intensity and, more generally, production and consumption become more sustainable.
� Whether through border measures and market controls or fiscal subsidies, policymakers will have to repurpose their support considering the potential inequality trade-offs that may emerge if small-scale farmers (including women and youth) are not in a position to specialize in the production of nutritious foods due to resource constraints.
� Moreover, to avoid other trade-offs, policymakers may choose not to shift fiscal subsidies from producers to consumers. Instead, they may phase out fiscal subsidies to producers that are tied to the production of a specific commodity or the use of specific inputs and are proven distorting, environmentally harmful and not promoting of nutritious foods. The resources should be redirected to fiscal subsidies to producers that are decoupled from production but whose design is nutrition-sensitive, promotes the adoption of low-emission intensity technologies, and includes other environmental conditionalities.
� Policymakers may also want to take advantage of the evidence emerging from this report, which indicates that a fiscal subsidy to commodities whose consumption needs to increase in adherence to the country dietary guidelines is a very efficient policy. Subsidies to consumers generally form the tiniest share of all the support being provided to food and agriculture in the world; hence, governments will have to allocate significant additional resources to them.
� Where agriculture is still key to the economy and job generation, particularly in LICs and also some LMICs, support through government services will have to be scaled up. This needs to be done, though, with careful prioritization to ensure that both productivity gaps are bridged where most needed and that agricultural transformation effectively helps increase incomes, resilience and the availability of nutritious foods, all of which will contribute to reducing the cost of such nutritious foods for the consumer.
To take advantage of the opportunities that repurposing support offers, countries will have to get together at the multilateral table. The repurposing of border measures, market price controls and fiscal subsidies will have to consider countries’ commitments and flexibilities under current WTO rules, as well as issues in the ongoing negotiations. Importantly, repurposing agricultural subsidies, if undertaken by many countries, could even open a new chapter for agricultural trade negotiations at the WTO. Countries could find new ground for discussion on how to discipline trade-distorting domestic support. Options could include increasing the flexibility for providing product-specific subsidies to producers of nutritious foods, and in the context of the negotiations on market access that includes tariffs, countries could consider reducing the bound level of tariffs on fruits, vegetables, legumes and other products important to healthy diets, to foster trade in these products.
Policymakers in LICs and perhaps also some LMICs will need to overcome two challenges. First, they will need to reach compromises in repurposing food and agricultural support to achieve several inclusive agricultural transformation objectives in alignment with the objective of reducing the cost and increasing the affordability of healthy diets. Second, considering their low budgets, they may also have to mobilize significant financing to step up the provision of general support services to effectively bridge productivity gaps in the production of nutritious foods. In this regard, international public investment support (e.g. from International Financial Organizations [IFIs], regional development banks, the Global Agriculture and Food Security Programme [GAFSP], and so forth) will be key to ease the transition towards higher general support services, especially in LICs.
This report also acknowledges that making nutritious foods more widely accessible and affordable is a necessary albeit insufficient condition for consumers to be able to choose, prefer and consume healthy diets. Thus the link to complementary policies that promote healthy diets is critical for success. Within agrifood systems, Section 4.2 pointed out the importance of policies that promote shifts in food environments and consumer behaviour towards healthy eating
| 132 |
THE STATE OF FOOD SECURITY AND NUTRITION IN THE WORLD 2022
patterns. These could include implementing mandatory limits or voluntary targets to improve the nutritional quality of processed foods and drink products, enacting legislation on food marketing, and implementing nutrition labelling policies and healthy procurement policies to ensure that food served or sold in public institutions contributes to healthy diets. Combining land-use policies with other complementing policies to address food deserts and swamps can also be very important.
As shown in Section 4.1, repurposing can lead to trade-offs that may negatively affect some stakeholders. In these cases, social protection policies may be necessary to mitigate possible trade-offs, particularly short-term income losses or negative effects on livelihoods, especially among the most vulnerable populations. Environmental policies, health system policies, and transportation and energy policies are necessary to enhance the positive outcomes of repurposing support in the realms of efficiency, equality, nutrition, health, climate mitigation and the environment. Health services that protect poor and vulnerable groups whose diets do not provide all the nutrients to meet dietary requirements are particularly relevant in the context of repurposing support efforts. Not adequately addressing inefficiencies and problems in transportation would also undermine and render ineffective such efforts.
The success of repurposing food and agricultural policy support will also be influenced by the political context, the interests of stakeholders, market power concentration, and the governance mechanisms and regulatory frameworks in place to facilitate the reform process, an important discussion at the centre of Section 4.3. Given the diversity of each country’s political context, strong institutions on a local, national and global level will be crucial, as well as engaging and incentivizing stakeholders from the public sector, the private sector and international organizations to support the repurposing support efforts. For many countries, agrifood systems transformation pathways provide a framework
through which to channel the repurposing efforts. The engagement of SMEs and civil society groups – as well as transparent governance and safeguards to prevent and manage conflicts of interest – will be key to balancing out unequal powers within agrifood systems.
To conclude, the need to realign food and agricultural policy support is not a new issue; however, it has gained impressive momentum as a specific issue in the run-up to, during and now after the 2021 UN Food Systems Summit, which triggered country pathways towards agrifood systems transformation and further called for a coalition for action in this area. As a result, the Coalition to Repurpose Public Support to Food and Agriculture is also being formed with the participation of international organizations, non-profit organizations, governments, farmers and other organizations.395 The objective of the coalition is to support countries who have indicated a desire to repurpose their public food and agricultural support. An important aspect is that priorities of this coalition are being defined according to science-based evidence.
There have been vast recent research and reports on the benefits of realigning and repurposing agricultural policy support to transform agrifood systems to improve their efficiency and environmental sustainability, as discussed in this report. However, the association, synergies and links between food and agricultural policy support and the cost of nutritious foods that constitute a healthy diet were under-researched before this edition of the report. The need to bridge this knowledge gap was the motivation for this year’s theme analysis, hoping that the new evidence that has been presented and the policy recommendations made will contribute to featuring healthy diets more prominently in the global agenda of repurposing food and agricultural support to achieve SDG 2 and generate impacts in favour of SDG 3 (Good Health and Well-Being), SDG 10 (Reduced Inequalities), SDG 12 (Responsible Consumption and Production) and SDG 13 (Climate Action), among other SDGs. n
| 133 |
SERBIAWheat field against a blue sky.©Shutterstock.com/Zeljko Radojko
ANNEXES
ANNEX 1AStatistical tables to Chapter 2 136
ANNEX 1BMethodological notes for the food security and nutrition indicators 162
ANNEX 2Methodologies used in Chapter 2 176
ANNEX 3Updated data series of the cost and affordability of a healthy diet, 2017–2020 184
ANNEX 4Policy support indicators: sources, coverage and methodology 191
ANNEX 5Tariff data and food group definitions 195
ANNEX 6Results from selected global model-based scenarios 196
ANNEX 7Glossary 200
| 135 |
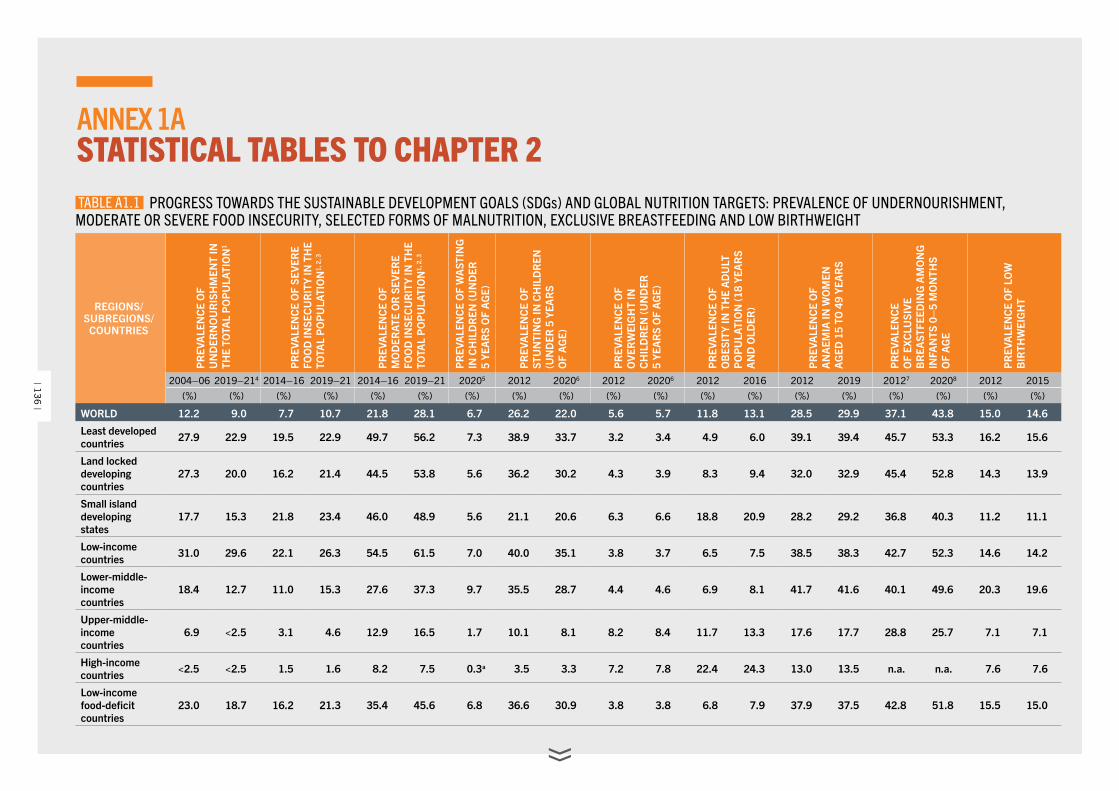
ANNEX 1ASTATISTICAL TABLES TO CHAPTER 2
REGIONS/SUBREGIONS/
COUNTRIES
PR
EVA
LEN
CE
OF
UN
DER
NO
UR
ISH
MEN
T IN
TH
E TO
TAL
PO
PU
LATI
ON
1
PR
EVA
LEN
CE
OF
SEVE
RE
FOO
D IN
SEC
UR
ITY
IN T
HE
TOTA
L P
OP
ULA
TIO
N1,
2, 3
PR
EVA
LEN
CE
OF
MO
DER
ATE
OR
SEV
ERE
FOO
D IN
SEC
UR
ITY
IN T
HE
TOTA
L P
OP
ULA
TIO
N1,
2, 3
PR
EVA
LEN
CE
OF
WA
STIN
G
IN C
HIL
DR
EN (U
ND
ER
5 YE
AR
S O
F A
GE)
PR
EVA
LEN
CE
OF
STU
NTI
NG
IN C
HIL
DR
EN
(UN
DER
5 Y
EAR
S O
F A
GE)
PR
EVA
LEN
CE
OF
OVE
RW
EIG
HT
IN
CH
ILD
REN
(UN
DER
5
YEA
RS
OF
AG
E)
PR
EVA
LEN
CE
OF
OB
ESIT
Y IN
TH
E A
DU
LT
PO
PU
LATI
ON
(18
YEA
RS
AN
D O
LDER
)
PR
EVA
LEN
CE
OF
A
NA
EMIA
IN W
OM
EN
AG
ED 1
5 TO
49
YEA
RS
PR
EVA
LEN
CE
OF
EXC
LUSI
VE
BR
EAST
FEED
ING
AM
ON
G
INFA
NTS
0–
5 M
ON
THS
OF
AG
E
PR
EVA
LEN
CE
OF
LOW
B
IRTH
WEI
GH
T
2004–06 2019–214 2014–16 2019–21 2014–16 2019–21 20205 2012 20206 2012 20206 2012 2016 2012 2019 20127 20208 2012 2015(%) (%) (%) (%) (%) (%) (%) (%) (%) (%) (%) (%) (%) (%) (%) (%) (%) (%) (%)
WORLD 12.2 9.0 7.7 10.7 21.8 28.1 6.7 26.2 22.0 5.6 5.7 11.8 13.1 28.5 29.9 37.1 43.8 15.0 14.6
Least developed countries 27.9 22.9 19.5 22.9 49.7 56.2 7.3 38.9 33.7 3.2 3.4 4.9 6.0 39.1 39.4 45.7 53.3 16.2 15.6
Land locked developing countries
27.3 20.0 16.2 21.4 44.5 53.8 5.6 36.2 30.2 4.3 3.9 8.3 9.4 32.0 32.9 45.4 52.8 14.3 13.9
Small island developing states
17.7 15.3 21.8 23.4 46.0 48.9 5.6 21.1 20.6 6.3 6.6 18.8 20.9 28.2 29.2 36.8 40.3 11.2 11.1
Low-income countries 31.0 29.6 22.1 26.3 54.5 61.5 7.0 40.0 35.1 3.8 3.7 6.5 7.5 38.5 38.3 42.7 52.3 14.6 14.2
Lower-middle-income countries
18.4 12.7 11.0 15.3 27.6 37.3 9.7 35.5 28.7 4.4 4.6 6.9 8.1 41.7 41.6 40.1 49.6 20.3 19.6
Upper-middle-income countries
6.9 <2.5 3.1 4.6 12.9 16.5 1.7 10.1 8.1 8.2 8.4 11.7 13.3 17.6 17.7 28.8 25.7 7.1 7.1
High-income countries <2.5 <2.5 1.5 1.6 8.2 7.5 0.3a 3.5 3.3 7.2 7.8 22.4 24.3 13.0 13.5 n.a. n.a. 7.6 7.6
Low-income food-deficit countries
23.0 18.7 16.2 21.3 35.4 45.6 6.8 36.6 30.9 3.8 3.8 6.8 7.9 37.9 37.5 42.8 51.8 15.5 15.0
TABLE A1.1 PROGRESS TOWARDS THE SUSTAINABLE DEVELOPMENT GOALS (SDGs) AND GLOBAL NUTRITION TARGETS: PREVALENCE OF UNDERNOURISHMENT, MODERATE OR SEVERE FOOD INSECURITY, SELECTED FORMS OF MALNUTRITION, EXCLUSIVE BREASTFEEDING AND LOW BIRTHWEIGHT
| 136 |
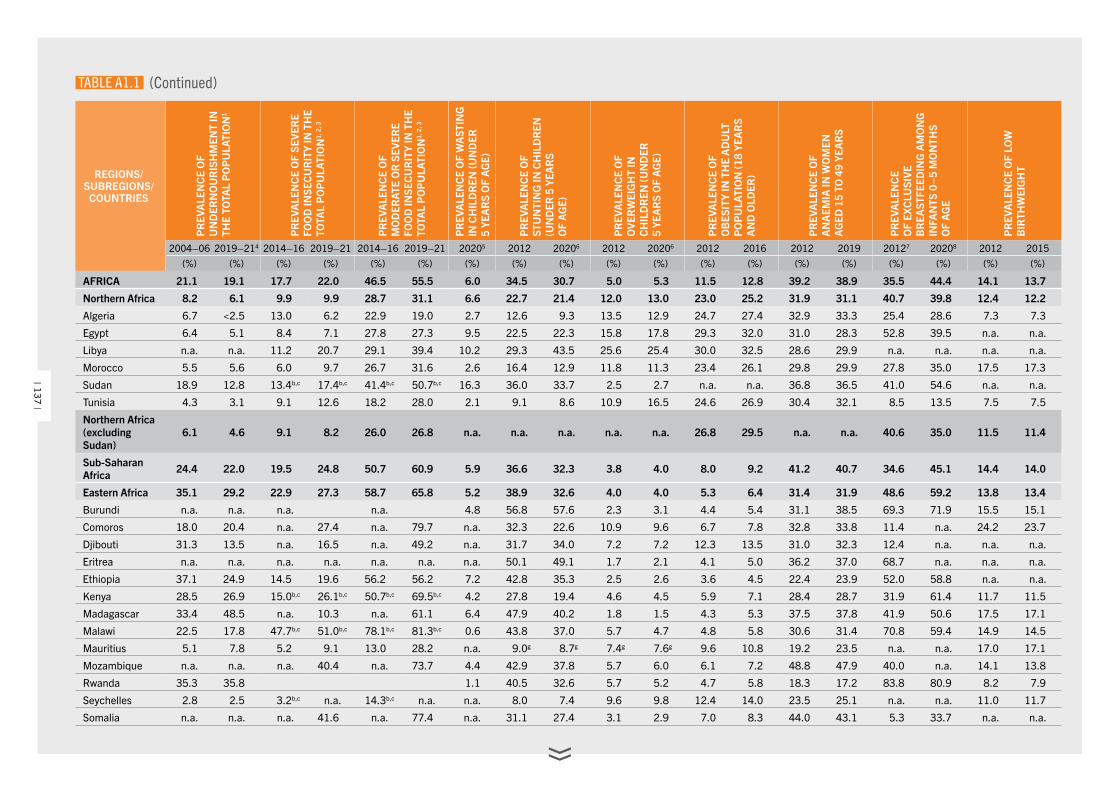
REGIONS/SUBREGIONS/
COUNTRIESP
REV
ALE
NC
E O
F U
ND
ERN
OU
RIS
HM
ENT
IN
THE
TOTA
L P
OP
ULA
TIO
N1
PR
EVA
LEN
CE
OF
SEVE
RE
FOO
D IN
SEC
UR
ITY
IN T
HE
TOTA
L P
OP
ULA
TIO
N1,
2, 3
PR
EVA
LEN
CE
OF
MO
DER
ATE
OR
SEV
ERE
FOO
D IN
SEC
UR
ITY
IN T
HE
TOTA
L P
OP
ULA
TIO
N1,
2, 3
PR
EVA
LEN
CE
OF
WA
STIN
G
IN C
HIL
DR
EN (U
ND
ER
5 YE
AR
S O
F A
GE)
PR
EVA
LEN
CE
OF
STU
NTI
NG
IN C
HIL
DR
EN
(UN
DER
5 Y
EAR
S O
F A
GE)
PR
EVA
LEN
CE
OF
OVE
RW
EIG
HT
IN
CH
ILD
REN
(UN
DER
5
YEA
RS
OF
AG
E)
PR
EVA
LEN
CE
OF
OB
ESIT
Y IN
TH
E A
DU
LT
PO
PU
LATI
ON
(18
YEA
RS
AN
D O
LDER
)
PR
EVA
LEN
CE
OF
A
NA
EMIA
IN W
OM
EN
AG
ED 1
5 TO
49
YEA
RS
PR
EVA
LEN
CE
OF
EXC
LUSI
VE
BR
EAST
FEED
ING
AM
ON
G
INFA
NTS
0–
5 M
ON
THS
OF
AG
E
PR
EVA
LEN
CE
OF
LOW
B
IRTH
WEI
GH
T
2004–06 2019–214 2014–16 2019–21 2014–16 2019–21 20205 2012 20206 2012 20206 2012 2016 2012 2019 20127 20208 2012 2015(%) (%) (%) (%) (%) (%) (%) (%) (%) (%) (%) (%) (%) (%) (%) (%) (%) (%) (%)
AFRICA 21.1 19.1 17.7 22.0 46.5 55.5 6.0 34.5 30.7 5.0 5.3 11.5 12.8 39.2 38.9 35.5 44.4 14.1 13.7
Northern Africa 8.2 6.1 9.9 9.9 28.7 31.1 6.6 22.7 21.4 12.0 13.0 23.0 25.2 31.9 31.1 40.7 39.8 12.4 12.2
Algeria 6.7 <2.5 13.0 6.2 22.9 19.0 2.7 12.6 9.3 13.5 12.9 24.7 27.4 32.9 33.3 25.4 28.6 7.3 7.3
Egypt 6.4 5.1 8.4 7.1 27.8 27.3 9.5 22.5 22.3 15.8 17.8 29.3 32.0 31.0 28.3 52.8 39.5 n.a. n.a.
Libya n.a. n.a. 11.2 20.7 29.1 39.4 10.2 29.3 43.5 25.6 25.4 30.0 32.5 28.6 29.9 n.a. n.a. n.a. n.a.
Morocco 5.5 5.6 6.0 9.7 26.7 31.6 2.6 16.4 12.9 11.8 11.3 23.4 26.1 29.8 29.9 27.8 35.0 17.5 17.3
Sudan 18.9 12.8 13.4b,c 17.4b,c 41.4b,c 50.7b,c 16.3 36.0 33.7 2.5 2.7 n.a. n.a. 36.8 36.5 41.0 54.6 n.a. n.a.
Tunisia 4.3 3.1 9.1 12.6 18.2 28.0 2.1 9.1 8.6 10.9 16.5 24.6 26.9 30.4 32.1 8.5 13.5 7.5 7.5
Northern Africa (excluding Sudan)
6.1 4.6 9.1 8.2 26.0 26.8 n.a. n.a. n.a. n.a. n.a. 26.8 29.5 n.a. n.a. 40.6 35.0 11.5 11.4
Sub-Saharan Africa 24.4 22.0 19.5 24.8 50.7 60.9 5.9 36.6 32.3 3.8 4.0 8.0 9.2 41.2 40.7 34.6 45.1 14.4 14.0
Eastern Africa 35.1 29.2 22.9 27.3 58.7 65.8 5.2 38.9 32.6 4.0 4.0 5.3 6.4 31.4 31.9 48.6 59.2 13.8 13.4
Burundi n.a. n.a. n.a. n.a. 4.8 56.8 57.6 2.3 3.1 4.4 5.4 31.1 38.5 69.3 71.9 15.5 15.1
Comoros 18.0 20.4 n.a. 27.4 n.a. 79.7 n.a. 32.3 22.6 10.9 9.6 6.7 7.8 32.8 33.8 11.4 n.a. 24.2 23.7
Djibouti 31.3 13.5 n.a. 16.5 n.a. 49.2 n.a. 31.7 34.0 7.2 7.2 12.3 13.5 31.0 32.3 12.4 n.a. n.a. n.a.
Eritrea n.a. n.a. n.a. n.a. n.a. n.a. n.a. 50.1 49.1 1.7 2.1 4.1 5.0 36.2 37.0 68.7 n.a. n.a. n.a.
Ethiopia 37.1 24.9 14.5 19.6 56.2 56.2 7.2 42.8 35.3 2.5 2.6 3.6 4.5 22.4 23.9 52.0 58.8 n.a. n.a.
Kenya 28.5 26.9 15.0b,c 26.1b,c 50.7b,c 69.5b,c 4.2 27.8 19.4 4.6 4.5 5.9 7.1 28.4 28.7 31.9 61.4 11.7 11.5
Madagascar 33.4 48.5 n.a. 10.3 n.a. 61.1 6.4 47.9 40.2 1.8 1.5 4.3 5.3 37.5 37.8 41.9 50.6 17.5 17.1
Malawi 22.5 17.8 47.7b,c 51.0b,c 78.1b,c 81.3b,c 0.6 43.8 37.0 5.7 4.7 4.8 5.8 30.6 31.4 70.8 59.4 14.9 14.5
Mauritius 5.1 7.8 5.2 9.1 13.0 28.2 n.a. 9.0g 8.7g 7.4g 7.6g 9.6 10.8 19.2 23.5 n.a. n.a. 17.0 17.1
Mozambique n.a. n.a. n.a. 40.4 n.a. 73.7 4.4 42.9 37.8 5.7 6.0 6.1 7.2 48.8 47.9 40.0 n.a. 14.1 13.8
Rwanda 35.3 35.8 1.1 40.5 32.6 5.7 5.2 4.7 5.8 18.3 17.2 83.8 80.9 8.2 7.9
Seychelles 2.8 2.5 3.2b,c n.a. 14.3b,c n.a. n.a. 8.0 7.4 9.6 9.8 12.4 14.0 23.5 25.1 n.a. n.a. 11.0 11.7
Somalia n.a. n.a. n.a. 41.6 n.a. 77.4 n.a. 31.1 27.4 3.1 2.9 7.0 8.3 44.0 43.1 5.3 33.7 n.a. n.a.
TABLE A1.1 (Continued)
| 137 |
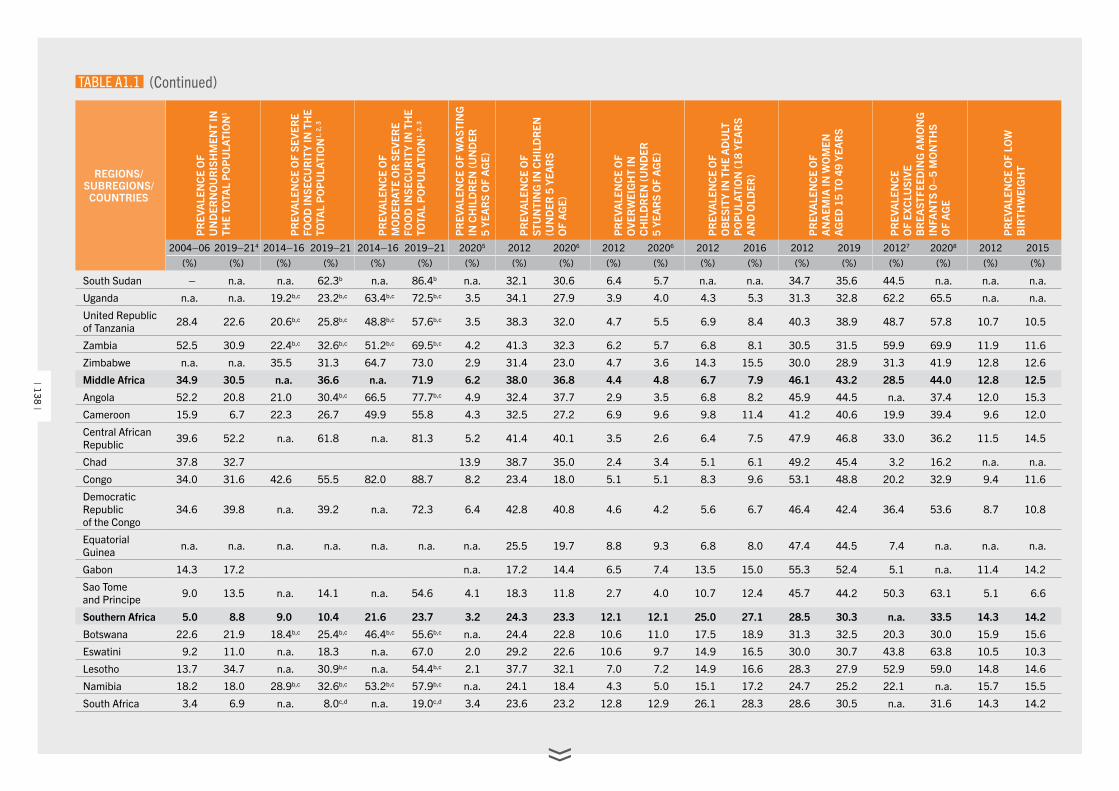
REGIONS/SUBREGIONS/
COUNTRIESP
REV
ALE
NC
E O
F U
ND
ERN
OU
RIS
HM
ENT
IN
THE
TOTA
L P
OP
ULA
TIO
N1
PR
EVA
LEN
CE
OF
SEVE
RE
FOO
D IN
SEC
UR
ITY
IN T
HE
TOTA
L P
OP
ULA
TIO
N1,
2, 3
PR
EVA
LEN
CE
OF
MO
DER
ATE
OR
SEV
ERE
FOO
D IN
SEC
UR
ITY
IN T
HE
TOTA
L P
OP
ULA
TIO
N1,
2, 3
PR
EVA
LEN
CE
OF
WA
STIN
G
IN C
HIL
DR
EN (U
ND
ER
5 YE
AR
S O
F A
GE)
PR
EVA
LEN
CE
OF
STU
NTI
NG
IN C
HIL
DR
EN
(UN
DER
5 Y
EAR
S O
F A
GE)
PR
EVA
LEN
CE
OF
OVE
RW
EIG
HT
IN
CH
ILD
REN
(UN
DER
5
YEA
RS
OF
AG
E)
PR
EVA
LEN
CE
OF
OB
ESIT
Y IN
TH
E A
DU
LT
PO
PU
LATI
ON
(18
YEA
RS
AN
D O
LDER
)
PR
EVA
LEN
CE
OF
A
NA
EMIA
IN W
OM
EN
AG
ED 1
5 TO
49
YEA
RS
PR
EVA
LEN
CE
OF
EXC
LUSI
VE
BR
EAST
FEED
ING
AM
ON
G
INFA
NTS
0–
5 M
ON
THS
OF
AG
E
PR
EVA
LEN
CE
OF
LOW
B
IRTH
WEI
GH
T
2004–06 2019–214 2014–16 2019–21 2014–16 2019–21 20205 2012 20206 2012 20206 2012 2016 2012 2019 20127 20208 2012 2015(%) (%) (%) (%) (%) (%) (%) (%) (%) (%) (%) (%) (%) (%) (%) (%) (%) (%) (%)
South Sudan – n.a. n.a. 62.3b n.a. 86.4b n.a. 32.1 30.6 6.4 5.7 n.a. n.a. 34.7 35.6 44.5 n.a. n.a. n.a.
Uganda n.a. n.a. 19.2b,c 23.2b,c 63.4b,c 72.5b,c 3.5 34.1 27.9 3.9 4.0 4.3 5.3 31.3 32.8 62.2 65.5 n.a. n.a.
United Republic of Tanzania 28.4 22.6 20.6b,c 25.8b,c 48.8b,c 57.6b,c 3.5 38.3 32.0 4.7 5.5 6.9 8.4 40.3 38.9 48.7 57.8 10.7 10.5
Zambia 52.5 30.9 22.4b,c 32.6b,c 51.2b,c 69.5b,c 4.2 41.3 32.3 6.2 5.7 6.8 8.1 30.5 31.5 59.9 69.9 11.9 11.6
Zimbabwe n.a. n.a. 35.5 31.3 64.7 73.0 2.9 31.4 23.0 4.7 3.6 14.3 15.5 30.0 28.9 31.3 41.9 12.8 12.6
Middle Africa 34.9 30.5 n.a. 36.6 n.a. 71.9 6.2 38.0 36.8 4.4 4.8 6.7 7.9 46.1 43.2 28.5 44.0 12.8 12.5
Angola 52.2 20.8 21.0 30.4b,c 66.5 77.7b,c 4.9 32.4 37.7 2.9 3.5 6.8 8.2 45.9 44.5 n.a. 37.4 12.0 15.3
Cameroon 15.9 6.7 22.3 26.7 49.9 55.8 4.3 32.5 27.2 6.9 9.6 9.8 11.4 41.2 40.6 19.9 39.4 9.6 12.0
Central African Republic 39.6 52.2 n.a. 61.8 n.a. 81.3 5.2 41.4 40.1 3.5 2.6 6.4 7.5 47.9 46.8 33.0 36.2 11.5 14.5
Chad 37.8 32.7 13.9 38.7 35.0 2.4 3.4 5.1 6.1 49.2 45.4 3.2 16.2 n.a. n.a.
Congo 34.0 31.6 42.6 55.5 82.0 88.7 8.2 23.4 18.0 5.1 5.1 8.3 9.6 53.1 48.8 20.2 32.9 9.4 11.6
Democratic Republic of the Congo
34.6 39.8 n.a. 39.2 n.a. 72.3 6.4 42.8 40.8 4.6 4.2 5.6 6.7 46.4 42.4 36.4 53.6 8.7 10.8
Equatorial Guinea n.a. n.a. n.a. n.a. n.a. n.a. n.a. 25.5 19.7 8.8 9.3 6.8 8.0 47.4 44.5 7.4 n.a. n.a. n.a.
Gabon 14.3 17.2 n.a. 17.2 14.4 6.5 7.4 13.5 15.0 55.3 52.4 5.1 n.a. 11.4 14.2
Sao Tome and Principe 9.0 13.5 n.a. 14.1 n.a. 54.6 4.1 18.3 11.8 2.7 4.0 10.7 12.4 45.7 44.2 50.3 63.1 5.1 6.6
Southern Africa 5.0 8.8 9.0 10.4 21.6 23.7 3.2 24.3 23.3 12.1 12.1 25.0 27.1 28.5 30.3 n.a. 33.5 14.3 14.2
Botswana 22.6 21.9 18.4b,c 25.4b,c 46.4b,c 55.6b,c n.a. 24.4 22.8 10.6 11.0 17.5 18.9 31.3 32.5 20.3 30.0 15.9 15.6
Eswatini 9.2 11.0 n.a. 18.3 n.a. 67.0 2.0 29.2 22.6 10.6 9.7 14.9 16.5 30.0 30.7 43.8 63.8 10.5 10.3
Lesotho 13.7 34.7 n.a. 30.9b,c n.a. 54.4b,c 2.1 37.7 32.1 7.0 7.2 14.9 16.6 28.3 27.9 52.9 59.0 14.8 14.6
Namibia 18.2 18.0 28.9b,c 32.6b,c 53.2b,c 57.9b,c n.a. 24.1 18.4 4.3 5.0 15.1 17.2 24.7 25.2 22.1 n.a. 15.7 15.5
South Africa 3.4 6.9 n.a. 8.0c,d n.a. 19.0c,d 3.4 23.6 23.2 12.8 12.9 26.1 28.3 28.6 30.5 n.a. 31.6 14.3 14.2
TABLE A1.1 (Continued)
| 138 |
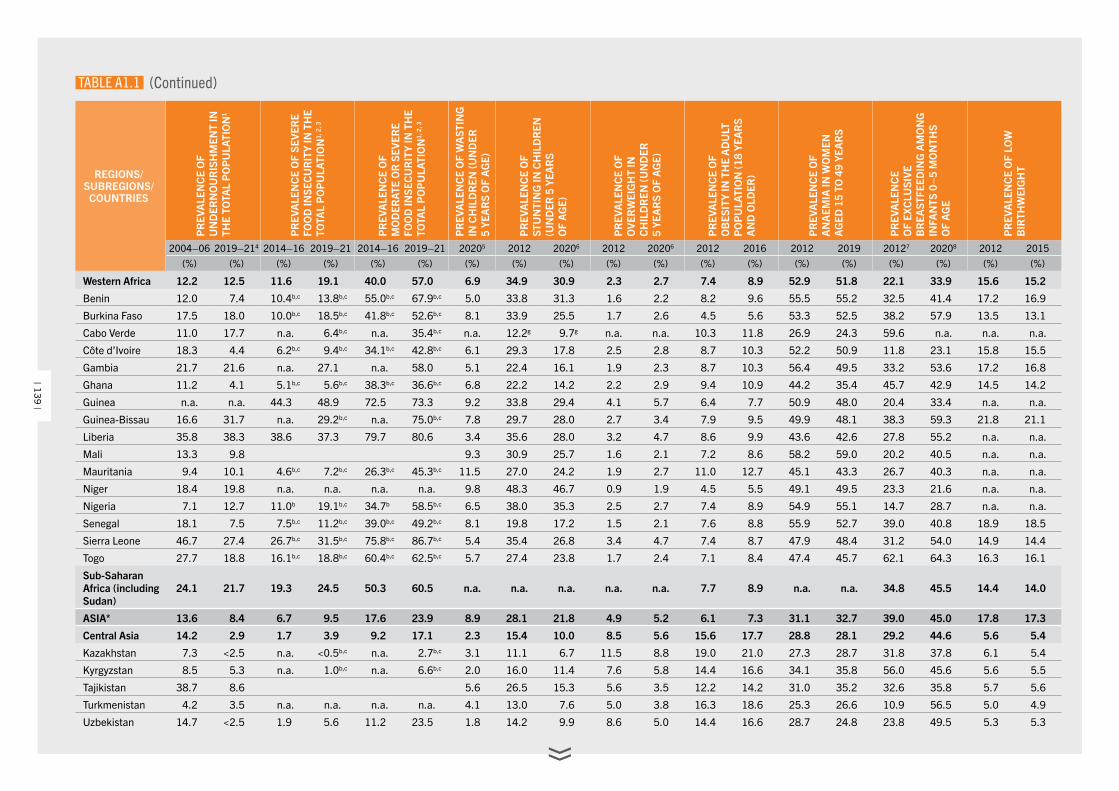
REGIONS/SUBREGIONS/
COUNTRIESP
REV
ALE
NC
E O
F U
ND
ERN
OU
RIS
HM
ENT
IN
THE
TOTA
L P
OP
ULA
TIO
N1
PR
EVA
LEN
CE
OF
SEVE
RE
FOO
D IN
SEC
UR
ITY
IN T
HE
TOTA
L P
OP
ULA
TIO
N1,
2, 3
PR
EVA
LEN
CE
OF
MO
DER
ATE
OR
SEV
ERE
FOO
D IN
SEC
UR
ITY
IN T
HE
TOTA
L P
OP
ULA
TIO
N1,
2, 3
PR
EVA
LEN
CE
OF
WA
STIN
G
IN C
HIL
DR
EN (U
ND
ER
5 YE
AR
S O
F A
GE)
PR
EVA
LEN
CE
OF
STU
NTI
NG
IN C
HIL
DR
EN
(UN
DER
5 Y
EAR
S O
F A
GE)
PR
EVA
LEN
CE
OF
OVE
RW
EIG
HT
IN
CH
ILD
REN
(UN
DER
5
YEA
RS
OF
AG
E)
PR
EVA
LEN
CE
OF
OB
ESIT
Y IN
TH
E A
DU
LT
PO
PU
LATI
ON
(18
YEA
RS
AN
D O
LDER
)
PR
EVA
LEN
CE
OF
A
NA
EMIA
IN W
OM
EN
AG
ED 1
5 TO
49
YEA
RS
PR
EVA
LEN
CE
OF
EXC
LUSI
VE
BR
EAST
FEED
ING
AM
ON
G
INFA
NTS
0–
5 M
ON
THS
OF
AG
E
PR
EVA
LEN
CE
OF
LOW
B
IRTH
WEI
GH
T
2004–06 2019–214 2014–16 2019–21 2014–16 2019–21 20205 2012 20206 2012 20206 2012 2016 2012 2019 20127 20208 2012 2015(%) (%) (%) (%) (%) (%) (%) (%) (%) (%) (%) (%) (%) (%) (%) (%) (%) (%) (%)
Western Africa 12.2 12.5 11.6 19.1 40.0 57.0 6.9 34.9 30.9 2.3 2.7 7.4 8.9 52.9 51.8 22.1 33.9 15.6 15.2
Benin 12.0 7.4 10.4b,c 13.8b,c 55.0b,c 67.9b,c 5.0 33.8 31.3 1.6 2.2 8.2 9.6 55.5 55.2 32.5 41.4 17.2 16.9
Burkina Faso 17.5 18.0 10.0b,c 18.5b,c 41.8b,c 52.6b,c 8.1 33.9 25.5 1.7 2.6 4.5 5.6 53.3 52.5 38.2 57.9 13.5 13.1
Cabo Verde 11.0 17.7 n.a. 6.4b,c n.a. 35.4b,c n.a. 12.2g 9.7g n.a. n.a. 10.3 11.8 26.9 24.3 59.6 n.a. n.a. n.a.
Côte d’Ivoire 18.3 4.4 6.2b,c 9.4b,c 34.1b,c 42.8b,c 6.1 29.3 17.8 2.5 2.8 8.7 10.3 52.2 50.9 11.8 23.1 15.8 15.5
Gambia 21.7 21.6 n.a. 27.1 n.a. 58.0 5.1 22.4 16.1 1.9 2.3 8.7 10.3 56.4 49.5 33.2 53.6 17.2 16.8
Ghana 11.2 4.1 5.1b,c 5.6b,c 38.3b,c 36.6b,c 6.8 22.2 14.2 2.2 2.9 9.4 10.9 44.2 35.4 45.7 42.9 14.5 14.2
Guinea n.a. n.a. 44.3 48.9 72.5 73.3 9.2 33.8 29.4 4.1 5.7 6.4 7.7 50.9 48.0 20.4 33.4 n.a. n.a.
Guinea-Bissau 16.6 31.7 n.a. 29.2b,c n.a. 75.0b,c 7.8 29.7 28.0 2.7 3.4 7.9 9.5 49.9 48.1 38.3 59.3 21.8 21.1
Liberia 35.8 38.3 38.6 37.3 79.7 80.6 3.4 35.6 28.0 3.2 4.7 8.6 9.9 43.6 42.6 27.8 55.2 n.a. n.a.
Mali 13.3 9.8 9.3 30.9 25.7 1.6 2.1 7.2 8.6 58.2 59.0 20.2 40.5 n.a. n.a.
Mauritania 9.4 10.1 4.6b,c 7.2b,c 26.3b,c 45.3b,c 11.5 27.0 24.2 1.9 2.7 11.0 12.7 45.1 43.3 26.7 40.3 n.a. n.a.
Niger 18.4 19.8 n.a. n.a. n.a. n.a. 9.8 48.3 46.7 0.9 1.9 4.5 5.5 49.1 49.5 23.3 21.6 n.a. n.a.
Nigeria 7.1 12.7 11.0b 19.1b,c 34.7b 58.5b,c 6.5 38.0 35.3 2.5 2.7 7.4 8.9 54.9 55.1 14.7 28.7 n.a. n.a.
Senegal 18.1 7.5 7.5b,c 11.2b,c 39.0b,c 49.2b,c 8.1 19.8 17.2 1.5 2.1 7.6 8.8 55.9 52.7 39.0 40.8 18.9 18.5
Sierra Leone 46.7 27.4 26.7b,c 31.5b,c 75.8b,c 86.7b,c 5.4 35.4 26.8 3.4 4.7 7.4 8.7 47.9 48.4 31.2 54.0 14.9 14.4
Togo 27.7 18.8 16.1b,c 18.8b,c 60.4b,c 62.5b,c 5.7 27.4 23.8 1.7 2.4 7.1 8.4 47.4 45.7 62.1 64.3 16.3 16.1
Sub-Saharan Africa (including Sudan)
24.1 21.7 19.3 24.5 50.3 60.5 n.a. n.a. n.a. n.a. n.a. 7.7 8.9 n.a. n.a. 34.8 45.5 14.4 14.0
ASIA* 13.6 8.4 6.7 9.5 17.6 23.9 8.9 28.1 21.8 4.9 5.2 6.1 7.3 31.1 32.7 39.0 45.0 17.8 17.3
Central Asia 14.2 2.9 1.7 3.9 9.2 17.1 2.3 15.4 10.0 8.5 5.6 15.6 17.7 28.8 28.1 29.2 44.6 5.6 5.4
Kazakhstan 7.3 <2.5 n.a. <0.5b,c n.a. 2.7b,c 3.1 11.1 6.7 11.5 8.8 19.0 21.0 27.3 28.7 31.8 37.8 6.1 5.4
Kyrgyzstan 8.5 5.3 n.a. 1.0b,c n.a. 6.6b,c 2.0 16.0 11.4 7.6 5.8 14.4 16.6 34.1 35.8 56.0 45.6 5.6 5.5
Tajikistan 38.7 8.6 5.6 26.5 15.3 5.6 3.5 12.2 14.2 31.0 35.2 32.6 35.8 5.7 5.6
Turkmenistan 4.2 3.5 n.a. n.a. n.a. n.a. 4.1 13.0 7.6 5.0 3.8 16.3 18.6 25.3 26.6 10.9 56.5 5.0 4.9
Uzbekistan 14.7 <2.5 1.9 5.6 11.2 23.5 1.8 14.2 9.9 8.6 5.0 14.4 16.6 28.7 24.8 23.8 49.5 5.3 5.3
TABLE A1.1 (Continued)
| 139 |
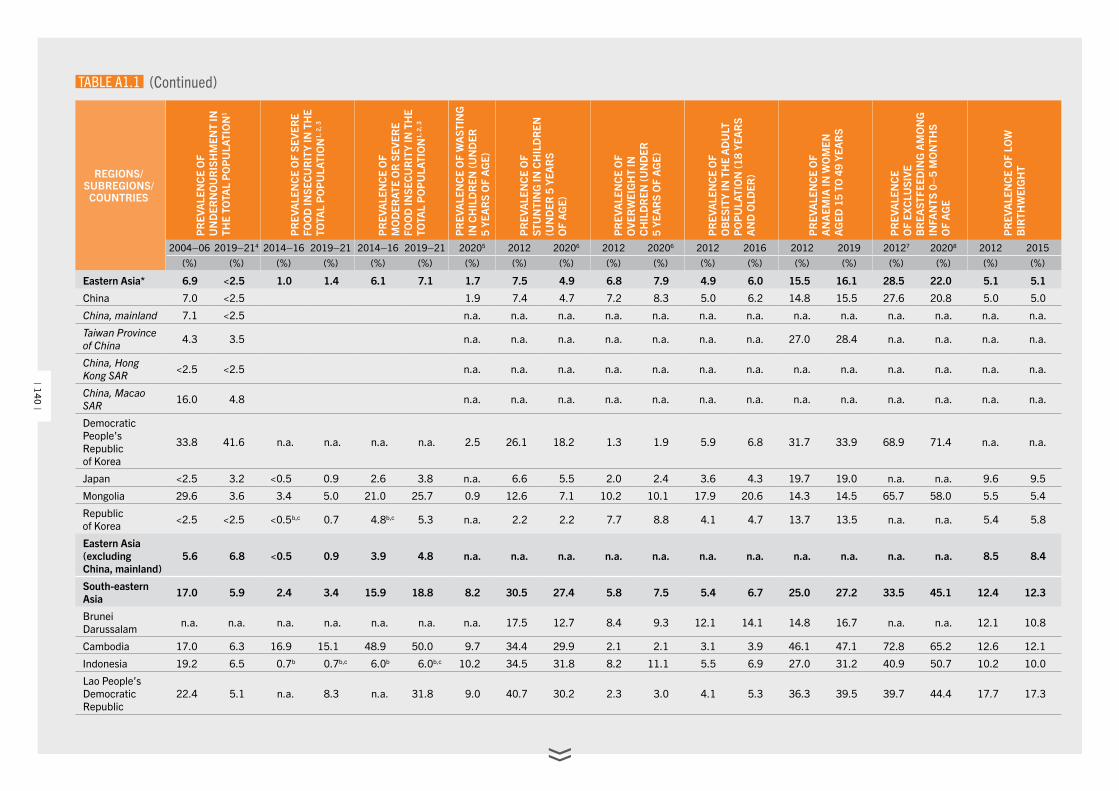
REGIONS/SUBREGIONS/
COUNTRIESP
REV
ALE
NC
E O
F U
ND
ERN
OU
RIS
HM
ENT
IN
THE
TOTA
L P
OP
ULA
TIO
N1
PR
EVA
LEN
CE
OF
SEVE
RE
FOO
D IN
SEC
UR
ITY
IN T
HE
TOTA
L P
OP
ULA
TIO
N1,
2, 3
PR
EVA
LEN
CE
OF
MO
DER
ATE
OR
SEV
ERE
FOO
D IN
SEC
UR
ITY
IN T
HE
TOTA
L P
OP
ULA
TIO
N1,
2, 3
PR
EVA
LEN
CE
OF
WA
STIN
G
IN C
HIL
DR
EN (U
ND
ER
5 YE
AR
S O
F A
GE)
PR
EVA
LEN
CE
OF
STU
NTI
NG
IN C
HIL
DR
EN
(UN
DER
5 Y
EAR
S O
F A
GE)
PR
EVA
LEN
CE
OF
OVE
RW
EIG
HT
IN
CH
ILD
REN
(UN
DER
5
YEA
RS
OF
AG
E)
PR
EVA
LEN
CE
OF
OB
ESIT
Y IN
TH
E A
DU
LT
PO
PU
LATI
ON
(18
YEA
RS
AN
D O
LDER
)
PR
EVA
LEN
CE
OF
A
NA
EMIA
IN W
OM
EN
AG
ED 1
5 TO
49
YEA
RS
PR
EVA
LEN
CE
OF
EXC
LUSI
VE
BR
EAST
FEED
ING
AM
ON
G
INFA
NTS
0–
5 M
ON
THS
OF
AG
E
PR
EVA
LEN
CE
OF
LOW
B
IRTH
WEI
GH
T
2004–06 2019–214 2014–16 2019–21 2014–16 2019–21 20205 2012 20206 2012 20206 2012 2016 2012 2019 20127 20208 2012 2015(%) (%) (%) (%) (%) (%) (%) (%) (%) (%) (%) (%) (%) (%) (%) (%) (%) (%) (%)
Eastern Asia* 6.9 <2.5 1.0 1.4 6.1 7.1 1.7 7.5 4.9 6.8 7.9 4.9 6.0 15.5 16.1 28.5 22.0 5.1 5.1
China 7.0 <2.5 1.9 7.4 4.7 7.2 8.3 5.0 6.2 14.8 15.5 27.6 20.8 5.0 5.0
China, mainland 7.1 <2.5 n.a. n.a. n.a. n.a. n.a. n.a. n.a. n.a. n.a. n.a. n.a. n.a. n.a.
Taiwan Province of China 4.3 3.5 n.a. n.a. n.a. n.a. n.a. n.a. n.a. 27.0 28.4 n.a. n.a. n.a. n.a.
China, Hong Kong SAR <2.5 <2.5 n.a. n.a. n.a. n.a. n.a. n.a. n.a. n.a. n.a. n.a. n.a. n.a. n.a.
China, Macao SAR 16.0 4.8 n.a. n.a. n.a. n.a. n.a. n.a. n.a. n.a. n.a. n.a. n.a. n.a. n.a.
Democratic People’s Republic of Korea
33.8 41.6 n.a. n.a. n.a. n.a. 2.5 26.1 18.2 1.3 1.9 5.9 6.8 31.7 33.9 68.9 71.4 n.a. n.a.
Japan <2.5 3.2 <0.5 0.9 2.6 3.8 n.a. 6.6 5.5 2.0 2.4 3.6 4.3 19.7 19.0 n.a. n.a. 9.6 9.5
Mongolia 29.6 3.6 3.4 5.0 21.0 25.7 0.9 12.6 7.1 10.2 10.1 17.9 20.6 14.3 14.5 65.7 58.0 5.5 5.4
Republic of Korea <2.5 <2.5 <0.5b,c 0.7 4.8b,c 5.3 n.a. 2.2 2.2 7.7 8.8 4.1 4.7 13.7 13.5 n.a. n.a. 5.4 5.8
Eastern Asia (excluding China, mainland)
5.6 6.8 <0.5 0.9 3.9 4.8 n.a. n.a. n.a. n.a. n.a. n.a. n.a. n.a. n.a. n.a. n.a. 8.5 8.4
South-eastern Asia 17.0 5.9 2.4 3.4 15.9 18.8 8.2 30.5 27.4 5.8 7.5 5.4 6.7 25.0 27.2 33.5 45.1 12.4 12.3
Brunei Darussalam n.a. n.a. n.a. n.a. n.a. n.a. n.a. 17.5 12.7 8.4 9.3 12.1 14.1 14.8 16.7 n.a. n.a. 12.1 10.8
Cambodia 17.0 6.3 16.9 15.1 48.9 50.0 9.7 34.4 29.9 2.1 2.1 3.1 3.9 46.1 47.1 72.8 65.2 12.6 12.1
Indonesia 19.2 6.5 0.7b 0.7b,c 6.0b 6.0b,c 10.2 34.5 31.8 8.2 11.1 5.5 6.9 27.0 31.2 40.9 50.7 10.2 10.0
Lao People’s Democratic Republic
22.4 5.1 n.a. 8.3 n.a. 31.8 9.0 40.7 30.2 2.3 3.0 4.1 5.3 36.3 39.5 39.7 44.4 17.7 17.3
TABLE A1.1 (Continued)
| 140 |
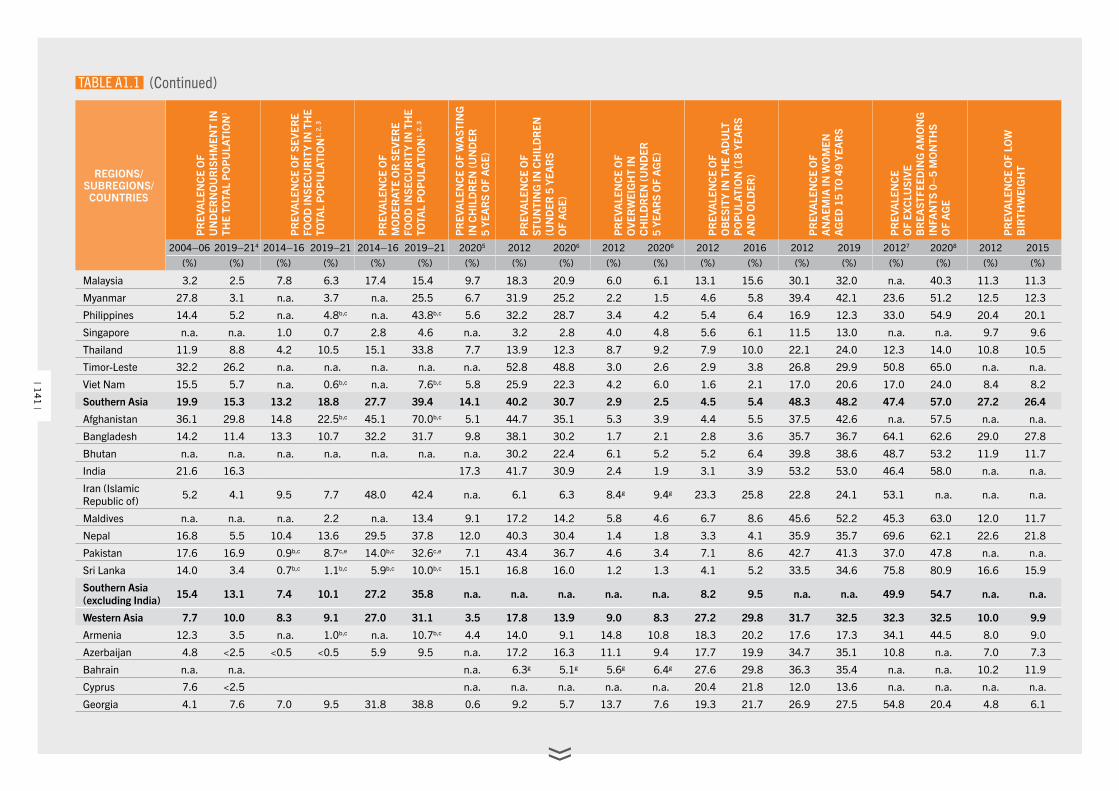
REGIONS/SUBREGIONS/
COUNTRIESP
REV
ALE
NC
E O
F U
ND
ERN
OU
RIS
HM
ENT
IN
THE
TOTA
L P
OP
ULA
TIO
N1
PR
EVA
LEN
CE
OF
SEVE
RE
FOO
D IN
SEC
UR
ITY
IN T
HE
TOTA
L P
OP
ULA
TIO
N1,
2, 3
PR
EVA
LEN
CE
OF
MO
DER
ATE
OR
SEV
ERE
FOO
D IN
SEC
UR
ITY
IN T
HE
TOTA
L P
OP
ULA
TIO
N1,
2, 3
PR
EVA
LEN
CE
OF
WA
STIN
G
IN C
HIL
DR
EN (U
ND
ER
5 YE
AR
S O
F A
GE)
PR
EVA
LEN
CE
OF
STU
NTI
NG
IN C
HIL
DR
EN
(UN
DER
5 Y
EAR
S O
F A
GE)
PR
EVA
LEN
CE
OF
OVE
RW
EIG
HT
IN
CH
ILD
REN
(UN
DER
5
YEA
RS
OF
AG
E)
PR
EVA
LEN
CE
OF
OB
ESIT
Y IN
TH
E A
DU
LT
PO
PU
LATI
ON
(18
YEA
RS
AN
D O
LDER
)
PR
EVA
LEN
CE
OF
A
NA
EMIA
IN W
OM
EN
AG
ED 1
5 TO
49
YEA
RS
PR
EVA
LEN
CE
OF
EXC
LUSI
VE
BR
EAST
FEED
ING
AM
ON
G
INFA
NTS
0–
5 M
ON
THS
OF
AG
E
PR
EVA
LEN
CE
OF
LOW
B
IRTH
WEI
GH
T
2004–06 2019–214 2014–16 2019–21 2014–16 2019–21 20205 2012 20206 2012 20206 2012 2016 2012 2019 20127 20208 2012 2015(%) (%) (%) (%) (%) (%) (%) (%) (%) (%) (%) (%) (%) (%) (%) (%) (%) (%) (%)
Malaysia 3.2 2.5 7.8 6.3 17.4 15.4 9.7 18.3 20.9 6.0 6.1 13.1 15.6 30.1 32.0 n.a. 40.3 11.3 11.3
Myanmar 27.8 3.1 n.a. 3.7 n.a. 25.5 6.7 31.9 25.2 2.2 1.5 4.6 5.8 39.4 42.1 23.6 51.2 12.5 12.3
Philippines 14.4 5.2 n.a. 4.8b,c n.a. 43.8b,c 5.6 32.2 28.7 3.4 4.2 5.4 6.4 16.9 12.3 33.0 54.9 20.4 20.1
Singapore n.a. n.a. 1.0 0.7 2.8 4.6 n.a. 3.2 2.8 4.0 4.8 5.6 6.1 11.5 13.0 n.a. n.a. 9.7 9.6
Thailand 11.9 8.8 4.2 10.5 15.1 33.8 7.7 13.9 12.3 8.7 9.2 7.9 10.0 22.1 24.0 12.3 14.0 10.8 10.5
Timor-Leste 32.2 26.2 n.a. n.a. n.a. n.a. n.a. 52.8 48.8 3.0 2.6 2.9 3.8 26.8 29.9 50.8 65.0 n.a. n.a.
Viet Nam 15.5 5.7 n.a. 0.6b,c n.a. 7.6b,c 5.8 25.9 22.3 4.2 6.0 1.6 2.1 17.0 20.6 17.0 24.0 8.4 8.2
Southern Asia 19.9 15.3 13.2 18.8 27.7 39.4 14.1 40.2 30.7 2.9 2.5 4.5 5.4 48.3 48.2 47.4 57.0 27.2 26.4
Afghanistan 36.1 29.8 14.8 22.5b,c 45.1 70.0b,c 5.1 44.7 35.1 5.3 3.9 4.4 5.5 37.5 42.6 n.a. 57.5 n.a. n.a.
Bangladesh 14.2 11.4 13.3 10.7 32.2 31.7 9.8 38.1 30.2 1.7 2.1 2.8 3.6 35.7 36.7 64.1 62.6 29.0 27.8
Bhutan n.a. n.a. n.a. n.a. n.a. n.a. n.a. 30.2 22.4 6.1 5.2 5.2 6.4 39.8 38.6 48.7 53.2 11.9 11.7
India 21.6 16.3 17.3 41.7 30.9 2.4 1.9 3.1 3.9 53.2 53.0 46.4 58.0 n.a. n.a.
Iran (Islamic Republic of) 5.2 4.1 9.5 7.7 48.0 42.4 n.a. 6.1 6.3 8.4g 9.4g 23.3 25.8 22.8 24.1 53.1 n.a. n.a. n.a.
Maldives n.a. n.a. n.a. 2.2 n.a. 13.4 9.1 17.2 14.2 5.8 4.6 6.7 8.6 45.6 52.2 45.3 63.0 12.0 11.7
Nepal 16.8 5.5 10.4 13.6 29.5 37.8 12.0 40.3 30.4 1.4 1.8 3.3 4.1 35.9 35.7 69.6 62.1 22.6 21.8
Pakistan 17.6 16.9 0.9b,c 8.7c,e 14.0b,c 32.6c,e 7.1 43.4 36.7 4.6 3.4 7.1 8.6 42.7 41.3 37.0 47.8 n.a. n.a.
Sri Lanka 14.0 3.4 0.7b,c 1.1b,c 5.9b,c 10.0b,c 15.1 16.8 16.0 1.2 1.3 4.1 5.2 33.5 34.6 75.8 80.9 16.6 15.9
Southern Asia (excluding India) 15.4 13.1 7.4 10.1 27.2 35.8 n.a. n.a. n.a. n.a. n.a. 8.2 9.5 n.a. n.a. 49.9 54.7 n.a. n.a.
Western Asia 7.7 10.0 8.3 9.1 27.0 31.1 3.5 17.8 13.9 9.0 8.3 27.2 29.8 31.7 32.5 32.3 32.5 10.0 9.9
Armenia 12.3 3.5 n.a. 1.0b,c n.a. 10.7b,c 4.4 14.0 9.1 14.8 10.8 18.3 20.2 17.6 17.3 34.1 44.5 8.0 9.0
Azerbaijan 4.8 <2.5 <0.5 <0.5 5.9 9.5 n.a. 17.2 16.3 11.1 9.4 17.7 19.9 34.7 35.1 10.8 n.a. 7.0 7.3
Bahrain n.a. n.a. n.a. 6.3g 5.1g 5.6g 6.4g 27.6 29.8 36.3 35.4 n.a. n.a. 10.2 11.9
Cyprus 7.6 <2.5 n.a. n.a. n.a. n.a. n.a. 20.4 21.8 12.0 13.6 n.a. n.a. n.a. n.a.
Georgia 4.1 7.6 7.0 9.5 31.8 38.8 0.6 9.2 5.7 13.7 7.6 19.3 21.7 26.9 27.5 54.8 20.4 4.8 6.1
TABLE A1.1 (Continued)
| 141 |
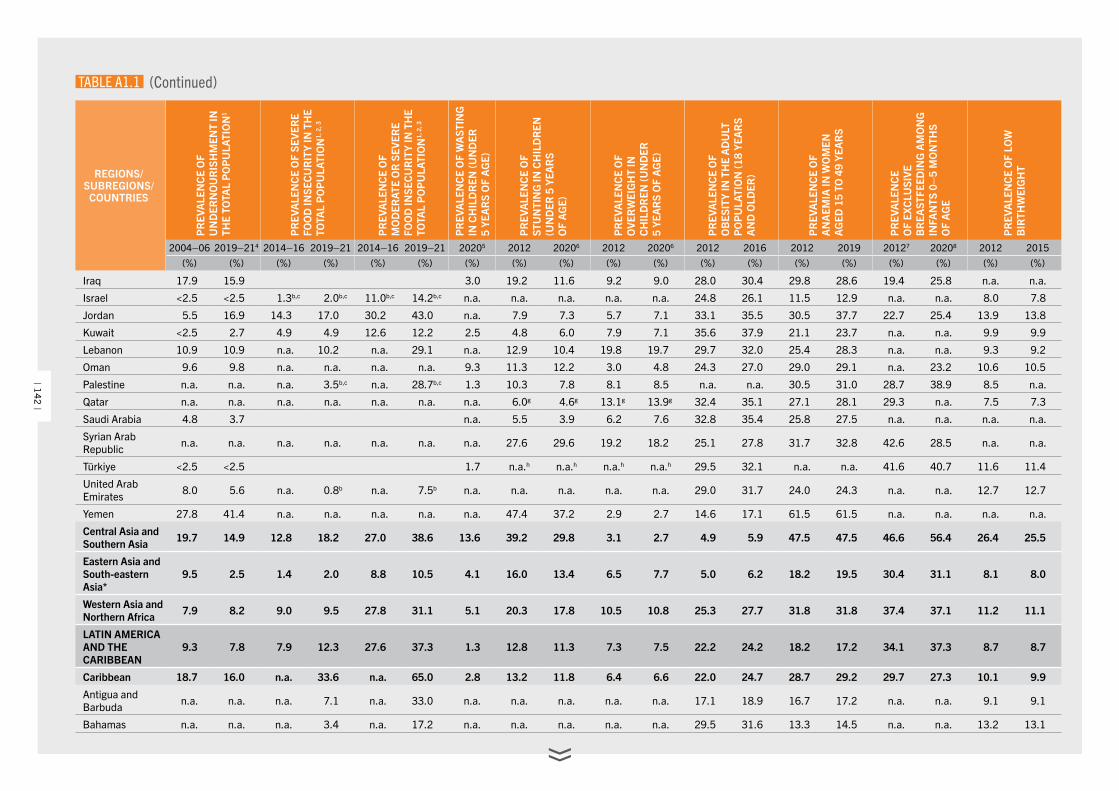
REGIONS/SUBREGIONS/
COUNTRIESP
REV
ALE
NC
E O
F U
ND
ERN
OU
RIS
HM
ENT
IN
THE
TOTA
L P
OP
ULA
TIO
N1
PR
EVA
LEN
CE
OF
SEVE
RE
FOO
D IN
SEC
UR
ITY
IN T
HE
TOTA
L P
OP
ULA
TIO
N1,
2, 3
PR
EVA
LEN
CE
OF
MO
DER
ATE
OR
SEV
ERE
FOO
D IN
SEC
UR
ITY
IN T
HE
TOTA
L P
OP
ULA
TIO
N1,
2, 3
PR
EVA
LEN
CE
OF
WA
STIN
G
IN C
HIL
DR
EN (U
ND
ER
5 YE
AR
S O
F A
GE)
PR
EVA
LEN
CE
OF
STU
NTI
NG
IN C
HIL
DR
EN
(UN
DER
5 Y
EAR
S O
F A
GE)
PR
EVA
LEN
CE
OF
OVE
RW
EIG
HT
IN
CH
ILD
REN
(UN
DER
5
YEA
RS
OF
AG
E)
PR
EVA
LEN
CE
OF
OB
ESIT
Y IN
TH
E A
DU
LT
PO
PU
LATI
ON
(18
YEA
RS
AN
D O
LDER
)
PR
EVA
LEN
CE
OF
A
NA
EMIA
IN W
OM
EN
AG
ED 1
5 TO
49
YEA
RS
PR
EVA
LEN
CE
OF
EXC
LUSI
VE
BR
EAST
FEED
ING
AM
ON
G
INFA
NTS
0–
5 M
ON
THS
OF
AG
E
PR
EVA
LEN
CE
OF
LOW
B
IRTH
WEI
GH
T
2004–06 2019–214 2014–16 2019–21 2014–16 2019–21 20205 2012 20206 2012 20206 2012 2016 2012 2019 20127 20208 2012 2015(%) (%) (%) (%) (%) (%) (%) (%) (%) (%) (%) (%) (%) (%) (%) (%) (%) (%) (%)
Iraq 17.9 15.9 3.0 19.2 11.6 9.2 9.0 28.0 30.4 29.8 28.6 19.4 25.8 n.a. n.a.
Israel <2.5 <2.5 1.3b,c 2.0b,c 11.0b,c 14.2b,c n.a. n.a. n.a. n.a. n.a. 24.8 26.1 11.5 12.9 n.a. n.a. 8.0 7.8
Jordan 5.5 16.9 14.3 17.0 30.2 43.0 n.a. 7.9 7.3 5.7 7.1 33.1 35.5 30.5 37.7 22.7 25.4 13.9 13.8
Kuwait <2.5 2.7 4.9 4.9 12.6 12.2 2.5 4.8 6.0 7.9 7.1 35.6 37.9 21.1 23.7 n.a. n.a. 9.9 9.9
Lebanon 10.9 10.9 n.a. 10.2 n.a. 29.1 n.a. 12.9 10.4 19.8 19.7 29.7 32.0 25.4 28.3 n.a. n.a. 9.3 9.2
Oman 9.6 9.8 n.a. n.a. n.a. n.a. 9.3 11.3 12.2 3.0 4.8 24.3 27.0 29.0 29.1 n.a. 23.2 10.6 10.5
Palestine n.a. n.a. n.a. 3.5b,c n.a. 28.7b,c 1.3 10.3 7.8 8.1 8.5 n.a. n.a. 30.5 31.0 28.7 38.9 8.5 n.a.
Qatar n.a. n.a. n.a. n.a. n.a. n.a. n.a. 6.0g 4.6g 13.1g 13.9g 32.4 35.1 27.1 28.1 29.3 n.a. 7.5 7.3
Saudi Arabia 4.8 3.7 n.a. 5.5 3.9 6.2 7.6 32.8 35.4 25.8 27.5 n.a. n.a. n.a. n.a.
Syrian Arab Republic n.a. n.a. n.a. n.a. n.a. n.a. n.a. 27.6 29.6 19.2 18.2 25.1 27.8 31.7 32.8 42.6 28.5 n.a. n.a.
Türkiye <2.5 <2.5 1.7 n.a.h n.a.h n.a.h n.a.h 29.5 32.1 n.a. n.a. 41.6 40.7 11.6 11.4
United Arab Emirates 8.0 5.6 n.a. 0.8b n.a. 7.5b n.a. n.a. n.a. n.a. n.a. 29.0 31.7 24.0 24.3 n.a. n.a. 12.7 12.7
Yemen 27.8 41.4 n.a. n.a. n.a. n.a. n.a. 47.4 37.2 2.9 2.7 14.6 17.1 61.5 61.5 n.a. n.a. n.a. n.a.
Central Asia and Southern Asia 19.7 14.9 12.8 18.2 27.0 38.6 13.6 39.2 29.8 3.1 2.7 4.9 5.9 47.5 47.5 46.6 56.4 26.4 25.5
Eastern Asia and South-eastern Asia*
9.5 2.5 1.4 2.0 8.8 10.5 4.1 16.0 13.4 6.5 7.7 5.0 6.2 18.2 19.5 30.4 31.1 8.1 8.0
Western Asia and Northern Africa 7.9 8.2 9.0 9.5 27.8 31.1 5.1 20.3 17.8 10.5 10.8 25.3 27.7 31.8 31.8 37.4 37.1 11.2 11.1
LATIN AMERICA AND THE CARIBBEAN
9.3 7.8 7.9 12.3 27.6 37.3 1.3 12.8 11.3 7.3 7.5 22.2 24.2 18.2 17.2 34.1 37.3 8.7 8.7
Caribbean 18.7 16.0 n.a. 33.6 n.a. 65.0 2.8 13.2 11.8 6.4 6.6 22.0 24.7 28.7 29.2 29.7 27.3 10.1 9.9
Antigua and Barbuda n.a. n.a. n.a. 7.1 n.a. 33.0 n.a. n.a. n.a. n.a. n.a. 17.1 18.9 16.7 17.2 n.a. n.a. 9.1 9.1
Bahamas n.a. n.a. n.a. 3.4 n.a. 17.2 n.a. n.a. n.a. n.a. n.a. 29.5 31.6 13.3 14.5 n.a. n.a. 13.2 13.1
TABLE A1.1 (Continued)
| 142 |
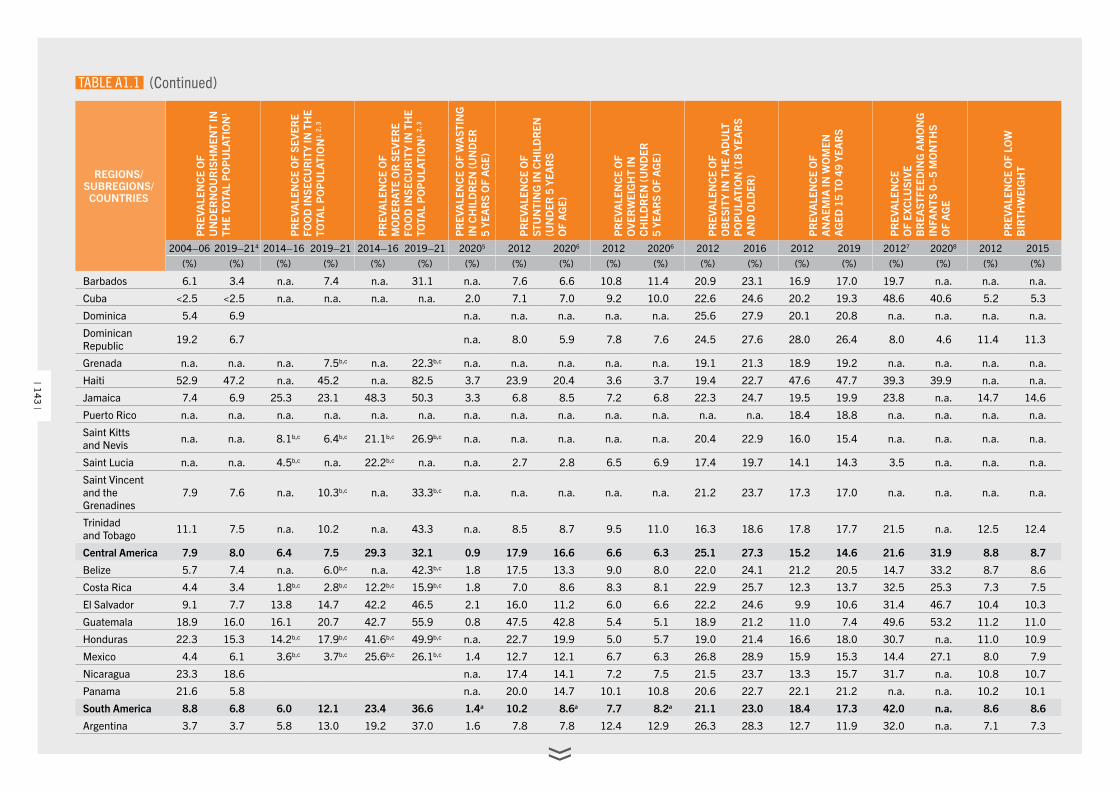
REGIONS/SUBREGIONS/
COUNTRIESP
REV
ALE
NC
E O
F U
ND
ERN
OU
RIS
HM
ENT
IN
THE
TOTA
L P
OP
ULA
TIO
N1
PR
EVA
LEN
CE
OF
SEVE
RE
FOO
D IN
SEC
UR
ITY
IN T
HE
TOTA
L P
OP
ULA
TIO
N1,
2, 3
PR
EVA
LEN
CE
OF
MO
DER
ATE
OR
SEV
ERE
FOO
D IN
SEC
UR
ITY
IN T
HE
TOTA
L P
OP
ULA
TIO
N1,
2, 3
PR
EVA
LEN
CE
OF
WA
STIN
G
IN C
HIL
DR
EN (U
ND
ER
5 YE
AR
S O
F A
GE)
PR
EVA
LEN
CE
OF
STU
NTI
NG
IN C
HIL
DR
EN
(UN
DER
5 Y
EAR
S O
F A
GE)
PR
EVA
LEN
CE
OF
OVE
RW
EIG
HT
IN
CH
ILD
REN
(UN
DER
5
YEA
RS
OF
AG
E)
PR
EVA
LEN
CE
OF
OB
ESIT
Y IN
TH
E A
DU
LT
PO
PU
LATI
ON
(18
YEA
RS
AN
D O
LDER
)
PR
EVA
LEN
CE
OF
A
NA
EMIA
IN W
OM
EN
AG
ED 1
5 TO
49
YEA
RS
PR
EVA
LEN
CE
OF
EXC
LUSI
VE
BR
EAST
FEED
ING
AM
ON
G
INFA
NTS
0–
5 M
ON
THS
OF
AG
E
PR
EVA
LEN
CE
OF
LOW
B
IRTH
WEI
GH
T
2004–06 2019–214 2014–16 2019–21 2014–16 2019–21 20205 2012 20206 2012 20206 2012 2016 2012 2019 20127 20208 2012 2015(%) (%) (%) (%) (%) (%) (%) (%) (%) (%) (%) (%) (%) (%) (%) (%) (%) (%) (%)
Barbados 6.1 3.4 n.a. 7.4 n.a. 31.1 n.a. 7.6 6.6 10.8 11.4 20.9 23.1 16.9 17.0 19.7 n.a. n.a. n.a.
Cuba <2.5 <2.5 n.a. n.a. n.a. n.a. 2.0 7.1 7.0 9.2 10.0 22.6 24.6 20.2 19.3 48.6 40.6 5.2 5.3
Dominica 5.4 6.9 n.a. n.a. n.a. n.a. n.a. 25.6 27.9 20.1 20.8 n.a. n.a. n.a. n.a.
Dominican Republic 19.2 6.7 n.a. 8.0 5.9 7.8 7.6 24.5 27.6 28.0 26.4 8.0 4.6 11.4 11.3
Grenada n.a. n.a. n.a. 7.5b,c n.a. 22.3b,c n.a. n.a. n.a. n.a. n.a. 19.1 21.3 18.9 19.2 n.a. n.a. n.a. n.a.
Haiti 52.9 47.2 n.a. 45.2 n.a. 82.5 3.7 23.9 20.4 3.6 3.7 19.4 22.7 47.6 47.7 39.3 39.9 n.a. n.a.
Jamaica 7.4 6.9 25.3 23.1 48.3 50.3 3.3 6.8 8.5 7.2 6.8 22.3 24.7 19.5 19.9 23.8 n.a. 14.7 14.6
Puerto Rico n.a. n.a. n.a. n.a. n.a. n.a. n.a. n.a. n.a. n.a. n.a. n.a. n.a. 18.4 18.8 n.a. n.a. n.a. n.a.
Saint Kitts and Nevis n.a. n.a. 8.1b,c 6.4b,c 21.1b,c 26.9b,c n.a. n.a. n.a. n.a. n.a. 20.4 22.9 16.0 15.4 n.a. n.a. n.a. n.a.
Saint Lucia n.a. n.a. 4.5b,c n.a. 22.2b,c n.a. n.a. 2.7 2.8 6.5 6.9 17.4 19.7 14.1 14.3 3.5 n.a. n.a. n.a.
Saint Vincent and the Grenadines
7.9 7.6 n.a. 10.3b,c n.a. 33.3b,c n.a. n.a. n.a. n.a. n.a. 21.2 23.7 17.3 17.0 n.a. n.a. n.a. n.a.
Trinidad and Tobago 11.1 7.5 n.a. 10.2 n.a. 43.3 n.a. 8.5 8.7 9.5 11.0 16.3 18.6 17.8 17.7 21.5 n.a. 12.5 12.4
Central America 7.9 8.0 6.4 7.5 29.3 32.1 0.9 17.9 16.6 6.6 6.3 25.1 27.3 15.2 14.6 21.6 31.9 8.8 8.7
Belize 5.7 7.4 n.a. 6.0b,c n.a. 42.3b,c 1.8 17.5 13.3 9.0 8.0 22.0 24.1 21.2 20.5 14.7 33.2 8.7 8.6
Costa Rica 4.4 3.4 1.8b,c 2.8b,c 12.2b,c 15.9b,c 1.8 7.0 8.6 8.3 8.1 22.9 25.7 12.3 13.7 32.5 25.3 7.3 7.5
El Salvador 9.1 7.7 13.8 14.7 42.2 46.5 2.1 16.0 11.2 6.0 6.6 22.2 24.6 9.9 10.6 31.4 46.7 10.4 10.3
Guatemala 18.9 16.0 16.1 20.7 42.7 55.9 0.8 47.5 42.8 5.4 5.1 18.9 21.2 11.0 7.4 49.6 53.2 11.2 11.0
Honduras 22.3 15.3 14.2b,c 17.9b,c 41.6b,c 49.9b,c n.a. 22.7 19.9 5.0 5.7 19.0 21.4 16.6 18.0 30.7 n.a. 11.0 10.9
Mexico 4.4 6.1 3.6b,c 3.7b,c 25.6b,c 26.1b,c 1.4 12.7 12.1 6.7 6.3 26.8 28.9 15.9 15.3 14.4 27.1 8.0 7.9
Nicaragua 23.3 18.6 n.a. 17.4 14.1 7.2 7.5 21.5 23.7 13.3 15.7 31.7 n.a. 10.8 10.7
Panama 21.6 5.8 n.a. 20.0 14.7 10.1 10.8 20.6 22.7 22.1 21.2 n.a. n.a. 10.2 10.1
South America 8.8 6.8 6.0 12.1 23.4 36.6 1.4a 10.2 8.6a 7.7 8.2a 21.1 23.0 18.4 17.3 42.0 n.a. 8.6 8.6
Argentina 3.7 3.7 5.8 13.0 19.2 37.0 1.6 7.8 7.8 12.4 12.9 26.3 28.3 12.7 11.9 32.0 n.a. 7.1 7.3
TABLE A1.1 (Continued)
| 143 |
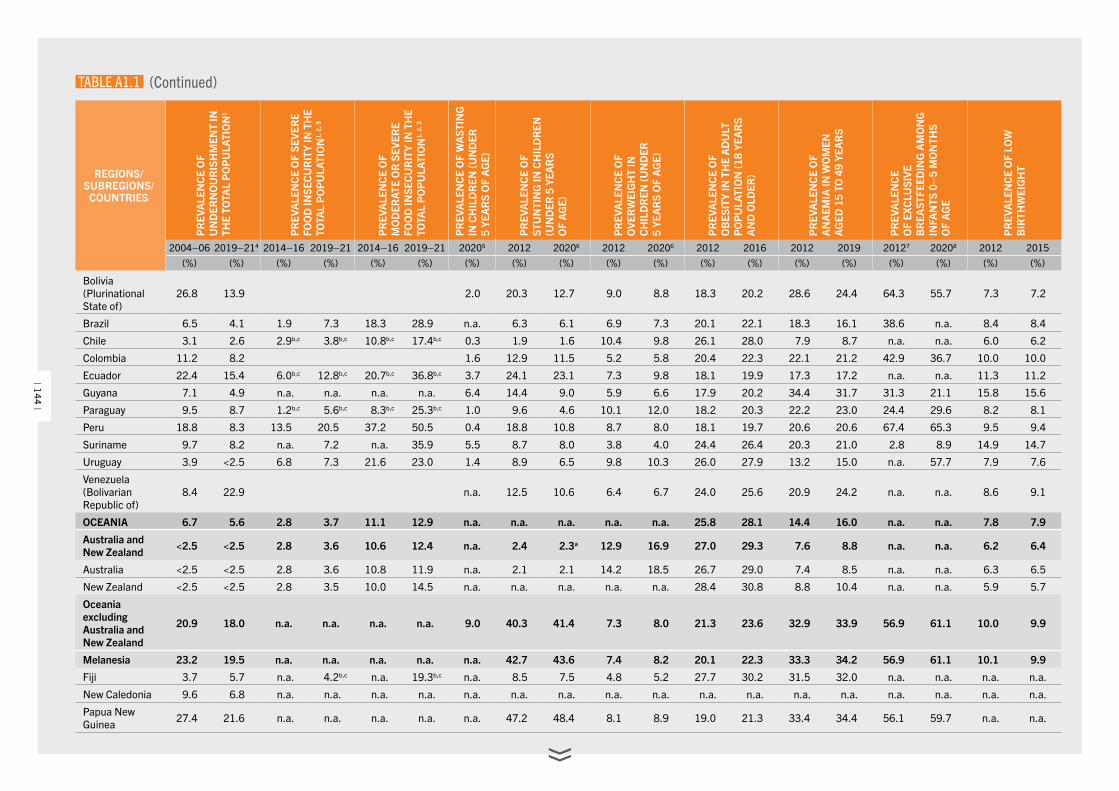
REGIONS/SUBREGIONS/
COUNTRIESP
REV
ALE
NC
E O
F U
ND
ERN
OU
RIS
HM
ENT
IN
THE
TOTA
L P
OP
ULA
TIO
N1
PR
EVA
LEN
CE
OF
SEVE
RE
FOO
D IN
SEC
UR
ITY
IN T
HE
TOTA
L P
OP
ULA
TIO
N1,
2, 3
PR
EVA
LEN
CE
OF
MO
DER
ATE
OR
SEV
ERE
FOO
D IN
SEC
UR
ITY
IN T
HE
TOTA
L P
OP
ULA
TIO
N1,
2, 3
PR
EVA
LEN
CE
OF
WA
STIN
G
IN C
HIL
DR
EN (U
ND
ER
5 YE
AR
S O
F A
GE)
PR
EVA
LEN
CE
OF
STU
NTI
NG
IN C
HIL
DR
EN
(UN
DER
5 Y
EAR
S O
F A
GE)
PR
EVA
LEN
CE
OF
OVE
RW
EIG
HT
IN
CH
ILD
REN
(UN
DER
5
YEA
RS
OF
AG
E)
PR
EVA
LEN
CE
OF
OB
ESIT
Y IN
TH
E A
DU
LT
PO
PU
LATI
ON
(18
YEA
RS
AN
D O
LDER
)
PR
EVA
LEN
CE
OF
A
NA
EMIA
IN W
OM
EN
AG
ED 1
5 TO
49
YEA
RS
PR
EVA
LEN
CE
OF
EXC
LUSI
VE
BR
EAST
FEED
ING
AM
ON
G
INFA
NTS
0–
5 M
ON
THS
OF
AG
E
PR
EVA
LEN
CE
OF
LOW
B
IRTH
WEI
GH
T
2004–06 2019–214 2014–16 2019–21 2014–16 2019–21 20205 2012 20206 2012 20206 2012 2016 2012 2019 20127 20208 2012 2015(%) (%) (%) (%) (%) (%) (%) (%) (%) (%) (%) (%) (%) (%) (%) (%) (%) (%) (%)
Bolivia (Plurinational State of)
26.8 13.9 2.0 20.3 12.7 9.0 8.8 18.3 20.2 28.6 24.4 64.3 55.7 7.3 7.2
Brazil 6.5 4.1 1.9 7.3 18.3 28.9 n.a. 6.3 6.1 6.9 7.3 20.1 22.1 18.3 16.1 38.6 n.a. 8.4 8.4
Chile 3.1 2.6 2.9b,c 3.8b,c 10.8b,c 17.4b,c 0.3 1.9 1.6 10.4 9.8 26.1 28.0 7.9 8.7 n.a. n.a. 6.0 6.2
Colombia 11.2 8.2 1.6 12.9 11.5 5.2 5.8 20.4 22.3 22.1 21.2 42.9 36.7 10.0 10.0
Ecuador 22.4 15.4 6.0b,c 12.8b,c 20.7b,c 36.8b,c 3.7 24.1 23.1 7.3 9.8 18.1 19.9 17.3 17.2 n.a. n.a. 11.3 11.2
Guyana 7.1 4.9 n.a. n.a. n.a. n.a. 6.4 14.4 9.0 5.9 6.6 17.9 20.2 34.4 31.7 31.3 21.1 15.8 15.6
Paraguay 9.5 8.7 1.2b,c 5.6b,c 8.3b,c 25.3b,c 1.0 9.6 4.6 10.1 12.0 18.2 20.3 22.2 23.0 24.4 29.6 8.2 8.1
Peru 18.8 8.3 13.5 20.5 37.2 50.5 0.4 18.8 10.8 8.7 8.0 18.1 19.7 20.6 20.6 67.4 65.3 9.5 9.4
Suriname 9.7 8.2 n.a. 7.2 n.a. 35.9 5.5 8.7 8.0 3.8 4.0 24.4 26.4 20.3 21.0 2.8 8.9 14.9 14.7
Uruguay 3.9 <2.5 6.8 7.3 21.6 23.0 1.4 8.9 6.5 9.8 10.3 26.0 27.9 13.2 15.0 n.a. 57.7 7.9 7.6
Venezuela (Bolivarian Republic of)
8.4 22.9 n.a. 12.5 10.6 6.4 6.7 24.0 25.6 20.9 24.2 n.a. n.a. 8.6 9.1
OCEANIA 6.7 5.6 2.8 3.7 11.1 12.9 n.a. n.a. n.a. n.a. n.a. 25.8 28.1 14.4 16.0 n.a. n.a. 7.8 7.9
Australia and New Zealand <2.5 <2.5 2.8 3.6 10.6 12.4 n.a. 2.4 2.3a 12.9 16.9 27.0 29.3 7.6 8.8 n.a. n.a. 6.2 6.4
Australia <2.5 <2.5 2.8 3.6 10.8 11.9 n.a. 2.1 2.1 14.2 18.5 26.7 29.0 7.4 8.5 n.a. n.a. 6.3 6.5
New Zealand <2.5 <2.5 2.8 3.5 10.0 14.5 n.a. n.a. n.a. n.a. n.a. 28.4 30.8 8.8 10.4 n.a. n.a. 5.9 5.7
Oceania excluding Australia and New Zealand
20.9 18.0 n.a. n.a. n.a. n.a. 9.0 40.3 41.4 7.3 8.0 21.3 23.6 32.9 33.9 56.9 61.1 10.0 9.9
Melanesia 23.2 19.5 n.a. n.a. n.a. n.a. n.a. 42.7 43.6 7.4 8.2 20.1 22.3 33.3 34.2 56.9 61.1 10.1 9.9
Fiji 3.7 5.7 n.a. 4.2b,c n.a. 19.3b,c n.a. 8.5 7.5 4.8 5.2 27.7 30.2 31.5 32.0 n.a. n.a. n.a. n.a.
New Caledonia 9.6 6.8 n.a. n.a. n.a. n.a. n.a. n.a. n.a. n.a. n.a. n.a. n.a. n.a. n.a. n.a. n.a. n.a. n.a.
Papua New Guinea 27.4 21.6 n.a. n.a. n.a. n.a. n.a. 47.2 48.4 8.1 8.9 19.0 21.3 33.4 34.4 56.1 59.7 n.a. n.a.
TABLE A1.1 (Continued)
| 144 |
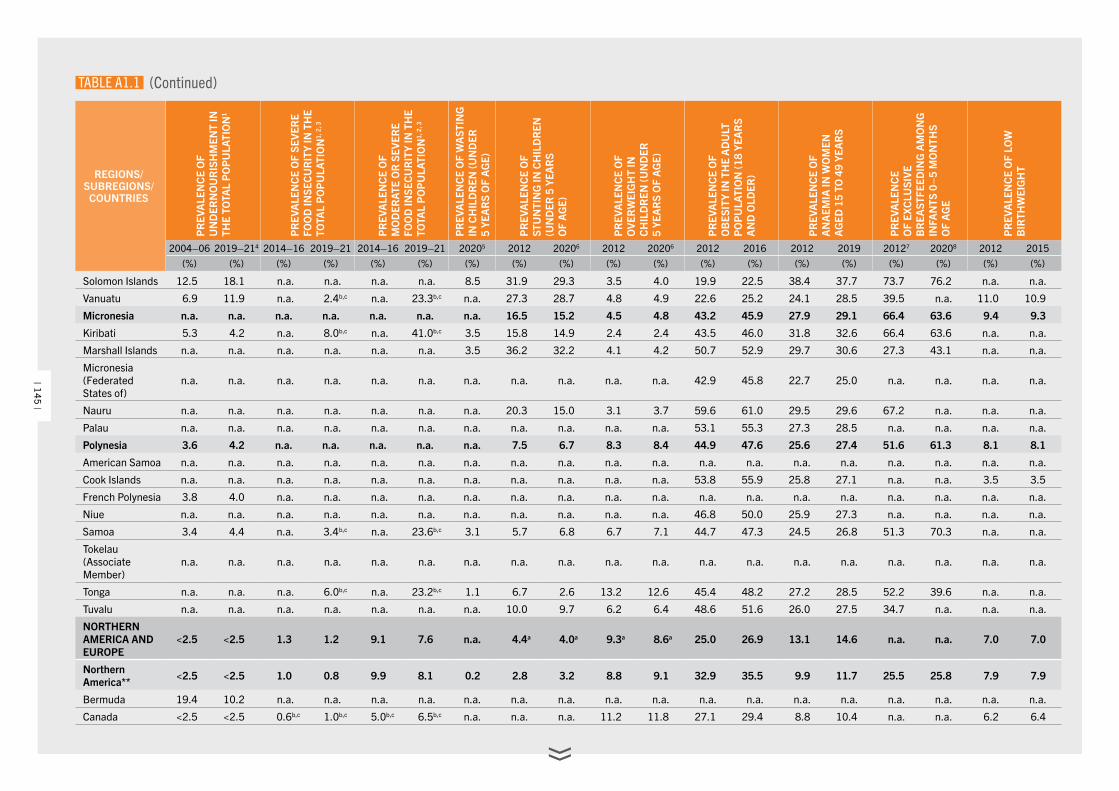
REGIONS/SUBREGIONS/
COUNTRIESP
REV
ALE
NC
E O
F U
ND
ERN
OU
RIS
HM
ENT
IN
THE
TOTA
L P
OP
ULA
TIO
N1
PR
EVA
LEN
CE
OF
SEVE
RE
FOO
D IN
SEC
UR
ITY
IN T
HE
TOTA
L P
OP
ULA
TIO
N1,
2, 3
PR
EVA
LEN
CE
OF
MO
DER
ATE
OR
SEV
ERE
FOO
D IN
SEC
UR
ITY
IN T
HE
TOTA
L P
OP
ULA
TIO
N1,
2, 3
PR
EVA
LEN
CE
OF
WA
STIN
G
IN C
HIL
DR
EN (U
ND
ER
5 YE
AR
S O
F A
GE)
PR
EVA
LEN
CE
OF
STU
NTI
NG
IN C
HIL
DR
EN
(UN
DER
5 Y
EAR
S O
F A
GE)
PR
EVA
LEN
CE
OF
OVE
RW
EIG
HT
IN
CH
ILD
REN
(UN
DER
5
YEA
RS
OF
AG
E)
PR
EVA
LEN
CE
OF
OB
ESIT
Y IN
TH
E A
DU
LT
PO
PU
LATI
ON
(18
YEA
RS
AN
D O
LDER
)
PR
EVA
LEN
CE
OF
A
NA
EMIA
IN W
OM
EN
AG
ED 1
5 TO
49
YEA
RS
PR
EVA
LEN
CE
OF
EXC
LUSI
VE
BR
EAST
FEED
ING
AM
ON
G
INFA
NTS
0–
5 M
ON
THS
OF
AG
E
PR
EVA
LEN
CE
OF
LOW
B
IRTH
WEI
GH
T
2004–06 2019–214 2014–16 2019–21 2014–16 2019–21 20205 2012 20206 2012 20206 2012 2016 2012 2019 20127 20208 2012 2015(%) (%) (%) (%) (%) (%) (%) (%) (%) (%) (%) (%) (%) (%) (%) (%) (%) (%) (%)
Solomon Islands 12.5 18.1 n.a. n.a. n.a. n.a. 8.5 31.9 29.3 3.5 4.0 19.9 22.5 38.4 37.7 73.7 76.2 n.a. n.a.
Vanuatu 6.9 11.9 n.a. 2.4b,c n.a. 23.3b,c n.a. 27.3 28.7 4.8 4.9 22.6 25.2 24.1 28.5 39.5 n.a. 11.0 10.9
Micronesia n.a. n.a. n.a. n.a. n.a. n.a. n.a. 16.5 15.2 4.5 4.8 43.2 45.9 27.9 29.1 66.4 63.6 9.4 9.3
Kiribati 5.3 4.2 n.a. 8.0b,c n.a. 41.0b,c 3.5 15.8 14.9 2.4 2.4 43.5 46.0 31.8 32.6 66.4 63.6 n.a. n.a.
Marshall Islands n.a. n.a. n.a. n.a. n.a. n.a. 3.5 36.2 32.2 4.1 4.2 50.7 52.9 29.7 30.6 27.3 43.1 n.a. n.a.
Micronesia (Federated States of)
n.a. n.a. n.a. n.a. n.a. n.a. n.a. n.a. n.a. n.a. n.a. 42.9 45.8 22.7 25.0 n.a. n.a. n.a. n.a.
Nauru n.a. n.a. n.a. n.a. n.a. n.a. n.a. 20.3 15.0 3.1 3.7 59.6 61.0 29.5 29.6 67.2 n.a. n.a. n.a.
Palau n.a. n.a. n.a. n.a. n.a. n.a. n.a. n.a. n.a. n.a. n.a. 53.1 55.3 27.3 28.5 n.a. n.a. n.a. n.a.
Polynesia 3.6 4.2 n.a. n.a. n.a. n.a. n.a. 7.5 6.7 8.3 8.4 44.9 47.6 25.6 27.4 51.6 61.3 8.1 8.1
American Samoa n.a. n.a. n.a. n.a. n.a. n.a. n.a. n.a. n.a. n.a. n.a. n.a. n.a. n.a. n.a. n.a. n.a. n.a. n.a.
Cook Islands n.a. n.a. n.a. n.a. n.a. n.a. n.a. n.a. n.a. n.a. n.a. 53.8 55.9 25.8 27.1 n.a. n.a. 3.5 3.5
French Polynesia 3.8 4.0 n.a. n.a. n.a. n.a. n.a. n.a. n.a. n.a. n.a. n.a. n.a. n.a. n.a. n.a. n.a. n.a. n.a.
Niue n.a. n.a. n.a. n.a. n.a. n.a. n.a. n.a. n.a. n.a. n.a. 46.8 50.0 25.9 27.3 n.a. n.a. n.a. n.a.
Samoa 3.4 4.4 n.a. 3.4b,c n.a. 23.6b,c 3.1 5.7 6.8 6.7 7.1 44.7 47.3 24.5 26.8 51.3 70.3 n.a. n.a.
Tokelau (Associate Member)
n.a. n.a. n.a. n.a. n.a. n.a. n.a. n.a. n.a. n.a. n.a. n.a. n.a. n.a. n.a. n.a. n.a. n.a. n.a.
Tonga n.a. n.a. n.a. 6.0b,c n.a. 23.2b,c 1.1 6.7 2.6 13.2 12.6 45.4 48.2 27.2 28.5 52.2 39.6 n.a. n.a.
Tuvalu n.a. n.a. n.a. n.a. n.a. n.a. n.a. 10.0 9.7 6.2 6.4 48.6 51.6 26.0 27.5 34.7 n.a. n.a. n.a.
NORTHERN AMERICA AND EUROPE
<2.5 <2.5 1.3 1.2 9.1 7.6 n.a. 4.4a 4.0a 9.3a 8.6a 25.0 26.9 13.1 14.6 n.a. n.a. 7.0 7.0
Northern America** <2.5 <2.5 1.0 0.8 9.9 8.1 0.2 2.8 3.2 8.8 9.1 32.9 35.5 9.9 11.7 25.5 25.8 7.9 7.9
Bermuda 19.4 10.2 n.a. n.a. n.a. n.a. n.a. n.a. n.a. n.a. n.a. n.a. n.a. n.a. n.a. n.a. n.a. n.a. n.a.
Canada <2.5 <2.5 0.6b,c 1.0b,c 5.0b,c 6.5b,c n.a. n.a. n.a. 11.2 11.8 27.1 29.4 8.8 10.4 n.a. n.a. 6.2 6.4
TABLE A1.1 (Continued)
| 145 |
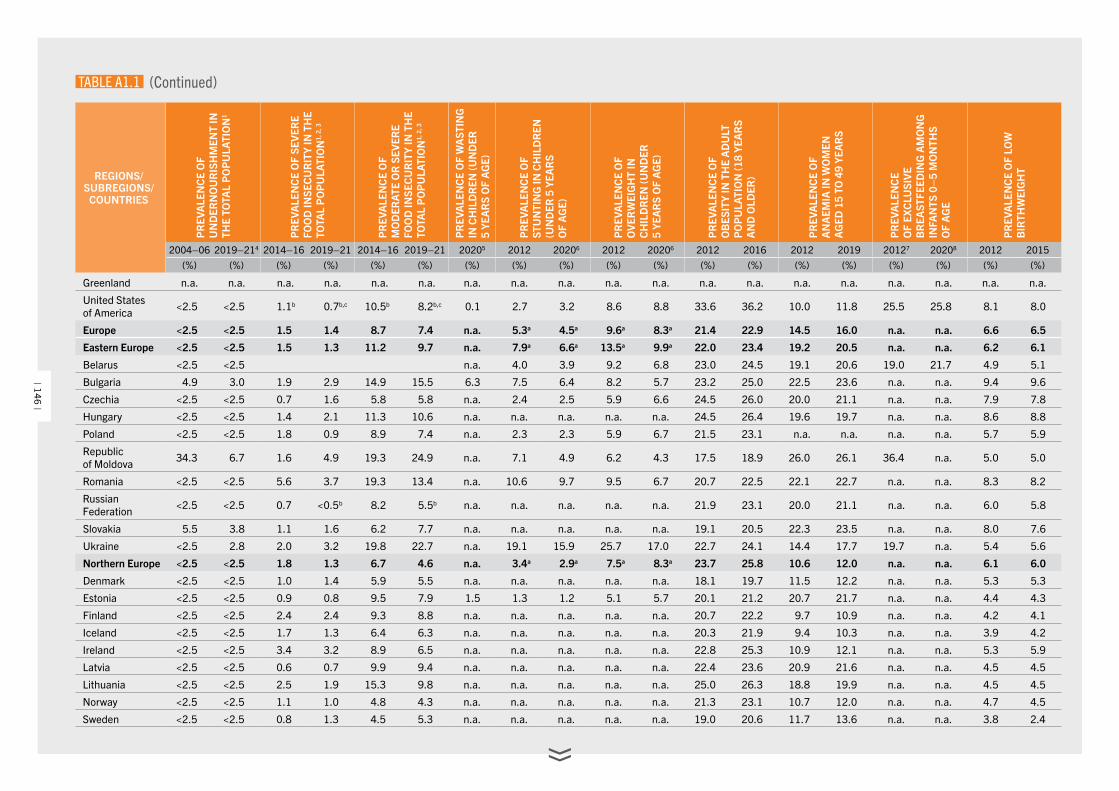
REGIONS/SUBREGIONS/
COUNTRIESP
REV
ALE
NC
E O
F U
ND
ERN
OU
RIS
HM
ENT
IN
THE
TOTA
L P
OP
ULA
TIO
N1
PR
EVA
LEN
CE
OF
SEVE
RE
FOO
D IN
SEC
UR
ITY
IN T
HE
TOTA
L P
OP
ULA
TIO
N1,
2, 3
PR
EVA
LEN
CE
OF
MO
DER
ATE
OR
SEV
ERE
FOO
D IN
SEC
UR
ITY
IN T
HE
TOTA
L P
OP
ULA
TIO
N1,
2, 3
PR
EVA
LEN
CE
OF
WA
STIN
G
IN C
HIL
DR
EN (U
ND
ER
5 YE
AR
S O
F A
GE)
PR
EVA
LEN
CE
OF
STU
NTI
NG
IN C
HIL
DR
EN
(UN
DER
5 Y
EAR
S O
F A
GE)
PR
EVA
LEN
CE
OF
OVE
RW
EIG
HT
IN
CH
ILD
REN
(UN
DER
5
YEA
RS
OF
AG
E)
PR
EVA
LEN
CE
OF
OB
ESIT
Y IN
TH
E A
DU
LT
PO
PU
LATI
ON
(18
YEA
RS
AN
D O
LDER
)
PR
EVA
LEN
CE
OF
A
NA
EMIA
IN W
OM
EN
AG
ED 1
5 TO
49
YEA
RS
PR
EVA
LEN
CE
OF
EXC
LUSI
VE
BR
EAST
FEED
ING
AM
ON
G
INFA
NTS
0–
5 M
ON
THS
OF
AG
E
PR
EVA
LEN
CE
OF
LOW
B
IRTH
WEI
GH
T
2004–06 2019–214 2014–16 2019–21 2014–16 2019–21 20205 2012 20206 2012 20206 2012 2016 2012 2019 20127 20208 2012 2015(%) (%) (%) (%) (%) (%) (%) (%) (%) (%) (%) (%) (%) (%) (%) (%) (%) (%) (%)
Greenland n.a. n.a. n.a. n.a. n.a. n.a. n.a. n.a. n.a. n.a. n.a. n.a. n.a. n.a. n.a. n.a. n.a. n.a. n.a.
United States of America <2.5 <2.5 1.1b 0.7b,c 10.5b 8.2b,c 0.1 2.7 3.2 8.6 8.8 33.6 36.2 10.0 11.8 25.5 25.8 8.1 8.0
Europe <2.5 <2.5 1.5 1.4 8.7 7.4 n.a. 5.3a 4.5a 9.6a 8.3a 21.4 22.9 14.5 16.0 n.a. n.a. 6.6 6.5
Eastern Europe <2.5 <2.5 1.5 1.3 11.2 9.7 n.a. 7.9a 6.6a 13.5a 9.9a 22.0 23.4 19.2 20.5 n.a. n.a. 6.2 6.1
Belarus <2.5 <2.5 n.a. 4.0 3.9 9.2 6.8 23.0 24.5 19.1 20.6 19.0 21.7 4.9 5.1
Bulgaria 4.9 3.0 1.9 2.9 14.9 15.5 6.3 7.5 6.4 8.2 5.7 23.2 25.0 22.5 23.6 n.a. n.a. 9.4 9.6
Czechia <2.5 <2.5 0.7 1.6 5.8 5.8 n.a. 2.4 2.5 5.9 6.6 24.5 26.0 20.0 21.1 n.a. n.a. 7.9 7.8
Hungary <2.5 <2.5 1.4 2.1 11.3 10.6 n.a. n.a. n.a. n.a. n.a. 24.5 26.4 19.6 19.7 n.a. n.a. 8.6 8.8
Poland <2.5 <2.5 1.8 0.9 8.9 7.4 n.a. 2.3 2.3 5.9 6.7 21.5 23.1 n.a. n.a. n.a. n.a. 5.7 5.9
Republic of Moldova 34.3 6.7 1.6 4.9 19.3 24.9 n.a. 7.1 4.9 6.2 4.3 17.5 18.9 26.0 26.1 36.4 n.a. 5.0 5.0
Romania <2.5 <2.5 5.6 3.7 19.3 13.4 n.a. 10.6 9.7 9.5 6.7 20.7 22.5 22.1 22.7 n.a. n.a. 8.3 8.2
Russian Federation <2.5 <2.5 0.7 <0.5b 8.2 5.5b n.a. n.a. n.a. n.a. n.a. 21.9 23.1 20.0 21.1 n.a. n.a. 6.0 5.8
Slovakia 5.5 3.8 1.1 1.6 6.2 7.7 n.a. n.a. n.a. n.a. n.a. 19.1 20.5 22.3 23.5 n.a. n.a. 8.0 7.6
Ukraine <2.5 2.8 2.0 3.2 19.8 22.7 n.a. 19.1 15.9 25.7 17.0 22.7 24.1 14.4 17.7 19.7 n.a. 5.4 5.6
Northern Europe <2.5 <2.5 1.8 1.3 6.7 4.6 n.a. 3.4a 2.9a 7.5a 8.3a 23.7 25.8 10.6 12.0 n.a. n.a. 6.1 6.0
Denmark <2.5 <2.5 1.0 1.4 5.9 5.5 n.a. n.a. n.a. n.a. n.a. 18.1 19.7 11.5 12.2 n.a. n.a. 5.3 5.3
Estonia <2.5 <2.5 0.9 0.8 9.5 7.9 1.5 1.3 1.2 5.1 5.7 20.1 21.2 20.7 21.7 n.a. n.a. 4.4 4.3
Finland <2.5 <2.5 2.4 2.4 9.3 8.8 n.a. n.a. n.a. n.a. n.a. 20.7 22.2 9.7 10.9 n.a. n.a. 4.2 4.1
Iceland <2.5 <2.5 1.7 1.3 6.4 6.3 n.a. n.a. n.a. n.a. n.a. 20.3 21.9 9.4 10.3 n.a. n.a. 3.9 4.2
Ireland <2.5 <2.5 3.4 3.2 8.9 6.5 n.a. n.a. n.a. n.a. n.a. 22.8 25.3 10.9 12.1 n.a. n.a. 5.3 5.9
Latvia <2.5 <2.5 0.6 0.7 9.9 9.4 n.a. n.a. n.a. n.a. n.a. 22.4 23.6 20.9 21.6 n.a. n.a. 4.5 4.5
Lithuania <2.5 <2.5 2.5 1.9 15.3 9.8 n.a. n.a. n.a. n.a. n.a. 25.0 26.3 18.8 19.9 n.a. n.a. 4.5 4.5
Norway <2.5 <2.5 1.1 1.0 4.8 4.3 n.a. n.a. n.a. n.a. n.a. 21.3 23.1 10.7 12.0 n.a. n.a. 4.7 4.5
Sweden <2.5 <2.5 0.8 1.3 4.5 5.3 n.a. n.a. n.a. n.a. n.a. 19.0 20.6 11.7 13.6 n.a. n.a. 3.8 2.4
TABLE A1.1 (Continued)
| 146 |
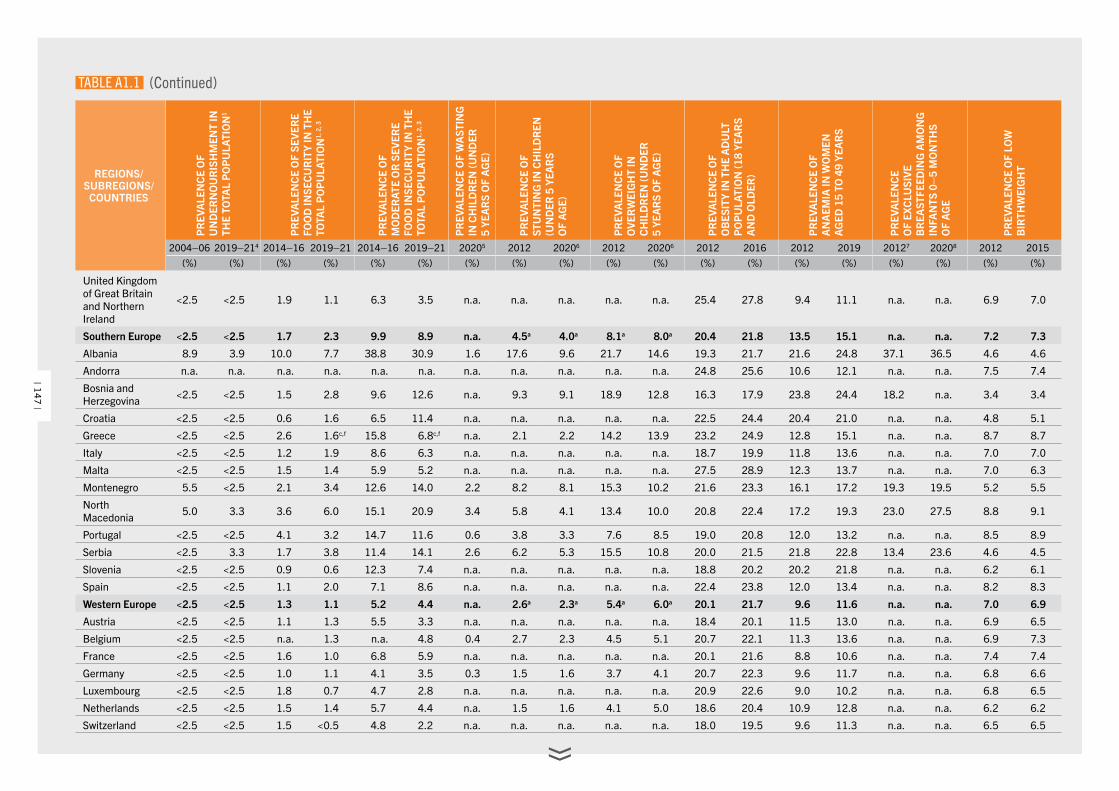
REGIONS/SUBREGIONS/
COUNTRIESP
REV
ALE
NC
E O
F U
ND
ERN
OU
RIS
HM
ENT
IN
THE
TOTA
L P
OP
ULA
TIO
N1
PR
EVA
LEN
CE
OF
SEVE
RE
FOO
D IN
SEC
UR
ITY
IN T
HE
TOTA
L P
OP
ULA
TIO
N1,
2, 3
PR
EVA
LEN
CE
OF
MO
DER
ATE
OR
SEV
ERE
FOO
D IN
SEC
UR
ITY
IN T
HE
TOTA
L P
OP
ULA
TIO
N1,
2, 3
PR
EVA
LEN
CE
OF
WA
STIN
G
IN C
HIL
DR
EN (U
ND
ER
5 YE
AR
S O
F A
GE)
PR
EVA
LEN
CE
OF
STU
NTI
NG
IN C
HIL
DR
EN
(UN
DER
5 Y
EAR
S O
F A
GE)
PR
EVA
LEN
CE
OF
OVE
RW
EIG
HT
IN
CH
ILD
REN
(UN
DER
5
YEA
RS
OF
AG
E)
PR
EVA
LEN
CE
OF
OB
ESIT
Y IN
TH
E A
DU
LT
PO
PU
LATI
ON
(18
YEA
RS
AN
D O
LDER
)
PR
EVA
LEN
CE
OF
A
NA
EMIA
IN W
OM
EN
AG
ED 1
5 TO
49
YEA
RS
PR
EVA
LEN
CE
OF
EXC
LUSI
VE
BR
EAST
FEED
ING
AM
ON
G
INFA
NTS
0–
5 M
ON
THS
OF
AG
E
PR
EVA
LEN
CE
OF
LOW
B
IRTH
WEI
GH
T
2004–06 2019–214 2014–16 2019–21 2014–16 2019–21 20205 2012 20206 2012 20206 2012 2016 2012 2019 20127 20208 2012 2015(%) (%) (%) (%) (%) (%) (%) (%) (%) (%) (%) (%) (%) (%) (%) (%) (%) (%) (%)
United Kingdom of Great Britain and Northern Ireland
<2.5 <2.5 1.9 1.1 6.3 3.5 n.a. n.a. n.a. n.a. n.a. 25.4 27.8 9.4 11.1 n.a. n.a. 6.9 7.0
Southern Europe <2.5 <2.5 1.7 2.3 9.9 8.9 n.a. 4.5a 4.0a 8.1a 8.0a 20.4 21.8 13.5 15.1 n.a. n.a. 7.2 7.3
Albania 8.9 3.9 10.0 7.7 38.8 30.9 1.6 17.6 9.6 21.7 14.6 19.3 21.7 21.6 24.8 37.1 36.5 4.6 4.6
Andorra n.a. n.a. n.a. n.a. n.a. n.a. n.a. n.a. n.a. n.a. n.a. 24.8 25.6 10.6 12.1 n.a. n.a. 7.5 7.4
Bosnia and Herzegovina <2.5 <2.5 1.5 2.8 9.6 12.6 n.a. 9.3 9.1 18.9 12.8 16.3 17.9 23.8 24.4 18.2 n.a. 3.4 3.4
Croatia <2.5 <2.5 0.6 1.6 6.5 11.4 n.a. n.a. n.a. n.a. n.a. 22.5 24.4 20.4 21.0 n.a. n.a. 4.8 5.1
Greece <2.5 <2.5 2.6 1.6c,f 15.8 6.8c,f n.a. 2.1 2.2 14.2 13.9 23.2 24.9 12.8 15.1 n.a. n.a. 8.7 8.7
Italy <2.5 <2.5 1.2 1.9 8.6 6.3 n.a. n.a. n.a. n.a. n.a. 18.7 19.9 11.8 13.6 n.a. n.a. 7.0 7.0
Malta <2.5 <2.5 1.5 1.4 5.9 5.2 n.a. n.a. n.a. n.a. n.a. 27.5 28.9 12.3 13.7 n.a. n.a. 7.0 6.3
Montenegro 5.5 <2.5 2.1 3.4 12.6 14.0 2.2 8.2 8.1 15.3 10.2 21.6 23.3 16.1 17.2 19.3 19.5 5.2 5.5
North Macedonia 5.0 3.3 3.6 6.0 15.1 20.9 3.4 5.8 4.1 13.4 10.0 20.8 22.4 17.2 19.3 23.0 27.5 8.8 9.1
Portugal <2.5 <2.5 4.1 3.2 14.7 11.6 0.6 3.8 3.3 7.6 8.5 19.0 20.8 12.0 13.2 n.a. n.a. 8.5 8.9
Serbia <2.5 3.3 1.7 3.8 11.4 14.1 2.6 6.2 5.3 15.5 10.8 20.0 21.5 21.8 22.8 13.4 23.6 4.6 4.5
Slovenia <2.5 <2.5 0.9 0.6 12.3 7.4 n.a. n.a. n.a. n.a. n.a. 18.8 20.2 20.2 21.8 n.a. n.a. 6.2 6.1
Spain <2.5 <2.5 1.1 2.0 7.1 8.6 n.a. n.a. n.a. n.a. n.a. 22.4 23.8 12.0 13.4 n.a. n.a. 8.2 8.3
Western Europe <2.5 <2.5 1.3 1.1 5.2 4.4 n.a. 2.6a 2.3a 5.4a 6.0a 20.1 21.7 9.6 11.6 n.a. n.a. 7.0 6.9
Austria <2.5 <2.5 1.1 1.3 5.5 3.3 n.a. n.a. n.a. n.a. n.a. 18.4 20.1 11.5 13.0 n.a. n.a. 6.9 6.5
Belgium <2.5 <2.5 n.a. 1.3 n.a. 4.8 0.4 2.7 2.3 4.5 5.1 20.7 22.1 11.3 13.6 n.a. n.a. 6.9 7.3
France <2.5 <2.5 1.6 1.0 6.8 5.9 n.a. n.a. n.a. n.a. n.a. 20.1 21.6 8.8 10.6 n.a. n.a. 7.4 7.4
Germany <2.5 <2.5 1.0 1.1 4.1 3.5 0.3 1.5 1.6 3.7 4.1 20.7 22.3 9.6 11.7 n.a. n.a. 6.8 6.6
Luxembourg <2.5 <2.5 1.8 0.7 4.7 2.8 n.a. n.a. n.a. n.a. n.a. 20.9 22.6 9.0 10.2 n.a. n.a. 6.8 6.5
Netherlands <2.5 <2.5 1.5 1.4 5.7 4.4 n.a. 1.5 1.6 4.1 5.0 18.6 20.4 10.9 12.8 n.a. n.a. 6.2 6.2
Switzerland <2.5 <2.5 1.5 <0.5 4.8 2.2 n.a. n.a. n.a. n.a. n.a. 18.0 19.5 9.6 11.3 n.a. n.a. 6.5 6.5
TABLE A1.1 (Continued)
| 147 |
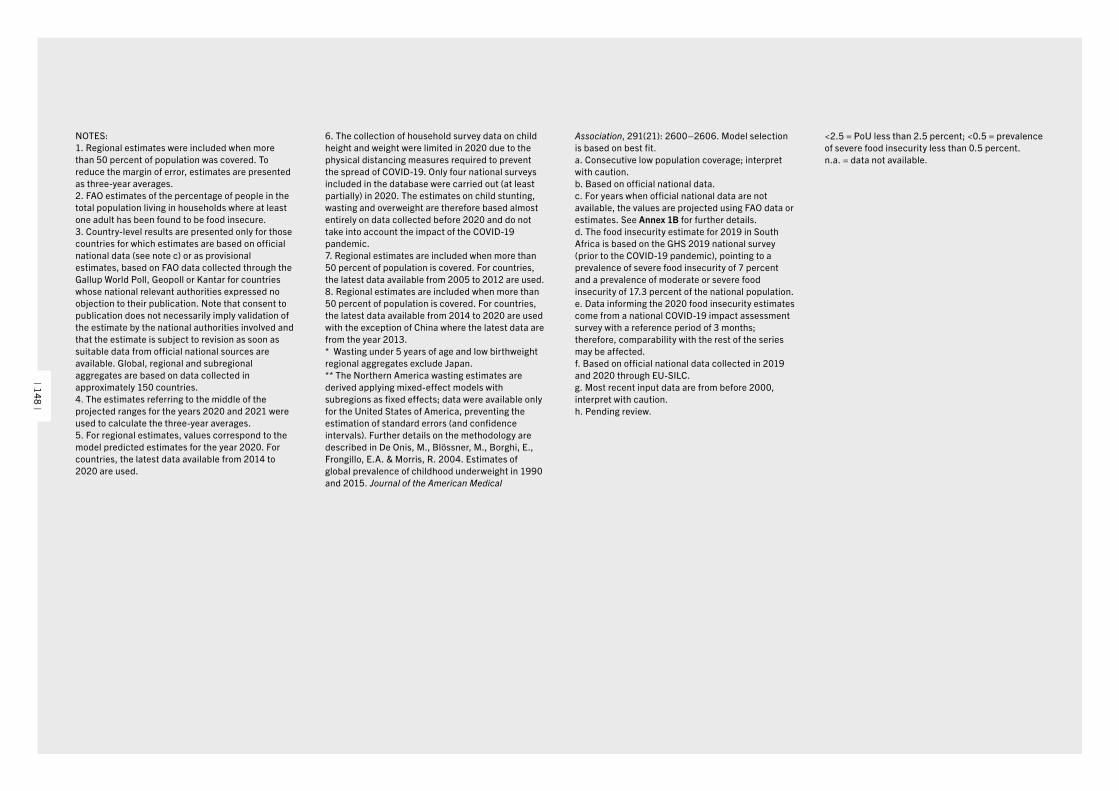
NOTES:1. Regional estimates were included when more than 50 percent of population was covered. To reduce the margin of error, estimates are presented as three-year averages.2. FAO estimates of the percentage of people in the total population living in households where at least one adult has been found to be food insecure. 3. Country-level results are presented only for those countries for which estimates are based on official national data (see note c) or as provisional estimates, based on FAO data collected through the Gallup World Poll, Geopoll or Kantar for countries whose national relevant authorities expressed no objection to their publication. Note that consent to publication does not necessarily imply validation of the estimate by the national authorities involved and that the estimate is subject to revision as soon as suitable data from official national sources are available. Global, regional and subregional aggregates are based on data collected in approximately 150 countries.4. The estimates referring to the middle of the projected ranges for the years 2020 and 2021 were used to calculate the three-year averages.5. For regional estimates, values correspond to the model predicted estimates for the year 2020. For countries, the latest data available from 2014 to 2020 are used.
6. The collection of household survey data on child height and weight were limited in 2020 due to the physical distancing measures required to prevent the spread of COVID-19. Only four national surveys included in the database were carried out (at least partially) in 2020. The estimates on child stunting, wasting and overweight are therefore based almost entirely on data collected before 2020 and do not take into account the impact of the COVID-19 pandemic.7. Regional estimates are included when more than 50 percent of population is covered. For countries, the latest data available from 2005 to 2012 are used.8. Regional estimates are included when more than 50 percent of population is covered. For countries, the latest data available from 2014 to 2020 are used with the exception of China where the latest data are from the year 2013.* Wasting under 5 years of age and low birthweight regional aggregates exclude Japan.** The Northern America wasting estimates are derived applying mixed-effect models with subregions as fixed effects; data were available only for the United States of America, preventing the estimation of standard errors (and confidence intervals). Further details on the methodology are described in De Onis, M., Blössner, M., Borghi, E., Frongillo, E.A. & Morris, R. 2004. Estimates of global prevalence of childhood underweight in 1990 and 2015. Journal of the American Medical
Association, 291(21): 2600–2606. Model selection is based on best fit.a. Consecutive low population coverage; interpret with caution.b. Based on official national data.c. For years when official national data are not available, the values are projected using FAO data or estimates. See Annex 1B for further details.d. The food insecurity estimate for 2019 in South Africa is based on the GHS 2019 national survey (prior to the COVID-19 pandemic), pointing to a prevalence of severe food insecurity of 7 percent and a prevalence of moderate or severe food insecurity of 17.3 percent of the national population.e. Data informing the 2020 food insecurity estimates come from a national COVID-19 impact assessment survey with a reference period of 3 months; therefore, comparability with the rest of the series may be affected.f. Based on official national data collected in 2019 and 2020 through EU-SILC. g. Most recent input data are from before 2000, interpret with caution.h. Pending review.
<2.5 = PoU less than 2.5 percent; <0.5 = prevalence of severe food insecurity less than 0.5 percent.n.a. = data not available.
| 148 |
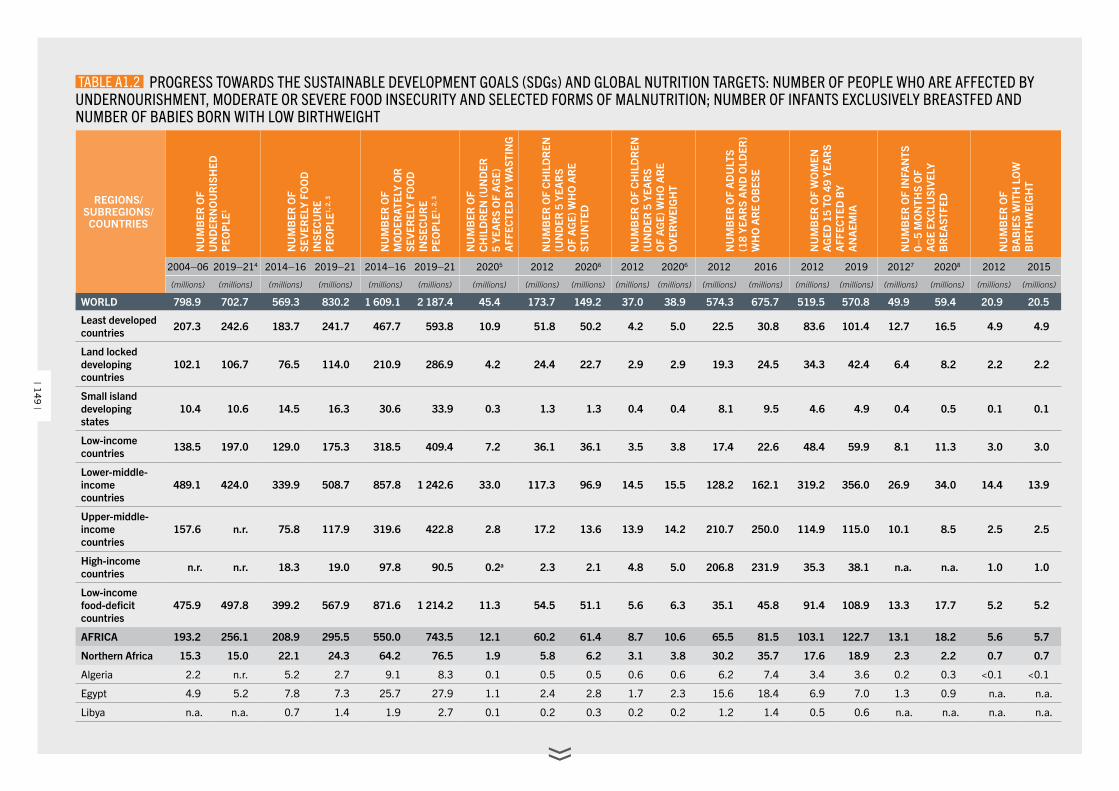
REGIONS/SUBREGIONS/
COUNTRIES
NU
MB
ER O
F U
ND
ERN
OU
RIS
HED
P
EOP
LE1
NU
MB
ER O
F
SEVE
REL
Y FO
OD
IN
SEC
UR
E P
EOP
LE1,
2, 3
NU
MB
ER O
F M
OD
ERAT
ELY
OR
SE
VER
ELY
FOO
D
INSE
CU
RE
P
EOP
LE1,
2, 3
NU
MB
ER O
F
CH
ILD
REN
(UN
DER
5
YEA
RS
OF
AG
E)
AFF
ECTE
D B
Y W
AST
ING
NU
MB
ER O
F C
HIL
DR
EN
(UN
DER
5 Y
EAR
S O
F A
GE)
WH
O A
RE
STU
NTE
D
NU
MB
ER O
F C
HIL
DR
EN
(UN
DER
5 Y
EAR
S O
F A
GE)
WH
O A
RE
OVE
RW
EIG
HT
NU
MB
ER O
F A
DU
LTS
(18
YEA
RS
AN
D O
LDER
) W
HO
AR
E O
BES
E
NU
MB
ER O
F W
OM
EN
AG
ED 1
5 TO
49
YEA
RS
A
FFEC
TED
BY
A
NA
EMIA
NU
MB
ER O
F IN
FAN
TS
0–5
MO
NTH
S O
F A
GE
EXC
LUSI
VELY
B
REA
STFE
D
NU
MB
ER O
F B
AB
IES
WIT
H L
OW
B
IRTH
WEI
GH
T
2004–06 2019–214 2014–16 2019–21 2014–16 2019–21 20205 2012 20206 2012 20206 2012 2016 2012 2019 20127 20208 2012 2015
(millions) (millions) (millions) (millions) (millions) (millions) (millions) (millions) (millions) (millions) (millions) (millions) (millions) (millions) (millions) (millions) (millions) (millions) (millions)
WORLD 798.9 702.7 569.3 830.2 1 609.1 2 187.4 45.4 173.7 149.2 37.0 38.9 574.3 675.7 519.5 570.8 49.9 59.4 20.9 20.5
Least developed countries 207.3 242.6 183.7 241.7 467.7 593.8 10.9 51.8 50.2 4.2 5.0 22.5 30.8 83.6 101.4 12.7 16.5 4.9 4.9
Land locked developing countries
102.1 106.7 76.5 114.0 210.9 286.9 4.2 24.4 22.7 2.9 2.9 19.3 24.5 34.3 42.4 6.4 8.2 2.2 2.2
Small island developing states
10.4 10.6 14.5 16.3 30.6 33.9 0.3 1.3 1.3 0.4 0.4 8.1 9.5 4.6 4.9 0.4 0.5 0.1 0.1
Low-income countries 138.5 197.0 129.0 175.3 318.5 409.4 7.2 36.1 36.1 3.5 3.8 17.4 22.6 48.4 59.9 8.1 11.3 3.0 3.0
Lower-middle-income countries
489.1 424.0 339.9 508.7 857.8 1 242.6 33.0 117.3 96.9 14.5 15.5 128.2 162.1 319.2 356.0 26.9 34.0 14.4 13.9
Upper-middle-income countries
157.6 n.r. 75.8 117.9 319.6 422.8 2.8 17.2 13.6 13.9 14.2 210.7 250.0 114.9 115.0 10.1 8.5 2.5 2.5
High-income countries n.r. n.r. 18.3 19.0 97.8 90.5 0.2a 2.3 2.1 4.8 5.0 206.8 231.9 35.3 38.1 n.a. n.a. 1.0 1.0
Low-income food-deficit countries
475.9 497.8 399.2 567.9 871.6 1 214.2 11.3 54.5 51.1 5.6 6.3 35.1 45.8 91.4 108.9 13.3 17.7 5.2 5.2
AFRICA 193.2 256.1 208.9 295.5 550.0 743.5 12.1 60.2 61.4 8.7 10.6 65.5 81.5 103.1 122.7 13.1 18.2 5.6 5.7
Northern Africa 15.3 15.0 22.1 24.3 64.2 76.5 1.9 5.8 6.2 3.1 3.8 30.2 35.7 17.6 18.9 2.3 2.2 0.7 0.7
Algeria 2.2 n.r. 5.2 2.7 9.1 8.3 0.1 0.5 0.5 0.6 0.6 6.2 7.4 3.4 3.6 0.2 0.3 <0.1 <0.1
Egypt 4.9 5.2 7.8 7.3 25.7 27.9 1.1 2.4 2.8 1.7 2.3 15.6 18.4 6.9 7.0 1.3 0.9 n.a. n.a.
Libya n.a. n.a. 0.7 1.4 1.9 2.7 0.1 0.2 0.3 0.2 0.2 1.2 1.4 0.5 0.6 n.a. n.a. n.a. n.a.
TABLE A1.2 PROGRESS TOWARDS THE SUSTAINABLE DEVELOPMENT GOALS (SDGs) AND GLOBAL NUTRITION TARGETS: NUMBER OF PEOPLE WHO ARE AFFECTED BY UNDERNOURISHMENT, MODERATE OR SEVERE FOOD INSECURITY AND SELECTED FORMS OF MALNUTRITION; NUMBER OF INFANTS EXCLUSIVELY BREASTFED AND NUMBER OF BABIES BORN WITH LOW BIRTHWEIGHT
| 149 |
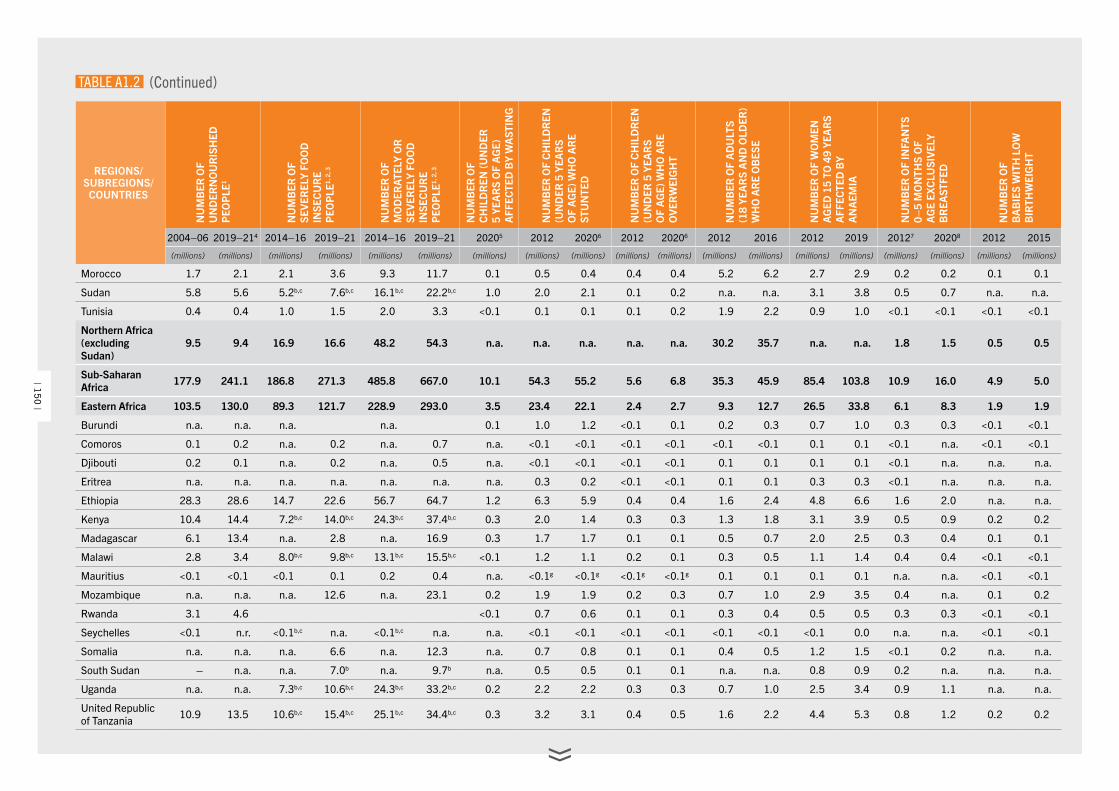
REGIONS/SUBREGIONS/
COUNTRIESN
UM
BER
OF
UN
DER
NO
UR
ISH
ED
PEO
PLE
1
NU
MB
ER O
F
SEVE
REL
Y FO
OD
IN
SEC
UR
E P
EOP
LE1,
2, 3
NU
MB
ER O
F M
OD
ERAT
ELY
OR
SE
VER
ELY
FOO
D
INSE
CU
RE
P
EOP
LE1,
2, 3
NU
MB
ER O
F
CH
ILD
REN
(UN
DER
5
YEA
RS
OF
AG
E)
AFF
ECTE
D B
Y W
AST
ING
NU
MB
ER O
F C
HIL
DR
EN
(UN
DER
5 Y
EAR
S O
F A
GE)
WH
O A
RE
STU
NTE
D
NU
MB
ER O
F C
HIL
DR
EN
(UN
DER
5 Y
EAR
S O
F A
GE)
WH
O A
RE
OVE
RW
EIG
HT
NU
MB
ER O
F A
DU
LTS
(18
YEA
RS
AN
D O
LDER
) W
HO
AR
E O
BES
E
NU
MB
ER O
F W
OM
EN
AG
ED 1
5 TO
49
YEA
RS
A
FFEC
TED
BY
A
NA
EMIA
NU
MB
ER O
F IN
FAN
TS
0–5
MO
NTH
S O
F A
GE
EXC
LUSI
VELY
B
REA
STFE
D
NU
MB
ER O
F B
AB
IES
WIT
H L
OW
B
IRTH
WEI
GH
T
2004–06 2019–214 2014–16 2019–21 2014–16 2019–21 20205 2012 20206 2012 20206 2012 2016 2012 2019 20127 20208 2012 2015
(millions) (millions) (millions) (millions) (millions) (millions) (millions) (millions) (millions) (millions) (millions) (millions) (millions) (millions) (millions) (millions) (millions) (millions) (millions)
Morocco 1.7 2.1 2.1 3.6 9.3 11.7 0.1 0.5 0.4 0.4 0.4 5.2 6.2 2.7 2.9 0.2 0.2 0.1 0.1
Sudan 5.8 5.6 5.2b,c 7.6b,c 16.1b,c 22.2b,c 1.0 2.0 2.1 0.1 0.2 n.a. n.a. 3.1 3.8 0.5 0.7 n.a. n.a.
Tunisia 0.4 0.4 1.0 1.5 2.0 3.3 <0.1 0.1 0.1 0.1 0.2 1.9 2.2 0.9 1.0 <0.1 <0.1 <0.1 <0.1
Northern Africa (excluding Sudan)
9.5 9.4 16.9 16.6 48.2 54.3 n.a. n.a. n.a. n.a. n.a. 30.2 35.7 n.a. n.a. 1.8 1.5 0.5 0.5
Sub-Saharan Africa 177.9 241.1 186.8 271.3 485.8 667.0 10.1 54.3 55.2 5.6 6.8 35.3 45.9 85.4 103.8 10.9 16.0 4.9 5.0
Eastern Africa 103.5 130.0 89.3 121.7 228.9 293.0 3.5 23.4 22.1 2.4 2.7 9.3 12.7 26.5 33.8 6.1 8.3 1.9 1.9
Burundi n.a. n.a. n.a. n.a. 0.1 1.0 1.2 <0.1 0.1 0.2 0.3 0.7 1.0 0.3 0.3 <0.1 <0.1
Comoros 0.1 0.2 n.a. 0.2 n.a. 0.7 n.a. <0.1 <0.1 <0.1 <0.1 <0.1 <0.1 0.1 0.1 <0.1 n.a. <0.1 <0.1
Djibouti 0.2 0.1 n.a. 0.2 n.a. 0.5 n.a. <0.1 <0.1 <0.1 <0.1 0.1 0.1 0.1 0.1 <0.1 n.a. n.a. n.a.
Eritrea n.a. n.a. n.a. n.a. n.a. n.a. n.a. 0.3 0.2 <0.1 <0.1 0.1 0.1 0.3 0.3 <0.1 n.a. n.a. n.a.
Ethiopia 28.3 28.6 14.7 22.6 56.7 64.7 1.2 6.3 5.9 0.4 0.4 1.6 2.4 4.8 6.6 1.6 2.0 n.a. n.a.
Kenya 10.4 14.4 7.2b,c 14.0b,c 24.3b,c 37.4b,c 0.3 2.0 1.4 0.3 0.3 1.3 1.8 3.1 3.9 0.5 0.9 0.2 0.2
Madagascar 6.1 13.4 n.a. 2.8 n.a. 16.9 0.3 1.7 1.7 0.1 0.1 0.5 0.7 2.0 2.5 0.3 0.4 0.1 0.1
Malawi 2.8 3.4 8.0b,c 9.8b,c 13.1b,c 15.5b,c <0.1 1.2 1.1 0.2 0.1 0.3 0.5 1.1 1.4 0.4 0.4 <0.1 <0.1
Mauritius <0.1 <0.1 <0.1 0.1 0.2 0.4 n.a. <0.1g <0.1g <0.1g <0.1g 0.1 0.1 0.1 0.1 n.a. n.a. <0.1 <0.1
Mozambique n.a. n.a. n.a. 12.6 n.a. 23.1 0.2 1.9 1.9 0.2 0.3 0.7 1.0 2.9 3.5 0.4 n.a. 0.1 0.2
Rwanda 3.1 4.6 <0.1 0.7 0.6 0.1 0.1 0.3 0.4 0.5 0.5 0.3 0.3 <0.1 <0.1
Seychelles <0.1 n.r. <0.1b,c n.a. <0.1b,c n.a. n.a. <0.1 <0.1 <0.1 <0.1 <0.1 <0.1 <0.1 0.0 n.a. n.a. <0.1 <0.1
Somalia n.a. n.a. n.a. 6.6 n.a. 12.3 n.a. 0.7 0.8 0.1 0.1 0.4 0.5 1.2 1.5 <0.1 0.2 n.a. n.a.
South Sudan – n.a. n.a. 7.0b n.a. 9.7b n.a. 0.5 0.5 0.1 0.1 n.a. n.a. 0.8 0.9 0.2 n.a. n.a. n.a.
Uganda n.a. n.a. 7.3b,c 10.6b,c 24.3b,c 33.2b,c 0.2 2.2 2.2 0.3 0.3 0.7 1.0 2.5 3.4 0.9 1.1 n.a. n.a.
United Republic of Tanzania 10.9 13.5 10.6b,c 15.4b,c 25.1b,c 34.4b,c 0.3 3.2 3.1 0.4 0.5 1.6 2.2 4.4 5.3 0.8 1.2 0.2 0.2
TABLE A1.2 (Continued)
| 150 |
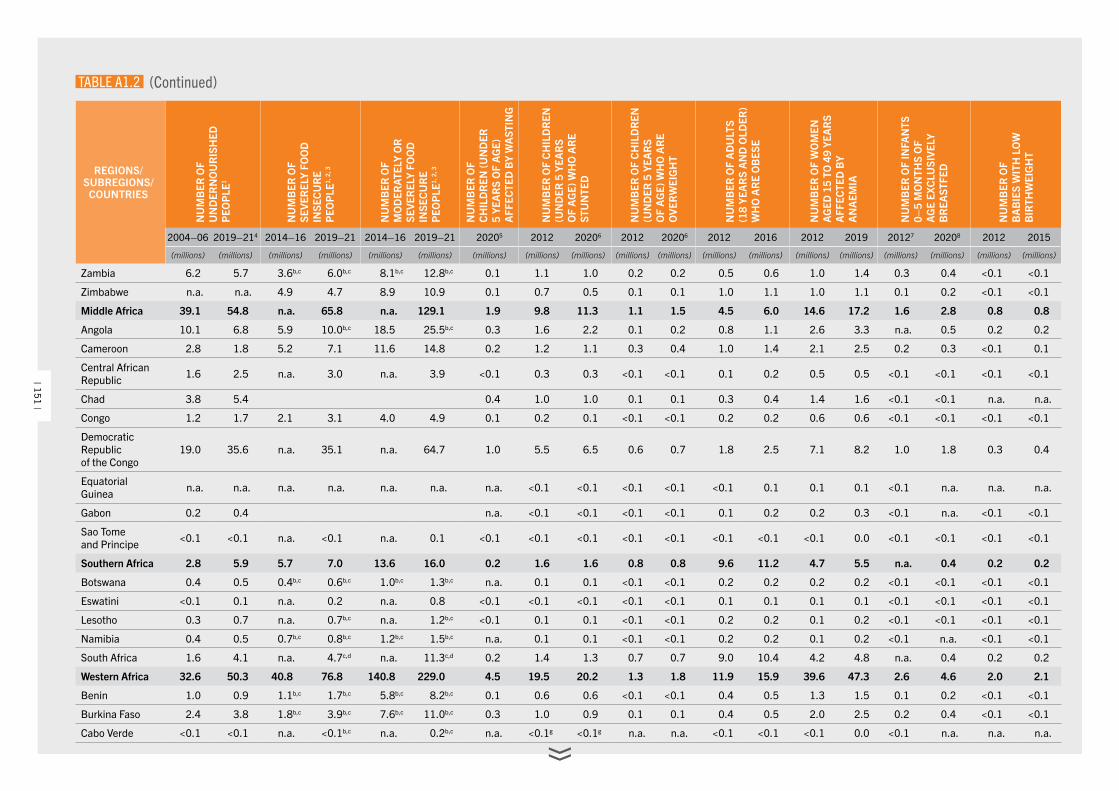
REGIONS/SUBREGIONS/
COUNTRIESN
UM
BER
OF
UN
DER
NO
UR
ISH
ED
PEO
PLE
1
NU
MB
ER O
F
SEVE
REL
Y FO
OD
IN
SEC
UR
E P
EOP
LE1,
2, 3
NU
MB
ER O
F M
OD
ERAT
ELY
OR
SE
VER
ELY
FOO
D
INSE
CU
RE
P
EOP
LE1,
2, 3
NU
MB
ER O
F
CH
ILD
REN
(UN
DER
5
YEA
RS
OF
AG
E)
AFF
ECTE
D B
Y W
AST
ING
NU
MB
ER O
F C
HIL
DR
EN
(UN
DER
5 Y
EAR
S O
F A
GE)
WH
O A
RE
STU
NTE
D
NU
MB
ER O
F C
HIL
DR
EN
(UN
DER
5 Y
EAR
S O
F A
GE)
WH
O A
RE
OVE
RW
EIG
HT
NU
MB
ER O
F A
DU
LTS
(18
YEA
RS
AN
D O
LDER
) W
HO
AR
E O
BES
E
NU
MB
ER O
F W
OM
EN
AG
ED 1
5 TO
49
YEA
RS
A
FFEC
TED
BY
A
NA
EMIA
NU
MB
ER O
F IN
FAN
TS
0–5
MO
NTH
S O
F A
GE
EXC
LUSI
VELY
B
REA
STFE
D
NU
MB
ER O
F B
AB
IES
WIT
H L
OW
B
IRTH
WEI
GH
T
2004–06 2019–214 2014–16 2019–21 2014–16 2019–21 20205 2012 20206 2012 20206 2012 2016 2012 2019 20127 20208 2012 2015
(millions) (millions) (millions) (millions) (millions) (millions) (millions) (millions) (millions) (millions) (millions) (millions) (millions) (millions) (millions) (millions) (millions) (millions) (millions)
Zambia 6.2 5.7 3.6b,c 6.0b,c 8.1b,c 12.8b,c 0.1 1.1 1.0 0.2 0.2 0.5 0.6 1.0 1.4 0.3 0.4 <0.1 <0.1
Zimbabwe n.a. n.a. 4.9 4.7 8.9 10.9 0.1 0.7 0.5 0.1 0.1 1.0 1.1 1.0 1.1 0.1 0.2 <0.1 <0.1
Middle Africa 39.1 54.8 n.a. 65.8 n.a. 129.1 1.9 9.8 11.3 1.1 1.5 4.5 6.0 14.6 17.2 1.6 2.8 0.8 0.8
Angola 10.1 6.8 5.9 10.0b,c 18.5 25.5b,c 0.3 1.6 2.2 0.1 0.2 0.8 1.1 2.6 3.3 n.a. 0.5 0.2 0.2
Cameroon 2.8 1.8 5.2 7.1 11.6 14.8 0.2 1.2 1.1 0.3 0.4 1.0 1.4 2.1 2.5 0.2 0.3 <0.1 0.1
Central African Republic 1.6 2.5 n.a. 3.0 n.a. 3.9 <0.1 0.3 0.3 <0.1 <0.1 0.1 0.2 0.5 0.5 <0.1 <0.1 <0.1 <0.1
Chad 3.8 5.4 0.4 1.0 1.0 0.1 0.1 0.3 0.4 1.4 1.6 <0.1 <0.1 n.a. n.a.
Congo 1.2 1.7 2.1 3.1 4.0 4.9 0.1 0.2 0.1 <0.1 <0.1 0.2 0.2 0.6 0.6 <0.1 <0.1 <0.1 <0.1
Democratic Republic of the Congo
19.0 35.6 n.a. 35.1 n.a. 64.7 1.0 5.5 6.5 0.6 0.7 1.8 2.5 7.1 8.2 1.0 1.8 0.3 0.4
Equatorial Guinea n.a. n.a. n.a. n.a. n.a. n.a. n.a. <0.1 <0.1 <0.1 <0.1 <0.1 0.1 0.1 0.1 <0.1 n.a. n.a. n.a.
Gabon 0.2 0.4 n.a. <0.1 <0.1 <0.1 <0.1 0.1 0.2 0.2 0.3 <0.1 n.a. <0.1 <0.1
Sao Tome and Principe <0.1 <0.1 n.a. <0.1 n.a. 0.1 <0.1 <0.1 <0.1 <0.1 <0.1 <0.1 <0.1 <0.1 0.0 <0.1 <0.1 <0.1 <0.1
Southern Africa 2.8 5.9 5.7 7.0 13.6 16.0 0.2 1.6 1.6 0.8 0.8 9.6 11.2 4.7 5.5 n.a. 0.4 0.2 0.2
Botswana 0.4 0.5 0.4b,c 0.6b,c 1.0b,c 1.3b,c n.a. 0.1 0.1 <0.1 <0.1 0.2 0.2 0.2 0.2 <0.1 <0.1 <0.1 <0.1
Eswatini <0.1 0.1 n.a. 0.2 n.a. 0.8 <0.1 <0.1 <0.1 <0.1 <0.1 0.1 0.1 0.1 0.1 <0.1 <0.1 <0.1 <0.1
Lesotho 0.3 0.7 n.a. 0.7b,c n.a. 1.2b,c <0.1 0.1 0.1 <0.1 <0.1 0.2 0.2 0.1 0.2 <0.1 <0.1 <0.1 <0.1
Namibia 0.4 0.5 0.7b,c 0.8b,c 1.2b,c 1.5b,c n.a. 0.1 0.1 <0.1 <0.1 0.2 0.2 0.1 0.2 <0.1 n.a. <0.1 <0.1
South Africa 1.6 4.1 n.a. 4.7c,d n.a. 11.3c,d 0.2 1.4 1.3 0.7 0.7 9.0 10.4 4.2 4.8 n.a. 0.4 0.2 0.2
Western Africa 32.6 50.3 40.8 76.8 140.8 229.0 4.5 19.5 20.2 1.3 1.8 11.9 15.9 39.6 47.3 2.6 4.6 2.0 2.1
Benin 1.0 0.9 1.1b,c 1.7b,c 5.8b,c 8.2b,c 0.1 0.6 0.6 <0.1 <0.1 0.4 0.5 1.3 1.5 0.1 0.2 <0.1 <0.1
Burkina Faso 2.4 3.8 1.8b,c 3.9b,c 7.6b,c 11.0b,c 0.3 1.0 0.9 0.1 0.1 0.4 0.5 2.0 2.5 0.2 0.4 <0.1 <0.1
Cabo Verde <0.1 <0.1 n.a. <0.1b,c n.a. 0.2b,c n.a. <0.1g <0.1g n.a. n.a. <0.1 <0.1 <0.1 0.0 <0.1 n.a. n.a. n.a.
TABLE A1.2 (Continued)
| 151 |
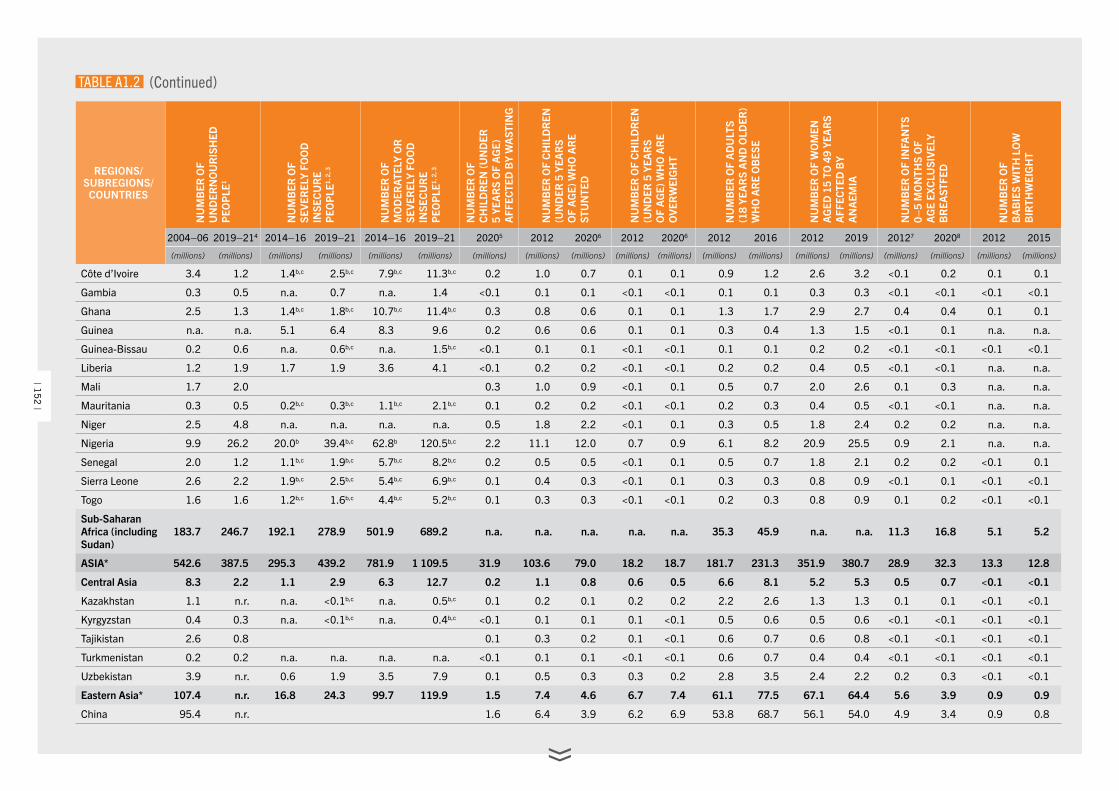
REGIONS/SUBREGIONS/
COUNTRIESN
UM
BER
OF
UN
DER
NO
UR
ISH
ED
PEO
PLE
1
NU
MB
ER O
F
SEVE
REL
Y FO
OD
IN
SEC
UR
E P
EOP
LE1,
2, 3
NU
MB
ER O
F M
OD
ERAT
ELY
OR
SE
VER
ELY
FOO
D
INSE
CU
RE
P
EOP
LE1,
2, 3
NU
MB
ER O
F
CH
ILD
REN
(UN
DER
5
YEA
RS
OF
AG
E)
AFF
ECTE
D B
Y W
AST
ING
NU
MB
ER O
F C
HIL
DR
EN
(UN
DER
5 Y
EAR
S O
F A
GE)
WH
O A
RE
STU
NTE
D
NU
MB
ER O
F C
HIL
DR
EN
(UN
DER
5 Y
EAR
S O
F A
GE)
WH
O A
RE
OVE
RW
EIG
HT
NU
MB
ER O
F A
DU
LTS
(18
YEA
RS
AN
D O
LDER
) W
HO
AR
E O
BES
E
NU
MB
ER O
F W
OM
EN
AG
ED 1
5 TO
49
YEA
RS
A
FFEC
TED
BY
A
NA
EMIA
NU
MB
ER O
F IN
FAN
TS
0–5
MO
NTH
S O
F A
GE
EXC
LUSI
VELY
B
REA
STFE
D
NU
MB
ER O
F B
AB
IES
WIT
H L
OW
B
IRTH
WEI
GH
T
2004–06 2019–214 2014–16 2019–21 2014–16 2019–21 20205 2012 20206 2012 20206 2012 2016 2012 2019 20127 20208 2012 2015
(millions) (millions) (millions) (millions) (millions) (millions) (millions) (millions) (millions) (millions) (millions) (millions) (millions) (millions) (millions) (millions) (millions) (millions) (millions)
Côte d’Ivoire 3.4 1.2 1.4b,c 2.5b,c 7.9b,c 11.3b,c 0.2 1.0 0.7 0.1 0.1 0.9 1.2 2.6 3.2 <0.1 0.2 0.1 0.1
Gambia 0.3 0.5 n.a. 0.7 n.a. 1.4 <0.1 0.1 0.1 <0.1 <0.1 0.1 0.1 0.3 0.3 <0.1 <0.1 <0.1 <0.1
Ghana 2.5 1.3 1.4b,c 1.8b,c 10.7b,c 11.4b,c 0.3 0.8 0.6 0.1 0.1 1.3 1.7 2.9 2.7 0.4 0.4 0.1 0.1
Guinea n.a. n.a. 5.1 6.4 8.3 9.6 0.2 0.6 0.6 0.1 0.1 0.3 0.4 1.3 1.5 <0.1 0.1 n.a. n.a.
Guinea-Bissau 0.2 0.6 n.a. 0.6b,c n.a. 1.5b,c <0.1 0.1 0.1 <0.1 <0.1 0.1 0.1 0.2 0.2 <0.1 <0.1 <0.1 <0.1
Liberia 1.2 1.9 1.7 1.9 3.6 4.1 <0.1 0.2 0.2 <0.1 <0.1 0.2 0.2 0.4 0.5 <0.1 <0.1 n.a. n.a.
Mali 1.7 2.0 0.3 1.0 0.9 <0.1 0.1 0.5 0.7 2.0 2.6 0.1 0.3 n.a. n.a.
Mauritania 0.3 0.5 0.2b,c 0.3b,c 1.1b,c 2.1b,c 0.1 0.2 0.2 <0.1 <0.1 0.2 0.3 0.4 0.5 <0.1 <0.1 n.a. n.a.
Niger 2.5 4.8 n.a. n.a. n.a. n.a. 0.5 1.8 2.2 <0.1 0.1 0.3 0.5 1.8 2.4 0.2 0.2 n.a. n.a.
Nigeria 9.9 26.2 20.0b 39.4b,c 62.8b 120.5b,c 2.2 11.1 12.0 0.7 0.9 6.1 8.2 20.9 25.5 0.9 2.1 n.a. n.a.
Senegal 2.0 1.2 1.1b,c 1.9b,c 5.7b,c 8.2b,c 0.2 0.5 0.5 <0.1 0.1 0.5 0.7 1.8 2.1 0.2 0.2 <0.1 0.1
Sierra Leone 2.6 2.2 1.9b,c 2.5b,c 5.4b,c 6.9b,c 0.1 0.4 0.3 <0.1 0.1 0.3 0.3 0.8 0.9 <0.1 0.1 <0.1 <0.1
Togo 1.6 1.6 1.2b,c 1.6b,c 4.4b,c 5.2b,c 0.1 0.3 0.3 <0.1 <0.1 0.2 0.3 0.8 0.9 0.1 0.2 <0.1 <0.1
Sub-Saharan Africa (including Sudan)
183.7 246.7 192.1 278.9 501.9 689.2 n.a. n.a. n.a. n.a. n.a. 35.3 45.9 n.a. n.a. 11.3 16.8 5.1 5.2
ASIA* 542.6 387.5 295.3 439.2 781.9 1 109.5 31.9 103.6 79.0 18.2 18.7 181.7 231.3 351.9 380.7 28.9 32.3 13.3 12.8
Central Asia 8.3 2.2 1.1 2.9 6.3 12.7 0.2 1.1 0.8 0.6 0.5 6.6 8.1 5.2 5.3 0.5 0.7 <0.1 <0.1
Kazakhstan 1.1 n.r. n.a. <0.1b,c n.a. 0.5b,c 0.1 0.2 0.1 0.2 0.2 2.2 2.6 1.3 1.3 0.1 0.1 <0.1 <0.1
Kyrgyzstan 0.4 0.3 n.a. <0.1b,c n.a. 0.4b,c <0.1 0.1 0.1 0.1 <0.1 0.5 0.6 0.5 0.6 <0.1 <0.1 <0.1 <0.1
Tajikistan 2.6 0.8 0.1 0.3 0.2 0.1 <0.1 0.6 0.7 0.6 0.8 <0.1 <0.1 <0.1 <0.1
Turkmenistan 0.2 0.2 n.a. n.a. n.a. n.a. <0.1 0.1 0.1 <0.1 <0.1 0.6 0.7 0.4 0.4 <0.1 <0.1 <0.1 <0.1
Uzbekistan 3.9 n.r. 0.6 1.9 3.5 7.9 0.1 0.5 0.3 0.3 0.2 2.8 3.5 2.4 2.2 0.2 0.3 <0.1 <0.1
Eastern Asia* 107.4 n.r. 16.8 24.3 99.7 119.9 1.5 7.4 4.6 6.7 7.4 61.1 77.5 67.1 64.4 5.6 3.9 0.9 0.9
China 95.4 n.r. 1.6 6.4 3.9 6.2 6.9 53.8 68.7 56.1 54.0 4.9 3.4 0.9 0.8
TABLE A1.2 (Continued)
| 152 |
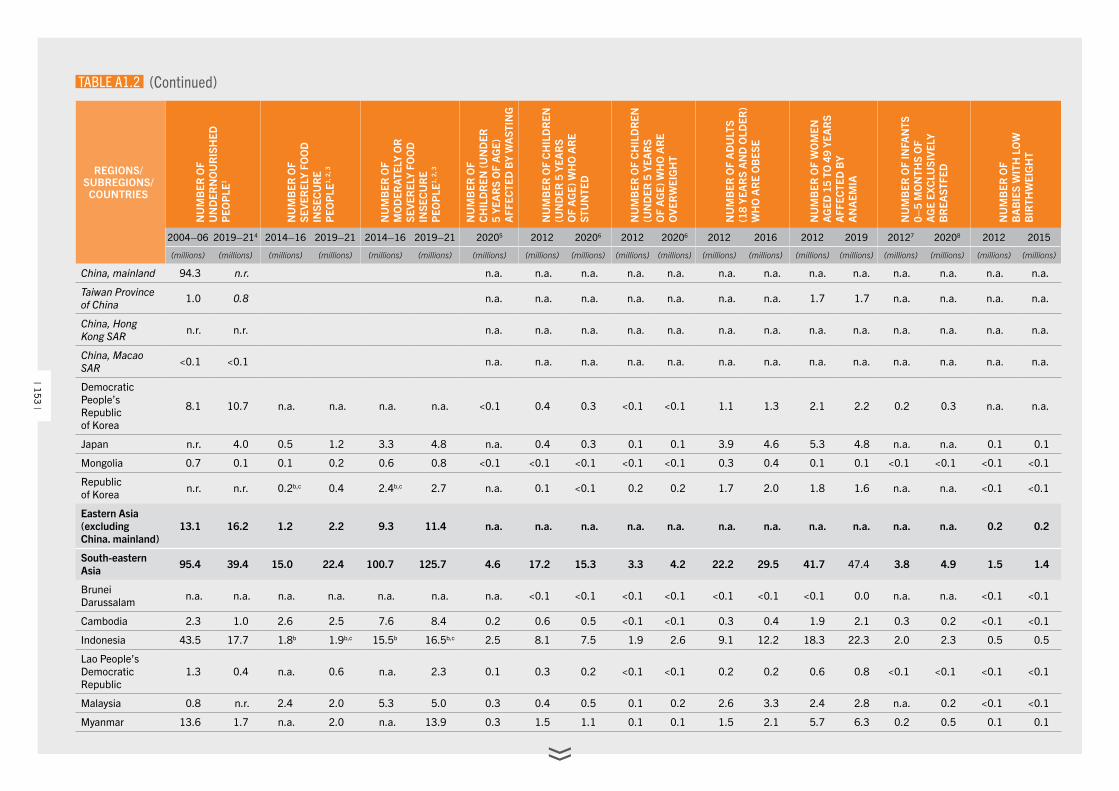
REGIONS/SUBREGIONS/
COUNTRIESN
UM
BER
OF
UN
DER
NO
UR
ISH
ED
PEO
PLE
1
NU
MB
ER O
F
SEVE
REL
Y FO
OD
IN
SEC
UR
E P
EOP
LE1,
2, 3
NU
MB
ER O
F M
OD
ERAT
ELY
OR
SE
VER
ELY
FOO
D
INSE
CU
RE
P
EOP
LE1,
2, 3
NU
MB
ER O
F
CH
ILD
REN
(UN
DER
5
YEA
RS
OF
AG
E)
AFF
ECTE
D B
Y W
AST
ING
NU
MB
ER O
F C
HIL
DR
EN
(UN
DER
5 Y
EAR
S O
F A
GE)
WH
O A
RE
STU
NTE
D
NU
MB
ER O
F C
HIL
DR
EN
(UN
DER
5 Y
EAR
S O
F A
GE)
WH
O A
RE
OVE
RW
EIG
HT
NU
MB
ER O
F A
DU
LTS
(18
YEA
RS
AN
D O
LDER
) W
HO
AR
E O
BES
E
NU
MB
ER O
F W
OM
EN
AG
ED 1
5 TO
49
YEA
RS
A
FFEC
TED
BY
A
NA
EMIA
NU
MB
ER O
F IN
FAN
TS
0–5
MO
NTH
S O
F A
GE
EXC
LUSI
VELY
B
REA
STFE
D
NU
MB
ER O
F B
AB
IES
WIT
H L
OW
B
IRTH
WEI
GH
T
2004–06 2019–214 2014–16 2019–21 2014–16 2019–21 20205 2012 20206 2012 20206 2012 2016 2012 2019 20127 20208 2012 2015
(millions) (millions) (millions) (millions) (millions) (millions) (millions) (millions) (millions) (millions) (millions) (millions) (millions) (millions) (millions) (millions) (millions) (millions) (millions)
China, mainland 94.3 n.r. n.a. n.a. n.a. n.a. n.a. n.a. n.a. n.a. n.a. n.a. n.a. n.a. n.a.
Taiwan Province of China 1.0 0.8 n.a. n.a. n.a. n.a. n.a. n.a. n.a. 1.7 1.7 n.a. n.a. n.a. n.a.
China, Hong Kong SAR n.r. n.r. n.a. n.a. n.a. n.a. n.a. n.a. n.a. n.a. n.a. n.a. n.a. n.a. n.a.
China, Macao SAR <0.1 <0.1 n.a. n.a. n.a. n.a. n.a. n.a. n.a. n.a. n.a. n.a. n.a. n.a. n.a.
Democratic People’s Republic of Korea
8.1 10.7 n.a. n.a. n.a. n.a. <0.1 0.4 0.3 <0.1 <0.1 1.1 1.3 2.1 2.2 0.2 0.3 n.a. n.a.
Japan n.r. 4.0 0.5 1.2 3.3 4.8 n.a. 0.4 0.3 0.1 0.1 3.9 4.6 5.3 4.8 n.a. n.a. 0.1 0.1
Mongolia 0.7 0.1 0.1 0.2 0.6 0.8 <0.1 <0.1 <0.1 <0.1 <0.1 0.3 0.4 0.1 0.1 <0.1 <0.1 <0.1 <0.1
Republic of Korea n.r. n.r. 0.2b,c 0.4 2.4b,c 2.7 n.a. 0.1 <0.1 0.2 0.2 1.7 2.0 1.8 1.6 n.a. n.a. <0.1 <0.1
Eastern Asia (excluding China. mainland)
13.1 16.2 1.2 2.2 9.3 11.4 n.a. n.a. n.a. n.a. n.a. n.a. n.a. n.a. n.a. n.a. n.a. 0.2 0.2
South-eastern Asia 95.4 39.4 15.0 22.4 100.7 125.7 4.6 17.2 15.3 3.3 4.2 22.2 29.5 41.7 47.4 3.8 4.9 1.5 1.4
Brunei Darussalam n.a. n.a. n.a. n.a. n.a. n.a. n.a. <0.1 <0.1 <0.1 <0.1 <0.1 <0.1 <0.1 0.0 n.a. n.a. <0.1 <0.1
Cambodia 2.3 1.0 2.6 2.5 7.6 8.4 0.2 0.6 0.5 <0.1 <0.1 0.3 0.4 1.9 2.1 0.3 0.2 <0.1 <0.1
Indonesia 43.5 17.7 1.8b 1.9b,c 15.5b 16.5b,c 2.5 8.1 7.5 1.9 2.6 9.1 12.2 18.3 22.3 2.0 2.3 0.5 0.5
Lao People’s Democratic Republic
1.3 0.4 n.a. 0.6 n.a. 2.3 0.1 0.3 0.2 <0.1 <0.1 0.2 0.2 0.6 0.8 <0.1 <0.1 <0.1 <0.1
Malaysia 0.8 n.r. 2.4 2.0 5.3 5.0 0.3 0.4 0.5 0.1 0.2 2.6 3.3 2.4 2.8 n.a. 0.2 <0.1 <0.1
Myanmar 13.6 1.7 n.a. 2.0 n.a. 13.9 0.3 1.5 1.1 0.1 0.1 1.5 2.1 5.7 6.3 0.2 0.5 0.1 0.1
TABLE A1.2 (Continued)
| 153 |
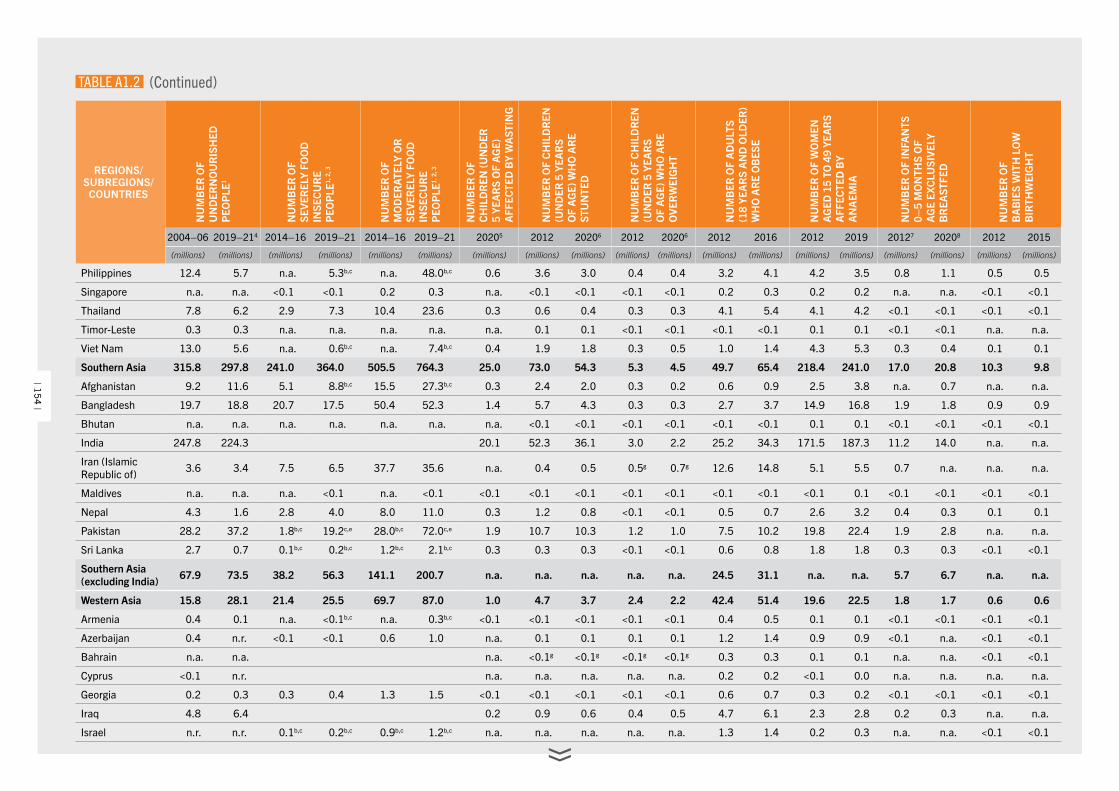
REGIONS/SUBREGIONS/
COUNTRIESN
UM
BER
OF
UN
DER
NO
UR
ISH
ED
PEO
PLE
1
NU
MB
ER O
F
SEVE
REL
Y FO
OD
IN
SEC
UR
E P
EOP
LE1,
2, 3
NU
MB
ER O
F M
OD
ERAT
ELY
OR
SE
VER
ELY
FOO
D
INSE
CU
RE
P
EOP
LE1,
2, 3
NU
MB
ER O
F
CH
ILD
REN
(UN
DER
5
YEA
RS
OF
AG
E)
AFF
ECTE
D B
Y W
AST
ING
NU
MB
ER O
F C
HIL
DR
EN
(UN
DER
5 Y
EAR
S O
F A
GE)
WH
O A
RE
STU
NTE
D
NU
MB
ER O
F C
HIL
DR
EN
(UN
DER
5 Y
EAR
S O
F A
GE)
WH
O A
RE
OVE
RW
EIG
HT
NU
MB
ER O
F A
DU
LTS
(18
YEA
RS
AN
D O
LDER
) W
HO
AR
E O
BES
E
NU
MB
ER O
F W
OM
EN
AG
ED 1
5 TO
49
YEA
RS
A
FFEC
TED
BY
A
NA
EMIA
NU
MB
ER O
F IN
FAN
TS
0–5
MO
NTH
S O
F A
GE
EXC
LUSI
VELY
B
REA
STFE
D
NU
MB
ER O
F B
AB
IES
WIT
H L
OW
B
IRTH
WEI
GH
T
2004–06 2019–214 2014–16 2019–21 2014–16 2019–21 20205 2012 20206 2012 20206 2012 2016 2012 2019 20127 20208 2012 2015
(millions) (millions) (millions) (millions) (millions) (millions) (millions) (millions) (millions) (millions) (millions) (millions) (millions) (millions) (millions) (millions) (millions) (millions) (millions)
Philippines 12.4 5.7 n.a. 5.3b,c n.a. 48.0b,c 0.6 3.6 3.0 0.4 0.4 3.2 4.1 4.2 3.5 0.8 1.1 0.5 0.5
Singapore n.a. n.a. <0.1 <0.1 0.2 0.3 n.a. <0.1 <0.1 <0.1 <0.1 0.2 0.3 0.2 0.2 n.a. n.a. <0.1 <0.1
Thailand 7.8 6.2 2.9 7.3 10.4 23.6 0.3 0.6 0.4 0.3 0.3 4.1 5.4 4.1 4.2 <0.1 <0.1 <0.1 <0.1
Timor-Leste 0.3 0.3 n.a. n.a. n.a. n.a. n.a. 0.1 0.1 <0.1 <0.1 <0.1 <0.1 0.1 0.1 <0.1 <0.1 n.a. n.a.
Viet Nam 13.0 5.6 n.a. 0.6b,c n.a. 7.4b,c 0.4 1.9 1.8 0.3 0.5 1.0 1.4 4.3 5.3 0.3 0.4 0.1 0.1
Southern Asia 315.8 297.8 241.0 364.0 505.5 764.3 25.0 73.0 54.3 5.3 4.5 49.7 65.4 218.4 241.0 17.0 20.8 10.3 9.8
Afghanistan 9.2 11.6 5.1 8.8b,c 15.5 27.3b,c 0.3 2.4 2.0 0.3 0.2 0.6 0.9 2.5 3.8 n.a. 0.7 n.a. n.a.
Bangladesh 19.7 18.8 20.7 17.5 50.4 52.3 1.4 5.7 4.3 0.3 0.3 2.7 3.7 14.9 16.8 1.9 1.8 0.9 0.9
Bhutan n.a. n.a. n.a. n.a. n.a. n.a. n.a. <0.1 <0.1 <0.1 <0.1 <0.1 <0.1 0.1 0.1 <0.1 <0.1 <0.1 <0.1
India 247.8 224.3 20.1 52.3 36.1 3.0 2.2 25.2 34.3 171.5 187.3 11.2 14.0 n.a. n.a.
Iran (Islamic Republic of) 3.6 3.4 7.5 6.5 37.7 35.6 n.a. 0.4 0.5 0.5g 0.7g 12.6 14.8 5.1 5.5 0.7 n.a. n.a. n.a.
Maldives n.a. n.a. n.a. <0.1 n.a. <0.1 <0.1 <0.1 <0.1 <0.1 <0.1 <0.1 <0.1 <0.1 0.1 <0.1 <0.1 <0.1 <0.1
Nepal 4.3 1.6 2.8 4.0 8.0 11.0 0.3 1.2 0.8 <0.1 <0.1 0.5 0.7 2.6 3.2 0.4 0.3 0.1 0.1
Pakistan 28.2 37.2 1.8b,c 19.2c,e 28.0b,c 72.0c,e 1.9 10.7 10.3 1.2 1.0 7.5 10.2 19.8 22.4 1.9 2.8 n.a. n.a.
Sri Lanka 2.7 0.7 0.1b,c 0.2b,c 1.2b,c 2.1b,c 0.3 0.3 0.3 <0.1 <0.1 0.6 0.8 1.8 1.8 0.3 0.3 <0.1 <0.1
Southern Asia (excluding India) 67.9 73.5 38.2 56.3 141.1 200.7 n.a. n.a. n.a. n.a. n.a. 24.5 31.1 n.a. n.a. 5.7 6.7 n.a. n.a.
Western Asia 15.8 28.1 21.4 25.5 69.7 87.0 1.0 4.7 3.7 2.4 2.2 42.4 51.4 19.6 22.5 1.8 1.7 0.6 0.6
Armenia 0.4 0.1 n.a. <0.1b,c n.a. 0.3b,c <0.1 <0.1 <0.1 <0.1 <0.1 0.4 0.5 0.1 0.1 <0.1 <0.1 <0.1 <0.1
Azerbaijan 0.4 n.r. <0.1 <0.1 0.6 1.0 n.a. 0.1 0.1 0.1 0.1 1.2 1.4 0.9 0.9 <0.1 n.a. <0.1 <0.1
Bahrain n.a. n.a. n.a. <0.1g <0.1g <0.1g <0.1g 0.3 0.3 0.1 0.1 n.a. n.a. <0.1 <0.1
Cyprus <0.1 n.r. n.a. n.a. n.a. n.a. n.a. 0.2 0.2 <0.1 0.0 n.a. n.a. n.a. n.a.
Georgia 0.2 0.3 0.3 0.4 1.3 1.5 <0.1 <0.1 <0.1 <0.1 <0.1 0.6 0.7 0.3 0.2 <0.1 <0.1 <0.1 <0.1
Iraq 4.8 6.4 0.2 0.9 0.6 0.4 0.5 4.7 6.1 2.3 2.8 0.2 0.3 n.a. n.a.
Israel n.r. n.r. 0.1b,c 0.2b,c 0.9b,c 1.2b,c n.a. n.a. n.a. n.a. n.a. 1.3 1.4 0.2 0.3 n.a. n.a. <0.1 <0.1
TABLE A1.2 (Continued)
| 154 |
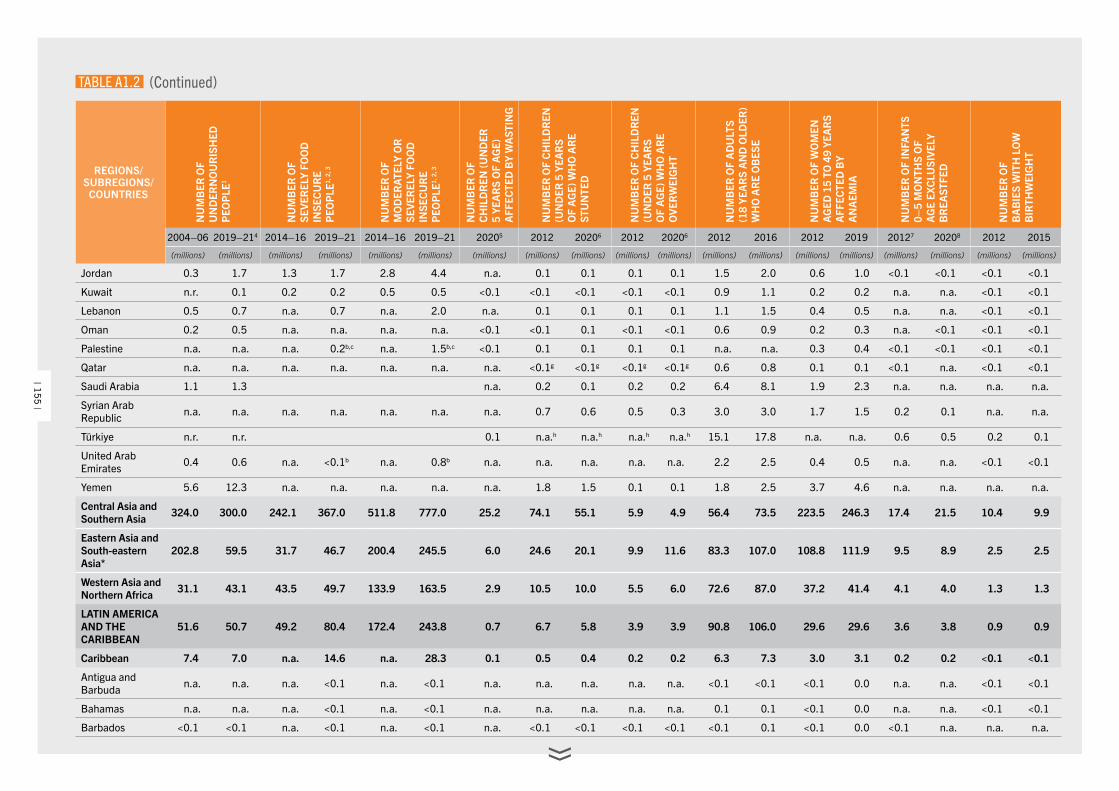
REGIONS/SUBREGIONS/
COUNTRIESN
UM
BER
OF
UN
DER
NO
UR
ISH
ED
PEO
PLE
1
NU
MB
ER O
F
SEVE
REL
Y FO
OD
IN
SEC
UR
E P
EOP
LE1,
2, 3
NU
MB
ER O
F M
OD
ERAT
ELY
OR
SE
VER
ELY
FOO
D
INSE
CU
RE
P
EOP
LE1,
2, 3
NU
MB
ER O
F
CH
ILD
REN
(UN
DER
5
YEA
RS
OF
AG
E)
AFF
ECTE
D B
Y W
AST
ING
NU
MB
ER O
F C
HIL
DR
EN
(UN
DER
5 Y
EAR
S O
F A
GE)
WH
O A
RE
STU
NTE
D
NU
MB
ER O
F C
HIL
DR
EN
(UN
DER
5 Y
EAR
S O
F A
GE)
WH
O A
RE
OVE
RW
EIG
HT
NU
MB
ER O
F A
DU
LTS
(18
YEA
RS
AN
D O
LDER
) W
HO
AR
E O
BES
E
NU
MB
ER O
F W
OM
EN
AG
ED 1
5 TO
49
YEA
RS
A
FFEC
TED
BY
A
NA
EMIA
NU
MB
ER O
F IN
FAN
TS
0–5
MO
NTH
S O
F A
GE
EXC
LUSI
VELY
B
REA
STFE
D
NU
MB
ER O
F B
AB
IES
WIT
H L
OW
B
IRTH
WEI
GH
T
2004–06 2019–214 2014–16 2019–21 2014–16 2019–21 20205 2012 20206 2012 20206 2012 2016 2012 2019 20127 20208 2012 2015
(millions) (millions) (millions) (millions) (millions) (millions) (millions) (millions) (millions) (millions) (millions) (millions) (millions) (millions) (millions) (millions) (millions) (millions) (millions)
Jordan 0.3 1.7 1.3 1.7 2.8 4.4 n.a. 0.1 0.1 0.1 0.1 1.5 2.0 0.6 1.0 <0.1 <0.1 <0.1 <0.1
Kuwait n.r. 0.1 0.2 0.2 0.5 0.5 <0.1 <0.1 <0.1 <0.1 <0.1 0.9 1.1 0.2 0.2 n.a. n.a. <0.1 <0.1
Lebanon 0.5 0.7 n.a. 0.7 n.a. 2.0 n.a. 0.1 0.1 0.1 0.1 1.1 1.5 0.4 0.5 n.a. n.a. <0.1 <0.1
Oman 0.2 0.5 n.a. n.a. n.a. n.a. <0.1 <0.1 0.1 <0.1 <0.1 0.6 0.9 0.2 0.3 n.a. <0.1 <0.1 <0.1
Palestine n.a. n.a. n.a. 0.2b,c n.a. 1.5b,c <0.1 0.1 0.1 0.1 0.1 n.a. n.a. 0.3 0.4 <0.1 <0.1 <0.1 <0.1
Qatar n.a. n.a. n.a. n.a. n.a. n.a. n.a. <0.1g <0.1g <0.1g <0.1g 0.6 0.8 0.1 0.1 <0.1 n.a. <0.1 <0.1
Saudi Arabia 1.1 1.3 n.a. 0.2 0.1 0.2 0.2 6.4 8.1 1.9 2.3 n.a. n.a. n.a. n.a.
Syrian Arab Republic n.a. n.a. n.a. n.a. n.a. n.a. n.a. 0.7 0.6 0.5 0.3 3.0 3.0 1.7 1.5 0.2 0.1 n.a. n.a.
Türkiye n.r. n.r. 0.1 n.a.h n.a.h n.a.h n.a.h 15.1 17.8 n.a. n.a. 0.6 0.5 0.2 0.1
United Arab Emirates 0.4 0.6 n.a. <0.1b n.a. 0.8b n.a. n.a. n.a. n.a. n.a. 2.2 2.5 0.4 0.5 n.a. n.a. <0.1 <0.1
Yemen 5.6 12.3 n.a. n.a. n.a. n.a. n.a. 1.8 1.5 0.1 0.1 1.8 2.5 3.7 4.6 n.a. n.a. n.a. n.a.
Central Asia and Southern Asia 324.0 300.0 242.1 367.0 511.8 777.0 25.2 74.1 55.1 5.9 4.9 56.4 73.5 223.5 246.3 17.4 21.5 10.4 9.9
Eastern Asia and South-eastern Asia*
202.8 59.5 31.7 46.7 200.4 245.5 6.0 24.6 20.1 9.9 11.6 83.3 107.0 108.8 111.9 9.5 8.9 2.5 2.5
Western Asia and Northern Africa 31.1 43.1 43.5 49.7 133.9 163.5 2.9 10.5 10.0 5.5 6.0 72.6 87.0 37.2 41.4 4.1 4.0 1.3 1.3
LATIN AMERICA AND THE CARIBBEAN
51.6 50.7 49.2 80.4 172.4 243.8 0.7 6.7 5.8 3.9 3.9 90.8 106.0 29.6 29.6 3.6 3.8 0.9 0.9
Caribbean 7.4 7.0 n.a. 14.6 n.a. 28.3 0.1 0.5 0.4 0.2 0.2 6.3 7.3 3.0 3.1 0.2 0.2 <0.1 <0.1
Antigua and Barbuda n.a. n.a. n.a. <0.1 n.a. <0.1 n.a. n.a. n.a. n.a. n.a. <0.1 <0.1 <0.1 0.0 n.a. n.a. <0.1 <0.1
Bahamas n.a. n.a. n.a. <0.1 n.a. <0.1 n.a. n.a. n.a. n.a. n.a. 0.1 0.1 <0.1 0.0 n.a. n.a. <0.1 <0.1
Barbados <0.1 <0.1 n.a. <0.1 n.a. <0.1 n.a. <0.1 <0.1 <0.1 <0.1 <0.1 0.1 <0.1 0.0 <0.1 n.a. n.a. n.a.
TABLE A1.2 (Continued)
| 155 |
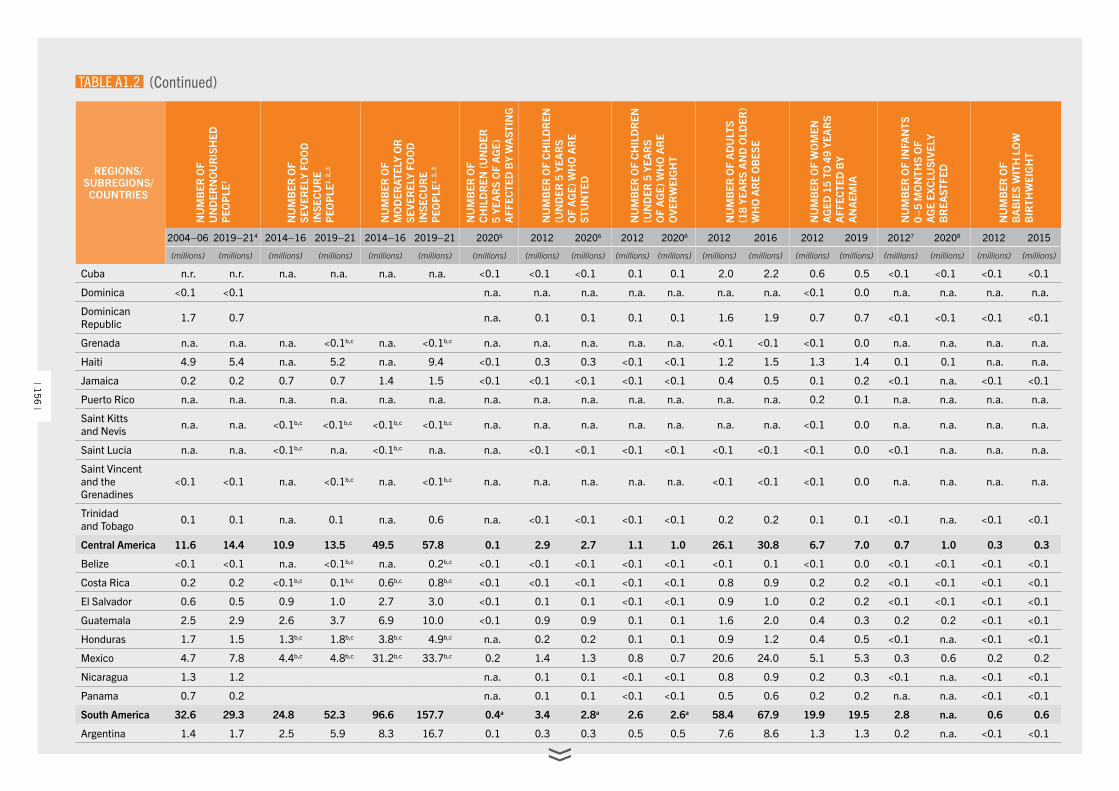
REGIONS/SUBREGIONS/
COUNTRIESN
UM
BER
OF
UN
DER
NO
UR
ISH
ED
PEO
PLE
1
NU
MB
ER O
F
SEVE
REL
Y FO
OD
IN
SEC
UR
E P
EOP
LE1,
2, 3
NU
MB
ER O
F M
OD
ERAT
ELY
OR
SE
VER
ELY
FOO
D
INSE
CU
RE
P
EOP
LE1,
2, 3
NU
MB
ER O
F
CH
ILD
REN
(UN
DER
5
YEA
RS
OF
AG
E)
AFF
ECTE
D B
Y W
AST
ING
NU
MB
ER O
F C
HIL
DR
EN
(UN
DER
5 Y
EAR
S O
F A
GE)
WH
O A
RE
STU
NTE
D
NU
MB
ER O
F C
HIL
DR
EN
(UN
DER
5 Y
EAR
S O
F A
GE)
WH
O A
RE
OVE
RW
EIG
HT
NU
MB
ER O
F A
DU
LTS
(18
YEA
RS
AN
D O
LDER
) W
HO
AR
E O
BES
E
NU
MB
ER O
F W
OM
EN
AG
ED 1
5 TO
49
YEA
RS
A
FFEC
TED
BY
A
NA
EMIA
NU
MB
ER O
F IN
FAN
TS
0–5
MO
NTH
S O
F A
GE
EXC
LUSI
VELY
B
REA
STFE
D
NU
MB
ER O
F B
AB
IES
WIT
H L
OW
B
IRTH
WEI
GH
T
2004–06 2019–214 2014–16 2019–21 2014–16 2019–21 20205 2012 20206 2012 20206 2012 2016 2012 2019 20127 20208 2012 2015
(millions) (millions) (millions) (millions) (millions) (millions) (millions) (millions) (millions) (millions) (millions) (millions) (millions) (millions) (millions) (millions) (millions) (millions) (millions)
Cuba n.r. n.r. n.a. n.a. n.a. n.a. <0.1 <0.1 <0.1 0.1 0.1 2.0 2.2 0.6 0.5 <0.1 <0.1 <0.1 <0.1
Dominica <0.1 <0.1 n.a. n.a. n.a. n.a. n.a. n.a. n.a. <0.1 0.0 n.a. n.a. n.a. n.a.
Dominican Republic 1.7 0.7 n.a. 0.1 0.1 0.1 0.1 1.6 1.9 0.7 0.7 <0.1 <0.1 <0.1 <0.1
Grenada n.a. n.a. n.a. <0.1b,c n.a. <0.1b,c n.a. n.a. n.a. n.a. n.a. <0.1 <0.1 <0.1 0.0 n.a. n.a. n.a. n.a.
Haiti 4.9 5.4 n.a. 5.2 n.a. 9.4 <0.1 0.3 0.3 <0.1 <0.1 1.2 1.5 1.3 1.4 0.1 0.1 n.a. n.a.
Jamaica 0.2 0.2 0.7 0.7 1.4 1.5 <0.1 <0.1 <0.1 <0.1 <0.1 0.4 0.5 0.1 0.2 <0.1 n.a. <0.1 <0.1
Puerto Rico n.a. n.a. n.a. n.a. n.a. n.a. n.a. n.a. n.a. n.a. n.a. n.a. n.a. 0.2 0.1 n.a. n.a. n.a. n.a.
Saint Kitts and Nevis n.a. n.a. <0.1b,c <0.1b,c <0.1b,c <0.1b,c n.a. n.a. n.a. n.a. n.a. n.a. n.a. <0.1 0.0 n.a. n.a. n.a. n.a.
Saint Lucia n.a. n.a. <0.1b,c n.a. <0.1b,c n.a. n.a. <0.1 <0.1 <0.1 <0.1 <0.1 <0.1 <0.1 0.0 <0.1 n.a. n.a. n.a.
Saint Vincent and the Grenadines
<0.1 <0.1 n.a. <0.1b,c n.a. <0.1b,c n.a. n.a. n.a. n.a. n.a. <0.1 <0.1 <0.1 0.0 n.a. n.a. n.a. n.a.
Trinidad and Tobago 0.1 0.1 n.a. 0.1 n.a. 0.6 n.a. <0.1 <0.1 <0.1 <0.1 0.2 0.2 0.1 0.1 <0.1 n.a. <0.1 <0.1
Central America 11.6 14.4 10.9 13.5 49.5 57.8 0.1 2.9 2.7 1.1 1.0 26.1 30.8 6.7 7.0 0.7 1.0 0.3 0.3
Belize <0.1 <0.1 n.a. <0.1b,c n.a. 0.2b,c <0.1 <0.1 <0.1 <0.1 <0.1 <0.1 0.1 <0.1 0.0 <0.1 <0.1 <0.1 <0.1
Costa Rica 0.2 0.2 <0.1b,c 0.1b,c 0.6b,c 0.8b,c <0.1 <0.1 <0.1 <0.1 <0.1 0.8 0.9 0.2 0.2 <0.1 <0.1 <0.1 <0.1
El Salvador 0.6 0.5 0.9 1.0 2.7 3.0 <0.1 0.1 0.1 <0.1 <0.1 0.9 1.0 0.2 0.2 <0.1 <0.1 <0.1 <0.1
Guatemala 2.5 2.9 2.6 3.7 6.9 10.0 <0.1 0.9 0.9 0.1 0.1 1.6 2.0 0.4 0.3 0.2 0.2 <0.1 <0.1
Honduras 1.7 1.5 1.3b,c 1.8b,c 3.8b,c 4.9b,c n.a. 0.2 0.2 0.1 0.1 0.9 1.2 0.4 0.5 <0.1 n.a. <0.1 <0.1
Mexico 4.7 7.8 4.4b,c 4.8b,c 31.2b,c 33.7b,c 0.2 1.4 1.3 0.8 0.7 20.6 24.0 5.1 5.3 0.3 0.6 0.2 0.2
Nicaragua 1.3 1.2 n.a. 0.1 0.1 <0.1 <0.1 0.8 0.9 0.2 0.3 <0.1 n.a. <0.1 <0.1
Panama 0.7 0.2 n.a. 0.1 0.1 <0.1 <0.1 0.5 0.6 0.2 0.2 n.a. n.a. <0.1 <0.1
South America 32.6 29.3 24.8 52.3 96.6 157.7 0.4a 3.4 2.8a 2.6 2.6a 58.4 67.9 19.9 19.5 2.8 n.a. 0.6 0.6
Argentina 1.4 1.7 2.5 5.9 8.3 16.7 0.1 0.3 0.3 0.5 0.5 7.6 8.6 1.3 1.3 0.2 n.a. <0.1 <0.1
TABLE A1.2 (Continued)
| 156 |
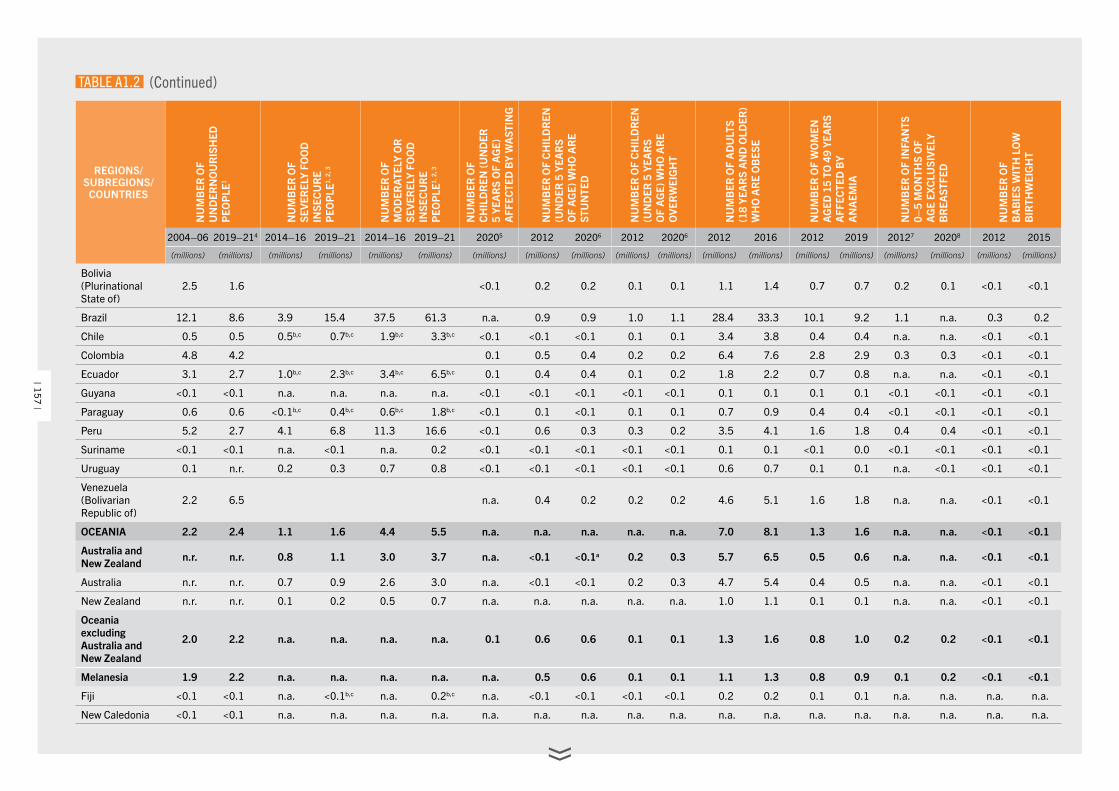
REGIONS/SUBREGIONS/
COUNTRIESN
UM
BER
OF
UN
DER
NO
UR
ISH
ED
PEO
PLE
1
NU
MB
ER O
F
SEVE
REL
Y FO
OD
IN
SEC
UR
E P
EOP
LE1,
2, 3
NU
MB
ER O
F M
OD
ERAT
ELY
OR
SE
VER
ELY
FOO
D
INSE
CU
RE
P
EOP
LE1,
2, 3
NU
MB
ER O
F
CH
ILD
REN
(UN
DER
5
YEA
RS
OF
AG
E)
AFF
ECTE
D B
Y W
AST
ING
NU
MB
ER O
F C
HIL
DR
EN
(UN
DER
5 Y
EAR
S O
F A
GE)
WH
O A
RE
STU
NTE
D
NU
MB
ER O
F C
HIL
DR
EN
(UN
DER
5 Y
EAR
S O
F A
GE)
WH
O A
RE
OVE
RW
EIG
HT
NU
MB
ER O
F A
DU
LTS
(18
YEA
RS
AN
D O
LDER
) W
HO
AR
E O
BES
E
NU
MB
ER O
F W
OM
EN
AG
ED 1
5 TO
49
YEA
RS
A
FFEC
TED
BY
A
NA
EMIA
NU
MB
ER O
F IN
FAN
TS
0–5
MO
NTH
S O
F A
GE
EXC
LUSI
VELY
B
REA
STFE
D
NU
MB
ER O
F B
AB
IES
WIT
H L
OW
B
IRTH
WEI
GH
T
2004–06 2019–214 2014–16 2019–21 2014–16 2019–21 20205 2012 20206 2012 20206 2012 2016 2012 2019 20127 20208 2012 2015
(millions) (millions) (millions) (millions) (millions) (millions) (millions) (millions) (millions) (millions) (millions) (millions) (millions) (millions) (millions) (millions) (millions) (millions) (millions)
Bolivia (Plurinational State of)
2.5 1.6 <0.1 0.2 0.2 0.1 0.1 1.1 1.4 0.7 0.7 0.2 0.1 <0.1 <0.1
Brazil 12.1 8.6 3.9 15.4 37.5 61.3 n.a. 0.9 0.9 1.0 1.1 28.4 33.3 10.1 9.2 1.1 n.a. 0.3 0.2
Chile 0.5 0.5 0.5b,c 0.7b,c 1.9b,c 3.3b,c <0.1 <0.1 <0.1 0.1 0.1 3.4 3.8 0.4 0.4 n.a. n.a. <0.1 <0.1
Colombia 4.8 4.2 0.1 0.5 0.4 0.2 0.2 6.4 7.6 2.8 2.9 0.3 0.3 <0.1 <0.1
Ecuador 3.1 2.7 1.0b,c 2.3b,c 3.4b,c 6.5b,c 0.1 0.4 0.4 0.1 0.2 1.8 2.2 0.7 0.8 n.a. n.a. <0.1 <0.1
Guyana <0.1 <0.1 n.a. n.a. n.a. n.a. <0.1 <0.1 <0.1 <0.1 <0.1 0.1 0.1 0.1 0.1 <0.1 <0.1 <0.1 <0.1
Paraguay 0.6 0.6 <0.1b,c 0.4b,c 0.6b,c 1.8b,c <0.1 0.1 <0.1 0.1 0.1 0.7 0.9 0.4 0.4 <0.1 <0.1 <0.1 <0.1
Peru 5.2 2.7 4.1 6.8 11.3 16.6 <0.1 0.6 0.3 0.3 0.2 3.5 4.1 1.6 1.8 0.4 0.4 <0.1 <0.1
Suriname <0.1 <0.1 n.a. <0.1 n.a. 0.2 <0.1 <0.1 <0.1 <0.1 <0.1 0.1 0.1 <0.1 0.0 <0.1 <0.1 <0.1 <0.1
Uruguay 0.1 n.r. 0.2 0.3 0.7 0.8 <0.1 <0.1 <0.1 <0.1 <0.1 0.6 0.7 0.1 0.1 n.a. <0.1 <0.1 <0.1
Venezuela (Bolivarian Republic of)
2.2 6.5 n.a. 0.4 0.2 0.2 0.2 4.6 5.1 1.6 1.8 n.a. n.a. <0.1 <0.1
OCEANIA 2.2 2.4 1.1 1.6 4.4 5.5 n.a. n.a. n.a. n.a. n.a. 7.0 8.1 1.3 1.6 n.a. n.a. <0.1 <0.1
Australia and New Zealand n.r. n.r. 0.8 1.1 3.0 3.7 n.a. <0.1 <0.1a 0.2 0.3 5.7 6.5 0.5 0.6 n.a. n.a. <0.1 <0.1
Australia n.r. n.r. 0.7 0.9 2.6 3.0 n.a. <0.1 <0.1 0.2 0.3 4.7 5.4 0.4 0.5 n.a. n.a. <0.1 <0.1
New Zealand n.r. n.r. 0.1 0.2 0.5 0.7 n.a. n.a. n.a. n.a. n.a. 1.0 1.1 0.1 0.1 n.a. n.a. <0.1 <0.1
Oceania excluding Australia and New Zealand
2.0 2.2 n.a. n.a. n.a. n.a. 0.1 0.6 0.6 0.1 0.1 1.3 1.6 0.8 1.0 0.2 0.2 <0.1 <0.1
Melanesia 1.9 2.2 n.a. n.a. n.a. n.a. n.a. 0.5 0.6 0.1 0.1 1.1 1.3 0.8 0.9 0.1 0.2 <0.1 <0.1
Fiji <0.1 <0.1 n.a. <0.1b,c n.a. 0.2b,c n.a. <0.1 <0.1 <0.1 <0.1 0.2 0.2 0.1 0.1 n.a. n.a. n.a. n.a.
New Caledonia <0.1 <0.1 n.a. n.a. n.a. n.a. n.a. n.a. n.a. n.a. n.a. n.a. n.a. n.a. n.a. n.a. n.a. n.a. n.a.
TABLE A1.2 (Continued)
| 157 |
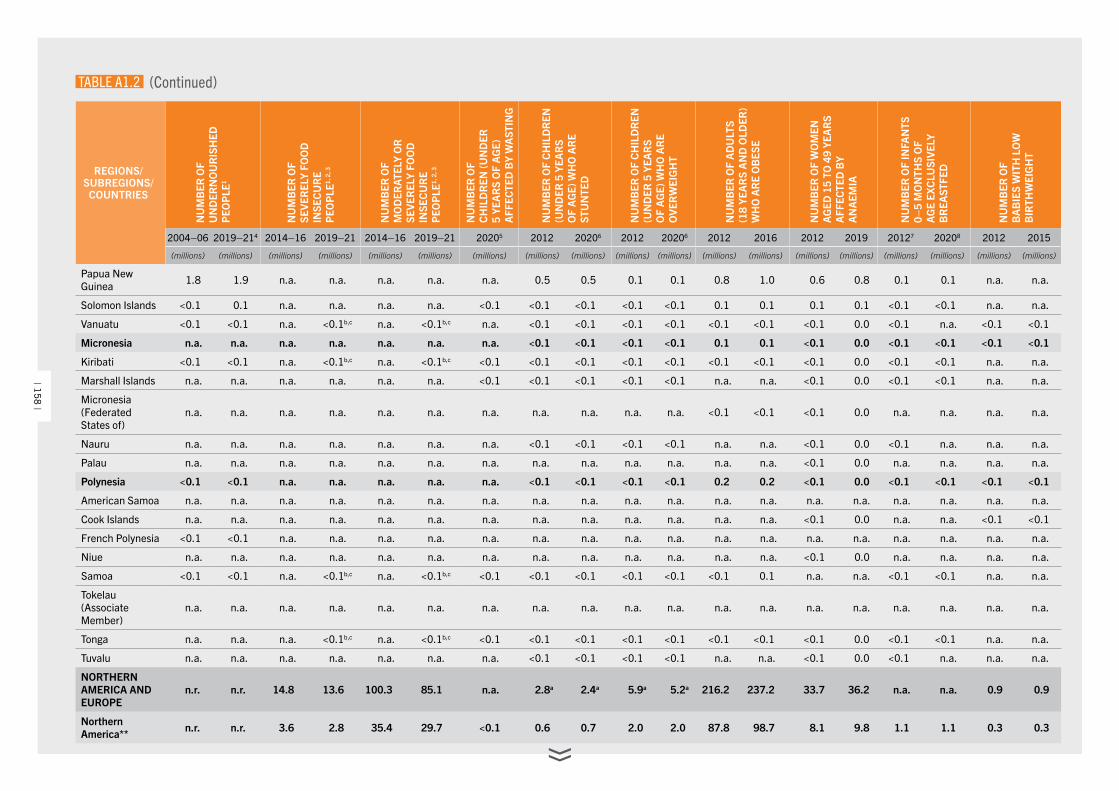
REGIONS/SUBREGIONS/
COUNTRIESN
UM
BER
OF
UN
DER
NO
UR
ISH
ED
PEO
PLE
1
NU
MB
ER O
F
SEVE
REL
Y FO
OD
IN
SEC
UR
E P
EOP
LE1,
2, 3
NU
MB
ER O
F M
OD
ERAT
ELY
OR
SE
VER
ELY
FOO
D
INSE
CU
RE
P
EOP
LE1,
2, 3
NU
MB
ER O
F
CH
ILD
REN
(UN
DER
5
YEA
RS
OF
AG
E)
AFF
ECTE
D B
Y W
AST
ING
NU
MB
ER O
F C
HIL
DR
EN
(UN
DER
5 Y
EAR
S O
F A
GE)
WH
O A
RE
STU
NTE
D
NU
MB
ER O
F C
HIL
DR
EN
(UN
DER
5 Y
EAR
S O
F A
GE)
WH
O A
RE
OVE
RW
EIG
HT
NU
MB
ER O
F A
DU
LTS
(18
YEA
RS
AN
D O
LDER
) W
HO
AR
E O
BES
E
NU
MB
ER O
F W
OM
EN
AG
ED 1
5 TO
49
YEA
RS
A
FFEC
TED
BY
A
NA
EMIA
NU
MB
ER O
F IN
FAN
TS
0–5
MO
NTH
S O
F A
GE
EXC
LUSI
VELY
B
REA
STFE
D
NU
MB
ER O
F B
AB
IES
WIT
H L
OW
B
IRTH
WEI
GH
T
2004–06 2019–214 2014–16 2019–21 2014–16 2019–21 20205 2012 20206 2012 20206 2012 2016 2012 2019 20127 20208 2012 2015
(millions) (millions) (millions) (millions) (millions) (millions) (millions) (millions) (millions) (millions) (millions) (millions) (millions) (millions) (millions) (millions) (millions) (millions) (millions)
Papua New Guinea 1.8 1.9 n.a. n.a. n.a. n.a. n.a. 0.5 0.5 0.1 0.1 0.8 1.0 0.6 0.8 0.1 0.1 n.a. n.a.
Solomon Islands <0.1 0.1 n.a. n.a. n.a. n.a. <0.1 <0.1 <0.1 <0.1 <0.1 0.1 0.1 0.1 0.1 <0.1 <0.1 n.a. n.a.
Vanuatu <0.1 <0.1 n.a. <0.1b,c n.a. <0.1b,c n.a. <0.1 <0.1 <0.1 <0.1 <0.1 <0.1 <0.1 0.0 <0.1 n.a. <0.1 <0.1
Micronesia n.a. n.a. n.a. n.a. n.a. n.a. n.a. <0.1 <0.1 <0.1 <0.1 0.1 0.1 <0.1 0.0 <0.1 <0.1 <0.1 <0.1
Kiribati <0.1 <0.1 n.a. <0.1b,c n.a. <0.1b,c <0.1 <0.1 <0.1 <0.1 <0.1 <0.1 <0.1 <0.1 0.0 <0.1 <0.1 n.a. n.a.
Marshall Islands n.a. n.a. n.a. n.a. n.a. n.a. <0.1 <0.1 <0.1 <0.1 <0.1 n.a. n.a. <0.1 0.0 <0.1 <0.1 n.a. n.a.
Micronesia (Federated States of)
n.a. n.a. n.a. n.a. n.a. n.a. n.a. n.a. n.a. n.a. n.a. <0.1 <0.1 <0.1 0.0 n.a. n.a. n.a. n.a.
Nauru n.a. n.a. n.a. n.a. n.a. n.a. n.a. <0.1 <0.1 <0.1 <0.1 n.a. n.a. <0.1 0.0 <0.1 n.a. n.a. n.a.
Palau n.a. n.a. n.a. n.a. n.a. n.a. n.a. n.a. n.a. n.a. n.a. n.a. n.a. <0.1 0.0 n.a. n.a. n.a. n.a.
Polynesia <0.1 <0.1 n.a. n.a. n.a. n.a. n.a. <0.1 <0.1 <0.1 <0.1 0.2 0.2 <0.1 0.0 <0.1 <0.1 <0.1 <0.1
American Samoa n.a. n.a. n.a. n.a. n.a. n.a. n.a. n.a. n.a. n.a. n.a. n.a. n.a. n.a. n.a. n.a. n.a. n.a. n.a.
Cook Islands n.a. n.a. n.a. n.a. n.a. n.a. n.a. n.a. n.a. n.a. n.a. n.a. n.a. <0.1 0.0 n.a. n.a. <0.1 <0.1
French Polynesia <0.1 <0.1 n.a. n.a. n.a. n.a. n.a. n.a. n.a. n.a. n.a. n.a. n.a. n.a. n.a. n.a. n.a. n.a. n.a.
Niue n.a. n.a. n.a. n.a. n.a. n.a. n.a. n.a. n.a. n.a. n.a. n.a. n.a. <0.1 0.0 n.a. n.a. n.a. n.a.
Samoa <0.1 <0.1 n.a. <0.1b,c n.a. <0.1b,c <0.1 <0.1 <0.1 <0.1 <0.1 <0.1 0.1 n.a. n.a. <0.1 <0.1 n.a. n.a.
Tokelau (Associate Member)
n.a. n.a. n.a. n.a. n.a. n.a. n.a. n.a. n.a. n.a. n.a. n.a. n.a. n.a. n.a. n.a. n.a. n.a. n.a.
Tonga n.a. n.a. n.a. <0.1b,c n.a. <0.1b,c <0.1 <0.1 <0.1 <0.1 <0.1 <0.1 <0.1 <0.1 0.0 <0.1 <0.1 n.a. n.a.
Tuvalu n.a. n.a. n.a. n.a. n.a. n.a. n.a. <0.1 <0.1 <0.1 <0.1 n.a. n.a. <0.1 0.0 <0.1 n.a. n.a. n.a.
NORTHERN AMERICA AND EUROPE
n.r. n.r. 14.8 13.6 100.3 85.1 n.a. 2.8a 2.4a 5.9a 5.2a 216.2 237.2 33.7 36.2 n.a. n.a. 0.9 0.9
Northern America** n.r. n.r. 3.6 2.8 35.4 29.7 <0.1 0.6 0.7 2.0 2.0 87.8 98.7 8.1 9.8 1.1 1.1 0.3 0.3
TABLE A1.2 (Continued)
| 158 |
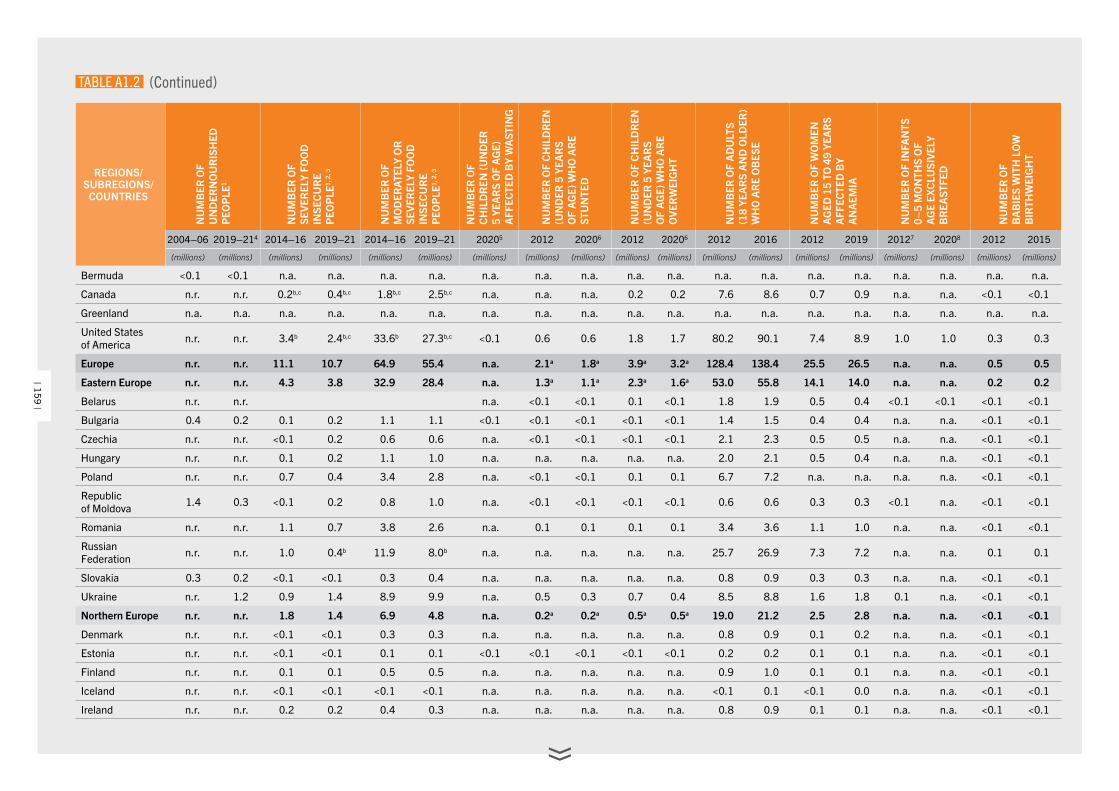
REGIONS/SUBREGIONS/
COUNTRIESN
UM
BER
OF
UN
DER
NO
UR
ISH
ED
PEO
PLE
1
NU
MB
ER O
F
SEVE
REL
Y FO
OD
IN
SEC
UR
E P
EOP
LE1,
2, 3
NU
MB
ER O
F M
OD
ERAT
ELY
OR
SE
VER
ELY
FOO
D
INSE
CU
RE
P
EOP
LE1,
2, 3
NU
MB
ER O
F
CH
ILD
REN
(UN
DER
5
YEA
RS
OF
AG
E)
AFF
ECTE
D B
Y W
AST
ING
NU
MB
ER O
F C
HIL
DR
EN
(UN
DER
5 Y
EAR
S O
F A
GE)
WH
O A
RE
STU
NTE
D
NU
MB
ER O
F C
HIL
DR
EN
(UN
DER
5 Y
EAR
S O
F A
GE)
WH
O A
RE
OVE
RW
EIG
HT
NU
MB
ER O
F A
DU
LTS
(18
YEA
RS
AN
D O
LDER
) W
HO
AR
E O
BES
E
NU
MB
ER O
F W
OM
EN
AG
ED 1
5 TO
49
YEA
RS
A
FFEC
TED
BY
A
NA
EMIA
NU
MB
ER O
F IN
FAN
TS
0–5
MO
NTH
S O
F A
GE
EXC
LUSI
VELY
B
REA
STFE
D
NU
MB
ER O
F B
AB
IES
WIT
H L
OW
B
IRTH
WEI
GH
T
2004–06 2019–214 2014–16 2019–21 2014–16 2019–21 20205 2012 20206 2012 20206 2012 2016 2012 2019 20127 20208 2012 2015
(millions) (millions) (millions) (millions) (millions) (millions) (millions) (millions) (millions) (millions) (millions) (millions) (millions) (millions) (millions) (millions) (millions) (millions) (millions)
Bermuda <0.1 <0.1 n.a. n.a. n.a. n.a. n.a. n.a. n.a. n.a. n.a. n.a. n.a. n.a. n.a. n.a. n.a. n.a. n.a.
Canada n.r. n.r. 0.2b,c 0.4b,c 1.8b,c 2.5b,c n.a. n.a. n.a. 0.2 0.2 7.6 8.6 0.7 0.9 n.a. n.a. <0.1 <0.1
Greenland n.a. n.a. n.a. n.a. n.a. n.a. n.a. n.a. n.a. n.a. n.a. n.a. n.a. n.a. n.a. n.a. n.a. n.a. n.a.
United States of America n.r. n.r. 3.4b 2.4b,c 33.6b 27.3b,c <0.1 0.6 0.6 1.8 1.7 80.2 90.1 7.4 8.9 1.0 1.0 0.3 0.3
Europe n.r. n.r. 11.1 10.7 64.9 55.4 n.a. 2.1a 1.8a 3.9a 3.2a 128.4 138.4 25.5 26.5 n.a. n.a. 0.5 0.5
Eastern Europe n.r. n.r. 4.3 3.8 32.9 28.4 n.a. 1.3a 1.1a 2.3a 1.6a 53.0 55.8 14.1 14.0 n.a. n.a. 0.2 0.2
Belarus n.r. n.r. n.a. <0.1 <0.1 0.1 <0.1 1.8 1.9 0.5 0.4 <0.1 <0.1 <0.1 <0.1
Bulgaria 0.4 0.2 0.1 0.2 1.1 1.1 <0.1 <0.1 <0.1 <0.1 <0.1 1.4 1.5 0.4 0.4 n.a. n.a. <0.1 <0.1
Czechia n.r. n.r. <0.1 0.2 0.6 0.6 n.a. <0.1 <0.1 <0.1 <0.1 2.1 2.3 0.5 0.5 n.a. n.a. <0.1 <0.1
Hungary n.r. n.r. 0.1 0.2 1.1 1.0 n.a. n.a. n.a. n.a. n.a. 2.0 2.1 0.5 0.4 n.a. n.a. <0.1 <0.1
Poland n.r. n.r. 0.7 0.4 3.4 2.8 n.a. <0.1 <0.1 0.1 0.1 6.7 7.2 n.a. n.a. n.a. n.a. <0.1 <0.1
Republic of Moldova 1.4 0.3 <0.1 0.2 0.8 1.0 n.a. <0.1 <0.1 <0.1 <0.1 0.6 0.6 0.3 0.3 <0.1 n.a. <0.1 <0.1
Romania n.r. n.r. 1.1 0.7 3.8 2.6 n.a. 0.1 0.1 0.1 0.1 3.4 3.6 1.1 1.0 n.a. n.a. <0.1 <0.1
Russian Federation n.r. n.r. 1.0 0.4b 11.9 8.0b n.a. n.a. n.a. n.a. n.a. 25.7 26.9 7.3 7.2 n.a. n.a. 0.1 0.1
Slovakia 0.3 0.2 <0.1 <0.1 0.3 0.4 n.a. n.a. n.a. n.a. n.a. 0.8 0.9 0.3 0.3 n.a. n.a. <0.1 <0.1
Ukraine n.r. 1.2 0.9 1.4 8.9 9.9 n.a. 0.5 0.3 0.7 0.4 8.5 8.8 1.6 1.8 0.1 n.a. <0.1 <0.1
Northern Europe n.r. n.r. 1.8 1.4 6.9 4.8 n.a. 0.2a 0.2a 0.5a 0.5a 19.0 21.2 2.5 2.8 n.a. n.a. <0.1 <0.1
Denmark n.r. n.r. <0.1 <0.1 0.3 0.3 n.a. n.a. n.a. n.a. n.a. 0.8 0.9 0.1 0.2 n.a. n.a. <0.1 <0.1
Estonia n.r. n.r. <0.1 <0.1 0.1 0.1 <0.1 <0.1 <0.1 <0.1 <0.1 0.2 0.2 0.1 0.1 n.a. n.a. <0.1 <0.1
Finland n.r. n.r. 0.1 0.1 0.5 0.5 n.a. n.a. n.a. n.a. n.a. 0.9 1.0 0.1 0.1 n.a. n.a. <0.1 <0.1
Iceland n.r. n.r. <0.1 <0.1 <0.1 <0.1 n.a. n.a. n.a. n.a. n.a. <0.1 0.1 <0.1 0.0 n.a. n.a. <0.1 <0.1
Ireland n.r. n.r. 0.2 0.2 0.4 0.3 n.a. n.a. n.a. n.a. n.a. 0.8 0.9 0.1 0.1 n.a. n.a. <0.1 <0.1
TABLE A1.2 (Continued)
| 159 |
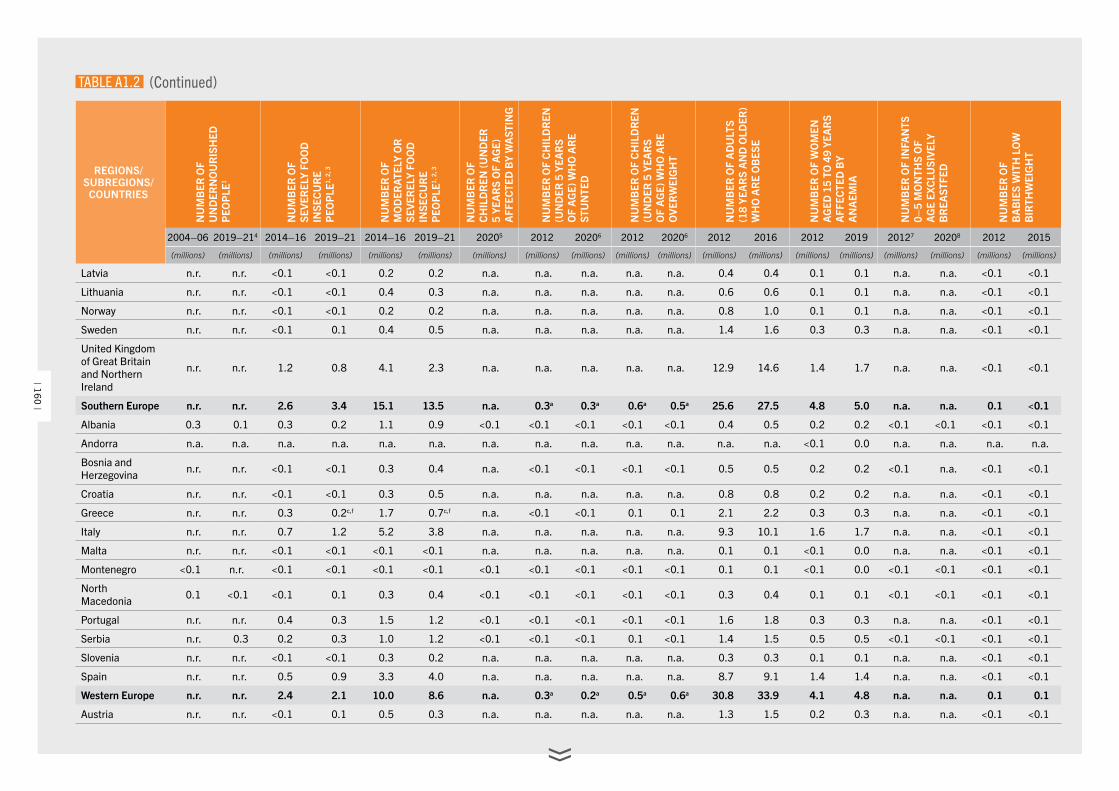
REGIONS/SUBREGIONS/
COUNTRIESN
UM
BER
OF
UN
DER
NO
UR
ISH
ED
PEO
PLE
1
NU
MB
ER O
F
SEVE
REL
Y FO
OD
IN
SEC
UR
E P
EOP
LE1,
2, 3
NU
MB
ER O
F M
OD
ERAT
ELY
OR
SE
VER
ELY
FOO
D
INSE
CU
RE
P
EOP
LE1,
2, 3
NU
MB
ER O
F
CH
ILD
REN
(UN
DER
5
YEA
RS
OF
AG
E)
AFF
ECTE
D B
Y W
AST
ING
NU
MB
ER O
F C
HIL
DR
EN
(UN
DER
5 Y
EAR
S O
F A
GE)
WH
O A
RE
STU
NTE
D
NU
MB
ER O
F C
HIL
DR
EN
(UN
DER
5 Y
EAR
S O
F A
GE)
WH
O A
RE
OVE
RW
EIG
HT
NU
MB
ER O
F A
DU
LTS
(18
YEA
RS
AN
D O
LDER
) W
HO
AR
E O
BES
E
NU
MB
ER O
F W
OM
EN
AG
ED 1
5 TO
49
YEA
RS
A
FFEC
TED
BY
A
NA
EMIA
NU
MB
ER O
F IN
FAN
TS
0–5
MO
NTH
S O
F A
GE
EXC
LUSI
VELY
B
REA
STFE
D
NU
MB
ER O
F B
AB
IES
WIT
H L
OW
B
IRTH
WEI
GH
T
2004–06 2019–214 2014–16 2019–21 2014–16 2019–21 20205 2012 20206 2012 20206 2012 2016 2012 2019 20127 20208 2012 2015
(millions) (millions) (millions) (millions) (millions) (millions) (millions) (millions) (millions) (millions) (millions) (millions) (millions) (millions) (millions) (millions) (millions) (millions) (millions)
Latvia n.r. n.r. <0.1 <0.1 0.2 0.2 n.a. n.a. n.a. n.a. n.a. 0.4 0.4 0.1 0.1 n.a. n.a. <0.1 <0.1
Lithuania n.r. n.r. <0.1 <0.1 0.4 0.3 n.a. n.a. n.a. n.a. n.a. 0.6 0.6 0.1 0.1 n.a. n.a. <0.1 <0.1
Norway n.r. n.r. <0.1 <0.1 0.2 0.2 n.a. n.a. n.a. n.a. n.a. 0.8 1.0 0.1 0.1 n.a. n.a. <0.1 <0.1
Sweden n.r. n.r. <0.1 0.1 0.4 0.5 n.a. n.a. n.a. n.a. n.a. 1.4 1.6 0.3 0.3 n.a. n.a. <0.1 <0.1
United Kingdom of Great Britain and Northern Ireland
n.r. n.r. 1.2 0.8 4.1 2.3 n.a. n.a. n.a. n.a. n.a. 12.9 14.6 1.4 1.7 n.a. n.a. <0.1 <0.1
Southern Europe n.r. n.r. 2.6 3.4 15.1 13.5 n.a. 0.3a 0.3a 0.6a 0.5a 25.6 27.5 4.8 5.0 n.a. n.a. 0.1 <0.1
Albania 0.3 0.1 0.3 0.2 1.1 0.9 <0.1 <0.1 <0.1 <0.1 <0.1 0.4 0.5 0.2 0.2 <0.1 <0.1 <0.1 <0.1
Andorra n.a. n.a. n.a. n.a. n.a. n.a. n.a. n.a. n.a. n.a. n.a. n.a. n.a. <0.1 0.0 n.a. n.a. n.a. n.a.
Bosnia and Herzegovina n.r. n.r. <0.1 <0.1 0.3 0.4 n.a. <0.1 <0.1 <0.1 <0.1 0.5 0.5 0.2 0.2 <0.1 n.a. <0.1 <0.1
Croatia n.r. n.r. <0.1 <0.1 0.3 0.5 n.a. n.a. n.a. n.a. n.a. 0.8 0.8 0.2 0.2 n.a. n.a. <0.1 <0.1
Greece n.r. n.r. 0.3 0.2c,f 1.7 0.7c,f n.a. <0.1 <0.1 0.1 0.1 2.1 2.2 0.3 0.3 n.a. n.a. <0.1 <0.1
Italy n.r. n.r. 0.7 1.2 5.2 3.8 n.a. n.a. n.a. n.a. n.a. 9.3 10.1 1.6 1.7 n.a. n.a. <0.1 <0.1
Malta n.r. n.r. <0.1 <0.1 <0.1 <0.1 n.a. n.a. n.a. n.a. n.a. 0.1 0.1 <0.1 0.0 n.a. n.a. <0.1 <0.1
Montenegro <0.1 n.r. <0.1 <0.1 <0.1 <0.1 <0.1 <0.1 <0.1 <0.1 <0.1 0.1 0.1 <0.1 0.0 <0.1 <0.1 <0.1 <0.1
North Macedonia 0.1 <0.1 <0.1 0.1 0.3 0.4 <0.1 <0.1 <0.1 <0.1 <0.1 0.3 0.4 0.1 0.1 <0.1 <0.1 <0.1 <0.1
Portugal n.r. n.r. 0.4 0.3 1.5 1.2 <0.1 <0.1 <0.1 <0.1 <0.1 1.6 1.8 0.3 0.3 n.a. n.a. <0.1 <0.1
Serbia n.r. 0.3 0.2 0.3 1.0 1.2 <0.1 <0.1 <0.1 0.1 <0.1 1.4 1.5 0.5 0.5 <0.1 <0.1 <0.1 <0.1
Slovenia n.r. n.r. <0.1 <0.1 0.3 0.2 n.a. n.a. n.a. n.a. n.a. 0.3 0.3 0.1 0.1 n.a. n.a. <0.1 <0.1
Spain n.r. n.r. 0.5 0.9 3.3 4.0 n.a. n.a. n.a. n.a. n.a. 8.7 9.1 1.4 1.4 n.a. n.a. <0.1 <0.1
Western Europe n.r. n.r. 2.4 2.1 10.0 8.6 n.a. 0.3a 0.2a 0.5a 0.6a 30.8 33.9 4.1 4.8 n.a. n.a. 0.1 0.1
Austria n.r. n.r. <0.1 0.1 0.5 0.3 n.a. n.a. n.a. n.a. n.a. 1.3 1.5 0.2 0.3 n.a. n.a. <0.1 <0.1
TABLE A1.2 (Continued)
| 160 |
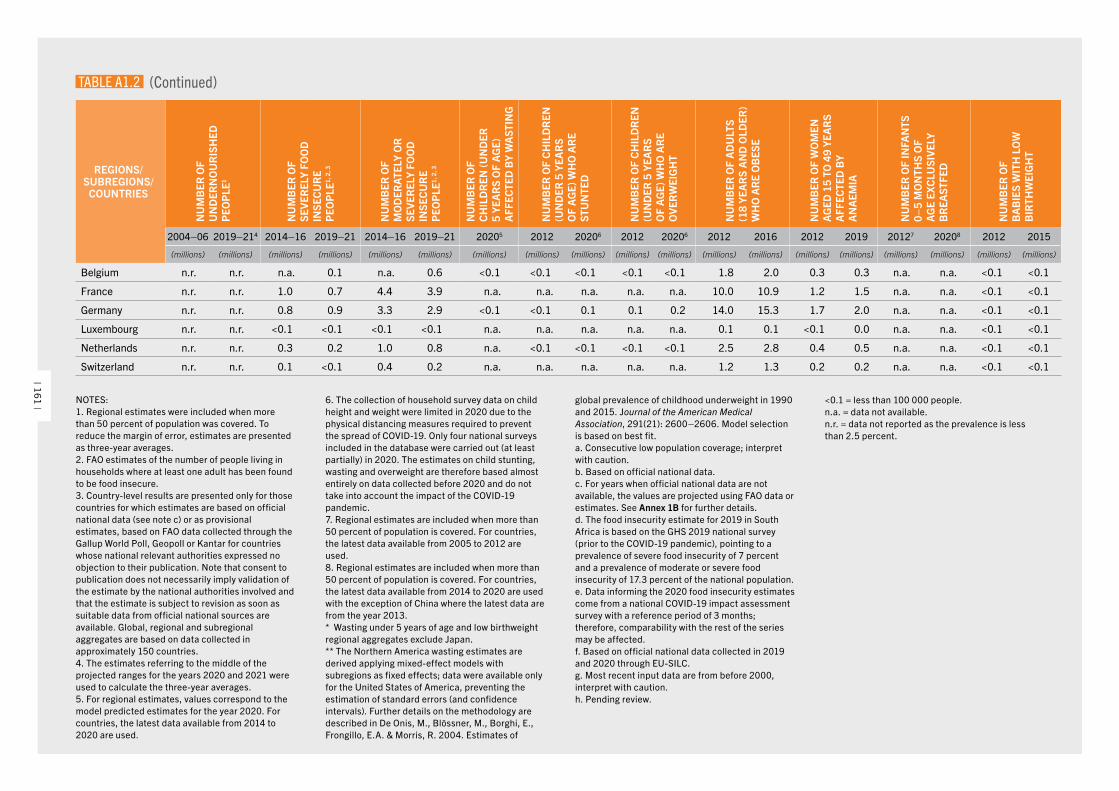
REGIONS/SUBREGIONS/
COUNTRIESN
UM
BER
OF
UN
DER
NO
UR
ISH
ED
PEO
PLE
1
NU
MB
ER O
F
SEVE
REL
Y FO
OD
IN
SEC
UR
E P
EOP
LE1,
2, 3
NU
MB
ER O
F M
OD
ERAT
ELY
OR
SE
VER
ELY
FOO
D
INSE
CU
RE
P
EOP
LE1,
2, 3
NU
MB
ER O
F
CH
ILD
REN
(UN
DER
5
YEA
RS
OF
AG
E)
AFF
ECTE
D B
Y W
AST
ING
NU
MB
ER O
F C
HIL
DR
EN
(UN
DER
5 Y
EAR
S O
F A
GE)
WH
O A
RE
STU
NTE
D
NU
MB
ER O
F C
HIL
DR
EN
(UN
DER
5 Y
EAR
S O
F A
GE)
WH
O A
RE
OVE
RW
EIG
HT
NU
MB
ER O
F A
DU
LTS
(18
YEA
RS
AN
D O
LDER
) W
HO
AR
E O
BES
E
NU
MB
ER O
F W
OM
EN
AG
ED 1
5 TO
49
YEA
RS
A
FFEC
TED
BY
A
NA
EMIA
NU
MB
ER O
F IN
FAN
TS
0–5
MO
NTH
S O
F A
GE
EXC
LUSI
VELY
B
REA
STFE
D
NU
MB
ER O
F B
AB
IES
WIT
H L
OW
B
IRTH
WEI
GH
T
2004–06 2019–214 2014–16 2019–21 2014–16 2019–21 20205 2012 20206 2012 20206 2012 2016 2012 2019 20127 20208 2012 2015
(millions) (millions) (millions) (millions) (millions) (millions) (millions) (millions) (millions) (millions) (millions) (millions) (millions) (millions) (millions) (millions) (millions) (millions) (millions)
Belgium n.r. n.r. n.a. 0.1 n.a. 0.6 <0.1 <0.1 <0.1 <0.1 <0.1 1.8 2.0 0.3 0.3 n.a. n.a. <0.1 <0.1
France n.r. n.r. 1.0 0.7 4.4 3.9 n.a. n.a. n.a. n.a. n.a. 10.0 10.9 1.2 1.5 n.a. n.a. <0.1 <0.1
Germany n.r. n.r. 0.8 0.9 3.3 2.9 <0.1 <0.1 0.1 0.1 0.2 14.0 15.3 1.7 2.0 n.a. n.a. <0.1 <0.1
Luxembourg n.r. n.r. <0.1 <0.1 <0.1 <0.1 n.a. n.a. n.a. n.a. n.a. 0.1 0.1 <0.1 0.0 n.a. n.a. <0.1 <0.1
Netherlands n.r. n.r. 0.3 0.2 1.0 0.8 n.a. <0.1 <0.1 <0.1 <0.1 2.5 2.8 0.4 0.5 n.a. n.a. <0.1 <0.1
Switzerland n.r. n.r. 0.1 <0.1 0.4 0.2 n.a. n.a. n.a. n.a. n.a. 1.2 1.3 0.2 0.2 n.a. n.a. <0.1 <0.1
NOTES:1. Regional estimates were included when more than 50 percent of population was covered. To reduce the margin of error, estimates are presented as three-year averages.2. FAO estimates of the number of people living in households where at least one adult has been found to be food insecure. 3. Country-level results are presented only for those countries for which estimates are based on official national data (see note c) or as provisional estimates, based on FAO data collected through the Gallup World Poll, Geopoll or Kantar for countries whose national relevant authorities expressed no objection to their publication. Note that consent to publication does not necessarily imply validation of the estimate by the national authorities involved and that the estimate is subject to revision as soon as suitable data from official national sources are available. Global, regional and subregional aggregates are based on data collected in approximately 150 countries.4. The estimates referring to the middle of the projected ranges for the years 2020 and 2021 were used to calculate the three-year averages.5. For regional estimates, values correspond to the model predicted estimates for the year 2020. For countries, the latest data available from 2014 to 2020 are used.
6. The collection of household survey data on child height and weight were limited in 2020 due to the physical distancing measures required to prevent the spread of COVID-19. Only four national surveys included in the database were carried out (at least partially) in 2020. The estimates on child stunting, wasting and overweight are therefore based almost entirely on data collected before 2020 and do not take into account the impact of the COVID-19 pandemic.7. Regional estimates are included when more than 50 percent of population is covered. For countries, the latest data available from 2005 to 2012 are used.8. Regional estimates are included when more than 50 percent of population is covered. For countries, the latest data available from 2014 to 2020 are used with the exception of China where the latest data are from the year 2013.* Wasting under 5 years of age and low birthweight regional aggregates exclude Japan.** The Northern America wasting estimates are derived applying mixed-effect models with subregions as fixed effects; data were available only for the United States of America, preventing the estimation of standard errors (and confidence intervals). Further details on the methodology are described in De Onis, M., Blössner, M., Borghi, E., Frongillo, E.A. & Morris, R. 2004. Estimates of
global prevalence of childhood underweight in 1990 and 2015. Journal of the American Medical Association, 291(21): 2600–2606. Model selection is based on best fit.a. Consecutive low population coverage; interpret with caution.b. Based on official national data.c. For years when official national data are not available, the values are projected using FAO data or estimates. See Annex 1B for further details.d. The food insecurity estimate for 2019 in South Africa is based on the GHS 2019 national survey (prior to the COVID-19 pandemic), pointing to a prevalence of severe food insecurity of 7 percent and a prevalence of moderate or severe food insecurity of 17.3 percent of the national population.e. Data informing the 2020 food insecurity estimates come from a national COVID-19 impact assessment survey with a reference period of 3 months; therefore, comparability with the rest of the series may be affected.f. Based on official national data collected in 2019 and 2020 through EU-SILC. g. Most recent input data are from before 2000, interpret with caution.h. Pending review.
<0.1 = less than 100 000 people.n.a. = data not available.n.r. = data not reported as the prevalence is less than 2.5 percent.
TABLE A1.2 (Continued)
| 161 |
| 162 |
PREVALENCE OF UNDERNOURISHMENTDefinition: Undernourishment is defined as the condition of an individual whose habitual food consumption is insufficient to provide, on average, the amount of dietary energy required to maintain a normal, active and healthy life.
How it is reported: The indicator (denominated as “prevalence of undernourishment” [PoU]) is an estimate of the percentage of individuals in the population that are in a condition of undernourishment. National estimates are reported as three-year moving averages, to control for the low reliability of some of the underlying parameters, such as the year-to-year variation in food commodity stocks, one of the components of the annual FAO Food Balance Sheets for which complete, reliable information is very scarce. Regional and global aggregates, on the other hand, are reported as annual estimates, on account of the fact that possible estimation errors are expected not to be correlated across countries.
Methodology: To compute an estimate of the prevalence of undernourishment in a population, the probability distribution of habitual dietary energy intake levels (expressed in kcal per person per day) for the average individual is modelled as a parametric probability density function (pdf), f(x).396,397 The indicator is obtained as the cumulative probability that the habitual dietary energy intake (x) is below the minimum dietary energy requirements (MDER) (i.e. the lowest limit of the range of energy requirements for the population’s representative average individual) as in the formula below:
PoU = ∫x<MDER f(x|θ)dx,
where θ is a vector of parameters that characterizes the pdf. The distribution is assumed
to be lognormal and thus fully characterized by only two parameters: the mean dietary energy consumption (DEC) and its coefficient of variation (CV).
Data source: Different data sources are used to estimate the different parameters of the model.
Minimum dietary energy requirement (MDER): Human energy requirements for an individual in a given sex/age class are determined on the basis of normative requirements for basic metabolic rate (BMR) per kilogram of body mass, multiplied by the ideal weights that a healthy person of that sex/age class may have, given his or her height, and then multiplied by a coefficient of physical activity level (PAL) to take into account physical activity.ao Given that both healthy BMIs and PALs vary among active and healthy individuals of the same sex and age, a range of energy requirements applies to each sex and age group of the population. The MDER for the average individual in the population, which is the parameter used in the PoU formula, is obtained as the weighted average of the lower bounds of the energy requirement ranges for each sex and age group, using the shares of the population in each sex and age group as weights. Similar to the MDER, the average dietary energy requirement (ADER) is estimated using the average values of the PAL category “Active or moderately active lifestyle”.
Information on the population structure by sex and age is available for most countries in the world and for each year from the UN Department of Economic and Social Affairs (DESA) Population Prospects, revised every two years. This edition of
ao A person is considered healthy if his or her body mass index (BMI) indicates neither underweight nor overweight. Human energy requirement norms per kilogram of body mass are given in FAO and WHO (2004).447
ANNEX 1BMETHODOLOGICAL NOTES FOR THE FOOD SECURITY AND NUTRITION INDICATORS
| 163 |
The State of Food Security and Nutrition in the World uses the 2019 revision of the World Population Prospects.398
Information on the median height in each sex and age group for a given country is derived from a recent demographic and health survey (DHS) or from other surveys that collect anthropometry data on children and adults. Even if such surveys do not refer to the same year for which the PoU is estimated, the impact of possible small intervening changes in median heights over the years on PoU estimates is expected to be negligible.
Dietary energy consumption (DEC): Ideally, data on food consumption should come from nationally representative household surveys (such as Living Standard Measurement Surveys or Household Incomes and Expenditure Surveys). However, only very few countries conduct such surveys on an annual basis. Thus, in FAO’s PoU estimates for global monitoring, DEC values are estimated from the dietary energy supply (DES) reported in the Food Balance Sheets (FBS), compiled by FAO for most countries in the world (see FAO, 2021).90
Since the last edition of this report, the new FBS domain on FAOSTAT has been updated up to 2019 for all countries. In addition, at the time of closing this report, the FBS series were updated for the following 63 countries that have the largest number of undernourished people, bringing them up to date through 2020: Afghanistan, Algeria, Angola, Bangladesh, Bolivia (Plurinational State of), Burkina Faso, Cambodia, Cameroon, Central African Republic, Chad, China (mainland), Colombia, Congo, Côte d’Ivoire, Democratic People’s Republic of Korea, Democratic Republic of the Congo, Ecuador, Eswatini, Ethiopia, Guatemala, Guinea, Haiti, Honduras, India, Indonesia, Iran (Islamic Republic of), Iraq, Kenya, Lao People’s Democratic Republic, Liberia, Madagascar, Malawi, Mali, Mexico, Mongolia, Mozambique, Myanmar, Nepal, Niger, Nigeria, Pakistan, Papua New Guinea, Peru, Philippines, Rwanda, Senegal, Sierra Leone, Somalia, South Africa, Sri Lanka, Sudan, Syrian Arab Republic, Tajikistan, Thailand, Togo, Uganda, United Republic of Tanzania, Uzbekistan, Venezuela (Bolivarian Republic of), Viet Nam, Yemen, Zambia and Zimbabwe.
Estimates for the per capita average DES in 2020 (for countries other than the 63 countries listed above) and in 2021 (for all countries), compiled on the basis of the short-run market outlook exercises conducted by FAO to inform the World Food Situation,5 are used to nowcast the 2020 and 2021 values of DEC for each country, starting from the last available year in the FBS series.
Coefficient of variation (CV): When reliable data on food consumption are available from nationally representative household surveys, the CV due to income (CV|y) can be estimated directly. Since the last edition of this report, 18 new surveys from the following 15 countries have been processed to update the CV|y: Côte d’Ivoire (2018), Ethiopia (2019), Iraq (2018), Kyrgyzstan (2018), Malawi (2019), Mali (2018), Myanmar (2017), Niger (2018), Philippines (2018), Senegal (2018), Sri Lanka (2016, 2019), Togo (2018), Uganda (2018), United Republic of Tanzania (2001, 2007, 2017) and Vanuatu (2019). That makes for a total of 118 surveys from 60 countries for which the estimate of CV|y is based on data from surveys.
When no suitable survey data are available, FIES data collected by FAO since 2014 are used to project the changes in the CV|y from 2015 (or from the year of the last food consumption survey, if more recent) up to 2019, based on a smoothed (three-year moving average) trend in severe food insecurity. The estimates are based on the assumption that recent changes in the extent of severe food insecurity measured with the FIES might closely reflect unobserved changes in the PoU. To the extent that such changes in PoU cannot be fully explained by the effect of the observed or estimated changes in average food supplies, they can thus be attributed to likely unobserved changes in the CV|y that might have occurred in the most recent year. Analysis of historic PoU estimates reveals that, on average, and once differences in DEC and MDER have been controlled for, differences in the CV|y explain about one-third of the differences in PoU across time and space. Therefore, for each country for which FIES data are available, the change in the CV|y that may have occurred from 2015, or from the date of the last available survey, is estimated as the change that would generate one-third of a percentage point change in the PoU for each observed percentage point change in
THE STATE OF FOOD SECURITY AND NUTRITION IN THE WORLD 2022
ANNEX 1B
| 164 |
the prevalence of severe food insecurity. For all other countries, the CV|y is kept constant at the estimated 2017 value. As in last year’s report, the nowcast of the CV|y for 2020 and 2021 – the years when access to food was heavily conditioned by the effects of the COVID-19 pandemic – required special treatment (see Annex 2A).
In the FAO PoU parametric approach, the CV due to differences in body weight and lifestyle, a.k.a. CV due to requirement (CV|r), represents the variability of the distribution of dietary energy requirements of a hypothetical average individual representative of a healthy population, which is also equal to the CV of the distribution of dietary energy intakes of a hypothetical average individual if everyone in the population were perfectly nourished. The distribution of dietary energy requirements of such a hypothetical average individual is assumed to be normal, and therefore its standard deviation can be estimated from any two known percentiles. We use the MDER and the average dietary energy requirement (ADER) mentioned above to approximate the 1st and the 50th percentiles.399,400 The value of CV|r is then derived as the inverse cumulative standard normal distribution of the difference between the MDER and the ADER.
The total CV is then obtained as the geometric mean of the CV|y and the CV|r:
𝐶𝐶𝐶𝐶𝐶𝐶𝐶𝐶 = �(𝐶𝐶𝐶𝐶𝐶𝐶𝐶𝐶|𝑦𝑦𝑦𝑦)2 + (𝐶𝐶𝐶𝐶𝐶𝐶𝐶𝐶|𝑟𝑟𝑟𝑟)2
𝑃𝑃𝑃𝑃𝑟𝑟𝑟𝑟𝑃𝑃𝑃𝑃𝑃𝑃𝑃𝑃�𝑋𝑋𝑋𝑋𝑖𝑖𝑖𝑖,𝑗𝑗𝑗𝑗 = Yes� =exp�𝑎𝑎𝑎𝑎𝑖𝑖𝑖𝑖 − 𝑃𝑃𝑃𝑃𝑗𝑗𝑗𝑗�
1 + exp�𝑎𝑎𝑎𝑎𝑖𝑖𝑖𝑖 − 𝑃𝑃𝑃𝑃𝑗𝑗𝑗𝑗�
𝐹𝐹𝐹𝐹𝐼𝐼𝐼𝐼𝐿𝐿𝐿𝐿 = ∑𝑝𝑝𝑝𝑝𝑖𝑖𝑖𝑖,𝐿𝐿𝐿𝐿𝑤𝑤𝑤𝑤𝑖𝑖𝑖𝑖
FI𝐿𝐿𝐿𝐿,𝑟𝑟𝑟𝑟 =∑ FI𝐿𝐿𝐿𝐿,𝑐𝑐𝑐𝑐 × 𝑁𝑁𝑁𝑁𝑐𝑐𝑐𝑐𝑐𝑐𝑐𝑐
∑ 𝑁𝑁𝑁𝑁𝑐𝑐𝑐𝑐𝑐𝑐𝑐𝑐
𝑃𝑃𝑃𝑃𝑃𝑃𝑃𝑃𝑃𝑃𝑃𝑃 = ∫ 𝑓𝑓𝑓𝑓(𝑥𝑥𝑥𝑥|𝐷𝐷𝐷𝐷𝐷𝐷𝐷𝐷𝐶𝐶𝐶𝐶;𝐶𝐶𝐶𝐶𝐶𝐶𝐶𝐶)𝑑𝑑𝑑𝑑𝑥𝑥𝑥𝑥 𝑀𝑀𝑀𝑀𝑀𝑀𝑀𝑀𝑀𝑀𝑀𝑀𝑀𝑀𝑀𝑀−∞ [1]
𝐶𝐶𝐶𝐶𝐶𝐶𝐶𝐶 = �(𝐶𝐶𝐶𝐶𝐶𝐶𝐶𝐶|𝑦𝑦𝑦𝑦)2 + (𝐶𝐶𝐶𝐶𝐶𝐶𝐶𝐶|𝑟𝑟𝑟𝑟)2 [2]
Ptarget = 𝐵𝐵𝐵𝐵𝐵𝐵𝐵𝐵𝐵𝐵𝐵𝐵𝐵𝐵𝐵𝐵𝐵𝐵𝐵𝐵𝑖𝑖𝑖𝑖𝐵𝐵𝐵𝐵𝐵𝐵𝐵𝐵 𝐵𝐵𝐵𝐵𝑛𝑛𝑛𝑛𝑛𝑛𝑛𝑛𝑛𝑛𝑛𝑛𝐵𝐵𝐵𝐵𝑟𝑟𝑟𝑟 𝑜𝑜𝑜𝑜𝑜𝑜𝑜𝑜 𝐵𝐵𝐵𝐵𝑠𝑠𝑠𝑠𝑛𝑛𝑛𝑛𝐵𝐵𝐵𝐵𝑠𝑠𝑠𝑠𝐵𝐵𝐵𝐵𝑠𝑠𝑠𝑠∗(1−𝑇𝑇𝑇𝑇𝐵𝐵𝐵𝐵𝑟𝑟𝑟𝑟𝑇𝑇𝑇𝑇𝐵𝐵𝐵𝐵𝑠𝑠𝑠𝑠 𝑟𝑟𝑟𝑟𝐵𝐵𝐵𝐵𝑠𝑠𝑠𝑠𝑛𝑛𝑛𝑛𝑐𝑐𝑐𝑐𝑠𝑠𝑠𝑠𝑖𝑖𝑖𝑖𝑜𝑜𝑜𝑜𝐵𝐵𝐵𝐵/100)
𝑃𝑃𝑃𝑃𝑜𝑜𝑜𝑜𝑃𝑃𝑃𝑃𝑛𝑛𝑛𝑛𝐵𝐵𝐵𝐵𝐵𝐵𝐵𝐵𝑠𝑠𝑠𝑠𝑖𝑖𝑖𝑖𝑜𝑜𝑜𝑜𝐵𝐵𝐵𝐵 𝐵𝐵𝐵𝐵𝐵𝐵𝐵𝐵𝑠𝑠𝑠𝑠𝑖𝑖𝑖𝑖𝑛𝑛𝑛𝑛𝐵𝐵𝐵𝐵𝑠𝑠𝑠𝑠𝐵𝐵𝐵𝐵 𝐵𝐵𝐵𝐵𝑠𝑠𝑠𝑠 𝑠𝑠𝑠𝑠ℎ𝐵𝐵𝐵𝐵 𝑠𝑠𝑠𝑠𝐵𝐵𝐵𝐵𝑟𝑟𝑟𝑟𝑇𝑇𝑇𝑇𝐵𝐵𝐵𝐵𝑠𝑠𝑠𝑠 𝑦𝑦𝑦𝑦𝐵𝐵𝐵𝐵𝐵𝐵𝐵𝐵𝑟𝑟𝑟𝑟
Challenges and limitations: While formally the state of being undernourished or not is a condition that applies to individuals, given the data usually available on a large scale, it is impossible to reliably identify which individuals in a certain group are actually undernourished. Through the statistical model described above, the indicator can only be computed with reference to a population or a group of individuals for which a representative sample is available. The prevalence of undernourishment is thus an estimate of the percentage of individuals in that group that are in such condition, and it cannot be further disaggregated.
Due to the probabilistic nature of the inference and the margins of uncertainty associated with
estimates of each of the parameters in the model, the precision of the PoU estimates is generally low. While it is not possible to formally compute margins of error around PoU estimates, they are expected to likely exceed 5 percent in most cases. For this reason, FAO does not consider PoU estimates that result to be lower than 2.5 percent as sufficiently reliable to be reported.
References:FAO. 1996. Methodology for assessing food inadequacy in developing countries. In FAO. The Sixth World Food Survey, pp. 114–143. Rome.FAO. 2003. Proceedings: Measurement and Assessment of Food Deprivation and Undernutrition: International Scientific Symposium. Rome.FAO. 2014. Advances in hunger measurement: traditional FAO methods and recent innovations. FAO Statistics Division Working Paper No. 14–04. Rome.Naiken, L. 2002. Keynote paper: FAO methodology for estimating the prevalence of undernourishment. Paper presented at the Measurement and Assessment of Food Deprivation and Undernutrition International Scientific Symposium, Rome, 26–28 June 2002. Rome, FAO.Wanner, N., Cafiero, C., Troubat, N. & Conforti, P. 2014. Refinements to the FAO methodology for estimating the prevalence of undernourishment indicator. Rome, FAO.
PREVALENCE OF FOOD INSECURITY AS MEASURED BY THE FOOD INSECURITY EXPERIENCE SCALE (FIES)Definition: Food insecurity as measured by this indicator refers to limited access to food, at the level of individuals or households, due to lack of money or other resources. The severity of food insecurity is measured using data collected with the Food Insecurity Experience Scale survey module (FIES-SM), a set of eight questions asking respondents to self-report conditions and experiences typically associated with limited access to food. For purposes of annual SDG monitoring, the questions are asked with reference to the 12 months preceding the survey.
Using sophisticated statistical techniques based on the Rasch measurement model, the information obtained in a survey is validated for internal consistency and converted into a quantitative
THE STATE OF FOOD SECURITY AND NUTRITION IN THE WORLD 2022
| 165 |
measure along a scale of severity, ranging from low to high. Based on their responses to the FIES-SM items, the individuals or households interviewed in a nationally representative survey of the population are assigned a probability of being in one of three classes: i) food secure or only marginally insecure; ii) moderately food insecure; and iii) severely food insecure, as defined by two globally set thresholds. Based on FIES data collected over three years from 2014 to 2016, FAO has established the FIES reference scale, which is used as the global standard for experience-based food-insecurity measures, and to set the two reference thresholds of severity.
SDG Indicator 2.1.2 is obtained as the cumulated probability to be in the two classes of moderate and severe food insecurity. A separate indicator (FIsev) is computed by considering only the severe food insecurity class.
How it is reported: In this report, FAO provides estimates of food insecurity at two different levels of severity: moderate or severe food insecurity (FImod+sev) and severe food insecurity (FIsev). For each of these two levels, two estimates are reported:
� the prevalence (percent) of individuals in the population living in households where at least one adult was found to be food insecure; and
� the estimated number of individuals in the population living in households where at least one adult was found to be food insecure.
Data source: Since 2014, the eight-question FIES survey module has been applied in nationally representative samples of the adult population (defined as aged 15 or older) in more than 140 countries included in the Gallup© World Poll (GWP), covering more than 90 percent of the world population. In 2021, interviews were conducted by both telephone and face-to-face modalities. Telephone interviews were maintained in some countries already covered with this modality in 2020 given the high risk of community transmission from conducting face-to-face data collection during the COVID-19 pandemic. By evaluating Dual Frame coverage (i.e. the proportion of the adult population that is covered by a combination of landline and mobile phones), countries with a minimum of 70 percent
coverage were included as part of the 2020 World Poll though Computer Assisted Telephone Interviewing (CATI).
Gallup traditionally uses telephone surveys in Northern America, Western Europe, some parts of Asia, and Gulf Cooperation Council (GCC) countries. In Central and Eastern Europe, much of Latin America, nearly all of Asia, the Near East and Africa, an area frame design is used for face-to-face interviewing.
In most countries, samples include about 1 000 individuals, with larger samples of 3 000 individuals in India, 3 500 in China (mainland) and 2 000 in the Russian Federation.
In addition to the GWP, in 2021 FAO collected data in 20 countries through Geopoll® and Kantar® with the specific objective of filling data gaps on access to food. The countries covered were: Antigua and Barbuda, Bahamas, Barbados, Comoros, Democratic Republic of the Congo, Djibouti, Dominica, Eswatini, Guinea-Bissau, Haiti, Lao People’s Democratic Republic, Madagascar, Maldives, Niger, Rwanda, Saint Kitts and Nevis, Sao Tome and Principe, Suriname, Trinidad and Tobago, and Zambia.
For Afghanistan, Angola, Armenia, Belize, Benin, Botswana, Burkina Faso, Cabo Verde, Canada, Chad, Chile, Costa Rica, Côte d’Ivoire, Dominican Republic, Ecuador, Fiji, Ghana, Greece, Grenada, Guinea-Bissau, Honduras, Indonesia, Israel, Kazakhstan, Kenya, Kiribati, Kyrgyzstan, Lesotho, Malawi, Mexico, Namibia, Niger, Nigeria, Pakistan, Palestine, Paraguay, Philippines, Republic of Korea, Russian Federation, Saint Kitts and Nevis, Saint Lucia, Saint Vincent and the Grenadines, Samoa, Senegal, Seychelles, Sierra Leone, South Africa, South Sudan, Sri Lanka, Sudan, Togo, Tonga, Uganda, United Arab Emirates, United Republic of Tanzania, United States of America, Vanuatu, Viet Nam and Zambia, national government survey data were used to calculate the prevalence estimates of food insecurity by applying FAO’s statistical methods to adjust national results to the same global reference standard, covering more than a quarter of the world population. Countries are considered for the year or years when national data are available. For the remaining years, the following strategy was followed:
ANNEX 1B
| 166 |
� When more than one year of national data is available, the missing years are linearly interpolated.
� If only one year of data is available, missing years are informed as follows:
– using FAO data if considered compatible with the national surveys;
– imputed using the trend suggested by FAO data if national data are not compatible;
– imputed using the trend of the subregion if no other information is available; and
– considered constant to the level of the national survey if the subregion cannot be computed or the trend of other surveys or the subregion is not applicable to the country-specific situation considering evidence found in support of the trend (for instance, evolution of poverty, extreme poverty, employment and food inflation, among others).
Methodology: The data were validated and used to construct a scale of food-insecurity severity using the Rasch model, which postulates that the probability of observing an affirmative answer by respondent i to question j is a logistic function of the distance, on an underlying scale of severity, between the position of the respondent, 𝑎𝑖, and that of the item, 𝑏𝑗.
Prob(Xi,j = Yes) = exp(ai – bj)
1 + exp(ai – bj)
By applying the Rasch model to the FIES data, it is possible to estimate the probability of being food insecure (𝑝 i,L) at each level of severity of food insecurity L (moderate or severe, or severe), for each respondent i, with 0 < 𝑝 i,L < 1.
The prevalence of food insecurity at each level of severity (FIL) in the population is computed as the weighted sum of the probability of being food insecure for all respondents (i) in a sample:
FIL = ∑ipi,Lwi
where 𝑤𝑖 are post-stratification weights that indicate the proportion of individuals or households in the national population represented by each record in the sample.
As only individuals aged 15 years or more are sampled in the GWP, the prevalence estimates directly produced from these data refer to the population aged 15 years and older. To arrive at the prevalence and number of individuals (of all ages) in the population, an estimate is required of the number of people living in the households where at least one adult is estimated to be food insecure. This involves a multistep procedure detailed in Annex II of the Voices of the Hungry Technical Report (see link in the “References” section, below).
Regional and global aggregates of food insecurity at moderate or severe, and severe levels, FIL,r, are computed as:
FIL,r = ∑c FIL,c × Nc
∑c Nc
where r indicates the region, FI L,𝑐 is the value of FI at level L estimated for country c in the region, and Nc is the corresponding population size. When no estimate of FIL is available for a country, it is assumed to be equal to the population-weighted average of the estimated values of the remaining countries in the same region. A regional aggregate is produced only if the countries for which an estimate is available cover at least 50 percent of the region’s population.
Universal thresholds are defined on the FIES global standard scale (a set of item parameter values based on results from all countries covered by the GWP in 2014–2016) and converted into corresponding values on local scales. The process of calibrating each country’s scale against the FIES global standard can be referred to as equating and permits the production of internationally comparable measures of food insecurity severity for individual respondents, as well as comparable national prevalence rates.
The problem stems from the fact that, when defined as a latent trait, the severity of food insecurity has no absolute reference against which it could be evaluated. The Rasch model enables identification of the relative position that the various items occupy on a scale that is denominated in logit units but whose “zero”
THE STATE OF FOOD SECURITY AND NUTRITION IN THE WORLD 2022
| 167 |
is arbitrarily set, usually to correspond to the mean estimated severity. This implies that the zero of the scale changes in each application. To produce comparable measures over time and across different populations requires establishing a common scale to use as a reference and finding the formula needed to convert measures across different scales. As is the case for converting measures of temperature across difference measuring scales (such as Celsius and Fahrenheit), this requires the identification of a number of “anchoring” points. In the FIES methodology, these anchoring points are the severity levels associated with the items whose relative position on the scale of severity can be considered equal to that of the corresponding items on the global reference scale. The “mapping” of the measures from one scale to the other is then obtained by finding the formula that equates the mean and the standard deviations (SD) of the common items’ severity levels.
Challenges and limitations: When food-insecurity prevalence estimates are based on FIES data collected in the GWP, with national sample sizes of about 1 000 in most countries, confidence intervals rarely exceed 20 percent of the measured prevalence (that is, prevalence rates of 50 percent would have margins of error of up to plus or minus 5 percent). Confidence intervals are likely to be much smaller, however, when national prevalence rates are estimated using larger samples and for estimates referring to aggregates of several countries. To reduce the impact of year-to-year sampling variability, country-level estimates are presented as three-year averages, computed as averages of all available years in the considered triennia.
References:Gallup. 2020. Gallup Keeps Listening to the World Amid the Pandemic. In: Gallup. Cited 25 May 2021. https://news.gallup.com/opinion/gallup/316016/gallup-keeps-listening-world-amid-pandemic.aspxFAO. 2016. Methods for estimating comparable rates of food insecurity experienced by adults throughout the world. Rome. www.fao.org/3/a-i4830e.pdfFAO. 2018. Voices of the Hungry. In: FAO. Rome. Cited 28 April 2020. www.fao.org/in-action/voices-of-the-hungry
STUNTING, WASTING AND OVERWEIGHT IN CHILDREN UNDER 5 YEARS OF AGE
Definition of stunting (children under 5 years of age): Height/length (cm) for age (months) < -2 SD of the WHO Child Growth Standards median. Low height-for-age is an indicator that reflects the cumulative effects of undernutrition and infections since and even before birth. It may be the result of long-term nutritional deprivation, recurrent infections and lack of water and sanitation infrastructures.
How it is reported: The percentage of children aged 0–59 months who are below -2 SD from the median height-for-age of the WHO Child Growth Standards.
Definition of wasting: Weight (kg) for height/length (cm) < -2 SD of the WHO Child Growth Standards median. Low weight-for-height is an indicator of acute weight loss or a failure to gain weight and can be a consequence of insufficient food intake and/or an incidence of infectious diseases, especially diarrhoea.
How it is reported: The percentage of children aged 0–59 months who are below -2 SD from the median weight-for-height of the WHO Child Growth Standards.
Definition of overweight: Weight (kg) for height/length (cm) > +2 SD of the WHO Child Growth Standards median. This indicator reflects excessive weight gain for height generally due to energy intakes exceeding children’s energy requirements.
How it is reported: The percentage of children aged 0–59 months who are above +2 SD from the median weight-for-height of the WHO Child Growth Standards.
Data source: UNICEF, WHO & World Bank. 2021. UNICEF-WHO-World Bank: Joint child malnutrition estimates - Levels and trends (2021 edition). Cited 6 April 2022. https://data.unicef.org/resources/jme-report-2021, www.who.int/data/gho/data/themes/topics/joint-child-malnutrition-estimates-unicef-who-wb, https://datatopics.worldbank.org/child-malnutrition
ANNEX 1B
| 168 |
Methodology: Country-level estimatesThe UNICEF/WHO-World Bank Group Joint Child Malnutrition Estimates (JME) country datasetThe UNICEF/WHO-World Bank Group JME dataset of country estimates requires the collection of national data sources that contain information on child malnutrition – specifically, data on the height, weight and age of children under 5, which can be used to generate national level prevalence estimates for stunting, wasting and overweight. These national-level data sources are mainly comprised of household surveys (e.g. Multiple Indicator Cluster Surveys, Demographic and Health Surveys). Some administrative data sources (e.g. from surveillance systems) are also included where population coverage is high. As of the latest review closure on 31 January 2021, the primary source dataset contained 997 data sources from 157 countries and territories, with nearly 80 percent of children living in countries with at least one data point within the past five years on stunting, wasting and overweight. This suggests that the global estimates are highly representative of the majority of children across the globe for the most recent period. The dataset contains the point estimate (and where available, the standard error), the 95 percent confidence bounds and the unweighted sample size. Where microdata are available, the JME uses estimates that have been recalculated to adhere to the global standard definition. Where microdata are not available, reported estimates are used, except in cases where adjustments are required to standardize for: i) use of an alternate growth reference from the 2006 WHO Growth Standards; ii) age ranges that do not include the full 0–59-month age group; and iii) data sources that were only nationally representative for populations residing in rural areas. Further details related to data source compilation, re-analysis of microdata, and data source review are described elsewhere.401
The JME country dataset serves different purposes for different indicators. For wasting, the JME country dataset serves as the country estimates themselves (i.e. the wasting prevalence in the JME country dataset from a household survey for a country in a given year is the wasting prevalence reported for that country in that year). For stunting and overweight, the JME country dataset is used to generate country-modelled
estimates which serve as the official JME estimates (i.e. the stunting prevalence from a household survey for a given country in a given year is not reported as the prevalence for that country in that year; rather, it feeds into the modelled estimates described in the next section below).
Country-level model for stunting and overweight estimatesThe technical details of the statistical models are provided elsewhere.401 Briefly, for both stunting and overweight, prevalence was modelled at logit (log-odds) scale using a penalized longitudinal mixed-model with a heterogeneous error term. The quality of the models was quantified with model-fit criteria that balance the complexity of the model with the closeness of the fit to the observed data. The proposed method has important characteristics, including non-linear time trends, regional trends, country-specific trends, covariate data and a heterogeneous error term. All countries with data contribute to estimates of the overall time trend and the impact of covariate data on prevalence. For overweight, the covariate data consisted of linear and quadratic socio-demographic index (SDI),ap and data source type. The same covariates were used for stunting, plus an additional covariate of the average health system access over the previous five years.
Annual country-level modelled estimates from 2000 to 2020aq on stunting and overweight were disseminated by the JME in 2021 for 155 countries with at least one data point (e.g. from a household survey) included in the JME country dataset described above. Modelled country estimates were also produced for an additional 49 countries, used solely for generation of regional and global aggregates. Modelled estimates for these 49 countries are not shown because they did not
ap SDI is a summary measure that identifies where countries or other geographic areas sit on the spectrum of development. Expressed on a scale of 0 to 1, SDI is a composite average of the rankings of the income per capita, average educational attainment, and fertility rates of all areas in the Global Burden of Disease study.
aq The collection of household survey data on child height and weight were limited in 2020 due to the distancing measures required to prevent the spread of COVID-19. Only four national surveys included in the JME database were carried out (at least partially) in 2020. The JME estimates on child stunting, wasting and overweight are therefore based almost entirely on data collected before 2020 and do not take into account the impact of the COVID-19 pandemic. However, one of the covariates used in the country stunting and overweight models takes the impact of COVID-19 partially into account.
THE STATE OF FOOD SECURITY AND NUTRITION IN THE WORLD 2022
| 169 |
have any household surveys in the JME country dataset or because the modelled estimates remained pending final review at the time of publication. The results for the 204 countries can be used to calculate estimates and uncertainty intervals for any group of countries aggregated. The uncertainty intervals are important in monitoring trends, especially for countries with sparse data and where primary data sources present large primary data source sampling errors. When only sparse data are available in the most recent period, the inclusion of a survey can affect a substantial change in the predicted trajectory. For this reason, uncertainty intervals are needed to enhance trend interpretability in terms of the caution level employed. The uncertainty intervals for the new JME method have been tested and validated with various data types.
Regional and global estimatesRegional and global wasting estimates are only presented for the most recent year, 2020, unlike stunting and overweight estimates for which an annual time series is available from 2000 to 2020.ar This is because the JME are based on national-level country prevalence data, which come from cross-sectional surveys (i.e. a snapshot at one point in time) that are collected infrequently (every three to five years) in most countries. Since stunting and overweight are relatively stable over the course of a calendar year, it is reasonable to track changes in these two conditions over time with these data, whereas wasting is an acute condition that can change frequently and rapidly. An individual child can be affected by wasting more than once in a calendar year (i.e. can recover but then become wasted again in the same year), and the risk of wasting in many contexts can be driven by seasonal variations, which can result in seasonal spikes in prevalence. For example, wasting prevalence, in some contexts, may double between the post‑harvest season (often associated with higher food availability and weather patterns that are less likely to cause disease) and the pre-harvest season (often associated with food shortages, heavy rains and related diseases that can affect nutrition status). Given that country surveys can be collected during any season, the prevalence
ar See footnote aq.
estimate from any survey may be at a high or a low; or it may fall somewhere in between if data collection spanned across several seasons. Thus, the prevalence of wasting captures the situation of wasting at a specific point in time and not over an entire year. Variations in seasons across surveys make it difficult to draw inferences on trends. The lack of methods to account for seasonality and incident cases of wasting are the main reasons why the JME does not present annual trends for this form of malnutrition.
Generation of regional and global estimatesDifferent methods were applied to generate regional and global estimates for stunting and overweight compared to wasting, as described below. In short, results from the new country-level model were used to generate the regional and global estimates for stunting and overweight, while the JME subregional multilevel model was used to generate the global and regional estimates for wasting.
Stunting and overweightGlobal and regional estimates for all years from 2000 to 2020as were derived as the respective country averages weighted by the countries’ under-five population from the United Nations World Population Prospects, 2019 revision,398 using model-based estimates for 204 countries. This includes 155 countries with national data sources (e.g. household surveys) included in the JME country dataset described above. It also includes 49 countries with modelled estimates generated for development of regional and global aggregates but for which country modelled estimates are not shown because they did not have any household surveys in the JME country dataset or because the modelled estimates remained pending final review at the time of publication. Confidence intervals were generated based on bootstrapping methodology.
Wasting The wasting prevalence data from national data sources described in the above section about the JME country dataset were used to generate the regional and global estimates for the year 2020at using the JME subregional multilevel model,
as See footnote aq.
at See footnote aq.
ANNEX 1B
| 170 |
applying population weights for children under 5 years of age from the United Nations World Population Prospects, 2019 revision.398
Challenges and limitations: The recommended periodicity for countries to report on stunting, overweight and wasting is every three to five years; however, for some countries, data are available less frequently. While every effort has been made to maximize the comparability of statistics across countries and over time, country data may differ in terms of data collection methods, population coverage and estimation methods used. Survey estimates come with levels of uncertainty due to both sampling errors and non-sampling errors (technical measurement errors, recording errors, etc.). Neither of the two sources of error has been fully taken into account for deriving estimates at the country or regional and global levels.
For the prevalence of wasting, as surveys are generally carried out during a specific period of the year, the estimates can be affected by seasonality. Seasonal factors related to wasting include food availability (e.g. pre-harvest periods) and disease (rainy season and diarrhoea, malaria, etc.), while natural disasters and conflicts can also show real shifts in trends that would need to be treated differently than a seasonal variation. Hence, country year estimates for wasting may not necessarily be comparable over time. Consequently, only estimates from the most recent year (2020)au are provided.
References: de Onis, M., Blössner, M., Borghi, E., Morris, R. & Frongillo, E.A. 2004. Methodology for estimating regional and global trends of child malnutrition. International Journal of Epidemiology, 33(6): 1260–1270. https://doi.org/10.1093/ije/dyh202
GBD 2019 Risk Factors Collaborators. 2020. Global burden of 87 risk factors in 204 countries and territories, 1990–2019: a systematic analysis for the Global Burden of Disease Study 2019. The Lancet, 396(10258): 1223–1249. https://doi.org/10.1016/s0140-6736(20)30752-2
UNICEF, WHO & World Bank. 2021. UNICEF-WHO-World Bank: Joint child malnutrition
au See footnote aq.
estimates - Levels and trends (2021 edition). Cited 6 April 2022. https://data.unicef.org/resources/jme-report-2021, www.who.int/data/gho/data/themes/topics/joint-child-malnutrition-estimates-unicef-who-wb, https://datatopics.worldbank.org/child-malnutrition
UNICEF, WHO & World Bank. 2021. Technical notes from the background document for country consultations on the 2021 edition of the UNICEF-WHO-World Bank Joint Malnutrition Estimates. SDG Indicators 2.2.1 on stunting, 2.2.2a on wasting and 2.2.2b on overweight. New York, USA, UNICEF. data.unicef.org/resources/jme-2021-country-consultations
WHO. 2014. Comprehensive Implementation Plan on maternal, infant and young child nutrition. Geneva, Switzerland. www.who.int/nutrition/publications/CIP_document/en
WHO. 2019. Nutrition Landscape Information System (NLIS) country profile indicators: interpretation guide. Geneva, Switzerland. www.who.int/publications/i/item/9789241516952
EXCLUSIVE BREASTFEEDINGDefinition: Exclusive breastfeeding (EBF) for infants <6 months of age is defined as receiving only breastmilk and no additional food or drink, not even water. Exclusive breastfeeding is a cornerstone of child survival and is the best food for newborns, as breastmilk shapes the baby’s microbiome, strengthens the immune system and reduces the risk of developing chronic diseases.
Breastfeeding also benefits mothers by preventing postpartum haemorrhage and promoting uterine involution, decreasing risk of iron-deficiency anaemia, reducing the risk of various types of cancer and providing psychological benefits.
How it is reported: Percentage of infants aged 0–5 months who are fed exclusively on breastmilk with no additional food or drink, not even water, in the 24 hours preceding the survey.402
Data source: UNICEF. 2021. Infant and young child feeding. In: UNICEF. New York, USA. Cited 6 April 2022. data.unicef.org/topic/nutrition/infant-and-young-child-feeding
THE STATE OF FOOD SECURITY AND NUTRITION IN THE WORLD 2022
| 171 |
Methodology:
Infants 0–5 months of age who received only breastmilk during the previous day
Infants 0–5 months of age
This indicator includes breastfeeding by a wet nurse and feeding expressed breastmilk.
The indicator is based on a recall of the previous day’s feeding to a cross-section of infants 0–5 months of age.
In 2012, the regional and global exclusive breastfeeding estimates were generated using the most recent estimate available for each country between 2005 and 2012. Similarly, 2020 estimates were developed using the most recent estimate available for each country between 2014 and 2020. Global and regional estimates were calculated as weighted averages of the prevalence of exclusive breastfeeding in each country, using the total number of births from the World Population Prospects, 2019 revision398 (2012 for the baseline and 2020 for the current) as weights. Estimates are presented only where the available data are representative of at least 50 percent of corresponding regions’ total number of births, unless otherwise noted.
Challenges and limitations: While a high proportion of countries collect data for exclusive breastfeeding, data are lacking in high-income countries in particular. The recommended periodicity of reporting on exclusive breastfeeding is every three to five years. However, for some countries, data are reported less frequently, meaning changes in feeding patterns are often not detected for several years after the change occurs.
Regional and global averages may be affected depending on which countries had data available for the periods considered in this report.
Using the previous day’s feeding as a basis may cause the proportion of exclusively breastfed infants to be overestimated, as some infants who may have been given other liquids or foods irregularly may not have received these on the day before the survey.
References: UNICEF. 2021. Infant and young child feeding: exclusive breastfeeding. In: UNICEF. New York, USA. Cited 6 April 2022. data.unicef.org/topic/nutrition/infant-and-young-child-feeding
WHO. 2014. Comprehensive Implementation Plan on maternal, infant and young child nutrition. Geneva, Switzerland. www.who.int/nutrition/publications/CIP_document/en
WHO. 2019. Nutrition Landscape Information System (NLIS) country profile indicators: interpretation guide. Geneva, Switzerland. www.who.int/publications/i/item/9789241516952
WHO & UNICEF. 2021. Indicators for assessing infant and young child feeding practices: definitions and measurement methods. https://apps.who.int/iris/rest/bitstreams/1341846/retrieve
LOW BIRTHWEIGHT Definition: Low birthweight is defined as a weight at birth of less than 2 500 g (less than 5.51 lbs), regardless of gestational age. A newborn’s weight at birth is an important marker of maternal and foetal health and nutrition.403
How it is reported: The percentage of newborns weighing less than 2 500 g (less than 5.51 lbs) at birth.
Data source: UNICEF & WHO. 2019. UNICEF-WHO joint low birthweight estimates. In: UNICEF. New York, USA and Geneva, Switzerland. Cited 28 April 2020. www.unicef.org/reports/UNICEF-WHO-low-birthweight-estimates-2019, www.who.int/nutrition/publications/UNICEF-WHO-lowbirthweight-estimates-2019
Methodology: Nationally representative estimates of low birthweight prevalence can be derived from a range of sources, broadly defined as national administrative data or representative household surveys. National administrative data are those coming from national systems including Civil Registration and Vital Statistics (CRVS) systems, national Health Management Information Systems (HMIS) and birth registries. National household surveys which contain information about birthweight as well as key related indicators
ANNEX 1B
| 172 |
including maternal perception of size at birth (MICS, DHS) are also an important source of low birthweight data especially in contexts where many births are unweighted and/or data heaping is a problem. Prior to entry into the country dataset, country data are reviewed for coverage and quality and adjusted where the source is a household survey. Administrative data are categorized as: i) high coverage, if representing ≥90 percent of live births; ii) medium coverage, if representing between 80 and 90 percent of live births; or iii) not included, if covering <80 percent of live births. To be included in the dataset, survey data need to have:
i. a birthweight in the dataset for at minimum 30 percent of the sample;
ii. a minimum of 200 birthweights in the dataset;
iii. no indication of severe data heaping – this means that: a) ≤55 percent of all birthweights can fall on the three most frequent birthweights (i.e. if 3 000 g, 3 500 g and 2 500 g were the three most frequent birthweights, when added together, they have to make up ≤55 percent of all birthweights in the dataset); b) ≤10 percent of all birthweights are ≥4 500 g; and c) ≤5 percent of birthweights fall on tail ends of 500 g and 5 000 g; and
iv. undergone an adjustment for missing birthweights and heaping.12
Modelling methods were applied to the accepted (and for household survey data, accepted and adjusted) country data to generate annual country estimates from 2000 to 2015, with methods varying by availability and type of input data as follows:
� b-spline: Data for countries with ≥8 data points from higher coverage administrative sources ≥1 point prior to 2005 and ≥1 point more recent than 2010 are smoothed with b-spline regression to generate annual low birthweight estimates. A b-spline regression model was used to predict the standard error and calculate 95 percent confidence intervals for the country-level low birthweight estimates. These low birthweight estimates follow very closely those included in the countries’ own administrative reports.
� Hierarchical regression: Data for countries not meeting requirements for b-spline but with ≥1 low birthweight data point from any source meeting inclusion criteria are fitted into a model using covariates to generate annual low birthweight estimates, as well as uncertainty ranges, using a bootstrap approach. The model includes natural log of neonatal mortality rate; the proportion of children underweight (weight-for-age z score below -2 SD from median weight for age of reference population); data type (higher quality administrative, lower quality administrative, household survey); UN region (e.g. Southern Asia, Caribbean); and a country-specific random effect. These low birthweight estimates may vary substantially from estimates reported by countries in administrative and survey reports, especially given that the household survey estimates are adjusted for missing birthweights and heaping, while survey reports often present a low birthweight estimate just for the children with a birthweight and with no adjustment for data heaping.
� No estimate: Countries for which low birthweight input data were not available and/or did not meet inclusion criteria are indicated in the database as “no estimate”. A total of 54 countries in the current country database were reported as having “no estimate”. Despite not presenting an estimate for these individual 54 countries, annual low birthweight estimates were derived for them using the hierarchical regression methods detailed above but were used only to input into regional and global estimates.
Modelled annual country estimates are used to generate regional and global estimates from 2000–2015. Global estimates are derived by summing the estimated number of live births weighing less than 2 500 g for 195av countries with an estimate in the United Nations regional grouping for each year, and then dividing by all live births in each year in those 195 countries. Regional estimates are similarly derived,
av While the world comprises 202 countries (as per the full set of countries in the regional grouping with the largest set of countries – i.e. the UNICEF regional grouping), seven countries did not have low birthweight input data or covariate data. It was therefore not possible to generate any estimates for these seven countries, and they are not included in the regional and global estimates.
THE STATE OF FOOD SECURITY AND NUTRITION IN THE WORLD 2022
| 173 |
based on countries in each regional grouping. To obtain the global and regional level estimates of uncertainty, 1 000 low birthweight point estimates were made for each country for each year using either b-spline (by randomly sampling from a normal distribution plotted using the calculated standard error) or hierarchical regression approach (using a bootstrap approach). The country low birthweight estimates for each of the 1 000 samples were summed at worldwide or regional level and the 2.5th and 97.5th centiles of the resulting distributions were used as the confidence intervals.
Challenges and limitations: A major limitation of monitoring low birthweight globally is the lack of birthweight data for many of the world’s children. There is a notable bias among the unweighted, with those born to poorer, less-educated, rural mothers being less likely to have a recorded birthweight when compared to their richer, urban counterparts with more highly educated mothers.13 As the characteristics of the unweighted are risk factors for having a low birthweight, estimates that do not well represent these children may be lower than the true value. Furthermore, poor quality of available data with regard to excessive heaping on multiples of 500 g or 100 g exists in the majority of available data from lower-middle-income countries (LMICs)13 and can further bias low birthweight estimates. The methods applied to adjust for missing birthweights and heaping for survey estimates in the current database404 are meant to address the problem; however, there were a total of 54 countries for which it was not possible to generate a reliable birthweight estimate. In addition, the confidence limits of the regional and global estimates may be artificially small given that about half of the modelled countries had a country-specific effect generated at random for each bootstrap prediction, some of which were positive and others negative, making the relative uncertainty at the regional and global level tend to be less than that at the individual country level.
References: Blanc, A. & Wardlaw, T. 2005. Monitoring low birth weight: An evaluation of international estimates and an updated estimation procedure. Bulletin World Health Organization, 83(3): 178–185.
Blencowe, H., Krasevec, J., de Onis, M., Black, R.E., An, X., Stevens, G.A., Borghi, E., Hayashi, C., Estevez, D., Cegolon, L., Shiekh, S., Ponce Hardy, V., Lawn, J.E. & Cousens, S. 2019. National, regional, and worldwide estimates of low birthweight in 2015, with trends from 2000: a systematic analysis. The Lancet Global Health, 7(7): e849–e860.
ADULT OBESITYDefinition: BMI ≥ 30.0 kg/m2. The body mass index (BMI) is the ratio of weight-to-height commonly used to classify the nutritional status of adults. It is calculated as the body weight in kilograms divided by the square of the body height in metres (kg/m2). Obesity includes individuals with BMI equal to or higher than 30 kg/m2.
How it is reported: Percentage of population over 18 years of age with BMI ≥ 30.0 kg/m2
standardized by age and weighted by sex.406
Data source: WHO. 2020. Global Health Observatory (GHO) data repository. In: WHO. Geneva, Switzerland. Cited 28 April 2020. apps.who.int/gho/data/node.main.A900A?lang=en (1 698 population-based studies with more than 19.2 million participants aged 18 years or older, measured in 186 countries).407
Methodology: A Bayesian hierarchical model was applied to selected population-based studies that had measured height and weight in adults aged 18 years and older to estimate trends from 1975 to 2014 in mean BMI and in the prevalence of BMI categories (underweight, overweight and obesity). The model incorporated nonlinear time trends and age patterns, national versus subnational and community representativeness, and whether data covered both rural and urban areas versus only one of them. The model also included covariates that help predict BMI, including national income, proportion of population living in urban areas, mean number of years of education, and summary measures of availability of different food types for human consumption.
Challenges and limitations: Some countries had few data sources, and only 42 percent of included sources reported data for people older than 70 years.
ANNEX 1B
| 174 |
References: NCD-RisC (NCD Risk Factor Collaboration). 2016. Trends in adult body-mass index in 200 countries from 1975 to 2014: a pooled analysis of 1698 population-based measurement studies with 19.2 million participants. The Lancet, 387(10026): 1377–1396.WHO. 2019. Nutrition Landscape Information System (NLIS) country profile indicators: interpretation guide. Geneva, Switzerland. www.who.int/publications/i/item/9789241516952
ANAEMIA IN WOMEN AGED 15 TO 49 YEARSDefinition: Percentage of women aged 15−49 years with a haemoglobin concentration less than 120 g/L for non-pregnant women and lactating women, and less than 110 g/L for pregnant women, adjusted for altitude and smoking.
How it is reported: Percentage of women aged 15 to 49 years with a haemoglobin concentration below 110 g/L for pregnant women and below 120 g/L for non-pregnant women.
Data source: WHO. 2021. Vitamin and Mineral Nutrition Information System (VMNIS). In: WHO. Geneva, Switzerland. Cited 25 May 2021. www.who.int/teams/nutrition-food-safety/databases/vitamin-and-mineral-nutrition-information-system
WHO. 2021. Global anaemia estimates, Edition 2021. In: WHO | Global Health Observatory (GHO) data repository. Geneva, Switzerland. Cited 25 May 2021. www.who.int/data/gho/data/indicators/indicator-details/GHO/prevalence-of-anaemia-in-women-of-reproductive-age-(-)
Methodology: The preferable source of data is population-based surveys. Data were taken from the Micronutrients Database of the WHO Vitamin and Mineral Information System (VMNIS). This database compiles and summarizes data on the micronutrient status of populations from various other sources, including data collected from the scientific literature and through collaborators, including WHO regional and country offices, United Nations organizations, ministries of health, research and academic
institutions, and non-governmental organizations. In addition, anonymized individual-level data are obtained from multi-country surveys, including demographic and health surveys, multiple indicator cluster surveys, reproductive health surveys and malaria indicator surveys.
The 2021 edition of anaemia estimates in women aged 15 to 49 years, by pregnancy status, included 489 data sources spanning 1995–2020. Adjustments of data on blood haemoglobin concentrations for altitude and smoking were carried out whenever possible. Biologically implausible haemoglobin values (<25 g/L or >200 g/L) were excluded. A Bayesian hierarchical mixture model was used to estimate haemoglobin distributions and systematically address missing data, non-linear time trends, and representativeness of data sources. Briefly, the model calculates estimates for each country and year, informed by data from that country and year themselves, if available, and by data from other years in the same country and in other countries with data for similar time periods, especially countries in the same region. The model borrows data, to a greater extent, when data are non-existent or weakly informative, and to a lesser extent for data-rich countries and regions. The resulting estimates are also informed by covariates that help predict blood haemoglobin concentrations (e.g. socio-demographic index, meat supply [kcal/capita], mean BMI for women, and log of under-five mortality for children).408 The uncertainty ranges (credibility intervals) reflect the major sources of uncertainty, including sampling error, non-sampling error due to issues in sample design/measurement, and uncertainty from making estimates for countries and years without data.
Challenges and limitations: Despite a high proportion of countries having nationally representative survey data available for anaemia, there is still a lack of reporting on this indicator, especially in high-income countries. As a result, the estimates may not capture the full variation across countries and regions, thus tending to “shrink” towards global means when data are sparse.
References: Stevens, G.A., Finucane, M.M., De-Regil, L.M., Paciorek, C.J., Flaxman, S.R., Branca,
THE STATE OF FOOD SECURITY AND NUTRITION IN THE WORLD 2022
| 175 |
F., Peña-Rosas, J.P., Bhutta, Z.A. & Ezzati, M. 2013. Global, regional, and national trends in haemoglobin concentration and prevalence of total and severe anaemia in children and pregnant and non-pregnant women for 1995–2011: a systematic analysis of population-representative data. The Lancet Global Health, 1(1): e16–e25. WHO. 2014. Comprehensive Implementation Plan on maternal, infant and young child nutrition. Geneva, Switzerland.WHO. 2021. Nutrition Landscape Information System (NliS) Country Profile. In: WHO.
Geneva, Switzerland. Cited 10 May 2021. www.who.int/data/nutrition/nlis/country-profileWHO. 2021. Vitamin and Mineral Nutrition Information System (VMNIS). In: WHO. Geneva, Switzerland. Cited 10 May 2021. www.who.int/teams/nutrition-food-safety/databases/vitamin-and-mineral-nutrition-information-systemWHO. 2021. WHO Global Anaemia estimates, 2021 Edition. In: WHO | Global Health Observatory (GHO) data repository. Geneva, Switzerland. Cited 10 May 2021. www.who.int/data/gho/data/themes/topics/anaemia_in_women_and_children n
ANNEX 2
ANNEX 2 METHODOLOGIES USED IN CHAPTER 2
A. Methodology for 2020 and 2021 PoU nowcastsAs in previous editions of this report, due to lack of detailed information on the most recent values of each of the elements that contribute to computing the PoU and NoU (see Annex 1B), estimates referring to the most recent year are nowcasted; in other words, they are predictions of the very recent past.
As already noted last year, 2020 was unique in many respects due to the COVID-19 pandemic, which imposed unprecedented restrictions on people’s ability to work and move. This demanded special considerations when nowcasting the values of the PoU, especially with respect to estimating the likely change in the CV and to modelling the way in which inequality in access to food contributes to rates of undernourishment. Both aspects required special treatment.
It is now clear that the COVID-19 pandemic has had effects on people’s ability to access food lasting into 2021, a reason why the special treatment to nowcast the CV is applied to nowcasting values for both 2020 and 2021.
Estimating changes in FIsev from 2019 to 2021While it was possible to nowcast the values of DEC in 2020 and 2021 using the traditional approach based on information provided by the Markets and Trade Division of FAO, used to inform FAO Agricultural Outlooks, it was necessary to modify the traditional approach used to nowcast the CV. Normally, changes in CV|y (the component of the CV associated with differences in households’ economic conditions) are derived from differences in three-year averages of the prevalence of severe food insecurity based on the FIES (FIsev) that are not explained by changes in food supplies. Use of the three-year average addressed the need to control for possible excess sampling variability in country-level estimates of the FIsev (which, for most countries, is based on relatively small samples of FIES data) and is consistent with an assumption that CV|y follows a relatively stable trend. The exceptional nature of 2020 and 2021 makes it difficult to maintain this last
assumption. Because of that, the changes between the 2017–2019 average and the 2020 annual values of FIsev were used to nowcast the 2020 values of CV|y, and the changes between the 2020 and 2021 annual values of FIsev were used to nowcast the 2021 values of CV|y.
Adjustments in the proportion of change in FIsev that is attributed to CV|yAnother parameter that needed attention last year to nowcast the 2020 value of PoU was the percentage of change in FIsev (used as a proxy for the expected change in the PoU) that is attributed to CV|y. Normally, this has been assumed to be equal to one-third, based on an econometric analysis of past values of PoU, DEC and CV|y. The exceptional nature of 2020 (and now of 2021) calls into question that regularity. As no national household consumption and expenditure survey collected data in 2020 or in 2021, we still lack any empirical basis to determine how to properly modify it. The solution last year was to conduct a sensitivity analysis modifying the percentage of change in FIsev that is attributed to CV|y from a minimum of one-third to a maximum of one. The same approach was followed this year. The result is a range of possible values of CV|y, and hence of PoU, in 2020 and in 2021. For completeness, Table A2.1 presents the lower and upper bounds of the PoU in 2020 and 2021 at the global, regional and subregional levels.
B. Methodology for projections of PoU to 2030To project PoU values to 2030, we project the three fundamental variables that enter in the PoU formula (DEC, CV and MDER) separately, based on different inputs, depending on the scenario considered.
The main source of information is the output of the MIRAGRODEP recursive, dynamic computable general equilibrium (CGE) model, which provides series of projected values, at country level, for:
� real per capita GDP (GDP_Vol_pc); � income Gini coefficient (gini_income); � an index of real food price (Prices_Real_Food);
| 176 |
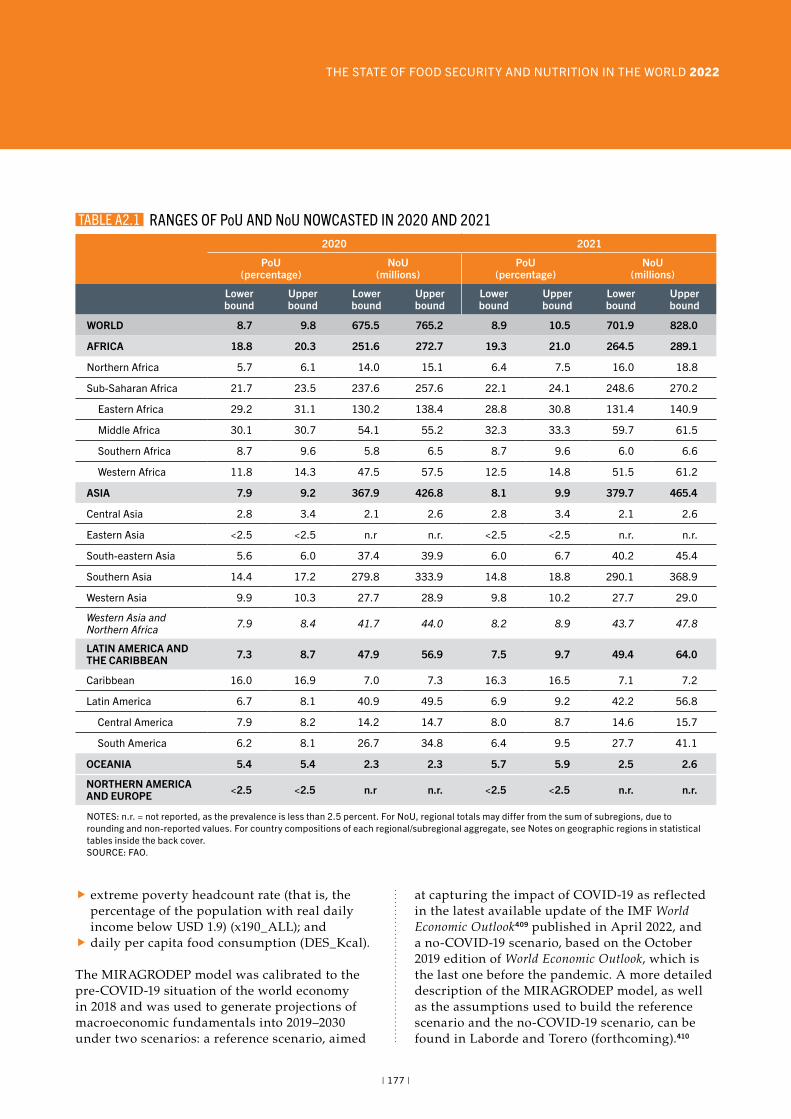
THE STATE OF FOOD SECURITY AND NUTRITION IN THE WORLD 2022
� extreme poverty headcount rate (that is, the percentage of the population with real daily income below USD 1.9) (x190_ALL); and
� daily per capita food consumption (DES_Kcal).
The MIRAGRODEP model was calibrated to the pre-COVID-19 situation of the world economy in 2018 and was used to generate projections of macroeconomic fundamentals into 2019–2030 under two scenarios: a reference scenario, aimed
at capturing the impact of COVID-19 as reflected in the latest available update of the IMF World Economic Outlook409 published in April 2022, and a no-COVID-19 scenario, based on the October 2019 edition of World Economic Outlook, which is the last one before the pandemic. A more detailed description of the MIRAGRODEP model, as well as the assumptions used to build the reference scenario and the no-COVID-19 scenario, can be found in Laborde and Torero (forthcoming).410
2020 2021
PoU(percentage)
NoU(millions)
PoU(percentage)
NoU(millions)
Lower bound
Upperbound
Lower bound
Upperbound
Lower bound
Upperbound
Lower bound
Upperbound
WORLD 8.7 9.8 675.5 765.2 8.9 10.5 701.9 828.0
AFRICA 18.8 20.3 251.6 272.7 19.3 21.0 264.5 289.1
Northern Africa 5.7 6.1 14.0 15.1 6.4 7.5 16.0 18.8
Sub-Saharan Africa 21.7 23.5 237.6 257.6 22.1 24.1 248.6 270.2
Eastern Africa 29.2 31.1 130.2 138.4 28.8 30.8 131.4 140.9
Middle Africa 30.1 30.7 54.1 55.2 32.3 33.3 59.7 61.5
Southern Africa 8.7 9.6 5.8 6.5 8.7 9.6 6.0 6.6
Western Africa 11.8 14.3 47.5 57.5 12.5 14.8 51.5 61.2
ASIA 7.9 9.2 367.9 426.8 8.1 9.9 379.7 465.4
Central Asia 2.8 3.4 2.1 2.6 2.8 3.4 2.1 2.6
Eastern Asia <2.5 <2.5 n.r n.r. <2.5 <2.5 n.r. n.r.
South-eastern Asia 5.6 6.0 37.4 39.9 6.0 6.7 40.2 45.4
Southern Asia 14.4 17.2 279.8 333.9 14.8 18.8 290.1 368.9
Western Asia 9.9 10.3 27.7 28.9 9.8 10.2 27.7 29.0
Western Asia and Northern Africa 7.9 8.4 41.7 44.0 8.2 8.9 43.7 47.8
LATIN AMERICA AND THE CARIBBEAN 7.3 8.7 47.9 56.9 7.5 9.7 49.4 64.0
Caribbean 16.0 16.9 7.0 7.3 16.3 16.5 7.1 7.2
Latin America 6.7 8.1 40.9 49.5 6.9 9.2 42.2 56.8
Central America 7.9 8.2 14.2 14.7 8.0 8.7 14.6 15.7
South America 6.2 8.1 26.7 34.8 6.4 9.5 27.7 41.1
OCEANIA 5.4 5.4 2.3 2.3 5.7 5.9 2.5 2.6
NORTHERN AMERICA AND EUROPE <2.5 <2.5 n.r n.r. <2.5 <2.5 n.r. n.r.
NOTES: n.r. = not reported, as the prevalence is less than 2.5 percent. For NoU, regional totals may differ from the sum of subregions, due to rounding and non-reported values. For country compositions of each regional/subregional aggregate, see Notes on geographic regions in statistical tables inside the back cover.SOURCE: FAO.
TABLE A2.1 RANGES OF PoU AND NoU NOWCASTED IN 2020 AND 2021
| 177 |
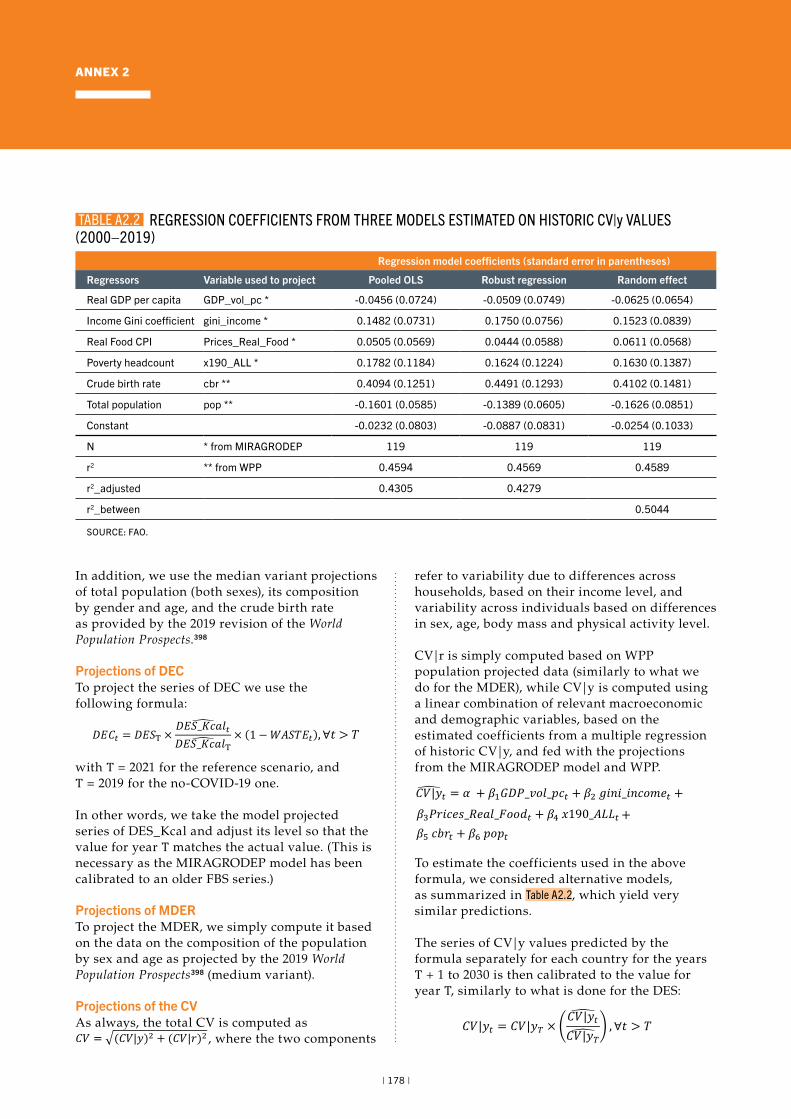
ANNEX 2
In addition, we use the median variant projections of total population (both sexes), its composition by gender and age, and the crude birth rate as provided by the 2019 revision of the World Population Prospects.398
Projections of DECTo project the series of DEC we use the following formula:
𝐷𝐷𝐷𝐷𝐶𝐶! = 𝐷𝐷𝐷𝐷𝐷𝐷" ×𝐷𝐷𝐷𝐷𝐷𝐷_𝐾𝐾𝐾𝐾𝐾𝐾𝑙𝑙!,
𝐷𝐷𝐷𝐷𝐷𝐷_𝐾𝐾𝐾𝐾𝐾𝐾𝑙𝑙", ×(1 −𝑊𝑊𝑊𝑊𝐷𝐷𝑊𝑊𝐷𝐷!), ∀𝑡𝑡 > 𝑇𝑇
𝐶𝐶𝐶𝐶 = 5(𝐶𝐶𝐶𝐶|𝑦𝑦)# + (𝐶𝐶𝐶𝐶|𝑟𝑟)#
𝐶𝐶𝐶𝐶|𝑦𝑦, ! = 𝛼𝛼 + 𝛽𝛽$𝐺𝐺𝐷𝐷𝐺𝐺_𝑣𝑣𝑣𝑣𝑙𝑙_𝑝𝑝𝐾𝐾! + 𝛽𝛽#𝑔𝑔𝑔𝑔𝑔𝑔𝑔𝑔_𝑔𝑔𝑔𝑔𝐾𝐾𝑣𝑣𝑖𝑖𝑒𝑒! + 𝛽𝛽%𝐺𝐺𝑟𝑟𝑔𝑔𝐾𝐾𝑒𝑒𝑃𝑃_𝑅𝑅𝑒𝑒𝐾𝐾𝑙𝑙_𝐹𝐹𝑣𝑣𝑣𝑣𝑑𝑑! + 𝛽𝛽&𝑥𝑥190_𝑊𝑊𝐴𝐴𝐴𝐴!+ 𝛽𝛽'𝐾𝐾𝑐𝑐𝑟𝑟! + 𝛽𝛽(𝑝𝑝𝑣𝑣𝑝𝑝!
𝐶𝐶𝐶𝐶|𝑦𝑦! = 𝐶𝐶𝐶𝐶|𝑦𝑦" × ,𝐶𝐶𝐶𝐶|𝑦𝑦!-
𝐶𝐶𝐶𝐶|𝑦𝑦"- .,∀𝑡𝑡 > 𝑇𝑇
#$(#$&'((_**++/#--)("#$%&$(%#)*+#&%,-.%(%#))
#$(#$+/0_**++/#--)(0121*+#&%,-.%(%#)),
𝐷𝐷𝐷𝐷𝐷𝐷𝑡𝑡𝐶𝐶𝐶𝐶𝐶𝐶𝑡𝑡(𝑈𝑈𝑈𝑈𝐷𝐷)1-1- =𝐷𝐷𝐷𝐷𝐷𝐷𝑡𝑡𝐶𝐶𝐶𝐶𝐶𝐶𝑡𝑡(𝐿𝐿𝐶𝐶𝑈𝑈)1-#2 ∗ ;
(𝑓𝑓)𝐶𝐶𝐶𝐶𝐶𝐶1-1-(𝑓𝑓)𝐶𝐶𝐶𝐶𝐶𝐶1-#2
?
𝐶𝐶𝐶𝐶𝐶𝐶1-1-
𝐷𝐷𝐷𝐷𝐷𝐷𝑡𝑡𝐶𝐶𝐶𝐶𝐶𝐶𝑡𝑡(𝑈𝑈𝑈𝑈𝐷𝐷)1-#3 =𝐷𝐷𝐷𝐷𝐷𝐷𝑡𝑡𝐶𝐶𝐶𝐶𝐶𝐶𝑡𝑡(𝐿𝐿𝐶𝐶𝑈𝑈)1-#2 ∗ ;
(𝑓𝑓)𝐶𝐶𝐶𝐶𝐶𝐶1-#3(𝑓𝑓)𝐶𝐶𝐶𝐶𝐶𝐶1-#2
?
𝐶𝐶𝐶𝐶𝐶𝐶1-#3
𝐷𝐷𝐷𝐷𝐷𝐷𝑡𝑡𝐶𝐶𝐶𝐶𝐶𝐶𝑡𝑡(𝑈𝑈𝑈𝑈𝐷𝐷)1-#4 =𝐷𝐷𝐷𝐷𝐷𝐷𝑡𝑡𝐶𝐶𝐶𝐶𝐶𝐶𝑡𝑡(𝐿𝐿𝐶𝐶𝑈𝑈)1-#2 ∗ ;
(𝑓𝑓)𝐶𝐶𝐶𝐶𝐶𝐶1-#4(𝑓𝑓)𝐶𝐶𝐶𝐶𝐶𝐶1-#2
?
𝐶𝐶𝐶𝐶𝐶𝐶1-#4
with T = 2021 for the reference scenario, and T = 2019 for the no-COVID-19 one.
In other words, we take the model projected series of DES_Kcal and adjust its level so that the value for year T matches the actual value. (This is necessary as the MIRAGRODEP model has been calibrated to an older FBS series.)
Projections of MDERTo project the MDER, we simply compute it based on the data on the composition of the population by sex and age as projected by the 2019 World Population Prospects398 (medium variant).
Projections of the CVAs always, the total CV is computed as
𝐷𝐷𝐷𝐷𝐶𝐶! = 𝐷𝐷𝐷𝐷𝐷𝐷" ×𝐷𝐷𝐷𝐷𝐷𝐷_𝐾𝐾𝐾𝐾𝐾𝐾𝑙𝑙!,
𝐷𝐷𝐷𝐷𝐷𝐷_𝐾𝐾𝐾𝐾𝐾𝐾𝑙𝑙", ×(1 −𝑊𝑊𝑊𝑊𝐷𝐷𝑊𝑊𝐷𝐷!), ∀𝑡𝑡 > 𝑇𝑇
𝐶𝐶𝐶𝐶 = 5(𝐶𝐶𝐶𝐶|𝑦𝑦)# + (𝐶𝐶𝐶𝐶|𝑟𝑟)#
𝐶𝐶𝐶𝐶|𝑦𝑦, ! = 𝛼𝛼 + 𝛽𝛽$𝐺𝐺𝐷𝐷𝐺𝐺_𝑣𝑣𝑣𝑣𝑙𝑙_𝑝𝑝𝐾𝐾! + 𝛽𝛽#𝑔𝑔𝑔𝑔𝑔𝑔𝑔𝑔_𝑔𝑔𝑔𝑔𝐾𝐾𝑣𝑣𝑖𝑖𝑒𝑒! + 𝛽𝛽%𝐺𝐺𝑟𝑟𝑔𝑔𝐾𝐾𝑒𝑒𝑃𝑃_𝑅𝑅𝑒𝑒𝐾𝐾𝑙𝑙_𝐹𝐹𝑣𝑣𝑣𝑣𝑑𝑑! + 𝛽𝛽&𝑥𝑥190_𝑊𝑊𝐴𝐴𝐴𝐴!+ 𝛽𝛽'𝐾𝐾𝑐𝑐𝑟𝑟! + 𝛽𝛽(𝑝𝑝𝑣𝑣𝑝𝑝!
𝐶𝐶𝐶𝐶|𝑦𝑦! = 𝐶𝐶𝐶𝐶|𝑦𝑦" × ,𝐶𝐶𝐶𝐶|𝑦𝑦!-
𝐶𝐶𝐶𝐶|𝑦𝑦"- .,∀𝑡𝑡 > 𝑇𝑇
#$(#$&'((_**++/#--)("#$%&$(%#)*+#&%,-.%(%#))
#$(#$+/0_**++/#--)(0121*+#&%,-.%(%#)),
𝐷𝐷𝐷𝐷𝐷𝐷𝑡𝑡𝐶𝐶𝐶𝐶𝐶𝐶𝑡𝑡(𝑈𝑈𝑈𝑈𝐷𝐷)1-1- =𝐷𝐷𝐷𝐷𝐷𝐷𝑡𝑡𝐶𝐶𝐶𝐶𝐶𝐶𝑡𝑡(𝐿𝐿𝐶𝐶𝑈𝑈)1-#2 ∗ ;
(𝑓𝑓)𝐶𝐶𝐶𝐶𝐶𝐶1-1-(𝑓𝑓)𝐶𝐶𝐶𝐶𝐶𝐶1-#2
?
𝐶𝐶𝐶𝐶𝐶𝐶1-1-
𝐷𝐷𝐷𝐷𝐷𝐷𝑡𝑡𝐶𝐶𝐶𝐶𝐶𝐶𝑡𝑡(𝑈𝑈𝑈𝑈𝐷𝐷)1-#3 =𝐷𝐷𝐷𝐷𝐷𝐷𝑡𝑡𝐶𝐶𝐶𝐶𝐶𝐶𝑡𝑡(𝐿𝐿𝐶𝐶𝑈𝑈)1-#2 ∗ ;
(𝑓𝑓)𝐶𝐶𝐶𝐶𝐶𝐶1-#3(𝑓𝑓)𝐶𝐶𝐶𝐶𝐶𝐶1-#2
?
𝐶𝐶𝐶𝐶𝐶𝐶1-#3
𝐷𝐷𝐷𝐷𝐷𝐷𝑡𝑡𝐶𝐶𝐶𝐶𝐶𝐶𝑡𝑡(𝑈𝑈𝑈𝑈𝐷𝐷)1-#4 =𝐷𝐷𝐷𝐷𝐷𝐷𝑡𝑡𝐶𝐶𝐶𝐶𝐶𝐶𝑡𝑡(𝐿𝐿𝐶𝐶𝑈𝑈)1-#2 ∗ ;
(𝑓𝑓)𝐶𝐶𝐶𝐶𝐶𝐶1-#4(𝑓𝑓)𝐶𝐶𝐶𝐶𝐶𝐶1-#2
?
𝐶𝐶𝐶𝐶𝐶𝐶1-#4
, where the two components
refer to variability due to differences across households, based on their income level, and variability across individuals based on differences in sex, age, body mass and physical activity level.
CV|r is simply computed based on WPP population projected data (similarly to what we do for the MDER), while CV|y is computed using a linear combination of relevant macroeconomic and demographic variables, based on the estimated coefficients from a multiple regression of historic CV|y, and fed with the projections from the MIRAGRODEP model and WPP.
𝐷𝐷𝐷𝐷𝐶𝐶! = 𝐷𝐷𝐷𝐷𝐷𝐷" ×𝐷𝐷𝐷𝐷𝐷𝐷_𝐾𝐾𝐾𝐾𝐾𝐾𝑙𝑙!,
𝐷𝐷𝐷𝐷𝐷𝐷_𝐾𝐾𝐾𝐾𝐾𝐾𝑙𝑙", ×(1 −𝑊𝑊𝑊𝑊𝐷𝐷𝑊𝑊𝐷𝐷!), ∀𝑡𝑡 > 𝑇𝑇
𝐶𝐶𝐶𝐶 = 5(𝐶𝐶𝐶𝐶|𝑦𝑦)# + (𝐶𝐶𝐶𝐶|𝑟𝑟)#
𝐶𝐶𝐶𝐶|𝑦𝑦, ! = 𝛼𝛼 + 𝛽𝛽$𝐺𝐺𝐷𝐷𝐺𝐺_𝑣𝑣𝑣𝑣𝑙𝑙_𝑝𝑝𝐾𝐾! + 𝛽𝛽#𝑔𝑔𝑔𝑔𝑔𝑔𝑔𝑔_𝑔𝑔𝑔𝑔𝐾𝐾𝑣𝑣𝑖𝑖𝑒𝑒! + 𝛽𝛽%𝐺𝐺𝑟𝑟𝑔𝑔𝐾𝐾𝑒𝑒𝑃𝑃_𝑅𝑅𝑒𝑒𝐾𝐾𝑙𝑙_𝐹𝐹𝑣𝑣𝑣𝑣𝑑𝑑! + 𝛽𝛽&𝑥𝑥190_𝑊𝑊𝐴𝐴𝐴𝐴!+ 𝛽𝛽'𝐾𝐾𝑐𝑐𝑟𝑟! + 𝛽𝛽(𝑝𝑝𝑣𝑣𝑝𝑝!
𝐶𝐶𝐶𝐶|𝑦𝑦! = 𝐶𝐶𝐶𝐶|𝑦𝑦" × ,𝐶𝐶𝐶𝐶|𝑦𝑦!-
𝐶𝐶𝐶𝐶|𝑦𝑦"- .,∀𝑡𝑡 > 𝑇𝑇
#$(#$&'((_**++/#--)("#$%&$(%#)*+#&%,-.%(%#))
#$(#$+/0_**++/#--)(0121*+#&%,-.%(%#)),
𝐷𝐷𝐷𝐷𝐷𝐷𝑡𝑡𝐶𝐶𝐶𝐶𝐶𝐶𝑡𝑡(𝑈𝑈𝑈𝑈𝐷𝐷)1-1- =𝐷𝐷𝐷𝐷𝐷𝐷𝑡𝑡𝐶𝐶𝐶𝐶𝐶𝐶𝑡𝑡(𝐿𝐿𝐶𝐶𝑈𝑈)1-#2 ∗ ;
(𝑓𝑓)𝐶𝐶𝐶𝐶𝐶𝐶1-1-(𝑓𝑓)𝐶𝐶𝐶𝐶𝐶𝐶1-#2
?
𝐶𝐶𝐶𝐶𝐶𝐶1-1-
𝐷𝐷𝐷𝐷𝐷𝐷𝑡𝑡𝐶𝐶𝐶𝐶𝐶𝐶𝑡𝑡(𝑈𝑈𝑈𝑈𝐷𝐷)1-#3 =𝐷𝐷𝐷𝐷𝐷𝐷𝑡𝑡𝐶𝐶𝐶𝐶𝐶𝐶𝑡𝑡(𝐿𝐿𝐶𝐶𝑈𝑈)1-#2 ∗ ;
(𝑓𝑓)𝐶𝐶𝐶𝐶𝐶𝐶1-#3(𝑓𝑓)𝐶𝐶𝐶𝐶𝐶𝐶1-#2
?
𝐶𝐶𝐶𝐶𝐶𝐶1-#3
𝐷𝐷𝐷𝐷𝐷𝐷𝑡𝑡𝐶𝐶𝐶𝐶𝐶𝐶𝑡𝑡(𝑈𝑈𝑈𝑈𝐷𝐷)1-#4 =𝐷𝐷𝐷𝐷𝐷𝐷𝑡𝑡𝐶𝐶𝐶𝐶𝐶𝐶𝑡𝑡(𝐿𝐿𝐶𝐶𝑈𝑈)1-#2 ∗ ;
(𝑓𝑓)𝐶𝐶𝐶𝐶𝐶𝐶1-#4(𝑓𝑓)𝐶𝐶𝐶𝐶𝐶𝐶1-#2
?
𝐶𝐶𝐶𝐶𝐶𝐶1-#4
To estimate the coefficients used in the above formula, we considered alternative models, as summarized in Table A2.2, which yield very similar predictions.
The series of CV|y values predicted by the formula separately for each country for the years T + 1 to 2030 is then calibrated to the value for year T, similarly to what is done for the DES:
𝐷𝐷𝐷𝐷𝐶𝐶! = 𝐷𝐷𝐷𝐷𝐷𝐷" ×𝐷𝐷𝐷𝐷𝐷𝐷_𝐾𝐾𝐾𝐾𝐾𝐾𝑙𝑙!,
𝐷𝐷𝐷𝐷𝐷𝐷_𝐾𝐾𝐾𝐾𝐾𝐾𝑙𝑙", ×(1 −𝑊𝑊𝑊𝑊𝐷𝐷𝑊𝑊𝐷𝐷!), ∀𝑡𝑡 > 𝑇𝑇
𝐶𝐶𝐶𝐶 = 5(𝐶𝐶𝐶𝐶|𝑦𝑦)# + (𝐶𝐶𝐶𝐶|𝑟𝑟)#
𝐶𝐶𝐶𝐶|𝑦𝑦, ! = 𝛼𝛼 + 𝛽𝛽$𝐺𝐺𝐷𝐷𝐺𝐺_𝑣𝑣𝑣𝑣𝑙𝑙_𝑝𝑝𝐾𝐾! + 𝛽𝛽#𝑔𝑔𝑔𝑔𝑔𝑔𝑔𝑔_𝑔𝑔𝑔𝑔𝐾𝐾𝑣𝑣𝑖𝑖𝑒𝑒! + 𝛽𝛽%𝐺𝐺𝑟𝑟𝑔𝑔𝐾𝐾𝑒𝑒𝑃𝑃_𝑅𝑅𝑒𝑒𝐾𝐾𝑙𝑙_𝐹𝐹𝑣𝑣𝑣𝑣𝑑𝑑! + 𝛽𝛽&𝑥𝑥190_𝑊𝑊𝐴𝐴𝐴𝐴!+ 𝛽𝛽'𝐾𝐾𝑐𝑐𝑟𝑟! + 𝛽𝛽(𝑝𝑝𝑣𝑣𝑝𝑝!
𝐶𝐶𝐶𝐶|𝑦𝑦! = 𝐶𝐶𝐶𝐶|𝑦𝑦" × ,𝐶𝐶𝐶𝐶|𝑦𝑦!-
𝐶𝐶𝐶𝐶|𝑦𝑦"- .,∀𝑡𝑡 > 𝑇𝑇
#$(#$&'((_**++/#--)("#$%&$(%#)*+#&%,-.%(%#))
#$(#$+/0_**++/#--)(0121*+#&%,-.%(%#)),
𝐷𝐷𝐷𝐷𝐷𝐷𝑡𝑡𝐶𝐶𝐶𝐶𝐶𝐶𝑡𝑡(𝑈𝑈𝑈𝑈𝐷𝐷)1-1- =𝐷𝐷𝐷𝐷𝐷𝐷𝑡𝑡𝐶𝐶𝐶𝐶𝐶𝐶𝑡𝑡(𝐿𝐿𝐶𝐶𝑈𝑈)1-#2 ∗ ;
(𝑓𝑓)𝐶𝐶𝐶𝐶𝐶𝐶1-1-(𝑓𝑓)𝐶𝐶𝐶𝐶𝐶𝐶1-#2
?
𝐶𝐶𝐶𝐶𝐶𝐶1-1-
𝐷𝐷𝐷𝐷𝐷𝐷𝑡𝑡𝐶𝐶𝐶𝐶𝐶𝐶𝑡𝑡(𝑈𝑈𝑈𝑈𝐷𝐷)1-#3 =𝐷𝐷𝐷𝐷𝐷𝐷𝑡𝑡𝐶𝐶𝐶𝐶𝐶𝐶𝑡𝑡(𝐿𝐿𝐶𝐶𝑈𝑈)1-#2 ∗ ;
(𝑓𝑓)𝐶𝐶𝐶𝐶𝐶𝐶1-#3(𝑓𝑓)𝐶𝐶𝐶𝐶𝐶𝐶1-#2
?
𝐶𝐶𝐶𝐶𝐶𝐶1-#3
𝐷𝐷𝐷𝐷𝐷𝐷𝑡𝑡𝐶𝐶𝐶𝐶𝐶𝐶𝑡𝑡(𝑈𝑈𝑈𝑈𝐷𝐷)1-#4 =𝐷𝐷𝐷𝐷𝐷𝐷𝑡𝑡𝐶𝐶𝐶𝐶𝐶𝐶𝑡𝑡(𝐿𝐿𝐶𝐶𝑈𝑈)1-#2 ∗ ;
(𝑓𝑓)𝐶𝐶𝐶𝐶𝐶𝐶1-#4(𝑓𝑓)𝐶𝐶𝐶𝐶𝐶𝐶1-#2
?
𝐶𝐶𝐶𝐶𝐶𝐶1-#4
Regression model coefficients (standard error in parentheses)
Regressors Variable used to project Pooled OLS Robust regression Random effect
Real GDP per capita GDP_vol_pc * -0.0456 (0.0724) -0.0509 (0.0749) -0.0625 (0.0654)
Income Gini coefficient gini_income * 0.1482 (0.0731) 0.1750 (0.0756) 0.1523 (0.0839)
Real Food CPI Prices_Real_Food * 0.0505 (0.0569) 0.0444 (0.0588) 0.0611 (0.0568)
Poverty headcount x190_ALL * 0.1782 (0.1184) 0.1624 (0.1224) 0.1630 (0.1387)
Crude birth rate cbr ** 0.4094 (0.1251) 0.4491 (0.1293) 0.4102 (0.1481)
Total population pop ** -0.1601 (0.0585) -0.1389 (0.0605) -0.1626 (0.0851)
Constant -0.0232 (0.0803) -0.0887 (0.0831) -0.0254 (0.1033)
N * from MIRAGRODEP 119 119 119
r2 ** from WPP 0.4594 0.4569 0.4589
r2_adjusted 0.4305 0.4279
r2_between 0.5044
SOURCE: FAO.
TABLE A2.2 REGRESSION COEFFICIENTS FROM THREE MODELS ESTIMATED ON HISTORIC CV|y VALUES (2000–2019)
| 178 |
THE STATE OF FOOD SECURITY AND NUTRITION IN THE WORLD 2022
with T = 2021 for the reference scenario, and T = 2019 for the no-COVID-19 one.
C. Methodology for inequality analysis on nutrition outcomesAn inequality analysis in Section 2.2 was carried out according to urban and rural residence, household wealth, education level and gender as applied to six nutrition indicators using Equiplots. This type of chart depicts mean prevalences for subpopulations within each category of the respective inequity dimension (e.g. rural and urban within type of residence, wealth quintiles). Equiplots allow visual interpretation of prevalence levels and distance between groups, which represents absolute inequality. The analysis was performed across regions based on data availability for countries within each region. Unweighted analysis was applied using the latest available data from national surveys between 2015 and 2021. The list of countries contributing to each region is presented in Table A2.3; data sources are included in table notes.
D. Methodology for assessment of progress against nutrition targets at the regional and global levelsThese methodological notes pertain to results presented in Figure 15 in Section 2.2 of the report which depicts the proportion of countries with progress ratios across the various categories, that is, the proportion of the number of countries with data available in each category.
Progress since the baseline year of 2012 was assessed against the 2030 nutrition targets established by UNICEF/WHO26 using an adapted version of rules from the WHO-UNICEF Technical Expert Advisory Group on Nutrition Monitoring.411
Country progress was assessed based on the ratio between the progress achieved (relative reduction) and the target reduction to achieve the 2030 targets. That is, the proportion of progress achieved so far is given by
𝐷𝐷𝐷𝐷𝐶𝐶! = 𝐷𝐷𝐷𝐷𝐷𝐷" ×𝐷𝐷𝐷𝐷𝐷𝐷_𝐾𝐾𝐾𝐾𝐾𝐾𝑙𝑙!,
𝐷𝐷𝐷𝐷𝐷𝐷_𝐾𝐾𝐾𝐾𝐾𝐾𝑙𝑙", ×(1 −𝑊𝑊𝑊𝑊𝐷𝐷𝑊𝑊𝐷𝐷!), ∀𝑡𝑡 > 𝑇𝑇
𝐶𝐶𝐶𝐶 = 5(𝐶𝐶𝐶𝐶|𝑦𝑦)# + (𝐶𝐶𝐶𝐶|𝑟𝑟)#
𝐶𝐶𝐶𝐶|𝑦𝑦, ! = 𝛼𝛼 + 𝛽𝛽$𝐺𝐺𝐷𝐷𝐺𝐺_𝑣𝑣𝑣𝑣𝑙𝑙_𝑝𝑝𝐾𝐾! + 𝛽𝛽#𝑔𝑔𝑔𝑔𝑔𝑔𝑔𝑔_𝑔𝑔𝑔𝑔𝐾𝐾𝑣𝑣𝑖𝑖𝑒𝑒! + 𝛽𝛽%𝐺𝐺𝑟𝑟𝑔𝑔𝐾𝐾𝑒𝑒𝑃𝑃_𝑅𝑅𝑒𝑒𝐾𝐾𝑙𝑙_𝐹𝐹𝑣𝑣𝑣𝑣𝑑𝑑! + 𝛽𝛽&𝑥𝑥190_𝑊𝑊𝐴𝐴𝐴𝐴!+ 𝛽𝛽'𝐾𝐾𝑐𝑐𝑟𝑟! + 𝛽𝛽(𝑝𝑝𝑣𝑣𝑝𝑝!
𝐶𝐶𝐶𝐶|𝑦𝑦! = 𝐶𝐶𝐶𝐶|𝑦𝑦" × ,𝐶𝐶𝐶𝐶|𝑦𝑦!-
𝐶𝐶𝐶𝐶|𝑦𝑦"- .,∀𝑡𝑡 > 𝑇𝑇
#$(#$&'((_**++/#--)("#$%&$(%#)*+#&%,-.%(%#))
#$(#$+/0_**++/#--)(0121*+#&%,-.%(%#)),
𝐷𝐷𝐷𝐷𝐷𝐷𝑡𝑡𝐶𝐶𝐶𝐶𝐶𝐶𝑡𝑡(𝑈𝑈𝑈𝑈𝐷𝐷)1-1- =𝐷𝐷𝐷𝐷𝐷𝐷𝑡𝑡𝐶𝐶𝐶𝐶𝐶𝐶𝑡𝑡(𝐿𝐿𝐶𝐶𝑈𝑈)1-#2 ∗ ;
(𝑓𝑓)𝐶𝐶𝐶𝐶𝐶𝐶1-1-(𝑓𝑓)𝐶𝐶𝐶𝐶𝐶𝐶1-#2
?
𝐶𝐶𝐶𝐶𝐶𝐶1-1-
𝐷𝐷𝐷𝐷𝐷𝐷𝑡𝑡𝐶𝐶𝐶𝐶𝐶𝐶𝑡𝑡(𝑈𝑈𝑈𝑈𝐷𝐷)1-#3 =𝐷𝐷𝐷𝐷𝐷𝐷𝑡𝑡𝐶𝐶𝐶𝐶𝐶𝐶𝑡𝑡(𝐿𝐿𝐶𝐶𝑈𝑈)1-#2 ∗ ;
(𝑓𝑓)𝐶𝐶𝐶𝐶𝐶𝐶1-#3(𝑓𝑓)𝐶𝐶𝐶𝐶𝐶𝐶1-#2
?
𝐶𝐶𝐶𝐶𝐶𝐶1-#3
𝐷𝐷𝐷𝐷𝐷𝐷𝑡𝑡𝐶𝐶𝐶𝐶𝐶𝐶𝑡𝑡(𝑈𝑈𝑈𝑈𝐷𝐷)1-#4 =𝐷𝐷𝐷𝐷𝐷𝐷𝑡𝑡𝐶𝐶𝐶𝐶𝐶𝐶𝑡𝑡(𝐿𝐿𝐶𝐶𝑈𝑈)1-#2 ∗ ;
(𝑓𝑓)𝐶𝐶𝐶𝐶𝐶𝐶1-#4(𝑓𝑓)𝐶𝐶𝐶𝐶𝐶𝐶1-#2
?
𝐶𝐶𝐶𝐶𝐶𝐶1-#4
where Curr_AARRaw is the AARR based on recent yearsax and Req_AARR is the required AARRay to reach the country target if the 2030 global target is adopted. Note, progress towards the exclusive breastfeeding target (EBF) was done based on the reduction of non-exclusive breastfeeding rate, that is, 100 minus EBF rate.
Country progress ratios represent the amount of progress made up to the latest year for which data are available (in terms of reduction), compared to the total required to reach the target. For example, a country that has reduced the number of children who are stunted by 30 percent by 2020 (the latest year for which data are available), when compared to the target of 50 percent reduction by 2030, will have a ratio of 30/50, or 60 percent. This means that country has achieved 60 percent of the progress needed to reach the target between baseline year 2012 and 2020, having still to attain 40 percent of the needed progress in the last 10 years before 2030.
For summarizing progress in each region, countries’ progress ratios were categorized into five categories:
� worsening (any negative progress – going in the wrong direction);
� progress ratio between 0 and 24.9 percent; � between 25 percent and 49.9 percent; � between 50 percent and 74.9 percent; and � greater than 75 percent.
Note, for each indicator other than EBF, when the latest prevalence was smaller than 3 percent, the value ratio was set at 100 percent to indicate that the target was reached already, even when worsening. In case of EBF, the value ratio was set at 100 percent when the latest prevalence was 70 percent or greater. For wasting and EBF, progress assessment is included only for those countries where the latest survey year is 2015
aw See technical note on how to calculate current AARR at UNICEF (2007).47
ax Recent years for the calculation of current AARR refers to: from baseline 2012 to latest year for low birthweight, stunting, overweight and anaemia, and from 2008 to latest year for exclusive breastfeeding and wasting.
ay The required AARR is given by 1- (Pt+n / Pt)(1/n), where n is the number of years between the baseline and 2030, Pt+n is the target prevalence for 2030, and Pt is the baseline prevalence.
| 179 |
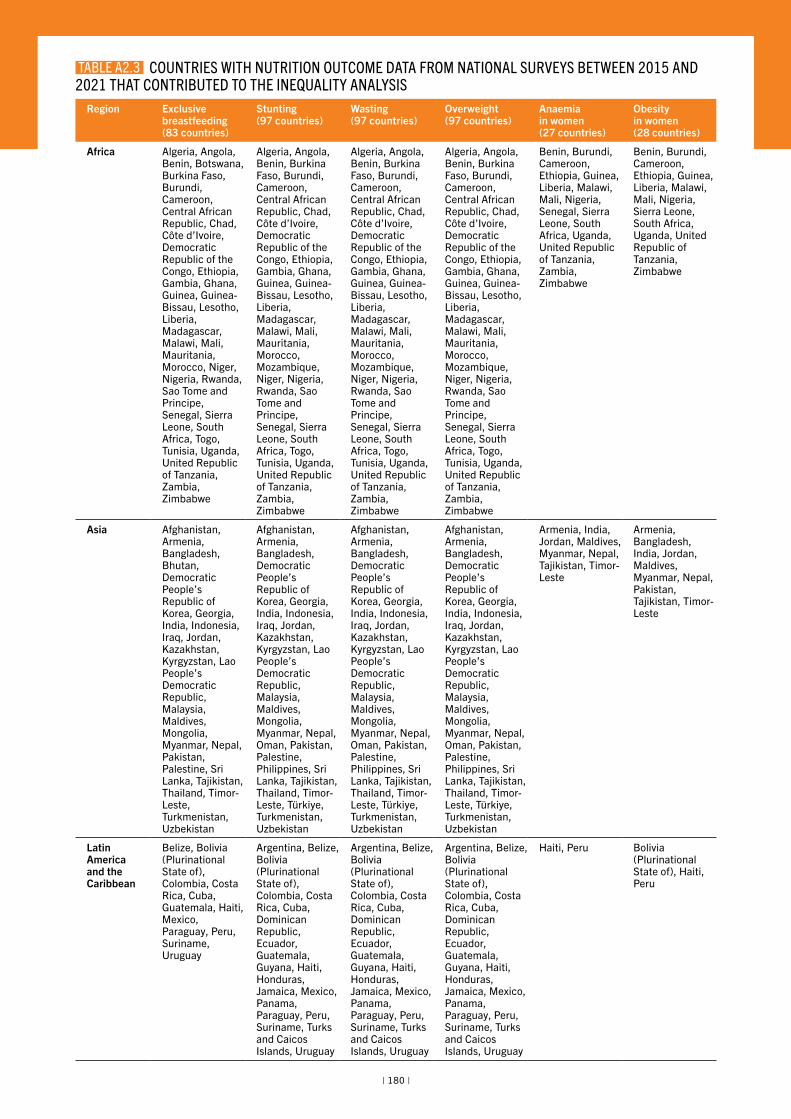
ANNEX 2
Region Exclusive breastfeeding (83 countries)
Stunting (97 countries)
Wasting (97 countries)
Overweight (97 countries)
Anaemia in women (27 countries)
Obesity in women (28 countries)
Africa Algeria, Angola, Benin, Botswana, Burkina Faso, Burundi, Cameroon, Central African Republic, Chad, Côte d’Ivoire, Democratic Republic of the Congo, Ethiopia, Gambia, Ghana, Guinea, Guinea-Bissau, Lesotho, Liberia, Madagascar, Malawi, Mali, Mauritania, Morocco, Niger, Nigeria, Rwanda, Sao Tome and Principe, Senegal, Sierra Leone, South Africa, Togo, Tunisia, Uganda, United Republic of Tanzania, Zambia, Zimbabwe
Algeria, Angola, Benin, Burkina Faso, Burundi, Cameroon, Central African Republic, Chad, Côte d’Ivoire, Democratic Republic of the Congo, Ethiopia, Gambia, Ghana, Guinea, Guinea-Bissau, Lesotho, Liberia, Madagascar, Malawi, Mali, Mauritania, Morocco, Mozambique, Niger, Nigeria, Rwanda, Sao Tome and Principe, Senegal, Sierra Leone, South Africa, Togo, Tunisia, Uganda, United Republic of Tanzania, Zambia, Zimbabwe
Algeria, Angola, Benin, Burkina Faso, Burundi, Cameroon, Central African Republic, Chad, Côte d’Ivoire, Democratic Republic of the Congo, Ethiopia, Gambia, Ghana, Guinea, Guinea-Bissau, Lesotho, Liberia, Madagascar, Malawi, Mali, Mauritania, Morocco, Mozambique, Niger, Nigeria, Rwanda, Sao Tome and Principe, Senegal, Sierra Leone, South Africa, Togo, Tunisia, Uganda, United Republic of Tanzania, Zambia, Zimbabwe
Algeria, Angola, Benin, Burkina Faso, Burundi, Cameroon, Central African Republic, Chad, Côte d’Ivoire, Democratic Republic of the Congo, Ethiopia, Gambia, Ghana, Guinea, Guinea-Bissau, Lesotho, Liberia, Madagascar, Malawi, Mali, Mauritania, Morocco, Mozambique, Niger, Nigeria, Rwanda, Sao Tome and Principe, Senegal, Sierra Leone, South Africa, Togo, Tunisia, Uganda, United Republic of Tanzania, Zambia, Zimbabwe
Benin, Burundi, Cameroon, Ethiopia, Guinea, Liberia, Malawi, Mali, Nigeria, Senegal, Sierra Leone, South Africa, Uganda, United Republic of Tanzania, Zambia, Zimbabwe
Benin, Burundi, Cameroon, Ethiopia, Guinea, Liberia, Malawi, Mali, Nigeria, Sierra Leone, South Africa, Uganda, United Republic of Tanzania, Zimbabwe
Asia Afghanistan, Armenia, Bangladesh, Bhutan, Democratic People’s Republic of Korea, Georgia, India, Indonesia, Iraq, Jordan, Kazakhstan, Kyrgyzstan, Lao People’s Democratic Republic, Malaysia, Maldives, Mongolia, Myanmar, Nepal, Pakistan, Palestine, Sri Lanka, Tajikistan, Thailand, Timor-Leste, Turkmenistan, Uzbekistan
Afghanistan, Armenia, Bangladesh, Democratic People’s Republic of Korea, Georgia, India, Indonesia, Iraq, Jordan, Kazakhstan, Kyrgyzstan, Lao People’s Democratic Republic, Malaysia, Maldives, Mongolia, Myanmar, Nepal, Oman, Pakistan, Palestine, Philippines, Sri Lanka, Tajikistan, Thailand, Timor-Leste, Türkiye, Turkmenistan, Uzbekistan
Afghanistan, Armenia, Bangladesh, Democratic People’s Republic of Korea, Georgia, India, Indonesia, Iraq, Jordan, Kazakhstan, Kyrgyzstan, Lao People’s Democratic Republic, Malaysia, Maldives, Mongolia, Myanmar, Nepal, Oman, Pakistan, Palestine, Philippines, Sri Lanka, Tajikistan, Thailand, Timor-Leste, Türkiye, Turkmenistan, Uzbekistan
Afghanistan, Armenia, Bangladesh, Democratic People’s Republic of Korea, Georgia, India, Indonesia, Iraq, Jordan, Kazakhstan, Kyrgyzstan, Lao People’s Democratic Republic, Malaysia, Maldives, Mongolia, Myanmar, Nepal, Oman, Pakistan, Palestine, Philippines, Sri Lanka, Tajikistan, Thailand, Timor-Leste, Türkiye, Turkmenistan, Uzbekistan
Armenia, India, Jordan, Maldives, Myanmar, Nepal, Tajikistan, Timor-Leste
Armenia, Bangladesh, India, Jordan, Maldives, Myanmar, Nepal, Pakistan, Tajikistan, Timor-Leste
Latin America and the Caribbean
Belize, Bolivia (Plurinational State of), Colombia, Costa Rica, Cuba, Guatemala, Haiti, Mexico, Paraguay, Peru, Suriname, Uruguay
Argentina, Belize, Bolivia (Plurinational State of), Colombia, Costa Rica, Cuba, Dominican Republic, Ecuador, Guatemala, Guyana, Haiti, Honduras, Jamaica, Mexico, Panama, Paraguay, Peru, Suriname, Turks and Caicos Islands, Uruguay
Argentina, Belize, Bolivia (Plurinational State of), Colombia, Costa Rica, Cuba, Dominican Republic, Ecuador, Guatemala, Guyana, Haiti, Honduras, Jamaica, Mexico, Panama, Paraguay, Peru, Suriname, Turks and Caicos Islands, Uruguay
Argentina, Belize, Bolivia (Plurinational State of), Colombia, Costa Rica, Cuba, Dominican Republic, Ecuador, Guatemala, Guyana, Haiti, Honduras, Jamaica, Mexico, Panama, Paraguay, Peru, Suriname, Turks and Caicos Islands, Uruguay
Haiti, Peru Bolivia (Plurinational State of), Haiti, Peru
TABLE A2.3 COUNTRIES WITH NUTRITION OUTCOME DATA FROM NATIONAL SURVEYS BETWEEN 2015 AND 2021 THAT CONTRIBUTED TO THE INEQUALITY ANALYSIS
| 180 |
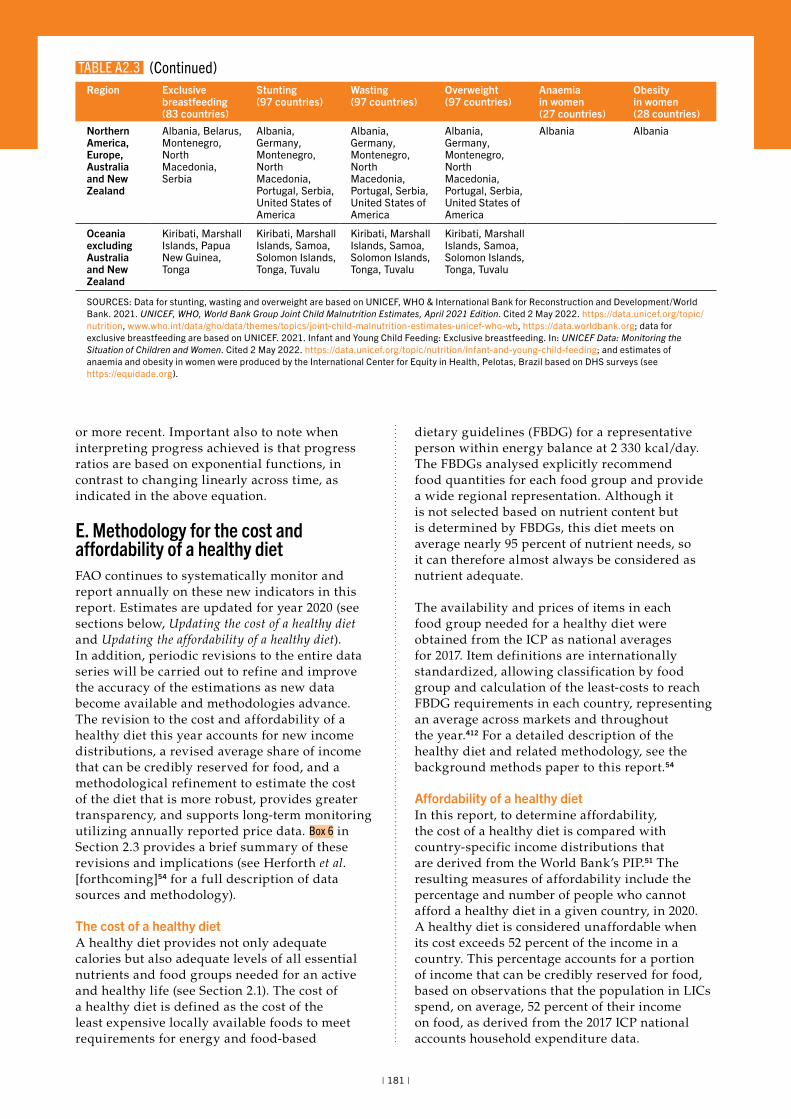
THE STATE OF FOOD SECURITY AND NUTRITION IN THE WORLD 2022
or more recent. Important also to note when interpreting progress achieved is that progress ratios are based on exponential functions, in contrast to changing linearly across time, as indicated in the above equation.
E. Methodology for the cost and affordability of a healthy dietFAO continues to systematically monitor and report annually on these new indicators in this report. Estimates are updated for year 2020 (see sections below, Updating the cost of a healthy diet and Updating the affordability of a healthy diet). In addition, periodic revisions to the entire data series will be carried out to refine and improve the accuracy of the estimations as new data become available and methodologies advance. The revision to the cost and affordability of a healthy diet this year accounts for new income distributions, a revised average share of income that can be credibly reserved for food, and a methodological refinement to estimate the cost of the diet that is more robust, provides greater transparency, and supports long-term monitoring utilizing annually reported price data. Box 6 in Section 2.3 provides a brief summary of these revisions and implications (see Herforth et al. [forthcoming]54 for a full description of data sources and methodology).
The cost of a healthy dietA healthy diet provides not only adequate calories but also adequate levels of all essential nutrients and food groups needed for an active and healthy life (see Section 2.1). The cost of a healthy diet is defined as the cost of the least expensive locally available foods to meet requirements for energy and food-based
dietary guidelines (FBDG) for a representative person within energy balance at 2 330 kcal/day. The FBDGs analysed explicitly recommend food quantities for each food group and provide a wide regional representation. Although it is not selected based on nutrient content but is determined by FBDGs, this diet meets on average nearly 95 percent of nutrient needs, so it can therefore almost always be considered as nutrient adequate.
The availability and prices of items in each food group needed for a healthy diet were obtained from the ICP as national averages for 2017. Item definitions are internationally standardized, allowing classification by food group and calculation of the least-costs to reach FBDG requirements in each country, representing an average across markets and throughout the year.412 For a detailed description of the healthy diet and related methodology, see the background methods paper to this report.54
Affordability of a healthy diet In this report, to determine affordability, the cost of a healthy diet is compared with country-specific income distributions that are derived from the World Bank’s PIP.51 The resulting measures of affordability include the percentage and number of people who cannot afford a healthy diet in a given country, in 2020. A healthy diet is considered unaffordable when its cost exceeds 52 percent of the income in a country. This percentage accounts for a portion of income that can be credibly reserved for food, based on observations that the population in LICs spend, on average, 52 percent of their income on food, as derived from the 2017 ICP national accounts household expenditure data.
Region Exclusive breastfeeding (83 countries)
Stunting (97 countries)
Wasting (97 countries)
Overweight (97 countries)
Anaemia in women (27 countries)
Obesity in women (28 countries)
Northern America, Europe, Australia and New Zealand
Albania, Belarus, Montenegro, North Macedonia, Serbia
Albania, Germany, Montenegro, North Macedonia, Portugal, Serbia, United States of America
Albania, Germany, Montenegro, North Macedonia, Portugal, Serbia, United States of America
Albania, Germany, Montenegro, North Macedonia, Portugal, Serbia, United States of America
Albania Albania
Oceania excluding Australia and New Zealand
Kiribati, Marshall Islands, Papua New Guinea, Tonga
Kiribati, Marshall Islands, Samoa, Solomon Islands, Tonga, Tuvalu
Kiribati, Marshall Islands, Samoa, Solomon Islands, Tonga, Tuvalu
Kiribati, Marshall Islands, Samoa, Solomon Islands, Tonga, Tuvalu
SOURCES: Data for stunting, wasting and overweight are based on UNICEF, WHO & International Bank for Reconstruction and Development/World Bank. 2021. UNICEF, WHO, World Bank Group Joint Child Malnutrition Estimates, April 2021 Edition. Cited 2 May 2022. https://data.unicef.org/topic/nutrition, www.who.int/data/gho/data/themes/topics/joint-child-malnutrition-estimates-unicef-who-wb, https://data.worldbank.org; data for exclusive breastfeeding are based on UNICEF. 2021. Infant and Young Child Feeding: Exclusive breastfeeding. In: UNICEF Data: Monitoring the Situation of Children and Women. Cited 2 May 2022. https://data.unicef.org/topic/nutrition/infant-and-young-child-feeding; and estimates of anaemia and obesity in women were produced by the International Center for Equity in Health, Pelotas, Brazil based on DHS surveys (see https://equidade.org).
TABLE A2.3 (Continued)
| 181 |
ANNEX 2
Based on this threshold and comparing the cost of the diet with country income distributions, we obtain the percentage of people for whom the cost of the diet is unaffordable. These proportions are then multiplied by the 2020 population in each country using the World Development Indicators (WDI) of the World Bank, to obtain the number of people who cannot afford a healthy diet in a given country. For a detailed description of the affordability indicators and related methodology, see Annex 3 of FAO, IFAD, UNICEF, WFP and WHO (2020).3
Updating the cost of a healthy diet The ICP is currently the only source of retail food price data for internationally standardized items, as part of the program’s larger effort to compute purchasing power parity (PPP) exchange rates across all countries of the world. However, these data are only available once every three to five years, which does not allow for yearly global monitoring of diet costs to guide programmes and policies. In the absence of updated food price data, in this report, the method of updating the cost indicator between ICP publication years relies on consumer price indices (CPIs) published by FAO. This dataset tracks change in monthly general and food CPIs at the national level with reference to a base year of 2015. The annual CPIs are computed as simple averages of the 12 monthly CPIs within a year. In particular, CPIs data for food and non-alcoholic beverages are used to update the cost of a healthy diet in 2020 for all countries except Bermuda, Central African Republic and Guyana, for which the general CPI is used. For Bermuda, the data are sourced from the government’s website.413 The cost of a healthy diet is estimated by multiplying each country’s 2017 actual cost, expressed in local currency units (LCU), with the CPI ratio:
𝐷𝐷𝐷𝐷𝐶𝐶! = 𝐷𝐷𝐷𝐷𝐷𝐷" ×𝐷𝐷𝐷𝐷𝐷𝐷_𝐾𝐾𝐾𝐾𝐾𝐾𝑙𝑙!,
𝐷𝐷𝐷𝐷𝐷𝐷_𝐾𝐾𝐾𝐾𝐾𝐾𝑙𝑙", ×(1 −𝑊𝑊𝑊𝑊𝐷𝐷𝑊𝑊𝐷𝐷!), ∀𝑡𝑡 > 𝑇𝑇
𝐶𝐶𝐶𝐶 = 5(𝐶𝐶𝐶𝐶|𝑦𝑦)# + (𝐶𝐶𝐶𝐶|𝑟𝑟)#
𝐶𝐶𝐶𝐶|𝑦𝑦, ! = 𝛼𝛼 + 𝛽𝛽$𝐺𝐺𝐷𝐷𝐺𝐺_𝑣𝑣𝑣𝑣𝑙𝑙_𝑝𝑝𝐾𝐾! + 𝛽𝛽#𝑔𝑔𝑔𝑔𝑔𝑔𝑔𝑔_𝑔𝑔𝑔𝑔𝐾𝐾𝑣𝑣𝑖𝑖𝑒𝑒! + 𝛽𝛽%𝐺𝐺𝑟𝑟𝑔𝑔𝐾𝐾𝑒𝑒𝑃𝑃_𝑅𝑅𝑒𝑒𝐾𝐾𝑙𝑙_𝐹𝐹𝑣𝑣𝑣𝑣𝑑𝑑! + 𝛽𝛽&𝑥𝑥190_𝑊𝑊𝐴𝐴𝐴𝐴!+ 𝛽𝛽'𝐾𝐾𝑐𝑐𝑟𝑟! + 𝛽𝛽(𝑝𝑝𝑣𝑣𝑝𝑝!
𝐶𝐶𝐶𝐶|𝑦𝑦! = 𝐶𝐶𝐶𝐶|𝑦𝑦" × ,𝐶𝐶𝐶𝐶|𝑦𝑦!-
𝐶𝐶𝐶𝐶|𝑦𝑦"- .,∀𝑡𝑡 > 𝑇𝑇
#$(#$&'((_**++/#--)("#$%&$(%#)*+#&%,-.%(%#))
#$(#$+/0_**++/#--)(0121*+#&%,-.%(%#)),
𝐷𝐷𝐷𝐷𝐷𝐷𝑡𝑡𝐶𝐶𝐶𝐶𝐶𝐶𝑡𝑡(𝑈𝑈𝑈𝑈𝐷𝐷)1-1- =𝐷𝐷𝐷𝐷𝐷𝐷𝑡𝑡𝐶𝐶𝐶𝐶𝐶𝐶𝑡𝑡(𝐿𝐿𝐶𝐶𝑈𝑈)1-#2 ∗ ;
(𝑓𝑓)𝐶𝐶𝐶𝐶𝐶𝐶1-1-(𝑓𝑓)𝐶𝐶𝐶𝐶𝐶𝐶1-#2
?
𝐶𝐶𝐶𝐶𝐶𝐶1-1-
𝐷𝐷𝐷𝐷𝐷𝐷𝑡𝑡𝐶𝐶𝐶𝐶𝐶𝐶𝑡𝑡(𝑈𝑈𝑈𝑈𝐷𝐷)1-#3 =𝐷𝐷𝐷𝐷𝐷𝐷𝑡𝑡𝐶𝐶𝐶𝐶𝐶𝐶𝑡𝑡(𝐿𝐿𝐶𝐶𝑈𝑈)1-#2 ∗ ;
(𝑓𝑓)𝐶𝐶𝐶𝐶𝐶𝐶1-#3(𝑓𝑓)𝐶𝐶𝐶𝐶𝐶𝐶1-#2
?
𝐶𝐶𝐶𝐶𝐶𝐶1-#3
𝐷𝐷𝐷𝐷𝐷𝐷𝑡𝑡𝐶𝐶𝐶𝐶𝐶𝐶𝑡𝑡(𝑈𝑈𝑈𝑈𝐷𝐷)1-#4 =𝐷𝐷𝐷𝐷𝐷𝐷𝑡𝑡𝐶𝐶𝐶𝐶𝐶𝐶𝑡𝑡(𝐿𝐿𝐶𝐶𝑈𝑈)1-#2 ∗ ;
(𝑓𝑓)𝐶𝐶𝐶𝐶𝐶𝐶1-#4(𝑓𝑓)𝐶𝐶𝐶𝐶𝐶𝐶1-#2
?
𝐶𝐶𝐶𝐶𝐶𝐶1-#4
The cost of a healthy diet is first updated in LCU and then converted into international dollars using the WDI PPP for private consumption conversion factors, to compare the cost across countries and political entities. For a detailed description of the methodology, see Bai et al. (forthcoming).414
The cost of a healthy diet was computed for 169 countries in 2017 and updated for 2018–2020 for all countries except Anguilla, Montserrat, and Taiwan Province of China that have neither information on CPIs nor on PPPs. Out of the remaining 166 countries, there are 22 countries with missing PPP data in any year between 2018 and 2020,az and one country with missing CPIs data (Turks and Caicos Islands). For the 22 countries, PPP imputations were applied using an Autoregressive Integrated Moving Average Model with External Explanatory Variable (ARIMAX). In line with the World Bank’s WDI methodology for PPP extrapolations, the ratio between a country’s general CPI and the CPI for the base country (in this case the United States of America) is included in the model specification as a key predictor of PPP values. Furthermore, per capita GDP and per capita household consumption expenditure are also added as external covariates, and the Holt-Winter smoothing methodology is applied to both series to fill the gaps, if needed. The ARIMAX approach allows to estimate, for each country, several model specifications that include an autoregressive component, an integration component, a moving average, and a combination of the three. The best specification is selected when at least the estimated coefficient of the CPI ratio is statistically significant, followed by the statistical significance of the ARIMAX parameters. For countries showing abnormal PPP series over time, the CPI ratio is found to be the only statistically significant coefficient to affect the variability of the PPP values. On the contrary, for countries with a less volatile PPP series, the historical PPP trend plays also a role in predicting PPP values, as well as the
az The 22 countries for which PPPs were imputed are the following: Angola, Argentina, Aruba, Belize, Bermuda, British Virgin Islands, Cayman Islands, Curaçao, Democratic Republic of the Congo, Eswatini, Ethiopia, Guinea-Bissau, Iran (Islamic Republic of), Liberia, Myanmar, Niger, Nigeria, Sao Tome and Principe, Sint Maarten (Dutch part), Suriname, Tajikistan and Zimbabwe.
| 182 |
THE STATE OF FOOD SECURITY AND NUTRITION IN THE WORLD 2022
coefficient estimates of per capita GDP and/or per capita expenditures. The ARIMAX computes the predicted values on the best specification selected for each country.
For one country with missing information on CPIs (Turks and Caicos Islands), cost imputations were applied using the average diet cost in the country’s subregion (s):
Imputed 2018 Diet Cost = (2017 Diet Cost/ Avg 2017 Diet Costs) × Avg 2018 Diet Costs
Imputed 2019 Diet Cost = (Imputed 2018 Diet Cost/ Avg 2018 Diet Costs) × Avg 2019 Diet Costs
Imputed 2020 Diet Cost = (Imputed 2019 Diet Cost/ Avg 2019 Diet Costs) × Avg 2020 Diet Costs
Subregional cost averages in 2017, 2018 and 2019 were computed excluding Turks and Caicos Islands.
A limitation of this method used to update the cost of a healthy diet in 2018–2020 is that changes in the cost depend on (food) CPIs and do not reflect item-specific changes in food prices, nor any differential changes in the price of different food groups, due to the lack of new item-level food price data for more nutritious food items. FAO is exploring how to expand reporting of item-level prices to allow more frequent and robust monitoring of the cost of a healthy diet.
Updating the affordability of a healthy diet In this report, affordability was updated for years 2018–2020. Through continuous updates based on incoming national surveys and data imputations, the income distributions in the PIP database51 are now available and updated for the 2017, 2018 and 2019 reference years in all countries. Income distributions in year 2020 are not available at the time of writing. Thus, the percent of people who cannot afford a healthy diet in 2020 was computed using the 2020 CPI-inflated cost of the diet described above, as well as the corresponding 2019 income distributions available in PIP.51 These proportions were multiplied by each country’s population in 2020 using the WDI of the World Bank, to obtain the number of people who cannot afford a healthy diet in this year.
Income distributions in PIP51 are not available for all the countries. Thus, of the 169 countries with cost information in 2017, the affordability indicators were computed for 143 countries. This information was updated for all countries for years 2018–2020, except for Taiwan Province of China. For this country, the unavailability of food CPI did not allow to compute the cost and, therefore, affordability.
The latest estimates of the affordability indicators were performed on 24 May 2022. As the PIP database is currently undergoing continuous updates of income distributions, affordability estimations after this date may marginally change. n
| 183 |
| 184 |
The cost and affordability of a healthy diet, and the change of these indicators from 2019 to 2020, are reported in Table 5 by region, subregion and country income groups, following the World Bank classification of countries by income level for 2021,33 based on per capita gross national income (GNI) in 2020. Income classification is provided for all countries except Anguilla and Montserrat. In FAO, IFAD, UNICEF, WFP and WHO (2021),15 results were presented using the 2019 income classification. Therefore, the composition of countries by income groups may have changed between 2019 and 2020.
Cost and affordability are also reported at the country level in Table A3.1 for the reference year 2017 when the ICP data were released, as well as for 2018, 2019 and 2020 when the two indicators are updated using the methodology described in Annex 2E. In 2018–2020, the cost indicator was updated for 166 of the 169 countries with information available in 2017, while affordability was updated for 142 of the 143 countries. For two countries, Argentina and Zimbabwe, cost and affordability in 2018–2020 are used to estimate aggregate indicators shown in Table 5 but are not reported in Table A3.1. To update the costs in 2018–2020, PPP exchange rates for both countries are imputed, but they
ANNEX 3 UPDATED DATA SERIES OF THE COST AND AFFORDABILITY OF A HEALTHY DIET, 2017–2020
may not thoroughly reflect the severe currency devaluation and economic instability that the countries have experienced.
Ranges of the affordability indicators, showing the percentage and number of people unable to afford a healthy diet in 2020, are presented in Table A3.2 by region and development status. Lower-bound estimates assume that 80 percent of income available is spent on food, where 80 percent represents the largest expenditure share on food observed in the ICP 2017 data (for Guinea-Bissau). Upper-bound estimates assume that the share of income reserved for food varies by country income group. Following ICP 2017 national accounts data, food expenditures represent, on average, 14 percent, 27 percent, 38 percent and 52 percent of total expenditures in HICs, UMICs, LMICs and LICs, respectively. For example, if the cost of a healthy diet is USD 3.00 in a LIC with an average food expenditure share of 52 percent, income would need to be USD 5.77 for a person to afford a healthy diet as well as non-food needs. For a full description of the methodology for determining the ranges, see Herforth et al. (2020).86 n
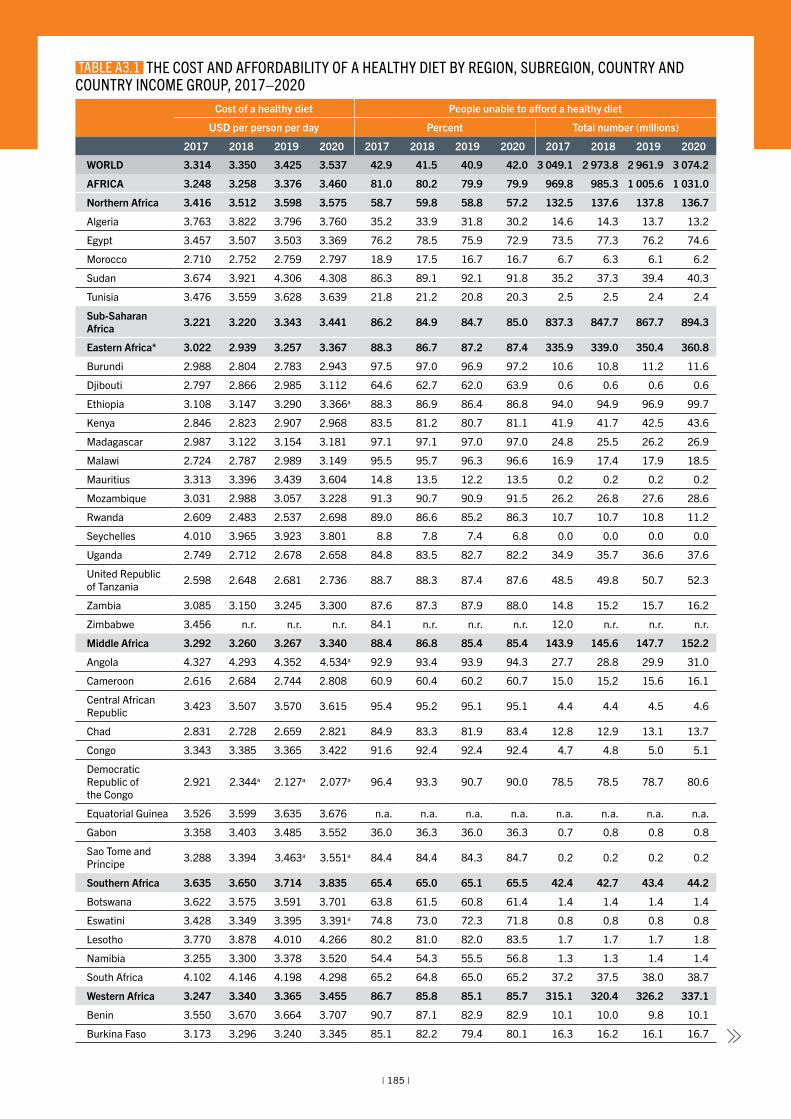
THE STATE OF FOOD SECURITY AND NUTRITION IN THE WORLD 2022
| 185 |
Cost of a healthy diet People unable to afford a healthy diet
USD per person per day Percent Total number (millions)
2017 2018 2019 2020 2017 2018 2019 2020 2017 2018 2019 2020
WORLD 3.314 3.350 3.425 3.537 42.9 41.5 40.9 42.0 3 049.1 2 973.8 2 961.9 3 074.2
AFRICA 3.248 3.258 3.376 3.460 81.0 80.2 79.9 79.9 969.8 985.3 1 005.6 1 031.0
Northern Africa 3.416 3.512 3.598 3.575 58.7 59.8 58.8 57.2 132.5 137.6 137.8 136.7
Algeria 3.763 3.822 3.796 3.760 35.2 33.9 31.8 30.2 14.6 14.3 13.7 13.2
Egypt 3.457 3.507 3.503 3.369 76.2 78.5 75.9 72.9 73.5 77.3 76.2 74.6
Morocco 2.710 2.752 2.759 2.797 18.9 17.5 16.7 16.7 6.7 6.3 6.1 6.2
Sudan 3.674 3.921 4.306 4.308 86.3 89.1 92.1 91.8 35.2 37.3 39.4 40.3
Tunisia 3.476 3.559 3.628 3.639 21.8 21.2 20.8 20.3 2.5 2.5 2.4 2.4
Sub-Saharan Africa 3.221 3.220 3.343 3.441 86.2 84.9 84.7 85.0 837.3 847.7 867.7 894.3
Eastern Africa* 3.022 2.939 3.257 3.367 88.3 86.7 87.2 87.4 335.9 339.0 350.4 360.8
Burundi 2.988 2.804 2.783 2.943 97.5 97.0 96.9 97.2 10.6 10.8 11.2 11.6
Djibouti 2.797 2.866 2.985 3.112 64.6 62.7 62.0 63.9 0.6 0.6 0.6 0.6
Ethiopia 3.108 3.147 3.290 3.366a 88.3 86.9 86.4 86.8 94.0 94.9 96.9 99.7
Kenya 2.846 2.823 2.907 2.968 83.5 81.2 80.7 81.1 41.9 41.7 42.5 43.6
Madagascar 2.987 3.122 3.154 3.181 97.1 97.1 97.0 97.0 24.8 25.5 26.2 26.9
Malawi 2.724 2.787 2.989 3.149 95.5 95.7 96.3 96.6 16.9 17.4 17.9 18.5
Mauritius 3.313 3.396 3.439 3.604 14.8 13.5 12.2 13.5 0.2 0.2 0.2 0.2
Mozambique 3.031 2.988 3.057 3.228 91.3 90.7 90.9 91.5 26.2 26.8 27.6 28.6
Rwanda 2.609 2.483 2.537 2.698 89.0 86.6 85.2 86.3 10.7 10.7 10.8 11.2
Seychelles 4.010 3.965 3.923 3.801 8.8 7.8 7.4 6.8 0.0 0.0 0.0 0.0
Uganda 2.749 2.712 2.678 2.658 84.8 83.5 82.7 82.2 34.9 35.7 36.6 37.6
United Republic of Tanzania 2.598 2.648 2.681 2.736 88.7 88.3 87.4 87.6 48.5 49.8 50.7 52.3
Zambia 3.085 3.150 3.245 3.300 87.6 87.3 87.9 88.0 14.8 15.2 15.7 16.2
Zimbabwe 3.456 n.r. n.r. n.r. 84.1 n.r. n.r. n.r. 12.0 n.r. n.r. n.r.
Middle Africa 3.292 3.260 3.267 3.340 88.4 86.8 85.4 85.4 143.9 145.6 147.7 152.2
Angola 4.327 4.293 4.352 4.534a 92.9 93.4 93.9 94.3 27.7 28.8 29.9 31.0
Cameroon 2.616 2.684 2.744 2.808 60.9 60.4 60.2 60.7 15.0 15.2 15.6 16.1
Central African Republic 3.423 3.507 3.570 3.615 95.4 95.2 95.1 95.1 4.4 4.4 4.5 4.6
Chad 2.831 2.728 2.659 2.821 84.9 83.3 81.9 83.4 12.8 12.9 13.1 13.7
Congo 3.343 3.385 3.365 3.422 91.6 92.4 92.4 92.4 4.7 4.8 5.0 5.1
Democratic Republic of the Congo
2.921 2.344a 2.127a 2.077a 96.4 93.3 90.7 90.0 78.5 78.5 78.7 80.6
Equatorial Guinea 3.526 3.599 3.635 3.676 n.a. n.a. n.a. n.a. n.a. n.a. n.a. n.a.
Gabon 3.358 3.403 3.485 3.552 36.0 36.3 36.0 36.3 0.7 0.8 0.8 0.8
Sao Tome and Principe 3.288 3.394 3.463a 3.551a 84.4 84.4 84.3 84.7 0.2 0.2 0.2 0.2
Southern Africa 3.635 3.650 3.714 3.835 65.4 65.0 65.1 65.5 42.4 42.7 43.4 44.2
Botswana 3.622 3.575 3.591 3.701 63.8 61.5 60.8 61.4 1.4 1.4 1.4 1.4
Eswatini 3.428 3.349 3.395 3.391a 74.8 73.0 72.3 71.8 0.8 0.8 0.8 0.8
Lesotho 3.770 3.878 4.010 4.266 80.2 81.0 82.0 83.5 1.7 1.7 1.7 1.8
Namibia 3.255 3.300 3.378 3.520 54.4 54.3 55.5 56.8 1.3 1.3 1.4 1.4
South Africa 4.102 4.146 4.198 4.298 65.2 64.8 65.0 65.2 37.2 37.5 38.0 38.7
Western Africa 3.247 3.340 3.365 3.455 86.7 85.8 85.1 85.7 315.1 320.4 326.2 337.1
Benin 3.550 3.670 3.664 3.707 90.7 87.1 82.9 82.9 10.1 10.0 9.8 10.1
Burkina Faso 3.173 3.296 3.240 3.345 85.1 82.2 79.4 80.1 16.3 16.2 16.1 16.7
TABLE A3.1 THE COST AND AFFORDABILITY OF A HEALTHY DIET BY REGION, SUBREGION, COUNTRY AND COUNTRY INCOME GROUP, 2017–2020
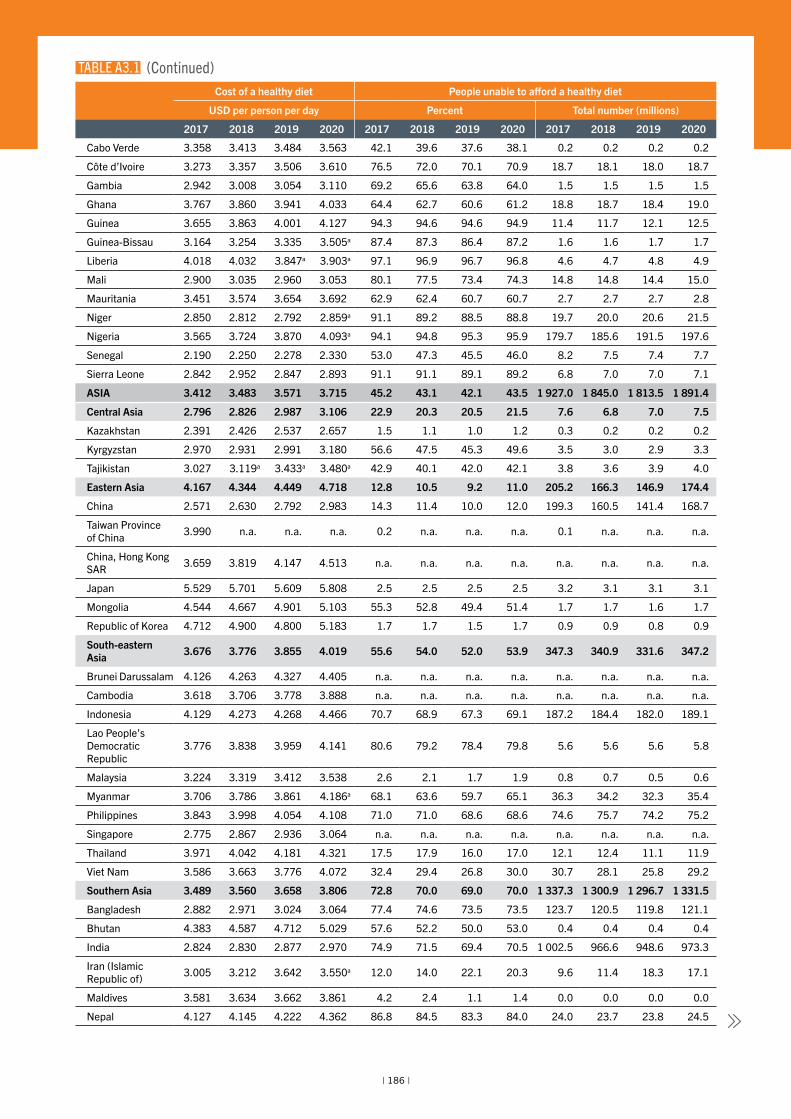
ANNEX 3
| 186 |
Cost of a healthy diet People unable to afford a healthy diet
USD per person per day Percent Total number (millions)
2017 2018 2019 2020 2017 2018 2019 2020 2017 2018 2019 2020
Cabo Verde 3.358 3.413 3.484 3.563 42.1 39.6 37.6 38.1 0.2 0.2 0.2 0.2
Côte d’Ivoire 3.273 3.357 3.506 3.610 76.5 72.0 70.1 70.9 18.7 18.1 18.0 18.7
Gambia 2.942 3.008 3.054 3.110 69.2 65.6 63.8 64.0 1.5 1.5 1.5 1.5
Ghana 3.767 3.860 3.941 4.033 64.4 62.7 60.6 61.2 18.8 18.7 18.4 19.0
Guinea 3.655 3.863 4.001 4.127 94.3 94.6 94.6 94.9 11.4 11.7 12.1 12.5
Guinea-Bissau 3.164 3.254 3.335 3.505a 87.4 87.3 86.4 87.2 1.6 1.6 1.7 1.7
Liberia 4.018 4.032 3.847a 3.903a 97.1 96.9 96.7 96.8 4.6 4.7 4.8 4.9
Mali 2.900 3.035 2.960 3.053 80.1 77.5 73.4 74.3 14.8 14.8 14.4 15.0
Mauritania 3.451 3.574 3.654 3.692 62.9 62.4 60.7 60.7 2.7 2.7 2.7 2.8
Niger 2.850 2.812 2.792 2.859a 91.1 89.2 88.5 88.8 19.7 20.0 20.6 21.5
Nigeria 3.565 3.724 3.870 4.093a 94.1 94.8 95.3 95.9 179.7 185.6 191.5 197.6
Senegal 2.190 2.250 2.278 2.330 53.0 47.3 45.5 46.0 8.2 7.5 7.4 7.7
Sierra Leone 2.842 2.952 2.847 2.893 91.1 91.1 89.1 89.2 6.8 7.0 7.0 7.1
ASIA 3.412 3.483 3.571 3.715 45.2 43.1 42.1 43.5 1 927.0 1 845.0 1 813.5 1 891.4
Central Asia 2.796 2.826 2.987 3.106 22.9 20.3 20.5 21.5 7.6 6.8 7.0 7.5
Kazakhstan 2.391 2.426 2.537 2.657 1.5 1.1 1.0 1.2 0.3 0.2 0.2 0.2
Kyrgyzstan 2.970 2.931 2.991 3.180 56.6 47.5 45.3 49.6 3.5 3.0 2.9 3.3
Tajikistan 3.027 3.119a 3.433a 3.480a 42.9 40.1 42.0 42.1 3.8 3.6 3.9 4.0
Eastern Asia 4.167 4.344 4.449 4.718 12.8 10.5 9.2 11.0 205.2 166.3 146.9 174.4
China 2.571 2.630 2.792 2.983 14.3 11.4 10.0 12.0 199.3 160.5 141.4 168.7
Taiwan Province of China 3.990 n.a. n.a. n.a. 0.2 n.a. n.a. n.a. 0.1 n.a. n.a. n.a.
China, Hong Kong SAR 3.659 3.819 4.147 4.513 n.a. n.a. n.a. n.a. n.a. n.a. n.a. n.a.
Japan 5.529 5.701 5.609 5.808 2.5 2.5 2.5 2.5 3.2 3.1 3.1 3.1
Mongolia 4.544 4.667 4.901 5.103 55.3 52.8 49.4 51.4 1.7 1.7 1.6 1.7
Republic of Korea 4.712 4.900 4.800 5.183 1.7 1.7 1.5 1.7 0.9 0.9 0.8 0.9
South-eastern Asia 3.676 3.776 3.855 4.019 55.6 54.0 52.0 53.9 347.3 340.9 331.6 347.2
Brunei Darussalam 4.126 4.263 4.327 4.405 n.a. n.a. n.a. n.a. n.a. n.a. n.a. n.a.
Cambodia 3.618 3.706 3.778 3.888 n.a. n.a. n.a. n.a. n.a. n.a. n.a. n.a.
Indonesia 4.129 4.273 4.268 4.466 70.7 68.9 67.3 69.1 187.2 184.4 182.0 189.1
Lao People’s Democratic Republic
3.776 3.838 3.959 4.141 80.6 79.2 78.4 79.8 5.6 5.6 5.6 5.8
Malaysia 3.224 3.319 3.412 3.538 2.6 2.1 1.7 1.9 0.8 0.7 0.5 0.6
Myanmar 3.706 3.786 3.861 4.186a 68.1 63.6 59.7 65.1 36.3 34.2 32.3 35.4
Philippines 3.843 3.998 4.054 4.108 71.0 71.0 68.6 68.6 74.6 75.7 74.2 75.2
Singapore 2.775 2.867 2.936 3.064 n.a. n.a. n.a. n.a. n.a. n.a. n.a. n.a.
Thailand 3.971 4.042 4.181 4.321 17.5 17.9 16.0 17.0 12.1 12.4 11.1 11.9
Viet Nam 3.586 3.663 3.776 4.072 32.4 29.4 26.8 30.0 30.7 28.1 25.8 29.2
Southern Asia 3.489 3.560 3.658 3.806 72.8 70.0 69.0 70.0 1 337.3 1 300.9 1 296.7 1 331.5
Bangladesh 2.882 2.971 3.024 3.064 77.4 74.6 73.5 73.5 123.7 120.5 119.8 121.1
Bhutan 4.383 4.587 4.712 5.029 57.6 52.2 50.0 53.0 0.4 0.4 0.4 0.4
India 2.824 2.830 2.877 2.970 74.9 71.5 69.4 70.5 1 002.5 966.6 948.6 973.3
Iran (Islamic Republic of) 3.005 3.212 3.642 3.550a 12.0 14.0 22.1 20.3 9.6 11.4 18.3 17.1
Maldives 3.581 3.634 3.662 3.861 4.2 2.4 1.1 1.4 0.0 0.0 0.0 0.0
Nepal 4.127 4.145 4.222 4.362 86.8 84.5 83.3 84.0 24.0 23.7 23.8 24.5
TABLE A3.1 (Continued)
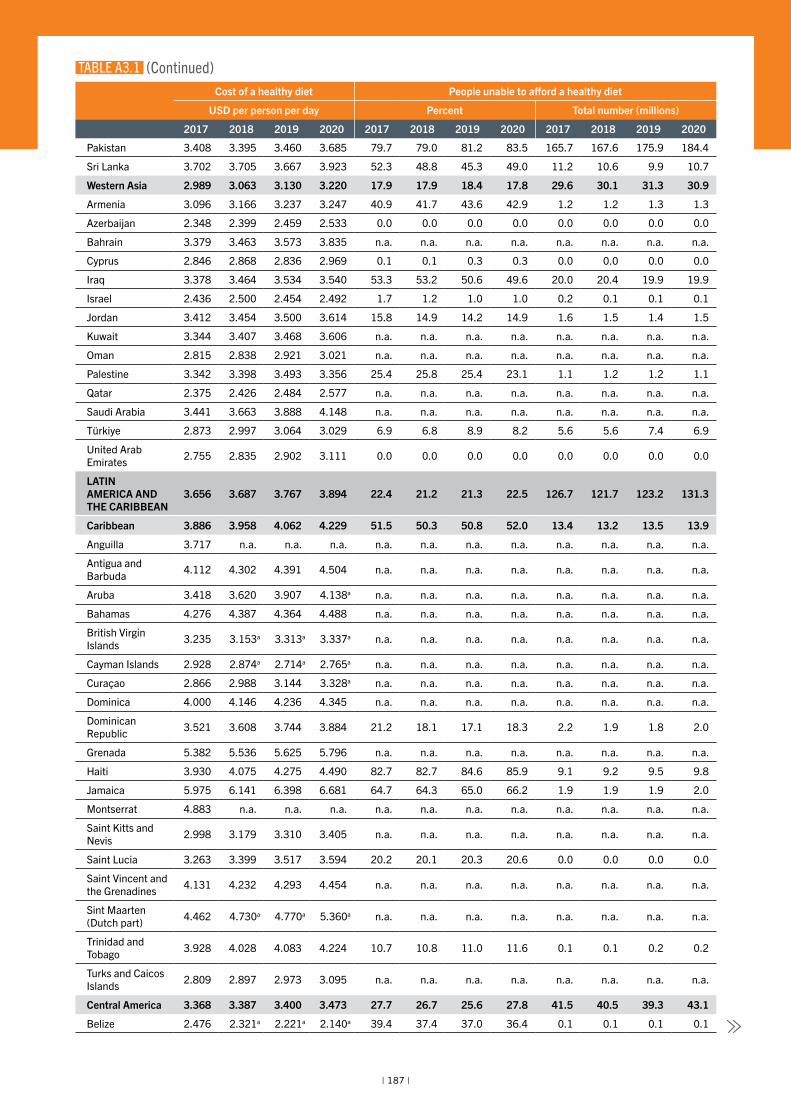
THE STATE OF FOOD SECURITY AND NUTRITION IN THE WORLD 2022
| 187 |
Cost of a healthy diet People unable to afford a healthy diet
USD per person per day Percent Total number (millions)
2017 2018 2019 2020 2017 2018 2019 2020 2017 2018 2019 2020
Pakistan 3.408 3.395 3.460 3.685 79.7 79.0 81.2 83.5 165.7 167.6 175.9 184.4
Sri Lanka 3.702 3.705 3.667 3.923 52.3 48.8 45.3 49.0 11.2 10.6 9.9 10.7
Western Asia 2.989 3.063 3.130 3.220 17.9 17.9 18.4 17.8 29.6 30.1 31.3 30.9
Armenia 3.096 3.166 3.237 3.247 40.9 41.7 43.6 42.9 1.2 1.2 1.3 1.3
Azerbaijan 2.348 2.399 2.459 2.533 0.0 0.0 0.0 0.0 0.0 0.0 0.0 0.0
Bahrain 3.379 3.463 3.573 3.835 n.a. n.a. n.a. n.a. n.a. n.a. n.a. n.a.
Cyprus 2.846 2.868 2.836 2.969 0.1 0.1 0.3 0.3 0.0 0.0 0.0 0.0
Iraq 3.378 3.464 3.534 3.540 53.3 53.2 50.6 49.6 20.0 20.4 19.9 19.9
Israel 2.436 2.500 2.454 2.492 1.7 1.2 1.0 1.0 0.2 0.1 0.1 0.1
Jordan 3.412 3.454 3.500 3.614 15.8 14.9 14.2 14.9 1.6 1.5 1.4 1.5
Kuwait 3.344 3.407 3.468 3.606 n.a. n.a. n.a. n.a. n.a. n.a. n.a. n.a.
Oman 2.815 2.838 2.921 3.021 n.a. n.a. n.a. n.a. n.a. n.a. n.a. n.a.
Palestine 3.342 3.398 3.493 3.356 25.4 25.8 25.4 23.1 1.1 1.2 1.2 1.1
Qatar 2.375 2.426 2.484 2.577 n.a. n.a. n.a. n.a. n.a. n.a. n.a. n.a.
Saudi Arabia 3.441 3.663 3.888 4.148 n.a. n.a. n.a. n.a. n.a. n.a. n.a. n.a.
Türkiye 2.873 2.997 3.064 3.029 6.9 6.8 8.9 8.2 5.6 5.6 7.4 6.9
United Arab Emirates 2.755 2.835 2.902 3.111 0.0 0.0 0.0 0.0 0.0 0.0 0.0 0.0
LATIN AMERICA AND THE CARIBBEAN
3.656 3.687 3.767 3.894 22.4 21.2 21.3 22.5 126.7 121.7 123.2 131.3
Caribbean 3.886 3.958 4.062 4.229 51.5 50.3 50.8 52.0 13.4 13.2 13.5 13.9
Anguilla 3.717 n.a. n.a. n.a. n.a. n.a. n.a. n.a. n.a. n.a. n.a. n.a.
Antigua and Barbuda 4.112 4.302 4.391 4.504 n.a. n.a. n.a. n.a. n.a. n.a. n.a. n.a.
Aruba 3.418 3.620 3.907 4.138a n.a. n.a. n.a. n.a. n.a. n.a. n.a. n.a.
Bahamas 4.276 4.387 4.364 4.488 n.a. n.a. n.a. n.a. n.a. n.a. n.a. n.a.
British Virgin Islands 3.235 3.153a 3.313a 3.337a n.a. n.a. n.a. n.a. n.a. n.a. n.a. n.a.
Cayman Islands 2.928 2.874a 2.714a 2.765a n.a. n.a. n.a. n.a. n.a. n.a. n.a. n.a.
Curaçao 2.866 2.988 3.144 3.328a n.a. n.a. n.a. n.a. n.a. n.a. n.a. n.a.
Dominica 4.000 4.146 4.236 4.345 n.a. n.a. n.a. n.a. n.a. n.a. n.a. n.a.
Dominican Republic 3.521 3.608 3.744 3.884 21.2 18.1 17.1 18.3 2.2 1.9 1.8 2.0
Grenada 5.382 5.536 5.625 5.796 n.a. n.a. n.a. n.a. n.a. n.a. n.a. n.a.
Haiti 3.930 4.075 4.275 4.490 82.7 82.7 84.6 85.9 9.1 9.2 9.5 9.8
Jamaica 5.975 6.141 6.398 6.681 64.7 64.3 65.0 66.2 1.9 1.9 1.9 2.0
Montserrat 4.883 n.a. n.a. n.a. n.a. n.a. n.a. n.a. n.a. n.a. n.a. n.a.
Saint Kitts and Nevis 2.998 3.179 3.310 3.405 n.a. n.a. n.a. n.a. n.a. n.a. n.a. n.a.
Saint Lucia 3.263 3.399 3.517 3.594 20.2 20.1 20.3 20.6 0.0 0.0 0.0 0.0
Saint Vincent and the Grenadines 4.131 4.232 4.293 4.454 n.a. n.a. n.a. n.a. n.a. n.a. n.a. n.a.
Sint Maarten (Dutch part) 4.462 4.730a 4.770a 5.360a n.a. n.a. n.a. n.a. n.a. n.a. n.a. n.a.
Trinidad and Tobago 3.928 4.028 4.083 4.224 10.7 10.8 11.0 11.6 0.1 0.1 0.2 0.2
Turks and Caicos Islands 2.809 2.897 2.973 3.095 n.a. n.a. n.a. n.a. n.a. n.a. n.a. n.a.
Central America 3.368 3.387 3.400 3.473 27.7 26.7 25.6 27.8 41.5 40.5 39.3 43.1
Belize 2.476 2.321a 2.221a 2.140a 39.4 37.4 37.0 36.4 0.1 0.1 0.1 0.1
TABLE A3.1 (Continued)
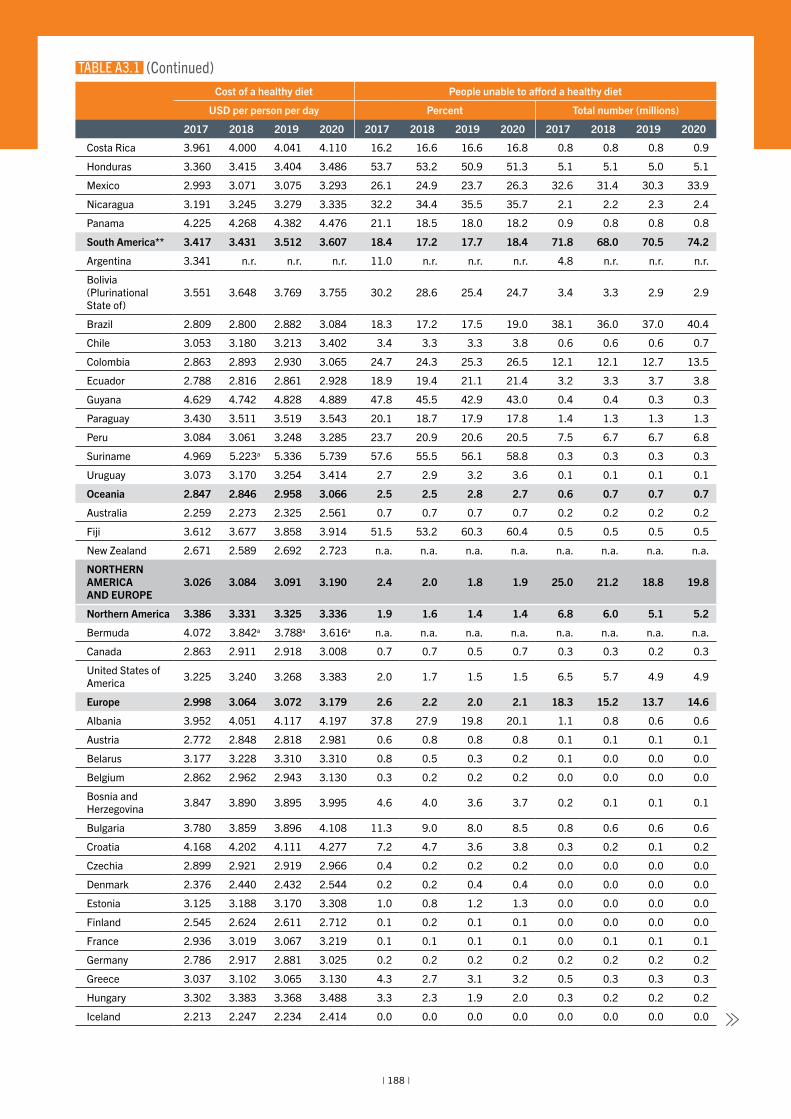
ANNEX 3
| 188 |
Cost of a healthy diet People unable to afford a healthy diet
USD per person per day Percent Total number (millions)
2017 2018 2019 2020 2017 2018 2019 2020 2017 2018 2019 2020
Costa Rica 3.961 4.000 4.041 4.110 16.2 16.6 16.6 16.8 0.8 0.8 0.8 0.9
Honduras 3.360 3.415 3.404 3.486 53.7 53.2 50.9 51.3 5.1 5.1 5.0 5.1
Mexico 2.993 3.071 3.075 3.293 26.1 24.9 23.7 26.3 32.6 31.4 30.3 33.9
Nicaragua 3.191 3.245 3.279 3.335 32.2 34.4 35.5 35.7 2.1 2.2 2.3 2.4
Panama 4.225 4.268 4.382 4.476 21.1 18.5 18.0 18.2 0.9 0.8 0.8 0.8
South America** 3.417 3.431 3.512 3.607 18.4 17.2 17.7 18.4 71.8 68.0 70.5 74.2
Argentina 3.341 n.r. n.r. n.r. 11.0 n.r. n.r. n.r. 4.8 n.r. n.r. n.r.
Bolivia (Plurinational State of)
3.551 3.648 3.769 3.755 30.2 28.6 25.4 24.7 3.4 3.3 2.9 2.9
Brazil 2.809 2.800 2.882 3.084 18.3 17.2 17.5 19.0 38.1 36.0 37.0 40.4
Chile 3.053 3.180 3.213 3.402 3.4 3.3 3.3 3.8 0.6 0.6 0.6 0.7
Colombia 2.863 2.893 2.930 3.065 24.7 24.3 25.3 26.5 12.1 12.1 12.7 13.5
Ecuador 2.788 2.816 2.861 2.928 18.9 19.4 21.1 21.4 3.2 3.3 3.7 3.8
Guyana 4.629 4.742 4.828 4.889 47.8 45.5 42.9 43.0 0.4 0.4 0.3 0.3
Paraguay 3.430 3.511 3.519 3.543 20.1 18.7 17.9 17.8 1.4 1.3 1.3 1.3
Peru 3.084 3.061 3.248 3.285 23.7 20.9 20.6 20.5 7.5 6.7 6.7 6.8
Suriname 4.969 5.223a 5.336 5.739 57.6 55.5 56.1 58.8 0.3 0.3 0.3 0.3
Uruguay 3.073 3.170 3.254 3.414 2.7 2.9 3.2 3.6 0.1 0.1 0.1 0.1
Oceania 2.847 2.846 2.958 3.066 2.5 2.5 2.8 2.7 0.6 0.7 0.7 0.7
Australia 2.259 2.273 2.325 2.561 0.7 0.7 0.7 0.7 0.2 0.2 0.2 0.2
Fiji 3.612 3.677 3.858 3.914 51.5 53.2 60.3 60.4 0.5 0.5 0.5 0.5
New Zealand 2.671 2.589 2.692 2.723 n.a. n.a. n.a. n.a. n.a. n.a. n.a. n.a.
NORTHERN AMERICA AND EUROPE
3.026 3.084 3.091 3.190 2.4 2.0 1.8 1.9 25.0 21.2 18.8 19.8
Northern America 3.386 3.331 3.325 3.336 1.9 1.6 1.4 1.4 6.8 6.0 5.1 5.2
Bermuda 4.072 3.842a 3.788a 3.616a n.a. n.a. n.a. n.a. n.a. n.a. n.a. n.a.
Canada 2.863 2.911 2.918 3.008 0.7 0.7 0.5 0.7 0.3 0.3 0.2 0.3
United States of America 3.225 3.240 3.268 3.383 2.0 1.7 1.5 1.5 6.5 5.7 4.9 4.9
Europe 2.998 3.064 3.072 3.179 2.6 2.2 2.0 2.1 18.3 15.2 13.7 14.6
Albania 3.952 4.051 4.117 4.197 37.8 27.9 19.8 20.1 1.1 0.8 0.6 0.6
Austria 2.772 2.848 2.818 2.981 0.6 0.8 0.8 0.8 0.1 0.1 0.1 0.1
Belarus 3.177 3.228 3.310 3.310 0.8 0.5 0.3 0.2 0.1 0.0 0.0 0.0
Belgium 2.862 2.962 2.943 3.130 0.3 0.2 0.2 0.2 0.0 0.0 0.0 0.0
Bosnia and Herzegovina 3.847 3.890 3.895 3.995 4.6 4.0 3.6 3.7 0.2 0.1 0.1 0.1
Bulgaria 3.780 3.859 3.896 4.108 11.3 9.0 8.0 8.5 0.8 0.6 0.6 0.6
Croatia 4.168 4.202 4.111 4.277 7.2 4.7 3.6 3.8 0.3 0.2 0.1 0.2
Czechia 2.899 2.921 2.919 2.966 0.4 0.2 0.2 0.2 0.0 0.0 0.0 0.0
Denmark 2.376 2.440 2.432 2.544 0.2 0.2 0.4 0.4 0.0 0.0 0.0 0.0
Estonia 3.125 3.188 3.170 3.308 1.0 0.8 1.2 1.3 0.0 0.0 0.0 0.0
Finland 2.545 2.624 2.611 2.712 0.1 0.2 0.1 0.1 0.0 0.0 0.0 0.0
France 2.936 3.019 3.067 3.219 0.1 0.1 0.1 0.1 0.0 0.1 0.1 0.1
Germany 2.786 2.917 2.881 3.025 0.2 0.2 0.2 0.2 0.2 0.2 0.2 0.2
Greece 3.037 3.102 3.065 3.130 4.3 2.7 3.1 3.2 0.5 0.3 0.3 0.3
Hungary 3.302 3.383 3.368 3.488 3.3 2.3 1.9 2.0 0.3 0.2 0.2 0.2
Iceland 2.213 2.247 2.234 2.414 0.0 0.0 0.0 0.0 0.0 0.0 0.0 0.0
TABLE A3.1 (Continued)
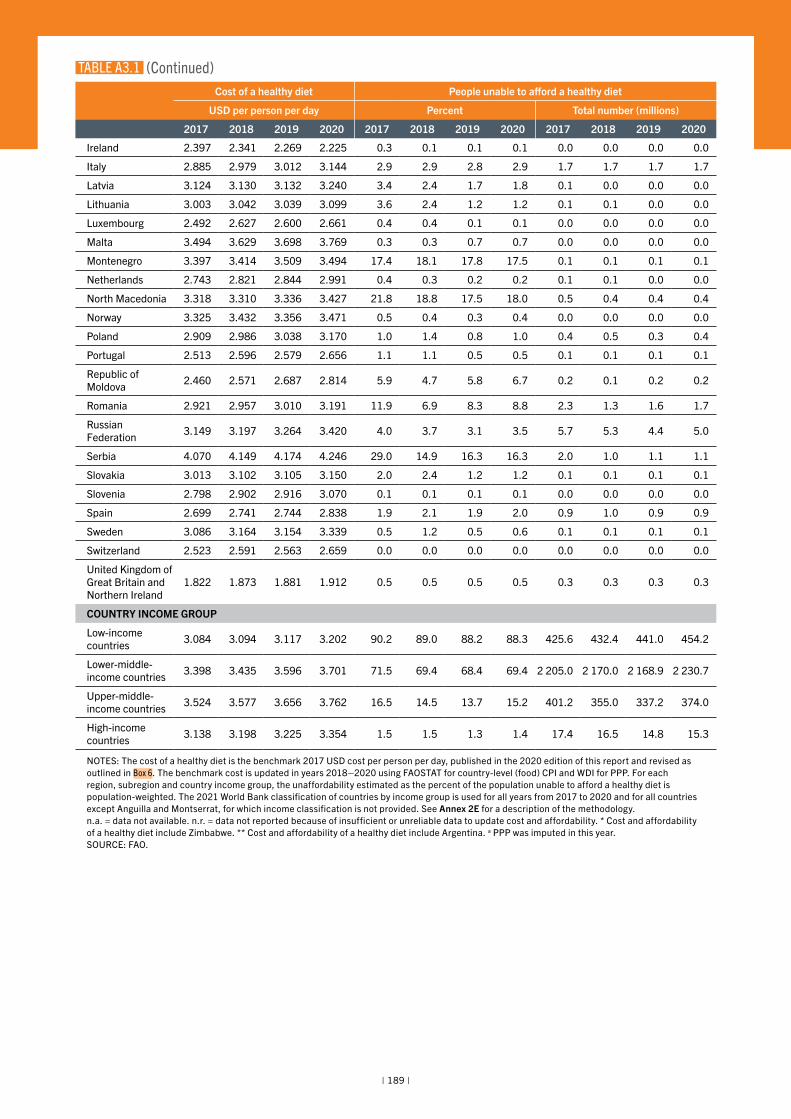
THE STATE OF FOOD SECURITY AND NUTRITION IN THE WORLD 2022
| 189 |
Cost of a healthy diet People unable to afford a healthy diet
USD per person per day Percent Total number (millions)
2017 2018 2019 2020 2017 2018 2019 2020 2017 2018 2019 2020
Ireland 2.397 2.341 2.269 2.225 0.3 0.1 0.1 0.1 0.0 0.0 0.0 0.0
Italy 2.885 2.979 3.012 3.144 2.9 2.9 2.8 2.9 1.7 1.7 1.7 1.7
Latvia 3.124 3.130 3.132 3.240 3.4 2.4 1.7 1.8 0.1 0.0 0.0 0.0
Lithuania 3.003 3.042 3.039 3.099 3.6 2.4 1.2 1.2 0.1 0.1 0.0 0.0
Luxembourg 2.492 2.627 2.600 2.661 0.4 0.4 0.1 0.1 0.0 0.0 0.0 0.0
Malta 3.494 3.629 3.698 3.769 0.3 0.3 0.7 0.7 0.0 0.0 0.0 0.0
Montenegro 3.397 3.414 3.509 3.494 17.4 18.1 17.8 17.5 0.1 0.1 0.1 0.1
Netherlands 2.743 2.821 2.844 2.991 0.4 0.3 0.2 0.2 0.1 0.1 0.0 0.0
North Macedonia 3.318 3.310 3.336 3.427 21.8 18.8 17.5 18.0 0.5 0.4 0.4 0.4
Norway 3.325 3.432 3.356 3.471 0.5 0.4 0.3 0.4 0.0 0.0 0.0 0.0
Poland 2.909 2.986 3.038 3.170 1.0 1.4 0.8 1.0 0.4 0.5 0.3 0.4
Portugal 2.513 2.596 2.579 2.656 1.1 1.1 0.5 0.5 0.1 0.1 0.1 0.1
Republic of Moldova 2.460 2.571 2.687 2.814 5.9 4.7 5.8 6.7 0.2 0.1 0.2 0.2
Romania 2.921 2.957 3.010 3.191 11.9 6.9 8.3 8.8 2.3 1.3 1.6 1.7
Russian Federation 3.149 3.197 3.264 3.420 4.0 3.7 3.1 3.5 5.7 5.3 4.4 5.0
Serbia 4.070 4.149 4.174 4.246 29.0 14.9 16.3 16.3 2.0 1.0 1.1 1.1
Slovakia 3.013 3.102 3.105 3.150 2.0 2.4 1.2 1.2 0.1 0.1 0.1 0.1
Slovenia 2.798 2.902 2.916 3.070 0.1 0.1 0.1 0.1 0.0 0.0 0.0 0.0
Spain 2.699 2.741 2.744 2.838 1.9 2.1 1.9 2.0 0.9 1.0 0.9 0.9
Sweden 3.086 3.164 3.154 3.339 0.5 1.2 0.5 0.6 0.1 0.1 0.1 0.1
Switzerland 2.523 2.591 2.563 2.659 0.0 0.0 0.0 0.0 0.0 0.0 0.0 0.0
United Kingdom of Great Britain and Northern Ireland
1.822 1.873 1.881 1.912 0.5 0.5 0.5 0.5 0.3 0.3 0.3 0.3
COUNTRY INCOME GROUP
Low-income countries 3.084 3.094 3.117 3.202 90.2 89.0 88.2 88.3 425.6 432.4 441.0 454.2
Lower-middle-income countries 3.398 3.435 3.596 3.701 71.5 69.4 68.4 69.4 2 205.0 2 170.0 2 168.9 2 230.7
Upper-middle-income countries 3.524 3.577 3.656 3.762 16.5 14.5 13.7 15.2 401.2 355.0 337.2 374.0
High-income countries 3.138 3.198 3.225 3.354 1.5 1.5 1.3 1.4 17.4 16.5 14.8 15.3
NOTES: The cost of a healthy diet is the benchmark 2017 USD cost per person per day, published in the 2020 edition of this report and revised as outlined in Box 6. The benchmark cost is updated in years 2018–2020 using FAOSTAT for country-level (food) CPI and WDI for PPP. For each region, subregion and country income group, the unaffordability estimated as the percent of the population unable to afford a healthy diet is population-weighted. The 2021 World Bank classification of countries by income group is used for all years from 2017 to 2020 and for all countries except Anguilla and Montserrat, for which income classification is not provided. See Annex 2E for a description of the methodology.n.a. = data not available. n.r. = data not reported because of insufficient or unreliable data to update cost and affordability. * Cost and affordability of a healthy diet include Zimbabwe. ** Cost and affordability of a healthy diet include Argentina. a PPP was imputed in this year.SOURCE: FAO.
TABLE A3.1 (Continued)
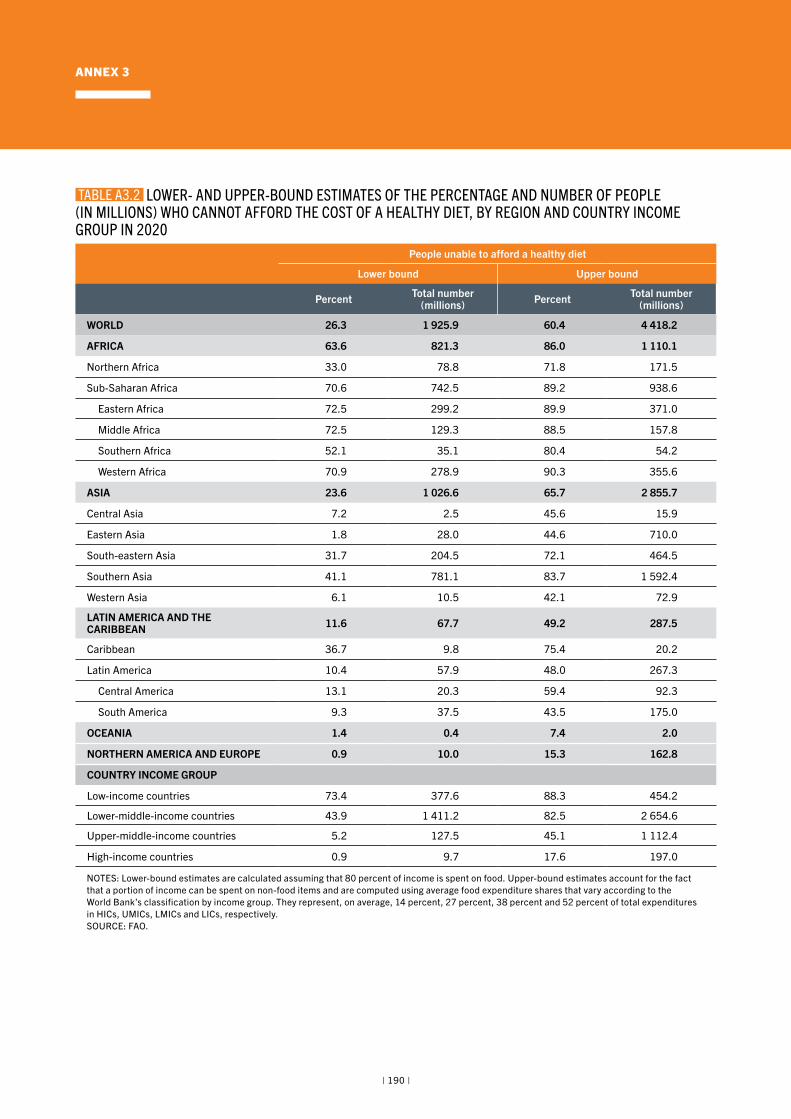
ANNEX 3
| 190 |
People unable to afford a healthy diet
Lower bound Upper bound
Percent Total number (millions) Percent Total number
(millions)
WORLD 26.3 1 925.9 60.4 4 418.2
AFRICA 63.6 821.3 86.0 1 110.1
Northern Africa 33.0 78.8 71.8 171.5
Sub-Saharan Africa 70.6 742.5 89.2 938.6
Eastern Africa 72.5 299.2 89.9 371.0
Middle Africa 72.5 129.3 88.5 157.8
Southern Africa 52.1 35.1 80.4 54.2
Western Africa 70.9 278.9 90.3 355.6
ASIA 23.6 1 026.6 65.7 2 855.7
Central Asia 7.2 2.5 45.6 15.9
Eastern Asia 1.8 28.0 44.6 710.0
South-eastern Asia 31.7 204.5 72.1 464.5
Southern Asia 41.1 781.1 83.7 1 592.4
Western Asia 6.1 10.5 42.1 72.9
LATIN AMERICA AND THE CARIBBEAN 11.6 67.7 49.2 287.5
Caribbean 36.7 9.8 75.4 20.2
Latin America 10.4 57.9 48.0 267.3
Central America 13.1 20.3 59.4 92.3
South America 9.3 37.5 43.5 175.0
OCEANIA 1.4 0.4 7.4 2.0
NORTHERN AMERICA AND EUROPE 0.9 10.0 15.3 162.8
COUNTRY INCOME GROUP
Low-income countries 73.4 377.6 88.3 454.2
Lower-middle-income countries 43.9 1 411.2 82.5 2 654.6
Upper-middle-income countries 5.2 127.5 45.1 1 112.4
High-income countries 0.9 9.7 17.6 197.0
NOTES: Lower-bound estimates are calculated assuming that 80 percent of income is spent on food. Upper-bound estimates account for the fact that a portion of income can be spent on non-food items and are computed using average food expenditure shares that vary according to the World Bank’s classification by income group. They represent, on average, 14 percent, 27 percent, 38 percent and 52 percent of total expenditures in HICs, UMICs, LMICs and LICs, respectively.SOURCE: FAO.
TABLE A3.2 LOWER- AND UPPER-BOUND ESTIMATES OF THE PERCENTAGE AND NUMBER OF PEOPLE (IN MILLIONS) WHO CANNOT AFFORD THE COST OF A HEALTHY DIET, BY REGION AND COUNTRY INCOME GROUP IN 2020
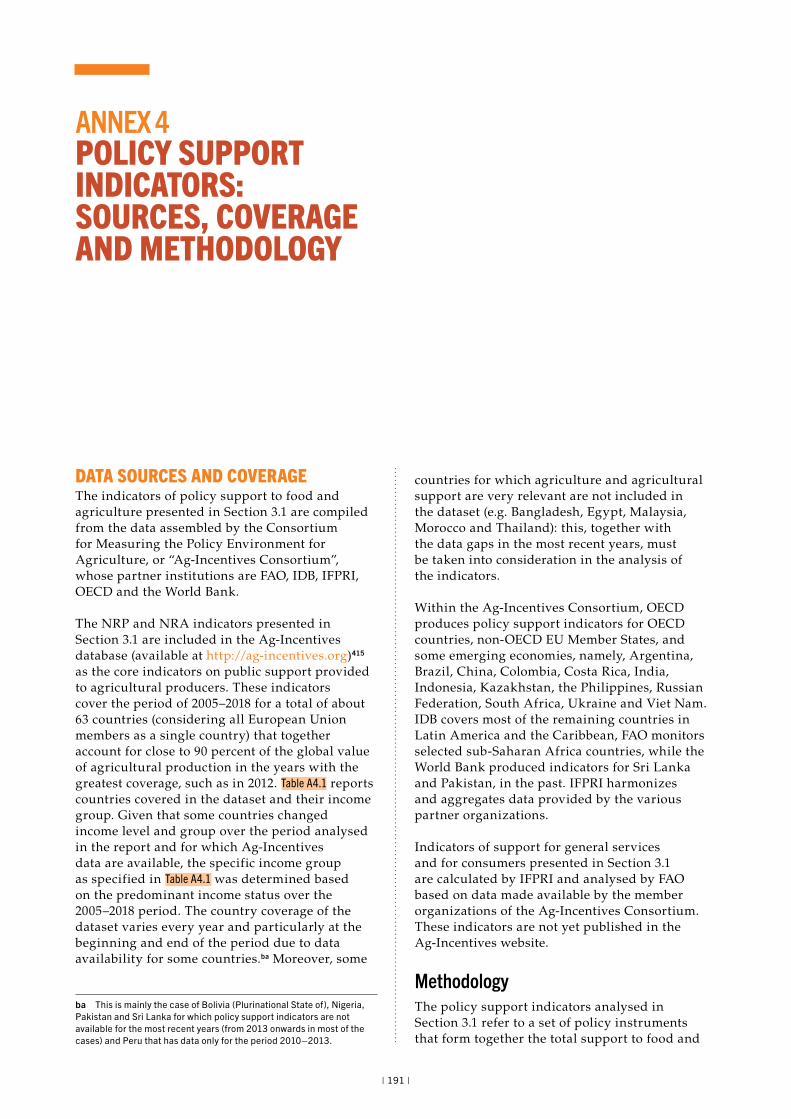
| 191 |
DATA SOURCES AND COVERAGEThe indicators of policy support to food and agriculture presented in Section 3.1 are compiled from the data assembled by the Consortium for Measuring the Policy Environment for Agriculture, or “Ag-Incentives Consortium”, whose partner institutions are FAO, IDB, IFPRI, OECD and the World Bank.
The NRP and NRA indicators presented in Section 3.1 are included in the Ag-Incentives database (available at http://ag-incentives.org)415 as the core indicators on public support provided to agricultural producers. These indicators cover the period of 2005–2018 for a total of about 63 countries (considering all European Union members as a single country) that together account for close to 90 percent of the global value of agricultural production in the years with the greatest coverage, such as in 2012. Table A4.1 reports countries covered in the dataset and their income group. Given that some countries changed income level and group over the period analysed in the report and for which Ag-Incentives data are available, the specific income group as specified in Table A4.1 was determined based on the predominant income status over the 2005–2018 period. The country coverage of the dataset varies every year and particularly at the beginning and end of the period due to data availability for some countries.ba Moreover, some
ba This is mainly the case of Bolivia (Plurinational State of), Nigeria, Pakistan and Sri Lanka for which policy support indicators are not available for the most recent years (from 2013 onwards in most of the cases) and Peru that has data only for the period 2010–2013.
ANNEX 4 POLICY SUPPORT INDICATORS: SOURCES, COVERAGE AND METHODOLOGY
countries for which agriculture and agricultural support are very relevant are not included in the dataset (e.g. Bangladesh, Egypt, Malaysia, Morocco and Thailand): this, together with the data gaps in the most recent years, must be taken into consideration in the analysis of the indicators.
Within the Ag-Incentives Consortium, OECD produces policy support indicators for OECD countries, non-OECD EU Member States, and some emerging economies, namely, Argentina, Brazil, China, Colombia, Costa Rica, India, Indonesia, Kazakhstan, the Philippines, Russian Federation, South Africa, Ukraine and Viet Nam. IDB covers most of the remaining countries in Latin America and the Caribbean, FAO monitors selected sub-Saharan Africa countries, while the World Bank produced indicators for Sri Lanka and Pakistan, in the past. IFPRI harmonizes and aggregates data provided by the various partner organizations.
Indicators of support for general services and for consumers presented in Section 3.1 are calculated by IFPRI and analysed by FAO based on data made available by the member organizations of the Ag-Incentives Consortium. These indicators are not yet published in the Ag-Incentives website.
MethodologyThe policy support indicators analysed in Section 3.1 refer to a set of policy instruments that form together the total support to food and
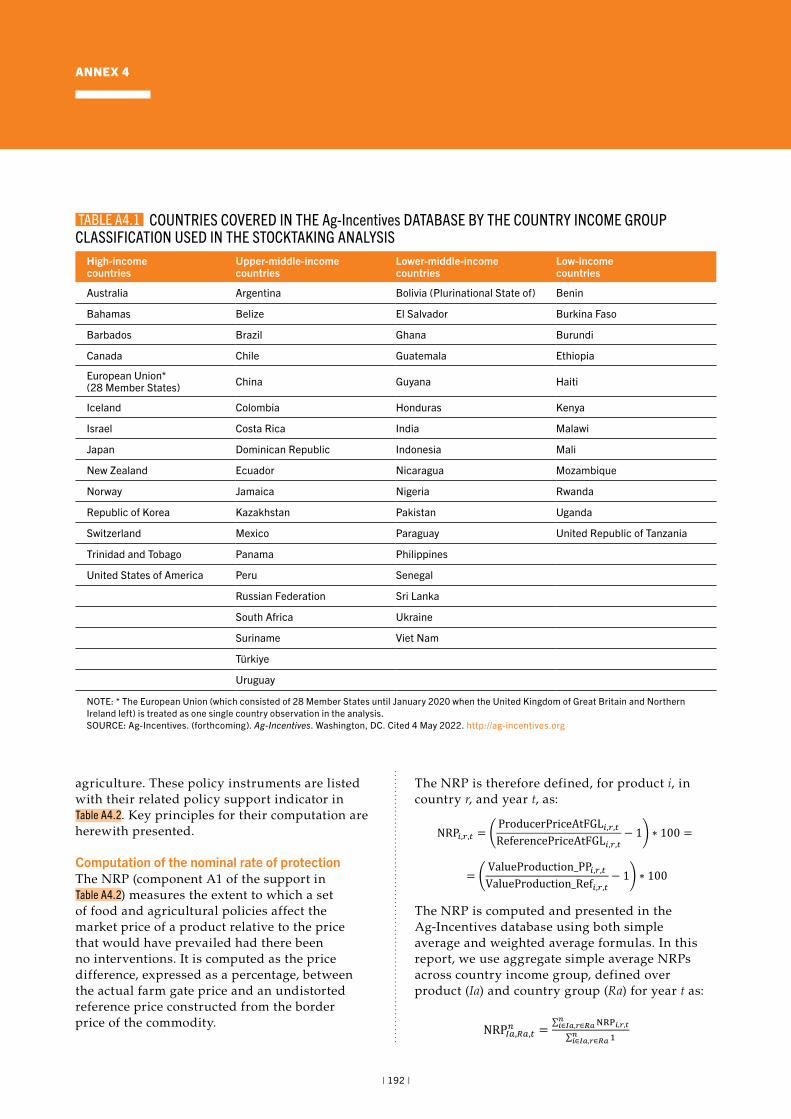
ANNEX 4
| 192 |
agriculture. These policy instruments are listed with their related policy support indicator in Table A4.2. Key principles for their computation are herewith presented.
Computation of the nominal rate of protectionThe NRP (component A1 of the support in Table A4.2) measures the extent to which a set of food and agricultural policies affect the market price of a product relative to the price that would have prevailed had there been no interventions. It is computed as the price difference, expressed as a percentage, between the actual farm gate price and an undistorted reference price constructed from the border price of the commodity.
The NRP is therefore defined, for product i, in country r, and year t, as:
NRP!,#,$ = %ProducerPriceAtFGL!,#,$ReferencePriceAtFGL!,#,$
− 16 ∗ 100 = %ValueProduction_PP!,#,$ValueProduction_Ref!,#,$
− 16 ∗ 100
NRP%&,'&,$( =∑ *+,!,#,$%!∈'(,#∈)(∑ -%!∈'(,#∈)(
NRA"$/$&0",#,$ = %∑ X1,!,#,$(1∈3,!
∑ ValueProduction+45!,#,$(!
6 ∗ 100
NRA!,#,$ = %A1!,#,$ + ∑ X6,!,#,$(
6∈7,
ValueProduction+45!,#,$6 ∗ 100 = NRP!,#,$ +
∑ X6,!,#,$(6∈7,
ValueProductio𝑛𝑛+45𝒊𝒊,𝒓𝒓,𝒕𝒕∗ 100
The NRP is computed and presented in the Ag-Incentives database using both simple average and weighted average formulas. In this report, we use aggregate simple average NRPs across country income group, defined over product (Ia) and country group (Ra) for year t as:
NRP!,#,$ = %ProducerPriceAtFGL!,#,$ReferencePriceAtFGL!,#,$
− 16 ∗ 100 = %ValueProduction_PP!,#,$ValueProduction_Ref!,#,$
− 16 ∗ 100
NRP%&,'&,$( =∑ *+,!,#,$%!∈'(,#∈)(∑ -%!∈'(,#∈)(
NRA"$/$&0",#,$ = %∑ X1,!,#,$(1∈3,!
∑ ValueProduction+45!,#,$(!
6 ∗ 100
NRA!,#,$ = %A1!,#,$ + ∑ X6,!,#,$(
6∈7,
ValueProduction+45!,#,$6 ∗ 100 = NRP!,#,$ +
∑ X6,!,#,$(6∈7,
ValueProductio𝑛𝑛+45𝒊𝒊,𝒓𝒓,𝒕𝒕∗ 100
High-income countries
Upper-middle-income countries
Lower-middle-income countries
Low-income countries
Australia Argentina Bolivia (Plurinational State of) Benin
Bahamas Belize El Salvador Burkina Faso
Barbados Brazil Ghana Burundi
Canada Chile Guatemala Ethiopia
European Union* (28 Member States) China Guyana Haiti
Iceland Colombia Honduras Kenya
Israel Costa Rica India Malawi
Japan Dominican Republic Indonesia Mali
New Zealand Ecuador Nicaragua Mozambique
Norway Jamaica Nigeria Rwanda
Republic of Korea Kazakhstan Pakistan Uganda
Switzerland Mexico Paraguay United Republic of Tanzania
Trinidad and Tobago Panama Philippines
United States of America Peru Senegal
Russian Federation Sri Lanka
South Africa Ukraine
Suriname Viet Nam
Türkiye
Uruguay
NOTE: * The European Union (which consisted of 28 Member States until January 2020 when the United Kingdom of Great Britain and Northern Ireland left) is treated as one single country observation in the analysis. SOURCE: Ag-Incentives. (forthcoming). Ag-Incentives. Washington, DC. Cited 4 May 2022. http://ag-incentives.org
TABLE A4.1 COUNTRIES COVERED IN THE Ag-Incentives DATABASE BY THE COUNTRY INCOME GROUP CLASSIFICATION USED IN THE STOCKTAKING ANALYSIS
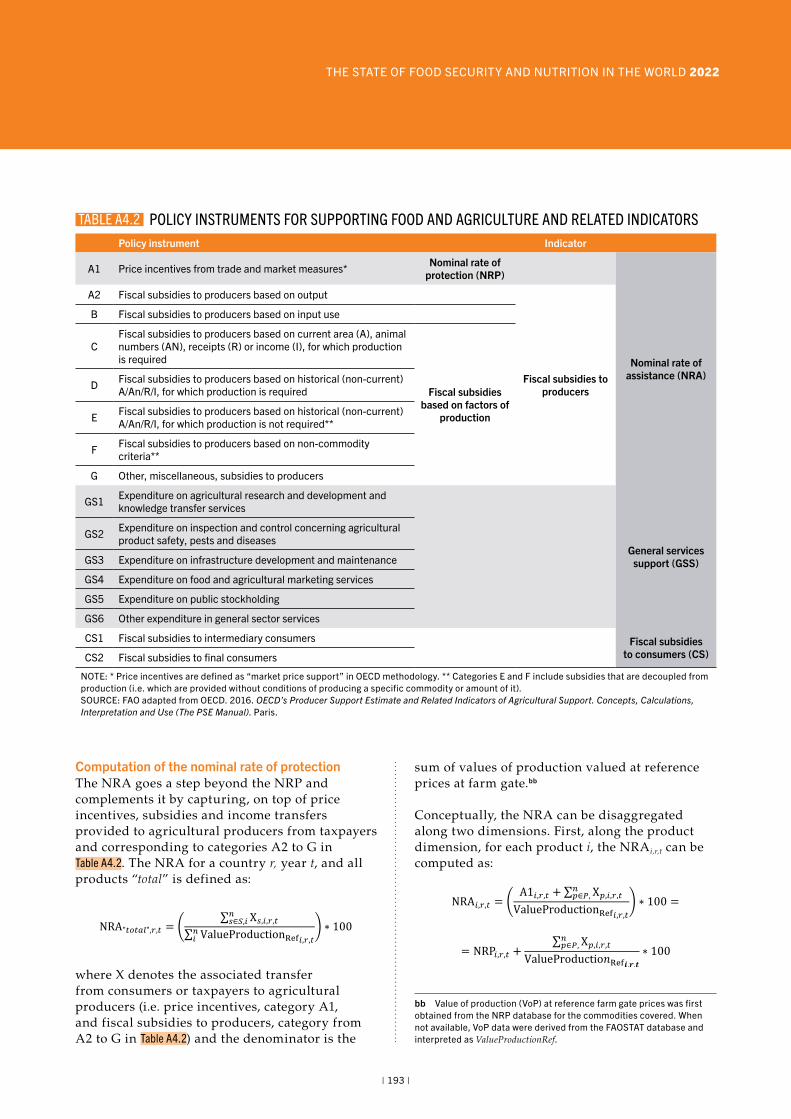
THE STATE OF FOOD SECURITY AND NUTRITION IN THE WORLD 2022
| 193 |
Computation of the nominal rate of protectionThe NRA goes a step beyond the NRP and complements it by capturing, on top of price incentives, subsidies and income transfers provided to agricultural producers from taxpayers and corresponding to categories A2 to G in Table A4.2. The NRA for a country r, year t, and all products “total” is defined as:
NRP!,#,$ = %ProducerPriceAtFGL!,#,$ReferencePriceAtFGL!,#,$
− 16 ∗ 100 = %ValueProduction_PP!,#,$ValueProduction_Ref!,#,$
− 16 ∗ 100
NRP%&,'&,$( =∑ *+,!,#,$%!∈'(,#∈)(∑ -%!∈'(,#∈)(
NRA"$/$&0",#,$ = %∑ X1,!,#,$(1∈3,!
∑ ValueProduction+45!,#,$(!
6 ∗ 100
NRA!,#,$ = %A1!,#,$ + ∑ X6,!,#,$(
6∈7,
ValueProduction+45!,#,$6 ∗ 100 = NRP!,#,$ +
∑ X6,!,#,$(6∈7,
ValueProductio𝑛𝑛+45𝒊𝒊,𝒓𝒓,𝒕𝒕∗ 100
where X denotes the associated transfer from consumers or taxpayers to agricultural producers (i.e. price incentives, category A1, and fiscal subsidies to producers, category from A2 to G in Table A4.2) and the denominator is the
sum of values of production valued at reference prices at farm gate.bb
Conceptually, the NRA can be disaggregated along two dimensions. First, along the product dimension, for each product i, the NRAi,r,t can be computed as:
NRP!,#,$ = %ProducerPriceAtFGL!,#,$ReferencePriceAtFGL!,#,$
− 16 ∗ 100 = %ValueProduction_PP!,#,$ValueProduction_Ref!,#,$
− 16 ∗ 100
NRP%&,'&,$( =∑ *+,!,#,$%!∈'(,#∈)(∑ -%!∈'(,#∈)(
NRA"$/$&0",#,$ = %∑ X1,!,#,$(1∈3,!
∑ ValueProduction+45!,#,$(!
6 ∗ 100
NRA!,#,$ = %A1!,#,$ + ∑ X6,!,#,$(
6∈7,
ValueProduction+45!,#,$6 ∗ 100 = NRP!,#,$ +
∑ X6,!,#,$(6∈7,
ValueProductio𝑛𝑛+45𝒊𝒊,𝒓𝒓,𝒕𝒕∗ 100
bb Value of production (VoP) at reference farm gate prices was first obtained from the NRP database for the commodities covered. When not available, VoP data were derived from the FAOSTAT database and interpreted as ValueProductionRef.
Policy instrument Indicator
A1 Price incentives from trade and market measures* Nominal rate of protection (NRP)
Nominal rate of assistance (NRA)
A2 Fiscal subsidies to producers based on output
Fiscal subsidies to producers
B Fiscal subsidies to producers based on input use
CFiscal subsidies to producers based on current area (A), animal numbers (AN), receipts (R) or income (I), for which production is required
Fiscal subsidies based on factors of
production
D Fiscal subsidies to producers based on historical (non-current) A/An/R/I, for which production is required
E Fiscal subsidies to producers based on historical (non-current) A/An/R/I, for which production is not required**
F Fiscal subsidies to producers based on non-commodity criteria**
G Other, miscellaneous, subsidies to producers
GS1 Expenditure on agricultural research and development and knowledge transfer services
General services support (GSS)
GS2 Expenditure on inspection and control concerning agricultural product safety, pests and diseases
GS3 Expenditure on infrastructure development and maintenance
GS4 Expenditure on food and agricultural marketing services
GS5 Expenditure on public stockholding
GS6 Other expenditure in general sector services
CS1 Fiscal subsidies to intermediary consumers Fiscal subsidies to consumers (CS)CS2 Fiscal subsidies to final consumers
NOTE: * Price incentives are defined as “market price support” in OECD methodology. ** Categories E and F include subsidies that are decoupled from production (i.e. which are provided without conditions of producing a specific commodity or amount of it). SOURCE: FAO adapted from OECD. 2016. OECD’s Producer Support Estimate and Related Indicators of Agricultural Support. Concepts, Calculations, Interpretation and Use (The PSE Manual). Paris.
TABLE A4.2 POLICY INSTRUMENTS FOR SUPPORTING FOOD AND AGRICULTURE AND RELATED INDICATORS
ANNEX 4
| 194 |
Second, along the policy dimension, the NRA can be disaggregated by type of policy support, and therefore by support provided by trade and market measures (captured by the NRP), by fiscal subsidies linked to output (A2 category), to inputs (B category), and to other factors of production (C, D, E, F and G).bc
For computation of the NRA, the various datasets provided by Ag-Incentives Consortium partner institutions have been reconciled to the OECD methodological framework in order to ensure no omission of data and no double counting. To obtain the same “scope” for fiscal subsidies and price incentives, an NRA indicator was constructed also for “non-NRP commodities”, i.e. those not targeted by trade and market measures that generate price incentives and for which an NRP was not available in the dataset. For the NRP computed at the country level, this is equivalent to considering that non-NRP commodities have the same NRP as NRP commodities; across countries, the average for NRP commodities is used to compute support on non-NRP commodities.bd
The NRA by food group presented in Section 3.1 in Figure 21 was computed accounting also for non-product-specific subsidies, which are those that target a broader food group (e.g. crops or livestock products) or the agricultural sector as a whole. These are allocated at the food group level based on the share in value of production in the relevant aggregate (e.g. share of wheat in staple foods’ value of production for subsidies going to all cereals, or share of wheat in total value of production for subsidies going to all agricultural commodities).
bc The NRA is conceptually very similar to the OECD Producer Support Estimate (PSE), with two differences: i) valuation of the price support component of NRA through the use of the NRP differs from the “market price support” concept used by OECD as it does not include other levies and it is not corrected for Excessive Feed Cost; and ii) the denominator used in most OECD indicators expressed in percentage is the gross farm income, i.e. value production at farm gate price, so including distortions. At the opposite, in Ag-Incentives, the “undistorted” reference price is used to value production.
bd This assumption of filling data gaps by using the average NRP for NRP-commodities to compute support on non-NRP commodities across countries diverges from the data currently published in the Ag-Incentives database, where no data gap filling assumption is applied.
Computation of general services supportThe GSS indicator measures monetary transfers (i.e. public expenditure) provided through policies and programmes that target agricultural producers collectively, rather than individually. These policies create enabling conditions for the primary agricultural sector through the development of private and public services, institutions and infrastructure regardless of their objectives and impact on farm production and income, or consumption of food and agricultural products. As such, GSS does not directly alter producer receipts or costs, or consumption expenditures.55
As reported in Table A4.2, GSS is broadly categorized into six subcategories (GS1 to GS6), which add up in the final aggregate GSS estimate compiled for all years available based on the data provided by the various Ag-Incentives Consortium partners. GSS indicators are provided in monetary value (USD) and as a share of value of production by country and by income group.
Computation of subsidies to consumerThe indicator of subsidies to consumers (CS) measures annual budgetary transfers from taxpayers to consumers of agricultural commodities. These transfers (or public expenditure) are provided to: i) intermediary consumers of food (processors, millers, etc.) as a means of compensating them for the higher prices they pay for agricultural products that result from policies that support producer prices (category CS1 in Table A4.2), or ii) final consumers to improve access to food via increased income (e.g. cash transfers) or in-kind food transfers (category CS2 in Table A4.2).
Subsidies to consumers were compiled and harmonized from the data provided by the various Ag-Incentives Consortium partners. CS indicator is provided in monetary terms (USD) and as share of value of production by country and by income group. n
| 195 |
For this analysis, data on “effectively applied tariffs” were taken from UNCTAD-TRAINS as hosted in the World Bank’s WITS database (2021).416 The data include Ad Valorem Equivalents for “specific tariffs” which are levied as fixed monetary amounts per imported quantity unit. The “effectively applied tariff” is the lowest duty that a country might apply to a specific imported product from a specific origin country after considering all preferential trade arrangements or trade agreements with that origin country, in addition to the country’s Most Favored Nation (MFN) tariffs (or simply “tariffs” in case the importing country is not a WTO member). To reflect that some product/country-of-origin combinations matter more in a country’s import basket than others, the “effectively applied tariffs” for product/country-of-origin combinations are weighted by their corresponding import value. The resulting import-value weighted tariff corresponds to the average tariff a country levies on the import value of an item within a food group. Finally, country-level tariff means per food group are averaged across countries included in the four income groups as defined by the World Bank.bf
� Highly processed foods are foods that have undergone multiple stages of processing and that are rich in sugars, salt, oil, or fats or in substances like high fructose corn syrup.417 Excessive consumption of these foods has been found to have detrimental impacts on human health.418,419 To identify these Foods in the tariff data, the analysis employs a mapping provided in Boysen et al. (2019),97 where products included under group four of the NOVA classification developed by Monteiro et al. (2019)417 are matched to individual food items in the Harmonized System at the 6-digit level of the HS. Group 4 in the NOVA classification encompasses products that are
be Products are identified through the Harmonized System (HS) nomenclature, see WCO (2022)448 for explanations.
bf See World Bank (2022)33 for identification.
ANNEX 5TARIFF DATA AND FOOD GROUP DEFINITIONSbe
identified as “ultra-processed” and include, for example, “(…) pre-prepared ready-to-heat products including pies and pasta and pizza dishes; poultry and fish ‘nuggets’ and ‘sticks’, sausages, burgers, hot dogs, and other reconstituted meat products; and powdered and packaged ‘instant’ soups, noodles, and desserts”.417
� Sugar and confectionary have received considerable policy attention due to potential ramifications for public health, and WHO suggests limiting intakes of free sugars.30 To curb their consumption, many governments have introduced nutrition-based taxes sometimes explicitly targeting imported foods.98 These products are identified through the HS headings 1701 and 1702, capturing sugar for various uses, as well as 1703 (“Molasses”). Additionally, products under heading 1704 are included, covering sugar confectionary and candy.
� Fruits and vegetables, by contrast, are a major source of dietary fibre, essential vitamins and minerals. Evidence suggests that consumption can reduce risk of some types of cancer and cardiovascular disease and prevent weight gain and FAO/WHO recommend consumption of at least 400 g of fruits and vegetables per day (excluding starch roots and tubers).93,420,421,422 Fruits and Vegetables are identified in the tariff data as HS2 chapters seven and eight, which are “Edible vegetables and certain roots and tubers” and “Edible fruits and nuts; peel of citrus or melons”, respectively. From these chapters the HS4 headings covering nuts (0801 and 0802) as well as dried leguminous vegetables (0713) and starchy roots and tubers such as potatoes (0714) are dropped, since they are not considered “Vegetables” as per the definition used for the report at hand (see Box 10, footnote 2).
� Food and beverages are identified through all HS6 codes subsumed under Category 1 of the United Nations Broad Economic Categories (Rev. 4): “Food and Beverages”. To this, the commodities included under HS headings 1004 (“Oats”) and HS heading 1005 (“Maize”) are added. n
| 196 |
Methodology and country groupsThe analysis of Section 4.1 uses the MIRAGRODEP CGE model – a global simulation model capturing multiple regions, sectors and international economic linkages. A full description of the MIRAGRODEP model, how it was expanded for this report and the data used are found in the background paper to this report.230 The classification of countries by income group is reported in Table A6.1 following the World Bank classification of countries by income level for 2021.33 It should be noted that the list of countries in Table A6.1 differs from the list provided in Table A4.1. In Section 4.1, the 2021 income classification is used as the analysis of policy scenarios focuses on recent years, from 2017 up to 2030. On the contrary, Section 3.1 takes a historical perspective on stocktaking of policy support, so it uses the most frequent income group category over the 2005–2018 period for each country.
The “Americas” region in Tables 8–13 of Section 4.1 includes HICs in Latin America and the Caribbean (Chile, Panama, Trinidad and Tobago, and Uruguay), plus Canada and the United States of America. Latin America and the Caribbean includes all countries in this region except HICs which are included in the group Americas.
ANNEX 6 RESULTS FROM SELECTED GLOBAL MODEL-BASED SCENARIOS
Results from removing support Results from two scenarios whereby support to agriculture is partially removed from the baseline scenario help reinforce the case for not eliminating such support. The discussion of the results of these two scenarios is presented in Section 4.1 of the report.
Results from fairly reallocating fiscal subsidies to producers An alternative scenario measures what would happen if, instead of repurposing public support to agricultural producers to specifically support healthy diets, governments more fairly distribute fiscal subsidies to producers. More specifically, fiscal subsidies at the aggregate level would not be affected, but all commodities would receive the similar same level of support on a percent of value of production (VoP) basis. The biases of the model-based baseline scenario are removed. No changes to border measures or support through general government services are applied. The results are presented below and are discussed in Section 4.1 of the report. n
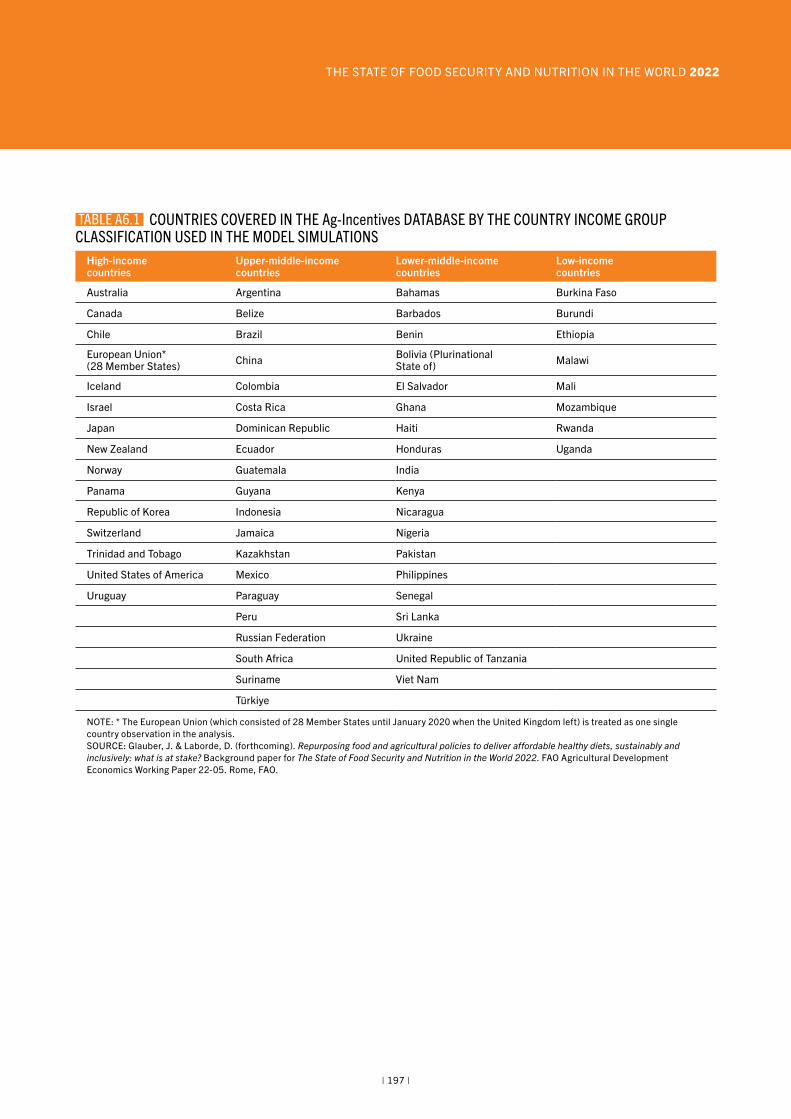
THE STATE OF FOOD SECURITY AND NUTRITION IN THE WORLD 2022
| 197 |
High-income countries
Upper-middle-income countries
Lower-middle-income countries
Low-income countries
Australia Argentina Bahamas Burkina Faso
Canada Belize Barbados Burundi
Chile Brazil Benin Ethiopia
European Union* (28 Member States) China Bolivia (Plurinational
State of) Malawi
Iceland Colombia El Salvador Mali
Israel Costa Rica Ghana Mozambique
Japan Dominican Republic Haiti Rwanda
New Zealand Ecuador Honduras Uganda
Norway Guatemala India
Panama Guyana Kenya
Republic of Korea Indonesia Nicaragua
Switzerland Jamaica Nigeria
Trinidad and Tobago Kazakhstan Pakistan
United States of America Mexico Philippines
Uruguay Paraguay Senegal
Peru Sri Lanka
Russian Federation Ukraine
South Africa United Republic of Tanzania
Suriname Viet Nam
Türkiye
NOTE: * The European Union (which consisted of 28 Member States until January 2020 when the United Kingdom left) is treated as one single country observation in the analysis. SOURCE: Glauber, J. & Laborde, D. (forthcoming). Repurposing food and agricultural policies to deliver affordable healthy diets, sustainably and inclusively: what is at stake? Background paper for The State of Food Security and Nutrition in the World 2022. FAO Agricultural Development Economics Working Paper 22-05. Rome, FAO.
TABLE A6.1 COUNTRIES COVERED IN THE Ag-Incentives DATABASE BY THE COUNTRY INCOME GROUP CLASSIFICATION USED IN THE MODEL SIMULATIONS
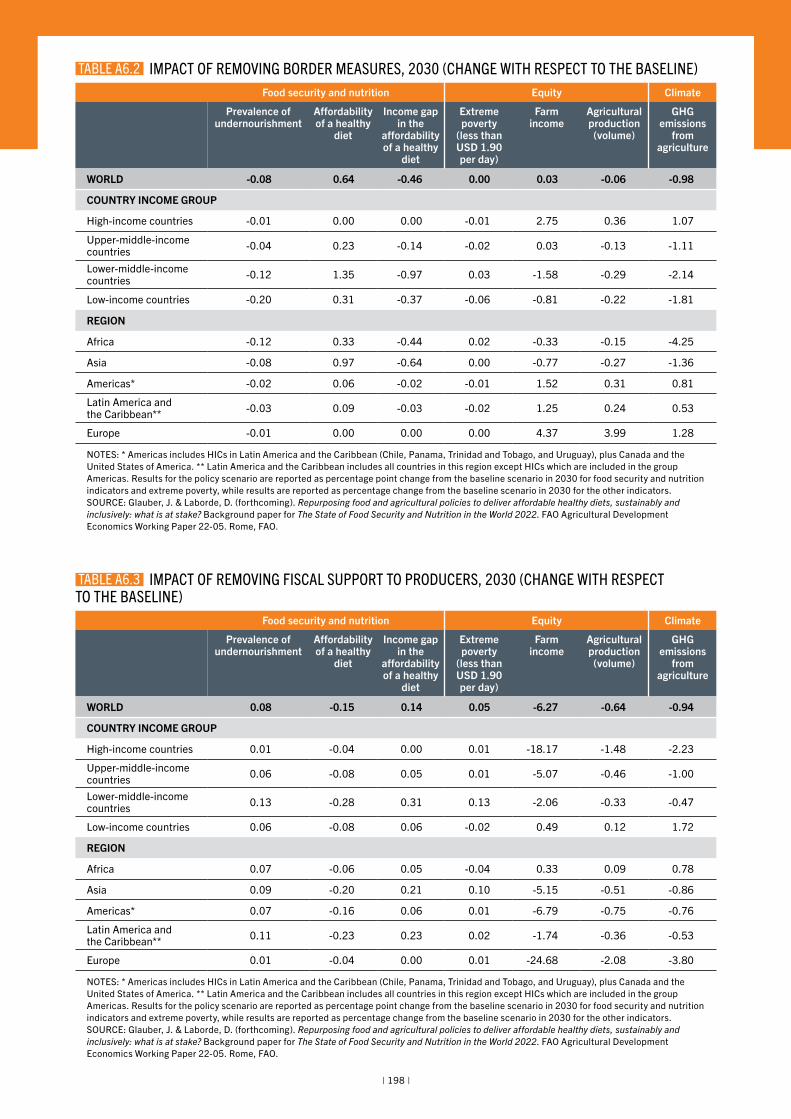
| 198 |
Food security and nutrition Equity Climate
Prevalence of undernourishment
Affordability of a healthy
diet
Income gap in the
affordability of a healthy
diet
Extreme poverty
(less than USD 1.90 per day)
Farm income
Agricultural production
(volume)
GHG emissions
from agriculture
WORLD -0.08 0.64 -0.46 0.00 0.03 -0.06 -0.98
COUNTRY INCOME GROUP
High-income countries -0.01 0.00 0.00 -0.01 2.75 0.36 1.07
Upper-middle-income countries -0.04 0.23 -0.14 -0.02 0.03 -0.13 -1.11
Lower-middle-income countries -0.12 1.35 -0.97 0.03 -1.58 -0.29 -2.14
Low-income countries -0.20 0.31 -0.37 -0.06 -0.81 -0.22 -1.81
REGION
Africa -0.12 0.33 -0.44 0.02 -0.33 -0.15 -4.25
Asia -0.08 0.97 -0.64 0.00 -0.77 -0.27 -1.36
Americas* -0.02 0.06 -0.02 -0.01 1.52 0.31 0.81
Latin America and the Caribbean** -0.03 0.09 -0.03 -0.02 1.25 0.24 0.53
Europe -0.01 0.00 0.00 0.00 4.37 3.99 1.28
NOTES: * Americas includes HICs in Latin America and the Caribbean (Chile, Panama, Trinidad and Tobago, and Uruguay), plus Canada and the United States of America. ** Latin America and the Caribbean includes all countries in this region except HICs which are included in the group Americas. Results for the policy scenario are reported as percentage point change from the baseline scenario in 2030 for food security and nutrition indicators and extreme poverty, while results are reported as percentage change from the baseline scenario in 2030 for the other indicators.SOURCE: Glauber, J. & Laborde, D. (forthcoming). Repurposing food and agricultural policies to deliver affordable healthy diets, sustainably and inclusively: what is at stake? Background paper for The State of Food Security and Nutrition in the World 2022. FAO Agricultural Development Economics Working Paper 22-05. Rome, FAO.
TABLE A6.2 IMPACT OF REMOVING BORDER MEASURES, 2030 (CHANGE WITH RESPECT TO THE BASELINE)
Food security and nutrition Equity Climate
Prevalence of undernourishment
Affordability of a healthy
diet
Income gap in the
affordability of a healthy
diet
Extreme poverty
(less than USD 1.90 per day)
Farm income
Agricultural production
(volume)
GHG emissions
from agriculture
WORLD 0.08 -0.15 0.14 0.05 -6.27 -0.64 -0.94
COUNTRY INCOME GROUP
High-income countries 0.01 -0.04 0.00 0.01 -18.17 -1.48 -2.23
Upper-middle-income countries 0.06 -0.08 0.05 0.01 -5.07 -0.46 -1.00
Lower-middle-income countries 0.13 -0.28 0.31 0.13 -2.06 -0.33 -0.47
Low-income countries 0.06 -0.08 0.06 -0.02 0.49 0.12 1.72
REGION
Africa 0.07 -0.06 0.05 -0.04 0.33 0.09 0.78
Asia 0.09 -0.20 0.21 0.10 -5.15 -0.51 -0.86
Americas* 0.07 -0.16 0.06 0.01 -6.79 -0.75 -0.76
Latin America and the Caribbean** 0.11 -0.23 0.23 0.02 -1.74 -0.36 -0.53
Europe 0.01 -0.04 0.00 0.01 -24.68 -2.08 -3.80
NOTES: * Americas includes HICs in Latin America and the Caribbean (Chile, Panama, Trinidad and Tobago, and Uruguay), plus Canada and the United States of America. ** Latin America and the Caribbean includes all countries in this region except HICs which are included in the group Americas. Results for the policy scenario are reported as percentage point change from the baseline scenario in 2030 for food security and nutrition indicators and extreme poverty, while results are reported as percentage change from the baseline scenario in 2030 for the other indicators.SOURCE: Glauber, J. & Laborde, D. (forthcoming). Repurposing food and agricultural policies to deliver affordable healthy diets, sustainably and inclusively: what is at stake? Background paper for The State of Food Security and Nutrition in the World 2022. FAO Agricultural Development Economics Working Paper 22-05. Rome, FAO.
TABLE A6.3 IMPACT OF REMOVING FISCAL SUPPORT TO PRODUCERS, 2030 (CHANGE WITH RESPECT TO THE BASELINE)
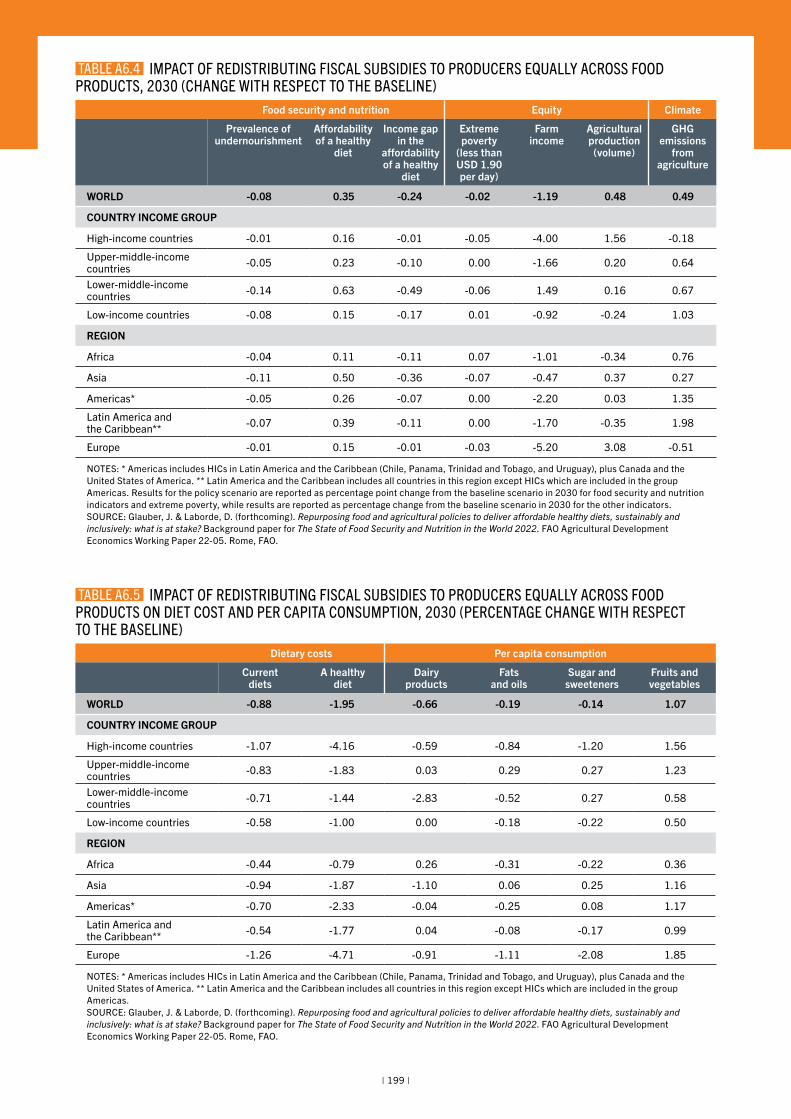
| 199 |
Food security and nutrition Equity Climate
Prevalence of undernourishment
Affordability of a healthy
diet
Income gap in the
affordability of a healthy
diet
Extreme poverty
(less than USD 1.90 per day)
Farm income
Agricultural production
(volume)
GHG emissions
from agriculture
WORLD -0.08 0.35 -0.24 -0.02 -1.19 0.48 0.49
COUNTRY INCOME GROUP
High-income countries -0.01 0.16 -0.01 -0.05 -4.00 1.56 -0.18
Upper-middle-income countries -0.05 0.23 -0.10 0.00 -1.66 0.20 0.64
Lower-middle-income countries -0.14 0.63 -0.49 -0.06 1.49 0.16 0.67
Low-income countries -0.08 0.15 -0.17 0.01 -0.92 -0.24 1.03
REGION
Africa -0.04 0.11 -0.11 0.07 -1.01 -0.34 0.76
Asia -0.11 0.50 -0.36 -0.07 -0.47 0.37 0.27
Americas* -0.05 0.26 -0.07 0.00 -2.20 0.03 1.35
Latin America and the Caribbean** -0.07 0.39 -0.11 0.00 -1.70 -0.35 1.98
Europe -0.01 0.15 -0.01 -0.03 -5.20 3.08 -0.51
NOTES: * Americas includes HICs in Latin America and the Caribbean (Chile, Panama, Trinidad and Tobago, and Uruguay), plus Canada and the United States of America. ** Latin America and the Caribbean includes all countries in this region except HICs which are included in the group Americas. Results for the policy scenario are reported as percentage point change from the baseline scenario in 2030 for food security and nutrition indicators and extreme poverty, while results are reported as percentage change from the baseline scenario in 2030 for the other indicators.SOURCE: Glauber, J. & Laborde, D. (forthcoming). Repurposing food and agricultural policies to deliver affordable healthy diets, sustainably and inclusively: what is at stake? Background paper for The State of Food Security and Nutrition in the World 2022. FAO Agricultural Development Economics Working Paper 22-05. Rome, FAO.
TABLE A6.4 IMPACT OF REDISTRIBUTING FISCAL SUBSIDIES TO PRODUCERS EQUALLY ACROSS FOOD PRODUCTS, 2030 (CHANGE WITH RESPECT TO THE BASELINE)
Dietary costs Per capita consumption
Current diets
A healthy diet
Dairy products
Fats and oils
Sugar and sweeteners
Fruits and vegetables
WORLD -0.88 -1.95 -0.66 -0.19 -0.14 1.07
COUNTRY INCOME GROUP
High-income countries -1.07 -4.16 -0.59 -0.84 -1.20 1.56
Upper-middle-income countries -0.83 -1.83 0.03 0.29 0.27 1.23
Lower-middle-income countries -0.71 -1.44 -2.83 -0.52 0.27 0.58
Low-income countries -0.58 -1.00 0.00 -0.18 -0.22 0.50
REGION
Africa -0.44 -0.79 0.26 -0.31 -0.22 0.36
Asia -0.94 -1.87 -1.10 0.06 0.25 1.16
Americas* -0.70 -2.33 -0.04 -0.25 0.08 1.17
Latin America and the Caribbean** -0.54 -1.77 0.04 -0.08 -0.17 0.99
Europe -1.26 -4.71 -0.91 -1.11 -2.08 1.85
NOTES: * Americas includes HICs in Latin America and the Caribbean (Chile, Panama, Trinidad and Tobago, and Uruguay), plus Canada and the United States of America. ** Latin America and the Caribbean includes all countries in this region except HICs which are included in the group Americas.SOURCE: Glauber, J. & Laborde, D. (forthcoming). Repurposing food and agricultural policies to deliver affordable healthy diets, sustainably and inclusively: what is at stake? Background paper for The State of Food Security and Nutrition in the World 2022. FAO Agricultural Development Economics Working Paper 22-05. Rome, FAO.
TABLE A6.5 IMPACT OF REDISTRIBUTING FISCAL SUBSIDIES TO PRODUCERS EQUALLY ACROSS FOOD PRODUCTS ON DIET COST AND PER CAPITA CONSUMPTION, 2030 (PERCENTAGE CHANGE WITH RESPECT TO THE BASELINE)
| 200 |
Acute food insecurityFood insecurity found in a specified area at a specific point in time and of a severity that threatens lives or livelihoods, or both, regardless of the causes, context or duration. Has relevance in providing strategic guidance to actions that focus on short-term objectives to prevent, mitigate or decrease severe food insecurity.449
AffordabilityAffordability refers to the ability of people to buy foods in their local environment. In this report, cost refers to what people have to pay to secure a healthy diet, while affordability refers to the cost relative to a person’s income, minus other required expenses. Affordability is determined by comparing the cost of a healthy diet with income distributions available in the PIP of the World Bank. This allows to compute the percentage and number of people in each country who are not able to afford a healthy diet (see Annex 2E for the full description of the methodology).
Agrifood systemsAgrifood systems, a term increasingly used in the context of transforming food systems for sustainability and inclusivity, are broader as they encompass both agricultural and food systems and focus on both food and non-food agricultural products, with clear overlaps. Agrifood systems encompass the entire range of actors and their interlinked value-adding activities involved in the production, aggregation, processing, distribution, consumption and disposal of food products. They comprise all food products that originate from crop and livestock production, forestry, fisheries and aquaculture, as well as the broader economic, societal and natural environments in which these diverse production systems are embedded.
Animal source foodsAll types of meat, poultry, fish, eggs, milk, cheese and yoghurt, and other dairy products.
ClimateClimate in a narrow sense is usually defined as the average weather, or more rigorously, as the statistical description in terms of the mean and variability of relevant quantities over a period of time ranging from months to thousands or millions of years.423
ANNEX 7 GLOSSARY
Climate change Climate change refers to a change in the state of the climate that can be identified (e.g. by using statistical tests) by changes in the mean and/or the variability of its properties, and that persists for an extended period, typically decades or longer.423
Climate extreme (extreme weather or climate event)The occurrence of a value of a weather or climate variable above (or below) a threshold value near the upper (or lower) ends of the range of observed values of the variable. For simplicity, both extreme weather events and extreme climate events are referred to collectively as “climate extremes”.424
Climate resilienceAn approach to building and/or strengthening resilience (see resilience definition below) that addresses current or expected climate variability and changing average climate conditions.
Climate shocksClimate shocks include not only those disturbances in the usual pattern of rainfall and temperatures but also complex events like droughts and floods. Equivalent to the concept of a natural hazard or stress, they are exogenous events that can have a negative impact on food and nutrition security, depending on the vulnerability of an individual, a household, a community, or systems to the shock.425,426,427,428
Climate variabilityRefers to variations in the mean state and other statistics (SD, the occurrence of extremes, etc.) of the climate on all spatial and temporal scales beyond that of individual weather events. Variability may be due to natural internal processes within the climate system (internal variability), or to variations in natural or anthropogenic external forcing (external variability).423
Commercial marketingAs defined by the 2010 WHA, marketing refers to “any form of commercial communication or message that is designed to increase, or has the effect of increasing, the recognition, appeal and/or consumption of particular products and services. It comprises anything that acts to advertise or otherwise promote a product or service“.262 Commercial marketing is part of
THE STATE OF FOOD SECURITY AND NUTRITION IN THE WORLD 2022
| 201 |
what in this report is called promotion which, in addition to branded advertising, includes a wider set of tools to reach consumers (e.g. from promotion campaigns, participation in international fairs, to activities promoting food quality).
ConflictConflict as used in this report is defined as struggles between interdependent groups that have either actual or perceived incompatibilities with respect to needs, values, goals, resources or intentions. This definition includes (but is broader than) armed conflict – that is, organized collective violent confrontations between at least two groups, either state or non-state actors.
Coupled subsidiesBudgetary transfers (fiscal subsidies) to producers that are tied to the production of a specific commodity, the use of variable inputs or of specific factors of production (e.g. area planted or animal numbers).
Diet qualityComprised of four key aspects: variety and/or diversity (within and across food groups), adequacy (sufficiency of nutrients or food groups compared to requirements), moderation (foods and nutrients that should be consumed with restraint) and overall balance (composition of macronutrient intake). Exposure to food safety hazards is another important quality aspect.
Dietary energy requirementsThe amount of dietary energy, measured in kilojoules or kilocalories (often referred to as calories), required by an individual to maintain body functions, health and normal activity. Dietary energy requirements are dependent upon age, sex, body size and level of physical activity. Additional energy is required to support optimal growth and development in children and in women during pregnancy, and for milk production during lactation, consistent with the good health of mother and child.
DroughtA period of abnormally dry weather lasting long enough to cause a serious hydrological imbalance.423
Economic downturnRefers to a period of decline in economic activity or negative growth as measured by the growth rate in real GDP. It is a synonym for economic recession, a temporary or short-term downturn in economic growth, usually occurring over at least two consecutive quarters of decline. In the analyses and figures presented in this report, an economic downturn is identified using the year as a period of reference.
Economic shockAn unexpected or unpredictable event that is external to the specific economy and can either harm or boost it. A global financial crisis causing bank lending or credit to fall, or an economic downturn in a major trading partner of a country reflect demand-side shocks that can have multiple effects on spending and investment. A steep rise in oil and gas prices, natural disasters that result in sharp falls in production, or conflict that disrupts trade and production, are examples of supply-side shocks.
Economic slowdownRefers to economic activity that is growing at a slower pace compared with the previous period. An economic slowdown occurs when real GDP growth declines from one period of time to another, but it is still positive. In the analyses and figures presented in this report, an economic slowdown is identified using the year as the period of reference, although it is usually measured in quarters of a year.
Energy-dense foods Food with a high content of calories (energy) with respect to its mass or volume.
Export prohibitions and restrictionsExport prohibitions and restrictions are export measures that have a limiting effect on the quantity or amount of a product being exported. They can take the form of a tax or a quantitative restriction. The latter is generally prohibited with some exceptions, notably those applied to prevent or relieve critical shortage of foodstuffs.429
ExposureThe presence of people; livelihoods; species or ecosystems; environmental functions, services
ANNEX 7
| 202 |
and resources; infrastructure; or economic, social or cultural assets in places and settings that could be adversely affected.423
Extreme povertyRefers to the percentage of people living on less than USD 1.90 a day (2011 PPP prices) in a country in a given year.
Extreme weather or climate eventThe occurrence of a value of a weather or climate variable above (or below) a threshold value near the upper (or lower) ends of the range of observed values of the variable. Many weather and climate extremes are the result of natural climate variability, and natural decadal or multi-decadal variations in the climate provide the backdrop for anthropogenic climate changes. Even if there were no anthropogenic changes in climate, a wide variety of natural weather and climate extremes would still occur.
Fiscal subsidies Fiscal subsidies are budget transfers made by governments in the context of policy measures, projects and programmes to individual actors of the food and agriculture sector, such as farmers (fiscal subsidies to producers) or consumers (fiscal subsidies to consumers). Fiscal subsidies to producers aim to reduce production costs or increase farm income and can be granted depending on output, input use or use of other factors of production. Fiscal subsidies to consumers include transfers under social protection programmes (given to final consumers) and food subsidies to lower the cost of food (provided to intermediaries, e.g. processors, traders, transporters, etc.).
FloodThe overflowing of the normal confines of a stream or other body of water, or the accumulation of water over areas not normally submerged. Floods include river (fluvial) floods, flash floods, urban floods, pluvial floods, sewer floods, coastal floods and glacial lake outburst floods.423
Food and agricultural marketingThis includes collective schemes for post-production facilities and other services designed to improve the marketing environment
for food and agriculture – it includes all the stages of a product value chain, from farm inputs supply to retail markets. For example, these services may include commodity grading schemes or agricultural machinery services. They may be services related to post-harvest losses, lower transaction costs, facilitating market exchange and trade, and strengthening or expanding supply networks.
Food Insecurity Experience Scale (FIES)An experience-based food security scale used to produce a measure of access to food at different levels of severity that can be compared across contexts. It relies on data obtained by asking people, directly in surveys, about the occurrence of conditions and behaviours that are known to reflect constrained access to food.
Food securityA situation that exists when all people, at all times, have physical, social and economic access to sufficient, safe and nutritious food that meets their dietary needs and food preferences for an active and healthy life. Based on this definition, four food security dimensions can be identified: food availability, economic and physical access to food, food utilization and stability over time. The concept of food security is evolving to recognize the centrality of agency and sustainability. See below for the definition of these two additional elements.
Food security dimensionsIn this report, food security dimensions refer to the four traditional dimensions of food security:
a. Availability – This dimension addresses whether or not food is actually or potentially physically present, including aspects of production, food reserves, markets and transportation, and wild foods.
b. Access – If food is actually or potentially physically present, the next question is whether or not households and individuals have sufficient physical and economic access to that food.
c. Utilization – If food is available and households have adequate access to it, the next question is whether or not households are maximizing the consumption of adequate nutrition and energy. Sufficient energy and nutrient intake
THE STATE OF FOOD SECURITY AND NUTRITION IN THE WORLD 2022
| 203 |
by individuals is the result of good care and feeding practices, food preparation, dietary diversity and intra-household distribution of food, and access to clean water, sanitation and healthcare. Combined with good biological utilization of food consumed, this determines the nutritional status of individuals.
d. Stability – If the dimensions of availability, access and utilization are sufficiently met, stability is the condition in which the whole system is stable, thus ensuring that households are food secure at all times. Stability issues can refer to short-term instability (which can lead to acute food insecurity) or medium- to long-term instability (which can lead to chronic food insecurity). Climatic, economic, social and political factors can all be a source of instability. The report also refers to two additional dimensions of food security that are proposed by the High Level Panel of Experts (HLPE) of the Committee on World Food Security (CFS); however, they are not formally agreed upon by FAO or others, and there is not a negotiated agreed upon language. However, due to their relevance in the context of this report, they are included here. These two additional dimensions of food security are reinforced in conceptual and legal understandings of the right to food and are currently referred to and defined as follows:
e. Agency refers to the capacity of individuals or groups to make their own decisions about what foods they eat; what foods they produce; how that food is produced, processed and distributed within food systems; and their ability to engage in processes that shape food system policies and governance.430
f. Sustainability refers to the long-term ability of food systems to provide food security and nutrition in a way that does not compromise the economic, social and environmental bases that generate food security and nutrition for future generations.430
FragilityFragility is defined as the combination of exposure to risk and insufficient coping capacities of the state, system and/or communities to manage, absorb or mitigate those risks. The new OECD fragility framework is built on five dimensions of fragility – economic,
environmental, political, societal and security – and measures each through the accumulation and combination of risks and capacity. See OECD (2016).431
General services support (GSS)Refers to public expenditure (or budget transfers) for the provision of public or collective goods and services that aim to create enabling and environmentally sustainable conditions for the food and agricultural sector. These services connect all economic actors of food supply chains and support the nexus between producers and consumers. The most common services part of GSS include R&D and knowledge transfer, inspection services, agricultural related infrastructure, public stockholding, and food and agricultural marketing, and promotion.
Governance Governance refers to formal and informal rules, organizations, and processes through which public and private actors articulate their interests and make and implement decisions.330
HazardA process, phenomenon or human activity that may cause loss of life, injury or other health impacts, property damage, social and economic disruption or environmental degradation.432
Natural hazard is synonymous with “climate shock” in this report.
HealthcareThe organized provision of medical care to individuals or a community. This includes services provided to individuals or communities by health service providers for the purpose of promoting, maintaining, monitoring or restoring health.
Healthy dietsHealthy diets: 1) start early in life with early initiation of breastfeeding, exclusive breastfeeding until six months of age, and continued breastfeeding until two years of age and beyond combined with appropriate complementary feeding; 2) are based on a great variety of unprocessed or minimally processed foods, balanced across food groups, while restricting highly processed food and drink products; 3) include wholegrains, legumes, nuts
ANNEX 7
| 204 |
and an abundance and variety of fruits and vegetables; 4) can include moderate amounts of eggs, dairy, poultry and fish, and small amounts of red meat; 5) include safe and clean drinking water as the fluid of choice; 6) are adequate (i.e. reaching but not exceeding needs) in energy and nutrients for growth and development and meet the needs for an active and healthy life across the life cycle; 7) are consistent with WHO guidelines to reduce the risk of diet-related NCDs and ensure health and well-being for the general population; and 8) contain minimal levels or none, if possible, of pathogens, toxins and other agents that can cause foodborne disease. According to WHO, healthy diets include less than 30 percent of total energy intake from fats, with a shift in fat consumption away from saturated fats to unsaturated fats and the elimination of industrial transfats; less than 10 percent of total energy intake from free sugars (preferably less than 5 percent); consumption of at least 400 g of fruits and vegetables per day; and not more than 5 g per day of salt (to be iodized).
Highly processed foodsHighly processed foods are foods that have been industrially prepared, including those from bakeries and catering outlets, and which require no or minimal domestic preparation apart from heating and cooking (such as bread, breakfast cereals, cheese, commercial sauces, canned foods including jams, commercial cakes, processed meats, biscuits and sauces).433 Highly processed foods can contain very high quantities of salt, free sugars and saturated or transfats and these products, when consumed in high amounts, can undermine diet quality.
HungerHunger is an uncomfortable or painful physical sensation caused by insufficient consumption of dietary energy. In this report, the term hunger is synonymous with chronic undernourishment and is measured by the PoU.
Input subsidiesGovernment transfers to agricultural producers arising from policy measures based on farm use of inputs, or measures related to the provision of inputs.
MacronutrientsMacronutrients are needed in larger quantities (in gram range) and are the major source of energy and bulk (volume) in our diets. They include carbohydrates, protein and fats. They are a main source of dietary energy, which is measured in calories. Getting sufficient energy is essential for everyone in order to maintain body growth, development and good health. Carbohydrates, protein and fats, in addition to providing energy, each have very specific functions in the body and must be supplied in sufficient amounts to carry out those functions.
MalnutritionAn abnormal physiological condition caused by inadequate, unbalanced or excessive intake of macronutrients and/or micronutrients. Malnutrition includes undernutrition (child stunting and wasting, and vitamin and mineral deficiencies) as well as overweight and obesity.
MicronutrientsMicronutrients include vitamins and minerals and are required in very small (micro) but specific amounts. Vitamins and minerals in foods are necessary for the body to grow, develop and function properly, and are essential for our health and well-being. Our bodies require a number of different vitamins and minerals, each of which has a specific function in the body and must be supplied in different, sufficient amounts.
Moderate food insecurityRefers to the level of severity of food insecurity, based on the FIES, at which people face uncertainties about their ability to obtain food and have been forced to reduce, at times during the year, the quality and/or quantity of food they consume due to lack of money or other resources. It thus refers to a lack of consistent access to food, which diminishes dietary quality, disrupts normal eating patterns, and can have negative consequences for nutrition, health and well-being.
Nominal rate of assistance (NRA)The NRA indicator measures transfers made to farmers individually arising from price incentives generated by trade and market policies and fiscal subsidies. In other words, the NRA accounts for
THE STATE OF FOOD SECURITY AND NUTRITION IN THE WORLD 2022
| 205 |
the price gap at the farm gate (i.e. the difference between the producer price and the undistorted reference price) and the fiscal subsidies provided to producers, which are usually commodity specific.
Nominal rate of protection (NRP)The NRP indicator measures the extent to which trade and market policies raise or lower the producer price of a commodity above or below the international reference price. As such, it measures how such policies incentivize (i.e. protect) or disincentivize (i.e. penalize) producers. It is therefore the measure used to estimate price incentives provided to agricultural producers.
Non-tariff measures (NTMs)NTMs have been broadly defined as “(…) policy measures, other than ordinary customs tariffs, that can potentially have an economic effect on international trade in goods, changing quantities traded, or prices or both”.434
Nutrition transitionAs incomes rise and populations become more urban, diets high in complex carbohydrates and fibre give way to more energy-dense diets high in fats, sugars and/or salt. These global dietary trends are accompanied by a demographic transition with a shift towards increased life expectancy and reduced fertility rates. At the same time, disease patterns move away from infectious and nutrient-deficiency diseases towards higher rates of overweight and obesity and diet-related NCDs including coronary heart disease, stroke, diabetes and some types of cancer.
Nutritional statusThe physiological state of an individual that results from the relationship between nutrient intake and requirements and the body’s ability to digest, absorb and use these nutrients.
Nutritious foodsAre referred to as safe foods that contribute essential nutrients such as vitamins and minerals (micronutrients), fibre and other components to healthy diets that are beneficial for growth, and health and development, guarding against malnutrition. In nutritious
foods, the presence of nutrients of public health concern including saturated fats, free sugars, and salt/sodium is minimized, industrially produced transfats are eliminated, and salt is iodized.
Output subsidiesGovernment transfers based on the level of the production (output) of a specific agricultural commodity.
Overweight and obesityDefined as body weight that is above normal for height as a result of an excessive accumulation of fat. It is usually a manifestation of expending less energy than is consumed. In adults, overweight is defined as a BMI of 25 kg/m2 or more, and obesity as a BMI of 30 kg/m2 or more. In children under five years of age, overweight is defined as weight-for-height greater than 2 SD above the WHO Child Growth Standards median, and obesity as weight-for-height greater than 3 SD above the WHO Child Growth Standards median.435
Political economyThe social, economic, cultural and political factors that structure, sustain and transform constellations of public and private actors, and their interests and relations over time. It affects the type of political and institutional reforms needed to enable and facilitate policy support.327,328
Prevalence of undernourishment (PoU)An estimate of the proportion of the population that lacks enough dietary energy for a healthy, active life. It is FAO’s traditional indicator used to monitor hunger at the global and regional level, as well as SDG Indicator 2.1.1.
Public food stockholdingPublic food stockholding refers to the procurement, storage and release of food stocks by governments through state-owned enterprises or other public agencies. Expenditure on public food stockholding covers the costs of maintaining and managing these food stocks created through market purchase interventions, as well as strategic reserves built for food security purposes.71
ANNEX 7
| 206 |
ResilienceResilience is the ability of individuals, households, communities, cities, institutions, systems and societies to prevent, resist, absorb, adapt, respond and recover positively, efficiently and effectively when faced with a wide range of risks, while maintaining an acceptable level of functioning and without compromising long-term prospects for sustainable development, peace and security, human rights and well-being for all.436
RiskThe probability or likelihood of occurrence of hazardous events or trends multiplied by the impacts if these events or trends occur. Risk to food insecurity is the probability of food insecurity resulting from interactions between a natural or human-induced hazard/shock/stress and vulnerable conditions.
Severe food insecurityThe level of severity of food insecurity at which people have likely run out of food, experienced hunger and, at the most extreme, gone for days without eating, putting their health and well-being at grave risk, based on the FIES.
Staple foodA staple food is one that is eaten regularly, and in such quantities as to constitute the dominant part of the diet and supply a major proportion of total dietary energy. The main kinds of staple foods are cereals (e.g. rice, maize, wheat, rye, barley, oats, millet, sorghum), roots and tubers (e.g. potatoes, cassava, yams) and legumes (e.g. beans, lentils, soybean).450
StuntingLow height-for-age, reflecting a past episode or episodes of sustained undernutrition. In children under five years of age, stunting is defined as height-for-age less than -2 SD below the WHO Child Growth Standards median.
TariffA tariff is a tax imposed on a good imported into a country. A tariff may be specific, when it is levied as a fixed sum per unit of the imported good, or ad valorem, when it is applied at a percentage rate with reference to the value of the import.437
UndernourishmentUndernourishment is defined as the condition in which an individual’s habitual food consumption is insufficient to provide the amount of dietary energy required to maintain a normal, active, healthy life. For the purposes of this report, hunger is defined as being synonymous with chronic undernourishment. The PoU is used to measure hunger.
UndernutritionThe outcome of poor nutritional intake in terms of quantity and/or quality, and/or poor absorption and/or poor biological use of nutrients consumed as a result of repeated instances of disease. It includes being underweight for one’s age, too short for one’s age (stunted), dangerously thin for one’s height (suffering from wasting) or deficient in vitamins and minerals (micronutrient deficiency).
VulnerabilityRefers to the conditions determined by physical, social, economic and environmental factors or processes that increase the susceptibility of an individual, community, assets or systems to the impacts of hazards.432 Vulnerability to food insecurity is the range of conditions that increases the susceptibility of a household to the impact on food security in case of a shock or hazard.
WastingLow weight-for-height, generally the result of weight loss associated with a recent period of inadequate dietary energy intake and/or disease. In children under five years of age, wasting is defined as weight-for-height less than -2 SD below the WHO Child Growth Standards median.
WeatherWeather describes conditions of the atmosphere over a short period of time (minutes to days), whereas climate is how the atmosphere behaves over relatively longer periods of time (the long-term average of weather over time). The difference between weather and climate is a measure of time (see above definitions for climate, climate change, climate variability and climate extremes).438 n
| 207 |
1 FAO, UNDP (United Nations Development Programme) & UNEP (United Nations Environment Programme). 2021. A multi-billion-dollar opportunity – Repurposing agricultural support to transform food systems. Rome. https://doi.org/10.4060/cb6562en
2 OECD (Organisation for Economic Co-operation and Development). 2006. Applying strategic environmental assessment. Good practice guidance for development co-operation. DAC Guidelines and Reference Series. Paris. www.oecd.org/environment/environment-development/37353858.pdf
3 FAO, IFAD (International Fund for Agricultural Development), UNICEF (United Nations International Children’s Emergency Fund), WFP (World Food Programme) & WHO (World Health Organization). 2020. The State of Food Security and Nutrition in the World 2020. Transforming food systems for affordable healthy diets. Rome, FAO. https://doi.org/10.4060/ca9692en
4 Laborde Debucquet, D., Gautam, M., Martin, W., Pineiro, V. & Vos, R. 2021. Repurposing agricultural policy support for climate change mitigation and adaptation. G20 Italy 2021, Task Force 2: Climate Change, Sustainable Energy & Environment. Policy brief, September 2021. www.t20italy.org/wp-content/uploads/2021/09/TF2-4.pdf
5 FAO. 2022. World Food Situation. Rome. Cited 5 May 2022. www.fao.org/worldfoodsituation
6 World Bank. 2022. Global Economic Prospects, January 2022. Washington, DC. https://openknowledge.worldbank.org/handle/10986/36519
7 Kugler, M., Viollaz, M., Duque, D., Gaddis, I., Newhouse, D.L., Palacios-Lopez, A. & Weber, M. 2021. How did the Covid-19 crisis affect different types of workers in the developing world? Jobs Working Paper No. 60. Washington, DC, World Bank. https://openknowledge.worldbank.org/handle/10986/35950
8 Sánchez-Páramo, C., Hill, R., Gerszon Mahler, D., Narayan, A. & Yonzan, N. 2021. COVID-19 leaves a legacy of rising poverty and widening inequality. In: World Bank Blogs. Washington, DC, World Bank. Cited 5 May 2022. https://blogs.worldbank.org/developmenttalk/covid-19-leaves-legacy-rising-poverty-and-widening-inequality
9 Narayan, A., Cojocaru, A., Agrawal, S., Bundervoet, T., Davalos, M., Garcia, N., Lakner, C. et al. 2022. COVID-19 and economic inequality: short-term impacts with long-term consequences. Policy Research Working Papers No. 9902. Washington, DC, World Bank. http://hdl.handle.net/10986/36848
10 Yonzan, N., Lakner, C., Mahler, D.G. & Gerszon Mahler, D. 2021. Is COVID-19 increasing global inequality? In: World Bank Blogs. Washington, DC, World Bank. Cited 5 May 2022. https://blogs.worldbank.org/opendata/covid-19-increasing-global-inequality
11 Gerszon Mahler, D., Yonzan, N., Lakner, C., Castaneda Aguilar, R.A. & Wu, H. 2021. Updated estimates of the impact of COVID-19 on global poverty: Turning the corner on the pandemic in 2021? In: World Bank Blogs. Washington, DC, World Bank. Cited 5 May 2022. https://blogs.worldbank.org/opendata/updated-estimates-impact-covid-19-global-poverty-turning-corner-pandemic-2021
12 Gentilini, U., Almenfi, M., Iyengar, H.T.M.M., Okamura, Y.Y., Downes, J.A., Dale, P., Weber, M. et al. 2022. Social protection and jobs responses to COVID-19: a real-time review of country measures. “Living paper” version 16 (2 February 2022). Washington, DC, World Bank. https://documents1.worldbank.org/curated/en/110221643895832724/pdf/Social-Protection-and-Jobs-Responses-to-COVID-19-A-Real-Time-Review-of-Country-Measures.pdf
13 Oxfam International. 2020. Shelter from the storm: the global need for universal social protection in times of COVID-19. Oxford, UK. https://doi.org/10.21201/2020.7048
14 Beazley, R., Marzi, M. & Steller, R. 2021. Drivers of timely and large-scale cash responses to COVID-19: what does the data say? SPACE (Social Protection Approaches to COVID-19: Expert Advice), DAI Global UK Ltd, United Kingdom. https://socialprotection.org/sites/default/files/publications_files/SPACE_Drivers of Timely and Large Scale Cash Responses to COVID_19 %281%29.pdf
15 FAO, IFAD, UNICEF, WFP & WHO. 2021. The State of Food Security and Nutrition in the World 2021. Transforming food systems for food security, improved nutrition and affordable healthy diets for all. Rome, FAO. https://doi.org/10.4060/cb4474en
NOTES
NOTES
| 208 |
16 FAO. 2022. Information Note – The importance of Ukraine and the Russian Federation for global agricultural markets and the risks associated with the current conflict. Rome. www.fao.org/3/cb9236en/cb9236en.pdf
17 FAO. 2022. Impact of the Ukraine-Russia conflict on global food security and related matters under the mandate of the Food and Agriculture Organization of the United Nations (FAO). FAO Council, 169th Session, CL169/3. Rome. www.fao.org/3/ni734en/ni734en.pdf
18 FAO, IFAD, UNICEF, WFP & WHO. 2019. The State of Food Security and Nutrition in the World 2019. Safeguarding against economic slowdowns and downturns. Rome, FAO. www.fao.org/3/ca5162en/ca5162en.pdf
19 Cafiero, C., Gheri, F., Kepple, A.W., Rosero Moncayo, J. & Viviani, S. 2022. Access to food in 2021: filling data gaps. Results of twenty national surveys using the Food Insecurity Experience Scale (FIES). Rome, FAO. https://doi.org/10.4060/cc0721en
20 FAO. 2020. Gendered impacts of COVID-19 and equitable policy responses in agriculture, food security and nutrition. Rome. https://doi.org/10.4060/ca9198en
21 UN Women. 2020. Whose time to care? Unpaid care and domestic work during Covid-19. New York, USA. https://data.unwomen.org/sites/default/files/inline-files/Whose-time-to-care-brief_0.pdf
22 WHO & UNICEF. 2017. The extension of the 2025 Maternal, Infant and Young Child nutrition targets to 2030. WHO/UNICEF Discussion paper. Geneva, Switzerland, WHO and New York, USA, UNICEF.
23 United Nations. 2019. Report of the Inter-Agency and Expert Group on Sustainable Development Goal Indicators. Statistical Commission Fifty-first session 3–6 March 2020. New York, USA. https://unstats.un.org/unsd/statcom/51st-session/documents/2020-2-SDG-IAEG-E.pdf
24 WHO. 2013. Global action plan for the prevention and control of noncommunicable diseases 2013-2020. Geneva, Switzerland. www.who.int/publications/i/item/9789241506236
25 WHO & UNICEF. 2004. Low birthweight: country, regional and global estimates. Geneva, Switzerland and New York, USA, WHO and UNICEF. https://apps.who.int/iris/handle/10665/43184
26 Jornayvaz, F.R., Vollenweider, P., Bochud, M., Mooser, V., Waeber, G. & Marques-Vidal, P. 2016. Low birth weight leads to obesity, diabetes and increased leptin levels in adults: The CoLaus study. Cardiovascular Diabetology, 15(73). http://doi.org/10.1186/s12933-016-0389-2
27 Lou, F., Qin, H., He, S., Li, M., An, X., Song, L., Tong, Y. et al. 2021. The benefits of breastfeeding still outweigh the risks of COVID-19 transmission. Frontiers in Medicine, 8: 703950. https://doi.org/10.3389/fmed.2021.703950
28 Bhutta, Z.A., Berkley, J.A., Bandsma, R.H.J., Kerac, M., Trehan, I. & Briend, A. 2017. Severe childhood malnutrition. Nature Reviews Disease Primers, 3(1): 17067. https://doi.org/10.1038/nrdp.2017.67
29 WHO. 2014. Global nutrition targets 2025: childhood overweight policy brief (WHO/NMH/NHD/14.6). Geneva, Switzerland. https://apps.who.int/iris/handle/10665/149021
30 WHO. 2020. Healthy diet. In: WHO. Geneva, Switzerland. Cited 6 May 2022. www.who.int/news-room/fact-sheets/detail/healthy-diet
31 Kinyoki, D., Osgood-Zimmerman, A.E., Bhattacharjee, N. V., Schaeffer, L.E., Lazzar-Atwood, A., Lu, D., Ewald, S.B. et al. 2021. Anemia prevalence in women of reproductive age in low- and middle-income countries between 2000 and 2018. Nature Medicine, 27(10): 1761–1782. www.nature.com/articles/s41591-021-01498-0
32 Amini, H., Habibi, S., Islamoglu, A.H., Isanejad, E., Uz, C. & Daniyari, H. 2021. COVID-19 pandemic-induced physical inactivity: the necessity of updating the Global Action Plan on Physical Activity 2018-2030. Environmental Health and Preventive Medicine, 26(32). https://doi.org/10.1186/s12199-021-00955-z
33 World Bank. 2022. World Bank country and lending groups. In: World Bank. Washington, DC. Cited 5 May 2022. https://datahelpdesk.worldbank.org/knowledgebase/articles/906519-world-bank-country-and-lending-groups
34 Osendarp, S., Verburg, G., Bhutta, Z., Black, R.E., de Pee, S., Fabrizio, C., Headey, D. et al. 2022. Act now before Ukraine war plunges millions into malnutrition. Nature, 604(7907): 620–624. www.nature.com/articles/d41586-022-01076-5
THE STATE OF FOOD SECURITY AND NUTRITION IN THE WORLD 2022
| 209 |
35 Osendarp, S., Akuoku, J.K., Black, R.E., Headey, D., Ruel, M., Scott, N., Shekar, M. et al. 2021. The COVID-19 crisis will exacerbate maternal and child undernutrition and child mortality in low- and middle-income countries. Nature Food, 2(7): 476–484. www.nature.com/articles/s43016-021-00319-4
36 UNICEF, USAID (United States Agency for International Development), WHO & USAID Advancing Nutrition (United States Agency for International Development Advancing Nutrition). 2022. The Analytical Framework. https://data.unicef.org/resources/nutrition-and-covid-19-pandemic-analytical-framework, www.who.int/tools/covid19-nutrition-analytical-framework, www.advancingnutrition.org/resources/analytical-framework
37 INSEED (Institut National de la Statistique des Etudes Economiques et Démographiques) & World Bank. 2020. Socio Economic Impacts of COVID-19 in Chad. Bulletin No. 1 – July 2020. N’Djamena, INSEED.
38 USAID. 2008. The Coping Strategies Index: field methods manual (2nd edition). Cited 6 May 2022. www.spring-nutrition.org/publications/tool-summaries/coping-strategies-index-field-methods-manual-2nd-edition
39 WFP. 2020. HungerMap: hunger and COVID-19 weekly snapshot - Chad. November 6, 2020. Rome.
40 INSEED & World Bank. 2020. Socio Economic Impacts of COVID-19 in Chad. Bulletin No. 2 – October 2020. N’Djamena, INSEED.
41 UNICEF. 2021. Tracking the situation of children during COVID-19. In: UNICEF. New York, USA. Cited 6 May 2022. data.unicef.org/resources/rapid-situation-tracking-covid-19-socioeconomic-impacts-data-viz
42 UNICEF, WHO & World Bank. 2021. UNICEF/WHO/World Bank: Joint child malnutrition estimates - Levels and trends: key findings of the 2021 edition. data.unicef.org/resources/jme-report-2021
43 NCD-RisC (NCD Risk Factor Collaboration). 2017. Worldwide trends in body-mass index, underweight, overweight, and obesity from 1975 to 2016: a pooled analysis of 2416 population-based measurement studies in 128·9 million children, adolescents, and adults. The Lancet, 390(10113): 2627–2642. https://doi.org/10.1016/S0140-6736(17)32129-3
44 NCD-RisC. 2019. Rising rural body-mass index is the main driver of the global obesity epidemic in adults. Nature, 569: 260–264. www.nature.com/articles/s41586-019-1171-x
45 WHO. 2017. The double burden of malnutrition. Geneva, Switzerland. http://apps.who.int/iris/bitstream/handle/10665/255413/WHO-NMH-NHD-17.3-eng.pdf?ua=1
46 Seferidi, P., Hone, T., Duran, A.C., Bernabe-Ortiz, A. & Millett, C. 2022. Global inequalities in the double burden of malnutrition and associations with globalisation: a multilevel analysis of Demographic and Health Surveys from 55 low-income and middle-income countries, 1992–2018. The Lancet Global Health, 10(4): e482–e490. https://linkinghub.elsevier.com/retrieve/pii/S2214109X21005945
47 UNICEF. 2007. How to calculate Average Annual Rate of Reduction (AARR) of underweight prevalance. New York, USA. https://data.unicef.org/resources/technical-note-calculate-average-annual-rate-reduction-aarr-underweight-prevalence
48 United Nations. 2022. Member State dialogues synthesis. Report 4, March 2022. Food Systems Summit Dialogues. New York, USA. https://summitdialogues.org/wp-content/uploads/2021/09/UN-Food-Systems-Summit-Dialogues-Synthesis-Report-3-Full-Text.pdf
49 Nutrition for Growth. 2021. Tokyo compact on global nutrition for growth annex: commitments. Tokyo. www.mofa.go.jp/files/100275456.pdf
50 FAO & WHO. 2017. United Nations Decade of Action on Nutrition 2016–2025: work programme. Rome and Geneva, Switzerland. www.un.org/nutrition/sites/www.un.org.nutrition/files/general/pdf/work_programme_nutrition_decade.pdf
51 World Bank. 2022. Poverty & Inequality Platform (PIP). In: World Bank. Washington, DC. Cited 27 May 2022. https://pip.worldbank.org/home
52 World Bank. 2021. Global Consumption Database – food and beverages. In: World Bank. Washington, DC. Cited 6 May 2022. datatopics.worldbank.org/consumption/sector/Food-and-Beverages
53 World Bank. 2022. ICP national accounts expenditure data. In: World Bank. Washington, DC. Cited 26 May 2022. www.worldbank.org/en/programs/icp/brief/methodology-national-accounts
NOTES
| 210 |
54 Herforth, A., Venkat, A., Bai, Y., Costlow, L., Holleman, C. & Masters, W.A. (forthcoming). Methods and options to monitor globally the cost and affordability of a healthy diet. Background paper to The State of Food Security and Nutrition in the World 2022. FAO Agricultural Development Economics Working Paper 22-03. Rome, FAO.
55 OECD. 2016. OECD’s Producer Support Estimate and related indicators of agricultural support. Concepts, calculations, interpretation and use. (The PSE manual). Paris.
56 FAO. 2015. Methodology working paper. Volume I. Measures of price incentives. MAFAP Technical Notes Series. Rome. www.fao.org/fileadmin/templates/mafap/documents/Methodological_Guidelines/METHODOLOGY_WORKING_PAPER_Vol1_Prices_Incentives.pdf
57 WTO (World Trade Organization). 2022. Glossary - domestic support. In: WTO. Geneva, Switzerland. Cited 6 May 2022. www.wto.org/english/thewto_e/glossary_e/domestic_support_e.htm
58 OECD. 2019. Evaluating the environmental impact of agricultural policies. OECD Food, Agriculture, and Fisheries Papers No. 130. Paris. https://doi.org/10.1787/add0f27c-en
59 Benton, T., Bieg, C., Harwatt, H., Pudasaini, R. & Wellesley, L. 2021. Food system impacts on biodiversity loss. Three levers for food system transformation in support of nature. London, Chatham House. www.chathamhouse.org/2021/02/food-system-impacts-biodiversity-loss
60 Ricker-Gilbert, J., Lunduka, R., Shively, G. & Jayne, T. 2014. Improving the effectiveness of Malawi’s FISP. Food Security Collaborative Policy Briefs 234944. Michigan, USA, Michigan State University, Department of Agricultural, Food, and Resource Economics. https://doi.org/10.22004/ag.econ.234944
61 Dorward, A. 2009. Rethinking agricultural input subsidy programmes in developing countries. In A. Elbehri & A. Sarris, eds. Non-distorting farm support to enhance global food production, pp. 311–374. Rome, FAO. http://dx.doi.org/10.2139/ssrn.1808847
62 DeBoe, G. 2020. Impacts of agricultural policies on productivity and sustainability performance in agriculture: A literature review. OECD Food, Agriculture and Fisheries Papers No. 141. Paris, OECD. https://doi.org/10.1787/6bc916e7-en
63 Mogues, T., Yu, B., Fan, S. & Mcbride, L. 2012. The impacts of public investment in and for agriculture. Synthesis of the existing evidence. ESA Working paper No. 12-07. Rome, FAO. www.fao.org/3/ap108e/ap108e.pdf
64 Fan, S., Yu, B. & Saurkar, A. 2008. Public spending in developing countries: trends, determination, and impact. In S. Fan, ed. Public expenditures, growth, and poverty. Lessons from developing countries, pp. 20–55. Baltimore, USA, Johns Hopkins University Press.
65 Pratt, A.N. & Magalhaes, E. 2018. Revisiting rates of return to agricultural R&D investment. IFPRI Discussion Paper 01718. Washington, DC, IFPRI (International Food Policy Research Institute). www.ifpri.org/cdmref/p15738coll2/id/132370/filename/132581.pdf
66 Norton, G.W., Alwang, J. & Masters, W.A. 2021. Economics of agricultural development: world food systems and resource use. Routledge. www.routledge.com/Economics-of-Agricultural-Development-World-Food-Systems-and-Resource-Use/Norton-Alwang-Masters/p/book/9780367321482
67 Bastagli, F., Hagen-Zanker, J., Harman, L., Barca, V., Sturge, G., Schmidt, T. & Pellerano, L. 2016. Cash transfers: what does the evidence say? A rigorous review of programme impact and of the role of design and implementation features. London, ODI. https://odi.org/en/publications/cash-transfers-what-does-the-evidence-say-a-rigorous-review-of-impacts-and-the-role-of-design-and-implementation-features
68 Daidone, S., Davis, B., Handa, S. & Winters, P. 2019. The household and individual-level productive impacts of cash transfer programs in Sub-Saharan Africa. American Journal of Agricultural Economics, 101(5): 1401–1431. https://doi.org/10.1093/ajae/aay113
69 OECD. 2021. Agricultural Policy Monitoring and Evaluation 2021. Addressing the Challenges facing food systems. Paris, OECD. https://doi.org/10.1787/2d810e01-en
70 Pernechele, V., Fontes, F., Baborska, R., Nkuingoua, J., Pan, X. & Tuyishime, C. 2021. Public expenditure on food and agriculture in sub-Saharan Africa: trends, challenges and priorities. Rome, FAO. https://doi.org/10.4060/cb4492en
71 FAO. 2021. Public food stockholding – a review of policies and practices. Rome. https://doi.org/10.4060/cb7146en
THE STATE OF FOOD SECURITY AND NUTRITION IN THE WORLD 2022
| 211 |
72 Pingali, P.L. 2012. Green revolution: Impacts, limits, and the path ahead. Proceedings of the National Academy of Sciences of the United States of America, 109(31): 12302–12308. https://doi.org/10.1073/pnas.0912953109
73 Pingali, P.L. 2015. Agricultural policy and nutrition outcomes – getting beyond the preoccupation with staple grains. Food Security, 7(3): 583–591. https://link.springer.com/article/10.1007/s12571-015-0461-x
74 Bowman, M.S. & Zilberman, D. 2013. Economic factors affecting diversified farming systems. Ecology and Society, 18(1): 33. http://dx.doi.org/10.5751/ES-05574-180133
75 UN Nutrition. 2021. The role of aquatic foods in sustainable healthy diets. Rome. www.unnutrition.org/wp-content/uploads/FINAL-UN-Nutrition-Aquatic-foods-Paper_EN_.pdf
76 Consalez, F., Ahern, M., Andersen, P. & Kjellevold, U.N. (forthcoming). A scoping review of the meat factor and the role of animal-source foods in alleviating micronutrient deficiencies. Advances in Nutrition
77 Öksüz, A. 2010. Determination of fillet yield in cultured bluefin tuna, Thunnus Thynnus (Linnaeus 1758) in Turkey. International Commission for the Conservation of Atlantic Tunas (ICCAT) Scientific Papers, 65(3): 962–967. www.iccat.int/Documents/CVSP/CV065_2010/n_3/CV065030962.pdf
78 FAO. 2020. The State of World Fisheries and Aquaculture 2020. Sustainability in action. Rome. https://doi.org/10.4060/ca9229en
79 Glover-Amengor, M., Ottah Atikpo, M.A., Abbey, L.D., Hagan, L., Ayin, J. & Toppe, J. 2012. Proximate composition and consumer acceptability of three underutilised fish species and tuna frames. World Rural Observations, 4(2): 65–70. www.sciencepub.net/rural/rural0402/011_9765rural0402_65_70.pdf
80 FAO. 2022. The contribution of small-scale fisheries to sustainable development. A snapshot of findings from the illuminating Hidden Harvests (IHH) report . Rome. www.fao.org/3/cb8233en/cb8233en.pdf
81 FAO. 2015. Voluntary guidelines for securing sustainable small-scale fisheries in the context of food security and poverty eradication. Rome. www.fao.org/3/i4356en/i4356en.pdf
82 World Bank. 2006. Repositioning nutrition as central to development: a strategy for large scale action. Washington, DC. https://openknowledge.worldbank.org/handle/10986/7409
83 CFS (Committee on World Food Security). 2021. CFS Voluntary Guidelines on Food Systems and Nutrition. Rome. www.fao.org/cfs/vgfsn
84 FAO & WHO. 2019. Sustainable healthy diets – guiding principles. Rome and Geneva, Switzerland. www.fao.org/3/ca6640en/ca6640en.pdf
85 Hoekman, B., Ng, F. & Olarreaga, M. 2004. Agricultural tariffs or subsidies: which are more important for developing economies? The World Bank Economic Review, 18(2): 175–204. www.jstor.org/stable/3990173
86 Herforth, A., Bai, Y., Venkat, A., Mahrt, K., Ebel, A. & Masters, W.A. 2020. Cost and affordability of healthy diets across and within countries. Background paper for The State of Food Security and Nutrition in the World 2020. FAO Agricultural Development Economics Technical Study No. 9. Rome, FAO. https://doi.org/10.4060/cb2431en
87 FAO. 2015. Key recommendations for improving nutrition through agriculture and food systems. Rome. www.fao.org/3/i4922e/i4922e.pdf
88 FAO. 2022. Why is gender equality and rural women’s empowerment central to the work of FAO? In: Gender. Cited 23 May 2022. www.fao.org/gender/background
89 FAO. 2018. Trade and nutrition technical note. FAO Trade Policy Technical Notes. No. 21. Rome. www.fao.org/3/I8545EN/i8545en.pdf
90 FAO. 2022. Food Balance Sheets. In: FAOSTAT. Rome. Cited 25 May 2022. www.fao.org/faostat/en/#data/FBS
91 FAO. 2018. The State of Agricultural Commodity Markets 2018. Agricultural trade, climate change and food security. Rome. www.fao.org/3/I9542EN/i9542en.pdf
92 Artuc, E., Porto, G. & Rijkers, B. 2021. Household impacts of tariffs: data and results from agricultural trade protection. The World Bank Economic Review, 35(3): 563–585. https://doi.org/10.1093/wber/lhaa005
NOTES
| 212 |
93 Bell, C., Latu, C., Coriakula, J., Waqa, G., Snowdon, W. & Moodie, M. 2020. Fruit and vegetable import duty reduction in Fiji to prevent obesity and non-communicable diseases: a case study. Public Health Nutrition, 23(1): 181–188. https://doi.org/10.1017/S1368980019002660
94 Barlow, P., McKee, M., Basu, S. & Stuckler, D. 2017. Impact of the North American Free Trade Agreement on high-fructose corn syrup supply in Canada: a natural experiment using synthetic control methods. Canadian Medical Association Journal (CMAJ), 189(26): E881–E887. www.cmaj.ca/content/189/26/E881
95 Giuntella, O., Rieger, M. & Rotunno, L. 2020. Weight gains from trade in foods: evidence from Mexico. Journal of International Economics, 122: 103277. https://doi.org/10.1016/j.jinteco.2019.103277
96 Abay, K.A., Ibrahim, H. & Breisinger, C. 2022. Food policies and obesity in low- and middle-income countries. World Development, 151: 105775. https://doi.org/10.1016/j.worlddev.2021.105775
97 Boysen, O., Boysen-Urban, K., Bradford, H. & Balié, J. 2019. Taxing highly processed foods: what could be the impacts on obesity and underweight in sub-Saharan Africa? World Development, 119: 55–67. https://doi.org/10.1016/j.worlddev.2019.03.006
98 Mazzocchi, M. 2017. Ex-post evidence on the effectiveness of policies targeted at promoting healthier diets. Trade Policy Technical Notes. Trade and Food Security No. 19. Rome, FAO. www.fao.org/3/i8191e/i8191e.pdf
99 Kareem, O.I. & Rau, M.L. 2018. Market access for Africa’s fruits and vegetables exports in the European Union: evidence from sanitary and phytosanitary measures. In A. Nicita & J. de Melo, eds. Non-tariff measures: economic assessment and policy options for development, pp. 327–369. Geneva, Switzerland, UNCTAD (United Nations Conference on Trade and Development).
100 WTO, ITC (International Trade Centre) & UNCTAD. 2021. World Tariff Profiles 2021 – Special topic: non-tariff measures: estimating analytical indicators using UNCTAD’s Trade Analysis Information System (TRAINS). Geneva, Switzerland, WTO, ITC and UNCTAD. https://doi.org/10.30875/11c286b5-en
101 Cadot, O. & Gourdon, J. 2015. NTMs, preferential trade agreements, and prices: new evidence. CEPR Discussion Paper No. DP10798. https://ssrn.com/abstract=2655484
102 Cadot, O., Gourdon, J. & Van Tongeren, F. 2018. Estimating ad valorem equivalents of non-tariff measures. Combining price-based and quantity-based approaches. OECD Trade Policy Papers No. 215. Paris, OECD. https://doi.org/10.1787/f3cd5bdc-en
103 Gourdon, J., Stone, S. & van Tongeren, F. 2020. Non-tariff measures in agriculture. OECD Trade Policy Papers No. 147. Paris, OECD. https://doi.org/10.1787/81933f03-en
104 WTO. 1994. The results of the Uruguay Round of multilateral trade negotiations: the legal texts. Geneva, Switzerland. www.wto.org/english/res_e/publications_e/legal_texts_e.htm
105 FAO. 2022. FAPDA - Food And Agriculture Policy Decision Analysis Tool. Rome. Cited 9 May 2022. http://fapda.apps.fao.org/fapda/#main.html
106 Sharma, R. 2011. Food export restrictions: review of the 2007-2010 experience and considerations for disciplining restrictive measures. FAO Commodity and Trade Policy Research Working Paper No.32. Rome, FAO. www.fao.org/fileadmin/templates/est/PUBLICATIONS/Comm_Working_Papers/EST-WP32.pdf
107 FAO. 2018. Review of agricultural trade policies in post-Soviet countries, 2016-2017. Rome. www.fao.org/3/CA0879EN/ca0879en.pdf
108 FAO. 2021. COVID-19: Agricultural trade and policy responses during the first wave of the pandemic in 2020. FAO support to the WTO negotiations at the 12th Ministerial Conference. Trade Policy Brief No. 37. Rome, FAO. https://doi.org/10.4060/cb5406en
109 FAO. 2017. Export restrictions in agriculture trade. Trade Policy Briefs No. 27. Rome. www.fao.org/3/a-i8006e.pdf
110 Guenette, J.-D. 2020. Price Controls: good intentions, bad outcomes. World Bank Policy Research Working Paper No. 9212. Washington, DC, World Bank. https://doi.org/10.1596/1813-9450-9212
THE STATE OF FOOD SECURITY AND NUTRITION IN THE WORLD 2022
| 213 |
111 Matthews, A., Salvatici, L. & Scoppola, M. 2017. Trade impacts of agricultural support in the EU. IATRC Commissioned Paper No. 19. Saint Paul, USA, IATRC (International Agricultural Trade Research Consortium).
112 Krivonos, E. & Dawe, D. 2014. Policy responses to high food prices in Latin America and the Caribbean country: case studies. Rome, FAO. www.fao.org/3/i3909e/i3909e.pdf
113 FAO. 2015. Egypt: wheat sector review. FAO Investment Centre. Country Highlights Report No. 21. Rome, FAO and London, EBRD (European Bank for Reconstruction and Development). https://agris.fao.org/agris-search/search.do?recordID=XF2017000329
114 UNCTAD & FAO. 2017. Commodities and Development Report 2017. Commodity markets, economic growth and development. New York, USA, and Geneva, Switzerland. www.fao.org/3/I7937EN/i7937en.pdf
115 Gómez, M.I., Barrett, C.B., Raney, T., Pinstrup-Andersen, P., Meerman, J., Croppenstedt, A., Lowder, S. et al. 2013. Post-Green Revolution food systems and the triple burden of malnutrition. ESA Working Paper No. 13-02. Rome. www.fao.org/3/CA2273EN/ca2273en.pdf
116 Alston, J.M., Sumner, D.A. & Vosti, S.A. 2008. Farm subsidies and obesity in the United States: national evidence and international comparisons. Food Policy, 33(6): 470–479. https://doi.org/10.1016/j.foodpol.2008.05.008
117 FAO. 2015. The State of Agricultural Commodity Markets 2015–16. Trade and food security: achieving a better balance between national priorities and the collective good. Rome. www.fao.org/3/i5090e/i5090e.pdf
118 Pingali, P.L. & Roger, P.A. 1995. Impact of pesticides on farmer health and the rice environment. Dordrecht, The Netherlands, Springer. https://doi.org/10.1007/978-94-011-0647-4
119 Rodríguez-Mireles, S., López-Valcárcel, B.G. & Serra-Majem, L. 2021. When industrial policies conflict with population health: potential impact of removing food subsidies on obesity rates. Value in Health, 24(3): 336–343. https://doi.org/10.1016/j.jval.2020.12.005
120 World Bank & IMF (International Monetary Fund). 2012. Global Monitoring Report 2012: Food prices, nutrition, and the Millennium Development Goals. Washington, DC, World Bank. http://hdl.handle.net/10986/6017
121 Kataki, P.K. 2002. Shifts in cropping system and its rffect on human nutrition: case study from India. Journal of Crop Production, 6(1–2): 119–144. https://doi.org/10.1300/J144v06n01_08
122 Siegel, K.R., Bullard, K.M.K., Imperatore, G., Kahn, H.S., Stein, A.D., Ali, M.K. & Narayan, K.M. 2016. Association of higher consumption of foods derived from subsidized commodities with adverse cardiometabolic risk among US adults. JAMA internal medicine, 176(8): 1124–1132. https://doi.org/10.1001/jamainternmed.2016.2410
123 Bouis, H.E. 2000. Improving human nutrition through agriculture: the role of international agricultural research. Conference summary and recommendations. Food and Nutrition Bulletin, 21(4): 550–567. https://doi.org/10.1177/156482650002100441
124 Hawkes, C., Ruel, M.T., Salm, L., Sinclair, B. & Branca, F. 2020. Double-duty actions: seizing programme and policy opportunities to address malnutrition in all its forms. The Lancet, 395(10218): 142–155. https://doi.org/10.1016/S0140-6736(19)32506-1
125 O’Neill Hayes, T. & Kerska, K. 2021. PRIMER: agriculture subsidies and their influence on the composition of U.S. food supply and consumption. Washington, DC, American Action Forum.
126 World Bank. 2017. An overview of links between obesity and food systems. Implications for the food and agriculture global practice agenda. Food and agriculture global practice. Washington, DC.
127 Alagiyawanna, A., Townsend, N., Mytton, O., Scarborough, P., Roberts, N. & Rayner, M. 2015. Studying the consumption and health outcomes of fiscal interventions (taxes and subsidies) on food and beverages in countries of different income classifications; a systematic review. BMC Public Health, 15(887). https://doi.org/10.1186/s12889-015-2201-8
128 IEG (Independent Evaluation Group). 2013. The World Bank Group and the global food crisis. An evaluation of the World Bank Group response. Washington, DC, World Bank.
129 CGIAR (Consultative Group on International Agricultural Research). 2021. Flagship 4: Social protection for agriculture and resilience. CGIAR Research Program on Policies, Institutions, and Markets. Montpellier, France. https://ebrary.ifpri.org/digital/collection/p15738coll2/id/134376
NOTES
| 214 |
130 ADB (Asian Development Bank). 2013. Food security in Asia and the Pacific. Mandaluyong City, the Philippines. http://hdl.handle.net/11540/1435
131 Tiba, Z. 2011. Chapter 26. Targeting the most vulnerable: implementing input subsidies. In A. Prakash, ed. Safeguarding food security in volatile global markets, pp. 510–542. Rome, FAO. www.fao.org/3/i2107e/i2107e00.htm
132 Prakash, A. 2011. Safeguarding food security in volatile global markets. Rome, FAO. www.fao.org/3/i2107e/i2107e26.pdf
133 FAO. 2011. Guide for policy and programmatic actions at country level to address high food prices. FAO’s Initiative on Soaring Food Prices. Rome. www.fao.org/fileadmin/user_upload/ISFP/revisedISFP_guide_web.pdf
134 Takeshima, H. & Lee, H.L. 2012. Agricultural inputs subsidy and their developmental impact: conventional wisdom. Mozambique, Strategy Support Program, Policy Note 1. Washington, DC, IFPRI. http://ebrary.ifpri.org/cdm/ref/collection/p15738coll2/id/127220
135 World Bank. 2021. Needed: A Climate-Smart Food System That Can Feed 10 Billion. In: World Bank. Washington, DC. Cited 9 May 2022. www.worldbank.org/en/news/feature/2021/09/22/needed-a-climate-smart-food-system-that-can-feed-10-billion
136 Hemming, D.J., Chirwa, E.W., Dorward, A., Ruffhead, H.J., Hill, R., Osborn, J., Langer, L. et al. 2018. Agricultural input subsidies for improving productivity, farm income, consumer welfare and wider growth in low- and lower-middle-income countries: a systematic review. Campbell Systematic Reviews, 14(1): 1–153. https://doi.org/10.4073/csr.2018.4
137 Asfaw, S., Cattaneo, A., Pallante, G. & Palma, A. 2017. Impacts of modifying Malawi’s farm input subsidy programme targeting. FAO Agricultural Development Economics Working Paper 17-05. Rome, FAO. www.fao.org/3/a-i7753e.pdf
138 Seabloom, E.W., Borer, E.T., Hobbie, S.E. & MacDougall, A.S. 2021. Soil nutrients increase long-term soil carbon gains threefold on retired farmland. Global Change Biology, 27(19): 4909–4920. https://onlinelibrary.wiley.com/doi/10.1111/gcb.15778
139 Lortie, C.J., Filazzola, A., Kelsey, R., Hart, A.K. & Butterfield, H.S. 2018. Better late than never: a synthesis of strategic land retirement and restoration in California. Ecosphere, 9(8): e02367. https://onlinelibrary.wiley.com/doi/10.1002/ecs2.2367
140 Cain, Z. & Lovejoy, S. 2004. History and outlook for farm bill conservation programs. Choices. The magazine of food, farm and resource issues, 2004(4th quarter).
141 Wimberly, M.C., Janssen, L.L., Hennessy, D.A., Luri, M., Chowdhury, N.M. & Feng, H. 2017. Cropland expansion and grassland loss in the eastern Dakotas: New insights from a farm-level survey. Land Use Policy, 63: 160–173. https://linkinghub.elsevier.com/retrieve/pii/S0264837716310857
142 Olagunju, K.O., Patton, M. & Feng, S. 2020. Estimating the impact of decoupled payments on farm production in northern Ireland: an instrumental variable fixed effect approach. Sustainability, 12(8): 3222. www.mdpi.com/2071-1050/12/8/3222
143 Joshi, P.K., Gulati, A., Birthal, P.S. & Tewari, L. 2004. Agriculture diversification in South Asia patterns, determinants and policy implications. Economic and Political Weekly, 39(24): 2457–2467.
144 Schiavo, M. & Aubert, P.-M. 2020. For a successful protein transition: what measures are needed? Policy Brief No. 4, October 2020. Paris, IDDRI (Institut du développement durable et des relations internationales).
145 Alston, J.M. & Pardey, P.G. 2015. Agricultural R&D, food prices, poverty, and malnutrition redux. In D.E. Sahn, ed. The fight against hunger and malnutrition. The role of food, agriculture, and targeted policies, pp. 208–239. Oxford, UK, Oxford University Press. https://doi.org/10.1093/acprof:oso/9780198733201.003.0010
146 von der Goltz, J., Dar, A., Fishman, R., Mueller, N.D., Barnwal, P. & McCord, G.C. 2020. Health impacts of the green revolution: evidence from 600,000 births across the developing world. Journal of Health Economics, 74. https://doi.org/10.1016/j.jhealeco.2020.102373
THE STATE OF FOOD SECURITY AND NUTRITION IN THE WORLD 2022
| 215 |
147 OECD. 2018. How digital technologies are impacting the way we grow and distribute food. GFA 2018: Digital technologies in food and agriculture: reaping the benefits. Paper presented at the Global Forum on Agriculture, 14–15 May 2018, OECD Conference Centre, Paris. www.oecd.org/officialdocuments/publicdisplaydocumentpdf/?cote=TAD/CA/GF(2018)1&docLanguage=En
148 Walter, A., Finger, R., Huber, R. & Buchmann, N. 2017. Smart farming is key to developing sustainable agriculture. Proceedings of the National Academy of Sciences of the United States of America, 114(24): 6148–6150. https://doi.org/10.1073/pnas.1707462114
149 Torero, M. 2021. Robotics and AI in food security and innovation: why they matter and how to harness their power. In S. von Braun, J., M. Archer, G.M. Reichberg & M. Sánchez Sorondo, eds. Robotics, AI, and humanity, pp. 99–107. Springer. https://link.springer.com/chapter/10.1007/978-3-030-54173-6_8
150 OECD. 2019. Innovation, productivity and sustainability in food and agriculture. Main findings from country reviews and policy lessons. OECD Food and Agricultural Reviews. Paris. https://doi.org/10.1787/c9c4ec1d-en
151 IFPRI. 2019. Global food policy report 2019. Washington, DC, IFPRI. https://ebrary.ifpri.org/digital/collection/p15738coll2/id/133129
152 Anderson, J.R. & Birner, R. 2020. Fruits and vegetables in international agricultural research: a case of neglect? In H.K. Biesalski, ed. Hidden hunger and the transformation of food systems. How to combat the double burden of malnutrition? World Review of Nutrition and Dietetics, pp. 42–59. Basel, Germany, Karger Publishers. https://doi.org/10.1159/000507518
153 FAO. 2020. Fruit and vegetables – your dietary essentials. The International Year of Fruits and Vegetables, 2021, background paper. Rome, FAO. www.fao.org/documents/card/en/c/cb2395en
154 IRRI (International Rice Research Institute). 2019. Annual Report 2018. Statement by the Chair of the IRRI Board of Trustees for 2018. In: IRRI. Los Baños, the Philippines. Cited 10 May 2022. www.irri.org/ar2018-statement-chair-irri-board-trustees-2018
155 Jouanjean, M.-A. 2013. Targeting infrastructure development to foster agricultural trade and market integration in developing countries: an analytical review. London, ODI. https://cdn.odi.org/media/documents/ 8557.pdf
156 Dercon, S. 2006. Economic reform, growth and the poor: Evidence from rural Ethiopia. Journal of Development Economics, 81(1): 1–24. https://doi.org/10.1016/j.jdeveco.2005.05.008
157 Van Der Straeten, D., Bhullar, N.K., De Steur, H., Gruissem, W., MacKenzie, D., Pfeiffer, W., Qaim, M. et al. 2020. Multiplying the efficiency and impact of biofortification through metabolic engineering. Nature Communications, 11(5203). https://doi.org/10.1038/s41467-020-19020-4
158 Fanzo, J., Marshall, Q., Dobermann, D., Wong, J., Merchan, R.I., Jaber, M.I., Souza, A. et al. 2015. Integration of nutrition into extension and advisory services: a synthesis of experiences, lessons, and recommendations. Food and Nutrition Bulletin, 36(2): 120–137. https://doi.org/10.1177/0379572115586783
159 Rowe, L.A. 2020. Addressing the fortification quality gap: a proposed way forward. Nutrients, 12(12): 3899. https://doi.org/10.3390/nu12123899
160 Osendarp, S.J.M., Martinez, H., Garrett, G.S., Neufeld, L.M., De-Regil, L.M., Vossenaar, M. & Darnton-Hill, I. 2018. Large-scale food fortification and biofortification in low- and middle-income countries: a review of programs, trends, challenges, and evidence gaps. Food and Nutrition Bulletin, 39(2): 315–331. https://doi.org/10.1177/0379572118774229
161 Sirdey, N. & Cirad Moisa, A.A. 2020. Food fortification and domestic small-scale food chains’ actors – The case of Burkina Faso. INSIDER, Lot 1, Task 1.4
162 FAO. 2022. Food inspection | Food safety and quality. In: FAO. Rome. Cited 10 May 2022. www.fao.org/food-safety/food-control-systems/official-controls/food-inspection
163 Hoffmann, V. & Jones, K. 2021. Improving food safety on the farm: Experimental evidence from Kenya on incentives and subsidies for technology adoption. World Development, 143: 105406. https://doi.org/10.1016/ j.worlddev.2021.105406
NOTES
| 216 |
164 OECD. 2021. Improving regulatory delivery in food safety. Mitigating old and new risks, and fostering recovery. Paris. https://doi.org/10.1787/bf34907e-en
165 Tefft, J., Jonasova, M., Adjao, R. & Morgan, A. 2017. Food systems for an urbanizing world. Washington, DC, World Bank and Rome, FAO. www.fao.org/3/I8346EN/i8346en.pdf
166 World Bank. 2016. Future of food – shaping the global food system to deliver improved nutrition and health. Washington, DC. https://documents.worldbank.org/en/publication/documents-reports/documentdetail/474831468186561685/future-of-food-shaping-the-global-food-system-to-deliver-improved-nutrition-and-health
167 Garris, A. 2021. Food safety investments in East Africa: analysis and recommendations (2021). In: Agrilinks. Cited 10 May 2022. www.agrilinks.org/post/food-safety-investments-east-africa-analysis-and-recommendations-2021
168 Jaffee, S., Henson, S., Unnevehr, L., Grace, D. & Cassou, E. 2019. The safe food imperative: accelerating progress in low- and middle-income countries. Agriculture and Food Series. Washington, DC, World Bank.
169 FAO & WHO. 2019. Food control system assessment tool: Dimension A – Inputs and resources. Food safety and quality series No. 7/2. Rome, FAO. www.fao.org/3/ca5336en/ca5336en.pdf
170 FAO. 2022. Services and infrastructure for fresh fish retail | Food loss and waste in fish value chains. In: FAO. Rome. Cited 10 May 2022. www.fao.org/flw-in-fish-value-chains/value-chain/retail/fresh-fish-retail/services-infrastructure
171 ADB (Asian Development Bank). 2019. Dysfunctional horticulture value chains and the need for modern marketing infrastructure: the case of Viet Nam. Mandaluyong, the Philippines. www.adb.org/publications/dysfunctional-horticulture-value-chains-viet-nam
172 Johnson, D., Thilsted, S.H. & Belton, B. 2020. Dried fish in a COVID-19 world. In: WorldFish. Cited 10 May 2022. www.worldfishcenter.org/blog/dried-fish-covid-19-world
173 World Economic Forum. 2019. Innovation with a purpose: improving traceability in food value chains through technology innovations. Geneva, Switzerland. www3.weforum.org/docs/WEF_Traceability_in_food_value_chains_Digital.pdf
174 Reardon, T., Chen, K., Minten, B. & Adriano, L. 2012. The quiet revolution in staple food value chains: Enter the Dragon, the Elephant, and the Tiger. Mandaluyong, the Philippines, ADB. www.adb.org/sites/default/files/publication/30063/quiet-revolution-staple-food-value-chains.pdf
175 Dijkxhoorn, Y., De, B., Piters, S., Brouwer, I., Hengsdijk, H. & Tichar, T. 2021. Enhancing fruit and vegetable consumption in low- and middle income countries through a food systems approach. The Hague, The Netherlands, Wageningen Economic Research. https://edepot.wur.nl/555408
176 Leavens, L. 2021. More than a few rotten tomatoes: is it time to shift the agenda on post-harvest losses? In: CGIAR (Consultative Group for International Agricultural Research). Montpellier, France. Cited 10 May 2022. https://a4nh.cgiar.org/2021/11/03/more-than-a-few-rotten-tomatoes-is-it-time-to-shift-the-agenda-on-post-harvest-losses
177 Cattaneo, A., Sánchez, M. V., Torero, M. & Vos, R. 2021. Reducing food loss and waste: five challenges for policy and research. Food Policy, 98: 101974. https://doi.org/10.1016/j.foodpol.2020.101974
178 FAO. 2011. Chapter 25. Targeting the most vulnerable: emergency reserves and other instruments. In A. Prakash, ed. food security in volatile global markets, pp. 490–528. Rome, FAO. www.fao.org/3/i2107e/ i2107e00.htm
179 Glauber, J. & Sinha, T. 2021. Procuring food stocks under World Trade Organization farm subsidy rules. Winnipeg, Canada, IISD (International Institute for Sustainable Development). www.iisd.org/system/files/2021-08/food-stocks-wto-farm-subsidy-rules.pdf
180 WHO. 2021. Action framework for developing and implementing public food procurement and service policies for a healthy diet. Geneva, Switzerland.
181 Crawford, I.M. 1997. Commodity marketing. In I.M. Crawford, ed. Agricultural and food marketing management, pp. 142–166. Rome, FAO. www.fao.org/3/w3240e/w3240e06.htm
THE STATE OF FOOD SECURITY AND NUTRITION IN THE WORLD 2022
| 217 |
182 Acharya, S.S. 2003. Theme paper: agricultural marketing in Asia and the Pacific: issues and priorities. In FAO, ed. Proceedings of the mini roundtable meeting on agricultural marketing and food security. 1 to 2 November 2001. Bangkok, Thailand, pp. 95–110. Bangkok, FAO. www.fao.org/3/ad639e/ad639e05.htm
183 Coulter, J. & Onumah, G. 2002. The role of warehouse receipt systems in enhanced commodity marketing and rural livelihoods in Africa. Food Policy, 27(4): 319–337. https://doi.org/10.1016/S0306-9192(02)00018-0
184 HLPE (High Level Panel of Experts on Food Security and Nutrition). 2017. Nutrition and Food Systems. Rome. www.fao.org/3/a-i7846e.pdf
185 Covic, N. & Hendriks, S.L. 2016. Achieving a nutrition revolution for Africa: the road to healthier diets and optimal nutrition. Washington, DC, IFPRI. http://dx.doi.org/10.2499/9780896295933
186 Kafle, K., Songsermsawas, T. & Winters, P. 2022. Agricultural value chain development in Nepal: understanding mechanisms for poverty reduction. Agricultural Economics, 53(3): 356–373. https://onlinelibrary.wiley.com/doi/10.1111/agec.12696
187 Van Campenhout, B., Minten, B. & Swinnen, J. 2019. Domestic versus export-led agricultural transformation: evidence from Uganda’s dairy value chain. IFPRI discussion paper. Washington, DC, IFPRI. https://doi.org/10.2499/p15738coll2.133502
188 Banskota, N., Prasad, H.P., Upreti, S., Shah, K.K., Paudyal, B.R. & Paudel, S. 2020. Milk production and value chain in rural area of Nepal: a case from Gandaki river basin. Journal of Dairy Research & Technology, 3(022). https://doi.org/10.24966/DRT-9315/100022
189 FAO. 2022. NSP - Agricultural marketing institutions and value chains. In: FAO. Rome. Cited 10 May 2022. www.fao.org/agriculture/crops/thematic-sitemap/theme/spi/scpi-home/framework/policies-for-scpi/agricultural-marketing-institutions-and-value-chains
190 IFPRI. 2021. Global food policy report 2021. Transforming food systems after COVID-19. Washington, DC. https://doi.org/10.2499/9780896293991
191 Hawkes, C. 2020. COVID-19 and the promise of food system innovation. In J. Swinnen & J. McDermott, eds. COVID-19 and global food security, pp. 129–131. Washington, DC, IFPRI. https://doi.org/10.2499/p15738coll2.133762_29
192 Rossi, R. 2019. The EU fruit and vegetable sector: Main features, challenges and prospects. Strasbourg, France, EPRS (European Parliamentary Research Service). www.europarl.europa.eu/thinktank/en/document/EPRS_BRI(2019)635563
193 Kneafsey, M., Venn, L., Schmutz, U., Balázs, B., Trenchard, L., Eyden-Wood, T., Bos, E. et al. 2013. Short food supply chains and local food systems in the EU. A state of play of their socio-economic characteristics. Joint Research Centre, Institute for Prospective Technological Studies. Luxembourg, European Union. https://doi.org/10.2791/88784
194 Maundu, P. 2022. Kenya’s push to promote traditional food is good for nutrition and cultural heritage. In: The Conversation. Cited 23 May 2022. https://theconversation.com/kenyas-push-to-promote-traditional-food-is-good-for-nutrition-and-cultural-heritage-176384
195 Gee, E. 2022. Now under protection: traditional vegetables recognized by UNESCO in Kenya. In: Alliance Biodiversity - CIAT. Cited 23 May 2022. https://alliancebioversityciat.org/stories/traditional-vegetables-recognized-unesco-kenya
196 Baker, P., Machado, P., Santos, T., Sievert, K., Backholer, K., Hadjikakou, M., Russell, C. et al. 2020. Ultra-processed foods and the nutrition transition: Global, regional and national trends, food systems transformations and political economy drivers. Obesity Reviews, 21(12). https://onlinelibrary.wiley.com/doi/10.1111/obr.13126
197 Kelly, B., Vandevijvere, S., Ng, S.H., Adams, J., Allemandi, L., Bahena-Espina, L., Barquera, S. et al. 2019. Global benchmarking of children’s exposure to television advertising of unhealthy foods and beverages across 22 countries. Obesity Reviews, 20(S2): 116–128. https://doi.org/10.1111/obr.12840
198 OECD. 2021. Making better policies for food systems. Paris, OECD. https://doi.org/10.1787/ddfba4de-en
NOTES
| 218 |
199 FAO. 2017. Transnational corporations, food systems and their impacts on diets in developing countries. Trade Policy Technical Notes No. 17. Rome. www.fao.org/3/a-i8192e.pdf
200 Dillman Carpentier, F.R., Correa, T., Reyes, M. & Taillie, L.S. 2020. Evaluating the impact of Chile’s marketing regulation of unhealthy foods and beverages: pre-school and adolescent children’s changes in exposure to food advertising on television. Public Health Nutrition, 23(4): 747–755. https://doi.org/10.1017/S1368980019003355
201 WHO. 2010. Sixty-third World Health Assembly. WHA63/2010/REC/1. Geneva, Switzerland, WHO. https://apps.who.int/gb/ebwha/pdf_files/WHA63-REC1/WHA63_REC1-en.pdf
202 Alderman, H., Gentilini, U. & Yemtsov, R. 2017. The 1.5 billion people question: food, vouchers, or cash transfers? Washington, DC, World Bank. www.worldbank.org/en/topic/safetynets/publication/food-vouchers-or-cash-transfers
203 FAO. 2015. Food and agriculture policy classification. Food and Agriculture Policy Decision Analysis (FAPDA). Rome. www.fao.org/fileadmin/templates/fapda/docs/FAPDA_policy_classification_April2015.pdf
204 Black, A.P., Brimblecombe, J., Eyles, H., Morris, P., Vally, H. & O Dea, K. 2012. Food subsidy programs and the health and nutritional status of disadvantaged families in high income countries: a systematic review. BMC Public Health, 12(1099). https://bmcpublichealth.biomedcentral.com/articles/10.1186/1471-2458-12-1099
205 India State-Level Disease Burden Initiative Malnutrition Collaborators. 2019. The burden of child and maternal malnutrition and trends in its indicators in the states of India: the Global Burden of Disease Study 1990–2017. The Lancet Child and Adolescent Health, 3(12): 855–870. https://doi.org/10.1016/S2352-4642(19)30273-1
206 Ecker, O., Al-Riffai, P., Breisinger, C. & El-Batrawy, R. 2016. Nutrition and economic development: Exploring Egypt’s exceptionalism and the role of food subsidies. Washington, DC, IFPRI. http://dx.doi.org/10.2499/9780896292383
207 Malaiarasan, U., Paramasivam, R. & Felix, K.T. 2021. Does food price subsidy affect dietary diversity? Evidence from south India. Margin: The Journal of Applied Economic Research, 15(2): 268–290. https://doi.org/10.1177/0973801021990397
208 FAO. 2015. Nutrition and Social Protection. Rome. www.fao.org/3/a-i4819e.pdf
209 Sabates-Wheeler, R. & Devereux, S. 2018. Social protection and the World Food Programme. Occasional Paper 25. Rome, WFP. https://docs.wfp.org/api/documents/WFP-0000073283/download/?_ga=2.19843256.1024435674.1652183435-1442718054.1652183435
210 WFP. 2019. Fill the Nutrient Gap: Bangladesh – concise report. Rome. https://docs.wfp.org/api/documents/WFP-0000114508/download
211 FAO. 2014. Women’s resilience to food price volatility: A policy response. Rome. www.fao.org/3/i3617e/i3617e.pdf
212 Chen, Q., Pei, C., Bai, Y. & Zhao, Q. 2019. Impacts of nutrition subsidies on diet diversity and nutritional outcomes of primary school students in rural northwestern China — do policy targets and incentives matter? International Journal of Environmental Research and Public Health, 16(16): 2891. https://doi.org/10.3390/ijerph16162891
213 Cobiac, L.J., Tam, K., Veerman, L. & Blakely, T. 2017. Taxes and subsidies for improving diet and population health in Australia: a cost-effectiveness modelling study. PLOS Medicine, 14(2): e1002232. https://doi.org/10.1371/journal.pmed.1002232
214 WHO Regional Office for Europe. 2015. Using price policies to promote healthier diets. Copenhagen. www.euro.who.int/__data/assets/pdf_file/0008/273662/Using-price-policies-to-promote-healthier-diets.pdf
215 Takeshima, H., Smart, J. & Diao, X. 2021. Public expenditure’s role in reducing poverty and improving food and nutrition security: Preliminary cross-country insights based on SPEED data. IFPRI Discussion Paper 02051. Washington, DC, IFPRI. https://doi.org/10.2499/p15738coll2.134726
216 World Bank. 2015. The State of Social Safety Nets 2015. Washington, DC. http://hdl.handle.net/10986/22101
THE STATE OF FOOD SECURITY AND NUTRITION IN THE WORLD 2022
| 219 |
217 Olney, D.K., Gelli, A., Kumar, N., Alderman, H., Go, A., Raza, A., Owens, J. et al. 2021. Nutrition-sensitive social protection programs within food systems. IFPRI Discussion paper 02044. Rome, FAO and Washington, DC, IFPRI. https://ebrary.ifpri.org/digital/collection/p15738coll2/id/134593
218 UNICEF & National Institute of Population Studies. 2017. Complementary feeding practices in Pakistan: an in-depth analysis of PDHS 2012-13. Islamabad, UNICEF. www.unicef.org/pakistan/media/1496/file/Complementary
219 Swensson, L.F.J. 2018. Aligning policy and legal frameworks for supporting smallholder farming through public food procurement: the case of home-grown school feeding programmes. International Policy Centre for Inclusive Growth (IPC-IG) Working Paper No. 177. Rome, FAO and Brasilia, UNDP. www.fao.org/3/CA2060EN/ca2060en.pdf
220 Ministerio de Desarrollo Social y Famila de Chile. 2021. Ministerio de Desarrollo Social y Familia y Elige Vivir Sano lanzan aplicación para comprar frutas y verduras de ferias libres a domicilio. In: Ministerio de Desarrollo Social y Familia. Santiago. Cited 4 March 2022. www.desarrollosocialyfamilia.gob.cl/noticias/ministerio-de-desarrollo-social-y-familia-y-elige-vivir-sano-lanzan-aplicacion-para-comprar-frutas-y
221 Shankar, B. 2017. The influence of agricultural, trade and food policies on diets. Trade Policy Technical Notes No. 18. Rome, FAO. www.fao.org/3/a-i8190e.pdf
222 GLOPAN (Global Panel on Agriculture and Food Systems for Nutrition). 2021. Repurposing agriculture support to improve nutrition, health, and the environment. In: GLOPAN. London. Cited 5 May 2022. www.glopan.org/repurposing-agriculture-support-to-improve-nutrition-health-and-the-environment
223 Sánchez, M. V., Cicowiez, M. & Ortega, A. 2022. Prioritizing public investment in agriculture for post-COVID-19 recovery: A sectoral ranking for Mexico. Food Policy, 109: 102251. https://doi.org/10.1016/j.foodpol.2022.102251
224 Mamun, A., Martin, W. & Tokgoz, S. 2021. Reforming agricultural support for improved environmental outcomes. Applied Economic Perspectives and Policy, 43(4): 1520–1549. https://doi.org/10.1002/aepp.13141
225 Laborde, D., Mamun, A., Martin, W., Piñeiro, V. & Vos, R. 2021. Agricultural subsidies and global greenhouse gas emissions. Nature Communications, 12(1): 2601. http://www.nature.com/articles/s41467-021-22703-1
226 Gautam, M., Laborde, D., Mamun, A., Martin, W., Piñeiro, V. & Vos, R. 2022. Repurposing agricultural policies and support: options to transform agriculture and food systems to better serve the health of people, economies, and the planet. Washington, DC, World Bank and IFPRI. https://openknowledge.worldbank.org/handle/10986/36875
227 Springmann, M. & Freund, F. 2022. Options for reforming agricultural subsidies from health, climate, and economic perspectives. Nature Communications, 13(1): 82. www.nature.com/articles/s41467-021-27645-2
228 Springmann, M., Flynn, D.J., Kelly, N., Thomas, S.M., Freund, F. & Webb, P. 2021. Repurposing agriculture support to improve nutrition, health, and the environment. London, GLOPAN. www.glopan.org/resources-documents/repurposing_agricultural_support
229 Laborde, D., Mamun, A., Martin, W.J., Pineiro, V. & Vos, R. 2020. Modeling the impacts of agricultural support policies on emissions from agriculture. IFPRI Discussion Paper 01954. Washnigton, DC, IFPRI.
230 Glauber, J. & Laborde, D. (forthcoming). Repurposing food and agricultural policies to deliver affordable healthy diets, sustainably and inclusively: what is at stake? Background paper to The State of Food Security and Nutrition in the World 2022. FAO Agricultural Development Economics Working Paper 22-05. Rome, FAO.
231 UNDESA (United Nations Department of Economic and Social Affairs). 2019. Median age of population. New York, USA. https://population.un.org/wpp/Download/Standard/Population
232 IMF. 2021. World Economic Outlook Database, October 2021 Edition. In: IMF. Washington, DC. Cited 5 May 2022. www.imf.org/en/Publications/WEO/weo-database/2021/October
233 Sánchez, M. V., Cicowiez, M. & Pereira Fontes, F. 2022. Productive public investment in agriculture for economic recovery with rural well-being: an analysis of prospective scenarios for Uganda. FAO Agricultural Development Economics Technical Study No. 16. Rome, FAO. www.fao.org/documents/card/en/c/cb8730en
NOTES
| 220 |
234 Sánchez, M. V. & Cicowiez, M. 2022. Optimising policies to achieve agricultural transformation objectives: an application for Ethiopia. Journal of Applied Economics, 25(1): 765–783. https://doi.org/10.1080/15140326.2022.2056407
235 Sánchez, M. V. & Cicowiez, M. (forthcoming). Repurposing agriculture’s public budget to align healthy diets affordability and agricultural transformation objectives in Ethiopia. Background paper for The State of Food Security and Nutrition in the World 2022. FAO Agricultural Development Economics Working Paper 22-04. Rome, FAO.
236 FAO. 2011. The State of Food and Agriculture 2010-11. Women in agriculture: closing the gap for development. Rome, FAO. www.fao.org/docrep/013/i2050e/i2050e.pdf
237 WHO. (forthcoming). Policy brief: Reformulation of foods and beverages for healthier diets. Geneva, Switzerland.
238 WHO. 2022. Global database on the Implementation of Nutrition Action (GINA). In: WHO. Geneva, Switzerland. Cited 5 May 2022. https://extranet.who.int/nutrition/gina/en/home
239 Vesper, H.W., Kuiper, H.C., Mirel, L.B., Johnson, C.L. & Pirkle, J.L. 2012. Levels of plasma trans-fatty acids in non-hispanic white adults in the United States in 2000 and 2009. JAMA, 307(6): 562. http://jama.jamanetwork.com/article.aspx?doi=10.1001/jama.2012.112
240 Zhang, Z., Gillespie, C. & Yang, Q. 2017. Plasma trans-fatty acid concentrations continue to be associated with metabolic syndrome among US adults after reductions in trans-fatty acid intake. Nutrition Research, 43: 51–59. https://linkinghub.elsevier.com/retrieve/pii/S0271531716307436
241 Brandt, E.J., Myerson, R., Perraillon, M.C. & Polonsky, T.S. 2017. Hospital admissions for myocardial infarction and stroke before and after the trans-fatty acid restrictions in New York. JAMA cardiology, 2(6): 627–634. www.ncbi.nlm.nih.gov/pubmed/28403435
242 Restrepo, B.J. & Rieger, M. 2016. Denmark’s policy on artificial trans fat and cardiovascular disease. American Journal of Preventive Medicine, 50(1): 69–76. www.ncbi.nlm.nih.gov/pubmed/26319518
243 Restrepo, B.J. & Rieger, M. 2016. Trans fat and cardiovascular disease mortality: evidence from bans in restaurants in New York. Journal of Health Economics, 45: 176–96. www.ncbi.nlm.nih.gov/pubmed/26620830
244 Downs, S.M., Thow, A.M. & Leeder, S.R. 2013. The effectiveness of policies for reducing dietary trans fat: a systematic review of the evidence. Bulletin of the World Health Organization, 91(4): 262-269H. www.who.int/entity/bulletin/volumes/91/4/12-111468.pdf
245 Downs, S.M., Thow, A.M., Ghosh-Jerath, S. & Leeder, S.R. 2015. Identifying the barriers and opportunities for enhanced coherence between agriculture and public health policies: improving the fat supply in India. Ecology of Food and Nutrition, 54(6): 603–624. www.tandfonline.com/doi/full/10.1080/03670244. 2015.1017759
246 WHO. 2021. Countdown to 2023: WHO report on global trans fat elimination 2021. Geneva, Switzerland. www.who.int/publications/i/item/9789240031876
247 Santos, J.A., Sparks, E., Thout, S.R., McKenzie, B., Trieu, K., Hoek, A., Johnson, C. et al. 2019. The Science of Salt: A global review on changes in sodium levels in foods. The Journal of Clinical Hypertension, 21(8): 1043–1056. https://onlinelibrary.wiley.com/doi/10.1111/jch.13628
248 Santos, J.A., McKenzie, B., Rosewarne, E., Hogendorf, M., Trieu, K., Woodward, M., Cobb, L.K. et al. 2021. Strengthening knowledge to practice on effective salt reduction interventions in low- and middle-income countries. Current Nutrition Reports, 10(3): 211–225. https://link.springer.com/10.1007/s13668-021-00365-1
249 WHO. 2021. WHO global sodium benchmarks for different food categories. Geneva, Switzerland. https://apps.who.int/iris/bitstream/handle/10665/341081/9789240025097-eng.pdf
250 GLOPAN. 2015. Biofortification: an agricultural investment for nutrition. Policy Brief N. 1. London. www.glopan.org/biofortification
251 Mkambula, P., Birol, E., Friesen, V.M., Munyua, H.M., Alberts, D., Aytekin, D., Mudyahoto, B. et al. 2022. Transforming food systems to deliver nutritious foods: the vital roles of fortification and biofortification. Geneva, Switzerland, GAIN and HarvestPlus. www.gainhealth.org/sites/default/files/publications/documents/GAIN-Discussion-Paper-Series-10-Transforming-food-systems-to-deliver-nutritious-foods-the-vital-roles-of-fortification-and-biofortification.pdf
THE STATE OF FOOD SECURITY AND NUTRITION IN THE WORLD 2022
| 221 |
252 WHO. 2009. Recommendations on wheat and maize flour fortification meeting report: interim consensus statement. Geneva, Switzerland.
253 WHO. 2016. Guideline: fortification of maize, flour and corn meal with vitamins and minerals. Geneva, Switzerland, Switzerland.
254 WHO. 2018. Guideline: fortification of rice with vitamins and minerals as a public health startegy. Geneva, Switzerland.
255 WHO & FAO. 2006. Guidelines on food fortification with micronutrients. Geneva, Switzerland, WHO and Rome, FAO. www.unscn.org/layout/modules/resources/files/fortification_eng.pdf
256 WHO. 2014. Guideline: fortification of food-grade salt with iodine for the prevention and control of iodine deficiency disorders. Geneva, Switzerland.
257 WHO. 2022. Food fortification. In: WHO. Geneva, Switzerland. Cited 18 May 2022. www.who.int/health-topics/food-fortification#tab=tab_1
258 WHO. 2019. Guiding principles and framework manual for front-of-pack labelling for promoting healthy diet. Geneva, Switzerland. https://apps.who.int/nutrition/publications/policies/guidingprinciples-labelling-promoting-healthydiet.pdf?ua=1
259 WHO. (forthcoming). Protecting children from the harmful impact of food marketing: policy brief. Geneva, Switzerland.
260 WHO. (forthcoming). Policy brief: nutrition labelling. Geneva, Switzerland.
261 WHO. 2022. Scope and impact of digital marketing strategies for promoting breastmilk substitutes. Geneva, Switzerland. www.who.int/publications/i/item/9789240046085
262 WHO. 2010. Set of recommendations on the marketing of foods and non-alcoholic beverages to children. Geneva, Switzerland.
263 WHO. 1981. International Code of Marketing of Breast-milk Substitutes. Geneva, Switzerland.
264 World Health Assembly. 2016. Ending inappropriate promotion of foods for infants and young children. Geneva, Switzerland, WHO. http://apps.who.int/gb/ebwha/pdf_files/WHA69/A69_R9-en.pdf
265 WHO. 2022. Marketing of breast-milk substitutes: national implementation of the International Code. Status Report 2022. Geneva, Switzerland. www.who.int/publications/i/item/9789240048799
266 Campos, S., Doxey, J. & Hammond, D. 2011. Nutrition labels on pre-packaged foods: a systematic review. Public Health Nutrition, 14(8): 1496–1506. www.cambridge.org/core/product/identifier/S1368980010003290/type/journal_article
267 Drichoutis, A.C. & Nayga, R.M. 2006. Consumers’ use of nutritional labels: a review of research studies and issues. Academy of Marketing Science Review, 2006(9): 1–26.
268 Volkova, E. & Ni Mhurchu, C. 2015. The influence of nutrition labeling and point-of-purchase information on food behaviours. Current Obesity Reports, 4(1): 19–29. http://link.springer.com/10.1007/s13679-014-0135-6
269 Shangguan, S., Afshin, A., Shulkin, M., Ma, W., Marsden, D., Smith, J., Saheb-Kashaf, M. et al. 2019. A meta-analysis of food labeling effects on consumer diet behaviors and industry practices. American Journal of Preventive Medicine, 56(2): 300–314. www.ncbi.nlm.nih.gov/pubmed/30573335
270 Anastasiou, K., Miller, M. & Dickinson, K. 2019. The relationship between food label use and dietary intake in adults: a systematic review. Appetite, 138: 280–291. https://linkinghub.elsevier.com/retrieve/pii/S0195666318312807
271 Cowburn, G. & Stockley, L. 2005. Consumer understanding and use of nutrition labelling: a systematic review. Public Health Nutrition, 8(1): 21–28. www.ingentaselect.com/rpsv/cgi-bin/cgi?ini=xref&body=linker&reqdoi=10.1079/PHN2005666
272 Hawley, K.L., Roberto, C.A., Bragg, M.A., Liu, P.J., Schwartz, M.B. & Brownell, K.D. 2013. The science on front-of-package food labels. Public Health Nutrition, 16(3): 430–439. www.cambridge.org/core/product/identifier/S1368980012000754/type/journal_article
NOTES
| 222 |
273 Mhurchu, C.N. & Gorton, D. 2007. Nutrition labels and claims in New Zealand and Australia: a review of use and understanding. Australian and New Zealand Journal of Public Health, 31(2): 105–112. https://onlinelibrary.wiley.com/doi/10.1111/j.1753-6405.2007.00026.x
274 WHO. 2017. Tackling NCDs: ‘Best buys’ and other recommended interventions for the prevention and control of noncommunicable diseases. Geneva, Switzerland.
275 Batis, C., Rivera, J.A., Popkin, B.M. & Taillie, L.S. 2016. First-year evaluation of Mexico’s tax on nonessential energy-dense foods: an observational study. PLOS Medicine, 13(7): e1002057. https://dx.plos.org/10.1371/journal.pmed.1002057
276 Eykelenboom, M., van Stralen, M.M., Olthof, M.R., Schoonmade, L.J., Steenhuis, I.H.M. & Renders, C.M. 2019. Political and public acceptability of a sugar-sweetened beverages tax: a mixed-method systematic review and meta-analysis. International Journal of Behavioral Nutrition and Physical Activity, 16(1): 78. https://ijbnpa.biomedcentral.com/articles/10.1186/s12966-019-0843-0
277 Nipers, A., Upite, I., Pilvere, I., Stalgiene, A. & Viira, A.-H. 2019. Effect of VAT rate reduction for fruits and vegetables on prices in Latvia: ex-post analysis. Agraarteadus: Journal of Agricultural Science, 30(1): 25–31.
278 Healthy Food Policy Project. 2022. Municipal policy options for healthy food access in stores and restaurants. Cited 9 May 2022. https://healthyfoodpolicyproject.org/key-issues/municipal-policy-options-for-healthy-food-access-in-stores-and-restaurants
279 WHO. 2021. Increasing access to healthy food in schools. Geneva, Switzerland. https://cdn.who.int/media/docs/default-source/urban-health-documents/lima_healthy-food-wcd-2021.pdf?sfvrsn=cc68950b_5
280 WCRF (World Cancer Research Fund International). 2022. Planning restrictions on food outlets. In: NOURISHING Database. London. Cited 9 May 2022. https://policydatabase.wcrf.org/level_one?page=nourishing-level-one#step2=5%23step3=340
281 Korean Ministry of Food and Drug Safety. 2008. Special Act on Safety Management of Children’s Dietary Lifestyle. Act No. 12391. Cheongju, South Korea.
282 New York City Economic Development Corporation. 2015. FRESH Impact Report. New York, USA. https://healthyfoodretailnyc.org/wp-content/uploads/2018/04/FRESH-Food-Retail-Expansion-to-Support-Health-Program-Impact-Report.pdf
283 Mikkelsen, B.E. & Madsen, B.B. 2021. Sustainable and healthy sourcing of food for the public plate: lessons learned in Denmark. In FAO, Alliance of Bioversity International and CIAT & Editora da UFRGS, eds. Public food procurement for sustainable food systems and healthy diets - Volume 2, pp. 82–98. Rome, FAO; Bioversity International. www.fao.org/documents/card/en/c/cb7969en
284 European Commission. 2020. Procuring healthy and sustainable vegetables for Vienna’s nursing homes. GPP in practice, Issue No 99. Brussels. https://ec.europa.eu/environment/gpp/pdf/news_alert/Issue_99_Case_Study_187_Vienna.pdf
285 European Commision. 2014. Procurement of 100% organic, seasonal food. Municipality of Copenhagen, Denmark. GPP In practice, N. 47. Brussels. https://ec.europa.eu/environment/gpp/pdf/news_alert/Issue47_Case_Study97_Copenhagen.pdf
286 Valencia, V., Wittman, H. & Blesh, J. 2019. Structuring markets for resilient farming systems. Agronomy for Sustainable Development, 39(2): 25. http://link.springer.com/10.1007/s13593-019-0572-4
287 Quezon City Government. 2021. QC first LGU to implement healthy food procurement. In: Quezon City Government Official Website. Cited 9 May 2022. https://quezoncity.gov.ph/qc-first-lgu-to-implement-healthy-food-procurement-policy/
288 Oxford Policy Management. 2017. Shock-Responsive Social Protection Systems Research: Literature review (2nd Edition). Oxford, UK. www.opml.co.uk/sites/default/files/Shock_responsive_social_protection_Literature review_EN.pdf
289 Devereux, S. 2021. Social protection responses to COVID-19 in Africa. Global Social Policy, 21(3): 421–447. http://journals.sagepub.com/doi/10.1177/ 14680181211021260
THE STATE OF FOOD SECURITY AND NUTRITION IN THE WORLD 2022
| 223 |
290 Cejudo, G.M., Michel, C.L. & de los Cobos, P. 2021. Policy responses to the pandemic for COVID-19 in Latin America and the Caribbean: the use of cash transfer programs and social protection information systems. Policy Documents Series - UNDP LAC C19 PDS N. 24. New York, USA, UNDP.
291 Marzi, M. 2021. Towards shock-responsive social protection: estimates from the COVID- 19 microsimulation in Sierra Leone. Shock-responsive social protection responses during COVID-19. Oxford, UK, Oxford Policy Management.
292 Yusuf, Y., Marzi, M., Seyfert, K. & Doyle, A. 2021. Towards shock-responsive social protection: lessons from the COVID-19 response in Sierra Leone. Shock-responsive social protection responses during COVID-19. Oxford, UK, Oxford Policy Management.
293 Sadoulet, E., Janvry, A. de & Davis, B. 2001. Cash transfer programs with income multipliers: PROCAMPO in Mexico. World Development, 29(6): 1043–1056. https://linkinghub.elsevier.com/retrieve/pii/S0305750X01000183
294 Lambert, F. & Park, H. 2019. Income inequality and government transfers in Mexico. IMF Working Papers - WP/19/148. Washington, DC, IMF.
295 Martini, R. 2007. The role of compensation in policy reform. OECD Food, Agriculture and Fisheries Papers N. 5. Paris, OECD.
296 WFP. 2021. The role of food security and nutrition-sensitive social protection in bridging the humanitarian-development divide in the Southern African Region. Rome. https://docs.wfp.org/api/documents/WFP-0000129083/download
297 Presidencia de la República Dominicana. 2021. Palabras del presidente Abinader durante la extensión del programa ‘Quédate en casa’ y creación de ‘Supérate’. In: Presidencia de la República Dominicana. Santo Domingo. Cited 9 May 2022. https://presidencia.gob.do/discursos/palabras-del-presidente-abinader-durante-la-extension-del-programa-quedate-en-casa-y
298 WFP. 2015. Lesotho Development School Meals Programme. In: WFP. Rome. Cited 9 May 2022. www.wfp.org/operations/200199-lesotho-development-school-meals-programme
299 Food Systems Summit Community. 2021. Social Protection for Food Systems Transformation Consortium. Cited 9 May 2022. https://foodsystems.community/social-protection-for-food-systems-transformation-consortium-2
300 FAO. 2010. Sustainable diets and biodiversity: directions and solutions for policy, research and action. Rome. www.fao.org/3/a-i3004e.pdf
301 IFAD & Bioversity International. 2021. How to do – Promote neglected and underutilized species for domestic markets. Nutrition-sensitive Agriculture - Note no. 3. Rome, IFAD. www.ifad.org/documents/38714170/43559125/HTDN_NUS_3.pdf/297d93eb-330b-19a1-4804-c31d49e9fd37?t=1629384619783
302 Montgomery, D.R., Biklé, A., Archuleta, R., Brown, P. & Jordan, J. 2022. Soil health and nutrient density: preliminary comparison of regenerative and conventional farming. PeerJ, 10: e12848. https://peerj.com/articles/12848
303 IFAD. 2021. Rural Development Report 2021. Transforming food systems for rural prosperity. Rome. www.ifad.org/documents/38714170/43704363/rdr2021.pdf/d3c85b6a-229a-c6f1-75e2-a67bb8b505b2?t=1631621454882
304 Chiriac, D., Naran, B. & Falconer, A. 2020. Examining the climate finance gap for small-scale agriculture. Rome, CPI and IFAD. www.ifad.org/documents/38714170/ 42157470/climate-finance-gap_smallscale_agr.pdf/34b2e25b-7572-b31d-6d0c-d5ea5ea8f96f
305 Cavatassi, R. & Gemessa, S.A. 2021. Impact assessment report: Economic Inclusion Programme for Families and Rural Communities in the Territory of Plurinational State of Bolivia. Rome, IFAD.
306 Boukaka, S., Azzarri, C., Haile, B., Yasser, R., Garbero, A. & Cavatassi, R. 2022. Impact assessment report: Programme to Reduce Vulnerability in Coastal Fishing Areas, Djibouti. Rome, IFAD.
307 Arslan, A., Cavatassi, R., Gemessa, S.A. & Maggio, G. 2022. Impact assessment report: Pro-Poor Value Chain Development in the Maputo and Limpopo Corridors, Mozambique. Rome, IFAD.
308 Cavatassi, R. & Gemessa, S.A. 2022. Impact assessment report: Livestock and Pasture Development Project II, Tajikistan. Rome, IFAD.
NOTES
| 224 |
309 Afonina, M., Bohn, S., Hamad, M., Marti, A. & Pasha, A. 2021. Impact assessment report: Viet Nam and Adaptation to Climate Change in the Mekong Delta in Ben Tre and Tra Vinh Provinces, Viet Nam. Rome, IFAD.
310 WHO. 2021. Food systems delivering better health: a new narrative to guide policy and practice for better human, ecosystem and animal health and well-being. Executive summary. Geneva, Switzerland. www.who.int/publications/i/item/9789240031814
311 WHO. 2019. Essential nutrition actions: mainstreaming nutrition through the life-course. Geneva, Switzerland.
312 World Bank. 2021. Employment in agriculture (% of total employment) (modeled ILO estimate). In: World Bank – Databank. Washington, DC. Cited 9 May 2022. https://data.worldbank.org/indicator/SL.AGR.EMPL.ZS
313 Boedeker, W., Watts, M., Clausing, P. & Marquez, E. 2020. The global distribution of acute unintentional pesticide poisoning: estimations based on a systematic review. BMC Public Health, 20(1): 1875. https://bmcpublichealth.biomedcentral.com/articles/10.1186/s12889-020-09939-0
314 WHO. 2017. One Health. In: WHO. Geneva, Switzerland. Cited 9 May 2022. www.who.int/news-room/questions-and-answers/item/one-health
315 Häsler, B., Bazeyo, W., Byrne, A.W., Hernandez-Jover, M., More, S.J., Rüegg, S.R., Schwarzmann, O. et al. 2020. Reflecting on One Health in action during the COVID-19 response. Frontiers in Veterinary Science, 7. www.frontiersin.org/articles/10.3389/fvets.2020.578649/full
316 FAO & WHO. 2020. Code of practice for fish and fishery products. Rome. https://doi.org/10.4060/cb0658en
317 Place, F.M., Stoian, D. & Minot, N. 2022. COVID-19, agricultural production, and food value chains. In J. McDermott & J. Swinnen, eds. COVID-19 and global food security: two years later, pp. 73–81. Washnigton, DC, IFPRI. https://ebrary.ifpri.org/digital/collection/p15738coll2/id/135009
318 Liverpool-Tasie, L.S.O., Reardon, T. & Belton, B. 2021. “Essential non-essentials”: COVID-19 policy missteps in Nigeria rooted in persistent myths about African food supply chains. Applied Economic Perspectives and Policy, 43(1): 205–224. https://onlinelibrary.wiley.com/doi/10.1002/aepp.13139
319 Chowdhury, M.A.F., Meo, M.S., Uddin, A. & Haque, M.M. 2021. Asymmetric effect of energy price on commodity price: New evidence from NARDL and time frequency wavelet approaches. Energy, 231: 120934. https://linkinghub.elsevier.com/retrieve/pii/S0360544221011828
320 FAO. 2022. FAO Food Price Index. In: World Food Situation. Rome. Cited 10 May 2022. www.fao.org/worldfoodsituation/foodpricesindex/en/
321 Crippa, M., Solazzo, E., Guizzardi, D., Monforti-Ferrario, F., Tubiello, F.N. & Leip, A. 2021. Food systems are responsible for a third of global anthropogenic GHG emissions. Nature Food, 2(3): 198–209. www.nature.com/articles/s43016-021-00225-9
322 IEA (International Energy Agency), IRENA (International Renewable Energy Agency), UNSD (United Nations Statistics Division), World Bank & WHO. 2021. Tracking SDG7: The Energy Progress Report. Washington, DC, World Bank. https://trackingsdg7.esmap.org/data/files/download-documents/2021_tracking_sdg7_report.pdf
323 FAO. 2011. ‘Energy-smart’ food for people and climate. Issue paper. Rome. www.fao.org/family-farming/detail/es/c/285125
324 Mercier, S., Mondor, M., McCarthy, U., Villeneuve, S., Alvarez, G. & Uysal, I. 2019. Optimized cold chain to save food. In C.M. Galanakis, ed. Saving Food, pp. 203–226. London, Elsevier. https://linkinghub.elsevier.com/retrieve/pii/B9780128153574000079
325 Han, J.-W., Zuo, M., Zhu, W.-Y., Zuo, J.-H., Lü, E.-L. & Yang, X.-T. 2021. A comprehensive review of cold chain logistics for fresh agricultural products: Current status, challenges, and future trends. Trends in Food Science & Technology, 109: 536–551. https://linkinghub.elsevier.com/retrieve/pii/S0924224421000728
326 IEA. 2021. Net Zero by 2050: a roadmap for the global energy sector. Paris. www.iea.org/reports/net-zero-by-2050
327 FAO. 2017. Strengthening sector policies for better food security and nutrition results: political economy analysis. Policy Guidance Note 8. Rome. www.fao.org/3/i7212en/I7212EN.pdf
328 North, D.C. 1991. Institutions. Journal of Economic Perspectives, 5(1): 97–112. https://doi.org/10.1257/jep.5.1.97
THE STATE OF FOOD SECURITY AND NUTRITION IN THE WORLD 2022
| 225 |
329 Bojić, D., Clark, M. & Urban, K. (forthcoming). Focus on governance for more effective policy and technical support. Governance and policy support framework paper. Rome, FAO.
330 FAO. 2013. Reviewed Strategic Framework. FAO Conference – Thirty-eight Session. Rome, 15 - 22 June 2013. Rome, FAO. www.fao.org/docrep/meeting/027/mg015e.pdf
331 Booth, A., Barnes, A., Laar, A., Akparibo, R., Graham, F., Bash, K., Asiki, G. et al. 2021. Policy action within urban African food systems to promote healthy food consumption: a realist synthesis in Ghana and Kenya. International Journal of Health Policy and Management, 10: 828–844. www.ijhpm.com/article_4011.html
332 Booth, D. 2014. Agricultural policy choice. Interests, ideas and the scope for reform. IIED Working Pape. London, IIED (International Institute for Environment and Development). https://pubs.iied.org/sites/default/files/pdfs/migrate/14634IIED.pdf
333 Swinnen, J. 2021. The political economy of agricultural and food policies. In K. Otsuka & S. Fan, eds. Agricultural development: New perspectives in a changing world, pp. 471–502. Washnigton, DC, IFPRI. https://ebrary.ifpri.org/digital/collection/p15738coll2/id/134122
334 Fałkowski, J. & Olper, A. 2014. Political competition and policy choices: the evidence from agricultural protection. Agricultural Economics, 45(2): 143–158. https://onlinelibrary.wiley.com/doi/10.1111/agec.12018
335 Baker, P., Brown, A.D., Wingrove, K., Allender, S., Walls, H., Cullerton, K., Lee, A. et al. 2019. Generating political commitment for ending malnutrition in all its forms: A system dynamics approach for strengthening nutrition actor networks. Obesity Reviews, 20(S2): 30–44. https://onlinelibrary.wiley.com/doi/10.1111/obr.12871
336 European Commission. 2021. Common Agricultural Policy: key graphs & figures. Brussels. https://ec.europa.eu/info/sites/default/files/food-farming-fisheries/farming/documents/cap-expenditure-graph1_en.pdf
337 Dengerink, J., Dirks, F., Likoko, E. & Guijt, J. 2021. One size doesn’t fit all: regional differences in priorities for food system transformation. Food Security, 13(6): 1455–1466. https://link.springer.com/10.1007/s12571-021-01222-3
338 Hawkes, C. 2006. Uneven dietary development: linking the policies and processes of globalization with the nutrition transition, obesity and diet-related chronic diseases. Globalization and Health, 2(1): 4. https://globalizationandhealth.biomedcentral.com/articles/10.1186/1744-8603-2-4
339 Thow, A.M., Greenberg, S., Hara, M., Friel, S., DuToit, A. & Sanders, D. 2018. Improving policy coherence for food security and nutrition in South Africa: a qualitative policy analysis. Food Security, 10(4): 1105–1130. http://link.springer.com/10.1007/s12571-018-0813-4
340 UNSCN. 2016. Enhancing coherence between trade policy and nutrition action: implementing the Framework for Action of the Second International Conference on Nutrition. Rome. www.unscn.org/uploads/web/news/document/ExSumm1-EN-WEBok.pdf
341 Thow, A.M., Snowdon, W., Schultz, J.T., Leeder, S., Vivili, P. & Swinburn, B.A. 2011. The role of policy in improving diets: experiences from the Pacific Obesity Prevention in Communities food policy project. Obesity Reviews, 12: 68–74. https://onlinelibrary.wiley.com/doi/10.1111/j.1467-789X.2011.00910.x
342 Branca, F., Demaio, A., Udomkesmalee, E., Baker, P., Aguayo, V.M., Barquera, S., Dain, K. et al. 2020. A new nutrition manifesto for a new nutrition reality. The Lancet, 395(10217): 8–10. https://linkinghub.elsevier.com/retrieve/pii/S014067361932690X
343 Gillespie, S., Haddad, L., Mannar, V., Menon, P. & Nisbett, N. 2013. The politics of reducing malnutrition: building commitment and accelerating progress. The Lancet, 382(9891): 552–569. https://linkinghub.elsevier.com/retrieve/pii/S0140673613608429
344 Du, M., Tugendhaft, A., Erzse, A. & Hofman, K.J. 2018. Sugar-sweetened beverage taxes: industry response and tactics. The Yale Journal of Biology and Medicine, 91(2): 185–190. www.ncbi.nlm.nih.gov/pubmed/29955223
345 Milsom, P., Smith, R., Modisenyane, S.M. & Walls, H. 2021. Do international trade and investment agreements generate regulatory chill in public health policymaking? A case study of nutrition and alcohol policy in South Africa. Globalization and Health, 17(1): 104. https://globalizationandhealth.biomedcentral.com/articles/10.1186/s12992-021-00757-6
NOTES
| 226 |
346 Baker, P., Zambrano, P., Mathisen, R., Singh-Vergeire, M.R., Escober, A.E., Mialon, M., Lawrence, M. et al. 2021. Breastfeeding, first-food systems and corporate power: a case study on the market and political practices of the transnational baby food industry and public health resistance in the Philippines. Globalization and Health, 17(1): 125. https://globalizationandhealth.biomedcentral.com/articles/10.1186/s12992-021-00774-5
347 Russ, K., Baker, P., Byrd, M., Kang, M., Siregar, R.N., Zahid, H. & McCoy, D. 2021. What you don’t know about the codex can hurt you: how trade policy trumps global health governance in infant and young child nutrition. International Journal of Health Policy and Management, 10: 983–997. www.ijhpm.com/article_4101.html
348 Mialon, M., Gaitan Charry, D.A., Cediel, G., Crosbie, E., Scagliusi, F.B. & Perez Tamayo, E.M. 2021. ‘I had never seen so many lobbyists’: food industry political practices during the development of a new nutrition front-of-pack labelling system in Colombia. Public Health Nutrition, 24(9): 2737–2745. www.cambridge.org/core/product/identifier/S1368980020002268/type/journal_article
349 Garton, K., Thow, A.M. & Swinburn, B. 2021. International trade and investment agreements as barriers to food environment regulation for public health nutrition: a realist review. International Journal of Health Policy and Management, 10: 745–765. www.ijhpm.com/article_ 3933.html
350 Thow, A.M., Jones, A., Schneider, C.H. & Labonté, R. 2019. Global governance of Front-of-Pack nutrition labelling: a qualitative analysis. Nutrients, 11(2): 268. www.mdpi.com/2072-6643/11/2/268
351 Lauber, K., Ralston, R., Mialon, M., Carriedo, A. & Gilmore, A.B. 2020. Non-communicable disease governance in the era of the sustainable development goals: a qualitative analysis of food industry framing in WHO consultations. Globalization and Health, 16(1): 76. https://globalizationandhealth.biomedcentral.com/articles/10.1186/s12992-020-00611-1
352 Reardon, T., Timmer, C.P. & Minten, B. 2012. Supermarket revolution in Asia and emerging development strategies to include small farmers. Proceedings of the National Academy of Sciences, 109(31): 12332–12337. https://pnas.org/doi/full/10.1073/pnas.1003160108
353 Walkenhorst, P. 2008. The geography of foreign direct investment in Poland’s food industry. Journal of Agricultural Economics, 52(3): 71–86. https://onlinelibrary.wiley.com/doi/10.1111/j.1477-9552.2001.tb00939.x
354 Pulker, C.E., Trapp, G.S.A., Scott, J.A. & Pollard, C.M. 2018. What are the position and power of supermarkets in the Australian food system, and the implications for public health? A systematic scoping review. Obesity Reviews, 19(2): 198–218. https://onlinelibrary.wiley.com/doi/10.1111/obr.12635
355 Blanchard, T. & Lyson, T. 2009. Retail concentration, food deserts, and food disadvantaged communities. In C.C. Hinrichs & T.A. Lyson, eds. Remaking the North American food system: strategies for sustainability, pp. 201–215. Lincoln, USA, University of Nebraska Press.
356 Minten, B., Reardon, T. & Sutradhar, R. 2010. Food prices and modern retail: the case of Delhi. World Development, 38(12): 1775–1787. https://linkinghub.elsevier.com/retrieve/pii/S0305750X10000884
357 FAO & GAIN (Global Alliance for Improved Nutrition). 2018. Leveraging small and medium enterprises to improve nutrition. Rome, FAO. www.fao.org/publications/card/es/c/CA2880EN/
358 Santacoloma, P. & Anta, M. 2020. The role of small-and medium-sized enterprises in addressing the nutrition challenge: reflections from project implementation in Ghana, Kenya and Viet Nam. Policy in Focus, 18(1): 19–21.
359 de Janvry, A., Fafchamps, M. & Sadoulet, E. 1991. Peasant household behaviour with missing markets: some paradoxes explained. The Economic Journal, 101(409): 1400. https://academic.oup.com/ej/article/101/409/1400-1417/5188354
360 Key, N., Sadoulet, E. & Janvry, A. De. 2000. Transactions costs and agricultural household supply response. American Journal of Agricultural Economics, 82(2): 245–259. https://onlinelibrary.wiley.com/doi/abs/10.1111/0002-9092.00022
361 Ajwang, F. 2020. Relational contracts and smallholder farmers’ entry, stay and exit, in Kenyan fresh fruits and vegetables export value chain. The Journal of Development Studies, 56(4): 782–797. www.tandfonline.com/doi/full/10.1080/00220388.2019.1618451
THE STATE OF FOOD SECURITY AND NUTRITION IN THE WORLD 2022
| 227 |
362 AGRA (Alliance for a Green Revolution in Africa). 2019. Africa Agriculture Status Report: The Hidden Middle: a quiet revolution in the private sector driving agricultural transformation (Issue 7). Nairobi. https://agra.org/wp-content/uploads/2019/09/AASR2019-The-Hidden-Middleweb.pdf
363 Arslan, A., Higgins, D., Egger, E.-M. & Zucchini, E. 2020. Impact assessment report for the Strengthening Local Development in the Highlands and High Rainforest Areas Project, Peru. Rome, IFAD.
364 Steiner, S., Arslan, A. & Paolantonio, A. 2022. Impact assessment report: Inclusive Rural Development Program (PRODERI), Argentina. Rome, IFAD.
365 Kern, J., Munoz, A., Richert, K. & Weiss, A. 2021. Impact assessment report: Productive Partnerships in Agriculture Project, Papua New Guinea. Rome, IFAD.
366 Arslan, A., Chiarella, C. & Songsermsawas, T. 2022. Impact assessment report: Rural Development Programme – Phase II, Solomon Islands. Rome, IFAD.
367 Rossi, A., Bui, S. & Marsden, T. 2019. Redefining power relations in agrifood systems. Journal of Rural Studies, 68: 147–158. https://linkinghub.elsevier.com/retrieve/pii/S0743016718304273
368 De Schutter, O. 2017. The political economy of food systems reform. European Review of Agricultural Economics, 44(4): 705–731. http://academic.oup.com/erae/article/44/4/705/3814333/The-political-economy-of-food-systems-reform
369 Ortiz, R. & Peris, J. 2022. The role of farmers’ umbrella organizations in building transformative capacity around grassroots innovations in rural agri-food systems in Guatemala. Sustainability, 14(5): 2695. www.mdpi.com/2071-1050/14/5/2695
370 Fernandez-Wulff, P. 2019. Collective agency in the making: how social innovations in the food system practice democracy beyond consumption. Politics and Governance, 7(4): 81–93. www.cogitatiopress.com/politicsandgovernance/article/view/2111
371 World Bank. 2008. The political economy of policy reform: issues and implications for policy dialogue and development operations. Washington, DC. https://openknowledge.worldbank.org/bitstream/handle/ 10986/7782/442880ESW0whit1Box0338899B01PUBLIC1.pdf?sequence=1&isAllowed=y
372 Brinkerhoff, D.W. 2000. Democratic governance and sectoral policy reform: tracing linkages and exploring synergies. World Development, 28(4): 601–615. https://linkinghub.elsevier.com/retrieve/pii/S0305750X99001473
373 WHO. 2017. Safeguarding against possible conflicts of interest in nutrition programmes: approach for the prevention and management of conflicts of interest in the policy development and implementation of nutrition programmes at country level. Executive Board 142nd session. 4 December 2017, Provisional agenda item 4.6. https://apps.who.int/iris/bitstream/handle/10665/274165/B142_23-en.pdf?sequence=1&isAllowed=y
374 PAHO. 2021. Preventing and managing conflicts of interest in country-level nutrition programs: a roadmap for implementing the World Health Organization’s Draft Approach in the Americas. Washington, DC. https://iris.paho.org/bitstream/handle/10665.2/55055/PAHONMHRF210014_eng.pdf?sequence=1&isAllowed=y
375 SUN Movement. 2022. SUN (Scaling Up Nutrition). Cited 10 May 2022. https://scalingupnutrition.org
376 Michéle, L., Prato, S., Rundall, P. & Valente, F. 2019. When the SUN casts a shadow. The human rights risks of multi-stakeholder partnerships: the case of Scaling up Nutrition (SUN). Geneva, Switzerland, FIAN International, IBFAN (International Baby Food Action Network) and SID (Society for International Development). www.fian.org/files/files/WhenTheSunCastsAShadow_En.pdf
377 Parsons, K. 2021. How connected is national food policy in England? Mapping cross-government work on food system issues. Rethinking Food Governance 2. London, Food Research Collaboration.
378 Ribeiro de Castro, I.R. 2019. A extinção do Conselho Nacional de Segurança Alimentar e Nutricional e a agenda de alimentação e nutrição. Cadernos de Saúde Pública, 35(2). www.scielo.br/scielo.php?script=sci_arttext&pid=S0102-311X2019000200101&tlng=pt
NOTES
| 228 |
379 Garton, K., Thow, A.M. & Swinburn, B. 2020. International trade and investment agreements as carriers to food environment regulation for public health nutrition: a realist review. International Journal of Health Policy and Management. www.ijhpm.com/article_3933.html
380 IPES-Food (International Panel of Experts on Sustainable Food Systems). 2017. Unravelling the food–health nexus: addressing practices, political economy, and power relations to build healthier food systems. Brussels, The Global Alliance for the Future of Food and IPES-Food. www.ipes-food.org/_img/upload/files/Health_FullReport(1).pdf
381 Sánchez, M. V. 2018. Climate impact assessments with a lens on inequality. The Journal of Environment & Development, 27(3): 267–298. http://journals.sagepub.com/doi/10.1177/1070496518774098
382 Blay-Palmer, A., Conaré, D., Meter, K. & Di Battista, A. 2019. Sustainable food system assessment: lessons from global practice. In A. Blay-Palmer, D. Conaré, K. Meter, A. Di Battista & C. Johnston, eds. Sustainable food system assessment, pp. 1–17. London, Routledge. www.taylorfrancis.com/books/9780429801396
383 Walls, H., Nisbett, N., Laar, A., Drimie, S., Zaidi, S. & Harris, J. 2020. Addressing malnutrition: the importance of political economy analysis of power. International Journal of Health Policy and Management, 10: 809–816. www.ijhpm.com/article_3986.html
384 New York City Government. 2022. Food metrics report. In: New York City Government. New York, USA. Cited 18 March 2022. www1.nyc.gov/site/foodpolicy/reports-and-data/food-metrics-report.page
385 Freudenberg, N., Willingham, C. & Cohen, N. 2018. The role of metrics in food policy: lessons from a decade of experience in New York City. Journal of Agriculture, Food Systems, and Community Development, 8(Suppl. 2): 191–209. www.foodsystemsjournal.org/index.php/fsj/article/view/636
386 Food Systems Summit 2021 Community. 2021. Commitments registry: Commitments to action. Cited 10 May 2022. https://foodsystems.community/commitments-registry/
387 WHO. 2022. The Coalition of Action on Healthy Diets from Sustainable Food Systems for Children and All (HDSFS). In: WHO. Geneva, Switzerland. Cited 31 May 2022. www.who.int/initiatives/food-systems-for-health/the-coalition-of-action-on-healthy-diets-from-sustainable-food-systems-for-children-and-all
388 Development Initiatives. 2022. The Nutrition Accountability Framework: summary of N4G commitments. Bristol, UK. https://cdn.who.int/media/docs/default-source/nutritionlibrary/events/2022/gnr-summary-of-n4g-commintments-presentation.pdf?sfvrsn=84177b74_7
389 Carden, F., Beintema, N.M., Admassie, A., Katera, L., Mboghoina, T. & Onyekwena, C. 2019. Informing policy with agricultural RD evidence: An ASTI pilot project in Ethiopia, Nigeria, and Tanzania. IFPRI Discussion Paper 01850. Washington, DC, IFPRI. https://ebrary.ifpri.org/digital/collection/p15738coll2/id/133373
390 Swinburn, B., Sacks, G., Vandevijvere, S., Kumanyika, S., Lobstein, T., Neal, B., Barquera, S. et al. 2013. INFORMAS (International Network for Food and Obesity/non-communicable diseases Research, Monitoring and Action Support): overview and key principles. Obesity Reviews, 14: 1–12. https://onlinelibrary.wiley.com/doi/10.1111/obr.12087
391 FAO. 2013. Monitoring African Food and Agricultural Policies (MAFAP). Lessons learned report. Rome. www.fao.org/3/at150e/at150e.pdf
392 CARE International. 2014. Participatory Monitoring, Evaluation, Reflection and Learning for Community-based Adaptation: PMERL. A revised manual for local practitioners. Geneva, Switzerland. https://careclimatechange.org/wp-content/uploads/2019/06/2014_PMERL.pdf
393 Clapp, J. 2021. The problem with growing corporate concentration and power in the global food system. Nature Food, 2(6): 404–408. www.nature.com/articles/s43016-021-00297-7
394 Climate Policy Initiative. 2021. Preview: global landscape of climate finance 2021. www.climatepolicyinitiative.org/wp-content/uploads/2021/10/Global-Landscape-of-Climate-Finance-2021.pdf
THE STATE OF FOOD SECURITY AND NUTRITION IN THE WORLD 2022
| 229 |
395 United Nations Food Systems Summit. 2021. The coalition to repurpose public support to food and agriculture. In: United Nations Food Systems Summit 2021. Cited 5 May 2022. https://foodsystems.community/coalitions/the-coalition-to-repurpose-public-support-to-food-and-agriculture
396 FAO. 1996. Methodology for assessing food inadequacy in developing countries. In FAO, ed. The Sixth World Food Survey, pp. 114–143. Rome. www.fao.org/3/w0931e/w0931e.pdf
397 FAO. 2014. Advances in hunger measurement: traditional FAO methods and recent innovations. FAO Statistics Division Working Paper 14-04. Rome. www.fao.org/3/i4060e/i4060e.pdf
398 UNDESA. 2019. World Population Prospects. In: UNDESA. New York, USA. Cited 25 May 2022. https://population.un.org/wpp
399 FAO. 2002. Summary of proceedings: measurement and assessment of food deprivation and undernutrition. International Scientific Symposium, 26–28 June 2002. Rome. www.fao.org/3/a-y4250e.pdf
400 Wanner, N., Cafiero, C., Troubat, N. & Conforti, P. 2014. Refinements to the FAO methodology for estimating the prevalence of undernourishment indicator. FAO Statistics Division Working Paper Series ESS / 14-05. Rome, FAO. www.fao.org/3/i4046e/i4046e.pdf
401 UNICEF, WHO & World Bank. 2021. Technical Notes from the background document for country consultations on the 2021 edition of the UNICEF-WHO-World Bank Joint Malnutrition Estimates – SDG Indicators 2.2.1 on stunting, 2.2.2a on wasting and 2.2.2b on overweight. New York, USA, UNICEF. https://data.unicef.org/resources/jme-2021-country-consultations
402 UNICEF. 2021. Infant and young child feeding. In: UNICEF. New York, USA. Cited 25 May 2022. https://data.unicef.org/topic/nutrition/infant-and-young-child-feeding
403 UNICEF & WHO. 2019. UNICEF-WHO Low birthweight estimates: Levels and trends 2000–2015. New global, regional and national estimates of low birthweight. Geneva, Switzerland, WHO. www.unicef.org/reports/UNICEF-WHO-low-birthweight-estimates-2019
404 Blencowe, H., Krasevec, J., de Onis, M., Black, R.E., An, X., Stevens, G.A., Borghi, E. et al. 2019. National, regional, and worldwide estimates of low birthweight in 2015, with trends from 2000: a systematic analysis. The Lancet Global Health, 7(7): e849–e860. https://linkinghub.elsevier.com/retrieve/pii/S2214109X18305655
405 Blanc, A.K. & Wardlaw, T. 2005. Monitoring low birth weight: An evaluation of international estimates and an updated estimation procedure. Bulletin of the World Health Organization, 83(3): 178–185.
406 WHO. 2022. Global Health Observatory (GHO) data repository. In: WHO. Geneva, Switzerland. Cited 28 April 2022. https://apps.who.int/gho/data/node.main
407 NCD-RisC (NCD Risk Factor Collaboration). 2016. Trends in adult body-mass index in 200 countries from 1975 to 2014: A pooled analysis of 1698 population-based measurement studies with 19.2 million participants. The Lancet, 387(10026): 1377–1396. https://doi.org/10.1016/S0140-6736(16)30054-X
408 WHO. 2019. Nutrition Landscape Information System (NLIS) country profile indicators: interpretation guide. Geneva, Switzerland. www.who.int/publications/i/item/9789241516952
409 IMF. 2022. World Economic Outlook Database, April 2022 Edition. In: IMF. Washington, DC. Cited 5 May 2022. www.imf.org/en/Publications/WEO/weo-database/2022/April
410 Laborde, D. & Torero, M. (forthcoming). Modelling actions for transforming agrifood systems. In J. von Braun, K. Afsana, L. Fresco & M. Hassan, eds. Science and innovations for food systems transformation. Springer.
411 WHO & UNICEF. 2017. Methodology for monitoring progress towards the global nutrition targets for 2025. Technical report by the WHO-UNICEF Technical Expert Advisory Group on Nutrition Monitoring (TEAM). Geneva, Switzerland, WHO and New York, USA, UNICEF.
412 World Bank. 2021. International Comparison Program (ICP). In: World Bank. Washington, DC. Cited 6 May 2022. www.worldbank.org/en/programs/icp
413 Government of Bermuda. 2022. The Consumer Price Index. Cited 20 May 2022. www.gov.bm/bermuda-business-statistics
NOTES
| 230 |
414 Bai, Y., Ebel, A., Herforth, A. & Masters, W.A. (forthcoming). Methodology to update costs and affordability of healthy diets in the gap years of the International Comparison Program. Rome, FAO.
415 Ag-Incentives. (forthcoming). Ag-Incentives. Washington, DC. Cited 5 May 2022. http://ag-incentives.org
416 World Bank. 2022. UNCTAD - Trade Analysis Information System (TRAINS). In: Databank. Washington, DC. Cited 5 May 2022. https://databank.worldbank.org/source/unctad-%5E-trade-analysis-information-system-(trains)
417 Monteiro, C.A., Cannon, G., Lawrence, M., Laura Da Costa Louzada, M. & Machado, P.P. 2019. Ultra-processed foods, diet quality, and health using the NOVA classification system. Rome, FAO. www.fao.org/3/ca5644en/ca5644en.pdf
418 Nardocci, M., Leclerc, B.S., Louzada, M.L., Monteiro, C.A., Batal, M. & Moubarac, J.C. 2019. Consumption of ultra-processed foods and obesity in Canada. Canadian Journal of Public Health, 110(1): 4–14. https://doi.org/10.17269/s41997-018-0130-x
419 Louzada, M.L. da C., Baraldi, L.G., Steele, E.M., Martins, A.P.B., Canella, D.S., Moubarac, J.C., Levy, R.B. et al. 2015. Consumption of ultra-processed foods and obesity in Brazilian adolescents and adults. Preventive Medicine, 81: 9–15. https://doi.org/10.1016/j.ypmed.2015.07.018
420 Menza, V. & Probart, C. 2013. Eating well for good health. Lessons on nutrition and healthy diets. Rome, FAO. www.fao.org/3/i3261e/i3261e.pdf
421 Slavin, J.L. & Lloyd, B. 2012. Health benefits of fruits and vegetables. Advances in Nutrition, 3(4): 506–516. https://doi.org/10.3945/an.112.002154
422 WHO. 2003. Diet, nutrition and the prevention of chronic diseases: report of a joint WHO/FAO expert consultation, Geneva, 28 January - 1 February 2002. Geneva, Switzerland. https://apps.who.int/iris/handle/10665/42665
423 Agard, J., Schipper, E.L.F., Birkmann, J., Campos, M., Dubeux, C., Nojiri, Y., Olsoon, L. et al. 2014. Glossary. In IPCC (Intergovernmental Panel on Climate Change), ed. Climate Change 2014: Impacts, Adaptation, and Vulnerability. Part A: Global and Sectoral Aspects. Contribution of Working Group II to the Fifth Assessment Report of the Intergovernmental Panel on Climate Change, pp. 1757–1776. Cambridge, UK and New York, USA, Cambridge University Press. www.ipcc.ch/site/assets/uploads/2018/02/WGIIAR5-AnnexII_FINAL.pdf
424 IPCC. 2012. The risks of extreme events and disasters to advance climate change adaptation. C.B. Field, V. Barros, T.F. Stocker, D. Qin, D.J. Dokken, K.L. Ebi, M.D. Mastrandrea, et al., eds. A Special Report of Working Groups I and II of the Intergovernmental Panel on Climate Change. Cambridge, UK, and New York, USA, Cambridge University Press. www.ipcc.ch/site/assets/uploads/2018/03/SREX_Full_Report-1.pdf
425 Chambers, R. & Conway, G.R. 1992. Sustainable rural livelihoods: practical concepts for the 21st century. IDS Discussion Paper 296. Institute of Development Studies (IDS). www.ids.ac.uk/publications/sustainable-rural-livelihoods-practical-concepts-for-the-21st-century
426 Dercon, S., Hoddinott, J. & Woldehanna, T. 2005. Shocks and consumption in 15 Ethiopian villages, 1999–2004. Journal of African Economies, 14(4): 559–585. https://doi.org/10.1093/jae/eji022
427 WFP. 2009. Comprehensive Food Security & Vulnerability Analysis (CFSVA) Guidelines - First Edition, 2009. Rome. www.wfp.org/publications/comprehensive-food-security-and-vulnerability-analysis-cfsva-guidelines-first-edition
428 FAO. 2016. Managing climate risk using climate-smart agriculture. Rome.
429 WTO. 2022. Glossary on agriculture. Geneva, Switzerland. Cited 23 May 2022. www.wto.org/english/thewto_e/glossary_e/glossbysubject_e.htm
430 HLPE. 2020. Food security and nutrition: building a global narrative towards 2030. A report by the High Level Panel of Experts on Food Security and Nutrition of the Committee on World Food Security. Rome.
431 OECD. 2016. States of Fragility 2016: understanding violence. Paris. www.oecd-ilibrary.org/development/states-of-fragility-2016_9789264267213-en
THE STATE OF FOOD SECURITY AND NUTRITION IN THE WORLD 2022
| 231 |
432 United Nations General Assembly. 2016. Report of the open-ended intergovernmental expert working group on indicators and terminology relating to disaster risk reduction. Seventy-first session, Agenda item 19 (c), A/71/644. New York, USA. www.undrr.org/publication/report-open-ended-intergovernmental-expert-working-group-indicators-and-terminology-0
433 FAO. 2015. Guidelines on the collection of information on food processing through food consumption surveys. Rome. www.fao.org/3/i4690e/I4690E.pdf
434 UNCTAD. 2010. Non-tariff measures: evidence from selected developing countries and future research agenda. Developing countries in international trade studies. New York, USA and Geneva, Switzerland, United Nations. https://unctad.org/system/files/official-document/ditctab20093_en.pdf
435 WHO. 2022. Child growth standards. In: WHO. Geneva, Switzerland. Cited 2 June 2022. www.who.int/tools/child-growth-standards/standards
436 United Nations. 2017. Report of the High-Level Committee on Programmes at its thirty-fourth session. Annex III. CEB/2017/6 (6 November 2017). New York, USA. https://digitallibrary.un.org/record/3844899
437 OECD. 2014. Tariff. In: Glossary of Statistical Terms. Brussels. Cited 23 May 2022. https://stats.oecd.org/glossary/detail.asp?ID=2647
438 AMS (American Meteorological Society). 2015. Weather - Glossary of Meteorology. In: AMS. Boston, USA. Cited 26 May 2021. https://glossary.ametsoc.org/wiki/Weather
439 OECD. 2002. Distortion. In: Glossary of Statistical Terms. Geneva, Switzerland. https://stats.oecd.org/glossary/detail.asp?ID=5005
440 WTO. 2022. Glossary. Geneva, Switzerland. Cited 23 May 2022. www.wto.org/english/thewto_e/glossary_e/glossary_e.htm
441 Vollaro, M., Raggi, M. & Viaggi, D. 2021. Public R&D and European agriculture: impact on productivity and return on R&D expenditure. Bio-based and Applied Economics, 10(1): 73–86. https://oaj.fupress.net/index.php/bae/article/view/9928
442 Pardey, P.G., Andrade, R.S., Hurley, T.M., Rao, X. & Liebenberg, F.G. 2016. Returns to food and agricultural R&D investments in Sub-Saharan Africa, 1975–2014. Food Policy, 65: 1–8. https://linkinghub.elsevier.com/retrieve/pii/S0306919216303761
443 Steensland, A. 2021. 2021 Global Agricultural Productivity Report: Climate for sustainable agricultural growth. T. Thompson, ed. Blacksburg, USA, Virginia Tech College of Agriculture and Life Sciences.
444 UNICEF. 2019. Programme guidance: strengthening shock responsive social protection systems. New York, USA.
445 WHO. 2022. Draft WHO Global Strategy for Food Safety 2022-2030. Geneva, Switzerland.
446 Wakeland, W., Cholette, S. & Venkat, K. 2012. Food transportation issues and reducing carbon footprint. In J.I. Boye & Y. Arcand, eds. Green technologies in food production and processing, pp. 211–236. Cham, Switzerland, Springer. http://link.springer.com/10.1007/978-1-4614-1587-9_9
447 Independent Group of Scientists appointed by the Secretary-General. 2019. Global Sustainable Development Report 2019: the future is now – science for achieving sustainable development. New York, USA, United Nations. https://sustainabledevelopment.un.org/content/documents/24797GSDR_report_2019.pdf
448 WCO (World Customs Organization). 2022. What is the Harmonized System (HS)? In: WCO. Brussels. Cited 5 May 2022. www.wcoomd.org/en/topics/nomenclature/overview/what-is-the-harmonized-system.aspx
449 IPC Global Partners. 2019. Technical Manual Version 3.0. Evidence and standards for better food security and nutrition decisions. Rome.
450 Menza, V. & Probart, C. 2013. Eating well for good health. Lessons on nutrition and healthy diets. Rome, FAO. www.fao.org/3/i3261e/i3261e.pdf
451 OECD. 2022. Agricultural support. In: OECD Data. Paris. Cited 26 May 2022. https://data.oecd.org/agrpolicy/agricultural-support.htm
NOTES ON GEOGRAPHIC REGIONS IN STATISTICAL TABLES IN CHAPTER 2 AND ANNEXES 1 AND 2Countries revise their official statistics regularly for past periods as well as for the latest reporting period. The same holds for statistics presented in this report. Whenever this happens, estimates are revised accordingly. Therefore, users are advised to refer to changes in estimates over time only within the same edition of The State of Food Security and Nutrition in the World and refrain from comparing data published in editions for different years.
Geographic regionsThis publication follows the composition of geographic regions as presented by the Statistics Division of the United Nations Secretariat primarily for use in its publications and databases (https://unstats.un.org/unsd/methodology/m49). The assignment of countries or areas to specific groupings is for statistical convenience and does not imply any assumption regarding political or other affiliation of countries or territories by the United Nations. Please refer to the list below for the country composition of each region in Annexes 1 and 2 tables, as well as in Tables 1–4 in Section 2.1.
Countries, areas and territories for which there were insufficient or unreliable data for conducting the assessment are not reported and not included in the aggregates. Specifically:
� Northern Africa: In addition to the countries listed in the table, PoU and food insecurity based on the FIES include an estimate for Western Sahara. Child wasting, stunting and overweight, low birthweight, adult obesity, exclusive breastfeeding and anaemia estimates exclude Western Sahara.
� Eastern Africa: With respect to the M49 classification, it excludes Chagos Archipelago, French Southern and Antarctic Territories, Mayotte and Réunion.
� Western Africa: With respect to the M49 classification, it excludes Saint Helena.
� Asia and Eastern Asia: With respect to the M49 classification, low birthweight and child wasting aggregates exclude Japan.
� Caribbean: With respect to the M49 classification, it excludes Anguilla, Aruba, Bonaire, Sint Eustatius and Saba, British Virgin Islands, Cayman Islands, Curaçao,
Guadeloupe, Martinique, Montserrat, Saint Barthélemy, Saint Martin (French Part), Sint Maarten (Dutch part), and Turks and Caicos Islands. Adult obesity, child wasting, low birthweight and exclusive breastfeeding exclude Puerto Rico and United States Virgin Islands.
� South America: With respect to the M49 classification, it excludes Bouvet Island, Falkland Islands (Malvinas), French Guyana, and South Georgia and the South Sandwich Islands.
� Australia and New Zealand: With respect to the M49 classification, it excludes Christmas Island, Cocos (Keeling) Islands, Heard and McDonald Islands, and Norfolk Island.
� Melanesia: With respect to the M49 classification, anaemia, child wasting, stunting and overweight, low birthweight and exclusive breastfeeding estimates exclude New Caledonia.
� Micronesia: With respect to the M49 classification, adult obesity, anaemia, child wasting, low birthweight and exclusive breastfeeding estimates exclude Guam, Northern Mariana Islands and US Minor Outlying Islands. Aggregates for child stunting and overweight exclude only US Minor Outlying Islands.
� Polynesia: With respect to the M49 classification, it excludes Pitcairn Islands, and Wallis and Futuna Islands. Adult obesity, child wasting, low birthweight and exclusive breastfeeding estimates exclude American Samoa, French Polynesia and Tokelau (Associate Member). Aggregates for child stunting and overweight exclude only French Polynesia.
� Northern America: With respect to the M49 classification, it excludes Saint Pierre and Miquelon. Adult obesity, anaemia, low birthweight and exclusive breastfeeding aggregates also exclude Bermuda and Greenland. Aggregates for wasting are based only on data for United States of America.
� Northern Europe: With respect to the M49 classification, it excludes Åland Islands, Channel Islands, Faroe Islands (Associate Member), Isle of Man, and Svalbard and Jan Mayen Islands.
� Southern Europe: With respect to the M49 classification, it excludes
Gibraltar, Holy See and San Marino. However, anaemia, child stunting, overweight and low birthweight estimates include San Marino.
� Western Europe: With respect to the M49 classification, it excludes Liechtenstein and Monaco. However, child stunting, overweight, anaemia and low birthweight estimates include Monaco.
Other groupingsLeast developed countries, land locked developing countries and Small Island Developing States groupings include the countries as presented by the Statistics Division of the United Nations (https://unstats.un.org/unsd/methodology/m49).
Small Island Developing States: Estimates for child stunting, wasting and overweight, adult obesity, exclusive breastfeeding and low birthweight exclude French Polynesia, Anguilla, Aruba, Bonaire, Sint Eustatius and Saba, British Virgin Islands, Curaçao, Montserrat, New Caledonia and Sint Maarten (Dutch part). In addition, estimates for child wasting, adult obesity, exclusive breastfeeding and low birthweight also exclude American Samoa and Puerto Rico.
High-income, upper-middle-income, lower-middle-income and low-income countries include the countries as presented by the World Bank classification for the 2021–2022 fiscal year (https://datahelpdesk.worldbank.org/knowledgebase/articles/906519).
Low-income food-deficit countries (2018): Afghanistan, Bangladesh, Benin, Burkina Faso, Burundi, Cameroon, Central African Republic, Chad, Comoros, Congo, Côte d’Ivoire, Democratic People’s Republic of Korea, the Democratic Republic of the Congo, Djibouti, Eritrea, Ethiopia, the Gambia, Ghana, Guinea, Guinea-Bissau, Haiti, India, Kenya, Kyrgyzstan, Lesotho, Liberia, Madagascar, Malawi, Mali, Mauritania, Mozambique, Nepal, Nicaragua, the Niger, Rwanda, Sao Tome and Principe, Senegal, Sierra Leone, Solomon Islands, Somalia, South Sudan, the Sudan, the Syrian Arab Republic, Tajikistan, Togo, Uganda, the United Republic of Tanzania, Uzbekistan, Viet Nam, Yemen and Zimbabwe.
Composition of geographic regions
AFRICA Northern Africa: Algeria, Egypt, Libya, Morocco, Sudan, Tunisia and Western Sahara.
Sub-Saharan AfricaEastern Africa: Burundi, Comoros, Djibouti, Eritrea, Ethiopia, Kenya, Madagascar, Malawi, Mauritius, Mozambique, Rwanda, Seychelles, Somalia, South Sudan, Uganda, United Republic of Tanzania, Zambia and Zimbabwe.
Middle Africa: Angola, Cameroon, Central African Republic, Chad, Congo, Democratic Republic of the Congo, Equatorial Guinea, Gabon, and Sao Tome and Principe.
Southern Africa: Botswana, Eswatini, Lesotho, Namibia and South Africa.
Western Africa: Benin, Burkina Faso, Cabo Verde, Côte d’Ivoire, Gambia, Ghana, Guinea, Guinea-Bissau, Liberia, Mali, Mauritania, Niger, Nigeria, Senegal, Sierra Leone and Togo.
ASIA Central Asia: Kazakhstan, Kyrgyzstan, Tajikistan, Turkmenistan and Uzbekistan.
Eastern Asia: China, Democratic People’s Republic of Korea, Japan, Mongolia and Republic of Korea.
South-eastern Asia: Brunei Darussalam, Cambodia, Indonesia, Lao People’s Democratic Republic, Malaysia, Myanmar, Philippines, Singapore, Thailand, Timor-Leste and Viet Nam.
Southern Asia: Afghanistan, Bangladesh, Bhutan, India, Iran (Islamic Republic of), Maldives, Nepal, Pakistan and Sri Lanka.
Western Asia: Armenia, Azerbaijan, Bahrain, Cyprus, Georgia, Iraq, Israel, Jordan, Kuwait, Lebanon, Oman, Palestine, Qatar, Saudi Arabia, Syrian Arab Republic, Türkiye, United Arab Emirates and Yemen.
LATIN AMERICA AND THE CARIBBEAN Caribbean: Antigua and Barbuda, Bahamas, Barbados, Cuba, Dominica, Dominican Republic, Grenada, Haiti, Jamaica, Puerto Rico, Saint Kitts and Nevis, Saint Lucia, Saint Vincent and the Grenadines, and Trinidad and Tobago.
Latin AmericaCentral America: Belize, Costa Rica, El Salvador, Guatemala, Honduras, Mexico, Nicaragua and Panama.
South America: Argentina, Bolivia (Plurinational State of), Brazil, Chile, Colombia, Ecuador, Guyana, Paraguay, Peru, Suriname, Uruguay and Venezuela (Bolivarian Republic of).
OCEANIA Australia and New Zealand: Australia and New Zealand.
Oceania excluding Australia and New ZealandMelanesia: Fiji, New Caledonia, Papua New Guinea, Solomon Islands and Vanuatu.
Micronesia: Kiribati, Marshall Islands, Micronesia (Federated States of), Nauru and Palau.
Polynesia: American Samoa, Cook Islands, French Polynesia, Niue, Samoa, Tokelau, Tonga and Tuvalu.
NORTHERN AMERICA AND EUROPE Northern America: Bermuda, Canada, Greenland and United States of America.
EuropeEastern Europe: Belarus, Bulgaria, Czechia, Hungary, Poland, Republic of Moldova, Romania, Russian Federation, Slovakia and Ukraine.
Northern Europe: Denmark, Estonia, Finland, Iceland, Ireland, Latvia, Lithuania, Norway, Sweden, and United Kingdom of Great Britain and Northern Ireland.
Southern Europe: Albania, Andorra, Bosnia and Herzegovina, Croatia, Greece, Italy, Malta, Montenegro, North Macedonia, Portugal, Serbia, Slovenia and Spain.
Western Europe: Austria, Belgium, France, Germany, Luxembourg, Netherlands and Switzerland.
FOOD SECURITY AND NUTRITION
IN THE WORLD
THE STATE OF
REPURPOSING FOOD AND AGRICULTURAL POLICIES TO MAKE
HEALTHY DIETS MORE AFFORDABLE
This year’s report should dispel any lingering doubts that the world is moving backwards in its efforts to end hunger, food insecurity and malnutrition in all its forms. We are now only eight years away from 2030, but the distance to reach many of the SDG 2 targets is growing wider each year. There are indeed efforts to make progress towards SDG 2, yet they are proving insufficient in the face of a more challenging and uncertain context. The intensification of the major drivers behind recent food insecurity and malnutrition trends (i.e. conflict, climate extremes and economic shocks) combined with the high cost of nutritious foods and growing inequalities will continue to challenge food security and nutrition. This will be the case until agrifood systems are transformed, become more resilient and are delivering lower cost nutritious foods and affordable healthy diets for all, sustainably and inclusively.
Early in the report, the latest updates of the food security and nutrition situation around the world are presented, including updated estimates on the cost and affordability of a healthy diet. The report acknowledges the current recessionary context, which makes it even more challenging for many governments to increase their budgets to invest in the agrifood systems transformation that their countries need to achieve SDG 2. Hence, the report then takes a deep dive into how governments are supporting the food and agriculture sector through policies, and based on evidence, it provides recommendations.
A stocktaking of the most predominant food and agricultural policy support currently in place around the world is presented to better understand the amount of support, the activities and actors mostly supported (or, on the contrary, penalized), and the pathways through which this support is pushing up the relative cost of nutritious foods and promoting unhealthy diets. Then guidance – based on analysis and evidence – is provided on alternative combinations of food and agricultural policy support that can help to reduce the cost of nutritious foods, as well as on how the resulting trade-offs need to be managed to ensure agrifood systems are not only more efficient, but also more sustainable and inclusive. A key recommendation is that governments must start rethinking how they can reallocate their existing public budgets to make them more cost-effective and efficient in reducing the cost of nutritious foods and increasing the availability and affordability of healthy diets, sustainably and leaving no one behind. Lastly, the report takes a close look at the complementing policies, within and outside agrifood systems, that are important to support repurposing efforts and at the political economy factors and dynamics that hamper or facilitate repurposing efforts.
Copyright © 2022 FDOKUMEN