United Nations GENERAL ASSEMBLY. Nations Vnies ASSEMBLEE ...
Upload
khangminh22Category
view
3download
0
FIRST NATIONS
FOOD, NUTRITION &ENVIRONMENT STUDY
University of Ottawa | Université de Montréal | Assembly of First Nations 2017
Results from the Atlantic Region 2014
Funding for this study was provided by Health Canada. The information and opinions expressed in this publication are those of the authors/researchers
and do not necessarily reflect the official views of Health Canada.
“Healthy Environment and Healthy Foods for
Healthy First Nations”
First Nations Food, Nutrition and Environment Study (FNFNES):Results from the Atlantic 2014
by University of OttawaUniversité de Montréal and Assembly of First Nations
is licensed under aCreative Commons Attribution-Noncommercial-NoDerivs 3.0 Unported License.
This report can be cited as: Laurie Chan, Olivier Receveur, Malek Batal, William David, Harold Schwartz, Amy Ing, Karen Fediuk and Constantine Tikhonov. First Nations Food, Nutrition and Environment Study (FNFNES): Results from the Atlantic. Ottawa: University of Ottawa, 2017. Print.
i
Results from the A
tlantic 2014

FOREWORD FROM THE NATIONAL CHIEF
Greetings,
The Assembly of First Nations (AFN) is committed to being an effective advocate for First Nations rights and human rights. We hold sacred rights to our traditional territories; rights given to us by the Creator, along with the responsibility of caring for the traditional territories that have sustained us for generations.
The First Nations Food, Nutrition and Environment Study (FNFNES) highlights the importance of the environment as it connects to our individual and collective health. The FNFNES is a ten year project, mandated by the Chiefs-in-Assembly and developed in partnership between First Nations and academia. The study seeks to quantify the health of our traditional food sources, the quality and amount of food sources First Nations consume on a daily basis, and the quality of water in our territories.
As stewards of the land, it is our inherent responsibility to care for and protect the land and waters. As this report shows, traditional food is a powerful factor for better, healthier lifestyles. However, many barriers exist for First Nations in accessing traditional foods. The FNFNES is an important tool in our understanding of how we can overcome those barriers and why it’s important to our citizens and nations.
First Nations are aware of current environmental challenges, both locally and globally. Studies like the FNFNES provide First Nations with both a local and regional picture of the environment. By understanding nutrition and food security outcomes, we will improve the ability of First Nations to measure current conditions and make informed decisions.
I want to take this opportunity to thank all those who participated in the FNFNES. This includes the Community Research Assistants and all levels of coordinators, principal investigators, Health Canada and those First Nations and First Nations community members who made this regional report possible.
I look forward to the upcoming final report as the FNFNES project nears completion. May this information help to restore First Nations environmental and nutritional well-being and create a better, healthier future.
Kinanâskomitin,Perry BellegardeNational Chief Assembly of First Nations
ii
Greetings,
It is my pleasure to introduce the First Nations Food, Nutrition and Environment Study (FNFNES) for the Atlantic Region. As the Assembly of First Nations (AFN) National Fisheries Committee (NFC) Chair, and in my previous roles in First Nations leadership, I take personal interest in the health our First Nations peoples and the environmental integrity of our land and water resources, particular as it relates to access to traditional food sources.
Having research projects, such as FNFNES, can provide important information on the health of our immediate environment, as well as the levels of access to traditional foods that our First Nations communities have.
The health and food security of First Nations is inexorably linked to the health of the environment. We must act in a manner that is respectful for the protection of our natural resources, such as traditional foods and water.
Wela’lioq Roger Augustine New Brunswick and Prince Edward Island Regional Chief Assembly of First Nations
Greetings,
I am proud to present this years’ report for the First Nations Food, Nutrition and Environmental Study (FNFNES) for the Maritimes. Healthy communities are built on a healthy environment, access to traditional food sources, and robust cultural practices. Research on access to traditional foods will be essential in planning for the future.
This report underscores the importance of creating benchmarks to track environmental changes to better understand our current surroundings as the climate changes worldwide. Having research backed numbers on the levels of food security on-reserve will also be an important feature for First Nations planners to build stronger communities in the long-term.
Projects such as the FNFNES give us a better understanding of on-the-ground nutritional outcomes of First Nations peoples. Here in the Atlantic, we pride ourselves on our traditions of hunting and gathering as a connection to our ancestry and culture. So much of First Nations daily life is built on our connection to the environment – ensuring generations of healthy interaction with it is a high priority.
It is no great secret that many First Nations houses suffer from poor water quality; testing the in-house tap water for contamination is a practical step included in the FNFNES. Useful, community driven data collection is vital to a new way of doing things in accordance with the principles of indigenous research standards, such as OCAP®. First Nations data ownership, a key component of FNFNES, should serve as a model for all future projects that involve First Nations and will be an important step on the road to reconciliation.
Please join me and the AFN Executive in our support for strong communities, a health environment, and thoughtful research initiatives that provide actionable information to First Nations communities, leadership, and technicians.
Thanks, Morley Googoo Regional Chief for Nova Scotia and Newfoundland Assembly of First Nations
Foreword from AFN Regional Chief for New Brunswick and Prince Edward Island
Foreword from AFN Regional Chief for Nova Scotia and Newfoundland
iii
Results from the A
tlantic 2014
iv
PRINCIPAL INVESTIGATORSLaurie Chan, Ph.D.
Professor and Canada Research Chair in Toxicology and Environmental HealthCentre for Advanced Research in Environmental Genomics
University of Ottawa
Olivier Receveur, Ph.D., M.P.H., Dt. P.Professor, Department of Nutrition, Faculty of Medicine
Université de Montréal
Malek Batal, Ph.D.Associate Professor, Department of Nutrition, Faculty of Medicine
Université de Montréal
William David, SB, LLBSenior Advisor
Assembly of First Nations
CO-INVESTIGATORSHarold Schwartz, Ph.D.
Manager, Chemical Safety of Traditional FoodsEnvironmental Public Health Division
Office of Population and Public HealthPopulation Health and Primary Care Directorate
First Nations and Inuit Health BranchHealth Canada
Constantine Tikhonov MD, MHAManager, Indicator Analysis, Planning,
Reporting and Climate Change AdaptationEnvironmental Public Health Division
Population Health and Primary Care DirectorateFirst Nations and Inuit Health Branch
Health Canada
St Mary’s First Nation. Photo by Linda Kerry. Miawpukek First Nation. Photo by Kelvin Latham.
iv

ACKNOWLEDGEMENTSThe authors of this report would like to thank the Chief and Council of the following First Nations partners in the Atlantic whose support made this work possible:
We would also like to recognize the hard work of the following community members who worked as community coordinators, research assistants, or helped with the traditional food or water sampling:
Woodstock First NationSaint Mary’s First NationEel Ground First NationEsgenoopetitj First Nations
Robert AsssineweJacqueline BasqueLorraine BearHolly BenoitJeffrey BernardKara BoylesCornelia CabotValerie ChisholmCraig ChristmasJared Cole Paul-FontaineRenelda DedamNoreen Dedam
Edward DoucetteEmerson FrancisLisha FrancisAmber FrancisMargaret FrancisAudrey FrancisShanna FrancisSheila Ginnish–Paul Delores Ginnish-VautourNatalie GoogooClaudine GoogooJessica Hamilton
Gail HanifanValerie J. PolchiesElaine JeddoreLori Jennifer WardClara Joan ClementMary Joe-FrancisJasmine JohnsonAnne LeclairMellena MacDonaldTonia MarshallKaren MarshallTerry May Simon
Tanya McGrawApril NicholasElizabeth NicholasElla NicholasHubert PaulJohn PaulJenilee PaulBrenda PaulShannon PaulLinda PaulAshlee PolchiesBrian Polchies
Tobi RussoBrian SimonCandi Simon Kerri SylliboyCarol SylvesterVerge ToneyLorena TraceyLaura UnderhillEsther WardErnie Ward
Elsipogtog First NationPictou Landing First NationWe’koqma’q First NationPotlotek First Nation
Eskasoni First NationMembertou First NationMiawpukek First Nation
v
Results from the A
tlantic 2014
We are grateful to the following Environmental Health Officers for their assistance with the surface water sampling:
Karen Boyles
Jason Catoul
Danika Gaudet
Linda Kerry
Kelvin Latham
Craig Wakelin
We extend our gratitude to the elders for their kind words of wisdom.
Finally, we would like to thank all the community members whose participation made this study possible.
The technical and funding support of Health Canada and the First Nations and Inuit Health Branch Laboratory are gratefully acknowledged.
Woliwon Welaliog We’lalin Oelalin Welaliek
vi
CONTRIBUTORSFNFNES Steering Committee:Laurie ChanOlivier ReceveurMalek BatalWilliam DavidJudy MitchellLynn BarwinLisa WabegijigRenata RosolAmy IngKaren FediukKathleen LindhorstJohanna Jimenez-PardoBen Waswa
FNFNES Steering Committee ex-officio members:Harold SchwartzConstantine TikhonovBrenda McIntyre
National Project Coordinator:Judy MitchellLynn Barwin
Regional Coordinator: Lisa WabegijigRenata Rosol
Lead Nutrition Research Coordinator:Kathleen Lindhorst
Nutrition Research Coordinators:Stéphane DecellesSue HamiltonRebecca HareRoberta LarsenStephanie LevesqueTeri MorrowKayla Thomas
Data Analysis and Technical Writing: Amy IngKaren Fediuk
Communications Coordinator, Assembly of First NationsBen WaswaJohanna Jimenez-Pardo
Health Canada Regions and Programs Bureau – Québec Region LaboratoryManager – Jean-François Paradis Analysts – Marie-Pier Lafontaine, Noureen Lalji
Health Canada Project Analysts:Alexander BevanSharon BoxallPriya GajariaJennifer GaleGenevieve Monnin Cheng Wu
Statistics Canada Statisticians:Jean DumaisIsabelle MichaudCraig SekoRossana Manriquez
University of Ottawa Research Staff:Kayla GreydanusKristen EcclesAmanda NitschkeLinda HaSrijanani PalaniyandiAmanda Juric
Université de Montréal Research Staff:Stéphane DecellesHiba Al-MasriLesya MarushkaFanny Savage
External Reviewers:Health Canada, First Nations and Inuit Health Branch, Population and Primary Care Directorate, Officer of Population and Public Health, Communicable Disease Control DivisionDr. David Jones- Senior Medical Officer
First Nations and Inuit Health Branch, Atlantic RegionDr. Maureen Baikie – Regional Medical OfficerDebra Keays-White RN BN BA MScN – Regional ExecutiveWilliam McGillivray – Regional Director, ProgramsKelly Bower – Director, Health Assessment and SurveillanceLen O’Neill – Regional Manager, Environmental Public HealthAnnette Elliott Rose – Director of Professional PracticeTracey MacDonald – Director of Health Protection
vii
Results from the A
tlantic 2014
FOREWORD FROM THE NATIONAL CHIEF ..................................... iiFOREWORD FROM THE ATLANTIC REGIONAL CHIEFS .................. iiiRegional Chief for AFN, Nova Scotia and Newfoundland........... iiiRegional Chief for AFN, New Brunswick and Prince Edward Island ........................................................... iiiPRINCIPAL INVESTIGATORS ......................................................... ivCO-INVESTIGATORS ..................................................................... ivACKNOWLEDGEMENTS ................................................................ vCONTRIBUTORS .......................................................................... viiTABLE OF CONTENTS ................................................................. viiiACRONYMNS AND ABBREVIATIONS ......................................... xivGLOSSARY .................................................................................xvEXECUTIVE SUMMARY ............................................................. xviii Results ...................................................................................xixINTRODUCTION ............................................................................ 1METHODOLOGY ........................................................................... 4
Sampling ................................................................................... 4Table A. Description of the two ecozones within the Atlantic AFN Regions .......... 4
Table B. Summary of collection effort for each ecozone in the Atlantic ............... 5
Principal Study Components ...................................................... 6 Household Interviews ................................................................ 7 Traditional Food Frequency Questionnaire .................................................... 7
Table C. Categories of frequency of consumption .......................................... 7
24-Hour Diet Recall .................................................................................. 7
Socio/Health/Lifestyle (SHL) Questionnaire .................................................. 8
Food Security Questionnaire ...................................................................... 8
Table D. Categorization of food security status .............................................. 8
Water Sampling for Trace Metals .............................................. 9Water Sampling ...................................................................................... 9
Water Sample Preparation ........................................................................ 9
TABLE OF CONTENTSAnalysis ................................................................................................. 9
Pharmaceuticals in Surface Water ........................................... 1017α-Ethinylestradiol in Water ................................................................... 10
Hair Sampling for Mercury ...................................................... 11Food Sampling for a TDS Suite of Contaminants ...................... 12Tissue Samples ...................................................................................... 12
Metals in Tissue Samples ......................................................................... 12
Perfluorinated Compounds in Tissue Samples .............................................. 12
PAH in Tissue Samples ............................................................................ 12
Pesticides and PCBs (organochlorines) in Tissue Samples ............................... 13
PCDD/F (Dioxins and Furans) in Tissue Samples .......................................... 13
PBDE in Tissue Samples .......................................................................... 13
Timeline for Data Collection ..................................................... 14Ethical Considerations .............................................................. 14Data Analyses ......................................................................... 15RESULTS ................................................................................... 16Sample Characteristics ............................................................. 16Socio-demographic Characteristics .......................................... 16Health and Lifestyle Practices .................................................. 17Body Mass Index and Obesity ................................................................. 17
Diabetes .............................................................................................. 17
Smoking .............................................................................................. 17
Physical Activity ..................................................................................... 18
Self-perceived health .............................................................................. 18
Traditional Food Use and Gardening ....................................... 18Nutrient Intake ........................................................................ 20Food Security ........................................................................... 23Concerns about Climate Change .............................................. 24Tap Water ............................................................................... 24Drinking Water Systems .......................................................................... 24
viii
Tap Water Analysis ................................................................................ 25
Metals of Public Health Concern .............................................................. 25
Aesthetic Objective (AO) and Operational Guidance (OG) Metals Sampled .... 26
Water Parameters-chlorine, pH, temperature ............................................... 26
Surface Water Sampling for Pharmaceuticals.......................... 27Pharmaceuticals Detected by Type and Prevalence in Surface water ................ 27
FNFNES Atlantic Region findings compared to Pharmaceutical Guidelines........ 28
Mercury in Hair Results ........................................................... 29Food Contaminant Results ....................................................... 29Heavy Metals ....................................................................................... 29
Persistent Organic Pollutants ..................................................................... 31
COMMUNITY INPUT ................................................................. 32CONCLUSIONS ........................................................................ 34TABLES AND FIGURES .............................................................. 36Sample Characteristics 36Table 1. Participating First Nations communities in the Atlantic ........................ 36
Figure 1. Map of participating First Nations communities in the Atlantic ........... 37
Table 2. Number of First Nations households surveyed and participation rate ... 37
Socio-demographic Characteristics 38Table 3. Average age (SE) of participants .................................................. 38
Figure 2a: Percentage of female respondents in each age group in the Atlantic region (n=668) .......................................................................... 38
Figure 2b: Percentage of male respondents in each age group in the Atlantic region (n=353) .......................................................................... 38
Figure 3. Percentage of household members by age group, First Nations in the Atlantic (n=1025) ............................................................................. 38
Table 4. Household size and years of education of First Nations adults in the Atlantic ............................................................................... 38
Figure 4: Diplomas, certificates and degrees obtained (n=1025) ................... 39
Figure 5. Main source of income for First Nations adults in the Atlantic (n=1015) .......................................................................... 39
Figure 6. Percent of full-time and part-time employment reported by First Nations households in the Atlantic ........................................................................ 39
Health and Lifestyle Practices 40Figure 7a. Overweight and obesity among First Nations adults in the Atlantic+* .................................................................................... 40
Figure 7b. Overweight and obesity among First Nations women in the Atlantic by age group (n=599) * ..................................................... 40
Figure 7c. Overweight and obesity among First Nations men in the Atlantic by age group (n=342)* ...................................................... 40
Figure 8. Prevalence of self-reported diabetes in First Nations adults in the Atlantic, total and by gender (weighted and age-standardized rates)+ ............. 40
Figure 9. Prevalence of diabetes in First Nations adults in the Atlantic by gender and age group ....................................................................... 41
Figure 10. Type of diabetes reported by First Nations adults (n=221)+ ............ 41
Table 5. Prevalence of self-reported diabetes among First Nations adults in the Atlantic compared to other Canadian studies .............................................. 41
Figure 11a. Percent of First Nations adults in the Atlantic dieting (to lose weight) on the day before the interview, by gender ........................... 42
Figure 11b. Percent of First Nations adults in the Atlantic dieting (to lose weight) on the day before the interview, by gender and age group (n=1019).............................................................................. 42
Figure 12. Smoking among First Nations adults in the Atlantic compared to other FNFNES regional findings and to the general Canadian population ..... 42
Figure 13a. Self-reported activity level in First Nations adults in the Atlantic+ ..... 43
Figure 13b. Self-reported activity level in First Nations women in the Atlantic, by age group+ ..................................................................................... 43
Figure 13c. Self-reported activity level in First Nations men in the Atlantic, by age group+ ..................................................................................... 43
Figure 14a. Self-perceived health in First Nations adults in the Atlantic ............. 44
Figure 14b. Self-perceived health in First Nations women in the Atlantic, by age group ....................................................................................... 44
Figure 14c. Self-perceived health in First Nations men in the Atlantic, by age group ....................................................................................... 44
ix
Results from the A
tlantic 2014
Traditional Food Use and Gardening 45Table 6. Percentage of First Nations adults in the Atlantic consuming traditional foods in the past year for all First Nations in the Atlantic (n=1025) .................. 45
Table 7. Yearly and seasonal frequency of use of top ten traditional food items, First Nations adults in the Atlantic ..................................................... 47
Table 8. Mean portion size of traditional food categories, by gender and age group, as reported from 24hr recalls, First Nations adults in the Atlantic, unweighted .......................................................................................... 48
Table 9a. Daily intake (average and 95th percentile) of traditional food (grams) by age group and gender for all First Nations adults in the Atlantic and consumers only ............................................................................... 49
Table 9b. Daily average and heavy (95th percentile) gram consumption of traditional food by category and top three species by category (based on seasonal frequency), consumers only ........................................... 50
Figure 15a. Percent of First Nations households in the Atlantic participating in traditional food harvest and gathering practices* (n=1025) ....................... 51
Figure 15b. Traditional food harvest practices by First Nations participants and households in the Atlantic (n=1025) .................................................... 51
Figure 16. Top 5 barriers preventing First Nations households in the Atlantic from using more traditional food ............................................................... 51
Figure 17. Percent of First Nations adults in the Atlantic who reported that the following affected (or limited) where they could hunt, fish or collect berries (n=1025) ............................................................................................. 51
Figure 18. Top 5 benefits of traditional food reported by First Nations adults in the Atlantic ........................................................................................ 52
Figure 19. Top 5 benefits of market food reported by First Nations adults in the Atlantic ........................................................................................ 52
Nutrient Intake 53Table 10.1 Total energy intake (kcal/d): Usual intakes from food, by DRI age-sex group, household population1 ...................................................... 53
Table 10.2 Protein (g/d): Usual intakes from food, by DRI age-sex group, household population1 ........................................................................... 53
Table 10.3 Total carbohydrates (g/d): Usual intakes from food, by DRI age-sex group, household population1 ...................................................... 54
Table 10.4 Total fats (g/d): Usual intakes from food, by DRI age-sex group, household population1 ........................................................................... 54
Table 10.5 Total saturated fats (g/d): Usual intakes from food, by DRI age-sex group, household population1 ...................................................... 54
Table 10.6 Total monounsaturated fats (g/d): Usual intakes from food, by DRI age-sex group, household population1 ............................................ 55
Table 10.7 Total polyunsaturated fats (g/d): Usual intakes from food, by DRI age-sex group, household population1 ............................................ 55
Table 10.8 Linoleic acid (g/d): Usual intakes from food, by DRI age-sex group, household population1 ............................................ 55
Table 10.9 Linolenic acid (g/d): Usual intakes from food, by DRI age-sex group, household population1 ............................................ 56
Table 10.10 Cholesterol (mg/d): Usual intakes from food, by DRI age-sex group, household population1 ............................................ 56
Table 10.11 Total sugars (g/d): Usual intakes from food, by DRI age-sex group, household population1 ............................................ 56
Table 10.12 Total dietary fibre (g/d): Usual intakes from food, by DRI age-sex group, household population1 ............................................ 57
Table 10.13 Vitamin A (RAE/d): Usual intakes from food, by DRI age-sex group, household population1 ............................................ 57
Table 10.14 Vitamin C (mg/d): Usual intakes from food, by DRI age-sex group, household population1 ............................................ 57
Table 10.15 Vitamin C (mg/d): Usual intakes from food (by smoking status) 1 .............................................................................. 58
Table 10.16 Vitamin D (μg/d): Usual intakes from food, by DRI age-sex group, household population1 ............................................ 58
Table 10.17 Folate (DFE/d): Usual intakes from food, by DRI age-sex group, household population1 ............................................ 59
Table 10.18 Vitamin B6 (mg/d): Usual intakes from food, by DRI age-sex group, household population1 ............................................ 59
x
Table 10.19 Vitamin B12 (μg/d): Usual intakes from food, by DRI age-sex group, household population1 ............................................ 59
Table 10.20 Thiamin (mg/d): Usual intakes from food, by DRI age-sex group, household population1 ............................................ 60
Table 10.21 Riboflavin (mg/d): Usual intakes from food, by DRI age-sex group, household population1 ............................................ 60
Table 10.22 Niacin (NE/d): Usual intakes from food, by DRI age-sex group, household population1 ............................................ 60
Table 10.23 Calcium (mg/d): Usual intakes from food, by DRI age-sex group, household population1 ............................................ 61
Table 10.24 Iron (mg/d): Usual intakes from food, by DRI age-sex group, household population1 ............................................ 61
Table 10.25 Potassium (mg/d): Usual intakes from food, by DRI age-sex group, household population1 ............................................ 61
Table 10.26 Sodium (mg/d): Usual intakes from food, by DRI age-sex group, household population1 ............................................ 62
Table 10.27 Magnesium* (mg/d): Usual intakes from food, by DRI age-sex group, household population1 ............................................ 62
Table 10.28 Phosphorus (mg/d): Usual intakes from food, by DRI age-sex group, household population1 ............................................ 62
Table 10.29 Zinc (mg/d): Usual intakes from food, by DRI age-sex group, household population1 ........................................................................... 63
Table 10.30 Percentage of total energy intake from protein, by DRI age-sex group, household population1 ............................................ 63
Table 10.31 Percentage of total energy intake from carbohydrates, by DRI age-sex group, household population1 ............................................ 63
Table 10.32 Percentage of total energy intake from fats, by DRI age-sex group, household population1 ............................................ 64
Table 10.33 Percentage of total energy intake from saturated fats, by DRI age-sex group, household population1 ............................................ 64
Table 10.34 Percentage of total energy intake from monounsaturated fats, by DRI age-sex group, household1 population ............................................ 64
Table 10.35 Percentage of total energy intake from polyunsaturated fats, by DRI age-sex group, household population1 ............................................ 65
Table 10.36 Percentage of energy from linoleic acid, by DRI age-sex group, household population1 ........................................................................... 65
Table 10.37 Percentage of energy from linolenic acid, by DRI age-sex group, household population1 ........................................................................... 65
Table 11. Mean number of Food Guide Servings consumed per day by First Nations men (n=355) and women (n=642) in the Atlantic compared to Eating Well with Canada’s Food Guide-First Nations, Inuit and Métis (CGF-FNIM) recommendations (unweighted) ................................................................ 66
Table 12. Top 5 contributors to the four food groups in Canada’s Food Guide (% of total group intake), First Nations women and men in the Atlantic region (unweighted) ......................................................................................... 66
Table 13. Ten most important contributors to macro and micronutrients for First Nations adults in the Atlantic .................................................................... 67
Table 14. Comparison of nutrient intake (mean ± SE) on days with and without traditional food (TF), First Nations adults in the Atlantic ................. 69
Table 15. Top 10 consumed market foods (grams/person/day), consumers and non-consumers combined, ranked by overall decreasing amount of consumption ........................................................... 70
Figure 20. Use of nutritional supplements by First Nations adults in the Atlantic by age group (n=1025) ...................................................... 70
Food Security 71Figure 21. Percent of households that worried that their traditional food would run out before they could get more, in the previous 12 months (n=1025) ......... 71
Figure 22. Percent of households that worried that their traditional food would not last and they couldn’t get more in the previous 12 months (n=1025) .......... 71
Table 16. Percent of First Nations adults in the Atlantic that responded affirmatively to food insecurity questions (in the previous 12 months) ................ 71
Table 17. Income-related household food security status for First Nations in the Atlantic, by households with and without children, in the previous 12 months .... 72
xi
Results from the A
tlantic 2014
Figure 23. Income-related household food insecurity in First Nations households in the Atlantic* (n=1013) ........................................................ 73
Figure 24. Income-related household food insecurity in First Nations households with children in the Atlantic* (n=486) ........................................ 73
Figure 25. Income-related household food insecurity in First Nations households without children in the Atlantic* (n=527) .................................... 73
Figure 26. Income-related marginal food insecurity in First Nations households in the Atlantic region (n=1013) + ............................................. 73
Figure 27. Income-related household food insecurity in First Nations communities in the Atlantic, by income sources ............................................ 74
Figure 28. Comparison of healthy food basket cost for a family of four* .......... 74
Concerns about Climate Change 75Figure 29. How climate change has affected traditional food availability in First Nations in the Atlantic ................................................................... 75
Tap Water Analyses 76Table 18. Characteristics of homes and plumbing, First Nations in the Atlantic ....76
Figure 30. Household (HH) water source and use, First Nations in the Atlantic ....76
Figure 31. Source of tap water, First Nations in the Atlantic ........................... 76
Figure 32. Source of drinking water if no tap water or don’t use tap water, First Nations in the Atlantic ...................................................................... 77
Figure 33. Source of water for preparation of food/beverages if no tap water or don’t use tap water, First Nations in the Atlantic ............................... 77
Figure 34. Deterrents to drinking the tap water ............................................ 77
Figure 35. Types of water treatment methods for those who treat their drinking water ....................................................................................... 77
Figure 36. If tap water consumed, from which tap is the water taken from? ...... 78
Figure 37. If tap water is used for cooking, from which tap is the water taken from? .................................................................................. 78
Table 19: Trace metals analysis results for parameters of health concern .......... 79
Table 20: Trace metals analysis results for parameters of aesthetic or operational concern ............................................................................... 79
Pharmaceutical Analyses in Surface Water 80Table 21. Pharmaceuticals tested for and quantified in First Nations communities in the Atlantic ....................................................................... 80
Table 22: Level of pharmaceuticals in surface water in First Nations communities in the Atlantic ....................................................................... 83
Table 23. Comparison of pharmaceutical levels detected in First Nations communities in the Atlantic to findings from Canadian, U.S. and Global studies.......................................................................... 84
Table 24. Comparison of FNFNES Atlantic results to drinking water guidelines in Australia, California and New York ......................................... 85
Mercury in Hair Analyses 86Table 25. Arithmetic (A.M.) and geometric (G.M.) means of total mercury in hair concentration (μg/g or ppm) for First Nations in the Atlantic ................. 86
Figure 38. Mercury concentration in hair of participants living in the Atlantic region (n=632) .................................................................. 87
Figure 39. Mercury concentration in hair of women of childbearing age (WCBA) living in the Atlantic region (n=296) .............................................. 87
Food Contaminant Analyses 88Table 26. Mean and maximum levels of toxic trace metals in traditional food samples from the Atlantic (μg/g fresh weight) ....................................... 88
Table 27. Top 10 traditional food sources of toxic trace metal intake among First Nations adults in the Atlantic ................................................... 92
Table 28. Exposure estimates (μg/kg body weight/day) for metals from traditional food for First Nations adults in the Atlantic, using mean and maximum concentrations (n=1025) ........................................................... 92
Table 29. Exposure estimates (μg/kg body weight/day) for mercury from traditional food (using mean and maximum concentrations) among First Nations women of child bearing age (WCBA) in the Atlantic (n=455) ........................ 93
Table 30. Toxic metal exposure estimates (μg/kg body weight/day) from traditional food for First Nations adults in the Atlantic, using mean and maximum concentrations, consumers only (n=892) .................................................... 93
xii
Table 31. Mercury exposure estimates (μg/kg body weight/day) from traditional food (using mean and maximum concentrations) among First Nations women of child bearing age in the Atlantic, consumers only (n=378 ) ............. 93
Figure 40. Correlation between mercury exposure from traditional food and hair mercury levels, total population (n=632) ........................................ 94
Figure 41. Correlation between mercury exposure from traditional food and hair mercury levels, women of child bearing age (n=296) ....................... 94
Table 32. Mean and maximum levels of Polycyclic Aromatic Hydrocarbons (PAHs) in Atlantic traditional food samples (ng TEQ/g fresh weight) ................. 94
Table 33. Mean and maximum levels of organochlorines in Atlantic traditional food samples (ng/g fresh weight) ............................................... 95
Table 34. Mean and maximum levels of Polybrominated Diphenyl Ethers (PBDEs) in Atlantic traditional food samples (ng/g fresh weight) ...................... 96
Table 35. Mean and Max total levels of Perfluorinated Compounds (PFCs) in Atlantic traditional food samples (ng/g fresh weight) ................................. 96
Table 36. Levels of Dioxins and Furans in Atlantic traditional food samples (ng TEQ/kg fresh weight) ........................................................................ 97
Table 37. Exposure estimates (μg/kg body weight/day) for organics from traditional food for Atlantic First Nations using mean concentrations (n=1025) ....98
APPENDICES ............................................................................ 99Appendix A. Chemical fact sheets ............................................................ 99
Appendix B. Statistical tools used to obtain weighted estimates at the regional level ...................................................................................... 104
Appendix C. Detection limit tables .......................................................... 105
Appendix D. Framework for mixed dishes categorization into food groupings ...109
Appendix E. Body Mass Index (BMI) ....................................................... 110
Appendix F. Conversion of Grams to Usual Household Measures .................. 111
Appendix G. Traditional Food Intake by species in grams per day ................ 112
Appendix H. Types of fruits and vegetables consumed from personal or community gardens in First Nations communities in the Atlantic ..................... 115
Appendix I. Eating Well with Canada’s Food Guide First Nations, Inuit and Métis .................................................................................... 116
Appendix J. List of common foods and beverages avoided because of intolerance ...................................................................................... 119
Appendix K. Market food intake (g/person/day) ...................................... 120
Appendix L. List of supplements taken by First Nations in the Atlantic .............. 124
Appendix M. Average costs of nutritious food basket items in grocery stores near First Nations communities and in major urban centres .................. 125
Appendix N. Participants comments about traditional food .......................... 128
Appendix O. Healthy Food Guidelines for First Nations Communities ............ 129
Appendix P. Summary of Results for the Atlantic ......................................... 138
REFERENCES ........................................................................... 140
xiii
Results from the A
tlantic 2014
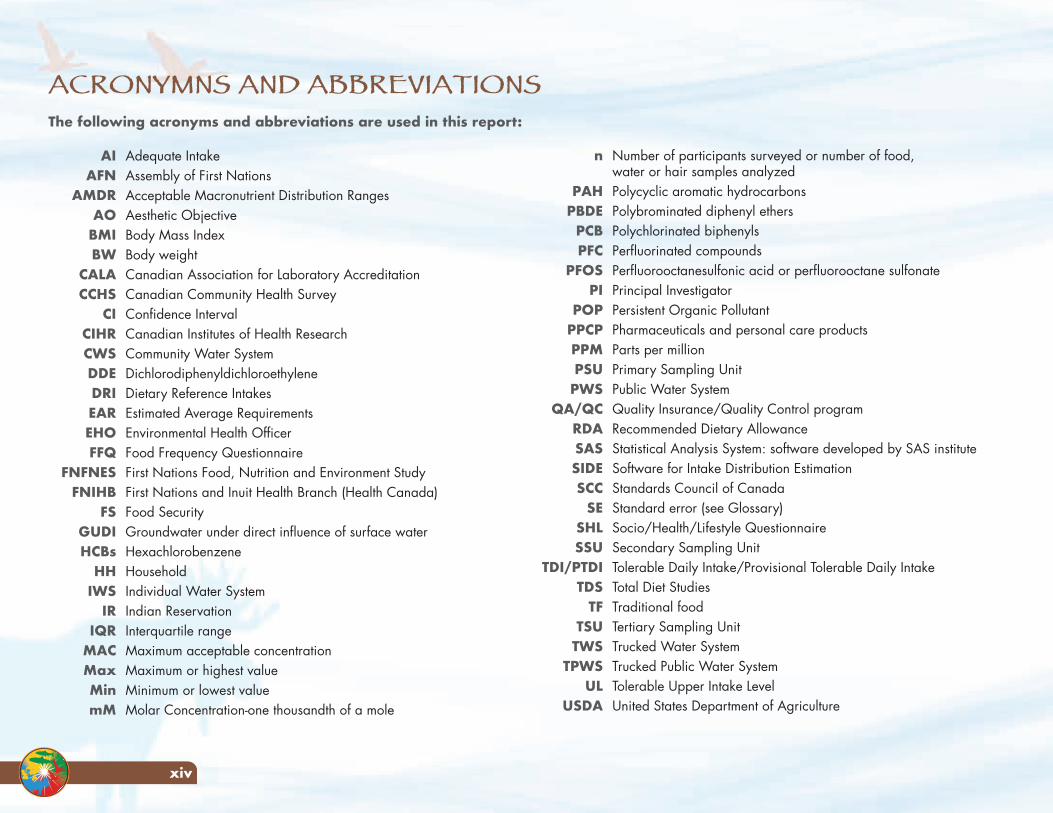
AI Adequate Intake AFN Assembly of First Nations AMDR Acceptable Macronutrient Distribution Ranges AO Aesthetic Objective BMI Body Mass Index BW Body weight CALA Canadian Association for Laboratory Accreditation CCHS Canadian Community Health Survey CI Confidence Interval CIHR Canadian Institutes of Health Research CWS Community Water System DDE Dichlorodiphenyldichloroethylene DRI Dietary Reference Intakes EAR Estimated Average Requirements EHO Environmental Health Officer FFQ Food Frequency Questionnaire FNFNES First Nations Food, Nutrition and Environment Study FNIHB First Nations and Inuit Health Branch (Health Canada) FS Food Security GUDI Groundwater under direct influence of surface water HCBs Hexachlorobenzene HH Household IWS Individual Water System IR Indian Reservation IQR Interquartile range MAC Maximum acceptable concentration Max Maximum or highest value Min Minimum or lowest value mM Molar Concentration-one thousandth of a mole
n Number of participants surveyed or number of food, water or hair samples analyzed PAH Polycyclic aromatic hydrocarbons PBDE Polybrominated diphenyl ethers PCB Polychlorinated biphenyls PFC Perfluorinated compounds PFOS Perfluorooctanesulfonic acid or perfluorooctane sulfonate PI Principal Investigator POP Persistent Organic Pollutant PPCP Pharmaceuticals and personal care products PPM Parts per million PSU Primary Sampling Unit PWS Public Water System QA/QC Quality Insurance/Quality Control program RDA Recommended Dietary Allowance SAS Statistical Analysis System: software developed by SAS institute SIDE Software for Intake Distribution Estimation SCC Standards Council of Canada SE Standard error (see Glossary) SHL Socio/Health/Lifestyle Questionnaire SSU Secondary Sampling Unit TDI/PTDI Tolerable Daily Intake/Provisional Tolerable Daily Intake TDS Total Diet Studies TF Traditional food TSU Tertiary Sampling Unit TWS Trucked Water System TPWS Trucked Public Water System UL Tolerable Upper Intake Level USDA United States Department of Agriculture
ACRONYMNS AND ABBREVIATIONSThe following acronyms and abbreviations are used in this report:
xiv
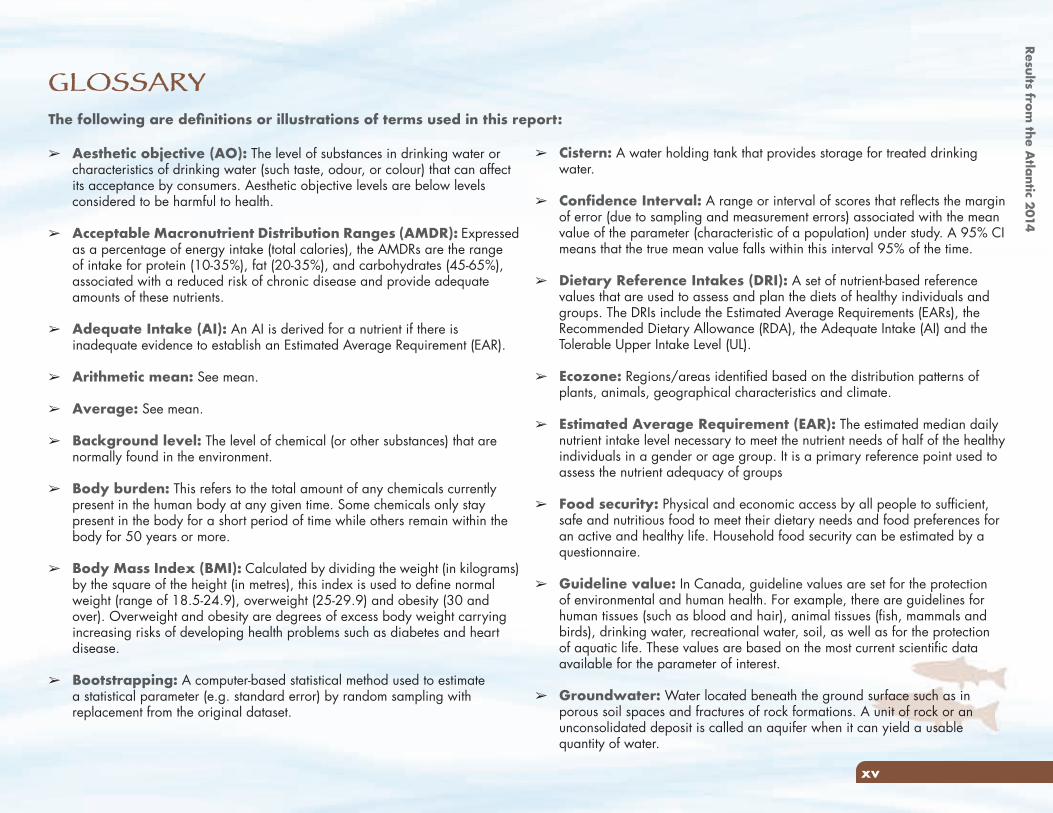
➢ Aesthetic objective (AO): The level of substances in drinking water or characteristics of drinking water (such taste, odour, or colour) that can affect its acceptance by consumers. Aesthetic objective levels are below levels considered to be harmful to health.
➢ Acceptable Macronutrient Distribution Ranges (AMDR): Expressed as a percentage of energy intake (total calories), the AMDRs are the range of intake for protein (10-35%), fat (20-35%), and carbohydrates (45-65%), associated with a reduced risk of chronic disease and provide adequate amounts of these nutrients.
➢ Adequate Intake (AI): An AI is derived for a nutrient if there is inadequate evidence to establish an Estimated Average Requirement (EAR).
➢ Arithmetic mean: See mean.
➢ Average: See mean.
➢ Background level: The level of chemical (or other substances) that are normally found in the environment.
➢ Body burden: This refers to the total amount of any chemicals currently present in the human body at any given time. Some chemicals only stay present in the body for a short period of time while others remain within the body for 50 years or more.
➢ Body Mass Index (BMI): Calculated by dividing the weight (in kilograms) by the square of the height (in metres), this index is used to define normal weight (range of 18.5-24.9), overweight (25-29.9) and obesity (30 and over). Overweight and obesity are degrees of excess body weight carrying increasing risks of developing health problems such as diabetes and heart disease.
➢ Bootstrapping: A computer-based statistical method used to estimate a statistical parameter (e.g. standard error) by random sampling with replacement from the original dataset.
➢ Cistern: A water holding tank that provides storage for treated drinking water.
➢ Confidence Interval: A range or interval of scores that reflects the margin of error (due to sampling and measurement errors) associated with the mean value of the parameter (characteristic of a population) under study. A 95% CI means that the true mean value falls within this interval 95% of the time.
➢ Dietary Reference Intakes (DRI): A set of nutrient-based reference values that are used to assess and plan the diets of healthy individuals and groups. The DRIs include the Estimated Average Requirements (EARs), the Recommended Dietary Allowance (RDA), the Adequate Intake (AI) and the Tolerable Upper Intake Level (UL).
➢ Ecozone: Regions/areas identified based on the distribution patterns of plants, animals, geographical characteristics and climate.
➢ Estimated Average Requirement (EAR): The estimated median daily nutrient intake level necessary to meet the nutrient needs of half of the healthy individuals in a gender or age group. It is a primary reference point used to assess the nutrient adequacy of groups
➢ Food security: Physical and economic access by all people to sufficient, safe and nutritious food to meet their dietary needs and food preferences for an active and healthy life. Household food security can be estimated by a questionnaire.
➢ Guideline value: In Canada, guideline values are set for the protection of environmental and human health. For example, there are guidelines for human tissues (such as blood and hair), animal tissues (fish, mammals and birds), drinking water, recreational water, soil, as well as for the protection of aquatic life. These values are based on the most current scientific data available for the parameter of interest.
➢ Groundwater: Water located beneath the ground surface such as in porous soil spaces and fractures of rock formations. A unit of rock or an unconsolidated deposit is called an aquifer when it can yield a usable quantity of water.
GLOSSARYThe following are definitions or illustrations of terms used in this report:
xv
Results from the A
tlantic 2014
➢ Groundwater under the direct influence of surface water (GUDI): groundwater that shows surface water characteristics. This can include water from a well that is not a drilled well or does not have a watertight casing and is up to 6 m in depth below ground level.
➢ Hazard Quotient (HQ): The HQ approach is used in contaminant exposure analyses to estimate risks of adverse health effects to COPCs. An HQ is calculated by dividing the estimated exposure to a COPC (ug/kg body weight/day) by the TDI. If the HQ is ≤ 1, the risk of an adverse health effect is not likely. If HQ is >1, there can be an increased health risk exposure from the contaminant.
➢ Individual Water System (IWS): A system serving individual homes that each have their own pressurized water supply (e.g. a well), or is connected to a piped distribution system that has less than five housing units and does not include any public access buildings.
➢ Interquartile range (IQR): A statistical term used to describe the distribution around the median (25% above and below the median).
➢ Maximum Acceptable Concentration (MAC): The concentration or level of a particular substance at which exposure to may cause harmful effects on health.
➢ Mean (arithmetic): A statistical term used to describe the value obtained by adding up all the values in a dataset and dividing by the number of observations. Also known as ‘average’.
➢ Mean, geometric (GM): To calculate a geometric mean, all observations [i.e. values] are multiplied together, and the nth root of the product is taken, where n is the number of observations. Geometric mean of skewed distribution such as hair mercury concentrations usually produces an estimate which is much closer to the true center of the distribution than would an arithmetic mean.
➢ Median: A statistical term used to describe the middle value obtained when all values in a dataset are placed in numerical order; at most half the observations in a dataset are below the median and at most half are above the median.
➢ Organochlorines: A group of organic compounds with a similar chemical structure. There are naturally occurring and man-made organochlorines. Organochlorine compounds have been used for a variety of purposes including pesticides (DDT, chlordane, toxaphene, solvents, material purposes (PVC pipes) insulators (PCB). Some organochlorines have been banned or their use restricted due to their harmful impacts and classification as a POP. See Appendix A for more detail.
➢ Oral Slope Factor: An upper bound, approximating a 95% confidence limit, on the increased cancer risk from a lifetime oral exposure to an agent. This estimate, usually expressed in units of proportion (of a population) affected per mg/kg-day, is generally reserved for use in the low-dose region of the dose-response relationship, that is, for exposures corresponding to risks less than 1 in 100.
➢ Persistent Organic Pollutant (POP): Groups of chemicals that persist in the environment and in the bodies of humans and other animals long after their use. See Appendix A for more detail.
➢ Public Water System (PWS): A community water system with five or more connections that has a distribution system (piped) and may also have a truck fill station.
➢ Recommended Dietary Allowance (RDA): The estimated average daily nutrient intake level that meets the needs of nearly all (98%) healthy individuals in an age or gender group.
➢ Semi Public Water System (SPWS): A well or cistern serving a public building(s) or where the public has a reasonable expectation of access and has less than 5 connections.
➢ Surface water (SW): All water situated above-ground (for example, rivers, lakes, ponds, reservoirs, streams, seas).
➢ Standard error (SE): A measure of variation to be expected from sampling strategy, measurement error, and natural variability in the calculated parameter (The parameter can be a percentage or a mean (average) for example).
xvi
➢ Tolerable Daily Intake (TDI) or Provisional Tolerable Daily Intake (PTDI): The amount of a substance in air, food or drinking water that can be taken in daily over a lifetime without adverse health effects. TDIs or PTDIs are calculated on the basis of laboratory toxicity data to which uncertainty factors are applied. TDIS are presented as daily dose rates in units of mass of a particular chemical per kilogram of body weight of a person per day
➢ Tolerable Upper Intake Level (UL): An estimate of the highest average daily nutrient intake level that is likely to pose no adverse health effects.
➢ Wastewater (WW): Used water, including greywater (used water kitchen, laundry), blackwater (used water from bathroom containing human waste), or surface runoff or used water from an industrial, commercial or institutional facility that is mixed with blackwater.
➢ Water treatment plant (WTP): The facility that treats water so that it is clean and safe to drink.
➢ Water treatment system (WTS): Includes all water delivery components such as the raw water intake, water treatment plant, distribution system, hydrants, etc.
➢ µg/g: Micrograms (1 millionth or 1/1,000,000 of a gram) per gram; in the case of the mercury in hair results, this measurement represents the weight of mercury measured per gram of hair. In the food contaminant results, this represents the weight of contaminant per gram of food.
➢ µg/L: Micrograms (1 millionth or 1/1,000,000 of a gram) per litre; found in the drinking water results, this measurement represents the weight of trace metals measured per litre of water.
➢ ng/g: Nanograms (1 billionth or 1/1,000,000,000 of a gram) per gram; found in the food contaminant results, this measurement represents the weight of a contaminant measured per gram of food.
➢ ppm: Parts per million; A common unit typically used to describe the concentration of contaminants in food or environment. This is approximately equivalent to one drop of water diluted into 50 liters (roughly the fuel tank capacity of a small car).
➢ ppb: Parts per billion; this is approximately equivalent to one drop of water diluted into 250- 55 gallon containers.
➢ pg/kg/day: Pico grams (1 trillionth or 1/1,000,000,000,000 of a gram) per kilogram per day; in the food contaminant results, this represents the weight of contaminants per kilogram body weight that is being consumed per day. This value is used for risk assessment.
xvii
Results from the A
tlantic 2014
First Nations have expressed concerns about the impacts of environmental pollution on the quality and safety of traditionally-harvested foods. However, very little is known about the composition of First Nations’ diets, or about the level of contaminants in traditional foods. The goal of this study is to fill this gap in knowledge about the diet of First Nations peoples living on-reserve, south of the 60th parallel. In addition, baseline information on human and veterinary pharmaceuticals in surface waters is being collected, especially where fish are being harvested or where water is being taken for drinking purposes. To ensure that the cultural and ecosystem diversity of First Nations in Canada is represented in this study, communities are selected using an ecozone framework. South of the 60th parallel, there are 11 ecozones within the eight Assembly of First Nations regions. In the Atlantic region, there are two ecozones, the Atlantic Maritime and the Boreal Shield.
This study, called the First Nations Food, Nutrition and Environment Study (FNFNES) is being implemented region by region across Canada over a 10-year period. Data collection started in 21 First Nations communities in British Columbia in 2008-2009 followed by nine First Nations communities in Manitoba in 2010, 18 communities in Ontario (2011-2012), and 10 communities in Alberta in 2013. Reports for these four AFN regions are available on the FNFNES website (www.fnfnes.ca).
In the fall of 2014, FNFNES was undertaken in the two Assembly of First Nations regions in the Atlantic: New Brunswick/Prince Edward Island (NB/PEI) and Nova Scotia/Newfoundland (NS/NL). Eleven First Nations communities in New Brunswick, Nova Scotia, and Newfoundland participated. There were no communities from Prince Edward Island since neither of the two First Nations communities in this province was selected during the random selection process. Due to the fact that only one community from the Boreal Shield was surveyed and could be easily identified, this report only presents the aggregated results from the 11 participating First Nations communities combined. This report does not represent communities in Labrador, which fall within the Quebec/Labrador AFN region but are included in the FNIHB Atlantic region.
EXECUTIVE SUMMARYThe FNFNES includes five components:
1) Household interviews to collect information on dietary patterns, lifestyle and general health status, environmental concerns and food security;
2) Drinking water sampling for trace metals;3) Hair sampling for exposure to mercury;4) Surface water sampling for pharmaceuticals; and 5) Traditional food sampling for chemical contaminant content.
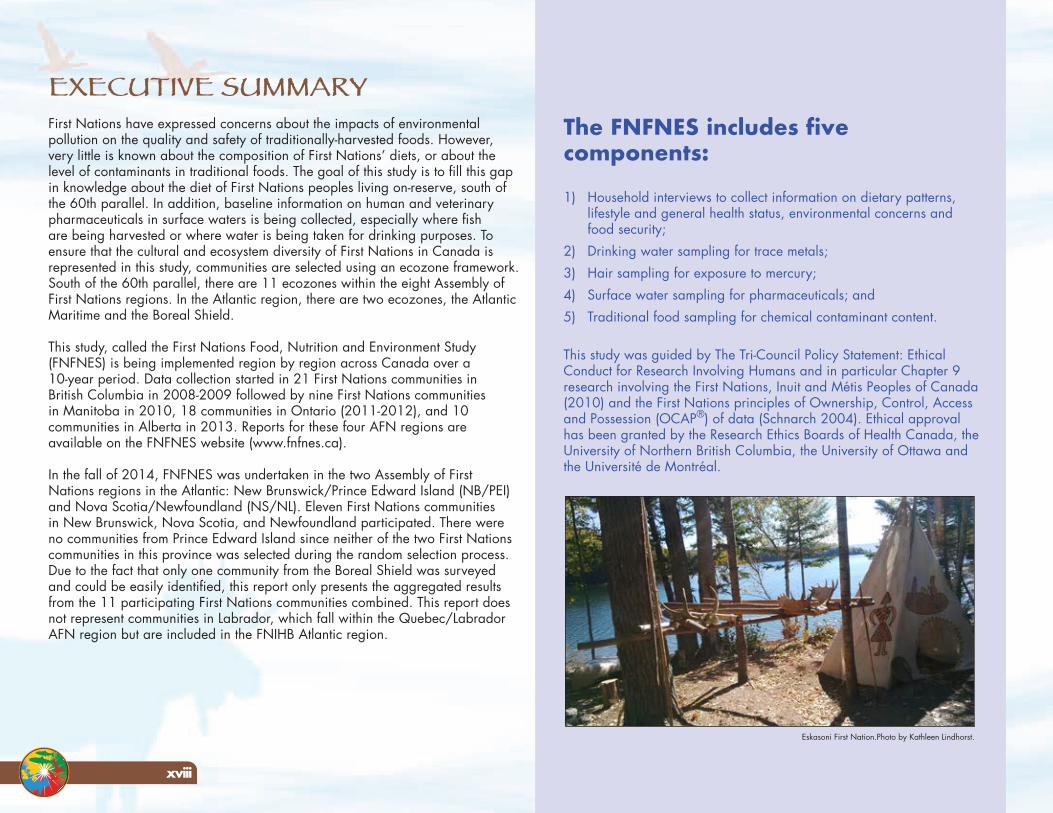
This study was guided by The Tri-Council Policy Statement: Ethical Conduct for Research Involving Humans and in particular Chapter 9 research involving the First Nations, Inuit and Métis Peoples of Canada (2010) and the First Nations principles of Ownership, Control, Access and Possession (OCAP®) of data (Schnarch 2004). Ethical approval has been granted by the Research Ethics Boards of Health Canada, the University of Northern British Columbia, the University of Ottawa and the Université de Montréal.
Eskasoni First Nation.Photo by Kathleen Lindhorst.
xviii
In terms of overall diet quality, First Nations adults in the Atlantic do not meet the amounts and types of food recommended in Eating Well with Canada’s Food Guide-First Nations, Inuit and Métis. First Nations adults in the Atlantic meet the recommended number of servings from the Meat and Alternatives group, but fall below the recommended intake for the other three food groups (Milk and Alternatives, Vegetables and Fruit, and Grain Products). Fibre and many nutrients that are needed for good health and prevention of disease, including vitamin A, vitamin B6, folate, vitamin C, vitamin D, calcium and magnesium, are at risk of insufficient intake. Dietary quality was much improved on days when traditional foods were consumed, as traditional foods are important contributors of protein, vitamin D, iron, zinc, magnesium and other essential nutrients.
Almost one-third (31%) of households experienced food insecurity; 22% of the households were moderately food insecure and 9% were severely food insecure. The cost of food relative to income is a contributing factor to food insecurity. The average cost of groceries per week for a family of four in the Atlantic was $218. Costs at the community level ranged from $193 to $238. When asked about traditional food security, 24% of households said that they worried that their traditional food supplies would run out before they could get more.
Results
In each community, households were randomly selected; one participant per household, nineteen years and older, living on-reserve and who self-identified as a First Nation person, was invited to participate. There was a total of 1025 participants (670 women and 355 men). The overall participation rate was 90% for questionnaires. Sixty-two percent of respondents (n=632) agreed to participate in hair testing for mercury. The average age of the participants was 42 years for women and 40 years for men. The median number of people living in a household was three: 75% were between the ages of 15 and 65, 20% were children under 15 years of age and 5% were over 65 years of age.
Based on measured and/or self-reported height and weight data, 21% of adults were at a normal weight, while 31% of adults were overweight (31% of women and men) and 48% were obese (50% of women and 44% of men). One out of five adults (20%) reported that they had been told by a health professional that they had diabetes. Over half of all adults (52%) were smokers.
Traditional food appeared in the diet of over three-quarters (83%) of all First Nations adults. Over 100 different traditional foods were harvested during the year, with the types varying across communities. The majority of adults reported eating berries (61%), fish (56%), shellfish (53%), land mammals (54%), while many ate wild plants (29%), cultivated traditional food (23%), tree foods (20%), and wild birds (10%). The most frequently eaten traditional foods were moose, blueberries and lobster. At the regional level, First Nations adults in the Atlantic consumed an average of 21 grams of traditional food a day while heavy consumers (those at the 95th percentile) had up to 85 grams/day. Sixty-two percent of households reported harvesting traditional food in the last year and more than half (60%) of participants reported that they would like to have more traditional food. However, the key barriers to increased use included a lack of time, a hunter in the household, and hunting/harvesting knowledge. External factors that inhibited access to traditional food included government restrictions, forestry operations, as well as roadways. Climate change was also perceived by participants to have impacted both the seasonal round (lifecycle pattern of plants and animals and harvesting times) and the availability of traditional food.
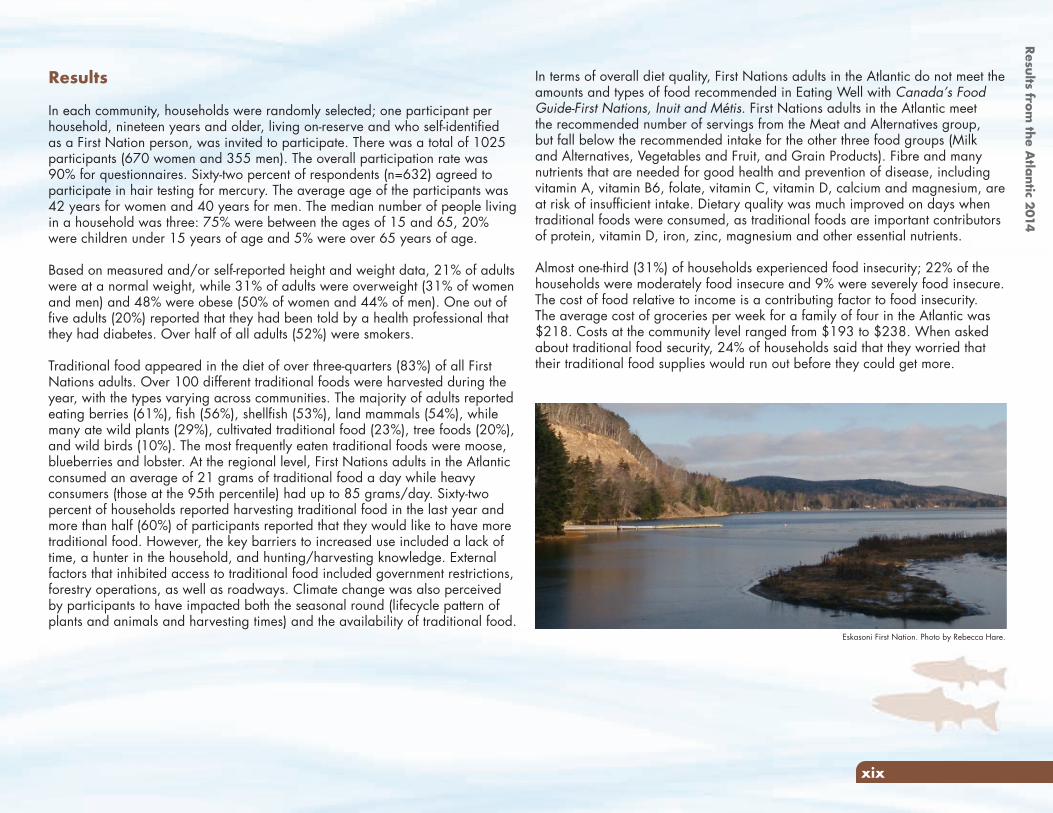
Eskasoni First Nation. Photo by Rebecca Hare.
xix
Results from the A
tlantic 2014
Testing for the presence of pharmaceuticals in surface water was undertaken in 11 communities: quantifiable pharmaceuticals were found in ten communities. Eleven pharmaceuticals were found in the surface water. The FNFNES results are considerably lower than those found in other wastewater and surface waters reported in Canada, the United States, Europe, Asia, Central America and Africa. However, the health effects of the mixtures of multiple pharmaceuticals in the surface water are unknown at this time.
Sixty-two percent of all participants (n=632) provided hair samples for mercury testing. There were no exceedances of Health Canada’s mercury biomonitoring guidelines. The average mercury concentration in hair among adults was 0.18 µg/g (geometric mean was at 0.1 µg/g). However, as more than 40% of the sample was below the level of detection (LOD), these means are not reliable. The distribution of mercury in hair among the 75th and 95th percentile of First Nations living on-reserve in the Atlantic indicate that average mercury body burden is generally below the established Health Canada mercury guideline (6 µg/g in hair for the general population and 2 µg/g for women of childbearing age and children). The results suggest with some certainty that mercury exposure is not a significant issue for First Nations in the Atlantic.
A total of 1173 food samples representing 90 different types of traditional foods were collected for contaminant analysis. Most of the contaminant concentrations found in the traditional foods were within the normal ranges that are typically found in Canada with no health concern associated with consumption. Some samples such as squirrel, rabbit and deer had higher concentrations of lead, likely as a result of contamination from lead-containing ammunition. It is recommended to use steel shot instead of lead shot when hunting and, when hunting with lead shot, to cut away the portion of meat surrounding the bullet entry area to decrease the risk of lead exposure.
Thus far, this study has been a valuable tool in addressing the gaps in knowledge about the diet, including both market and traditional food consumption and levels of environmental contaminants to which First Nations in the Atlantic are exposed. It should be noted that this is the first study of this type to be conducted on a regional level across the country. The data collected will serve as a critical source of information to inform human health risk assessments and to serve as a benchmark for future studies to determine if changes in the environment are resulting in an increase or decrease in concentrations of chemicals of concern and how diet quality will change over time.
In terms of water treatment systems, there were 9 water treatment systems located in and maintained by the communities. Two First Nations had agreements in place with nearby municipalities to provide treated water to some homes. In the 12 months preceding this study, seven communities reported water disruptions and one boil water advisory. One community reported that more than one advisory was issued within the year. The drinking water advisories were largely issued due to power outages and water line breakages.
All participants reported that their households have tap water; 12% of households reported having water storage tanks (90% had inside water storage tanks and 10% had exterior tanks). Three-quarters (75%) of households in the participating communities reported that they obtained their tap water from water treatment plants, while 17% stated that their water was piped in from a nearby municipality and 8% obtained their water from wells. Fifty-eight percent of participants reported that they use the tap water for drinking while 93% use it for cooking. Participants reported that taste, smell, colour and drinking water advisories affected their confidence in the drinking water quality. Of the 216 homes that had their tap water tested for metals, there were no exceedances in the flushed samples.
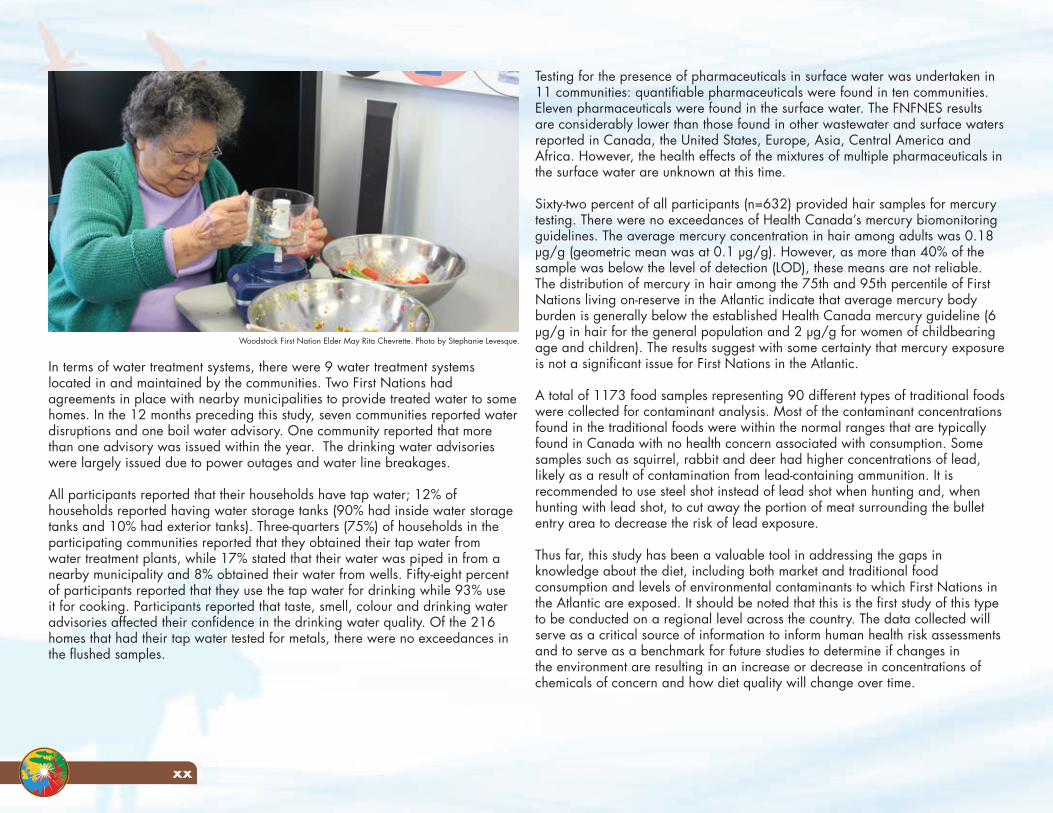
Woodstock First Nation Elder May Rita Chevrette. Photo by Stephanie Levesque.
xx
Increasing industrialization in the last century has led to various degrees of pollution in all ecosystems. First Nations are particularly at risk to environmental contaminant exposure because of a traditional lifestyle with a close connection to the land and water, as well as a diet that includes traditional foods from the local environment. First Nations communities from different geographical areas in Canada face their own unique environmental problems due to the nature of the point sources of environmental pollution and the degree to which their diet is obtained from the local environment. It has been suggested that major health problems (e.g. cancer, diabetes, low infant weight) may be related to the amount of chemical contaminants in the environment (Hectors, et al. 2011; Lee, et al. 2011; Li, et al. 2006; Institute of Medicine 2007). There are also concerns of new or unknown health issues associated with the consumption of food contaminated with chemicals that have not been fully characterized. However, the risks and benefits of traditional food must be better understood before recommendations can be made. Unfortunately, there has been very limited information on both the nutritional composition of the average diet of most First Nations and the levels of contaminants in their traditional foods.
Exposure to food toxicants and environmental contaminants as well as nutritional imbalances have been associated with a range of human health conditions including; cancer, kidney and liver dysfunction, hormonal imbalance, immune system suppression, musculoskeletal disease, birth defects, premature births, impeded nervous and sensory system development, reproductive disorders, mental health problems, cardiovascular diseases, genito-urinary disease, old-age dementia, and learning disabilities. Toxicants in food can occur naturally or can enter during processing or through environmental contamination. Toxicants can be ‘natural’ or ‘manufactured’. For example, some mushrooms produce toxins that can be harmful to human health. Toxic metals such as arsenic, cadmium, lead and mercury are found naturally in soil and rocks. However, they can also be emitted as a waste product (pollutant) of human activities such as mining and forestry and accumulate in animals and plants in high enough amounts that are harmful to the human consumers. The burning of wood and fossil fuels can release toxic chemicals such as polycyclic aromatic hydrocarbons (PAHs) and dioxins and furans into the environment. Man-made (anthropogenic) chemicals such as PCBs (derived from industrial activities), PBDEs and PFCs (used in consumer products) and organochlorine pesticides (used in agriculture and forestry) can also enter into the food system.
In Canada, there remain large gaps in health between First Nations and the non-Aboriginal population. First Nations continue to experience a lower life expectancy (Health Canada 2011), higher rates of chronic and infectious diseases, and mental health issues (Public Health Agency of Canada 2012; 2011; 2010). Rates of obesity, diabetes and heart disease among First Nations Peoples have reached epidemic levels (Ayach and Korda 2010; Belanger-Ducharme and Tremblay 2005; Young 1994). The well-being of individuals and communities is determined by a broad range of factors including diet and lifestyle, genetics, the state of the environment and the social determinants of health. The social determinants of health (social and economic factors including income, education, employment, early childhood development, social networks, food security, gender, ethnicity, disability that can result in inequities and exclusion) play a key role in health inequities: those who have more advantages tend to have better health (Frohlich, Ross and Richmond 2006; Mikkonen and Raphael 2010). For First Nations peoples, the history of colonization and the loss of jurisdiction over traditional territories is an additional dimension of the determinants of health (Egeland and Harrison, 2013; Reading and Wein 2009). For thousands of years, First Nations communities relied on ecozone-adapted traditional food systems (Waldram, Herring and Young 1995). Traditional food is nutritionally, culturally, and economically important for First Nations Peoples. Traditional foods are often more nutrient dense compared to market food replacements. First Nations communities are experiencing a dietary transition away from traditional foods that could be attributed to a multitude of factors including acculturation, harvesting restrictions, financial constraints and loss of time for harvesting activities, and declining traditional food access and availability due to development, pollution and climate change (Kuhnlein, Erasmus, et al. 2013; Kuhnlein and Receveur 1996). As the proportion of traditional food decreases in the diet of First Nations, there is a risk of a decrease in the nutritional quality of the diet and a rise in nutrition related health problems such as anemia, heart disease, obesity, osteoporosis, cancer, infections, diabetes and tooth decay (Kuhnlein and Receveur 1996). The health and nutrition of First Nations peoples are strongly affected by social disparities, the erosion of a traditional lifestyle and the resulting high food insecurity and a poor quality diet (Adelson 2005; Kuhnlein and Receveur 1996; Power 2008; Willows, Veugelers, et al. 2011; Willows 2005).
INTRODUCTION
1
Results from the A
tlantic 2014
3. Estimate the actual consumption of chemicals in the diet by population at risk, and compare these intakes with toxicological reference points, such as the acceptable daily intake (ADI) or provisional tolerable weekly intake (PTWI). On a yearly basis, Health Canada purchases store-bought food and analyses high-priority chemicals as part of the Total Diet Study (TDS).
4. Conduct biomonitoring projects by measuring the chemical concentrations in blood, urine breast milk, hair, nail clippings and/or fetal cords blood collected from the target population as indicators of exposure. The Canadian Health Measures Survey (CHMS) is an ongoing bio-monitoring surveillance study that began in 2007 (Statistics Canada, Health Canada, Public Health Agency of Canada 2014).
Canada is one of the global leaders in conducting Total Diet Studies (TDS). Health Canada (2013) has been collecting and analyzing store-bought foods since 1969 to assess nutrient intake and exposure to chemical contaminants from these foods. In each TDS, a variety of store-bought foods are purchased from several supermarkets in major cities and analysed for nutrients and chemical contaminants. This information is combined with available dietary data for Canadians to estimate exposure. Results of the studies have been published in the scientific literature. As the TDS only focuses on the chemical contaminants found in store-bought foods, the findings have limited value for First Nations communities that rely on traditionally harvested foods. A similar situation exists for the evaluation of food intake and diet quality. National dietary surveys, such as the 2004 Canadian Community Health Survey Cycle 2.2, Nutrition (Health Canada 2009), do not include First Nations peoples living on-reserve.
There have been a number of dietary studies conducted in First Nations communities since the 1970s. They provide a general understanding of the types of foods eaten by some First Nations peoples living on-reserve. The data are not easily comparable as the studies were conducted at different times by different research teams that used different investigative tools to address a variety of research objectives. Relatively more complete information is available for First Nations, Inuit and Métis communities in the three northern territories. With the funding support from the Northern Contaminants Program, three comprehensive
About 8,400,000 chemical substances are commercially available and 240,000 are reported to be inventoried/regulated chemicals. Combined with pesticides, food additives, drugs and cosmetics, over 100,000 chemicals have been registered for use in commerce in the United States in the past 30 years, with similar numbers in the EU and Japan (Muir and Howard 2006). Canada has compiled a list of approximately 23,000 chemicals manufactured, imported or used in Canada on a commercial scale and identified 4,300 chemicals as priorities for assessment by 2020: as of 2015, 60% have been assessed (Health Canada and the Public Health Agency of Canada 2015). Some organic chemicals, such as pesticides, PCBs and dioxins, as well as organic lead and mercury, have physical and chemical characteristics that allow them to resist degradation and persist in the environment, to be transported globally via air and water currents and to bioaccumulate and biomagnify along biological food chains. These persistent organic pollutants (POPs) are of particular concern in aquatic environments since the aquatic food chains are usually longer than the terrestrial food chains, resulting in higher bioaccumulation in the top predators. Where these chemicals are present in fish, they will also accumulate in the animals that consume them, such as birds, marine mammals and bears, eventually reaching humans.
In the last few years, concern has also been raised about pharmaceuticals and personal care products (PPCPs) in the environment (Treadgold, Liu and Plant 2012). Some of these compounds, including human pharmaceuticals and veterinary drugs, are excreted intact or in conjugated form in urine and feces. These PPCPs have also been found in sewage treatment effluent and surface waters.
Health authorities usually employ four complementary approaches to assess and characterize risk and develop programs meant to minimize the potential health impact of toxic chemicals:
1. Monitor foods for compliance with national and international food safety regulatory standards. In Canada, this function is the responsibility of the Canadian Food Inspection Agency.
2. Conduct targeted surveys to identify and eliminate sources of high-priority contaminants of public health concern, such as lead, dioxins and pesticides, from foods.
2
food monitoring at the community level. Results of this study will also empower communities to make informed decisions to address and mitigate environment health risks.
The FNFNES is being implemented in the eight Assembly of First Nations regions over a 10-year period and will be representative of all First Nations for regions south of the 60th parallel. The study was first undertaken in 21 First Nations communities in British Columbia in 2008 and 2009 (Chan et al., 2011). In 2010, data collection occurred in nine Manitoba First Nations communities (Chan et al. 2012). A total of 18 First Nations in Ontario participated in 2011 and 2012 (Chan et al. 2014). In 2013, 10 First Nations from Alberta participated in the study (Chan et al. 2016).
The FNFNES started with a resolution passed by the Chiefs-in-Assembly at the Assembly of First Nations’ (AFN) Annual General Assembly in Halifax, Nova Scotia on July 12, 2007. Within the Atlantic AFN regions, there are 32 First Nations communities, 31 which have populations on-reserve, comprised mainly by the Mi’kmaq and the Maliseet peoples. This total differs from INAC and the First Nations and Inuit Health Branch (FNIHB), Atlantic region information which lists 33 First Nations in the Atlantic with population on-reserve. Two communities in Labrador (Sheshatshiu Innu First Nation, Mushuau Inn First Nation) are included in the FNIHB Atlantic region. However, these two communities are included within the Quebec/Labrador AFN region and were included in the sampling for the Quebec region (fall 2016).
Data collection in 11 First Nations in the Atlantic region occurred in the fall of 2014. This phase of the study was led by four principal investigators: Dr. Laurie Chan from the University of Ottawa, Dr. Malek Batal and Dr. Olivier Receveur from the Université de Montréal, and William David from the Assembly of First Nations.
This regional report, descriptive in its intent, was developed on the basis of aggregated information and has been provided to the communities that participated in the study, as well as to regional and national First Nations organizations. The FNFNES regional reports are publicly available in print and online (www.fnfnes.ca). Preliminary results were disseminated through meetings with each participating community in October 2016 and feedback on the content of these community level reports is included in this report.
dietary surveys were conducted in the Yukon, the Northwest Territories and Nunavut in the 1990’s providing information on the diets, the nutritional value of foods eaten and the food pathways of exposure to environmental chemicals (Kuhnlein, Receveur and Chan 2001). A comprehensive dietary study was conducted among Canadian Inuit as part of the Inuit Health Survey conducted in 2007-2009 (Saudney, Leggee and Egeland 2012). Diets have been shown consistently to be of greater nutritional quality when traditional food is consumed compared to when only market food is consumed. Furthermore, the nutritional, as well as cultural benefits of traditional food repeatedly outweigh the risks from chemical contamination (Donaldson, et al. 2010; Kuhnlein, Receveur and Chan 2001; Laird, et al. 2013).
In summary, although there is a valuable but disparate patchwork of research that helps in assessing the contribution of nutrients from traditional foods to the diet and some major issues in regard to chemical exposures through food pathways, research to date has not succeeded in providing reliable regional information on First Nations’ diets and the risk of chemical exposure through the consumption of locally-harvested foods in the 10 Canadian provinces. This gap is targeted by this study entitled the First Nations Food, Nutrition and Environment Study (FNFNES).
The FNFNES goal is to provide information needed for the promotion of healthy environments and healthy foods for healthy First Nations. The measurement of baseline levels of key environmental chemicals of concern and an assessment of diet quality of First Nations on a regional level across the country are this study’s main objectives. The FNFNES is measuring chemicals of potential concern reported by Health Canada (1998) including arsenic, cadmium, lead, mercury, PCB and organochlorines, PAH, PFCs, PBDE, dioxin and furans, and PFOS. Fact sheets of the contaminants measured in this study can be found in Appendix A. This study also aims to quantify the intake of metals through drinking water and the presence of various pharmaceutically-active compounds that may find their way into surface waters that are used for fishing or as a source for drinking water. Pharmaceuticals are emerging contaminants and the FNFNES is the first study to quantify them in waters on First Nations reserves.
Results of this study will be useful for the development of community-level dietary advice and food guidance for First Nations at the regional level. The information on background exposures to POPs, toxic metals and pharmaceutical products is also essential for First Nations as an enabling foundation for any future
3
Results from the A
tlantic 2014
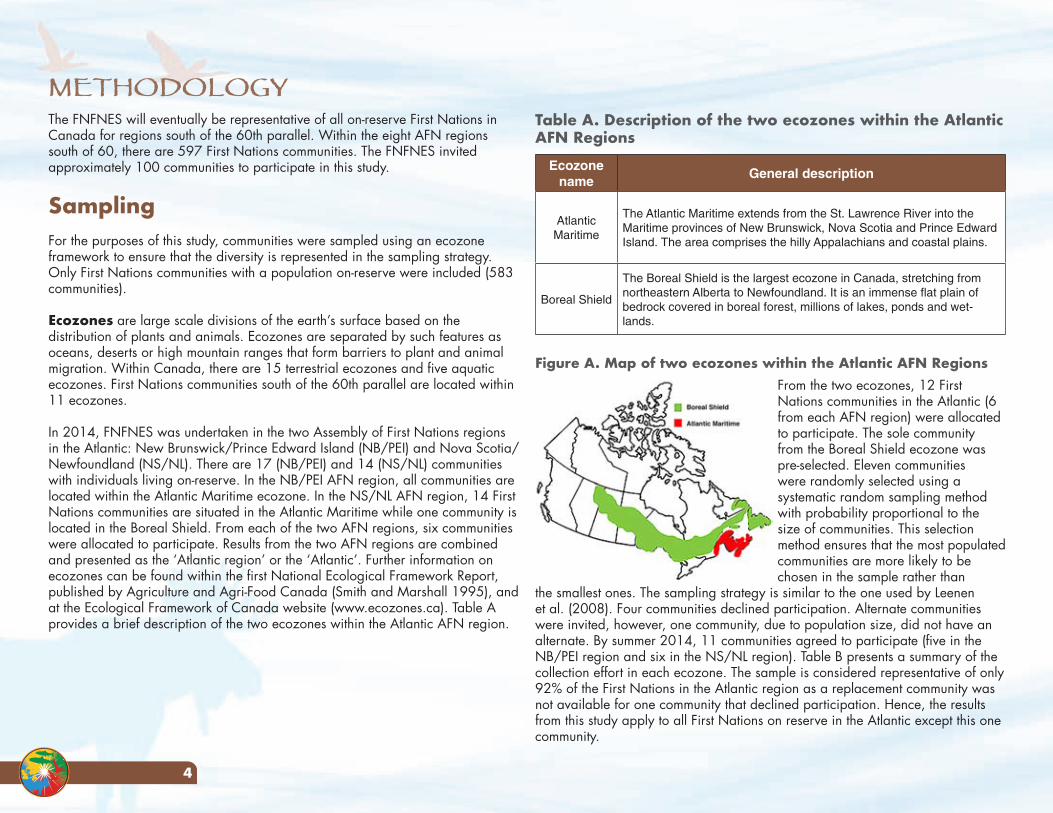
4
Table A. Description of the two ecozones within the Atlantic AFN Regions
Ecozone name
General description
Atlantic Maritime
The Atlantic Maritime extends from the St. Lawrence River into the Maritime provinces of New Brunswick, Nova Scotia and Prince Edward Island. The area comprises the hilly Appalachians and coastal plains.
Boreal Shield
The Boreal Shield is the largest ecozone in Canada, stretching from northeastern Alberta to Newfoundland. It is an immense flat plain of bedrock covered in boreal forest, millions of lakes, ponds and wet-lands.
Figure A. Map of two ecozones within the Atlantic AFN Regions From the two ecozones, 12 First Nations communities in the Atlantic (6 from each AFN region) were allocated to participate. The sole community from the Boreal Shield ecozone was pre-selected. Eleven communities were randomly selected using a systematic random sampling method with probability proportional to the size of communities. This selection method ensures that the most populated communities are more likely to be chosen in the sample rather than
the smallest ones. The sampling strategy is similar to the one used by Leenen et al. (2008). Four communities declined participation. Alternate communities were invited, however, one community, due to population size, did not have an alternate. By summer 2014, 11 communities agreed to participate (five in the NB/PEI region and six in the NS/NL region). Table B presents a summary of the collection effort in each ecozone. The sample is considered representative of only 92% of the First Nations in the Atlantic region as a replacement community was not available for one community that declined participation. Hence, the results from this study apply to all First Nations on reserve in the Atlantic except this one community.
The FNFNES will eventually be representative of all on-reserve First Nations in Canada for regions south of the 60th parallel. Within the eight AFN regions south of 60, there are 597 First Nations communities. The FNFNES invited approximately 100 communities to participate in this study.
SamplingFor the purposes of this study, communities were sampled using an ecozone framework to ensure that the diversity is represented in the sampling strategy. Only First Nations communities with a population on-reserve were included (583 communities).
Ecozones are large scale divisions of the earth’s surface based on the distribution of plants and animals. Ecozones are separated by such features as oceans, deserts or high mountain ranges that form barriers to plant and animal migration. Within Canada, there are 15 terrestrial ecozones and five aquatic ecozones. First Nations communities south of the 60th parallel are located within 11 ecozones.
In 2014, FNFNES was undertaken in the two Assembly of First Nations regions in the Atlantic: New Brunswick/Prince Edward Island (NB/PEI) and Nova Scotia/Newfoundland (NS/NL). There are 17 (NB/PEI) and 14 (NS/NL) communities with individuals living on-reserve. In the NB/PEI AFN region, all communities are located within the Atlantic Maritime ecozone. In the NS/NL AFN region, 14 First Nations communities are situated in the Atlantic Maritime while one community is located in the Boreal Shield. From each of the two AFN regions, six communities were allocated to participate. Results from the two AFN regions are combined and presented as the ‘Atlantic region’ or the ‘Atlantic’. Further information on ecozones can be found within the first National Ecological Framework Report, published by Agriculture and Agri-Food Canada (Smith and Marshall 1995), and at the Ecological Framework of Canada website (www.ecozones.ca). Table A provides a brief description of the two ecozones within the Atlantic AFN region.
METHODOLOGY
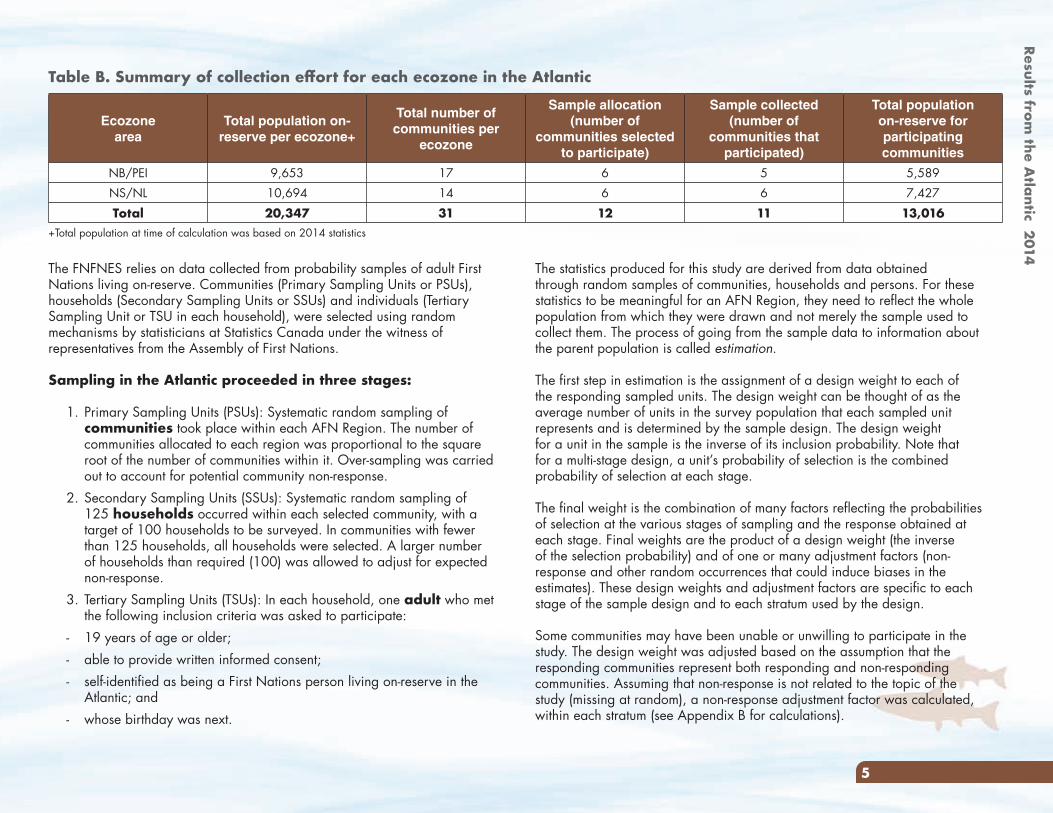
Results from the A
tlantic 2014
5
The statistics produced for this study are derived from data obtained through random samples of communities, households and persons. For these statistics to be meaningful for an AFN Region, they need to reflect the whole population from which they were drawn and not merely the sample used to collect them. The process of going from the sample data to information about the parent population is called estimation.
The first step in estimation is the assignment of a design weight to each of the responding sampled units. The design weight can be thought of as the average number of units in the survey population that each sampled unit represents and is determined by the sample design. The design weight for a unit in the sample is the inverse of its inclusion probability. Note that for a multi-stage design, a unit’s probability of selection is the combined probability of selection at each stage.
The final weight is the combination of many factors reflecting the probabilities of selection at the various stages of sampling and the response obtained at each stage. Final weights are the product of a design weight (the inverse of the selection probability) and of one or many adjustment factors (non-response and other random occurrences that could induce biases in the estimates). These design weights and adjustment factors are specific to each stage of the sample design and to each stratum used by the design.
Some communities may have been unable or unwilling to participate in the study. The design weight was adjusted based on the assumption that the responding communities represent both responding and non-responding communities. Assuming that non-response is not related to the topic of the study (missing at random), a non-response adjustment factor was calculated, within each stratum (see Appendix B for calculations).
The FNFNES relies on data collected from probability samples of adult First Nations living on-reserve. Communities (Primary Sampling Units or PSUs), households (Secondary Sampling Units or SSUs) and individuals (Tertiary Sampling Unit or TSU in each household), were selected using random mechanisms by statisticians at Statistics Canada under the witness of representatives from the Assembly of First Nations.
Sampling in the Atlantic proceeded in three stages:
1. Primary Sampling Units (PSUs): Systematic random sampling of communities took place within each AFN Region. The number of communities allocated to each region was proportional to the square root of the number of communities within it. Over-sampling was carried out to account for potential community non-response.
2. Secondary Sampling Units (SSUs): Systematic random sampling of 125 households occurred within each selected community, with a target of 100 households to be surveyed. In communities with fewer than 125 households, all households were selected. A larger number of households than required (100) was allowed to adjust for expected non-response.
3. Tertiary Sampling Units (TSUs): In each household, one adult who met the following inclusion criteria was asked to participate:
- 19 years of age or older;- able to provide written informed consent; - self-identified as being a First Nations person living on-reserve in the
Atlantic; and- whose birthday was next.
Table B. Summary of collection effort for each ecozone in the Atlantic
Ecozone area
Total population on-reserve per ecozone+
Total number of communities per
ecozone
Sample allocation (number of
communities selected to participate)
Sample collected (number of
communities that participated)
Total population on-reserve for participating communities
NB/PEI 9,653 17 6 5 5,589NS/NL 10,694 14 6 6 7,427
Total 20,347 31 12 11 13,016+Total population at time of calculation was based on 2014 statistics
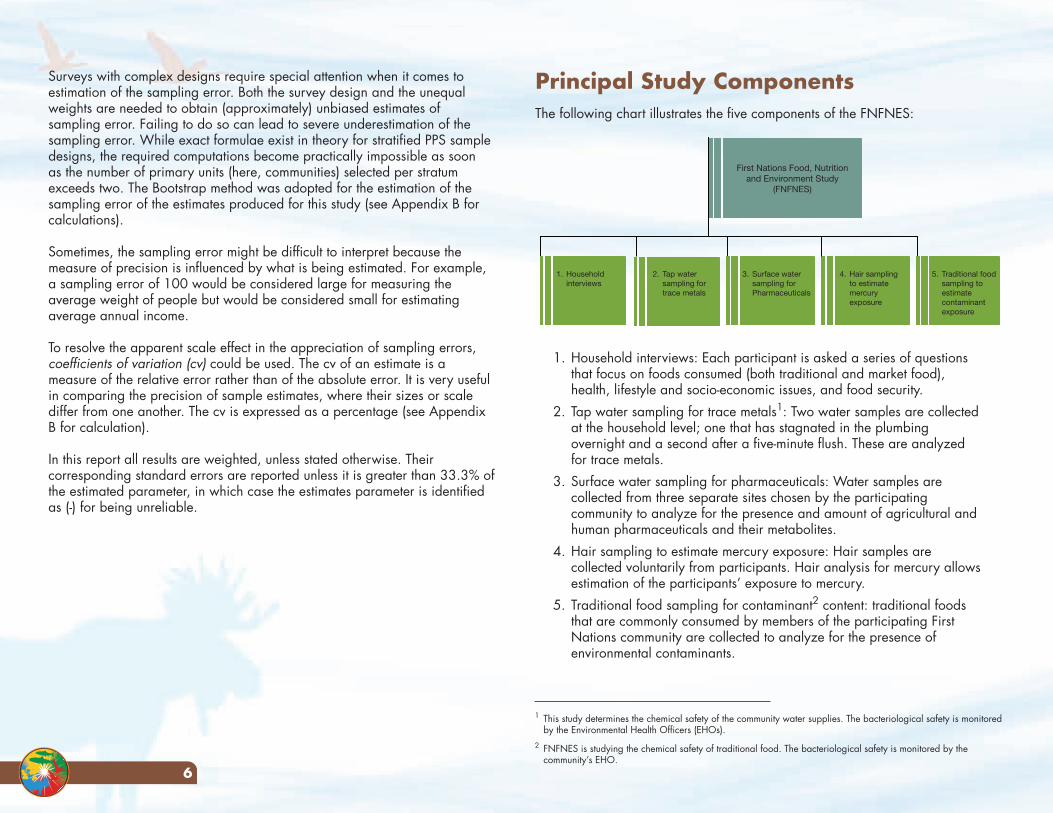
6
Principal Study ComponentsThe following chart illustrates the five components of the FNFNES:
1. Household interviews: Each participant is asked a series of questions that focus on foods consumed (both traditional and market food), health, lifestyle and socio-economic issues, and food security.
2. Tap water sampling for trace metals1: Two water samples are collected at the household level; one that has stagnated in the plumbing overnight and a second after a five-minute flush. These are analyzed for trace metals.
3. Surface water sampling for pharmaceuticals: Water samples are collected from three separate sites chosen by the participating community to analyze for the presence and amount of agricultural and human pharmaceuticals and their metabolites.
4. Hair sampling to estimate mercury exposure: Hair samples are collected voluntarily from participants. Hair analysis for mercury allows estimation of the participants’ exposure to mercury.
5. Traditional food sampling for contaminant2 content: traditional foods that are commonly consumed by members of the participating First Nations community are collected to analyze for the presence of environmental contaminants.
Surveys with complex designs require special attention when it comes to estimation of the sampling error. Both the survey design and the unequal weights are needed to obtain (approximately) unbiased estimates of sampling error. Failing to do so can lead to severe underestimation of the sampling error. While exact formulae exist in theory for stratified PPS sample designs, the required computations become practically impossible as soon as the number of primary units (here, communities) selected per stratum exceeds two. The Bootstrap method was adopted for the estimation of the sampling error of the estimates produced for this study (see Appendix B for calculations).
Sometimes, the sampling error might be difficult to interpret because the measure of precision is influenced by what is being estimated. For example, a sampling error of 100 would be considered large for measuring the average weight of people but would be considered small for estimating average annual income.
To resolve the apparent scale effect in the appreciation of sampling errors, coefficients of variation (cv) could be used. The cv of an estimate is a measure of the relative error rather than of the absolute error. It is very useful in comparing the precision of sample estimates, where their sizes or scale differ from one another. The cv is expressed as a percentage (see Appendix B for calculation).
In this report all results are weighted, unless stated otherwise. Their corresponding standard errors are reported unless it is greater than 33.3% of the estimated parameter, in which case the estimates parameter is identified as (-) for being unreliable.
First Nations Food, Nutrition and Environment Study
(FNFNES)
1. Householdinterviews
2. Tap watersampling for trace metals
3. Surface water sampling forPharmaceuticals
4. Hair samplingto estimate mercury exposure
5. Traditional food sampling to estimate contaminant exposure
1 This study determines the chemical safety of the community water supplies. The bacteriological safety is monitored by the Environmental Health Officers (EHOs).
2 FNFNES is studying the chemical safety of traditional food. The bacteriological safety is monitored by the community’s EHO.
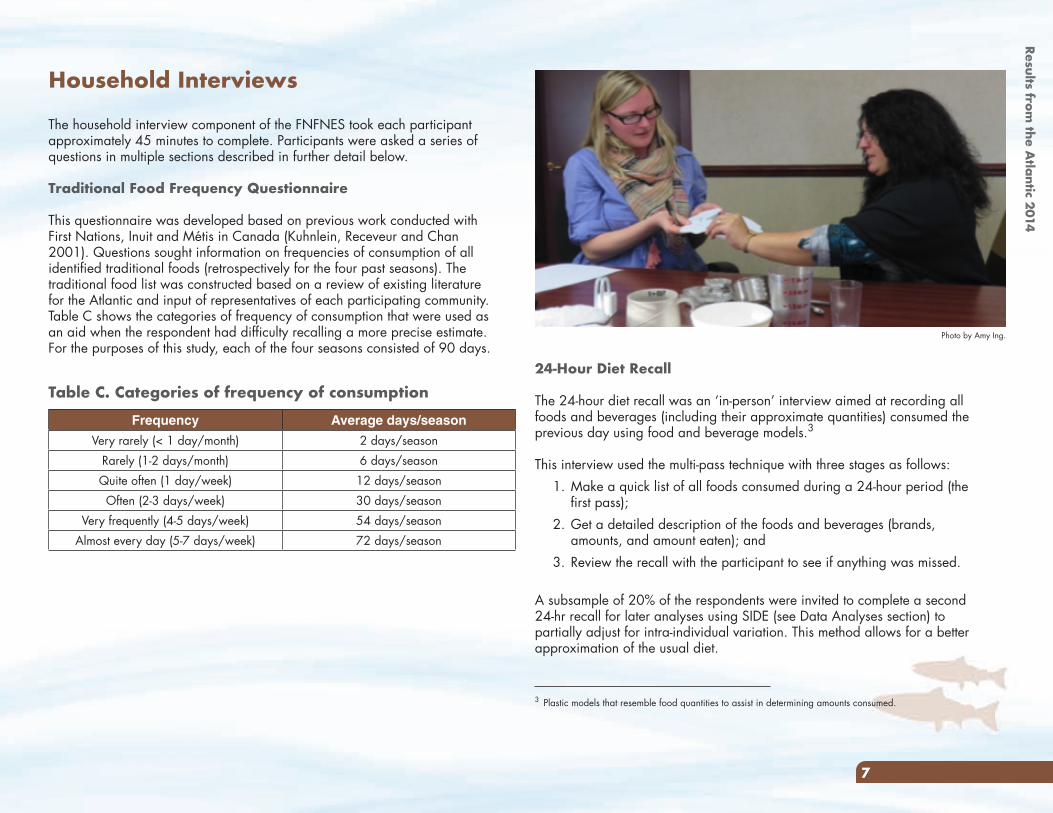
7
24-Hour Diet Recall
The 24-hour diet recall was an ‘in-person’ interview aimed at recording all foods and beverages (including their approximate quantities) consumed the previous day using food and beverage models.3
This interview used the multi-pass technique with three stages as follows:1. Make a quick list of all foods consumed during a 24-hour period (the
first pass);2. Get a detailed description of the foods and beverages (brands,
amounts, and amount eaten); and3. Review the recall with the participant to see if anything was missed.
A subsample of 20% of the respondents were invited to complete a second 24-hr recall for later analyses using SIDE (see Data Analyses section) to partially adjust for intra-individual variation. This method allows for a better approximation of the usual diet.
Household Interviews
The household interview component of the FNFNES took each participant approximately 45 minutes to complete. Participants were asked a series of questions in multiple sections described in further detail below.
Traditional Food Frequency Questionnaire
This questionnaire was developed based on previous work conducted with First Nations, Inuit and Métis in Canada (Kuhnlein, Receveur and Chan 2001). Questions sought information on frequencies of consumption of all identified traditional foods (retrospectively for the four past seasons). The traditional food list was constructed based on a review of existing literature for the Atlantic and input of representatives of each participating community. Table C shows the categories of frequency of consumption that were used as an aid when the respondent had difficulty recalling a more precise estimate. For the purposes of this study, each of the four seasons consisted of 90 days.
3 Plastic models that resemble food quantities to assist in determining amounts consumed.
Table C. Categories of frequency of consumption
Frequency Average days/season
Very rarely (< 1 day/month) 2 days/seasonRarely (1-2 days/month) 6 days/seasonQuite often (1 day/week) 12 days/seasonOften (2-3 days/week) 30 days/season
Very frequently (4-5 days/week) 54 days/seasonAlmost every day (5-7 days/week) 72 days/season
Photo by Amy Ing.
Results from the A
tlantic 2014
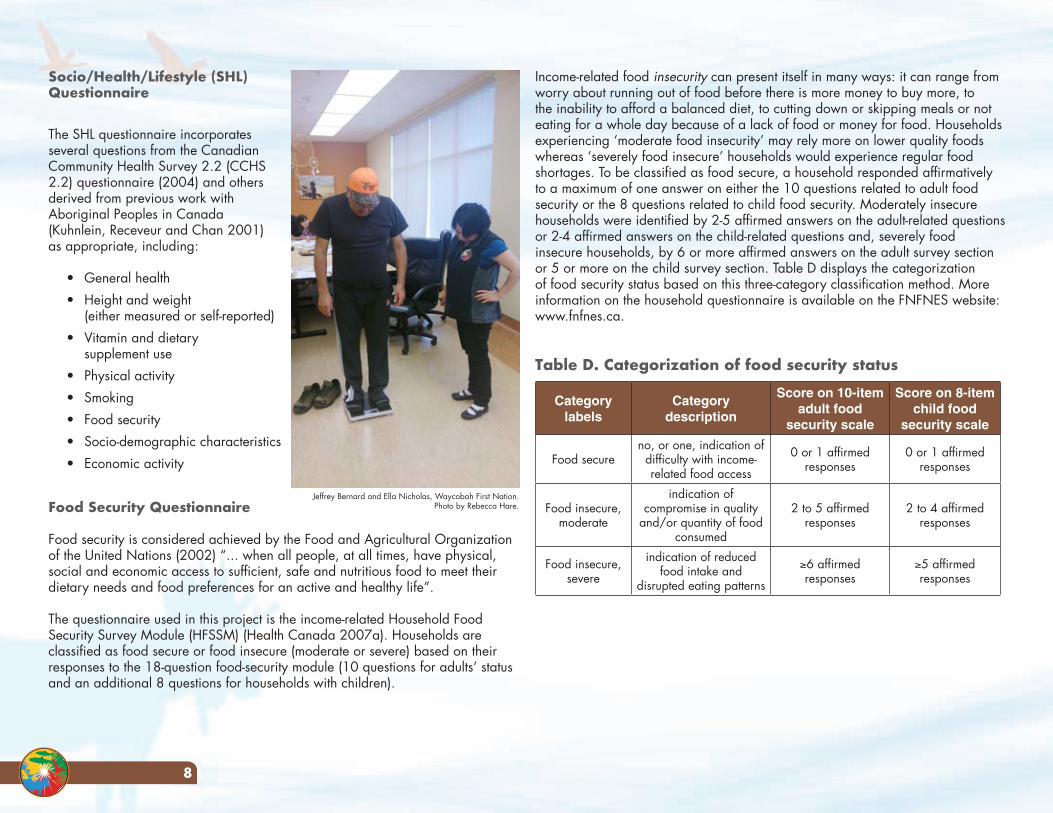
8
Income-related food insecurity can present itself in many ways: it can range from worry about running out of food before there is more money to buy more, to the inability to afford a balanced diet, to cutting down or skipping meals or not eating for a whole day because of a lack of food or money for food. Households experiencing ‘moderate food insecurity’ may rely more on lower quality foods whereas ‘severely food insecure’ households would experience regular food shortages. To be classified as food secure, a household responded affirmatively to a maximum of one answer on either the 10 questions related to adult food security or the 8 questions related to child food security. Moderately insecure households were identified by 2-5 affirmed answers on the adult-related questions or 2-4 affirmed answers on the child-related questions and, severely food insecure households, by 6 or more affirmed answers on the adult survey section or 5 or more on the child survey section. Table D displays the categorization of food security status based on this three-category classification method. More information on the household questionnaire is available on the FNFNES website: www.fnfnes.ca.
Table D. Categorization of food security status
Category labels
Category description
Score on 10-itemadult food
security scale
Score on 8-item child food
security scale
Food secureno, or one, indication of
difficulty with income-related food access
0 or 1 affirmed responses
0 or 1 affirmed responses
Food insecure, moderate
indication of compromise in quality
and/or quantity of food consumed
2 to 5 affirmed responses
2 to 4 affirmed responses
Food insecure, severe
indication of reduced food intake and
disrupted eating patterns
≥6 affirmed responses
≥5 affirmed responses
Socio/Health/Lifestyle (SHL) Questionnaire
The SHL questionnaire incorporates several questions from the Canadian Community Health Survey 2.2 (CCHS 2.2) questionnaire (2004) and others derived from previous work with Aboriginal Peoples in Canada (Kuhnlein, Receveur and Chan 2001) as appropriate, including:
• General health• Height and weight
(either measured or self-reported)• Vitamin and dietary
supplement use• Physical activity• Smoking• Food security• Socio-demographic characteristics• Economic activity
Food Security Questionnaire
Food security is considered achieved by the Food and Agricultural Organization of the United Nations (2002) “... when all people, at all times, have physical, social and economic access to sufficient, safe and nutritious food to meet their dietary needs and food preferences for an active and healthy life”.
The questionnaire used in this project is the income-related Household Food Security Survey Module (HFSSM) (Health Canada 2007a). Households are classified as food secure or food insecure (moderate or severe) based on their responses to the 18-question food-security module (10 questions for adults’ status and an additional 8 questions for households with children).
Jeffrey Bernard and Ella Nicholas, Waycobah First Nation.Photo by Rebecca Hare.
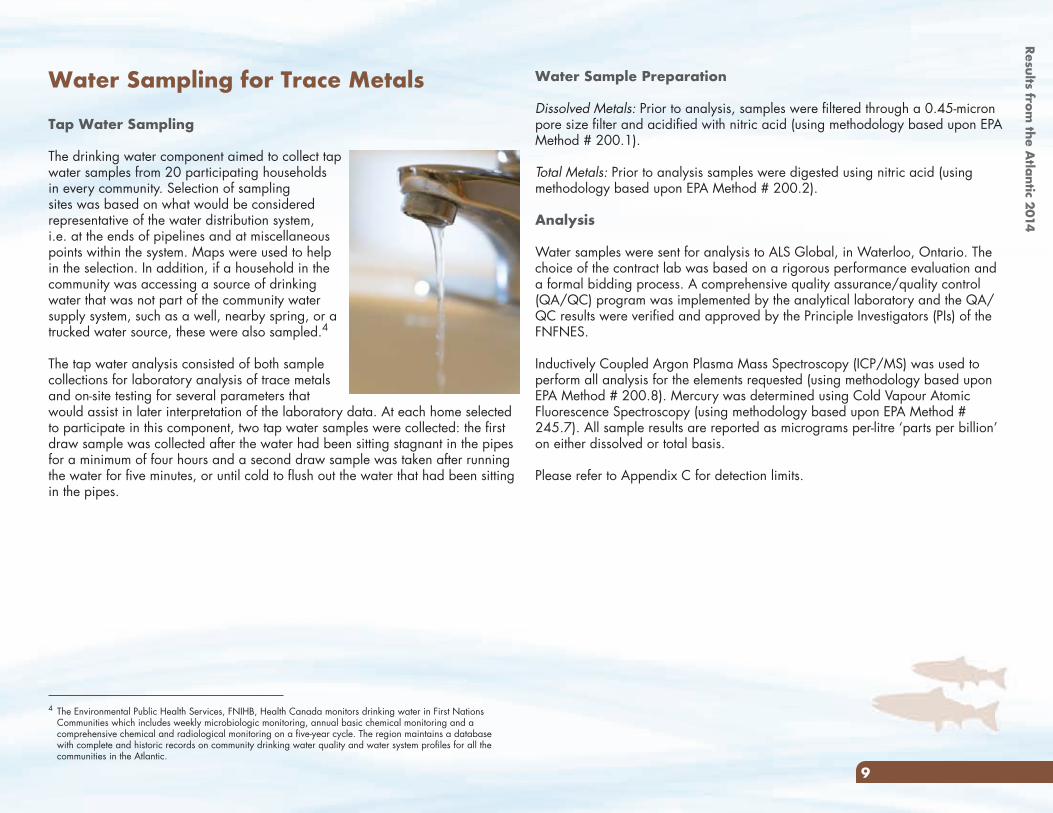
9
Water Sample Preparation
Dissolved Metals: Prior to analysis, samples were filtered through a 0.45-micron pore size filter and acidified with nitric acid (using methodology based upon EPA Method # 200.1).
Total Metals: Prior to analysis samples were digested using nitric acid (using methodology based upon EPA Method # 200.2).
Analysis
Water samples were sent for analysis to ALS Global, in Waterloo, Ontario. The choice of the contract lab was based on a rigorous performance evaluation and a formal bidding process. A comprehensive quality assurance/quality control (QA/QC) program was implemented by the analytical laboratory and the QA/QC results were verified and approved by the Principle Investigators (PIs) of the FNFNES.
Inductively Coupled Argon Plasma Mass Spectroscopy (ICP/MS) was used to perform all analysis for the elements requested (using methodology based upon EPA Method # 200.8). Mercury was determined using Cold Vapour Atomic Fluorescence Spectroscopy (using methodology based upon EPA Method # 245.7). All sample results are reported as micrograms per-litre ‘parts per billion’ on either dissolved or total basis.
Please refer to Appendix C for detection limits.
Water Sampling for Trace Metals
Tap Water Sampling
The drinking water component aimed to collect tap water samples from 20 participating households in every community. Selection of sampling sites was based on what would be considered representative of the water distribution system, i.e. at the ends of pipelines and at miscellaneous points within the system. Maps were used to help in the selection. In addition, if a household in the community was accessing a source of drinking water that was not part of the community water supply system, such as a well, nearby spring, or a trucked water source, these were also sampled.4
The tap water analysis consisted of both sample collections for laboratory analysis of trace metals and on-site testing for several parameters that would assist in later interpretation of the laboratory data. At each home selected to participate in this component, two tap water samples were collected: the first draw sample was collected after the water had been sitting stagnant in the pipes for a minimum of four hours and a second draw sample was taken after running the water for five minutes, or until cold to flush out the water that had been sitting in the pipes.
4 The Environmental Public Health Services, FNIHB, Health Canada monitors drinking water in First Nations Communities which includes weekly microbiologic monitoring, annual basic chemical monitoring and a comprehensive chemical and radiological monitoring on a five-year cycle. The region maintains a database with complete and historic records on community drinking water quality and water system profiles for all the communities in the Atlantic.
Results from the A
tlantic 2014
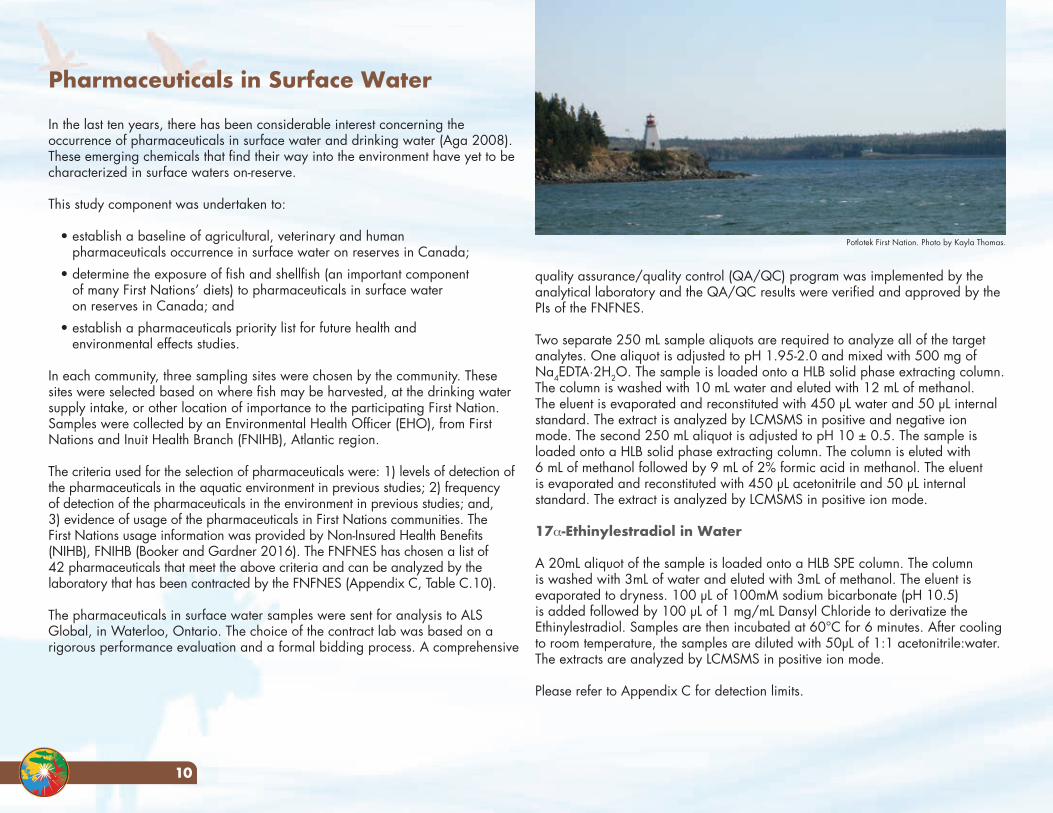
10
quality assurance/quality control (QA/QC) program was implemented by the analytical laboratory and the QA/QC results were verified and approved by the PIs of the FNFNES.
Two separate 250 mL sample aliquots are required to analyze all of the target analytes. One aliquot is adjusted to pH 1.95-2.0 and mixed with 500 mg of Na4EDTA·2H2O. The sample is loaded onto a HLB solid phase extracting column. The column is washed with 10 mL water and eluted with 12 mL of methanol. The eluent is evaporated and reconstituted with 450 µL water and 50 µL internal standard. The extract is analyzed by LCMSMS in positive and negative ion mode. The second 250 mL aliquot is adjusted to pH 10 ± 0.5. The sample is loaded onto a HLB solid phase extracting column. The column is eluted with 6 mL of methanol followed by 9 mL of 2% formic acid in methanol. The eluent is evaporated and reconstituted with 450 µL acetonitrile and 50 µL internal standard. The extract is analyzed by LCMSMS in positive ion mode.
17α-Ethinylestradiol in Water
A 20mL aliquot of the sample is loaded onto a HLB SPE column. The column is washed with 3mL of water and eluted with 3mL of methanol. The eluent is evaporated to dryness. 100 µL of 100mM sodium bicarbonate (pH 10.5) is added followed by 100 µL of 1 mg/mL Dansyl Chloride to derivatize the Ethinylestradiol. Samples are then incubated at 60°C for 6 minutes. After cooling to room temperature, the samples are diluted with 50µL of 1:1 acetonitrile:water. The extracts are analyzed by LCMSMS in positive ion mode.
Please refer to Appendix C for detection limits.
Pharmaceuticals in Surface Water
In the last ten years, there has been considerable interest concerning the occurrence of pharmaceuticals in surface water and drinking water (Aga 2008). These emerging chemicals that find their way into the environment have yet to be characterized in surface waters on-reserve.
This study component was undertaken to:
• establish a baseline of agricultural, veterinary and human pharmaceuticals occurrence in surface water on reserves in Canada;
• determine the exposure of fish and shellfish (an important component of many First Nations’ diets) to pharmaceuticals in surface water on reserves in Canada; and
• establish a pharmaceuticals priority list for future health and environmental effects studies.
In each community, three sampling sites were chosen by the community. These sites were selected based on where fish may be harvested, at the drinking water supply intake, or other location of importance to the participating First Nation. Samples were collected by an Environmental Health Officer (EHO), from First Nations and Inuit Health Branch (FNIHB), Atlantic region.
The criteria used for the selection of pharmaceuticals were: 1) levels of detection of the pharmaceuticals in the aquatic environment in previous studies; 2) frequency of detection of the pharmaceuticals in the environment in previous studies; and, 3) evidence of usage of the pharmaceuticals in First Nations communities. The First Nations usage information was provided by Non-Insured Health Benefits (NIHB), FNIHB (Booker and Gardner 2016). The FNFNES has chosen a list of 42 pharmaceuticals that meet the above criteria and can be analyzed by the laboratory that has been contracted by the FNFNES (Appendix C, Table C.10).
The pharmaceuticals in surface water samples were sent for analysis to ALS Global, in Waterloo, Ontario. The choice of the contract lab was based on a rigorous performance evaluation and a formal bidding process. A comprehensive
Potlotek First Nation. Photo by Kayla Thomas.
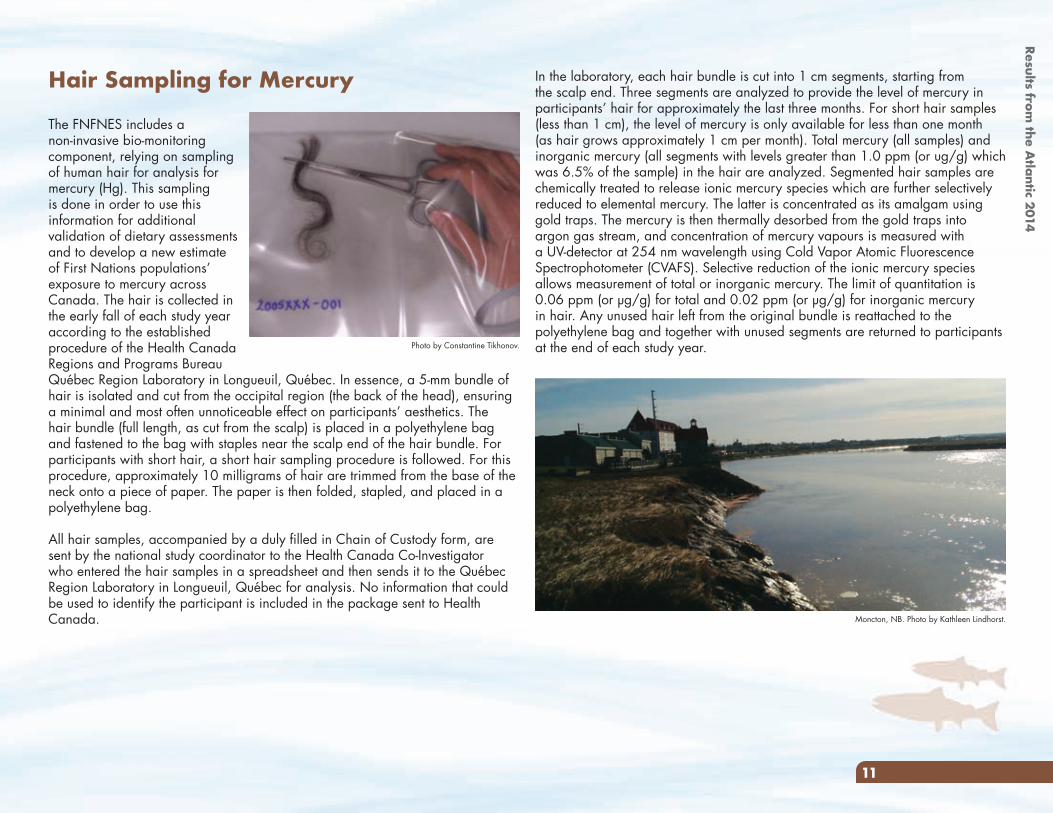
In the laboratory, each hair bundle is cut into 1 cm segments, starting from the scalp end. Three segments are analyzed to provide the level of mercury in participants’ hair for approximately the last three months. For short hair samples (less than 1 cm), the level of mercury is only available for less than one month (as hair grows approximately 1 cm per month). Total mercury (all samples) and inorganic mercury (all segments with levels greater than 1.0 ppm (or ug/g) which was 6.5% of the sample) in the hair are analyzed. Segmented hair samples are chemically treated to release ionic mercury species which are further selectively reduced to elemental mercury. The latter is concentrated as its amalgam using gold traps. The mercury is then thermally desorbed from the gold traps into argon gas stream, and concentration of mercury vapours is measured with a UV-detector at 254 nm wavelength using Cold Vapor Atomic Fluorescence Spectrophotometer (CVAFS). Selective reduction of the ionic mercury species allows measurement of total or inorganic mercury. The limit of quantitation is 0.06 ppm (or µg/g) for total and 0.02 ppm (or µg/g) for inorganic mercury in hair. Any unused hair left from the original bundle is reattached to the polyethylene bag and together with unused segments are returned to participants at the end of each study year.
11
Hair Sampling for Mercury
The FNFNES includes a non-invasive bio-monitoring component, relying on sampling of human hair for analysis for mercury (Hg). This sampling is done in order to use this information for additional validation of dietary assessments and to develop a new estimate of First Nations populations’ exposure to mercury across Canada. The hair is collected in the early fall of each study year according to the established procedure of the Health Canada Regions and Programs Bureau Québec Region Laboratory in Longueuil, Québec. In essence, a 5-mm bundle of hair is isolated and cut from the occipital region (the back of the head), ensuring a minimal and most often unnoticeable effect on participants’ aesthetics. The hair bundle (full length, as cut from the scalp) is placed in a polyethylene bag and fastened to the bag with staples near the scalp end of the hair bundle. For participants with short hair, a short hair sampling procedure is followed. For this procedure, approximately 10 milligrams of hair are trimmed from the base of the neck onto a piece of paper. The paper is then folded, stapled, and placed in a polyethylene bag.
All hair samples, accompanied by a duly filled in Chain of Custody form, are sent by the national study coordinator to the Health Canada Co-Investigator who entered the hair samples in a spreadsheet and then sends it to the Québec Region Laboratory in Longueuil, Québec for analysis. No information that could be used to identify the participant is included in the package sent to Health Canada. Moncton, NB. Photo by Kathleen Lindhorst.
Photo by Constantine Tikhonov.
Results from the A
tlantic 2014
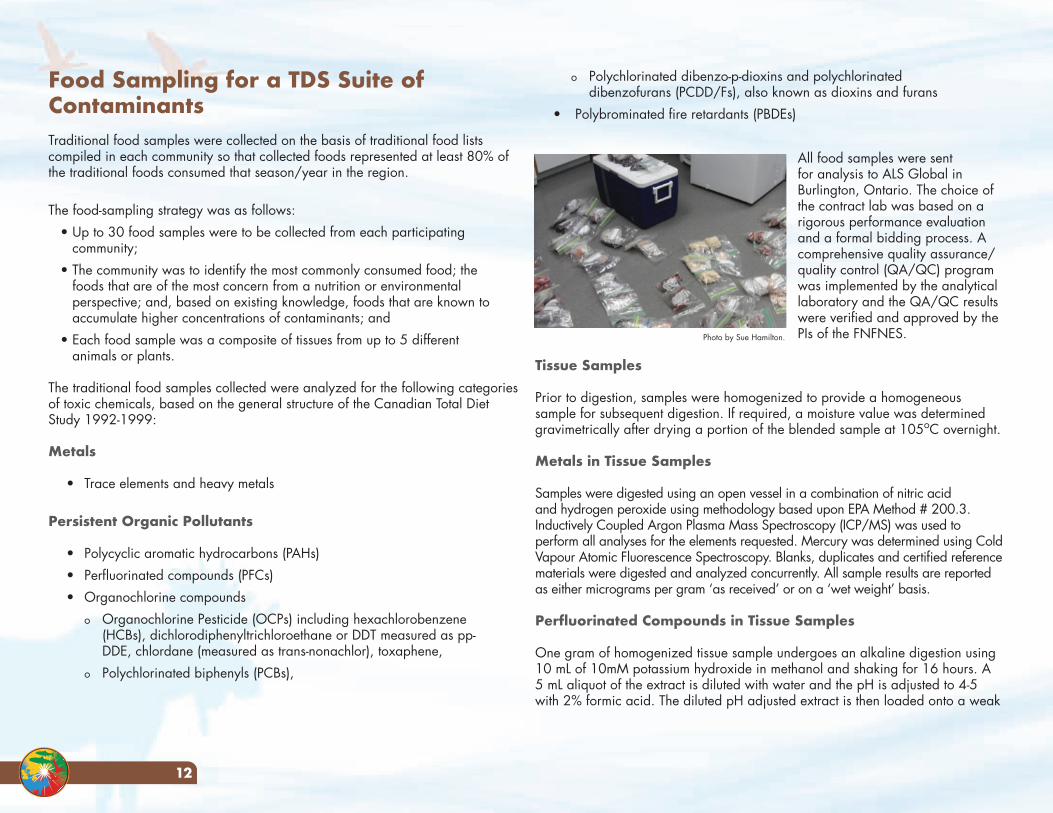
12
o Polychlorinated dibenzo-p-dioxins and polychlorinated dibenzofurans (PCDD/Fs), also known as dioxins and furans
• Polybrominated fire retardants (PBDEs)
All food samples were sent for analysis to ALS Global in Burlington, Ontario. The choice of the contract lab was based on a rigorous performance evaluation and a formal bidding process. A comprehensive quality assurance/quality control (QA/QC) program was implemented by the analytical laboratory and the QA/QC results were verified and approved by the PIs of the FNFNES.
Tissue Samples
Prior to digestion, samples were homogenized to provide a homogeneous sample for subsequent digestion. If required, a moisture value was determined gravimetrically after drying a portion of the blended sample at 105oC overnight.
Metals in Tissue Samples
Samples were digested using an open vessel in a combination of nitric acid and hydrogen peroxide using methodology based upon EPA Method # 200.3. Inductively Coupled Argon Plasma Mass Spectroscopy (ICP/MS) was used to perform all analyses for the elements requested. Mercury was determined using Cold Vapour Atomic Fluorescence Spectroscopy. Blanks, duplicates and certified reference materials were digested and analyzed concurrently. All sample results are reported as either micrograms per gram ‘as received’ or on a ‘wet weight’ basis.
Perfluorinated Compounds in Tissue Samples
One gram of homogenized tissue sample undergoes an alkaline digestion using 10 mL of 10mM potassium hydroxide in methanol and shaking for 16 hours. A 5 mL aliquot of the extract is diluted with water and the pH is adjusted to 4-5 with 2% formic acid. The diluted pH adjusted extract is then loaded onto a weak
Food Sampling for a TDS Suite of ContaminantsTraditional food samples were collected on the basis of traditional food lists compiled in each community so that collected foods represented at least 80% of the traditional foods consumed that season/year in the region.
The food-sampling strategy was as follows:• Up to 30 food samples were to be collected from each participating
community; • The community was to identify the most commonly consumed food; the
foods that are of the most concern from a nutrition or environmental perspective; and, based on existing knowledge, foods that are known to accumulate higher concentrations of contaminants; and
• Each food sample was a composite of tissues from up to 5 different animals or plants.
The traditional food samples collected were analyzed for the following categories of toxic chemicals, based on the general structure of the Canadian Total Diet Study 1992-1999:
Metals
• Trace elements and heavy metals
Persistent Organic Pollutants
• Polycyclic aromatic hydrocarbons (PAHs)• Perfluorinated compounds (PFCs) • Organochlorine compounds
o Organochlorine Pesticide (OCPs) including hexachlorobenzene (HCBs), dichlorodiphenyltrichloroethane or DDT measured as pp-DDE, chlordane (measured as trans-nonachlor), toxaphene,
o Polychlorinated biphenyls (PCBs),
Photo by Sue Hamilton.
13
remainder of solvent is removed by passing a gentle stream of nitrogen over the surface. The sample is reweighed for lipid concentration. The sample is placed in a vial to which 10 mL of concentrated H2SO4 is added. It is vigorously shaken and left to sit overnight to allow the layers to separate. The extract is then cleaned up on a mixed bed silica gel column (basic, neutral and acidic silica gel). The final cleanup is with basic alumina. The eluate from the alumina column is concentrated by rotary evaporator to 2 mL and final reduction to dryness is by a gentle stream of nitrogen. Recovery standard (1 ng) is added and the final volume made up to 10 µL.
All samples are analyzed on a Thermo Instruments DFS high resolution mass spectrometer coupled with a Thermo Trace gas chromatograph. The column used is a 60 m RTX-DIOXIN2, 0.25 µm, 0.25 mm internal diameter (i.d). An initial six-point calibration (CS-Lo, CS-1 to CS-5) containing all PCDD/F congeners is run covering the range of 0.1 ng/mL to 2000 ng/mL.
PBDE in Tissue Samples
Approximately 10-12 grams of tissue is spiked with 1-10 ng each of carbon-13 labeled PBDE standards and then digested with 80 mL of pre-cleaned concentrated HCl. Following overnight digestion of the tissue, the samples are extracted with three 20 mL portions of 9:1 dichloromethane:acetone. The sample extract is concentrated and placed in a vial to which 10 mL of concentrated H2SO4 is added. It is vigorously shaken and left to sit overnight to allow the layers to separate. The extract is then cleaned up on a mixed bed silica gel column (basic, neutral and acidic silica gel). The final cleanup is with basic alumina. The eluate from the alumina column is concentrated by rotary evaporator to 2 mL and final reduction to 50 µL is by a gentle stream of nitrogen. Recovery standard (1-5 ng) is added and the final volume made up to 100 µL.
All samples are analyzed on a Thermo Instruments DFS high resolution mass spectrometer coupled with a Thermo Trace gas chromatograph. The column used is a 15 m DB-5HT, 0.1 µm, 0.25 mm i.d. An initial five-point calibration (CS-1 to CS-5) consisting all PBDEs is run covering the range of 0.25 ng/mL to 1000 ng/mL.
Please refer to Appendix C for detection limits.
anion exchange (WAX) column and the column washed with 1 mL of 25mM sodium acetate at pH 4.0. The first fraction is eluted with 3 mL of methanol to recover PFOSA. This is directly transferred to a vial for analysis by LC-MS/MS in negative ion mode. The second fraction is eluted with 3 mL of 0.1% ammonium hydroxide in methanol to recover the remaining PFCs. This fraction is evaporated and reconstituted with 1 mL of 85:15 water: acetonitrile and analyzed by LC-MS/MS in negative ion mode.
PAH in Tissue Samples
Six grams of homogenized tissue is homogenized in dicloromethane (DCM) and filtered through anhydrous sodium sulphate. The extract is evaporated to 6 mL, and 5 mL is injected onto the Gel Permeation Chromatography (GPC) column where a fraction of the eluent is collected, concentrated, and solvent exchanged to hexane. Further clean-up is performed by eluting this extract through 7.3% deactivated silica gel and anhydrous sodium sulphate. The final extract is concentrated and solvent exchanged to isooctane. Analysis is performed using GC-MS in Selective Ion Monitoring (SIM) mode with an EI source.
Pesticides and PCBs (organochlorines) in Tissue Samples
Six grams of tissue is homogenized in dicloromethane (DCM) and filtered through anhydrous sodium sulphate. The extract is evaporated to 6 mL and 5 mL is injected onto the Gel Permeation Chromatography (GPC) column where a fraction of the eluent is collected, concentrated, and solvent exchanged to acetone:hexane (1:1). Further clean-up is performed by eluting this extract through PSA columns. The final extract is concentrated and solvent exchanged to isooctane. Analysis is performed for the organochlorine pesticides (except for toxaphene) and PCBs using GC-MS in Selective Ion Monitoring (SIM) mode with an EI source. Analysis for toxaphene is performed using GC-MS in SIM mode with a CI source.
PCDD/F (Dioxins and Furans) in Tissue Samples
Approximately 10-12 grams of tissue is spiked with 0.5-1 ng each of 15 carbon-13 labeled PCDD/F internal standards and then digested with 80 mL of pre-cleaned concentrated hydrochloric acid. Following overnight digestion of the tissue, the samples are extracted with three 20 mL portions of 9:1 dichloromethane:acetone. The sample is placed in a pre-tared test tube and the
Results from the A
tlantic 2014
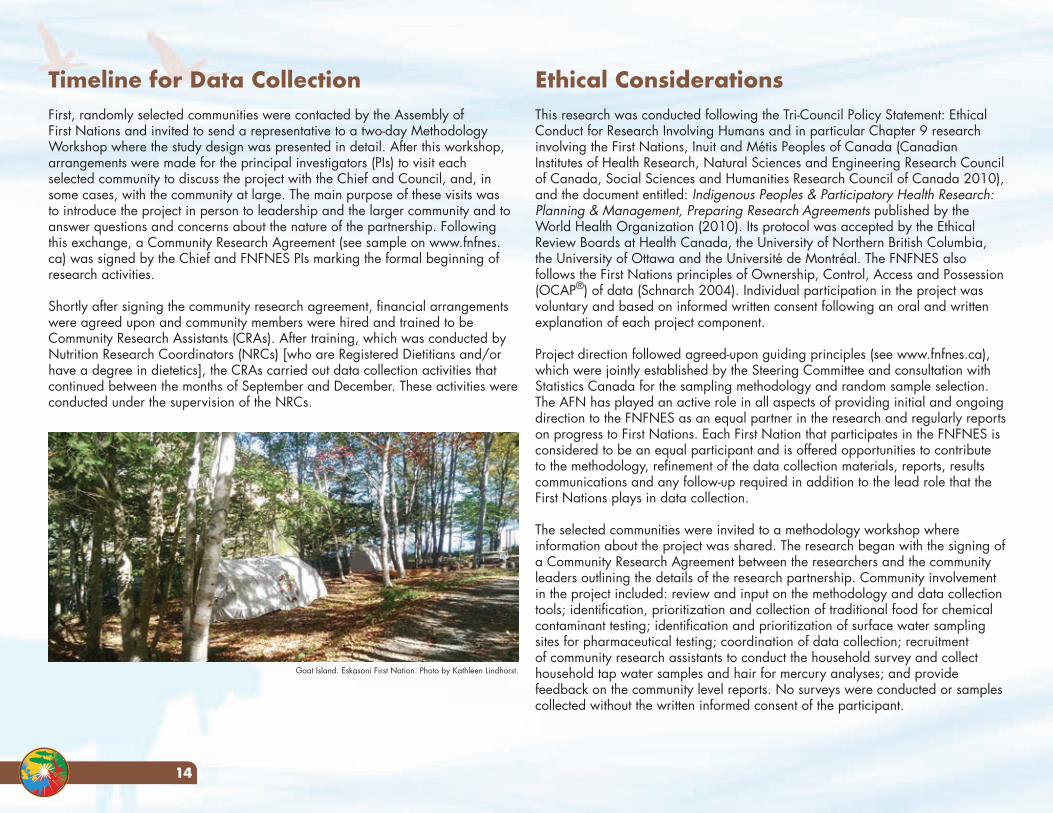
Ethical ConsiderationsThis research was conducted following the Tri-Council Policy Statement: Ethical Conduct for Research Involving Humans and in particular Chapter 9 research involving the First Nations, Inuit and Métis Peoples of Canada (Canadian Institutes of Health Research, Natural Sciences and Engineering Research Council of Canada, Social Sciences and Humanities Research Council of Canada 2010), and the document entitled: Indigenous Peoples & Participatory Health Research: Planning & Management, Preparing Research Agreements published by the World Health Organization (2010). Its protocol was accepted by the Ethical Review Boards at Health Canada, the University of Northern British Columbia, the University of Ottawa and the Université de Montréal. The FNFNES also follows the First Nations principles of Ownership, Control, Access and Possession (OCAP®) of data (Schnarch 2004). Individual participation in the project was voluntary and based on informed written consent following an oral and written explanation of each project component.
Project direction followed agreed-upon guiding principles (see www.fnfnes.ca), which were jointly established by the Steering Committee and consultation with Statistics Canada for the sampling methodology and random sample selection. The AFN has played an active role in all aspects of providing initial and ongoing direction to the FNFNES as an equal partner in the research and regularly reports on progress to First Nations. Each First Nation that participates in the FNFNES is considered to be an equal participant and is offered opportunities to contribute to the methodology, refinement of the data collection materials, reports, results communications and any follow-up required in addition to the lead role that the First Nations plays in data collection.
The selected communities were invited to a methodology workshop where information about the project was shared. The research began with the signing of a Community Research Agreement between the researchers and the community leaders outlining the details of the research partnership. Community involvement in the project included: review and input on the methodology and data collection tools; identification, prioritization and collection of traditional food for chemical contaminant testing; identification and prioritization of surface water sampling sites for pharmaceutical testing; coordination of data collection; recruitment of community research assistants to conduct the household survey and collect household tap water samples and hair for mercury analyses; and provide feedback on the community level reports. No surveys were conducted or samples collected without the written informed consent of the participant.
Timeline for Data CollectionFirst, randomly selected communities were contacted by the Assembly of First Nations and invited to send a representative to a two-day Methodology Workshop where the study design was presented in detail. After this workshop, arrangements were made for the principal investigators (PIs) to visit each selected community to discuss the project with the Chief and Council, and, in some cases, with the community at large. The main purpose of these visits was to introduce the project in person to leadership and the larger community and to answer questions and concerns about the nature of the partnership. Following this exchange, a Community Research Agreement (see sample on www.fnfnes.ca) was signed by the Chief and FNFNES PIs marking the formal beginning of research activities.
Shortly after signing the community research agreement, financial arrangements were agreed upon and community members were hired and trained to be Community Research Assistants (CRAs). After training, which was conducted by Nutrition Research Coordinators (NRCs) [who are Registered Dietitians and/or have a degree in dietetics], the CRAs carried out data collection activities that continued between the months of September and December. These activities were conducted under the supervision of the NRCs.
Goat Island. Eskasoni First Nation. Photo by Kathleen Lindhorst.
14
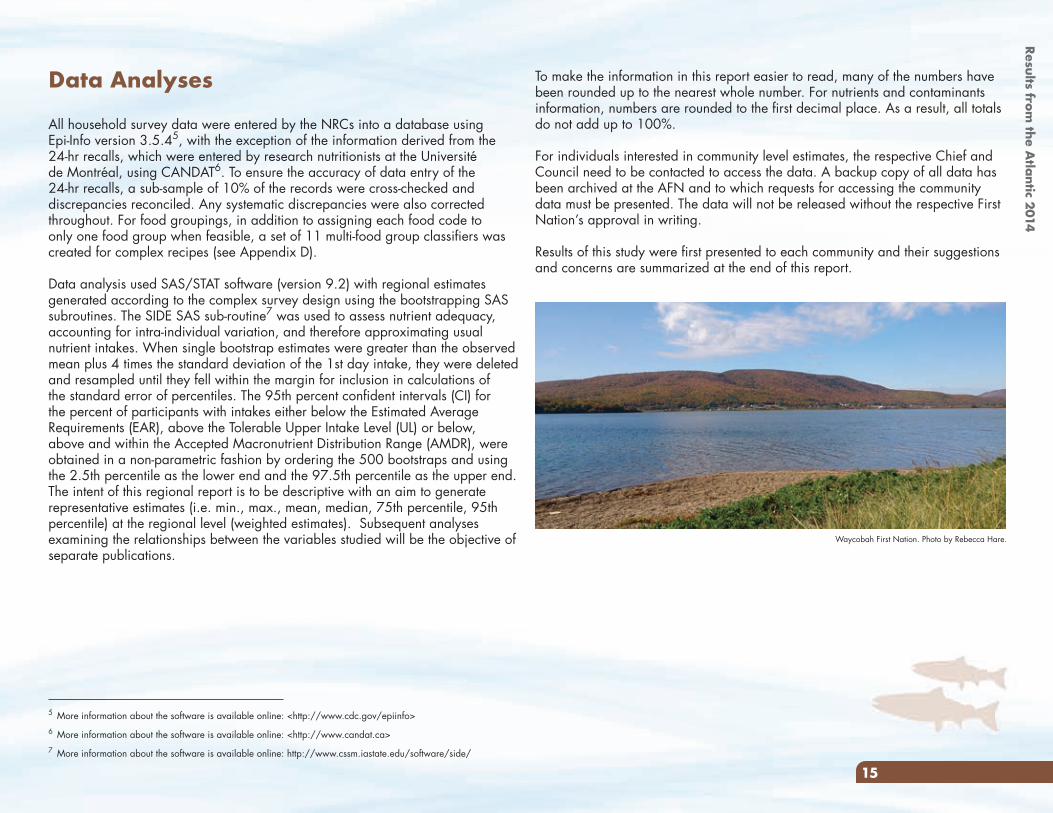
Data Analyses
All household survey data were entered by the NRCs into a database using Epi-Info version 3.5.45, with the exception of the information derived from the 24-hr recalls, which were entered by research nutritionists at the Université de Montréal, using CANDAT6. To ensure the accuracy of data entry of the 24-hr recalls, a sub-sample of 10% of the records were cross-checked and discrepancies reconciled. Any systematic discrepancies were also corrected throughout. For food groupings, in addition to assigning each food code to only one food group when feasible, a set of 11 multi-food group classifiers was created for complex recipes (see Appendix D).
Data analysis used SAS/STAT software (version 9.2) with regional estimates generated according to the complex survey design using the bootstrapping SAS subroutines. The SIDE SAS sub-routine7 was used to assess nutrient adequacy, accounting for intra-individual variation, and therefore approximating usual nutrient intakes. When single bootstrap estimates were greater than the observed mean plus 4 times the standard deviation of the 1st day intake, they were deleted and resampled until they fell within the margin for inclusion in calculations of the standard error of percentiles. The 95th percent confident intervals (CI) for the percent of participants with intakes either below the Estimated Average Requirements (EAR), above the Tolerable Upper Intake Level (UL) or below, above and within the Accepted Macronutrient Distribution Range (AMDR), were obtained in a non-parametric fashion by ordering the 500 bootstraps and using the 2.5th percentile as the lower end and the 97.5th percentile as the upper end.The intent of this regional report is to be descriptive with an aim to generate representative estimates (i.e. min., max., mean, median, 75th percentile, 95th percentile) at the regional level (weighted estimates). Subsequent analyses examining the relationships between the variables studied will be the objective of separate publications.
To make the information in this report easier to read, many of the numbers have been rounded up to the nearest whole number. For nutrients and contaminants information, numbers are rounded to the first decimal place. As a result, all totals do not add up to 100%.
For individuals interested in community level estimates, the respective Chief and Council need to be contacted to access the data. A backup copy of all data has been archived at the AFN and to which requests for accessing the community data must be presented. The data will not be released without the respective First Nation’s approval in writing.
Results of this study were first presented to each community and their suggestions and concerns are summarized at the end of this report.
5 More information about the software is available online: <http://www.cdc.gov/epiinfo>6 More information about the software is available online: <http://www.candat.ca>7 More information about the software is available online: http://www.cssm.iastate.edu/software/side/
Waycobah First Nation. Photo by Rebecca Hare.
15
Results from the A
tlantic 2014
16
Socio-demographic CharacteristicsIn this study, 1025 individuals (670 women and 355 men) participated. The average age was 42 years for women and 40 years for men (Table 3). Figures 2a and 2b demonstrate the age group distribution of participants by gender. Participants aged 31-50 made up approximately half of all participants, while elders aged 71 and over only comprised 3% of all participants.
In participating First Nations households in the Atlantic, 75% of individuals were between the ages of 15-65 years of age, with children under 15 years of age representing 20%, and elders (over the age of 65), representing 5% (Figure 3). These results are slightly different when compared to the 2014 Indian Registration System (IRS) population count for the Atlantic region (27% under 15 years, 68% between 15-65, and 5% over the age of 65) (First Nations and Inuit Health (FNIH) personal communication, 2016).
In terms of household size, the median number of people living in a First Nations household in the Atlantic was 3, with a range of 1 to 12 people (Table 4). One quarter (25%) of households contained 5 or more people (results not shown). Half of the adults reported that they had completed up to 12 years of education, with 25% having completed 12 or more years.
Figure 4 displays further results on education: about 53% of adults had obtained a high school diploma, 15% had obtained a general education development (GED) certificate, 27% had obtained a vocational degree, 32% had obtained a postsecondary degree (21% college degree, 10% bachelor’s degree, 1% master’s degree) (Figure 4).
Figure 5 shows that the main source of income was wages (52%), followed by social assistance (32%), and worker’s compensation/employment insurance (8%). Overall, 71% of households reported that at least one adult had employment (part or full-time) (Figure 6). The percentage of households reporting full-time employment ranged from 35%-59% between communities (results not shown).
This report contains information on socio-demographics, health and lifestyle practices, nutrient and food intake with comparisons to Eating Well with Canada’s Food Guide – First Nations, Inuit and Métis (Health Canada 2007b), traditional food use, income-related household food security, environmental concerns, contaminant exposure, and drinking water and hair analyses.
Sample CharacteristicsEleven First Nations communities in the Atlantic region participated in this study (Table 1). All communities have year-round road access. All communities, except for Miawpukek, are located between 3 to 45 km away from urban centres. All communities had more than 100 households on their reserve lands, with two communities having more than 500 homes.
Data collection in the Atlantic was conducted from September to December 2014 in the following First Nations communities: Woodstock First Nation, Saint Mary’s First Nation, Eel Ground First Nation, Esgenoopetitj First Nation, Elsipogtog First Nation, Pictou Landing First Nation, We’koqma’q First Nation, Potlotek First Nation, Eskasoni First Nation, Membertou First Nation, Miawpukek First Nation (Figure 1).
The majority of results presented in this report are based on in-person interviews conducted with a total of 1025 First Nations respondents living on-reserve in the Atlantic. As some questions were not always answered, there are different sample sizes (n) for some of the results. All estimates presented in this report have been adjusted (weighted) whenever possible to be considered representative of all on-reserve First Nations adults in the Atlantic. However, some estimates are presented unweighted (Tables 8, 11 and 12) and illustrate only geographical variation when applicable.
Table 2 provides details on the sample selected to ensure that the results were representative for First Nations adults living on-reserve in the Atlantic. Approximately 1406 households were randomly selected with the aim of reaching a targeted survey sample size of 1100 adults. Community research assistants visited 1166 homes (83% of homes selected). In the households visited, 1139 adults were eligible to participate. The overall participation rate was 90% (1025/1139 eligible households) which is higher than the rate reported for the CCHS 2.2 (2004) at 76.5%. No formal probing was conducted to determine how participants differed from non-participants but there was a higher ratio of female participants (65%) than male participants (35%).
RESULTS
Woodstock First Nation. Photo by Stephanie Levesque.
17
Diabetes
Obesity is a major risk factor for diabetes and heart disease. Twenty percent of First Nations adults in the Atlantic reported having been told by a health care provider that they had diabetes (Figure 8). Adults aged 40 and over were four times more likely to report having diabetes than younger adults (Figure 9). Type 2 diabetes was the most common form of diabetes reported (Figure 10). In order to compare with previous studies, age-standardized rates were calculated using the 1991 Canadian census data (Statistics Canada’s standard for vital statistics due to its relatively current population structure). Age standardization allows for comparison of populations with different age profiles. The age-standardized rate was 23.2% (Table 5). This rate is three times higher than the rate of 6.7% reported nationally (8.2% in N.S., 8.4% in N.B., 9.0% in N.L) by Canadians aged 12 and older (Statistics Canada 2015) and is higher than reported in other studies involving First Nations, Inuit and Métis communities including the 2008/2010 RHS (age standardized rate of 20.7% among adults 25 years and older) (FNIGC 2012).
In an effort to lose weight, a small percentage of adults (10%) did report that they were dieting on the day of the 24-hour recall (Figure 11a). Dieting among older women appeared to be more common than among younger women (Figure 11b).
Smoking
Half (52%) of First Nations adults in the Atlantic reported that they smoked (Figure 12). This rate is three times greater than the national smoking rate of 14.6% for all Canadians aged 15 and older and more than double the rate reported in the Atlantic provinces (19.6% in N.B., 19.4% in N.S., 19.5 % in N.L. and 17.3% in P.E.I.) (Reid, et al. 2015). The smoking rate among First Nations adults in the Atlantic is similar to the 57% rate reported nationally in the 2008/2010 RHS (FNIGC 2012). Across the Atlantic, adults in this study smoked an average of 13 cigarettes a day (half a pack). This is similar to the Canadian average of 14 cigarettes (Reid et al. 2015).
Health and Lifestyle PracticesBody Mass Index and Obesity
Participants were asked a series of health related questions in order to understand the relationships between diet, lifestyle and health risks. Height and weight measurements were both self-reported and measured for individuals who agreed to have these values recorded. In total, 824 individuals provided both measured height and weight while 121 individuals provided only self-reported height and/or weight. Statistical differences were found between measured and self-reported body weights (underestimated by women) and heights (overestimated by men). Due to this reporting bias, Body Mass Index (BMI) was calculated using both measured heights and weights when the data were available. In cases where only reported or a combination of reported and measured heights and weights were available, the BMI values were adjusted by the addition of the estimated bias value (by gender). The estimated bias value is the mean difference found between the BMIs using measured and reported values using a paired t-test.
The BMI is a proxy measure of body fat based on a person’s weight and height and is an index used to categorize body weights and risk of disease (See Appendix E for further information). A BMI less than 18.5 categorizes a person as underweight, while a BMI between 18.5 and 24.9 categorizes a person as normal weight. A BMI over 25 categorizes a person as overweight, while a person with a BMI over 30 is obese. People who are overweight or obese are more likely to develop health problems.
Based on their BMIs, 21% of adults had a normal or ‘healthy weight’, 31% were classified as overweight and 48% of adults were classified as obese (Figure 7a). Sixty-five percent of women aged 19-30 and 85% of women over the age of 30 were overweight or obese (Figure 7b). Sixty-two percent of men aged 19-30 and 80% of men over the age of 30 were overweight or obese (Figure 7c). Nationally, the 2008/2010 RHS reported that 34.2% of First Nations adults living on-reserve were overweight and 40.2% were obese based on self-reported height and weight (First Nations Information Governance Centre (FNIGC) 2012). In the Canadian general population, based on measured weight and height data from the CCHS 2008, approximately 37% of adults aged 18 years and older were overweight and 25% were obese (Public Health Agency of Canada 2011a).
Results from the A
tlantic 2014
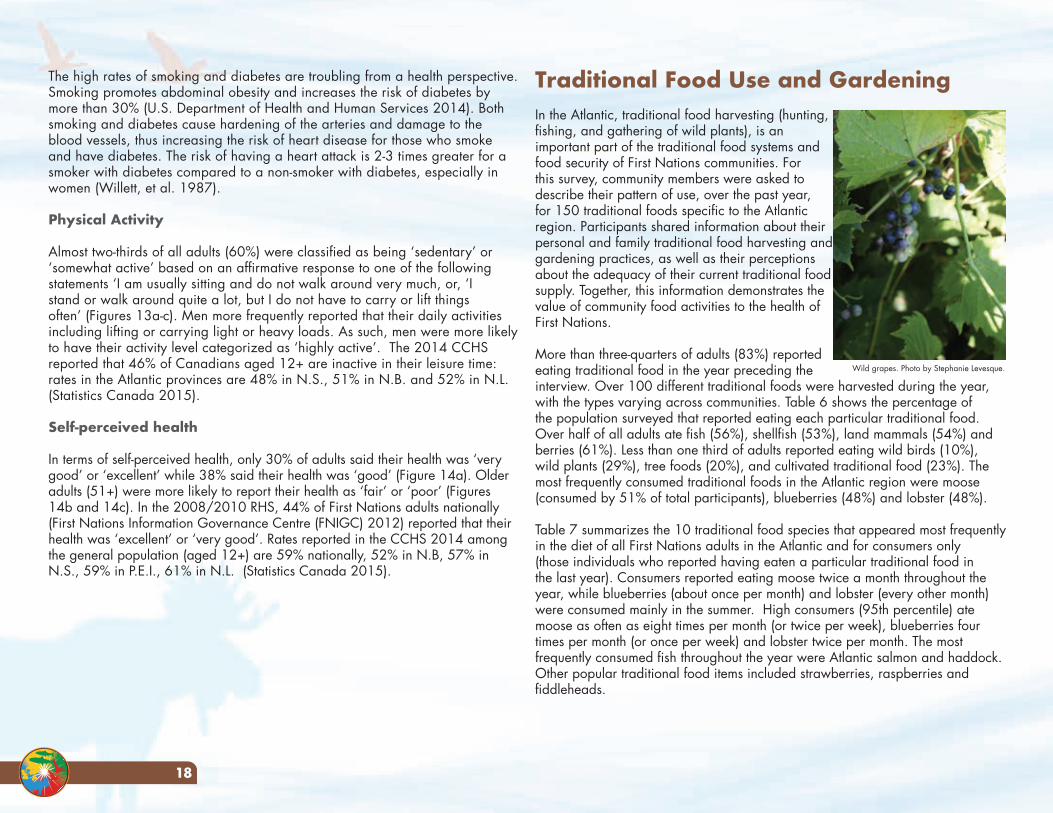
Traditional Food Use and GardeningIn the Atlantic, traditional food harvesting (hunting, fishing, and gathering of wild plants), is an important part of the traditional food systems and food security of First Nations communities. For this survey, community members were asked to describe their pattern of use, over the past year, for 150 traditional foods specific to the Atlantic region. Participants shared information about their personal and family traditional food harvesting and gardening practices, as well as their perceptions about the adequacy of their current traditional food supply. Together, this information demonstrates the value of community food activities to the health of First Nations.
More than three-quarters of adults (83%) reported eating traditional food in the year preceding the interview. Over 100 different traditional foods were harvested during the year, with the types varying across communities. Table 6 shows the percentage of the population surveyed that reported eating each particular traditional food. Over half of all adults ate fish (56%), shellfish (53%), land mammals (54%) and berries (61%). Less than one third of adults reported eating wild birds (10%), wild plants (29%), tree foods (20%), and cultivated traditional food (23%). The most frequently consumed traditional foods in the Atlantic region were moose (consumed by 51% of total participants), blueberries (48%) and lobster (48%).
Table 7 summarizes the 10 traditional food species that appeared most frequently in the diet of all First Nations adults in the Atlantic and for consumers only (those individuals who reported having eaten a particular traditional food in the last year). Consumers reported eating moose twice a month throughout the year, while blueberries (about once per month) and lobster (every other month) were consumed mainly in the summer. High consumers (95th percentile) ate moose as often as eight times per month (or twice per week), blueberries four times per month (or once per week) and lobster twice per month. The most frequently consumed fish throughout the year were Atlantic salmon and haddock. Other popular traditional food items included strawberries, raspberries and fiddleheads.
The high rates of smoking and diabetes are troubling from a health perspective. Smoking promotes abdominal obesity and increases the risk of diabetes by more than 30% (U.S. Department of Health and Human Services 2014). Both smoking and diabetes cause hardening of the arteries and damage to the blood vessels, thus increasing the risk of heart disease for those who smoke and have diabetes. The risk of having a heart attack is 2-3 times greater for a smoker with diabetes compared to a non-smoker with diabetes, especially in women (Willett, et al. 1987).
Physical Activity
Almost two-thirds of all adults (60%) were classified as being ‘sedentary’ or ‘somewhat active’ based on an affirmative response to one of the following statements ‘I am usually sitting and do not walk around very much, or, ‘I stand or walk around quite a lot, but I do not have to carry or lift things often’ (Figures 13a-c). Men more frequently reported that their daily activities including lifting or carrying light or heavy loads. As such, men were more likely to have their activity level categorized as ‘highly active’. The 2014 CCHS reported that 46% of Canadians aged 12+ are inactive in their leisure time: rates in the Atlantic provinces are 48% in N.S., 51% in N.B. and 52% in N.L. (Statistics Canada 2015).
Self-perceived health
In terms of self-perceived health, only 30% of adults said their health was ‘very good’ or ‘excellent’ while 38% said their health was ‘good’ (Figure 14a). Older adults (51+) were more likely to report their health as ‘fair’ or ‘poor’ (Figures 14b and 14c). In the 2008/2010 RHS, 44% of First Nations adults nationally (First Nations Information Governance Centre (FNIGC) 2012) reported that their health was ‘excellent’ or ‘very good’. Rates reported in the CCHS 2014 among the general population (aged 12+) are 59% nationally, 52% in N.B, 57% in N.S., 59% in P.E.I., 61% in N.L. (Statistics Canada 2015).
Wild grapes. Photo by Stephanie Levesque.
18
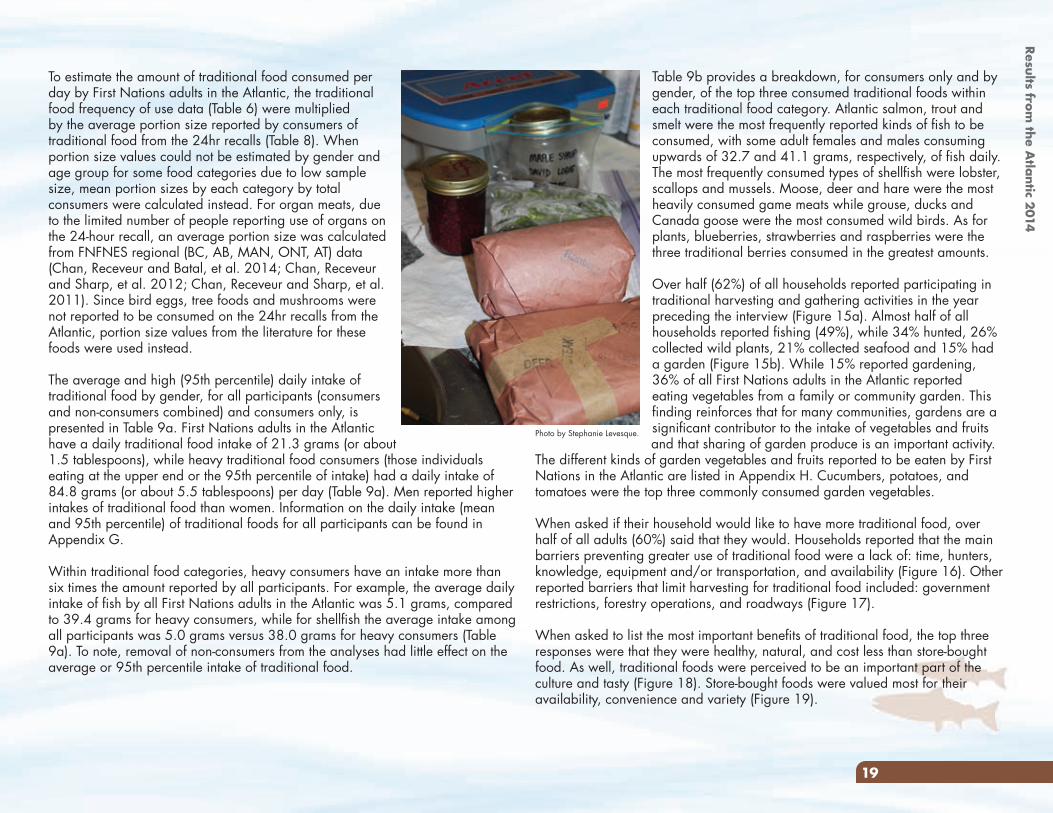
Table 9b provides a breakdown, for consumers only and by gender, of the top three consumed traditional foods within each traditional food category. Atlantic salmon, trout and smelt were the most frequently reported kinds of fish to be consumed, with some adult females and males consuming upwards of 32.7 and 41.1 grams, respectively, of fish daily. The most frequently consumed types of shellfish were lobster, scallops and mussels. Moose, deer and hare were the most heavily consumed game meats while grouse, ducks and Canada goose were the most consumed wild birds. As for plants, blueberries, strawberries and raspberries were the three traditional berries consumed in the greatest amounts.
Over half (62%) of all households reported participating in traditional harvesting and gathering activities in the year preceding the interview (Figure 15a). Almost half of all households reported fishing (49%), while 34% hunted, 26% collected wild plants, 21% collected seafood and 15% had a garden (Figure 15b). While 15% reported gardening, 36% of all First Nations adults in the Atlantic reported eating vegetables from a family or community garden. This finding reinforces that for many communities, gardens are a significant contributor to the intake of vegetables and fruits and that sharing of garden produce is an important activity.
The different kinds of garden vegetables and fruits reported to be eaten by First Nations in the Atlantic are listed in Appendix H. Cucumbers, potatoes, and tomatoes were the top three commonly consumed garden vegetables.
When asked if their household would like to have more traditional food, over half of all adults (60%) said that they would. Households reported that the main barriers preventing greater use of traditional food were a lack of: time, hunters, knowledge, equipment and/or transportation, and availability (Figure 16). Other reported barriers that limit harvesting for traditional food included: government restrictions, forestry operations, and roadways (Figure 17).
When asked to list the most important benefits of traditional food, the top three responses were that they were healthy, natural, and cost less than store-bought food. As well, traditional foods were perceived to be an important part of the culture and tasty (Figure 18). Store-bought foods were valued most for their availability, convenience and variety (Figure 19).
To estimate the amount of traditional food consumed per day by First Nations adults in the Atlantic, the traditional food frequency of use data (Table 6) were multiplied by the average portion size reported by consumers of traditional food from the 24hr recalls (Table 8). When portion size values could not be estimated by gender and age group for some food categories due to low sample size, mean portion sizes by each category by total consumers were calculated instead. For organ meats, due to the limited number of people reporting use of organs on the 24-hour recall, an average portion size was calculated from FNFNES regional (BC, AB, MAN, ONT, AT) data (Chan, Receveur and Batal, et al. 2014; Chan, Receveur and Sharp, et al. 2012; Chan, Receveur and Sharp, et al. 2011). Since bird eggs, tree foods and mushrooms were not reported to be consumed on the 24hr recalls from the Atlantic, portion size values from the literature for these foods were used instead.
The average and high (95th percentile) daily intake of traditional food by gender, for all participants (consumers and non-consumers combined) and consumers only, is presented in Table 9a. First Nations adults in the Atlantic have a daily traditional food intake of 21.3 grams (or about 1.5 tablespoons), while heavy traditional food consumers (those individuals eating at the upper end or the 95th percentile of intake) had a daily intake of 84.8 grams (or about 5.5 tablespoons) per day (Table 9a). Men reported higher intakes of traditional food than women. Information on the daily intake (mean and 95th percentile) of traditional foods for all participants can be found in Appendix G.
Within traditional food categories, heavy consumers have an intake more than six times the amount reported by all participants. For example, the average daily intake of fish by all First Nations adults in the Atlantic was 5.1 grams, compared to 39.4 grams for heavy consumers, while for shellfish the average intake among all participants was 5.0 grams versus 38.0 grams for heavy consumers (Table 9a). To note, removal of non-consumers from the analyses had little effect on the average or 95th percentile intake of traditional food.
Photo by Stephanie Levesque.
19
Results from the A
tlantic 2014
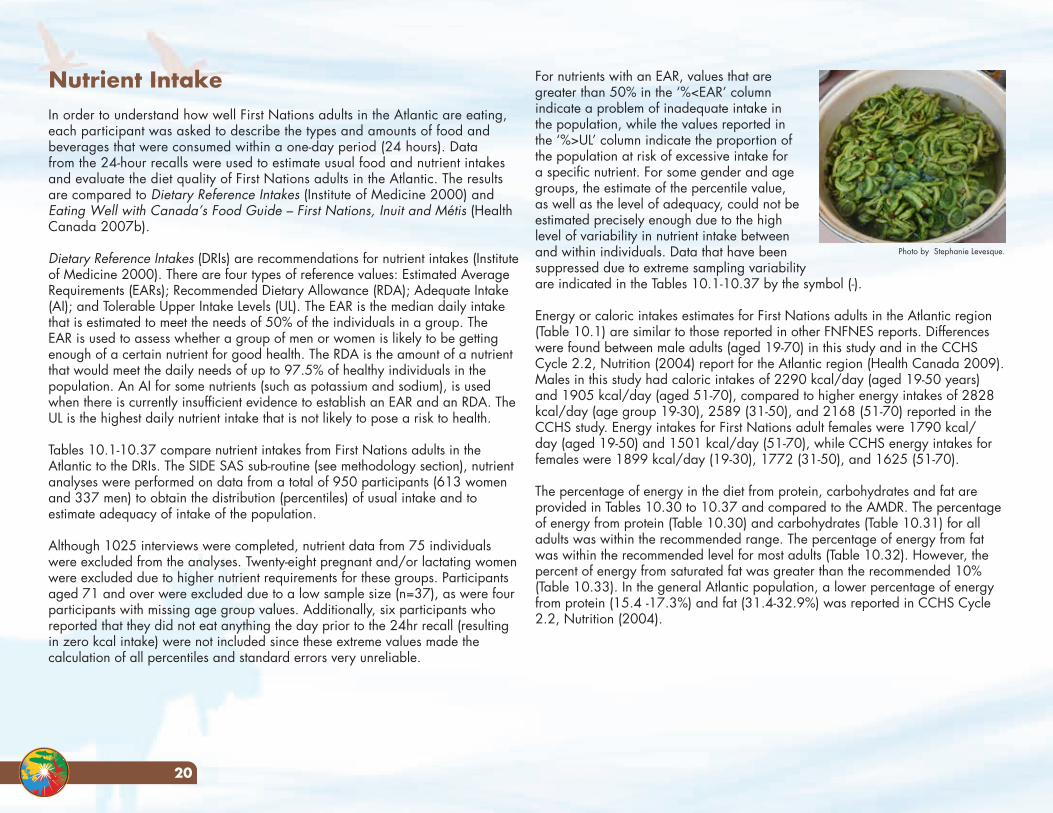
For nutrients with an EAR, values that are greater than 50% in the ‘%<EAR’ column indicate a problem of inadequate intake in the population, while the values reported in the ‘%>UL’ column indicate the proportion of the population at risk of excessive intake for a specific nutrient. For some gender and age groups, the estimate of the percentile value, as well as the level of adequacy, could not be estimated precisely enough due to the high level of variability in nutrient intake between and within individuals. Data that have been suppressed due to extreme sampling variability are indicated in the Tables 10.1-10.37 by the symbol (-).
Energy or caloric intakes estimates for First Nations adults in the Atlantic region (Table 10.1) are similar to those reported in other FNFNES reports. Differences were found between male adults (aged 19-70) in this study and in the CCHS Cycle 2.2, Nutrition (2004) report for the Atlantic region (Health Canada 2009). Males in this study had caloric intakes of 2290 kcal/day (aged 19-50 years) and 1905 kcal/day (aged 51-70), compared to higher energy intakes of 2828 kcal/day (age group 19-30), 2589 (31-50), and 2168 (51-70) reported in the CCHS study. Energy intakes for First Nations adult females were 1790 kcal/day (aged 19-50) and 1501 kcal/day (51-70), while CCHS energy intakes for females were 1899 kcal/day (19-30), 1772 (31-50), and 1625 (51-70).
The percentage of energy in the diet from protein, carbohydrates and fat are provided in Tables 10.30 to 10.37 and compared to the AMDR. The percentage of energy from protein (Table 10.30) and carbohydrates (Table 10.31) for all adults was within the recommended range. The percentage of energy from fat was within the recommended level for most adults (Table 10.32). However, the percent of energy from saturated fat was greater than the recommended 10% (Table 10.33). In the general Atlantic population, a lower percentage of energy from protein (15.4 -17.3%) and fat (31.4-32.9%) was reported in CCHS Cycle 2.2, Nutrition (2004).
Nutrient IntakeIn order to understand how well First Nations adults in the Atlantic are eating, each participant was asked to describe the types and amounts of food and beverages that were consumed within a one-day period (24 hours). Data from the 24-hour recalls were used to estimate usual food and nutrient intakes and evaluate the diet quality of First Nations adults in the Atlantic. The results are compared to Dietary Reference Intakes (Institute of Medicine 2000) and Eating Well with Canada’s Food Guide – First Nations, Inuit and Métis (Health Canada 2007b).
Dietary Reference Intakes (DRIs) are recommendations for nutrient intakes (Institute of Medicine 2000). There are four types of reference values: Estimated Average Requirements (EARs); Recommended Dietary Allowance (RDA); Adequate Intake (AI); and Tolerable Upper Intake Levels (UL). The EAR is the median daily intake that is estimated to meet the needs of 50% of the individuals in a group. The EAR is used to assess whether a group of men or women is likely to be getting enough of a certain nutrient for good health. The RDA is the amount of a nutrient that would meet the daily needs of up to 97.5% of healthy individuals in the population. An AI for some nutrients (such as potassium and sodium), is used when there is currently insufficient evidence to establish an EAR and an RDA. The UL is the highest daily nutrient intake that is not likely to pose a risk to health. Tables 10.1-10.37 compare nutrient intakes from First Nations adults in the Atlantic to the DRIs. The SIDE SAS sub-routine (see methodology section), nutrient analyses were performed on data from a total of 950 participants (613 women and 337 men) to obtain the distribution (percentiles) of usual intake and to estimate adequacy of intake of the population.
Although 1025 interviews were completed, nutrient data from 75 individuals were excluded from the analyses. Twenty-eight pregnant and/or lactating women were excluded due to higher nutrient requirements for these groups. Participants aged 71 and over were excluded due to a low sample size (n=37), as were four participants with missing age group values. Additionally, six participants who reported that they did not eat anything the day prior to the 24hr recall (resulting in zero kcal intake) were not included since these extreme values made the calculation of all percentiles and standard errors very unreliable.
Photo by Stephanie Levesque.
20
levels for the other three food groups (Vegetables and Fruit, Grain Products, and Milk and Alternatives). One in three (34%) adults reported that they avoided specific food or beverages because of intolerance: milk and dairy products were the most commonly avoided foods (13% of all respondents) (see Appendix J). The following describes the eating patterns of First Nations adults in the Atlantic compared to the guidelines in more detail:
Vegetables and Fruit group: CFG-FNIM recommends that adult males have 7-10 Food Guide servings daily while females have 7-8 Food Guide servings of vegetables and fruit per day. A Food Guide serving from this food group is equivalent to ½ cup (4 ounces) of a fresh, frozen or canned vegetable, berries, fruit or 100% fruit juice or 1 cup (8 ounces) of raw leafy greens. Adults from First Nations in the Atlantic consumed about half the minimum recommended amounts (3 servings per day by First Nations men and women). As well, a large portion of the vegetable servings came from potatoes (Table 12), which are not as rich in vitamins and minerals as leafy green and orange vegetables. Not eating the recommended amount of fruits and vegetables on a regular basis can lead to low intakes of fibre and several nutrients, including vitamin A, vitamin C, magnesium and folate. These nutrients are important for several functions within the body, including: maintaining healthy skin (vitamins A and C); regulating blood pressure and bone mass (magnesium); producing healthy blood (folate and vitamin C); and reducing the risk of infection (vitamins A and C) and some cancers (fibre).
Grain Products: CFG-FNIM recommends that adult males have 7-8 Food Guide servings a day, while females are recommended to have 6-7 Food Guide servings of grain products per day; half of these servings should be whole grain foods. Examples of a Food Guide serving from the Grain Products include 1 slice of bread, a 2” x 2” x 1” piece of bannock, ½ a bagel or pita, or tortilla, and ½ cup of cooked rice. Whole grain foods, such as whole wheat bread, brown rice, wild rice, barley and oats, are a good source of fibre and have many health benefits. Foods high in fibre can help us feel full longer, and maintain a healthy body weight, as well as reduce the risk of heart disease, diabetes and cancer. Grain products are also an important source of several nutrients necessary for good health including riboflavin, thiamin, zinc, folate, iron, magnesium and niacin. First Nations men and women in the Atlantic fell short of the recommended number of servings from this group by 1 Food Guide serving a day.
Overall, in comparison to the Dietary Reference Intakes, First Nations adults in the Atlantic have:
• Adequate intakes for iron, vitamin B12, riboflavin, niacin, thiamin, zinc and phosphorous;
• High intakes of saturated fat; • High intakes of sodium;• Low intakes of fibre, vitamin A, vitamin D, calcium and magnesium;• Low intakes of vitamin C for older women aged 51+ and men, as well
as smokers; and• Low intakes of folate and vitamin B6 among older women aged 51+
These findings are similar to what has been reported for the general Atlantic adult population, (Health Canada 2009). High (excess), as well as low (inadequate), intakes can have serious consequences on health. High intake of saturated fat is associated with heart disease (Wang, et al. 2016) and high intake of sodium (salt) has been linked to high blood pressure, which can also lead to heart disease. People with diabetes are two to three times more likely to develop heart disease than those without. Reducing intake of foods high in saturated fat and sodium are key steps to promoting better health. Increasing the intake of fibre improves the intestinal transit and control of blood sugar.
Eating Well with Canada’s Food Guide - First Nations, Inuit and Métis (Health Canada, 2007b describes the amount and types of food needed on a daily basis to supply the nutrients needed for good health and to lower the risk of obesity, type 2 diabetes, heart disease, some cancers, and osteoporosis. There are four food groups in Canada’s Food Guide (CFG-FNIM): Vegetables and Fruit, Grain Products, Milk and Alternatives, and Meat and Alternatives. A copy of CFG-FNIM is in Appendix I and is available online at Health Canada’s website (http://www.hc-sc.gc.ca/fn-an/pubs/fnim-pnim/index-eng.php#).
When compared to CFG-FNIM, First Nations adults in the Atlantic do not appear to be meeting the recommendations for healthy eating (Table 11). First Nations adults in the Atlantic consumed the recommended number of servings from the Meat and Alternatives group, however, the intake was below the recommended
21
Results from the A
tlantic 2014
22
fortified beverages (such as fortified soy beverages), bannock (made with baking powder that contains calcium), and dark green vegetables and wild plants (calcium rich sources), would increase intakes of vitamin D and calcium. Finally, eating more whole grain products such as whole grain breads, cereals and pasta would increase intakes of folate and fibre.
Table 14 demonstrates that while traditional food appears to be a minor contributor to the nutrient intake for the Atlantic population, on the days that traditional food was eaten, the intake of many nutrients (protein, iron, zinc, vitamin D) was significantly higher.
Table 15 shows the top 10 market foods consumed for the Atlantic region. For the longer list of market foods consumed by adults in the Atlantic, see Appendix K (market foods are organized/coded using the Total Diet Study food codes). There is little variation observed in the types of foods being consumed. Pasta was the most popular food consumed by First Nations adults. Water was the most popular beverage, followed by carbonated (soft) drinks, with one cup consumed per person per day. When combined with fruit-flavoured drinks, the intake of sugar-sweetened beverages averaged 1 1/3 cups per person per day. It should be noted that sugar-sweetened beverages such as soft drinks, fruit-flavoured drinks, lemonade, sweetened iced tea, sports drinks, and energy drinks can increase the risk of becoming overweight, thereby increasing the risk of diabetes and heart disease (Hu and Malik 2010). Drinking water instead of these other above-mentioned beverages would be a healthier alternative, however, drinking water quality appears to be a barrier to greater consumption. More than one third of adults in seven of the 11 communities did not use tap water for drinking: two communities had issued boil water advisories within the previous 12 months of the study, while three communities had high manganese levels which can affect taste and appearance (see Section 2: Tap water sampling).
Twenty percent of adults reported taking a nutritional supplement. The use of nutritional supplements increased with age for women and was slightly higher in older men aged 31+ compared to younger men (Figure 20). Overall, the most commonly reported supplements were multivitamin/mineral supplements, vitamin D and vitamin B. The complete list of nutrient supplements reported to be taken by participants is listed in Appendix L. Nutrient supplements can help individuals meet their nutrient needs when the diet quality is low. Also, the need for vitamin D increases over the age of 50. As such, Heath Canada recommends that men and women over 50 take a vitamin D supplement of 10 µg (400 IU) per day (Health Canada, 2007b.
Milk and Alternatives group: CFG-FNIM recommends that adult males and females aged 19-50 consume 2 servings from this food group per day. Adults aged 51+ are advised to have at least 3 servings a day. Examples of a Food Guide serving from this group include: 1 cup of milk or fortified soy beverage, ¾ cup of yogurt and 1 ½ ounces of cheese. This food group contains the primary sources of calcium and vitamin D which are essential for building and maintaining healthy bones and teeth. In the Atlantic, both male and female First Nations adults reported having 1 serving per day. This may be explained, in part, by some milk product intolerance, as reported by 13% of the respondents (see Appendix J). This low intake poses a concern for adequacy for calcium and vitamin D.
Meat and Alternatives group: CFG-FNIM recommends that adult men consume 3 Food Guide servings of food from the meat and alternates food group every day, while the recommendation for women is 2 servings per day. A Food Guide serving from the Meat and Alternatives Group is equivalent to 2 eggs or 2 ½ ounces (½ cup) of wild or store-bought meat, fish, poultry, shellfish, ¾ cup of cooked beans (lentils, black beans, split peas), or 2 tablespoons of peanut butter. In this study, men consumed an average of 3 Food Guide servings from this food group daily and women consumed 2 servings per day.
Overall, the food choices of First Nations men and women in the Atlantic are very similar. Within each of the four food groups, there is a limited variety of foods that appear frequently (Table 12). The low consumption of whole grains, fresh berries and fruit, and the low consumption of fresh and frozen vegetables relative to the use of potatoes, are particularly problematic. This highlights the need to find ways to increase their consumption to improve the intake of fibre, vitamins and minerals but decrease sodium.
Table 13 lists the foods that are the most important contributors to each nutrient, ranked in descending order. The main sources of both protein and fat were chicken and beef. Together, white bread, cereal and pasta supplied 33% of the iron and 43% of folate in the diet. Milk, margarine and eggs provided 60% of vitamin D in the diet. Moose meat contributed 4% of protein and 3% of iron in the diet. As mentioned above, salt intakes for all age groups and saturated fat intakes for adults aged 19-50 were above the recommended levels. The main sources of salt were processed food: white bread, pizza and sandwiches. Increasing consumption of vegetables and fruit would help to increase intakes of vitamin A, vitamin C and fibre. Increasing intake of foods such as fish, milk and milk products (cheese and vitamin D fortified yogurt), calcium and vitamin D
23
Total food insecurity affects a slightly higher percentage of First Nations on-reserve households in the Atlantic region (31%) than reported by FNFNES in Ontario (29%), but lower than that reported in Manitoba (38%), British Columbia (41%), and Alberta (47%). The rate of severe food insecurity in the Atlantic region (9%) was higher than the rates found in Ontario (8%), British Columbia (7%) and Manitoba (6%) but lower than Alberta (13%). Food insecurity rates among First Nations households on-reserve are much higher than other Canadian households. In 2011/2012, the national food insecurity rate was 8.3% and 23% among Aboriginal households off reserve. In the Atlantic provinces, the rate of food insecurity was 10.1% in New Brunswick, 11.8% in Nova Scotia, 10.3% in Prince Edward Island and 7.7% in Newfoundland and Labrador (Statistics Canada 2013). More recent 2014 household food insecurity rates exist, although data for a few regions (British Columbia, Manitoba, Newfoundland and Labrador and the Yukon) are not available as they opted out of the food security module. In 2014, 8.2% of households and 19.7% of Aboriginal households off-reserve experienced food insecurity. In the Atlantic, household food insecurity rates were 10.7% in New Brunswick, 9.8% in Nova Scotia and 10.2% in Prince Edward Island (Tarasuk, Mitchell and Dachner 2016).
Recently, some food security experts recommended that households be classified as food secure only if all questions are answered ‘no’. Households affirming ‘yes’ to no more than one question on either the adult or child survey should be classified as ‘marginally food insecure’ (Tarasuk, Mitchell and Dachner 2013). The rate of food insecurity among First Nations in the Atlantic region rose to 39% (Figure 26) when this approach was taken.
Figure 27 shows that when stratified by income level, adults on social assistance reported the highest levels of food insecurity (28% moderately and 17% severely). However, 23% of households with at least one adult earning wages reported some degree of food insecurity.
Likely, a combination of insufficient wages, lack of employment and the high cost of food are contributing factors to high food insecurity. In each participating community, a Nutrition Research Coordinator (NRC) asked permission of the local grocery store manager to document the cost of common grocery items using Health Canada’s 2008 National Nutritious Food Basket tool (Health Canada 2009). The food basket contains 67 basic food items that require preparation (see Appendix M for description and costs). Pre-packaged meals (such as pizza), non-food items (such as household supplies or personal care items) and the cost of transportation are also not included in the food basket pricing. The
Food SecurityIn order to gain a better picture of food security (the ability of households to access enough food) among First Nations households, a series of questions were asked about access to both traditional and store-bought food. Some of the findings about traditional food (harvesting, barriers to use) appear in the Traditional Food Use and Gardening section of this report.
As reported in the Traditional Food Use and Gardening section, while the majority of adults would like to have more traditional food in their diet, financial and household constraints (see Figure 17) prevent greater access. Almost a quarter of participants (24%) said that they often or sometimes worried that their traditional food supplies would run out before they could get more (Figure 21). Just over a quarter (27%) of the population also worried that they wouldn’t be able to replace their traditional foods when they ran out (Figure 22).
Almost all participants (99%) completed the income-related Household Food Security Survey Module (HFSSM). Within the households completing the questionnaire, 48% contained children under the age of 18 years. In previous FNFNES reports, the percentages of households with children were: 58% (BC), 68% (AB), 74% (Manitoba) and 48% (Ontario). Household responses to the 18-item food security section of the questionnaire are presented in Table 16. Examining the responses to the 18 questions in detail, 31% of households worried that their food would run out before they could buy more, 27% said that the food that they bought didn’t last and there wasn’t any money to get more and 29% couldn’t afford to eat balanced meals. Moreover, 33% of households with children relied on less expensive foods to feed their children and 22% said they couldn’t afford to feed their children balanced meals.
Based on the three categories of food security, 31% of First Nations households in the Atlantic were classified as food insecure: 22% of all households were classified as moderately food insecure and 9% were classified as severely food insecure (Table 17 and Figure 23). Households with children experienced greater food insecurity (35%) (Table 17 and Figure 24) than those without children (27%) (Table 17 and Figure 25). Among households with children, 22% experienced food insecurity at the child level. That is, one or more children in each of these households were food insecure in the last year. In general, children tend to be protected from food insecurity, and particularly so from its most severe form (11% of adults with severe food insecurity vs 3% of children).
Results from the A
tlantic 2014
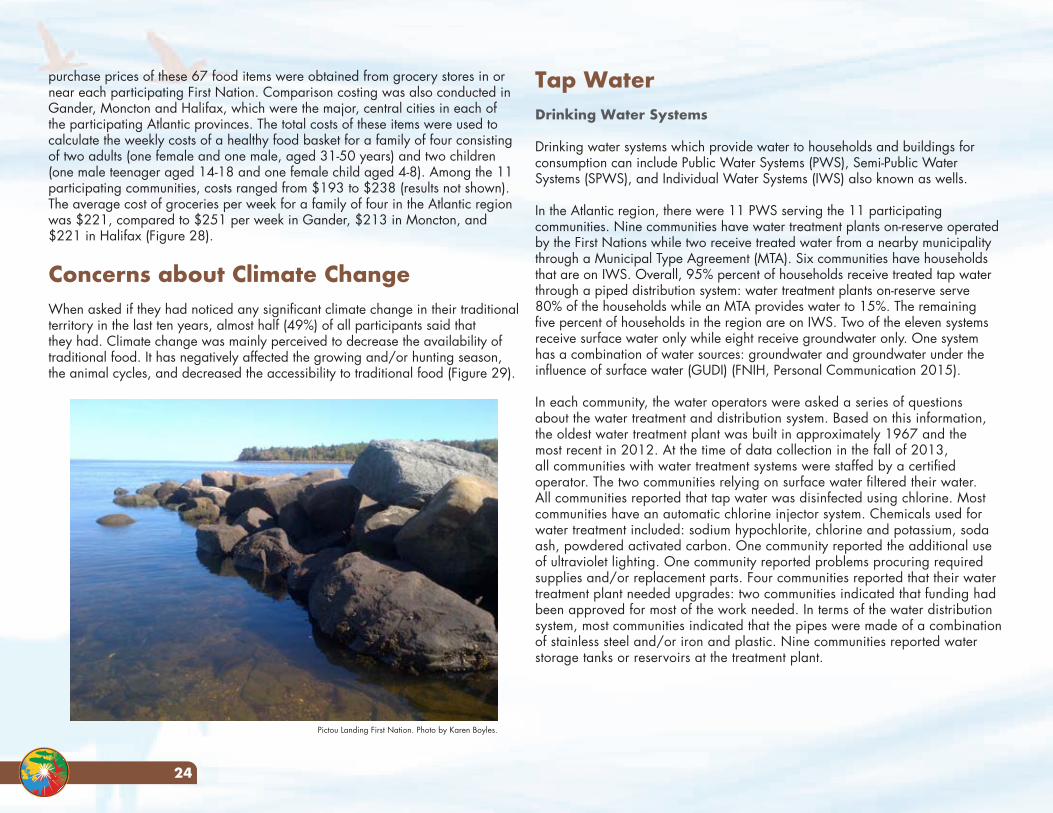
24
Tap Water Drinking Water Systems
Drinking water systems which provide water to households and buildings for consumption can include Public Water Systems (PWS), Semi-Public Water Systems (SPWS), and Individual Water Systems (IWS) also known as wells.
In the Atlantic region, there were 11 PWS serving the 11 participating communities. Nine communities have water treatment plants on-reserve operated by the First Nations while two receive treated water from a nearby municipality through a Municipal Type Agreement (MTA). Six communities have households that are on IWS. Overall, 95% percent of households receive treated tap water through a piped distribution system: water treatment plants on-reserve serve 80% of the households while an MTA provides water to 15%. The remaining five percent of households in the region are on IWS. Two of the eleven systems receive surface water only while eight receive groundwater only. One system has a combination of water sources: groundwater and groundwater under the influence of surface water (GUDI) (FNIH, Personal Communication 2015).
In each community, the water operators were asked a series of questions about the water treatment and distribution system. Based on this information, the oldest water treatment plant was built in approximately 1967 and the most recent in 2012. At the time of data collection in the fall of 2013, all communities with water treatment systems were staffed by a certified operator. The two communities relying on surface water filtered their water. All communities reported that tap water was disinfected using chlorine. Most communities have an automatic chlorine injector system. Chemicals used for water treatment included: sodium hypochlorite, chlorine and potassium, soda ash, powdered activated carbon. One community reported the additional use of ultraviolet lighting. One community reported problems procuring required supplies and/or replacement parts. Four communities reported that their water treatment plant needed upgrades: two communities indicated that funding had been approved for most of the work needed. In terms of the water distribution system, most communities indicated that the pipes were made of a combination of stainless steel and/or iron and plastic. Nine communities reported water storage tanks or reservoirs at the treatment plant.
purchase prices of these 67 food items were obtained from grocery stores in or near each participating First Nation. Comparison costing was also conducted in Gander, Moncton and Halifax, which were the major, central cities in each of the participating Atlantic provinces. The total costs of these items were used to calculate the weekly costs of a healthy food basket for a family of four consisting of two adults (one female and one male, aged 31-50 years) and two children (one male teenager aged 14-18 and one female child aged 4-8). Among the 11 participating communities, costs ranged from $193 to $238 (results not shown). The average cost of groceries per week for a family of four in the Atlantic region was $221, compared to $251 per week in Gander, $213 in Moncton, and $221 in Halifax (Figure 28).
Concerns about Climate ChangeWhen asked if they had noticed any significant climate change in their traditional territory in the last ten years, almost half (49%) of all participants said that they had. Climate change was mainly perceived to decrease the availability of traditional food. It has negatively affected the growing and/or hunting season, the animal cycles, and decreased the accessibility to traditional food (Figure 29).
Pictou Landing First Nation. Photo by Karen Boyles.
25
Tap Water Analysis
Tap water samples were collected from a range of 16 to 21 households in 11 of the participating communities (20 was the average). It is the standard protocol to invite up to 20 households in each community to provide tap water samples for analysis. A total of 216 of a planned 220 household sampling plan participated in the tap water sampling component. There were nine samples that were collected from alternate drinking water sources.
Metals of Public Health Concern
The FNFNES quantified ten metals that are of concern to human health when the maximum acceptable concentration (MAC) of the Canadian Guidelines of Drinking Water Quality (CGDWQ) (Health Canada 2014) is exceeded:
• Antimony• Arsenic• Barium• Boron• Cadmium
• Chromium• Lead• Mercury• Selenium• Uranium
The results of water sample testing for metals in drinking water of public health concern are listed in Table 19. Of the 216 households, no exceedances were found for any metals of public health concern.
Lead:In the first round of sample taking (first draw), 19 households had lead levels above the maximum acceptable guideline of 10 µg/L. These households were in one community (10.9 - 107 µg/L). Following a five-minute flush of the household piping, all households had lead levels below the maximum acceptable guideline (ranging from below the detection limit to 2.9 µg/L). This indicates that water in these households should be run for several minutes before being used for drinking or cooking purposes.
With respect to water availability and bacteriological safety, water disruptions and drinking water advisories (DWA) occurred in seven First Nations communities in the 12 months preceding the study. Water disruptions were reported to have occurred due to broken watermains, cleaning of the lines, power outages or water delivery truck stoppages. DWA’s were issued in seven communities. Five communities had one DWA listed while one community reported issuing four DWA and in one community a boil water advisory (BWA) was issued. The community which issued four water advisories cited sample errors and a watermain breakage as the reason for the advisories. At the time this report was written (2017), there were four communities under a BWA.
Table 18 reports the characteristics of all First Nations households and plumbing systems in the Atlantic. At the time of the study, the average age of a home was reported to be 19 years with the oldest house in the study being built in 1920 and the newest house in 2014. A total of 17% of households had upgraded plumbing, 27% of households treated their water (mainly by using filters or boiling it) and 12% had outside water storage tanks. One third of the households (32%) had plastic pipes under their kitchen sink, while 20% had braided flex lines and 20% had copper pipes with braided flex lines.
Figure 30 shows that all participants have tap water, however, only 58% use it for drinking while 93% use it for cooking. Three quarters (75%) of households reported that the source of their drinking water was the PWS, while 17% had water piped in from a nearby municipality, and 8% obtained it from IWS (Figure 31). In households where tap water was not used for drinking or cooking, bottled water was the common replacement used (Figure 32 and 33). The main deterrents cited included the taste, smell and colour of the water, a boil water advisory, and lack of confidence in the water quality (Figure 34). Of the participants who drink the tap water in their homes, 27% treated it, mainly with filters or by boiling it (Figure 35). Overall, less than 65% of respondents in seven of the 11 communities reported using the tap water for drinking.
Forty percent of participants reported obtaining their drinking water from both the hot water and cold water taps (Figure 36). As for cooking water, this figure rose to 75% (Figure 37). This is a concern since higher levels of metals are found in hot water: metals in hot water tanks and pipes dissolve more easily in hot water. It is safer to only use water from cold taps for drinking and cooking (Health Canada 2010).
Results from the A
tlantic 2014
26
Manganese:Four communities were found to have elevated levels of manganese above the aesthetic objective of 50 µg/L. Thirty-two households had first round sampling levels ranging from 50.8 – 532 µg/L. Following a 5-minute flush, 31 households had levels of 53.2 – 813 µg/L. While there are no health concerns, the Chief and Council, the Health Canada EHO for the communities and the householders have been made aware of these exceedances.
Water Parameters; chlorine, pH, temperature
Chlorine:Levels of chlorine in household tap water were measured to determine where there was a minimal acceptable level for disinfection (0.2 mg free chlorine per litre of water) present. In total, 42 samples had levels of free chlorine below the minimal level of disinfection. Free chlorine was not detected in 25 of the tap wa-ter samples. It appears that only five of these samples were taken from an IWS, which may not have chlorine added. Therefore, in at least 18% (38/211) of tap water samples where chlorine is actively being used as a disinfectant, levels are inadequate. pH:The pH in tap water was measured to determine whether the water was at a neutral, acidic or alkaline level. The Canadian Drinking Water Guideline recom-mends that the pH in drinking water be maintained between 6.5 and 8.5 (Health Canada 2014). Water at a lower pH (below 6.5) is acidic and can leach metal from pipes and pipe fittings, resulting in a higher metal content in drinking water. Lower pH can also reduce disinfection efficiency. Drinking water with a pH above 8.5 indicates high alkalinity. A high alkalinity can cause scale build-up in plumbing. Levels of pH outside of the optimal range can have adverse effects on taste, odour and appearance. Low pH can give water a sour or metallic taste and cause blue-green stains in sinks and drains. Exposure to extreme high or low pH values can irritate the skin, and in sensitive individuals, may irritate the stomach. In seven communities, all tap water samples were within the acceptable range. In three communities, a reading of a pH level of 6.2 was found in 5% (1/20) of tap water samples. In one community, half of the tap water samples (11/21) had a reading of 6.2.
Aesthetic Objective (AO) and Operational Guidance (OG) Metals Sampled
The FNFNES quantified six metals that have operational guidance values (OG) and aesthetic objectives (AO):
• Aluminum• Copper• Iron
• Manganese• Sodium• Zinc
Concentrations were above the aesthetic guidelines of the Canadian Guidelines of Drinking Water Quality (Health Canada, 2014) for three metals: aluminum, iron and manganese. The results of water sample testing for metals with OG and AO values in drinking water are listed in Table 20.
Aluminum:Four communities had aluminum levels above the guidance value (100 µg/L). Three communities had elevated aluminum levels after the first round of sampling ranging from 103 - 806 µg/L. The large number of high aluminum levels (42), in two communities even after the 5 minute flushed samples were taken (101 – 203 µg/L), indicated that the aluminum was originating from the water treatment plants. One of these plants has had a history of aluminum levels slightly above the aesthetic objective in the twice-yearly monitoring of the drinking water treat-ment plant. The other is a new water treatment plant that has recently experi-enced operational changes. The plant was scheduled to be back in full operation by the end of the summer 2016. While these elevated levels of aluminum pose no health concern, the Chief and Council, the Health Canada Regional Environ-mental Health Manager, Atlantic region and the householders have been made aware of these exceedances.
Iron:Two communities had elevated levels of iron above the guideline of 300 µg/L. Twenty households had elevated first draw levels of 301 – 589 µg/L. Follow-ing a 5-minute flush, 22 households had levels ranging from 334 – 407 µg/L. While there are no health concerns, the Chief and Council, the Health Canada EHO for the communities and the householders have been made aware of these exceedances.
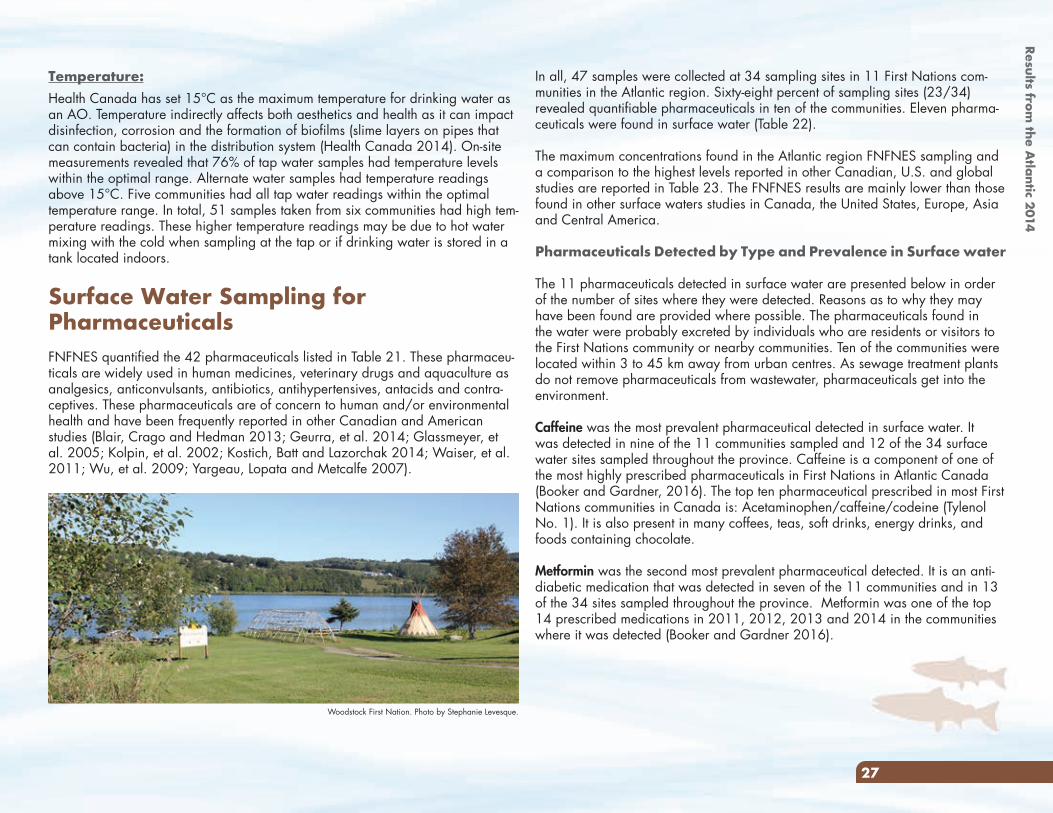
27
In all, 47 samples were collected at 34 sampling sites in 11 First Nations com-munities in the Atlantic region. Sixty-eight percent of sampling sites (23/34) revealed quantifiable pharmaceuticals in ten of the communities. Eleven pharma-ceuticals were found in surface water (Table 22).
The maximum concentrations found in the Atlantic region FNFNES sampling and a comparison to the highest levels reported in other Canadian, U.S. and global studies are reported in Table 23. The FNFNES results are mainly lower than those found in other surface waters studies in Canada, the United States, Europe, Asia and Central America.
Pharmaceuticals Detected by Type and Prevalence in Surface water
The 11 pharmaceuticals detected in surface water are presented below in order of the number of sites where they were detected. Reasons as to why they may have been found are provided where possible. The pharmaceuticals found in the water were probably excreted by individuals who are residents or visitors to the First Nations community or nearby communities. Ten of the communities were located within 3 to 45 km away from urban centres. As sewage treatment plants do not remove pharmaceuticals from wastewater, pharmaceuticals get into the environment.
Caffeine was the most prevalent pharmaceutical detected in surface water. It was detected in nine of the 11 communities sampled and 12 of the 34 surface water sites sampled throughout the province. Caffeine is a component of one of the most highly prescribed pharmaceuticals in First Nations in Atlantic Canada (Booker and Gardner, 2016). The top ten pharmaceutical prescribed in most First Nations communities in Canada is: Acetaminophen/caffeine/codeine (Tylenol No. 1). It is also present in many coffees, teas, soft drinks, energy drinks, and foods containing chocolate.
Metformin was the second most prevalent pharmaceutical detected. It is an anti-diabetic medication that was detected in seven of the 11 communities and in 13 of the 34 sites sampled throughout the province. Metformin was one of the top 14 prescribed medications in 2011, 2012, 2013 and 2014 in the communities where it was detected (Booker and Gardner 2016).
Temperature:Health Canada has set 15°C as the maximum temperature for drinking water as an AO. Temperature indirectly affects both aesthetics and health as it can impact disinfection, corrosion and the formation of biofilms (slime layers on pipes that can contain bacteria) in the distribution system (Health Canada 2014). On-site measurements revealed that 76% of tap water samples had temperature levels within the optimal range. Alternate water samples had temperature readings above 15°C. Five communities had all tap water readings within the optimal temperature range. In total, 51 samples taken from six communities had high tem-perature readings. These higher temperature readings may be due to hot water mixing with the cold when sampling at the tap or if drinking water is stored in a tank located indoors.
Surface Water Sampling for PharmaceuticalsFNFNES quantified the 42 pharmaceuticals listed in Table 21. These pharmaceu-ticals are widely used in human medicines, veterinary drugs and aquaculture as analgesics, anticonvulsants, antibiotics, antihypertensives, antacids and contra-ceptives. These pharmaceuticals are of concern to human and/or environmental health and have been frequently reported in other Canadian and American studies (Blair, Crago and Hedman 2013; Geurra, et al. 2014; Glassmeyer, et al. 2005; Kolpin, et al. 2002; Kostich, Batt and Lazorchak 2014; Waiser, et al. 2011; Wu, et al. 2009; Yargeau, Lopata and Metcalfe 2007).
Woodstock First Nation. Photo by Stephanie Levesque.
Results from the A
tlantic 2014
Bezafibrate is a cholesterol medication that was detected in one community at one site. Bezafibrate was not prescribed in the community where it was found (Booker and Gardner 2016).
FNFNES Atlantic region findings compared to Pharmaceutical Guidelines
Drinking Water Guidelines
There are no Canadian Drinking Water Quality Guidelines for pharmaceuticals. Australia has set a drinking water guideline for water recycling that includes ten of the pharmaceuticals found in Atlantic Canada: acetaminophen, bezafi-brate, caffeine, carbamazepine, clarithromycin, cotinine, ketoprofen, metformin, naproxen and sulfamethoxazole (Australian guidelines for Water Recycling 2008). In addition, the state of California has developed Monitoring Trigger Levels (MTLs) for potable water reuse for seven of the pharmaceuticals found in Atlantic Canada: acetaminophen, atenolol, caffeine, carbamazepine, ketoprofen, naproxen and sulfamethoxazole (Anderson, et al. 2010). The state of New York has established standards for: acetaminophen, caffeine, cotinine, carbamazepine and sulfamethoxazole (New York City Environment Protection 2011). No Atlantic Canada FNFNES samples exceeded these guideline levels. The comparison of the Atlantic Canada results to drinking water guidelines in Australia, California and New York is provided in Table 24.
The concentrations of the pharmaceuticals found in the Atlantic FNFNES study should not pose a threat to human health. In several communities, there are as many as seven pharmaceuticals in the surface water. It is unknown at this time the health effects from drinking the water from these surface water sites over a prolonged period.
To reduce the presence of pharmaceuticals in the environment, it is recommended to return unused or expired prescription drugs, over-the-counter medications and natural health products to a local pharmacy for proper disposal instead of flushing them down the toilet or throwing them into the garbage.
Atenolol was detected in four of the 11 communities sampled and in 10 of the 34 surface water sites. Atenolol is a heart medication that is not highly prescribed in First Nations in Atlantic Canada (Booker and Gardner, 2016).
Carbamazepine was detected in four of the 11 communities sampled and in five of the 34 surface water sites. Carbamazepine is a medication prescribed as an anticonvulsant and mood stabilizer. It is a potential endocrine disrupting chemi-cal. It is not highly prescribed in First Nations communities in Atlantic Canada. In two of the four communities, it is not in the top 100 pharmaceuticals prescribed (Booker and Gardner, 2016).
Acetaminophen, a pain reliever and a fever reducer, was detected in three com-munities at four sites. Acetaminophen is also a component of one of the top pre-scribed pharmaceuticals in Atlantic Canada First Nations (Tylenol No. 1) (Booker and Gardner 2016).
Naproxen, a pain reliever and a fever reducer, was detected in three communi-ties at three sites. Naproxen was one of the top 40 pharmaceuticals prescribed in the three communities where it was detected (Booker and Gardner, 2016).
Sulfamethoxazole, an antibiotic used to treat urinary tract and respiratory tract infections, was found in two communities at two sites. Sulfamethoxazole is not highly prescribed in Atlantic Canada (Booker and Gardner 2016).
Clarithromycin, an antibiotic used to treat bacterial infections such as strep throat and pneumonia, was found in two communities at two sites. Clarithromycin is not highly prescribed in Atlantic Canada (Booker and Gardner 2016).
Cotinine (a metabolite of nicotine) was detected in one community and two of the 34 surface water sites sampled in Atlantic Canada. An average of 80% of nicotine that is consumed by people is excreted as cotinine. However, although nicotine is prescribed (e.g. smoking cessation products, such as patches and gum) in the community where it was detected (Booker and Gardner, 2016), its presence most probably reflects tobacco use.
Ketoprofen is an arthritis and pain medication that was detected in one commu-nity at two sites. Ketoprofen is not a prescribed pharmaceutical in the community where it was found (Booker and Gardner 2016).
28
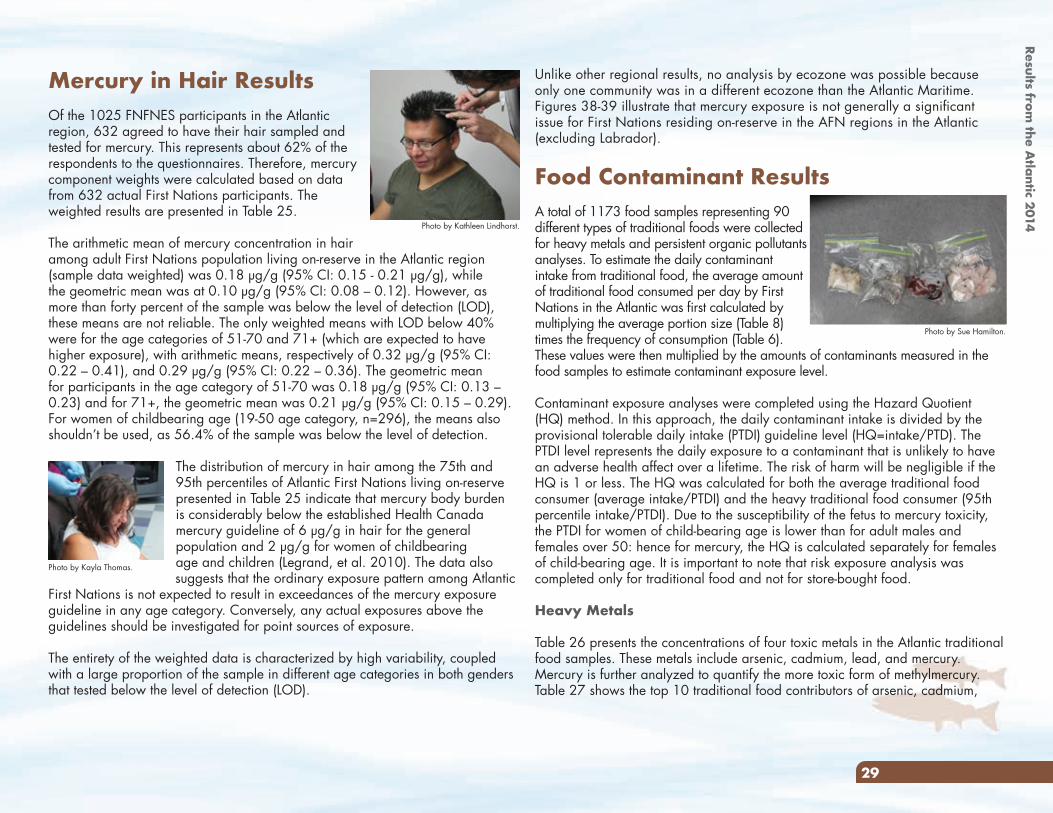
Mercury in Hair ResultsOf the 1025 FNFNES participants in the Atlantic region, 632 agreed to have their hair sampled and tested for mercury. This represents about 62% of the respondents to the questionnaires. Therefore, mercury component weights were calculated based on data from 632 actual First Nations participants. The weighted results are presented in Table 25.
The arithmetic mean of mercury concentration in hair among adult First Nations population living on-reserve in the Atlantic region (sample data weighted) was 0.18 µg/g (95% CI: 0.15 - 0.21 µg/g), while the geometric mean was at 0.10 µg/g (95% CI: 0.08 – 0.12). However, as more than forty percent of the sample was below the level of detection (LOD), these means are not reliable. The only weighted means with LOD below 40% were for the age categories of 51-70 and 71+ (which are expected to have higher exposure), with arithmetic means, respectively of 0.32 µg/g (95% CI: 0.22 – 0.41), and 0.29 µg/g (95% CI: 0.22 – 0.36). The geometric mean for participants in the age category of 51-70 was 0.18 µg/g (95% CI: 0.13 – 0.23) and for 71+, the geometric mean was 0.21 µg/g (95% CI: 0.15 – 0.29). For women of childbearing age (19-50 age category, n=296), the means also shouldn’t be used, as 56.4% of the sample was below the level of detection.
The distribution of mercury in hair among the 75th and 95th percentiles of Atlantic First Nations living on-reserve presented in Table 25 indicate that mercury body burden is considerably below the established Health Canada mercury guideline of 6 µg/g in hair for the general population and 2 µg/g for women of childbearing age and children (Legrand, et al. 2010). The data also suggests that the ordinary exposure pattern among Atlantic
First Nations is not expected to result in exceedances of the mercury exposure guideline in any age category. Conversely, any actual exposures above the guidelines should be investigated for point sources of exposure.
The entirety of the weighted data is characterized by high variability, coupled with a large proportion of the sample in different age categories in both genders that tested below the level of detection (LOD).
Photo by Kathleen Lindhorst.
Photo by Sue Hamilton.
Unlike other regional results, no analysis by ecozone was possible because only one community was in a different ecozone than the Atlantic Maritime. Figures 38-39 illustrate that mercury exposure is not generally a significant issue for First Nations residing on-reserve in the AFN regions in the Atlantic (excluding Labrador).
Food Contaminant ResultsA total of 1173 food samples representing 90 different types of traditional foods were collected for heavy metals and persistent organic pollutants analyses. To estimate the daily contaminant intake from traditional food, the average amount of traditional food consumed per day by First Nations in the Atlantic was first calculated by multiplying the average portion size (Table 8) times the frequency of consumption (Table 6). These values were then multiplied by the amounts of contaminants measured in the food samples to estimate contaminant exposure level.
Contaminant exposure analyses were completed using the Hazard Quotient (HQ) method. In this approach, the daily contaminant intake is divided by the provisional tolerable daily intake (PTDI) guideline level (HQ=intake/PTD). The PTDI level represents the daily exposure to a contaminant that is unlikely to have an adverse health affect over a lifetime. The risk of harm will be negligible if the HQ is 1 or less. The HQ was calculated for both the average traditional food consumer (average intake/PTDI) and the heavy traditional food consumer (95th percentile intake/PTDI). Due to the susceptibility of the fetus to mercury toxicity, the PTDI for women of child-bearing age is lower than for adult males and females over 50: hence for mercury, the HQ is calculated separately for females of child-bearing age. It is important to note that risk exposure analysis was completed only for traditional food and not for store-bought food.
Heavy Metals
Table 26 presents the concentrations of four toxic metals in the Atlantic traditional food samples. These metals include arsenic, cadmium, lead, and mercury. Mercury is further analyzed to quantify the more toxic form of methylmercury. Table 27 shows the top 10 traditional food contributors of arsenic, cadmium,
Photo by Kayla Thomas.
29
Results from the A
tlantic 2014
lead and mercury in the diet. Exposure estimates for these heavy metals were analyzed for all adults (Tables 28), and separately for mercury for women of child-bearing age (Table 29) as well as consumers only i.e. excluding those who did not eat any traditional food in the year prior to the interview (Tables 30-31).
Arsenic: Since lobster and crab were eaten most often, they were the main traditional food sources of arsenic (Table 27). For average traditional food consumers (mean/PTDI), the HQ values for arsenic were lower than 1, therefore the risk of harm is negligible based on current consumption (Table 28). For heavy traditional food consumers (95th/PTDI), the HQ values were above 1. However, the arsenic accumulated in animal tissues is mainly in a non-toxic organic form known as arsenobetaine (AB) and should not be of any safety concern (Agency for Toxic Substances and Disease Registry (ATSDR) n.d.).
Cadmium: Higher levels of cadmium were found in samples of moose kidney, liver (moose, rabbit and deer), as well as some shellfish (oyster, lobster and mussels). Higher concentrations of cadmium are found in the liver and kidneys of mammals as they tend to accumulate in these organs. Cadmium is also commonly found in shellfish. Based on their reported use, the main traditional source of cadmium in the diet was lobster (Table 27). For both the average and heavy traditional food consumers, the HQ values for cadmium were lower than 1, therefore the risk of harm is negligible based on current consumption (Table 28).
Lead: Among the samples collected, higher levels of lead were found in samples of game meat (squirrel, rabbit and deer), wild birds (grouse) and one sample of dandelion root. The main traditional food contributors of lead in the diet were rabbit and deer (Table 27). The finding of lead in meat samples is likely residuals from lead-containing ammunition. The presence of lead in the sample of dandelion root indicated local contamination. The community that provided the dandelion root confirmed that the sample was harvested late in the season (October) and from an area known to be contaminated. As dandelion roots are known to accumulate contaminants, they are usually harvested in the spring/summer.
For both the average and heavy traditional food consumers, the HQ values for lead were lower than 1, therefore the risk of harm is low based on current consumption (Table 28). However, these results should be treated cautiously because of the recent findings that there is no threshold for lead toxicity. Any lead exposure will lead to adverse effects, particularly among
children. Because of these findings, Health Canada no longer uses the HQ approach for risk assessment. For consistency with other regions, FNFNES has undertaken risk exposure using the TDI to serve as a preliminary screening. A more comprehensive approach that monitors background exposure including all sources of lead (including market food and drinking water) is needed to determine the additional risk of lead exposure from traditional food consumption. It has been widely reported that lead concentrations can reach high levels in game animals as a result of contamination from lead bullets and shot (Pain, et al. 2010). Therefore, it is important to raise awareness of the potential risk of eating any waterfowl and game killed by lead shot. Lead ammunition can shatter into fragments too small to detect and remove (Bellinger, et al. 2013). A study in Minnesota found that only 30% of lead fragments were within 2 inches of the exit wound: some lead fragments were found 18 inches away from the exit hole. Rinsing the meat is not effective as it merely spreads the lead fragments (Grund, et al. 2010). Thus, the use of steel shot is recommended instead of lead shot, since the consumption of game contaminated by lead-containing ammunition may increase the risk of lead exposure.
Mercury: There were higher levels of the more toxic form of mercury, known as methyl mercury, in samples of bass and seal meat. Based on consumption levels, lobster and cod were the main traditional food sources of mercury in the diet (Table 27).
For the adult population, both the average (average/PTDI) and high end (95th percentile/PTDI) HQ values for mercury were lower than 1, therefore the risk of harm is negligible based on current consumption (Table 30). Table 31 shows the exposure estimates for mercury for female participants of child-bearing age. Due to the susceptibility of the fetus to mercury toxicity, the PTDI for women of child-bearing age (as well as teenagers and children) is lower at 0.2 µg/kg/day. The HQs for both the average and the high end consumers (95th percentile intake) using the average and maximum mercury concentrations in food were below 1, which means that the risk of mercury exposure is low. The relationship between the estimated dietary mercury exposure from traditional food and hair mercury levels was investigated using correlation analyses. Dietary intake of mercury was correlated with hair mercury for all adults (Pearson correlation coefficient=0.30), (Figure 40) and for women of child-bearing age (Pearson correlation coefficient=0.25) (Figure 41).
30
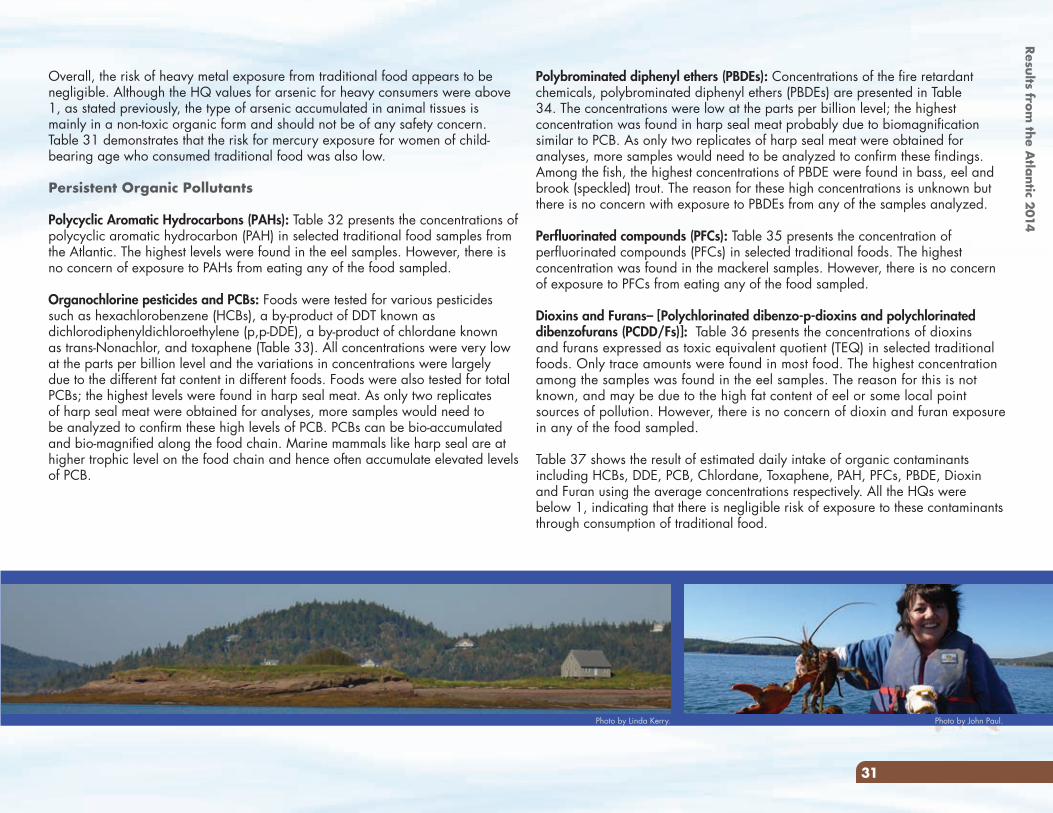
Overall, the risk of heavy metal exposure from traditional food appears to be negligible. Although the HQ values for arsenic for heavy consumers were above 1, as stated previously, the type of arsenic accumulated in animal tissues is mainly in a non-toxic organic form and should not be of any safety concern. Table 31 demonstrates that the risk for mercury exposure for women of child-bearing age who consumed traditional food was also low.
Persistent Organic Pollutants
Polycyclic Aromatic Hydrocarbons (PAHs): Table 32 presents the concentrations of polycyclic aromatic hydrocarbon (PAH) in selected traditional food samples from the Atlantic. The highest levels were found in the eel samples. However, there is no concern of exposure to PAHs from eating any of the food sampled.
Organochlorine pesticides and PCBs: Foods were tested for various pesticides such as hexachlorobenzene (HCBs), a by-product of DDT known as dichlorodiphenyldichloroethylene (p,p-DDE), a by-product of chlordane known as trans-Nonachlor, and toxaphene (Table 33). All concentrations were very low at the parts per billion level and the variations in concentrations were largely due to the different fat content in different foods. Foods were also tested for total PCBs; the highest levels were found in harp seal meat. As only two replicates of harp seal meat were obtained for analyses, more samples would need to be analyzed to confirm these high levels of PCB. PCBs can be bio-accumulated and bio-magnified along the food chain. Marine mammals like harp seal are at higher trophic level on the food chain and hence often accumulate elevated levels of PCB.
Polybrominated diphenyl ethers (PBDEs): Concentrations of the fire retardant chemicals, polybrominated diphenyl ethers (PBDEs) are presented in Table 34. The concentrations were low at the parts per billion level; the highest concentration was found in harp seal meat probably due to biomagnification similar to PCB. As only two replicates of harp seal meat were obtained for analyses, more samples would need to be analyzed to confirm these findings. Among the fish, the highest concentrations of PBDE were found in bass, eel and brook (speckled) trout. The reason for these high concentrations is unknown but there is no concern with exposure to PBDEs from any of the samples analyzed.
Perfluorinated compounds (PFCs): Table 35 presents the concentration of perfluorinated compounds (PFCs) in selected traditional foods. The highest concentration was found in the mackerel samples. However, there is no concern of exposure to PFCs from eating any of the food sampled.
Dioxins and Furans– [Polychlorinated dibenzo-p-dioxins and polychlorinated dibenzofurans (PCDD/Fs)]: Table 36 presents the concentrations of dioxins and furans expressed as toxic equivalent quotient (TEQ) in selected traditional foods. Only trace amounts were found in most food. The highest concentration among the samples was found in the eel samples. The reason for this is not known, and may be due to the high fat content of eel or some local point sources of pollution. However, there is no concern of dioxin and furan exposure in any of the food sampled.
Table 37 shows the result of estimated daily intake of organic contaminants including HCBs, DDE, PCB, Chlordane, Toxaphene, PAH, PFCs, PBDE, Dioxin and Furan using the average concentrations respectively. All the HQs were below 1, indicating that there is negligible risk of exposure to these contaminants through consumption of traditional food.
Photo by Linda Kerry. Photo by John Paul.
31
Results from the A
tlantic 2014
32
General Comments: The FNFNES community results offered an opportunity to compare results to personal perspectives. It also offered the opportunity to compare results to the region as a whole. Overall, participating communities found the survey to be helpful and accurate and saw the results within the survey to be useful. Following their individual presentations, a number of communities identified social media and local communication resources as effective platforms for reaching the broader First Nations community membership. Communities with high smoking rates had previously identified this as an important concern that needed to be addressed and, after their individual presentation, affirmed their commitment to developing strategies to reducing smoking levels. Other concerns raised had to do with the food insecurity levels and the use of lead shot in harvesting traditional foods as demonstrated by FNFNES data – a number of communities identified poverty as a major contributor and an underlying factor to the current levels of food insecurity within their community reports. One community in particular expressed concern over the use of lead shot and was in the process of encouraging its members to participate in an ammunition exchange program to remove lead shot from circulation.
Community Presentations: The FNFNES Regional Coordinator worked with participating First Nations to establish opportunities for reporting back on results. Each community hosted a Principal Investigator (PI) or a communication coordinator to report back their individual results. Following the presentation, each community was asked a series of questions relating to the survey results and process. Answers and general comments were recorded. Report presentations were attended by a variety of community members. After the presentation, time was given to answer questions from the community and record their feedback. The following sections are a condensed report of those 11 communities’ input on the FNFNES Atlantic regional report. Samples of questions asked are provided below:
1. Do you feel the results are accurate?2. Are you concerned about any of the results? If yes, which ones?3. Do you see the FNFNES results as useful to your community?4. How do you plan on using these results?5. Based on the results in the report, what kind of programs do you think your
community could benefit from?6. Do you think more research is needed? If yes, what types of research?
COMMUNITY INPUT
This report would not have been possible without the commitment and participation of the 11 First Nations across the Atlantic region that were involved in this study. This acknowledgement includes the community research assistants, community members and those who contributed to the data collection process. Included in all FNFNES agreements with First Nations is the understanding that communities own their own data. As such, FNFNES researchers and team members report community-specific results back to the community first, before unveiling regional results. Feedback from the First Nations on their own results is collected and incorporated into this final regional report in an effort to improve the report overall and enhance its relevance. The summarized results included in this section are a reflection of that input.
3232
33
Pharmaceuticals in Surface Water and Metals in Tap Water: Many communities expressed interest in the results of water testing done by FNFNES. Water resources were a consistent point of conversation between the presenters and presentation participants. Particular points of interests centred on the impact of pharmaceuticals in surface water on traditional food sources. Those communities with good sources of water were interested in using the results for internal promotion of the safety of drawing from traditional food sources to meet nutritional needs. Some communities had concerns with the FNFNES water testing results, mainly about the quality of their water sources and surface water contaminant levels. Reactions varied over water test results; some communities expressed discontent over the taste and appearance of their tap water sources.
Next Steps: After brainstorming sessions about locations for a regional presentation, community participants listed several suggestions for the location of this regional report including Chiefs’ Meetings and several upcoming First Nations-related Atlantic region conferences. Participants from several communities recommended follow-up research relating to food, nutrition, and environmental security in coming years with an adjusted focus. Some communities cited their own efforts to address ongoing food insecurity, citing the need for greater support in the future, while other First Nations planned to use the results to promote their own traditional foods and water quality. Some communities expressed the need for awareness between the difference between perceived and actual health with FNFNES data helping to illustrate that difference as well as the need for greater access to a dietitian. Other communities wished to use the results to promote the value of traditional foods and harvesting practices; FNFNES results were to be a component in demonstrating the value of those food resources. Communities were also excited to use this data as a baseline for future use and comparison.
Nutrition and Food Security: Food security was one aspect of FNFNES research in the Atlantic. One community expressed surprise at the nutritional benefits of traditional foods and the impact that even a small amount of intake of traditional food could have on nutritional outcomes for an entire day. Concerns over obesity numbers were expressed in multiple communities with more education on how to access traditional foods being identified as a possible solution. Lack of financial resources was also identified as a barrier to traditional foods as people turned to food banks to meet their daily nutritional needs. Participants identified the continuing need for a variety of resources to alleviate food insecurity levels among their local populations. One First Nation pointed out that even with the comparatively low costs of store-bought food, the cost of travel to and from remains a consistent barrier as many First Nations members are without sources of transportation. One presentation group suggested that community member support for traditional harvesting practices could support greater access to traditional foods. Another issue affecting food security levels was identified by several communities: younger portions of the population were perceived as being disinterested by traditional food and that addressing this gap was a priority. One community found that food security levels mirrored the percentage of people making use of their food programs. Most found that food security remains a concern and, while certain resources exist for educating people about methods to reduce food insecurity, more work is needed to counteract levels of food insecurity.
Chemical Contaminants in Traditional Food: Contaminants are a consistent concern among community presentation participants. One community expressed interest in using FNFNES contaminants data as a baseline and establish another study in the following years to track changes in contamination in traditional foods and local nutritional resources. One First Nation also described a potential use for FNFNES findings in demonstrating low levels of contamination in traditional foods and using that as a means of promoting greater usage of traditional food sources. Another community pointed out concern over previous land use by industry as a source of contamination in traditional food; this perception led some First Nations to worry about possible contamination levels in their traditional food sources. Contamination levels were also deemed useful in identifying safe levels of traditional food consumption.
33
Results from the A
tlantic 2014
34
foods for all kinds of community settings. Appendix N of this report, adapted from the B.C. First Nations Health Council’s (now known as First Nations Health Authority) Healthy Food Guidelines, contains a listing of the types of foods to serve (and not serve) at community events. While these programs, activities, and policies can have a valuable impact on the nutrition of community members, it is imperative that progress be made to reduce the gaps in income, education and the burden of illness seen in First Nations communities. In addition to food security, issues of food sovereignty have been identified. Many First Nations have reported that they have limited ability to affect what foods are available for purchase in communities. Others have reported various restrictions on traditional food harvest. Self-determination for First Nations and respect for Aboriginal and Treaty rights may lead to greater control of food systems in a way that positively affects food security and the environmental health of First Nations communities. There is generally no health concern regarding the trace metal levels in the drinking water of the participating households but close monitoring is needed as water sources and the level of water treatment vary by community. With respect to bacteriological safety of water, although no tap water samples were tested for the presence of pathogens, water parameters (chlorine and temperature), which can indirectly impact health, were measured. Overall, 24% of samples had temperature levels measured above 15°C and 9% of samples had levels of free chlorine below disinfection levels. Many adults reported using water from both the hot water and cold water taps for drinking and cooking. This is a concern since higher levels of metals are found in hot water: metals in hot water tanks and pipes dissolve more easily in hot water. It is safer to only use water from cold taps for drinking, cooking and making baby formula.
The levels of pharmaceuticals found in the surface water in the Atlantic region should not pose a threat to human health. Our results also suggest that there is no wide-spread problem of sewage contamination of the sources of drinking water supply, important fishing ground and/or recreational waters. However, in several communities there are as many as four pharmaceuticals detected in the surface water. The health effects from drinking the water from these surface water sites over a prolonged period are unknown at this time; it is also unknown whether there are any effects on the fish and wildlife in the river/lakes. To reduce the presence of pharmaceuticals in the environment, it is recommended to return unused or expired prescription drugs, over-the-counter medications and natural health products to a local pharmacy for proper disposal instead of flushing them down the toilet or throwing them into the garbage.
This is the first comprehensive study addressing the gaps in knowledge about the diet, traditional food and environmental contaminants to which First Nations in the Atlantic are exposed. The overall results indicate that traditional food is safe to eat and contributes important nutrients to the diets of First Nations adults in the Atlantic. Participants’ own comments about the relevance of traditional food for well-being are found in Appendix N.
Food insecurity, obesity, smoking and diabetes are major health issues across the Atlantic region. The diet does not meet nutrition needs; there are excess intakes of fat and sodium (salt), and inadequate intakes of fibre, vitamin A, vitamin B6, vitamin C, vitamin D, calcium, magnesium and folate. The inadequate intake of several nutrients is a result of a diet that does not meet the recommended servings for three food groups (Vegetables and Fruit, Grain Products, and Milk and Alternatives) and is made up of a limited variety of foods eaten within the food groups.
These findings highlight the need to continue to build upon current efforts at the community, regional, provincial and national levels to improve food security and nutrition in First Nations communities through a social determinants of health approach. It is recognized that across the AFN regions, there are many community-led initiatives currently addressing these issues, such as community gardens, community sponsored harvests, traditional sharing, inter-generational training. Some programs are partially funded by the Health Canada supported Canada Prenatal Nutrition Program and the Aboriginal Diabetes Initiative. As the results of this report indicate, however, further work is needed.
Additional potential activities that have the potential to improve nutrition and food security in First Nations communities include: subsidized community agriculture (such as greenhouses and freezers), bulk buying programs (such as the Good Food Box and Buying Club programs), and nutrition education and cooking programs (such as community kitchens). Policies that promote healthy meals at preschool, school and community events would also reinforce the importance of healthy food choices for better health of all community members. Eating Well with Canada’s Food Guide - First Nations, Inuit and Métis and Healthy Food Guidelines for First Nations Communities, by the First Nations Health Council in B.C. (both available online), are two resources designed to assist communities to promote and serve healthier food in schools and at community events. Both can assist communities in developing healthy food policies. The Healthy Food Guidelines provide an expanded list of appropriate
CONCLUSIONS
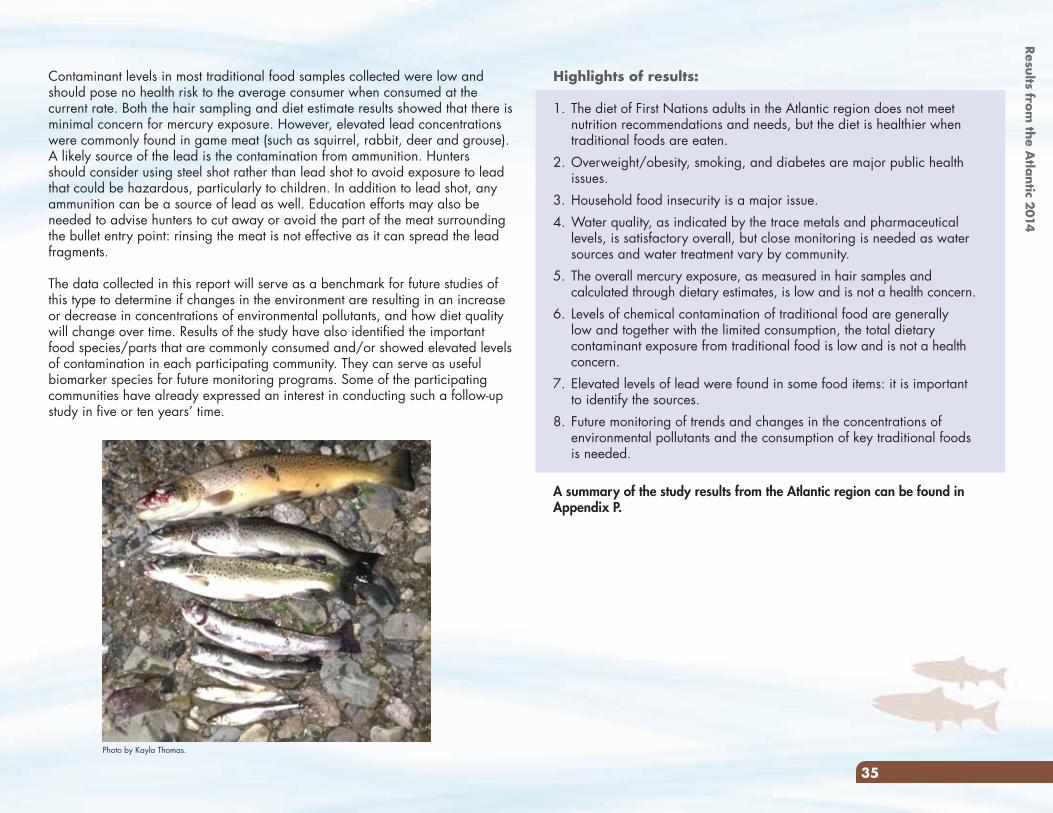
35
Highlights of results:
1. The diet of First Nations adults in the Atlantic region does not meet nutrition recommendations and needs, but the diet is healthier when traditional foods are eaten.
2. Overweight/obesity, smoking, and diabetes are major public health issues.
3. Household food insecurity is a major issue.4. Water quality, as indicated by the trace metals and pharmaceutical
levels, is satisfactory overall, but close monitoring is needed as water sources and water treatment vary by community.
5. The overall mercury exposure, as measured in hair samples and calculated through dietary estimates, is low and is not a health concern.
6. Levels of chemical contamination of traditional food are generally low and together with the limited consumption, the total dietary contaminant exposure from traditional food is low and is not a health concern.
7. Elevated levels of lead were found in some food items: it is important to identify the sources.
8. Future monitoring of trends and changes in the concentrations of environmental pollutants and the consumption of key traditional foods is needed.
A summary of the study results from the Atlantic region can be found in Appendix P.
Contaminant levels in most traditional food samples collected were low and should pose no health risk to the average consumer when consumed at the current rate. Both the hair sampling and diet estimate results showed that there is minimal concern for mercury exposure. However, elevated lead concentrations were commonly found in game meat (such as squirrel, rabbit, deer and grouse). A likely source of the lead is the contamination from ammunition. Hunters should consider using steel shot rather than lead shot to avoid exposure to lead that could be hazardous, particularly to children. In addition to lead shot, any ammunition can be a source of lead as well. Education efforts may also be needed to advise hunters to cut away or avoid the part of the meat surrounding the bullet entry point: rinsing the meat is not effective as it can spread the lead fragments.
The data collected in this report will serve as a benchmark for future studies of this type to determine if changes in the environment are resulting in an increase or decrease in concentrations of environmental pollutants, and how diet quality will change over time. Results of the study have also identified the important food species/parts that are commonly consumed and/or showed elevated levels of contamination in each participating community. They can serve as useful biomarker species for future monitoring programs. Some of the participating communities have already expressed an interest in conducting such a follow-up study in five or ten years’ time.
Photo by Kayla Thomas.
Results from the A
tlantic 2014
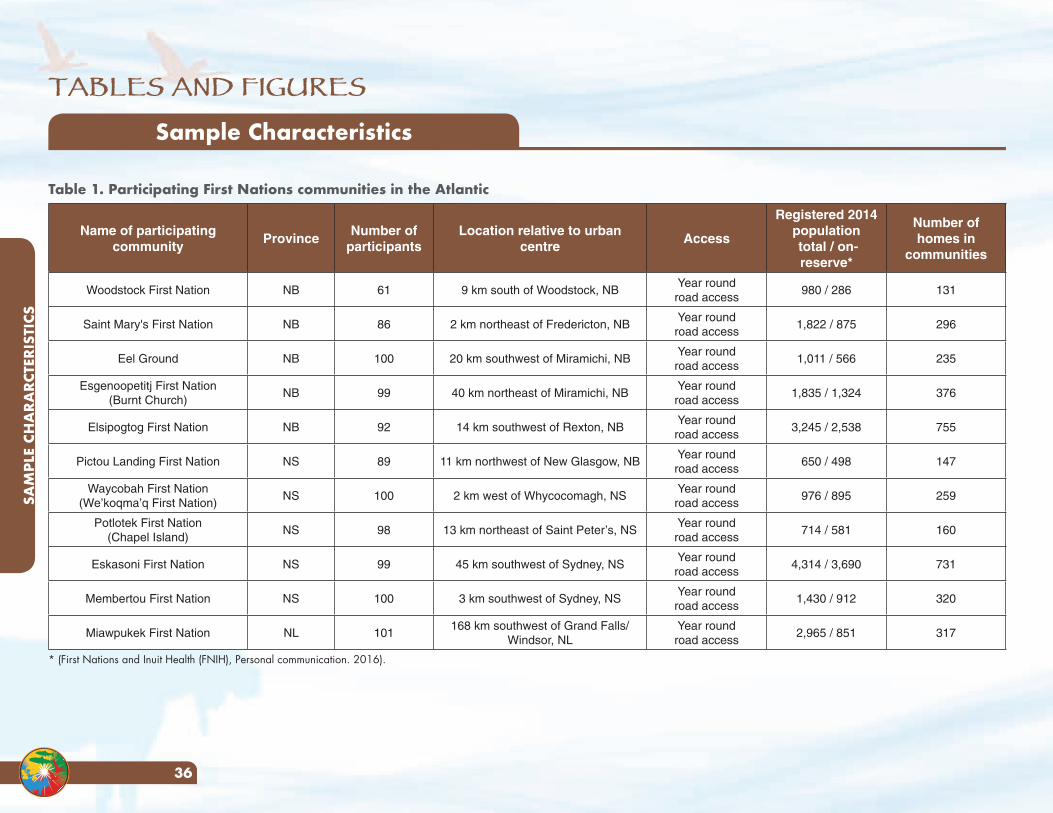
TABLES AND FIGURES
SAM
PLE
CHA
RARC
TERI
STIC
S
36
Table 1. Participating First Nations communities in the Atlantic
Name of participating community
ProvinceNumber of
participantsLocation relative to urban
centreAccess
Registered 2014 population total / on-reserve*
Number of homes in
communities
Woodstock First Nation NB 61 9 km south of Woodstock, NBYear round road access
980 / 286 131
Saint Mary's First Nation NB 86 2 km northeast of Fredericton, NBYear round road access
1,822 / 875 296
Eel Ground NB 100 20 km southwest of Miramichi, NBYear round road access
1,011 / 566 235
Esgenoopetitj First Nation(Burnt Church)
NB 99 40 km northeast of Miramichi, NBYear round road access
1,835 / 1,324 376
Elsipogtog First Nation NB 92 14 km southwest of Rexton, NBYear round road access
3,245 / 2,538 755
Pictou Landing First Nation NS 89 11 km northwest of New Glasgow, NBYear round road access
650 / 498 147
Waycobah First Nation(We’koqma’q First Nation)
NS 100 2 km west of Whycocomagh, NSYear round road access
976 / 895 259
Potlotek First Nation(Chapel Island)
NS 98 13 km northeast of Saint Peter’s, NSYear round road access
714 / 581 160
Eskasoni First Nation NS 99 45 km southwest of Sydney, NSYear round road access
4,314 / 3,690 731
Membertou First Nation NS 100 3 km southwest of Sydney, NSYear round road access
1,430 / 912 320
Miawpukek First Nation NL 101168 km southwest of Grand Falls/
Windsor, NLYear round road access
2,965 / 851 317
* (First Nations and Inuit Health (FNIH), Personal communication. 2016).
Sample Characteristics
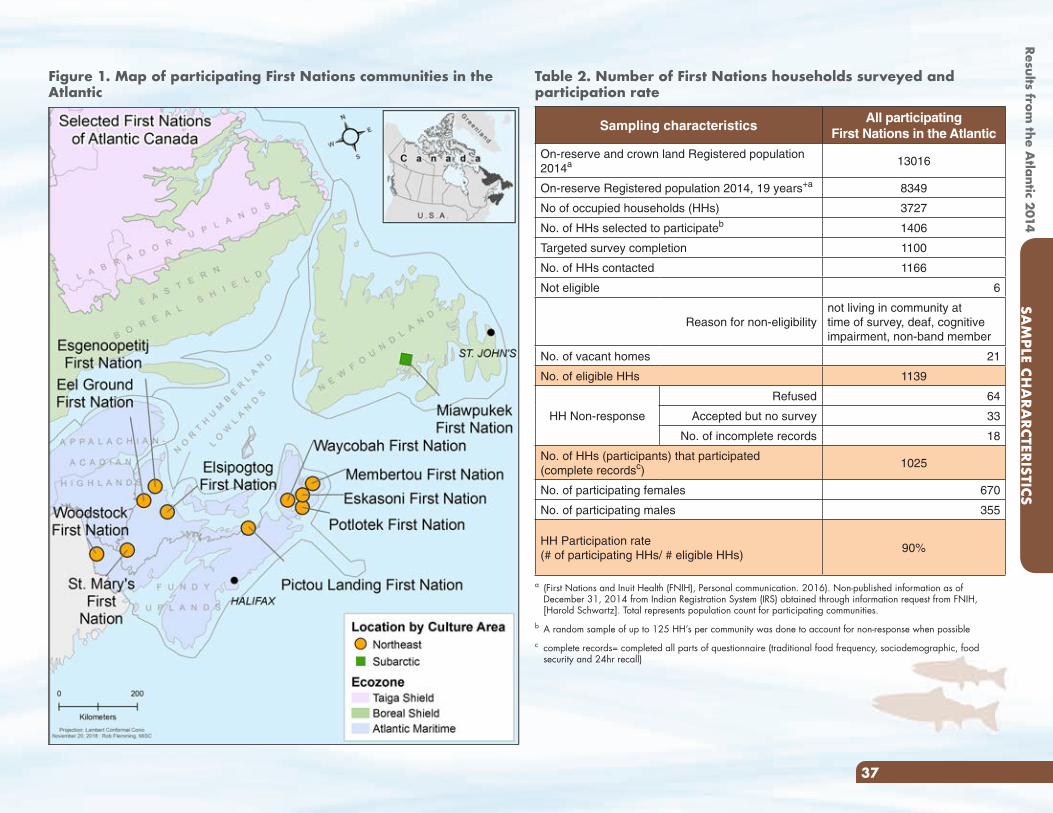
Results from the A
tlantic 2014
37
Figure 1. Map of participating First Nations communities in the Atlantic
Table 2. Number of First Nations households surveyed and participation rate
Sampling characteristicsAll participating
First Nations in the Atlantic
On-reserve and crown land Registered population 2014a 13016
On-reserve Registered population 2014, 19 years+a 8349
No of occupied households (HHs) 3727
No. of HHs selected to participateb 1406
Targeted survey completion 1100
No. of HHs contacted 1166
Not eligible 6
Reason for non-eligibilitynot living in community at time of survey, deaf, cognitive impairment, non-band member
No. of vacant homes 21
No. of eligible HHs 1139
HH Non-response
Refused 64
Accepted but no survey 33
No. of incomplete records 18
No. of HHs (participants) that participated (complete recordsc)
1025
No. of participating females 670
No. of participating males 355
HH Participation rate (# of participating HHs/ # eligible HHs)
90%
a (First Nations and Inuit Health (FNIH), Personal communication. 2016). Non-published information as of December 31, 2014 from Indian Registration System (IRS) obtained through information request from FNIH, [Harold Schwartz]. Total represents population count for participating communities.
b A random sample of up to 125 HH’s per community was done to account for non-response when possiblec complete records= completed all parts of questionnaire (traditional food frequency, sociodemographic, food
security and 24hr recall)
SAM
PLE CHA
RARCTERISTICS
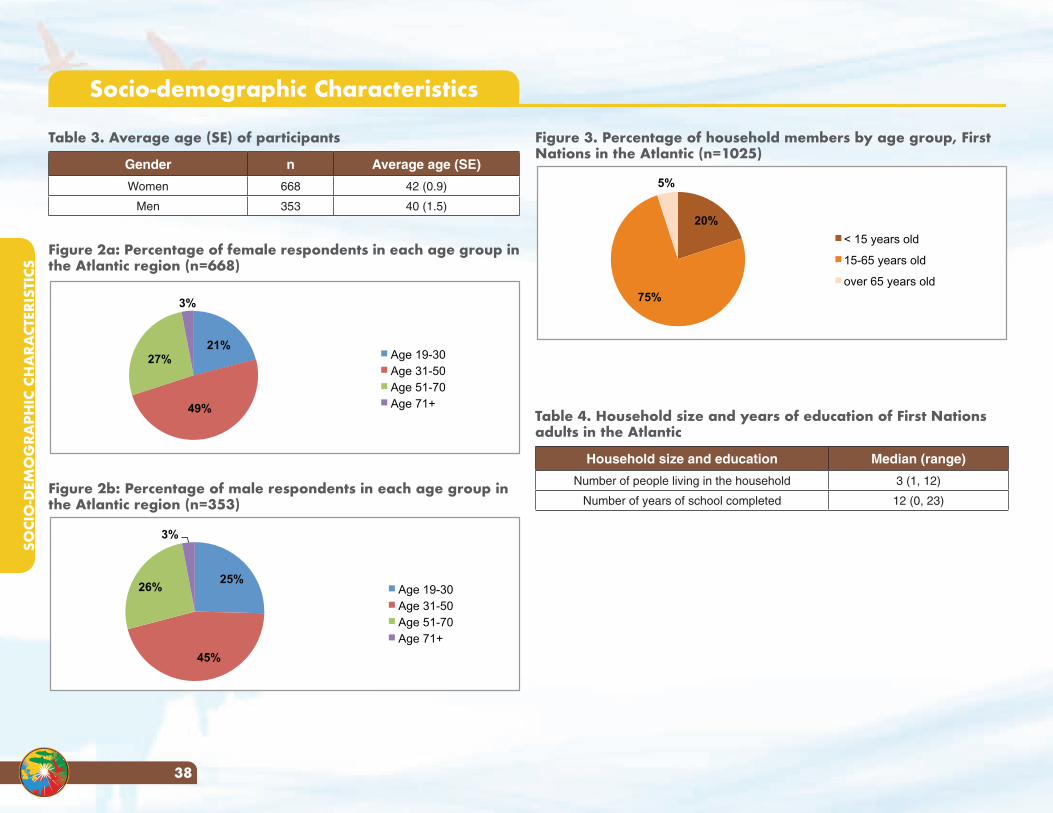
SOCI
O-D
EMO
GRA
PHIC
CH
ARA
CTER
ISTI
CS
38
Figure 3. Percentage of household members by age group, First Nations in the Atlantic (n=1025)
20%
75%
5%
< 15 years old
15-65 years old
over 65 years old
Table 4. Household size and years of education of First Nations adults in the Atlantic
Household size and education Median (range)
Number of people living in the household 3 (1, 12)
Number of years of school completed 12 (0, 23)
Socio-demographic Characteristics
Table 3. Average age (SE) of participants
Gender n Average age (SE)
Women 668 42 (0.9)
Men 353 40 (1.5)
Figure 2a: Percentage of female respondents in each age group in the Atlantic region (n=668)
21%
49%
27%
3%
Age 19-30 Age 31-50 Age 51-70 Age 71+
Figure 2b: Percentage of male respondents in each age group in the Atlantic region (n=353)
25%
45%
26%
3%
Age 19-30 Age 31-50 Age 51-70 Age 71+
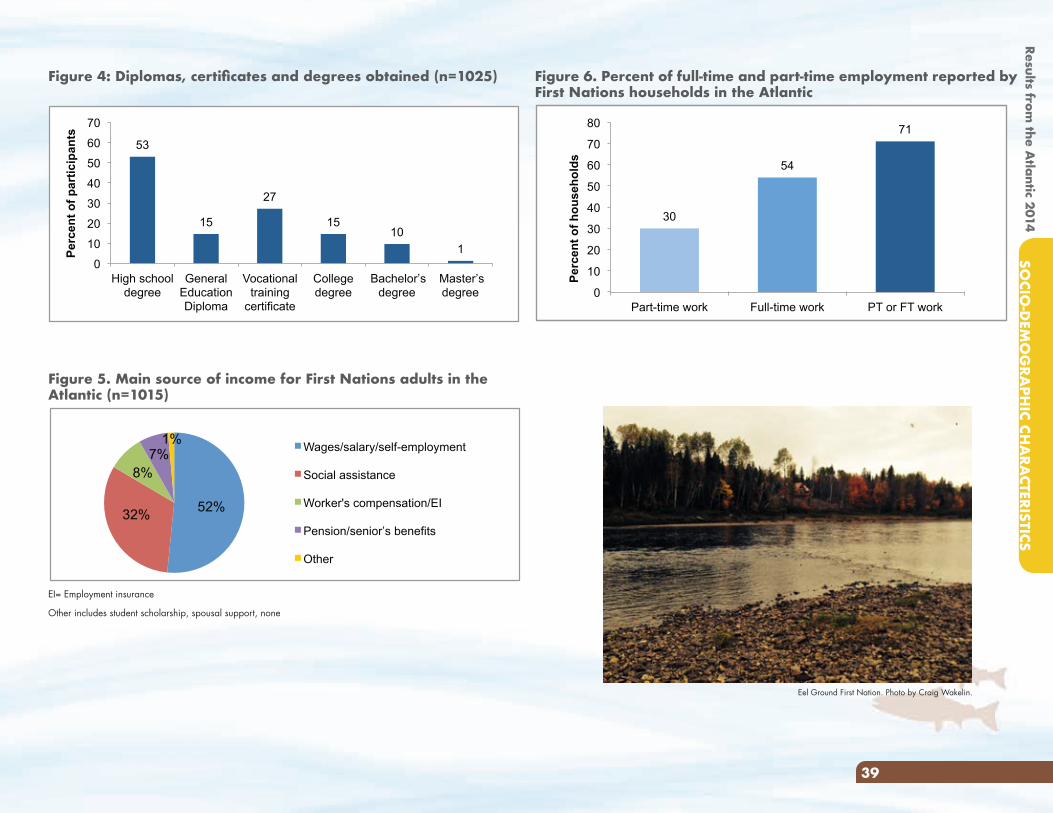
Results from the A
tlantic 2014SO
CIO-D
EMO
GRA
PHIC CH
ARA
CTERISTICS
39
Figure 6. Percent of full-time and part-time employment reported by First Nations households in the Atlantic
Figure 5. Main source of income for First Nations adults in the Atlantic (n=1015)
52% 32%
8% 7%
1% Wages/salary/self-employment
Social assistance
Worker's compensation/EI
Pension/senior’s benefits
Other
EI= Employment insurance
Other includes student scholarship, spousal support, none
Figure 4: Diplomas, certificates and degrees obtained (n=1025)
53
15
27
15 10
1 0
10
20
30
40
50
60
70
High school degree
General Education Diploma
Vocational training
certificate
College degree
Bachelor’s degree
Master’s degree
Perc
ent o
f par
ticip
ants
30
54
71
0
10
20
30
40
50
60
70
80
Part-time work Full-time work PT or FT work
Per
cen
t o
f h
ou
seh
old
s
Eel Ground First Nation. Photo by Craig Wakelin.
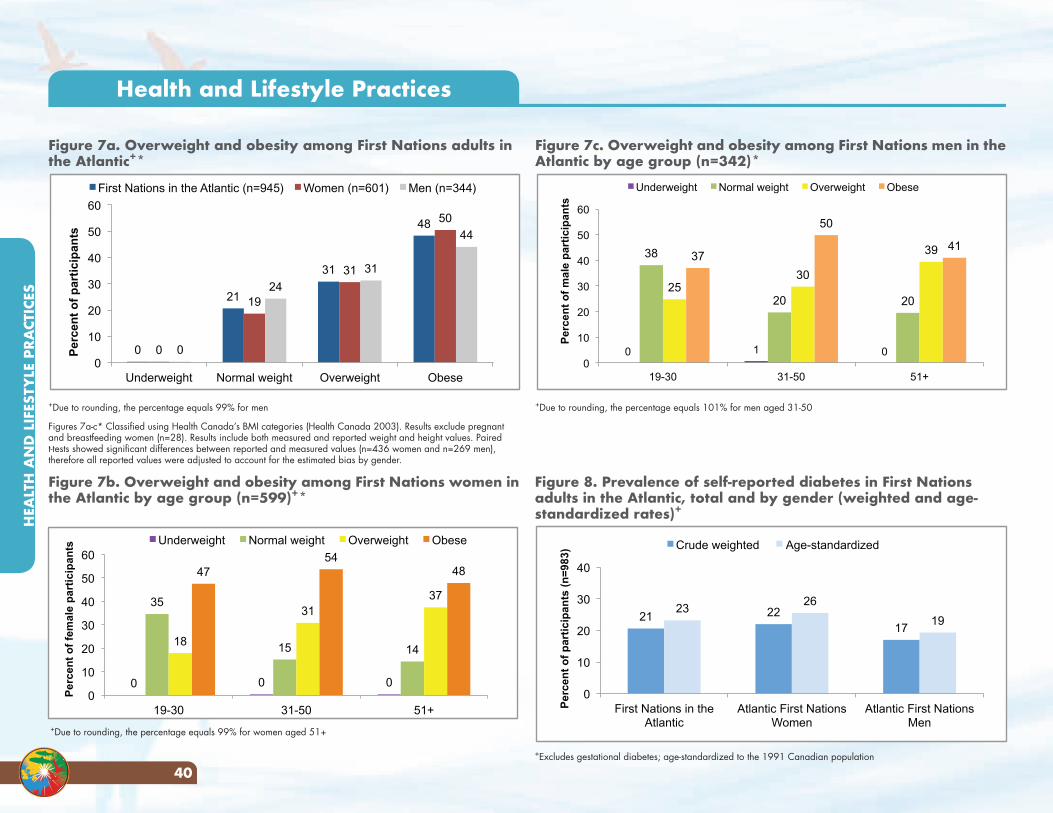
HEA
LTH
AN
D L
IFES
TYLE
PRA
CTIC
ES
40
Figure 7c. Overweight and obesity among First Nations men in the Atlantic by age group (n=342)*
0 1 0
38
20 20 25
30
39 37
50
41
0
10
20
30
40
50
60
19-30 31-50 51+
Per
cen
t o
f m
ale
par
tici
pan
ts
Underweight Normal weight Overweight Obese
+Due to rounding, the percentage equals 101% for men aged 31-50
Figure 7a. Overweight and obesity among First Nations adults in the Atlantic+*
0
21
31
48
0
19
31
50
0
24
31
44
0
10
20
30
40
50
60
Underweight Normal weight Overweight Obese
Per
cen
t o
f p
arti
cip
ants
First Nations in the Atlantic (n=945) Women (n=601) Men (n=344)
+Due to rounding, the percentage equals 99% for men
Figures 7a-c* Classified using Health Canada’s BMI categories (Health Canada 2003). Results exclude pregnant and breastfeeding women (n=28). Results include both measured and reported weight and height values. Paired t-tests showed significant differences between reported and measured values (n=436 women and n=269 men), therefore all reported values were adjusted to account for the estimated bias by gender.
Figure 7b. Overweight and obesity among First Nations women in the Atlantic by age group (n=599)+*
Health and Lifestyle Practices
Figure 8. Prevalence of self-reported diabetes in First Nations adults in the Atlantic, total and by gender (weighted and age-standardized rates)+
+Excludes gestational diabetes; age-standardized to the 1991 Canadian population
+Due to rounding, the percentage equals 99% for women aged 51+
0 0 0
35
15 14 18
31 37
47 54
48
0
10
20
30
40
50
60
19-30 31-50 51+
Per
cen
t o
f fe
mal
e p
arti
cip
ants
Underweight Normal weight Overweight Obese
21 22 17
23 26
19
0
10
20
30
40
First Nations in the Atlantic
Atlantic First Nations Women
Atlantic First Nations Men
Per
cen
t o
f p
arti
cip
ants
(n
=98
3) Crude weighted Age-standardized
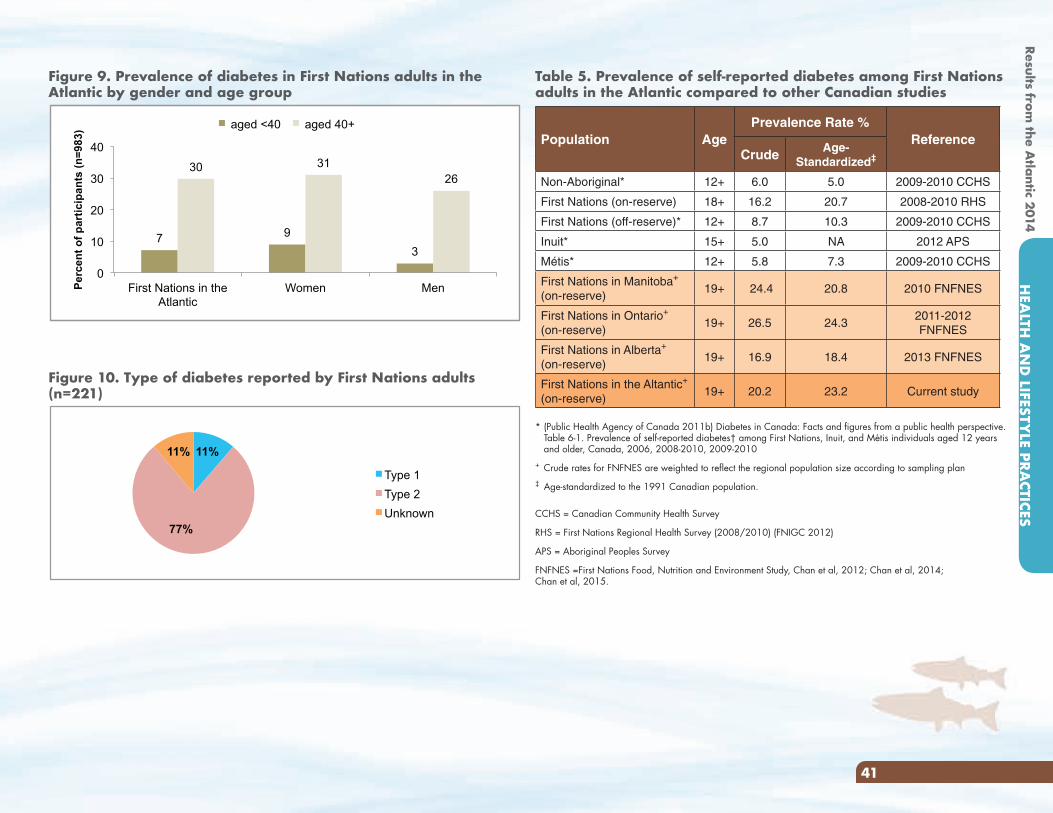
Results from the A
tlantic 2014H
EALTH
AN
D LIFESTY
LE PRACTICES
41
Table 5. Prevalence of self-reported diabetes among First Nations adults in the Atlantic compared to other Canadian studies
Population AgePrevalence Rate %
ReferenceCrude Age-
Standardized‡
Non-Aboriginal* 12+ 6.0 5.0 2009-2010 CCHS
First Nations (on-reserve) 18+ 16.2 20.7 2008-2010 RHS
First Nations (off-reserve)* 12+ 8.7 10.3 2009-2010 CCHS
Inuit* 15+ 5.0 NA 2012 APS
Métis* 12+ 5.8 7.3 2009-2010 CCHS
First Nations in Manitoba+
(on-reserve)19+ 24.4 20.8 2010 FNFNES
First Nations in Ontario+
(on-reserve)19+ 26.5 24.3
2011-2012 FNFNES
First Nations in Alberta+
(on-reserve)19+ 16.9 18.4 2013 FNFNES
First Nations in the Altantic+
(on-reserve)19+ 20.2 23.2 Current study
* (Public Health Agency of Canada 2011b) Diabetes in Canada: Facts and figures from a public health perspective. Table 6-1. Prevalence of self-reported diabetes† among First Nations, Inuit, and Métis individuals aged 12 years and older, Canada, 2006, 2008-2010, 2009-2010
+ Crude rates for FNFNES are weighted to reflect the regional population size according to sampling plan‡ Age-standardized to the 1991 Canadian population.
CCHS = Canadian Community Health Survey
RHS = First Nations Regional Health Survey (2008/2010) (FNIGC 2012)
APS = Aboriginal Peoples Survey
FNFNES =First Nations Food, Nutrition and Environment Study, Chan et al, 2012; Chan et al, 2014; Chan et al, 2015.
Figure 9. Prevalence of diabetes in First Nations adults in the Atlantic by gender and age group
7 9 3
30 31 26
0
10
20
30
40
First Nations in the Atlantic
Women Men Perc
ent o
f par
ticip
ants
(n=9
83) aged <40 aged 40+
Figure 10. Type of diabetes reported by First Nations adults (n=221)
11%
77%
11%
Type 1
Type 2
Unknown
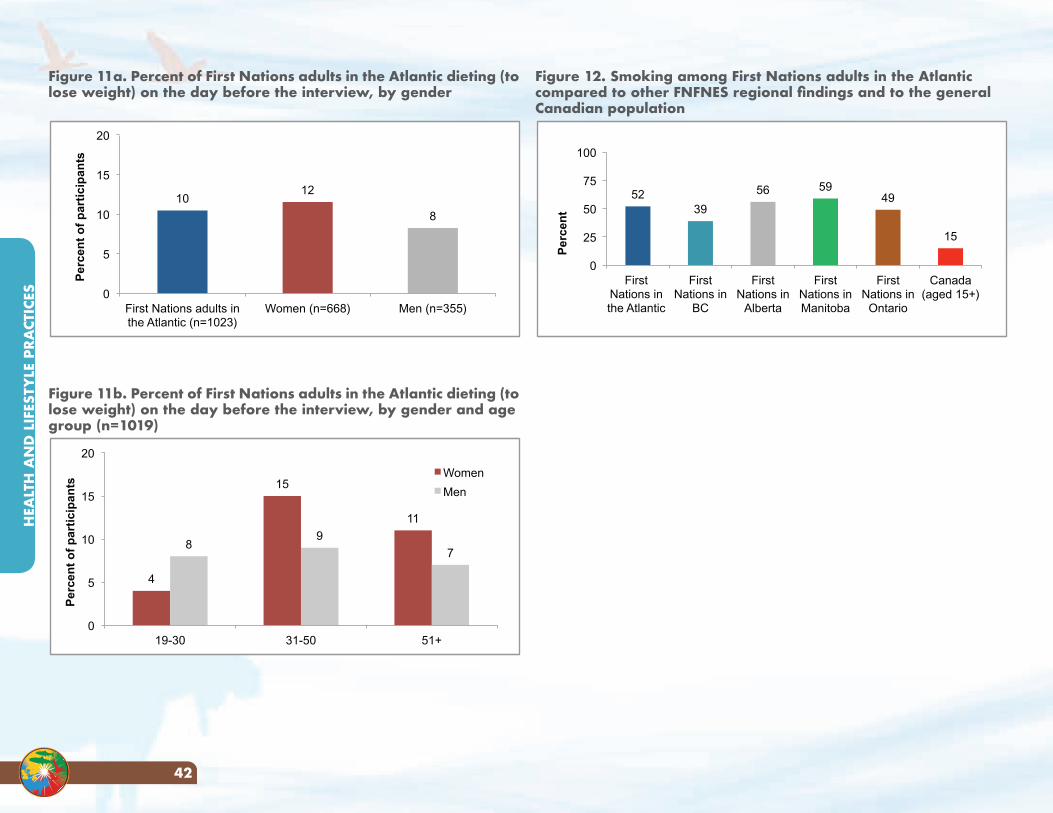
HEA
LTH
AN
D L
IFES
TYLE
PRA
CTIC
ES
42
Figure 12. Smoking among First Nations adults in the Atlantic compared to other FNFNES regional findings and to the general Canadian population
52 39
56 59 49
15
0
25
50
75
100
First Nations in the Atlantic
First Nations in
BC
First Nations in
Alberta
First Nations in Manitoba
First Nations in
Ontario
Canada (aged 15+)
Per
cen
t
Figure 11a. Percent of First Nations adults in the Atlantic dieting (to lose weight) on the day before the interview, by gender
10 12
8
0
5
10
15
20
First Nations adults in the Atlantic (n=1023)
Women (n=668) Men (n=355)
Per
cen
t o
f p
arti
cip
ants
Figure 11b. Percent of First Nations adults in the Atlantic dieting (to lose weight) on the day before the interview, by gender and age group (n=1019)
4
15
11
8 9
7
0
5
10
15
20
19-30 31-50 51+
Per
cen
t o
f p
arti
cip
ants
Women
Men
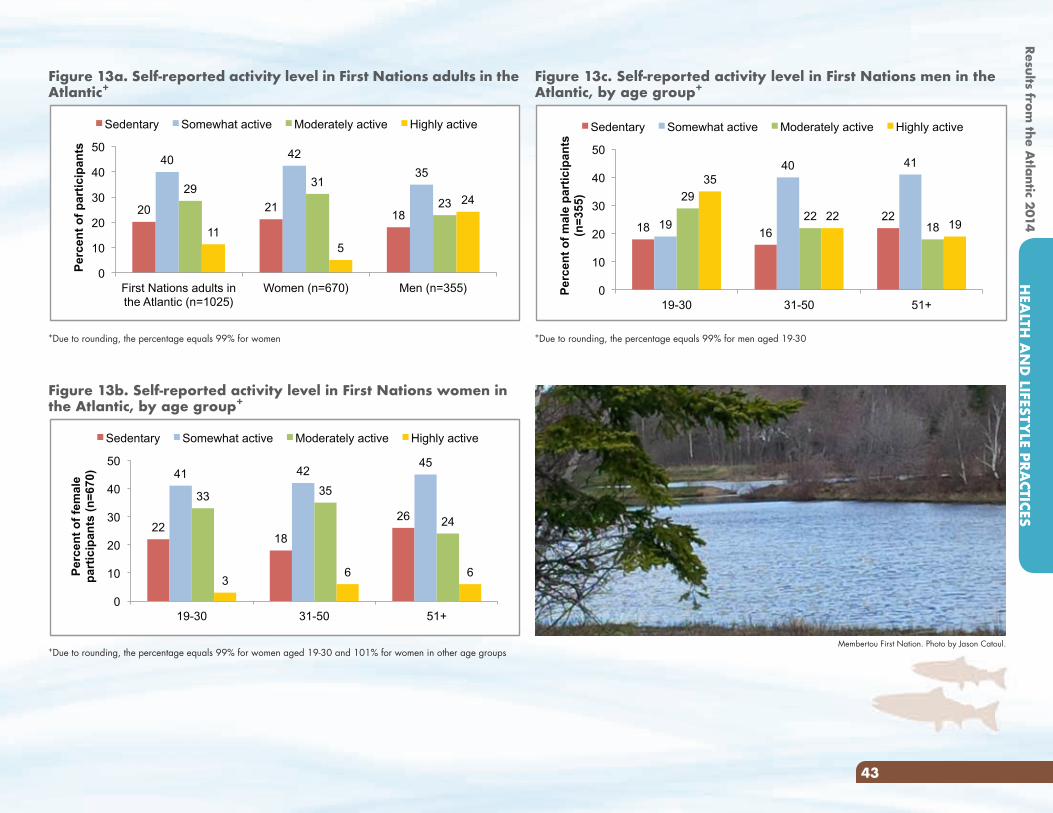
Results from the A
tlantic 2014H
EALTH
AN
D LIFESTY
LE PRACTICES
43
Figure 13a. Self-reported activity level in First Nations adults in the Atlantic+
20 21 18
40 42
35 29
31
23
11 5
24
0
10
20
30
40
50
First Nations adults in the Atlantic (n=1025)
Women (n=670) Men (n=355)
Per
cen
t o
f p
arti
cip
ants
Sedentary Somewhat active Moderately active Highly active
+Due to rounding, the percentage equals 99% for women
Figure 13c. Self-reported activity level in First Nations men in the Atlantic, by age group+
18 16
22 19
40 41
29
22 18
35
22 19
0
10
20
30
40
50
19-30 31-50 51+
Per
cen
t o
f m
ale
par
tici
pan
ts
(n=
355)
Sedentary Somewhat active Moderately active Highly active
+Due to rounding, the percentage equals 99% for men aged 19-30
Figure 13b. Self-reported activity level in First Nations women in the Atlantic, by age group+
22 18
26
41 42 45
33 35
24
3 6 6
0
10
20
30
40
50
19-30 31-50 51+
Per
cen
t o
f fe
mal
e p
arti
cip
ants
(n
=67
0)
Sedentary Somewhat active Moderately active Highly active
+Due to rounding, the percentage equals 99% for women aged 19-30 and 101% for women in other age groupsMembertou First Nation. Photo by Jason Catoul.
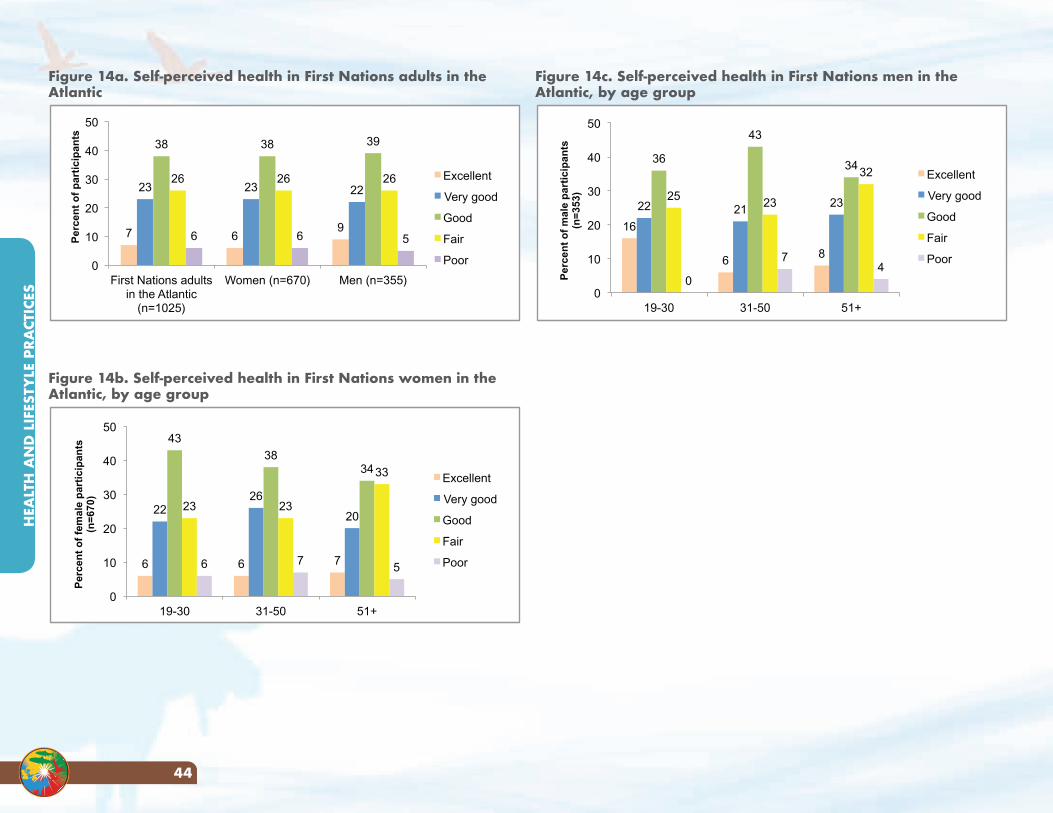
HEA
LTH
AN
D L
IFES
TYLE
PRA
CTIC
ES
44
Figure 14c. Self-perceived health in First Nations men in the Atlantic, by age group
16
6 8
22 21 23
36
43
34
25 23
32
0
7 4
0
10
20
30
40
50
19-30 31-50 51+
Per
cen
t o
f m
ale
par
tici
pan
ts
(n=
353)
Excellent
Very good
Good
Fair
Poor
Figure 14a. Self-perceived health in First Nations adults in the Atlantic
7 6 9
23 23 22
38 38 39
26 26 26
6 6 5
0
10
20
30
40
50
First Nations adults in the Atlantic
(n=1025)
Women (n=670) Men (n=355)
Per
cen
t o
f p
arti
cip
ants
Excellent
Very good
Good
Fair
Poor
Figure 14b. Self-perceived health in First Nations women in the Atlantic, by age group
6 6 7
22 26
20
43
38 34
23 23
33
6 7 5
0
10
20
30
40
50
19-30 31-50 51+
Per
cen
t o
f fe
mal
e p
arti
cip
ants
(n
=67
0)
Excellent
Very good
Good
Fair
Poor
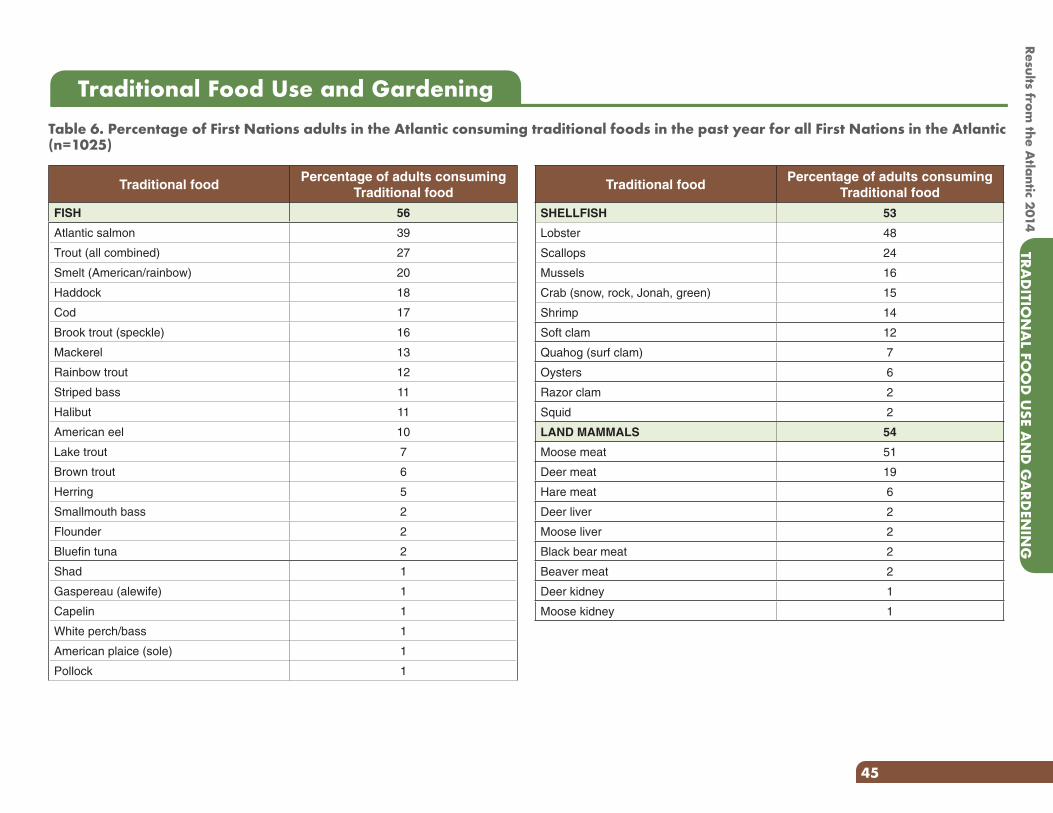
Results from the A
tlantic 2014TRA
DITIO
NA
L FOO
D U
SE AN
D G
ARD
ENIN
G
45
Table 6. Percentage of First Nations adults in the Atlantic consuming traditional foods in the past year for all First Nations in the Atlantic (n=1025)
Traditional Food Use and Gardening
Traditional foodPercentage of adults consuming
Traditional food
FISH 56
Atlantic salmon 39
Trout (all combined) 27
Smelt (American/rainbow) 20
Haddock 18
Cod 17
Brook trout (speckle) 16
Mackerel 13
Rainbow trout 12
Striped bass 11
Halibut 11
American eel 10
Lake trout 7
Brown trout 6
Herring 5
Smallmouth bass 2
Flounder 2
Bluefin tuna 2
Shad 1
Gaspereau (alewife) 1
Capelin 1
White perch/bass 1
American plaice (sole) 1
Pollock 1
Traditional foodPercentage of adults consuming
Traditional food
SHELLFISH 53
Lobster 48
Scallops 24
Mussels 16
Crab (snow, rock, Jonah, green) 15
Shrimp 14
Soft clam 12
Quahog (surf clam) 7
Oysters 6
Razor clam 2
Squid 2
LAND MAMMALS 54
Moose meat 51
Deer meat 19
Hare meat 6
Deer liver 2
Moose liver 2
Black bear meat 2
Beaver meat 2
Deer kidney 1
Moose kidney 1
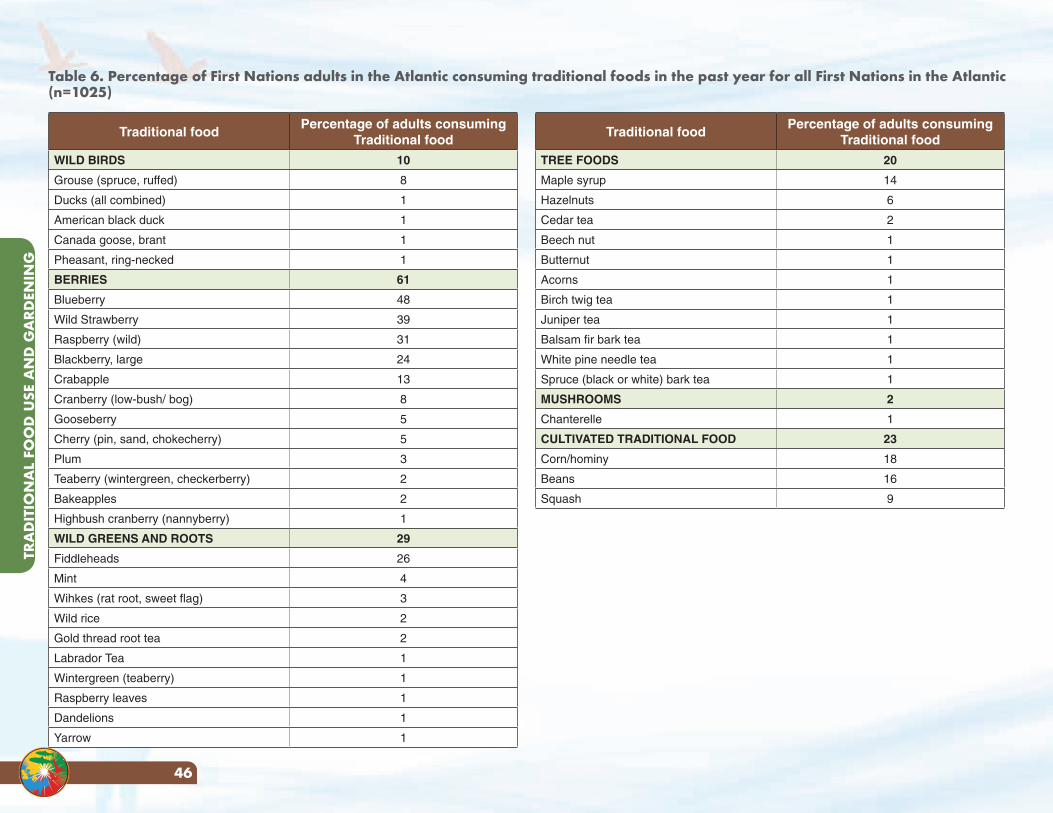
TRA
DIT
ION
AL
FOO
D U
SE A
ND
GA
RDEN
ING
46
Traditional foodPercentage of adults consuming
Traditional food
WILD BIRDS 10
Grouse (spruce, ruffed) 8
Ducks (all combined) 1
American black duck 1
Canada goose, brant 1
Pheasant, ring-necked 1
BERRIES 61
Blueberry 48
Wild Strawberry 39
Raspberry (wild) 31
Blackberry, large 24
Crabapple 13
Cranberry (low-bush/ bog) 8
Gooseberry 5
Cherry (pin, sand, chokecherry) 5
Plum 3
Teaberry (wintergreen, checkerberry) 2
Bakeapples 2
Highbush cranberry (nannyberry) 1
WILD GREENS AND ROOTS 29
Fiddleheads 26
Mint 4
Wihkes (rat root, sweet flag) 3
Wild rice 2
Gold thread root tea 2
Labrador Tea 1
Wintergreen (teaberry) 1
Raspberry leaves 1
Dandelions 1
Yarrow 1
Traditional foodPercentage of adults consuming
Traditional food
TREE FOODS 20
Maple syrup 14
Hazelnuts 6
Cedar tea 2
Beech nut 1
Butternut 1
Acorns 1
Birch twig tea 1
Juniper tea 1
Balsam fir bark tea 1
White pine needle tea 1
Spruce (black or white) bark tea 1
MUSHROOMS 2
Chanterelle 1
CULTIVATED TRADITIONAL FOOD 23
Corn/hominy 18
Beans 16
Squash 9
Table 6. Percentage of First Nations adults in the Atlantic consuming traditional foods in the past year for all First Nations in the Atlantic (n=1025)
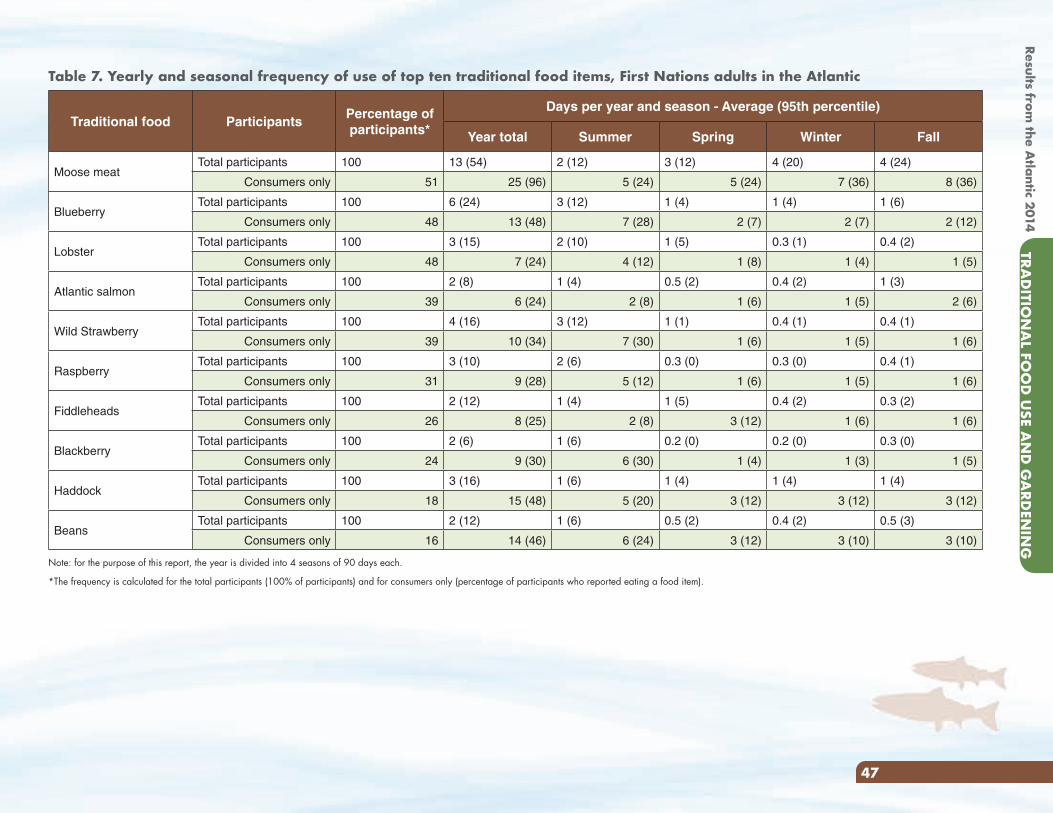
Results from the A
tlantic 2014TRA
DITIO
NA
L FOO
D U
SE AN
D G
ARD
ENIN
G
47
Table 7. Yearly and seasonal frequency of use of top ten traditional food items, First Nations adults in the Atlantic
Traditional food ParticipantsPercentage of participants*
Days per year and season - Average (95th percentile)
Year total Summer Spring Winter Fall
Moose meatTotal participants 100 13 (54) 2 (12) 3 (12) 4 (20) 4 (24)
Consumers only 51 25 (96) 5 (24) 5 (24) 7 (36) 8 (36)
BlueberryTotal participants 100 6 (24) 3 (12) 1 (4) 1 (4) 1 (6)
Consumers only 48 13 (48) 7 (28) 2 (7) 2 (7) 2 (12)
LobsterTotal participants 100 3 (15) 2 (10) 1 (5) 0.3 (1) 0.4 (2)
Consumers only 48 7 (24) 4 (12) 1 (8) 1 (4) 1 (5)
Atlantic salmonTotal participants 100 2 (8) 1 (4) 0.5 (2) 0.4 (2) 1 (3)
Consumers only 39 6 (24) 2 (8) 1 (6) 1 (5) 2 (6)
Wild StrawberryTotal participants 100 4 (16) 3 (12) 1 (1) 0.4 (1) 0.4 (1)
Consumers only 39 10 (34) 7 (30) 1 (6) 1 (5) 1 (6)
RaspberryTotal participants 100 3 (10) 2 (6) 0.3 (0) 0.3 (0) 0.4 (1)
Consumers only 31 9 (28) 5 (12) 1 (6) 1 (5) 1 (6)
FiddleheadsTotal participants 100 2 (12) 1 (4) 1 (5) 0.4 (2) 0.3 (2)
Consumers only 26 8 (25) 2 (8) 3 (12) 1 (6) 1 (6)
BlackberryTotal participants 100 2 (6) 1 (6) 0.2 (0) 0.2 (0) 0.3 (0)
Consumers only 24 9 (30) 6 (30) 1 (4) 1 (3) 1 (5)
HaddockTotal participants 100 3 (16) 1 (6) 1 (4) 1 (4) 1 (4)
Consumers only 18 15 (48) 5 (20) 3 (12) 3 (12) 3 (12)
Beans Total participants 100 2 (12) 1 (6) 0.5 (2) 0.4 (2) 0.5 (3)
Consumers only 16 14 (46) 6 (24) 3 (12) 3 (10) 3 (10)
Note: for the purpose of this report, the year is divided into 4 seasons of 90 days each.
*The frequency is calculated for the total participants (100% of participants) and for consumers only (percentage of participants who reported eating a food item).
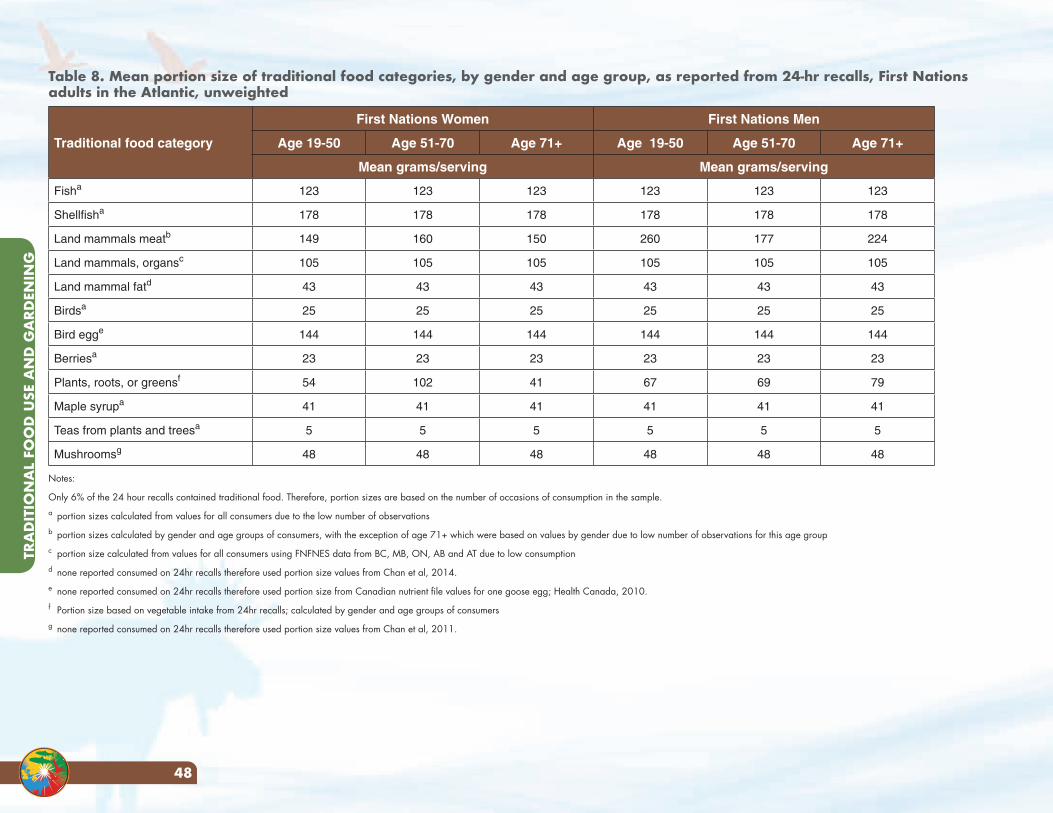
TRA
DIT
ION
AL
FOO
D U
SE A
ND
GA
RDEN
ING
48
Table 8. Mean portion size of traditional food categories, by gender and age group, as reported from 24-hr recalls, First Nations adults in the Atlantic, unweighted
Traditional food category
First Nations Women First Nations Men
Age 19-50 Age 51-70 Age 71+ Age 19-50 Age 51-70 Age 71+
Mean grams/serving Mean grams/serving
Fisha 123 123 123 123 123 123
Shellfisha 178 178 178 178 178 178
Land mammals meatb 149 160 150 260 177 224
Land mammals, organsc 105 105 105 105 105 105
Land mammal fatd 43 43 43 43 43 43
Birdsa 25 25 25 25 25 25
Bird egge 144 144 144 144 144 144
Berriesa 23 23 23 23 23 23
Plants, roots, or greensf 54 102 41 67 69 79
Maple syrupa 41 41 41 41 41 41
Teas from plants and treesa 5 5 5 5 5 5
Mushroomsg 48 48 48 48 48 48
Notes:
Only 6% of the 24 hour recalls contained traditional food. Therefore, portion sizes are based on the number of occasions of consumption in the sample.a portion sizes calculated from values for all consumers due to the low number of observationsb portion sizes calculated by gender and age groups of consumers, with the exception of age 71+ which were based on values by gender due to low number of observations for this age group c portion size calculated from values for all consumers using FNFNES data from BC, MB, ON, AB and AT due to low consumptiond none reported consumed on 24hr recalls therefore used portion size values from Chan et al, 2014.e none reported consumed on 24hr recalls therefore used portion size from Canadian nutrient file values for one goose egg; Health Canada, 2010.f Portion size based on vegetable intake from 24hr recalls; calculated by gender and age groups of consumersg none reported consumed on 24hr recalls therefore used portion size values from Chan et al, 2011.
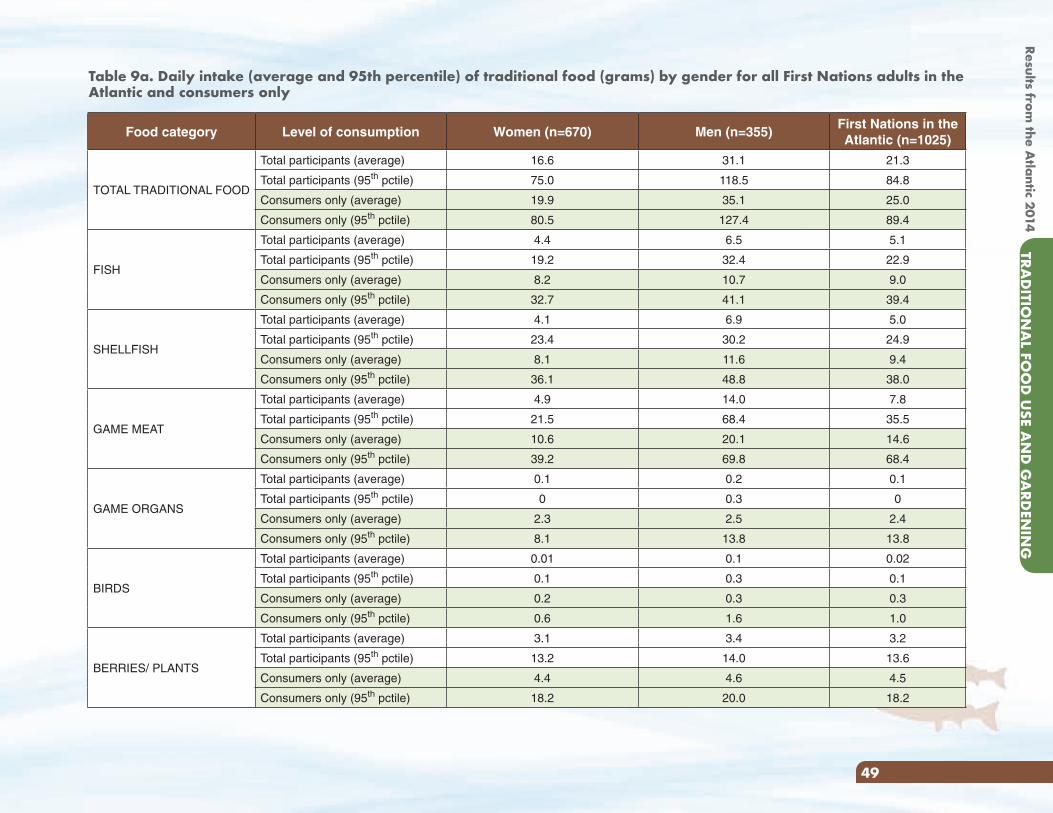
Results from the A
tlantic 2014TRA
DITIO
NA
L FOO
D U
SE AN
D G
ARD
ENIN
G
49
Food category Level of consumption Women (n=670) Men (n=355)First Nations in the Atlantic (n=1025)
TOTAL TRADITIONAL FOOD
Total participants (average) 16.6 31.1 21.3
Total participants (95th pctile) 75.0 118.5 84.8
Consumers only (average) 19.9 35.1 25.0
Consumers only (95th pctile) 80.5 127.4 89.4
FISH
Total participants (average) 4.4 6.5 5.1
Total participants (95th pctile) 19.2 32.4 22.9
Consumers only (average) 8.2 10.7 9.0
Consumers only (95th pctile) 32.7 41.1 39.4
SHELLFISH
Total participants (average) 4.1 6.9 5.0
Total participants (95th pctile) 23.4 30.2 24.9
Consumers only (average) 8.1 11.6 9.4
Consumers only (95th pctile) 36.1 48.8 38.0
GAME MEAT
Total participants (average) 4.9 14.0 7.8
Total participants (95th pctile) 21.5 68.4 35.5
Consumers only (average) 10.6 20.1 14.6
Consumers only (95th pctile) 39.2 69.8 68.4
GAME ORGANS
Total participants (average) 0.1 0.2 0.1
Total participants (95th pctile) 0 0.3 0
Consumers only (average) 2.3 2.5 2.4
Consumers only (95th pctile) 8.1 13.8 13.8
BIRDS
Total participants (average) 0.01 0.1 0.02
Total participants (95th pctile) 0.1 0.3 0.1
Consumers only (average) 0.2 0.3 0.3
Consumers only (95th pctile) 0.6 1.6 1.0
BERRIES/ PLANTS
Total participants (average) 3.1 3.4 3.2
Total participants (95th pctile) 13.2 14.0 13.6
Consumers only (average) 4.4 4.6 4.5
Consumers only (95th pctile) 18.2 20.0 18.2
Table 9a. Daily intake (average and 95th percentile) of traditional food (grams) by gender for all First Nations adults in the Atlantic and consumers only
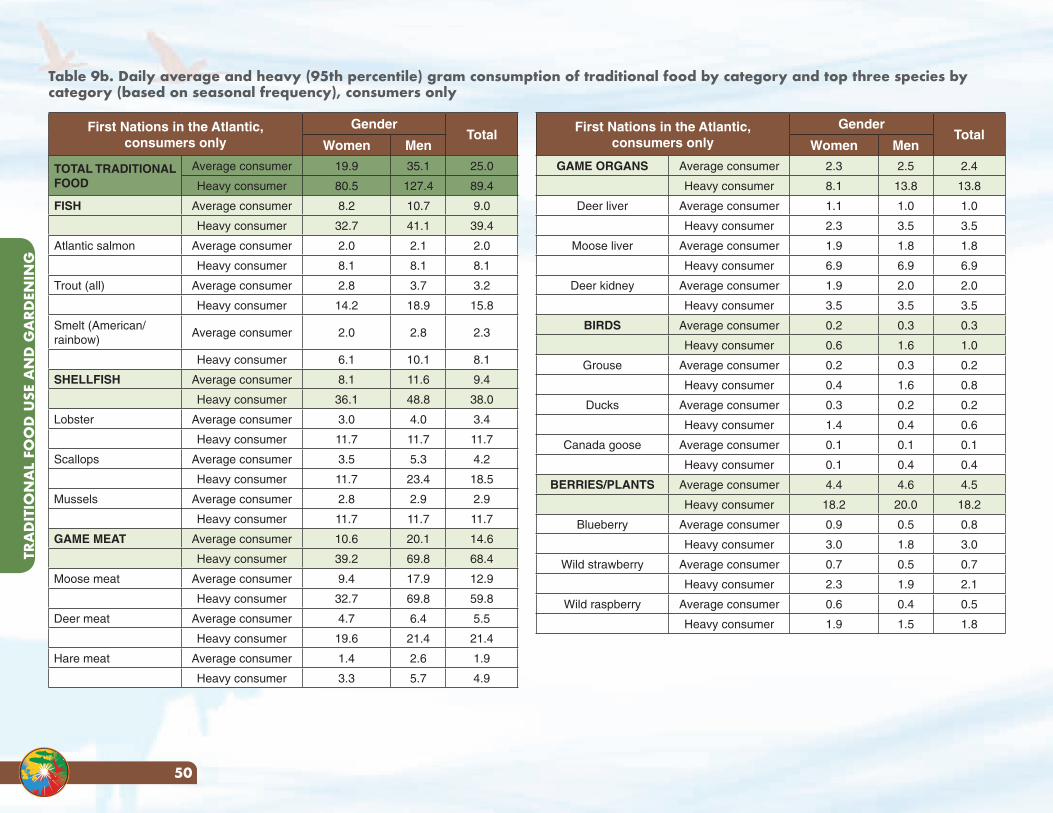
TRA
DIT
ION
AL
FOO
D U
SE A
ND
GA
RDEN
ING
50
First Nations in the Atlantic, consumers only
GenderTotal
Women Men
TOTAL TRADITIONAL FOOD
Average consumer 19.9 35.1 25.0
Heavy consumer 80.5 127.4 89.4
FISH Average consumer 8.2 10.7 9.0
Heavy consumer 32.7 41.1 39.4
Atlantic salmon Average consumer 2.0 2.1 2.0
Heavy consumer 8.1 8.1 8.1
Trout (all) Average consumer 2.8 3.7 3.2
Heavy consumer 14.2 18.9 15.8
Smelt (American/rainbow)
Average consumer 2.0 2.8 2.3
Heavy consumer 6.1 10.1 8.1
SHELLFISH Average consumer 8.1 11.6 9.4
Heavy consumer 36.1 48.8 38.0
Lobster Average consumer 3.0 4.0 3.4
Heavy consumer 11.7 11.7 11.7
Scallops Average consumer 3.5 5.3 4.2
Heavy consumer 11.7 23.4 18.5
Mussels Average consumer 2.8 2.9 2.9
Heavy consumer 11.7 11.7 11.7
GAME MEAT Average consumer 10.6 20.1 14.6
Heavy consumer 39.2 69.8 68.4
Moose meat Average consumer 9.4 17.9 12.9
Heavy consumer 32.7 69.8 59.8
Deer meat Average consumer 4.7 6.4 5.5
Heavy consumer 19.6 21.4 21.4
Hare meat Average consumer 1.4 2.6 1.9
Heavy consumer 3.3 5.7 4.9
First Nations in the Atlantic, consumers only
GenderTotal
Women Men
GAME ORGANS Average consumer 2.3 2.5 2.4
Heavy consumer 8.1 13.8 13.8
Deer liver Average consumer 1.1 1.0 1.0
Heavy consumer 2.3 3.5 3.5
Moose liver Average consumer 1.9 1.8 1.8
Heavy consumer 6.9 6.9 6.9
Deer kidney Average consumer 1.9 2.0 2.0
Heavy consumer 3.5 3.5 3.5
BIRDS Average consumer 0.2 0.3 0.3
Heavy consumer 0.6 1.6 1.0
Grouse Average consumer 0.2 0.3 0.2
Heavy consumer 0.4 1.6 0.8
Ducks Average consumer 0.3 0.2 0.2
Heavy consumer 1.4 0.4 0.6
Canada goose Average consumer 0.1 0.1 0.1
Heavy consumer 0.1 0.4 0.4
BERRIES/PLANTS Average consumer 4.4 4.6 4.5
Heavy consumer 18.2 20.0 18.2
Blueberry Average consumer 0.9 0.5 0.8
Heavy consumer 3.0 1.8 3.0
Wild strawberry Average consumer 0.7 0.5 0.7
Heavy consumer 2.3 1.9 2.1
Wild raspberry Average consumer 0.6 0.4 0.5
Heavy consumer 1.9 1.5 1.8
Table 9b. Daily average and heavy (95th percentile) gram consumption of traditional food by category and top three species by category (based on seasonal frequency), consumers only
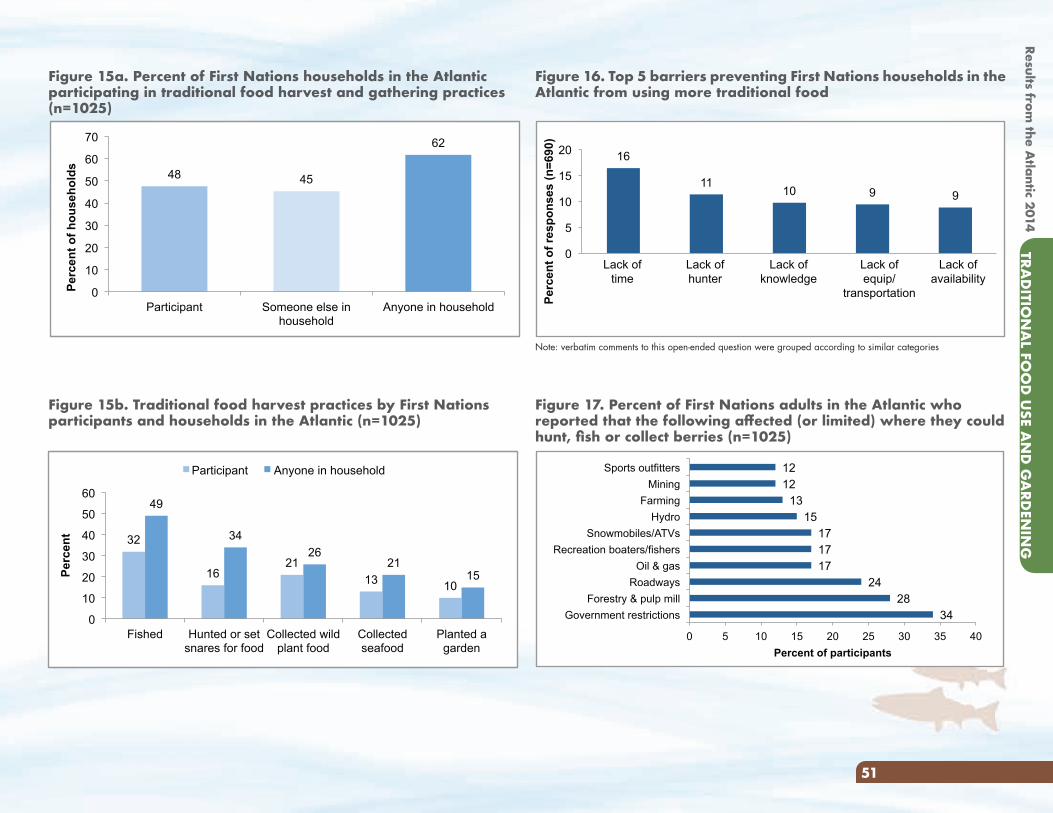
Results from the A
tlantic 2014TRA
DITIO
NA
L FOO
D U
SE AN
D G
ARD
ENIN
G
51
Figure 16. Top 5 barriers preventing First Nations households in the Atlantic from using more traditional food
Note: verbatim comments to this open-ended question were grouped according to similar categories
Figure 17. Percent of First Nations adults in the Atlantic who reported that the following affected (or limited) where they could hunt, fish or collect berries (n=1025)
Figure 15b. Traditional food harvest practices by First Nations participants and households in the Atlantic (n=1025)
Figure 15a. Percent of First Nations households in the Atlantic participating in traditional food harvest and gathering practices (n=1025)
48 45
62
0
10
20
30
40
50
60
70
Participant Someone else in household
Anyone in household
Per
cen
t o
f h
ou
seh
old
s
34 28
24 17 17 17
15 13
12 12
0 5 10 15 20 25 30 35 40
Government restrictions Forestry & pulp mill
Roadways Oil & gas
Recreation boaters/fishers Snowmobiles/ATVs
Hydro Farming
Mining Sports outfitters
Percent of participants
32
16 21
13 10
49
34
26 21
15
0
10
20
30
40
50
60
Fished Hunted or set snares for food
Collected wild plant food
Collected seafood
Planted a garden
Per
cen
t
Participant Anyone in household
16
11 10 9 9
0
5
10
15
20
Perc
ent o
f res
pons
es (n
=690
)
Lack oftime
Lack ofhunter
Lack ofknowledge
Lack ofequip/
transportation
Lack ofavailability
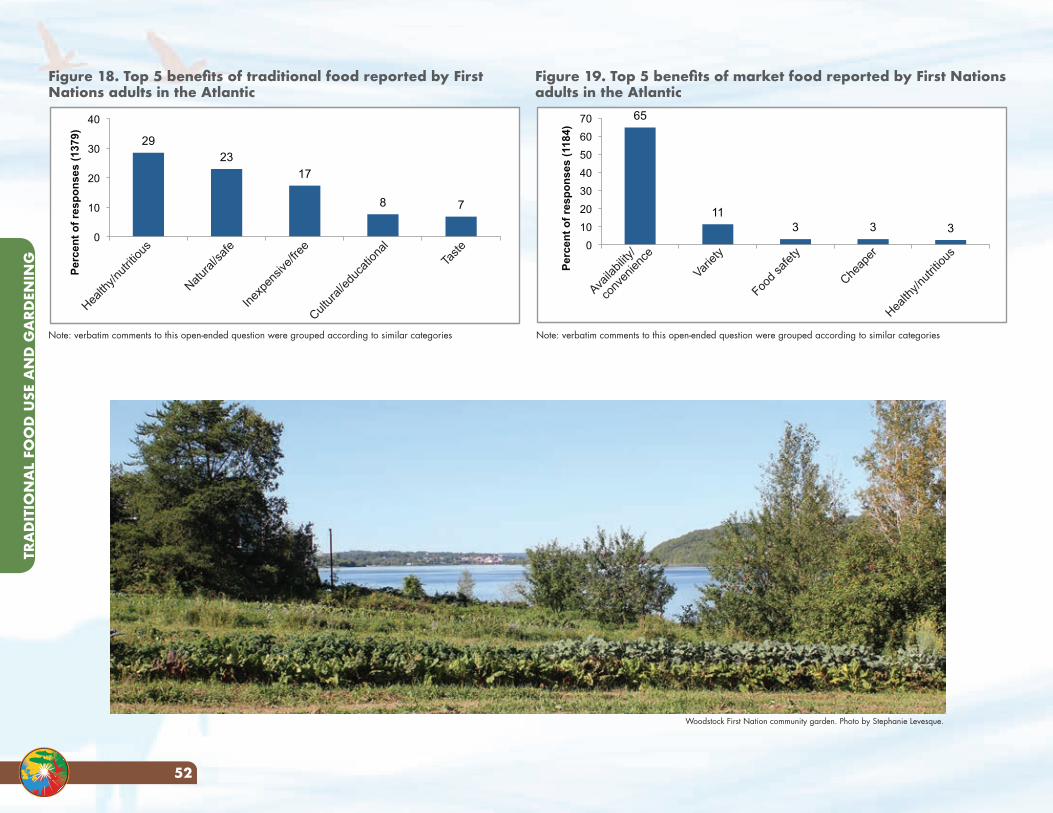
TRA
DIT
ION
AL
FOO
D U
SE A
ND
GA
RDEN
ING
52
Figure 19. Top 5 benefits of market food reported by First Nations adults in the Atlantic
65
11 3 3 3
0 10 20 30 40 50 60 70
Perc
ent o
f res
pons
es (1
184)
Availa
bility
/
conv
enien
ce
Variety
Food s
afety
Cheap
er
Health
y/nutr
itious
Figure 18. Top 5 benefits of traditional food reported by First Nations adults in the Atlantic
29 23
17
8 7
0
10
20
30
40
Perc
ent o
f res
pons
es (1
379)
Health
y/nutr
itious
Natural
/safe
Inexp
ensiv
e/free
Cultura
l/edu
catio
nal
Taste
Woodstock First Nation community garden. Photo by Stephanie Levesque.
Note: verbatim comments to this open-ended question were grouped according to similar categoriesNote: verbatim comments to this open-ended question were grouped according to similar categories
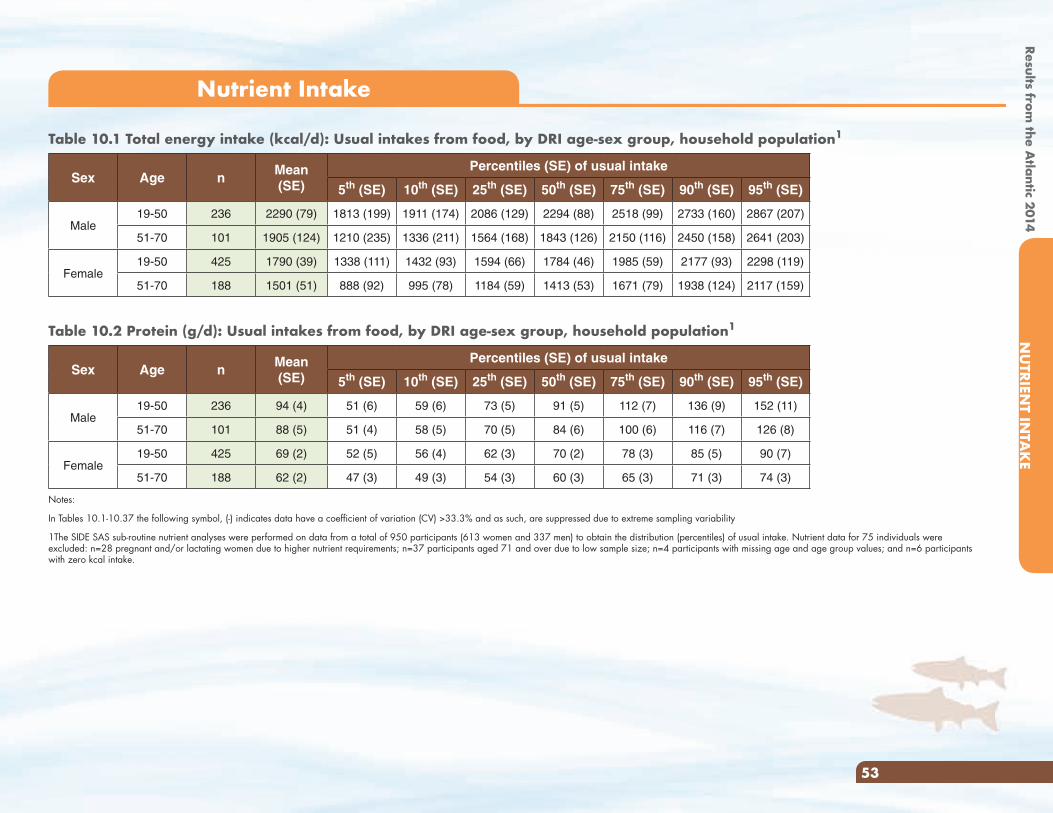
Results from the A
tlantic 2014N
UTRIEN
T INTA
KE
Results from the A
tlantic 2014N
UTRIEN
T INTA
KE
53
Nutrient Intake
Table 10.1 Total energy intake (kcal/d): Usual intakes from food, by DRI age-sex group, household population1
Sex Age nMean (SE)
Percentiles (SE) of usual intake
5th (SE) 10th (SE) 25th (SE) 50th (SE) 75th (SE) 90th (SE) 95th (SE)
Male19-50 236 2290 (79) 1813 (199) 1911 (174) 2086 (129) 2294 (88) 2518 (99) 2733 (160) 2867 (207)
51-70 101 1905 (124) 1210 (235) 1336 (211) 1564 (168) 1843 (126) 2150 (116) 2450 (158) 2641 (203)
Female19-50 425 1790 (39) 1338 (111) 1432 (93) 1594 (66) 1784 (46) 1985 (59) 2177 (93) 2298 (119)
51-70 188 1501 (51) 888 (92) 995 (78) 1184 (59) 1413 (53) 1671 (79) 1938 (124) 2117 (159)
Table 10.2 Protein (g/d): Usual intakes from food, by DRI age-sex group, household population1
Sex Age nMean (SE)
Percentiles (SE) of usual intake
5th (SE) 10th (SE) 25th (SE) 50th (SE) 75th (SE) 90th (SE) 95th (SE)
Male19-50 236 94 (4) 51 (6) 59 (6) 73 (5) 91 (5) 112 (7) 136 (9) 152 (11)
51-70 101 88 (5) 51 (4) 58 (5) 70 (5) 84 (6) 100 (6) 116 (7) 126 (8)
Female19-50 425 69 (2) 52 (5) 56 (4) 62 (3) 70 (2) 78 (3) 85 (5) 90 (7)
51-70 188 62 (2) 47 (3) 49 (3) 54 (3) 60 (3) 65 (3) 71 (3) 74 (3)
Notes:
In Tables 10.1-10.37 the following symbol, (-) indicates data have a coefficient of variation (CV) >33.3% and as such, are suppressed due to extreme sampling variability
1The SIDE SAS sub-routine nutrient analyses were performed on data from a total of 950 participants (613 women and 337 men) to obtain the distribution (percentiles) of usual intake. Nutrient data for 75 individuals were excluded: n=28 pregnant and/or lactating women due to higher nutrient requirements; n=37 participants aged 71 and over due to low sample size; n=4 participants with missing age and age group values; and n=6 participants with zero kcal intake.
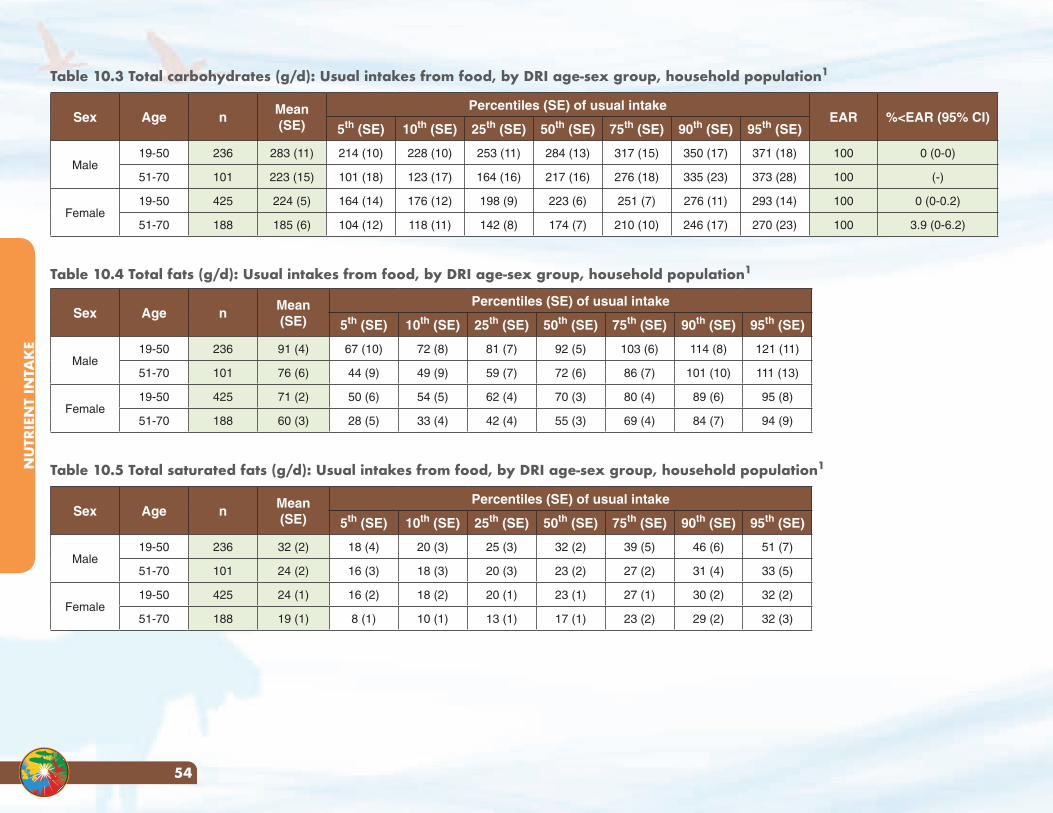
NU
TRIE
NT
INTA
KE
54
Table 10.3 Total carbohydrates (g/d): Usual intakes from food, by DRI age-sex group, household population1
Sex Age nMean (SE)
Percentiles (SE) of usual intakeEAR %<EAR (95% CI)
5th (SE) 10th (SE) 25th (SE) 50th (SE) 75th (SE) 90th (SE) 95th (SE)
Male19-50 236 283 (11) 214 (10) 228 (10) 253 (11) 284 (13) 317 (15) 350 (17) 371 (18) 100 0 (0-0)
51-70 101 223 (15) 101 (18) 123 (17) 164 (16) 217 (16) 276 (18) 335 (23) 373 (28) 100 (-)
Female19-50 425 224 (5) 164 (14) 176 (12) 198 (9) 223 (6) 251 (7) 276 (11) 293 (14) 100 0 (0-0.2)
51-70 188 185 (6) 104 (12) 118 (11) 142 (8) 174 (7) 210 (10) 246 (17) 270 (23) 100 3.9 (0-6.2)
Table 10.4 Total fats (g/d): Usual intakes from food, by DRI age-sex group, household population1
Sex Age nMean (SE)
Percentiles (SE) of usual intake
5th (SE) 10th (SE) 25th (SE) 50th (SE) 75th (SE) 90th (SE) 95th (SE)
Male19-50 236 91 (4) 67 (10) 72 (8) 81 (7) 92 (5) 103 (6) 114 (8) 121 (11)
51-70 101 76 (6) 44 (9) 49 (9) 59 (7) 72 (6) 86 (7) 101 (10) 111 (13)
Female19-50 425 71 (2) 50 (6) 54 (5) 62 (4) 70 (3) 80 (4) 89 (6) 95 (8)
51-70 188 60 (3) 28 (5) 33 (4) 42 (4) 55 (3) 69 (4) 84 (7) 94 (9)
Table 10.5 Total saturated fats (g/d): Usual intakes from food, by DRI age-sex group, household population1
Sex Age nMean (SE)
Percentiles (SE) of usual intake
5th (SE) 10th (SE) 25th (SE) 50th (SE) 75th (SE) 90th (SE) 95th (SE)
Male19-50 236 32 (2) 18 (4) 20 (3) 25 (3) 32 (2) 39 (5) 46 (6) 51 (7)
51-70 101 24 (2) 16 (3) 18 (3) 20 (3) 23 (2) 27 (2) 31 (4) 33 (5)
Female19-50 425 24 (1) 16 (2) 18 (2) 20 (1) 23 (1) 27 (1) 30 (2) 32 (2)
51-70 188 19 (1) 8 (1) 10 (1) 13 (1) 17 (1) 23 (2) 29 (2) 32 (3)
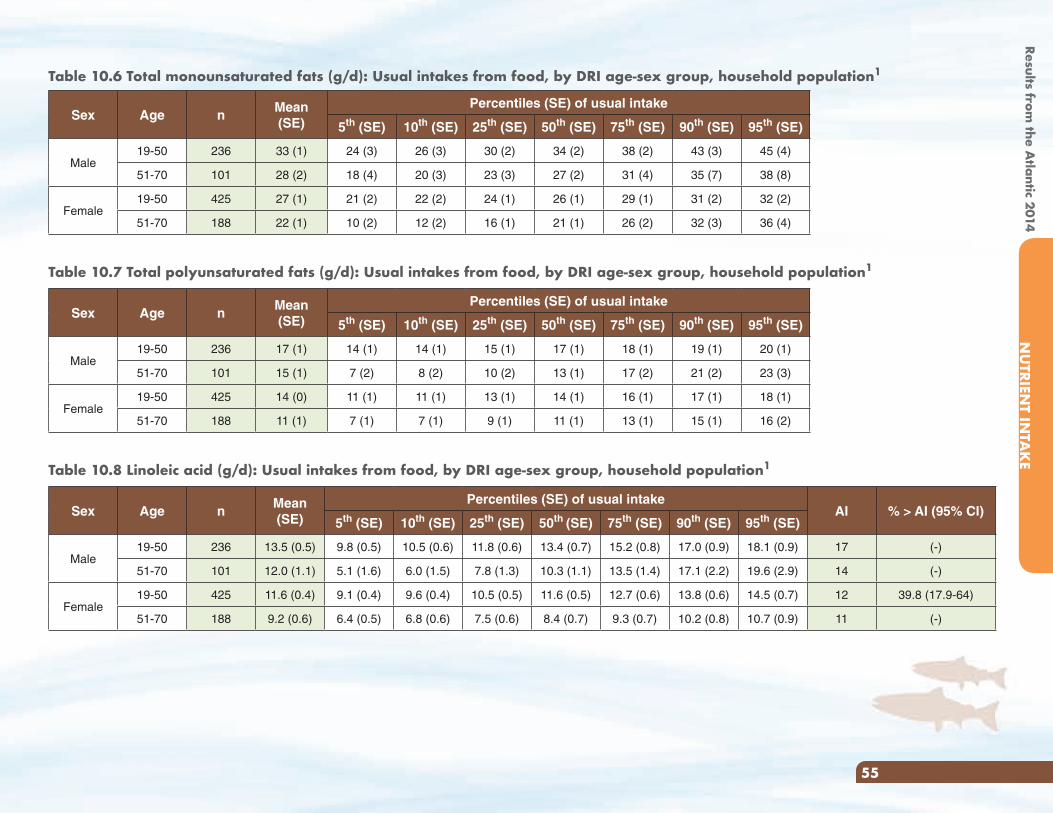
Results from the A
tlantic 2014N
UTRIEN
T INTA
KE
55
Table 10.6 Total monounsaturated fats (g/d): Usual intakes from food, by DRI age-sex group, household population1
Sex Age nMean (SE)
Percentiles (SE) of usual intake
5th (SE) 10th (SE) 25th (SE) 50th (SE) 75th (SE) 90th (SE) 95th (SE)
Male19-50 236 33 (1) 24 (3) 26 (3) 30 (2) 34 (2) 38 (2) 43 (3) 45 (4)
51-70 101 28 (2) 18 (4) 20 (3) 23 (3) 27 (2) 31 (4) 35 (7) 38 (8)
Female19-50 425 27 (1) 21 (2) 22 (2) 24 (1) 26 (1) 29 (1) 31 (2) 32 (2)
51-70 188 22 (1) 10 (2) 12 (2) 16 (1) 21 (1) 26 (2) 32 (3) 36 (4)
Table 10.7 Total polyunsaturated fats (g/d): Usual intakes from food, by DRI age-sex group, household population1
Sex Age nMean (SE)
Percentiles (SE) of usual intake
5th (SE) 10th (SE) 25th (SE) 50th (SE) 75th (SE) 90th (SE) 95th (SE)
Male19-50 236 17 (1) 14 (1) 14 (1) 15 (1) 17 (1) 18 (1) 19 (1) 20 (1)
51-70 101 15 (1) 7 (2) 8 (2) 10 (2) 13 (1) 17 (2) 21 (2) 23 (3)
Female19-50 425 14 (0) 11 (1) 11 (1) 13 (1) 14 (1) 16 (1) 17 (1) 18 (1)
51-70 188 11 (1) 7 (1) 7 (1) 9 (1) 11 (1) 13 (1) 15 (1) 16 (2)
Table 10.8 Linoleic acid (g/d): Usual intakes from food, by DRI age-sex group, household population1
Sex Age nMean (SE)
Percentiles (SE) of usual intakeAI % > AI (95% CI)
5th (SE) 10th (SE) 25th (SE) 50th (SE) 75th (SE) 90th (SE) 95th (SE)
Male19-50 236 13.5 (0.5) 9.8 (0.5) 10.5 (0.6) 11.8 (0.6) 13.4 (0.7) 15.2 (0.8) 17.0 (0.9) 18.1 (0.9) 17 (-)
51-70 101 12.0 (1.1) 5.1 (1.6) 6.0 (1.5) 7.8 (1.3) 10.3 (1.1) 13.5 (1.4) 17.1 (2.2) 19.6 (2.9) 14 (-)
Female19-50 425 11.6 (0.4) 9.1 (0.4) 9.6 (0.4) 10.5 (0.5) 11.6 (0.5) 12.7 (0.6) 13.8 (0.6) 14.5 (0.7) 12 39.8 (17.9-64)
51-70 188 9.2 (0.6) 6.4 (0.5) 6.8 (0.6) 7.5 (0.6) 8.4 (0.7) 9.3 (0.7) 10.2 (0.8) 10.7 (0.9) 11 (-)

NU
TRIE
NT
INTA
KE
56
Table 10.9 Linolenic acid (g/d): Usual intakes from food, by DRI age-sex group, household population1
Sex Age nMean (SE)
Percentiles (SE) of usual intakeAI % > AI (95% CI)
5th (SE) 10th (SE) 25th (SE) 50th (SE) 75th (SE) 90th (SE) 95th (SE)
Male19-50 141 1.5 (0.1) 0.9 (0.2) 1.0 (0.2) 1.2 (0.1) 1.4 (0.1) 1.7 (0.1) 1.9 (0.2) 2.1 (0.3) 1.6 (-)
51-70 60 1.5 (0.2) 0.4 (0.1) 0.5 (0.1) 0.7 (0.1) 1.1 (0.1) 1.7 (0.2) 2.4 (0.4) 3.0 (0.8) 1.6 29.2 (15.5-44.5)
Female19-50 247 1.3 (0.1) 0.9 (0.1) 1.0 (0.1) 1.1 (0.1) 1.3 (0.1) 1.4 (0.1) 1.5 (0.1) 1.6 (0.1) 1.1 78.1 (47.6-91.4)
51-70 80 1.0 (0.1) 0.5 (0.1) 0.5 (0.1) 0.7 (0.1) 0.9 (0.1) 1.2 (0.1) 1.5 (0.1) 1.7 (0.1) 1.1 33.5 (15-44.2)
Table 10.10 Cholesterol (mg/d): Usual intakes from food, by DRI age-sex group, household population1
Sex Age nMean (SE)
Percentiles (SE) of usual intake
5th (SE) 10th (SE) 25th (SE) 50th (SE) 75th (SE) 90th (SE) 95th (SE)
Male19-50 236 341 (28) 159 (42) 191 (41) 251 (37) 332 (34) 429 (74) 529 (144) 593 (76)
51-70 101 351 (23) 170 (23) 202 (25) 262 (28) 335 (30) 410 (30) 477 (33) 518 (37)
Female19-50 425 267 (9) 182 (23) 198 (20) 228 (15) 264 (11) 304 (15) 343 (22) 367 (28)
51-70 188 252 (10) 88 (25) 112 (23) 160 (18) 228 (14) 308 (24) 389 (41) 439 (52)
Table 10.11 Total sugars (g/d): Usual intakes from food, by DRI age-sex group, household population1
Sex Age nMean (SE)
Percentiles (SE) of usual intake
5th (SE) 10th (SE) 25th (SE) 50th (SE) 75th (SE) 90th (SE) 95th (SE)
Male19-50 236 101 (5) 37 (4) 46 (4) 65 (5) 92 (6) 129 (8) 171 (12) 200 (14)
51-70 101 65 (7) 22 (7) 28 (8) 41 (8) 61 (9) 87 (10) 117 (13) 138 (15)
Female19-50 425 82 (3) 47 (8) 53 (7) 64 (6) 78 (5) 94 (4) 110 (6) 121 (8)
51-70 188 64 (4) 25 (4) 31 (4) 41 (4) 56 (5) 74 (6) 95 (8) 110 (10)
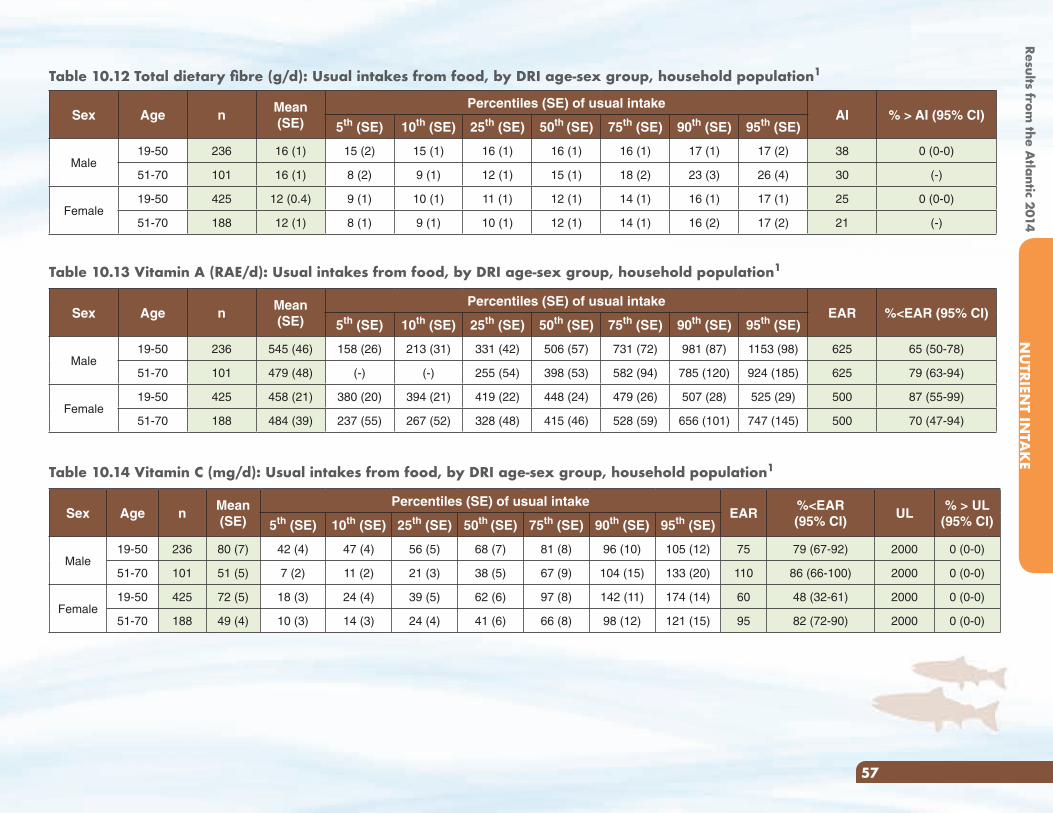
Results from the A
tlantic 2014N
UTRIEN
T INTA
KE
57
Table 10.12 Total dietary fibre (g/d): Usual intakes from food, by DRI age-sex group, household population1
Sex Age nMean (SE)
Percentiles (SE) of usual intakeAI % > AI (95% CI)
5th (SE) 10th (SE) 25th (SE) 50th (SE) 75th (SE) 90th (SE) 95th (SE)
Male19-50 236 16 (1) 15 (2) 15 (1) 16 (1) 16 (1) 16 (1) 17 (1) 17 (2) 38 0 (0-0)
51-70 101 16 (1) 8 (2) 9 (1) 12 (1) 15 (1) 18 (2) 23 (3) 26 (4) 30 (-)
Female19-50 425 12 (0.4) 9 (1) 10 (1) 11 (1) 12 (1) 14 (1) 16 (1) 17 (1) 25 0 (0-0)
51-70 188 12 (1) 8 (1) 9 (1) 10 (1) 12 (1) 14 (1) 16 (2) 17 (2) 21 (-)
Table 10.13 Vitamin A (RAE/d): Usual intakes from food, by DRI age-sex group, household population1
Sex Age nMean (SE)
Percentiles (SE) of usual intakeEAR %<EAR (95% CI)
5th (SE) 10th (SE) 25th (SE) 50th (SE) 75th (SE) 90th (SE) 95th (SE)
Male19-50 236 545 (46) 158 (26) 213 (31) 331 (42) 506 (57) 731 (72) 981 (87) 1153 (98) 625 65 (50-78)
51-70 101 479 (48) (-) (-) 255 (54) 398 (53) 582 (94) 785 (120) 924 (185) 625 79 (63-94)
Female19-50 425 458 (21) 380 (20) 394 (21) 419 (22) 448 (24) 479 (26) 507 (28) 525 (29) 500 87 (55-99)
51-70 188 484 (39) 237 (55) 267 (52) 328 (48) 415 (46) 528 (59) 656 (101) 747 (145) 500 70 (47-94)
Table 10.14 Vitamin C (mg/d): Usual intakes from food, by DRI age-sex group, household population1
Sex Age nMean (SE)
Percentiles (SE) of usual intakeEAR
%<EAR(95% CI)
UL% > UL
(95% CI)5th (SE) 10th (SE) 25th (SE) 50th (SE) 75th (SE) 90th (SE) 95th (SE)
Male19-50 236 80 (7) 42 (4) 47 (4) 56 (5) 68 (7) 81 (8) 96 (10) 105 (12) 75 79 (67-92) 2000 0 (0-0)
51-70 101 51 (5) 7 (2) 11 (2) 21 (3) 38 (5) 67 (9) 104 (15) 133 (20) 110 86 (66-100) 2000 0 (0-0)
Female19-50 425 72 (5) 18 (3) 24 (4) 39 (5) 62 (6) 97 (8) 142 (11) 174 (14) 60 48 (32-61) 2000 0 (0-0)
51-70 188 49 (4) 10 (3) 14 (3) 24 (4) 41 (6) 66 (8) 98 (12) 121 (15) 95 82 (72-90) 2000 0 (0-0)
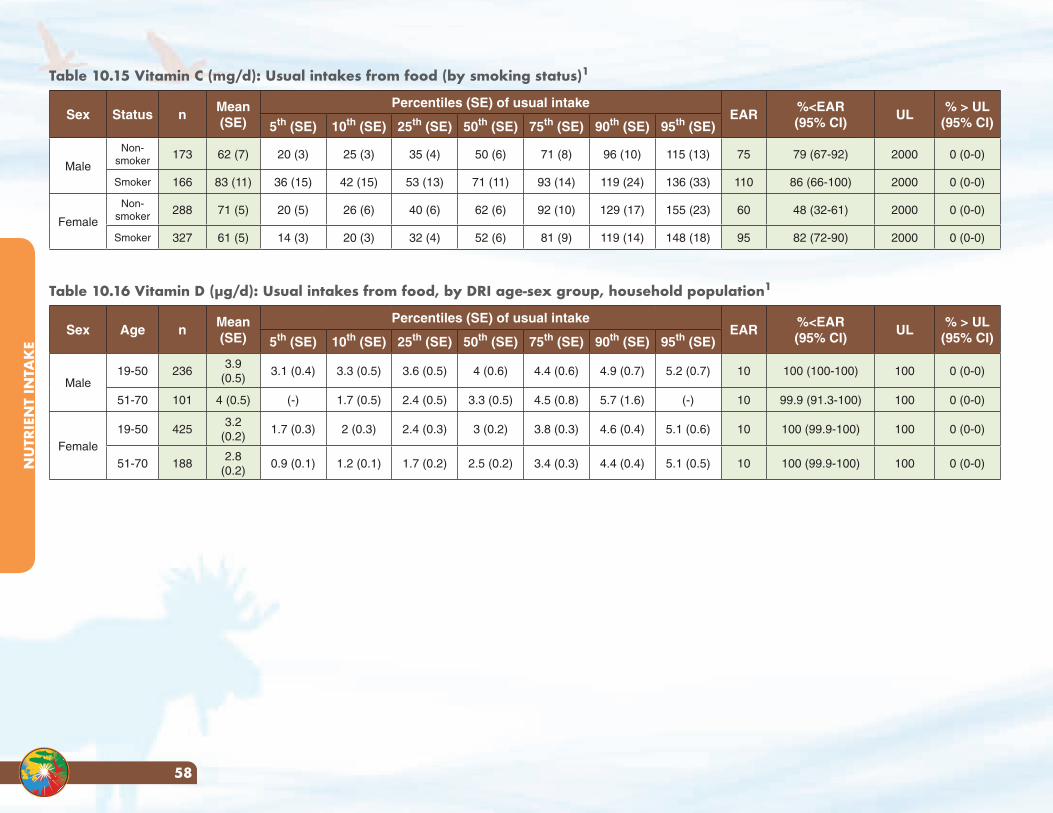
NU
TRIE
NT
INTA
KE
58
Table 10.15 Vitamin C (mg/d): Usual intakes from food (by smoking status)1
Sex Status nMean (SE)
Percentiles (SE) of usual intakeEAR
%<EAR(95% CI)
UL% > UL
(95% CI)5th (SE) 10th (SE) 25th (SE) 50th (SE) 75th (SE) 90th (SE) 95th (SE)
Male
Non-smoker 173 62 (7) 20 (3) 25 (3) 35 (4) 50 (6) 71 (8) 96 (10) 115 (13) 75 79 (67-92) 2000 0 (0-0)
Smoker 166 83 (11) 36 (15) 42 (15) 53 (13) 71 (11) 93 (14) 119 (24) 136 (33) 110 86 (66-100) 2000 0 (0-0)
Female
Non-smoker 288 71 (5) 20 (5) 26 (6) 40 (6) 62 (6) 92 (10) 129 (17) 155 (23) 60 48 (32-61) 2000 0 (0-0)
Smoker 327 61 (5) 14 (3) 20 (3) 32 (4) 52 (6) 81 (9) 119 (14) 148 (18) 95 82 (72-90) 2000 0 (0-0)
Table 10.16 Vitamin D (μg/d): Usual intakes from food, by DRI age-sex group, household population1
Sex Age nMean (SE)
Percentiles (SE) of usual intakeEAR
%<EAR(95% CI)
UL% > UL
(95% CI)5th (SE) 10th (SE) 25th (SE) 50th (SE) 75th (SE) 90th (SE) 95th (SE)
Male19-50 236
3.9 (0.5)
3.1 (0.4) 3.3 (0.5) 3.6 (0.5) 4 (0.6) 4.4 (0.6) 4.9 (0.7) 5.2 (0.7) 10 100 (100-100) 100 0 (0-0)
51-70 101 4 (0.5) (-) 1.7 (0.5) 2.4 (0.5) 3.3 (0.5) 4.5 (0.8) 5.7 (1.6) (-) 10 99.9 (91.3-100) 100 0 (0-0)
Female19-50 425
3.2 (0.2)
1.7 (0.3) 2 (0.3) 2.4 (0.3) 3 (0.2) 3.8 (0.3) 4.6 (0.4) 5.1 (0.6) 10 100 (99.9-100) 100 0 (0-0)
51-70 1882.8
(0.2)0.9 (0.1) 1.2 (0.1) 1.7 (0.2) 2.5 (0.2) 3.4 (0.3) 4.4 (0.4) 5.1 (0.5) 10 100 (99.9-100) 100 0 (0-0)
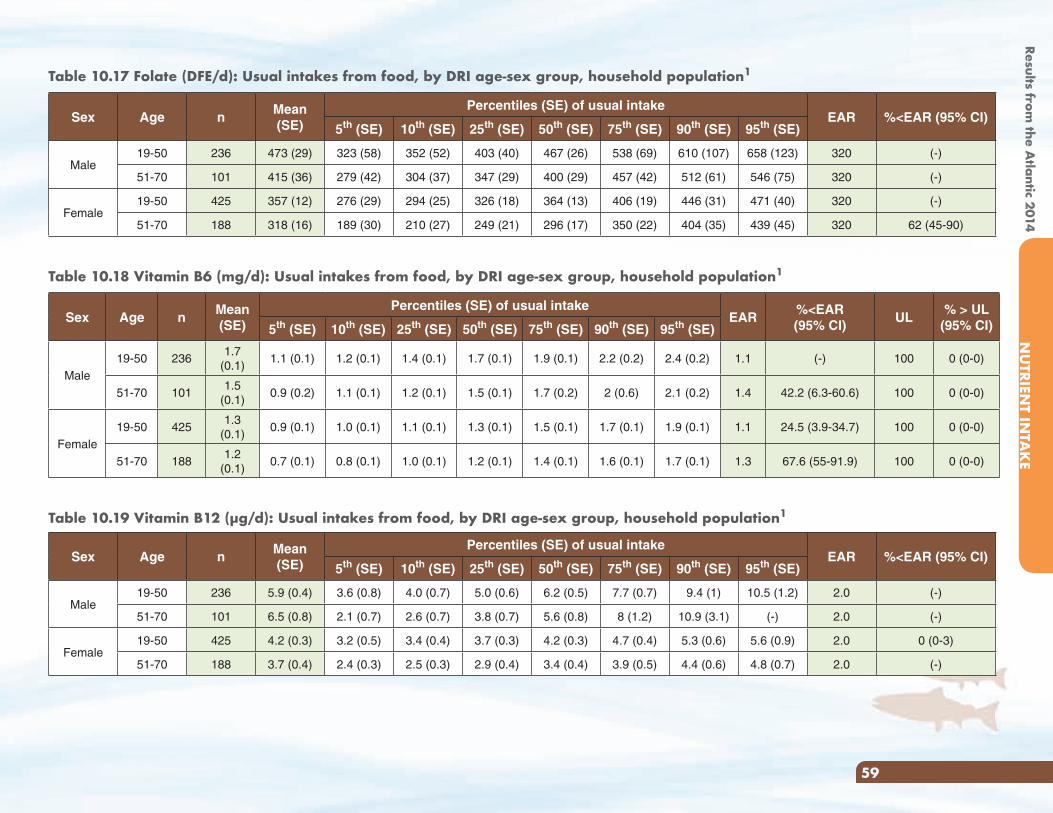
Results from the A
tlantic 2014N
UTRIEN
T INTA
KE
59
Table 10.17 Folate (DFE/d): Usual intakes from food, by DRI age-sex group, household population1
Sex Age nMean (SE)
Percentiles (SE) of usual intakeEAR %<EAR (95% CI)
5th (SE) 10th (SE) 25th (SE) 50th (SE) 75th (SE) 90th (SE) 95th (SE)
Male19-50 236 473 (29) 323 (58) 352 (52) 403 (40) 467 (26) 538 (69) 610 (107) 658 (123) 320 (-)
51-70 101 415 (36) 279 (42) 304 (37) 347 (29) 400 (29) 457 (42) 512 (61) 546 (75) 320 (-)
Female19-50 425 357 (12) 276 (29) 294 (25) 326 (18) 364 (13) 406 (19) 446 (31) 471 (40) 320 (-)
51-70 188 318 (16) 189 (30) 210 (27) 249 (21) 296 (17) 350 (22) 404 (35) 439 (45) 320 62 (45-90)
Table 10.18 Vitamin B6 (mg/d): Usual intakes from food, by DRI age-sex group, household population1
Sex Age nMean (SE)
Percentiles (SE) of usual intakeEAR
%<EAR(95% CI)
UL% > UL
(95% CI)5th (SE) 10th (SE) 25th (SE) 50th (SE) 75th (SE) 90th (SE) 95th (SE)
Male19-50 236
1.7 (0.1)
1.1 (0.1) 1.2 (0.1) 1.4 (0.1) 1.7 (0.1) 1.9 (0.1) 2.2 (0.2) 2.4 (0.2) 1.1 (-) 100 0 (0-0)
51-70 1011.5
(0.1)0.9 (0.2) 1.1 (0.1) 1.2 (0.1) 1.5 (0.1) 1.7 (0.2) 2 (0.6) 2.1 (0.2) 1.4 42.2 (6.3-60.6) 100 0 (0-0)
Female19-50 425
1.3 (0.1)
0.9 (0.1) 1.0 (0.1) 1.1 (0.1) 1.3 (0.1) 1.5 (0.1) 1.7 (0.1) 1.9 (0.1) 1.1 24.5 (3.9-34.7) 100 0 (0-0)
51-70 1881.2
(0.1)0.7 (0.1) 0.8 (0.1) 1.0 (0.1) 1.2 (0.1) 1.4 (0.1) 1.6 (0.1) 1.7 (0.1) 1.3 67.6 (55-91.9) 100 0 (0-0)
Table 10.19 Vitamin B12 (μg/d): Usual intakes from food, by DRI age-sex group, household population1
Sex Age nMean (SE)
Percentiles (SE) of usual intakeEAR %<EAR (95% CI)
5th (SE) 10th (SE) 25th (SE) 50th (SE) 75th (SE) 90th (SE) 95th (SE)
Male19-50 236 5.9 (0.4) 3.6 (0.8) 4.0 (0.7) 5.0 (0.6) 6.2 (0.5) 7.7 (0.7) 9.4 (1) 10.5 (1.2) 2.0 (-)
51-70 101 6.5 (0.8) 2.1 (0.7) 2.6 (0.7) 3.8 (0.7) 5.6 (0.8) 8 (1.2) 10.9 (3.1) (-) 2.0 (-)
Female19-50 425 4.2 (0.3) 3.2 (0.5) 3.4 (0.4) 3.7 (0.3) 4.2 (0.3) 4.7 (0.4) 5.3 (0.6) 5.6 (0.9) 2.0 0 (0-3)
51-70 188 3.7 (0.4) 2.4 (0.3) 2.5 (0.3) 2.9 (0.4) 3.4 (0.4) 3.9 (0.5) 4.4 (0.6) 4.8 (0.7) 2.0 (-)
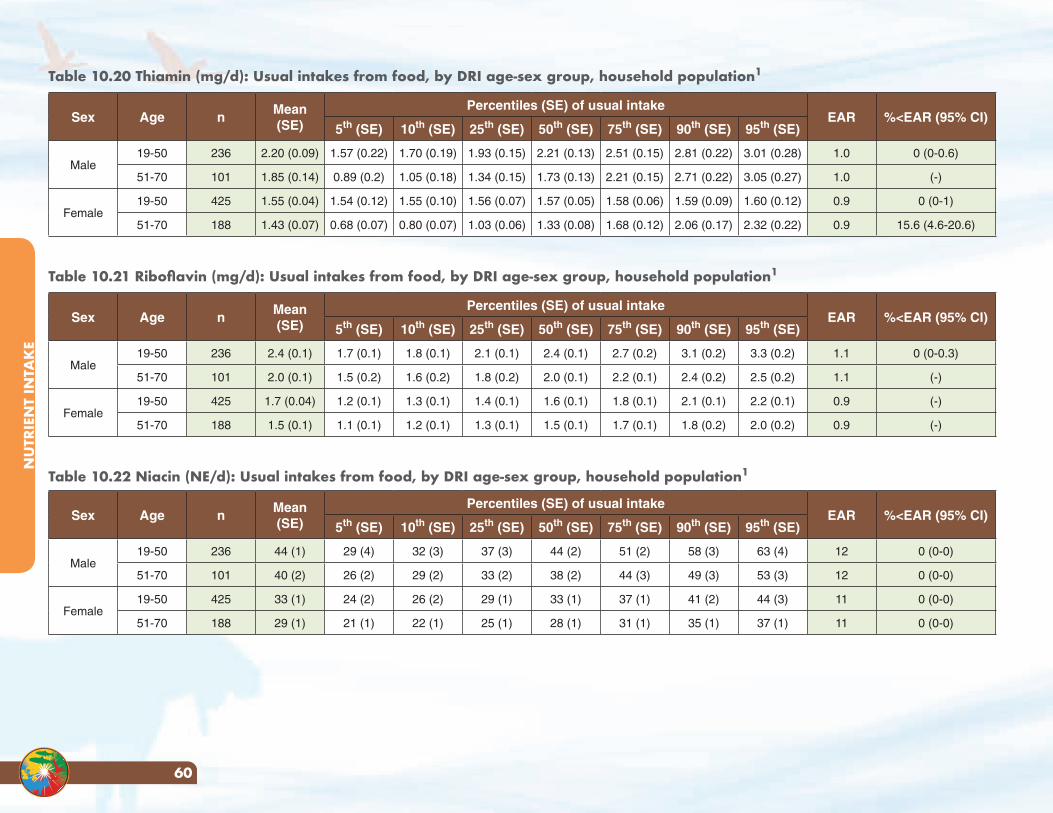
NU
TRIE
NT
INTA
KE
60
Table 10.20 Thiamin (mg/d): Usual intakes from food, by DRI age-sex group, household population1
Sex Age nMean (SE)
Percentiles (SE) of usual intakeEAR %<EAR (95% CI)
5th (SE) 10th (SE) 25th (SE) 50th (SE) 75th (SE) 90th (SE) 95th (SE)
Male19-50 236 2.20 (0.09) 1.57 (0.22) 1.70 (0.19) 1.93 (0.15) 2.21 (0.13) 2.51 (0.15) 2.81 (0.22) 3.01 (0.28) 1.0 0 (0-0.6)
51-70 101 1.85 (0.14) 0.89 (0.2) 1.05 (0.18) 1.34 (0.15) 1.73 (0.13) 2.21 (0.15) 2.71 (0.22) 3.05 (0.27) 1.0 (-)
Female19-50 425 1.55 (0.04) 1.54 (0.12) 1.55 (0.10) 1.56 (0.07) 1.57 (0.05) 1.58 (0.06) 1.59 (0.09) 1.60 (0.12) 0.9 0 (0-1)
51-70 188 1.43 (0.07) 0.68 (0.07) 0.80 (0.07) 1.03 (0.06) 1.33 (0.08) 1.68 (0.12) 2.06 (0.17) 2.32 (0.22) 0.9 15.6 (4.6-20.6)
Table 10.21 Riboflavin (mg/d): Usual intakes from food, by DRI age-sex group, household population1
Sex Age nMean (SE)
Percentiles (SE) of usual intakeEAR %<EAR (95% CI)
5th (SE) 10th (SE) 25th (SE) 50th (SE) 75th (SE) 90th (SE) 95th (SE)
Male19-50 236 2.4 (0.1) 1.7 (0.1) 1.8 (0.1) 2.1 (0.1) 2.4 (0.1) 2.7 (0.2) 3.1 (0.2) 3.3 (0.2) 1.1 0 (0-0.3)
51-70 101 2.0 (0.1) 1.5 (0.2) 1.6 (0.2) 1.8 (0.2) 2.0 (0.1) 2.2 (0.1) 2.4 (0.2) 2.5 (0.2) 1.1 (-)
Female19-50 425 1.7 (0.04) 1.2 (0.1) 1.3 (0.1) 1.4 (0.1) 1.6 (0.1) 1.8 (0.1) 2.1 (0.1) 2.2 (0.1) 0.9 (-)
51-70 188 1.5 (0.1) 1.1 (0.1) 1.2 (0.1) 1.3 (0.1) 1.5 (0.1) 1.7 (0.1) 1.8 (0.2) 2.0 (0.2) 0.9 (-)
Table 10.22 Niacin (NE/d): Usual intakes from food, by DRI age-sex group, household population1
Sex Age nMean (SE)
Percentiles (SE) of usual intakeEAR %<EAR (95% CI)
5th (SE) 10th (SE) 25th (SE) 50th (SE) 75th (SE) 90th (SE) 95th (SE)
Male19-50 236 44 (1) 29 (4) 32 (3) 37 (3) 44 (2) 51 (2) 58 (3) 63 (4) 12 0 (0-0)
51-70 101 40 (2) 26 (2) 29 (2) 33 (2) 38 (2) 44 (3) 49 (3) 53 (3) 12 0 (0-0)
Female19-50 425 33 (1) 24 (2) 26 (2) 29 (1) 33 (1) 37 (1) 41 (2) 44 (3) 11 0 (0-0)
51-70 188 29 (1) 21 (1) 22 (1) 25 (1) 28 (1) 31 (1) 35 (1) 37 (1) 11 0 (0-0)
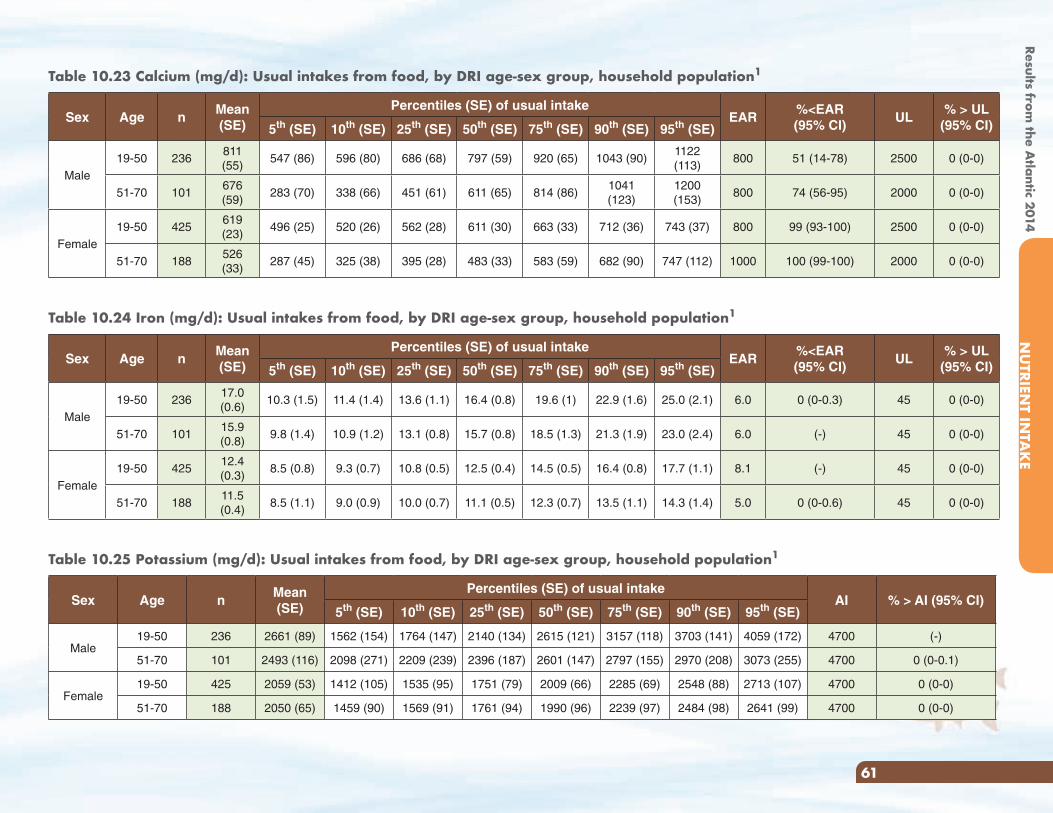
Results from the A
tlantic 2014N
UTRIEN
T INTA
KE
61
Table 10.23 Calcium (mg/d): Usual intakes from food, by DRI age-sex group, household population1
Sex Age nMean (SE)
Percentiles (SE) of usual intakeEAR
%<EAR(95% CI)
UL% > UL
(95% CI)5th (SE) 10th (SE) 25th (SE) 50th (SE) 75th (SE) 90th (SE) 95th (SE)
Male19-50 236
811 (55)
547 (86) 596 (80) 686 (68) 797 (59) 920 (65) 1043 (90)1122 (113)
800 51 (14-78) 2500 0 (0-0)
51-70 101676 (59)
283 (70) 338 (66) 451 (61) 611 (65) 814 (86)1041 (123)
1200 (153)
800 74 (56-95) 2000 0 (0-0)
Female19-50 425
619 (23)
496 (25) 520 (26) 562 (28) 611 (30) 663 (33) 712 (36) 743 (37) 800 99 (93-100) 2500 0 (0-0)
51-70 188526 (33)
287 (45) 325 (38) 395 (28) 483 (33) 583 (59) 682 (90) 747 (112) 1000 100 (99-100) 2000 0 (0-0)
Table 10.24 Iron (mg/d): Usual intakes from food, by DRI age-sex group, household population1
Sex Age nMean (SE)
Percentiles (SE) of usual intakeEAR
%<EAR(95% CI)
UL% > UL
(95% CI)5th (SE) 10th (SE) 25th (SE) 50th (SE) 75th (SE) 90th (SE) 95th (SE)
Male19-50 236
17.0 (0.6)
10.3 (1.5) 11.4 (1.4) 13.6 (1.1) 16.4 (0.8) 19.6 (1) 22.9 (1.6) 25.0 (2.1) 6.0 0 (0-0.3) 45 0 (0-0)
51-70 10115.9 (0.8)
9.8 (1.4) 10.9 (1.2) 13.1 (0.8) 15.7 (0.8) 18.5 (1.3) 21.3 (1.9) 23.0 (2.4) 6.0 (-) 45 0 (0-0)
Female19-50 425
12.4 (0.3)
8.5 (0.8) 9.3 (0.7) 10.8 (0.5) 12.5 (0.4) 14.5 (0.5) 16.4 (0.8) 17.7 (1.1) 8.1 (-) 45 0 (0-0)
51-70 18811.5 (0.4)
8.5 (1.1) 9.0 (0.9) 10.0 (0.7) 11.1 (0.5) 12.3 (0.7) 13.5 (1.1) 14.3 (1.4) 5.0 0 (0-0.6) 45 0 (0-0)
Table 10.25 Potassium (mg/d): Usual intakes from food, by DRI age-sex group, household population1
Sex Age nMean (SE)
Percentiles (SE) of usual intakeAI % > AI (95% CI)
5th (SE) 10th (SE) 25th (SE) 50th (SE) 75th (SE) 90th (SE) 95th (SE)
Male19-50 236 2661 (89) 1562 (154) 1764 (147) 2140 (134) 2615 (121) 3157 (118) 3703 (141) 4059 (172) 4700 (-)
51-70 101 2493 (116) 2098 (271) 2209 (239) 2396 (187) 2601 (147) 2797 (155) 2970 (208) 3073 (255) 4700 0 (0-0.1)
Female19-50 425 2059 (53) 1412 (105) 1535 (95) 1751 (79) 2009 (66) 2285 (69) 2548 (88) 2713 (107) 4700 0 (0-0)
51-70 188 2050 (65) 1459 (90) 1569 (91) 1761 (94) 1990 (96) 2239 (97) 2484 (98) 2641 (99) 4700 0 (0-0)
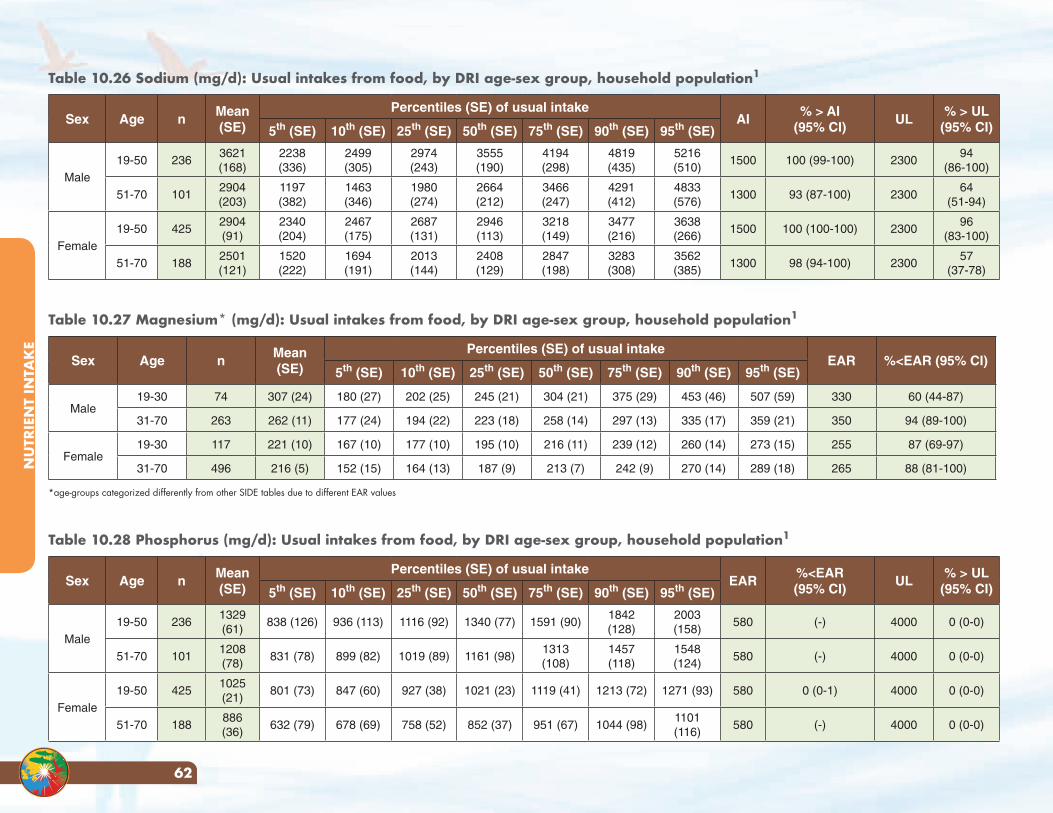
NU
TRIE
NT
INTA
KE
62
Table 10.26 Sodium (mg/d): Usual intakes from food, by DRI age-sex group, household population1
Sex Age nMean (SE)
Percentiles (SE) of usual intakeAI
% > AI(95% CI)
UL% > UL
(95% CI)5th (SE) 10th (SE) 25th (SE) 50th (SE) 75th (SE) 90th (SE) 95th (SE)
Male19-50 236
3621 (168)
2238 (336)
2499 (305)
2974 (243)
3555 (190)
4194 (298)
4819 (435)
5216 (510)
1500 100 (99-100) 230094
(86-100)
51-70 1012904 (203)
1197 (382)
1463 (346)
1980 (274)
2664 (212)
3466 (247)
4291 (412)
4833 (576)
1300 93 (87-100) 230064
(51-94)
Female19-50 425
2904 (91)
2340 (204)
2467 (175)
2687 (131)
2946 (113)
3218 (149)
3477 (216)
3638 (266)
1500 100 (100-100) 230096
(83-100)
51-70 1882501 (121)
1520 (222)
1694 (191)
2013 (144)
2408 (129)
2847 (198)
3283 (308)
3562 (385)
1300 98 (94-100) 230057
(37-78)
Table 10.27 Magnesium* (mg/d): Usual intakes from food, by DRI age-sex group, household population1
Sex Age nMean (SE)
Percentiles (SE) of usual intakeEAR %<EAR (95% CI)
5th (SE) 10th (SE) 25th (SE) 50th (SE) 75th (SE) 90th (SE) 95th (SE)
Male19-30 74 307 (24) 180 (27) 202 (25) 245 (21) 304 (21) 375 (29) 453 (46) 507 (59) 330 60 (44-87)
31-70 263 262 (11) 177 (24) 194 (22) 223 (18) 258 (14) 297 (13) 335 (17) 359 (21) 350 94 (89-100)
Female19-30 117 221 (10) 167 (10) 177 (10) 195 (10) 216 (11) 239 (12) 260 (14) 273 (15) 255 87 (69-97)
31-70 496 216 (5) 152 (15) 164 (13) 187 (9) 213 (7) 242 (9) 270 (14) 289 (18) 265 88 (81-100)
*age-groups categorized differently from other SIDE tables due to different EAR values
Table 10.28 Phosphorus (mg/d): Usual intakes from food, by DRI age-sex group, household population1
Sex Age nMean (SE)
Percentiles (SE) of usual intakeEAR
%<EAR(95% CI)
UL% > UL
(95% CI)5th (SE) 10th (SE) 25th (SE) 50th (SE) 75th (SE) 90th (SE) 95th (SE)
Male19-50 236
1329 (61)
838 (126) 936 (113) 1116 (92) 1340 (77) 1591 (90)1842 (128)
2003 (158)
580 (-) 4000 0 (0-0)
51-70 1011208 (78)
831 (78) 899 (82) 1019 (89) 1161 (98)1313 (108)
1457 (118)
1548 (124)
580 (-) 4000 0 (0-0)
Female19-50 425
1025 (21)
801 (73) 847 (60) 927 (38) 1021 (23) 1119 (41) 1213 (72) 1271 (93) 580 0 (0-1) 4000 0 (0-0)
51-70 188886 (36)
632 (79) 678 (69) 758 (52) 852 (37) 951 (67) 1044 (98)1101 (116)
580 (-) 4000 0 (0-0)
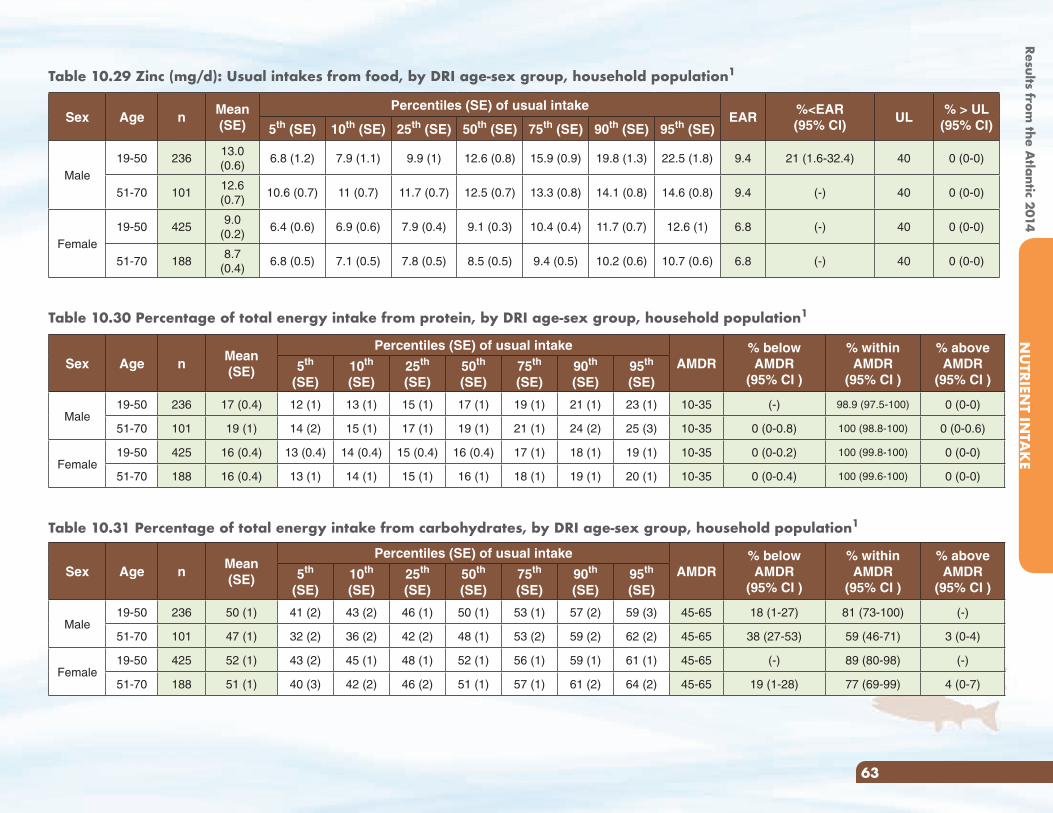
Results from the A
tlantic 2014N
UTRIEN
T INTA
KE
63
Table 10.29 Zinc (mg/d): Usual intakes from food, by DRI age-sex group, household population1
Sex Age nMean (SE)
Percentiles (SE) of usual intakeEAR
%<EAR(95% CI)
UL% > UL
(95% CI)5th (SE) 10th (SE) 25th (SE) 50th (SE) 75th (SE) 90th (SE) 95th (SE)
Male19-50 236
13.0 (0.6)
6.8 (1.2) 7.9 (1.1) 9.9 (1) 12.6 (0.8) 15.9 (0.9) 19.8 (1.3) 22.5 (1.8) 9.4 21 (1.6-32.4) 40 0 (0-0)
51-70 10112.6 (0.7)
10.6 (0.7) 11 (0.7) 11.7 (0.7) 12.5 (0.7) 13.3 (0.8) 14.1 (0.8) 14.6 (0.8) 9.4 (-) 40 0 (0-0)
Female19-50 425
9.0 (0.2)
6.4 (0.6) 6.9 (0.6) 7.9 (0.4) 9.1 (0.3) 10.4 (0.4) 11.7 (0.7) 12.6 (1) 6.8 (-) 40 0 (0-0)
51-70 1888.7
(0.4)6.8 (0.5) 7.1 (0.5) 7.8 (0.5) 8.5 (0.5) 9.4 (0.5) 10.2 (0.6) 10.7 (0.6) 6.8 (-) 40 0 (0-0)
Table 10.30 Percentage of total energy intake from protein, by DRI age-sex group, household population1
Sex Age nMean (SE)
Percentiles (SE) of usual intakeAMDR
% below AMDR
(95% CI )
% within AMDR
(95% CI )
% above AMDR
(95% CI )5th
(SE)10th (SE)
25th (SE)
50th (SE)
75th (SE)
90th (SE)
95th (SE)
Male19-50 236 17 (0.4) 12 (1) 13 (1) 15 (1) 17 (1) 19 (1) 21 (1) 23 (1) 10-35 (-) 98.9 (97.5-100) 0 (0-0)
51-70 101 19 (1) 14 (2) 15 (1) 17 (1) 19 (1) 21 (1) 24 (2) 25 (3) 10-35 0 (0-0.8) 100 (98.8-100) 0 (0-0.6)
Female19-50 425 16 (0.4) 13 (0.4) 14 (0.4) 15 (0.4) 16 (0.4) 17 (1) 18 (1) 19 (1) 10-35 0 (0-0.2) 100 (99.8-100) 0 (0-0)
51-70 188 16 (0.4) 13 (1) 14 (1) 15 (1) 16 (1) 18 (1) 19 (1) 20 (1) 10-35 0 (0-0.4) 100 (99.6-100) 0 (0-0)
Table 10.31 Percentage of total energy intake from carbohydrates, by DRI age-sex group, household population1
Sex Age nMean (SE)
Percentiles (SE) of usual intakeAMDR
% below AMDR
(95% CI )
% within AMDR
(95% CI )
% above AMDR
(95% CI )5th
(SE)10th (SE)
25th (SE)
50th (SE)
75th (SE)
90th (SE)
95th (SE)
Male19-50 236 50 (1) 41 (2) 43 (2) 46 (1) 50 (1) 53 (1) 57 (2) 59 (3) 45-65 18 (1-27) 81 (73-100) (-)
51-70 101 47 (1) 32 (2) 36 (2) 42 (2) 48 (1) 53 (2) 59 (2) 62 (2) 45-65 38 (27-53) 59 (46-71) 3 (0-4)
Female19-50 425 52 (1) 43 (2) 45 (1) 48 (1) 52 (1) 56 (1) 59 (1) 61 (1) 45-65 (-) 89 (80-98) (-)
51-70 188 51 (1) 40 (3) 42 (2) 46 (2) 51 (1) 57 (1) 61 (2) 64 (2) 45-65 19 (1-28) 77 (69-99) 4 (0-7)
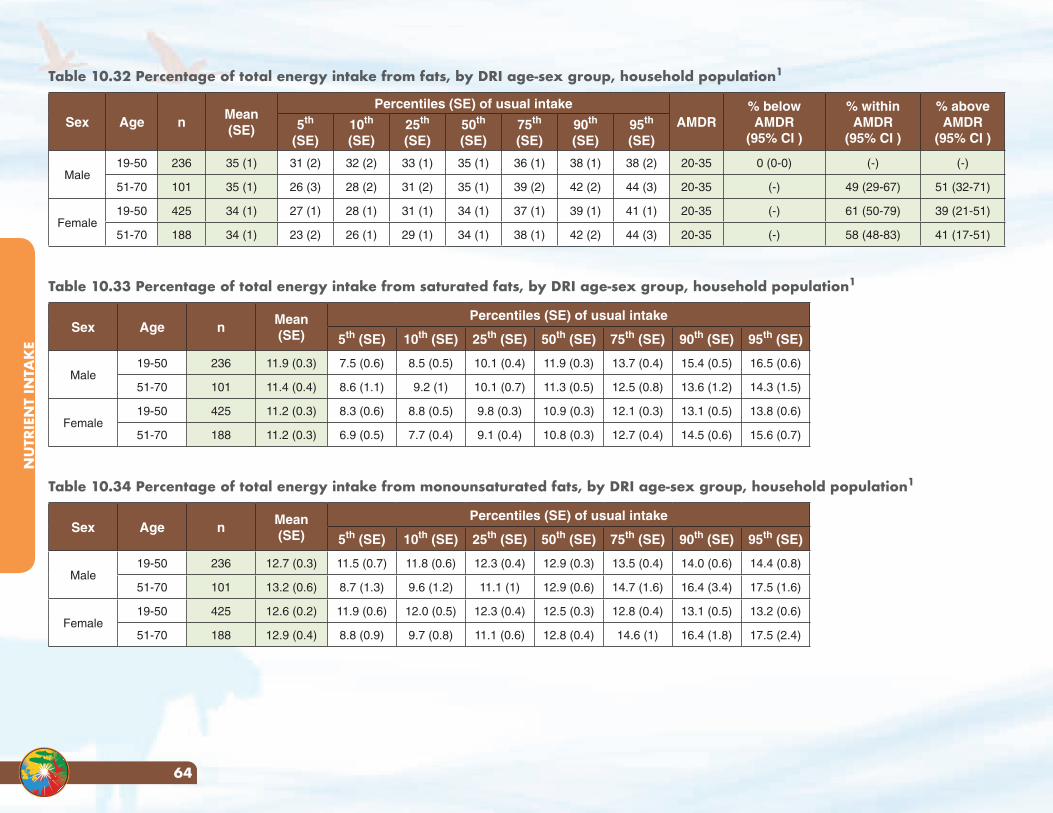
NU
TRIE
NT
INTA
KE
64
Table 10.32 Percentage of total energy intake from fats, by DRI age-sex group, household population1
Sex Age nMean (SE)
Percentiles (SE) of usual intakeAMDR
% below AMDR
(95% CI )
% within AMDR
(95% CI )
% above AMDR
(95% CI )5th
(SE)10th (SE)
25th (SE)
50th (SE)
75th (SE)
90th (SE)
95th (SE)
Male19-50 236 35 (1) 31 (2) 32 (2) 33 (1) 35 (1) 36 (1) 38 (1) 38 (2) 20-35 0 (0-0) (-) (-)
51-70 101 35 (1) 26 (3) 28 (2) 31 (2) 35 (1) 39 (2) 42 (2) 44 (3) 20-35 (-) 49 (29-67) 51 (32-71)
Female19-50 425 34 (1) 27 (1) 28 (1) 31 (1) 34 (1) 37 (1) 39 (1) 41 (1) 20-35 (-) 61 (50-79) 39 (21-51)
51-70 188 34 (1) 23 (2) 26 (1) 29 (1) 34 (1) 38 (1) 42 (2) 44 (3) 20-35 (-) 58 (48-83) 41 (17-51)
Table 10.33 Percentage of total energy intake from saturated fats, by DRI age-sex group, household population1
Sex Age nMean (SE)
Percentiles (SE) of usual intake
5th (SE) 10th (SE) 25th (SE) 50th (SE) 75th (SE) 90th (SE) 95th (SE)
Male19-50 236 11.9 (0.3) 7.5 (0.6) 8.5 (0.5) 10.1 (0.4) 11.9 (0.3) 13.7 (0.4) 15.4 (0.5) 16.5 (0.6)
51-70 101 11.4 (0.4) 8.6 (1.1) 9.2 (1) 10.1 (0.7) 11.3 (0.5) 12.5 (0.8) 13.6 (1.2) 14.3 (1.5)
Female19-50 425 11.2 (0.3) 8.3 (0.6) 8.8 (0.5) 9.8 (0.3) 10.9 (0.3) 12.1 (0.3) 13.1 (0.5) 13.8 (0.6)
51-70 188 11.2 (0.3) 6.9 (0.5) 7.7 (0.4) 9.1 (0.4) 10.8 (0.3) 12.7 (0.4) 14.5 (0.6) 15.6 (0.7)
Table 10.34 Percentage of total energy intake from monounsaturated fats, by DRI age-sex group, household population1
Sex Age nMean (SE)
Percentiles (SE) of usual intake
5th (SE) 10th (SE) 25th (SE) 50th (SE) 75th (SE) 90th (SE) 95th (SE)
Male19-50 236 12.7 (0.3) 11.5 (0.7) 11.8 (0.6) 12.3 (0.4) 12.9 (0.3) 13.5 (0.4) 14.0 (0.6) 14.4 (0.8)
51-70 101 13.2 (0.6) 8.7 (1.3) 9.6 (1.2) 11.1 (1) 12.9 (0.6) 14.7 (1.6) 16.4 (3.4) 17.5 (1.6)
Female19-50 425 12.6 (0.2) 11.9 (0.6) 12.0 (0.5) 12.3 (0.4) 12.5 (0.3) 12.8 (0.4) 13.1 (0.5) 13.2 (0.6)
51-70 188 12.9 (0.4) 8.8 (0.9) 9.7 (0.8) 11.1 (0.6) 12.8 (0.4) 14.6 (1) 16.4 (1.8) 17.5 (2.4)
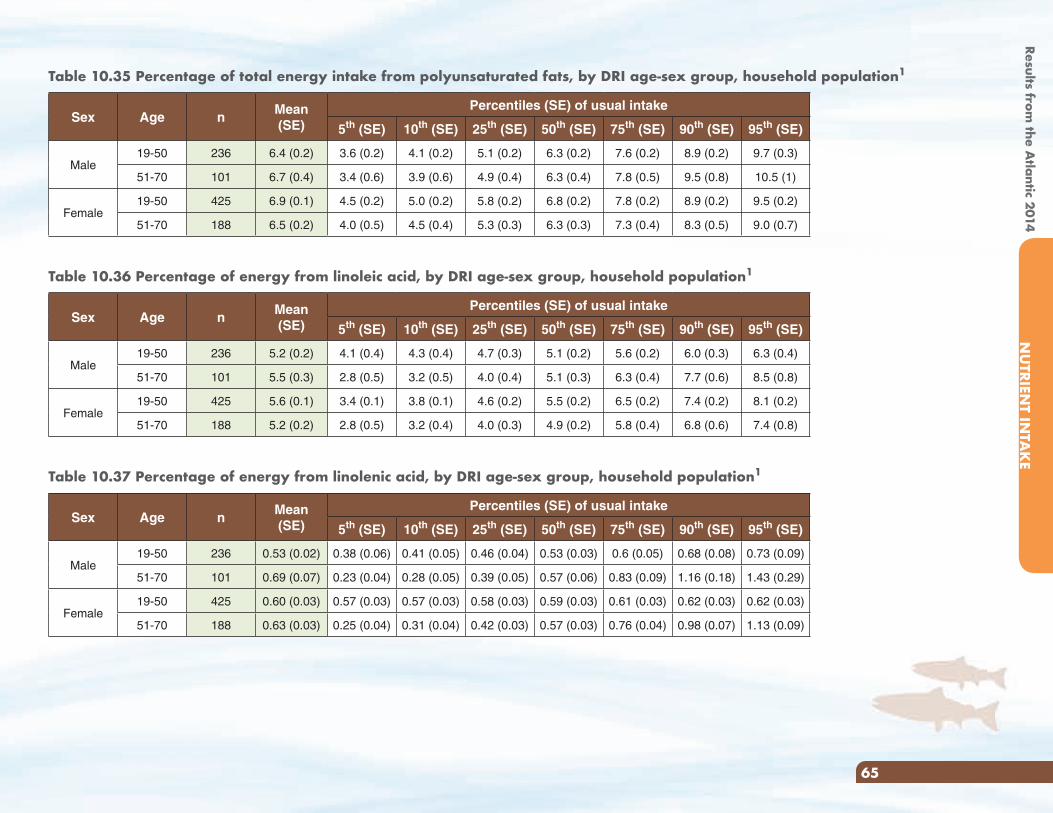
Results from the A
tlantic 2014N
UTRIEN
T INTA
KE
65
Table 10.35 Percentage of total energy intake from polyunsaturated fats, by DRI age-sex group, household population1
Sex Age nMean (SE)
Percentiles (SE) of usual intake
5th (SE) 10th (SE) 25th (SE) 50th (SE) 75th (SE) 90th (SE) 95th (SE)
Male19-50 236 6.4 (0.2) 3.6 (0.2) 4.1 (0.2) 5.1 (0.2) 6.3 (0.2) 7.6 (0.2) 8.9 (0.2) 9.7 (0.3)
51-70 101 6.7 (0.4) 3.4 (0.6) 3.9 (0.6) 4.9 (0.4) 6.3 (0.4) 7.8 (0.5) 9.5 (0.8) 10.5 (1)
Female19-50 425 6.9 (0.1) 4.5 (0.2) 5.0 (0.2) 5.8 (0.2) 6.8 (0.2) 7.8 (0.2) 8.9 (0.2) 9.5 (0.2)
51-70 188 6.5 (0.2) 4.0 (0.5) 4.5 (0.4) 5.3 (0.3) 6.3 (0.3) 7.3 (0.4) 8.3 (0.5) 9.0 (0.7)
Table 10.36 Percentage of energy from linoleic acid, by DRI age-sex group, household population1
Sex Age nMean (SE)
Percentiles (SE) of usual intake
5th (SE) 10th (SE) 25th (SE) 50th (SE) 75th (SE) 90th (SE) 95th (SE)
Male19-50 236 5.2 (0.2) 4.1 (0.4) 4.3 (0.4) 4.7 (0.3) 5.1 (0.2) 5.6 (0.2) 6.0 (0.3) 6.3 (0.4)
51-70 101 5.5 (0.3) 2.8 (0.5) 3.2 (0.5) 4.0 (0.4) 5.1 (0.3) 6.3 (0.4) 7.7 (0.6) 8.5 (0.8)
Female19-50 425 5.6 (0.1) 3.4 (0.1) 3.8 (0.1) 4.6 (0.2) 5.5 (0.2) 6.5 (0.2) 7.4 (0.2) 8.1 (0.2)
51-70 188 5.2 (0.2) 2.8 (0.5) 3.2 (0.4) 4.0 (0.3) 4.9 (0.2) 5.8 (0.4) 6.8 (0.6) 7.4 (0.8)
Table 10.37 Percentage of energy from linolenic acid, by DRI age-sex group, household population1
Sex Age nMean (SE)
Percentiles (SE) of usual intake
5th (SE) 10th (SE) 25th (SE) 50th (SE) 75th (SE) 90th (SE) 95th (SE)
Male19-50 236 0.53 (0.02) 0.38 (0.06) 0.41 (0.05) 0.46 (0.04) 0.53 (0.03) 0.6 (0.05) 0.68 (0.08) 0.73 (0.09)
51-70 101 0.69 (0.07) 0.23 (0.04) 0.28 (0.05) 0.39 (0.05) 0.57 (0.06) 0.83 (0.09) 1.16 (0.18) 1.43 (0.29)
Female19-50 425 0.60 (0.03) 0.57 (0.03) 0.57 (0.03) 0.58 (0.03) 0.59 (0.03) 0.61 (0.03) 0.62 (0.03) 0.62 (0.03)
51-70 188 0.63 (0.03) 0.25 (0.04) 0.31 (0.04) 0.42 (0.03) 0.57 (0.03) 0.76 (0.04) 0.98 (0.07) 1.13 (0.09)
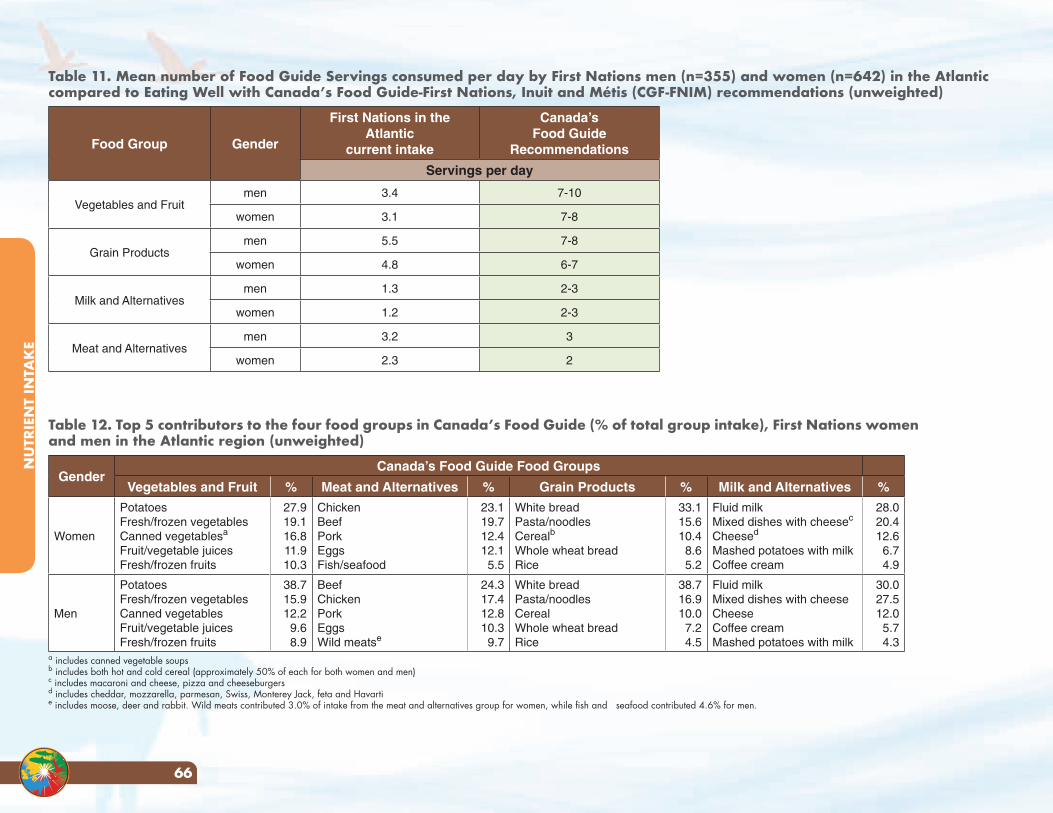
NU
TRIE
NT
INTA
KE
66
Table 11. Mean number of Food Guide Servings consumed per day by First Nations men (n=355) and women (n=642) in the Atlantic compared to Eating Well with Canada’s Food Guide-First Nations, Inuit and Métis (CGF-FNIM) recommendations (unweighted)
Food Group Gender
First Nations in the Atlantic
current intake
Canada’sFood Guide
Recommendations
Servings per day
Vegetables and Fruitmen 3.4 7-10
women 3.1 7-8
Grain Productsmen 5.5 7-8
women 4.8 6-7
Milk and Alternativesmen 1.3 2-3
women 1.2 2-3
Meat and Alternativesmen 3.2 3
women 2.3 2
Table 12. Top 5 contributors to the four food groups in Canada’s Food Guide (% of total group intake), First Nations women and men in the Atlantic region (unweighted)
GenderCanada’s Food Guide Food Groups
Vegetables and Fruit % Meat and Alternatives % Grain Products % Milk and Alternatives %
Women
PotatoesFresh/frozen vegetablesCanned vegetablesa
Fruit/vegetable juicesFresh/frozen fruits
27.919.116.811.910.3
ChickenBeefPorkEggsFish/seafood
23.119.712.412.15.5
White breadPasta/noodlesCerealb
Whole wheat breadRice
33.115.610.4
8.65.2
Fluid milkMixed dishes with cheesec
Cheesed
Mashed potatoes with milkCoffee cream
28.020.412.6
6.74.9
Men
PotatoesFresh/frozen vegetablesCanned vegetablesFruit/vegetable juicesFresh/frozen fruits
38.715.912.29.68.9
BeefChickenPorkEggsWild meatse
24.317.412.810.39.7
White breadPasta/noodlesCerealWhole wheat breadRice
38.716.910.0
7.24.5
Fluid milkMixed dishes with cheeseCheeseCoffee creamMashed potatoes with milk
30.027.512.0
5.74.3
a includes canned vegetable soupsb includes both hot and cold cereal (approximately 50% of each for both women and men)c includes macaroni and cheese, pizza and cheeseburgersd includes cheddar, mozzarella, parmesan, Swiss, Monterey Jack, feta and Havartie includes moose, deer and rabbit. Wild meats contributed 3.0% of intake from the meat and alternatives group for women, while fish and seafood contributed 4.6% for men.
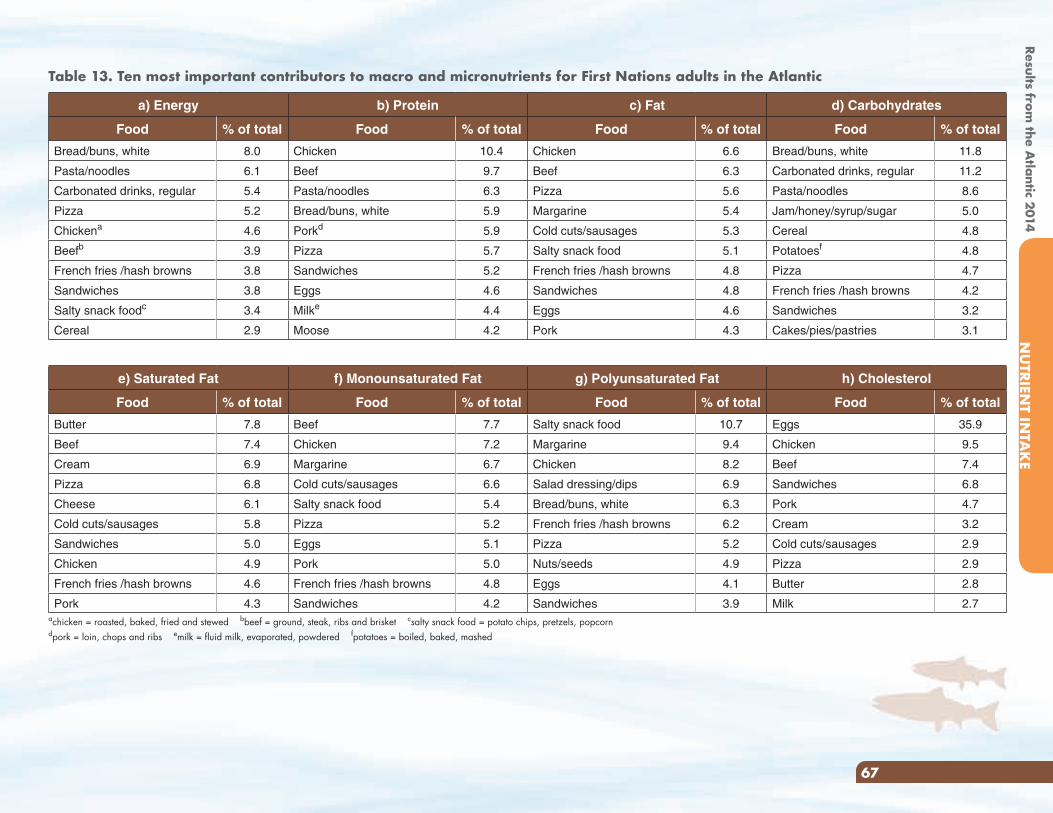
Results from the A
tlantic 2014N
UTRIEN
T INTA
KE
67
Table 13. Ten most important contributors to macro and micronutrients for First Nations adults in the Atlantic
a) Energy b) Protein c) Fat d) Carbohydrates
Food % of total Food % of total Food % of total Food % of total
Bread/buns, white 8.0 Chicken 10.4 Chicken 6.6 Bread/buns, white 11.8
Pasta/noodles 6.1 Beef 9.7 Beef 6.3 Carbonated drinks, regular 11.2
Carbonated drinks, regular 5.4 Pasta/noodles 6.3 Pizza 5.6 Pasta/noodles 8.6
Pizza 5.2 Bread/buns, white 5.9 Margarine 5.4 Jam/honey/syrup/sugar 5.0
Chickena 4.6 Porkd 5.9 Cold cuts/sausages 5.3 Cereal 4.8
Beefb 3.9 Pizza 5.7 Salty snack food 5.1 Potatoesf 4.8
French fries /hash browns 3.8 Sandwiches 5.2 French fries /hash browns 4.8 Pizza 4.7
Sandwiches 3.8 Eggs 4.6 Sandwiches 4.8 French fries /hash browns 4.2
Salty snack foodc 3.4 Milke 4.4 Eggs 4.6 Sandwiches 3.2
Cereal 2.9 Moose 4.2 Pork 4.3 Cakes/pies/pastries 3.1
e) Saturated Fat f) Monounsaturated Fat g) Polyunsaturated Fat h) Cholesterol
Food % of total Food % of total Food % of total Food % of total
Butter 7.8 Beef 7.7 Salty snack food 10.7 Eggs 35.9
Beef 7.4 Chicken 7.2 Margarine 9.4 Chicken 9.5
Cream 6.9 Margarine 6.7 Chicken 8.2 Beef 7.4
Pizza 6.8 Cold cuts/sausages 6.6 Salad dressing/dips 6.9 Sandwiches 6.8
Cheese 6.1 Salty snack food 5.4 Bread/buns, white 6.3 Pork 4.7
Cold cuts/sausages 5.8 Pizza 5.2 French fries /hash browns 6.2 Cream 3.2
Sandwiches 5.0 Eggs 5.1 Pizza 5.2 Cold cuts/sausages 2.9
Chicken 4.9 Pork 5.0 Nuts/seeds 4.9 Pizza 2.9
French fries /hash browns 4.6 French fries /hash browns 4.8 Eggs 4.1 Butter 2.8
Pork 4.3 Sandwiches 4.2 Sandwiches 3.9 Milk 2.7achicken = roasted, baked, fried and stewed bbeef = ground, steak, ribs and brisket csalty snack food = potato chips, pretzels, popcorn dpork = loin, chops and ribs emilk = fluid milk, evaporated, powdered fpotatoes = boiled, baked, mashed
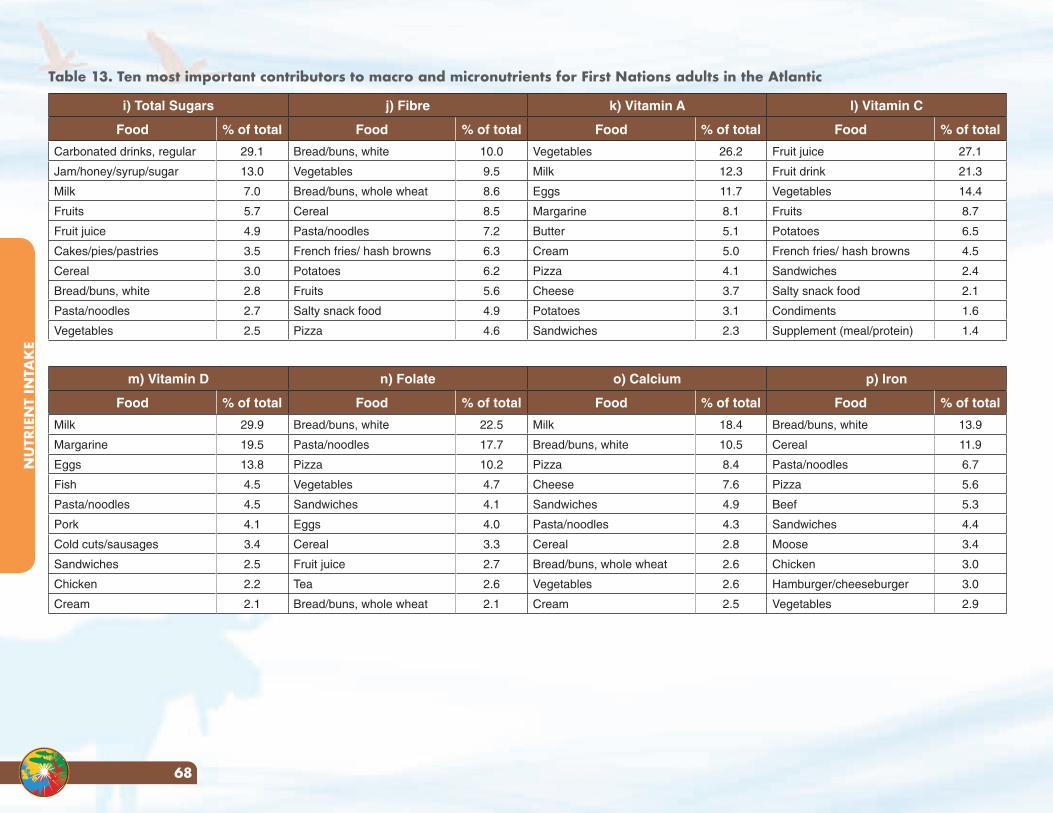
NU
TRIE
NT
INTA
KE
68
Table 13. Ten most important contributors to macro and micronutrients for First Nations adults in the Atlantic
i) Total Sugars j) Fibre k) Vitamin A l) Vitamin C
Food % of total Food % of total Food % of total Food % of total
Carbonated drinks, regular 29.1 Bread/buns, white 10.0 Vegetables 26.2 Fruit juice 27.1
Jam/honey/syrup/sugar 13.0 Vegetables 9.5 Milk 12.3 Fruit drink 21.3
Milk 7.0 Bread/buns, whole wheat 8.6 Eggs 11.7 Vegetables 14.4
Fruits 5.7 Cereal 8.5 Margarine 8.1 Fruits 8.7
Fruit juice 4.9 Pasta/noodles 7.2 Butter 5.1 Potatoes 6.5
Cakes/pies/pastries 3.5 French fries/ hash browns 6.3 Cream 5.0 French fries/ hash browns 4.5
Cereal 3.0 Potatoes 6.2 Pizza 4.1 Sandwiches 2.4
Bread/buns, white 2.8 Fruits 5.6 Cheese 3.7 Salty snack food 2.1
Pasta/noodles 2.7 Salty snack food 4.9 Potatoes 3.1 Condiments 1.6
Vegetables 2.5 Pizza 4.6 Sandwiches 2.3 Supplement (meal/protein) 1.4
m) Vitamin D n) Folate o) Calcium p) Iron
Food % of total Food % of total Food % of total Food % of total
Milk 29.9 Bread/buns, white 22.5 Milk 18.4 Bread/buns, white 13.9
Margarine 19.5 Pasta/noodles 17.7 Bread/buns, white 10.5 Cereal 11.9
Eggs 13.8 Pizza 10.2 Pizza 8.4 Pasta/noodles 6.7
Fish 4.5 Vegetables 4.7 Cheese 7.6 Pizza 5.6
Pasta/noodles 4.5 Sandwiches 4.1 Sandwiches 4.9 Beef 5.3
Pork 4.1 Eggs 4.0 Pasta/noodles 4.3 Sandwiches 4.4
Cold cuts/sausages 3.4 Cereal 3.3 Cereal 2.8 Moose 3.4
Sandwiches 2.5 Fruit juice 2.7 Bread/buns, whole wheat 2.6 Chicken 3.0
Chicken 2.2 Tea 2.6 Vegetables 2.6 Hamburger/cheeseburger 3.0
Cream 2.1 Bread/buns, whole wheat 2.1 Cream 2.5 Vegetables 2.9
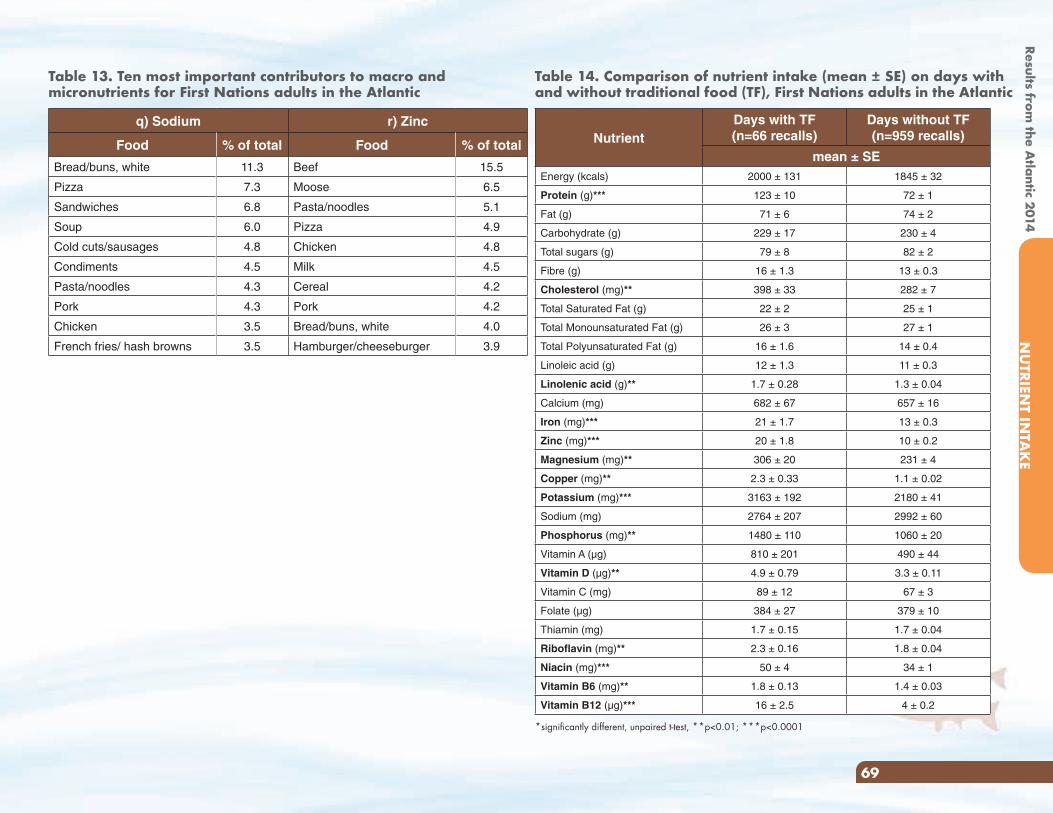
Results from the A
tlantic 2014N
UTRIEN
T INTA
KE
69
Table 13. Ten most important contributors to macro and micronutrients for First Nations adults in the Atlantic
q) Sodium r) Zinc
Food % of total Food % of total
Bread/buns, white 11.3 Beef 15.5
Pizza 7.3 Moose 6.5
Sandwiches 6.8 Pasta/noodles 5.1
Soup 6.0 Pizza 4.9
Cold cuts/sausages 4.8 Chicken 4.8
Condiments 4.5 Milk 4.5
Pasta/noodles 4.3 Cereal 4.2
Pork 4.3 Pork 4.2
Chicken 3.5 Bread/buns, white 4.0
French fries/ hash browns 3.5 Hamburger/cheeseburger 3.9
Table 14. Comparison of nutrient intake (mean ± SE) on days with and without traditional food (TF), First Nations adults in the Atlantic
NutrientDays with TF (n=66 recalls)
Days without TF(n=959 recalls)
mean ± SEEnergy (kcals) 2000 ± 131 1845 ± 32
Protein (g)*** 123 ± 10 72 ± 1
Fat (g) 71 ± 6 74 ± 2
Carbohydrate (g) 229 ± 17 230 ± 4
Total sugars (g) 79 ± 8 82 ± 2
Fibre (g) 16 ± 1.3 13 ± 0.3
Cholesterol (mg)** 398 ± 33 282 ± 7
Total Saturated Fat (g) 22 ± 2 25 ± 1
Total Monounsaturated Fat (g) 26 ± 3 27 ± 1
Total Polyunsaturated Fat (g) 16 ± 1.6 14 ± 0.4
Linoleic acid (g) 12 ± 1.3 11 ± 0.3
Linolenic acid (g)** 1.7 ± 0.28 1.3 ± 0.04
Calcium (mg) 682 ± 67 657 ± 16
Iron (mg)*** 21 ± 1.7 13 ± 0.3
Zinc (mg)*** 20 ± 1.8 10 ± 0.2
Magnesium (mg)** 306 ± 20 231 ± 4
Copper (mg)** 2.3 ± 0.33 1.1 ± 0.02
Potassium (mg)*** 3163 ± 192 2180 ± 41
Sodium (mg) 2764 ± 207 2992 ± 60
Phosphorus (mg)** 1480 ± 110 1060 ± 20
Vitamin A (µg) 810 ± 201 490 ± 44
Vitamin D (µg)** 4.9 ± 0.79 3.3 ± 0.11
Vitamin C (mg) 89 ± 12 67 ± 3
Folate (µg) 384 ± 27 379 ± 10
Thiamin (mg) 1.7 ± 0.15 1.7 ± 0.04
Riboflavin (mg)** 2.3 ± 0.16 1.8 ± 0.04
Niacin (mg)*** 50 ± 4 34 ± 1
Vitamin B6 (mg)** 1.8 ± 0.13 1.4 ± 0.03
Vitamin B12 (µg)*** 16 ± 2.5 4 ± 0.2
*significantly different, unpaired t-test, **p<0.01; ***p<0.0001
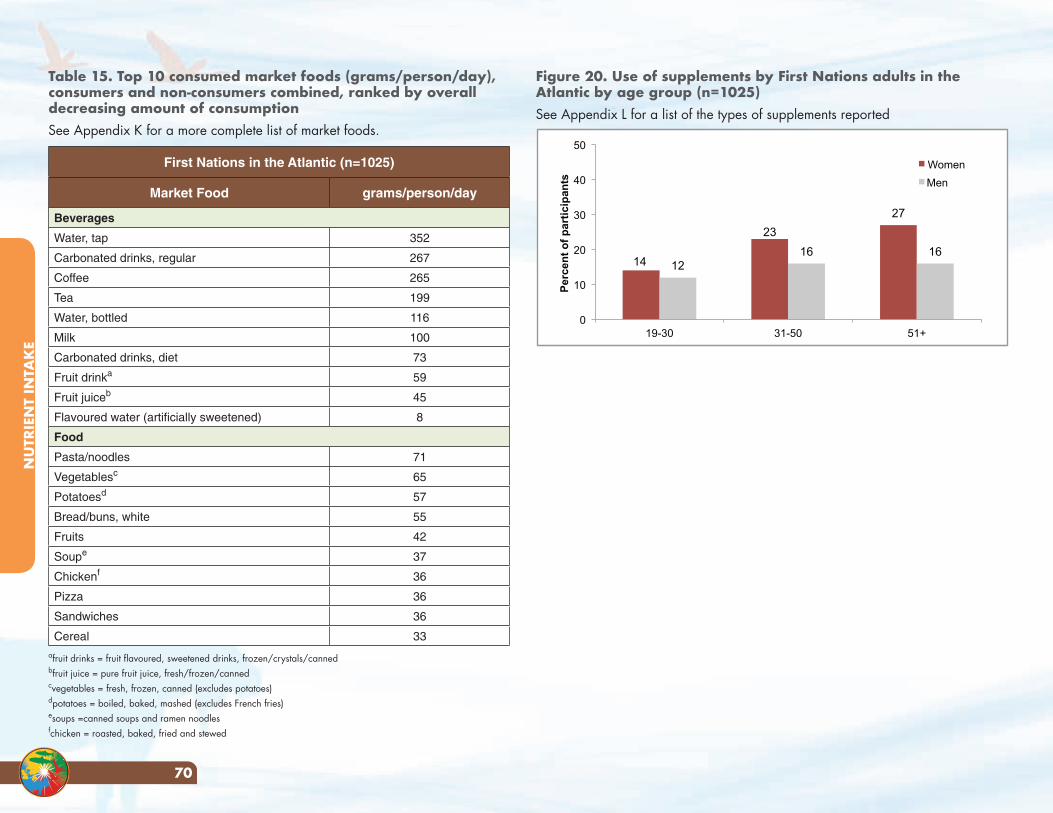
NU
TRIE
NT
INTA
KE
70
NU
TRIE
NT
INTA
KE
70
Table 15. Top 10 consumed market foods (grams/person/day), consumers and non-consumers combined, ranked by overall decreasing amount of consumptionSee Appendix K for a more complete list of market foods.
First Nations in the Atlantic (n=1025)
Market Food grams/person/day
Beverages
Water, tap 352
Carbonated drinks, regular 267
Coffee 265
Tea 199
Water, bottled 116
Milk 100
Carbonated drinks, diet 73
Fruit drinka 59
Fruit juiceb 45
Flavoured water (artificially sweetened) 8
Food
Pasta/noodles 71
Vegetablesc 65
Potatoesd 57
Bread/buns, white 55
Fruits 42
Soupe 37
Chickenf 36
Pizza 36
Sandwiches 36
Cereal 33afruit drinks = fruit flavoured, sweetened drinks, frozen/crystals/cannedbfruit juice = pure fruit juice, fresh/frozen/cannedcvegetables = fresh, frozen, canned (excludes potatoes) dpotatoes = boiled, baked, mashed (excludes French fries) esoups =canned soups and ramen noodlesfchicken = roasted, baked, fried and stewed
Figure 20. Use of supplements by First Nations adults in the Atlantic by age group (n=1025) See Appendix L for a list of the types of supplements reported
14
23
27
12 16 16
0
10
20
30
40
50
19-30 31-50 51+
Per
cen
t o
f p
arti
cip
ants
Women
Men
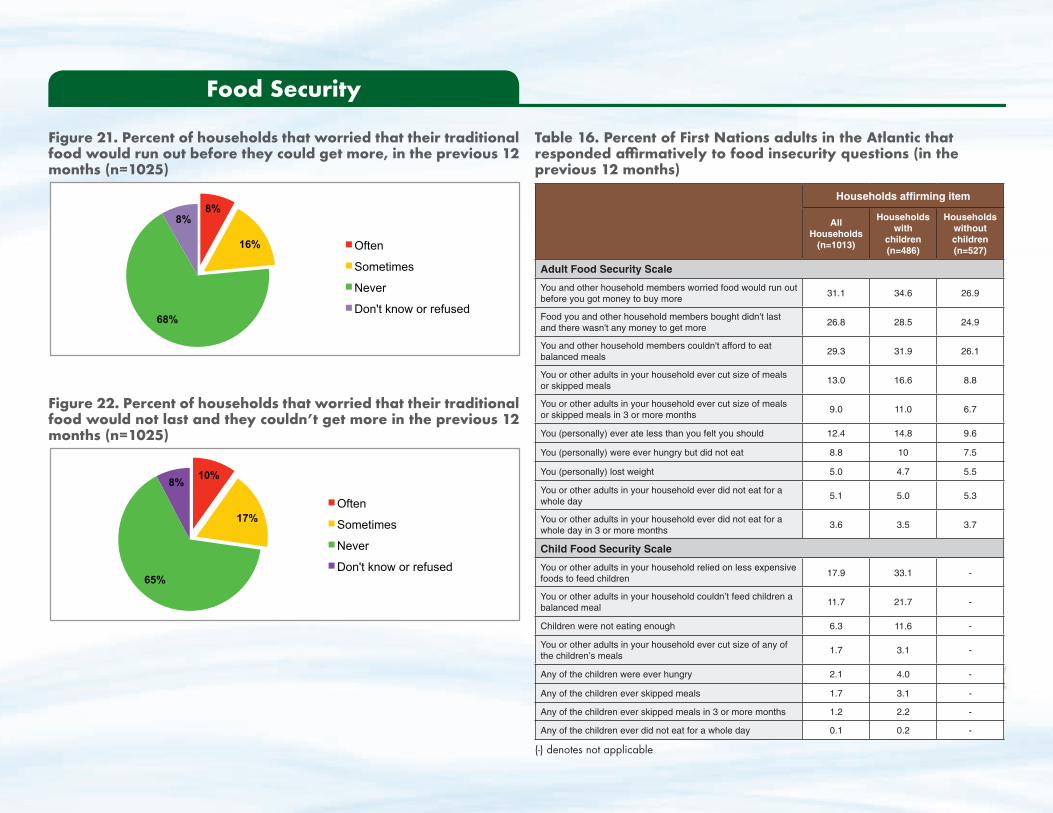
Results from the A
tlantic 2014FO
OD
SECURITY
71
Figure 21. Percent of households that worried that their traditional food would run out before they could get more, in the previous 12 months (n=1025)
8%
16%
68%
8%
Often
Sometimes
Never
Don't know or refused
Figure 22. Percent of households that worried that their traditional food would not last and they couldn’t get more in the previous 12 months (n=1025)
10%
17%
65%
8%
Often
Sometimes
Never
Don't know or refused
Food Security
Table 16. Percent of First Nations adults in the Atlantic that responded affirmatively to food insecurity questions (in the previous 12 months)
Households affirming item
All Households
(n=1013)
Households with
children (n=486)
Households without children (n=527)
Adult Food Security Scale
You and other household members worried food would run out before you got money to buy more
31.1 34.6 26.9
Food you and other household members bought didn't last and there wasn't any money to get more
26.8 28.5 24.9
You and other household members couldn't afford to eat balanced meals
29.3 31.9 26.1
You or other adults in your household ever cut size of meals or skipped meals
13.0 16.6 8.8
You or other adults in your household ever cut size of meals or skipped meals in 3 or more months
9.0 11.0 6.7
You (personally) ever ate less than you felt you should 12.4 14.8 9.6
You (personally) were ever hungry but did not eat 8.8 10 7.5
You (personally) lost weight 5.0 4.7 5.5
You or other adults in your household ever did not eat for a whole day
5.1 5.0 5.3
You or other adults in your household ever did not eat for a whole day in 3 or more months
3.6 3.5 3.7
Child Food Security Scale
You or other adults in your household relied on less expensive foods to feed children
17.9 33.1 -
You or other adults in your household couldn’t feed children a balanced meal
11.7 21.7 -
Children were not eating enough 6.3 11.6 -
You or other adults in your household ever cut size of any of the children’s meals
1.7 3.1 -
Any of the children were ever hungry 2.1 4.0 -
Any of the children ever skipped meals 1.7 3.1 -
Any of the children ever skipped meals in 3 or more months 1.2 2.2 -
Any of the children ever did not eat for a whole day 0.1 0.2 -
(-) denotes not applicable
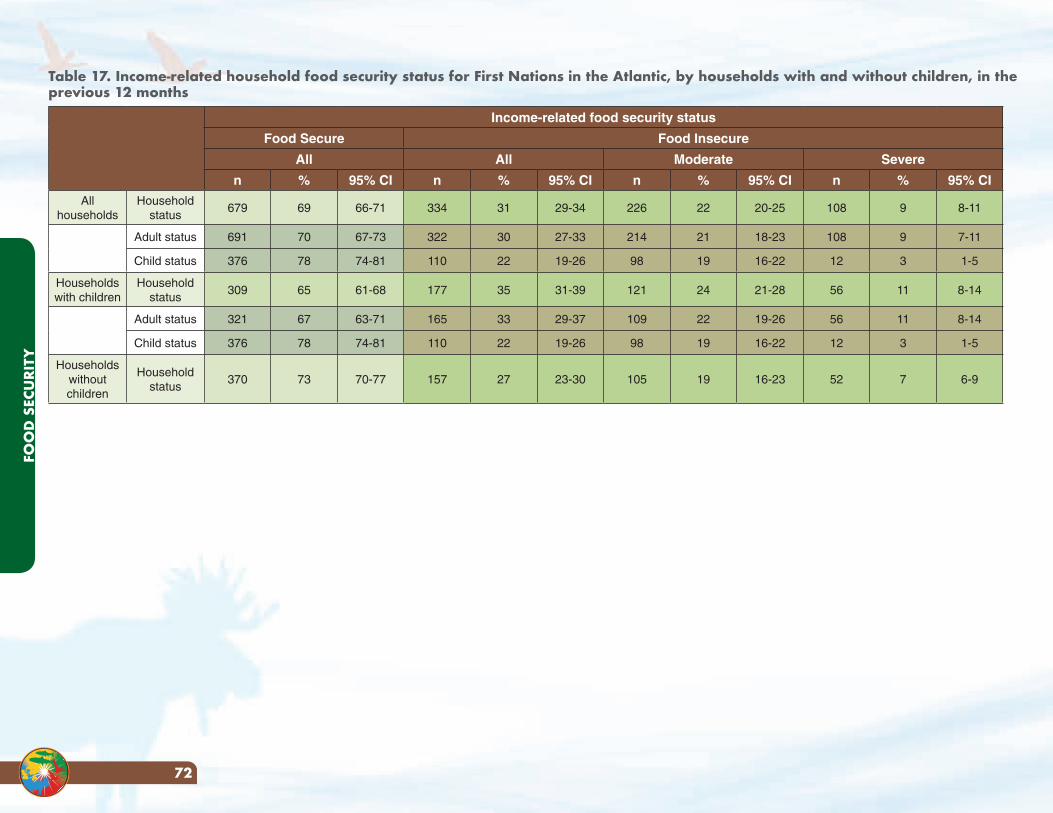
FOO
D S
ECU
RITY
72
Table 17. Income-related household food security status for First Nations in the Atlantic, by households with and without children, in the previous 12 months
Income-related food security status
Food Secure Food Insecure
All All Moderate Severe
n % 95% CI n % 95% CI n % 95% CI n % 95% CI
All households
Household status
679 69 66-71 334 31 29-34 226 22 20-25 108 9 8-11
Adult status 691 70 67-73 322 30 27-33 214 21 18-23 108 9 7-11
Child status 376 78 74-81 110 22 19-26 98 19 16-22 12 3 1-5
Households with children
Household status
309 65 61-68 177 35 31-39 121 24 21-28 56 11 8-14
Adult status 321 67 63-71 165 33 29-37 109 22 19-26 56 11 8-14
Child status 376 78 74-81 110 22 19-26 98 19 16-22 12 3 1-5
Households without children
Household status
370 73 70-77 157 27 23-30 105 19 16-23 52 7 6-9
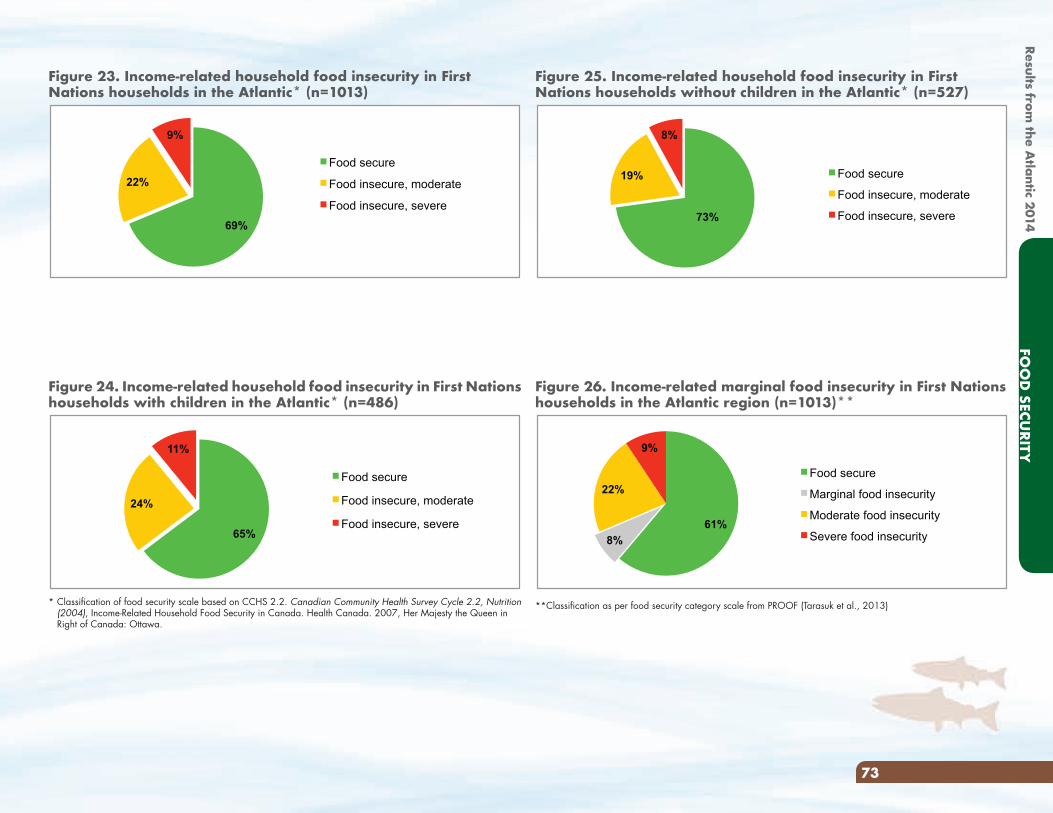
Results from the A
tlantic 2014FO
OD
SECURITY
73
Figure 25. Income-related household food insecurity in First Nations households without children in the Atlantic* (n=527)
73%
19%
8%
Food secure
Food insecure, moderate
Food insecure, severe
Figure 26. Income-related marginal food insecurity in First Nations households in the Atlantic region (n=1013)**
61%
8%
22%
9%
Food secure
Marginal food insecurity
Moderate food insecurity
Severe food insecurity
**Classification as per food security category scale from PROOF (Tarasuk et al., 2013)
Figure 23. Income-related household food insecurity in First Nations households in the Atlantic* (n=1013)
69%
22%
9%
Food secure
Food insecure, moderate
Food insecure, severe
Figure 24. Income-related household food insecurity in First Nations households with children in the Atlantic* (n=486)
65%
24%
11%
Food secure
Food insecure, moderate
Food insecure, severe
* Classification of food security scale based on CCHS 2.2. Canadian Community Health Survey Cycle 2.2, Nutrition (2004), Income-Related Household Food Security in Canada. Health Canada. 2007, Her Majesty the Queen in Right of Canada: Ottawa.
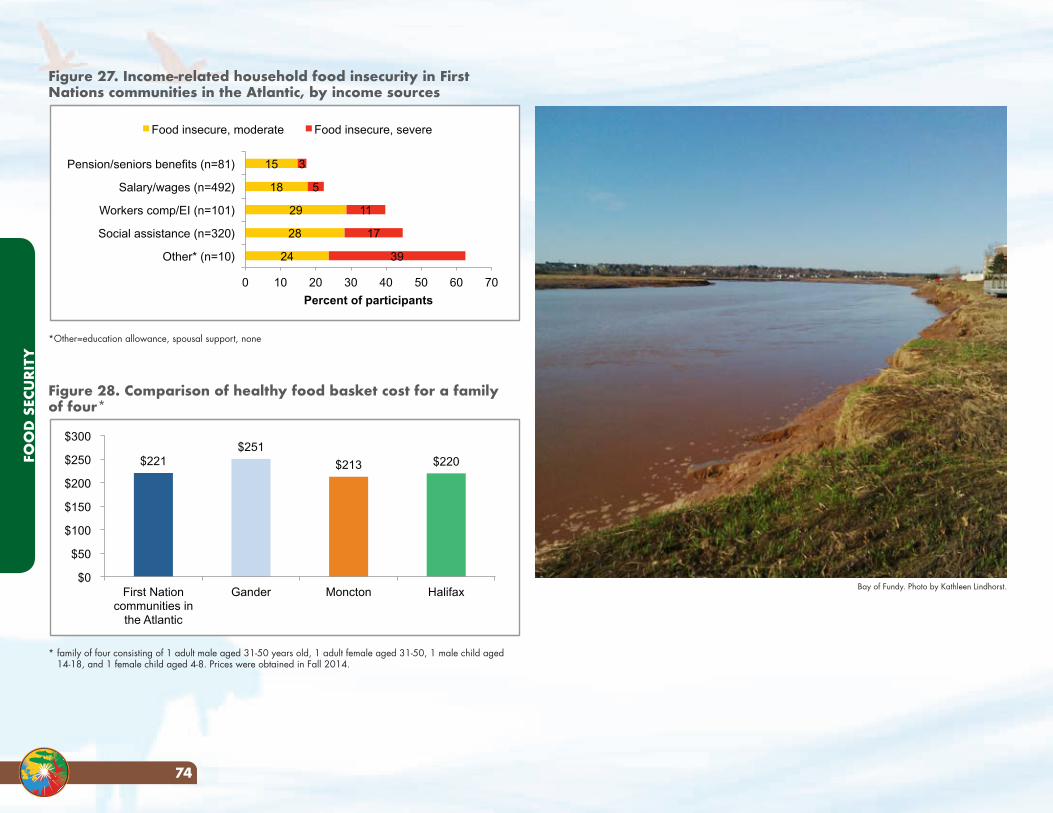
FOO
D S
ECU
RITY
74
Figure 27. Income-related household food insecurity in First Nations communities in the Atlantic, by income sources
24
28
29
18
15
39
17
11
5
3
0 10 20 30 40 50 60 70
Other* (n=10)
Social assistance (n=320)
Workers comp/EI (n=101)
Salary/wages (n=492)
Pension/seniors benefits (n=81)
Percent of participants
Food insecure, moderate Food insecure, severe
*Other=education allowance, spousal support, none
Figure 28. Comparison of healthy food basket cost for a family of four*
$221 $251
$213 $220
$0
$50
$100
$150
$200
$250
$300
First Nation communities in
the Atlantic
Gander Moncton Halifax
* family of four consisting of 1 adult male aged 31-50 years old, 1 adult female aged 31-50, 1 male child aged 14-18, and 1 female child aged 4-8. Prices were obtained in Fall 2014.
Bay of Fundy. Photo by Kathleen Lindhorst.
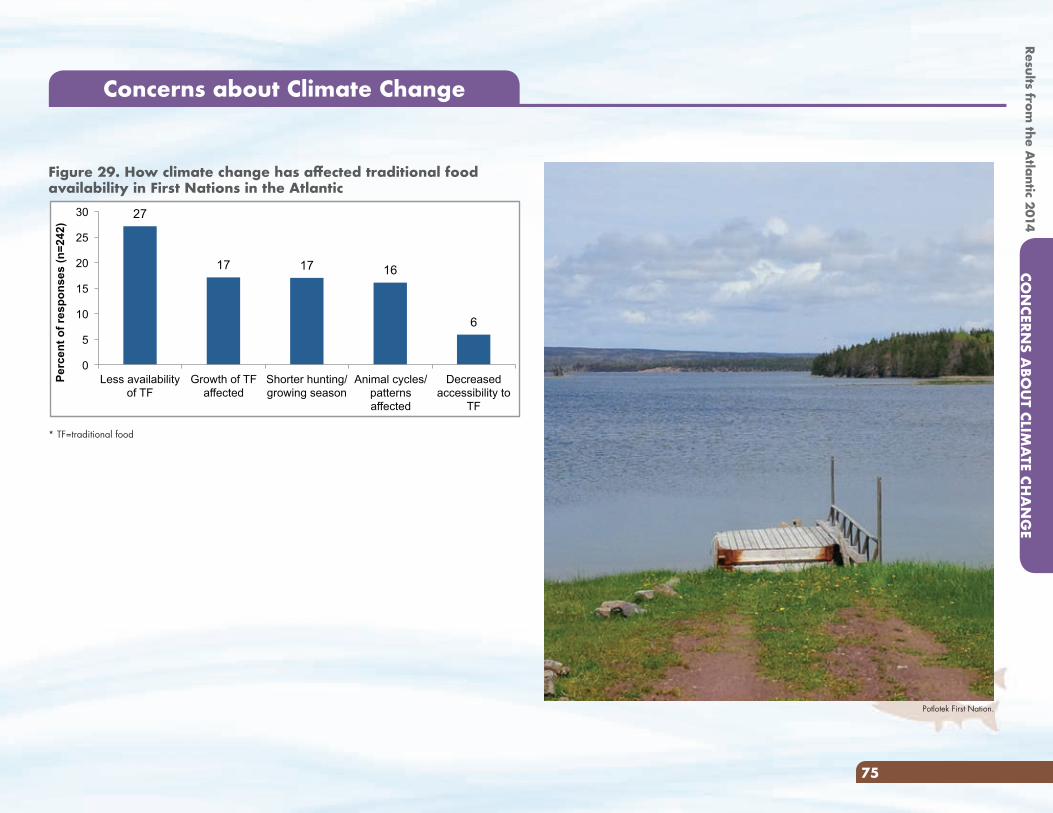
Results from the A
tlantic 2014CO
NCERN
S ABO
UT CLIM
ATE CH
AN
GE
75
Figure 29. How climate change has affected traditional food availability in First Nations in the Atlantic
27
17 17 16
6
0
5
10
15
20
25
30
Less availability of TF
Growth of TF affected
Shorter hunting/growing season
Animal cycles/patterns affected
Decreased accessibility to
TF
Per
cen
t o
f re
spo
nse
s (n
=24
2)
* TF=traditional food
Concerns about Climate Change
Potlotek First Nation.
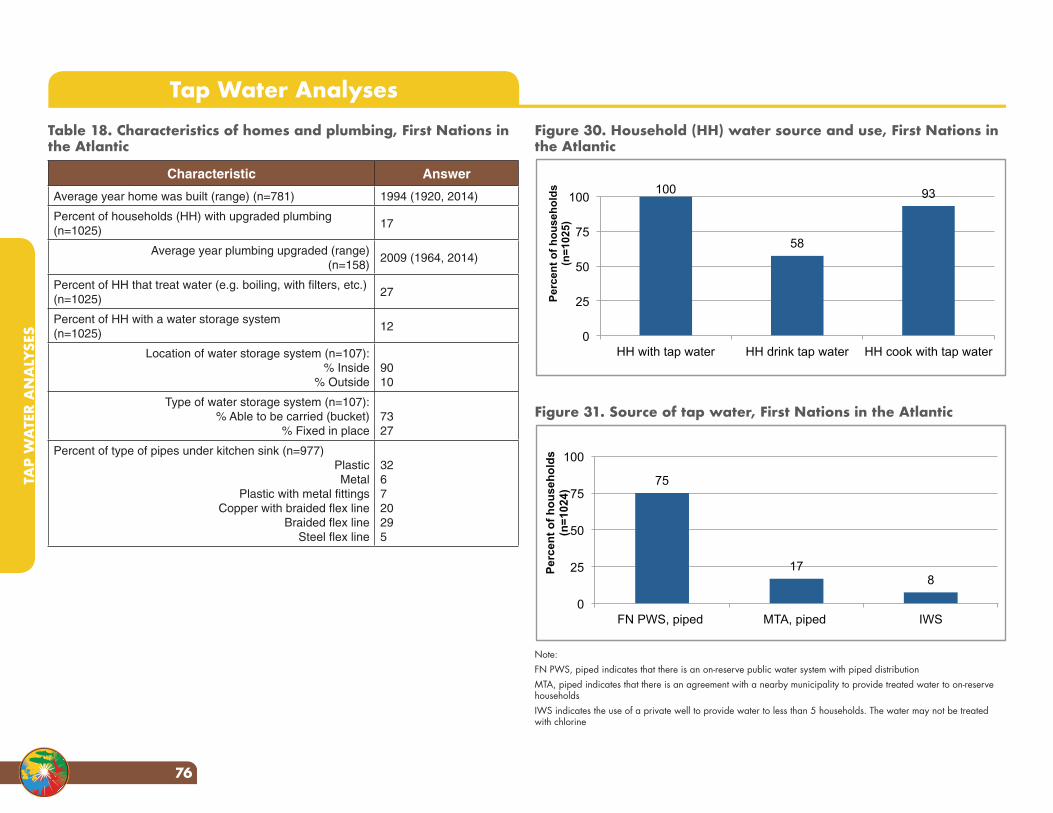
Figure 30. Household (HH) water source and use, First Nations in the Atlantic
100
58
93
0
25
50
75
100
HH with tap water HH drink tap water HH cook with tap water
Per
cen
t o
f h
ou
seh
old
s
(n=
1025
)
Figure 31. Source of tap water, First Nations in the Atlantic
75
17 8
0
25
50
75
100
FN PWS, piped MTA, piped IWS
Per
cen
t o
f h
ou
seh
old
s (n
=10
24)
Note: FN PWS, piped indicates that there is an on-reserve public water system with piped distributionMTA, piped indicates that there is an agreement with a nearby municipality to provide treated water to on-reserve householdsIWS indicates the use of a private well to provide water to less than 5 households. The water may not be treated with chlorine
Table 18. Characteristics of homes and plumbing, First Nations in the Atlantic
Characteristic Answer
Average year home was built (range) (n=781) 1994 (1920, 2014)
Percent of households (HH) with upgraded plumbing (n=1025)
17
Average year plumbing upgraded (range) (n=158)
2009 (1964, 2014)
Percent of HH that treat water (e.g. boiling, with filters, etc.)(n=1025)
27
Percent of HH with a water storage system(n=1025)
12
Location of water storage system (n=107):% Inside
% Outside9010
Type of water storage system (n=107):% Able to be carried (bucket)
% Fixed in place7327
Percent of type of pipes under kitchen sink (n=977)PlasticMetal
Plastic with metal fittingsCopper with braided flex line
Braided flex lineSteel flex line
326720295
Tap Water Analyses
TAP
WA
TER
AN
ALY
SES
76
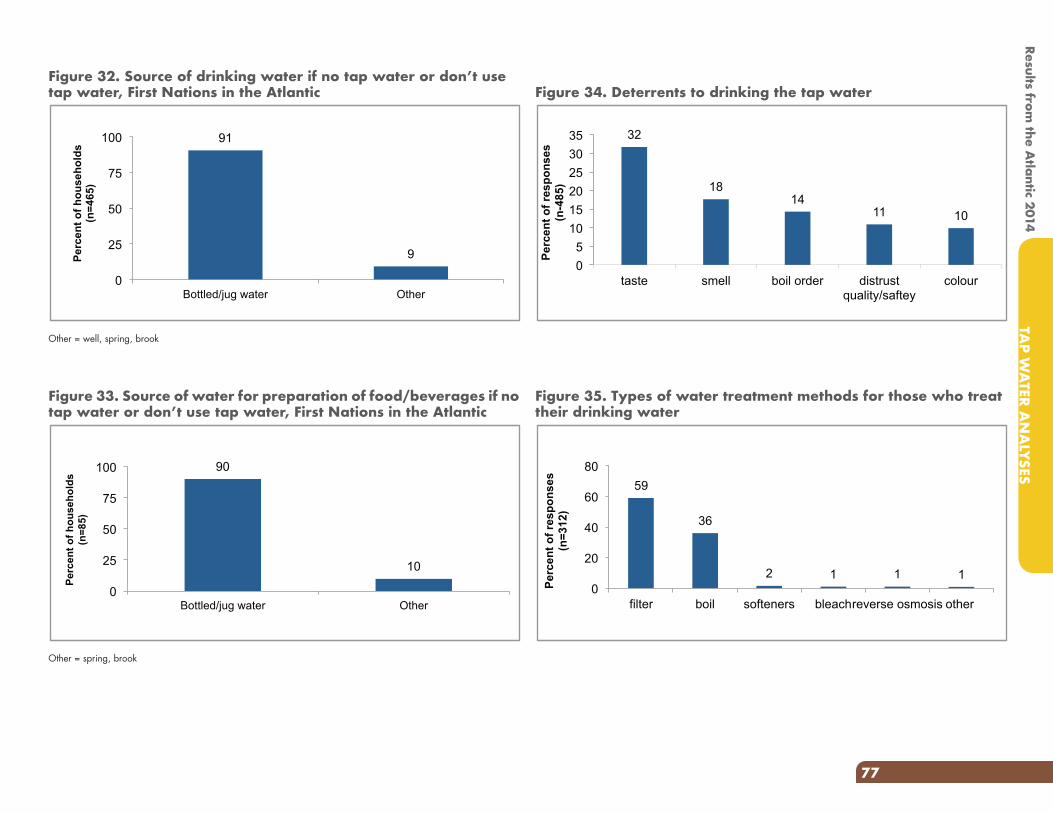
Figure 34. Deterrents to drinking the tap water
32
18 14
11 10
0 5
10 15 20 25 30 35
taste smell boil order distrust quality/saftey
colour
Perc
ent o
f res
pons
es
(n
-485
)
Figure 35. Types of water treatment methods for those who treat their drinking water
59
36
2 1 1 1 0
20
40
60
80
filter boil softeners bleach reverse osmosis other
Perc
ent o
f res
pons
es
(n=3
12)
Figure 32. Source of drinking water if no tap water or don’t use tap water, First Nations in the Atlantic
91
9
0
25
50
75
100
Bottled/jug water Other
Per
cen
t o
f h
ou
seh
old
s (n
=46
5)
Other = well, spring, brook
Figure 33. Source of water for preparation of food/beverages if no tap water or don’t use tap water, First Nations in the Atlantic
90
10
0
25
50
75
100
Bottled/jug water Other
Per
cen
t o
f h
ou
seh
old
s (n
=85
)
Other = spring, brook
Results from the A
tlantic 2014TA
P WA
TER AN
ALYSES
77
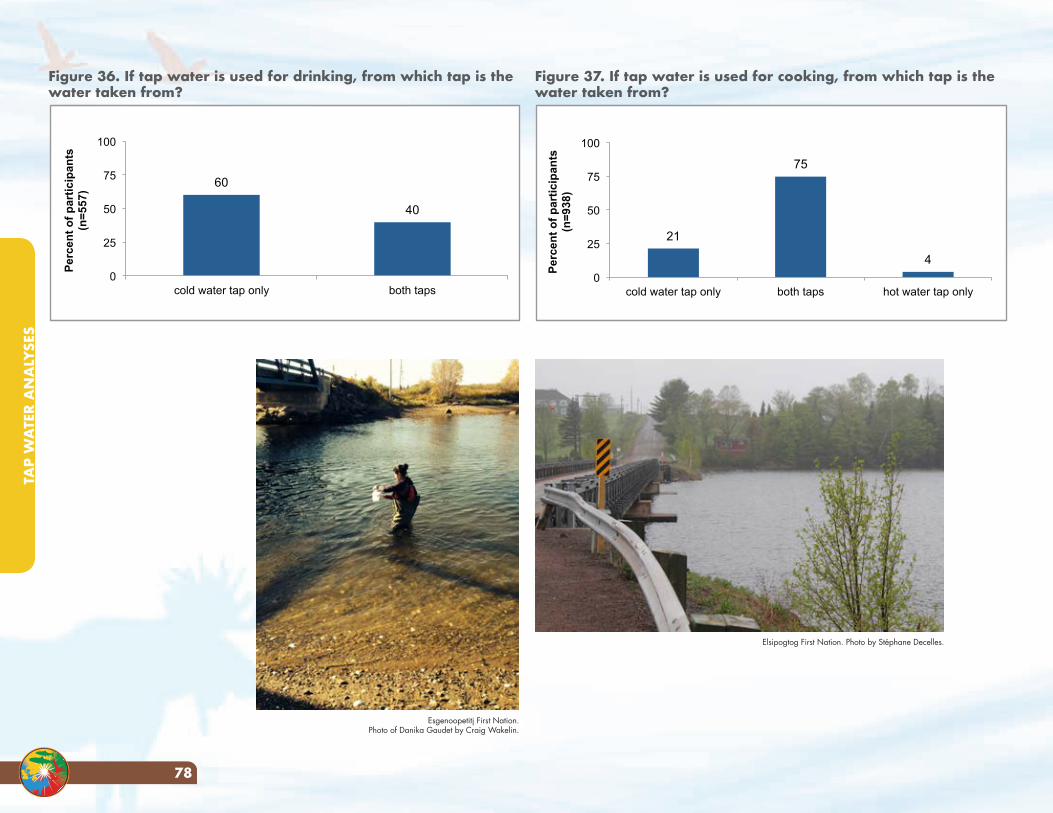
Figure 36. If tap water is used for drinking, from which tap is the water taken from?
60
40
0
25
50
75
100
cold water tap only both taps
Per
cen
t o
f p
arti
cip
ants
(n
=55
7)
Figure 37. If tap water is used for cooking, from which tap is the water taken from?
21
75
4
0
25
50
75
100
cold water tap only both taps hot water tap only
Per
cen
t o
f p
arti
cip
ants
(n
=93
8)
Esgenoopetitj First Nation. Photo of Danika Gaudet by Craig Wakelin.
Elsipogtog First Nation. Photo by Stéphane Decelles.
TAP
WA
TER
AN
ALY
SES
78
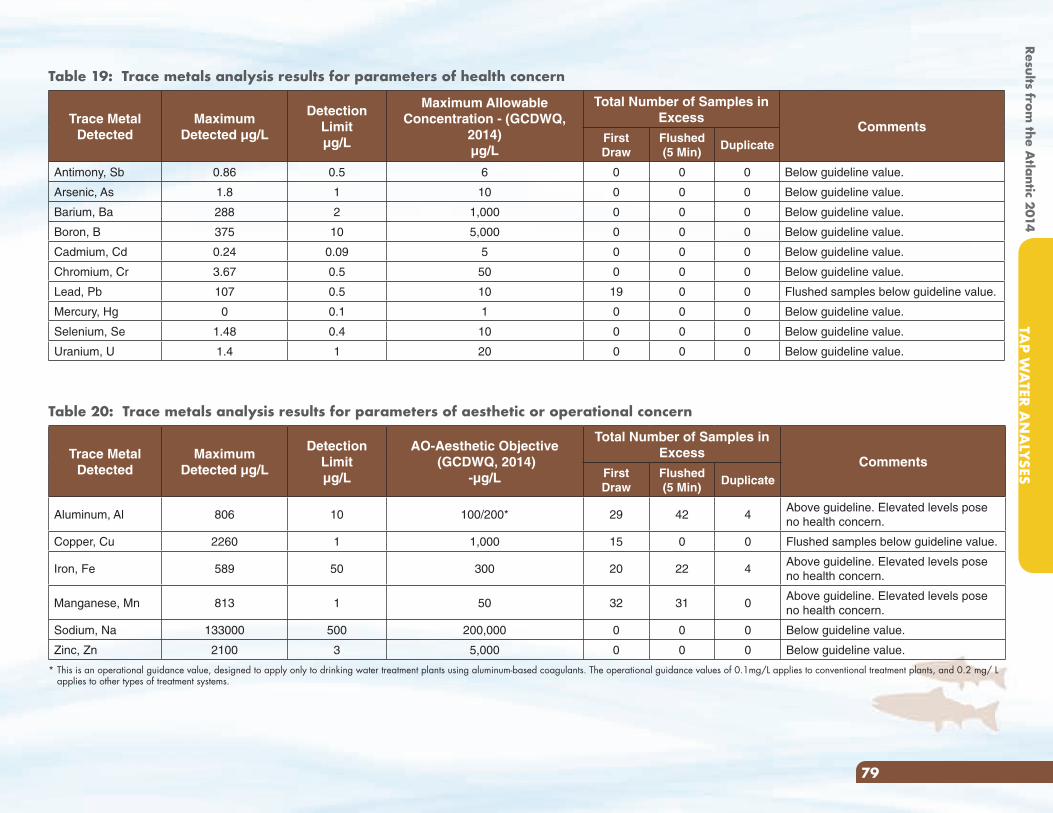
Table 19: Trace metals analysis results for parameters of health concern
Trace Metal Detected
Maximum Detected µg/L
Detection Limitµg/L
Maximum Allowable Concentration - (GCDWQ,
2014)µg/L
Total Number of Samples in Excess
CommentsFirst Draw
Flushed(5 Min)
Duplicate
Antimony, Sb 0.86 0.5 6 0 0 0 Below guideline value.
Arsenic, As 1.8 1 10 0 0 0 Below guideline value.
Barium, Ba 288 2 1,000 0 0 0 Below guideline value.
Boron, B 375 10 5,000 0 0 0 Below guideline value.
Cadmium, Cd 0.24 0.09 5 0 0 0 Below guideline value.
Chromium, Cr 3.67 0.5 50 0 0 0 Below guideline value.
Lead, Pb 107 0.5 10 19 0 0 Flushed samples below guideline value.
Mercury, Hg 0 0.1 1 0 0 0 Below guideline value.
Selenium, Se 1.48 0.4 10 0 0 0 Below guideline value.
Uranium, U 1.4 1 20 0 0 0 Below guideline value.
Table 20: Trace metals analysis results for parameters of aesthetic or operational concern
Trace Metal Detected
Maximum Detected µg/L
Detection Limitµg/L
AO-Aesthetic Objective (GCDWQ, 2014)
-µg/L
Total Number of Samples in Excess
CommentsFirst Draw
Flushed(5 Min)
Duplicate
Aluminum, Al 806 10 100/200* 29 42 4Above guideline. Elevated levels pose no health concern.
Copper, Cu 2260 1 1,000 15 0 0 Flushed samples below guideline value.
Iron, Fe 589 50 300 20 22 4Above guideline. Elevated levels pose no health concern.
Manganese, Mn 813 1 50 32 31 0Above guideline. Elevated levels pose no health concern.
Sodium, Na 133000 500 200,000 0 0 0 Below guideline value.
Zinc, Zn 2100 3 5,000 0 0 0 Below guideline value.
* This is an operational guidance value, designed to apply only to drinking water treatment plants using aluminum-based coagulants. The operational guidance values of 0.1mg/L applies to conventional treatment plants, and 0.2 mg/ L applies to other types of treatment systems.
Results from the A
tlantic 2014TA
P WA
TER AN
ALYSES
79
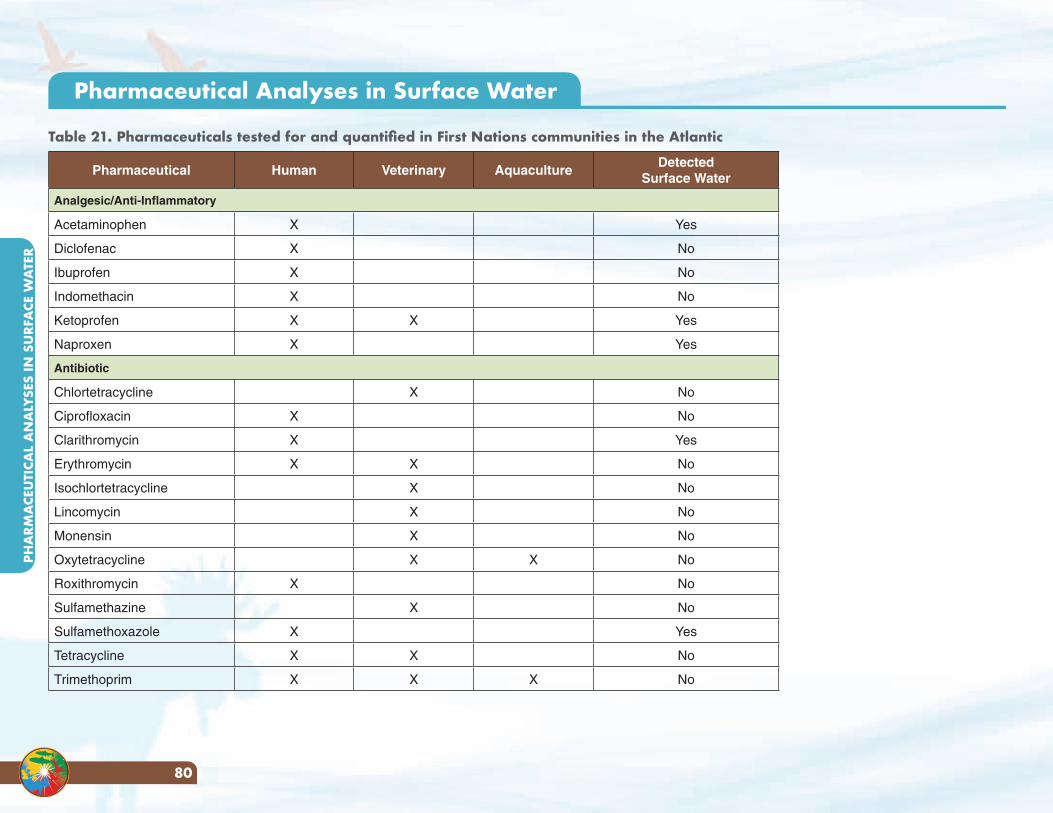
Pharmaceutical Human Veterinary AquacultureDetected
Surface Water
Analgesic/Anti-Inflammatory
Acetaminophen X Yes
Diclofenac X No
Ibuprofen X No
Indomethacin X No
Ketoprofen X X Yes
Naproxen X Yes
Antibiotic
Chlortetracycline X No
Ciprofloxacin X No
Clarithromycin X Yes
Erythromycin X X No
Isochlortetracycline X No
Lincomycin X No
Monensin X No
Oxytetracycline X X No
Roxithromycin X No
Sulfamethazine X No
Sulfamethoxazole X Yes
Tetracycline X X No
Trimethoprim X X X No
Pharmaceutical Analyses in Surface Water
Table 21. Pharmaceuticals tested for and quantified in First Nations communities in the Atlantic
PHA
RMA
CEU
TICA
L A
NA
LYSE
S IN
SU
RFA
CE W
ATE
R
80
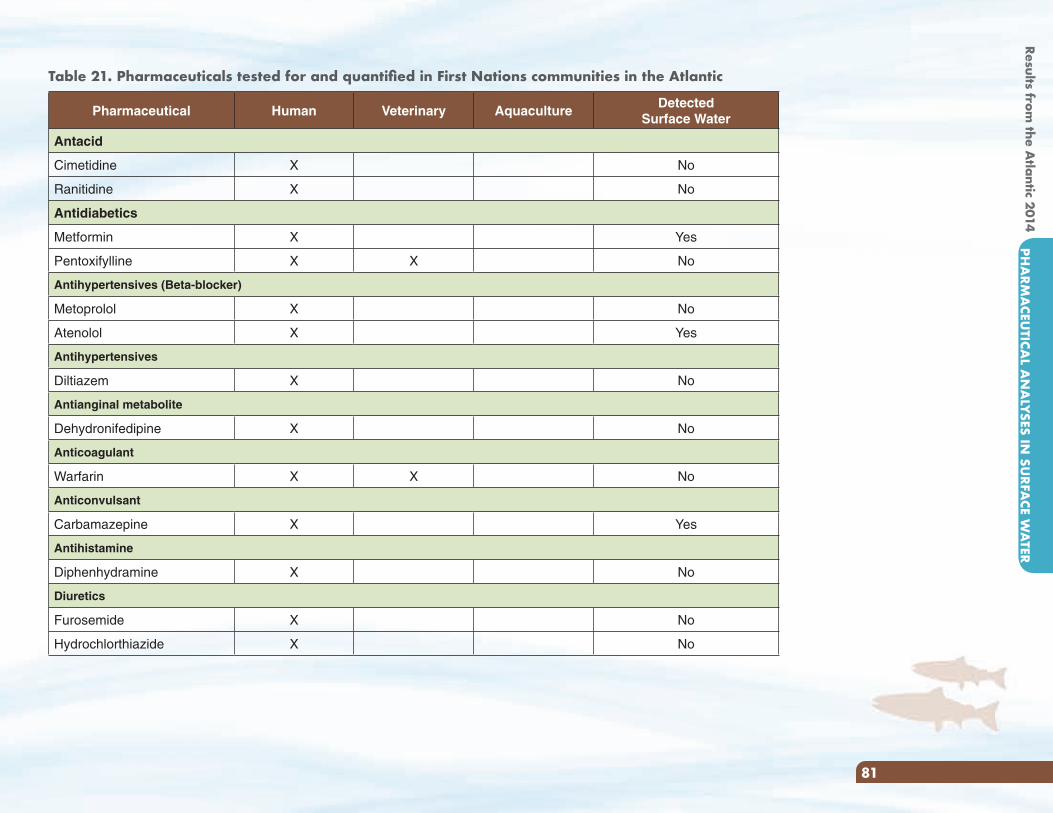
Pharmaceutical Human Veterinary AquacultureDetected
Surface Water
Antacid
Cimetidine X No
Ranitidine X No
Antidiabetics
Metformin X Yes
Pentoxifylline X X No
Antihypertensives (Beta-blocker)
Metoprolol X No
Atenolol X Yes
Antihypertensives
Diltiazem X No
Antianginal metabolite
Dehydronifedipine X No
Anticoagulant
Warfarin X X No
Anticonvulsant
Carbamazepine X Yes
Antihistamine
Diphenhydramine X No
Diuretics
Furosemide X No
Hydrochlorthiazide X No
Table 21. Pharmaceuticals tested for and quantified in First Nations communities in the Atlantic
Results from the A
tlantic 2014PH
ARM
ACEU
TICAL A
NA
LYSES IN SU
RFACE W
ATER
81
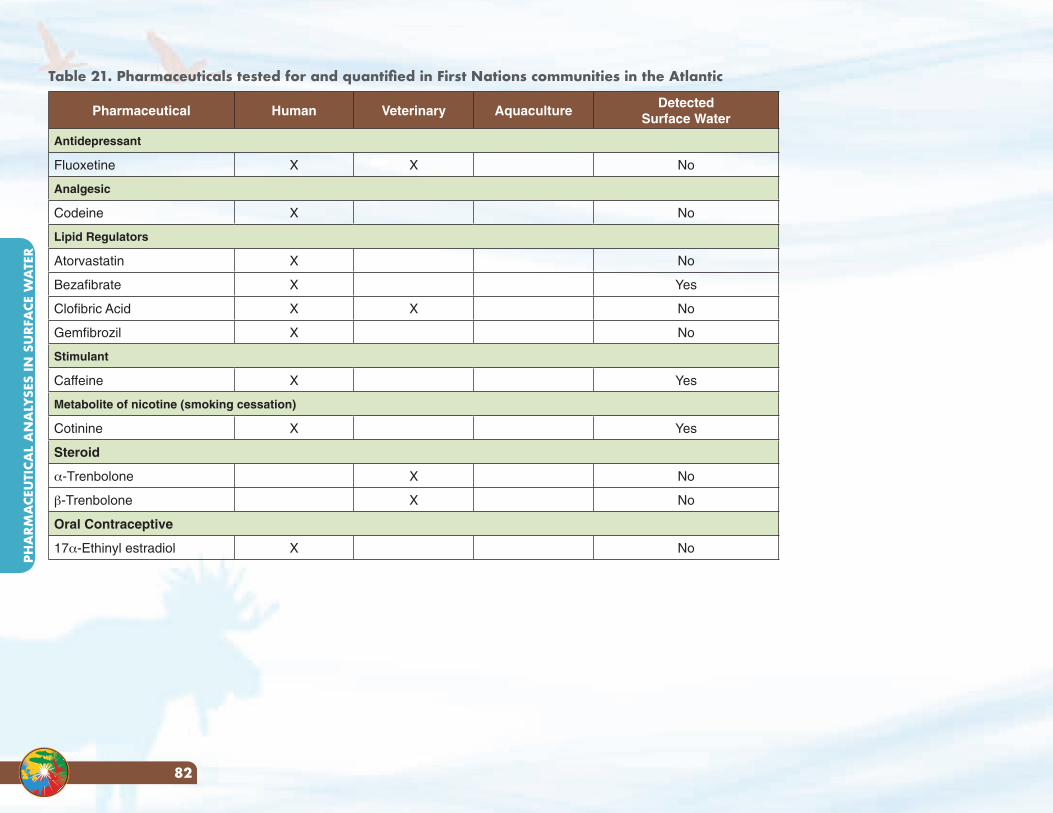
Pharmaceutical Human Veterinary AquacultureDetected
Surface Water
Antidepressant
Fluoxetine X X No
Analgesic
Codeine X No
Lipid Regulators
Atorvastatin X No
Bezafibrate X Yes
Clofibric Acid X X No
Gemfibrozil X No
Stimulant
Caffeine X Yes
Metabolite of nicotine (smoking cessation)
Cotinine X Yes
Steroid
α-Trenbolone X No
β-Trenbolone X No
Oral Contraceptive
17α-Ethinyl estradiol X No
Table 21. Pharmaceuticals tested for and quantified in First Nations communities in the Atlantic
PHA
RMA
CEU
TICA
L A
NA
LYSE
S IN
SU
RFA
CE W
ATE
R
82
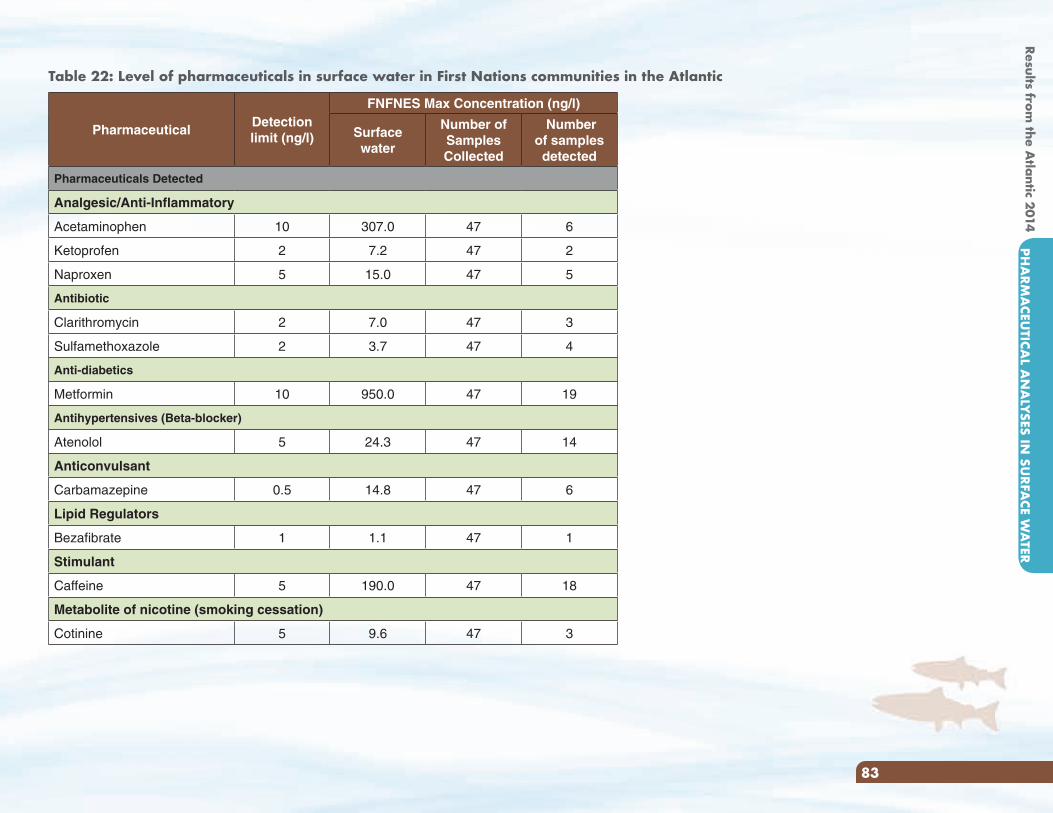
PharmaceuticalDetection limit (ng/l)
FNFNES Max Concentration (ng/l)
Surface water
Number of Samples Collected
Number of samples detected
Pharmaceuticals Detected
Analgesic/Anti-Inflammatory
Acetaminophen 10 307.0 47 6
Ketoprofen 2 7.2 47 2
Naproxen 5 15.0 47 5
Antibiotic
Clarithromycin 2 7.0 47 3
Sulfamethoxazole 2 3.7 47 4
Anti-diabetics
Metformin 10 950.0 47 19
Antihypertensives (Beta-blocker)
Atenolol 5 24.3 47 14
Anticonvulsant
Carbamazepine 0.5 14.8 47 6
Lipid Regulators
Bezafibrate 1 1.1 47 1
Stimulant
Caffeine 5 190.0 47 18
Metabolite of nicotine (smoking cessation)
Cotinine 5 9.6 47 3
Table 22: Level of pharmaceuticals in surface water in First Nations communities in the Atlantic
Results from the A
tlantic 2014PH
ARM
ACEU
TICAL A
NA
LYSES IN SU
RFACE W
ATER
83
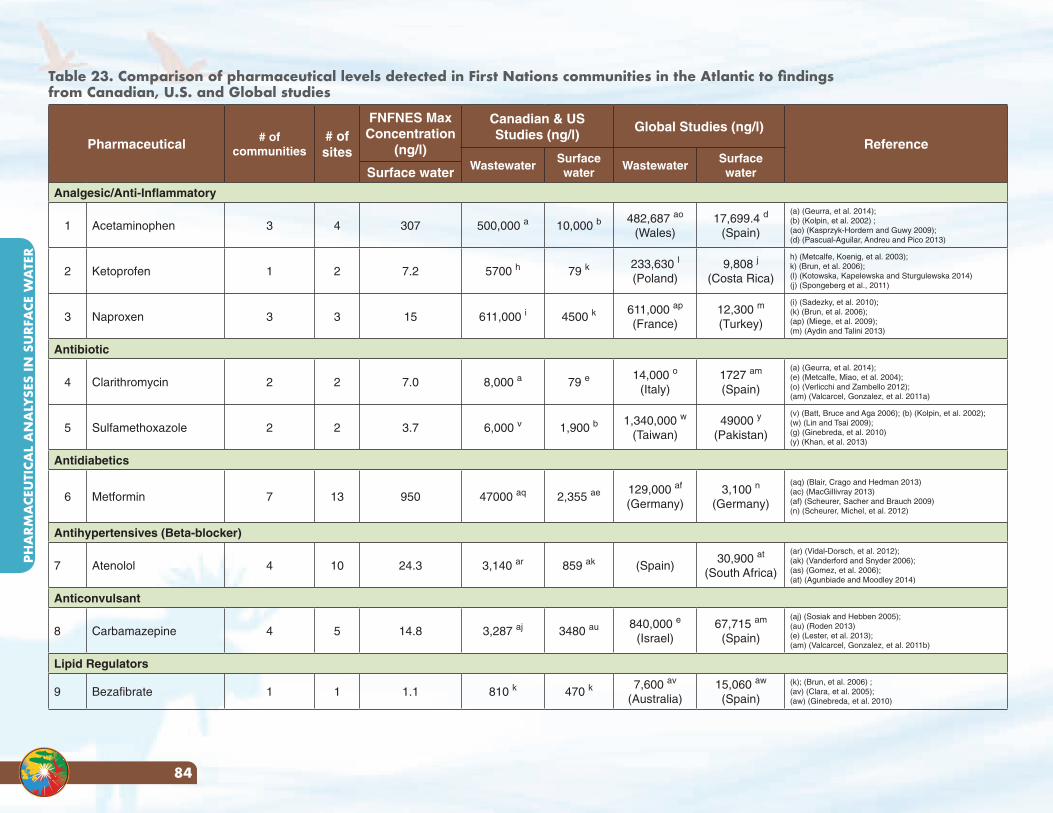
Pharmaceutical # of communities
# of sites
FNFNES Max Concentration
(ng/l)
Canadian & US Studies (ng/l)
Global Studies (ng/l)Reference
WastewaterSurface water
WastewaterSurface waterSurface water
Analgesic/Anti-Inflammatory
1 Acetaminophen 3 4 307 500,000 a 10,000 b482,687 ao
(Wales)17,699.4 d
(Spain)
(a) (Geurra, et al. 2014); (b) (Kolpin, et al. 2002) ; (ao) (Kasprzyk-Hordern and Guwy 2009); (d) (Pascual-Aguilar, Andreu and Pico 2013)
2 Ketoprofen 1 2 7.2 5700 h 79 k233,630 l
(Poland)9,808 j
(Costa Rica)
h) (Metcalfe, Koenig, et al. 2003);k) (Brun, et al. 2006); (l) (Kotowska, Kapelewska and Sturgulewska 2014)(j) (Spongeberg et al., 2011)
3 Naproxen 3 3 15 611,000 i 4500 k611,000 ap
(France)12,300 m
(Turkey)
(i) (Sadezky, et al. 2010); (k) (Brun, et al. 2006); (ap) (Miege, et al. 2009); (m) (Aydin and Talini 2013)
Antibiotic
4 Clarithromycin 2 2 7.0 8,000 a 79 e14,000 o
(Italy)1727 am
(Spain)
(a) (Geurra, et al. 2014); (e) (Metcalfe, Miao, et al. 2004); (o) (Verlicchi and Zambello 2012); (am) (Valcarcel, Gonzalez, et al. 2011a)
5 Sulfamethoxazole 2 2 3.7 6,000 v 1,900 b1,340,000 w
(Taiwan)49000 y
(Pakistan)
(v) (Batt, Bruce and Aga 2006); (b) (Kolpin, et al. 2002);(w) (Lin and Tsai 2009);(g) (Ginebreda, et al. 2010) (y) (Khan, et al. 2013)
Antidiabetics
6 Metformin 7 13 950 47000 aq 2,355 ae 129,000 af
(Germany)3,100 n
(Germany)
(aq) (Blair, Crago and Hedman 2013) (ac) (MacGillivray 2013)(af) (Scheurer, Sacher and Brauch 2009) (n) (Scheurer, Michel, et al. 2012)
Antihypertensives (Beta-blocker)
7 Atenolol 4 10 24.3 3,140 ar 859 ak (Spain)30,900 at
(South Africa)
(ar) (Vidal-Dorsch, et al. 2012);(ak) (Vanderford and Snyder 2006);(as) (Gomez, et al. 2006); (at) (Agunbiade and Moodley 2014)
Anticonvulsant
8 Carbamazepine 4 5 14.8 3,287 aj 3480 au 840,000 e
(Israel)67,715 am
(Spain)
(aj) (Sosiak and Hebben 2005);(au) (Roden 2013)(e) (Lester, et al. 2013); (am) (Valcarcel, Gonzalez, et al. 2011b)
Lipid Regulators
9 Bezafibrate 1 1 1.1 810 k 470 k7,600 av
(Australia)15,060 aw
(Spain)
(k); (Brun, et al. 2006) ;(av) (Clara, et al. 2005); (aw) (Ginebreda, et al. 2010)
Table 23. Comparison of pharmaceutical levels detected in First Nations communities in the Atlantic to findings from Canadian, U.S. and Global studies
PHA
RMA
CEU
TICA
L A
NA
LYSE
S IN
SU
RFA
CE W
ATE
R
84
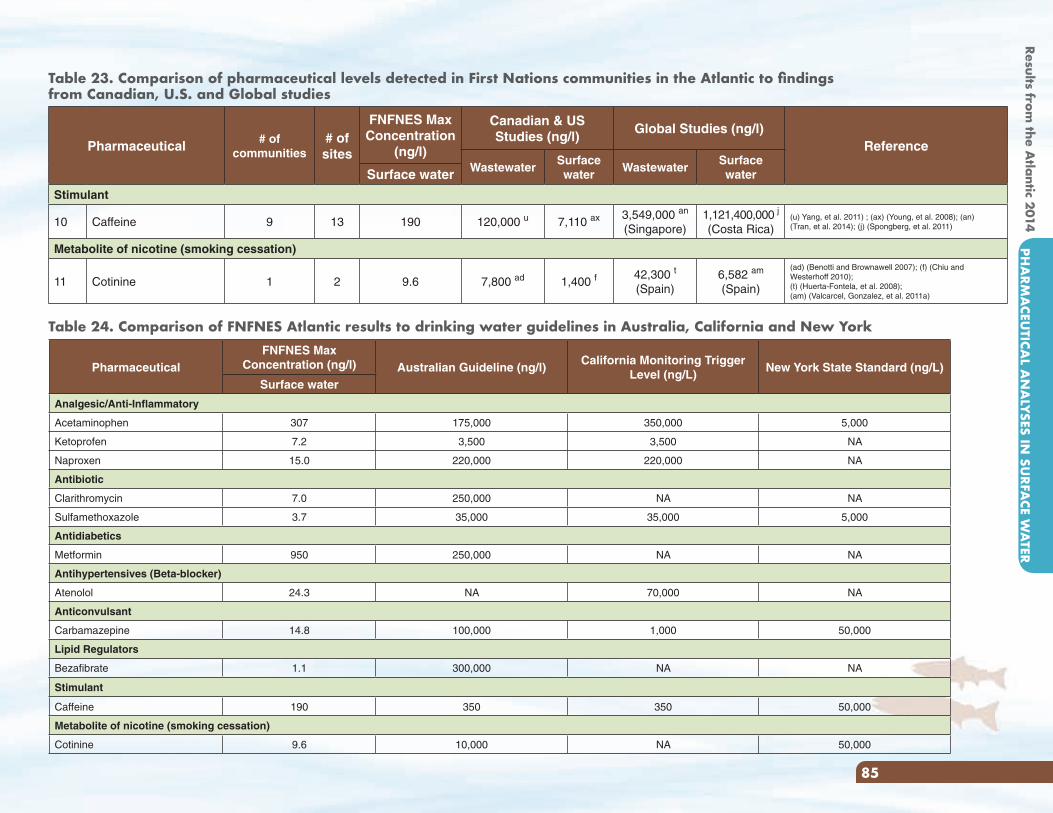
Pharmaceutical # of communities
# of sites
FNFNES Max Concentration
(ng/l)
Canadian & US Studies (ng/l)
Global Studies (ng/l)Reference
WastewaterSurface water
WastewaterSurface waterSurface water
Stimulant
10 Caffeine 9 13 190 120,000 u 7,110 ax 3,549,000 an
(Singapore)1,121,400,000 j
(Costa Rica)(u) Yang, et al. 2011) ; (ax) (Young, et al. 2008); (an) (Tran, et al. 2014); (j) (Spongberg, et al. 2011)
Metabolite of nicotine (smoking cessation)
11 Cotinine 1 2 9.6 7,800 ad 1,400 f42,300 t
(Spain)6,582 am
(Spain)
(ad) (Benotti and Brownawell 2007); (f) (Chiu and Westerhoff 2010);(t) (Huerta-Fontela, et al. 2008); (am) (Valcarcel, Gonzalez, et al. 2011a)
Table 23. Comparison of pharmaceutical levels detected in First Nations communities in the Atlantic to findings from Canadian, U.S. and Global studies
Table 24. Comparison of FNFNES Atlantic results to drinking water guidelines in Australia, California and New York
PharmaceuticalFNFNES Max
Concentration (ng/l) Australian Guideline (ng/l)California Monitoring Trigger
Level (ng/L)New York State Standard (ng/L)
Surface water
Analgesic/Anti-Inflammatory
Acetaminophen 307 175,000 350,000 5,000
Ketoprofen 7.2 3,500 3,500 NA
Naproxen 15.0 220,000 220,000 NA
Antibiotic
Clarithromycin 7.0 250,000 NA NA
Sulfamethoxazole 3.7 35,000 35,000 5,000
Antidiabetics
Metformin 950 250,000 NA NA
Antihypertensives (Beta-blocker)
Atenolol 24.3 NA 70,000 NA
Anticonvulsant
Carbamazepine 14.8 100,000 1,000 50,000
Lipid Regulators
Bezafibrate 1.1 300,000 NA NA
Stimulant
Caffeine 190 350 350 50,000
Metabolite of nicotine (smoking cessation)
Cotinine 9.6 10,000 NA 50,000
Results from the A
tlantic 2014PH
ARM
ACEU
TICAL A
NA
LYSES IN SU
RFACE W
ATER
85
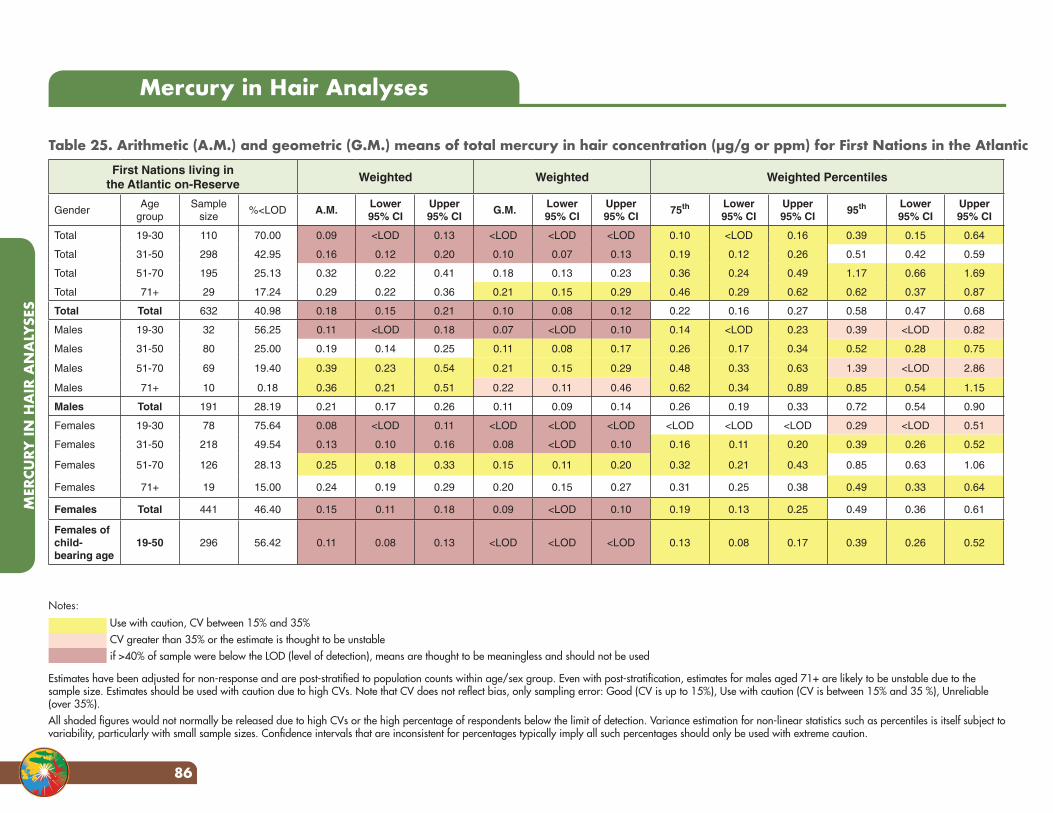
Mercury in Hair Analyses
Table 25. Arithmetic (A.M.) and geometric (G.M.) means of total mercury in hair concentration (µg/g or ppm) for First Nations in the Atlantic
First Nations living in the Atlantic on-Reserve
Weighted Weighted Weighted Percentiles
GenderAge
groupSample
size%<LOD A.M.
Lower 95% CI
Upper 95% CI
G.M.Lower 95% CI
Upper 95% CI
75th Lower 95% CI
Upper 95% CI
95th Lower 95% CI
Upper 95% CI
Total 19-30 110 70.00 0.09 <LOD 0.13 <LOD <LOD <LOD 0.10 <LOD 0.16 0.39 0.15 0.64
Total 31-50 298 42.95 0.16 0.12 0.20 0.10 0.07 0.13 0.19 0.12 0.26 0.51 0.42 0.59
Total 51-70 195 25.13 0.32 0.22 0.41 0.18 0.13 0.23 0.36 0.24 0.49 1.17 0.66 1.69
Total 71+ 29 17.24 0.29 0.22 0.36 0.21 0.15 0.29 0.46 0.29 0.62 0.62 0.37 0.87
Total Total 632 40.98 0.18 0.15 0.21 0.10 0.08 0.12 0.22 0.16 0.27 0.58 0.47 0.68
Males 19-30 32 56.25 0.11 <LOD 0.18 0.07 <LOD 0.10 0.14 <LOD 0.23 0.39 <LOD 0.82
Males 31-50 80 25.00 0.19 0.14 0.25 0.11 0.08 0.17 0.26 0.17 0.34 0.52 0.28 0.75
Males 51-70 69 19.40 0.39 0.23 0.54 0.21 0.15 0.29 0.48 0.33 0.63 1.39 <LOD 2.86
Males 71+ 10 0.18 0.36 0.21 0.51 0.22 0.11 0.46 0.62 0.34 0.89 0.85 0.54 1.15
Males Total 191 28.19 0.21 0.17 0.26 0.11 0.09 0.14 0.26 0.19 0.33 0.72 0.54 0.90
Females 19-30 78 75.64 0.08 <LOD 0.11 <LOD <LOD <LOD <LOD <LOD <LOD 0.29 <LOD 0.51
Females 31-50 218 49.54 0.13 0.10 0.16 0.08 <LOD 0.10 0.16 0.11 0.20 0.39 0.26 0.52
Females 51-70 126 28.13 0.25 0.18 0.33 0.15 0.11 0.20 0.32 0.21 0.43 0.85 0.63 1.06
Females 71+ 19 15.00 0.24 0.19 0.29 0.20 0.15 0.27 0.31 0.25 0.38 0.49 0.33 0.64
Females Total 441 46.40 0.15 0.11 0.18 0.09 <LOD 0.10 0.19 0.13 0.25 0.49 0.36 0.61
Females of child- bearing age
19-50 296 56.42 0.11 0.08 0.13 <LOD <LOD <LOD 0.13 0.08 0.17 0.39 0.26 0.52
Use with caution, CV between 15% and 35%CV greater than 35% or the estimate is thought to be unstableif >40% of sample were below the LOD (level of detection), means are thought to be meaningless and should not be used
Estimates have been adjusted for non-response and are post-stratified to population counts within age/sex group. Even with post-stratification, estimates for males aged 71+ are likely to be unstable due to the sample size. Estimates should be used with caution due to high CVs. Note that CV does not reflect bias, only sampling error: Good (CV is up to 15%), Use with caution (CV is between 15% and 35 %), Unreliable (over 35%).All shaded figures would not normally be released due to high CVs or the high percentage of respondents below the limit of detection. Variance estimation for non-linear statistics such as percentiles is itself subject to variability, particularly with small sample sizes. Confidence intervals that are inconsistent for percentages typically imply all such percentages should only be used with extreme caution.
Notes:
MER
CURY
IN H
AIR
AN
ALY
SES
86
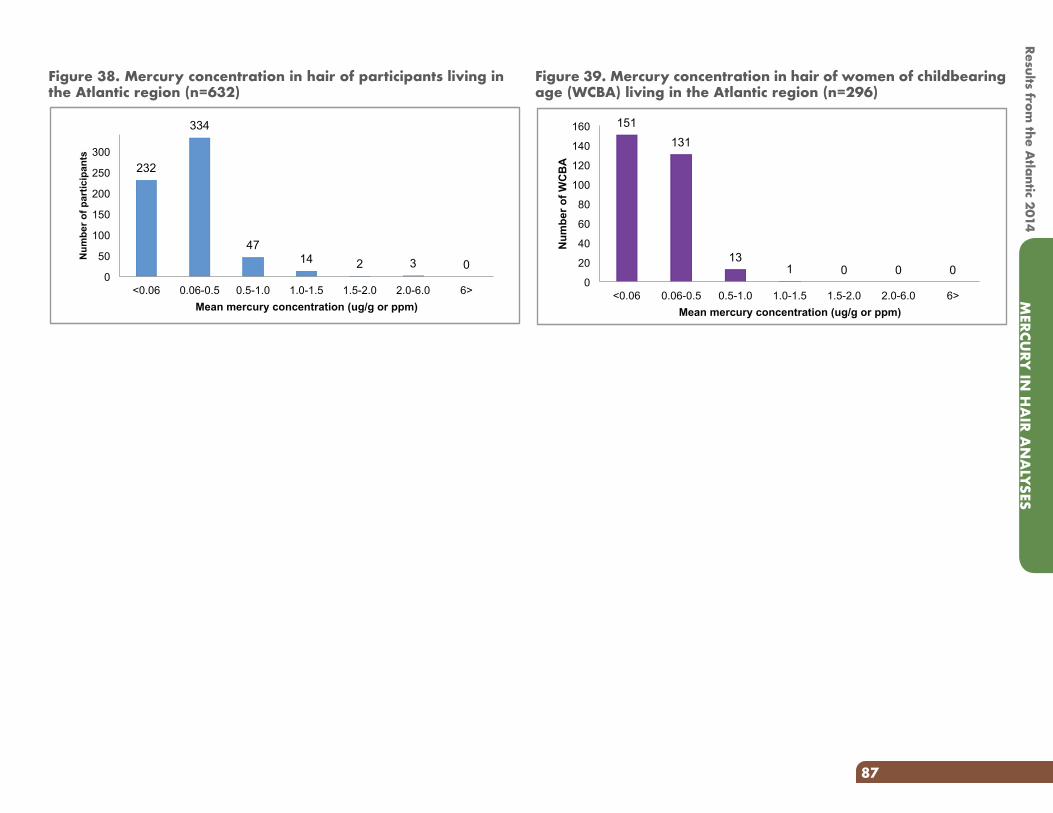
Figure 38. Mercury concentration in hair of participants living in the Atlantic region (n=632)
232
334
47 14 2 3 0
0
50
100
150
200
250
300
<0.06 0.06-0.5 0.5-1.0 1.0-1.5 1.5-2.0 2.0-6.0 6>
Num
ber o
f par
ticip
ants
Mean mercury concentration (ug/g or ppm)
Figure 39. Mercury concentration in hair of women of childbearing age (WCBA) living in the Atlantic region (n=296)
151 131
13 1 0 0 0
0
20
40
60
80
100
120
140
160
<0.06 0.06-0.5 0.5-1.0 1.0-1.5 1.5-2.0 2.0-6.0 6>
Num
ber o
f WC
BA
Mean mercury concentration (ug/g or ppm)
MERCU
RY IN
HA
IR AN
ALYSES
87
Results from the A
tlantic 2014
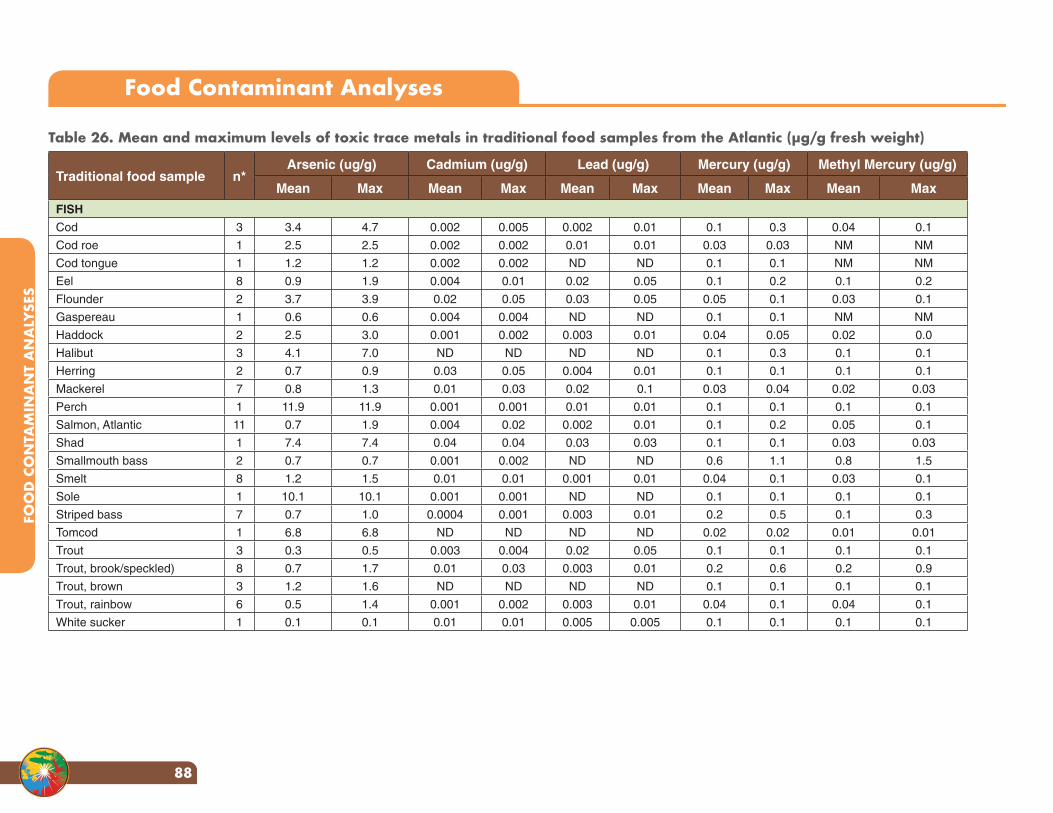
Table 26. Mean and maximum levels of toxic trace metals in traditional food samples from the Atlantic (µg/g fresh weight)
Traditional food sample n*Arsenic (ug/g) Cadmium (ug/g) Lead (ug/g) Mercury (ug/g) Methyl Mercury (ug/g)
Mean Max Mean Max Mean Max Mean Max Mean Max
FISH
Cod 3 3.4 4.7 0.002 0.005 0.002 0.01 0.1 0.3 0.04 0.1
Cod roe 1 2.5 2.5 0.002 0.002 0.01 0.01 0.03 0.03 NM NM
Cod tongue 1 1.2 1.2 0.002 0.002 ND ND 0.1 0.1 NM NM
Eel 8 0.9 1.9 0.004 0.01 0.02 0.05 0.1 0.2 0.1 0.2
Flounder 2 3.7 3.9 0.02 0.05 0.03 0.05 0.05 0.1 0.03 0.1
Gaspereau 1 0.6 0.6 0.004 0.004 ND ND 0.1 0.1 NM NM
Haddock 2 2.5 3.0 0.001 0.002 0.003 0.01 0.04 0.05 0.02 0.0
Halibut 3 4.1 7.0 ND ND ND ND 0.1 0.3 0.1 0.1
Herring 2 0.7 0.9 0.03 0.05 0.004 0.01 0.1 0.1 0.1 0.1
Mackerel 7 0.8 1.3 0.01 0.03 0.02 0.1 0.03 0.04 0.02 0.03
Perch 1 11.9 11.9 0.001 0.001 0.01 0.01 0.1 0.1 0.1 0.1
Salmon, Atlantic 11 0.7 1.9 0.004 0.02 0.002 0.01 0.1 0.2 0.05 0.1
Shad 1 7.4 7.4 0.04 0.04 0.03 0.03 0.1 0.1 0.03 0.03
Smallmouth bass 2 0.7 0.7 0.001 0.002 ND ND 0.6 1.1 0.8 1.5
Smelt 8 1.2 1.5 0.01 0.01 0.001 0.01 0.04 0.1 0.03 0.1
Sole 1 10.1 10.1 0.001 0.001 ND ND 0.1 0.1 0.1 0.1
Striped bass 7 0.7 1.0 0.0004 0.001 0.003 0.01 0.2 0.5 0.1 0.3
Tomcod 1 6.8 6.8 ND ND ND ND 0.02 0.02 0.01 0.01
Trout 3 0.3 0.5 0.003 0.004 0.02 0.05 0.1 0.1 0.1 0.1
Trout, brook/speckled) 8 0.7 1.7 0.01 0.03 0.003 0.01 0.2 0.6 0.2 0.9
Trout, brown 3 1.2 1.6 ND ND ND ND 0.1 0.1 0.1 0.1
Trout, rainbow 6 0.5 1.4 0.001 0.002 0.003 0.01 0.04 0.1 0.04 0.1
White sucker 1 0.1 0.1 0.01 0.01 0.005 0.005 0.1 0.1 0.1 0.1
Food Contaminant Analyses
FOO
D C
ON
TAM
INA
NT
AN
ALY
SES
88
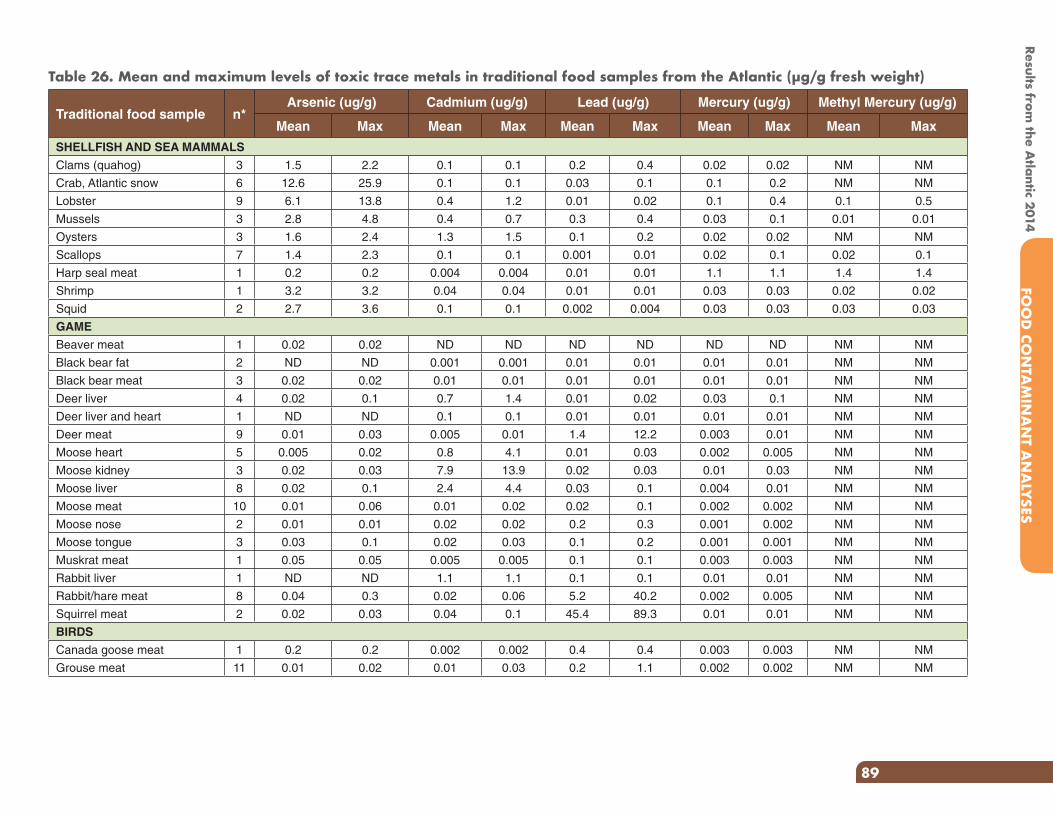
Traditional food sample n*Arsenic (ug/g) Cadmium (ug/g) Lead (ug/g) Mercury (ug/g) Methyl Mercury (ug/g)
Mean Max Mean Max Mean Max Mean Max Mean Max
SHELLFISH AND SEA MAMMALS
Clams (quahog) 3 1.5 2.2 0.1 0.1 0.2 0.4 0.02 0.02 NM NM
Crab, Atlantic snow 6 12.6 25.9 0.1 0.1 0.03 0.1 0.1 0.2 NM NM
Lobster 9 6.1 13.8 0.4 1.2 0.01 0.02 0.1 0.4 0.1 0.5
Mussels 3 2.8 4.8 0.4 0.7 0.3 0.4 0.03 0.1 0.01 0.01
Oysters 3 1.6 2.4 1.3 1.5 0.1 0.2 0.02 0.02 NM NM
Scallops 7 1.4 2.3 0.1 0.1 0.001 0.01 0.02 0.1 0.02 0.1
Harp seal meat 1 0.2 0.2 0.004 0.004 0.01 0.01 1.1 1.1 1.4 1.4
Shrimp 1 3.2 3.2 0.04 0.04 0.01 0.01 0.03 0.03 0.02 0.02
Squid 2 2.7 3.6 0.1 0.1 0.002 0.004 0.03 0.03 0.03 0.03
GAME
Beaver meat 1 0.02 0.02 ND ND ND ND ND ND NM NM
Black bear fat 2 ND ND 0.001 0.001 0.01 0.01 0.01 0.01 NM NM
Black bear meat 3 0.02 0.02 0.01 0.01 0.01 0.01 0.01 0.01 NM NM
Deer liver 4 0.02 0.1 0.7 1.4 0.01 0.02 0.03 0.1 NM NM
Deer liver and heart 1 ND ND 0.1 0.1 0.01 0.01 0.01 0.01 NM NM
Deer meat 9 0.01 0.03 0.005 0.01 1.4 12.2 0.003 0.01 NM NM
Moose heart 5 0.005 0.02 0.8 4.1 0.01 0.03 0.002 0.005 NM NM
Moose kidney 3 0.02 0.03 7.9 13.9 0.02 0.03 0.01 0.03 NM NM
Moose liver 8 0.02 0.1 2.4 4.4 0.03 0.1 0.004 0.01 NM NM
Moose meat 10 0.01 0.06 0.01 0.02 0.02 0.1 0.002 0.002 NM NM
Moose nose 2 0.01 0.01 0.02 0.02 0.2 0.3 0.001 0.002 NM NM
Moose tongue 3 0.03 0.1 0.02 0.03 0.1 0.2 0.001 0.001 NM NM
Muskrat meat 1 0.05 0.05 0.005 0.005 0.1 0.1 0.003 0.003 NM NM
Rabbit liver 1 ND ND 1.1 1.1 0.1 0.1 0.01 0.01 NM NM
Rabbit/hare meat 8 0.04 0.3 0.02 0.06 5.2 40.2 0.002 0.005 NM NM
Squirrel meat 2 0.02 0.03 0.04 0.1 45.4 89.3 0.01 0.01 NM NM
BIRDS
Canada goose meat 1 0.2 0.2 0.002 0.002 0.4 0.4 0.003 0.003 NM NM
Grouse meat 11 0.01 0.02 0.01 0.03 0.2 1.1 0.002 0.002 NM NM
Table 26. Mean and maximum levels of toxic trace metals in traditional food samples from the Atlantic (µg/g fresh weight)
Results from the A
tlantic 2014FO
OD
CON
TAM
INA
NT A
NA
LYSES
89
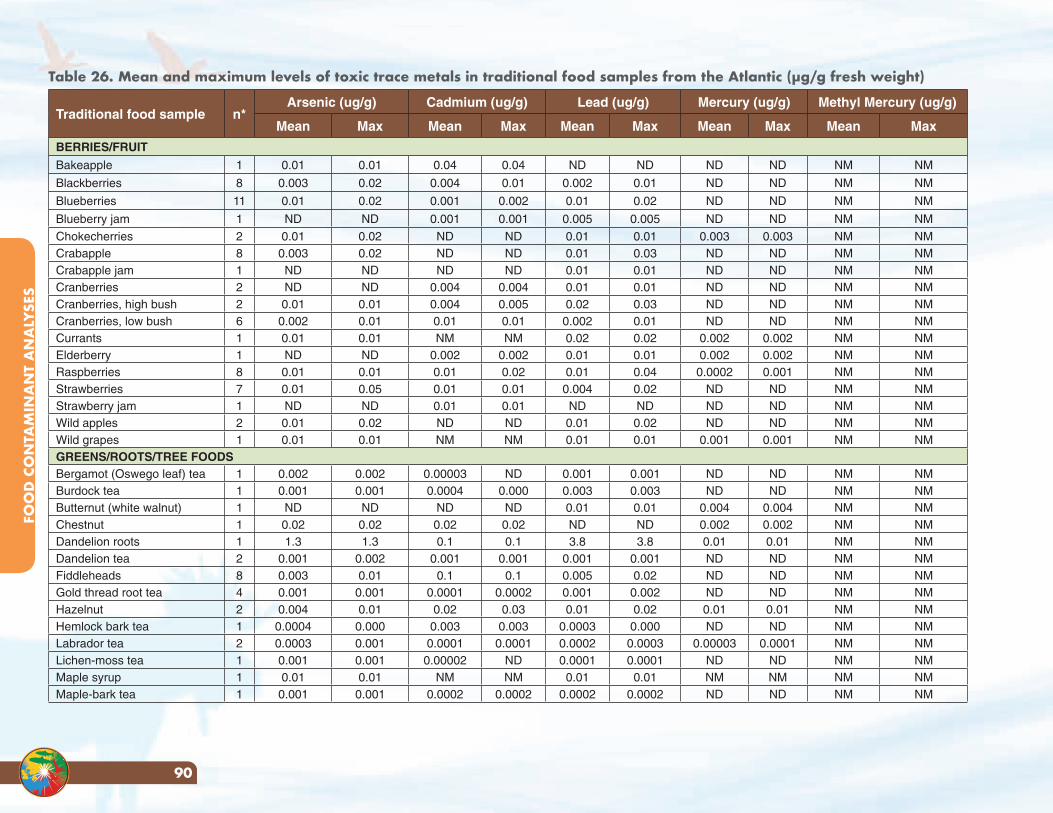
Traditional food sample n*Arsenic (ug/g) Cadmium (ug/g) Lead (ug/g) Mercury (ug/g) Methyl Mercury (ug/g)
Mean Max Mean Max Mean Max Mean Max Mean Max
BERRIES/FRUIT
Bakeapple 1 0.01 0.01 0.04 0.04 ND ND ND ND NM NM
Blackberries 8 0.003 0.02 0.004 0.01 0.002 0.01 ND ND NM NM
Blueberries 11 0.01 0.02 0.001 0.002 0.01 0.02 ND ND NM NM
Blueberry jam 1 ND ND 0.001 0.001 0.005 0.005 ND ND NM NM
Chokecherries 2 0.01 0.02 ND ND 0.01 0.01 0.003 0.003 NM NMCrabapple 8 0.003 0.02 ND ND 0.01 0.03 ND ND NM NMCrabapple jam 1 ND ND ND ND 0.01 0.01 ND ND NM NMCranberries 2 ND ND 0.004 0.004 0.01 0.01 ND ND NM NMCranberries, high bush 2 0.01 0.01 0.004 0.005 0.02 0.03 ND ND NM NMCranberries, low bush 6 0.002 0.01 0.01 0.01 0.002 0.01 ND ND NM NMCurrants 1 0.01 0.01 NM NM 0.02 0.02 0.002 0.002 NM NMElderberry 1 ND ND 0.002 0.002 0.01 0.01 0.002 0.002 NM NMRaspberries 8 0.01 0.01 0.01 0.02 0.01 0.04 0.0002 0.001 NM NMStrawberries 7 0.01 0.05 0.01 0.01 0.004 0.02 ND ND NM NMStrawberry jam 1 ND ND 0.01 0.01 ND ND ND ND NM NMWild apples 2 0.01 0.02 ND ND 0.01 0.02 ND ND NM NMWild grapes 1 0.01 0.01 NM NM 0.01 0.01 0.001 0.001 NM NMGREENS/ROOTS/TREE FOODSBergamot (Oswego leaf) tea 1 0.002 0.002 0.00003 ND 0.001 0.001 ND ND NM NMBurdock tea 1 0.001 0.001 0.0004 0.000 0.003 0.003 ND ND NM NMButternut (white walnut) 1 ND ND ND ND 0.01 0.01 0.004 0.004 NM NMChestnut 1 0.02 0.02 0.02 0.02 ND ND 0.002 0.002 NM NMDandelion roots 1 1.3 1.3 0.1 0.1 3.8 3.8 0.01 0.01 NM NMDandelion tea 2 0.001 0.002 0.001 0.001 0.001 0.001 ND ND NM NMFiddleheads 8 0.003 0.01 0.1 0.1 0.005 0.02 ND ND NM NMGold thread root tea 4 0.001 0.001 0.0001 0.0002 0.001 0.002 ND ND NM NMHazelnut 2 0.004 0.01 0.02 0.03 0.01 0.02 0.01 0.01 NM NMHemlock bark tea 1 0.0004 0.000 0.003 0.003 0.0003 0.000 ND ND NM NMLabrador tea 2 0.0003 0.001 0.0001 0.0001 0.0002 0.0003 0.00003 0.0001 NM NMLichen-moss tea 1 0.001 0.001 0.00002 ND 0.0001 0.0001 ND ND NM NMMaple syrup 1 0.01 0.01 NM NM 0.01 0.01 NM NM NM NMMaple-bark tea 1 0.001 0.001 0.0002 0.0002 0.0002 0.0002 ND ND NM NM
Table 26. Mean and maximum levels of toxic trace metals in traditional food samples from the Atlantic (µg/g fresh weight)
FOO
D C
ON
TAM
INA
NT
AN
ALY
SES
90
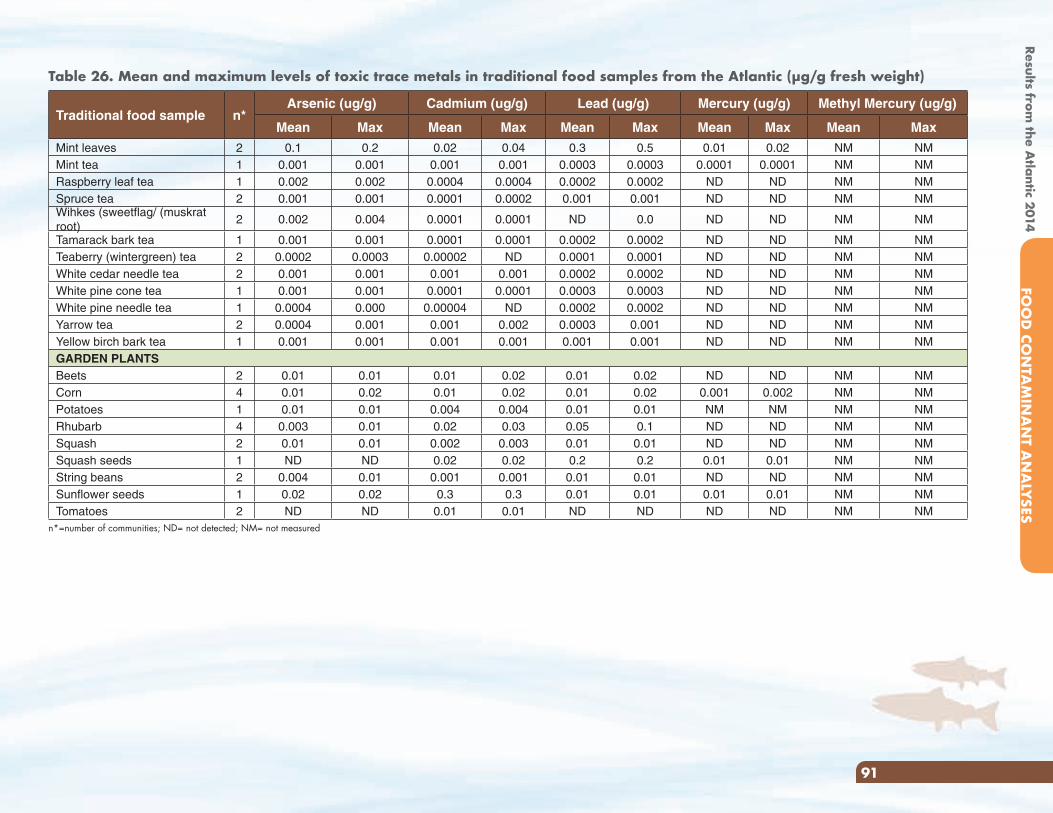
Traditional food sample n*Arsenic (ug/g) Cadmium (ug/g) Lead (ug/g) Mercury (ug/g) Methyl Mercury (ug/g)
Mean Max Mean Max Mean Max Mean Max Mean Max
Mint leaves 2 0.1 0.2 0.02 0.04 0.3 0.5 0.01 0.02 NM NMMint tea 1 0.001 0.001 0.001 0.001 0.0003 0.0003 0.0001 0.0001 NM NMRaspberry leaf tea 1 0.002 0.002 0.0004 0.0004 0.0002 0.0002 ND ND NM NMSpruce tea 2 0.001 0.001 0.0001 0.0002 0.001 0.001 ND ND NM NMWihkes (sweetflag/ (muskrat root)
2 0.002 0.004 0.0001 0.0001 ND 0.0 ND ND NM NM
Tamarack bark tea 1 0.001 0.001 0.0001 0.0001 0.0002 0.0002 ND ND NM NMTeaberry (wintergreen) tea 2 0.0002 0.0003 0.00002 ND 0.0001 0.0001 ND ND NM NMWhite cedar needle tea 2 0.001 0.001 0.001 0.001 0.0002 0.0002 ND ND NM NMWhite pine cone tea 1 0.001 0.001 0.0001 0.0001 0.0003 0.0003 ND ND NM NMWhite pine needle tea 1 0.0004 0.000 0.00004 ND 0.0002 0.0002 ND ND NM NMYarrow tea 2 0.0004 0.001 0.001 0.002 0.0003 0.001 ND ND NM NMYellow birch bark tea 1 0.001 0.001 0.001 0.001 0.001 0.001 ND ND NM NMGARDEN PLANTSBeets 2 0.01 0.01 0.01 0.02 0.01 0.02 ND ND NM NMCorn 4 0.01 0.02 0.01 0.02 0.01 0.02 0.001 0.002 NM NMPotatoes 1 0.01 0.01 0.004 0.004 0.01 0.01 NM NM NM NMRhubarb 4 0.003 0.01 0.02 0.03 0.05 0.1 ND ND NM NMSquash 2 0.01 0.01 0.002 0.003 0.01 0.01 ND ND NM NMSquash seeds 1 ND ND 0.02 0.02 0.2 0.2 0.01 0.01 NM NMString beans 2 0.004 0.01 0.001 0.001 0.01 0.01 ND ND NM NMSunflower seeds 1 0.02 0.02 0.3 0.3 0.01 0.01 0.01 0.01 NM NMTomatoes 2 ND ND 0.01 0.01 ND ND ND ND NM NM
n*=number of communities; ND= not detected; NM= not measured
Table 26. Mean and maximum levels of toxic trace metals in traditional food samples from the Atlantic (µg/g fresh weight)
Results from the A
tlantic 2014FO
OD
CON
TAM
INA
NT A
NA
LYSES
91
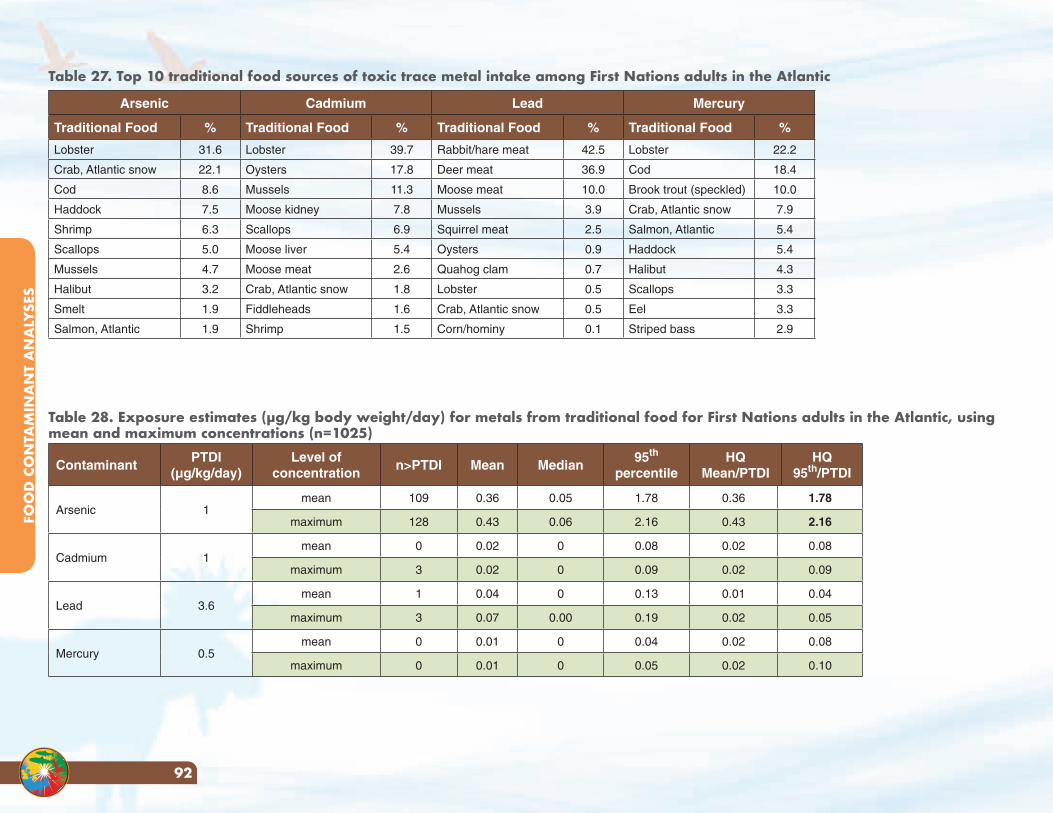
Table 27. Top 10 traditional food sources of toxic trace metal intake among First Nations adults in the Atlantic
Arsenic Cadmium Lead Mercury
Traditional Food % Traditional Food % Traditional Food % Traditional Food %
Lobster 31.6 Lobster 39.7 Rabbit/hare meat 42.5 Lobster 22.2
Crab, Atlantic snow 22.1 Oysters 17.8 Deer meat 36.9 Cod 18.4
Cod 8.6 Mussels 11.3 Moose meat 10.0 Brook trout (speckled) 10.0
Haddock 7.5 Moose kidney 7.8 Mussels 3.9 Crab, Atlantic snow 7.9
Shrimp 6.3 Scallops 6.9 Squirrel meat 2.5 Salmon, Atlantic 5.4
Scallops 5.0 Moose liver 5.4 Oysters 0.9 Haddock 5.4
Mussels 4.7 Moose meat 2.6 Quahog clam 0.7 Halibut 4.3
Halibut 3.2 Crab, Atlantic snow 1.8 Lobster 0.5 Scallops 3.3
Smelt 1.9 Fiddleheads 1.6 Crab, Atlantic snow 0.5 Eel 3.3
Salmon, Atlantic 1.9 Shrimp 1.5 Corn/hominy 0.1 Striped bass 2.9
Table 28. Exposure estimates (µg/kg body weight/day) for metals from traditional food for First Nations adults in the Atlantic, using mean and maximum concentrations (n=1025)
ContaminantPTDI
(µg/kg/day)Level of
concentrationn>PTDI Mean Median
95th percentile
HQMean/PTDI
HQ95th/PTDI
Arsenic 1mean 109 0.36 0.05 1.78 0.36 1.78
maximum 128 0.43 0.06 2.16 0.43 2.16
Cadmium 1mean 0 0.02 0 0.08 0.02 0.08
maximum 3 0.02 0 0.09 0.02 0.09
Lead 3.6mean 1 0.04 0 0.13 0.01 0.04
maximum 3 0.07 0.00 0.19 0.02 0.05
Mercury 0.5mean 0 0.01 0 0.04 0.02 0.08
maximum 0 0.01 0 0.05 0.02 0.10
FOO
D C
ON
TAM
INA
NT
AN
ALY
SES
92
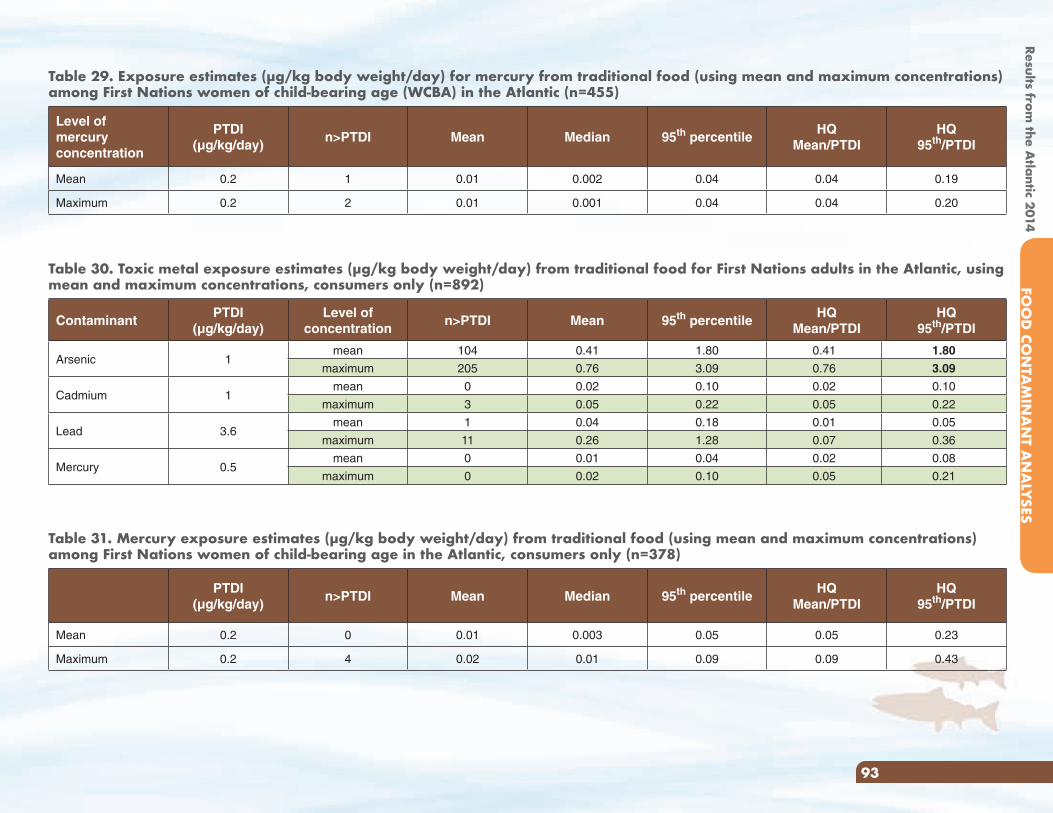
Table 29. Exposure estimates (µg/kg body weight/day) for mercury from traditional food (using mean and maximum concentrations) among First Nations women of child-bearing age (WCBA) in the Atlantic (n=455)
Level of mercury concentration
PTDI(µg/kg/day)
n>PTDI Mean Median 95th percentileHQ
Mean/PTDIHQ
95th/PTDI
Mean 0.2 1 0.01 0.002 0.04 0.04 0.19
Maximum 0.2 2 0.01 0.001 0.04 0.04 0.20
Table 30. Toxic metal exposure estimates (µg/kg body weight/day) from traditional food for First Nations adults in the Atlantic, using mean and maximum concentrations, consumers only (n=892)
ContaminantPTDI
(µg/kg/day)Level of
concentrationn>PTDI Mean 95th percentile
HQMean/PTDI
HQ95th/PTDI
Arsenic 1mean 104 0.41 1.80 0.41 1.80
maximum 205 0.76 3.09 0.76 3.09
Cadmium 1mean 0 0.02 0.10 0.02 0.10
maximum 3 0.05 0.22 0.05 0.22
Lead 3.6mean 1 0.04 0.18 0.01 0.05
maximum 11 0.26 1.28 0.07 0.36
Mercury 0.5mean 0 0.01 0.04 0.02 0.08
maximum 0 0.02 0.10 0.05 0.21
Table 31. Mercury exposure estimates (µg/kg body weight/day) from traditional food (using mean and maximum concentrations) among First Nations women of child-bearing age in the Atlantic, consumers only (n=378)
PTDI(µg/kg/day)
n>PTDI Mean Median 95th percentileHQ
Mean/PTDIHQ
95th/PTDI
Mean 0.2 0 0.01 0.003 0.05 0.05 0.23
Maximum 0.2 4 0.02 0.01 0.09 0.09 0.43
Results from the A
tlantic 2014FO
OD
CON
TAM
INA
NT A
NA
LYSES
93
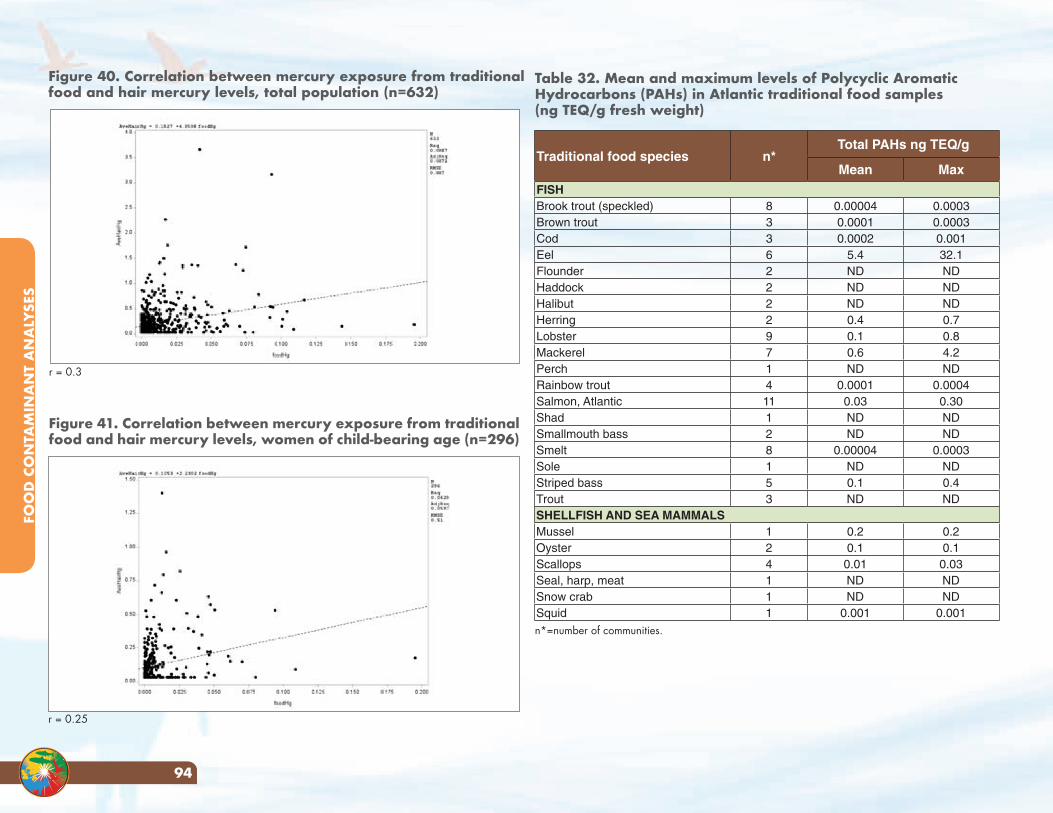
Figure 41. Correlation between mercury exposure from traditional food and hair mercury levels, women of child-bearing age (n=296)
Figure 40. Correlation between mercury exposure from traditional food and hair mercury levels, total population (n=632)
Traditional food species n*Total PAHs ng TEQ/g
Mean MaxFISHBrook trout (speckled) 8 0.00004 0.0003Brown trout 3 0.0001 0.0003Cod 3 0.0002 0.001Eel 6 5.4 32.1Flounder 2 ND NDHaddock 2 ND NDHalibut 2 ND NDHerring 2 0.4 0.7Lobster 9 0.1 0.8Mackerel 7 0.6 4.2Perch 1 ND NDRainbow trout 4 0.0001 0.0004Salmon, Atlantic 11 0.03 0.30Shad 1 ND NDSmallmouth bass 2 ND NDSmelt 8 0.00004 0.0003Sole 1 ND NDStriped bass 5 0.1 0.4Trout 3 ND NDSHELLFISH AND SEA MAMMALSMussel 1 0.2 0.2Oyster 2 0.1 0.1Scallops 4 0.01 0.03Seal, harp, meat 1 ND NDSnow crab 1 ND NDSquid 1 0.001 0.001
r = 0.3
r = 0.25
n*=number of communities.
Table 32. Mean and maximum levels of Polycyclic Aromatic Hydrocarbons (PAHs) in Atlantic traditional food samples (ng TEQ/g fresh weight)
FOO
D C
ON
TAM
INA
NT
AN
ALY
SES
94
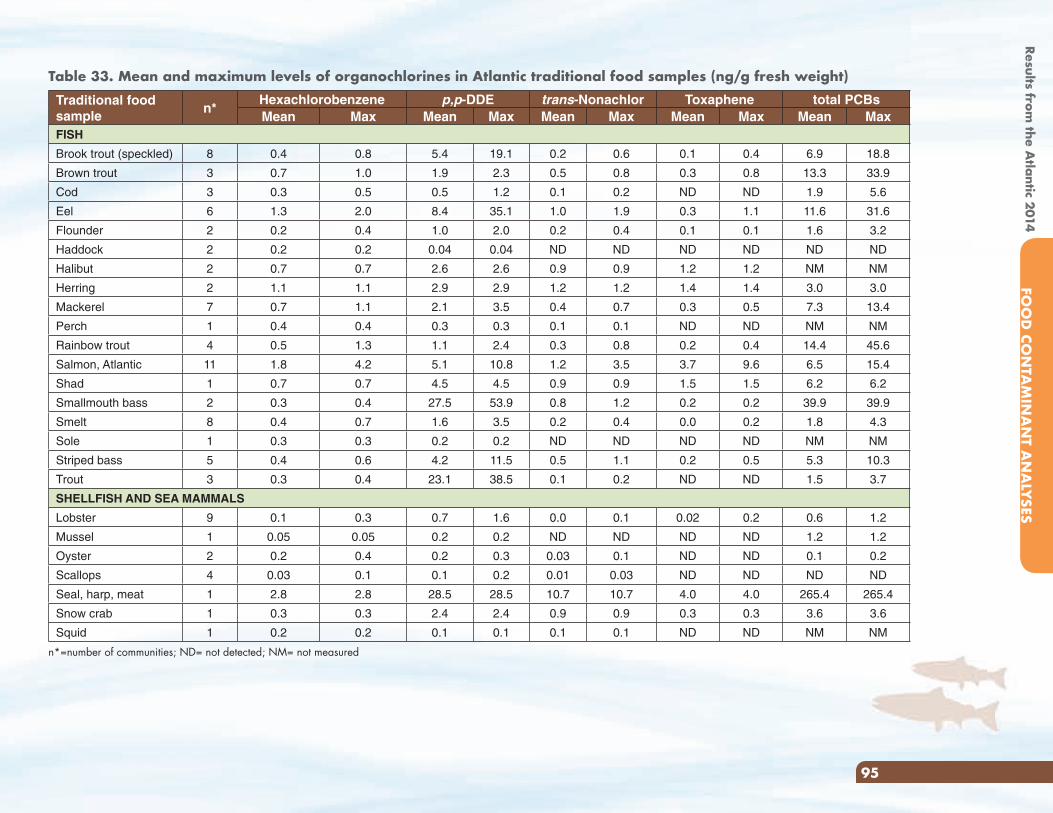
Table 33. Mean and maximum levels of organochlorines in Atlantic traditional food samples (ng/g fresh weight)Traditional food sample
n*Hexachlorobenzene p,p-DDE trans-Nonachlor Toxaphene total PCBsMean Max Mean Max Mean Max Mean Max Mean Max
FISH
Brook trout (speckled) 8 0.4 0.8 5.4 19.1 0.2 0.6 0.1 0.4 6.9 18.8
Brown trout 3 0.7 1.0 1.9 2.3 0.5 0.8 0.3 0.8 13.3 33.9
Cod 3 0.3 0.5 0.5 1.2 0.1 0.2 ND ND 1.9 5.6
Eel 6 1.3 2.0 8.4 35.1 1.0 1.9 0.3 1.1 11.6 31.6
Flounder 2 0.2 0.4 1.0 2.0 0.2 0.4 0.1 0.1 1.6 3.2
Haddock 2 0.2 0.2 0.04 0.04 ND ND ND ND ND ND
Halibut 2 0.7 0.7 2.6 2.6 0.9 0.9 1.2 1.2 NM NM
Herring 2 1.1 1.1 2.9 2.9 1.2 1.2 1.4 1.4 3.0 3.0
Mackerel 7 0.7 1.1 2.1 3.5 0.4 0.7 0.3 0.5 7.3 13.4
Perch 1 0.4 0.4 0.3 0.3 0.1 0.1 ND ND NM NM
Rainbow trout 4 0.5 1.3 1.1 2.4 0.3 0.8 0.2 0.4 14.4 45.6
Salmon, Atlantic 11 1.8 4.2 5.1 10.8 1.2 3.5 3.7 9.6 6.5 15.4
Shad 1 0.7 0.7 4.5 4.5 0.9 0.9 1.5 1.5 6.2 6.2
Smallmouth bass 2 0.3 0.4 27.5 53.9 0.8 1.2 0.2 0.2 39.9 39.9
Smelt 8 0.4 0.7 1.6 3.5 0.2 0.4 0.0 0.2 1.8 4.3
Sole 1 0.3 0.3 0.2 0.2 ND ND ND ND NM NM
Striped bass 5 0.4 0.6 4.2 11.5 0.5 1.1 0.2 0.5 5.3 10.3
Trout 3 0.3 0.4 23.1 38.5 0.1 0.2 ND ND 1.5 3.7
SHELLFISH AND SEA MAMMALS
Lobster 9 0.1 0.3 0.7 1.6 0.0 0.1 0.02 0.2 0.6 1.2
Mussel 1 0.05 0.05 0.2 0.2 ND ND ND ND 1.2 1.2
Oyster 2 0.2 0.4 0.2 0.3 0.03 0.1 ND ND 0.1 0.2
Scallops 4 0.03 0.1 0.1 0.2 0.01 0.03 ND ND ND ND
Seal, harp, meat 1 2.8 2.8 28.5 28.5 10.7 10.7 4.0 4.0 265.4 265.4
Snow crab 1 0.3 0.3 2.4 2.4 0.9 0.9 0.3 0.3 3.6 3.6
Squid 1 0.2 0.2 0.1 0.1 0.1 0.1 ND ND NM NM
n*=number of communities; ND= not detected; NM= not measured
Results from the A
tlantic 2014FO
OD
CON
TAM
INA
NT A
NA
LYSES
95
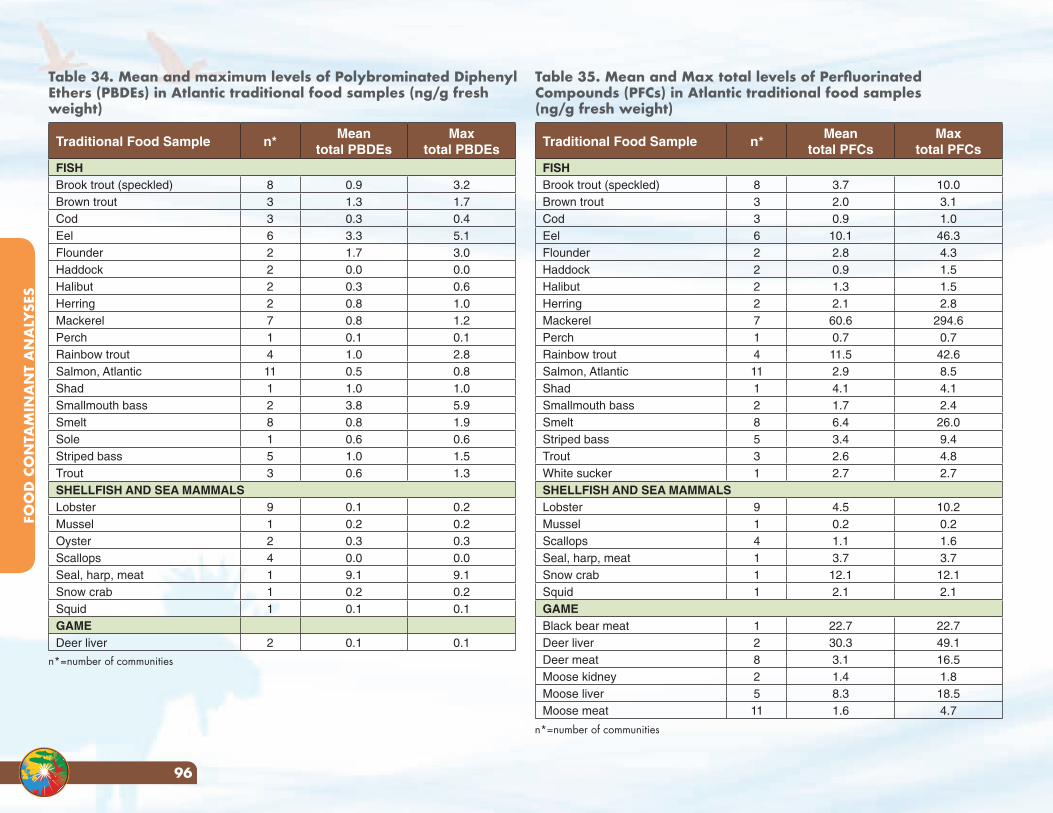
Table 34. Mean and maximum levels of Polybrominated Diphenyl Ethers (PBDEs) in Atlantic traditional food samples (ng/g fresh weight)
Traditional Food Sample n*Mean
total PBDEsMax
total PBDEsFISHBrook trout (speckled) 8 0.9 3.2Brown trout 3 1.3 1.7Cod 3 0.3 0.4Eel 6 3.3 5.1Flounder 2 1.7 3.0Haddock 2 0.0 0.0Halibut 2 0.3 0.6Herring 2 0.8 1.0Mackerel 7 0.8 1.2Perch 1 0.1 0.1Rainbow trout 4 1.0 2.8Salmon, Atlantic 11 0.5 0.8Shad 1 1.0 1.0Smallmouth bass 2 3.8 5.9Smelt 8 0.8 1.9Sole 1 0.6 0.6Striped bass 5 1.0 1.5Trout 3 0.6 1.3SHELLFISH AND SEA MAMMALSLobster 9 0.1 0.2Mussel 1 0.2 0.2Oyster 2 0.3 0.3Scallops 4 0.0 0.0Seal, harp, meat 1 9.1 9.1Snow crab 1 0.2 0.2Squid 1 0.1 0.1GAMEDeer liver 2 0.1 0.1
Table 35. Mean and Max total levels of Perfluorinated Compounds (PFCs) in Atlantic traditional food samples (ng/g fresh weight)
Traditional Food Sample n*Mean
total PFCsMax
total PFCsFISHBrook trout (speckled) 8 3.7 10.0Brown trout 3 2.0 3.1Cod 3 0.9 1.0Eel 6 10.1 46.3Flounder 2 2.8 4.3Haddock 2 0.9 1.5Halibut 2 1.3 1.5Herring 2 2.1 2.8Mackerel 7 60.6 294.6Perch 1 0.7 0.7Rainbow trout 4 11.5 42.6Salmon, Atlantic 11 2.9 8.5Shad 1 4.1 4.1Smallmouth bass 2 1.7 2.4Smelt 8 6.4 26.0Striped bass 5 3.4 9.4Trout 3 2.6 4.8White sucker 1 2.7 2.7SHELLFISH AND SEA MAMMALSLobster 9 4.5 10.2Mussel 1 0.2 0.2Scallops 4 1.1 1.6Seal, harp, meat 1 3.7 3.7Snow crab 1 12.1 12.1Squid 1 2.1 2.1GAMEBlack bear meat 1 22.7 22.7Deer liver 2 30.3 49.1Deer meat 8 3.1 16.5Moose kidney 2 1.4 1.8Moose liver 5 8.3 18.5Moose meat 11 1.6 4.7
n*=number of communities
n*=number of communities
FOO
D C
ON
TAM
INA
NT
AN
ALY
SES
96
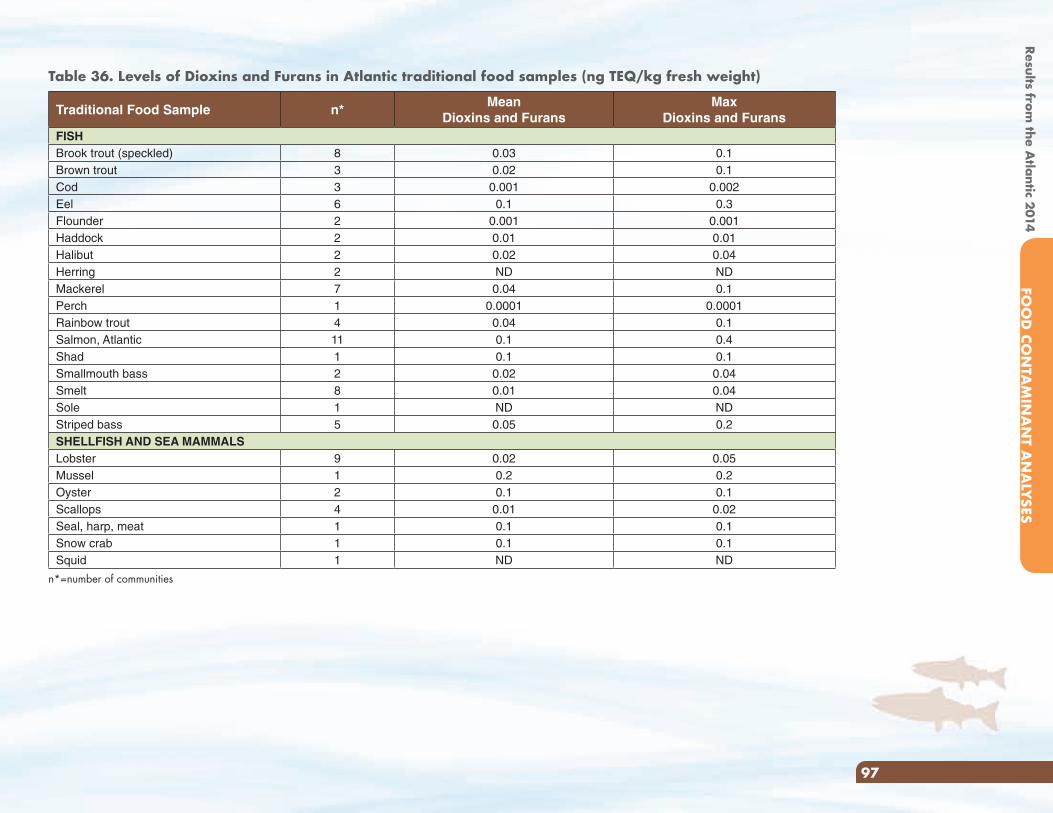
Traditional Food Sample n*Mean
Dioxins and FuransMax
Dioxins and FuransFISHBrook trout (speckled) 8 0.03 0.1Brown trout 3 0.02 0.1Cod 3 0.001 0.002Eel 6 0.1 0.3Flounder 2 0.001 0.001Haddock 2 0.01 0.01Halibut 2 0.02 0.04Herring 2 ND NDMackerel 7 0.04 0.1Perch 1 0.0001 0.0001Rainbow trout 4 0.04 0.1Salmon, Atlantic 11 0.1 0.4Shad 1 0.1 0.1Smallmouth bass 2 0.02 0.04Smelt 8 0.01 0.04Sole 1 ND NDStriped bass 5 0.05 0.2SHELLFISH AND SEA MAMMALSLobster 9 0.02 0.05Mussel 1 0.2 0.2Oyster 2 0.1 0.1Scallops 4 0.01 0.02Seal, harp, meat 1 0.1 0.1Snow crab 1 0.1 0.1Squid 1 ND ND
n*=number of communities
Table 36. Levels of Dioxins and Furans in Atlantic traditional food samples (ng TEQ/kg fresh weight)
Results from the A
tlantic 2014FO
OD
CON
TAM
INA
NT A
NA
LYSES
97
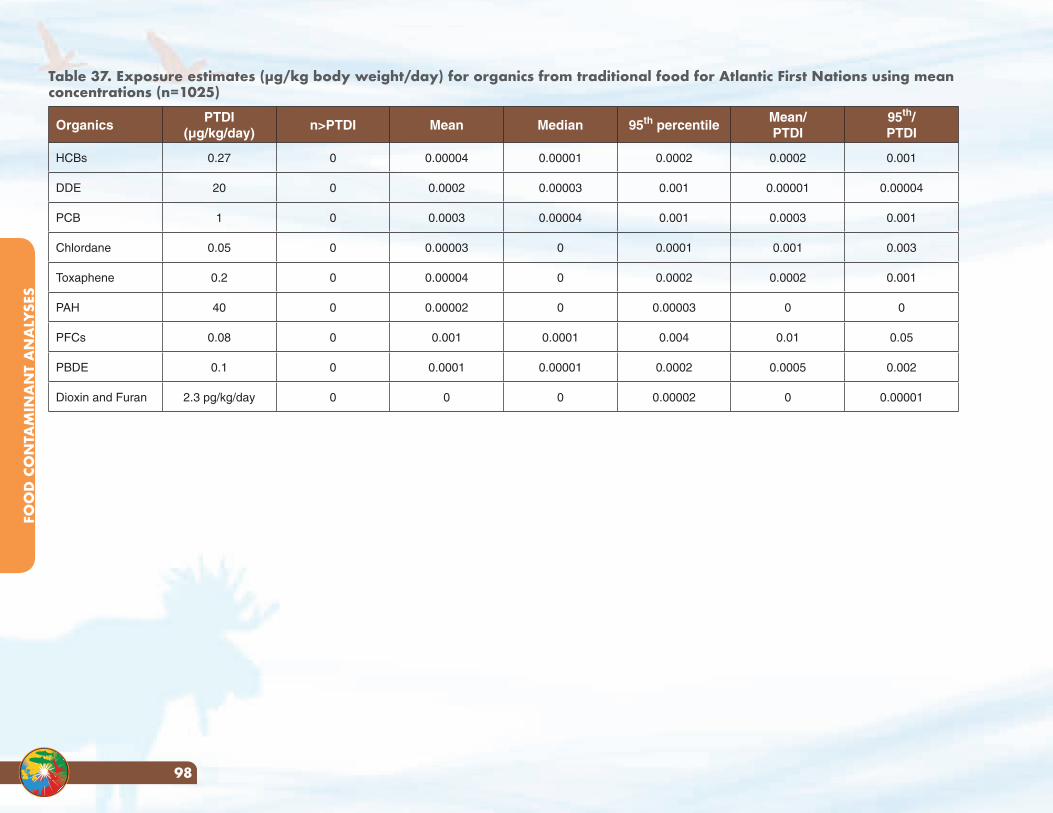
Table 37. Exposure estimates (µg/kg body weight/day) for organics from traditional food for Atlantic First Nations using mean concentrations (n=1025)
OrganicsPTDI
(µg/kg/day)n>PTDI Mean Median 95th percentile
Mean/PTDI
95th/PTDI
HCBs 0.27 0 0.00004 0.00001 0.0002 0.0002 0.001
DDE 20 0 0.0002 0.00003 0.001 0.00001 0.00004
PCB 1 0 0.0003 0.00004 0.001 0.0003 0.001
Chlordane 0.05 0 0.00003 0 0.0001 0.001 0.003
Toxaphene 0.2 0 0.00004 0 0.0002 0.0002 0.001
PAH 40 0 0.00002 0 0.00003 0 0
PFCs 0.08 0 0.001 0.0001 0.004 0.01 0.05
PBDE 0.1 0 0.0001 0.00001 0.0002 0.0005 0.002
Dioxin and Furan 2.3 pg/kg/day 0 0 0 0.00002 0 0.00001
FOO
D C
ON
TAM
INA
NT
AN
ALY
SES
98
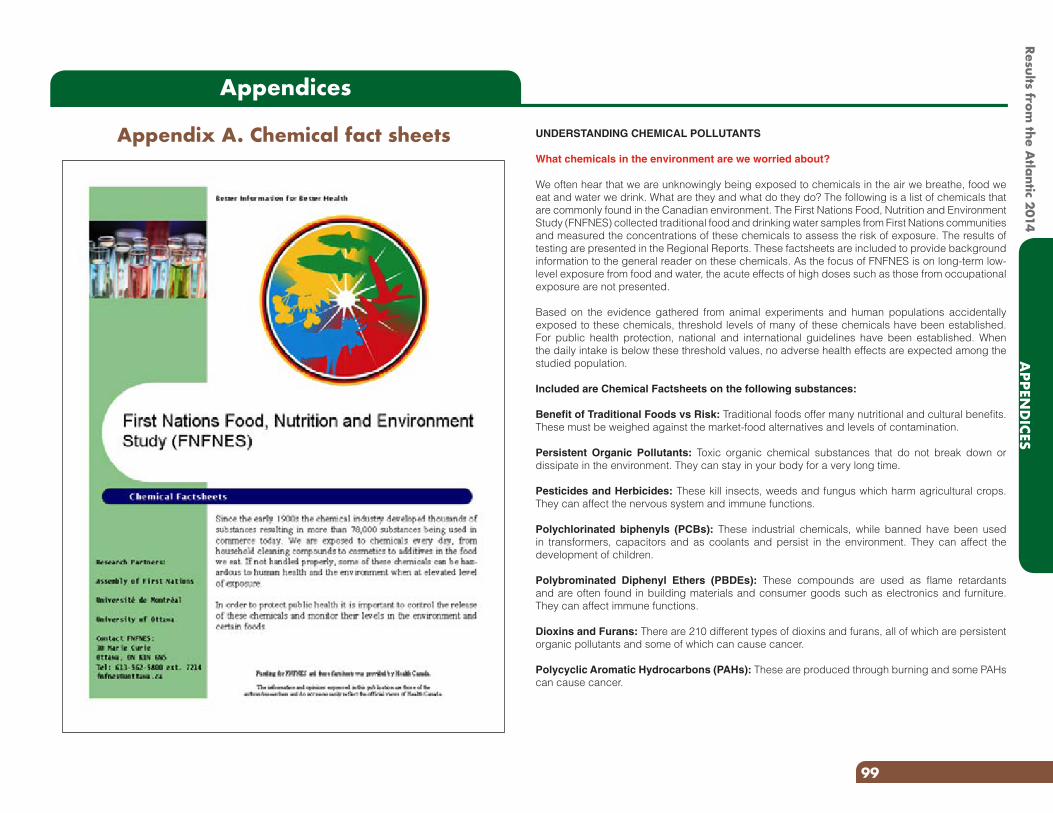
Results from the A
tlantic 2014A
PPEND
ICES
99
Appendices
Appendix A. Chemical fact sheets UNDERSTANDING CHEMICAL POLLUTANTS
What chemicals in the environment are we worried about?
We often hear that we are unknowingly being exposed to chemicals in the air we breathe, food we eat and water we drink. What are they and what do they do? The following is a list of chemicals that are commonly found in the Canadian environment. The First Nations Food, Nutrition and Environment Study (FNFNES) collected traditional food and drinking water samples from First Nations communities and measured the concentrations of these chemicals to assess the risk of exposure. The results of testing are presented in the Regional Reports. These factsheets are included to provide background information to the general reader on these chemicals. As the focus of FNFNES is on long-term low-level exposure from food and water, the acute effects of high doses such as those from occupational exposure are not presented.
Based on the evidence gathered from animal experiments and human populations accidentally exposed to these chemicals, threshold levels of many of these chemicals have been established. For public health protection, national and international guidelines have been established. When the daily intake is below these threshold values, no adverse health effects are expected among the studied population.
Included are Chemical Factsheets on the following substances:
Benefit of Traditional Foods vs Risk: Traditional foods offer many nutritional and cultural benefits. These must be weighed against the market-food alternatives and levels of contamination.
Persistent Organic Pollutants: Toxic organic chemical substances that do not break down or dissipate in the environment. They can stay in your body for a very long time.
Pesticides and Herbicides: These kill insects, weeds and fungus which harm agricultural crops. They can affect the nervous system and immune functions.
Polychlorinated biphenyls (PCBs): These industrial chemicals, while banned have been used in transformers, capacitors and as coolants and persist in the environment. They can affect the development of children.
Polybrominated Diphenyl Ethers (PBDEs): These compounds are used as flame retardants and are often found in building materials and consumer goods such as electronics and furniture. They can affect immune functions.
Dioxins and Furans: There are 210 different types of dioxins and furans, all of which are persistent organic pollutants and some of which can cause cancer.
Polycyclic Aromatic Hydrocarbons (PAHs): These are produced through burning and some PAHs can cause cancer.
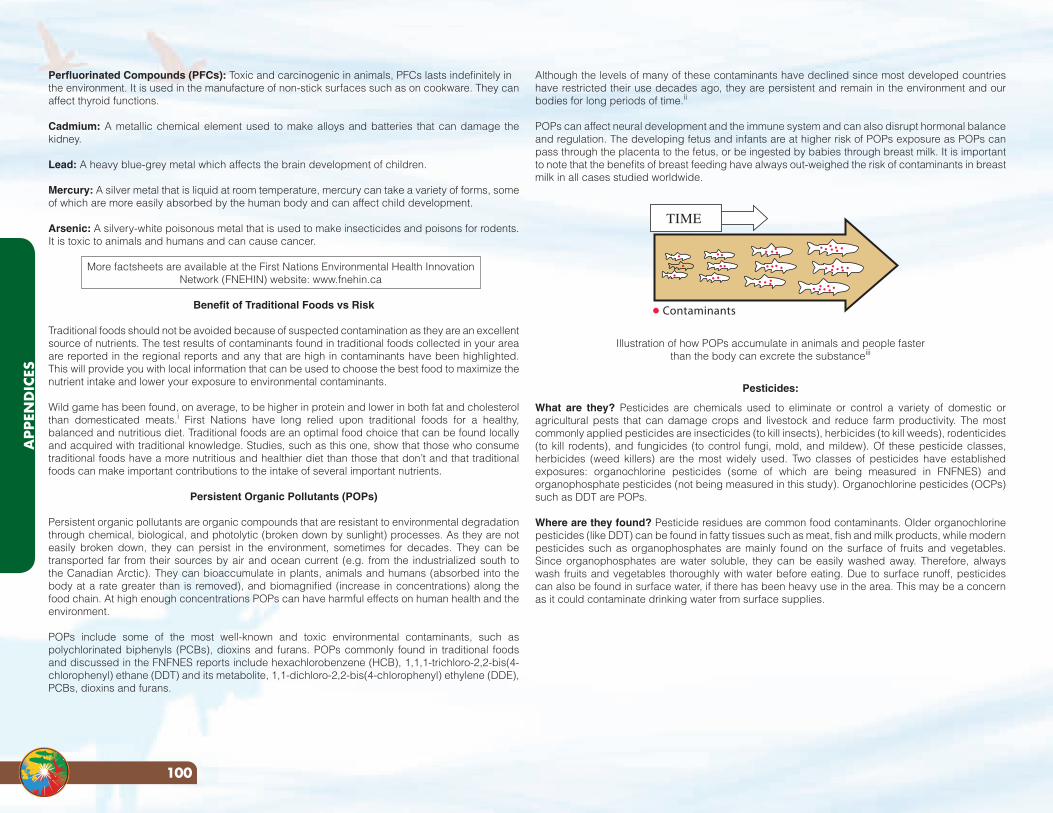
Although the levels of many of these contaminants have declined since most developed countries have restricted their use decades ago, they are persistent and remain in the environment and our bodies for long periods of time.ii
POPs can affect neural development and the immune system and can also disrupt hormonal balance and regulation. The developing fetus and infants are at higher risk of POPs exposure as POPs can pass through the placenta to the fetus, or be ingested by babies through breast milk. It is important to note that the benefits of breast feeding have always out-weighed the risk of contaminants in breast milk in all cases studied worldwide.
Illustration of how POPs accumulate in animals and people faster than the body can excrete the substanceiii
Pesticides:
What are they? Pesticides are chemicals used to eliminate or control a variety of domestic or agricultural pests that can damage crops and livestock and reduce farm productivity. The most commonly applied pesticides are insecticides (to kill insects), herbicides (to kill weeds), rodenticides (to kill rodents), and fungicides (to control fungi, mold, and mildew). Of these pesticide classes, herbicides (weed killers) are the most widely used. Two classes of pesticides have established exposures: organochlorine pesticides (some of which are being measured in FNFNES) and organophosphate pesticides (not being measured in this study). Organochlorine pesticides (OCPs) such as DDT are POPs.
Where are they found? Pesticide residues are common food contaminants. Older organochlorine pesticides (like DDT) can be found in fatty tissues such as meat, fish and milk products, while modern pesticides such as organophosphates are mainly found on the surface of fruits and vegetables. Since organophosphates are water soluble, they can be easily washed away. Therefore, always wash fruits and vegetables thoroughly with water before eating. Due to surface runoff, pesticides can also be found in surface water, if there has been heavy use in the area. This may be a concern as it could contaminate drinking water from surface supplies.
Perfluorinated Compounds (PFCs): Toxic and carcinogenic in animals, PFCs lasts indefinitely inthe environment. It is used in the manufacture of non-stick surfaces such as on cookware. They canaffect thyroid functions.
Cadmium: A metallic chemical element used to make alloys and batteries that can damage the kidney.
Lead: A heavy blue-grey metal which affects the brain development of children.
Mercury: A silver metal that is liquid at room temperature, mercury can take a variety of forms, some of which are more easily absorbed by the human body and can affect child development.
Arsenic: A silvery-white poisonous metal that is used to make insecticides and poisons for rodents. It is toxic to animals and humans and can cause cancer.
More factsheets are available at the First Nations Environmental Health Innovation Network (FNEHIN) website: www.fnehin.ca
Benefit of Traditional Foods vs Risk
Traditional foods should not be avoided because of suspected contamination as they are an excellent source of nutrients. The test results of contaminants found in traditional foods collected in your area are reported in the regional reports and any that are high in contaminants have been highlighted. This will provide you with local information that can be used to choose the best food to maximize the nutrient intake and lower your exposure to environmental contaminants.
Wild game has been found, on average, to be higher in protein and lower in both fat and cholesterol than domesticated meats.i First Nations have long relied upon traditional foods for a healthy, balanced and nutritious diet. Traditional foods are an optimal food choice that can be found locally and acquired with traditional knowledge. Studies, such as this one, show that those who consume traditional foods have a more nutritious and healthier diet than those that don’t and that traditional foods can make important contributions to the intake of several important nutrients.
Persistent Organic Pollutants (POPs)
Persistent organic pollutants are organic compounds that are resistant to environmental degradation through chemical, biological, and photolytic (broken down by sunlight) processes. As they are not easily broken down, they can persist in the environment, sometimes for decades. They can be transported far from their sources by air and ocean current (e.g. from the industrialized south to the Canadian Arctic). They can bioaccumulate in plants, animals and humans (absorbed into the body at a rate greater than is removed), and biomagnified (increase in concentrations) along the food chain. At high enough concentrations POPs can have harmful effects on human health and the environment.
POPs include some of the most well-known and toxic environmental contaminants, such as polychlorinated biphenyls (PCBs), dioxins and furans. POPs commonly found in traditional foods and discussed in the FNFNES reports include hexachlorobenzene (HCB), 1,1,1-trichloro-2,2-bis(4-chlorophenyl) ethane (DDT) and its metabolite, 1,1-dichloro-2,2-bis(4-chlorophenyl) ethylene (DDE), PCBs, dioxins and furans.
Contaminants
TIME
APP
END
ICES
100
in human breast milk in Canada, the United States and Europe. PBDEs are generally found in higher concentrations in fatty foods of animal origin, such as some fish, meats and dairy products. Exposure to PBDEs is nearly impossible to avoid due to their presence in the air, indoor dust, water, food, animal fats, and breast milk. Nearly all Americans tested have trace amounts of flame retardants in their body. While the levels in humans are very low, they have been increasing with time, and are higher in North Americans than in Europeans.
What are the major health effects? Many are considered harmful, as they are linked to adverse health effects in laboratory animal research. Concerns are being raised because of their persistence, bioaccumulation, and potential for toxicity, both in animals and in humans. Research in laboratory animals has linked PBDE exposure to an array of adverse health effects including thyroid hormone disruption, neurobehavioural effects and possibly, cancer.x
What are the guideline levels in water and food and daily intake? There is no guideline level for PBDE from Health Canada.
Dioxins and Furans:
What are they? There are over 200 types of polychlorinated dibenzodioxins (PCDDs), or dioxins. Polychlorinated dibenzofurans (PCDFs) are related chemicals. Some other persistent organic pollutants can act like dioxins, and are called ‘dioxin-like compounds’.
Where are they found? The largest source of dioxins and furans entering the environment is through large-scale waste incinerators. Emissions are also made from small-scale burning of plastics, diesel, treated wood and cigarette smoke. The primary source of exposure to dioxins and dioxin-like compounds in developed countries is via food, especially meat, milk, dairy, eggs, and fish, which together make up 93% of total exposure. Inhalation, consumption of water, vegetable oils, grains, fruits and vegetables only constitute a small percentage of overall exposure.xi
What are the major health effects? Dioxins are known to suppress the immune system of animals and humans,xii and are likely to cause cancer.xiii Changes to animals’ hormone and reproduction systems and development have also been observed due to high exposure to dioxins and furans.xiv The question of whether dioxins can influence the body’s immune system to attack its own cells causing disease, like type 1 diabetes, is still being investigated.
What are the guideline levels in water and food and daily intake? Health Canada has set a tolerable daily intake (TDI) for PCDDs and PCDFs at 2.3 pg/Kg BW/day (Health Canada, 2005 and WHO 2010).
Polycyclic Aromatic Hydrocarbons (PAHs):
What are they? PAHs are a group encompassing over 100 different chemicals and are usually found as two or more of these compounds in a mixture. They are created through incomplete burning of many substances.
Where are they found? Exposure can be through inhalation, drinking contaminated water, or eating contaminated foods including grilled or charred meats. Air can become contaminated with PAHs by wild fires, vehicle exhaust, trash incinerators, cigarette smoke or coal tar, and water and foods can be contaminated from the soil and ground water.xv Waste sites where construction materials or ash
What are the major health effects? Some pesticides are toxic to the nervous and immune system, and some are endocrine (hormone) disruptors. Endocrine disruptors are substances that can interfere with the endocrine system of animals, including humans by mimicking certain hormones. Endocrine disruption is important because hormones play a critical role in controlling how the body develops. A number of environmental contaminants (as well as other substances, such as some pharmaceuticals) are endocrine disruptors. Some pesticides, such as pentachlorophenol are contaminated with dioxins, which may play a role in their toxicityiv. For example, daily ingestion of low doses of diquat, an extensively used herbicide, induces intestinal inflammation in rats. It has been suggested that repeated ingestion of small amounts of pesticides, as could be found in food, may have consequences for human health and may be involved in the development of gastrointestinal disordersv . Exposure to pesticides during the fetal stage and in childhood can cause long-term damage.
What are the guideline levels in water and food and daily intake? The tolerable daily intake (TDI) established by Health Canada for DDT, a classic organochlorine pesticides, is 0.01 mg/Kg BW/day. There is no drinking water guideline for DDT as it does not dissolve in water easily.
Polychlorinated biphenyls (PCBs):
What are they? PCBs are a class of compounds that are mixtures of up to 209 different chlorinated hydrocarbons, or congeners. Different congeners sometimes act differently from one another, and some are more resistant to break down than others in the environment. Some congeners can act like dioxins (‘dioxin-like congeners’) and others act in other ways (‘non dioxin-like congeners’). PCBs were used in paints, lubricants and electrical equipment.
Where are they found? PCBs are generally found in higher concentrations in fatty foods of animal origin, such as some fish, meats and dairy products. Everyone living in developed countries have PCBs in their bodies and long-range transport of PCBs by global air currents have caused PCBs to be distributed globally.vi Most PCBs enter the environment from landfill sites and leaks from old equipment. Food is the largest source of exposure but air, water and soil can play a part as well.vii What are the major health effects? Since people are never exposed to only one of these groups, people exposed to PCBs are at risk of the same health effects caused by dioxins, as well as those caused by non-dioxin-like PCB congeners. People eating large amounts of certain sports fish, wild game and marine mammals are at increased risk for higher exposures and possible adverse health effects. Long-term, high level exposure may also cause liver and kidney cancer.viii Fetal exposure to PCBs can cause developmental deficits such as lowering IQ among children.
What are the guideline levels in water and food and daily intake? The tolerable daily intake (TDI) established by Health Canada is 0.0001 3mg/kg bw/day.ix
Flame Retardants - Polybrominated Diphenyl Ethers (PBDEs):
What are they? Flame retardants are chemicals that prevent the spread of fire and are persistent organic pollutants. PBDE flame retardants are added to some plastics, electrical and electronic equipment, upholstered furniture, non-clothing textiles and foam products. Because PBDEs are added to the products rather than chemically bound into them, they can be slowly and continuously released from the products during their manufacture, while in use, or after their disposal. As of 2008 the EU has banned several types of brominated flame retardants following evidence beginning in 1998 that the chemicals were accumulating in human breast milk.
Where are they found? PBDEs have been found both in the environment and in humans, including
101
APPEN
DICES
Results from the A
tlantic 2014
Waste-derived fuels and coal are especially prone to containing metals, so they should be a central concern in a consideration of their use. Living organisms require trace amounts of some metals, such as iron, cobalt, copper, manganese, molybdenum, and zinc which are beneficial. However, excessive levels can be detrimental to health. Other metals such as cadmium, lead, mercury, and arsenic are considered to be toxic and have no known vital or beneficial effects and over time their accumulation in the bodies of animals can cause serious illness.
Cadmium:
What is it? Cadmium is a natural element that is found in all soils and rocks. It is a metal that resists corrosion and is used in many applications such as batteries, some plastics such as PVC, and metal coatings.
Where is it found? It can enter the environment from mining, industry, coal and household waste burning and hazardous waste sites and can travel great distances before entering the local environment through ground or water. Cadmium does not break down, can travel great distances in the environment and can change in form. Cigarette smoke is a major source of exposure to cadmium and can effectively double the average daily intake. Other sources of exposure include from foods (cadmium is often found to be highest in shellfish and the liver and kidneys of large mammals like moose and deer) drinking water, and breathing air near a waste incinerator. What are the major health effects? Long-term exposure to lower levels can cause kidney and lung damage, fragile bones and an increase in cancers.
What are the guideline levels in water and food and daily intake? The drinking water guideline for Cd is 0.005 mg/L. The tolerable daily intake (TDI) established by Health Canada is 0.008 mg/Kg BW/day.
Lead:
What is it? Lead is found naturally in the environment and has many industrial uses.Where is it found? Lead was once commonly used in gasoline, paint, and pipes, although its use has now been restricted in these areas. It can currently be found in lead-acid car batteries, toys, solder, stained glass, crystal vessels, lead ammunition, jewelry and PVC plastic. Some of the most common ways to be exposed to lead include improper disposal of old lead-based paint, leaded gasoline, some ceramics or other lead-containing products. Lead from these sources can find its way into drinking water in homes with old pipes containing lead solder, inhaling paint dust or ingesting broken or peeling lead paint, and through animals that have been killed with lead shot. Fragments can be too small to detect and washing can merely spread them. Detectable fragments contain even more lead and should be avoided when eating for everyone. Canada continues to permit the use of lead in hunting, except for hunting migratory birds and in wetlandsxix). What are the major health effects? Lead is well known to be a serious toxin for humans and has contributed to nervous system, kidney and reproductive system problems. Long term exposure can also cause anemia. Recent studies in children in other parts of the world are beginning to suggest that amounts of lead much lower than previously thought can contribute to impaired intelligence. This is especially true for very young children.
What are the guideline levels in water and food and daily intake? The drinking water guideline for lead is 0.01 mg/L. There is no known level of lead exposure that is considered safe and no established tolerable daily intake (TDI).
are buried can also contaminate ground water. Breathing smoke which contains PAHs is the most common way people are exposed to PAHs. Eating food grown in contaminated soil can expose people to PAHs. Charring or grilling food can increase the amount of PAHs that the food contains.
What are the major health effects? Some PAHs are expected to be carcinogens and have caused cancer and reproductive problems in laboratory animals, but there is a lack of data on the effect of PAHs on humans.xvi PAHs can damage lungs, liver, kidneys and skin.xvii According to the US Environmental Protection Agency, PAHs also can damage red blood cells and weaken the immune system. PAHs are a large class of chemicals which range from nontoxic to extremely toxic. Their toxicity, and therefore the amount of the PAH needed to cause a health effect, is dependent upon the type of PAH. Seven types of PAHs have been deemed probable human carcinogens by the U.S. Environmental Protection Agency.
What are the guideline levels in water and food and daily intake? Health Canada recommended a maximum acceptable concentration of 0.01 µg/L Benzo[α]pyrene (a PAH) in drinking water. Health Canada has no guideline level for non-carcinogenic endpoints of PAHs. The oral slope factor for Benzo[α]pyrene is 2.3 mg/Kg BW/day.
Perfluorinated Compounds (PFCs):
What are they? Perfluorinated compounds (PFCs) are a family of fluorine-containing chemicals with unique properties to make materials stain and stick resistant. PFCs are incredibly resistant to breakdown and are turning up in unexpected places around the world. Although these chemicals have been used since the 1950s in countless familiar products, they’ve been subjected to little government testing. There are many forms of PFCs, but the two getting attention recently are: PFOA or perfluorooctanoic acid, used to make Teflon products and PFOS or perfluorooctane sulfonate, a breakdown product of chemicals formerly used to make Scotch Gard products.
Where are they found? PFCs are used in a wide array of consumer products and food packaging. Grease-resistant food packaging and paper products, such as microwave popcorn bags and pizza boxes, contain PFCs. PFOS was used until 2002 in the manufacture of 3M’s Scotch Gard treatment and used on carpet, furniture, and clothing. PFOA is used to make DuPont’s Teflon product, famous for its use in non-stick cookware. If Teflon-coated pans are overheated, PFOA is released. PFCs are in cleaning and personal-care products like shampoo, dental floss, and denture cleaners. Even Gore-Tex clothing, beloved in the Northwest for its ability to shed water, contains PFCs.
What are the major health effects? In recent studies there have been indications that PFOAs interfere with normal reproduction by adversely affecting fertility, and has caused developmental toxicity in offspring resulting in birth defects.xviii
What are the guideline levels in water and food and daily intake? There is no guideline level for PFCs from Health Canada.
Metals:
Metals include elements like arsenic, mercury, lead and cadmium, all of which are toxic. Metals occur naturally in the environment with large variations in concentration. In modern times, economic activity has resulted in several sources of metals that are introduced to the environment via pollution.
APP
END
ICES
102
Arsenic:
What is it? Arsenic is a natural element found widely throughout the earth. It can be found in some drinking water, such as from deep wells, and is produced as a by-product from certain mining operations. The main use of metallic arsenic is for strengthening copper and lead alloys (for example, in automotive batteries). Arsenic is commonly found in semiconductor electronic devices. Arsenic and its compounds, especially the trioxide, are used in the production of pesticides, herbicides, insecticides and treated wood products. Where is it found? Arsenic is found everywhere in low levels; including in air, food and water. It can even result in arsenic poisoning in certain areas of the world when ingested in drinking water. It can take on various different forms, some of which are more toxic than others, and is most often used as a preservative in pressure treated wood, and as an active ingredient in some pesticides (such as those used in orchards). Sources of contamination include cigarette smoke and coal burning facilities. Arsenic can travel great distances when in the air and water. Exposure to arsenic is most often from arsenic treated wood, small amounts from food, water and air and living within an area with high natural levels of arsenic in rock.
What are the major health effects? Arsenic can irritate the throat and lungs, cause numbness in hands and feet, nausea and vomiting, decreased production of blood cells, skin irritation on contact, loss of movement and in very high levels can cause death. Studies have shown that ingesting certain types of arsenic can increase the risk of skin, liver, bladder and lung cancer.xxii Long-term exposure of children may also affect development. Arsenic is considered to cause cancer.
What are the guideline levels in water and food and daily intake? Health Canada recommended a maximum acceptable concentration of 0.01 mg/L arsenic in drinking water. Health Canada has no guideline level for non-carcinogenic endpoints. The oral slope factor for arsenic is 1.5 mg/Kg BW/day.
Mercury:
What is it? Mercury is the only metal that is liquid at normal air temperature and pressure. Mercury occurs in deposits throughout the world mostly as cinnabar (mercuric sulfide). Mercury can exist in different forms in the environment. It can be found in either elemental form such as liquid or vapour, dissolved inorganic form or organic form. Mercury can change forms through natural processes.
Where is it found? Mercury can be released naturally from rocks, soil and volcanoes. It is found in certain dental fillings (dental amalgam), thermometers, and compact fluorescent lights (CFLs) and its use in other applications is being phased out.
Mercury is released from waste incineration, coal and fossil fuel burning, cement production, mining and smelting. Much of the airborne mercury that settles in Canada actually originates from outside Canada. Mercury can also be released into the environment through flooding. For example, a new reservoir is created, the mercury naturally present in soils and vegetation is converted in water by bacterial action to methylmercury, a more toxic form of mercury where it enters the food chain and bioaccumulates in fish. Mercury accumulates within living organisms so that when one animal eats other animals, much of that mercury stays within the animal which has eaten the other. This process of bioaccumulation applies to humans who eat animals which contain mercury so that those higher in the food chain (predatory fish and carnivorous mammals) often have higher mercury levels. Methylmercury is most often found in large predatory and bottom feeding fish (such as mackerel, orange roughy, walleye, trout) and shellfish.
What are the major health effects? Long-term exposure to mercury can affect brain functions, weaken the immune system, and cause neurological disorders and damage. High-level exposure can also permanently damage the brain, kidneys, and developing fetus and produce tremors, changes in vision or hearing and memory problems. Children are more sensitive to mercury than adults and mercury can be passed from a mother’s body to the fetus.
What are the guideline levels in water and food and daily intake? The drinking water guideline for mercury is 0.001 mg/L. The provisional tolerable weekly intake (pTWI) for methylmercury established by the WHO is 1.6 ug/Kg BW and 4 ug/Kg BW for inorganic mercury.xx Health Canada has set guideline levels for methylmercury at 0.47 ug/Kg BW/day for adults and 0.2 ug/Kg BW/day for women of child-bearing age, pregnant women and children.xxi
103
APPEN
DICES
Results from the A
tlantic 2014
References for Chemical Fact Sheets i Health Canada. Canadian Nutrient File, version 2010.
http://www.hc-sc.gc.ca/fn-an/nutrition/fiche-nutri-data/index-eng.php
ii Shen H MK, Virtanen HE, Damggard IN, Haavisto AM, Kaleva M, Boisen KA, Schmidt IM, Chellakooty M, Skakkebaek NE, Toppari J, Schramm KW. From mother to child: investigation of prenatal and postnatal exposure to persistent bioaccumulating toxicants using breast milk and placenta biomonitoring. Chemosphere 2007; 67:S256-S62.
iii Aboriginal Affairs and Northern Development Canada. Fish. Northwest Territories Contaminants Fact Sheets. 2004, Available Online: https://www.aadnc-aandc.gc.ca/eng/1100100023393/1100100023401
iv Saldana T, Basso O, Hoppin J, Baird D, Knott C, Blair A, et al. Pesticide exposure and self-reported gestational diabetes mellitus in the Agricultural Health Study. Diabetes Care 2007;30:529-34.
v Anton P, Theodorou V, Bertrand V, Eutamene H, Aussenac T, Feyt N, et al. Chronic ingestion of a potential food contaminant induces gastrointestinal inflammation in rats: role of nitric oxide and mast cells. Dig Dis Sci 2000; 45:1842-49.
vi Health Canada. It’s Your Health: PCBs. 2005. Available Online: http://www.hc-sc.gc.ca/hl-vs/alt_formats/pacrb-dgapcr/pdf/iyh-vsv/environ/pcb-bpc-eng.pdf .
vii Carpenter, David. Polychlorinated Biphenyls (PCBs): Routes of Exposure and Effects on Human Health. Reviews on Environmental Health, 2006. 21(1): 1-23
viii Health Canada. It’s Your Health: PCBs. 2005. Available Online: http://www.hc-sc.gc.ca/hl-vs/alt_formats/pacrb-dgapcr/pdf/iyh-vsv/environ/pcb-bpc-eng.pdf
ix Health Canada. Federal Contaminated Site Risk Assessment in Canada Part II: Health Canada Toxicological Reference Values (TRVS) and Chemical-Specific Factors, Version 2.0. 2010. Available Online: http://www.hc-sc.gc.ca/ewh-semt/pubs/contamsite/part-partie_ii/index-eng.php
x Agency for Toxic Substances and Disease Registry. Toxic Substances Portal. Polybrominated Biphenyls (PBBs) & Polybrominated Diphenyl Ethers (PBDEs). Available from: http://www.atsdr.cdc.gov/toxfaqs/tf.asp?id=900&tid=94.
xi Lorber M, Patterson D, Huwe J, Kahn H. Evaluation of background exposures of Americans to dioxin-like compounds in the 1990s and the 2000s. Chemosphere 2009;77:640-51.
xii Baccarelli A, Mocarelli P, Patterson D, Jr, Bonzini M, Pesatori A, Caporaso N, et al. Immunologic effects of dioxin: new results from Seveso and comparison with other studies. Environ Health Perspective 2002;110:1169-73.
xiii United States Environmental Protection Agency, 2010. Dioxins and Furans Fact Sheet, Available from:http://www.epa.gov/osw/hazard/wastemin/minimize/factshts/dioxfura.pdf
xiv United States Environmental Protection Agency, 2010. Dioxins and Furans Fact Sheet, Available from:http://www.epa.gov/osw/hazard/wastemin/minimize/factshts/dioxfura.pdf
xv Agency for Toxic Substances and Disease Registry ToxFAQs. Polycyclic Aromatic Hydrocarbons. U.S. Department of Health and Human Services. Sep 1996.
xvi Ibid. 1996.
xvii Wisconsin Department of Health Services. 2000. Chemical Fact Sheets: Polycyclic Aromatic Hydrocarbons (PAHs). Available Online: http://www.dhs.wisconsin.gov/eh/chemfs/fs/pah.htm. Accessed 19 Oct, 2010.
xviii United States Environmental Protection Agency (USEPA) Chemical Safety and Pollution Prevention: Perfluorooctanoic Acid (PFOA) and Fluorinated Telomeres, 2010. Available Online: http://www.epa.gov/opptintr/pfoa
xix Health Canada. Risk Management Strategy for Lead. February 2013.http://www.hc-sc.gc.ca/ewh-semt/alt_formats/pdf/pubs/contaminants/prms_lead-psgr_plomb/prms_lead-psgr_plomb-eng.pdf
xx World Health Organization. Safety evaluation of certain contaminants in food. WHO Food Additives Series: 63, FAO JECFA Monographs 8. Geneva, 2011.
xxi Health Canada. 2007. Mercury, Your Health and the Environment. Available Online: http://www.hc-sc.gc.ca/ewh-semt/pubs/contaminants/mercur/index-eng.php
xxii Agency for Toxic Substances & Disease Registry. Arsenic August 2007. Updated Sep 1, 2010. Available Online: http://www.atsdr.cdc.gov/toxfaqs/tf.asp?id=19&tid=3. Accessed Nov 2, 2010
Appendix B. Statistical tools used to obtain weighted estimates at the regional level
1: Non-Response adjustment factor:
For each stratum h=1, ,H, and each community i=1, ,nh, if rh communities
participated in the study out of the nh selected, then the non-response adjustment factor
is given by:
2. Bootstrap method for Standard Error
i) Draw a simple random sample of mh=nh-1 communities with
replacement from the nh sampled communities, independently for
each stratum h=1, H.
ii) Let be the number of times the (hi)-th sample community is
selected ( ).
iii) Define the bootstrap weights as
If the (hi)-th community is not selected in the bootstrap sample,
and then .
=scommunitie ingparticipat-nonfor ,0
scommunitie ingparticipatfor ,1h
h
hi rn
WADJ
*him
hi hi mm =• *
hijkhih
hhijk WFINALm
n
nw 3
1** =
0* =him 0* =hijkw
iv) Do steps i) to iii) B=500 times.
For estimating the sampling error, let be the population parameter of interest. Let
be the full-sample estimate for obtained by using the final weight and let , b = 1,
..., 500, be the Bootstrap replicate estimates of the same parameter of interest obtained
by using the Bootstrap weights. Then, setting B = 500, the Bootstrap estimate of the
sampling error of is given by:
,
where
with a CV:
ˆ
*b̂
ˆ
)ˆ(ˆ)ˆ( BOOTBOOT Vse =
( ) ( ) .ˆˆ002.0ˆˆB1)ˆ(ˆ
500
1
2*
1
2* ••==
==b
b
B
bbBOOTV
%100ˆ)ˆ()ˆ( = BOOTse
cv
APP
END
ICES
104
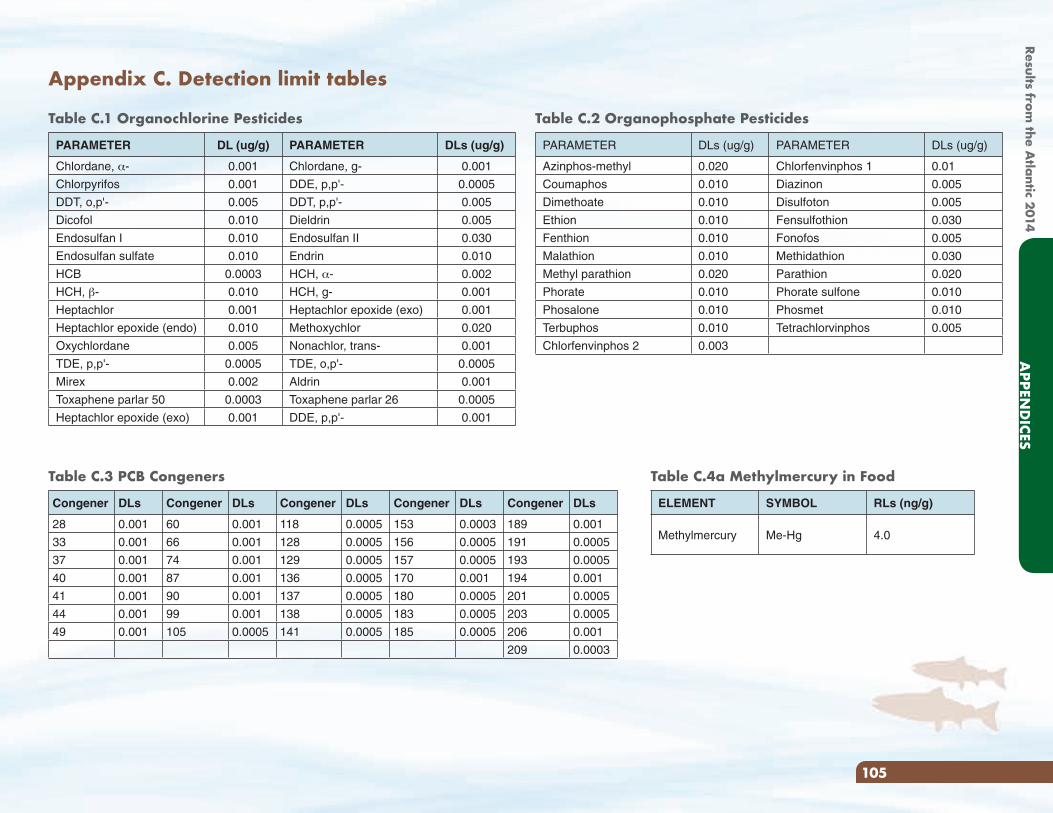
Table C.3 PCB Congeners
Congener DLs Congener DLs Congener DLs Congener DLs Congener DLs
28 0.001 60 0.001 118 0.0005 153 0.0003 189 0.001
33 0.001 66 0.001 128 0.0005 156 0.0005 191 0.0005
37 0.001 74 0.001 129 0.0005 157 0.0005 193 0.0005
40 0.001 87 0.001 136 0.0005 170 0.001 194 0.001
41 0.001 90 0.001 137 0.0005 180 0.0005 201 0.0005
44 0.001 99 0.001 138 0.0005 183 0.0005 203 0.0005
49 0.001 105 0.0005 141 0.0005 185 0.0005 206 0.001
209 0.0003
Appendix C. Detection limit tables
Table C.1 Organochlorine Pesticides
PARAMETER DL (ug/g) PARAMETER DLs (ug/g)
Chlordane, α- 0.001 Chlordane, g- 0.001
Chlorpyrifos 0.001 DDE, p,p'- 0.0005
DDT, o,p'- 0.005 DDT, p,p'- 0.005
Dicofol 0.010 Dieldrin 0.005
Endosulfan I 0.010 Endosulfan II 0.030
Endosulfan sulfate 0.010 Endrin 0.010
HCB 0.0003 HCH, α- 0.002
HCH, β- 0.010 HCH, g- 0.001
Heptachlor 0.001 Heptachlor epoxide (exo) 0.001
Heptachlor epoxide (endo) 0.010 Methoxychlor 0.020
Oxychlordane 0.005 Nonachlor, trans- 0.001
TDE, p,p'- 0.0005 TDE, o,p'- 0.0005
Mirex 0.002 Aldrin 0.001
Toxaphene parlar 50 0.0003 Toxaphene parlar 26 0.0005
Heptachlor epoxide (exo) 0.001 DDE, p,p'- 0.001
Table C.2 Organophosphate Pesticides
PARAMETER DLs (ug/g) PARAMETER DLs (ug/g)
Azinphos-methyl 0.020 Chlorfenvinphos 1 0.01
Coumaphos 0.010 Diazinon 0.005
Dimethoate 0.010 Disulfoton 0.005
Ethion 0.010 Fensulfothion 0.030
Fenthion 0.010 Fonofos 0.005
Malathion 0.010 Methidathion 0.030
Methyl parathion 0.020 Parathion 0.020
Phorate 0.010 Phorate sulfone 0.010
Phosalone 0.010 Phosmet 0.010
Terbuphos 0.010 Tetrachlorvinphos 0.005
Chlorfenvinphos 2 0.003
Table C.4a Methylmercury in Food
ELEMENT SYMBOL RLs (ng/g)
Methylmercury Me-Hg 4.0
105
APPEN
DICES
Results from the A
tlantic 2014
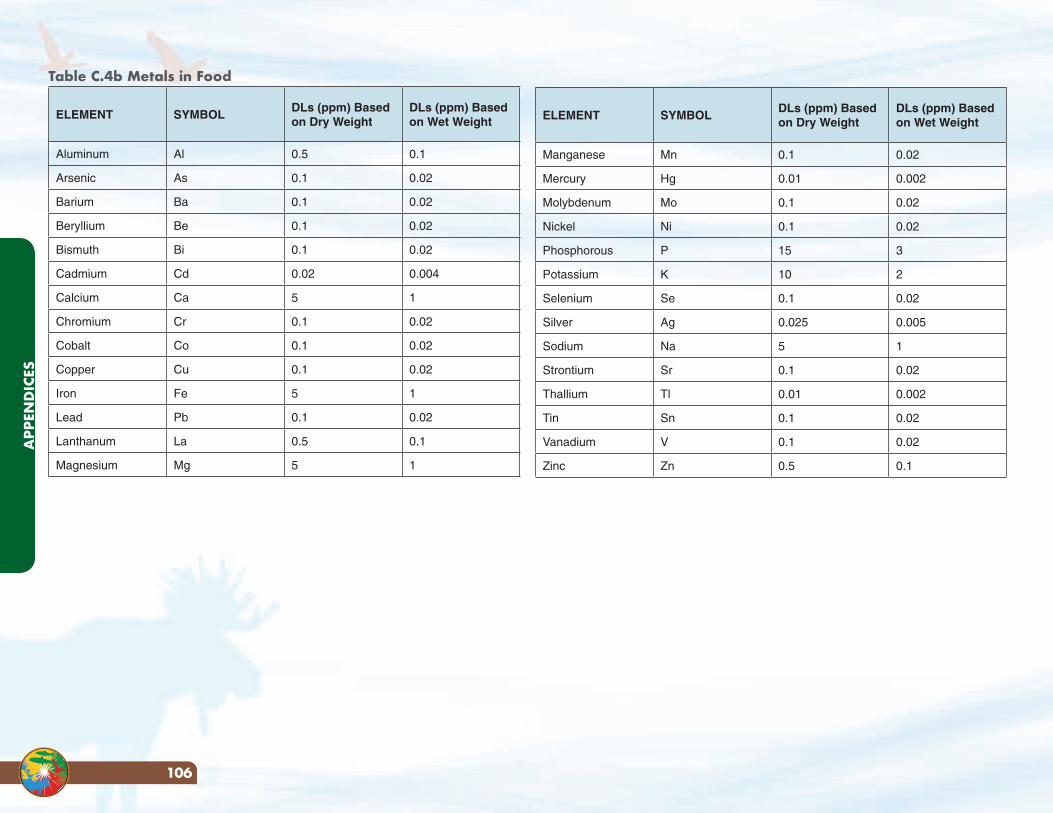
ELEMENT SYMBOLDLs (ppm) Based on Dry Weight
DLs (ppm) Based on Wet Weight
Manganese Mn 0.1 0.02
Mercury Hg 0.01 0.002
Molybdenum Mo 0.1 0.02
Nickel Ni 0.1 0.02
Phosphorous P 15 3
Potassium K 10 2
Selenium Se 0.1 0.02
Silver Ag 0.025 0.005
Sodium Na 5 1
Strontium Sr 0.1 0.02
Thallium Tl 0.01 0.002
Tin Sn 0.1 0.02
Vanadium V 0.1 0.02
Zinc Zn 0.5 0.1
Table C.4b Metals in Food
ELEMENT SYMBOLDLs (ppm) Based on Dry Weight
DLs (ppm) Based on Wet Weight
Aluminum Al 0.5 0.1
Arsenic As 0.1 0.02
Barium Ba 0.1 0.02
Beryllium Be 0.1 0.02
Bismuth Bi 0.1 0.02
Cadmium Cd 0.02 0.004
Calcium Ca 5 1
Chromium Cr 0.1 0.02
Cobalt Co 0.1 0.02
Copper Cu 0.1 0.02
Iron Fe 5 1
Lead Pb 0.1 0.02
Lanthanum La 0.5 0.1
Magnesium Mg 5 1
APP
END
ICES
106
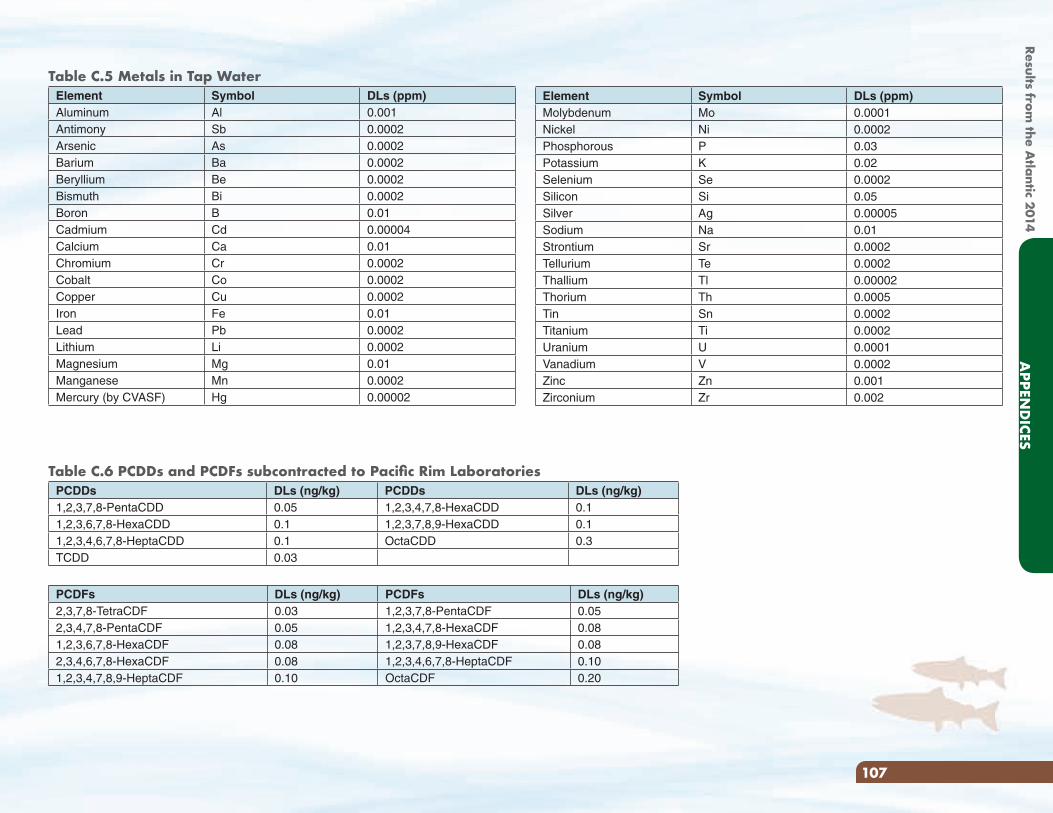
Element Symbol DLs (ppm)Molybdenum Mo 0.0001Nickel Ni 0.0002Phosphorous P 0.03Potassium K 0.02Selenium Se 0.0002Silicon Si 0.05Silver Ag 0.00005Sodium Na 0.01Strontium Sr 0.0002Tellurium Te 0.0002Thallium Tl 0.00002Thorium Th 0.0005Tin Sn 0.0002Titanium Ti 0.0002Uranium U 0.0001Vanadium V 0.0002Zinc Zn 0.001Zirconium Zr 0.002
Table C.5 Metals in Tap WaterElement Symbol DLs (ppm)Aluminum Al 0.001Antimony Sb 0.0002Arsenic As 0.0002Barium Ba 0.0002Beryllium Be 0.0002Bismuth Bi 0.0002Boron B 0.01Cadmium Cd 0.00004Calcium Ca 0.01Chromium Cr 0.0002Cobalt Co 0.0002Copper Cu 0.0002Iron Fe 0.01Lead Pb 0.0002Lithium Li 0.0002Magnesium Mg 0.01Manganese Mn 0.0002Mercury (by CVASF) Hg 0.00002
Table C.6 PCDDs and PCDFs subcontracted to Pacific Rim LaboratoriesPCDDs DLs (ng/kg) PCDDs DLs (ng/kg)1,2,3,7,8-PentaCDD 0.05 1,2,3,4,7,8-HexaCDD 0.11,2,3,6,7,8-HexaCDD 0.1 1,2,3,7,8,9-HexaCDD 0.11,2,3,4,6,7,8-HeptaCDD 0.1 OctaCDD 0.3TCDD 0.03
PCDFs DLs (ng/kg) PCDFs DLs (ng/kg)2,3,7,8-TetraCDF 0.03 1,2,3,7,8-PentaCDF 0.052,3,4,7,8-PentaCDF 0.05 1,2,3,4,7,8-HexaCDF 0.081,2,3,6,7,8-HexaCDF 0.08 1,2,3,7,8,9-HexaCDF 0.082,3,4,6,7,8-HexaCDF 0.08 1,2,3,4,6,7,8-HeptaCDF 0.101,2,3,4,7,8,9-HeptaCDF 0.10 OctaCDF 0.20
107
APPEN
DICES
Results from the A
tlantic 2014
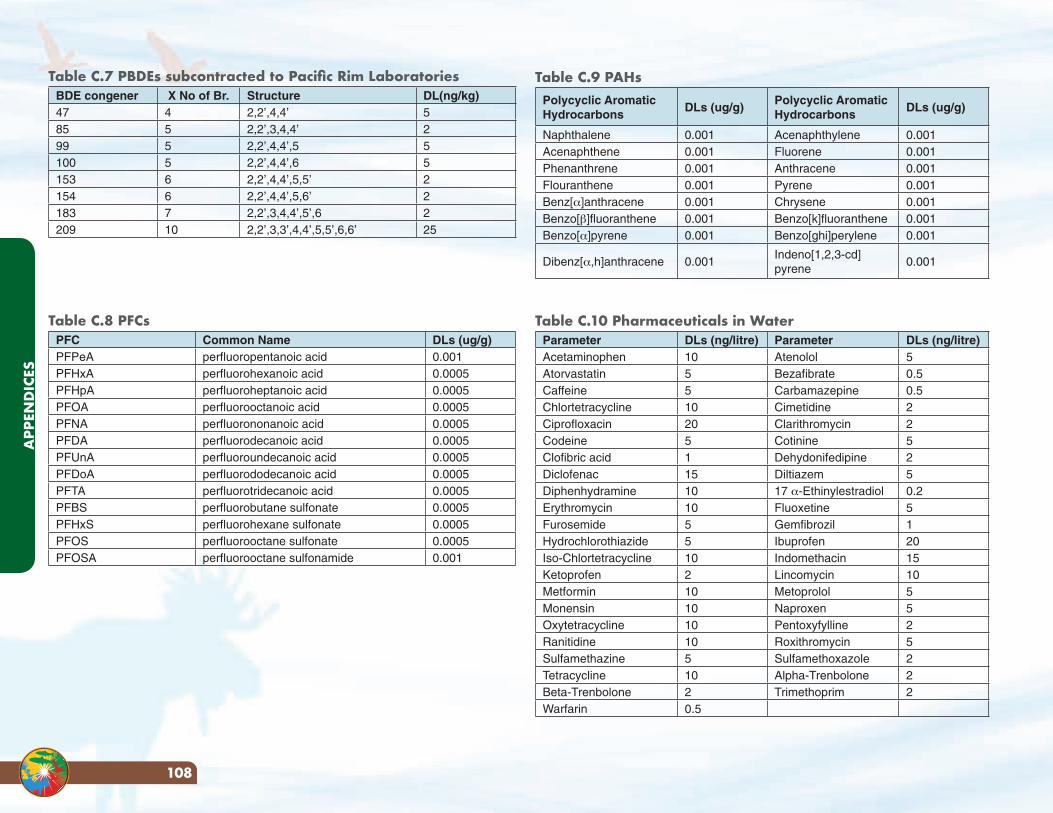
Table C.9 PAHsPolycyclic Aromatic Hydrocarbons
DLs (ug/g)Polycyclic Aromatic Hydrocarbons
DLs (ug/g)
Naphthalene 0.001 Acenaphthylene 0.001Acenaphthene 0.001 Fluorene 0.001Phenanthrene 0.001 Anthracene 0.001Flouranthene 0.001 Pyrene 0.001Benz[α]anthracene 0.001 Chrysene 0.001Benzo[β]fluoranthene 0.001 Benzo[k]fluoranthene 0.001Benzo[α]pyrene 0.001 Benzo[ghi]perylene 0.001
Dibenz[α,h]anthracene 0.001Indeno[1,2,3-cd]pyrene
0.001
Table C.10 Pharmaceuticals in WaterParameter DLs (ng/litre) Parameter DLs (ng/litre)Acetaminophen 10 Atenolol 5Atorvastatin 5 Bezafibrate 0.5Caffeine 5 Carbamazepine 0.5Chlortetracycline 10 Cimetidine 2Ciprofloxacin 20 Clarithromycin 2Codeine 5 Cotinine 5Clofibric acid 1 Dehydonifedipine 2Diclofenac 15 Diltiazem 5Diphenhydramine 10 17 α-Ethinylestradiol 0.2Erythromycin 10 Fluoxetine 5Furosemide 5 Gemfibrozil 1Hydrochlorothiazide 5 Ibuprofen 20Iso-Chlortetracycline 10 Indomethacin 15Ketoprofen 2 Lincomycin 10Metformin 10 Metoprolol 5Monensin 10 Naproxen 5Oxytetracycline 10 Pentoxyfylline 2Ranitidine 10 Roxithromycin 5Sulfamethazine 5 Sulfamethoxazole 2Tetracycline 10 Alpha-Trenbolone 2Beta-Trenbolone 2 Trimethoprim 2Warfarin 0.5
Table C.7 PBDEs subcontracted to Pacific Rim LaboratoriesBDE congener X No of Br. Structure DL(ng/kg)47 4 2,2’,4,4’ 585 5 2,2’,3,4,4’ 299 5 2,2’,4,4’,5 5100 5 2,2’,4,4’,6 5153 6 2,2’,4,4’,5,5’ 2154 6 2,2’,4,4’,5,6’ 2183 7 2,2’,3,4,4’,5’,6 2209 10 2,2’,3,3’,4,4’,5,5’,6,6’ 25
Table C.8 PFCsPFC Common Name DLs (ug/g)PFPeA perfluoropentanoic acid 0.001PFHxA perfluorohexanoic acid 0.0005PFHpA perfluoroheptanoic acid 0.0005PFOA perfluorooctanoic acid 0.0005PFNA perfluorononanoic acid 0.0005PFDA perfluorodecanoic acid 0.0005PFUnA perfluoroundecanoic acid 0.0005PFDoA perfluorododecanoic acid 0.0005PFTA perfluorotridecanoic acid 0.0005PFBS perfluorobutane sulfonate 0.0005PFHxS perfluorohexane sulfonate 0.0005PFOS perfluorooctane sulfonate 0.0005PFOSA perfluorooctane sulfonamide 0.001
APP
END
ICES
108
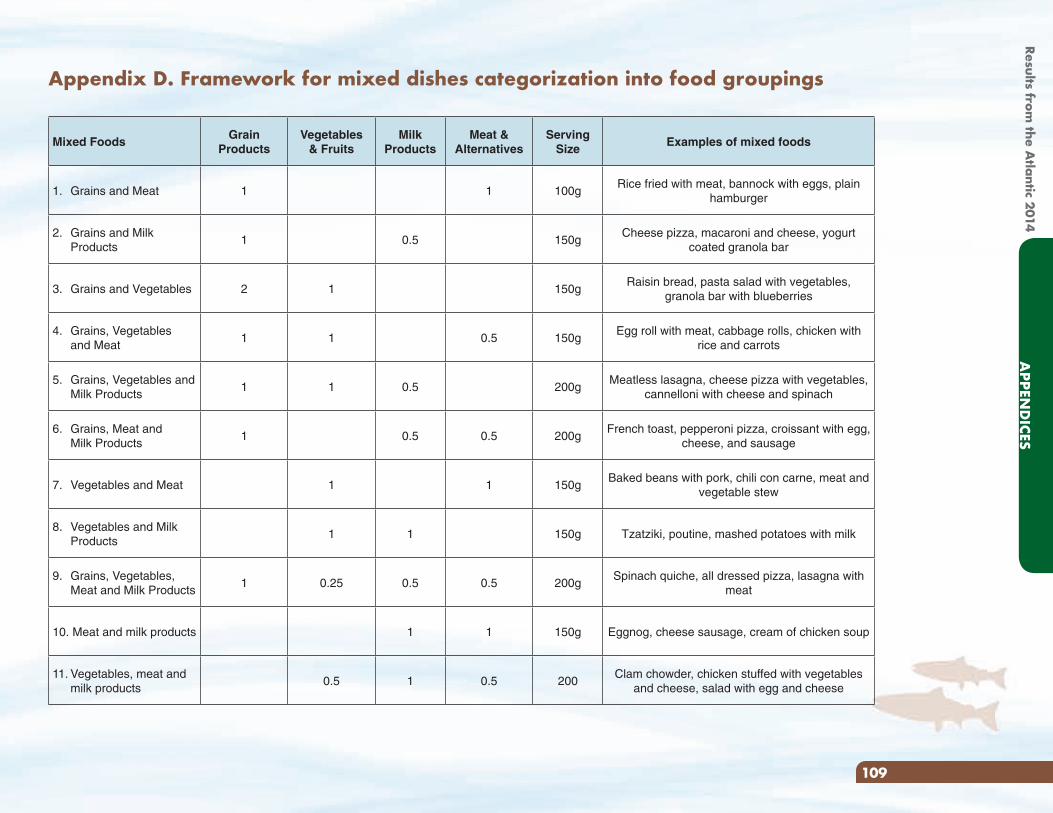
Appendix D. Framework for mixed dishes categorization into food groupings
Mixed FoodsGrain
ProductsVegetables
& FruitsMilk
ProductsMeat &
AlternativesServing
SizeExamples of mixed foods
1. Grains and Meat 1 1 100gRice fried with meat, bannock with eggs, plain
hamburger
2. Grains and Milk Products
1 0.5 150gCheese pizza, macaroni and cheese, yogurt
coated granola bar
3. Grains and Vegetables 2 1 150gRaisin bread, pasta salad with vegetables,
granola bar with blueberries
4. Grains, Vegetables and Meat
1 1 0.5 150gEgg roll with meat, cabbage rolls, chicken with
rice and carrots
5. Grains, Vegetables and Milk Products
1 1 0.5 200gMeatless lasagna, cheese pizza with vegetables,
cannelloni with cheese and spinach
6. Grains, Meat and Milk Products
1 0.5 0.5 200gFrench toast, pepperoni pizza, croissant with egg,
cheese, and sausage
7. Vegetables and Meat 1 1 150gBaked beans with pork, chili con carne, meat and
vegetable stew
8. Vegetables and Milk Products
1 1 150g Tzatziki, poutine, mashed potatoes with milk
9. Grains, Vegetables, Meat and Milk Products
1 0.25 0.5 0.5 200gSpinach quiche, all dressed pizza, lasagna with
meat
10. Meat and milk products 1 1 150g Eggnog, cheese sausage, cream of chicken soup
11. Vegetables, meat and milk products
0.5 1 0.5 200Clam chowder, chicken stuffed with vegetables
and cheese, salad with egg and cheese
109
APPEN
DICES
Results from the A
tlantic 2014
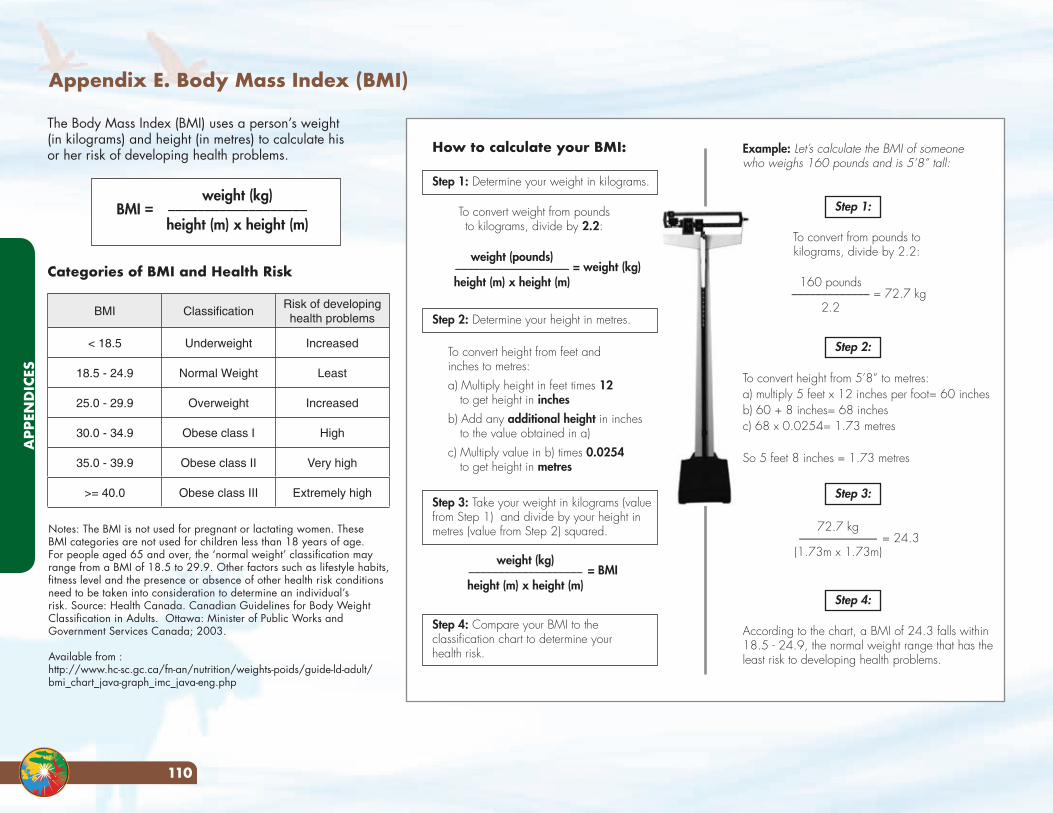
Appendix E. Body Mass Index (BMI)
Notes: The BMI is not used for pregnant or lactating women. These BMI categories are not used for children less than 18 years of age. For people aged 65 and over, the ‘normal weight’ classification may range from a BMI of 18.5 to 29.9. Other factors such as lifestyle habits, fitness level and the presence or absence of other health risk conditions need to be taken into consideration to determine an individual’s risk. Source: Health Canada. Canadian Guidelines for Body Weight Classification in Adults. Ottawa: Minister of Public Works and Government Services Canada; 2003.
Available from :http://www.hc-sc.gc.ca/fn-an/nutrition/weights-poids/guide-ld-adult/bmi_chart_java-graph_imc_java-eng.php
The Body Mass Index (BMI) uses a person’s weight (in kilograms) and height (in metres) to calculate his or her risk of developing health problems.
Categories of BMI and Health Risk
BMI =weight (kg)___________________
height (m) x height (m)
BMI ClassificationRisk of developing health problems
< 18.5 Underweight Increased
18.5 - 24.9 Normal Weight Least
25.0 - 29.9 Overweight Increased
30.0 - 34.9 Obese class I High
35.0 - 39.9 Obese class II Very high
>= 40.0 Obese class III Extremely high
weight (pounds)___________________height (m) x height (m)
= weight (kg)160 pounds_____________
2.2= 72.7 kg
72.7 kg_____________(1.73m x 1.73m)
= 24.3
weight (kg)___________________height (m) x height (m)
= BMI
How to calculate your BMI:
Step 1: Determine your weight in kilograms.
To convert from pounds to kilograms, divide by 2.2:
According to the chart, a BMI of 24.3 falls within 18.5 - 24.9, the normal weight range that has the least risk to developing health problems.
Example: Let’s calculate the BMI of someone who weighs 160 pounds and is 5’8” tall:
Step 2: Determine your height in metres.
Step 3: Take your weight in kilograms (value from Step 1) and divide by your height in metres (value from Step 2) squared.
Step 4: Compare your BMI to the classification chart to determine your health risk.
To convert weight from pounds to kilograms, divide by 2.2:
To convert height from feet and inches to metres: a) Multiply height in feet times 12
to get height in inchesb) Add any additional height in inches
to the value obtained in a)c) Multiply value in b) times 0.0254
to get height in metres
Step 1:
Step 2:
Step 3:
Step 4:
To convert height from 5’8” to metres:a) multiply 5 feet x 12 inches per foot= 60 inchesb) 60 + 8 inches= 68 inchesc) 68 x 0.0254= 1.73 metres
So 5 feet 8 inches = 1.73 metres
APP
END
ICES
110
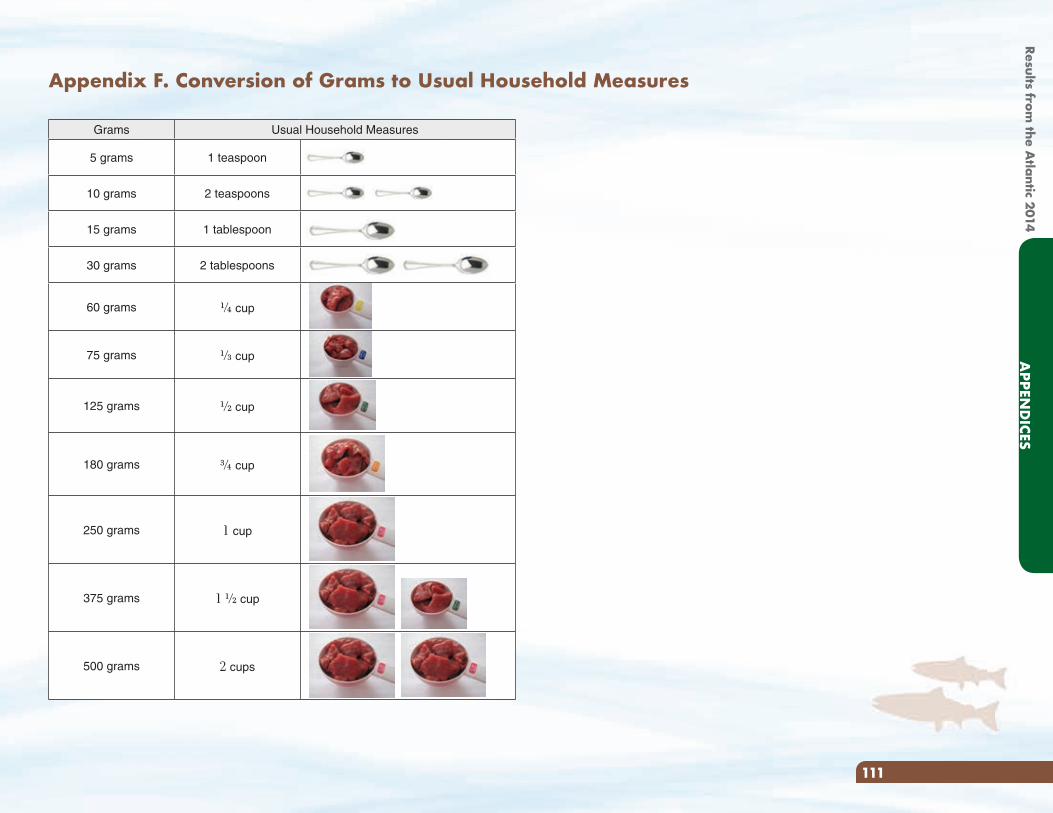
Appendix F. Conversion of Grams to Usual Household Measures
Grams Usual Household Measures
5 grams 1 teaspoon
10 grams 2 teaspoons
15 grams 1 tablespoon
30 grams 2 tablespoons
60 grams G cup
75 grams N cup
125 grams H cup
180 grams I cup
250 grams 1 cup
375 grams 1 H cup
500 grams 2 cups
111
APPEN
DICES
Results from the A
tlantic 2014
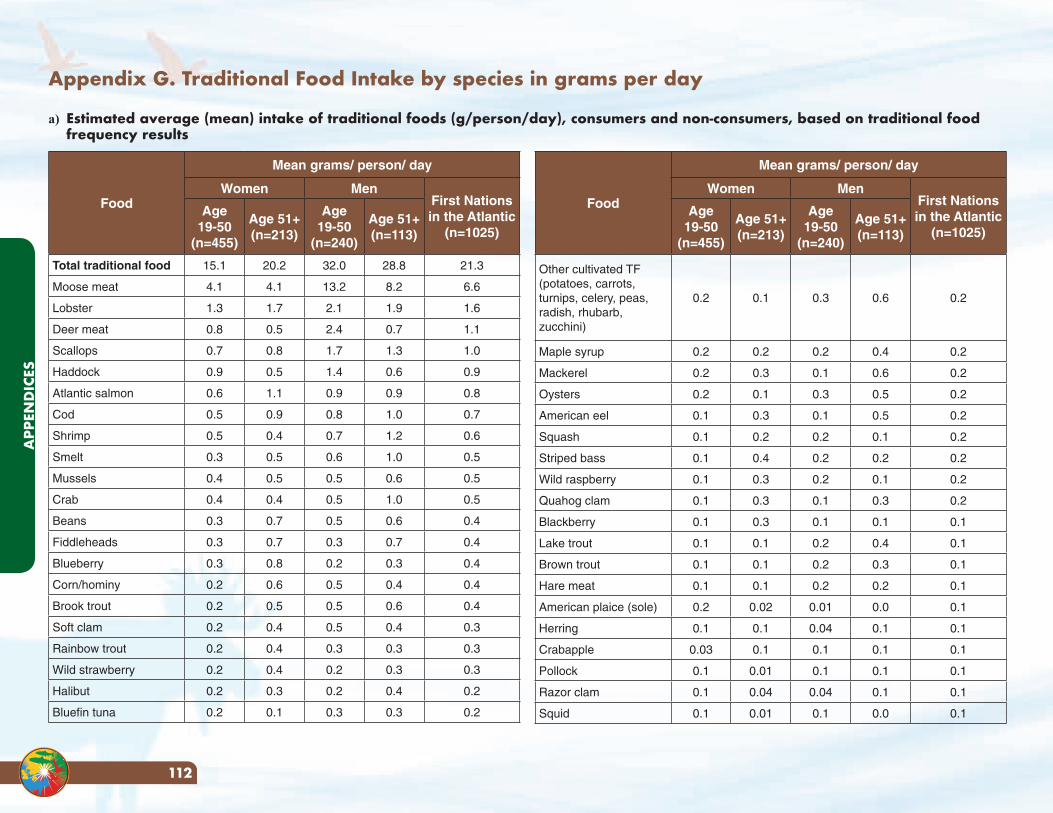
Appendix G. Traditional Food Intake by species in grams per day
a) Estimated average (mean) intake of traditional foods (g/person/day), consumers and non-consumers, based on traditional food frequency results
Food
Mean grams/ person/ day
Women MenFirst Nations in the Atlantic
(n=1025)
Age 19-50
(n=455)
Age 51+ (n=213)
Age 19-50
(n=240)
Age 51+ (n=113)
Total traditional food 15.1 20.2 32.0 28.8 21.3
Moose meat 4.1 4.1 13.2 8.2 6.6
Lobster 1.3 1.7 2.1 1.9 1.6
Deer meat 0.8 0.5 2.4 0.7 1.1
Scallops 0.7 0.8 1.7 1.3 1.0
Haddock 0.9 0.5 1.4 0.6 0.9
Atlantic salmon 0.6 1.1 0.9 0.9 0.8
Cod 0.5 0.9 0.8 1.0 0.7
Shrimp 0.5 0.4 0.7 1.2 0.6
Smelt 0.3 0.5 0.6 1.0 0.5
Mussels 0.4 0.5 0.5 0.6 0.5
Crab 0.4 0.4 0.5 1.0 0.5
Beans 0.3 0.7 0.5 0.6 0.4
Fiddleheads 0.3 0.7 0.3 0.7 0.4
Blueberry 0.3 0.8 0.2 0.3 0.4
Corn/hominy 0.2 0.6 0.5 0.4 0.4
Brook trout 0.2 0.5 0.5 0.6 0.4
Soft clam 0.2 0.4 0.5 0.4 0.3
Rainbow trout 0.2 0.4 0.3 0.3 0.3
Wild strawberry 0.2 0.4 0.2 0.3 0.3
Halibut 0.2 0.3 0.2 0.4 0.2
Bluefin tuna 0.2 0.1 0.3 0.3 0.2
Food
Mean grams/ person/ day
Women MenFirst Nations in the Atlantic
(n=1025)
Age 19-50
(n=455)
Age 51+ (n=213)
Age 19-50
(n=240)
Age 51+ (n=113)
Other cultivated TF (potatoes, carrots, turnips, celery, peas, radish, rhubarb, zucchini)
0.2 0.1 0.3 0.6 0.2
Maple syrup 0.2 0.2 0.2 0.4 0.2
Mackerel 0.2 0.3 0.1 0.6 0.2
Oysters 0.2 0.1 0.3 0.5 0.2
American eel 0.1 0.3 0.1 0.5 0.2
Squash 0.1 0.2 0.2 0.1 0.2
Striped bass 0.1 0.4 0.2 0.2 0.2
Wild raspberry 0.1 0.3 0.2 0.1 0.2
Quahog clam 0.1 0.3 0.1 0.3 0.2
Blackberry 0.1 0.3 0.1 0.1 0.1
Lake trout 0.1 0.1 0.2 0.4 0.1
Brown trout 0.1 0.1 0.2 0.3 0.1
Hare meat 0.1 0.1 0.2 0.2 0.1
American plaice (sole) 0.2 0.02 0.01 0.0 0.1
Herring 0.1 0.1 0.04 0.1 0.1
Crabapple 0.03 0.1 0.1 0.1 0.1
Pollock 0.1 0.01 0.1 0.1 0.1
Razor clam 0.1 0.04 0.04 0.1 0.1
Squid 0.1 0.01 0.1 0.0 0.1
APP
END
ICES
112
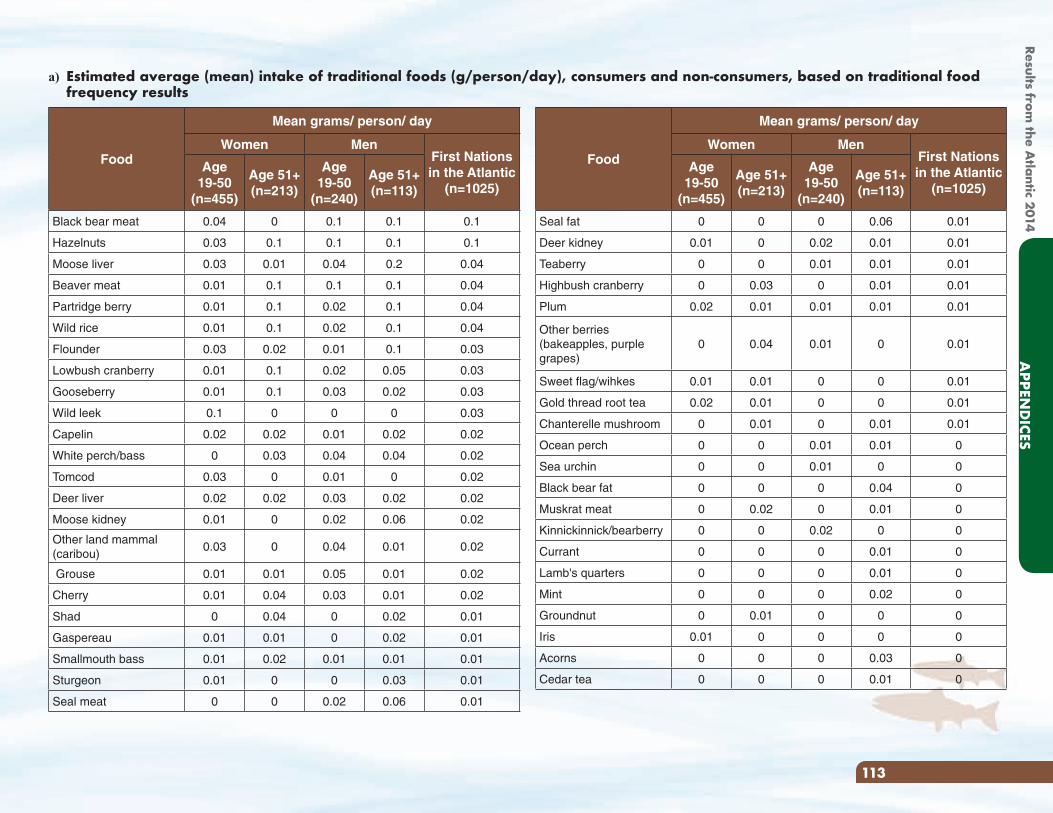
a) Estimated average (mean) intake of traditional foods (g/person/day), consumers and non-consumers, based on traditional food frequency results
Food
Mean grams/ person/ day
Women MenFirst Nations in the Atlantic
(n=1025)
Age 19-50
(n=455)
Age 51+ (n=213)
Age 19-50
(n=240)
Age 51+ (n=113)
Seal fat 0 0 0 0.06 0.01
Deer kidney 0.01 0 0.02 0.01 0.01
Teaberry 0 0 0.01 0.01 0.01
Highbush cranberry 0 0.03 0 0.01 0.01
Plum 0.02 0.01 0.01 0.01 0.01
Other berries (bakeapples, purple grapes)
0 0.04 0.01 0 0.01
Sweet flag/wihkes 0.01 0.01 0 0 0.01
Gold thread root tea 0.02 0.01 0 0 0.01
Chanterelle mushroom 0 0.01 0 0.01 0.01
Ocean perch 0 0 0.01 0.01 0
Sea urchin 0 0 0.01 0 0
Black bear fat 0 0 0 0.04 0
Muskrat meat 0 0.02 0 0.01 0
Kinnickinnick/bearberry 0 0 0.02 0 0
Currant 0 0 0 0.01 0
Lamb's quarters 0 0 0 0.01 0
Mint 0 0 0 0.02 0
Groundnut 0 0.01 0 0 0
Iris 0.01 0 0 0 0
Acorns 0 0 0 0.03 0
Cedar tea 0 0 0 0.01 0
Food
Mean grams/ person/ day
Women MenFirst Nations in the Atlantic
(n=1025)
Age 19-50
(n=455)
Age 51+ (n=213)
Age 19-50
(n=240)
Age 51+ (n=113)
Black bear meat 0.04 0 0.1 0.1 0.1
Hazelnuts 0.03 0.1 0.1 0.1 0.1
Moose liver 0.03 0.01 0.04 0.2 0.04
Beaver meat 0.01 0.1 0.1 0.1 0.04
Partridge berry 0.01 0.1 0.02 0.1 0.04
Wild rice 0.01 0.1 0.02 0.1 0.04
Flounder 0.03 0.02 0.01 0.1 0.03
Lowbush cranberry 0.01 0.1 0.02 0.05 0.03
Gooseberry 0.01 0.1 0.03 0.02 0.03
Wild leek 0.1 0 0 0 0.03
Capelin 0.02 0.02 0.01 0.02 0.02
White perch/bass 0 0.03 0.04 0.04 0.02
Tomcod 0.03 0 0.01 0 0.02
Deer liver 0.02 0.02 0.03 0.02 0.02
Moose kidney 0.01 0 0.02 0.06 0.02
Other land mammal (caribou)
0.03 0 0.04 0.01 0.02
Grouse 0.01 0.01 0.05 0.01 0.02
Cherry 0.01 0.04 0.03 0.01 0.02
Shad 0 0.04 0 0.02 0.01
Gaspereau 0.01 0.01 0 0.02 0.01
Smallmouth bass 0.01 0.02 0.01 0.01 0.01
Sturgeon 0.01 0 0 0.03 0.01
Seal meat 0 0 0.02 0.06 0.01
113
APPEN
DICES
Results from the A
tlantic 2014
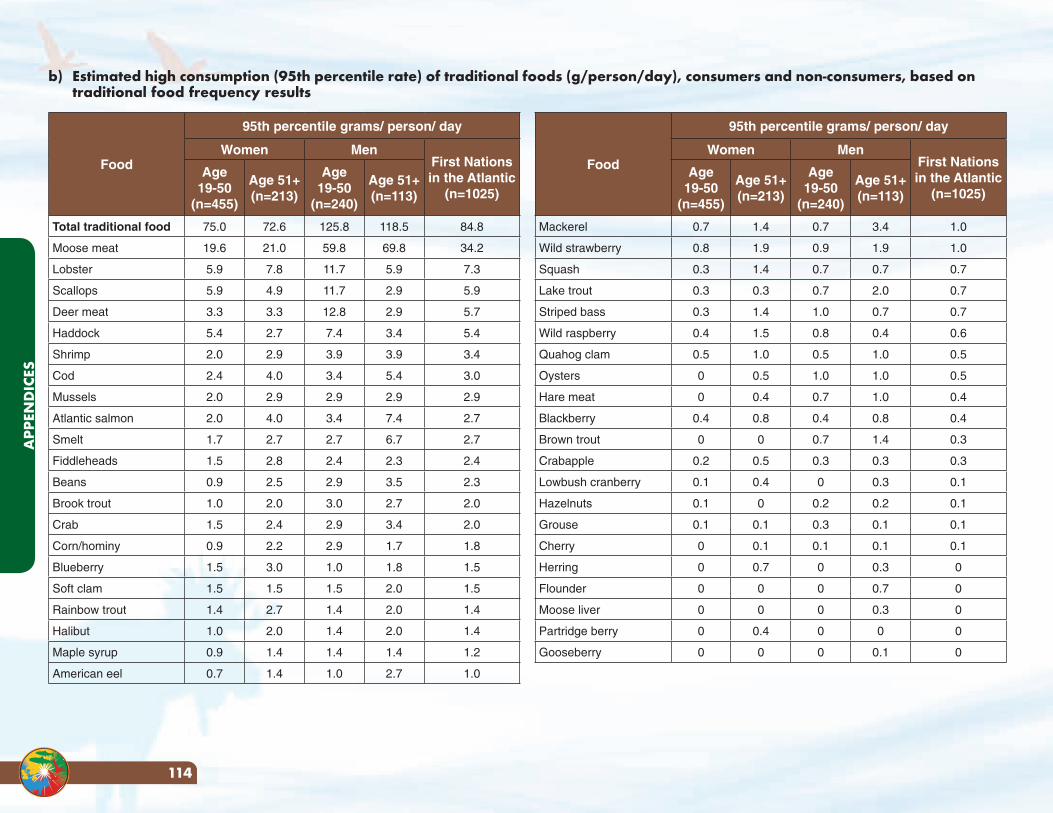
Food
95th percentile grams/ person/ day
Women MenFirst Nations in the Atlantic
(n=1025)
Age 19-50
(n=455)
Age 51+ (n=213)
Age 19-50
(n=240)
Age 51+ (n=113)
Total traditional food 75.0 72.6 125.8 118.5 84.8
Moose meat 19.6 21.0 59.8 69.8 34.2
Lobster 5.9 7.8 11.7 5.9 7.3
Scallops 5.9 4.9 11.7 2.9 5.9
Deer meat 3.3 3.3 12.8 2.9 5.7
Haddock 5.4 2.7 7.4 3.4 5.4
Shrimp 2.0 2.9 3.9 3.9 3.4
Cod 2.4 4.0 3.4 5.4 3.0
Mussels 2.0 2.9 2.9 2.9 2.9
Atlantic salmon 2.0 4.0 3.4 7.4 2.7
Smelt 1.7 2.7 2.7 6.7 2.7
Fiddleheads 1.5 2.8 2.4 2.3 2.4
Beans 0.9 2.5 2.9 3.5 2.3
Brook trout 1.0 2.0 3.0 2.7 2.0
Crab 1.5 2.4 2.9 3.4 2.0
Corn/hominy 0.9 2.2 2.9 1.7 1.8
Blueberry 1.5 3.0 1.0 1.8 1.5
Soft clam 1.5 1.5 1.5 2.0 1.5
Rainbow trout 1.4 2.7 1.4 2.0 1.4
Halibut 1.0 2.0 1.4 2.0 1.4
Maple syrup 0.9 1.4 1.4 1.4 1.2
American eel 0.7 1.4 1.0 2.7 1.0
Food
95th percentile grams/ person/ day
Women MenFirst Nations in the Atlantic
(n=1025)
Age 19-50
(n=455)
Age 51+ (n=213)
Age 19-50
(n=240)
Age 51+ (n=113)
Mackerel 0.7 1.4 0.7 3.4 1.0
Wild strawberry 0.8 1.9 0.9 1.9 1.0
Squash 0.3 1.4 0.7 0.7 0.7
Lake trout 0.3 0.3 0.7 2.0 0.7
Striped bass 0.3 1.4 1.0 0.7 0.7
Wild raspberry 0.4 1.5 0.8 0.4 0.6
Quahog clam 0.5 1.0 0.5 1.0 0.5
Oysters 0 0.5 1.0 1.0 0.5
Hare meat 0 0.4 0.7 1.0 0.4
Blackberry 0.4 0.8 0.4 0.8 0.4
Brown trout 0 0 0.7 1.4 0.3
Crabapple 0.2 0.5 0.3 0.3 0.3
Lowbush cranberry 0.1 0.4 0 0.3 0.1
Hazelnuts 0.1 0 0.2 0.2 0.1
Grouse 0.1 0.1 0.3 0.1 0.1
Cherry 0 0.1 0.1 0.1 0.1
Herring 0 0.7 0 0.3 0
Flounder 0 0 0 0.7 0
Moose liver 0 0 0 0.3 0
Partridge berry 0 0.4 0 0 0
Gooseberry 0 0 0 0.1 0
b) Estimated high consumption (95th percentile rate) of traditional foods (g/person/day), consumers and non-consumers, based on traditional food frequency results
APP
END
ICES
114
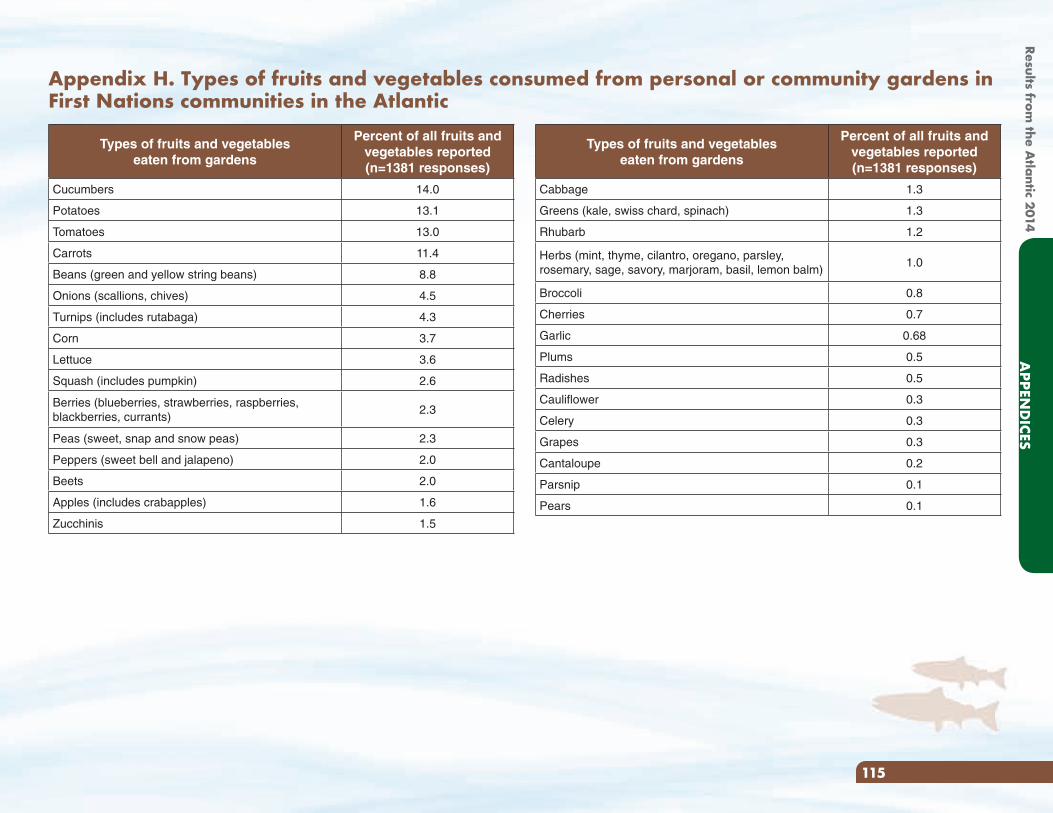
Types of fruits and vegetables eaten from gardens
Percent of all fruits and vegetables reported (n=1381 responses)
Cabbage 1.3
Greens (kale, swiss chard, spinach) 1.3
Rhubarb 1.2
Herbs (mint, thyme, cilantro, oregano, parsley, rosemary, sage, savory, marjoram, basil, lemon balm)
1.0
Broccoli 0.8
Cherries 0.7
Garlic 0.68
Plums 0.5
Radishes 0.5
Cauliflower 0.3
Celery 0.3
Grapes 0.3
Cantaloupe 0.2
Parsnip 0.1
Pears 0.1
Types of fruits and vegetables eaten from gardens
Percent of all fruits and vegetables reported (n=1381 responses)
Cucumbers 14.0
Potatoes 13.1
Tomatoes 13.0
Carrots 11.4
Beans (green and yellow string beans) 8.8
Onions (scallions, chives) 4.5
Turnips (includes rutabaga) 4.3
Corn 3.7
Lettuce 3.6
Squash (includes pumpkin) 2.6
Berries (blueberries, strawberries, raspberries, blackberries, currants)
2.3
Peas (sweet, snap and snow peas) 2.3
Peppers (sweet bell and jalapeno) 2.0
Beets 2.0
Apples (includes crabapples) 1.6
Zucchinis 1.5
Appendix H. Types of fruits and vegetables consumed from personal or community gardens in First Nations communities in the Atlantic
115
APPEN
DICES
Results from the A
tlantic 2014
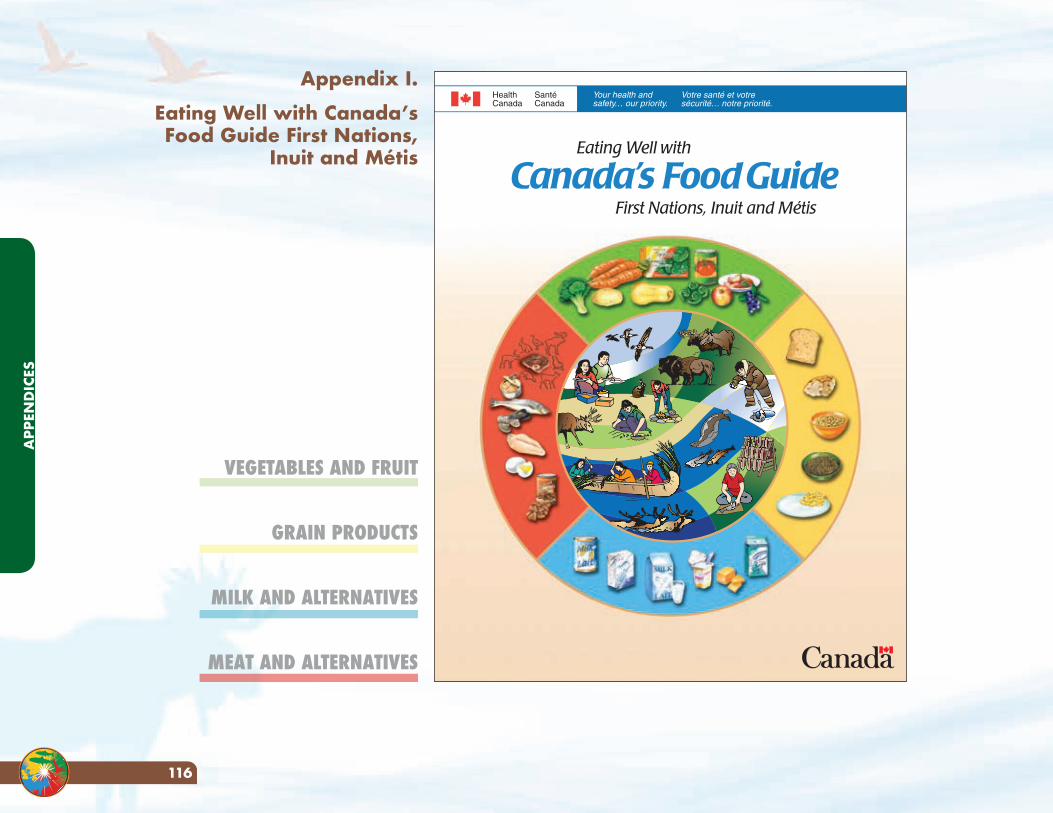
Appendix I.
Eating Well with Canada’s Food Guide First Nations,
Inuit and Métis
VEGETABLES AND FRUIT
GRAIN PRODUCTS
MILK AND ALTERNATIVES
MEAT AND ALTERNATIVES
Eating Well with
Canada’s FoodGuideFirst Nations, Inuit and Métis
APP
END
ICES
116
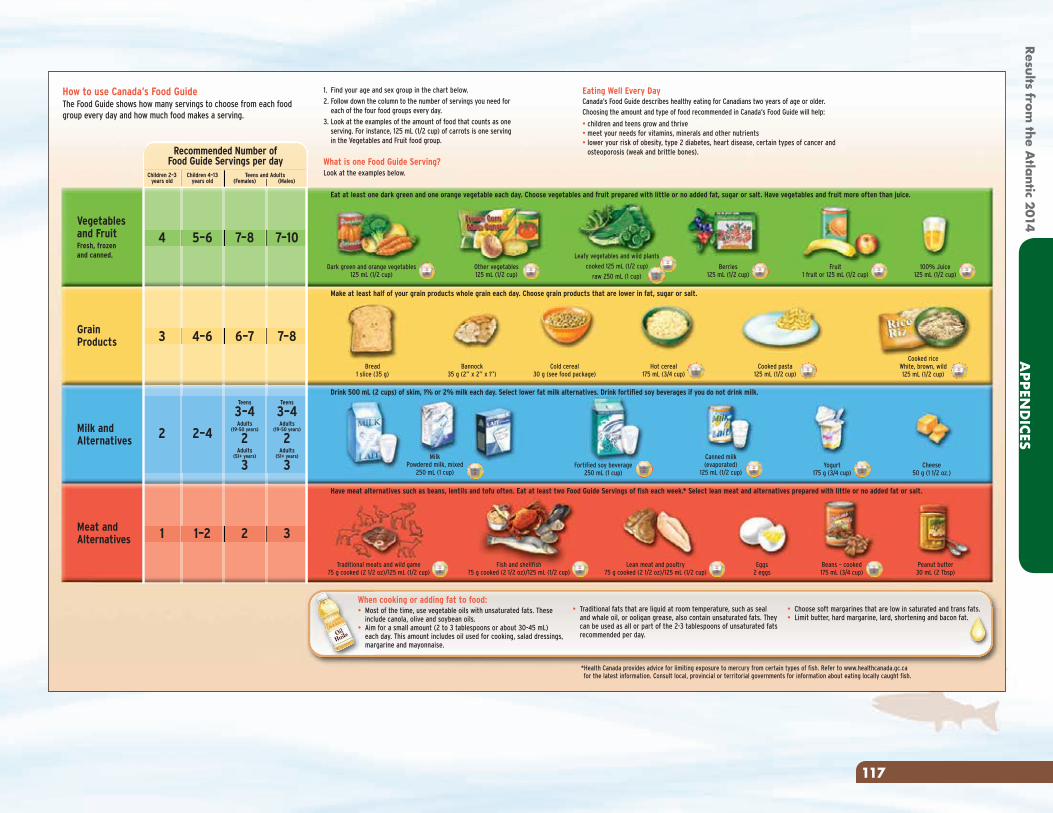
How to use Canada’s Food GuideThe Food Guide shows how many servings to choose from each foodgroup every day and how much food makes a serving.
Eating Well Every DayCanada’s Food Guide describes healthy eating for Canadians two years of age or older.Choosing the amount and type of food recommended in Canada’s Food Guide will help:
• children and teens grow and thrive• meet your needs for vitamins, minerals and other nutrients• lower your risk of obesity, type 2 diabetes, heart disease, certain types of cancer and
osteoporosis (weak and brittle bones).
Other vegetables125 mL (1/2 cup)
Fruit1 fruit or 125 mL (1/2 cup)
100% Juice125 mL (1/2 cup)
Berries125 mL (1/2 cup)
Bread1 slice (35 g)
Bannock35 g (2” x 2” x 1”)
Cold cereal30 g (see food package)
Cheese50 g (1 1/2 oz.)
Peanut butter30 mL (2 Tbsp)
Dark green and orange vegetables125 mL (1/2 cup)
Eat at least one dark green and one orange vegetable each day. Choose vegetables and fruit prepared with little or no added fat, sugar or salt. Have vegetables and fruit more often than juice.
Make at least half of your grain products whole grain each day. Choose grain products that are lower in fat, sugar or salt.
Drink 500 mL (2 cups) of skim, 1% or 2% milk each day. Select lower fat milk alternatives. Drink fortified soy beverages if you do not drink milk.
Have meat alternatives such as beans, lentils and tofu often. Eat at least two Food Guide Servings of fish each week.* Select lean meat and alternatives prepared with little or no added fat or salt.
Lean meat and poultry75 g cooked (2 1/2 oz)/125 mL (1/2 cup)
Fish and shellfish75 g cooked (2 1/2 oz)/125 mL (1/2 cup)
Canned milk(evaporated)
125 mL (1/2 cup)Fortified soy beverage
250 mL (1 cup)
MilkPowdered milk, mixed
250 mL (1 cup)
Traditional meats and wild game75 g cooked (2 1/2 oz)/125 mL (1/2 cup)
Beans – cooked175 mL (3/4 cup)
Yogurt175 g (3/4 cup)
Cooked riceWhite, brown, wild125 mL (1/2 cup)
Cooked pasta125 mL (1/2 cup)
Hot cereal175 mL (3/4 cup)
Eggs2 eggs
Leafy vegetables and wild plants
cooked 125 mL (1/2 cup)
raw 250 mL (1 cup)
Vegetablesand FruitFresh, frozenand canned.
GrainProducts
Milk andAlternatives
Meat andAlternatives
7–107–85–64
3 4–6 6–7 7–8
2 2–4
Teens
3–4Adults
(19-50 years)
2Adults
(51+ years)
3
2 31 1–2
Teens
3–4Adults
(19-50 years)
2Adults
(51+ years)
3
Recommended Number ofFood Guide Servings per day
Children 2–3 years old
Children 4–13 years old
1. Find your age and sex group in the chart below.
2. Follow down the column to the number of servings you need foreach of the four food groups every day.
3. Look at the examples of the amount of food that counts as oneserving. For instance, 125 mL (1/2 cup) of carrots is one servingin the Vegetables and Fruit food group.
What is one Food Guide Serving?Look at the examples below.
When cooking or adding fat to food:• Most of the time, use vegetable oils with unsaturated fats. These
include canola, olive and soybean oils.• Aim for a small amount (2 to 3 tablespoons or about 30-45 mL)
each day. This amount includes oil used for cooking, salad dressings,margarine and mayonnaise.
• Traditional fats that are liquid at room temperature, such as sealand whale oil, or ooligan grease, also contain unsaturated fats. Theycan be used as all or part of the 2-3 tablespoons of unsaturated fatsrecommended per day.
• Choose soft margarines that are low in saturated and trans fats.• Limit butter, hard margarine, lard, shortening and bacon fat.
*Health Canada provides advice for limiting exposure to mercury from certain types of fish. Refer to www.healthcanada.gc.cafor the latest information. Consult local, provincial or territorial governments for information about eating locally caught fish.
Teens and Adults(Females) (Males)
117
APPEN
DICES
Results from the A
tlantic 2014
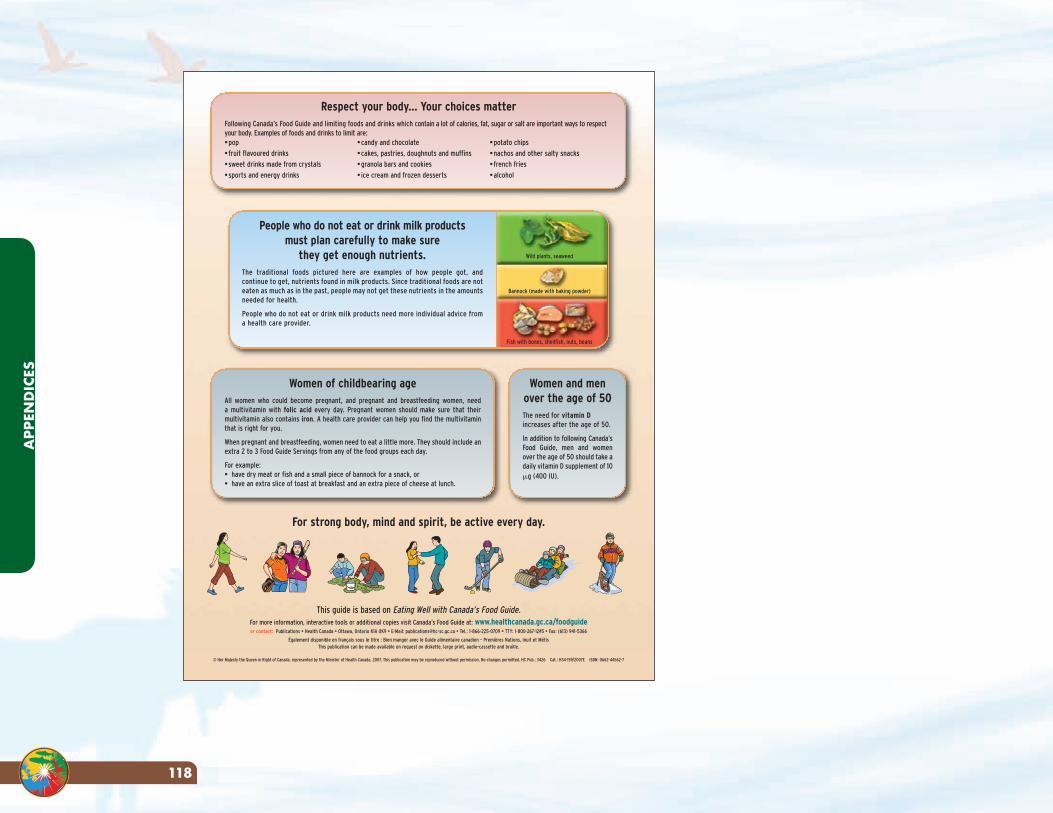
For more information, interactive tools or additional copies visit Canada’s Food Guide at: www.healthcanada.gc.ca/foodguideor contact: Publications • Health Canada • Ottawa, Ontario K1A 0K9 • E-Mail: [email protected] • Tel.: 1-866-225-0709 • TTY: 1-800-267-1245 • Fax: (613) 941-5366
Également disponible en français sous le titre : Bien manger avec le Guide alimentaire canadien – Premières Nations, Inuit et MétisThis publication can be made available on request on diskette, large print, audio-cassette and braille.
© Her Majesty the Queen in Right of Canada, represented by the Minister of Health Canada, 2007. This publication may be reproduced without permission. No changes permitted. HC Pub.: 3426 Cat.: H34-159/2007E ISBN: 0662-44562-7
People who do not eat or drink milk productsmust plan carefully to make sure
they get enough nutrients.The traditional foods pictured here are examples of how people got, andcontinue to get, nutrients found in milk products. Since traditional foods are noteaten as much as in the past, people may not get these nutrients in the amountsneeded for health.
People who do not eat or drink milk products need more individual advice froma health care provider.
Wild plants, seaweed
Fish with bones, shellfish, nuts, beans
Bannock (made with baking powder)
For strong body, mind and spirit, be active every day.
Women of childbearing ageAll women who could become pregnant, and pregnant and breastfeeding women, need a multivitamin with folic acid every day. Pregnant women should make sure that theirmultivitamin also contains iron. A health care provider can help you find the multivitaminthat is right for you.
When pregnant and breastfeeding, women need to eat a little more. They should include anextra 2 to 3 Food Guide Servings from any of the food groups each day.
For example:• have dry meat or fish and a small piece of bannock for a snack, or• have an extra slice of toast at breakfast and an extra piece of cheese at lunch.
Women and menover the age of 50The need for vitamin Dincreases after the age of 50.
In addition to following Canada’sFood Guide, men and womenover the age of 50 should take adaily vitamin D supplement of 10�g (400 IU).
Respect your body... Your choices matterFollowing Canada’s Food Guide and limiting foods and drinks which contain a lot of calories, fat, sugar or salt are important ways to respectyour body. Examples of foods and drinks to limit are:•pop
•fruit flavoured drinks
•sweet drinks made from crystals
•sports and energy drinks
•candy and chocolate
•cakes, pastries, doughnuts and muffins
•granola bars and cookies
• ice cream and frozen desserts
•potato chips
•nachos and other salty snacks
• french fries
•alcohol
This guide is based on Eating Well with Canada’s Food Guide.
APP
END
ICES
118
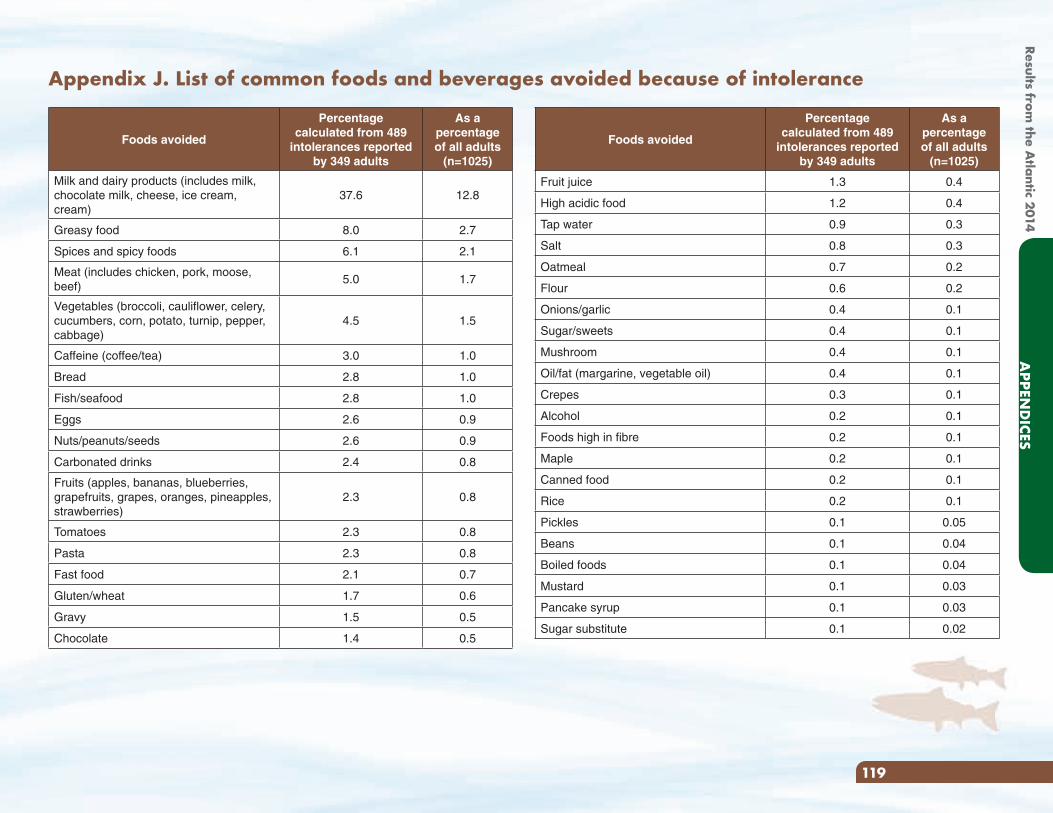
Appendix J. List of common foods and beverages avoided because of intolerance
Foods avoided
Percentagecalculated from 489
intolerances reported by 349 adults
As a percentage of all adults
(n=1025)
Milk and dairy products (includes milk, chocolate milk, cheese, ice cream, cream)
37.6 12.8
Greasy food 8.0 2.7
Spices and spicy foods 6.1 2.1
Meat (includes chicken, pork, moose, beef)
5.0 1.7
Vegetables (broccoli, cauliflower, celery, cucumbers, corn, potato, turnip, pepper, cabbage)
4.5 1.5
Caffeine (coffee/tea) 3.0 1.0
Bread 2.8 1.0
Fish/seafood 2.8 1.0
Eggs 2.6 0.9
Nuts/peanuts/seeds 2.6 0.9
Carbonated drinks 2.4 0.8
Fruits (apples, bananas, blueberries, grapefruits, grapes, oranges, pineapples, strawberries)
2.3 0.8
Tomatoes 2.3 0.8
Pasta 2.3 0.8
Fast food 2.1 0.7
Gluten/wheat 1.7 0.6
Gravy 1.5 0.5
Chocolate 1.4 0.5
Foods avoided
Percentagecalculated from 489
intolerances reported by 349 adults
As a percentage of all adults
(n=1025)
Fruit juice 1.3 0.4
High acidic food 1.2 0.4
Tap water 0.9 0.3
Salt 0.8 0.3
Oatmeal 0.7 0.2
Flour 0.6 0.2
Onions/garlic 0.4 0.1
Sugar/sweets 0.4 0.1
Mushroom 0.4 0.1
Oil/fat (margarine, vegetable oil) 0.4 0.1
Crepes 0.3 0.1
Alcohol 0.2 0.1
Foods high in fibre 0.2 0.1
Maple 0.2 0.1
Canned food 0.2 0.1
Rice 0.2 0.1
Pickles 0.1 0.05
Beans 0.1 0.04
Boiled foods 0.1 0.04
Mustard 0.1 0.03
Pancake syrup 0.1 0.03
Sugar substitute 0.1 0.02
119
APPEN
DICES
Results from the A
tlantic 2014
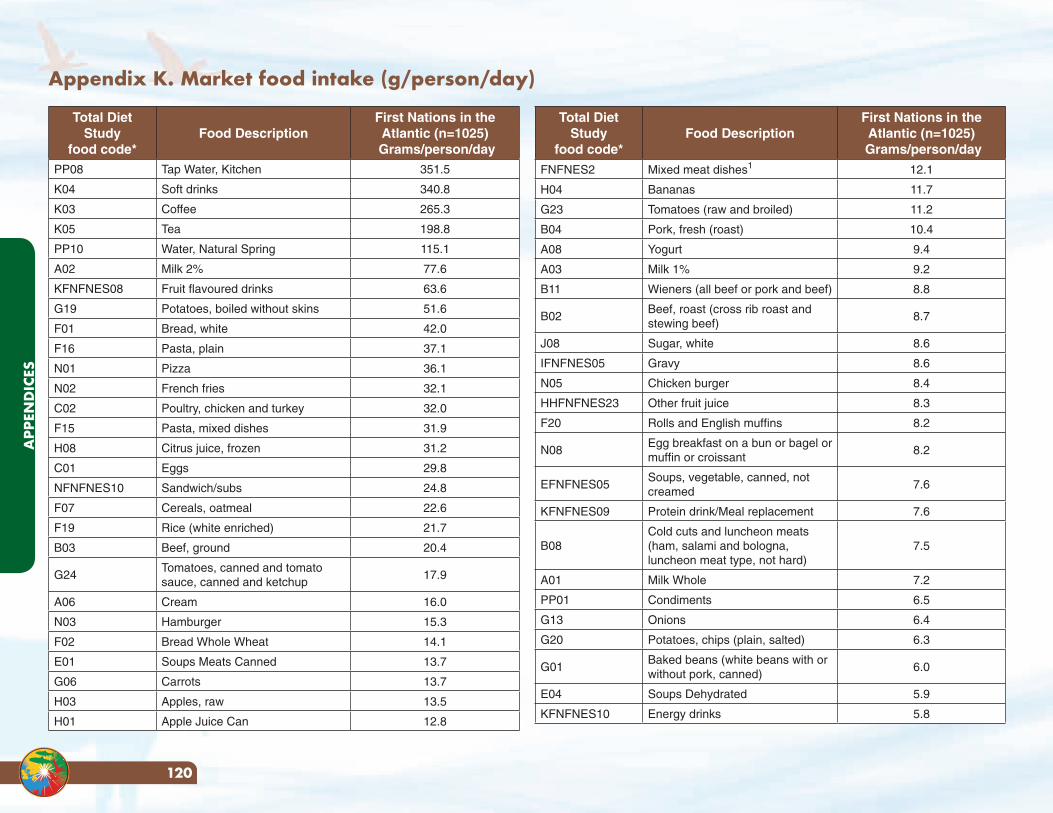
Appendix K. Market food intake (g/person/day)
Total Diet Study
food code*Food Description
First Nations in the Atlantic (n=1025)
Grams/person/dayPP08 Tap Water, Kitchen 351.5
K04 Soft drinks 340.8
K03 Coffee 265.3
K05 Tea 198.8
PP10 Water, Natural Spring 115.1
A02 Milk 2% 77.6
KFNFNES08 Fruit flavoured drinks 63.6
G19 Potatoes, boiled without skins 51.6
F01 Bread, white 42.0
F16 Pasta, plain 37.1
N01 Pizza 36.1
N02 French fries 32.1
C02 Poultry, chicken and turkey 32.0
F15 Pasta, mixed dishes 31.9
H08 Citrus juice, frozen 31.2
C01 Eggs 29.8
NFNFNES10 Sandwich/subs 24.8
F07 Cereals, oatmeal 22.6
F19 Rice (white enriched) 21.7
B03 Beef, ground 20.4
G24Tomatoes, canned and tomato sauce, canned and ketchup
17.9
A06 Cream 16.0
N03 Hamburger 15.3
F02 Bread Whole Wheat 14.1
E01 Soups Meats Canned 13.7
G06 Carrots 13.7
H03 Apples, raw 13.5
H01 Apple Juice Can 12.8
Total Diet Study
food code*Food Description
First Nations in the Atlantic (n=1025)
Grams/person/day
FNFNES2 Mixed meat dishes1 12.1
H04 Bananas 11.7
G23 Tomatoes (raw and broiled) 11.2
B04 Pork, fresh (roast) 10.4
A08 Yogurt 9.4
A03 Milk 1% 9.2
B11 Wieners (all beef or pork and beef) 8.8
B02Beef, roast (cross rib roast and stewing beef)
8.7
J08 Sugar, white 8.6
IFNFNES05 Gravy 8.6
N05 Chicken burger 8.4
HHFNFNES23 Other fruit juice 8.3
F20 Rolls and English muffins 8.2
N08Egg breakfast on a bun or bagel or muffin or croissant
8.2
EFNFNES05Soups, vegetable, canned, not creamed
7.6
KFNFNES09 Protein drink/Meal replacement 7.6
B08Cold cuts and luncheon meats (ham, salami and bologna, luncheon meat type, not hard)
7.5
A01 Milk Whole 7.2
PP01 Condiments 6.5
G13 Onions 6.4
G20 Potatoes, chips (plain, salted) 6.3
G01Baked beans (white beans with or without pork, canned)
6.0
E04 Soups Dehydrated 5.9
KFNFNES10 Energy drinks 5.8
APP
END
ICES
120
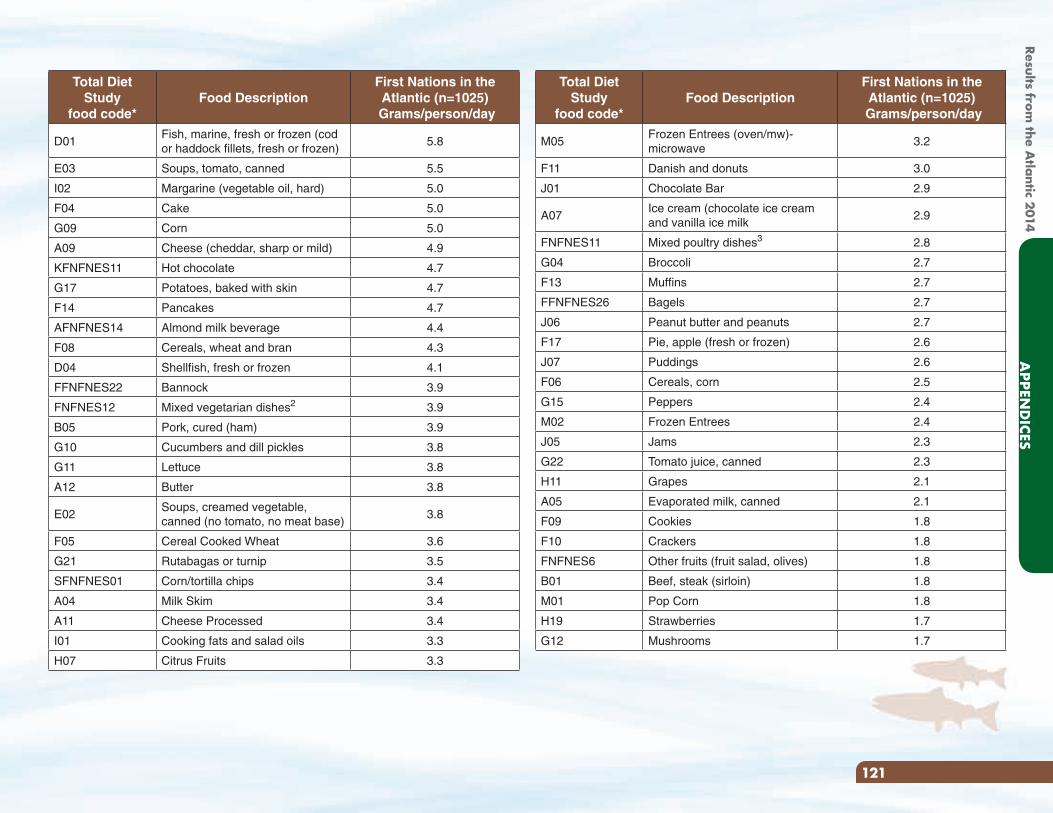
Total Diet Study
food code*Food Description
First Nations in the Atlantic (n=1025)
Grams/person/day
M05Frozen Entrees (oven/mw)- microwave
3.2
F11 Danish and donuts 3.0
J01 Chocolate Bar 2.9
A07Ice cream (chocolate ice cream and vanilla ice milk
2.9
FNFNES11 Mixed poultry dishes3 2.8
G04 Broccoli 2.7
F13 Muffins 2.7
FFNFNES26 Bagels 2.7
J06 Peanut butter and peanuts 2.7
F17 Pie, apple (fresh or frozen) 2.6
J07 Puddings 2.6
F06 Cereals, corn 2.5
G15 Peppers 2.4
M02 Frozen Entrees 2.4
J05 Jams 2.3
G22 Tomato juice, canned 2.3
H11 Grapes 2.1
A05 Evaporated milk, canned 2.1
F09 Cookies 1.8
F10 Crackers 1.8
FNFNES6 Other fruits (fruit salad, olives) 1.8
B01 Beef, steak (sirloin) 1.8
M01 Pop Corn 1.8
H19 Strawberries 1.7
G12 Mushrooms 1.7
Total Diet Study
food code*Food Description
First Nations in the Atlantic (n=1025)
Grams/person/day
D01Fish, marine, fresh or frozen (cod or haddock fillets, fresh or frozen)
5.8
E03 Soups, tomato, canned 5.5
I02 Margarine (vegetable oil, hard) 5.0
F04 Cake 5.0
G09 Corn 5.0
A09 Cheese (cheddar, sharp or mild) 4.9
KFNFNES11 Hot chocolate 4.7
G17 Potatoes, baked with skin 4.7
F14 Pancakes 4.7
AFNFNES14 Almond milk beverage 4.4
F08 Cereals, wheat and bran 4.3
D04 Shellfish, fresh or frozen 4.1
FFNFNES22 Bannock 3.9
FNFNES12 Mixed vegetarian dishes2 3.9
B05 Pork, cured (ham) 3.9
G10 Cucumbers and dill pickles 3.8
G11 Lettuce 3.8
A12 Butter 3.8
E02Soups, creamed vegetable, canned (no tomato, no meat base)
3.8
F05 Cereal Cooked Wheat 3.6
G21 Rutabagas or turnip 3.5
SFNFNES01 Corn/tortilla chips 3.4
A04 Milk Skim 3.4
A11 Cheese Processed 3.4
I01 Cooking fats and salad oils 3.3
H07 Citrus Fruits 3.3
121
APPEN
DICES
Results from the A
tlantic 2014
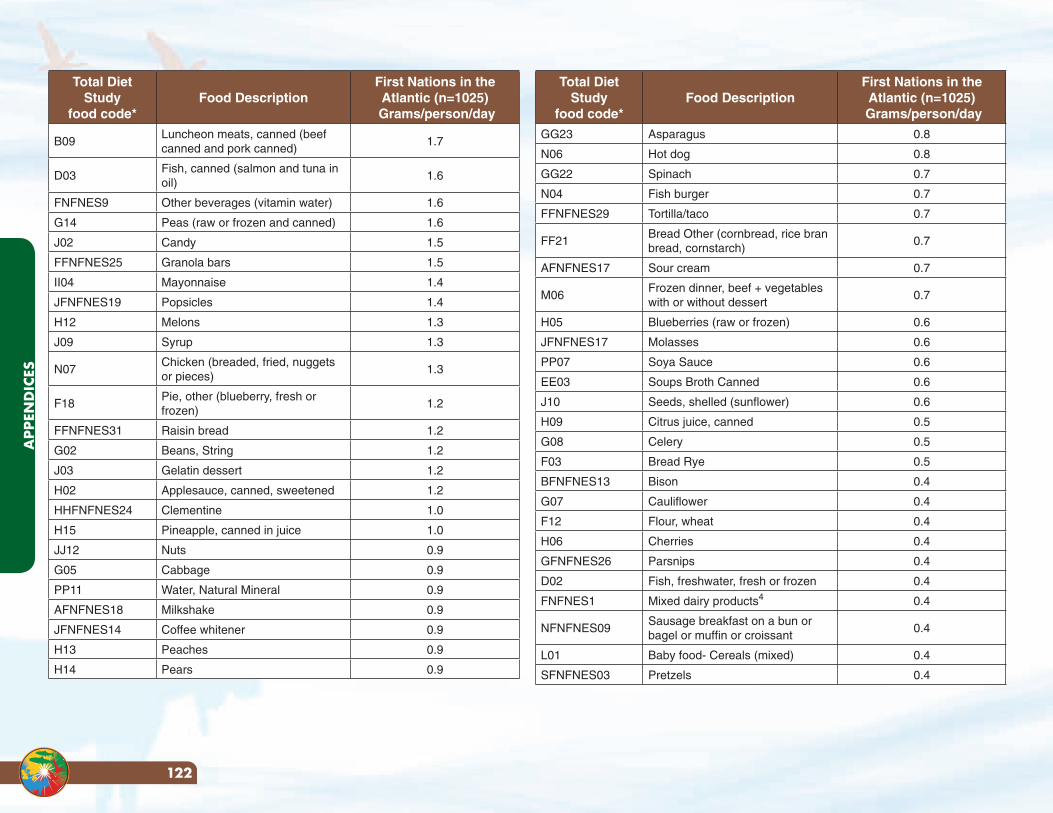
Total Diet Study
food code*Food Description
First Nations in the Atlantic (n=1025)
Grams/person/day
GG23 Asparagus 0.8
N06 Hot dog 0.8
GG22 Spinach 0.7
N04 Fish burger 0.7
FFNFNES29 Tortilla/taco 0.7
FF21Bread Other (cornbread, rice bran bread, cornstarch)
0.7
AFNFNES17 Sour cream 0.7
M06Frozen dinner, beef + vegetables with or without dessert
0.7
H05 Blueberries (raw or frozen) 0.6
JFNFNES17 Molasses 0.6
PP07 Soya Sauce 0.6
EE03 Soups Broth Canned 0.6
J10 Seeds, shelled (sunflower) 0.6
H09 Citrus juice, canned 0.5
G08 Celery 0.5
F03 Bread Rye 0.5
BFNFNES13 Bison 0.4
G07 Cauliflower 0.4
F12 Flour, wheat 0.4
H06 Cherries 0.4
GFNFNES26 Parsnips 0.4
D02 Fish, freshwater, fresh or frozen 0.4
FNFNES1 Mixed dairy products4 0.4
NFNFNES09Sausage breakfast on a bun or bagel or muffin or croissant
0.4
L01 Baby food- Cereals (mixed) 0.4
SFNFNES03 Pretzels 0.4
Total Diet Study
food code*Food Description
First Nations in the Atlantic (n=1025)
Grams/person/day
B09Luncheon meats, canned (beef canned and pork canned)
1.7
D03Fish, canned (salmon and tuna in oil)
1.6
FNFNES9 Other beverages (vitamin water) 1.6
G14 Peas (raw or frozen and canned) 1.6
J02 Candy 1.5
FFNFNES25 Granola bars 1.5
II04 Mayonnaise 1.4
JFNFNES19 Popsicles 1.4
H12 Melons 1.3
J09 Syrup 1.3
N07Chicken (breaded, fried, nuggets or pieces)
1.3
F18Pie, other (blueberry, fresh or frozen)
1.2
FFNFNES31 Raisin bread 1.2
G02 Beans, String 1.2
J03 Gelatin dessert 1.2
H02 Applesauce, canned, sweetened 1.2
HHFNFNES24 Clementine 1.0
H15 Pineapple, canned in juice 1.0
JJ12 Nuts 0.9
G05 Cabbage 0.9
PP11 Water, Natural Mineral 0.9
AFNFNES18 Milkshake 0.9
JFNFNES14 Coffee whitener 0.9
H13 Peaches 0.9
H14 Pears 0.9
APP
END
ICES
122
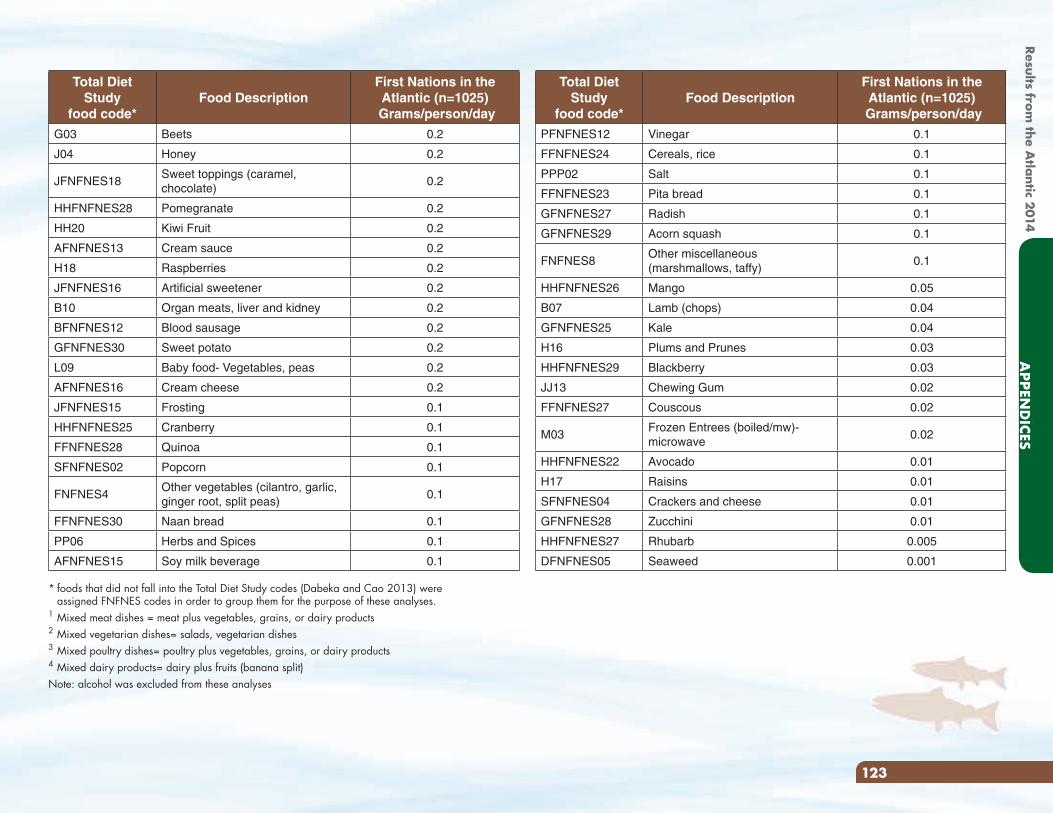
Total Diet Study
food code*Food Description
First Nations in the Atlantic (n=1025)
Grams/person/day
PFNFNES12 Vinegar 0.1
FFNFNES24 Cereals, rice 0.1
PPP02 Salt 0.1
FFNFNES23 Pita bread 0.1
GFNFNES27 Radish 0.1
GFNFNES29 Acorn squash 0.1
FNFNES8Other miscellaneous (marshmallows, taffy)
0.1
HHFNFNES26 Mango 0.05
B07 Lamb (chops) 0.04
GFNFNES25 Kale 0.04
H16 Plums and Prunes 0.03
HHFNFNES29 Blackberry 0.03
JJ13 Chewing Gum 0.02
FFNFNES27 Couscous 0.02
M03Frozen Entrees (boiled/mw)- microwave
0.02
HHFNFNES22 Avocado 0.01
H17 Raisins 0.01
SFNFNES04 Crackers and cheese 0.01
GFNFNES28 Zucchini 0.01
HHFNFNES27 Rhubarb 0.005
DFNFNES05 Seaweed 0.001
Total Diet Study
food code*Food Description
First Nations in the Atlantic (n=1025)
Grams/person/day
G03 Beets 0.2
J04 Honey 0.2
JFNFNES18Sweet toppings (caramel, chocolate)
0.2
HHFNFNES28 Pomegranate 0.2
HH20 Kiwi Fruit 0.2
AFNFNES13 Cream sauce 0.2
H18 Raspberries 0.2
JFNFNES16 Artificial sweetener 0.2
B10 Organ meats, liver and kidney 0.2
BFNFNES12 Blood sausage 0.2
GFNFNES30 Sweet potato 0.2
L09 Baby food- Vegetables, peas 0.2
AFNFNES16 Cream cheese 0.2
JFNFNES15 Frosting 0.1
HHFNFNES25 Cranberry 0.1
FFNFNES28 Quinoa 0.1
SFNFNES02 Popcorn 0.1
FNFNES4Other vegetables (cilantro, garlic, ginger root, split peas)
0.1
FFNFNES30 Naan bread 0.1
PP06 Herbs and Spices 0.1
AFNFNES15 Soy milk beverage 0.1
* foods that did not fall into the Total Diet Study codes (Dabeka and Cao 2013) were assigned FNFNES codes in order to group them for the purpose of these analyses.
1 Mixed meat dishes = meat plus vegetables, grains, or dairy products2 Mixed vegetarian dishes= salads, vegetarian dishes3 Mixed poultry dishes= poultry plus vegetables, grains, or dairy products4 Mixed dairy products= dairy plus fruits (banana split)Note: alcohol was excluded from these analyses
123
APPEN
DICES
Results from the A
tlantic 2014
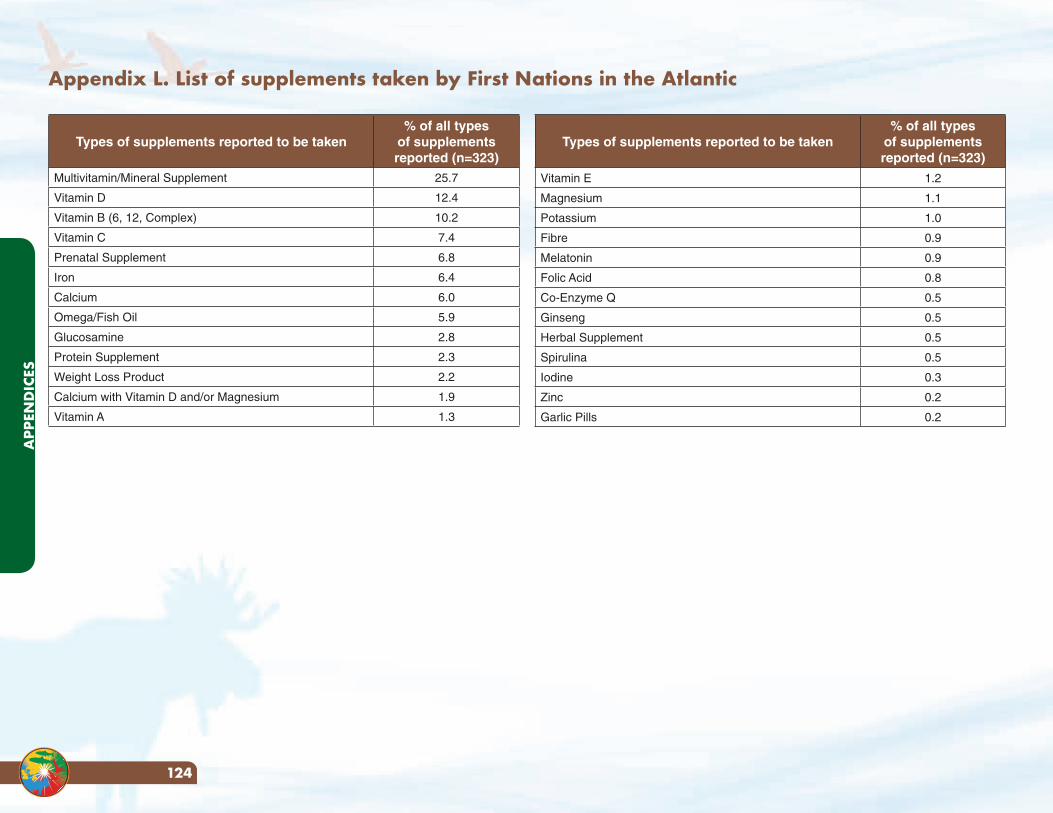
Appendix L. List of supplements taken by First Nations in the Atlantic
Types of supplements reported to be taken% of all types
of supplements reported (n=323)
Multivitamin/Mineral Supplement 25.7
Vitamin D 12.4
Vitamin B (6, 12, Complex) 10.2
Vitamin C 7.4
Prenatal Supplement 6.8
Iron 6.4
Calcium 6.0
Omega/Fish Oil 5.9
Glucosamine 2.8
Protein Supplement 2.3
Weight Loss Product 2.2
Calcium with Vitamin D and/or Magnesium 1.9
Vitamin A 1.3
Types of supplements reported to be taken% of all types
of supplements reported (n=323)
Vitamin E 1.2
Magnesium 1.1
Potassium 1.0
Fibre 0.9
Melatonin 0.9
Folic Acid 0.8
Co-Enzyme Q 0.5
Ginseng 0.5
Herbal Supplement 0.5
Spirulina 0.5
Iodine 0.3
Zinc 0.2
Garlic Pills 0.2
APP
END
ICES
124
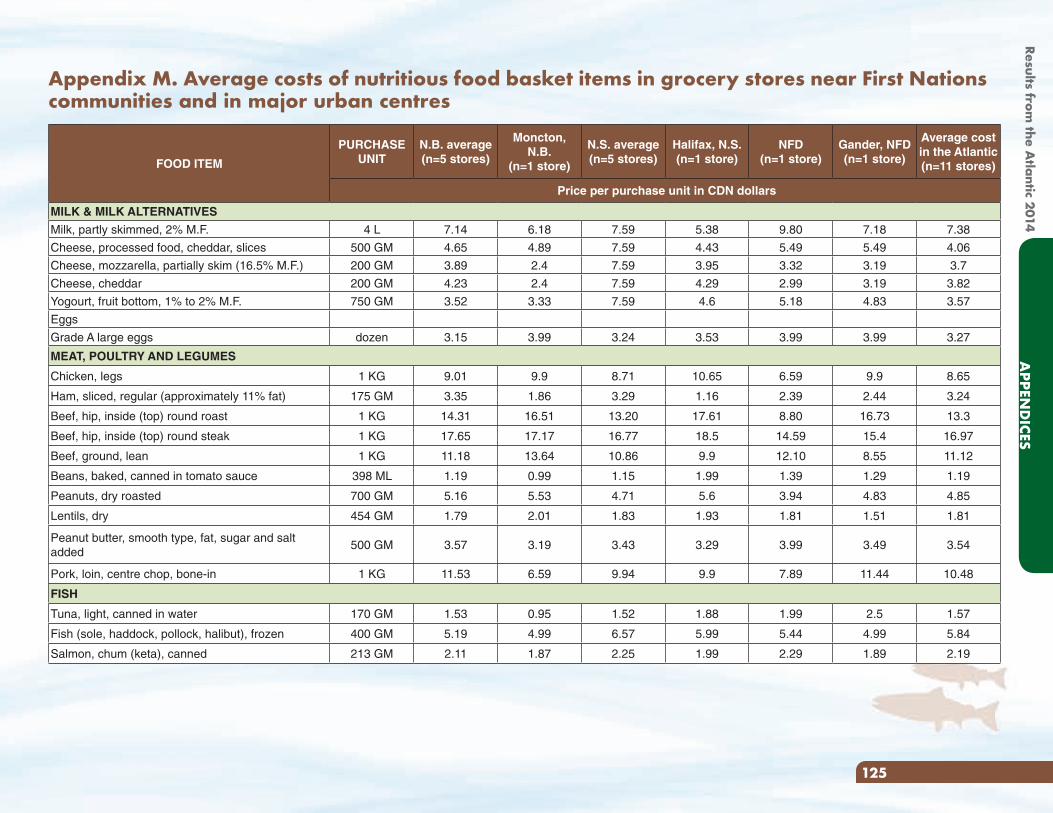
FOOD ITEM
PURCHASE UNIT
N.B. average (n=5 stores)
Moncton, N.B.
(n=1 store)
N.S. average (n=5 stores)
Halifax, N.S. (n=1 store)
NFD (n=1 store)
Gander, NFD (n=1 store)
Average cost in the Atlantic(n=11 stores)
Price per purchase unit in CDN dollars
MILK & MILK ALTERNATIVES
Milk, partly skimmed, 2% M.F. 4 L 7.14 6.18 7.59 5.38 9.80 7.18 7.38
Cheese, processed food, cheddar, slices 500 GM 4.65 4.89 7.59 4.43 5.49 5.49 4.06
Cheese, mozzarella, partially skim (16.5% M.F.) 200 GM 3.89 2.4 7.59 3.95 3.32 3.19 3.7
Cheese, cheddar 200 GM 4.23 2.4 7.59 4.29 2.99 3.19 3.82
Yogourt, fruit bottom, 1% to 2% M.F. 750 GM 3.52 3.33 7.59 4.6 5.18 4.83 3.57
Eggs
Grade A large eggs dozen 3.15 3.99 3.24 3.53 3.99 3.99 3.27
MEAT, POULTRY AND LEGUMES
Chicken, legs 1 KG 9.01 9.9 8.71 10.65 6.59 9.9 8.65
Ham, sliced, regular (approximately 11% fat) 175 GM 3.35 1.86 3.29 1.16 2.39 2.44 3.24
Beef, hip, inside (top) round roast 1 KG 14.31 16.51 13.20 17.61 8.80 16.73 13.3
Beef, hip, inside (top) round steak 1 KG 17.65 17.17 16.77 18.5 14.59 15.4 16.97
Beef, ground, lean 1 KG 11.18 13.64 10.86 9.9 12.10 8.55 11.12
Beans, baked, canned in tomato sauce 398 ML 1.19 0.99 1.15 1.99 1.39 1.29 1.19
Peanuts, dry roasted 700 GM 5.16 5.53 4.71 5.6 3.94 4.83 4.85
Lentils, dry 454 GM 1.79 2.01 1.83 1.93 1.81 1.51 1.81
Peanut butter, smooth type, fat, sugar and salt added
500 GM 3.57 3.19 3.43 3.29 3.99 3.49 3.54
Pork, loin, centre chop, bone-in 1 KG 11.53 6.59 9.94 9.9 7.89 11.44 10.48
FISH
Tuna, light, canned in water 170 GM 1.53 0.95 1.52 1.88 1.99 2.5 1.57
Fish (sole, haddock, pollock, halibut), frozen 400 GM 5.19 4.99 6.57 5.99 5.44 4.99 5.84
Salmon, chum (keta), canned 213 GM 2.11 1.87 2.25 1.99 2.29 1.89 2.19
Appendix M. Average costs of nutritious food basket items in grocery stores near First Nations communities and in major urban centres
125
APPEN
DICES
Results from the A
tlantic 2014
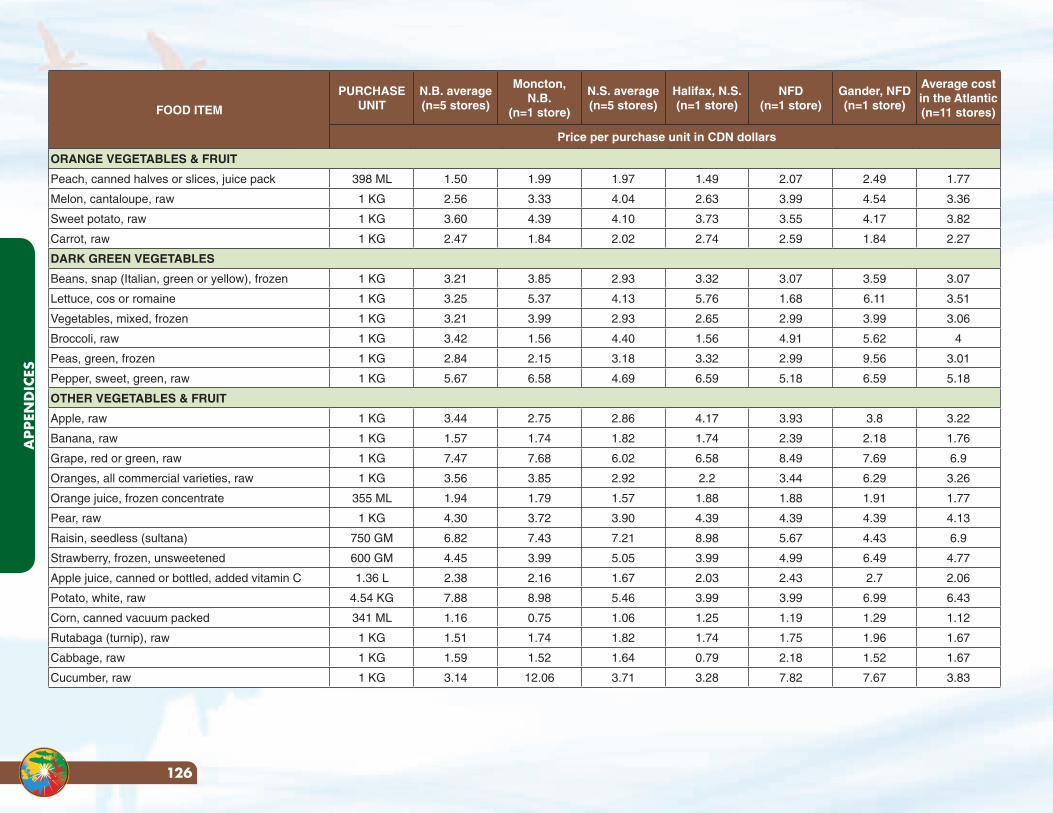
FOOD ITEM
PURCHASE UNIT
N.B. average (n=5 stores)
Moncton, N.B.
(n=1 store)
N.S. average (n=5 stores)
Halifax, N.S. (n=1 store)
NFD (n=1 store)
Gander, NFD (n=1 store)
Average cost in the Atlantic(n=11 stores)
Price per purchase unit in CDN dollars
ORANGE VEGETABLES & FRUIT
Peach, canned halves or slices, juice pack 398 ML 1.50 1.99 1.97 1.49 2.07 2.49 1.77
Melon, cantaloupe, raw 1 KG 2.56 3.33 4.04 2.63 3.99 4.54 3.36
Sweet potato, raw 1 KG 3.60 4.39 4.10 3.73 3.55 4.17 3.82
Carrot, raw 1 KG 2.47 1.84 2.02 2.74 2.59 1.84 2.27
DARK GREEN VEGETABLES
Beans, snap (Italian, green or yellow), frozen 1 KG 3.21 3.85 2.93 3.32 3.07 3.59 3.07
Lettuce, cos or romaine 1 KG 3.25 5.37 4.13 5.76 1.68 6.11 3.51
Vegetables, mixed, frozen 1 KG 3.21 3.99 2.93 2.65 2.99 3.99 3.06
Broccoli, raw 1 KG 3.42 1.56 4.40 1.56 4.91 5.62 4
Peas, green, frozen 1 KG 2.84 2.15 3.18 3.32 2.99 9.56 3.01
Pepper, sweet, green, raw 1 KG 5.67 6.58 4.69 6.59 5.18 6.59 5.18
OTHER VEGETABLES & FRUIT
Apple, raw 1 KG 3.44 2.75 2.86 4.17 3.93 3.8 3.22
Banana, raw 1 KG 1.57 1.74 1.82 1.74 2.39 2.18 1.76
Grape, red or green, raw 1 KG 7.47 7.68 6.02 6.58 8.49 7.69 6.9
Oranges, all commercial varieties, raw 1 KG 3.56 3.85 2.92 2.2 3.44 6.29 3.26
Orange juice, frozen concentrate 355 ML 1.94 1.79 1.57 1.88 1.88 1.91 1.77
Pear, raw 1 KG 4.30 3.72 3.90 4.39 4.39 4.39 4.13
Raisin, seedless (sultana) 750 GM 6.82 7.43 7.21 8.98 5.67 4.43 6.9
Strawberry, frozen, unsweetened 600 GM 4.45 3.99 5.05 3.99 4.99 6.49 4.77
Apple juice, canned or bottled, added vitamin C 1.36 L 2.38 2.16 1.67 2.03 2.43 2.7 2.06
Potato, white, raw 4.54 KG 7.88 8.98 5.46 3.99 3.99 6.99 6.43
Corn, canned vacuum packed 341 ML 1.16 0.75 1.06 1.25 1.19 1.29 1.12
Rutabaga (turnip), raw 1 KG 1.51 1.74 1.82 1.74 1.75 1.96 1.67
Cabbage, raw 1 KG 1.59 1.52 1.64 0.79 2.18 1.52 1.67
Cucumber, raw 1 KG 3.14 12.06 3.71 3.28 7.82 7.67 3.83
APP
END
ICES
126
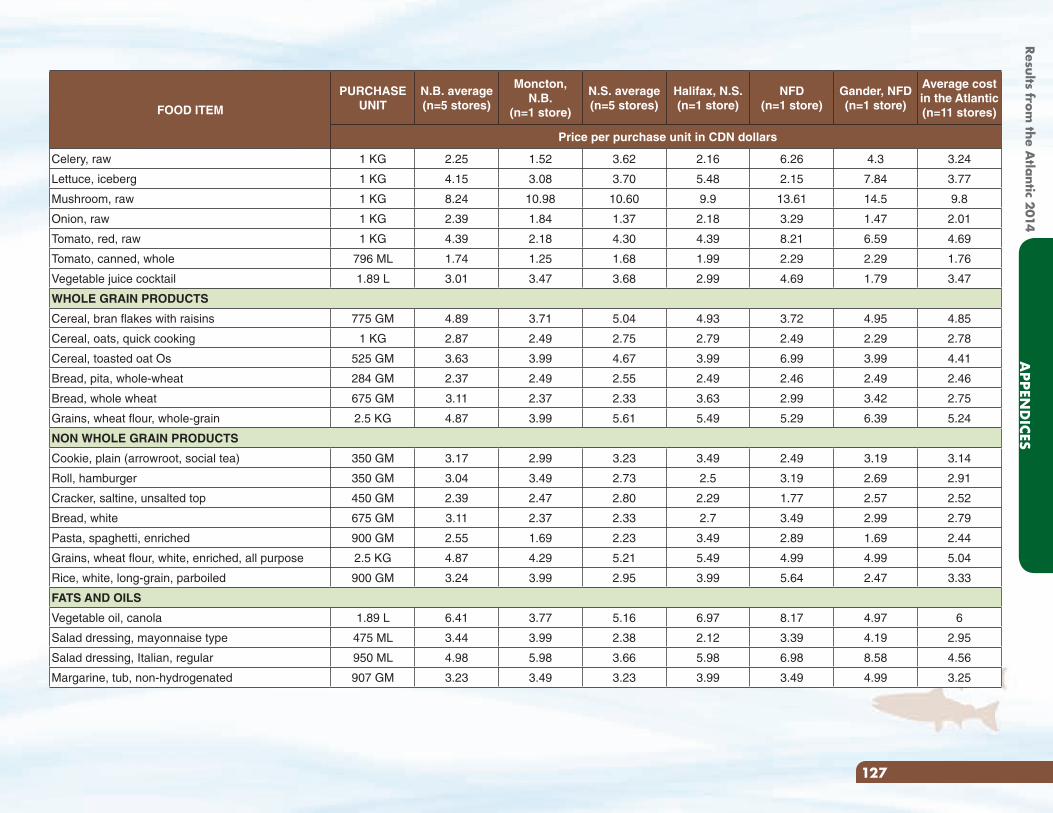
FOOD ITEM
PURCHASE UNIT
N.B. average (n=5 stores)
Moncton, N.B.
(n=1 store)
N.S. average (n=5 stores)
Halifax, N.S. (n=1 store)
NFD (n=1 store)
Gander, NFD (n=1 store)
Average cost in the Atlantic(n=11 stores)
Price per purchase unit in CDN dollars
Celery, raw 1 KG 2.25 1.52 3.62 2.16 6.26 4.3 3.24
Lettuce, iceberg 1 KG 4.15 3.08 3.70 5.48 2.15 7.84 3.77
Mushroom, raw 1 KG 8.24 10.98 10.60 9.9 13.61 14.5 9.8
Onion, raw 1 KG 2.39 1.84 1.37 2.18 3.29 1.47 2.01
Tomato, red, raw 1 KG 4.39 2.18 4.30 4.39 8.21 6.59 4.69
Tomato, canned, whole 796 ML 1.74 1.25 1.68 1.99 2.29 2.29 1.76
Vegetable juice cocktail 1.89 L 3.01 3.47 3.68 2.99 4.69 1.79 3.47
WHOLE GRAIN PRODUCTS
Cereal, bran flakes with raisins 775 GM 4.89 3.71 5.04 4.93 3.72 4.95 4.85
Cereal, oats, quick cooking 1 KG 2.87 2.49 2.75 2.79 2.49 2.29 2.78
Cereal, toasted oat Os 525 GM 3.63 3.99 4.67 3.99 6.99 3.99 4.41
Bread, pita, whole-wheat 284 GM 2.37 2.49 2.55 2.49 2.46 2.49 2.46
Bread, whole wheat 675 GM 3.11 2.37 2.33 3.63 2.99 3.42 2.75
Grains, wheat flour, whole-grain 2.5 KG 4.87 3.99 5.61 5.49 5.29 6.39 5.24
NON WHOLE GRAIN PRODUCTS
Cookie, plain (arrowroot, social tea) 350 GM 3.17 2.99 3.23 3.49 2.49 3.19 3.14
Roll, hamburger 350 GM 3.04 3.49 2.73 2.5 3.19 2.69 2.91
Cracker, saltine, unsalted top 450 GM 2.39 2.47 2.80 2.29 1.77 2.57 2.52
Bread, white 675 GM 3.11 2.37 2.33 2.7 3.49 2.99 2.79
Pasta, spaghetti, enriched 900 GM 2.55 1.69 2.23 3.49 2.89 1.69 2.44
Grains, wheat flour, white, enriched, all purpose 2.5 KG 4.87 4.29 5.21 5.49 4.99 4.99 5.04
Rice, white, long-grain, parboiled 900 GM 3.24 3.99 2.95 3.99 5.64 2.47 3.33
FATS AND OILS
Vegetable oil, canola 1.89 L 6.41 3.77 5.16 6.97 8.17 4.97 6
Salad dressing, mayonnaise type 475 ML 3.44 3.99 2.38 2.12 3.39 4.19 2.95
Salad dressing, Italian, regular 950 ML 4.98 5.98 3.66 5.98 6.98 8.58 4.56
Margarine, tub, non-hydrogenated 907 GM 3.23 3.49 3.23 3.99 3.49 4.99 3.25
127
APPEN
DICES
Results from the A
tlantic 2014
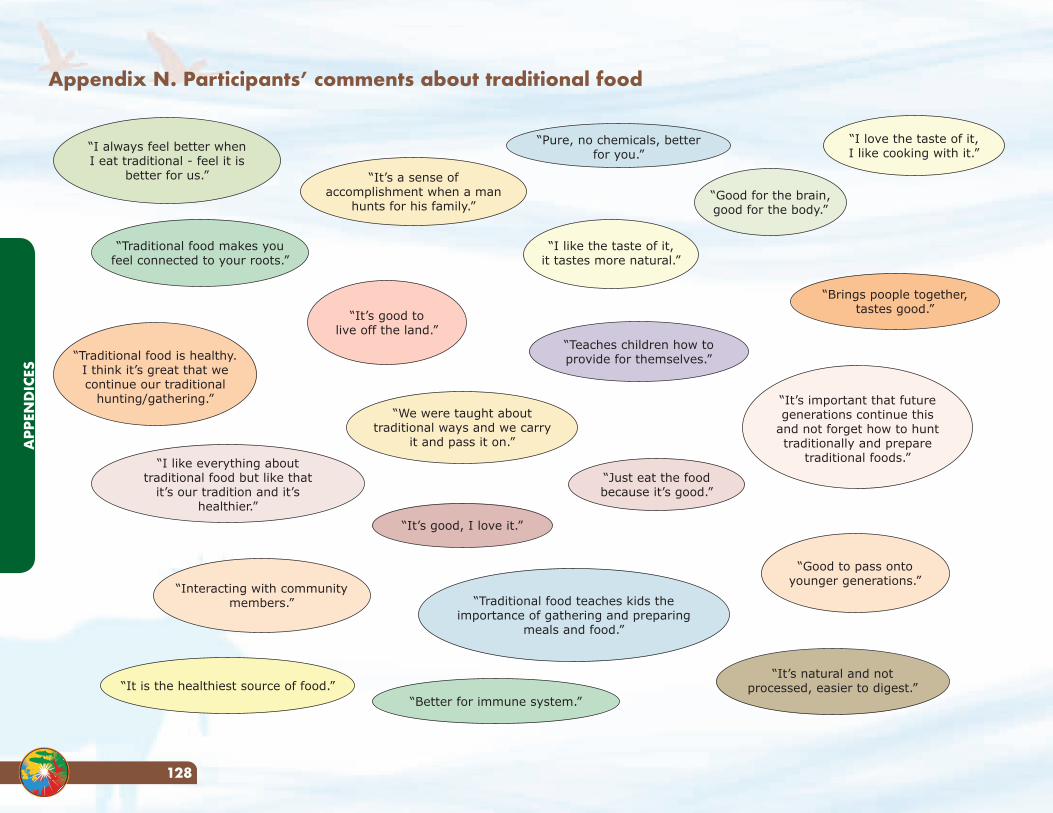
Appendix N. Participants’ comments about traditional food
“I always feel better when I eat traditional - feel it is
better for us.”
“Traditional food is healthy. I think it’s great that we continue our traditional
hunting/gathering.” “It’s important that future generations continue this
and not forget how to hunt traditionally and prepare
traditional foods.”
“Traditional food makes you feel connected to your roots.”
“It’s a sense of accomplishment when a man
hunts for his family.”
“I love the taste of it,I like cooking with it.”
“Pure, no chemicals, better for you.”
“I like the taste of it,it tastes more natural.”
“It’s good tolive off the land.”
“I like everything about traditional food but like that
it’s our tradition and it’s healthier.”
“Interacting with community members.”
“It’s good, I love it.”
“We were taught about traditional ways and we carry
it and pass it on.”
“It is the healthiest source of food.”“Better for immune system.”
“Traditional food teaches kids the importance of gathering and preparing
meals and food.”
“Just eat the foodbecause it’s good.”
“Teaches children how to provide for themselves.”
“Brings poople together, tastes good.”
“Good for the brain,good for the body.”
“Good to pass ontoyounger generations.”
“It’s natural and not processed, easier to digest.”
APP
END
ICES
128
Appendix O. Healthy Food Guidelines for First Nations Communities8
Food is part of celebration, ceremony, social functions, learning functions and is one of our best ways to bring people together. With many occasions to offer and share food, we have plenty of opportunity to promote healthy choices by ensuring that healthy foods are available almost all of the time.
Serving healthy foods in communities means having healthy food selections at all community activities that include food such as: community programs, gatherings, meetings and special events as well as at daycares and schools and even as part of fundraising events. Serving healthy foods starts with the types of food offered as well as the amount of food offered.
The following table of foods was based on the Guidelines for Food and Beverage Sales in British Columbia Schools and further adapted from a document created by the First Nations Health Council in BC. It has been modified for this report to assist communities in the promotion of healthy food choices at community events. The table is broken into Food Categories based on nutrition criteria that assess the calories and amount of sugar, fat and salt (sodium) in these foods. The first category, “Leave off the Table”, contains foods that are generally high in fat and sugar and/or salt. The second category, “Better on the Table”, includes foods that may be low in fat or salt (sodium) but do not meet all of the criteria of foods that fit within the third category, “Great on the Table Anytime”.
In order to promote healthy eating, we encourage communities to make and serve the types of foods listed under “Better on the Table” and “Great on the Table Anytime” as often as possible. Foods listed under “Leave off the Table” should be offered as little as possible or only at special occasions.
8Adapted with permission from First Nations Health Council. 2009. Healthy Food Guidelines for First Nations Communities(BC). The complete guidelines are available through the First Nations
Health Authority www.fnha.ca
129
APPEN
DICES
Results from the A
tlantic 2014
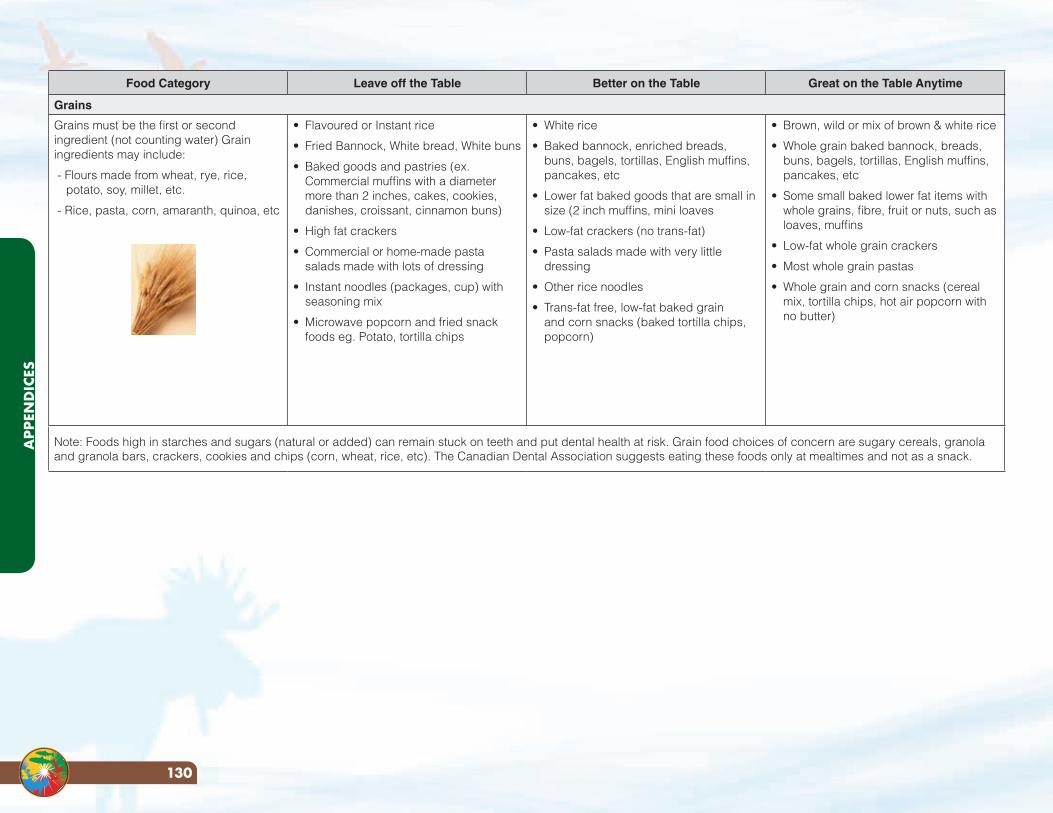
Food Category Leave off the Table Better on the Table Great on the Table Anytime
Grains
Grains must be the first or second ingredient (not counting water) Grain ingredients may include:
- Flours made from wheat, rye, rice, potato, soy, millet, etc.
- Rice, pasta, corn, amaranth, quinoa, etc
• Flavoured or Instant rice
• Fried Bannock, White bread, White buns
• Baked goods and pastries (ex. Commercial muffins with a diameter more than 2 inches, cakes, cookies, danishes, croissant, cinnamon buns)
• High fat crackers
• Commercial or home-made pasta salads made with lots of dressing
• Instant noodles (packages, cup) with seasoning mix
• Microwave popcorn and fried snack foods eg. Potato, tortilla chips
• White rice
• Baked bannock, enriched breads, buns, bagels, tortillas, English muffins, pancakes, etc
• Lower fat baked goods that are small in size (2 inch muffins, mini loaves
• Low-fat crackers (no trans-fat)
• Pasta salads made with very little dressing
• Other rice noodles
• Trans-fat free, low-fat baked grain and corn snacks (baked tortilla chips, popcorn)
• Brown, wild or mix of brown & white rice
• Whole grain baked bannock, breads, buns, bagels, tortillas, English muffins, pancakes, etc
• Some small baked lower fat items with whole grains, fibre, fruit or nuts, such as loaves, muffins
• Low-fat whole grain crackers
• Most whole grain pastas
• Whole grain and corn snacks (cereal mix, tortilla chips, hot air popcorn with no butter)
Note: Foods high in starches and sugars (natural or added) can remain stuck on teeth and put dental health at risk. Grain food choices of concern are sugary cereals, granola and granola bars, crackers, cookies and chips (corn, wheat, rice, etc). The Canadian Dental Association suggests eating these foods only at mealtimes and not as a snack.
APP
END
ICES
130
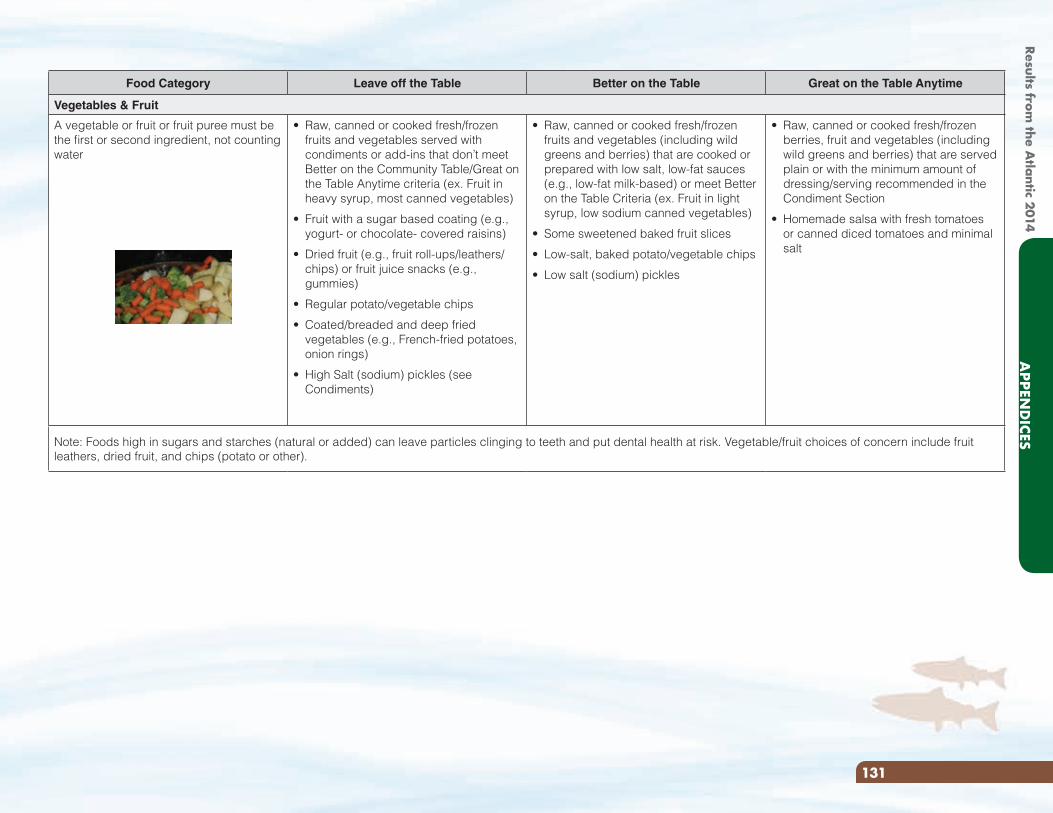
Food Category Leave off the Table Better on the Table Great on the Table Anytime
Vegetables & Fruit
A vegetable or fruit or fruit puree must be the first or second ingredient, not counting water
• Raw, canned or cooked fresh/frozen fruits and vegetables served with condiments or add-ins that don’t meet Better on the Community Table/Great on the Table Anytime criteria (ex. Fruit in heavy syrup, most canned vegetables)
• Fruit with a sugar based coating (e.g., yogurt- or chocolate- covered raisins)
• Dried fruit (e.g., fruit roll-ups/leathers/chips) or fruit juice snacks (e.g., gummies)
• Regular potato/vegetable chips
• Coated/breaded and deep fried vegetables (e.g., French-fried potatoes, onion rings)
• High Salt (sodium) pickles (see Condiments)
• Raw, canned or cooked fresh/frozen fruits and vegetables (including wild greens and berries) that are cooked or prepared with low salt, low-fat sauces (e.g., low-fat milk-based) or meet Better on the Table Criteria (ex. Fruit in light syrup, low sodium canned vegetables)
• Some sweetened baked fruit slices
• Low-salt, baked potato/vegetable chips
• Low salt (sodium) pickles
• Raw, canned or cooked fresh/frozen berries, fruit and vegetables (including wild greens and berries) that are served plain or with the minimum amount of dressing/serving recommended in the Condiment Section
• Homemade salsa with fresh tomatoes or canned diced tomatoes and minimal salt
Note: Foods high in sugars and starches (natural or added) can leave particles clinging to teeth and put dental health at risk. Vegetable/fruit choices of concern include fruit leathers, dried fruit, and chips (potato or other).
131
APPEN
DICES
Results from the A
tlantic 2014
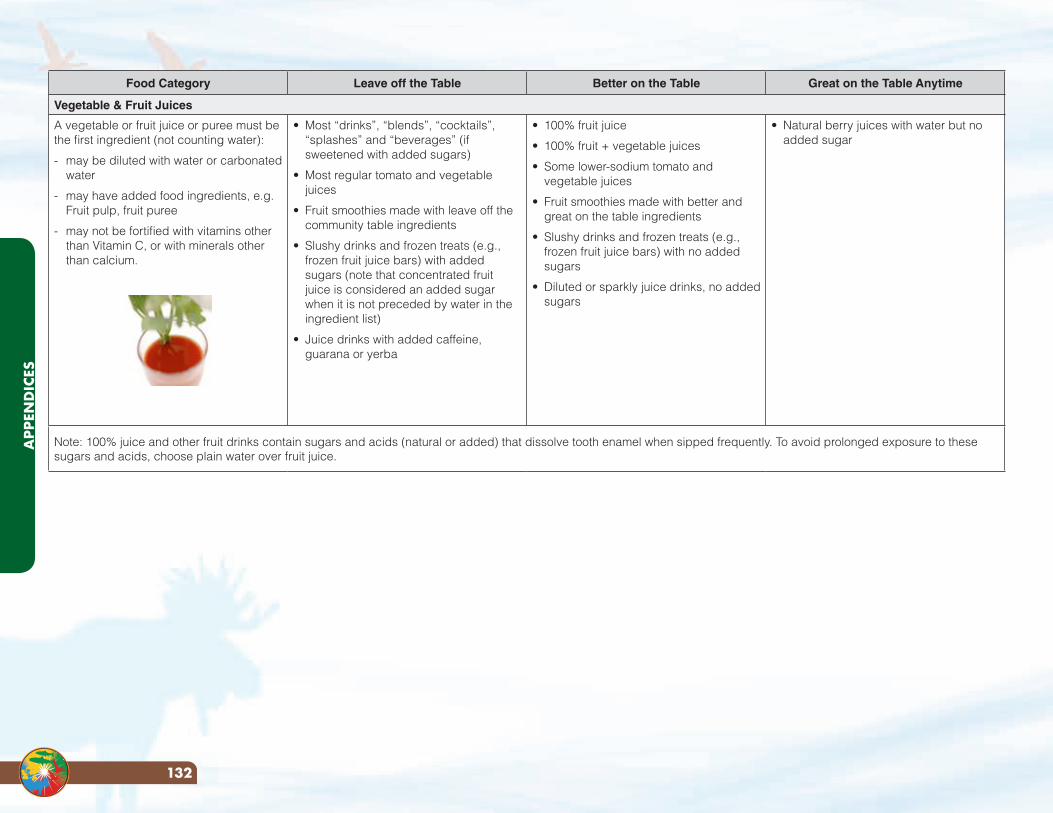
Food Category Leave off the Table Better on the Table Great on the Table Anytime
Vegetable & Fruit Juices
A vegetable or fruit juice or puree must be the first ingredient (not counting water):
- may be diluted with water or carbonated water
- may have added food ingredients, e.g. Fruit pulp, fruit puree
- may not be fortified with vitamins other than Vitamin C, or with minerals other than calcium.
• Most “drinks”, “blends”, “cocktails”, “splashes” and “beverages” (if sweetened with added sugars)
• Most regular tomato and vegetable juices
• Fruit smoothies made with leave off the community table ingredients
• Slushy drinks and frozen treats (e.g., frozen fruit juice bars) with added sugars (note that concentrated fruit juice is considered an added sugar when it is not preceded by water in the ingredient list)
• Juice drinks with added caffeine, guarana or yerba
• 100% fruit juice
• 100% fruit + vegetable juices
• Some lower-sodium tomato and vegetable juices
• Fruit smoothies made with better and great on the table ingredients
• Slushy drinks and frozen treats (e.g., frozen fruit juice bars) with no added sugars
• Diluted or sparkly juice drinks, no added sugars
• Natural berry juices with water but no added sugar
Note: 100% juice and other fruit drinks contain sugars and acids (natural or added) that dissolve tooth enamel when sipped frequently. To avoid prolonged exposure to these sugars and acids, choose plain water over fruit juice.
APP
END
ICES
132
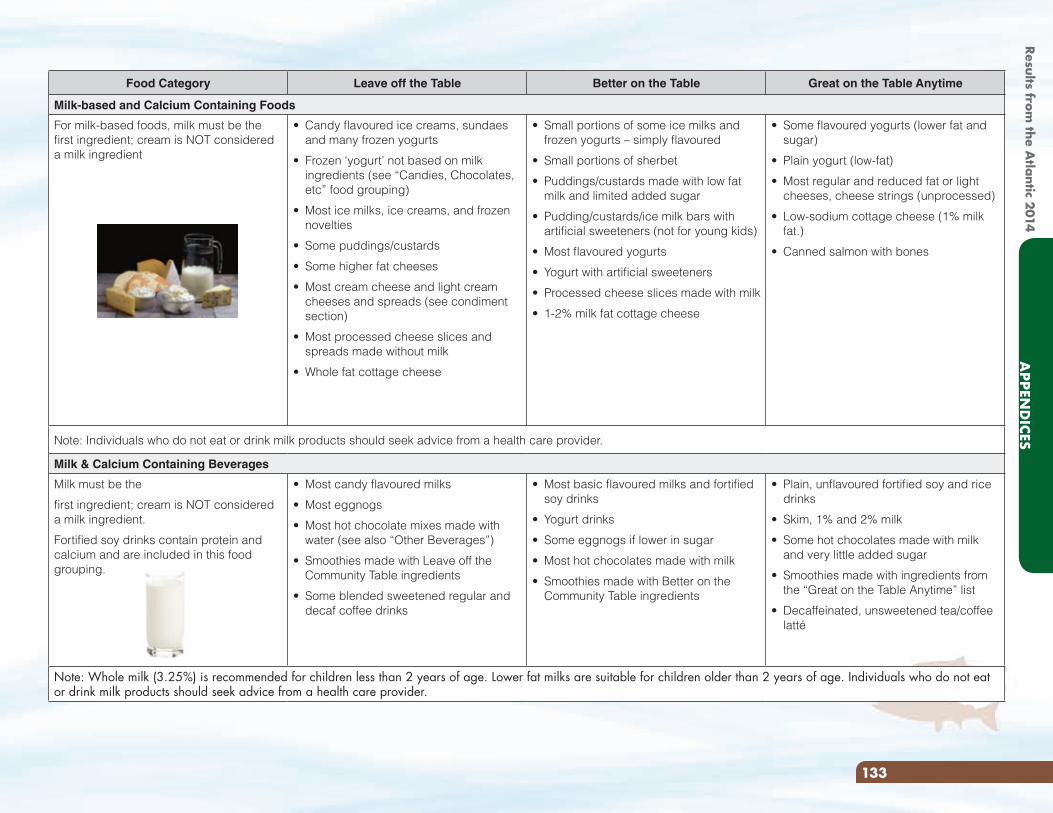
Food Category Leave off the Table Better on the Table Great on the Table Anytime
Milk-based and Calcium Containing Foods
For milk-based foods, milk must be the first ingredient; cream is NOT considered a milk ingredient
• Candy flavoured ice creams, sundaes and many frozen yogurts
• Frozen ‘yogurt’ not based on milk ingredients (see “Candies, Chocolates, etc” food grouping)
• Most ice milks, ice creams, and frozen novelties
• Some puddings/custards
• Some higher fat cheeses
• Most cream cheese and light cream cheeses and spreads (see condiment section)
• Most processed cheese slices and spreads made without milk
• Whole fat cottage cheese
• Small portions of some ice milks and frozen yogurts – simply flavoured
• Small portions of sherbet
• Puddings/custards made with low fat milk and limited added sugar
• Pudding/custards/ice milk bars with artificial sweeteners (not for young kids)
• Most flavoured yogurts
• Yogurt with artificial sweeteners
• Processed cheese slices made with milk
• 1-2% milk fat cottage cheese
• Some flavoured yogurts (lower fat and sugar)
• Plain yogurt (low-fat)
• Most regular and reduced fat or light cheeses, cheese strings (unprocessed)
• Low-sodium cottage cheese (1% milk fat.)
• Canned salmon with bones
Note: Individuals who do not eat or drink milk products should seek advice from a health care provider.
Milk & Calcium Containing Beverages
Milk must be the
first ingredient; cream is NOT considered a milk ingredient.
Fortified soy drinks contain protein and calcium and are included in this food grouping.
• Most candy flavoured milks
• Most eggnogs
• Most hot chocolate mixes made with water (see also “Other Beverages”)
• Smoothies made with Leave off the Community Table ingredients
• Some blended sweetened regular and decaf coffee drinks
• Most basic flavoured milks and fortified soy drinks
• Yogurt drinks
• Some eggnogs if lower in sugar
• Most hot chocolates made with milk
• Smoothies made with Better on the Community Table ingredients
• Plain, unflavoured fortified soy and rice drinks
• Skim, 1% and 2% milk
• Some hot chocolates made with milk and very little added sugar
• Smoothies made with ingredients from the “Great on the Table Anytime” list
• Decaffeinated, unsweetened tea/coffee latté
Note: Whole milk (3.25%) is recommended for children less than 2 years of age. Lower fat milks are suitable for children older than 2 years of age. Individuals who do not eat or drink milk products should seek advice from a health care provider.
133
APPEN
DICES
Results from the A
tlantic 2014
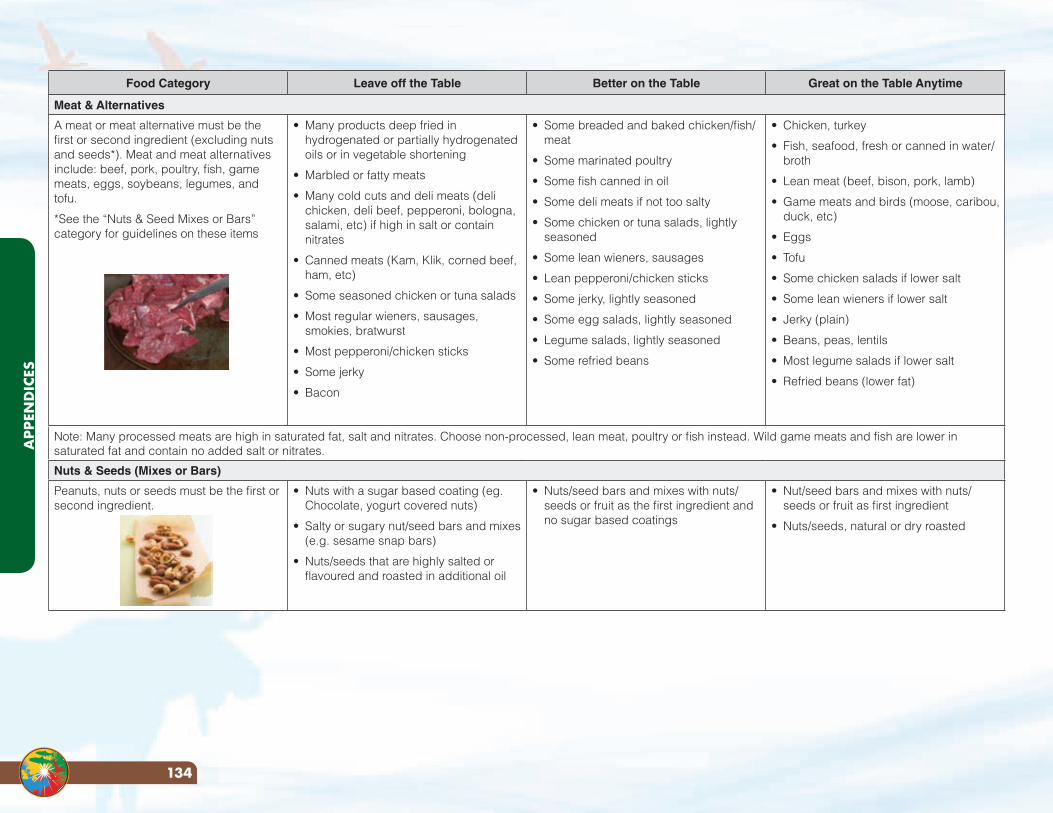
Food Category Leave off the Table Better on the Table Great on the Table Anytime
Meat & Alternatives
A meat or meat alternative must be the first or second ingredient (excluding nuts and seeds*). Meat and meat alternatives include: beef, pork, poultry, fish, game meats, eggs, soybeans, legumes, and tofu.
*See the “Nuts & Seed Mixes or Bars” category for guidelines on these items
• Many products deep fried in hydrogenated or partially hydrogenated oils or in vegetable shortening
• Marbled or fatty meats
• Many cold cuts and deli meats (deli chicken, deli beef, pepperoni, bologna, salami, etc) if high in salt or contain nitrates
• Canned meats (Kam, Klik, corned beef, ham, etc)
• Some seasoned chicken or tuna salads
• Most regular wieners, sausages, smokies, bratwurst
• Most pepperoni/chicken sticks
• Some jerky
• Bacon
• Some breaded and baked chicken/fish/meat
• Some marinated poultry
• Some fish canned in oil
• Some deli meats if not too salty
• Some chicken or tuna salads, lightly seasoned
• Some lean wieners, sausages
• Lean pepperoni/chicken sticks
• Some jerky, lightly seasoned
• Some egg salads, lightly seasoned
• Legume salads, lightly seasoned
• Some refried beans
• Chicken, turkey
• Fish, seafood, fresh or canned in water/broth
• Lean meat (beef, bison, pork, lamb)
• Game meats and birds (moose, caribou, duck, etc)
• Eggs
• Tofu
• Some chicken salads if lower salt
• Some lean wieners if lower salt
• Jerky (plain)
• Beans, peas, lentils
• Most legume salads if lower salt
• Refried beans (lower fat)
Note: Many processed meats are high in saturated fat, salt and nitrates. Choose non-processed, lean meat, poultry or fish instead. Wild game meats and fish are lower in saturated fat and contain no added salt or nitrates.
Nuts & Seeds (Mixes or Bars)
Peanuts, nuts or seeds must be the first or second ingredient.
• Nuts with a sugar based coating (eg. Chocolate, yogurt covered nuts)
• Salty or sugary nut/seed bars and mixes (e.g. sesame snap bars)
• Nuts/seeds that are highly salted or flavoured and roasted in additional oil
• Nuts/seed bars and mixes with nuts/seeds or fruit as the first ingredient and no sugar based coatings
• Nut/seed bars and mixes with nuts/seeds or fruit as first ingredient
• Nuts/seeds, natural or dry roasted
APP
END
ICES
134
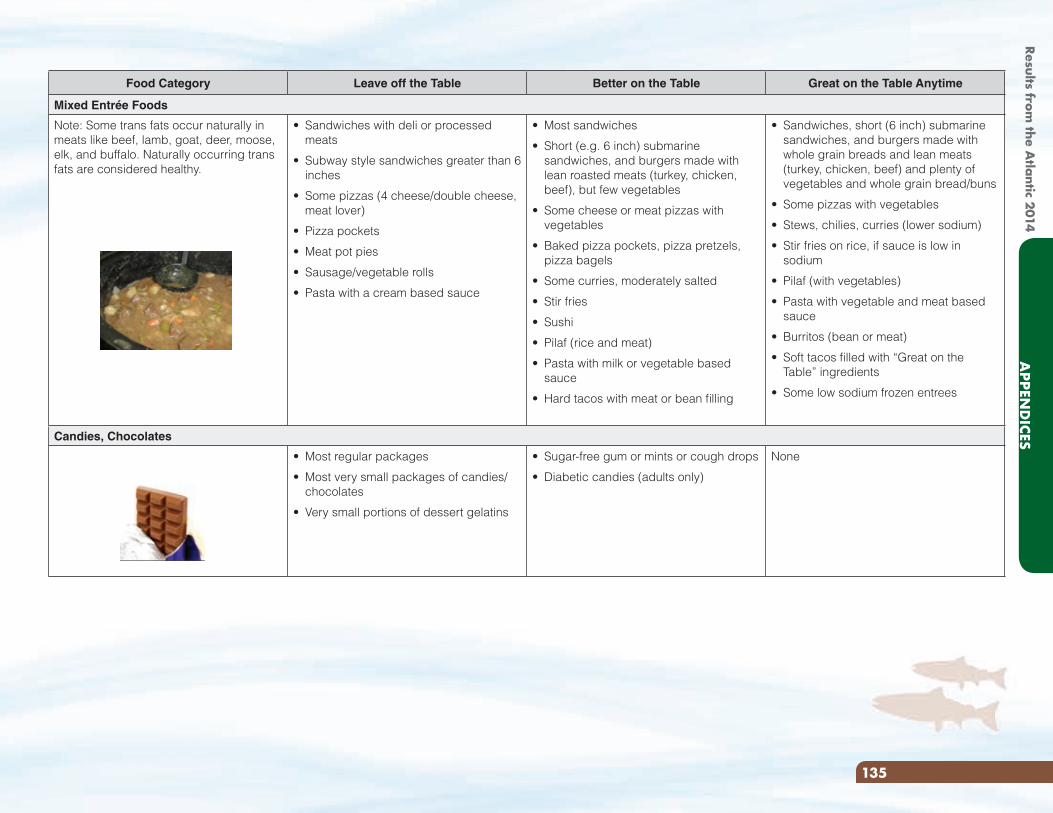
Food Category Leave off the Table Better on the Table Great on the Table Anytime
Mixed Entrée Foods
Note: Some trans fats occur naturally in meats like beef, lamb, goat, deer, moose, elk, and buffalo. Naturally occurring trans fats are considered healthy.
• Sandwiches with deli or processed meats
• Subway style sandwiches greater than 6 inches
• Some pizzas (4 cheese/double cheese, meat lover)
• Pizza pockets
• Meat pot pies
• Sausage/vegetable rolls
• Pasta with a cream based sauce
• Most sandwiches
• Short (e.g. 6 inch) submarine sandwiches, and burgers made with lean roasted meats (turkey, chicken, beef), but few vegetables
• Some cheese or meat pizzas with vegetables
• Baked pizza pockets, pizza pretzels, pizza bagels
• Some curries, moderately salted
• Stir fries
• Sushi
• Pilaf (rice and meat)
• Pasta with milk or vegetable based sauce
• Hard tacos with meat or bean filling
• Sandwiches, short (6 inch) submarine sandwiches, and burgers made with whole grain breads and lean meats (turkey, chicken, beef) and plenty of vegetables and whole grain bread/buns
• Some pizzas with vegetables
• Stews, chilies, curries (lower sodium)
• Stir fries on rice, if sauce is low in sodium
• Pilaf (with vegetables)
• Pasta with vegetable and meat based sauce
• Burritos (bean or meat)
• Soft tacos filled with “Great on the Table” ingredients
• Some low sodium frozen entrees
Candies, Chocolates
• Most regular packages
• Most very small packages of candies/chocolates
• Very small portions of dessert gelatins
• Sugar-free gum or mints or cough drops
• Diabetic candies (adults only)
None
135
APPEN
DICES
Results from the A
tlantic 2014
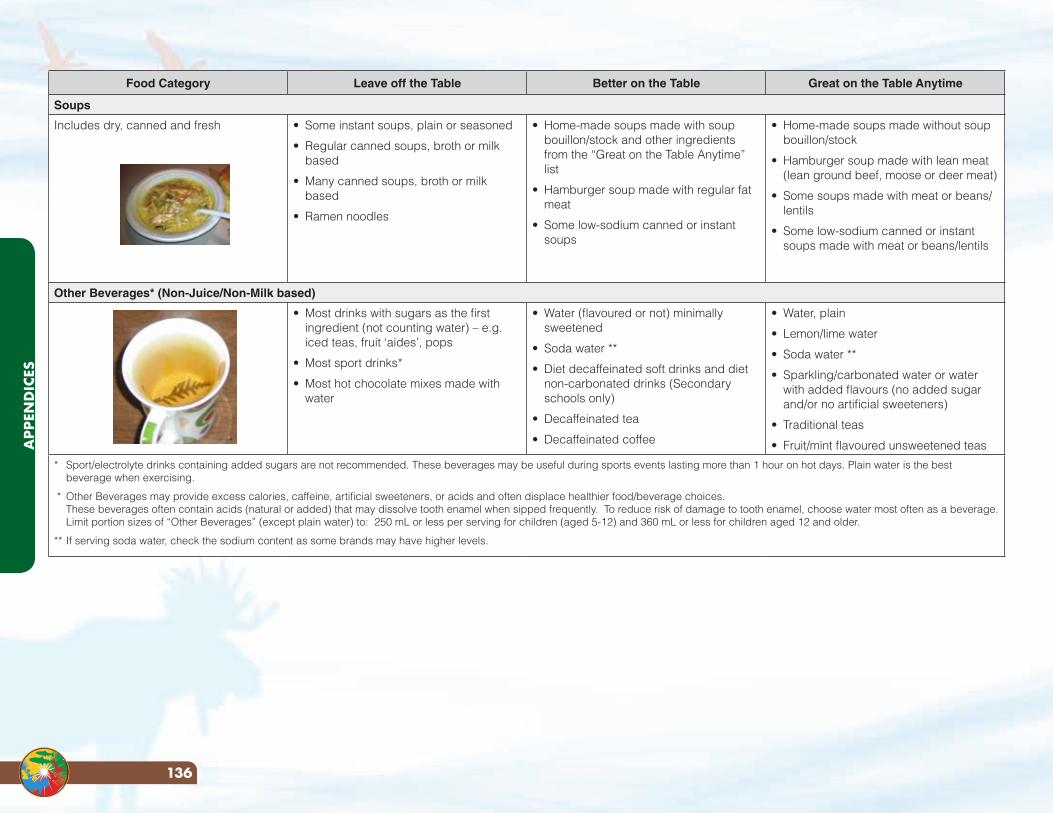
Food Category Leave off the Table Better on the Table Great on the Table Anytime
Soups
Includes dry, canned and fresh • Some instant soups, plain or seasoned
• Regular canned soups, broth or milk based
• Many canned soups, broth or milk based
• Ramen noodles
• Home-made soups made with soup bouillon/stock and other ingredients from the “Great on the Table Anytime” list
• Hamburger soup made with regular fat meat
• Some low-sodium canned or instant soups
• Home-made soups made without soup bouillon/stock
• Hamburger soup made with lean meat (lean ground beef, moose or deer meat)
• Some soups made with meat or beans/lentils
• Some low-sodium canned or instant soups made with meat or beans/lentils
Other Beverages* (Non-Juice/Non-Milk based)
• Most drinks with sugars as the first ingredient (not counting water) – e.g. iced teas, fruit ‘aides’, pops
• Most sport drinks*
• Most hot chocolate mixes made with water
• Water (flavoured or not) minimally sweetened
• Soda water **
• Diet decaffeinated soft drinks and diet non-carbonated drinks (Secondary schools only)
• Decaffeinated tea
• Decaffeinated coffee
• Water, plain
• Lemon/lime water
• Soda water **
• Sparkling/carbonated water or water with added flavours (no added sugar and/or no artificial sweeteners)
• Traditional teas
• Fruit/mint flavoured unsweetened teas
* Sport/electrolyte drinks containing added sugars are not recommended. These beverages may be useful during sports events lasting more than 1 hour on hot days. Plain water is the best beverage when exercising.
* Other Beverages may provide excess calories, caffeine, artificial sweeteners, or acids and often displace healthier food/beverage choices. These beverages often contain acids (natural or added) that may dissolve tooth enamel when sipped frequently. To reduce risk of damage to tooth enamel, choose water most often as a beverage. Limit portion sizes of “Other Beverages” (except plain water) to: 250 mL or less per serving for children (aged 5-12) and 360 mL or less for children aged 12 and older.
** If serving soda water, check the sodium content as some brands may have higher levels.
APP
END
ICES
136
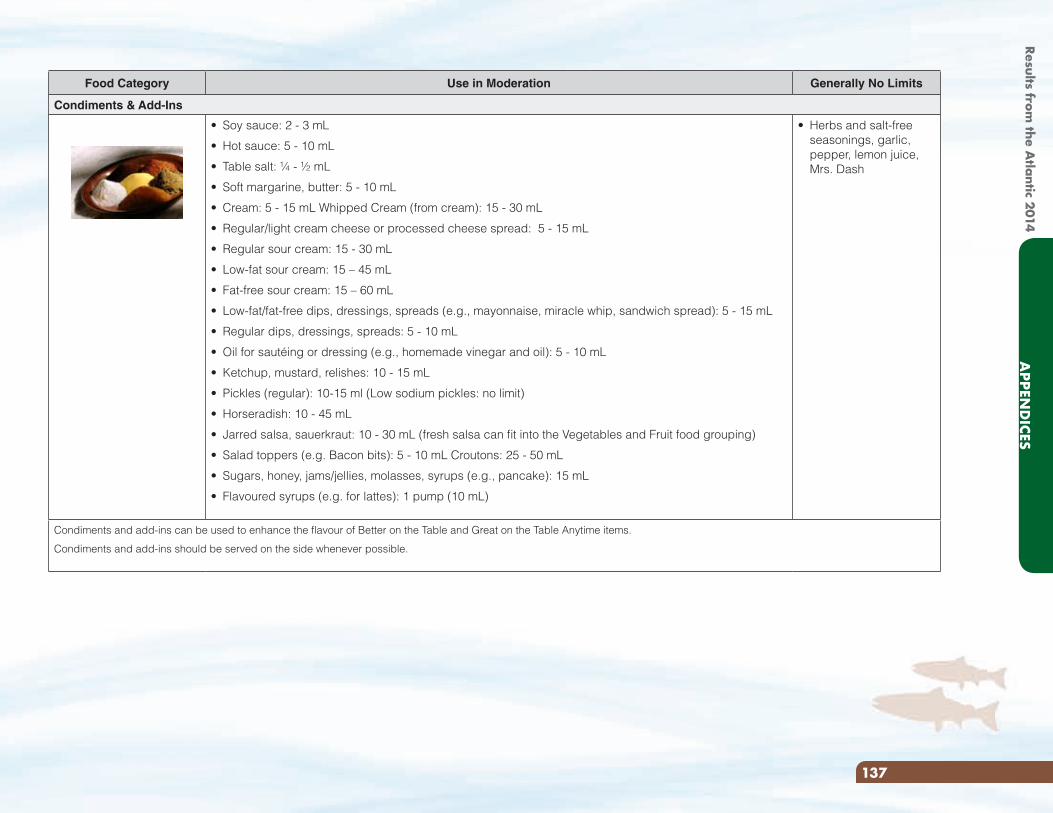
Food Category Use in Moderation Generally No Limits
Condiments & Add-Ins
• Soy sauce: 2 - 3 mL
• Hot sauce: 5 - 10 mL
• Table salt: ¼ - ½ mL
• Soft margarine, butter: 5 - 10 mL
• Cream: 5 - 15 mL Whipped Cream (from cream): 15 - 30 mL
• Regular/light cream cheese or processed cheese spread: 5 - 15 mL
• Regular sour cream: 15 - 30 mL
• Low-fat sour cream: 15 – 45 mL
• Fat-free sour cream: 15 – 60 mL
• Low-fat/fat-free dips, dressings, spreads (e.g., mayonnaise, miracle whip, sandwich spread): 5 - 15 mL
• Regular dips, dressings, spreads: 5 - 10 mL
• Oil for sautéing or dressing (e.g., homemade vinegar and oil): 5 - 10 mL
• Ketchup, mustard, relishes: 10 - 15 mL
• Pickles (regular): 10-15 ml (Low sodium pickles: no limit)
• Horseradish: 10 - 45 mL
• Jarred salsa, sauerkraut: 10 - 30 mL (fresh salsa can fit into the Vegetables and Fruit food grouping)
• Salad toppers (e.g. Bacon bits): 5 - 10 mL Croutons: 25 - 50 mL
• Sugars, honey, jams/jellies, molasses, syrups (e.g., pancake): 15 mL
• Flavoured syrups (e.g. for lattes): 1 pump (10 mL)
• Herbs and salt-free seasonings, garlic, pepper, lemon juice, Mrs. Dash
Condiments and add-ins can be used to enhance the flavour of Better on the Table and Great on the Table Anytime items.
Condiments and add-ins should be served on the side whenever possible.
137
APPEN
DICES
Results from the A
tlantic 2014
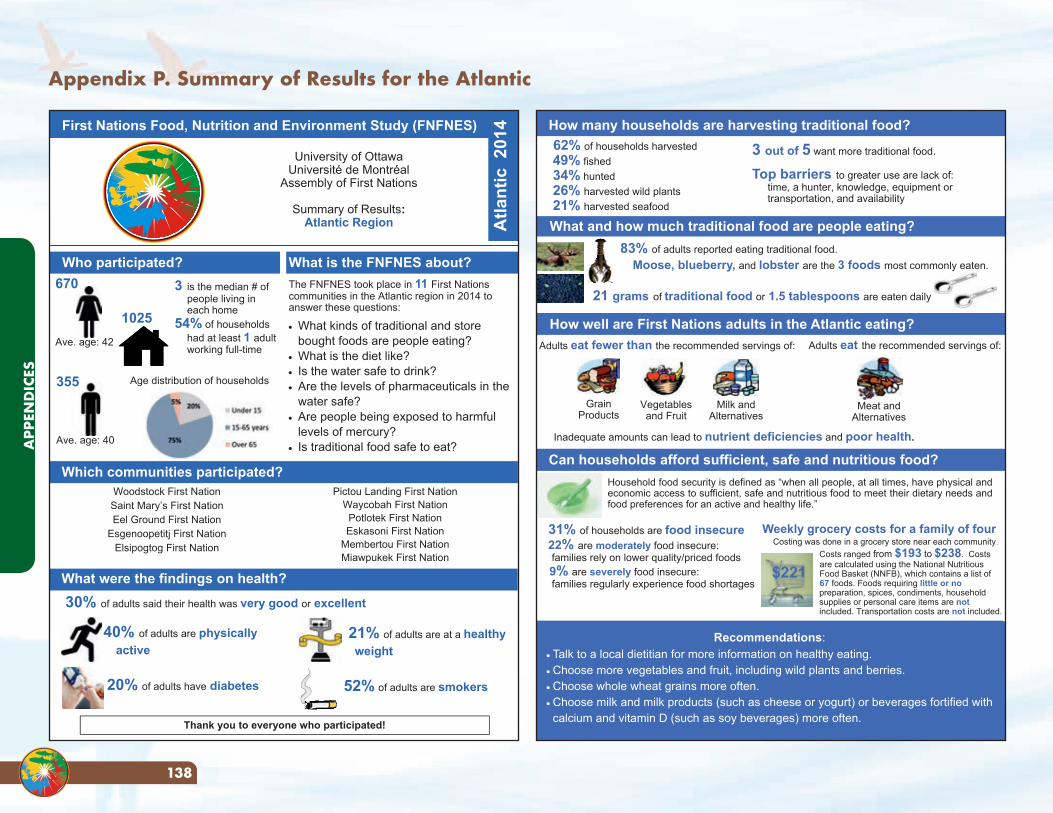
Appendix P. Summary of Results for the Atlantic
University of Ottawa Université de Montréal
Assembly of First Nations
Summary of Results: Atlantic Region
First Nations Food, Nutrition and Environment Study (FNFNES)
Who participated? The FNFNES took place in 11 First Nations communities in the Atlantic region in 2014 to answer these questions: What kinds of traditional and store
bought foods are people eating? What is the diet like? Is the water safe to drink? Are the levels of pharmaceuticals in the
water safe? Are people being exposed to harmful
levels of mercury? Is traditional food safe to eat?
Atla
ntic
201
4
670
Ave. age: 42
What is the FNFNES about?
355
Ave. age: 40
1025
3 is the median # of people living in each home 54% of households had at least 1 adult working full-time
Age distribution of households
Thank you to everyone who participated!
Which communities participated?
40% of adults are physically active
21% of adults are at a healthy weight
20% of adults have diabetes 52% of adults are smokers
30% of adults said their health was very good or excellent
What were the findings on health?
Woodstock First Nation Saint Mary’s First Nation Eel Ground First Nation
Esgenoopetitj First Nation Elsipogtog First Nation
Pictou Landing First Nation Waycobah First Nation Potlotek First Nation Eskasoni First Nation
Membertou First Nation Miawpukek First Nation
How well are First Nations adults in the Atlantic eating?
Household food security is defined as “when all people, at all times, have physical and economic access to sufficient, safe and nutritious food to meet their dietary needs and food preferences for an active and healthy life.”
Can households afford sufficient, safe and nutritious food?
Adults eat the recommended servings of: Adults eat fewer than the recommended servings of:
Grain Products
Vegetables and Fruit
Milk and Alternatives
Inadequate amounts can lead to nutrient deficiencies and poor health.
Meat and Alternatives
31% of households are food insecure 22% are moderately food insecure: families rely on lower quality/priced foods 9% are severely food insecure: families regularly experience food shortages
What and how much traditional food are people eating?
21 grams of traditional food or 1.5 tablespoons are eaten daily
83% of adults reported eating traditional food. Moose, blueberry, and lobster are the 3 foods most commonly eaten.
3 out of 5 want more traditional food.
Top barriers to greater use are lack of: time, a hunter, knowledge, equipment or transportation, and availability
62% of households harvested 49% fished 34% hunted 26% harvested wild plants 21% harvested seafood
How many households are harvesting traditional food?
Recommendations: Talk to a local dietitian for more information on healthy eating. Choose more vegetables and fruit, including wild plants and berries. Choose whole wheat grains more often. Choose milk and milk products (such as cheese or yogurt) or beverages fortified with calcium and vitamin D (such as soy beverages) more often.
Weekly grocery costs for a family of four Costing was done in a grocery store near each community.
Costs ranged from $193 to $238. Costs are calculated using the National Nutritious Food Basket (NNFB), which contains a list of 67 foods. Foods requiring little or nopreparation, spices, condiments, householdsupplies or personal care items are not included. Transportation costs are not included.
$221
APP
END
ICES
138
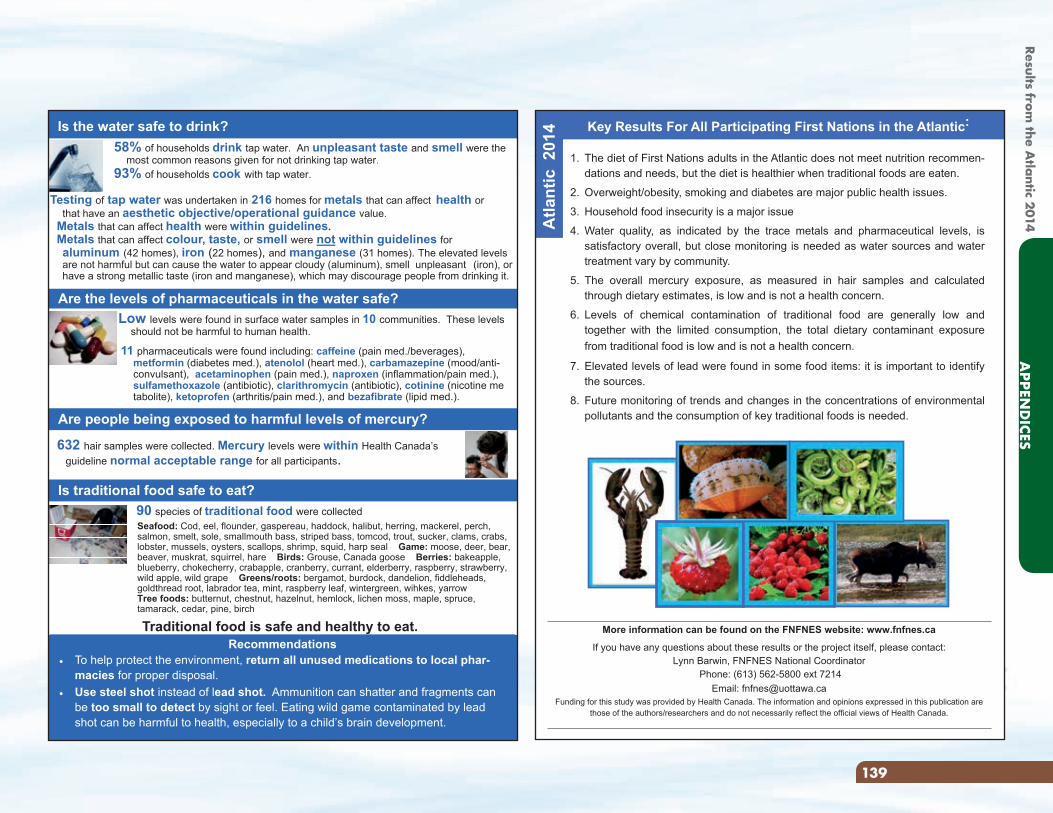
Is the water safe to drink?
Are the levels of pharmaceuticals in the water safe?
Are people being exposed to harmful levels of mercury?
Is traditional food safe to eat?
632 hair samples were collected. Mercury levels were within Health Canada’s guideline normal acceptable range for all participants.
58% of households drink tap water. An unpleasant taste and smell were the most common reasons given for not drinking tap water. 93% of households cook with tap water.
Recommendations To help protect the environment, return all unused medications to local phar-
macies for proper disposal. Use steel shot instead of lead shot. Ammunition can shatter and fragments can
be too small to detect by sight or feel. Eating wild game contaminated by lead shot can be harmful to health, especially to a child’s brain development.
Testing of tap water was undertaken in 216 homes for metals that can affect health or that have an aesthetic objective/operational guidance value. Metals that can affect health were within guidelines. Metals that can affect colour, taste, or smell were not within guidelines for aluminum (42 homes), iron (22 homes), and manganese (31 homes). The elevated levels
are not harmful but can cause the water to appear cloudy (aluminum), smell unpleasant (iron), or have a strong metallic taste (iron and manganese), which may discourage people from drinking it.
Low levels were found in surface water samples in 10 communities. These levels should not be harmful to human health.
11 pharmaceuticals were found including: caffeine (pain med./beverages), metformin (diabetes med.), atenolol (heart med.), carbamazepine (mood/anti- convulsant), acetaminophen (pain med.), naproxen (inflammation/pain med.), sulfamethoxazole (antibiotic), clarithromycin (antibiotic), cotinine (nicotine me tabolite), ketoprofen (arthritis/pain med.), and bezafibrate (lipid med.).
90 species of traditional food were collected Seafood: Cod, eel, flounder, gaspereau, haddock, halibut, herring, mackerel, perch, salmon, smelt, sole, smallmouth bass, striped bass, tomcod, trout, sucker, clams, crabs, lobster, mussels, oysters, scallops, shrimp, squid, harp seal Game: moose, deer, bear, beaver, muskrat, squirrel, hare Birds: Grouse, Canada goose Berries: bakeapple, blueberry, chokecherry, crabapple, cranberry, currant, elderberry, raspberry, strawberry, wild apple, wild grape Greens/roots: bergamot, burdock, dandelion, fiddleheads, goldthread root, labrador tea, mint, raspberry leaf, wintergreen, wihkes, yarrow Tree foods: butternut, chestnut, hazelnut, hemlock, lichen moss, maple, spruce, tamarack, cedar, pine, birch
Traditional food is safe and healthy to eat.
Key Results For All Participating First Nations in the Atlantic:
More information can be found on the FNFNES website: www.fnfnes.ca
If you have any questions about these results or the project itself, please contact: Lynn Barwin, FNFNES National Coordinator
Phone: (613) 562-5800 ext 7214 Email: [email protected]
Funding for this study was provided by Health Canada. The information and opinions expressed in this publication are those of the authors/researchers and do not necessarily reflect the official views of Health Canada.
1. The diet of First Nations adults in the Atlantic does not meet nutrition recommen-dations and needs, but the diet is healthier when traditional foods are eaten.
2. Overweight/obesity, smoking and diabetes are major public health issues.
3. Household food insecurity is a major issue
4. Water quality, as indicated by the trace metals and pharmaceutical levels, is satisfactory overall, but close monitoring is needed as water sources and water treatment vary by community.
5. The overall mercury exposure, as measured in hair samples and calculated through dietary estimates, is low and is not a health concern.
6. Levels of chemical contamination of traditional food are generally low and together with the limited consumption, the total dietary contaminant exposure from traditional food is low and is not a health concern.
7. Elevated levels of lead were found in some food items: it is important to identify the sources.
8. Future monitoring of trends and changes in the concentrations of environmental pollutants and the consumption of key traditional foods is needed.
Atla
ntic
201
4
139
APPEN
DICES
Results from the A
tlantic 2014
REFERENCESAdelson, N. 2005. “The embodiment of inequity: health disparities in Aboriginal Canada.” Canadian Journal of Public Health 96 (Suppl 2): S45-61.
Aga, D.S. 2008. Fate of Pharmaceuticals in the Environment and Water Treatment Systems. Boca Raton: CRC Press.
Agency for Toxic Substances and Disease Registry (ATSDR). n.d. “Toxic Substances Portal-Arsenic.” Agency for Toxic Substances and Disease Registry. Accessed 04 30, 2012. http://www.atsdr.cdc.gov/ToxProfiles/tp.asp?id=22&tid=3.
Agunbiade, F.O., and B. Moodley. 2014. “Pharmaceuticals as emerging contaminants in Umgeni River system, KwaZulu-Natal, South Africa.” Environmental Monitoring Research 186: 7273-7291.
Anderson, P., N. Denslow, J.E. Drewes, A. Olivieri, D. Schlenk, and S. Snyder. 2010. Monitoring Strategies for Chemicals of Emerging Concern (CECs) in Recycled Water. Recommendations of a Science Advisory Panel. Final Report, Sacramento: State Water Resources Control Board. Accessed 2015. http://www.waterboards.ca.gov/water_issues/programs/water_recycling_policy/docs/cec_monitoring_rpt.pdf.
Australian guidelines for Water Recycling. 2008. “Australian Guidelines for Water Recycling: Managing Health and Environmental Risks (Phase 2) Augmentation of Drinking Water Supplies.” Canberra: Environment Protection and Heritage Council, the National Health and Medical Research Council and the Natural Resource Management Ministerial Council.
Ayach, B.B., and H. Korda. 2010. “Commentary: Type 2 diabetes epidemic in First Nations peoples in Canada.” Ethnicity and Disease 20 (3): 300-303.
Aydin, E., and I. Talini. 2013. “Analysis, occurrence and fate of commonly used pharmaceuticals and hormones in the Buyukcekmece watershed, Turkey.” Chemosphere 90: 2004-2012.
Batt, A.L., I.B. Bruce, and D.S. Aga. 2006. “Evaluating the vulnerability of surface waters to antibiotic contamination from varying wastewater treatment plant discharges.” Environmental Pollution 142: 295-302.
Belanger-Ducharme, F., and A. Tremblay. 2005. “A Prevalence of obesity in Canada.” Obesity Review 6 (3): 183-6.
Bellinger, D.C., J. Burger, T. J. Cade, D. A. Cory-Slechta, M. Finkelstein, H. Hu, M. Kosnett, et al. 2013. “Health Risks from Lead-Based Ammunition in the Environment.” Environmental Health Perspectives 121 (6): a178-a179. doi: doi:10.1289/ehp.1306945.
Benotti, M., and B Brownawell. 2007. “Distributions of pharmaceuticals in an urban estuary during both dry- and wet-weather conditions.” Environmental Science and Technology 41: 5795-5802.
Blair, B. D., J. P. Crago, and C. J. Hedman. 2013. “Pharmaceuticals and personal care products found in the Great Lakes above the concentration of environmental concern.” Chemosphere 93: 2016-2123.
Booker, D, and M Gardner. 2016. “Atlantic First Nations pharmaceutical use. List of pharmaceuticals from the Non-Insured Health Benefits Directorate (NIHB). First Nations and Inuit Health Branch, Health Canada. Personal Communication.” “.
Booker, D, and M. Gardner. 2016. “Personal Communication.”
Brun, G.L., M. Bernier, R. Losier, Jackman, P. Doe K., and Lee H.B. 2006. “Pharmaceutically Active Compounds in Atlantic Canadian Sewage Treatment Plant Effluents and Receiving Waters, and Potential for Environmental Effects as Measured by Acute and Chronic Aquatic Toxicity.” Environmental Toxicology and Chemistry 25 (8): 2163-2176.
Canadian Institutes of Health Research, Natural Sciences and Engineering Research Council of Canada, Social Sciences and Humanities Research Council of Canada . 2010. Tri-Council Policy Statement: Ethical Conduct for Research Involving Humans. http://www.pre.ethics.gc.ca/pdf/eng/tcps2/TCPS_2_FINAL_Web.pdf.
Chan, L., O. Receveur, D. Sharp, H. Schwartz, A. Ing, and C. Tikhonov. 2011. First Nations Food, Nutrition and Environment Study (FNFNES): Results from British Columbia (2008/2009). Prince George: University of Northern British Columbia. http://www.fnfnes.ca/docs/BC%20Reports/FNFNES_Report_BC_FINAL_PRINT_v2-lo.pdf.zip.
Chan, L., O. Receveur, D. Sharp, H. Schwartz, A. Ing, K. Fediuk, A. Black, and C. Tikhonov. 2012. First Nations Food, Nutrition and Environment Study (FNFNES): Results from Manitoba (2010). Prince George: University of Northern British Columbia. http://www.fnfnes.ca/docs/MB%20Reports/FNFNES%20Report-MB_WEB_rev.pdf.
Chan, L., O. Receveur, M. Batal, W. David, H. Schwartz, A. Ing, K. Fediuk, A. Black, and C. Tikhonov. 2014. First Nations Food, Nutrition and Environment Study (FNFNES): Results from Ontario (2011/2012). Ottawa: University of Ottawa. http://www.fnfnes.ca/docs/FNFNES_Ontario_Regional_Report_2014_final.pdf.
Chan, L., O. Receveur, M. Batal, W. David, H. Schwartz, A. Ing, K. Fediuk, and C. Tikhonov. 2016. First Nations Food, Nutrition and Environment Study (FNFNES): Results from Alberta (2013). Ottawa: University of Ottawa.
Chiu, C., and P.K. Westerhoff. 2010. “Trace organics in Arizona surface and waste waters.” Chap. 4 in Contaminants of Emerging Concern in the Environment: Ecological and Human Health Considerations.American Chemical Society Symposium Series, edited by R. U. Halden, 81-117. Washington, D.C.: American Chemical Society.
Churchill, R., R. Dabeka, and D. Forsyth. 2013. “The Canadian Total Diet Study. Presentation to the NCCEH/PHAC Environmental Health Workshop.” National Collaborating Centre for Environmental Health. February 25-26. Accessed March 28, 2014. http://www.ncceh.ca/sites/default/files/Surveillance_Workshop_Feb_2013-Churchill-etal.pdf.
REFE
REN
CES
140
Clara, M., Kreuzinger, N., Strenn, B., Gans, O., and H. Kroiss. 2005. “The solids retention time- a suitable design parameter to evaluate the capacity of wastewater treatment plants to remove micropollutants.” Water Research. Vol. 39. 97-106.
Dabeka, R, and X Cao. 2013. “The Canadian total diet study design: 1992-1999.” Food additives & contaminants: Part A 30 (3): 477-490. doi:DOI:10.1080/19440049.2012.747004.
Donaldson, S.G., J. Van Oostdam, C. Tikhonov, M. Feeley, B. Armstrong, P. Ayotte, O. Boucher, et al. 2010. “Environmental contaminants and human health in the Canadian Arctic.” The Science of the Total Environment 408 (22): 5165-234. http://www.ncbi.nlm.nih.gov/pubmed/20728918.
Egeland, G., and G.G. Harrison. 2013. “Health Disparities: Promoting Indigenous Peoples’ health through traditional food systems and self-determination.” In Indigenous Peoples’ food systems and well-being: interventions and policies, edited by H V Kuhnlein, B Erasmus, D Spigelski and B Burlingame, 9-21. Rome: Food and Agricultural Organization.
Environment Canada and Health Canada. 2013. Chemicals Management Plan Progress Report. Fall 2013. Ottawa: Canada. http://www.ec.gc.ca/ese-ees/5C49C89D-D6C2-48C2-A256-72870B4044AA/Progress%20Report%20%28December%202013%29_EN.pdf.
First Nations and Inuit Health (FNIH), Personal communication. 2016. “Indian Register Data by Individuals Age 19 years and older for Atlantic First Nations, December 31, 2014. Indigenous and Northern Affairs Canada. Unpublished file.”
FNIH, Personal Communication. 2015. “National Assessment of First Nations Water and Wastewater Systems-Atlantic Region Community Site Visit Reports, 2010.” Indigenous and Northern Affairs Canada.
First Nations Information Governance Centre (FNIGC). 2012. First Nations Regional Health Survey (RHS) 2008/10: National report on adults, youth and children living in First Nations communities. Ottawa: First Nations Information Governance Centre. Accessed 04 26, 2012. http://fnigc.ca/sites/default/files/First_Nations_Regional_Health_Survey_2008-10_National_Report.pdf.
Food and Agriculture Organization. 2002. “The State of Food Insecurity in the World 2001.” Rome. Accessed October 31, 2011. www.fao.org/docrep/003/w3613e/w3613e00.htm.
Frohlich, K. L., N. Ross, and C. Richmond. 2006. “Health disparities in Canada today: some evidence and a theoretical framework.” Health Policy 79 (2-3): 132-143.
Geurra, P., M. Kim, A. Shah, M. Alaee, and S.A. Smyth. 2014. “Occurrence and fate of antibiotic, analgesic/anti-inflammatory and antifungal compounds in five wastewater treatment processes.” Science of the Total Environment 473-474: 235-243.
Ginebreda, A., I. Munoz, M.L. De Alda, R. Brix, J. Lopez-Doval, and D. Barcelo. 2010. “Environmental risk assessment of pharmaceuticals in rivers: relationships between hazard indexes and aquatic macroinvertebrate diversity indexes in the Llobregat River (NE Spain).” Environment International 36: 153-162.
Glassmeyer, S.T., E.T. Furlong, D.W. Kolpin, J.D. Cahill, S.D. Zaugg, S.L. Werner, M.T. Meyer, and D.D. Kryak. 2005. “Transport of chemical and microbial compounds from known wastewater discharges: potential for use as indicators of human fecal contamination.” Environmental Science & Technology (American Chemical Society) 39 (14): 5157–5169. Accessed 04 19, 2011. doi:10.1021/es048120k.
Gomez, M.J., M. Petrovic, A.R. Fernandez-Alba, and D. Barcelo. 2006. “Determination of pharmaceuticals of various therapeutic classes by solid-phase extraction and liquid chromatography-tandem mass spectrometry analysis in hospital effluent wastewaters.” Journal of Chromatography A 1114: 224-233.
Grund, M.D., L. Cornicelli, L.T. Carlson, and E.A. Butler. 2010. “Bullet fragmentation and lead deposition in white-tailed deer and domestic sheep.” Human Wildlife Ineractions 4 (2): 257-65.
Health Canada and the Public Health Agency of Canada. 2015. Evaluation of Phase II of the Chemicals Management Plan 2011-2012 to 2015-2016. Final Report. Available at: http://www.hc-sc.gc.ca/ahc-asc/alt_formats/pdf/performance/eval/evaluation-chemicalsplan_planproduitschimiques-2011-2016-eng.pdf.
Health Canada. 2014. Guidelines for Canadian Drinking Water Quality. Available at: http://www.hc-sc.gc.ca/ewh-semt/pubs/water-eau/sum_guide-res_recom/index-eng.php.
—. 2011. A Statistical Profile on the Health of First Nations in Canada. Statistics for Atlantic and Western Canada 2001/2002. Ottawa, Ontario. Available at
http://www.hc-sc.gc.ca/fniah-spnia/pubs/aborig-autoch/index-eng.php.
—. 2010. Your Health at Home. What you can do! An Environmental Health Guide for First Nations. Ottawa. Minister of Health ISBN: H34-218/1-2010E
—. 2009. Canadian Community Health Survey Cycle 2.2, Nutrition: Nutrients intake from food. Provinical, Regional and National summary data tables (Volume 1). Ottawa
—. 2009. National Nutritious Food Basket. Ottawa
—. 2007a. Canadian Community Health Survey Cycle 2.2, Nutrition (2004). Income-Related Household Food Security in Canada. Ottawa. ISBN 978-0-662-45455-7.
—. 2007b. Eating Well with Canada’s Food Guide: First Nations, Inuit and Métis. Ottawa. ISBN: 978-0-662-45521-9.
—. 2003. Canadian Guidelines for Body Weight Classification in Adults. Ottawa: Minister of Public Works and Government Services Canada..
—. 1998. The Health and Environment Handbook for Health Professionals. Ottawa
REFERENCES
141
Results from the A
tlantic 2014
Hectors, T.L.M., C. Vanparys, K. van der Ven, G.A. Martens, P.G. Jorens, L.F. Van Gaal, A. Covaci, W. De Coen, and R. Blust. 2011. “Environmental pollutants and type 2 diabetes: A review of mechanisms that can disrupt bea cell function.” Diabetologia 54: 1273-1290.
Hu, F.B., and V.S. Malik. 2010. “Sugar-sweetened beverages and risk of obesity and type 2 diabetes.” Physiology & Behavior (Elsevier Inc.) 100: 47-54. doi:10.1016/j.physbeh.2010.01.036.
Huerta-Fontela, M., Galceran, M.T., J. Martin-Alonso, and F. Ventura. 2008. “Occurrence of psychoactive stimulatory drugs in wastewaters in north-eastern Spain.” Science of the Total Environmen 297 (1-3): 31-40.
Institute of Medicine. 2000. Dietary Reference Intakes. Applications in Dietary Assessment. Washington, District of Columbia: National Academy Press.
—. 2007. Preterm Birth. Causes, Consequences, and Prevention. Edited by Richard E. Behrman and Adrienne Stith Butler. Washington, DC: National Academies Press.
Kasprzyk-Hordern, B., Dinsdale, R.M., and A.J. Guwy. 2009. “The removal of pharmaceuticals, personal care products, endocrine disruptors and ilicit drugs during wastewater treatment and its impact on the quality of receiving waters.” Water Research 43: 363-380.
Khan, G.A., B. Berglund, K.M. Khan, P.E. Lindgren, and J. Fick. 2013. “Occurrence and abundance of antibiotics and resistance genes in rivers, canal and near drug formulation facilities--a study in Pakistan.” PLoS One e62712. Accessed June 2015. doi:10.1371/journal.pone.0062712.
Kleywegt, S., V. Pileggi, Yang, P., Hao, C., Zhao, X., Rocks, C., Thatch, S., Cheung, P, and B. . Whitehead. 2011. “Pharmaceuticals, hormones and bisphenol A in untreated source and finished drinking water in Ontario, Canada- occurrence and treatment efficiency.” Science of the Total Environment 409 (8): 1471-1478.
Kolpin, D.W., E.T. Furlong, M.T. Meyer, E.M. Thurman, S.D. Zaugg, L.B. Barber, and H.T. Buxton. 2002. “Pharmaceuticals, Hormones and Other Organic Wastewater. Contaminants in U.S. Streams, 1999-2000. A National Reconaissance.” Environmental Science & Technology 36 (6): 1202-1211.
Kostich, M. S., A. L. Batt, and J. M. Lazorchak. 2014. “Concentrations of prioritized pharmaceuticals in effluents from 50 large wastewater treatment plants in the US and implications for risk estimation.” Environmental Pollution 184: 354-359.
Kotowska, U., J. Kapelewska, and J. Sturgulewska. 2014. “Determination of phenols and pharmaceuticals in municipal wastewaters from Polish treatment plants by ultrasound-assisted emulsification-microextraction followed by GC-MS.” Environment Science & Pollution Research 21 (1): 660-673.
Kuhnlein, H.V., and O. Receveur. 1996. “Dietary change and Traditional Food Systems of Indigenous People.” Annual Review of Nutrition 16: 417-442.
Kuhnlein, H.V., B. Erasmus, D. Spigelski, and B. Burlingame, . 2013. Indigenous Peoples’ food systems and well-being: interventions and policies for healthy communities. Rome: Food and Agricultural Organization.
Kuhnlein, H.V., O. Receveur, and H.M Chan. 2001. “Traditional Food systems research with Canadian Indigenous Peoples.” International Journal of Circumpolar Health 60 (2): 112-122.
Laird, B.D., A.B. Goncharov, G.M. Egeland, and H.M. Chan. 2013. “Dietary advice on Inuit traditional food use needs to balance benefits and risks of mercury, selenium and n3 fatty acids.” Journal of Nutrition 143: 923-930.
Lee, D., M.W. Steffes, A. Sjodin, R.S. Jones, L.L. Needham, and D.R. Jacobs. 2011. “Low dose organochlorine pesticides and polychlorinated biphenyls predict obesity, dyslipidemia, and insulin resistance among people free of diabetes.” PLoS ONE 6 (1).
Leenen, F.H.H., J. Dumais, N.H. McInnis, P Turton, L. Stratychuk, K. Nemeth, M.M. Lumkwong, and G. Fodor. 2008. “Results of the Ontario survey on the prevalence and control of hypertension.” Canadian Medical Association Journal 178 (11).
Legrand, M., M. Feeley, C. Tikhonov, D. Schoen, and A.L. Li-Muller. 2010. “Methylmercury Blood Guidance Values for Canada Melissa.” Canadian Journal of Public Health 101 (1): 28-31.
Lester, Y., H. Mamane, I. Zucker, and D. Avisar. 2013. “ Treating wastewater from a pharmaceutical formulation facility by biological process and ozone. .” Water Research 4349-4356.
Li, Q.Q., A. Loganath, Y.S. Chong, J. Tan, and J.P. Obbard. 2006. “Persistent organic pollutants and adverse health effects in humans.” Journal of Toxicology and Environmental Health, Part A 69 (21): 1987-2005.
Lin, A., and Y. Tsai. 2009. “Occurrence of pharmaceuticals in Taiwan’s surface waters: Impact of waste streams from hospitals and pharmaceutical production facilities.” Science of the Total Environment 407: 3793-3802.
MacGillivray, A.R. 2013. Contaminants of emerging concern in the Tidal Delaware River Pilot Monitoring Survey, 2007-2009. Delaware River Basin Commission. Delaware River Basin Commission, 87. Accessed January 29, 2014. http://www.nj.gov/drbc/library/documents/contaminants-of-emerging-concernAug2013rev.pdf.
Metcalfe, C., B.G. Koenig, D.T. Bennie, M. Servos, T.A. Ternes, and R. and Hirsch. 2003. “Occurrence of neutral and acidic drugs in the effluents of Canadian sewage treatment plants.” Environmental Toxicology and Chemistry 22 (12): 2872–2880.
Metcalfe, C., X. S. Miao, W. Hua, R. Letcher, and M. Servos. 2004. “Pharmaceuticals in the Canadian environment.” In Pharmaceuticals in the Environment: Sources, Fate, Effects and Risks., by K. Kummerer, 67-90. Berlin: Germany.
Miege, C., J.M. Choubert, Ribiero, L., Eusebe, M., and M. Coquery. 2009. “Fate of pharmaceuticals and personal care products in wastewater treatment plants - conception of a database and first results.” Environmental Pollution 157: 1721-1726.
REFE
REN
CES
142
Mikkonen, J., and D. Raphael. 2010. Social Determinants of Health: The Canadian Facts. Toronto, ON: York University School of Health Policy and Management. http://www.thecanadianfacts.org/The_Canadian_Facts.pdf.
Muir, D.C.G., and P.H. Howard. 2006. “Are there other persistent organic pollutants? A challenge for environmental chemists.” Environmental Science and Technology 40 (23): 7157-7166.
Nagpal, N K, and C L Meays. 2009. Water Quality Guidelines for Pharmaceutically-active Compounds (PhACs): 17 α-ethinylestradiol (EE2) – Overview Report. Government report, Ministry of Environment, Government of British Columbia, Victoria: Ministry of Environment.
New York City Environment Protection. 2011. 2010 Occurrence of Pharmaceuticals and Personal Care Products (PPCPs) in Source water of the New York City Water Supply. Final Report, New York: NYC EP. Accessed July 2015. http://www.nyc.gov/html/dep/pdf/quality/nyc_dep_2010_ppcpreport.pdf.
Pain, D.J., R.L. Cromie, J. Newth, M.J. Brown, E. Crutcher, P. Hardman, L. Hurst, et al. 2010. “Potential hazard to human health from exposure to fragments of lead bullets and shot in the tissues of game animals.” PLoS ONE 5 (4): e10315. doi:doi:10.1371/journal.pone.0010315.
Pascual-Aguilar, J., V. Andreu, and Y. Pico. 2013. “An envinronmental forensic procedure to analyse anthropogenic pressures of urban origin on surface water of protected coastal agro-environmental wetlands (L’Albufera de Valencia Natural Park, Spain).” Journal of Hazardous Materials 263: 214-223.
Power, E.M. 2008. “Conceptualizing food security of aboriginal people in Canada.” Canadian Journal of Public Health 99 (2): 95-7.
Public Health Agency of Canada. 2012. Tuberculosis in Canada 2008. Report, Ottawa: Minister of Public Works and Government Services Canada, Available at http://www.publications.gc.ca/collections/collection_2012/aspc-phac/HP37-5-2008-eng.pdf.
—. 2011a. “Obesity in Canada.” Public Health Agency of Canada.Available at: http://www.phac-aspc.gc.ca/hp-ps/hl-mvs/oic-oac/adult-eng.php#figure-1.
—. 2011b. “Diabetes in Canada: Facts and figures from a public health perspective.” Public Health Agency of Canada. http://www.phac-aspc.gc.ca/cd-mc/publications/diabetes-diabete/facts-figures-faits-chiffres-2011/chap1-eng.php#DIA.
—. 2010. “HIV/AIDS Epi Update. HIV/AIDS Among Aboriginal People in Canada. Public Health Agency of Canada.” Available at: http://www.phac-aspc.gc.ca/aids-sida/publication/epi/2010/8-eng.php.
Reading, C.L., and F. Wein. 2009. Health Inequalities and Social Determinants of Aboriginal Peoples’Health. Prince George: National Collaborating Centre for Aboriginal Health.
Reid, J. L., D. Hammond, V. L. Rynard, and R. Burkhalter. 2015. Tobacco Use in Canada: Patterns and Trends, 2015 edition. Waterloo: Propel Centre for Population Health Impact, University of Waterloo. Accessed 4 8, 2014. http://www.tobaccoreport.ca/2014/atr_sc.cfm.
Roden, N.M. 2013. “The cumulative risk of pharmaceuticals in New Jersey surface water to human health. PhD Thesis.” University of Medicine and Dentistry of New Jersey. Graduate School-New Brunswick Rutgers. The State University of New Jersey.
Sadezky, A., R.D. Löffle, M. Schlüsener, B. Roig, and T. Ternes. 2010. “Real Situation: Occurrence of the main investigated PPs in water bodies. European Water Research Series.” Chap. 4 in Pharmaceuticals in the Environment: Current Knowledge and need assessment to reduce presence and impact., edited by B. Roig. London: IWA Publishing.
Saudny, H., D. Leggee, and G. Egeland. 2012. “Design and methods of the Adult Inuit Health Survey 2007-2008.” International Journal of Circumpolar Health 71: 1-9.
Scheurer, M., A. Michel, H.J. Brauch, W. Ruck, and F. Sacher. 2012. “Occurrence and fate of the antidiabetic drug metformin and its metabolite guanylurea in the environment and during drinking water treatment.” Water Research 46 (15): 4790-4802.
Scheurer, M., F. Sacher, and H.J. Brauch. 2009. “Occurrence of the antidiabetic drug metformin in sewage and surface waters in Germany.” Journal of Environmental Monitoring 11: 1608-1613.
Schnarch, B. 2004. “Ownership, Control, Access and Possession ( OCAP®) or Self-Determination Applied to Research. A critical analysis of contemporary First Nations research and some options for First Nations communities.” Journal of Aboriginal Health (January).
Scientific Committee on Health and Environmental Risks (SCHER). 2011. Opinion on Ethinylestradiol. Brussels: European Commission (EC).
Smith, S., and I. Marshall. 1995. “Defining the Framework.” Ecozones. Accessed January 28, 2011. http://ecozones.ca/english/preface.html.
Sosiak, A., and T. Hebben. 2005. A preliminary survey of pharmaceuticals and endocrine disrupting compounds in treated municipal wastewaters and receiving rivers of Alberta. Technical Report T/773, Alberta Environment, Government of Alberta, Edmonton: Environmental Monitoring and Evaluation Branch, 52. Accessed April 28, 2014. http://environment.gov.ab.ca/info/library/7604.pdf.
Spongberg, A.L., J.D. Witter, J. Acuna, J. Vargas, M. Murillo, G. Umana, E. Gomez, and G. Perez. 2011. “Reconnaissance of selected PPCP compounds in Costa Rican surface waters.” Water Research 45: 6709-6717.
Statistics Canada. 2015. “Table 105-0501 - Health indicator profile, annual estimates, by age group and sex, Canada, provinces, territories, health regions (2013 boundaries) and peer groups, occasional, CANSIM (database).” June. Accessed April 2016. http://www5.statcan.gc.ca/cansim/a26.
REFERENCES
143
Results from the A
tlantic 2014
REFE
REN
CES
144
—.2013. “Health Fact Sheets (82-625-X), Household food insecurity, 2011-2012. Percentage of households with food insecurity, by province/territory, CCHS 2011-2012.” Statistics Canada. Dec 12. Accessed April 24, 2014. http://www.statcan.gc.ca/pub/82-625-x/2013001/article/11889/c-g/desc/desc04-eng.htm.
Statistics Canada, Health Canada, Public Health Agency of Canada. 2014. “The Canadian Health Measures Survey.” Health Canada. Accessed April 10, 2014. http://www.hc-sc.gc.ca/ewh-semt/contaminants/human-humaine/chms-ecms-eng.php.
Tarasuk, V., A. Mitchell, and N. Dachner. 2013. Household food insecurity in Canada 2011. Toronto: Research to identify policy options to reduce food inseucrity (PROOF). http://nutritionalsciences.lamp.utoronto.ca/.
Tarasuk, V., A. Mitchell, and N. Dachner. 2016. Household food insecurity in Canada, 2014. Toronto: Research to identify policy options to reduce food insecurity (PROOF).
Tran, N.H., J. Li, J. Hu, and S.L. Ong. 2014. “Occurrence and suitability of pharmaceuticals and personal care products as molecular markers for raw wastewater contamination in surface water and groundwater.” Environmental Science and Pollution Research 21: 4727-4740.
Treadgold, J., Q.T. Liu, and J. Plant. 2012. “Pharmaceuticals and personal-care products.” In Pollutants, Human Health and the Environment: A Risk Based Approach, edited by Jane Plant, Nick Voulvoulis and K Vala Ragnarsdottir. Wiley-Blackwell.
U.S. Department of Health and Human Services. 2014. The Health Consequences of Smoking - 50 Years of Progress: A Report of the Surgeon General. Atlanta: U.S. Department of Health and Human Services, Centers for Disease Control and Prevention, National Center for Chronic Disease prevention and Health Promotion, Office on Smoking and Health,. Accessed 4 8, 2014. http://www.cdc.gov/tobacco/data_statistics/sgr/50th-anniversary/index.htm.
Valcarcel, Y., A.S. Gonzalez, J.L. Rodriguez-Gil, Romo Maroto R., A. Gil, and M. Catala. 2011a. “Analysis of the presence of cardiovascular and analgesic//anti-inflammatory/antipyretic pharmaceuticals in river- and drinking water of the Madrid Region in Spain.” Chemosphere 82: 1062-1071.
Valcarcel, Y., A.S. Gonzalez, J.L. Rodriguez-Gil, A. Gil, and A. Catala. 2011b. “Detection of pharmaceutically active compounds in the rivers and tap water of the Madrid Region (Spain) and potential ecotoxicological risk.” Chemosphere 84: 1336-1348.
Vanderford, B.J., and S.A. Snyder. 2006. “Analysis of pharmaceuticals in water by isotope dilution liquid chromatography/tandem mass spectrometry.” Environmental Science and Technology 40 (23): 7312-20.
Verlicchi, P., and E. Zambello. 2012. “How efficient are constructed wetlands in removing pharmaceuticals from untreated and treated urban wastewaters? A review.” Science of the Total Environment 470-471: 1281-1306.
Vidal-Dorsch, D.E., S.M. Bay, K. Maruya, S.A Snyder, R.A. Trenholm, and B.J. Vanderford. 2012. “Contaminants of emerging concern in municipal wastewater effluents and marine receiving water.” Environmental Toxicology and Chemistry 31 (12): 2674-2682.
Waiser, M.J., D. Humphries, V. Tumber, and J. Holm. 2011. “Effluent-dominated streams. part 2: Presence and possible effects of pharmaceuticals and personal care products in Wascana creek, Saskatchewan, Canada.” Environmental Toxicology and Chemistry 30 (2): 508-519.
Waldram, J.B., D.A. Herring, and T.K. Young. 1995. Aboriginal Health in Canada. Historical, Cultural and Epidemiological Perspectives. Toronto: University of Toronto Press.
Wang, D. D., Y. Li, S. E. Chiuve, M. J. Stampfer, J. E. Manson, E. B. Rimm, and F. B. Hu. 2016. “Association of Specific Dietary Fats With Total and Cause-Specific Mortality.” JAMA Internal Medicine. Accessed 2016. doi:10.1001/jamainternmed.20.
Willett, W.C., A Green, M.J. Stampfer, F.E. Speizer, G.A. Colditz, B. Rosner, and et al. 1987. “Relative and absolute excess risks of coronary heart disease among women who smoke cigarettes.” New England Journal of Medicine 317: 1303-1309.
Willows, N. 2005. “Determinants of healthy eating in Aboriginal Peoples in Canada: the current state of knowledge and research gaps.” Canadian Journal of Public Health 96 (Suppl 3): S32-6, S36-41.
Willows, N., P. Veugelers, K. Raine, and S. Kuhle. 2011. “Associations between household food insecurity and health outcomes in the Aboriginal population (excluding reserves).” Statistics Canada, Catalogue no. 82-003-XPE, Health Reports, June.
World Health Organization. 2010. “Indigenous Peoples & Participatory Health Research: Planning & Management, Preparing Research Agreements.” Geneva.
Wu, C., J.D. Witter, A.L. Spongberg, and K.P. Czajkowski. 2009. “Occurence of selected pharmaceuticals in an agricultural landscape, western Lake Erie basin.” Water Research (IWA Publishing) 43 (15): 3407-3416. Accessed April 19, 2011. http://www.iwaponline.com/wr/default.htm.
Yang X., Flowers RC., Weinberg HS. and Singer PC. 2011. Occurrence and removal of pharmaceuticals and personal care products (PPCPs) in an advanced wastewater reclamation plant. Water Research 45: 5218-5228.
Yargeau, V., A. Lopata, and C. Metcalfe. 2007. “Pharmaceuticals in the Yamaska River, Quebec, Canada.” Water Quality Research Journal of Canada (IWA Publishing) 42 (4): 231 - 239. Accessed 04 19, 2011. http://www.cawq.ca/cgi-bin/journal/abstract.cgi?language=english&pk_article=361.
Young, T.A., J. Heidler, C.R. Matos-Perez, A. Sapkota, T. Toler, K.E. Gibson, K.J. Schwab, and R.U. Halden. 2008. “Ab initio and in situ comparison of caffeine, triclosan and triclocarbon as indicators of sewage –derived microbes in surface water.” Environmental Science and Technology 42 (9): 3335-3340.
Young, T.K. 1994. The health of Native Americans: towards a bio-cultural epidemiology. New York: Oxford University Press.


146
Copyright © 2022 FDOKUMEN