UK Food Security Report 2021 - GOV.UK
322
UK Food Security Report 2021 Presented to Parliament pursuant to Section 19 of the Agriculture Act 2020 Ordered by the House of Commons to be printed on 16 December 2021
-
Upload
khangminh22 -
Category
Documents
-
view
0 -
download
0
Transcript of UK Food Security Report 2021 - GOV.UK

UK Food Security Report 2021
Presented to Parliament pursuant to Section 19 of the Agriculture Act
2020
Ordered by the House of Commons to be printed on 16 December 2021

2
We are the Department for Environment, Food and Rural Affairs. We’re responsible
for improving and protecting the environment, growing the green economy,
sustaining thriving rural communities and supporting our world-class food, farming
and fishing industries.
We work closely with our 33 agencies and arm’s length bodies on our ambition to
make our air purer, our water cleaner, our land greener and our food more
sustainable. Our mission is to restore and enhance the environment for the next
generation, and to leave the environment in a better state than we found it.
© Crown copyright 2021
This information is licensed under the Open Government Licence v3.0. To view this licence, visit www.nationalarchives.gov.uk/doc/open-government-licence/
This publication is available at https://www.gov.uk/government/collections/united-
kingdom-food-security-report
Any enquiries regarding this publication should be sent to us at
www.gov.uk/defra
ISBN 978-1-5286-3111-2
E02702656 12/21
Printed on paper containing 75% recycled fibre content minimum
Printed in the UK by HH Associates Ltd. on behalf of the Controller of Her Majesty’s
Stationery Office

3
Contents
Introduction.................................................................................................................. 6
Theme 1 Global Food Availability .............................................................................. 11
Indicator 1.1.1 Global output per capita ..................................................................... 16
Indicator 1.1.2 Cereal yield growth rates by region ................................................... 20
Case Study 1.1 Plant diseases and pests ................................................................. 24
Indicator 1.1.3 Real agricultural commodity prices .................................................... 26
Indicator 1.1.4 Stock to consumption ratios ............................................................... 31
Indicator 1.1.5 Global livestock and dairy production ................................................ 34
Case Study 1.2 African Swine Fever ......................................................................... 43
Indicator 1.1.6 Global fish stocks ............................................................................... 45
Indicator 1.1.7 Global land use change ..................................................................... 51
Indicator 1.1.8 Phosphate rock reserves ................................................................... 57
Indicator 1.1.9 Water withdrawn for agriculture ......................................................... 61
Indicator 1.2.1 Global agricultural labour force capacity ............................................ 66
Indicator 1.2.2 Components of global food demand growth ...................................... 70
Indicator 1.2.3 Share of global production internationally traded ............................... 74
Indicator 1.2.4 Concentration in world agricultural commodity markets ..................... 77
Theme 2 UK Food Supply Sources ........................................................................... 82
Indicator 2.1.1 UK Production Capability ................................................................... 86
Indicator 2.1.2 Current land area in production ......................................................... 88
Indicator 2.1.3 UK food imports and exports ............................................................. 90
Indicator 2.1.4 EU share of UK imports ..................................................................... 93
Indicator 2.1.5 Overall diversity of supply .................................................................. 95
Indicator 2.1.6 Domestic grain production ................................................................. 96
Indicator 2.1.7 Livestock ............................................................................................ 99
Indicator 2.1.8 Other domestic crops ....................................................................... 103
Indicator 2.1.9 Supply sources of UK fresh fruit and vegetable imports .................. 110
Indicator 2.1.10 Seasonality .................................................................................... 112
Indicator 2.1.11 Fish ................................................................................................ 115
Indicator 2.2.1 Essential inputs ................................................................................ 119
Indicator 2.2.2 Agriculture and supply chain waste ................................................. 125
Indicator 2.2.3 Household food waste ..................................................................... 128
Indicator 2.3.1 Sustainable agriculture .................................................................... 130
Indicator 2.3.2 UK soil health ................................................................................... 134
Indicator 2.3.3 Climate change impacts on yields ................................................ 135
Case Study 2.1 Climate change: farming impacts and risks.................................... 138
Indicator 2.3.5 Environmental impacts of agriculture ............................................... 142
Theme 3 Food Supply Chain Resilience ................................................................. 149

4
Indicator 3.1.1 Business resilience and response ................................................... 154
Case Study 3.1 COVID-19 response ...................................................................... 156
Indicator 3.1.2 Energy dependency in the food sector ............................................ 159
Case Study 3.2 9 August 2019 Power Outage: Food Sector Impact ...................... 164
Indicator 3.1.3 Transport dependency in the UK ..................................................... 166
Indicator 3.1.4 Points of entry in the UK.................................................................. 171
Indicator 3.1.5 Food imports via Short Strait ........................................................... 175
Indicator 3.1.6 Border closures ............................................................................... 178
Case Study 3.3 French Border Closure, December 2020 ....................................... 179
Case Study 3.4 UK-Imposed Border Closures (southern Africa; South America),
January 2021 .......................................................................................................... 180
Indicator 3.1.7 Key inputs to the food supply chain resilience ................................. 181
Case Study 3.5 Carbon Dioxide (CO2) Shortage 2018 .......................................... 185
Indicator 3.1.8 Consumer behaviour ....................................................................... 186
Context and rationale .............................................................................................. 187
Case Study 3.6 Consumer behaviour in the 2020 lockdown................................... 189
Indicator 3.1.9 Labour and skills dependency ......................................................... 193
Indicator 3.2.1 Cyber threat in the food supply chain .............................................. 198
Case Study 3.7 Cyber threat to USA meat company .............................................. 200
Indicator 3.2.2 Diversity of food retailers ................................................................. 202
Indicator 3.2.3 Economic resilience in the food supply chain .................................. 204
Case Study 3.8 COVID-19 impacts upon the Wholesale sector ............................. 205
Discussion .............................................................................................................. 205
Theme 4 Food Security at Household Level ........................................................... 207
Indicator 4.1.1 Food expenditure growth compared to other household spending
growth ..................................................................................................................... 210
Indicator 4.1.2 Low-income households’ share of spending on food ...................... 213
Indicator 4.1.3 Price changes of main food groups ................................................. 219
Indicator 4.1.4 Household food security .................................................................. 222
Indicator 4.1.5 Access to food shops in England .................................................... 228
Indicator 4.2.1 Eligibility for Free School Meals ...................................................... 232
Indicator 4.2.2 Take-up of Healthy Start voucher scheme ...................................... 236
Case study 4.1 Food Aid ...................................................................................... 239
Case Study 4.2 Public Sector Food Procurement in England ................................. 242
Theme 5 Food Safety & Consumer Confidence ..................................................... 245
Indicator 5.1.1 Consumer confidence in the food system and its regulation ...... 250
Indicator 5.1.2 Consumer concerns ........................................................................ 256
Case Study 5.1 Allergen information on Food Pre-packed for Direct Sale ............. 260
Case Study 5.2 Codex ............................................................................................ 261
Indicator 5.1.3 Food business compliance with food safety regulation ................... 262
Data and assessment ............................................................................................. 263

5
Indicator 5.1.4 Food safety incidents, alerts and recalls ...................................... 267
Case Study 5.3 Product recalls instigated by malicious tampering with retail
consumer products 275
Indicator 5.1.5 Prevalence of foodborne pathogens ................................................ 278
Indicator 5.1.6 Foodborne disease outbreak surveillance ....................................... 284
Case Study 5.4 Listeria outbreak linked to consumption of pre-prepared hospital
sandwiches in England ............................................................................................ 293
Indicator 5.1.7 Food Crime ...................................................................................... 295
Case Study 5.5 Unlawful processing in the red meat sector ................................... 298
Case Study 5.6 Operation OPSON and the Food Industry Intelligence Network .... 300
Case Study 5.7 Activities of the Food Authenticity Network and Centres of Expertise
................................................................................................................................ 302
About the UK Food Security Report ........................................................................ 306
Appendix ................................................................................................................. 309

6
Introduction
Executive summary
This report is an analysis of statistical data on food security in the United Kingdom.
It is the first in a series of reports which will be published under a new duty in the
Agriculture Act 2020 to report to Parliament on food security in the United
Kingdom at least once every three years.
The UK Food Security Report (UKFSR) examines past, current, and predicted
trends relevant to food security, to present the best available and impartial
analysis of food security in the UK, and to lay the groundwork for future Food
Security Reports.
Food security is a complex and multi-faceted issue. To address the subject’s many
diverse aspects, the UKFSR is structured around five principal ‘themes’, each
addressing an important component of modern-day food security in the UK. They
are as follows: global food availability, which describes supply and demand
issues, trends and risk on a global scale, and how they may affect UK food supply;
UK food supply, which looks at the UK’s main sources of food at home and
overseas; supply chain resilience, which outlines the physical, economic, and
human infrastructure that underlies the food supply chain, and that chain’s
vulnerabilities; household-level food security, which deals with issues of
affordability and access to food; and food safety and consumer confidence,
which details food crime and safety issues.
The report draws on a broad range of published statistical data from government
and other sources. These quantitative sources are supplemented with case
studies and qualitative analysis where necessary and helpful. In some cases,
where quantitative evidence is not available due to data being limited or
confidential, or where the report references recent events which are not yet
reflected in published statistics, only qualitative analysis is available.
Context
As set out under Section 19 of the Agriculture Act 2020: “The Secretary of State
must, on or before the relevant day and at least once every three years thereafter,
prepare and lay before Parliament a report containing an analysis of statistical
data relating to food security in the United Kingdom.”
The UKFSR is the first comprehensive review of the UK’s food security to be
published since the UK Food Security Assessment (UKFSA), which was first

7
published in 2009 and updated in 2010. In the decade since the UKFSA, the food
security landscape has changed significantly. The UK’s departure from the
European Union has brought along changes in areas as diverse as trade, farming,
and access to fisheries, representing both challenges and opportunities in food
security. Climate change and its impacts on farming and the food supply chain are
now also better understood. The COVID-19 pandemic and other concurrent
events happening towards the end of 2020, such as the UK leaving the EU and
increased food demand due to Christmas, have stress-tested the supply chain,
highlighting both the vulnerabilities in this complex system and the resilience and
flexibility of the UK’s food supply. In addition, the pandemic has increased public
awareness in a range of food security areas. This includes the complexities and
dependencies of the UK’s food supply chain, notably the advantages and risks of
just-in-time food supplies, as well as the issues surrounding household food
insecurity as households struggled to afford food.
While the UKFSR is a different document to the UKFSA, it has some important
similarities. It shares a number of common data sources and covers a similar
spread of topics in its five themes as the UKFSA did in its six.
The production of this report is the responsibility of the Department for
Environment, Food and Rural Affairs (Defra). It has been produced in collaboration
with relevant officials in the Devolved Administrations, and with UK food safety
bodies. An area as all-encompassing as food security touches on a wide range of
government bodies. Agricultural and food supply policy is devolved to each
national administration. National Security and Counter Terrorism (CT) policy is a
specific reservation under the Home Affairs heading. As lead departments for food
as a Critical National Infrastructure (CNI) sector, Defra and the FSA manage those
risks specifically relating to National Security and CT across the UK. For all other
areas of risk, food supply chain resilience and security are the responsibility of
Defra in England; DAERA and Department for Communities in Northern Ireland;
Scottish Government in Scotland; and Welsh Government in Wales. The FSA is
responsible for food safety and tackling food crime in England, Northern Ireland,
and Wales. Food Standards Scotland are responsible for food safety and food
crime in Scotland.
What is food security?
Food security has many dimensions. As a topic, it encompasses the state of
global agriculture and markets on which the UK is reliant; the sources of raw
materials and foodstuffs in the UK and abroad; the manufacturing, wholesale, and
retail industries that ultimately bring food to shelves and plates, and their complex
supply chains of inputs and logistics; and the systems of inspection that allow
consumers to be confident their food is safe, authentic, and of a high standard.

8
Accordingly, this report examines the issue of whether the UK is food secure
across five ‘themes.’
Theme 1: Global Food Availability looks at food security in terms of supply and
demand at a global level. It is concerned with the security and stability of the
international food supply system, on which the UK relies for nearly half of its food.
It assesses trends in global agriculture and food production set against population
growth, the impacts of climate change and other factors on food production, and
the state of key inputs to agriculture, such as labour, water and fertiliser. It also
looks at trends in global trade, which is essential for the UK to access food
produced abroad.
Theme 2: UK Food Supply Sources looks at food security in terms of where the
UK gets its food. It focuses specifically on the UK’s principal sources of food at
home and overseas. It describes the UK’s domestic production, and trends in
agricultural productivity; fisheries; and food manufacturing. It considers important
factors in maintaining domestic productivity, such as soil health; pesticide use; and
biodiversity. It discusses the principal sources the UK relies on for its food imports,
and food waste in the system. It also considers the indicators which will help future
reports assess the food security impacts of the UK’s 2020 departure from the
European Union, both in terms of changes to domestic production practices and to
the UK’s trading relationship with the world. As a number of these factors would
not be expected to change significantly in the short term, longer term monitoring of
these indicators will be required to fully understand the impacts.
Theme 3: Supply Chain Resilience looks at food security in terms of the
physical, human and economic infrastructure underlying the supply chain. It
describes the sophisticated infrastructure of just-in-time supply chains, their
strengths and potential vulnerabilities. It considers how the supply chain responds
to issues, for example the impacts the Covid-19 pandemic had throughout the
supply chain. It also describes the risk of cyber-attacks, labour issues in the supply
chain, and other significant vulnerabilities.
Theme 4: Food Security at Household Level looks at food security in terms of
whether households can reliably afford and access sufficient healthy and nutritious
food. It discusses the affordability of food and drink, in real terms and compared to
other living costs. It considers whether people have access to food shops. The
theme covers household food security levels in the UK and breaks this down into
various factors that may impact these levels. It also looks at the use of food aid in
the UK including during the COVID-19 pandemic.
Theme 5: Food Safety and Consumer Confidence looks at food security in
terms of the perceived and actual safety and authenticity of food in the UK. It
describes the inspections and surveillance regime for ensuring food standards in

9
the UK are upheld and examines trends in food safety issues such as food crime,
foodborne pathogens, labelling and metrics on public trust in the food system.
How to read the UKFSR
Each theme of the UKFSR begins with an introduction, which sets out the broader
context and reasoning behind the theme, and a summary, which provides the
headline conclusions. The body of each theme is then comprised of indicators and
case studies, each of which sets out a specific aspect of food security and the
available data.
Each indicator, in turn, has a Headline summary and a more detailed Context and
Rationale section for why the indicator has been included. A Data and
Assessment section then sets out the relevant data and what it tells us. Finally, a
Trends section articulates what this assessment means in terms of food security
and what can usefully be observed. Where there is an observable past or future
trend in the data, this section will articulate it. Relevant information on survey
methodology and notes explaining specific concepts are included in an annex.
The great variety of data sources and the different collection periods of the
available information mean it is not always possible to talk about every indicator in
the exact same way. Some indicators contain data that has only recently started to
be collected and therefore, this iteration of the UKFSR can only serve as a starting
point for a future time series.
The UKFSR is not a policy document. Its purpose is to understand the landscape and the issues at stake, and to set out and interpret the best available evidence regarding food security. It is not a showcase of current or future government policy. It aims to provide policymakers across the UK nations with the best possible information and analysis they need to maintain the UK’s food security, in all its many aspects.


11
Theme 1: Global Food Availability
This chapter of the UK Food Security Report looks at the food security of the
United Kingdom in terms of supply and demand at a global level. It is concerned
with the security and stability of the international food supply system. It assesses
trends in global agriculture and food production set against population growth, the
impacts of climate change and other factors on food production, and the state of
key inputs to agriculture, such as labour, water, and fertiliser. It also looks at
trends in global trade, key for the UK to access food produced abroad.
In terms of this theme, food security means stable global production and a well-
functioning global trading system that reliably, efficiently and sustainably meets
the needs of the UK and the world.
Key messages
• Global food supply and availability has improved since 2010, which is a
positive sign for the UK’s overall food security.
• The coronavirus (COVID-19) pandemic caused some disruption to trans-
boundary supply chains but global trade in products is expected to recover
and to continue in the long term.
• Projected growth in agricultural production will be largely due to increasing
cereal yields and efficiency improvements in meat and dairy production, and
less due to expansions in agricultural land and herd size growth.
• Several factors threaten the stability and long-term sustainability of global
food production: climate change and climate variability, biodiversity loss
caused by agricultural land expansion, and overexploitation of natural capital
resources, including fish stocks and water resources. Current data on
undernourishment as well as obesity levels across the world may indicate
that global food production is not equitably meeting populations' nutritional
requirements, including the UK's.
The UK has relied on imported foodstuffs to supplement domestic production for
over two centuries and currently almost half of food consumed in the UK is
imported, although the UK is around 75% self-sufficient in foodstuffs that can be
produced domestically. Sourcing food from global markets contributes to the UK’s
food resilience. Diverse supply chains and global trade in agricultural and food
commodities reduce the risk of food becoming unavailable and, as the risks are
shared across the globe, can mitigate price shocks. as the risks are shared across
the globe. It also allows consumers to access fresh, out-of-season foods which
cannot be produced in the UK. However, an over-reliance on global trade can
expose food supplies to global risks including logistical, political, and production
disruption.

12
Balance of Global Food Production and Consumption
As the world population continues to grow from 7.7 billion people in 2021 to an
estimated 8.5 billion in 2030, it is essential to understand how agricultural
production levels will keep up with growing food demand.1
The rate of increase in global food production output per capita currently outpaces
global food demand, though global food production is unevenly distributed across
regions. For the UK, global food sources are secure and expected to remain so for
the coming years. However, substantial amounts of food are lost or wasted across
the global supply chain. Reductions in loss and wastage could increase the
sustainability of food production.
Stock to consumption ratios are an indicator of global resilience to food shortages
and price stability. Food stocks can serve as buffers to supply or demand shocks.
If stocks are low, markets become more sensitive to any potential shocks and the
probability of price spikes increases. The world’s stock to consumption levels
fluctuate, with good harvests leading to higher stocks.
Cereal yield growth rates have been growing at a slower pace since 2010,
compared to earlier periods, but are keeping pace with overall global food
demand. Some of the main risks for cereals in the future will be climate variability
and change, and the effects it will have on cereal growth rates in different regions.
Changing climate, pests and diseases, harvest losses, inefficient use of inputs,
and under-investment can all hamper yields and yield growth. Evidence indicates
that between 20% and 40% of global crop production is lost annually due to plant
diseases and pests. Impacts of wheat rust diseases on the world’s wheat
production are of note for the UK’s food security.
Current stocks are healthy with the exception of soybeans. Poor soybean harvests
or other supply disruptions could cause price fluctuations and present a risk to
imported soy-based animal feed, an important input into UK meat production.
Global meat production has grown significantly since 2010 and is projected to
increase over the coming years. Consumption increases are likely to vary, with
high-income countries potentially having reached peak meat consumption per
capita, and lower- and middle-income countries expected to see more increases in
consumption rates. Milk production is also set to continue to increase, mainly
driven by improvements in efficiency and less due to increases in herd size.
Animal disease outbreaks in the late 2010s have substantially reduced pig herd
numbers, particularly in China.
1 UN, ‘World Population Prospects 2019: Data Booklet’, https://population.un.org/wpp/.

13
While most of the fish stocks that the UK relies on are considered sustainable,
global fish stocks are overexploited. Consumption of fish has increased globally in
the last two decades (including in the UK), while the proportion of fish stocks at
biologically sustainable levels has fallen. Around one third of all stocks are being
fished at unsustainable levels. As well as overfishing, stocks are at risk from the
effects of climate change, particularly through ocean acidification and algal
blooms.
Overall, the global availability of agricultural commodities is driven by the
fundamental market forces of supply and demand and exchange rate dynamics.
Population growth will play the most significant role in food demand growth over
the coming years. Increasing incomes in low- and middle-income countries are
likely to lead to increased calorie consumption and meat consumption. In high-
income countries other factors, such as health and environmental concerns, are
likely to be more relevant in determining consumers’ food preferences.
Shorter term shocks to supply and demand also influence price. The financial
crisis of 2007 to 2008 caused a significant price spike, followed by a gradual
decline. The COVID-19 pandemic led to new price spikes, albeit not as severe as
that which followed the financial crisis. The Food and Agriculture Organisation of
the United Nations (FAO) projects that real prices will return to a general
downward trend once COVID-19 measures have been lifted.
Agricultural inputs
Agricultural production puts strain on key inputs such as fertilisers and labour as
well as natural capital resources such as water, soil, and land. Increased global
pressure to intensify food production to meet demand may also exacerbate the
harmful impacts agricultural practices and the food system have on the
environment and wildlife in the form of habitat destruction and pollution.
Combined, these may undermine the fundamentals upon which production
systems rely if production cannot become more sustainable.
Around one third of the land on Earth is used for growing food. This proportion has
stayed broadly stable since 2010, although there has been a decline in forest land
and some significant regional changes, particularly in South America. Most
projected increases in global food production are the result of more intensive
practices rather than of the creation of new farmland. Both increases in agricultural
land and intensified production pose a threat to biodiversity. The role of
biodiversity in food production is crucial: more than 75% of the leading types of
global food crops rely to some extent on animal pollination for yields and/or
quality.

14
Fertilisers are key to global industrial farming methods. Phosphate rock is the only
large-scale source of phosphorus, an essential element for plant growth and an
important chemical fertiliser. The UK has no phosphate reserves and relies on
imports. Phosphate consumption has declined both in the UK and globally as a
result of more efficient usage, and known reserves of exploitable phosphate rock
have increased since 1995.
Water is essential to food production. Agriculture accounts for around 70% of fresh
water withdrawn (from rivers, reservoirs, or groundwater extraction) globally.
Water withdrawals for irrigation have increased globally, most significantly in
Organisation for Economic Development (OECD) and EU countries. However,
they have declined in the Middle East and North Africa. Climate change is likely to
increase the importance of irrigation relative to rainfed agriculture and increase
pressures on water withdrawals. There has been a strong trend towards the use of
more water-efficient crops and better water management practices. Higher water
efficiency can also be gained by using nitrogen-based fertilisers.
The availability of agricultural workers is an important factor in global food
production and on global food supply. The number of people employed in
agricultural labour has decreased globally since 2010 by 44.5 million due to
productivity increases and mechanisation. Besides permanent agricultural
workers, seasonal workers are required to meet fluctuating demand across the
world. The COVID-19 pandemic, however, has highlighted how the sector’s
reliance on seasonal workers for critical harvesting periods can be a potential risk
to production if there are factors that reduce the availability of these workers.
Global commodity markets
Global trade in agricultural and food products plays an essential role in providing
food security for the UK, but also for the rest of the world. Volume and freedom of
trade are key, as is diversity of global supply into those markets.
The proportion of agricultural products traded has increased since the 2000s. A
growing global trade in agricultural products increases resilience to supply shocks
affecting geographical areas and allows for a more efficient global food supply
chain. However, reliance on the global trading system increases vulnerability to
events, such as trade restrictions, which disrupt the system. The COVID-19
pandemic caused some disruption to trans-boundary supply chains but global
trade in products is expected to recover and continue growing in the long term.
High concentration of a particular commodity in a few countries could have
negative impacts on price, supply, and food security globally. Since 2010 Ukraine
has increased its market share for maize, reducing the overall concentration of
world supplies. Brazil is now the world largest producer and exporter of soybeans

15
representing an overall increase in the concentration of soybean production
across the world over the last decade. India is now the world’s biggest producer of
rice, where there has been a recent uptick in concentration of world supply in the
last few years. Russia is now the world’s biggest producer of wheat, while
concentration of wheat production around the world has remained stable along
with most other major agricultural commodities. Palm oil and soybean oilseed
represent the two commodities with the most concentrated production globally. No
major changes are expected for the concentration in world agricultural commodity
markets and the top exporting countries of these commodities. Over the last
decade, stable trade relations with key exporters have ensured that the UK’s
access to global food supplies remains secure. The emergence of other exporting
countries such as Vietnam for rice, and continued strong trade relations with key
exporting countries, will further support the stability of the UK’s access to food.

16
Indicator 1.1.1 Global output per capita
Headline
The rate of increase in global food production output per capita now outpaces
global food demand. This means that the global food sources that the UK
accesses are secure and expected to remain so in the coming years. However,
substantial amounts of food are lost or wasted across the global supply chain.
Global food production is unevenly distributed across regions. In addition, growth
in obesity and malnutrition may indicate that global production is not meeting
nutritional needs.
Context and Rationale
Global production of food relative to global population size is a fundamental
indicator of global food security. Demographic and demand increases, availability
of suitable land, water resources, bio-fuel production, climate change, and other
factors play an important role in determining the levels of global food production
and availability.
A secure global food supply is essential to guaranteeing the availability and
affordability of food in the UK in the long term. Any deterioration in global
availability, or associated increases in prices, will also impact the UK’s food
security.
While evidence suggests that, at the global level, agricultural production can be
increased enough to satisfy the additional demand projected to 2050, fair resource
distribution across all countries will remain a challenge, as outlined further in
Indicator 1.2.2. Moreover, there are indications that food prices can be volatile.
Economic shocks such as the financial crisis, disease outbreaks, and extreme
weather events can adversely impact production and consumption costs leading
to spikes in food prices. This volatility could lead to a call for a more sustainable
use of food and inputs needed to grow food. This is discussed in more depth in
Indicators 1.1.7, 1.1.8, and 1.1.9.
Food waste in medium and high-income countries occurs largely at the
consumption stage, arising from consumer behaviour. In lower-income countries,
food is lost mainly within the food supply chain before it reaches the consumer.
These losses are due to financial, managerial, and technical limitations in
harvesting techniques, as well as poor storage and cooling facilities in difficult

17
climatic conditions. Inadequate infrastructure, transportation, packaging, and
marketing systems also contribute.2
Data and Assessment
Indicator: Calories and world agricultural production per person; global food loss
and waste
Source: FAO; UNEP Food Waste Index Report 2021; Fefac; Alltech
Figure 1.1.1a: World food production per capita 1961-2019
(See appendix for an explanation of index numbers.)
Food production per capita has risen since the 1960s. The rate of increase in the
production of food now outpaces the increase in calorie demand per capita. The
food production index includes seed and feed, which is not intended for human
consumption and therefore slightly skews the real availability of food for humans.
The use of animal feed has also increased significantly since 2012 by 149 million
tonnes per annum to 1,103 million tonnes in 2019 as is shown in figure 1.1.1d.
2 UNCTAD, ‘Goal 12: Responsible consumption and production’,
https://stats.unctad.org/Dgff2016/planet/goal12/index.html.

18
Figure 1.1.1b: Food waste at food service, household, and retail level per region,
kg/capita/year from UNEP 2021 Food Index
The quality of data on food waste varies significantly by region. Drawing any
definite conclusions on regional variation is therefore problematic. From available
data, food waste per capita appears relatively constant globally. Household food
waste accounts for the largest proportion of food waste.
Figure 1.1.1c: Percentage of food loss by region, 2016
Food loss, as shown in figure 1.1.1c, is highest in Central and Southern Asia at
20.7%, followed by Europe and Northern America at 15.7% and Sub-Saharan

19
Africa at 14%. All these regions exceeded the world average percentage of food
loss of 13.8%. Australia and New Zealand have the lowest food waste percentage
globally at 5.8%.
Figure 1.1.1d: Animal Feed consumption at global level, million tonnes 2012-2018
Trends
Global food production output has been on a permanent upward trend, with
enough calories being produced to feed the growing world population now and in
future years. Therefore, the UK’s ability to meet its import demands from global
food production is in a good state. Risks concerning global food production levels
are discussed in more detail in Indicators 1.1.2, 1.1.5, 1.1.6, 1.1.7.
The Food and Agriculture Organization (FAO) of the United Nations projects that
global agricultural production will increase by 1.4% per annum over the next ten
years if most COVID-19 measures are lifted by the end of 2021. This is a slightly
slower growth rate compared to the last decade, which saw an increase of 1.7%
per annum. Most of the agricultural production growth will likely take place in low-
income countries. These increases will be driven by productivity-increasing
investments in agricultural infrastructure and research and development, wider
access to agricultural inputs and improved management skills. High-income

20
countries will contribute less to production growth, mainly due to constraints
imposed by environmental policies.3
Although calories per capita are rising globally, distribution is unequal. The UN
estimates that between 720 and 811 million people were undernourished in 2020.
This constitutes an increase from 650 million in 2019 as a result of the COVID-19
pandemic.4 Moreover, the type of food that makes up the consumed calories also
plays an important role in determining whether the world population can meet their
nutritional requirements. Some regions still suffer from undernourishment, while
others are dealing with increasing obesity levels.
Indicator 1.1.2 Cereal yield growth rates
by region
Headline
Growth in cereal yields is keeping pace with overall global food demand, although
has been slower in the last decade compared to earlier periods. Some of the main
risks for cereal production in the future will be climate variability and change, and
the effects these will have on the growth rates in different regions.
Context and Rationale
Yield growth rates are an important measure to assess the world’s supply of food.
Yields measure the harvested production per unit of harvested area, and yield
growth denotes an increase in harvested production within a unit of area.
Historically, yield growth has been a key factor in food production increases. It is
expected that most of the increase in production over the next 40 years will also
come from improved yields and less so from expansions in agricultural land.5
The agricultural sector is both affected by and the cause of some risks. Changing
climate, pests and diseases, harvest losses, inefficient use of inputs, and
underinvestment can all hamper yields and yield growth. Some of these risks are
further outlined below. Efficient applications of fertiliser and water usage are key
factors in yield growth. However, yield growth driven by applying greater quantities
3 FAO, ‘OECD-FAO Agricultural Outlook 2021-2030’, https://www.fao.org/publications/oecd-fao-agricultural-outlook/2021-2030/en/. 4 Action against Hunger. ‘World Hunger: Key Facts and Statistics 2021’, https://www.actionagainsthunger.org/world-hunger-facts-statistics. 5 FAO, ‘World Agriculture towards 2030/2050: The 2012 revision’, https://www.fao.org/global-perspectives-studies/resources/detail/en/c/411108/.

21
of fertiliser and water can be environmentally damaging. Fertilisers and water
resources are covered in more depth within Indicators 1.1.8, 1.1.9, and Theme 2
in this report.
Data and Assessment
Indicator: Cereals yields and yield growth rates
Source: FAO
(See appendix for further information on OECD and an explanation of index
numbers.)
Figure 1.1.2a: Cereal yield growth rates by region 1970-2019
Note: 2010 is designated as the base year for this graph to measure the growth
rate against.

22
Figure 1.1.2b: Cereal yields and yield growth rates by region
Yields(tonnes) Growth of Yields
Area 1970 1999 2009 2019 1999-2009 2009-2019
MENA 1.1 3.2 4.7 5.4 47.8 14.6
OECD & EU 2.5 4.3 4.9 5.6 14.6 14.0
South & East
Asia 2.0 3.1 3.7 4.2 21.7 14.0
South America 1.6 3.0 3.6 4.7 19.5 32.2
Sub-Saharan
Africa 1.0 1.4 1.4 1.5 3.7 8.1
World 1.6 2.7 3.3 3.8 22.4 16.9
Cereal yields have increased dramatically since the 1970s. Since 2011, however,
growth of yields has significantly slowed. This can be seen in the Middle East and
North Africa (MENA), which had a 14.76% growth between 2009 and 2019
compared with a 47.98% growth between 1999 and 2009. This represents a
greater volatility in the yield in the last decade than previously seen. South
America saw the largest acceleration in growth in yield at 32.2% over the last
decade.
Trends
Data from the FAO suggests that the increase in improvements in yields in the last
two decades can mostly be attributed to increased use of irrigation, pesticides and
fertilisers, better farming practices, and the use of high yield crops. Increased
growth rates, therefore, are largely due to improved technologies rather than
expansions of cultivated areas.6
Although yield growth rates have been slowing down in recent years, this should
not be taken as cause for concern given that overall food production, as outlined
in indicator 1.1.1, has been increasing and is projected to continue to do so.
Falling real commodity prices have reduced some of the incentives to improve
yield growth at the same pace as in the late 20th century.
6 FAO, ‘World Food and Agriculture: Statistical Yearbook 2020’, https://www.fao.org/family-farming/detail/en/c/1316738/.

23
The FAO estimates that global crop production will grow by 18% over the next ten
years. 88% of this growth is expected to come from yield improvements. The
additional output is projected to mainly originate in the Asian and Pacific region.
Lower-income countries will improve their yields through better adapted seeds and
improved crop management. In high-income countries, yield increases will come
mainly from improvements in cultivated varieties and the adoption of precision
farming technology to optimise the application of inputs.7
Despite the current positive status and projections for cereal yields, there are
concerns about how climate variability and change will impact future yield growth
rates. These risks, and how they could impact the UK’s food supply chains, are
discussed in further detail below.
Risk: Global dimensions of climate variability and change
The UK’s food security is dependent on growing conditions in other parts of the
world. Not only does the UK import 45% of the food it consumes, large parts of
animal feed for the UK’s domestic production are also imported. Climate variability
presents a risk to the availability and stability of these supplies. The likelihood of
yield reductions is expected to increase due to more frequent adverse weather
conditions such as droughts, floods, and hurricanes, or due to food production
being pushed out of its safe climatic space. Beyond primary production, changing
climate variability may also affect the way food is processed, stored, and
transported, which could impact on food quality, quantity, and prices.
Around 80% to 85% of wheat milled in the UK is home-grown, with 1 to 2 million
tonnes per year imported, half of which comes from France, Germany, and
Canada.8 While typical year-to-year UK wheat yield variations are not highly
correlated with those in France, Germany or Canada, simultaneous yield
reductions can occur because of large-scale weather patterns that result in
droughts and floods. Climate change is projected to increase the occurrence of
adverse conditions including droughts and floods, and is, therefore, expected to
increase the likelihood of yield shocks.
The United States and China combined provide 60% of the world's maize and are,
therefore, crucial to global food security. Severe water stress is known to be a risk
factor for maize production, with climate models showing up to a 6% chance per
decade that these conditions could occur simultaneously in the United States and
7 FAO, ‘OECD-FAO Agricultural Outlook 2021-2030’, https://www.fao.org/publications/oecd-fao-agricultural-outlook/2021-2030/en/. 8 UK Flour Millers, ‘Information Centre: Statistics’, https://www.ukflourmillers.org/statistics.
24
China. These conditions are also expected to occur more frequently in the future
as the climate continues to warm, increasing the likelihood of experiencing large
reductions in global maize availability. While most of the 1 to 3 million tonnes of
maize imported by the UK each year come from Europe, maize yield shocks in the
United States and China could affect global markets and UK access to maize.
Domestic production of maize is increasing, in part because of a warming climate,
which may partly offset increased risk of international production shocks.
The UK typically requires 2.5 to 3 million tonnes of soybean products every year,
used primarily for animal feed, human consumption, and pharmaceutical or
industrial purposes. Virtually all soybean requirements are currently met by
imports, the vast majority of which come from Argentina, Brazil, and the USA – the
world’s largest soybean producers and exporters. The high concentration of
soybean production in the Americas means that global soybean supplies are
vulnerable to adverse weather conditions, such as droughts and floods, which are
expected to become more frequent in a warmer climate. In addition, China is the
world’s largest importer of soybean products, primarily for animal feed. China’s
increasing demand for consuming meat products fed on soybean may therefore
affect the UK’s access to soybeans.
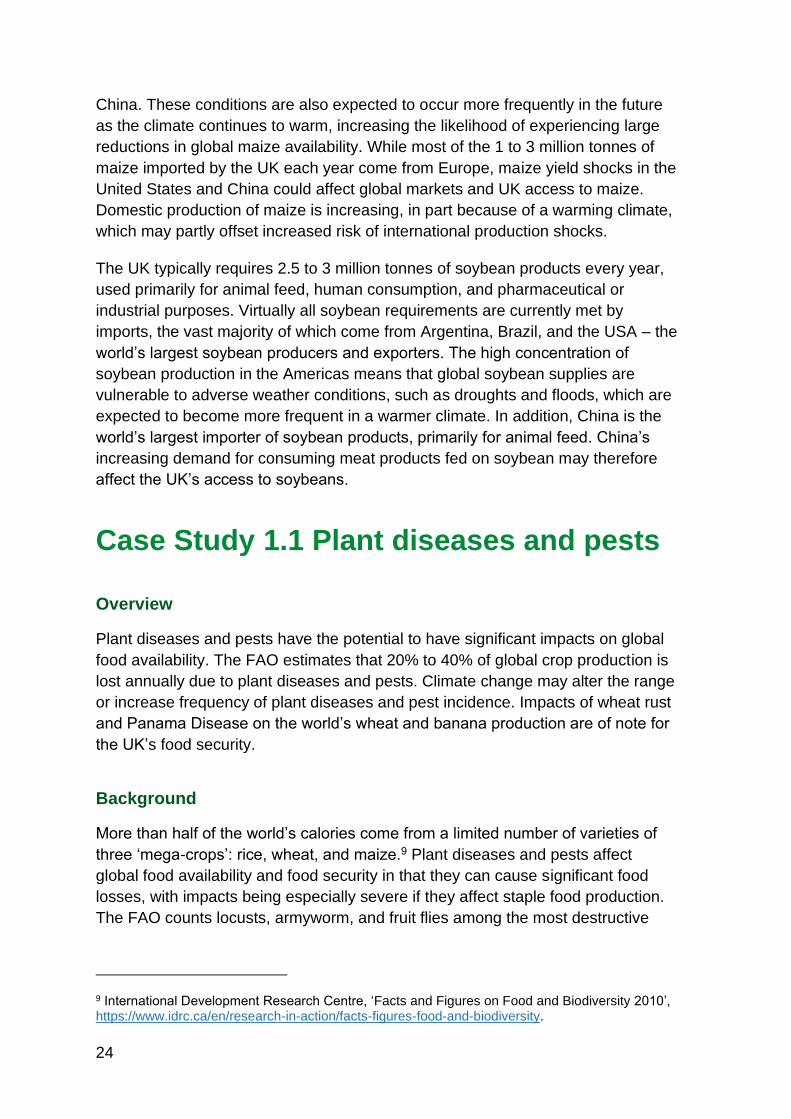
Case Study 1.1 Plant diseases and pests
Overview
Plant diseases and pests have the potential to have significant impacts on global
food availability. The FAO estimates that 20% to 40% of global crop production is
lost annually due to plant diseases and pests. Climate change may alter the range
or increase frequency of plant diseases and pest incidence. Impacts of wheat rust
and Panama Disease on the world’s wheat and banana production are of note for
the UK’s food security.
Background
More than half of the world’s calories come from a limited number of varieties of
three ‘mega-crops’: rice, wheat, and maize.9 Plant diseases and pests affect
global food availability and food security in that they can cause significant food
losses, with impacts being especially severe if they affect staple food production.
The FAO counts locusts, armyworm, and fruit flies among the most destructive
9 International Development Research Centre, ‘Facts and Figures on Food and Biodiversity 2010’, https://www.idrc.ca/en/research-in-action/facts-figures-food-and-biodiversity.

25
plant pests, and banana disease, cassava disease, and wheat rust among the
most harmful plant diseases. Climate change, trade, passenger movement, and
reduced resilience in production systems due to agricultural intensification all risk
increasing the spread of these diseases and pests.10
Discussion
The FAO estimates that 20% to 40% of global crop production could be lost
because of plant and pest diseases each year.11 A recent scientific review
undertaken by the International Plant Protection Convention, which is overseen by
the FAO, has concluded that climate change will likely alter or increase the risks of
plant diseases and pests. These risks include range expansion or retreat of certain
diseases and pests, increased risks of disease or pest introduction, as well as
increased pest population growth rates. Although the overall risk trend for plant
and pest diseases to occur is expected to increase due to climate change, there
are some regional variations. For instance, some studies12 show that the risk for
diseases affecting rice in the Philippines may reduce. In general, most pests,
weeds, and diseases tend to favour higher temperatures up to a certain threshold,
which means that climate change might increase risks within a type-specific
temperature range.13
Most recently, outbreaks of desert locust in Eastern Africa, Southwest Asia, and
the Red Sea area in 2020 and 2021 caused significant impacts on crops and
pasturelands. This upsurge in desert locust was caused by favourable climatic
conditions. While there are various locust species, the desert locust is considered
the most important species and the most destructive migratory pest in the world.
Large swarms can pose serious food security risks, either locally or at a wider
scale, depending on the affected region. A single square kilometre of locust swarm
can contain up to 80 million adults, with the capacity to consume the same amount
of food in one day as 35,000 people. Food security impacts due to desert locust in
Eastern Africa have mainly been contained to the region.14
10 FAO, ‘Plant pests and diseases’, https://www.fao.org/emergencies/emergency-types/plant-pests-and-diseases/en/. 11 FAO, ‘International Year of Plant Health 2020’, https://www.fao.org/plant-health-2020/about/en/. 12 Luo, Y., D.O. TeBeest, P.S. Teng, and N.G. Fabellar, Simulation studies on risk analysis of rice blast epidemics associated with global climate change in several Asian countries, Journal of Biogeography 22 (1995), pages 673 to 678; Luo, Y., P.S. Teng, N.G. Fabellar, and D.O. TeBeest, ‘The effects of global temperature change on rice leaf blast epidemics: a simulation study in three agroecological zones’, Agriculture, Ecosystems and Environment 68 (1998), pages 187 to 196. 13 FAO, ‘Scientific review of the impact of climate change on plant pests – A global challenge to prevent and mitigate plant pest risks in agriculture, forestry and ecosystems’ (2021),https://www.fao.org/documents/card/en/c/cb4769en. 14 FAO, ‘Desert Locust’, https://www.fao.org/locusts/en/.

26
With wheat being a key global source for food and feed, it is worth noting the
impacts that various strands of wheat rust, a disease caused by fungal pathogens,
can have on global food production levels. Wheat rust diseases are counted
amongst the most serious biotic (meaning resulting from living organisms) risks to
wheat productivity levels. The most common wheat rusts include stem rust, stripe
rust, and leaf rust. While these diseases can threaten the production in any wheat-
growing region, the areas currently affected or at most risk include North and East
Africa, the Near East, Central Asia, and some Asian countries.15 The FAO
estimates that around 30% of global wheat production stemming from the
previously mentioned regions are at risk of being impacted by wheat rust
diseases. Rust diseases are also among the major concerns in more developed
wheat producing countries. Due to improved technology, capacity, and
awareness, however, the implementation of management strategies is easier and
has reduced some risks.16
The FAO counts the banana as the most important fruit in the world. In the UK,
too, bananas make up large parts of a person’s total fruit consumption based on
Kantar data. Four races of the Panama Diseases, which pose a risk to different
banana varieties, have been identified to date. Due to race one of the Panama
Disease, banana producers had to shift from the Gros Michel banana variety in the
1950s to the Cavendish variety used today. Race four, a more recent strain of the
disease, however, can infect the Cavendish variety. With the Cavendish banana
being the only traded variety, and no existing disease control available yet, this
disease poses a serious risk to global fruit consumption.17
Indicator 1.1.3 Real agricultural
commodity prices
Headline
Agricultural commodity prices reflect the results of global supply and demand for
particular commodities. They are relevant both to the availability of foodstuffs and
to the prices consumers pay for food. The financial crisis caused a significant price
spike, followed by a gradual decline. The COVID-19 pandemic led to new price
15 FAO, ‘Strengthening capacities and promoting collaboration to prevent wheat rust epidemics’ (2014), https://www.fao.org/food-chain-crisis/resources/news/detail/en/c/234243/. 16 FAO, ‘NSP-FAO Wheat Rust Disease Global Programme’, https://www.fao.org/agriculture/crops/thematic-sitemap/theme/pests/wrdgp/en/. 17 Safe Food, ‘The Impact of Plant Diseases’, https://www.safefood.net/food-safety/news/impact-plant-diseases.

27
spikes, albeit not as severe as ten years ago. The FAO projects that real prices
will return to a general downward trend once COVID-19 measures have been
lifted.
Context and Rationale
This indicator reflects the global availability of agricultural commodities as it is
driven by the fundamental market forces of supply and demand and exchange
rate dynamics. Higher prices signal relative shortages, whilst falling prices signal
improved supply or even oversupply. Higher prices give an incentive for producers
to increase supplies and for consumers to reduce demand. It is partly an outcome
indicator of any underlying supply issues, and a leading indicator of potential price
changes to consumers.
Many factors can affect commodity prices, including favourable or poor harvests,
production costs, market structure, and external factors, such as economic
sanctions. The food supply chain includes the transformation of goods and the
incorporation of services along the chain. Its characteristics mean that price
shocks are at times absorbed by producers or passed on to consumers. In
general, prices of agricultural commodities have been following long-term
downward trends.18 This has been the result of productivity improvements in
agriculture and related industries, which has lowered the marginal production
costs of the main food commodities. Deviations from the general trend, such as
price peaks during 2007 to 2014, were temporary and did not alter the long-term
declining trend.
Commodity prices send the appropriate signals when the global market is over or
undersupplied. In the medium to longer-term, supply and demand of agricultural
commodities would ideally be in balance and be reflected in relatively affordable
prices.
Data and Assessment
Indicator: Global real prices for selected agricultural commodities
Source: UNCTAD; OECD-FAO Agricultural Outlook
18 Our World in Data, ‘Real commodity price index, food products’, https://ourworldindata.org/grapher/real-commodity-price-index-food-products?country=~OWID_WRL.

28
Figure 1.1.3a: Commodity prices for palm oil, rice, soybeans, wheat January
1995-April 2021
Figure 1.1.3b: Commodity prices for beef January 1995-April 2021
29
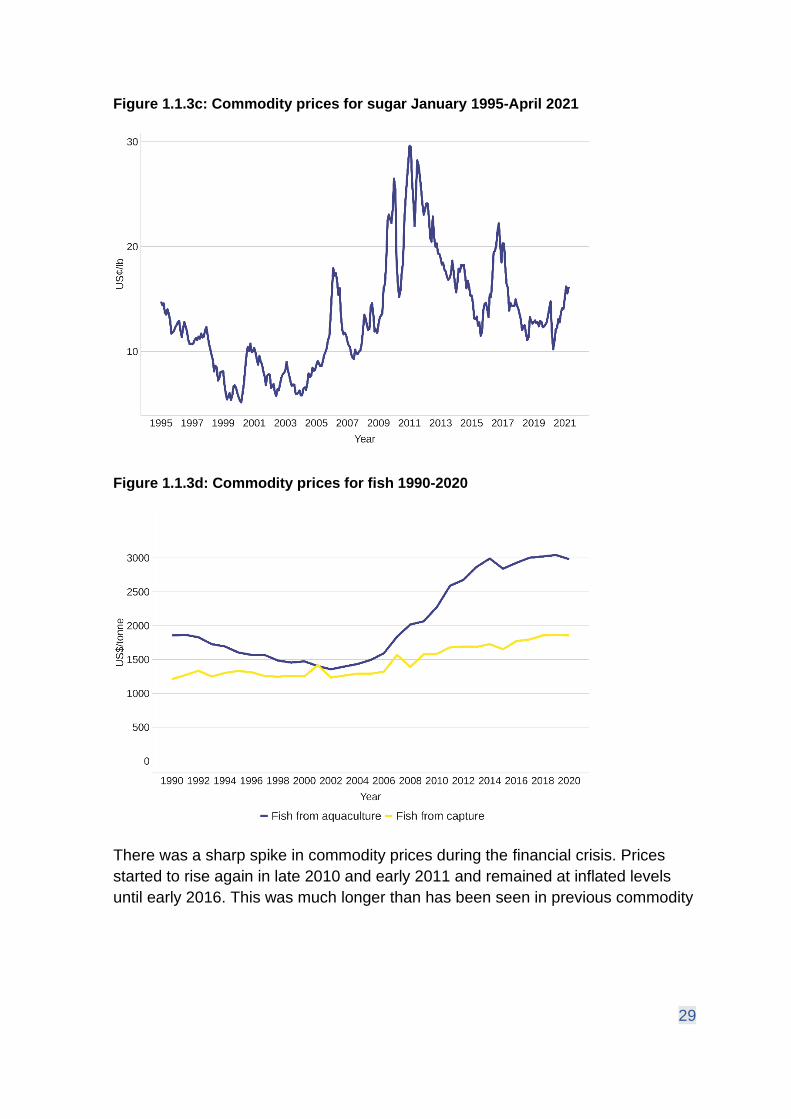
Figure 1.1.3c: Commodity prices for sugar January 1995-April 2021
Figure 1.1.3d: Commodity prices for fish 1990-2020
There was a sharp spike in commodity prices during the financial crisis. Prices
started to rise again in late 2010 and early 2011 and remained at inflated levels
until early 2016. This was much longer than has been seen in previous commodity

30
price spikes.19 Palm oil and sugar were particularly badly affected. There have
also been price spikes in sugar and beef which are not part of this general trend.
The beef price has shown strong growth since the turn of the century whilst still
being affected by the same variation in price as previously described. This is likely
to be due to rising demand for red meat in emerging economies such as Brazil.
Fish prices have risen steadily in the last decade, with a greater increase in price
rises from aquaculture than from capture.
After an initial drop in the first quarter of 2020, there have been sharp commodity
price rises during the COVID-19 pandemic. Beef, palm oil, soybeans and sugar
have been particularly strongly affected, showing strong rises in 2021. The sugar
price drop was fuelled by a slump in the crude oil price which led to a lower
demand for sugar cane for ethanol production.
Trends
Global events can have a significant impact on supply and demand, which in turn
affects global commodity prices. This was the case for 2020, where many of the
price highs not seen since the mid-2010s experienced in commodities such as
wheat, rice, soybeans, and palm oil have been attributed by the FAO to the
COVID-19 pandemic. While the current situation for real commodity prices (Real
prices denote the value of a commodity after adjusting for inflation expressed in
constant dollars, which reflects buying power relative to a base year) means that
prices are above the general downward trend, the FAO expects real prices for
most commodities to decline over the next ten years. Any future events either at
the global level or in agriculturally significant regions may, however, lead to
unexpected price spikes.
Real wheat prices are expected to decline in the coming years based on large
supplies being produced in the Black Sea region and slow growing global food
demand. Assuming a return to normal growing and logistical conditions, export
prices for rice, that may impact on prices in the UK, are expected to decrease to
trend level by 2023, with declines thereafter promoted by ample global
availabilities and intensifying competition for markets amongst exporters.
Real soybean and palm oil prices are expected to return to trend levels in the early
2000s, reflecting an increase in global supply. This is based on average
production prospects in major producing countries, and the gradual elimination of
COVID-19 related logistics constraints. After this correction, the declining price
trend is expected to slow. This price trend will be subject to multiple uncertainties,
19 FAO, ‘World Food and Agriculture: Statistical Yearbook 2020’, https://www.fao.org/family-farming/detail/en/c/1316738/.

31
such as weather variations in major producing countries and shifts in demand
preferences. China’s demand for soybean imports in their effort to rebuild their
pork production following the African Swine Fever outbreak (see African Swine
Fever case study) will also play a crucial role in determining market outcomes in
the coming years.
Meat prices are anticipated to rebound from COVID-19 induced lows in 2020 and
to rise moderately over the medium term as demand recovers due to the
reopening of the hospitality sector. Thanks to ongoing feed productivity gains
within the meat sector, feed price increases will have less of an impact on meat
prices.
Real sugar prices are projected to resume their long-term decline due to
productivity gains from better yields. Overall, real prices should fall below the
average level of the last twenty years, when prices were under upward pressure
due to competition for the land from growing biofuel crops. Some domestic policies
and the dominance of few exporters, however, may result in some price variability
of international sugar prices over the next ten years.20
Real fish prices are expected to decline slightly over the next decade, though
remaining relatively high. There may be some price volatility for individual fish
species due to supply and demand fluctuations. In addition, as aquaculture is
expected to represent a higher share of world fish supply, prices for fish from
aquaculture could have a stronger impact on overall fish price formation in
international markets.21
Indicator 1.1.4 Stock to consumption
ratios
Headline
Stored stocks of agricultural commodities serve as an important buffer against
poor harvests and demand shocks. The world’s stock to consumption levels
fluctuate, with good harvests leading to higher stocks. Current stocks are healthy
with the exception of soybeans. Poor soybean harvests or other supply disruptions
20 FAO, ‘OECD-FAO Agricultural Outlook 2021-2030’, https://www.fao.org/publications/oecd-fao-agricultural-outlook/2021-2030/en/. 21 FAO, ‘The State of World Fisheries and Aquaculture 2020’, https://www.fao.org/documents/card/en/c/ca9229en.

32
could cause price fluctuations and present a risk to imported soy-based animal
feed, an important input into UK meat production.
Context and Rationale
Stock to consumption ratios are an indicator of global resilience to food shortages
and price stability. Food stocks can serve as buffers to supply or demand shocks.
If stocks are low, markets become more sensitive to any potential shocks and the
probability of price spikes increases.22 Therefore, observing stock to consumption
ratios can serve as an early warning for possible shortages and price spikes, and
enable an early response to potential food security risks. Especially for crops,
supply shocks are a regular feature of the market, which is why this indicator
focuses on cereals.
Sufficient stock levels provide the market with some resilience to supply or
demand shocks. It is, however, difficult to establish an ideal stock ratio as high
stock levels could also indicate a structural oversupply of markets. Any changes in
the stock ratio also require careful interpretation to fully understand the root
causes and possible effects.
Data and Assessment
Indicator: Global stock to consumption ratios
Source: USDA
22 Defra, ‘Food Statistics in your pocket: Global and UK supply’, https://www.gov.uk/government/statistics/food-statistics-pocketbook/food-statistics-in-your-pocket-global-and-uk-supply.
33
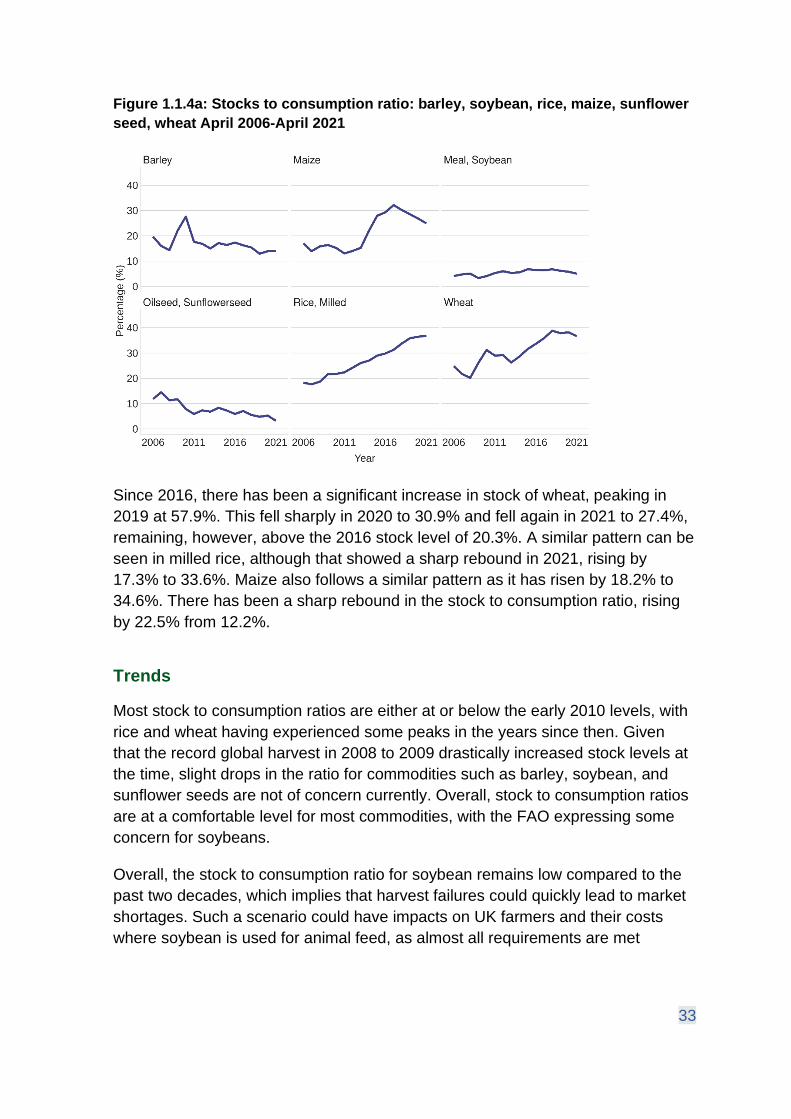
Figure 1.1.4a: Stocks to consumption ratio: barley, soybean, rice, maize, sunflower
seed, wheat April 2006-April 2021
Since 2016, there has been a significant increase in stock of wheat, peaking in
2019 at 57.9%. This fell sharply in 2020 to 30.9% and fell again in 2021 to 27.4%,
remaining, however, above the 2016 stock level of 20.3%. A similar pattern can be
seen in milled rice, although that showed a sharp rebound in 2021, rising by
17.3% to 33.6%. Maize also follows a similar pattern as it has risen by 18.2% to
34.6%. There has been a sharp rebound in the stock to consumption ratio, rising
by 22.5% from 12.2%.
Trends
Most stock to consumption ratios are either at or below the early 2010 levels, with
rice and wheat having experienced some peaks in the years since then. Given
that the record global harvest in 2008 to 2009 drastically increased stock levels at
the time, slight drops in the ratio for commodities such as barley, soybean, and
sunflower seeds are not of concern currently. Overall, stock to consumption ratios
are at a comfortable level for most commodities, with the FAO expressing some
concern for soybeans.
Overall, the stock to consumption ratio for soybean remains low compared to the
past two decades, which implies that harvest failures could quickly lead to market
shortages. Such a scenario could have impacts on UK farmers and their costs
where soybean is used for animal feed, as almost all requirements are met

34
through imports. Although substitutes are available, soybeans remain one of most
effective animal feeds.23
Indicator 1.1.5 Global livestock and dairy
production
Headline
Global meat production has grown significantly since 2010 and is projected to
increase over the coming years. Consumption increases are likely to vary, with
high-income countries potentially having reached peak meat consumption per
capita, and lower and middle-income countries expected to see more increases in
consumption rates. Milk production is also set to continue to increase, mainly
driven by improvements in efficiency rather than increases in herd size. Animal
disease outbreaks in the late 2010s have substantially reduced pig herd numbers,
particularly in China.
Context and Rationale
Meat makes up an important source of nutrition for many people. Global demand
for meat has grown over the last 50 years, leading to a trebling of meat production
over that period. In that same time span, there has also been a geographical
switch in the leading meat production sites. Asia now accounts for 40% to 45% of
total global meat production, having overtaken Europe and North America as the
dominant producers.
While pig meat is the most popular source of meat at the global level, the
production percentage of poultry meat has seen the highest increases in the last
50 years compared to other types of meat. In the UK, poultry meat is the most
popular type of meat, followed by pork and then beef.24
The UK is not exposed to a significant degree to changes in global availability of
milk and dairy products due to a high supply-to-demand ratio for milk and only
some reliance on cheese imports from the EU.
23 FAO, ‘OECD-FAO Agricultural Outlook 2021-2030’, https://www.fao.org/publications/oecd-fao-agricultural-outlook/2021-2030/en/. 24 Our World in Data, ‘Meat and Dairy Production’, https://ourworldindata.org/meat-production.

35
Data and Assessment
Indicator: Meat production by region; global dairy production. Source: FAO
Figure 1.1.5a: Million tonnes of meat by region, beef 1961-2019
Beef production has shown growth in Sub-Saharan Africa at 22.8%, as well as in
South and East Asia at 11.8%. OECD and EU countries also show a large growth
in beef production, but that is due to a sharp spike in 2020 caused by a change in
the way beef production is recorded. Otherwise, there has been a gradual decline
between 2010 and 2019. Beef production between 2010 and 2020 fell in South
America by -6.9% and the Middle East and North Africa by -8.4%.
36
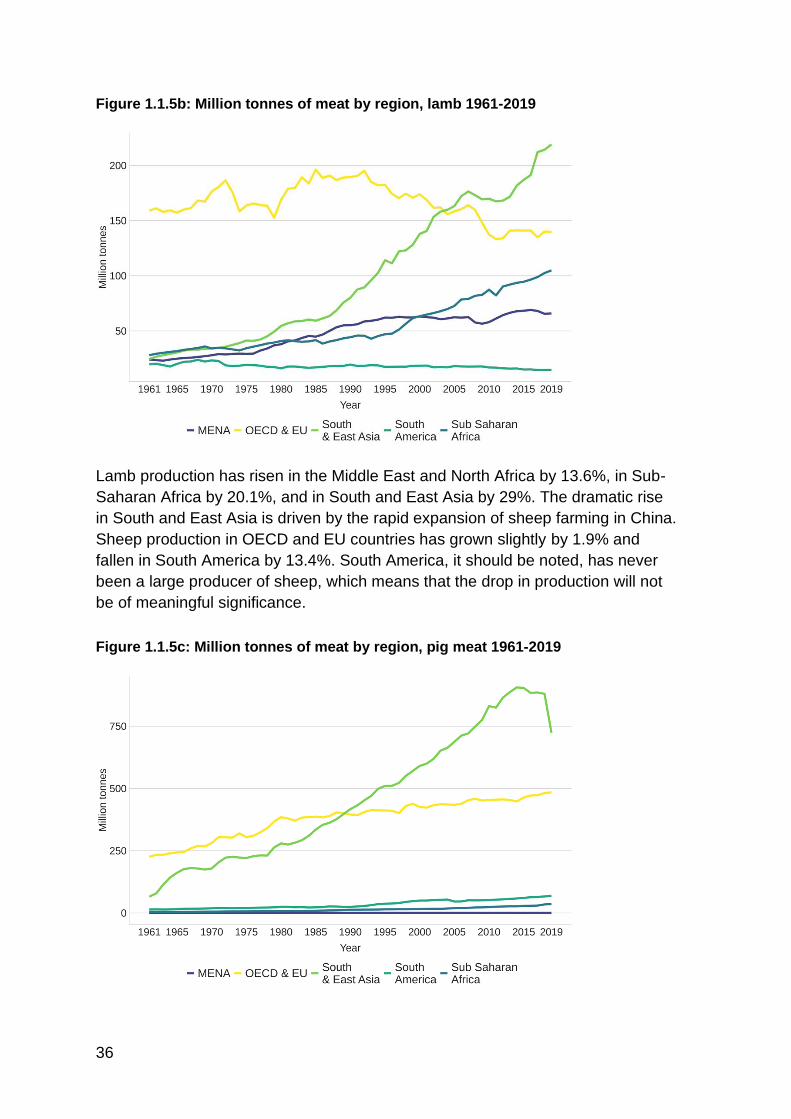
Figure 1.1.5b: Million tonnes of meat by region, lamb 1961-2019
Lamb production has risen in the Middle East and North Africa by 13.6%, in Sub-
Saharan Africa by 20.1%, and in South and East Asia by 29%. The dramatic rise
in South and East Asia is driven by the rapid expansion of sheep farming in China.
Sheep production in OECD and EU countries has grown slightly by 1.9% and
fallen in South America by 13.4%. South America, it should be noted, has never
been a large producer of sheep, which means that the drop in production will not
be of meaningful significance.
Figure 1.1.5c: Million tonnes of meat by region, pig meat 1961-2019

37
Pig meat production has risen in OECD and EU countries by 6.8%, in South
America by 32.7%, and in Sub-Saharan Africa by 50.4%. In South and East Asia
there was a sharp drop in production in 2019 by 12.9% due to the spread of
African Swine Fever into China and South East Asia. The impacts of African
Swine Fever on the global pig production are covered in more detail in the case
study on African Swine Fever below. The Middle East and North Africa also fell by
4.4%, but the region is not a major producer of pigs.
Figure 1.1.5d: Million tonnes of meat by region, poultry 1961-2019
All regions have shown a rise in poultry meat production. The largest producer
was South and East Asia, which also had the largest percentage rise in production
at 42.7%. The next biggest producers were OECD and EU countries, which had a
14.3% rise between 2010 and 2019. The percentage rises of the other regions are
28.2% for the Middle East and North Africa, 12.9% for South America, and 12.0%
for Sub-Saharan Africa.
38
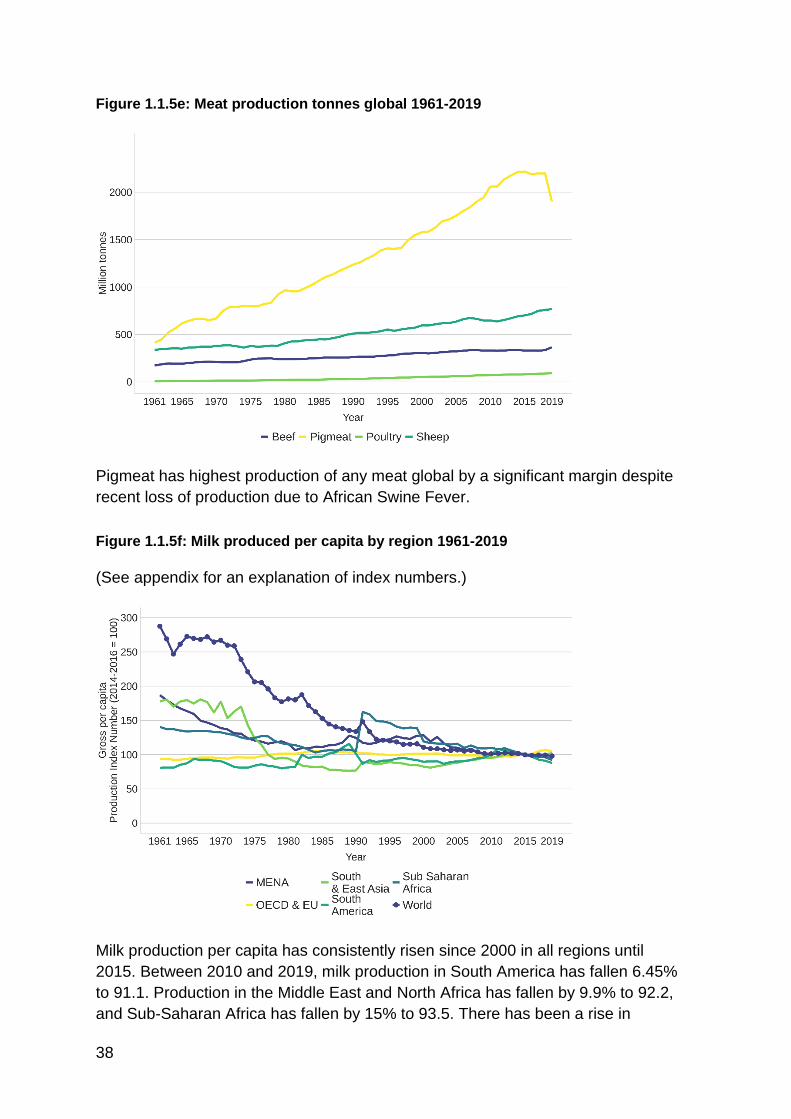
Figure 1.1.5e: Meat production tonnes global 1961-2019
Pigmeat has highest production of any meat global by a significant margin despite
recent loss of production due to African Swine Fever.
Figure 1.1.5f: Milk produced per capita by region 1961-2019
(See appendix for an explanation of index numbers.)
Milk production per capita has consistently risen since 2000 in all regions until
2015. Between 2010 and 2019, milk production in South America has fallen 6.45%
to 91.1. Production in the Middle East and North Africa has fallen by 9.9% to 92.2,
and Sub-Saharan Africa has fallen by 15% to 93.5. There has been a rise in

39
OECD countries by 9.7% to 105.1 as well as in South and East Asia by 4.4% to
100.4.
Trends
While COVID-19 impacted global meat production temporarily due to logistical
hurdles, reduced food services and household spend, the FAO expects global
meat production to increase by 13% over the next ten years, due to increases in
the number of animals and higher output per animal.
Poultry meat is projected to make up more than half of the growth in meat
production levels in the next decade, with China, Brazil, and the US accounting for
large parts of this growth. Following behind poultry, increases in pig meat
production levels will make up a third of total meat production growth. Large parts
of this increase are expected to come from the production recovery in Asian
countries by 2023, particularly China and Vietnam, from African Swine Fever. Beef
and sheep meat production is expected to increase the least, contributing 9% and
6% respectively to overall growth.
With global consumption patterns moving towards including more meat in diets,
there is also an expected increase in the quantities of crops being used as feed.
The current 1.7 billion tonnes of cereals, protein meals, and processing by-
products used between 2018 and 2020 for animal feed are forecast by the FAO to
increase to two billion tonnes by 2030. Overall growth rate in future is likely to be
slower than in the last ten years. This reflects efforts by large meat producers to
lower the protein meal share in feed. There are also some climate risks associated
with the projected amount of animal feed to be produced by 2030. Maize yields,
which is one of the most important commodities used as feed, alongside protein
meal, are particularly vulnerable to volatility in terms of supply, price, and extreme
weather events.
High-income countries already have the highest meat consumption levels. The
FAO expects changes in those consumption levels to be low over the coming ten
years, with some regions, such as the US and the European Union, having likely
reached the saturation point in their meat consumption levels. Moreover, due to
health and environmental concerns, consumers are expected to increasingly
replace red meat with poultry meat and dairy products. Meat consumption
increases are projected to mainly take place in developing regions due to high
population levels and growth rates. Especially Africa and Asia are expected to
have high growth rates in the coming years.

40
Risk: Impact of animal disease on meat production
Animal diseases carry a potential threat to the supply of meat and livestock related
foods. Several animal diseases result in either the animal’s death as a direct result
of the disease, or the animal being culled for the purpose of disease control.
Moreover, animal diseases carry additional risks in terms of zoonotic diseases
which have the potential to transmit to the human population. There is also the risk
that animal disease outbreaks could have a negative impact on consumer
confidence in animal-sourced foods.
While disease outbreaks can have a marked impact on the animal population of
individual countries, the UK has not experienced significant impacts on its meat
supply in recent years.

41
Source: FAO, OIE
Figure 1.1.5g: Percentage of disease related deaths in livestock population: World
2005-2019
Figure 1.1.5h: Disease Deaths as a percentage of animal population: World 2005-
2019

42
Figure 1.1.5i: Disease Deaths as a percentage of animal population: EU 2005-2019
Figure 1.1.5j: Disease Deaths as a percentage of animal population: EU 2015-2019
Some of the notable animal disease outbreaks in recent years outlined in figures
1.1.5 g to j include the Avian Influenza outbreak in 2016 to 2017 in the EU and
UK, which led to the culling of many birds across Europe. Most recently, the UK
had to declare to the World Organisation for Animal Health (OIE) in November
2020 that the UK was no longer free from notifiable Avian Influenza following an
outbreak of H5N8, highly pathogenic Avian Influenza. The Chief Veterinary
Officers for England, Scotland, and Wales also agreed to impose a housing order

43
for all birdkeepers in Great Britain from December 2020 to March 2021. Risk to
public health was assessed to be low by Public Health England.25
The peak in pig deaths in Europe in 2011 was due to a Classical Swine Fever
outbreak in Russia and the Baltic States as well as an outbreak of Aujesky’s
Disease. The African Swine Fever outbreak in China in 2018 had large impacts on
China’s domestic meat production and is discussed in more detail in the case
study on African Swine Fever. The steep rise in pig deaths after 2017 is due the
incursion of African Swine Fever into Eastern Europe. An outbreak of brucella
melitensis in North Macedonia contributed to the particularly high mortality in
sheep and goats before 2008 in Europe.
Pests, pathogens, and invasive non-native species (INNS) pose a significant
threat to agriculture. Estimates of the economic costs of INNS are in the region of
£1.3 billion per year in England.26 Climate Change will likely increase these costs.
For example, Bluetongue virus outbreaks in livestock may happen every year in
the UK by 2070 due to milder winters.27
Case Study 1.2 African Swine Fever
Overview
African swine fever (ASF) is a viral disease that can be spread by live or dead pigs
as well as pork products. It is not, however, a risk to human health. China has
seen one of the largest ASF outbreaks, which started in 2018 and has led to 1.2
million pigs having to be culled since then. With China needing to fill domestic
production shortfalls via imports, global exports to China grew drastically and led
to an increase in global pig prices. This effect has started to reverse, with China
restocking its pig herds, having a knock-on effect on global prices again. The UK
is currently ASF-free. However, due to the geographic proximity of ASF cases in
Eastern Europe and some EU countries, the risk has been at medium level since
2018 due to the possibility of the disease being imported via pork products.
25 Defra, ‘Avian influenza (bird flu) in Europe, Russia and in the UK’, https://www.gov.uk/government/publications/avian-influenza-bird-flu-in-europe. 26 Environment Agency, ‘2021 river basin management plans: Invasive non-native species challenge’ (2019), https://consult.environment-agency.gov.uk/++preview++/environment-and-business/challenges-and-choices/user_uploads/inns-challenge-rbmp-2021-1.pdf. 27 UK Climate Risk Independent Assessment, ‘Technical Report: Chapter 3: Natural Environment and Assets’, https://www.ukclimaterisk.org/independent-assessment-ccra3/technical-report/, page 160.

44
Background
African swine fever (ASF) is a highly contagious haemorrhagic viral disease of
domestic and wild pigs, which is responsible for serious economic and production
losses. This transboundary animal disease can be spread by live or dead pigs,
domestic or wild/feral pigs, and pork products. ASF can survive for months to
years in smoked, dried, cured, and frozen meat from affected pigs or wild boar.
Transmission can also occur via contaminated feed and fomites (non-living
objects) such as shoes, clothes, vehicles, knives, equipment, and others, due to
the high environmental resistance of the ASF virus. ASF is, however, not a risk to
human health
Currently there is no approved vaccine for ASF. Prevention in countries free of the
disease depends on implementation of appropriate import policies and biosecurity
measures, ensuring that neither infected live pigs nor pork products are introduced
into areas free of ASF. As observed in Europe and in some regions of Asia, the
transmission of ASF seems to depend largely on the wild boar population density
and wild boars’ interaction with low-biosecurity pig production systems.
Discussion
The most notable outbreak of ASF in recent years started in China in 2018. Since
then, the disease has spread across many South East Asian countries, including
Mongolia, Vietnam, the Philippines, India, and others. Based on FAO reports,
more than 1.2 million pigs had to be culled between 2018 and 2021 in China
alone. Outside of Asia and Oceania, there are also ongoing cases of ASF in wild
boars and domestic pigs in Eastern Europe as well as Belgium and Germany.
The risk level to the UK was raised to medium in August 2018 and has remained
at that level to-date as a result of the number of outbreaks of ASF being reported
in Eastern Europe, and subsequent detection of ASF in wild boar in Belgium in
September 2018. Although case numbers were higher in Asia and Oceania, the
geographical distance to those outbreak sites meant that these outbreaks did not
add to the risk level in the UK.
Illegal importation of infected pork meat from affected parts of Asia and Oceania,
however, presents a significant route of entry of ASF virus into the UK. While it is
legal to import pork products from unaffected areas of the EU, personal imports
from affected countries also poses a risk as the subsequent food waste could be
discarded in areas where wild boar, feral pigs, or domestic pigs could access it.
Some of the risks of passengers bringing back pork products to the UK from
affected countries was reduced when COVID-19 movement restrictions were in
place.
45
At the time of publication, no ASF cases have been detected in the UK. To
prevent an outbreak of ASF in the UK, the UK government has raised awareness
of ASF amongst travellers via various information campaigns. In addition, the
government has worked with the pig sector to ensure all the relevant biosecurity
measures are being followed.
ASF occurred in the Chinese pig sector in 2018 and has had significant impact on
its ability to supply China’s domestic market. The volume of pigs exported to China
from third countries, including the UK, increased dramatically over the period
between 2018 and 2020. This increased pig prices generally.
Indicator 1.1.6 Global fish stocks
Headline
Despite some regional improvements in sustainable fishing, the over-exploitation
of world fishery stocks remains a major issue. These unsustainable practices will
have significant impacts on the medium- to long- term global fishing stock
availability.
Context and Rationale
Over the last few decades, overall fish consumption at the global level has seen a
steady increase. While the nutritional composition of fish varies between species,
fish constitutes a valuable source of protein, accounting for about 17% of total
animal protein consumed globally in 2017.28 Production has increased thanks to
technological improvements in the way fish is caught, processed, stored, and
distributed. Demand for fish has also increased in correlation with rising incomes
and awareness amongst consumers of its health benefits.
International markets and aquaculture have had significant impacts on the
availability and consumption of fish. They have reduced the importance of
geographical location, broadened the markets for many species, and offered wider
choices to consumers, often at cheaper prices.
Threats to fish production include over-exploitation of fish stocks, water pollution,
and climate change. Rising water temperatures and acidification impact marine
28 FAO, ‘The State of World Fisheries and Aquaculture 2020’, https://www.fao.org/documents/card/en/c/ca9229en.

46
biodiversity and affect both the productivity and the distribution of marine fish
stocks.
Data and Assessment
Indicator: Share of marine fish stocks under or moderately exploited
Source: UN Sustainable Development Goal 14, 2020
Figure 1.1.6a: Percentage of fish stocks within biologically sustainable levels,
Atlantic Ocean, 2004 to 2017
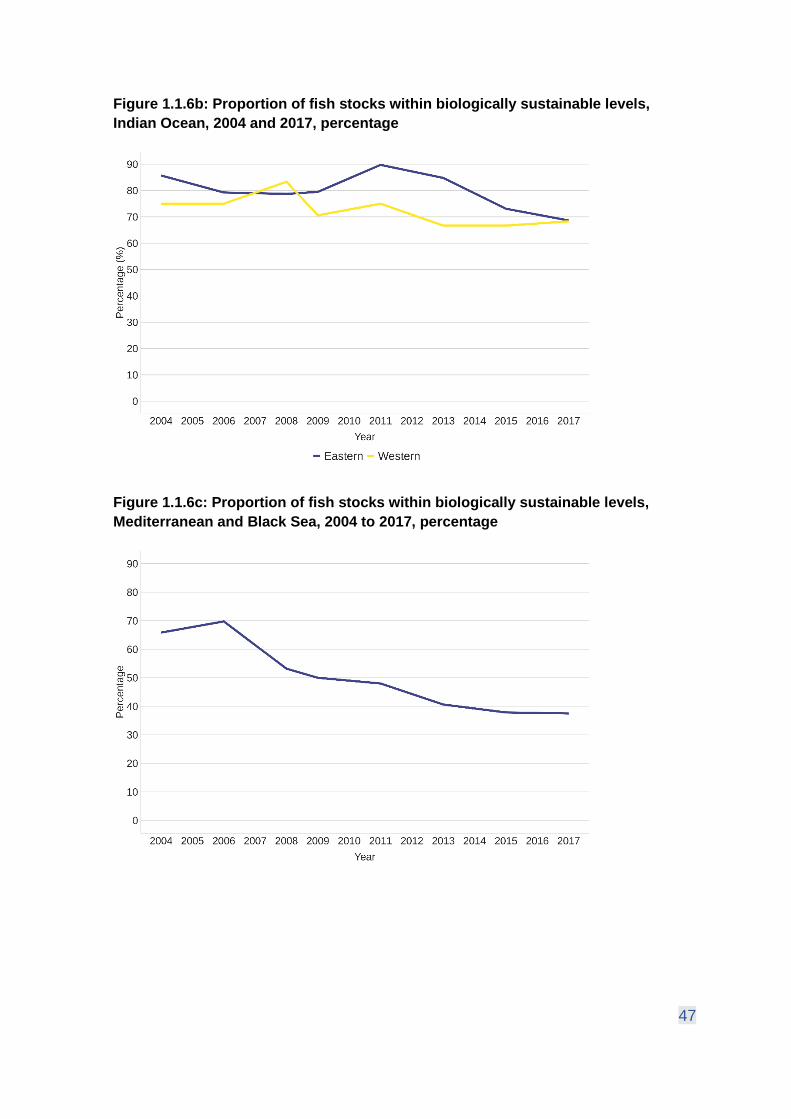
47
Figure 1.1.6b: Proportion of fish stocks within biologically sustainable levels,
Indian Ocean, 2004 and 2017, percentage
Figure 1.1.6c: Proportion of fish stocks within biologically sustainable levels,
Mediterranean and Black Sea, 2004 to 2017, percentage

48
Figure 1.1.6d: Proportion of fish stocks within biologically sustainable levels,
Pacific Ocean,
2004 to 2017, percentage
Figure 1.1.6e: Percentage of global fish stocks within biologically sustainable
levels, 1974-2017
In 2013, 68% of global fish stocks were within biologically sustainable levels. This
fell to 66.7% in 2015, and 65.9% in 2017 as seen in figure 1.1.6e. Between 2015
and 2017, the share of stocks fished sustainably fell at a slower rate than for the
period between 2013 to 2015. Improved regulations on fishing, along with
monitoring and surveillance, have proved effective in some regions. Uptake of
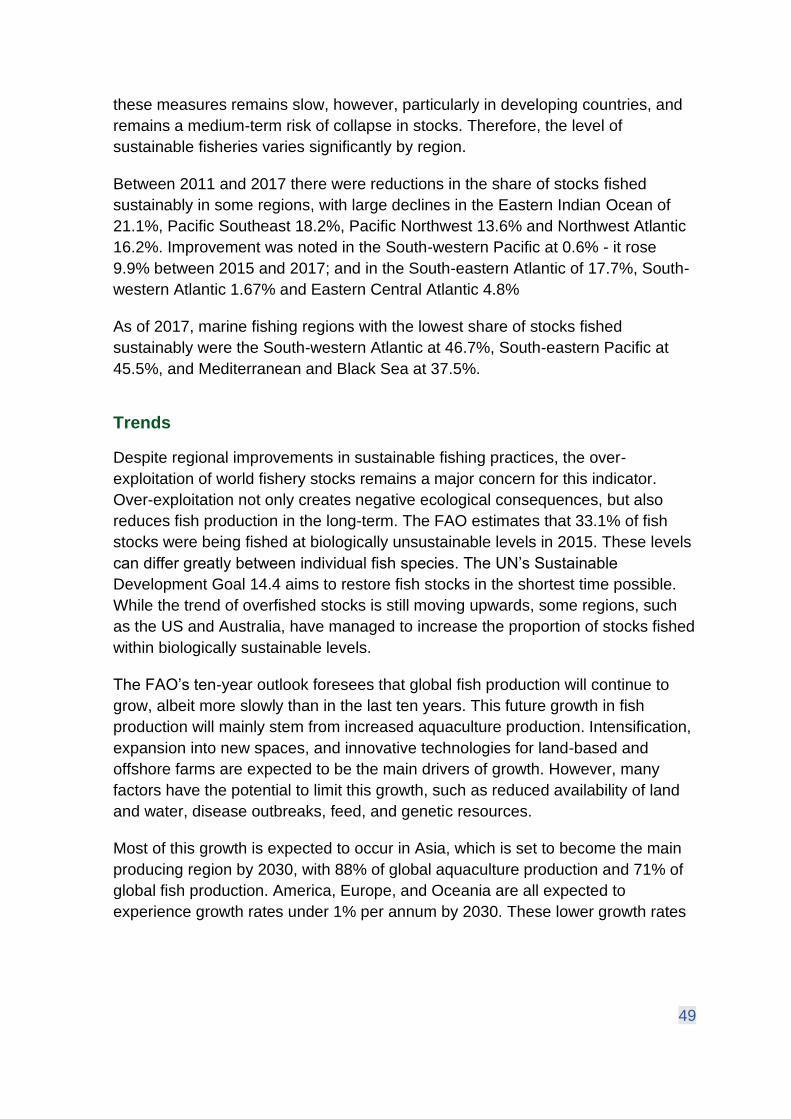
49
these measures remains slow, however, particularly in developing countries, and
remains a medium-term risk of collapse in stocks. Therefore, the level of
sustainable fisheries varies significantly by region.
Between 2011 and 2017 there were reductions in the share of stocks fished
sustainably in some regions, with large declines in the Eastern Indian Ocean of
21.1%, Pacific Southeast 18.2%, Pacific Northwest 13.6% and Northwest Atlantic
16.2%. Improvement was noted in the South-western Pacific at 0.6% - it rose
9.9% between 2015 and 2017; and in the South-eastern Atlantic of 17.7%, South-
western Atlantic 1.67% and Eastern Central Atlantic 4.8%
As of 2017, marine fishing regions with the lowest share of stocks fished
sustainably were the South-western Atlantic at 46.7%, South-eastern Pacific at
45.5%, and Mediterranean and Black Sea at 37.5%.
Trends
Despite regional improvements in sustainable fishing practices, the over-
exploitation of world fishery stocks remains a major concern for this indicator.
Over-exploitation not only creates negative ecological consequences, but also
reduces fish production in the long-term. The FAO estimates that 33.1% of fish
stocks were being fished at biologically unsustainable levels in 2015. These levels
can differ greatly between individual fish species. The UN’s Sustainable
Development Goal 14.4 aims to restore fish stocks in the shortest time possible.
While the trend of overfished stocks is still moving upwards, some regions, such
as the US and Australia, have managed to increase the proportion of stocks fished
within biologically sustainable levels.
The FAO’s ten-year outlook foresees that global fish production will continue to
grow, albeit more slowly than in the last ten years. This future growth in fish
production will mainly stem from increased aquaculture production. Intensification,
expansion into new spaces, and innovative technologies for land-based and
offshore farms are expected to be the main drivers of growth. However, many
factors have the potential to limit this growth, such as reduced availability of land
and water, disease outbreaks, feed, and genetic resources.
Most of this growth is expected to occur in Asia, which is set to become the main
producing region by 2030, with 88% of global aquaculture production and 71% of
global fish production. America, Europe, and Oceania are all expected to
experience growth rates under 1% per annum by 2030. These lower growth rates

50
reflect modest growth in capture fisheries production and the lower contribution of
aquaculture to total fish production in these continents.29
The UK is a net importer of seafood, with key species purchased at retail and out
of home satisfied by imports, alongside domestic production in the case of salmon.
Key species for out of home seafood consumption include cod, tuna and salmon,
and prawns. In 2019, based on imported value, the top 5 imported species,
accounting for around 70% of imports, were salmon, prawns (warm water and cold
water), cod, tuna, and haddock.
Imported salmon and warm water prawns mainly stem from aquaculture, and their
sustainability is therefore not assessed in this indicator as its focus lies on wild
caught fish and seafood. Most cold-water prawns sold in the UK come from wild
capture fisheries in the North Atlantic, and future supply is likely to remain stable.
Most imports of cod are caught in the Atlantic, with fishing assessed by the Sea
Fish Industry Authority, a UK public body, to be below maximum sustainable yield
and stock biomass at full reproductive capacity. Tuna imports mainly come from
the Pacific and Indian Ocean. While there are some concerns over illegal,
unregulated, and unreported fishing for continued sustainability, overfishing for
tuna from the Indian Ocean is assessed to be a low risk by the FAO’s Indian
Ocean Tuna Commission. Haddock imports largely come from the Arctic, which is
not covered by the data in this indicator, and the North Atlantic. Fish stocks from
both oceans is assessed to be in good condition.
Risk: Rising temperatures and ocean acidification
Projections of a 1 to 2-degree Celsius increase over a 40-year period in ocean
temperatures, alongside reductions in oxygen content, foresee a decline in body
size for several globally important fish species. Algal blooms, which can become
toxic to fish, and an increased risk of disease outbreak, pose a further threat both
to the fishing and aquaculture industry. Higher ocean temperatures also produce
shifts in the distribution of aquatic species so that species can keep to their
thermal or related ecological preferences. Recent evidence reviewed by the FAO
indicates that poleward expansion will result in a net local increase in species
richness in most places, except in tropical regions, where strong decreases in
richness are expected.30
29 FAO, ‘OECD-FAO Agricultural Outlook 2021-2030’, https://www.fao.org/publications/oecd-fao-agricultural-outlook/2021-2030/en/. 30 UK Climate Risk Independent Assessment, ‘Technical Report: Chapter 7: Natural Environment and Assets’, https://www.ukclimaterisk.org/independent-assessment-ccra3/technical-report/; FAO, ‘The State of World Fisheries and Aquaculture 2016’, https://www.fao.org/publications/sofia/2018/en/.

51
Ocean acidification is also a risk to fish and shellfish production. Ocean
acidification occurs when the pH level of the ocean is reduced. Due to the rising
carbon dioxide levels in the atmosphere, more carbon dioxide is being
sequestered in the oceans, leading to a more acidic pH level. Acidification
particularly affects shellfish, such as oysters and clams, in that it makes building
and maintaining shells more difficult. It also impacts other species vital to the
marine ecosystem, such as reef-building corals that provide a habitat to some fish
species.
Indicator 1.1.7 Global land use change
Headlines
Although the changes in global land use have been minimal over the last decade,
even small changes in the way land is used can have significant impacts on
biodiversity levels and ecosystems. Any losses in these areas could lead to
negative consequences for global agricultural production.
Context and Rationale
Global agricultural production can not only be increased by improved yields (as
outlined in indicator 1.1.2), but also by converting more land to farmland. Over the
last twenty years, however, there has been very little change globally in the share
between agricultural, forest, and other land. Given that total agricultural production
has been increasing over the same period, this indicates that food is being
produced more efficiently, requiring less land resources.
Land use has become one of the central environmental concerns. Agricultural
production, while fundamental for human well-being, also has significant impacts
on biodiversity, ecosystems, and climate change. The challenges of reversing
biodiversity declines, preventing further outbreaks of zoonotic diseases, and
mitigating climate change, while producing sufficient food to ensure zero hunger,
must be resolved together.
Biodiversity plays a vital role in food production. For instance, more than 75% of
the leading types of global food crops rely to some extent on animal pollination for
yields and / or quality. Therefore, making land use systems sustainable is central
to securing continued global food availability.
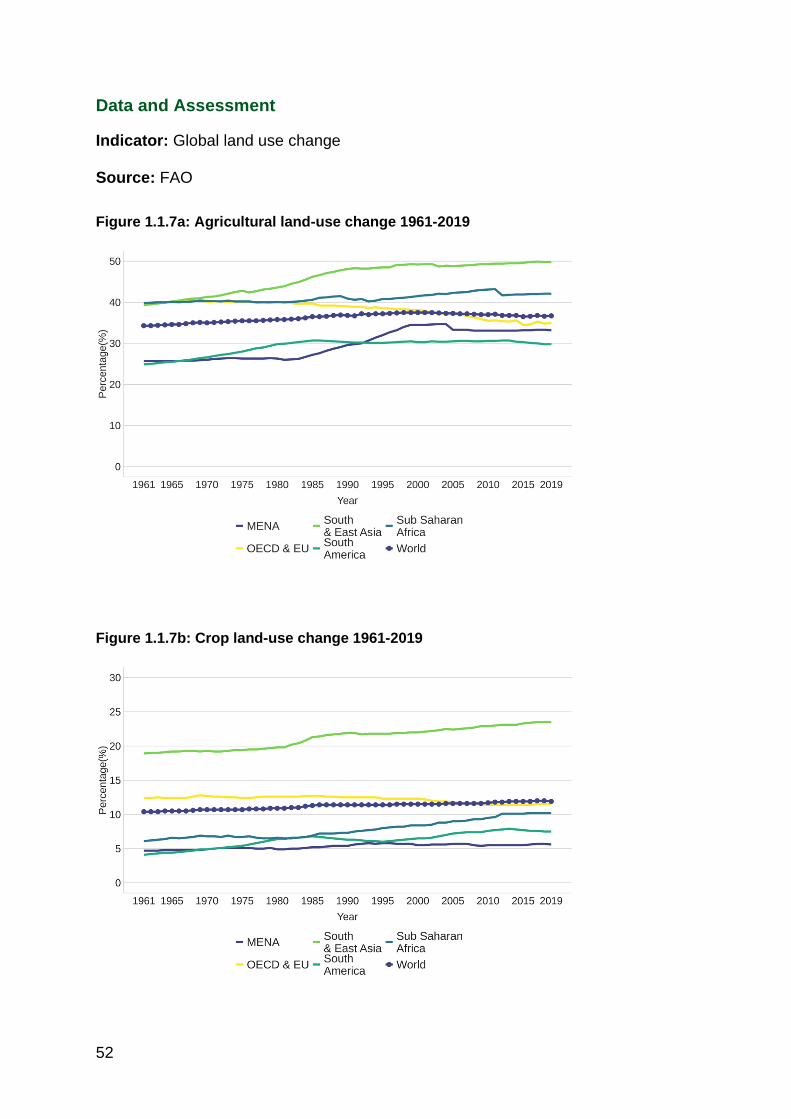
52
Data and Assessment
Indicator: Global land use change
Source: FAO
Figure 1.1.7a: Agricultural land-use change 1961-2019
Figure 1.1.7b: Crop land-use change 1961-2019

53
Figure 1.1.7c: Land used for pasture change 2002-2019
Figure 1.1.7d: Forestland-use change 1990-2019
The amount of global agricultural land has remained relatively constant, with
relevantly little decline in forest and permanent pastures over the last couple of
decades. There has been an increase in cropland and land under irrigation in this
period. However, the majority of the increase in food production is down to
increased yields rather than increased land area used for agricultural production.

54
In OECD and EU countries, there has been a marked decline in the amount of
land used for agriculture from 39.9% in 1961 to 35% in 2019. Since 2010, the
percentage for the Middle East and North Africa has risen by 0.1% to 33.2%, in
Sub-Saharan Africa it has fallen by 1% to 42.1%, in South and East Asia it has
risen by 0.5% to 49.8%, and in South America it has fallen by 0.8% to 29.8%. The
change in South America is the most significant change in agricultural land use
since 2010.
In OECD and EU countries, cropland has fallen by 1% since 1961 to 11.4% in
2019, and risen by 0.1% since 2010. Since 2010, the percentage for Sub-Saharan
Africa has risen by 0.7% to 10.2%, in South and East Asia it has risen by 0.6% to
23.5%, in South America it has decreased by 0.1% to 7.5%, and in the Middle
East and North Africa it has risen by 0.1% to 5.6%. The increase in the Sub-
Saharan Africa is the most significant change in cropland use since 2010.
In OECD and EU countries, pastureland has fallen by 0.4% since 2010 to 12%
2019. Since 2010, the percentage for the Middle East and North Africa has risen
0.1% to 15.3%, in Sub-Saharan Africa it has fallen by 0.8% to 16.3.%, in South
and East Asia it has risen by 0.1% to 13.5%, and in South America it has fallen by
0.4% to 12%. The decrease in Sub Saharan Africa is the most significant change
in pastureland use since 2010.
In OECD and EU countries, forestland has risen by 0.2% since 2010 to 32.7%
2019. Since 2010, the percentage for the Middle East and North Africa has risen
0.1% to 2.1%, in South and East Asia it has risen by 0.4% to 29.3%, in South
America it has fallen by 1.3% to 48.2%. and in Sub-Saharan Africa it has fallen by
1.6% to 26.6%. The decreases in South America and Sub-Saharan Africa are the
most significant changes in forestland use since 2010.
Trends
Although land use change has been relatively stable in the last few decades, there
has still been an overall decline in forest land between 2000 and 2018 of 89
million ha, or expressed in percentages, a drop from 32.2% of forest land to
31.2%.31 While not indicated in the data, forest land is of ecological significance
for a variety of reasons, including biodiversity. The Dasgupta review from 2021
points out how intrinsically linked human wellbeing is to nature’s diversity, but
acknowledges how difficult it is to measure the ‘worth’ of nature as a whole due to
people’s failure to understand some of the hidden benefits nature is providing to
31 FAO, ‘World Food and Agriculture: Statistical Yearbook 2020’, https://www.fao.org/family-farming/detail/en/c/1316738/.
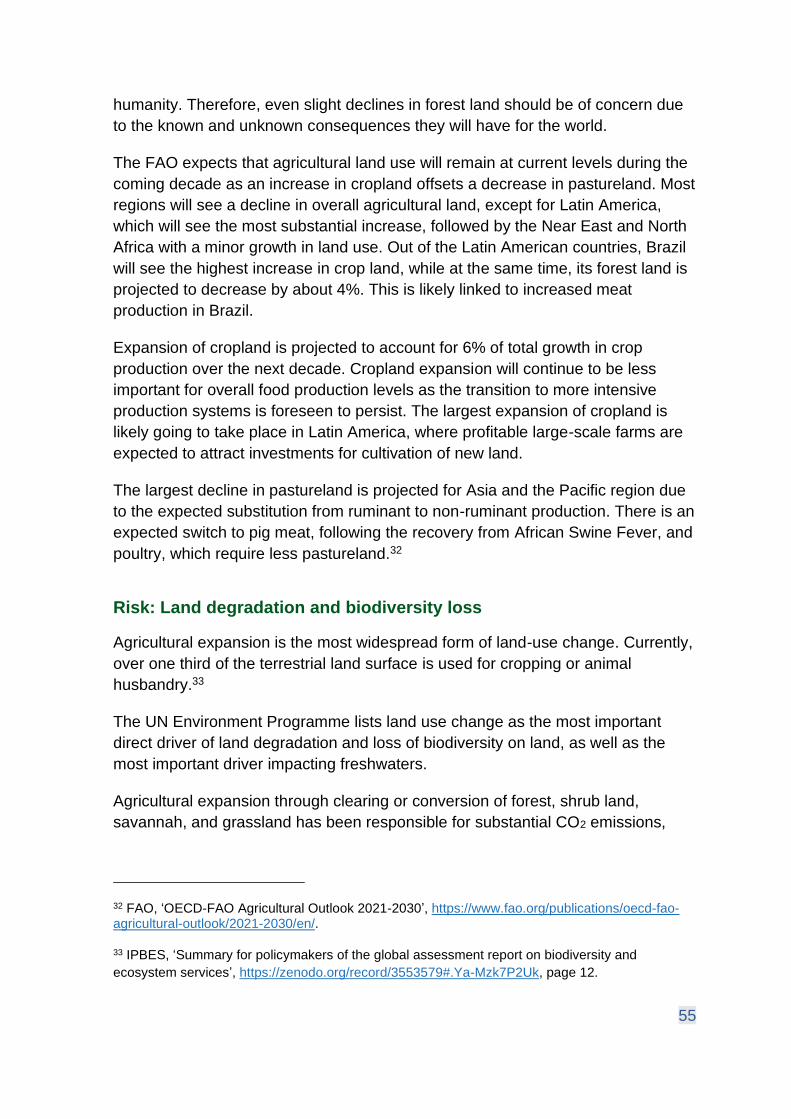
55
humanity. Therefore, even slight declines in forest land should be of concern due
to the known and unknown consequences they will have for the world.
The FAO expects that agricultural land use will remain at current levels during the
coming decade as an increase in cropland offsets a decrease in pastureland. Most
regions will see a decline in overall agricultural land, except for Latin America,
which will see the most substantial increase, followed by the Near East and North
Africa with a minor growth in land use. Out of the Latin American countries, Brazil
will see the highest increase in crop land, while at the same time, its forest land is
projected to decrease by about 4%. This is likely linked to increased meat
production in Brazil.
Expansion of cropland is projected to account for 6% of total growth in crop
production over the next decade. Cropland expansion will continue to be less
important for overall food production levels as the transition to more intensive
production systems is foreseen to persist. The largest expansion of cropland is
likely going to take place in Latin America, where profitable large-scale farms are
expected to attract investments for cultivation of new land.
The largest decline in pastureland is projected for Asia and the Pacific region due
to the expected substitution from ruminant to non-ruminant production. There is an
expected switch to pig meat, following the recovery from African Swine Fever, and
poultry, which require less pastureland.32
Risk: Land degradation and biodiversity loss
Agricultural expansion is the most widespread form of land-use change. Currently,
over one third of the terrestrial land surface is used for cropping or animal
husbandry.33
The UN Environment Programme lists land use change as the most important
direct driver of land degradation and loss of biodiversity on land, as well as the
most important driver impacting freshwaters.
Agricultural expansion through clearing or conversion of forest, shrub land,
savannah, and grassland has been responsible for substantial CO2 emissions,
32 FAO, ‘OECD-FAO Agricultural Outlook 2021-2030’, https://www.fao.org/publications/oecd-fao-agricultural-outlook/2021-2030/en/.
33 IPBES, ‘Summary for policymakers of the global assessment report on biodiversity and
ecosystem services’, https://zenodo.org/record/3553579#.Ya-Mzk7P2Uk, page 12.

56
including from the loss of carbon sinks, and is associated with negative effects on
biodiversity.
Agriculture relies on biodiversity for the provision of essential ‘ecosystem
services’. These services are vital to human well-being and include crop
pollination, water purification, flood protection, and carbon sequestration. Globally,
these ‘services’ are worth an estimated $125 to 140 trillion per year, more than
one and a half times the size of the global GDP.34
Different agricultural practices have both advantages and drawbacks. Less
intensive forms of agriculture can promote biodiversity within the farming system
but require more land for an equivalent food output. Conversely, more intensive
forms of agriculture require greater inputs of energy, fertilisers, and feeds, but can
provide significant yield benefits per unit of land. They are inherently biodiversity-
poor, as increased use of fertilisers and pesticides, specialisation, and
rationalisation can contribute to a loss of both semi-natural habitats and species
abundance. As these agricultural practices require less land, however, they can
contribute to habitat creation elsewhere.
Source: UN Sustainable Development Goal 15
Figure 1.1.7e: Best estimates of the proportions of species threatened with
extinction in the Red List Index, by species group, 2021
34 OECD, ‘Biodiversity: Finance and the Economic and Business Case for Action’ (2019), https://www.oecd.org/env/resources/biodiversity/biodiversity-finance-and-the-economic-and-business-case-for-action.htm.

57
The UN reports that human activities are causing biodiversity to decline faster than
at any other time in human history. Countries participating in the UN Sustainable
Development Goals have fallen short on their 2020 targets to halt biodiversity loss.
The Red List Index of the International Union for Conservation of Nature, as
shown in figure 1.1.7e, monitors the overall extinction risk for various species. The
figure shows an overall % decline since 1993 of 10%. Among 134,400 species
assessed, 28% (more than 37,400 species) are threatened with extinction,
including 41% of amphibians, 34% of conifers, 33% of reef-building corals, 26% of
mammals and 14% of birds. The main drivers of species loss are agricultural and
urban development, unsustainable harvesting through hunting, fishing, trapping,
and logging, and invasive alien species.35
Indicator 1.1.8 Phosphate rock reserves
Headline
Phosphate rock is the only large-scale source of phosphorus, an essential
element for plant growth and an important chemical fertiliser. The UK has no
phosphate reserves and relies on imports; Exploitable reserves of phosphate rock
have increased since 1995. At the same time, some regions, including the UK,
have reduced their use of phosphate rock as a fertiliser while increasing
agricultural production. Many countries are also in the process of making more
efficient use of phosphate rock, which could reduce the demand for this type of
fertiliser.
Context and Rationale
Phosphorus is an essential element for life, second only to nitrogen as the most
limiting element for plant growth. Food production everywhere is dependent on the
availability of phosphorus for plant uptake in an available form. Over the past
century phosphate rock has been one of the main sources of phosphorus for
agriculture but is limited to certain geological deposits, which makes this both a
finite and important resource globally. It is conventionally added to the soil in
preparation for plant uptake and can take many years to increase or decrease soil
reserves. A deficiency of phosphate lowers crop yield and quality, a surplus of
phosphate can lead to environmental pollution.
35 UN, ‘Sustainable Development Goal 15’, https://unstats.un.org/sdgs/report/2021/goal-15/.

58
Phosphorus cannot be produced, unlike nitrogen or potassium, the two other main
fertilisers. In addition, phosphate rock is a geologically finite resource and is also a
geopolitical issue due to the location of phosphate rock deposits. The UK solely
relies on imports of phosphate rock to meet its demands. It is desirable in the
medium to long term to transition away from consuming finite resources and
instead focus on more sustainable ways of providing phosphorus for the food
chain, such as the increased use of manure. More details are provided on the
sustainability aspect in a UK context in Theme 2.
Data and Assessment
Indicator: Phosphate rock reserves relative to production
Source: US Geological Survey 36
Figure 1.1.8a: Phosphate Rock Production and reserves from US Geological
Survey (USGS)
Production Reserve Base Global share
1995 2019 Change 1995 2019 Change Production Reserves
Mt Mt % Mt Mt % % %
World 131 227 73 34,000 71,000 109
USA 44 23 -48 4,400 1,000 -77 10.1 1.4
Algeria 1 2,200 0.4 3.1
Australia 3 1,100 1.3 1.5
Brazil 4 5 370 1,600 2.2 2.3
China 21 95 352 210 3,200 1424 41.9 4.5
Egypt 5 2,800 2.2 3.9
Finland 1 1,000 0.4 1.4
Israel 4 3 180 57 1.3 0.1
Jordan 5 9 570 800 4.0 1.1
Morocco /
W Sahara
20 36 80 21,000 50,000 138 15.9 70.4
Russia 9 13 44 1,000 600 -40 5.7 0.8
S Africa 3 2 2,500 1,400 0.9 2.0
Saudi
Arabia
7 1,400 3.1 2.0
Tunisia 7 4 270 100 1.8 0.1
R of W 14 20 43 3,500 3,743 7 8.8 5.3
36 The US Geological Survey (USGS) defines global reserves as Reserves, referring to the world supply, which can be profitably extracted with present technology and prices, and Base Reserves, which is the total quantity of known phosphate rock deposits, regardless of whether it can be profitably extracted at present. However, there is no accepted worldwide system for classifying phosphate rock reserves and resources, so those summarised here should not be taken as definitive. Apart from the Reserves and Base Reserves distinction, data does not differentiate reserves according to cost-effectiveness of extraction. The higher the price of phosphate, the more economical it becomes to invest in extracting less accessible reserves.

59
Mt= million tonnes https://www.usgs.gov/centres/nmic/phosphate-rock-statistics-and-information
Source: FAO, World fertiliser trends and outlook to 2022, (2019)
Figure 1.1.8b: Anticipated world balance of nitrogen (N), phosphate (P2O5), and
potassium (K2O) for 2022, Europe
Figure 1.1.8c: Anticipated world balance of nitrogen (N), phosphate (P2O5), and
potassium (K2O) for 2022, Americas

60
World reserves have increased on average and this means that the risk of running
out of phosphate rock resources is low.
Volatility in the global supply of rock phosphate is likely to be affected more by
global supply chain risks such as financial crashes, geopolitical decision making,
or environmental regulations than by the reserve base itself.
From the USGS estimated figures in figure 1.1.8a, there was a 73% increase in
production and a 109% increase in the reserve base from 1995 to 2019. This
suggests that there is no significant risk in the short to medium term supply of
phosphate rock from global reserves.
The location of key reserves remains in a selection of key countries, namely
Morocco, China, the US, and to some extent Russia and South Africa.
In areas with historically high phosphate use such as the UK, soil reserves are
high and food production continues to increase despite decreasing use of
inorganic phosphate fertilisers from phosphate rock. This is further illustrated in
figure 1.1.8b, which shows the differences of phosphate use between different
global regions.
More efficient use of phosphate fertiliser, increased use and availability of recycled
phosphate from organic materials, such as anaerobic digestate, animal manures,
and sewage sludge, will mean a higher percentage of phosphate requirements in
certain countries could be replaced by organic sources.
Trends
With world reserves of phosphate rock having increased, as well as the fact that
some regions have managed to increase food production while decreasing
phosphate rock use, the current and future status for this indicator is positive. In
addition, the UK and other countries are also working toward making better use of
phosphate fertiliser, which could further extend the availability of phosphate
reserves.
According to the USGS, the rated capacity of global phosphate rock mines is
projected to increase to 261 million tons in 2024 from 238 million tons in 2020,
including production of marketable phosphate rock in China of between 80 million
and 85 million tons per year. Most of the increases in production capacity are
planned for Africa and the Middle East, where major expansion projects are in
progress in Algeria, Egypt, Guinea Bissau, Morocco, Senegal, and Togo.

61
World consumption of phosphate rock is projected to increase to 49 million tons in
2024 from 47 million tons in 2020. Asia and South America are expected to be the
leading regions of growth.37
Indicator 1.1.9 Water withdrawn for
agriculture
Headline
Water is essential to food production. Agriculture accounts for around 70% of fresh
water withdrawn (from rivers, reservoirs, or groundwater extraction) globally.
Water withdrawals for irrigation have increased globally, most significantly in
OECD and EU countries, but have declined in the Middle East and North Africa.
Climate change is likely to increase the importance of irrigation relative to rainfed
agriculture and increase pressures on water withdrawals.
Context and Rationale
The principal sources of water resources for agriculture are rainfall and ‘stored’
sources, mainly surface water (rivers and lakes) and groundwater (shallow and
deep aquifers). Rainfed agriculture relies on precipitation water that does not run
over the surface in the form of streams (and subsequently rivers and lakes) or
soak down to enter groundwater reservoirs. Irrigated agriculture relies on drawing
freshwater from surface water or groundwater sources in competition with other
sectors and human activities.
Rainfed agriculture is facing the greatest challenges from changing weather
patterns resulting from climate change. These challenges include droughts, floods,
and extreme rainfall and weather events. Precipitation anomalies on grazing lands
are also a threat to livestock production.
A majority of world agriculture currently relies on rainfall rather than irrigation.
However, irrigated agriculture plays a crucial role in global food supply. Low-
income and lower-middle income countries as well as landlocked developing
countries heavily rely on water withdrawals for agriculture compared to other
sectors, such as industries and municipalities. Irrigation leads to a fall in the
overall volatility of agricultural output, raises cropping intensity and encourages the
37 USGS, ‘Mineral Commodity Summaries 2021’, https://pubs.er.usgs.gov/publication/mcs2021.
62
cultivation of high-value crops. Irrigation is an important source of global
agricultural output growth. Agriculture is by far the largest user of freshwater,
accounting for more than 70% of global withdrawals of water, which are continuing
to increase. In the past two decades, industrial withdrawals have declined, while
municipal withdrawals have increased only marginally since 2010. Agricultural
withdrawals have continued to grow at a faster pace, although more slowly since
1980, and the share of agricultural withdrawals has increased slightly since 2000.
Demand for water resources does not only come from agriculture, but also from
other industry sectors and a human need for water to meet drinking and sanitation
needs. There is increasing concern about how these various demands will be met
going forward alongside threats from climate change that could diminish water
availability and increase demand in some sectors and regions. Therefore, this
indicator considers one aspect of this wider issue, the amount of water withdrawn
for agriculture. Water challenges, in the form of physical lack of freshwater and
inadequate infrastructure or shortages through inadequate rainfall, affect different
regions to greater or lesser extents.
There has been a strong trend towards the use of more water efficient crops and
better water management practices. Higher water efficiency can also be gained by
using nitrogen-based fertilisers.

63
Data and Assessment
Indicator: Agricultural water withdrawal
Source: World Resources Institute (WRI); FAO Statistics
Figure 1.1.9a: Agricultural water withdrawal, by region m3/year
Figure 1.1.9b: Percentage change of irrigated land area by region

64
Figure 1.1.9c: Water withdrawal for use by agriculture as a percentage of total
internal renewable water resources
Water extracted for agriculture has risen in all regions except the Middle East and
North Africa, which has seen a small fall of 3.5% between 2007 and 2017 as seen
in figure 1.1.9a. Note that each region has been plotted on different scale for
clarity.
Sub-Saharan Africa has seen the largest rise in water extraction since 2007 with a
50.5% rise in usage, followed by South America with 16.6% and OECD and EU
countries with 4.4%.
Since 2010, the percentage of land area irrigated has remained relatively constant
with small rises in the Middle East and North Africa (0.8%), South and East Asia
(0.4%), South America (0.1%), and OECD and EU countries (0.08%). Sub-
Saharan Africa saw a small drop of 0.003%, which is due to an increase in land
area. However, in some cases these increases represent quite a large change in
the amount of land irrigated. For instance, South America currently has 1.4% of
agricultural land irrigated, South and East Asia 9.7%, the Middle East and North
Africa 4.8%, Sub-Saharan Africa 0.6%, and OECD and EU countries 4%.
Figure 1.1.9c shows that between 2007 and 2017, the percentage of water
withdrawn for agriculture has risen in all regions except the Middle East and North
Africa, which fell by 1.4% to 84.7%. The Middle East and North Africa, however,
remains the region with the highest proportion of water extracted for agriculture.
OECD and EU countries had the largest rise in water extracted for agriculture of
5.2%, to 47.5%. However, this is still significantly below the other regions,
reflecting the proportion of industrialised economies within OECD and EU

65
countries. South America at 2.2% and Sub-Saharan Africa at 4.3% have had small
rises in the proportion of water extracted for agriculture. The Middle East and
North Africa has recorded a small fall of 1.4% in the proportion of water extracted
for agriculture, but this is still the highest proportion of any region at 84.7%.
Aquastat only has a representative sample of countries from South and East Asia
since 2012. The complete dataset has only been collected for two years, so it’s not
possible to draw any firm conclusion of trends about water extraction. However,
water extraction for agriculture appears to be stable.
Overall, this data shows that agriculture is placing more stress on water resources
than other sectors.
Trends
The levels of water efficiency in crops vary between regions. High-income
countries in Europe and Northern America have a capital-intensive and efficient
agriculture sector as well as a high rate of public expenditure on agricultural
research and development. Such countries have a greater capacity to address the
water efficiency and scarcity challenges. By contrast, in Sub-Saharan Africa,
where countries have lower levels of agricultural capital intensity and expenditure
on research and development, farmers have difficulty in accessing irrigation
equipment, modern inputs and technologies, including technologies to optimize
the efficiency of water use in rainfed agriculture. Conversely, countries in Southern
Asia irrigate and employ modern inputs on about half of the region’s cropland,
while most irrigated areas are highly water stressed
As outlined in the risk section of indicator 1.1.2, climate variability and change will
increase the likelihood of extreme weather events, such as droughts and changes
in rain patterns. This will further increase reliance on withdrawn water rather than
on rainwater. More than 62 million hectares of crop and pasture land already
experience both very high water stress and drought frequency, with 15 times that
area suffering from either one or the other. Global temperature rises on the way to
2oC will cause a steep increase in exposure to water scarcity from reduced
precipitation, particularly in Northern and Eastern Africa, the Arabian Peninsula
and Southern Asia. River flow will also drop, increasing water scarcity in regions
including the Mediterranean, Near East and large parts of Northern and Southern
America. The scale of the impact is highly uncertain however, with a range of
models producing different results. Drought frequency and severity will also
increase, with particular impacts in parts of Southern America, Western and
Central Europe, Central Africa, and Australia. Direct climate impacts on heavily

66
irrigated regions could see 20 to 60 million hectares of irrigated land reverting to
dependency on rainfall.38
Indicator 1.2.1 Global agricultural labour
force capacity
Headline
Productivity increases and mechanisation have meant the number of people
employed as agricultural labour has decreased globally since 2010. The COVID-
19 pandemic, however, has highlighted how the sector’s reliance on seasonal
workers for critical harvesting periods can be a potential risk to production if there
are factors that reduce the availability of these workers.
Context and Rationale
The availability of agricultural workers plays an important factor in global food
production and the impacts this has on global food supply. Besides permanent
agricultural workers, there is also a great need for seasonal workers to meet the
fluctuating seasonal labour needs across the world. The COVID-19 pandemic has
particularly shown the contributions internal and international seasonal workers
make towards ensuring food supply when travel restrictions hindered their ability
to work within the agri-food system.
Lower-income countries tend to have a higher percentage of people employed in
the agriculture sector compared to high-income countries. The economic
importance of the agriculture sector, and with it the number of employees,
decreases the richer a country becomes. At the same time, agricultural workers in
high-income countries add more value to the gross domestic product than in
lower-income countries. This likely means that thanks to technological advances,
more efficient farming practices, and other factors, fewer agricultural workers are
needed in high-income countries than in low-income ones.
Over the last twenty years, there has been a decline in the number of people
working in the agriculture sector due to productivity increases, requiring fewer
workers. Despite that, agriculture is still the second largest source of employment
38 FAO, ‘The State of Food and Agriculture: Overcoming Water Challenges in Agriculture’ (2020), https://www.fao.org/documents/card/en/c/cb1447en, pages 28, 40 and 41.

67
in the world after the service sector, with China and India accounting for almost
half of the global agricultural labour force.
This indicator tracks the employment figures within the agriculture sector at the
global level. The data needs to be carefully interpreted given that any changes in
the global agricultural labour force could be a sign of productivity gains, meaning
technological improvements have reduced the need for large numbers of workers,
or of emerging issues within the sector.
Data and Assessment
Indicator: Number of employees in the agriculture sector by region
Source: FAO; UN Department of Economic and Social Affairs International
Migration
Figure 1.2.1a: Number of total agricultural employees by region

68
Figure 1.2.1b: International migrant workers as a percentage of total local
population by region
Figure 1.2.1c: Total population of each region, in millions
Figure 1.2.1c: Total population of each region, in millions

69
Assessment
The number of agricultural employees globally continues to decline, most likely
due to increased mechanisation in Asia and the Pacific Region, which employ
572,488,000 workers. Sub-Saharan Africa, employing 209,392,000 workers.
These continue to have the highest number of agricultural employees and show
an increase in the number of agricultural employees of 29,757,000 workers, since
2010. The Arab States are the only other region to show an increase of 231,000
workers. In developed countries, agricultural labour constitutes a lower proportion
of the workforce.
Europe (11%), North America (16%), and Oceania (21.2%) have a particularly
high availability of migrant labour compared to Africa (2.03%), Asia (1.82%), and
Latin America and the Caribbean (1.8%). The proportion of migrant stock has
risen faster in these regions: in Europe by 1.4%, North America by 1.15%, and
Oceania by 1.9% compared to Africa at 0.32%, Asia at 0.25%, Latin America and
Caribbean at 0.4%. All regions, however, are seeing a higher proportion of
migrants today than in 2010.
Trends
In 2020, COVID-19 movement restrictions impacted on the availability of seasonal
workers, especially in high-income countries. Many governments enacted policies
to counteract such shortfalls by extending the stay of seasonal workers already
present in the country, incentivising the domestic population to work in the
agriculture sector, or facilitating limited entry of seasonal workers under strict
health protocols.39 Despite the success of some of these policies in mitigating
against the worst predicted labour shortages, the COVID-19 pandemic has shown
the vulnerability the agriculture sector faces regarding its reliance on seasonal
workers during critical harvest periods. The data above suggests both that the
global agricultural workforce is declining over time and that the reliance on migrant
labour in increasing. Although both trends are very gradual at the global level,
stronger trends are seen at a country-by-country and region-by-region basis.
Whether this represents an increased vulnerability in relation to the global food
system will depend upon which food product is being considered and its individual
reliance on labour, whether domestic or migrant.
39 IOM UN Migration, ‘COVID-19: Policies and Impact on Seasonal Agricultural Workers’ (2020), https://www.iom.int/resources/covid-19-policies-and-impact-seasonal-agricultural-workers.

70
Indicator 1.2.2 Components of global
food demand growth
Headline
Population growth will play the most significant role in food demand growth over
the coming years. As outlined in indicator 1.1.1, global food production is
projected to outpace global food demand. While increasing incomes in low and
middle-income countries will lead to increased calorie consumption and meat
consumption, other factors, such as health and environmental concerns, will be
more relevant in determining consumers’ food preferences in high-income
countries.
Context and Rationale
Global demand growth for food is closely linked to the issues outlined in indicator
1.1.1 regarding the capacity of global agriculture to increase food supply to meet
demand. It is, therefore, essential to understand the underlying factors that will
drive global food demand growth over the coming decades to predict whether food
supply can meet demand. The factors that have the most influence on global food
demand are population growth, increasing calorie consumption, and changing
consumption patterns:
• Population growth is expected to be the main driver of demand growth for
most agricultural commodities.
• The average dietary energy supply, measured as calories per capita per
day, indicates whether people can meet their daily calorific needs. In 2019,
the average global energy supply stood at 2950 calories per person,
indicating that there is, theoretically, enough food produced globally to meet
people’s calorie requirements.40 These calories, however, are not evenly
distributed across regions, with high-income countries consuming more
calories than low-income ones. The calories also do not reflect the quality
of people’s diet and whether they enable people to meet their nutritional
requirements.
• Changing consumption patterns will also have an impact on overall demand
growth. These patterns are determined by populations’ food preferences
and available income to realise them.
Data and Assessment
40 FAO, ‘World Food and Agriculture: Statistical Yearbook 2020’, https://www.fao.org/family-farming/detail/en/c/1316738/.
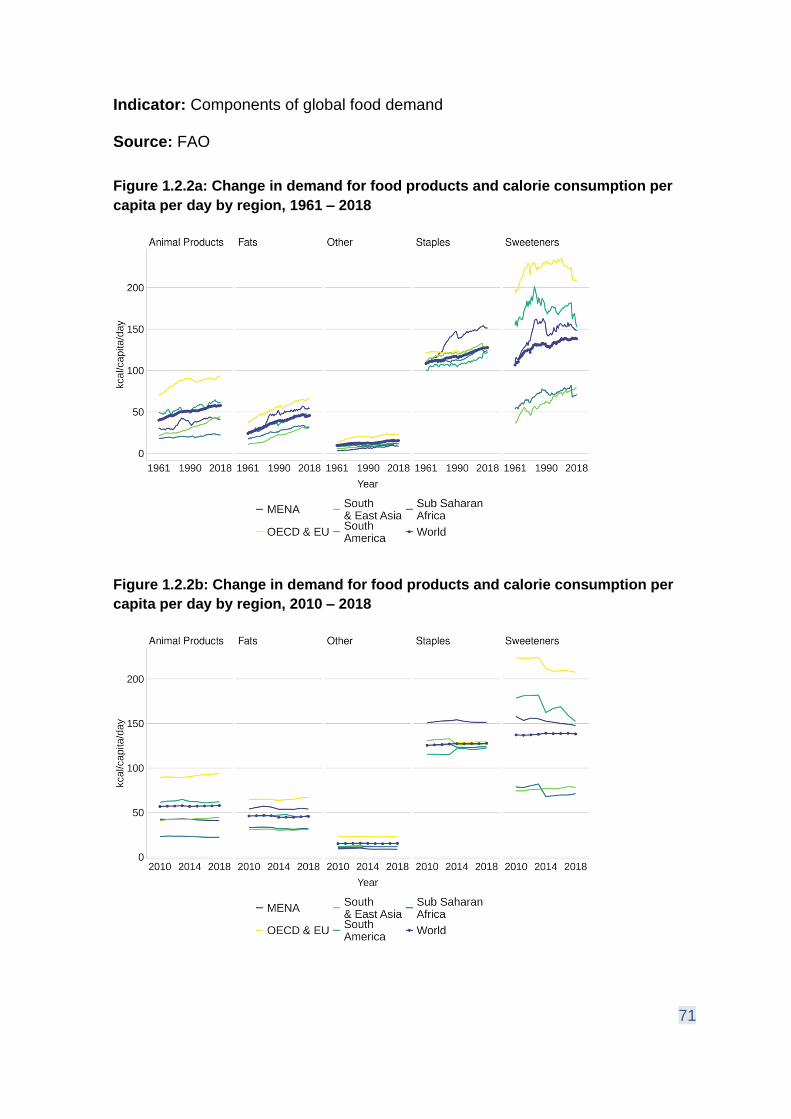
71
Indicator: Components of global food demand
Source: FAO
Figure 1.2.2a: Change in demand for food products and calorie consumption per
capita per day by region, 1961 – 2018
Figure 1.2.2b: Change in demand for food products and calorie consumption per
capita per day by region, 2010 – 2018

72
OECD-FAO Outlook 2020-2030 Shows demand for all food products type is rising
across all regions. Expect for Fish which forecast to fall in Europe and Central
Asia, Staples which forecast to fall in the Near East and North Africa and North
America and Sweeteners which demand is forecast to fall in Europe and Central
Asia and Latin America and Caribbean.
The OECD and EU countries have consistently had the highest calorie intake
across different food products except for staples, which is led by the Middle East
and North Africa. Sub-Saharan Africa and South and East Asia typically have the
lowest calorie intake except for staples, South America has the lowest calorie
intake of staples.
Since 1961, the amount of animal products, fats and staples consumed has slowly
increased, Consumption of other products has remained reasonably stable, and
the consumption of sweeteners has been quite volatile.
Since 2010, global demand has risen for all product types other than fats which
have fallen slightly (0.4 kcals per capita). Regionally, the picture is slightly more
complicated. OECD and EU countries have seen a rise in per capita consumption
of all products except sweeteners which have fallen by 16.1 kcals/capita/day to
207.4 kcals/capita/day.
MENA per capita consumption has fallen for all products except staples that has
risen 0.5 kcals kcals/capita/day to 151.3 kcals/capita/day.
Sub Saharan Africa per capita consumption has fallen for all products except other
products that has risen 1.1 kcals kcals/capita/day to 11.5 kcals/capita/day.
South and East Asia per capita consumption has risen for all products except
other products that has fallen 3.4 kcals kcals/capita/day to 127.3 kcals/capita/day.
South America per capita consumption has risen for all products except other
products and sweeteners that have fallen 0.1 kcals kcals/capita/day to 11.5
kcals/capita/day and 26.2 kcals kcals/capita/day to 152.3 kcals/capita/day.
Trends
The FAO expects an annual growth rate of 0.9% for the global population size
over the next ten years to 8.5 billion people in 2030. Population growth will be
mainly concentrated in developing regions, such as Sub-Saharan Africa and India.
This is an important figure to observe to determine how changes in food demand
will impact the UK’s food supply as agricultural demand growth will mainly be
driven by population growth and less so by per capita demand growth.
Global demand for agricultural commodities, including for non-food uses, is
projected to grow at 1.2% per annum over the coming decade. This is well below
the growth experienced over the last decade, which amounted to 2.2% per

73
annum. This is mainly due to an expected slowdown in demand growth in China
and other emerging economies, and lower global demand for biofuels.
While it is estimated that demand will rise for all agricultural commodities, a larger
increase will likely be seen in high-value products such as vegetable oils, livestock
products, and fish. In high-income countries, per capita availability of animal
protein is expected to grow slowly over the coming decade. The increase in
poultry meat availability is projected to account for over half of additional animal
protein availability over the coming decade. Demand for poultry meat is projected
to grow steadily as consumers see it as a healthier and more environmentally
sustainable product than beef and pig meat. Poultry is also more affordable than
other meat types, which will also contribute to growing poultry demand in middle
and low-income countries. By contrast, beef, pig meat and sheep meat
consumption levels are expected to remain stable. Weakening demand for beef in
high-income countries is due to several factors, including concerns about the
climate impact of cattle production, and dietary recommendations by governments,
which in several countries, advise limiting weekly intakes of red meat. In the UK it
is advised to limit your intake to under 70g per day.
There are some uncertainties when creating projections for consumption patterns.
Consumers’ purchasing decisions are increasingly driven by factors beyond prices
and taste, such as health and environmental concerns. One expression of such
environmental concerns is the increase in vegetarian and vegan lifestyles in high-
income countries.41
Looking at the average dietary energy supply, the FAO has produced different
predictions for high, low, and middle-income countries based on different future
scenarios. Depending on the level of change towards more sustainable practices,
high-income countries would reach a daily calorie consumption between 3,271
and 3,408 calories by 2030, while low and middle-income countries could achieve
between 2,724 and 2,923 calories per day. Throughout all of these scenarios,
animal products make up a larger number of calories in high-income countries
than in low and middle-income countries. The food group providing the most
calories in low and middle-income countries are cereals.42
41 FAO, ‘OECD-FAO Agricultural Outlook 2021-2030’, https://www.fao.org/publications/oecd-fao-agricultural-outlook/2021-2030/en/. 42 FAO, ‘The future of food and agriculture: Alternative pathways to 2050’ (2018), https://www.fao.org/global-perspectives-studies/resources/detail/en/c/1157074/.

74
Indicator 1.2.3 Share of global production
internationally traded
Headline
The proportion of agricultural products traded has increased since the 2000s. A
growing global trade in agricultural products increases resilience to supply shocks
affecting particular geographical areas and allows for a more efficient global food
supply chain. However, reliance on the global trading system increases
vulnerability to events which disrupt to this system, such as trade restrictions. The
COVID-19 pandemic caused some disruption to supply chains but global trade in
products is expected to continue in the long term.
Context and Rationale
Global trade in agricultural and food products plays an essential role in providing
food security for the UK, but also for the world. Trade allows for a more efficient
global food system where products can move from regions with more suitable
conditions and resources for production to countries with less ideal conditions or
higher demand for food than can be met by domestic production. A functional
trading system also allows to spread the risks of supply shortages or price spikes
if a country can import agricultural and food products from multiple supply sources.
Thinly traded commodity markets can reflect substantial trade protectionism, an
increase in bilateral land deals, but also the costs of transporting goods between
countries. If some type of shock occurs in such a market, the impacts on the
availability and affordability of the commodity will be greater than in a more active
market.
In the last few decades, international trade in agricultural and food products has
more than doubled in real terms due to technical and economic trade barriers
having been lowered or removed. Developing countries are increasingly
participating in global markets, and their exports make up more than one‑third of
global agri‑food trade.
Increasing or stable trends in the percentage of commodities internationally traded
would be desirable in order to strengthen the resilience of the global commodity
markets and the UK’s food security.

75
Data and Assessment
Indicator: Share of global production internationally traded
Source: FAO
Figure 1.2.3a: Percentage of global production internationally traded
Assessment
Since the early 2000s, growth in agricultural trade has been facilitated by a
lowering of agri-food tariffs, reforms to trade-distorting producer support, and the
signing of multiple trade agreements. Agricultural trade has also been supported
by strong economic growth in emerging countries, particularly in China, and by
growing demand for biofuels as countries seek to reduce their CO2 emissions and
their dependence on fossil fuels. This expansion in trade has contributed to a
more efficient allocation of agricultural production across countries and regions.
The percentage of global commodity trade has remained relatively constant since
2010/2011. Palm oil has been the most volatile commodity, falling to 66.4% in
2019/2020 from 78.3% in 2009/2010. Soybeans remain the second highest
commodity traded globally by percentage at 48.6% in 2020/2021.

76
Trends
Overall, trade in terms of value has been increasing over the last twenty years.
High-income and upper-income countries account for the highest increase in
global agri-food exports, having grown their exports from about 25% in 2001 to
36% in 2018. Lower-middle income and low-income countries export and import
fewer agricultural and food products in comparison, although notable exceptions
are Vietnam, Nepal, and Uganda, which have managed to slowly increase their
exports over this time period.43
Primary production, processing, trade, logistics (both domestic and international),
and final demand have been affected by COVID-19 measures. Nevertheless,
global food markets remained well balanced over the last year.
The FAO expects that trade will increasingly reflect diverging demand and supply
developments among trading partners over the next ten years. Some regions are
projected to experience large population or income-driven increases in food
demand but do not necessarily have the resources for a corresponding increase in
agricultural output. Moreover, socio-cultural and lifestyle-driven changes in
consumption patterns are transforming the profile of demand in most regions.
Agricultural trade will therefore play an increasing role in ensuring global food
security and nutrition over the next decade, by connecting producers to diversified
consumer demand around the world.
Divergent productivity growth, climate change impacts on production, the outdoor
workforce, food safety, as well as transport being affected by extreme weather
events such as storm surges, heat and flooding, and developments in crop and
animal diseases may all pose a risk to food supply.
Globally, about 17% of cereal production is traded internationally, with shares for
single commodities ranging from 9% for rice to 25% for wheat. The share for total
cereals is projected to increase to 18% by 2030, largely due to increased trade in
rice. Rice will nevertheless remain a thinly traded commodity. India, Vietnam, and
Thailand will continue to lead global rice trade, but Cambodia and Myanmar are
expected to play an increasingly important role in global rice exports. Russia
surpassed the European Union in 2016 to become the largest wheat exporter and
is expected to increase its lead throughout the next ten years, accounting for 22%
of global exports by 2030. Concerning maize, the United States will remain the
leading exporter, followed by Brazil, Ukraine, Argentina, and Russia. The
43 FAO, ‘The State of Agricultural Commodity Markets 2020’, https://www.fao.org/publications/soco/en/.

77
European Union, Australia, and the Black Sea region are expected to continue to
be the main exporters of other coarse grains.44
Risk: Restrictions and barriers to trade
Global markets and trade play an important role in managing disruptions to food
supply. Some countries may respond to supply disruption by reducing or banning
exports to shore up domestic supplies. This can reduce the availability of global
commodities and drive prices up, which may cause further shocks to markets.
During the COVID-19 pandemic, the International Food Policy Research Institute
tracked the number of food export restrictions imposed by countries. In 2020, a
total of 19 countries imposed temporary export bans on certain agricultural goods,
all of which were lifted within the same year.45 None of these restrictions had a
significant impact on UK food supply.
Indicator 1.2.4 Concentration in world
agricultural commodity markets
Headline
The concentration in world agricultural commodity markets shows how diversely
traded a commodity is. A strong concentration for a particular commodity in a few
countries could have negative impacts on price, supply, and food security. No
major changes are expected for the concentration in world agricultural commodity
markets and the top exporting countries of these commodities. This stability
means that there are no concerns in relation to the UK’s ability to access global
food supply.
Context and Rationale
The concentration of production and market power over a commodity in a
particular country or region can have harmful effects both in terms of price, supply,
and overall food security. If production is heavily concentrated, overall markets are
vulnerable to localised supply shocks including those from weather and climate
44 FAO, ‘OECD-FAO Agricultural Outlook 2021 to 2030’, https://www.fao.org/publications/oecd-fao-agricultural-outlook/2021-2030/en/. 45 IFPRI, ‘COVID-19 Food Trade Policy Tracker’ (2020), https://www.ifpri.org/project/covid-19-food-trade-policy-tracker.

78
change. They are also vulnerable to economically or politically motivated national
actions.
Greater diversity in countries supplying some of the main agricultural and food
commodities provides a higher level of food security. Attempts by individual
countries to restrict export supplies, for whatever reason, would not result in any
substantial, sustained increase in prices or actual shortages.
Data and Assessment
Indicator: Herfindahl index of exporter concentration for various commodities /
Share of top 3 leading exporting countries46
Source: USDA PSD
Figure 1.2.4a: Herfindahl indices of export concentration
46 The Herfindahl Index (HI) measure of market concentration is often used by competition authorities, but it also provides a measure of export market concentration. The HI is a sum of the squares each market share has, this gives larger market share a stronger influence on the results or heavier weighting. Thus, a market completely dominated by one country would give a HI of 1.0. If all top 20 suppliers had equal shares, the index would be 1/20 =0.05. This is considered a better measure than the concentration ratio (CR) of the top 3 or 5 suppliers because it accounts for the shares of all suppliers, and it is affected by the split of the market between the largest suppliers. For example, if a country had 50% of the export market and the remaining 50% of market was equally divided between 10 countries. The Herfindahl Index would account for all 11 countries. The 3 suppliers CR would be 60% and 5 suppliers CR 70% whereas the HI would be 0.3. Market concentration here is defined in terms of exporting countries rather than firms.

79
Figure 1.2.4b: Table on shares of the leading supplier countries (*data from 2018)
Commodity 2010/2011 2020/2021
Top 3 Exporters Share of
global trade
Top 3
Exporters
Share of global
trade
Beef Brazil 20.4% Brazil 22.4%
Australia 17.7% Australia 13.0%
USA 9.9% USA 11.8%
Maize USA 50.8% USA 39.3%
Argentina 17.9% Brazil 21.1%
Brazil 9.2% Ukraine 13.4%
Palm oil Malaysia 45.9% Indonesia 56.0%
Indonesia 44.0% Malaysia 32.9%
Papua New
Guinea
1.5% Guatemala 1.7%
Rice Thailand 30.2% India 40.7%
Vietnam 19.9% Vietnam 12.6%
USA 10.0% Thailand 11.%
Soybeans USA 44.7% Brazil 49.5%
Brazil 32.7% USA 37.4%
Argentina 10.1% Paraguay 1.5%
Wheat USA 26.4% Russia 19.1%
EU 17.4% EU 14.8%
Australia 14.0% USA 13.4%

80
Assessment
The overall trade picture remains stable. There has been considerable
diversification in Maize supplies in recent years, as is indicated by the HI falling by
0.492 to 0.206. Maize HI has fallen 0.1 since 2010. Oilseed showed a small
upward trend rising from 0.322 in 2010/2011 to 0.400 in 2020/2021. Other
products have remained relatively constant. The main countries of export are
remaining relatively static with two out of three remaining in the top three in 2019
compared to 2009.
Trends
The FAO expects no change in the top three exporting countries for wheat, maize,
and rice over the next ten years. While normal growing conditions are expected to
lead to positive production prospects for the main grain-producing regions, inter
annual climate variability and extreme weather events accentuated by climate
change may cause higher volatility in cereal yields, thereby affecting global
supplies and prices. Wheat and maize yields are particularly volatile in some large
exporting countries such as Russia, Ukraine, Brazil, and Argentina, compared to
Canada, the United States, and the European Union.
Meat exports, including beef, sheep, pork, and poultry, are concentrated, and the
combined share of the three largest meat exporting countries, Brazil, the
European Union, and the United States. These are projected to remain stable and
account for around 60% of global world meat exports over the next ten years. In
Latin America, traditional exporting countries are expected to retain a high share
of the global meat trade, benefiting from the depreciation of their currencies and
surplus feed grain production.
Regarding exports of soybeans, Brazil has taken over the role of main exporting
country with steady growth in its export capacity and is projected to account for
50% of total global exports of soybean over the next ten years.
Indonesia and Malaysia are expected to continue to account for 60% of total
vegetable oil exports, mainly palm oil, during the next decade. However, the share
of exports in production is projected to contract slightly in these countries as
domestic demand for food, oleochemicals, and, especially, biodiesel uses is
expected to grow.47
47 FAO, ‘OECD-FAO Agricultural Outlook 2021-2030’, https://www.fao.org/publications/oecd-fao-agricultural-outlook/2021-2030/en/.


82
Theme 2: UK Food Supply Sources
This chapter of the UK Food Security Report looks at food security in terms of
where the UK gets its food from. It focuses specifically on the UK’s principal
sources of food at home and overseas. It describes the UK’s domestic production,
and trends in agricultural productivity, fisheries and food waste both before and
after the “farm gate”. It considers important factors in maintaining domestic
productivity, such as soil health, fertiliser use, agricultural inputs, and biodiversity.
The chapter also discusses the principal sources on which the UK relies for its
food imports. It considers data points which will help future UK Food Security
Reports assess the food security impacts of the UK’s 2020 departure from the EU,
in terms both of changes to domestic production practices and to the UK’s trading
relationship with the world. These impacts are likely to take some time to become
apparent in statistics.
In terms of this theme, food security means strong and consistent domestic
production of food combined with a diversity of supply sources that avoids
overreliance on any one source.
Key messages
• The UK has diverse and longstanding trade links that meet consumer demand for a range of products at all times of the year. Trade is dominated by countries in the EU and it is too early to say what effect leaving the EU might have on that trade.
• Domestic production is also stable, with variations in yield and consumer demand balanced by imports and exports. Both agricultural production and manufacturing have become increasingly efficient and are geared towards meeting consumer demand, although food waste is still high.
• The biggest medium to long term risk to the UK’s domestic production comes from climate change and other environmental pressures like soil degradation, water quality and biodiversity. Wheat yields dropped by 40% in 2020 due to heavy rainfall and droughts at bad times in the growing season. Although they have bounced back in 2021, this is an indicator of the effect that increasingly unreliable weather patterns may have on future production.
Domestic production
To ensure a consistent supply of food, the UK relies both on its own production
and on imports. Home-grown produce is the largest source of food for the UK.
Resilience is ensured through a combination of strong domestic production from
the UK’s productive agriculture and food manufacturing sectors, and a diverse
range of overseas supply sources.
83
The UK currently produces about 60% of its domestic food consumption by
economic value, part of which is exported. This means just under half of the actual
food on plates is produced in the UK, including the majority of grains, meat, dairy,
and eggs. This figure would be higher without exports. UK supply comprises
domestic production excluding exports, plus imported food. The production to
supply ratio, important for understanding the UK’s self-sufficiency, has remained
stable over the last two decades, and for crops that can be commercially grown in
the UK has been around 75%.
The UK has a productive agricultural sector and a domestic agri-food
manufacturing industry that produces food to high standards. The amounts and
types of food produced are driven by market forces and consumer demand for
goods, rather than by assessment of overall quantity of food or of self-sufficiency.
Many factors affect the output of domestic production, including:
• The availability and suitability of land for particular forms of production.
• Inputs such as labour, water, fertiliser, pesticides, and seeds.
• Climate and environmental factors such as soil health and rainfall.
In 2020 71% of UK land area was used for agricultural production, the majority of
this being grassland for grazing rather than crops. Not all land is suitable for
growing crops, and some is suitable only for specific crops. Land use overall has
changed little in the last thirty years, with annual variation between specific crops
due to factors such as the weather and prices rather than long-term or systematic
variation. Domestic production faces a number of long-term and short-term risks,
including soil degradation, drought and flooding, diseases, risks to fuel and
fertiliser supplies, and changing labour markets. In the long term, climate change
impacts are likely to have a negative effect on the proportion of high-grade arable
farmland available in the UK.
Diverse international supply sources
Overreliance on one geographical area and dependence on particular supply
sources makes food supply more vulnerable, while diversity of sources makes it
more resilient. UK consumer preferences and diets include a range of products
that cannot be grown in the UK or cannot be grown year-round. Therefore, the UK
does not produce everything it eats or eat everything it produces.
In 2020, the UK imported 46% of the food it consumed. Having a diverse range of
international sources makes food supply more resilient, as if the production or
output of one source is disrupted, other sources can meet demand. No one
country provided more than 11% of those imports, a picture which has been stable
for some time. By value, £48 billion of food, feed, and drink (FFD) was imported
and £21.4 billion was exported.

84
Overall, the UK’s food supply is concentrated on the UK and Europe, with over
80% of supply coming from these main sources. The remainder is mostly spread
between Africa, Asia, North America, and South America. This picture has
changed little in the last 10 years. EU countries continue to be the main source for
FFD imports and are therefore essential to the UK’s food security. 39% of FFD
imports by value were despatched from 4 EU countries (the Netherlands, Republic
of Ireland, Germany, and France) in 2020.
The landscape of UK imports and domestic production is currently in a state of
change after leaving the European Union, the UK’s largest trading partner in agri-
food. The impact of the UK’s new trading relationship is not yet visible in data.
Domestic production may also change in future with the removal of subsidies
managed through the European Common Agricultural Policy (CAP) and through
the planned introduction of new environmental land management schemes in
parts of the UK.
The UK is more reliant on particular countries or regions for specific foodstuffs at
different times of the year, due to a variety of growing seasons across the world.
Seasonality is complex and product specific. The UK depends on diverse supply
lines to meet demand for out-of-season products throughout the year, following
growing seasons across the world. Year-round access to out of season fresh fruit
and vegetables (FFV) has increased in the last 20 to 30 years, leading to longer
and more complex supply chains.
Focusing on food categories:
• The UK is largely self-sufficient in production of grains, producing over 100% of domestic consumption of oats and barley and over 90% of wheat. Average yields over recent decades have been broadly stable but fluctuate from year to year as a result of better or worse weather. Increasingly unpredictable and extreme weather as a result of climate change is likely to exacerbate these fluctuations. Wheat yields in 2020 were the lowest since 1981 due to of unusually bad weather. However, preliminary data indicates they have since increased in 2021.
• In meat, milk, and eggs, the UK produces roughly equivalent volume to what it consumes. In 2020 it produced 61kg of meat, 227L of milk and 172 eggs per person per year. By value, the UK is a net importer of dairy and beef. This reflects UK consumer preferences for eating higher value products, while lower value products are exported.
• The UK produces a significant proportion of its other crop needs, including around 60% of sugar beet, 70% of potatoes and 80% of oilseeds. Apart from a recent pest-related reduction in oilseeds, these proportions have remained stable over the last ten years. Climate change represents a risk to production both in terms of making conditions unsuitable for some crops and allowing new pests to proliferate but it may also benefit new types of crops.
• The UK produces over 50% of vegetables consumed domestically, but only 16% of fruit. 93% of domestic consumption of fresh vegetables was fulfilled

85
by domestic and European production, while fruit supply is more widely spread across the EU, Africa, the Americas, and the UK.
• The UK both produces and consumes fish and seafood, but is a net importer overall. UK consumer preference is for fish mainly caught outside UK waters, such as cod, haddock, tuna, and shrimp and prawns. This means that the UK exports much of what it catches and imports much of what it eats. Supply sources for imports are diverse, with northwest Europe and China the most significant sources. Most of the fisheries which supply UK imports are well managed and have sustainable stocks, although climate change presents a risk to fish stocks. The UK has a significant fishing fleet which mainly exports to the EU, US and China. Important exports include herring, mackerel, salmon and nephrops (scampi).
Inputs and waste in domestic production
There are a range of contributing inputs and risk factors which can affect the UK’s
domestic production capacity and food security both in the short and medium
term.
Agriculture relies on specific inputs to produce food. The cost of these inputs
varies year to year. This presents a significant risk to farming economies, and
therefore to food security. Profit margins in agriculture are low and so fluctuations
in prices can cause problems. Feed is both the most significant expense for UK
farmers and the least stable in terms of price. The overall supply, diversity, and
sustainability of fertilisers, pesticides, seeds, and fuel amongst other inputs are
also important and vary in different degrees for different categories.
Inefficiencies and wastage in food production and processing reduce both the
quantity of food that can be consumed domestically or be exported. They also
represent unnecessary land and resource use, contributes millions of tonnes of
carbon emissions, and involves billions of pounds of wasted value.
Estimated annual combined surplus and waste in primary production is 3.6 million
tonnes (Mt), which is between 6 and 7% of total output. Wastage in households
and post farm gate businesses also reduces the effective supply of UK food.
Waste post-farmgate is estimated at 9.5Mt, of which 7.7Mt is in households and
hospitality and 1.8Mt in manufacturing and retail. These figures compare to around
43Mt of food purchased for consumption in the UK. The highest contributor to this
total by weight were UK households, with 70% of post-farmgate waste arising in
the home. Long term trends do show a reduction in UK household food waste but
average waste of 4 key products was generally around 20% between 2018 and
2021. Household food waste fell sharply at the outset of the coronavirus (COVID-
19) pandemic with improved food management behaviours leading to a significant
reduction in self-reported household food waste in 2020. These positive changes,
however, have started to decline with people returning to a pre-pandemic lifestyle
and food waste levels have increased again in 2021 to pre-pandemic levels.

86
Long term sustainability of UK food production
The UK’s agriculture sector relies on natural capital, and the degradation of this
natural capital poses an underlying threat to the UK’s ability to produce food. The
ecosystems services from natural capital provide key inputs to food production,
which often go uncounted, as does the impact of agriculture on the environment
which produces them. The UK is not unique in this around the world and
understanding and adapting to produce food sustainably and to maintain and
improve natural capital stocks in the long term is key.
Sustainable production methods help to ensure the UK’s long term food security
by protecting the natural capital embedded in soil, water, and biodiverse
ecosystems. In England, three new environmental land management schemes will
incentivise producers in to farm more sustainably. A Sustainable Farming Scheme
is currently being considered by the Welsh Government. The impacts of these
schemes on agricultural land use are not currently clear but will be monitored in
future UK Food Security Reports.
Key natural capital assets for food production are soils. Estimates suggest soil
degradation, erosion, and compaction are costing about £1.2 billion each year and
reducing the capacity of UK soils to produce food. Whilst trends appear to be
negative, specific data is currently lacking.
The wider impacts of human exploitation of the atmosphere as a natural asset
through climate change and emissions also pose significant risks to production
and food security. As a consequence of unusual weather patterns linked to climate
change, wheat yields in 2018 were 7% below the 2016 to 2020 average, and 17%
down in 2020. Total economic losses for wheat, potatoes and oilseed rape in the
UK caused by ozone were calculated to be £173.5 million in 2018, with more than
97% of those losses occurring in England. Based on modelling by the Met Office,
significant future risks to UK food production include heat stress to livestock,
drought, pests and pathogens, and increased soil erosion risks.
Indicator 2.1.1 UK Production Capability
Headline
The UK currently produces the equivalent of about 60% of domestic consumption
by value, part of which is exported. About 54% of food on plates is produced in the
UK, including the majority of grains, meat, dairy, and eggs. Self-sufficiency is
about 54% in fresh vegetables, and 16% in fruit, as subsequent indicators will set

87
out. UK food production is driven by market forces rather than aiming to maximise
calorie production from available land.
Context and Rationale
The Food Production to Supply Ratio is calculated as the farmgate value of raw
food production divided by the value of raw food for human consumption.
Essentially it compares the value of what is produced in the UK with what is
consumed. The production to supply ratio is higher for indigenous type food, the
food products which can be produced in the UK. For all food it is lower because
this accounts for consumption of food types which cannot be produced in the UK
for reasons of climate, soil, or other factors.
Data and Assessment
Figure 2.1.1a: UK food production to supply ratio
Source: Defra Agriculture in the United Kingdom (AUK) 2020
The production to supply ratio is estimated to be 60% for all food in 2020 and 76%
for indigenous type food (that which can be commercially grown domestically).
Actual consumption of UK-produced food is closer to 54%, as a part of UK
production is exported.
Trends
From a peak in the mid-1980s the production to supply ratio declined into the early
2000s and has not changed significantly since then. Market prices and the

88
economics and risks inherent in agricultural production have led the ratio to settle
at about 60%. Alterations in the proportion of domestic production to supply would
change the level of exposure to national scale risks, including climate change and
extreme weather events.
Indicator 2.1.2 Current land area in
production
Headline
In June 2020, 71% of the UK’s land, or 17.3 million hectares, was used for
agricultural production, of which 72% was grassland and 26% cropland, with the
remainder being set-aside or fallow land. Trends in land use have been generally
stable over the last 30 years, but climate change poses a threat to high quality
arable farmland and competition for land use is increasing.
Context and Rationale
Measuring the land area in production gives a sense of the place of food
production in overall land use. The definition of land used for agricultural
production includes arable, horticultural, uncropped arable, common rough
grazing, grassland (temporary and permanent), and land for outdoor pigs, but not
woodland or other non-agricultural land.
It is important to recognise that not all land is created equal. Grass will grow
almost anywhere, but gradient, soil quality, rainfall, water levels, and other factors
make much of the UK’s agricultural area unsuitable for crops, while other parts are
suitable only for specific crops.

89
Data and Assessment
Figure 2.1.2a: UK agricultural land use
Source: Defra AUK 2020
Total agricultural land use, divided here into grassland and cropland, has declined a little since 1990. The high proportion of grassland primarily reflects the unsuitability of much of the UK’s land for growing crops, and the relative suitability of those areas for grazing. As illustrated by the next figure, a small proportion of this grassland (1.2 million ha) is temporary grassland on croppable land, for example in crop rotations.
Figure 2.1.2b: Breakdown of UK croppable area on agricultural holdings

90
Source: Defra AUK 2020
The majority of the UK’s croppable land is used for grain production (3 million ha),
with 415,000 ha used for oilseed, 142,000 ha for potatoes, 166,000 ha for
horticultural crops, and 719,000 ha for other crops in 2020. Much of the annual
variation between specific crops is due to factors such as the weather and prices
rather than any long-term and more systematic variation. An exception is the
decline since 2018 in land given to oilseeds, which partly reflects increased
pesticide resistance among stem flea beetles and the withdrawal of neonicotinoid
insecticides. An increase in ‘Other crops’ suggests farmers are planting a larger
variety of crops than previously.
Trends
Over the last 30 years land use has been fairly stable for most crops, allowing for
fluctuations in prices and weather conditions. However, Defra-commissioned
research suggests climate change impacts under a medium emissions scenario
could reduce the proportion of ’best and most versatile’ arable farmland (ALC 1, 2,
and 3a) from 38.1% of agricultural land on a 1961 to 1990 baseline to 11.4% by
2050, with consequences for food production and meeting Net Zero. Under a high
emissions scenario it could reduce to 9.2% of agricultural land; however there is
quite high uncertainty about projections of this kind.48 Meeting Net Zero, climate
change mitigation, and biodiversity goals will increasingly add to existing,
competing pressures on land use.
Indicator 2.1.3 UK food imports and
exports
Headline
In 2020, the UK imported 46% of the food it consumed. No one country provides
more than 11% of those imports, a picture which has been stable for some time.
By value, £48 billion of FFD was imported and £21.4 billion was exported.
48 Keay and others, ‘The impact of climate change on the suitability of soils for agriculture as defined by the Agricultural Land Classification - SP1104’ (2014), http://sciencesearch.defra.gov.uk/Document.aspx?Document=13364_SP1104Finalreport.pdf, page 65.

91
Context and Rationale
The scale of the UK’s imports highlights the value to the UK of imported food and
drink. Being well connected with producer countries and having a strong internal
economy to compete for their exports puts the UK in a more secure position in
terms of food security.
Imports and exports also support consumer preference for particular types of
products. In the meat industry, for example, international supply chains allow UK
consumers to buy their preferred cuts, while others are exported for profit. Exports
also make valuable economic contributions to the sector, helping to sustain
domestic production and local economies all around the UK. For food security
purposes, considering exports alongside imports gives perspective to the scale of
imports, as well as providing an overview of the value of UK production which is
not consumed in the UK. It should be noted that this economic value is not
equivalent to nutritional value for consumers when considering imports and
exports; for example, whisky is the UK’s most valuable FFD export.
Data and Assessment
Figure 2.1.3a: UK imports of FFD by value and by country of dispatch, 2020
Source: Defra AUK 2020

92
Figure 2.1.3b: UK exports of FFD by value and by country of destination, 2020
Source: Defra AUK 2020
The UK’s top trading partners in value terms, with the exception of the USA, are all
close geographical neighbours. In the case of Ireland, there is a shared land
border, whilst France and the Netherlands represent the shortest sea crossing and
a major international port facility respectively. In addition, the climate in Italy,
southern France, and Spain, coupled with UK consumer expectations for year-
round availability, mean that these countries are essential for trade in fresh
produce.
Figure 2.1.3c: Values of UK FFD trade EU and non-EU, 2019 to 2021

93
Source: HMRC
From the latest available data, which covers the period up to September 2021, the
overall value of FFD trade has recovered from the low levels seen in early 2021
and is largely back to levels seen in previous years. In Q3 2021, the total value of
exports was 6% lower than Q3 2020 and the total value of imports was 2% lower
than Q3 2020.
For many commodities, imports were higher than usual at the end of 2020,
suggesting that some trade may have been brought forward to avoid potential
issues at the border in early 2021. In addition, for some sectors (including meat
and fish), imports have continued to be affected by reduced requirements for
hospitality as a result of the pandemic.
Trends
The make-up of leading trading partners has been very stable over many years,
with occasional intermittent small changes to the order of the top 10. The
departure of the UK from the European Union and the Single Market on 1 January
2021 has changed the rules and regulations that govern export and import
processes with the EU, and in 2020, COVID-19- had a temporary impact on
availability of some products, like pasta and eggs. Changes have also been
evident to trade patterns between GB and Northern Ireland as a result of the
Northern Ireland Protocol (NIP). Geographical proximity will still be a major factor
in trading arrangements, particularly for relatively low-value short shelf-life
products.
Indicator 2.1.4 EU share of UK imports
Headline
EU countries continue to be the main source for FFD imports and are therefore
essential to the UK’s food security. 39% of FFD imports by value were despatched
from 4 EU countries (the Netherlands, Republic of Ireland, Germany, and France)
in 2020.
Context and Rationale
Data on imports shows the continued importance of the EU for food imports. In
winter months countries in the south of the EU are particularly significant in terms

94
of fruit and vegetables and the nutritional value and consumer choice those
products provide.
Data and Assessment
Figure 2.1.4a: Balance of EU and non-EU imports by value
Source: HMRC
The geographical proximity of the EU influences the amount of trade that it
accounts for, and for some animal products like bacon and ham, milk, cream, and
eggs, all imports are sourced from the EU. But there are also products where
imports are more diverse, such as rice, spices, coffee, and citrus fruits.
Trends
The EU’s share of UK imports has remained very stable at around 70% in recent
times. It remains to be seen if this will be affected by the UK having left the EU in
January 2021. Whilst there appears to be some shift in 2021 from EU to non-EU,
this shift is not necessarily new sources of goods. For some items such as fish,
coffee, and some fruit, this is thought to be a "trade hub" effect with some imports
(including third country origin material) now coming directly to the UK (or recorded
as doing so) rather than being previously cleared in the EU before moving to the
UK.

95
Indicator 2.1.5 Overall diversity of supply
Headline
The UK’s food supply is concentrated on the UK and EU countries, with over 80%
of supply coming from these main sources. The remainder is mostly spread fairly
evenly between Africa, Asia, North America, and South America. This picture has
changed little in the last 10 years.
Context and Rationale
Diversity of supply reflects the range of supply sources the UK has, including
domestic production. Tracking this data allows the UK to prepare in case
environmental, economic, or political changes affect the ability of a given country
to produce or export a key product, for example due to a natural disaster.
Data and Assessment
Figure 2.1.5a: Origins of food consumed in the UK, 2009-to 2020
Source: HMRC
Supply includes domestic production plus imports, and excludes exports of home
production. In 2020, 54% of domestic consumption came from UK production
(based on unprocessed value at farmgate), 28% from the EU and the remaining
18% from the rest of the world. 42 countries accounted for 90% of imported

96
supply, and 27 for 80%. Some countries or regions are uniquely important to
supply of particular products like bananas from the Caribbean and Central
America, reducing the security of this supply.
Trends
These percentages have changed little over the last 10 years (longer term trends
in domestic production as a percentage of supply can be found in the indicators
that follow). The vagaries of the weather and harvest impact UK production from
year to year, as they do throughout the world. Underlying trends in consumption
and demand evolve very slowly over time and structural shifts in trading
arrangements also lag.
Indicator 2.1.6 Domestic grain production
Headline
The UK is largely self-sufficient in grain production. Production of grains is
dependent on weather conditions and can be volatile year to year but is fairly
stable in the long term. Yields were unusually low in 2020 due to bad weather, but
provisional results for 2021 show a return to the 5-year average.
Context and Rationale
Wheat plays a vital part in the UK’s diet, environment and economy, accounting
for about 30% of daily food energy intake per person in the UK during 1961 to
2011.49 It is consumed in bread and bakery products, in breakfast cereals, in
pasta, and indirectly (via animal feed) in meat and some types of alcohol such as
beer and whisky. Grain is generally also the most efficient form of production in
terms of calories per hectare, though the bulk of it is grown intensively, relying on
inputs in the form of fertilisers, pesticides, and tractor diesel. Grain production has
a significant environmental impact, due to the lack of biodiversity in conventional
grain fields, damage to the soil through ploughing, environmental harms caused
by fertilisers and pesticides, and the oil use embedded in fertilisers and field
operations.
49 Shewry, P.R. and S.J. Hey, ‘The contribution of wheat to human diet and health’, Food and Energy Security 2015: volume 4, https://www.ncbi.nlm.nih.gov/pmc/articles/PMC4998136/, pages 178 to 202.

97
Data and Assessment
Figure 2.1.6a: Domestic UK grain production
Source: Defra AUK 2020
The UK grows roughly 15 million tonnes of wheat annually, occupying nearly 2
million hectares with some of the highest yields in the world at around 8 tonnes
per hectare. The 2018 financial value of wheat produced in the UK was roughly £2
billion, representing a significant contribution to the total value of £9.3 billion for all
crops produced by the UK that year.
Production of barley and oats has been fairly stable, with wheat (primarily a winter-
grown crop) a little more volatile depending on weather patterns during planting
and growing, as seen in 2020. At 9.6 million tonnes, wheat production was its
lowest since 1981 due to unusually poor weather conditions at critical points of
crop production: very wet weather for preparing the soil and sowing, too dry in the
spring when the crops should have established, and bad weather for harvesting.
This appears to be an outlier compared to recent years, and provisional results for
2021 indicate a return to the 5-year average; however, climate change is projected
to increase the frequency of such events. Barley production on the other hand was
1 million tonnes higher than the 2015 to 2019 average.
In 2020, 11.9 million tonnes of wheat, barley, and oats were used as animal feed,
5.9 million tonnes of wheat and 0.6 million tonnes of oats were milled, while 1.6
million tonnes of barley went into brewing and distilling, and about 0.5 million
tonnes of these three grains were used for seed.

98
Figure 2.1.6b: Domestic UK grain production as percentage of consumption
Source: Defra AUK 2020
The UK is largely self-sufficient in barley and oats, and 81% self-sufficient in
milling wheat (slightly higher for wheat overall), which is the most significant grain
crop for food consumption in the UK. It is not likely or desirable for this figure of
81% to rise much higher, as the remaining percentage is largely made up of hard
wheat types not suited to the UK’s climate and soils. Further to this, global
competition in wheat production and prices means there is significant economic
risk involved with trying to fully meet domestic milling needs, since any surplus
could be undervalued relative to the costs incurred during production. UK farmers
instead grow what they are best able to, a mix of milling and feed wheat according
to market demand and prevailing weather conditions.
For these reasons, the mix of grain grown in the UK differs somewhat from the
grain consumed in the UK. Grain alone does not provide a healthy and nutritious
diet or meet consumer demand for a varied diet. However, from a purely calorific
perspective, the (below average) grain yield in 2020 of 19 million tonnes would be
sufficient to sustain the population. It is equivalent to 283kg per person, 0.8 kilos
per day. A kilo of wheat provides 3,400 calories (and barley slightly more at 3520
calories), making 0.8 kilos of grain over 2,600 calories, compared to
recommended calorie intake of 2 to 2500 for adults. From these figures it is easy
to demonstrate that, even without accounting for other domestic products like
potatoes, vegetables, grass-fed meat and dairy, and fisheries, current UK grain
production alone could meet domestic calorie requirements if it was consumed
directly by humans in a limited choice scenario.

99
Defra currently supports a long-term research platform for the genetic
improvement of arable crops and fresh produce. These Genetic Improvement
Networks (GINs) aim to improve the productivity, sustainability, resilience, and
nutritional quality of UK crops, including wheat, oilseed rape, leafy vegetables, and
pulses. This includes significant research to enhance resilience to climate change
risks such as drought and heat stress. Overall resilience is supported by trading
with a variety of external partners and the UK imports and exports flexibly as
production and prices dictate.
Trends
Long term grain production is stable, though the 40% reduction in wheat
production in 2020 shows the sensitivity of the sector to unusual weather patterns,
and therefore to climate change. Water stress is already a significant factor for
wheat yields in southern and eastern England, and is likely to worsen in future,
while excess wetness is also expected to rise in the winter season, preventing
access to fields for cultivation and sowing.
Indicator 2.1.7 Livestock
Headline
In meat, milk, and eggs, the UK produces a roughly equivalent volume to what it
consumes. In 2020 it produced 61kg of meat, 227 litres of milk and 172 eggs per
person per year. By value the UK is a net importer of dairy and beef, reflecting
consumer preferences for eating higher value products and exporting lower value
products.
Context and Rationale
Meat, dairy, and eggs make up an important part of the UK’s overall diet and
agricultural economy and are areas where the UK is largely self-sufficient in
volume. Imports of high value dairy and beef allow consumers their preferred cuts
of meat and dairy products. These products are all contributors to a healthy diet,
providing important proteins, amino acids, omega oils, vitamins, and minerals such
as calcium.
Livestock sectors have higher average greenhouse gas emissions than plant-
based products, though the impact of livestock varies greatly depending on the
production method. Well-managed livestock can provide benefits like supporting
biodiversity, protecting the character of the countryside, generating important
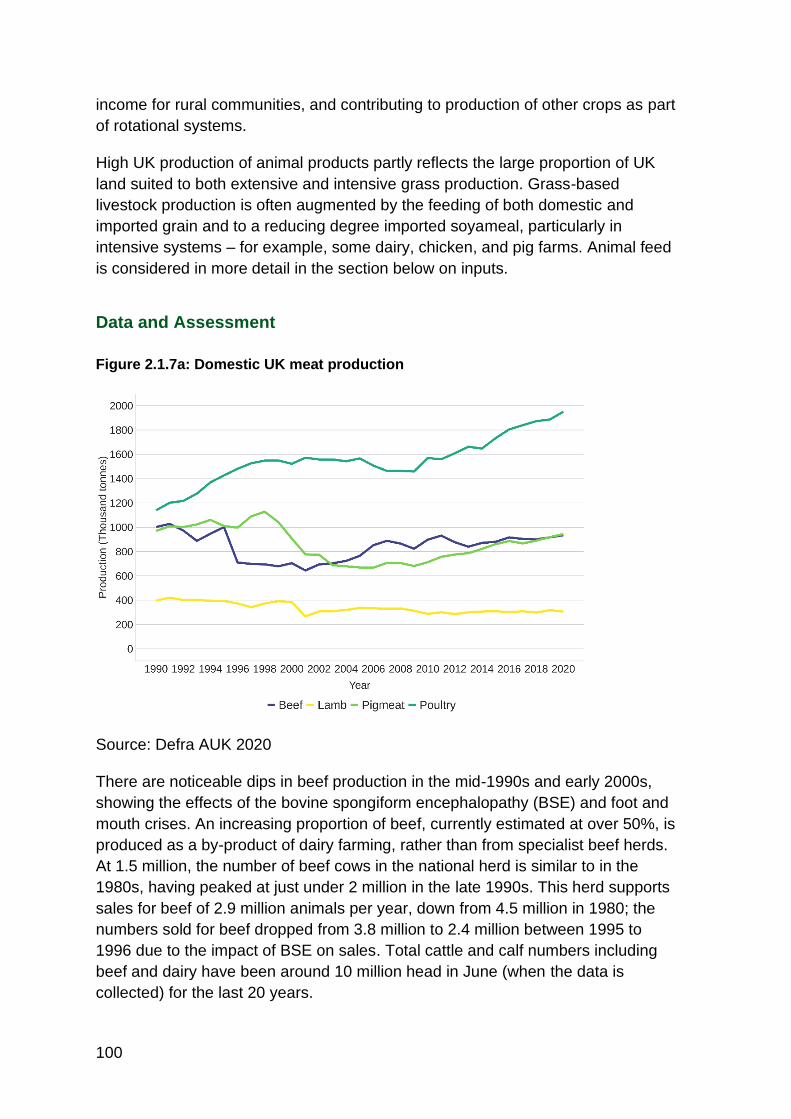
100
income for rural communities, and contributing to production of other crops as part
of rotational systems.
High UK production of animal products partly reflects the large proportion of UK
land suited to both extensive and intensive grass production. Grass-based
livestock production is often augmented by the feeding of both domestic and
imported grain and to a reducing degree imported soyameal, particularly in
intensive systems – for example, some dairy, chicken, and pig farms. Animal feed
is considered in more detail in the section below on inputs.
Data and Assessment
Figure 2.1.7a: Domestic UK meat production
Source: Defra AUK 2020
There are noticeable dips in beef production in the mid-1990s and early 2000s,
showing the effects of the bovine spongiform encephalopathy (BSE) and foot and
mouth crises. An increasing proportion of beef, currently estimated at over 50%, is
produced as a by-product of dairy farming, rather than from specialist beef herds.
At 1.5 million, the number of beef cows in the national herd is similar to in the
1980s, having peaked at just under 2 million in the late 1990s. This herd supports
sales for beef of 2.9 million animals per year, down from 4.5 million in 1980; the
numbers sold for beef dropped from 3.8 million to 2.4 million between 1995 to
1996 due to the impact of BSE on sales. Total cattle and calf numbers including
beef and dairy have been around 10 million head in June (when the data is
collected) for the last 20 years.

101
Pig and poultry production has increased substantially over the last 12 years,
which may reflect higher demand for cheaper meats in more economically
challenging times, and greater efficiency in poultry production. Total head count
for pigs in June has reduced from 7.8 million in 1980 to 5.1 million in 2020, with a
steep decrease of over 3 million between 1998 and 2003; annual sales are around
10 million head. Poultry population for meat in June has doubled from 60 million in
1984 to about 120 million in 2020, with over 1 billion birds sold for meat.
Mutton and lamb production has remained stable throughout this period and while
demand has varied, production generally met or exceeded demand over the last
decade. Total flock size in June rose from 31.4 million in 1980 to about 45 million
throughout the 1990s, then declined again to 32.7 million by 2020; sales per year
are at about 15 million head.
For all four species there has been an improvement in yield relative to number of
animals.
Figure 2.1.7b: Domestic UK meat production as percentage of consumption
Source: Defra AUK 2020
The UK is close to self-sufficient in lamb and poultry. Most beef consumption is
also met by domestic production, with imports from the Republic of Ireland making
up the bulk of the remainder, though there is some trade reflecting consumer
preference for particular cuts. Pigmeat is lowest in terms of self-sufficiency at 66%
of consumption. Considering production and percentages of consumption
together, it seems overall meat consumption has increased over the period, driven
by increased poultry consumption.

102
Figure 2.1.7c: Domestic UK raw milk production and consumption
Source: Defra AUK 2020
Raw milk production has held steady and generally exceeded consumption, with a
notable rise following the end of milk quotas in March 2015. Herd size has
decreased from 3.5 million to 1.9 million since 1973, while yield per animal has
more than doubled.
Figure 2.1.7d: Domestic UK egg production and consumption
Source: Defra AUK 2020

103
Egg production has also been consistent, meeting between 89% and 98% of
domestic demand and increasing substantially over the last decade, despite a
significant move to free range methods, which now make up about half of
production. It is likely that a slight dip in 2020 was caused by the COVID-19
pandemic reducing demand from hospitality and canteens. Although production
has increased slightly, laying fowl numbers have decreased from 53 million in
1984 to 40 million in 2020, with the main reduction taking place in the 1980s and
1990s.
Trends
Poultry, pigmeat, and egg production is increasing, while beef, lamb, and milk
remains largely stable. The UK now consumes less milk and more eggs relative to
production. Changing domestic production is broadly reflected in consumption
percentages for beef, pigmeat, and mutton and lamb, with a slight decrease in
demand for beef and mutton and lamb in the last two years. Poultry production
has increased considerably but is still a smaller percentage of consumption than in
1985, indicating a marked dietary shift towards poultry.
Climate change is projected to cause more than tenfold increases in thermal heat-
stress for livestock across the UK. For example, risk of dairy cattle thermal heat
stress is projected to increase in the next 30 to 50 years by over 1000% in
the South West, the region with the most dairy cattle (see Theme 2, Indicator
2.3.3, Case Study 2.1.).
Indicator 2.1.8 Other domestic crops
Headlines
The UK produces a significant proportion of the other domestic crops it needs,
including 54% of fresh vegetables, 67% of sugar beet, 71% of potatoes, and 79%
of oilseeds, though only 16% of fresh fruit. Apart from a reduction in oilseeds,
these proportions have remained stable over the last ten years. Climate change
represents a risk to existing production both in terms of making conditions
unsuitable for some crops and allowing new pests to proliferate, although it may
also benefit new types of crops.

104
Context and rationale
Cooking oil, sugar, potatoes, other vegetables, and fruit are significant for
domestic consumption, with fruit and vegetables particularly important for a
healthy diet. Fruit and vegetables are areas where the UK is more dependent on
imports, as detailed in Indicators 2.1.9 and 2.1.10.
Data and assessment
Figure 2.1.8a: Domestic UK production of other crops
Source: Defra AUK 2020
Production of most of these crops is fairly stable. The most noticeable change is a
reduction in oilseed production in recent years due to stem flea beetle damage, as
discussed under Indicator 2.1.2. However, longer-term trends over the last 35
years show that oilseed production is still comparable to the 1990s. Sugar beet
trends follow demand from processing factories (dominated by British Sugar
(Silver Spoon)), overall down slightly through this period but still higher than in the
1980s, with annual variations due to weather. Sugar beet yields per hectare have
improved, suggesting greater production efficiency. Fresh fruit production is small
in terms of tonnage and percentage of domestic consumption, but as a crop it is
among the most valuable, so should not be underestimated as an economic
contributor to the sector. In 2019, horticulture, including potatoes, contributed 17%
of farm gate output in value from less than 2% of farmed land.

105
Figure 2.1.8b: Domestic UK production of other crops as percentage of
consumption
Source: Defra AUK 2020
Despite the dip in oilseed production, domestic production still fulfils 79% of
consumption. Some imported vegetable oils can be linked to tropical
deforestation, so there is a risk of offshoring environmental and social harms if
domestic production were to reduce further. For sugar beet (63% in 2020), the
remaining percentage of sugar demand can vary significantly and is primarily met
by imported cane sugar. Potato production to consumption is at 71%. Fresh
vegetables are at 54%, and fresh fruit are at 16%, making the UK more reliant on
imports for these products.

106
Figure 2.1.8c: Domestic UK production of fresh vegetables
Source: Defra Horticulture Statistics 2020
For field vegetables overall there has been a steady decline in production (down
10%), which varies between crops following consumer tastes. For example,
brassica production has halved over this period, but within this category
cauliflower production has fallen to approximately a third of 1990 production while
broccoli production has nearly tripled over the same period. Production of root
crops has increased, notably onions (by 80%) and carrots (by 60%) while turnips
and swedes (down 25%) are no longer as much in favour.

107
Figure 2.1.8d: Domestic UK production of fresh vegetables as percentage of
consumption
Source: Defra Horticulture Statistics 2020
The UK is essentially self-sufficient in root vegetables and cabbage but produces
a smaller but rising proportion of other greens, such as cauliflowers and broccoli
than in 1990. Domestic fulfilment of demand is also lower for lettuce, mushrooms
and especially tomatoes, domestic production of which has halved since 1990.
Detailed percentage of consumption data for onions is not available but is believed
to be around the 50% mark. Over the last 15 years imports of onions have
hovered between about 300,000 tonnes and 400,000 tonnes (with exceptionally
high years beyond that in 2013, 2014 and 2019), varying in relation to domestic
production.

108
Figure 2.1.8e: Domestic UK production of fresh fruit
Source: Defra Horticulture Statistics 2020
Total volume of fruit production is more volatile than vegetable production. Fruit
production fell in the 1990s but recovered from about 2000 onwards and, with a
couple of dips (most likely due to adverse weather) increased slowly up to 2020.
Fruit production has doubled in real term value from approximately £0.5bn to
£1bn, while production increased from below 300,000 tonnes in the early 2000s to
657,000 tonnes in 2020.
There has been significant change to the variety of apples grown, with a move
away from traditional varieties such as Cox’s and Discovery to new higher-yielding
varieties such as Gala and Braeburn. Apple production has increased during a
period when the production area has nearly halved. For soft fruits, strawberry
production has more than doubled due to new varieties and longer growing
seasons and partly due to innovations like LED lighting and table-top production.
Raspberry production has almost halved, blackcurrant production is stable, and
overall production of other soft fruit not covered in the chart has nearly doubled.

109
Figure 2.1.8f: Domestic UK production of fresh fruit as percentage of consumption
Source: Defra Horticulture Statistics 2020
Demand for soft fruit has increased, with the domestic strawberry supply to use
ratio similar to 1990 despite production being two to three times greater.
Raspberry demand also grew slightly despite a reduction in domestic production,
bringing the supply ratio down sharply from 100% to 40%. Supply ratios for
apples, pears and plums is more consistent, and reflects trends in production year
on year.
Trends
Changing and extreme weather will have varied effects on different crops. Potato
yields are vulnerable to hot dry summers, as the 20% fall in the 2018 harvest
shows, but other new crops like red wine grapes are already benefitting from
changing weather patterns. A related risk is of imported pests and diseases; Plant
Health checks at borders are already important and will become more so as
climate changes expose the UK to new threats of this kind. The changing UK
climate will likely alter the emergence, survival rates, and spread of both
indigenous and invasive pests, weeds, and diseases (see Indicators 2.3.3 and
2.3.4).

110
Indicator 2.1.9 Supply sources of UK
fresh fruit and vegetable imports
Headlines
The UK produces over 50% of vegetables consumed domestically, but only 16%
of fruit. In 2020, 93% of domestic consumption of fresh vegetables was fulfilled by
domestic and EU production, while fruit supply was more widely spread across the
EU, Africa, the Americas, and the UK.
Context and rationale
The UK has a high dependency on FFV, so monitoring the diversity of supply is
necessary to ensure supply routes are adequate. Many imported products
(tomatoes, courgettes, and oranges for example) are part of the regular diet of UK
consumers, so are important for nutritional value and consumer choice.
Data and assessment
Figure 2.1.9a: Origins of fresh vegetables in UK domestic consumption
Source: HMRC
93% of domestic consumption of fresh vegetables was fulfilled by domestic and
EU production, reflecting the importance of geographical proximity for importing
fresh produce of relatively low value. UK production to consumption has declined

111
slightly over the last decade, while reliance on EU and African supply sources has
increased.
Figure 2.1.9b: Origins of fresh fruit in UK domestic consumption
Source: HMRC
Origin of fresh fruit consumption is more diverse, with 97% by volume from the
UK, EU, South America, North America, and Africa. This reflects UK consumer
demand for tropical and out-of-season fruit which cannot be sourced domestically
or from Europe. UK production to consumption has increased a little since 2009
but remains low.
Trends
There are concerns about water availability for fruit and vegetable production in
many of the countries on which the UK currently depends, for example in the
Mediterranean region.50 The spread of plant diseases could also be significant for
fruit and vegetable imports. For example, diseases such as Fusarium wilt
(Panama TR4) could significantly affect the future availability of bananas in the UK
and worldwide. While this might not impact directly on food security, the disruption
of supply chains for staple foods such as bananas could have a serious impact on
consumer confidence and trust.
50 WRAP, ‘Working together to protect critical water resources’, https://wrap.org.uk/resources/report/working-together-protect-critical-water-resources.

112
Indicator 2.1.10 Seasonality
Headlines
The relationship of supply to the time of year is complex and depends on the
product. The UK has diverse supply lines to meet demand throughout the year.
Context and rationale
Seasonality varies with product, growing season, and growing method, and is
important for understanding how the UK’s fresh fruit and vegetable (FFV) supply
changes during the year. Domestic production is concentrated in the summer
months, particularly for higher value crops like berries.
There is year-round FFV production in the UK, but winter crops are more limited in
range, being dominated by root vegetables and leafy greens. In winter months the
UK is particularly dependent on imports to keep supermarkets stocked with
diverse out-of-season FFV. Over the last thirty years consumer preferences have
developed, favouring more ingredients which cannot be grown in the UK and
expecting access to out-of-season fruit all year round.
Data and assessment
Figure 2.1.10a: UK citrus fruit imports seasonal variation
Source: HMRC

113
Citrus fruit imports reflect global harvest seasons, which are generally in winter
months, so EU imports are highest in the UK winter when produce comes from the
Mediterranean countries. In the UK summer, imports are sourced from the
southern hemisphere, especially South Africa.
Figure 2.1.10b: UK lettuce imports seasonal variation
Source: HMRC
Other seasonal effects for some products reflect the UK growing season. Imports
of lettuce come almost exclusively from the EU during the autumn and winter,
whilst domestic production reduces trade in the spring and summer, as shown in
the large dip in imports during those months.
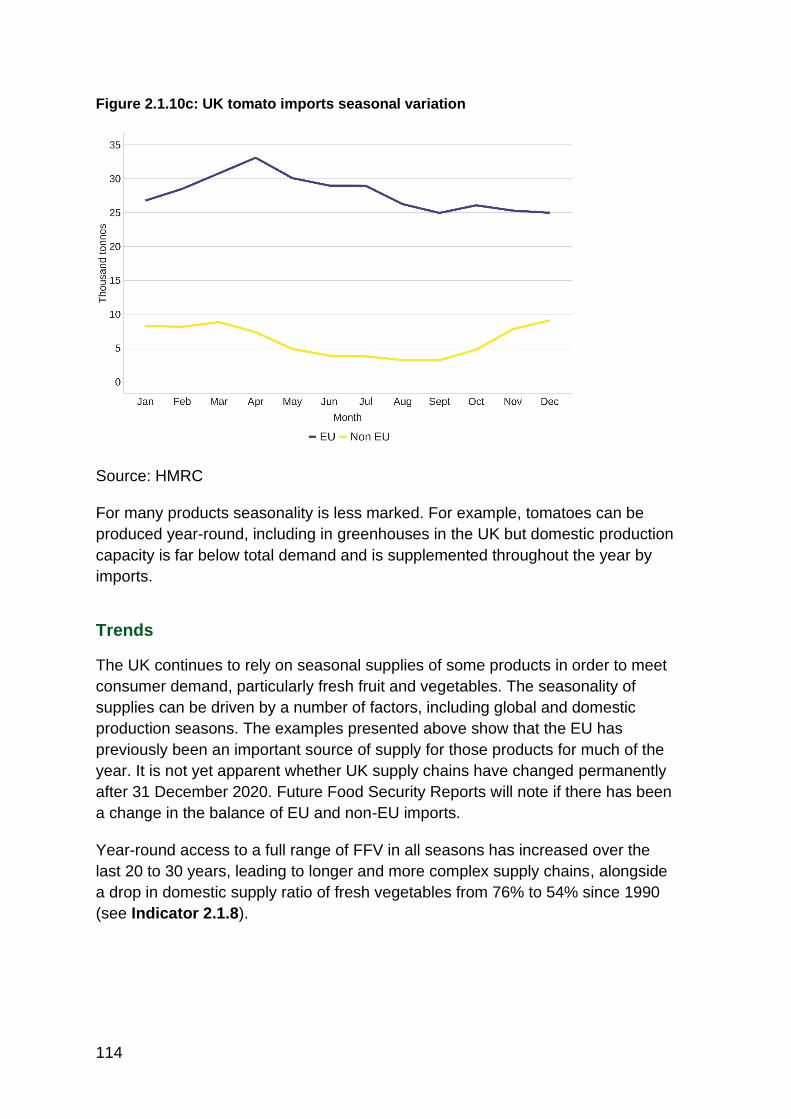
114
Figure 2.1.10c: UK tomato imports seasonal variation
Source: HMRC
For many products seasonality is less marked. For example, tomatoes can be
produced year-round, including in greenhouses in the UK but domestic production
capacity is far below total demand and is supplemented throughout the year by
imports.
Trends
The UK continues to rely on seasonal supplies of some products in order to meet
consumer demand, particularly fresh fruit and vegetables. The seasonality of
supplies can be driven by a number of factors, including global and domestic
production seasons. The examples presented above show that the EU has
previously been an important source of supply for those products for much of the
year. It is not yet apparent whether UK supply chains have changed permanently
after 31 December 2020. Future Food Security Reports will note if there has been
a change in the balance of EU and non-EU imports.
Year-round access to a full range of FFV in all seasons has increased over the
last 20 to 30 years, leading to longer and more complex supply chains, alongside
a drop in domestic supply ratio of fresh vegetables from 76% to 54% since 1990
(see Indicator 2.1.8).

115
Indicator 2.1.11 Fish
Headlines
The UK is a net importer of fish, and heavily dependent on imports for the types of
fish consumers prefer, as these are different to the main types caught
domestically. Fisheries in general are threatened by overfishing and climate
change, but most of the fisheries which export to the UK are sustainably managed
and have healthy stocks.
Context and rationale
Fish represent a small but significant part of UK production and consumption. The
picture of UK imports and exports is complicated by the fact the consumption of
fish in the UK is dominated by non-native species, so much of the UK’s catch is
exported and fish for domestic consumption are imported instead.
Data and assessment
Figure 2.1.11a: UK fish imports and exports by weight
Source: HMRC
The UK exports around 452,000 tonnes and imports around 721,000 tonnes of
fish globally. The UK is a net importer with imports exceeding exports by 269,000
tonnes (the trade gap).

116
Figure 2.1.11b: UK fish imports and exports by species 2020
Source: HMRC
The UK relies on imports to meet domestic demand, especially for cod, haddock,
tuna, and shrimp and prawns but is a net exporter of herring, mackerel, salmon,
nephrops (langoustines), and scallops. Salmon is the only species which is both
imported and exported in significant quantities.
Figure 2.1.11c: Domestic production of wild fish native to UK waters
Source: Seafish
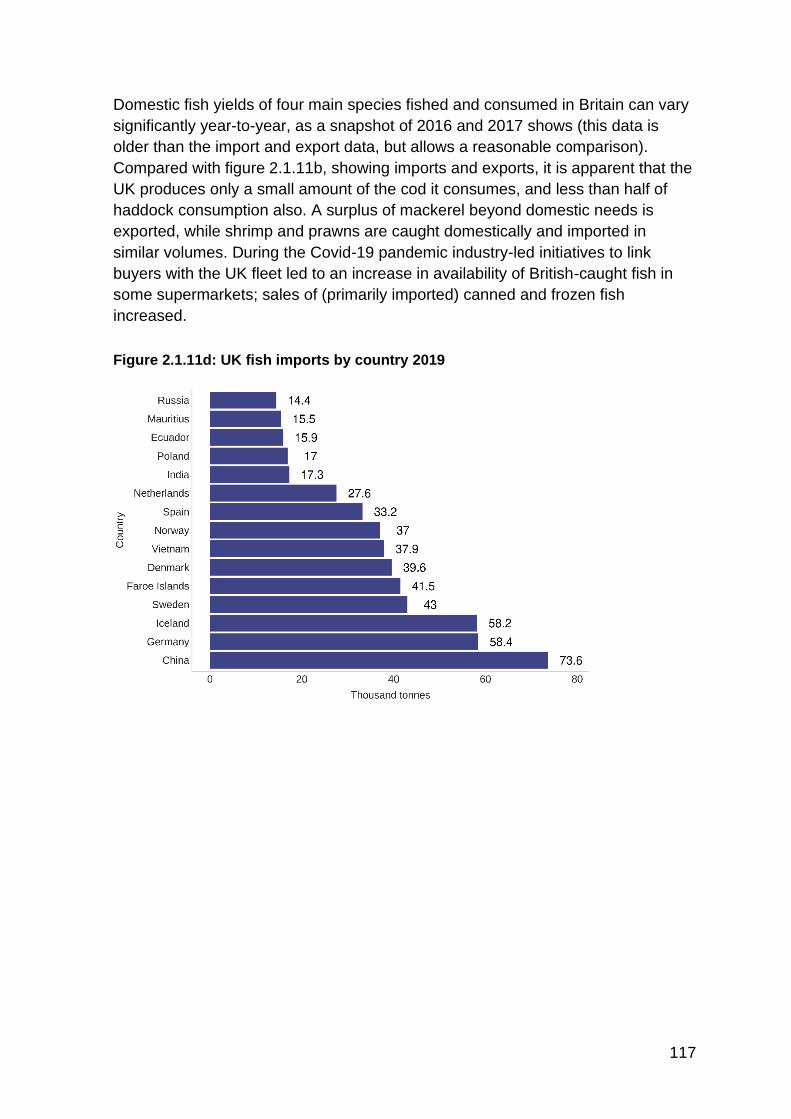
117
Domestic fish yields of four main species fished and consumed in Britain can vary
significantly year-to-year, as a snapshot of 2016 and 2017 shows (this data is
older than the import and export data, but allows a reasonable comparison).
Compared with figure 2.1.11b, showing imports and exports, it is apparent that the
UK produces only a small amount of the cod it consumes, and less than half of
haddock consumption also. A surplus of mackerel beyond domestic needs is
exported, while shrimp and prawns are caught domestically and imported in
similar volumes. During the Covid-19 pandemic industry-led initiatives to link
buyers with the UK fleet led to an increase in availability of British-caught fish in
some supermarkets; sales of (primarily imported) canned and frozen fish
increased.
Figure 2.1.11d: UK fish imports by country 2019

118
Figure 2.1.11e: UK fish exports by country 2019
Source: HMRC
EU countries are the largest export market, followed by the US and China (a key
processing hub), while China and the UK’s North Sea neighbours are the main
sources of fish imports. A shift in diet to more locally sourced fish and shellfish
would make the UK more self-sufficient in marine protein. However, from a food
security perspective, having strong trade links and a diversity of supply is
beneficial.
Trends
There are risks to fishing and marine sustainability from overfishing. Continuing
international management of stocks and quota is necessary – for example, any
unilateral increase in quota by other nations has a direct impact on food security
for the UK nations who also fish in those sectors. A summary of stock health by
species for the UK’s main sources is as follows (as of 2017) – note salmon and
warm water prawns are primarily farmed, so not included:51
• Cod (Iceland, Norway): healthy
• Haddock (UK, Iceland): variable but healthy, with UK stocks now being managed sustainably.
• Skipjack tuna (Mauritius, Ecuador, Seychelles, Philippines, Ghana): healthy and underexploited. Note that other species of tuna (making up about 7% of
51 Seafish, ‘Market insight reports’, https://www.seafish.org/insight-and-research/foodservice-data-and-insight/.

119
UK tuna imports) are often overfished, with illegal, unregulated, and unreported catch.
• Cold water prawns (Canada and Greenland): variable stocks but managed stably.
• Mackerel (UK, North Sea nations): stocks good but trend uncertain.
Climate change presents a separate risk. The Climate Change Committee’s
Independent Assessment of UK Climate Risk projects warming of 0.2-0.4°C per
decade to 2100 and beyond in the shallow shelf seas around the UK, particularly
in the English Channel and southern North Sea. Warming seas, ocean
acidification, and changes in salinity impact the entire marine biosphere and food
chain on which commercial fishing depends. Fish farms face separate climate-
related risks.
Climate change impacts are projected to include range shifts, decline in fish stock
recruitment for species such as cod and herring, and risk of passing critical
temperature thresholds for salmonid populations including Atlantic salmon, Arctic
charr, and brown trout. Climate change impacts are also likely to impact
abundance, distribution, and nutritional quality of prey species, which can
indirectly affect commercially valuable fish stocks (for example cod). Climate
change impacts can also increase risk and prevalence of pests and pathogens,
potentially reducing quality and survivability of targeted fish species. Changing
conditions can encourage the presence of invasive species (such as Pacific
oysters), creating increased competition for resources for native fisheries.
However, there may also opportunities for increases in warmer water species like
mackerel, anchovies, and sardines. Under the Fisheries Act 2020, the UK is
committed to fishing within sustainable limits, avoiding wasteful bycatch and
supporting marine ecosystems. A climate change objective in the Act aims to
encourage management policies to mitigate against the effects of climate change.
Indicator 2.2.1 Essential inputs
Headlines
The cost of inputs varies year to year and is a significant risk to farming
economies due to the narrow margins on which they operate – and therefore to
food security. Out of £26.7 billion gross agricultural output in 2020, £17.3 billion
was spent on ‘intermediate consumption’ (costs and inputs). In 2020, seeds cost
UK farmers £922m, fertilisers £1,147m, energy and fuel £1,290m, pesticides
£1,097m, and animal feed £5,586 million. Animal feed is both the most expensive
input across the entire sector and the one for which prices fluctuate most.

120
Context and rationale
Production of food requires several essential inputs. For crops these include
natural and chemical fertilisers, pesticides, and seeds for crops, vegetables, and
pasture leys. Animal feed is required for livestock production, from direct grazing,
farm-grown fodder, or through buying in feed. Feed varies in cost and
environmental impact from locally grown hay and silage, to UK-grown grain, and to
imports of grain and soyameal. These inputs all represent significant costs to
farmers. Reducing them while maintaining yields is desirable from an economic
and environmental point of view.
Soil and water are the most important inputs of all for primary food production.
They have already been discussed in a global context in Theme 1 and will be
further addressed in the Sustainability and Environment (2.3) section of this
chapter, along with biodiversity-related ecosystem services which are also
essential to food production. Labour and energy, two other key inputs, are
discussed in Theme 3.
Data and assessment
Figure 2.2.1a: UK principal farm costs
Source: Defra AUK 2020
Animal feed is the single largest input cost for UK agriculture, with 30 million
tonnes costing livestock farmers £5.6 billion in 2020. Fertiliser costs were £1.1
billion in 2020, the lowest since 2007 and reflected low oil prices as well as the
reduced capacity of farmers to grow wheat in 2020. Fertiliser prices are volatile,

121
being subject to global production and markets and dependent on production
inputs like natural gas. Application levels of mineral fertilisers are affected annually
by price of fertiliser and crops, crop type, and weather, with oil prices particularly
affecting costs. The total cost of agricultural pesticide products was over £1 billion
in 2020.
Seeds are another of the main expenses in crop production. Costs in 2020 were
abnormally high due to weather conditions preventing autumn sowing and winter
crops failing and being resown in spring. Seeds are required for planting crops
and re-sowing grassland in rotations and are typically purchased from specialist
suppliers (especially for higher value crops). Much of the required vegetable seed
is imported, as are some young plants for propagation, for example tomato plants.
Seed saving remains a small but important part of the UK’s food production and
security, varying with production and market demands.
Figure 2.2.1b: UK animal feed
Source: Defra AUK 2020
Animal feed is the most important input for livestock production. It can be grown
on farm or bought in as grain, protein crops (for example beans and soya), or
grass in the form of hay, silage, or haylage. As highlighted in indicator 2.1.6 on
grain production, 11.9 million tonnes, over 60% of UK grain, was used for animal
feed in 2020, making up 40% of total animal feed. Dependency on grain is
reduced where grazing livestock have access to grassland (including in all-grass
systems) and is affected by annual fluctuations in the growth of such forage due to
weather and climate.

122
Total feed use increased in the 1990s and continues to climb, now about 76%
higher than in the mid-1970s and 50% higher than the early 1990s and correlates
only a little with price changes (for example in 200 to 2008 and 2011 to 2012) – as
livestock need feeding regardless of cost. Over the same period most livestock
outputs have remained stable, though there has been intensification, for example
in milk production, where 24% fewer cows now produce 9% more milk than in
2020. Production of poultry and eggs have also increased. Comparing the 2020
cost of feed (£5.6 billion) with the £13.8 billion combined value of livestock
production it is clear that livestock production remains vulnerable to changes in
feed prices, for example through competition with energy crops, poor harvests,
and global competition for grain. In 2020, £2.5 billion of animal feed was imported,
and £1.1 billion exported, about 60% of both with EU countries. This means net
dependency on imports is about 25% of total feed cost but actual use of feed
imports is closer to 45%.
In terms of land and energy use, there is also an opportunity cost when feeding
these calories to animals rather than directly to humans, considering a substantial
proportion are cereals and other high protein and energy crops. Reducing their
use as feed crops would free up land and resources for other land uses. However,
animal feed can play a role in making use of surplus foodstuffs that would
otherwise be wasted. There may also be opportunities for novel feedstuffs for
animals that could be more efficient, such as insect protein.
Figure 2.2.1c: Fertiliser use in UK agriculture 1966-2020
Source: British Survey of Fertiliser Practice
123
Plant growth requires three main elements: nitrogen, phosphorous (commonly in
the form of phosphate), and potassium (commonly in the form of potash). The use
of these elements for agriculture, in the form of fertilisers, peaked in the mid-1980s
following a rapid increase in use in the 1960s and 1970s of nitrogen and steady
increase of the others. Use of all reduced between 1990 and 2010 but has been
fairly steady over the last decade. In 2020, overall fertiliser application rates
reduced by an estimated 6.2% due primarily to increased spring sowing, which
uses less fertiliser.
Inorganic fertilisers, especially ammonium nitrate for nitrogen, are often imported,
so global availability of the key minerals is an important factor, as covered in
Theme 1. Organic fertilisers (primarily manure) make up just under half of nitrogen
applications and are typically sourced on farm in mixed holdings, or from other
local sources.52 Generally speaking, manures are more often used on grassland
and inorganic fertilisers on crops.
The UK imports roughly 50% of its ammonium nitrate, with 75% of imports for
fertiliser use coming from the EU (primarily from Lithuania, Poland, and the
Netherlands) and the remaining 25% from Georgia and Russia. If the only UK
manufacturer were to close, demand for imports would increase. Dependency on
other suppliers like Russia or China is only likely to occur if EU suppliers could not
increase their supply to the UK. There are also alternative nitrogen-based
fertilisers that could potentially be used. More than 90% of the UK’s total Calcium
Ammonium Nitrate and Urea Ammonium Nitrate supply is imported from the EU,
while only about 40% of Urea arrives from the EU. Urea imports from outside the
EU are currently sourced from Algeria, Russia, and Egypt, with supplies also
coming from Belarus and Bahrain. Importing ammonium nitrate requires specialist
port facilities due to its explosive nature, so an issue at a major port could be
challenging (see further discussion of port substitutability in Theme 3).
Fertilisers have the potential to cause environmental damage to water and air
quality as well as contributing to climate change through nitrous oxide emissions.
These effects can be exacerbated and mitigated by application method and rate.
52 Defra, ‘Soil nutrient balances UK, 2020’, https://www.gov.uk/government/statistics/uk-and-england-soil-nutrient-balances-2020/soil-nutrient-balances-uk-2020-statistics-notice.

124
Figure 2.2.1d: Pesticide use on cereals, Great Britain and UK
Source: Defra. Figures from 2010 onwards include Northern Ireland, prior to that
coverage is GB only. 2018 figure for pesticides does not exclude desiccants.
Pesticides (or ‘plant protection products’) are used to protect crops from a variety
of plant, fungal, and animal pests that can affect yields. Application volume can
vary year to year depending primarily on pest, disease, and weed incidence, and
is also influenced by the weather at key crop development stages when pesticide
applications are most often made. There is significant variation crop to crop, but
approximately 90% of pesticides used in agriculture are applied to arable crops.
The weight of pesticides used reduced from 1990 to 2010, largely down to
declines in the use of sulphuric acid as a desiccant on potatoes. Since 2010 it has
gradually increased, but the weight applied remains lower than pre-2010 levels.
Since 1998, when the relevant data collection began, the frequency of pesticide
application and the number of active substances applied has increased. For
arable crops the average number of spray rounds has increased from 4.8 in 2000
to 6.2 in 2018, with the average number of active substances applied rising from
11.6 to 16.7 over the same period. This translates into increases in the total
area treated (which represents the area multiplied by number of treatments made).
This is partly driven by greater use of mixtures of products in spray tanks to
overcome challenges around resistance.
Pesticides are subject to regulatory controls which may alter the way in which
products are permitted to be used (range of crops, frequency, or rate of
application). Such changes usually reflect post-registration concerns arising from
unforeseen environmental effects (for example the impact of neonicotinoid
insecticides on bee behaviour and survival) or operator and consumer exposure.

125
The use of pesticides can have direct and indirect effects on soil health, water
quality, and biodiversity.
Trends
Seed supply is generally resilient in the sense that additional seed can be sourced
from stocks held by suppliers. In future, seed that provides resilience to the
changing climate will be needed.
Feed volumes used continue to rise steadily while the price per tonne is falling
slowly (in real terms). The use of grain and imported soya for livestock feed may
questions about the environmental sustainability of this practice, including
substantial resource use in the UK and abroad, and a risk of exporting harms.
Changing weather patterns and climate will impact nutrient cycles with implications
for fertiliser application patterns. Lower oil prices have made fertilisers cheaper in
recent years, but sudden fuel price increases can lead to production halting at
short notice, as experienced with gas in autumn 2021 (see Theme 3).
Tensions between environmental protection and crop yields are likely to increase
as climate change fuels warmer and damper conditions that are more likely to
encourage disease and pests, like potato blight and peach-potato aphids. Climate
change will also likely change pesticide use and impacts through changing
temperatures and rainfall patterns.
Indicator 2.2.2 Agriculture and supply
chain waste
Headlines
Food waste in agriculture and in the supply chain is an economic and
environmental loss, as well as being a factor in understanding overall domestic
production and efficiency, and therefore food security. It represents unnecessary
land and resource use, millions of tonnes of carbon emissions, and billions of
pounds of wasted value.
Estimated annual combined surplus and waste in primary production is 3.6 million
tonnes (Mt), 6-7% of total harvest. Waste post-farm gate is estimated at 9.5Mt, of
which 7.7Mt is in households and hospitality and 1.8Mt in manufacturing and

126
retail. These figures compare to around 43Mt of food purchased for consumption
in the UK.
Context and rationale
The Waste and Resources Action Programme (WRAP) is a charity established in
2000 which works on reducing food, clothing, and packaging waste, recycling, and
improving the entire lifecycle of food consumed in the UK. WRAP monitors food
waste throughout the supply chain and has produced several reports on which the
main indicators here are based. It should be noted that whilst the UK evidence
base on food waste has been recognised as one of the strongest in the world,
there remain significant uncertainties associated with the data. The quality of data
varies by sector, in order of robustness from households and retail (both relatively
accurate), to manufacture and hospitality and food service (relatively weak) and
primary production (weak, and partly modelled using non-UK data).53
Data and assessment
Figure 2.2.2a: Central estimate for annual food waste and surplus in UK primary
production
in 2020
53 Further information on progress in reducing food waste and details on interventions with that aim, as well as water use and other issues, can be found on the WRAP website, for example on UK food surplus and waste (https://wrap.org.uk/resources/report/food-surplus-and-waste-uk-key-facts) and updates on the food waste reduction roadmap (https://wrap.org.uk/resources/report/food-waste-reduction-roadmap-progress-report-2021).

127
Source: WRAP: Food waste in primary production in the UK
Surplus and waste in primary production compares to approximately 55 million
tonnes total UK food production in 2020, making it about 6-7% of production. A
distinction is made between food waste (1.6Mt) and surplus food (2Mt), which
rather than reaching its intended market is instead redistributed, becomes animal
feed or goes into bio-based materials. Food waste in primary production is hard to
estimate, and there is no definitive data. WRAP’s estimates are based on applying
the ‘best available data’ from comparable geographies around the world to UK
production quantities. As a result, there is a wide possible range, from 2.2Mt to
5.0Mt. Based on the central estimate of 3.6Mt, up to £1.2 billion value of food is
lost, of which part is recovered in sales for animal feed.
Figure 2.2.2b: Post farmgate food waste arising in the UK in 2018 by sector
Source: WRAP: Food surplus and waste in the UK
The 9.5Mt of food wasted annually post-farmgate compares to 43Mt of food
purchased for consumption in the UK, and has a value estimated at over £19
billion, primarily in household waste. However, only 70% of that was intended for
consumption, with 30% the ‘inedible parts’ (fruit and vegetable peelings etc).
Between farm and fork, 1.5Mt are wasted in manufacture (0.7Mt of which is
‘inedible parts’), 1.1Mt in hospitality and food service (HaFS), and 0.3Mt in retail.
Around 0.7Mt of food surplus from manufacturing, retail, and hospitality and food

128
service is either redistributed via charitable and commercial routes or diverted to
produce animal feed (up about 10% since 2015).54
Trends
Since 2007, there have been large-scale interventions aimed at reducing food
waste across supply chains and households in the UK. WRAP estimates that this
may have contributed to a reduction in post farmgate total food waste between
2007 and 2018 of around 15% (1.7Mt). Total post farmgate food waste in the UK
was 476,000 tonnes lower in 2018 compared to 2015 which equates to a 4.8%
reduction (10Mt down to 9.5Mt). This can be partly attributed to consumer
campaigns like WRAP’s ‘Love Food Hate Waste’ and the UK Food Waste
Reduction Roadmap (aimed at businesses), along with better labelling and
storage guidance, and also more widespread food waste collections from
councils.55 Food waste in manufacturing reduced by around 395,000 tonnes
between 2011 and 2018 (an approximate 20% reduction, from around 1.9Mt),
whilst levels of food waste reported by retailers were around 290,000 tonnes in
2009 compared to 259,000 tonnes in 2020.
The UK has a commitment to UN Sustainable Development Goal 12.3 and the
Courtauld Commitment 2030 to reduce per capita food system waste by 50% by
2030 (alongside targets on greenhouse gas emissions and water use).56
Compared to the 2007 baseline, total per capita food waste had reduced by 20%
by 2018, and 27% if ‘inedible parts’ are excluded. Climate change could have an
impact, with extreme weather events, pests, diseases, and warmer temperatures
all risks for increased food waste in production and the supply chain, unless
adaptations are put in place.
Indicator 2.2.3 Household food waste
Headlines
Average waste of four key products was generally around 20% between 2018 and
2021. This fell sharply at the outset of the COVID-19 pandemic, with improved
food management behaviours leading to a significant reduction in self-reported
54 WRAP, ‘Surplus food redistribution in the UK 2015 to 2020’, https://wrap.org.uk/resources/report/surplus-food-redistribution-uk-2015-2020. 55 WRAP, ‘Love Food Hate Waste’, https://www.lovefoodhatewaste.com/; ‘Food Waste Reduction Roadmap’, https://wrap.org.uk/taking-action/food-drink/initiatives/food-waste-reduction-roadmap. 56 WRAP, ‘The Courtauld Commitment 2030’, https://wrap.org.uk/taking-action/food-drink/initiatives/courtauld-commitment.

129
household food waste in 2020. These positive changes, however, have started to
decline with people returning to a pre-pandemic lifestyle, and food waste levels
have increased again in 2021 to pre-pandemic levels.
Context and rationale
WRAP estimates that in 2018, total annual food waste across the UK reached 9.5
million tonnes. The highest contributor to this total by weight were UK households,
with 70% of post-farmgate waste arising in the home.
There are various approaches to measuring household food waste. For the
purposes of this report, statistics have been chosen that are frequently updated to
make tracking changes easier. The WRAP research used here estimates that
bread, chicken, milk, and potatoes are some of the products most likely to be
wasted, and therefore asked consumers to estimate the percentage that was
thrown away uneaten of these four products following the last time they purchased
each item.
Data and Assessment
Figure 2.2.3a: Estimated UK percentage of bread, chicken, milk, and potatoes
wasted

130
Source: WRAP food waste trends survey 202157
There was a 10% decrease in reported levels of food waste, from almost a quarter
(24.1%) of four key products in November 2019 to 13.7% in April 2020. This was
mainly due to improved food management behaviours adopted during lockdown.
Levels of food waste then rebounded to some degree but remained consistently
below pre-lockdown levels across 2020. Self-reported food waste in June 2021 is
now back in line with the levels recorded in 2018. It remains below the results for
2019 but shows a return to pre-pandemic levels.
Trends
WRAP’s research in 2020 provided important insights into was how well UK
households responded to the pandemic by adopting positive food management
behaviours. The decline in food waste in 2020 indicates how important it is to
foster and maintain behavioural change to reduce food waste in the long-term.
The gradual increase in food waste observed in 2021 could be an indication that
returning to a pre-pandemic lifestyle, where people spend more time outside the
house and experience higher levels of time pressure, has a negative influence on
behaviours and waste levels.
WRAP also produces more in-depth research into household food waste but at a
less frequent rate than the self-reported household levels presented in this report.
Based on their data, there has been an overall 31% per capita reduction in edible
household food waste with the majority of the reduction having occurred between
2007 and 2010.58
Indicator 2.3.1 Sustainable agriculture
Headlines
Sustainable production methods ensure the UK’s long term food security by
protecting the natural capital embedded in healthy soil, water, and biodiverse
ecosystems. Food security rests ultimately not on maximising domestic production
(which is market driven), but on making best use of land types which vary in
quality and potential uses. Balancing and integrating food production with
57 WRAP, ‘Food waste trends survey’, https://wrap.org.uk/resources/report/food-waste-trends-survey-2021. 58 WRAP, ‘UK progress against Courtauld 2025 targets and UN Sustainable Development Goal 12.3’, https://wrap.org.uk/resources/report/uk-progress-against-courtauld-2025-targets-and-un-sustainable-development-goal-123.

131
environmental factors supports efficient and sustainable land use without
offshoring harms associated with lower production standards. Following the UK’s
departure from the EU, new government incentives are being developed or
considered across the four UK nations to support sustainable production.
Context and Rationale
Food production does not happen in isolation from society or the environment.
Farming can damage soil, air, and water, drive species loss and contribute to
climate change, all of which threaten the current and future productivity and
sustainability of agriculture, and therefore food security itself. On the other hand,
good farming practices can reduce or reverse these harms, encourage
biodiversity, and capture carbon all while producing healthy food.
Agricultural policy is devolved across the four UK nations. Following the UK’s
departure from the EU, the UK governments are able to set their own agricultural
support schemes. The Scottish Government is currently consulting on a future
policy, and the Welsh Government plans to launch a Sustainable Farming Scheme
in 2025. In England, Defra has announced three new environmental land
management schemes to pay farmers for land management and environmental
services. The environmental impacts of these schemes may also affect
productivity and Defra is investigating different methodologies to assess these.
Future Food Security Reports will aim to show the effect these schemes have on
food security.
Organic farming is in broad terms an indicator for current environment-orientated
food production in the UK. Other systems such as no and low-till farming,
agroecology, and agroforestry also contribute towards balancing sustainability and
food production. Organic farming practices do not allow the application of chemical
fertilisers or pesticides, or the routine feeding of antibiotics to animals, and they
also have high standards for animal welfare. Consequently, productivity tends to
be lower than in conventional systems. One of the core principles of organic
farming is that by good land management, such as crop rotation, environmental
harms can be reduced and soil health improved, offering greater sustainability in
the long run.

132
Data and Assessment
Figure 2.3.1a: UK area of land in-conversion and fully organic
Source: Organic certification bodies collated by Defra statistics
In 2020, organically farmed land represented 2.8% of total UK farmed area, at a
little under 500,000 hectares. Organically farmed land has declined from a peak in
2008, but risen slightly again since 2018, while the number of organic processors
and producers continues to fall, now down over 25% since 2008. These trends
seem to indicate movement towards fewer farmers managing larger areas of land,
mirroring trends across agriculture.
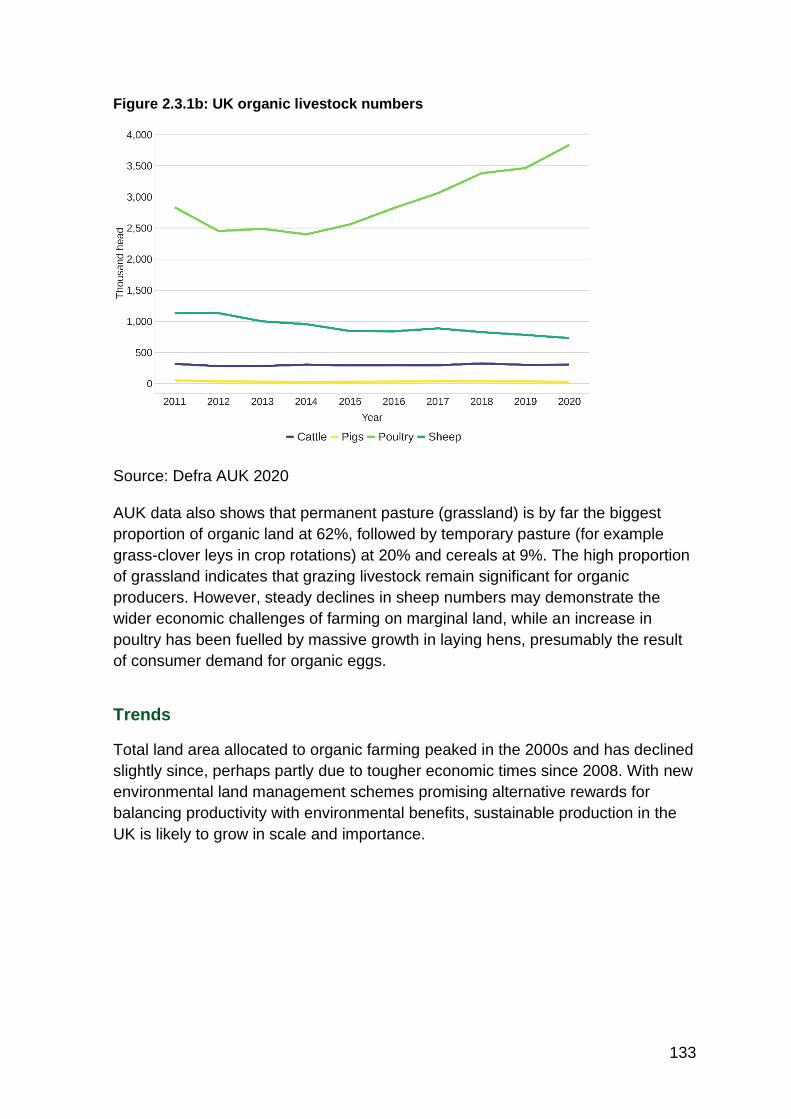
133
Figure 2.3.1b: UK organic livestock numbers
Source: Defra AUK 2020
AUK data also shows that permanent pasture (grassland) is by far the biggest
proportion of organic land at 62%, followed by temporary pasture (for example
grass-clover leys in crop rotations) at 20% and cereals at 9%. The high proportion
of grassland indicates that grazing livestock remain significant for organic
producers. However, steady declines in sheep numbers may demonstrate the
wider economic challenges of farming on marginal land, while an increase in
poultry has been fuelled by massive growth in laying hens, presumably the result
of consumer demand for organic eggs.
Trends
Total land area allocated to organic farming peaked in the 2000s and has declined
slightly since, perhaps partly due to tougher economic times since 2008. With new
environmental land management schemes promising alternative rewards for
balancing productivity with environmental benefits, sustainable production in the
UK is likely to grow in scale and importance.

134
Indicator 2.3.2 UK soil health
Headlines
Estimates suggest soil degradation, erosion, and compaction result in losses of
about £1.2 billion each year and reduce the capacity of UK soils to produce food.
Context and Rationale
Soil health is essential to the long-term security of food production globally and in
the UK, and the Climate Change Committee has also identified it as one of the key
concerns for climate change. Soil health is affected by several factors, including
structure, water retention, soil organic matter, mineral content, and damage
through erosion, compaction, and contamination. There is some data available,
but the challenge of covering it graphically reflects the difficulties of adequately
representing the complexity of soil health with any single indicator, and the great
variety of soil types in the UK. Consequently, this section relies on qualitative
analysis.
Data and Assessment
Two soil health factors tracked by Defra are soil nitrogen and phosphorus levels,
which have remained broadly stable over the last ten years at around
90kg/hectare and 6kg/hectare respectively.59 Indicators on nitrogen and
phosphorus levels in soil are useful for judging optimum fertiliser application rates
but have little to say about soil health more generally.
Soil erosion reduces productive capacity and causes nutrient loss, as well as off-
site environmental harms such as water pollution. Improving soil organic matter
can benefit long term soil health and sustainable productivity. For example, with
some cereals, planting early in the autumn to establish soil cover reduces soil
erosion risk while increasing yields.
It has been estimated that soil degradation costs England and Wales £1.2 billion
per year and that intensive agriculture has already caused arable soils to lose
40% to 60% of their organic carbon. Soil erosion in England and Wales is lower
than many other countries, but it is estimated that 2 million hectares are still at
risk. Around 3.9 million hectares are at risk of soil compaction in England and
Wales – nearly twice the total area of Wales – with a potential yield penalty of
59 Defra, ‘Soil nutrient balances UK 2020’, https://www.gov.uk/government/statistics/uk-and-england-soil-nutrient-balances-2020/soil-nutrient-balances-uk-2020-statistics-notice.

135
£163 million every year; the risk is highest on clay soils during wet periods.60
Similar impacts have been recorded in Scotland.61
Soil health is perhaps the single most important factor for future domestic food
production. It is hoped that future editions of the UK Food Security Report will
cover soil health with quantitative data as well as qualitative analysis, as filling this
data gap will be important for understanding future food security.
Trends
Soil health in the UK is an extensive and costly problem, but without proper
indicators it is difficult to determine the speed and direction of change. Climate is a
key factor in soil formation and processes, and severe degradation of soil would
have long-term, potentially irreversible, implications considering the critical
importance of soil for protecting the environment and providing high quality
farmland. Conversely, well-planned mitigation activities around soil management
have the potential to contribute to climate adaptation through, for example,
increased soil organic matter and water holding capacity, contributing to
‘sustainable intensification’.
Indicator 2.3.3 Climate change impacts
on yields
Headlines
Climate change and emissions pose significant risks to production and food
security. As a consequence of unusual weather patterns associated with climate
change, wheat yields in 2018 were 7% below the 2016 to 2020 average, and in
2020 were 17% below that average. Ozone in the low atmosphere has a separate,
ongoing effect on yields; total economic losses for wheat, potato, and oilseed rape
in the UK caused by damage due to ozone may have been over £185 million in
2018, with more than 97% of losses occurring in England.
60 Environment Agency, ‘State of the Environment: Soils’, https://www.gov.uk/government/publications/state-of-the-environment/summary-state-of-the-environment-soil. 61 CREW (Scotland’s centre of expertise for waters), ‘Effect of Soil Structure and Field Drainage on Water Quality and Flood Risk’, https://www.crew.ac.uk/sites/www.crew.ac.uk/files/publication/CRW2014_03_Soil_Structure_Drainage_Flood_Risk_Main_Report.pdf.
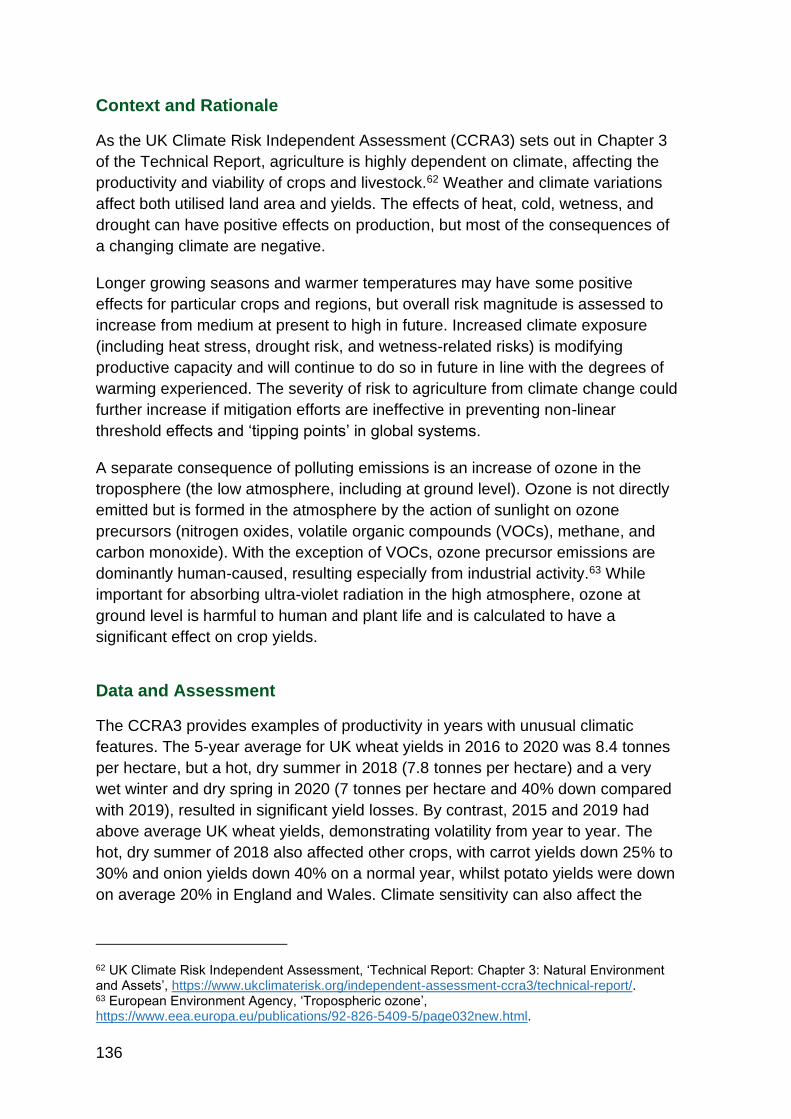
136
Context and Rationale
As the UK Climate Risk Independent Assessment (CCRA3) sets out in Chapter 3
of the Technical Report, agriculture is highly dependent on climate, affecting the
productivity and viability of crops and livestock.62 Weather and climate variations
affect both utilised land area and yields. The effects of heat, cold, wetness, and
drought can have positive effects on production, but most of the consequences of
a changing climate are negative.
Longer growing seasons and warmer temperatures may have some positive
effects for particular crops and regions, but overall risk magnitude is assessed to
increase from medium at present to high in future. Increased climate exposure
(including heat stress, drought risk, and wetness-related risks) is modifying
productive capacity and will continue to do so in future in line with the degrees of
warming experienced. The severity of risk to agriculture from climate change could
further increase if mitigation efforts are ineffective in preventing non-linear
threshold effects and ‘tipping points’ in global systems.
A separate consequence of polluting emissions is an increase of ozone in the
troposphere (the low atmosphere, including at ground level). Ozone is not directly
emitted but is formed in the atmosphere by the action of sunlight on ozone
precursors (nitrogen oxides, volatile organic compounds (VOCs), methane, and
carbon monoxide). With the exception of VOCs, ozone precursor emissions are
dominantly human-caused, resulting especially from industrial activity.63 While
important for absorbing ultra-violet radiation in the high atmosphere, ozone at
ground level is harmful to human and plant life and is calculated to have a
significant effect on crop yields.
Data and Assessment
The CCRA3 provides examples of productivity in years with unusual climatic
features. The 5-year average for UK wheat yields in 2016 to 2020 was 8.4 tonnes
per hectare, but a hot, dry summer in 2018 (7.8 tonnes per hectare) and a very
wet winter and dry spring in 2020 (7 tonnes per hectare and 40% down compared
with 2019), resulted in significant yield losses. By contrast, 2015 and 2019 had
above average UK wheat yields, demonstrating volatility from year to year. The
hot, dry summer of 2018 also affected other crops, with carrot yields down 25% to
30% and onion yields down 40% on a normal year, whilst potato yields were down
on average 20% in England and Wales. Climate sensitivity can also affect the
62 UK Climate Risk Independent Assessment, ‘Technical Report: Chapter 3: Natural Environment and Assets’, https://www.ukclimaterisk.org/independent-assessment-ccra3/technical-report/. 63 European Environment Agency, ‘Tropospheric ozone’, https://www.eea.europa.eu/publications/92-826-5409-5/page032new.html.

137
quality of produce, with consequences for food security. For example, weather
conditions prior to harvest can impact the quality of milling flour and its protein
content. Changes in temperature and humidity can also exacerbate problems with
pests, diseases, and heat stress, as set out in the next case study.
On the positive side, warmer temperatures may open opportunities for new crops,
and a reduction in the frequency of frost days across the UK has benefits for both
arable agriculture and horticulture, through reduced incidence of frost damage for
vulnerable crops. However, many tree species and other crops need a period of
cold weather to produce a good crop every year, and therefore suffer from a lack
of proper cold temperatures over winter.
Beyond unusual temperatures, rainfall and drought, the consequences of climate
change also include increased risk of wildfires, flooding, coastal erosion, and high
winds. All of these can have severe impacts on agricultural production in affected
areas.
A report for the UK Centre for Ecology and Hydrology calculates that the ozone
impact on crops in 2018 reduced UK wheat production by 5.5%, amounting to a
production loss of 800,000 tonnes with an economic value of approximately £125
million (at average prices for 2018).64 The highest production losses were
indicated for eastern and southern counties of England, particularly
Cambridgeshire, Essex, Suffolk and Lincolnshire, and parts of Hampshire,
Wiltshire and Dorset. It also reduced UK potato yield by 6.5%, resulting in a loss of
305,000 tonnes of potato tubers worth £50 million, with the highest production
losses in parts of North Yorkshire, Cambridgeshire, Hertfordshire and
Bedfordshire. Ozone reduced UK oilseed rape production by 1.9% in 2018,
amounting to 39,000 tonnes of lost production, worth £11 million; the highest
production losses were predicted for central England.
Ozone also affects other plants, reducing flower numbers in perennial grassland
by 10%, annual total biomass increment in perennial grassland in the UK by 2.7%,
and annual biomass increment in managed broadleaf woodland by 7.3%. These
impacts could affect overall biodiversity, and livestock and biomass yields, with
consequences for land use.
Trends
Climate change poses a risk to UK food production already, and this risk will grow
substantially over the next 30 to 60 years. Minimising the extent of global warming
64 Centre for Ecology and Hydrology, ‘NECD Reporting 2020 – Quantifying and mapping exceedances of ozone flux-based critical levels for vegetation in the UK in 2018’, forthcoming, https://uk-air.defra.gov.uk/library/, pages 4 to 5.

138
and addressing the risks it poses to food production are both essential to future
food security. Ozone causes yield loss every year, particularly in Southern and
Eastern England.
Case Study 2.1 Climate change: farming
impacts and risks65
Understanding how the climate is projected to change across the UK during the
21st century is vital for UK agriculture, food security, and commercial food sectors.
Plants, animals, and soils are affected by the weather through variations in
temperature, rainfall, and humidity. Climate-related impacts may occur through
gradual change, or as a result of more rapid changes triggered by extreme
weather events such as drought and flood.
The UK climate is changing, average temperatures have increased, and seasonal
rainfall is highly variable. To understand how the climate may change in the future,
the UK Climate Projections (UKCP18) use a range of climate models to provide
probabilistic simulations of UK climate to the end of the 21st century in a high
concentration climate scenario known as RCP 8.5.
How might temperature change in the future?
From the UKCP18 data, all areas of the UK are projected to experience warming,
particularly in the summer, which could have implications for growing season
duration, crop yield, and quality. Regional projections for 2061 to 2080, using the
RCP 8.5 scenario, show greater warming in Southern England compared to
northern regions of the UK.
Warmer temperatures will increase the occurrence of heat stress, which can
impact livestock productivity, fertility, welfare, and mortality. The area of greatest
risk for thermal heat stress in dairy cattle now and in the future is South West
England. Other key areas of high future risk and large risk increases include
Northern Ireland, Wales, the Midlands, North West England and North West
65 Met Office Hadley Centre Climate Programme 2018 to 2021, Developed from Joanna Jones,
Edward Pope, Debbie Hemming, Freya Garry, James Bacon and Jemma Davie, ‘Future climate
risk to UK agriculture from compound events’,
https://www.sciencedirect.com/science/article/pii/S2212096321000115.

139
Scotland. Risk of thermal heat stress in dairy cattle is projected to increase by
over 1000% in South West England, the region with the most dairy cattle.
Warmer temperatures can also encourage fungal diseases such as potato blight
(in combination with higher relative humidity), and other pests and pathogens,
including the peach-potato aphid (Myzus persicae) which is a risk to over 400
plant species, including potatoes and sugar beet.
The Met Office is currently researching how increasing future temperatures may
impact different livestock types, combined with changes in grass productivity.
Figure 2.1a: Increases in risk for future climate (2051 to 2070) compared with
current climate (1998 to 2017) for thermal heat stress in cattle (red) and potato
blight (brown).
Risks to soils from changes in UK rainfall
Understanding climate impacts on soil erosion is vital for ensuring a sustainable
and resilient food system. Using the UKCP18 climate simulations, the Met Office
looked at the potential future impacts of climate change on soil erosion risk
through changes to rainfall erosivity.

140
Figure 2.1b: Categorisation of erosion risk using mean annual precipitation totals
and annual mean erosion values derived from hourly precipitation data for the
UKCP18 convection permitting models. Regions with low rainfall-high erosivity
density and high rainfall-high erosivity density are considered at the greatest risk
of erosion.
Rainfall erosivity is the measure of rainfall total and intensity, and is one of five
main predictors that can be used to describe soil loss rates. To identify regions at
risk of soil erosion, information on present-day soil erodibility is combined with
rainfall erosivity.
The study looked at rainfall total and erosivity across the UK for three time periods
(1980 to 2000, 2020 to 2040, and 2060 to 2080) in a high concentration climate
scenario (RCP8.5). Key findings include:
• Large projected increases in areas of relatively high erosion risk and potential soil degradation across South and East England.
• By 2060 to 2080, regions considered at the greatest risk of soil erosion, due to rainfall, included the Midlands, East Anglia, and the Yorkshire coastline.
• Combined with the soil erodibility data, a large area of Southern England is at risk of increased rates of soil erosion.
Potential impacts: Arable farming in East Anglia is likely to be adversely affected
by soil erosion, due to the entire region being considered at relatively high risk of
erosion by 2060 to 2080. The results shown in the figure below only consider
meteorological factors, and further work is needed to incorporate land cover and
land management practices for a comprehensive assessment of erosion risk.

141
How might seasonal and spatial rainfall patterns change in the future?
Rainfall is the largest source of water for growing grass and crops in the UK.
Changes in rainfall patterns can impact water storage, plant productivity, and
cause soil erosion and waterlogging. Using data from UKCP18, the Met Office
looked at how annual rainfall across the UK may change in the future. As
highlighted in the figure below, by 2051 to 2070 average 12-month rainfall
accumulations are projected to increase across North West England, Scotland,
and coastal regions around Wales. In contrast, rainfall accumulations across the
rest of England and Wales are projected to decrease. Annual rainfall variability is
projected to increase with greater potential for both extremely high and low
national rainfall totals. South-central England and North West Scotland are
projected to experience the greatest annual rainfall variability, which may require
changes in water management.
Figure 2.1c: Difference in average 1-year rainfall accumulations (measured in
mm) compared to baseline period (1991–2010) under RCP8.5, using bias
corrected UKCP18 convection-permitting climate model projections.
Risks to UK agricultural areas from drought
Seasonal drought can lead to significant reductions in crop yield and there is
currently a 3% chance per year that at least 80% of the UK wheat area could
experience drought. Wheat varieties that are tolerant to a range of weather
conditions, such as flooding and drought, may need to be considered in the future.
Recent Met Office research used UKCP18 simulations to assess the future impact
of drought in the UK, focusing on the period 2041 to 2070. Key findings include:

142
• Winters are projected to be slightly wetter, on average, while all other seasons are projected to be typically drier, particularly June to September.
• During the summer months, the South East showed the greatest increase in severe drought conditions.
• Between April and October drought conditions are more likely, suggesting that a changing climate will affect water availability during the UK’s main crop growing season.
Indicator 2.3.5 Environmental impacts of
agriculture
Headlines
Agriculture is impacted by the environment and climate change, but it also affects
them in turn. The UK has environmental standards and targets relating to water
quality, meeting Net Zero, and biodiversity, all of which continue to be areas where
agriculture has a negative impact on the environment.
Context and Rationale
As well as soil health (discussed at Indicator 2.3.2), agriculture also has an
impact on water, air, and living things.
In some areas an abundance of water falls and flows, whereas in other areas it is
a scarce and valuable resource and is abstracted for agricultural use. As a
percentage of total water abstraction this is tiny (around 1% in England), but this
abstraction is highly regionally and seasonally concentrated and represents a
substantial burden in some areas, particularly in summer months. Furthermore,
agriculture can have a negative effect on water bodies that provide other vital
services, especially through pollution caused by soil and fertiliser run-off.
The farming sector is a significant source of greenhouse gases, such as methane
and nitrous oxide from livestock and fertilisers. Carbon dioxide emissions are
largely caused by farm vehicles and machinery and can also result from poor soil
management.
Biodiversity is an important indicator for understanding the overall sustainability of
food production, fisheries, and farming practices in the UK. Good biodiversity also
provides important ecosystem services to agriculture. Biodiversity is difficult to
measure, so Defra has tended to rely on the long-standing Farmland Bird Index,
which tracks the numbers of 19 bird species: 7 ‘generalist’ species that thrive in

143
many environments, and 12 ‘specialist’ birds which rely heavily on farmland
habitats. Birds sit at the top of the food chain and reflect the diversity and
availability of insect and plant species; however, they directly show only a part of
the biodiversity picture, and do not in themselves provide ecosystem services to
agriculture.
Data and Assessment
WRAP’s 2019 progress report on the Courtauld 2025 Water Ambition notes that
14% of rivers are over-abstracted and nearly a quarter of rivers in England are at
risk from unsustainable water abstraction; a similar proportion of aquifers are
classed as in ‘poor quantitative status’.66 The same study asserts that 86% of
rivers do not meet good ecological status and over 50% of England’s freshwater
and wetland species have declined since 1970.
For water availability, the UK is vulnerable to drought and flooding. The 2018
drought severely affected harvests, resulting in costly alternatives such as
sourcing onions from New Zealand to fill supply gaps. UKCP18 show projected
patterns of hotter, drier summers and a risk of more frequent and intense periods
of aridity, which will have an impact on water availability for agriculture and food
production. Building resilience reduces risk but could also have positive effects.
For example, WRAP estimates that better water management could boost crop
production by 20% globally.
Agriculture contributes to the pollution of water bodies through run-off and soil
absorption of fertilisers and manure nutrients, pesticides, sediments, and faecal
bacteria. High nutrient concentrations damage aquatic ecosystems and must be
removed from drinking water, which is expensive. The same WRAP report
estimates that it costs approximately £1.2 billion each year to remove pollutants
from water so that it is safe to drink. At the same time, soils and nutrients are lost
into watercourses through diffuse pollution. It has been estimated that agriculture
accounts for around 61% of the total nitrogen in river water in England and Wales
and around 28% of the total phosphorus load in river water in Great Britain.
Diffuse water pollution from agriculture and rural land use has been directly
attributed to 28% of failures to meet Water Framework Directive (WFD) standards
in England.67 This is monitored separately across the four nations.68
66 WRAP, ‘Working together to protect critical water resources, https://wrap.org.uk/resources/report/working-together-protect-critical-water-resources. 67 Parliamentary Office of Science and Technology, ‘Diffuse pollution of water by agriculture’ https://researchbriefings.files.parliament.uk/documents/POST-PN-478/POST-PN-478.pdf. 68 Environment Agency, ‘2021 River Basin Management Plan: Nitrates’, https://consult.environment-agency.gov.uk/++preview++/environment-and-business/challenges-
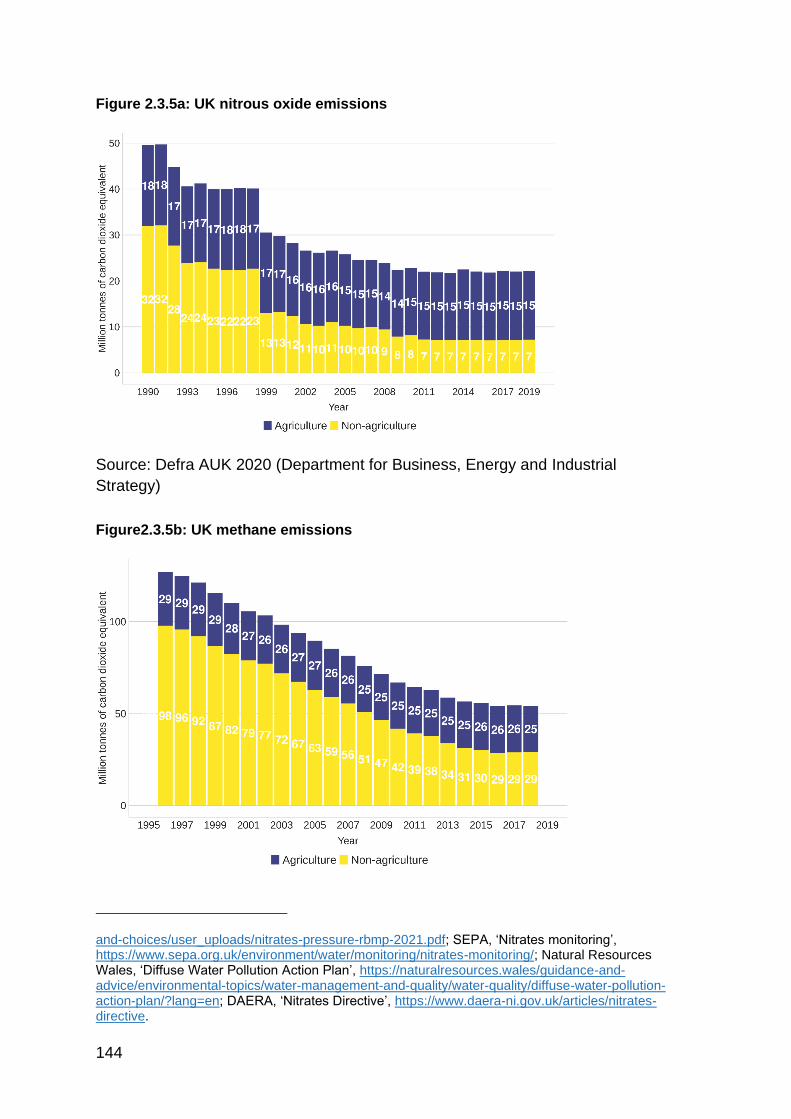
144
Figure 2.3.5a: UK nitrous oxide emissions
Source: Defra AUK 2020 (Department for Business, Energy and Industrial
Strategy)
Figure2.3.5b: UK methane emissions
and-choices/user_uploads/nitrates-pressure-rbmp-2021.pdf; SEPA, ‘Nitrates monitoring’, https://www.sepa.org.uk/environment/water/monitoring/nitrates-monitoring/; Natural Resources Wales, ‘Diffuse Water Pollution Action Plan’, https://naturalresources.wales/guidance-and-advice/environmental-topics/water-management-and-quality/water-quality/diffuse-water-pollution-action-plan/?lang=en; DAERA, ‘Nitrates Directive’, https://www.daera-ni.gov.uk/articles/nitrates-directive.

145
Source: Defra AUK 2020 (Department for Business, Energy and Industrial
Strategy)
Agriculture accounted for about 11% of total greenhouse emissions in the UK in
2019, with agricultural emissions 13% lower than in 1990. This was primarily the
result of reduced livestock numbers following BSE and foot and mouth outbreaks
in the 1990s and early 2000s, and have not reduced significantly since 2008. A
recent WRAP report estimates that total UK food system emissions are equivalent
to 35% of UK territorial emissions; over a third of food system emissions are from
production overseas.69
Agricultural emissions of nitrous oxide and methane declined through the 1990s
and 2000s and have remained fairly stable since. The majority of nitrous oxide
emissions from agriculture result from manure management and application of
organic and mineral fertilisers to land, and have fallen with lower fertiliser
application rates. The majority of methane emissions come from enteric ruminant
digestion in livestock, which has fallen and then remained level just as livestock
numbers have. There is research underway to investigate the link between
ruminant diet and emissions to see if food additives like Bovaer 3-NOP or dietary
supplements such as seaweed might help mitigate methane emissions. Even
between systems producing the same outputs (like beef or dairy), greenhouse gas
emissions vary greatly, and average emissions are not necessarily that
informative. A nuanced, full lifecycle approach to policy on agriculture and
greenhouse gases is required to understand the complexities.
It is also important to consider greenhouse gases in a global context to ensure the
UK does not export emissions (and other environmental harms) to other parts of
the world by replacing domestic production with imports from more
environmentally damaging systems.
69 WRAP, ‘UK Food System GHG Emissions’, https://wrap.org.uk/resources/report/uk-food-system-ghg-emissions.
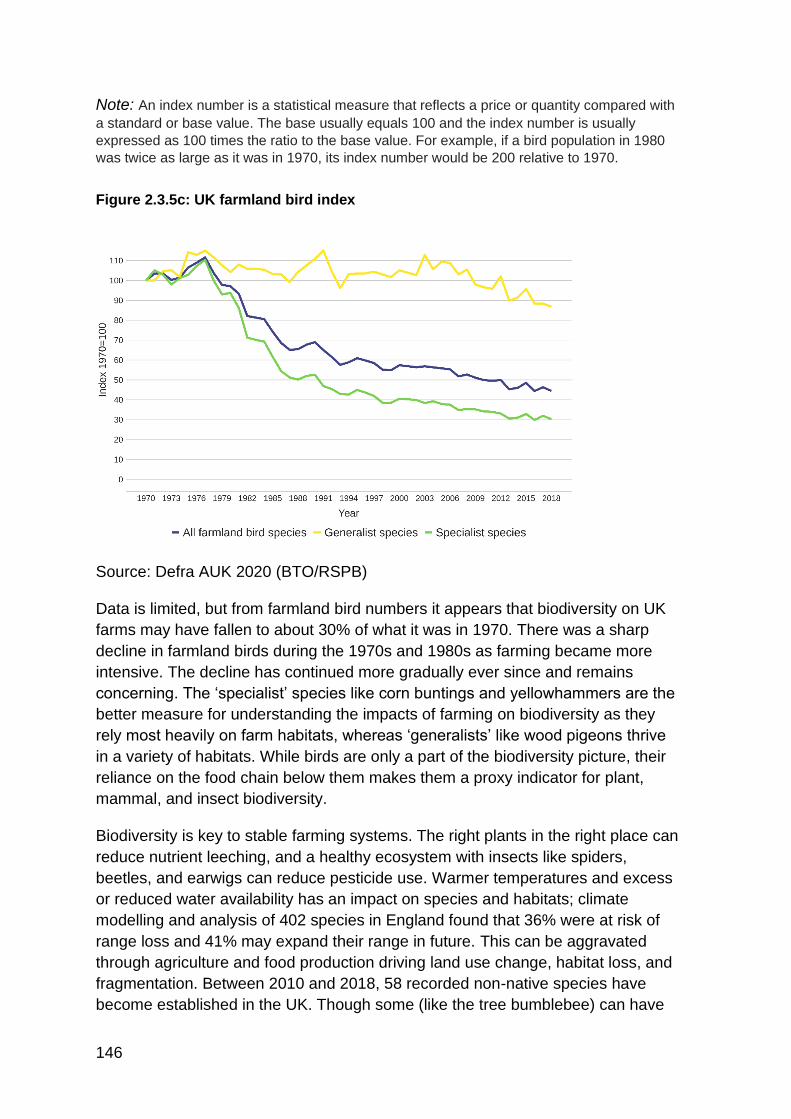
146
Note: An index number is a statistical measure that reflects a price or quantity compared with
a standard or base value. The base usually equals 100 and the index number is usually
expressed as 100 times the ratio to the base value. For example, if a bird population in 1980
was twice as large as it was in 1970, its index number would be 200 relative to 1970.
Figure 2.3.5c: UK farmland bird index
Source: Defra AUK 2020 (BTO/RSPB)
Data is limited, but from farmland bird numbers it appears that biodiversity on UK
farms may have fallen to about 30% of what it was in 1970. There was a sharp
decline in farmland birds during the 1970s and 1980s as farming became more
intensive. The decline has continued more gradually ever since and remains
concerning. The ‘specialist’ species like corn buntings and yellowhammers are the
better measure for understanding the impacts of farming on biodiversity as they
rely most heavily on farm habitats, whereas ‘generalists’ like wood pigeons thrive
in a variety of habitats. While birds are only a part of the biodiversity picture, their
reliance on the food chain below them makes them a proxy indicator for plant,
mammal, and insect biodiversity.
Biodiversity is key to stable farming systems. The right plants in the right place can
reduce nutrient leeching, and a healthy ecosystem with insects like spiders,
beetles, and earwigs can reduce pesticide use. Warmer temperatures and excess
or reduced water availability has an impact on species and habitats; climate
modelling and analysis of 402 species in England found that 36% were at risk of
range loss and 41% may expand their range in future. This can be aggravated
through agriculture and food production driving land use change, habitat loss, and
fragmentation. Between 2010 and 2018, 58 recorded non-native species have
become established in the UK. Though some (like the tree bumblebee) can have

147
positive effects, overall these are one of the top 5 threats to England’s natural
environment, with estimates of the economic cost at around £1.3bn per annum.70
Farming practices and global supply chains have accelerated their spread.
A fuller view of biodiversity indicators, including pollinators, marine environment,
non-native species, and many others can be found in a new report on UK
biodiversity indicators by the Joint Nature Conservation Committee.71
Trends
Water health and abstraction are both expensive societal costs, and important
issues for agriculture to address for a sustainable, food-secure future. WRAP is
working towards the Courtauld 2030 Water Ambition to improve water quality and
availability through sustainable water management; a progress report on a series
of UK (and international) case studies on water use can be found in the 2021
annual report.72
Greenhouse gas emissions from agriculture have reduced overall since 1990, but
have not changed in recent years. The newly published Net Zero Strategy sets out
areas where innovation and emerging technologies may support the sector in
adapting to climate change, and also discusses alternative proteins (Chapter 3,
sections 22 and 33).73 WRAP’s Courtauld Commitment 2030 aims to reduce UK
food system greenhouse gas emissions by 50% by 2030 (alongside targets on
water and waste).74
The continued decline of farmland birds shows that the agricultural intensification
which accelerated in the 1970s continues to harm the UK’s biodiversity and,
consequently, ability to produce food sustainably and in symbiosis with nature. A
changing climate also increases the threat to specific species and ecosystem
services through spread of new pests, pathogens, and invasive non-native
species. Farming and food production can exacerbate these risks but could also
play a major role in supporting the UK’s natural ecosystems, delivering mutual
benefits to biodiversity and society.
70 UK Climate Risk Independent Assessment, ‘Technical Report: Chapter 3: Natural Environment and Assets’, https://www.ukclimaterisk.org/independent-assessment-ccra3/technical-report/, pages 24 and 47 to 48. 71 JNCC, ‘UK Biodiversity Indicators 2021 Revised’, https://jncc.gov.uk/our-work/uk-biodiversity-indicators-2021/. 72 WRAP, Courtauld Commitment Annual Report 2021, https://wrap.org.uk/resources/report/courtauld-commitment-annual-report-2021. 73 BEIS, ‘Net Zero Strategy: Build Back Greener’, https://www.gov.uk/government/publications/net-zero-strategy. 74 WRAP, ‘Courtauld Commitment 2030’, https://wrap.org.uk/taking-action/food-drink/initiatives/courtauld-commitment.

149
Theme 3: Food Supply Chain Resilience
This chapter of the UK Food Security Report looks at food security in terms of key
infrastructure underlying the supply chain. Sourcing and supplying food to
consumers in the UK is dependent on a complex and interacting web of systems.
The theme considers how efficient and resilient systems are to transport, store,
manufacture, and sell food on its path from commodity to consumers. It describes
the potential threats and vulnerabilities to the sophisticated ‘just-in-time’ supply
chains underlying the modern food system and how industry and government
collaborate to prepare for and respond to issues.
In terms of this theme, food security means a supply chain that is consistently able
to deliver adequate quantities of food, both through preparing for disruption and
having the capacity and flexibility to respond effectively to unexpected problems. A
resilient supply chain is robust and resilient, possessing an ability to recover from
disruption and which can re-orientate to alternate outcomes when necessary.
Key Messages
• The UK is resilient to potential shocks in the food supply chain. Supply
systems, which are owned and operated by the private sector, are
adaptable and flexible in responding to problems. Government monitors
risks and works with industry to respond to emerging issues and maintain
supply chains.
• Notable risks to the supply chain stem from its dependence upon other
critical sectors including energy, transportation, borders, labour, key inputs
(chemicals, additives and ingredients), and data communications. In
addition, the threat of cyber-attack to UK businesses, including those in the
agri-food sector, is significant and growing.
• The food and drink sector’s dependency on energy has marginally declined
thanks to increased energy efficiency, whereas demand for energy in the
agricultural sector has remained stable in the last 20 years.
• Both EU and non-EU food imports, via all modes of transport, are well
spread across a number of ports of entry, with no port having a dominant
share. There is, however, a reliance upon the Short Strait for some food
products, including fruit and vegetables (62% of fruit and vegetable imports
arrive from the EU via the Short Strait), meats (43%), and dairy (41%). Only
simultaneous disruption to several ports would be serious enough to have a
material effect on UK food supply.
• Securing sufficient labour at appropriate skill levels presents additional
issues for the agriculture and food sectors. This includes short-term
challenges, mainly due to high levels of absenteeism caused by
coronavirus (COVID-19), and the longer-term challenges of filling vacancies
across the agri-food sector.

150
• A number of pressures in recent years, including the COVID-19 pandemic
widely impacted the UK food supply chain. However, it also demonstrated
the resilience held within supply chains, through an effective industry-led
response, supported by government, to apply key mitigations to uphold
continuity in the food supply chain.
The UK’s food supply chain is a highly complex system. It encompasses:
• primary producers (for example, farming, fishing)
• food manufacturing (for example, factories, process plants, mills, refineries,
production plans)
• logistics (for example, storage, distribution centres, transportation, ports)
• wholesale and retail (for example, wholesalers, supermarkets, local
businesses)
• food services (for example, restaurants, cafes and caterers).
The importance of the UK food supply chain cannot be overestimated. Food is
one of 13 Critical National Infrastructure (CNI) sectors in the UK. CNI sectors are
“those facilities, systems, sites, information, people, networks and processes
necessary for a country to function and upon which daily life depends”.75 Every
element of the supply chain, from food manufacturing to retailers, relies on
physical infrastructure (buildings, vehicles, machines, power and data
connections); digital infrastructure (the digital technologies that provide the cyber
foundation for information technology and operations); human infrastructure (the
skilled people who work in the supply chain and their working relationships with
each other) and economic infrastructure (the system of finance, contracts and
agreements that allow businesses to make money and operate productively.)
Problems arising anywhere in this system can cause disruption to the supply of
food.
In the UK the underlying infrastructure of the supply chain is owned and operated
by private industry. The agri-food sector holds the capability, levers, and expertise
to respond to potential disruptions.
Food supply policy including risks relating to resilience and security is devolved to
each national administration. National Security and Counter Terrorism (CT) policy
is a specific reservation under the Home Affairs heading. As lead departments for
food as a CNI sector, Defra and the Food Standards Agency (FSA) manage those
risks specifically relating to National Security and CT across the UK government.
However, the role of government is an indirect one; to plan for and coordinate
responses and intervene only where necessary to ensure the continuity of supply.
75 CPNI, ‘Critical National Infrastructure’ (2021), https://www.cpni.gov.uk/critical-national-infrastructure-0

151
Energy and other critical resource inputs
All stages of the food supply chain, including production, processing, packaging,
distribution, transport, retailing and the consumption of food itself, are dependent
on their use of energy, other key inputs, and the functioning of critical
interconnected systems. Fluctuations in the energy market also affect the prices of
commodities or key inputs such as carbon dioxide (CO2). These fluctuations can
therefore affect the economic viability of food businesses.
Over the last 20 years, energy demands for UK agriculture have remained
consistent whilst demand for energy from the food and beverage sector has
declined in the same period, indicating increased energy efficiency. This reduces
the risk posed to businesses by disruption to energy supply or price shocks, but
the sector remains reliant on energy sources, which can be volatile. The source of
risks to the supply of electricity, natural gas, and petroleum products varies, with
the most significant current risks being a reliance on imported natural gas.
Disruptions to major power networks in August 2019 highlighted the challenge of
energy supply for the food system. Though the power disconnection itself was
relatively short-lived, the knock-on impacts to other services were significant. This
event demonstrated the need for essential service providers, including those in the
food sector, to have robust business continuity plans in place for disruptive events
such as power outages.
Certain goods critical to the functioning of the food supply chain are known as ‘key
inputs’ and their supply is monitored by government. Although the provision of
these goods is industry led, government supports industry in developing plans and
mitigations to ensure continuity of supply.
Key inputs in the food supply chain are diverse and interface with an array of
different markets. Challenges to access for these key inputs can come from a
range of sources and causes. As an example, disruptions to CO2 supply occurred
both in 2018 (as a result of unexpected maintenance and operational challenges
for fertiliser plants) and 2021 (as a result of complex economic factors ultimately
caused by an increase in the price of natural gas). Where necessary, government
can make targeted interventions to support continuity of supply, and over the
longer-term, work with industry to build resilience.
Transport and logistics
The transport sector plays a strategic role in connecting the UK food supply chain.
It links UK ports, farms, food manufacturers, retailers, food service providers, and
consumers. It is essential to the import and export of food. Food is primarily
transported by sea, road and rail, and recent challenges related to the COVID-19

152
pandemic and the UK’s departure from the EU have made clear just how reliant
the food supply chain is upon the transport sector.
The UK food supply chain is dependent upon just-in-time logistics systems, which
allow the transportation of all food within short timeframes and as close as
possible to when it is needed. For fruit, vegetables, and other items with a short
shelf life, this allows food to be as fresh as possible and avoids food waste. These
transportation systems are highly efficient, regular, and predictable, and allow
consumers to have widespread access to food on supermarket shelves.
Just-in-time supply chains are sensitive to disruption to transport, particularly in
road freight. Overall delay times on the Strategic Road Network, responsible for
two thirds of all freight, have increased over the last five years.
Ports of entry to the UK are particularly important links in the just-in-time supply
chain. As a nation the UK imports 46% of the food it consumes. Having a diverse
range of international supply sources provides greater flexibility and makes food
supply more resilient in the event of disruption. Equally, diversity in these access
points provides flexibility and greater resilience in response to disruptions.
Around a quarter of the UK’s food imports pass through the Short Strait (Dover
and the Channel Tunnel), and short-life products from the EU are highly reliant on
these routes. 62% of fruit and vegetable imports from the EU arrive via the Short
Strait, 43% of meats and 41% of dairy imports. Food and beverage imports are
otherwise spread across a number of ports of entry, with no one port dominating.
Despite diversity of entry for the most part, UK ports are also subject to a variety of risks that may be geographically correlated, such as tidal surges on the East Coast. The impact of any disruption to ports would depend on the length and scale of the disruption, as well as the ability to find alternative points of entry in the timescales required. A further consideration is the dependency of the UK on the resilience and regulatory approach of ports, especially in the EU. For example, imports can be severely disrupted by border closures. Border issues may have different dynamics and affect freight differently. During the COVID-19 pandemic, the UK experienced two border closures, neither of which caused serious supply issues.
Labour and skills dependency
Throughout the supply chain, people are vital. In growing and harvesting,
transporting goods, food manufacturing, and in retail of finished food products, the
agri-food workforce employs 4.1 million people and represents 13% of Great
Britain’s employment. The continuity of food supply is dependent upon securing
sufficient labour with skills necessary to carry out specialised tasks.

153
The types of roles across the agri-food sector are vast. They include skilled and
highly skilled roles – including, for example, engineers, butchers, supervisors,
auditors, and veterinary nurses. The agri-food sector is also highly reliant upon
roles classified as ‘low-skilled’. These roles are often labour intensive and
common in the agriculture and hospitality sectors.
There are challenges securing sufficient labour across the agri-food chain. These
challenges are both short-term and longer-term and interact with the wider
challenges facing the UK economy, posing a threat to food supply resilience. They
include dependency on agricultural seasonal workers and other skilled food chain
labour from the EU along with the continued impact of COVID-19 on the
workforce.
Food retail and wholesale
Diversity is essential to food security, not only in terms of trade in agri-food
commodities, but also within the domestic supply chain which consists of retailers,
food manufacturers, wholesalers, and food service operations. If one major supply
chain or company were to fail, for example due to economic failure, cyber-attack,
or power failure, there could be a significant impact on availability of, and access
to, food, if other parts of the supply chain were not able to help to fill the gap.
The size and diversity of the UK food retail and wholesale sector provides
economic resilience. The greatest risk is in the retail sector, where the five biggest
retailers have 60% of market share between them. The size and diversity of the
food supply chain allows flexibility when an agri-food business fails, however the
COVID-19 pandemic has placed pressure on all parts of the food supply chain –
especially in the wholesale sector. The closure of the hospitality sector due to
COVID-19 and other lockdown impacts resulted in financial distress across
significant parts of the wholesale market. However, despite these pressures the
wholesale sector maintained financial viability and food supply was not
compromised.
Consumer behaviour
The UK’s just-in-time food supply chain relies on balancing supply with
consumers’ demand. Consumer behaviour can cause sudden demand shocks
and impact the effectiveness of the food supply chain. Given the UK’s history of
secure food supply, consumer shocks resulting from stockpiling are rare.
However, during disruption caused by the COVID-19 pandemic, industry proved
effective in responding to increased demand, with government taking a supporting
role. Consumer behaviour was characterised by a moderate increase in the
amount of food purchased and in the number of shop visits made, rather than
indiscriminate ‘panic buying’.

154
Cyber threats
The risk of cyber-attack to UK businesses is significant and continues to grow. It
presents a threat to all CNI sectors. The nature of cyber-attacks means that they
are varied and that attackers can adapt their approaches to their targets.
While the UK food supply chain has not been subject to significant attack,
disruptions have been recorded in other areas of the globe with implications for
their food security. Given the interconnectedness of the global food supply chain
attacks elsewhere potentially also pose risks for UK food supply.
Indicator 3.1.1 Business resilience and
response
Headline
The food supply chain is entirely owned and operated by private business, which
is adaptable and flexible in responding to problems. Government monitors risks
and works with industry to respond to emerging issues and maintain supply
chains. A number of pressures in recent years, including the unprecedented stress
of the COVID-19 pandemic, have threatened supply chains, but industry
response, with government support, has succeeded in maintaining overall supply.
Context and Rationale
The threats which can impact the continuity of the UK food supply chain are
diverse. The most significant risk of disruption lies in the agri-food sector’s reliance
upon other critical sectors, for example energy and transport. Disruption
experienced in one sector could put food supply chain continuity at risk. Given the
wide range of potential shocks and disruptions that might occur within the agri-
food chain – whether affecting energy, labour, data communications, raw materials
(known as key inputs), or transport – government and industry need to be
confident that adequate continuity and contingency planning is in place to mitigate
against these risks.
The capability, levers, and expertise to respond to disruption lie with the agri-food
industry, which is experienced in dealing with scenarios that can affect food supply
disruption. Government’s role is to support and enable an industry-led response.
This includes extensive and ongoing engagement to support industry in
preparedness for, and response to, potential food supply chain disruptions.

155
Defra, other UK government departments, and the devolved administrations
routinely identify, prepare, and respond to risks of national significance. This
includes contributing to the National Security Risk Assessment, a classified and
scientifically rigorous cross-government assessment of the most serious threats
facing the UK and its interests overseas.76 The National Risk Register (NRR)
provides public information on the most significant risks that could occur in the
next two years, and which could have a wide range of impacts on the UK.
The COVID-19 case study illustrates how the UK government, devolved
administrations and industry collaborated effectively to mitigate against the risks of
COVID-19. It also highlights the need for both industry and government to
continue business continuity planning.
This indicator remains qualitative due to the commercial confidentiality of the agri-
food sector.
Data and Assessment
The COVID-19 pandemic response demonstrated that the UK has a resilient food
supply chain and a food industry which is good at responding to disruptions.
Government actions, such as the temporary relaxation of UK Competition Law,
supported industry in working collaboratively to minimise disruption, establish
alternative supply routes and suppliers, and accommodate pressures in the supply
chain.
The risks to the UK food supply chain from COVID-19 in 2020 were complex and
unprecedented. The impacts were highly interrelated across the food supply chain
and required a combination of mitigation measures to safeguard future continuity
of supply. It is therefore difficult to identify the effectiveness of each individual
mitigation measure, as it was the diversity of these actions which allowed product
availability to steadily improve from late March 2020. It is clear that close
collaboration between UK government, the devolved administrations and industry
was critical to the effectiveness of the COVID-19 response.
Defra and the devolved administrations have continued to develop mitigations in
response to evolving risks and issues associated with COVID-19. For example, in
anticipation of border congestion in January 2021, government developed the
Expedited Return Scheme (ERS) which allowed the prioritisation of empty food
vehicles travelling from the UK to the EU through the Kent Traffic Management
System. This allowed food vehicles to restock and return to the UK with fresh
76 Cabinet Office, ‘National Risk Register 2020’ (2020), https://www.gov.uk/government/publications/national-risk-register-2020, p. 5.

156
supplies. The ERS did not need to be activated and congestion issues were
managed at the border.
In recent years the agri-food sector has experienced significant challenges not
limited to COVID-19. This has included although is not limited to; the March 2021
disruptions to global supply chains in the Suez Canal; shortages of key inputs
such as CO2; and labour and skill shortfalls in critical sectors. Although consumer
choice may have been temporarily affected by these risks, the agri-food sector has
ensured that there has not been an overall food shortage within the UK’s supply
chain.
Case Study 3.1 COVID-19 response
Overview
The COVID-19 pandemic widely impacted the UK food supply chain. The
government played a supportive role, utilising well-established ways of working
with the food industry. This support enabled an industry-led response that met the
demand placed on it.
Background
This case study reflects the UK’s response to COVID-19 across the agri-food
sector at the start of the pandemic and the months that followed. Interventions
differed in some ways across England, Scotland, Wales, and Northern Ireland.
COVID-19 and its impacts still present risks to the UK’s food supply despite the
resilience of industry.
At the beginning of the crisis, early in 2020, risks to the UK’s food supply began to
materialise. These included:
• An upsurge in demand for certain products due to increased consumer
purchasing. This represented a demand shock and led to temporary
shortages of mainly non-food products, partly caused by a perception of
potential shortages in the food supply chain.
• Increased staff absences due to rates of COVID-19 and requirements to self-
isolate.
• Social distancing requirements meant businesses needed to adapt ways of
working to maintain operability within their sectors, reducing capacity.
• Financial difficulties in food sector businesses, particularly due to closures of
some sectors, for example, in hospitality.
• Minor international trade disruption and quotas leading to some temporary
shortages of products.

157
• Difficulties for those classified as ‘vulnerable’ (financially
vulnerable/shielded/elderly) in accessing food throughout the lockdown
stages.
Discussion
Defra worked closely and quickly with the food sector, other government
departments, and the devolved administrations to understand key issues and
develop interventions to ensure food supply to the UK population. A number of
government measures were put in place to maintain food supply chain resilience.
Stakeholder Engagement
Stakeholder forums were used to maintain regular communication between
industry, government departments and the devolved administrations. These
included:
• The Food Chain Emergency Liaison Group (FCELG): Defra’s long-
established food industry sector working group for resilience and security
issues. The group formally met regularly to identify and mitigate potential
risks to food supply and interdependent sectors. The group also met in
emergencies to act as a conduit between the food industry, UK government,
and the devolved administrations. The FCELG has since been replaced by
the Food Supply Resilience Planning Group, focusing on planning for
medium- to longer- term risks to the food supply chain.
• Food Resilience Industry Forum (FRIF): a bespoke forum which was
established at the start of the COVID-19 pandemic to support the logistical
and technical operations of food supply across the UK food supply chain.
• Sector specific industry meetings aimed at providing effective
communication between food sectors and government.
• The Scottish Government’s Food Sector Resilience Group: specific to
Scottish stakeholders, but similar to FCELG and FRIF, with regular
ministerial involvement. A Scottish Public Sector Food Forum was also
established.
Temporary measures introduced by industry
• Communications to the public – government worked closely with retailers
to develop and share messaging that aimed to help consumers understand
the resilient nature of the supply chains and the impacts of their own actions.
• Item limits on high demand goods (food and non-food) – to allow time
for restocking of popular products.
• Specific shopping slots allocated for vulnerable groups and key
workers both online and in person – to ensure access to food.
• Social distancing measures for public and staff – to safeguard individuals
from COVID-19 infection.

158
• Enhanced cleaning measures – to mitigate against the spreading of
COVID-19.
Temporary measures introduced by government
Defra and wider government introduced a number of temporary mitigation
measures:
• Extended delivery and drivers’ hours – relaxing regulations on delivery
times and driver regulations to allow a higher frequency of deliveries to and
from stores.
• Relaxation to UK Competition Law – two separate exclusion orders (the
Competition Act 1998 (Groceries) (Public Policy Exclusion) Order 2020)
allowed grocery retailers and their suppliers (directly or indirectly) to
collaborate effectively to prepare for and, if required, respond to potential
disruption only in the instance that it related to specified ‘qualifying activities’.
This allowed more open discussion on areas such as stock levels, item limits,
and store hours. A temporary relaxation to UK competition law was also
made specifically for the dairy sector to allow further collaboration in the
supply chain.
• Relaxation of the plastic bag fee for minimum contact between deliveries
and more time-efficient deliveries.
• Labelling easements to allow for minor deviations on labels.
• The Pick for Britain campaign and website - a collaboration with industry
to ensure sufficient seasonal labour for domestic food production.
• Food parcels for shielded groups - to ensure the clinically vulnerable had
access to food during lockdown.
• Government support for businesses experiencing increased costs and
disrupted cash flow as a result of COVID-19. This included the Coronavirus
Job Retention Scheme, the Coronavirus Business Interruption Loan
Schemes for small and large businesses (CBILS/CLBILS) and the Bounce
Back Scheme for small and medium enterprises (SMEs)
• The Trade Credit (TCI) Reinsurance Scheme which provided £10bn of
guarantees on business-to-business transactions currently supported by
TCI, backdated to April 2020 and running to 31 December 2020.
• Legislation supporting information sharing agreements between
industry and government. Defra included provisions in the Coronavirus Act
(2020) which allowed government powers to obtain information from industry
if necessary in a disruption. However, these provisions were not brought into
effect due to the continued collaborative relationship between industry and
government.

159
• Adding essential food items to the Category 1 (CAT 1) goods list during
COVID-19 response - to allow inclusion in mitigations where appropriate,
such as prioritisation on commercial freight and access to hauliers.
Trends
The government will continue to review threats and risks as part of its
responsibilities to food as a Critical National Infrastructure (CNI) sector. The risks
exposed through the COVID-19 pandemic and transition planning for EU Exit have
highlighted the significance of business continuity planning within industry and
helped inform risk mitigation as part of their operations. Government intelligence
suggests that broadly, industry continues to prioritise business continuity planning
where possible. However, this is more likely to be possible for larger agri-food
companies than for small and medium-sized enterprises (SMEs).
Indicator 3.1.2 Energy dependency in the
food sector
Headline
The food supply chain is highly dependent upon the energy sector and vulnerable
to both short-term supply disruption and medium-term energy price fluctuations.
Demand for energy from the food and beverage sector has declined in the last 20
years, reflecting increased energy efficiency, but the sector remains reliant on
imported natural gas. Demand has remained consistent for the agriculture sector
for the past 20 years.
Context and rationale
The food supply chain depends directly and indirectly upon energy through its
reliance upon common energy sources such as electricity, natural gas, and
petroleum products. This dependency is evident across the supply chain, through
production, processing, packaging, distribution, transport, retailing and
consumption of food itself. Energy security is vital to the functioning of the whole
economy. The food supply chain has high energy demands and is vulnerable to
disruptions to energy supply or changes in energy prices. Capturing the energy
intensity of the food supply chain is complex because it spans several sectors not
all of which are purely food related. If the UK’s energy supply is not secure, the
food supply chain will be vulnerable to disruptions.

160
Fluctuations in the energy market may affect the prices of commodities or key
inputs such as carbon dioxide (CO2), and thus the economic viability of food
businesses. Oil prices represent one of the most important drivers of change in
global food commodity prices. Consumer prices also depend on wider factors
including agri-food import prices, domestic agricultural prices, domestic labour and
manufacturing costs, and Sterling exchange rates.
The UK meets its energy needs through production and trade. In 2020, total
energy net import dependency was 28% of primary supply. This was 7.2
percentage points lower than 2019 and the lowest level since 2009, largely a
result of lower demand during the COVID-19 pandemic.
For oil, import dependency varies by product. The UK is a net exporter of petrol
meaning all demand could be met through indigenous production alone in the
event of disruption. In 2020, the UK met close to 60 percent of road diesel
demand through indigenous production. The UK imports diesel from a large
number of sources which increases security of supply. The UK is self-sufficient in
the production of gas oil (red diesel) which is commonly used by agricultural
vehicles.
In recent years around half of natural gas demand was met through indigenous
production, in 2020 this was 54%. The remainder is met through imports via
pipelines and of liquefied natural gas (LNG). In 2020, a third of supply was met
through imports from Norway. The UK has a large number of other import sources
which increases security of supply.
A small proportion of UK electricity supply is provided by imports. In 2020, net
imports accounted for 5.4% of supply. Whilst domestic generation capacity is
sufficient to meet UK needs, interconnectors can provide additional flexibility and
reduce costs. Northern Ireland and the Republic of Ireland have a single electricity
market, by which electricity can flow freely across borders, balancing the market
for the whole island of Ireland.
The Department for Business, Energy and Industrial Strategy (BEIS) is the lead
UK Government Department for the risk of major power disruption. BEIS works
closely with the Cabinet Office and other government departments to ensure that
appropriate preparedness and mitigation measures are in place so that impacts
from energy supply disruption are minimised.
This indicator includes data collected from BEIS through the Digest of UK Energy
Statistics (DUKES) to illustrate energy demand in the food and drink
manufacturing and agriculture sectors. A case study is provided on the major
power disruption which took place on Friday 9 August 2019.

161
Data and assessment
Indicator: Aggregate energy demand for agriculture and food and drink
manufacturing
Sources: DUKES
Figure 3.1.2a: Aggregate energy demand for agriculture and food and drink
manufacturing.
In 2020, natural gas accounted for close to 60% of demand in the food and drink
manufacturing sector, whilst electricity accounted for a third. Although minimal,
demand for energy from bioenergy and waste has increased in recent years in line
with substantial growth in renewable energy production. Continuing this trend in
line with Net Zero targets may be challenging for manufacturing processes that
use high temperature heat sources for which electricity is less effective than
gas/petroleum products.

162
Figure 3.1.2b: Energy demand by energy type in the food and drink manufacturing
sector.
Overall total demand for energy by the food and drink manufacturing sector has
remained stable in the last 20 years. Natural gas meets 60% of energy needs
followed by electricity at a third.

163
Figure 3.1.2c: Energy demand by energy type in the agriculture sector.
Demand for energy in the agricultural sector shows an increase in 2016, which is somewhat explained by methodological updates. This includes apparent increased demand for petroleum products from 2015, in fact due to a change in method of estimating sector demand for oil products, and a peak in bioenergy and waste in 2013-14.77 To note, further revisions and back casting were delayed due to COVID-19 and will likely be published in 2022.
Petroleum products play an important role in the agricultural sector, meeting more than 60% of energy needs. Within the DUKES balance this largely consists of burning oil, used for drying of crops and heating, and gas oil (commonly known as red diesel) used to power non-road machinery (NRMM). In addition, a small amount of propane is used, mainly for heating (most commonly on poultry farms). Indirect agricultural demand for energy inputs such as fertiliser are not captured within this sector of the balance, but in demand for energy by the chemical industry.
The drop off in demand for coal is in line with reducing coal demand across the
board.
77 BEIS, ‘Change to method of estimating sector demand for oil products’ (2019), https://www.gov.uk/government/publications/energy-trends-june-2019-special-feature-article-change-to-method-of-estimating-sector-demand-for-oil-products

164
Trends
In absolute terms, energy used in food and drink manufacturing has generally
been declining over the last 20 years (more significantly on a per capita basis),
reflecting increased energy efficiency. For agriculture, energy use has been more
stable, with a slight upward trend between 2016 and 2020. Energy use in
agriculture is also likely to be impacted by other inputs such as fertiliser, which is
not reflected here.
Case Study 3.2 9 August 2019 Power
Outage: Food Sector Impact
Overview
On Friday 9 August 2019, over 1 million customers were affected by a major
power disruption that occurred across England, Wales, and some parts of
Scotland. Though the power disconnection itself was relatively short lived - as all
customers were restored - the knock-on impacts to other services were significant.
This event demonstrated the need for essential service providers, including those
in the food sector, to have robust business continuity plans in place for disruptive
events such as power outages.
Background
The 9 August power disruption was triggered by a lightning strike to an overhead
transmission line and the near simultaneous loss of a number of generators. The
loss of generation caused an imbalance between the amount of electricity being
generated and the amount of electricity being used by businesses and the public.
This triggered an automatic protection system (known as Low Frequency Demand
Disconnection) which had the effect of disconnecting over 1 million customers to
address the imbalance and protect the electricity network from a total shut down.
Although all customers were restored within 45 minutes, a number of sites and
services were impacted including:
• Rail – 371 cancelled services, 220 part cancelled services and 870 delayed
trains; some signalling assets were also affected. Major delays extended into
Sunday 11 August.
• Hospitals – 4 hospitals automatically switched to their back-up generators.
• Water Treatment – 3,000 customers experienced a reduction in water
pressure and 1 water treatment plant needed to switch to its back-up
generator.
165
• Airports – 2 airports automatically switched to their back-up generators.
Discussion
The majority of these services were not disconnected by the Low Frequency
Demand Disconnection Scheme. Instead, the service disruptions were caused by
protection systems under the control of individual essential service operators,
which reacted to the disturbance on the electricity network.
A number of investigations were carried out by the impacted industries to better
understand why internal safety systems reacted to the frequency and voltage
fluctuations in the way that they did and whether any mitigations are available. For
example, the rail industry took proactive steps to assess why some trains stopped
operating when the frequency on the power network dropped. Several engineering
and incident response solutions were introduced to ensure resilience to future
potential power disruptions. These are set out in the Office of Rail and Road’s
report on the rail disruption.78
Impacts were further exacerbated by the ineffectiveness of essential services’
business continuity plans. Guidance developed by the Energy Emergency
Executive Committee (E3C) was developed and cascaded to operators of
essential services to ensure their preparedness and resilience to a range of
possible power disruption scenarios. The E3C includes industry, regulators, UK
government and devolved administrations who work together to build resilience in
energy supplies
Whilst the power outage did not have a large impact on the food sector - no
disruptions were reported across the food production, distribution or sale - this
event illustrates the importance of adequate preparation and planning for power
disruptions, to minimise any disruption to customers and the public.
78 Office of Rail and Road, ‘Report following railway power disruption on 9 August 2019, (2020) https://www.orr.gov.uk/media/10752

166
Indicator 3.1.3 Transport dependency in
the UK
Headline
The functioning of the food supply chain depends on an efficient transport
network, especially the road network. Just in time supply chains are sensitive to
disruption to transport, particularly in road freight. Overall delay times on the
Strategic Road Network, responsible for two thirds of all freight, have increased
over the last five years.
Context and rationale
The transport sector plays a strategic role in connecting the UK food supply chain.
It links UK ports, farms, factories, retailers, food service providers, and consumers.
It is essential to the import and export of food. Food is primarily transported by
sea, road and rail. Food products were the most common commodity imported by
UK-registered heavy goods vehicles in 2020, with 1.2 million tonnes imported,
accounting for 35% of all imports.79,80
The UK food supply chain is dependent upon the use of ‘just-in-time’ logistics,
which allow the transportation of food within short timeframes and as close as
possible to when it is needed. For fruit, vegetables and other items with a short
shelf life, this allows food to be as fresh as possible and avoids food waste. These
transportation systems are highly efficient, regular, and predictable, and allow
consumers to have widespread access to food on supermarket shelves. Food
security disruption could however occur if the continuity of the transportation
system was compromised. The reasons for transport disruption could include, for
example, border delays, extreme weather events, flooding or any other accidental
or malicious disruption affecting multiple points of the transportation network. As a
result of the just-in-time approach, retailers do not usually hold substantial stock
on-site, meaning that the supply chain is sensitive to sudden increases in demand
and disruption is likely to be felt relatively quickly. However, on such occasions,
the UK is unlikely to experience an overall shortage of food, though some
products may experience temporary disruptions. On such occasions products in
short supply may be able to be sourced from alternative suppliers.
79 35% includes food products, beverages and tobacco. 80 DFT, ‘International Road Freight Statistics’, (2021) https://www.gov.uk/government/statistics/road-freight-statistics-2020

167
The COVID-19 pandemic and the challenges related to EU Exit have illustrated
how reliant the food supply chain is upon the transport sector. During the
pandemic, despite shocks to the food system, food supply was maintained with
only temporary disruptions. Although there are ongoing recruitment and retention
challenges of Heavy Goods Vehicle (HGV) drivers which has caused significant
challenges within the transport sector. Certain areas of the UK, in particular
remote and island communities, are more vulnerable to disruption occurring in the
transport system due to the length and complexity of their supply lines. EU Exit
has also created new challenges for supply of food to Northern Ireland, which has
in general a more complex supply chain due to the greater distances and ferry
connections needed to ship goods from Great Britain.
As all food is transported at least part of the way via road, this indicator looks at
the Road Congestion and Travel Time Statistics collected by the Department for
Transport (DFT) which cover the Strategic Road Network (SRN) in England. The
SRN is the most heavily used part of the national road network covering
motorways and major A roads, and carries a third of all traffic and two-thirds of all
freight. Delay indicators are only available for the SRN in England. However, as a
high proportion of food to all parts of the UK travels through England, this indicator
is relevant to the food supply of the entire UK.
Data and Assessment
Indicator: Road Congestion and Travel Time Statistics
Sources: Strategic Road Network
Figure 3.1.3a: Average speed on the Strategic Road Network (SRN).

168
This indicator only includes data up to the end of 2019 as from March 2020 the
average speed increased due to there being fewer vehicles on the road during the
first COVID-19 lockdown. The DFT has published a report on the impact of the
pandemic on travel time measures, including estimates of what average speeds
would have been in 2020 without coronavirus impacts.81
The average monthly speed on the Strategic Road Network in England varied between 57
and 61 miles per hour from 2015 to 2019. Each year the month with the slowest average
speed is November, while April often has the highest. There is seasonality within the
congestion data, with higher speeds experienced around April and slower speeds in
November, after the clocks change. This change causes a slight increase to average
delays which might be due to darker mornings causing people to get up later, therefore
increasing the number of people using the roads during peak times. In April, when the
clocks go forward, the average delay is slightly lower, which could be attributed to people
getting up earlier with the lighter mornings, decreasing the number of vehicles on the
roads during peak times. This seasonality is generally incorporated into planning by
hauliers and other logistics businesses.
81 DFT, ‘Impact of the coronavirus (COVID-19) pandemic on travel time measures’ (2020), https://www.gov.uk/government/statistics/travel-time-measures-for-the-strategic-road-network-and-local-a-roads-july-2019-to-june-2020/impact-of-the-coronavirus-covid-19-pandemic-on-travel-time-measures.

169
Figure 3.1.3b: Average delay on the Strategic Road Network (SRN) in England,
2019.
The average delay on individual main carriageway links was less than 10 seconds
across England in 2019. Around major cities, the delay was approximately 20
seconds per vehicle per mile (spvpm). This could be due to the high demand on
the network around them, relative to their capacity. The roads with the greatest
year-on-year increases in delay also tended to have the greatest decreases in
average speed. These were primarily in areas with ongoing roadworks,
implemented as part of the Road Investment Strategy (RIS).

170
Figure 3.1.3c: Average delay on the Strategic Road Network (SRN).
For 2019, the average delay on the SRN was estimated to be 9.5 seconds per
vehicle per mile (spvpm) compared to speed limits. This is 0.9% higher compared
to 2018, which means on average there were more delays in 2019 than 2018.
2019 is used as a reference year because the travel restrictions under COVID-19
in 2020 affected traffic flow in a way that was atypical.
Since 2016, there has been a gradual increase in the average delay on the SRN
in England, although the number of vehicles travelling on it over that time has
increased at a greater rate.
Average speeds on the SRN have decreased slightly by 0.5 miles per hour (1%
decrease) since 2016, while in the same period average delays have increased by
0.5 spvpm (5% increase).
Overall, continuity of the SRN system is expected to be maintained. There has
been a slight worsening in average delay times which can be explained by the
decrease in average speeds due to roadworks. However, in the past 5 years there
have been no significant disruptions to just-in-time supply chains, suggesting high
food security for food already within the UK.
171
Trends
In absolute terms there has been a slight increase in average delay times on the
SRN, although this is not significant. It will be important to monitor any changes
resulting from structural breaks caused by COVID-19 and the UK’s exit from the
EU. Longitudinal evaluation of the SRN will be needed to determine its resilience.
The road freight sector has been impacted by a reduction in the number of drivers. An estimated 268,000 people were employed as HGV drivers between July 2020 and June 2021. This is 39,000 fewer than the year ending June 2019, and 53,000 fewer than the peak of 321,000 HGV drivers during the year ending June 2017.82 The UK government is taking action to address this shortage.83 This includes attracting drivers back to the industry by investing £32.5 million to improve facilities across the country, to investing £17 million to create new HGV Skills Bootcamps to train up to 5,000 more people to become HGV drivers in England.
Indicator 3.1.4 Points of entry in the UK
Headline
Food imports from the EU, particularly short shelf-life goods, are concentrated on
the Short Strait (Dover and the Channel Tunnel). The risks of this concentration
are discussed in Indicator 3.1.5. Imports are otherwise spread across a number
of ports of entry, with no one port dominating non-EU imports.
Context and Rationale
The UK’s points of entry are the places where goods enter the country from abroad. Food from overseas, as well as animal feed and fertiliser inputs for domestic agriculture, enter the country through these international gateways. The following analysis focuses mainly on UK seaports, which are the most important of those gateways. The Channel Tunnel and airports (particularly Heathrow) handle the remainder of the UK’s food imports, around 15% of the total.
82 Office for National Statistics (ONS), ‘Fall in HGV drivers largest among middle-aged workers’
(2021)
https://www.ons.gov.uk/employmentandlabourmarket/peopleinwork/employmentandemployeetypes
/articles/fallinhgvdriverslargestamongmiddleagedworkers/2021-10-19
83 UK Government, 'HGV driver shortage: UK government response', (2021) www.gov.uk/government/topical-events/hgv-driver-shortage-uk-government-response.

172
Understanding the spread of imports across the UK’s ports helps to identify key infrastructures such as port facilities, roads and railways which connect those ports to the food supply chain. Food security could be compromised where risks are not spread between a sufficient number of ports, or where there is a lack of flexibility to switch between suitable ports, should the need arise.
UK ports are also subject to a variety of risks that may be geographically correlated, such as tidal surges on the East Coast. The impact of any disruption to ports would depend on the length and scale of the disruption, as well as the ability to find alternative points of entry in the timescales required.
A further consideration is the dependency of the UK on the resilience and regulatory approach of ports in the EU from which the bulk of UK imports depart. This varies between countries like France, Spain, and the Netherlands, and affects the ease with which goods flow to the UK.
Data and Assessment
Indicator: Percentage share of UK food imports by port and mode of transport
Source: A report by Baker P, PRB associates (2020), commissioned by Defra
Figure 3.1.4a: Percentage share of UK food imports by port (EU countries, 2018).
The graph above shows the main ports used for UK food imports from the EU in 2018. The top six ports responsible for EU imports account for 58% of total shipments. The port of Dover represents the biggest source of EU food imports, at

173
22% of the total. In 2018, the UK imported 28 million tonnes of food products from the EU.
Figure 3.1.4b: Percentage share of UK food imports by port (non-EU countries,
2018).
Non-EU imports are more concentrated within the top 6 ports. The graph above shows that the top 6 ports account for 72% of non-EU imports, with Liverpool the biggest source of shipments, at 18%. In 2018, a total of 11.3 million tonnes of food products were imported from non-EU countries.

174
Figure 3.1.4c: Percentage share of UK food imports by mode of transport (EU
countries,
2018)
Although equivalent data is not available for non-EU countries, the graph above demonstrates the split of UK imports from EU countries by mode of transport. Accompanied ‘roll on roll off’ (RoRo) accounts for just over half of EU imports, at 52% of the total. This is when freight is carried in trailers attached to a road goods vehicle, on sea-going vessels fitted with ramps for discharging without the use of cranes. The next most significant is Bulk Good Transport, accounting for 23% of the total and involving the import of agricultural commodities, such as sugar and grain. Unaccompanied RoRo (freight carried on unattached trailer) and container ‘load on load off’ (LoLo) (cargo carried in 20-foot and 40-foot containers) account for the remaining quarter of food imports from the EU between them.
In aggregate, both EU and non-EU food imports, via all modes of transport, are well spread across a number of ports of entry, with no port having a dominant share. Only simultaneous disruption to several ports would be serious enough to have an overall effect on UK food supply.
There are clusters of ports used for handling food import traffic, for instance in the South East and North East regions. Their geographical proximity suggests that they could share some risks of disruption from extreme events such as coastal flooding. A tidal surge on the east coast could have a concurrent impact across multiple key ports in the UK and on the European mainland. Government, ports, and many businesses have plans to reroute goods to other ports in this event, but the combined effect of rerouting all east coast traffic would likely cause delays and

175
congestion at other ports.84 The just-in-time nature of the supply chain makes it vulnerable to this kind of disruption, with the greatest impact on availability of fresh produce.
However, the resilience of port infrastructure is not solely a matter of having a range of ports to potentially divert to. Alternative ports must have the correct protocols, staffing capacity and suitable infrastructure to receive food imports and different cargo types. A port’s capacity and configuration govern both the types and sizes of sea-going vessels that can be received, and therefore the types and quantity of food cargo that can be discharged there. Currently, there is a data gap at both the individual port and UK level, to allow for an accurate assessment of the ease with which food import traffic can be switched between ports in the event of disruption. This is an area which could be considered for future Food Security Reports.
Trends
There has not been a significant change in the diversification of EU and non-EU
food imports in recent years. It will be important to monitor any changes resulting
from the UK’s exit from the EU, or any new developments in port capacity, such as
the planned Poole-Tangier route.
Indicator 3.1.5 Food imports via Short
Strait
Headlines
There is a degree of reliance on the Short Strait import routes for some food
products, especially perishable goods such as fresh fruit and vegetables. In the
event of disruption to the Short Strait, it is expected that the use of alternative
points of entry could decrease the impact to food supply.
Context & Rationale
The Short Strait routes refer to the ferry connections between the port of Dover
and Calais and Dunkirk, and the Channel Tunnel railway connection between
Folkestone and Calais. The Short Strait routes are the shortest routes from Dover
to continental Europe, and offer advantages in time, cost, and frequency of
84 Achuthan and others, ‘Resilience of the food supply to port flooding on east coast’ (2015), http://randd.defra.gov.uk/Document.aspx?Document=13179_SynthesisReport.pdf.

176
services. The short journey times are particularly important for the transport of
goods with a short shelf life, such as fresh fruit and vegetables.
Given the perishability of many food products and the just-in-time basis of the food
supply chain, food importers have increasingly used these routes through shipping
in accompanied trailers. An over-reliance on the Short Strait routes could mean
that an issue with one or both of them could significantly disrupt the supply of
some imported food products.
It is estimated that 36% (10 million tonnes) of food imports from the EU arrived via the Short Strait in 2018, which equates to around 25% of total UK food imports. Given that around half of the food consumed in the UK is imported, it can be estimated that around 12.5% of food consumed in the UK is being imported via the Short Strait.
Data and Assessment
Indicator – Breakdown of the Short Strait food imports from the EU
Source: - The source of all the data in this section is a report by Baker P, PRB
associates (2020), commissioned by Defra
Figure 3.1.5a: Percentage breakdown of the Short Strait food imports from the EU

177
Figure 3.1.5b: Breakdown (in tonnes) of the Short Strait food imports from the EU.
The graph above presents volumes data on the breakdown of food imports from
the EU and their corresponding shares of total food imports from the EU in 2018.
The UK is reliant on the Short Strait for certain food groups, in particular: fruit and
vegetables (62% of fruit and vegetables imported from the EU arrive via the Short
Strait), meats (43%) and dairy (41%). Of the total EU food products imported via
the Short Strait, it is estimated that 44% are fruit and vegetables, 19% are
beverages, 9% are meats, and 9% are dairy.
In addition, there are 0.3 million tonnes of non-EU food imports that arrive via the
port of Dover. Of those imports, 98% are “Edible fruit and nuts; peel of citrus fruits
or melons.”
There is some reliance on Short Strait routes for food imports of certain products,
there is potential for these imports to be redirected to other ports on the south and
east coasts of England in the event of disruption at Dover and the Channel
Tunnel.
Examples of ports that may be suitable for this substitution include Harwich,
Portsmouth, Immingham, Hull, and Killingholme. The ability of these ports to take
on additional shipments at potentially short notice will be determined by factors
including:
• current utilisation levels
• competing demand for spare capacity from other sectors
• having the relevant infrastructure
• trained inspection staff in place to accommodate increased traffic flows

178
• the ability of industry to reconfigure their supply chains.
Finding extra capacity could present significant challenges given the volumes
involved. In an ordinary week, around 36,000 trailers use the Short Strait
crossings, compared to 20,000 trailers on the North Sea and Western Channel
routes, all of which are much longer sailings. The port of Dover handled 1.07
million imports of road goods vehicles in 2020, while Harwich, Portsmouth,
Immingham, Hull and Killingholme handled 220,000 combined.
Trends
There has not been a significant change in the level of reliance on the Short Strait
routes in recent years, but the UK’s exit from the EU could affect this in the future.
Indicator 3.1.6 Border closures
Headlines
Border closures intended to control disease have the potential to threaten food
imports. Border issues may have different dynamics and affect freight differently.
The below case studies draw on two border closures experienced during the
COVID-19 pandemic; one imposed on the UK by France, and the other imposed
by the UK on Southern Africa and South America, neither of which caused serious
supply issues.
Context & Rationale
Border closures are the decision taken by a country to close its borders to people
or goods entering from elsewhere. Border closures limiting the travel of people
were used by the UK and other nations during the COVID-19 pandemic to limit the
spread of the virus.
Border closures pose a risk to the food supply chain as the UK imports around
45% of the food it consumes. Consequently, border closures can cause temporary
disruptions to the supply of certain food items, particularly fresh products from the
EU as these often arrive via road accompanied by a driver. Freight which arrives
unaccompanied is less susceptible to the impact of a border closure that prevents
hauliers from entering the UK. This is because no single person is accompanying
the food between countries. The container with the food inside is loaded onto a
ship and then collected by another driver at the destination port.

179
Although disruption to certain foodstuffs may occur, border closures are unlikely to
be a threat to overall food security as the UK’s food supply is diverse. In addition,
accurate data, real-time intelligence sharing, and cross-government collaboration
bolster the capacity of both government and industry to respond to border
closures. However, delays to shipments of fresh food can lead to shortages on
shelves due to the just-in-time supply chain, and economic losses through
spoilage. This section will include two case studies on the French-imposed border
closure in December 2020, and the UK imposed border closures for Southern
Africa and South American countries in January 2021.
Case Study 3.3 French Border Closure,
December 2020
Overview:
In December 2020, France closed its border with the UK as a consequence of the Alpha variant of COVID-19 circulating amongst the UK population. France banned the entry of people, including accompanied freight (both sea and air), from the UK at 23:00 Sunday, 20 December for 48 hours.
Travel bans were also imposed on the UK by other countries, including the Netherlands, Belgium, and Italy, though these restrictions did not include accompanied freight.
Background:
The border closure was a threat to the UK’s food supply due to the volume of food imports that come from or through France to the UK, and because of the lack of warning, which gave the UK little time to respond.
The UK imports many food items directly from France, such as 13.4% of cheese imports, 32.4% of yoghurt imports, 27.6% of apple imports, and 19.4% of bread, crispbread, and savoury imports. France accounts for 9.1% of the UK’s total food imports.
The France - UK route is also important for food imports from other EU nations. Many of these imports arrive accompanied, so the total ban on both people and accompanied freight posed a significant threat to the UK food supply.
This manifested in two ways. Firstly, hauliers transporting food were unable to
travel to the UK from France. Secondly, hauliers were stuck in the UK and unable
to return to mainland Europe to pick up more food.
180
Discussion
Despite the potential threat, no serious disruption to the supply of food into the UK occurred. The interruption was relatively short-lived, with the ban on accompanied freight lasting only 48 hours. Many businesses had sufficient stockpiles to mitigate this disruption to supply for this period.
French officials ended the restrictions after the UK government set up prioritised COVID-19 testing sites for hauliers, who could then return to France if they tested negative. Although the UK has a significant dependence on France-to-UK shipping lanes for its food imports, there are a number of other important routes such as from Rotterdam in the Netherlands, as well as domestic production.
The availability of data regarding UK imports of food and other key inputs in the
food supply chain was significant in this situation. The government always had the
evidence required to make informed decisions about the next steps. The
availability of communicable and up-to-date trade data is crucial in combatting
such instances of disruption.
Case Study 3.4 UK-Imposed Border
Closures (southern Africa; South
America), January 2021
Overview
In January 2021, the UK government imposed border closures due to the
presence of COVID-19 variants in several countries. The first border closure was
with South Africa in early January. It prevented aircraft travelling directly from
South Africa to England, as well as a ban on entry for travellers who had been in
or transited through South Africa in the previous 10 days. Equivalent restrictions
were imposed on all southern African countries.
In mid-January a second border closure of the same nature was imposed, this
time with Brazil and other South American countries.
Background
These border closures mirrored the French border closure in that only
unaccompanied freight was permitted into the UK. As this travel ban impacted
included over 20 countries, it posed a significant threat to food supply.

181
Discussion
Although direct flights were prevented from arriving in the UK, the arrival of
unaccompanied ships continued. Many of the food items imported from southern
Africa and South America such as bananas and grapes travel unaccompanied on
ships, so the travel bans did not disrupt their supply.
The risk to food supply was further reduced because food imports from both
regions remain relatively low in comparison to Europe. The three biggest
suppliers, Brazil, South Africa, and Argentina, only account for 1.7%, 1.6% and
1.5% of the UK’s total food imports respectively.
Combining Defra’s trade data with an understanding of how food imports are
transported, the government was able to impose travel bans without impacting the
UK’s food supply. It is crucial that the government continues to gather up-to-date
data in this area so that difficult decisions can be made efficiently and confidently.
Foreign-imposed border closures do not occur in a vacuum. Vulnerabilities that might normally be of minimal concern can be amplified in the context of a major incident. The French border closure occurred concurrently with two producers of a critical ingredient closing their UK production sites. In this instance, the supply of that ingredient was not severely disrupted but it is vital that the government tracks all such threats to the UK’s food supply, through live monitoring of issues as well as engaging with various stakeholders.
The UK imposed border closure was not inconsequential, but the impact on food
supply was small, and the impact on food security was virtually non-existent.
Trends
The UK has experienced an increased number of border closures due to the
COVID-19 pandemic. Whilst it is difficult to predict future incidents of border
closures, the food supply chain has illustrated its resilience in responding to such
disruptions.
Indicator 3.1.7 Key inputs to the food
supply chain resilience
Headline
Certain goods are critical to the functioning of the food supply chain. Although the
supply of these goods is industry led, government monitors the supply of these

182
key inputs and supports industry in developing plans and mitigations to ensure
continuity of supply. Where necessary, government is able to make targeted
interventions to maintain supplies.
Context & Rationale
Key inputs are those chemicals, ingredients and additives used in the production,
supply, and storage of essential food items. Essential food items are products that
are recommended for a nutritionally balanced diet in line with the Eatwell Guide
(for example cheese, fresh meat, bread).85
Key inputs include all inputs from farm to fork, with products as diverse as
fertilisers and chilled meats. In manufacturing, sodium hydroxide (NaOH) is a key
input as it is a cleaning agent necessary for the safe and hygienic manufacturing
of food. Other examples of key inputs include ammonium nitrate (fertiliser),
ethylene glycol (refrigerant), wheat flour (ingredient), tinplate (packaging), potable
water, and fresh fruit and vegetables (ingredient).
Key inputs in the food supply chain are diverse and interface with an array of
different markets. The same input could have a myriad of uses within the industry
and therefore be vulnerable to several shocks in the system. An example of this is
carbon dioxide (CO2) which is produced, in one instance, as a by-product of
ammonium nitrate and used in the meat and drinks manufacturing and packaging
industries.
Therefore, contingency planning is essential to ensure that industry and the
government are prepared to respond to different shocks to the system. In general,
key inputs are resilient to the most common disruptions.
The significance of key inputs to the food supply chain was highlighted during the
summer of 2018 when there was a shortage of CO2. This incident revealed that
for the government to have a comprehensive understanding of the food supply
chain, it was crucial to map hidden inputs like CO2. Since then, government has
gained foresight into the vulnerabilities in the supply of key inputs. Yet the 2021
shortage of CO2 has demonstrated that disruptions to key inputs are still a
genuine possibility.
The causes of disruption to key inputs are diverse. They include border or
transport disruption, company closures, shortages of HGV drivers or shortages of
products required to produce the key input.
85 PHE, ‘Eatwell Guide’, https://www.gov.uk/government/publications/the-eatwell-guide.

183
A ‘perfect storm’ of incidents like this can seriously disrupt the supply of key
inputs, so it is important that government maps and monitors them. The initial work
undertaken following the CO2 shortages in 2018, coupled with the work done
when the UK left the EU, ensured that the government was in a good position to
understand the potential vulnerabilities in the supply of key inputs into the food
supply chain during the first wave of COVID-19.
Data and Assessment
The government plays an active role in engaging with the agri-food sector to
develop industry-led mitigations. This includes providing advice on substitution
and seeking alternative supplier routes to mitigate against shortages of key inputs.
If disruption did occur, depending on the severity, and where industry mitigations
were not possible (e.g., alternative supplier, substitution, reasonable production
adjustment), the government would consider appropriate levers on a case-by-case
basis and work with the relevant departments to alleviate the impact. This could
include regulatory easements, laying legislation to relax food production or
labelling regulations, competition law exclusions or prioritising critical products in
freight transport into the UK.
An example of these mitigations is Government Secured Freight Capacity (GSFC),
a legacy mitigation that was put in place to reduce disruption in a no-deal scenario
to ensure a smooth movement of key input goods (known as Category 1 or CAT1
goods) into the UK through reserved freight capacity.
Within Defra, some industries produce certain CAT1 goods. This includes the food
sector which is dependent on key inputs such as raw materials, refrigerants and
additives (for example thiamine used in flour fortification). This intervention was
used to support the flow of key inputs into the food supply chain. On the date it
was stood down in June 2021, GSFC had never been used during the period of
live monitoring of disruption to key inputs into the food chain. This is a reflection of
the work done by Defra to anticipate a possible disruption in January 2021.
Additionally, Defra’s role within the Capacity Management Centre (CMC) – the
operation centre that ran GSFC – was highly successful in managing and
resolving any potential issues without needing further progress into GSFC.
The government, and in particular Defra, conducts research into key inputs into
the food supply chain and actively monitors their supply. Intelligence on supply of
key inputs is shared across government departments (for example BEIS and the
Department for Health and Social Care (DHSC)) and with industry, especially
during instances of increased potential for disruption. This collaboration is vital for
ensuring government has a clear view of threats to the food supply chain.

184
Collaboration was particularly important in the context of EU Exit and the COVID-
19 pandemic, which had the potential to place stress on the supply of key inputs
as a result of consumer-driven demand shocks, border closures, absenteeism,
and delays at ports. In addition, regular horizon scanning for signals of change
which might impact the supply of key inputs in the medium-term and long-term is
undertaken by government.
Figure 3.1.7a: How Defra monitors the supply of key inputs into the food chain
The aim of research into key inputs is two-pronged. Firstly, the research helps
government understand the importance of any particular key input to the food
supply chain. Secondly, it identifies vulnerabilities in the supply chain of each key
input. The research is centred on five broad characteristics:
1. Supplier – including major supplying companies; major supplying countries.
2. Transport – including lorry type; ship type; accompanied vs.
unaccompanied; driver qualifications required.
3. Supply Chain – including supply chain type; points of entry.
4. Production –including process automation; dependence on migrant labour.
5. Food Technology – including importance for essential food items; shelf life;
stockpiles; substitutability.
The government also considers cross-sectoral demand for key inputs to aid
prioritisation, as well as environmental questions such as the sustainability of their
production.
Overall, such work continues to provide insight into food chain key inputs to
understand their importance to the food supply chain and the vulnerabilities which
might exist in their supply. This has afforded government a clearer, more detailed
185
understanding of the food supply chain and has strengthened the capacity of
Defra to plan for, and ultimately mitigate, potential threats to the UK’s food supply.
The response to the carbon dioxide shortage illustrated government’s role in
coordinating an industry response to a short-term supply issue.
The government’s work in preparation for leaving the EU and during COVID-19
has helped to increase knowledge of the supply of key inputs into the food supply
chain. Within this, government has developed clear mitigations aimed at
supporting industry should there be disruption to a key input.
Case Study 3.5 Carbon Dioxide (CO2)
Shortage 2018
Overview
In June 2018 the agri-food sector experienced a shortage of carbon dioxide (CO2)
due to several concurrent factors.
Background
Carbon dioxide is used extensively in the food supply chain, including in supply,
storage, as a stunning gas in slaughterhouses, in the packaging of perishable
foods, the carbonation of soft and alcoholic beverages, the refrigeration of food,
and the refining of sugar.
The factors contributing to the shortage of carbon dioxide included:
• CO2is a by-product of ammonium nitrate fertiliser production, so low
fertiliser prices across Europe affected the commercial viability of CO2
production.
• Several UK and EU manufacturers capitalised on the opportunity to shut
plants for maintenance works.
• This coincided with high summer temperatures which created problems
at some plants, made liquefying CO2 more difficult, and led to unforeseen
failures in restarting plants.
• High temperatures and the 2018 FIFA World Cup also raised demand for
carbonated beverages. With low CO2 stocks, tight supply in continental
Europe, and restrictions on sources of supply, many UK suppliers and
manufacturers defaulted on contracts to supply CO2.
The response was led by industry and supported by the UK government.
Discussion:

186
The Food Chain Emergency Liaison Group (FCELG) was used as a forum for
obtaining a detailed view of the UK and European situation, exploring industry use
of carbon dioxide and its alternatives, as well as for industry-supplier discussions.
Government maintained awareness of emerging concerns and issues for the food
and farming sectors, and concerns about their CO2 stock levels. Through
established industry liaison, government understood that industry was assessing
the viability of electric stunning and exploring alternatives to CO2in packaging.
The pig and poultry sectors were identified as particularly vulnerable to interrupted
CO2 supply due to its use for stunning before slaughter. The Food Standards
Agency (FSA) worked to establish practical steps to keep abattoirs running.
Measures were quickly implemented such as the authorisation by the FSA of
electric stun facilities and the use of CO2alternatives at key sites. Staff working
hours at plants were extended where required and a risk assessment was issued
to businesses with technical advice on CO2 and gas substitutes for packaging.
Defra also shared intelligence with key government departments, including BEIS
and the Cabinet Office (CO), in order to maintain an overview of the UK’s available
CO2 supply.
Although some product lines were impacted by the shortages, the government’s
close relationship with industry, alongside collaborative intel sharing across
government, ensured that no serious food supply issues occurred.
The incident brought to light the vulnerabilities in the supply of CO2. This
encouraged industry to put in place mitigations, such as increased storage
capacity, and also motivated government to conduct research into the supply
chain of CO2, and subsequently many other key inputs into the food chain.
Trends
There is a risk of disruption and government will continue to monitor the key inputs
into the food supply chain and, where required, work with industry in cases of
disruption.
Indicator 3.1.8 Consumer behaviour
Headline
Consumer behaviour can cause sudden demand shocks. During recent disruption
caused by the COVID-19 pandemic, industry proved effective in responding to
increased demand, with government taking a supporting role. Consumer

187
behaviour was characterised by a moderate increase in the amount of food
purchased and in the number of shop visits made, rather than indiscriminate ‘panic
buying’. Consumer behaviour was characterised by a moderate increase in the
amount of food purchased and in the number of shop visits made, rather than
indiscriminate ‘panic buying’.
Context and rationale
Consumer purchasing behaviours are the actions taken by consumers to purchase
food, drink, and groceries. Consumer purchasing behaviours are complex and
widely studied.86 Most purchasing decisions are habitual and are reliant on
unconscious biases, rules of thumb, and social and cultural norms. A range of
factors can shape what consumers choose to buy, and how often, such as:
• shopping priorities such as price or convenience
• personal and household taste/preferences
• advertisement and marketing
• availability
• public messaging
• food concerns such as safety issues
• values such as concern for animal welfare or sustainability
Stockpiling
The decision to stockpile food is an adaptation made by consumers when there is
an anticipation that there will be disruption in food supply, a food shortage, or price
increases. If this is perceived to be a likely event, then these may be rational
behaviours for the individual, especially for consumers concerned with affordability
or people with limited access to food shops.
In response to perceived risk to supply consumers can exhibit a range of
stockpiling purchasing behaviours. These can range from considered purchasing,
whereby consumers add a little more to their baskets, through to bulk buying,
where consumers buy significantly more than they would of one item or more in
either one or multiple trips, to more extreme behaviours such as looting. These
can range from considered purchasing, whereby consumers add a little more to
their baskets, through to bulk buying, where consumers buy significantly more
than they would usually, to more extreme behaviours such as looting.
86 d'Angelo and others, ‘Food consumption in the UK: Trends, Attitudes and Drivers’ (2020), https://www.rand.org/pubs/research_reports/RR4379.html.

188
For the purposes of this report, stockpiling behaviour is defined as when
individuals build up a reserve stock of goods over a period of time to mitigate
against the loss of not having that product at a later date.
An individual’s assessment of whether a risk to food supply is credible is based on
the information available to them. This information can take many forms, such as
an official government response, media or news content, and also public
discourse (such as social media discussion) and the behaviour of others.
Depending on the perceived severity of the risk, consumer adaptation strategies
sit on a spectrum from normal purchasing behaviour through to stockpiling, then to
the more extreme behaviours of panic buying and looting.
Having (access to) more information does not necessarily always lead to a return
of normal shopping behaviours. Any additional information, particularly
sensationalist coverage on traditional and social media, can risk increasing the
visibility of the issue, making it more plausible, thus creating an increased
perception of risk and feeding into the overall stockpiling cycle.
Industry is effective in responding to fluctuations in demand including planned
(such as Christmas and Easter) and unplanned events (for example, people
stockpiling bread and milk during bad weather events). More severe shortages
due to sustained consumer demand shocks or ‘buying’ may require additional
interventions by industry, such as item purchasing limits, with government playing
a supportive role. More severe shortages, due to sustained consumer demand
shocks or ‘panic buying’, may require additional interventions by industry, such as
item purchasing limits, with government playing a supportive role.
Demand spikes can exacerbate shortages of products and increase the pressure
on supply chains, making it more challenging to manage stock through supply.
Changes in consumer behaviour can cause potential impacts such as product
shortages. Even incremental shifts in food purchasing behaviours at the
population level can have significant impacts on just-in-time supply chains.
Data and Assessment
Behaviours driving purchasing spikes in a crisis are often reported in the media as
irrational responses to perceived supply disruption. However, evidence suggests
that the majority of consumer behaviour observed during March and April 2020
was not indiscriminate ‘panic buying’ to bulk buy goods, but a more moderate
increase in purchasing in response to perceived supply uncertainty.
The cumulative effect of these small changes in shopping behaviours can play a
significant role in disrupting just-in-time supply chains which are finely tuned to
‘normal’ consumer purchasing patterns. This disruption led to availability and
supply issues which presented as empty shelves or reduced product range in

189
shops. This was picked up by conventional and social media. Headlines about
empty shelves further exacerbated consumer uncertainty and fed into the
perception of shortages, which likely led to consumers continuing to purchase
more than they normally would. There is a risk of headlines creating a real
demand issue from a perceived one.
The strength and speed of this episode was unprecedented. Future (potential) episodes
would likely benefit from more effective and earlier coordination with industry, to enable
more impactful joined up communications. Response to potential future episodes would
benefit from more effective and earlier coordination with industry, to enable more
impactful joined up communications. Industry reported that the logistical interventions
government made at speed were helpful and would likely need to be enacted again in a
similar situation. Increases in purchasing during the COVID-19 pandemic have been the
only food related demand shock observed in recent years, although other demand spikes
have been observed such as fuel in the autumn of 2020. Future purchasing spikes are
likely to be caused by shocks in the food supply chain, but there is the potential for media
coverage or rumour to cause demand shocks without any actual supply issue. This is
likely to be exacerbated if consumer confidence in the supply chain is low. Both
government and industry worked collaboratively in response to consumer behaviour
during COVID-19 and are well placed to respond to any future disruptions.
Case Study 3.6 Consumer behaviour in
the 2020 lockdown
Overview
The COVID-19 pandemic resulted in a series of sudden changes in consumer
purchasing behaviours with two clear phases, effectively separated by the
imposition of the hard lockdown on 23 March 2020:
• Pre-Lockdown: Starting in late February a fast-rising sense of urgency to
secure hygiene supplies swiftly followed by demand for food and other
consumables to last a period of potential disruption to supply.
• Post-Lockdown: a focus on securing household needs safely, observing
and adapting to social distancing measures in a much more closely
controlled retail environment.
In both phases a key shopper priority was to establish and maintain a higher level
of household resilience than normal. These shopping changes had several
significant impacts within the food and consumer goods industry over the spring
and early summer of 2020.
190
Background
COVID-19 tested the UK food supply system perhaps more than any other time in
over 70 years. Businesses across the food supply chain had to adjust rapidly to
greatly increased consumer demand as the nation came to terms with national
lockdown and the closure of businesses, schools, and the hospitality sector.
Businesses across the food supply chain had to adjust rapidly to greatly increased
consumer demand as the UK came to terms with national lockdown and the
closure of businesses, schools, and the hospitality sector. As a result, people were
spending more time at home and eating out less.
However, despite a challenging start, the food industry showed its resilience as it
continued to function throughout and provide an essential service.
COVID-19 changed lifestyles, as it altered the frequency, volume and the way
people bought their food. Understanding how behavioural changes impacted food
availability will help government and industry better respond to a future crisis.
Discussion
What was the problem?
Increases in COVID-19 cases and a general expectation that the government
would impose some limitations on movements and socialising, and close schools
created a degree of uncertainty amongst consumers as to how they may be able
acquire food in the short-term. This uncertainty was compounded by events in
other countries which were reporting that consumers were stockpiling food drinks
and household goods. To mitigate the perceived risk of being unable to acquire
food due to lockdown restrictions, quarantine measures, or the stockpiling
behaviours of others, UK consumers rationally increased purchasing.
What was the scale of the challenge?
Immediately prior to the implementation of a nationwide lockdown on 23 March
2020 there was a substantive increase in the volume of food purchased compared
to the same week in 2019.
This increase was seen in three main ways;
1) From mid-February there was a slight increase in the amount of food
consumers were purchasing every time they visited the shops
2) An increase in the frequency of trips consumers were making to the shops
3) A slight increase in the range of products going into consumer baskets,
particularly long-life products, and staples. This reflected the fact that
consumers were spending more time eating at home.

191
Figure 3.6a: Consumer purchasing behaviours pre and post lockdown (Kantar,
Worldpanel FMCG, England, Wales, and Scotland): percentage change in year on
year trips per household and year on year purchased volume per trip. Further
information on the methodology can be found in the appendix.
Bulk buyers (for example people buying substantially more than they would
normally do in a single trip) were actually in the minority. Data on consumer
purchasing patterns did not reflect the media narrative of consumers engaging in
indiscriminate ‘panic buying’. To some degree consumers exhibited a rational
increase in visits to the shop to acquire the food and drink products they wanted in
the face of uncertain circumstances. When this incremental purchasing behaviour
was replicated at the population level it created an unprecedented surge in
demand over a short period of time which led to product availability issues.
When lockdown began, consumer purchasing behaviours underwent a dramatic
transformation (see figure 3.1.8a). The number of shopping trips per week fell
while the amount of food purchased per trip increased. This behaviour was likely
due to consumers minimising time spent in shops. Retailers just-in-time supply
chains struggled initially to replenish the goods on shelves in the face of this
sudden shift in consumer purchasing behaviours.
What actions were taken to resolve the issue?
Supply chains were able to adapt to the changes in consumer purchasing patterns
swiftly and availability of products largely recovered by June. There were longer
term availability issues with some specific items, such as flour and eggs which
192
were key ingredients in the large increase in home baking which occurred during
the lockdown in March to June 2020.
Many of the measures implemented to mitigate impacts of accelerated consumer
purchases did not require direct government intervention. Retailers implemented
item limits on specific items to stabilise supply and removed a large proportion of
promotions including multi-buy offers and quantity discounts.
Retailers suggested that the relaxation of elements of competition law enabled
them to coordinate on setting item limits and store opening hours. Additionally,
government interventions to allow for additional supplies to be delivered outside of
normal delivery hours helped with the push to fill shelves, such as relaxing
planning rules for night-time store deliveries and driver hour limits.
Close and frequent communication between retailers, supply chain businesses
and government was critical in ensuring these interventions were implemented
effectively. The UK governments have multiple forums for engagement with the
food retail sector and these were employed throughout the disruption.
It is not clear from evidence which factors and mitigating actions were most
significant in ending the demand shock. The pandemic caused a general trend
towards fewer, larger shopping trips. Supermarkets were able to readjust to
ensure supply was stabilised through government-supported mitigations and
setting item limits in place, which may have renewed consumer confidence. It may
also be that consumers who had filled their cupboards felt less at risk and returned
to their previous purchasing habits.
Trends
Increases in purchasing during the COVID-19 pandemic have been the only food related
demand shock in recent years, although demand spikes have been observed such as fuel
in the autumn of 2020. Future purchasing spikes are likely to be caused by shocks in the
food supply chain, but there is the potential for media coverage or rumour to cause
demand shocks without any actual supply issue. This is likely to be exacerbated if
consumer confidence in the supply chain is low. Both government and industry worked
collaboratively in response to consumer behaviour during COVID-19 and are well placed
to respond to any future disruptions.

193
Indicator 3.1.9 Labour and skills
dependency
Headline
The food supply chain is dependent on a large workforce and specific labour skills.
There are challenges securing sufficient labour and skill levels across the agri-
food chain, which pose a threat to resilience.
Context and rationale
The agri-food workforce employs 4.1 million people, covering 13% of Great
Britain’s employment87 and is critical to the resilience of the UK food sector. The
continuity of food supply is dependent upon securing sufficient labour levels and
the skills necessary to carry out specialised tasks. This is true for all levels of the
food supply chain, from farming production and processing, manufacturing,
logistics and retail, right through to transportation of goods. The food supply chain
is also reliant upon sufficient labour levels and skills in those sectors upon which it
depends, such as energy and transport. Government holds limited quantitative
data for labour on a subsector-by-subsector basis. This section includes
employment data and supportive qualitative evidence.
The types of roles across the agri-food sector are vast. They include skilled and highly
skilled roles – including for example engineers, butchers, supervisors, auditors and
veterinary nurses.88 The increasing use of digitisation, robotics and automation requires
highly qualified staff to maintain and operate such technologies. The specialised skills
required for these roles, which often require degrees and postgraduate
qualifications, can make recruitment of staff more difficult.
The agri-food sector is also highly reliant upon roles classified as ‘low-skilled’.
These roles are often labour intensive and common in the agriculture and
hospitality sectors.
A key feature of labour within the agri-food chain is the reliance on migrant labour
from both EU and non-EU countries. It is estimated that the number of non-UK
87 Defra, ‘Food statistics in your pocket’ (2020), https://www.gov.uk/government/statistics/food-statistics-pocketbook/food-statistics-in-your-pocket-summary. 88 UKVA, ‘Skilled worker visa: eligible occupations and codes’ (2021), https://www.gov.uk/government/publications/skilled-worker-visa-eligible-occupations/skilled-worker-visa-eligible-occupations-and-codes.

194
nationals working in the UK is approximately 3.7 million, with approximately 1.5
million non-EU nationals working in the UK.89
There are both short-term and longer-term challenges in recruiting across the agri-
food sector, which has faced difficulty in securing sufficient labour in recent years.
The COVID-19 pandemic caused a shock in the supply chain. The impact of
COVID-19 infection rates and requirements for people to self-isolate led to
elevated absence rates across the food industry and other interdependent sectors
at various points since the start of the pandemic. COVID-19 has also presented
logistical challenges for foreign nationals wishing to work in the UK.
At the same time, the introduction of the new points-based immigration system at
the end of the transition period has meant it is more difficult for sectors
to recruit workers from overseas. Under the points-based immigration
system there is no general route for low-skilled workers to enter the UK on a
working visa. This has presented challenges in securing labour for parts for
the agricultural sector, which in recent history has relied upon EU labour to fill low
skilled roles, for example in the meat processing and fruit and vegetable sectors.
A key labour mitigation is the Seasonal Workers Pilot. The Pilot opened in 2019 and is designed to test the effectiveness of the immigration system at supporting UK growers during peak production periods, whilst maintaining robust immigration control. The Pilot also provides a valuable source of labour for the fruit and vegetable growers of the UK, helping to ensure the food security of the country.
The Seasonal Workers Pilot operates in the edible horticulture sector, to support farmers growing UK fruit and vegetables. This is the sector of agriculture which has the highest dependency on seasonal labour and ensures food supply chains in the UK are maintained. Of those granted a Seasonal Worker visa in the year ending September 2021, 18,019 or 73% were Ukrainian nationals. Eastern European nationalities make up most grants in the Seasonal Worker visa, with the next highest grants being to Russian (1,862, 8%), Belarusian (853, 3%) and Moldovan (706, 3%).
Some sectors also have longstanding challenges in securing the appropriate
labour levels and acquiring the right skills for their sector. This can include
negative perceptions of roles within the agri-food sector. For example, the farming
sector roles can be physically demanding and often in rural locations which may
limit the labour available. Further, the Food and Drink Federation has estimated
over the next ten years, 25% of the food and drink manufacturing workforce is due
to retire, with up to a third of the workforce set to reach retirement age by 2033 to
89 ONS, ‘Labour Force Survey’ (2021) https://www.ons.gov.uk/employmentandlabourmarket/peopleinwork/employmentandemployeetypes/bulletins/uklabourmarket/august2021.
195
2035.90 Similar recruitment and retention problems are experienced in roles such
as heavy goods vehicle drivers and warehouse operatives in distribution centres.
For example, an estimated 268,000 people were employed as HGV drivers
between July 2020 and June 2021. This is 39,000 fewer than the year ending
June 2019, and 53,000 fewer than the peak of 321,000 HGV drivers during the
year ending June 2017.91 Further, some roles are highly skilled and therefore the
number of individuals available to fill specific roles may be limited. This is
particularly the case for dairy and meat sectors and areas where specialist
engineers and technicians are required.
The impacts of labour and skills shortages will vary between each sub-sector and
business type in the food supply chain. Larger companies may have more
flexibility to manage higher absence rates due to their ability to move staff around,
whereas small and medium-sized enterprises (SMEs) may have limited capacity to
develop contingency plans for sudden increases in absence rates. The ‘just-in-
time’ nature of the supply chain may also add additional strain when quickly
adapting to smaller workforces.
Defra relies on a collaborative relationship with industry to effectively respond to disruption. In particular, government is dependent on information from industry which allows it to develop an overall assessment of the implications ‘on the ground’. This in turn informs the industry response as well as a proportionate and effective cross-government response.
Data and Assessment
Figure 3.1.9a: Agri-food sector employees and self-employed farmers 2020
(millions, percentage).
Indicator: – Employment levels of people in agri-food sector over time
Source: – Agriculture in the UK 2021 (AUK)
90 Food and Drink Sector Council, ‘Preparing for a changing workforce: a drink and supply chain approach to skills’, (2019), https://www.fdfscotland.org.uk/fdf/resources/publications/reports/preparing-for-a-changing-workforce-a-food-and-drink-supply-chain-approach-to-skills/ 91 ONS, ‘Fall in HGV drivers largest among middle-aged workers’ (2021), https://www.ons.gov.uk/employmentandlabourmarket/peopleinwork/employmentandemployeetypes/articles/fallinhgvdriverslargestamongmiddleagedworkers/2021-10-19.

196
Figure 3.1.9a: Agri-food sector employees and self-employed farmers 2020
(millions, percentage).
Figure 3.1.9b: Agri-food sector employees and self-employed farmers over time
(thousands).

197
The agri-food sector is one of the most significant employers in the UK. In the
fourth quarter of 2020, the agri-food sector employed 4 million people, or 13% of
all employees in Great Britain.92
In the twelve months to December 2020, employment in the agri-food sector
decreased by 1.0%. Employment in 2020 fell in wholesaling (7.1%), non-
residential catering (2.8%), manufacturing (1.4%), and agriculture (0.6%).
Employment in 2020 rose only in retailing, by 3.4%. Employment across the whole
economy decreased by 1.0% over the same period. The COVID-19 pandemic
clearly meant that this was an unusual time, and the partial closure of the
hospitality sector (with knock on impacts for wholesale and retail) for periods
during this year probably accounts for these figures.
Over a longer period, employment in the agri-food sector has risen 9.7% since
2000. Changes in each of the sectors since that time show that employment in
agriculture, manufacturing and wholesaling reduced by 24%, 14% and 1.2%
respectively, while non-residential catering and retailing increased by 40% and 5%
respectively.
In recent years the agri-food sector has been highly reliant on labour from abroad
for specific tasks. For example, Defra estimates that up until the last two years
99% of seasonal workers in the horticultural sector came from outside the UK
each season. In the short term, there have been challenges in securing sufficient
labour levels and the necessary skills since the start of the COVID-19 pandemic.
This is due to high levels of staff absenteeism from COVID-19 infection and the
requirement to self-isolate. There remain longer term challenges in recruiting for
vacancies in specific sectors in both high and low skilled roles.
The impacts of labour and skills shortages will vary between each sub-sector.
However, it is unlikely that there would ever be an overall shortage of food due to
a lack of labour levels and skills. In exceptional circumstances in times of reduced
capacity this could result in reduced supply availability and choice of some agri-
food products, in particular fresh produce. Further, any impacts to one sector
could provide knock-on implications to other parts of the food supply chain.
Although the risks associated with labour and skills shortages can add additional
strain, the agri-food sector is experienced in responding to disruptions within the
food supply chain.
92 Defra, ‘Agriculture in the UK 2020’, p. 17.

198
Trends
Employment numbers across the agri-food sector have remained stable for over
20 years. The non-residential catering sector saw a gradual increase in years
leading up to 2019. The data in this report does not cover 2021 and therefore it
cannot account for any further changes in employment rates due to the COVID-19
pandemic.
Indicator 3.2.1 Cyber threat in the food
supply chain
Headline
The threat of cyber-attack to UK businesses, including those in the agri-food
sector, is significant and growing. A cyber-attack can affect any part of the food
supply chain and other sectors which the food sector depends upon.
Context and Rationale
The risk of cyber-attack to UK businesses is significant and continues to grow. It
presents a threat to Critical National Infrastructure (CNI) sectors, which includes
food and broader areas which the food supply chain depends upon, such as
energy, transport, and water. The nature of cyber-attacks means that they are
varied and that attackers can adapt their approaches to their targets. It can range
from high volume, opportunistic attacks where technical expertise is bought, not
learned, to highly sophisticated and persistent threats involving bespoke malware
designed to compromise specific targets.93
As with any other industry sectors, agri-food businesses are vulnerable to cyber-
attacks. Potential scenarios which could be experienced by UK businesses
include:
• Espionage: Infiltrating organisations’ corporate and financial systems with
the intention of learning and pre-positioning for future attacks.
• Hacktivist attacks: Company website defacement, or forcing a website offline
through a distributed denial of service (DDOS) attack, which could cause
reputational damage.
• Ransomware: Attacks via ‘ransomware’ where data is made inaccessible to
the victim, or systems made inoperable, until a ransom is paid.
93 NCSC, ‘The Cyber Threat to UK Business’, 2017. https://www.ncsc.gov.uk/report/cyber-threat-uk-business

199
• Phishing: the theft of personal data (staff and/or consumers), corporate data
and/or intellectual property or trick staff into making erroneous decisions (for
example visiting websites that host malware) and financial transactions (such
as sending money to hoax suppliers).
• Other criminality: Attacks on manufacturing plants and industrial control
systems.
• Insider Threat: A motivated insider with requisite knowledge of cyber systems
could increase the likelihood of a successful cyber-attack. A cyber incident
could also result from a lack of employee cyber education or due diligence in
following safe procedures.
The specific risks and probable impact associated with cyber-attack varies for
different actors within the food supply chain. However, there are specific
behaviours which can increase a business’s vulnerability to cyber-attack. These
include, but are not limited to, weak overall internet or IT security measures, poor
password policies, failure to keep software up to date, poor system monitoring,
and inadequate access controls. These lack of security measures considerably
increase the risk of a cyber-attack taking place.
The overall impact to food supply would depend upon the nature of the cyber-
attack and its location within the agri-food chain or other relevant sectors such as
energy, transport, or water. The impact could influence the production capability of
individual businesses, though it is unlikely to affect the overall food supply chain.
For example, any impact to computer systems for logistics businesses could
cause some disruption, but its impacts would be limited due to the diversity of
logistical companies in the UK.
The National Cyber Security Centre (NCSC) is the UK government’s technical
authority for cyber security in the UK. It takes a leading role in providing guidance
and advice on cyber security for UK organisations. Responsibility for mitigating the
risk of cyber-attack rests with industry. Defra and the NCSC work with industry
and trade bodies to promote proportionate cyber security measures.
The NCSC produces extensive guidance documents to help mitigate against the
risk of cyber-attacks. The NCSC website has a list of 46 different topics related to
cyber-security, from ransomware passwords best practice to remote working. All
these articles can be found on their website. More broadly, Defra and the FSA
jointly sponsor publicly available guidance aimed to build resilience from cyber-
attack in agri-food businesses. This guidance is known as PAS 96.

200
Case Study 3.7 Cyber threat to USA meat
company
Overview
In June 2021 the world’s largest meat packer, José Batista Sobrinh (JBS),
experienced a ransomware attack, with servers affected in North America and
Australia. The breach forced the company to pause operations at the majority of
its meat plants in the USA, causing concerns about potential meat shortages and
animal welfare issues.
Background
JBS has more than 150 plants in 15 countries, employing over 150,000
employees worldwide. Its customers include supermarkets and fast-food chains
such as McDonalds.
A ransomware attack is when attackers breach a victim’s network and encrypt it.
Data is almost always stolen prior to encryption. The attackers then offer to
decrypt the victim’s network in return for a ransom payment, and threaten to leak
the stolen data on the dark web if no payment is made.
Discussion
On 30 May 2021, JBS USA’s IT systems were infected by a sophisticated
ransomware attack, and the company suspended all affected IT systems as a
result. IT systems are essential in modern meat processing plants as they are
used extensively throughout the production process. The company believed this
ransomware attack, the largest known attack on a food manufacturer, originated
from a criminal gang.
This breach forced the company to suspend operations at nearly all its plants in
the USA, as the plants were unable to complete even basic tasks, like weighing
poultry, sharpening knives, and clocking in employees. The breach also affected
the company’s operations in Australia, though on a smaller scale.
Although the company did eventually restore its operations back to full capacity on
8 June 2021 (10 days of disruption) through the help of the authorities and third-
party experts, they still paid a ransom of £7.8m via Bitcoin to the attackers to
decrypt their network and in response to threats to leak the data. Paying the
ransom relied on the promises of criminals, and gave no guarantee that the
attackers would not leak the data or attack again in future.

201
Although the attack did not have any noticeable impact on food security in the
USA or the UK, this case study has been highlighted to show the potential risks
cyber threats can pose food manufactures in the future.
In a sector which is increasingly becoming more dependent on technology, it is
difficult to be immune to cyber-attack, but companies can put measures in place to
reduce the risk and limit damage once it does occur. The NCSC has produced a
number of guidance documents for businesses to plan ahead for future potential
attacks. They have listed some recommended standards which companies can
voluntarily adopt.
At the time of writing there have been no major cyber-attacks on a UK based food
manufacturer. This could reflect the highly resilient nature of the food supply chain
as 66% of all businesses have a formalised incident response process. In the
event of minor attacks 89% of UK food businesses managed to restore operations
within 24 hours.
Assessment
The risk of a cyber-attack is not limited specifically to the food industry, and cyber-
attacks on other businesses can cause indirect disruption to individual food
businesses. For example, in July 2021 a ransomware attack on the US IT firm
Kaseya caused Swedish Coop supermarkets to close (NCSC, 2021). To date
there have been no serious incidents in which a cyber-attack on a food business
has created widespread disruption to the UK food supply chain.
Defra, the FSA, and the NCSC have been working with major food businesses to
promote awareness of sensible and proportionate cyber security measures
throughout supply chains including SMEs.
Trends
The threat of cybercrime is growing with attacks becoming increasingly
sophisticated. It is essential that industry takes the precautions necessary to help
respond to future cyber-attacks and understands the implications should a cyber-
attack happen in another sector upon which they rely.
202
Indicator 3.2.2 Diversity of food retailers
Headline
The size and diversity of the food retail sector provides resilience. If an individual
company fails, others can maintain the UK’s food supply. No one company has
overwhelming market share, although the majority of food retail is concentrated in
a small number of supermarket companies. The resilience of the sector was
illustrated during the COVID-19 response.
Context and Rationale
Diversity is essential to security, not only in terms of trade in agri-food
commodities, but also within the domestic supply chain, which consists of retailers,
food manufacturers, wholesalers, and food service operations. High
concentrations in specific parts of the food chain may make the chain more
vulnerable to temporary supply shortages, which could be exacerbated by
increased consumer purchasing. If one major supply chain or company were to
fail, for example due to economic failure, cyber-attack, or power failure, there
could be a significant impact on availability and access of food, if other chains
were not able to help to fill the gap. In the UK, this is an unlikely scenario due to
the size and diversity of the agri-food sector, which gives flexibility in case any one
sector or company should fail. The greatest risk is in the retail sector, where the
five biggest retailers have 60% of market share between them. If one closed, there
would be short-term disruption and an additional burden on the supply chains of
the other four. This indicator considers the market share of retailers in the UK.
Data and Assessment
Indicator: Diversity within the food industry
Source: Kantar94
94 Kantar, ‘Grocery Market Share’, https://www.kantarworldpanel.com/global/grocery-market-share.

203
Figure 3.2.2a: Food and drink retailer market share, Great Britain (12 weeks
ending 31 October 2021).
The fact that the UK has several large retail and wholesaling operations suggests
a reasonable balance between economies of scale and diversity. Larger
companies can enhance resilience in the supply chain through having greater
resources and infrastructure to respond flexibly to shocks in the food supply chain.
However, small and medium size enterprises, through their adaptability and
flexibility, to the diversity of supply and consumer choice.
Trends
The combined market share of food and non-alcoholic drinks of the largest four
food and drink retailers accounted for about two thirds of the overall market in
2021. Tesco commanded the largest market share at just over a quarter. The most
marked trend in the retail landscape since 2011 has been the rise of the
‘discounters’, notably Aldi and Lidl, whose market share has increased from
around 2% each in 2011 to around 8% and 6% respectively. This has generally
been at the cost of the biggest four retailers. The COVID-19 pandemic had an
immediate and marked effect on internet sales: in the 12 months to March 2020
internet sales of food accounted for around 5% of all retailing on average, in the
following 12 months to March 2021 this was 11%. It is not clear that this is a

204
permanent shift but as of October 2021 this proportion has shown no signs of
moving back to pre-pandemic levels.95
Indicator 3.2.3 Economic resilience in the
food supply chain
Headline
The wholesale sector experienced significant financial pressure due to the closure
of the hospitality and public sector food sectors during the COVID-19 pandemic.
However, despite these pressures the wholesale sector maintained financial
viability and food supply was not compromised.
Context and rationale
The size and diversity of the food supply chain allows flexibility when an agri-food
business fails, as identified in Indicator 3.2.2. The COVID-19 pandemic placed
increased pressures on all parts of the food supply chain. This included some
sectors experiencing complete or partial closures, such as those in hospitality and
in public sector food. These closures also had knock-on economic impacts for
other parts of the food supply chain, including the wholesale sector. The closure of
the hospitality sector due to COVID-19 and other lockdown impacts resulted in
financial distress across significant parts of the wholesale sector. Due to
commercial sensitivity quantitative statistics are unavailable for this indicator. A
case study is therefore included which outlines the financial threats faced by the
wholesale sector due to partial or full closure of the hospitality and public sector
food sectors during the COVID-19 pandemic.
Case study: COVID-19 impacts upon Wholesale Sector
Source: Defra
95 ONS, ‘Online Retail’, https://www.ons.gov.uk/businessindustryandtrade/retailindustry/bulletins/retailsales/october2021#online-retail.

205
Case Study 3.8 COVID-19 impacts upon
the Wholesale sector
Overview
Retail wholesalers provide stock to retail customers such as convenience stores. Foodservice wholesalers supply customers, such as caterers, restaurants, hotels, and schools. Retail wholesalers maintained stable demand throughout the pandemic.
Public sector food contracts are fulfilled primarily by foodservice wholesalers. The
closure of the hospitality sector due to COVID-19 and other lockdown impacts resulted in financial distress across significant parts of the foodservice wholesale sector.
While wholesalers were eligible for some limited non-sector specific support, they did not benefit to the same extent as the hospitality sector they support.
Despite this financial distress, the food service wholesale sector continued to service public sector food contracts, ensuring people in schools, care homes, nursing
homes, prisons, and hospitals continued to be fed throughout the COVID-19 response.
Background
Food and drink wholesalers act as intermediaries throughout the food supply
chain, with foodservice wholesalers serving both private hospitality contracts and
public sector food contracts. The foodservice wholesale sector operates on low
profit margins, and the national lockdown in spring 2020 led to a drop of 40% in
food service orders without corresponding reductions in businesses’ fixed costs.
The foodservice wholesale market is dominated by five firms, which account for
around 80% of industry revenues; public sector food is most reliant on larger
suppliers, for whom hospitality typically makes up a large proportion of revenue.
Discussion
The cumulative impact of COVID-19 measures resulted in financial distress for
foodservice wholesalers who supply public sector food. Impact on provision of
food to the public sector posed a food supply challenge for
significant and also highly vulnerable parts of the population.
Throughout the pandemic, Defra officials worked closely with the wholesale
industry via the Federation of Wholesale Distributers, a dedicated Task and Finish
Group, extensive bilateral engagement, and a monthly Defra Wholesale survey.
This allowed Defra to assess the scale of the problem and monitor risks to the
sector, and in turn to public sector food supply. Defra shared this intelligence and

206
broader expertise of food supply chain issues with lead government departments
responsible for public sector food (DfE, DHSC, MoJ, MoD) This helped to support
their contingency planning. Defra also re-established the Public Sector Food
Working Group with Cabinet Office. This working group helped to share risks and
issues relating to public sector food provision between departments and with
devolved administrations.
The Governments of Scotland, Wales and Northern Ireland brought in a number of
measures to support wholesalers:
• The Scottish Government launched a £5 million bespoke wholesale Food and Drink Resilience Fund. Providing grants for foodservice wholesalers suffering hardships as a result of COVID-19. The fund was targeted at any SME wholesalers selling food and drink to the hospitality and/or public sector.
• The Welsh Government launched two schemes that could benefit wholesalers supplying hospitality and public sector food: a grant of £5,000 to supply chain businesses whose turnover has been impacted by more than 40% due to the Covid-19 restrictions; and a sector-specific fund for supply chain businesses whose turnover has been impacted by more than 60%, dependent on turnover and employee numbers.
The Northern Ireland Executive offered businesses required to close due to
restrictions, including wholesalers, a one-off grant of up to £4,800, depending on
business size and length of restrictions.
Assessment
Although there was financial distress across the wholesale sector due to the drop-
off in demand from hospitality, the greatest risk of business failure was confined to
small and medium-sized foodservice wholesale businesses who are typically
engaged with small and medium-sized care homes. Such failures would not affect
overall UK food supply to the public sector given the saturation in the sector and
the highly competitive market but did pose a risk of short-term shortages for
customers. Any failure of these companies would have been managed through re-
letting of contracts to competitors.

Theme 4: Food Security at Household
Level
This chapter of the UK Food Security Report looks at food security in terms of
whether households can consistently afford and access sufficient healthy and
nutritious food. It discusses the affordability of food and drink, in real terms and
compared to other living costs, and trends in the cost of healthy foods. It looks at
physical access to food shops, measures of household food security across the UK,
and government schemes to support households to access food. It also looks at the
landscape and use of food aid in the UK.
In terms of this theme, food security refers to people in the UK having physical and
economic access to sufficient healthy food at all times.
Key messages
• Data on household food security indicates that 92% of households regarded
themselves as being food secure in the financial year 2019 to 2020.
• In the last decade, food and non-alcoholic drinks have, on average, become
cheaper compared to other goods and services. However, affordability needs
to be understood in the wider context of overall household expenditure.
Housing and transport make up the largest share of spend for the average UK
household, and both categories have seen increases in their share in the last
decade.
• Access to food shops in England is for the most part adequate, with at least
84% of the population in every region able to reach a shop by public transport
or walking within 15 minutes.
Understanding household food security
There are various complex factors that determine whether a household is food
secure. At a high level, household food security can be broken down into
affordability, access, utilisation, and stability. Affordability, access, and utilisation
provide three key links in the chain, or tests, for households to get food on their
plates. Simply, these are whether they can fill shopping bags, pay for them, and
prepare nutritious meals. Stability is determined by the consistency with which the
previous three tests are met.
Affordability
The relative affordability of food indicates whether a household has the financial
means to meet their nutritional requirements. The ability to afford food is linked to

208
overall pressures on the household budget. Across all households in the UK, food
and non-alcoholic drink is the fourth most significant household expenditure after
housing, transport, and recreation and culture. Between 2009 and the financial year
ending (FYE) March 2020, across all households in the UK, real terms expenditure
on food increased by 3.9%, compared to 13.4% for housing and 4.7% for transport.
Compared to the EU, UK consumers spend a lower proportion of their household
budgets on food and non-alcoholic drink, around 10% against an EU average of
16%. It is important to remember that some of these household expenditures can be
considered non-discretionary, meaning that it is difficult for a household to cut back
on spending. Changes in these non-discretionary costs could squeeze household
food budgets.
Food price pressures do not seem to be adversely impacting household food
security. In the last ten years, food prices overall have fallen in real terms, but there
are variations between food groups. Vegetables (including potatoes), milk, cheese
and eggs have all become cheaper in real terms. Fruit prices have increased faster
than inflation, meaning they cost more in real terms than ten years ago. Growth in
average weekly household expenditure for housing, transport, and recreation and
culture suggests that the pressure these categories are exerting on the household
budget are, on average, more significant than food.
Not all households are equal in this regard. The poorest 20% of households, for
whom income has decreased since 2017, spend a higher proportion of their income
on food and are thus more impacted by changes in food prices. The proportion of
household income spent on food by UK households in each income bracket has
remained broadly consistent in the last decade.
Access
Physical access to buy healthy, nutritious food is necessary for food security.
Households must have ease of physical access to food shops or affordable food
delivery to meet their nutritional requirements.
Data on travel time is currently only available for England. In the regions of England
with the lowest access to food shops, over 95% of the population can reach a food
shop within 30 minutes without needing a car, and over 84% within 15 minutes.
Access to food shops is not equal across regions, with fewer people able to access a
food shop quickly without a car in more rural regions. It is also important to note that
currently it is not possible to assess the cost and selection of food that is available to
consumers in their nearest food shop. Advances in the availability of online grocery
shopping across the UK have the potential to alleviate some of the difficulties
regarding physical access to food shops. It is likely that the switch to more online
grocery shopping might become permanent amongst certain consumers, with the
potential for more businesses to offer these services. Trends over time and the
impacts of the COVID-19 pandemic are not currently available but will be tracked in
future UK Food Security Reports.

209
Utilisation
Even if affordability and access needs are met, the ability and opportunity to prepare
food within households is also important to food security. There are many factors that
can prevent people from doing so, including disabilities, lack of infrastructure to store
and prepare food, the energy costs of cooking, and lack of skills or time to cook.
Measuring the prevalence of these factors is currently very challenging, and there is
a lack of sufficient evidence to produce a representative picture across the UK.
According to the most recent data for all UK households in the Family Resources
Survey for FYE 2020, 92% of households in the UK reported they were food secure.
However, 8% reported being food insecure, and of this, 4% reported low food
security and another 4% very low food security. Food insecurity is not evenly spread
across society, with age, disability, ethnicity, and geographical location all factors
affecting household food security. Trends in this data, including the impacts of the
COVID-19 pandemic, will be monitored in future UK Food Security Reports. This
report focuses mainly on measuring affordability and access as these factors have
the most consistent indicators.
The wider context of household food security
Household food security is not evenly spread across society. For those households in
the UK less able to afford food, support schemes exist which provide food aid or
otherwise help with food security.
Two of the main government support schemes for households on low incomes are
free school meals and the Healthy Start (in England, Wales, and Northern Ireland)
and Best Start Foods (in Scotland) schemes. Eligibility for, and uptake of, these
schemes provides useful indicators for the wider household food security picture.
Healthy Start vouchers are a scheme in England, Wales, and Northern Ireland to
support people on low incomes to access pre-natal vitamins, infant milk formula, and
healthy food for young children. In Scotland an equivalent Best Start Foods scheme
launched in August 2019. The take-up rate of the Healthy Start voucher scheme was
relatively stable between 2019 and 2021. The number of people who can apply for
the scheme, known as the eligibility rates, have increased in England, Wales, and
Northern Ireland when data from early 2019 is compared with August 2021. These
increases are likely linked to COVID-19 and its impacts on the financial situation of
households.
Eligibility rates for free school meals have been stable across the UK in recent years,
with Wales and England seeing an increase from 2018 due to the introduction of
Universal Credit and its transitional protection. Data for England and Wales,
however, shows that more pupils became eligible for free school meals between
January 2020 and January 2021. This is likely due to COVID-19 impacting
households’ financial situation as well as the continuing Universal Credit transitional
protection measures, which have extended eligibility to more pupils.
210
Eligibility rates are also expected to increase in Scotland in the coming years due to
the staggered expansion of universal free school meals for Primary 4 pupils in
August 2021, Primary 5 pupils in January 2022, and all primary school children in
August 2022.
Where households struggle to afford food, direct food aid is provided by many
different types of organisations, including registered charities, places of worship,
community organisations, schools, hospitals, and commercial and social enterprises.
These are commonly referred to collectively as ‘food banks’. Due to the great
diversity of food aid provision, there is no comprehensive record of the number of
organisations providing food aid in the UK. Government data is limited regarding the
number of individuals or households receiving food aid, how much they might have
received and over what period.
Outside the home, public food procurement impacts almost 24% of the population in
England and is an important lever to promote a healthy, sustainable food system.
The government sets both buying and nutrition standards for food procurement by
public bodies.
Indicator 4.1.1 Food expenditure growth
compared to other household spending
growth
Headline
Across all households in the UK, food and non-alcoholic drink is the fourth most
significant household expenditure after housing, transport, and recreation and
culture. Between 2009 and 2020, across all households in the UK, real terms
expenditure on food increased by 3.9%, compared to 13.4% for housing and 4.7% for
transport.
Context and Rationale
Households’ ability to afford food is linked to overall pressures on the household
budget. This indicator puts food expenditure in the wider context of other household
spending to illustrate how growth in other household spending categories may impact
the budget available to spend on food.
Other essential expenditures from the household budget include housing, fuel and
power, household goods and services, and transport. Some of these expenditures
such as electricity and gas bills are considered non-discretionary, meaning that it is

211
difficult for a household to cut back on spending. Price increases in these categories,
therefore, can reduce the available food budget. For food, consumers may be able to
adjust the money they spend by buying less of a certain product, by switching to
cheaper products within a food grouping, or by reducing the consumption of luxury
food items or treats. For some households, it could also mean that people might rely
on food aid or miss meals if they cannot afford to buy enough food.
The data used in this indicator represents the average household in the UK. It is
important to note that within a household there may be differences at the individual
level that are not captured in this data.
Data and Assessment
Data: Contributions to household expenditure growth by Classification of Individual
Consumption According to Purpose (COICOP) category over time
Source: ONS Family Spending in the UK
Figure 4.1.1a: Average share of spend in all households FYE 2020
In FYE 2020, the average weekly household expenditure in the UK was £588, down
slightly, but not significantly, from FYE 2019 when it was £603 (adjusted for inflation).
In FYE 2020, housing, which does not include mortgage interest or council tax, was
the largest expenditure in the average UK household at 14.1%, followed by transport

212
at 13.9%, recreation and culture at 12.7%, and food and non-alcoholic drinks at
10.8%.
Figure 4.1.1b: Actual average weekly household expenditure in 2009 and FYE 2020
(real terms)
Between 2009 and FYE 2020, the increase in total weekly expenditure was 4.8%,
from £561 to £588. In the 10-year period covered by the data, housing increased by
13.4% (from £73 per week per household to £83) and transport by 4.7% (from £78 to
£82). Recreation and culture expenditure increased by 15.8% (from £65 to £75) and
food expenditure increased by 3.9% (from £61 to £64). Apparent increases in
communication expenditure were partly due to changes in the Office for National
Statistics (ONS) questionnaire. Households reported a decrease in weekly
expenditure on education and alcoholic drinks between 2009 and FYE 2020,
although education was only 0.8% and alcoholic drinks 2.2% of total expenditure in
FYE 2020.
Trends
The growth in average weekly household expenditure for housing, transport, and
recreation and culture suggests that the pressure these categories are exerting on
the household budget is, on average, more significant than food. Housing and
transport are largely non-discretionary expenditures, meaning that households have
less control over reducing these expenses. With food being a non-discretionary
expense, some households may choose to ‘trade down’ by switching to cheaper
products of the same type or buying less of certain types of food to save money.

213
Based on data from FYE 2020, the ONS calculated that in those 12 months UK
households spent an average of £187 per week on activities that were largely
prevented during the lockdown of 2020 due to COVID-19 restrictions. These activities
included going on holiday, dining out, and travelling. These potential savings,
however, were not equally accessible to all households. Younger households, those
who are renting, and those living in London spend proportionally more on essentials
and relatively little on goods and services that were unavailable under lockdown
compared to average households. This could have limited their ability to cut back on
spending if their income decreased. Some companies, including mortgage providers
and gas, electricity, and water suppliers, offered payment holidays on regular bills.
The ONS estimates that 40% of household spending on essentials could have been
subject to a payment holiday, equivalent to £177 per week. Any payment holidays,
however, were temporary and money saved would need to be paid back.96
Food prices can be impacted by a range of factors, including international food
commodity and oil prices, exchange rates, transportation, domestic agricultural
prices, and labour costs. Significant increases in these areas create upward
pressures on UK consumer food prices.
Food retailers generally compete on price and may absorb temporary cost rises. This
means that very significant increases to consumer food prices in the UK are not
expected unless sustained and significant upwards pressure is created by one or,
more likely, multiple major price drivers. If that happens, households on lower
incomes within the UK are more affected by food price increases as they tend to
spend a larger proportion of their household expenditure on food products. This is
discussed in more detail in Indicator 4.1.2.
Indicator 4.1.2 Low-income households’
share of spending on food
Headline
The poorest 20% of households spend a higher proportion of their income on food
and are thus more exposed to changes in food prices. Incomes for the bottom 20% of
households have decreased since 2016 to 2017. The proportion of household
income spent on food has remained broadly consistent in the last decade for all UK
96 ONS, ‘More than one-fifth of usual household spending has been largely prevented during lockdown’ (2020), https://www.ons.gov.uk/peoplepopulationandcommunity/personalandhouseholdfinances/expenditure/articles/morethanonefifthofusualhouseholdspendinghasbeenlargelypreventedduringlockdown/2020-06-11.

214
households, including the bottom 20%. Between 2014 and 2020, food prices in real
terms were on a downward trend, meaning that food has become cheaper compared
to previous years.
Context and Rationale
The purpose of this indicator is to measure the burden that spend on food places on
the household budget for low-income households. The data in this indicator looks at
the share of the household budget spent on food purchased to consume at home.
Food tends to account for a greater percentage of household spend for low-income
households compared to higher income households. Comparing against all
households shows the greater effects food price rises may have on low-income
households. Low income is one of many factors that can make someone vulnerable
to food insecurity. In the context of this report, low-income households are identified
as those within the lowest 20% of households by equivalised disposable income, a
measure of household income that accounts for differences in household size and
composition.
According to the Office for National Statistics (ONS), between 1957 and 2017 the
share of household expenditure spent on food halved. This partly reflects larger
incomes, smaller households, and a greater choice of products at different price
points.97 UK households devote a lower share of their spending to food and non-
alcoholic drinks compared to households elsewhere in Europe, and particularly in
developing countries. For instance, for the average UK household, 10.8% of spend
went on food and non-alcoholic drinks in FYE 2020,98 whereas in EU households,
13.0% of consumption expenditure went towards food and non-alcoholic drinks on
average in 2019.99
Data and Assessment
Indicator: Spending on food purchased for home consumption as a percentage of
total spending, by all households and low-income households
Source: ONS Family Spending, 2019 to 2020 and ONS Consumer Price Inflation
97 AHDB, ‘Why UK consumers spend 8% of their money on food’ (2020), https://ahdb.org.uk/news/consumer-insight-why-uk-consumers-spend-8-of-their-money-on-food. 98 ONS, ‘Family Spending in the UK 2019 to 2020’, https://www.ons.gov.uk/peoplepopulationandcommunity/personalandhouseholdfinances/expenditure/bulletins/familyspendingintheuk/april2019tomarch2020. 99 Eurostat, ‘Household expenditure in 2019’, https://ec.europa.eu/eurostat/de/web/products-eurostat-news/-/ddn-20201130-1.

215
Figure 4.1.2a: Average spend on food and non-alcoholic drinks, percentage of total
spending by low-income and all households, 2008 to FYE 2020
The data compares the percentage of the average weekly household expenditure
that is being spent on food and non-alcoholic drinks, for all households and for
households in the lowest quintile (bottom 20%) by equivalised disposable income.
This is expenditure, not income, so does not account for money that households
have put away in savings.
In the period since 2008, households in the lowest quintile by income (bottom 20%)
have spent between 14% and 17% of their household expenditure on food and non-
alcoholic drinks, while the average household has spent between 10% and 12%.
Since 2008, there has been a gradual decrease in food expenditure, as a
percentage, for both the lowest 20% by income and for all households.

216
Figure 4.1.2b: Changes in the food price index (real terms prices) 2010 to October
2021
Figure 4.1.2b is included in this indicator to support the overall assessment of the
trends in household spend on food. Real terms prices are adjusted for the effects of
overall inflation, which makes it possible to measure the actual change in food and
non-alcoholic drinks prices and not just an increase because of overall inflation. From
a peak in February 2014, food prices fell continually until October 2016. Prices
fluctuated between 2016 and 2019, before falling steadily from May 2020 onwards.100
100 ONS, ‘Consumer price inflation, UK: October 2021’, https://www.ons.gov.uk/economy/inflationandpriceindices/bulletins/consumerpriceinflation/october2021.

217
Figure 4.1.2c: Year on year percentage change in income, before housing costs, by
quintile median and overall population median (pounds per week equivalised in
2019/20 prices)
Figure 4.1.2c shows income before housing costs by quintile and overall population
medians (equivalised in real terms). This is not the average, but the medians of the
income quintiles. These figures have been deflated to FYE 2020 prices and take
account of household composition. The sample size is about 20,000. Another data
source on income is from ONS’ Average Household Income publication, on the
median equivalised disposable household income of individuals by income quintile,
published as pounds per year. It has a sample of about 17,000 households, but
5,000 households before 2019. The data is from the Living Costs and Food Survey
(and Survey on Living Costs from 2019), which is also the data source used in the
expenditure data in Figure 4.1.2a.
In FYE 2020 the median income before housing costs in the UK was £547 per week.
From FYE 2017 to FYE 2020 income in the bottom quintile fell by 1.1%, to £264 per
week, while for the top quintile income grew by 3.9%, to £1,070 per week. In the 10
years from FYE 2010 to FYE 2020, the median income before housing costs for the
overall population rose by 7.7%, while the bottom quintile has seen income rise by
2.4% and the top quintile has seen a 2.3% rise in income. Since 2000 median
incomes for all households have risen by 25%.
Data from ONS’s Average Household Income analysis also show that in the last 3
years the income of households on low incomes has decreased while the income of

218
households on high income has increased. This dataset shows the median
equivalised disposable household income of individuals by income quintile.
Between FYE 2017 and FYE 2020, the median disposable income of households in
the bottom quintile fell by 11.1% while for all individuals it grew by 0.3%. In the 10
years from FYE 2010 to FYE 2020 median disposable household income in the
bottom quintile fell by 2.7%, and in the top quintile it grew by 2.9%. The average
disposable income for all individuals in the UK over the same 10-year period has
grown 6.9%.
The GSS income and earnings coherence work plan was published on 14 October
2021.101 It has been produced collaboratively by three government departments:
ONS, Department for Work and Pensions (DWP) and HM Revenue and Customs
(HMRC). This work plan recognises the recommendation from the Office for Statistics
Regulation to improve the accessibility of language and guidance, and is working to
ensure that government publications provide a coherent description of the income
and earnings landscape with an action to explore the feasibility of producing a single
set of cross-sectional household income estimates.102
There is a published, and soon to be updated, guide to sources of data on income
and earnings which outlines the different data sources and outputs that feed into the
analysis of income and earnings within the UK.103 It explains important information for
each data source, including what data are available and the sources’ main uses,
strengths and limitations. This guidance sets out that the Living Costs and Food
Survey is the primary source of household expenditure data and can be used to carry
out joint analysis of income and expenditure; and the Family Resources Survey and
Households Below Average Income series is the foremost source of data and
information about household income, income poverty and inequality and is used for
the analysis of low income by researchers and the government.104
For this report on Food Security, the Living Costs and Food Survey has been used
for analysis looking at expenditure on food and the direct relationship between this
expenditure and household incomes; with the Households Below Average Income
series used when reporting on trends in household income and analysis of low
incomes.
101 Government Statistical Service, ‘Income and earnings statistics’, https://gss.civilservice.gov.uk/user-facing-pages/income-and-earnings-statistics/. 102 Office for Statistics Regulation, ‘Review of Income-based poverty statistics’, https://osr.statisticsauthority.gov.uk/publication/review-of-income-based-poverty-statistics/. 103 ONS, ‘A guide to sources of data on income and earnings’, https://www.ons.gov.uk/employmentandlabourmarket/peopleinwork/earningsandworkinghours/methodologies/aguidetosourcesofdataonearningsandincome. 104 DWP, ‘Family Resources Survey’, https://www.gov.uk/government/statistics/family-resources-survey-financial-year-2019-to-2020/family-resources-survey-financial-year-2019-to-2020; Households Below Average Income: financial year 2020’, https://www.gov.uk/government/statistics/households-below-average-income-for-financial-years-ending-1995-to-2020.

219
Trends
Household spend on food as part of their total budget has remained fairly constant
since 2010 for average households and low-income households. Between 2010 and
2020, real terms food prices decreased, so that to buy the same food in 2020 cost
less than in 2010. Since 2010 median income in real terms for low-income
households (bottom quintile) has increased by 2.4% meaning that low-income
households have more money to spend.
Low-income households saw their income fall by 1.1% between FYE 2017 and FYE
2020 in contrast to the average household whose income has increased by 4.9%
since FYE 2017. With a decrease in income alongside the percentage spent on food
having remained the same, the poorest households could have had a diminished
budget available for food since FYE 2017.
Indicator 4.1.3 Price changes of main food
groups
Headline
Since 2011, food prices overall have fallen in real terms. This has varied by food
groups. Vegetables (including potatoes), milk, cheese and eggs, and meat have all
become cheaper in real terms. Fruit prices have increased faster than overall
inflation, meaning they have become more expensive in real terms than ten years
ago.
Context and Rationale
The aim of this indicator is to monitor trends in the affordability of a healthy diet to
provide a measure of consumers’ nutritional food security. The Consumer Prices
Index including Owner Occupiers’ Housing costs (CPIH) food groups that are
analysed in this indicator serve as a proxy for some of the main foods recommended
by government for a healthy diet and look at vegetables including potatoes, fruit, milk,
cheese, and eggs, fish, meat, and bread and cereals.
Food price increases can affect consumers’ purchasing behaviour. Price rises may
mean that consumers either ‘trade down’ by switching to cheaper products of the
same type, buy less of a type of food, or spend more money for the same product.
The evidence of the extent to which food price rises affect dietary habits is limited.
Nevertheless, tracking the real term prices of key food groups for a healthy diet is still
a useful tool to understand some of the factors affecting consumers’ ability to follow a
healthy diet.

220
Providing guidance on a healthy diet is complex and will often need to account for an
individual’s circumstances. The Eatwell Guide depicts a diet based on five food
groups and shows the proportions of foods from each food group that are needed to
obtain the wide range of nutrients required to stay healthy.105 For this report, several
foods from some of the larger segments of the Eatwell Guide have been selected to
track their affordability. It should be noted that there are differences between the
composition of the five food groups the Eatwell Guide uses, and the CPIH food
groups used in this report due to different categorisation.
The Consumer Price Index (CPI) is a measure of consumer price inflation produced
to international standards and in line with European regulations. The CPI is the
inflation measure used in the government’s target for inflation. The CPIH is the most
comprehensive measure of inflation. It extends the CPI to include a measure of the
costs associated with owning, maintaining, and living in one’s own home, known as
Owner Occupiers’ Housing Costs (OOH), along with Council Tax. Both are significant
expenses for many households and are not included in the CPI.
Data and Assessment
Indicator: Index of real terms food prices for vegetables, fruit, fish, meat, bread and
cereals, and milk, cheese, and eggs.
Data: Office for National Statistics, CPIH
Figure 4.1.3a: Percentage change in prices between October 2011 and October 2021,
overall CPIH and food and non-alcoholic beverages
105 PHE, ‘Eatwell Guide’, https://www.gov.uk/government/publications/the-eatwell-guide.

221
The overall CPIH rose 20% between October 2011 and October 2021. Food and
non-alcoholic beverages rose 9% in the same period.
Figure 4.1.3b: Percentage change in real terms prices between October 2011 and
October 2021, food product classes
Food and non-alcoholic drink prices have decreased in real terms between October
2011 and October 2021. Within food categories, most prices have decreased in real
terms in this period. Milk, cheese, and eggs have decreased the most at 16.5%,
followed by meat at 12.6% and vegetables (including potatoes and tubers) at 12.3%.
CPIH for fruit (fresh and preserved) is the only food category that has increased in
the 10-year period, by 5.9%.
Trends
Prices for all main food categories except fruit have fallen in real terms in the last 10
years, as food prices have grown more slowly than the overall CPIH. The increase in
fruit prices is above that for food and non-alcoholic drinks. There could be
consequences for health, as government recommends that individuals consume at
least five portions of fruit and vegetables a day, making up a third of what an
individual should eat. While fruit juice can also be a substitute for raw fruit, usually at
a lower price, consumption should be limited to no more than 150ml a day.
222
Food prices are determined by various factors. For fruit in particular, poor harvests, a
fall in Sterling exchange rates, or transport disruptions leading to fresh fruit being
spoilt, can have an impact on consumer prices. The UK imports most of its fruit from
the EU, South America, and Africa. Any issues arising in these regions as well as
further down the supply chain may affect fruit prices in future. It is not clear whether
the increase in fruit prices since 2011 has been driven by increased consumer
preferences for imported out-of-season fruit.
Indicator 4.1.4 Household food security
Headline
According to government data from FYE 2020, 92% of households in the UK
regarded themselves as food secure. 8% regarded themselves as food insecure; of
this, 4% reported low food security and another 4% had very low food security. Food
insecurity is not evenly spread across society, with age, disability, ethnicity, and
geographical location all factors affecting household food security.
Context and Rationale
In March 2021, food security data for all UK households was published in the ‘Family
Resources Survey: financial year 2019 to 2020’ for the first time, covering the period
of April 2019 to March 2020. This surveys whether heads of households have
sufficient food to facilitate an active and healthy lifestyle.
The person with the most responsibility for buying and preparing food in the
household (head of household) is asked to assess their overall household food
security within the last 30 days by answering a series of questions. The limitations of
this indicator mean that information about individual experiences of food insecurity
within the household is not available, nor can it directly measure hunger. Instead, the
indicator illustrates the financial situation of households and how that affects their
access to food. The broad structure and sequence of the questions is the same as
those used internationally, including by the United States Department of Agriculture,
enabling international comparisons. Although the Food Standard Agency’s (FSA)
Food and You 2 survey uses the same ten questions as the Family Resources
Survey, it is worth noting that the results between the surveys may differ due to the
FSA asking these questions about a longer period of 12 months.106
106 FSA, ‘Food and You 2’, https://www.food.gov.uk/research/food-and-you-2.

223
The 30-day reference period used in the Family Resources Survey may have some
limitations in that it can provide only a snapshot of food insecurity at a given time.107
Nevertheless, this indicator primarily uses data from the Family Resources Survey,
as the sample size is bigger compared to the FSA’s Food and You 2 survey.
Additionally, the Family Resources Survey covers the whole of the UK, whereas the
Food and You 2 survey only covers England, Wales, and Northern Ireland.
While the intention is to use the Family Resources Survey data as the only source for
future iterations of the UKFSR, for this report, data from the FSA’s Food and You 2
survey has been included. This is because the FSA’s data covers the latter half of
2020, providing some understanding of the impacts the COVID-19 pandemic has had
on household food security. The differences between the Family Resources Survey
and Food and You 2 are outlined in more detail below.
Data and Assessment
Indicator: Household food security status of all households, FYE 2020, UK
Source: Department for Work and Pensions, Family Resources Survey
Note: A summary of the scoring of food security categories and definitions in the
Family Resources Survey can be found in the Appendix of this report.
107 ENUF, ‘Food insecurity measurement on the Family Resources Survey’ (2019), https://enuf.org.uk/research-blogs/food-insecurity-measurement-family-resources-survey.
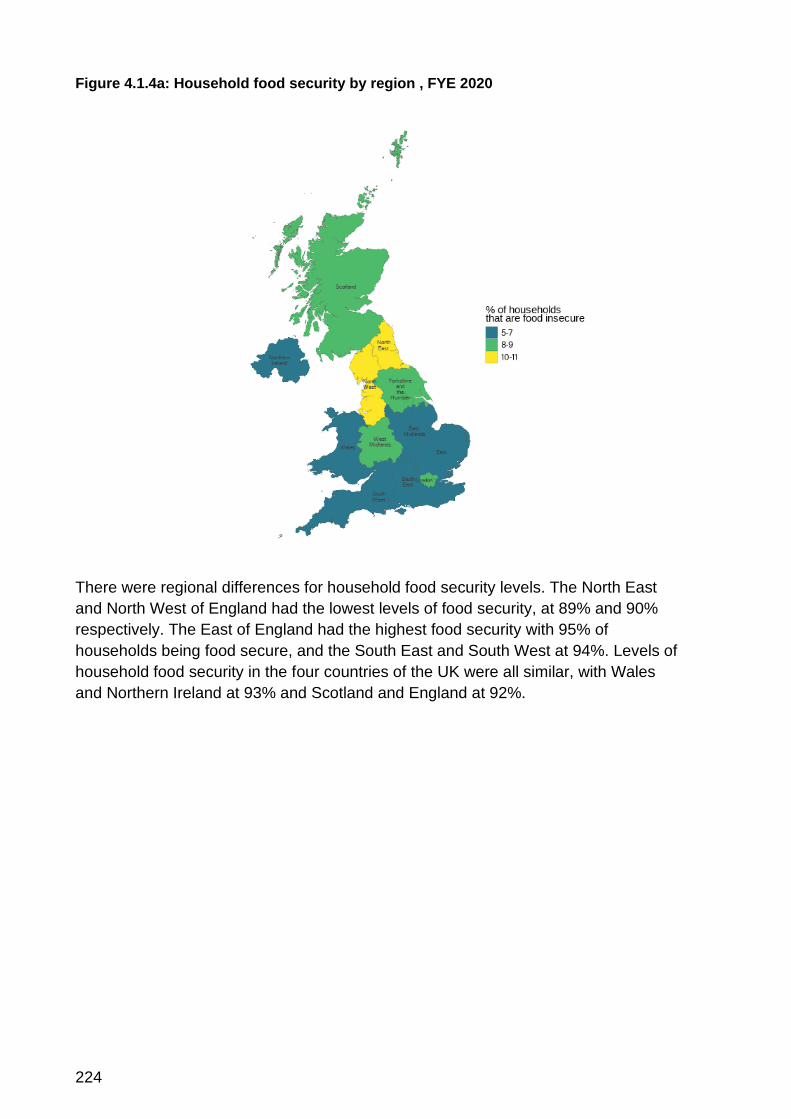
224
Figure 4.1.4a: Household food security by region , FYE 2020
There were regional differences for household food security levels. The North East
and North West of England had the lowest levels of food security, at 89% and 90%
respectively. The East of England had the highest food security with 95% of
households being food secure, and the South East and South West at 94%. Levels of
household food security in the four countries of the UK were all similar, with Wales
and Northern Ireland at 93% and Scotland and England at 92%.

225
Figure 4.1.4b: Household food security by disability, FYE 2020
88% of households with one or more disabled people were food secure, compared to
95% of households without any disabled people living in them. In households with
disabled people, 7% had very low food security, while only 2% did in households
without any disabled people.
Figure 4.1.4c: Household food security by age of head of household, FYE 2020
Households where the head is younger were less likely to be food secure than
households with older heads of household. 15% of households where the head of

226
household was aged 16 to 24 were food insecure, while only 1% of households with
an 85-year-old or over as head of household were food insecure. As the age of the
head of household increased, so too did the likelihood that the household was food
secure, apart from where the head of household was aged 35-44, where there was a
slight decrease in food security.
Figure 4.1.4d: Household food security by ethnicity of head of household, FYE 2020
Heads of households who are White were most likely to be food secure, with 93%
being food secure compared to 81% of Black/African/Caribbean/Black British heads
of households. 8% of Black heads of households had very low food security,
compared to 4% of those whose ethnicity is White. 92% of households headed by an
Asian/British Asian person were food secure. Within that category, those headed by
an Indian person had the highest food security of all groups, with 95% food secure.
While not displayed in the graphs above, there are further factors that influence a
household’s food security. Households with gross incomes of less than £200 per
week (7% of households) were the least likely to be food secure (74% high food
security, 7% marginal). In comparison, those with gross incomes of £1,000 or more
per week (26% of households) were the most likely to be food secure (96% high, 3%
marginal).
The composition of the household also played an important role. Households with
children (81% high food security; 8% marginal) were less likely to be food secure
than households with no children (89% high; 5% marginal). In addition, single-adult
households with children were more likely to be food insecure than households with

227
two or more adults and children. Households receiving state support have differing
levels of food security, depending on the type of support they receive. In general,
households receiving income-related benefits had 64% high and 11% marginal food
security.
Food and You 2 The data on household food security contained in the Family
Resources Survey report spans FYE 2020, and thus has only limited overlap with the
COVID-19 pandemic. As discussed earlier, the FSA’s Food and You 2 surveys used
the same 10 questions as the Family Resources Survey but asked about a 12-month
period in England, Wales, and Northern Ireland only. Data was collected between
July and October 2020 for Wave 1, and between November 2020 and January 2021
for Wave 2, allowing more insight into the impacts of the COVID-19 pandemic.
For Wave 1, 84% of respondents were classified as food secure (72% high, 12%
marginal) and 16% were classified as food insecure (9% low, 7% very low). 32% of
households with an income below £19,000 experienced food insecurity compared to
households earning more than £32,000, where food insecurity levels ranged between
4% and 10%. Age was also an important factor; younger adults, particularly 16 to 24-
year-olds, had higher food insecurity levels (16% low, 9% very low) compared to
older adults, for instance 55 to 64-year-olds (6% low, 5% very low). Households with
a child were also more likely to report food insecurity. 77% of households with
children reported that they were food secure compared to 88% of households without
children. In addition, food insecurity was more likely to be reported by respondents
who were long term unemployed or had never worked (44%) compared to those in
most occupational groups (range 11-26%).108
Overall household food security levels in Wave 2 were similar to Wave 1, where 84%
of respondents were classified as food secure (73% high, 11% marginal), and 16% of
respondents were classified as food insecure (8% low, 7% very low). Similarly,
income levels, age, the presence of children in the household, and the employment
status influenced food security levels.109
Trends
Due to the limited data around household food insecurity and not being able to
directly compare the Family Resources Survey results with the Food and You 2
results, it is difficult to give a long-term analysis of any trends. The data indicates,
however, that age, disability, ethnicity, regions, income, family composition, and
benefits status play a role in the level of household food security.
108 FSA, ‘Food and You 2: Wave 1 Key Findings’ (2021), https://www.food.gov.uk/sites/default/files/media/document/fy2-wave-1-report-_key-findings_1.pdf. 109 FSA, ‘Food and You 2: Wave 2 Key Findings’ (2021), https://www.food.gov.uk/sites/default/files/media/document/fy2-w2-key-findings_review_final_0.pdf.

228
Indicator 4.1.5 Access to food shops in
England
Headline
Household food security depends on physical access to food shops. In the regions of
England with the lowest access to food shops, over 95% of the population can reach
a food shop within 30 minutes without needing a car, and over 84% within 15
minutes. Data on the issue is currently only available for England. Access to food
shops is not equal across regions, with percentages being lower in more rural areas.
Trends towards increased use of online shopping and deliveries, and the impacts of
the COVID-19 pandemic, are not currently available but will be tracked in future Food
Security Reports.
Context and Rationale
Household food security does not only depend on food affordability, but also on the
ability of consumers to physically access food shops. Potentially vulnerable are those
households without access to a car or means of private transport as well as less
mobile individuals such as disabled people or the elderly. Travel distances are higher
in rural areas, which typically have a more dispersed population.
What this data does not show is the cost and selection of food available to
consumers in their nearest food shop. Groceries at convenience shops can be more
expensive than in larger supermarkets, resulting in higher food costs for a household.
Some food shops may also have a smaller selection of food, which could limit
consumers’ choice and ability to meet all their nutritional requirements.
The growing number and scope of online grocery shopping services across the UK
have the potential to alleviate some of the difficulties of physical accessibility of food
shops. During the COVID-19 pandemic, there was significant demand for online
delivery services across the major supermarket chains. Retailers reacted quickly to
increase capacity of both delivery services and click and collect services to meet this
demand. To support particularly vulnerable groups, government worked closely with
retailers to enable priority access to online groceries. There are, however, some
barriers to accessing these services, particularly amongst low-income households,
disabled people, and the elderly. Some households cannot afford digital devices,
meet the minimum spend or the delivery charges required by some retailers, or might
not have the necessary skills to access these digital services. In addition, some
areas have lower digital connectivity levels.
It is likely that the switch to more online grocery shopping might become permanent
amongst certain consumers, and that there is the potential for further businesses to
offer these services.
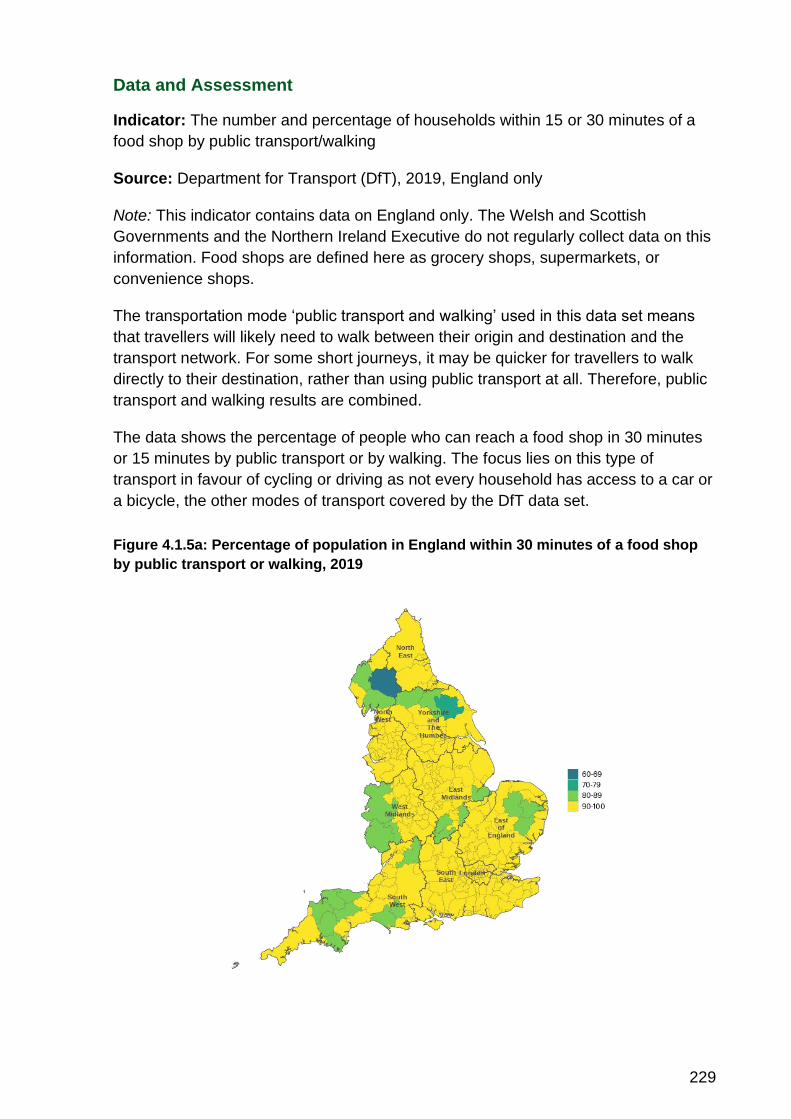
229
Data and Assessment
Indicator: The number and percentage of households within 15 or 30 minutes of a
food shop by public transport/walking
Source: Department for Transport (DfT), 2019, England only
Note: This indicator contains data on England only. The Welsh and Scottish
Governments and the Northern Ireland Executive do not regularly collect data on this
information. Food shops are defined here as grocery shops, supermarkets, or
convenience shops.
The transportation mode ‘public transport and walking’ used in this data set means
that travellers will likely need to walk between their origin and destination and the
transport network. For some short journeys, it may be quicker for travellers to walk
directly to their destination, rather than using public transport at all. Therefore, public
transport and walking results are combined.
The data shows the percentage of people who can reach a food shop in 30 minutes
or 15 minutes by public transport or by walking. The focus lies on this type of
transport in favour of cycling or driving as not every household has access to a car or
a bicycle, the other modes of transport covered by the DfT data set.
Figure 4.1.5a: Percentage of population in England within 30 minutes of a food shop
by public transport or walking, 2019

230
In all regions taken as a whole, over 95% of the population could reach a food shop
in 30 minutes. London has the highest rate at 100% reaching a food shop in 30
minutes, while the South West has the lowest rate at 95.8%. Across England, and at
Local Authority level within the regions, there are only a few areas where access
within 30 minutes was available to less than 90%: local authorities covering parts of
North Yorkshire and Cumbria, parts of the East Midlands, the Welsh border area in
the West Midlands, and the rural areas in Devon covering Exmoor and Dartmoor.
Figure 4.1.5b: Percentage of population in England within 15 minutes of a food shop
by public transport or walking, 2019
In all regions 84% of the population could reach a food shop in 15 minutes. London
has the highest rate at 99.0% in 15 minutes, with the South West having the lowest
rate at 84.2% for 15 minutes. It should be noted that the South West also has the
highest proportion of their population living in rural areas at 31.6%, while London has
the lowest at 0.2%.
At this level, urban centres and population-dense areas are more clearly discernible.
There are more parts of England where 70% or less of the population are within 15
minutes of a food store, containing around 1 million households. The remote rural
area covering North Yorkshire and Cumbria is more clearly defined.
Trends
This indicator illustrates that accessibility of food shops is not a major issue for most
of the population even if they do not have access to a car.

231
Due to changes in DfT’s data collection, the earliest comparable data set for this
indicator is from 2015. Between 2015 and 2019, there were not any marked changes
in the accessibility of food shops.
Urban areas already have a high saturation of food shops. Opening new shops in
rural areas might not be financially viable due to lower customer numbers. Expansion
in, and changes to, online grocery offers, such as changes to minimum spend and
delivery charges, could improve accessibility rates further. To measure the effect that
online grocery shopping has on household food security, a new indicator may be
considered for the next iteration of the UK Food Security Report.
While this report does not contain data on food shop accessibility in the devolved
administrations (DAs), some research for Northern Ireland suggests low-income
households in rural areas may experience food insecurity differently compared to
low-income households in urban areas. With rural areas having reduced access to
services such as public transport and retail options compared to urban areas, the
effects of food poverty can be exacerbated.110
Poverty Premium
There are various approaches to defining what the poverty premium is, but generally
it is understood as the extra costs low-income households incur when buying the
same goods and services as high-income households. Some of the main drivers
behind the poverty premium are based on low-income households’ constrained
finances, which prevent them from accessing favourable deals. Other factors include
the geography and corresponding infrastructure in the area a household resides in, a
household’s digital access, as well as market failures where the needs of low-income
households are not met. People can pay a poverty premium in many areas, including
fuel, financial and banking services, transport, housing, insurance, and groceries.
Low-income households paying extra costs for services compared to high-income
households exacerbates pre-existing inequalities in these households.111
With low-income households already spending a higher percentage of their
household budget on food than the average household, it is important to understand
whether they also face additional costs. A study undertaken by the Institute for Fiscal
Studies (IFS) in 2012, as well as other studies conducted in 2009 and 2010, noted
that there was no evidence to suggest that low-income households pay more for
food, or that they faced a premium by not being able to buy food in bulk. In fact, they
110 McClelland, N., ‘Putting food poverty in NI on the map’ (2019), https://pure.ulster.ac.uk/en/clippings/putting-food-poverty-in-ni-on-the-map. 111 Davies, S. and others, ‘Paying to be poor: Uncovering the scale and nature of the poverty premium’ (2016), http://www.bristol.ac.uk/media-library/sites/geography/pfrc/pfrc1615-poverty-premium-report.pdf.

232
stated that many households purposefully buy in bulk to pay lower prices.112
However, the food budget is not the only factor enabling bulk buying. Buying in bulk
is contingent on having the facilities to refrigerate or freeze food, and space to store it
at ambient temperatures. Access to food shops is more of a challenge for people
who do not have such facilities as they must shop more often. Furthermore, those
who have limited cooking facilities or who cannot afford to run them may be paying a
premium for items such as ready meals.
Geography is an important factor in determining whether low-income households
face a poverty premium for groceries. The same IFS report suggests that households
living in rural areas without access to a car are more likely to use local shops, where
food prices can be higher. More research needs to be done to understand how low-
income households without digital access to online food shopping might be impacted
financially.
Indicator 4.2.1 Eligibility for Free School
Meals
Headline
Eligibility rates for free school meals have been fairly stable across the UK in recent
years, with Wales and England seeing an increase from 2018 due to the introduction
of Universal Credit and its transitional protection. There was also a further increase
between January 2020 and January 2021. This is likely due to COVID-19 impacting
households’ financial situations as well as the continuing Universal Credit transitional
protection measures, which have extended eligibility to more pupils.
Eligibility rates are also expected to increase in Scotland in the coming years due to
the staggered expansion of universal free school meals for Primary 4 pupils in
August 2021, Primary 5 pupils in January 2022, and all primary school children in
August 2022.
Context and Rationale
All four nations in the UK offer the option of free school meals to eligible pupils. Free
school meals are intended to support learning and development to ensure that pupils
do not miss out on lunch due to financial constraints. To claim free school meals
112 NatCen, ‘Advice on the Measurement of the Poverty Premium across UK markets’ (2019), https://assets.publishing.service.gov.uk/government/uploads/system/uploads/attachment_data/file/782513/natcen_report.pdf.

233
(outside of the infant free school meals available to all households in England and
Scotland), either family or pupil must be claiming particular state benefits. Data from
the Family Resources Survey shows that households on these benefits all have
below average food security status, except for households claiming pension
credits.113 57% of households on Universal Credit are food secure compared to 92%
of all households. Free school meals data provides important context on households
with children which have a low food security status.
Other programmes exist to support pupils’ food requirements. These include the
School Fruit and Vegetable Scheme in England, the School Holiday Enrichment
programme in Wales, as well as the School Milk Scheme and Breakfast Club
Programmes available across the UK. This report focuses on free school meals,
however, as they provide the most substantial daily meal and reach the largest
number of pupils.
Data and Assessment
Indicator: Eligibility rates of Free School Meals
Source: Department for Education, Welsh Government, Scottish Government,
Northern Ireland Department of Education
Note: The different countries have different eligibility thresholds for Free School
Meals. This may impact the levels of eligibility between countries and make direct
comparisons between countries more complex.
113 DWP, ‘Family Resources Survey’, https://www.gov.uk/government/statistics/family-resources-survey-financial-year-2019-to-2020/family-resources-survey-financial-year-2019-to-2020.

234
Figure 4.2.1a: Percentage of pupils eligible for Free School Meals, UK, 2020/21
In FYE 2021 the region or country with the highest proportion of school children
eligible for free school meals is Scotland with 37.5%, although the data for Scotland
includes all children in primary 1 to 3. Northern Ireland is the next highest with 28.4%,
followed by the North East with 27.5%. The region with the lowest eligibility is the
South East at 16.0%, followed by the East of England with 16.7%.

235
Figure 4.2.1b: Percentage of pupils eligible for Free School Meals, UK, 2015/16 –
2020/21
When looking only at the countries, not regions, Scotland had the highest rate in
2020/21 at 37.5% while England had the lowest rate at 20.8%, very slightly lower
than Wales with 20.9%.
In the years for which data is available, Northern Ireland and Scotland have both very
slightly decreased in their free school meal eligibility rate. Northern Ireland from
29.9% in 2017/18 to 28.4% in 2020/21 and Scotland from 38.2% in 2015/16 to 37.5%
in 2020/21. Wales and England have both increased between 2015/16 and 2020/21,
Wales from 16.8% to 20.9% and England from 14.3% to 20.8%.
Trends
The increase in eligibility rates observed for England and Wales from 2018 can be
attributed to the introduction of Universal Credit and its transitional protection
measures, which have enabled more pupils to stay eligible for free school meals. In
April 2018, the criteria used to determine which pupils are eligible for free school
meals were updated to reflect the introduction of Universal Credit and the phasing
out of other income-based benefits. In England, under the updated criteria, the
government estimated in 2018 that by 2022 around 50,000 more pupils would benefit
from a free school meal compared to the previous benefits system. From 1 April 2018
in England and 1 April 2019 in Wales, transitional protection was also implemented
for those pupils who might otherwise have lost free school meals following the update
to the eligibility criteria. This means that any existing pupil who no longer met the
236
eligibility criteria at the point at which Universal Credit was fully rolled out continued
to receive free school meals until the end of their current phase of education.
Although trends in eligibility rates have been stable across the UK for the last few
years, there have been recent increases that are likely linked to COVID-19 impacts
on households’ income and the ongoing Universal Credit transitional protection for
England and Wales. Between January 2020, before COVID-19, and January 2021,
the percentage of pupils entitled to free school meals has increased in Wales and
England, but not in Northern Ireland. In England, it has increased from 17.3% to
20.8% and in Wales from 18.3% to 20.9%.
The Scottish Government’s annual Schools Healthy Living Survey Report in 2021 did
not provide data on the uptake of free school meals. The annual school meals survey
which provides data for this report normally takes place every February, but the
schools were closed at this point due to the COVID-19 pandemic. The Scottish
Government provided local authorities with funding to provide support in lieu of free
school meals to eligible families during all periods of school closures. Monitoring
returns from local authorities showed this support was reaching up to 175,000
children and young people.
The uptake rates are expected to increase in Scotland in future years. In addition to
children in Primary 1 to 3, all children in Primary 4 became entitled to receive free
school lunches in August 2021. Universal provision will be extended to all children in
Primary 5 in January 2022 and then to all primary school children in August 2022.
Indicator 4.2.2 Take-up of Healthy Start
voucher scheme
Headline
Healthy Start vouchers are a scheme in England, Wales, and Northern Ireland to
support people on low incomes to access pre-natal vitamins, infant milk formula, and
healthy food for young children. In Scotland an equivalent Best Start Foods scheme
launched in August 2019. The take-up rate of the Healthy Start voucher scheme was
relatively stable between 2019 and 2021. Eligibility rates have increased in England
and Wales, nd decreased in Northern Ireland between early 2019 and summer 2021.
These increases are likely linked to COVID-19 and its impacts on the financial
situation of households.

237
Context and Rationale
The Healthy Start voucher scheme is available in England, Wales, and Northern
Ireland. In August 2019, Scotland introduced its own scheme called the Best Start
Foods scheme. Both schemes are aimed at enabling low-income families with young
children, and women during pregnancy, to access healthy food and vitamins.
Beneficiaries need to meet certain criteria determined by their income level, stage of
pregnancy, and age of their children to be eligible for the schemes. Once qualified,
families receive vouchers, or in the case of the Best Start Foods scheme, a prepaid
card, which helps them pay towards products such as infant milk formula, milk, fresh,
frozen, or tinned fruits and vegetables, fresh or dried pulses, and vitamins. The
Healthy Start scheme is in the process of moving towards a card system as well.
Including data on the take-up rate of these schemes amongst eligible households
contributes to the wider picture of household food security. Both schemes provide
assistance to households that might otherwise struggle to purchase healthy food
during the important development stages of young children.
Due to the Best Start Food scheme in Scotland launching in August 2019, February
2019 data for Scotland is not available to include in this indicator.
Data and Assessment
Indicator: Take-up rate in the UK
Source: Department of Health and Social Care
Note: The take-up rate shows the percentage of people who have successfully
applied for vouchers or payment cards, out of the people who are eligible. This does
not mean that the vouchers were spent.

238
Figure 4.2.2a: Take-up rate for Healthy Start vouchers by region and country, February
2019 and August 2021
In August 2021, the take-up of Healthy Start vouchers (and Best Start payments in
Scotland) in the UK was 61.9%, with 376,000 people receiving vouchers or
payments. This has increased slightly since February 2019 when the take-up was
57.2%, although this rate did not include Scotland as its scheme did not start until
August 2019.
In August 2021 the region with the highest take-up was Scotland, with 77.0% (36,720
people) while in February 2019 it was the North East with 63.2% (16,411 people).
Northern Ireland had the lowest take-up rate in 2021 with 56.0% (10,589 people) and
East of England did in 2019 with 51.5% (18,670 people).
There has been an increase in the take-up rate in all regions participating in the
Healthy Start voucher scheme between 2019 and 2021, except in Northern Ireland
which saw a drop from 59.1% to 56.0%. The South West saw the highest increase,
rising from a take-up of 52.0% to 59.7%, followed by the East of England which rose
from 51.5% to 56.7%.
There has been an increase in the number of people eligible for Healthy Start
vouchers and Best Start Food payments in all regions and countries in the UK
between February 2019 and August 2021. The highest increase was seen in London
at 34.2% while the lowest increase was in Northern Ireland at 12.2%.

239
Trends
Although the Healthy Start voucher (and Best Start payment) schemes have been
available for more than ten years, this report focuses on data from 2019 to 2021 as
full data on the total number of people eligible for the scheme was not available prior
to 2019. Since 2019, this data has been available, making it possible to draw more
meaningful comparisons between different time periods.
While trends have been relatively stable, between February 2019 and August 2021,
eligibility in England has increased by 28.8%, in Wales by 18.7%, and in NI by
12.2%. This is likely due to the COVID-19 pandemic and its impacts on households’
financial situation.
Case study 4.1 Food Aid
Overview
There is no comprehensive record of the number of organisations providing food aid
in the UK. This is because many different types of organisations provide food aid,
including registered charities, places of worship, community organisations, schools,
hospitals, and commercial and social enterprises. Government data is limited
regarding the number of individuals or households receiving food parcels, how many
parcels they might have received and over what period. However, DWP has
measures in train to improve the official statistics on this subject in the future.
Background
This report defines food banks as organisations that distribute food to those in need.
Food banks are seen as emergency crisis provision and are often the last resort for
individuals before going hungry. According to the Trussell Trust, ‘destitution – and the
resulting inability to afford essentials – is the main reason for people needing to use a
food bank.’114
Food aid is provided by a very broad range of organisations, including registered
charities, churches, schools, hospitals, and community centres. Businesses may
support these or distribute food directly. Organisations providing food aid proliferated
in wealthy countries, including the UK, after the financial crash of 2007 to 2008. Over
the COVID-19 pandemic food banks saw an upward shift in demand as social
restrictions in 2020 impacted on peoples’ lives and livelihoods, and the government
114 Trussell Trust, ‘End of year stats’, https://www.trusselltrust.org/news-and-blog/latest-stats/end-year-stats/.

240
implemented a range of measures to mitigate them. Third sector aid is not widely
available for other non-discretionary living expenses such as housing or transport,
making food aid an immediate source of support for people in financial hardship.
The two main charitable food bank organisations in the UK are the Trussell Trust and
the Independent Food Aid Network (IFAN). In February 2021, there were over 1,300
Trussell Trust food banks in the UK, in addition to over 1,000 independent food
banks. Both have reported increases in the number of food parcels distributed.115
Due to the complexity of the food aid landscape, the UK government does not hold
data on the precise number of organisations which distribute food aid. Questions
related to food aid access have been added to DWP’s Family Resources Survey and
the results for financial year 2021 to 2022 will be published in 2023. These new
questions will assess the number of households accessing food banks within the
previous 30 days and will improve government understanding of food aid use and its
links to food poverty. This data will be included in future UK Food Security Reports.
Food aid is provided through various means, and to have a thorough understanding
of the true scale of the problem requires additional data to fully understand the
landscape of food aid and food poverty. Data that DWP are collecting will produce
robust official statistics on food bank usage for the first time, and will be an important
step forward for the evidence base in this area.
Impact of the COVID-19 pandemic and government response
The COVID-19 pandemic tested the UK’s food supply system more than any other
time in over 70 years. Businesses across the food supply chain had to adjust rapidly
to greatly increased consumer demand. People spent more time at home and ate out
less. The overnight closure of many businesses due to lockdown meant that many
individuals lost their source of income and had to find alternative ways to feed
themselves and their families.
During the period when lives and livelihoods were significantly impacted due to public
health restrictions, the government provided significant financial support. As part of
its pandemic response, the UK government supported incomes through the
Coronavirus Job Retention Scheme (‘furlough’) with a total of £69.3bn in claims to
date, and the Self-Employment Income Support Scheme has paid out over £27bn
across all five grants.
In England, £429.1m were given to Local Authorities to provide further support to
households struggling with the cost of food and other essentials due to the pandemic.
In summer 2020, there was also a £3.5m package of support made available for
small food charities through a grant scheme and a further £10m grant assistance
115 House of Commons Library, ‘Food Banks in the UK’ (2021), https://commonslibrary.parliament.uk/research-briefings/cbp-8585/.

241
made available to FareShare, a national network of charitable food redistributors, to
deliver food to the most vulnerable.116 There was also a package of further support
for vulnerable individuals and families during the winter period 2020 to 2021. This
package included a further £16m of funding to FareShare to work with local charities
and organisations to provide food for those struggling due to the immediate impacts
of the pandemic.
In Scotland, amongst wider measures there was £56 million worth of assistance
provided in lieu of free school meals to low-income households during school
holidays and periods of remote learning. Over £100 million was provided across the
Wellbeing, Supporting Communities, and Third Sector Recovery Funds which include
supporting a range of food-based activity alongside wider wellbeing action. In 2021 to
2022, the Scottish Government continued to provide assistance in lieu of free school
meals to low-income families during the school holidays. In early 2021 the Scottish
Government issued a position statement on a human rights approach to tackling food
insecurity, and in October 2021 launched a consultation on a national plan to end the
need for food banks as a primary response to food insecurity.117
In Wales, amongst wider measures an additional £50.7m was allocated to ensure
children eligible for free school meals did not go hungry during school holidays. £2m
was awarded under the EU Transition Fund to local authorities in Wales to help build
resilience in the food aid network. More than 3,000 food boxes were delivered to
independent food banks to help meet an increase in demand. The Voluntary Services
Emergencies Fund approved £1m for voluntary projects related to food distribution,
and £198,000 was allocated to FareShare to support operations which divert good
food from going to waste.
Within Northern Ireland, amongst wider measures, £415,000 was allocated to
FareShare to increase the supply of food to charities who support those in food
poverty.
The Food and You Survey, discussed in Indicator 4.1.4, provides a snapshot of the
use of food aid in England, Wales, and Northern Ireland between November 2020
and January 2021, at the height of the second wave of the pandemic. Although this
currently only offers one data point, the survey results are recognised as an Official
Statistics output. Respondents were asked if their household had received a free
parcel of food from a food bank or other emergency food provider in the last 12
months. 90% reported that they had not used a food bank or other emergency food
provider in the last 12 months, while 7% reported that they had. The 7% of
respondents who had received a food parcel from a food bank or other emergency
provider were asked how often they had received one in the last 12 months. 26% had
116 Fareshare, https://fareshare.org.uk/. 117 Scottish Government, ‘Food insecurity and poverty - United Nations: Scottish Government response’, https://www.gov.scot/publications/scottish-government-response-un-food-insecurity-poverty/; ‘Ending the need for food banks: a draft national plan’, https://consult.gov.scot/housing-and-social-justice/ending-the-need-for-food-banks/.

242
received a food parcel on only one occasion in the last 12 months, 41% had received
a food parcel on more than one occasion but less often than every month, and 6%
had received a food parcel every month or more often.
Case Study 4.2 Public Sector Food
Procurement in England
Overview
Public food procurement impacts almost 24% of the population in England and is an
important lever to promote a healthy, sustainable food system, to support economic
growth, and deliver a broad range of social, environmental, and health benefits. Defra
is responsible for updating the public sector food procurement standards and
ensuring any risk of food supply disruption is mitigated. The Department of Health
and Social Care (DHSC) is responsible for the nutrition standards in the government
buying standards for food and catering services (GBSF).
Background
The GBSF set mandatory and best practice requirements for procurement of
healthier, more sustainable food in the public sector in England. The standards were
originally introduced in 2011 as a means of demonstrating leadership and providing
clarity around what constitutes sustainable, healthy food and catering procurement.
The standards will be consulted upon and updated in early 2022 to maximise the
intended social, economic, and environmental impact. This may include reporting on
key metrics associated with the objectives of the GBSF, enabling government to
benchmark and set targets.
It is currently mandatory for central government departments, their executive
agencies, and non-departmental public bodies to comply with the GBSF, along with
the NHS, armed forces, and HM Prison and Probation Service. The wider public
sector is encouraged to, but not mandated, to comply with the standards. For
example, the GBSF is referenced by the School Food Standards.
The public procurement landscape is highly fragmented, and there are a wide range
of delivery models. Procurement decisions are devolved to individual organisations,
such as government departments and agencies, hospital trusts, and schools. In
schools, around 40% of catering is outsourced to private caterers, 40% is under local
authority control, with the remaining 20% managed in-house where food is procured
directly from wholesalers. Large public sector organisations like NHS trusts, the
armed forces, and government departments frequently procure food and catering as
part of facilities management contracts. These are commonly delivered by a small

243
number of ‘big players’ in the market. HM Prison and Probation Service has one
national contract with a single wholesaler to deliver prison food, alongside two other
contracts for additional provisions.
Discussion
Almost 2 billion meals are served in public sector settings each year.118 Government
spend on food is an estimated £2.4bn, which is 5.5% of the UK food service sector
turnover. Of the total spend, 29% is in schools, 29% in further and higher education
settings, 25% in hospitals and care homes, 11% in the armed forces, 5% in
prisons, and 1% in government offices.119 Food eaten in schools could make up as
much as 50% of a child’s diet in termtime, and for some a free school lunch is their
only main meal of the day.120 Improving public sector food buying standards benefits
all and has the potential to help close the health gap between those from the lowest
and highest income households.
Maintaining a secure food supply
Through engagement and monitoring, Defra gathers relevant industry intelligence
related to potential food supply concerns and potential risks. The Department for
Education, Ministry of Justice, DHSC, and the Ministry of Defence are responsible for
public sector food provision within their respective sectors (for schools, prisons,
hospitals, social care providers and the armed forces) and a cross government
approach to understanding the risks and issues to public sector food supply is taken.
Lead government departments regularly meet with suppliers to understand potential
issues. Defra closely monitors and proactively engages with public sector food
service providers in the wholesale sector to understand emerging risks.
The economic viability of the food service wholesale sector, notably larger
companies, is not considered at risk. Monitoring, however, and close collaboration
between government and industry continues following the COVID-19 pandemic.
In the event of food supply disruption, or when risks emerge that may result in
disruption, Defra will convene and chair with Cabinet Office a Public Sector Food
118 Defra, ‘National Food Strategy: Independent Review’, https://www.gov.uk/government/publications/national-food-strategy-for-england, page 253. 119 Defra, ‘A plan for public procurement: food and catering’ (2014),
https://www.gov.uk/government/publications/a-plan-for-public-procurement-food-and-catering.
120 Royston, S. and others, ‘Fair and square: a policy report on the future of free school meals’, The
Children’s Society (2012),
https://d3hgrlq6yacptf.cloudfront.net/5f3ecf1e68cdc/content/pages/documents/1429471607.pdf, page
12.

244
Working Group. This group provides a forum for government departments to jointly
discuss broader strategic concerns that impact the public sector food supply chain,
share intelligence and mitigations. Lead government departments can enact
enhanced engagement directly with their suppliers to understand the risk landscape
and agree to mitigations such as substitution, menu modifications, and potential
relaxation of standards if required.

245
Theme 5: Food Safety and Consumer
Confidence
This chapter of the UK Food Security Report looks at food security in terms of the
extent to which consumers are confident in the overall safety and authenticity of
the food they eat and the supply chain that delivers it. Public trust in UK food, both
in the UK and overseas relies heavily upon confidence in food safety, food
standards and confidence in a high-quality food regulatory regime. Without public
trust in food safety and standards the UK food supply chain could be undermined.
Safe food produced to high standards is integral to food security: it protects public
health, reduces the economic and social burden of foodborne disease and food
hypersensitivity, and contributes to economic growth and international trade. This
theme provides data on the key factors that underpin confidence in the UK food
system and risks to this, such as food business compliance with food safety
regulation, food safety incidents and recalls, levels of foodborne disease, and
activity to disrupt food crime.
Key messages
• The majority of consumers in the UK trust the food they buy and eat to be
safe and accurately labelled, when prompted consumers express concern
around animal welfare, environmental issues, nutrition, and food production
methods.
• Food business compliance with food safety regulation has remained high
with slight increases in all four countries of the UK in the past six years,
although there is some year-to-year variation.
• Laboratory confirmed reports of pathogens causing foodborne
gastrointestinal disease in the UK and the proportional trends in foodborne
disease outbreak surveillance data generally remained relatively stable over
the period 2015 – 2019.
• Although food safety incident reports have increased since 2010, this is
attributable to better detection and higher levels of reporting rather than an
increase in risk.
Both safety and consumer confidence in the food system are key to national food
security. If there are products which people are not confident in eating, or if doing
so actively risks undermining health, this could effectively reduce supply.
The UK nations have a strong regulatory base to ensure the confidence and
safety of the UK food supply is maintained. Within this regulatory context it is the
responsibility of food businesses to ensure that all food placed on the market is

246
safe, that its quality is what consumers would expect, and that it is not labelled in a
false or misleading way. Consumers are responsible for the safe preparation and
storage of food in the home and for checking labels to make sure that food is
suitable for them to eat.
In the context of assessing UK food security, the effectiveness of the UK’s
regulatory system for food safety is paramount. Metrics to monitor confidence in
the system, indicators to track compliance, challenges which could undermine
confidence and realised risks (incidents) help to illustrate this.
Consumer confidence in the food system and its regulation
Confidence in food systems is key to food security. It ensures that physical
supplies of food are fully utilised and reduces the risks of consumer demand
shocks which may result from product substitution through loss in confidence in
some elements of the system. Food regulation is a cornerstone of the
maintenance of high standards and confidence in authenticity and safety.
The food system is complex, and its regulation involves multiple bodies. Risks to
consumers are varied, including foodborne disease, food allergic reactions or
intolerances, risks associated with food crime such as the misrepresentation or
adulteration of food and risks arising from mislabelling. Food regulation, and its
enforcement, are designed to prevent or reduce these risks. Critical interventions
include legislation, enforcement regimes, cross-government and cross-agency
working, and partnership working with industry, food sector, and consumer bodies
nationally and internationally.
Food and feed safety, including incidents, food poisoning, outbreaks, allergens
and intolerances, recalls and risks associated with food crime are regulated by the
Food Standards Agency (FSA) in England, Wales, and Northern Ireland, and by
Food Standards Scotland (FSS) in Scotland. These independent government
departments work with local authorities to enforce food safety regulations and
check that standards are being met. The use of the best scientific evidence and
analysis available enables effective responses to food incidents and outbreaks.
This includes surveillance work to monitor and prevent potential risks to food.
Consumer trust in the FSA and FSS is high. In England, Wales, and Northern
Ireland, 78% of consumers who have some knowledge of the FSA trust the FSA to
make sure food is safe and what it says it is, and in Scotland 77% of consumers
trust FSS. In England, Wales, and Northern Ireland 93% of consumers are
confident that the food they buy is safe to eat and 89% are confident the
information on food labels is accurate. In Scotland, 68% of consumers trust the
information on food labels. In England, Wales, and Northern Ireland consumers
report most confidence in farmers (88%) and shops and supermarkets (87%) and

247
least confidence in takeaways (70%) and food delivery services (52%). While time
series data is available in Scotland, for consistency trends are not presented due
to changes in how data were collected by the FSA in 2020 in the rest of the UK.
Most consumers in England, Wales, and Northern Ireland (88%) report no
concerns about the food they eat. When prompted, the most common concerns
amongst respondents in England, Wales, and Northern Ireland are the amount of
sugar in food (60%), food waste (60%), and animal welfare (57%). When
presented with a separate list of issues, respondents in Scotland are most
concerned about animal welfare (79%) and the use of pesticides, hormones,
steroids, and antibiotics in growing or producing food (77%).
Food business compliance with food safety regulation
It is the responsibility of food businesses to ensure that all food placed on the
market is safe. Compliance with food safety regulation is an indicator of good food
hygiene practices among those who handle food and is associated with a lower
risk to consumers. Across England, Wales and Northern Ireland the percentage of
establishments that are found on inspection to be broadly compliant or better with
food hygiene law has increased from 89% in 2014/15 to 90.4% in 2019/20. In
Scotland, compliance with food hygiene increased from 88% in 2015/16 to 93% in
2020/21, and compliance with food standards has remained high at 99% over the
same period. Since 2017/18 food hygiene and food standards inspections in
Scotland have been combined into a single food law inspection, and the food law
compliance status has increased from 92% in 2017/18 (the first year of the
scheme) to 96% in 2020/21.
Food safety incidents, alerts and recalls
A food incident occurs when concerns around the safety or quality of food may
require action to protect consumers. Incidents broadly fall into two categories:
contamination during food processing, distribution, retail or catering, and
environmental pollution such as fires and chemical leaks. Numbers of food safety
incidents are not a direct measure of food security. Fluctuations in numbers reflect
a diverse range of factors. However, whilst it is unlikely that a food safety incident
would cause an overall shortage to food supply, it could impact specific products
within the food supply chain and undermine consumer confidence in food safety.
Incidents, food poisoning, outbreaks, allergens and intolerances, recalls and risks
associated with food crime, are regulated by the FSA in England, Wales, and
Northern Ireland, and by FSS in Scotland. These independent government
departments work with local authorities to enforce food safety regulations and
check that standards are being met. The use of the best scientific evidence and

248
analysis available enables effective responses to food incidents and outbreaks.
This includes surveillance work to monitor and prevent potential risks to food.
The number of food safety incidents reported has increased; much of this is due to
better ways of detection and increased voluntary reporting by food businesses and
does not necessarily indicate a change in the food and feed safety profile of the
UK. The types of incidents that are reported, however, provide an insight into the
causes of incidents and the associated risks. These include detection of
pathogenic micro-organisms, residues of veterinary medicinal products, chemical
contamination, as well as allergens.
The number of food recall notices has remained relatively stable. The number of
allergy alerts increased when new legislation required better labelling of allergenic
ingredients in 2017 but has remained small: no more than 2 in any of the last 3
years.
Prevalence of foodborne pathogens and outbreak surveillance
For overall food security in the UK, it is important that the food consumed is safe
to eat and does not constitute a threat to consumers’ health. While not all
gastrointestinal infections caused by organisms such as bacteria, viruses, or
protozoa, are foodborne, food is an important vehicle of transmission for many
gastrointestinal pathogens that cause a substantial public health burden.121
The UK Health Security Agency (formerly Public Health England), Public Health
Wales (PHW), Public Health Scotland (PHS), and Public Health Agency Northern
Ireland (PHA) are the lead agencies responsible for the protection of public health
in the four nations. While these executive agencies do not have direct statutory
powers to enforce legislation in relation to food safety, they are responsible for the
surveillance of infectious gastrointestinal disease, including disease caused by
pathogens that pose a food safety risk in the UK. This includes the identification,
investigation, and management of foodborne disease outbreaks.
The four most significant bacterial pathogens that may contaminate food are
Campylobacter, non-typhoidal Salmonella, Shiga toxin-producing E. coli O157
(STEC O157), and Listeria monocytogenes.
Campylobacter sp is the most commonly reported bacterial gastrointestinal (GI)
pathogen. Campylobacter reporting showed a marginal overall increasing trend
121 World Health Organisation, ‘Estimates of the global burden of foodborne diseases’, 2015
https://apps.who.int/iris/bitstream/handle/10665/200046/WHO_FOS_15.02_eng.pdf
249
from 2015 to 2019, with a peak in reporting of 102.3 cases per 100,000
population in 2018. Salmonella is the second most commonly reported bacterial GI
pathogen; reporting remained relatively stable during 2015-2019, with a peak of
15.2 cases per 100,000 population in 2018.
STEC O157 and Listeria monocytogenes are less commonly reported but reported
cases have higher rates of severe illness than Campylobacter and Salmonella. For
both STEC O157 and for Listeria monocytogenes there has been a slight
decrease in laboratory confirmed reports between 2016 to 2019, although there
are some year-to-year fluctuations. For STEC O157 the decrease in reporting rate
was from 1.35 to 1.07 per 100,000 population, and for Listeria monocytogenes the
decrease was from 0.29 to 0.23 per 100,000 population, although low numbers of
reported cases complicate interpretation of trends for L. monocytogenes infection.
The 2020 foodborne pathogen surveillance data indicators cannot be compared to
the data from previous years, as a substantial and sustained reduction in reporting
of gastrointestinal pathogens to national surveillance has been observed
coinciding with the SARS-CoV-2 (COVID-19) pandemic. The impact is likely multi-
factorial and related to the introduction of non-pharmaceutical interventions (NPIs)
to control the pandemic, as well as other factors so trend analysis for the data
presented in this report should only be considered for 2015 – 2019, with exclusion
of 2020 data.
An ‘outbreak’ is defined as an incidence of two or more human cases of the same
disease, linked to the same source. Specifically in relation to foodborne disease
outbreaks it is where the cases are linked, or are probably linked, to the same food
source. In total, the UK public health agencies investigated and reported 276
foodborne disease outbreaks during the period 2015-2020, with nearly 10,000
associated human disease cases. The proportional trends in causative pathogens,
hospitalisation rates, associated foods implicated in the outbreak investigations,
and outbreak settings remained relatively stable over the period 2015 to 2019 and
generally consistent with that seen in the previous decade. However, the
implementation of whole genome sequencing since 2015 and the COVID-19
pandemic in 2020 have impacted on this data indicator.
Food Crime
Food crime interventions demonstrate the UK food safety authorities’ ability to
receive, assess, and respond to intelligence concerning food crime. The FSS’s
Scottish Food Crime and Incidents Unit (SFCIU) and the FSA’s National Food
Crime Unit (NFCU) are responsible for tackling food crime in Scotland, and
England, Wales, and Northern Ireland respectively.

250
Disruptions are a recently implemented measure of food crime interventions which
stop or reduce the opportunity for food crime offending and in doing so, increase
UK food security by ensuring food is safe. Recorded disruptions from the NFCU
and successful operations by the SFCIU demonstrate the delivery of activity to
stop or reduce the overall scale of food crime across the UK.
The NFCU began recording food crime disruptions in 2020/21. Data shows a
steady increase in the number of disruptions recorded through the year attributed
to improvements in operational capability and a greater focus on, and awareness
of, the full scope of disruption strategies. Overall, NFCU recorded 190 disruptions
to food crime, with 52 Pursue disruptions and 138 Prepare, Prevent or Protect
disruptions being delivered. The SFCIU was involved in a significant number of
investigations during 2020/21 which had various intervention and disruption
strands, and are developing an approach to capture the percentage of actionable
intelligence that resulted in a positive outcome.
Indicator 5.1.1 Consumer confidence in
the food system and its regulation
Headline
Consumer trust in the FSA and FSS is high. Most respondents in England, Wales,
and Northern Ireland are confident that the food they buy is safe to eat and that
the information on food labels is accurate. In Scotland, the majority of respondents
trust the information on food labels. Consumers in England, Wales, and Northern
Ireland have more confidence in farmers and shops and supermarkets compared
to takeaways and food delivery services
Context and rationale
A loss of consumer trust (either domestic consumers or international trade
partners) in food safety can lead to reduced demand and significant economic
impacts which in turn can threaten whole sectors of the economy. A fall in
consumer confidence can also erode trust in how government and industry
communicate risk to the public. Attributes such as safety, sustainability, and
authenticity cannot be verified by the consumer at the point of purchase, so
consumers must rely on others to communicate this information.
Data and assessment

251
Indicator: Proportion of consumers reporting confidence in food safety (FSA),
proportion of consumers reporting confidence in accuracy of food labelling (FSA
and FSS), trust in food regulators (FSA and FSS).
Source: FSA; FSS
Figure 5.1.1a: FSA respondents’ confidence that food is safe to eat: Food and You
2, Wave 2 (2021)
Figure 5.1.1b: FSA respondents’ confidence that information on food labels is
accurate: Food and You 2, Wave 2 (2021)

252
Figure 5.1.1c: FSS respondents’ trust in the information on food labels: Consumer
Tracker Survey, Wave 11 (2021)
In 2020 to 2021 the majority of respondents (93%) in England, Wales, and
Northern Ireland reported that they were confident that the food they buy is safe to
eat. 89% of respondents reported that they were confident that the information on
food labels, for example, ingredients, nutritional information, country of origin, is
accurate. 68% of respondents in Scotland agreed with the statement “I trust the
information on food labels” with 4% disagreeing with the statement.

253
Figure 5.1.1d: FSA respondents’ trust in the FSA: Food and You 2, Wave 2 (2021)
Figure 5.1.1e: FSS respondents’ trust in FSS: Consumer Tracker Survey, Wave 11
(2021)
Amongst the sample in England, Wales, and Northern Ireland, 52% knew a lot or a
little about the FSA and what it does. Of those consumers who have at least some
knowledge of the FSA, trust in the FSA is high with 78% of respondents reporting
that they trust the FSA to do its job (that is to make sure that food is safe and what

254
it says it is). 1% of respondents reported that they distrust the FSA. Respondents
in Scotland had very similar levels of trust in the FSS with 77% of respondents
reporting that they trust FSS and only 1% reporting that they distrust the
organisation.
Figure 5.1.1f: FSA respondents’ confidence in the food supply chain: Food and You
2, Wave 2 (2021)
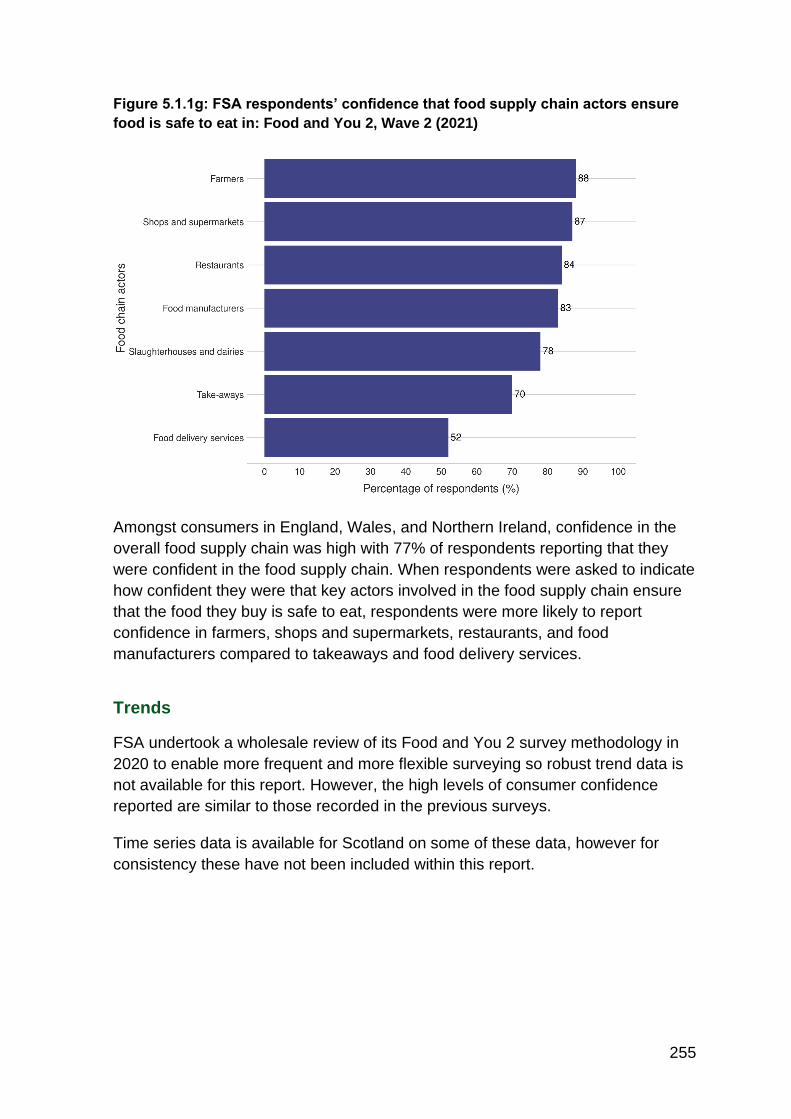
255
Figure 5.1.1g: FSA respondents’ confidence that food supply chain actors ensure
food is safe to eat in: Food and You 2, Wave 2 (2021)
Amongst consumers in England, Wales, and Northern Ireland, confidence in the
overall food supply chain was high with 77% of respondents reporting that they
were confident in the food supply chain. When respondents were asked to indicate
how confident they were that key actors involved in the food supply chain ensure
that the food they buy is safe to eat, respondents were more likely to report
confidence in farmers, shops and supermarkets, restaurants, and food
manufacturers compared to takeaways and food delivery services.
Trends
FSA undertook a wholesale review of its Food and You 2 survey methodology in
2020 to enable more frequent and more flexible surveying so robust trend data is
not available for this report. However, the high levels of consumer confidence
reported are similar to those recorded in the previous surveys.
Time series data is available for Scotland on some of these data, however for
consistency these have not been included within this report.

256
Indicator 5.1.2 Consumer concerns
Headline
Most people in England, Wales, and Northern Ireland report no concerns about
the food they eat. When a list of potential concerns are presented, the most
common concerns amongst respondents in England, Wales, and Northern Ireland
are the amount of sugar in food, food waste, and animal welfare. When presented
with a separate list of issues, respondents in Scotland are most concerned about
animal welfare and the use of pesticides, hormones, steroids, and antibiotics in
growing or producing food.
Context and rationale
There are many constituent parts of the food system, and consumers may have
concerns about one or more of these parts. Understanding which areas of the
food system are of most concern to consumers is important for policy
development, risk communications and advice, and ensuring consumers can
make informed choices about the food and drink they purchase.
Data and assessment
Indicator: Proportion of respondents reporting concern from a list of issues
Source: FSA; FSS

257
Figure 5.1.2a: FSA respondents – ten most common prompted concerns: Food and
You 2, Wave 2 (2021)
Most respondents in England, Wales, and Northern Ireland (88%) had no
concerns about the food they eat. However, when asked to indicate if they had
concerns about a number of food-related issues from a list of given options, the
most common concerns amongst consumers in England, Wales, and Northern
Ireland were the amount of sugar in food (60%), food waste (60%), and animal
welfare (57%). 43% of respondents reported being concerned about food fraud or
crime (for example, food not being what the label says it is).

258
Figure 5.1.2b: FSS respondents – ten most common prompted concerns:
Consumer Tracker Survey, Wave 11 (2021)
Animal welfare was the top concern amongst consumers in Scotland, with 79% of
respondents in Scotland choosing this. 77% of respondents reported that some
food production methods or inputs such as pesticides or antibiotics were also a
concern. 69% of respondents were concerned about food not being what the label
says it is.
It should be noted that respondents in Scotland would have selected concerns
from a different set of survey options compared to respondents in England, Wales,
and Northern Ireland as the methods of data collection differ substantially between
surveys.

259
Figure 5.1.2c: FSA respondents’ concern about availability of food: Food and You
2, Wave 2 (2021)
Respondents in England, Wales, and Northern Ireland were also asked
specifically about the extent to which they were concerned about the availability of
a wide variety of food; 13% of respondents were highly concerned, 34%
somewhat concerned, 38% not very concerned and 11% not at all concerned.
Trends
FSA undertook a wholesale review of its Food and You 2 survey methodology in
2020 to enable more frequent and more flexible surveying so robust trend data is
not available for this report. However, the consumer concerns reported are similar
to those recorded in previous surveys.
Time series data is available for Scotland on some of these data, however for
consistency these have not been included within this report.

260
Case Study 5.1 Allergen information on
Food Pre-packed for Direct Sale
Overview
Government has a key role to play in setting the regulatory framework to ensure
that consumers are provided with the information they need to allow them to make
safe food choices.
In 2019, following the death of teenager Natasha Ednan-Laperouse, Defra, the
FSA, and FSS reviewed the legal framework for allergen information for food
which is pre-packed for direct sale (PPDS). They also consulted on proposed
amendments relating to the provision of mandatory information, the form of
expression and the presentation of allergen labelling information for PPDS foods.
Background
PPDS is food packaged at the same premises where it is sold or offered to
consumers and is also in its packaging before it is ordered or selected.
In the UK, it is estimated that 1% to 2% of adults and 5% to 8% of children have a
food allergy. This equates to around 2 million people living in the UK with a food
allergy, but this figure does not include those with food intolerances.
There is no cure for food allergies and intolerances. The only way to manage the
condition is to avoid food that makes the person ill. Therefore, it is important that
consumers are provided with accurate information about allergenic ingredients in
products to allow them to make safe food choices.
Discussion
Natasha died as a result of an allergic reaction to sesame in a baguette she had
eaten. The inquest into Natasha’s death highlighted that food which is offered to
consumers in a package without any allergen information can be dangerous.
During the consultation, consumers were clear that they wanted more information
about the food they are eating provided on food labels.
Defra, the FSA, and FSS worked together to introduce the Pre-packed food for
Direct Sale Regulations from 1 October 2021. The introduction of this new
requirement is supported by online training and guidance.

261
This will help protect food hypersensitive consumers by requiring potentially life-
saving allergen information to be highlighted with an ingredients list with the 14
major allergens emphasised on the label of pre-packed food for direct sale. The
change means more food products will now have allergen labelling.
Case Study 5.2 Codex
Overview
The UK is widely respected for its technical expertise and is influential in international
standard setting. By working to deliver improved global food standards, the UK supports
both global and domestic food safety and security.
Background
The Codex Alimentarius is a collection of internationally adopted food standards
and related texts that aims to protect consumer health whilst ensuring the safety,
quality, and fairness of international food trade. While voluntary, Codex standards
serve in many cases as the basis for national legislation. In 2019, the UK provided £500k
to the Codex Trust Fund to support eligible developing countries’ participation in Codex.
Understanding and participating in the work of Codex means countries benefit from
increased food safety, security, and harmonisation with global standards which in turn
increases their opportunity to trade internationally.
Discussion
The UK is an influential member of Codex and is widely respected for its technical
expertise. Steve Wearne, the FSA Director of International Affairs, was one of three
Codex Vice-Chairs from 2017 to 2021 and notably led the work on creating and adopting
the current Codex Strategic Plan. Steve Wearne has recently been elected as the new
Codex Chairperson and this role will help the UK build stronger relations with all
Codex members.
To improve global food standards and protect consumers, the UK will share its expertise as
co-chair for new Codex work on food fraud. The work aims to develop guidance to
improve risk management activities and the exchange of information between authorities
and government agencies related to the prevention of food fraud that may impact the
health and safety of the consumer and/or disruption of trade.
The COVID-19 pandemic highlighted more than ever the need for good hygiene
practices and the importance of the General Principles of Food Hygiene which is
used globally as a benchmark for national hygiene rules. The ‘General Principles’

262
serves as the foundation hygiene text. It is cross-referenced with other Codex
guidelines and sector and product-specific codes of practice as a means of
ensuring that basic food hygiene measures are adopted in the production,
processing, and distribution of food commodities along the entire food supply
chain.
The UK successfully led the work to update this Codex text when it chaired the
working group on the revision of the principles. The key actions for change were to
revise the text to clarify the key concepts and terms used and simplify the text.
Through the electronic working group and plenary discussions, additional changes
were made. This included moving to a risk-based approach to water being fit for its
intended purpose and introducing significant text on ‘food safety culture’ within the
section on management commitment.
The UK has long recognised the value of food safety culture in determining
compliance and influencing behavioural change to improve compliance. In 2012
the FSA developed a Food Safety Culture Diagnostic toolkit for inspectors for local
authorities. This was to support the assessment of food safety management
during food hygiene official controls, with a particular focus on micro and small
businesses.
With the increasing global and national interest in business culture and its
relationship with regulation, the FSA decided to look again at food safety culture
and its potential role as part of a modernised regulatory system, work on which is
ongoing.
Indicator 5.1.3 Food business compliance
with food safety regulation
Headline
Across England, Wales and Northern Ireland the percentage of establishments
that are found on inspection to be broadly compliant or better with food hygiene
law has remained high. In Scotland the compliance status in terms of food hygiene
within food business establishments has continued to increase for the same
period, and compliance status for food standards has stayed consistent over the
period.
Context and Rationale
Compliance with food safety regulation is an indicator of good food hygiene
practices among those who handle food. The FSA is responsible for monitoring
and reporting on the performance of local authority food law enforcement services

263
in England, Wales, and Northern Ireland. Within Scotland, FSS is responsible for
monitoring and reporting on local authority food law enforcement.
Local authorities carry out a range of proactive and reactive interventions at food
establishments. Planned checks and interventions, including inspections are
carried out in line with the Food Law Codes of Practice in England, Wales, and
Northern Ireland.122 In Scotland planned checks and interventions, including
inspections are carried out in line with the Food Law Code of Practice 2019 for
food hygiene, at a planned frequency in accordance with a business’ risk rating. In
England, Wales, and Northern Ireland businesses are rated from A to E, with 'A'
being highest risk and 'E' lowest risk. Higher risk businesses receive such
interventions more frequently than lower risk ones. The Local Authority
Enforcement Monitoring System (LAEMS) was used to collect annual data until
2019/20. For food standards a new delivery model is being developed and is
currently being piloted. For this reason, comparable compliance data is not
available.
In Scotland, these category descriptors were reversed when FSS started to
gradually move from the previous risk rating scheme to the new Food Law Rating
System (FLRS) in 2018. Within this E and D premises are the highest risk and A,
B and C are lower risk. Until 2017, annual data in Scotland was collected
electronically from the LAEMS. However, following the introduction of the Scottish
National Database (SND), data was collated electronically from that system.
Compliance data for 2020 to 2021 in England, Wales and Northern Ireland is not
available due to the implementation of the local authority Recovery Plan as part of
the COVID-19 response. This suspended the LAEMS data collection and has
been temporarily replaced with bespoke surveys to monitor progress against the
plan. A new system of reporting is under development in England, Wales, and
Northern Ireland.
Data and assessment
Indicator: Food business operation compliance status
Source: England, Wales, and Northern Ireland: The Local Authority Enforcement
Monitoring System (LAEMS) data; Scotland: The Local Authority Enforcement
Monitoring System data and the Scottish National Database (SND).
122 FSA, ‘Food and Feed Codex of Practice’ (2021), https://www.food.gov.uk/about-us/food-and-feed-codes-of-practice.

264
In England, Wales and Northern Ireland the FSA tracks the proportion of food
establishments that are broadly compliant (equivalent to a Food Hygiene Rating
Scheme score of 3 or above).
In Scotland, Food Law (FL) compliance refers to the compliance status under the
Food Law Rating Scheme (FLRS), the new risk rating scheme gradually
implemented in Scotland in 2018. The compliance categories for the FLRS are A-
C. In 2015/16 and 2016/17 the FLRS had not been implemented, therefore there
were no FL interventions carried out. Within the former risk rating scheme, which
was previously set out in Annex 5 of the Food Law Code of Practice in Scotland,
food hygiene (FH) and food standards (FS) compliance categories were E-C for
food hygiene and C and B for food standards. Since 2018, new inspection cycles
within existing premises and initial inspections in new premises has seen more
premises move across to the FLRS risk rating and less premises being inspected
under the previous Annex 5 scheme.
While the precise definitions of compliance between Scotland and other three
countries are slightly different, both relate to the assessment of an establishment’s
adherence to food law during an inspection, and so are broadly comparable.

265
Figure 5.1.3a: Compliance status of inspected food business operators in
England, Wales, and Northern Ireland (including unrated establishments).
2014/15123
2015/16 2016/17 2017/18 2018/19 2019/20124
2020/21
England
% broadly
compliant or
better
88.7% 89.2% 89.8% 89.8% 90.4% 90.0% Not
collected
Wales
% broadly
compliant or
better
92.1% 92.6% 92.6% 93.5% 93.1% 92.7% Not
collected
Northern Ireland
% broadly
compliant or
better
91.5% 93.0% 91.2% 95.4% 94.1% 95.4% Not
collected
Total
% broadly
compliant or
better
89.0% 89.5% 90.0% 90.2% 90.7% 90.4% Not
collected
123 Based on nine months data for Northern Ireland. During 2013/14 preparations were underway for local government reorganisation. In view of this, it was agreed that returns for councils for 2014/15 should be made in advance of the changes becoming effective and would cover the first three quarters of the reporting period. 124 The 2019/2020 data for England was based on 98% of expected food hygiene returns (all but six returns were received). Wales and Northern Ireland data was for 100% returns received.
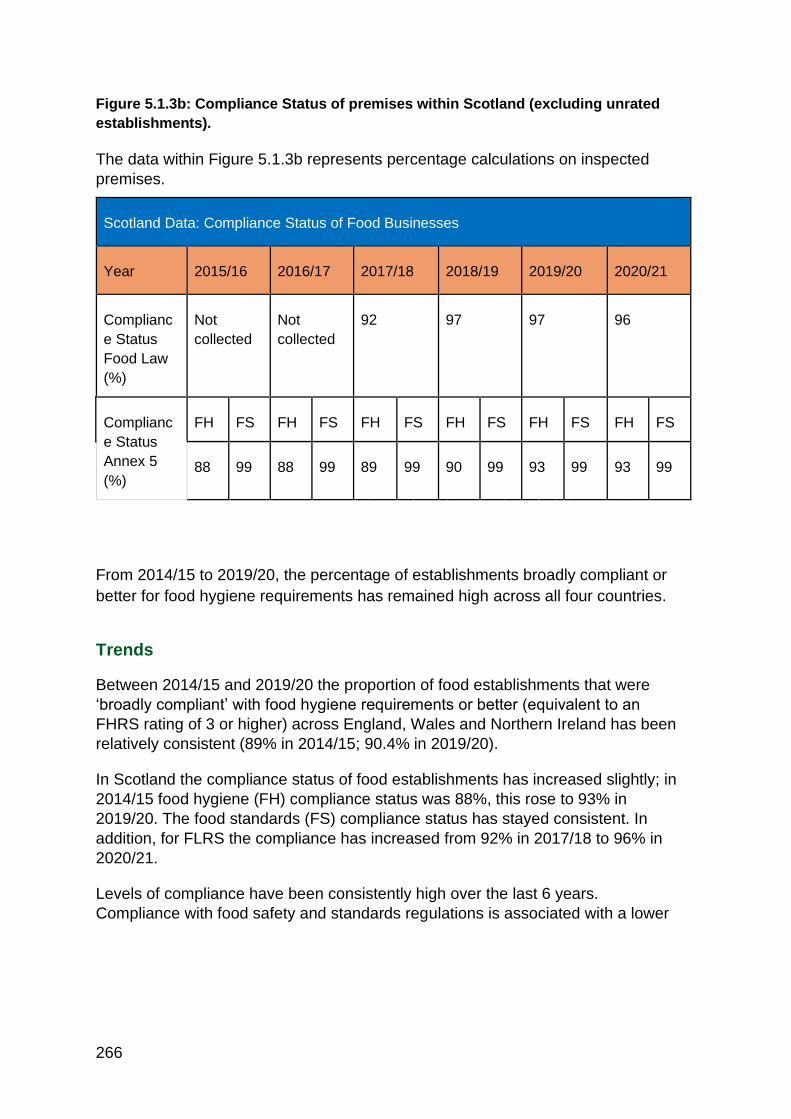
266
Figure 5.1.3b: Compliance Status of premises within Scotland (excluding unrated
establishments).
The data within Figure 5.1.3b represents percentage calculations on inspected
premises.
Scotland Data: Compliance Status of Food Businesses
Year 2015/16 2016/17 2017/18 2018/19 2019/20 2020/21
Complianc
e Status
Food Law
(%)
Not
collected
Not
collected
92 97 97 96
Complianc
e Status
Annex 5
(%)
FH FS FH FS FH FS FH FS FH FS FH FS
88 99 88 99 89 99 90 99 93 99 93 99
From 2014/15 to 2019/20, the percentage of establishments broadly compliant or
better for food hygiene requirements has remained high across all four countries.
Trends
Between 2014/15 and 2019/20 the proportion of food establishments that were
‘broadly compliant’ with food hygiene requirements or better (equivalent to an
FHRS rating of 3 or higher) across England, Wales and Northern Ireland has been
relatively consistent (89% in 2014/15; 90.4% in 2019/20).
In Scotland the compliance status of food establishments has increased slightly; in
2014/15 food hygiene (FH) compliance status was 88%, this rose to 93% in
2019/20. The food standards (FS) compliance status has stayed consistent. In
addition, for FLRS the compliance has increased from 92% in 2017/18 to 96% in
2020/21.
Levels of compliance have been consistently high over the last 6 years.
Compliance with food safety and standards regulations is associated with a lower
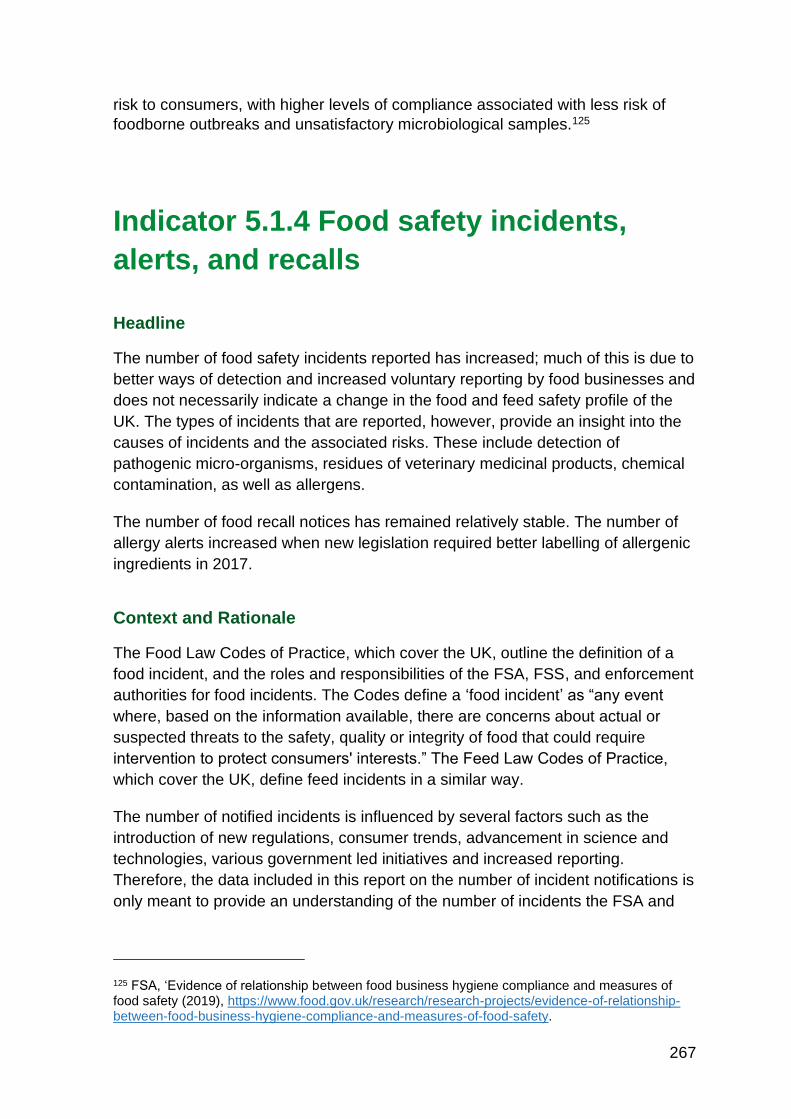
267
risk to consumers, with higher levels of compliance associated with less risk of
foodborne outbreaks and unsatisfactory microbiological samples.125
Indicator 5.1.4 Food safety incidents,
alerts, and recalls
Headline
The number of food safety incidents reported has increased; much of this is due to
better ways of detection and increased voluntary reporting by food businesses and
does not necessarily indicate a change in the food and feed safety profile of the
UK. The types of incidents that are reported, however, provide an insight into the
causes of incidents and the associated risks. These include detection of
pathogenic micro-organisms, residues of veterinary medicinal products, chemical
contamination, as well as allergens.
The number of food recall notices has remained relatively stable. The number of
allergy alerts increased when new legislation required better labelling of allergenic
ingredients in 2017.
Context and Rationale
The Food Law Codes of Practice, which cover the UK, outline the definition of a
food incident, and the roles and responsibilities of the FSA, FSS, and enforcement
authorities for food incidents. The Codes define a ‘food incident’ as “any event
where, based on the information available, there are concerns about actual or
suspected threats to the safety, quality or integrity of food that could require
intervention to protect consumers' interests.” The Feed Law Codes of Practice,
which cover the UK, define feed incidents in a similar way.
The number of notified incidents is influenced by several factors such as the
introduction of new regulations, consumer trends, advancement in science and
technologies, various government led initiatives and increased reporting.
Therefore, the data included in this report on the number of incident notifications is
only meant to provide an understanding of the number of incidents the FSA and
125 FSA, ‘Evidence of relationship between food business hygiene compliance and measures of food safety (2019), https://www.food.gov.uk/research/research-projects/evidence-of-relationship-between-food-business-hygiene-compliance-and-measures-of-food-safety.

268
FSS have been made aware of in each Reporting Year. The data is not a clear
indicator of any changes in risks to the UK’s food security. The break-down of the
incidents into various categories, on the other hand, provides an insight into the
various hazards or areas of concern that cause food incidents in the UK. The
trends in these categories can be a useful indicator to assess where key risks lie.
The FSA and FSS investigate the same incident types but have different
categorisation or reporting systems. Incident notifications are categorised
according to the potential hazard that is under investigation or that is ultimately of
concern. So, where no risk to the safety, quality or integrity of food and feed is
identified, the incident may still be classified by the potential issue of concern.
The food, feed and drink supply chains are complex and involve numerous food
chain actors from primary producers, to processors, packaging providers and
retailers or restaurants. There are multiple points in the supply chain where
potential hazards can be detected and communicated to regulators who can then
in turn alert consumers.
The FSA and FSS issue alerts to let consumers and food businesses know about
problems associated with food, feed, and drink and what action they need to take.
These notices and alerts are an important way of communicating to consumers
where they need to act and are issued at the FSA’s and FSS’s earliest opportunity
and published online. In addition, point of sale notices are displayed at each of the
affected stores for a given time. This is aimed at informing consumers who may
have not received the alert through the online platforms.
The alerts indicate a formal response to food safety risks in the food supply chain.
The majority of food alerts issued by the FSA and FSS are Product Recall
Information Notices and Allergy Alerts (AAs).
A Food Alert for Action (FAFA) is issued to local authorities in cases where a food
business operator demonstrates that it cannot or will not adequately recall or
withdraw products which fail to meet the safety requirement, and which require
specific urgent actions to be taken by local authorities. Very few Food Alerts for
Action, which are issued when a food business operator does not adequately
comply with safety requirements, have been issued. This indicates that most food
business operators comply with the safety requirements laid out in law.
UK food safety bodies are rolling out several incident prevention strategies, the
initial focus is the full implementation of the use of root cause analysis (RCA) by
industry, enforcement authorities and FSA with analysis and reporting of data;
such that root causes can be used to identify themes and underlying trends to
help prevent incidents occurring. In addition, strategic surveillance workstreams
have developed a number of models based on open and non-open-source data
which harness the power of data science to identify emerging risks before they
become risks to public health.
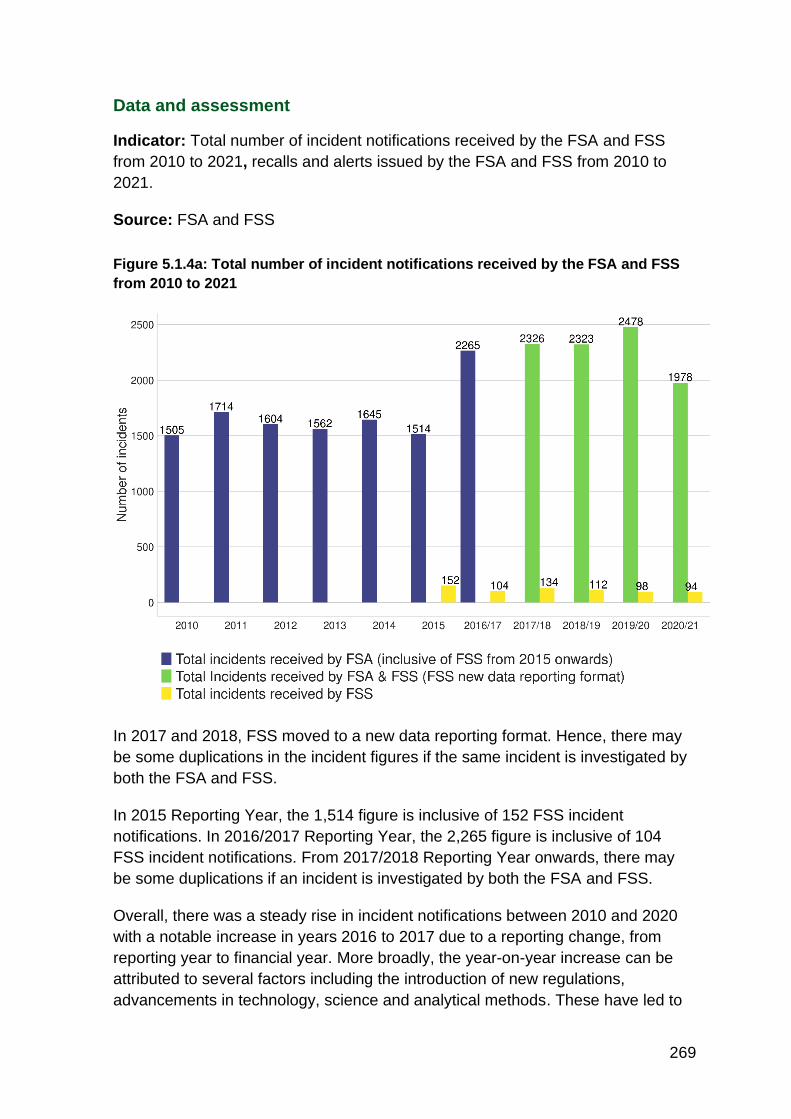
269
Data and assessment
Indicator: Total number of incident notifications received by the FSA and FSS
from 2010 to 2021, recalls and alerts issued by the FSA and FSS from 2010 to
2021.
Source: FSA and FSS
Figure 5.1.4a: Total number of incident notifications received by the FSA and FSS
from 2010 to 2021
In 2017 and 2018, FSS moved to a new data reporting format. Hence, there may
be some duplications in the incident figures if the same incident is investigated by
both the FSA and FSS.
In 2015 Reporting Year, the 1,514 figure is inclusive of 152 FSS incident
notifications. In 2016/2017 Reporting Year, the 2,265 figure is inclusive of 104
FSS incident notifications. From 2017/2018 Reporting Year onwards, there may
be some duplications if an incident is investigated by both the FSA and FSS.
Overall, there was a steady rise in incident notifications between 2010 and 2020
with a notable increase in years 2016 to 2017 due to a reporting change, from
reporting year to financial year. More broadly, the year-on-year increase can be
attributed to several factors including the introduction of new regulations,
advancements in technology, science and analytical methods. These have led to

270
better detection and reporting as well as detection of new hazard types including
clandestine traveller (stowaways) in food vehicles. The number of notifications
received represents how many incidents the FSA and FSS have been made
aware of and is not indicative of a change in the UK’s food and feed safety profile.
Instead, it is more instructive of changes in behaviours, technology, and statutory
requirements.
Figure 5.1.4b: FSA breakdown of incidents by category during 2013 to 2021
Reporting Years126
2013
2014
/15
2015
/16
2016
/17
2017/
18
2018
/19
2019
/20
2020
/21
Biological Origin 477 509 478 504 470 468 531 475
Pathogenic Micro-
Organisms
307 348 304 307 376 362 376 350
Non-Pathogenic
Micro-Organisms
26 20 35 27 0 4 37 49
Mycotoxins 88 54 58 113 80 87 94 61
Biotoxins (Other) 52 68 56 21 5 6 15 9
Parasitic Infestations 4 0 4 3 9 3 1 0
Bio-contaminants 0 19 21 33 0 6 8 6
Farming Practices 210 251 168 295 324 327 268 242
Residues of
Veterinary
Medicinal Products
75 210 116 212 218 144 140 114
Pesticide Residues 114 30 41 72 98 177 106 100
Feed Additives 11 9 8 10 7 4 19 27
TSEs (Transmissible
Spongiform
Encephalopathies)
10 2 3 1 1 2 3 1
Industrial /
Chemical
369 290 332 298 123 128 152 109
Heavy Metals 75 74 64 73 39 42 46 43
Migration 29 17 8 14 18 16 33 15
Radiation 4 4 8 3 4 0 1 1
Industrial
Contaminants
20 28 63 67 1 4 3 2
126 FSA (including FSS) breakdown of incidents by category during 2013 to 2014 Reporting Years.
From 2015 to 2016-2017 Reporting Years figures include FSA and FSS incidents. From 2017-2018
Reporting Years figures include FSA incident notifications only.

271
2013
2014
/15
2015
/16
2016
/17
2017/
18
2018
/19
2019
/20
2020
/21
Chemical
Contamination
(Other)
241 167 189 141 61 66 69 48
Other 506 513 757 1168 1408 1400 1527 1152
Allergens 89 140 213 187 260 302 350 187
Adulteration / Fraud 63 62 66 91 18 28 30 12
Labelling Absent /
Incomplete /
Incorrect
97 69 81 118 160 170 210 155
Genetically Modified
Organism / Novel
Food
10 9 16 41 64 59 100 54
Food Additives and
Flavourings
52 49 35 62 42 43 52 84
Composition 18 46 38 58 100 86 76 89
Foreign Bodies 105 65 97 104 110 104 120 106
Poor or Insufficient
Controls
34 25 57 136 287 188 164 91
Organoleptic Aspects 5 9 16 19 5 8 4 0
Packaging Defective
/ Incorrect
1 5 20 21 10 21 23 6
Environmental
Pollutants
n/a127 n/a n/a n/a n/a n/a n/a 3
Clandestine
Detection
n/a n/a n/a n/a 179 198 193 111
CHEMET n/a n/a n/a n/a 169 181 203 146
Undefined n/a n/a n/a n/a n/a 0 0 6
Not Determined /
Other
32 34 118 331 4 12 2 26
COVID-19
Outbreaks128 0
0 0 0 0 0 0 76
Total 1562 1563 1733 2265 2326 2323 2478 1978
127 n/a means data is unavailable for a particular year. This is attributed to a review of incident categories. For example ‘Water Quality’ incident notifications have been refined and categorised as ‘Environmental Pollutants’. This categorisation will capture food incidents resulting from flooding and sewage spillage.
128 The COVID-19 Outbreak figure reflects the number of notifications logged within the FSA
incident management system only. However, we hold additional information on over 200 COVID-
19 Outbreaks within a separate record. Other Government Departments and relevant stakeholders
also hold additional data on a number of COVID-19 Outbreaks.

272
This table shows the breakdown of incidents by category reported to the FSA
between 2013 and 2021. Overall, there has been a steady increase in incidents
with the exception of 2020 to 2021, where a 20% downturn was observed. This
downturn is attributed to changes in consumer behaviours, fewer food businesses
operating due to the COVID-19 pandemic control procedures and streamlined
food production lines. More information on the categories is provided in the
appendix.
Figure 5.1.4c: FSS breakdown of incidents by category between 2015 to 2016
and 2020 to 2021
Category 2015/16 2016/17 2017/18 2018/19 2019/20 2020/21
Allergens 11 8 21 20 18 13
Animal Feed 5 3 7 9 4 4
Chemical 5 1 14 8 10 17
Emergency 4 9 11 6 4 2
Genetically
Modified
Organism /
Novel Food
1 0 0 1 3 5
Illegal Activity 10 5 1 1 3 6
Microbiologic
al 20 23 23 24 27 17
On-farm 12 18 9 6 7 11
Other 3 1 2 3 1 0
Physical 1 1 3 7 7 2
Production
Error 3 3 6 7 7 4
Regulatory
Breach 11 17 22 17 4 8
Shellfish129 66 15 15 3 3 5
Total 152 104 134 112 98 94
129 FSS amended the way Shellfish incidents are recorded from the 2016 to 2017 Reporting Year. Shellfish incidents are now recorded and investigated when harvesting is known to have taken place.

273
This table shows the number of incidents by category reported to FSS between
2015 and 2021. Overall, there has been a reduction in the number of incidents
recorded by FSS since 2015. The main reason for this is a change in how FSS
record their incidents, in particular Shellfish incidents. There are several factors
explaining why incidents fluctuate from year to year. These include the
introduction of new – or changes to – regulations, advancements in technology,
science and analytical methods.
Figure 5.1.4d: Total number of food alerts issued by the UK during 2015/16 to
2020/21 Reporting Years
Led by 2015/16 2016/17 2017/18 2018/19 2019/20 2020/21
FSA 166 179 140 190 178 141
FSS 12 26 12 17 8 3
Total 178 205 152 207 186 144
In total, the FSA and FSS issued 144 food alerts during the 2020/21 Reporting
Year in comparison to 186 alerts issued in the previous Reporting Year. This
represents a 23% decrease when compared to 2019/20. This reduction was
primarily driven by the fall in Allergy Alerts.
Figure 5.1.4e: Number of Allergy Alerts issued by the UK during 2015/16 to
2020/21 Reporting Years
Led by 2015/16 2016/17 2017/18 2018/19 2019/20 2020/21
FSA 84 98 92 118 106 67
FSS 10 6 1 12 4 3
Total 94 104 93 130 110 70
An Allergy Alert (AA) is issued when the product has been, or is being, recalled
from consumers because allergen information on food labels is undeclared or
incorrect. The FSA and FSS issued a total of 70 Allergy Alerts during the 2020/21
Reporting Year in comparison to 110 Allergy Alerts issued in the previous
Reporting Year. This represents a 36% decrease when compared to 2019/20.
Figure 5.1.4f: Number of Product Recall Information Notices (PRINs) issued by
the UK during 2015/16 to 2020/21 Reporting Years.
Led by 2015/16 2016/17 2017/18 2018/19 2019/20 2020/21
FSA 80 77 46 72 70 73
FSS 1 14 9 5 4 0
Total 81 91 55 77 74 73
A Product Recall Information Notice (PRIN) will be issued when the product has
been, or is being, recalled from the final consumer. The FSA and FSS issued a

274
total of 73 Product Recall Information Notices during 2020/21, much the same as
in the previous year (74).
Figure 5.1.4g: Number of Food Alert for Action (FAFA) issued by the UK during
2015/16 to 2020/21 Reporting Years
Led by 2015/16 2016/17 2017/18 2018/19 2019/20 2020/21
FSA 2 4 1 1 2 1
FSS 1 6 2 0 0 0
Total 3 10 3 1 2 1
A Food Alert for Action (FAFA) is issued when intervention by enforcement
authorities is required. These notices and alerts are often issued in conjunction
with a product withdrawal or recall. While the number of recall notices issued has
remained stable, very few FAFAs have been issued.
Trends
The number of incidents recorded in any given year can be affected by many
factors including new consumer trends, legislative changes, technological and
scientific developments, the amount of testing performed, and even the weather.
There is a steady year on year increase in incidents from 2013 onwards with the
exception of 2020/21 where there was a 20% downturn caused by the pandemic
driving changes in consumer behaviour; the streamlining of food production lines;
fewer food businesses operating and a reduction in the complexity of the product
ranges on offer. The number of incidents reported has now increased following the
easing of the national lockdown and is returning to near pre-pandemic levels.
The FSA and FSS highlighted the benefits of Root Cause Analysis (RCA) in food,
feed, and outbreak investigations in communications to the enforcement
community, and have since committed to the use of RCA as a mechanism for
working with industry to prevent incidents.
Between 2015 and 2017, FSS saw an increase in relation to their on-farm
incidents. As a result, FSS carried out an incident prevention initiative which
involved working with partners to produce a leaflet providing guidance on how
farmers could help avoid on-farm incidents. This initiative started at the beginning
of 2017 and has helped to reduce the number of on-farm incidents in this
category.
There was a rise in the detection of allergen incidents resulting from incorrectly
labelled packaging after the implementation of the new Food Information for
Consumers Regulation (FICR) in 2014, though changes in dietary trends and
international supply chains may also be partially attributable to the observed
increases.

275
Between June 2016 and June 2021, the FSA was notified of 11 allergen related
deaths and 11 food related allergic reactions. Notifications from members of the
public related to allergies and/or intolerances are referred to the local enforcing
authority in the first instance. During the same period, FSS were notified of seven
food related allergic reactions.
The reduction of AAs issued in recent years may be partially attributed to:
• High-profile cases resulting in heightened media coverage, leading to greater
emphasis on allergen control by food business operators
• Increased allergen awareness campaigns, including by the FSA and FSS
• Impact of Food Information to Consumers Regulation, resulting in greater
awareness and allergen risk assessments by food business operators.
Almost all the incidents in the ‘Industrial/Chemical’ group related to fires which
resulted in some potential chemical contamination incident. From 2017/18
Reporting Year onwards, a dedicated CHEMET (Chemical Meteorology) category
was introduced for such incidents.
Additionally, each year the FSA runs a Coordinated Food Standards Sampling
Programme. This sets different priorities for enforcement authority risk-based
sampling and surveillance. The levels of investigation may influence the numbers
and types of incidents identified. FSS co-ordinates its own Local Authority
Sampling Grants Programme which is designed to take account of UK food
standards priorities in addition to areas of particular interest to Scotland.
Finally, during the COVID-19 pandemic, data indicates a downturn of 20% and 4%
in the number of incident notifications received by the FSA and FSS respectively.
This may reflect fewer food businesses trading over the pandemic and fewer new
products coming to the market, as well as a reduction in the complexity of the
product ranges offered during this period, and a reduction in local authority
inspections. The number of incidents being reported has increased as the national
lockdown eased and has now returned to normal level.
Case Study 5.3 Product recalls instigated
by malicious tampering with retail
consumer products
Overview
In 2019, the FSA and FSS worked with UK law enforcement agencies and Public
Health England (PHE) in response to an attempt to blackmail a high-profile

276
supermarket company based in the UK. Prompt responsive action to the threat,
including notification to the public by both the FSA and FSS, saw the supermarket
company voluntarily recall 182,000 jars of baby food. Direct harm to consumers
was avoided, and the impact on wider consumer confidence in the food supply
chain was estimated to be at a low level.
Background
The FSA was initially notified by UK law enforcement agencies in October 2019
that a blackmail demand had been received by a supermarket company,
threatening the contamination of baby food products from a food producer
(‘Company 1’), and that the matter was under investigation with those agencies.
Subsequently, the FSA and FSS were notified by UK law enforcement agencies in
December 2019 that a complaint had been received by the supermarket company
of sharp pieces of metal having been discovered in a jar of baby food purchased
in a store in Scotland by a consumer, while feeding their baby. Another jar of
contaminated baby food was reported to the police having been purchased from a
store in the North West of England.
In light of the first discovered tampered product, a voluntary product recall of 8
varieties within the specific baby food range sold by the supermarket company
was undertaken as a precautionary measure following close co-operation and
discussion between the companies and agencies. A Product Recall Information
Notice to the public to highlight the recall was undertaken by both the FSA and
FSS.
A further threat was received by the retailer in January 2020 in relation to jars of
baby food produced by a second food company (‘Company 2’). Neither the retailer
nor producer had received complaints, and the threat did not specify locations or
product lines. A voluntary recall of 15 varieties within the baby food range was
again undertaken as a precautionary measure and the FSA and FSS issued a
Product Recall Information Notice to the public to highlight the recall.
Following a successful investigation and prosecution by co-operating UK law
enforcement agencies, in what became the UK’s largest ever blackmail
investigation, the offender was convicted of offences related to this incident as
well as other offences. In October 2020, the offender received a sentence of 14
years in prison, including an 11-year sentence in relation to this incident. There
are no known cases of injury associated with the incident.
Discussion
The Food Law Code of Practice issued by both FSS and the FSA to competent
authorities responsible for the delivery of official food controls and other official
activities defines ‘malicious tampering’ as the deliberate contamination of food by

277
terrorist activity, or with a view to blackmail or extortion. Arrangements for dealing
with malicious tampering incidents have been established between the FSA, FSS,
and appropriate law enforcement agencies throughout the UK.
If there is a suspected or confirmed safety or quality problem with a food product
that means it should not be sold, then it can be 'withdrawn' (taken off the shelves
before the product reaches the consumer) and/or 'recalled' (when customers are
asked to return the product). The FSA and FSS issue Product Recall Information
Notices to let consumers and other stakeholders know about hazards associated
with food and/or feed. All alerts published by the FSA and FSS are sent to the
local authorities and other stakeholder groups to inform them. In some cases, a
Food Alert for Action is issued. This provides local authorities with details of
specific action to be taken on behalf of consumers.
The potential for criminal behaviour of this nature to affect the health and
wellbeing of consumers directly is obvious, and it also presents a serious risk of
harm to food businesses such as retailers and the food industry in general through
loss of consumer confidence in the security of the food supply chain. In this
particular incident, a careful assessment of the risks presented by the threats
identified that while the impact for the wider general public might be considered
low, it could be high for the individuals that might be affected by products that had
been tampered with. This precautionary principle informed the strategies and
contingencies which emerged from the close co-operation between the companies
and agencies responding to the incident.
In total, the supermarket company voluntarily recalled 42,000 jars of Company 1’s baby food and 140,000 jars of Company 2’s baby food, which will have had substantial costs for the companies involved. Against those costs, however, the reported level of consumer concern detected following the recalling of the products and the notification of the recalls by the FSA and FSS appears to have been low. The risk of a wider loss of consumer confidence may well have been mitigated by the prompt responsive action taken as well as the successful subsequent prosecution of the offender.
Additionally, the press coverage of the criminal trial identified that the reporting of at least one of the tampered products to the police was prompted by the first product recall and the value of such action might also be seen in that outcome.

278
Indicator 5.1.5 Prevalence of foodborne
pathogens
Headline
During the period 2015 to 2020, Campylobacter continued to be the most
frequently reported bacterial pathogen causing infectious gastrointestinal disease
in the UK. Campylobacter reporting showed a marginal overall increasing trend
from 2015 to 2019, while Salmonella case reporting remained relatively stable. A
decreasing trend in reports of Shiga toxin-producing E. coli (STEC) O157 has
been observed since 2016 and, although reported case numbers are low, reports
of Listeria monocytogenes infection have also declined marginally since 2016. The
COVID-19 pandemic had variable impacts on the reporting of case numbers of
these four bacterial pathogens in 2020.
Context and Rationale
The UKHSA, PHW, PHS and PHA are responsible for the surveillance of
infectious diseases, including gastrointestinal pathogens that cause foodborne
disease. Laboratory testing data and epidemiological information on each reported
case is recorded in national surveillance databases and case management
systems. The aim is to monitor trends in reporting of gastrointestinal pathogens,
changes in disease epidemiology and to detect new and/or emerging disease
threats, including foodborne disease outbreaks, so that timely and appropriate
action to protect public health can be taken.
For overall food security in the UK it is important that the food consumed is safe to
eat and does not constitute a threat to consumers’ health. While not all
gastrointestinal infections caused by organisms such as bacteria, viruses or
protozoa are foodborne, food is an important vehicle of transmission for many
gastrointestinal pathogens that cause a substantial public health burden.130 Food
poisoning leading to diarrhoea and vomiting as well as other more serious health
problems, such as haemolytic uraemic syndrome (HUS).131 Guillain-Barré
130 World Health Organisation, ‘Estimates of the global burden of foodborne diseases’ (2015), https://www.who.int/publications/i/item/9789241565165. 131 Byrne, L., and others, ‘The epidemiology, microbiology and clinical impact of Shiga toxin-producing Escherichia coli in England, 2009-2012’, Epidemiology and Infection, 143(16) (2015), pages 3475 to 3487.

279
syndrome, irritable bowel syndrome),132 and reactive arthritis,133 can result in
significant negative impacts on both individuals and society as a whole. Published
estimates suggest that around one in four people in the UK suffers an episode of
infectious gastrointestinal disease each year and foodborne disease in England
and Wales results in costs of around £9.1 billion per year to the NHS, the
economy and individuals).134
There are many gastrointestinal pathogens and microbial contaminants that have
a food safety impact. However, four major bacterial pathogens are considered
priority pathogens for national surveillance due to the substantial implications for
food safety in the UK: Campylobacter, non-typhoidal Salmonella, STEC O157, and
L. monocytogenes. This indicator focusses on these pathogens. Campylobacter
causes a high disease burden because of the considerable numbers of cases
reported at a population level each year. Salmonella causes the second highest
burden in terms of reported numbers of disease cases, with the highest reporting
rate seen in children under the age of 10; a population group which is at higher
risk of more severe clinical disease. STEC O157 causes gastrointestinal disease
with potentially severe complications, especially in children under the age of 5,
such as development of HUS.135 Llisteriosis can have severe health
consequences in people who are immunosuppressed or have underlying health
conditions, people over the age of 60, pregnant women and new-born babies
(typically through infection during pregnancy). Although annual reports of cases of
L. monocytogenes are relatively small compared to other foodborne pathogens,
listeriosis has a high mortality rate (20% to 30%).136
No disease surveillance system is perfect and there are both surveillance biases
and under-ascertainment of infectious gastrointestinal disease, further information
132 McCarthy, N. and J. Giesecke, ‘Incidence of Guillain-Barre syndrome following infection with Campylobacter jejuni’, American Journal of Epidemiology 153(6) (2001), pages 610 to 614; Neal, K.R., L. Barker, and R.C. Spiller, ‘Prognosis in post-infective irritable bowel syndrome: a six year follow up study’, Gut 51(3) (2002), pages 410 to 413. 133 Dworkin, M.S., and others, ‘Reactive arthritis and Reiter's syndrome following an outbreak of gastroenteritis caused by Salmonella enteritidis’ Clinical Infectious Diseases 33(7) (2001), pages 1010 to 1014. 134 FSA, ‘The second study of infectious intestinal disease in the community (IID2 Study)’, (2016), https://www.food.gov.uk/research/research-projects/the-second-study-of-infectious-intestinal-disease-in-the-community-iid2-study; FSA, ‘The Burden of Foodborne Disease in the UK 2018’, 2020, https://www.food.gov.uk/research/research-projects/the-burden-of-foodborne-disease-in-the-uk-2018. 135 Adams, N. and others, ‘Sociodemographic and clinical factors for paediatric typical haemolytic uraemic syndrome: retrospective cohort study’, British Medical Journal Paediatrics Open 3 (1) (2019). 136 PHE, ‘Listeriosis in England and Wales’ (2021), https://www.gov.uk/government/publications/listeria-monocytogenes-surveillance-reports/listeriosis-in-england-and-wales-summary-for-2018; Scobie, A. and others, ‘Mortality risk factors for listeriosis - a 10 year review of non-pregnancy associated cases in England 2006-2015’, Journal of Infection 78 (3) (2019), pages 208 to 214.

280
on which is included in the annex to this report.137 Additionally, it is important to
note that the surveillance indicators for 2020 were adversely impacted by the
COVID-19 pandemic so the 2020 surveillance data cannot be compared to the
data from previous years.
Data and assessment
Indicator: Reported infections of Campylobacter, non-typhoidal Salmonella
species (sp)., STEC O157 and Listeria monocytogenes in the United Kingdom,
2015 to 2020
Source: Second Generation Surveillance system (SGSS) and Electronic
Communication of Surveillance in Scotland (ECOSS).
Figure 5.1.5a: Number of laboratory-confirmed reported infections in the United
Kingdom138, 2015 to 2020
Year Campylobacter sp.
Non-typhoidal Salmonella sp.
STEC O157
Listeria monocytogenes
2015 63,193 9,479 880 186
2016 58,149 9,610 981 201
2017 63,623 10,010 773 156
2018 67,984 10,107 836 174
2019 68,006 9,724 717 154
2020 54,979 5,329 577 148
Figure 5.1.5b: Rate of reported Campylobacter sp., non-typhoidal Salmonella sp.,
STEC O157 and Listeria monocytogenes infections per 100,000 population per
year in the United Kingdom, 2015 to 2020
137 FSA, ‘The second study of infectious intestinal disease in the community (IID2 Study)’ (2016), https://www.food.gov.uk/research/research-projects/the-second-study-of-infectious-intestinal-disease-in-the-community-iid2-study.
138 Scottish data include serum positive cases and cases that were polymerase chain reaction
(PCR) test positive but bacterial culture test negative (pcr+/culture neg). Northern Irish totals for 2019 and 2020 are provisional.

281
Figure 5.1.5b: Rate of reported Campylobacter sp., non-typhoidal Salmonella sp.,
STEC O157 and Listeria monocytogenes infections per 100,000
population
per year in the United Kingdom, 2015 to 2020
The pathogen with the highest number of reported cases annually across all years
from 2015 to 2020 was Campylobacter. Case reporting is particularly high in the
summer months, with annual peaks usually seen across the months June to
August.
Non-typhoidal Salmonella was the second most commonly reported pathogen.
Peak reporting is usually during the late summer and autumn months.
STEC O157 and L. monocytogenes had lower numbers of cases reported, with
reporting rate peaks in 2016 of 1.49 cases per 100,000 population for STEC O157
and 0.31 cases per 100,000 population for L. monocytogenes.
As illustrated by figure 5.1.5b, the impact of the COVID-19 pandemic on
gastrointestinal pathogen reporting rates varied by pathogen. In 2020, there were
5,329 reported salmonellosis cases, a reduction of 45% compared to 2019.
Campylobacter reporting appeared to be less impacted by the pandemic. Initially
there was a substantial reduction in Campylobacter reports in April 2020 (between
19% to 33% reduction) but reports had increased to similar levels to those
recorded before the COVID-19 pandemic by August 2020 (1% to 7% reduction)
and this return to reporting levels seen in previous years was sustained

282
throughout the remainder of 2020 (data not shown) with an overall reduction in
reports in 2020 compared to 2019 of 19%.139 The number of reported cases of
STEC O157 fell from an average of 837 cases between 2015 and 2019 to 577
cases in 2020 (overall reduction of 31%). Like Campylobacter, there were fewer
than expected STEC O157 cases from April 2020 but with levels rising to numbers
comparable to the five-year average by August 2020 (data not shown). The
reporting rate of L. monocytogenes decreased marginally in 2020 (148 cases
compared to an average of approximately 170 cases reported in the previous five
years, a decrease of 13%).
Trends
After an initial decline in reporting rate between 2015 to 2016, the reporting rate
for Campylobacter increased from 2017 and reached a peak of 102.33 cases per
100,000 population in 2018. Overall, there has been a marginal but sustained
upward trend in Campylobacter reports seen over the last decade.
The decreasing trend seen at the start of the decade in reports of Salmonella was
not sustained in recent years, but case reporting remained lower than pre-2010
levels and relatively stable at approximately 10,000 reports each year until 2020,
peaking in 2018 with a reporting rate of 15.21 per 100,000 population.140
Reported cases of STEC O157 have shown an overall decreasing trend since
2016. The reason for this decline is unclear, although phage typing indicates a
decrease in numbers of one of the most frequently detected types (PT 21/28)
(data not shown). In contrast, the number of cases infected with other STEC
serogroups (called non-O157 STEC), in particular STEC O26, has been
increasing over the last decade (data not shown), likely predominantly due to the
increasing number of laboratories implementing enhanced testing methods which
enable the detection of all STEC and not just STEC O157.141 However, a real
increase in the number of gastrointestinal infections caused by non-O157 STEC
cannot be ruled out and the UK public health agencies are assessing these
changes in trends.
139 Ondrikova, N. and others, ‘Differential impact of the COVID-19 pandemic on laboratory reporting of norovirus and Campylobacter in England: A modelling approach’, PLOS One 16 (8) (2021). 140 Lane, C. R. and others, ‘Salmonella enterica serovar Enteritidis, England and Wales, 1945-2011’, Emerging infectious diseases, 20(7), pages 1097 to 1104. 141 Vishram, B. and others, ‘The emerging importance of Shiga toxin-producing Escherichia coli
other than serogroup O157 in England’, Journal of Medical Microbiology 70 (7) (2021).

283
Low numbers of reported cases complicate interpretation of trends for L.
monocytogenes infection. However, the number of reported cases in the UK has
declined marginally from 2016 to 2020, following a small increase in 2016.
The 2020 surveillance data indicators 5.1.5a and 5.1.5b cannot be compared to
the data from previous years, as an overall substantial and sustained reduction in
reporting of gastrointestinal pathogens to national surveillance has been observed
coinciding with the COVID-19 pandemic. This may be due to the effects of
lockdowns and restrictions on peoples’ behaviours, making them less at risk of
acquiring certain infections. Examples could include changes in eating out
patterns and changes in travel patterns. However, changes in health care seeking
behaviours are also likely to have contributed, with fewer people visiting general
practitioners and hospitals and having samples taken for testing, as well as
changes in laboratory testing practices. Therefore, trend analysis should only be
considered for 2015 to 2019, with exclusion of 2020 data.
The significantly lower number of Salmonella reports in 2020 was likely driven by
multiple reasons, but a marked reduction in number of reports of travel-associated
cases due to a reduction in foreign travel during the pandemic was likely to have
played a notable role. Travel-associated Salmonella in the UK in the pre-pandemic
era is estimated to constitute as much as 45% of overall disease burden).142
Similarly, the reduction in STEC O157 reports reflected a marked reduction in
cases reporting foreign travel which normally account for approximately 20% of
cases.143
The less notable reduction in reports of L. monocytogenes throughout 2020 may
be due to the fact that reported cases of Listeria are typically very unwell and often
require hospitalisation, therefore ascertainment is less impacted by a decrease in
people visiting their general practitioners and other healthcare settings.
142 Zenner, D. and I. Gillespie, ‘Travel-associated Salmonella and Campylobacter gastroenteritis in England: estimation of under-ascertainment through national laboratory surveillance’, Journal of Travel Medicine 18 (6) (2011); PHE, ‘Travel-associated non typhoidal Salmonella infection in England, Wales and Northern Ireland: 2014’ (2017).
143 Byrne, L. and others, ‘The epidemiology, microbiology and clinical impact of Shiga toxin-
producing Escherichia coli in England, 2009-2012’, Epidemiology and Infection, 143(16) (2015),
pages 3475 to 3487.

284
Indicator 5.1.6 Foodborne disease
outbreak surveillance
Headline
In total, the UK public health agencies, together with partner organisations,
investigated and reported 276 foodborne disease outbreaks during 2015 to 2020,
with nearly 10,000 associated human disease cases. The proportional trends in
causative pathogens, hospitalisation rates, associated foods implicated in the
outbreak investigations and outbreak settings remained relatively stable over the
period 2015 to 2019 and generally consistent with that seen in previous years.
However, the implementation of whole genome sequencing since 2015 and the
COVID-19 pandemic in 2020 have impacted on this data indicator.
Context and Rationale
The UKHSA, PHW, PHS, and the PHA are the lead organisations responsible for
the detection, investigation and management of outbreaks of foodborne disease in
the UK, working in partnership with food safety, animal health and local authority
colleagues for the implementation of food safety controls (see appendix for further
detail).
There are inherent biases which should be considered when assessing the data
presented in this indicator. The data derived through systematic national
surveillance of foodborne disease outbreaks nonetheless provides an important
source of information for foodborne disease trend analysis. This data is used
alongside other surveillance indicators for foodborne gastrointestinal pathogens to
inform risk assessment and policy development for the protection of UK
consumers against risks posed by foodborne disease.
An ‘outbreak’ is defined as an incidence of two or more human cases of the same
disease, linked to the same source. Specifically for foodborne outbreaks, the
definition usually applied is ‘an incidence, observed under given circumstances, of
two or more human cases of the same disease and/or infection, or a situation in
which the observed number of human cases exceeds the expected number and

285
where the cases are linked, or are probably linked, to the same food source
(including potable water)’ (Directive 2003/99/EC).144
Public Health Agencies in the UK now routinely perform whole genome
sequencing (WGS) for genomic characterisation of several bacterial
gastrointestinal pathogens, including Salmonella sp., Listeria monocytogenes,
Shigella sp., Yersinia sp. and shigatoxin producing E. coli (STEC). The data
derived from the systematic national surveillance of foodborne disease outbreaks
pre and post the implementation of WGS is not directly comparable.
Data and assessment
Indicators:
• Number of foodborne outbreaks investigated and reported in the UK and
associated number of human cases and hospitalisations 2015 to 2020
• Foodborne disease causative agents and food vehicles implicated in the
foodborne outbreaks investigated and reported from 2015 to 2020 and outbreak
settings
Source: Electronic Foodborne and non-foodborne outbreak surveillance system
(eFOSS) in England and Wales, ObSurv in Scotland and the outbreak surveillance
dataset in Northern Ireland
144 European Union and Council, ‘Directive 2003/99 EC of the European Parliament and of the Council of 17 November 2003 on the monitoring of zoonoses and zoonotic agents, Official Journal 325 (2003), https://eur-lex.europa.eu/legal-content/EN/TXT/?uri=CELEX:32003L0099. .

286
Figure 5.1.6a: Number of foodborne outbreaks by causative agent investigated and
reported to national public health surveillance in the UK, 2015 to 2020
Of the 276 outbreaks reported, 251 outbreaks were investigated where a causative agent
was identified between 2015 and 2020. Salmonella sp. was the most frequently reported
in most years (68 out of 251 outbreaks in total, 27%), with enteric viruses second (49
outbreaks, 20%), followed by Campylobacter (42 outbreaks, 17%) and Clostridium
perfringens (39 outbreaks, 16%). There were between 2 and 8 outbreaks of STEC
reported each year during this time period. There were no outbreaks of Listeria
monocytogenes reported in 2015 and 2016, but 8 outbreaks in total reported between
2017 and 2020.

287
Table 5.1.6b. Total number of associated human cases and percentage
hospitalised (X%) associated with foodborne outbreaks reported to national
public health surveillance by causative pathogen in UK, 2015 to 2020145
Causative agent 2015 2016 2017 2018 2019 2020 Total
Salmonella sp.
274
(4%)
540
(4%)
688
(11%)
673
(5%)
549
(7%)
732
(7%)
3,456
(7%)
Enteric viruses146
210
(0%)
1,407
(0%)
317
(1%)
370
(0%)
476
(1%)
180
(0%)
2,960
(0%)
Campylobacter sp.
190
(2%)
173
(0%)
146
(6%)
140
(4%)
39
(0%)
28
(4%)
716
(3%)
Clostridium perfringens
205
(1%)
163
(2%)
114
(0%)
293
(0%)
141
(0%)
90
(8%)
1,006
(1%)
STEC/Other
E. coli
106
(21%)
306
(32%)
48
(25%)
55
(36%)
65
(40%)
93
(32%)
673
(31%)
Listeria monocytogenes N/a N/a N/a
17
(100%)
17
(100%)
9 (
100%)
43
(100%)
Shigella sp.
17
(47%) N/a N/a
34
(12%) N/a N/a
51
(24%)
Cryptosporidium sp.
16
(0%) N/a N/a N/a N/a N/a
16
(0%)
Other147
2
(0%)
23
(0%)
14
(0%)
5
(60%)
13
(0%)
3
(0%)
60
(5%)
Unknown148
177
(0%)
15
(0%) N/a
119
(1%)
140
(0%)
13
(0%)
464
(0%)
Total
1,197
(4%)
2,627
(5%)
1,327
(7%)
1,706
(5%)
1,440
(6%)
1,148
(9%)
9,445
(6%)
There were 9,445 cases of foodborne illness reported to be associated with the
total 276 outbreaks investigated and reported during 2015 to 2020. The majority of
cases (3,456 cases, 37%) were associated with Salmonella outbreaks and enteric
viruses (2,960 cases, 31%). While just under 6% of the total associated outbreak
145 Hospitalisation data not known for all cases; ascertainment of both cases and hospitalisation varies according to the pathogen, clinical severity and differences in laboratory testing.
146 Includes foodborne norovirus outbreaks or norovirus outbreaks related to infected food handlers. 147 ’Other’ includes marine biotoxins such as scrombotoxin and okadaic acid as well as other entero-toxin producing bacteria such as Staphylococcus or Bacillus spp. 148 Unknown’ are outbreaks where a causative agent was not identified as the cause of the disease in the outbreak associated human disease cases.
288
cases between 2015 and 2020 reported hospitalisation, this varied substantially by
pathogen from 0% to 100%.
The effect of routine implementation of WGS for surveillance of bacterial
gastrointestinal pathogens has been particularly notable for Salmonella. The
proportion of all Salmonella outbreaks detected at the national level has increased
since 2015 from 27% to 67% in 2019, with outbreak associated case numbers per
outbreak showing an overall increasing trend (see the appendix for further detail).
Table 5.1.6c. Foodborne outbreaks by food vehicle investigated and
reported to national public health surveillance per year, 2015 to 2020 in the
UK149
Food vehicle 2015 2016 2017 2018 2019 2020 Total
Poultry meat and poultry meat
products
12 7 6 5 4 4 38
Composite or mixed foods 6 6 4 5 11 0 32
Other mixed meat/poultry/products 7 5 2 4 2 1 21
Eggs and egg products 3 5 2 2 6 1 19
Beef/bovine meat and products 3 4 2 4 2 2 17
Crustaceans/shellfish/molluscs 1 1 2 6 3 3 16
Fruits and vegetables 0 3 3 3 0 3 12
Dairy 0 1 3 1 1 4 10
Pork meat and products 3 0 2 2 2 0 9
Lamb meat and products 2 0 1 3 2 0 8
Finfish and products 1 0 0 2 0 1 4
Herbs/spices/cereal products/nuts and
seeds
0 0 1 1 1 1 4
Potable water 1 0 0 0 0 0 1
Unknown150 14 17 10 11 23 10 85
Total 53 49 38 49 57 30 276
For the 191 outbreaks investigated between 2015 and 2020 with a food vehicle
reported as implicated or suspected to be implicated, poultry meat and poultry
meat products were most commonly reported as vehicles of infection (38
149 Not all outbreaks are microbiologically linked to the implicated food vehicle. 150 Epidemiological investigations may not always be able to identify the food causing the outbreak,
and food sampling may not always be undertaken. For those outbreaks where a food vehicle could
not be identified, these outbreaks are reported as ‘unknown food vehicle’.

289
outbreaks, 20%), followed by composite/mixed foods (32 outbreaks, 17%) and
other mixed meat/poultry/products (21 outbreaks, 11%).
The overall number of reported outbreaks in 2020 (30 outbreaks) was lower than
any other year (2015 to 2019) and 40% lower than the average for this 2015 to
2019 (49 outbreaks). Although the total number of cases (1,148) in 2020 was
lower compared to the five-year (2015 to 2019) average (1,659) the percentage
hospitalised (9%) was higher than the five-year average (5%).
Figure 5.1.6d: Foodborne outbreaks by food vehicle investigated and causative
agent reported to national public health surveillance, 2015 to 2020 in the UK
Reported Campylobacter outbreaks were predominantly associated with poultry
products (implicated as the vehicle in 62% of all reported Campylobacter
outbreaks with 583 associated outbreak cases), with chicken liver pate/parfait
being the most commonly reported vehicle. Eggs and poultry meat products were
most commonly implicated in Salmonella outbreaks (being the implicated vehicles
in 26% and 10% of Salmonella outbreaks respectively with a total of 1,089 and
561 associated outbreak cases respectively). Ruminant meat and meat products
(lamb and beef) were associated with a total of 28 outbreaks, involving 1,064
associated human cases, nearly half of which (517 cases) were associated with
Salmonella outbreaks. Beef products were the most commonly reported vehicle in
Clostridium perfringens outbreaks (implicated as the vehicle in 31% of C.
perfringens outbreaks with 267 associated outbreak cases). All of the 16 reported

290
outbreaks associated with crustaceans/shellfish/ molluscs were norovirus
outbreaks (involving 587 cases).
Outbreaks associated with fruit and/or vegetables were reported as implicated
food vehicles in 14% of outbreaks caused by STEC (with 277 associated
foodborne illness cases), in 6% of Salmonella outbreaks (186 associated cases),
in 4% enteric virus outbreaks (93 cases) and 13% Listeria monocytogenes
outbreaks (12 cases, associated with one outbreak). Outbreaks with dairy
products reported as implicated food vehicles were associated with
Campylobacter and STEC most frequently. The single outbreak reported during
this period associated with potable water was an STEC O157 outbreak linked to a
private water supply.
Figure 5.1.6e: Percentage of foodborne outbreaks reported by setting, 2015 to
2020151
151 ‘Multiple places of exposure’ refers to national outbreaks where nationally distributed food vehicle has been consumed in more than one different setting. ‘Others’ include settings with less than 3 outbreaks reported including, hospital or medical settings, workplace canteens or other undisclosed settings.

291
By overall reported number and by number of associated outbreak cases, the
majority of outbreak investigations reported between 2015 to 2020 were
associated with catering settings (54% with specific restaurants/food service
establishments and 3% associated with takeaways or fast-food outlets, together
contributing 51% of total associated human disease cases). Only 4% of outbreaks
were associated with school or other institutional settings. The largest outbreaks
(28% of total number of reported outbreaks but constituting 39% of overall number
of reported outbreak associated cases), were designated as multiple places of
exposure, when a contaminated food product that caused the outbreak is
consumed in the home or at multiple locations, including in institutions and
multiple different food service establishments. Outbreaks associated with the farm
setting were exclusively outbreaks associated with raw drinking milk, caused by
Campylobacter or STEC O157. There was a significant reduction in the proportion
of outbreaks associated with the food service sector in 2020 (6% versus a range
of 39% to 67% in previous years).
Trends
The number of foodborne outbreaks reported each year is small but overall,
proportionally, the 2015 to 2019 surveillance data demonstrates trends not
significantly dissimilar to previous years’ data. Several key aspects were generally
consistent with some of the long-term trends observed since systematic national
surveillance for foodborne outbreaks was first instituted in 1992.152 There are
some notable exceptions. The overall number of outbreaks reported, especially
those due to salmonellosis, has declined to levels significantly lower than in the
1990s and 2000s. For Salmonella, this is likely due, at least in part, to the
implementation of EU wide controls for Salmonella in chickens under Regulation
(EC) No 2160/2003153. There were also several large Salmonella Enteritidis
outbreaks reported during 2015 - 2020 associated with imported poultry products
(ECDC, 2017; ECDC, 2020; ECDC, 2021).154 This indicates that Salmonella
152 Gormley, F.J. and others, ‘A 17-year review of foodborne outbreaks: describing the continuing decline in England and Wales (1992-2008)’, Epidemiology and Infection 139 (5) (2011), pages 688 to 699. 153 European Parliament and Council, ‘Regulation (EC) No 2160/2003 of the European Parliament and of the Council of the 17 November 2003 on the control of salmonella and other specified food-borne zoonotic agents (2003), https://eur-lex.europa.eu/legal-content/EN/TXT/?uri=CELEX%3A02003R2160-20210421. 154 European Centre for Disease Prevention and Control: ‘Re-emerging multi-country WGS-defined outbreak of Salmonella Enteritidis, MLVA type 2-12-7-3-2 and 2-14-7-3-2 (2017), https://ecdc.europa.eu/sites/portal/files/media/en/publications/Publications/rapid-risk-assessment-WGS-defined-outbreak-Salmonella-Enteritidis-3-feb-2017.pdf; ‘European Food Safety Authority, 2021. Multi-country outbreak of Salmonella Enteritidis sequence type (ST)11 infections linked to

292
contamination of poultry products at the EU level is still an ongoing public health
concern. When considering the data for pathogens subject to routine whole
genome sequencing (Salmonella sp, STEC, Listeria monocytogenes and Shigella
sp), there has been a year-on-year increase in the proportion of reported national
level outbreaks ranging from 26% in 2015 to 94% in 2020 and the average size of
outbreaks has steadily increased since 2015, particularly notable for Salmonella.
Although sporadic campylobacteriosis places a significant health burden on the
community, the number of outbreaks investigated and reported does not reflect
this burden. This is likely because Campylobacter outbreaks are difficult to detect
through existing surveillance systems.155
The proportion of outbreaks linked specifically to food service establishments
remains significant. Outbreaks associated with these settings are most commonly
related to and amplified by poor hygiene controls, environmental contamination
and cross-contamination in the kitchen. Therefore, continued efforts to improve
hygiene and lower the risk of introducing contaminated products and ingredients
into food service establishments are needed in order to realize further public
health benefits.
There are some notable differences in the 2020 data compared to the data
collected from the previous five years. There was a higher overall hospitalisation
rate seen in 2020, potentially indicating that during the pandemic less clinically
severe cases may not have been identified and associated with foodborne
outbreaks. There was also a reduction in the number of Salmonella,
Campylobacter, norovirus and Cl. Perfringens outbreaks, likely associated with the
COVID-19 pandemic restrictions on the hospitality and catering sector and a
notable reduction overall in outbreaks associated with food service settings (see
report annex for further detail).
poultry products in the EU/EEA and the United Kingdom’ (2021), https://www.ecdc.europa.eu/sites/default/files/documents/salmonella-enteritidis-rapid-outbreak-assessment-united-kingdom-poultry-2021.pdf; ‘European Food Safety Authority, 2020. Multi-country outbreak of Salmonella Enteritidis infections linked to eggs, third update’ (2020), https://www.ecdc.europa.eu/en/publications-data/multi-country-outbreak-salmonella-enteritidis-infections-linked-eggs. 155 Pebody, R.G., M.J. Ryan and P.G. Wall, ‘Outbreaks of campylobacter infection: rare events for a common pathogen’, Communicable Disease Report Review 7 (1997).
293
Case Study 5.4 Listeria outbreak linked to
consumption of pre-prepared hospital
sandwiches in England
Overview
Listeriosis is a rare disease in the UK, but its clinical severity renders it a public
health concern, particularly in the context of clinically vulnerable groups.
Identification of Listeria monocytogenes from a patient sample is notifiable in
England. Public health investigation and follow-up including completion of a
questionnaire on what foods individuals who have been diagnosed with listeriosis
have eaten prior to illness onset is attempted for all reported cases of listeriosis as
an integral part of the enhanced surveillance system for listeriosis in England.
An outbreak of listeriosis in hospitals in England, which caused nine cases and
seven deaths, was identified and investigated between May and July 2019 and
confirmed to be linked to consumption of pre-prepared sandwiches served to
patients in hospitals across England.
The epidemiological, microbiological and food chain investigations, carried out by
the multi-disciplinary Incident Management Team (IMT) identified the cause of the
outbreak to be contaminated poultry meat used in the production of sandwiches.
This was exacerbated by inadequate food safety protocols in hospital catering
facilities. Whole genome sequencing confirmed that isolates from all nine cases
were closely genetically related and isolates sampled from chicken and other
sandwich ingredients had indistinguishable genetic profiles, providing
microbiological evidence of the common source of foodborne transmission.
Background
In May 2019, the UKHSA (formerly Public Health England) notified partner
agencies of an outbreak detected using analysis of whole genome sequencing
data after two patients, with pre-existing medical conditions, contracted listeriosis
in the same hospital. Both had overlapping hospital admission dates and had
consumed sandwiches whilst in hospital. Between May and June 2019, 9
confirmed cases of listeriosis associated with the outbreak were identified in
England in 8 hospitals across 7 NHS Trusts. By the time the outbreak was
declared over, 7 patients had died.

294
An IMT was convened by UKHSA, involving colleagues from UKHSA, local
authorities, the FSA and FSS, Public Health Scotland (formerly Health Protection
Scotland), Public Health Wales, NHS England, and NHS Scotland.
The individuals diagnosed with listeriosis were interviewed (or family members,
where direct interview of the confirmed cases was not possible) to ascertain what
foods they had eaten prior to becoming ill and inspection of hospital catering
records where available, was carried out as part of the food tracing investigations.
This identified that the first three cases had all consumed chicken sandwiches,
which the FSA identified to be sourced from a common supplier, which supplied
sandwiches to NHS hospitals across Great Britain and were manufactured by one
specific business.
In turn, the contamination was traced back to diced chicken which tested positive
for L. monocytogenes at high levels and whole genome sequencing confirmed that
it matched the outbreak strain identified from the cases. Not all cases consumed
sandwiches made with the chicken, and some other sandwiches from the same
producer were consumed, suggesting that both cross-contamination within the
manufacturing environment and a lack of food safety controls in place at the
hospitals had contributed to the outbreak.156
Discussion
The outbreak posed food safety and public health concerns for vulnerable
consumers and patients attending hospitals, and attracted prolonged media and
public interest. This risked loss of confidence in hospital food, and particularly
sandwiches served in hospital, with pre-prepared sandwiches having been
commonly associated with outbreaks of listeriosis in the UK in previous years.
The FSA has a key role as the Central Competent Authority (CCA) in overseeing
official food safety controls undertaken by Local Authority (LA) food law
enforcement authorities in England, Wales, and Northern Ireland. It is important to
understand that, in most cases, enforcement of food law is a direct statutory duty
of the competent authority (in this case, the LA).
Following the outbreak, a full cross-government strategic lessons learned exercise
was undertaken to identify best practice in the supply chain for NHS food. This
also focused on the actions required to prevent future recurrence. The FSA and
FSS contributed to a ’root and branch‘ review commissioned by the Secretary of
156 PHE, ‘Investigation into an outbreak of Listeria Monocytogenes infections associated with hospital-provided pre-prepared sandwiches, UK May to July’ (2019) https://assets.publishing.service.gov.uk/government/uploads/system/uploads/attachment_data/file/937907/2019-05-Listeria-CC8-Outbreak-Report.pdf.

295
State for Health and Social Care. The subsequent Report of the Independent
Review of NHS Food made 8 recommendations for system-level changes to be
taken forward by an expert group with representation drawn from across the
sector and government.157 Both the evidence obtained during this specific
outbreak and provided by the FSA and FSS contributed to the report which was
later published on the FSA’s website.
In summary, this outbreak of listeriosis led to a thorough investigation of what
happened and why. To help avoid repetition of the incident, the report
recommended that NHS purchasers must have effective mechanisms in place to
assure food safety within their supplier base and drive improvements where
necessary to ensure all businesses supplying high-risk foods meet the highest
standards.
The report recommended that the standards of food-safety audits for high-risk
food manufacturers be raised, to give confidence that legal and contractual
requirements were being met. It was noted that most NHS trusts used a private
company to accredit food suppliers as safe, but they must be aware that third-
party accreditation was not a guarantee that a product was safe.
The report also recommended that NHS trusts must recognise their legal
obligations as food business operators and ensure effective compliance with
robust food safety procedures is achieved across their supply base. These
procedures must be clearly understood, properly implemented, and verified to
ensure compliance.
Indicator 5.1.7 Food Crime
Headline
Recorded disruptions from the FSA’s NFCU and successful operations by the
SFCIU help to quantify the successful delivery of activity to stop or reduce the
opportunity for food crime offending within the UK food chain. The NFCU began
recording food crime disruptions in 2020 to 2021, with a steady increase in the
number of disruptions recorded through the year. Increases can be attributed to
improvements in operational capability and a greater focus on, and awareness of,
the full scope of disruption strategies. While still in an early phase, food crime
interventions are an important indicator for the security of UK food, demonstrating
157 DHSC, ‘Report of the Independent Review of NHS Hospital Food’ (2020), https://www.gov.uk/government/publications/independent-review-of-nhs-hospital-food.

296
the UK food safety authorities’ ability to receive, assess, and respond to
intelligence concerning food crime.
Context and Rationale
Following the horsemeat incident in 2013 that affected consumers in the UK and
Europe, government-commissioned reviews recommended the establishment of
food crime units to prevent further food crime incidents. As a result, the FSA set
up its NFCU, operating in England, Wales, and Northern Ireland, and FSS created
the SFCIU.
The Units define food crime as serious fraud and related criminality in food supply
chains.158 Most food crime relates to two broad classes of activity:
• The deliberate inclusion of lower-grade, unsafe or alternative ingredients as edible
and marketable.
• The sale of passable food, drink, or feed as a product with greater volume or more
desirable attributes.
In many cases, consumers will be unable to identify they have been victims of
fraud. However, in some instances, especially when ingredients are
misrepresented, they can have significant impacts. These can come from
individuals consuming products they avoid due to dietary requirements, religious
or cultural observances, and/or allergies which can lead to serious physical harm,
or even death. By tracking food crime interventions, it is possible to better
articulate where food crime incidents have manifested (and have required some
form of response).
The NFCU and SFCIU both follow similar investigative and disruption strategies,
4P and 4D, respectively as detailed below:
158 FSS, ‘Food Crime Strategic Assessment’ (2020), https://www.foodstandards.gov.scot/publications-and-research/publications/food-crime-strategic-assessment-2020.

297
NFCU 4P Approach (taken from the Home Office’s Serious and Organised
Crime Strategy)159
Pursue Prepare Protect Prevent
Deal with
offenders through
prosecution and
disruption
Build capacity and
capability to
identify and
mitigate the impact
of food crime
Protect industry
and the public
from the effects of
food crime
Prevent people
from committing
food crime
SFCIU 4D Approach (taken from the Scottish Government’s Serious
Organised Crime Strategy)160
Disrupt Detect Deter Divert
Target those
committing food
crime and related
fraudulent activity
and identify
opportunities to
take enforcement
action
Identify those
involved in food
crime and related
fraudulent activity
using all power
available to the
organisation, local
authorities and
partner agencies
To deter
individuals
involved in food
crime and related
fraudulent activity
through
intelligence
gathering,
investigation,
regulatory
compliance and
surveillance of the
supply chain
To divert people
from becoming
involved in food
crime and related
fraudulent activity
The NFCU record operational outcomes across the 4P approach as disruptions.
These are achieved where the NFCU leads or supports action in response to a
food crime threat which has a measurable impact. It is a measure of impact, not
the activity or effort to achieve it.
The way this data is recorded and reported may change in coming years, so this
indicator might be subject to change in future iterations to reflect these
developments.
159 Home Office, ‘Serious and Organised Crime Strategy’ (2018), https://www.gov.uk/government/publications/serious-and-organised-crime-strategy-2018. 160 Scottish Government, ‘Serious and Organised Crime Strategy (2015), https://www.gov.scot/publications/scotlands-serious-organised-crime-strategy/documents/.

298
Data and assessment
Indicator: Total number of disruptions recorded by FSA
Source: NFCU
Figure 5.1.7a: Number of disruptions recorded in 2020 to 2021
During 2020 to 2021, the number of disruptions recorded each quarter by the
NFCU increased steadily across the year, with 52 Pursue disruptions and 138
Prepare, Prevent or Protect disruptions being delivered overall. This was driven by
the NFCU achieving full operating capability, applying greater focus to prepare,
prevent, and protect outcomes, and increasing awareness amongst staff with
regards to identifying and recording disruptions resulting from their work.
SFCIU was involved in a significant number of investigations during 2020 to 2021
which had various intervention and disruption strands. As part of developing a
disruption activity indicator SFCIU are developing an approach to capture the
percentage of actionable intelligence that has resulted in a positive outcome.
Trends
Due to limited time series data it is not possible to provide an assessment of the
trends, however this will be possible in coming years.
Case Study 5.5 Unlawful processing in
the red meat sector
Overview
NFCU worked in partnership with other agencies and authorities to tackle a case
of unlawful processing in the red meat sector. This led to the seizure of 5.3 tonnes
of meat, which had been prepared in unsanitary conditions and was being sold to
consumers online. This case also started the process of considering further policy
development in the online food sales space.
299
Background
Unlawful processing in unregulated premises can lead to unsafe product being
placed in the human food chain posing a risk to human health. In addition, this sort
of food crime is often linked to other manifestations of food crime, such as
livestock theft, document fraud, and misrepresentation. Such practices are
damaging to law-abiding food business operators, who comply with the regulatory
requirements, both as there are lower costs associated with operating outside of
approval, and as the existence of unregulated business could undermine
confidence in the UK food industry.
The NFCU worked to support and coordinate a local authority led investigation into
a suspected illegal meat supplier. The initial concerns were that the meat was
derived from stolen livestock. The subject of the investigation used an identified
social media Facebook page as a ‘shop window’ to advertise the product and
direct customers on how to buy the meat.
The NFCU worked with the police, local authority food teams, and other partners
to co-ordinate activity at the suspect’s premises. On two separate occasions, a
total of 5.3 tonnes of meat, roughly translating to three full transit vans, was
discovered being prepared in unsanitary conditions rather than a registered and
hygienic food preparation environment. It is suspected that a significant amount of
meat had already been supplied to consumers in addition to the meat seized.
Whilst initial concerns regarding stolen livestock were not proven in this instance,
support from local rural policing partners aided enquiries and produced useful
information for the future.
An investigation into identified regulatory offences continues to be led by the local
authority, and the NFCU are supporting financial investigation into the subject as a
result of this activity.
Discussion
The product was due to be distributed across a large geographical area, spanning
the north and south of England, which demonstrates the reach that such
interventions can have in protecting consumers across the UK. The FSA’s
assessments of potential risk, including details of how and where the meat was
produced, resulted in a FAFA notice being issued. FAFAs are issued by the FSA
and provide local authorities with details of specific action to be taken on behalf of
consumers. In this instance, authorities were asked to contact premises who may
have purchased the product and to ensure they were withdrawn from the market
and recalled from consumers.

300
NFCU’s support and co-ordination resulted in a significant amount of meat being
removed from the market and protected consumers from unsafe meat. Working
across teams with both internal and external partners also led to:
• the service of a Remedial Action Notice and Hygiene Emergency Prohibition notice
stopping the unlawful business from operating;
• discussions with FSA teams responsible for policy development to ensure any
appropriate preventative measures regarding online sales are taken forward;
• applications from the operator of the unregistered food business for appropriate
approvals, making their activities visible to the regulators, who can ensure the
safety and hygiene of production. This also ensured a potential food business
operator was aware of food safety law, further protecting their consumers.
There is still work to be done to increase the understanding and ability to prevent
criminality associated with unlawful processing, as well as to understand the
demands for products within specific communities in the UK. Strong partnership
action such as this has, however, strengthened NFCU knowledge and ability to
tackle similar issues in the future, has protected consumers from potential harm,
and helped level the playing field for legitimate businesses in this sector.
Case Study 5.6 Operation OPSON and the
Food Industry Intelligence Network
Overview
The Food Industry Intelligence Network (FIIN) supported UK Regulators during
Operation OPSON VII (2017-18), which focused on illegal treatment of tuna in the
supply chain. Information and expertise provided on the supply chain were
invaluable in supporting intelligence gathering and enforcement activities in the
UK and across Europe. The activity strengthened relations between regulators
and FIIN and assisted in outlining the scale of illegal activity from a global
perspective.
Background
The FIIN consists of 46 major food businesses active in the UK. They co-operate
to share anonymised and aggregated authenticity testing data to enhance their
response to potential food crime threats such as product adulteration or
misrepresentation, discernible either from regulatory activity and intelligence, or
from industry supply chain assurance. UK food standards agencies have signed
Information Sharing Agreements (ISAs) with FIIN. This relationship continues to
develop and has allowed for the sharing of valuable information including tens of

301
thousands of lines of data each year, contributing to the identification and
investigation of food crime, and supporting a number of national operations.
Discussion
The ISA between FIIN and both SFCIU and NFCU has provided a collaborative
gateway to share intelligence and data in relation to vulnerabilities across the
supply chain. This has supported threat assessment, targeting of authenticity
sampling, and general situational awareness. NFCU and SFCIU are also involved
in the FIIN’s plenary meetings and the development of food fraud awareness
training.
Operation OPSON is a yearly Europol/Interpol joint operation focused on
counterfeit and substandard food and beverages which is coordinated by SFCIU
and NFCU in the UK.
The relationship between the NFCU, SFCIU, and FIIN was particularly effective
during OPSON VII which targeted the production and distribution of illegally
treated processed tuna. This related to extension of durability dates and use of
chemicals and additives to enhance the visual appearance of poorer quality tuna.
This issue was a concern at a global level, involving organised crime, and it was
suspected that fraudulent product was entering the UK supply chains. This not
only defrauds UK businesses and consumers but poses a health risk to
consumers from histamine and high levels of chemical and additives injected into
the tuna.
Due to the complex nature of the tuna supply chain and sophistication of the fraud,
support from FIIN provided an enhanced understanding of these issues and
allowed access to experts in this area. These insights provided by FIIN were
shared with other agencies and supported a number of significant enquiries
across Europe. The specialist knowledge provided from FIIN also assisted in
directing the focus of the sampling undertaken in the UK, where a picture on illegal
treatments could be developed and patterns drawn from the findings.
Along with sampling and intelligence activity occurring in the UK for the operation,
there were more than 51 tonnes of tuna suspected to have been illegally treated
seized across Europe.161 The operation found that the fraud was an established,
on-going, and highly organised criminal practice. An assessment by the SFCIU
capturing the findings of the operation was presented to the EU Food Fraud
Network which included a number of recommendations informed by consultation
161 Europol, ‘Operation Opson VII – Analysis Report’ (2019), https://www.europol.europa.eu/publications-events/publications/operation-opson-vii-analysis-report.

302
with FIIN. The link between the regulator and industry was key in understanding
the threat and vulnerability to consumers and responsible businesses in the UK
from criminality within the tuna supply chain, and as part of seeking to develop a
preventative approach moving forward.
The fusion of FIIN’s insight and expertise and the NFCU’s and SFCIU’s
intelligence and operational co-ordination makes clear the importance of the
regulatory relationship with FIIN. The success of the operation highlights the value
of similar activities as well as the importance of creating and expanding
relationships with other industry bodies as part of a holistic food crime response.
Case Study 5.7 Activities of the Food
Authenticity Network and Centres of
Expertise
Overview
The Food Authenticity Network (FAN) is helping to build a more resilient, secure,
global food supply chain. This is achieved through collating, curating, and raising
awareness of the tools available to check for and mitigate against food
fraud, providing an accessible and valuable network for an increasingly
global stakeholder community.
FAN also helps to ensure that the UK has access to a resilient network of
laboratories by providing fit for purpose testing through the food
authenticity Centres of Expertise (CoE) acknowledged on its website.
FAN now has over 2,600 members from 81 countries and territories. In 2020, it
attracted over 21,500 unique users from 133 different countries to its open access
website. Its international membership enables sharing of best practice information
for the benefit of all stakeholders, helping to raise standards worldwide, whilst
showcasing UK global leadership in food authenticity testing and food fraud
detection.
Background
The FAN was set-up in July 2015 by LGC (formerly known as Laboratory of the
Government Chemist) with funding from Defra, as a response to

303
recommendations in the Elliott Review.162 The Elliot Review was an independent
review into the integrity and assurance of food supply networks that was
commissioned following the horsemeat incident in 2013. The report highlighted the
need for access to resilient and sustainable laboratory services that use
standardised validated approaches. FAN gathers information on food authenticity
testing, food fraud mitigation, and food supply chain integrity and disseminates it
via its open access website. FAN is led by LGC and funded through a public-
private partnership approach.
Discussion
Recognising that no one organisation will be equipped with all the
necessary expertise in all methods and techniques used in food authenticity
testing and all of the different commodity groups impacted by food fraud,
fourteen CoEs covering different disciplines and techniques are
acknowledged on the FAN. Following a recent workshop and incident simulation
exercise for CoEs, a framework of collaboration is being developed to lay out how
a collective technical view can be formulated during an emergency national or
international food fraud incident. The framework also considers how laboratory
capability and capacity issues could be mitigated during a serious future incident,
minimising the impact of such an event on legitimate businesses and consumers.
FAN also undertakes a range of knowledge transfer activities to disseminate best
practice information to industry, enforcement, and analysts, through publication of
e-seminars and a new programme of quarterly webinars covering topics from
allergen risk assessments to fish speciation.
FAN recently collaborated with Mérieux NutriSciences to undertake a detailed
assessment of data presented at a webinar in April 2020, which showed a
‘dramatic’ increase in food fraud activity at the beginning of 2020 and attributed
this to the COVID-19 pandemic. The assessment found that although the
pandemic had increased food fraud vulnerability, there was insufficient evidence
of ‘dramatic’ increases in specific COVID-19 related food fraud incidents.
162 Defra and FSA, ‘Elliot review into the integrity and assurance of the food supply networks: final report’ (2014), https://www.gov.uk/government/publications/elliott-review-into-the-integrity-and-assurance-of-food-supply-networks-final-report.

304
Figure 5.7a: FAN number of unique users by country, 2020163
Figure 5.7b: FAN1b – FAN membership by professional category in 2021
163 FAN, ‘What we do’, https://www.foodauthenticity.global/FAN.


306
About the UK Food Security Report
The UK Food Security Report sets out an analysis of statistical data relating to
food security, examining past, current, and predicted trends relevant to food
security to present the best available understanding of food security. It fulfils a
duty under Part 2, Chapter 1 (Section 19) of the Agriculture Act 2020 to prepare
and lay before Parliament “a report containing an analysis on statistical data
relating to food security in the United Kingdom”. The first report must be published
before Christmas Recess 2021, and subsequent reports must be published at
least once every three years thereafter.
It contains statistics for different time periods, but always using latest available
data at the time of release. Data comes from surveys run by Defra and from a
wide range of other sources including government departments, agencies and
commercial organisations, in the UK and internationally.
Associated datasets from this publication are also available. Data are a mixture of
National Statistics, Official Statistics and unofficial statistics. Unofficial statistics
are used where there are gaps in the evidence base. Further information on
National Statistics can be found on the Office for Statistics Regulation website.
Contact and feedback
Enquiries to: [email protected]
You can also contact us via Twitter: @DefraStats
We want to understand the uses that readers make of this new report. To help us
ensure that future versions of this report are better for you, please answer our
short questionnaire to send us feedback.
Production team: Matt Bardrick, Jasmin Eng, Ros Finney, Luke Hamilton, Jenny
Kemp, David Lee, Jeremy Levett, Will Norman, Maria Prokopiou, Andrew Scaife,
Chris Silwood, Jonathan Smith, Beth White, Isabella Worth.

307
We are extremely grateful to the following for their expert contributions and
guidance throughout the synthesis of this Report, helping to ensure it delivers a
thorough analysis of a robust evidence base:
• Professor Tim Benton, Chatham House
• Dr Tom Breeze, University of Reading
• Professor Bob Doherty, University of York and FixOurFood
• Selvarani Elahi MBE, UK Deputy Government Chemist, LGC
• Dr Pete Falloon, Met Office, Climate Service Lead - Food Farming &
Natural Environment
• Alan Hayes, Food Systems and Sustainability Advisor
• Dr John Ingram, University of Oxford
• Professor Peter Jackson, Institute for Sustainable Food, University of
Sheffield
• Dr Ian Noble, Mondelez International
• Dr Bill Parker, Head of Technical Programmes, AHDB
• Dr Maddy Power, Wellcome Trust


309
Appendix
Theme 1 – Global Food Availability
Index numbers used in figures 1.1.1a, 1.1.2a, and 1.1.5f
An index number is statistical measure that reflects a price or quantity compared
with a standard or base value. The base usually equals 100 and the index number
is usually expressed as 100 times the ratio to the base value. For example, if food
production per capita in 2010 was twice as large as its 5-year average between
2014-2019, its index number would be 200 relative to 2014-2019.
Indicator 1.1.2, figure 1.1.2.a
The Organisation for Economic Co-operation and Development (OECD) is made
up of Australia, Austria, Belgium, Canada, Chile, Colombia, Costa Rica, Czech
Republic, Denmark, Estonia, Finland, France, Germany, Greece, Hungary,
Ireland, Iceland, Italy, Israel, Japan, South Korea, Latvia, Lithuania, Luxembourg,
Mexico, the Netherlands, New Zealand, Norway, Poland, Portugal, Slovakia,
Slovenia, Spain, Sweden Switzerland, Turkey, the UK, and the US. MENA refers
to Middle East and North Africa.
Theme 3 – Food Supply Chain Resilience
Case study 3.6, figure 3.1.8a
Consumer purchasing behaviours pre and post lockdown (Kantar, Worldpanel
FMCG, England, Wales, and Scotland): year on year trips per household and year
on year purchased volume per trip.
The Kantar Take Home household panel is made up of 30,000 households that
are chosen to be demographically representative of the Great British population,
by region of the country, household size, presence of children, and age of main
shopper. Socio-economic group is not included in the sample targets but is part of
the weightings applied to ensure the survey population is representative of GB.
Panellist population targets are obtained from the results of the BARB
Establishment Survey and the Office for National Statistics (ONS).
The panel reports on a continuous basis on all Fast Moving Consumer Goods
purchases that are brought back into the home, reporting where items were
purchased, what was purchased, how much was paid and if a promotion was
used.

310
Theme 4 – Food Security at Household Level
Indicator 4.1.4, figures 4.1.4a-d
Scoring: The categories of ‘high’, ‘marginal’, ‘low’, and ‘very low’ food security are
based on the points scored out of the ten questions.
High food security, or a score equal to 0, means the household has no problem, or
anxiety about, consistently accessing adequate food.
Marginal food security, or a score of 1 or 2, means the household had problems at
times, or anxiety about, accessing adequate food, but the quality, variety, and
quantity of their food intake were not substantially reduced.
Low food security, or a score of 3 to 5, means the household reduced the quality,
variety, and desirability of their diets, but the quantity of food intake and normal
eating patterns were not substantially disrupted.
Very low food security, or a score of 6 to 10, means that at times during the last 30
days, eating patterns of one or more household members were disrupted and food
intake reduced because the household lacked money and other resources for
food.
Disability - In this dataset, a person is defined as having a disability if they regard
themselves as having a long-standing illness, disability, or impairment which
causes substantial difficulty with day-to-day activities. Some people classified as
disabled and having rights under the Equality Act 2010 are not captured by this
definition, such as people with a long-standing illness or disability which is not
currently affecting their day-to-day activities.
Ethnicity - The ethnic groups used in the data denote the group to which
respondents consider that they belong.
Sample sizes for ‘Gypsy, Traveller or Irish Traveller’ are small. In Northern Ireland,
‘Irish Traveller’ is included in ‘Other ethnic group’ whereas in England, Scotland,
and Wales, ‘Gypsy or Irish Traveller’ is included in ‘White’. The group ‘Arab’ is
included in ‘Other ethnic group’.
The group ‘Asian/Asian British’ includes ‘Indian’, ‘Pakistani’, ‘Bangladeshi’,
‘Chinese’, and ‘Any other Asian background’.
It is not possible to disaggregate the group ‘Black/African/Caribbean/Black British’
due to differences in data collection of the country specific question.
311
Theme 5 – Food Safety and Consumer Confidence
Indicators 5.1.1 and 5.1.2
In England, Wales, and Northern Ireland consumer confidence in food and its
regulation is measured through Food and You 2, the FSA’s flagship survey, which
is an Official Statistic. In Scotland consumer confidence is measured through the
Food in Scotland Consumer Tracking Survey.
The Food and You 2 survey conducted biannually by the FSA since 2020,
measures self-reported consumer knowledge, attitudes, and behaviours related to
food safety and other food issues amongst adults (16+ years) in England, Wales,
and Northern Ireland.
The survey is primarily carried out online using a methodology known as ‘push-to-
web’. Fieldwork for Wave 2 was conducted between 20 November 2020 and 21
January 2021. A total of 5,900 adults from 3,955 households across England,
Wales and Northern Ireland completed the survey.
The Food in Scotland Consumer Tracking Survey monitors attitudes, knowledge
and reported behaviours relating to food amongst a representative sample of
Scotland’s population, identifying changes over time. The survey is online and
1,016 Scottish adults were surveyed for Wave 11.
Direct comparisons cannot be made between these two data sources due to
methodological differences and different time periods covered by the surveys. As
such, data are presented separately for England, Wales, and Northern Ireland
(combined) and Scotland.
Many of the indicators in this section for FSA findings do not have time series
data. This is because the primary source of this data for England, Wales, and
Northern Ireland (the FSA’s Food & You 2 survey) commenced in 2020 therefore
there are not enough waves of data to present a time series or make any
assessments regarding trends. FSS’s Food in Scotland consumer tracker survey
does contain time series data, and future iterations of the UK Food Security
Report will include FSA and FSS time series data to presents trends subject to the
FSA retaining these questions.
Indicator 5.1.1 Consumer confidence in the food system and its regulation
Figure 5.1.1a FSA respondents – confidence that food is safe to eat: Food and
You 2, Wave 2 (2021)
Figure 5.1.1b FSA respondents – confidence that information on food labels is
accurate. Food and You 2, Wave 2 (2021)

312
Question: How confident are you that… A) the food you buy is safe to eat. B) the
information on food labels is accurate (for example, ingredients, nutritional
information, country of origin, Base= 4814, all respondents. N.B. ‘Very confident’
or ‘Fairly confident’ respondents are referred to as confident.
Figure 5.1.1c FSS respondents – trust in food label information: Food in Scotland
Consumer Tracker Survey Wave 11 (2021)
Question: How much do you agree or disagree with each of these statements? I
trust the information on food labels, Base = 1016. ‘I definitely agree’ and ‘I tend to
agree’ are referred to as ‘Agree’ and ‘I definitely disagree’ and ‘I tend to disagree’
are referred to as disagree.
Figure 5.1.1d FSA respondents – trust in the FSA: Food and You 2, Wave 2
(2021)
Question: How much do you trust or distrust the Food Standards Agency to do its
job? Base=3309, all respondents who know a lot or a little about the FSA and
what it does. N.B. ‘I trust it a lot’ and ‘I trust it’ referred to as trust.
Figure 5.1.1e FSS respondents – trust in FSS: Food in Scotland Consumer
Tracker Survey Wave 11 (2021)
Question: How much do you trust or distrust Food Standards Scotland to do its
job? Base= those aware of FSS W11 827. Trust is classed as those who
responded ‘I trust it a lot’ and ‘I trust it’. Distrust is classed as those who
responded ‘I distrust it’ and ‘I distrust it a lot’
Figure 5.1.1f FSA respondents - Consumer confidence in the food supply chain:
Food and You 2, Wave 2 (2021)
Question: How confident are you in the food supply chain? That is all the
processes involved in bringing food to your table. Base= 4814, all online
respondents and those answering the Eating at Home postal questionnaire. N.B.
‘Very confident’ or ‘Fairly confident’ respondents are referred to as confident.
Figure 5.1.1g FSA respondents – confidence that food supply chain actors ensure
food is safe to eat in: Food and You 2, Wave 2 (2021)
Question: How confident are you that... A) Farmers, B) Slaughterhouses and
dairies, C) Food manufacturers for example, factories, D) Shops and
supermarkets, E) Restaurants, F) Takeaways, G) Food delivery services for
example, Just Eat, Deliveroo, Uber Eats…in the UK (and Ireland) ensure the food
you buy is safe to eat. Base= 4850, all online respondents and those who
completed the Eating Out postal questionnaire.
313
Indicator 5.1.2 Consumer Concerns
Figure 5.1.2a FSA respondents– ten most common prompted concerns: Food and
You 2, Wave 2 (2021)
Question: Do you have concerns about any of the following? Responses : The
amount of sugar in food, Food waste, Animal welfare, Hormones, steroids or
antibiotics in food, The amount of salt in food, The amount of fat in food, Food
poisoning, Food hygiene when eating out, The use of pesticides, Food fraud or
crime, The use of additives (for example, preservatives and colouring), Food
prices, Genetically modified (GM) foods, Chemical contamination from the
environment, Food miles, The number of calories in food, Food allergen
information, Cooking safely at home, None of these, Don’t know. Base= 3764,
all online respondents.
Figure 5.1.2b: FSS respondents – ten most common prompted concerns: Food in
Scotland Consumer Tracker Survey Wave 11 (2021)
Question: Please sort each of these issues according to whether or not they cause
you concern or do not cause you concern.
Figure 5.1.2c FSA respondents – concern about availability of a wide variety of
food: Food and You 2, Wave 2 (2021)
Question: (In England and Wales) Thinking about food today in the UK and Wales,
how concerned, if at all, do you feel about each of the following topics? The
availability of a wide variety of food: Base = 5900
Question: (In Northern Ireland) Thinking about food today in the UK and Northern
Ireland, how concerned, if at all, do you feel about each of the following topics?
The availability of a wide variety of food: Base = 5900
Indicator 5.1.4 Food safety incidents, alerts and recalls
Figure 5.1.4b
‘Pathogenic Micro-Organisms’ incidents relate to suspected, possible, or actual
contamination by harmful bacteria, fungi, or viruses. It also includes concerns
about measures to control the risk from pathogenic micro-organisms. In contrast,
‘Non-Pathogenic Micro-Organisms’ incidents primarily relate to fungi or bacteria of
a non-pathogenic or unidentified species.
The concern for ‘Mycotoxins’ and ‘Biotoxin (other)’ incidents is contamination by
toxins produced by living organisms. Mycotoxins such as aflatoxins are produced
by certain moulds that grow on crops and other feedstuffs. ‘Biotoxin (other)’
incidents include algal toxins in shellfish, which are mainly reported as part of the

314
regular monitoring of shellfish beds. ‘Bio-contaminants (other)’ incidents include
sewage spills and toxins produced by the degeneration of animal or vegetable
material.
‘Residues of Veterinary Medicinal Products’ incidents accounted for most of the
notifications in the ‘Farming Practices’ group. This includes those incidents that
are routinely reported from the long-standing Statutory Surveillance Programme of
residues of veterinary medicines in food producing animals.
Many of the incidents in the ‘Industrial/Chemical’ group relate to ‘Chemical
contamination (other)’ notifications. Almost all of such incidents related to fires,
which recorded possible risks due to the production of potentially carcinogenic
polycyclic aromatic hydrocarbons (PAHs) during combustion. From the 2017/18
Reporting Year onwards, a dedicated CHEMET (Chemical Meteorology) category
was introduced for such incidents. ‘Heavy Metal’ incident notifications primarily
involve lead and copper poisoning, usually occurring on farm to livestock.
Incident notifications relating to migrant travel were previously recorded in “Not
Determined/Other” or “Poor or Insufficient Controls” categories. The 2017/18
Reporting Year saw the introduction of a dedicated ‘Clandestine Travellers’
(stowaways) category to refine the recording of the associated hazard type.
‘Allergens’ incidents concern the undeclared presence of allergens, either as
cross-contamination or undeclared ingredients. Labelling issues can include
improper health claims, incorrect date labels and misleading food descriptions or
usage instructions.
‘Foreign Bodies’ incidents refer to physical contamination notifications, whereby
unintended material (e.g., glass, metal, plastic or from an animal origin) is present
in the product.
‘Poor or Insufficient Controls’ include incidents resulting from lack of good
manufacturing practice such as poor temperature control of perishable foods,
undercooking, unhygienic premises, and inadequate documentation.
Furthermore, the ‘Adulteration/Fraud’ category includes counterfeit products;
illegal import and export (including irregularities with documentation), and the use
of unauthorised premises to produce food. It should be noted the FSA’s National
Food Crime Unit use a refined definition when reporting the number of fraud-
related incidents. In particular, this would not typically include incidents where
there is no or limited evidence of intention to deceive. A similar process exists for
the Scottish Food Crime & Incidents unit.

315
Indicators 5.1.5 and 5.1.6 Foodborne disease
The UK Health Security Agency (UKHSA), Public Health Wales (PHW), Public
Health Scotland (PHS) and the Public Health Agency Northern Ireland (PHA) are
responsible for the surveillance164 of pathogens (primarily bacteria, viruses and
parasites) that can cause gastrointestinal disease, including diseases related to
food poisoning. The public health agencies are also the lead organisations
responsible for the detection, investigation and reporting of foodborne disease
outbreaks in the UK, working in partnership with food safety, animal health and
local authority colleagues. Data presented in this report are derived from
laboratory reports of gastrointestinal pathogens from clinical diagnostic
laboratories and the systematic surveillance of outbreaks of foodborne disease.
Indicator 5.1.5 Prevalence of foodborne pathogens
While not all gastrointestinal infections are foodborne, food is an important vehicle
of transmission (FSA, 2020)165 for many gastrointestinal pathogens that cause a
substantial public health burden (WHO, 2015)166. The term “burden of disease” is
used to describe the overall cumulative consequences of a defined disease. While
Campylobacter and Salmonella cause the greatest burden of disease in terms of
number of reported cases each year, Listeria monocytogenes and Shiga toxin-
producing E. coli (STEC) O157 cause more severe disease leading to higher rates
of hospitalisation and death. There are many other gastrointestinal pathogens and
microbial contaminants that have a food safety impact, such as norovirus, hepatitis
A, Cryptosporidium sp. and Clostridium sp. Further information on surveillance
indicators for these pathogens is available elsewhere, including on the UKHSA,
PHS, PHW and PHA websites and in outbreak reports.
Surveillance based on laboratory confirmed reports of gastrointestinal disease
generally starts with a clinical diagnostic sample being taken by a general
practitioner (GP) or at a hospital from an individual suffering with gastrointestinal
disease symptoms, usually most commonly vomiting and/or diarrhoea. It is
mandatory for testing laboratories to notify the public health agencies within 7
164 Surveillance is defined as the systematic collection, analysis and interpretation of data essential to the planning, implementation and evaluation of public health practice, and the timely dissemination of this information for public health action. 165 FSA, 2020. Foodborne Disease Estimates for the United Kingdom in 2018
https://www.food.gov.uk/sites/default/files/media/document/foodborne-disease-estimates-for-the-united-kingdom-in-2018_0.pdf 166 World Health Organisation 2015: WHO estimates of the global disease burden of foodborne diseases

316
days when certain specified pathogens are isolated from human clinical diagnostic
samples under Health Protection Regulations167.
Once a laboratory result is available, this, together with epidemiological
information on each case is reported into national surveillance databases and
case management systems in each country. For three of the four key bacterial
gastrointestinal pathogens, non-typhoidal Salmonella, STEC O157 and Listeria
monocytogenes, the testing laboratory will forward the isolates to the relevant
public health agency’s National Reference Laboratory for further characterisation
by whole genome sequencing (WGS). For Campylobacter, currently only a
proportion of isolates, usually those associated with outbreaks, are forwarded to
the reference laboratories for WGS.
Using these surveillance databases, regional and national public health protection
teams throughout the UK analyse the laboratory test results, WGS data and
epidemiological data. The aim is to monitor trends in reporting of gastrointestinal
pathogens, changes in disease epidemiology and to detect new and/or emerging
disease threats, including foodborne disease outbreaks, so that timely and
appropriate action to protect public health can be taken.
No disease surveillance system is perfect and there is known under-ascertainment
of infectious gastrointestinal disease and for every laboratory confirmed report of
gastrointestinal disease made to national surveillance systems, there will be
additional unreported cases in the community due to people not seeking
healthcare for their illness or samples for laboratory testing not always being taken
even when they do. There are various estimates available attempting to quantify
the under-reporting of gastrointestinal pathogens. In the UK, the measures used
most commonly by the public health and food safety agencies when assessing the
burden of infectious gastrointestinal diseases have been derived from a large
research study undertaken in 2008-2009 (Tam et al, 2012)168. The researchers
estimated that for every case of infectious intestinal disease where a sample is
taken and tested at a diagnostic laboratory with a confirmed result subsequently
reported to national surveillance, there were 147 (95% CI, 136 - 158) community
167 Health Protection (Notification) Regulations 2010 https://www.legislation.gov.uk/uksi/2010/659/contents/made and
www.legislation.gov.uk/wsi/2010/1546/contents/made and Public Health etc. (Scotland) Act 2008.
https://www.legislation.gov.uk/asp/2008/5/pdfs/asp_20080005_en.pdf
168 Tam, C.C., Rodrigues, L.C., Viviani, L., Dodds, J.P., Evans, M.R., Hunter, P.R., Gray, J.J., Letley, L.H., Rait, G.,
Tompkins, D.S. & O'Brien, S.J. (2012) Longitudinal study of infectious intestinal disease in the UK (IID2 Study):
incidence in the community and presenting to general practice. Gut 61(1), 69-77 doi: 10.1136/gut.2011.238386 https://www.food.gov.uk/research/research-projects/the-second-study-of-infectious-intestinal-disease-in-the-community-iid2-
study

317
cases that remained unreported. The extent of under-reporting varies by
pathogen. The study established that the ratio of unreported human
Campylobacter disease to reports to national surveillance is 9.3 to 1 (95% CI 6-
14.3), suggesting that in 2019, there were over 600,000 cases of
campylobacteriosis in the UK. For Salmonella it is estimated that for every report
of non-typhoidal Salmonella infection made to national surveillance, there are
potentially 4.7 cases of salmonellosis in the community (95% CI 1.2 – 18.2),
suggesting the total number of undiagnosed Salmonella cases in the UK
community in 2019 was 45,703 (95% CI 11,688-176,977).
In relation to figure 5.1.5b and rate of reported Campylobacter sp., non-typhoidal
Salmonella sp., STEC O157 and Listeria monocytogenes infections in the United
Kingdom, 2015-2020. The table below includes the data of reported infections per
100,00 population in the United Kingdom, 2015-2020
Year
Campylobacter
sp.
Non typhoidal
Salmonella sp. STEC O157
Listeria
monocytogenes
2015 97.06 14.56 1.35 0.29
2016 90.1 14.64 1.49 0.31
2017 96.34 15.16 1.17 0.24
2018 102.33 15.21 1.26 0.26
2019 101.81 14.56 1.07 0.23
2020 82.31 7.98 0.86 0.22
It must be noted that the 2020 surveillance data indicators cannot be compared to
the data from previous years, as a substantial and sustained reduction in reporting
of gastrointestinal pathogens to national surveillance has been observed
coinciding with the SARS-CoV-2 (COVID-19) pandemic. The impact is likely multi-
factorial and related to the introduction of non-pharmaceutical interventions (NPIs)
to control the pandemic, for example due to the effects of lockdowns on people’s
behaviours making them less at risk of acquiring infections, such as changes in
eating out. However, changes in health care seeking behaviour are also likely to
have contributed, with fewer people visiting general practitioners and hospitals
and having samples taken for testing as well as changes in laboratory testing
practices. Therefore, trend analysis for the data presented in this report should
only be considered for 2015 – 2019, with exclusion of 2020 data.
Indicator 5.1.6 Foodborne disease outbreak surveillance
Systematic surveillance of foodborne disease outbreaks starts with UKHSA, PHW,
PHS and/or PHA receiving preliminary reports of outbreaks of gastrointestinal
disease from laboratories, health protection teams or boards or local authority
environmental health departments or through detection of outbreaks through
analysis of laboratory report exceedances or WGS data and epidemiological data.
An appropriate minimum dataset for each outbreak is collected and supplemented

318
with additional information as it becomes available during the investigation. This
standardised dataset includes date and place of outbreak, number of cases, case
demographic, admission to hospital, associated fatalities, details of the food
vehicle suspected or implicated in the outbreak, the level of evidence implicating
the food vehicle and contributory factors considered significant in terms of
causality in the outbreak.
Data derived from foodborne outbreak investigations in England and Wales is
reported into a stand-alone, web-based surveillance system: eFOSS (the
electronic Foodborne and non-foodborne Gastrointestinal Outbreak Surveillance
System). Data for Scotland is reported into a similar system: ObSurv, the
surveillance system for all general outbreaks of infectious gastrointestinal disease
in Scotland. In Northern Ireland data for foodborne outbreaks is collated in a local
database for monitoring outbreaks of infectious disease in general. The
surveillance information derived from foodborne disease outbreak investigations
(comparable datasets based on accepted international definitions and criteria) is
collated in these dedicated national surveillance databases and case
management systems and summarised to provide annual national datasets. This
national level foodborne outbreak surveillance data, the collation of which started
nearly 30 years ago in 1992, provides an important source of information for
foodborne disease trend analysis that is used alongside general surveillance
indicators for gastrointestinal pathogens to inform risk assessment and policy
development for the protection of UK consumers against risks posed by foodborne
disease.
Only data for general outbreaks of foodborne disease are collated and presented
in surveillance reports, i.e. household/family outbreaks and foreign travel
associated outbreaks are excluded. Norovirus outbreaks associated with
hospitals, other institutional/residential settings (care homes, schools, prisons, etc)
and community outbreaks that are due to person-to-person transmission are also
excluded from the foodborne outbreak datasets.
Not all outbreaks are microbiologically linked to an implicated food vehicle as food
vehicles are not always identified or available for microbiological testing, and the
level of evidence derived through epidemiological and microbiological
investigations varies with some outbreaks having stronger epidemiological
evidence in support of a link between the implicated food product and the
outbreak than in other outbreaks. Additionally, for some outbreaks not all
individuals linked to the outbreak will have laboratory confirmation of illness. The
number of hospitalisations reported is only known for cases which received public
health follow-up, e.g. via interviews with cases or through notification by their
doctor, which is more likely to occur for certain pathogens such as STEC and
Listeria monocytogenes. Ascertainment of both cases and hospitalisation varies
according to the clinical severity and differences in testing of the causative agent

319
(for example, testing for Listeria monocytogenes predominately occurs in people
who are hospitalised, so non-hospitalised cases are less likely to be identified), as
well as due to the setting of the outbreak. Where individuals are reported to have
died, it is usually not known whether the cause of death was directly related to the
outbreak.
In relation to figure 5.1.6b, the number of foodborne outbreaks by causative agent
investigated and reported to national public health surveillance in the UK 2015 –
2020
Number of outbreaks per pathogen 2015 2016 2017 2018 2019 2020 Total
Salmonella sp. 11 12 13 10 15 7 68
Enteric viruses* 3 10 7 11 16 2 49
Campylobacter sp. 11 8 9 7 3 4 42
Clostridium perfringens 12 8 2 6 7 4 39
STEC/ Entero-invasive E. coli
(EIEC)
6 8 6 2 6 7 35
Listeria monocytogenes 0 0 0 2 3 3 8
Shigella sp. 2 0 0 1 0 0 3
Cryptosporidium sp. 1 0 0 0 0 0 1
Other** 1 1 1 1 1 1 6
Unknown*** 6 2 0 9 6 2 25
Total 53 49 38 49 57 30 276
*Includes foodborne norovirus outbreaks or norovirus outbreaks related to infected food handlers
**’Other’ includes marine biotoxins such as scrombotoxin and okadaic acid as well as other entero-toxin
producing bacteria such as Staphylococcus or Bacillus spp.
***’Unknown’ are outbreaks where a causative agent was not identified as the cause of the disease in the
outbreak associated human disease cases
Public Health Agencies in the UK now routinely perform whole genome
sequencing (WGS) for genomic characterisation for several bacterial
gastrointestinal pathogens, including Salmonella spp., Listeria monocytogenes,
Shigella spp, Yersinia spp and shigatoxin producing E. coli (STEC). Isolates of
Campylobacter spp may be submitted for WGS to inform specific outbreak
investigations, but this is not always a routine approach.
The high resolution WGS typing of isolates for pathogen strain discrimination
provides has enhanced the detection of outbreaks and enables ‘sensitive and
specific’ case definitions to be applied, improving case ascertainment, focussing
outbreak investigations and increasing the strength of association in analytical
studies to identify the implicated food vehicles. Where possible integration of the
microbiological genomic and epidemiological data derived from analysis of the
human disease data with that from animal samples, environmental sampling or the

320
food chain, has significantly improved the ability to identify the source of the
outbreak and better understand transmission of contamination through food
supply chains. The use of WGS has also resulted in an enhanced ability to detect
re-emergence of outbreaks and trace them back to the same source of
contamination as previously identified when control measures have not been fully
effective in eliminating contamination (PHE, 2018)169.
Implementation of WGS has enabled the consolidation of multiple local/regional
outbreaks into single national level outbreaks based on the WGS and
epidemiological information obtained during the investigations. This has resulted
in a higher proportion of outbreaks being identified to be national rather than
local/regional outbreaks with an associated increase in case numbers (Mook et al,
2018)170. Therefore, while consideration of total numbers of outbreaks reported is
useful, these data are affected by whether WGS is used or not. Both the re-
emergence of cases associated with outbreak clusters and the consolidation of
multiple outbreaks into large national outbreaks of long duration has meant that
comparison of number of foodborne outbreaks and number of associated cases
pre and post the implementation of WGS should be undertaken with caution, and
the foodborne outbreak surveillance data reported for the years prior to
implementation of WGS (pre-2014 for Salmonella, pre-2015 for STEC and
Shigella and pre-2017 for Listeria monocytogenes) is not directly comparable to
the data held for subsequent years. Therefore, the size of the outbreak and
number of individuals affected should be considered together with the information
given on the overall numbers of outbreaks in this report.
Although whole genome sequencing is able to provide a highly discriminatory
method to determine the genetic relatedness of bacterial strains and therefore
improved detection of outbreaks and greater accuracy in ascertaining numbers of
associated human outbreak cases, there is still under-ascertainment generally due
to underreporting to healthcare settings and surveillance systems. It must also be
noted that, as the foodborne outbreak surveillance databases rely upon reports to
national surveillance systems, there is likely to be under-ascertainment due to
incomplete reporting.
The COVID-19 pandemic impact is possibly less apparent in the foodborne
disease outbreak surveillance data than in the laboratory testing surveillance data,
but there are some notable differences in the 2020 data compared to the data
169 PHE, 2018. Implementing pathogen genomics: a case study. https://www.gov.uk/government/publications/implementing-pathogen-genomics-a-case-study
170 Mook P, Gardiner D, Verlander NQ, McCormick J, Usdin M, Crook P, Jenkins C, Dallman TJ. Operational burden of implementing Salmonella Enteritidis and Typhimurium cluster detection using whole genome sequencing surveillance data in England: a retrospective assessment. Epidemiol Infect. 2018 Aug;146(11):1452-1460. doi: 10.1017/S0950268818001589. Epub 2018 Jul 2. PMID: 29961436.

321
collected in the previous five years. These impacts are also likely related to the
introduction of non-pharmaceutical interventions (NPIs) as well as multifactorial
influences on surveillance systems for the detection and reporting of
gastrointestinal pathogen outbreaks and potentially also impacted by the reduced
resource availability for the investigation and reporting of particularly smaller
regional foodborne outbreaks caused by pathogens with less severe clinical
outcomes. The reduced number of Campylobacter and norovirus outbreaks is
likely linked to the almost year-long restrictions on large events such as weddings
where foods particularly associated with Campylobacter outbreaks (chicken liver
pate/parfait) are often served and the closure of hospitality during national
lockdowns is likely to have reduced consumption of raw oysters commonly
associated with foodborne norovirus outbreaks, with also fewer outbreaks
associated with infected food handlers. However, other influencers such as
reduced investigation and reporting of outbreaks during 2020 due to COVID-19
make interpretation of these trends difficult.

E02702656
978-1-5286-3111-2