Second Food Aid and Food Security Assessment (FAFSA-2)
366
Second Food Aid and Food Security Assessment (FAFSA-2) March 2013 Roberta van Haeſten Mary Ann Anderson Herbert Caudill Eamonn Kilmarn FANTA FHI 360 1825 Connecticut Ave., NW Washington, DC 20009-5721 Tel: 202-884-8000 Fax: 202-884-8432 [email protected] www.fantaproject.org
-
Upload
khangminh22 -
Category
Documents
-
view
1 -
download
0
Transcript of Second Food Aid and Food Security Assessment (FAFSA-2)

Second Food Aid and Food Security Assessment (FAFSA-2)
March 2013
Roberta van HaeftenMary Ann AndersonHerbert CaudillEamonn Kilmartin
FANTAFHI 3601825 Connecticut Ave., NW Washington, DC 20009-5721Tel: 202-884-8000 Fax: 202-884-8432 [email protected] www.fantaproject.org

This assessment was made possible by the generous support of the American people through the support of the U.S. Agency for International Development’s Office of Food for Peace (USAID/FFP) and the USAID Bureau for Global Health, Office of Health, Infectious Diseases, and Nutrition, under terms of Cooperative Agreement No. AID-OAA-A-12-00005, through the Food and Nutrition Technical Assistance III Project (FANTA), managed by FHI 360.
The contents are the responsibility of FHI 360 and do not necessarily reflect the views of USAID or the United States Government.
Recommended Citation:
van Haeften, R.; Anderson, M.A.; Caudill, H.; and Kilmartin, E. 2013. Second Food Aid and Food Security Assessment (FAFSA-2). Washington, DC: FHI 360/FANTA.
Contact information:
Food and Nutrition Technical Assistance III Project (FANTA)FHI 3601825 Connecticut Avenue, NWWashington, DC 20009-5721Tel: 202-884-8000Fax: 202-884-8432Email: [email protected]: www.fantaproject.org
AcknowledgmentsThe second Food Aid and Food Security Assessment (FAFSA-2) team would like to thank USAID/FFP, which is housed in the Bureau for Democracy, Conflict, and Humanitarian Assistance, for commissioning this cross-cutting, worldwide assessment of the overall Title II development program. The team is grateful for the opportunity to assist USAID/FFP’s efforts to strengthen the contribution of Title II development programs to reducing food insecurity and undernutrition in some of the most vulnerable populations in the developing world.
The FAFSA-2 could not have been completed without the involvement and support of a wide range of individuals within USAID/FFP; the Office of Health, Infectious Diseases, and Nutrition, Bureau for Global Health; USAID/FFP partner organizations (including the Famine Early Warning Systems Network [FEWS NET], Bellmon Estimation Studies for Title II [BEST], the Technical and Operational Performance Support [TOPS] Project, and AMEX); and the Title II Awardee organizations at headquarters and in the field. We are grateful to all for their help in making the basic program documents accessible to us, for taking time to answer our many questions, and for being willing to discuss, in an open and transparent manner, the challenges, lessons learned, and options for improving program performance. We also owe a debt of gratitude to all the people we met with during our five country field visits from the USAID Missions, local governments, other donors, and the Awardee organizations, whose knowledge and guidance were essential to making these visits a success—and especially to the program participants and local leaders that we met in the Title II communities that took time out of their busy lives to share with us their experiences, challenges, opinions, and hopes for the future. We were impressed by the competence and dedication to the achievement of the program’s overall goal on the part of so many of the people that we came into contact with during this assessment, in Washington and in the field, and wish all great success in the future.

i
Second Food Aid and Food Security Assessment (FAFSA-2)
Abbreviations and Acronyms .................................................................................ix
Executive Summary ......................................................................................... ES-1
Chapter 1. Introduction........................................................................................ 1-1
1.1 Objectives .........................................................................................................................................................1-1
1.2 Program Scope and Assessment Methods ......................................................................................................1-21.2.1 Scope: Time Frame, Countries, Programs, and Technical Sectors ...................................................................1-2
1.2.1.1 Time Frame ........................................................................................................................................1-21.2.1.2 Countries ...........................................................................................................................................1-21.2.1.3 Programs and Awardees ...................................................................................................................1-31.2.1.4 Technical Sectors ..............................................................................................................................1-3
1.3 The Assessment Team .....................................................................................................................................1-3
1.4 Assessment Methods .......................................................................................................................................1-41.4.1 Document Review ...............................................................................................................................................1-41.4.2 Data Review ........................................................................................................................................................1-51.4.3 Stakeholder Interviews and Consultations .........................................................................................................1-51.4.4 Field Visits ...........................................................................................................................................................1-5
1.5 Basic Terminology and an Alternative Food Security Framework ....................................................................1-6
1.6 Limitations and Gaps in the Program Documentation and Data ......................................................................1-9
1.7 Organization of the Report ............................................................................................................................. 1-10
Bibliography for Chapter 1 .................................................................................................................................... 1-16
Chapter 2. Background ...................................................................................... 2-1
2.1 Evolution of the Title II Food Security Objective ..............................................................................................2-12.1.1 The 1990 Farm Bill .............................................................................................................................................. 2-12.1.2 Defining Food Security ....................................................................................................................................... 2-12.1.3 The 1995 USAID Policy Paper ............................................................................................................................2-22.1.4 The 2006–2010 USAID/FFP Strategic Plan .......................................................................................................2-3
2.2 The Current Operating Environment ................................................................................................................2-82.2.1 The Development Challenge: Food Insecurity Is a Continuing Problem............................................................2-82.2.2 The Foreign Assistance Environment—Changes and Challenges .................................................................. 2-11
2.2.2.1 Stakeholder Support ....................................................................................................................... 2-112.2.2.2 Legislation and the Current Budget Climate ................................................................................... 2-122.2.2.3 The Executive Branch: New Priorities and Initiatives ..................................................................... 2-122.2.2.4 Health and Nutrition ........................................................................................................................ 2-15
Bibliography for Chapter 2 .................................................................................................................................... 2-18
Contents

ii
Chapter 3. Overall Program Performance during the FAFSA-2 Time Period ...... 3-13.1 Basic Facts on the Programs Included in the FAFSA-2 Universe ....................................................................3-1
3.1.1 Programs and Countries .....................................................................................................................................3-13.1.2 Resources and Beneficiaries ..............................................................................................................................3-1
3.1.2.1 Resources ..........................................................................................................................................3-13.1.2.2 Beneficiaries ......................................................................................................................................3-5
3.2 Reallocating Resources to a Smaller Set of Priority Countries ...................................................................... 3-63.2.1 Background to the Policy Decision ....................................................................................................................3-63.2.2 The Targeting Method .......................................................................................................................................3-73.2.3 The Priority Countries and Changes in Resource Allocations ...........................................................................3-7
3.3 Program Integration in the Context of a Changing Foreign Assistance Environment ....................................3-103.3.1 Integrating Programs into Mission Strategies ...................................................................................................3-103.3.2 Integrating Programs within the Foreign Assistance Framework ....................................................................3-103.3.3 Integrating Programs with the New Food Security and Health Initiatives ........................................................ 3-11
3.3.3.1 Feed the Future ............................................................................................................................... 3-113.3.3.2 The Global Health Initiative .............................................................................................................3-12
3.4 Improvements in Program Design ..................................................................................................................3-133.4.1 Improving Problem Assessments ..................................................................................................................... 3-13
3.4.1.1 Country-Specific Food Security Programming Frameworks ........................................................... 3-133.4.1.2 Awardee Proposals and Problem Assessments .............................................................................3-14
3.4.2 Improving Targeting within Countries ............................................................................................................... 3-153.4.2.1 Improving In-Country Geographic Targeting ...................................................................................3-153.4.2.2 Targeting at the Community Level .................................................................................................. 3-17
3.4.3 Improving the Integration of Program Interventions .........................................................................................3-183.4.3.1 Rationale for the Integration of Technical Programs .......................................................................3-183.4.3.2 Guidance Promoting Greater Technical Integration .......................................................................3-193.4.3.3 Evidence from Programs in the FAFSA-2 Universe .......................................................................3-193.4.3.4 Constraints to Expanding Program Integration ...............................................................................3-20
3.4.4 Adding a Risk and Vulnerability Dimension to Development Programs ..........................................................3-213.4.4.1 Creating a New Technical Sector ....................................................................................................3-213.4.4.2 Early Warning and Response Systems ..........................................................................................3-213.4.4.3 Trigger Indicators ............................................................................................................................3-23
3.5 Finding the Right Balance between Food and Cash Resources ...................................................................3-243.5.1 Using Food in Direct Distribution Programs .....................................................................................................3-243.5.2 Combining Food with Other Resources ...........................................................................................................3-25
3.5.2.1 Monetization ....................................................................................................................................3-253.5.2.2 Efforts to Access Other USAID Resources for Development Programs ........................................3-26
3.6 Technical Assistance and Capacity Building Mechanisms ............................................................................3-273.6.1 Creating an Evidence Base for the Development of More Effective Programs ...............................................3-27
3.6.1.1 Food and Nutrition Technical Assistance Project ............................................................................3-273.6.1.2 Famine Early Warning Systems Network .......................................................................................3-283.6.1.3 Bellmon Estimation Studies .............................................................................................................3-283.6.1.4 Special Studies ................................................................................................................................3-30
3.6.2 Support for Technical Excellence and Innovation ............................................................................................3-313.6.2.1 Institutional Capacity Building Grants ............................................................................................3-313.6.2.2 Technical and Operational Performance Support Project .............................................................3-32
3.7 Program Management ....................................................................................................................................3-323.7.1 Office Management and Operations .................................................................................................................3-323.7.2 Reorganizing the Washington Office ................................................................................................................3-323.7.3 Strengthening Program Management and Oversight .......................................................................................3-333.7.4 Aligning USAID/FFP Management and Operations with the Rest of USAID ...................................................3-33
Contents

iii
3.8 Cross-Cutting Issues ..................................................................................................................................... 3-333.8.1 Women, Gender, and Gender Equity ................................................................................................................3-333.8.2 Urbanization .....................................................................................................................................................3-353.8.3 The Environment ..............................................................................................................................................3-363.8.4 Sustainability ....................................................................................................................................................3-37
3.9 Conclusions and Recommendations ............................................................................................................. 3-383.9.1 Conclusions ......................................................................................................................................................3-383.9.2 Recommendations ............................................................................................................................................3-39
3.9.2.1 Recommendations to Improve Program Performance ...................................................................3-393.9.2.2 Special Issues .................................................................................................................................3-413.9.2.3 Two Key Issues for Further Deliberation .........................................................................................3-42
Bibliography for Chapter 3 ................................................................................................................................... 3-43
Chapter 4. Agriculture, Natural Resource Management, Livelihoods, Income Generation ........................................................................... 4-1
Abstract ..................................................................................................................................................................4-1
4.1 Introduction .......................................................................................................................................................4-24.1.1 Policy and Program Environment ........................................................................................................................4-24.1.2 Country Context ..................................................................................................................................................4-4
4.1.2.1 Where the Programs Work ................................................................................................................4-44.1.2.2 Target Population ...............................................................................................................................4-5
4.2 Basic Facts about Programs in the FAFSA-2 Universe ...................................................................................4-74.2.1 Projects and Countries .......................................................................................................................................4-74.2.2 Resources and Beneficiaries .............................................................................................................................4-7
4.3 Program Approaches and Interventions.......................................................................................................... 4-84.3.1 Objectives and Intermediate Results .................................................................................................................4-84.3.2 Interventions and Outcomes ..............................................................................................................................4-8
4.3.2.1 Crop Production and Productivity .....................................................................................................4-84.3.2.2 Natural Resource Management at the Farm Level .........................................................................4-164.3.2.3 Irrigation .........................................................................................................................................4-204.3.2.4 Storage ...........................................................................................................................................4-254.3.2.5 Marketing.........................................................................................................................................4-274.3.2.6 Livestock .........................................................................................................................................4-334.3.2.7 Rural and Agricultural Finance .......................................................................................................4-374.3.2.8 Non-Farm Income Generation (Non-AG IG) Programs .................................................................4-42
4.3.3 Approaches ..................................................................................................................................................... 4-434.3.3.1 Disseminating New Knowledge ..................................................................................................... 4-434.3.3.2 Organizing and Working with Groups ............................................................................................ 4-484.3.3.3 Providing Inputs ..............................................................................................................................4-52
4.4 Program Impact ............................................................................................................................................. 4-544.4.1 Household Consumption.................................................................................................................................. 4-544.4.2 Household Income ...........................................................................................................................................4-564.4.3 Household Assets ............................................................................................................................................4-574.4.4 Qualitative Information Suggesting Impact ......................................................................................................4-58
4.5 Cross-Cutting Issues and Opportunities ....................................................................................................... 4-594.5.1 New Approaches to Market-Oriented Programs ..............................................................................................4-59
4.5.1.1 Market-Driven Programs ..................................................................................................................4-594.5.1.2 The Value of Value Chains .............................................................................................................4-61
4.5.2 Economics 101 .................................................................................................................................................4-624.5.3 Managing Risks and Reducing Vulnerabilities ................................................................................................ 4-64
Contents

iv
4.5.4 Sustainability ................................................................................................................................................... 4-644.5.4.1 Commercialization, Profitability, and Increased Incomes ............................................................. 4-644.5.4.2 Capacity Strengthening ..................................................................................................................4-67
4.5.5 Key Assumptions and Alternative Development Models ..................................................................................4-674.5.5.1 Key Assumptions .............................................................................................................................4-674.5.5.2 Alternative Development Hypotheses and Models .........................................................................4-72
4.6 Conclusions and Recommendations ..............................................................................................................4-744.6.1 Conclusions ......................................................................................................................................................4-744.6.2 Recommendations ............................................................................................................................................4-80
Bibliography for Chapter 4 ................................................................................................................................... 4-82
Chapter 5. Infrastructure .....................................................................................5-1
Abstract ..................................................................................................................................................................5-1
5.1 Introduction .......................................................................................................................................................5-25.1.1 Policy and Program Environment ........................................................................................................................5-25.1.2 Country Context ..................................................................................................................................................5-3
5.2 Basic Facts about Infrastructure Programs in the FAFSA-2 Universe ............................................................ 5-55.2.1 Projects and Countries .......................................................................................................................................5-55.2.2 Resources .........................................................................................................................................................5-5
5.3 Program Approaches and Interventions ......................................................................................................... 5-65.3.1 Objectives ...........................................................................................................................................................5-65.3.2 Approaches .......................................................................................................................................................5-65.3.3 Interventions and Outcomes ..............................................................................................................................5-6
5.3.3.1 Roads ................................................................................................................................................5-65.3.3.2 Water Management Structures .........................................................................................................5-95.3.3.3 Natural Resource Management Interventions ................................................................................5-105.3.3.4 Buildings ..........................................................................................................................................5-12
5.4 Cross-Cutting Issues and Opportunities ........................................................................................................5-135.4.1 The Role of Infrastructure in Title II Development Programs ...........................................................................5-135.4.2 Technical Efficiency and Cost Effectiveness ..................................................................................................5-135.4.3 Collaborating with Communities and Local Governments ...............................................................................5-145.4.4 Infrastructure Priorities: Project- and/or Community-Driven ............................................................................5-165.4.5 Using Food-for-Work in Infrastructure Programs ............................................................................................. 5-175.4.6 Capacity Strengthening ...................................................................................................................................5-195.4.7 Sustainability .....................................................................................................................................................5-195.4.8 Basic Principles for Guiding Infrastructure Development ...............................................................................5-21
5.5 Conclusions and Recommendations..............................................................................................................5-225.5.1 Conclusions ......................................................................................................................................................5-225.5.2 Recommendations ............................................................................................................................................5-23
Bibliography for Chapter 5 ....................................................................................................................................5-25
Chapter 6. Maternal and Child Health and Nutrition ...........................................6-1Abstract ..................................................................................................................................................................6-1
6.1 Introduction .......................................................................................................................................................6-26.1.1 Policy and Program Environment ........................................................................................................................6-26.1.2 Methods .............................................................................................................................................................6-4
Contents

v
6.2 Basic Facts about Programs in the FAFSA-2 Universe .................................................................................. 6-56.2.1 Projects and Countries .......................................................................................................................................6-56.2.2 Resources and Beneficiaries .............................................................................................................................6-6
6.3 Program Approaches and Interventions ......................................................................................................... 6-86.3.1 Nutrition Interventions and their Outcomes ........................................................................................................6-8
6.3.1.1 Targeting Women and Children in the First 1,000 Days ....................................................................6-86.3.1.2 Essential Nutrition Actions ................................................................................................................6-96.3.1.3 Breastfeeding ..................................................................................................................................6-106.3.1.4 Complementary Feeding .................................................................................................................6-126.3.1.5 Feeding the Sick or Severely Malnourished Child and Community-Based
Management of Acute Malnutrition ................................................................................................6-186.3.1.6 Vitamin A Supplementation .............................................................................................................6-196.3.1.7 Iron and Folic Acid Supplementation for Anemia Prevention and Control ......................................6-206.3.1.8 Maternal Nutrition ............................................................................................................................6-216.3.1.9 Supplementary Feeding ..................................................................................................................6-26
6.3.2 Health Interventions and their Outcomes .........................................................................................................6-356.3.2.1 Birth Preparedness and Maternity Services ...................................................................................6-356.3.2.2 Newborn Care and Treatment .........................................................................................................6-366.3.2.3 Immunization ...................................................................................................................................6-376.3.2.4 Treatment of Child Illness ................................................................................................................6-386.3.2.5 Hygiene, Deworming, and Diarrhea Prevention .............................................................................6-386.3.2.6 Family Planning and Healthy Timing and Spacing of Pregnancies ............................................... 6-406.3.2.7 Malaria Prevention ......................................................................................................................... 6-44
6.3.3 Approaches and Processes ............................................................................................................................ 6-456.3.3.1 Community Health Workers or Volunteers ..................................................................................... 6-456.3.3.2 Child Health Days .......................................................................................................................... 6-486.3.3.3 Health Services Support ................................................................................................................ 6-486.3.3.4 Social and Behavior Change Communication ............................................................................... 6-496.3.3.5 Community-Based Growth Promotion ........................................................................................... 6-546.3.3.6 Care Groups ....................................................................................................................................6-566.3.3.7 Positive Deviance/Hearth ................................................................................................................6-576.3.3.8 Homestead Food Production and Home Economics......................................................................6-616.3.3.9 Cross-Cutting Male Involvement .................................................................................................... 6-63
6.4 Program Impact on Nutritional Status of Children ......................................................................................... 6-646.4.1 Evaluation Survey Quality ................................................................................................................................ 6-646.4.2 Methods ........................................................................................................................................................... 6-656.4.3 Nutritional Status Impact by Sex ..................................................................................................................... 6-666.4.4 Nutritional Status Impact Overall ......................................................................................................................6-676.4.5 Nutritional Status Impact by Type of Supplementary Feeding .........................................................................6-706.4.6 Nutritional Status Impact of Preventive Supplementary Feeding by Ration Size ...........................................6-716.4.7 Nutritional Status Impact of Positive Deviance/Hearth ....................................................................................6-756.4.8 Programs with Unintended Negative Impact on Nutritional Status ..................................................................6-75
6.5 Cross-Cutting Issues and Opportunities ........................................................................................................6-766.5.1 Essential Interventions Delivered at Scale .......................................................................................................6-766.5.2 Nutrition 101 .....................................................................................................................................................6-776.5.3 Evaluating Applications ....................................................................................................................................6-786.5.4 Learning from Failure .......................................................................................................................................6-786.5.5 Local Fortified Complementary Foods as a Long-Term Solution ....................................................................6-79
6.6 Conclusions and Recommendations ..............................................................................................................6-796.6.1 Conclusions ......................................................................................................................................................6-796.6.2 Recommendations .......................................................................................................................................... 6-84
Bibliography for Chapter 6 ................................................................................................................................... 6-89
Contents

vi
Annex 6.1. FAFSA-2 Examples of the Early Onset of Undernutrition in Children in the First Two Years of Life from Title II Programs, Measured as Mean Z-Scores ..................................................... 6-95
Chapter 7. Water, Sanitation, and Hygiene ......................................................... 7-1
Abstract .................................................................................................................................................................. 7-1
7.1 Introduction .......................................................................................................................................................7-27.1.1 Policy and Program Environment ........................................................................................................................ 7-27.1.2 Status of Water and Sanitation in Countries Prior to Title II Programs ...............................................................7-3
7.2 Basic Facts about Programs in the FAFSA-2 Universe ....................................................................................7-47.2.1 Projects and Countries ........................................................................................................................................7-47.2.2 Resources and Beneficiaries ..............................................................................................................................7-5
7.3 Program Approaches and Interventions ...........................................................................................................7-57.3.1 Addressing Community Needs ...........................................................................................................................7-57.3.2 Selecting Communities ......................................................................................................................................7-57.3.3 Using Appropriate Technologies .........................................................................................................................7-67.3.4 Providing or Upgrading Systems to Higher Levels of Service ............................................................................7-87.3.5 Promoting Better Hygiene, including Using Social and Behavior Change Communication ..............................7-97.3.6 Hygiene Education in the Absence of Water and Sanitation Infrastructure ..................................................... 7-127.3.7 Dealing with Issues of Water Quality ................................................................................................................ 7-127.3.8 Encouraging Community Participation and Strengthening Capacity ............................................................... 7-137.3.9 Coordinating and Collaborating with Host Government Institutions ................................................................. 7-147.3.10 Integrating Water, Sanitation, and Hygiene within Title II Development Programs ........................................ 7-157.3.11 Water and Sanitation Infrastructure Outputs ................................................................................................... 7-157.3.12 Outcomes of Water, Sanitation, and Hygiene Interventions ........................................................................... 7-16
7.4 Cross-Cutting Issues and Opportunities ........................................................................................................ 7-18
7.5 Conclusions and Recommendations .............................................................................................................. 7-197.5.1 Conclusions ....................................................................................................................................................... 7-197.5.2 Recommendations ............................................................................................................................................ 7-20
Bibliography for Chapter 7 .................................................................................................................................... 7-21
Chapter 8. HIV .................................................................................................... 8-1
Abstract ..................................................................................................................................................................8-1
8.1 Introduction .......................................................................................................................................................8-28.1.1 Policy and Program Environment ........................................................................................................................8-28.1.2 Methods .............................................................................................................................................................8-2
8.2 Basic Facts about Programs Addressing HIV in the FAFSA-2 Universe ........................................................ 8-48.2.1 Projects and Countries .......................................................................................................................................8-48.2.2 Resources, Technical Sectors, and Beneficiaries ............................................................................................8-4
8.3 Program Approaches and Interventions ......................................................................................................... 8-58.3.1 Prevention of Sexual Transmission of HIV .........................................................................................................8-58.3.2 HIV Counseling and Testing ..............................................................................................................................8-68.3.3 Supplementary Feeding for PLHIV, OVC, TB Cases, and Other Vulnerable People ........................................8-6
8.3.3.1 Characteristics and Targeting of Title II HIV Supplementary Feeding .............................................8-88.3.3.2 Objectives of Title II HIV Supplementary Feeding ...........................................................................8-98.3.3.3 Nutrition Assessment, Counseling, and Support for PLHIV ...........................................................8-108.3.3.4 Approaches Used in Title II HIV Supplementary Feeding .............................................................. 8-11
Contents

vii
8.3.3.5 Graduation Criteria from Title II HIV Supplementary Feeding ........................................................ 8-118.3.4 Livelihood Strengthening and Protection ........................................................................................................ 8-128.3.5 Co-Programming with PEPFAR ......................................................................................................................8-14
8.4 Program Impact ..............................................................................................................................................8-16
8.5 Cross-Cutting Issues and Opportunities ........................................................................................................8-168.5.1 Role of Title II Supplementary Feeding in the Context of HIV ..........................................................................8-168.5.2 Clear Objectives and Measurable Results ....................................................................................................... 8-178.5.3 Food and Livelihood Security Solutions ...........................................................................................................8-18
8.6 Conclusions and Recommendations ..............................................................................................................8-188.6.1 Conclusions ......................................................................................................................................................8-188.6.2 Recommendations ............................................................................................................................................8-19
Bibliography for Chapter 8 ....................................................................................................................................8-20
Chapter 9. Performance Management ................................................................9-1
9.1 Introduction .......................................................................................................................................................9-1
9.2 Monitoring and Evaluation General Findings ..................................................................................................9-29.2.1 Strengths .............................................................................................................................................................9-29.2.2 Weaknesses .......................................................................................................................................................9-3
9.3 Monitoring ....................................................................................................................................................... 9-49.3.1 USAID Monitoring ...............................................................................................................................................9-49.3.2 An Alternative Proposal to Strengthen USAID Monitoring .................................................................................9-59.3.3 Monitoring Innovations by Awardees ................................................................................................................9-5
9.4 Evaluation ....................................................................................................................................................... 9-59.4.1 Evaluation Design Type ......................................................................................................................................9-79.4.2 Program Reviews by USAID ..............................................................................................................................9-79.4.3 Findings on Evaluation ......................................................................................................................................9-8
9.4.3.1 Strengths ...........................................................................................................................................9-89.4.3.2 Weaknesses ......................................................................................................................................9-8
9.5 Reporting ....................................................................................................................................................... 9-11
9.6 Conclusions and Recommendations ..............................................................................................................9-159.6.1 Conclusions .....................................................................................................................................................9-159.6.2 Recommendations ...........................................................................................................................................9-16
Bibliography for Chapter 9 ....................................................................................................................................9-22
Contents


ix
Second Food Aid and Food Security Assessment (FAFSA-2)
Abbreviations and Acronyms
ADP Area Development Program CLUSA Cooperative League of the USA
ADRA
ADS
AED
AER
AG
Adventist Development and Relief Agency
Automated Directives System
Academy for Educational Development
Annual Estimate of Requirements
Agriculture
CMAM
COPE
CPI
CRS
Community-Based Management of Acute Malnutrition
Community-Based Orphan Care, Protection, and Empowerment Project
Counterpart International
Catholic Relief ServicesAG/NRM
AIDIS
Sustainable Agricultural Production/Natural Resources Management
Inter-American Sanitary Engineering Association
CS
CSB
CSHGP
Cooperating Sponsor
Corn-Soy Blend
Child Survival and Health Grants Program
AIDS Acquired Immunodeficiency Syndrome CSS Civil Society Strengthening
AIN-C Atención Integral a la Niñez en la Comunidad(Honduras Community-Based Integrated Child Care Program)
DA
DAP
Development Assistance (USAID Funding Account)
Development Assistance ProgramAMEX
AOR
AMEX International
Agreement Officer’s RepresentativeDCHA USAID Bureau for Democracy, Conflict, and
Humanitarian Assistance
ARR Annual Results Reports DEC Development Experience Clearinghouse
ART Antiretroviral Therapy DHS Demographic and Health Surveys
ARV Antiretroviral Drug dl Deciliter(s)
BASICS Basic Support for Institutionalizing Child Survival
DOTS
DRC
Directly Observed Treatment, Short-Course
Democratic Republic of the CongoBCC
BEST Project
Behavior Change Communication
Bellmon Estimation Studies for Title II ProjectECHO European Commission’s Humanitarian Aid
Office
BEST Best Practices at Scale in the Home, ED Education
BFS
Community, and Facilities: An Action Plan for Smart Integrated Programming in Family Planning, Maternal and Child Health, and Nutrition
USAID Bureau for Food Security
EGAT
EKATA
ENA
USAID Bureau for Economic Growth and Trade
Empowerment, Knowledge, and Transformative Action (Bangladesh)
Essential Nutrition ActionsBMI Body Mass Index
ENSMI Encuesta Nacional de Salud Materno Infantil BRAC Bangladesh Rural Advancement Committee (National Maternal and Child Health SurveyBSD
C-IMCI
Brown Streak Disease
Community-Integrated Management of Childhood Illness
EPDM
EWR
Emergency Preparedness and Disaster Management
Early Warning and Response
CBGP
CBO
CCB
CDC
Community-Based Growth Promotion
Country Backstop Officer
Community Cereal Bank
United States Centers for Disease Control and Prevention
F
FACTS
FADUA
Office of U.S. Foreign Assistance Resources (U.S. Department of State)
Foreign Assistance Tracking System
Frequency, Amount, Density/Quality, Utilization, Active Feeding
CGAP
CHW
CI
CIAT
CLTS
Consultative Group to Assist the Poor
Community Health Worker
Confidence Interval
International Center for Tropical Agriculture
Community-Led Total Sanitation
FAFSA
FAM
FANTA
FAO
Food Aid and Food Security Assessment
Food Aid Management
Food and Nutrition Technical Assistance Project
Food and Agricultural Organization of the United Nations

x
FAQR Food Aid Quality Review
FATVAH Frequency, Amount, Thickness, Variety, Active Feeding, and Hygiene
FBF Fortified-Blended Food(s)
FBP Food by Prescription
FCF Fortified Complementary Food(s)
FEWS NET Famine Early Warning Systems Network
FFP Food for Peace
FFPA Food for Peace Act
FFPIB Food for Peace Information Bulletin
FFS Farmers Field School
FFW Food-for-Work
FH Food for the Hungry
FSCF Food Security Country Framework
FSN Food Security and Nutrition
FTF Feed the Future Initiative
FY Fiscal Year
g Gram(s)
GAFSP Global Agriculture and Food Security Program
GAIN Global Alliance for Improved Nutrition
GAM Global Acute Malnutrition
GAO U.S. Government Accountability Office
GFDRE Government of the Federal Democratic Republic of Ethiopia
GH USAID Bureau for Global Health
GH/PRH USAID Bureau for Global Health/Office of Population and Reproductive Health
GHCS Global Health and Child Survival
GHI Global Health Initiative
GINA Gender Informed Nutrition Agriculture Project
GIS Geographic Information System
Global Fund Global Fund to Fight AIDS, Tuberculosis and Malaria
HAZ Height-for-Age Z-Score
HCT HIV Counseling and Testing
HDDS Household Dietary Diversity Score
HH Household
HHS Household Hunger Scale
HIP Hygiene Improvement Project
HIV Human Immunodeficiency Virus
HN Health and Nutrition
HTSP Healthy Timing and Spacing of Pregnancies
I-LIFE Improving Livelihoods through Increasing Food Security
ICB Institutional Capacity Building
ICRISAT International Crops Research Institute for the Semi-Arid Tropics
IDP Internally Displaced Person
IEC Information, Education, and Communication
IEE Initial Environmental Examination
IFAR International Food Assistance Report
IFPRI International Food Policy Research Institute
IG Income Generation
IMCI Integrated Management of Childhood Illness
IMPACT Integrated HIV Effect Mitigation and Positive Action for Community Transformation
INHP Integrated Nutrition and Health Program
IPT Intermittent Preventive Treatment
IPTT Indicator Performance Tracking Table
IR Intermediate Result
IRC International Rescue Committee
IT Information Technology
ITN Insecticide-Treated Bednet
IYCF Infant and Young Child Feeding
IYCN Infant and Young Child Nutrition Project
JHSPH Johns Hopkins Bloomberg School of Public Health
kcal Kilocalorie(s)
kg Kilogram(s)
LAC Latin America and the Caribbean
LBT Labor-Based Technology
LER Office of Learning, Evaluation and Research
LH Livelihood(s)
LIAP Liberia Integrated Assistance Program
LIFT Livelihood and Food Security Technical Assistance Project
LLHY Low Labor, High Yield
LNS Lipid-Based Nutrition Supplement(s)
LOA Length of Activity
LOL Land O’Lakes
LQAS Lot Quality Assurance Sampling
m Meter(s)
M&E Monitoring and Evaluation
MAHFP Months of Adequate Household Food Provisioning
MAM Moderate Acute Malnutrition
MC Mercy Corps
MCC Millennium Challenge Corporation
MCH Maternal and Child Health
MCHIP Maternal and Child Health Integrated Program
MCHN Maternal and Child Health and Nutrition
MDG Millennium Development Goal
MFI Microfinance Institution
ml Millimeter(s)
MOH Ministry of Health
MSU Michigan State University
MT Metric Ton(s)
MTE Mid-Term Evaluation
MUAC Mid-Upper Arm Circumference
Acronyms and Abbreviations

xi
MYAP Multi-Year Assistance Program
NACS Nutrition Assessment, Counseling, and Support
NASA National Aeronautics and Space Administration
NCHS National Center for Health Statistics
NGO Non-Governmental Organization
NOAA National Oceanic and Atmospheric Administration
Non-AG IG Non-Agricultural Income Generation
NRM Natural Resources Management
OFDA USAID Office of U.S. Foreign Disaster Assistance
OICI Opportunities Industrialization Centers International
OMB Office of Management and Budget
OPIC Overseas Private Investment Corporation
ORT Oral Rehydration Therapy
OSP Orange Sweet Potato(es)
OVC Orphans and Vulnerable Children
P/L Pregnant/Lactating
P4P Purchase for Progress
PAHO Pan American Health Organization
PCI Project Concern International
PD/H Positive Deviance/Hearth
PDA Personal Data Assistant Device
PEP Poor and Extreme Poor
PEPFAR U.S. President’s Emergency Plan for AIDS Relief
PG Producer Group
PHAST Participatory Hygiene and Sanitation Transformation
PLHIV People Living with HIV
PM2A Preventing Malnutrition in Children under 2 Approach
PMP Performance Management Plan
PMTCT Prevention of Mother-to-Child Transmission of HIV
Policy Paper 1995 USAID Food Aid and Food Security Policy Paper
PREP Pipeline and Resource Estimate Proposal
PRH Office of Population and Reproductive Health
PPL USAID Bureau for Policy, Planning, and Learning
PSNP Productive Safety Net Program
PVC Polyvinyl Chloride
PVO Private Voluntary Organization
QI Quality Improvement
REST Relief Society of Tigray
RFA Request for Applications
RHS Reproductive Health Survey
RUTF Ready-to-Use Therapeutic Food
SAM Severe Acute Malnutrition
SAPQ Standardized Annual Performance Questionnaire
SBC Social and Behavior Change
SBCC Social and Behavior Change Communication
SC Save the Children
SCN Standing Committee on Nutrition
SD Standard Deviation
SHARE Asociación SHARE de Guatemala
SHOUHARDO Strengthening Household Ability to Respond to Development Opportunities Project
SILC Savings and Internal Lending Committee
SMILER Simple Measurement of Indicators for Learning and Evidence-Based Reporting
SO Strategic Objective
SOW Scope of Work
SUN Scaling Up Nutrition
TA Technical Assistance
TANGO Technical Assistance to NGOs
TB Tuberculosis
TBA Traditional Birth Attendant
TIPs Trials of Improved Practices
TNS TechnoServe
TOPS Technical and Operational Performance Support
TRM Technical Reference Materials
U.N. United Nations
U.S. United States
UNAIDS Joint United Nations Programme on HIV/AIDS
UNSCN United Nations System Standing Committee on Nutrition
UP Union Parishad
USAID U.S. Agency for International Development
USAID/FFP USAID Office of Food for Peace
USDA U.S. Department of Agriculture
USG U.S. Government
USGS U.S. Geological Survey
VGF/SSN Vulnerable Group Feeding/Social Safety Net
VSL Village Savings and Loan
VWC Village Water Committee
WALA Wellness & Agriculture for Life Advancement
WASH Water, Sanitation, and Hygiene
WAZ Weight-for-Age Z-Score
WBA Well-Being Analysis
WFP World Food Programme
WHO World Health Organization
WS Water and Sanitation
WV World Vision
Acronyms and Abbreviations


Second Food Aid and Food Security Assessment (FAFSA-2)
Executive Summary
Title II Development Program ImpactFrom the 1990s through the Second Food Aid and Food Security Assessment (FAFSA-2) time period, the Title II development program was unique among U.S. Agency for International Development (USAID) programs in its mandate to address the breadth of determinants of household food insecurity and undernutrition. Title II development programs implemented during the FAFSA-2 time period delivered a wide range of interventions to respond to unique problems and opportunities to improve the lives of people in targeted areas. These programs worked in agriculture and natural resources management; maternal and child health and nutrition (MCHN); vulnerable group feeding; HIV; education; water, sanitation, and hygiene; non-agricultural income generation; infrastructure; and emergency preparedness and disaster management. The programs were technically complex and challenging to design and implement successfully, and operated in difficult environments in some of the poorest and most food insecure countries in the world.
The results of the FAFSA-2 analysis indicate that Title II development programs can indeed reduce undernutrition in young children, improve a number of important MCHN outcomes, and increase household access to income and food. The assessment identified various technical sector models, approaches, and practices that are more likely to contribute to positive food security impacts. Because it is just as important to learn from failures as it is to emulate successes, the FAFSA-2 also includes examples of approaches and practices that have not worked well. Learning from the experiences of Title II development programs, made available through the FAFSA-2 analysis and findings, and doing more of what works in future programs presents a tremendous opportunity for USAID’s Office of Food for Peace (USAID/FFP) and its Awardees to improve overall program performance.
Impact on Child Nutrition
Reducing child undernutrition saves lives and protects human potential. The standard, population-based anthropometric indicators used by USAID/FFP and Title II Awardees to measure whether their programs were having a positive nutritional impact are the percentage of children under five years that have low weight-for-age (underweight) and the percentage of children under five years that have low height-for-age (stunting or chronic undernutrition). The FAFSA-2 analyzed nutritional status impact data for children under five years reported in Title II final evaluation surveys compared to baseline surveys with no known limitations: 28 programs with weight-for-age data and 28 with height-for-age data (not necessarily the same 28 programs for both measures). The median length of time between baseline and final evaluation surveys was four years.1 The programs in the analysis had a bigger impact on stunting (reducing it on
1 A complete description of the methodology used for this meta-analysis of anthropometric data from Title II development program evaluations is found in Section 6.4.2.
ES-1

Second Food Aid and Food Security Assessment (FAFSA-2)
average across all programs by 1.32 percentage points per year) than on underweight (which declined on average by 0.63 percentage points per year). These declines were greater than the secular trend changes in stunting and underweight reported in Demographic and Health Surveys for a number of the same countries. There were marked regional differences in reducing chronic undernutrition, with Title II programs in the combined Asia and Latin America and the Caribbean regions achieving a bigger average annual reduction in stunting of 1.53 percentage points, compared to Africa programs, where stunting fell only 0.98 percentage points per year. These differences in the impact of Title II development programs on child stunting track with the differences in program interventions, approaches, and budgets for MCHN across the regions. Greater reductions in stunting and underweight were seen in programs that did preventive supplementary feeding, which is discussed in Section 6.4.5.
Impact on Household Diets and Incomes
USAID/FFP had no standardized approach to measuring the impact of Title II development programs on food access at the beginning of the FAFSA-2 time period. This changed in 2007, when USAID/FFP began requiring Awardees to include two standard “household food consumption indicators” in their monitoring and evaluation systems for any Title II development program that included activities to improve “household access” to food (i.e., programs with agriculture, microenterprise development, income generation, and/or diversification interventions). Twenty-five programs in the FAFSA-2 universe reported on the number of months of adequate household food provisioning indicator, with 92 percent reporting improvements. Twenty-four programs reported on the household dietary diversity score indicator, with 79 percent reporting improvements. These are proxy indicators to measure access to food and not actual dietary intake. Twenty-four programs also reported on some measure of household income, with 80 percent exceeding their targets for increasing income (see Section 4.4).
ES-2 Executive Summary

1-1
Second Food Aid and Food Security Assessment (FAFSA-2)
1. IntroductionThe second Food Aid and Food Security Assessment (FAFSA-2) was commissioned by the U.S. Agency for International Development’s Office of Food for Peace (USAID/FFP), which is housed in the Bureau for Democracy, Conflict, and Humanitarian Assistance (DCHA). The report was commissioned to review the changes in and accomplishments of the Title II non-emergency (development) program since the previous assessment in 2002 (Bonnard, 2002). The Title II development program strives to enhance food security in developing countries, an objective that dates from the 1990 Farm Bill and the 1995 USAID “Food Aid and Food Security Policy Paper” (Policy Paper). During the time period covered by the FAFSA-2 (FY 2003–FY 2009), more than US$2.5 billion was made available to individual Title II development programs in 36 food insecure countries in Africa, Asia, and Latin America and the Caribbean (LAC), making Title II one of the major sources of U.S. government (USG) funding for food security-related activities during the period.
The basic policies that guided program development and resource allocation during the FAFSA-2 time period were first laid out in the 1995 Policy Paper. Key among the changes introduced then were the focus on rural areas; identification of two geographic priorities, namely, sub-Saharan Africa and South Asia; and two program priorities: improving household nutrition and increasing agricultural productivity. The Policy Paper also recognized the importance of complementary resources—especially cash—to the success of the development programs and to the achievement of food security on a sustainable basis, and it encouraged more integration of Title II and USAID Mission programs. The 2006–2010 USAID/FFP Strategic Plan (Strategic Plan), which was developed during the early 2000s in an environment characterized by the increasing frequency and severity of natural and man-made disasters, added a stronger emphasis on addressing risk and vulnerability in Title II programs. This included changing the overall
objective of the program to “Food insecurity in vulnerable populations reduced” and adding activities to the development programs that were designed to reduce the risks that target communities, households, and individuals face and to increase their capacity to cope with shocks.
1.1 ObjectivesThe primary objective of the FAFSA-2 was to document the overall achievements of Title II development programs since the 2002 FAFSA. This included assessing the approaches adopted and results achieved in the principal technical sectors and identifying promising practices, innovations, lessons learned, strengths, weaknesses, and constraints to achieving results. While the emphasis was on the technical review, USAID/FFP also asked the FAFSA-2 team to assess the extent to which the objectives, approaches, planning, and management changes proposed in its 2006–2010 Strategic Plan were adopted and how these changes influenced the program. The focus of the assessment was on Intermediate Result (IR) 2 of the Strategic Plan: “Title II impact in the field increased.” Emergency programs were not included in the assessment, and the review of activities under IR 1—“Global leadership in reducing food insecurity enhanced”—was limited to those that were directly relevant to the performance of the field programs. At the request of USAID/FFP, the FAFSA-2 also includes recommendations for future program directions in light of assessment findings and changes in the legislative, organizational, policy, and development environment. The FAFSA-2 could best be described as a systematic review of the qualitative and quantitative information available in documentation and evaluations of the Title II development programs in the FAFSA-2 universe. The FAFSA-2 was not an evaluation, nor was it an in-depth management review. And it did not review United States (U.S.) assistance to the World Food Programme (WFP) for development programs.

1-2 Introduction
1.2 Program Scope and Assessment Methods
1.2.1 Scope: Time Frame, Countries, Programs, and Technical Sectors
1.2.1.1 Time Frame
A decision was made early on to look at all Title II development programs that were in operation between FY 2003 and FY 20092 rather than to draw a sample. This resulted in an initial list that included 36 countries and 151 programs. The year FY 2003 was selected as the starting point, to pick up where the previous FAFSA left off, and FY 2009 was selected as the ending point to ensure that the assessment would include a significant number of programs that had completed their five-year life of activity by the time the FAFSA-2 review began in 2010.
The next issue was whether to include or exclude all the programs that began before the starting year (FY 2003) or extended beyond the end year (FY 2009). The decision was to include any programs whose time frame overlapped with FAFSA-2’s time frame by at least three of the five years. This meant excluding all programs that ended in FY 2004 or earlier or started later than FY 2007. Setting FY 2007 as the latest starting date also increased the likelihood that the team would have access to mid-term evaluations of these programs. An exception was made for the programs that were under way in the five countries included in the field visits—Bangladesh, Guatemala, Malawi, Niger, and Uganda—all of which were included in the review, even though some had been in operation for only a year or less. The special research programs on the Preventing Malnutrition in Children under 2 Approach (PM2A) in Burundi and Guatemala were also excluded from the assessment because they
started too recently, i.e., in FY 2009, and had an atypical research focus.
Although the FAFSA-2 time frame began in 2003 and the USAID/FFP Strategic Plan took effect in 2006, there is more overlap between these two time frames than is apparent at first glance. Work had already begun on two background papers in 2002 (Webb and Rogers, 2003; Haddad and Frankenberger, 2003),3 for example. Work had also begun on the initial concept paper in 2002, and, in 2004, USAID/FFP included a summary of the approved concept paper in its development program policies and guidelines for FY 2005 programs.
1.2.1.2 Countries
A number of countries were purposively eliminated from the assessment, namely, Afghanistan (because the program was too new and atypical due to the war), Angola (because the programs were transition programs), Peru (because the programs were being phased out as the new Strategic Plan started), Benin and Tajikistan (because the programs were not focused on the major technical sectors, i.e., agriculture/natural resource management [AG/NRM] and/or maternal and child health and nutrition [MCHN]), and Eritrea (because the programs were subjected to a considerable amount of interference from the host government).
Throughout the report, reference is made to “USAID/FFP priority countries.” The countries referred to are the 20 that were on the priority list in FY 2010 when FAFSA-2 began, namely, Afghanistan, Bangladesh, Burkina Faso, Burundi, Chad, the Democratic Republic of the Congo (DRC), Ethiopia, Guatemala, Haiti, Liberia, Madagascar, Malawi, Mali, Mauritania, Mozambique, Niger, Sierra Leone, Sudan, Uganda, and Zambia.4
2 This includes Development Assistance Programs (DAPs)—a term that was in use between 2002 and 2005—and Multi-Year Assistance Programs (MYAPs)—a term that was introduced in 2005. In 2011, USAID/FFP changed the term for these programs to “development programs” instead of MYAPs.
3 These papers were produced under the auspices of the Food and Nutrition Technical Assistance Project (FANTA).4 Zambia has been dropped since 2010 and replaced by Zimbabwe, Sudan is now referred to as the newly independent country of South Sudan, and USAID/FFP now refers to all of these as its “focus” countries.

1-3Introduction
1.2.1.3 Programs and Awardees5
The final list—the FAFSA-2 universe—included 101 programs in 28 countries: 64 programs in Africa, 14 in Asia, and 23 in LAC (see Table 1.2 at the end of this chapter). This report refers to programs by the name of the country and Awardee, and mentions the fiscal years during which a program was implemented only as a distinguishing feature in cases where the same Awardee had more than one program in the same country during the FAFSA-2 time frame.
Sixteen Awardees were the sole or lead implementer on one or more programs during the FAFSA-2 time period: Africare; ACDI/VOCA; Adventist Development and Relief Agency (ADRA); Asociación SHARE de Guatemala (SHARE); CARE; Counterpart International (CPI); Catholic Relief Services (CRS); Food for the Hungry (FH); Land O’Lakes (LOL); Mercy Corps (MC); Opportunities Industrialization Centers International (OICI); Project Concern International (PCI); Relief Society of Tigray (REST); Save the Children (SC); TechnoServe (TNS); and World Vision (WV).
1.2.1.4 Technical Sectors
A decision was also made early on to focus the assessment on technical sectors, in particular on the two technical sectors that received the majority of the Title II development resources during the FAFSA-2 time period, namely, AG/NRM6 and health and nutrition (HN). The 2002 FAFSA also concentrated on these two sectors, but the expectation was that considerably more information on these programs and program performance would be available for the FAFSA-2 time period. The review of AG/NRM components and activities also
includes the USAID/FFP non-agricultural income generation (Non-AG IG) technical sector. In the case of HN, the review is presented in two chapters, namely, MCHN and HIV, due to the breadth of the subject matter. Given the importance of water, sanitation, and hygiene (WASH) to health and development, there is a separate chapter on the WASH technical sector. The other four technical sectors that were in existence in FY 2009—civil society strengthening (CSS), education (ED), emergency preparedness and disaster management (EPDM), and vulnerable group feeding/social safety net (VGF/SSN)—were not reviewed in the FAFSA-2 since each received only a small proportion of Title II commodities (less than 10 percent each in FY 2009).7 While not one of the USAID/FFP technical sectors, the FAFSA-2 report includes a technical chapter on “Infrastructure” because of the important contribution of Title II resources to supporting public works and the use of food in Food-for-Work (FFW) activities for this purpose. One of the FAFSA-2 recommendations is for USAID/FFP to make “Infrastructure” a specific reporting category for Title II programs in the future to better capture these essential development activities. The FAFSA-2 did not have the time or resources to focus on program performance with respect to managing risks and reducing vulnerabilities/increasing resiliency or the relief to development continuum; these issues are more suitable for the more focused types of assessments that the FAFSA-2 is recommending that USAID/FFP concentrate on in the future.
1.3 The Assessment TeamThe FAFSA-2 team was multidisciplinary. The basic team included a specialist in AG, livelihoods (LH), and income generation (IG) (who also served as the
5 The term “Awardee” is currently the preferred way to refer to Title II grantees. It replaces the term “Cooperating Sponsor,” which was in use at the beginning of the FAFSA-2 time period.6 “AG/NRM” is used both when referring to agriculture and natural resource management in general and when referring specifically to the USAID/FFP sustainable agricultural production/natural resources management technical sector. When it is being used to refer to the USAID/FFP technical sector, this will be noted in the text.
7 USAID/FFP established these technical sectors for Awardees to use when filling out the USAID/FFP Tracking Tables for Resources and Beneficiaries. The definitions of these eight technical sectors can be found in USAID/FFP Annual Results Reporting Guidelines for FY 2009. These technical sectors have changed over time; there were only five in FY 2003, for example: HN (which also included water and sanitation [WS]), AG/NRM, ED, Non-AG IG, and VGF.

1-4 Introduction
team leader) and a specialist in MCHN and HIV. Two short-term technical consultants—a sanitation engineer and a civil engineer—were also contracted to review WASH and infrastructure activities supported by Title II resources, respectively.
1.4 Assessment MethodsThe methods used in the assessment included:
• A review of project-specific and other relevant documents
• An analysis of the quantitative data available on Title II resource allocations, beneficiaries, and project performance
• Stakeholder interviews
• Field visits
Although the assessment covers the entire portfolio, certain countries and programs have probably had a greater influence on the report, including on the findings and conclusions, than others. Field visits, for example, naturally led to a more in-depth understanding of programs seen and discussed firsthand. As a result, programs in the countries visited may have received more attention than programs in other countries, where the team had to rely entirely on information available in the program documents, which varied considerably in quality. However, the limited number of countries and programs visited made it difficult to generalize about some of the findings.
1.4.1 Document Review
Basic project documents were available and reviewed for all programs in the FAFSA-2 universe. For programs that had ended, this included, at a minimum8:
• The original proposal/application and any amendments (because these provided essential information on program goals, strategic objectives (SOs), and key interventions and activities)
• The final evaluation (because it provided an independent assessment of results achieved, the extent to which program targets and objectives were met, and explanations)
The mid-term evaluations were reviewed for programs that had not yet completed their final evaluation, as were the most recent Annual Results Reports (ARRs) for some of the programs that were visited that had been under way for only one or two years. The FAFSA-2 team also reviewed numerous other project documents, including baseline and final survey reports, mid-term evaluations, ARRs, Pipeline and Resource Estimate Proposals (PREPs), and other special studies and technical documents, including those provided by individual Title II Awardees. Many project documents were reviewed by several team members, depending on the technical areas that were included in each of the programs. (See Table 1.3 at the end of this chapter for a complete list of all the programs and their respective reviewers).
Team members also reviewed USAID/FFP and other USAID policy and strategy documents. This included those related to the Feed the Future Initiative (FTF) and the Global Health Initiative (GHI); other food aid program assessments; and a wide range of background literature on agriculture, natural resource management, health, nutrition, HIV,
Box 1.1. FAFSA-2 Team Members
Roberta van Haeften: Team Leader and AG, LH, and IG specialist
Mary Ann Anderson: MCHN and HIV specialist
Herbert Caudill: WASH specialist (sanitation engineer)
Eamonn Kilmartin: Infrastructure specialist (civil engineer)
8 Although these are basic project documents, it proved much more difficult and time consuming to assemble them for all 101 programs than was originally expected. Assembly went on for the first six months of FAFSA-2, simultaneous with reviewing programs for which documents were available.

1-5Introduction
water and sanitation, public works, food aid, and food security.
1.4.2 Data Review
The FAFSA-2 team used several sources of quantitative data available on the Title II development programs to analyze program performance. These included data from:
• USAID/FFP’s Annual Estimates of Requirements (AERs) to assess trends during the FAFSA-2 time period in commodities and resource allocations by region, country, and Awardee
• Resource and Beneficiary Tracking Tables from Awardees’ annual reports to determine the allocations of resources and beneficiaries reached by technical sector in FY 2003 and FY 2009
The final or most recent Indicator Performance Tracking Tables (IPTTs) were also assembled for all the projects in the FAFSA-2 universe. Final IPTTs were used to assess the extent to which programs had achieved improvements in indicators (baseline versus final survey data) and met targets and objectives, supplemented in some cases with further reviews of baseline and final survey reports, if available.
1.4.3 Stakeholder Interviews and Consultations
Team members conducted stakeholder interviews with USAID/FFP/Washington staff, including country backstop officers (CBOs); other USAID staff, including from the Bureaus for Global Health (GH), Economic Growth and Trade (EGAT), and Food Security (BFS); and the regional Bureaus. USAID Mission staff were also interviewed during the field visits, as were a selection of host country representatives from government, international organizations, other donors, and non-governmental organizations (NGOs). Interviews were also held with staff from a number of the Awardees’ headquarters offices and from several of USAID/FFP’s technical support projects, including the Food and Nutrition Technical Assistance II Project
(FANTA-2), the Famine Early Warning Systems Network (FEWS NET), the Bellmon Estimation Studies for Title II (BEST) Project, the Technical and Operational Performance Support (TOPS) project, and AMEX International (AMEX).
1.4.4 Field Visits
Field visits were made to five countries, one each in Asia (Bangladesh), LAC (Guatemala), East Africa (Uganda), Southern Africa (Malawi), and West Africa (Niger). None of the countries visited was visited in the first FAFSA. The visits to Niger and Uganda were combined with visits to their respective FFP regional offices, in Dakar, Senegal, and Nairobi, Kenya (see Table 1.1).
Countries and programs selected for FAFSA-2 field visits met the following criteria:
• Provided a good cross-section of AG/NRM/LH/IG and MCHN programs
• Included a good representation of other technical sector programs
• Included programs that were integrated with USAID Mission strategies
• Included at least one country where the Title II program was subject to shocks
• Were priority USAID/FFP countries
• Had an ongoing Title II development program
The objectives of the field visits were to “ground truth” information from the document reviews, as well as to add depth to the assessment. The field visits also provided an opportunity for FAFSA-2 team members to interact with the USAID Missions and the Title II Awardees working in the field. The field visits did not evaluate individual Awardee or Mission management of Title II programs.
The field assessments included a review of USAID, Awardee, and other relevant documents, and interviews with key USAID, Awardee, and partner institution staff. Visits were made to project sites to talk with project beneficiaries, staff, community leaders, and other stakeholders, individually and in

1-6 Introduction
focus groups, and to observe project activities, such as service delivery in facilities, in the community, in homes, and in farmers’ fields, and public works at construction sites (primarily roads and irrigation schemes).
Although time in the capital cities was limited, because the team wanted to spend as much time as possible with the projects in the field, the team did try to meet with other key players in the food security arena in each country. This included representatives from the governments, FEWS NET, WFP, the Food and Agricultural Organization of the United Nations (FAO), the European Commission’s Humanitarian Aid Office (ECHO), and UNICEF. In the West and East African regional USAID/FFP offices, team members were also able to meet with staff from several of the Awardees’ regional offices and from the USAID Office of U.S. Foreign Disaster Assistance (OFDA).
1.5 Basic Terminology and an Alternative Food Security Framework
The FAFSA-2 team found misconceptions about and inconsistencies in the use of key terms, including hunger, undernourishment, undernutrition, and acute or chronic malnutrition, in Washington and in the field, among USAID and Awardee staff and
other stakeholders. To avoid confusion, readers are advised to consult Box 1.2 for the definitions the FAFSA-2 team used in making its assessment.
Early on, the FAFSA-2 team also decided that the “Expanded Conceptual Framework for Understanding Food Insecurity” introduced in the USAID/FFP Strategic Plan (see Chapter 2, Figure 2.1) was more useful as a checklist to ensure that one did not forget any of the myriad of risk factors that might be applicable in any given situation than it was as a conceptual framework that team members could use to help them understand the basic logic of a program. The “Expanded Conceptual Framework” was described in the USAID/FFP Strategic Plan as being innovative, which it was, adding richness and multidimensionality to the analysis of determinants of food insecurity. But that framework is also overly complex, and its complexity can easily obscure, rather than help clarify, the basic interventions and approaches to include in a program design and the many intervention points and causal pathways among them.
The conceptual framework that the team developed for FAFSA-2 (see Figure 1.1) is a modified version of the 1990 UNICEF “Causes of Child Malnutrition” framework combined with a food and agricultural systems framework. It highlights the three basic food security elements—the three ovals: food utilization, food access, and food availability—as well as the
Table 1.1. Basic Information on the Countries and Programs Selected for Field Visits
Region CountryAwardees (Consortium Members)
Number of Programs ReviewedTechnical SectorsCompleted Ongoing
Asia Bangladesh ACDI/VOCA, CARE, SC (Helen Keller International [HKI])
2 3 AG/NRM, Non-AG IG, HN, WASH, CSS, EPDM
LAC Guatemala CARE, CRS, SC, SHARE 4 3 AG/NRM, Non-AG IG, HN, CSS
Africa: East Uganda ACDI/VOCA, Africare, CRS, MC, SC, WV
5 2 AG/NRM, Non-AG IG, HN, WASH, VGF/SSN, HIV/AIDS
Africa: Southern
Malawi CRS (ACDI/VOCA, Africare, CARE, Emmanuel International, PCI, Salvation Army, SC, WV)
2 1 AG/NRM, Non-AG IG, HN, CSS, VGF/SSN, HIV/AIDS
Africa: West Niger Africare, CRS (CARE, HKI), CPI 1 3 AG/NRM, Non-AG IG, HN, WASH, CSS

1-7Introduction
Box 1.2. The Meaning of Basic Nutrition-Related Concepts
• Hunger is usually understood to refer to discomfort associated with a lack of food. FAO defines it specifically as consumption of fewer than about 1,800 kcal a day—the minimum that most people require to live healthy and productive lives.
• Undernourishment refers to an FAO-developed indicator that is based on per capita food supplies in a country, adjusted on the basis of additional assumptions about the distribution of these food supplies across households and a minimum energy requirement threshold.
• Undernutrition manifests as underweight, stunting, wasting, or vitamin and mineral (collectively known as micronutrients) deficiencies. It is the result of inadequate food intake (and, more specifically, a deficiency in the consumption of energy and essential nutrients, such as fatty acids, protein, vitamins, and minerals), poor utilization of nutrients due to disease, or a combination of these two factors.
• Malnutrition refers more broadly to undernutrition (due to nutrient deficiencies and/or infection) and overnutrition (due to overconsumption of energy from macronutrients, namely carbohydrates, fat, and protein, in relation to requirements and expenditure, with or without micronutrient deficiencies). Overnutrition conditions include both overweight and obesity. Both undernutrition and overnutrition contribute to poor health. Malnutrition is frequently used as a synonym for undernutrition, but nutrition experts now more commonly distinguish “malnutrition” from the more precise “undernutrition.”
• Chronic undernutrition (also referred to as stunting) is a term for low height-for-age, that is, being too short for one’s age and sex compared to a well-nourished child of the same age and sex. This “shortness,” also referred to as linear growth retardation, develops slowly over a long period due to insufficient nutrient intake, infections, toxins in food eaten, maternal undernutrition and poor nutrient stores, suboptimal feeding and care practices, and poverty. Children with chronic undernutrition fail to grow to their full genetic potential, both mentally and physically. Preventing stunting must be done during pregnancy and the first two years of life, when growth is rapid and most of the damage occurs. Once this opportunity is missed, the stunted child is unlikely to make up the difference in growth and development, and will be adversely affected for the rest of his/her life.
• Acute malnutrition (also referred to as wasting) is a term for low weight-for-height, that is, being too thin for one’s height/length compared to a well-nourished child of the same height/length and sex. This “thinness” develops as a result of an immediate problem—a crisis induced by a sudden, drastic reduction in food intake, food shortages, drought, catastrophes, or illness, leading to rapid weight loss or a failure of children to gain weight. Acute malnutrition is a rarer, more serious form of undernutrition, associated with high mortality rates. Wasting in children is often detected by measuring mid-upper arm circumference (MUAC), which is easier to measure and interpret in the field than weight and height/length are. In adults, body mass index (BMI) is an indicator of weight adequacy in relation to height, used to detect wasting or overweight. It is calculated as weight (in kg) divided by height squared (in m).
• Underweight refers to low weight-for-age, compared to growth standards for well-nourished children of the same age and sex. It reflects both chronic and acute undernutrition (being too short, too thin, or a combination of the two). Being underweight is due to inadequate nutrient intake or infection or both. Monthly weight gain for age and sex is what growth monitoring and promotion programs measure and plot on growth charts for each child. Height is more difficult to measure and linear growth occurs more in spurts. Growth faltering refers to not gaining enough weight each month to stay on one’s personal growth trajectory, which is governed by size at birth, heredity, and growth standards. Preventing underweight and growth faltering must be done during pregnancy and the first two years of life, when weight gain is rapid and most of the damage occurs.

1-8 Introduction
major determinants of each of these elements and the causal relationships among them. It is very clear in this framework, for example, that food availability is influenced by food production, imports, and food aid, and that food production also influences food access. On the other hand, the framework also shows that food transfers and market purchases (influenced by food prices and cash income from agricultural sales and/or wages) can also play an important role in improving households’ access to food. This framework also makes clear that food utilization and nutritional status, which is a high-level indicator of Title II program performance, are dependent on a
number of other factors, in addition to improvements in diets (due to improvements in food availability and access), including cultural practices and access to and use of health services and WASH. These latter factors, if unaddressed, often explain why high levels of child undernutrition persist in countries and communities that produce (and even export) significant quantities of food.
This framework can also be used to better understand some of the more important factors and pathways that could influence whether a given agricultural intervention—the transfer of agricultural
Figure 1.1. The Food Security Conceptual Framework Developed for Use in the FAFSA-2
Practices
Inputs
Capital LaborTechnology
(Agricultural)Land/Water
Non-AgriculturalProduction
Non-FoodAgriculturalProduction
MarketPurchases
FoodPrices
Cash Income
WagesSales
Transfers and Loans(Food/Cash)
NATURAL ENVIRONMENTSOCIAL/POLITICAL ENVIRONMENT
* Indicator
Food Access(Household)
• Community• Social Networks• Government/Donor Programs• Remittances
Number andSpacing of Children
• Water/Sanitation/Hygiene• Use of Preventive and Curative Health Care
Stocks
FoodProduction
Food Availability(National)
Food Aid
Imports
Food Utilization(Individual)
Nutritional Status*
HealthStatus
DietaryIntake
IntrahouseholdFood Allocation
• Knowledge• Culture• Time/Workload
Maternal andChild CarePractices
Adapted by Roberta van Haeften and Mary Ann Anderson from: Riely et al., 1999 and UNICEF, 1990.

1-9Introduction
technology, for example (which is found at the bottom right of the framework)—might have the desired impact on food access and nutritional status. Most of the changes in the agricultural sector will influence nutritional status through their effects on food availability and access. But changes in agricultural technologies and practices can also influence child nutritional status through changes in health status (the introduction of a water-related disease along with a new irrigation system) or changes in the amount of time women spend on agricultural and income generation-related activities, which affects the amount of time they have for child care.
1.6 Limitations and Gaps in the Program Documentation and Data
The FAFSA-2 could best be described as a systematic review of Title II development programs that combines information from qualitative studies with some quantitative data from the Awardees’ IPTTs.9 This means that the completeness and accuracy of this assessment (review) is limited by the completeness and accuracy of the program documents and results data reported by the Awardees. The following are some of the difficulties encountered in undertaking the assessment.
• Difficulties in defining the universe of interventions/activities. The program documentation available does enable one to get an idea of the wide range of interventions and activities supported by Title II development resources. But there is no easy way to determine which programs include which types of interventions and activities, and how many programs include specific types of interventions and activities in total and by country, region, and Awardee. To develop this information, the team had to set up its own “library,” with all the
program documentation, read and manually cull findings from hundreds of program documents, and create its own notes and databases. Even then, it was difficult to be certain that one had captured all the interventions and activities actually under way. Proposals frequently did not identify all the interventions, activities, and approaches that Awardees were thinking about implementing. Some interventions and activities that were included in proposals may never be implemented, while others may have been added during the life of the project and still others abandoned, without being documented in reports to USAID. The annual reports did not describe all the activities that were being implemented during the year and were not consistent year to year in the activities that they did cover. The mid-term and final evaluations tended to focus on the bigger program components, and sometimes on the interventions and activities that the evaluators themselves were interested in, and said little or nothing about many of the others. The lack of standard terminology for describing similar activities across programs further complicated the task of rolling up the results.
• Lack of information on program strategies and models. Many program documents, including evaluations, lacked information on the nature of the program interventions and approaches, which made it difficult to draw conclusions about their relative effectiveness in each technical sector. Final evaluation reports often did not describe the intervention strategy(ies)/model(s) and implementation processes in enough detail that they could be replicated. Evaluations that did contain information on the causal chain for program interventions and approaches, strengths, weaknesses, quality of implementation processes, and extent and length of participation or exposure by the beneficiaries to the intervention were most useful and given more weight. Lack of this information is a handicap for explaining how and why certain results were or were not achieved, and where in the causal chain programs are more likely to break down. Although final performance reports, which are required for some USAID
9 An argument could be made that the term “meta analysis” could be used to describe the analysis of the nutritional status data in Chapter 6 in the sense that it involved statistical methods of combining evidence.

1-10 Introduction
projects, often provide the type of information lacking in Title II program final evaluations, Title II Awardees are not required to submit final reports.
• Lack of or insufficient standardization of results indicators. A number of activities had no results indicators associated with them; for many that did, the lack of standardization across programs limited their inclusion in the broader analysis. The technical sector with the most standardization of monitoring and evaluation (M&E) is HN. The FAFSA-2 team was unable to check the quality of the reported evaluation data or do new re-analysis of survey datasets. However, if survey limitations were reported or observed by the FAFSA-2 team, the problems were documented and the data were not included in the MCHN analysis. The limitations of a number of the evaluation surveys that precluded using their data in the review are discussed in Chapter 6.
1.7 Organization of the ReportThe rest of the report is organized as follows.
• Chapter 2 includes brief discussions of the evolution of the Title II development program and the food security objective prior to the approval of the 2006–2010 Strategic Plan, the key elements of the 2006–2010 Strategic Plan, and the environment in which the Title II development program was operating at the time of the FAFSA-2 assessment (2010–2011).
• Chapter 3 provides an overview of the performance of the Title II development program as a whole.
• Chapters 4–8 focus on the technical performance of AG/NRM, infrastructure, MCHN, WASH, and HIV components and activities. Each of these technical chapters follows a similar format: background information on each of the sectors; basic facts on the numbers of countries and programs in the FAFSA-2 universe, the amount and proportion of resources allocated to
the sector, and the number of beneficiaries; an assessment of the interventions and approaches adopted and outcomes achieved; and a discussion of cross-cutting issues and opportunities in the sector.
• The assessment of the overall impact of the program is divided between the MCHN chapter (Chapter 6), which includes a discussion of the impact of the program on the two indicators of child undernutrition that USAID/FFP has adopted as higher-order measures of food utilization, as well as the success of the Title II development program overall (see Table 1.2), and the AG/NRM chapter (Chapter 4), which includes a discussion of the impact of the program on the two household food consumption indicators that USAID/FFP has adopted as higher-order measures of food availability and access.
• The paper concludes with a review of the systems being used by USAID/FFP to manage and assess program performance (Chapter 9).
• Separate sections on conclusions and recommendations are included at the end of Chapters 3–9.

1-11Introduction
Table 1.2. Title II Development Programs included in the FAFSA-2 Universe, by Country, Awardee, and Fiscal Year
Region Country Awardee
Years of Operation (Fiscal Years)
2000 2001 2002 2003 2004 2005 2006 2007 2008 2009 2010 2011 2012 2013
AFR
ICA
Burkina Faso AFRICARE
CRS
Cape Verde ACDI/VOCA
Chad/Mali* AFRICARE
Ethiopia CARE
CARE
CRS
CRS
FH
REST
REST
SC US
SC US
WV
WV
Ghana ADRA
CRS
OICI
TNS
Guinea ADRA
AFRICARE
OICI
Kenya ADRA
CARE
CRS
FH
WV
Liberia CRS
Madagascar ADRA
CARE
CRS
Malawi CRS
CRS
CRS FY 2014
Mauritania CPI
WV
Mozambique ADRA
AFRICARE
CARE
FH
SC
WV
Niger AFRICARE
AFRICARE
CPI
CRS
Rwanda ACDI/VOCA
ACDI/VOCA
CRS
WV

1-12 Introduction
Region Country Awardee
Years of Operation (Fiscal Years)
2000 2001 2002 2003 2004 2005 2006 2007 2008 2009 2010 2011 2012 2013A
FRIC
A (c
ont’d
)
Senegal/Gambia CRS
Senegal CPI
Sierra Leone CARE
CARE
Uganda ACDI/VOCA
ACDI/VOCA
AFRICARE
CRS
MCI
SC
WV
Zambia CRS
LOL
ASI
A
Bangladesh ACDI/VOCA FY 2015
CARE
CARE FY 2015
SC
SC FY 2015
India CARE
CARE
CRS
CRS
Indonesia CARE
CRS
MCI
SC
WV
LAC
Bolivia ADRA
CARE
FH
SC
Guatemala CARE
CRS
CRS
SC
SC
SHARE
SHARE
Haiti CARE
CRS
SC
WV
Honduras ADRA
CARE
SC
WV
Nicaragua ADRA
CRS
PCI
SC
* The Africare Chad/Mali program is counted as two programs.

1-13Introduction
Table 1.3. Title II Development Programs included in the FAFSA-2 Universe, by Region, Country, Awardee,i
and FAFSA-2 Technical Reviewerii
Region Country Awardee Program Years
Technical ReviewerMCHN and HIV
AG/IG MCHN HIV WASH INF
AFR
ICA
Burkina Faso AFRICARE FY04-10 1 1 1
CRS FY04-10 1 1
Cape Verde ACDI/VOCA FY03-08 1 1
Chad/Maliiii AFRICARE FY03-08 2 2 2 2
Ethiopia CARE FY02-05 1 1
CARE FY05-08 1 1
CRS FY03-08 1 1 1 1 1
CRS FY05-08 1 1
FH FY05-08 1 1
REST FY03-07 1
REST FY05-08 1 1
SC FY03-07 1
SC FY05-08 1 1
WV FY03-08 1 1 1 1 1
WV FY05-08 1 1
Ghana ADRA FY02-08 1 1 1
CRS FY03-08 1 1
OICI FY04-09 1 1 1 1
TNS FY06-10 1
Guinea ADRA FY00-09 1
AFRICARE FY01-08 1 1 1
OICI FY05-09 1 1 1
Kenya ADRA FY03-08 1 1 1
CARE FY04-09 1 1
CRS FY01-06 1 1 1
FH FY04-08 1 1 1
WV FY03-07 1 1
Liberia CRS FY07-10 1 1 1 1 1
Madagascar ADRA FY04-09 1 1 1
CARE FY03-09 1 1
CRS FY03-08 1 1
Malawi CRS FY00-05 1
CRS FY05-09 1 1 1
CRS FY09-14 1 1 1
Mauritania CPI FY07-11 1 1 1
WV FY01-07 1 1
Mozambique ADRA FY02-08 1
AFRICARE FY02-08 1 1 1
CARE FY02-08 1 1 1
FH FY02-08 1 1 1
SC FY02-08 1 1 1
WV FY02-08 1 1 1
Niger AFRICARE FY00-07 1 1 1
AFRICARE FY07-11 1 1 1 1
CPI FY08-13 1 1 1
CRS FY07-11 1 1 1 1

1-14 Introduction
Region Country Awardee Program Years
Technical ReviewerMCHN and HIV
AG/IG MCHN HIV WASH INF
AFR
ICA
(con
t’d)
Rwanda ACDI/VOCA FY00-05 1
ACDI/VOCA FY05-10 1 1 1
CRS FY00-09 1 1
WV FY04-09 1 1
Senegal/Gambia CRS FY02-07 1
Senegal CPI FY05-11 1 1
Sierra Leone CARE FY04-07 1
CARE FY07-10 1 1
Uganda ACDI/VOCA FY02-06 1 1 1
ACDI/VOCA FY07-11 1 1 1
AFRICARE FY02-06 1 1 1 1
CRS FY02-06 1 1
MC FY08-13 1 1 1
SC FY03-09 1 1 1 1
WV FY03-09 1 1 1 1
Zambia CRS FY06-11 1
LOL FY04-09 1
ASI
A
Bangladesh ACDI/VOCA FY10-15 1 1
CARE FY05-10 1 1 1 1
CARE FY10-15 1 1 1 1
SC FY05-10 1 1 1 1
SC FY10-15 1 1 1 1
India CARE FY02-06 1
CARE FY07-10 1
CRS FY02-06 1
CRS FY07-10 1
Indonesia CARE FY05-08 1
CRS FY05-08 1 1
MC FY05-08 1
SC FY05-09 1
WV FY05-08 1
LAC
Bolivia ADRA FY03-09 1 1 1 1
CARE FY02-09 1 1 1 1
FH FY02-09 1 1 1 1
SC FY02-09 1 1 1 1
Guatemala CARE FY01-08 1 1 1 1
CRS FY01-07 1 1 1 1
CRS FY07-11 1 1 1 1
SC FY00-07 1 1 1 1
SC FY07-11 1 1 1 1
SHARE FY01-07 1 1 1 1
SHARE FY07-11 1 1 1 1
Haiti CARE FY02-08 1 1 1
CRS FY02-08 1 1 1 1
SC FY02-08 1 1
WV FY02-08 1 1 1
Honduras ADRA FY05-09 1 1 1 1
CARE FY01-08 1 1
SC FY05-09 1 1 1 1
WV FY05-09 1 1 1 1

1-15Introduction
Region Country Awardee Program Years
Technical ReviewerMCHN and HIV
AG/IG MCHN HIV WASH INFNicaragua ADRA FY02-09 1 1 1
CRS FY02-09 1 1
PCI FY02-09 1 1 1
SC FY02-09 1 1
TOTAL 28 Countries 101 Programsiii 91 69 41 38 33
i ACDI/VOCA; ADRA (Adventist Development and Relief Agency); CPI (Counterpart International); CRS (Catholic Relief Services); FH (Food for the Hungry); LOL (Land O’Lakes); MC (Mercy Corps); OICI (Opportunities Industrialization Centers International); PCI (Project Concern International); REST (Relief Society of Tigray); SC (Save the Children); TNS (TechnoServe); WV (World Vision).ii The number 1 in a cell in the columns for the four technical reviewers indicates that the reviewer reviewed the documents for that program.iii The Chad/Mali program is counted as two programs, which is why there is a number 2 in the cells for the Chad/Mali program.

1-16 Introduction
Bibliography for Chapter 1Bonnard, Patricia et al. 2002. “Report of the Food Aid and Food Security Assessment: A Review of the Title II Development Food Aid Program.” http://www.fantaproject.org/downloads/pdfs/FAFSA.pdf.
Haddad, Lawrence and Frankenberger, Tim. 2003. Integrating Relief and Development to Accelerate Reductions in Food Insecurity in Shock Prone Areas. Occasional Paper No. 2. Washington, DC: USAID/FFP.
Riely et al. 1999. “Food Security Indicators and Framework for Use in the Monitoring and Evaluation of Food Aid Programs.” http://www.fantaproject.org/downloads/pdfs/fsindctr.pdf.
UNICEF. 1990. Strategy for Improved Nutrition of Children and Women in Developing Countries. New York: UNICEF.
Webb, Patrick and Rogers, Beatrice. 2003. Addressing the “In” in Food Insecurity. Occasional Paper No. 1. Washington, DC: USAID/FFP.

2-1
Second Food Aid and Food Security Assessment (FAFSA-2)
2. Background 2.1 Evolution of the Title II Food
Security Objective Food security has been an important focus of the U.S. Title II food assistance program for more than two decades, beginning with the passage of the 1990 Farm Bill and reinforced by USAID’s 1995 Policy Paper and the USAID/FFP 2006–2010 Strategic Plan. It was not until the major increases in international food prices in 2007 and 2008, however, that this interest spread more broadly within USAID as a whole, and the decision was made to make improved food security within USAID a humanitarian and development priority. With the development of FTF in 2009, food security has become an even greater priority—mainstreamed—within USAID, the U.S. Department of State, and the U.S. Department of Agriculture (USDA).
2.1.1 The 1990 Farm Bill
The 1990 Farm Bill made major changes in the U.S. Public Law 480 food assistance program, starting with the designation of improved food security in the developing world as the program’s overriding objective. The legislation included addressing “famine or other urgent or extraordinary relief requirements” and carrying out “feeding programs” as two of the uses of food under the Title II program. But it went beyond these activities, which are focused on the satisfaction of immediate food needs, to identify a number of broader, longer-term uses for U.S. Public Law 480 food assistance, including combating “malnutrition, especially in children and mothers”; carrying out “activities that attempt to alleviate the causes of hunger, mortality and morbidity”; promoting “economic and community development”; and promoting “sound environmental practices.”
2.1.2 Defining Food Security
In 1990, many still thought of food security in very narrow terms, as dependent primarily on the
availability or supply of food at the national level. The definition of food security used in the Title II legislation was much broader than that, as was the definition that USAID adopted in 1992.
Food security exists when all people at all times have both physical and economic access to sufficient food to meet their dietary needs for a productive and healthy life.10
This definition of food security is founded on three fundamental elements:
• Adequate food availability
• Adequate access to food by all people (i.e., the ability of a household to acquire sufficient quality and quantity of food to meet all household members’ nutritional requirements for productive lives)
• Appropriate food utilization11
The three elements have a hierarchical relationship: Food must be available for households to have access, and a household must have access to food for individual household members to have appropriate food utilization. All three elements of food security must be achieved for food security to be attained.
10 USAID Policy Determination Number 19, April 1992. The definition, adopted by the 1996 World Food Summit, also includes the concepts of safe and nutritious food, and food that meets people’s dietary preferences.11 Policy Determination #19 (1992) also provided the following definitions for these elements: “Food availability: sufficient quantities of food from household production, other domestic output, commercial imports or food assistance; Food Access: adequate resources to obtain appropriate foods for a nutritious diet, which depends on income available to the household, on the distribution of income within the household and on the price of food; Food utilization: proper biological use of food, requiring a diet providing sufficient energy and essential nutrients, potable water and adequate sanitation, as well as knowledge within the household of food storage and processing techniques, basic principles of nutrition and proper child care and illness management.”

2-2 Background
2.1.3 The 1995 USAID Policy Paper
In 1995, USAID issued a major new policy on food aid and food security. This Policy Paper was designed to bring the Title II program into better conformity with the purposes laid out in the 1990 Farm Bill, and the policies set forth in this document guided program development and resource allocations during the FAFSA-2 time period. Key among the changes introduced were a focus on rural areas, the identification of new geographic priorities, sub-Saharan Africa and South Asia, and two program priorities, improving household nutrition and increasing agricultural productivity. The Policy Paper also recognized the importance of complementary resources—especially cash—to the success of development programs in particular and to achieving food security on a sustainable basis. And it encouraged more integration of Title II and USAID Mission programs.
USAID/FFP responded to the 1995 Policy Paper by making a series of major changes in the Title II program, particularly the development program.12 The nature of these changes and their impact were documented in the 2002 FAFSA and are summarized below.
• Geographic priorities. The number of development programs and the percentage of Title II development resources going to sub-Saharan Africa increased significantly between FY 1994 and FY 2001, as USAID/FFP responded to the Policy Paper’s directive to “give more priority to countries in Sub-Saharan Africa where food insecurity is greatest.”
• Technical sectoral priorities. USAID/FFP also placed more priority on “improving household nutrition, especially in mothers and children,” and on “alleviating the causes of hunger, especially by increasing agricultural productivity.” Despite the change in USAID/FFP guidance, the percentage of Title II development resources programmed
12 These and subsequent policy and programmatic changes were communicated to potential Awardees through the Development Program Guidelines that USAID/FFP published each year in advance of the next year’s proposal submissions.
to these two priority sectors—agriculture and household nutrition—remained fairly constant, at 80 percent, between FY 1998 and FY 2001. The relative priority of these two sectors did shift, however, with more attention being devoted to agricultural activities, as measured by changes in the percent of programs with agricultural components and an increase in the proportion of resources going to agricultural activities. Some of this shift, as the FAFSA pointed out, was probably due to the increase in resources going to programs in Africa, many of which were heavily focused on agriculture (only 55 percent of the African development programs included an HN component in FY 2001, for example, while 87 percent included an AG component.)
• Managing for results. USAID/FFP also began to place much greater emphasis on monitoring the food security impacts of the Title II programs in response to the Policy Paper. Concrete steps taken to focus more attention on program results included the development of a strategy and a set of “generic” performance indicators and the provision of technical assistance (TA) and training. As the FAFSA also pointed out, however, there was still a need to reduce the variability in how indicators were defined, measured, and reported; to provide more guidance on data collection methods, analysis, and use; and to improve monitoring of program management.
• Expanding complementary activities. According to the FAFSA, much of the success in the HN and AG/NRM components, within the development program, was achieved through increases in complementary inputs, including TA and training, financed largely by monetization. The need for funds to support these important complementary activities resulted in a dramatic increase in monetization during this time period, from less than one-third of the total commodities used in the program in FY 1994 to more than three-quarters in FY 2001.
• Integration with Mission strategies. The Policy Paper put considerable emphasis on the integration of food aid resources with other

2-3Background
development resources (other USAID resources in particular). The FAFSA found that some progress was made in integrating the Title II programs with Mission strategies, but more at the conceptual level than in terms of the operational integration of Mission and Title II resources.
• Sustainability. The question of the sustainability of program activities and impacts became much more important as the Title II development program shifted its emphasis from feeding people in the short run to trying to improve the food security of the more food insecure populations over the medium and longer term.
• Strengthening food aid partner capacity. The Awardees, with USAID/FFP assistance, took a number of steps to improve the food security focus of their programs and to improve their ability to manage for results. These efforts were important, since the changes introduced by the Policy Paper required major changes in the way development programs had to be designed and implemented, as well as in the technical quality of the Awardee staff.13
• Strengthening the food aid partnership. USAID/FFP made progress in strengthening its partnerships with its internal partners (i.e., USAID’s regional Bureaus and Missions) and its external partners (primarily the Awardees). However, the FAFSA also concluded that additional improvements were needed in the areas of transparency, consistency, flexibility, communications, and consultation.
2.1.4 The 2006–2010 USAID/FFP Strategic Plan
The environment in which the Title II program was operating had changed significantly by the early 2000s, around the time that the initial work began on the 2006–2010 USAID/FFP Strategic Plan. New challenges that USAID/FFP had to deal with, according to the Strategic Plan, included “the increased frequency and severity of natural and man-made disasters; the heightened diplomatic, military and humanitarian demands on the United States; and the destabilizing potential of HIV/AIDS and the persistent high levels of corruption, conflicts and refugees and internally displaced persons” (USAID/FFP, 2005, p. 12). The integration of USAID/FFP into DCHA also brought changes, including the decision that fragile, failed, and failing states should be the organizing principle for the Bureau. This decision also raised the question of how the Title II program, which typically had worked in two basic types of environments—emergencies and non-emergencies (or development)—fit within this new optic.
The USAID/FFP Strategic Plan, which was developed in close collaboration with major stakeholders, the Title II NGO community in particular, included much that was new conceptually, strategically, and operationally.14 The decision to have a single SO rather than separate objectives for the emergency and development programs was a major one, as was the decision to couch this objective in terms of reducing food insecurity—“Food insecurity in vulnerable populations reduced”—rather than increasing food security. This new emphasis on the “in” in food insecurity was done deliberately to put the focus where it should be, as the argument went, on those populations already food insecure or vulnerable to food insecurity. These are the target groups for the program: populations that are at risk of food insecurity because of their physiological status, which includes pregnant
13 Examples of USAID’s efforts to strengthen the capacity of the Awardees included the provision of Development Assistance (DA)-funded Institutional Support Grants (ISGs), Institutional Support Assistance (ISA) grants, and Title II-funded 202(e) grants to the Awardees to strengthen field and headquarters offices and to support the Food Aid Management (FAM) Unit; technical support in program design and implementation, M&E, and dissemination of best practices through the USAID Office of Population, Health, and Nutrition’s IMPACT and FANTA projects; and a partnership between the DCHA Environmental Office and the FAM Environmental Working Group for TA and training to the Awardees in environmental review and compliance.
14 A number of the new concepts reflected in the USAID/FFP Strategic Plan were drawn from the two background papers that were produced under FANTA’s auspices by Webb and Rogers (2003) and Haddad and Frankenberger (2003).

2-4 Background
and lactating women and children under two; socioeconomic status; or physical security (see Box 2.1).
This formulation also put much greater emphasis on reducing risk and vulnerability to decrease the likelihood of shocks; decrease the damage caused by shocks when they do occur; and increase the capacity of communities, households, and individuals to cope with shocks. To provide intellectual support to this new emphasis on risks and vulnerability, the Strategic Plan also introduced a new conceptual framework that added a fourth pillar to the basic food security framework that
makes explicit the risks (economic, social, health, and political, as well as the risk of natural shocks) that impede progress toward improvements in food availability, access, and utilization (see Figure 2.1). Bringing the emergency and development programs together under a single SO was expected to facilitate synergies between emergency and development interventions and encourage program designers and implementers to think more in terms of the relief to development continuum.
The Strategic Plan also introduced an important new dimension to the work of USAID/FFP through its first IR—“FFP’s global leadership in reducing food insecurity enhanced”—in addition to its more traditional focus on the field, which is captured in the second IR—“Title II program impact in the field increased.” The language that was used to describe the supporting activities was also changed to focus on protecting and enhancing “human capabilities” (IR 2.1), “livelihoods capacities” (IR 2.2), and “community resiliency” (IR 2.3), and increasing “community capacity to influence factors (decisions) that affect food security” (IR 2.4) (see Figure 2.2). This is in contrast to the more traditional focus on technical sectors—AG, NRM, MCHN, and WASH—or in terms of the three elements of food security—availability, access, and utilization.
The Strategic Plan also committed USAID/FFP to several key approaches that built on and reinforced approaches first introduced in the 1995 Policy Paper. These are summarized below.
• Using food in direct distribution programs. The wording in the Strategic Plan made it clear that USAID/FFP expected the direct distribution of food to play an important role under the new strategic framework. Food, according to the Strategic Plan, “will be used to have an immediate impact—protecting lives and maintaining consumption levels—while also contributing to longer-term impacts—enhancing community and household resilience to shocks, helping people build more durable livelihood bases (enhancing assets, resources and infrastructure), and enhancing the capabilities of individuals through improvements in health, education and nutrition.”
Box 2.1. Definitions Related to Target Groups
• Vulnerable populations are people that are at risk of food insecurity because of their physiological status, socioeconomic status, or physical security; also people whose ability to cope has been temporarily overcome by a shock.
• Physiological status includes people that are undernourished, suffering from HIV/AIDS, pregnant and lactating women, and children under two years of age.
• Socioeconomic status includes the poor (those that by definition do not have sufficient income to purchase an adequate diet and other basic necessities) as well as those that suffer from economic and social discrimination due to ethnicity, gender, or other characteristics, and many that live in environmentally marginal regions.
• Physical security includes refugees, internally displaced persons, and victims of war.
Source: USAID/FFP Strategic Plan, p. 26.

2-5Background
Figure 2.1. An Expanded Conceptual Framework for Understanding Food Insecurity
Strategic Goal
Food Security Outcomes
Adequate Food Availability
ResourcesNatural resource sustainability,productive assets, secure livelihoods
ProductivityLabor productivity, livelihood stability and diversification
IncomeMarket integration, purchasing power, savings potential, credit access
Consumption Equity in intra-household food distribution, food quality, quantity, and diversity
Human CapitalNutrition, health and sanitation, maternal/child care, dignity, education, skills,political voice, capacity, indigenous knowledge
Desired Program Outcomes
Food Security Risks to be Tackled
Food Insecurity
Food Security
Adequate Food Access
Appropriate FoodUtilization
EnhancedCommunity Resiliency
EnhancedLivelihood Capacity
Enhanced Human Capital
Economic Risks Income fluctuation, collapsed terms of trade, savings depletion, employment insecurity, price volatility, high transaction costs, information asymmetry, inflation
Social and Health Risks Epidemics, HIV, widespread untended malnutrition, risk perceptions, corruption, social disintegration, predatory extraction by armed forces, conflict, ethnic and social discrimination
Natural Shocks Climatic shocks, natural resource mining and degradation, yield volatility, asset depletion, neglect of natural hazard mitigation
Political Risks Poor governance (national and local), lack of legal recourse, lack of accountability, inadequate provision of services and creation of public goods, adverse regulations, lack of recognition of human rights, political instability, ineffective institutions
Source: USAID/FFP Strategic Plan, p. 20.

2-6 Background
Figure 2.2. USAID/FFP’s Strategic Framework for 2006–2010
IR 1: Global leadership in reducing food insecurity enhanced
Strategic ObjectiveFood insecurity in vulnerable populations reduced
Contributing Result:* Country enabling environments conducive to reduced food insecurity promoted
IR 1.1: FFP’s role in U.S. and multilateral policy development increased
IR 1.2: National and global partnerships strengthened
IR 1.4: Technical excellence and innovation supported
IR 1.3: Evidence base for more effective policy and program approaches improved
IR 2: Title II impact in the field increased
IR 2.4: Community capacity to influence factors (decisions) that affect food security increased
IR 2.3: Community resiliency protected and enhanced
IR 2.2: Livelihood capacities protected and enhanced
IR 2.1: Human capabilities protected and enhanced
IR 1.5/2.5: Timely and efficient program management achieved
Contributing Result:* Improvements in governance and conflict mitigation in a broader country context achieved
KEY
FFP responsible
*Other USAID officesor partners responsible
Source: USAID/FFP Strategic Plan, p. 24.

2-7Background
• Combining food with other resources. The Strategic Plan recognized, as did the 1995 Policy Paper, that distributing food by itself was of limited value in reducing food insecurity, even in emergency situations. “Food,” the Strategic Plan concluded, “needs to be combined with other non-food (cash and in-kind) resources…to insure that it has an impact beyond just feeding people.” To further emphasize this point, the Strategic Plan included in its elaboration of illustrative activities detailed information on the use of non-food assistance in conjunction with food assistance. The Strategic Plan also recognized that “mobilizing sufficient resources, whether from FFP’s expanded 202(e) authority, monetization, and/or increased access to other resources through improved collaboration and integration with other USAID and other donor programs,” was going to be a major challenge.15
• Targeting resources to the vulnerable. The Strategic Plan continued USAID/FFP’s commitment to target Title II resources to the most vulnerable countries and communities within these countries. In the Strategic Plan, USAID/FFP also committed itself to developing new criteria to identify these countries and populations which are more consistent with the Strategic Plan focus on food insecurity and vulnerability.
• Building capacity. Enhancing the capacity of vulnerable individuals, households, and communities was a central focus of the Strategic Plan, as was the continued commitment to helping build the capacity of USAID/FFP’s partners in the field. To help strengthen the capacity of its partners (including local cooperators), USAID/FFP indicated that it planned to use a combination of approaches, as in the past, including funding of individual Awardee grants, development of guidance and standards, identification of best practices, and training.
15 See FFPIB 11-01, of October 15, 2010, for additional information on Section 202(e) and eligible uses.
Box 2.2. Specific Strategic and Streamlining Activities Identified in the USAID/FFP Strategic Plan
• Developing a new set of criteria for identifying countries, areas, and populations in greatest need of food aid resources, and the level and type of resources needed, and using them to improve the allocation of Title II resources.
• Identifying strategic management countries for the Title II development program and developing and implementing a strategy for enhancing the impact of the Title II program in these countries, including by focusing more staff time and attention on the programs in these countries, developing food security plans in these countries, and integrating food security concerns and objectives into Mission strategic plans.
• Integrating the FEWS NET program into USAID/FFP, expanding its geographical coverage, and supporting improvements in early warning and vulnerability assessment techniques.
• Reorganizing the Washington Office; replacing the Emergency and Development Programs Divisions with two regional divisions to better integrate the emergency and development assistance programs; and strengthening the regional offices, building their surge capacity, and providing them with expanded and redelegated authorities.
• Adding a section on the Title II program to USAID’s Automated Directive Systems (ADS) to ensure that Title II programming is better integrated with programming in the rest of USAID.
• Reviewing and updating USAID/FFP’s information technology (IT) systems to create a management tool that provides accurate, user-friendly, secure, web-based information.
• Reducing time cycles for USAID/FFP operations through the use of procedure manuals, training and appropriate staffing, and improvement in results reporting guidelines and reporting requirements.

2-8 Background
• Measuring impact and learning what works. The Strategic Plan also continued USAID/FFP’s commitment to manage for results. Specific activities identified included activities to assess the impact of the program on the achievement of the first Millennium Development Goal (MDG) to reduce the prevalence of underweight children under five and to improve the measures of food access and community coping capacity. The Strategic Plan also committed USAID/FFP to putting more emphasis on knowledge management—learning more about what works and why and “using this knowledge to influence policy and program impact in the field.”
USAID/FFP also used the Strategic Plan to outline its intention to adopt a more strategic approach to how it manages its program and to streamline its management processes. USAID/FFP, as the Strategic Plan pointed out, manages the largest budget of any office in USAID, regularly obligating more than US$1 billion each year. Since USAID/FFP programs commodities as well as dollars, the management of these resources also comes with many regulations and complications that other USAID offices do not have to deal with. These resources also have to be programmed with and through other agencies, such as USDA. The USAID/FFP staff also work with a wide range of programs, from short-term disaster responses to longer-term development activities. All of this puts a unique and heavy burden on USAID/FFP and its staff.
2.2 The Current Operating Environment
The environment in which the Title II development program is operating has changed since 2003 (the beginning of the FAFSA-2 time period). Many of the challenges that USAID/FFP faced at the time its Strategic Plan was being written still exist, but the severity of some challenges has lessened and new challenges have arisen, as have new opportunities.
2.2.1 The Development Challenge: Food Insecurity Is a Continuing Problem
For the United States, reducing the number of people in the world suffering from hunger and undernutrition and threatened by famine continues to be “both a humanitarian concern and a development challenge”—a point that was also made in the Strategic Plan (p. 12).
• Crises resulting from human conflict and natural disasters will continue to place additional pressure on food resources during a time of increasing budget constraints. The number of people displaced in their own countries due to conflict and violence increased from more than 17.4 million in 1997 to 27.5 million in 2010, and the displacements are increasingly prolonged. The number of natural disasters reported each year during the 2000s also continued at more than double the rate in the 1980s and 1990s, and it is predicted that the number and scale of natural disasters will continue to increase. These trends are reflected in the WFP Appeal funding requirements, which also increased during the 2000s, from just under US$1 billion in 2000 to US$6.8 billion in 2010.
• Famine, war, and drought in the Horn of Africa are in the headlines again,16 but there have been improvements in other areas of Africa since the early 2000s. The large-scale civil wars in Africa of the 1990s and 2000s have ended, and political stability has improved in former conflict countries. Title II transition/development programs were initiated in Liberia and Sierra Leone during the FAFSA-2 time period as their civil wars ended and the countries began to return to democracy, and the Title II development programs in Uganda were moved to the northern area of the country as the fighting there began to recede. Economic growth also resumed in Africa during the FAFSA-2 time period, and advances in preventing and treating
16 http://action.usaid.gov/index.php. Accessed June 22, 2012.

2-9Background
HIV contributed to reducing child mortality and the burden of the disease in countries most affected by the pandemic.
• The food security situation in the world worsened toward the end of the FAFSA-2 time period, initially as a result of the steep rise in global food prices that began in 2007. These rapid increases in food prices led to food riots and political changes in some countries, but they also shocked many in the donor community and helped put the issue of food insecurity back on the international agenda. Although food prices did start falling in the second half of 2008, about the time that the global economic crisis began to accelerate, the combination of still-high food prices and the economic crisis led to a significant increase in the number of undernourished people in the world—from 852 million in 2000–2002, just before the beginning of the FAFSA-2 time period, to 1.02 billion in 2009. According to FAO (2010, p. 8), this meant that there were more undernourished people in the world in 2009 than at any time since 1970, and a worsening of the adverse trends that were present even before the food price and economic crises. Small, import-dependent economies, especially in Africa, were most negatively affected by the food and economic crises. The poor, who spend proportionately more of their household budgets on food, were also most adversely affected, including many of the rural poor that are net purchasers of food.
• Higher and volatile food prices are likely to continue, with adverse effects on food security in both the short and longer term. On the demand side, populations will continue to grow, demand from consumers in rapidly growing economies will increase, and further growth in biofuels will place additional demand on food systems. Challenges on the supply side include increasingly scarce natural resources in some regions, climate change, and declining rates of growth in yield for some food staples. Food price volatility may also increase due to
stronger linkages between the agricultural and energy markets and an increased frequency of weather shocks. Higher food prices can mean more incentives to invest in agriculture, which could help improve food security in the longer term. But, in the short run, the benefits of higher prices are likely to be captured by better-off farmers, who have access to more land and other resources, with the urban and rural poor, many of whom are net purchasers of food, the losers. Price volatility can also make smallholder farmers and poor consumers increasingly vulnerable to poverty and food insecurity. Since food can represent a large share of household budgets for poor urban and rural consumers (as well as a large share of the incomes of many small farmers), large price changes can have significant effects on their real incomes. This means that even short episodes of high prices for consumers or low prices for farmers can lead to sales of productive assets at low prices, further decapitalizing already poor households. Resource-poor farmers are also less likely to invest in measures to raise their productivity when price changes are frequent and unpredictable.
• Meeting the MDGs remains a challenge, especially for many of the Title II priority countries. The first MDG, to “eradicate extreme poverty and hunger,” has two targets: to halve the number of people living in extreme poverty between 1990 and 2015 and to halve the proportion of people suffering from hunger.17 According to a September 2011 Progress Report on the MDGs from the Center for Global Development (Leo and Thuotte, 2011), low-income countries have improved on average on four core MDG indicators: extreme poverty, hunger, HIV/AIDs, and water. Five of the Title II
17 The poverty reduction target is being measured using World Bank data on the proportion of people living on less than US$1.25 per day. The hunger reduction target is being measured using two indicators: the prevalence of underweight children under five years of age (UNICEF-FAO data) and the proportion of the population below a minimum level of dietary energy consumption (FAO data on undernourishment).

2-10 Background
priority countries—Burkina Faso, Ethiopia, Mali, Mozambique, and Niger—were on track to meet both their poverty and their hunger targets by 2015, and four—Burundi, Guatemala, Madagascar, and Zambia—were not on track (see Table 2.1). Four other countries (three for which poverty data were not available)—DRC, Haiti, Liberia, and Uganda—were also not on track to meet their hunger goals.
Progress appears to be worse with respect to the nutrition indicators, according to the United Nations Standing Committee on Nutrition 6th Report on the World Nutrition Situation (United Nations System Standing Committee on Nutrition [UNSCN], 2010). “Child underweight and stunting prevalence are falling significantly in most countries,” according to this report, “except in Africa…Overall African countries show
insufficient progress to achieve MDG1, whereas many Asian countries as well as Latin American (and Caribbean) countries are on track to achieve it or have already achieved it.”
• Progress was made in controlling the threat of HIV during the FAFSA-2 time period. “On the cusp of the fourth decade of the AIDS epidemic, the world has turned the corner—it has halted and begun to reverse the spread of HIV (MDG 6.A)” (UNAIDS, 2010). While the challenges that HIV can pose to household food security described in the USAID/FFP Strategic Plan remain valid, the impressive progress in controlling the epidemic has reduced the magnitude of the threats foreseen at the time of the FAFSA in 2002. As described in the UNAIDS Report on the Global AIDS Epidemic (2010), governments, donor agencies, and the private sector invested an unprecedented amount in the AIDS response during the FAFSA-2 time period, e.g., US$15.9 billion in 2009, more than 25 percent of which came from the U.S. government. According to the UNAIDS 2010 report, “HIV prevention works—new HIV infections are declining in many countries most affected by the epidemic.” The incidence of HIV fell more than 25 percent in 33 countries from 2001 to 2009, including 22 countries in sub-Saharan Africa. The biggest epidemics in sub-Saharan Africa have either stabilized or declined. More than 5 million people are receiving therapy in low- and middle-income countries, a 13-fold increase since 2004 that is greatly extending and improving lives. Fewer HIV infections and AIDS-related deaths (a 14 percent decline from 2004 to 2009) and less illness affecting work capacity and livelihoods together have had a favorable impact on food security. Nevertheless, HIV continues to be a major concern in a number of the USAID/FFP priority countries in Africa, particularly Southern Africa, where an estimated 11.3 million people were living with HIV in 2009, up nearly one-third from the number a decade earlier. Access to HIV prevention, treatment, care, and support are far from universal, and are heavily dependent on international assistance. Ten million people living with HIV (PLHIV) eligible for treatment are still in need according to the
Table 2.1. USAID/FFP Priority Countries’ Progress with Respect to the MDG Poverty and Hunger Targets in 2011
Priority Countries
Poverty (P) and Hunger (H)
Off TrackSome
Progress On TrackAfghanistan H
Bangladesh P H
Burkina Faso P H
Burundi P H
Chad H
DRC H
Ethiopia P H
Guatemala P H
Haiti H
Liberia H
Madagascar P H
Malawi P H
Mali P H
Mauritania H
Mozambique P H
Niger P H
Sierra Leone P H
Sudan H
Uganda H P
Zambia P H

2-11Background
Joint United Nations Programme on HIV/AIDS (UNAIDS) (2010).
• Urban food insecurity is growing. As noted in the USAID/FFP Strategic Plan, the developing world is continuing to urbanize, and the number and proportion of urban poor and food insecure are increasing rapidly, including in sub-Saharan Africa. Poverty still remains primarily a rural problem in many of the Title II priority countries, however, extreme poverty in particular.
2.2.2 The Foreign Assistance Environment—Changes and Challenges
2.2.2.1 Stakeholder Support
At the beginning of the FAFSA-2 time period, food assistance still enjoyed strong support from a broad coalition of political, agricultural, commercial, and civil society interests within the United States. Supporters included farmers; other agricultural interests, such as food processors and producers of nutrient supplements; transporters and shippers; private voluntary organizations (PVOs); and the American public more generally. Food aid also represented the major source of resources available within the U.S. government to devote to the problem of reducing food insecurity in the world. Attitudes were already changing elsewhere in the world at the time the Strategic Plan was being developed, however, with other donors becoming less supportive of food aid as a development assistance tool. These critics argued that food aid was an inferior resource, less efficient than cash, and more likely to distort markets and local economies. These changes in attitudes were reflected in the positions that other donors took in a number of international forums and in a reduction in overall food aid donations.
Criticism of food aid as a development tool—the use of monetization,18 in particular—began to increase in the development community in the United States in the mid-2000s. Most of this criticism
centered on the inefficiency of food in comparison to cash, the fact that the amount of money that the Awardees receive from the sales (monetization) of the food commodities does not cover the costs of getting them to these markets, and worries about the potential for these sales to have adverse impacts on the markets in these countries and on local production.
CARE, one of the bigger players in the Title II development program, announced in 2007 that it was no longer going to monetize food aid, because it was too expensive to manage and because of its potential adverse impacts on development in the countries where the food was being monetized.19 Using cash to support food security programs, it argued, was more cost-effective than monetization (CARE, 2006). A number of other major assessments of monetization have been published by prominent organizations since then, including the Partnership to Cut Hunger and Poverty in Africa (Simmons, 2009), the Chicago Council on Global Affairs (Barrett and Lentz, 2009), the U.S. Government Accountability Office20 (GAO) (GAO, 2011), and the Center for Global Development in cooperation with the Center for American Progress (Norris and Veillette, 2011). Recommendations from these assessments ranged from making improvements in how the monetization process is handled, with better data and analysis done before programs are undertaken and more systematic, independent M&E of programs as
18 Monetization is a practice that involves the sale in a recipient country of the food aid commodities that have been bought in and shipped from the United States.
19 Bangladesh is the only country where CARE is continuing to use the proceeds from monetization to support its Title II development program, and that is because the commodities are sold to the Bangladesh government, which uses them in its own direct feeding programs.20 The GAO recommendations focused on steps that USAID and USDA could take to increase the level of cost recovery and reduce the likelihood of adverse market impacts, including: (1) jointly developing an agreed-upon benchmark or indicator to determine “reasonable market price” for sales of U.S. food aid for monetization; (2) monitoring food aid sales transactions to ensure that the benchmark set to achieve “reasonable market price” in the country where the commodities are being sold is being achieved, as required by law; (3) improving market assessments and coordinating their development in countries where both USAID and USDA may monetize; and (4) conducting market impact evaluations after monetization transactions have taken place to determine whether they caused adverse market impacts.

2-12 Background
they are being implemented (Partnership to Cut Hunger and Poverty in Africa and GAO) to limiting monetization under the Title II development program and looking for other sources of funding to replace the resources lost to the Awardees (Chicago Council) to eliminating monetization entirely (Center for Global Development and Center for American Progress).
2.2.2.2 Legislation and the Current Budget Climate
The U.S. Congress, on the other hand, has continued to be supportive of the Title II development programs and monetization, at least through the 2008 Farm Bill (which was renamed the Food for Peace Act [FFPA] in 2008). The Title II program, which has been authorized by a series of farm bills, has a legislative history that is very different from the rest of the foreign assistance program. The program is under the jurisdiction of the agricultural committees in Congress and its budget is included in USDA’s budget, although the budget totals are now included in the International Affairs (150) account.
In the 1990 Farm Bill, which introduced a food security focus into the program, Congress also called for increased coordination and integration of food aid with U.S. Development Assistance (DA) and facilitated this integration by giving USAID sole responsibility for managing the relief and economic development programs (i.e., Titles II and III of Public Law 480). Congress also added a number of provisions, some at the behest of stakeholders, to support and strengthen the development programs. This included the establishment of a yearly minimum commodity tonnage for the program as a whole and a second minimum (referred to as the sub-minimum) for the quantity of commodities that are required to be used in the non-emergency (development) programs each year, both of which could be waived by the USAID administrator. The process of monetization was also introduced into the program in the 1986 Farm Bill as a means of making additional cash available for transporting and handling commodities. The 1990 Farm Bill increased the monetization minimum to 10 percent of the total value of non-emergency
commodities and expanded the use of these proceeds to include income generation, health, nutrition, and agricultural activities. The 1996 Farm Bill raised the minimum to 15 percent. The current minimum total commodity tonnage for the whole of the program is set at 2.5 million metric tons (MT) of agricultural commodities/year, with at least 1.875 million MT/year to be used for non-emergency (development) assistance.
The 2008 FFPA included two new provisions, one that created a new mandate for the development program and a second that strengthened USAID/FFP’s oversight and M&E activities. The new mandate requires that at least US$375 million be used for non-emergency food assistance beginning in FY 2009 and that this amount must increase by US$25 million per year until FY 2012. It has also been referred to as a “hard” mandate, because it can be waived only “if an extraordinary food emergency exists and the President determines, and informs Congress, that no other food or financial resources are available to meet the emergency.” The program oversight and M&E activities envisioned in the FFPA include “in-country monitoring, evaluation of food aid impacts and monetization activities, identification and implementation of best practices, early warning systems to prevent famine, and upgrading of information technology (IT) systems.”21 The FFPA also authorized up to US$22.0 million in funds each year to be used for oversight of the Title II development programs from FY 2009 through FY 2012.22
2.2.2.3 The Executive Branch: New Priorities and Initiatives
The “F” process. The Office of U.S. Foreign Assistance Resources (F) was created in the U.S. Department of State in June 2006 to focus the use
21 The 2008 Farm Bill Side-by-Side—Title III: Trade. 2008. http://www.ers.usda.gov/FarmBill/2008/Titles/TitleIIITrade.htm. Accessed July 15, 2011.22 The legislation also provided that up to US$2.5 million of the US$22.0 million could be used for upgrading IT systems and up to US$8.0 million for famine and early warning systems, but only if at least US$8.0 million is provided for that purpose under the Foreign Assistance Act of 1961.

2-13Background
of foreign assistance on achieving the Secretary’s transformational diplomacy goal. State/F was given responsibility for developing, among other things, a coherent, coordinated USG foreign assistance strategy; multi-year, country-specific assistance strategies and annual country-specific operational plans; consolidated policy, planning, budget, and implementation mechanisms and staff functions required to provide leadership to USAID and Department of State foreign assistance; and guidance for foreign assistance delivered through other USG agencies.
The development of a standard Foreign Assistance Framework with a common goal, objectives, program areas, elements, and indicators was also part of this process (see Box 2.3). The current administration is in the process of rebuilding USAID’s policy, planning, and budgeting responsibilities, but USAID programs, including USAID/FFP, are still required to report on the Standard Foreign Assistance Indicators.
Food security. The U.S. government took swift action in response to the global food price crisis in 2007–2008 by providing more than US$1.5 billion in food and DA to meet immediate humanitarian needs and to stimulate increases in agricultural productivity in developing countries hard hit by the food price increases. These investments served as the foundation for FTF, which is one of several Presidential Initiatives (another being the GHI, which is discussed in the following section).
FTF is the U.S. component of a global initiative launched by the President at the London Summit of the G20 in 2009. Its aims are to promote a comprehensive approach to food security by accelerating economic growth and raising incomes through greater agricultural productivity, increasing incomes and market access for the rural poor, and enhancing nutrition. U.S. government efforts are driven by country-owned strategies and coordinated with the efforts of other donors and stakeholders. Other stakeholders include academia, foundations, multilateral institutions, NGOs, and the private sector. The global part of the initiative also includes the establishment of the Global Agriculture and
Food Security Program (GAFSP), a multilateral trust fund based at the World Bank designed to help poor farmers grow, sell, and earn more. GAFSP was launched in April 2010 with commitments from the United States, Canada, South Korea, and the Bill and Melinda Gates Foundation. At an earlier 2009 G8 Summit in L’Aquila, Italy, the President also pledged at least US$3.5 billion in assistance over three years, which helped leverage more than US$18.5 billion from other donors to support the common approach. The United States was also instrumental in the development of five key principles adopted at the Rome Food Security Summit in November 2009 (see Box 2.4), which provide the foundation for common action.
USAID, which is the lead USG agency for FTF, has created a new BFS to spearhead the program (U.S. State Department, 2010). But the intent is to also make good use of the expertise in other USG agencies, including the Department of State, the Peace Corps, the Millennium Challenge Corporation (MCC), the Treasury Department, the U.S. Trade Representative, the Overseas Private Investment Corporation (OPIC), the U.S. African Development Foundation, and USDA. Investments
Box 2.3. U.S. Foreign Assistance Framework
Goal: Helping to build and sustain democratic and well-governed states that will respond to the needs of their people and conduct themselves responsibly in the international system.
Objectives:
• Peace and Security
• Governing Justly and Democratically
• Investing in People
• Economic Growth
• Humanitarian Assistance
Source: http://www.state.gov/f/indicators/.

2-14 Background
by USAID in FTF, which vary by country depending on each country’s priorities and its own and other donor and key actors’ investments, are addressing the key elements of food insecurity: food availability and access through investments in agricultural productivity, agribusiness, and market development, and the equitable distribution and control over productive resources; food utilization, through a multifaceted approach to nutrition; and food stability by ensuring that effective mechanisms are in place to address chronic food insecurity. More information on the expected results of the initiative is provided in Box 2.5.
FTF includes 19 focus countries—Bangladesh, Cambodia, Ethiopia, Ghana, Guatemala, Haiti, Honduras, Kenya, Liberia, Malawi, Mali, Mozambique, Nepal, Rwanda, Senegal, Tajikistan, Tanzania, Uganda, and Zambia—and 5 regions—Asia, Central America and the Caribbean, East Africa, West Africa, and Southern Africa.23 Ten countries were included in both FTF and the Title II development program focus country lists as of the beginning of 2011—Bangladesh, Ethiopia, Guatemala, Haiti, Liberia, Malawi, Mali, Mozambique, Uganda, and Zambia—and multi-year FTF strategies had been developed and formally reviewed for all 10 of these countries by the end of 2011. These five-
23 See http://feedthefuture.gov/sites/default/files/ftf_progress_report_2012.pdf. Accessed February 20, 2013.
Box 2.4. Rome Principles for Advancing Global Food Security
• Invest in country-owned plans that support results-based programs and partnerships, so that assistance is tailored to the needs of individual countries through consultative processes and plans that are developed and led by country governments
• Strengthen strategic coordination to mobilize and align the resources of the diverse partners and stakeholders—including the private sector and civil society—that are needed to achieve our common objectives
• Ensure a comprehensive approach that accelerates inclusive agricultural-led growth and improves nutrition, while also bridging humanitarian relief and sustainable development efforts
• Leverage the benefits of multilateral institutions so that priorities and approaches are aligned, investments are coordinated, and financial and technical assistance gaps are filled
• Deliver on sustained and accountable commitments, phasing in investments responsibly to ensure returns, using benchmarks and targets to measure progress toward shared goals, and holding ourselves and other stakeholders publicly accountable for achieving results.
Source: USAID Feed the Future Guide, 2010, p. iv.
Box 2.5. Expected Results of the FTF Initiative over Three Years
The FTF initiative aims to:
• Assist 18 million vulnerable women, children, and family members—mostly smallholder farmers—to escape hunger and poverty.
• Reach 7 million children with highly effective nutrition interventions to prevent stunting and child mortality.
• Generate US$2.8 billion in agricultural gross domestic product in target regions through research and development activities.
• Leverage US$70 billion in private investment in agriculture that improves sustainable market opportunities and linkages with smallholder farmers.
Source: USAID Policy Framework 2011–2015, p. ii.

2-15Background
year planning documents represent a coordinated, whole-of-the-U.S.-government approach to addressing food security in these countries/regions that align with and support country priorities.
2.2.2.4 Health and Nutrition
Maternal and child survival. USAID has had a maternal and child survival focus in the health sector for the past several decades, supporting interventions that have successfully prevented the major causes of death of women in pregnancy and childbirth, newborns, and children in the first five years of life (USAID, 2009 and 2011a). A renewed consensus on and push for scaling up high-impact interventions came with the review of evidence on child survival interventions feasible for delivery at high coverage in low-income settings, and the quantification of how many children’s lives could be saved (Jones et al., 2003). By design, the health components of Title II programs work on many of the same high-impact maternal and child health (MCH) interventions as other USAID programs, focusing on those that are community based or for which coverage can readily be increased by assisting local health systems with outreach, referrals, and supplies.
HIV. The implications of the HIV pandemic for food security were noted as a concern in the 2002 FAFSA. In 2003, the U.S. government stepped up its response to the pandemic exponentially through the US$3 billion/year U.S. President’s Emergency Plan for AIDS Relief (PEPFAR), which was reauthorized in 2008 for five years and US$46 billion total.24 This program has greatly increased access to prevention, care and support, counseling and testing, medications for HIV treatment and prevention of mother-to-child transmission of HIV (PMTCT), as well as nutrition assessment, counseling, and support (NACS). The USAID/FFP and PEPFAR “HIV and Food Security Conceptual Framework,” issued in 2007 for coordinating their activities and mutual objectives, encouraged Title II programs
to provide food and livelihood assistance to HIV-affected vulnerable families, while PEPFAR targeted its resources for food and NACS to specific priority target groups. For the past five years, PEPFAR has increasingly funded its own nutrition and food security activities. It now has an earmark for nutrition of US$130–US$150 million annually. (See Chapter 8 on HIV for more discussion on PEPFAR and joint programming with Title II.) The United States (through PEPFAR) is also a major contributor to the Global Fund to Fight AIDS, Tuberculosis and Malaria (Global Fund), which was launched in 2002.
The Global Health Initiative. The ongoing GHI, which was launched in 2009 with a US$63 billion pledge for six years, is the latest chapter in the U.S. government’s commitment to global health.25 The GHI has an ambitious agenda for achieving major health outcomes using a new business model (see Box 2.6 and Box 2.7). It moves away from a vertical approach to specific diseases toward an integrated service delivery system that is community based as much as possible. The GHI is a woman- and girl-centered approach that emphasizes improving the health of women, newborns, and children. Strengthening health systems is a priority for ensuring sustainability. While the GHI applies everywhere, the U.S. government assists health programs in developing countries. In its initial phase, eight “GHI Plus” countries26 will receive
24 This includes funding for malaria and tuberculosis (TB). There were originally 15 focus countries, but support now goes to 32 countries and 2 regional programs. The original 15 countries continue to receive a greater share of the funding. http://www.pepfar.gov. Accessed November 14, 2011.
25 The GHI budget includes the funding for PEPFAR. http://www.ghi.gov. Accessed November 14, 2011.26 Bangladesh, Ethiopia, Guatemala, Kenya, Malawi, Mali, Nepal, and Rwanda.
Box 2.6. Global Health Initiative: New Business Model
• Collaborate for impact
• Do more of what works
• Build on/expand existing platforms
• Innovate for results
Source: http://transition.usaid.gov/ghi/factsheet.html, accessed November 11, 2011.

2-16 Background
additional support for intense implementation and learning to inform the work of all countries. Five of these countries are also USAID/FFP focus countries, creating special opportunities for synergy. Title II program experience with integration at the community level provides valuable lessons and promising practices to shorten the learning curve for new GHI activities. As part of the GHI, USAID has assisted a planning process in 29 countries; this process is known as BEST—Best Practices at Scale in the Home, Community, and Facilities: An Action Plan for Smart Integrated Programming in Family Planning, Maternal and Child Health, and Nutrition.27
Nutrition. While nutrition is part of USAID’s MCH activities, it was not a high budget priority for USAID DA during the FAFSA-2 time period, and was underfunded relative to maternal health and child survival interventions. The main funding for nutrition during that time came from PEPFAR for HIV-related nutrition activities. Limited funding for nutrition from other parts of USAID made the USAID/FFP Strategic Plan that directs major resources and gives high priority to nutrition all the more important. A boost was given to the importance of nutrition programs by the 2008 maternal and child undernutrition series in The Lancet, which lays out the magnitude and consequences of the problem (Black et al., 2008). The authors in the series make it clear that there is ample evidence of the effectiveness of a package of direct nutrition interventions that reduce child mortality, improve nutrition outcomes, and protect human capital
27 The following BEST process countries are also USAID/FFP priority countries: Afghanistan, Bangladesh, DRC, Ethiopia, Guatemala, Haiti, Liberia, Madagascar, Malawi, Mali, Mozambique, South Sudan, and Uganda.
Box 2.7. Global Health Initiative: Expected Outcomes over Six Years
• HIV/AIDS. Through PEPFAR: Prevent more than 12 million new HIV infections; treat more than 4 million people; and care for more than 12 million people, including 5 million orphans and vulnerable children (OVC).
• Malaria. The President’s Malaria Initiative will reduce the burden of malaria by 50 percent for 450 million people, representing 70 percent of the at-risk population in Africa.
• Tuberculosis (TB). Save approximately 1.3 million lives by reducing TB prevalence by 50 percent. Treat 2.6 million new TB cases and 57,200 multi-drug resistant TB cases across assisted countries.
• Maternal health. Save approximately 360,000 women’s lives by reducing maternal mortality by 30 percent across assisted countries.
• Child health. Save approximately 3 million children’s lives, including 1.5 million newborns, by reducing under-five mortality by 35 percent across assisted countries.
• Nutrition. Reduce child undernutrition by 30 percent across assisted food insecure countries, in conjunction with FTF.
• Family planning and reproductive health. Prevent 54 million unintended pregnancies by meeting unmet need for modern contraception. Contraceptive prevalence is expected to rise to 35 percent across assisted countries, reflecting an average annual 2 percentage point increase. First births by women under 18 should decline to 20 percent.
• Neglected tropical diseases. Reduce the prevalence of seven neglected tropical diseases by 50 percent among 70 percent of the affected population, and eliminate onchocerciasis in Latin America by 2016, lymphatic filariasis globally by 2017, and leprosy.
Source: http://transition.usaid.gov/ghi/factsheet.html, accessed November 11, 2011.

2-17Background
(Bhutta et al., 2008). Another breakthrough came in 2009 with the inclusion of nutrition alongside agriculture in FTF, formalizing the U.S. government’s commitment to increasing its assistance to nutrition programs as part of an integrated global response to reducing hunger and food insecurity.
In recognition of the critical role of nutrition in both the GHI and FTF, in September 2009, the Acting Director of State/F approved the incorporation of a Nutrition Program Element as the ninth element in Program Area 3.1, “Health,” of the “Investing in People” Objective in the Foreign Assistance Standardized Program Structure and Definitions.28 That elevated the importance of working on nutrition and monitoring USAID resources and nutrition outputs and outcomes. Until that change, which also made nutrition a separate budget category, it was merely a sub-element under the MCH Program Element, competing with many other MCH priorities. The United States is committed to helping 7 million children through nutrition interventions that prevent stunting and child mortality (USAID, 2011b). Nutritional status indicators will be used to measure the impact of the GHI and FTF, as they have been in the Title II program.
International nutrition initiatives. The international community, along with the United States, is also increasing support for preventing undernutrition in developing countries. At center stage is the Scaling Up Nutrition (SUN) Movement, launched in September 2010, which 21 developing countries had joined as of 2011.29 Along with the SUN Movement, the 1,000 Days Partnership was also launched in New York in September 2010, on the occasion of the United Nations (U.N.) Summit on the MDGs.30 (Also see Box 2.8.)
28 http://www.state.gov/F/. Accessed April 8, 2010.29 See http://www/unscn.org/en/scaling_up_nutrition_sun/ and http://ScalingUpNutriton.org. Accessed November 16, 2011. Countries that are a priority for USAID/FFP that are also SUN countries are: Bangladesh, Burkina Faso, Ethiopia, Guatemala, Malawi, Mali, Mauritania, Mozambique, Niger, Uganda, and Zimbabwe.30 The U.N. General Assembly launched the 1,000 Days Partnership in conjunction with U.S. Secretary of State Hillary Rodham Clinton, the Irish Minister for Foreign Affairs, and other global leaders. See “1,000 Days: Change a Life, Change the Future.” Joint Donor Statement. http://transition.usaid.gov/our_work/global_health/nut/news/joint_donor_statement.pdf. September 21, 2010. Accessed September 28, 2010. A follow-up high-level meeting on nutrition was held in New York on September 20, 2011, at the U.N. General Assembly.
Box 2.8. Two International Nutrition Initiatives
• Scaling Up Nutrition Movement. The SUN movement is led by developing countries affected by and tackling undernutrition. It brings organizations together across sectors to support national plans to scale up nutrition interventions. The basis is the 2010 SUN Framework, which promotes: (1) increasing the coverage of 13 evidence-based direct nutrition interventions (from Bhutta et al., 2008); (2) integrating nutrition goals into broader efforts in health, agriculture, education, employment, social protection, and development; and (3) expanding the pool of resources for this effort. The target group is pregnant and lactating women and children under the age of two years, in what is now popularly referred to as the “1,000-day window of opportunity,” during which better nutrition can have its greatest impact on reducing death and disease, increasing intellectual and physical work capacity, and lowering the risk of non-communicable diseases. The framework was endorsed by more than 100 governments, including the United States (USAID), in addition to academic, business, and civil society organizations.
• 1,000 Days Partnership. This partnership (http://www.thousanddays.org) is an advocacy hub formed by Interaction and the Global Alliance for Improved Nutrition (GAIN) in collaboration with the U.S. Department of State. It strives to achieve measurable results in global nutrition during the 1,000 days between September 2010 and June 2013 by promoting targeted action and investment to improve nutrition for mothers and children during the first 1,000 days of life, including galvanizing support for the SUN movement.

2-18 Background
Bibliography for Chapter 2Barrett, Chris and Lentz, Erin. 2009. “U.S. Monetization Policy: Recommendations for Improvement.” A paper sponsored by the Chicago Council on Global Affairs. http://ssrn.com/abstract=1844744.
Bhutta, Zulfiqar et al. 2008. “Maternal and Child Undernutrition 3. What Works? Interventions for Maternal and Child Undernutrition and Survival.” Lancet. 371:417–440.
Black, Robert E. et al. 2008. “Maternal and Child Undernutrition 1. Maternal and Child Undernutrition: Global and Regional Exposures and Consequences.” Lancet. 371:243–260.
CARE USA. 2006. “White Paper on Food Aid Policy.” http://www.care.org/newsroom/publications/whitepapers/food_aid_whitepaper.pdf.
FAO. 2010. “The State of Food Insecurity in the World.” http://www.fao.org/docrep/014/i2330e/i2330e.pdf.
GAO. 2011. International Food Assistance: Funding Development Projects through the Purchase, Shipment, and Sale of U.S. Commodities is Inefficient and Can Cause Adverse Market Impacts. Report to Congressional Requesters #GAO-11-636. Washington, DC.
Haddad, Lawrence and Frankenberger, Tim. 2003. Integrating Relief and Development to Accelerate Reductions in Food Insecurity in Shock Prone Areas. Occasional Paper No. 2. Washington, DC: USAID/FFP.
Joint United Nations Programme on HIV/AIDS (UNAIDS). 2010. Global Report: UNAIDS Report on the Global AIDS Epidemic. Geneva: UNAIDS.
Jones, Gareth et al. 2003. “How Many Child Deaths can we Prevent this Year?” Child Survival II. Lancet. 362:65–71.
Leo, Benjamin and Thuotte, Ross. 2011. “MDG Progress Index 2011: The Good (Country Progress), the Bad (Slippage), and the Ugly (Fickle Data).”
Notes. Washington, DC: Center for Global Development.
Norris, John and Veillette, Connie. 2011. Five Steps to Make Our Aid More Effective and Save More Than $2 Billion. Washington, DC: USAID Monitor, Center for Global Development, and the Center for American Progress.
Simmons, Emmy. 2009. Monetization of Food Aid: Reconsidering U.S. Policy and Practice. Washington, DC: Partnership to Cut Hunger and Poverty in Africa.
UNSCN. 2010. 6th Report on the World Nutrition Situation: Progress in Nutrition. Geneva: UNSCN Secretariat c/o WHO.
U.S. State Department. 2010. Leading through Civilian Power: The First Quadrennial Diplomacy and Development Review. Washington, DC.
USAID. 2009. Two Decades of Progress: USAID’s Child Survival and Maternal Health Programs. Washington, DC: USAID.
———. 2010. Feed the Future Guide. Washington, DC: USAID.
———. 2011a. Striving for a Healthy Future. Fiscal Year 2009 Global Health and Child Survival Progress Report to Congress. Washington, DC: USAID.
———. 2011b. USAID Policy Framework 2011–2015. Washington, DC: USAID.
USAID/FFP. 2005. Strategic Plan for 2006-2010. Washington, DC: USAID.
USAID/FFP and PEPFAR. 2007. USAID P.L. 480 Title II Food Aid Programs and the President’s Emergency Plan for AIDS Relief: A Conceptual Framework. Washington, DC: USAID.
Webb, Patrick and Rogers, Beatrice. 2003. Addressing the “In” in Food Insecurity. Occasional Paper No. 1. Washington, DC: USAID/FFP.

3-1
Second Food Aid and Food Security Assessment (FAFSA-2)
3. Overall Program Performance during the FAFSA-2 Time Period
3.1 Basic Facts on the Programs Included in the FAFSA-2 Universe
3.1.1 Programs and Countries
The FAFSA-2 universe includes 101 programs in 28 countries. Sixty-four of these programs were undertaken in 20 African countries, 14 programs in 3 Asian countries, and 23 programs in 5 LAC countries. (See Table 1.3 in Chapter 1 for the complete list of countries and programs.)
The majority of programs implemented during the FAFSA-2 time period (60 of the 101 programs) had a goal related to “improving food security” (see Figure 3.1), based on the Results Frameworks included in their proposals. “Reducing food insecurity” became more common as a goal after the adoption of the USAID/FFP 2006–2010 Strategic Plan, with the percentage of programs having this as their stated goal increasing from 12 percent in FY 2003 to 33 percent in FY 2009.
Eighty-two of 101 programs in the FAFSA-2 universe included an SO related to MCHN,31 79 programs included an SO related to AG, and 72 included both of these objectives in their designs. The next most frequently found SOs included those related to community capacity (24 programs), IG (19 programs), safety nets (18 programs), NRM (10 programs), and ED (8 programs). A few programs included separate SOs focused on IG and WASH, but it was more common to include these objectives as IRs under the AG and MCHN SOs—46 of the 79 AG SOs included an IG dimension, and 34 of the 82 MCHN SOs included a WASH dimension.
Programs that focused only on MCHN or AG/NRM tended to be special cases. Examples of the first include the CARE programs in India (FY 2002–FY 2006 and FY 2007–FY 2010), which provided support to the Government of India’s Ministry of Women and Child Development’s Integrated Child Development Services scheme and the five urban nutrition programs in Indonesia. The six Productive Safety Net Programs (PSNPs) in Ethiopia lacked an MCHN dimension. The number of programs that included an SO related to community capacity, which included aspects of two IRs that were included in the USAID/FFP Strategic Plan—“community resiliency protected and enhanced” and “community capacity to influence factors (decisions) that affect food security increased”—increased from 13 percent in FY 2003 to 26 percent in FY 2009. School feeding (also referred to as Food for Education) was a popular intervention in the Title II development program prior to the 1995 USAID Policy Paper, which refocused the Title II program on food security as its primary objective. The 2002 FAFSA also included a separate chapter on Food for Education, but, by 2009, only three programs in the FAFSA-2 universe had Food for Education as one of their SOs—the CRS programs in Burkina Faso and India (both of which were scheduled to end in 2010) and the CARE program in Kenya (which ended in 2009).32
3.1.2 Resources and Beneficiaries
3.1.2.1 Resources
Levels and trends. Funding for the Title II program as a whole increased substantially during the first decade of the 21st century as USAID assumed a leadership role in relief efforts with
31 Although 82 of the programs in the FAFSA-2 universe adopted an MCHN SO, only 69 dedicated at least one-third of their total resources to this objective. (See Section 6.2.2 for further discussion of this issue.)
32 Other programs that reported allocating Title II development resources to school feeding included CPI/Senegal, FH/Kenya, CARE/Haiti, and CRS in Ghana and Haiti.

3-2 Overall Program Performance during the FAFSA-2 Time Period
increased emergency food aid. More specifically, total funding for the Title II program increased from US$1.1 billion in FY 2002 to more than US$2.1 billion in FY 2003 and peaked again in FY 2008 at more than US$2.6 billion (see Figure 3.2). In relative terms, this meant that the portion of the Title II budget spent on emergency programs increased from approximately 56 percent (the FY 2002/FY 2003 average) to an average of 79 percent for FY 2008/FY 2009.
The growing demand for emergency food aid put increasing pressure on funding for the Title II development programs during the FAFSA-2 time period. These programs were/are protected by a Congressional mandate (the sub-minimum), which requires that a certain minimum amount of commodities be set aside for use in the non-emergency (development) programs each year. These mandates are waivable, however, and USAID/FFP has waived the sub-minimum each year since FY 2002.
FY 2003 was the high point with respect to funding for the Title II development programs, when funding reached almost US$412 million (see Figure 3.3). The lowest point was in FY 2005, when funding dropped to US$333 million, and it took until FY 2010 (and perhaps the introduction of the so-called “hard” mandate in the FY 2008 FFPA) for the value of the program to climb back over US$400 million.33 These funds bought smaller amounts of food later in the FAFSA-2 time period, however, as increasing commodity and freight costs eroded their purchasing power (see Figure 3.3). Title II development programs that dedicated high percentages of their resources to direct distribution of food rations
33 The “hard” mandate required that at least US$375 million be used for development programs in FY 2009 (the actual amount was US$377.5 million) and at least US$400 million in FY 2010 (the actual amount was US$401 million). It can be waived only in cases when “an extraordinary food emergency exists and the President determines, and informs Congress, that no other food or financial resources are available to meet the emergency.” Further details are provided in Chapter 2, Section 2.2.2.2.
Figure 3.1. Title II Development Program Designs Based on Proposal Results Frameworks
SO: Maternal Child Health Nutrition
(82 Programs)
SO: Income Generation (19 Programs)
Water and Sanitation
(34 Programs)
SO: Natural Resource
Management (10 Programs)
Goal: Improve Food Security (60 Programs)
Goal: Reduce Food Insecurity (32 Programs)
SO: Community Capacity
(24 Programs)
SO: Education (8 Programs)
SO: Safety Net (18 Programs)
SO: Agriculture/Livelihoods (79 Programs)
Income Generation (46 Programs)
+ +
72 Programs with Both Objectives
Program Universe:101 programs in 28 countries

3-3Overall Program Performance during the FAFSA-2 Time Period
were more adversely affected by these upward price trends, because higher food prices and fixed budgets meant fewer commodities were available to distribute to the planned number of recipients.
Allocations to priority regions. In response to the geographic priorities established in USAID’s 1995 Policy Paper, the dollar value of Title II development resources going to countries in sub-Saharan Africa had increased during the later years of the 1990s. This trend continued during the FAFSA-2 time period, with the value of the programs in sub-Saharan Africa increasing from less than US$150 million in FY 2002 to more than US$250 million in FY 2009 (see Figure 3.4). Since the total value of Title II development resources did not increase, this resulted in fewer resources going to the programs in Asia and LAC.
Allocations to major technical sectors. During the FAFSA-2 time period, the majority of Title II development resources continued to flow to two technical sectors—AG/NRM and HN.34 In FY 2009, 40 percent of the development resources were devoted to AG/NRM, and 38 percent of the resources to HN plus WASH (i.e., HN=33 percent
plus WASH=5 percent).35 The amounts devoted to the other technical sectors were considerably smaller, with only 10 percent going to VGF, 5 percent to ED, 4 percent to emergency preparedness and disaster management, 3 percent to Non-AG IG, and less than 1 percent to CSS (see Figure 3.5).
The relative importance of the two major technical sectors changed slightly during the FAFSA-2 time period (see Figure 3.6), with the share allocated to HN/WASH declining by two percentage points (from 40 to 38 percent) and the share allocated to AG/NRM increasing by one percentage point (from 39 to 40 percent). This allocation was not very different from the one described in the 2002 FAFSA, when 39 percent of Title II development resources were allocated to HN/WASH in FY 2001 and 41 percent were allocated to AG/NRM (FAFSA, Bonnard et al., 2002, p. 15).
The differences in the relative importance of these two technical sectors by major geographical region are striking, however (see Figure 3.7 and Table 3.1). In Africa, the proportion of resources going to the AG/NRM sector has been much higher than in Asia and LAC, ranging between 47 percent (2009) and
34 The analysis in this section is based on the data on resource allocations that the Title II Awardees provide to USAID/FFP in the Resource Tracking Tables that they submit annually to USAID/FFP as part of their AERs.
35 HN and WASH, which were reported as separate technical sectors in FY 2009, are combined to be able to compare these data with data for FY 2003 when WASH was part of HN.
Figure 3.2. Trends in Title II Funding during the FAFSA-2 Time Period
0
500
1,000
1,500
2,000
2,500
3,000
FY02 FY03 FY04 FY05 FY06 FY07 FY08 FY09 FY10
Mill
ion
US$
Development Emergency Total Title II
Figure 3.3. Changes in the Value and Quantity of Food Made Available through the Title II Development Program
0
100
200
300
400
500
600
700
800
900
1,000
FY02 FY03 FY04 FY05 FY06 FY07 FY08 FY09 FY10
Mill
ion
US$
/Tho
usan
d M
etric
Ton
s
Program Value Quantity of Food

3-4 Overall Program Performance during the FAFSA-2 Time Period
Figure 3.4. Distribution of Title II Development Resources by Region
0
50
100
150
200
250
300
FY02 FY03 FY04 FY05 FY06 FY07 FY08 FY09 FY10
Mill
ion
US$
Africa Asia LAC
Figure 3.5. Distribution of Title II Development Resources by Technical Sectors in FY 2009*
HN33%
WASH5%
AG/NRM40%
ED5%
Non-AG IG3%
VGF10%
EPDM4%
CSS1%
*Percentages do not add up to 100 due to rounding.
Figure 3.6. Distribution of Title II Development Resources to the HN/WASH and AG/NRM Technical Sectors (FY03 and FY09)
40% 38%
39% 40%
0%
20%
40%
60%
80%
100%
FY03 FY09
HN/WASH AG/NRM
Figure 3.7. Changes in the Distribution of Title II Development Resources to the HN/WASH and AG/NRM Sectors by Region
28%
52%
45%
30%
52%
27%27%
47%
74%
9%
55%
31%
0%
10%
20%
30%
40%
50%
60%
70%
80%
HN/WASH AG/NRM HN/WASH AG/NRM HN/WASH AG/NRM
AFRICA ASIA LAC
FY03FY09

3-5Overall Program Performance during the FAFSA-2 Time Period
52 percent (2003). In Asia and LAC, HN (including WASH) programs were favored. This was especially true in Asia where the percentage of resources going to HN (with WASH) increased from 45 percent in FY 2003 to 74 percent in FY 2009 and the percentage going to AG/NRM fell from 30 percent in FY 2003 to only 9 percent in FY 2009. In LAC, the percentage of resources going to AG/NRM increased slightly, from 27 percent in 2003 to 31 percent in 2009, but this was still relatively small in comparison to the approximately 50 percent of the resources going to the HN sector (with WASH).
Allocations to Awardees. The number of Awardee organizations participating in the Title II program as direct grantees declined during the FAFSA-2 time period, from 17 in FY 2003 to 14 in FY 2009.36 The same three Awardees—CARE, CRS, and WV—were in the top three in terms of total value of programs in FY 2003 and FY 2009. CRS’s share increased from 25.6 percent in FY 2003 to 34.1 percent in FY 2009. CARE was in second place in FY 2003 (22.5 percent), but dropped to third (9.4 percent) in FY 2009, and WV went from third place in FY 2003 (14.7 percent) to second place (11.1 percent) in FY 2009 (see Figure 3.8).
3.1.2.2 Beneficiaries
More than 6.2 million people benefited from the Title II development program in FY 2009, 61 percent in Africa, 28 percent in Asia, and 11 percent in LAC.37 Thirty-eight percent of the total (2.3 million people) benefited from the AG/NRM programs and 35 percent (2.2 million people) benefited from the HN programs. Most of the beneficiaries of the AG/NRM programs were in Africa (76 percent or nearly 1.8 million). This is in contrast to the HN sector, where 45 percent of the beneficiaries (984,000 people) were located in Africa, 36 percent (803,000) in Asia, and 19 percent (415,000) in LAC (see Figure 3.9).
Women were major beneficiaries of the Title II development programs by the end of the FAFSA-2 time period, comprising 57 percent of all beneficiaries in FY 2009. Women’s participation rates in the other sectors ranged from 50 percent in CSS and 53 percent in AG/NRM to 59 percent in HN and 68 percent in Non-AG IG activities (see Figure 3.10).
36 Some organizations that had been direct recipients of Title II awards in the past are now participating as members of consortia, for example, LOL as part of the C-FAARM consortium headed by CRS in Zambia.
37 The analysis in this section is based on the data on beneficiary allocations that the Title II Awardees provide to USAID/FFP in their annual Beneficiary Tracking Tables. The number of years for which comparisons are possible is limited due to the considerable amount of time that is required to calculate the numbers.
Table 3.1. Percentage of Title II Development Resources Allocated among Technical Sectors in FY 2003 and FY 2009 Worldwide and by Major Geographical Region*
Technical SectorAfrica Asia LAC All Regions
2003 2009 2003 2009 2003 2009 2003 2009HN/WASH 28% 27% 45% 74% 52% 55% 40% 38%
AG/NRM 52% 47% 30% 9% 27% 31% 39% 40%
ED 7% 3% 8% 10% 8% 5% 7% 5%
Non-AG IG 3% 4% 0% 0% 10% 2% 5% 3%
VGF 9% 11% 17% 7% 3% 6% 9% 10%
EPDM** – 5% – < 1% – < 1% – 4%
CSS** – 2% – 0% – < 1% – 1%
Total Program Cost (US$ millions) 172.5 222.0 97.8 37.5 132.6 55.7 403.0 315.2* The FY 2009 data exclude the Title II PM2A research programs in Burundi and Guatemala, which were just beginning in late FY 2009, and the Afghanistan program because they are not part of the FAFSA-2 universe. Percentages do not always add up to 100 due to rounding. Data come from the FY 2009 Resource Tracking Tables in the AERs submitted to USAID/FFP by Title II Awardees.
** These were not separate technical sectors in FY 2003.

3-6 Overall Program Performance during the FAFSA-2 Time Period
3.2 Reallocating Resources to a Smaller Set of Priority Countries
USAID/FFP made a major change in how Title II development resources were allocated among countries soon after the Strategic Plan was approved, with more resources being allocated to a smaller set of priority countries and programs in non-priority countries being closed out. The desirability of targeting Title II development resources to a smaller set of more food insecure countries was initially raised in the 1995 Policy Paper. The USAID/FFP Strategic Plan also proposed allocating more resources to the more vulnerable (priority) countries.38 However, resource constraints, rather than policy pronouncements, were the more likely drivers of the priority country policy change.
3.2.1 Background to the Policy Decision
The amount of resources devoted to emergency programs almost doubled between FY 2002 and FY 2003, and USAID/FFP clearly expected that the needs for food for emergency purposes would continue at these high levels and that “resources available to the program [were] likely to grow at a modest rate.”39 By this time, USAID/FFP was also committed to funding a large number of multi-year development programs—86 programs in 31 countries in FY 2004. This decision to fund multi-year development programs was part USAID/FFP’s commitment to increase these programs’ longer-term impact. However, this decision also meant that USAID/FFP had less flexibility to move resources among programs to respond to unanticipated increases in the demand for emergency food. There was/is a tension between these two objectives—being responsive to the needs of both
38 The Strategic Plan talked about the desirability of focusing staff time and effort on a smaller set of “Strategic Management” countries as a means to improve program management.39 This was one of the “Critical Assumptions” included in the USAID/FFP Strategic Plan, along with the assumption that USAID/FFP was going to have to “continue to make the case for using food resources in non-emergency (development) settings” (p. 25).
Figure 3.8. Allocation of Title II Development Resources among Awardees in FY 2009
ACDI/VOCA6% ADRA
3%
Africare5%
CARE9%
CPI3%
CRS34%
FH6%
MCI6%
OIC2%
REST7%
SC UK1%
SC US6%
SHARE1%
WV11%
Figure 3.9. Number of Beneficiaries by Major Technical Sector by Region in FY 2009
984803
415
1,783
413
151
0
500
1,000
1,500
2,000
AFRICA ASIA LAC
HN/WASH
AG/NRM
Thou
sand
s of
Peo
ple
Figure 3.10. Distribution of Beneficiaries by Sex by Technical Sector in FY 2009
68%
66%
65%
65%
59%
57%
54%
53%
50%
32%
34%
35%
35%
41%
43%
46%
47%
50%
0% 20% 40% 60% 80% 100%
Non-AG IG
EPDM
ED
VGF/SSN
HN
Program average
WASH
AG/NRM
CSS
Women Men

3-7Overall Program Performance during the FAFSA-2 Time Period
the emergency and development programs—and this came to a head in FY 2005. This is when USAID/FFP found itself having to delay call forwards for a number of development programs until the middle of the year, when it had a better idea of the amount of non-emergency resources it was going to have available for the rest of the year, and also having to make cuts across the board in some development programs in response to the potential budget shortfalls. These strategies were unavoidable, but also had adverse effects on program implementation and impact in the field. The effects of these resource cuts and/or delays in getting resources were particularly serious in countries where the Title II development programs were integrated with Mission programs and expected to contribute to specific Mission SOs.
The Awardees wanted support for the Title II development programs to continue. However, to operate effectively, Awardees also needed assurance that they would continue to receive the resources that had been agreed to and on a timely basis. The Office of Management and Budget (OMB) would have preferred to have seen reductions in the development programs and to focus these programs more in countries and in areas prone to shocks, with the expectation that if more resources were devoted to the longer-term development of these areas, their needs for emergency assistance in the future might be reduced. For its part, USAID/FFP wanted to find a solution that would enable it to support the development programs at some level, but with the flexibility it needed to respond effectively to emergencies.
The “Grand Bargain,” as one USAID/FFP staff member referred to it, and one that all major parities eventually agreed to, was to reduce the number of countries eligible for Title II development programs to a smaller set of the more food insecure. The decision was made and the “priority countries” were identified in FY 2006. Country rankings were data-based and the country rankings were scrupulously followed to avoid a long, drawn-out process in which special exemptions were requested by advocates of countries that fell into the non-priority category.
3.2.2 The Targeting Method
The methodology USAID/FFP used to rank countries by level of food insecurity was developed in consultation with FANTA-240 and the International Food Policy Research Institute (IFPRI). The methodology uses three indicators that address the three basic elements of food security—availability (defined as “percentage of population undernourished”),41 access (defined as “percentage of population living on less than US$1 per day”), and utilization (defined as “percentage of children under five stunted”)—and two sets of calculations. The analysis involved calculating three sets of country rankings, one for each indicator, and then calculating an average score, one for each country, using the three rankings. The average is weighted, with USAID/FFP giving greatest weight to the stunting indicator (60 percent), lesser weight to the poverty indicator (30 percent), and least weight to the undernourishment indicator (10 percent). Because one of the objectives of this exercise was to reduce the number of countries with multi-year (i.e., development) programs, USAID/FFP focused on countries that already had ongoing programs.
3.2.3 The Priority Countries and Changes in Resource Allocations
Fifteen countries made the first cutoff, with another five added during the second round, including Afghanistan and Sudan, to reach the 20 countries that were on the list from FY 2006 to FY 2010 (see Figure 3.11). Sixteen of the 20 countries were in Africa (Burkina Faso, Burundi, Chad, DRC, Ethiopia, Liberia, Madagascar, Malawi, Mali, Mauritania, Mozambique, Niger, Sierra Leone, Sudan, Uganda, and Zambia), two were in Asia
40 FANTA-2 was originally implemented under the auspices of the Academy for Educational Development (AED) and was transferred to FHI 360 in July 2011.41 This FAO-developed indicator is based on estimates of per capita food supplies available in a country, adjusted on the basis of additional assumptions about the distribution of these food supplies across households, the age distribution of the population, and a minimum age-specific energy requirement threshold.

3-8 Overall Program Performance during the FAFSA-2 Time Period
(Afghanistan and Bangladesh), and two were in LAC (Guatemala and Haiti).
The shift in resources from the non-priority to the priority countries was rapid—one might even say dramatic (see Figure 3.12). In FY 2006, approximately US$170 million was allocated to each set of countries. Four years later (i.e., in FY 2010), programs in the priority countries received almost US$400 million a year, while only US$3.7 million went to the one program left in a non-priority country—the CRS program in India.42 By FY 2010, Title II development programs had also been closed out in 14 of the countries that had been receiving resources in FY 2003—nine in Africa (Angola, Benin, Cape Verde, Eretria, Ghana, Guinea, Kenya, Rwanda, and a West African regional program), one in Asia (Indonesia), and four in LAC (Bolivia, Honduras, Nicaragua, and Peru) (see Table 3.2).
USAID/FFP also reaped additional management benefits from the adoption of its “priority country” policy. This has included a reduction in the overall number of development programs it has to manage, from 79 in FY 2003 to 50 in FY 2009 to 42 in 2010 (see Figure 3.13). The average program value also increased, from US$5.2 million in FY 2003 to US$7.6 million in FY 2009 to US$9.5 million in FY 2010 (see Figure 3.14).
At the time the FAFSA-2 report was written, USAID/FFP was in the process of updating its list of priority countries. USAID/FFP had obtained updated information for the original three criteria. However, it was also looking at other criteria and issues, including the potential in specific countries for integrating Title II resources with other USAID programs to take advantage of potential synergies and increase the likelihood of program impact.43
42 The US$3.7 million was provided as final funding for the CRS program in India. Final funding for the CARE program occurred in FY 2009.
43 Zambia was dropped in 2010 and replaced by Zimbabwe, Sudan is now referred to as the newly independent country of South Sudan, and USAID/FFP now refers to all of these as its “focus” countries.
Figure 3.11. USAID/FFP Priority Countries, FY 2006–FY 2010
Haiti
Guatemala
Afghanistan
Bangladesh
Mauritania
Sierra LeoneLiberia
Mali
Burkina Faso
NigerChad
Ethiopia
UgandaDem. Republicof Congo
Burundi
ZambiaMalawi
MozambiqueMadagascar
Sudan
20 FFP prioritycountries for nonemergencyfood aid programs
BangladeshAfghanistan

3-9Overall Program Performance during the FAFSA-2 Time Period
Table 3.2. Countries Receiving Title II Development Assistance in FY 2003 and FY 2010 (US$ millions)COUNTRIES* FY03 FY10AFGHANISTAN 0.0 15.5Angola 3.2 0.0BANGLADESH 38.6 42.0Benin 4.5 0.0Bolivia 29.8 0.0BURKINA FASO 7.8 13.0BURUNDI 0.0 7.5Cape Verde 3.7 0.0CHAD 2.6 5.7DRC 0.0 15.6Eretria 2.9 0.0ETHIOPIA 26.7 62.1Ghana 22.6 0.0GUATEMALA 22.0 25.0Guinea 4.1 0.0HAITI 33.1 36.5Honduras 7.0 0.0India 42.8 3.7Indonesia 14.4 0.0Kenya 23.7 0.0LIBERIA 0.0 15.0MADAGASCAR 10.5 17.1MALAWI 3.3 18.0MALI 0.0 10.2MAURITANIA 4.7 5.0MOZAMBIQUE 17.3 19.6Nicaragua 13.7 0.0NIGER 10.4 15.0Peru 26.7 0.0Rwanda 6.2 0.0Senegal 0.2 0.0SIERRA LEONE 0.0 12.0SUDAN 0.0 30.3UGANDA 19.2 25.0ZAMBIA 0.0 7.2Number of Countries 27 21Value of Program Total 401.7 401.0 Priority Countries 196.2 397.3 Non-Priority Countries 205.5 3.7
* Priority countries are in ALL CAPITALS and bold.
Source: AERs submitted by the Awardees to USAID/FFP.
Figure 3.12. Distribution of Title II Development Resources by FFP Priority and Non-Priority Countries
0
50
100
150
200
250
300
350
400
450
FY02 FY03 FY04 FY05 FY06 FY07 FY08 FY09 FY10
Mill
ion
US$
FFP Priority Countries Non-priority Countries
Figure 3.13. Changes in the Number of Title II Development Programs and Countries
0
10
20
30
40
50
60
70
80
90
100
FY02 FY03 FY04 FY05 FY06 FY07 FY08 FY09 FY10
Number of Programs Number of Countries
Figure 3.14. Changes in the Average Value of a Title II Development Program
0
2
4
6
8
10
12
FY02 FY03 FY04 FY05 FY06 FY07 FY08 FY09 FY10
Mill
ion
US$
Average Program Value

3-10 Overall Program Performance during the FAFSA-2 Time Period
Almost half of USAID/FFP’s priority countries—Burkina Faso, Burundi, Chad, DRC, Madagascar, Mauritania, Niger, Sierra Leone, and Zimbabwe—did not receive much in the way of other USAID resources, and many have not benefited from FTF or the GHI. In short, the adoption of the “priority country” policy meant that more Title II development resources were reaching the needier countries, but the trade-off was that many of the Title II development programs had to go it alone with food aid and little access to other USAID resources.
3.3 Program Integration in the Context of a Changing Foreign Assistance Environment
Better integration of Title II programs with the priorities and strategies of the rest of USAID has been an objective of USAID/FFP since the 1995 Policy Paper. But the environment in which this objective has been pursued has gone through at least three phases since the start of the FAFSA-2 time period.
3.3.1 Integrating Programs into Mission Strategies
USAID/FFP’s focus at the beginning of the FAFSA-2 time period was on trying to make sure that Title II development programs were integrated into Mission strategies and were seen as contributing to specific Mission SOs. Most Missions integrated their Title II development programs into their strategies as a separate SO on food security, or under economic growth and rural development, or under health-related SOs. Missions in Bangladesh, Bolivia, Ethiopia, and Haiti managed their Title II development programs out of separate food security units, but the degree to which these programs were integrated with and/or expected to contribute to other Mission SOs varied by Mission and over time.
How these arrangements were structured, however, did not seem to be as important to successful program integration as the active involvement of other Mission staff in the Title II programs, technical
staff in particular. Based on the FAFSA-2 field visits and team members’ previous experiences working with Title II development programs in the field, much seems to start with the FFP officer and how proactive she or he is. When the FFP officer makes a concerted effort to involve other Mission staff in Title II program activities, as the FAFSA-2 team found to be the case in Bangladesh and Malawi, for example, she/he was able to increase the opportunities for program complementarities, synergies, and integration. Joint visits by USAID staff to programs in the field was one of the better practices observed, as was the participation of FFP officers in field visits made as part of Title II program assessments and evaluations. In Mozambique, the active engagement on the part of the FFP officer led to an agreement from USAID/Mozambique to co-finance with USAID/FFP the preparation of a Food Security Country Framework (FSCF) (see Section 3.4.1.1) and the Mission’s use of this document as a basis for its new food security-oriented agricultural development program. It can also help when the push for greater program integration comes from higher up. This was the case in Bangladesh, when the Mission Director, as one example, insisted that the Title II FSCF team, the GH HN strategy team, and the EGAT food security strategy team do their field work in Bangladesh at the same time and coordinate their findings and recommendations. The importance of active involvement on the part of Mission staff from different technical sectors as critical to project success was also emphasized in the 2002 FAFSA.44
3.3.2 Integrating Programs within the Foreign Assistance Framework
This focus on Mission strategies changed in FY 2006 with the creation of the “F” and the development of a standardized Foreign Assistance Framework
44 “Whichever integration approach is taken, active involvement of Mission staff from the different technical sectors the Title II addresses seems to be critical to program strength and quality. What appears to be a necessary condition is the interest and effort among all partners, both food aid and DA funded, to promote more interaction, collaboration and integration. Setting up a particular structure alone is insufficient” (FAFSA, Bonnard et al., 2002, p. 33).

3-11Overall Program Performance during the FAFSA-2 Time Period
to guide both State and USAID programs. (See Section 2.2.2.3 for further information on what was referred to as the “F” process.) With the adoption of the Foreign Assistance Framework, Department of State and USAID funding was required to be aligned with the framework’s five key objectives and their program areas, elements, and sub-elements. All programs were also expected to report on their results, selecting from among the Standard Foreign Assistance Indicators that had also been developed. In the case of Title II development programs, this meant that Title II Awardees were now required to report on program performance using USAID/FFP, Mission, and F indicators. Most Title II development programs were/are seen as being aligned with and contributing to three of the five objectives: “Investing in People,” “Economic Growth,” and “Humanitarian Assistance.” (See Table 3.3 for further information on how the Title II programs align with the program areas and elements.) All Title II development programs approved since FY 2006 were designed, developed, and implemented within the context of this framework. Responsibility for annual reporting on the F indicators is split between USAID/FFP and Missions. USAID/FFP in Washington reports on the indicators for Title II emergency programs, while Missions include performance data from the Title II Awardees’ development programs in their own reporting to Washington.
3.3.3 Integrating Programs with the New Food Security and Health Initiatives
The context in which the issue of program integration was/is being discussed changed again in 2009, when the new administration took office and with the new emphasis within State and USAID on food security and the development of FTF and the GHI.
3.3.3.1 Feed the Future
The SO of the Title II development program—“Food insecurity in vulnerable populations reduced”—is consistent with and can help support the broader goal of FTF “to sustainably reduce global hunger and poverty.” The two programs have adopted
Table 3.3. Alignment of Title II Development Programs with the U.S. Foreign Assistance FrameworkOBJECTIVES PROGRAM AREAS AND ELEMENTSPeace and SecurityGoverning Justly and Democratically
2.2 Civil Society• Civic Participation (2.4.1)
Investing in People
3.1 Health• HIV/AIDS (3.1.1)
• Maternal and Child Health (3.1.6)
• Family Planning and Reproductive Health (3.1.7)
• Water Supply and Sanitation (3.1.8)
• Nutrition (3.1.9)
3.2 Education• Basic Education (3.2.1)
3.3 Social and Economic Services and Protection for Vulnerable People
• Social Assistance (3.3.3)Economic Growth
4.4 Infrastructure• Transport Services (4.4.3)*
4.5 Agriculture• Agricultural Sector Capacity
(4.5.2)
4.7 Economic Opportunity• Strengthen Microenterprise
Productivity (4.7.3)
4.8 Environment• Natural Resources and
Biodiversity (4.8.1)Humanitarian Assistance
5.1 Protection, Assistance, and Solutions
• Protection and Solutions (5.1.1)
• Assistance and Recovery (5.1.2)
5.2 Disaster Readiness• Capacity Building,
Preparedness, and Planning (5.2.1)
• Mitigation (5.2.2)*
* The FAFSA-2 recommends that USAID/FFP also report under these program areas and elements because of the infrastructure work that is implemented under the Title II development programs, on roads in the case of Transport Services (4.4.3) and on disaster-related infrastructure in the case of Mitigation (5.2.2).

3-12 Overall Program Performance during the FAFSA-2 Time Period
similar approaches, including the commitment to a comprehensive approach to reducing poverty and food insecurity and a focus on strengthening the links between agriculture and improved nutrition outcomes and impact. Both have also decided to focus on a subset of high-priority countries to make more effective use of their resources. Nine countries—Bangladesh, Ethiopia, Guatemala, Haiti, Liberia, Malawi, Mali, Mozambique, and Uganda—were eligible for both programs as of the end of 2011.
Title II programs are more limited in terms of their geographical focus than FTF programs. This is in response to the requirement that they focus on the poorer areas in the countries in which they operate and on the poorer and more food insecure communities and populations within those areas. They are also likely to work with farmers that are poorer and more resource constrained than many of FTF farmers, given the communities that they work in. Their objectives, however, are similar to the objectives in the FTF results framework: increasing agricultural productivity and rural incomes in the communities where they are working, increasing the resilience of these vulnerable communities and households, and improving the nutritional status of the people in their target areas, women and children in particular. Experiences from the FAFSA-2 time period that should be of particular relevance to FTF include introducing resource-poor farmers to improved agricultural technologies and practices and helping link them to stronger markets to improve their sales and incomes. Many Title II programs implemented during the FAFSA-2 time period were also successful in implementing the types of investments that FTF has identified as key to improving nutrition, for example: (1) preventing undernutrition through community-based programs, especially for pregnant and lactating women and children under two years; (2) improving diet quality and diversity through agricultural interventions and educating women to improve family diets; and (3) improving delivery of nutrition services by health systems linked to community programs.
Both FTF and Title II programs are operating in four of the five countries that were included in the
FAFSA-2 field visits—Bangladesh, Guatemala, Malawi, and Uganda. In Guatemala, the decision had been made to locate FTF and Title II programs in the same areas of the country, but the details about how the programs would relate to each other programmatically were still being worked out at the time of the FAFSA-2 visit. In Bangladesh, FTF areas overlap with two of the Title II programs. The Bangladesh Mission wanted to add FTF resources to the programs of the two Awardees working in the areas of overlap, but was running into procurement problems at the time the FAFSA-2 report was being written. In Malawi, the FTF program is working in an area that is contiguous to the area where the Title II development program is currently working. The previous Title II program (Improving Livelihoods through Increasing Food Security [I-LIFE]) had also been working in this area, but the current Title II program (Wellness & Agriculture for Life Advancement [WALA]) moved to an area further south, which the Malawi FSCF had identified as being more food insecure. In Uganda, the Title II program is being moved into an area in the northeast of the country where few USAID programs are operative, and there is likely to be little or no geographic or programmatic overlap between it and the FTF program.
3.3.3.2 The Global Health Initiative
Achieving major, sustainable improvements in health outcomes, especially for women, newborns, and children, is the main goal of the GHI—a goal shared and described by the Title II program as “human capacities protected and enhanced” in the USAID/FFP Strategic Plan. The GHI helps partner countries strengthen health systems, combat infectious diseases, and provide quality health services for HIV, malaria, tuberculosis (TB), neglected tropical diseases, child health, nutrition, family planning, and reproductive health. The Title II program uses food aid and supplementary feeding to support the broad GHI agenda, most significantly in woman-centered MCHN activities mainly at the community level. Food aid also addresses food insecurity of people affected by or infected with HIV and improvement in HIV treatment, care, and support. While the GHI applies everywhere the U.S. government assists

3-13Overall Program Performance during the FAFSA-2 Time Period
health programs in developing countries, its initial focus is on eight “GHI Plus” countries for intense implementation and learning to inform the work of all countries. Five of these countries—Bangladesh, Ethiopia, Guatemala, Mali, and Malawi—are also FFP priority countries with ongoing health and nutrition activities, creating special opportunities for synergy, especially as smart integrated programming in nutrition, MCH, and family planning is tested. Title II program experience with integration at the local level can provide valuable lessons and promising practices to shorten the learning curve for new GHI activities.
Two-thirds of Title II development activities in the FFP priority countries in FY 2009 had a major MCHN or HIV component, offering valuable platforms that the GHI can build on. Food assistance supports the following interventions that are priorities for the GHI, either directly or through integration with government health services: (1) improving women’s nutrition and infant and young child feeding (IYCF) practices; (2) preventing undernutrition through community-based programs, especially for children under two years and their mothers and pregnant women, such as PM2A; (3) water, sanitation, and improved hygiene practices; (4) micronutrient supplementation; (5) malaria prevention through insecticide-treated bednets (ITNs); (6) prenatal, delivery, postpartum, and newborn care; (7) treatment of diarrhea, pneumonia, and malaria; (8) immunization; (9) treatment of moderate malnutrition and referral of severe cases to services for Community-Based Management of Acute Malnutrition (CMAM); and (10) HIV-nutrition interventions.
3.4 Improvements in Program Design3.4.1 Improving Problem Assessments
The 1995 Policy Paper stressed the importance of good problem assessments, arguing that it is “essential to understand the food security problems in recipient countries and make the link between initial problem assessments and the selection of specific program interventions most likely to succeed.” The USAID/FFP Strategic Plan went
even further, taking the position that better problem assessments would result in more effective programs and committing USAID/FFP to taking specific steps to improve its own problem assessments and those of its partners (see Box 3.1). The FSCFs that USAID/FFP asked FANTA-2 to prepare for countries whose Title II development programs were coming up for renewal could be thought of as one of the efforts taken after the Strategic Plan was approved to put this commitment to improved problem assessments into practice.
3.4.1.1 Country-Specific Food Security Programming Frameworks
The FSCFs are a new tool developed for USAID/FFP to use in preparing its country-specific guidance to Awardees developing new Title II development program proposals. The first FSCFs were prepared in 2007 for three countries—Madagascar, Malawi, and Mozambique—and a second set was prepared in 2009 for four countries—Bangladesh, Burkina Faso, Liberia, and Sierra Leone.45 These FSCFs
45 Work was also done in 2010 on country frameworks for Ethiopia and Zambia, but they were never finalized as full-fledged FSCFs.
Box 3.1. The Commitment of the USAID/FFP Strategic Plan to Good Problem Assessments
“FFP recognizes the importance of good problem assessments and plans to take further steps under this strategy to improve its own assessments and those carried out by its partners—both the PVOs and the WFP. In the future, problem assessments will need to be based on credible livelihood and market analyses and include estimates of needs and program approaches that recognize when and where food is needed and when and where non-food resources are needed, alone or in combinations with food.”
Source: USAID/FFP Strategic Plan, p. 45.

3-14 Overall Program Performance during the FAFSA-2 Time Period
describe the nature of the food insecurity problems in the country, including their determinants and geographical distribution; identify the areas of greatest food insecurity and the nature of the risks and vulnerabilities in these areas; and provide a broad overview of the contextual factors affecting the food security conditions in the country, including the food security-related policies and programs of the host government and other donors and stakeholders. These frameworks also define program goals and objectives, recommend areas where the programs should be concentrated geographically, identify program priorities, describe the types of interventions and approaches that should be considered, and identify potential strategic partnerships. Other issues frequently dealt with include integrating gender equity into program design and implementation; finding the right balance between food and cash; integrating programs at the community level; developing sustainability and exit strategies; and addressing cross-cutting issues, such as risk and vulnerability, strengthening local capacity, and the environment. This level of analysis (i.e., a rigorous description of the food security situation in a country and evidence-based prescriptions as to the location and contents of the programs) did not exist before, and USAID/FFP has used these frameworks effectively to increase the quality of its country-specific program guidance.
Although the FAFSA-2 team did hear a few complaints about specific FSCFs, several from Awardees involving targeting issues, the overall feedback was favorable. USAID/Mozambique used its FSCF as a basis for developing its own integrated agriculture and health and nutrition program. The FSCFs also seem to have value beyond their immediate use as a basis for program guidance. The detailed background information was useful to a broader audience, including at least two Mission Directors.
These analyses can be expensive, however, and some also took a long time to complete, up to 18 months in several cases. This long lead time was also a challenge at times, because USAID/FFP does not always know that far in advance which programs
it is going to put up for rebid. In 2011, for example, the assessments for the three countries where programs were coming up for rebid in FY 2012—Guatemala, Niger, and Uganda—were done as desk reviews, because USAID/FFP was not able to provide sufficient advance notice to FANTA-2 to conduct comprehensive analyses.
3.4.1.2 Awardee Proposals and Problem Assessments
Most proposals reviewed during FAFSA-2 were well written, and appeared to be well designed. The quality of the problem assessments also improved over time. The arguments were more likely to be data-based, consistent, and coherent, improvements that are likely due in part to the availability of the FSCFs. Many Awardee proposals still lacked specificity about the nature of the problems in the areas where they were proposing to work, however, and the constraints they were likely to face in trying to implement effective programs in these areas.
Table 3.4. Summary of the Status of the FSCFs as of December 31, 2011
Country
For the Program Starting in FY:
Food Security Country
Framework Finalized and
Available
Country-Specific
Guidance Provided
Afghanistan 2012 X (Draft)
Bangladesh 2010 X (2009) X
Burkina Faso 2011 X (2009) X
DRC 2011 X (2010) X
Ethiopia 2011 X
Guatemala 2012 * X
Liberia 2010 X (2009) X
Madagascar 2009 X
Malawi 2009 X (2007) X
Mozambique 2009 X (2007) X
Niger 2012 * X
Sierra Leone 2010 X (2010) X
South Sudan 2011 * X
Uganda 2012 * X* Desk review

3-15Overall Program Performance during the FAFSA-2 Time Period
There is also a difference between information that can be used to describe a situation and information that is actionable. Information from livelihood assessments, for example, can be used to describe what people are doing in a particular target area in order to earn a living, but this information does not provide much in the way of insight into what other types of activities people could be doing or should be doing to earn a better living. For the latter purpose, information is also needed on market and production potentials and on the relative profitability of alternative activities. Few proposals prepared during the FAFSA-2 time period include information on the specific markets and market potentials, value chains, and activity profitability in the target areas, however. Information missing from most MCHN designs includes information on specific child feeding practices in the areas to be targeted and the likely barriers to change—information that is crucial to the development of an effective behavior change program.
One reason for this lack of specificity could be resource constraints, but another could be a result of the design process itself. There are limits as to how much time and effort an organization can afford to spend on proposal development. On the other hand, Title II Awardees already working in a country should be able to provide more specific information than many do, if they are asking the right questions. Taking a few more trips to the proposed target areas and talking to potential project participants, as well as to a range of potential stakeholders, about markets and production potentials and current child feeding practices would be a good start. Some of the feedback that the FAFSA-2 team received from the field is that many proposals are written by consultants or professionals from the Awardee’s headquarters and not by field-level implementers, which may be another reason why so many proposals lack specificity. This process may also lead to program designs that are not realistic given field conditions.
Furthermore, approved proposals are not always an accurate guide to what is actually under way in the field, as the FAFSA-2 team found during its program
reviews and field visits. During implementation, many programs begin to stray from the designs and the program descriptions in their agreements with USAID. This can be for several reasons. Implementers find the design not feasible, face budget constraints and cut back on activities or take shortcuts, decide to give more priority to other components than what USAID agreed to, or learn as they go and adjust interventions to do more of what works. Many changes are desirable. However, there were examples of substantive changes that were not formalized in amendments to USAID’s agreements with the Awardees, which made it difficult for reviewers to understand how and why the program evolved over time.
3.4.2 Improving Targeting within Countries
3.4.2.1 Improving In-Country Geographic Targeting
Considerable progress was made during the FAFSA-2 time period in targeting Title II programs to the more food insecure regions and districts within countries. Some of this improvement was due to the guidance provided in the FSCFs. However, Title II Awardees also appeared to have become more skilled in the analyses they need to undertake in order to make informed decisions about how best to target their programs within the larger geographical units identified in the FSCFs. More sources of information also seem to be available now than at the beginning of the FAFSA-2 time period for many of the countries where the Title II development programs were/are operating. This includes livelihood assessments from a number of sources and the WFP’s Comprehensive Food Security and Vulnerability Assessments and Vulnerability Assessment Maps. Most targeting began with an analysis of the distribution of poverty within the country (a measure of access) and chronic child undernutrition (arguably the best measure of utilization). Both measures have been available for most Title II priority countries, although some datasets are more current than others. One limitation in using these data for targeting purposes, however, is that they are usually collected to develop national-

3-16 Overall Program Performance during the FAFSA-2 Time Period
level estimates, which means that the information tends not to be available for geographical divisions below major regions and/or political divisions. Therefore, most recommendations provided in the FSCFs have been couched in terms of the more food insecure regions of a country and/or major political divisions.
The processes and indicators that Awardees used to make decisions about how best to target their programs within these larger geographical units varied by Awardee, and details are not always available in program documents. In Malawi, the consortium that ran the I-LIFE program (FY 2005–FY 2009) selected the seven districts where they were working based on an assessment of five indicators of food insecurity and vulnerability: chronic malnutrition, HIV,46 poverty, food needs, and illiteracy rates. The FSCF based its recommendation to re-target the next program (FY 2009–FY 2014) on an analysis of more recent data on the prevalence of poverty and chronic malnutrition by district. The new Malawi program—WALA—accepted these recommendations and then selected its implementation sites by livelihood zones (identified based on a detailed livelihood zones assessment CRS conducted in 2008) rather than by district, as was done in the case of the I-LIFE project. CARE also developed a very elaborate process for targeting its programs to the more food insecure villages in its area of operation in Bangladesh and to the poorer households in these villages, through the process of a well-being analysis, to better target its asset distribution activities to the poor and extremely poor (see Box 3.2).
Most Awardees focused their programs in areas where the food insecurity problems were the most severe, i.e., areas with the highest percentages of poor people, and chronically malnourished children. However, a case can also be made, as it was in the 2009 Bangladesh FSCF, that programs could be more cost effective if the absolute numbers of food insecure people living in an area were also taken into account. As another example, at the time the targeting recommendations were being developed for the Nicaragua Title II development
46 The I-LIFE mid-term evaluation and the Malawi FSCF expressed some concern about the use of HIV as one of the selection factors, since other data indicated that not all households affected by HIV were also poor, which is a key indicator of people’s ability to access food.
Box 3.2. The Village and Beneficiary Selection Process Used in the CARE Title II Development Program in Bangladesh
“The process begins by first meeting with the Union Parishad (UP) Government of Bangladesh officials, elected representatives, and key individuals in a group discussion to identify the villages within their UP who are poorest and disenfranchised—all of which are ranked. SHOUHARDO II [Strengthening Household Ability to Respond to Development Opportunities Project] [the CARE project] staff then physically visit, in order of poverty, these villages to verify whether or not the status[es] of these villages are as poor as they are made out to be. The result of this physical verification process is then brought back to the UP Group to make final changes in the ranking of these villages. This is an important step to ensure later accusations and criticisms are avoided in the targeting process, as well as being an important first step to building relations with these individuals who will be important throughout the life of SHOUHARDO II. Once the villages are finally ranked, starting with the poorest village, program staff facilitate a Well-Being Analysis (WBA) to identify and rank the Poor and Extreme Poor (PEP) households in the village. Each of these households will be registered at the end of this process. This approach continues until the total number of PEP allocated for that area has been reached, at which time no further villages are visited.” (According to CARE, this process, which was expected to take four months to complete, i.e., August through November 2010, involved the majority of the SHOUHARDO II staff plus an additional 240 short-term hires that were recruited solely to help with this effort.)
Source: SHOUHARDO II FY 2010 ARR.

3-17Overall Program Performance during the FAFSA-2 Time Period
programs, information became available from a new World Bank Living Standards survey that indicated that rates (percentages) of poverty and chronic child malnutrition were the highest in the Atlantic Coast region. But the actual numbers of poor households and chronically malnourished children were much higher in the north central area of the country, meaning that it would be more cost effective for implementers to locate their programs in this area. The logistic costs per beneficiary of running the program in the north central area would be lower than in the more isolated Atlantic Coast area, because implementers would be able to distribute these costs over a larger beneficiary group.
3.4.2.2 Targeting at the Community Level
Targeting at the community level can be complicated and appears to work better when adapted to the nature and objectives of the specific interventions, as the example in Figure 3.15 suggests.
Interventions focused on increasing community capacity and resilience. Based on FAFSA-2 and other field experiences, the better practice with respect to increasing community capacity and resilience is to open program participation to all community members, both formal and informal leaders, as well as the more vulnerable. Inclusive programs work best for a wide range of activities, including community organization, planning, and capacity strengthening activities focused on risk
identification, protection of community assets, and disaster preparedness. Awardees have learned that they may have to be proactive to ensure that women and poor households are involved in these activities and that the needs of other vulnerable groups, including children, the elderly and disabled, and socially excluded groups, are taken into account. This was one lesson learned by both the CARE and SC programs in Bangladesh, for example. Being too exclusionary at the community level, as several evaluations pointed out, can also result in programs being viewed as insensitive to community dynamics and local culture and could easily become divisive and undercut their effectiveness.
Interventions focused on improving household livelihoods and incomes. Agricultural technology transfer and marketing programs that are open to all community members that are interested in participating also appear to be better practices, based on FAFSA-2 and other field experiences. More inclusive programs are more likely to capture the farm leaders and first adopters, who play a critical role in getting the agricultural technology adoption process started. They can often be more effective transmitters of new technologies and practices than external extension agents. And their early adoption of these new technology packages can also help pave the way for poorer farmers in a community that may be more reluctant to try new practices because they have fewer assets and need additional
Figure 3.15. Targeting at the Community Level
Food Insecure Communities – Increasing Community Capacity and Resilience
Farm Households (Including the Food Insecure) – Improving
Livelihoods and IncomesHouseholds with Children under Two and Pregnant and Lactating Women – Reducing Chronic Child Malnutrition

3-18 Overall Program Performance during the FAFSA-2 Time Period
assurances as to the value of the new technologies.47 But experiences with the AG/NRM/LH programs during the FAFSA-2 time period also suggests that Title II development programs are likely to have to be proactive to ensure that the more food insecure individuals and households in their target communities have the opportunity and are able to participate in these programs. Approaches that the Title II programs have used to expand participation include additional training, including literacy training, and asset transfers. Women could be, and frequently were, the main targets of some AG/NRM/LH activities. However, limiting programs to women only is likely to exclude some of the early adopters and did not/does not guarantee that all the poor and more food insecure in a community will be reached, as the SC/Bangladesh program (FY 2005–FY 2010), which initially focused its LH program on the target group for its MCHN program (households with pregnant and lactating women and children under two), learned. FFW and asset and/or cash transfers, on the other hand, to be cost effective need to be means tested. That is, they need to be targeted to the poorer, more insecure households and individuals that have more need for such assistance. Food and cash for work can be self-targeted to the poor and food insecure by setting the value of the ration below the prevailing wage rate in rural areas. Food rations are sometimes more attractive to women, and programs have also found that they can attract more women and poorer women by setting a low value on the ration.
Interventions focused on reducing chronic child malnutrition. Many MCHN programs implemented during the FAFSA-2 time period focused their activities on the households in the community that had malnourished children (the recuperation model), while others concentrated on the poorer households. There is now evidence from research, including
USAID/FFP-supported research in Haiti (see Section 3.6.1.4 on the PM2A study) and from the FAFSA-2 (see Section 6.4.5) that the recuperation-only model is less effective than programs that focus more broadly on all children under two and pregnant and lactating women in a food insecure community (the prevention model). Another rationale for age-based targeting of children is that in the food insecure rural communities where Title II programs work, even households in the upper-income quintiles may be food insecure and their children’s growth faltering, which means that these households can also benefit from social and behavior change communication (SBCC) to improve IYCF practices, as well as from supplementary feeding.48
3.4.3 Improving the Integration of Program Interventions
3.4.3.1 Rationale for the Integration of Technical Programs
The rationale for viewing the integration of AG/IG and MCHN activities as a better practice stems from a recognition by many in the development community of the links between poverty (i.e., lack of income), lack of access to food, and undernutrition (see Figure 1.1). Poverty and lack of access to sufficient food can be important underlying causes of undernutrition, as a number of studies have
47 Considerable information exists on the technology adoption process based on years of research in the United States and in developing countries. This topic is also discussed in more detail in Section 4.3.2.1 on “Crop Production and Productivity.” Several Title II program evaluations also argued that being more inclusive, including in the implementation of the AG/NRM components, helped programs avoid exacerbating social tensions in a community.
48 The FAFSA-2 concludes that a strong case can be made for using a conditional food or cash transfer to MCHN beneficiaries in the 1,000-day window. Food transfers in particular can play an important biological role in improving mothers’ and children’s dietary intake at a critical stage of growth and development in food insecure communities. The use of conditional food or cash transfers is also frequently necessary to compensate mothers for the time spent participating in MCHN activities and also as an encouragement to improve feeding practices, because the positive impact of this behavior change on children’s cognitive development, health, and nutritional status is less visible in the short term. This is in contrast to the agricultural sector, where paying farmers in food or cash as an incentive to apply recommended practices on their own lands is generally not a good idea because farmers are able to directly benefit from the results of their decisions and because the feedback between the action—planting a recommended seed variety, for example—and the results—a larger crop—tends to be more visible and timely. (Also see discussion in Section 4.5.4 on “Sustainability.”)

3-19Overall Program Performance during the FAFSA-2 Time Period
shown.49 However, increased incomes alone often do not translate into improved family diets, if families lack information on the importance of as well as what constitutes a more nutritious diet and do not purchase and consume better diets. Nor do increased incomes translate into less child undernutrition, if IYCF and hygiene practices are poor and families lack access to water, sanitation, and health services. The latter situation is illustrated by the high prevalence of stunting in middle- and upper-income quintiles in a number of the USAID/FFP focus countries.
3.4.3.2 Guidance Promoting Greater Technical Integration
Various attempts were made during the FAFSA-2 time period to promote the integration of AG/LH/IG/Non-AG IG and MCHN activities within Title II development programs, at the community level in particular. Better program integration was promoted in several of the FSCFs (Bangladesh, Burkina Faso, and Malawi, for example) as a way to create synergies and increase impact. However, the evidence base in favor of integrating technical programs is relatively slim. The request for applications (RFA) for the FY 2011 Title II Non-Emergency Food Aid Programs made no reference even to the desirability of multi-sector programs, while the RFA for 2012 programs called for applicants to provide an estimate of how many beneficiaries will benefit from more than one sector (for multi-sector applications). “Awardees are also encouraged to use a Venn diagram to show how many beneficiaries are expected to overlap across sectors” (2012 RFA, pp. 8–9).
3.4.3.3 Evidence from Programs in the FAFSA-2 Universe
Many of the final evaluations reviewed by the FAFSA-2 team also made reference to the value of integrating MCHN and AG/IG activities. However, it was difficult for the FAFSA-2 team to determine the extent to which this type of program integration was actually taking place in the field, since only a few programs provided information on this practice.
Joint evaluations of the four Title II programs in Guatemala (2006) and four programs in Haiti (2007) measured the extent to which the same households received AG and MCHN interventions (see Figure 3.16). In Guatemala, 70 percent of families participated in MCHN; 26 percent in AG and IG activities; and 20 percent in FFW, infrastructure, democracy, or other activities. In Haiti, 74 percent of households had a member that participated in health activities (range of 46–92 percent across the four Awardees). The best integrated coverage was achieved by WV, with 92 percent of households having a member participating in the HN activities and 26 percent in the AG activities.
Other Awardees reported on integration at the community level, not the household level. In the CRS/Ethiopia program, for example, only 38 percent of communities were to receive both HN and AG/NRM. The SC/Uganda final evaluation has a useful
49 Alderman, H. et al. review evidence that income growth helps improve both food demand and nutritional outcomes. The authors also argue that “despite the importance of income growth as a factor in reducing malnutrition, it is, by itself, almost surely unlikely to meet the needs of the coming generation of children…and a combination of growth and specific nutrition programs will be needed” (2000). Ecker, O. et al. argue that economic growth is good, especially during the earlier stages of development when growth can help “reduce the prevalence of calorie deficiencies,” but that “growth—whether driven by the agricultural or non-agricultural sectors—is insufficient to address child malnutrition and reduce micronutrient malnutrition in all their dimensions” (2012).
Figure 3.16. Percent of Households in the Title II Development Programs in Haiti and Guatemala Participating in Health and Nutrition vs. Agriculture Interventions
0
10
20
30
40
50
60
70
80
Guatemala 2006 Haiti 2007
Agriculture Health Nutrition
Perc
ent H
ouse
hold
Par
ticip
atio
n
Four Programs Four Programs

3-20 Overall Program Performance during the FAFSA-2 Time Period
table on integration. Only 18 percent of program communities (40/226) got more than two of the nine project components. The final evaluation of the CRS/Madagascar program stated that 30 percent of the target communities (42/142) were fully integrated, i.e., received all four components.
Only the Bangladesh and Bolivia programs reported on the food access or nutritional impact of integrating AG and IG with MCHN. The final evaluation of the SC/Bangladesh program (FY 2005–FY 2010) found that the program almost achieved its nutritional goals in the unions where they did both interventions (i.e., food access [LH] and food utilization [HN]), while the nutritional improvement was minimal in unions where they did just HN and no LH. CARE/Bangladesh (FY 2005–FY 2010) documented a positive correlation between the household dietary diversity score (HDDS) and the number of project components in which the household participated. These examples of in-depth analysis of the impact evaluation survey data, disaggregating results to compare different intervention packages, are better practices and should be done more often. The joint final evaluation of the Bolivia programs also concluded that the impressive reductions in stunting and underweight achieved were due to doubling or quadrupling incomes plus effective community-based growth promotion (CBGP), SBCC, and health services in the same communities.
3.4.3.4 Constraints to Expanding Program Integration
Better program integration is probably one of those things that is easier said than done. The documentation available for the programs did not provide much in the way of insights into the practical constraints to improving program integration, but discussions with Awardee staff with field experience did.
Resource constraints came up in a number of discussions, for example. If Title II MCHN components have to cover larger geographic areas to reach a critical mass of children under two than when their objective was to reach all
children under five, this has implications for their AG/IG components and whether resources will be sufficient to enable them to expand the coverage of their AG/IG components so that a significant percentage of their communities will be able to benefit from both sets of interventions. Or if a Title II program has to decrease the area in which its MCHN program operates to increase the size of its MCHN ration, does this mean that it should also reduce the number of communities covered by its AG/IG activities? Differences in the coverage and capacities of host governments to deliver health and agricultural services in Awardees’ target areas can also affect program costs and decisions about program coverage and integration. There are also differences in the underlying logic of how these programs operate, with the AG/IG programs seeing technology adoption and market participation as a dynamic process that starts with a smaller group of early adopters and expands over time, with the rate of expansion depending on the suitability and profitability of the technology being promoted. This is in contrast to the MCHN programs, which tend to be focused on providing complete service coverage of a predetermined population group. These differences can result in the AG/IG and MCHN programs operating on a different time frame, leading to Awardees having to make difficult choices in designing their programs between an exit strategy that has programs exiting from communities when specific benchmarks are reached or one that maintains program integration at the community level. In short, trade-offs abound and, in the real world, decisions with respect to program integration also need to be balanced against other objectives, including achieving desirable levels of coverage for the individual components. This is especially the case in a resource-constrained environment. These issues arise in the program design, proposal/application review, and implementation phases.
More information on the actual benefits and impact of program integration would help USAID/FFP and Awardees define the right balance among sectors and interventions. More information on the effectiveness and impact of different approaches to program integration would also be useful. The arguments for

3-21Overall Program Performance during the FAFSA-2 Time Period
integrating programs at the community level, rather than at the household level, are stronger, in part because well-designed and -executed commercially oriented AG/IG programs frequently have multiplier effects that can lead to increases in incomes of non-participant households. There is also evidence from the FAFSA-2 universe that the programs that were successful in increasing household incomes and reducing child undernutrition got the basics right. That is, they focused first on the development of strong, commercially oriented, agricultural-based IG programs and strong community-based MCHN programs focused on the application of the Essential Nutrition Actions (ENA) in the first 1,000 days.
3.4.4 Adding a Risk and Vulnerability Dimension to Development Programs
The Strategic Plan committed USAID/FFP to reorienting its programs to focus more directly on the vulnerabilities of the food insecure—individuals, households, and communities—“focusing more on prevention and helping countries, communities and households cope and manage risk better.” Risk, as defined in the Expanded Conceptual Framework in the Strategic Plan, includes natural shocks and economic, social and health, and political risks (see Figure 2.1 and Box 3.3). This commitment to adding a risk and vulnerability dimension to the development programs was put into effect in a
number of different ways after the adoption of the Strategic Plan.
3.4.4.1 Creating a New Technical Sector
USAID/FFP created a new technical sector in FY 2006 that Awardees can use to report on the amount of resources they are devoting to emergency preparedness and disaster management activities (see Box 3.4). In FY 2009, only 4 percent of the Title II development resources were spent on this category worldwide and only 5 percent of the total resources allocated to Africa. Fewer than 200,000 people were estimated as directly benefiting from these programs worldwide (out of 6.2 million Title II program beneficiaries), but 95,000 of them (49 percent) were in Africa. Countries that reported using resources for these purposes included Bangladesh (SC), Burundi (CRS), Chad (Africare), Ethiopia (FH and REST), Guatemala (CRS and SHARE), India (CRS), Mali (Africare and CRS), Mozambique (ADRA, SC, and WV), Niger (Africare and CRS), and Zambia (CRS).
3.4.4.2 Early Warning and Response Systems
More emphasis was also given to programs contributing to “enhancing community resiliency” by helping communities develop (improve) early warning and food security information systems and/or disaster preparedness and mitigation plans
Box 3.3. Source of Risk for Title II Target Populations Identified in the USAID/FFP Strategic Plan
“Risks, as the expanded food insecurity framework makes clear, come from many sources. Food supply can be affected by climatic fluctuations, depletion of soil fertility, or the loss of a household’s productive assets. Factors that can disrupt access to markets include changes in policies or global terms of trade, a disruption of markets during crises, or risks stemming from the insecurity of non-farm incomes. Food access can be negatively affected by physical insecurity stemming from conflict, loss of livelihood or coping options (such as border closings that prevent seasonal job migration), or the collapse of safety-net institutions that once protected people with low incomes. Factors that can impair food utilization include epidemic diseases, lack of appropriate nutrition knowledge or socio-cultural practices that affect access to nutritious foods according to age or gender. Political risks, including the lack of good governance, can exacerbate natural, economic, social, and health risks.”
Source: USAID/FFP Strategic Plan, 2005.

3-22 Overall Program Performance during the FAFSA-2 Time Period
and the capacity to implement them.50 USAID/FFP also added an indicator to the Performance Management Plan (PMP) for Awardees to use to assess performance with respect to the development of early warning and response (EWR) systems—“Percent of Title II assisted communities with disaster and early warning systems in place.” In FY 2007, the first year that the indicator was required, only 30 percent of the Title II-assisted communities had disaster and early warning systems in place, but by FY 2009, this had increased to 78 percent (FY 2009 Standardized Annual Performance Questionnaire [SAPQ] database).
Some programs were much further ahead in the development of early warning systems than others. For example, the CARE program in Bangladesh, which had a relatively long history of helping improve the early warning and disaster response systems in the communities where it was/is working, worked with national-level organizations to help
develop and/or update national-level disaster early warning systems. Others were just getting started in 2007 when FANTA did a review for USAID/FFP of the experiences that Awardees were having with the introduction of Trigger Indicators and Early Warning and Response Systems in Multi-Year Title II Assistance Programs (Mathys, 2007).
The FANTA report identified the characteristics of EWR systems (see Box 3.5) and described the characteristics of the community-based EWRs included in the review as ranging from being largely external to being genuinely community managed. The report also noted a tension on the part of Awardees between maintaining sufficient control over food security information to ensure technical rigor in the system and working with and through partners to promote local ownership and sustainability. It is not surprising that community-based EWR systems are often not truly community managed in the sense of communities (and their local leadership or representatives) actually playing a leadership role in developing the systems and indicators, ongoing data collection, analysis, interpretation, and use or response. Rather, community EWR systems may collect data at a community level (local governments and community-level monitors and community members may even conduct tabulations), but Awardees usually control the analysis and linkages to the response. The FAFSA-2 team was able to visit community EWR systems in Bangladesh and Guatemala. In Bangladesh, the community groups that the team met with were very focused on the natural disasters that were most likely to affect their communities. The groups were highly organized and linked in with the regional and national systems, which is not surprising in a country that has to deal with serious floods and cyclones on almost an annual basis. In Guatemala, one of the programs was clearly driven by the Awardee, and in one of the communities visited, the team was skeptical that the system would be sustainable given the large number of indicators that community members were being asked to report on, many of which seemed to be more useful as descriptors and were not actionable by the communities or local authorities.
50 This was one of the illustrative activities included in the USAID/FFP Strategic Plan under the heading: “To help communities increase their capacity to predict and respond to shocks,” p. 73.
Box 3.4. USAID/FFP Definition of Its “Emergency Preparedness/Disaster Mitigation” Technical Sector
“Objectives include improving the ability of communities and other partners to prepare for and mitigate the effects of disasters, including both natural disasters and complex emergencies. Activities include efforts to enhance the capacities of national host-country authorities, humanitarian assistance providers, and local communities to engage in disaster reduction and response activities, including early warning information systems and disaster response plans.”
Source: USAID/FFP Annual Results Reporting Guidance for FY 2009.

3-23Overall Program Performance during the FAFSA-2 Time Period
3.4.4.3 Trigger Indicators
The concept of “trigger indicators” (see Box 3.6) was first introduced in the USAID/FFP FY 2006 Annual Proposal Guidelines and defined in more detail in the FY 2007 Guidelines.51 The idea was that these indicators would give Awardees a greater degree of flexibility and make it quicker and easier to respond to emerging crises and shocks in their operating areas. This was expected to be particularly true in the case of slow onset and subnational crises, where national emergency declarations might not be issued and where the Awardee may be in the best position to detect any indicators of deteriorating food security conditions. Prior to 2006, to respond to an increase in food needs due to a shock, Awardees had to divert resources from their development programs to the emergency response. While this approach facilitated a rapid response to new food
needs, Awardees, in making this decision, ran the risk of undermining their ability to accomplish the objectives of their development programs, especially in the event that USAID/FFP did not reimburse them for the resources that were diverted.
Considerable time and effort was spent on elaborating the trigger indicator concept. USAID/FFP commissioned FANTA-2 to undertake a review of the Awardees’ experiences in developing these indicators (Mathys, 2007). In 2010, USAID/FFP published an Information Bulletin on “Trigger Indicators in Multi-Year Title II Assistance Programs” (USAID/FFP Information Bulletin [FFPIB] 10-01). Several Missions (e.g., Haiti) also requested specific TA from FANTA-2 to build trigger indicators into ongoing development programs. Awardees also invested considerable time and effort in identifying potential shocks in each of their target areas; defining potential indicators and response thresholds; and then setting up the systems needed to collect, monitor, and analyze the data. And much of this work had to be done and basic agreements reached between USAID/FFP and Awardees at the proposal/application approval stage.
The team also interviewed a number of USAID/FFP staff, in Washington and in the field, several of whom suggested that trigger indicators were likely to be useful only in the case of slow onset emergencies,
51 This concept was further elaborated in the FY 2008 Guidelines as follows: “Where specific types of shocks and emergencies are predictable in a country, FFP prefers that these be identified and planned for in MYAP proposals as trigger indicators. In these cases, when predicted emergency indicators are triggered, the [Awardee] will respond in the manner indicated in the proposal. In some cases, however, when unforeseen emergencies occur, SYAPs [Single-Year Assistance Programs] may be approved apart from an existing MYAP to respond” (p. 24).
Box 3.5. Characteristics of Early Warning and Response Systems
According to a FANTA-2-sponsored review, “early warning and response systems broadly encompass vulnerability analysis, monitoring, food security scenario development, assessment, action (e.g., contingency and response planning, humanitarian assistance) and continuing institutional and network strengthening.”
Source: Mathys, 2007, Trigger Indicators and Early Warning Response Systems in Multi-Year Title II Assistance Programs, p. 8.
Box 3.6. Definition of Trigger Indicators
“Trigger indicators are used to signal the emergency threshold at which MYAP awardees should shift activities to respond to a shock affecting the MYAP target community. By utilizing trigger indicators and the emergency response they signal, awardees will be able to respond quickly to food security emergencies in MYAP-targeted communities.”
Source: USAID/FFP, 2010.

3-24 Overall Program Performance during the FAFSA-2 Time Period
such as drought, as opposed to natural disasters, such as floods or cyclones. Others pointed out that trigger indicators were useful only as a response mechanism in areas of a country where the Title II development programs were located. This may not be a problem in some countries, such as Bangladesh, where there is considerable overlap between the Title II programs and the areas that are most vulnerable to natural disasters as well as the areas with the most serious chronic food insecurity. In other countries, there may be very little overlap; in Guatemala, for example, the areas most subject to drought are in the east and the areas of highest chronic food insecurity are in the western highlands. In Mozambique, the areas most subject to droughts are in the south and west and the areas with the most serious chronic food insecurity are in the center and north.
Several USAID/FFP staff members described the trigger indicator concept as one that was interesting and seemed to have promise but turned out to be difficult to operationalize, and the FAFSA-2 was unable to identify any cases where trigger indicators were actually used. Other interviewees suggested that trigger indicators were no longer necessary, given other changes that had taken place since the idea was first introduced. These included recent procurement changes (including the use of Annual Program Statements for Emergency Programs), which have made it much quicker and easier for USAID/FFP to respond to emergencies, a point that was made by both Washington-based and field staff, and the introduction of the Emergency Food Security Program, through which International Development Assistance funds are used to support cash transfers, food vouchers, and/or local and regional procurement. Others in Washington also argued that the transfer of responsibility for USAID’s FEWS NET52 to USAID/FFP, which took place after the USAID/FFP Strategic Plan was adopted, means that they have much better early warning information from FEWS NET now than they did prior to the transfer, which also lessens the need for trigger indicators.
3.5 Finding the Right Balance between Food and Cash Resources
One of the more important issues that USAID/FFP had to deal with during the FAFSA-2 time period was to find the right balance between food and cash. The Title II program was the largest source of USG resources available to focus on food insecurity during the FAFSA-2 time period, as was pointed out in the USAID/FFP Strategic Plan (p. 39), and the main resource available to the program was/is food. On the other hand, as was initially recognized in the 1995 Policy Paper, cash was/is also necessary to pay for all of the complementary inputs that are essential ingredients to a successful Title II development program, including TA and training activities and the provision of inputs and other services. These needs for cash had led to a major increase in the levels of monetization during the time period covered by the 2002 FAFSA, with the percent of commodities being monetized increasing from a little more than one-quarter of the commodities made available to the program in 1994 to three-quarters in 2001 (FAFSA, Bonnard et al., 2002, p. 27). The ramifications of increased monetization were discussed in the 2002 FAFSA and a number of the issues identified continued to be of concern when the work began on the USAID/FFP Strategic Plan in the early 2000s.
3.5.1 Using Food in Direct Distribution Programs
Given the issues being raised about monetization, USAID/FFP decided to use its 2006–2010 Strategic Plan as a vehicle for putting more emphasis on the use of food as food in its development programs, as well as in its emergency programs. USAID/FFP also decided that it wanted food to be used in ways that had positive impacts beyond just feeding people. So arguments were also included in the Strategic Plan in support of giving more emphasis on the use of food to:
• Enhance physical capital through the use of FFW to pay for labor on public works52 See Section 3.6.1 for more information on FEWS NET.

3-25Overall Program Performance during the FAFSA-2 Time Period
• Enhance human capital through the provision of food as take-home rations to encourage greater participation in MCHN activities and to supplement inadequate diets
Efforts to increase direct food distribution were not very successful, however, as an analysis of data from the AERs on the allocations of food to FFW and MCHN activities indicates. In both cases, the tonnages of food used in these activities declined sharply over the FAFSA-2 time period. If one excludes Ethiopia, which is a special case (see Section 5.1.2 and Box 5.2), Title II development resources devoted to FFW activities declined from almost 100,000 MT in FY 2003 to less than 20,000 MT in FY 2009 (see Figure 3.17). The amount of food used in MCHN programs also declined during the FAFSA-2 time period, from almost 90,000 MT in FY 2003 to a little more than 50,000 MT in FY 2009 (see Figure 3.18). What is particularly surprising is the relatively little amount of food that was used in MCHN programs in Africa—an average of approximately 10,000 MT per year during the FAFSA-2 time period—given the high rates of acute and chronic malnutrition in many of these countries (see Chapter 6 on MCHN).
3.5.2 Combining Food with Other Resources
The USAID/FFP Strategic Plan also recognized that non-food resources to complement the food were critical to the achievement of the Strategic Plan’s objective. The Strategic Plan also concluded that “[m]obilizing sufficient non-food resources to complement food aid will be one of FFP’s greatest challenges under this strategy” (USAID/FFP Strategic Plan, p. 41).
3.5.2.1 Monetization
Monetization remained a major source of cash resources for Title II development programs throughout the FAFSA-2 time period. USAID/FFP was more successful in managing the monetization levels during the FAFSA-2 time period, however, maintaining levels at an average of approximately 62 percent of total Title II development resources between 2002 and 2010 (see Figure 3.19), with
Figure 3.17. Trends in the Use of Title II Food in FFW Activities
0
20
40
60
80
100
120
FY2003
FY2004
FY2005
FY2006
FY2007
FY2008
FY2009
Thou
sand
Met
ric T
ons
Rest of World Ethiopia
Figure 3.18. Trends in the Use of Food to Support MCHN Activities
0
20
40
60
80
100
2003 2004 2005 2006 2007 2008 2009
Thou
sand
Met
ric T
ons
World Africa Asia LAC
Figure 3.19. Percent of Title II Development Resources Monetized during the FAFSA-2 Time Period
0
20
40
60
80
100
2002 2003 2004 2005 2006 2007 2008 2009 2010
Perc
ent

3-26 Overall Program Performance during the FAFSA-2 Time Period
the level exceeding 70 percent in only one year, i.e., FY 2007. Factors that helped USAID/FFP accomplish this were changes in the 2008 Farm Bill that expanded the acceptable uses of Section 202(e) funds53; the introduction of PM2A; and access to Community Development Funds, which became available in FY 2010.
With the creation of the BEST Project (see Section 3.6.1.3), it is also clearer now what needs to be done to keep the potential disincentive effects of monetization under control. BEST Project analyses have laid out the conditions that need to be met to minimize the disincentive effects on local market prices. This includes the need to ensure that the monetized commodities are sold at a “fair market price” (defined as the import parity price) and in a volume that would not be expected to cause disruption of normal trade patterns.
3.5.2.2 Efforts to Access Other USAID Resources for Development Programs
The importance of getting access to additional USAID resources to complement the food resources available in Title II programs was first raised in the 1995 Policy Paper, under the rubric of resource
integration, and repeated in the 2002 FAFSA and the USAID/FFP Strategic Plan. But USAID/FFP has had more success in achieving greater program integration with Mission strategies than it has had in co-programming resources.
Many of the co-programming problems appear to have been procurement issues. Early attempts to add DA resources to the Title II transfer authorizations did not always work, and some more recent attempts by Missions to provide DA resources directly to Title II Awardees through a non-competitive waiver have ended up with Missions having to compete these activities under a separate RFA, with the hope that one or more of the Title II Awardees would win one or more of the awards (on their own and/or as part of a consortium). This was the case in Mozambique, when the Mission tried to integrate its DA resources with the final round of Title II programs (FY 2008–FY 2012/13). This was also the situation that the Bangladesh Mission faced at the end of 2011, when it tried to add some of its FTF funds to the two Title II programs that overlap geographically with its FTF programs. USAID/FFP has more flexibility than Missions when it comes to getting waivers for non-competitive procurement in emergencies (see Box 3.7), and waivers for non-competitive procurements in Missions may also be easier to come by in situations in which programs are in the process of coming out of an emergency situation. The most recent attempt to facilitate the
53 See Section 2.1 for a brief discussion of the legislative history of the Title II program and FFPIB 11-01, of October 15, 2010, for additional information on Section 202(e) and eligible uses.
Box 3.7. Automated Directives System (ADS) Section 303 Requirements for International Disaster Assistance and Title II Programs
“USAID may award without competition new or follow-on awards, or amend existing awards, for disaster relief, rehabilitation or reconstruction assistance provided under section 491 of the Foreign Assistance Act and for emergency food aid under Title II of the Food for Peace Act without competition following the written determination that competition is impracticable by the Director of the Office of Foreign Disaster Assistance or the Director of the Office of Food for Peace for awards within their respective areas of responsibility on an award-by-award or disaster-by-disaster basis. Following such a determination, no other requirements of this section ADS 303.3.6.6 apply.”

3-27Overall Program Performance during the FAFSA-2 Time Period
integration of USAID/FFP and Mission resources can be found in the USAID/FFP’s FY 2012 RFA for Haiti.54
3.6 Technical Assistance and Capacity Building Mechanisms
As part of its efforts to improve program performance in the field, USAID/FFP committed itself to learning more about what works in its field programs and why (Strategic Plan Sub-IR 1.3: “Evidence base for more effective policy and program approaches improved”) and to strengthening the capacity of its partners in key technical sectors in particular (Strategic Plan Sub-IR 1.4: “Technical excellence and innovation supported”). These activities were included under the first IR—“Global leadership in reducing food insecurity enhanced”—but many activities supported under these two sub-IRs were designed to improve the performance of field programs. This is why the decision was made to include some information, although brief, about these activities and their accomplishments in the FAFSA-2.
3.6.1 Creating an Evidence Base for the Development of More Effective Programs
In 2003, USAID/FFP had only two mechanisms in place to call on for technical support: FANTA, which is described below, and a contract with AMEX, which was not included in this assessment because its primary function was/is to provide institutional support. Two new technical support mechanisms added during the FAFSA-2 time period were FEWS NET, a project that was transferred to USAID/FFP in 2006 as part of a broader effort to improve USAID’s
response to the growing number of emergencies in the world,55 and the BEST Project, a pilot project launched in 2009.
3.6.1.1 Food and Nutrition Technical Assistance Project
USAID/FFP began funding FANTA in 1998. This GH project has been implemented through several cooperative agreements, initially with the Academy for Education Development (AED) and currently with FHI 360. The current cooperative agreement runs through February 7, 2017.
FANTA played a key role in the formulation of the USAID/FFP Strategic Plan. It also worked to strengthen Title II programs throughout the program cycle of assessment, strategy, design, implementation, monitoring, and evaluation, and made major contributions to the state of the art in these areas based on academic research and a strong evidence base. Notable examples were the development of new indicators that became standard for measuring the results of Title II, FTF, and GHI programs, including HDDS, the Household Hunger Scale (HHS), the Women’s Dietary Diversity Score, and the Minimum Acceptable Diet for children from 6 to 24 months of age. Other major contributions include PM2A research and the PM2A Technical Reference Materials, and the Exit Strategy Study, which was still under way at the time the FAFSA-2 report was being finalized.56 The USAID/FFP website has a link to FANTA’s website, which contains numerous reference materials for use by Awardees and USAID/FFP staff to improve Title II program design, implementation, and M&E.57 A brief review of these publications indicates that considerable effort was directed to M&E, with fewer products focused on design and implementation.
54 This document includes the following statement: “The U.S. Agency for International Development in Haiti (USAID/Haiti) and FFP anticipate that a portion of this $35 million of FY 2012 funding may be replaced with complementary cash resources (up to $12 million) from USAID/Haiti, subject to the availability of funds.” http://transition.usaid.gov/our_work/humanitarian_assistance/ffp/fy12.finalcsi.pdf.
55 This was one of the specific management improvements anticipated in the USAID/FFP Strategic Plan.56 See Section 3.6.1.4 for further details on these studies.57 See http://www.fantaproject.org.

3-28 Overall Program Performance during the FAFSA-2 Time Period
3.6.1.2 Famine Early Warning Systems Network
FEWS NET is implemented through a private sector contractor (Chemonics) that works in tandem with several USG agencies—the U.S. Geological Survey (USGS), the National Aeronautics and Space Administration (NASA), the National Oceanic and Atmospheric Administration (NOAA), and USDA. FEWS NET also collaborates with international, regional, and national partners to develop and disseminate accurate, timely early warning and vulnerability information on emerging and evolving food security issues. It develops its predictions by combining remote analyses of crop conditions and agricultural production, including satellite-based information, with on-the-ground monitoring, using household surveys and observations of local socioeconomic conditions. Its reporting products, maps, data, and satellite imagery are posted on the project’s website.58
FEWS NET was initially created in response to the 1985 famine in Ethiopia, and prior to its transfer to USAID/FFP, it had been located in and received most of its financial support from the USAID Africa Bureau. Two objectives for the transfer were to expand FEWS NET’s geographical coverage and to strengthen its linkages with and increase the relevance of its products to USAID/FFP. In 2007, FEWS NET had 23 country and regional offices, in Africa, Central Asia, and Central America and the Caribbean covering 25 countries. Resource constraints, including those stemming from the loss of DA financing from USAID’s Africa Bureau, put financial pressures on the FEWS NET program, which resulted in, among other things, the closing of five offices during 2008 and 2009.
This financial pressure seems to have had a positive side, however, in that it also stimulated FEWS NET to look for ways to make its products more relevant to its new funder—USAID/FFP—and to find more cost-effective ways to produce those products. Initiatives started after the transfer include:
58 See http://www.fews.net.
• FEWS NET’s FY 2008 launch of a monthly “Price Watch” publication that reports on staple food prices in key markets in urban and town centers in food insecure countries as another type of advance warning of potential problems that USAID/FFP can use for planning purposes.
• The initiation of a “remote monitoring” system in FY 2009, which FEWS NET is using to develop early warning information on significant changes in food availability and access in a country that could lead to a food security crisis without having to maintain a physical presence in that country. This system combines information available from the existing FEWS NET global monitoring system with information produced by organizations already working in the target country, which FEWS NET partners with, supplemented by a minimum number of on-the-ground visits. The system, which was initially pilot tested in three countries—Burundi, Tajikistan, and Yemen—provided important information on the accuracy of nutritional surveys in Yemen and the food security implications of a drop in remittances in Tajikistan.
• The development of another new reporting product—the Food Assistance Outlook Briefing—which provides warning of potential food assistance needs six months into the future. The purpose of these medium-term warnings is to help USAID/FFP improve its advance planning and reduce the amount of time it takes to respond to an emergency.
• Other activities designed to increase its relevancy to USAID/FFP, including providing more reports on a monthly basis and providing briefings to USAID/FFP staff prior to their monthly budget/call forward reviews.
3.6.1.3 Bellmon Estimation Studies
In FY 2009, USAID/FFP launched a three-year pilot project to help USAID comply with the requirements of the Bellmon Amendment, which include requirements that adequate storage facilities be available in recipient countries at the time

3-29Overall Program Performance during the FAFSA-2 Time Period
commodities are to be shipped to prevent them from spoiling or being wasted and that the distribution of these commodities in the recipient countries does not result in a substantial disincentive or interference with domestic production or marketing in those countries.59 The Bellmon Amendment also requires that the USAID Administrator certify that these requirements have been met before shipments can be made.
Prior to the BEST Project, USAID made determinations about the market impacts of its Title II development programs based primarily on the Bellmon analyses made by the Awardees (i.e., the recipients of the grants). Under the BEST Project, one organization has the responsibility for doing the Bellmon market analyses for all Title II development programs. This organization—Fintrac—has expertise in commodity markets, is independent from the Title II development program, and reports directly to USAID/FFP. As of November 2011, BEST Project analyses had been completed for 14 countries (see Box 3.8).
The methodology used for BEST Project analyses includes identifying the commodities that have the potential to be monetized, reviewing trends in imports and local production to ensure that the commodities that are being considered have been imported in sufficient quantities and that local production is insufficient to meet demand, ensuring that there are no official barriers or restrictions on these commodities, reviewing local market structures and previous and planned food aid initiatives, and examining the likelihood of achieving fair and competitive market prices. Fintrac’s methodology also includes field visits to obtain additional data and interviews with stakeholders in the recipient countries, such as Awardees; commercial importers; and potential buyers, including millers and processors. BEST Project analyses also include an
59 These requirements were included in the Bellmon Amendment, which was passed in 1977 as an amendment to Public Law 480. A third requirement that “the importation of U.S. agricultural commodities and the use of local currencies for development purposes will not have a disruptive impact on the farmers or the local economy of the recipient country” was added at a later date.
assessment of the potential disincentive effects of direct distribution programs on local production and markets, if the amounts of food brought into an area are too large or poorly timed.
Although a few initial glitches were mentioned to the FAFSA-2 team, the vast majority of stakeholders interviewed, USAID staff in particular, were in agreement that this new arrangement was/is a major improvement over the previous arrangement. The quality of the analyses has improved greatly, and having one organization do the market analyses for all countries has resulted in much more consistency in the analytical methodology used as well as in the reporting structure and format. Putting an
Box 3.8. Bellmon Estimates Completed as of November 2011
• Bangladesh BEST, August 2009
• Burkina Faso BEST, August 2009
• Burundi BEST, November 2010
• DRC BEST, January 2010
• Ethiopia BEST, November 2010
• Ethiopia BEST Annex, November 2010
• Ethiopia BEST Addendum, November 2010
• Guatemala BEST, October 2011
• Haiti Market Analysis, January 2011
• Haiti Market Analysis Annex, January 2011
• Liberia BEST, August 2009
• Madagascar BEST, December 2008
• Malawi BEST, December 2008
• Niger BEST, October 2011
• Niger BEST Annex, October 2011
• Sierra Leone BEST, August 2009
• Southern Sudan BEST, August 2009
• Uganda BEST, July 2011
• Uganda BEST Annex, July 2011

3-30 Overall Program Performance during the FAFSA-2 Time Period
organization in charge that is not directly affected by the results of its own analyses, as the Awardees were, has also reduced the potential for conflicts of interest.
3.6.1.4 Special Studies
To expand the evidence base for making program improvements, the Strategic Plan also committed USAID/FFP to “support selected research activities to validate best practices, especially those related to problem analyses and program design and implementation, and clarify key theoretical models on food aid and food security” (USAID/FFP Strategic Plan, p. 53). Several key assessments and research activities were initiated during the FAFSA-2 time period, including the research on PM2A (Menon et al., 2007; Ruel et al., 2008); the Food Aid Quality Review (FAQR) (Webb et al., 2011a and 2011b); and the Exit Strategy Study, which is nearing completion. The FAFSA-2, which is the subject of this report, also falls into this category.
PM2A. In 2002, IFPRI, Cornell University, WV/Haiti, and FANTA began work on research designed to compare two methods of targeting and delivering food-assisted MCHN programs in Haiti. The first model used a recuperative approach that provided nine months of food and other health and nutrition assistance to children six months to five years of age that were identified as underweight. The second model used a preventive approach that targeted all pregnant and lactating women and children 6–23 months of age with similar food and health and nutrition services until they were 24 months of age. The results showed that the prevalence of undernutrition was lower in communities receiving the preventive program, which confirmed that population-based interventions that aim to prevent undernutrition can be much more effective than those that target children once they have become undernourished (i.e., recuperative programs). With these results in hand, USAID/FFP began promoting prevention programs more vigorously, starting in its Proposal Guidelines for FY 2009, and branded this approach as PM2A, following the model tested in Haiti (FANTA, 2010). Additional USAID-funded research on PM2A is ongoing in the CRS/Burundi and MC/Guatemala Title II programs (FY 2009–
FY 2014) to better define if household rations increase impact and, if so, the most cost-effective ration size, as well as the minimum duration of participation.60 The potential role of specialized foods, such as lipid-based nutrition supplements (LNS), is also being tested; all of this research is being conducted by FANTA.
FAQR. In April 2009, USAID/FFP commissioned the two-year FAQR by Tufts University’s Friedman School of Nutrition Science and Policy. Prepared in consultation with industry, PVOs, technical experts, U.N. agencies, and others, the review aimed to identify cost-effective ways to better match the nutritional quality of U.S. food aid with the nutritional requirements of target populations in developing countries applying new understanding in nutrition science, including the importance of optimal dietary intake during the 1,000 days from pregnancy through the first two years of life (Webb et al., 2011a).61 The recommendations of the FAQR are summarized in Box 3.9.
The GAO recently completed a performance audit on the extent to which the U.S. government’s international food assistance programs: “(1) meet the nutritional needs of intended recipients, and (2) maintain the quality of commodities throughout the food aid supply chain” (GAO, 2011). While the focus was emergency food aid, many of the findings and recommendations are relevant to development food aid programs, which distribute the same commodities through the same food aid supply chain. One example is the need to evaluate the performance of specialized food products and issue guidance on their use, track key quality indicators, and evaluate food packaging specifications for durability.
Exit Strategy Study. USAID/FFP required Awardees to include a sustainability or exit strategy in their proposals throughout the FAFSA-2 time period in an attempt to increase the likelihood of lasting program impact, but also realized that
60 The PM2A research programs are not in the FAFSA-2 universe because they are studies with recent start dates. However, the FAFSA-2 team met with MC and discussed PM2A during the visit to Guatemala.61 See http://nutrition.tufts.edu/research/food-aid-quality.

3-31Overall Program Performance during the FAFSA-2 Time Period
little information existed on what constitutes a successful sustainability or exit strategy or how to go about implementing one (Rogers and Macías, 2004a and 2004b). To remedy this gap, USAID/FFP commissioned Tufts University in 2009, under the auspices of FANTA-2, to conduct a special assessment of the situation after program closeout in four countries: Bolivia, Honduras, India, and Kenya. Each country study includes a review of each of the planned exit strategies, the implementation
of these strategies during the final year of the program, a qualitative review of developments one year after each of the programs ended, and in-depth qualitative and quantitative assessments two years after each of the program endings. The goal is to provide guidance to USAID/FFP and its Awardees on general approaches to planning for program exit, identification of key elements of a successful exit strategy, and how to build sustainability into program design from the beginning. This study was in its final phase at the time the FAFSA-2 was written, but some of the preliminary findings are discussed in this report.
3.6.2 Support for Technical Excellence and Innovation
The main steps that USAID/FFP took during the FAFSA-2 time period to strengthen the capacity of its Awardees are described below.62
3.6.2.1 Institutional Capacity Building Grants
From FY 2003 to FY 2008, USAID/FFP provided Institutional Capacity Building (ICB) grants to 14 Awardees that also had Title II programs. The goal was to build technical capacity in implementing Title II food security and nutrition interventions. According to the Awardees, the ICB grants, and tools developed under them, were very useful. However, there was not enough time in the grants to complete training and to roll out use of the new tools in the field. Most Awardees said that they continued to expand the use of new tools in the field after the grants ended. They reported that there were spin-off benefits from these tools beyond Title II because they are also used in other Awardee programs.
In 2008, on behalf of USAID/FFP, FANTA assessed the effectiveness of ICB grants in meeting USAID/FFP’s capacity building objectives. The review
62 The FAFSA-2 team was not able to assess the quality of capacity strengthening activities undertaken by the Awardees in their field programs from program documents or from the limited number of programs that the team was able to visit in the field and the short duration of these visits. However, it is well understood that effective capacity strengthening is a key input to successful and sustainable programs, and Awardees spend considerable time and resources on it.
Box 3.9. Food Aid Quality Review
The FY 2010 International Food Assistance Report (USAID and USDA, 2011) summarized the FAQR recommendations, stating “the implementation of these recommendations should dramatically enhance the nutritional impact of food aid rations in both emergency and development settings:
• Reformulating fortified, blended foods by enhancing micronutrient content and adding animal protein to improve both absorption and growth;
• Improving both composition and use of fortified vegetable oil;
• Improving fortified cereals used in general food distributions;
• Using ready-to-use products when appropriate;
• Modifying programming guidance so that the quality improvements can be used more cost-effectively to achieve specific nutritional outcomes; and
• Changing the processes used to approve new products, develop specifications, procure, and monitor the use of food aid commodities.”
Source: USAID and USDA, 2011; Webb et al., 2011a.

3-32 Overall Program Performance during the FAFSA-2 Time Period
found that Awardees generally used ICB grant funds to develop tools, disseminate them to field staff, and support training as intended by USAID. It also concluded that the training supported by the grants often did not result in solid technical mastery at the local, program level. Most of the benefits of the ICB grants accrued to each Awardee. There was little evidence of networking with other Title II Awardees, sharing of tools, or inter-organizational learning. Some Awardees said that it had become harder to collaborate since 2003 when the mechanism USAID/FFP had funded for a number of years for that purpose, namely the Food Aid Management (FAM) Consortium of 15 Title II Awardees, disbanded when USAID funding ended.
3.6.2.2 Technical and Operational Performance Support Project
With the conviction that a central, inclusive, stakeholder-driven, field-oriented network could lead to greater capacity strengthening and consensus building than individual grants to each Awardee, USAID/FFP ended the ICB grants and launched the TOPS project at the end of FY 2010. The purpose of the TOPS project is to improve the design and implementation of Title II programs by fostering collaboration, innovation, and knowledge sharing around food security and nutrition promising practices from the field. In 2010, USAID/FFP awarded a Leader with Associate-type cooperative agreement for the TOPS project to SC and a consortium of the CORE Group, FH, MC, Technical Assistance to NGOs (TANGO), and a number of other collaborating and resource partners. The project formed the Food Security and Nutrition (FSN) Network—an email group—and has held several technical knowledge sharing and capacity strengthening events. The priority technical areas are commodity management, nutrition and food technology, agriculture, social and behavior change, M&E, gender integration, and knowledge management. Task forces directed by TOPS project lead advisors are working on a number of these topics. There is also a small grants component. The TOPS project and FANTA collaborate closely as they both work to improve the effectiveness of Title II food aid.
Several of the TOPS project FSN Network task forces have defined key competencies for Title II Awardee staff responsible for M&E, social and behavior change, and nutrition and food technology. These are intended to be used for self-assessment to identify competency gaps. The TOPS project is gathering and reviewing tools that can support skill building in these competency areas. The Social and Behavior Change Task Force has conducted several “Designing for Behavior Change” training workshops for an audience of multi-sector agriculture and nutrition programmers. However, FAFSA-2 identified a greater and more urgent need for offering this type of training to Awardee staff working on improving IYCF practices in Title II programs and strengthening their formative research skills, where there is a bigger gap.
3.7 Program Management
3.7.1 Office Management and Operations
After approval of the Strategic Plan, USAID/FFP made major improvements in its business practices, many of which the Strategic Plan had recommended as part of its commitment to the implementation of “strategic management and streamlined approaches.” Since USAID/FFP deals with commodities as well as dollars, “the management of these resources comes with many complications and regulations that other USAID offices do not have to deal with,” as pointed out in the Strategic Plan. The extent of the changes and how rapidly they were implemented at a time of high staff turnover, including at senior management levels, is remarkable. The FAFSA-2 team also found that the consensus among staff is that USAID/FFP operates more effectively and transparently as a result of these management improvements.
3.7.2 Reorganizing the Washington Office
The Washington office was reorganized in 2006 and the Emergency and Development Program Divisions were replaced by two regional divisions, as recommended in the Strategic Plan, to better integrate emergency and development activities. Based on interviews with USAID/FFP management

3-33Overall Program Performance during the FAFSA-2 Time Period
and staff, the reorganization has helped USAID/FFP respond more quickly and effectively to differing regional needs and has reduced the inconsistencies and fragmentation that occurred previously when program responsibilities were divided among two divisions and two CBOs. There are limits, however, to how far USAID/FFP can go in erasing the distinction between its emergency and development programs, since these distinct categories are still used in the Congressional Presentation, authorization, and appropriation processes.
3.7.3 Strengthening Program Management and Oversight
USAID/FFP has also made considerable progress since 2006 in strengthening program management and oversight. This includes adding staff in its three African regional offices and placing at least one Food for Peace Officer in each of its focus countries to manage the Title II programs. USAID/FFP also put more effort into strengthening the capacities of its own staff during the FAFSA-2 time period. It encouraged staff to take advantage of other training opportunities at USAID, including the course for Agreement Officer’s Representatives (AORs), and supported the development of tailored courses, workshops, and manuals focused on the specific needs of its staff. More proactive management and oversight on the part of USAID/FFP CBOs and field staff and involving other USAID Mission staff in Title II program activities also fostered program complementarities, synergies, and integration. Joint visits by USAID/FFP field officers and other USAID staff to field programs was one of the better practices observed during the FAFSA-2, as was the participation of USAID/FFP officers in field visits for Title II program assessments and evaluations.
3.7.4 Aligning USAID/FFP Management and Operations with the Rest of USAID
Significant advances were made in aligning basic management systems and practices, including terminology, the filing system, and the project funding cycle, with the way things are done in the rest of USAID. The recent adoption of country
program/portfolio reviews open to all staff and monthly budget/pipeline reviews increased transparency and improved program oversight within USAID/FFP, according to many staff. These changes, which are common practices elsewhere in USAID, were expected to promote more consistency across divisions and USAID/FFP CBOs in the way that policies are interpreted and programs managed. Soon after the 1995 Policy Paper was issued, USAID/FFP began taking steps to increase consistency among its development programs at the country level in the location of programs, program objectives and interventions, and time frames, including having all programs in a given country start and end in the same fiscal year. These and other changes led to proposals that were more focused and fully developed and to a more rigorous review process. In late 2010, USAID/FFP made the final conversion to using an RFA mechanism for competing the 2011 Title II development programs, which USAID/FFP management expected to lead to better project proposals and more effective program implementation in the field.
3.8 Cross-Cutting Issues
3.8.1 Women, Gender, and Gender Equity
According to the 2002 FAFSA, most of the development programs included in its review claimed to be “gender sensitive and inclusive of women.” However, the FAFSA criticized performance in the field, concluding that, with few exceptions, Awardees needed “to place more emphasis on overcoming the obstacles to incorporating women as active economic agents and full participants in their programs.” This emphasis was repeated in the development Proposal Guidelines that USAID/FFP issued for the FY 2003 and FY 2004 development programs in separate discussions in the subsections on “Women in Development” in the sections on “Agency Policies.” These subsections made two basic points: (1) “women and girls suffer the differential impact of intra-household food distribution and, therefore, may suffer from higher rates of malnutrition” and (2) programs using Title II resources “should seek

3-34 Overall Program Performance during the FAFSA-2 Time Period
to maximize the role of women and improve the inequitable distribution of household resources, including food, to girls.”
The USAID/FFP Strategic Plan took a slightly more nuanced approach to the gender issue. It did note that “women are generally recognized as being among the most vulnerable to food insecurity along with young children and the elderly.” But it also recognized that there is a tension between women’s roles as the major participants in and beneficiaries of the community-based MCHN programs, which are among the most important Title II interventions in the HN sector, and their roles with respect to household livelihoods and in community organizations, which vary greatly across countries and regions depending on culture and tradition. The Strategic Plan ended its gender discussion with two requirements: (1) that Awardees need to make sure that their “program designs include strategies for addressing gender issues and objectives” and (2) that “all livelihood programs, agricultural programs in particular, will need to be designed and implemented in ways that recognize women as producers and economic agents in their own right with their own unique constraints and opportunities.” The first requirement was added to the USAID/FFP Proposal Guidelines for FY 2005 through FY 2009, i.e., that Awardees should describe a gender strategy in their proposals to ensure equitable participation by both men and women in the design, targeting, and management of their development programs.
More than 60 percent of the proposals reviewed as part of the FAFSA-2 assessment included a discussion of gender, and the majority of these discussions were short, usually only one paragraph. Major issues raised in these sections included: the importance of women in the agricultural sector, including as farmers (30 proposals); the long distances that women usually have to walk to fetch water and firewood (19 proposals); the high female rate of illiteracy (15 proposals); and men’s control over the distribution of household resources, including food (13 proposals).
According to USAID/FFP beneficiary data cited earlier, women accounted for 50 percent or more
of the beneficiaries in all eight technical sectors in FY 2009 (see Figure 3.10). What the FAFSA-2 team saw on its field visits was also apparently quite different from the experience of the 2002 FAFSA. That is, at every program in every country visited, the Awardees seemed to be going to great lengths to make sure that women in their communities were involved in a wide range of project activities, including many agricultural and livelihood activities. And, in fact, team members were concerned in several cases that the amount of time women were spending in all the groups that the projects had created—producer groups, marketing groups, village savings and loan (VSL) groups, Non-AG IG groups, and mother care groups—was not leaving them enough time to take care of their own well-being and the health and nutrition of their young children and families. (See Chapter 6 for a further discussion on this issue.)
To deal with concerns related to women’s workloads, USAID/FFP began to add a requirement to its Proposal Guidelines, beginning in FY 2007, that new Awardees include a description in their proposals of how their activities, including agricultural activities, will affect women’s workloads. This issue did not seem to be on the agendas of program staff in any of the programs visited, even though women’s workloads can be critical, including because of their potential negative effects on child malnutrition (see the example in Section 6.4.8).
USAID’s and USAID/FFP’s understanding of and guidance on gender equality and equity have advanced over time. This can be seen in the guidance provided in the FSCFs. (See Box 3.11 for information on the guidance that was included in the Bangladesh FSCF, for example.) Other important developments include the preparation, with FANTA assistance, of Occasional Paper #7, Gender Integration in USAID Bureau for Democracy, Conflict, and Humanitarian Assistance, Office of Food for Peace Operations, released in 2011 (McNairn and Sethuraman), and the addition of stronger language in the FY 2010 Proposal Guidelines that states that “[u]nderstanding gender constraints as they affect food security and integrating gender considerations into food

3-35Overall Program Performance during the FAFSA-2 Time Period
aid programming is essential and a mandatory requirement as noted in [Automated Directives System] 201 to ensure, promote and sustain food security” (USAID/FFP, 2009, p. 9).63 Key recommendations in the Occasional Paper include: developing comprehensive guidelines specific to
63 Similar emphasis was given to gender equality and equity in USAID/FFP’s FY 2011 and FY 2012 RFAs.
gender and food security for use in improving the monitoring of Title II programs, strengthening staff competencies on gender integration in food security, and supporting pilot efforts to determine how best to empower women in food assistance programming. Gender equality, as defined in USAID’s 2012 Gender Equality and Female Empowerment Policy, “concerns women and men, and it involves working with men and boys, women and girls to bring about changes in attitudes, behaviors, role and responsibilities at home, in the workplace, and in the community. Gender equality means more than parity in numbers or laws on the books; it means expanding freedoms and improving overall quality of life so that equality is achieved without sacrificing gains for males or females” (USAID, 2012, p. 3).
3.8.2 Urbanization
The 1995 Policy Paper gave priority to programs in rural areas, since food insecurity was predominantly a rural problem at that time. And this rural focus continued throughout the FAFSA-2 time period.
Most countries have become more urbanized since the mid-1990s, however, and the numbers of poor and food insecure living in urban areas have also increased. These trends were recognized in the 2002 FAFSA, which included a recommendation that USAID/FFP consider the merits of Title II development programs with an “urban focus and prepare guidance on the role of agriculture in promoting better food security in urban and peri-urban environments.” The USAID/FFP Strategic Plan also recognized that there could be “cases where strong arguments could be made for supporting urban-based activities” (see Box 3.12). This was the case with respect to the FH and SC programs in Bolivia that had urban FFW components (which are discussed in more detail in Box 5.3).
The numbers of poor and food insecure in urban areas are increasing rapidly, including in a number of the USAID/FFP priority countries. According to U.N. projections, for example, more than 50 percent of the populations of Liberia and Guatemala and more than 40 percent of the populations of Haiti,
Box 3.11. Integrating Gender Equity in Program Design and Implementation
“A better understanding of the gender constraints, how gender issues will affect the various dimensions of their programs and their ability to achieve their food security objectives, should inform the design and implementation of the Title II programs. Men’s and women’s needs and constraints will differ, and they will not always be affected in the same way by project interventions. Adding a gender lens to these programs means understanding and taking these differences into account in the design and implementation of the Title II programs. As such, integrating gender equity into programming is context specific. Mainstreaming gender into a program does not mean that a program has to become exclusively or even primarily focused on women. It is about understanding the social context in the program areas sufficiently to transform the enabling environment at the community level so that men and women can dialog, participate and gain equably from programs’ efforts in food security and nutrition. Integrating gender equity in this way will facilitate and deepen program impact, and along the way will likely promote gender equity as well.”
Source: Bangladesh Food Security Country Framework FY 2010–FY 2014 (van Haeften and Moses, 2009, p. 87).

3-36 Overall Program Performance during the FAFSA-2 Time Period
Mauritania, Mozambique, and Sierra Leone will be living in urban areas in 2015 (World Bank, 2009). The urban poor in developing countries are particularly vulnerable to high food prices and greater price volatility. This was the case during the food price crisis in 2007 and 2008. And high and volatile food prices are likely to continue to be problems in the foreseeable future, according to predictions by both FAO and IFPRI.
Adding an urban focus to the Title II development program also might be one way to increase the use of food as food in the program, which would be consistent with the emphasis given to this objective in the USAID/FFP Strategic Plan. Urban FFW programs have been out of favor since the 1995 Policy Paper, but one lesson learned from the two Bolivian urban FFW components is that “[i]t is easier logistically and more cost effective to implement FFW in an urban area where projects and beneficiaries are more concentrated than in rural areas, especially in Bolivia, where populations and priority infrastructure projects are likely to be more dispersed geographically” (van Haeften et al., 2009, p. 253). Urban FFW programs can also be designed to contribute to longer-term objectives, such as
increasing worker skills (improving human capital) and the physical environment in which the workers are living (improving physical and human capital), in addition to helping poor people, many of whom may be recent migrants from rural areas, to meet their immediate food needs.
3.8.3 The Environment
All USAID projects, including Title II development programs, must comply with Environmental Regulation 22 CFR 216, which requires them to be environmentally sound in design and management. Regulation 216 provides guidelines for writing an Initial Environmental Examination (IEE), in which all Title II development program activities are analyzed to ensure that no harm comes to the environment in the execution of these activities. Mitigation measures are also written into these documents to minimize or eliminate possible negative environmental impacts—the Environmental Threshold Decision. The IEE, once final clearance is granted by the USAID DCHA Bureau’s Environmental Officer, is also the key environmental management tool for the Awardees, in addition to host government laws and regulations. These tools not only guarantee environmental compliance with laws, but certify that projects are designed with mitigation measures that should be executed throughout the implementation phase of the program. A quality design is expected to reduce potential environmental damage and offer alternatives that could be less costly to implement and help guarantee sustainability.
Environmental compliance is an important issue, but one that the FAFSA-2 team was not able to spend much time on. Neither the FAFSA-2 team nor the majority of individual program evaluation teams included environmental specialists, which limited the amount of information available on environmental issues and compliance. The result was that little information was available to the FAFSA-2 team about program performance, how and how well programs were monitored, what steps were taken to ensure that the appropriate mitigation measures were
Box 3.12. Urbanization in the USAID/FFP Strategic Plan
“The assumption underlying the 1995 ‘Food Aid and Food Security Policy’ was that food insecurity is primarily a rural problem. Now, with many developing countries rapidly urbanizing and urban poverty increasing, there will be cases when strong arguments can be made for supporting urban-based activities. However, increased urban poverty in itself will not cause a structural reorientation of Title II activities away from rural areas if country-specific analyses of risks and vulnerabilities indicate that this is where the priorities still lie.”
Source: USAID/FFP Strategic Plan, p. 41.

3-37Overall Program Performance during the FAFSA-2 Time Period
taken and when, and whether the negative effects that had been identified were avoided.
Most Title II development programs involved large amounts of education and training activities across technical sectors, which fell under the categorical exclusion category. Infrastructure activities, which included roads, dams, canals, soil and water conservation structures, tube wells, latrines, and a variety of different types of buildings, were given negative determinations, usually with conditions. Types of potential adverse effects that were typically identified included: soil erosion; land degradation; deforestation; damage to habitat and biodiversity; contamination of waterways and aquifers; increased flooding and/or water logging; and damages to human health due to improper use and disposal of ITNs, agricultural chemicals, and human waste. One issue that was raised in several final evaluations had to do with training in the proper use of agricultural chemicals. In these cases, the Awardees were not promoting the use of these chemicals, but their client farmers were using them on their own, and the evaluations recommended that the Awardees add a training module to their programs to ensure that their client farmers learned how to use these chemicals properly.
3.8.4 Sustainability
It was beyond the scope and resources of the FAFSA-2 to explore in any depth the sustainability of Title II development programs after they ended. Additionally, sustainability of the Title II development programs after they ended is the focus of the Tufts Exit Strategy Study, which was already under way at the time the FAFSA-2 began. Achieving sustainability is extremely important, however, and the FAFSA-2 team took advantage of the analytical framework developed for the Tufts study to better understand some of the sustainability issues that arose during the assessment.
The distinction between the sustainability of the people-level impact versus the sustainability of the activities/services producing the impact is an important concept with respect to MCHN programs in the FAFSA-2, while the potential tradeoffs
between immediate impact and longer-term sustainability were found to be critical issues in AG/NRM programs. In the case of MCHN, if a program is able to prevent children under two from becoming stunted, this positive impact will benefit these individuals for the rest of their lives. That is, the long-term individual impact is sustained, even if the mothers revert back to traditional feeding practices for their next child and/or the system that was put into place to achieve this result does not last beyond the life of the project, for example, when community health workers (CHWs) are no longer paid and cease to provide services after a project ends. Ideally, one would like to see mothers continuing positive child feeding practices and workers continuing to deliver services long after programs end, but the FAFSA-2 takes the position that having a positive impact on the nutritional status of the first cohort of children is of immense benefit in its own right. Whether the MCHN interventions are sustainable beyond one generation is unknown and would require research. It is known, however, that there are intergenerational nutritional improvements in birth weight, through improving the nutrition of young girls and pregnant women (see the UNSCN 6th Report on the World Nutrition Situation, 2010).
In AG and NRM activities, economic incentives (i.e., profits) are key to getting farmers to adopt new technologies and practices as well as to keep using them. One way to encourage farmers to adopt project-recommended technology packages is to provide these inputs to farmers for free or at subsidized prices64 and, in the case of NRM structures and practices, to pay farmers for the amount of time that they spend in their fields building these structures and applying these practices. These subsidies can help Awardees increase the numbers of new technology adopters
64 Input subsidies can have their rationale in the short run, including as a way to demonstrate the value of a promising new technology and/or as a way to reduce the risk to client farmers of trying a promising but not yet fully proven technology. Longer-term disadvantages include encouraging dependencies on the part of farmers and discouraging input dealers in the private sector from supplying these goods, reducing the likelihood of their availability once the Title II project ends. (See Chapter 4 for further discussion on this issue.)

3-38 Overall Program Performance during the FAFSA-2 Time Period
(the percentage of adopters is one of the major outcome indicators for AG/NRM components), but these are artificial incentives and there is no guarantee that farmers will continue to use these new technologies and practices once a project is over and the subsidies and payments end. Having an impact in the short run, in cases where subsidies are used, in other words, is not necessarily an indicator of success in the longer term and may actually make it harder for a project to achieve a sustainable impact, or as the Tufts Exit Strategy Study recently concluded, the “provision of free resources poses risks to sustainability.”65
3.9 Conclusions and Recommendations
3.9.1 Conclusions
Program Designs
• The Results Framework for IR 2—“Title II program impact in the field increased”—in the USAID/FFP Strategic Plan was focused on protecting and enhancing individual capabilities and livelihood and community capacities. In the proposals prepared prior to the Strategic Plan, programs were organized by technical sector (e.g., AG/NRM and MCHN) or by the three food security pillars (i.e., food availability, access, and utilization). The few programs that tried to use the new expanded framework included in the Strategic Plan as a basis for organizing their programs found it unworkable and reverted to the more traditional frameworks.
Program Resources
• The majority of Title II development resources continued to be allocated according to the priorities initially established in the 1995 Policy Paper. That is, the majority of the resources
65 Beatrice Rogers and Jenifer Coates, “Effectiveness of Title II Program Exit Strategies: Conclusions and Recommendations,” a PowerPoint presentation given at a Title II stakeholder meeting on February 7, 2013.
continued to be allocated to programs in Africa and to the two major technical sectors: AG/NRM and HN.
• USAID/FFP was very successful during the FAFSA-2 time period in reallocating Title II development resources to a smaller set of more vulnerable (“priority”) countries. This was a major undertaking, and it is quite remarkable that USAID/FFP was able to complete the transition in such a relatively short period of time, and especially for an organization that had very little experience in closing programs.
• The quantities of food used as food in FFW and MCHN programs declined during the FAFSA-2 time period despite the heavy emphasis in the USAID/FFP Strategic Plan on the use of direct food distribution to enhance physical and human capital.
Program Integration
• Feed the Future. Title II development programs have the potential to make an important contribution to FTF in countries where the two programs operate and overlap geographically, with both programs benefiting from each other’s presence, creating synergies among and enhancing the impacts of each other’s programs. FTF could build on existing Title II community-based program platforms that reach the most vulnerable populations, increasing the likelihood that the growth in the agricultural sector that its programs are promoting will be “inclusive.” And Title II programs could benefit from the ability of the FTF programs to work on problems and constraints higher up the value chain, for example, and/or in the policy environment.
Creating an Evidence Base for More Effective Programming
• Although some progress was made during the FAFSA-2 time period, USAID/FFP still does not have enough evidence on which types of interventions and approaches work better and which ones do not work so well based

3-39Overall Program Performance during the FAFSA-2 Time Period
on systematic, rigorous, and independent comparisons of program performance across countries and programs.
• That said, the FANTA and FANTA-2 projects made major contributions to the state of the art in some areas based on applied research and to the development of new indicators that have become standard for measuring the impact of Title II, FTF, and GHI programs. Considerable effort was devoted to M&E, with fewer products focused on project design and implementation.
Planning and Analysis
• The transfer of FEWS NET to USAID/FFP was successful, resulting in USAID/FFP having access to more reliable early warning information earlier, in more detail, and in ways that have made it much more useful to USAID/FFP for advance planning.
• The creation of the BEST Project has also resulted in Bellmon analyses whose methodologies are now consistent across countries and programs, independent, and of consistently higher quality.
Guidance and Technical Assistance
• The preparation of country-specific FSCFs has resulted in a significant improvement in the quality of USAID/FFP’s country-specific proposal guidance.
• There is still a lack of guidance from USAID/FFP on what interventions and programs work better, based on cross-cutting programmatic research, and complementary TA to Awardees.
• The need for trigger indicators appears to have been obviated with the transfer of FEWS NET to USAID/FFP and the procurement changes that have made it easier and quicker for USAID/FFP to respond to requests for emergency resources. Broader EWR systems, on the other hand, appear to have real potential as a risk management and responsive program implementation tool and could benefit from additional support to increase their usefulness and likelihood of sustainability in
specific community and country contexts. Efforts to improve the linkages between these systems, which are able to amass more detailed and country-specific early warning information, and FEWS NET would also be useful.
Capacity Strengthening
• The TOPS project got off to a good start facilitating networking and knowledge sharing among Awardees and other stakeholders. However, it remains to be seen if it can overcome the challenge of “competitive isolation” and the reluctance of some Awardees to truly share their tools, what they are doing, and what they have learned. Caution is also needed to be certain that approaches and tools promoted are based on objectively verifiable evidence, or a rigorous, independent review of their effectiveness or utility.
3.9.2 Recommendations
3.9.2.1 Recommendations to Improve Program Performance
USAID/FFP’s accomplishments with respect to improving program guidance, procurement, oversight, and evaluation during the FAFSA-2 time period are summarized in Figure 3.20 along with the FAFSA-2 recommendations for making further improvements in program performance in the field.
To Create an Evidence Base for More Effective Programming:
• USAID/FFP should develop an applied research agenda and sponsor studies that focus on the implementation of Title II programs in the field to better define what works and what does not work. This should include comparative analyses of program approaches and their effectiveness and cost-effectiveness based on: (1) more analyses of existing reports and data; (2) collection and submission of additional information by Awardees; and (3) more systematic, rigorous, and

3-40 Overall Program Performance during the FAFSA-2 Time Period
independent cross-country case studies and other original applied research. (Recommendation 1)66
• USAID/FFP should not try to do a broad FAFSA once every 10 years, but divide the assessment into annual reviews on one or two technical sectors, program approaches, or management issues (perhaps the “F” program areas or program elements) and go into more depth. Examples of potential topics for more in-depth reviews include assessing program approaches and performance with respect to: (1) community-based EWR systems and (2) targeting to more food insecure districts and communities, including processes, tools, and indicators.
• USAID/FFP should conduct a technical review of the major findings coming out of the final evaluations submitted each year—a “mini-FAFSA”—and have technical meetings on the cross-cutting results attended by USAID/FFP principals, Awardees, and other stakeholders. The results of these reviews should be disseminated
66 The numbers after certain recommendations throughout this report are the same as those assigned to the major recommendations in the FAFSA-2 summary report.
widely and changes should be made in programs so that they do more of what works and eliminate ineffective approaches. TA could be used to conduct the in-depth analysis and highlight the salient points.
To Improve Guidance and Technical Assistance:
• USAID/FFP should provide more guidance, direction, and standardization to the field using the evidence on what works and what does not.
• USAID/FFP should ask FANTA to review the FAFSA-2 report and recommendations and suggest what it can do to address them through TA and applied research.
• USAID/FFP should provide Awardees with the option, if they win a new agreement in the same country in which they are completing a Title II program, to stay in touch with some of the communities where they used to work to encourage community members to continue the interventions, learn what is not continued and why, and share their findings with USAID/FFP and other Title II partners. This will better inform effective sustainability and exit strategies, and
Figure 3.20. Improving Program Performance in the Field
Program Design Procurement Implementation Closure
Guidance Procurement FFP Program Oversight Evaluation
USAID/FFP ACCOMPLISHMENTS
RECOMMENDATIONS FOR USAID/FFP CONSIDERATION
Improved country-specific proposal guidance,
Bellmon Estimates, and FEWS NET early warning
information
Introduced competitive
procurement
Fielded at least one FFP Officer in each Focus Country and strengthened
regional offices
Standardized indicators and required
representative, quantitative program
evaluations
Guidance on better practices in technical
sectors needs strengthening
Adjustments in procurement
process could enhance program
quality
Staff could be more proactive managers, doing more program reviews and being more involved in mid-term evaluations;
more emphasis on improving monitoring systems, making more effective use of
data to improve programs; and establishing a program database would
be useful
Evaluations should be independent and high
quality and should fully document program
models; results should be widely communicated/
incorporated into knowledge base

3-41Overall Program Performance during the FAFSA-2 Time Period
nudge community members to continue with activities that they found worthwhile, with their own resources. Such extended accompaniment would add to what is being learned in the Tufts Exit Strategy Study. Encourage Awardees to propose this in their applications and allow some agreement funds to be used for post-graduation community-level follow-up.
To Strengthen Capacity:
• USAID/FFP should ask the TOPS project to review the FAFSA-2 report and make recommendations about what it can do to address them.
• USAID/FFP should ask the TOPS project to give highest priority in selecting participants for its “Designing for Behavior Change” training to Awardee staff working to improve IYCF practices in Title II programs, where there is a bigger gap and more urgent need than among the multi-sector agriculture and nutrition program audience reached so far. The training should strengthen qualitative research skills. The TOPS small grants program should be used to fund formative research on IYCF practices, especially complementary feeding.
To Improve Program Procurement and Enhance Program Effectiveness:
• USAID/FFP should include options for extensions of awards or separate follow-on awards to enable USAID/FFP to continue to support high-performing programs beyond five years and up to ten years while complying with the Automated Directives System (ADS) 303.3. This would be consistent with what is known about the time requirements of the AG/NRM programs (e.g., the technology identification and adoption process) and the evidence from the MCHN programs that longer implementation periods are associated with greater impact. (Recommendation 3)
• USAID/FFP should select the review panel for new Title II applications carefully to ensure appropriate technical expert representation, and give reviewers a “cheat sheet” on interventions
and approaches that USAID/FFP is and is not interested in funding because they work better or do not work as well. Provide this same information in the RFA. (Recommendation 4)
• USAID/FFP should require Awardees to identify up to five key personnel and provide their CVs in applications, not just the Chief of Party’s CV, to ensure programs have sufficient technical expertise in their field staff in: (1) nutrition; (2) agriculture, agribusiness, marketing, and economics; (3) M&E; and (4) gender. (Recommendation 5)
• USAID/FFP should arrange for Awardees to make presentations during in-country application reviews, a practice followed in some other USAID procurements. This presentation, if managed correctly, can help clarify points up front and reduce the amount of time on the preparation of written issues and responses. This presentation might also help clarify the extent to which proposed local staff and key personnel are involved with and understand the proposed program design and implementation strategies. (Recommendation 6)
• USAID/FFP should ensure substantive changes made to the program description during implementation are approved by the Agreement Officer and formalized in amendments to the agreement. (Recommendation 7)
3.9.2.2 Special Issues
Enhancing Program Impact on Child Nutrition
As long as high rates of undernutrition among young children is one of the major criteria USAID/FFP uses to identify its “priority countries” and reducing undernutrition is one of the main measures of overall program impact, and given the evidence, including from the FAFSA-2, that preventive supplementary feeding for pregnant and lactating women and young children, delivered along with an integrated package of community- and population-based SBCC and essential health and nutrition interventions has the biggest positive impact on nutritional status (see Section 6.4.5), USAID/FFP should:

3-42 Overall Program Performance during the FAFSA-2 Time Period
• Require Title II programs in its focus countries to include an integrated, community-based MCHN component and, at a minimum, to provide preventive food rations to women during pregnancy and the first six months postpartum and to children from 6 to 23 months in participating communities—or make a very convincing case to USAID/FFP why this would not be advisable and/or feasible. Provision of these rations should be conditioned on the participation of the mothers and children in specified MCHN activities.67 (Recommendation 22)
Responding to the Increasing Poverty and Food Insecurity in Urban Areas
• The 1995 Policy Paper gave priority to programs in rural areas since food insecurity was predominantly a rural problem at that time. This rural focus continued throughout the FAFSA-2 time period, even though most countries in the FAFSA-2 universe continued to urbanize rapidly and urban poverty and food insecurity increased substantially. The FAFSA-2 concluded that the position on urbanization that was set forth in the USAID/FFP 2006–2010 Strategic Plan remains relevant for now (see Box 3.12), but recommends that USAID/FFP continue to monitor these trends and make readjustments as necessary.
Addressing Environmental Issues More Effectively
• USAID/FFP should consider commissioning a review of the extent to which Title II development programs are being implemented in accordance with Regulation 21668 and their approved IEEs or whether further guidance and training is needed to improve compliance and performance in the field.
67 When food is directly distributed in Title II development programs, it is generally in the form of a conditional resource transfer. The provision of food to individuals in FFW activities is conditioned on the amount of work they perform, and the better practice in MCHN programs is to condition the food ration on the caregiver’s and child’s participation in specified MCHN activities, as is the case with similar conditional cash transfer programs.68 All USAID projects, including Title II development programs, must comply with Environmental Regulation 22 CFR 216, which requires them to be environmentally sound in design and management.
As part of this assessment, reviewers should also consider whether USAID/FFP should require that an assessment of compliance with Regulation 216 be included in the scopes of work (SOWs) for mid-term and final evaluations of all Title II development programs. (Recommendation 23)
3.9.2.3 Two Key Issues for Further Deliberation
Strategic Plan
• Should USAID/FFP prepare a new Strategic Plan? The 2006–2010 Strategic Plan was useful as a frame of reference for Title II development programs during the later years of the FAFSA-2 time period, according to most of the USAID/FFP Washington-based and field staff that were interviewed. Most supported the idea of having a USAID/FFP Strategic Plan, but felt that the current one needed to be updated—not rewritten. If the Strategic Plan is updated, it should include a revision of the results framework for IR.2—“Title II impact in the field improved”—to make it more consistent with the framework being used by FTF. If a new strategy is not advisable, USAID/FFP needs to find another mechanism for disseminating any new guidance developed in response to the FAFSA-2 recommendations, in addition to its annual RFAs.
AG/NRM and MCHN Interventions
• Is there a proper balance between AG/NRM and MCHN programs? The programs in Africa have tended to give much higher preference in resource allocations to AG/NRM interventions at the expense of MCHN, and there are some programs in the Asian and LAC regions that may have erred in favor of MCHN. The FAFSA-2 team does not have a “one size fits all” recommendation with respect to this issue, but it is one that deserves more analysis and discussion to inform guidance.

3-43Overall Program Performance during the FAFSA-2 Time Period
Bibliography for Chapter 3Alderman, H. et al. 2000. Reducing Child Malnutrition: How Far Does Income Growth Take Us? World Bank HNP Discussion Paper 12.
Bonnard, Patricia et al. 2002. “Report of the Food Aid and Food Security Assessment: A Review of the Title II Development Food Aid Program.” http://www.fantaproject.org/downloads/pdfs/FAFSA.pdf.
Ecker, O. et al. 2012. “Growth Is Good, but Not Enough to Improve Nutrition” in Reshaping Agriculture for Nutrition and Health, Shenggen, F. and Pandya-Lorch, R. (eds.). IFPRI.
FANTA. 2010. “Title II Technical Reference Materials. TRM-01: Preventing Malnutrition in Children under 2 Approach (PM2A): A Food-Assisted Approach.” Revised November 2010. http://www.fantaproject.org/pm2a/TRM_PM2A_RevisedNov2010.pdf.
GAO. 2011. Better Nutrition and Quality Control can Further Improve U.S. Food Aid. Report to Congressional Requesters. GAO-11-491 International Food Assistance. Washington, DC: GAO.
Mathys, Ellen. 2007. Trigger Indicators and Early Warning Response Systems in Multi-Year Title II Assistance Programs. USAID/FFP Occasional Paper 5. Washington, DC: USAID.
McNairn, Rosemarie and Sethuraman, Kavita. 2011. Gender Integration in USAID Bureau for Democracy,Conflict,andHumanitarianAssistanceOfficeofFoodforPeaceOperations:OccasionalPaper #7. Washington, DC: FANTA.
Menon, Purnima et al. 2007. “Prevention or Cure? Comparing Preventive and Recuperative Approaches to Targeting Maternal and Child Health and Nutrition Programs in Rural Haiti. Executive Summary of the Evaluation Report.” http://www.fantaproject.org/pm2a/Haiti_Exec_Summary_Dec07.pdf.
Rogers, Beatrice Lorge and Macías, Kathy E. 2004a. “Program Graduation and Exit Strategies: Title II Program Experiences and Related Research.” http://www.fantaproject.org/downloads/pdfs/Exit_Strategies2004.pdf.
———. 2004b. “Program Graduation and Exit Strategies: A Focus on Title II Food Aid Development Programs.” Technical Note No. 9. http://www.fantaproject.org/downloads/pdfs/TN9_EXITS.pdf.
Ruel, Marie T. et al. 2008. “Age-Base Preventive Targeting of Food Assistance and Behaviour Change and Communication for Reduction of Childhood Undernutrition in Haiti: A Cluster Randomised Trial.” Lancet 371: 588–595.
UNSCN. 2010. 6th Report on the World Nutrition Situation: Progress in Nutrition. Geneva: UNSCN Secretariat c/o WHO.
USAID. 2012. “Gender Equality and Female Empowerment Policy.” http://transition.usaid.gov/our_work/policy_planning_and_learning/documents/GenderEqualityPolicy.pdf.
USAID and USDA. 2011. U.S. International Food Assistance Report 2010. Washington, DC: USAID.
USAID/FFP. 2005. Strategic Plan for 2006–2010. Washington, DC: USAID.
USAID/FFP. 2009. “Fiscal Year 2010: Title II Proposal Guidance and Program Policies.”
USAID/FFP. 2010. “Trigger Indicators in Multi-Year Title II Assistance Programs.” Food for Peace Information Bulletin (FFPIB) 10-01.
van Haeften, Roberta; Bentley, Jeffery; Fernandez, Alfredo; and McNulty, Judiann. 2009. The Final Evaluation of the FY 2002–FY 2008 Bolivia Title II Development Program.
van Haeften, Roberta and Moses, Phil. 2009. USAID OfficeofFoodforPeaceBangladeshFoodSecurityCountry Framework FY 2010–FY 2014. Washington, DC: FANTA-2.

3-44 Overall Program Performance during the FAFSA-2 Time Period
Webb, Patrick et al. 2011a. Delivering Improved Nutrition: Recommendations for Changes to U.S. Food Aid Products and Programs. FAQR Report to USAID. Boston, MA: Tufts University Friedman School of Nutrition Science and Policy.
———. 2011b. Improving the Nutritional Quality of U.S. Food Aid: Recommendations for Changes to Products and Programs. Boston, MA: Tufts University Friedman School of Nutrition Science and Policy.
World Bank. 2009. World Development Report: Reshaping Economic Geography. Washington, DC: World Bank.

4-1
Second Food Aid and Food Security Assessment (FAFSA-2)
4. Agriculture, Natural Resource Management, Livelihoods, Income Generation
Abstract
More than three-quarters of the Title II development programs in the FAFSA-2 universe had an SO related to AG. Fifty of these programs were in Africa (20 countries), 6 were in Asia (3 countries), and 23 were in LAC (5 countries). Almost 60 percent also focused on LH and IG. The vast majority were designed based on the assumptions that most of their clients were farmers and that the solutions to their food insecurity lay primarily in production agriculture. Most AG/NRM programs included a wide range of interventions focused on improving crop and livestock production, NRM, irrigation, storage, marketing, and rural and agricultural finance in an attempt to be responsive to the different opportunities and production potentials available to farmers in their target areas. Key approaches included disseminating knowledge about improved technologies and practices to their client farmers, organizing them into groups, and distributing agricultural inputs and capital investment goods. These programs were often technically complex and difficult to design and implement successfully. The FAFSA-2 universe includes many examples of programs that helped improve their clients’ lives, usually by providing them access to a combination of improved agricultural technologies and market opportunities. The successes that these programs achieved are even more noteworthy given the challenging environments in which they worked. Not all clients in Title II target areas are farmers, however, and many that do farm do not have the asset base needed to farm their way out of poverty. A few programs also included limited amounts of support to the development of microenterprises in their target areas, but since most people do not have strong entrepreneurial skills, the rural poor included, what is really needed for those households that will not be able to succeed as farmers is access to more and better-paying jobs. In FY 2009, 40 percent of Title II development resources (US$125 million) was devoted to AG/NRM technical sector activities and only 3 percent (US$8.9 million) to Non-AG IG. The policy implications of the AG/NRM/LH/IG assessment are provided in Box 4.37 and details on the conclusions and recommendations are provided in Sections 4.6.1 and 4.6.2.

4-2 Agriculture, Natural Resource Management, Livelihoods, Income Generation
4.1 Introduction
4.1.1 Policy and Program Environment
Title II agricultural development programs underwent a major change in the late 1990s as a result of the 1995 Policy Paper, which shifted the focus and goal of the program to “rural areas” and to “increasing agricultural productivity.” In an effort to address the underlying causes of food insecurity identified in the Policy Paper, the focus of Title II development programs also shifted from shorter- to longer-term interventions that were expected to have a higher probability of sustainability.
Prior to the 1995 Policy Paper, the Title II development program supported activities that had a more indirect relationship to agriculture, such as road rehabilitation, soil conservation, and reforestation, using FFW. The portfolio began to change during the time covered by the 2002 FAFSA. More emphasis was given to increasing agricultural productivity and production and to reducing post-harvest losses, and more attention was given to crop diversification, marketing, and agricultural-based enterprises—activities that required significant amounts of non-food resources to implement. FFW continued to be used to support community-based soil conservation and reforestation activities, but
more attention began to be placed on NRM practices that would have more direct effects on improving on-farm agricultural productivity (e.g., giving more emphasis to using crop residues in farmers’ fields than to building stone terraces on community land). These changes were dramatic, according to the 2002 FAFSA, and required Awardees to make significant changes in their programming, implementation, and staffing.
Many of these same emphases continued into and throughout the FAFSA-2 time period. This includes the emphasis on increasing agricultural productivity; promoting improvements in NRM as part of an emphasis on developing sustainable agricultural systems; and marketing, with a more updated view of the role of market-driven demand in maximizing economic “return and the predictability of income generation” (see Box 4.1).
What was expected to be new under the 2006–2010 Strategic Plan was an increased focus on helping farmers manage risk, including during (but not limited to) the agricultural production cycle. This was expected to include: “providing technical assistance and training on soil and water conservation techniques; agricultural technologies that reduce risk (e.g., drought resistant crops, low-external input agriculture); and improved post
Box 4.1. USAID/FFP Definition of Its “Sustainable Agricultural Production/Natural Resources Management” (AG/NRM) Technical Sector
“Objectives include reducing risk during the agricultural production cycle, increasing agricultural productivity, and promoting natural resource management in a socially, economically, and environmentally sustainable manner. Includes activities related to production, processing, marketing, distribution, use, and trade of food, feed, and fiber produced by a sustainable agricultural system in a manner that is non-degrading to the environment, technically appropriate, economically viable, market-driven, locally replicable, equitable, and socially acceptable. Activities promote agricultural technologies that: offset losses of and/or regenerate soil fertility; prevent erosion of top soil; protect water point quality and quantity; employ a judicious use of affordable purchased inputs; reduce post harvest storage losses; diversify and integrate crops, livestock, agro-forestry, fisheries production systems to enhance resiliency to climatic fluctuations; and rely on market-driven demand to maximize return and predictability of income generation. Food rations are used to build agriculture-related physical and human assets.”
Source: USAID/FFP Annual Results Reporting Guidance for FY 2009.

4-3Agriculture, Natural Resource Management, Livelihoods, Income Generation
harvest handling to reduce post harvest losses.” Crop and income diversification activities were also expected to receive added attention, because the Strategic Plan viewed support to more diversified livelihoods as “another important risk reduction strategy as well as an income enhancing strategy.” This latter focus, according to the Strategic Plan, meant that Awardees would need to pay “more attention to markets and market demand and working more closely with the private sector, helping support as well as take advantage of mission and other USAID market strengthening activities where possible” (USAID/FFP, 2005, p. 69).
The 2006–2010 Strategic Plan also clarifies the roles of food and non-food resources in the Title II development programs, including by providing numerous examples of how food and non-food (primarily cash) resources can be used in combination to achieve a broad range of objectives within the sub-IR category, “Livelihoods capacities
protected and enhanced” (see Table 4.1 for an example of one of the illustrative activities). The Strategic Plan reemphasized the importance of cash, by pointing out that the Title II development programs were going to have to continue to “rely primarily on non-food assistance to increase agricultural productivity and diversify production.” Food, the Strategic Plan argued, could be used in public works programs. (See Chapter 5 on “Infrastructure” for a further discussion of the uses of food and non-food resources to support public works programs.) Food could also be used as an incentive to offset the opportunity costs of participating in the training and TA activities (which needed to be funded with cash), which were paramount to the success of the AG/NRM/LH programs. The Strategic Plan also included two caveats with respect to the latter uses of food, pointing out that “food might not be necessary to insure participation, particularly if the programs are well designed so that people can see their economic
Box 4.2. Limitations and Gaps and in the Program Documentation and Data
The completeness and accuracy of the assessment of the AG/NRM/LH programs are dependent on the completeness and accuracy of the program documents and results data reported by the Awardees. These programs are complex and most contain a wide range of interventions and activities, many of which are not clearly identified or consistently reported on in the current documentation system. One cannot say for certain, for example, how many programs include activities focused on conservation agriculture, small ruminants, home storage, distribution of processing equipment to women’s income generation groups, planting of trees, rural/agricultural finance, or small-scale irrigation. Proposals frequently do not identify all the various types of interventions/activities that Awardees are considering including in their programs; some interventions/activities that are identified in proposals may never be implemented; and some may be added during a project and others subtracted. Annual reports do not report on all the activities implemented during the year and are not consistent year to year in the activities that they do report on. Mid-term and final evaluations tend to focus on bigger program components and sometimes on interventions and activities that evaluators themselves are interested in and say little or nothing about many others. Many activities in the AG/NRM/LH programs have no indicators associated with them, and, for those that do, the lack of standardization makes it difficult to aggregate information on program performance for the Title II development program as a whole, as well as to compare performance across programs and countries. Many program documents, including evaluations, also lack information on the nature of program interventions and approaches. This makes it difficult to draw conclusions about the relative effectiveness of alternative types of interventions, even in major program areas, including the promotion of improved agricultural technologies and practices and the organization and strengthening of producer associations and cooperatives.

4-4 Agriculture, Natural Resource Management, Livelihoods, Income Generation
benefits.” The Strategic Plan also pointed out the dangers that “food could also distort behaviors, encouraging farmers to adopt new farming practices that are not profitable or sustainable and/or attracting participants away from other agricultural development programs that do not have a subsidy component” (USAID/FFP Strategic Plan, p. 69).
4.1.2 Country Context
4.1.2.1 Where the Programs Work
The Title II development programs that were implemented during the FAFSA-2 time period, in accordance with policy and program guidance, were deliberately located in some of the poorest and most food insecure areas in countries that were already some of the poorest and most food insecure in the world. Most programs also worked in rural areas characterized by their:
• Low agricultural productivity
• Heavy dependence on rain-fed agriculture
• Geographical isolation
• Degraded natural resource base
• Vulnerability to the effects of lack of access to water(drought)and/ortoomuchwater(flooding)
• Lack of productive infrastructure, including market roads and irrigation systems
• Lack of agricultural support services
• Weak and underdeveloped market linkages
• Low household incomes
• Migration, both internally and internationally, to earn money, especially during the dry season
The specific problems and combinations of problems varied significantly across countries and within countries, however. In some areas where Title II development programs worked, agricultural potential was low due to high altitudes, encroaching desertification, limited or uncertain rainfall, degraded soils, steep slopes, or other biophysical constraints. In other areas, the agricultural potential was better, but the level of development was low due to a lack of infrastructure, long distances to markets, and lack of investments. In some areas, low population densities made it difficult to find cost-effective approaches to service delivery; in other areas, high population densities reduced plot
Table 4.1. Illustrative Activities from the 2006–2010 Strategic Plan Related to Sub-IR 2.2, Livelihoods Capacities Protected and Enhanced
Illustrative Activities: To increase agricultural productivity and diversify production
Non-Food Assistance Food AssistanceThe Title II program:
• Provides and/or coordinates the provision of the complementary inputs needed for the successful completion of the relevant infrastructure, such as engineering drawings and services and cement. Also provides or ensures the provision of the TA and training needed to ensure that the public works are operated properly and maintained.
• Provides training and TA on new agricultural technologies (including storage and agro-processing).
• Provides information on markets and TA and training to increase capacity to identify and access markets.
• Provides and/or coordinates the provision of credit to finance agricultural activities.
The Title II program:
• Provides food through public works programs to construct water reservoirs and irrigation systems (which also helps reduce production risks and adds to community assets).
• Provides food through public works programs to rebuild/build roads and improve market access.
• Provides food as an incentive and to offset the opportunity costs of participating in training activities.
Source: This table is taken verbatim from the USAID/FFP Strategic Plan, p. 71.

4-5Agriculture, Natural Resource Management, Livelihoods, Income Generation
sizes and increased the numbers of rural households that were effectively landless. Some areas suffered from years of political neglect and others from years of civil conflict that damaged productive and social infrastructure. Countries and communities also varied greatly in terms of the capacities of their public and private sectors and civil societies, not to mention their histories and cultures.
4.1.2.2 Target Population
Following the guidance originally laid out in the 1995 Policy Paper, the Title II development programs that were implemented during the FAFSA-2 time period continued to work in rural areas, and the target population for their AG/NRM/LH programs were small, resource-poor farmers. This included farmers that had only small amounts of land and/or poor-quality land (the soils were poor and/or the land was mountainous).
Many in the Title II target population did not have enough land or land of sufficient quality to become food secure by focusing only on increasing farm production, however, at least not without getting access to improved technologies and markets for higher-valued products. And in some countries—Bangladesh, for example—the majority of the most food insecure in rural areas is landless. In other words, as John Staatz, Professor Emeritus, Michigan State University (MSU), pointed out during an October 2011 IFPRI seminar on “Agribusiness in Africa,” “Not all farmers will be able to farm their way out of poverty,” even in Africa. His actual estimate, reported in a Background Paper for the World Bank Development Report 2008 (Staatz and Dembele, 2008), is that “somewhere between one- and two-thirds of smallholder farmers (depending on the country) appear to lack the resources to ‘farm their way out of poverty’ and will therefore need eventually to move to more remunerative employment outside farming.”
Agriculture can also be a very risky business, especially for most of the Title II farmers that do not have access to irrigation and thus have to depend on rains to provide water for their crops and animals. Being so dependent on the weather means that they can lose their entire crop and a significant percentage
of their annual income in the case of drought or even a delay in the rains. Poor farmers typically have to cover 100 percent of their losses, since they have no access to insurance. Most also have to come up with 100 percent of any capital investments that they make, on their own or out of the accumulated wealth of their families (self-finance), since few have access to credit and what little credit is available is usually available only at very high interest rates.
Because they have limited agricultural assets and opportunities, many households that were/are included in the Title II target population have developed alternative livelihoods to farming, including other on-farm and/or off-farm wage labor; petty trading; and a variety of microenterprises, including tailoring, carpentry, and brick making. These activities help them supplement their farm incomes and better cope with the many risks that they have to deal with on a daily basis. Small farmers all over the world, as a recent IFPRI publication describes them (see Box 4.3), are
Box 4.3. The Title II Target Population: Poor, Rural Households
• “Everywhere in the world, small agricultural producers are entrepreneurs, traders, investors, and consumers, all rolled into one” (Kloeppinger-Todd and Sharma, 2010, Overview).
• A U.S. Secretary of Agriculture during the 1960s—Orville Freeman—used to say that he had visited with small farmers all over the world and met many that couldn’t read or write, but that he had yet to meet a farmer who couldn’t count.
• “…the poor are like hedge fund managers—they live with huge amounts of risk. The only difference is in their levels of income” (Banerjee and Duflo, 2011, pp. 134–135).

4-6 Agriculture, Natural Resource Management, Livelihoods, Income Generation
“entrepreneurs, traders, investors, and consumers, all rolled into one.” Migration was/is another common way that poor, food insecure households living in the Title II target areas cope(d) with low and/or variable incomes, with some travelling to the nearest big city, others to where agricultural labor was/is needed for harvesting, and others leaving the country—Bolivians migrating to Argentina, Malawians and Mozambicans to South Africa, and Bangladeshis to the United Arab Emirates.
The populations targeted by the Title II development programs, in other words, although poor and food insecure, were/are also economic actors that respond to economic incentives. These latter characteristics are not always recognized, however, or sufficiently appreciated, by some program staff and others in the Title II stakeholder community that still tend to think of the Title II target populations in their role as program “beneficiaries”69 and as “objects of compassion” rather than “economically empowered entrepreneurs,” as one Title II Awardee expressed it (see Box 4.4). Some programs have started using the term “participant,” which recognizes that the target populations have a more active role to play in the Title II development programs. The FAFSA-2 prefers to use the term “client” when discussing the Title II AG/NRM/LH/IG programs because it better describes the fact that the resource-poor farmers, who are the main targets of these programs, are economic actors that respond to economic incentives
69 USAID/FFP requires its Awardees to report on the number of“directbeneficiaries”oftheirdevelopmentprograms,whichitdefinesas“thosewhocomeintodirectcontactwiththesetofinterventions (goods and services) provided by the program in each technical area.” This information is necessary, including as a measure of the scope of programs and their potential impact.However,theuseoftheterm“beneficiary”tendstoputmoreemphasisonthereceiptofthebenefitsratherthantheiruse. (See USAID/FFP Annual Results Reporting Guidance for FY2009formoredetailsontheUSAID/FFPdefinitionsfordirectandindirectbeneficiaries.)
in managing their farms and other household enterprises, in light of their own needs, objectives, and priorities, and not just program “recipients” or “objects of compassion.”70
70 This rationale for the use of the term “client” is similar to the one that the United Nations Development Programme used to explain why it decided to use the term “emerging markets” rather than “developing countries” in its report on “Value Chain Development for Decent Work,” arguing that by doing so the implication is that it is “no longer regarding developing countries as the recipients of aid and development programs, but acknowledging that they are serious players in the market—both as suppliers to global markets, and also as consumers, workers/employees, and providers of services” (Herr and Muzira, 2009, p. 2).
Box 4.4. The Title II Target Populations: “Objects of Compassion” or “Economically Empowered Entrepreneurs”
“One of the lessons that SC learned from its Title II program in Bolivia was the changing vision of the producer. At the beginning of Title II [program,] producers took on the role and were viewed as objects of compassion. Over time, this vision [on the part of the SC staff] changed to one of economically empowered entrepreneurs.”
Source: Piper et al., 2010, p. 17.

4-7Agriculture, Natural Resource Management, Livelihoods, Income Generation
4.2 Basic Facts about Programs in the FAFSA-2 Universe
4.2.1 Projects and Countries71
More than three-quarters of the Title II development programs in the FAFSA-2 universe included an SO related to agriculture. This included 50 programs in Africa (Burkina Faso, Cape Verde, Chad, Ethiopia, Gambia, Ghana, Guinea, Kenya, Liberia, Madagascar, Malawi, Mali, Mauritania, Mozambique, Niger, Rwanda, Senegal, Sierra Leone, Uganda, and Zambia), six programs in Asia (Bangladesh and India), and 23 programs in LAC (Bolivia, Guatemala, Haiti, Honduras, and Nicaragua). Almost 60 percent of this set of programs also included a focus on livelihoods and incomes.
4.2.2 Resources and Beneficiaries72
Forty percent of Title II development resources were devoted to AG/NRM activities in FY 2009, up slightly from 39 percent in FY 2003. The dollar amounts, on the other hand, declined from
71 This analysis is based on a FAFSA-2 review of the results frameworks included in the Awardees program proposals.72 Theinformationonresourcesandbeneficiariesincludedin this section is based on the information Title II Awardees report annually to USAID/FFP in their Resource and BeneficiaryTrackingTables.
US$155.2 million in FY 2003 to US$125.6 million in FY 2009 (see Figures 3.1, 3.5, 3.6, and 3.7 and Table 3.1 for further information on the distribution of program objectives and resource allocations). The amount of resources devoted to Non-AG IG activities was significantly smaller: US$32.6 million in FY 2003 (5 percent of total resources) and US$9.6 million in FY 2009 (3 percent of total resources).
In FY 2009, more than 2.3 million people (38 percent of the 6.2 million total) were beneficiaries of the AG/NRM programs. Seventy-six percent of these beneficiaries were in Africa, 18 percent in Asia, and 6 percent in LAC. More than half the beneficiaries of the AG/NRM programs in FY 2009 were women (53 percent), with the highest percentage of women beneficiaries in Asia (66 percent), followed by Africa (50 percent) and LAC (45 percent) (see Figures 3.9 and 3.10).
The numbers of people benefiting from the Non-AG IG programs were much smaller (fewer than 113,000 in FY 2009), with 62 percent of the beneficiaries in Africa, 18 percent in Asia, and 20 percent in LAC. The proportion of women beneficiaries of these programs was even higher than for the AG/NRM programs: 68 percent overall and 79 percent in Asia, 69 percent in Africa, and 52 percent in LAC.
Figure 4.1. Title II AG, NRM, LH, and IG Programs
AG/NRM Technical
Sector
40% of total resources in
FY 2009
NON-AG IG
Technical Sector
3% of total resources in
FY 2009
Livelihoods Income Generation
Dietary Intake/
Quality of Life
=+

4-8 Agriculture, Natural Resource Management, Livelihoods, Income Generation
4.3 Program Approaches and Interventions
4.3.1 Objectives and Intermediate Results
The Title II development programs implemented during the FAFSA-2 time period were still focused on a variety of objectives, ranging from a more narrow focus on increasing food production and/or increasing agricultural productivity to higher-level objectives related to increasing and/or diversifying household incomes through sales of food and non-food products (see Box 4.5 for examples of objectives and IRs included in the Title II programs in the FAFSA-2 universe). In some programs that were under way at the beginning of the FAFSA-2 time period, the income objective was separated from the agricultural production/productivity-related objective, even when the increased income was expected to come from the sale of agricultural products. More recent programs were more likely to include agricultural production and income objectives within the same SO, in recognition of the intimate relationships in rural areas between agricultural development and improvements in household incomes and quality of life. Plus, Non-AG IG activities have been given their own technical sector (see Section 4.3.2.8).
4.3.2 Interventions and Outcomes
The vast majority of the Title II development programs that were implemented during the FAFSA-2 time period started with the assumptions that most of their clients were farmers and that solutions to their problems lay primarily in production agriculture. This strategy worked for numerous programs in the FAFSA-2 universe. But not all clients in the Title II target areas had/have the asset base needed to farm their way out of poverty, as was noted earlier.
4.3.2.1 Crop Production and Productivity
The vast majority of Title II development programs in the FAFSA-2 universe included a strong focus
on crop agriculture. This was particularly true of programs in the Africa and LAC regions. Much of the focus was also on the major food crops (cassava, maize, millet, rice, and sorghum), especially at the beginning of the FAFSA-2 time period (see Table 4.2). A few programs also worked with secondary crops, including pigeon peas, cow peas, sesame, and sunflower. Many programs also began to focus on a variety of other crops with higher values in the market as a way to help their clients increase their incomes and access to food.
There are two ways to increase agricultural production in the areas where the Title II programs
Box 4.5. Objectives and Intermediate Results Included in Title II Development Programs Related to Increasing Food Availability and Access
• Increasing agricultural productivity
• Increasing food production
• Increasing cash crop production
• Diversifying crop production
• Increasing livestock production
• Increasing/diversifying household incomes through sales of farm products
• Improving use of/protecting the natural resource base
• Reducing crop losses
• Adding value to basic agricultural products
• Increasing market access
• Increasing/diversifying household incomes, including through support to agricultural- and non-agricultural-based microenterprises

4-9Agriculture, Natural Resource Management, Livelihoods, Income Generation
are operating where productivity levels tend to be low. Title II development programs can (1) expand the area under production by opening up new land or expand the area under irrigation so that more crops can be grown each year on the same amount of land and/or (2) increase the yields per unit of land. Programs that were implemented during the time period covered by the 2002 FAFSA were focused
primarily on increasing agricultural productivity, of staple foods in particular. This emphasis probably originated with the 1995 Policy Paper and subsequent USAID/FFP guidance that continued to stress increases in agricultural productivity as one of the best indicators of the food security impacts of the Title II devolvement program.
Promoting and Disseminating New Technologies and Practices
Agricultural productivity levels are low in the Title II target areas, and most Title II clients made only limited use of improved technologies. As a result, most programs focused their efforts on increasing the crop productivity (yields) of their target farmers. During the FAFSA-2 time period, this meant, among other activities, introducing farmers to new/improved seeds and planting materials and providing them with information on more productive farming practices.
• Promoting improved varieties. A primary objective of many programs was to introduce farmers to a more productive variety of their major staple (i.e., one that would produce higher yields per unit of land), which was one of the key objectives for the Title II development program from the time of the 1995 Policy Paper. Other varieties were introduced because they were resistant to common plant pests and diseases (e.g., a new variety of cassava in Mozambique and Uganda that was resistant to the brown streak disease [BSD] that was ravaging cassava harvests in East Africa), they were more drought resistant (e.g., new millet varieties in Niger and rice varieties in Bangladesh), or they could be used to improve the quality of the local weaning foods (e.g., the orange fleshed sweet potato in Mozambique and Uganda).
• Promoting improved agronomic practices. Most programs also included a set of agronomic practices in their package of recommendations. Common recommendations across countries and programs in Africa, for example, included: planting in lines, better spacing between seeds,
Table 4.2. Programs with a Focus on Staple CropsStaple Crops Country and AwardeeCassava Madagascar: ADRA, CRS
Mozambique: ADRA, CRS
Rwanda: ACDI/VOCA, WV
Uganda: SC, WV
Maize Cape Verde: ACDI/VOCA
Ghana: ADRA, OICI, TN
Guatemala: CRS, SC
Guinea: ADRA, OICI
Haiti: SC, WV
Honduras: ADRA, CARE, SC, WV
Kenya: ADRA, CARE
Madagascar: ADRA, CRS
Malawi: CRS
Mozambique: ADRA, CARE, FH, SC
Uganda: SC
Millet Ghana: OICI
Kenya: ADRA
Niger: CRS
Rice Ghana: TN
Guinea: ADRA, OICI
Kenya: ADRA
Madagascar: ADRA, CRS
Uganda: WV
Sorghum Ghana: ADRA, TN
Guinea: ADRA
Haiti: SC, WV
Honduras: CARE, SC
Kenya: ADRA, CARE, WV
Mozambique: FH

4-10 Agriculture, Natural Resource Management, Livelihoods, Income Generation
thinning seedlings to achieve the proper plant density, and weeding. Other programs also added technology packages related to improving soil fertility (e.g., the use of commercial fertilizers, manure, and mulch, and the use of plant legume cover and crop rotation in association with legumes) and crop protection (e.g., the use of commercial pesticides, botanicals, and integrated pest management).
The development of new and improved technologies and practices is an essential component of any productivity-oriented agricultural development strategy. This process can take significant time, however, and this more basic research is also an activity that Title II Awardees do not have a comparative advantage in undertaking. Both were/are reasons why the Title II programs usually looked/look to others (local, national, and international research institutes; other donor projects; and the private sector) for the technologies that they promote in their projects. Over time, many Title II Awardees have strengthened these links, including with a number of the International Agricultural Research Centers, such as the International Center for Tropical Agriculture (CIAT) and the International Crops Research Institute for the Semi-Arid Tropics (ICRISAT).
The process involved in disseminating these new technologies and practices can also take time, particularly when it comes to the dissemination of new seeds and planting materials, which may need to be multiplied in large numbers at the beginning of the dissemination process. In situations where there is only one crop cycle per year, it can take at least three years to get an improved crop into individual farmer’s fields. In year one, the vegetative material is multiplied in project nurseries. In year two, it is given to farmers to multiply in community plots. In year three, the material finally gets to individual farmer’s fields (see Box 4.6 for an example of this process on the ground in Mozambique). Even three years is a long lead time, however, when viewed in the context of a five-year program, and especially when the first year of most Title II development programs, even follow-on programs, is usually
devoted to getting organized, staffing up, and identifying and getting established in the new target communities.
The Technology Adoption and Diffusion Process
Considerable research lies behind what we now know about the technology adoption and diffusion process (Rogers, 2003).73 Much of this work began in the United States in the 1950s and 1960s in an attempt to understand the diffusion of innovations in the agricultural sector. This work, which soon spread to other sectors and, after the early 1960s, to the developing countries in Africa, Asia, and
73 Everett Rogers, in his seminal work, Diffusion of Innovations,definesdiffusionas“theprocessbywhich(1)an innovation (2) is communicated through certain channels (3) over time (4) among the members of a social system” (2003, p. 11).
Box 4.6. Disseminating a Variety of Cassava Resistant to the Brown Streak Disease
Cassava BSD was first recognized in the SC/Mozambique project area in 1998, under the predecessor SC Title II emergency program, but the real magnitude of the problem was not fully understood until 1999. A number of BSD-tolerant varieties were discovered in Mozambique, which probably helped shorten the dissemination process, but testing them, multiplying them in project-run nurseries under controlled conditions, and distributing the cuttings to farmer groups for further multiplication and dissemination also took a number of years. But, by 2006, according to estimates provided in the SC final evaluation, up to 45,000 households in the SC project area were growing some BSD-tolerant varieties.
Source: SC/Mozambique Final Evaluation (Sullivan and Selvester, 2006, pp. 9–12).

4-11Agriculture, Natural Resource Management, Livelihoods, Income Generation
Latin America,74 explains how new ideas are spread by different communication channels over time. Innovators in a community, who are likely to be leaders, are the first to try out a new technology or idea, followed by early adopters. Their early adoption can help pave the way for others in a community—poorer farmers, for example—that may be more reluctant to try out new practices because they have fewer assets and need additional assurances about the value of the new technologies. These innovations are perceived as risky; to overcome this risk, most people seek other people like themselves that have already adopted the new idea.
According to the diffusion literature, the adoption of an innovation usually follows a normal, bell-shaped curve when plotted over time on a frequency basis (see Figure 4.2), with successive groups of farmers adopting the new technologies/practices and the cumulative number of adopters represented by the “S” curve. Not all innovations diffuse at the same rate over time, however. Some are more popular and diffuse more rapidly (producing a steeper “S” curve), and others diffuse more slowly.75 Professional change agents, agricultural extension agents, for example, also have a role to play in this process, especially in the earlier stages of the adoption process, and the extent of a change agent’s promotion efforts in diffusing an innovation affects the rate at which an innovation is adopted.
According to diffusion experts, relative advantage, which is a ratio of the expected benefits and costs from adopting an innovation, is one of the strongest predictors of the rate at which an innovation is adopted. “The greater the perceived relative advantage of an innovation, the more rapid its rate
74 A 1981 World Bank-sponsored survey of the literature focusing on the adoption of agricultural innovations in developing countries included a comment that the “volume of such published research is overwhelming” (Feder, 1981).75 The rate of adoption is the relative speed with which an innovation is adopted by members of a social system. It is generally measured as the number of individuals that adopt anewideainaspecifiedperiod,suchasayear.Sotherateof adoption is a numerical indicator of the steepness of the adoption curve for an innovation (Rogers, 2003, p. 221).
of adoption will be.”76 Economic profitability is a key component of relative advantage, but low initial cost, a decrease in discomfort, social prestige, savings of time and effort, and the immediacy of award have also been shown to be important factors in getting people to change their behaviors (Rogers, 2003, p. 233). These factors help explain the speed of the uptake of the high-yielding varieties that were introduced as part of the Green Revolution in Asia that were adopted at exceptionally rapid rates in those areas where they were technically and economically superior to local varieties according to Ruttan (1977). According to Haggblade and Hazel, several case studies included in an IFPRI-supposed assessment of “Successes in African Agriculture” also “demonstrate that farmers can respond with alacrity when clearly superior new technology arrives together with financially attractive market outlets” (2010, p. 332).
The FAFSA-2 universe also includes a number of examples of new technologies and practices that
76 Other key characteristics of innovations, as perceived by individuals, which help explain their differential rates of adoption include: compatibility, i.e., the degree to which an innovation is perceived as being consistent with the existing values, past experiences, and needs of potential adopters; complexity, i.e., the degree to which an innovation is perceived asdifficulttounderstandanduse;trialability,i.e.,thedegreeto which an innovation may be experimented with on a limited basis; and observability, i.e., the degree to which the results of an innovation are visible to others (Rogers, 2003).
Figure 4.2. Diffusion of Innovation
Innovators2.5%
Early Adoptors 13.5%
Early Majority 34%
Market share %
Laggards 16%
Late Majority 34%
100
75
50
25
0
Source: http://en.wikipedia.org/wiki/Everett_Rogers.

4-12 Agriculture, Natural Resource Management, Livelihoods, Income Generation
were adopted relatively quickly, including several that did not have a relative advantage when they were first introduced to the Title II clients. One example of the latter involved a number of Bolivian fruit growers that did not begin to adopt the improved technologies and practices that SC/Bolivia was promoting until SC introduced them to a new set of buyers that were willing to pay considerably higher prices for better-quality fruit. This changed the farmers’ calculations: the SC-promoted technologies and practices were profitable once farmers were able to sell into this new market, which led to a rapid increase in their adoption in a relatively short period of time (see Box 4.7 and Section 4.3.2.5 on “Marketing” and Section 4.5.1.1 on “Market-Driven Programs”).
Constraints to Technology Adoption
Providing farmers with information about new technologies and practices does not guarantee that they learn the messages, however, and knowing about these new technologies and practices does not mean that farmers are going to change their behaviors and start using them or continue to use them. Knowledge, in other words, is different from practice. Still, during the FAFSA-2 time period, most Awardees did not appear to be spending much time trying to understand why some practices that they were recommending were not adopted and others were.
Some of the more likely constraints to technology adoption in the Title II programs are discussed next.77
77 A 1981 survey of the adoption of agricultural innovations in developing countries focused on several potential constraints to adoption, including farm size, land tenure, labor availability, credit, risk and uncertainty, human capital, and sociological factors, findingconflictingconclusionsacrosscountriesandregions along with methodological problems (Feder, 1981). A more recent survey of the adoption of agricultural technologies in developing countries focused on the role ofmarketinefficienciesininputandoutput,land,labor,credit risk, and information markets, and recommended further research on the barriers to agricultural technology adoption using randomized control trials (Jack, 2011).
Box 4.7. Behavior Change in a Title II Program in Bolivia: The Adoption of a New Technology Package by Fruit Producers
In one of the valley communities in Bolivia, SC/Bolivia extension agents were not having much success in promoting improved fruit cultivation practices, including convincing farmers that they should prune the existing peach and pear trees that were seriously overgrown and infested with a parasitic vine. One explanation given to members of the mid-term evaluation (MTE) team was that some of the older women in the community believed pruning was harmful to the trees and to pacha mama (mother earth). Two years later, one of the members of the MTE team returned to the same community on another assessment and found the community hardly recognizable. The farmers were selling premium fruit in high-end markets, trees in large areas of the valley had been severely pruned, some tree replacement was under way, and many of the improved production practices that SC had been recommending had also been adopted. One of the key things that had taken place during these two years was that SC staff, as a result of the decision to convert to a market-driven program, had introduced the fruit growers to the buyers in these high-end markets that explained what qualities they were looking for and how much they were willing to pay for fruit that met these qualities. SC also showed farmers how they could improve the harvesting, packing, and transport of their fruit. Learning that they could get higher prices for larger fruit led a few households to try the new technology package the first year after the MTE and large numbers tried it in the second year. Several older women, who had been against pruning, were now in charge of getting the fruit ready for the market. They took great pains to explain to the assessment team all the benefits that they had received from pruning their trees, including higher-quality fruit and higher sales prices.
Source: SC/Bolivia Assessment (van Haeften et al., 2006).

4-13Agriculture, Natural Resource Management, Livelihoods, Income Generation
Lack of Profitability
When adoption rates are low, or mixed, one of the most likely explanations is that the technologies and/or practices that are being promoted are not profitable to farmers, i.e., in the terminology of the diffusion literature, its relative advantage is low. Based on information available in program proposals, annual reports, and evaluations, however, most Awardees appear to have had little or no information on the costs and returns to alternative packages of technologies and practices that they could use to help them make informed decisions on which crops and technologies were more promising and/or to help them make mid-course corrections. CARE/Mozambique made good use of cost of production data available from a USAID-supported project with MSU to make adjustments to the technology package it was promoting in Mozambique (see Box 4.8), but having such data from other sources was an exception. The four Bolivia programs, which developed costs of production information for the technology packages that they were recommending, were also an exception.78
Labor Constraints
The problem of labor constraints is frequently mentioned in Title II evaluations as one of the main reasons why farmers were not adopting a particular technology package or, more frequently, were adopting some but not all of the recommended practices. The issue of labor constraints also came up while interviewing farmers during the FAFSA-2 field visits and, in particular, during the visits to the three countries in Africa. The reduced labor requirements of the new conservation agricultural package that ACDI/VOCA/Uganda was disseminating at the time of the FAFSA-2 field visit to northern Uganda may be one of its most attractive features, at least from the perspective of its farmer clients. This new package, which ACDI/VOCA refers to as low labor, high yield (LLHY),
78 The Bolivia programs also trained many of their farmers to do their own costs of production estimates. This information wasreadilyavailableatmanyofthefieldsitesvisitedduringthefinalevaluation,withmanyfarmersinthegroupsconversant about the estimates and their implications.
seems particularly suitable for these farmers that do not have enough labor to open up all the land that they have access to using only a hoe. The oxen many used to use to help with the plowing disappeared during the fighting in northern Uganda (see Box 4.9 for further details).
Unavailability of Commercial Inputs
A lack of supply of inputs in local markets can be another explanation for low adoption rates. This was initially thought to be the case in Mozambique, but CARE/Mozambique eventually concluded that it was the lack in demand for external inputs, due to the marginal benefits to be gained from their use that was responsible for the scarcity of external inputs in the markets in its region of the country (see Box 4.8). Sometimes projects can run into a
Box 4.8. A Low External Input Technology Package Was More Cost-Effective in Mozambique
CARE/Mozambique had access to information from field experiments that indicated that using certified seed and fertilizer would provide only marginal benefits for most crops at current prices. This led CARE to adopt a low external input approach in its extension program—promoting farmer-level seed selection, improved seed storage and exchange techniques, and conservation farming, and helping its farmers become certified producers of organic groundnuts. This information, along with a range of other economic analyses, was available from a USAID-supported project with MSU. This low-external input approach was quite successful, according to the final evaluation, but this success was not reflected in the indicators that were used to measure program performance because they were focused on purchased fertilizers and seed.
Source: CARE/Mozambique Final Evaluation (Selvester et al., 2006, p. 6).

4-14 Agriculture, Natural Resource Management, Livelihoods, Income Generation
“Catch 22” situation, as seemed to be the case in northern Uganda, where farmers were having trouble getting access to the herbicides and sprayers that were essential ingredients in the LLHY package that ACDI/VOCA was promoting. The private sector input dealers in the area were reluctant to stock large quantities of these items in the absence of any prior
demand for either one of these products. In this case, ACDI/VOCA stepped in to take the orders and buy and deliver the products to their farmer clients at cost, because it did not want to let a lack of supply dampen farmers’ interest in testing what looked like a very promising new technology package. This was definitely a stopgap measure, however, because the ACDI/VOCA project was ending in a couple of months. This was also not a sustainable approach, and Awardees have to be very careful in situations like these to not take steps that will discourage or crowd out private sector participation.
The Time Requirements of the Technology Dissemination and Adoption Processes and Program Performance Measurement
The nature and rapidity of these processes—the dissemination and adoption of new technologies and practices—can affect the conclusions about program performance and cost effectiveness. If Awardees have only a few years in which to identify and introduce a new package of technologies and practices, as is likely the case in many Title II development programs, they could easily find themselves having to measure program impact at too early a stage in the technology adoption process, e.g., while it is still in the early adopters stage. In these cases, one could easily draw the wrong conclusions, underestimating program performance over the longer term and overestimating the cost of the program per adopter.
Impact on yields. The emphasis on increases in crop productivity and yields, which was characteristic of the programs implemented during the 2002 FAFSA time period, decreased somewhat during the FAFSA-2 time period. Only 26 programs in 14 countries (40 percent of the total programs included in the AG/NRM/LH sub-universe)79 reported on whether they were able to increase the yields of the crops that they were promoting, with many
79 The sub-universe of countries/programs included in the review of the AG/NRM/LH programs includes 64 programs in 26 countries. The sub-universe is smaller than the FAFSA-2 universe because it is limited to programs that had one or more components focused on food availability and access and also toprogramsforwhichfinalperformanceinformationwasavailable.
Box 4.9. The Introduction of a Conservation Agriculture Technology Package in Uganda
During the FAFSA-2 field visit, ACDI/VOCA/Uganda was in the process of rolling out a new package of conservation agricultural practices that it refers to as LLHY. This set of practices, which was based on a set of practices developed in Zambia, seemed to be providing immediate benefits to farmers in northern Uganda, who were still returning home from the internally displaced persons camps, because they did not have to use as much labor to open land that in some cases had been lying fallow for ten or more years. LLHY requires less labor for subsequent weeding (a reduction of 50–75 percent), which means that farmers can manage larger land areas. Lower labor requirements also make LLHY more attractive to women and PLHIV. Using this package enables farmers to plant earlier, because they do not have to plow twice, and there is less weed competition, which results in higher yields for many crops. The residue left on the surface also traps and conserves soil moisture, reducing the effects of drought. Use of these practices over the longer term, according to ACDI/VOCA, can also reduce soil erosion (more of the rainfall is retained on fields) and rejuvenate degraded soils.
Sources: “Less Labor, High Yield Farming Practices” presentation (Lukungu, 2011); and discussion with John Wendt, ACDI/VOCA, May 2011.

4-15Agriculture, Natural Resource Management, Livelihoods, Income Generation
programs reporting separately on multiple crops. Fifteen programs reported having exceeded some or all of their targets: ADRA in Ghana, Honduras, Kenya, Madagascar, and Nicaragua; CRS in Burkina Faso, Haiti, and Madagascar; SC in Guatemala and Mozambique; CARE in Honduras and Kenya; ACDI/VOCA in Cape Verde; TNS in Ghana; and WV in Rwanda. Ten of these same programs also reported on not meeting their targets for some of the crops that they were promoting: the ADRA and TNS programs in Ghana; the CRS programs in Haiti; the ADRA and CARE programs in Honduras; the ADRA and CARE programs in Kenya; the CRS program in Kenya; the CRS program in Madagascar; the SC program in Mozambique; and the WV program in Rwanda. Most programs focused on measuring improvements in the yields of important food crops, including beans, cassava, groundnuts, maize, oilseeds, peanuts, pigeon peas, plantains, rice, sesame, sorghum, sunflower, sweet potato, and taro. In Honduras, ADRA also measured and reported on the yields of a variety of cash crops, including green peppers, broccoli, onions, tomatoes, potatoes, cucumbers, and cabbages.
Outcomes. During the FAFSA-2 time period, USAID/FFP, with assistance from FANTA-2, began focusing more attention on the development of outcome indicators, including those designed to measure rates of technology adoption, rather than production or productivity (yields). USAID/FFP began requiring its Awardees to collect and report on an indicator of agricultural technology adoption in 2007. FTF is also planning to require its implementing partners to report on the number of farmers and others who have applied new technologies or management practices
as a result of USG assistance. These types of indicators are important because they represent one of the major ways of measuring behavior change in the agricultural sector. They should also be of particular use to the Title II Awardees themselves as monitoring indicators to be tracked annually, assessed, and used as a basis for making adjustments in how they are implementing their programs, including helping them determine whether they need to make changes in the technology packages that they are promoting.
In September 2011, USAID/FFP issued new guidance on the outcome indicators for which Awardees will be expected to collect data in their baseline and final surveys. These requirements are applicable to programs directed to the achievement of four AG/NRM-related objectives, including increased access to improved agricultural practices and technologies (see Table 4.3).
During the FAFSA-2 time period, 23 programs in 17 countries reported on the percent of farmers adopting improved technologies and practices (i.e., more than 35 percent of the total programs included in the AG/NRM/LH sub-universe). Eighteen programs reported having achieved some or all of their targets: CARE in Bangladesh, Bolivia, Guatemala, and Madagascar; WV in Haiti, Kenya, Rwanda, and Uganda; Africare in Chad/Mali, Guinea, and Mozambique; CRS in Malawi and Uganda; FH in Bolivia and Mozambique; SC in Bangladesh and Mozambique; and PCI in Nicaragua. Eight of these programs also reported not meeting their targets for some of the crops they were promoting: the CARE and SC programs in Bangladesh; the Africare program in Guinea; the
Table 4.3. USAID/FFP Standard Outcome Indicator Required in Baseline and Final Surveys for Use in Title II Development Programs That Have Objectives Related to Agriculture, Natural Resources Management, and LivelihoodsApplicable to development programs that aim to: No. Indicator titleIncrease farmers’ access to improved agriculture (crop/livestock and NRM) practices and technologies.
14 Percentage of farmers who used at least (a project-defined minimum number of) sustainable agriculture (crop/livestock and/or NRM) practices and/or technologies in the most recent growing season (overall and disaggregated by sex).
Source: USAID/FFP, FFPIB 11-03, 2011.

4-16 Agriculture, Natural Resource Management, Livelihoods, Income Generation
CARE program in Madagascar; the Africare and SC programs in Mozambique; and the CRS and WV programs in Uganda. Most indicators were couched in more general terms (e.g., percent of households adopting improved technologies). Some specified numbers of practices (e.g., one, two, three, four, or five out of seven, or five out of ten). Others mentioned specific practices (e.g., using organic or commercial fertilizer, using improved seeds/planting materials, preparing fields without burning, planting in lines, using proper spacing between plants, using approved commercial or botanical pesticides, and adopting organic farming practices).
Yields and rates of technology adoption. The performance of the Title II programs with respect to both the technology adoption and yield indicators was mixed. The FAFSA-2 team attempted to use these data to assess whether any relationships could be discerned between rates of technology adoption and yields, but this also provided little insight. Only 7 of 38 programs reported on both technology adoption and yield indicators. Of these seven, four reported adoption rates improving and yields decreasing; one program reported adoption rates down and yields up, one program reported mixed results for its adoption indicators and yields decreasing, and one program reported mixed results for both indicators.
4.3.2.2 Natural Resource Management at the Farm Level
Soil and water conservation activities have been supported under Title II development programs as part of public works programs implemented on community/state lands and as part of packages of improved technologies and practices implemented by farmers on their own lands to increase their productivity and promote more sustainable farming systems. The public works activities, which were especially important components in many of the Title II programs implemented prior to the 1995 Policy Paper, are discussed in Chapter 5 on “Infrastructure.” The farm-focused activities are discussed here. The problem in trying to assess these programs is that much of the documentation on NRM activities is not clear on whether a given
component and/or activities within that component are focused on creating public goods and/or improving farm management systems. Many appear to have included both objectives. This lack of clarity in program descriptions can make it difficult to draw appropriate conclusions about individual Title II development programs, as well as at the level of the Title II program as a whole.
Conserving soils and improving their quality were/are of particular importance in many Title II programs. This is because of the poor quality of the soils in most areas where the Title II programs work and the reliance of the poor and food insecure farmers in these areas on the productivity of their land. Low soil fertility is a particular problem in much of Africa, but most of the poor, food insecure farmers in the programs in LAC—in Bolivia, Guatemala, Haiti, Honduras, and Nicaragua—were/are also relegated to farming on small plots in some of the less fertile and more mountainous and isolated areas of their countries.
The FAFSA-2 universe included examples of soil conservation techniques popular during the 1960s and 1970s that involved the construction of different kinds of terraces, embankments, and ditches—activities that often required moving large amounts of earth. These practices required considerable physical effort to build and maintain and produced benefits only in the long term, if then, which helps explain why so many farmers proved reluctant to adopt them.80 Resource-poor farmers, in developing countries in particular, cannot afford to make major investments in soil quality only to have the payback come years later. The same is true with respect to planting trees. Resource-poor farmers cannot afford to spend their scarce time planting trees on public land without some compensation. It is not that they are insensitive to environmental issues; it is that
80 Thediffusionofinnovationsliteratureidentifiestheimmediacy of the award as one of the key factors that can help increase or decrease the relative advantage of adopting a new innovation and argues that the lack of the immediacy of an award helps “explain in part why preventive innovations generally [also read many NRM and environment innovations] have an especially slow rate of adoption…” (Rogers, 2003, p. 233).

4-17Agriculture, Natural Resource Management, Livelihoods, Income Generation
they are too poor to be able to spend their scarce time on activities that do not have a more immediate payback. Planting fruit trees around their homes, on the other hand, was popular among farmers in many of the Title II programs because they were able to obtain direct benefits from many of these trees in one to two years.81
As extra encouragement to the adoption of program recommendations and to overcome farmer reluctance, many soil conservation programs began to offer subsidies to farmers, including cash payments and donated or subsidized tools. Having what seemed to be a positive way to use food to have a development impact also made these activities of interest to the Title II development programs. Being able to use food to encourage farmer adoption can appear to be a major advantage during the implementation phase, if the focus is on the number of trees planted or terraces built. On the other hand, if the objective is to have a sustainable impact on the environment, whether on individual farms and/or communal and state lands, better approaches are needed. A stronger case can be made for using food to pay farmers to work on public lands because these efforts, which are producing public goods, are not likely to be made otherwise, since the farmers involved will not be able to capture all the benefits from their own efforts. However, even in these cases, farmers and communities need to see an economic benefit from these activities in the near term to have an incentive to maintain them.
A more serious problem is created when food and/or cash are used to compensate farmers for applying these practices on their own land. When farmers are paid, one does not know whether these practices are adopted because of the payment or because farmers expect to benefit economically from them, with the former being more likely. The final evaluation of the CRS/Kenya program concluded, for example, that using FFW contributed a great deal to the expansion of the area under conservation in the program, but
81 Theamountoftimeittakesfromplantingtothefirstcropcan vary considerably by type and variety of fruit, and some programs also taught their farmer clients how to graft new/improved varieties onto old rock stock in order to shorten the timeuntilthefirstharvest.
recommended that farmers be encouraged to adopt these conservation practices without food rewards in the future (except in cases of complete crop failures) to ensure that the results would be sustainable (CRS/Kenya, 2004, p. 6). Other arguments against using artificial incentives to encourage farmers to adopt soil conservation practices are that they tend to foster the development of paternalistic attitudes toward farmers on the part of program staff, they cause farmers to become increasingly dependent on outside assistance, and they create disincentives within communities (see Box 4.10). Including incentives in Title II technology transfer programs can also adversely affect the quality of the work, according to Bunch (1994), with extension agents becoming “deliverers of benefits and labor bosses, rather than educators.”
Box 4.10. Arguments Against using Artificial Incentives to Encourage the Adoption of Soil Conservation Technologies
“…all the arguments in favor of the use of artificial incentives are useless if we want the technologies to outlast the program. What is the point of attracting more people, or enabling the poor to participate, if the benefits do not last? What is the objective of getting a fast start if in the end the medium- to long-term impact is reduced, in spite of the costs having been increased? On the other hand, the argument against artificial incentives are legion: they cause dependency, create paternalistic attitudes, create divisions within the community, make future development work more difficult, blind people to the need to solve underlying problems, are monstrously expensive, destroy the possibility of a multiplier effect, and make accurate program evaluation difficult.”
Source: Bunch, 1999.

4-18 Agriculture, Natural Resource Management, Livelihoods, Income Generation
The approaches being promoted by the soil conservation community have been changing, however, with a growing number of practitioners coming to recognize that soil conservation practices, to be more widely adopted, need to provide concrete economic benefits in a much shorter time period.82 As a result, more recent innovations are moving away from an emphasis on building structures designed to stop water that is already running down the surface of the soil to simpler, less expensive solutions that focus on taking away the causes of erosion. These include maintaining high organic content in the soils; keeping the soils covered; reducing, changing, or ending tillage; and preventing compaction. Many of these techniques, such as green manure and cover crops, improved fallows, and using more live barriers with a greater variety of grasses, bushes, and trees can also provide additional economic benefits, including food, fodder, and firewood. The Title II programs in the FAFSA-2 universe were making progress in this direction, but more efforts/actions are still needed. In Bolivia, for example, programs began placing less emphasis on the promotion of stone structures (see Figure 4.3) during the FAFSA-2 time period and more emphasis on the development of live barriers and the integration of NRM with income generation activities (see Figure 4.4). According to the Bolivia Joint Final Evaluation, the farmers that built the stone terrace in Figure 4.3 “enthusiastically adopted other soil conservation methods, such as straw barriers and mulching instead of burning, but they would only build stone terraces for FFW, or to compete in a contest” (p. 222).
The FAFSA-2 universe also included efforts to better integrate soil conservation techniques with technologies and practices designed to increase yields and, in environments where water is a limiting factor, small-scale irrigation and water
82 Bunch argues that soil conservation will be sustainably adoptedbypoorerfarmersonlyifeachyear’sbenefitsmorethan counterbalance the costs (1999). A similar lesson was learned from an IFPRI analysis of the adoption of NRM techniques in Burkina Faso and Niger—that “farmers are more likely to adopt resources conservation techniques if at least one innovationorcomponentprovidessignificantbenefitsinthefirstorsecondyear”(Reijetal.,2009,p.57).
harvesting. In northern Uganda, the conservation agriculture technology package that ACDI/VOCA was introducing at the time of the FAFSA-2 field visit (see Box 4.9 and Figure 4.5) includes soil conservation as well as yield-increasing techniques. In southern Malawi, the conservation agricultural package that CRS and its consortium partners are promoting in their FY 2009–FY 2014 project, which is based on technology packages developed in Zambia, also includes a recommendation that farmers begin planting their crops in shallow basins (see Figure 4.6).83 These micro-catchments, which
83 The FY 2005–FY 2009 CRS project also included a conservation agriculture component, but it is being given more emphasis under the FY 2009–FY 2014 project.
Figure 4.3. A stone terrace in Bolivia that would not have been constructed in the absence of FFW
Jeffe
ry B
entle
y
Figure 4.4. A live barrier of alfalfa helps hold and fertilize the soil in a peach orchard in Bolivia
Jeffe
ry B
entle
y

4-19Agriculture, Natural Resource Management, Livelihoods, Income Generation
farmers are being encouraged to construct in their own fields, are a form of water harvesting that, when coupled with recommendations that farmers add manure, fertilizers, and/or mulch to these basins, also helps improve soil fertility.
Soil conservation and water harvesting activities were also promoted in a number of the Title II development programs in the Western Sahel, including the CRS programs in Burkina Faso and Niger. Specific techniques included the construction of water harvesting structures—zais (planting pits/holes), demi lunes (shallow depressions that are made in the soil in the form of half moons), stone walls, and grass strips—and the natural regeneration of trees in farmers’ fields. These Title II-supported NRM efforts were a small part of a much broader dissemination effort on the part of the development
community, which some observers have described as the “regreening of the Sahel,” since many of these practices have spread broadly within the Sahel, often solely on the basis of knowledge transferred through farmer-to-farmer exchanges.84 The final evaluations of the CRS Burkina Faso and Niger programs reported that the target farmers were particularly interested in adopting the zai and natural regeneration of tree systems and, in Niger, this happened in the absence of FFW or any other type of external support other than TA, training, and farmer visits (Robins et al., 2009; Gaudreau et al., 2009). Since the zais and demi lunes, which are another form of micro-catchments, are constructed within individual farmer’s fields (also the tree regeneration activities), farmers are able to benefit directly from any of the production increases stemming from their labors on these activities, which suggests that farmers should be willing to construct them on their own without subsidies, assuming that they are profitable. The macro-catchments that were also supported by these programs, such as the stone bunds and banquettes, are more in the nature of public works, since their benefits accrue to larger numbers of farmers and were/are less likely to be adopted in the absence of some form of subsidy (see further discussion in Section 5.3.3.2).85
Outcomes. Only 10 programs in the FAFSA-2 time period reported on the percentage of farmers adopting some measure of improved NRM practices. Eight reported exceeding their targets—the SC programs in Bolivia, Guatemala, Honduras,
84 The extent of this spread and its impact has been documented in a presentation on “Transformational Development in Niger” (McGahuey and Winterbottom, 2007) and in an IFPRI paper on “Agroenvironmental Transformation in the Sahel: Another Kind of ‘Green Revolution.’ ” The “regreening of the Sahel began when local farmers’ practices were rediscovered and enhanced in simple, low-cost ways by innovative farmers and non-governmental organizations. An evolving coalition of local, national, and international actors then enabled large-scale diffusion and continued use of these improvedpracticeswheretheybenefitedfarmers”(Reijetal.,2009, p. 53).85 CRS used FFW to promote the adoption of its entire menu of NRM practices in Burkina Faso, but Government of Niger policy required it to limit its use of FFW in Niger to the construction of banquettes, which are a form of macro-water catchments and are more in the nature of public goods.
Figure 4.5. Application of conservation agricultural techniques in northern Uganda
AC
DI/V
OC
A/U
gand
aFigure 4.6. Application of conservation agricultural techniques in southern Malawi
CR
S C
onso
rtium
/Mal
awi

4-20 Agriculture, Natural Resource Management, Livelihoods, Income Generation
Nicaragua, and Mozambique; the ADRA programs in Ghana and Madagascar; and the PCI program in Nicaragua—and one program reported meeting its targets—the CRS program in Nicaragua. It is not clear from these indicators, however, whether food rations had any influence on these adoption rates.
4.3.2.3 Irrigation
Title II development programs provided support to smallholder-focused irrigation activities in at least 15 countries during the FAFSA-2 time period: 10 in Africa (Burkina Faso, Cape Verde, Ethiopia, Ghana, Guinea, Kenya, Madagascar, Malawi, Mauritania, and Niger), 2 in Asia (Bangladesh and India), and 3 in LAC (Bolivia, Guatemala, and Nicaragua). The characteristics and size of these systems varied considerably, depending on the local context, but usually included some combination of gravity, manual, and diesel pumps and main and feeder canals to deliver the water from nearby rivers, springs, and/or underground aquifers to farmers’ fields by flooding the entire field, into basins or furrows, or through sprinklers or drip pipes (drip irrigation). A few programs provided minimal help—free vegetable seeds and watering cans combined with some training in improved production practices—to enable farmers to take advantage of water in nearby rivers or existing wells to plant small gardens during the dry season. Other programs were more ambitious and involved the construction of dams, relatively large water intakes along rivers, major canals, and smaller “overnight” storage reservoirs. Title II Awardees helped with the engineering designs and helped organize and train the water user groups needed to take over responsibility for operating and maintaining the systems. FFW was also used for some of the larger-scale activities, which were more in the nature of public goods, for example, the dams, the major canals, and the night storage reservoirs. (See Chapter 5 on “Infrastructure” for a more detailed discussion of the uses of FFW in irrigation projects as well as a discussion of some of the other water management and control activities that Title II development programs helped implement.)
Rationale for the Programs
Numerous mid-term and final evaluations emphasized the importance of irrigation in the context of the Title II programs, arguing that helping small farmers obtain access to water to irrigate their crops was one of the most important steps these programs could take to enhance the food security of their target populations. Many evaluations also argued that these programs should have done more to increase access to irrigation in their target areas. This included evaluations of programs in Bolivia, Ethiopia, Guatemala, Ghana, Guinea, Malawi, Mozambique, Nicaragua, and Niger. When improved access to water is combined with the provision of improved technologies, the impact on farmers’ incomes can be even greater than when the intervention involves only one or the other intervention. When farming areas are drought-prone and farm holdings are small, which is the situation facing many Title II client farmers, the only way that many of these farmers are going to be able to produce more is to increase their yields and/or harvest more crops per year. The team found numerous examples from the FAFSA-2 time period of Title II-supported irrigation systems that were doing both. That is, these systems provided farmers with a more assured source of water when it was needed for crop growth, which helped improve yields, and for more months, which enabled farmers to produce an additional one or two crops a year.
Examples of Systems Developed
Several programs in West Africa helped target farmers expand their access to water during the dry season so that they could make more money producing vegetables for sale (market gardens) and secondarily for home consumption.86 Several of these programs also supported the development
86 Market gardens are a common practice in West Africa, according to FAO, particularly in urban and peri-urban areas, and are also used in rural areas to grow vegetables for sale during the dry season. The use of watering cans to deliver water is also a common practice. Watering cans are cheap and provide farmers with considerable control over the application of the water, but, according to FAO, this is also a relatively labor intensive technology. FAO, p. 101.

4-21Agriculture, Natural Resource Management, Livelihoods, Income Generation
of new wells, including TNS in Ghana and CPI in eastern Niger. CPI/Niger had already financed the construction of several boreholes in existing wetlands (oases) at the time of the FAFSA-2 field visit and had provided groups of farmers with diesel pumps to make it easier to pump water into their fields (see Figure 4.7), along with TA and training in improved agricultural practices. One of the wetlands where CPI was beginning to work appeared to have tremendous production potential once the boreholes were drilled and the irrigation pumps installed, and was located close to good markets in northern Nigeria.
The SC/Bolivia program brought more than 230 new hectares under irrigation. The program got off to a slow start, due in part to its initial reliance on the municipal governments to develop the proposals and SC’s lack of in-house engineering capacity—problems that were corrected after its mid-term evaluation. The program concentrated on developing sprinkler irrigation (see Figure 4.8),87 which makes better use of the scarce water resources in the region than flood irrigation. It was also a better choice in areas where the slopes were moderate because the systems can be operated without having to make additional investments in the construction of terraces. These sprinkler systems are also simpler and require less labor to operate than gravity-fed systems. In addition, SC was able to connect its clients with private equipment suppliers, who had already begun providing limited amounts of TA to SC’s clients at the time of the final evaluation. SC staff also conducted value chain analyses for the priority products it had identified for these irrigation systems and worked with the farmers on technology transfer and marketing issues.
One hundred eighteen small-scale irrigation systems were built under the CRS/Malawi (I-LIFE) program (FY 2005–FY 2009), using a combination of Title II and OFDA resources. These systems benefited more than 6,000 households, with women accounting for 55 percent of the membership.
87 ThefinalevaluationreportedthatSC/Boliviahadestimatedthat the cost of developing these sprinkler irrigation systems was approximately US$3,500 per hectare. p. 12.
Five hundred sixty-three hectares were brought under irrigation—75 percent by diverting water from nearby rivers and 25 percent using treadle pumps to pump the water out of a river or shallow well88—with main and feeder canals distributing water to the farmers’ fields (see Figure 4.9). FFW was used in only five systems. The consensus of the staff that worked on the systems was that FFW “lowered the sense of ownership by the water users involved and creates an expectation of compensation in other developing schemes nearby” (I-LIFE Final Evaluation, Robins et al., 2008, p. 11). The exception was the use of FFW to develop the night storage reservoirs, which are more in the nature of public goods. Members of the I-LIFE
88 Thefinalevaluationreportedthattheestimatedcostofdevelopingthestreamdiversionwiththegravityflowsystemwas US$613 per hectare and US$808 per hectare for the shallow well/river using the treadle pumps system. p. 11.
Figure 4.7. Inspecting a recently completed borehole and pump in a wetland in eastern Niger
Eam
onn
Kilm
artin
/CP
I/Nig
er
Figure 4.8. Sprinkler irrigation and contour plowing that was part of the SC/Bolivia program
Jeffe
ry B
entle
y

4-22 Agriculture, Natural Resource Management, Livelihoods, Income Generation
consortium helped with the design of the systems. They also helped organize and train user groups in the operation and maintenance of the systems and helped communities and user farmers work through complicated and potentially contentious land tenure issues.
The Tomoyo irrigation project in Bolivia was a major undertaking for FH, diverting enough water to irrigate 600 hectares of land spread among three communities along a river valley. The construction of the intake that diverts the water from the river upstream and the main canal that delivers the water to the communities was completed during a previous FH/Bolivia Title II development program. During the project included in the FAFSA-2 universe, FH helped farmers systematize their plots for irrigation and finish the canals that deliver water to their fields, provided farmers with information on improved technologies and practices and marketing assistance, and helped organize and increase the capacity of the irrigation association to operate and maintain the system. FFW was used appropriately, that is, to pay community members for the work they did on the intake and the main canal (public works) but not for work they did on the feeder canals that delivered water to their fields or on their own fields. The number of cropping cycles per year increased over the life of the project from one to three, production became more diversified, production levels rose, and the value of sales through forward contracts and producers’ associations increased from nothing in 2002 to almost US$65,000 in 2008. Average
household income also increased from US$238 in 2002 to US$1,725 in 2008 (p. 134).
Providing Advice on Farming under Irrigated Conditions
Farmers also need information and advice on better practices with respect to farming under irrigated conditions, a step that not all Title II development programs in the FAFSA-2 time period paid enough attention to, based on comments in some of the final evaluations. Helping farmers understand that these water resources are still scarce and how to make the most efficient use of them was/is also important. Using water more efficiently means applying appropriate quantities at strategic stages in a plant’s growth. Using too little water can be wasteful, since it will not produce the desired effects, and using too much water (flooding) can be harmful, leading to nutrient leaching as well as inducing greater evaporation and salinization. Making more effective use of the limited water resources available was one reason why SC/Bolivia decided to focus on the development of sprinkler, rather than gravity-fed, irrigation systems in Bolivia. It is also why a number of other programs experimented with and promoted drip irrigation, including programs in Nicaragua and Niger.
Organizing and Strengthening Water Users Associations
Most programs also helped organize and train water users associations, which experience has shown are critical to the long-term sustainability of these systems. Programs helped organize these user groups and taught them how to maintain the systems and to develop simple operating plans, rules, and schedules for water distribution; set up fee structures and collect fees; and manage the funds that are necessary to cover the costs of operating and maintaining the systems. Helping users get organized and learn how to operate and maintain their systems needs to be a high priority in any irrigation development intervention.
Water is a common pool resource, which means that it may be owned by national, regional, or local governments as public goods; by communal groups as common property resources; or by private
Figure 4.9. Inspecting a main irrigation canal in southern Malawi
CR
S C
onso
rtium
/Mal
awi

4-23Agriculture, Natural Resource Management, Livelihoods, Income Generation
individuals or firms as private goods. The irrigation systems that the Title II Awardees helped develop were/are small. National and local governments were/are not willing or able to maintain and operate these systems, and individual farmers cannot manage these water resources on their own. So the people directly benefiting from the systems—the group of users—will have to. The sustainability of these irrigation systems, in other words, depends on the users being willing and able to continue to operate and maintain them once the project ends.
Standard economic models predict that resources owned in common will be exploited in the absence of clearly defined property rights, with individuals acting without regard for the effects of their actions on the overall resource pool. More recent research on the use of common resources, including by Elinor Ostrom, has found that people can devise rather sophisticated governance systems to ensure that these common pool resources continue to be used appropriately, which involves explicit rules about what people can use, what their responsibilities are, and how they will be punished if they break the rules.89 FAO analyses also suggest that keeping these small-scale, community-based irrigation systems simple and the number of users relatively small are important contributors to their success (including increasing the likelihood of their being sustainable) (Liniger et al., 2011). (Also see Box 4.32 in Section 4.5.4 on “Sustainability” for additional information on what has happened to four Title II-supported irrigation systems in Malawi since project support ended several years ago.)
In Malawi, the I-LIFE program (FY 2005–FY 2009) and now the WALA program (FY 2009–FY 2014) took extra steps to try to ensure that poorer households in the target communities would also benefit from the irrigation systems and not just the
89 In her book Governing the Commons, Ostrom described the rules needed to keep a commons going. These include rules about who can use resources and when; making sure that what is taken out of a commons is proportional to what is put in; ensuring that usage is compatible with the long-term health of the commons; enabling everyone to have some say in the development and application of the rules; and emphasizing the monitoringofabusesandconflictresolution,whichtendtobemore effective than sanctions and punishment (Ostrom, 1990).
land owners. This involved working out formal arrangements in each of the communities between households that owned the land within the planned irrigation perimeters and other potential users that gave the owners the right to continue to use their land during the rainy season, but to share its use during the dry season with others in the community that were willing to commit their time and labor to the construction of the systems and to their operation and maintenance. These can be complicated negotiations, and part of the training of these groups involved/involves negotiating skills as well as the more typical training in system operation and maintenance. These types of arrangements had been worked out and seemed to still be functioning in all four of the I-LIFE irrigation systems that the FAFSA-2 team visited during its field visit to Malawi.
Assessing, Using, and Protecting Water Sources
As part of the design and implementation of small-scale irrigation systems, issues also arise pertaining to the overall availability of the water resources being developed and the adequacy of the measures being taken to manage the use and protection of these water resources. Some issues were clearly more important in the longer term. One issue raised in both the mid-term and final evaluations of the four Bolivia programs related to climate change and how long the water resources that the programs were tapping into would continue to be available given the decline in the snow pack in the Andes. Other issues were more immediate in nature, including those that involved the harvesting of water from underground aquifers in programs in eastern and western Africa. The potential negative effects of pumping water out of these aquifers were recognized in several of the IEEs that were reviewed. These IEEs also identified a range of mitigation measures that could be undertaken, including advising user associations to limit the amount of water drawn from the aquifer to the water table renewal rate and building dams around the perimeters of the aquifer to help recharge the water table. However, it is not clear from the documentation available, or during the FAFSA-2 field visit in the case of Niger, that the programs that were actually being implemented were based on any

4-24 Agriculture, Natural Resource Management, Livelihoods, Income Generation
professional assessment of the overall amount of water available in the aquifers, what a proper usage level might be, and/or what effects these programs might have on these aquifers over time. In Ethiopia, the shallow well technology that was introduced by one of the projects in Tigray was so attractive that farmers in some valleys were digging wells on their own in much greater numbers than project staff had anticipated. One could have concluded that this intervention was a great success, and it was in terms of numbers of wells dug. But project staff expressed their concerns to the final evaluation team that all these extra wells could be having an adverse effect on the water table and undoing the efforts of their FFW activities, which were supporting the application of NRM practices on the hills surrounding these valleys designed to reduce soil erosion and increase water retention (CRS/WV FY 2003–FY 2005 Final Evaluation).
Issues of water rights were identified as problems in some of the documentation, as were developments downstream and upstream from Title II-supported irrigation systems. In some cases, the problems had to do with disagreements among farmers/communities over water rights. In other cases, they resulted from specific actions that farmer groups or communities took or did not take. Examples were cited of Title II irrigation programs that used so much water that not enough was left for communities downstream, for human consumption, or even for agricultural uses. In still other cases, Title II programs were adversely affected by actions of other farmer groups or communities upstream, for example, when they cleared land around the water source for the Title II irrigation programs, which reduced water retention and eventually water flow, or when they cleared land along the river/stream, which increased flooding downstream.
Although not always clear in the documentation, discussions in the field seemed to indicate a growing awareness on the part of Title II Awardee staff of the need to do more to help protect important water sources and to transfer this concern to the individuals and communities with which they were/are working. Awardee staff also raised concerns about the possible adverse affects of actions
being taken by other non-project communities. These concerns reflect the growing interest in the landscape effects of Title II interventions that occurred during the FAFSA-2 time period, among those involved with NRM interventions in particular. (See Section 5.3.3.3 for a discussion of landscape effects and integrated watershed management in the context of the Title II development program during the FAFSA-2 time period.)
Outcomes. Sixteen programs in the FAFSA-2 universe reported on one or more indicators related to irrigation: nine in Africa (Burkina Faso, Cape Verde, Ghana, Kenya, Madagascar, Malawi, Mauritania, and Niger), one in Asia (India), and six in LAC (Bolivia and Nicaragua). Only 11 of these programs reported on a common indicator—number of new hectares brought under irrigation—but 9 of these 11 programs (more than three-quarters) reported having exceeded their targets: ACDI/VOCA in Cape Verde, ADRA in Bolivia and Madagascar, Africare in Niger, CARE in Madagascar, CRS in Malawi, FH in Bolivia, and SC in Bolivia and Nicaragua.
Concerns were also raised about the high costs (per hectare) of some of the irrigation systems that were implemented during the FAFSA-2 time period and the fact that frequently only a small portion of the overall target populations seemed to have benefited from their development. These outcomes were identified as shortcomings in the CRS evaluation of its integrated watershed management programs in Ethiopia, for example (Herbert et al., 2010). The reality is that not all communities in the Title II target areas will be able to benefit from irrigation projects, starting with those that do not have access to sufficient water sources. Whether this should be interpreted to mean that none should benefit, which some people have suggested, seems questionable, especially given the fact that cost-benefit analysis techniques are available for Awardees to use to determine whether the returns to specific systems will be positive.
It is also a reality that not all community members will be able to benefit equally as producers from all irrigation projects. Some farmers own more land than others do, for example, and some may

4-25Agriculture, Natural Resource Management, Livelihoods, Income Generation
own land that is located above the main canal. On the other hand, considerable evidence also exists, including from Title II interventions, that many households that were/are not able to benefit directly, as producers, were/are able to benefit from the increases in other economic activities that occurred/occur as a result of the development of these systems. This can include, as it did in the case of the Tomoyo irrigation project in Bolivia: an increase in the demand for farm labor as a result of the increased number of crop cycles, the increased need for marketing and transport inputs and services, and the increased demand for consumer goods and services as a result of more people making more money. Many of these multiplier benefits are probably missed by the current Title II performance measurement system. Some are not captured because they are not measured—off-farm jobs created, for example—and others because the changes may take longer to take full effect and measurement stops when the project ends.
4.3.2.4 Storage
Reducing the percentage of food staples lost post-harvest was another strategy that some Title II programs used to try to increase food availability at the household level.90 Many proposals approved during the FAFSA-2 time frame emphasized the high level of post-harvest losses in the areas where they were proposing to work. The importance of reducing post-harvest losses as a key strategy for increasing food availability at the household level was also emphasized in the 2002 FAFSA.
Farm-Level Storage
Typical approaches used by Awardees to promote improvements in farm-level storage included providing farmers with information about improved storage techniques (e.g., treating grains with
90 Although many proposals still make reference to the hungry season, the large post-harvest losses, and the need to reduce these losses, most Awardees still seem to devote more effort to activities expected to increase food production rather than reduce losses. For example, 142 indicators out of the more than 1,000 AG/NRM/LH performance indicators in the FAFSA-2 universe were designed to measure changes in yields, but only 25 were designed to measure changes in post-harvest losses.
botanical and/or commercial pesticides prior to bagging and storing) and introducing farmers to improved storage facilities. Several types and sizes of metal silos were promoted in LAC programs, for example, and improvements to traditional storage units (building them higher off the ground and adding rat guards) were promoted in west, east, and southern Africa.
Awardees also had to deal with constraints to the adoption of the storage practices and facilities that they were recommending. A number of evaluations raised cost issues, suggesting that some recommended facilities were too expensive for Title II client farmers and, in particular, that the required initial cash outlays were too high. This was an issue raised in the ACDI/VOCA/Uganda program (FY 2007–FY 2011), for example, and in the joint final evaluation of the four Title II development programs in Guatemala (FY 2000–FY 2007). The problem of high initial costs led some programs to experiment with the development of group storage arrangements, providing a silo to a group of women on credit and/or at a subsidized price and encouraging them to use this as a basis for a micro-storage business. Several programs in LAC experimented with this approach, but found it to be very costly in terms of the time staff had to spend organizing the women and providing them with training in business management and bookkeeping. It was also not a very profitable way for the women to use their time. Household worries about possible theft of their grain stores was another reason given for not adopting the recommended storage facilities in Uganda and was also cited as a major concern by farmers interviewed by the FAFSA-2 team in Malawi.
The Title II program in Malawi (WALA) (FY 2009–FY 2014) that the FAFSA-2 team visited was providing its client farmers with information on a number of different storage options. Several consortium members had recently started experimenting with the use of a relatively new “green bag” technology. This plastic bag, which comes in many sizes, can be rolled up to create a vacuum that kills pests without the need for botanical or chemical pesticides. More

4-26 Agriculture, Natural Resource Management, Livelihoods, Income Generation
experimentation is needed to determine how well these bags will work under the conditions common to Title II clients; whether they are cost-effective will depend to some extent on their reusability. But the initial outlay is relatively small; plus, this new technology has the advantage of enabling families to keep their grain stores inside their houses and safer from theft.
Outcomes. Farmers’ performance with respect to the adoption of project-recommended improved storage facilities was quite mixed. The four programs that reported on the numbers of farmers using improved storage practices—CARE in Haiti, CRS in Guatemala, SC in Nicaragua, and TNS in Ghana—exceeded their targets. On the other hand, only two of the six programs that reported on the percentage of households adopting the recommended storage practices—SC in Guatemala and Africare in Mozambique—exceeded their targets.91 Numerous evaluations also cited poor adoption rates and the many constraints to adoption of improved storage techniques and facilities.
Community Storage
During the FAFSA-2 time period, a number of programs also supported the development of community storage facilities, using project funds to help build facilities and train communities in their operation and management. Community storage activities and other types of community-based, in-kind (also cash) revolving funds have had a poor track record, however, with funds/stocks declining in value, and they usually ceased to exist after several seasons. The community cereal banks (CCBs), which have been particularly popular interventions in the Sahelian countries in West Africa, are a variant of this approach. These CCBs, which are basically village cooperatives that buy, store, and sell basic food grains, became especially popular
91 Africaredefineditsindicatorasthe% [of households] adopting effective traditional storage systems. The four programs that reported on the percent of households adopting improved/recommended storage practices that did not meet their targets were ADRA in Madagascar and Nicaragua, FH/Mozambique, and TNS/Ghana.
among donors in the 1980s as a way of using the significant amounts of food aid that were coming into the Sahel in response to the droughts. The CCBs were effective as “slow release mechanisms for food aid,” as one observer put it, which can be a useful attribute in the context of a drought (Kent, 1998a, p. 14 and 1998b). It is also easier to stock a few dozen community grain banks with food aid than it is to use this food in FFW programs or as rations in a community-based MCHN program. The problem is that CCBs are not sustainable as institutions—their propensity for stocks to decline (the “slow release,” which is also referred to as “leakages”) is one of the reasons for their lack of sustainability. Proponents of CCBs consistently underestimate the difficulties involved in grain trading, which is a complicated, risky, and competitive business, and overestimate the ability of CCB managers, who are managing collective goods—not their own—which means that they have fewer incentives to manage efficiently or to minimize costs and whose inexperience coupled with the slowness of collective decision making and social pressures also leads to poor decisions on the timing and pricing of grain purchases and sales92 (see Box 4.11). There are also downsides to this option in terms of potential benefits forgone. When these leakages (the slow releases) occur, due to members borrowing food from the CCBs and not repaying it, for example, or unwise purchases or sales on the part of the CCB management, this food does not necessarily reach either the poorest in these communities or those in most need of nutritional support, such as pregnant and lactating women and children under two years of age.
92 A 2011 analysis of the CCBs in Niger by the USAID RegionalOfficeoftheInspectorGeneralandamorerecentassessment of the CCBs in several of the Sahelian countries by USAID/FFP’sWestAfricanRegionalOfficerecognizedthatthe CCBs have had a poor record with respect to sustainability but were overly optimistic about the likelihood of being able to improve the management of these institutions through training andimprovementsinmanagementandfinancialcontrolsgiventhe fundamental reasons why they continue to fail, which are described in the text and in Box 4.11.

4-27Agriculture, Natural Resource Management, Livelihoods, Income Generation
4.3.2.5 Marketing
By the end of the FAFSA-2 time period, the vast majority of Title II development programs included a marketing dimension. This was not always the case at the beginning of the time period, and programs still vary considerably in terms of the importance given to market issues and the timing of their market activities. The distinction between including marketing activities in a program and having a market-driven program is discussed in Section 4.5.1.1.
Marketing Strategies
Common marketing strategies used by Title II Awardees during the FAFSA-2 time period included:
(1) helping farmers get access to timely and reliable market price information, (2) encouraging farmers to sell as a group to increase their negotiating power and get higher prices for their products, (3) helping farmers identify and diversify into higher-value markets and products, and (4) facilitating linkages between client farmers and buyers of higher-value products.
Providing market information and analyses and analytical support. Some of the earliest market activities focused on helping farmers get access to more reliable and timely information on prices so that they would be able to identify and take advantage of opportunities in alternative markets. A number of the proposals approved in the beginning
Box 4.11. Why Community Cereal Bank Projects Rarely Work
Evidence from extensive research on grain markets in the Sahel indicates that grain trading is a risky, difficult, and competitive business. Buying grain right after the harvest, and storing and selling it during the hungry season, is no guarantee of making a profit, or even breaking even. Many proponents of CCBs overestimate the size of the price increases between the harvest and hungry seasons and vastly underestimate the cost of operating a CCB. The end result is that the vast majority of these CCBs go out of business, usually after project support ends, if not before. More than 1,200 of the 1,500 CCBs created in Burkina Faso before 1991 (80 percent) went bankrupt within five years of their creation, and a review of 100 CCBs created by FAO in Niger found that only 1 was able to survive after outside support ended.
Reasons for these high failure rates include: (1) a failure to recognize that net margins in the grain trade are thin, which leaves little room for error in trading; (2) CCBs frequently make management mistakes, with inexperience, slow collective decision making, and social pressures leading to poor decisions on the timing and pricing of purchases and sales; (3) CCB managers are managing collective goods—not their own—which means that they have fewer incentives for managing efficiently or minimizing costs; (4) speculative storage is riskier and less profitable than most people assume; (5) grain that is loaned by CCBs is frequently not paid back, contributing to the decapitalization of the stock; and (6) CCBs often suffer from corruption and support agents can also become “predators,” stealing money from the CCBs that they are supposed to be helping. The creation of a CCB can also have adverse effects on the longer-term food security of a village if it displaces private traders, breaks traditional relationships between traders and villages, or keeps these relationships from developing. Finally, since CCBs rarely make a profit, they are rarely in a position to subsidize other village activities, such as literacy training, which some proponents suggest is one of their strong points.
Sources: Kent, 1998a and 1998b.

4-28 Agriculture, Natural Resource Management, Livelihoods, Income Generation
the FAFSA-2 time period made references to using program resources to design and implement their own market information systems.93 Over time, more programs began to focus on what they could do to take better advantage of the price information already available from other sources, sometimes with the support of USAID (in Bolivia, for example) and other donors. This included supporting the dissemination of price information on local radio stations and using project volunteers to post price information in community centers. The next step for many programs was to help farmers begin to make use of these data so that they could improve their understanding of how local markets worked (market dynamics) and, in particular, determine whether there were price differentials between markets and/or seasonal price differences that they might be able to use to their advantage. Many programs did this analysis for their clients at the start, but many also eventually developed training programs to teach farmers how to conduct these analyses on their own.
The information environment has changed dramatically since the beginning of the FAFSA-2 time period, however, with the spread of cell phones to some of the poorest and more isolated areas where the Title II programs are located. The FAFSA-2 team met with many farmers in all five countries that had cell phones. Cell phones were/are in widespread use in Guatemala and Bangladesh, and their use was spreading fast in Malawi and Uganda at the time of the FAFSA-2 visit. Cell phones were introduced into the Title II program in Guatemala in the late 1990s, when one of the Awardees gave one each to several of its women’s groups that made money by charging local farmers that used them to call nearby markets to check on prices. Now small farmers in Guatemala are using their own phones to call buyers to check on buyers’ needs and prices. This included one small-scale onion producer in Guatemala, who explained to team members that he had just used his cell phone to check prices in several markets and decided that he could make more money by selling his onions
93 A number of these plans were never implemented, for example, in several of the Bolivian programs, as a result of these systems being developed by other organizations.
to the buyer who was willing to come to his farm than he could if he took them to the market himself. USAID and Awardee staff in Malawi and Uganda were also talking about the potential for making more effective use of cell phones to access price information, including by making use of “Esoko,” which is a mobile-enabled, cloud-based service to which users can subscribe that collects and provides content, including on prices, bids and offers, weather, and agricultural tips.94 In short, cell phones are quickly becoming a ubiquitous technology, but further efforts are needed within the Title II development program to identify cost-effective ways of helping farmers use this technology to greater advantage.
Promoting marketing by groups. Promoting collective sales was another of the early marketing strategies adopted by a number of the Title II programs implemented during the FAFSA-2 time period. The idea was that if farmers were able to sell their products as a group (i.e., in bulk), they would be in a stronger position vis-à-vis buyers and would be able to negotiate higher prices for their products. What is not clear, however, is whether farmers actually have to sell as a group to get the higher prices or whether they can also get the higher prices if they bring their produce together in one place but still sell as individuals. Much of the transaction costs to buyers can be reduced just by having sellers congregate in one place, so buyers could afford to pay sellers higher prices in either case. Efforts to promote sales by groups can also be costly, requiring Title II program staff to spend considerable time helping groups organize more formally and training them in business management and bookkeeping.95
Selling in bulk makes more sense for field crops, where the price differentials for quality that farmers can take advantage of are less likely to be available. But for higher-value products, where quality makes a difference, it may be preferable for farmers to
94 http://www.esoko.com/about/index.php.95 The issues of costs and opportunity costs are discussed further in Section 4.3.3.2, “Organizing and Working with Groups.”

4-29Agriculture, Natural Resource Management, Livelihoods, Income Generation
continue to sell as individuals so that they can capture quality premiums for themselves. For example, the clients of Emanuel International (part of the CRS WALA consortium in southern Malawi) were selling Bird’s Eye chilies at the time of the FAFSA-2 field visit. These farmers, mostly women, brought their chilies to one location, making it easier for the buyer, but sold their chilies as individuals, which enabled them to capture the higher price for premium quality (see Figure 4.10). Similarly, women in Bangladesh, who were part of SC/Helen Keller’s homestead gardening component, arranged to have their produce taken to the market at the same time, but each woman’s produce was sold separately, again ensuring that the benefits of any extra time and attention taken during the production and harvesting processes could be captured by that woman. The final evaluation of the CARE/Mozambique program also wrote positively about market facilitation by farmers’ groups, which involved “bulking, weighing and price and transport negotiation with traders—but with the group never actually owning the crop” (Selvester et al., 2006, p. 35). This model, according
to the final evaluation, can empower smallholder farmers within the existing market and requires less intensive training and continued support (e.g., with credit, legislation, bookkeeping, bank accounts) than to funnel all these activities through formal associations and associations of associations. (See Section 4.3.3.2 for a further discussion of CARE’s experience working with these farmers’ associations.)
Assessing markets and identifying priority products. The FAFSA-2 universe includes numerous examples of programs that helped their resource-poor clients switch to producing products for higher-value markets. This includes Bird’s Eye chilies (Malawi and Uganda); broad beans (Bolivia); French beans (Guatemala); potatoes (Bolivia, Guatemala, and Uganda); sesame (Mozambique); peanuts (Mozambique); onions (Bolivia and Guatemala); tomatoes and green peppers (Nicaragua); peaches, plums, and grapes (Bolivia); cashew nuts (Mozambique); milk (Bolivia and Zambia); and several indigenous crops (organic
Figure 4.10. Women farmers in Malawi selling Bird’s Eye chilies for export
Dr.
Jaya
chan
dran
Vas
uden
evan
/CR
S (E
man
uel
Inte
rnat
iona
l)/M
alaw
i

4-30 Agriculture, Natural Resource Management, Livelihoods, Income Generation
maca, a medicinal product, and amaranth in Bolivia) (see Box 4.12). Some of these products were new to the farmers—Bird’s Eye chilies in Uganda and Malawi, French beans in Guatemala, and potatoes in Uganda. In other cases, the products were already being grown by farmers in the target area, and the programs helped farmers make changes in the quality of their products and how they marketed them so that they would be saleable in higher-value, often niche markets.
Many programs did much of the initial analyses of market potentials themselves, looking for markets for products that were of high value and for which there was a growing demand, and then assessing
the production potentials in their target areas.96 The more effective programs began to involve their farmers and farmers’ groups in the market assessments, having learned that assessing markets is an ongoing process and one for which farmers are eventually going to have to take responsibility. Going to the source was also important.97 So, priority activities included taking groups of farmers to visit with potential buyers (including supermarkets, wholesalers, processing plants, and regional and national food and agricultural fairs) about their immediate requirements, as well as to gain perspectives on market conditions in the future.
In addition to information on the quantities demanded, these analyses also collected information on the unique demands of each market with respect to the quality required (e.g., the variety, size, shape, and color of the product) and timing. With this information, programs were able to help their client farmers change how their products were harvested, dried, packed, shipped, and presented and when they were marketed, a little earlier or later than their main competitors, for example. A few programs, for example CARE in Bolivia and ADRA in Nicaragua, also introduced the idea of calendarization, which is a planting/harvesting system frequently used for horticulture crops. The basic idea is that if farmers take a longer time to plant the crop (a month instead of a week, for example), harvests and sales can also take place over a longer time period, which enables farmers to average their sales prices over a longer
96 Determining production potentials is also important, i.e., determining whether a product can be physically produced in thetargetareasandatapotentialprofit.OthercriteriausedinTitle II market-oriented programs to identify priority products included: whether small producers could have a competitive advantage; whether the Title II clients would be able to differentiate their products in some way, including by placing their products in the market before or after current suppliers; and whether there were any potentials for generating additional employment, both on- and off-farm.97 This was also one of the lessons learned by a USAID-financedprojectinEthiopiadesignedtoexploretheuseofmarkets to alleviate extreme poverty. “Establishing a real dialogue between local market actors leads to the most reliable market information. The best way to understand the opportunities and constraints in the market is by talking to the actors on the ground—they know better than anyone” (Chemonics International, 2007, p. 42).
Box 4.12. Examples of Priority Products and Market Linkages Developed during the FAFSA-2 Time Period
• Bolivia/ADRA: Sale of fresh peaches in high-end fairs and dried peaches to processors
• Bolivia/FH and SC: Sale of milk to dairy processors
• Bolivia/SC: Sale of premium and branded potatoes to supermarkets in the capital city
• Guatemala/CRS: Export of French beans
• Guatemala/SHARE: Sale of potatoes to a potato chip processor
• Malawi/CRS (Emmanuel International): Export of Bird’s Eye chilies
• Mozambique/CARE: Export of organic groundnuts
• Nicaragua/ADRA: Export of green peppers and tomatoes to the U.S. market
• Uganda/Africare: Sale of potatoes to fast food restaurants in the capital city
• Zambia/LOL: Sale of milk to collection centers/processors

4-31Agriculture, Natural Resource Management, Livelihoods, Income Generation
period and, hopefully, avoid selling their entire harvest at the lowest point in the market. In Bolivia, several Awardees also developed branding programs for some of the products intended for higher-value, niche markets, including developing logos and attractive advertising materials and packaging.
Promoting and facilitating market linkages. Over the FAFSA-2 time period, a number of programs became more active, adept, and successful in promoting and facilitating market linkages for their farmer clients. This included: helping farmers identify and make contact with specific buyers in specific markets; facilitating deals with these buyers, including developing forward contracts; helping with initial negotiations between their Title II clients and potential buyers; and encouraging the development and strengthening of these relationships.
Many programs included in the FAFSA-2 time period focused initially on organizing their clients into market groups/associations and providing them with training on a variety of marketing topics, with the apparent expectation that farmers would be able to translate their knowledge into practice largely on their own. This approach did not always work that well, as SC/Bolivia learned (see Box 4.28). In addition, the more successful programs learned that they needed to take a more proactive approach, using their project staff to help guide their clients through new and unfamiliar business practices in what for their clients can be very unfamiliar environments. In LAC, this process of providing hands-on guidance and support was referred to as acompañamiento, which can be translated as “accompanying,” but in English, the word “mentoring” is more applicable.98
Outside help in initiating and facilitating market linkages between Title II farmers and buyers can be
98 A recent book focused on creating jobs for the poor describes this role as follows: “But, what they [the clients] most appreciated was the ESC [Economic Service Center] advisors accompanying them in new and unfamiliar business transactions. Whether in discussing prices or delivery dates or quality standards, the ESC advisors were there to help clients interpret,understandandgainconfidenceinthemselvesandtheir business partners. In short, they drew strength from the ready access to an independent third party willing to serve as a sounding board for testing ideas and as a source of objective advice and encouragement” (Riordan, 2011, pp. 84–85).
extremely important to building farmers’ confidence and also trust among the parties in the market chain. This is even more important when there are class, cultural, ethnic, and language differences between the Title II clients and buyers, situations that are common in some Title II countries, and/or when the buyers represent larger processors, for example, or supermarkets and exporters. The objective is to facilitate the development of these linkages, not to do the work for their clients, an approach that some marketing programs were criticized for during the 2002 FAFSA and FAFSA-2 time periods. Instead, the better practice, as SC/Bolivia learned, was to let their clients take over more responsibility for their own marketing activities over time as the clients learned the ropes and gained confidence (Piper, Zavaleta, and Scavone, 2010). In CRS’s case, its active involvement in the global CIAT-supported Agroenterprise Learning Alliance helped lead it to start putting more emphasis on working with local actors and the private sector to facilitate changes in market chains rather than on providing goods and services (CRS, 2009b).
Programs implemented during the FAFSA-2 time period helped link their clients to a wide range of buyers, including: small and large firms; cooperatives and private sector businesses from local, regional, and international markets; and small traders, wholesalers, exporters, processors, supermarkets, and restaurant chains. Decisions with respect to which organizations to work with are site-specific and need to be based on a variety of factors in addition to whether they are large or small or cooperatives or private sector businesses. Several programs were criticized in the 2002 FAFSA for relying too heavily on larger firms. Experience during the FAFSA-2 time period, on the other hand, provides many examples of the benefits that can be gained from working with larger firms (see Box 4.13).
Awardee Marketing Capacity
The 2002 FAFSA noted that few Awardee field staff were trained and/or had experience in marketing, business administration, and/or economics. This was still a problem during the FAFSA-2 time period. Agronomists were still likely to be put in charge

4-32 Agriculture, Natural Resource Management, Livelihoods, Income Generation
of marketing programs at the field level, and, even if they had some training in market development and business, production problems still tended to get priority attention. This problem was noticeable during a number of the field visits, including visits to programs in Guatemala, Niger, Malawi, and Uganda. This is one reason why many programs that were designed with a relatively strong emphasis
on marketing still ended up being too production oriented.
Outcomes. Sixteen of the programs in the FAFSA-2 universe reported on a sales indicator, with three-quarters of these indicators exceeding their targets. Programs that reported increases in sales included ADRA, CARE, FH, and SC in Bolivia; TNS in Ghana; FH in Kenya; WV in Mozambique; SC in Uganda; and LOL in Zambia. Tracking changes in the value of sales made through forward contracts and producers’ associations proved to be a useful indicator in these market-oriented, agricultural-based income generation programs. The data, which are easily understood, were also fairly easy to collect through these programs’ monitoring systems and were reported on annually. Having sales information also made it easier to understand the links between project production and marketing strategies and their impacts on incomes and assets.
The data from the Bolivia programs are interesting (see Figure 4.11) because the sales numbers can be related to the programs’ marketing strategies. According to the joint final evaluation of the four Bolivia programs (pp. 10, 108), for example, ADRA, which had a market-driven approach from the beginning, saw a significant increase in sales even during the first year of its project. The sales figures for the FH and SC programs, on the other hand, did not really begin to take off until FY 2005–FY 2006, after the mid-term evaluation and after they, SC in particular, recast their programs to give them a stronger market orientation. The value of sales facilitated by ADRA might have increased more substantially toward the end of the project had it not been for the adverse effects of El Niño on production and post-harvest losses in more than half the ADRA program area.
In the 2011 FFPIB 11-03, USAID/FFP also included an indicator related to the adoption of improved marketing practices (see Table 4.4). While useful as an indicator of one type of outcome, it is lower in the hierarchy of indicators leading up to improvements in household incomes and food consumption than the value of sales indicator. This outcome indicator also lacks the body of evidence that exists confirming the link between the adoption
Box 4.13. Examples of Advantages of Working with Larger Firms Noted in Title II Program Evaluations
It may be easier for larger firms to buy through forward contracts, for example, a mechanism that can provide small farmers with some degree of price stability. Many large firms are also in a better position to assess market demand and develop and promote new products than are the Title II small-farmer clients. Plus, these larger firms may frequently find it to their benefit to provide their suppliers with what are referred to as “embedded services.” That is, these firms are in a position to provide and may benefit from providing their suppliers with the market intelligence and/or technology packages and TA that will enable these suppliers to better meet the firms’ requirements. The availability of embedded services can be important to sustainability, particularly in cases where government services are weak or nonexistent. Making contacts with and learning how to work with larger firms has been particularly important in some Title II programs with respect to export markets, where larger firms have more contacts and should find it easier to track what is happening in overseas markets, anticipating and identifying changes earlier, than smaller farmers could, whether operating individually or as part of a group.

4-33Agriculture, Natural Resource Management, Livelihoods, Income Generation
of a given set of agronomic practices and/or the use of improved seeds and increases in yields, for example.
4.3.2.6 Livestock
Approximately one-quarter of the programs in the FAFSA-2 universe included livestock activities, usually in addition to crop activities. In a few cases—the LOL dairy program in Zambia and several pilot programs working with pastoralists in Ethiopia—the focus was solely on animals. A few programs were focused on larger animals, including cattle (the FH program in Kenya) and dairy cattle (in addition to the LOL program in Zambia mentioned previously, the FH and SC programs in Bolivia also helped link their clients to dairy value chains). The CARE program in Bolivia also included value chains focused on the markets for sheep and llama meat and fiber. More programs chose to focus on small animals (including goats, sheep, pigs, and rabbits) and poultry in an effort to help households
diversify their income sources and/or household diets. These included programs in Burkina Faso (Africare), Ghana (OICI), Guatemala (CRS, SC, and SHARE), Nicaragua (CRS, PCI, and SC), and Rwanda (CRS and WV). Most programs included some combination of the following interventions: the introduction of new breeds to improve the breeding stock; the distribution of animals to poor and/or women-headed households, often through some form of animal pass-on system99; the promotion of improved management practices (e.g., improved pastures, penning animals and adopting cut and feed practices, and improved shelters); and support to improved animal health (e.g., training community-based livestock health workers [paravets] and facilitating access to veterinary medicine, including through initial grants or loans to the paravets).
The most successful livestock programs, including from a sustainability perspective, seem to be those that were developed using a business model. This included the FH market-driven livestock program in Kenya, the development of community-based paravets in a number of programs in Africa and LAC, and the LOL dairy value chain in Zambia and the FH and SC dairy value chains in Bolivia.
Development of a Livestock Market
In 2004, when FH expanded its Title II development program into the lowlands in northern Kenya, it decided to increase its focus on livestock, in addition to crop agriculture, because livestock was an important source of income for the target
99 Some animal distribution programs require recipients of an animaltopassonacertainnumberofthefirstchicks,goats,orpigs to other people in the community. Programs vary in terms of the numbers of animals expected to be passed on and the number of pass-on cycles.
Figure 4.11. The Bolivia Title II Development Programs: The Value of Sales made through Forward Contracts and Producers’ Associations
0
100
200
300
400
500
600
700
800
2002 2003 2004 2005 2006 2007 2008
ADRA CARE FH SC
Cur
rent
US$
(000
)
Table 4.4. USAID/FFP Standard Outcome Indicator Required in Baseline and Final Surveys for Use in Title II Development Programs that have Objectives Related to Agriculture, Natural Resources Management, and LivelihoodsApplicable to development programs that aim to: No. Indicator titleImprove farmers’ marketing of agricultural products
15 Percentage of farmers that participated in post-harvest value chain activities in the most recent growing season (overall and disaggregated by sex).
Source: USAID/FFP, FFPIB 11-03, September 2011.

4-34 Agriculture, Natural Resource Management, Livelihoods, Income Generation
groups in the new area. The program focused on the market, including putting in the physical infrastructure needed to support the development of livestock markets in six sites. Livestock trade was already present at all six sites at the beginning of the program, along with trading in other goods and services. FH focused on helping transform these sites into permanent markets, equipping them with loading ramps, enclosures for animals, and auction blocks. These structures were constructed with some community support, primarily labor compensated with FFW, and contributions of local materials, including sand and stone. FH hoped to regularize livestock trade in the area, opening it up to a wider market, promoting more competition among prospective buyers, and raising the market value of animals. The vision behind this intervention was that of a series of competitive markets, managed by livestock marketing management committees, which would attract buyers from larger population centers as far away as Nairobi willing to pay increased prices for quality animals. FH also helped organize and train these market management committees, helping to ensure that they were broadly representative of various interest groups, including both sellers and traders.
Outcomes. The FH program came close to or exceeded the final targets that it had set for the mean annual value of livestock trade in the markets it had developed, despite the adverse effects of the 2005–2006 drought. Income from livestock production also more than doubled between 2006 and 2008 among target households. The final evaluation in 2008 concluded that the markets were being used and valued, despite the drought and the closure of some markets due to quarantine regulations (Robins et al., 2008, p. 38). Drought continued to be a problem into 2010, according to the preliminary results from the Tufts sustainability study, reducing market use and the collection of user fees (Coates and Kegode, 2011).
A Fee for Service Model for Providing Animal Health Services
Several Awardees included a community-based animal health worker or paravet component in their programs during the FAFSA-2 time period,
including FH in Kenya and CARE, FH, and SC in Bolivia. These programs trained community members in basic animal health practices and provided them with veterinarian supplies and medical kits. Animals are an important component of many small farmers’ operations in countries where Title II programs work, and these programs seem to be a cost-effective way of expanding poor farmers’ access to basic health services for their animals. Keeping animals alive and healthy can have a major positive impact on farmers’ asset bases and incomes, even in the absence of other programs designed to introduce improved production practices and/or upgrade local breeds.
The concept of a community-based animal health worker was not new in northern Kenya where the FH program was working, having been promoted by several other donors in the 1990s. So FH focused its efforts on strengthening the existing system and extending it to the lowlands, which were more heavily pastoral. In Kenya, FH also adopted a business model approach to the delivery of these animal health services from the beginning of its program, as did SC in Bolivia. CARE and FH took a different approach in the beginning of their programs in Bolivia, starting with the idea that the paravets could be the focal point for a community-based enterprise, with the communities setting the fees and the paravets depositing part of their fees into a revolving fund to be managed by the community. But both programs switched to a business model approach in response to one of the mid-term evaluation’s recommendations. In Kenya, FH provided the training in collaboration with the Ministry of Livestock and Development and FARM Africa (a United Kingdom-based NGO), while in Bolivia most training was done in collaboration with local universities.100 The technical training focused on animal diseases and treatment; the use of drugs; and preventive care, vaccinations in particular. In Bolivia, the programs also provided the paravets with training in how to set up and run a microenterprise, set fees (charging enough to
100 SC/Bolivia had an agreement with the Bolivian Catholic University, for example.

4-35Agriculture, Natural Resource Management, Livelihoods, Income Generation
cover the costs of their time and to replenish their supplies), and keep accounts.
Outcomes. Preliminary findings from the Tufts sustainability study indicate that: (1) considerable demand for paravet services still existed two years after the FH program ended in Kenya, (2) the fee for services model enabled paravets to purchase the needed medical supplies and to earn a living, and (3) links between the paravets and the Department of Veterinary Services continued to be mutually beneficial (Coates and Kegode, 2011).
Development of a Dairy Value Chain
The LOL/Zambia dairy development program was initially designed to be active at all key points along the dairy value chain in Zambia, with the ultimate objective of increasing the incomes of vulnerable households through the sales of milk and other dairy products. The program, which had a strong business and marketing orientation, was also clearly designed to focus on smallholders and vulnerable households.
Key intermediate results included:
• Increasing milk output of the smallholder farmers, through the distribution of improved in-calf dairy animals (a pass-on scheme where each recipient of an improved dairy animal passes on the first born female animal to another recipient household) and the provision of artificial insemination services to improve and/or maintain the genetic quality of the animals owned by the clients
• Increasing the quantity and quality of raw milk supplied by smallholder producers to milk processors, through the provision of TA in animal nutrition and health, pasture establishment and management, and milk quality assurance
• Providing market linkages, through the formation of farmers’ associations and cooperatives; the establishment of and support to milk collection centers, where clients sell and bulk their milk; and the provision of market services through the facilitation of linkages to dairy processors.
The third component was taken out of the Title II development program after the 2006 mid-term
evaluation, however, and moved to a related USAID-supported LOL program. This decision was fortuitous, since it is doubtful that the program could have achieved its income objectives for smallholder dairy producers in the absence of any work further up the value chain, and in particular the work done to help establish and support the milk collection centers. The milk collection centers, in fact, were crucial to being able to successfully link small, widely dispersed dairy producers to a growing market that was dominated by urban-based, bulk, private sector milk processors that did not even consider the small farmer as a source of milk. Over time, LOL was able to successfully link its target groups to the two largest milk processors in Zambia as well as a considerable number of medium and smaller processors.
LOL partnered with Heifer International, which handled the animal distribution component of the program. Most of the more vulnerable households in the LOL target areas did not have cows of their own. Therefore, including the in-calf heifer distribution component was an essential mechanism for ensuring that these households would be able to participate in the program. The distribution component did suffer from a number of problems that seem to be characteristic of many of these components: too many animals died, especially at the beginning of the program; many animals did not come into heat; and a larger number of bull calves were born than were expected. The end result was that the number of calf pass-ons did not come anywhere near the program targets, according to the final evaluation, but the herd size did keep growing (55 percent according to one estimate), which may have helped encourage some of the potential recipients to continue to believe that they might eventually receive their pass-on animal.
Several factors contributed to making this program a success, according to the final evaluation, where other animal distribution programs have failed. This included the fact that LOL/Zambia had an experienced partner in Heifer International, which also had a long-term commitment in the project area. LOL also took a very aggressive stance with respect to managing the pass-on component, insisting that

4-36 Agriculture, Natural Resource Management, Livelihoods, Income Generation
animals (either the original in-calf heifer provided to a recipient or a pass-on calf) be repossessed if poorly managed, a strategy that resulted in program participants taking the management practices that were recommended by the project more seriously than they might have otherwise. But in the end, it was probably the existence of a profitable and growing market for their milk that was one of the most, if not the most, important incentives to all the farmers participating in the LOL program, and not just those that had received or were still anticipating receiving an animal.
Outcomes. The project was able to exceed its targets for the value of milk collection center sales by 211 percent and increases in average household incomes by 125 percent. Households also benefited from the fact that milk sales produced a steady stream of income, unlike crop sales, and that peak incomes from milk sales coincided with the former “hunger months.” The final evaluation also estimated that the entire US$10 million cost of the project would be recovered in terms of a positive
net gain within two years after the end of the project (Swanson, 2009, pp. 9–10).
Small Animal Programs
Relatively little information is available on the small animal interventions in the FAFSA-2 universe. What information is available, however, suggests that most faced many problems and achieved limited success.101 The interventions that seemed to work best were the ones that focused on the distribution of an animal asset and did not require an animal pass-on. For example, they provided a baby goat to the poorest women in a community, as the CARE and SC programs did in Bangladesh, and the women fed it, sold it, and bought two goats or another more valuable animal. Animal health could/can be a problem, and difficulties in finding sufficient feed
101 The animal distribution activities were among the least well documented of the Title II livestock interventions. Only one program, the OICI program in Ghana, included indicators in its IPTT that were designed to measure the performance of its small animal pass-on program, and the results, in terms of the program meeting its targets, were disappointing.
Box 4.14. A Dairy Value Chain in Bolivia
The dairy value chain that SC/Bolivia helped develop was only a small component of its overall program, and its geographical impact was much smaller than the LOL program in Zambia. Still SC’s experience illustrates some of the factors that can be important to the success of a dairy value chain: current demand was strong and the market was growing; the price producers received for their milk was attractive and they could produce and sell milk year round; the dairies bought their milk on contract, which helped mitigate price risks to farmers; and the dairies also provided the producers with TA and access to improved feed. SC’s contributions to this chain, which were numerous and varied, also provide a good illustration of how the value chain approach helped SC better integrate its activities. SC helped build the road that made it possible for the milk producers to get their milk to market during the rainy as well as the dry season. SC’s marketing specialists helped make the initial contacts with the dairies and facilitated the development of the forward contracts. Once the links were made to the market, a number of other activities that SC had initiated earlier in its program began to have more value to the milk producers. This included SC’s agricultural technicians that provided TA in forage production and animal nutrition; the paravets SC trained, who became available to provide veterinarian services; and the atajados (stock tanks) and family stables that were constructed with SC assistance, which contributed to increased milk production—the atajados by increasing animals’ access to water year round and the stables by providing them protection from the cold.
Source: Bolivia Joint Final Evaluation (van Haeften et al., 2009).

4-37Agriculture, Natural Resource Management, Livelihoods, Income Generation
limited the number of animals these women could handle at any one time, but the basics of rearing these animals were known to them and markets existed, particularly at the time of the Muslim holiday of Eid. On the other hand, if an animal—or other asset—was/is provided within the context of a value chain, as was the case with the LOL dairy program described previously, it was likely to have more value.
The problems seemed to arise when the interventions got more complicated. Awardees established a pass-on system in an attempt to expand the number of people reached by the asset transfers. Awardees added a nutrition objective to their program, trying to get mothers to feed goat milk to their young children, in the absence of a tradition of doing so. They tried to improve the breeding stock by using new breeds in their distribution programs and/or implementing artificial insemination programs, and/or they tried to introduce new management practices, encouraging clients to pen the animals and to adopt a cut and feed system instead of their traditional system of letting the animals free range. These more complex small animal interventions can require significant amounts of Awardee staff time to be successful. But, since these activities tended to be add-ons, the level of support needed was often not programmed or available. On the other hand, it is also not clear that more resources should have been devoted to these activities, since diverting more staff time to what were considered to be more marginal activities could have had significant opportunity costs in terms of less progress on other higher-priority activities.
Outcomes. The few evaluations that included any discussion of these programs tended to cite the problems involved in making them work and to suggest that the pass-on system was not likely to continue to function beyond the first or second cycle and certainly not beyond the life of the project. FH’s experience with goats in Kenya seems to be somewhat typical of many of these programs. The introduction of dairy goats was intended to provide community groups with an asset that would provide additional income and augment the family food supply, through increased milk production,
and improve children’s nutritional status. The groups had numerous problems, however: goat care was very labor intensive, particularly with the introduction of the cut and feed management practice; the goats introduced were susceptible to disease; milk yields were mixed; and slow breeding was a problem. The conclusion of the final evaluation was that the component had a very low probability of sustainability because the groups were still too dependent on FH for inputs, breeding and production results were low with respect to targets, and owners found the special care that the goats needed was a drain on their resources (Robins et al., 2008, pp. 42–43). The goat distribution programs in Guatemala also seemed to be beset with many of these same problems, based on what was seen during the FAFSA-2 team visit.
4.3.2.7 Rural and Agricultural Finance
Two of the Title II development programs included in the FAFSA-2 universe had a separate SO focused on improving their clients’ access to finance (CARE in Kenya and ACDI/VOCA in Cape Verde). At least 20 other programs included some rural and/or agricultural finance activities in their programs, 9 as separate IRs under their agricultural SO (Africare in Chad/Mali; TNS in Ghana; ACDI/VOCA in Uganda; CRS in Malawi; ADRA, FH, and SC in Bolivia; CARE and SHARE in Guatemala; and ADRA and CRS in Nicaragua).
These programs varied considerably in terms of their focus and approaches—whether the Awardees were focused on:
• The poor—helping develop microfinance institutions (MFIs) (e.g., ACDI/VOCA in Cape Verde and WV in Mauritania).
• The rural poor—helping organize and develop community-based savings and loan groups (e.g., CARE in Kenya, CRS in Burkina Faso, the CRS consortium in Malawi, and ACDI/VOCA in its FY 2007–FY 2011 program in Uganda).
• Small resource-poor farmers—experimenting with alternative ways to supply agricultural credit to the clients of their agricultural programs, either

4-38 Agriculture, Natural Resource Management, Livelihoods, Income Generation
directly and/or by linking them with other credit-providing institutions, including rural-based MFIs and commercial banks (e.g., FH and SC in Bolivia; ADRA, CRS, and PCI in Nicaragua; CRS and SHARE in Guatemala; and ACDI/VOCA in Rwanda).
The Title II development programs used their resources to help organize and train community savings and loan groups and to support the development of MFIs, cooperatives, and associations, providing them with TA and training and, in the case of some MFIs and cooperatives, seed capital.
Microfinance
The MFI component in ACDI/VOCA’s FY 2003–FY 2009 program in Cape Verde was probably the most significant MFI program undertaken during the FAFSA-2 time period in terms of resources and impact.102 The final evaluation of the program in late 2005 credited ACDI/VOCA with the development of the entire microfinance sector in Cape Verde, including stimulating interest on the part of the Bank of Cape Verde in establishing a legal framework for the sector. The ACDI/VOCA program worked on a number of the islands over the years with a variety of different credit organizations, including banks, women’s organizations, and microfinance associations, providing them with technical support, training, and, in some cases, seed capital. These programs were urban-based, however, with most of the credit being used to finance non-farm business and trading opportunities. ACDI/VOCA’s ventures into agricultural credit—the creation of a fund at a local bank that farmers could use to invest in drip irrigation, for example—were much less successful. Drip irrigation had been a key intervention in both of ACDI/VOCA’s Title II development programs, but the lack of a viable long-term mechanism for providing capital for investment in drip irrigation remained an issue at the time of the final evaluation (Langworthy et al., 2005, p. 5).
102 This program was a follow-on to the MFI component in ACDI’s previous Title II development program and to a USAID-supported Micro Enterprise and Training Program that it had managed from 1997 through 2001.
Providing support to the development of MFIs was more popular during the time period covered by the 2002 FAFSA than during the FAFSA-2 period. The problem with focusing too heavily on MFIs, which the Title II Awardees learned over time, along with the rest of the development community (see Box 4.15), is that they are not well suited to serve farmers’ needs for agricultural credit, including the needs of the small, resource-poor farmers, who are the majority of the Title II clients. The MFI approach originated in more urbanized areas to serve poor micro-entrepreneurs and petty traders whose major credit needs were for short-term credit to replace their inventories. Most MFIs still do not lend to farmers, unless the household has other sources of income to accommodate their frequent repayment
Box 4.15. Microfinance Has Not Led to an Expansion of Finance for Agriculture
“In the 1980s and 1990s the deleterious impact of limited financial access caught the attention of many academics, policymakers, donor agencies, and development practitioners, who generated an outpouring of new thinking and new ideas. Innovative concepts such as group liability, village banking, micro insurance and index-based insurance were tested in new and emerging microfinance institutions. But progress in expanding agricultural finance—as opposed to nonagricultural microenterprise finance—lagged. Donors and governments that had invested heavily in agricultural development banks and agricultural credit in the early 1980s and 1990s found that these efforts did not produce the expected results and withdrew their support. It was hoped that private commercial banks would step in, but for the most part they did not.”
Source: Kloeppinger-Todd and Sharma, 2010.

4-39Agriculture, Natural Resource Management, Livelihoods, Income Generation
cycles. More specifically, most MFIs require that loan payments be made on a weekly or monthly basis, which does not work well for crop farmers who may have to wait for four to six months from planting to harvest time to pay back a loan used to buy seeds and fertilizer, for example.
Rural Savings Mobilization
A number of experts in rural and agricultural finance believe that it may be better to start with rural savings mobilization, when working with the food insecure, rather than with rural credit programs. The poor, they argue, can and do save, and households can and do use their savings to “manage emergencies, prepare investments, and smooth consumption” (Campion and van Haeften, 2010, p. 8). The VSL interventions supported by Title II programs during the FAFSA-2 time period also seem to have developed into a relatively simple but effective approach to solving the problem of farmers not having enough cash on hand when they need it to buy fertilizer and other inputs, at least in Kenya and Malawi, based on information from final evaluations and field visits.
The initial idea was simple, to see whether poor people in rural areas, initially primarily women, would be able to contribute small amounts of money on a regular basis into a capital fund, which could be loaned out to members during the year to help them meet consumption needs and/or to invest in small-scale economic activities. These interventions are rural-based, and their members include farmers as well as agricultural laborers, rural-based micro-entrepreneurs, and petty traders. Most loans were/are used by members to expand their businesses or for petty trading activities, with smaller percentages used to pay for school fees, books and uniforms, and household expenses, including food and clothing.103 The loans made by VSLs also tend to require frequent repayments. As a result, it is the savings that they get back at the end of the year, when the funds are liquidated, that members use to buy
103 In Kenya, 41 percent of the VSL members reported using these loans for business or petty trading activities, for example, 16 percent for school expenses, and 14 percent for household expenses (CARE/Kenya Evaluation, Macher et al., 2009).
fertilizer and other agricultural inputs, buy livestock, pay school fees, and pay for improvements to their homes.
The groups are self-selected, and all funds come from the personal savings of the members. The funds are usually lent to members with interest and by consensus. Over time, the interest allows groups’ funds to grow, giving each member greater access to money and greater savings than they could feasibly save on their own. Since the savings are internally generated, groups have more incentive to manage this money well, and since the group is lending its own money to its members, collateral is not required. The major cost to the Title II development program was/is the cost of training the community and community-based field agents in the group savings and loan methodology. This includes training in individual self-screening, group formation and leadership, group fund development, and record keeping. Awardees often try to graduate groups after the first savings cycle, with Awardee personnel still available to provide TA during the remainder of the Title II program.
Outcomes. Preliminary evidence from the Tufts Exit Strategies Study indicates that Title II-supported VSL groups in Kenya were still working well two years after the program ended. According to the Tufts study, this is because the groups still have: (1) the capacity to keep the programs running (the groups had been trained to manage their own operations), (2) access to the resources needed (no outside capital is needed, and group operations are financed by internal donations), and (3) the incentives needed to keep functioning (access to credit and payouts are still helping group members meet their consumption and investment needs) (Coates and Rogers, 2011). The FAFSA-2 team also visited with VSLs in Malawi that had been organized under the I-LIFE program (FY 2005–FY 2009), which were still flourishing and spinning off new groups.
In short, these VSLs seem to have found a way to use social pressure to help people save money and invest it later. They have helped members smooth

4-40 Agriculture, Natural Resource Management, Livelihoods, Income Generation
consumption as well as provided a source of limited amounts of operating capital. Their ability to grow, on the other hand, appears to be constrained by local capacity, which is frequently limited. Some observers also question the advisability of trying to link VSLs with formal MFIs, believing that this would not be compatible with the basic principles of the program and could jeopardize their continued operation. VSLs, whose basic unit is the individual, have not yet become a source of capital for group investments and/or larger and longer-term investments, in agriculture in particular, and some observers also question the advisability of encouraging such a development.
Agricultural Finance
Although the VSL programs have provided some help, most Title II clients still have difficulties getting access to the additional funds that they need to be able to invest in the technology packages being promoted by the Title II programs—to buy the improved seeds and fertilizers (operating capital) and equipment, such as irrigation pumps, sprayers, and plows (investment capital). The Title II development programs have not had much success in finding and/or helping develop institutions specialized in the provision of agricultural finance, a problem that was/is not unique to the Title II programs.
Access to credit from the commercial banking system has not been a viable alternative for small, resource-poor farmers, Title II client farmers included. One reason is that most banks and other financial entities are willing to provide loans only in exchange for collateral in the form of some fixed asset, such as real estate, which is particularly difficult for small farmers to provide. Part of the problem is that rural and agricultural finance face unique risks and challenges beyond those typically found in financial markets. Providing finance in rural areas has higher transaction costs, for example, because populations are generally smaller and more dispersed in rural areas. Agricultural finance is also exposed to additional risks associated with weather and inappropriate government actions, such as politically motivated price controls and debt forgiveness (see Box 4.16).
Many Title II programs in the FAFSA-2 universe responded to these challenges by providing some of the inputs that they were recommending free or on a subsidized basis to jump-start the technology adoption process. (See Section 4.3.3.3 for further discussion on the use of this approach in Title II development programs.) This enabled their clients to try program recommendations on an experimental basis, but this is not a viable approach in the long term. CRS’s response to these challenges was to change its focus from MFIs to community-based savings programs (see Box 4.17), but this approach also has its limits, as discussed in the previous section on “Rural Savings Mobilization.” The response of some other Title II Awardees was to shift the focus of their finance activities to working with rural-based commercial and nonprofit MFIs and cooperatives.
Box 4.16. Challenges of Agricultural Finance
• Lending for agriculture is seasonal and covariant in communities, which causes liquidity management challenges.
• Market interventions, such as interest rate controls, subsidized credit, and ad hoc debt forgiveness, distort markets and discourage formal financial institutions from offering agricultural finance.
• Financial institutions have limited capacity to assess and mitigate full risks involved with agricultural lending.
• Lending for staple crops is especially difficult, because they usually offer low returns and are vulnerable to global price fluctuations and politically motivated price interventions.
Source: Campion and van Haeften, 2010, p. 9.

4-41Agriculture, Natural Resource Management, Livelihoods, Income Generation
Many thought that the rural-based MFIs would be a good fit with the Title II development programs, since their interests were/are similar (i.e., most were/are interested in serving the needs of the rural poor). Plus, some rural-based MFIs have developed interesting technologies for reducing transaction costs in rural areas.104 The problem was/is that very few of these institutions had/have the necessary technical knowledge or the appropriate resources, management information systems, and methodologies to be able to implement successful agricultural finance programs (including providing larger and longer-term loans that require seasonal grace periods rather than an MFI’s typical weekly or monthly repayment schedule).
The Title II Awardees also experimented with several other options during the FAFSA-2 time period, including equipment leasing, inventory credit programs,105 and value chain financing. The financing arrangements that FH and SC helped arrange for their dairy farmer clients, which are described next in “Outcomes,” could be viewed as a variant of value chain financing. Several recent assessments of agricultural credit have identified value chain financing as a (or perhaps the most) promising approach for financing small, cash-crop farmers (Empel, 2010; Campaigne and Roush, 2010; and AZM, 2011). Most of the agricultural finance efforts supported during the FAFSA-2 time period had limited success, however, particularly if assessed in terms of their sustainability.
Outcomes. USAID/Bolivia encouraged its Title II development programs to collaborate with
104 Theseincludecharacter-andcashflow-basedlendingand innovative technologies to reduce the transaction costs of serving rural areas (e.g., branchless banking and mobile banking) (Campion and van Haeften, 2010, p. 9).105 TNS included an inventory credit component in its program inGhana.Thefinalevaluationprovidesabriefdescriptionof this component, which included building warehouses and training farmers and linking farmers’ groups to banks, but stresses the implementation challenges, which suggests that thiseffortwasprobablynotsustainable.Thefinalevaluationof the OICI program in Ghana also reported that the inventory credit schemes that were included in the program had had limited use (p. vii).
other specialized credit organizations rather than implement agricultural credit programs on their own. FH/Bolivia and SC/Bolivia were able to find MFIs with experience in agricultural sector lending with which to work. Both were able to develop some innovative arrangements that enabled their dairy farmers to buy improved dairy cows on credit. In the FH case, the Tomoyo irrigation users association, which was well capitalized, guaranteed the loans; in the SC case, the dairy processors collected the loan payments for the credit organization. These arrangements seemed to be working well at the time of the final evaluation, but they were time consuming to develop.
In Uganda, ACDI/VOCA tried capitalizing several rural credit institutions over two consecutive programs, with mixed results (including problems with repayments and declines in their capital base), according to the final evaluation of the FY 2002–FY 2006 program. As a result, ACDI/VOCA decided to promote an individual and group savings approach in its follow-on program rather than continue to
Box 4.17. A Change in One Awardee’s Approach to Linking Agriculture to Finance
“Underlying any new intervention in agriculture is the need for investment in new technologies and systems. Lack of access to financing is a critical impediment to agricultural development in areas without formal banking facilities. In the past five years, CRS has fundamentally changed our approach to microfinance, by divesting in microfinance institutions and refocusing on savings-led methods with poor communities. Agriculture requires a similar rethink, so that new financial instruments can be developed to support agroentrepreneurs.”
Source: CRS, 2009a, p. 12.

4-42 Agriculture, Natural Resource Management, Livelihoods, Income Generation
capitalize and guarantee institutional rural credit facilities (Pierce and Gardner, 2006, p. 30).106
Three of the Awardees in Nicaragua (ADRA, CRS, and PCI) included a credit component in their programs, to which they contributed more than US$2.4 million in project funds. ADRA decided to run its own credit programs, developing lines of credit for non-agricultural as well as agricultural loans. ADRA also decided that it would offer agricultural credit at no interest, since it was expecting its client farmers to adopt strategies that ADRA itself considered to be experimental. ADRA discontinued its credit component part way into its program, due to the low recovery rates on its agricultural loans, and moved its clients over to several MFIs already working in its target area. CRS and PCI worked through other specialized MFIs right from the beginning, but also encountered financial and managerial problems. The three programs did succeed in making credit available to their clients while the programs were under way, but it is not clear whether these clients continued to have access to agricultural credit from these organizations once the Title II programs ended. SC—the fourth program in Nicaragua—had no credit component, but provided more of the inputs included in its agricultural program—drip irrigation, seedlings, fence wire—at an 80 –100 percent subsidy. SC also actively assisted its clients in accessing credit from other sources, helping its clients develop business plans and fill out loan and grant application forms, but at least one of the lending institutions that it was working with was in the process of losing its capital base at the time of the joint final evaluation (pp. 47–59).
4.3.2.8 Non-Farm Income Generation (Non-AG IG) Programs
A number of programs also included components designed to help the rural poor increase their non-
106 ThefinalevaluationalsogaveACDI/VOCAcreditforhaving realized halfway through its program that promoting and mobilizing group savings was a more effective way of providing liquidity to its client farmers than continuing to support institutional rural credit facilities.
farm incomes. These activities were located in a separate SO in a few programs, but they were more likely to be included as part of a broader SO focused on improving livelihoods and incomes more generally. Strategies used included support to microfinance activities; cash and in-kind grants to the poor, women in particular, to help them jump-start a business—cash to buy inventory to start a small village store, for example, or a sewing machine to start a tailoring business, or the provision of equipment, on a grant or loan basis, to a women’s group that they could use to process locally produced agricultural products for sale. Relatively few resources were allocated to these types of interventions, however—only 3 percent in FY 2009, down from 5 percent in FY 2003. Assessing the performance of these programs is difficult given the scarcity of information available in the evaluations.
Box 4.18. USAID/FFP Definition of Its “Non-Agricultural Income Generation” (Non-AG IG) Technical Sector
“Objectives include increasing and diversifying non-agricultural sources of income. Activities include: micro-finance and business development services, including provision of information on markets and technical assistance and training to increase capacity to identify and access markets; and vocational and business practices training and apprenticeship programs for youth and adults, including orphans and vulnerable children (OVC). Food rations are used to offset the opportunity costs of program participation and build human assets.”
Source: USAID/FFP Annual Results Reporting Guidance for FY 2009.

4-43Agriculture, Natural Resource Management, Livelihoods, Income Generation
Group Businesses
One type of group business promoted by a number of Title II programs during the FAFSA-2 time period involved the introduction of processing equipment to use to add value to locally produced agricultural products, including rice, maize, groundnuts, cassava, and shea-nuts. Much of this equipment is too expensive for a poor individual to buy, but if donated to a women’s group, or lent to them on favorable terms, the expectation was that they would be able to use this as a basis for generating additional incomes. These activities seemed to be fairly widespread, in West Africa in particular. However, little information is provided in the evaluations about how these programs were implemented (the costs of the equipment, the amount of staff time devoted to training the recipients in operating and maintaining the equipment, or in the marketing and bookkeeping skills needed to run these operations as a micro-business) or about how well they were/are working (what types of constraints they face, whether they are making any money, and whether they have any chance of becoming sustainable micro-businesses). Potential issues such as operating and maintenance problems and non-availability of parts were not mentioned in the evaluations, but lack of access to markets, especially for groups isolated by distance and/or poor roads, were mentioned, along with the suggestion that programs focus on markets and market issues at an earlier stage in project implementation.
Urban Income Generation Programs
The two CARE programs in Bangladesh (FY 2005–FY 2010 and FY 2010–FY 2015) included income generation activities in their urban components as well as in their much larger rural programs. The 2002 FAFSA focused its attention on the potentials for agricultural activities to promote better food security in urban and peri-urban environments (Bonnard et al. 2002, p. 19). In Bangladesh, CARE was able to successfully link its client groups—poor and extremely poor urban women—to a wide range of income-earning opportunities. One FAFSA-2 team member saw two examples, one in 2009 during
the preparation of the Bangladesh FSCF and the second during the visit of the FAFSA-2 team. In the first case, CARE linked a group of poor women to a local businessman who bought and sold baskets used for transporting products to market. This businessman told the women in advance how many baskets he would need and showed the women how to make baskets that met his quality standards. In the beginning, he also provided the women with the raw materials, but after several sales they determined that they could make more money if they bought the supplies themselves. In the second case, CARE Title II staff worked with their Business Development Unit to facilitate contacts between a small, local manufacturer, a local NGO, and a large European retailer. This arrangement resulted in permanent jobs for a number of poor urban women, who were clients of the Title II development program, making tufted rugs for sale in the European market using castoff remnants from one of the larger garment factories in Bangladesh.
4.3.3 Approaches
The Title II AG/NRM/LH programs were/are geographic based and client focused. That is, they were/are designed to respond to the problems faced by and have an impact on specific target groups in specific target areas. This means that Title II problem assessments and programs need to be unique to each target group and not generic to major geographic regions or to the country as a whole. Within this context, Title II Awardees functioned/function largely as service providers to their client groups—disseminating knowledge about improved technologies and practices to farmers in their target areas, organizing them into groups, and distributing agricultural inputs and capital investment goods.
4.3.3.1 Disseminating New Knowledge
The promotion and dissemination of new knowledge is a key approach that the Title II development programs have used/use in all their interventions—in marketing and rural credit interventions as well as those focused on increasing crop and livestock production and productivity. As part of their

4-44 Agriculture, Natural Resource Management, Livelihoods, Income Generation
approach to knowledge dissemination, Title II Awardees identified/identify promising technologies and practices, in consultation with government extension services and national, regional, and international research centers, and developed/develop approaches and methods for extending these technologies and practices to their target farmers. Some Awardees during the FAFSA-2 time period hired their own staff to provide these extension services, while others worked through local organizations, which some partnered with from the beginning and others selected through competitive grants programs. CRS frequently partners with local dioceses and CARITAS, for example; ACDI/VOCA used a competitive grants program to select its partners in Mauritania and Uganda; and WV frequently works closely with its own Area Development Programs (ADPs), when the geographical locations of the two programs overlap.
In disseminating these new technologies and practices, the Title II programs were/are taking on an extension role that is still widely thought to be a government function, although NGO and private sector actors are alternative extension service providers. The Title II Awardees took/take on this function, because in most of the Title II countries,
and particularly in the poorer, more isolated areas where Title II programs work, government extension staff are either not present or, if present, do not have the ability to provide extension services to Title II client groups, often because they do not have enough funds to travel to the field. The capacities of the government extension services vary by country. The government agricultural research and extension services are much stronger in Bangladesh, a poor but populous country with a long history of public service that began during its colonial period, than they are in poor countries with small populations, such as Haiti, Niger, or Bolivia.
Approaches and Methods Used in the Title II Programs to Disseminate New Technologies and Practices
FAO, in the Guide on Alternative Extension Approaches, identifies eight major approaches to extension that have been used in various parts of the world (Axinn, 1988). The one that best describes the approach most frequently used by Title II Awardees during the FAFSA-2 time period, which Axinn labels the “Agricultural Extension Participatory Approach,” is briefly described in Box 4.20.107 Areas of commonality between what one sees in the field with the Title II programs and the approach described by Axinn include the importance of farmer participation; the recognition that programs can reach more small farmers through their groups and organizations than through more individualized approaches; the preference for using group meetings, demonstrations, and individual and group travel to disseminate messages; and the need for combining knowledge from the outside with farmers’ knowledge of local conditions. Where Title II programs differ is in terms of how they measure success. The focus of the “Agricultural Extension Participatory Approach,” according to Axinn, is on “the numbers of farmers actively participating and benefiting, as well as the continuity
107 Otherapproachesidentifiedare:thegeneralagriculturalextension approach, the commodity specialized approach, the training and visit approach, the project approach, the farming systems development approach, the cost sharing approach, and the educational institution approach.
Box 4.19. The Goals of Agricultural Extension
The goals of extension include transferring knowledge from researchers to farmers, advising farmers in their decision making, and educating farmers on how to make better decisions, enabling farmers to make better decisions, enabling farmers to clarify their own goals and possibilities, and stimulating desirable agricultural development.
Source: Van den Ban and Hawkins, 1996.

4-45Agriculture, Natural Resource Management, Livelihoods, Income Generation
of local extension organizations.” This is in contrast to the Title II development programs, where the objectives are more directly linked to concrete changes in farmers’ behaviors (technology adoption, for example) and the impact that these changes have on yields, incomes, and consumption.108
108 Governments tend to take a different approach to extension, according to Axinn, giving more emphasis to increasing production, setting priorities at a national level rather than at a regional or local level, controlling program planning and staff from the central government level, relying on a relatively largefieldstafftoimplementprograms(resultinginarelativelyhigh cost program), and measuring success in terms of rates of adoption of important recommendations and increases in national production (Axinn, 1988, p. 6).
Unfortunately, very little descriptive or evaluative material is available in project documents about the specific approaches and methods that individual Awardees were using to promote and disseminate new technologies and practices. In many cases, little or nothing is said about the extension philosophy that was adopted; the number of field workers and how they were organized, trained, and supervised; or the nature and content of the training materials. This made it difficult for the FAFSA-2 to draw meaningful conclusions about the relative merits of alternative approaches and their appropriateness and effectiveness, even within the same country.
The approach most frequently mentioned in the documentation is often described as the “lead farmer” approach, in which a subset of farmers in a community, which may be self-selected—the early adopters—or community-selected, were/are trained in a package of technologies by project-supported extension staff and expected to transfer this information to other interested farmers—sometimes referred to as “follower farmers”—in the community. Another approach used in some programs, which is often referred to as “farmers field schools” (FFSs), is notable for the source of its recommendations, which are supposed to be based on knowledge identified locally and tested in farmer groups. A third approach used by a few programs puts more focus on the introduction of new technologies and practices that it promotes by providing them free or at subsidized prices to selected farmers—the “model farmers”—that are expected to serve as role models.
Several of the programs that tried the FFS approach indicated that they did so because they found the idea of building on farmers’ indigenous knowledge and encouraging them to conduct their own experiments in the field attractive. Others, including some evaluators, Awardees, and USAID staff, questioned the cost-effectiveness of this approach. Some critics suggested that the FFS approach requires more field staff time and effort to organize and manage than other approaches and may require more time to get information about new/improved technologies and practices to farmers because
Box 4.20. The Agricultural Extension Participatory Approach
“Here the assumption is that farming people have much more wisdom regarding production of food from their land, but their levels of living could be improved by learning more of what is known outside. It further assumes that effective extension cannot be achieved without the active participation of farmers themselves, as well as research and related services; that there is a reinforcing effect in group learning and group action; and that extension efficiency is gained by focusing on important points based on expressed needs of farmers and by reaching more small farmers through their groups/organizations instead of through individualized approaches. The purpose is to increase production and consumption and to enhance the quality of life of rural people…Implementation is through group meetings, demonstrations, individual and group travel and local sharing of appropriate technologies…”
Source: Axinn, 1988, p. 9.

4-46 Agriculture, Natural Resource Management, Livelihoods, Income Generation
the protocol is to be more demand-driven and encourages the extension agents/volunteers to delay providing information until farmers ask for it.109
The “model farm” approach also has a mixed record. Some argue that model farms can be useful as a place where farmers can go to see the various technologies and capital investments that are being promoted by a program. Others argue that model farmers may not be representative enough of the client group, and that technologies that tend to be demonstrated on model farms are frequently more expensive, more complex, higher-end options that are less likely to be replicated by others in the community. The latter is most likely to happen when the project provides some or all of these new technologies to the model farmers free or at a subsidized cost. Examples of this, which the team saw during its visit to Guatemala, included the selection of storage facilities and animal pens that are larger and more expensive than necessary, using unnecessary purchased inputs, and constructing rock walls on steep slopes to control soil erosion when vegetative barriers would have been easier and cheaper to install. Model farmers could be useful, according to the joint evaluation of the four Nicaragua programs and the LOL program in Zambia, but to be able to function effectively as “real” role models, both during a program and after it ends, they need to be “real” model farmers (see Box 4.21).
Extension Methods
Some programs implemented during the FAFSA-2 time period still used more formalized training
109 Anderson and Feder, in a 2007 review entitled “Agricultural Extension” for the Handbook of Agricultural Economics, cite the high costs per farmer trained as a key drawback to the FFS approach,plusevidencefromseveralfieldstudiesthatlittlediffusion of knowledge had taken place during FFSs from trained farmers to other farmers (p. 2,367). Glennerster and Jack, in a Note prepared for FTF, suggest that more evidence is needed on the effectiveness of demand-driven extension models, which are hard to implement, more labor intensive than other models, and thus more expensive (Glennerster and Jack, 2012, pp. 4–5).
courses to disseminate information.110 However, most programs relied most heavily on demonstration plots on farmer fields as a basis for their extension programs, coupled with field days and exchange visits. These learning by doing and seeing activities were very popular among the client farmers, according to many evaluations, and also rated as among the most effective activities by numerous evaluators.111 The WV program in Ethiopia (FY 2003–FY 2008) helped finance a series of formal training courses that were implemented by the woreda Agricultural and Rural Development Offices, in addition to its own farm-based extension efforts. The final evaluation looked at both types of
110 Glennerster and Jack also note that remarkably little evidence exists on the effectiveness of training programs in agriculture or other sectors, with little known about how much people retain of what is covered in the training, whether they change their practices, or what types of training are most effective (Glennerster and Jack, 2012, p. 3).111 See the Agricultural Communications Documentation Center (http://www.library.illinois.edu/funkaces/acdc), and in particular the Francis C. Byrnes collection for publications related to agricultural communication, development communication, extension communication, intercultural communication, and training.
Box 4.21. A Recommendation on the Role of Model Farms from the Nicaragua Programs
“Model farms should be the best of the regular farms, rather than special creations of projects that benefit from unusual levels of resources. Farmers who visit a model farm should know that the model farmer started just like they are and received the same resources that they receive, and were able to make a dramatic difference on that basis alone. Artificially-created model farms do not make legitimate examples for replication.”
Source: Nicaragua Joint Final Evaluation (Harris, et al., 2007, p. 89).

4-47Agriculture, Natural Resource Management, Livelihoods, Income Generation
training activities, and the brief descriptions that are included in Box 4.22 and Box 4.23 provide some idea of the strengths and weaknesses of the two different types of interventions.
Not all programs implemented during the FAFSA-2 time period produced training materials, and what materials were produced and/or used varied in quality.112 Some materials still seemed to be developed for more educated audiences and/or were not translated into local languages. Female illiteracy was also a problem in some places, in the largely
112 Many of the materials produced focused on target-area-specifictechnologypackages.Avarietyofmanualswerealso produced that covered a range of topics, including the construction and maintenance of roads and other infrastructure, the organization and management of water user groups, marketing and market analyses, and farming as a business.
Muslim areas of West Africa, for example. The lack of sharing of materials, which had been identified as a problem in the 2002 FAFSA, also remained a problem during the FAFSA-2 time period, even among Awardees working on similar problems in nearby locations.
Extension Staff
Extension (behavior change) agents play important roles in the Title II AG/NRM/LH programs, which, according to the diffusion of innovation literature, includes helping develop a need for change on the part of the Title II clients, establish an information exchange relationship, diagnose problems, create an attempt to change the client, and translate intentions into action (Rogers, 2003, p. 400). The FAFSA-2 team met with numerous extension workers during its field visits, most of whom were knowledgeable,
Box 4.22. A Formal Approach to Disseminating Knowledge in Ethiopia
The formal courses. “Much of the training that was done under the auspices of the DAP [Development Assistance Program] seems to have been done on an ad hoc basis at the request of the local woreda offices without any one in the ADPs or the woreda having undertaken a needs assessments and/or developed a clear strategy linking the training to the other activities being promoted under the DAP. Too much emphasis was placed on more formal courses with not enough attention given to demonstrations and demonstration plots. No training manuals were prepared, and the lack of manuals coupled with the high staff turn-over made it more difficult to replicate programs and/or to follow-up on previous programs. Many of the farmers that were interviewed seemed more interested in the per diem payments than in the skills to be acquired from the training sessions. Some farmers also complained that a limited number of farmers were getting all the opportunities for training repeatedly” (WV/Ethiopia Final Evaluation, van Haeften et al., 2006, p. 85).
Box 4.23. A Less Formal Approach to Disseminating Knowledge in Ethiopia
The field-based extension program. In Bosset, WV/Ethiopia “identified model (lead) farmers and used them in conjunction with follow farmers to demonstrate new technologies on their farms. These demonstrations were coupled with a variety of diverse and intensive training sessions covering row cropping, timely weeding, timely planting, and reducing post harvest losses. According to project staff, this strategy was very effective and resulted in significant productivity increments (more than 100%) due to the improvements in crop husbandry. These demonstrations have already influenced many other farmers in the area” (WV/Ethiopia Final Evaluation, van Haeften et al., 2006, p. 66).

4-48 Agriculture, Natural Resource Management, Livelihoods, Income Generation
enthusiastic about their work, and seemed to have good working relationships with their farmer clients, characteristics that are consistent with those of a successful change agent, which are outlined in Box 4.24. Several FAFSA-2 team members noticed considerable improvements in the technical quality of the field staff since the beginning of the FAFSA-2 time period. These improvements appeared to have taken place in all five of the countries visited, which is notable, since these five countries vary considerably in terms of the numbers and levels of trained and experienced people available. Programs still had human resource problems, according to many of the evaluations that were reviewed. These included insufficient staff, technical staff in particular; too much staff turnover; lack of supervisors and poor supervision; and problems in motivating volunteer workers.
Returns to Technology Dissemination
Information is also lacking on the dollar value of the benefits produced by these extension programs, as it is for most of the other AG/NRM interventions and activities implemented during the FAFSA-2 time period. One of the few cost/benefit estimates available comes from an analysis that MSU did of the SC/Mozambique BSD-resistant cassava dissemination intervention in Mozambique. The results of this analysis, which are summarized in Box 4.25, suggest that the returns to some of the Title II interventions could be considerable.
4.3.3.2 Organizing and Working with Groups
Most Title II development programs worked/work with groups of farmers, which is more cost effective than meeting with each farmer individually to
Box 4.25. Returns to the Dissemination of the BSD-Resistant Cassava in Mozambique
MSU, as part of a USAID-supported project, estimated that the “value of getting this new variety out to poor farm households in six districts on the Nampula’s coast [was] expected to result in annual benefits of over 8 million dollars with a 100% rate of return on investment.” This analysis also identified the ingredients of success as including “the rapid identification of a tolerant variety, that also looked good on other traits, such as consumption preferences, a focus on low-cost methods to multiply and distribute [plant] materials as widely as possible, a rigorous monitoring program of the incidence of the disease and the up-take of the material, and a five-year project duration that afforded sufficient time to get the job done.”
Source: SC/Mozambique Final Evaluation (Sullivan and Selvester, 2006, pp. 24–25).
Box 4.24. Characteristics of a Successful Change Agent
Evidence from the diffusion literature suggests that the degree to which a change agent is able to succeed in getting his/her clients to adopt an innovation is positively related to: (1) the extent of the exchange agents’ effort in contacting clients; (2) a client orientation rather than a change agent orientation; (3) the degree to which the diffusion program is compatible with clients’ needs; (4) the change agent’s empathy with clients; (5) the degree to which the change agent and his/her clients share similar beliefs, education, and socioeconomic status; (6) credibility in the clients’ eyes; (7) the extent to which he or she works through opinion leaders; and (8) increasing clients’ ability to evaluate innovations.
Source: Rogers, 2003, p. 400.

4-49Agriculture, Natural Resource Management, Livelihoods, Income Generation
deliver a message or provide a service. Programs implemented during the FAFSA-2 time period supported farmers’ groups, marketing groups, savings and loan groups, cooperatives, and networks of farmers’ associations. Many of these groups were women’s groups, and many of the Awardees also worked hard during the FAFSA-2 time frame to increase the percentage of women members in the mixed gender groups, although many of the evaluations reviewed and comments heard during the field visits suggest that women still tend to be underrepresented in the leadership of many groups.
Producer Groups
Working with groups was/is an essential part of Title II extension activities. Programs differed, however, in the amount of time Awardees spent organizing these groups and how they worked with them, with some Awardees working with relatively informal groups, self-selected groups with common interests, for example, and others developing formal rules about the size and composition of the groups and/or spending considerable time up front organizing them into more formal organizations or associations with a constitution, bylaws, and officers.
Some approaches to working with groups that were used during the FAFSA-2 time period were more successful than others. Two not-so-good practices, based on conclusions reached in program evaluations and field observations, were: (1) trying to limit group participation to the poorer, more food insecure households in communities and (2) encouraging, and in some cases requiring, group members to farm as a group and to sell their output as a group.
Extension programs, as discussed in the earlier section on “Technology Adoption” (Section 4.3.2.1), are less likely to be successful if they try to exclude more progressive farmers from their activities. The progressive farmers are frequently among the early adopters of the technologies and practices being recommended by the Title II programs. And, in taking on that role, they can help pave the way for poorer farmers in a community that may be more reluctant to try new practices because they have fewer assets and need additional assurances
as to the value of the new technologies. This was confirmed by a number of the final evaluations of the programs included in the FAFSA-2 universe. As one example, the final evaluation of the CRS/Kenya program (CRS/Kenya, 2004, p. 6) concluded that the practice of excluding the progressive farmers from the program had a negative effect on program performance and recommended that future programs be designed to include all farmers living in the selected catchment areas.
Other evaluations were critical of what some referred to as collective action programs, i.e., programs that encouraged or required their client farmers to farm and sell their produce as part of a group activity. Although the documentation is somewhat limited, a number of Title II Awardees seemed to have devoted considerable time and effort during the FAFSA-2 time period to these types of activities. The joint final evaluation of the four Title II development programs in Guatemala argued, for example, that the emphasis of some of the Awardees on collective activity ignored the evidence that most smallholders prefer to work and make decisions at the household level, and choose to work as a community when the resources are too large for a single family or individual to handle, such as an irrigation system, grazing lands, and forests (Schnell et al., 2006, p. 29). A recent assessment of markets and poverty reached a similar conclusion about the use of groups to help the rural poor access markets (see Box 4.26).
In Guinea, a program that was focused on dry season vegetable gardening required members of its producer groups (PGs) to farm collectively on communal land and market their produce collectively, a requirement that ended up disadvantaging poorer women, who could not afford to spend their time on the communal plots in addition to their own fields. The lesson learned about collective action, cited in the final evaluation, was that “[w]omen’s vegetable production should be organized at the field level—rows or small plots within the PG’s collective field—because ‘laziness has no support’ with individual production, and the women work harder for their own individual profit than they do for collective profit” (Adelski et al.,

4-50 Agriculture, Natural Resource Management, Livelihoods, Income Generation
2006, p. 57). Some FFSs were also criticized for requiring their farmer groups to find communal plots on which to experiment, farm the land as a group, and then sell the output collectively.113 In Niger, the FAFSA-2 team had a chance to interview a group of Title II women farmers, who were also involved in off-season vegetable gardening. Off-season market gardens had been promoted by an earlier Nigerien president, who also decreed that the women should produce and sell as a group. This group approach did not work very well, according to these women, because some of the women did not always show up for work or, if they did show up, they didn’t work as hard as the others—what economists refer to as “free riders.” So the women decided to continue to locate their plots close together so that they could share some of the land preparation tasks and the costs of a fence to protect the area from livestock. But each had her own plot, which she worked on her own, and each sold her own produce separately. When the Title II program entered the picture, its staff also
113 There was one example in Bolivia when members of the joint mid-term evaluation team were taken into a nearby forest to meet with members of an FFS who happened to be in the process of cutting down trees so that they could have a piece of communal land on which to carry out the FFS experiments and farm as a group. Not surprisingly, the two environmental experts on the team were somewhat dismayed by the situation.
encouraged the women to farm and sell together as a group, but the women found that this approach did not work any better the second time. So they dropped it after one season.
Cost-effectiveness, sequencing, and incentives. There is no question that it is more efficient to work with farmers in groups than meeting with each farmer individually to deliver a message or provide a service. There are also clear economies of scale in selling at the same time and place, which can benefit both sellers and buyers. On the other hand, it is not clear how formal these groups have to be to be effective. There are numerous examples from the FAFSA-2 universe that are discussed in the marketing and technology dissemination sections (Section 4.3.2.5 and Section 4.3.3.1) that seem to suggest that farmers do not have to be organized into formal groups to take advantage of many of the economies of scale of groups to deliver messages or encourage farmers to bring their produce to one place to sell to a buyer or take to market. The widespread availability of cell phones is also making it easier to deliver messages to a large number of farmers at the same time and/or to assemble groups of farmers in the same place at the same time.
Economic incentives are also essential to get farmers involved in the AG/NRM programs to
Box 4.26. Another Perspective on Using Groups (Horizontal Coordination)
In their book Markets and Rural Poverty: Upgrading in Value Chains, Mitchell and Coles concluded the following: “Horizontal coordination can allow participants to pool resources and achieve economies of scale which is important given ever-increasing standards and cost-pressures from buyer driven supply chains. Coordination also allows producers to share costs and risks…Development experience suggests that horizontal coordination can be necessary to provide particular members with specific support, which would be difficult to access as individuals. However, other functions are best left to individual agency, and collectivist models may damage livelihoods by seeking to bring functions into the group, which could be more competitively provided by individual entrepreneurs. A form of the ‘subsidiarity’ organizing principle (that matters are best handled by the most local competent party) emerges from the field evidence. So only in cases where individual entrepreneurs are unable to provide a function, should this role by elevated to group structure. In this way the horizontal structure focuses on providing functions that cannot be carried out by individual entrepreneurs.”
Source: Mitchell and Coles, 2011, p. 238.

4-51Agriculture, Natural Resource Management, Livelihoods, Income Generation
begin with and to keep them involved, and to be effective, activities need to be designed and sequenced keeping incentives in mind. What the Title II programs in Bolivia found was that farmers were more interested in getting organized once they saw some real concrete financial benefits from the activities that were being promoted and then began to see how further organization could help them expand and sustain these benefits. Early sales seemed to motivate farmers to spend their scarce time participating in these groups much more than theoretical arguments about the benefits of producer associations (see Box 4.7 and Box 4.26, for example). The numerous examples cited in evaluations of farmers dropping out of program-created organizations several years into programs or after programs ended are also likely due to the absence of non-project-provided incentives to participate.
Opportunity costs. Efforts to promote farming as a group business, which did not have a good track record with respect to suitability for the Title II clientele or program performance, as was indicated earlier, can also be costly. The direct costs of these activities during the FAFSA-2 time period were likely to have been high, since it seemed typical for many Awardees to require their field staff to spend considerable time helping groups get organized formally and providing them with TA and training in group business and financial management. The opportunity costs of this strategy were also likely to have been high, since Awardee staff could have spent this time on other activities more directly related to achieving more immediate production and marketing objectives. Encouraging their clients to spend time and effort on group activities could also have diverted their clients’ limited time and capital resources from other, more profitable, but individually owned income earning opportunities.
Producers’ Associations and Cooperatives
A number of the Title II development programs focused on producers’ associations and cooperatives, working with and through them, and putting significant effort into helping strengthen their
capacities.114 Most evaluations did not spend enough time discussing these organizations, their effectiveness, strengths and weaknesses, or likelihood of sustainability. Based on what little information is available, developing these organizations into viable business organizations has proven more difficult than many had expected, requiring more training and assistance in business and financial management than originally programmed and more time to take effect.115
In Bolivia, ADRA financed the development of six agricultural service centers, which provided services to their members as well as a physical place for them to bring their products for consolidation and sale. ADRA’s ultimate objective was to transform these centers into true commercial enterprises. As part of this effort, ADRA helped them obtain legal status and develop business plans and provided members with training in small business organization and management. As part of its exit strategy, ADRA also arranged for business students from a local university to take over some of the management tasks that ADRA’s technical staff had been performing. To be viable longer term, however, these centers needed to be able to hire good managers
114 In some cases, this focus may have had a lot to do with the philosophy of the Awardee. ACDI/VOCA had its beginnings in cooperative development, for example, and LOL is a cooperative. In other cases, preferences may have been given to working with producers’ associations, in Mozambique and Zambia, for example, to support national government policy. 115 Jack suggests that “[f]armer organizations have the potential to address many of the adoption constraints associated with inputandoutputmarketinefficiencies,suchasimprovingfarmer bargaining power, aggregating demand, reducing individual risk, decreasing transactions cost associated with marketing, and improving credit access.” Jack also points out that “the challenges faced by these organizations are numerous and include legal restrictions, low managerial capacity, elite capture, exclusion of women and the poor…” (Jack, 2011, p. 17). The Mitchell and Coles assessment, Markets and Rural Poverty, also points out that although many development workers see the cooperative as “the obvious institutional form for the horizontal coordination of low-income producers…The evidence suggests that, while appropriate in some circumstances, cooperatives have inherent institutional limitations that constrain their ability to provide a vehicle for sustainable growth” (Mitchell and Coles, 2011, p. 238).

4-52 Agriculture, Natural Resource Management, Livelihoods, Income Generation
from the private sector, a step that had not yet been taken at the time of the final evaluation.
In Zambia, the milk collection centers, many of which were built on the basis of cooperatives that already existed in LOL target areas, were key to the continued sustainability of the LOL dairy value chain. Working with these organizations made sense as a way to get started, but the final evaluation warned that the management structure of these dairy cooperatives represented perhaps the greatest long-term threat to the sustainability of the overall system. The final evaluation described these cooperatives as being “run like social welfare agencies, with management by committee at the lowest common denominator” (Swanson, 2009, p. 10). Other weaknesses cited included financial accounting systems that were “inadequate and open to potential for abuse” and lack of smallholder farmer engagement (or ownership) in the cooperatives. The final evaluation concluded that dairy cooperatives in Zambia had an uncertain future without professional managers and oversight, and it recommended that the development of linkages between smallholder dairy farmers and private sector processors continue to be an option (p. 102).
In Mozambique, CARE worked with CLUSA (Cooperative League of the USA), using the CLUSA methodology to graduate farmers’ extension groups into more formal associations and associations of associations (or forums). Marketing through these associations and forums had mixed results, according to the final evaluation, and was an issue that went beyond the CARE project (Selvester et al., 2006, p. 35). Some associations were successful, according to the final evaluation, but many faced increasing competition from other traders and had to cut their margins, making it difficult for them to cover their credit costs and to pay forum officials’ expenses. This led some to try to buy from their farmer members at the lowest possible prices, so that they could cover their costs, which meant that these associations began behaving much like the private traders that they were supposed to be replacing. Other identified problems included corruption, the fact that profits sometimes were not returned to ordinary members, and the likelihood that continued
support would be needed to maintain the association/forum model.
4.3.3.3 Providing Inputs
Many Title II programs also distributed agricultural inputs and capital investment goods to participants, sometimes for free, but often at subsidized prices and sometimes to individuals but also to groups.116 During the FAFSA-2 time period, these inputs included seeds, fertilizer, pesticides, small tools, carts, water pumps, food processing equipment (e.g., grain mills), and animals (e.g., oxen, dairy cows, small animals, and poultry). A few programs also provided cash—to poor women to set themselves up as petty traders, for example, or to groups of poor farmers to buy water pumps, seeds, and/or other agricultural investment goods. Although these distribution programs were clearly important, it was impossible for the FAFSA-2 team to get a precise idea of how important, as they were not adequately described in proposals or mid-term and final evaluations.117
Rationale
Sometimes there was/is no alternative to providing inputs directly, in a transition program, when farmers are returning to their land at the end of a conflict, for example, and have no seeds or access to fertilizer. In other cases, individuals and/or groups of farmers may be given seeds and other planting materials to multiply and make available to other farmers in their area as part of a systematic process for disseminating new/improved varieties (see Box 4.6 in Section 4.3.2.1 on “Crop Production and Productivity” for one example of such a dissemination program).
In many cases, however, the real constraint to project performance was/is that Title II farmer clients did/do not have enough cash on hand to purchase
116 Many programs also provide complementary inputs, such as cement, pipes, and iron sheeting, to support community infrastructure development efforts, which are discussed in more detail in Chapter 5 on “Infrastructure.” 117 Documents did not adequately describe what subsidies were being proposed or used, for what activities, over what period of time, or what their expected costs were, by subsidy type or in total.

4-53Agriculture, Natural Resource Management, Livelihoods, Income Generation
the technology packages that the programs were/are recommending, even in cases where it was/is clear that the returns to adoption outweigh the costs.118 As a result, many programs implemented during the FAFSA-2 time period decided to use the distribution of subsidized inputs to jump-start the technology adoption process and to work on the problems of improving the access of their client farmers to agricultural credit over the longer term. Some programs implemented during the FAFSA-2 time period also provided subsidized inputs on the basis that a subsidy was the only way for a program to demonstrate the value of a promising new technology to its client farmers and/or that a subsidy was needed to reduce the risk to client farmers of trying a promising but not yet fully proven technology.
One can understand why programs were/are tempted to use subsidies to get their agricultural interventions off the ground, especially given the time constraints under which they were/are operating. In other words, these distribution programs had/have their rationale, but they also had/have some disadvantages. One problem is the potential to create dependencies among program participants. This seemed to be a problem in a number of programs included in the FAFSA-2 universe, based on discussions included in a number of final evaluations. In some cases, evaluations indicated that program participants said that they would not be able to continue using the new technologies and practices once the programs ended. In other cases, the evaluators concluded that continued use of these technology packages was questionable once program resources were no longer available. Providing subsidized inputs also makes it harder for Awardees to assess how well their programs are doing. Adoption rates may look good,
118 Some programs also used subsidies to promote the use of larger investment goods, with some programs making an outright gift of the good (CPI made outright grants of irrigation pumps to farmer groups in Niger, for example), others required clients to pay a certain percentage of the cost of the item (ADRA/Bolivia, for example), and others established credit programs. One advantage of the one-time grant is its simplicity andefficiency.One-timesubsidiestocoverpurchasesofcapitalequipment also are less likely to distort economic decisions than programs that subsidize farmers’ operating costs, according to a number of economists.
but one does not know whether farmers will continue to use these inputs in the absence of the subsidy, or if these behaviors will stop once the subsidies stop.119 The free or subsidized distribution of inputs, such as seeds and fertilizers, can also undercut private sector profitability and discourage private sector input dealers from supplying or continuing to supply these goods, reducing the likelihood of their availability once the project ends.
Using Revolving Funds to Graduate Farmers from a Reliance on Project-Provided Inputs
During the FAFSA-2 time period, a number of Title II development programs experimented with the development of community-based, cash and/or in-kind revolving funds as a way to wean client farmers away from their reliance on project-supplied inputs. The idea was that farmers that received the subsidized project inputs would make contributions in cash or in-kind (seed, for example) to a local fund from which they and others in their community would be able to continue to borrow. These programs did not a have good track record during the FAFSA-2 time period. Farmers often paid back in poor-quality grain, for example, reserving the better-quality for seeds or sale, or did not pay back at all, citing a poor harvest or other extenuating circumstances. Issues also arose related to who would be responsible for managing the fund, where the products would be stored, and how. The result was that funds declined in value and after several seasons usually ceased to exist. Other critics worried that if the cash and in-kind programs were not well managed and farmers were allowed to default, this experience could undermine other attempts to establish credit programs and instill a credit mentality. These arrangements were also thought to have high opportunity costs for Awardees’ field staff in terms of the time and effort that went into organizing, managing, and monitoring them. Others
119 According to Rogers, “Although incentives increase the quantity of adopters of an innovation, the quality of such adoption decisions may be relatively low, thus limiting the intended consequences of adoption. If individuals adopt an innovation partly in order to obtain an incentive, there is relatively less motivation to continue using the innovation (if it can be discontinued), so the innovation’s sustainability may be lessened” (Rogers, 2003, p. 238).

4-54 Agriculture, Natural Resource Management, Livelihoods, Income Generation
argued that these programs could put staff, whose primary purpose was to provide information to and assist people, into the role of debt collector.
The Benefits of Adopting a Commercially Oriented, Market-Focused Strategy
This is another example where a commercially oriented, market-focused program has its advantages. If farmers are able to sell their products at a profit, for example, they will get access to the additional resources needed to pay for inputs on their own, instead of having to rely on project-distributed inputs. Of course, having sufficient cash right after harvest, as many development programs have learned, does not guarantee that farmers will have enough cash on hand when the time comes to purchase these inputs. But there seems to be some effective strategies for dealing with this problem. The rural savings mobilization strategy, which was used in a number of Title II development programs during the FAFSA-2 time period (see Section 4.3.2.7), uses social pressure to help farmers save money and invest it later, including to buy fertilizer and seeds. The book Poor Economics also describes a program developed in Kenya that gives farmers an opportunity to buy a voucher right after the harvest, when they have money in hand, that entitles them to receive fertilizer at sowing time (Banerjee and Duflo, 2011, pp. 192–193). There were also numerous examples during the FAFSA-2 time period of buyers providing their Title II suppliers with many of the necessary production inputs and subtracting their costs from the purchase price at the time of sale.
4.4 Program Impact
4.4.1 Household Consumption
In 2007, to standardize the measurement of the impact of Title II development programs on food access, USAID/FFP began requiring Awardees to include two standardized “consumption indicators” in their M&E systems for any Title II development programs that included activities to improve “household access” to food (i.e., programs
in agriculture, microenterprise development, income generation, and diversification).120 The two indicators selected were: (1) the number of months of adequate household food provisioning (MAHFP) and (2) the household dietary diversity score.121 According to the Indicator Guide developed for the HDDS, these two indicators represent a more direct measure of improved food access than household income does because “they focus on the desired outcome of improved food access—improved household food consumption” (Swindale and Bilinsky, 2006, p. 1). These are both proxy indicators, however, and do not measure actual dietary intake.
These two consumption indicators were not in use at the time of the 2002 FAFSA and were not yet in widespread use during the FAFSA-2 time period. Twenty-five of the programs (39 percent) included in the FAFSA-2 sub-universe of completed programs122 reported on the MAHFP indicator, for example, and 24 of the programs (38 percent) reported on the HDDS indicator.123 These percentages vary considerably by region. Forty-nine percent of the African programs reported on changes in the MAHFP indicator, compared to only 33 percent
120 The term “consumption” is used here to distinguish the three measures of access discussed in this section from income measures, which many, especially among the economics profession, also consider to be measures of access to food.121 FFPIB 07-02, of August 8, 2007, states that all MYAPs that include activities designed to increase households’ access to food (e.g., programs in agriculture, microenterprise development,incomegeneration,and/ordiversification)willberequired to report on the following indicators collected using a population-based, representative sample survey at baseline andfinal:(1)number of months of adequate household food provisioning and (2) household dietary diversity score. In addition, FFPIB 07-02 states that MYAPs reporting on these indicators must also report the number of households benefiting from activities to maintain or improve household access to food during the fiscal year (USAID/FFP, 2007).122 The universe of countries/programs included in the assessment of program performance for the AG/NRM/LH programs includes 64 programs in 26 countries. This sub-universe is smaller than the FAFSA-2 universe because it is limited to programs that had one or more components focused on food availability and access and also to programs for which finalperformanceinformationwasavailable.123 The HDDS measures the number of different food groups consumed over a given reference period.

4-55Agriculture, Natural Resource Management, Livelihoods, Income Generation
of the Asia programs and 20 percent of the LAC programs. The HDDS was more popular in the Asian programs, with two of the three programs reporting on dietary diversity compared to 40 percent of the LAC programs and 34 percent of the Africa programs.
On the other hand, for those that did report, the rates of success were quite high,124 i.e., 92 percent of the programs that reported on the MAHFP reported an improvement in this indicator and 79 percent of the programs that reported on the HDDS reported an increase in this indicator (see Table 4.5). The number of months of improvement in household food provisioning ranged from 0.2 to 5.2 months, and improvements in dietary diversity ranged from 0.4 to 4.4 food groups.125
In September 2011, USAID/FFP eliminated its requirement that Title II development programs collect information in their baseline and final surveys on average months of adequate household food provisioning and substituted a new indicator—percentage of households with moderate or severe hunger (FFPIB 11-03).126 This new indicator, also referred to as the HHS, is also one of the required FTF indicators. This means that future programs will still have to collect data on two consumption indicators—an HDDS and an HHS (see Table 4.6).
124 Performance with respect to the consumption indicators was assessed by comparing the endline results with the baseline data. 125 Based on information included in Title II MCHN program documents, the FAFSA-2 concluded that 46 percent of the 54 evaluation surveys completed during the FAFSA-2 time period could not be used as a basis for drawing conclusions about the impact of the Title II MCHN development programs on child stunting and undernutrition. Almost 20 percent of the surveys were deemed problematic as a result of the poor quality of the anthropometric data; other major reasons included sampling problems(13percent)andbaselinesandfinalevaluationsbeingundertaken during different seasons (see Section 6.4.1 on “Evaluation Survey Quality” and Table 6.15). The information availableintheseprogramdocumentswasnotsufficienttobeable to determine the extent to which these limitations also had an adverse affect on the quality of the consumption indicator data.126 According to FFPIB 11-03, the MAHFP indicator was eliminated because its 12-month recall period was considered to be too long to provide reliable results.
Table 4.5. Examples of Title II Development Programs in the FAFSA-2 Universe That Reported on the MAHFP and/or the HDDS between Baseline and Final Surveys
Country Program
Indicator
MAHFP HDDS
Bangladesh CARE X X
SC X
Burkina Faso Africare X
Chad/Mali Africare X
Ghana ADRA X
OICI X X
TNS X
Guatemala SC X
Guinea ADRA X
Africare X
OICI X X
Haiti CARE X
CRS X X
WV X
Honduras ADRA X X
SC X
WV X X
Madagascar CRS X
Malawi CRS X
Mozambique ADRA X
Africare X
CARE X X
SC X X
WV X
Niger Africare X
Rwanda WV X
Senegal/Gambia CRS X
Sierra Leone CARE* X
Uganda ACDI/VOCA X
Africare X
Zambia LOL X X
* Two programs

4-56 Agriculture, Natural Resource Management, Livelihoods, Income Generation
4.4.2 Household Income
Twenty-four of the programs in the FAFSA-2 universe reported on some form of household income indicator, with more than 80 percent of these indicators exceeding their targets. There was considerable variation in terms of how these indicators were defined, however, with some focusing on actual changes in some measure of household income and others focusing on changes in the percent of households that increased their incomes or sources of incomes.127
Examples of programs that exceeded their income targets include programs in Bangladesh (CARE), Bolivia (ADRA, CARE, FH, and SC), Ghana (OICI), Honduras (ADRA and CARE), Kenya (FH), Mozambique (ADRA, CARE, FH, SC, and WV), Nicaragua (ADRA, CRS, and PCI), and Zambia (LOL) (see Box 4.27). These programs all tracked the changes in average (mean) incomes, which is a relatively simple measure to calculate. A potential problem with this indicator is that large increases in
127 A variety of different indicators were used during the FAFSA-2 time period to measure household income. These included: average annual household income, average monthly household income, percent increase in household revenues from value added marketing activities, number of households reporting having diversified their sources of income, number of households benefiting from two or more new income generation activities, number of households reporting increases in income over the previous year, percent of women that have received increases in income, and annual increase in earnings from the sale of agricultural products.
household incomes on the part of a few households can raise the average (mean), making it look like incomes for the target group as a whole increased. To avoid this problem, three of the four Bolivian programs also collected information annually on the percent of households whose [annual] incomes increased by 5 percent or more over the previous year, which they used to get some sense as to how the increases in incomes generated under their programs were distributed among their clients.
Household income is a notoriously difficult indicator to measure, both for definitional reasons and because it can be very difficult to get accurate information from respondents, who are frequently reluctant to provide information on their incomes and have poor or no records on their production costs. Measuring household expenditures, which is often used as a proxy for household incomes, can also be difficult, especially in rural areas where expenditures frequently represent only a small share of total household consumption and because of the difficulty in determining appropriate values for the production that is directly consumed by the household rather than sold. Length of recall can also be a problem when collecting both income and expenditure data, with longer periods of recall reducing the likelihood of reliable results. Measuring gross farm incomes, which some Awardees did during the FAFSA-2 time period, should be somewhat easier for them because they should have access to information on crop yields and sales prices from their own project activities. This should give them an advantage in
Table 4.6. FFP Standard Impact Indicators Required in Baseline Surveys and Final Evaluations for Use in Title II Development Programs That Aim to Improve Access to FoodApplicable to development programs that aim to: No. Indicator Title
FTF Ind. Indicator background information
Improve household access to food
1 Average Household Dietary Diversity Score
Household Dietary Diversity Score (HDDS) for Measurement of Household Food Access: Indicator Guide
http://www.fantaproject.org/downloads/pdfs/HDDS_v2_Sep06.pdf
2 Percentage of households with moderate or severe hunger
X The Household Hunger Scale (HHS) Indicator Definition and Measurement Guide
http://www.fantaproject.org/downloads/pdfs/HHS_Indicator_Guide_Aug2011.pdf

4-57Agriculture, Natural Resource Management, Livelihoods, Income Generation
assessing the adequacy of the information provided by their respondents that others assessing farm incomes do not always have. Other potential weaknesses of using household income as an indicator is that incomes can vary considerably from year to year and are also driven by many factors outside the control of the individual Awardees, including weather and economic developments elsewhere in the country.
4.4.3 Household Assets
Tracking changes in household assets is another option for assessing program impact, but one that was not widely used during the FAFSA-2 time period. Only six programs included some type of asset indicator in their IPTTs—CARE in Honduras and Kenya, CRS in Liberia and Malawi, and WV in Haiti and Rwanda—and all six indicators were
different.128 Only two programs reported on their results, with CRS/Liberia meeting its target with respect to percent of targeted households with increased assets and the I-LIFE Malawi program exceeding the target that it set for its household asset indicator.
Asset indicators have several potential advantages: (1) they provide an indication of economic surplus (or deficit) over time, unlike measures of annual income/expenditures; (2) they may be more stable over time than income indicators, which are likely to vary more with changes in the weather; and (3) questions about asset ownership are easier to
128 The six indicators were: percent of targeted households with increased assets, average value of household assets, average number of key household assets, household asset index, percent of households with increased targeted assets, and percent of households accumulating liquid and productive assets.
Box 4.27. Raising Household Incomes in the Title II Programs
• Bangladesh: Monthly incomes of the participants in the CARE project increased by 133 percent between 2006 and 2009. These income increases did not result in any significant changes in assets, but the percentages of households not having to resort to certain food coping strategies, such as eating less food in a meal or skipping meals, also increased.
• Bolivia: All four of the Bolivia Title II development programs were able to achieve significant increases in the average annual gross farm incomes of their client households between 2002 and 2008, with the average household income in constant dollars doubling (ADRA), tripling (CARE and SC), and quadrupling (FH).
• Kenya: In the FH program, annual income from livestock production more than doubled between 2006 and 2008 among target households.
• Mozambique: The total annual household incomes of the households participating in the ADRA, CARE, FH, SC, and WV Title II programs ranged from 1.2 to 1.4 times greater than the non-participating households in 2007, the year before the projects ended.
• Nicaragua: Average annual gross household incomes increased by more than 130 percent in the ADRA project, and CRS and PCI reported that 53 and 89 percent of their households were able to increase their incomes between 2002 and 2008, respectively.
• Zambia: Average annual household incomes of participants in the LOL dairy project increased by 125 percent, with households also benefiting from a steady stream of income, with peak incomes from milk sales coinciding with the former “hunger months.”

4-58 Agriculture, Natural Resource Management, Livelihoods, Income Generation
answer than those about production and income levels because they rely less on estimates of quantities and prices. Asset indicators may also have some shortcomings. What is defined as an asset may vary considerably from area to area, for example; plus asset indicators could be difficult to aggregate across regions and countries.
4.4.4 Qualitative Information Suggesting Impact
Many evaluations also provided information on other changes that had occurred in people’s lives over the life of the project that project participants reported on and/or evaluators observed. This type of qualitative information may lack precision in terms of numbers of people affected and the magnitude of the changes. However, qualitative information can increase one’s understanding of project performance and likely sustainability, including by providing additional information on what changes people value more, what they perceive to have been their greatest challenges during the project and going forward, and how they plan to use the knowledge and opportunities they gained from project activities in the future.
• Quality of life. The positive impact of the programs on participants’ quality of life is frequently mentioned in many annual reports and mid-term and final evaluations. People that were interviewed during the FAFSA-2 five country visits also described how they used some of the increases in income to better their lives: improve their diets, make improvements to their houses, and keep their children in school, and, in some cases, send their children out of their communities to high school. Some also used their increases in income to make investments in their agricultural operations, buying fertilizer to use during the next cropping season and animals to feed and sell.
• Dietary preferences and nutrition. Dietary preferences and the nutritional quality of a diet are not the same. When the people interviewed during the FAFSA-2 five country visits talked about making improvements in their diets as a result of the Title II program’s assistance, most were referring to being able to afford some of the more
desired foods (e.g., foods that taste better and that add variety to their diets), and not about making improvements in their diets in a nutritional sense. In other words, increases in incomes do not automatically translate into improvements in the nutritional quality of people’s diets, if people lack basic knowledge about why good nutrition is important, what foods are more nutritious, how to plan and prepare more nutritious meals, and how to make better uses of their increased incomes to improve the nutritional quality of family diets. Higher incomes will also not necessarily result in a reduction in child undernutrition in the absence of community-based MCHN programs that deliver the ENA in the first 1,000 days and that provide access to improved waster, sanitation, and health services (also see Chapter 6 on “Maternal Child Health and Nutrition”).
• Migration. A reduction in the numbers of people migrating temporarily or permanently (e.g., fewer men in Bangladesh leaving their communities to go to Dhaka to find work pedaling a rickshaw or fewer men in Niger going south during the dry season to pour tea on the streets of a city in northern Nigeria) may also be one of the positive impacts of a successful program. The places people migrate to, the length of time they spend migrating, and the things they do to make money while they are in their new location differ, but all have social costs to their families and their communities. Most programs do not try to measure changes in migration, but a few evaluations make reference to migrants having returned home and/or that fewer people migrate now as a result of the new income opportunities closer to home as positive consequences of program interventions. A decline in the number of people migrating can be an ambiguous event, however; it could be the result of fewer job opportunities available in the areas to which people typically migrate, for example, instead of an increase in job opportunities closer to home.
• Pride and self-reliance. During many of their interviews in the field, FAFSA-2 team members were struck with how proud many people were when they explained what they had learned from

4-59Agriculture, Natural Resource Management, Livelihoods, Income Generation
the program and how they were able to use this new knowledge and these new opportunities to better their lives and the lives of their families. This pride and sense of self-reliance is hard to measure quantitatively, but it is real nonetheless. It also contrasts sharply with the sense of dependency and lack of self-reliance observed by the FAFSA-2 team in some communities, where the primary concerns of many community members was to make sure that the visitors understood how needy the community still was and to request more and/or continued assistance.
4.5 Cross-Cutting Issues and Opportunities
4.5.1 New Approaches to Market-Oriented Programs
It became increasingly popular during the FAFSA-2 time period for development practitioners to talk about making their programs more market-driven and, within the agricultural development community, to also move from a focus on agricultural production to thinking about the entire value chain for their priority commodities. This evolution in thinking about the role and importance of markets has also been taking place within the Title II development program, albeit somewhat unevenly, within USAID/FFP as well as within the Awardee community. The need to “rely on market-driven demand to maximize return and predictability of income generation” is highlighted in USAID/FFP’s current definition of its AG/NRM technical sector, for example (see Box 4.1). One also began to see more references in Title II development program documents during the FAFSA-2 time period to the AG/LH programs being market-driven and using a value chain approach.
During the FAFSA-2 time period, a number of donors also became more interested in the use of markets more generally to help improve the livelihoods of the poor. Programs with this focus include the “Making Markets Work for the Poor” approach, whose central idea is that “the poor are dependent on market systems for their livelihoods” and that “changing these market systems to work
more effectively and sustainably for the poor will improve their livelihoods and consequently reduce poverty.”129 Other programs with a similar focus on markets and the poor include the “Growing Inclusive Markets” program of the United Nations Development Programme, the “Opportunities for the Majority” program of the Inter-American Development Bank, and the “Next 4 Billion” program of the International Finance Corporation.130 These programs are not specifically focused on rural areas or on markets for agricultural or agricultural-based products, and they take a more systemic approach to markets instead of the more transactional approach used in the Title II development programs. That is, their primary focus is on how to bring about effective changes in market systems, which is in contrast to the Title II programs, which focus more on their clients and the actions that can be taken to assist and facilitate their participation in specific markets. Still, there may be lessons to be learned from these programs as well as potential areas for collaboration.
4.5.1.1 Market-Driven Programs
There is also growing evidence, including from the Title II programs in the FAFSA-2 universe, that programs that were/are more market-driven were/are more successful in helping their poor clients increase their incomes. However, not all programs that claim to be market-driven are actually driven by markets. Adding a market component to a project does not change a production-driven program into a market-driven one. Adopting a market-driven approach, in
129 The “Making Markets Work for the Poor” program receives funding from the United Kingdom’s Department for International Development, the Swedish Development Agency, the Swiss Agency for Development and Cooperation, and USAID. http://www.enterprise-development.org/page/m4p.130 More information about these programs is available at the following websites: “Growing Inclusive Markets” at http://www.undp.org/content/undp/en/home/ourwork/partners/private_sector/GIM.html; “Opportunities for the Majority” at http://www.iadb.org/en/topics/opportunities-for-the-majority/idb-opportunities-for-the-majority-serving-the-base-of-the-pyramid-in-latin-america.1377.html; and “Next 4 Billion” at http://www1.ifc.org/wps/wcm/connect/3c2787004cc75e6094d7b59ec86113d5/Pub_009_The%2BNext%2B4%2BBillion.pdf?MOD=AJPERES.

4-60 Agriculture, Natural Resource Management, Livelihoods, Income Generation
fact, requires a new way of thinking on the part of the Title II program staff and their farmer clients, one that requires them to focus on the market first and figuring out what people want and can be sold and not trying to figure out how to sell what they are already producing. Or, as Figure 4.12 suggests, if consumers want square watermelons, farmers should start producing square watermelons.
At the operational level, adopting a market-driven approach means that decisions about what products a Title II program should focus on need to start with an assessment of the market potentials that exist for their client farmers (market opportunities) and then move on to a more detailed assessment of the production potentials for these products (i.e., whether the Title II clients already do or could produce the products in question). Knowing about market opportunities and production potentials in the absence of information on production and marketing costs is also insufficient. Costs also count. Costs and returns also have to be calculated to determine whether the Title II clients can be competitive in these markets and make a profit.
Too many programs included in the FAFSA-2 universe were still too production-driven, however. That is, first priority was given to increasing the production of products that were already being/could be produced in their target areas, and programs frequently did not get around to dealing with marketing issues until the third or fourth year of the project. Marketing, in other words, still tended to be an afterthought or an add-on—a problem to be dealt with after the major production problems had been addressed.
Implementing a successful market-driven strategy that benefits the poor is not easy. Countries that are poor and landlocked, with small populations, which are characteristics common to a number of countries included in the Title II development program, are at a particular disadvantage; they have small local markets and can face higher transportation costs in getting their products to external markets. Plus, the areas where most Title II programs work tend to be isolated with poor infrastructure. But there are examples of successes. The four Title II
development programs in Bolivia (a landlocked country) were able to help their clients find a number of promising markets in nearby cities, regionally, and internationally for a broad range of products. Bird’s Eye chilies have also been successfully exported from Malawi and Uganda (also landlocked countries), with Title II assistance. Title II programs have also helped their client farmers make more money by selling to more promising local markets, including selling potatoes as seed potatoes in Bolivia, to a local potato chip maker in Guatemala, and to fast food restaurants in Kampala, Uganda.131 Other examples of programs that have succeeded in linking the poor to markets can be found in Markets and Rural Poverty (Mitchell and Coles, 2011) and on the websites cited in the previous section.
131 OneofthekeyfindingsfromMarkets and Rural Poverty is that “local and regional value chains and their associated labor markets are often of greater relevance to low-income producers in rural areas” (Mitchell and Coles, 2011, p. 236).
Figure 4.12. A Market-Driven Program: Focuses on Producing What You Can Sell, Not on Selling What You Are Producing
SC
/Bol
ivia

4-61Agriculture, Natural Resource Management, Livelihoods, Income Generation
4.5.1.2 The Value of Value Chains
The value chain approach also became increasingly popular within USAID during the FAFSA-2 time period, and it has been adopted as a major approach within FTF. The interest in this approach has also been growing within the Title II development community. More proposals are being submitted that include references to value chains, for example, the ACDI/VOCA, CARE, and SC proposals for the FY 2010–FY 2015 programs in Bangladesh. Numerous meetings have included or been organized around this topic by USAID knowledge management projects, including the USAID-supported Micro Links seminars and the USAID/FFP-supported TOPS project.
Within the FAFSA-2 time frame, the four Title II development programs that were implemented in Bolivia between FY 2003 and FY 2009—ADRA, CARE, FH, and SC—probably had the longest and most in-depth experience working with the value chain concept and applying it to their programs. What they learned was that adopting a value chain approach helped them think more systematically about the potential markets for their clients and what needed to be done to help their clients access these markets. It was a “tool,” in other words, that they used to improve both the design and implementation of their programs. SC, for example, identified one or more priority products for each of its intervention sites and then conducted specific value chain analyses for each of these sites and products. (See
Box 4.28. The Adoption of a Market-Driven Focus in Bolivia
In response to the results of an MTE, SC/Bolivia decided to convert its production-oriented program to what became a very successful market-driven program, which took a proactive approach to the development of value chains and to the promotion and facilitation of market linkages between its primarily indigenous farmer clients and a range of buyers, including supermarkets, processors, and exporters. At the time of the MTE visit to one of the highland communities, SC extension staff were focused on increasing the production of potatoes, which were the staple crop, but had not had much success in getting farmers to adopt the new technology package that they were recommending. SC staff were also spending some time organizing producers and marketing groups and familiarizing members with some basic marketing concepts, but none of the farmer members that were interviewed seemed to have much understanding of what their marketing opportunities were or how to take advantage of them. One of these communities was visited two years later by one of the MTE evaluators as part of a follow-on assessment and the changes that had taken place as a result of the shift to a more market-driven focus were dramatic. Farmers were producing a new product—broad beans—and selling them through forward contracts to an export firm that SC had helped identify. This firm was also providing producers with seeds and production and post-harvest TA. Farmers were also making more money selling potatoes, to higher-end markets—the traditional variety as certified seed potatoes and another potato variety that was more desired in the higher-end markets. SC had helped these farmers identify the market opportunities for these higher-value products and had shown them how to improve their production, harvesting, packaging, and transport practices. Significant changes had also occurred in people’s knowledge and attitudes. Community members appeared to have become more entrepreneurial, better organized, and more knowledgeable about business and markets, and could talk much more concretely about their plans for the future.
Source: SC/Bolivia Assessment (van Haeften et al., 2006).

4-62 Agriculture, Natural Resource Management, Livelihoods, Income Generation
Figure 4.13, an example of the value chain that SC developed for dry beans destined for export markets.) These analyses included information on specific buyers in each chain and specific players at each stage in the chain, from input and service providers through production, assembly, processing, packing, and marketing.
As these analyses were developed, gaps were identified (e.g., lack of service providers), as well as constraints, bottlenecks, and opportunities. SC used this information as a basis for deciding where its Title II programs could make the greatest contributions, with which organizations currently active in the value chain it should think about collaborating and partnering, and what role these and other organizations could play—in some cases with some assistance on their part—as part of their sustainability and exit strategies. More specific lessons learned about the value of a value chain approach by the four Bolivian Title II programs are summarized in Box 4.29. What distinguished these Title II value chain activities from other value chain activities, however, and what was essential to their success, was that they were focused on specific
clients in specific geographic areas and were market-driven.132
4.5.2 Economics 101
USAID reported in a 2012 publication, Frontiers in Development, that it had decided to reclaim economic analysis within the agency to “direct practitioners to the most promising and sustainable paths to development” and to ensure that “we use scarce funds to benefit the poor by intervening where necessary and leveraging private funds and untapped sources of capital wherever possible” (Bahn and Lane, 2012, p. 192). The analytical tools that it plans to use include the traditional ones, such as cost-benefit analyses and cost-effectiveness analyses, and newer ones, such as growth diagnostics and randomized control trials. USAID/FFP also needs
132 The Markets and Rural Poverty assessment also stressed the importance of markets in the development of value chains, arguing that “[a] value chain development exercise which focuseson‘empoweringproducers,’butfailstofindaviablemarketing channel in which they can sell their output, is not an effective use of development funding” (Mitchell and Coles, 2011, p. 259).
Figure 4.13. Dried Haba Bean Chain
Save the Children
Certificaton committee
ASOHABA
Certification
DESTINATION: EXPORT TO JAPAN AND EUROPE
PRIMARY PRODUCTION COMMERCIALIZATIONPROCESSINGGATHER
Farmers Producers Assoc. Enterprise Enterprise
Communities at the Municipality of Cairoma
Save the ChildrenDemonstrative plotsTechnical assistanceIrrigationCooperación Tec. BelgaGathering centerASOHABASeeds provision
ASOHABA ASCEXAMPROARACA ASOHABA ASCEX
Technical Services Enterprise Services
Save the ChildrenFormationStrengtheningTrainingSelling contractServicios Industriales CruceñoSICIndustrial Machinery
Certification Services
Source: Recreated from SC/Bolivia.

4-63Agriculture, Natural Resource Management, Livelihoods, Income Generation
to be more concerned about issues of cost benefits and cost-effectiveness, especially now at a time of growing resource scarcity and to increase the likelihood that the Title II AG/NRM/LH programs have substantial and sustainable impacts on the economic well-being of their target groups.
Title II Awardees also need more information on the costs and returns of their own programs (those involving knowledge transfers as well as physical structures) to ensure that they are making effective use of scarce resources. And, to be of most use to their clients, Awardees also need to have a better understanding of whether and how much their clients
will benefit if they accept their advice, i.e., if the client farmers adopt the technologies and practices that the programs are promoting. Awardees also need to be thinking about working more closely with their clients to help them develop a better understanding of the economics of their enterprises as well as their households as a whole. If their programs involve working with micro-, small, and medium businesses and/or the development and strengthening of producers’ and marketing associations, Awardees also need to be able to assist these groups/organizations with the development of business plans and to help them understand the importance of becoming and remaining profitable and competitive.
Box 4.29. Lessons Learned about the Value of the Value Chains Approach from the Four Title II Development Programs in Bolivia
“The adoption of a value chain approach provided a number of benefits to the CSs [cooperating sponsors] including:• Providingconceptualclarity—The analytical process that the CSs went through to develop these
value chains was useful because it helped them better understand the nature of the markets that they were trying to help their clients participate in, the opportunities in these markets and the constraints and bottlenecks. It also made it easier for them to identify where their assistance was most needed, and what that assistance should be, providing technical assistance in production and post harvest technologies, for example, helping conduct market assessments, and/or facilitating market connections, or providing business management training.
• Guidingprogrammanagement—The adoption of the value chain approach was also useful at a more practical level, because it helped the CSs organize the individual activities they had been implementing under their IG programs in a more coherent way that facilitated the management of their own programs and staff, and helped them better coordinate activities with other actors in the chain. The value chain approach also seemed to have helped some field technicians do their work better by giving them a clearer vision of their roles and the contribution that their work made to the overall program.
• Encouragingtheidentificationofandcollaborationwithpartners—Several of the CSs were criticized in the MTE for trying to do too much on their own and not collaborating enough with other organizations operating in their areas with similar or overlapping objectives. This need to enlist the help of other organizations in order to achieve their income generation objectives seemed to be more obvious and harder to ignore once a value chain was developed. And, by the end of the project all four CSs were working more closely with and relying to a larger extent on other organizations as a major aspect of their sustainability strategies. Having a clearly articulated value chain also seemed to help some of the CSs partners get a better understanding of where and how their activities were contributing to improving and sustaining the overall operation of the value chain.”
Source: Joint Final Evaluation Bolivia (van Haeften et al., 2009, p. 100).

4-64 Agriculture, Natural Resource Management, Livelihoods, Income Generation
Awardees will need to add basic economic and business management skills to their staff, but might be able to access the additional expertise needed for more specific analytical work through partnering with local universities and business schools, for example.
Unfortunately, during the FAFSA-2 time period, the capacity of most Title II Awardees to conduct and make use of economic analyses to support the selection and management of their AG/NRM/LH interventions was quite limited. Only a few programs had access to information on the costs and returns of their own interventions, or the costs and returns to farmers of the technology packages that they were recommending. Even fewer programs had the capacity to develop this information on their own.
4.5.3 Managing Risks and Reducing Vulnerabilities
The 2006–2010 Strategic Plan committed USAID/FFP to reorienting its programs to focus more directly on the vulnerabilities of the food insecure. This included focusing more on risk prevention and helping farmers manage their risks better. Title II farmer clients, as was pointed out earlier in this chapter, have to cope with large amounts of risk in their lives. AG/NRM/LH strategies that the Title II development programs have used to help their client farmers reduce their risks and increase their resiliency include helping them diversify what they are producing on their farms and/or into non-farm sources of income133 and introducing more drought resistant crop varieties, conservation agricultural practices, water harvesting techniques, soil and water conservation, and irrigation.
133 As indicated in Section 4.1.2.2, many households in the Title II target population have already developed alternative livelihoodstofarming.Thisdiversificationstrategyhelpsthem supplement their incomes and manage their risks, but it also has costs as is pointed out in Poor Economics: A Radical Rethinking of the Way to Fight Global Poverty: “Having multipleoccupations…isalsoinefficient.Itishardtobecomeaspecialist in anything without specializing in something” and “[b]y passing up these opportunities [to specialize], [the poor] also pass up the gains from specializing in what they are really goodat”(BanerjeeandDuflo,2011,p.143).
Many Title II development programs in the FAFSA-2 universe were already employing these strategies prior to the adoption of the Strategic Plan, and it was difficult to determine from the documentation available or from the field visits whether Awardees were giving more emphasis to risk prevention and management after the adoption of the Strategic Plan. The FAFSA-2 team encountered more good examples of the application of conservation agricultural practices in the field than during previous field visits, in Malawi, for example. This may have had more to do with the maturation of the technology, however, and the fact that the researchers and practitioners have been paying more attention to the labor requirements of these practices, which may have been one of the more important factors limiting the uptake of some of the packages that were being promoted earlier in the FAFSA-2 time period. A similar situation may be occurring with respect to the adoption of improved soil and water conservation technologies more generally. The new approaches used to promote soil and water conservation give more emphasis to the use of biological measures, which are less labor intensive than building structures, and to practices that provide concrete economic benefits to farmers in a much shorter time period. These approaches are more attractive to farmers economically, and it is this change that may be responsible for the higher adoption rates rather than more attention being devoted to these programs. More attention should also be paid to the development of irrigation systems, which, as many Title II final evaluations pointed out, is one of the more effective ways to reduce risk and increase production and incomes in the drought-prone areas where so many of the Title II development programs work.
4.5.4 Sustainability
4.5.4.1 Commercialization, Profitability, and Increased Incomes
Preliminary results from the Tufts study on Title II exit strategies support the FAFSA-2 conclusion that commercialization, profitability, and increased incomes do matter. In fact, they seem to be essential to achieving both impact and sustainability. One

4-65Agriculture, Natural Resource Management, Livelihoods, Income Generation
of the lessons learned from the four Nicaragua agricultural-based income generation programs, for example, was the importance of “commercial, market-oriented production in order to increase incomes” (see Box 4.30).
These characteristics (commercialization, profitability, and increased incomes) also seem to be key to the sustainability of these production and income increases. Program interventions/activities in the AG/NRM/LH programs that were most likely to be sustainable were those that were organized around economic incentives—profitability—and supplied their own resources. This means projects
that used a business model and focused on markets and the sale of goods and services to these markets.
Using the language of the Tufts analytical framework, which identifies motivation, resources, and capacity as the three key factors contributing to sustainability (see Box 4.31), the Title II farmers included in these commercialization programs had the:
• Motivation (incentives) to continue to use these technologies and practices (as long as they were able to continue to sell their products at a profitable price). (Others in the value chain are also likely to continue participating in the chain as long as their participation remains profitable.)
• Resources they needed to be able to continue to buy the necessary inputs (from the sales of their products).
• Capacity to continue to use these improved technologies and practices (having been trained by the Title II extension programs).
The importance of economic incentives and business models is also stressed in discussions on sustainability in the recent literature on markets and the poor. The “Making Markets Work for the Poor” approach recommends building programs around incentives and capacities, arguing that successful change in markets is “based around developing the technical capacities of different players and aligning better their incentives and motivations” and that
Box 4.30. Lessons Learned from the Nicaragua Income Generation Programs
“One of the most important lessons learned during this [program] has been the importance of commercial, market-oriented production in order to increase incomes. Some of the cooperating sponsors focused mainly on small-scale, socially-oriented interventions in the beginning, but since 2006 all of them have had commercial agricultural components. Certain key elements have been universal: Choosing crops based on the results of market surveys, identifying industrial clients and signing production contracts, collective marketing assisted by current market price information, technical production advice, adoption of productive technologies such as drip irrigation and hybrid seeds, the formation of profitable producer enterprises, and the development of the entire value chain simultaneously. This strategy has led to results that are both durable and significant in scale.”
Source: Nicaragua Joint Final Evaluation (Harris, et al., 2007, p. 82).
Box 4.31. Key Factors Contributing to Sustainability
• Motivation (e.g., profit)
• Resources (e.g., a self-financing business model)
• Capacity (e.g., technical and managerial knowledge/skills)
Source: Tufts Exit Strategies Study (Rogers and Coates, 2013).

4-66 Agriculture, Natural Resource Management, Livelihoods, Income Generation
incentives and capacities are key to sustainability.134 And Markets and Rural Poverty concluded, based on its seven action-research projects, that “no amount of good will, money or effort is sufficient to develop relationships that operate against business models” (Mitchell and Coles, 2011, p. 250).
In Bolivia, which was one of the Tufts focus countries, the value chains established under the four Title II programs were still operating successfully two years after the programs had ended. The key benefit from these programs, according to the Tufts analysis, was the increased incomes of producers and the profitability of these activities, which means that producers can continue to invest in inputs and TA (Rogers and Houk, 2011). In Honduras, another Tufts focus country, the study found that program activities and benefits were sustained in communities where farmers (e.g., coffee farmers) could translate their increased yields into profits because they had access to certification systems and to buyer organizations. What did not seem to be sustainable in Honduras, according to the Tufts study, were programs focused on increasing the production of food crops, primarily for home consumption. In these cases, farmers reported some increases in yields and incomes during the life of the project, when inputs were supplied by the project(s). However, after the projects ended, farmers indicated that they lacked the resources to purchase these inputs and thus were not able to continue to capitalize on the yield-increasing technology packages that were originally provided by the projects (Rogers and Sanchez, 2011). During its field visit to Malawi, the FAFSA-2 team also saw firsthand the important role that commercialization and profitability played with respect to the sustainability of several irrigation systems developed under the I-LIFE project (FY 2005–FY 2009) (see Box 4.32).
134 “Sustainability is a prime concern of the [‘Making Markets Work for the Poor’ approach],” according to the synthesis document. “This means not just considering the existing alignment of key market functions and players but how they can work more effectively in the future, based on the incentives and capacities of players (government, private sector, associations, etc.) to play different roles” (Tschumi and Hagan, 2008c).
Box 4.32. A Lesson in Sustainability from Four Small-Scale Irrigation Projects in Malawi
The FAFSA-2 team visited four irrigation systems that had been developed under the I-LIFE project (FY 2005–FY 2009) in Malawi by three of the CRS Consortium members: Africare, WV, and Emmanuel International. Two of the systems were doing very well at the time of the visit and two not so well. Why the differences? The two that were doing well were located close to good markets, and business was so good that both user groups had expanded their systems, one digging a second long diversion canal to bring water from the river to an expanded irrigation perimeter. A third group asked for additional resources to help make improvements in their system. But when asked why they couldn’t use their own resources, from their savings and loan groups, they explained that any additional investment in the system on their part would not pay off, because selling more produce on the nearby roadside, which was the only market readily available to them, would only drive down prices. The fourth system was no longer functioning because its water source had dried up earlier in the season. The biggest challenge facing the farmer group that had dug the second diversion canal was the hippopotamus that was walking up from the nearby river to eat their irrigated maize. Their solution to this challenge? To dig another deep ditch on their own around their entire irrigation perimeter.

4-67Agriculture, Natural Resource Management, Livelihoods, Income Generation
4.5.4.2 Capacity Strengthening
To be sustainable, the Title II development programs also have to focus on capacity strengthening. To be effective, however, this effort needs to go beyond the traditional focus on producers and producer and community groups to encompass other actors along the value chain. One of the advantages of the value chain approach, as was suggested in Box 4.29, is that it forced the Bolivia programs to identify the existing actors along the chain and the roles that they played and could possibly play, including whether they could take over some of the service delivery activities that the Title II programs planned to provide. Much of the focus in the past has been on the role of local and national government agencies as service providers and, failing that, on strengthening producer and community groups. But, as the experiences of a number of programs in the FAFSA-2 universe demonstrated, the potential suppliers of key services, including extension services, include local NGOs, universities, input suppliers, processors, buyers from large retail stores, and exporters. And, if these potential service providers are identified early on in a program, Awardees can take steps to increase the likelihood that these service providers will be able to take over from the Awardees at the end of the Title II program, including by initiating and strengthening linkages between these organizations and the Title II clients, helping build trust among these groups, and, when appropriate, including them in project extension and training activities.
The reality in most cases is that the governments will not be able to take on many of the service delivery activities being provided by the Title II development programs. One element of CARE’s exit strategy in Bangladesh was to make sure that people in the communities it was exiting had the cell phone numbers for their local government service providers and their local political representatives. This is part of CARE’s “rights-based” strategy, but it is more likely to work in situations where who gets access to services may be more of a problem than whether services are actually available. In most areas where the Title II development programs work,
most services are likely to be unavailable or in short supply. Some staff are located in district offices, for example, but they do not have the resources to travel to the field. It would be preferable if more government services were available in these poor, rural areas where the Title II development programs work. But their absence does not mean that Title II development programs cannot help establish successful and sustainable commercialization programs, including by involving other actors available in the local NGO, university, and private sector communities, for example.
4.5.5 Key Assumptions and Alternative Development Models
The documentation for the Title II development programs tends not to be very clear about the assumptions that underlie the design of a given program or the model that the program is using.
4.5.5.1 Key Assumptions
Farmers and Farming
The vast majority of Title II development programs implemented during the FAFSA-2 time period appear to have been designed based on the assumptions that the vast majority of their clients were farmers and that solutions to their clients’ problems lay primarily in production agriculture. This strategy was successful in numerous situations. That is, the FAFSA-2 universe includes numerous examples of programs that helped improve the lives of their clients, usually by providing them access to a combination of improved agricultural technologies and market opportunities. But not all clients in the Title II target areas were/are farmers, and many who did/do farm did/do not have the asset base needed to farm their way out of poverty. Some programs included limited amounts of support to the development of microenterprises, which undoubtedly helped these clients in the short run. The value of these programs over the longer term is not that clear, however, given the growing body of evidence that most of the poor do not have sufficient entrepreneurial skills to be able to transform a microenterprise into a successful small business

4-68 Agriculture, Natural Resource Management, Livelihoods, Income Generation
(Banerjee and Duflo, 2011, Chapter 9, “Reluctant Entrepreneurs,” pp. 223–234).135
What most programs need to do is broaden their focus to include opportunities that would create more off-farm employment activities for their clients, as was recommended in the Bangladesh FSCF for FY 2010–FY 2014 (see Box 4.33). IFPRI, in its 2011 Global Hunger Index, also recommended that development practitioners “foster and support non-farm income opportunities in rural areas,” arguing that farmers producing solely for subsistence without additional income opportunities will remain vulnerable to weather and price shocks” and that “[i]mproving resilience also involves fostering nonfarm income opportunities in rural areas and fostering an environment in which nonfarm activities can thrive” (IFPRI, 2011, p. 8).
The Vulnerable or the Vulnerable and Viable
Related to the issue of farmers and farming is the question of whether the target clients for the AG/NRM/LH programs should be the “vulnerable” or the “vulnerable and viable.” At the time of the FAFSA-2, one still heard some stakeholders describe the Title II programs working with the poorest of the poor, the bottom 10 percent of the income distribution, and the most vulnerable, and not always making the distinction that FTF programs do between the “vulnerable” and the “vulnerable and viable.” This focus on the most vulnerable led some Title II programs to try to adopt an agricultural solution for some farmers that were very unlikely to be able to farm their way out of poverty or food insecurity, because the agricultural resources that they had access to, land in particular, were insufficient even with the application of new technologies and access to higher-value markets.
135 Paul Collier also makes the point that few people are suited for entrepreneurship, arguing that “[g]iven the chance, smallholder farmers in poorer countries seek local wage jobs and their offspring head to the cities. This is because at low income levels rural bliss is precarious, isolated and tedious. The life forces millions of ordinary people into the role of entrepreneur, for which most are ill suited. In successful economies, a majority of people invariably opt for wage employment, so they can leave to others the worry and grind of running a business; entrepreneurship is a minority pursuit” (Collier, 2010, p. 213).
(Also see the discussion in Section 4.1.2.2 on the Title II target population.) Few proposals written during the FAFSA-2 time period addressed this issue, let alone indicated how they planned to deal with it.
The distinction between the “vulnerable” and the “vulnerable and viable” is an important one that needs to be made in the AG/NRM programs, given the likelihood of continuing pressure on the availability of resources for Title II development
Box 4.33. Broadening the Focus in Bangladesh to Include Creating Jobs for Clients of Title II Development Programs
“In Bangladesh, in other words, Awardees are going to have to consider including several different types of approaches to working with their client groups in their IG programs. Some households will be able to benefit from options that will enable them to derive more value from what limited land they do have, adopting improved rice varieties and production practices, for example, or more likely, moving into higher valued horticultural crops or other higher valued agricultural activities such as poultry, livestock feeding and aquaculture. In these cases, Awardees will be able to work with their client households directly, which is the typical approach used in Title II IG programs. Other households will need access to better paying jobs and/or other income earning opportunities, however, and, finding effective ways to assist these households is likely to require more experimentation and creativity. This is also likely to include finding acceptable ways of working and collaborating with other actors, including other USAID projects that are focused on the development of small and medium enterprises as well as private sector businesses.”
Source: Bangladesh Food Security Country Framework (van Haeften and Moses, 2009, p. 62).

4-69Agriculture, Natural Resource Management, Livelihoods, Income Generation
programs. The basic question is whether Title II development resources should continue to be used to try to help people become better farmers that basically stand no chance of becoming economically viable as farmers. Economists would argue that this strategy is not cost-effective and that Title II development programs, if they are truly development programs, should focus on farmers that are “vulnerable and viable” and look for other options involving the creation of off-farm jobs, for example, for those clients that do not fall into this category. Many economists would also argue that a strategy that focuses scarce resources on activities that have little chance of success have high opportunity costs in that they divert resources from other activities that might have a higher probability of success. Other avenues are also available within the Title II development program to provide short-term assistance to the truly vulnerable, the elderly, and orphans, for example, through Vulnerable Group Feeding Programs. There are serious trade-offs that many programs are not taking into account, in other words; Title II Awardees can choose to focus primarily on agricultural programs, in which case they need to target the “vulnerable and viable,” or they can chose to focus on all the vulnerable, in which case they need to explore other options for their target clients in addition to farming (see Table 4.7).
A variety of indicators have been used to assess degrees of household vulnerability, including assessments of poverty levels (based on household incomes and/or expenditures), number or value of assets, size of land holdings, and extent of market participation. These indicators are less useful in distinguishing among households in terms of potential to participate in new economic opportunities, however. Farming is not likely to be a promising activity for households that have little
or no land, but small amounts of land or the fact that households do not have crop surpluses to currently sell are not necessarily good indicators of whether they will be able to participate if they are helped to gain access to a new market for a higher-value product and to the knowledge of new and improved technologies and practices that will help them become more competitive.136 Michael Carter, in a Thematic Note for FTF, describes the experiences that a Millennium Challenge Corporation program in Nicaragua had in trying to restrict participation in its value chain activities to households with a minimum of two to five hectares. According to Carter, there was no evidence that farmers with resources less than the eligibility criteria were not able to effectively participate in the value chain activities. If anything, the data actually suggest that “initial living standards were higher among the households that benefited least from the program” (Carter, 2012, p. 3).137 The economic viability of communities and households can also be changed with the introduction of new productive infrastructure, feeder roads, and small-scale irrigation in particular.
To get a better idea of which households and communities are likely to be viable is going to require more information on the market
136 Small farm sizes were not a serious constraint to the adoption of the Green Revolution high-yield grain varieties either (although smaller farmers and tenants tended to lag behind in the early years following their adoption), or an important source of a differential growth in productivity (Ruttan, 1977).137 The message for FTF, Carter argues, is that “the minimum requirements for effective participation in value chain programs is an open question that requires exploration. From this perspective, standard program evaluation criteria that fail to create either the incentives or the space for program implementers to probe these requirements should be revisited. More globally, FTF’s learning agenda needs to prioritize exploration of these requirements or minimum asset thresholds” (p. 3).
Table 4.7. Clarifying Project Design: Farmers and Farming and the “Vulnerable” or the “Vulnerable and Viable”
VulnerableNot Viable as Farmers Viable
Livelihoods Farming NO YES
Non-Farming (microenterprises and/or jobs) YES YES

4-70 Agriculture, Natural Resource Management, Livelihoods, Income Generation
opportunities that might be available to a particular community or sets of communities, the production potentials in the area, and an analysis of what it would take for farmers in these communities to be able to compete in these markets. Program developers and implementers should begin to get a better idea of which households are likely to be viable as they develop their value chain analyses and especially during their assessment of production potentials and constraints to participation in the chain and what are the likelihoods of being able to overcome them, which could differ by location, how near households are to a road, for example, and/or whether they have access to a source of water. Costs of production and costs of getting products to market would also have to be estimated for different groups. Some notions as to the relative costs and benefits of alternative strategies for decreasing these constraints will have to be developed, recognizing that some activities may not be cost-effective if they will benefit only a few households, for example, or in cases when the benefits may be widespread but are minimal.
Productivity and Profitability
Programs that were implemented during the 2002 FAFSA time period tended to be focused on increasing agricultural productivity, the productivity of food staples in particular. The 2002 FAFSA suggested that this focus originated with the 1995 Policy Paper and subsequent USAID/FFP guidance that continued to put stress on increases in agricultural productivity as one of the best indicators of the food security impacts of the Title II development program (Bonnard et al., 2002, p. 48).
Increasing agricultural productivity means helping resource-poor farmers get higher returns from their scarce land and labor resources, which is important. But many food insecure farmers have little or no land. This means that increasing yields (output per hectare of land), which is the usual measure of increased productivity, is not as important to them as increasing the returns to their labor (i.e., output produced per person). Output per person is the indicator small farmers are more likely to use when trying to decide what to do with their scarce time—whether to spend more time working on
their own land, looking for casual labor nearby, or migrating further afield—not yields. Increasing agricultural productivity may be important to policy makers and planners, but for small farmers it is the increased profitability of their enterprise that is more important, along with managing risk.138 There are also other, more promising routes to increased profitability than increasing the productivity of staple food crops, as the 2002 FAFSA also pointed out. These more promising strategies include switching into livestock, off-season vegetable production, tree crops, and other products for which there are high-value niche markets. (See Box 4.34 for information on the economics of growing basic grains in Guatemala and why farmers are likely to prefer growing high-value winter vegetables for export rather than their staple food. Also see Section 3.4.3 on “Improving the Integration of Program Interventions” for a discussion on the various pathways between production for own consumption and sale and incomes and improved diets.)
Food from Purchases and/or from Own Production
Some in the Title II development community remain conflicted about the switch that is occurring to more commercially oriented programs. More practitioners recognize that their Title II clients can make more money by producing products for sale in more profitable markets. However, some still worry that these successes in increasing household incomes will not lead to improvements in family diets or the nutritional status of family members, young children in particular. These are legitimate worries, but not all cash crop programs have had negative consumption/nutrition effects (see Box 4.35 for information on a well-documented export program that had a positive effect on the consumption and nutrition of small, resource-poor farmers in the highlands of Guatemala).
138 Glennerster and Jack cite an example where overconcentration on yields led to “inappropriate advice being disseminated through agricultural extension” and argue that“[u]nderstandingtherelativeprofitabilityofdifferenttechnologies in real farm conditions is an area where more evidence is needed to inform the strategies of FTF—i.e., where best to focus energies” (Glennerster and Jack, 2012, p. 2).

4-71Agriculture, Natural Resource Management, Livelihoods, Income Generation
Box 4.34. The Economics of Basic Grains in Guatemala
The costs and returns to small farmers of growing corn versus horticulture products indicates that small farmers can make much more money by growing French Beans or Snow Peas on one half a manzana of their land than by growing corn on one manzana—almost 17,000 quetzales from the French Beans (two harvests) or Snow Peas (one harvest) compared to only 1,784 [quetzales] from traditional corn. And, the total income (for farmers plus laborers) generated from the production of either one of these horticulture products is over 37,000 [quetzales] compared to only 6,084 [quetzales] from corn.
Source: Wingert, 2010, pp. 30–31.
Box 4.35. The Consumption/Nutrition Effects on Small, Resource-Poor Farmers in Guatemala of the Switch to Producing Labor-Intensive Crops for High-Value Export Markets
In the late 1980s, as one of several in-depth analyses of the cash crop consumption/nutrition issue, IFPRI looked at the potential benefits and risks to small, resource-poor Guatemalan farmers from switching to the production of high-value winter vegetables for export. These new export crops were rapidly adopted by the smallest farmers in the Western highlands, an area known for its high levels of poverty and undernutrition, because they were substantially more profitable than their traditional maize and beans. Households without access to reliable sources of off-farm income showed significantly higher probabilities of adopting these new crops. Income gains were highest among the adopters on the smallest farms. The non-traditional export crops were more labor intensive than the traditional crops, creating more local employment on farms and indirectly through forward and backward linkages and multiplier effects from increased income spent locally. Food expenditures and consumption increased relatively less than expected. But the nutritional status of young children improved, with the most significant decreases in wasting (weight-for-height). Most export crop producers preferred to continue to use some of their limited land for food production for home consumption, but their yields were higher because they now had the money to buy fertilizer. So the end result was that they were able to obtain more of their maize and beans (per person) from their own production than other non-export producers with farms of the same size. The nutritional benefits from the economic growth generated from this export program were “substantial,” according to IFPRI. Equally interesting in the Title II context was IFPRI’s conclusion that “joint operation and development of the health and sanitation infrastructure in rural areas is required to translate the growth effects into nutritional welfare effects for the poor.”
Source: von Braun, 1989, pp 11–13.

4-72 Agriculture, Natural Resource Management, Livelihoods, Income Generation
Title II development programs can also take actions that can help avoid/mitigate the potential adverse effects of an increased emphasis on market-oriented, agricultural development programs. Increases in income do not automatically translate into improvements in the nutritional quality of people’s diets if people lack basic nutrition knowledge and/or basic foods are not available in local markets and/or only at unaffordable prices. Dealing effectively with clients’ lack of knowledge is a problem that most Title II Awardees already have considerable experience with, including by adding nutrition education activities in home economics add-ons to their agricultural components or to their community-based MCHN components. Most Title II clients need more information about why and how they can improve their diets, including information on why good nutrition is important, what foods are more nutritious, and how to plan and prepare more nutritious meals. This is true whether they are consuming food that they are producing on their own land or buying it in local markets or both. Improving the nutrition of the younger children in the household is also likely to require another set of activities (e.g., improved child care practices; access to and use of preventive and curative health care; and improved water, sanitation, and hygiene). (See the top section of Figure 1.1, “Food Security Conceptual Framework Developed for Use in the FAFSA-2.” Also see discussions in Chapter 6.)
4.5.5.2 Alternative Development Hypotheses and Models
Most proposals approved during the FAFSA-2 time period included results frameworks, per USAID/FFP requirements, but many were not clear about the models that they were using or their positions with respect to markets and whether linking their clients to markets was a viable strategy for lifting them out of poverty and food insecurity. As one outcome of its program review, the FAFSA-2 team was able to articulate four distinct models that differ in terms of the assumptions made about whether the Title II target populations can be linked to growing markets and, if so, what strategies work and in what
order. The basic characteristics of these models are described next and in Figure 4.14.
The Food Production for Home Consumption Model
The 2002 FAFSA assumed that there would be some households among the Title II target groups that one should forget about trying to link to markets and recommended that programs just concentrate on helping these households improve agricultural productivity for home consumption. The approaches used in these programs were similar to those used in more market oriented programs, i.e., the promotion of new/improved technologies and practices using TA, training, and the provision of inputs. Usually the focus was on basic staples, but some programs also included a focus on vegetable gardening and small animals, including goats and chickens—all for home consumption. Some argued that this strategy was most suitable for farmers that lacked surpluses to sell, the so-called “subsistence farmers,” forgetting that even subsistence farmers are active in markets when they sell their labor. What has become more apparent recently, in part as a result of the preliminary results from the Tufts Exit Strategies Study (see Section 4.5.4.1), is that the changes that are produced using this model seem not to be sustainable. For example, the Tufts study found that programs in Honduras that focused on increasing the productivity of food crops primarily for home consumption did not result in any lasting changes. Farmers used the new practices and inputs while the project was under way, but stopped using them once the projects were over because they lacked the resources to buy the inputs that the projects had been supplying.
The Graduation Model
A number of programs included in the FAFSA-2 universe implemented some version of what has come to be called the “Graduation Model.” This model, according to the Consultative Group to Assist the Poor (CGAP), is based on five core elements: (1) targeting to ensure that only the poorest households are selected for the program,

4-73Agriculture, Natural Resource Management, Livelihoods, Income Generation
(2) consumption support to stabilize consumption, (3) savings to build assets and instill financial discipline (with some variants relying on MFIs and others on VSLs), (4) skills training to learn how to care for an asset and run a business, and (5) an in-kind asset (often livestock) to help jump-start a sustainable economic activity.139 Proponents argue that these activities, if well sequenced and intensely monitored, “can lead to increased consumption, asset and income diversification, and some level of empowerment.” Proponents also recognize that the model may be too challenging for some households (including the elderly, the disabled,
139 According to CGAP, this model is based on an approach developed by the Bangladesh Rural Advancement Committee (BRAC), which, in 1986, began partnering with “the Government of Bangladesh and the World Food Programme to add a graduation ladder to an existing national safety net program that was providing the poorest households with a monthly allocation of food-grain for a two-year period. BRAC workedwiththesebeneficiariesandaddedskillstraining,mandatory savings and small loans to accelerate livelihoods development” (Hashemi and de Montesquiou, 2011, p. 1).
and the dysfunctional), because it “rests on the ability of individuals to seize the opportunity to create new economic activities and create their own pathways out of poverty.” Market opportunities and challenges are supposed to be taken into account when livelihood options are designed, so markets are not ignored. But the model itself does nothing to “directly tackle market conditions,” even though proponents recognize that lack of markets or poorly functioning markets can severely constrain the development of the household-level entrepreneurs that the model is trying to promote (Hashemi and de Montesquiou, 2011, p. 11).
The Pull Model
Other models focus on using markets as a pathway out of poverty but have different hypotheses about how to link the vulnerable to growth, how these links work, and what approaches are more effective in fostering these links. The focus of the “Pull Model,” as some describe it, is on developing markets/value chains first and secondarily on
Figure 4.14. Alternative Models for Working with Title II AG/NRM/LH Development Programs
FOOD PRODUCTION FOR HOME CONSUMPTION MODELAssists producers improve food production for home consumption, including through dissemination, improved technologies, and training.
GRADUATION MODELAssists farmers improve their asset bases, including through asset transfers, training, and increasing access to financial services. Some also include consumption support.
PULL MODELLinks producers to markets/value chains, including graduates from a push model (aka a graduation model).
PULL PLUS PUSH MODELLinks producers to new/higher value markets in combination and simultaneously with the introduction of new/improved crops, technologies, and practices; TA and training; and, in some cases, asset transfers.
EMPHASIS ON MARKET-DRIVEN PATHWAYS OUT OF POVERTY AND FOOD INSECURITY

4-74 Agriculture, Natural Resource Management, Livelihoods, Income Generation
linking producers to these markets/value chains. Many of the earlier “Pull Models” focused on the larger, more commercially oriented farmers, but since the mid-years of the last decade, there have been a growing number of programs that have had some success in linking poorer producers to more promising higher-valued markets, including through value chains. Since the primary focus of these programs is on markets and improving marketing, resources to tackle problems at lower levels of the value chains have often been limited, especially when it comes to the special needs of the smaller, more vulnerable producers. USAID/Ethiopia, in its Strategic Review for FTF (2010), proposed to deal with this problem by marrying two models—the “Graduation Model,” which it renamed the “Push Model,” and a separate “Pull Model.” The larger, more commercially oriented farmers were expected to be ready to participate in the “Pull Model” immediately, while the more vulnerable households would have to be enrolled in and graduate from the “Push Model” before they would be ready to be linked into value chains.140 One issue with the “Graduation Model” (aka “Push Model”) is whether or not one can realistically expect to be able to make a meaningful and sustainable difference in poor people’s lives without “directly tackling market conditions.” There are also issues in trying to marry the “Push Model” and the “Pull Model,” including an issue of sequencing. How interested are resource-poor farmers likely to be in participating in a “Push Model” if they are excluded from the incentives that come from making sales for a number of years until they are deemed to have graduated? Asset transfers may keep them interested for a while, but integration into a growing market offers longer-term advantages.
140 USAID/Ethiopia had already been experimenting with alternative approaches to working with the chronically poor and food insecure populations in Ethiopia prior to FTF. Examples of these earlier efforts included the PSNP Plus project, which worked with a subset of the PSNP population using a “Graduation Model” that included additional interventions focused on linking these households to microfinanceandvaluechains(the“plus”intheprojecttitle)(CARE, 2011) and the Using Markets to Alleviate Extreme Poverty project, which tested a market-led livelihoods approach to reach the chronically poor (Chemonics International, 2007).
The Pull Plus Push Model
A fourth strategy/model, which the more successful Title II programs in the FAFSA-2 universe have used, begins with the market linkages and the incentives that markets provide (i.e., facilitates the access of its clients to new market opportunities), but combines this with the provision of new technologies and the TA and training needed to help them increase their capacity to produce for and compete in these markets. In other words, this fourth model includes both pull and push elements, but these are implemented simultaneously so that the Title II clients are able to benefit from market sales early, which gives them greater incentives to participate, at the same time the clients receive the resources that they need to continue participating in the program. To encourage and enable greater participation on the part of the more vulnerable in these programs, Awardees may also need to be more proactive, providing the more vulnerable with additional/more tailored TA, training, mentoring, and cash and/or in-kind asset transfers (a “Pull Plus Extra Push Model”) (see Box 4.36).
4.6 Conclusions and Recommendations
4.6.1 Conclusions
Program Impact
• The FAFSA-2 universe includes many examples of AG/NRM/LH programs that helped their clients increase their incomes and access to food, usually by providing them access to a combination of improved agricultural technologies/practices and market opportunities. These programs were often technically complex and difficult to design and implement successfully. The successes that these programs achieved are even more noteworthy given the challenging environments in which they worked.
• Considerable progress was made during the FAFSA-2 time period in measuring the impact of the Title II programs on food access with the development of several standardized consumption

4-75Agriculture, Natural Resource Management, Livelihoods, Income Generation
Box 4.36. What Distinguishes the Title II AG/NRM/LH Programs from Other Agricultural-Based, Food Security-Oriented Development Programs?
There are some within USAID and the development community that still think of the Title II development programs, including the AG/NRM/LH programs, as primarily humanitarian assistance programs. Some also still believe that food is an important component of the AG/NRM/LH programs, even though their greatest need is for cash to pay for the TA, training, and agricultural input distribution activities that are essential to their success. Others recognize that food does not play a very important role in the Title II development programs anymore. But this leads them to question their cost-effectiveness, given the fact that much of the cash comes from monetization, and to question whether they have any added value now that the FTF programs are also focused on the same target group—the food insecure that are “vulnerable and viable.”
One feature that distinguishes Title II AG/NRM/LH programs from other USAID agricultural-based, food security-oriented development programs is that they are geographic based and client focused. That is, they are designed to respond to the problems faced by and have an impact on specific target groups in specific target areas. This means that Title II problem assessments and programs need to be unique to each target group and its needs, market opportunities, and production potentials and not generic to major geographic regions or to the country as a whole.
Title II development programs also have the flexibility to use their resources to expand the number of households in their target groups that will be able to succeed as farmers (i.e., that are viable as well as vulnerable) by:
• Providing more and more tailored training and TA to some of the more disadvantaged households (including literacy training for women as part of their business management training activities, for example, as some programs in West Africa did)
• Providing poor individuals and households with an economic asset that they might not have access to otherwise (providing an in-calf cow to a poor household so that they can participate in a dairy value chain as LOL did in Zambia, for example, or a cash grant to a group of very poor farmers so that they could buy a pump to irrigate their fields and expand the number of crops that they could produce per year from one to three, as CARE did in Bangladesh)
• Changing the underlying environment for larger groups of farmers and entire communities (helping groups of farmers and communities develop small-scale irrigation systems so that they can begin to produce and market crops during the dry season, adding to their incomes and reducing their risks, or upgrading a feeder road into a community to enable farmers to access markets that were previously unattainable).
To be responsive to clients that are unlikely to be able to succeed as farmers, Title II development programs also have the flexibility to work on off-farm and non-farm activities (Non-AG Income Generation) to support micro- and small enterprise development and job creation.

4-76 Agriculture, Natural Resource Management, Livelihoods, Income Generation
indicators. These indicators were not yet in widespread use during the FAFSA-2 time period, but for those that did report, the rates of success were quite high.
• Learning from the experiences of these AG/NRM/LH programs and making greater use of more effective models and better practices highlighted later in this section present a major opportunity for USAID/FFP and its Awardees to improve program outcomes and impacts in the coming years.
Title II Target Groups
• The resource-poor farmers, who are the main targets of the Title II AG/NRM/LH programs, are economic actors that respond to economic incentives in managing their farms and other household enterprises, and not just “objects of compassion,” as one Title II Awardee put it.
• Small, resource-poor farmers respond positively to market incentives, but payoffs need to come in the short term, given their poverty. Therefore, facilitating market contacts and sales early on helps spur interest, increases farmers’ participation, and improves technology adoption rates.
• Title II clients are not all farmers, even if they live in rural areas. In some Title II countries, such as Bangladesh, the majority of the most food insecure are landless. And in many rural areas in many countries, many food insecure households do not have the asset base to become food secure by focusing only on increasing farm production. Many need alternative livelihoods to farming, an opportunity to start a microenterprise, for example. But, since most people do not have strong entrepreneurial skills, the rural poor included, what is really needed for those households, who will not be able to succeed as farmers, is access to more and better jobs.
• Title II clients live with large amounts of risk. Strategies that the Title II programs have employed successfully to help their clients reduce/manage their risks include helping them
diversify what they are producing on their farms and/or into non-farm sources of income and introducing more drought resistant varieties, conservation agricultural practices, water harvesting techniques, and irrigation.
Program Strengths and Weaknesses
• Title II development programs are client- and geographic-based, i.e., they are designed to have a specific impact on specific groups in specific
Box 4.37. AG/NRM/LH/IG Policy Implications
• Title II development programs that are market-oriented and focus on linking producers to more promising, higher-value markets in combination and simultaneously with the introduction of new technologies, TA, and training tend to be more successful in terms of technologies and practices adopted, income generated, and activities sustained.
• To be cost-effective, Title II development programs should focus their agricultural interventions on farmers that are “vulnerable and viable” and look for other options involving the creation of off-farm jobs, for example, for those clients in their target areas that do not fall into this category.
• Increasing overall household incomes is crucial. However, higher incomes will not necessarily result in more nutritious diets if people lack basic nutrition knowledge. Higher incomes will also not necessarily result in reductions in child undernutrition in the absence of community-based MCHN programs focused on the application of the ENA in the first 1,000 days and access to improved water, sanitation, and health services.

4-77Agriculture, Natural Resource Management, Livelihoods, Income Generation
areas of a country. This is a strength when it comes to working effectively with the rural poor. It also means that programs may need to work with a wide range of crops and problems, including improving the delivery of extension services to farmers and helping link their farmer clients to markets, in order to be responsive to the needs of their clients and their specific market opportunities and production possibilities.
• The quality of many of the Title II agricultural programs has improved significantly. The technology packages being disseminated now tend to be better developed, and the Awardees also tend to have more competent staff working in the field, i.e., staff with more technical expertise in agriculture.
• More programs are using best practices. Programs are better linked to sources of new and improved technologies and practices, including local and international research institutions and other donor- and NGO-supported programs. More programs are also using practical, hands-on methods to extend packages of new technologies and practices, including using lead farmers, on-farm demonstrations, field days, and exchange visits.
• Too many programs are still too production oriented, however, with a tendency to view marketing as something to be thought about later in the project after the production problems have been addressed. Many programs are still being designed with a production focus. And, because the Title II agricultural components tend to be staffed primarily with technicians with a production background, many programs designed with a stronger marketing focus end up being more production oriented.
• The vast majority of the Title II development programs included in the FAFSA-2 universe did not have enough information on the basic economics of their programs. Few knew whether the technology packages that they were recommending were profitable to their client farmers (whether the returns were greater than
the costs) or the costs and benefits of their own interventions.
• Few programs appeared to have made much of an effort to understand the technology adoption process, including why some of the practices that they were recommending were not adopted and whether lack of adoption was due to lack of profitability, labor constraints, and/or lack of availability of commercial inputs, for example.
• One area where the Title II development programs tend to be strong is in organizing and working with community-level groups. Working with groups of small farmers is essential to achieve economies of scale in agricultural extension and marketing. Farmers/communities also are likely to need to work together to manage common pool resources, such as small irrigation systems and key natural resources affecting these systems. On the other hand, many Awardees try to push their clients to work in groups and to develop group businesses in situations in which allowing individuals to work on their own and as individual entrepreneurs is more appropriate.
• The experiences that the Title II development programs have had with rural and agricultural finance have been mixed. Savings mobilization interventions seemed to be very effective in a number of Title II programs as a way to use social pressures to help people save money and invest it later. These programs have helped poor rural households smooth consumption, as well as provide a source of working capital for their farms and other business activities. What they have not seemed to have been successful in doing is becoming a source of capital for larger and longer-term investments, in agriculture in particular. And some practitioners believe that encouraging VSLs to get involved in this type of lending activity or to be linked with formal MFIs would not be compatible with the basic principles of the VSL program and could jeopardize their continued operation.
• Like many development programs, the Title II programs have still not figured out sustainable

4-78 Agriculture, Natural Resource Management, Livelihoods, Income Generation
and cost-effective ways to increase their clients’ access to the credit that they need to purchase agricultural inputs and, in particular, to the longer-term credit that they need to purchase larger investment items, such as pumps, sprayers, plows, and improved breeds of animals. This problem is not unique to the Title II programs, however.
• Many Title II programs use the distribution of subsidized inputs to jump-start the technology transfer components of their programs. These distributions have their rationale in the short run, including as a mechanism for reducing the risks to farmers of adopting a not-yet-proven technology. Longer-term disadvantages, on the other hand, include encouraging dependencies on the part of the Title II client farmers and discouraging input dealers in the private sector from supplying or continuing to supply these goods, reducing the likelihood of their availability once the Title II program ends.
More Successful Programs
• Agricultural programs and income generation programs generally are more successful, in terms of technologies and practices adopted, income generated, and sustainability, if they are market-oriented. Preliminary results from the Tufts study of sustainability and exit strategies also support the FAFSA-2 conclusion that commercialization,
profitability, and increased incomes are key factors contributing to the sustainability of the Title II AG/LH programs.
• Market-based agricultural programs can be designed and implemented so that the clients of the Title II development programs, the “vulnerable but viable,” can participate successfully, a conclusion that is consistent with those reached by other market-oriented programs that have been working with the rural poor.
• The value chain model is useful for Title II programs, as it has been for other market-oriented programs working with the rural poor. Among other advantages, it can help Awardees conceptualize and organize their activities and better plan and execute their sustainability and exit strategies. Value chains need to be market- and not production-driven, however, and tailored to the market opportunities and production potentials of their Title II clients.
• More successful programs also make good use of market incentives, including in ways that enable their clients to begin to see concrete economic benefits from participating in the programs and adopting the recommended technologies and practices early on (e.g., in one or two years), and limit their reliance on artificial incentives to get farmers to change their behaviors.
Figure 4.15. Summary of Major Weaknesses in Title II AG/NRM/LH Development Programs during the FAFSA-2 Time Frame
VISION/DESIGN
Programs lack clarity (Farming and/or non-farming? Vulnerable or vulnerable and viable?
Model?)
PROVISION OF KNOWLEDGE
SERVICES
Programs lack expertise in marketing
and economics
PROVISION OF INPUTS (Cash, In-
Kind, Food)
Programs may rely too much on subsidizing
inputs
OUTCOMES/ IMPACT
< Impact< Sustainability

4-79Agriculture, Natural Resource Management, Livelihoods, Income Generation
• Title II agricultural development programs that focus on rural households that are unlikely to be viable as agricultural producers are not likely to be sustainable. They also have high opportunity costs, in that they divert resources from other food insecure clients and/or other types of interventions where the probability of these resources having a positive impact in both the short and longer term may be much higher.
Better and Not-So-Good Practices
• The “Pull Plus Push Model,” with its focus on linking farmers to more promising, higher-value markets in combination and simultaneously with improved technologies and practices, is a better practice.
• Extension and training programs that give emphasis to learning by doing and seeing methods, including in their marketing activities, are better practices. Programs that are more pragmatic and give priority to understanding and finding solutions to their clients’ problems are more effective. Programs that are more prescriptive (e.g., require their producer groups to be of a certain size and/or require group members to farm and sell collectively) or exclusionary (e.g., excluding more progressive farmers that may be best situated to get the technology adoption process started and to provide continuing support) are less effective and sometimes even counterproductive. Activities that are most effective include on-farm demonstrations; farmers’ field days; exchange visits; and visits to potential buyers, markets, and agricultural fairs.
• Expanding farmers’ access to irrigation in the drought-prone areas where so many Title II clients live, when feasible technically and cost-effective, is a better practice. When linked to markets, these programs can increase farmers’ incomes, reduce risks, and, in many cases, help increase other economic activities in the area (multiplier effects). Conversely, increasing crop production and incomes in the absence of expanding farmers’ access to irrigation may be difficult, if not impossible, in many communities where the Title II development programs operate.
• VSL groups, which promote individual savings (as a way for individuals to accumulate cash that they can use to invest in their own homes, farms, and microenterprises), and value chain financing are better practices and should be encouraged.
• Revolving funds, especially in-kind funds, that are collectively owned and managed by communities are not good practices and should be discouraged. CCBs, which have been described as effective “slow release mechanisms” for distributing emergency food assistance during the droughts in the Sahel, also have a poor record as a development intervention, especially in terms of their lack of sustainability. Therefore, Awardees should be discouraged from including CCBs in future applications, especially given the alternative of being able to use food to have a more direct impact on reducing the high rates of child undernutrition in these countries (see the discussion in Section 6.3.1.9, “Supplementary Feeding”).
• Training community-based animal health workers and helping set them up as microenterprises is a better practice and should be encouraged in countries with a supportive (or at least neutral) policy environment. The distribution of animal assets to Title II clients can also be a better practice, if the animals are targeted to the poorer households in a community as an economic asset that can be sold in local markets or through a value chain. Adding an animal pass-on requirement to these programs, on the other hand, seemed fraught with problems and should probably be avoided unless it is key to the success of a program and closely managed, as was the case with the LOL dairy value chain program in Zambia.
• Using FFW and cash to develop public, productive assets is a good practice and should be encouraged (also see Chapter 5).
• Using FFW or cash for work as an incentive to get farmers to apply AG and/or NRM practices on their own lands or to participate in other activities from which they will receive a direct economic benefit are not good practices and, with few

4-80 Agriculture, Natural Resource Management, Livelihoods, Income Generation
exceptions (the PSNP program in Ethiopia may be one), should not be approved.
4.6.2 Recommendations
• USAID/FFP and Awardees should give preference to models and strategies that are market-oriented and that focus on linking producers to more promising, higher-value markets, in combination and simultaneously with the introduction of new technologies, TA, training, and, in some cases, asset transfers (e.g., the “Pull Plus Push Model” in Figure 4.14). To encourage and enable greater participation on the part of the more vulnerable in these programs, Awardees may also need to be more proactive, providing them with additional, more tailored TA, training, and mentoring; cash and/or in-kind grants; and upgrading roads and other productive infrastructure (a “Pull Plus Extra Push Model”). (Recommendation 24)141
• USAID/FFP and Awardees should give preference to the use of better practices and avoid practices that experience indicates do not work as well. (Recommendation 25)
• USAID/FFP should require Awardees to be more specific in their proposals about: (1) the commercial aspects of their AG and LH programs, including providing more information on priority products, markets, possible buyers, and other organizations with which they plan to partner and collaborate along the value chain; and (2) their plans, if any, to make use of inputs and other subsidies, as well as how they plan to use them and for how long and how they plan to avoid dependencies and disruptions to private sector suppliers. (Recommendation 26)
141 The numbers after certain recommendations are the same as those assigned to the major recommendations in the FAFSA-2 summary report.
• In addition to taking full advantage of any business and value chain development expertise available elsewhere in their organizations, Awardees should: (1) strengthen the business development and management skills of their staff and increase their marketing expertise, especially among country-level program staff; (2) develop a better understanding of the basic costs and returns of their interventions (those involving knowledge transfers as well as physical structures) and the technology packages they are promoting; and (3) focus more on program monitoring and the use of rapid appraisals and focus groups as management tools for improving performance by helping them understand why certain components and activities are not progressing as expected and identify better practices. (Recommendation 27)
• USAID/FFP should require all programs with food access and income objectives to report, on an annual basis, the value of sales made through program-supported processes, including forward contracts and producers’ associations. USAID/FFP should also consider adding several indicators to its list of standard indicators that are both meaningful measures of impact and more directly connected to AG and LH interventions than the current food access/consumption indicators are. This could include an asset indicator and an indicator that measures income from farm operations (e.g., the gross value of farm-based income) (see Figure 4.16). (Recommendation 28)
• USAID/FFP should devote more attention and resources to identifying and describing better practices and not-so-good practices in its AG/NRM/LH programs. Encouraging and facilitating more sharing of knowledge and experiences among Awardees will be beneficial. However, this sharing of knowledge should be combined with an effort to develop a better knowledge base about

4-81Agriculture, Natural Resource Management, Livelihoods, Income Generation
what works and what does not based on more rigorous, data-rich, and independent analyses of important issues, interventions, and activities. These comparative case studies and other applied research activities could focus on a range of topics, including those that are cross-cutting (e.g., assessing the effectiveness of alternative approaches to agricultural extension and training), related to emerging issues/activities (e.g., conservation agriculture technology packages and/or new information and communication
technologies), or involve more minor activities that are frequently added to programs but whose scope and effectiveness are poorly understood (e.g., small animal programs, new agricultural finance instruments, tree nurseries, and income generation programs organized around the donation of processing equipment). The possibilities of collaborating in these efforts with other potentially interested parties within USAID as well as the broader donor and research community should also be explored.
Figure 4.16. Recommendations Regarding Indicators
Food Security Conceptual Framework Developed for Use in the FAFSA-2(Adapted by Roberta van Haeften and Mary Ann Anderson from Riely et al., 1999 and UNICEF, 1990.)
Recommended Indicators
Farm Income
Indicator
Current Indicators
Consumption Indicators
Technology Adoption Indicators
Practices
Inputs
Capital LaborTechnology
(Agricultural)Land/Water
Non-AgriculturalProduction
Non-FoodAgriculturalProduction
MarketPurchases
FoodPrices
Cash Income
WagesSales
Transfers and Loans(Food/Cash)
NATURAL ENVIRONMENTSOCIAL/POLITICAL ENVIRONMENT
* Indicator
Food Access(Household)
• Community• Social Networks• Government/Donor Programs• Remittances
Number andSpacing of Children
• Water/Sanitation/Hygiene• Use of Preventive and Curative Health Care
Stocks
FoodProduction
Food Availability(National)
Food Aid
Imports
Food Utilization(Individual)
Nutritional Status*
HealthStatus
DietaryIntake
IntrahouseholdFood Allocation
• Knowledge• Culture• Time/Workload
Maternal andChild CarePractices
Annual Sales
Indicator

4-82 Agriculture, Natural Resource Management, Livelihoods, Income Generation
Bibliography for Chapter 4Adelski, Elizabeth; Diop, Ousmane; and Joseph, Marguerite. 2006. Final Evaluation of the Africare Guinea Food Security Initiative. A report prepared for Africare/Guinea.
Anderson, J. and Feder, G. 2007. “Agricultural Extension” in Handbook of Agricultural Economics. Volume 3:2343–2378.
Axinn, George H. 1988. Guide on Alternative Extension Approaches. Rome: FAO.
AZM. 2011. Cracking the Nut: Overcoming Obstacles to Rural and Agricultural Finance, Lessons from the 2011 Conference. Washington, DC.
Bahn, Rachel and Lane, Sara. 2012. “Reclaiming Economic Analysis” in Frontiers in Development, edited by Shah, Rajiv and Radelet, Steven.Washington, DC: USAID.
Banerjee, Abhijit and Duflo, Esther. 2011. Poor Economics: A Radical Rethinking of the Way to Fight Global Poverty. New York: Public Affairs.
Bonnard, Patricia et al. 2002. “Report of the Food Aid and Food Security Assessment: A Review of the Title II Development Food Aid Program.” http://www.fantaproject.org/downloads/pdfs/FAFSA.pdf.
Bunch, Roland. n.d. “Soil Recuperation in Central America: Measuring the Impact Four to Forty Years After Intervention.” COSECHA.
Bunch, Roland. 1999. Reasons for Non-Adoption of Soil Conservation Technologies and How to Overcome Them. Mountain Research and Development, Vol. 19, No. 3, pp. 213-220.
Bunch, Roland. 2003. Water Management for Small-Scale Farmers: What We Have learned to Date. COSECHA.
Byerlee, Derek. June 2, 2011. “Agricultural Technology Adoption and Productivity Growth in Sub-Saharan Africa.” USAID Evidence Summit. Washington, DC.
Campaigne, Jonathan and Rausch, Tom. 2010. “Bundling Development Services with Agricultural Finance: The Experience of DrumNet” in Innovations in Rural and Agriculture Finance, edited by Kloeppinger-Todd, Renate and Sharma, Manohar. Washington, DC: IFPRI/World Bank.
Campion, Anita and van Haeften, Roberta. 2010. FS Share Series #8: Rural and Agricultural Finance for Food Security: Primer, Model Scope of Work, and Diagnostic Checklist. Washington, DC: Chemonics International.
CARE. 2011. PSNP Plus: Linking Poor Rural Households to Microfinance and Markets – Final Report. Addis Ababa, Ethiopia: USAID.
Carter, Michael. 2012. Thematic Overview Note: Expanded Markets and Increased Investments. Washington, DC: USAID/IFPRI Feed the Future Learning Agenda.
Chemonics International. 2007. Using Markets to Alleviate Extreme Poverty: Market-Led Livelihoods for Vulnerable Populations (MLVP) Project Terminal Report. Washington, DC: USAID.
Coates, Jenifer and Kegode, Elizabeth. 2011. “Kenya Exit Strategies Study: Round 2 Results.” FANTA Workshop, March 10, Washington, DC.
Coates, Jenifer and Rogers, Beatrice. 2011. “Exit Strategies Study: Concepts and Methods.” FANTA Workshop, March 10, Washington, DC.
Collier, Paul. 2010. The Plundered Planet: Why We Must—and How We Can—Manage Nature for Global Prosperity. Oxford, England: Oxford University Press.
CRS. 2009a. Agriculture and Environment Strategy 2009–2014. Baltimore, Maryland: CRS.
CRS. 2009b. Getting to Market: From Agriculture to Agroenterprise. Baltimore, Maryland: CRS.
CRS/Kenya. 2004. Report on the End-term Evaluation of the Integrated Health and Agriculture Project in Kenya.

4-83Agriculture, Natural Resource Management, Livelihoods, Income Generation
Empel, Gerard van. 2010. “Rural Banking in Africa: The Rabobank Approach” in Innovations in Rural and Agriculture Finance, edited by Kloeppinger-Todd, Renate and Sharma, Manohar. Washington, DC: IFPRI/World Bank.
Feder, Gershon. 1981. Adoption of Agricultural Innovations in Developing Countries: A Survey. Staff Working Paper No. 44. Washington, DC: World Bank.
Foster, A.D. and Rosenzweig, M.R. 1995. “Learning by doing and learning from others: Human capital and technical change in agriculture.” The Journal of Political Economy 103(6): 1176–1209.
Fowler, Ben and Brand, Margie. 2011. Pathways out of Poverty: Applying Key Principles of the Value Chain Approach to Reach the Very Poor. microREPORT #173. Washington, DC: USAID, Accelerated Microenterprise Advancement Project—Knowledge and Practice II/ACDI/VOCA.
Gaudreau, Mimi et al. 2009. Mid-term Qualitative Evaluation of the CRS Food and Nutrition Security Program in Niger-PROSAN Rayuwa. A report prepared for CRS/Niger.
Glennerster, Rachel and Jack, Kelsey. 2012. Thematic Overview Note: Improved R&D, Agricultural Extension, Technology Adoption, and Diffusion. Washington, DC: USAID/IFPRI Feed the Future Learning Agenda.
Haggblade, Steve and Hazell, Peter R.B. 2010. Successes in African Agriculture: Lessons for the Future. Washington, DC: IFPRI.
Hall, Andy. 2007. Challenges to Strengthening Agricultural Innovation Systems. Working Paper Series 2007-038. Maastricht, Netherlands: United Nations University.
Harris, Timm et al. 2007. Joint Final Evaluation of the Nicaragua Title II Development Programs, 2002-2008. A report prepared for ADRA/Nicaragua, CRS/Nicaragua, PCI/Nicaragua, and SC/Nicaragua.
Hashemi, Syed M. and de Montesquiou. 2011. Reaching the Poorest: Lessons from the Graduation Model. Focus Note #69. Washington, DC: CGAP.
Herbert, Paul V.; Emana, Bezabih; and Gessema, Tsegahun. 2010. Transforming Lives: An Evaluation of CRS Integrated Watershed Management Programs in Ethiopia. Baltimore: CRS.
Herr, Matthias I. and Muzira, Tapera J. 2009. Value Chain Development for Decent Work: A Guide for Development Practitioners, Government and Private Sector Initiatives. Geneva: United Nations Development Programme/International Labor Office.
IFPRI. 2011. 2011 Global Hunger Index. The Challenge of Hunger: Taming Price Spikes and Excessive Food Price Volatility. Washington, DC.
Jack,B.K.2011.“MarketInefficienciesandthe Adoption of Agricultural Technologies in Developing Countries.” White paper prepared for the Agricultural Technology Adoption Initiative, JPAL (MIT)/CEGA (Berkeley).
Kassam, Amir et al. 2009. “The Spread of ConservationAgriculture:Justification,Sustainability and Uptake.” International Journal of Agricultural Sustainability 7(4): pp. 292–320.
Kent, Lawrence. 1998a. “Notes from the Workshop on: Community-Level Grain Storage Banks (Cereal Banks): Why Do They Rarely Work and What Are the Alternatives.” January 19-22, Dakar,Senegal.http://lasdanaides.files.wordpress.com/2009/02/1998-crs.pdf.
Kent, Lawrence. 1998b. “Why Cereal Bank Projects Rarely Work: A Summary of Findings.” http://lasdanaides.files.wordpress.com/2009/02/1998-kent.pdf.
Kloeppinger-Todd, Renate and Sharma, Manohar. 2010. Innovations in Rural and Agricultural Finance. Washington, DC: IFPRI/World Bank.

4-84 Agriculture, Natural Resource Management, Livelihoods, Income Generation
Kula, Olaf; Downing, Jean; and Field, Michael. 2006. Globalization and the Small Firm: An Industry Value Chain Approach to Economic Growth and Poverty Reduction. microREPORT #42. Washington, DC: USAID, Accelerated Microenterprise Advancement Project—Business Development Services.
Langworthy, Mark et al. 2005. Final Evaluation of the Cape Verde P.L. 480 Title II Monetization Program. A report prepared for ACDI/VOCA/ Cape Verde.
Liniger, Hanspeter; Studer, Rima Mekdaschi; Hauert, Christine; and Gurtner, Mats. 2011. “Rainwater Harvesting” and “Smallholder Irrigation Management” in Sustainable Land Management Practice: Guidelines and Best Practices for Sub-Saharan Africa. http://www.fao.org/docrep/014/i1861e/i1861e00.pdf.
Lukungu, David. 2011. “Less Labor, High Yield Farming Practices.” Presentation. Kampala, Uganda: USAID, ACDI/VOCA.
Macher, Mumbi et al. 2009. Report on the End Term Evaluation of the CARE/Kenya Sustainable Livelihoods Security for Vulnerable Households in Nyanza Province “DAK ACHANA” Program. A report prepared for CARE/Kenya.
Mariko, Dramine; Malik, Sabina; and Mohamoud, Osman. 2012. Building Resilience in the Sahel through Cereal Banks. Issue #9. Dakar, Senegal: USAID/FFP West Africa.
McGahuey, Mike and Winterbottom, Bob. 2007. “Transformational Development in Niger.” Presentation. USAID.
Mitchell, Jonathan and Coles, Christopher, eds. 2011. Markets and Rural Poverty: Upgrading in Value Chains. London: International Development Research Center.
Netting, Robert McC. 1993. Smallholders, Householders: Farm Families and the Ecology of Intensive Sustainable Agriculture. Stanford, California: Stanford University Press.
Ostrom, Elinor. 1990. Governing the Commons: The Evolution of Institutions for Collective Action. Cambridge, England: Cambridge University Press.
Pierce, Robert and Gardner, Allison. 2006. Final Evaluation of the ACDI/VOCA/Uganda, FY 2002-2006 Title II DAP. A report prepared for ACDI/VOCA/Uganda.
Piper, Lisa; Zavaleta, K. Williams; and Scavone, Mariko. 2010. Sustained Market Access for Subsistence Farmers in Bolivia. Final Learning Agenda Report, Field Report No. 7.
Reij, Chris; Tappen, Gray; and Smale, Melinda. 2009. “Re-Greening the Sahel: Farmer-led innovation in Burkina Faso and Niger.” http://www.ifpri.org/sites/default/files/publications/oc64ch07.pdf.
Riely et al. 1999. “Food Security Indicators and Framework for Use in the Monitoring and Evaluation of Food Aid Programs.” http://www.fantaproject.org/downloads/pdfs/fsindctr.pdf.
Riordan, James T. 2011. We Do Know How: A Buyer-Led Approach to Creating Jobs for the Poor. Washington, DC: New Academia Publishing.
Robins, Catherine et al. 2008. Final Evaluation of the Food for the Hungry (FH) Title II Marsabit FY2004-FY2008 Integrated Food Security Program for Kenya. A report prepared for FH/Kenya.
Robins, Catherine et al. 2008. Final Evaluation of the I-LIFE (Improving Livelihoods though Increasing Food Security) Title II Development Assistance Program, October 1, 2005 through June 30, 2009. A report prepared for CRS/Malawi.
Robins, Catherine et al. 2009. Final Evaluation of the CRS FY 2004-FY 2009 P.L. 480 Title II Development Assistance Program in Burkina Faso. A report prepared for CRS/Burkina Faso.
Rogers, Beatrice and Coates, Jenifer. 2013. “Effectiveness of Title II Program and Exit Strategies: Introduction and Conceptual Overview.” FANTA Workshop, February, Washington, D.C.

4-85Agriculture, Natural Resource Management, Livelihoods, Income Generation
Rogers, Beatrice Lorge and Houk, Katie. March 10, 2011. “Exit Strategies Study: Bolivia Phase II Findings.” FANTA Workshop. Washington, DC.
Rogers, Beatrice Lorge and Sanchez, Leslie. March 10, 2011. “Exit Strategies Study: Honduras Phase II Findings.” FANTA Workshop. Washington, DC.
Rogers, Everett. 2003. Diffusion of Innovation. New York: Free Press.
Ruttan, Vernon. 1977. “The Green Revolution: Seven Generalizations.” International Development Review 19(4):16–23.
Schnell, Charles; McNulty, Judiann; and Bentley, Jeffery. 2006. Joint Evaluation of the 2001-2006 Title Development Programs in Guatemala. A report prepared by Tango International for CARE, CRS, SC, and SHARE.
Selvester, Kerry; Tapulua, Raul; and Whiteside, Martin. 2006. Final Evaluation of the CARE/Mozambique Viable Initiatives for the Development of Agriculture IVIDA 2) Title II Development Program. A report prepared for CARE/Mozambique.
Staatz, J.M. and Dembele, N.N. 2008. Agriculture for Development in Sub-Saharan Africa. Washington, DC: World Bank.
Sullivan, Frank and Selvester, Kerry. 2006. Final Evaluation of the Save the Children Coastal Region Integrated Food Security Program. A report submitted to Save the Children Mozambique and USAID/Mozambique.
Swanson, Richard. 2009. Final Evaluation of the Land O’ Lakes Title II Development Assistance Program (DAP) for Vulnerable Populations in Zambia. A report prepared for LOL/Zambia.
Swindale, Anne and Bilinsky, Paula. 2006. “Household Dietary Diversity Score (HDDS) for Measurement of Household Food Access: Indicator Guide, Version 2.” http://www.fantaproject.org/downloads/pdfs/HDDS_v2_Sep06.pdf.
Tschumi, Peter and Hagan, Harry. 2008a. The Operational Guide for the Making Markets Work for the Poor (MP4) Approach. Bern, Switzerland: Swiss Agency for Development and Cooperation.
Tschumi, Peter and Hagan, Harry. 2008b. Perspectives on the Making Markets Work for the Poor (MP4) Approach. Bern, Switzerland: Swiss Agency for Development and Cooperation.
Tschumi, Peter and Hagan, Harry. 2008c. A Synthesis of the Making Markets Work for the Poor (MP4) Approach. Bern, Switzerland: Swiss Agency for Development and Cooperation.
UNICEF. 1990. Strategy for Improved Nutrition of Children and Women in Developing Countries. New York: UNICEF.
USAID/Ethiopia. 2010. Strategic Review for Feed the Future. Washington, DC: USAID.
USAID/FFP. Annual Results Reporting Guidance for FY 2009. Updated 2012 Guidance available at http://transition.usaid.gov/our_work/humanitarian_assistance/ffp/fy12.arr.guidance.pdf.
USAID/FFP. 2005. Strategic Plan for 2006-2010.Washington, DC: USAID.
USAID/FFP. 2007. “New Reporting Requirements for Food for Peace.” FFPIB 07-02.
USAID/FFP. 2011. “Revision to Food for Peace Standard Indicators Collected in Baseline Surveys and Final Evaluations.” FFPIB 11-03.
USAIDOfficeoftheInspectorGeneral.2011.Audit of USAID’s Food Assistance Under the Multiyear Assistance Program in Niger. Audit Report No.7-683-11-008-P. Dakar, Senegal: USAID.
Van den Ban, A.W. and Hawkins, H.S. 1996. Agricultural Extension, Second Edition. Oxford: Blackwell.
van Haeften, Roberta; Bentley, Jeffery; Fernandez, Alfredo; and McNulty, Judiann. 2009. The Final Evaluation of the FY 2002–FY 2008 Bolivia Title II Development Program.

4-86 Agriculture, Natural Resource Management, Livelihoods, Income Generation
van Haeften, Roberta; Fernandez, Alfredo; McNulty, Judiann; and Peterson, Tricia. 2006. An Assessment of the Save the Children Bolivia Title II Program Post Mid-Term Evaluation. La Paz, Bolivia: SC.
van Haeften, Roberta and Moses, Phil. 2009. USAID Office of Food for Peace Bangladesh Food Security Country Framework FY 2010 – FY 2014.Washington, DC: Food and Nutrition Technical Assistance II Project (FANTA-2).
van Haeften, Roberta; Zewditu Getahun Ayicheh; TesafiMebrahtu;andSorssaNateaMerga.2006.Final Evaluation of the CRS/Ethiopia and World Vision/Ethiopia 2001-2007 Title II Development Assistance Programs (DAPs). A report prepared for CRS/Ethiopia and WV/Ethiopia.
Vanmeenen, Guy. 2010. Savings and Internal Lending Communities – SILC – Voices from Africa. Nairobi: CRS.
von Braun, Joachim. 1989. Non-Traditional Export Crops in Guatemala: Effects on Production, Income, and Nutrition. Washington, DC: IFPRI.
Wingert, Steve. 2010. Feed the Future Initiative Achieving Food Security in Guatemala: Opportunities and Challenges. Washington, DC: Abt Associates.
World Bank. 2012. Agricultural Innovation Systems: An Investment Source Book. Washington, DC: World Bank.
World Bank. 2008. World Development Report: Agriculture for Development. Washington, DC: World Bank.
Yumkella, Kandeh et al., eds. 2011. Agribusiness for Africa’s Prosperity. Austria: United Nations Development Organization.

5-1
Second Food Aid and Food Security Assessment (FAFSA-2)
5. InfrastructureAbstract
Infrastructure activities (not including drinking water and sanitation infrastructure, which are assessed in Chapter 7) were implemented in 61 Title II development programs in 23 countries. This included 39 programs in Africa, 3 programs in Asia, and 19 programs in LAC. Using food to pay unskilled labor to work on public infrastructure (i.e., FFW) was a common feature of food assistance programs prior to USAID’s 1995 Policy Paper. Since then, more attention has been paid to the contributions that public infrastructure can make to a Title II development program’s longer-term goals, such as increasing agricultural productivity and production, increasing community resiliency, and reducing rural poverty. Most areas where Title II development programs work are relatively isolated geographically, and their lack of productive infrastructure, access roads, and irrigation and other water harvesting structures in particular is frequently a major constraint to their development over the longer term. Infrastructure activities were particularly crucial during the FAFSA-2 time period in countries where the focus was on the repair and rehabilitation of infrastructure damaged or destroyed by natural disasters or complex emergencies. The Title II program is somewhat unique within USAID in its ability to support small-scale infrastructure activities. During the FAFSA-2 time period, few other USAID projects had the resources needed to help poor rural communities improve their basic productive infrastructure and their links to markets. However, many implementers seemed reluctant to use this capability for a variety of reasons, including the technical complexities of these activities, the additional technical staffing required, and the additional efforts needed to respond to the increased emphasis on quality and sustainability. The value of the food devoted to FFW activities (excluding Ethiopia) declined from approximately US$50 million in FY 2003 to a little more than US$20 million in FY 2009, despite the emphasis in the USAID/FFP Strategic Plan on the importance of increasing the use of FFW in public works programs. The amount of cash used to pay for all the necessary complementary inputs, including engineering drawings and services and the TA and training needed to ensure that the public works would be constructed, operated, and maintained properly is unknown since USAID/FFP has not required its Awardees to report on the total amount of resources devoted to infrastructure. The policy implications of the infrastructure assessment are provided in Box 5.13, and the details on the conclusions and recommendations are provided in Sections 5.5.1 and 5.5.2.

5-2 Infrastructure
5.1 Introduction
5.1.1 Policy and Program Environment
After USAID’s 1995 Policy Paper was issued, more attention began to be paid to the contributions that public infrastructure can make to the Title II development program’s longer-term goals, such as increasing agricultural productivity and production and reducing rural poverty. Infrastructure activities were more fully integrated into Title II development programs during the FAFSA-2 time frame than they had been before, frequently under an AG/NRM/LH/IG SO. This was particularly true both at the beginning of the FAFSA-2 time period and then again later, following the adoption of the USAID/FFP Strategic Plan, under components that focused on increasing “community resilience” and/or reducing “community vulnerabilities.”142 Public works programs were viewed as attractive interventions in the USAID/FFP Strategic Plan because of the contribution they can make to protecting and enhancing “livelihood capacities” and “community resilience.” They were also promoted in the Strategic Plan as a “particularly attractive way to use food” (USAID/FFP Strategic Plan, 2005, p. 68). “The income transfer from the food provides a safety net for vulnerable households,” the Strategic Plan argued, “while the infrastructure creates assets that can help households increase their productivity and incomes,” “reduce their vulnerability to risks during the agricultural production cycle,” and “help communities protect and enhance their resiliency” (USAID/FFP Strategic Plan, pp. 68 and 72). Repairing and rebuilding roads, according to the Strategic Plan, can help connect communities and markets, expand economic opportunities, and increase competition in local markets. Having access to a more reliable source of water, through the construction of water harvesting structures and irrigation systems, means farmers are less exposed to the effects of droughts and more able to increase current crop yields and to diversify into
142 Some infrastructure activities were integrated into components that focused on water and sanitation. These are discussed in more detail in Chapter 7.
Box 5.1. Limitations and Gaps in the Program Documentation and DataThere are significant gaps and limitations in information available on the Title II infrastructure activities implemented during the FAFSA-2 time period. Most documents reviewed had little to say about the infrastructure components included in the programs. This included mid-term and final evaluations, very few of which included civil engineers on the evaluation teams. There was also considerable variation across Awardees and programs as to whether or not they reported on certain types of infrastructure and, if so, what indicators they used. Key information was frequently lacking about: what was actually constructed (how many roads, bridges, canals, etc.) during the FAFSA-2 time period, the quality of the construction, its socioeconomic impacts, and its likely sustainability. The fact that only partial information was available on the amount of resources devoted to infrastructure activities in Title II programs during the FAFSA-2 time period was also a limitation. Title II Awardees were required to report on the amount and value of the food resources devoted to FFW programs in their AERs through FY 2009, but not since then. Plus, there is no infrastructure category for Title II Awardees to use in filling out their annual resources Tracking Tables. Thus, the FAFSA-2 was not able to determine the total amount of resources that went to infrastructure or the relative importance of cash versus food in these programs.

5-3Infrastructure
higher-yielding and higher-value crops. Building cyclone shelters, flood embankments, dams, and other soil and water conservation structures can help communities reduce damage due to storms and floods. These and other examples are included in the “Illustrative Activities” section of the 2006–2010 Strategic Plan (see one example in Table 5.1). These examples also include information on the types of non-food assistance (cash in particular) needed for these activities to be successful. Food, in other words, is only a part of the solution, a point that is made in numerous places in the Strategic Plan.
5.1.2 Country Context
During the FAFSA-2 time period, infrastructure programs were implemented in four types of country contexts143:
• To rehabilitate infrastructure damaged or destroyed by natural disasters or complex
143 Additional information on the performance of the infrastructure components may be available from Layers, a tool that FANTA-2 developed to use to assess the quality of Awardees’ operations. Layers was carried out in a few countries during the FAFSA-2 time period, but the data it generated were not included in the FAFSA-2.
emergencies, including in Liberia, Mozambique, Sierra Leone, and northern Uganda. Road rehabilitation was a major focus in all four programs, although bridges were also a major activity in Liberia, and the Sierra Leone program also helped repair almost 4,000 houses damaged during the country’s civil war, which ended in 2002.
• As an integral part of broader AG/NRM/LH programs, building roads, dams, canals, NRM structures, and a variety of buildings, including cyclone shelters and storage facilities.
• To support the Government of the Federal Democratic Republic of Ethiopia’s (GFDRE) PSNP. This is not a typical Title II development program, given how closely the Awardees’ individual programs are integrated into the GFDRE program. However, it is an important program, given its size and potential impact (see Box 5.2).
• In two urban public works programs in Bolivia (see Box 5.3) and the CARE urban slum program in Bangladesh.
Table 5.1. Illustrative Activities: To Help Communities Build/Rebuild Community Physical Assets to Expand Economic Opportunities and Improve Access to and Increase Competitiveness of MarketsNon-Food Assistance Food AssistanceThe Title II program:
• Provides and/or coordinates the provision of the complementary inputs needed for the successful completion of the relevant infrastructure, such as engineering drawings and services and cement; also provides or ensures the provision of the TA and training needed to ensure that the public works are operated properly and maintained
The Title II program:
• Provides food through public works programs (food for work) to build community infrastructure, including roads, markets, and other public goods
• Monetizes food through small lot sales to support small traders and increase market competition
Source: This table is taken verbatim from the USAID/FFP Strategic Plan, p. 72.

5-4 Infrastructure
Box 5.2. The Ethiopian Productive Safety Net ProgramThe USG has been contributing to the GFDRE’s PSNP since its initiation in 2005, using Title II emergency resources during FY 2006 and FY 2007 and Title II development resources since then. The program, which has been described as sub-Saharan Africa’s largest safety net program, has multiple objectives. These include providing labor-intensive employment during the slack agricultural season, preventing dependency and encouraging a work ethic, and creating community infrastructure to increase production and incomes and promote sustainable development through increased access to services. The PSNP accomplishes these objectives by paying individuals from food insecure households in food, cash, or some combination of food and cash for spending five days a month working on a public works project. These projects are labor intensive (the GFDRE’s objective is that 80 percent of the costs go to unskilled labor) and include soil and water conservation activities and road rehabilitation and construction. Six Title II Awardees were involved in this program during the FAFSA-2 time period—CARE, CRS, FH, REST, SC US, and SC UK—through two separate program rounds (FY 2005–FY 2008 and FY 2008–FY 2011). In 2009, Title II programs covered about 18 percent of PSNP beneficiaries nationally and were active in 40 districts (woredas) and two pastoral areas. The USG’s contribution was primarily in the form of food. Nine other bilateral and multilateral donors also contributed to the PSNP, in cash, and there was a growing emphasis within the GFDRE to move to a combined food and cash payment and eventually to all cash.
Source: Joint Final Evaluation (Robins and Tessema, 2011).
Box 5.3. Urban Food-for-Work Programs in Bolivia
Urban FFW activities were an important part of the Bolivian Title II development programs prior to USAID’s 1995 Policy Paper. During the FAFSA-2 time period, two of the four programs included FFW activities in urban areas, in addition to their primary interventions, which were rural based. The FH/Bolivia urban FFW activities, which were part of the program from the start, were focused on the construction of water systems, storm drains, and sewer projects in two Bolivian cities—Potosi and Sucre. In the SC/Bolivia case, urban FFW activities were added to its program after several years of operation in an attempt to help the municipality of El Alto—the second largest city in Bolivia—cope with a major influx of immigrants from rural areas and the social tensions that were being created as a result of the lack of job opportunities for these recent migrants and their lack of access to public services. SC also used FFW to support the construction of water and sewer projects, plus parks and playgrounds, schools, and street improvements (including leveling, cobbling, and paving curbs, sidewalks, and streets). Both FH and SC worked closely with the cities’ municipal governments and were able to leverage considerable additional financial, technical, and in-kind support for these programs. These programs were more professionalized than the earlier programs, and both FH and SC paid more attention to the quality of the works and their sustainability.
Source: Bolivia Joint Final Evaluation (van Haeften et al., 2009, pp. 249–251).

5-5Infrastructure
5.2 Basic Facts about Infrastructure Programs in the FAFSA-2 Universe
5.2.1 Projects and Countries
Some types of infrastructure activities (not including drinking water and sanitation infrastructure, which are discussed in Chapter 7) were implemented during the FAFSA-2 period in 61 programs in 23 countries: 3 programs in Asia (Bangladesh and India), 19 in LAC (Bolivia, Guatemala, Haiti, Honduras, and Nicaragua), and 39 in Africa (Burkina Faso, Cape Verde, Ethiopia, Ghana, Guinea, Kenya, Liberia, Madagascar, Malawi, Mauritania, Mozambique, Niger, Rwanda, Sierra Leone, Uganda, and Zambia). Programs were counted as including infrastructure activities if they reported on an infrastructure indicator in their IPTT and/or they reported the value and quantity of resources devoted to FFW activities in the USAID/FFP AERs.144
5.2.2 Resources
Infrastructure activities implemented during the FAFSA-2 time period were supported with food and cash. Food was used to pay for unskilled workers, and cash was used to pay for skilled workers, including engineering staff and/or services, to rent and/or buy equipment, and to pay for construction to be done by private contractors. Cash was also used in some cases, in 100 percent monetization programs, for example, to pay for unskilled workers.
If one excludes the Ethiopia PSNP,145 which is a special case, the value of the food devoted to FFW activities declined from approximately US$50 million in FY 2003 to a little more than US$20 million in FY 2009, despite the emphasis in the USAID/FFP Strategic Plan on the importance of
144 This includes only programs completed during the FAFSA-2 time period.145 The substitution of Title II development food for emergency food in the Ethiopia PSNP program in FY 2008 and FY 2009 led to an increase in the total value of the resources being devoted to FFW in these years, but this is likely to change as the GFDRE continues to move to a more cash-dominated program.
increasing the use of food in FFW public works programs (see Figure 5.1). The value of the food represents only a portion of the Title II development resources spent on infrastructure during the FAFSA-2 time period. But whether this was a small or large share or what the total amount of resources spent on infrastructure added up to is unknown, since USAID/FFP does not have an infrastructure category that Awardees can use to report on their annual expenditures on infrastructure, i.e., the amount of cash plus the value of food used, if any (see Table 5.2). The amount of cash spent could have been considerable, however. All the infrastructure built under the ACDI/VOCA/Cape Verde programs plus the four programs in Mozambique were financed with cash, since these were 100 percent monetization programs. Other projects also included infrastructure components financed completely with cash, including, for example, the ACDI/VOCA programs in Rwanda and Uganda.
A Title II-Improved Road in Bolivia Reduced the Time to Market from a Week to Half an Hour
Photo credit: Jeffery Bentley
Figure 5.1. Trends in the Use of Title II Resources
0
10
20
30
40
50
60
70
FY 03 FY 04 FY 05 FY 06 FY 07 FY 08 FY 09
Mill
ion
US$
TOTAL FFW
Total Less Ethiopia Programs
Ethiopia Program
Table 5.2. Total Value of Title II Development Resources Devoted to Infrastructure during the FAFSA-2 Time Period
Food in FFW (million US$)
Cash (million US$) Total
FY 2003 60.5 ? ?
FY 2009 58.5 ? ?
Source: USAID/FFP Annual AERs.

5-6 Infrastructure
5.3 Program Approaches and Interventions
5.3.1 Objectives
The Ethiopian PSNP, as the name suggests, has both an employment creation (the safety net) and a capital formation (the productive assets) dimension, as did the urban public works components in the FH and SC programs in Bolivia. In the roads program in Mozambique, which was an all-cash program, it was the asset—the road—that was more important. This was true for the majority of the infrastructure programs that were implemented during the FAFSA-2 time frame, i.e., the completion of the asset and its longer-term development effects were the primary objective.146
5.3.2 Approaches
The approaches that the Awardees used to implement their infrastructure programs differed, with some Awardees taking responsibility for building the roads themselves (e.g., Africare in Uganda) and others contracting the work out to private contractors (e.g., ACDI/VOCA in Rwanda and Uganda). Awardees also developed different levels of technical capacity, with some hiring their own engineers, others contracting with consulting engineers to design and oversee the work, and still others relying on local governments for the design work and oversight of the actual construction. Some of these differences may have occurred in response to local conditions, but different Awardees also seemed to have developed their own preferred approaches.
5.3.3 Interventions and Outcomes
The Title II development programs implemented during the FAFSA-2 time period were basically
146 This puts most of the infrastructure developed under the Title II development programs during the FAFSA-2 time frame into the labor-intensive public works category that Clay and Singer refer to as “[l]ow cost infrastructure programmes” that put the main emphasis on assets created rather than the incomes of those employed to construct the asset. The other three categories are: relief works, long-term employment programs, and income-augmenting programs (Clay and Singer, 1985, p. 69).
consistent with USAID/FFP policy in that most focused on the development of public-type infrastructure (i.e., infrastructure usually financed and constructed by governments), including roads, bridges, dams, canals, soil and water conservation structures, and other structures that augment physical assets in an area.147
5.3.3.1 Roads
Road improvements were among the most common infrastructure activities funded under the Title II development program during the FAFSA-2 time frame, and in isolated rural areas roads are often among communities’ highest priorities. There are many examples from the FAFSA-2 time period of Title II-supported road improvements helping improve farmers’ access to markets, reducing the time that it takes to get goods to markets, expanding access to markets further afield, and helping reduce product losses. Roads also provide social benefits, as many of the Title II evaluations attested to, making it easier for people to get to schools and health posts and for social service providers to get to communities and helping decrease social isolation.
Thirty programs completed during the FAFSA-2 time frame included road indicators in their IPTTs. This included 10 programs in LAC (Bolivia, Guatemala, Honduras, and Nicaragua) and 20 programs in Africa (Ethiopia, Ghana, Guinea, Kenya, Madagascar, Malawi, Mozambique, Rwanda, Sierra Leone, and Uganda).
Most of the roads worked on could be categorized as farm-to-market or feeder roads,148 and the types of improvements described included rehabilitation
147 A few Title II programs also used relatively small amounts of resources to fund small-scale, family-level infrastructure (e.g., grain storage facilities and animal pens and stables). The difficultiesassociatedwiththeuseofTitleIIfundstosupportthe creation of private assets are discussed in Sections 5.3.3.3 and 5.4.5. Other activities, also small in scale, involved the rehabilitation of buildings for use as agricultural warehouses and social facilities, such as schools and clinics.148 Some reports also refer to some of these roads as “low volume roads.” These types of roads have relatively low use (e.g.,anaveragedailytrafficoflessthan400vehiclesperday),low design speeds (e.g., less than 80 kmh), and corresponding geometry (Keller, 2003, p. 21).

5-7Infrastructure
and upgrades. Although building feeder or farm-to-market roads is not as demanding as building a major highway, these are still complex activities, as illustrated in the brief description in Box 5.4 of the Title II road improvements implemented in Bolivia. A certain level of technical capacity is also required to produce a road that meets basic technical standards in a cost-effective manner. Poorly planned and constructed roads can have high maintenance and repair costs, contribute to excessive erosion, fail to meet the needs of the users, and deteriorate rapidly.
Although creation of the asset—the road—was the primary objective, many Title II programs were also sensitive to the value of providing part-time employment opportunities in the areas where they worked. WV/Mozambique referred to its approach to
building roads as “labor-based technology” (LBT), which it described as “maximizing opportunities for the employment of labor (skilled and unskilled),” but also one supported by basic equipment, including tractors and trailers for hauling gravel and tractor-drawn rollers for compacting soil. This approach, WV argued, was the most appropriate given the availability of labor in the areas where it worked and its relative lack of financial resources.
In Uganda, Africare and ACDI/VOCA adopted an approach fairly similar to the LBT approach WV used in Mozambique, with Africare ultimately buying the basic equipment it needed and ACDI/VOCA contracting the work out to local firms. MC/Uganda took a slightly different, somewhat more labor intensive approach to its road improvement efforts, opting to buy five small roller compactors (at
Box 5.4. Road Improvements in BoliviaAccording to the Title II program’s final evaluation, making improvements in rural roads in Bolivia usually involved making corrections to the horizontal and vertical alignments and transversal sections. The purposes of these activities are to correct the horizontal curves, making them wider; the vertical curves, to improve visibility; and the slopes along the road, so that they are not too steep. Road platforms are widened and their stability and durability increased and the slopes are corrected to reduce the likelihood of landslides. Putting in or improving drainage systems is another important component of a road improvement project to help avoid the destruction of the road platform. The construction of roadside ditches, brow ditches, culverts, fords, and bridges can all help channel water from streams or rainfall off the road platform. Controlling ravines and gullies, building retaining walls, and constructing other environmental mitigation works also help ensure the stability and durability of a road.
Source: Bolivia Joint Final Evaluation (van Haeften et al., 2009, p. 151).
J
A Title II-Improved Road in Bolivia Reduced the Time to Market from a Week to Half an Hour
effe
ry B
entle
y
Check Dams Controlling Erosion along a Title II-Improved Road in Bolivia
Jeffe
ry B
entle
y

5-8 Infrastructure
a cost of approximately US$17,000 each) when its arrangements with the district government to access some of its heavy equipment fell through. In MC’s case, the road grading is being done by hand, using FFW. But the quality of the roadbed produced by these small roller compactors, verified on site by the FAFSA-2 team, was much better than what could have been achieved with manual labor alone.
The challenges involved in finding the right balance between employment creation and quality are also reflected in the “Lessons Learned” section of the final evaluation of the four Bolivian Title II development programs (van Haeften et al., 2009, pp. 154–155). The basic point made here is that some “heavy equipment” is likely to be needed in road improvement programs, especially when one needs to compact roadbeds and to move large quantities of soil, “to insure that all the necessary technical, engineering and quality requirements are met.” “Making quality improvements in roads,” the final evaluation concluded, is not possible using only local manual labor “equipped with picks, shovels, and wheelbarrows and paid with food rations.” “Food can be used to cover the costs of unskilled labor, but money is needed to pay for the costs of design, skilled personnel, heavy equipment, and non-local materials.”149
The roads projects in Ethiopia, on the other hand, were/are highly labor intensive, as a result of the GFDRE’s requirement that 80 percent of the costs of all projects built under the PSNP go to unskilled labor. This policy may help explain some of the quality issues raised in the 2011 joint final evaluation of the two rounds of Title II programs implemented during the 2005–2011 time frame. Most soil and water conservation activities were well engineered, according to this evaluation, but the evaluators were concerned about the quality of the road construction and, in particular, about the fact that several areas had been identified where
149 Civil engineers were included as part of the evaluation teamsforboththejointmid-termandfinalevaluationsofthefourBolivianTitleIIdevelopmentprograms,astaffingpatternthat was not common even in cases where programs included significantamountsofinfrastructure.
improved access roads were regularly damaged by seasonal rainfall. This could have been a result of poor compaction of the roadbed and/or the fact that many roads were constructed without storm drainage systems, side ditches, or culverts, which made them “highly vulnerable” to soil erosion (Robins and Tessema, 2011, p. 35). The evaluation also questioned the advisability of relying so heavily on manual labor, particularly when trying to construct roads in rough terrain.
Outcomes. The results in terms of kilometers of roads built, rehabilitated, upgraded, repaired and/or maintained150 were mixed, with only 18 of 30 programs exceeding their targets. A larger percentage of the programs in the LAC region exceeded their targets (more than three-quarters), and three of the nine programs in Africa that did not meet their targets were in Uganda. Based on estimates provided in the IPTTs, approximately 13,060 km of roads were built, repaired, rehabilitated, upgraded, repaired, and/or maintained under the Title II development program between 2002 and 2009. A few programs also attempted to report on some measure of maintenance, including ADRA/Madagascar, Africare/Uganda, CARE/Madagascar, and WV in Ethiopia and Mozambique,
150 Thedefinitionsofeachofthesetermsvariesanddefinitionsalso vary by Awardees and country programs.
Roller Compactors Being Used to Compact a Roadbed in Northern Uganda
Eam
onn
Kilm
artin

5-9Infrastructure
but these indicators are not similar enough to be able to draw any program-level conclusions.
The 2002 FAFSA found that few Title II development programs provided information on the broader food-access impacts of their roads activities, with only a few programs providing information on changes in road use and commodity flows. This remained a problem during the FAFSA-2 time frame. A few programs implemented during the FAFSA-2 time period—Africare and ACDI/VOCA in Uganda—did track and report on changes in the amount of vehicular traffic on the roads they rehabilitated. Several Awardees also provided information from rapid surveys commissioned to assess the socioeconomic impacts of their road work on the surrounding communities. The final evaluation of the Africare program in southwestern Uganda describes some of the impacts of the roads it upgraded in Kabale as follows: More than 100 houses were constructed along the road, as were a new primary school, a nursery, two clinics, and one government health center; numerous businesses also flourished, including two grinding mills, a fish farming facility, and brick and stone quarrying, plus several shops, including five groceries, three butcheries, eight roadside food stalls selling fresh vegetables and dry agricultural produce, numerous local brew bars, and three locations for weekly markets selling household items and farm inputs (Anderson, 2006, p. 73). Both types of reporting—on changes in vehicular traffic and on the availability of businesses and services—are “better” practices. None of the programs reported on changes in the seasonal variability in commodity prices and transportation times and fees, which had been identified in the 2002 FAFSA as other “important food-access impacts of rural roads” (Bonnard, 2002, p. 46).
5.3.3.2 Water Management Structures
Irrigation
As discussed in more detail in Chapter 4, a number of programs implemented during the FAFSA-2 time period also helped their client farmers and communities build simple irrigation systems. Some
interventions could be considered public works, because they included the construction of dams (REST in Ethiopia), relatively large intake structures (FH in Bolivia), canals (CARE and FH in Bolivia and Kenya), and overnight storage reservoirs (CARE and SC in Bolivia and CRS in Malawi). Title II Awardees helped with the engineering designs, provided FFW as pay for unskilled workers, and helped organize and train the water user groups that are needed to take over the responsibility for operating and maintaining the systems.
Water Harvesting Structures
Water scarcity is a major problem in many Title II target areas. A number of programs used food and/or cash for work and/or TA to support the construction of a variety of structures designed to make more effective use of the limited water resources that are available. This included the construction of ponds to harvest water for animals (Bolivia and Ethiopia) and a variety of structures designed to slow water runoff and increase water retention. The latter included the construction of low check dams and contour stone bunds (referred to as banquettes in Niger), which are constructed along contour lines, to slow water runoff and allow more time for the water and organic matter to soak into the fields to increase water retention, replenish the water table, and help recuperate agricultural land (Niger and Burkina Faso).
Example of a Newly Built Stone Bund or Banquette in Niger
Eam
onn
Kilm
artin

5-10 Infrastructure
Water Control Structures
In other areas, too much water was/is the biggest problem. Recurrent flooding is a major problem in the areas where CARE/Bangladesh works, for example. So CARE helps poor households in some of the most vulnerable communities in the north raise their homesteads above normal flood levels. In the Haor area in the northeast, where entire villages are built on mounds that are surrounded by water during the rainy season, CARE/Bangladesh has helped communities build retaining walls around their villages to protect them from damage by wave erosion. SC/Bolivia included defense walls along river banks among its infrastructure activities in the first years of its program. CARE/Kenya also used FFW to rehabilitate drainage canals, clean stream beds, and raise and reinforce stream banks as part of a flood mitigation program.
Outcomes. Few Awardees reported on the water management structures constructed under the auspices of their programs in their IPTTs. This may be due in part to the considerable variety of types of infrastructure that fall under this category and inconsistencies in definitions. Although the little available information is interesting, it is not enough to use as a basis for any program-level conclusions. For example, ACDI/VOCA/Cape Verde reported on the number of reservoirs constructed (153 against a length of activity [LOA] target of 130) and number of check dams constructed (768 against a target of 118) (FY 2003–FY 2008). CARE/Kenya reported on the kilometers of irrigation and drainage canals rehabilitated under its program (820 against an LOA target of 210) and kilometers of seasonal rivers and streams rehabilitated (430 against an LOA target of 200). And CARE/Madagascar reported on the number of small dams rehabilitated (187 against an LOA target of 100) and number of meters of canals rehabilitated (539,431 against an LOA target of 550,000).
5.3.3.3 Natural Resource Management Interventions
Ten programs in the FAFSA-2 universe had separate SOs focused on improving the management of the natural resources in their target areas—five in
Africa (Chad/Mali, Ghana, Guinea, Ethiopia, and Malawi) and five in LAC (Bolivia and Guatemala). Numerous other programs included NRM components. Most programs included a mix of activities focused on improving the management of soil, water, forests, and grasslands. Many included a strong focus on the construction of soil and water conservation structures, including live and dead barriers, gully plugs, terracing, infiltration trenches, micro dams, dikes, and water harvest ponds. These types of activities accounted for an important share of the infrastructure activities included in the Ethiopia PSNP and the ACDI/VOCA/Cape Verde program, for example. Some programs also included the development of area enclosures to rehabilitate pasture land and the production of tree seedlings (in project-supported nurseries, which are discussed in more detail in Box 5.5) and planting of tree seedlings to help regenerate community forests. To help communities better manage their natural resources, some Title II Awardees also worked with communities and local governments on the development and implementation of watershed and conservation area management plans.
NRM activities, when implemented on community land, are clearly a public good, in that large numbers of community members are likely to benefit. It is also clear that, with the exception of some cultures that still have a tradition of community members contributing a prescribed amount of free labor to their communities in a given time period, this work would not be done in most poor communities because most members are too poor to devote scarce time to activities that are not going to provide them a relatively immediate return.
On the other hand, using food to encourage farmers to apply NRM practices on their own land is not a better practice, for reasons discussed in Section 5.4.5. One exception may be when the work to be done is on private land that is interspersed with community land and not applying the NRM practices on the private land could reduce the effectiveness of the whole program. In other words, there may be cases where not paying for work done on private land could have adverse effects on the creation of a public good. Behind this argument is the

5-11Infrastructure
recognition that, to be effective, many soil and water conservation structures and other NRM treatments need to be located close together and constructed in sufficient numbers to have an effect at a landscape level (i.e., on an entire watershed, micro watershed, hillside, or gully). If these structures and plantings are not implemented in a contiguous area, their impact will be limited and community members will have less incentive to maintain them in the absence of additional payments. In these situations, programs could end up generating short-term employment and little else.
This focus on a landscape effect is often discussed in the context of taking an integrated approach to watershed management. This emerged during the FAFSA-2 time period as a popular approach to designing and implementing soil and water conservation activities, including in Title II development programs. The issues with respect to taking a landscape effect approach include program size and resource availability, and whether having an impact at the watershed or even sub-watershed level is a feasible objective for most Title II programs.
This approach does seem to be a valid one for the programs that support the PSNP in Ethiopia,
where soil and water conservation and other NRM activities, including regenerating forests and pastures, are being implemented under a “Community-Based Participatory Watershed Development” approach (Robins and Tessema, 2011, p. 32). These programs are designed to have an impact at the watershed level, and there is some evidence that water tables are rising due to improved water retention after highland drainage areas have been closed, terraced, and reforested. But these are large programs in terms of financial and human resources and time (they have been under way for more than 20 years in some areas in northern Ethiopia, such as Tigray). REST, an Ethiopian-based Title II implementer, has made a commitment to this approach. CRS has also adopted the concept of integrated watershed management in Ethiopia, using it as a way to focus and organize all its program activities (Herbert et al., 2010, p. 1). The final evaluation of the CRS and WV programs in Ethiopia that were implemented between FY 2003 and FY 2005 also reported that these programs, which were applying physical and biological treatments consistently throughout sub-watersheds, could have a noticeable impact on reducing the rates of soil erosion and increasing water retention and availability in only a few years (see Box 5.6).
Box 5.5. The Role of Project Nurseries Project-supported nurseries were critical components in many NRM programs, when large numbers of tree seedlings were needed to supply a reforestation component, for example, but sufficient quantities were not available from government sources or the private sector. Some nurseries were project-run, but the more common strategy was to organize and train community groups to produce the planting materials and to reimburse workers for their time with FFW. These programs can have technical problems. The Bolivian mid-term evaluation team, which included an environmental specialist with experience running tree nurseries, found technical problems related to nursery management in all the nurseries visited and the absence of tree seedling production best practices. Sustainability can also be an issue. It is debatable whether sustainability of these nurseries should even be a program objective and, if so, what approaches are more likely to be sustainable. Although fewer in number, the family nurseries that FH supported in Bolivia and the private producer of horticulture seedlings that ADRA worked with in Nicaragua had some chance of being sustainable after these projects ended. Community-based nurseries, on the other hand, are unlikely to continue operating once FFW ends, and private sector takeovers of these nurseries, as some Title II programs began to entertain as they neared completion, were/are highly unlikely.

5-12 Infrastructure
On the other hand, most Title II programs do not have enough money or locally available labor to be able to apply soil and water conservation measures to all watersheds, or even the most important watersheds, in their target areas. Under these conditions, the better practice is to focus the resources available for the implementation of environmental protection measures on the protection of economic assets important to communities, a strategy that should also increase the likelihood of their sustainability. The four programs in Bolivia used FFW to support a variety of environmental protection measures, including stream protection, terraces, gully plugs, check dams, vegetative barriers, and other soil and water conservation structures and plantings, to protect sources of water for irrigation and household use, for example, and valued feeder roads. In Malawi, the FAFSA-2 team saw members of the CRS consortium using FFW to pay community members to construct gully plugs and vegetative barriers to protect water sources and fields the project was also helping to bring under irrigation. In Niger, the team saw some of the mechanical and biological structures that CPI/Niger was helping communities put in place to stabilize sand dunes that were encroaching on valuable
wetlands (which the project was also helping develop), nearby houses, and roads.
Outcomes. Thirty-two of the programs included in the FAFSA-2 AG/NRM universe reported on the “number of hectares of land conserved” or had “new/improved NRM practices applied to them,” and three-quarters of these programs reported exceeding their targets. Based on the estimates provided in the IPTTs, approximately 60,000 hectares were conserved or had new/improved NRM practices applied to them151 under Title II development programs between FY 2002 and FY 2009. Millions of tree seedlings were also produced under these Title II programs, usually in project-run or -supported nurseries, and planted during this same time period.152 Without further documentation, these numbers tell us very little about the nature of these achievements, however, or how they were obtained. It is not clear, for example, whether all these hectares were public land or whether any food and/or cash was used to encourage farmers to build these structures, apply these practices, or plant these trees on their own or on public land.
5.3.3.4 Buildings
Relatively few buildings were included in the infrastructure programs, and the few that were were usually built to satisfy specific project objectives (e.g., stores and warehouses to store agricultural products, markets, and storm shelters for emergency use). In many cases, buildings were rehabilitated rather than newly constructed. In Bangladesh, CARE and SC helped develop flood and cyclone shelters in their target areas. Many of these were actually schools that had been rehabilitated to
151 Thedefinitionofeachofthesetermsvaries;definitionsalsovary by Awardees and country programs.152 Very few programs reported in their IPTTs on the number of tree seedlings produced and/or planted, but the numbers can be substantial. ACDI/VOCA reported planting more than 700,000 forestry, fruit, and coffee seedlings in its Cape Verde program (FY 2003–FY 2008), for example, and at least 500,000 forestry and fruit tree seedlings in its Rwanda program (FY 2000–FY 2005). CRS reported planting more than 5.2 million tree seedlings in its Ethiopia program (FY 2003–FY 2005) and more than 500,000 in its Kenya program (FY 2001–FY 2006).
Box 5.6. Lessons Learned from the CRS and WV NRM Programs in Ethiopia“The new approach to land rehabilitation [that] combines physical soil and water conservation structures with biological measures and applies them consistently throughout a sub-watershed to have a landscape effect can have a noticeable impact even in a few years in reducing the rates of soil erosion and increasing water retention in the soil and water availability for domestic consumption and agriculture…”
Source: Final Evaluation of the CRS and WV Programs (van Haeften et al., 2006, p. 53).

5-13Infrastructure
a higher standard, while also maintaining their original function as schools. Floor elevations for these structures were designed to be higher than the anticipated maximum flood level, and, in some cases, the ground floor was left open, with all rooms located on upper levels. This enabled people to use the ground level to shelter their livestock.
5.4 Cross-Cutting Issues and Opportunities
5.4.1 The Role of Infrastructure in Title II Development Programs
Infrastructure development continued to play an important role in a number of countries during the FAFSA-2 time period. Infrastructure activities were particularly crucial in countries where the focus was on the repair and rehabilitation of infrastructure damaged or destroyed by natural disasters or complex emergencies. In other countries and programs, the immediate challenges to the implementation of successful infrastructure components appeared to drive many Awardees’ decision-making processes about whether to do infrastructure, rather than their longer-term benefits. Challenges frequently cited by Awardee staff included: problems in meeting technical standards; the need for a completely different set of technical skills (e.g., engineers) than needed for other interventions; the need for more human
resources to properly oversee construction and other management problems; the high cost, taking scarce resources from other important activities; the inherent sustainability issues; and, particularly, the susceptibility to fraud.
The decision whether or not to include an infrastructure component in a project appeared to be a dilemma for some. Infrastructure can be difficult to implement, and adding infrastructure to a project may require Awardees to make adjustments in their organization and staffing, adding more engineers, for example, and improving supervision, which some have done. However, there are also downsides to de-emphasizing infrastructure, especially if one is interested in promoting the longer-term developmental impact of Title II programs. The nature of this dilemma was illustrated during a discussion with one Title II program director with whom the FAFSA-2 team spoke during one of its African field visits. The discussion began with the director listing all the difficulties one has to deal with when working on infrastructure, roads in particular. Later in the discussion, however, and in response to a question about what types of activities were likely to make the biggest and longest-lasting difference in people’s lives, infrastructure was at the top of his list.
5.4.2 Technical Efficiency and Cost Effectiveness
Public works programs, according to Clay and Singer, “have had a poor record with respect to the quality of the assets created and the efficiency with which the work is done,” and this lack of quality and cost-effectiveness lessens their development impact (Clay and Singer, 1985, p. 77). Several factors are responsible for these quality and efficiency problems, including insufficient complementary inputs (including design, management resources, equipment, and materials); lack of or poor maintenance; and low labor productivity and poor work. While these problems have also been evident in Title II-supported public works programs, steps can be taken, according to Clay and Singer, to increase the likelihood that the assets created will be productive. These steps, which are outlined in
Dune Stabilization in Niger to Protect the Development of a Title II-Supported Agricultural Wetland and an Adjacent Village
Eam
onn
Kilm
artin

5-14 Infrastructure
Box 5.7, are still relevant for guiding the design and implementation of infrastructure created under the Title II development programs.
To deal with issues of cost-effectiveness, more information is needed on program costs and effectiveness. The Title II development program, following the lead of the rest of USAID, has focused its attention on improving the availability of information on indicators of performance and has paid relatively little attention to collecting data on and assessing the costs and relative cost-effectiveness of alternative interventions.153 The CRS/Ethiopia evaluation of its integrated watershed management programs is a good, but rare, example of an attempt to assess not only the relative contribution of each program component to overall program performance, but also its relative cost-effectiveness. Lack of data on the relative costs of various program components and on the number of households targeted by various interventions were two of the biggest hurdles the evaluators faced (Herbert et al., 2010).154
5.4.3 Collaborating with Communities and Local Governments
Awardees typically tried to work closely with target communities on infrastructure programming, to get their support early, with the expectation that this would lead to the communities taking responsibility for the maintenance of the infrastructure once the projects ended. Many also tried to collaborate with local governments, for example, the districts (woredas) in Ethiopia and the municipalities in Bolivia. In some cases, the programs were able
153 USAID recently began to re-emphasize the importance ofcost-benefitandcost-effectivenessanalyses“todirectpractitioners to the most promising and sustainable paths to development”and“toinsurethatweusescarcefundstobenefitthe poor by intervening where necessary and leveraging private funds and untapped sources of capital wherever possible” (Bahn and Lane, 2012, pp. 192–195).154 CARE/Bangladeshalsofinancedanassessmentofthecost-effectiveness of its homestead raising and mound protection programs in northern Bangladesh, concluding, for example, thatthehomesteadraisingprogramwasasoundfinancialinvestment as long as the homesteads remained for at least sevenyearsintheNorthCharandfiveyearsintheMid-Char(Todd, 2008, p. 30).
to work in cooperation with local representatives of central government agencies, such as technical staff from the ministries responsible for water resources and the environment in Niger. In this case, government engineers provided the designs for some of the structures (e.g., dams) and oversaw the construction work, with the Title II program covering their expenses in the field. In Uganda, local officials often had master plans for rehabilitating and/or upgrading rural and community feeder roads and were usually involved along with target communities in the road selection process. In Bolivia, the four Awardees were able to leverage considerable monies from the local municipalities to support their infrastructure programs, roads in particular.
Collaborating with communities and local governments in the selection, design, and
Box 5.7. Suggested Guidelines for Enhancing the Productivity of Public WorksTo be productive, assets created through public works programs need to:
• Use technology appropriate to the environment
• Be technically and economically feasible
• Conform to acceptable minimum engineering standards
• Not present costly maintenance problems
• Be consistent with economic priorities
• Use labor in amounts that are sensitive to the employment needs in the locality but also consistent with the need to ensure that the infrastructure meets basic quality standards
• Be effectively utilized and maintained
Source: Adapted from Clay and Singer, 1985, p. 78.

5-15Infrastructure
implementation of infrastructure projects is a better practice, in part because of the important role communities and local governments will have to play in any Awardee’s exit strategy and to enhance the likelihood of sustainability. There can be downsides to these arrangements, however, particularly when local governments cannot and/or do not meet their commitments, whether these include providing the initial engineering designs, taking over the responsibility for on-site supervision, or supplying the heavy equipment needed in the case of roads projects. Awardees have found that they also need to be realistic about what they can and cannot expect from target communities and local governments and agencies to avoid delays and poor quality work.
For example, SC/Bolivia decided at the beginning of its program to rely on municipal governments to prepare the technical proposals for their community-level infrastructure projects. Unfortunately, this resulted in projects that were of poor quality and not completed on time. To deal with these problems, SC created a separate infrastructure unit and hired additional staff for this unit that were given responsibility for the design and supervision of all its infrastructure activities. Creating this in-house capacity enabled SC to improve the technical quality of its projects and eliminated the need to contract with outside consultants to correct the technical proposals that it had been receiving from the municipal governments. It also reduced the number of problems that SC staff had to solve on-site. SC also found that having an in-house engineering capacity improved coordination between the engineers and the other project components, making it easier to get input from the MCHN, AG, and NRM staff in the process of identifying infrastructure. It also helped ensure that environmental considerations were built into each infrastructure project from the beginning.
Road work was also delayed in a number of programs, including in Bolivia, Kenya, and Uganda, because the governments did not make good on their commitment to provide the Title II Awardees with the heavy equipment that they had promised. Sometimes the equipment was old and/or poorly
maintained; in other cases, it was simply not made available. This happened to Africare in Uganda. As a result, Africare decided to buy its own heavy equipment (including road graders, compactors, trucks, and excavators), which it used to complete the road work in southwestern Uganda and is now using in northern Uganda in the FY 2007–FY 2011 ACDI/VOCA-headed program. In Kenya, the Ministry of Public Works failed to provide gravel and heavy machinery to compact the roads CARE was rehabilitating, as was agreed to. This had a negative effect on the quality of the roads, according to the final evaluation, and resulted in the roads being passable only during the dry season (CARE, 2009, p. 4). ACDI/VOCA/Uganda also faced delays in its road-building activities in northern Uganda because many of the local districts with which it had planned to collaborate were new and did not have the necessary equipment. ACDI/VOCA eventually decided to contract out all its road-building activities to private sector contractors, contracting with a consulting engineer to handle the design and supervisory functions.
Program documents and field visits also provided several examples of successful links between Title II infrastructure programs and other donor programs. Careful planning and some element of luck can sometimes tie a project intervention into a larger project being implemented by another agency, thus leveraging a relatively small amount of funding into an overall impact of some significance. This was the case with a road project that the FAFSA-2 team visited in Guatemala. The road, which was financed with World Bank funds administered through the central and municipal governments, was designed by department highway engineers and built by a construction company contracted by the department. The SHARE/Guatemala Title II program assisted with project supervision and also provided FFW as payment for some of the labor used in building the road. The SHARE engineer estimated that SHARE’s contribution of FFW accounted for around 10 percent of the total cost of the road. The project began in the spring of 2010 and took about 12 months to complete. Some FFW was used to pay to have strategic slopes along the road planted with trees and grass as erosion control.

5-16 Infrastructure
5.4.4 Infrastructure Priorities: Project- and/or Community-Driven
Some programs in the FAFSA-2 universe—those with road components in particular—started out with a relatively clear idea of what types of infrastructure they were going to focus on and what their targets were going to be. Others took a more decentralized approach, allowing more decisions to be made at the individual community level. Both approaches had their challenges. To be successful, programs had to find an appropriate balance between being responsive to communities’ perceptions of needs and achieving overall project impact as well as community-level impact.
Involving communities starting at the planning stage is important—project designers may not have the same priorities as community members. On the other hand, if one tries to be too responsive to community requests, one could end up supporting activities that are not cost-effective. Two communities may want their own road connection to the main road, when, from a project perspective, one road connecting them to each other and to the main road might be more cost-effective, as was the case in Bolivia. Providing community members with FFW to clean up a road—an activity that they should have been willing to do themselves—because the project had made a commitment to supporting an FFW activity in that community is another example (from Guatemala) of an inappropriate balance between trying to be responsive to a community and overall project effectiveness.
Several evaluations reviewed contain information on the criteria that the programs used to identify the roads that they worked on. The criteria used by Africare/Uganda (see Box 5.8) and WV/Mozambique (see Box 5.9) demonstrate a concern for the economic benefits to be gained from a road, but also recognize the importance of obtaining local support (the Africare criteria were applied to the lists of proposed roads provided by the districts). Both programs also went through a lengthy consultative process with key stakeholders, including communities and local governments, before final decisions were made. One did not get such clear answers in the field to questions about
the process or criteria used to select specific roads or other infrastructure activities. This may be because the people involved in the initial selections were no longer around. On the other hand, it could also suggest a certain lack of transparency in the selection process, which, if true, could be a sign of other potential issues, including manipulation of the process by certain interests and underlying dissatisfaction on the part of others.
Box 5.8. Uganda: Criteria Used by Africare to Select Project Roads• The roads must link inaccessible areas.
• The roads must connect the targeted communities in other parts of the Africare program.
• The roads must be economically viable and feasible.
• The total road length must be in accordance with the budget.
Source: Africare/Uganda Final Evaluation (Anderson, 2006, p. 71).
Box 5.9. Mozambique: Criteria Used by WV to Select Project Roads• Roads that serve areas of high agricultural
potential with large populations.
• Roads that are suggested by District Administrators.
• Roads that link populations in need of agriculture or health services.
• Roads that serve as potential links to other markets, cities, or districts.
Source: Mozambique Final Evaluation (WV, 2006, p. 12).

5-17Infrastructure
The final evaluation of the ACDI/VOCA/Cape Verde program identified some of the shortcomings of trying to be too specific up front about the types and number of public works that a project is going to support. The practice of setting specific targets for specific types of soil and water conservation activities at the beginning of the project, the evaluation argued, was inconsistent with the association-led planning process, which ACDI/VOCA had also adopted as a way “to better reflect the needs of the communities and to give more ownership of the works by the communities so they will have a more direct interest in maintaining the works” (Langworthy et al., 2005, p. 6).
On the other hand, the final joint evaluation of the four Guatemala Title II programs expressed a number of concerns related to the consequences of Awardees not having a clear vision up front of the real infrastructure needs in their target areas or of the contributions that these infrastructure activities should make to their overall project objectives. Specific concerns included: (1) the lack of a clear process for selecting infrastructure activities (FFW projects, it was noted, were often generated at the suggestion of technical staff); (2) the lack of a standardized approach to the use of food in the four programs (two used food to encourage project participants to adopt the project-recommended practices on their own lands, which in itself is not a good practice, and two did not); and (3) the impression that some of the infrastructure activities may have been supported primarily to meet food distribution goals. The final evaluation also recommended that the Awardees consider using a competitive selection process for identifying their infrastructure projects in the future “so that communities will see themselves as obtaining these resources on merit rather than as a gift” (Schnell et al., 2006, p. 4 and pp. 47–56).
5.4.5 Using Food-for-Work in Infrastructure Programs
Some programs included in the FAFSA-2 universe used food in their infrastructure programs, usually to pay for unskilled labor. This was the case in the Ethiopia PSNP and the Bolivian urban public
works programs (see Box 5.2 and Box 5.3). In Cape Verde and Mozambique, all infrastructure activities were paid for with monetization funds, including payments to unskilled labor, since these were 100 percent monetization programs. Some cash will always be needed in all infrastructure programs (e.g., to pay for technical staff; skilled manual labor; and non-local materials, including cement, pipes, and iron sheeting for roofs), as was emphasized in the USAID/FFP Strategic Plan.
FFW programs were such a common feature of past food aid programs that Clay and Singer suggest that “food aid has become almost synonymous in much writing with food for work” (Clay and Singer, 1985, p. 80). The use of food in the form of FFW has also generated considerable controversy over the years. Two issues of particular importance with respect to the use of FFW during the FAFSA-2 time frame were the use of food as FFW to support the creation of private assets and the use of food (in lieu of cash) to pay the workers for time spent working on public works project.
Normally, one should avoid using food (or cash) to reward farmers for undertaking activities on their own land and from which they are expected to receive direct economic benefits. This includes various land preparation activities, planting fruit trees around their houses, and making individual compost pits, activities that were still being supported with food in some of the Title II programs that were under way during the FAFSA-2 time frame.155 Using food can make an activity profitable for farmers to undertake in the short run, as long as the food is available. But if activities are not profitable in the absence of food, farmers will not continue them or will not continue to maintain the structures built once the food is no longer available. Using food to promote the adoption of activities that are not economic in the absence of food has the additional disadvantage of diverting people’s time and attention from other potentially profitable
155 Thesecriticismswereraisedinthe2006jointfinalevaluation of several of the Title II programs implemented in Guatemala from FY 2001 to FY 2006 (Schnell et al., 2006, pp. 47–52).

5-18 Infrastructure
activities. (Some of these issues are also discussed in Section 4.3.2.2 on “Natural Resource Management at the Farm Level.”)
Roads are clearly a public good, and there are numerous examples during the FAFSA-2 time frame of Title II development programs making good use of FFW in their roads programs. One of the more attractive uses of food has been to pay community members to carry out the relatively labor-intensive environmental mitigation measures along the sides of the roads, including planting trees and grasses to stabilize road banks and adjacent slopes. Some of the quality issues associated with the use of food in a public works program can also be true of the use of cash for work, and are more likely to stem from the desire to include a large labor component in the project than from the actual payment method.
Irrigation systems, on the other hand, can have both private and public dimensions, a fact that was recognized in many of the small-scale irrigation systems implemented during the FAFSA-2 time frame, some of which were developed without using food (or cash) for work. In these cases, Awardees helped organize the communities and/or the user group(s), did the design work, and helped provide purchased inputs (e.g., cement, polyvinyl chloride [PVC] pipe, and pumps), and users contributed labor and some local materials for free. This is the preferable approach in the case of smaller systems, where participants are able to directly capture the economic benefits of their own work (e.g., from digging feeder canals to their own plots). Cases also exist where FFW is an appropriate approach, e.g., to reimburse community members for time spent working on the larger-scale infrastructure that is part of some irrigation systems (e.g., the dams, major canals, and night storage reservoirs that are more in the nature of public goods).
There has also been extensive debate over the years over the advantages and disadvantages of using food as a wage good. These issues fall into several categories, according to Clay and Singer, including the advantages of a food element in wages, the risks of disincentives to local agriculture, handling
problems with bulky food commodities, the acceptability to workers of food aid commodities, and non-food wage components (Clay and Singer, 1985, p. 81). These issues were still being debated during the FAFSA-2 time frame, with an increasing number of stakeholders expressing a preference for cash payments. This preference also extended to some governments, including the Ethiopian government. The Government of Niger went further and, in 2007, banned the use of FFW activities in non-emergency programs. This decision left the Africare/Niger and CRS/Niger Title II development programs scrambling to try to find appropriate alternative uses for the food that they had already programmed as FFW, with some of the food being used to stock CCBs (see Box 4.11 for additional information on these interventions) and as Food for Literacy. However, the Clay and Singer conclusions remain relevant. “Findings about the performance of food for work more generally appear contradictory,” they write, “and suggest that success is a local phenomenon dictated by the need for and design of projects, the socio-political climate and the ability and integrity of officials, not the type of remuneration” (Clay and Singer, 1985, p. 84).
The potential for FFW programs to have disincentive effects on local agriculture is a particularly important issue given the context. That is, the programs are being implemented in conjunction with broader agricultural development programs and are expected to make a positive contribution to the production and livelihood/income objectives of these programs. For example, FFW programs have to be particularly careful to avoid creating perverse economic incentives and having adverse effects on local labor and product markets. The timing of the work can be important, for example, and may place practical limits on the size of a FFW program that can be implemented. It may be difficult to do road work in the rainy season, for example, and the work should not be undertaken during the times when farmers need to be working in their fields, even when some of these activities could be undertaken during the so-called “lean season.” Most poor rural households, which are the targets of Title II development programs, are also heavily

5-19Infrastructure
dependent on agriculture as their main (sometimes only) source of income, and they need to have time to invest in their own assets and livelihoods to ensure longer-term survival. One also needs to be careful in setting the ration, keeping its value below the prevailing wage rate to avoid having the program interfere with the functioning of local labor markets. Food aid commodities distributed through MCHN and/or safety net programs, if they are relatively large with respect to the market in the area where the distribution is taking place and not managed well, can also have disincentive effects on local production and markets. Title II development programs also need to be aware that some types of FFW activities that have been used effectively in emergency environments, when markets were likely in disarray, may no longer be appropriate once production levels have been restored and markets have returned to more normal conditions.
5.4.6 Capacity Strengthening
Most Awardees also included capacity strengthening efforts in their infrastructure programs, including activities designed to sensitize community members to the importance of maintaining the roads and training them in simple road maintenance techniques. Several other capacity strengthening efforts that took place during the FAFSA-2 time period are also of interest. In Cape Verde, ACDI/VOCA/Cape Verde decided it would be more cost-effective to implement its soil and water conservation activities through contracts with rural associations rather than through the government and government road gangs. ACDI/VOCA provided these associations with technical training and training in organization, management, and financial control systems, to strengthen the organizations and improve their performance. Later in the project, it added a focus on business development, internal income-generating activities, and partnering with other organizations as part of its exit strategy. In Mozambique, one of WV/Mozambique’s specific objectives was to improve the capacity of the small-scale local firms that it contracted with to rehabilitate the local access roads. WV supplied these firms with the machinery (including tractors,
compaction rollers, and tractor-towed graders) needed to rehabilitate these roads,156 plus training in business management to help the firms improve their operations. Over time, according to the project’s final evaluation, these firms were able to buy additional road construction equipment using income earned from the road works, open up offices and workshops, become licensed enterprises, compete for road works outside the WV program, and diversify their businesses into other income-generating activities unrelated to road construction (WV, 2006, p. 22). To improve targeting and the timeliness and scheduling of food and cash transfers, the six Awardees in Ethiopia worked with local governments to strengthen their capacities to manage and utilize computerized systems for beneficiary tracking, in early warning activities, for M&E, and for commodity management.
5.4.7 Sustainability
The factors that influence whether infrastructure built under the Title II development programs will be sustainable differ depending on the type of infrastructure. Roads are a public good, and whether the roads that were built, rehabilitated, upgraded, and/or repaired are sustained depends largely on whether the communities that benefit from these roads and/or some government entity (e.g., a local roads department) take responsibility for maintaining them. Proper maintenance is particularly important for rural roads, which can quickly fall into disrepair if the roadbeds are not kept in good shape and their drainage systems are not regularly and properly cleaned.
As part of their sustainability strategies, many Awardees devoted considerable time and attention to building local commitment and capacity to take over
156 WV/Mozambique set up a facility for contractors to use to help them purchase equipment. At the beginning of the project, some of the equipment that was initially used by WV was transferred to these contractors and the payments for this equipment were deducted from the payments that they received for work performed. Contractors were then encouraged to buy more essential construction equipment, using funds generated from their contracts (WV, 2006, p. 4).

5-20 Infrastructure
responsibility for maintaining the roads once they were finished. As they began to better understand the value of environmental mitigation activities, many Awardees also began to pay more attention to ensuring that appropriate environmental mitigation measures were incorporated into the design and implementation of their roads components.
Most programs in the FAFSA-2 time frame appear to have tried to get communities and local governments to take over responsibility for maintaining the roads and the drainage systems that they helped construct. These efforts seemed to work well in some cases, such as in Bolivia, where the municipalities had access to resources. In these cases, the Title II Awardees worked with the communities and municipalities to ensure that the funds needed to maintain the roads were written into the municipalities’ annual operating budgets. In other countries and programs, arrangements ended up not working out, for a variety of reasons, including situations where the agencies did not have the necessary technical staff, equipment, resources, and/or political will.
Alternatives to local governments taking over responsibility for the maintenance of these roads may also be available, but it is usually a better practice to try to identify and firm up these arrangements early on. In one case—the road that the FAFSA-2 team inspected in the CRS/Niger program—the community was charging tolls on the road to help pay for maintenance costs. In another case, the final evaluation of the ACDI/VOCA/Rwanda project suggested that, in the future, ACDI/VOCA should consider aligning its road rehabilitation interventions directly with the specific transportation needs and constraints identified by the cooperatives, associations, and other agribusinesses it plans to work with to get their support for road maintenance (Swanson, 2004, p. 39). The final evaluation of the Africare program in southwestern Uganda also supported Africare’s attempt to get funding for road maintenance from a Forest Conservation Trust that was benefiting from
one of the roads that it helped upgrade.157 This final evaluation also recommended that Africare continue the practice of looking for other possible partners to contribute to construction and maintenance costs (see Box 5.10).
Title II development programs can also do much to train local people in road maintenance techniques and sensitize them to the critical nature of these interventions and the process of planning and carrying out these repairs. In Bolivia, for example, all four Awardees worked to organize and train roads committees in the participating communities, which they initially used to coordinate with the communities on aspects related to the design and later the construction of the roads. Once construction was completed, the Awardees trained the construction committees and communities in routine road maintenance. This included filling potholes and cleaning and maintaining roadside ditches, culverts, and gully controls. Evaluations of all the programs that included major road components (Bolivia, Ethiopia, Mozambique, and Uganda) paid particular attention to this subject in the “best practices” section of these reports.
The sustainability of some of the other types of infrastructure that were being built under Title II development programs will depend on whether the people that are affected by the infrastructure feel that the benefits they are receiving, especially the economic benefits, are worth the costs in time and money to do the necessary repairs and maintenance. This is true for the irrigation systems that were constructed under the Title II programs, whose sustainability depends on whether the water users associations that were developed continue to function and how effective they are in carrying out their operation and maintenance tasks (see Section 4.3.2.3 on “Irrigation”). NRM structures are also more likely to be effective and sustainable if they are tied to income generation activities. These include activities designed to help protect
157 Accordingtothefinalevaluation,thetimethatitwouldtaketourists to reach this site was cut in half as a result of the road improvements Africare made (Anderson, 2006, p. 87).

5-21Infrastructure
water sources, wetland areas, and roads, as well as communities themselves (see Box 5.11).
5.4.8 Basic Principles for Guiding Infrastructure Development
The USAID/FFP Strategic Plan is clear about the importance of public infrastructure components in Title II development programs and that these programs should be designed and implemented in ways that support the broader objectives of the Title II program, contributing to improvements
in agricultural productivity and access to food and to reductions in vulnerability. The FAFSA-2 team found examples, in the documents reviewed and during the field visits, of Title II-supported infrastructure activities that were well designed and implemented. The team also found examples of activities that were not consistent with some of the most basic principles for the implementation of successful infrastructure components in the context in which the Title II development programs work. One of the most basic principles and the one that was emphasized in the USAID/FFP Strategic Plan
Box 5.10. Road Sustainability: One Example from UgandaThe FAFSA-2 team engineer visited the area in southwestern Uganda where Africare was active during its FY 2002–FY 2006 project to get an idea of the impact and sustainability of what had been an extensive and ambitious infrastructure project. According to the IPTT summaries, Africare built approximately 88 km of roads during this period. A representative sample of roads equivalent to about a third of the total length built was visited in three days in five districts around Kabale city. In general, the condition of the roads was not bad, and the communities had been fairly consistent in carrying out rudimentary upkeep of road surfaces and drainage systems. Environmental mitigation measures had matured well, and vegetation on slopes and roadsides had stabilized nicely. The roads projects had been well integrated with the agriculture and income generation program components and many of the communities along the routes seemed to be thriving, with many small businesses, such as shops and fruit stands. Many of those interviewed had moved to the area because of the improved conditions, and because the communities now had easy access to employment opportunities in neighboring towns. The program was also able to involve the communities in helping sustain the roads by implementing training and awareness programs to sensitize the target populations to the need to maintain their new roadway access systems. Other projects trained residents in the basic skills involved in road maintenance. Since the routes chosen were feeder roads, built according to Government of Uganda standards, they were eligible for adoption by local authorities and their maintenance crews were already upgrading and/or maintaining sections of some of the roads visited.
Box 5.11. Lessons Learned on Sustainability from the CRS and WV NRM Programs in Ethiopia“Incentives are crucial in determining the extent to which community members will participate in natural resource management activities and they will have to continue to receive tangible benefits from these activities or they will not be sustained. These incentives and their effects need to be understood when designing, implementing and phasing out of any conservation and natural resource management activity.”
Source: Final Evaluation of the CRS and WV Programs (van Haeften et al., 2006, p. 89).

5-22 Infrastructure
is the need to give priority to the development of productive assets at the community level. A broader set of principles that were originally developed for use in the Malawi Food Security Programming Strategy for FY 2008–FY 2014 (see Box 5.12) are directly applicable to Title II infrastructure activities.
5.5 Conclusions and Recommendations
5.5.1 Conclusions
• A strong case can be made that small-scale public infrastructure activities should continue to play an important role in Title II development programs. Most areas where Title II development programs work are relatively isolated geographically, and their lack of productive infrastructure is frequently a major constraint to their development over the longer term. Agricultural development programs often falter because farmers, and in particular the resource-poor farmers with whom the Title II programs work, are not able to access
inputs from or transport their products to markets, as one example. In other words, well-chosen and -implemented infrastructure can also increase the likelihood that Title II development programs are able to achieve their other objectives, including their agricultural productivity and income objectives.
• The Title II program is somewhat unique within USAID in its ability to support small-scale infrastructure activities. During the FAFSA-2 time period, few other USAID projects had the resources needed to help poor rural communities improve their basic productive infrastructure and their links to markets. However, many implementers seemed reluctant to use this capability for a variety of reasons, including the technical complexities of these activities, the additional technical staffing required, and the additional efforts needed to respond to the increased emphasis on quality and sustainability.
• Issues with respect to the quality of the infrastructure still exist, but there is evidence from a number of programs in the FAFSA-2
Box 5.12. Suggested Principles for Implementing Infrastructure Activities in a Title II Development Program• Give priority to (1) the creation of assets rather than the generation of temporary employment,
(2) productive assets rather than social assets, and (3) community assets (public goods) rather than private assets.
• Involve communities in the identification, design, and implementation of the infrastructure, recognizing that communities are more likely to contribute to and maintain assets they recognize as having an economic value.
• Enhance the likelihood of sustainability by (1) ensuring quality, (2) building in appropriate environmental mitigation measures, and (3) strengthening local commitment and capacity to operate and maintain any infrastructure that is constructed.
• Avoid selecting activities or implementing activities in ways that are likely to distort participants’ economic incentives in perverse ways and/or have adverse effects on local labor and product markets (e.g., by setting wage rates below the locally prevailing rates).
Source: Malawi Food Security Programming Strategy FY 2008–FY 2014 (USAID/Malawi, 2007); Bangladesh Food Security Country Framework FY 2010–FY 2014 (van Haeften and Moses, 2009).

5-23Infrastructure
universe (including the SC/Bolivia program, the WV/Mozambique program, and the Africare/Uganda program) that the Title II implementers have the capacity to deal effectively with them.
• More information is needed on the costs and benefits of the infrastructure being implemented under Title II development programs. This is especially true for larger interventions or in cases where a whole series of similar interventions are involved (e.g., support to the banquettes in Niger). Awardees need more information on these costs and benefits to be able to make wiser choices among alternative interventions in their programs. USAID/FFP also needs more information on the costs and effectiveness of alternative interventions to guide its own decisions and to help build support for the overall Title II development program.
• During the FAFSA-2 time period, a number of organizations involved in food assistance programs, including WFP, began to make a distinction between FFW and Food for Assets, presumably as a way to distinguish between programs whose basic objective was to transfer resources to the food insecure and those whose primary focus was on asset creation. In a Title II development program, one should not have to make this distinction. All FFW programs—and
all infrastructure programs—should be giving priority to the creation of productive, public assets.
5.5.2 Recommendations
In the future, USAID/FFP should:
• Encourage Awardees to include small-scale infrastructure activities in their Title II development programs in recognition of the fact that there are many situations in which infrastructure can help reduce key constraints in the poor and relatively isolated rural areas where the Title II development programs are concentrated. (Recommendation 29)158
• Make it clear in its guidance that Title II development programs should give priority to (1) the creation of assets rather than the generation of temporary employment, (2) the creation of productive assets rather than social assets, and (3) the creation of community assets (public goods) rather than private assets. (Recommendation 29)
• Restore the FFW category to the AER and add a program element for infrastructure to the Resources and Beneficiaries Tracking Tables, so that USAID/FFP will know and be able to report on the amount of Title II development resources being spent on infrastructure activities. (Recommendation 30)
• Require Awardees to devote more attention to the assessment of costs and benefits of their infrastructure interventions, as a basis for making and adjusting decisions about project priorities, especially in cases where a whole series of similar interventions are involved (e.g., support to the stock ponds in Bolivia, homestead raising in Bangladesh, and the banquettes in Niger). As part of this requirement, Awardees also need to collect more information on the socioeconomic effects of roads (see the discussion on outcomes in Section 5.3.3.1).
158 The numbers after certain recommendations are the same as those assigned to the major recommendations in the FAFSA-2 summary report.
Box 5.13. Infrastructure Policy Implications
• Title II development programs should continue to take advantage of their capacity to support the development of small-scale public infrastructure to help reduce key constraints in the poor and often relatively isolated rural areas where many Title II development programs are concentrated.
• These infrastructure activities should be designed and implemented consistent with the principles outlined in Box 5.12.

5-24 Infrastructure
• Require Awardees engaged in infrastructure activities to report on concrete measures of performance on an annual basis (e.g., kilometers of roads built, rehabilitated, upgraded, and/or repaired; numbers of bridges, canals constructed; and hectares of public land brought under irrigation). This amount of detail may not be necessary for reporting on program performance, but it is essential for effective program oversight. (Recommendation 31)
• Require that mid-term and final evaluations pay more attention to infrastructure components, when they exist, especially in cases when the component is substantial or when questions have been raised about performance. There are also likely to be more cases when including a local engineer on an evaluation team would add value, as was the case with the Bolivian mid-term and final evaluations.

5-25Infrastructure
Bibliography for Chapter 5Anderson, Katrine. 2006. Africare Uganda Food Security Initiative, Phase 2: Final Evaluation Report.
Bahn, Rachel and Lane, Sara. 2012. “Reclaiming Economic Analysis” in Frontiers in Development, edited by Shah, Rajiv and Radelet, Steven. Washington, DC: USAID.
Bonnard, Patricia et al. 2002. “Report of the Food Aid and Food Security Assessment: A Review of the Title II Development Food Aid Program.” http://www.fantaproject.org/downloads/pdfs/FAFSA.pdf.
CARE. 2009. Food-for-Work Component of the Final Project Documentation for the DAK ACHANA Program.
Clay, E.J. and Singer, H.W. 1985. “Public Works, Food-for-Work and Rural Poverty” in Food Aid and Development: Issues and Evidence – A Survey of the Literature since 1977 on the Role and Impact of Food in Developing Countries. Rome: WFP.
Herbert, Paul; Emana, Beabih; and Tessema, Tsegahun. 2010. Transforming Lives: An Evaluation of the CRS Integrated Watershed Management Programs in Ethiopia. Baltimore: CRS.
Keller, Gordon and Sherar, James. 2003. “Low-Volume Roads Engineering” in Low-Volume Roads Engineering: Best Management Practices Field Guide. USDA Forest Service/USAID.
Langworthy, Mark et al. 2005. Final Evaluation of the Cape Verde P.L. 480 Title II Monetization Program. A report prepared for ACDI/VOCA/Cape Verde.
Reij, C.; Tappen, G.; and Smale, M. 2009. “Agro-Environmental Transformation in the Sahel: Another Kind of Green Revolution.” Washington, DC: IFPRI.
Robins, Catherine and Tessema, Tsegahun. 2011. Final Evaluation: Ethiopia Development Assistance Consortium—USAID/FFP Title II DAP/MYAP/PAP
Assistance in Support of the Productive Safety Net Programs: 2005–2011.
Schnell, Charles; McNulty, Judiann; and Bentley, Jeffery. 2006. Food Security in Guatemala: Evaluation of the Title II Program 2001–2006.
Swanson, Richard. 2004. Final Evaluation of the ACDI/VOCA Rwanda P.L. 480 Title II Monetization Development Program (2000–2005).
Todd, Ian. 2008. An Assessment of the Effectiveness of Homestead Raising and Mound Protection Works Implemented by the SHOUHARDO Program.
———. 2009. Thematic Study on Infrastructure.
USAID/FFP. 2005. Strategic Plan for 2006-2010.Washington, DC: USAID.
USAID/Malawi. 2007. Malawi Food Security Programming Strategy FY 2008–2014. Food and Nutrition Technical Assistance (FANTA) Project, Washington, D.C.
van Haeften, Roberta; Bentley, Jeffery; Fernandez, Alfredo; and McNulty, Judiann. 2009. The Final Evaluation of the FY 2002–FY 2008 Bolivia Title II Development Program.
van Haeften, Roberta and Moses, Phil. 2009. USAID Office of Food for Peace Bangladesh Food Security Country Framework FY 2010 – FY 2014. Washington, DC: Food and Nutrition Technical Assistance II Project (FANTA-2).
van Haeften, Roberta; Zewditu Getahun Ayicheh; TesafiMebrahtu;andSorssaNateaMerga.2006.Final Evaluation of the CRS/Ethiopia and World Vision/Ethiopia 2001-2007 Title II Development Assistance Programs (DAPs). A report prepared for CRS/Ethiopia and WV/Ethiopia.
Wiseman, Will, et al. 2010. Designing and Implementing a Rural Safety Net in a Low Income Setting: Lessons Learned from Ethiopia’s Productive Safety Net Program 2005–2009.
World Vision. 2006. Ovata Roads Program: Final Evaluation Report.


6-1
Second Food Aid and Food Security Assessment (FAFSA-2)
6. Maternal and Child Health and Nutrition
Abstract
Title II development food aid supported more than 15 proven, high-impact HN interventions in the 69 programs reviewed in 23 countries. Promoting optimal breastfeeding, complementary feeding, and feeding of sick and severely malnourished children, and increasing vitamin A supplementation coverage were the most common nutrition interventions; 70 percent of the programs worked on four or more of the ENA. Two-thirds of the programs distributed Title II food rations to women and children; 70 percent of this supplementary feeding used a preventive targeting approach covering all children in the eligible age group, whereas 30 percent targeted food only for recuperation of malnourished children. Common health interventions were hygiene improvement, immunization, treatment of child illness, and birth preparedness and maternity services. Programs achieved impressive improvements in the use of HN services, child feeding and hygiene practices, and child nutritional status by applying effective approaches and integrating services. Most importantly, many children are alive and have been spared ill health and life-long disabilities thanks to Title II development programs. Stunting in children under five years fell an average of 1.32 percentage points per year across 28 programs. The program experiences and results have contributed a wealth of evidence on what works and what does not, consistent with published evidence. For example, the average annual decline in stunting of 1.69 percentage points in programs that provided preventive supplementary feeding was twice that achieved in recuperative feeding only or in no-food-ration programs. Furthermore, programs with greater success reducing stunting provided interpersonal nutrition counseling and home visits, and targeted children under two or three years. Less successful programs did not use these effective, population- and community-based SBCC strategies, and many implemented a stand-alone Positive Deviance/Hearth (PD/H) approach, focused on recuperating malnourished children versus preventing undernutrition. Food rations given to all household members, in addition to individual mother-child rations, were not associated with greater declines in undernutrition. Household rations increase cost and reduce coverage; evidence is needed to substantiate their merit. In FY 2009, US$92.3 million was spent on Title II HN activities reaching nearly two million beneficiaries; this represents approximately 29 percent of the total cost of Title II development programs and excludes water, sanitation, and HIV. In Africa, programs spent only 17 percent of the total regional Title II development resources on HN—an underinvestment problem. The policy implications of the assessment are provided in Box 6.15 and the conclusions and recommendations are provided in Sections 6.6.1 and 6.6.2.

6-2 Maternal and Child Health and Nutrition
6.1 Introduction
6.1.1 Policy and Program Environment
For at least four decades, the Title II program has been a major source of USG resources to reduce maternal and child undernutrition in developing countries. Reducing undernutrition saves lives and is vital to achieving USAID/FFP’s Strategic Plan objective—“Reducing food insecurity in vulnerable populations.” Indeed, two of the four indicators used by USAID/FFP to measure the people-level impact of its Title II development programs are reducing stunting and reducing underweight in children under five years of age. According to the Strategic Plan, Title II development programs are intended to “protect and enhance human capabilities” through MCHN interventions. Table 6.1 shows illustrative activities “to reduce the prevalence of chronic undernutrition among young children” from the Strategic Plan. Additional illustrative activities from the Strategic Plan “to enhance the nutritional status of women” and “to identify, treat and prevent recurrence of cases of acute undernutrition” are shown later in this chapter.
Throughout the FAFSA-2 time period, USAID/FFP considered HN one of eight priority technical sectors supported by Title II development programs.
(See Box 6.1 for the definition of the HN technical sector.) This chapter reviews Title II MCHN activities implemented during the FAFSA-2 time period. Title II-assisted HIV activities are reviewed in Chapter 8.159
What MCHN services does Title II support? The three core services to be provided in MCHN Title II development programs are: (1) community-based SBCC,160 (2) preventive and curative HN services, and (3) supplementary feeding as elaborated in Box 6.1. The USAID/FFP guidance promoting these services is sound and built on a solid foundation of state-of-the-art science. That science includes broad international consensus on the basic MCHN interventions in the package, based on evidence of their effectiveness (Bhutta et al., 2008; Klemm et al., 2009; Jones et al., 2003; SUN, 2010). The delivery of the package of preventive MCHN interventions should be population-based, following the public health principle of reaching everyone in the target geographic area based on age and physiological
159 In FY 2009, Title II HIV activities comprised 21 percent of all HN activities in Africa, less than 2 percent in LAC, and 0 percent in Asia according to annual reporting Tracking Tables submitted to USAID/FFP by Awardees.160 See Section 6.3.3.4 for a definition of SBCC and an explanation of why the term now includes social communication.
Table 6.1. Illustrative Activities from the 2006–2010 Strategic Plan Related to Sub-IR 2.1, Human Capabilities Protected and Enhanced
Illustrative Activities: To reduce the prevalence of chronic undernutrition among young children
Non-Food Assistance Food AssistanceThe Title II program:
• Provides individualized counseling to caregivers on appropriate IYCF and health-seeking practices.
• Provides and/or facilitates access to other essential services, such as growth monitoring, health education, and immunizations.
• Educates parents and caregivers about how to improve the nutritional status of their children.
• Provides training and supports the implementation of community-based nutritional rehabilitation activities (e.g., Hearth approach).
• Promotes and supports peer-networks to sustain positive IYCF behaviors and to prevent recurrence of negative behaviors.
The Title II program:
• Provides food as an incentive to encourage parents to participate in the community-based MCHN programs and to offset the opportunity costs of participation.
• Provides food to supplement inadequate diets.
Source: This table is taken verbatim from the USAID/FFP Strategic Plan, p. 66.

6-3Maternal and Child Health and Nutrition
status. It should also be community-based, i.e., doing interventions such as SBCC to improve IYCF practices in the same community where people live. A popular term for the nutrition interventions recommended by USAID/FFP is ENA (Guyon and Quinn, 2011; CORE Group, 2010; FANTA, 2010). The term and concept—ENA—will be used as an organizing principle for presenting FAFSA-2 findings on nutrition interventions supported by Title II (see Box 6.2). Supplementary feeding is an important additional nutrition intervention supported by Title II and reviewed here.
Nutrition interventions in Title II are expected to be complemented by essential preventive and curative health services through collaboration with national and local government systems or other partners and by health behavior change.
Since the MCHN services that need to be delivered in a complete, integrated program are many, it is beyond the scope and resources of individual Title II programs to support all of these services directly. Prioritizing what to support depends on national norms, partnering with others, and closing gaps. The comparative advantage of Title II development programs is delivering supplementary feeding and community-based SBCC interventions, where outreach by health systems is weak or absent. The
Box 6.1. USAID/FFP Definition of Its Health and Nutrition Technical Sector
“Objectives include reducing the prevalence of chronic undernutrition among young children; identifying, treating and preventing recurrence of cases of acute undernutrition; preventing, treating and mitigating the impact of chronic diseases such as HIV and TB; and enhancing the nutritional status of women. Activities include interventions to improve maternal and child survival, health, nutrition, productivity, growth and development—promotion of improved feeding behaviors, such as exclusive breastfeeding and appropriate complementary feeding of infants and young children; and, optimal dietary intake before, during and after pregnancy for women; prevention and treatment of preventable diseases, including diarrhea, malaria, and intestinal parasites; increased micronutrient consumption of women and children; and, improvements in ante, intra, and postpartum care, including newborn care. Activities also include interventions to improve treatment, care and support of people living with HIV. Food rations are used to prevent and treat malnutrition while supporting participation in activities that improve overall survival, health and nutrition.”
Source: USAID/FFP Annual Results Reporting Guidance for FY 2009.
Box 6.2. Essential Nutrition Actions
• Promotion of optimal breastfeeding during the first six months
• Promotion of optimal complementary feeding starting at six months with continued breastfeeding to two years of age and beyond
• Promotion of optimal nutritional care of sick and severely malnourished children
• Prevention of vitamin A deficiency in women and children
• Promotion of adequate intake of iron or folic acid and prevention and control of anemia for women and children
• Promotion of optimal nutrition for women
• Promotion of adequate intake of iodine by all members of the household
See http://www.coregroup.org for nutrition and ENA programming tools.

6-4 Maternal and Child Health and Nutrition
programs also play a critical role in facilitating participation in health services by Title II participants and outreach by the health system to deliver services closer to the community to increase coverage.
Whom should Title II MCHN programs target? The USAID/FFP Strategic Plan target group for MCHN activities is pregnant and lactating women and children under two, because they are vulnerable due to their physiological status (see Box 2.1 in Chapter 2). This particular target group was mentioned specifically in the USAID/FFP Proposal Guidelines for FY 2002–FY 2004 and FY 2009–FY 2011, with preventing undernutrition emphasized in the guidelines in the later years. It has been known for several decades that nutrition programs in developing countries, including Title II, should target children under two or three years of age; USAID/FFP has specifically promoted reaching children under two years. However, for CMAM in countries with a high prevalence of wasting in children, the recommended age group is children under five years for screening, referral, and treatment.161
The focus on pregnant and lactating women and children under two in USAID/FFP guidance is based on extensive scientific evidence. Programs to improve the health and nutritional status and survival of mothers and children will have the greatest impact if they target people in the age groups and physiological status during which most of the problems occur and can best be prevented or reversed. The period between a woman’s pregnancy and her child’s second birthday, popularly referred to as the first “1,000 days,”162 is a unique window of opportunity when better nutrition can have a high impact on reducing death and disease and avoiding irreversible harm (Black et al., 2008; Victora et al., 2008). Of special relevance to Title II is the fact that “[r]esearch from several program sites has found that supplementary feeding is more effective in improving child growth and preventing growth faltering in younger children than in older children,
161 Sources: PM2A TRM (FANTA, 2010) and the USAID/FFP FY 2012 and FY 2013 RFAs for Title II development programs.162 http://www.thousanddays.org. Accessed February 10, 2012.
with the greatest benefits occurring during the first and second years of life” (FANTA, 2010).
The first two years of life are normally a time of rapid growth and a critical time for cognitive development. However, this is when most growth faltering and related cognitive impairment occur in children in developing countries due to inadequate dietary intake and infection. Analysis by Victora et al. (2010) of child anthropometric data from 54 countries using World Health Organization (WHO) child growth standards found that, although most children are born with normal weight and length, early growth faltering starting in the first six months of life was even faster than assumed and that the window of opportunity for preventing stunting ends at two years of age. It is common after two years of age for children with low height-for-age to remain stunted, with their weight normally proportional to their height. The average adult height deficit found to be associated with a deficit in height-for-age of 1 z-score at two years of age is 3.2 cm (Victora et al., 2008). See Annex 6.1 for graphs of the rapid decline into low weight- and height-for-age in the first two years of life taken from evaluation survey cross-sectional data reported in Title II development program documents from Ghana, India, and Indonesia reviewed for the FAFSA-2. The graphs illustrate how children’s weight and height-for-age z-scores remain low after two years of age, and the urgency of preventing undernutrition early in life.
6.1.2 Methods
The performance of the Title II MCHN programs reviewed was judged by the following criteria: (1) whether they targeted appropriate beneficiaries and (2) whether they incorporated appropriate interventions and approaches. The FAFSA-2 HN reviewer developed and used an Excel spreadsheet to tally the numerous interventions, program approaches, documents read, evaluation survey limitations, indicators used, and whether improvements were achieved for all of the programs assessed. This helped tremendously for describing the breadth of Title II MCHN activities and their results, and identifying gaps
6-5Maternal and Child Health and Nutrition
(see Box 6.3 for limitations of the review). Most of the assessment was based on the massive task of reading 518 program documents, as described under methods in Section 1.4, and on field visits to seven ongoing Title II development programs with MCHN activities in five countries.
The general term “preschool children” is used throughout this chapter to refer to children that were Title II development program beneficiaries. Use of this vague term is unavoidable because the mix of programs reviewed did not all target the same age group of children. The variations seen in age cutoffs for participation were 24 months, 36 months, 59 months, and 72 months. There was also considerable heterogeneity across programs in the age groups measured for outcome and impact indicators.
This chapter first describes basic facts about the MCHN programs in the FAFSA-2 universe. Next, findings are presented on age groups targeted in the Title II programs reviewed. The chapter then proceeds to describe in turn each of the nutrition and health interventions implemented and by how many of the programs (the “what” and “how many”). The outcomes achieved (the “so what”) are found at the end of each intervention subsection. After presenting each of the interventions and their outcomes, the next section describes and analyzes the program approaches used (the “how”). Because
most approaches supported multiple interventions, they are discussed only once, rather than under each intervention, to avoid repetition. A brief summary of the rationale for and state of the art of the interventions and approaches to which the Title II programs were compared is also included in each subsection. Toward the end of the chapter, the nutritional status impact of the overall Title II development program is reported. Finally, issues and opportunities identified for program improvement, conclusions, and recommendations are provided.
6.2 Basic Facts about Programs in the FAFSA-2 Universe
6.2.1 Projects and Countries
The FAFSA-2 review of MCHN activities followed the same rule used in the 2002 FAFSA of including only programs with at least one-third of Title II development resources dedicated to HN, for the sake of consistency (Bonnard et al., 2002).163 This resulted in 69 programs in 23 countries
163 Several of the programs that did some MCHN work but were below the threshold of 33 percent of resources dedicated to HN had low HN budgets because they did no direct MCHN food distribution and followed a low-cost PD/H approach for recuperating malnourished children, e.g., Africare/Burkina Faso, OICI/Guinea, WV/Rwanda, CARE/Sierra Leone, and CRS/Zambia.
Box 6.3. Limitations of the FAFSA-2 Review of MCHN Components of Title II Programs
The completeness and accuracy of this assessment is limited by the completeness and accuracy of the program documents and results data reported by Awardees. It was not possible for the FAFSA-2 team to check the quality of the reported evaluation data or to conduct new analyses of survey datasets. However, if survey limitations were reported or observed by the team, the problems were documented and these data were not used. Indicators that measured knowledge instead of actual practice at the highest outcome level were also eliminated from the review of results. The Title II reports had more information on what interventions and approaches were implemented and the results achieved than on how programs were designed and implemented; the quality of implementation; or the extent of coverage, participation, or exposure of the beneficiaries to the interventions. This review could have been improved by having more information to explain why certain results were or were not achieved and to describe program models. Fortunately, some of the evaluations reported on quality issues. The FAFSA-2 team was able to observe the quality of MCHN service delivery during field visits to seven ongoing programs in five countries.
6-6 Maternal and Child Health and Nutrition
for the assessment, with 34 programs in Africa, 12 programs in Asia, and 23 programs in LAC (see the FAFSA-2 universe in Table 1.3). These programs represent 68 percent of all programs in the FAFSA-2 universe of 101 programs. The programs reviewed were predominantly rural, with only those of CARE, MC, and WV in Indonesia and CARE/Bangladesh FY 2005–FY 2010 reporting urban activities. Several programs that did meet the HN funding threshold reported that the HN component was underfunded due to budget constraints caused by food monetization problems.164
Nine of the Ethiopia programs in the FAFSA-2 universe were not included in the MCHN review because they were not doing HN. Their primary focus was on assisting the Government of Ethiopia’s national PSNP. Ethiopia is the second-most populous country in Africa, with 10 percent of the entire population of sub-Saharan Africa.165 It has been a large recipient of U.S. development and emergency food aid.166 Ethiopia’s national stunting prevalence was 51 percent in children under five years of age in 2005, fifth highest in the developing world (Kothari and Abderrahim, 2010). Given its large population, Ethiopia is a major contributor to the high burden of stunting in Africa and the world. In 2005, Ethiopia also had a national prevalence of acute malnutrition of 12 percent, a serious level according to WHO. Thus, not having Title II MCHN activities in Ethiopia disproportionately handicapped USAID/FFP from meeting its goal of reducing child undernutrition, especially in Africa.
6.2.2 Resources and Beneficiaries
In the FY 2009 Tracking Table analysis, 76 percent of Title II development programs (34/45) reported some resources for HN, and 78 percent (35/45)
164 The Africare Chad/Mali, Africare/Niger, and CRS/Liberia programs. The Africare/Burkina Faso program, which did not meet the threshold, also mentioned HN funding shortages due to monetization problems.165 “2012 World Population Data Sheet” found at http://www.prb.org/pdf12/2012-population-data-sheet_eng.pdf. Accessed October 25, 2012.166 Ethiopia was a top recipient of Title II development food aid in FY 2009 and FY 2010 according to the USAID/FFP Fact Sheets on the overall program for those years.
reported some HN beneficiaries—all non-HIV. These programs used 90,683 MT of Title II commodities to reach 1,849,662 beneficiaries with HN activities at a total annual cost of US$92.3 million.167
In the 2002 FAFSA, there was a concern that the percent of Title II development resources dedicated to household nutrition activities had fallen from 50 percent in 1998 to 35 percent in 2001. This decline was not reversed during the FAFSA-2 time period. The percent of the total cost of Title II programs spent on HN was 40 percent at the start of the period in FY 2003 and 38 percent at the end in FY 2009, including HIV and WASH.168 If HIV and WASH programming are excluded from this calculation, then the remaining HN activities comprised 29 percent of the total cost of Title II programs in FY 2009.
The problem of underinvesting specifically in the HN technical sector was limited to the Africa region, where only 17 percent of Title II development resources were spent on HN in FY 2009, excluding HIV activities and WASH, or 21 percent including HIV activities (see Table 6.2). Programs in Africa contrast sharply to programs in Asia, which spent a proportion on HN more than four times greater (70 percent), and programs in LAC, which spent a proportion three times greater (53 percent).169, 170
These same discrepancies between Africa and the other regions were present in FY 2003, with Africa
167 This excludes FY 2009 Title II PM2A research programs in Burundi and Guatemala, which were just beginning in late FY 2009, and the Afghanistan program, because they are not part of the FAFSA-2 universe.168 For this analysis, HIV and WASH were added to the FY 2009 HN technical sector because these were included in the HN technical sector in 2003 and earlier years. 169 There was only one LAC program with HN funding coded as HIV and no programs in Asia. Therefore, excluding HIV funding does not change the percentages spent on HN in these regions.170 Given that Ethiopia was the largest recipient of Title II development food aid in FY 2009, but programs there attributed only 0.19% of their total cost to HN, the analysis was repeated without Ethiopia. Excluding Ethiopia, the percent invested in HN by Africa Title II programs in FY 2009 was still low compared to other regions, namely, 22 percent of total cost spent on HN excluding HIV activities and 28 percent with HIV.

6-7Maternal and Child Health and Nutrition
Title II programs spending only 28 percent of their total budget on HN, in contrast to programs in Asia, which spent 45 percent, and those in LAC, which spent 52 percent.171 This raises the question of why so many Title II development programs in Africa had small or no HN components during the FAFSA-2 time period; nearly two-thirds of the programs in the FAFSA-2 universe were in Africa. Such programs are inconsistent with achieving one of the main impact indicators of the Strategic Plan, namely, reducing child undernutrition. Ensuring that most Title II development programs in Africa have adequately funded and well-designed HN components is critical to achieving the objective of the Strategic Plan, because 85 percent of the current USAID/FFP focus countries are in Africa and programs in these countries receive more than two-thirds of the Title II development resources.
During the later years of the FAFSA-2 time period (FY 2007–FY 2010), there were two sources of annual reporting on resources spent on specific technical sectors. The main one was composed of Excel Tracking Tables submitted by Awardees to USAID/FFP in which all Title II commodities received and beneficiaries reached were reported against eight technical sectors. In addition, Title II Awardees reported to USAID Missions, which submitted information to Washington in the automated Foreign Assistance Tracking System (FACTS) on people reached; indicators achieved; and resources for standard program areas, elements, sub-elements, and indicators in the U.S. Foreign Assistance Framework.
In FY 2011, USAID/FFP ceased to use the eight technical sectors for classifying what Title II does.
171 Includes HIV and WASH.
Annual reporting from that point forward uses 14 program elements selected from the standard list used by all of USAID that best describe the main interventions in Title II programs, five of which are in “Program Area 3.1: Health.”172 This change is excellent because the prior reporting by broad technical sectors, e.g., HN, or in the USAID FACTS information system did not capture the breadth of program elements and sub-elements to which Title II programs contributed. Using the FAFSA-2 tally, the Title II programs reviewed worked in six of the nine program elements in Program Area 3.1: Health, namely, HIV/AIDS, Malaria, MCH, Family Planning and Reproductive Health, Water Supply and Sanitation, and Nutrition.173 Title II worked on 18 of 52 (35 percent) of all sub-elements under these six program elements. In contrast, in the official FACTS reporting prior to FY 2011, Title II MCHN programs may have been counted using only the standard indicator “number of children reached by USG-supported nutrition programs” or only under the MCH or Nutrition Program Element, when they actually worked on several program elements. The FY 2010 rack-up of Title II reporting by program elements shared with the FAFSA-2 team by USAID/FFP illustrates this underrepresentation of Title II. Not one Mission reported Title II resources under the Malaria or Family Planning and Reproductive Health Program Element, despite the work of a number of Title II programs on these types of interventions. Thus, to enhance appreciation of the broader contributions of Title II programs, this chapter indicates the program elements and sub-
172 See Table 3.3, “Alignment of Title II Development Programs with the U.S. Foreign Assistance Framework,” in Chapter 3.173 “Foreign Assistance Standardized Program Structure and Definitions.” 2010. http://www.state.gov/documents/organization/141836.pdf. Accessed August 23, 2012.
Table 6.2. Percent of Total FY 2009 Title II Development Program Cost Attributed to Health and Nutrition Activities by Region (excludes WASH)
RegionNumber of Programs
Percent of Total Program Cost for Health and Nutrition—No HIV
Percent of Total Program Cost for Health and Nutrition—Including HIV
Africa 33 17 21
Asia 3 70 70
LAC 9 53 54
All Regions 45 29 33

6-8 Maternal and Child Health and Nutrition
elements that Title II programs supported when describing their MCHN interventions and outcomes.
6.3 Program Approaches and Interventions
6.3.1 Nutrition Interventions and their Outcomes
6.3.1.1 Targeting Women and Children in the First 1,000 Days
Maximizing the nutritional impact of Title II resources by targeting the right people is a basic Title II development program principle. So how well did the Title II programs reviewed in FAFSA-2 comply with USAID/FFP guidance on this? The FAFSA-2 team answered this question by examining the age groups of children eligible for supplementary feeding (see Table 6.3). In 33 programs that gave food rations for prevention, nearly all were reaching children under three years, but only 39 percent were targeted appropriately to children 6–23 months, and only 7 percent of the recuperative feeding was targeted to children 6–23 months in the 14 programs that distributed food rations only for recuperation of malnourished children based on low weight-for-age. More than half the recuperative feeding only programs distributed food rations to children over three years, in addition to children from six months to three years of age, despite the evidence that growth retardation in older children is difficult to reverse.
Programs in LAC came closest to following the USAID/FFP guidelines: 87 percent enrolled only children under two or three years. However, in the Africa and Asia regions, only 42 percent of programs limited participation to children under two or three years.
It is of concern that more than two-thirds of the 47 supplementary feeding programs reviewed in the FAFSA-2 did not limit eligibility to children under two years. Awardees designed, and USAID/FFP approved, many programs that included older children. This was not consistent with the USAID/FFP Strategic Plan, which specified children under two as the target group, or with Proposal Guidelines issued by USAID/FFP that called for targeting children from 6 to 23 months.174 The failure in many cases to target Title II food aid to younger children was a missed opportunity to increase the nutritional impact of the program and to reach more pregnant
174 There was specific language giving priority to under twos in USAID/FFP’s Title II development program Proposal Guidelines in FYs 2002 (p. 3), 2003 (p. 3), and 2004 (p. 6). The language in FYs 2002 and 2003 was as follows: “Research indicates that the most important age group to reach is very young children from the age of 6 months to two years. Malnutrition in this age group has a lasting impact on a child’s ability to mature and grow mentally and physically.” In FY 2004, pregnant and lactating women were added as follows: “Research indicates that the most important age groups to reach are pregnant and lactating mothers and children under two years. Malnutrition in these groups has a lasting impact on a child’s ability to mature and grow mentally and physically.” Working with this target group was also stressed in Proposal Guidelines for FYs 2009 and 2010 and in RFAs for FYs 2011, 2012, and 2013.
Table 6.3. FAFSA-2 Age Range for Supplementary Feeding Eligibility Reported by Title II Development Programs with MCHN Direct Distribution
Age Range of IndicatorPercent of Programs with
Prevention Rations (33 Programs)Percent of Programs with Recuperation
Only Rations (14 Programs)Up to six years
6–59 months 9 57
6–71 months 6
Up to three years
6–35 months 46 36
Up to two years
6–23 months 39 7

6-9Maternal and Child Health and Nutrition
and lactating women and children 6–23 months in time to prevent children from suffering permanent disabilities or death.
One argument given for enrolling all children under five years is that programs also work on Integrated Management of Childhood Illness (IMCI) in children across this age range. However, these illnesses are also more prevalent in the first two years of life. Episodes of diarrhea, the infection with the greatest impact on child growth, are two to three times more frequent in children under two than in older preschoolers (Dewey and Mayers, 2011). Furthermore, the objective of the USAID/FFP Strategic Plan is reducing undernutrition. Therefore, working on IMCI is important, but should not be a justification for expanding the target group beyond 24 months. If younger children are reached, there will likely be a spread effect in the community benefiting older children as well, with better community case management of infections. One challenge is that Title II programs work within host country government norms, which may target children under five years with growth monitoring
and promotion and other nutrition services. Policy dialogue by USAID to change such norms is required at a national level. With more and more countries joining the SUN Movement, which emphasizes the 1,000-day window of opportunity from pregnancy to a child’s second birthday, unsound targeting policies will hopefully become less of a challenge going forward.
6.3.1.2 Essential Nutrition Actions
The performance of Title II programs in working on six of the seven ENA interventions, namely, changing individual behaviors to improve dietary intake, feeding, and care practices and increasing coverage of micronutrient supplementation interventions through the health system, is shown in Table 6.4. Title II development programs reported working on all the ENA interventions except promoting adequate intake of iodine. Support from USAID to address iodine deficiency worldwide is programmed through UNICEF. Therefore, USAID programs usually do not work directly on salt fortification or treating iodine deficiency,
Table 6.4. FAFSA-2 Title II Development Programs Delivering Essential Nutrition Actions (ENA)
ENA InterventionNumber of Programs
Percent of Programs (N = 69)
Results (%)*Had Indicator Improved Indicator (N)
1. Promotion of optimal breastfeeding during the first six months
64 93 81 71 (49)
2. Promotion of optimal complementary feeding starting at six months with continued breastfeeding to two years of age and beyond
62 90 49 70 (30)
3. Promotion of optimal nutritional care of sick and severely malnourished children
53 77 49 71 (31)
4. Prevention of vitamin A deficiency in women and children (supplementation)
43 62 32 68 (19)
5. Promotion of adequate intake of iron or folic acid and prevention and control of anemia for women and children (supplementation)
12 17 16 20 (10)
6. Promotion of optimal nutrition for women (apart from supplementary feeding)
32 46 11 86 (7)
* The denominator for “Had Indicator” represents the 63 of the 69 HN programs in the FAFSA-2 universe that had been under way long enough to have had at least a mid-term evaluation, if not a final evaluation. The denominator for “Improved Indicator” represents the number of programs (N) that had reached the stage in their implementation when they had collected and reported evaluation data for that indicator.

6-10 Maternal and Child Health and Nutrition
but may focus on SBCC. In countries with iodine deficiency and iodized salt, consumption of iodized salt is good to promote.175 The work of Title II programs on each of the remaining six ENA is discussed in the following sections. But first, how do individual Title II programs stack up in terms of comprehensiveness, i.e., delivering/promoting all or most of the remaining six ENA to their target populations? Three programs reviewed did not work on any ENA interventions.176 Of the 66 programs that delivered ENA interventions, only 9 percent did all six—all in Asia. The average Title II program delivered four ENA interventions. An impressive 70 percent of programs worked on four or more of the ENA. Title II programs have to prioritize what interventions they will support based on available resources, what they can reasonably expect to accomplish, and what is already being offered by complementary programs in their catchment areas. The fact that 30 percent of programs did three or fewer of the ENA may not be of concern if the complete package was being delivered through the combined efforts of Title II and other programs. This is a question that the FAFSA-2 is unable to answer.
The most common interventions were the three on IYCF practices (breastfeeding, complementary feeding, and feeding sick or severely malnourished children). Less common were women’s nutrition interventions, other than supplementary feeding (46 percent of programs). Few programs included improving iron and folic acid intake and reducing anemia through supplementation for women or children (17 percent). In contrast to the neglect of interventions to address anemia, 62 percent of the 69 programs were working to improve coverage of vitamin A supplementation for children and women (postpartum).
The work Title II programs did on ENA can also be categorized using the Nutrition Program Element and its sub-elements in the USG “F” standardized
175 According to UNICEF (2011), global coverage of iodized salt reached 71 percent in 2009.176 ADRA/Kenya, WV/Kenya, and ACDI/VOCA/Rwanda programs from FY 2005 to FY 2010 delivered broad nutrition education to improve household diets.
definitions. When nutrition activities are reported this way, 93 percent of the Title II programs reviewed worked on “Individual Prevention Programs” and 62 percent on “Population-Based Nutrition Services” (Sub-Elements 3.1.9.1 and 3.1.9.2, respectively).
6.3.1.3 Breastfeeding
Rationale. Exclusive breastfeeding in the first six months of life and continued breastfeeding from 6 to 11 months is the top-ranked intervention for preventing the most child deaths in low-income settings (Jones et al., 2003). Breastfeeding has many well-documented nutrition, health, developmental, and economic benefits. Yet, often breastfeeding practices are sub-optimal. A review of data on exclusive breastfeeding from zero to six months in the most recent Demographic and Health Surveys (DHS) for 17 of the 20 countries that were a USAID/FFP priority during the FAFSA-2 time frame revealed a prevalence of 50 percent or less in all countries except Madagascar (67 percent), Malawi (53 percent), and Zambia (61 percent).177 The practice is almost nonexistent in Chad and Niger, with exclusive breastfeeding rates of only 2 and 8 percent, respectively.
What programs did. It was most encouraging to find that 93 percent of the Title II development programs reviewed promoted optimal breastfeeding practices—the most common nutrition intervention delivered. SBCC was used to promote early initiation of breastfeeding, exclusive breastfeeding during the first 6 months of life, and continued breastfeeding though 24 months of age. One program noted that an important cause of not continuing to breastfeed after 18 months of age was women getting pregnant again. Short inter-pregnancy intervals are indeed a threat to continued breastfeeding, and family planning can prolong breastfeeding duration by lengthening the interval. Baby bottles are also an obstacle (see Box 6.4).
Outcomes. Breastfeeding practices, primarily initiation within one hour of birth and practicing
177 See http://www.statcompiler.com and WHO, 2010a. The USAID/FFP priority countries with no data were Afghanistan, Burundi, and South Sudan.

6-11Maternal and Child Health and Nutrition
exclusive breastfeeding in the first six months of life, were the most common IYCF behavior indicators measured by Title II programs. Some programs measured breastfeeding indicators that were not useful, such as starting breastfeeding within eight hours of giving birth and knowledge of the importance of exclusive breastfeeding versus actually practicing it. From FY 2007 onward, the practice of exclusive breastfeeding has been a USAID/FFP required indicator.178
Of the 49 programs that evaluated useful breastfeeding indicators, 71 percent reported increasing optimal practices. Major increases in exclusive breastfeeding rates for infants in the first six months of life were achieved by several programs. The results of six programs that measured the standard exclusive breastfeeding indicator, and,
178 Useful references on the state of the art for IYCF indicators are WHO, 2008 and 2010a.
thus, could be compared, are shown in Figure 6.1. Across these six programs, exclusive breastfeeding rates quadrupled, on average, after three to five years of SBCC. The impressive gains prove that, with effective behavior change, sub-optimal practices are amenable to change. Rates achieved were greater than the national prevalence of exclusive breastfeeding in the DHS. The increases in exclusive breastfeeding in Title II development programs compare favorably with published results from similar programs (Quinn et al., 2005).
A special evaluation research study of the CARE/India FY 2002–FY 2006 program, funded by USAID/India, with a quasi-experimental design, documented a dramatic increase in initiation of breastfeeding in the first hour of life, from 5 percent at baseline to 59 percent in the final evaluation in the program district in the state of Uttar Pradesh, and a reduction in prelacteal feeds from 92 percent to 44 percent (Dreyfuss et al., 2008). In the program
Box 6.4. Baby Bottles: An Obstacle
A threat to exclusive breastfeeding that Title II programs faced was that baby bottles were used to give young children sugary liquids, e.g., coffee, tea, soft drinks, and juice, which can cause diarrhea and tooth decay; fill the child with liquid and sugar, rather than nutrients; and cause nipple confusion that leads to premature weaning. Baby bottles were considered upper-class and urban. Use of bottles was encouraged by relatives working in cities or abroad. CRS/Guatemala (FY 2007–FY 2011) reported that its program had to tackle this practice with SBCC.
Figure 6.1. Increased Exclusive Breastfeeding for Infants 0–6 Months: Results of Some Title II Development Programs
30%
57%
17%
5%
50%
27%
64%
84% 85%
74%
64%
51%
0%
10%
20%
30%
40%
50%
60%
70%
80%
90%
Bangladesh SC Indonesia CRS Ghana CRS Mozambique SC Guatemala SC Honduras SC
% In
fant
s 0-
6 M
onth
s Ex
clus
ivel
y B
reas
tfed
Baseline 3-5 years later

6-12 Maternal and Child Health and Nutrition
district in Andhra Pradesh state, breastfeeding in the first hour increased from 22 percent to 36 percent, and there was a reduction in prelacteal feeds from 62 percent to 49 percent. The improvements were significantly better than those seen in the comparison group at p < 0.05. Neonatal health was an important component of this program, and, therefore, extra effort was put into improving early initiation of exclusive breastfeeding, so critical to the survival of the newborn.
6.3.1.4 Complementary Feeding
Rationale. While successful breastfeeding interventions have large effects on child survival, their effect on stunting is small compared to complementary feeding (Bhutta et al., 2008). Thus, focusing on improving both breastfeeding and complementary feeding practices is indispensable.
At the beginning of the FAFSA-2 time period in 2003, an important development was WHO’s publication of the Guiding Principles for Complementary Feeding of the Breastfed Child. This key reference makes clear the different, concurrent good practices it takes to achieve optimal complementary feeding for children 6–23 months of age. As a memory aide and training and communication tool, the LINKAGES Project developed the acronym “FADUA” for the WHO Guiding Principles for Complementary Feeding (frequency, amount, density/quality, utilization, active feeding)179 in its Bolivia and Ghana programs (LINKAGES Project, 2004). The goal is to get mothers/caregivers to introduce complementary foods at six months with continued breastfeeding, and to meet all of the FADUA principles for feeding children 6–23 months of age, which is a real challenge. However, complementary feeding practices in developing countries can be improved though effective SBCC (Caulfield et al., 1999; Bhutta et al., 2008).
The FADUA principles and data on practices in USAID/FFP priority countries (DHS) and in Title II
179 UNICEF uses the similar acronym “FATVAH” (frequency, amount, thickness, variety, active feeding, and hygiene) for optimal complementary feeding principles.
programs are explained in Table 6.5. There was a paucity of data on complementary feeding practices in the Title II programs reviewed, in part due to the lack of well-defined, standard indicators for measuring practices during most of the FAFSA-2 time frame. During that period, USAID supported research to clearly define standard complementary feeding indicators (WHO, 2008; WHO, 2010a; WHO, 2010b).180 Prior to that pioneering work, there was only one WHO-recognized indicator on “timely introduction of complementary foods” that, as a one-time behavior, did not capture the multidimensionality of feeding practices needed. Once the new complementary feeding indicators were available, USAID/FFP chose the “minimum acceptable diet” indicator to replace the indicator “children 6–23 months with three appropriate infant and young child feeding practices” required since 2007 (FFPIB 07-02, 2007; FFPIB 11-03, 2011b).181 A breastfed child 6–23 months of age has a “minimum acceptable diet” if the diet meets both “minimum dietary diversity” and “minimum meal frequency.”
To date the “minimum acceptable diet” indicator has mainly been measured in baseline surveys in newer Title II programs. Awardees have found low rates, e.g., 11 percent (CARE/Bangladesh 2011); 12 percent (CRS/Malawi 2010); and 17 percent (ACDI/VOCA/Bangladesh 2011). The low percentage of children with a “minimum acceptable diet” in 13 USAID/FFP priority countries in a WHO publication of DHS data illustrates what a huge problem poor complementary feeding practices are (WHO, 2010b). Across all 13 countries, 25 percent or less of children ate a “minimum acceptable diet,” and in 75 percent of the countries the rate was 16 percent or less.182
180 This research was conducted by investigators at FANTA, WHO, UNICEF, IFPRI, Macro International, and University of California – Davis.181 The required “minimum acceptable diet” indicator has been used since FY 2009 (prior to FFPIB 11-03 in 2011). This indicator is not interchangeable with the prior indicator “children 6–23 months with three appropriate infant and young child feeding practices,” because the definitions of the two indicators differ.182 No data were available for Afghanistan, Burundi, Chad, Guatemala, Mauritania, Sierra Leone, or South Sudan.

6-13Maternal and Child Health and Nutrition
What programs did. The FAFSA-2 found that, although 90 percent of Title II programs reported working to improve complementary feeding practices, few programs described specific behavior change strategies to improve them. One of the biggest gaps is that few Title II programs did formative research on IYCF practices to learn what mothers are feeding, how much, how often, why mothers do what they do, the role and attitude of family members, and barriers and facilitators to improving these practices. This information is indispensable to strategically design and implement effective counseling and behavior change strategies. Most programs also did no formative research or
quantitative evaluation to measure whether their educational efforts led to improved practices. The FAFSA-2 review did find that a number of programs had supplied CHWs with illustrated, age-specific counseling cards on optimal IYCF practices to use for SBCC, often taking advantage of materials produced by other programs. Other approaches included homestead food production to increase dietary diversity and community cooking demonstrations of nutritious recipes for complementary foods. All of these are discussed later in this chapter in Section 6.3.3. Results from the few Title II programs that did measure change in complementary feeding practices are reported
Table 6.5. Complementary Feeding of the Breastfed Child: FADUA Definition and Data from DHS and Title II Programs
Principle WHO Guidance (2003)
Practices: DHS Data in Children 6–23 months (WHO, 2010b) Practices: FAFSA-2 Title II Data
Frequency Increase feeding frequency with age: 2–3 times/day at 6–8 months; 3–4 times/day at 9–23 months.
Only 30%–55% met “minimum meal frequency” in 11 FFP priority countries. But 81% did in Bangladesh and 76% did in Madagascar.
Children 6–23 months with “minimum meal frequency” from baseline surveys:
• CARE/Bangladesh 2011 – 45%
• ACDI/VOCA/Bangladesh 2011 – 56%
• CRS/Malawi 2010 – 50%
Amount Introduce small amount of food at six months and increase quantity as child gets older, with continued breastfeeding. Approximate energy needs from complementary foods are 200 kcal/day at 6–8 months, 300 kcal/day at 9–11 months, and 550 kcal/day at 12–23 months.
No data Only the CARE/India program (FY 2002–2006) had data. It increased the percent of children 12–23 months that ate at least half the recommended quantity between baseline and endline from 2% to 7% (Barabanki, Uttar Pradesh) and from 20% to 45% (Karimnagar, Andhra Pradesh).
Density/Quality
Increase food consistency or thickness with age, avoiding watery preparations and adding fat/oil to maximize energy/nutrient density per volume eaten. Improve diversity or diet quality. Children should eat daily at least four foods from these seven food groups: grains, roots, and tubers; legumes and nuts; dairy products; flesh foods (meat, fish, poultry, and liver/organ meats); eggs; vegetables and foods rich in vitamin A; other fruits and vegetables.
≤ 16% met “minimum dietary diversity” in six FFP priority countries. Rates were very low in Ethiopia (4%) and Niger (5%), but better (30%–40%) in Chad, Malawi, Madagascar, and Zambia. Lack of diversity is a bigger problem than frequency.
Children 6–23 months with “minimum dietary diversity” from baseline surveys:
• CARE/Bangladesh 2011 – 16%
• ACDI/VOCA/Bangladesh 2011 – 29%
• CRS/Malawi 2010 – 25%
Utilization Practice good hygiene, proper food handling, and storage.
No data 59% of programs evaluated hygiene practices and 74% reported improving practices.
Active Feeding
Feed infants directly and assist older children to feed themselves, encouraging children to eat and offering them more, if they are still hungry, but not forcing them.
No data CARE/India (FY 2002–2006) increased the percent of children 12–23 months “usually fed by mother” between baseline and endline from 33% to 52% (Barabanki, Uttar Pradesh) and from 64% to 79% (Karimnagar, Andhra Pradesh).

6-14 Maternal and Child Health and Nutrition
under “Outcomes,” at the end of this section, and in Table 6.5. Findings on each of the FADUA principles are presented next.
Frequency. The bottom line is that meal frequency needs to be increased for around half of all children 6–23 months of age in the USAID/FFP focus countries (see Table 6.5). Key constraints to preparing food frequently are time, fuel, and safe water. Women’s heavy workloads and lack of time make frequent food preparation and feeding difficult because of the time they must spend fetching fuel and water and working away from the home, e.g., in agriculture in Africa. Children may be left behind with siblings. As school enrollment goes up, especially for girls, even siblings are not available to provide child care, as mentioned by Africare/Uganda. Women need affordable, convenient, and nutritious fortified complementary foods, but these are often not available to the poor in rural areas who need to prepare children’s meals from scratch.
Amount. Many children do not eat enough to meet their requirements for the energy, protein, and fat needed for rapid growth. Feeding extra food for
catch-up growth after illness is critical, but not widely practiced, nor are offering children second helpings and feeding to appetite. There is often a quantity problem. The “minimum acceptable diet” indicator does not measure the quantity of food consumed and provides only a rough proxy. It may lead some to conclude that children are eating an adequate amount to achieve age-specific recommended nutrient intake just because they are eating frequently. The importance of stressing that young children need to eat enough and of increasing the energy and nutrient density of their diets was lost sight of in several Title II programs where all that was talked about was improving the quality of the diet or dietary diversity. This was often the case in programs promoting vegetable gardens as a micronutrient intervention. While increasing the intake of green leafy vegetables improves the quality of the diet and may improve micronutrient status, it alone does not address the deficiency of macronutrients in the child’s diet that contribute to stunting and underweight. Producing and consuming crops rich in energy, as well as vitamins and minerals, was the exception, e.g., the cultivation of orange sweet potatoes (OSP) in home gardens in a number of Title II programs in Africa. What is needed to achieve adequate dietary intake is a balanced diet with enough food in terms of quantity, diversity, and quality.
Title II programs did not collect or report data on the amount of food consumed by children 6–23 months compared to requirements, except the CARE/India FY 2002–FY 2006 program, thanks to the special evaluation research study funded by USAID/India. “Because the quantities of solids consumed in the study areas were very low, the indicator used for evaluation purposes was the proportion of children consuming at least half the recommended quantity of solids per day” in the evaluation in India (Dreyfuss et al., 2008, p. 82). In other words, so many children were eating fewer than half of the age-specific recommendations for kilocalorie intake of semi-solid/solid foods that, if the investigators had reported the percent of children that ate the full recommended amount, there would have been no one to report! The positive changes in complementary feeding practices as a result of the
In Guatemala, a mother with good complementary feeding practices actively feeds her child enriched porridge.
SH
AR
E G
uate
mal
a

6-15Maternal and Child Health and Nutrition
CARE program are discussed under “Outcomes” and shown in Figure 6.2. Those with an asterisk improved significantly more than the comparison group (p < 0.05).
Box 6.5 provides an excellent example of findings in Malawi from USAID- and World Bank-funded formative research on IYCF (Picado et al., 2011). This research using the Trials of Improved Practices (TIPs) methodology illustrates the type of studies that need to be done in Title II programs. A major finding was how much less young children were eating than the amount needed to meet recommendations for kilocalorie intake from semi-solid/solid foods. The researchers determined the energy content of the local improved porridge recipe used by mothers and caregivers and calibrated how much would need to be fed using local feeding utensils, namely, 16 tablespoons (240 ml) of porridge for children 12–23 months per meal. What they found at the start of the study was that mothers were feeding far too little, i.e., only 5 tablespoons (75 ml) of porridge per meal. Mothers increased the amount of porridge fed per meal to 7–9 tablespoons after being counseled—a 40–80 percent improvement, but still only about half what the children needed to eat for adequate nutrient intake. Getting children to consume the right
amount is a big challenge that Title II programs do not seem to be focusing enough on, starting with not doing formative research. Exceptional programs with effective complementary feeding counseling materials had: (1) developed nutritious recipes based on research on the local diet and nutrient content to meet recommended kilocalorie intake, for example, porridge recipes; and (2) calibrated commonly used feeding utensils that would contain or measure the right amount of the recipe to meet the age-specific recommendations for children’s kilocalorie intake of semi-solid/solid foods at each meal. These specifics—what to feed (with recipe details) and how much of it to feed (measured with local feeding utensils)—were included in illustrated counseling materials used to teach mothers in more effective programs.
Density/Quality. Most children have poor quality diets in the USAID/FFP priority countries (see Table 6.5). Inadequate dietary diversity is more widespread than feeding young children infrequently. Nearly half of all MCHN programs reviewed supported homestead food production to improve dietary diversity.
Consumption of sweet or salty snacks, junk food, and soda by very small children undermines dietary
Figure 6.2. The Impact of the CARE Title II Program on Complementary Feeding of Children 12–23 Months in Barabanki District, Uttar Pradesh, India
7%
7%
58%
52%
38%
53%
2%
1%
37%
33%
9%
26%
0% 10% 20% 30% 40% 50% 60% 70% 80% 90% 100%
Ate at Least 1/2 Recommended Quantity of Solids*
Oil Added to Solids
Fed from Separate Plate*
Usually Fed by Mother*
Feeding Frequency (ate solids 3+ times/day)*
Dietary Diversity (ate 3+ food groups/day)*
Complementary Feeding Practices - Percent of Children
Baseline
Endline

6-16 Maternal and Child Health and Nutrition
quality. The mid-term evaluation of the CRS/Guatemala FY 2007–FY 2011 program found that families spent up to 200 quetzales (US$25) a month on junk food for children that could have been used to buy more nutritious foods. Similar challenges were seen in the urban MC/Indonesia FY 2005–FY 2008 program, and reported in the Malawi TIPs study (Picado et al., 2011).
Water, water in everything, but nothing to eat. Required energy and nutrient density is often not achieved when the custom is to feed young children prepared foods that contain a lot of water, e.g., cooked bulky staples, watery gruels, and drinks,
as complementary foods in a number of countries, e.g., Bangladesh, Guatemala, and Malawi. When consuming these foods, the child’s small stomach rapidly fills mainly with water and not the needed nutrients. In cooking demonstrations in several of the programs visited in Guatemala, even the Title II corn-soy blend (CSB) was being made into a watery traditional corn flour drink, atole, instead of promoting thicker, more energy dense CSB recipes. Improving energy and nutrient density means getting more calories, protein, fat, and micronutrients into the meal usually by reducing the amount of water used in the recipe. Increasing food consistency gets more food into a smaller space (the child’s stomach), so that the child will not become full before getting what she or he needs to develop and grow. Nutrient and energy density can be improved by adding fat, animal products, fruits, or vegetables to porridge. Adding fat/oil increases the energy content of a recipe both through the kilocalorie content of the fat/oil and by reducing the amount of water needed to cook grains, thus, increasing consistency; this was an excellent improved feeding practice promoted by a number of Title II programs. Germinating grains (sprouting or malting) and then drying the sprouts and making flour was also an improved feeding practice. Germination of cereals and tubers serves to pre-digest them, increasing amylase enzymes and reducing the amount of water needed to cook them. This technique was promoted by Africare in programs in Mozambique and Uganda; households successfully germinated sorghum in Uganda.
Utilization. To ensure that complementary foods eaten are fully utilized by the body and not lost to malabsorption and diarrhea, good hygiene is necessary to prevent infections or parasites from contaminated hands, bowls, or spoons used to feed the child. Foods need to be stored safely or served immediately after preparation to prevent food-borne illness. Feeding bottles should be avoided because they are difficult to keep clean. Continued breastfeeding from 6 to 23 months, a practice promoted by Title II programs, reduces infection while improving dietary intake. Many programs worked to improve hygiene practices (see Section 7.3.5 on hygiene promotion as part of WASH and Section 6.3.2.5 later in this chapter).
Box 6.5. Malawi IYCF Study
“For almost all children [12–23 months], the overall quantity of food must be addressed: a combination of frequency and amount per meal plus encouragement to finish what is served. Meal frequency was relatively good, although some mothers should be encouraged to offer healthy snacks. The emphasis needs to be on the amount of food offered per meal. All but one mother was well below the recommended amount of about one cup of food (240 ml [16 tablespoons]) per meal (on average, children received about five tablespoons [75 ml]). As with the younger age group, the greatest increase was by two to four tablespoons per meal. On a positive note, no adverse reactions were reported from children eating more; in fact, mothers said they were happy to see that their children were not hungry, did not beg for tea, and had improved appetites. A variety of tools to help mothers visualize appropriate quantities for the child’s age would be useful. The child feeding bowl, such as those found useful in other countries, could be tested and modified for Malawi.”
Source: Picado et al., 2011.

6-17Maternal and Child Health and Nutrition
Active Feeding. Active feeding is also referred to as responsive feeding or maternal child care practices. Talking to children, making eye contact, minimizing distractions, and making meals time for learning and love are all good practices. Feeding children from their own plate or bowl is desirable and helps them signal if they are full or still hungry, while also helping determine if the quantities served and consumed are adequate. Whether programs promoted active feeding was not discussed in most reports, and the only results measured were from CARE/India (see Table 6.5).
Outcomes. Only half the programs (49 percent) had complementary feeding behavior change indicators versus 81 percent that had breastfeeding indicators. This is in part due to the 2007 instructions in FFPIB 07-02 on “required standard indicators,” which gave Awardees the choice of reporting on one or more of a list of six behavior change indicators that included “% of children 0–5 months of age who are fed exclusively with breast milk” and “% of children 6–23 months of age who receive a minimum acceptable diet (apart from breast milk),” or four indicators on the percent of caregivers demonstrating proper hygiene—personal, food, water, or environmental. Most Awardees decided not to measure and report on the most challenging—complementary feeding—a loophole that USAID/FFP closed several years later by requiring Awardees to report on all indicators that apply to the work they are doing from the same menu of six indicators. The lack of good indicators to measure complementary feeding practices in the first half of the FAFSA-2 time frame is another explanation. Good indicators to measure complementary feeding behavior change are now available and required. However, there were still a number of recent programs without the “minimum acceptable diet” indicator or any complementary feeding indicators. For example, none of the three programs visited in Niger had complementary feeding indicators—two of the programs started in FY 2007 and one in FY 2008. Indicators were harmonized across the three Guatemala programs that started in FY 2007, but unfortunately they did not include “minimum acceptable diet” or any other complementary feeding indicator. Some programs had indicators that could
not be included in the review because they were too vague and set the performance bar very low, e.g., “% of children 6–23 months who received complementary feeding during the last 24 hours.”
Of those programs that measured useful indicators of complementary feeding practices, 70 percent reported improving these practices. The four Haiti programs were the only ones to provide reliable survey data with statistical tests of significance on changes in “minimum acceptable diet” between the baseline and final evaluation. Children 6–23 months consuming a “minimum acceptable diet” increased from 30 percent to 44 percent in the CRS program, from 25 percent to 34 percent in the SC program, and doubled from 14 percent to 28 percent in the CARE program (all significant at p < 0.01). SC noted that the improvement was due to increasing appropriate meal frequency from 31 percent to 42 percent, but not diversity. The increases are encouraging, but also sobering because fewer than half of the children consumed a “minimum acceptable diet” by the end of the programs. Dietary diversity improved in the WV program, but the “minimum acceptable diet” indicator deteriorated significantly (p < 0.01) from 35 percent to 11 percent, because of declines in the percent of mothers that fed children frequently enough. However, no explanation was provided for why practices may have worsened, illustrating how critical it is to do formative research to find answers.
The evaluation research done on the CARE/India FY 2002–FY 2006 program provided the only reliable Title II survey data with statistical tests of significance of success in getting mothers to practice the FADUA principles while feeding children 12–23 months (Dreyfuss et al., 2008). Figure 6.2 shows the large improvements between the baseline and final surveys for dietary diversity (26 percent to 53 percent), feeding frequency (9 percent to 38 percent), active feeding by mother (33 percent to 52 percent), and child eating from a separate plate (37 percent to 58 percent) in one of the program districts studied in the state of Uttar Pradesh. These increases were significantly greater than those in the comparison district at p < 0.05. Where the program struggled and had little success was getting mothers

6-18 Maternal and Child Health and Nutrition
to feed an adequate quantity of solid foods to meet age-specific recommendations for kilocalorie intake. Only 7 percent of children 12–23 months ate at least half the recommended quantity of solid foods by the end of the program, compared to 2 percent at baseline—statistically significant, but far short of the amount of energy intake needed for normal growth and far too few caregivers adopted the practice. Most disturbing are the 93 percent of mothers that could not be convinced to do even that. Similarly, the program was able to increase only from 1 percent to 7 percent the mothers that added oil to the child’s food.
6.3.1.5 Feeding the Sick or Severely Malnourished Child and Community-Based Management of Acute Malnutrition
Rationale. Adequate feeding during and after illness to ensure adequate nutrient intake and promote catch-up growth are key to reducing the negative effects of infection on growth. The ways that improved nutrition can lessen the impact of infection on child nutrition status are summarized from a review by Dewey and Mayers (2011) in Box 6.6. In this review, four intervention trials that provided macronutrient or micronutrient supplements to children reduced or eliminated the negative effects of diarrhea on growth. Similarly, supplementary feeding provided to young children by many Title II programs can play an important role in convalescence during and catch-up growth after illness.
What programs did. Many Title II programs (77 percent) promoted improved practices for feeding the sick child. The most common practices promoted and measured were: (1) increasing frequency of breastfeeding for sick children; (2) continuing to feed during illness and not reducing the amount; (3) increasing fluid intake during illness for children 6–23 months, including breast milk; and (4) increasing variety, frequency, and amount of food after illness until the child regains weight and is growing well. These behavior change efforts were linked to work by the programs on Community-Integrated Management of Childhood Illness (C-IMCI).
Feeding the severely malnourished child. A number of programs used direct distribution of Title II commodities to recuperate malnourished children and promote catch-up growth; this is discussed in Section 6.3.1.9, “Supplementary Feeding.”
CMAM. Screening of children under five years to detect severe acute malnutrition (SAM) and referral of SAM cases to health services for therapeutic feeding, as well as follow-up through home visits, are important. Illustrative activities recommended in the USAID/FFP Strategic Plan “to identify, treat, and prevent recurrence of cases of acute undernutrition” are shown in Table 6.6. Most Title II programs (65 percent) detected and referred children with acute malnutrition to local health services for rehabilitation (CMAM). These are the main roles Title II programs play in support of CMAM and therapeutic feeding of children with SAM. The screening and referral of cases of SAM in the community by Title II programs, coupled with their activities to prevent undernutrition, are vital in countries with a high prevalence of global acute malnutrition (GAM) of 10 percent or more.
Only four Title II programs worked directly on CMAM—one each in Malawi and Niger, and two
Box 6.6. “Improved Nutrition May Reduce the Negative Impact of Infections on Growth by:
a) Strengthening the immune system;
b) Compensating for malabsorption, reallocation, or losses of key nutrients;
c) Allowing for catch-up growth following infection;
d) Enhancing appetite; and
e) Favoring the growth of beneficial gut microorganisms.”
Source: Dewey and Mayers, 2011, p. 136.

6-19Maternal and Child Health and Nutrition
in Haiti. These programs provided supplementary feeding using Title II commodities to children 6–59 months with moderate acute malnutrition (MAM), either once they had graduated from CMAM or to prevent SAM. Title II programs assisting CMAM in Niger and Malawi were doing no preventive supplementary feeding, just targeting food rations to children with MAM. Children with MAM were most often referred to Title II programs for supplementary feeding by CMAM programs in health services. As expected, no programs reviewed reported doing therapeutic feeding for SAM, because Title II programs did not have access to the necessary ready-to-use therapeutic food (RUTF) during the FAFSA-2 time frame like they do now.
It has generally proven difficult to successfully implement CMAM and interventions to prevent chronic undernutrition in the same community due to very different goals and services provided by each. Operations research and implementation experience are needed to test models that effectively integrate the two approaches and “enable a more comprehensive continuum of care from prevention to treatment” (Bergeron and Castleman, 2012, p. 242).
Outcomes. Only half the programs (49 percent) measured results for sick child feeding practices, and 71 percent of those that evaluated these indicators reported improving these practices. However, the Title II programs working on CMAM did not report specific results, such as the outcomes of screening, referral, supplementary feeding, or recovery and relapse rates.
6.3.1.6 Vitamin A Supplementation
Rationale. Micronutrient supplementation for preschool children (vitamin A and zinc) was the intervention ranked #1 among 30 proposals for solving the world’s main development problems in the 2008 Copenhagen Consensus, because of the tremendously high benefits compared to costs.183 High coverage of children 6–59 months of age with vitamin A supplements twice a year has been achieved in many countries using a Child Health Day model (Klemm et al., 2009). This successful delivery approach, namely, outreach from government health facilities to provide immunization, vitamin A supplements, and other services closer to where people live, will be discussed later in this section. Yet improvements are still needed in coverage of vitamin A supplementation in many of the neediest developing countries.
What programs did. Many Title II development programs (62 percent) worked to increase both coverage of women postpartum and children 6–59 months of age with vitamin A supplements. The supplements were provided by ministries of health and distributed by health workers, per national norms, while Title II programs did community mobilization and outreach to promote participation by program beneficiaries, often distributing food supplements at the same Child Health Days as an
183 Copenhagen Consensus 2008, “Outcome – The Experts.” http://copenhagenconsensus.com/Projects/Copenhagen%20Consensus%202008/Outcome.aspx.
Table 6.6. Illustrative Activities from the 2006–2010 Strategic Plan Related to Sub-IR 2.1, Human Capabilities Protected and Enhanced
Illustrative Activities: To identify, treat, and prevent recurrence of cases of acute undernutrition
Non-Food Assistance Food Assistance
The Title II program:
• Develops and uses surveillance systems to identify cases of acute undernutrition.
• Educates and supports mothers, families, and communities in changing critical feeding and care practices for infants and young children.
The Title II program:
• Provides food as part of:
− Community-based therapeutic feeding programs, or
− Therapeutic feeding center programs.
Source: This table is taken verbatim from the USAID/FFP Strategic Plan, p. 65.

6-20 Maternal and Child Health and Nutrition
incentive to increase attendance. Title II programs provided organizational and logistical support to ministries of health, e.g., transport, funds for fuel, or per diems to health staff to come to communities from the health center. The program documentation did not separately describe activities to promote coverage of postpartum women versus children.
Outcomes. One-third of the programs had results indicators on the percent of children receiving vitamin A supplements, and 68 percent of those that had evaluated vitamin A supplementation reported increased coverage. The 2007 joint evaluation of the four Haiti Title II programs reported a large, statistically significant increase in children from 12 to 60 months of age that received vitamin A supplements from 44 percent to 75 percent between baseline and endline (p < 0.01). Evaluation research of the CARE/India FY 2002–FY 2006 program also found significantly greater increases between baseline and endline than the comparison group in children 12–23 months that received vitamin A in the program districts in Andhra Pradesh state (55 percent to 79 percent) and in Uttar Pradesh state, a dramatic fourfold increase from 18 percent to 69 percent (p < 0.05) (Dreyfuss et al., 2008).
6.3.1.7 Iron and Folic Acid Supplementation for Anemia Prevention and Control
Rationale. The consequences of iron deficiency and anemia are increased maternal and perinatal mortality, increased numbers of preterm births and low birth weight babies, impaired cognitive development, and reduced work productivity (FANTA, 2006). As one Title II program reported, anemia drained women’s energy, discouraging them from participating in project activities for their empowerment and advancement. Thus, anemia exacerbates the problem of heavy workloads for women. Recent DHS data for 10 of the USAID/FFP priority countries show that 21–69 percent of women of reproductive age are anemic, a medium to high public health threat according to WHO.184 The data also illustrate that anemia is not limited to pregnancy.
184 See http://www.statcompiler.com. Non-pregnant women 15–49 years of age with hemoglobin < 12 g/dl.
Iron deficiency is the principal cause of anemia in all regions, but anemia may also be caused by hookworm, HIV, malaria, and high fertility, with the latter two being major causes in Africa (FANTA, 2006; Galloway, 2003). Inadequate dietary intake and poor absorption of iron from plant foods and beverages with inhibitors (e.g., tannins) are the main reasons for iron deficiency, as well as the low intake of animal foods from which iron is more bioavailable. To address inadequate intakes and provide for the increased requirements of pregnancy and lactation, most countries’ health systems routinely distribute iron and folic acid supplements to pregnant and lactating women. There are many logistical challenges to ensuring an adequate supply of supplements. It is regrettable that distribution of iron and folic acid supplements is rarely part of the services delivered at Child Health Days, in contrast to vitamin A supplements. Behavior change to create demand is also needed.
Linked to maternal anemia, child anemia is also very high in the same countries, ranging from 39 percent to 85 percent per DHS data.185 Child anemia has not been a focus of most ministries of health. Few countries have a national policy for iron supplementation for children or fortification of complementary foods and other staples. Furthermore, in endemic malaria areas, which includes the USAID/FFP focus countries in Africa, WHO’s guidelines currently caution against universal iron supplementation for children, although a recent review suggests that supplementation is not harmful (Ojukwu et al., 2009), and WHO is considering revised guidelines. Until there are national programs to prevent and reduce child anemia, and the WHO guidelines are revised, it will be difficult for Title II programs in Africa to address child iron deficiency anemia.
What programs did. Maternal iron and folic acid supplementation, done by only 12 programs, was the ENA intervention least frequently supported by Title II development programs, in contrast to the previously mentioned DHS data on what a huge nutritional problem anemia is in the countries
185 Children 6–59 months of age with hemoglobin < 11 g/dl.

6-21Maternal and Child Health and Nutrition
where Title II programs work. It is encouraging to see that FTF places high priority on implementing interventions to reduce anemia as evidenced by its required indicator “prevalence of anemia among women of reproductive age” to measure achievement of the IR “Improved use of maternal and child health and nutrition services.”186 Hopefully, Title II development programs will follow suit and place more emphasis on what they can do to reduce anemia in women and children.
Outcomes. Of the 10 programs that evaluated receipt of iron and folic acid supplements by pregnant and lactating women, only 20 percent improved coverage. The documentation does not provide insights into this low success rate. Low coverage may have been due to logistical constraints in government health services to making the tablets available in adequate amounts, beyond the control of the Title II program; women not having been convinced of the benefits versus side effects through effective SBCC; or Title II programs not having trained health workers adequately or prioritized increasing coverage.
According to the evaluation research on the CARE/India program, the program significantly increased the percent of pregnant women receiving iron and folic acid tablets from 41 percent to 55 percent in the project district in Uttar Pradesh state compared to the comparison district (p < 0.05). No increased coverage was achieved in the program district in Andhra Pradesh, but the program did significantly increase the percent of women that consumed all of the iron and folic acid tablets they received, from 25 percent to 57 percent (Dreyfuss et al., 2008). However, the changes in supplementation coverage and consumption were not enough to reduce the prevalence of anemia among pregnant women (Baqui et al., 2006). The Government of India had a policy on providing pediatric iron to children over one year of age. The CARE/India program significantly increased coverage with pediatric iron from 0 percent at baseline to 30 percent at endline in the program district studied in Andhra Pradesh and to 69 percent in the program district in Uttar
186 http://feedthefuture.gov/progress. Accessed February 6, 2012.
Pradesh. Gains in coverage occurred during the second year of the intervention. However, few children reported consumption of more than a handful of tablets (Dreyfuss et al., 2008). CARE/Indonesia used its hearth centers for pregnant women to focus on reducing anemia, and measured hemoglobin, but did not show improvement.
6.3.1.8 Maternal Nutrition
Rationale. The USAID/FFP Strategic Plan calls for activities to “enhance the nutritional status of women” (see Table 6.7). Impacts of recent food price crises have been found to first manifest themselves in a worsening of maternal nutritional status (Shrimpton et al., 2009). “Because of gender inequality, the mother is often the last to benefit in a household when things are going well, and the first to be sacrificed when things are going poorly” (UNSCN, 2010, p. 6). Whether this is true and there actually is discrimination against women, leading to inequitable intra-household food distribution, needs to be verified through research on the dietary intake of different household members and the determinants for those behaviors in each program setting. As explained by Millman and DeRose (1998), women may or may not suffer more food deprivation than men and generalizations that are not evidence-based should be avoided. However, pregnancy and lactation do increase women’s nutrient requirements, and there is no debate that women in the developing world often do not increase their food intake or reduce their energy expenditure (workload) enough to meet those requirements. Thus, women living in food insecure households are vulnerable because of their reproductive roles (physiological status). If dietary intake is not sufficient to support optimal pregnancy outcomes and lactation, undernutrition results for both the mother and her child and the child’s risk of dying is increased. Title II MCHN programs are expected to place high priority on delivering services to pregnant and lactating women to prevent these negative outcomes.
A key measure of women’s nutritional status is body mass index (BMI), an indicator of weight adequacy in relation to height in adults. It is calculated as

6-22 Maternal and Child Health and Nutrition
weight (in kg) divided by height squared (in meters). The acceptable BMI range for adults is 18.5 to 24.9. Low BMI indicates thinness or wasting, which is indeed a problem for women in 12 of the 17 USAID/FFP priority countries with data. A prevalence of wasting (BMI < 18.5) in women of 10.0–19.9 percent is considered “poor” and of medium public health significance by WHO, and a prevalence of 20.0–39.9 percent is “severe” and of high public health significance (CORE Group, Nutrition Working Group, 2010). Low BMI may be due in part to HIV in countries with generalized epidemics, especially in Africa. Table 6.8 presents DHS statistics on the prevalence of low BMI (< 18.5) in non-pregnant women 15–49 years of age in 17 USAID/FFP priority countries. These data are presented to make the case that women’s nutrition is a major problem that warrants interventions using Title II resources. Bangladesh, Burkina Faso, Chad, Ethiopia, and Madagascar had “severe” levels of wasting in women. “Poor” levels were found in DRC, Haiti, Liberia, Mali, Niger, Sierra Leone, and Uganda. In countries with “poor” or “severe” levels of wasting in women of reproductive age, prevalence may be higher among adolescent women 15–19 years of age. For example, in the 2007 DHS
in Bangladesh, 34.9 percent of women 15–19 years of age had low BMI versus 29.7 percent of women 15–49 years of age. As stated under “Gender Equity” or “Gender” in the USAID/FFP Proposal Guidelines for FY 2010 and RFAs for FY 2011, FY 2012, and FY 2013: “Many women are married and bear children during their adolescent years, at a time when they have the least access to resources and decision-making power in the household, which affects food utilization and nutrition outcomes.” Therefore, interventions to improve women’s nutrition in adolescence are especially important.
Several countries had the opposite problem of high rates of overweight in women (BMI ≥ 25.0), exceeding 20 percent, namely Guatemala, Haiti, Liberia, Mauritania, and Sierra Leone. This presents a different malnutrition problem to be tackled. Being overweight may increase the risk of developing many health problems, including diabetes, heart disease, stroke, cancer, and pregnancy complications.187 Another challenge is the high prevalence of extreme shortness (< 145 cm tall) in
187 U.S. National Institutes of Health Weight-Control Information Network. http://win.niddk.nih.gov/publications/health_risks.htm. Accessed January 24, 2012.
Table 6.7. Illustrative Activities from the 2006–2010 Strategic Plan Related to Sub-IR 2.1, Human Capabilities Protected and Enhanced
Illustrative Activities: To enhance the nutritional status of women
Non-Food Assistance Food AssistanceThe Title II program:
• Educates women, families, and communities on how to improve the nutritional status of women.
• Enhances access to micronutrient supplements by women in communities with high prevalence of iron deficiency, anemia, and vitamin A deficiency.
• Promotes the consumption of iodized salt.
• Provides improved household technology to reduce excessive energy expenditure on food processing and production tasks by women.
• Provides and/or facilitates access to other essential services for comprehensive care during pregnancy, at birth, and postpartum; treatment of infections; improved hygiene and sanitation; and nutrition information and counseling for adequate quantity and diversity of diets.
• Educates families and communities about the importance of delaying the age of marriage and first pregnancy for adolescent girls.
The Title II program:
• Provides food to non-pregnant adolescent girls to improve pre-pregnancy body mass index (BMI).
• Provides food to pregnant women to ensure adequate weight gain during pregnancy.
• Provides food to women during lactation and inter-pregnancy intervals to ensure maintenance or achievement of adequate BMI.
Source: This table is taken verbatim from the USAID/FFP Strategic Plan, p. 67.

6-23Maternal and Child Health and Nutrition
women 15–49 years in rural areas of Bangladesh and Guatemala, which is associated with increased risk of obstructed labor and other delivery complications, maternal mortality, and low birth weight.188 This shortness can be traced back to becoming stunted in early childhood.
The 6th Report on the World Nutrition Situation (UNSCN, 2010) looked at the importance of maternal nutrition in the intergenerational transmission of growth failure and found that, as the rates of low BMI in women fall, so do the prevalence of low birth weight and underweight in children; maternal nutrition is the determinant and child nutrition is the result. Furthermore, improving the quantity and quality of the pregnant woman’s diet can improve birth weight, even in small women,
188 Bangladesh 2007 DHS; Guatemala 2008/09 National Maternal and Child Health Survey (ENSMI).
with greater impact if women are reached in the first six months of pregnancy or earlier (UNSCN, 2010).189
Women’s heavy physical workloads are a big determinant of their being underweight and of intrauterine growth retardation, when energy expenditure exceeds energy intake. Heavy work demands, especially outside the home, can also lead to neglect of child care and feeding, contributing to child undernutrition. Few programs focused on getting women to rest or involving men to assume
189 A concern that increasing weight (size) of babies born to small mothers by maternal dietary supplementation might increase head size and thereby maternal mortality due to obstructed labor, or cephalo pelvic disproportion, is not supported by the evidence. The UNSCN 2010 review cited studies in the Gambia and Malawi that found no cephalo pelvic disproportion, even when food supplements were given to short women or adolescents (Ceesay et al., 1997; Brabin et al., 2002).
Table 6.8. Prevalence of Low and High BMI in Non-Pregnant Women 15–49 Years of Age in USAID/FFP Priority Countries (BMI: weight in kg/height in m2)
USAID/FFP Priority Countries
Year of DHS/RHS*
WHO Level of Prevalence/Public Health Significance
for Low BMI**
Nutritional Status of Non-Pregnant Women 15–49 Years of Age
Percent Underweight BMI < 18.5
Percent Overweight BMI ≥ 25
Bangladesh 2007 High/Severe 29.7 11.8
Burkina Faso 2003 High/Severe 20.8 9.3
Chad 2004 High/Severe 22.1 7.1
DRC 2007 Medium/Poor 18.5 11.3
Ethiopia 2005 High/Severe 26.5 4.4
Guatemala 2008/09 Normal 1.6 50.5
Haiti 2005/06 Medium/Poor 15.5 21.2
Liberia 2006 Medium/Poor 10.0 20.5
Madagascar 2008/09 High/Severe 26.7 6.3
Malawi 2004 Low/Monitoring required 9.2 13.6
Mali 2006 Medium/Poor 13.5 17.6
Mauritania 2000 Low/Monitoring required 8.6 42.7
Mozambique 2003 Low/Monitoring required 8.6 14.2
Niger 2006 Medium/Poor 19.2 13.0
Sierra Leone 2008 Medium/Poor 10.9 27.3
Uganda 2006 Medium/Poor 12.1 16.5
Zambia 2007 Low/Monitoring required 9.6 19.2* Source: DHS or Reproductive Health Survey (RHS) data from http://www.statcompiler.com and Kothari and Abderrahim, 2010.
** Source: WHO Expert Committee, 1995.

6-24 Maternal and Child Health and Nutrition
some of the women’s chores during pregnancy and lactation. CARE/India FY 2002–FY 2006 promoted rest by pregnant and lactating women for two or more hours in the afternoon. It would be useful for programs to measure reducing pregnant and lactating women’s workloads as a behavior change outcome indicator. It is encouraging to see that the USAID/FFP FY 2012 and FY 2013 RFAs for Title II development programs call for applicants to assess the impact of proposed activities on women’s workloads.
Also, pregnant women’s smoking or drinking alcohol endanger the mother’s health and put the unborn child at risk of low birth weight and fetal alcohol syndrome in some countries, e.g., in Burundi, Rwanda, and Uganda. Alcoholism among men in northern Uganda was reported to be a major problem that contributes to women’s heavy workloads. Furthermore, gender-based violence by men against women is another factor that is often exacerbated by men’s heavy drinking. The threat of violence can impair a mother’s ability to participate in Title II program activities (difficulty getting permission) and to care for young children (due to depression that undermines her caring capabilities). A Title II program can engage in community-based awareness-raising to shift norms and practices—promoting positive approaches to conflict resolution and cooperation within households. Working with men and not just women is essential. These could be new areas for Title II programs as they work more on gender integration. They were not promoted in the Strategic Plan or Proposal Guidelines during the FAFSA-2 time frame. Thus, it is not surprising that the FAFSA-2 did not encounter Title II programs trying to change these harmful behaviors.
Measuring women’s nutrition. The nature and magnitude of the undernutrition problem are important to determine in each program context. This is true for maternal as well as child nutrition. An important step in designing and evaluating program interventions should, therefore, be measuring women’s nutritional status. A major advance in 2011 was that USAID/FFP added “women’s BMI” and “women’s dietary diversity score” as standard indicators for evaluating Title II
programs (FFPIB 11-03, USAID/FFP, 2011). Both will also be required in FTF programs. The indicator “women’s dietary diversity score” is a good marker not only for the micronutrient adequacy of women’s diets, but also for household food security (Arimond et al., 2011). It has also been found to correlate well with the dietary diversity of women’s children from 6 to 23 months of age using DHS data for Cambodia, Ghana, and Haiti.190 Programs need to improve women’s dietary diversity to improve women’s health and nutritional status and to ensure healthy pregnancy and birth outcomes.
What programs did. Requiring measurement of women’s nutrition is important, given the women’s BMI data presented in Table 6.8, which indicate that wasting in women is a major problem in 12 of 17 USAID/FFP priority countries.191 During the FAFSA-2 time frame, only eight Title II MCHN programs measured women’s anthropometry.
Only one program used “women’s BMI” as an impact indicator (CRS/Niger). In this program, low BMI (< 18.5) in women of reproductive age rose to “severe” levels, from 18 percent in 2008 to 31 percent in 2010 during the drought/food crisis. The CRS/Niger program design did not include direct MCHN food distribution for women or children, and no food or other women’s nutrition interventions were added after the mid-term evaluation, which said that the program should focus more on women’s nutrition. The Africare/Uganda program had proposed to measure maternal BMI as a results indicator in the IPTT in its proposal, but later dropped it; no information was reported on why.
190 Melissa Daniels’s presentation at the Infant and Young Child Nutrition Project (IYCN) Conference on “Preventing Maternal Malnutrition: Evidence, Challenges and Opportunities.” August 16, 2011. Washington, DC. See http://iycn.wpengine.netdna-cdn.com/files/Melissa-Daniels-Presentation.pdf. 191 Women’s BMI was measured in the baseline surveys for the three Bangladesh FY 2010–FY 2015 programs of ACDI/VOCA, CARE, and SC and for the previous SC program. The prevalence of low BMI (< 18.5) was similar to the national average of 33 percent in the 2007 DHS, a “severe” level per WHO.

6-25Maternal and Child Health and Nutrition
Researchers evaluating the CARE/India FY 2002–FY 2006 program measured women’s BMI and found a very high prevalence of wasting (BMI < 18.5) among pregnant and non-pregnant women in an intervention and comparison district in each of two of the project states (Uttar Pradesh and Andhra Pradesh). It was particularly alarming in the Andhra Pradesh intervention district that more than 50 percent of mothers of children 6–23 months were underweight for their height—“very high level” rates per WHO (Dreyfuss et al., 2008). However, the program was able to achieve significant improvements in the nutritional status of both pregnant and postpartum women in both program districts in both states. This was an unexpected positive result. Nevertheless, even with the improvements, the prevalence of low BMI remained at a very high level (> 40 percent). Greater improvements in women’s nutritional status will be needed to translate into gains in child nutritional status (Dreyfuss et al., 2008).
The CRS/Malawi FY 2009–FY 2014 and CARE/Haiti programs measured pregnant women’s mid-upper arm circumference (MUAC) to target Title II supplementary feeding only to wasted pregnant women with MUAC < 22.5 cm, indicating fetuses at greater risk of intrauterine growth retardation. During the FAFSA-2 team’s visit to Malawi, the team was told by CRS that it had restricted eligibility due to budget constraints. CARE/Haiti reported that FANTA had recommended using MUAC to target food rations to wasted pregnant women, but CARE found that the MUAC cutoff lacked sensitivity because it excluded too many underweight women and their unborn children that could have benefited from food rations. In contrast to targeting food rations only to wasted pregnant women, as done in programs in Haiti and Malawi, the state of the art is to provide food supplements to all pregnant women in food insecure target areas, given the risks of low birth weight and its lifelong negative impact on height, cognitive function, and intellectual development (UNSCN, 2010).
Interventions. The majority of Title II MCHN programs (62 percent) provided food rations to pregnant and lactating women, an excellent
intervention that should continue. If food rations are consumed as intended and increase women’s dietary intake, supplementary feeding can ensure that women receive needed nutrients. However, women’s diets may not improve with supplementary feeding, due to sharing rations with other family members or substituting the donated foods for other home foods they would have eaten anyway. Food rations for pregnant and lactating women can also provide an incentive for these often hard-to-reach women and their babies to participate in maternal and neonatal health interventions and preventive behavior change. Of the 22 programs with no direct MCHN food distribution, many of which were focused on recuperating malnourished children using the Positive Deviance/Hearth (PD/H) approach, only 8 programs (36 percent) addressed women’s nutrition. Programs that provided rations for recuperative feeding of malnourished children also tended not to focus on maternal nutrition. Although providing food to non-pregnant adolescent girls to improve pre-pregnancy BMI was an illustrative activity in the USAID/FFP Strategic Plan, FAFSA-2 did not find examples of Title II MCHN programs doing this.
Behavior change. The neglect of women’s nutrition in Title II development programs was a finding of the 2002 FAFSA (Bonnard et al., 2002). During the FAFSA-2 time frame, close to half of the Title II programs (46 percent) used SBCC to improve women’s diets, reduce women’s workloads, and promote other practices to improve maternal nutrition. While this is positive, there is clearly room for improvement in the programs that did not include it. However, programs with SBCC to improve women’s dietary intake were not measuring the USAID/FFP required behavior change indicators (“consume food rich in vitamin A, iron, or calcium”).
The CARE/India program FY 2002–FY 2006 promoted the following dietary advice to pregnant and lactating women during home visits and educational talks at monthly Nutrition and Health Days and growth promotion sessions by village promoters: (1) eat one additional meal every day, (2) eat all available foods in the house, and

6-26 Maternal and Child Health and Nutrition
(3) eat the program food ration. The Africare/Uganda program promoted communal or household vegetable gardens, including orange and yellow sweet potatoes, fruit tree growing, and small live-stock rearing (rabbits and pigs) to increase income as well as household dietary diversity, especially of women and young children. This program helped improve the traditional high carbohydrate diet that was protein-poor and lacked micronutrients.
Outcomes. Only seven Title II programs (11 per-cent) had women’s dietary improvement indicators; 86 percent of these reported improve ments in their program evaluations. The Africare/Uganda program increased the mean women’s dietary diversity score from 4.2 to 7.3 over the life of the project. The mean children’s baseline and final dietary diversity scores also improved and were similar to the women’s scores. The increased consumption of vegetables, fruits, and rabbit meat by the end of project were noteworthy.
The CARE/India FY 2002–FY 2006 intervention yielded tangible improvements in the dietary intake and nutritional status of both pregnant and postpartum women in both states (Uttar Pradesh and Andhra Pradesh). Although nutrition advice was targeted to women during pregnancy and the first six months postpartum, broad improvements in dietary intake among all women were observed in both states, through increasing the number of meals and/or snacks eaten. Consumption of at least three meals a day increased, but snack consumption decreased in the program district studied in Andhra Pradesh, where the vast majority of women already consumed three meals a day. In the program district in Uttar Pradesh, only 25 percent of women ate three meals a day at baseline, but both meal and snack consumption increased at endline. In both states, these changes in meal and snack consumption occurred among pregnant and recently delivered women, as well as among mothers of children 6–23 months of age (Dreyfuss et al., 2008).
There were multiple improvements in the diversity or quality of women’s diets in the CARE/India program in both states. Recent consumption of legumes, dark green leafy vegetables, and yellow-orange fruits increased among all groups of women
in Andhra Pradesh. In Uttar Pradesh, only yellow-orange fruit intake increased significantly among all women, but pregnant women and mothers of children 6–23 months increased their weekly intake of meat, fish, chicken, and eggs. Women that had recently delivered increased their dairy intake. Dietary messages delivered to women during pregnancy and the early postpartum period appeared to have had a positive effect on all women’s diets.
CARE/India also promoted that pregnant and lactating women rest for two or more hours in the afternoons. In one state (Uttar Pradesh), the program managed to significantly increase (p < 0.05) pregnant women resting, from 27 percent at baseline to 39 percent at endline, but not lactating women. The Bangladesh FY 2005–FY 2010 programs of CARE and SC also promoted more daytime rest than usual for pregnant women and were able to achieve increases. For example, in the SC program, women resting more in their most recent pregnancy increased significantly, from 46 percent at baseline to 96 percent at endline according to the final survey report (p < 0.01).
6.3.1.9 Supplementary Feeding
Rationale. Providing food rations (supplementary feeding) to pregnant and lactating women and preschool children in food insecure communities is a core nutrition service in Title II MCHN programs. Food assistance is given to families for the primary purpose of improving the quantity and quality of dietary intake to meet nutrient requirements for: (1) rapid growth and development and catch-up growth during recovery from infections and undernutrition in young children, and (2) increased demands of pregnancy and lactation. Title II blended foods, such as CSB, are more nutritious, energy- and protein-dense, convenient-to-prepare complementary foods than foods that most participating families can access otherwise.192 Vegetable oil in rations plays an important role in increasing energy density and providing essential fatty acids when added to
192 The recent FAQR conducted for USAID/FFP by Tufts University recommended further improving the formulation of CSB and ensuring that it is always consumed along with vegetable oil (Webb et al., 2011).

6-27Maternal and Child Health and Nutrition
complementary foods. It is often scarce in the diet of food insecure populations because of high cost. Fortification of Title II commodities with vitamins and minerals contributes to higher micronutrient intakes. An important additional role of MCHN rations is to provide an incentive to engage food insecure, time-constrained mothers, caregivers, and families to participate in training, behavior change activities, and preventive and curative HN services, by compensating for their opportunity costs. The goal is improved pregnancy outcome—increased birth weight and length, and prevention or treatment of undernutrition in children. It has been known for at least three decades that supplementary feeding alone is not sufficient to improve nutritional status. It needs to be integrated with community-based SBCC, the ENA interventions, WASH, and essential preventive and curative health services (Anderson, 1977; Anderson et al., 1981).
One reference on the merits of supplementary feeding is a study that compared the effectiveness of conditional cash transfers in the Honduran government’s MCH safety net program and supplementary feeding in the CARE/Honduras Title II MCHN program. The study found that provision of food rather than cash induced stronger links with health services, including increased visits for preventive MCH services. Furthermore, supplementary feeding, but not cash transfers, had significant positive effects on average household and child calorie consumption and on the calorie and protein consumption of women and adolescent girls (Sanghvi et al., 1995). More recently, supplementary feeding made the list of effective child nutrition interventions in the Lancet review because providing food rations to children in populations with “insufficient food” had a significant impact on reducing stunting, with or without SBCC (Bhutta et al., 2008). Based on that finding in the Lancet review, supplementary feeding is one of the 13 highly cost-effective interventions to prevent and treat undernutrition in the package promoted by the SUN Movement (SUN, 2010). The meta-analysis by Bhutta et al. (2008) defined populations with “insufficient food” as those with an average income of US$1 or less per day. The USAID/FFP priority countries were also selected
based on a high prevalence of people living on US$1 or less per day (extreme poverty), as well as a high prevalence of stunting and of undernourished people (FAO indicator of caloric availability). Furthermore, Title II programs work in the most food insecure rural communities in those countries. Thus, since Title II programs serve populations with “insufficient food,” greater nutritional impact would be expected by offering an integrated package of HN interventions that include MCHN supplementary feeding.
An even more compelling justification for doing MCHN supplementary feeding in USAID/FFP priority countries is the fact that in 16 of these 20 countries, with recent DHS data, all but Guatemala had levels of acute malnutrition greater than 5 percent in children under five years (Kothari and Abderrahim, 2010). The prevalence of acute malnutrition in 10 of the countries was 10 percent or more, the WHO threshold for a serious emergency situation.
What programs did. The main target groups for supplementary feeding during the FAFSA-2 time period were intended to be pregnant and lactating women and children 6–23 months of age based on USAID/FFP’s Strategic Plan (see Box 2.1 in Chapter 2) and Proposal Guidelines. However, as seen earlier in Table 6.3, 70 percent of Title II MCHN supplementary feeding programs distributed rations to older children, along with younger children, despite USAID/FFP guidelines and despite the evidence of greater benefit in younger children.
The FAFSA-2 team expected to find a supplementary feeding component in all Title II programs reviewed with MCHN objectives, given the benefits of this intervention, the availability of U.S. food aid, and the emphasis in the Strategic Plan on the use of food to enhance human capital through take-home MCHN rations. This expectation was bolstered by the previously mentioned evidence on effectiveness and need. However, contrary to the expectation and justification for MCHN supplementary feeding, many programs did not include this intervention. That was surprising, especially in countries with acute malnutrition rates greater than 15 percent, the WHO critical level, and

6-28 Maternal and Child Health and Nutrition
poor or severe levels of wasting in women, such as the case in Burkina Faso, Chad, Mali, Madagascar, and Niger. See Figure 6.3 for the distribution of Title II programs with and without MCHN supplementary feeding in Africa and Figure 6.4 for the worldwide distribution.
Title II development programs with no supplementary feeding. A major finding is that 22 of the 69 MCHN programs reviewed (32 percent of all programs) did no direct food distribution to women or children; 19 of these were in Africa.193 Most of the no-food-assistance programs (81 percent) were doing a PD/H approach.194
One example of a program that did not provide food supplements to very vulnerable mothers and young children is the CRS/Niger program, where 15 percent of children under five years of age suffered from acute malnutrition, a prevalence that has changed little since the first DHS in 1992. The mid-term evaluation of the CRS/Niger no-food-assistance program found that the only program districts where underweight in children 0–59 months of age had been reduced were those where WFP had intervened during the drought emergency with blanket supplementary feeding for these children. Furthermore, in the same CRS program, low BMI (< 18.5) in women of reproductive age rose to severe levels, from 18 percent in 2008 to 31 percent in 2010 (during the drought/food crisis), but there was no food aid provided or other action taken. The impact of drought and food price increases on maternal and child nutrition have likely been more severe in countries like Niger than they would have been had there been supplementary feeding programs to prevent undernutrition. Not preventing undernutrition through supplementary feeding, where possible, in countries with chronically high rates of wasting increases the cost of emergency
193 The absence of direct MCHN food distribution in the 22 programs was confirmed by cross-checking the USAID/FFP database for AERs.194 The remaining MCHN programs that did no direct food distribution and no PD/H implemented a variety of approaches to improve nutrition, including support groups (1 program), homestead food production (1 program), growth promotion (1 program), nutrition education using community extension agents (3 programs), and radio messages (1 program).
relief by USAID/FFP, OFDA, and other international organizations. Treating child acute malnutrition with RUTF is more expensive than prevention. Furthermore, when a crisis occurs, being able to reprogram food commodities already in-country for a development program speeds up the emergency response. The irony is that some of the Title II Awardees with no preventive supplementary feeding in Niger were implementing the OFDA emergency programs for CMAM. It should be noted that the other two Niger MCHN programs, while providing supplementary feeding, were not maximizing its potential for preventing child undernutrition. Africare/Niger limited food distribution to young children only in the lean season and CPI/Niger targeted only acutely malnourished children, while both programs appropriately gave food to all pregnant and lactating women all year.
In certain cases, programs did not implement direct food distribution at the request of the host
Figure 6.3. Title II MCHN Programs in Africa by Type of Food Ration
None, 19 programs,
56%
Prevention, 4 programs,
12%
Recuperation only, 11 programs,
32%
Figure 6.4. Title II MCHN Programs Worldwide by Type of Food Ration
None, 22 programs,
32%
Prevention, 33 programs, 48%
Recuperation only, 14 programs, 20%

6-29Maternal and Child Health and Nutrition
government. Some governments were opposed to broad food distribution for preventive MCHN supplementary feeding because they did not want to receive U.S. food aid containing genetically modified corn and soybean. Other governments feared that supplementary feeding might create dependency, might not be sustainable, or might be an acknowledgment of hunger in their countries, e.g., Malawi, Niger, and Uganda. However, these governments were not opposed to less targeted use of food as an incentive for attending literacy classes or for social protection of PLHIV and vulnerable adults. At the community level, only giving food aid to adults for social protection and not to women and children in the 1,000 days for prevention sends the wrong message to community leaders and households that there is no maternal and child undernutrition problem, and that is why no food is being given. In terms of sustainability, an important argument is that the benefits of achieving normal physical growth and mental development through supplementary feeding during the 1,000 days are sustained throughout that individual’s lifetime. Governments opposed to preventive MCHN supplementary feeding may favor RUTF distribution for treatment of acute malnutrition, if donors provide it, e.g., in Malawi and Niger. With donors supplying the expensive RUTF, the host governments do not have to worry about how much more cost-effective it would have been to prevent than to treat the acute malnutrition. For example, Plumpy’Nut® used for therapeutic feeding for SAM may cost US$2,500 per MT vs. CSB used for preventive supplementary feeding, which costs around US$300 per MT.195
The Malawi and Uganda governments have championed the international SUN Framework for their countries, which includes supplementary feeding as one of the 13 effective interventions to be scaled up for women and children in the first 1,000 days. The fact that some governments’ policies discouraging preventive supplementary feeding for women and children are inconsistent with SUN and with the FAFSA-2 findings should be used by
195 The World Bank has estimated the cost of treatment of SAM with RUTF to be US$200/child/episode vs. the cost of supplementary feeding to prevent or treat moderate malnutrition to be US$40–$80/child/year (Horton et al., 2010).
USAID to have a dialogue with these governments to get them to change unsound policies. It is also contradictory that some of the same governments have approved preventive supplementary feeding programs by WFP.
Preventive and recuperative supplementary feeding in Title II development programs. Programs doing MCHN supplementary feeding used two main types of targeting: prevention and recuperation. Common characteristics of these two types of supplementary feeding in the programs reviewed, as well as advantages and disadvantages, are described next. As seen in Figure 6.4, nearly half of all Title II MCHN programs reviewed (48 percent) did preventive supplementary feeding and 20 percent provided recuperative feeding only. Of the 47 MCHN programs worldwide that provided Title II supplementary feeding, 33 (70 percent) did prevention and 14 (30 percent) did recuperation only. However, the decision to use preventive or recuperative targeting strategies for supplementary feeding varied widely by region. Figure 6.3 and Figure 6.5 show the regional distribution of Title II programs with MCHN supplementary feeding for prevention or recuperation, as well as programs with no supplementary feeding. There were only four prevention programs in Africa (12 percent of Title II MCHN programs in that region), compared to high numbers in Asia and LAC, where prevention was the norm: 75 percent and 87 percent of all Title II MCHN programs, respectively. In contrast, recuperation-only programs were more common
Figure 6.5. FAFSA-2 Types of Title II MCHN Food Rations by Region
56%
12%
32%25%
75%
0%0%
87%
13%
0%
10%
20%
30%
40%
50%
60%
70%
80%
90%
100%
None Prevention Recuperation
AFR
Asia
LAC
Rat
ion
Type
-%
of P
rogr
ams
by R
egio
n

6-30 Maternal and Child Health and Nutrition
in Africa (11 programs or 32 percent of all Title II MCHN programs in that region), compared to no recuperation-only programs in Asia and three recuperation-only programs in LAC (13 percent of all LAC Title II MCHN programs in that region).
Prevention model. Prevention programs targeted food rations to all members of the target group (defined by age and physiological status) in the selected geographic area, irrespective of their current nutritional status. The target group was pregnant and lactating women and preschool children greater than six months of age.196 As a rule, prevention programs included community-based SBCC to improve IYCF practices. Receipt of rations was conditioned on mothers and children participating in certain preventive or curative HN services, e.g., monthly CBGP or Child Health Days. Therefore, in addition to the direct nutritional benefits of the food ration, the conditionality increased participation in important services, similar to the way conditional cash transfers operate. One rationale for age-based targeting of children is that in the food insecure rural communities where Title II works, even the upper-income quintiles may be food insecure and their children’s growth faltering; thus, they can benefit from supplementary feeding in addition to SBCC to improve feeding practices. Furthermore, targeting only the extremely poor has a high administrative cost and can be divisive in the community. In peri-urban areas, programs may need to target the poor, if there are wide disparities between income groups. For well-nourished children, food supplements and other program services help prevent or correct mild growth faltering; whereas for children that are already malnourished, food rations, if consumed in the intended quantity to significantly increase dietary intake, contribute to nutritional recuperation.
Thus, prevention programs actually both prevent and treat undernutrition, with their effectiveness for nutritional recuperation dependent on the size, nutrient content, and intake of the ration, and the degree of undernutrition. A number of programs
196 Age eligibility in supplementary feeding programs reviewed varied considerably across a range from 6 to 72 months. See Table 6.3 for the various age eligibility criteria used in preventive and recuperative feeding only programs.
(45 percent) classified in the FAFSA-2 as preventive supplementary feeding, because this was their main targeting strategy, also offered recuperative feeding to children they identified as underweight during growth monitoring and promotion.
Recuperation model. Recuperative feeding only programs in the FAFSA-2 provided food rations only to treat children that were already malnourished, usually defined by low weight-for-age. Four of the recuperation-only programs targeted food rations to children with MAM (low weight-for-height) in CMAM services. Recuperation programs sometimes provided food supplements to pregnant and lactating women, but the focus was on malnourished pre school children over six months of age.197 Participation was time-limited, with graduation once the child gained a certain amount of weight or achieved normal nutritional status, and much shorter than in the prevention model. Programs referred children to health services if they did not recover within the stipulated time, or if they were severely underweight or wasted. These programs may not provide any population-based community services—no SBCC to improve IYCF practices or preventive and curative health services, which are essential. This was the case in 29 percent of the recuperative feeding only programs reviewed, two of which were visited by the FAFSA-2 team. Since no food rations are provided to most mothers and young children in return for participating in HN services, this lack of an incentive or compensation for mothers’ opportunity costs contributes to lower coverage.
Prevention versus recuperation. Research has shown that supplementary feeding for prevention has a greater impact on reducing child undernutrition compared to recuperation programs. A USAID-funded, cluster-randomized trial compared the two types of supplementary feeding in Haiti and found at the end of the three-year intervention that stunting, underweight, and wasting were 4–6 percentage points lower in communities enrolled in the prevention model than in communities that
197 Age eligibility in supplementary feeding programs reviewed varied considerably across a range from 6 to 72 months. See Table 6.3 for the various age eligibility criteria used in preventive and recuperative feeding only programs.

6-31Maternal and Child Health and Nutrition
received the recuperation model (Ruel et al., 2008).198 Based on these findings, USAID/FFP has promoted prevention programs more vigorously in its Proposal Guidelines and RFAs since FY 2009, branding this PM2A, following the model tested in Haiti (FANTA, 2010). Additional USAID-funded research on PM2A is ongoing in the CRS/Burundi and MC/Guatemala Title II programs (FY 2009–FY 2014) to better define if household rations in addition to individual mother-child rations increase participation in preventive and curative HN services and impact on nutritional status, and, if so, the most cost-effective ration size, as well as the minimum duration of participation.199 The potential role of specialized foods, such as LNS and micronutrient powders, is also being tested; all of this research is being conducted by FANTA. Given the newness of PM2A, the only programs reviewed for MCHN in the FAFSA-2 that were doing this approach are the FY 2010–FY 2015 Title II programs of ACDI/VOCA, CARE, and SC in Bangladesh, a country visited by the FAFSA-2 team.
Drawbacks of recuperation-only programs. The FAFSA-2 team had the opportunity to visit three recuperation-only feeding programs in Malawi, Niger, and Uganda. Two of the programs were not doing any community-based SBCC to prevent undernutrition by improving IYCF practices.200 The focus was almost entirely on screening and food distribution. Children were weighed and MUAC was measured to screen for eligibility for rations, but not to detect early growth faltering due to inadequate weight gain or to counsel mothers on optimal IYCF
198 In the prevention model, severely malnourished children (weight-for-age z-scores < −3) 24–59 months of age received rations for recuperative feeding.199 The PM2A research programs are not in the FAFSA-2 universe because they are studies with recent start dates. However, the FAFSA-2 team met with MC about PM2A during its visit to Guatemala.200 Not working at the community level would be a negative in a prevention program as well as a recuperation program. However, all of the preventive supplementary feeding programs reviewed, including the three preventive supplementary feeding programs visited by the FAFSA-2 team, did community-based SBCC. This contrasted sharply to the absence of community-based activities in several recuperative feeding only programs, including two visited by the FAFSA-2 team.
and how to get the child to gain weight again. Mothers and children had to travel for miles to come to the central undernutrition screening or food distribution sites, instead of the program coming to the community. If a mother or caregiver did not have a malnourished child, she left with nothing—no food ration, no counseling, and the misperception that her child was fine. Many children were not doing well—they were stunted or not gaining adequate weight—but had not lost enough weight to cross below the cutoff point for being malnourished enough to be eligible. Others were well nourished. Mothers of children that were underweight (z-score < −2) or suffering from MAM got all the attention and lots of food aid. This seemed to be a perverse incentive for encouraging families to have a malnourished child—to qualify for the ration—rewarding bad IYCF behavior. Furthermore, mothers and children may be missed when food distribution is centralized away from the village, because the distance mothers must travel may keep them from participating with young children, along with the opportunity costs and their past experience with getting nothing at these sessions.
Only 7 percent of the recuperation programs reviewed limited participation to children under two years (versus 39 percent of prevention programs). In contrast, 36 percent of recuperation programs targeted malnourished children up to three years of age and most (57 percent) targeted children up to six years of age (see Table 6.3). Since most stunting occurs before two years of age, low weight-for-age in children above two years is often due to their being too short and their weight being proportional to their retarded height. Stunted older children with low weight-for-age, but normal weight-for-height, tend not to recover from low weight-for-age, and, if they do, it indicates that they have become overweight for their height.
The above limitations could explain in part why the nutritional impact of recuperative feeding only programs has been disappointing. (See Box 6.7 for an example of lessons learned in Guatemala by one Awardee on the drawbacks of recuperative feeding.) To reward good behavior in its FY 2007–FY 2011 program, SHARE/Guatemala tested giving a mother

6-32 Maternal and Child Health and Nutrition
much-prized sugar if her child’s nutritional status improved from one month to the next. One could debate the pros and cons of giving a non-nutritious product like sugar with its empty calories as a reward in a country like Guatemala where adult overweight is on the rise. However, the concept of rewarding good behavior is sound.
While providing assistance to USAID/FFP and USAID Missions to shape country-specific guidelines for new Title II programs in Afghanistan, DRC, and Uganda, FANTA has found recuperative feeding to be especially problematic in these post-conflict settings.201 It appears that recuperation models are more destabilizing for food security in post-conflict settings because of the lack of equity in food distribution. Families do not understand why some children get food and others do not and this leads to conflict between community members and with program staff. This is understandable when development food aid programs follow protracted emergency programs in which all family members got blanket feeding through WFP, which is withdrawn once “peace” is established. There appeared to be a tendency for USAID and implementing partners to prefer to do recuperative feeding to clearly distinguish the development program from the prior blanket relief feeding. But the recuperative approach has not worked well.
Findings substantiating the disadvantages of recuperative feeding in post-conflict settings come from formative research done in northern Uganda by FANTA-2 and MC to inform the design of an SBCC strategy for improving IYCF practices in the MC Title II development program. The population had lived in refugee camps for several decades and returned to their villages only in the past few years to rebuild their lives and reclaim their farms. Community members reported that parents waited for their children to become more malnourished so that they could qualify for the food ration. They did not understand the eligibility criteria. “Respondents referred to some households that tended to keep their children hungry or had many babies (i.e., the woman
201 Sethuraman, Kavita. FANTA. November 29, 2011. Personal communication.
was always pregnant) as a strategy to continue to get relief food. It was unfortunate that for some families food relief was the only means of survival, as it contributed greatly to the food in the home, and the caretakers had to use unconventional means to continue to get food” (Mwadime et al., 2012). Indeed, during the field visit to the MC program, the FAFSA-2 team learned that an audit had found that women were falsifying pregnancy to qualify for food rations. Mothers in a focus group discussion in the FANTA-2 formative research reported that: “Another [issue] is from us, the mothers. When a mother’s child has been weighed but the name happens not to appear among the eligible beneficiaries, she gets annoyed and starts to quarrel with those whose names appear on the list…So there are many quarrels and grudges between families.” While these findings are negative, they will help MC/Uganda improve its Title II program and illustrate why doing formative research is indispensable.
Box 6.7. Recuperative Feeding is Problematic
SHARE/Guatemala learned through experience that targeting rations only to malnourished children is detrimental to achieving program goals because: (1) participation at monthly education sessions drops if there is no ration, and the program cannot reach the critical mass necessary to have community-level impact; (2) it can be a perverse incentive—some extremely poor, rural families have a tendency to “sacrifice” the nutrition of one member—in this case, a child potentially eligible to receive a ration—to access food that benefits the whole family; and (3) community promoters and members may falsify nutritional status data of children to enable more households to access rations, thereby jeopardizing the validity of M&E data.
Source: World SHARE, Inc., 2000, Development Activity Proposal FY 2001–05 for Guatemala, p. 25.

6-33Maternal and Child Health and Nutrition
Sustainability of prevention programs. A criticism of prevention programs with large household rations is that this much food may create issues with the Bellmon Amendment,202 dependency, and sustainability concerns, because a family reached during the first 1,000 days receives food supplements continuously for about two-and-a-half years. For example, the 2008 final evaluation of the four Bolivia programs that had a large, 29.9 kg monthly ration reported that some communities lost up to half their participants when food assistance was stopped as the program was ending. SC had an innovative, more sustainable targeting strategy in its Bangladesh FY 2005–FY 2010 and Haiti programs, based on the assumption that the main constraint was inappropriate dietary practices and not food shortages, and that the project’s income-generating activities would improve food security. In Bangladesh, small rations of 4 kg per month were given as an incentive to participation. Furthermore, women were eligible only for preventive food rations for one pregnancy cycle during the life of the Title II program, i.e., a ration for the pregnant woman through six months of lactation and then for the child from 6 to 23 months. They focused on first-time mothers or first-time-in-the-program mothers. Using food assistance, the purpose was to teach mothers desirable HN and child care practices and have mothers be able to do these on their own later on without food aid. While such a targeting strategy limited eligibility for food rations to one pregnancy cycle, it did not exclude mothers from participating in SBCC and other preventive and curative HN services during subsequent pregnancies. This approach had been recommended in FANTA’s 1999 publication on improving targeting of food rations. Some experts say this may be an unrealistically short participation period to achieve lasting positive behavior change, that this kind of targeting could be difficult to control, and that this approach will not be effective if food security does not improve. It is also possible that this strategy may be less appropriate in many countries in Africa with much higher fertility rates than Bangladesh (see Table 6.11), because in
202 See Section 3.6.1.3 for a discussion of Bellmon Amendment issues.
a high-fertility setting more mothers would give birth to more than one child during a five-year program, and birth outcomes and child nutritional status could be negatively affected by the lack of food supplements. However, another argument for limiting participation to one pregnancy cycle is to avoid the unintended effect of encouraging mothers to have more children, or to not space pregnancies at least three years apart, in order to receive food rations. The FAFSA-2 team heard reports from Awardees that women had falsified pregnancies to qualify for food aid in the Burundi PM2A study and in the MC/Uganda program. CRS/Burundi reported that they wanted to target food rations to women for only one pregnancy cycle, but were not allowed to pursue this under the PM2A research because it would confound the study.
Little rationale for ration design. There was tremendous variation in rations, ranging from programs that gave none to a recuperation program that gave 38 kg per month to a malnourished child and pregnant or lactating mother pair. Some of the variants are: age groups covered; length of participation; and how many of those eligible in a family get rations at the same time, e.g., just one pregnant or lactating woman or child at a time or both the pregnant or lactating woman and one or more children concurrently? Are household rations given and to how many members? Do household rations attempt to close the energy or other nutrient gaps of every family member or just of women and children in the 1,000 days? Is the size of individual rations increased sufficiently to compensate for sharing with other family members or substituting the ration for other household foods the mother and child may have eaten? Are rations given only to women for one 1,000-day cycle during a five-year program or are women eligible again every time they get pregnant? Are rations given all year or only in the lean or hungry season? Which commodities and how much of each are used? Is the ration conditional or unconditional? Are only the poor and extremely poor eligible or is everyone in the age/physiological status group in the community eligible? What are the entry and exit criteria? What geographic or cultural factors need to be considered?

6-34 Maternal and Child Health and Nutrition
Each of these differences has major cost and effectiveness implications, determining how many people can be reached with scarce resources, whether programs can be done at scale, and whether they achieve net increases in dietary intake and nutritional status improvements for the beneficiaries. Operations research is needed to strengthen the evidence base on design features of food-assisted, undernutrition prevention programs that will maximize impact at the lowest possible cost. But FAFSA-2 did not find any examples of this type of research. As a result, supplementary feeding, a specialty of Title II, was the MCHN intervention for which there was the least guidance available to implementers.
Most supplementary feeding programs distributed rations in dry form to families to take home once a month from a central location. Rations were rarely harmonized across the same types of programs in the same country; the four Bolivia programs were the exception. Variations greater than 33 percent without sufficient justification were seen when comparing rations across programs in some countries. See an example in Table 6.9 from programs in Guatemala showing the fixed monthly rations that eligible households received. Ration size/type in those programs did not vary with the number or type of eligible target group members in the household. The program with the largest ration previously had a ration that was in line with the other two programs at the time its proposal was approved, but was later increased by 26 percent. Furthermore, in the joint final evaluation in 2006 of the prior programs of the same three Awardees in Guatemala, the Awardee with the biggest ration in 2011 had the biggest, most
expensive ration per capita in its prior program, but achieved the least nutritional impact. Bigger was not better.
Most of the imprecision in the rations is due to the total lack of data on actual dietary intakes of mothers and children, gaps compared to recommended nutrient intakes, and the impact of the rations on intake in the types of populations served by Title II development programs. The only dietary intake data available for Title II development programs were collected in a USAID-funded five-country study of CARE Title II programs more than 30 years ago (Anderson et al., 1981). Nor are there data on intra-household distribution of the rations. The Tufts University FAQR found the same thing and recommends “attempts to narrow the gaping chasm between knowledge of dietary realities and program design” (Webb et al., 2011). Program designers make guesses or use gross national data on average energy gaps estimated by FAO in its “depth of hunger” indicator. In the absence of target area-specific dietary intake data, the FAFSA-2 team came to the conclusion that centrally planned, standardized nutrient content for worldwide MCHN rations would be no worse than those being distributed now, and probably a more cost-effective use of scarce food resources to benefit more people. The variation in the average dietary energy deficit of undernourished people calculated by FAO in 2005–2007 for the USAID/FFP priority countries is small—a mean kcal gap/day of 305 ± 62 (standard deviation [SD]).203 The second alternative is to collect the dietary
203 See http://www.fao.org/publications/sofi/food-security-indicators/en/ for country data on “Depth of the food deficit.”
Table 6.9. Guatemala Title II Programs (FY 2007–FY 2011), MCHN Component, Preventive MCHN Rations for Pregnant or Lactating Women or Children 6–35 Months of Age
ImplementerRation Size (kg/household/month)
TotalRice Pinto Beans CSB OilAwardee #1* 2.72 2.72 6.36 2.00 13.80
Awardee #2* 3.63 3.18 4.54 2.00 13.35
Awardee #3* 4.54 4.54 6.81 2.50 18.39
PM2A Research** 6.00 4.00 4.00 1.85 15.85* All three regular programs had a total annual cost in the range of US$4.3 million to US$4.5 million.
** Children enrolled for supplementary feeding in PM2A are 6–23 months of age.

6-35Maternal and Child Health and Nutrition
data required to make the rations more precise, at least periodically in USAID/FFP focus countries. The Tufts FAQR also noted that the USAID/FFP Commodities Reference Guide used to plan rations is outdated and should be revised to improve its usefulness for planning rations (Webb et al., 2011).
6.3.2 Health Interventions and their Outcomes
Undernutrition in children is caused by inadequate dietary intake, disease, or a combination of the two (see Figure 1.1). Infections negatively affect child growth by reducing appetite, impairing absorption of nutrients, increasing nutrient requirements and losses, and diverting nutrients away from growth (Dewey and Mayers, 2011). They are also major killers of children. Therefore, essential preventive and curative health services and behavior change should be part of an integrated package of interventions in Title II MCHN programs. This section presents the health interventions supported by Title II programs and the outcomes achieved.
A number of Title II MCHN program Awardees have also received grants from USAID’s Child Survival and Health Grants Program (CSHGP)
and benefited from the TA and tools provided by USAID in support of these grants.204 The increased technical capacity of organizations that participated in CSHGP no doubt strengthened their work on HN interventions in Title II. However, some USAID staff familiar with both programs have questioned why there has not been even more cross-fertilization within these organizations.
Table 6.10 shows the percent of Title II programs working on interventions under USAID’s MCH Program Element and the results achieved. Each intervention (sub-element) is presented next.
6.3.2.1 Birth Preparedness and Maternity Services
Rationale. According to the GHI Strategy, 358,000 women die annually from largely preventable complications related to pregnancy or childbirth; millions more women suffer often debilitating pregnancy-related infections.205
204 See http://www.mchipngo.net/controllers/link.cfc?method=home, http://www.coregroup.org, and http://www.k4health.org.205 http://www.ghi.gov/resources/strategies/159150.htm. Accessed March 19, 2012.
Table 6.10. FAFSA-2 Title II Development Programs Contributing to U.S. Foreign Assistance Program Area 3.1, Health: Program Element 3.1.6 – MCH
MCH Sub-Element Number MCH Sub-Element
Number of Programs
Percent of Programs (N = 69)
Results (%)*
Had Indicator
Improved Indicator (N)
3.1.6.1 Birth Preparedness and Maternity Services 40 58 44 85 (27)
3.1.6.3 Newborn Care and Treatment 6 9 3 50 (2)
3.1.6.4
3.1.6.5
Other Immunization**
Polio**
50 72 57 82 (34)
3.1.6.7 Treatment of Child Illness (includes oral rehydration therapy [ORT])
44 64 52 71 (31)
3.1.6.8 Household Level Water, Sanitation, Hygiene, and Environment
54 78 59 74 (35)
* The denominator for “Had Indicator” represents the 63 of the 69 health and nutrition programs in the FAFSA-2 universe that had been under way long enough to have had at least a mid-term evaluation, if not a final evaluation. The denominator for “Improved Indicator” represents the number of programs (N) that had reached the stage in their implementation when they had collected and reported evaluation data for that indicator.
** It is not possible to disaggregate these two sub-elements from the available documentation.

6-36 Maternal and Child Health and Nutrition
What programs did. Many Title II programs (58 percent) focused on increasing the use of earlier and more frequent prenatal care and postnatal care by women. A few programs assisted women to better recognize danger signs during pregnancy and delivery, promoted delivery by trained providers, and encouraged women to seek care in the case of obstetric emergencies. More concretely, several programs helped families prepare birth plans and arrange for emergency transport so that they would not lose time in getting to a health facility in the case of delivery complications, e.g., Bolivia (ADRA, CARE, and FH), and Honduras (ADRA, SC). The Africare/Chad program included training of traditional birth attendants (TBAs); as a result, during deliveries, TBAs reduced the use of physical force that can be harmful while extracting the baby, and women experienced less pain in childbirth according to participants. The CRS/Niger program provided donkey carts to villages for emergency transport in case of obstetric and other health emergencies. Bicycle ambulances were also mentioned in the CRS/Malawi FY 2009–FY 2014 program. Providing supplementary feeding to pregnant and lactating women in many preventive programs made contact with and referrals of these women easier.
Outcomes. Nearly half of the programs had results indicators for maternal health interventions (44 percent). Of the 27 programs that evaluated these indicators, 85 percent achieved improvements in use of maternal health services, most often in prenatal care coverage. Where use of prenatal care was already high, e.g., the CARE/India program in the state of Andhra Pradesh, where 86 percent of women received prenatal care at baseline, it was difficult for programs to increase it further. However, in the program district in Uttar Pradesh where coverage was low, significantly greater increases than the comparison group (p < 0.05) were achieved—women that had one prenatal visit rose from 35 percent at baseline to 53 percent at endline, and those that had three visits rose from 11 percent at baseline to 25 percent at endline (Dreyfuss et al., 2008). The percent of pregnant women that received home visits by HN workers more than doubled as
a result of the program. The joint 2007 evaluation of the four Title II programs in Haiti reported that coverage of women with postnatal care increased significantly (p < 0.01), from only 17 percent at baseline to 51 percent at the end of the program, whereas the increase in use of prenatal care from 86 percent at baseline to 95 percent at endline was not significant, given the high initial coverage.
6.3.2.2 Newborn Care and Treatment
Rationale. Since the late 1990s, there has been increasing attention in USAID child survival programs to reducing neonatal mortality, which has remained relatively high despite declines in infant and child mortality overall. In developing countries, most infant deaths occur in the first month of life and most newborn deaths occur in the first week of life. Most births and newborn deaths occur at home, outside the formal health care system. Thus, interventions are needed at household and community levels that link with the health care system for treatment of life-threatening conditions. These include essential newborn care and improving care-seeking for newborn illnesses (Baqui et al., 2006).
What programs did. Only a handful of Title II programs (9 percent)—in Guatemala, Honduras, and India—were doing neonatal health interventions. In each case, the work was made possible by additional bilateral funding from USAID Missions, TA from the Basic Support for Institutionalizing Child Survival (BASICS) project, or other funding sources. Programs providing supplementary feeding to pregnant and lactating women had the advantage of being able to identify and reach newborns early, in the first days of life when they are most at danger. This early contact facilitated timely enrollment of newborns in CBGP, making sure breastfeeding was exclusive and started in the first hour after birth, and referrals of newborns with health problems.
Outcomes. Only the two CARE/India Title II programs from FY 2002–FY 2006 and FY 2007–FY 2010 measured neonatal health care indicators. An evaluation study by researchers from the Johns Hopkins School of Public Health of the CARE

6-37Maternal and Child Health and Nutrition
newborn health and survival intervention was funded by USAID/India and offers valuable lessons (Baqui et al., 2006). This was the first time that the large-scale effectiveness of a neonatal health package implemented through a platform of existing governmental and non-governmental organization services had been examined in a low-resource setting. There were dramatic improvements in essential newborn care practices achieved through home visits and effective behavior change strategies, i.e., sterile cord cutting, delaying bathing the baby for at least six hours, drying and wrapping the newborn before the placenta was delivered, initiation of breastfeeding within one hour of birth, and giving colostrum. The comparison area saw no change in these indicators. However, the project had no impact on neonatal mortality.
The researchers offered the following explanations for why the CARE/India program did not improve newborn survival. While increases in home visits to newborns in the first week of life by the village promoter or auxiliary nurse midwife were significant in the intervention area, they remained too few: Fewer than one-fourth of newborns were visited or checked by a trained provider in the first week of life. Timely identification and treatment of neonatal complications, as well as extra care for low birth weight newborns, were challenges. Having a skilled attendant at birth and using trained providers for complications remained low. The project had more impact on increasing the use of prenatal than postnatal services. The quality of counseling during home visits was weak. The study concluded that, while there were improvements in newborn care, much work still needs to be done to effectively deliver essential newborn care at scale to reduce deaths.
The evaluation of the overall CARE/India program in 2006 found that it had been difficult for CARE and the village promoters to focus adequately on the critical nutrition interventions, namely, SBCC to improve IYCF practices for children after the first month of life through two years of age. There was greater attention to newborn health in the first month of life and less attention thereafter. Trying
to effectively deliver both nutrition and neonatal health interventions was an overload for the same community worker. The trade-offs for spending more time on the newborn intervention appeared to be infrequent home visits to children 6–23 months, no program involvement with improving CBGP, and failure to significantly improve complementary feeding practices. The project recommended three home visits to mothers and newborns in the first week of life, the critical time period to prevent neonatal mortality. However, from 6 to 12 months, when growth faltering accelerates and complementary feeding advice and optimal practices are particularly important, the project recommended contact with mothers only every three months. From 12 to 23 months of age, contacts were recommended every six months, whereas there should be at least monthly contact with mothers/caregivers and children 6–23 months of age. The main intervention that nutrition and neonatal health programs share is promotion of early and exclusive breastfeeding. That is a good fit and essential to do in Title II programs in any case, but the trade-off of expanding into clinical newborn care may be inadequate attention to the ENA.
6.3.2.3 Immunization
Rationale. Immunization against vaccine-preventable diseases is a major child survival intervention. Measles has extremely negative impacts on nutritional status, and preventing it through immunization prevents undernutrition. USAID (2009) reported a nearly fourfold increase in immunization coverage in developing countries between 1980 and 2006, from about 20 percent to 77 percent. Many actors played a role in achieving this impressive result, including Title II development programs.
What programs did. Of the programs reviewed in the FAFSA-2, 72 percent facilitated immunization by promoting it, using food rations as an incentive, monitoring coverage, and providing logistical support to health services for outreach. More information on how programs boosted immunization coverage, most importantly using Child Health Days

6-38 Maternal and Child Health and Nutrition
to make immunization more accessible, can be found in Section 6.3.3.
Outcomes. The majority of the Title II programs (57 percent) had an immunization coverage indicator, and 82 percent of those that evaluated immunization coverage increased it. The 2007 joint evaluation of the four Haiti Title II programs reported a statistically significant increase in children 12–60 months of age that were fully vaccinated, from 39 percent to 63 percent between baseline and endline (p < 0.01).
6.3.2.4 Treatment of Child Illness
Rationale. The essential IMCI services are: oral rehydration therapy (ORT) and zinc for diarrhea (in some countries); antibiotics for pneumonia; and medications for malaria, where it is endemic. Access to care and information, behavior change, and successful referrals are critical. Title II programs have worked on IMCI since the concept was first introduced in the 1990s, mainly assisting referral of sick children to health care facilities. New during the FAFSA-2 time period was the realization by international and host country public health experts of the importance of timely detection and treatment of child illnesses, not only at health facilities, but in the community by trained CHWs in partnership with health facilities. Mothers/caregivers are often unable or unwilling to travel to health centers; there are time and cost constraints. Thus, in the same way that nutrition interventions need to be community-based in partnership with health facilities, so does treatment of common childhood diseases. This community-based approach is known as C-IMCI.
What programs did. Most Title II MCHN programs (64 percent) supported treatment of child illness. Community case management has been integrated well with CBGP in several countries, including in Title II programs in Bolivia, Guatemala, Honduras, and Nicaragua. SC/Honduras promoted rational use of drugs by health workers to tackle overprescribing, which leads to drug resistance. The Awardees rarely treated child illness directly, but rather they provided critical support for logistics, strengthening
local health staff capacity, improved outreach, and conducted SBCC.
Outcomes. About half of the Title II programs had indicators on treatment of child illness (52 percent), and 71 percent of those that evaluated these indicators reported improvements.
6.3.2.5 Hygiene, Deworming, and Diarrhea Prevention
Rationale. Interventions to improve hygiene practices are discussed in Section 7.3.5 on WASH. However, the impact of improved hygiene practices is discussed briefly here, given their critical role in preventing diarrhea and growth faltering. While respiratory infections and malaria contribute to growth faltering, diarrhea is particularly important (Black et al., 2008; Dewey and Mayers, 2011). Behavior change for hygiene improvement can be effective for preventing diarrhea. Intestinal parasites contribute to undernutrition through robbing children of nutrients, reducing the absorption of food, and causing bleeding and anemia. Deworming is a cost-effective way to prevent these problems, especially in areas where the prevalence of worm infestation is greater than 20 percent. It also increases vitamin A absorption (WHO/UNICEF, 2004). Thus, deworming drugs for children and improved hygiene practices, including handwashing, are 2 of the 13 evidence-based direct nutrition interventions in the SUN Framework.
What programs did. Hygiene improvement was the most common health intervention, in 78 percent of all Title II programs. See Box 6.8 for frequently promoted hygiene improvement behaviors.
Deworming. One-third of Title II programs worked to ensure that participating children were dewormed, either providing anthelmintic medications from the Awardees non-Title II resources or facilitating contact with and outreach by health services. Programs should also deworm pregnant women after the first trimester. However, the documentation was not clear whether programs were deworming pregnant women or just deworming children. Given the high cost-effectiveness of deworming,

6-39Maternal and Child Health and Nutrition
more Title II programs should make it part of their intervention package in the future by promoting it, facilitating delivery of anthelmintics by ministries of health, or providing anthelmintics through complementary non-Title II resources.
Reduction of exposure to indoor smoke from cooking. Although it may seem an outlier here, USAID Sub-Element 3.1.6.8 for Household Level Water, Sanitation, Hygiene and Environment includes fuel-efficient stoves to reduce indoor smoke, which is hazardous to human health (Smith et al., 2004; Bruce et al., 2006). Including improved cook stoves in Title II programs was first recommended by USAID/FFP in its FY 2008 Proposal Guidelines. A number of programs assisted participants with smokeless, fuel-efficient cook stoves intended to save time and money, have a positive environmental effect by reducing pollution and firewood whose use contributes to climate change, and improve health by reducing exposure to toxic indoor smoke. However, the degree of fuel efficiency and adoption by households depends on the design of the stove. An evaluation of fuel-efficient stoves in camps for internally displaced
persons (IDPs) in northern Uganda found that some stoves tested consumed more fuel than an open fire (AED, 2007) and recommended that more attention be paid by USAID-assisted NGOs to demonstrating the capacity of particular stoves to reduce energy consumption before they are produced and distributed on a large scale. While the evaluation by the AED team did not specify whether the NGO activities reviewed were Title II-funded or not, it did report that NGOs with standardized stove production via paid specialist staff or mass production were better able to ensure efficient combustion than NGOs that relied on beneficiaries to construct their own stoves. More time needs to be spent on client education to ensure adoption and correct use of stoves. The final evaluation of the WV/Uganda Title II program supporting fuel-efficient stoves for beneficiaries in IDP camps referenced the findings of the AED evaluation as cause for concern.
Outcomes. Many Title II programs included indicators on hygiene practices (59 percent). Of those programs that evaluated change in hygiene practices, 74 percent reported improvements. More significant is the actual reduction in the prevalence of diarrhea in young children. Preventing diarrhea and actually measuring the results are important in Title II programs, because reducing diarrhea is key to reducing undernutrition and preventing child deaths. Forty percent of Title II programs measured changes in diarrhea prevalence. Half of these programs succeeded in reducing the prevalence of diarrhea. The results of seven programs that measured change in the prevalence of diarrhea in preschool children in a standard way, and, thus, could be compared, are found in Figure 6.6.206 They achieved an impressive average annual four percentage point reduction in diarrhea. No outcomes were reported by programs that introduced fuel-efficient stoves.
206 Diarrhea was defined as more than three loose stools passed in a 24-hour period in the prior two weeks and was measured by caregiver’s recall. Age groups of preschool children measured by programs varied as follows: 0–23 months in Bangladesh, Honduras, and Mozambique; 0–35 months in Ghana; 6–59 months in Kenya; 0–59 months in Indonesia; and 6–36 months in Guatemala.
Box 6.8. Essential Hygiene Actions
• Treatment and safe storage of drinking water
• Handwashing with soap or ash at critical times (i.e., after defecation or handling children’s feces, before preparing food, before feeding children, and before eating)
• Safe disposal of feces
• Proper storage and handling of food to prevent contamination
• Community construction and use of affordable latrines

6-40 Maternal and Child Health and Nutrition
6.3.2.6 Family Planning and Healthy Timing and Spacing of Pregnancies
Rationale. Family planning saves lives and is one of the most cost-effective MCH interventions (Smith et al., 2009). For example, in Zambia, every one dollar invested in family planning saved four dollars in other development areas.207 Family planning can contribute to better maternal and child nutritional status by delaying the first pregnancy, lengthening the interval between pregnancies, and reducing family size (Rutstein, 2008; WHO, 2005). Recent evidence from USAID-supported research in Bangladesh found that family planning is also an important poverty reduction intervention, because it increases incomes, women’s opportunities, school attendance, and family well-being (Gribble and Voss, 2009).
There is a large unmet need for family planning in the world; more than 215 million women do not want to become pregnant, but are not using a modern method of contraception.208 The unmet need for family planning is high in all of the USAID/FFP priority countries for which DHS data are available, with unmet need greater than 30 percent in Haiti, Ethiopia, Liberia, Mali, Mauritania, and Uganda (see Table 6.11). Many women, particularly in
207 USAID. “Family Planning. The World at 7 Billion.” http://transition.usaid.gov/our_work/global_health/pop/news/wpd11.html. Accessed August 30, 2012.208 Ibid.
rural areas, do not have access to family planning services.
According to the DHS data, fertility is high in the USAID/FFP Africa priority countries. While populations in other regions have doubled, Africa has grown twice as fast, quadrupling since 1950, from approximately 230 million to around 1.02 billion in 2010.209 High population density in several of the USAID/FFP priority countries, including Bangladesh, Burundi, Guatemala, Haiti, Malawi, and Uganda, may exacerbate conflict; environmental degradation; and competition for scarce water, arable land, and other resources.
Children born less than two years apart are three times more likely to die before reaching age five and 50 percent more likely to be stunted and underweight, compared to those born three to five years apart (Rutstein, 2008; WHO, 2005). Yet DHS found that most children in the USAID/FFP priority countries were born after a shorter than desirable birth interval, except in Bangladesh, which has had a successful national family planning program for several decades (see Table 6.11). Low birth weight increases with early marriage and pregnancy, and is the start of much of the problem of underweight in children (UNSCN, 2010). See Box 6.9 for key messages promoted to achieve healthy timing and spacing of pregnancies (HTSP).
209 Ibid.
Figure 6.6. Reductions in Diarrhea Prevalence in Preschool Children—Results after 2–4 Years in Some Title II Programs
48%
32% 30% 30% 31%27%
37%
20% 22%18%
22% 23%
16%
23%
0%
10%
20%
30%
40%
50%
60%
Ghana OICI Kenya WV Mozambique FH Bangladesh SC Indonesia CRS Guatemala SC Honduras SC
% W
ith D
iarr
hea
Baseline 2-4 yrs later

6-41Maternal and Child Health and Nutrition
Table 6.11. Fertility, Family Planning, and Birth Intervals in USAID/FFP Priority Countries
USAID/FFP Priority Countries
Year of DHS/RHS
Total Fertility Rate
% of Married Women Using Any Method of
Family Planning
% of Married Women with Unmet Need for
Family Planning
% Births with Interval < 36 Months
ASIA
Bangladesh 2007 2.7 55.8 16.8 36.9
LAC
Guatemala 2008–09 3.6 54.1 20.8 56.1
Haiti 2005–06 3.9 32.0 37.5 54.8
AFRICA
Burkina Faso 2003 5.9 13.8 28.8 50.6
Chad 2004 6.3 2.8 20.7 66.1
DRC 2007 6.3 20.6 24.4 65.1
Ethiopia 2005 5.4 14.7 33.8 56.0
Liberia 2006 5.2 11.4 35.6 49.0
Madagascar 2008–09 4.8 39.9 18.9 56.7
Malawi 2004 6.0 32.5 27.6 50.1
Mali 2006 6.6 8.2 31.2 62.8
Mauritania 2000 4.5 8.0 31.6 53.1
Mozambique 2003 5.5 25.5 18.4 55.2
Niger 2006 7.0 11.2 15.8 60.8
Sierra Leone 2008 5.1 8.2 27.6 49.7
Uganda 2006 6.7 23.7 40.6 68.8
Zambia 2007 6.2 40.8 26.5 54.9
Source: DHS or RHS data from http://www.statcompiler.com.
Box 6.9. Healthy Timing and Spacing of Pregnancies: Key Messages
• Wait until at least age 18 before becoming pregnant
• Wait at least 24 months after a birth before trying to become pregnant again
• Wait at least six months after a miscarriage or abortion before trying to become pregnant again
• Limit pregnancies to a mother’s healthiest years: 20–35

6-42 Maternal and Child Health and Nutrition
With all of the arguments in favor, it was surprising that neither family planning nor HTSP was included as illustrative activities to achieve the USAID/FFP Strategic Plan result of “human capabilities protected and enhanced” and the objective of “reducing food insecurity in vulnerable populations.” Family planning and HTSP were also not mentioned in the USAID/FFP Proposal Guidelines for any year throughout the FAFSA-2 time period.
There were positive developments in FY 2011, with the GH Office of Population and Reproductive Health (GH/PRH) and USAID/FFP encouraging more integration of family planning services in Title II programs. As a boost, they held a workshop, organized by ICF Macro and the Maternal and Child Health Integrated Program (MCHIP), in Washington, DC, on October 13, 2010, at which three Title II Awardees shared their field experiences on the integration of family planning.210 As a result of the workshop, at USAID’s request, FANTA-2 revised the PM2A technical reference materials (TRM) in November 2010 to include family planning as a useful complementary health service in Title II
210 ADRA/Madagascar, SC/Uganda, and WV/Haiti, done with competitively awarded Flexible Fund grants from GH/PRH to complement Title II food resources.
MCHN programs. In 2011, GH/PRH called for proposals from Title II Awardees to use Flexible Funds for the integration of family planning into food assistance programs, as they had done in earlier years.
The USAID/FFP FY 2012 and FY 2013 RFAs for Title II development programs encourage applicants to include improving access and quality of family planning services in their proposals as part of the minimum package for preventing chronic malnutrition in the first 1,000 days. Furthermore, starting in FY 2011, USAID/FFP included “family planning and reproductive health” among 14 program elements to be used by Awardees to describe their programs in annual reports. Strategic coordination and integration is one of the GHI’s key principles; integrating family planning and maternal and child health care is an excellent example now being promoted (Ringheim et al., 2011; Ringheim, 2012).
What programs did. It was encouraging that family planning services were integrated into 24 Title II programs (35 percent of all), with 13 of these programs explicitly promoting HTSP, despite it not being included in program guidance (see Table 6.12). Awardees worked in partnerships with ministries of
Table 6.12. FAFSA-2 Title II Development Programs Contributing to U.S. Foreign Assistance Program Area 3.1, Health—Malaria and Family Planning Program Elements
Health Program Element Health Sub-Element
Number of Programs
Percent of Programs (N = 69)
Results (%)*Had
IndicatorImproved
Indicator (N)Malaria 3.1.3 Malaria Prevention:**
3.1.3.2 Insecticide Treated Nets to Prevent Malaria
3.1.3.4 Intermittent Preventive Treatment for Pregnant Women
16 23 11 67 (6)
Family Planning and Reproductive Health 3.1.7
Family Planning Service Delivery and Communication:**
3.1.7.1 Service Delivery
3.1.7.2 Communication (Family Planning)
24 35 10 83 (6)
* The denominator for “Had Indicator” represents the 63 of the 69 health and nutrition programs in the FAFSA-2 universe that had been under way long enough to have had at least a mid-term evaluation, if not a final evaluation. The denominator for “Improved Indicator” represents the number of programs (N) that had reached the stage in their implementation when they had collected and reported evaluation data for that indicator.
** It is not possible to disaggregate these two sub-elements from the available documentation.

6-43Maternal and Child Health and Nutrition
health, private family planning providers, and other USAID projects, which supplied the contraceptives and delivered the family planning services. The Awardees organized outreach for convenient delivery of family planning information and services to participants in other Title II program activities, sometimes at the same place and time. They played an important role in facilitating logistics, mobilizing the community, and implementing SBCC. This integration was made possible in several cases by additional USAID funding, e.g., from bilateral funds in the CARE/India FY 2002–FY 2006 program, and with Flexible Fund grants from GH/PRH in ADRA/Madagascar, SC/Guatemala, SC/Uganda, and WV/Haiti FY 2000–FY 2007 programs. In Haiti, the Awardees collaborated with USAID’s bilateral family planning project implementer, Management Sciences for Health.
In most cases, Awardees made community-based family planning services and information available by partnering with ministries of health and other family service providers that had the contraceptives and health workers to deliver them to Title II clients.
Outcomes. Ten percent of programs measured a family planning use indicator and, of these, 83 percent increased family planning use. The average increase was two percentage points per year across five programs that measured change in the contraceptive prevalence rate in a standard way, and, thus, could be compared (see Figure 6.7). The
biggest success was the SC/Honduras program, which increased use of modern family planning methods from 17 percent to 42 percent in four years. In contrast, in the SC/Uganda program, use of family planning actually fell during the project due to men’s discouraging attitude toward contraceptives. The project began men’s groups to address this barrier during its final year. Much more work to educate and convince men is important. According to SC, the Title II program in Uganda, working in collaboration with a pilot project of Family Health International, succeeded in demonstrating the feasibility of community-based distribution of Depo-Provera. This contributed to major reform in national policy, making Uganda the first country in Africa to allow community-based delivery of Depo-Provera.211 Madagascar then followed Uganda’s policy of allowing CHWs to provide Depo-Provera, and so have seven other African countries, greatly increasing access to this popular contraceptive.
CARE/Bangladesh FY 2005–FY 2010 worked on women’s empowerment. The goal was not family planning, but one of several impressive results was a statistically significant increase in women’s
211 Mwebesa, Winifrede, SC Senior Reproductive Health Advisor. Presentation on “Family Planning in the Title II Enhancing Food Security through Poverty Alleviation Project in Nakasongola District, Uganda from FY 2003–2008” at the USAID Flexible Fund Partners’ Meeting on Integrating Family Planning and Title II Food for Peace Programs in Washington, DC, October 13, 2010.
Figure 6.7. FAFSA-2 Use of Family Planning by Women of Reproductive Age—Results of Some Title II Programs
17%11%
57%
6%
31%
42%
16%
76%
17%23%
0%
10%
20%
30%
40%
50%
60%
70%
80%
Honduras SC(modern methods)
Honduras CARE Nicaragua ADRA Guinea AfricareDinguiraye
Uganda SC
% C
ontr
acep
tive
Prev
alen
ce
Baseline 4-6 yrs later

6-44 Maternal and Child Health and Nutrition
decision-making power to buy contraceptives (p < 0.0000). CARE achieved this by organizing community-level Empowerment, Knowledge, and Transformative Action (EKATA) groups of 20 women and 10 adolescent girls each that provided a platform for empowering women and girls through education, solidarity, group planning, and rights advocacy.
Healthy timing and spacing of pregnancy. Of 13 Awardees that promoted increased spacing between pregnancies, the effect on the length of birth intervals was evaluated in five programs. As seen in Box 6.10, increases in the average birth interval in Haiti after four years of intervention ranged from 9 months to 11.3 months among four Title II programs (statistically significant at p < 0.01). The prevalence of children born at short intervals of less than three years decreased across the four programs from 68 percent at baseline to 50 percent at endline. Short birth intervals were correlated with more diarrhea and more stunting. In evaluation research on the CARE/India FY 2002–FY 2006 program, 36 percent of program cohort mothers had birth
intervals of at least 24–47 months versus 30 percent in the comparison group, a statistically significant difference (p < 0.05) (Dreyfuss et al., 2008).
A concern has been raised that Title II supplementary feeding for pregnant or lactating women and young children could have a pronatalist effect. To date, there is no evidence on which to judge whether this is true. The success of the previously referenced Title II programs in increasing the use of family planning and lengthening birth intervals is very encouraging. These results suggest that Awardees could mitigate a pronatalist effect, if any, by actively promoting longer birth intervals and partnering to increase access to and use of family planning information and services.
6.3.2.7 Malaria Prevention
Rationale. Malaria has negative impacts on health and nutritional status and caused 8 percent of the deaths of children under five years in 2005 (USAID, 2009). It is important to prevent and treat malaria in endemic areas, mainly in Africa. Cost-effective preventive interventions are ITNs and antimalarial intermittent preventive treatment (IPT) during pregnancy. By preventing malaria, IPT and ITN in pregnancy also prevent low birth weight and anemia caused by malaria.
What programs did. Sixteen programs (23 percent) did malaria prevention (see Table 6.12); 15 of them were in Africa (44 percent of all Africa programs) and one in India. The small number is due in part to the fact that many of the Title II programs reviewed were not in malaria-endemic areas. Some of the Africa programs did social marketing to sell affordable ITN, e.g., ADRA/Madagascar, while others promoted use of ITN given free by other programs, e.g., with assistance from the U.S. President’s Malaria Initiative or the Global Fund. Ministries of health provided antimalarial drugs for IPT that the programs promoted.
Outcomes. Eleven percent of Title II programs had indicators to measure their malaria prevention results, such as use of ITN or IPT. Two-thirds of the programs that evaluated malaria prevention interventions achieved improvements.
Box 6.10. Big Increase in Birth Intervals in Haiti
The 2007 joint evaluation of four Title II programs in Haiti from FY 2002 to FY 2008 (CARE, CRS, SC, and WV) reported that each program significantly lengthened the number of months between births (p < 0.01). The mean birth interval across the four programs increased by nearly one year, from 31.9 months at baseline to 42.4 months at endline, four years later. This increase is much greater than that of only four months between the Haiti DHS surveys in 2000 and 2006, from a mean interval of 30 months to 34 months. The biggest increase in birth interval of 11.3 months was achieved by WV, due in part perhaps to the additional resources they received in a grant from GH/PRH.

6-45Maternal and Child Health and Nutrition
6.3.3 Approaches and Processes
Insights gleaned during the FAFSA-2 on a number of approaches and processes used in the MCHN components of Title II programs are described in this section. These are the delivery science or implementation details that make or break a program. The most common approaches used, which varied by region, are summarized in Table 6.13.
6.3.3.1 Community Health Workers or Volunteers
It is absolutely essential to the success of Title II or any other MCHN program to have well-selected, trained, motivated, supported, skilled CHWs at an appropriate ratio to the number of households to be covered to allow frequent contact with the target group in the first 1,000 days. In asking the question “what triggers (and sustains) periods of rapid improvement in child nutrition?” the 6th Report on the World Nutrition Situation found that in most cases both the improved socioeconomic environment and wide coverage of community-based HN programs played a role (UNSCN, 2010). “Achieving a high ratio of community workers to families is a key measure of the potential for impact,” based on the key role they played in most of the countries with large reductions in undernutrition (UNSCN, 2010, p. 45). While community workers or volunteers have many different titles depending on the country or program, the FAFSA-2 uses the generic term “community
health worker” or “CHW.” Principal responsibilities of CHWs are community mobilization, identifying and enrolling everyone in the 1,000-day window, SBCC for ENA and health practices, detecting people with HN problems and referring or treating them, and recordkeeping. In some cases, depending on a country’s ministry of health (MOH) norms, CHWs may distribute vitamin A, iron and folic acid, antibiotics, contraceptives, oral rehydration salts, and deworming and other medications.
While community workers are indispensable for delivering preventive MCHN services, as noted previously, many priority countries do not have such workers in every community as part of established national government programs. One major exception is India, with its village HN promoter (the anganwadi worker), through the national Integrated Child Development Services scheme. Therefore, in most other countries, a key role of Title II programs is selecting, training, motivating, and paying village workers to implement the MCHN preventive interventions, unless they can be persuaded to volunteer. In many countries, community members will not work without some remuneration, especially if they are at a supervisory level. Programs ask a lot of volunteers. Several people interviewed in the Title II community commented that it seems easier for faith-based organizations to motivate people to volunteer. The downside of volunteers is that there can be high turnover. In many Title II programs, CHWs were paid with a FFW ration or cash from the program budget.
Table 6.13. FAFSA-2 Common Approaches for MCHN in Title II Development Programs Worldwide and by Major Geographic Region
ApproachesAFRICA
34 Programs (%)ASIA
12 Programs (%)LAC
23 Programs (%)Worldwide
69 Programs (%)
Child Health Days 26 58 43 38
Interpersonal Counseling 50 100 70 70
Home Visits 35 67 57 57
Growth Monitoring and Promotion
59 100 78 78
Homestead Gardens 56 25 46 46
PD/H 59 50 46 46

6-46 Maternal and Child Health and Nutrition
Client-worker ratio. One concern of the FAFSA-2 was that some Awardees decided not to have any CHWs, or to reduce their number below a critical level, perhaps due to tight budgets. Instead, rather than being community-based, these programs were facility-based; expected women and children to travel to sessions at central locations for 10–15 villages—distant from their homes; or increased the ratio of clients to CHWs, which contributed to infrequent or no contact in the community. Most Title II Awardees did not describe in detail how many community workers they planned to have; their progress in recruiting and training the intended number of community workers; and the client-worker and supervisory ratios, in their proposals, annual reports, or evaluations. This limits USAID/FFP’s ability to detect when programs are understaffed for community work. Best practice is not to exceed about 20 children per CHW, if the worker is a volunteer who is expected to deliver the growth promotion package and who works only a limited amount of time (Griffiths et al., 1996). A full-time, paid worker might be able to cover up to 100 children, if only 20 or so would need close follow-up (Griffiths et al., 1996). Obviously, the cost and number of workers will be higher in countries with high fertility rates. Some good examples from Title II programs are SC/Mozambique, where each CHW served two groups of 15 families each for a total of 30 families, and Care Groups in the CRS/Malawi program. Care Groups usually have one volunteer for 10 families. In the CRS/Malawi FY 2009–FY 2014 program, there was one paid promoter to oversee seven Care Groups. Each Care Group had 11 volunteers. One volunteer visited 10 households. So there was one paid promoter supervising 77 volunteers that visited 770 households.
Contrast these examples to the facility-based Title II program of one Awardee that the FAFSA-2 team visited in Niger with one paid project health agent for 80 villages. This made it impossible to do community work. The proposal did not describe how the project would establish a presence in every community and deliver services there. The Awardee planned to get nurses from the MOH
health posts to visit 60 villages only 3–4 times per year by paying for gas, supplies, and daily stipends, which is far too infrequent contact. Instead of working in communities, the modus operandi was to call mothers and children to large sessions for 10–15 villages at distant clinics for undernutrition screening and recuperative food distribution. A similar approach of delivering food at central locations outside the community and not having ongoing services in the community was used in another recuperative feeding Title II program visited in Uganda.
The FAFSA-2 team also visited a program in Guatemala that had cut back on the number of CHWs and supervisors approved in its proposal to one Mother Leader for 140 households, versus the original plan of having one for every 25 children under 36 months of age. They eliminated the supervisors that used to cover nine Mother Leaders each. The mid-term evaluation flagged this, saying, “Currently there are too few CHWs to adequately cover participating households (each CHW covers, on average, 140 households), and not enough PROMASA II project personnel to supervise their work. In this estimation, with 15 months remaining in the five-year project, the frequency of contact between CHWs and project participants—combined with other important factors beyond the project’s control—will probably not prove sufficient enough to translate into the planned level of end-of-project impact” (Heffron et al., 2010). These changes were not formalized in an amendment to the agreement approved by USAID. That same Awardee had a newer program in Bangladesh in which they had eliminated CHWs during the design, which was inconsistent with the evaluation finding that CHWs were critical to the success of that Awardee’s prior Title II program in Bangladesh. The reason given for doing so was that the CHWs in the prior program had not been absorbed by the MOH. Instead of CHWs, they planned to have an all-volunteer Village Health Committee. It is unrealistic to expect a committee to deliver the SBCC and the frequent contacts needed for ENA and the health interventions in the community. In its concern about sustainability after the program, this Awardee’s

6-47Maternal and Child Health and Nutrition
decision to eliminate CHWs will likely reduce the effectiveness of delivery of MCHN services and SBCC in the ongoing program.
Motivation. In its FY 2008 Annual Report, SC/Mozambique shared findings from research on its program done for a master’s degree thesis by a public health student on “Community Volunteers’ Motivation.” Motivations included: (1) self-development, (2) impact of their interventions, (3) personal satisfaction, (4) pride and status, (5) desire for training in maternal care, and (6) hope for future opportunities. Community-level factors included: (1) community development, (2) community demand, and (3) community cohesion.
Specialized vs. multipurpose workers. Valuable lessons can be learned from programs that share insights into approaches that did not work. Two programs hoped to cut costs by using agricultural extension workers as multipurpose nutrition promoters, in addition to their agricultural work. This did not work well for CARE/Mozambique because the program found it needed a dedicated nutrition promoter in the village who could spend more time, and locally adapt messages and counseling to the situation. Similar constraints were seen in the CRS/Niger program, visited by the FAFSA-2 team, where the only worker was a zone agent agronomist responsible for 4–5 villages who spent very little time on HN.
Capacity strengthening. Capacity strengthening is critical to the success of Title II MCHN programs. While many programs mentioned that they had trained CHWs and often government health service providers from nearby health facilities, there was not enough detail provided in the program documentation to be able to assess the quantity and quality of capacity building, nor the methods used. Findings gleaned from the documentation suggest that training was sometimes an end in itself, and not the beginning of capacity strengthening, with follow-up by trainers/supervisors to do the necessary hand-holding to yield solid mastery in the field. Many Awardees considered capacity building their main sustainability strategy to leave something behind,
so that programs would continue after graduation. Box 6.11 provides some insights from Awardees regarding capacity building.
Supervision. Good supportive supervision of CHWs is also essential. The key features are joint problem solving and in-service training of CHWs by supervisors. CARE/India developed the Supervisor’s Checklist to improve supervision of village nutrition promoters in its FY 2002–FY 2006 and FY 2007–FY 2010 programs (Bongiovanni et al., 2007). Involving MOH staff in supervising community volunteers was a feature of WV’s sustainability plan for its Honduras program.
Box 6.11. Awardees’ Insights on Capacity Building in Title II MCHN Programs
Learning by doing and seeing real cases are more effective than theoretical training, according to WV/Honduras. It also considered involving MOH staff in the training of volunteers to be the key to sustainability.
SC/Honduras found that learning shared among CHWs is more effective than formal training. Selected CHWs, with some coaching and using local modalities and their own words, can transmit knowledge, promote attitudes, and transfer skills among themselves more effectively than outside trainers, i.e., CHW to CHW learning.
CARE/India FY 2002–FY 2006 found that monthly sector meetings between supervisors and village workers provided a great opportunity for in-service training to improve their home visit and behavior change skills. They developed a Tool for Conducting Sector Meetings and a Guide for Facilitating Sector Meetings (Bongiovanni et al., 2007).

6-48 Maternal and Child Health and Nutrition
Sustainability of CHWs. How to ensure that CHWs continue to do their job after the Title II program ends is one of the biggest sustainability issues Awardees face. Most of these workers do not continue to perform their duties after the program ends unless the Awardee has identified another source of payment or substitute incentives as part of an exit strategy. Here are some examples of Awardees’ attempts to do that. One strategy was to form CHWs into associations to professionalize them. In Bolivia, the Awardees (ADRA, CARE, FH, and SC) formed associations of CHWs, modeled after Peru, which provided: (1) a forum for sharing and learning from each other, (2) a system for providing training and support to each other and new volunteers, and (3) a single voice in representing the volunteers before the MOH and municipal governments. SC worked with a local university to accredit the CHWs to increase their prospects for obtaining work. CARE reported that a measure of the female empowerment achieved in its program was the increased self-confidence expressed by these women volunteers, a number of whom were successful in landing official positions in their communities and municipalities. CRS/Haiti gave small loans to volunteer CHWs for small businesses to support themselves. CARE/Honduras formed networks of CHWs, and gave them diplomas and identification cards to increase their status and prospect for continuing to work after the program ended. The Tufts Exit Strategies Study on what happens after Title II programs end will shed light on whether the CHWs have continued to work in the program communities in Honduras and Bolivia.212
SC/Mozambique also organized CHWs into associations. Some Awardees planned to help CHWs start a fee-for-service business in their communities. In the Chad/Mali program, Africare planned to get CHWs legally recognized by the MOH so that they could earn a small income managing village-level revolving drug funds. Whether these plans materialized and were successful is unclear.
212 See a brief description of the Tufts University Exit Strategies Study in Section 3.6.1.4.
6.3.3.2 Child Health Days
The Child Health Day model goes by different names in different countries, e.g., outreach clinic (Malawi), satellite clinic (Bangladesh), rally post (Haiti), or nutrition and health days (India). The common concept is outreach by government health workers, usually monthly, at a fixed-day, fixed-site clinic that brings mobile preventive MCHN services closer to where people live and thereby increases coverage. In addition to being closer, these health outreach sessions are more convenient, as multiple services are offered at one time (“one-stop shopping”). The services most commonly provided are immunization, vitamin A supplementation, and child growth monitoring and promotion. Both the CARE/India FY 2002–FY 2006 and the SC/Bangladesh FY 2005–FY 2010 programs used Child Health Days to also reach pregnant women with prenatal checkups, weight gain monitoring, iron and folic acid supplements, safe birth kits, and tetanus toxoid immunization. In Bangladesh, family planning and IMCI services were also included.
While 38 percent of Title II programs used the Child Health Day strategy to increase coverage of health services, this tactic was used least in programs in Africa (26 percent), as opposed to programs in Asia (58 percent) and LAC (43 percent). Distributing preventive Title II food rations for pregnant and lactating women and young children at Child Health Days as an incentive to attendance made them even more effective.
Limitations of the Child Health Day approach are that attendance may drop off after children reach one year of age and are fully immunized. While conditional food rations that require attendance at these outreach clinics prevent this decline in attendance, once the food is withdrawn at the end of the program, there may be a significant decline in participation.
6.3.3.3 Health Services Support
Nearly one-fourth of Title II programs assisted with health services support. These programs often provided limited financial support for transportation

6-49Maternal and Child Health and Nutrition
and per diem to local MOH service providers to ensure active participation in Child Health Days and outreach from health centers. Some programs constructed health facilities. Many programs trained government primary health care workers, especially in C-IMCI. Government health infrastructure is very weak in a number of Title II countries, particularly in the Sahel in Africa. The FAFSA-2 team was surprised in its field visits in rural Niger to find only health posts staffed by paramedical personnel at the level one would find a health center with a physician and nurse(s) in most other parts of the developing world. However, these relatively new health posts were a big improvement over the past situation, when there were no health services at this level. Lack of government health services hinders Title II programs from achieving their HN goals. Title II budgets are insufficient to compensate for any large gaps.
Following national MOH norms and coordinating closely with the MOH is a must for success and sustainability of MCHN components of Title II programs. Yet there are examples of some programs that are not doing a good job of this, either duplicating services or competing with the MOH. For example, the Guatemala joint final evaluation in 2006 states, “There is reason to be concerned about the lack of explicit intent by some of the cooperating sponsors to strengthen the [Ministry of Public Health and Social Assistance] service provision and outreach at community level” (Schnell et al., 2006). The FAFSA-2 team had this same concern during its field visits in Guatemala, where one program visited was not coordinating with the ministry and, as a result, was duplicating services.
Quality improvement. Another way Awardees strengthened health services was introducing quality improvement (QI) tools to increase the use and effectiveness of evidence-based interventions. SC/Bangladesh (FY 2005–FY 2010) and SC/Haiti developed a “Community-Defined Quality” tool that increased community involvement in defining, implementing, and monitoring the QI process in health services. This tool is now known as “Partnership-Defined Quality” and is available
from the CORE Group (SC, 2004). To improve supervision, some programs used the Community Development Worker Quality Improvement and Verification Checklist (FSN Network Social and Behavior Change [SBC] Task Force/TOPS, 2011). In July 2011, task forces of the FSN Network of the TOPS project defined core competencies for Awardee staff responsible for nutrition and food technology, SBC, gender integration, and M&E. More work is needed to measure the extent to which the performance standards (minimum criteria, essential elements, state of the art, etc.) for the essential nutrition interventions and approaches are being met.
6.3.3.4 Social and Behavior Change Communication
The term “behavior change communication” (BCC) has been widely used by Title II implementers to describe a key service that they offer in the MCHN package, although some may still describe this approach as “nutrition and health education” or “information, education, and communication” (IEC). More recently, the literature on health communication has stressed the need to understand human behavior, with a particular focus on shifting social and cultural influences and norms that are deleterious to health and nutrition. Therefore, the state-of-the-art approach now used is called “social and behavior change communication,” which refers to using communication resources to promote a shift in social norms and to change specific behaviors (CSHGP, 2010). These alternative terms have subtle differences in meaning but have the common objective to change knowledge, attitudes, behaviors, and norms. The behaviors that Title II programs need to change to achieve impact on health and nutritional status are: maternal diet and workload, IYCF and child care practices, hygiene, malaria prevention, appropriate health care-seeking, and HTSP. What worked and what did not work for some of the key elements of SBCC in Title II programs are discussed next.
Formative research. This type of research is an essential first step to plan or “form” a program.

6-50 Maternal and Child Health and Nutrition
Formative research uses various qualitative methods to collect data, for example, focus groups and in-depth key informant interviews, to inform the design of effective SBCC by answering key questions. (See Box 6.12 and the training module on conducting formative research about IYCF practices designed by the LINKAGES Project, 2004.) It would be difficult for a program to improve IYCF practices if implementers did not know: (1) what mothers in the target geographic area are feeding their young children, (2) which of the FADUA principles for complementary feeding are strong and which are weak, (3) why mothers do what they do, (4) what the barriers and facilitators are to improving these behaviors, (5) what fathers think, and (6) what grandmothers recommend. Without such formative research and the answers to these questions, programs would be flying blind and constrained to giving ineffective general lectures about optimal IYCF practices (Favin and Griffiths, 1999). Generic, cookie-cutter nutrition education materials are not effective. As Marcia Griffiths recommended in a recent presentation on formative research, “Don’t let global templates limit caregiver insights (from research) for program design.”213 Yet very few Title II programs reported having done any formative research to shape their communication strategy, materials, and activities, or to make their SBCC client-centered. A number of Awardees had been working in the same geographic area for several rounds of Title II and still knew very little about their audience’s knowledge, attitudes, behaviors, and norms. Formative research is just as important during and at the end of a program, to evaluate if the communication strategy is working and to make necessary adjustments. The paucity of local-level information on behaviors was also noted as a gap in Title II programs in the first FAFSA (Bonnard et al., 2002).
The main type of formative research done in Title II was positive deviance inquiries in programs that did PD/H. These inquiries studied the IYCF and
213 Griffiths, Marcia. July 19, 2011. “Remedial action needed: Our failure to use formative research effectively.” USAID’s IYCN Meeting on What Works for Community-based Nutrition Programming? Washington, DC. http://iycn.wpengine.netdna-cdn.com/files/Remedial-action-needed-griffiths.pdf.
care practices of positive deviant mothers whose children were thriving to use as real examples to teach other mothers with malnourished children to follow. This type of formative research is good, but one drawback of such studies that only examine the feeding practices of mothers and children that are doing well is that they miss a lot of other important information by not looking at all types of mothers and probing into the reasons for negative practices as well. It is especially important to learn what the barriers are from mothers with sub-optimal practices. An effective IYCF formative research tool is TIPs because it studies the barriers and resistance to new behaviors in addition to current behaviors (Manoff Group, n.d.). No examples of Title II programs doing TIPs were reported.
Apart from PD/H, programs that did formative research on IYCF practices to inform their behavior change strategies were in Honduras (ADRA, SC, and WV), Guatemala (SC, SHARE, and CRS), CRS/Madagascar, and FH/Bolivia. The Bolivia
Box 6.12. “Formative Research will Help Program Planners to:
• Understand the behaviors, benefits, barriers, and social context from the point of view of the target audience, rather than from that of program planners and implementers;
• Give a clear sense of priority audiences and meaningful audience segments;
• Clearly specify what factors influence those behaviors;
• Explore the issue of at what levels to focus program activities—individual, community, health system or other institution and/or policy;
• Identify preferred channels of communication.”
Source: CSHGP, 2010, p. 5.

6-51Maternal and Child Health and Nutrition
research used the technique known as barrier analysis pioneered by FH and was supported by TA from headquarters (Davis Jr., 2010). The Honduras programs received TA from FANTA. To assist the MC/Uganda program, FANTA-2 did formative research on IYCF.
More technical guidance and training is needed for Awardees’ staff on doing formative research, especially on IYCF practices, using TIPs, barrier analysis, and other qualitative methods. The CORE Group has a “Designing for Behavior Change Curriculum” that organizations could use for this capacity building (CORE Group SBC Working Group, 2008). It is good that one of the TOPS project FSN Network Task Forces is dedicated to SBC. There are useful tools available that Awardees could make better use of. An updated PM2A TRM (FANTA, 2010) could be a good place to emphasize the importance of doing formative research, list the principles to be followed, and describe the available tools.
Community mobilization, advocacy, and awareness-raising. For programs to succeed, community mobilization and participation must be incorporated from the beginning. Success and sustainability are enhanced by developing roles and responsibilities for beneficiaries in program implementation. These principles are some of the most common “lessons learned” or “promising practices” reported by Awardees. A common example of putting these ideals into practice was forming or strengthening village health committees. Some programs went a step further to help communities understand their HN problems, and to empower them to solve these problems. One example was the formation of Committees to Analyze Information, i.e., HN data at the community and sectoral levels, in the CARE/Bolivia program. These committees were a place for community leaders, CHWs, and local health personnel to take immediate actions to solve HN problems in the community. SC found in their programs in Bangladesh and Bolivia that making community leaders and parents aware of the link between stunting, mental development, and school performance was a more powerful motivator for
taking action than other HN arguments. A USAID/FFP CBO familiar with the Bolivia programs said they were excellent examples of nutrition advocacy and community management because local leaders could tell you every house where a malnourished child lived and what his/her community was doing about it.
Nevertheless, in meetings with village leaders and parents during field visits to ongoing program communities and communities that had graduated from Title II in five countries, the FAFSA-2 team did not encounter one site where the local people really understood how big an undernutrition problem their children had. Stunting in particular remained an invisible scourge. When asked about the nutrition situation in the community, residents gave answers like “the children are no longer dying” or “the children are playing” as indications that the community no longer had an undernutrition problem. Therefore, the FAFSA-2 concludes that much more nutrition advocacy needs to be done at the local level, stressing that undernutrition can and should be prevented. The “S” in SBCC was weak because Title II programs were not focusing enough on shifting social norms to prevent undernutrition. Data on children’s growth and nutritional status collected by programs could be turned into easy-to-understand illustrations and charts that each village could publicly post and use to focus attention on improving the nutrition situation. Such results should be presented at the aggregate level for the community, so as not to stigmatize individual children or their families. Not using available data for advocacy is a huge missed opportunity to make undernutrition visible; help people understand the lifelong damage being done; and win their commitment to tackling undernutrition with feasible, sustainable solutions.
Counseling at key contacts. Counseling, if done well, is a very effective communication technique for changing behavior. In successful interpersonal counseling, CHWs or other workers usually: (1) congratulate the mother/caregiver on her infant or child; (2) ask the mother/caregiver exactly what the child is eating, if the child has been ill, and if there are problems, and listen to the

6-52 Maternal and Child Health and Nutrition
answers; (3) counsel the mother/caregiver and give recommendations on new practices or changes to try based on the age and specific situation of the child or mother/caregiver, showing counseling materials; (4) get the mother/caregiver to commit to try a new practice, discussing various options; and (5) leave reminder materials with the mother/caregiver. The counseling is often more effective if both the worker and the mother/caregiver know how well the child is growing through participation in growth monitoring and promotion with an up-to-date growth chart that the mother/caregiver is allowed to have at home. These five essential interactive counseling steps and the give-and-take allow the worker to provide mother-child specific messages—“right mother, right message, right time” versus general nutrition education talks or a theme of the month for teaching all mothers/caregivers. Excellent IYCF counseling materials were available in the Bangladesh, Bolivia, Ghana, Guatemala, Honduras, and Nicaragua programs. There was a lot of sharing and learning from each other in all of the Title II Latin America programs, with lessons learned used to shape the SC/Bangladesh FY 2005–FY 2010 program. The Title II programs in Bolivia and Ghana used USAID-funded IYCF counseling materials prepared by the LINKAGES Project. Materials in Guatemala and Honduras were developed by the USAID Missions’ bilaterally funded HN projects with the University Research Corporation and BASICS, respectively. Well-designed, pretested counseling materials based on formative research are essential. Several program evaluations reported that there were no educational materials due to budget constraints.214
Improving IYCF counseling skills with tools, training, or other remedies could be a useful focus for the SBC Task Force in the FSN Network of the TOPS project. The FAFSA-2 team observed effective counseling in several programs during field visits, but noted the need for strengthening CHWs’ counseling skills in most programs. Indeed, around a third of the programs reviewed (30 percent) reported no counseling at all, and, in Africa, one-half of all programs did no counseling.
214 CRS/Liberia, CPI/Mauritania, and SC/Uganda.
Home visits. Outreach to pregnant and lactating women and children under two through home visits is a critical component of MCHN programs. The main purpose of home visits are to: (1) enroll new pregnant women, newborns, and lactating mothers in the program; (2) find out why some mothers/caregivers and their children are not attending growth promotion, Child Health Days, and other activities, and motivate them to attend; (3) follow up on high-risk children that are not gaining weight, acutely malnourished, or ill; (4) refer to health services mothers/caregivers and children that need attention due to illness, danger signs, or acute malnutrition; and (5) provide counseling on optimal health, hygiene, maternal diet, and IYCF practices. The challenges are prioritizing which homes to visit and what to do during visits to make them effective, because CHWs can make only a few home visits. The majority of Title II programs (57 percent) provided home visits, but in Africa only 35 percent did. In programs with home visits, not much was reported on efforts to make this kind of outreach effective. However, the CARE/India FY 2002–FY 2006 and FY 2007–FY 2010 programs developed and tested a “Home Visit Diary” as a job aid for volunteer village nutrition promoters to plan and improve the productivity of their home visits to pregnant and lactating women and children under two years of age (Bongiovanni et al., 2007). The aid was most useful to the worker as a reference on critical time periods and expected behaviors during those periods to consult before embarking on home visits, and not as a register of home visits. The tool alone had no influence on whether beneficiaries received home visits. However, many supervisors took advantage of information contained within the diary to revisit homes to assess the quality of the workers’ home visits.
Cooking demonstrations. Getting program participants together to cook nutritious meals and to learn how to prepare Title II commodities was a popular activity in every region. A lot of good work was done by Title II programs developing local recipes for nutritious complementary feeding with or without Title II commodities. “Recipe and Cooking Competitions with Local Foods” was a fun way to

6-53Maternal and Child Health and Nutrition
motivate and teach about more nutritious meals. Cookbooks with local recipes and photos were given to participants in the Bolivia programs (ADRA, CARE, FH, and SC). The joint final evaluation in 2008 found the CARE cookbook particularly useful because it had “recipes by age group moving from semi-solids and purees for children 6–7 months old to more substantive foods” and nutritious recipes for children over one year of age that could be enjoyed by the whole family, reinforcing the message that children “that age should be eating the same foods as the rest of the family.” However, the FAFSA-2 review did not find in this evaluation (or others) any information on how effective cooking demonstrations and development and dissemination of local recipes were and, most importantly, the extent to which mothers/caregivers actually prepared and served the recipes to the target group in their own homes.
An interesting knowledge management activity would be to make a country-by-country, regional, or worldwide recipe book series to pool the different recipes and avoid duplication or loss of all this effort in the future. It would be good to have this information somewhere online available to the entire world. As programs end, these recipes are important to leave behind as a legacy with the MOH or a private book publisher. It is important to make sure that the recipes are indeed nutritious and meet young children’s requirements. This takes nutrition expertise, which not all Awardees possessed. Some local recipes did not meet expected nutrient content, for example, in PD/H Indonesia programs, which led to slower recovery for malnourished children (McNulty and Pambudi, 2008). The FAFSA-2 team had some hygiene concerns at some of the cooking demonstrations it visited. Modeling good hygiene practices should be incorporated into these cooking demonstrations, especially handwashing with soap and not leaving cooked food standing in the heat too long before it is eaten.
Nutrition and health education via lectures, radio, and community edu-tainment. One of the most common SBCC activities was nutrition and health education talks at monthly growth promotion,
food distribution, or Child Health Day activities. This technique is one of the easiest to implement, and can be used to provide information on topics of broad interest and to reinforce more specific messages. However, alone, it is not effective for changing IYCF behaviors, because the broad topics addressed each month are not relevant to the specific needs of many of the clients in the audience. The crowds are often large and it is hard to hear the talk or see any of the materials being used. A few programs (17 percent) used other innovative methods for nutrition and health education, such as local folk drama and radio talk shows or public service messages. The SC/Guatemala FY 2007–FY 2011 program had a popular local music group, the Internacionales Conejos, record a song to reinforce nutrition messages.
Support groups. Only 17 percent of programs used mother-to-mother support groups as a method to reinforce behavior change. The main theme was breastfeeding promotion. “Studies show that breastfeeding support groups are effective in improving the breastfeeding practices of their members,” according to a review of support groups (Green, 1998). That study found that support groups increase community participation and have the following advantages for their members: improved psychosocial well-being, greater message comprehension, and individual assistance. Given these positives, it was surprising that this approach was not more common in Title II MCHN programs.
All four Title II programs reviewed in Haiti used support groups as part of their behavior change approach. These groups were called Mothers’ Clubs. The use of Mothers’ Clubs was fine-tuned during the PM2A research in the WV/Haiti program to address the challenge of providing mothers with age-specific advice on IYCF practices. Groups were organized based on the age of the child, so that only mothers of children of the same age could meet and receive and share information specific to IYCF practices for that age group. This allowed messages to be more targeted, practical, and immediately applicable. Message retention rates increased dramatically, compared to recall of the general messages provided

6-54 Maternal and Child Health and Nutrition
at monthly growth monitoring and promotion sessions.215
Two Title II programs organized groups—called hearth sessions—for pregnant women in the community that met regularly; the FAFSA-2 considered these sessions support groups. CARE/Indonesia set up sessions for pregnant women to learn the importance of immediate and exclusive breastfeeding and how to improve their diets through cooking, eating, and meeting with peers. Africare/Guinea experimented with monthly sessions for pregnant women to learn about good nutrition practices at which MOH staff delivered antenatal care, malaria prophylaxis, iron/folic acid tablets, and tetanus toxoid vaccinations. The 2006 final evaluation found, using focus group interviews, that the sessions created a bond among pregnant women, providing them with a forum to share their concerns, discomforts, and solutions. TBAs identified pregnant women early and encouraged them to attend. Community health assistants made home visits to encourage husbands to support buying meat, fish, and other nutritious foods, and to allow the pregnant mother to rest, thereby creating an enabling environment for behavior change. Project staff in Guinea noted that the success of the hearth sessions for pregnant women reduced the need for undernutrition recuperation sessions for children by reducing low birth weight and increasing exclusive breastfeeding (Box 6.13).
6.3.3.5 Community-Based Growth Promotion
CBGP is a preventive approach based on monthly contact by community workers with pregnant and lactating women and mothers and caregivers of young children. Activities include weighing children to catch inadequate weight gain and growth faltering early (monitoring) and, most importantly, nutrition counseling of mothers and caregivers to improve IYCF practices (promotion). This approach was used in more than three-quarters of all Title II programs (78 percent). Community mobilization and advocacy are additional objectives of CBGP.
215 Bergeron, Gilles. Deputy Director for Country Programs, FANTA. November 30, 2011. Personal communication. Dr. Bergeron oversaw the PM2A research in Haiti.
Two potential strengths of CBGP are frequent contact between CHWs and caregivers, pregnant and lactating women, and young children, and providing an entry point to preventive and curative health services. The state of the art for doing CBGP effectively is described in the World Bank tool by Griffiths et al. (1996). The high percentage of Title II programs reporting doing CBGP may be an overestimate because some programs weighed children only to target recuperative supplementary feeding, but reported that as CBGP. Programs that only weigh children for monitoring purposes with no or weak nutrition counseling (promotion) have been widely criticized because they have little or no effect on nutritional status (Bhutta et al., 2008). In contrast, a meta-analysis of numerous programs found that children participating in CBGP that truly integrated growth monitoring with promotion and access to health services had better nutritional status or survival than children that did not (Ashworth et al., 2008). While advising that CBGP may not be the best use of scarce resources in countries where it does not exist or coverage is low with little potential for improvement, the authors recommend maximizing the potential of CBGP in other countries by targeting younger children, strengthening nutrition counseling, and integrating
Box 6.13. Pregnant Women’s Support Group—Africare/Guinea Focus Group Evaluation Results
• Earlier disclosure of pregnancy and antenatal care attendance
• Increased consumption of green leafy vegetables
• Increased consumption of iron/folate tablets and malaria prophylaxis
• Increased consumption of postpartum vitamin A supplements
Source: Africare/Guinea FY 2001–FY 2008 Title II Program Final Evaluation, 2006.

6-55Maternal and Child Health and Nutrition
it with basic health interventions. “Impact will be related to coverage, intensity of contact, health worker performance, adequacy of resources, and the ability and motivation of families to follow advice” (Ashworth et al., 2008). The recommendation to maximize the potential of CBGP is applicable to most Title II programs given the high percentage that did CBGP. It is better for Awardees to strengthen CBGP provided by the host government than to set up parallel services.
Evaluations of two non-food-assisted USAID-funded CBGP programs in Uganda and Honduras found that positive impact on nutritional status and IYCF practices was dependent on higher rates of participation and well-established, supportive supervision (Schaetzel et al., 2008; Stevens-Muyeti and Del Rosso, 2008). The benchmarks are 100 percent enrollment on a continuous basis of all eligible women and children, and monthly participation of at least 80 percent of enrolled children. A child should participate at least 80 percent of the time, i.e., have growth monitored at least 10 out of 12 months (Stevens-Muyeti and Del Rosso, 2008). Home visits are essential to encourage those absent to come, and to enroll newly eligible newborns and pregnant and lactating women.
Quality of implementation. In Section 6.3.3.4, the absence of or ineffective nutrition counseling was discussed as a weakness in Title II development programs. This limits achieving the full potential of CBGP. The FAFSA-2 review found other common problems with the quality of CBGP implementation as follows.
• Wrong level—facility-based or distant from the community
• Wrong target group—children under five years versus under two years of age
• Frequency—not done monthly, but rather every two to three months
• Lack of equipment and materials—no or not enough scales, growth charts, and counseling materials
• Weighing and plotting errors—or not filling in the growth chart at all
• Not client-centered—mothers and caregivers not given the growth charts to keep, and child’s growth not explained to mothers/caregivers or used to tailor counseling messages
• Growth charts not well designed—not user-friendly and hard for illiterates to understand; focus on nutritional status categories, e.g., mild, moderate, severe underweight for age, versus child’s weight gain every month on its own growth trajectory; implementing the new WHO growth standards that do not have accompanying recommended weight gain charts is a challenge
• Purpose—screening for undernutrition to enroll children in recuperative supplementary feeding versus focusing on weight gain and early growth faltering to prevent undernutrition (see Box 6.14).
The following are the promising practices of CBGP.
• Community education. A large, wall-sized growth chart used in several programs for
Box 6.14. Weighing Children to Target Recuperative Feeding is NOT Growth Promotion
“The criterion is usually a weight-for-age below one of the reference curves on the growth chart, equivalent to ‘moderate’ underweight. This invariably shifts the focus of growth monitoring towards identifying children who meet this criterion, rather than intervening at the first sign of growth faltering. Consequently no action is taken until the child is significantly underweight. As health workers choose who should receive assistance, the collaborative involvement of families in decision-making is lost, as well as any educational benefit of regular growth monitoring. Using weight charts in this way is contrary to the precept of growth monitoring.”
Source: Ashworth et al., 2008.

6-56 Maternal and Child Health and Nutrition
educational purposes and for plotting all the children’s weights in the community.
• Scheduling appointments for mothers. To avoid the chaos of a large crowd, which results in an all-mothers-and-children session, the SHARE and CRS Guatemala programs scheduled staggered visits with mothers and children at fixed times during which the worker could give them undivided attention and provide good quality nutrition counseling.
• Cross-program learning. Programs in Bolivia, Guatemala, and Nicaragua learned from the successful CBGP program in Honduras, Atención Integral a la Niñez en la Comunidad (AIN-C) (Honduras Community-Based Integrated Child Care Program), and from each other, with USAID Mission-funded TA from FANTA. SC used its experiences in Bolivia to shape its Bangladesh program.
• Improved growth charts. The bubble chart is an elongated, vertical individual growth chart; there is one for boys and one for girls. It is only for children under two years of age. The vertical layout accentuates small weight gain increments to make growth more visible. It is easy to accurately count the number of bubbles (circles), which represent 100 g weight increments, and then fill in the right one. These features make the bubble growth chart more user-friendly for workers and mothers/caregivers than traditional growth charts (see Figure 6.8).
6.3.3.6 Care Groups
“Care Groups” is a newer approach to organizing large numbers of village volunteers to do community mobilization, outreach, home visits, and behavior change. It was pioneered by World Relief in Mozambique in a primary health care project (Laughlin, 2004). Care Groups have expanded in other HN programs and minimum criteria for them have been defined.216 The application of the Care
216 The CORE Group has produced a manual and other resources on Care Groups that are available at http://www.coregroup.org/our-technical-work/initiatives/diffusion-of-innovations/50. Additional Care Group resources and curricula are also available at http://www.caregroupinfo.org.
Group model in programs with nutrition goals, such as Title II, remains experimental. The approach, with its numerous volunteers, is promising for achieving the outreach and frequent contact in the community with women and children in the first 1,000 days that are critical to successful SBCC, but its effectiveness depends on what the volunteers do and how well.
Seven Title II programs, all but one in Africa, mentioned Care Groups as part of their implementation strategies. FH used Care Groups in its Title II programs in Kenya and Mozambique. In Malawi, CRS and its I-LIFE consortium partners introduced Care Groups toward the end of the FY 2005–FY 2009 program after the PD/H approach failed, and they continue to use them in the ongoing Malawi program FY 2009–FY 2014. The approach does not usually include CBGP, but rather relies on the MOH to do CBGP at health facilities or at Child Health Days, and may not fully use available information on the individual child’s growth to
Figure 6.8. Bubble-Type Growth Chart: CARE/Bangladesh Program

6-57Maternal and Child Health and Nutrition
counsel the mother. During its field visit to the Malawi program, the FAFSA-2 team met many well-motivated Care Group volunteers. However, they were diluting their efforts by visiting all homes of children under five years close to their own home instead of making the larger outreach effort necessary to visit enough homes with children under two years of age, the target group of the program per the proposal. Most of the attention in the Malawi program up to June 2011 had been on the biweekly training meetings that the paid promoters hold with the Care Group volunteers that they supervise. Much greater attention is still needed to train the volunteers in good nutrition counseling skills and on how to make home visits effective, starting with visiting the homes of the right age group. Although most children had growth charts with recent weights plotted by the MOH at outreach clinics, these charts were not being used by the volunteers as a focus for individualized nutrition counseling—an unfortunate disconnect between this important MOH service and the Title II nutrition SBCC efforts. An additional concern was that the Malawi program was not monitoring or evaluating its coverage of children under two years with essential services, but rather under fives.
6.3.3.7 Positive Deviance/Hearth
Nearly half of all Title II programs (46 percent) reported PD/H as their main approach to reducing undernutrition. This figure rises to 59 percent in programs in Africa. The focus of PD/H is on treating moderately malnourished children in the community by teaching mothers/caregivers how to better use local foods, following the example of a “positive deviant” mother in the community who has a well-nourished child because of her good feeding and care practices. A positive deviance inquiry (formative research) is conducted in every community to identify the best practices to promote. The hearth is the daily communal session where mothers of malnourished children gather with their children to cook together and feed their children and help them recover, learning nutritious recipes and beneficial child care practices. The approach is referred to by some, e.g., Africare, as “Hearth,” not PD/H. The goals are to: (1) rehabilitate
malnourished children; (2) enable families to sustain the rehabilitation of these children at home on their own; and (3) prevent undernutrition among the community’s other children, current and future (Nutrition Working Group, 2003 and 2005).
Community nutrition rehabilitation centers using local foods have a long history going back to the 1960s in Haiti where they began. In 1997, Wollinka et al. reviewed the evolution of the approach, its pros and cons, and described successful experiences with introduction of the Hearth Nutrition Model into Asia in Bangladesh (World Relief) and Vietnam (SC). A period of rediscovery, spreading Hearth to new countries, e.g., Indonesia, and linking the hearth session to the concept of positive deviance in child nutrition ensued (Zeitlin et al., 1990). Thus, PD/H was born. This “new” old approach caught the imagination of Title II implementers in Africa, some of whom were implementing Title II nutrition programs there for the first time. It had additional appeal because of its low cost and because no direct food aid needed to be distributed. It was also expected to be more sustainable.
Most programs doing PD/H (56 percent) in the FAFSA-2 review did no direct MCHN Title II food distribution. Several evaluators of Title II programs implementing PD/H criticized the small HN budgets. In addition to small budgets, the FAFSA-2 review found that PD/H experienced a number of design and implementation problems in many places, leading to disappointing performance. These are discussed here to aid learning from the experience and to avoid making the same mistakes. One of the main limitations is that the PD/H focus on recuperation led to the neglect of or failure to engage in population-based activities to prevent undernutrition in under twos and to improve maternal nutrition during pregnancy and lactation. Without prevention, new cases of undernutrition keep appearing. To identify malnourished children, PD/H programs did population-based weighing and screening. This screening for nutritional status is distinct from monthly CBGP, which focuses on weight gain and growth with prevention in mind. Some PD/H programs did legitimate growth monitoring and promotion, but many did only screening, and this

6-58 Maternal and Child Health and Nutrition
screening was the only program contact with the whole population. Once malnourished children and their mothers or caregivers were detected by screening, they were usually the only ones eligible to benefit from the PD/H nutrition education component.
Special studies have been done on PD/H Title II programs—five in Indonesia and eight in Africa—which enabled the FAFSA-2 to assess in a standard way the number of children reached and the undernutrition recovery rate (Maslowsky et al., 2008; McNulty and Pambudi, 2009). These PD/H programs were very small scale and reached few children—an average of only 367 children enrolled per year per program (see Table 6.14). Fewer than 5,000 children participated per year across all 13 programs. Compare this to several typical Title II programs with direct food distribution to pregnant and lactating women and young children for preventing undernutrition, which annually reached 50 times the number of beneficiaries as PD/H.217 One reason for low enrollment is the most
217 The CPI/Senegal program had 20,910 beneficiaries according to its FY 2009 ARR, for example, and there was an average of 18,150 beneficiaries each across four Guatemala programs per the 2006 joint evaluation.
often used eligibility criterion of low weight-for-age. The prevalence of underweight is lower than the prevalence of stunting, often by a large amount, e.g., the regional prevalence of low weight-for-age in children under five in Africa in 2007 was 19.6 percent compared to the prevalence of low height-for-age of 38.5 percent (UNSCN, 2010). Therefore, many stunted children are never selected for the program. Furthermore, PD/H programs may only do one hearth session in a village per year or once during the life of the project, which also explains the small number of children that benefited.
The problems experienced with PD/H will be discussed under three broad categories: (1) design issues and assumptions, (2) feasibility of the approach, and (3) coverage and participation. Design modifications made by the Awardees to the PD/H model to address some of these challenges are described below. The results, as measured by undernutrition recuperation rates, are reviewed in Section 6.4.7 on the nutritional impact of Title II programs.
Design issues. One design flaw was selecting communities for PD/H that had a prevalence of low weight-for-age of less than 30 percent, the recommended minimum (Nutrition Working
Table 6.14. Enrollment and Undernutrition Recuperation Rates of Children under Five Years in 13 PD/H Programs in the FAFSA-2 Universe*
Country Awardee (Years)Mean Number of Children
Enrolled/YearPercent
RecuperatedBurkina Faso Africare (FY04–FY10) 182 55
Chad Africare (FY03–FY08) 544 No Data
Indonesia 5 PVO Programs (FY04–FY08) 500 45
Malawi CRS (FY05–FY09) 853 83
Mali Africare (FY03–FY08) 208 25
Mozambique Africare (FY02–FY08) 859 45
Niger Africare (FY07–FY11) 1,012 No Data
Rwanda ACDI/VOCA (FY05–FY10) 510 74
Sierra Leone CARE (FY07–FY10) 103 66
TOTAL 4,771AVERAGE 367 48
Sources: McNulty and Pambudi, 2009; Maslowsky et al., 2008.
* Age groups varied. Programs in Burkina Faso, Chad, Mali, and Niger enrolled children 6–35 months, and programs in Indonesia, Malawi, Mozambique, Rwanda, and Sierra Leone enrolled children 6–59 months.

6-59Maternal and Child Health and Nutrition
Group, 2005). Focusing on older children—over two years—was also a limitation, because, as explained earlier concerning recuperative feeding, most stunting occurs before two years of age, and therefore, low weight-for-age in children over two years is often due to their weight being proportional to their retarded height. In those cases where older children’s weight-for-height is normal, they would not recover from low weight-for-age. Current thinking is that PD/H may be more effective in addressing low weight-for-height (acute malnutrition) than low weight-for-age, and should target younger children 6–23 months (McNulty and Pambudi, 2009). The contradiction, however, is that communities with high wasting are the least likely to have sufficient local foods available to help their children recuperate at a hearth, a real constraint experienced in PD/H programs in several Sahel countries in Africa.
Feasibility of the approach and quality of implementation. In some food insecure communities, it was hard to find any positive deviant mothers with well-nourished children. The program just promoted nutritious recipes, not derived from a positive deviance inquiry. In some cases, the hearths became on-site feeding centers where parents brought their children for free local meals versus learning for themselves how to prepare nutritious meals.
Hearth sessions were rarely offered year-round in the community due to lack of local foods, time constraints by the Awardee and by participating households, and pressure to go to new villages. Instead, sessions were held once or twice a year or maybe only once in a village during the project. Yet undernutrition is a year-round problem and cannot be resolved with one or two 12-day sessions. There are new mothers and children to teach all the time, so it is an ongoing need not solved by the occasional hearth. However, programs that did sessions more often found that families got bored with them and stopped participating. It was hard to hold their interest.
Foods for the local hearth sessions are supposed to be donated by the families of the malnourished
children that are being rehabilitated. This was difficult to achieve in a number of settings. In Chad, Mali, and Niger, Awardees found they could only do the hearth in a narrow window of time between May and July, when food was plentiful and mothers had the time. The other seven months of the year nothing was done. There is something wrong with the concept when the hearth can only be done at the time of the year when it is least needed, and not in the lean season when undernutrition peaks. In very food insecure settings, like rural areas of countries in the Sahel, the program design decision to do PD/H with no Title II food rations was inappropriate, given that households have enough food for only about half the year from their own production in a normal season. In fact, Africare/Niger had tried PD/H with no food rations in its prior program and, learning from that failure, decided in its FY 2007–FY 2011 Niger program to give food rations to pregnant women that attend prenatal care and to children 6–36 months during the lean season, conditioned on their mother’s attendance at CBGP. Africare had a similar experience in its prior Chad/Mali program, but continues to not provide MCHN food rations in its ongoing follow-on programs in both countries. Africare tried PD/H in various countries, but seemed to have the most success with it in Guinea and southwest Uganda, where more households were food secure and local foods were plentiful, but IYCF practices needed to improve.
Doing PD/H is very labor intensive and can be done only on a small scale. Some Awardees selected this approach thinking it would be easy, but to do it right took more technical staff time than any of the other sectors. In one program, they had only completed positive deviant inquiries for 19 of their 240 communities in four-and-a-half years and they were running out of time with the program ending. The work involved to do PD/H right makes it less suitable for Title II programs that need to achieve scale and population-level impact on undernutrition in five years, balancing staff time across a number of sectors.
Implementation of PD/H is also complicated, and program staff and volunteers did not have the nutritional expertise required. Getting local

6-60 Maternal and Child Health and Nutrition
workers/volunteers trained and able to do the positive deviance inquiry in every community is a big challenge. In Indonesia, the positive deviance inquiry process identified many irrelevant behaviors (e.g., tooth brushing, shampooing hair daily), but seldom identified IYCF strategies used by or that could be used by families to overcome obstacles (McNulty and Pambudi, 2009). It is therefore not surprising that doing these positive deviance inquiries had no relation with better rates of recuperating underweight children. Messages in hearth sessions were too numerous and rarely related to the positive deviance inquiry findings. The local workers or volunteers were, but should not have been, expected to translate the positive deviance inquiry findings into nutritionally adequate local recipes, because this requires knowledge of nutrition science. Local recipes need to be developed by a nutritionist or dietitian; otherwise, the nutrient content is dubious. The menus for meals and snacks at the hearth for two weeks (1) need to be nutrient dense and diverse with the recommended amount of energy, protein, and micronutrients based on the child’s age and (2) meet all of the FADUA principles, as seen in Table 6.5.
Coverage and participation. A finding of the mid-term evaluation of the CRS/Liberia program was that at least three sequential hearth cycles are required in a village before graduating the village to ensure the transfer of knowledge from the participating mothers to others. Because of pressure to meet targets for covering more villages, they withdrew from villages prematurely. While reaching more villages looks good on paper, when they did not implement PD/H at the adequate intensity for long enough in each village, not much was accomplished.
Women’s work, particularly in agriculture, made it difficult for them to attend a hearth daily for two weeks. In Chad, Mali, and Niger, Awardees found they could not do the hearth in harvest season, because women were busy with harvesting, or in the planting season. Furthermore, the implementers observed that women’s work outside the home contributed to their children’s undernutrition because it constrained them from being able to feed children frequently enough.
Judging from the percent of PD/H programs doing home visits, which are critical to follow up on recovering malnourished children and which are a good measure of a continuing community support system, this approach was more fully implemented in Asia and LAC, where 67 percent of programs included home visits, than in Africa, where only 20 percent did. The Africa PD/H often had no CHWs on a continuing basis. PD/H is intended to be part of a comprehensive program that focuses on preventing undernutrition for all mothers and young children in the community, reaching families with malnourished children with extra support. In Africa, however, it was usually a stand-alone program focused only on nutrition rehabilitation.
Common modifications. Experts have defined appropriate settings for and essential elements of PD/H to maximize its impact (Nutrition Working Group, 2005). “Experience repeatedly shows these elements cannot be adapted, modified, or skipped altogether without seriously diminishing the effectiveness of the program” (Nutrition Working Group, p. 1). Nevertheless, most Title II Awardees strayed into uncharted territory, by modifying or jettisoning essential elements to test solutions to the challenges they were facing with PD/H. Several programs mentioned abandoning PD/H because it did not work, e.g., SC/Bolivia, Africare/Niger FY 2007–FY 2011, and CRS/Malawi FY 2005–FY 2009. In fact, SC, who championed PD/H in the late 1990s in Vietnam and Indonesia, no longer does PD/H in its programs worldwide.218
One common modification was shortening the duration of the hearth session to fewer days or as little as a one- to two-hour cooking demonstration once a month in conjunction with other monthly services. The aims were to increase participation by making this more convenient and feasible for busy mothers/caregivers to attend, reduce the amount of foods needed for the sessions, and reduce workload for program staff and volunteers. This revised approach fits better under “cooking demonstrations”
218 Jennings, Joan. TOPS Project Nutrition and Food Technology Advisor, Save the Children, Washington, DC. July 2011. Personal communication.

6-61Maternal and Child Health and Nutrition
discussed earlier. One move in the right direction was to open participation to all mothers with young children in the community to give everyone the benefit of the new knowledge, make the educational session preventive, and lessen stigma on the families with malnourished children. In an effort to save time and money, some Awardees opted to not do a positive deviance inquiry in every village. Instead, standard recipes and materials were developed after doing research in a few villages. To solve the lack of local foods donated by the families, some Awardees supplied some or all of the ingredients. A number of programs linked PD/H to promoting vegetable gardens to produce food for the sessions and to increase food access at home. Little is known about how effective these modifications were, many of which were introduced late in the programs.
6.3.3.8 Homestead Food Production and Home Economics
The FAFSA-2 team determined that homestead food production should be classified under the HN sector because, although this may generate income, the main purpose appeared to be nutritional. This was a popular approach implemented in nearly half of the Title II MCHN programs reviewed (46 percent). Vegetable gardens were the most common activity and mainly done to improve household dietary diversity and micronutrient intake. Home gardens may provide the family’s only source of fruits and vegetables rich in provitamin A and iron. Included here are various food-based approaches to achieve dietary diversification, e.g., biofortification via the OSP, vegetable gardens, fruit cultivation, small animal production, and home economics. These interventions are not in the package of essential nutrition interventions and the SUN Framework discussed earlier because they have not been proven to affect nutritional or micronutrient status indicators on a large scale (Bhutta et al., 2008; Klemm et al., 2009; Masset et al., 2011). Before including homestead food production, Title II programs should carefully analyze whether this activity will increase women’s workload to the degree that it negatively affects child care and feeding, whether there are sufficient project resources to do it without cutting
back on MCHN, and how to make these activities sustainable.219
Africare/Uganda promoted production in home and communal gardens and consumption of orange and yellow sweet potato varieties and indigenous, culturally acceptable, disease/pest/drought-resistant, nutrient-rich vegetables that have longer harvesting periods. The program also promoted fruit tree cultivation (apple, orange, mango, and avocado). Africare worked in collaboration with the USAID-funded Gender Informed Nutrition Agriculture Project (GINA). From these gardens, an estimated 153,140 kg of vegetables were harvested and consumed primarily by the beneficiary households, according to the final survey and evaluation report in 2006, which also states that the final survey results “showed that 78 percent of households surveyed consumed vegetables from their own production” (Anderson et al., 2006, p. 93). Cultivation of the nutrient-rich Moringa plant was featured in several programs, e.g., Africare/Guinea.
The OSP was promoted in a number of programs in other countries because it provides calories and provitamin A beta-carotene and some iron in the leaves. Increases in children’s vitamin A intake and serum retinol (vitamin A) have been found with increased consumption of OSP in rural Mozambique (Low et al., 2007; Hotz et al., 2011).
Constraints. SC/Mozambique found that vegetable gardens competed for women’s time with other farming activities and domestic chores. There was not enough water to irrigate them. The variety of OSP used could not survive the dry season. Therefore, families needed to get new plants every year. A number of other programs reported the same limitations, namely, that gardens added to women’s workload, reducing time for child care, participation at CBGP, and good IYCF practices. Furthermore, gardens were not feasible in the dry season in communities not near a water source and dependent on rain-fed cultivation. According to
219 Since 2007, USAID/FFP has required an analysis of the impact of project activities on women’s workloads in proposals for new Title II programs. See Section 3.8.1.

6-62 Maternal and Child Health and Nutrition
findings of the Tufts Exit Strategies Study, gardens were not sustained after programs ended unless the household was getting income from selling the produce. Resources are needed to buy the inputs that Title II programs subsidized or gave away during the program.
Some Awardees described vegetable gardening and fruit cultivation as the main long-term solution to undernutrition. They did not seem to understand that even if gardening is successful and children consume what is grown, this alone will not ensure improved growth. Consuming more fruits and vegetables may increase intake of provitamin A beta-carotene, iron, and other vitamins and minerals, but will not address major deficiencies in macronutrients in children’s diets—energy (OSP is an exception), protein, and fat that are critical to normal growth. For this same reason, vitamin A supplements alone have no effect on children’s weight and height (Bhutta et al., 2008).
Another common misunderstanding is that even for addressing vitamin A deficiency in young children, increased consumption of plant source vitamin A precursors (beta-carotene) has much less effect on increasing children’s serum vitamin A levels than preformed vitamin A (retinol) from animal foods or vitamin A supplements, due to the low bioavailability of vitamin A precursors. Research has shown that the conversion ratio to retinol (the animal source of vitamin A that the body uses) from beta-carotene (provitamin A) in plant foods is 14 units to make 1 unit. Experts used to think that the conversion was much more efficient at 6:1. For other carotenoids, the conversion factor may be as low as 28:1 (WHO/FAO, 2004). Absorption is influenced by adequate fat intake and the absence of intestinal helminths, neither of which can be taken for granted in the rural food insecure communities where Title II works. This further reinforces the importance of adequate vegetable oil in the rations. The bioavailability and absorption of iron from plant foods is also low. It can be improved somewhat by reducing the consumption of foods and beverages with inhibitors, such as tannins (e.g., tea), at the same meal or by increasing absorption by eating foods rich in vitamin C at the same meal. The bottom line is that children cannot eat enough
beta-carotene from plant foods to meet their vitamin A requirements. Nor can they meet their iron requirements solely from fruits and vegetables. They need to eat animal foods. That is why they are given vitamin A (retinol) and iron supplements in national health programs. The lowest bioavailability of vitamin A precursors is reported for leafy green vegetables and raw carrots and the highest for roots and tubers.
Small animal production. Giving chickens and goats to Title II clients to increase the family food supply and consumption of animal protein was popular in the three programs visited in Guatemala. SC/Guatemala promoted mothers feeding goat’s milk to young children daily, though this is not traditional in the diet. A constraint was that the breed of goats distributed produced very little milk, less than one cup (250 ml) per day. Goats given in other projects in other countries, e.g., in Bangladesh, were for fattening and selling for income generation, not to be consumed by the family for meat or milk. Rabbits and pig-rearing were successful in the Africare/Uganda program. Rabbits multiplied rapidly and did not require special feeding, making them a cheap source of protein and other nutrients for families. According to the 2006 final evaluation report, more children in the project households consumed meat than in the comparison group (7.4 percent versus 3.7 percent). Although low, this is a great start toward improving the protein-poor diet. Animal source foods are also critical for iron; zinc; and vitamins A, B6, and B12. The program noted that men did not raise small ruminants traditionally, so women controlled their production and their inclusion in the family diet. However, the gender roles would need to be analyzed in each program setting based on the following lessons learned from the FANTA-2 project’s work on gender integration.220 In Ghana, women that had poultry in their name were forbidden from using it as food or selling it. Poultry was considered part of the family’s assets that could be consumed only when they had guests. Elsewhere, when women were perceived as
220 Sethuraman, Kavita. FANTA. November 29, 2011. Personal communication.

6-63Maternal and Child Health and Nutrition
successful with small business activities, men often took control of the business, leaving women with no more resources than they had at the start.
Broad home economics and nutrition education. In the CRS/Malawi FY 2005–FY 2009 and FY 2009–FY 2014 programs, women learned how to save fuel and time with the fireless cooker, dry and preserve fruits and vegetables, and make juice and soy milk. Better grain storage through construction of a new style of bins or adding of chemicals and use of hermetically sealed plastic bags was also a focus. Several programs also helped families construct and use dish drying racks, mainly as a hygiene intervention. In Bolivia, the ADRA and FH programs taught family economics and how to overcome cost constraints to eating a healthy diet with fruits and vegetables. These are examples of useful add-ons in programs that were also doing a good job of delivering the essential MCHN interventions. However, several other Title II programs in Africa focused mainly on agriculture, e.g., in Kenya and Uganda, and had nutrition components that consisted of only broad nutrition education to change household diets, e.g., “eat more green leafy vegetables,” “eat more protein,” and “make and drink soy milk.” These latter programs had specific indicators and targets for reducing undernutrition in children under five years, even though it is well known that a broad nutrition education approach alone is ineffective for improving specific IYCF and maternal dietary practices. Disease as a cause of undernutrition also needs to be addressed. Thus, the lack of nutritional impact of such programs is no surprise. In the current attempts to link nutrition and agriculture in FTF, USAID and partners should learn from and avoid simplistic approaches like those of grafting broad nutrition/home economics education onto agricultural programs and thinking that these alone will have the intended impact on reducing maternal undernutrition and chronic undernutrition in children, especially in the 1,000-day window.
6.3.3.9 Cross-Cutting Male Involvement
One lesson learned by a number of programs across all three regions was how important it was to involve men in MCHN. One of UNICEF’s 16 key family
practices is to “ensure that men actively participate in providing childcare, and that they are involved in reproductive health initiatives.”221 The FAFSA-2 found some excellent examples of male involvement reported by Title II programs. In Uganda and Bangladesh, SC learned that men needed to be convinced of the merits of family planning or they would block it. Men also needed to understand that women’s heavy workloads affect pregnancy outcomes, women’s ability to breastfeed optimally, complementary feeding and child care, and, therefore, the health not only of their wives but of their children. Once persuaded, men would relieve women of some of the work during pregnancy and lactation. The ongoing SC/Bangladesh FY 2010–FY 2015 program includes the following indicators: “% of beneficiary women whose husband attended prenatal/postnatal care with them” and “% of men that score ≥ 80% on a knowledge test of correct care practices for pregnant/lactating women and children under five.”
In Liberia, some men attended hearth sessions for recuperating malnourished children in place of women that were busy in agriculture (CRS). One innovative approach to improve a couple’s communication and increase male involvement in MCHN was holding a couples conference (CRS/Malawi) to discuss the issues. Africare/Mozambique previously worked through model mothers, but realized the need to involve men. Because of men’s inclusion, Africare changed the program designation from “model mothers” to “model families.” The number of fathers participating in the program increased over the years. Men took the lead in hygiene, sanitation, and latrine construction. However, they also demonstrated awareness of the importance of adequate IYCF for a healthy child. SC/Mozambique involved at least one man as a member of the HN support group.
In Bolivia, several programs worked to increase male involvement. CARE convinced men to help their wives by herding the livestock on days women needed to take children to growth monitoring and
221 See http://www.unicef.org/nutrition/23964_familypractices.html. Accessed October 15, 2011.

6-64 Maternal and Child Health and Nutrition
promotion. Men understood that women needed to reduce their workloads during pregnancy and eat a good variety of foods. FH formed men’s groups. SC also encouraged male involvement and renamed “Women’s Centers” to “Family Centers.”
6.4 Program Impact on Nutritional Status of Children
Reducing stunting and underweight in children under five years of age are key measures of meeting the USAID/FFP Strategic Plan objective of reducing food insecurity in vulnerable populations. USAID/FFP is to be congratulated for requiring that quantitative impact evaluation survey data be collected with standard indicators in Title II development programs, as are Title II Awardees for gathering these data. Weight-for-age was an indicator in 97 percent of programs reviewed, height-for-age in 89 percent, and weight-for-height in 32 percent. Final evaluations had been completed for 54 programs.222 Of those, 52 measured weight-for-age, 48 measured height-for-age, and 20 measured weight-for-height. The results presented here are based on data published by Awardees in their final evaluations. After eliminating problematic data and surveys from the analysis, children’s weight- and height-for-age data were available from reliable, population-based, representative baseline and final evaluation surveys of 28 programs.223 Only 12 programs had reliable weight-for-height data; half of these reported reducing acute malnutrition. Given the small number of programs, impact on weight-for-height is not analyzed further.
6.4.1 Evaluation Survey Quality
Of the 69 programs reviewed for MCHN, 54 had been completed and had reported their final
222 Two programs in the FAFSA-2 MCHN universe, namely, CRS and WV in Ethiopia (FY 2003–FY 2008), ended prematurely and did not do final evaluation surveys. The other programs in Ethiopia in the larger FAFSA-2 universe in Table 1.3 in Chapter 1 also ended early and therefore did no final evaluation surveys.223 The 28 programs with height data in 13 countries do not completely coincide with the 28 programs that had weight data in 15 countries.
evaluation survey data. However, many of these evaluation surveys (46 percent) had limitations, so the data could not be used (see Table 6.15). The most common issues were poor-quality anthropometric data, sampling problems, and seasonality differences that made it invalid to compare the baseline and final survey data. Problematic surveys with questionable data represent a great deal of wasted effort and resources. Such surveys reduce the amount of reliable evidence about the impact of the programs involved. This argues strongly for USAID/FFP centralizing, professionalizing, standardizing, and making independent the conduct of future Title II program evaluation surveys.
Table 6.15. Limitations of the Evaluation Surveys of Title II Development MCHN Programs during the FAFSA-2 Time Period (FY 2003–FY 2009)
LimitationsNumber of Programs
Percent of Programs (N = 54)
None 29 54
Surveys with limitations 25 46
Main limitations*
Anthropometric data of poor quality
10 19
Sampling problems, no comparability—baseline versus final
7 13
Different seasons—baseline versus final
6 11
Not population-based, representative
2 4
Data collection poor quality
2 4
No question/indicator comparability—baseline versus final
1 2
Small sample 1 2
Other limitations 3 6
* Programs were counted more than once if there was more than one limitation.

6-65Maternal and Child Health and Nutrition
6.4.2 Methods
The FAFSA-2 analysis followed similar methods to those used in 2004 to assess the impact of Title II MCHN programs on nutritional status (Swindale et al., 2004). Because the length of time between baseline and final evaluation measures varied, an annualized indicator was generated for each program, and averaged across programs: “percentage point change in prevalence per year.” The median length of time between baseline and final evaluation surveys was four years.
Title II programs reported their impact on various anthropometric indicators of nutritional status. The FAFSA-2 analysis focused on the USAID/FFP required indicators of the prevalence of stunting and underweight (“percent of children of a given age group with height-for-age z-scores < −2” and “percent of children of a given age group with weight-for-age z-scores < −2,” respectively). Stunting is an indicator of past growth failure (chronic undernutrition or being too short for one’s age and sex) and reflects a number of long-term determinants that may include insufficient energy and nutrient intake (macronutrients, micronutrients), toxic factors, frequent infection, maternal nutrition and nutrient stores at birth, less-than-optimal feeding practices/care, and poverty (Frongillo, 1999). Underweight reflects both chronic and acute undernutrition (being too short, too thin, or a combination of the two). Different programs measured different age groups for the weight-for-age and height-for-age indicators, because most of these data were collected before 2007 when USAID/FFP defined standard indicators and age groups. Table 6.16 shows the age groups measured for anthropometric indicators in the larger set of Title II MCHN programs reviewed. The age groups measured in the 28 programs used in the FAFSA-2 analysis of nutritional impact are in Table 6.17.
Awardees applied the National Center for Health Statistics (NCHS) reference standard to interpret anthropometric data because most surveys were conducted before the 2006 WHO growth standards came into widespread use. Z-scores are standard deviations below the reference median for age and sex. Data on the national prevalence of stunting
Table 6.16. Age Range of Stunting and Underweight Indicators Reported by Title II MCHN Programs during the FAFSA-2 Time Period
Age Range of Indicator
Percent of Stunting
Indicators (59 Programs)
Percent of Underweight
Indicators (61 Programs)
Up to five years
0–59 months 11.9 32.8
37–59 months 1.6
6–59 months 45.8 19.7
24–59 months 20.3 3.3
Up to three years
0–35 months 6.8 19.7
6–35 months 3.4 1.6
3–35 months 6.8 6.6
Up to two years
6–23 months 3.4 4.9
12–23 months 4.9
0–23 months 1.7 4.9
Table 6.17. Age Range of Stunting and Underweight Indicators Reported by Title II MCHN Programs during the FAFSA-2 Time Period (with Reliable Survey Data)
Age Range of Indicator
Percent of Stunting
Indicators (28 Programs)
Percent of Underweight
Indicators (28 Programs)
Up to five years
0–59 months 10.7 14.3
37–59 months 3.6
6–59 months 28.6 25.0
24–59 months 35.7 7.1
Up to three years
0–35 months 7.1 21.4
6–35 months 3.6 3.6
3–35 months 10.7 10.7
Up to two years
6–23 months 3.6 7.1
12–23 months 3.6
0–23 months 3.6

6-66 Maternal and Child Health and Nutrition
and underweight were available from the two most recent DHS in 15 countries with Title II programs and were used for comparison purposes.224 There was considerable overlap between the years when baseline and final evaluations of Title II programs were conducted and the years of the initial and subsequent DHS used for comparison; 83 percent of the Title II baseline and final evaluation surveys used in the FAFSA-2 analysis of nutritional impact were implemented within two years of the DHS to which they were compared.225
The results of this analysis would be more robust if it had been possible to re-analyze the anthropometry in the actual evaluation survey datasets. Attempts to do this as part of the FAFSA-2 failed due to the difficulties of obtaining enough of the baseline and final evaluation paired datasets from the Awardees. It is a positive step forward that, as a result of this experience, USAID/FFP now requires all Awardees to submit these evaluation datasets along with the survey reports to USAID/FFP and the USAID Development Experience Clearinghouse (DEC) (FFPIB 11-02, USAID/FFP, 2011a).
6.4.3 Nutritional Status Impact by Sex
Most Awardees did not disaggregate and report child anthropometric data by sex. Thus, the FAFSA-2
224 Prior and repeat DHS were conducted in the 15 countries between 1999 and 2010, with all but one of the prior surveys conducted in 2000 or later. The NCHS standard was used for interpreting DHS anthropometric data for children born in the five years preceding the survey. There were no DHS anthropometric trend data for Chad, India, Indonesia, Liberia, Mauritania, Mozambique, Niger, or Senegal. For Madagascar, no DHS weight-for-age trend data were available (see http://www.statcompiler.com). While analyzing secular changes between DHS to provide a counterfactual for the meta-analysis of nutritional impact of Title II programs, the FAFSA-2 did analyze the results using only rural versus national DHS data, given that most of the Title II programs included were in rural areas. However, since the DHS trends for rural areas varied little from the national trends, the FAFSA-2 decided to use only national DHS data. Using only rural DHS data for comparison does not change the FAFSA-2 results on nutritional status.225 The mean interval between Title II surveys and the DHS to which they were compared was 1.7 years for baselines and 1.3 years for final evaluations. None of the DHS used for comparison were conducted more than four years before or after the Title II program evaluation survey.
was unable to assess nutritional status impact by sex for the overall program. Recent research has found that boys grow differently and faster than girls in the womb and are at greater risk of becoming undernourished when subjected to food shortages (Eriksson et al., 2010). Therefore, the major differences between undernutrition in boys and girls found in a number of Title II programs that did report sex-disaggregated data are not surprising. Examples of programs with evaluation survey findings of more undernutrition among boys are SC/Bangladesh and CARE/Bangladesh FY 2005–FY 2010; CARE/India FY 2002–FY 2006; CARE/Mozambique; SC/Uganda, WV/Uganda, and MC/Uganda; CARE/Sierra Leone FY 2007–FY 2010; CRS/Niger; SC/Bolivia; and the 2007 Haiti joint final evaluation survey of four programs. None of these programs had done qualitative research to probe further into what might be the causes of undernutrition, or reported on special approaches that they tried to eliminate the higher prevalence of undernutrition in boys. Such research is essential to inform SBCC for improving IYCF and child care practices, and without it one does not know if the differences in nutritional status are only due to boys’ increased vulnerability to deficits in growth in food insecure environments or also exacerbated by gender inequality. Boys should weigh more and be taller than girls at any given age, according to WHO growth standards. The Title II programs are not alone in finding nutritional status differences between boys and girls. In 20 of 33 DHS from 2003 to 2009, the prevalence of stunting in boys was at least four percentage points worse than in girls (Kothari and Abderrahim, 2010).
Sex-disaggregated anthropometric data are now required in the USAID Evaluation Policy (2011) and in USAID/FFP’s latest guidance on standard indicators and on gender integration (FFPIB 11-03, USAID/FFP, 2011b; McNairn and Sethuraman, 2011). The most important use of sex-disaggregated anthropometric data should be by the Awardees themselves. Large nutritional status differences between boys and girls should trigger formative research to understand if there are any behavioral determinants, followed by implementing specific approaches to reduce them.

6-67Maternal and Child Health and Nutrition
Figure 6.9 from the CARE/Bangladesh FY 2010–FY 2015 Strengthening Household Ability to Respond to Development Opportunities Project (SHOUHARDO II) Baseline Study Report illustrates the higher prevalence of stunting and underweight in boys (Caldwell et al., 2011).
6.4.4 Nutritional Status Impact Overall
“Child underweight and stunting prevalence[s] are falling significantly in most countries, except in Africa” (UNSCN, 2010, p. 98). This is the conclusion of the 6th Report on the World Nutrition Situation based on trends from 1990 to 2007.226 What impact did the Title II programs have on reducing undernutrition in children under five years of age during the FAFSA-2 time period from FY 2003 to FY 2009? These programs had a bigger impact on stunting, reducing it by 1.32 percentage points per year, than on underweight, which declined by 0.63 percentage points per year (see Figure 6.10). These declines were greater than the average DHS secular trend changes in stunting and underweight across the 15 countries with DHS data (see Table 6.18). The averages mask considerable variability in the results given the wide SDs. The average annual percentage point reduction in stunting of 1.32 achieved in the 28 Title II programs in the FAFSA-2 universe is less than the average reduction in stunting of 2.4 percentage points per year reported by FANTA in 2004 for 18 Title II programs (Swindale et al., 2004). Possible explanations for the difference in impact are: (1) the larger number of programs analyzed in the FAFSA-2 (28 vs. 18); (2) the deliberate exclusion of poor-quality data and evaluation designs in the FAFSA-2 that were not excluded from the 2004 study; and (3) the much narrower SD of 1.31 (less variability) around the stunting reduction estimate found in the FAFSA-2, compared to the wide SD of 2.3 reported by FANTA in 2004, due to the larger number of programs analyzed and elimination of poor-quality data and evaluation designs in the FAFSA-2. The 2004 study also reported a smaller SD of 1.6 for the average annual
226 The annual percentage point reductions in underweight and stunting in developing countries from 1990 to 2007 were 0.55 and 0.78, respectively, whereas in Africa both went down only 0.11 percentage points per year.
reduction in stunting when they analyzed only data from nine programs with a quality rating of “average” or “good” (Swindale et al., 2004).
Given the above explanations, the average annual percentage point reduction in stunting of 1.32 found in the FAFSA-2 is a more reliable and realistic estimate of the average impact that a mixed group of Title II MCHN programs can have on improving height-for-age. However, the mixed group varied widely, from programs that
Figure 6.9. Percent of Children under Five Stunted, Wasted, and Underweight, by Sex, in Baseline Survey for CARE/Bangladesh Title II Program, 2011
62.3
54.2
44.636.5
14.3 14.8
0
10
20
30
40
50
60
70
Boys Girls
Stunted Underweight Wasted
Note: The number of observations for the stunted and wasted estimates (for children 6–59 months) is 2,807. The number of observations for the underweight estimates (children 0–59 months) is 3,417. Source: Caldwell et al., 2011.
Figure 6.10. FAFSA-2 Nutritional Impact in Children under Five Years of 28 Title II MCHN Programs Compared to DHS Secular Trends—All Regions
-1.40
-1.20
-1.00
-0.80
-0.60
-0.40
-0.20
0.00< −2 Height-for-Age Z-Score < −2 Weight-for-Age Z-Score
DHS Title II
Ann
ual %
Poi
nt R
educ
tion
Title
II M
CH
N v
s. D
HS

6-68 Maternal and Child Health and Nutrition
provided supplementary feeding with distinct recuperative or preventive targeting strategies to programs that did not distribute food rations. The effectiveness or nutritional status impact associated with these distinct strategies varied greatly, as discussed in the next section. The FAFSA-2 found that preventive supplementary feeding is the most effective approach. Therefore, going forward, one would expect fewer Title II programs to do the less effective approaches, and the overall average impact of Title II programs on nutritional status to increase, as more or all programs focus on prevention, including supplementary feeding. The expected reduction in stunting in these more effective prevention programs should be at least the average found in the FAFSA-2 for preventive supplementary feeding programs, and not the lower reduction cited for the mixed group.
There were marked differences in reducing chronic undernutrition between regions, with programs in the combined Asia and LAC regions achieving a bigger average annual decrease of 1.53 percentage
points, compared to programs in Africa, where stunting fell only 0.98 percentage points per year (see Figure 6.11). No regional differences were seen in reducing low weight-for-age. These contrasts in impact track with the differences in Title II program interventions, approaches, and budgets for HN between the regions, as already described, as well as with the regional secular trends.
Turning to the nutritional impact of individual programs, the FAFSA-2 found that 71 percent of the programs reduced stunting more than the annual percentage point decline seen in DHS in the same country, and 64 percent reduced underweight more than the annual percentage point decline in DHS in the same country.227 Fourteen programs in eight countries reduced the prevalence of stunting at an annual rate greater than both the changes in stunting as measured by DHS in the same country and the
227 In countries without DHS data, the nutritional status impact data for Title II programs were compared to the average secular changes in DHS data at the regional level.
Table 6.18. Impact of Title II Programs in the FAFSA-2 Universe on Nutritional Status of Children 0–59 Months of Age* Compared to DHS Secular Trends
Nutritional Status Indicator < −2 Z-Scores
Percent of Programs with this Indicator (N = 63)**
RESULTSPrograms
that Reported Improving Indicator % (N)***
Annual Percentage Point Reduction in Prevalence of UndernutritionPrograms DHS Secular Trends
N***Mean +SD
95% CI N***
Mean +SD
95% CI
CHRONIC MALNUTRITION—STUNTING
Low Height-for-Age
89 28 −1.32
+1.31
−1.81 to
−0.83
15 −0.58
+0.94
−1.06 to −0.10
51 (53)
UNDERWEIGHT
Low Weight-for-Age
97 28 −0.63
+1.28
−1.10 to
−0.16
14 −0.43
+0.64
−0.77 to −0.09
45 (58)
ACUTE MALNUTRITION—WASTING
Low Weight-for-Height
32 12 NA**** NA**** NA**** NA**** NA**** 30 (20)
* This is a pooled analysis of program indicators that measured the following age groups of children in months: 0–59, 37–59, 6–59, 24–59, 0–35, 6–35, 3–35, 6–23, 12–23, 0–23. See Table 6.17.
** The denominator for “Percent of Programs with this Indicator” is 63 programs (of the 69 HN programs in the FAFSA-2) that had been under way long enough to have had at least a mid-term evaluation, if not a final evaluation.
*** The denominator for “Programs that Reported Improving Indicator” represents the number of programs (N) that had reached the stage in their implementation when they had collected and reported evaluation data for that anthropometric indicator. SD = Standard Deviation. CI = Confidence Interval.
**** The annual change could not be calculated because of the small number of programs with reliable weight-for-height data.

6-69Maternal and Child Health and Nutrition
average annual reduction in stunting achieved across the 28 Title II programs. Furthermore, 8 of these 14 programs in six countries were also able to reduce the prevalence of underweight at an annual rate greater than both the DHS national secular changes and the average annual reduction in low weight-for-age across the 28 Title II programs. The eight programs with major reductions in underweight and stunting were: OICI/Ghana, Africare/Uganda, CARE/Mozambique, SC/Bolivia, SC/Honduras, CARE/Honduras, SC/Nicaragua, and PCI/Nicaragua.
An additional six programs that achieved major reductions in stunting, without major declines in underweight were: WV/Mozambique (no weight data collected), CRS/Indonesia, ADRA/Bolivia, CARE/Bolivia, CRS/Haiti, and ADRA/Honduras (no weight data available). Most of the programs with greater nutritional impact were in the Asia or LAC regions. Major differences in approaches used by these successful programs are contrasted to approaches used in eight programs that achieved little or no improvement in children’s height-for-age compared to the annual percentage point decline in DHS in the same country (see Figure 6.12).228 Approaches more common in unsuccessful
228 The eight programs with low or no impact on stunting were: Africare/Chad; WV/Kenya; SC/Guatemala FY 2000–FY 2007; SC/Bangladesh FY 2005–FY 2010; CARE/Haiti; SC/Haiti; WV/Haiti; and WV/Honduras.
programs were supplementary feeding only for recuperation (13 percent vs. 7 percent) and PD/H (63 percent vs. 36 percent). Distinguishing features of programs that were more successful than most at improving height-for-age were: (1) nutrition counseling on IYCF (86 percent vs. 50 percent); (2) targeting children under two or three years of age (71 percent vs. 50 percent); and (3) home visits (64 percent vs. 38 percent), which were less frequent in unsuccessful programs. Furthermore, the star performers in Bolivia, Honduras, and Nicaragua learned much from each other and benefited from technical exchanges and cross-program learning that shaped the design and implementation of their community-based approaches. More programs than these 14 may have had a major positive impact on nutritional status, but due to the large number with no reliable data, it is impossible to know.
Ten of the 14 programs with large declines in stunting were in five more developed countries that have since graduated from Title II. It is sobering to realize that achieving this same impact on stunting in ongoing and future programs in the least developed USAID/FFP focus countries, with their greater food insecurity and undernutrition, will likely be harder.229 Fortunately, the Tufts Exit Strategies Study for USAID/FFP includes Bolivia and Honduras, where six of the more effective, but graduated, programs
229 All of the USAID/FFP focus countries except Guatemala are on the United Nations Least Developed Country list.
Figure 6.11. FAFSA-2 Nutritional Impact in Children under Five Years of Title II MCHN Programs, by Region
-1.80
-1.60
-1.40
-1.20
-1.00
-0.80
-0.60
-0.40
-0.20
0.00
< −2 Height-for-Age Z-Score
< −2 Weight-for-Age Z-Score
Africa Asia/LAC
Ann
ual %
Poi
nt R
educ
tion
by R
egio
n
Figure 6.12. FAFSA-2 Comparison of Approaches in Title II Programs with High and Low or No Impact on Reducing Stunting in Children under Five Years
86%
64%
71%
36%
7%
50%
38%
50%
63%
13%
0% 20% 40% 60% 80% 100%
Counseling on IYCF
Home Visits
Target Children < 2 or 3years
PD/Hearth
Recuperative FeedingOnly
Low or No Impact High Impact

6-70 Maternal and Child Health and Nutrition
are located. They will further analyze nutritional status impact, collect follow-up data, determine if the positive changes were sustained two years after project close-out, and identify associated factors. The remaining four high-performance programs were in three countries that continue to be a focus for USAID/FFP: Mozambique CARE and WV, Africare/Uganda, and CRS/Haiti. Current Title II programs face major challenges to achieving as much or more nutritional status impact as that documented in the FAFSA-2, because, within countries, they have been relocated to the most food insecure, underdeveloped regions. Uganda is a good example. The current geographic priority area for Title II is the previously war-torn northeast, specifically the Karamoja region, where it is more difficult to work due to insecurity, violence, drought, and underdevelopment, than the prosperous southwest, where the Africare program was able to improve nutritional status.
6.4.5 Nutritional Status Impact by Type of Supplementary Feeding
There were considerable differences in the nutritional impact of Title II programs depending on the type of MCHN supplementary feeding they did, that is, (1) no food rations, (2) recuperative feeding only, and (3) preventive feeding (see Figure 6.13). Prevention programs achieved a three times greater average annual reduction in stunting of 1.69 percentage points, compared to the DHS
secular trend reduction of 0.58.230 The reduction in stunting achieved in prevention programs was twice that of the 0.75 achieved in recuperative feeding only programs, or 0.85 in no-food-ration programs. However, in evaluating this comparison, it is important to note that recuperative feeding and preventive feeding do not typically target the same age range. The superior performance of prevention programs was also seen in greater annual reductions in low weight-for-age of 0.95 percentage points, although the impact was much smaller than on stunting.
However, the preventive feeding programs in LAC did achieve annual decreases in underweight of 0.92, nearly three times the regional average annual decline in LAC DHS of 0.33, while also reducing stunting by 1.65 percentage points per year (see Figure 6.14). Clearly, preventive supplementary feeding for pregnant and lactating women and young children, delivered along with an integrated package of community and population-based SBCC and
230 For programs with preventive supplementary feeding, the 95 percent confidence interval (CI) for the mean annual percentage point reduction in stunting was −2.22 to −1.16. This did not overlap with the 95 percent CI of −1.06 to −0.10 for the mean annual percentage point reduction in stunting measured by DHS across 15 countries (see Table 6.18), indicating that the changes in height-for-age of the children in these two groups were significantly different. However, without further statistical tests, it cannot be determined whether there were significant differences between the groups with overlapping CIs.
Figure 6.13. FAFSA-2 Nutritional Impact in Children under Five Years by Type of Title II Supplementary Feeding Compared to DHS Data
DH
S
DH
S
Non
e
Non
e
Rec
uper
atio
n
Rec
uper
atio
n
Prev
entio
n
Prev
entio
n
-2.00
-1.50
-1.00
-0.50
0.00
0.50
Ann
ual %
Poi
nt C
hang
e by
Typ
e
< −2 Height-for-Age Z-Score < −2 Weight-for-Age Z-Score
Figure 6.14. FAFSA-2 Nutritional Impact in LAC in Children under Five Years of 13 Title II Programs with Preventive Supplementary Feeding Compared to DHS Data
DH
S DH
S
Title
II
Title
II
-1.80
-1.60
-1.40
-1.20
-1.00
-0.80
-0.60
-0.40
-0.20
0.00< −2 Height-for-Age Z-Score < −2 Weight-for-Age Z-Score
Ann
ual %
Poi
nt R
educ
tion

6-71Maternal and Child Health and Nutrition
essential HN interventions, has the biggest positive impact on nutritional status. This package should be the norm in Title II programs.
Recuperative feeding only programs were the poorest performers. Both the no-food model and recuperative feeding only had limited impact on stunting, compared to preventive supplementary feeding, and the declines were not much better than in the DHS, i.e., the status quo without Title II. And the prevalence of underweight in children increased in communities with recuperative feeding only programs, in contrast to reductions in underweight seen in the DHS, the no-food-ration programs, and preventive supplementary feeding programs (see Figure 6.13).231 It has been argued that restricting eligibility for food assistance to the malnourished rewards bad behavior and may provide a perverse incentive for families to have a malnourished child in order to benefit (Ashworth et al., 2008). The findings of the FAFSA-2 and of the FANTA-2 formative research in northern Uganda suggest that this is a valid concern about recuperative feeding (Mwadime et al., 2012). The PM2A research in Haiti found that not only did underweight increase by 1.0 percentage point per year in the group that received recuperative feeding only, but stunting and wasting also increased by 0.5 and 1.23, respectively (Menon et al., 2007; Ruel et al., 2008). In contrast, in the group receiving preventive feeding, stunting was reduced by 1.23 percentage points per year and underweight by 1.00 percentage point per year.
The FAFSA-2 findings on nutritional impact are consistent with the 2008 Lancet review of nutrition interventions that found a significant positive impact of supplementary feeding on young children’s height-for-age in populations with insufficient food (Bhutta et al., 2008). The reduction in stunting in the Title II group receiving the integrated package of preventive supplementary feeding and SBCC to improve IYCF practices is of the same magnitude as the 1.67 percentage point per year reduction
231 The CIs in Table 6.21 for the mean annual percentage point changes in stunting and underweight for the groups “no food” and “recuperation” range from a decrease to an increase in these conditions, illustrating that some programs actually had a negative impact on nutritional status.
achieved in a similar conditional cash transfer program in Nicaragua, which contributed to increased food expenditures, more varied household diet, and increased use of preventive health care (Maluccio and Flores, 2004).
6.4.6 Nutritional Status Impact of Preventive Supplementary Feeding by Ration Size
Individual and household rations. Within programs doing supplementary feeding for prevention, the range in rations was huge—from 4.0 kg to 36.4 kg per month. The FAFSA-2 decided to delve deeper into the quantity and composition of the food rations for 16 prevention programs in eight countries that had reliable nutritional status impact data. Two significantly different groups emerged with no overlap in the 95 percent confidence intervals (CIs). Group 1 had five programs that distributed on average less than 15 kg of food a month to their beneficiaries, defined by the FAFSA-2 as a level consistent with individual rations for pregnant and lactating women and young children. The average amount of food provided to participants monthly was 8.41 kg ± 4.88 SD, and the range across the five programs was 4.0–14.35 kg. Group 2 had 11 programs that distributed more than 16 kg of food a month to beneficiaries, defined by the FAFSA-2 as a level consistent with individual rations for pregnant and lactating women and young children plus household rations. The average amount of food provided to participants monthly was 23.85 kg ± 6.87 SD, and the range across the 11 programs was 16.2–36.4 kg, often exceeding the current illustrative PM2A TRM rations (FANTA, 2010). Dividing the prevention programs into these two groups, one with smaller rations and one with much larger rations of nearly triple the size, was a more objective way to analyze the differences, since Awardees did not use standard definitions when they described their supplementary feeding programs as giving incentive rations, individual rations, or individual plus household rations.232 See Table 6.19 and Table 6.20 and Figure 6.15 and Figure 6.16 for the ration size and commodity mix of the 16 programs.
232 None of the programs reviewed had ration sizes of 15 kg to 16 kg.

6-72 Maternal and Child Health and Nutrition
Table 6.19. Individual Prevention Rations (< 15 kg)
Country Awardee (Years)MCHN Ration (kg/person/month)
Cereal Pulse CSB/SFB Oil TotalBangladesh SC (FY05–FY10) 3.00 0.50 0.50 4.00Indonesia CRS (FY05–FY08) 3.99 0.80 4.79Guatemala SHARE (FY03–FY08) 1.40 0.9 2.70 0.92 5.92Honduras SC (FY05–FY09) 7.00 5.00 1.00 13.00Nicaragua PCI (FY02–FY09) 12.50 1.85 14.35
Average 3.79 0.71 6.06 1.01 8.41SD 2.90 0.29 4.40 0.50 4.88
95% CI 0.51 to 7.07 −0.27 to 1.69 1.69 to 10.37 0.57 to 1.45 4.13 to 12.69Median 3.00 0.71 4.50 0.92 5.92
Table 6.20. Individual Plus Household Prevention Rations (> 16 kg)
Country Awardee (Years)MCHN Ration (kg/person/month)
Cereal Pulse CSB/SFB Oil TotalHaiti SC (FY02–FY08) 4.50 9.97 2.20 16.67
WV (FY02–FY08) 3.10 14.60 2.40 20.10Bolivia ADRA (FY02–FY09) 10.00 9.00 10.00 0.92 29.92
CARE (FY02–FY09) 10.00 9.00 10.00 0.92 29.92SC (FY02–FY09) 10.00 9.00 10.00 0.92 29.92
Guatemala SC (FY00–FY07) 8.16 4.54 9.07 2.31 24.08Honduras ADRA (FY05–FY09) 12.50 3.70 16.20
CARE (FY01–FY08) 17.30 9.10 9.10 0.90 36.40WV (FY05–FY09) 7.00 5.00 10.00 2.00 24.00
Nicaragua SC (FY02–FY09) 2.34 13.33 2.52 18.19Ghana OICI (FY04–FY09) 15.00 1.92 16.92
Average 11.07 6.18 10.86 1.88 23.85SD 3.71 2.82 1.91 0.90 6.87
95% CI 8.32 to 13.82 4.34 to 8.02 9.68 to 12.04 1.35 to 2.41 19.79 to 27.91Median 10.00 5.00 10.00 2.00 24.00
Figure 6.15. FAFSA-2 Monthly Prevention Rations for Pregnant and Lactating Women and Preschool Children with or without Household (HH) Rations
8.4 kg
23.9 kg
0
5
10
15
20
25
30
Mea
n kg
per
Mon
th
Individual Ration Individual + HH Ration
Figure 6.16. FAFSA-2 Monthly Prevention Rations for Pregnant and Lactating Women and Preschool Children with or without Household (HH) Rations
1.88
6.18
11.07
10.86
1.01
0.71
3.79
6.06
0 1 2 3 4 5 6 7 8 9 10 11 12
Oil
Pulses
Cereal
CSB/SFB
Mean kg per Month
Individual Individual + HH

6-73Maternal and Child Health and Nutrition
A tremendous variation in MCHN rations was also found in the FAQR (Webb et al., 2011). Furthermore, the FAQR recommended that individual daily MCHN rations should contain both 30 g of fortified vegetable oil and 100 g of an improved formulation of CSB to be eaten together to achieve the required energy density. Only four of the prevention programs in the FAFSA-2 analysis were giving enough oil in proportion to the cereal-based part of the ration to meet that new recommendation. The second illustrative ration in the PM2A TRM also has only one-third of the FAQR recommended fat (oil) content (FANTA, 2010). Furthermore, the monthly ration for the study group receiving only individual rations in the ongoing PM2A research in the Mercy Corps/Guatemala Title II program contains only 4 kg of CSB and no oil according to the Mercy Corps FY 2012 ARR.
No better impact with household rations. Program impact on stunting and underweight in the two ration groups is shown in Table 6.21 and Figure 6.17. Group 1 programs with only individual rations had greater impact on reducing stunting (1.91 average annual percentage point reduction) and
double the decrease in underweight (1.37), with the latter particularly striking. The Group 2 results for programs with individual plus household rations can be compared to the three-year Haiti PM2A research in which the prevention group that received individual plus household rations achieved an annual percentage point reduction in low height-for-age of 1.23 and of 1.0 in low weight-for-age (Menon et al,. 2007; Ruel et al., 2008).
Figure 6.17. FAFSA-2 Nutritional Impact in Children under Five Years of Title II Individual Prevention Rations with or without Household Rations, All Regions
-2.5
-2.0
-1.5
-1.0
-0.5
0.0
Ann
ual %
Poi
nt R
educ
tion
by
Rat
ion
Type
< −2 Height-for-Age Z-Score < −2 Weight-for-Age Z-Score
Individual Individual + HH
Table 6.21. Impact of Title II Programs in the FAFSA-2 Universe on Nutritional Status of Children 0–59 Months of Age* by Type of Supplementary Feeding Eligibility Criteria and Rations
Nutritional Status Impact NO FOOD
RECUPERATION Food Targeted Only
to Malnourished Children
PREVENTION Individual Rations
for All P/L** Women, Children in Age Group
PREVENTION Individual Rations for
All P/L Women, Children in Age Group, Plus Household Rations
PREVALENCE of LOW HEIGHT-FOR-AGE < −2 Z-Scores
Number of Programs 8 4 5 11
Mean Annual Percentage Point Change in Prevalence
−0.85 −0.75 −1.91 −1.60
SD 1.67 1.07 0.87 1.20
95% CI −2.01 to 0.31 −1.80 to 0.30 −2.67 to −1.15 −2.31 to −0.89
PREVALENCE of LOW WEIGHT-FOR-AGE < −2 Z-Scores
Number of Programs 6 7 5 10
Mean Annual Percentage Point Change in Prevalence
−0.76 0.20 −1.37 −0.76
SD 1.57 1.71 0.90 0.65
95% CI −2.02 to 0.50 −1.07 to 1.47 −2.16 to −0.58 −1.16 to −0.36* A pooled analysis of program indicators measured in children in the following age groups in months: 0–59, 37–59, 6–59, 24–59, 0–35, 6–35, 3–35, 6–23, 12–23, and 0–23. See Table 6.17.
** P/L = Pregnant/Lactating.

6-74 Maternal and Child Health and Nutrition
To compare the impact of the two types of rations in programs in similar settings, the FAFSA-2 analyzed a subset of 8 of the 16 programs in three of the eight countries, where both models were used in the same country, namely, in Guatemala, Honduras, and Nicaragua. In two of the three countries, programs giving only smaller individual rations achieved greater reductions in stunting and underweight than programs in the same countries that gave larger individual plus household rations. The only exception was in Nicaragua, where one program with a household ration reduced stunting more. The 2006 joint evaluation of the four Title II programs in Guatemala with varying ration sizes found no correlation between ration size and nutritional impact, i.e., bigger rations did not translate into greater impact. These findings comparing both models in the same countries lend further weight to doubts about whether household rations contribute to greater nutritional impact.
Household rations questioned. The FAFSA-2 could find no dietary intake data from the PM2A research in Haiti or any other Title II program reviewed to substantiate the hypothesis that giving household rations protects the individual mother-child rations from being shared by other family members or substituted for household foods that the beneficiaries would have eaten anyway. “Sharing” and “substitution” of rations have been documented as problems in supplementary feeding programs (Anderson et al., 1981), although there has been no recent research. Nor was there evidence from Title II programs to support the assertion that additional household rations are necessary as incentives to achieve adequate participation.
Household rations are an income transfer intended to improve food security. The theory is that by giving household rations there is less sharing of the food assistance beyond the target group, therefore better maternal and young child dietary intake, and in turn bigger nutritional status impacts. The Haiti PM2A study documented that, while household food insecurity was the same across study groups at baseline, it was significantly less pronounced in households enrolled in the prevention arm than those in the recuperation arm at the end of
the intervention. The reasons for this are that the prevention model included individual plus household rations and reached more households (73 percent of all households in the population were in the prevention arm versus 28 percent of all households in the recuperation arm), and for twice the duration of the recuperation model.233 Unfortunately, the study did not measure whether improved household food security due to large food rations in the prevention arm translated into increased nutrient intakes by pregnant and lactating women and young children, and, therefore, better nutritional status—the hypothesized causal pathway.
Household rations greatly limit the scale of Title II programs by increasing their cost per person. Household rations are by far the most important cost in programs doing PM2A; the quantities given as part of the household ration are much greater than the individual ration given for the mother or child.234 It should be noted that the World Bank’s cost projections of US$40–US$80/year/child 6–23 months of age for the complementary (supplementary) and therapeutic feeding interventions in SUN, the most expensive interventions in the package, are based on individual rations and do not include household rations (Horton et al., 2010).235
There remains an urgent need to conduct cost-effectiveness research on rations in Title II MCHN programs that would include collecting dietary intake data from pregnant and lactating women and young children to compare to HN outcomes, impact, and program cost in groups that receive: (1) individual plus household rations, (2) only individual rations, and (3) no food rations. Having such data on the impact of different ration sizes on the dietary intake of the target group is critical to elucidate the causal pathway by which rations affect nutrition status, and how large food rations need to
233 Bergeron, Gilles. Deputy Director for Country Programs, FANTA. November 30, 2011. Personal communication. Dr. Bergeron oversaw the PM2A research in Haiti.234 Ibid.235 Does not include CMAM, which World Bank estimated would cost US$200/episode/child 6–59 months of age (Horton et al., 2010).

6-75Maternal and Child Health and Nutrition
be. It would have been helpful to shed light on these important questions if the outgoing PM2A research in Guatemala and Burundi had been designed to collect such dietary intake data for groups receiving different ration sizes.
In summary, some have hypothesized that individual rations alone are insufficient, and that complementing them with large household rations is cost-effective and necessary to achieve greater program participation, less intra-household sharing of mother-child rations, and improved dietary intake and nutrition status of beneficiary mothers and children. However, there is an absence of evidence to support these hypotheses, and research is needed on these questions. Meanwhile, many more people would benefit if programs, while following the prevention model, provided individual rations only, and not such large individual plus household rations to so few families.
6.4.7 Nutritional Status Impact of Positive Deviance/Hearth
The age of children enrolled was 6–35 months in four PD/H programs and 6–59 months in nine PD/H programs. Recuperation was most often defined as gaining at least 400 g in one month, irrespective of age. On average, the success rate with recuperating malnourished children was 48 percent in the 13 Title II PD/H programs reviewed in special studies (see Table 6.14) (McNulty and Pambudi, 2009; Maslowsky et al., 2008). This is a disappointing recovery rate, especially since it is based on the less stringent criterion of weight gain. Furthermore, it is common for a number of recovered children to relapse into undernutrition in the months following graduation, because constraints to adopting new feeding and care behaviors have not been removed.
6.4.8 Programs with Unintended Negative Impact on Nutritional Status
Three Title II programs had a large, unexpected negative impact on nutritional status associated with irrigation activities, namely Africare in Chad and Mali and WV/Kenya. In Mali, the overall program achieved reductions in stunting and underweight, especially for children under three years of age,
despite drought and locusts. The final evaluation attributed some of this impact to blanket feeding of children under five years by WFP during the crisis in the program villages. The Africare program did no direct MCHN food distribution. The final evaluation team hypothesized that the greatest impact on children’s nutritional status would be found in villages that had received Title II support to introduce irrigation systems, because the greatest increases in food production were observed in these villages. To test this theory the evaluators analyzed the anthropometric data for the irrigation villages alone, disaggregated by children’s age. They found that the nutritional status of children in the irrigation villages actually deteriorated over the three-year project period. In children 25–59 months of age, underweight more than doubled, from 28 percent to 61 percent (statistically significant at p < 0.003), and acute malnutrition rose from 0 percent at baseline to 23 percent at the end of the project (statistically significant at p < 0.009), a level that indicates a critical emergency situation according to WHO. These negative impacts were attributed to the introduction of irrigation, which added a second agricultural cycle in the year. Women did most of the agricultural work, so the additional agricultural cycle doubled their workloads in the fields, preventing them from adequately caring for and feeding their children. Children under two years of age were less affected because they were taken to the fields with their mothers and breastfed. In contrast, older preschoolers were left at home with inadequate substitute caregivers.
The Africare/Chad program also introduced irrigation in some villages that made possible a second harvest. This program had a negative impact on height-for-age at the overall project level, which is hypothesized to be due in part to increasing women’s work in the fields and reducing their time spent on child care and feeding. The program did no supplementary feeding, which might have mitigated the negative effects in the short term. A special study of the Africare/Chad program was done to determine the impact of women’s gardening activities on children’s school attendance (West Africa Regional Food for Peace Office, USAID/Senegal, 2005). The findings suggested that women’s gardening had a

6-76 Maternal and Child Health and Nutrition
negative impact on children’s school attendance as garden size, labor demands, and household income increased. The gardening program appeared to discourage women from sending their children to school because their assistance was needed in the fields.
It would have been useful if the evaluators had done further analysis of the Africare/Chad program to separately determine the nutritional status impact in irrigation villages, especially given the negative findings in Mali. The Mali program evaluators are to be congratulated for having done this in-depth analysis of the survey data; otherwise, these adverse impacts would have remained hidden in the overall results. However, these lessons learned were not fully incorporated into Africare’s proposals for its Chad FY 2008–FY 2012 and Mali FY 2008–FY 2013 Title II programs, which also include irrigation and no MCHN supplementary feeding. While the Mali proposal mentioned lessons learned on the negative impact of irrigation increasing women’s workloads outside the home and increasing undernutrition, more tangible measures were needed to prevent these negative impacts. The two programs provide an excellent example of why gender analysis is so critical during project design and implementation and why it is required by USAID/FFP (McNairn and Sethuraman, 2011). They also illustrate why the effect of project activities on increasing women’s workload and mitigation measures should be taken very seriously, because a mother’s heavy workload may negatively affect her own nutritional status, pregnancy outcome, and child care and feeding practices, and cause child undernutrition. The emphasis that FTF and USAID/FFP are placing on gender and on better understanding women’s roles in agriculture is good.
Irrigation activities in the third program of WV/Kenya were associated with significant increases in stunting and underweight in children. Farm land was taken out of production during construction of irrigation systems, reducing household food availability and access by reducing food production. The negative impact was supposed to be mitigated by FFW, but the commodities arrived too late. This program did no direct MCHN food distribution that might also have mitigated the negative effects.
6.5 Cross-Cutting Issues and Opportunities
Resolving the following issues common to a number of programs would present an opportunity to improve performance.
6.5.1 Essential Interventions Delivered at Scale
Program managers need to be able to answer whether the essential intervention package was actually delivered and to how many people in the 1,000-day window. Ultimately, population-level outcomes and impact will be determined by coverage/scale, whether the program is truly community-based, the client-worker ratio, the intensity of contact with women and children in the 1,000 days, CHW performance, effective SBCC, adequacy of resources, and participation and motivation of families (and communities) to follow advice (Ashworth et al., 2008; Marini et al., 2009; Mason et al., 2006; Independent Evaluation Group, 2010). Program context is also important. The issue is how do program managers plan for and ensure that the critical results listed are happening and report on them to USAID/FFP. Most of the performance data that Awardees report are at the outcome and impact levels. However, these higher-level indicators shed no light on whether the intervention package was actually delivered, how many people received it, and what percent of the expected population the beneficiaries actually represent (coverage). Measuring higher-level results is questionable if one is not certain that the intervention package was actually delivered. It may be that Awardees have their own indicators for monitoring this, which are not reported to USAID. However, since the FAFSA-2 revealed gaps in intervention delivery and low beneficiary numbers, it would be valuable if detailed implementation plans and annual reports that USAID/FFP receives from Awardees included this kind of information. Some problems observed were programs that called themselves community-based when they were really facility-based; working out of one distant community and requiring participants to come there, versus reaching down into every community where people live; low

6-77Maternal and Child Health and Nutrition
MCHN budgets; high client-worker ratios; and no CHWs in some programs. Low enrollments or low coverage, for example, in stand-alone PD/H or due to giving a lot of inputs to a few families, is another constraint impeding preventing undernutrition at scale. The performance of CHWs is a very important QI factor that Awardees need to work on more.
How many people actually received the intervention package and what percent do they represent of all persons in the target area that should be covered? Coverage is also critical to population-level impact. Part of the explanation for less impact is that the intervention may not have been delivered to an adequate number of people. The reporting on beneficiaries reviewed in the FAFSA-2 was often confusing. For example, it appears that there are many MCHN beneficiaries in programs with household rations because every family member is counted as a beneficiary. It is erroneous to code these family members (not in the first 1,000 days) as receiving MCHN interventions when all they got was food, their consumption of which does not contribute directly to MCHN outcomes and impact. If household rations continue, it would be useful to tighten the definition of a direct MCHN beneficiary and to add a separate recipient reporting category for “household rations.” Some Awardees count all people that attended a nutritional status screening session for targeting recuperative feeding as beneficiaries, when they actually received no services. What Awardees and USAID/FFP really need to know is the number and percent of all women and children in the first 1,000 days that are direct beneficiaries of which interventions.
Numbers game. Some programs “save” money by covering broader age groups with children up to five years of age, because they can locate more children in a smaller geographic radius and get to higher beneficiary numbers easily. This is misleading, because older children will benefit much less and contribute little to population-level impact on undernutrition. Older children are taking the place of children under two years of age that would benefit much more. Furthermore, not all beneficiaries are served equally. Some do not receive all the core services, so they should not be counted toward expected project impact. Other
programs eliminate community-based services, and require participants to travel to central locations outside the village to receive services, using food distribution as the incentive. While this cuts costs and increases beneficiary numbers, it may negatively affect program impact and results achievement because contact with beneficiaries is less frequent and many in the target group may not be reached because they cannot travel the distance or afford the opportunity cost of the time to go to the central distribution point. A great deal can be gained by clear reporting and close tracking by USAID/FFP, program managers, and evaluators of how many direct MCHN beneficiaries are reached in the 1,000-day window.
6.5.2 Nutrition 101
The FAFSA-2 encountered a number of instances in which USAID and Awardee staff had a limited understanding of basic nutrition, which some acknowledged was a handicap to their ability to more effectively manage Title II programs with nutrition goals. At USAID’s request, FANTA-2 developed an e-learning course on “Introduction to Nutrition” for USAID staff, which could help USAID/FFP and Awardee staff increase their knowledge and skills. FANTA hopes to develop a second course that explains the program design process and approaches to delivering nutrition interventions.
Insufficient understanding of basic nutritional concepts has contributed to programs that focused on the wrong age groups (see Section 6.3.1.1) or overestimated the nutritional benefits of vegetable gardens (see Section 6.3.3.8). Additional examples of nutrition concepts that the FAFSA-2 found not well understood are discussed next.
The difference between chronic and acute malnutrition. In two countries where the emphasis was on treatment of acute malnutrition in CMAM, and where there was very little preventive focus, the FAFSA-2 team found implementers talking only about “moderate” and “severe” malnutrition and leaving out the word “acute,” although they were referring to children suffering from low weight-for-height or acute malnutrition. This gave the

6-78 Maternal and Child Health and Nutrition
impression that acute malnutrition was the only problem faced in their countries. More precise terminology would be “moderate acute malnutrition” or “severe acute malnutrition.” Acute malnutrition, that is low weight-for-height, is much rarer than stunting and underweight and just the tip of the iceberg (of undernutrition). Implementers should have used the broader term “moderate malnutrition” correctly and comprehensively to include moderate stunting and moderate underweight—problems that are up to tenfold more common in the same countries than acute malnutrition.
Consuming complete protein with all the essential amino acids is required to meet the body’s needs for growth, maintenance, and repair. Most animal foods contain complete protein. The protein in most plant foods is incomplete. If eating a diet of predominantly plant foods, one needs to complement cereals with pulses, nuts, or milk, over the course of the same day, if not eating meat, fish, or eggs, to get the essential amino acids that are missing. That is why corn and soybean are combined to make CSB, a source of complete protein once these two foods are blended, because each supplies essential amino acids missing in the other. One Awardee designed a ration for children under two years that was just whole wheat kernels, referring to the protein content of the wheat as sufficient to meet children’s needs, and USAID/FFP approved the ration. Wheat protein is incomplete and alone will not support human growth. Another food that supplies the essential amino acids missing in wheat is needed to complement it. In addition to the protein limitations of the ration, it was nutritionally inadequate because fortification with micronutrients was lacking in the wheat kernels and there was no oil in the ration. Harmonizing with or copying the well-balanced rations of other Awardees in the same country would have been a better bet. USAID/FFP, which has the bigger picture, is in the best position to facilitate sharing across programs and Awardees and to promote harmonization of more nutritious rations.
Accurate age estimation and anthropometric measurements are essential to correctly measure child nutritional status. The FAFSA-2 team observed poor-quality age determination and anthropometry in
some field visits and evaluation surveys. Weight and height need to be compared to sex- and age-specific WHO standards to determine how many z-scores they are above or below the median (nutritional status). The other extreme is the final evaluation of one program in Kenya in which mothers were asked to recall the weights of their children. The average of all the recalled weights was calculated and reported as the measure of nutritional impact.
6.5.3 Evaluating Applications
Technical evaluation panels need members that are experienced in food aid programming and the state of the art in MCHN interventions to avoid giving favorable ratings to applications that are not well designed or vice versa (not scoring excellent applications high). Several persons familiar with the review process that were interviewed in the FAFSA-2 gave this as one of the main reasons why certain programs that were not state of the art had gotten approved, e.g., recuperative feeding. Technical reviewers should be selected carefully, with an emphasis on their qualifications and relevant experience. Additionally, USAID/FFP should include in its RFAs a list of interventions and approaches that it is not interested in funding, because they are ineffective, and a list of promising approaches to consider. Reviewers should be oriented by USAID/FFP not to give high scores to applications with approaches that do not work, referring to the guidelines in the RFA. Programs that are poorly designed, once approved, are difficult to redesign and get on track.
6.5.4 Learning from Failure
The increase in child undernutrition that apparently resulted from increasing mothers’ agricultural workloads after the introduction of irrigation in programs in Chad and Mali raises questions of how USAID/FFP ensures that mistakes are not repeated and that the broader Title II community of practice learns from the experience of specific programs. Both Awardee and USAID/FFP staff in-country and in the regional and headquarters’ offices have a role to play in ensuring that lessons are learned from failures as well as successes. But the challenge

6-79Maternal and Child Health and Nutrition
is how to do this in a constructive way without backlash or retribution.236
6.5.5 Local Fortified Complementary Foods as a Long-Term Solution
There is a need for affordable, nutritious, convenient, fortified complementary foods (FCF) as part of a long-term solution to undernutrition in the USAID/FFP focus countries. The WFP has been assisting production of locally processed, affordable, convenient FCF made from corn and soybeans, and fortified with micronutrients, like Vitacereal in Guatemala and Likuni Phala in Malawi, under its Purchase for Progress (P4P) program in collaboration with UNICEF. Incaparina, an older FCF in Guatemala, is widely available commercially. Under the Bolivia national nutrition policy, an FCF, Nutribebe, is produced locally from rice flour, dried milk, sugar, vegetable oil, and micronutrients, and distributed free through health services. There are many challenges to producing FCF for children 6–23 months that have the optimal nutrient/energy density and long shelf life. Many available FCFs, including CSB, remain sub-optimal. However, well-formulated, local FCFs could be important to ensuring sustainability and long-term availability for young children to replace Title II fortified-blended foods (FBF). More emphasis also needs to be put on preparing healthy ready-to-eat foods that young children can snack on, given mothers’/caregivers’ time constraints. Convenience is part of the success of Plumpy’Nut®. How can Title II contribute to these efforts toward long-term, sustainable access to FCF? Assisting local production of FCF through the P4P program is an advantage WFP has over Title II, which has only been doing local and regional procurement in emergency programs. What role, if any, should Title II MCHN direct food distribution play in countries that are working to subsidize and make local FCF available to lower-income groups as a policy? Avoiding duplication can be a challenge. Experimenting with local and regional procurement of foods for MCHN activities in Title II development programs could be an interesting option, including
236 See http://www.admittingfailure.com.
giving families cash vouchers for local foods, as has been done in emergency programs.
6.6 Conclusions and Recommendations
6.6.1 Conclusions
Impressive results overall. Title II development food aid supported more than 15 proven, high-impact HN interventions in the 69 programs reviewed in 23 countries. Impressive HN outcomes and improvements in child nutritional status were achieved by applying a number of effective approaches and integrating services in nutrition, MCH, family planning, WASH, and malaria. Most importantly, many children are alive and have been spared ill health and life-long disabilities thanks to Title II programs. The program experiences and results data of Awardees contributed a wealth of evidence on what works in Title II MCHN programming, and what does not, consistent with published evidence.
• Title II resources dedicated to the HN technical sector remained unchanged. While most Title II programs included HN activities, the decline in Title II resources dedicated to the HN technical sector found in the earlier FAFSA was not reversed during the FAFSA-2 time period. In FY 2009, 29 percent of the total cost of Title II was spent on HN (excluding HIV and WASH).
• Africa lagged behind. The problem of underinvesting specifically in HN (excluding HIV and WASH) was limited to Africa, where only 17 percent of Title II development resources were spent on HN in FY 2009. Title II programs in Africa contrast sharply to programs in Asia, which spent four times more on HN (70 percent), and LAC programs, which spent three times more (53 percent). These same discrepancies between programs in Africa and those in other regions were present in FY 2003 at the start of the FAFSA-2 time period and did not improve after the USAID/FFP Strategic Plan went into effect.

6-80 Maternal and Child Health and Nutrition
• Essential Nutrition Actions. An impressive 70 percent of programs worked on four or more of the ENA. The most common interventions were community-based behavior change to improve IYCF practices (breastfeeding, complementary feeding, and feeding sick or severely malnourished children). Less attention was paid to women’s nutrition interventions, which was also a finding of the 2002 FAFSA. Few programs included improving intake of iron and folic acid supplements to reduce anemia in women or children (17 percent). More programs (62 percent) worked to improve coverage of vitamin A supplementation for women and children.
• Nutrition outcomes. The most widely implemented intervention—by 93 percent of programs—was breastfeeding promotion, with 81 percent measuring changes in early initiation of or exclusive breastfeeding and 71 percent achieving improvements. Major increases in exclusive breastfeeding rates for infants 0–6 months were reported by several programs. It is of concern that, although 90 percent of programs worked on complementary feeding, only half of the programs measured their results; 70 percent of those with indicators reported improving practices. Similarly, half of programs measured feeding practices for sick and severely malnourished children and 71 percent achieved improvements. The USAID/FFP standard indicator for complementary feeding—“minimum acceptable diet”—is a must to measure. Baseline levels on this indicator in breastfed children 6–23 months of age are abysmal and need much more focus. One-third of programs measured receipt of vitamin A supplements by children and 68 percent improved coverage. Least measured were women’s nutrition results, reported in only 11 percent of programs, but with improvements achieved in 86 percent of those. Having BMI in the 2011 revised USAID/FFP standard indicators should help programs emphasize women’s nutrition more.
• Complementary feeding interventions could have been stronger and are critical to achieving greater nutritional impact. The FAFSA-2 found
that complementary feeding was like a “black box” in the programs reviewed because so little was known about it, but prefers to use the analogy of an “empty bowl.” A child’s bowl (if the child has one) is “empty” due to a number of weaknesses. One gap is that few Awardees conducted formative research on IYCF practices to strategically design and implement nutrition counseling. Performance data were rarely collected to measure if messages were adopted or to determine how empty or full the child’s bowl was. Knowing little about the actual complementary feeding practices is analogous to flying blind. The quality of the diet is a big problem that a number of programs worked to improve, but often without due recognition that the inadequate quantity of food eaten is also a problem. Old-fashioned nutrition education lectures on the day of food distribution were too often the main approach, versus child-specific, effective interpersonal counseling to the “right mother with the right message at the right time.” Community workers had weak interpersonal counseling skills and often lacked educational materials. Indeed, only about half of the programs
Box 6.15. MCHN Policy Implications
To maximize the nutritional impact of Title II development food aid, more attention must be paid to:
• Targeting women and children in the first 1,000 days
• Making prevention the goal
• Improving complementary feeding practices
• Including preventive, conditional supplementary feeding as an essential intervention
• Developing an Africa Initiative to close the MCHN intervention gaps that the FAFSA-2 identified there

6-81Maternal and Child Health and Nutrition
reviewed reported providing any counseling at all. In some cases, the ratio of workers to families to be covered was too small, leading to infrequent contact and distant or facility-based, rather than community-based, programs.
• Supplementary feeding. A major finding is that one-third of the 69 MCHN programs reviewed did no direct food distribution to women or children; 19 of the 22 programs without supplementary feeding were in Africa. Most of the no-food-assistance programs used a PD/H approach (81 percent). Not providing food supplements to very vulnerable mothers and young children in Title II programs that could have was a mistake given the high rates of undernutrition where these programs worked and the missed opportunity to have a positive nutritional impact.
• Supplementary feeding for prevention and recuperation. Of the 47 MCHN programs that did provide supplementary feeding, 33 (70 percent) used food aid for preventing undernutrition, distributing rations to all pregnant and lactating women and children in a selected age group in the target area. In the remaining 14 programs (30 percent), eligibility for food rations was restricted to malnourished children for a limited period of time, for the purpose of their recuperation. Among programs reviewed in Africa, only 12 percent did preventive supplementary feeding, versus 75 percent of programs in Asia and 87 percent of programs in LAC, where prevention was the norm.
• Little rationale for the ration design. There was tremendous variation in rations within countries and across countries, from programs that gave none to a recuperation program that gave 38 kg per month to a pregnant or lactating mother and her malnourished child. Within programs doing supplementary feeding for prevention, the range was from 4.0 kg to 14.3 kg per month for individual mother-child rations. In prevention programs with both individual and household rations, the range was from 16.2 kg to 36.4 kg, often exceeding the current illustrative PM2A rations (FANTA, 2010). Most of the imprecision in rations is due to a lack of data on actual
dietary intakes of mothers and children, intra-household distribution, and deficits compared to recommended nutrient intakes in the populations served. Inadequate dietary intake is the immediate cause of undernutrition, apart from disease. Not knowing about dietary intake impairs the cost-effective use of supplementary feeding and SBCC to improve food consumption and thereby reduce undernutrition.
• Did programs target women and children in the first 1,000 days? Most did not. In 33 programs that provided food rations for prevention, nearly all served children under three years, but only 39 percent were targeted appropriately to children 6–23 months of age. In 14 programs that distributed food rations only for recuperation of undernutrition (usually not wasting), only 7 percent of the recuperative feeding was targeted to children 6–23 months. More than half of the programs distributed food rations to children over three years, despite the evidence that stunting in older children is mostly permanent and prospects for recuperation are slim. Since stunting occurs before two years of age, low weight-for-age detected in children above that age is often due to their weight being proportional to their retarded height. Stunted older children with low weight-for-age, but normal weight-for-height, would not usually recover from low weight-for-age, and, if they did, it would indicate that they had become overweight for their height.
• Health interventions. Many Title II programs supported health interventions critical to maternal and child survival and prevention of undernutrition caused by infections. The most common were: (1) hygiene improvement (78 percent), (2) immunization (72 percent), (3) treatment of child illness (64 percent), and (4) birth preparedness and maternity services (58 percent). Less common were: (1) deworming (33 percent), (2) family planning (35 percent), (3) malaria prevention (23 percent), and (4) newborn care and treatment (9 percent). Title II programs supported and strengthened existing health services and followed national norms. One very effective approach to achieving

6-82 Maternal and Child Health and Nutrition
high coverage was outreach from health centers at Child Health Days where immunization, vitamin A, growth monitoring and promotion, food supplements, and other services were delivered. Community case management of child illness was also successful. Greater impact on child nutrition and survival could be achieved if more programs integrated community-based, voluntary family planning services and information into the basic package. The recent efforts of USAID/FFP and GH/PRH to encourage integration of family planning in Title II programs are a positive step.
• Health outcomes. The most common indicators—measured by 59 percent of programs—were hygiene practices; 74 percent of these programs achieved improvements. More significant is the success in preventing diarrhea in young children. Forty percent of Title II programs measured changes in diarrhea prevalence and half of these programs documented reductions. Seven programs achieved an impressive average annual reduction in diarrhea of four percentage points. Around half of the programs had indicators for the following interventions, with the percentage of programs that improved these outcomes shown in parentheses: immunization (82 percent), treatment of child illness (71 percent), and prenatal care (85 percent). Of the 11 percent of programs that measured malaria prevention with ITN or IPT, 67 percent showed increased use. The few programs that measured family planning indicators (10 percent) had impressive results. The average increase in contraceptive use in five programs was two percentage points per year. Across four programs in Haiti, the mean birth interval increased from 31.9 months to 42.4 months.
• Approaches that work. Targeting pregnant and lactating women and children under two years, Child Health Days, FADUA principles of complementary feeding, SBCC with the right message to the right person at the right time based on formative research on maternal dietary and IYCF practices, counseling following the five steps, home visits, community mobilization,
client-centered CBGP, at least monthly contact between workers and clients in the community, and cross-program learning are all examples of approaches that work according to the results of this review. A much lower percentage of Africa Title II development programs did some of the more effective approaches, i.e., Child Health Days (26 percent), nutrition counseling (50 percent), and home visits (35 percent), compared to programs in the Asia and LAC regions.
• Approaches that do not work. No CHW or a high client-worker ratio, facility-based or distant delivery of services, multipurpose agricultural extension/nutrition workers, infrequent contact between workers and clients, increasing mothers’/caregivers’ workloads to the detriment of child care and nutrition, stand-alone PD/H without community- and population-based prevention, general nutrition and health education talks as the main SBCC approach, and stand-alone home economics are examples of approaches that did not contribute to reaching MCHN targets.
• Promising Practices. Integrating information and services for family planning and healthy timing and spacing of pregnancies, QI, male involvement, local nutrition advocacy, and Care Groups are promising practices identified by Awardees.
• PD/H was not successful in most places where it was tried for numerous reasons. Nearly half of all Title II programs reported PD/H as a principal nutrition approach, 59 percent in Africa. A major weakness is that the PD/H focus on treatment led to the neglect of or no efforts to prevent stunting and underweight in under twos (key measures of Title II program impact) or to improve maternal nutrition during pregnancy and lactation. The PD/H programs were very small scale—average enrollment was only 367 malnourished children per year per program. The success rate with recuperating malnourished children was disappointing: only 48 percent on average gained adequate weight. The approach was often misapplied, i.e., the essential elements or delivery of the intervention in appropriate settings were not effectively implemented.

6-83Maternal and Child Health and Nutrition
• Limitations of impact evaluation surveys. Final evaluation surveys were completed and reported for 54 programs. However, a high percentage of these evaluation surveys (46 percent) had limitations, so the data could not be used. Problematic surveys with data that cannot be used waste effort and resources and do not contribute reliable information on the impact of the programs involved.
• Nutritional status impact. The FAFSA-2 analyzed the impact on child nutritional status of Title II MCHN programs using data reported from impact evaluation surveys with no known limitations—28 programs with weight-for-age data and 28 with height-for-age data, not necessarily the same 28 programs for both measures. The median length of time between baseline and final evaluations was four years. These programs had a bigger impact on stunting, reducing it by 1.32 percentage points per year, than on underweight, which declined by 0.63 percentage points per year. These declines were greater than the DHS secular trend changes in stunting and underweight for a number of the same countries. There were marked differences in reducing chronic undernutrition between regions, with 17 programs in the combined Asia and LAC regions achieving a bigger average annual reduction of 1.53 percentage points, compared to 11 programs in Africa, where stunting fell only 0.98 percentage points per year. No regional differences were seen in reducing low weight-for-age. These differences in impact track with the differences in Title II program interventions, approaches, and budgets for MCHN across the regions.
• More successful programs. Fourteen programs in eight countries were able to reduce the prevalence of stunting at an annual rate greater than both the changes in stunting as measured by DHS in the same country and the average annual reduction in stunting achieved across 28 Title II programs. Furthermore, 8 of these 14 programs in six countries were also more successful at reducing underweight in children compared to DHS in the same country and to the average
annual reduction in underweight achieved across 28 Title II programs. Most programs with greater nutritional impact were in Asia or LAC. Common features of more successful programs were nutrition counseling to improve IYCF practices, targeting children under two or three years of age, and home visits. Most of the programs with little or no impact on stunting did not do these approaches, and a high percentage of them did PD/H.
• Nutritional status impact by type of supplementary feeding. Programs that provided MCHN preventive supplementary feeding achieved an average annual reduction in stunting of 1.69 percentage points, a decline three times greater than the DHS secular changes, and double that achieved in recuperative feeding only or no-food-ration programs (consistent with the PM2A research results in Haiti). Preventive supplementary feeding was also superior at reducing underweight. Clearly, a preventive approach to supplementary feeding, along with the integrated package of community and population-based SBCC and essential MCHN interventions delivered in these programs, has the biggest positive impact on nutritional status. This should be the norm in Title II programs going forward. Recuperative feeding only programs had the worst performance.
• Are household rations necessary? The FAFSA-2 analysis found that preventive MCHN programs with only individual rations had greater impact on reducing stunting (1.91 average annual percentage point reduction), and double the reduction in underweight (1.37), compared to programs with individual plus household rations. The FAFSA-2 found no evidence that large household rations are necessary as incentives for greater program participation, less intra-household sharing of the mother-child rations, or improved dietary intake and nutritional status of beneficiary mothers and children, compared to individual rations. Research is needed on these questions. Meanwhile, many more people could be reached by not providing such large rations to so few families, which may create issues with the Bellmon Amendment,

6-84 Maternal and Child Health and Nutrition
dependency, and sustainability concerns. Large food transfers may convey the message to families that every member of the household is a priority in the program, taking the spotlight off the mother and child in the 1,000-day window of opportunity and off the urgency of improving their diets and care.
• Reducing undernutrition. No direct MCHN food distribution, no preventive supplementary feeding, no focus on MCHN in Ethiopia, and not focusing on children under two years of age together equal a large amount of development food aid that was not used to reduce undernutrition during the FAFSA-2 time period. Turning “not doing” into “doing” in the future could have a big impact on preventing undernutrition in the first 1,000 days in USAID’s focus countries for Title II development food aid, especially in Africa, where the program gaps were the greatest throughout the FAFSA-2 time period.
6.6.2 Recommendations
Implementers of Title II development food aid programs have made great strides in using this invaluable resource to improve the health and nutritional status and survival of millions of women and children. Insights gained through firsthand experience and results data should be used to maximize the impact and efficiency of Title II MCHN activities. That is the intent of the following recommendations.
Policy and Priorities
• USAID/FFP should engage in policy dialogue with host government leaders in focus countries that do not currently allow MCHN preventive, conditional supplementary feeding, with the FAFSA-2 evidence and the SUN Framework as talking points. USAID Missions and U.S. embassies should lead these efforts. If unsuccessful in changing unsound policies, it would be better not to do Title II MCHN interventions in such countries. In several Title II focus countries, FANTA is assisting national nutrition advocacy efforts with Mission funding, and USAID/FFP could leverage these activities.
• USAID/FFP should make sound host government nutrition policies a criterion for selecting USAID/FFP focus countries.
• USAID/FFP should give top priority to an Africa Initiative to make existing and future Title II MCHN programs there more effective by closing the intervention gaps identified in the FAFSA-2, namely, underinvestment in MCHN (only 17 percent of total Title II resources in FY 2009), less impact on stunting than programs in other regions, high percentage of MCHN programs with no supplementary feeding (56 percent) and 73 percent of those with supplementary feeding doing the less effective recuperative feeding only model and only 12 percent doing the more effective preventive supplementary feeding model, no interpersonal counseling to improve feeding practices (50 percent), no Child Health Days (74 percent), no home visits (65 percent), no MCHN in Ethiopia, and doing PD/H as a stand-alone approach (59 percent). (Recommendation 32)237
• USAID/FFP should disapprove programs with no MCHN preventive, conditional supplementary feeding in countries with a prevalence of acute malnutrition of 5 percent or more or a prevalence of stunting equal to or greater than 30 percent.
Qualified Staff
• USAID/FFP should bequire basic nutrition training and certification of USAID/FFP staff. (Recommendation 38)
• USAID/FFP should require nutrition credentials and experience in Awardees’ key personnel. (Recommendation 38)
Program Strategy and Design
To maximize the HN impact, effectiveness, and efficiency of Title II MCHN activities the following principles should be respected by USAID/FFP and Title II Awardees.
237 The numbers after certain recommendations are the same as those assigned to the major recommendations in the FAFSA-2 summary report.
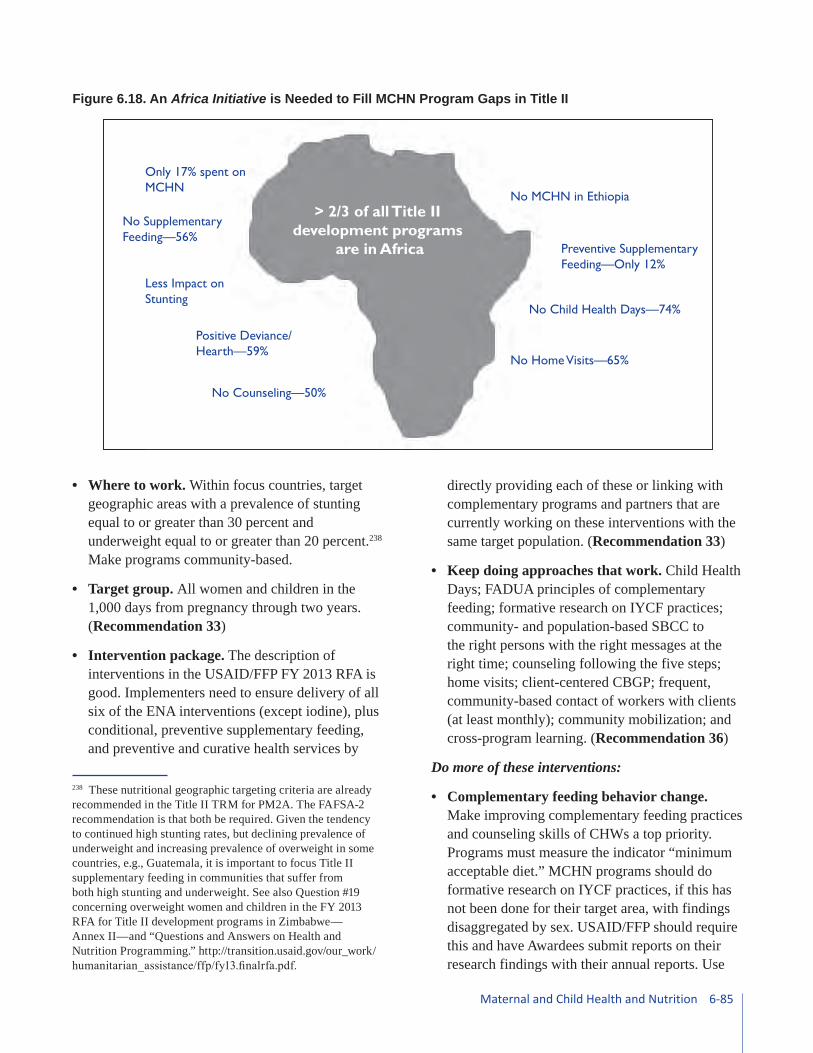
6-85Maternal and Child Health and Nutrition
• Where to work. Within focus countries, target geographic areas with a prevalence of stunting equal to or greater than 30 percent and underweight equal to or greater than 20 percent.238 Make programs community-based.
• Target group. All women and children in the 1,000 days from pregnancy through two years. (Recommendation 33)
• Intervention package. The description of interventions in the USAID/FFP FY 2013 RFA is good. Implementers need to ensure delivery of all six of the ENA interventions (except iodine), plus conditional, preventive supplementary feeding, and preventive and curative health services by
238 These nutritional geographic targeting criteria are already recommended in the Title II TRM for PM2A. The FAFSA-2 recommendation is that both be required. Given the tendency to continued high stunting rates, but declining prevalence of underweight and increasing prevalence of overweight in some countries, e.g., Guatemala, it is important to focus Title II supplementary feeding in communities that suffer from both high stunting and underweight. See also Question #19 concerning overweight women and children in the FY 2013 RFA for Title II development programs in Zimbabwe—Annex II—and “Questions and Answers on Health and Nutrition Programming.” http://transition.usaid.gov/our_work/humanitarian_assistance/ffp/fy13.finalrfa.pdf.
directly providing each of these or linking with complementary programs and partners that are currently working on these interventions with the same target population. (Recommendation 33)
• Keep doing approaches that work. Child Health Days; FADUA principles of complementary feeding; formative research on IYCF practices; community- and population-based SBCC to the right persons with the right messages at the right time; counseling following the five steps; home visits; client-centered CBGP; frequent, community-based contact of workers with clients (at least monthly); community mobilization; and cross-program learning. (Recommendation 36)
Do more of these interventions:
• Complementary feeding behavior change. Make improving complementary feeding practices and counseling skills of CHWs a top priority. Programs must measure the indicator “minimum acceptable diet.” MCHN programs should do formative research on IYCF practices, if this has not been done for their target area, with findings disaggregated by sex. USAID/FFP should require this and have Awardees submit reports on their research findings with their annual reports. Use
Figure 6.18. An Africa Initiative is Needed to Fill MCHN Program Gaps in Title II
> 2/3 of all Title II development programs
are in Africa
Only 17% spent on MCHN
No Child Health Days—74%
Preventive Supplementary Feeding—Only 12%
No MCHN in Ethiopia
No Counseling—50%
Positive Deviance/Hearth—59%
Less Impact on Stunting
No Supplementary Feeding—56%
No Home Visits—65%

6-86 Maternal and Child Health and Nutrition
the TOPS project to fund some formative research small grants and hands-on training in qualitative research methods and improved interpersonal counseling skills. (Recommendation 35)
• Deworming of children and pregnant women.
• Family planning and healthy timing and spacing of pregnancy. Partner with stakeholders and other organizations to make information and services readily accessible to Title II MCHN beneficiaries, preferably at the community level. Get GH/PRH and USAID Missions to complement Title II resources with health funds.
• Maternal nutrition. Address diet, anemia and iron/folic acid supplementation, workload, and male involvement with a focus on pregnant and lactating women, as well as adolescent girls. Measure BMI.
• Local nutrition advocacy. Make stunting and its consequences visible to local leaders so that they recognize the problem and own the solution. Share community nutritional status data, and win commitment to tackling the problem. Start a Social Movement—the “S” in SBCC.
Do not do approaches that do not work:
• The following are ineffective: no CHW or a high client-worker ratio (> 100 clients/CHW), facility-based or distant delivery of services, multipurpose agricultural extension/nutrition workers instead of dedicated CHWs, infrequent (less than once per month) contact, recuperative feeding only (without prevention), no MCHN direct food distribution, increasing women’s workloads to the detriment of maternal and child nutrition and care, stand-alone PD/H without community- and population-based prevention, general nutrition and health education talks as the main SBCC method, and stand-alone home economics.
• USAID/FFP should not approve new programs with any of the ineffective approaches mentioned previously.
• Do no harm. USAID/FFP should review ongoing Title II MCHN programs that have several years of implementation remaining that are doing
recuperative feeding only, including CMAM only (e.g., CRS/Malawi, MC/Uganda, CPI/Niger) or providing no direct food assistance to women and children (Mozambique and Ethiopia programs, Africare/Chad, Africare/Mali and CRS/Mali), or doing stand-alone PD/H, in light of the FAFSA-2 findings. These programs should be redesigned and formally amended to increase their prospects for improving nutritional status during the remainder of the agreements by adding preventive supplementary feeding. Reviews of the Chad and Mali programs should verify that measures are in place to address increasing women’s workloads, e.g., in irrigation activities, and to prevent any negative consequences on children’s nutritional status. (Recommendation 37)
Supplementary Feeding
• USAID/FFP should fund collection of quantitative dietary intake data from pregnant and lactating women and children 6–23 months in geographic target areas in several focus countries (e.g., representative of subregions of Africa, plus Haiti, Guatemala, and Bangladesh) to scientifically inform decisions on the minimum nutrient content and size of standard rations. The goal is to maximize the efficiency of food aid to prevent undernutrition in more women and children through least-cost, most-nutritious, effective supplementary feeding. Data should be collected in Title II programs at baseline prior to starting supplementary feeding and during supplementary feeding. This might be done with TA by MEASURE DHS, USDA, the United States Centers for Disease Control and Prevention (CDC), other research institutions including local ones, or the Awardees.
• USAID/FFP should discourage Awardees from doing new programs with preventive individual plus household rations with greater than 16 kg of food per month until there are data from PM2A or operations research that show that this approach is more cost-effective for increasing dietary intake, nutritional status, and program participation than individual rations. The FAFSA-2 analysis did not find any evidence that these large

6-87Maternal and Child Health and Nutrition
plus-ups with household rations are necessary. (Recommendation 34)
• USAID/FFP should harmonize MCHN rations for all programs in the same country. Include guidance on harmonized rations in the country-specific information with the RFA for new applications.
• USAID/FFP should consider centrally planned, standardized, nutrient content for MCHN rations worldwide, in the absence of target-area-specific dietary intake data. Commodities would vary based on local preferences, but the mix would meet standard nutrient content specifications. This could be a more cost-effective use of scarce food resources to benefit more people. This idea tracks with the set serving size and nutrient content of improved CSB and oil rations for children 12–36 months of age recommended in the FAQR (Webb et al., 2011).
• USAID/FFP should conduct operations research on MCHN preventive, conditional supplementary feeding and share results to shape USAID/FFP guidance. Some research topics would be: (1) a comparison in ongoing programs of communities and households with individual plus household rations and others with just individual rations in terms of effect on cost, nutrient intake, participation, and nutritional status to complement ongoing PM2A research; and (2) feasibility and effectiveness of a one pregnancy cycle targeting approach.
Applications for New Title II Programs
• Applicants should describe what type of community worker, how many, and what the client-CHW ratio will be. The application should state how many beneficiaries in the 1,000-day window will get each of the main interventions and what percent of the total population in the target geographic area they represent (scale and coverage).
• USAID/FFP should make successful past performance in reducing undernutrition in Title II programs an important evaluation criterion and
include evaluation results and lessons learned from Awardees’ prior programs as part of the review for new programs. Both Awardee and USAID/FFP staff in-country and in the regional and headquarters offices have a role to play in ensuring learning from past programs to shape future programs in the same country.
Implementation
• Do better. Provide Awardees with more direction, standardization, and TA from USAID/FFP/Washington, regional and Mission-based FFP officers, FANTA, and the TOPS project to put the evidence of what works and what does not into practice.
• Awardees should monitor their implementation compared to standards for the interventions and approaches used (essential elements, minimum criteria, state of the art) and work to improve quality. Many organizations have already developed their own performance standards, but the TOPS project could compile and develop harmonized MCHN checklists and tools for measuring performance, counseling, home visits, monitoring, and supervision. Awardees should use these to measure compliance with performance standards and progress in QI.
Monitoring and Evaluation
• The client-CHW ratio should be monitored for compliance by USAID/FFP during implementation. It would be good to have programs report on this indicator.
• Service delivery indicators should be for children under two, e.g., percent participation of under twos in CBGP, home visits to under twos, not under threes or under fives, to be consistent with the focus on children under two years of age in the first 1,000 days.
• All programs should measure and report on the standard USAID/FFP indicators. “Minimum acceptable diet” should not be missing in IPTTs for programs working in MCHN. USAID/FFP should get ongoing programs to start collecting

6-88 Maternal and Child Health and Nutrition
data on these indicators, even if it means doing another survey.
• Awardees should count and report the number of beneficiaries in the first 1,000 days that received key interventions and what percent of the total population in the target geographic area they represent (scale and coverage). USAID/FFP and Awardees should work together to design a standard template and indicators for reporting on coverage and scale. All IPTTs should show the sample size for all indicators.
• USAID/FFP field monitors need to verify/audit Awardee reporting on direct beneficiaries.
• USAID/FFP should design a different place for Awardees to separately report family members that received MCHN household rations, if these rations are continued, and not report them as beneficiaries under HN Program Elements in tracking tables and AERs.
Gender Integration
• Take women’s workloads and male involvement seriously through gender integration as required by USAID/FFP. Encourage programs to study,
monitor, and mitigate: (1) women’s workloads as a potential determinant of poor pregnancy outcomes, maternal undernutrition, poor IYCF and care practices, and child undernutrition; (2) changes in women’s workloads due to Title II program activities, such as irrigation, agriculture, microenterprise, income generation, homestead food production, MCHN, and WASH; and (3) ways to involve men to reduce women’s workloads and improve IYCF and care practices. USAID/FFP called for describing the impact of project activities on women’s workloads in its FY 2012 and FY 2013 RFAs for development programs, providing a basis for follow-up on this recommendation. USAID/FFP should use the real experiences from Chad and Mali to caution all Awardees to monitor and mitigate any negative MCHN consequences of Title II activities that increase women’s workloads.
Innovation to Shape the Future
• USAID/FFP and Awardees should explore partnering with stakeholders and other organizations to develop and promote locally produced, nutritious, convenient, affordable FCF to replace Title II FBF in the long term.

6-89Maternal and Child Health and Nutrition
Bibliography for Chapter 6Academy for Educational Development. 2007. “Fuel-Efficient Stove Programs in IDP Settings: Summary Evaluation Report, Uganda.” http://pdf.usaid.gov/pdf_docs/PDACM098.pdf.
Anderson, Katrine et al. 2006. Uganda Food Security Initiative Phase 2 Final Evaluation Report. Kampala: Africa/Uganda.
Anderson, Mary Ann. 1977. CARE Preschool Nutrition Project: Phase II Report. Evaluation of Supplementary Feeding in: Colombia, Costa Rica, Dominican Republic, India/Tamil Nadu, and Pakistan. New York: CARE.
Anderson, Mary Ann; Austin, James E.; Wray, Joe; and Zeitlin, Marian. 1981. “Supplementary Feeding, Study I.” In Nutrition Interventions in Developing Countries, edited by Austin, J.E. Cambridge: Harvard Institute for International Development and Oelgeschlager, Gunn and Hain Publishers, Inc.
Arimond, Mary et al. 2011. “Dietary Diversity as a Measure of the Micronutrient Adequacy of Women’s Diets in Resource-Poor Areas: Summary of Results from Five Sites.” http://www.fantaproject.org/downloads/pdfs/WDDP_Summary_Report_Jul2011.pdf.
Ashworth, Ann; Shrimpton, Roger; and Jamil, Kazi. 2008. “Growth Monitoring and Promotion: Review of Evidence of Impact.” Maternal and Child Nutrition. Vol. 4, pp. 86–117.
Baqui, Abdullah et al. 2006. Evaluation Research to Improve Newborn Health and Survival in the Integrated Nutrition and Health Program (INHP) II Areas of CARE/India. Endline report. Baltimore: Johns Hopkins Bloomberg School of Public Health (JHSPH). DEC #PDACM356.
Bergeron, Gilles and Castleman, Tony. 2012. “Program Responses to Acute and Chronic Malnutrition: Divergences and Convergences.” Advances in Nutrition. Vol. 3, pp. 242–249.
Bhutta, Zulfiqar et al. 2008. “Maternal and Child Undernutrition 3. What Works? Interventions for
Maternal and Child Undernutrition and Survival.” Lancet. Vol. 371, pp. 417–40.
Black, Robert E. et al. 2008. “Maternal and Child Undernutrition 1. Maternal and Child Undernutrition: Global and Regional Exposures and Consequences.” Lancet. Vol. 371, pp. 243–60.
Bongiovanni, Annette; Acharya, Karabi; Kumar, Satish; and Tripathy, Prasantha. 2007. “Assessment of CARE India’s Integrated Nutrition and Health Project Tools and Change Agents.” http://www.fantaproject.org/downloads/pdfs/INHP_Tools_CA_Assessment.pdf.
Bonnard, Patricia et al. 2002. “Report of the Food Aid and Food Security Assessment: A Review of the Title II Development Food Aid Program.” http://www.fantaproject.org/downloads/pdfs/FAFSA.pdf.
Brabin, L.; Verhoeff, F.; and Brabin, B.J. 2002. “Maternal Height, Birth Weight and Cephalo Pelvic Disproportion in Urban Nigeria and Rural Malawi.” Acta Obstetrica et Gynecologica Scandinavica. Vol. 81, pp. 502–507.
Bruce, Nigel et al. 2006. “Chapter 42: Indoor Air Pollution.” In Disease Control Priorities in Developing Countries, 2nd edition, edited by Jamison, Dean T. et al. New York: Oxford University Press.
Caldwell, Richard; Ravesloot, Bruce; and Smith, Lisa. 2011. SHOUHARDO II Baseline Study Report. Dhaka: CARE/Bangladesh.
Caulfield, Laura; Huffman, Sandra; and Piwoz, Ellen. 1999. “Interventions to Improve Intake of Complementary Foods by Infants 6–12 Months of Age: Impact on Growth and on the Prevalence of Malnutrition and Potential Impact for Child Survival.” Food and Nutrition Bulletin. Vol. 20, pp. 183–200.
Ceesay, S.M. et al. 1997. “Effects on Birth Weight and Perinatal Mortality of Maternal Dietary Supplements in Rural Gambia: 5-Year Randomized Control Trial.” British Medical Journal. Vol. 315, pp. 786–790.
Child Survival and Health Grants Program. 2010. “Technical Reference Materials. Behavior Change

6-90 Maternal and Child Health and Nutrition
Interventions.” http://www.mchip.net/sites/default/files/Behavior%20Change%20Interventions%202010.pdf.
CORE Group. 2009. PD/Hearth Technical Advisory Group (TAG) Report. Washington, DC: CORE Group.
CORE Group, Nutrition Working Group. 2010. “Nutrition Program Design Assistant: A Tool for Program Planners – Workbook” and “Nutrition Program Design Assistant: A Tool for Program Planners – Reference Guide.” http://www.coregroup.org/storage/documents/Workingpapers/NPDA_workbook_web.pdf and http://www.coregroup.org/storage/documents/Workingpapers/NPDA_RefGuide_web.pdf.
CORE Group SBC Working Group. 2008. “Designing for Behavior Change Curriculum.” http://www.coregroup.org/storage/documents/Workingpapers/dbc_curriculum_final_2008.pdf.
Davis Jr., Thomas P. 2010. Barrier Analysis Facilitator’s Guide: A Tool for Improving Behavior Change Communication in Child Survival and Community Development Programs. Second reprint edition. Washington, DC: Food for the Hungry and CORE Group.
Dewey, Kathryn C. and Mayers, Daniel R. 2011. “Early Child Growth: How do Nutrition and Infection Interact?” Maternal and Child Nutrition. Vol. 7 (Suppl. 3), pp. 129–142.
Dreyfuss, Michelle et al. 2008. Evaluation Research of the Nutrition Interventions in the Integrated Nutrition and Health Program (INHP) II Areas of CARE India. Final Report. Baltimore: JHSPH. DEC #PDACM361.
Eriksson, Johan G. et al. 2010. “Boys Live Dangerously in the Womb.” American Journal of Humam Biology. Vol. 22, pp. 330–335.
FANTA. 1999. “Improving the Use of Food Rations in Title II Maternal Child Health and Nutrition Programs. DRAFT.” http://pdf.usaid.gov/pdf_docs/PNACK710.pdf.
———. 2006. “Maternal Anemia: A Preventable Killer.” http://www.fantaproject.org/publications/maternal_anemia06.shtml.
———. 2010. “Title II Technical Reference Materials. TRM-01: Preventing Malnutrition in Children under 2 Approach (PM2A): A Food-Assisted Approach.” Revised November 2010. http://www.fantaproject.org/pm2a/TRM_PM2A_RevisedNov2010.pdf.
Favin, Michael and Griffiths, Marcia. 1999. Communication for Behavior Change in Nutrition Projects: A Guide for World Bank Task Managers. Human Development Network. Washington, DC: World Bank.
Frongillo, Jr., Edward A. 1999. “Introduction. Symposium: Causes and Etiology of Stunting.” Journal of Nutrition. Vol. 129, pp. 529–530S.
FSN Network SBC Task Force/TOPS. 2011. “Quality Improvement & Verification Checklist for Practice Promotion Sessions by Community Development Workers (CDWs).” http://www.caregroupinfo.org/docs/CDW_Practice_Promotion_QIVC_(English).doc.
Galaa, Sylvester and Saaka, Mahama. 2008. Ghana: Final Evaluation of Title II 2004–08 DAP. Accra: CRS.
Galloway, Rae. 2003. Anemia Prevention and Control. Washington, DC: USAID.
Green, Cynthia P. 1998. Mother Support Groups: A Review of Experience in Developing Countries. Arlington, VA: BASICS.
Gribble, James and Voss, Maj-Lis. 2009. “Family Planning and Economic Well-Being: New Evidence from Bangladesh. Policy Brief.” http://www.prb.org/pdf09/fp-econ-bangladesh.pdf.
Griffiths, Marcia; Dickin, Kate; and Favin, Michael. 1996. “Nutrition Toolkit Tool #4: Promoting the Growth of Children, What Works.” http://web.worldbank.org/WBSITE/EXTERNAL/TOPICS/EXTHEALTHNUTRITIONANDPOPULATION/EXTNUTRITION/0,,contentMDK:20187633~menu

6-91Maternal and Child Health and Nutrition
PK:282580~pagePK:148956~piPK:216618~theSitePK:282575,00.html.
Guyon, Agnes B. and Quinn, Victoria I. 2011. “The Essential Nutrition Actions (ENA) Framework.” http://www.coregroup.org/our-technical-work/working-groups/nutrition.
Heffron, Peter; Saenz de Tejada, Sandra; and Tabaj, Kristi. 2010. Mid-Term Evaluation of the FY 2006-FY 2011 PROMASA Project. Executive Summary in English. Guatemala City: Save the Children.
Horton, Susan P. et al. 2010. Scaling Up Nutrition—What Will it Cost? Washington, DC: World Bank.
Hotz, Christine et al. 2011. “A Large-Scale Intervention to Introduce Orange Sweet Potato in Rural Mozambique Increases Vitamin A Intakes among Children and Women.” British Journal of Nutrition. Cambridge Journals Online, doi:10.1017/S0007114511005174.
Independent Evaluation Group. 2010. What Can We Learn from Nutrition Impact Evaluations: Lessons from a review of interventions to reduce child malnutrition in developing countries. Washington, DC: World Bank.
Jones, Gareth et al. 2003. “How Many Child Deaths Can We Prevent this Year? Child Survival II.” Lancet. Vol. 362, pp. 65–71.
Klaas, Naomi; McNulty, Judiann; and Siekmans, Kendra. 2009. Positive Deviance/Hearth Programme Evaluation. Mississauga, Ontario: Nutrition Centre of Expertise, Global Health Centre, World Vision.
Klemm, Rolf D.W. et al. 2009. Scaling Up Micronutrient Programs: What Works and What Needs More Work? A Report of the 2008 Innocenti Process. Washington, DC: Micronutrient Forum.
Kothari, Monica T. and Abderrahim, Noureddine. 2010. Nutrition Update 2010. MEASURE DHS. Calverton: ICF Macro.
Laughlin, M. 2004. “The Care Group Difference: A guide to mobilizing community-based volunteer health educators.” http://www.coregroup.org/storage/
documents/Diffusion_of_Innovation/Care_Manual.pdf.
LINKAGES Project. 2004. “Behavior Change Communication for Improved Infant Feeding: Training of Trainers for Negotiating Sustainable Behavior Change.” http://www.linkagesproject.org/media/publications/Training%20Modules/BCC_and_IF.pdf; Bolivia and Ghana IYCF counseling materials and posters; and “Formative Research: Skills and Practice for Infant and Young Child Feeding and Maternal Nutrition.” http://www.linkagesproject.org/media/publications/Training%20Modules//Formative_Research_Module_2-23-04.pdf.
Low, Jan W. et al. 2007. “A Food-Based Approach Introducing Orange-Fleshed Sweet Potatoes Increased Vitamin A Intake and Serum Retinol Concentrations in Young Children in Rural Mozambique.” Journal of Nutrition. Vol. 137, pp. 1320–1327.
Maluccio, John A. and Flores, Rafael. 2004. Impact Evaluation of a Conditional Cash Transfer Program: The Nicaraguan Red de Protección Social. Discussion Paper 184. Washington, DC: IFPRI.
Manoff Group. n.d. “Reminder Materials.” http://www.manoffgroup.com/reminder.html; and “Trials of Improved Practices (TIPs).” http://www.manoffgroup.com/approach_developing.html.
Marini, Alessandra et al. 2009. Promoción del crecimiento para prevenir la desnutrición crónica: Estrategias con base comunitaria en Centro América. Washington, DC: World Bank.
Maslowsky, Stacey; Sidibé, Sidkiba; and Traoré, Bonaventure B. 2008. “The Success of the Hearth Model in Guinea.” http://www.africare.org/our-work/tech/Food_Security_AFSR%20papers/Updated%20Paper%20July%202008/AFSRNo12.pdf.
Mason, John et al. 2006. “Chapter 56: Community Health and Nutrition Programs.” In Disease Control Priorities in Developing Countries, Second Edition, edited by Jamison, Dean T. et al. http://www.dcp2.org/pubs/DCP.

6-92 Maternal and Child Health and Nutrition
Masset, Edoardo; Haddad, Lawrence; Cornelius, Alex; and Isaza-Castro, Jairo. 2011. A Systematic Review of Agricultural Interventions that Aim to Improve Nutritional Status of Children. London: EPPI-Centre, Social Science Research Unit, Institute of Education, University of London.
McNairn, Rosemarie and Sethuraman, Kavita. 2011. “Gender Integration in USAID Bureau for Democracy, Conflict, and Humanitarian Assistance Office of Food for Peace Operations. USAID Office of Food for Peace Occasional Paper 7.” http://transition.usaid.gov/our_work/humanitarian_assistance/ffp/gendemainstreaming.pdf.
McNulty, Judiann and Pambudi, Eko Setyo. 2008. “Report of the Pos Gizi Assessment: Suggestions for Expanding the Approach in Indonesia.” http://www.positivedeviance.org/PD_Evaluation_Report_for_DEPKES_FINAL.pdf.
———. 2009. “Findings and Lessons Learned: An In-Depth Assessment of the Large Scale Implementation of PD/Hearth in Indonesia Funded by USAID Food for Peace.” http://www.coregroup.org/storage/documents/Workingpapers/Final_Report_Indonesia_PD_Hearth_Assessment.pdf.
Menon, Purnima et al. 2007. “Prevention or Cure? Comparing Preventive and Recuperative Approaches to Targeting Maternal and Child Health and Nutrition Programs in Rural Haiti. Executive Summary of the Evaluation Report.” http://www.fantaproject.org/pm2a/Haiti_Exec_Summary_Dec07.pdf.
Millman, Sara R. and DeRose, Laurie F. 1998. “Food Deprivation.” In Who’s Hungry? And How do We Know? Food Shortage, Poverty, and Deprivation, edited by DeRose, Laurie; Messer, Ellen; and Millman, Sara. Tokyo: United Nations University Press.
Mwadime, Robert et al. 2012. Informing the Design of a Social and Behaviour Change Communications Strategy for Infant and Young Child Feeding in a Community-Based Nutrition Program: The Case of Kitgum and Pader Districts. Strengthening Maternal and Child Nutrition in Uganda. Washington, DC: FANTA/FHI 360.
Nutrition Working Group. 2003. “Positive Deviance/Hearth: A Resource Guide for Sustainably Rehabilitating Malnourished Children.” http://www.coregroup.org/storage/documents/Diffusion_of_Innovation/Hearth_Book.pdf.
———. 2005. “Positive Deviance/Hearth Essential Elements: A Resource Guide for Sustainably Rehabilitating Malnourished Children (Addendum).” http://www.coregroup.org/storage/documents/Diffusion_of_Innovation/PD_Hearth_Addendum_Jun_2009.pdf.
Ojukwu, Juliana U.; Okebe, Joseph U.; Yahav, Dafna; and Paul, Mical. 2009. “Oral Iron Supplementation for Preventing or Treating Anaemia among Children in Malaria-Endemic Areas (Review).” Cochrane Database of Systematic Reviews 2009. Vol 3.
Picado, Janet Irene; Mtimuni, Beatrice; and Kalimbira, Alexander. 2011. Consulting with Caregivers: Formative Research to Determine the Barriers and Facilitators to Optimal Infant and Young Child Feeding in Three Regions of Malawi. Washington, DC: IYCN Project, PATH.
Quinn, Victoria J. et al. 2005. “Improving Breastfeeding Practices on a Broad Scale at the Community Level: Success Stories from Africa and Latin America.” Journal of Human Lactation. Vol. 21, No. 3, pp. 345–354.
Ringheim, Karin; Gribble, James; and Foreman, Mia. 2011. “Integrating Family Planning and Maternal and Child Health Care: Saving Lives, Money, and Time.” http://www.prb.org/pdf11/familyplanning-maternal-child-health.pdf.
Ringheim, Karin. 2012. Better Together: Linking Family Planning and Community Health for Health Equity and Impact. 2nd Edition. Washington, DC: CORE Group.
Ruel, Marie T. et al. 2008. “Age-Based Preventive Targeting of Food Assistance and Behaviour Change and Communication for Reduction of Childhood Undernutrition in Haiti: A Cluster Randomised Trial.” Lancet. Vol. 371, pp. 588–595.

6-93Maternal and Child Health and Nutrition
Rutstein, Shea. 2008. “Further Evidence of the Effects of Preceding Birth Intervals on Neonatal, Infant, and Under-Five-Years Mortality and Nutritional Status in Developing Countries: Evidence from Demographic and Health Surveys.” http://pdf.usaid.gov/pdf_docs/PNADM649.pdf.
Sanghvi, Tina et al. 1995. The Impact of Food and Cash Transfers on Health and Nutrition: An Evaluation of the Bonos (PMI) and PL 480 Title II MCH Programs in Honduras. Washington, DC: Internatinal Science and Technology Institute. DEC #PNABZ747.
Save the Children. 2004. “Partnership Defined Quality Facilitation Guide.” http://www.coregroup.org/storage/documents/Diffusion_of_Innovation/Save_PDQ_Facil_Guide.pdf.
SUN. 2010. “Scaling Up Nutrition: A Framework for Action. Policy Brief.” Food and Nutrition Bulletin. Vol. 31, No. 1, pp. 179–186.
Schaetzel, Tom et al. 2008. Evaluation of the AIN-C Program in Honduras. Arlington, VA: BASICS.
Schnell, Charles, McNulty, Judiann, and Bentley, Jeffery. 2006. Food Security in Guatemala: Evaluation of the Title II Program 2001-2006. Tucson: TANGO International. DEC# PDACT247.
Shrimpton, Roger; Prudhon, Claudine; and Engesveen, Kaia. 2009. “The Impact of High Food Prices on Maternal and Child Nutrition.” SCN News. Vol. 37, pp. 60–68.
Smith, Kirk; Mehta, R. Sumi; and Feuz, M. 2004. “Chapter 18: Indoor Smoke from Household Use of Solid Fuels.” In Comparative Quantification of Health Risks: The Global Burden of Disease Due to Selected Risk Factors, edited by Ezzati, M.; Lopez, A.D.; Rodgers, A.; and Murray, C.J.L. Geneva: WHO.
Smith, Rhonda; Ashford, Lori; Gribble, James; and Clifton, Donna. 2009. “Family Planning Saves Lives.” http://www.prb.org/pdf09/familyplanningsaveslives.pdf.
Stevens-Muyeti, Rianne and Del Rosso, Joy Miller. 2008. Uganda Community-Based Growth
Promotion: Program Review. Washington, DC: Manoff Group.
Swindale, Anne; Deitchler, Megan; Cogill, Bruce; and Marchione, Thomas. 2004. “The Impact of Title II Maternal and Child Health and Nutrition Programs on the Nutritional Status of Children.” http://www.fantaproject.org/downloads/pdfs/ffpOP4.pdf.
UNICEF. 2011. State of the World’s Children. New York: UNICEF.
UNSCN. 2010. 6th Report on the World Nutrition Situation: Progress in Nutrition. Geneva: UNSCN Secretariat c/o WHO.
USAID. 2009. Two Decades of Progress: USAID’s Child Survival and Maternal Health Programs. Washington, DC: USAID.
———. 2011. Evaluation Policy. Washington, DC: USAID Bureau for Policy, Planning and Learning, Office of Learning, Evaluation and Research.
USAID/FFP. 2005. Strategic Plan for 2006-2010.Washington, DC: USAID.
USAID/FPP. 2007. “New Reporting Requirements for Food for Peace.” FFPIB 07-02.
USAID/FPP. 2011a. “Submission of Baseline/Final Evaluation Datasets by Food for Peace Awardees.” FFPIB 11-02.
USAID/FPP. 2011b. “Revision to Food for Peace Standard Indicators Collected in Baseline Surveys and Final Evaluations (Reissuance).” FFPIB 11-03 (Reissued).
Victora, Cesar G. et al. 2008. “Maternal and Child Undernutrition 2. Maternal and Child Undernutrition: Consequences for Adult Health and Human Capital.” Lancet. Vol. 371, pp. 340–357.
Victora, Cesar G. et al. 2010. “Worldwide Timing of Growth Faltering: Revisiting Implications for Interventions.” Pediatrics. Vol. 125, No. 3, pp. e473–480.
Webb, Patrick et al. 2011. Delivering Improved Nutrition: Recommendations for Changes to U.S.

6-94 Maternal and Child Health and Nutrition
Food Aid Products and Programs. Boston, MA: Tufts University Friedman School of Nutrition Science and Policy.
West Africa Regional Food for Peace Office, USAID/Senegal. 2005. Might Women’s Gardening Activities have an Unintended Negative Impact on Children’s School Attendance? Professional Paper Series, No.3, November 2005. Dakar: USAID.
WHO. 2003. Guiding Principles for Complementary Feeding of the Breastfed Child. Geneva: WHO.
———. 2005. “Report of a Technical Consultation on Birth Spacing.” http://www.who.int/making_pregnancy_safer/documents/birth_spacing05/en/index.html.
———. 2008. Indicators for Assessing Infant and Young Child Feeding Practices. Part I: Definitions. Geneva: WHO.
———. 2010a. Indicators for Assessing Infant and Young Child Feeding Practices. Part II: Measurement. Geneva: WHO.
———. 2010b. Indicators for Assessing Infant and Young Child Feeding Practices. Part III: Country Profiles. Geneva: WHO.
WHO/FAO. 2004. Vitamin and Mineral Requirements in Human Nutrition. Second edition. Geneva: WHO.
WHO/UNICEF. 2004. How to Add Deworming to Vitamin A Distribution. Geneva: WHO.
WHO Expert Committee. 1995. Physical Status: The Use and Interpretation of Anthropometry. WHO Technical Report Series #854. Geneva: WHO.
Wollinka, Olga; Keeley, Erin; Burkhalter, Barton R.; and Bashir, Naheed (eds.). 1997. Hearth Nutrition Model: Applications in Haiti, Vietnam, and Bangladesh. Arlington, VA: BASICS.
Zeitlin, Marian et al. 1990. Positive Deviance in Child Nutrition: With Emphasis on Psychosocial and Behavioral Aspects and Implications for Development. Tokyo: United Nations University.

6-95Maternal and Child Health and Nutrition
Annex 6.1. FAFSA-2 Examples of the Early Onset of Undernutrition in Children in the First Two Years of Life from Title II Programs, Measured as Mean Z-Scores
Weight-for-Age Z-Scores (WAZ)
Indonesia (Pooled baseline data from CARE, CRS, MC, SC, and WV FY 2005–FY 2008 Programs—WHO vs. National Center for Health Statistics [NCHS] standards)
Source: McNulty and Pambudi, 2008, p. 40.
-2,50
-2,00
-1,50
-1,00
-0,50
0,00
0,50
1,00
1,50
2,00
0 2 4 6 8 10 12 14 16 18 20 22 24 26 28 30 32 34 36 38 40 42 44 46 48 50 52 54 56 58Age (months)
Ave
rage
Z-s
core
WHO-WAZ NGO-WAZ
60
India (Endline intervention vs. comparison cohort, CARE FY 2002–FY 2006, NCHS standards)
Source: Dreyfuss et al., 2008, p. 142.
Mean WAZ among children in the cohort sample at follow-up from 0-18 months, by district
-3
-2.5
-2
-1.5
-1
-0.5
0< 1 3 6 9 12 15 18
Age (months)
Wei
ght-
for-
age
Z sc
ore
Intervention
Comparison
* Student t test comparing means by district, significant at p<0.05.
*
*

6-96 Maternal and Child Health and Nutrition
Height-for-Age Z-Scores (HAZ)
Indonesia (Pooled baseline data from CARE, CRS, MC, SC, and WV FY 2005–FY 2008 Programs—WHO vs. NCHS standards)
Source: McNulty and Pambudi, 2008, p. 41.
-2,50
-2,00
-1,50
-1,00
-0,50
0,00
0,50
1,00
1,50
2,00
0 2 4 6 8 10 12 14 16 18 20 22 24 26 28 30 32 34 36 38 40 42 44 46 48 50 52 54 56 58 60
Age (months)
Ave
rage
Z-s
core
WHO-HAZ NGO-HAZ
India (Endline intervention vs. comparison cohort, CARE FY 2002–FY 2006, NCHS standards)
Source: Dreyfuss et al., 2008, p. 144.
Mean height-for-age Z score (HAZ) among children in the cohort sample at follow-up from 0-18 months, by district
-2.5
-2
-1.5
-1
-0.5
0< 1 3 6 9 12 15 18
Age (months)
Hei
ght-f
or-a
ge Z
sco
re
Intervention
Comparison
* Student t test comparing means by district, significant at p<0.05.
*

6-97Maternal and Child Health and Nutrition
Ghana (Endline CRS FY 2003–FY 2008, NCHS standards)
Source: Galaa and Saaka, 2008, p. 25.
36-59 24-35 12-23 6-11 months 0-5 months
Mea
n of
Hei
ght-f
or-a
ge z
-sco
res
.2
0.0
-.2
-.4
-.6
-.8
-1.0
-1.2
Age grouping

7-1
Second Food Aid and Food Security Assessment (FAFSA-2)
7. Water, Sanitation, and Hygiene
Abstract
Health and nutrition benefits increase when potable water, environmental sanitation, and hygiene education are part of Title II development programs and households have access to all three. The term WASH refers to these three critical components. Two-thirds of all programs in the FAFSA-2 universe included a WASH activity. Among the 69 programs reviewed for MCHN in the FAFSA-2, 55 percent delivered an integrated package of water and/or sanitation and hygiene interventions. Twelve percent had only a water and/or sanitation component and 23 percent did only hygiene. There were seven MCHN programs with no WASH (10 percent). The WASH review focused on 31 programs in 19 countries that supported sizeable water and sanitation infrastructure. A significant amount of water and sanitation infrastructure was constructed during the FAFSA-2 time frame, e.g., 570 water systems for 228,000 people and 3,277 wells for 98,310 people. On average, 16 programs increased access to an improved water source by 23 percentage points. Most program clients (61 percent) accessed improved drinking water at a shared community site (categorized as Level I services or lower). Level II and higher water and sanitation services consist of household-level pour flush latrines and water connections (versus community level) and are associated with better health outcomes. Twelve programs in LAC delivered Level II services—a level that should be the goal of Title II WASH. A number of Awardees appeared reluctant to do water and sanitation infrastructure for various reasons, including technical complexity, additional technical staff required, and greater effort needed to meet the increased emphasis on quality and sustainability. In programs that did infrastructure, the low level of Title II funding often precluded addressing the needs of all program communities, or providing all three essential WASH components in each community. Village water committees (VWCs) are essential for sustainability; 94 percent of programs organized VWCs for operation, maintenance, and charging fees. Many programs promoted better hygiene and measured change in hygiene practices; 74 percent reported improvements. US$16.4 million was spent on WASH in FY 2009, approximately 5 percent of the total cost of Title II development programs that year. But less than a third of all Title II development programs did WASH in FY 2009, a lower proportion than earlier in the FAFSA-2 time period. The policy implications of the WASH assessment are provided in Box 7.8 and the conclusion and recommendations are provided in Sections 7.5.1 and 7.5.2.

7-2 Water, Sanitation, and Hygiene
7.1 Introduction
7.1.1 Policy and Program Environment
The potential health and nutrition benefits of a Title II food security program are greatly increased when potable water,239 environmental sanitation, and hygiene education components are included in the program. The term WASH is used throughout this chapter to refer to these three critical components: water, sanitation, and hygiene. The USAID/FFP Strategic Plan recognized WASH interventions as essential to achieving its result of “human capabilities protected and enhanced.” Illustrative WASH activities from the Strategic Plan “to improve health status and contribute to improved household nutrition through improved water and sanitation infrastructure and practices” are shown in Table 7.1. During the FAFSA-2 time frame, USAID/FFP considered water and sanitation one of eight priority technical sectors supported by Title II development programs. See Box 7.1 for the USAID/FFP definition of the water and sanitation technical sector.
Diarrhea, a major determinant of undernutrition, is closely linked with environmental sanitation
239 “Potable” or “safe” water is defined as drinking water that does not contain harmful bacteria, toxic materials, or chemicals. Water may have problems with taste, odor, color, or mineral content, but still be considered safe.
and hygiene, including access to potable water and excreta disposal facilities and handwashing practices. Rohde (1984) states that “diarrhea is a major contributor to malnutrition through a variety of mechanisms including anorexia, intestinal malabsorption, and social practices depriving the patient of food.” Having access to adequate water and sanitation facilities and practicing good hygiene are of particular importance to vulnerable populations, including pregnant and lactating women and children through two years of age (referred to as the first 1,000 days), especially because of the serious, long-term consequences of inadequate nutrition at this critical stage of growth and development. The association between diarrhea and undernutrition has been confirmed by a number of studies. In referring to this relationship, McJunkin (1982) writes in Water and Human Health: “A significant body of evidence supports the positive linkage between sanitary water supply and excreta disposal and long-term improvements in health status. The linkage is supported by long-term observations in both the developed and less developed countries.” Studies by Brown (2003) and Hunter et al. (2010) also confirm the relationship between diarrhea and undernutrition. Illnesses, such as typhoid, schistosomiasis, hepatitis, scabies, bacillary dysentery, and amebiasis, related to acceptable water supply and general household and community sanitation, represent additional risks to adequate growth in children (McJunkin,
Table 7.1. Illustrative Activities from the 2006–2010 Strategic Plan Related to Sub-IR 2.1, Human Capabilities Protected and Enhanced
Illustrative Activities: To improve health status and contribute to improved household nutrition through improved water and sanitation infrastructure and practices
Non-Food Assistance Food AssistanceThe Title II program:
• Provides and/or coordinates the provision of the complementary inputs needed for the successful completion of the water and sanitation infrastructure such as engineering drawings and services and cement and pipes. Also provides or insures the provision of technical assistance and training to enable communities to properly operate and maintain new/rebuilt facilities.
• Provides people with education and training that encourages them to adopt critical hygiene practice such as handwashing.
The Title II program:
• Provides food through public works programs for repairing and/or building/rebuilding water and sanitation facilities. (These programs can also be viewed as helping increase community assets.)
Source: This table is taken verbatim from the USAID/FFP Strategic Plan (2005, p. 67).

7-3Water, Sanitation, and Hygiene
1982). Water- and sanitation-related health risks are especially high in the countries prioritized for Title II development programs during the last 10 years. It is clear that if a food security program is to have an impact on undernutrition, a reduction of diarrhea needs to be an integral part of that program.
The Water and Sanitation Indicators Measurement Guide, a FANTA publication (Billig et al., 1999) that established a methodology to measure the impact of WASH interventions, particularly those funded under Title II, states that “[r]aising the quality of drinking water reduces the ingestion of pathogens. With less disease, children can eat and absorb more food, thereby improving their nutritional status.” The document further states, “Improvements in sanitation have been shown consistently to result in better health, as measured by less diarrhea, reductions in parasitic infections, increased child growth, and
lower morbidity and mortality” (p. 6). There are other benefits of increased access to more water (quantity) related to personal and household hygiene and to reducing the time and physical exertion spent obtaining water.
Access to safe water and sanitation is also a specific policy objective of U.S. foreign assistance as a result of the Senator Paul Simon Water for the Poor Act, signed into law on December 1, 2005 (U.S. Department of State, 2009). The Act requires the Secretary of State, in consultation with USAID and other USG agencies, to develop and implement a strategy to provide “affordable and equitable access to safe water and sanitation within the context of sound water resources management in developing countries” (p. 1).
In other words, although some may focus on the expense of including a WASH component in a Title II development program, a more realistic view is that it is very expensive not to include a WASH component in a food security program.
7.1.2 Status of Water and Sanitation in Countries Prior to Title II Programs
The starting point for providing WASH services is quite different from country to country, as seen in Table 7.2, which shows the percent of the population with access to improved drinking water sources in the 19 countries included in the FAFSA-2 WASH universe (UNICEF and WHO, 2010). In 2000, access to improved drinking water ranged from 18 percent in Ethiopia to 84 percent in Guatemala, for example, and, in 2008, it ranged from 26 percent in Ethiopia and Sierra Leone to 90 percent in Guatemala. In fact, access to improved water sources increased in all countries except Sierra Leone over the eight-year period.
These numbers do not tell the complete story, however. When Title II programs assess the status of water and sanitation infrastructure as they move into their new target communities, they are likely to find that the infrastructure in some communities is no longer adequate, even though they had been classified at some point in time as having access to “potable water” or “sanitation facilities.”
Box 7.1. USAID/FFP Definition of its “Water and Sanitation” Technical Sector
“Objectives include improving water and sanitation infrastructure and practices. Activities include: organizational, technical and financial support for water and sanitation services; promotion of practices that protect water supplies from contamination by improper handling of domestic water supplies, household waste and inadequate sanitation; promotion of improved hygiene practices and behavior change; and, provision of technical assistance and training to enable communities to properly operate and maintain the new/rebuilt facilities. Food rations are used to build water and sanitation-related infrastructure.”
Source: USAID/FFP Annual Results Reporting Guidance for FY 2009.

7-4 Water, Sanitation, and Hygiene
7.2 Basic Facts about Programs in the FAFSA-2 Universe
7.2.1 Projects and Countries
Only three of the programs in the FAFSA-2 universe (101 programs in 28 countries) had a separate SO for WASH.240 Of the 69 programs reviewed for MCHN activities (Chapter 6), 46 programs in 21 countries constructed water or sanitation infrastructure activities or both (see Figure 7.1).241 In 38 programs (55 percent), Awardees delivered an
240 The ADRA/Bolivia and PCI/Nicaragua programs appear to have been especially effective in directing Title II resources to WASH because they had a WASH objective.241 Only five of the WASH programs in the FAFSA-2 universe were not also MCHN programs, which is why the tallying of WASH components was done as part of the MCHN review.
integrated package of water and/or sanitation and hygiene activities. Eight programs (12 percent) had only a water and/or sanitation component and 16 (23 percent) had only a hygiene component. There were only seven Title II MCHN programs with no WASH interventions (10 percent).
This chapter focuses on the 38 programs in 19 countries that had sizeable water and sanitation infrastructure activities (see Table 1.3 for a list of programs reviewed).242 For the purposes of the analysis in this chapter, follow-on programs by the same Awardee in the same country were counted along with the predecessor program as only one program. Thus, the 38 individual grants for Title II projects that were reviewed will be referred to as 31 programs in the remainder of this chapter. Field visits were also made to 9 of the 31 programs in four countries: Bangladesh, Guatemala, Honduras, and Niger.243
242 Sixteen additional programs with water and sanitation infrastructure encountered during the larger review of MCHN programs are not reviewed in this chapter. They were missed in the earlier selection of programs for the WASH review because their work on water and sanitation infrastructure was not readily apparent in their Tracking Tables or IPTTs.243 The review of Title II programs with WASH was not as thorough as the authors would have liked due to missing documentation (which meant that the results of some of the programs are unknown), the limited number of countries included in the field visits (making it difficult to generalize results), and the limited amount of time to review documents.
Table 7.2. Trends in Access to Improved Water Sources by Rural Populations in 19 Countries in the FAFSA-2 WASH Universe between 2000 and 2008
Year2000 2008
Ethiopia 18 26
Madagascar 24 29
Mali 34 44
Niger 35 39
Chad 41 44
Kenya 43 52
Liberia 44 51
Sierra Leone 44 26
Haiti 49 55
Guinea 51 61
Uganda 53 64
Burkina Faso 55 72
Bolivia 56 67
Ghana 58 74
Nicaragua 62 68
Indonesia 67 71
Honduras 69 77
Bangladesh 77 78
Guatemala 84 90Source: UNICEF and WHO, 2010.
Figure 7.1. Title II Health and Nutrition Programs with and without WASH Activities
Only Hygiene, 23% (16)
Only Water and/or Sanitation, 12% (8)
Water and/or Sanitation and
Hygiene, 55% (38)
No WASH Activities,
10% (7)

7-5Water, Sanitation, and Hygiene
7.2.2 Resources and Beneficiaries
According to the data that the Title II Awardees submitted to USAID/FFP in their annual Tracking Tables, 5 percent of all Title II development resources—US$16.4 million—were devoted to the WASH technical sector in FY 2009, benefitting 394,932 persons.244 Programs with WASH activities represented fewer than one-third of all Title II development programs in the FY 2009 Tracking Tables. This is a much lower proportion than in the earlier years of the FAFSA-2 time frame, when most programs did WASH.
7.3 Program Approaches and Interventions
7.3.1 Addressing Community Needs
To achieve their full potential, Title II development programs should address WASH needs in each of their communities. At a minimum, this includes
244 This excludes FY 2009 Title II PM2A research programs in Burundi and Guatemala, which were just beginning in late FY 2009, and the Afghanistan program, because they are not part of the FAFSA-2 universe.
ensuring availability of safe water and sanitation services, accompanied by adequate hygiene education. There are three basic pillars of a successful rural WASH program:
• Appropriate water and sanitation technology
• Hygiene education
• Community participation and capacity strengthening (to ensure the continuing operation and maintenance of the systems)
Many of the Title II programs included in the FAFSA-2 WASH universe appear to have attempted to do too many things in too many places, often failing to make sure that individual communities had access to all three of the essential WASH components—potable water, adequate sanitation, and hygiene education. This has meant that dozens, perhaps hundreds, of villages were not able to benefit from the synergies that can be obtained in truly integrated programs.
7.3.2 Selecting Communities
The criteria used for including specific communities in a WASH component varied. The main one stated or implied in the proposals was that the community
In Niger, a girl carries water home from a well.
Her
bert
Cau
dill,
CR
S/N
iger

7-6 Water, Sanitation, and Hygiene
be in the Title II target area. Examples of the types of criteria and the number of programs using them are provided in Table 7.3. One important criterion not stated in the program documentation reviewed is the community’s track record in doing its part in other community development activities. It is also important that programs maintain the flexibility to add or delete communities as circumstances dictate rather than establishing a rigid list that cannot be changed.
7.3.3 Using Appropriate Technologies
Water sources and delivery systems. The selection of water sources is a function of what is available. Sources of water and delivery systems in the WASH programs reviewed in the FAFSA-2 included: hand-dug wells, drilled wells (boreholes), rainwater catchment devices, springs, and surface water. Wells were used in most of the programs. Some existing wells were rehabilitated, but others were newly constructed. Wells were both drilled and hand-dug. Spring water was used when available, particularly if topography allowed for gravity-fed systems. Surface water was often used, generally requiring some degree of treatment. At a minimum, chlorination was required. In a few cases, rainwater harvesting was used, but this was limited because generally it involved individual household infrastructure that can require intensive attention on the part of Awardee personnel and costs more per capita, as was the case in the SC/Guatemala FY 2007–FY 2011 program.
Point of delivery of water. User access to potable water in the FAFSA-2 WASH universe programs included community open wells and wells with hand pumps, community taps, and household taps. Household connections are generally the preferred method, because they provide fewer opportunities for contamination during transportation and families develop a greater sense of ownership. Household members are more likely to wash their hands at the appropriate moments and to practice personal hygiene if the water is more readily available. They are also more likely to pay a periodic fee and to keep anyone from damaging their tap. The 12 programs that provided Level II services included household connections. (See Table 7.4 for a discussion of levels of water and sanitation services.)
The disadvantage of public taps or wells with hand pumps is that they also provide more opportunities for contamination post-collection, because water must be hauled a distance and stored. When water
Table 7.3. Community Selection Criteria
CriteriaNumber of Programs
Percent of Programs
Within target area 17 55
Need 3 10
First come/first served 2 6
Health indices 1 3
No criteria stated 8 26
Table 7.4. Characteristics of Alternative Water and Sanitation Service Levels
Service Level
Average per Capita Water Demand (liters per day) Water Distribution Facilities Sanitation: Water/Excreta Disposal Facilities
I 25 Public stand posts serving 200–400 people within 100 meters
One privy per household
II 50 One yard hydrant per household One pour-flush toilet/latrine with soak pit per household
III 100 One kitchen tap and shower per household
One pour-flush toilet/latrine with septic tank per household
IV 100 Same as III Same pour-flush toilets/latrines, but small-bore street sewers for treatment of wastes
V 200 Full plumbing Conventional waterborne sewerage with treatment of wastes
Source: McJunkin, 1982.

7-7Water, Sanitation, and Hygiene
is more difficult and time consuming to obtain than from a household tap, family members are less likely to wash hands. Also, since the tap or well is not on anyone’s private property, the sense of ownership and responsibility is diminished, and the likelihood of vandalism or just plain carelessness increases. On the other hand, circumstances do exist when Level I (see Table 7.4) solutions are the best choice.
Hand Pumps. Programs visited that used hand pumps had either locally manufactured or imported pumps. Generally, spare parts are readily available on the local market, although the programs in northern Uganda noted a dearth of spare parts in that region, perhaps due to years of armed conflict. The technology used is simple, and operation and maintenance is not a problem as the Title II programs have generally done an excellent job of creating and training village water committees (VWCs). Nor do there appear to be cases where technological choices rendered the devices too expensive to operate and maintain, or where spare parts and know-how were not available in-country.
Point-of-use water treatment. Several Title II programs promoted disinfecting water at the
household level. While this is a proven technology for preventing diarrhea in developing countries, widespread adoption has not occurred (Fiebelkorn et al., 2012). These methods present difficult challenges in motivating sustained behavior change. Therefore, disinfecting water at the point of consumption should be encouraged only when there is no feasible way to provide potable water through a community system. The primary reason is that any intervention on the part of an Awardee requires a very large investment of time (and therefore money), and the behavior change can be short-lived. Also some methods, such as boiling water, require large amounts of fuel, which is often scarce and may mean accelerating deforestation on lands that are already under stress. Other methods, such as solar disinfection, have raw water quality requirements that may be difficult to meet. Getting households to purchase water treatment products can also be challenging.
Disposal of excreta. The technologies used by Title II development programs to dipose of excreta have been adequate. There were very few community sewerage facilities. Generally,
Woman using a hand pump in Bangladesh to draw drinking water from a well.
Her
bert
Cau
dill,
SC
/Ban
glad
esh

7-8 Water, Sanitation, and Hygiene
pit, ventilated improved pit, or water seal (pour-flush) latrines were used. The first two are service Level I and the water seal latrine245 is Level II (see Table 7.4). In Bangladesh individuals frequently deliberately broke the seals on water seal latrines because of the amounts of water required to flush them. Project hygiene education personnel did a commendable job of convincing users that by breaking the water seals they were negating most of the benefits of owning a latrine. In one village a lady said, “After we understood that we didn’t have to use potable water to flush and that the water seal was better for our health because of the absence of flies and odors, we purchased new water seals and fixed our latrines.”
7.3.4 Providing or Upgrading Systems to Higher Levels of Service
Since one of the major objectives of Title II development programs is to improve health and reduce child undernutrition, more consideration needs to be given to encouraging WASH programs to improve the levels of service that they are providing, including taking steps to upgrade the levels of service that they find in their target communities. Higher levels of service will have a
245 A water seal latrine is a pour-flush pit latrine that has a water barrier/seal to prevent odors.
more significant impact on improving health. This can be seen in the results of a study conducted in seven Indian villages, shown in Figure 7.2, which found a definite decrease in the incidence of diarrhea in relationship to increasing the level of service (McJunkin, 1982). Only 39 percent of the 31 programs in the FAFSA-2 WASH universe—all in Latin America—provided water and sanitation infrastructure at Level II, which should become the goal for Title II development programs. (See Table 7.4 for convenient and useful definitions of levels of service.) Forty-eight percent provided infrastructure at Level I (15 programs), while only 13 percent (4 programs) provided infrastructure below Level I, i.e., below the minimum acceptable level (see Table 7.5). In Latin American, there is a long history of WASH programs that, through trial and error over the last 40 years, have reached an unwritten consensus that Level II is the appropriate level that development agencies should strive for in rural areas. Such organizations as the Inter-American Sanitary Engineering Association (AIDIS), the Pan American Health Organization (PAHO), and several bilateral and multilateral cooperation agencies have consistently updated and upgraded to what is most cost-efficient in terms of obtaining the greatest health results per dollar. Anecdotal evidence also indicates that a significant percentage of households in a village will elect, after having benefitted from an externally funded WASH project, to install indoor plumbing, including showers, sinks, and flush toilets from their own resources.
It is helpful when Awardee organizations provide technical guidance to their staff to improve the quality of their programs based on the state of the art and lessons that they have learned during program implementation. The comprehensive guidelines for small-scale rural water supply and sanitation projects in East Africa developed by CRS (2005) are a good example of this. CRS held a regional workshop to review water and sanitation guidelines it designed for the CRS/Ethiopia Title II program and adapted them for regional use. These guidelines included appropriate technology, community participation, and hygiene education. The guidelines have served CRS well in encouraging the inclusion of WASH activities within its Title II programs. It would be
Man pouring water to flush his water seal latrine in Bangladesh
Her
bert
Cau
dill,
SC
/Ban
glad
esh

7-9Water, Sanitation, and Hygiene
useful if these or other technical reference materials for doing WASH in Title II programs could be made available to other Awardees by the TOPS project or USAID/FFP.
Assessment of the level of water and sanitation infrastructure. Title II development programs, at a minimum, should be making an assessment of the WASH situation in all their target communities at the beginning of their programs. As indicated earlier, the infrastructure in some communities may no longer be adequate, even though they may have been classified at some point in time as having access to “potable water” or “sanitation facilities.” In these cases, it is desirable for the Title II program to take steps to bring whatever water supply and/or excreta disposal systems exist up to standard. This assessment should include identifying what infrastructure exists and its condition, and identifying gaps in infrastructure and the capacity of the communities to operate and maintain it.
This assessment would include answers to such questions as: Does every household have at least a water seal latrine and a yard tap from a community water system? Are there other WASH problems that need to be addressed? As part of this assessment, Awardees should also identify potential collaborators among the other organizations working in their areas—government organizations, NGOs, and other donor projects. This information can be used as a basis for developing a strategy to upgrade the level of services when necessary and for seeking other possible funding sources and partnerships to help in closing the gaps. Some ideas of what is possible can be gleaned from the experiences of the 12 Title II programs in LAC—all of which provided Level II services (see Box 7.2).
7.3.5 Promoting Better Hygiene, including Using Social and Behavior Change Communication
All 31 programs included in the FAFSA-2 WASH universe reported doing hygiene education. Most programs promoted the adoption of four hygiene behaviors (see Box 7.3). Many hygiene education models are in use in the world. In Latin America, the Casa Saludable (Healthy Home) model is common and has been quite successful in numerous countries. “Community-led total sanitation” (CLTS) is another model applied by some Title II programs (Chambers and Bongartz, 2009; Kar and Pasteur, 2005). Several of the Title II Awardees also employed the “participatory hygiene and sanitation transformation” (PHAST) model, which strives to change hygiene behavior with strong community involvement (WHO, 2011). These models are similar in that they all promote changes in the same behaviors and include community participation. Many models may look good on paper. But what is often forgotten is that to succeed they all require: (1) many health educator workdays per family educated, (2) very capable health educators, and (3) very committed health educators.
The USAID Hygiene Improvement Project (HIP) (FY 2004–FY 2010) included CLTS—an approach that brings community pressure to bear to eliminate the practice of open defecation. HIP
Figure 7.2. Diarrhea Incidence in Seven Indian Villages
6.2
7.8
18.4
0 5 10 15 20
House Tap
Standpost
Open Well
Diarrhea Incidence (%)
Table 7.5. Levels of Water and Sanitation Services Provided by Title II Development Programs
Service LevelNumber of Programs Percentage
Below Level I 4 13
Level I 15 48
Level II 12 39

7-10 Water, Sanitation, and Hygiene
Box 7.2. A Strategy for Providing Level II Services Based on Experiences in LAC Title II Development Food Aid Programs
Many of the 12 programs in LAC demonstrated considerable creativity in providing Level II services to their target populations. This included:
• Improving existing WASH facilities. In many countries, extensive work has already been done in rural water and sanitation. The scope of work in communities with existing, albeit deficient, water and sanitation infrastructure may require minimal investment to bring it up to Level II standards. CRS/Guatemala, for example, took advantage of a very good water system serving the village of Chuatega that had been built years before and reorganized the VWC, financed minor repairs to the water system, introduced chlorination, assisted families requiring latrines, and provided intensive hygiene education. That village benefitted from a comprehensive WASH intervention that complemented the health and nutrition interventions. All of this was accomplished at minimum cost.
• Establishing alliances with other donors. Other donors are engaged in water and sanitation activities in most countries included in the FAFSA-2 WASH universe. Many Awardees established partnerships with such organizations that invest extensively in water and sanitation infrastructure. This was a common experience among the 12 programs offering Level II services. SC/Honduras, for example, established alliances with a rather large WASH program funded by the European Union and with various Rotary Clubs and was able to ensure that all Title II communities benefitted from comprehensive WASH interventions. SHARE/Guatemala also identified organizations to establish partnerships for WASH activities.
• Focusing on fewer communities. At the design stage, the Honduras Title II Awardees purposefully reduced the number of communities in order to provide all of the WASH components in each of the communities served.
• Increasing WASH activity budgets. Some Title II development programs did not budget for WASH activities and needed to mitigate this lack of budget in some way, for example, by using funds budgeted for SBCC to introduce hygiene education.
• Taking advantage of existing technical capabilities. Various programs took advantage of existing professional capabilities within host country government water and sanitation agencies. The three Honduras Title II programs—SC, WV, and ADRA—took advantage of SANAA (the Honduran national water authority) engineers and water and sanitation technicians that gladly provided project designs, project supervision, community organization, and hygiene education at no cost to the Title II program. SANAA’s efforts were a contribution of the Government of Honduras.
• Maximizing use of voluntary community labor. Voluntary community labor (not FFW) reduced costs of interventions and at the same time fostered a sense of ownership in the water and sanitation construction projects in Title II programs in Bolivia, Guatemala, Honduras, and Nicaragua.

7-11Water, Sanitation, and Hygiene
promoted changes in three key hygiene behaviors: (1) handwashing with soap, (2) safe disposal of feces, and (3) safe storage of household drinking water. For the hardware for safe disposal of feces, the project encouraged local market solutions. The project also emphasized deep community involvement and peer pressure to elicit changes in behavior. The main lessons learned were that: (1) a collaborative, inter-institutional approach to hygiene is very effective, (2) sanitation marketing can be effectively introduced to complement community-led initiatives, and (3) an “at-scale” approach is preferable to taking a successful pilot program and expanding it to a larger audience (HIP, 2011).
The level of effort dedicated to improving hygiene practices varied considerably across the Title II programs reviewed, with programs in Bangladesh at the intense range of the scale. The CARE/Bangladesh program (FY 2005–FY 2010) was very committed to the CLTS concept. This approach, coupled with very dedicated institutional personnel and with an ongoing, intensive Government of Bangladesh national campaign in the last few years to eliminate open defecation and maintain a sanitary environment, has been extremely effective. The SC/Bangladesh FY 2005–FY 2010 program also promoted CLTS and reported a reduction in diarrhea in children 6–23 months from 29.8 percent at baseline to 21.8 percent at endline as a result of hygiene education integrated with assistance for water and sanitation infrastructure.246 Furthermore,
246 The impact of WASH interventions on diarrhea prevalence in preschool children in seven Title II programs, including SC/Bangladesh, is shown in Figure 6.6 in Chapter 6.
during the FAFSA-2 field visit to Bangladesh, in virtually every community members responded correctly when asked such questions as: “What would you do if you became aware that someone in the community is practicing open defecation?” or “When are the appropriate times to wash your hands?” The Title II programs in Latin America using the Casa Saludable model were equally successful.
The 2009 joint final evaluation of the four Title II development programs in Bolivia reported that Awardees worked to improve hygiene behaviors by applying social pressure within the community. The CHWs or community members visited homes frequently to monitor and observe practices, such as cleanliness of the latrine and dooryard, and to reinforce appropriate sanitation and hygiene messages. Volunteers used checklists to track their observations and negotiate with families to improve their behaviors. Several examples of creative strategies employed were soap necklaces, awards for the cleanest household, and promotion of health and hygiene messages in schools to change family norms.
On the other hand, some Awardees appeared to be dedicating less time to hygiene interventions, conducting only one “sanitation awareness” meeting with the community and calling that “hygiene education,” for example. The hygiene education methodology is important, but ultimately the capability and commitment of the educator are what is going to make a difference in the success of the behavior change efforts.
It is important that hygiene education be accompanied by devices that facilitate putting into practice what has been learned. Certain innovative technologies were introduced in various Title II programs to complement the hygiene education. For example, the programs in Malawi and Uganda used the “tippy tap.” This device is a simple water dispenser that enables people to wash their hands without wasting water. It consists of a can or plastic container that releases just enough water for a clean handwash each time it is tipped. When the tippy tap is released, it returns to its upright position (International Rescue Committee [IRC] WASH
Box 7.3. Hygiene Behaviors Promoted by Title II Programs
• Proper personal hygiene
• Proper food hygiene
• Proper water hygiene
• Proper environmental hygiene

7-12 Water, Sanitation, and Hygiene
Library, 2009). In addition to assisting communities with convenient handwashing facilities, much effort was made to promote the use of soap or ash for handwashing to be effective in preventing disease. Despite the usefulness of these tools, programs cannot be based solely on introducing appropriate technology, but rather the technologies can be used to complement an integrated WASH program.
7.3.6 Hygiene Education in the Absence of Water and Sanitation Infrastructure
While hygiene education is a key ingredient in bringing about changes in the health status of a given population, the need for potable water and sanitary infrastructure cannot be minimized. In a meeting with leaders in a Sahelian rural village in Niger, all the right answers were given in response to the question: “When is it necessary to wash hands?” However, after giving all the right answers, one participant asked, “How can we do all this handwashing when we barely have enough water from our well to drink?” It is not realistic to assume that health and nutritional status are going to improve significantly with a series of educational interventions when there is no adequate source of water or a sanitary method of excreta disposal available. Therefore, it is a concern that 23 percent of the programs in the MCHN FAFSA-2 review
were doing only hygiene education with no support for water or sanitation infrastructure (see Figure 7.1).
7.3.7 Dealing with Issues of Water Quality
Many water quality issues exist in the 19 countries with Title II programs included in the FAFSA-2 WASH universe. All faced high risks of bacteriological contamination; as a result, chlorination was essential and often done in water systems assisted by Title II.
Programs in Bangladesh, Bolivia, and Mali are illustrative of some of the problems that Title II Awardees run into. In Bangladesh, the presence of arsenic, a poison, in the groundwater is a major problem. Arsenic removal is technically possible but requires a level of community involvement and expense that is unlikely no matter how much the population is educated about the hazards of arsenic ingestion. An equally serious problem is how to dispose of the arsenic that has been removed. There is now consensus in Bangladesh among organizations engaged in managing water supplies that the hand pumps of wells declared arsenic free will be painted green and the hand pumps of wells containing arsenic will be painted red. Water with arsenic is acceptable for cleaning, for flushing latrines, and for many other uses. However, it is a very laborious educational challenge to ensure that users understand that, while it is acceptable for some purposes, it is not acceptable for drinking.
Salinization of groundwater is another serious water quality issue. This is a critical problem in Bangladesh and Mali. In areas of Bolivia, where there had been mining operations, groundwater was frequently not safe for drinking because it contained minerals hazardous to human health.
Post-project monitoring of water quality is perhaps a more serious, long-term issue. Host country agencies (such as the MOH) are responsible for checking water quality, but they frequently do not have the resources to do so. Kits that can be used by community personnel to keep track of residual chlorine, the presence of chemical contaminants, and
Illustration of a “tippy tap,” used in programs in Malawi and Uganda.
Source: Elena Hurtado, http://tilz.tearfund.org/Publications/Footsteps+21-30/Footsteps+30/The+Tippy+Tap.htm.

7-13Water, Sanitation, and Hygiene
bacteriological quality are on the market.247 There are some challenges with each of these kits, but they should be considered as an option within the context of the particular country.248
7.3.8 Encouraging Community Participation and Strengthening Capacity
Communities need to be fully involved in the development of a WASH program from the very beginning. In the case of a water system, it is relatively simple to elicit involvement from the community because access to water is something that most community members are very interested in, and they will expend an incredible amount of energy and effort to ensure that it gets done. Having access to potable water, in other words, is a much felt need. Communities need to participate in the planning of the system, the construction process, and management of the system. There are choices that must be made, and it is good for them to participate in making these choices. An important lesson learned is that labor to construct their water system or latrines is something that community members can donate, and projects that require this have found that community involvement in building WASH infrastructure generates a sense of community ownership of and commitment to maintain water systems and latrines. Paying for this community labor with FFW can be a deterrent to community ownership of the infrastructure.
Equally important is the establishment of VWCs. The committees’ names vary by country, but essentially all have responsibility for:
• Operating and maintaining water and sanitation infrastructure
• Establishing and collecting fees
• Abiding by established guidelines
• Establishing clear responsibilities for operation and maintenance
247 See, for example, http://www.hach.com/.248 Typical problems include the difficulty in procuring and the high cost of spare parts and reagents, training appropriate candidates to use the equipment, interpretation of test results, and taking action based on that interpretation.
Twenty-nine of the 31 programs included in the FAFSA-2 WASH universe established and trained VWCs. Field visits to programs in four countries confirmed that Awardees had done a very good job creating VWCs and training committee members. Interviews with VWC personnel also indicated that they had a clear vision of their responsibilities (see Box 7.4 and Box 7.5).
Although little mention was made of “second tier” organizations, communities appeared to have someone they could turn to when there was a problem that they could not solve. Many years ago, SC/Honduras pioneered the creation of a second tier organization, Asociación de Juntas de Agua Potable (Village Water Committee Association), with a representative from each VWC in a particular geographical area. Each VWC contributes a certain amount of money to that regional association, which in turn provides services, such as the sale of chlorine
Box 7.4. Assessing the Capacity of the Village Water Committees
Questions typically asked by the FAFSA-2 team included:• What are the responsibilities of the
VWC?
• What is your role in the VWC?
• What happens when something goes wrong with the system? (This question was tailored to the nature of the system. For example, if the source of water was a hand pump, the question was: “What do you do when you move the pump handle but no water comes out?”)
• How much is the user tariff? Do users pay it?
• What tools do you have for repairs?
• What training did the (Awardee) give you? Did the (Awardee) leave an operations manual with you?

7-14 Water, Sanitation, and Hygiene
in retail amounts, the sale of tools and spare parts, and TA. SC/Honduras ensured that VWCs organized under the Title II program were incorporated into their respective associations. Honduras has now gone a step further and each municipality has created (or is in the process of creating) an Asociación de Juntas de Agua Municipal (Municipal Water Committee Association).
These municipal water committee associations are providing many of the same services the SC model provided during the Title II program. A second tier organization is a very useful tool in providing a mechanism for follow up of repair and maintenance of village water and sanitation systems.
7.3.9 Coordinating and Collaborating with Host Government Institutions
Awardees can add considerable value to their programs by working in close coordination with the
host government institution and other institutions that deal with WASH issues. Frequently, these are national water agencies, municipal governments, or other local organizations. Such collaboration has the following advantages:
• Access to information as to who is working in the sector already in order to take advantage of other funding
• Access to high-quality technical support, which is often available from water ministries or equivalent organizations
• An increased likelihood of sustainability due to the permanence of host country organizations
• Useful guidance about what is already being done in a given geographical area
Mr. Attaou Mahaman Laminou, Secretary General of the Ministry of Water, Environment and Anti
Box 7.5. Village Water Committees: Promising Practices, Innovations, and Lessons Learned
• Assisting communities with the process of obtaining legal status for their VWCs has been very valuable in establishing the importance of the committees and enabling them to carry out their assigned tasks.
• Providing adequate training of VWC members and maintenance personnel has contributed significantly to the sustainability of water systems and water points.
• Arranging with local entities to conduct periodic audits of VWCs to ensure transparent handling of collected tariffs helps instill confidence on the part of village members in the management team of their facilities.
• Providing VWCs with portable devices to monitor water quality (e.g., chlorination testing kits) was effective in certain circumstances. Village water committee in Niger.
Her
bert
Cau
dill,
CR
S/N
iger

7-15Water, Sanitation, and Hygiene
Desertification in Niger, expressed this well when he told members of the FAFSA-2 team, “There is much that our Ministry can contribute. We have an inventory of wells in Niger and of the population served. We can make available our technical resources, and we can assist in helping to avoid duplication of effort.”249 In the short run, it may seem like extra effort to coordinate with these institutions, but it will pay off in the long run with a greater sense of ownership on the part of the national and local authorities. Twelve of the 31 programs (39 percent) included in the FAFSA-2 WASH universe were classified as having an “intense” close working relationship with host country national and local institutions (see Table 7.6). But an equal number had a “negligible” relationship. Reasons frequently given by the Awardees for non-collaboration with national and local agencies include irresponsibility, unreliability, inefficiency, corruption, and unresponsiveness. While working with local government institutions may be challenging, it is clear that the effort to involve the national and local agencies will, in the long term, pay off. National water agencies are much more likely to be around for many years, long after the Awardee is gone. If there is going to be any follow-up to what was accomplished under Title II WASH programs, local agencies need to be involved.
249 Laminou, Attaou Mahaman. February 23, 2011. Personal communication.
7.3.10 Integrating Water, Sanitation, and Hygiene within Title II Development Programs
How well WASH activities were integrated with other Title II program components, including AG/NRM, HN, and EPDM, can be best appreciated in the field. In the programs visited, it was clear to the observer that field personnel would meet periodically to make sure that visits to target population communities would be as efficient as possible and include as many members of the team as feasible. Hygiene education activities were often combined with other training events to take advantage of members of the community gathering in a specific place. Another example was the use of wells for both irrigation and domestic water when it made sense to do so. This type of integration was more difficult in some programs, because different villages would be participating in different interventions. While in some cases this fragmentation of interventions could not be avoided, the synergy obtained from a variety of interventions in one community produces a benefit that is not possible with single interventions.
7.3.11 Water and Sanitation Infrastructure Outputs
It is surprising that only 18 of the 31 programs in the FAFSA-2 WASH universe (58 percent) included water and sanitation infrastructure targets in their proposals and reported on them. Only 8 of the 18
Table 7.6. Intensity of the Relationship between Title II Programs and Host Government WASH Agencies
Category Description of the Relationship
Number of Programs in
Category
Percent of Programs in
CategoryNegligible Little or no interaction with host government WASH agencies. 12 39
Moderate Occasional TA, encounters, meetings. Perhaps help in drilling wells, identifying a potential contractor, etc.
7 22
Intense Total involvement on the part of the host country WASH agency, be it a municipal government or a national water agency. May include monetary or in-kind contributions to projects. Inclusion in national or local programs. May involve agreement to follow-up on operation and maintenance of the project’s water and sanitation systems.
12 39

7-16 Water, Sanitation, and Hygiene
(26 percent of all projects reviewed or 44 percent of the projects with targets) met their targets (see Table 7.7). Despite these reporting issues, the review of program documents by the FAFSA-2 revealed that Awardees constructed a significant amount of water and sanitation infrastructure, benefiting a large number of people (see Table 7.8). However, performance was not even across Awardees and programs. More specifically, only 37 percent of the programs account for all of the water systems constructed, and 59 percent of the latrines were constructed in one program—SC/Bangladesh (FY 2005–FY 2010).
7.3.12 Outcomes of Water, Sanitation, and Hygiene Interventions
Evolution of Indicators. The indicators recommended or required by USAID/FFP and measured by Awardees to monitor and evaluate Title II WASH activities evolved considerably over the FAFSA-2 time period. From 1999 to 2007, the indicators most commonly used to measure the results of Title II WASH activities were those recommended by FANTA (Billig et al., 1999). These were classified as “impact indicators” and “monitoring indicators” as described in Box 7.6 and Box 7.7. In current parlance, all the indicators in these two boxes would be called “outcome indicators” and not “impact indicators,” except “prevalence of diarrhea in children under 36 months.” For the first time in 2007, USAID/FFP established required “monitoring indicators” for health behavior change to be used in Title II Programs with WASH activities as follows: “percent of caregivers demonstrating proper (1) personal hygiene behaviors, (2) food hygiene behaviors, (3) water hygiene behaviors, and (4) environmental hygiene behaviors” (FFPIB 07-02, USAID/FFP, 2007). Because these new reporting requirements were issued well into the life of most of the programs reviewed in the FAFSA-2 and were only required for programs that began in FY 2007 or later, they did not apply in most cases.
Standard outcome indicators were revised by USAID/FFP in December 2011 as shown in Table 7.9, superseding earlier guidance (FFPIB 11-03, USAID/FFP, 2011). The revised WASH indicators apply only to Title II development programs awarded in FY 2011 or later, and are not relevant to this assessment. Regrettably, these new indicators do not include one that measures the impact of WASH activities on preventing/reducing diarrhea in children 0–35 months of age.
Outcomes. Seventeen (55 percent) of the 31 programs in the FAFSA-2 WASH universe used at least one of the FANTA-recommended WASH “impact indicators” (see Box 7.6). Fifteen (88 percent) of these programs achieved improvements between the baseline and final
Table 7.7. Water and Sanitation Infrastructure Target-Setting and Achievement in Title II Development Programs
Number of Programs
Percent of Programs
Programs that set infrastructure targets and met them
8 26
Programs that set infrastructure targets and did not fully meet them
10 32
Programs that did not set infrastructure targets and did not build anything
6 19
Programs that did not set infrastructure target but did build something
7 23
Table 7.8. Types and Beneficiaries of Water and Sanitation Infrastructure Constructed by Title II Development Programs
Infrastructure TypeNumber
ConstructedEstimated
Beneficiaries
Water systems 570 228,000
Wells 3,277 98,310
Latrines 65,822 394,932

7-17Water, Sanitation, and Hygiene
Box 7.6. Recommended WASH Impact Indicators (FANTA, 1999)• Percentage of children under 36 months with diarrhea in the last two weeks, where “diarrhea” is
defined as more than three loose stools passed in a 24-hour period.
• Quantity of water used per capita per day, where all the water collected or delivered to the household and used for personal purposes is considered.
• Percentage of child caregivers and food preparers with appropriate handwashing behavior, where “appropriate handwashing” includes the four critical times at which this needs to be done and the technique used.
• Percentage of population using hygienic sanitation facilities, where “sanitation facility” is defined as an excreta disposal facility, typically a toilet or latrine, and “hygienic” means that there are no feces on the floor or seat and there are few flies.
Source: Billig et al., 1999.
Box 7.7. Recommended WASH Monitoring Indicators (FANTA, 1999)• Percentage of households with year-round access to improved water source, where “access” means
either direct connection to the home or a public facility within 200 meters of the home.
• Percentage of households with access to a sanitation facility, where “sanitation facility” is defined as an excreta disposal facility, typically a toilet or latrine, and “access” means that the household has a private facility or shares a facility with others in the building or compound.
• Percentage of recurrent costs for water supply services provided by the community served, where “recurrent costs” refers to the full operating and maintenance costs of the water supply system that serves the community, including preventive maintenance and repairs. The numerator for this indicator is monthly recurrent costs paid by the community for water supply services, and the denominator is total monthly recurrent costs for water supply services.
• Percentage of constructed water supply facilities maintained by the communities served, where “constructed facilities” refers to those established by the NGO or project.
Source: Billig et al., 1999.
Table 7.9. 2011 Revised USAID/FFP Standard WASH IndicatorsIndicator Number
Applicable to Development Programs that Aim to: Outcome Indicator Title
9 Increase access to potable drinking water
Percentage of households using an improved drinking water source
10 Increase access to improved sanitation facilities
Percentage of households with access to an improved sanitation facility
11 Improve hygiene practices Percentage of households with children 0–23 months that have water and soap or locally available cleaning agent at a handwashing place
Source: FFPIB 11-03 (Reissued), December 20, 2011.

7-18 Water, Sanitation, and Hygiene
evaluation surveys. CRS/Liberia, for example, achieved an increase in handwashing before food preparation from 43 percent at baseline to 70 percent at endline four years later.
Nineteen programs (61 percent) used at least one of the FANTA-recommended WASH “monitoring indicators” (see Box 7.7). All nineteen (100 percent) showed improvements in their chosen indicators between their baseline and final evaluation surveys. On average, 16 programs increased access to an improved water source by 23 percentage points. Some of the results were quite impressive. For example, in the CARE/Bolivia program, “access to safe drinking water” increased from 34 percent to 83 percent and “access to an improved latrine” increased from 0 percent to 76 percent in their target areas. Increases in “access to an improved water source” achieved by the Title II programs reviewed with data are shown in Table 7.10. CARE/Sierra Leone and CRS/Kenya raised the proportion of their target populations with access to an improved water source between their baseline and final evaluation surveys from 0 percent to 19 percent and 87 percent, respectively, which is impressive.250
7.4 Cross-Cutting Issues and Opportunities
Country-level Awardee offices appear to have highly motivated staff willing to take on the challenges inherent in implementing a food security program. They also seem to have a good grasp of the special circumstances of the country where they are working. Resolving the following issues common to a number of programs would present an opportunity to improve performance.
• Hesitancy to implement WASH projects. A number of Awardees appear to have been reluctant to include WASH activities in their programs, especially infrastructure, for many of the same reasons described in Section 5.5.1, such as the additional technical staff required to construct
250 Section 6.3.2.5 reports on measurement of hygiene improvement indicators and the results in Title II MCHN programs.
quality potable water systems and the technical complexity of such systems. There is a need to probe into why this is the case and to remove barriers that preclude Awardees from doing more water and sanitation infrastructure in Title II development programs.
• Start-up delays. Many programs had significant start-up delays, including problems with food shipments, monetization, and delays in the arrival of appropriate personnel in-country. While these delays are not unique to programs with WASH and have been discussed elsewhere in this report, they are particularly problematic for construction activities and meeting infrastructure targets. Either an allowance of extra time to provide for
Table 7.10. Increases in the Percent of Target Populations with Access to an Improved Water Source in 16 Title II Programs in the FAFSA-2 WASH Universe between Baseline and Final Evaluation Surveys
Surveys
Baseline Final
Guatemala/CRS 4 12
Sierra Leone/CARE 0 19
Madagascar/CARE 28 27
Kenya/CARE 34 49
Ethiopia/CRS 22 58
Bolivia/FHI 30 67
Indonesia/CRS 59 74
Honduras/ADRA 71 75
Bolivia/ADRA 58 77
Guatemala/CARE 49 80
Bolivia/CARE 34 83
Guatemala/SC 74 85
Kenya/CRS 0 87
Bolivia/SC 59 88
Bangladesh/SC 95 99
Bangladesh/CARE 97 100

7-19Water, Sanitation, and Hygiene
initial delays or a downward adjustment in targets needs to be made, recognizing that one to two years are likely to be lost in project start-up.
7.5 Conclusions and Recommendations
7.5.1 Conclusions
• Access to improved water sources by target populations consistently increased between the baseline and final evaluation surveys of Title II programs that constructed water infrastructure.
• A high percentage of the programs used at least one of the 1999 FANTA-recommended WASH “monitoring indicators” (61 percent) or “impact indicators” (55 percent). Among programs that evaluated these indicators, all achieved improvements in monitoring indicators and 88 percent achieved improvements in impact indicators. Sixteen programs increased access to an improved water source by an average of 23 percentage points.
• A significant amount of water and sanitation infrastructure was constructed by Title II programs.
• With some exceptions, most of the hand pumps provided to the communities were appropriate in that maintenance was generally simple and spare parts were readily available.
• The “level of service” for water and sanitation infrastructure was generally acceptable. Thirteen percent of the programs, however, provided infrastructure that was below the minimum acceptable Level I. The success of many LAC Title II programs demonstrated that there are many feasible strategies to provide Level II services.
• Ninety-four percent of the Title II programs with WASH interventions created and trained VWCs. This very important step greatly improved the likelihood of successful operation and maintenance once the Title II programs ended.
• Many Awardees appear to include water and sanitation infrastructure in their Title II programs only reluctantly. This may be due to a fear to commit to a program in which the potential Awardee is not experienced or uncertainty about whether sufficient funds will be available. More information from Awardees on the barriers is needed.
• While 39 percent of the Title II programs doing WASH had a close working relationship with host country organizations, most programs did not, which reduces the likelihood of long-term sustainability and impact.
• Many WASH activities were not well integrated within communities. Water and sanitation infrastructure appeared to be scattered randomly, with one community getting a well and another a few latrines. Few programs had a comprehensive plan to solve the overall environmental health problem in each of their intervention communities.
• Awardees also neglected to take advantage of specific opportunities to intervene. For example, in a village in Niger, where water scarcity is a major concern, the Awardee fully rehabilitated a well and brought it up to satisfactory standards, but did not rehabilitate the other well in the village, which was totally unprotected and
Box 7.8. WASH Policy Implications
To maximize the health and nutritional impact of Title II development resources, more programs should deliver an integrated WASH package in more communities by:
• Assessing needs
• Forging alliances to increase funding
• Improving the level of service to Level II
• Measuring the impact on diarrhea prevalence

7-20 Water, Sanitation, and Hygiene
obviously contaminated, but nevertheless used for drinking water. A very small expenditure would have left the community with its two wells fully meeting Level I standards.
• Budget allocations to WASH activities are very low considering that a main objective of the Title II program is to diminish undernutrition and the relationship between WASH, diarrhea, and undernutrition is well established.
• There seems to be a limited understanding among many Awardees of the importance of WASH activities at the time proposals are developed and during the initial stages of project implementation.
• Communities involved in Title II WASH activities appeared to be eager to make great efforts to improve their community environment for better health.
• Program WASH personnel in the field were highly motivated and appeared to have good relationships with their communities.
• Health educators appeared to have the right tools to promote hygiene. The availability of a variety of proven methodologies and innovative technologies, such as the tippy tap, facilitated implementing adequate hygiene education components in Title II programs.
7.5.2 Recommendations
• USAID/FFP should strongly encourage in RFAs that potential Awardees include integrated WASH activities in their applications to elevate communities’ water and sanitation infrastructure to Level II; make the case that integrated WASH services are essential for reducing diarrhea, undernutrition, and food insecurity; and furthermore, urge applicants to thoroughly analyze and provide the most cost-effective WASH alternatives to achieve the best health and nutrition results. (Recommendation 42)251
251 The numbers after certain recommendations are the same as those assigned to the major recommendations in the FAFSA-2 summary report.
• USAID/FFP should consider making WASH activities a separate specific result.
• USAID/FFP should require Awardees to assess the water and sanitation infrastructure situation in every program community, make an inventory, and prepare a plan for closing the gaps. This could include:
− Taking advantage of what is already there
− Identifying organizations as partners that are already working in the area
− Seeking other funding sources and establishing partnerships to close the gaps
(Recommendation 43)
• USAID/FFP should, as a rule, require Awardees to work in close collaboration with host country governments.
• USAID/FFP should strongly encourage Awardees to form alliances with partners working in water and sanitation to increase funding and coverage, including:
− Host government agencies
− Other NGOs, bilateral aid agencies, international organizations, and the private sector
− Other USAID projects
(Recommendation 44)
• USAID/FFP should require that impact on reducing diarrhea prevalence in children under 36 months of age be evaluated in Title II WASH activities. (Recommendation 45)
• USAID/FFP should probe into the barriers to Awardees constructing water and sanitation infrastructure and ways to overcome them, with the assistance of the TOPS project. It would be helpful if TRM for doing WASH in Title II programs could be made available to Awardees by the TOPS project or USAID/FFP.
• Awardees should avoid using FFW to pay for community labor to construct water and sanitation

7-21Water, Sanitation, and Hygiene
infrastructure. This practice denies villagers the opportunity to make a significant, sacrificial contribution that will foster a deeper sense of ownership in their water and sanitation systems. (Recommendation 46)
• Awardees should set and report on numerical targets for water and sanitation and establish monitoring systems. (Recommendation 47)
Bibliography for Chapter 7Billig, Patricia; Bendahmane, Diane; and Swindale, Anne. 1999. “Water and Sanitation Indicators Measurement Guide.” http://www.fantaproject.org/downloads/pdfs/watsan.pdf.
Brown, Kenneth H. 2003. “Diarrhea and Malnutrition.” Journal of Nutrition. Vol. 133, No. 1, p. 3285.
Catholic Relief Services, East Africa Regional Office. 2005. Guidelines for the Development of Small-Scale Rural Water and Sanitation Projects in East Africa. Nairobi, Kenya: CRS.
Chambers, Robert and Bongartz, Petra. 2009. “Beyond Subsidies: Triggering a Revolution in Rural Sanitation.” http://opendocs.ids.ac.uk/opendocs/handle/123456789/497.
Fiebelkorn, Amy P. et al. 2012. “Systematic Review of Behavior Change Research on Point-of-Use Water Treatment Interventions.” Social Science and Medicine. Vol. 75, No. 4, pp. 622-33.
Hunter, Paul R.; MacDonald, Alan M.; and Carter, Richard C. 2010. “Water Supply and Health.” PLoS Medicine. Vol. 7, No. 11, e1000361.
Hygiene Improvement Project. 2011. USAID Hygiene Improvement Project (2004–2010): End of Project Report. Washington, DC: AED.
International Rescue Committee (IRC) WASH Library. 2009. “Low-Cost Hand-Washing Technology.” http://www.IRC.nl/page/13215.
Kar, Kamal and Pasteur, Katherine. 2005. Subsidy or Self Respect? Community Led Total Sanitation. Brighton: Institute for Development Studies.
McJunkin, F. Eugene. 1982. Water and Human Health. Washington, DC: USAID.
Rohde, Jon Elliot. 1984. “Selective Primary Health Care: Strategies for Control of Disease in the Developing World. XV. Acute Diarrhea.” Reviews of Infectious Diseases. Vol. 5, No. 6, p. 840.
UNICEF and WHO. 2010. Progress on Sanitation and Drinking Water: 2010 Update. Geneva: UNICEF/WHO.
USAID/FFP. 2005. Strategic Plan for 2006–2010. Washington, DC: USAID.
USAID/FFP. 2007. “New Reporting Requirements for Food for Peace.” FFPIB 07-02.
USAID/FFP. 2011. “Revision to Food for Peace Standard Indicators Collected in Baseline Surveys and Final Evaluations (Reissuance).” FFPIB 11-03 (Reissued).
U.S. Department of State. 2009. Senator Paul Simon Water for the Poor Act: Report to Congress. Washington, DC: U.S. Department of State.
WHO. 2011. PHAST Step-by-Step Guide. A Participatory Approach for the Control of Diarrheal Diseases. Geneva: WHO.

8-1
Second Food Aid and Food Security Assessment (FAFSA-2)
8. HIV
Abstract
HIV activities were implemented by 41 Title II development programs in 20 countries. Nearly all of these programs were in Africa, where half of all programs in the FAFSA-2 universe had HIV components. HIV programming evolved significantly during the FAFSA-2 time frame, spurred by an exponential increase in donor resources, most notably PEPFAR, with major advances in access to and quality of prevention, counseling, testing, treatment, and care, including nutrition support. However, nearly all Title II programs reviewed were designed without the benefit of the increased resources and more recent knowledge and experience on what works, because 85 percent of them began in FY 2005 or earlier. The main HIV intervention in 78 percent of the programs reviewed was SBCC to prevent HIV transmission by reducing high-risk sexual practices. Fourteen of the programs that worked on HIV prevention measured behavior change and half of these programs reported reducing high-risk practices. Nineteen programs did direct food distribution in 10 countries, primarily to PLHIV, HIV-affected households, orphans and vulnerable children (OVC), TB cases, and other vulnerable households for short-term food insecurity mitigation. With few exceptions, there were no specific objectives or results reported beyond the number of food recipients. Coverage of food recipients with livelihood strengthening and protection interventions was very low, with little focus on achieving long-term solutions to food insecurity. Title II development programs need to move beyond short-term mitigation and implement effective and sustainable long-term solutions to food insecurity in the context of HIV. In FY 2009, US$21.1 million was spent on Title II HIV activities, reaching 514,169 beneficiaries; this represents approximately 7 percent of the total cost of Title II development programs. Nearly all of these resources supported HN or AG/NRM interventions, with only 7 percent of the US$21.1 million attributed to VGF. The policy implications of the HIV assessment are provided in Box 8.4 and the conclusions and recommendations are provided in Sections 8.6.1 and 8.6.2.
8-2 HIV
8.1 Introduction
8.1.1 Policy and Program Environment
Recognition of the importance of nutritional management of HIV grew by leaps and bounds during the FAFSA-2 time frame, as did the delivery science of HIV interventions (FANTA, 2004; World Bank, 2007). At the time of the first FAFSA, the USAID/FFP focus on HIV was via direct food distribution for humanitarian assistance or general relief. Starting with its FY 2002 Proposal Guidelines, USAID/FFP broadened the definition of HIV activities it would support to include AG, MCH, or other sector(s) where: (1) HIV/AIDS is a critical constraint to food security, (2) direct and measurable impact on food security in that sector can be achieved, (3) primary USAID/FFP input is food distribution, and (4) integration with HIV/AIDS activities and service providers funded by others can be maximized.252 With the issuance of its Strategic Plan in 2005, USAID/FFP called for activities “to help prevent, treat and mitigate the impact of chronic diseases such as HIV/AIDS and TB” (see Table 8.1). From FY 2006 onward, the USAID/FFP Proposal Guidelines stressed tightening the targeting of food rations to ensure that HIV-infected people and HIV-affected households assisted with Title II resources were indeed food insecure. That year, USAID/FFP introduced the requirement to separately track and report Title II resources and beneficiaries for HIV activities.
Two major developments during the FAFSA-2 time period were the launchings of PEPFAR and the Global Fund, which together greatly increased the resources available to address HIV. Through PEPFAR, which began in 2003 and was reauthorized in 2008, and the Global Fund, billions of dollars of assistance to HIV programs in developing countries have expanded access to PMTCT and NACS. Co-programming using PEPFAR funds for services and Title II food aid for direct mitigation and strengthening of food and livelihood security
252 USAID/FFP annual Proposal Guidelines for FY 2002 through FY 2005.
of PLHIV and affected households was first recommended in the FY 2006 USAID/FFP Proposal Guidelines. The USAID/FFP and PEPFAR HIV and Food Security Conceptual Framework, issued in 2007 for guidance on coordinating activities with mutual objectives, encouraged Title II programs to provide food and livelihood assistance to HIV-affected vulnerable families, while PEPFAR dedicated its resources to food and nutrition support, including provision of specialized food products at the clinic level for specific priority target groups.253 The extent to which USAID and its implementing partners were able to co-program Title II and PEPFAR resources is discussed later in this chapter.
8.1.2 Methods
The FAFSA-2 HIV reviewer employed the same methods used to review the Title II-supported MCHN activities described in Chapter 6. Most of the assessment was based on reading 287 program documents and using a specially designed Excel spreadsheet to tabulate the results (see Box 8.1 for limitations of the review).
This chapter covers primarily Title II HIV HN and VGF activities. Livelihood strengthening and protection interventions, which are critical to achieving sustainable solutions and helping PLHIV and their household members successfully exit from receiving food aid, were integrated with supplementary feeding for PLHIV in a number of programs reviewed. Therefore, they are also discussed. The interventions and approaches used and the outcomes and impact achieved by Title II programs are presented. A brief summary of the state of the art of interventions and approaches to which the Title II programs were compared is also described. Finally, this chapter identifies issues and opportunities for program improvement and provides conclusions and recommendations.
253 The PEPFAR target groups for nutrition support or supplementary feeding are: (1) orphans and vulnerable children (OVC) born to an HIV-infected parent, (2) HIV-positive pregnant or lactating women in PMTCT programs, and (3) adult patients in antiretroviral therapy and care programs with a BMI < 18.5 (PEPFAR, 2008).

8-3HIV
Table 8.1. Illustrative Activities from the 2006–2010 Strategic Plan Related to Sub-IR 2.1, Human Capabilities Protected and Enhanced
Illustrative Activities: To help prevent, treat, and mitigate the impact of chronic diseases, such as HIV/AIDS and TB
Non-Food Assistance Food Assistance
The Title II program:
• Incorporates HIV/AIDS prevention education as a cross-cutting theme in community-level activities.
• Provides training to village health workers and caregivers in home-based care and support, including preventing mother to child transmission (PMTCT) of HIV/AIDS.
• Provides training and supports the implementation of community-based nutrition recuperation programs.
• Coordinates with HIV/AIDS service providers to increase access to critical HIV/AIDS services such as voluntary testing and counseling and antiretroviral therapies.
• Educates women with HIV/AIDS about appropriate breastfeeding practices to prevent mother to child transmission.
The Title II program:
• Provides food as an incentive for people to get tested for HIV/AIDS and to get counseling.
• Provides food transfers as part of home-based care services.
• Provides food as part of community-based nutrition recuperation programs.
• Provides food as an incentive for Directly Observed Treatment, Short-Course (DOTS) of TB patients.
Source: This table is taken verbatim from the USAID/FFP Strategic Plan (2005, p. 66).
Box 8.1. Limitations of the FAFSA-2 Review of HIV Components of Title II Programs
The completeness and accuracy of this assessment are dependent on the completeness and accuracy of the program documents and results data reported by Awardees. The reviewer was unable to verify the quality of the reported evaluation data or conduct new re-analysis of survey datasets. However, when survey limitations were reported, the problems were documented and the data were not used. Indicators that measured knowledge instead of actual practice at the highest outcome level were eliminated from the review of results. The Title II reports had more information on what interventions and approaches were implemented and the results achieved than on how programs were designed and implemented; the quality of implementation; or the extent of coverage, participation, or exposure of the beneficiaries to the interventions. This review could have been improved by having more information to explain why certain results were or were not achieved and to describe program models. The FAFSA-2 team was able to observe the quality of service delivery during field visits to HIV activities in two ongoing programs in two countries.

8-4 HIV
8.2 Basic Facts about Programs Addressing HIV in the FAFSA-2 Universe
8.2.1 Projects and Countries
The number of programs using Title II resources to address the impact of HIV increased during the FAFSA-2 time frame. During this period, 41 Title II development programs included HIV interventions in 20 countries: 34 of these programs were in Africa, 7 in LAC, and none in Asia. (See Table 1.3 for the list of the 41 programs reviewed.) In Africa, 76 percent of the Title II programs with a significant HN component (26 of 34) also included HIV interventions.
Eighty-five percent of the programs reviewed started in FY 2005 or earlier, well before the importance of comprehensive nutrition care for PLHIV and approaches to providing it were well understood. Nearly half started in FY 2003 or earlier, before PEPFAR funding became available to address the epidemic. Of the 15 focus countries in the first phase of PEPFAR (FY 2003–FY 2008), which coincided with the FAFSA-2 time frame, 7 countries had a combined total of 20 Title II programs with HIV components (Ethiopia, Haiti, Kenya, Mozambique, Rwanda, Uganda, and Zambia), but most of these programs started before PEPFAR. In the current Phase II of PEPFAR (FY 2009–FY 2013), the
number of countries receiving PEPFAR assistance has more than doubled, whereas the list of USAID/FFP focus countries has been shortened. Given the differences between PEPFAR and USAID/FFP focus country lists, there is now potential for Title II and PEPFAR to converge in only six countries (DRC, Ethiopia, Haiti, Malawi, Mozambique, and Uganda).
8.2.2 Resources, Technical Sectors, and Beneficiaries
In the FAFSA-2 analysis of the FY 2009 Tracking Tables, 18 awardees (40 percent) reported HIV components using 26,245 MT of Title II commodities to reach 514,169 beneficiaries at a total annual cost of US$21.1 million.254 Funding for Title II HIV interventions reported that year represented 6.7 percent of the total cost of Title II development programs. Nearly all of these resources supported activities for PLHIV and HIV-affected households in the HN or AG/NRM technical sectors (46 percent each), with only 7 percent of the US$21.1 million attributed to VGF (see Table 8.2). Awardees attributed two-thirds of the more than half a million HIV beneficiaries reached in FY 2009 to HN activities, 18 percent to VGF, and only 13 percent to AG/NRM.
254 This excludes FY 2009 Title II PM2A research programs in Burundi and Guatemala, which were just beginning in late FY 2009, and the Afghanistan program, because they are not part of the FAFSA-2 universe.
Table 8.2. HIV Activities: Technical Sector Distribution of Commodities Used and Beneficiaries Reached in Title II Development Programs in FY 2009*
Technical SectorCommodities
for HIV (Percent)HIV Beneficiaries
Number PercentHealth and nutrition 45.8 352,607 68.6
Sustainable agricultural production/natural resources management 45.7 68,116 13.2
Vulnerable group feeding 7.2 92,672 18.0
Emergency preparedness and disaster management 1.2 0 0.0
Non-agriculture 0.0 774 0.2
Education 0.1 0 0.0
TOTAL 100.0 514,169 100.0* The FY 2009 data presented exclude Title II PM2A research programs in Burundi and Guatemala, which were just beginning in late FY 2009, and the Afghanistan program, because they are not part of the FAFSA-2 universe. Data come from the FY 2009 Resources and Beneficiaries Tracking Tables in the ARRs submitted to USAID/FFP by Title II Awardees.

8-5HIV
Title II HIV work was underreported and underrepresented. In FY 2010, not one Mission reported Title II resources under the HIV/AIDS “F” Program Element, despite the fact that a number of Title II programs worked on HIV prevention and home-based care and support, and provided direct food distribution to PLHIV and orphans and vulnerable children (OVC).255
In 2011, USAID/FFP revised its annual reporting guidance to include 14 “F” program elements, one of which is HIV/AIDS. These are now aligned with the Foreign Assistance Framework and should better capture the important role of Title II programs in USG HIV programming than did the previous reporting system that used technical sectors unique to USAID/FFP. With the aim of giving Title II the credit it deserves for contributing to U.S. foreign assistance objectives, Table 8.3 documents the interventions supported using the standard “F” sub-elements under the HIV/AIDS Program Element.
8.3 Program Approaches and Interventions
Prevention, counseling and testing, treatment, and care are the main health interventions of HIV programming worldwide. Support for the needs of OVC affected by HIV is another priority. Equally important is supplementary feeding using food
255 The FY 2010 rack-up of Title II reporting by “F” program elements shared with the FAFSA-2 team by USAID/FFP illustrates this underrepresentation of Title II. This underreporting is similar to that in Title II MCHN programs, as discussed in Section 6.2.2.
assistance directly to help meet the nutritional needs of PLHIV and to strengthen their food and livelihood security (FANTA, 2004; FANTA and WFP, 2007; PEPFAR, 2006). Table 8.3 lists the HIV interventions implemented in the 41 Title II programs reviewed, namely, prevention of sexual transmission, food rations for adult care and support and OVC, and HIV counseling and testing (HCT).
FAFSA-2 found that the focus of the 41 Title II programs reviewed was on HIV and not on other chronic diseases, though a number of programs targeted individuals infected with and households affected by “chronic illness” as a proxy for HIV. Some programs provided food aid to people with TB, identified by HIV or broader chronic illness eligibility criteria. However, the only program that stated it worked to increase treatment for TB using Directly Observed Treatment, Short-Course (DOTS) was CRS/Ethiopia (FY 2003–FY 2008). None of the programs reported working directly on PMTCT, but a number of programs promoted use of PMTCT services as part of their educational activities.
8.3.1 Prevention of Sexual Transmission of HIV
The principal HIV intervention assisted by Title II programs was prevention of sexual transmission using SBCC and “ABC” messages.256 Prevention is the most cost-effective response to public health problems. Therefore, this emphasis in Title II
256 The ABC approach to HIV prevention promotes the following safe sex practices: Abstain from sex until marriage, Be faithful to your partner (or reduce the number of partners), and Consistently and correctly use condoms.
Table 8.3. HIV Interventions in Title II Programs in the FAFSA-2 Universe and Their Contribution to Program Element 3.1.1 HIV/AIDS of the U.S Foreign Assistance Program Area 3.1 HealthHIV/AIDS Sub-Element Number of Programs Percent of Programs (N = 41)Sexual Prevention*:
3.1.1.2 Abstinence/Be Faithful
3.1.1.5 Other Sexual Prevention
32 78
3.1.1.6 Adult Care and Support (Food Rations) 19 46
3.1.1.8 Orphans and Vulnerable Children (Food Rations) 12 29
3.1.1.9 Counseling and Testing 2 5* It is not possible to disaggregate sexual prevention by sub-elements 3.1.1.2 and 3.1.1.5 from the available documentation.

8-6 HIV
programs was appropriate and consistent with the USAID/FFP Strategic Plan Illustrative Activity to incorporate HIV/AIDS prevention education as a cross-cutting theme in community-level activities (see Table 8.1). Most programs with an HIV component (78 percent) implemented SBCC to prevent HIV. However, Awardees not providing direct food distribution to PLHIV tended not to attribute Title II resources to this HIV prevention work in their annual reporting Tracking Tables.257 They may have mainstreamed SBCC for HIV prevention into other health education activities. The programs used awareness-raising, mobile cinema, theater forums, computer literacy classes, radio broadcasts, peer education, and peer counseling to disseminate HIV prevention messages and to promote participation in HCT and PMTCT.
Outcomes. While participants in a number of programs increased their knowledge of the causes of HIV and how to prevent it, indicators of improved practices are more important. One-half of the 14 programs that had outcome indicators on reducing high-risk sexual practices for HIV transmission achieved improvements in these HIV prevention practices. Unfortunately, given the heterogeneity of indicators measured, it is impossible to report overall quantitative results here.
8.3.2 HIV Counseling and Testing
While a number of programs promoted HCT as part of their HIV prevention strategy, only two programs worked directly to increase use of HCT. The ACDI/VOCA/Rwanda FY 2005–FY 2010 program, with ACDI/VOCA’s partner, Africare, in the lead, trained staff at seven public HCT centers. Africare also provided HCT through a mobile clinic as well as a stationary center.258 SC/Uganda offered mobile HCT on a small scale.
257 This may be because USAID/FFP expressed, in its FY 2006 through FY 2010 Proposal Guidelines, its preference for using Title II monetization resources for “direct food security mitigation or intervention to strengthen food and livelihood security for those affected by HIV/AIDS rather than for HIV/AIDS prevention or education programs.”258 The latter was started earlier under Africare’s USAID-funded sub-agreement with Family Health International.
Outcomes. The only outcome reported was in the ACDI/VOCA/Rwanda program in which 72,866 people received HCT (nearly twice the target).
8.3.3 Supplementary Feeding for PLHIV, OVC, TB Cases, and Other Vulnerable People
The term “supplementary feeding,” as used in the FAFSA-2, refers to direct distribution of Title II food rations to individuals infected with and households affected by HIV.259 Food rations are intended to supplement the diet and may include cereal and legume staples, vegetable oil, or FBF. Although Title II supplementary feeding for HIV is a form of nutrition support, it should not be confused with the narrower definition of “nutrition support” used in PEPFAR programs. Introduced by PEPFAR in the latter part of the FAFSA-2 time period, nutrition support refers mainly to providing RUTF or other specialized food products to malnourished PLHIV for therapeutic feeding. This was not done in the Title II programs reviewed.
Adequate dietary intake is a challenge for PLHIV because of the increased energy needs created by HIV; micronutrient deficiencies precipitated by HIV and opportunistic infections; HIV-related symptoms and frequent diarrhea that interfere with appetite, digestion, absorption, and metabolism; and the difficulty of remaining economically productive and accessing sufficient food. The increased availability of antiretroviral therapy (ART) has resulted in a better understanding of the difficulty that patients face in complying with drug regimens without sufficient food (FANTA, 2004). Food security and HIV are linked in a bidirectional relationship. Food insecure PLHIV are less able to meet their nutrient requirements to stay healthy with HIV, and energy- and resource-depleted PLHIV are less able to produce food or earn income. Thus, food assistance is important in effective HIV care, treatment, and food insecurity mitigation.
259 This should not be confused with the narrower use of this term in CMAM to refer only to providing supplementary foods to recuperate children with MAM (low weight-for-height).

8-7HIV
Supplementary feeding in the context of HIV can be used either (1) for nutrition support for care and treatment programs or (2) as a safety net for social protection and food insecurity mitigation. Nutrition support to PLHIV uses food assistance to enable PLHIV in food insecure households to participate in treatment, increase adherence to treatment, and help prevent or treat undernutrition (World Bank, 2007). The performance of Title II supplementary feeding for HIV nutrition support or safety nets should be reviewed in the context of the current state of the art, which is summarized briefly here.
Since 2006, PEPFAR has contributed a great deal to the knowledge and experience base on how to use food assistance cost-effectively for nutrition support to PLHIV in order to save the most lives, an approach initially referred to as “Food by Prescription” (FBP) and first introduced in Kenya. Program implementers have learned that while distributing food to treat undernutrition (nutrition support) is often the most visible intervention that attracts the most attention, nutrition assessment and counseling are equally important components that need to be firmly established before prescription of specialized food products is rolled out. PEPFAR now considers an integrated approach known (since 2010) as NACS to be an essential standard of care (PEPFAR, 2011).
In the NACS approach, nutrition assessment includes anthropometric measurements and clinical assessment to identify individuals with weight loss or wasting, which are independent risk factors for HIV progression and mortality,260 and assessment of biochemical, dietary, and food security parameters. Both clinic- and community-based providers can do anthropometric, clinical, and dietary assessment, while biochemical assessment is done in clinics and food security assessment is usually done in the community. Nutrition counseling is tailored to the results of the nutrition assessment and includes determining enablers and barriers to
260 Taken from “A Wholesome Approach: Nutrition and HIV/AIDS.” http://transition.usaid.gov/our_work/global_health/aids/TechAreas/caresupport/nutrition.html. Accessed October 19, 2012.
optimal behaviors and counseling on diet, treatment adherence, WASH, IYCF and other positive living behaviors. Nutrition support at the clinic level includes provision of therapeutic food to treat SAM (extreme thinness or wasting) and FBF to clients with MAM, micronutrient supplements, and point-of-use water treatment products. Nutrition support at the community level includes food assistance, economic strengthening, and livelihood services such as those supported by Title II to improve food security.
PEPFAR prioritizes food assistance for those groups for whom it will have greater impact on reducing undernutrition, mortality, and HIV progression and transmission, and will likely be more cost-effective. PEPFAR food assistance targets: (1) HIV-exposed infants from 6 to 23 months (irrespective of anthropometric status); (2) underweight pregnant and lactating women in PMTCT programs; (3) OVC, including children of HIV-infected parents, with acute malnutrition; and (4) adult HIV patients with moderate or severe acute malnutrition (i.e., with a BMI < 18.5). Specialized food products “are prescribed for a limited duration on the basis of clear anthropometric entry and exit eligibility criteria or nutrition vulnerability” (PEPFAR, 2011, p. 3).
The state of the art for food assistance for safety nets in rural areas where food insecurity is widespread, such as those where Title II programs work, calls for not targeting food assistance solely to food insecure PLHIV and HIV-affected households. The reason is a likelihood of creating stigma and resentment for beneficiaries when the entire community is food insecure (FANTA and WFP, 2007). Multi-criteria targeting is recommended, using clinical, social, economic, and demographic indicators. This can be further improved using community-based targeting, which engages community members with knowledge of households in the targeting process, thereby increasing community awareness and understanding of HIV as well as ownership of the intervention. Any food assistance should be short term and part of an overall strategy that strengthens livelihood security of HIV-affected and other food insecure households to live independently in the long term. It is important not

8-8 HIV
to disrupt local markets and create disincentives to food production or create dependency (FANTA and WFP, 2007).
8.3.3.1 Characteristics and Targeting of Title II HIV Supplementary Feeding
Nineteen of the Title II HIV programs reviewed (46 percent) did direct food distribution. Several Awardees used the FANTA 2004 manual, HIV/AIDS: A Guide for Nutrition Care and Support, to determine rations and nutrition counseling to meet the nutritional needs of PLHIV. Programs strived to maintain the confidentiality of beneficiaries’ HIV status by distributing food outside the community or using associations of PLHIV to distribute food rations, rather than the Awardee distributing rations directly. Program implementers reported that empowering PLHIV through membership in associations (discussed later) and working with community leaders to reduce the stigma associated with HIV were critical to increasing participation of PLHIV. Implementers were also careful when collecting and disclosing M&E data to maintain the confidentiality of beneficiaries’ HIV status. Awardees sought to follow other “do no harm” principles for HIV food assistance, e.g., not to exacerbate community divisions, disrupt traditional safety nets and support systems, or create dependency and community resentment.
Three types of targeting were used in the 19 programs, namely, food assistance for: (1) PLHIV, TB cases, and OVC only (32 percent); (2) PLHIV, TB cases, OVC, and their households (26 percent); and (3) food insecure households, including the chronically ill, the elderly, PLHIV, TB cases, OVC, and female-headed households (42 percent) (see Figure 8.1.) Most of the programs provided food rations to all household members. Twelve programs (63 percent) benefited OVC. In those programs targeted to PLHIV that had been diagnosed as HIV-positive by clinics, local NGOs, or community associations, the ability to ensure that beneficiaries were not only HIV-positive but also the most food insecure, was limited. On the other hand, programs that used broader criteria and proxy indicators at the community level
identified households that were food insecure, but not necessarily HIV-affected.261, 262 Since ensuring that beneficiaries were food insecure emerged as a challenge in the early years of the FAFSA-2 time period, USAID/FFP began to stress in its Proposal Guidelines for HIV programming from FY 2006 onward that Title II food go to food insecure HIV-affected populations.
Unlike PEPFAR, none of the Title II programs reviewed used BMI or other anthropometric measurements of nutritional status as an entry criterion. Thus, there was no targeting of food rations specifically to underweight and malnourished PLHIV. Only in their last two program years did the Rwanda ACDI/VOCA (FY 2005–FY 2010), CRS, and WV programs use BMI > 18.5 in adults (the cutoff for moderate thinness or acute malnutrition) as a graduation criterion from supplementary feeding, and monitor relapse post-graduation of BMI < 18.5 for readmission. The late introduction
261 The CRS/Rwanda program was in the third category and did targeting based on broader vulnerability criteria. However, they did report in their final evaluation that 45 percent of those that qualified for supplementary feeding were PLHIV.262 In the CRS/Zambia and CRS/Malawi programs, the broader targeting of food insecure households had its historical roots in the beneficiary selection process used in the emergency response to drought in Southern Africa in 2003–2004 implemented by the Consortium for Southern Africa Food Security Emergency, which CRS was a member of.
Figure 8.1. Target Groups for Food Rations in Title II HIV Programs in the FAFSA-2 Universe
Vulnerable or Chronically Ill (8 Programs)
42%
PLHIV, TB, OVC Only (6 Programs)
32%
PLHIV, TB, OVC +
Households (5 Programs)
26%

8-9HIV
of BMI measurement was a result of efforts to make Title II targeting criteria consistent with those of PEPFAR in Rwanda.
In its newer follow-on Title II program in Malawi (FY 2009–FY 2014) and in Zambia (FY 2006–FY 2011), CRS has used a more systematic selection process known as “Community-Managed Targeting and Food Distribution.” This approach combines community-defined criteria with other predetermined criteria to identify the most food insecure households. This approach was also used in Kenya, South Sudan, and Tanzania and is featured in the FANTA and WFP 2007 publication, Food Assistance Programming in the Context of HIV. The first stage identifies households that are poor or very poor with limited food availability and access using the following criteria: (1) own less than two acres of land; (2) have less than three months of food stock, starting from harvest time; (3) own no livestock; and (4) do not participate in regular income-generating activities. Among households that meet at least three of those criteria, village committees then select the most vulnerable with any of the following characteristics:
• Caring for orphaned children (with both parents dead)
• Child-headed (parent or grandparent cannot play usual head of household role)
• Elderly-headed (> 60 years of age) with no other able-bodied adult members
• Chronically ill members or PLHIV
• Female-headed
• Two or more years of crop failure
The selected households are announced at a public meeting. In the CRS experience using two-phase, multi-criteria targeting in rural Southern Malawi, about 15 percent of households in the target communities qualified.
8.3.3.2 Objectives of Title II HIV Supplementary Feeding
From 2006 onward, USAID/FFP’s Proposal Guidelines called for clearly defined objectives for food assistance to HIV-affected populations. This was much needed, as corroborated by the FAFSA-2 finding that most programs with an HIV component did not have well-defined objectives for distributing food, e.g., HIV, nutrition, livelihood security, or income generation objectives. Half of the programs had no stated objective or IR to describe the purpose of providing HIV supplementary feeding. A quarter of the programs had a food insecurity mitigation objective. Three programs had the stated goals of improving health services, and care and support, including nutrition support. Food rations were not conditioned on attending health services, except in a couple of cases where being on antiretroviral drugs (ARVs) was required. Only one program had an objective of improving livelihood outcomes, and two strove to maintain or mitigate impact on the nutritional status of PLHIV and affected households.
Given the mitigation focus, the lack of clear technical sector objectives and nutritional targeting criteria, and the paucity of evaluation indicators in the programs reviewed, the supplementary feeding in nearly all of the programs is best described by USAID/FFP’s VGF technical sector, as defined in Box 8.2. However, Awardees reported most of the beneficiaries of HIV food distribution under the HN technical sector (see definition in Chapter 6, Box 6.1, and Table 8.2), and not as VGF. However, many of these programs did not belong in the HN technical sector because they did little, working directly or in partnerships, to ensure that people received HCT or that PLHIV received ARVs, NACS, and other health services. These complementary services were usually provided by the clinics and organizations that referred PLHIV for food assistance, and most Title II development programs were not proactively involved.

8-10 HIV
8.3.3.3 Nutrition Assessment, Counseling, and Support for PLHIV
Building on earlier experiences with FBP, the NACS approach has been introduced by PEPFAR programs in Côte d’Ivoire, Ethiopia, Haiti, Kenya, Mozambique, Tanzania, Uganda, and Zambia over the last several years. Title II programs with HIV components are ongoing in two of these countries—Haiti and Uganda. However, in contrast to these PEPFAR programs, the Title II programs providing supplementary feeding or nutrition support for PLHIV did not provide the complete NACS package as a practice. The component most often lacking was nutrition assessment. This was not surprising given that most Title II programs reviewed started in 2005 or earlier before FBP/NACS was introduced by PEPFAR. The three programs in Rwanda
came closest to doing NACS once they started measuring the BMI of adult supplementary feeding beneficiaries in the later years of these programs. One handicap of Title II programs in implementing NACS, compared to PEPFAR, was that they did not have access to the therapeutic foods (RUTF) required to treat SAM in adults or children, if they had diagnosed it. As USAID/FFP increases the availability of RUTF on the Title II commodity list, this will become less of a constraint. A different challenge is that therapeutic feeding is done under clinic-based protocols and Title II programs are community-based, not clinic-based. Thus, none of the Title II programs were doing therapeutic feeding for PLHIV, nor did programs report referring malnourished PLHIV to clinics for this. In contrast, PEPFAR programs are mainly clinic-based and are authorized to do local, regional, or international procurement of RUTF as well as FBF.
Counseling. The CRS/Rwanda program had an innovative approach to nutrition education through village hearth cooking demonstration sessions for vulnerable adults (not necessarily PLHIV) with BMI < 18.5 enrolled in supplementary feeding. The purpose was to teach them to cook complete, nutritious meals and to practice good hygiene. These sessions afforded the opportunity for interpersonal counseling. According to the final evaluation, the proportion of adults with low BMI decreased from 88 percent at the beginning of the sessions to 52 percent after six months, and fell further to 39 percent six months after food supplements had stopped. Examples of other programs providing nutrition counseling for PLHIV are those of CPI/Senegal and ACDI/VOCA/Uganda (FY 2007–FY 2011). The latter also provided hygiene education and did cooking demonstrations at the food distribution using recipes with CSB. In the communities, program extension workers gave classes using a manual on nutrition for PLHIV adapted from a national manual prepared by FANTA (ACDI/VOCA, 2007; Sserunjogi, 2004).
Outcomes. USAID/FFP introduced new required indicators in 2007, including “percent of PLHIV eating: (1) the recommended number of times per day, (2) the recommended number of food groups, or
Box 8.2. USAID/FFP Definition of Its “Vulnerable Group Feeding/Social Safety Net” Technical Sector
“Objectives include saving lives and providing food to low-income and other vulnerable individuals and populations who are unable to meet basic needs for survival and human dignity. Individuals may be unable to meet these needs due to an external shock, such as a natural disaster or war, or due to socioeconomic circumstances, such as age, illness, disability or discrimination. Such individuals are often dependent to some extent on outside resources to meet their basic food and livelihood needs. Activities include provision of general or supplementary on-site or take-home rations through unconditional safety nets, and food support to institutions assisting the destitute, terminally ill, or highly vulnerable children and youth.”
Source: USAID/FFP Annual Results Reporting Guidance for FY 2009.

8-11HIV
(3) the percent of caregivers using diet appropriately to help manage symptoms or side effects of medication” (FFPIB 07-02, USAID/FFP, 2007). Beginning in that year, improvements in dietary practices of PLHIV in Title II development programs with HIV activities should have been measured. However, only two of the programs reviewed measured meal frequency—ACDI/VOCA/Uganda FY 2002–FY 2006 and FY 2007–FY 2011—and they improved this indicator in both cases. Most other programs with no outcomes measured (88 percent) started before USAID/FFP introduced required indicators for HIV components of Title II programs.
8.3.3.4 Approaches Used in Title II HIV Supplementary Feeding
Associations or PLHIV support groups. In some countries, such as Rwanda, the government requires PLHIV to belong to associations to receive services. In the ACDI/VOCA/Rwanda program (FY 2005–FY 2010), its partner Africare formed 35 such associations, many of which were consolidated into registered cooperatives. Africare/Burkina Faso also worked through community HIV associations to deliver services and required supplementary feeding beneficiaries to be members of associations. SC/Uganda formed livelihood support groups where PLHIV received assistance. WV/Ethiopia reported that in its FY 2003–FY 2008 program, the most successful component was community mobilization of PLHIV. The program organized Community Care and Coalition committees to raise money for OVC and PLHIV and their families and for self-care community support groups.
In Ghana, CRS safety net food rations played a key role in motivating PLHIV to join community associations. In the OICI/Ghana program, the majority of PLHIV served belonged to community associations whose primary purpose was care and support. The program got a list of existing support groups from hospitals and vetted them to decide which ones to assist. The CRS/Malawi program (FY 2004–FY 2009) formed some HIV support groups. During field visits in Malawi, the FAFSA-2 team met with members of one of these support groups from the prior project that was still going
strong two years after Title II assistance had ended. The members were self-assured as they explained the positive role such groups and community mobilization supported by the Title II program had played in reducing stigma and discrimination against PLHIV in their community.
Home-based care. Six programs provided home-based care along with supplementary feeding—Africare/Burkina Faso, WV/Ethiopia FY 2003–FY 2006, OICI/Ghana, CRS/Malawi (FY 2009–FY 2014), CPI/Senegal, and CARE/Haiti. During home visits, CHWs provided care that consisted primarily of checking on the health and nutritional status of the PLHIV and providing information, education, and counseling. Illustrative topics addressed included hygiene, infection prevention, safe sex, diet, stress management, adherence to ART, management of common illnesses, and psychosocial support.
Food-for-Work. OICI/Guinea, Africare/Burkina Faso, and ACDI/VOCA/Rwanda (FY 2005–FY 2010) used FFW to pay peer educators and counselors and also paid volunteer, home-based care and nutrition community workers in food. No further details were reported by Awardees.
8.3.3.5 Graduation Criteria from Title II HIV Supplementary Feeding
Since 2006, USAID/FFP has required clear, realistic, and explicit graduation criteria and exit strategies in Title II proposals for HIV programming to ensure that positive outcomes are sustainable. Fixed terms of participation are desirable to avoid creating dependency. Furthermore, several programs reported that fixed, shorter terms for participation gave other qualified community members, who could not be covered initially due to the limits of food aid available, the opportunity to participate. In the ACDI/VOCA/Uganda program (FY 2007–FY 2011), which started under these newer guidelines, graduation took place after a one-year fixed term of participation. The need to tighten graduation criteria was a lesson learned in ACDI/VOCA’s earlier program (FY 2003–FY 2007) in a different part of Uganda. This program had no graduation criteria,

8-12 HIV
and PLHIV and their household members received rations for the life of the program, even after the HIV-infected person died. The implementers found that this created dependency and resulted in hardship when the program ended. The OICI/Ghana program had a two-year fixed term of participation. Another program noted that graduating PLHIV from food rations is difficult because, although the participants may be self-reliant with sufficient income, they feel insecure and do not want to lose the psychosocial support from the program in case they become more ill. No services were provided once a participant graduated out of the program.
Three Awardees’ programs in Rwanda initially had no graduation criteria. Any HIV-positive person with proof of their HIV status and membership in an association could participate in sequential six-month cycles. Starting in 2007, in the last two years of these programs, more stringent health, nutrition, and socioeconomic eligibility and graduation criteria were introduced for six-month supplementary feeding cycles.263 However, PLHIV could re-enroll for another cycle if they met the eligibility criteria; 54 percent of graduated participants were re-admitted for another cycle in the ACDI/VOCA/Rwanda program (FY 2005–FY 2010), according to the final evaluation. The CRS/Rwanda final evaluation found, through interviewing former participants (vulnerable households, not necessarily PLHIV), that 28 percent were self-sufficient and 21 percent reverted to their initial nutritional vulnerability status. The latter category included patients that had no strength to work and healthy people that had no land to apply the bio-intensive agricultural techniques taught by the project. Another 45 percent experienced intermediate levels of vulnerability after graduation as measured by weight loss, not eating enough, and
263 The more recent Rwanda graduation criteria were improved health and nutritional status as measured by increased CD4 count and BMI > 18.5, respectively; not taking ARVs; a regular source of income; and better socioeconomic status. Criteria were reassessed every six months. However, people could re-enroll if any of those factors deteriorated, if they started ARVs, if the number of PLHIV in the household increased, or if there were infected child survivors after an HIV-positive parent participant died.
reducing the number of meals eaten, citing lack of CSB (previously received from CRS) as a major hindrance to taking their ARVs.
The earlier CRS/Malawi program (FY 2005–FY 2009) used suffering from chronic illness as a proxy indicator for identifying PLHIV eligible for food rations. Only 10–20 percent of the beneficiaries graduated before the end of the program, according to the final evaluation.264 CRS found that chronic illness alone was not a reliable indicator of HIV or food insecurity. Applying this lesson in its ongoing program, CRS/Malawi (FY 2009–FY 2014) uses a two-stage food targeting process: first, meeting food insecurity criteria, then also meeting chronic illness or demographic criteria, both reassessed every year. Participants graduate when they no longer meet the eligibility criteria. The program implementers expect only about one-third of the participants to graduate because many of the vulnerability characteristics that made them eligible for food rations are permanent or difficult to improve.
Beyond the examples of graduation criteria from HIV supplementary feeding described, most programs had no criteria for graduation from assistance. Eligibility for supplementary feeding continued until the end of the program or the death of the participant.
8.3.4 Livelihood Strengthening and Protection
A recognized strength of Title II development programs is working to enhance food and livelihood security. A number of programs complemented HIV supplementary feeding with livelihood strengthening and protection interventions for the beneficiaries. No Title II HIV programs reviewed did livelihood strengthening or protection alone without direct HIV food distribution. Long-term, sustainable solutions are needed as an exit strategy from providing food rations to PLHIV and HIV-affected households, either through national, community, or faith-based social protection programs or through
264 Chronic illness is defined as a condition, disease, or disability that has prevented an individual from being fully functional for at least three months within the previous year.

8-13HIV
enhanced livelihood security. However, it has been a challenge for Title II programs with broader income generation activities and VGF for PLHIV to integrate the participants of these two interventions. One constraint is that often the PLHIV do not live in the same geographic areas where the projects’ mainstream income generation activities are located. Another is that when projects have insufficient resources to do livelihood interventions in all project communities and with all participating households, PLHIV may get left out of projects that focus mainly on agriculture, if they need non-agricultural income-generating activities or are less viable. The importance of livelihood strengthening for PLHIV and acknowledgment of gaps in programs implemented during the FAFSA-2 time period were important lessons learned by Awardees (see Box 8.3). USAID/FFP has recommended using an HIV lens to modify program approaches to income generation activities for PLHIV in its Proposal Guidelines from FY 2008 onward. However, FAFSA-2 cannot assess if this was done in the older programs reviewed in the FAFSA-2 time frame prior to these guidelines.
The principal livelihood strengthening and protection interventions and approaches used in HIV components of Title II programs reviewed were the following.
Agriculture and animal husbandry. To generate income for PLHIV in urban areas, the CRS/Ethiopia program (FY 2003–FY 2008) assisted them with animal fattening and vegetable production. Africare, the partner of ACDI/VOCA in the Rwanda program (FY 2005–FY 2010), trained program participants in new agricultural techniques, provided seeds and seedlings, and promoted growing and consuming the nutritious leaves of the Moringa tree. In Rwanda, the WV and CRS programs also assisted PLHIV with progressive terraces, seeds, and the introduction of bio-intensive kitchen gardens. Both ACDI/VOCA and CRS found that vegetable gardening in Rwanda is not possible during the dry season on plots not close to a water source, and that other strategies were needed. ACDI/VOCA/Uganda also provided seeds and tools.
Box 8.3. Lessons Learned by Awardees on the Importance of Livelihood Strengthening for PLHIV as a Food Aid Exit Strategy
• Implementers of the CRS/Ethiopia (FY 2003–FY 2008) program learned that they needed to reduce food support to PLHIV and focus more on sustainable livelihoods and community support strategies. Food assistance was expensive and food beneficiaries often did not graduate from the program, thereby limiting the number of PLHIV that the program could help.
• The final evaluation of the Africare/ Burkina Faso program noted that, while nutrition support with food aid for PLHIV is critical, it needs to be better targeted to avoid leaving participants with a permanent need for food aid. “Support in the form of income-generating activities is more sustainable and it needs to be strengthened in terms of both the number of beneficiaries and amount of credit” (Gordon et al., 2009).
• The final evaluation of the OICI/Ghana program found that the program did not have adequate resources for viable income-generating activities, which were needed to reduce the dependency on food rations and to ensure the program’s sustainability.
• A program review by Africare identified the lack of income-generating activities for PLHIV as a gap in its Burkina Faso and Rwanda (FY 2005–FY 2010) programs (Maslowsky et al., 2008). ACDI/VOCA was a partner in the Rwanda program.

8-14 HIV
Microenterprise. ACDI/VOCA/Uganda (FY 2007–FY 2011) partnered with a local microenterprise NGO that facilitated small business start-ups by PLHIV and provided in-kind inputs, such as sewing machines and grain mills. The Africare/Burkina Faso program provided microcredit, whereas the CPI/Senegal program provided PLHIV with small grants for microenterprise.
Vocational training. Scholarships given to children of PLHIV by the OICI/Ghana program provided them with an otherwise unobtainable opportunity to acquire income-generating skills. This had the additional benefit of easing parents’ worries about what would become of their children if they died.
Village savings and loans. Formation of VSL groups has been a very popular, mainstream, successful intervention in Malawi in the previous CRS program (FY 2005–FY 2009) (I-LIFE Consortium) and in the ongoing program (FY 2009–FY 2014) (WALA Consortium). It has been equally popular with PLHIV and helped them save to meet the costs of their health care and other contingencies. VSLs were also formed in the CRS/Ethiopia (FY 2003–FY 2008) and Rwanda programs, where they were known as Savings and Internal Lending Committees (SILCs). However, the CRS/Rwanda final evaluation reported that most PLHIV and OVC caregivers were too poor to save much, contributing on average US$2.00 per month. The ACDI/VOCA/Rwanda program (FY 2005–FY 2010) also promoted VSLs.
Health insurance. Health insurance can protect livelihoods from the shock of catastrophic medical costs that can drive households into extreme poverty and debt. In the ACDI/VOCA/Rwanda program (FY 2005–FY 2010), its partner Africare paid health insurance premiums for 997 households with PLHIV, which covered 3,950 family members at US$1.80 per person per year as part of the community-based health insurance offered through the national health system. However, in the other two programs in Rwanda (CRS and WV), participants paid their own premiums. In the CRS program, these funds were taken from the SILC. Thus, Africare’s payment of these premiums was
an additional income transfer to the beneficiaries, but was not sustainable in the absence of successful livelihood strengthening activities to help HIV-affected households generate increased income.
Outcomes. In most programs that had data on the coverage of their supplementary feeding participants with livelihood strengthening or protection interventions, the coverage rates were quite low. For example, by the fourth year of the ACDI/VOCA/Uganda program (FY 2007–FY 2011), cumulatively, 40,881 HIV-affected household members had received food. The target was 17 percent (7,000) of those household members graduating to livelihood groups after one year of food rations. However, ACDI/VOCA/Uganda’s FY 2010 ARR stated that only 1,072 HIV-affected household members receiving rations had transitioned to participate in livelihood activities by FY 2010 (15 percent of the target of 7,000). The program made a special effort in its final year to increase the number of PLHIV receiving livelihood assistance. The CPI/Senegal program gave an average of 30 small grants per year to PLHIV for income-generating activities through FY 2009, exceeding its target, but falling far short of the need for these grants by the 1,100 PLHIV receiving food rations. Only the SC/Uganda program reported almost universal enrollment (92 percent) of food beneficiaries in livelihood support groups. The low coverage of PLHIV with livelihood strengthening activities found by the FAFSA-2 is consistent with the low percentage of HIV beneficiaries reported for AG/NRM in the FY 2009 Tracking Tables, only 13 percent, despite attribution to AG/NRM of nearly half of all Title II commodities that supported HIV activities (see Table 8.2).
None of the program documentation went beyond reporting on coverage to describe the outcome, i.e., whether HIV-affected households had achieved self-reliance and were able to support themselves without food rations or other project inputs as a result of the livelihood strengthening and protection interventions.

8-15HIV
8.3.5 Co-Programming with PEPFAR
Mitigating food insecurity and strengthening livelihoods for households affected by HIV is a logical niche for Title II development programs that could complement PEPFAR programs in target geographic areas where both programs operate (USAID/FFP and PEPFAR 2007 Conceptual Framework). However, the distinct geographic locations of the highest concentrations of HIV and of food insecurity are major constraints to realizing this complementarity. HIV prevalence is highest in urban and peri-urban areas, while food insecurity is found mainly in rural areas. Title II focuses on rural areas with the highest levels of food insecurity, while PEPFAR focuses more on urban and peri-urban areas with the highest HIV prevalence, leaving little opportunity to work together with the same participants. Furthermore, Title II programs identify the most food insecure beneficiaries using community-level mechanisms and vulnerability criteria and further seek out PLHIV among the food insecure. In PEPFAR programs, patients are tested for HIV, assessed for nutritional status, and selected for nutrition counseling and support based on the results (mainly at hospitals and clinics); food insecurity criteria are not used.
Due to these fundamental differences and constraints, the ideal of PEPFAR and Title II development programs working together to serve the same HIV-infected individuals and HIV-affected households—with Title II resources meeting food and livelihood security needs and PEPFAR resources funding prevention, testing, treatment, and care, including NACS—has been difficult to achieve. The FAFSA-2 found no examples of PEPFAR and Title II working together to improve longer-term food and livelihood security for the same HIV-affected households. Three Title II programs reported doing shorter-term food insecurity mitigation through supplementary feeding of PLHIV on ARVs from PEPFAR—the CRS/Ethiopia (FY 2003–FY 2008), CRS/Haiti, and ACDI/VOCA/Uganda (FY 2003–FY 2007) programs. Partly in recognition of the constraints to co-programming with Title II, PEPFAR procured another food
security solution to serve its clients. The Livelihood and Food Security Technical Assistance Project (LIFT) (FY 2009–FY 2013) provides TA to link clinic-based services with community-based economic strengthening and food security support services so that PLHIV that graduate from receiving PEPFAR-funded food rations do not relapse into undernutrition.
Several other types of collaboration between PEPFAR and Title II were reported. In each case, it was a result of Title II Awardees receiving separate PEPFAR grants to work with the same population served in the Title II programs, rather than collaborating with other PEPFAR implementers or doing jointly funded activities planned from the proposal stage. The ACDI/VOCA/Uganda program (FY 2003–FY 2007) reported receiving complementary funding from PEPFAR for community-based nutrition and hygiene education. In the CRS/Ethiopia program (FY 2003–FY 2008), PEPFAR complemented Title II food assistance for PLHIV with funds for meeting their health, education, shelter, and psychosocial support needs. The Africare/Mozambique and ACDI/VOCA/Rwanda (FY 2005–FY 2010) programs coordinated with Africare’s PEPFAR-funded regional Community-Based Orphan Care, Protection, and Empowerment Project (COPE) for OVC. Prevention of HIV with PEPFAR funds complemented Title II resources in the CRS/Malawi program (FY 2005–FY 2009). In the ongoing Malawi Title II program, CRS implements a PEPFAR-funded initiative (Integrated HIV Effect Mitigation and Positive Action for Community Transformation [IMPACT]) to provide services to OVC and PLHIV. The IMPACT Project uses Title II program staff and structures, namely, Care Groups, VSLs, and support groups. In Guinea, funding from PEPFAR to Africare’s HIV/AIDS Service Corps made possible educational and promotional meetings for HIV prevention with videos and audio-visual equipment in some of the Title II communities.

8-16 HIV
8.4 Program Impact
The only program with impact data was CRS/Rwanda, which measured BMI of PLHIV at the beginning of supplementary feeding and six months later at graduation. This was done in the later years of the program. From these service statistics, the final evaluation reported an impressive decline in low BMI—from 44 percent at enrollment to 21 percent six months later. These findings also highlight that 56 percent of the participants were not underweight at enrollment and did not necessarily need supplementary feeding. The program used broad chronic illness vulnerability targeting criteria and was not restricted to PLHIV or the malnourished. There may have been impact in other Title II programs, if any had been measured. Even though most of the programs reviewed primarily provided general relief, the FAFSA-2 is unable to document the development impacts of this large investment of food aid because they were not measured.
8.5 Cross-Cutting Issues and Opportunities
8.5.1 Role of Title II Supplementary Feeding in the Context of HIV
General relief. While using Title II food assistance for general relief to PLHIV and HIV-affected households was the charitable thing to do, especially before treatment became widely available and palliative care was the only option, should this be a high priority for scarce development food aid resources going forward? The dilemma is that in communities with widespread food insecurity where Title II works, there is never enough food aid available to provide it as an income transfer to all the extreme poor that might need it. Furthermore, what is the exit strategy to avoid creating dependency and hardship when the food assistance stops at the end of the program? For OVC, people that are too ill to work, the indigent, and helpless people in institutions, it is appropriate to use Title II resources
for VGF? But what about the general feeding of PLHIV and their families that most of the programs described in this chapter were doing?
Food aid is usually provided as short-term humanitarian assistance or general relief to mitigate transitory food insecurity. However, unlike natural disasters, famine, war, and drought, the HIV pandemic is not cyclical or limited in duration; the disease is chronic. Fortunately, now in 2012, increased access to ART is serving both to prevent new cases of HIV and to increase longevity and quality of life for PLHIV, making many less vulnerable and more economically productive. This is a dramatic improvement from the early 2000s, when most of the Title II programs reviewed began. The more hopeful current situation argues for prioritizing the use of Title II resources for achieving long-term solutions through feasible livelihood strategies for the food insecure, including HIV-affected households. As Title II programs run for five years or less, their strength is not long-term social protection, which is normally the purview of national governments. In contrast, well-designed Title II programs can do a great deal to strengthen long-term food and livelihood security for HIV-affected and other vulnerable households, if this is one of their main priorities and if it is adequately funded. According to the Development-Relief concept promoted in the USAID/FFP Strategic Plan, programs should be designed to achieve both an immediate impact—protecting lives and maintaining consumption levels—and longer-term impacts—helping people and communities build more resilient livelihood bases.265 Thus, future Title II programs should play to their strengths by focusing a significant amount of their budgets on increasing livelihood security for food insecure populations in target communities, including the food insecure PLHIV that live there (FANTA and WFP, 2007).266
265 USAID/FFP Proposal Guidelines for FY 2006.266 The FAFSA-2 team benefited greatly from the insights of Tony Castleman, former Deputy Director for Field Support of FANTA-2, based on his extensive experience in nutrition and food security programming for HIV throughout the FAFSA-2 time period. Dr. Castleman is a co-author of the publication cited.

8-17HIV
Nutrition assessment, counseling, and support. Integrating NACS into both clinical and community HIV care and treatment services is a priority for PEPFAR. PEPFAR programs are best equipped to implement NACS because PEPFAR supports all of the components of this integrated nutrition services package, as well as HIV testing, treatment, and care. Some Title II programs provided nutrition counseling for PLHIV and a few started measuring BMI (nutrition assessment) in the later years of the review period. But these programs were designed before NACS became the norm, and they could not provide all three components of NACS due to lack of funding, experience, links with clinics and hospitals, and RUTF for treating SAM (nutrition support). Title II programs could complement the clinical HIV services provided by national health systems by assisting NACS in the community in countries with generalized HIV epidemics, if there were additional funding for this. This suggested division of responsibility for nutrition and HIV is analogous to the way some Title II programs screen children for SAM in the community and refer them to clinical therapeutic feeding or CMAM (done by others using RUTF), and sometimes provide supplementary feeding to children that recover from SAM but are still moderately malnourished. However, given that PEPFAR’s annual budget for bilateral HIV is at least 14 times greater than the Title II development food aid budget and that the Title II budget supports 14 program elements, whereas PEPFAR supports only 3, one could argue that NACS should continue to be done mainly by PEPFAR.267
Furthermore, the different geographic locations of PEPFAR and Title II (the urban and peri-urban concentration of HIV and the rural concentration of food insecurity) present formidable constraints to working together to implement NACS. The two
267 In FY 2009, US$5.503 billion was enacted for PEPFAR bilateral HIV/AIDS programs according to http://www.pepfar.gov/documents/organization/80161.pdf. The same year, USAID/FFP received US$377.5 million for non-emergency programs according to USAID/FFP’s “Fact Sheet: Office of Food for Peace 2009 Statistics.” http://foodaid.org/news/wp-content/uploads/2011/01/fy09_factsheet.pdf.
programs co-exist in only six countries. However, if PEPFAR could complement Title II food resources in those countries via co-programming cash resources and co-locating programs, then Title II programs could play a role providing some NACS services at the community level and referring PLHIV to PEPFAR-supported or other clinical services. This has not been possible to date. Regardless, a vital and feasible role for Title II is providing food and livelihood security strengthening services to which food insecure HIV-positive clients, including those graduating from treatment of severe or moderate acute malnutrition with therapeutic foods, can be referred—a niche rarely filled by anyone else in rural areas.
8.5.2 Clear Objectives and Measurable Results
Most of the programs reviewed that provided supplementary feeding to address HIV did not specify a clear objective for doing so, which is understandable given that their aim was general relief. However, without clear objectives, program designs lacked clarity and evaluating program results was not possible. Only a couple of programs measured any results. The majority of programs measured only the number of people that received rations. Examples of some objectives that might have been appropriate are to: (1) improve nutritional status and the effectiveness of ART through care and support, (2) prevent or mitigate malnutrition in PLHIV or HIV-affected households, (3) improve dietary practices of PLHIV, (4) improve adherence to ART, and (5) increase access to food (apart from food aid) and prevent negative coping strategies.
The bottom line is that the FAFSA-2 estimates that approximately US$148 million in Title II resources were spent on HIV-related programming, for which there are few available, measured development impacts.268 This contrasts sharply with the many
268 The US$148 million is an amount for the seven-year FAFSA-2 time frame extrapolated by multiplying seven times the total cost of Title II programming attributed to HIV of US$21.1 million in the FY 2009 Resources Tracking Tables submitted by the Awardees.

8-18 HIV
positive results reported when food aid was used for MCHN programming. If Title II resources are to be used to address HIV, clear objectives must be established, such as the examples listed, and the results must be measured and demonstrated.
8.5.3 Food and Livelihood Security Solutions
Low coverage, underfunding, and a lack of available, measured results for sustainable food and livelihood security interventions for PLHIV and HIV-affected households receiving food assistance (as described in Section 8.3.4) are serious concerns. The Title II program is one of the largest sources of USG resources dedicated to reducing food insecurity in vulnerable populations internationally. This comparative advantage was not capitalized on adequately in Title II development programs that provided supplementary feeding to PLHIV or HIV-affected households. What was needed, because it was not being done by other donors or with national resources, was “strengthening the capacity of all individuals and families receiving nutrition and food support to sustainably address their long-term food needs through improved food production, employment and other vocational and livelihood assistance” (USAID/FFP. n.d., p. 42).
8.6 Conclusions and Recommendations
8.6.1 Conclusions
• The focus on preventing sexual transmission of HIV through SBCC in a large number of Title II programs was appropriate. The reduction in high-risk behaviors in half of the programs that measured these indicators is encouraging.
• The 19 HIV supplementary feeding programs reviewed appear to have been successful at food insecurity mitigation in the short term and are best characterized as VGF and not HN. Many lacked clear, time-bound graduation criteria.
• Program objectives of Title II direct food distribution for HIV were unclear, and there were few documented results. It is understandable
that almost no programs measured the USAID/FFP required indicators, since most started before these were required. However, without results data, the FAFSA-2 can say very little about the outcome of nutrition counseling or the impacts of supplementary feeding and livelihood strengthening.
• NACS for PLHIV is best assisted by PEPFAR. Title II programs did some nutrition counseling, but little nutrition assessment, which PEPFAR is better equipped to do for a variety of reasons. Title II programs lack cash resources and ample access to RUTF to treat SAM in adults or children, which is PEPFAR’s mandate. However, if PEPFAR could complement Title II food resources in the six countries that the two programs have in common via co-programming cash resources and co-locating programs, then Title II development programs could conduct some NACS activities at the community level and refer PLHIV to PEPFAR-supported or other clinical services. Furthermore, PEPFAR-supported clinical care and treatment services could refer PLHIV to Title II programs for food assistance/safety nets and livelihood strengthening to prevent relapse into malnutrition.
Box 8.4. HIV Policy Implications
Title II development programs should move beyond short-term mitigation and implement effective and sustainable solutions to food insecurity in the context of HIV by:
• Addressing HIV less through food rations as relief and more through improving long-term food and livelihood security of households and communities to provide sufficient food for themselves (including, but not restricted to, HIV-affected households)
• Defining objectives and measuring the results of their efforts

8-19HIV
• There are considerable constraints to co-programming Title II and PEPFAR resources to reach the same PLHIV and HIV-affected households and few examples of both programs working together. Collaboration occurred where the Title II Awardee received separate funding from PEPFAR for complementary activities with the same population served in its Title II program.
• Enrollment of Title II HIV program food ration recipients in livelihood security activities was low, due in part to resource constraints. Greater effort should have been dedicated to income generation and livelihood security interventions to benefit PLHIV and HIV-affected households, along with the larger, food insecure, rural populations in projects’ target geographic areas.
8.6.2 Recommendations
USAID/FFP and Awardees should:
• Continue to mainstream SBCC for prevention of sexual transmission of HIV in Title II programs in countries with generalized HIV epidemics. (Recommendation 39)269
269 The numbers after certain recommendations are the same as those assigned to the major recommendations in the FAFSA-2 summary report.
• Define clear objectives for HIV components of Title II programs and measure results. Indicators should be included in IPTTs and selected from those recommended by Castleman et al. (2008) or FANTA and WFP (2007), depending on the objectives of the program. (Recommendation 40)
• Design programs to address HIV less through food rations as short-term relief and more through interventions that improve long-term food and livelihood security of households and communities to provide sufficient food for themselves. These interventions include building safety net systems, increasing food production and marketing, improving food storage, and creating employment and income generation opportunities. Implementers should apply an HIV lens to make livelihood strengthening activities more accessible to PLHIV (see FANTA and WFP, 2007). However, they should not design food security programs to benefit only PLHIV and HIV-affected households. (Recommendation 41)

8-20 HIV
Bibliography for Chapter 8ACDI/VOCA. 2007. Improving Quality of Life for Feeding People Living with HIV/AIDS Through Better Nutrition: A Guide for Field Extension Workers. Kampala: ACDI/VOCA.
Castleman, Tony; Deitchler, Megan; and Tumilowicz, Alison. 2008. “A Guide to Monitoring and Evaluation of Nutrition Assessment, Education, and Counseling of People Living with HIV.” http://www.fantaproject.org/downloads/pdfs/M&E_NAEC_Jun08.pdf.
FANTA. 2004. “HIV/AIDS: A Guide for Nutritional Care and Support.” 2nd edition. http://www.fantaproject.org/downloads/pdfs/HIVAIDS_Guide02.pdf.
FANTA and WFP. 2007. “Food Assistance Programming in the Context of HIV.” http://www.fantaproject.org/downloads/pdfs/Food_Assistance_Context_of_HIV_Oct_2007.pdf.
Gordon, Denise et al. 2009. Final Evaluation Africare/Burkina Faso Zondoma Food Security Initiative Phase II. Ouagadougou, Burkina Faso: Africare.
Maslowsky, Stacey; Sidibé, Sidikiba; and Cohen, Leah J. 2008. Direct Distribution of Commodities for People Living with HIV/AIDS: Lessons Learned from Rwanda and Burkina Faso. Africare Food Security Review Number 11. Washington, DC: Africare.
PEPFAR. 2006. Report to Congress on Food and Nutrition for People Living with HIV/AIDS. Washington, DC: PEPFAR.
PEPFAR. 2008. Report to Congress by the U.S. Global AIDS Coordinator on Food Security. Washington, DC: PEPFAR.
PEPFAR. 2011. Technical Considerations Provided by PEPFAR Technical Working Groups for FY 2012 COPS and ROPS. Washington, DC: PEPFAR.
Sserunjogi, L. 2004. “Improving the Quality of Life through Nutrition: A Guide for Feeding People Living with HIV/AIDS.” http://www.fantaproject.org/downloads/pdfs/RCQHC_Improving_QOL_Nutrition.pdf.
USAID/FFP. n.d. “Technical Sectors and Relevant Initiatives: Human Immunodeficiency Virus-Related Activities” in Fiscal Year 2010: Title II Proposal Guidance and Program Policies.
USAID/FFP. 2005. Strategic Plan for 2006-2010. Washington, DC: USAID.
USAID/FFP. 2007. “New Reporting Requirements for Food for Peace.” FFPIB 07-02.
USAID/FFP and PEPFAR. 2007. USAID P.L. 480 Title II Food Aid Programs and the President’s Emergency Plan for AIDS Relief: A Conceptual Framework. Washington, DC: USAID.
World Bank. 2007. HIV/AIDS, Nutrition, and Food Security: What Can We Do. A Synthesis of International Guidance. Washington, DC: World Bank.

9-1
Second Food Aid and Food Security Assessment (FAFSA-2)
9. Performance Management9.1 IntroductionThe term performance management, as used in this report, encompasses program monitoring, evaluation, communicating results (reporting), and learning from results. See Box 9.1 for USAID/FFP’s definitions of monitoring and evaluation, which are derived from USAID’s ADS 203.3.2. Performance management is arguably where USAID/FFP, Title II Awardees, and FANTA jointly made the greatest progress during the FAFSA-2 time frame. It is thanks to these advances that there was sufficient program performance information available to review in the FAFSA-2.
During the FAFSA-2 time period, USAID/FFP required Awardees to include a results framework in their proposals to depict “the food aid program’s theory of change by laying out the activities and outputs that will lead to short, medium and long-term outcomes and objectives” (FFPIB 09-06, 2009a). USAID/FFP also required an IPTT with project-relevant indicators at the impact, outcome, and output levels. The Awardees established baseline values and targets for these indicators during project start-up and reported progress toward targets annually. It was mandatory to conduct population-based, representative baseline and final evaluation (endline) surveys to measure change in the project’s impact and outcome indicators and to have an endline evaluation done by external evaluators. In addition, USAID/FFP required each project to have a mid-term evaluation. Most of the final evaluations reviewed for the FAFSA-2 included the findings of an external team’s qualitative evaluation substantiated with quantitative data from the surveys. FANTA prepared several Technical Notes on M&E in Title II development programs (Bonnard, 2002; Bergeron et al., 2006a; and Bergeron et al., 2006b) to assist Awardees with the requirements.
Standard indicators. A consensus building process and applied research over several years culminated
in the 2007 release by USAID/FFP of required standard impact and monitoring indicators for development food aid programs (FFPIB 07-02, 2007). Use of standard indicators greatly increased the comparability of results across programs, especially at the impact level. Most notable was the introduction of new indicators to measure household access to food. More recent advances are the
Box 9.1. Monitoring and Evaluation
• “Monitoring and evaluation perform two separate but related functions.” (GAO, 2009)
• “Monitoring reveals whether desired results are occurring and whether assistance objectives’ outcomes are on track by addressing the ‘what’ of performance and using pre-selected indicators to measure progress toward planned results at every level of the Results Framework.” (FFPIB 09-06, USAID/FFP, 2009a)
• “Evaluation answers the ‘why,’ ‘why not’ and the ‘what else’ of performance; it is used on a periodic basis to identify the reasons for success or lack of it, to assess effects and impacts, or to indicate which, among a range of program or project and activity alternatives, is the most efficient and effective. For Title II programs, evaluation is also used to assess the extent to which a program is meeting outcome and impact level objectives.” (FFPIB 09-06, USAID/FFP, 2009a)

9-2
Household Hunger Scale, the Minimum Acceptable Diet, and the Women’s Dietary Diversity Score indicators.270 The standard indicators were updated in 2011 to improve their quality and usefulness, and to demonstrate coordination with the FTF Strategic Results Framework and GHI goals and targets (FFPIB 11-03, USAID/FFP, 2011b). Two 2009 USAID/FFP Information Bulletins describe reporting requirements and M&E responsibilities of Awardees (FFPIB 09-06, 2009a and FFPIB 09-07, 2009b). Prior to the release by USAID/FFP of Information Bulletins from FY 2007 forward, M&E and reporting requirements for development food aid were less formal.
This chapter’s findings are based primarily on the strengths and weaknesses in performance management encountered during the FAFSA-2 while reviewing individual project’s progress, monitoring, and evaluation reports, data, and information. This is not an in-depth review of performance management by USAID/FFP or Awardees. A useful reference that enriched FAFSA-2 insights was the GAO’s 2009 report on its performance audit of M&E in U.S. international food assistance programs and that report’s appendix, the December 31, 2008 USAID Report to Congress on “efforts undertaken by the Administrator to conduct oversight of non-emergency food aid programs.”271
9.2 Monitoring and Evaluation General Findings
The following are some strengths and weaknesses of Title II development programs’ overall M&E efforts found during the FAFSA-2 review.
270 The USAID/FFP Strategic Plan for 2006–2010 states that “only 25% of current Title II development programs with access activities include indicators of household food access in their monitoring and evaluation systems” (2005, p. 36)271 This Report to Congress was required under the 2008 FFPA. It is available at http://www.gao.gov/products/GAO-09-980.
9.2.1 Strengths
• Harmonizing indicators across similar programs in the same country is very useful for comparing programs and summarizing overall results. Programs in Bolivia, Guatemala, Haiti, Honduras, and Indonesia had harmonized core indicators. While harmonized indicators are advantageous, if they are well chosen and defined, limitations to their usefulness for evaluation are multiplied if harmonized indicators are not selected well, e.g., missing standard indicators, not consistent with the theory of change, or knowledge instead of practice indicators at the highest behavior change outcome level.
• USAID/FFP M&E training workshops conducted by FANTA started in FY 2009 to strengthen Title II development programs’ results frameworks, IPTTs (including “F” and USAID/FFP standard indicators), and baseline survey plans drafted by Awardees before or during the workshops.272 Awardees of all new development food aid programs send M&E staff, technical sector leads, and program managers to the workshops.273 Program chiefs of party and USAID Mission staff also attend. According to FAFSA-2 in-country interviews, the workshops conducted for program start-ups were well received. However, the feedback also indicated that the workshops were too short for the amount of material covered.
• FANTA has conducted periodic training of USAID/FFP staff on various M&E topics.274
272 WorkshopdurationisfivedaysforAwardeesinthefield.InJuly2011,FANTA-2organizeditsfirsttwo-dayM&Eworkshop in Washington, DC, for Awardee headquarters staff.273 Through December 2011, M&E training workshops had been conducted for programs in Afghanistan, Bangladesh, Burkina Faso, Burundi, Chad, DRC, Ethiopia, Liberia, Madagascar, Malawi, Mali, Mozambique, Niger, Sierra Leone, South Sudan, and Uganda. Only the programs in Bangladesh, Malawi, Niger, and Uganda were in the FAFSA-2 universe and visited by the FAFSA-2 team.274 Examples of training topics include: (1) “USAID/FFP Standard Indicators,” (2) “How to Review a Results Framework,” and (3) “How to Review an IPTT.”
Performance Management

9-3Performance Management
• Technical reviews and feedback by FANTA-2 M&E staff have helped improve the quality of Title II program results frameworks, IPTTs, M&E plans, and evaluation survey designs, including sampling and questionnaires.
• In FY 2010, FANTA-2 launched Discussion for Title II M&E (Discussion-TIIME), a listserv where Title II M&E practitioners can learn from each other and access technical advice. The goals are to promote professional development of M&E staff, introduce new staff to Title II M&E, provide updates, and improve M&E quality.
• USAID/FFP hired and placed two new M&E specialists in the West and Southern Africa regional offices in 2011. There now are M&E experts in all three regional Africa offices. Furthermore, all USAID/FFP focus countries now have FFP Officers based in-country, due to increased hiring since 2009.
• The TOPS project FSN Network M&E Task Force has defined core competencies for M&E managers and officers and is working with Awardees to identify gaps and strengthen capacity.
• Title II Awardees have implemented several useful M&E innovations that have strengthened program M&E and that can be adopted by other Awardees. SC/Bangladesh (FY 2005–FY 2010) used geographic information system (GIS) software to map levels of undernutrition; ensure sampling was done correctly for their final evaluation survey; and locate cyclone shelter centers, village water points, and model farms. An M&E system design called “Simple Measurement of Indicators for Learning and Evidence-Based Reporting” (SMILER), developed by CRS, compiles all M&E tools in one system and in one operating manual. This is in use in the CRS/Malawi FY 2009–FY 2014 program. The Malawi program, in collaboration with FANTA-2, also tested cell phone text messaging and Frontline software to collect data on the Household Hunger Scale indicator. It was beyond the scope of the FAFSA-2 to assess the quality of these reported innovations.
9.2.2 Weaknesses
• There are not enough M&E experts in USAID/FFP Washington, in part because the 2008 FFPA does not give USAID/FFP authority to use Title II funds to hire personnel to work in headquarters on non-emergency programs.
• Considerable heterogeneity of indicators, especially in the earlier years of the FAFSA-2 time frame, often precluded being able to assess overall performance across programs or to do meta-analyses.
• In a number of programs reviewed, IPTT indicators were inappropriate for the content of the proposals, the results frameworks, or the state of the art for M&E of a particular intervention. The M&E training workshops, along with the reviews of IPTTs by the AOR and FANTA, should lead to better indicators. However, the FAFSA-2 found that the problems mentioned persist in more recent programs, suggesting a need for more efforts to strengthen IPTTs and more thorough reviews by technical sector experts. Examples of less useful indicators at the highest outcome level include: “knowledge” indicators to evaluate behavior change interventions, when the indicator should measure “practice”; not including all the relevant USAID/FFP standard indicators; and not focusing nutrition service delivery indicators on pregnant and lactating women and children under two years in programs targeting these beneficiaries.
• Because they rarely include sample size or CIs, the data in IPTTs are hard to interpret and use.
• Anthropometric data reported were rarely sex-disaggregated.
• Some programs with USAID-funded multi-year extensions did not measure and report results data for the extension period.
• The amount of funds budgeted for M&E by Awardees may be too low. According to several stakeholders interviewed during the FAFSA-2, a lack of funds impairs the quality of Title II M&E.
Performance Management

9-4
9.3 Monitoring
9.3.1 USAID Monitoring
Less attention appears to have been paid to strengthening monitoring of Title II development programs than to evaluating them. Monitoring of programs is critical. The FAFSA-2 found that in programs with proactive oversight by USAID, this monitoring was associated with better program results. In contrast, there were other examples of weak technical monitoring by USAID and not holding Awardees to commitments made in their program descriptions and to achieving performance indicator targets. USAID has increased efforts to strengthen its monitoring of Title II programs through training workshops in Africa, called “boot camp” for FFP Officers and staff, and through the development of the CBO Handbook, also known as the Program and Policy Manual. The manual includes information on what to look for during monitoring site visits. At the time of the FAFSA-2, USAID/FFP was preparing a new M&E manual for its staff. Methodologies to systematize USAID field monitoring, with guidance on sampling, indicators, checklists, and analysis, include: (1) the Layers tool developed by FANTA, which is based on Lot Quality Assurance Sampling (LQAS)275; and (2) monitoring plans used by USAID/Ethiopia.
In response to audit findings in Haiti and Madagascar, FANTA developed and introduced Layers to strengthen USAID monitoring of Title II programs in Haiti, Ethiopia, and Madagascar from 2002 to 2004. Field monitors collect, enter, and analyze program information from a small random sample of program sites, using personal data assistant devices (PDAs), to assess the quality of the implementing partner’s operations. From the data collected on inputs, outputs, and processes, Layers generates a report on program performance that USAID sends to the Title II Awardee to use to improve the program. Since 2009, Layers has also been used in Chad, Guatemala, Mali, and Uganda, with TA from FANTA-2 and its subcontractor, TANGO. In these countries, data collection was
275 See http://www.fantaproject.org/layers/reference.shtml.
outsourced to local research firms contracted by FANTA-2, rather than done directly by USAID field monitors. This is in contrast to Layers implementation in Ethiopia, Haiti, and Madagascar, where USAID field monitors collected the data.276
There is extensive experience with Layers from the initial three countries. The Ethiopia and Haiti Missions continue to use Layers, with their own field monitors collecting the data, but Madagascar has discontinued Layers. It is too early to say if Layers will be continued in the other countries, most of which have just completed one round.
A number of questions raised about Layers in the FAFSA-2 interviews during field visits and in feedback from USAID Missions and embassies (in non-presence countries) to a 2010 survey by USAID/FFP and FANTA-2 can be summarized as follows:
• Is the information generated by Layers worth the time, complexity, and cost, especially when it provides little insight on why problems are occurring?
• If Layers is useful but Missions are unwilling to pay for it, how can Layers be financed?
• Do the findings lead to program improvements, especially when improvements require more funds?
• Is outsourcing USAID’s monitoring responsibilities using Layers a good idea?
• Should Layers be used mainly for monitoring commodity management, a function for which it has been especially helpful, versus broader application to technical activities?
• What should be monitored by USAID and what by Awardees?
• Can other limitations of Layers be resolved, for example, not turnkey, not as fast or as efficient as hoped, lack of access to the software in Missions due to USAID restrictions on loading it on its network, too many players, and statistical concerns?
276 Madagascar outsourced data collection for their last round of Layers.
Performance Management

9-5
There are plans by USAID/FFP to reassess the value and role of Layers and to address the issues raised by the field. A key question is, “Does it make sense to do Layers routinely in all Title II programs in all 20 USAID/FFP focus countries”? If not, how can USAID field monitoring be systematized and strengthened and audit concerns addressed?
9.3.2 An Alternative Proposal to Strengthen USAID Monitoring
The USAID/FFP East Africa Regional Office designed a new approach called a “monitoring plan,” which has been implemented by USAID/Ethiopia to monitor its entire large FFP portfolio, including emergency (with WFP) and development programs.277 What is new in this hybrid approach, which strives to instill a greater degree of rigor, is: (1) using Layers only for commodity management monitoring; (2) employing purposive, versus random, sampling of program implementation sites based on issues identified in routine reporting and while observing food distribution, and collecting other information from stakeholder consultations while at these sites; (3) using iterative qualitative inquiry as an essential part of monitoring to determine why program implementation is off track; and (4) holding quarterly meta-analysis meetings of the USAID monitoring team to: (a) identify cross-cutting concerns and trends, (b) formulate policy and operational recommendations that require follow-up, and (c) share lessons learned in monitoring.
The next steps to expand the use of monitoring plans by other USAID Missions are to write normative guidance and for the three Africa-based regional USAID/FFP M&E specialists to work together to design and launch monitoring plans in other focus countries in Africa. USAID/Ethiopia is exceptionally well staffed, with four full-time food aid field monitors. Therefore, a challenge to expanding monitoring plans will be their feasibility in countries with fewer (or no) dedicated full-time FFP monitoring staff. Furthermore, an important question
277 Gregory Collins designed the monitoring plan while assignedtotheUSAID/FFPEastAfricaRegionalOfficeinNairobi and shared it with the FAFSA-2 team on November 28, 2011.
is whether monitoring plans will be as useful as Layers in responding to audit concerns about how well USAID monitors Title II programs, given that Layers is standardized, whereas the qualitative inquiry component of monitoring plans is dependent on the reviewer’s judgment.
9.3.3 Monitoring Innovations by Awardees
There was little information in the Awardees’ reports on their approaches to program monitoring. Several Awardees mentioned using LQAS and PDAs for monitoring. Some said they would benefit from advice on how to determine when LQAS samples are too small for measuring certain common outcome indicators during annual or mid-term monitoring surveys. The managers of the SC/Bangladesh program (FY 2005–FY 2010) wrote a brief case study on integrating program and commodity management using PDAs.278 As part of this integration, SC introduced a health information system called McAid that tracks individual children’s health and nutritional status and use of MCHN services. Based on the information generated by McAid, SC reported the capacity to alert health workers to follow up on malnourished children and to look for positive and negative deviants. Using Pendragon software and PDAs, SC/Bolivia (FY 2002–FY 2009) collected monthly growth monitoring data. Advantages reported included improved data quality, reduced duplication, less time spent transcribing data from written to electronic records, and savings in the M&E budget. It is hoped that these and other innovations can be disseminated to the Title II community through the TOPS project FSN Network M&E Task Force.
9.4 Evaluation Committed to managing for results, USAID/FFP has required all Title II development programs over the past decade to conduct independent, quantitative evaluations. This focus on evaluation is remarkable given that neither USAID/FFP nor USAID had a dedicated M&E unit during this time period.
278 Attachment H of SC/Bangladesh FY 2009 ARR.
Performance Management

9-6
The performance information generated by these evaluations was invaluable to the FAFSA-2 team.
In 2009, USAID reestablished its central evaluation leadership role, staffing a new unit with evaluation experts in the Bureau for Policy, Planning, and Learning, Office of Learning, Evaluation and Research (PPL/LER). In January 2011, USAID released an Evaluation Policy that updates evaluation standards and practices and renews its commitment to learning and accountability through evaluation (see Box 9.2). Evaluations are required for large projects and pilot or innovative development interventions. USAID/FFP is updating its guidance on Title II development program evaluation in accordance with USAID’s new policy. Other USAID programs could learn a great deal from the extensive evaluation experience of USAID/FFP, its Awardees, and TA partners, such as FANTA.
During the FAFSA-2 time period, USAID/FFP required, and continues to require, that Awardees conduct: (1) a population-based household baseline survey in the first year of the program, (2) a mid-term evaluation halfway through the program, and (3) a population-based household endline survey. A qualitative final evaluation, substantiated with quantitative data from the baseline and endline surveys, is encouraged and often done, but not required. Only the endline survey/final evaluation must be done by external consultants to ensure independence. The mid-term evaluation does not require collecting quantitative data, and USAID encourages participatory qualitative assessments (FFPIB 09-06, USAID/FFP, 2009a). Satisfactory review of the baseline and endline survey plans by the USAID/FFP AOR279 is required before data collection begins, and FANTA’s M&E experts also provide technical reviews of these plans, if requested.
279 Usually the CBO.
Box 9.2. USAID’s Evaluation Policy
“The evaluation policy builds on the Agency’s long and innovative history of evaluation, while seeking to redress a decline in the quantity and quality of evaluation practice within the Agency in the recent past. As part of a series of recent reforms known as USAID Forward, the Agency is transforming into a learning organization and a modern development enterprise. The policy is an initial step to strengthen USAID’s evaluation practice as part of the broader reform efforts.”
“USAID Evaluation Practices
• Integrateevaluationintodesign. Include evaluation specialists in strategy and project design teams, identify questions, plan for baseline data collection;
• Minimizebias. Disclosure of conflicts of interest, external evaluation experts as team leads;
• Ensurerelevancetofuturedecisions. Evaluation questions developed with stakeholders and are linked to future decisions;
• Usethebestmethods. Qualitative and quantitative methods that generate reproducible and high quality evidence;
• Reinforcelocalcapacity. Work with local expert evaluation leads, use host country systems and build local capacity;
• Betransparent. Findings from evaluations are shared publicly and in a timely manner; and
• Dedicatesufficientresources. Goal of approximately 3 percent of a USAID operating unit’s total program funds to be set aside for external evaluations.”
Source: PPL/LER Briefer, USAID’s Evaluation Policy, 2011.
Performance Management

9-7
9.4.1 Evaluation Design Type
Nearly all quantitative evaluation surveys reviewed for the FAFSA-2 followed an adequacy design of simple pre/post comparisons (i.e., changes in outcome and impact indicators between baseline and endline surveys), without comparison groups. The assumption underlying this approach is that effects seen are associated with program activities. This assumption is to be substantiated by sufficient information on program inputs, processes, and outputs. This evaluation design, the least technically challenging and expensive, is a good fit for Awardees with limited technical capacity in survey research, whose primary responsibility is service delivery and not studies. It recognizes that finding a geographically proximate comparison group similar to the program beneficiaries in all or most socioeconomic and other characteristics except program participation is very difficult. However, without a comparison group, it is hard to rule out the possibility that changes may be due to factors unrelated to project activities. Because they lack a credible counterfactual, or comparison group, to control for factors other than the program interventions that might account for the observed changes, current Title II development program evaluation surveys do not meet the USAID Evaluation Policy definition of “impact evaluations.”280 They are instead considered “performance evaluations” for which the policy states that a mix of quantitative and qualitative methods (as used in Title II evaluations) is optimal.
Mid-term evaluations reviewed for the FAFSA-2 were usually qualitative. Since these are internally managed and conducted by Awardees, improving the methodology and maximizing the utility of Title II mid-term evaluations has not been a central focus for USAID/FFP or FANTA. Yet mid-term evaluations are critical for examining whether project implementation is on track and the desired outcomes are being achieved, while there is still time for mid-course corrections. A first step toward defining
280 See http://transition.usaid.gov/policy/evalweb/USAID_Evaluation_Policy_FAQ.pdf.
the purpose and guidelines for Title II mid-term evaluations was an exchange of information and ideas between Awardees and FANTA-2 about these topics on the Discussion TIIME listserv in 2010.
There were several good examples in the FAFSA-2 of projects being redesigned in response to findings of mid-term evaluations, and ending well with positive impact on nutritional status as a result of fine-tuning interventions, namely, the Bolivia programs, as well as the SC/Bangladesh (FY 2005–FY 2010) and CRS/Haiti (FY 2002–FY 2008) programs. The joint mid-term evaluation of the four Bolivia programs was managed by the USAID Mission with Mission FFP staff participating extensively in the field visits, as they did in the joint final evaluation. The CRS/Haiti program followed a useful two-phase methodology in its mid-term evaluation in January 2006 with assistance from FANTA. In the first phase, quantitative data were collected using LQAS to assess which inputs, outputs, and outcomes were off track compared to targets. The second phase was a participatory qualitative inquiry in the field to probe into constraints or explanations for why certain indicators flagged in Phase 1 were lagging. That information was used to implement corrective actions. In contrast to these promising practices, too few other programs reported using mid-term evaluation findings to adjust project activities and improve implementation, when expected outcomes were not being achieved. Least useful were mid-term evaluations that were just opinion polls of whether project participants were pleased with the project, which were invariably positive, but lacked insight into whether the project was on track to achieve expected results and why or why not.
9.4.2 Program Reviews by USAID
To compensate for the limitations of mid-term evaluations led by Awardees, including the potential for bias in self-evaluation, USAID/FFP is planning to conduct its own “program reviews” to respond to implementation and design problems detected through routine monitoring or other sources, following a methodology designed in the USAID/
Performance Management

9-8
FFP East Africa Regional Office and implemented in Ethiopia.281 Based on FAFSA-2 findings, program reviews would be particularly useful to address design and implementation problems observed in nutrition interventions during field visits. In these cases, it is urgent for USAID/FFP to send teams of technical experts to review program progress and the appropriateness of designs, and to use these findings to work with Awardees on improving performance and redesigning programs (see Section 6.6.2 and Recommendation 37). Therefore, the FAFSA-2 team is in favor of USAID/FFP’s plan to do USAID-led program reviews between the baseline and final evaluation surveys, to complement mid-term evaluations done by Awardees. Having team members with technical expertise in the interventions to be reviewed will be essential to the success of designing and conducting effective program reviews.
9.4.3 Findings on Evaluation
The following are examples of some evaluation strengths and weaknesses found by the FAFSA-2 team in Awardees’ progress and evaluation reports and outcome and impact data used to assess the overall performance of Title II development programs. These findings were also informed by interviews with USAID, Title II Awardee, and FANTA staff.
9.4.3.1 Strengths
• Based on the example of the joint baseline and final evaluation surveys of MCHN programs in Haiti, the FAFSA-2 team thinks that, in a country with multiple Awardees and projects on the same timeline, doing joint quantitative evaluation surveys is a promising practice. The Haiti MCHN final evaluation survey report included overall findings, as well as separate tables with data for each Awardee; both individual and joint findings are critical. Joint surveys standardize evaluation among and across programs, making comparative analysis and cross-program learning possible.
281 Gregory Collins designed the program review while in the USAID/FFPEastAfricaRegionalOfficeinNairobiandsharedit with the FAFSA-2 team on November 28, 2011.
Undertaking a joint survey seems more efficient than each Awardee doing separate surveys, which hampers comparability and likely increases total costs. Programs in Ethiopia and Madagascar conducted joint baseline surveys, but due to external factors (e.g., changes in program design, political unrest), joint final surveys were done only for some of the Ethiopia programs. The FAFSA-2 team understands that a joint baseline survey will be done for the newest programs in Ethiopia.
• Conducting joint qualitative final evaluations, with one team assessing all Title II development programs, in countries with multiple Awardees on similar project timelines, is also a promising practice. Examples are the final evaluations of the Bolivia, Haiti, Honduras, Guatemala (FY 2000–FY 2008), Indonesia, and Nicaragua programs. The FAFSA-2 team learned a lot more about performance, what works, and why from these joint evaluations. Missions in these countries preferred joint evaluations so that they could review the Title II development portfolio as a whole. It is important that joint final evaluation reports include overall findings, as well as separate findings for each Awardee and that the process allows time for individually debriefing each Awardee. But Awardees may not favor the comparative nature of joint evaluations, because they are competitors hoping to win their next award. A drawback is the intense level of coordination involved to plan the field work for a single team, and this may divert Awardees from getting data and monitoring reports organized for the evaluation team.282
9.4.3.2 Weaknesses
• Until recently, when USAID/FFP issued a new directive, Title II development program Awardees were not required to submit the datasets for their baseline and endline evaluation surveys to
282 Thisdiscussionofjointevaluationprosandconsbenefitedfrom the insights of the FAFSA-2 team leader, Roberta van Haeften, and Judiann McNulty, an independent HN consultant, both of whom have conducted several joint evaluations of Title II development programs.
Performance Management

9-9
USAID (FFPIB 11-02, 2011a). Final evaluation reports reviewed for the FAFSA-2 often did not include detailed information on the final survey, i.e., the methodology, sampling, and findings on indicator data compared to baseline values with sample sizes and CIs. Instead, submitted reports tended to be qualitative evaluations that cited some comparative findings from the baseline and endline surveys. In some cases, Awardees submitted additional detailed reports on the endline survey. The lack of information in reports to USAID is understandable because it was not until July 2009, at the end of the FAFSA-2 time period, that USAID/FFP issued FFPIBs 09-06 and 09-07 requiring “confidence intervals along with point estimates, a full description of the survey design type, and sampling methodologies” in baseline and final evaluation study reports from Awardees. But the guidance does not require reporting on actual sample size. Not having a pair of detailed baseline and endline survey reports with methodological information for all of the completed programs reviewed made it difficult for the FAFSA-2 team to ascertain the quality of the data and of the evaluation designs using criteria defined by USAID/FFP and FANTA (Swindale et al., 2004). The FAFSA-2 team had to rely mainly on what the final evaluation team said about the methodology and quality of the surveys (usually conducted by others) in the project’s (qualitative) final evaluation report, if anything, as well as the team’s judgment when obvious flaws were detected. Thus, the number of evaluation surveys found with methodological limitations is probably an underestimate.
• In response to USAID/FFP’s March 2011 special request to Awardees to submit baseline and endline survey datasets for 77 completed Title II development programs for further analysis as part of the FAFSA-2, pairs of baseline and endline datasets were received for only 19 programs. After eliminating surveys with limitations, datasets from only 10 programs could potentially be used, too small a number for meta-analysis.
• The FAFSA-2 team reviewed data quality and design of Title II MCHN evaluations to identify
programs with reliable data to include in the overall analysis of nutritional status impact during the FAFSA-2 time period. (See Section 6.4.1 and Table 6.15 for a discussion of this issue.) Serious limitations were found in the evaluations of 46 percent of the 54 programs that had ended and reported their baseline and endline data. The most common issues (discussed next) were poor-quality anthropometric data, sampling problems, and seasonality differences that made comparison of baseline and final survey data invalid.
• The poor quality of some of the evaluation surveys and of the mid-term and final qualitative evaluations suggests that neither the evaluators nor the Awardees had the necessary technical expertise. Lack of adequate technical expertise on evaluation teams could be due to the selection process by Awardees, but it could also be that there are simply not enough technically strong evaluators available with a basic knowledge of Title II development programs. Only a relatively few names are associated with the better evaluations, for example. Certain expertise also seemed to be missing from many of the evaluation teams, including civil engineers, environmental specialists, and economists/business management specialists.
• The problem of some programs sampling from too large a geographic area at baseline, because the villages that will participate in the project have not yet been selected, may contribute to underestimating the population-based effect of the project when that same large geographic area is sampled and surveyed at endline, including villages that never benefited from project activities.283
• One reason for conducting the final evaluation survey in a different season is racing to meet both the USAID/FFP deadline for submitting applications for new Title II development programs and the requirement that Title II
283 This can be controlled during analysis by removing data from the baseline for those villages that never participated in the program, and in the endline sampling only villages that were in the program from the same geographic area as the baseline.
Performance Management

9-10
Awardees submit the final evaluation report for their existing program “two months prior to the submission date of the new [Multi-Year Assistance Program] proposal” (FFPIB 09-07, USAID/FFP, 2009b). However, this renders the survey results unreliable.
• Poor-quality anthropometric data are common due to measurement and age estimation errors.
• While conducting their required review of Awardees’ evaluation survey plans, USAID AORs did not always take advantage of FANTA’s survey and evaluation experts, whom USAID/FFP has funded to review the plans for technical soundness. As a result, several bad evaluation designs were approved. The AORs did not have the technical expertise to identify limitations in sampling and evaluation design and, therefore, did not request the Awardee to redesign the survey plan to correct the problems.
• The requirement that external evaluators conduct Title II final evaluations to ensure an independent, unbiased review is compromised at times, because Awardees almost always manage the funding for evaluations, decide who the evaluators will be, and procure their own evaluations and evaluators. Even if an evaluator is independent, it can be difficult to report negative findings to the same Awardee that is paying the consultant’s fee. This approach of Awardee-managed evaluations of Title II programs does not comply with the USAID Evaluation Policy’s standard for minimizing bias, which defines an external evaluator as a third party contractor or grantee managed directly by USAID.
• Several stakeholders interviewed mentioned underfunding as a likely contributor to some of the poorer-quality evaluations of Title II programs. Awardees submit an attachment to the PREP that describes their expenditures on evaluations in the prior year. However, since this budget information is not submitted prior to doing the evaluation, the AORs cannot determine whether Awardees are spending an adequate amount on evaluation as part of their agreement oversight and review of baseline study and final evaluation plans.
• The GAO reported in its 2009 performance audit of M&E in international food assistance that Title II development program evaluations usually do not assess the effectiveness and efficiency of different approaches. The FAFSA-2 review also found that Title II final evaluations do not collect, analyze, and report enough information on service delivery, demand-side behavioral outcomes, and implementation processes. If expected results are not achieved, it is important to determine where in the causal chain the program broke down. The evaluations also do not report adequately on participation in project activities/receipt of project inputs, including food rations, and the duration. Project impacts are rarely disaggregated by socioeconomic status to test if targeting was appropriate. However, this type of in-depth, comparative analysis and disaggregation would require larger sample sizes and evaluation budgets.
• Title II evaluations also did not measure cost and cost-effectiveness of different interventions and approaches.
• In several instances where Awardees hired a research firm to do their evaluation surveys, and separately contracted a qualitative final evaluation team, the endline quantitative data on outcome and impact indicators were not yet available when the qualitative evaluation team did its work in-country. This led to qualitative evaluations that missed the opportunity for rigorous analysis, interpretation, and learning from survey findings.
• A number of final evaluations, especially in the earlier years of the FAFSA-2 time period, were mere opinion polls of whether project participants were pleased with the project, but lacked information on whether the project had achieved its expected results and why. As the USAID Evaluation Policy states, evaluation findings should not be based on anecdotes, hearsay, or the compilation of people’s opinions (USAID, 2011).
• Standard core survey modules were not developed centrally for the different technical sectors during the FAFSA-2 time period. These could have increased efficiency, quality, and comparability
Performance Management

9-11
of surveys. However, questionnaires are now available.284
9.5 Reporting This section discusses FAFSA-2 findings on USAID/FFP and Awardee reporting on Title II development programs. Reports prepared annually by USAID and assessed for the FAFSA-2 include: the International Food Assistance Report (IFAR), written jointly with USDA, and USAID Mission reporting in FACTS, based on information received from Awardees. Reports on program performance prepared by Awardees and assessed in the FAFSA-2 include: ARRs with Tracking Tables for Resources and Beneficiaries by technical sectors, IPTTs, SAPQs, and final evaluation reports. While recognizing how invaluable the performance information in these reports is, and congratulating USAID/FFP and its implementing partners for their excellent work in preparing the reports, the FAFSA-2 found that reporting needs to be strengthened to address the following gaps.
• The Foreign Assistance Framework, Standardized Program Structure and Definitions, and indicators developed by USAID and the U.S. Department of State were introduced in 2006, and are referred to in short as the “F” process (USAID/U.S. Department of State, 2010). USAID/FFP shared the results of FY 2010 Mission reporting on Title II programs in FACTS with the FAFSA-2 team. While USAID Missions reported the contribution of Title II development programs to some of the “F” standardized program elements and indicators based on information from Title II Awardees, they did not report on a number of others in which programs supported major activities. This underrepresented the work of Title II development programs in meeting key foreign assistance priorities. Examples
284 On December 20, 2011, USAID/FFP reissued FFPIB 11-03 on “Revision to Food for Peace Standard Indicators Collected in Baseline Surveys and Final Evaluations.” Drafted with TA from FANTA-2, it has guidance on gender-sensitive indicators, Performance Indicator Reference Sheets, and a Standard Indicators Handbook with questionnaires for data collection and tabulation instructions.
of underreporting are discussed further in Section 6.2.2 (MCHN) and Section 8.2.2 (HIV). Improved reporting on the work of Title II programs toward “F” program elements and indicators may also help address the GAO finding that USAID/FFP needs to better link its M&E to key USAID and USAID/FFP goals (2009).
• Until FY 2011, the Tracking Tables for Beneficiaries and Resources that USAID/FFP required Awardees to submit with ARRs continued to use eight technical sectors unique to USAID/FFP, and not the “F” program elements used by the rest of USAID to describe similar activities.285 This gap was partially closed with the new ARR, PREP, and AER guidance issued by USAID/FFP for FY 2011/2012 to better align Title II reporting with the foreign assistance standardized program structure and definitions. The new instructions require Awardees to classify resources and beneficiaries in Tracking Tables by 14 “F” program elements versus the 8 technical sectors used before.286
• There are several reasons for saying the “F” reporting gap was only “partially closed” by USAID/FFP’s revised guidance. The 14 program elements selected do not include any for reporting on public infrastructure constructed, repaired, or maintained using Title II resources. This could be remedied by reporting on standard Program Element 4.4.3 “Transport Services” for roads and by reporting on Program Element 5.2.2 “Mitigation” for protective infrastructure to enhance emergency preparedness and disaster management. However, the “F” reporting structure only captures other infrastructure supported by Title II, e.g., water management
285 The USAID/FFP technical sectors and management information system predated the “F” process and FACTS. The eight technical sectors are listed in Section 1.2.1.4.286 The 14 “F” program elements now used in Title II reporting are: civic participation; HIV/AIDS; maternal and child health; family planning and reproductive health; water supply and sanitation; nutrition; basic education; social assistance; agricultural sector capacity; strengthen microenterprise productivity; natural resources and biodiversity; protection and solutions; assistance and recovery; and capacity building, preparedness, and planning.
Performance Management

9-12
infrastructure for irrigation, flood control, drought prevention, and watershed protection in Sub-Element 4.5.2.2 “Land and Water Management” under Program Element 4.5.2 “Agricultural Sector Capacity,” and FFW in Sub-Element 3.3.3.4 “Self-Help Programs” under Program Element 3.3.3 “Social Assistance.” But Title II Awardees will not report at the sub-element level in their annual Tracking Tables sent to USAID/FFP, and USAID Missions are unlikely to report on Title II activities in these sub-elements in FACTS. In addition to the infrastructure work of Title II going unreported, there are a number of “F” program elements and many sub-elements supported by Title II for which the program will continue to get no recognition because they are not reported by Awardees or USAID Missions.
• The IFAR is a critical annual report to Congress on highlights of USAID and USDA international food assistance. However, it does not report on the impressive quantitative results of Title II development programs. Thus, it does not effectively tell the story of the importance of Title II development programs in improving nutrition and food security among some of the world’s most vulnerable populations. Yet such impact and outcome data are available in the Awardees’ evaluations and IPTTs. The IFAR reports stand in sharp contrast to USAID’s Reports to Congress on its Global Health and Child Survival (GHCS) Program, which are full of data on dramatic progress in saving children’s lives, increasing coverage of essential health services, and changing health and nutrition behavior for the better (USAID, 2009 and 2010).
• An important look-up table in the IFAR is the appendix on USAID Title II development activities by Awardee and country, which reports “recipients” of direct food aid. However, beneficiaries of Title II-supported activities that do not receive food rations are not reported in that table or anywhere in the IFAR. This is another example of undercounting Title II, and the many lives it touches, that is especially striking in countries with small direct food distribution components. Nearly twice as many beneficiaries
were reported in the FY 2009 Tracking Tables as the number of food “recipients” in the FY 2009 IFAR.
• There may be errors in filling the Total Food Aid Commodity (MT) column of the Resources Tracking Tables due to leaving out from this figure the food that was monetized, and only reporting food for direct distribution, e.g., CRS/Malawi FY 2009. The form has a separate column for Monetization Budget ($), but the Total Food Aid Commodity (MT) column is supposed to include both food tonnage for monetization and direct distribution.
• Most Tracking Tables lacked essential identifiers (i.e., country, name of Awardee, submission date, fiscal year, and agreement number).
• The number of HN beneficiaries reported by Awardees in the annual Tracking Tables is misleading in cases where household members receiving food rations in MCHN or HIV programs are counted as HN beneficiaries, because these family members do not receive any HN interventions. Including such household members inflates the number of beneficiaries listed as receiving HN programming, making it difficult to discern how many people in the mother-child or PLHIV target groups ultimately receive HN interventions. Household members that are only food recipients need to be counted somewhere, but it would be better to have a separate category for this.
• Existing reporting makes gauging the coverage and scale of individual Title II projects difficult. Projects with low coverage of the expected number of beneficiaries with service delivery and project activities, or that reach few people in the geographic area of influence, are unlikely to achieve positive population-based changes in outcome and impact indicators.
• The SAPQ is an Excel-based questionnaire designed by FANTA that Awardees complete annually to assist USAID/FFP in collecting standard data across countries and programs on indicators designed to measure Strategic
Performance Management

9-13
Plan implementation progress. Such reporting is essential to aggregating data across all Title II development programs and reporting on standard indicators’ overall impact. However, the SAPQ process has not been useful for overall performance reporting to date. Awardees submitted SAPQs each year since FY 2008, with FANTA tabulating these data annually. However, the FAFSA-2 team found no examples of USAID/FFP using SAPQ data. The FAFSA-2 team could not use the tabulated SAPQ data for its review due to concerns about Awardee reporting errors and the aggregation of Awardee data for analysis, e.g., the weighted average prevalence of underweight from all baselines done in the reporting year compared to the weighted average prevalence of underweight in all endlines done in the same reporting year. A better way to measure nutritional impact across all programs would be to calculate the annual percentage point change in underweight and stunting achieved by each completed program between its baseline and final surveys and then to calculate the average annual percentage point change in underweight and stunting across all programs that ended that year.287 The FAFSA-2 team questions whether a separate SAPQ form is needed when data on changes in indicators between baselines and endlines could be obtained from the IPTTs Awardees submit with their ARRs, especially if a standard IPTT template/online form were designed to facilitate data processing and analysis and to fulfill SAPQ-like functions. The main value of the SAPQ to the FAFSA-2 was the summary contact and program information in the first block (Awardee name, country and program location in-country, start and end dates, program name, and award number), as this information was not readily available elsewhere.
• There is no standard format or template for the IPTT, although USAID/FFP provides an illustrative example with its RFA. Allowing every Awardee to design its own IPTT has led to varying quality in the reporting and further
287 This is the method used in the FAFSA-2 and described in Section 6.4.
complicated the process of aggregating overall data. Common problems found in IPTTs in the FAFSA-2 were: (1) format, such as too small a font; (2) completeness, such as no identification of country, Awardee, date, or award number; no sample sizes; no CIs; no labeling of the month and year of the baseline (no year is specified in the USAID/FFP sample form either) and endline surveys or the fiscal or calendar years when data were collected (e.g., FY 1 taken literally from the USAID/FFP example instead of FY 2011); (3) mixing monitoring and survey data for the same indicator on the same line, leading to faulty comparisons; and (4) not distinguishing final year results from cumulative life-of-agreement results. Several of these problems come from copying the USAID/FFP sample IPTT, which needs improvement.
• The IPTT is not a required part of program final evaluation reports, yet it should be because it summarizes the impact and outcome of the project on key indicators. Including this document in the final evaluation report would ensure that evaluators review these results and that readers get a fuller picture of the project’s achievements.
• No final performance (or end of program) report is required from the Awardee, as USAID/FFP considers the final evaluation report written by the external evaluators to serve as the final program report. Consequently, most Awardees do not submit final reports. Yet it is the Awardee, not the evaluator, who is best able to explain and document the logical structure of the project and what was accomplished, including: the interventions and implementation approaches used, the theory of change or development hypotheses tested, the program model employed, and the project’s inputs, outputs, number of people and communities benefited by each component (and by multiple components/integration) and for how long, actual coverage compared to planned coverage, and cost.
• Final evaluation reports the FAFSA-2 team reviewed seldom clearly described the development hypotheses and program models
Performance Management

9-14
the projects employed. Basic information, such as what interventions programs delivered to how many people for how long, was often lacking. The requirement to include this information is not specified in USAID/FFP’s guidance (FFPIB 09-07, 2009b). Furthermore, evaluators usually visit programs for a month or less and are not as familiar with the specific interventions and approaches used as are the implementers. As such, many evaluations present mainly the quantitative survey data on outcomes and impacts without much explanation as to why programs did or did not achieve targets. The lack of this information in the final evaluation report and the lack of a requirement for a final performance report by the Awardee make it difficult to learn which approaches did or did not work and why, and inhibit replication of successful program models.
• Central to USAID’s Evaluation Policy is transparency, achieved by publicly sharing evaluation findings in a timely manner as widely as possible. Transparency is a guiding principle that USAID/FFP has followed for many years by requiring Awardees to post their ARRs, baseline surveys, and mid-term and final evaluation reports to the DEC. Yet, when the FAFSA-2 team looked for Title II final evaluations on the DEC, it could find only 23 of the 67 documents, i.e., only one-third of those that should have been there. (See Table 9.1 at the end of this chapter.) The GAO also found only 16 percent of Title II program reports on the DEC that should have been there and found that USAID/FFP had not ensured that Awardees routinely comply with this requirement (2009). According to USAID’s 2011 Evaluation Policy, within three months of completing an evaluation, the report should be posted on the DEC. Some Awardees told the FAFSA-2 team that they are reluctant to post their reports on the DEC and share their tools because other PVOs may use these to compete against them during the RFA process for new Title II awards.
• Once reports are submitted to the DEC, the FAFSA-2 team learned that there can be lengthy delays in actually posting them. Moreover, searching the DEC for Title II program
evaluations by logical keywords does not readily produce reports that are on the DEC.
• Another impediment to transparency and to learning from results is that there is no requirement for public posting of the evaluation data from Title II development programs. Evaluators determine what results data to include in final evaluation reports and which are to be posted on the DEC. Grantees of USAID’s CSHGP are required to post their evaluation data on the CSHGP website, where other grantees can see and learn from them or use the data for secondary analysis. This could be a good model to follow.
• Database on interventions and approaches. There is no reporting on or a USAID/FFP database with standardized information on common interventions and approaches used in each Title II program. Therefore, USAID/FFP has no readily available data source to describe what interventions and approaches it is supporting and where. The FAFSA-2 team had to hand count this information by reading and tallying from the program documentation, using an Excel spreadsheet designed for the purpose (HN only), a tedious, time-consuming, and massive process that should be automated going forward. This is another example of underrepresentation of the Title II program in terms of the many technical areas it works in. Not documenting this also makes it difficult to detect interventions and approaches that are rarely done that should be promoted more. A lack of descriptive information on what Title II programs are doing in different countries also impedes the ability to coordinate and co-program with other USAID programs and partners. There are many other needs and requests for this information that cannot be met.
• Data for decision making. Although this is an important step in USAID’s performance management process, the extent to which USAID/FFP and Awardees are using Title II M&E data to improve program design, implementation, and management is unclear from the program documentation and interviews undertaken during the FAFSA-2. The FAFSA-2 found few examples where mid-term evaluation findings drove mid-
Performance Management

9-15
course corrections and little technical guidance by USAID/FFP based on evidence from the many Title II evaluations conducted. The FAFSA-2 team did not encounter any USAID/FFP-commissioned cross-cutting studies or in-depth analyses of Title II evaluation results to advance organizational learning other than the FAFSA and the FAFSA-2. Much greater use could be made of the evaluation data and findings for systematic reviews, meta-analyses, secondary analyses, learning, adapting, and decision making.
9.6 Conclusions and Recommendations
9.6.1 Conclusions
M&E General
• There were major advances in Title II M&E during the FAFSA-2 time period, e.g., standardized indicators; new indicators; normative guidance from USAID/FFP in Information Bulletins; the requirement for independent, population-based, quantitative evaluation surveys; and M&E training workshops.
• The shortage of M&E expertise in both USAID/FFP and Awardee organizations is a constraint. There are not enough qualified evaluators.
Monitoring
• Valuable efforts to strengthen monitoring of Title II programs by USAID/FFP included Layers and monitoring plans, but more attention to improving monitoring is needed.
Evaluation
• USAID/FFP’s evaluation requirements for Title II development programs were more extensive and ambitious with respect to quantitative performance data than those of other USAID programs in the same time frame. As a result, there is a wealth of outcome- and impact-level performance data available to assess the Title II development program overall.
• USAID/FFP’s expectation that all its Awardees have the capability to design and conduct, or to oversee others to implement, quality quantitative evaluation surveys is unrealistic. Specialized sampling and survey research skills are essential to ensure that data collected are reliable, valid, and generalizable. These skills are scarce among the Awardees. Thus, the laudable requirement to do quantitative evaluations with the goal of generating solid data on program effectiveness was frustrated by the poor quality of many (46 percent of MCHN evaluations) of the baseline and final surveys. Problematic baseline and endline surveys with questionable data represent a great deal of wasted effort and resources. Such evaluation surveys reduce the amount of reliable evidence about program outcomes and impact. Furthermore, the considerable effort Awardees put into these surveys likely detracted from the more important task of implementing their programs well. This experience argues strongly for USAID/FFP centralizing, professionalizing, standardizing, and making independent the conduct of future Title II development program evaluations, including baseline and final evaluation surveys. The 2002 FAFSA also recommended reducing Awardees’ responsibility for conducting complex and burdensome evaluation activities, such as baseline and final evaluation surveys, and instead suggested using external TA to improve evaluation quality and timeliness.
• The contribution to organizational learning of many Title II final evaluation reports is reduced by the absence of: an adequate description of the development hypothesis; the interventions and implementation approaches used; the project’s inputs, outputs, and processes; and the number of people and communities benefited (compared to the expected number) by each component and by multiple components (integration), and for how long and at what cost. The reader is often unable to discern the logical structure of the project and what it was supposed to accomplish and is not given sufficient detail to be able to replicate a successful model. Most reports focus mainly on the outcome and impact indicators and do not describe the program model or analyze
Performance Management

9-16
why results were or were not achieved so the development community can learn from the experience.
Reporting
• The Title II development program is seriously underrepresented, undercounted, and undervalued in terms of the many technical areas it supports and results it achieves. There is no central database that tracks interventions and approaches ongoing in field programs. Not knowing what is being supported where has many drawbacks. It impedes being able to readily quantitatively describe/aggregate ongoing programs, as well as coordinating and co-programming with other USAID programs. Recent steps by USAID/FFP to better align Title II reporting and “F” reporting by using the same program elements and indicators are positive developments, but gaps remain. For example, there is nowhere to report infrastructure and FFW supported by Title II.
• The IPTT is an invaluable tool for Awardees and USAID to monitor, record, and report the progress and final results of each Title II program using agreed-on targets and indicators. The usefulness of a number of IPTTs was reduced by the lack of a standard template, format issues, and incomplete information. Furthermore, unless made publicly available on the DEC as part of the final evaluation or final report on the program, the data reported in IPTTs are not available for broader learning and accountability.
9.6.2 Recommendations
All recommendations listed below are for actions by USAID/FFP unless otherwise noted.
General M&E
• Work together with Awardees to harmonize indicators in countries with multiple Title II development programs and ensure that data are collected and analyzed in a standardized way. The USAID/FFP standard indicators should be universally used to aid comparing performance across projects worldwide. In-country harmonization would further facilitate
performance management at that level. Individual programs could have additional indicators, as needed.
Monitoring
• Strengthen monitoring of Title II development programs by USAID/FFP and Awardees. (Recommendation 8)288
Evaluation
• Have Title II program baseline and final evaluation surveys done independently and standardized by contracting a professional, central survey research organization. The centrally funded survey research firm would select and contract local data collection firms and supervise all of the field work. The central survey research firm would also do the data analysis and report preparation and dissemination.289 Another essential task for this central contractor would be creating a worldwide database with the Title II evaluation data, similar to the StatCompiler used for accessing DHS data.290 The central evaluation survey research contractor should make data publically available electronically; strive for as much standardization and cross-program, cross-country comparability as feasible; and undertake in-depth analyses based on adequate sample size. For example, in-depth analyses could include disaggregating evaluation results to compare effectiveness of different intervention packages, impact by length of exposure to the intervention, or participation and results by socioeconomic status or other sub-groups. (Recommendation 11)
288 The numbers after certain recommendations are the same as those assigned to the major recommendations in the FAFSA-2 summary report.289 If monetization funds in the Awardees’ agreements are the only way USAID/FFP has to fund local survey costs, then Awardees could use monetization proceeds to hire the local survey data collection agency, with the central survey research organization overseeing the selection process and supervising theperformanceofthelocalfirm.Ideally,however,theevaluations should be entirely external and directly managed by the central survey research contractor, with no direct involvement of Awardees.290 http://www.statcompiler.com.
Performance Management

9-17
• Along with the survey report, require the survey organization to submit a checklist of whether quality survey performance standards were met. (Recommendation 12)
• Centralize and professionalize independent qualitative evaluations of Title II development programs through several contracts with qualified firms. These contractors would not necessarily be the same as the survey contractor mentioned previously. (Recommendation 11)
• Consider the total dollar value of all Title II development projects in a country as one block to determine whether together they are large enough to meet the criteria for a performance evaluation of all of them to be conducted according to the USAID Evaluation Policy. Continue to encourage external evaluations of smaller Title II projects for which performance evaluation is not required. (Recommendation 14)
• Have the central evaluation survey contractor do joint baseline and final evaluation surveys for all Title II programs in countries with multiple Awardees and projects with similar timelines. USAID/FFP should also make joint final qualitative evaluations the standard in countries with multiple Awardees. Surveys should measure common indicators across programs, as well as indicators that each Awardee wants to evaluate. Evaluation reports should contain joint findings as well as individual findings for each Awardee. (Recommendation 15)
• Ensure that there are enough professionals available with the relevant technical expertise and knowledge of Title II development programs to meet the demand for independent, high-caliber evaluators. This could be accomplished by: (1) contracting qualified firms to do the evaluations; (2) having a core professional staff dedicated to Title II program evaluation at such firms, as well as short-term consultants hired to do the evaluations; and (3) inviting Title II development program evaluators to attend technical capacity building and knowledge-sharing events organized by USAID/FFP, its TA partners, or Awardees. (Recommendation 13)
• When programs are extended by a year or more, require the Awardee to commit to and measure new results targets through the new end date.
• Mid-term evaluations. USAID/FFP and FANTA should promote further experimentation by other Title II projects with the two-phase approach of collecting quantitative data on project indicators using LQAS, and then doing qualitative inquiry to identify reasons for lagging indicators and implementing an action plan to improve the program (the CRS/Haiti example). The utility of this methodology for mid-term evaluations could be determined through testing in other programs. FANTA and CRS could prepare a Technical Note on the mid-term evaluation methodology used in Haiti to aid others to replicate and experiment with it. Similarly, FANTA should disseminate information on promising approaches used by other Awardees and provide TA to develop better models for Title II mid-term evaluations. FANTA could then document more effective methodologies in a Technical Note. (Recommendation 9)
• Conduct USAID-led program reviews to complement mid-term evaluations done by Awardees. Ensure that the reviews are done by qualified teams. (Recommendation 10)
Reporting
• Require all Title II Awardee reporting documents, including the IPTT, to be in at least size 10 point font. All documents should be labeled with the date, country, name of Awardee, years of the program, and agreement number, including the IPTT and Resource and Beneficiary Tracking Tables, which are often submitted as separate documents from the main ARR.
• Add results data to the IFAR and make it look more like USAID’s GHCS Report to Congress. Similarly, ensure that the GHCS report includes more Title II results. Another column should be added in the IFAR appendix table on Title II development programs to report direct beneficiary numbers for Title II project activities, not just food recipients. (Recommendation 18)
Performance Management

9-18
• Standardize the IPTT form with a required template, as the current IPTT example included in the RFA is contributing to errors. Have Awardees complete the IPTT that they submit to USAID as an online form that won’t allow omissions. An IPTT submitted as an online form could serve as the data source for standard indicators for overall performance reporting, in lieu of the separate SAPQ form. The IPTT template should include the date of the baseline and final evaluation surveys (calendar month and year), sample size for each indicator, name of country, Awardee organization, agreement number, separate rows for monitoring data versus survey data for the same indicator, and CI.
• Ensure that all relevant USAID/FFP standard indicators are included in the IPTT, that indicators are logically appropriate for the program model, that behavior change indicators at the highest outcome level measure practices not knowledge, and that the groups measured for people-level indicators (the denominator) are consistent with the project’s target groups. Use FANTA TA, as needed.
• Post final IPTT data online for access by other Awardees. If such data were readily available, they could also be used in the IFAR to tell the story of the impact of the program and for secondary analysis by Awardees or USAID. (Recommendation 17)
• In the Tracking Table for Beneficiaries, make another category for household members receiving food in MCHN and HIV activities and instruct Awardees not to include these people under the Nutrition, MCH, or HIV program elements. It would be useful to redesign the AER to have food recipient categories for MCH-mother, MCH-child, and MCH-household member, plus FFW, PLHIV, and PLHIV-household member.
• Design a standard table for inclusion in ARRs that would better report on how many direct beneficiaries received each of a project’s key interventions, how many received multiple
interventions, and the percent coverage of the total eligible population in the project area or of the expected number to be covered per project targets.
• Add program elements for infrastructure to the AER and to the Resources and Beneficiaries Tracking Tables in the PREP and ARR (use the “F” Program Element 4.4.3, “Transport Services,” for work on roads and Program Element 5.2.2, “Mitigation,” for protective infrastructure to enhance emergency preparedness and disaster management). Establish a method for capturing information on other kinds of Title II-assisted infrastructure and FFW, which fits the definition of “F” Sub-Elements 3.3.3.4, “Self-Help Programs,” and 4.5.2.2, “Land and Water Management.” (Recommendation 19)
• Develop a database to better describe the interventions and approaches used in Title II development programs. The data should come from a new, standard, electronic, online reporting form that Awardees would be required to submit annually to USAID/FFP for each Title II development program. In the form, Awardees would check off the standard types of interventions and approaches they are implementing in each program from a menu with definitions, agreed upon by USAID, Awardees, and other technical experts and stakeholders.291 (Recommendation 20)
• Require final performance reports by Awardees, have more detailed guidelines for required sections in final evaluation and final performance reports, and include the completed IPTT in both. Follow the USAID Evaluation Policy Checklist for Assessing USAID Evaluation Reports.292 Require proof in the final performance report that Awardees have posted the final evaluation to the DEC (e.g., assigned DEC numbers or other proof of transmittal). (Recommendations 16 and 21)
291 The Excel spreadsheet developed for the review of HN in the FAFSA-2 could be used as a starting point. 292 http://transition.usaid.gov/policy/evalweb/evaluation_resources.html.
Performance Management

9-19
• To maximize the utility of final evaluation reports and final performance reports for learning and accountability, these reports need to clearly describe the program model and its implementation in enough detail to allow for replication. This should include information on the: (1) development hypothesis; (2) interventions and approaches; (3) inputs, outputs, and processes; (4) final IPTT with results, sample size, and CIs for all indicators; (5) number of people and communities benefited, by each separate component and by multiple components, compared to targets, and for how long; and (6) cost. (Recommendation 21)
• Review whether the SAPQ form is the most efficient method for collecting data on standard indicators from Awardees or whether a required online IPTT template could serve the same purpose. USAID/FFP should use the results data reported in the SAPQs. If reports produced from the SAPQ information are not essential to USAID/FFP for performance management, then consider eliminating the requirement for Awardees to submit the SAPQ. If the SAPQ continues to be required, FANTA and USAID/FFP agree that it should be redesigned for Awardees to complete as an online form with data cleaning filters to reject errors. This would also speed up delivery and analysis of the forms.
• Post summaries of Title II programs on the USAID/FFP and/or TOPS websites, following the example of the CSHGP one-page reports on specific child survival projects and their results featured on the CSHGP home page.293
• Enforce the requirement that Awardees post project reports and evaluations to the DEC. (Recommendation 16)
• Request for all Awardees with final evaluation reports for completed Title II development programs not found in the DEC by the FAFSA-2 (see Table 9.1) to immediately post these missing
293 See http://www.mchipngo.net/controllers/link.cfc?method=home.
reports to the DEC and to provide USAID/FFP with the assigned DEC number for the document. (Recommendation 16)
• DEC. Work with personnel responsible for the DEC to improve the keyword search so that it readily locates Title II reports, and require Awardees to submit reports identified by these keywords.
Learning from Results
• Use the Title II development results data and evaluation findings for decision making and learning.
• Have a technical contractor analyze Title II development program-wide (worldwide) results data and evaluation findings annually and organize knowledge-sharing events to foster learning from the evaluations. The focus could be to review one technical sector or approach in-depth each year. In addition, this contractor should present the program-wide results in a format that USAID/FFP can readily use for high-level reporting and wide dissemination to communicate what Title II development programs accomplish. (Recommendation 2)
Performance Management

9-20
Table 9.1. Availability of Title II Final Evaluations in USAID’s DEC as of June 2011
Country Bangladesh
AwardeeCARESC
Dates of ProgramFY05–10FY05–10
Grant NumberFFP-A-00-04-00079FFP-A-00-04-00080
Final in DEC?Yes No
11
DEC NumberPD-ACP-746PD-ACP-903
Bolivia ADRA FY03–09 FFP-A-00-02-00052 1 PD-ACO-837CARE FY02–09 FFP-A-00-02-00028FH FY02–09 FFP-A-00-02-00057SC FY02–09 FFP-A-00-02-00056
Burkina Faso CRS FY04–10 FFP-A-00-03-00076 1AFRICARE FY04–10 FFP-A-00-04-00078 1
Cape VerdeChad/MaliEthiopia
ACDI/VOCAAFRICARECARECRS
FY03–08FY03–08FY02–05FY03–07
FFP-A-00-02-00022FFP-A-00-02-00094FFP-A-00-03-00002FFP-A-00-02-00095
1111
REST FY03–07 FFP-A-00-03-00004 1SC US FY03–07 NA 1WV FY03–08 FFP-A-00-03-00003 1CARE FY05–08 FFP-A-00-05-00032 1CRS FY05–08 FFP-A-00-05-00027FH FY05–08 FFP-A-00-05-00030REST FY05–08 FFP-A-00-05-00028SC US FY05–08 FFP-A-00-05-00029WV FY05–09 FFP-A-00-05-00031
Ghana ADRA FY02–08 FFP-A-00-02-00015 1 PD-ACH-634CRS FY03–08 FFP-A-00-03-00081 1OICI FY04–09 FFP-A-00-04-00085 1TNS FY06–10 NA 1
Guatemala CARE FY01–08 FFP-A-00-01-00012 1 PD-ACT-247CRS FY01–07 FFP-A-00-02-00007SC FY00–07 FFP-A-00-02-00027SHARE FY03–07 FFP-A-00-03-00015
Guinea ADRA FY00–09 FFP-A-00-00-00085 1 PD-ACD-461AFRICARE FY01–08 FFP-A-00-01-00034 1OICI FY05–09 FFP-A-00-04-00074 1
Haiti CARECRS
FY02–08FY02–08
FFP-A-00-02-00055FFP-A-00-02-00053
2 PD-ACJ-025 PD-ACN-886
SC FY02–08 FFP-A-00-02-00045WV FY02–08 FFP-A-00-02-00054
Honduras CARE FY01–08 FFP-A-00-01-00002 1 PD-ACP-7751 PD-ACP-998
ADRA FY05–09 FFP-A-00-05-00001 1 PD-ACP-894SC FY05–09 FFP-A-00-04-00071
IndiaWV/ACDI/VOCACRS
FY05–09FY02–06
FFP-A-00-05-00002FFP-A-00-02-00017 1 PD-ACH-642
CRS FY07–10 FFP-A-00-07-00025 1CARE FY02–06 FFP-A-00-02-00011 1 PD-ACI-026CARE FY07–10 FFP-A-00-07-00024 1
Performance Management

9-21
Country AwardeeDates of Program Grant Number
Final in DEC?DEC NumberYes No
Indonesia CARE FY05–08 FFP-A-00-04-00070 1CRS FY05–08 FFP-A-00-04-00069 1MC FY05–08 FFP-A-00-04-00072 1SC FY05–09 FFP-A-00-04-00076 1WV FY05–08 FFP-A-00-04-00068 1
Kenya ADRA FY03–08 FFP-A-00-03-00082 1CARE FY04–09 FFP-A-00-03-00085 1 PD-ACQ-780CRS FY01–06 FFP-A-00-01-00003 1FH FY04–08 FFP-A-00-03-00090 1WV FY03–07 FFP-A-00-02-00001 1
Liberia LIAP Consortium (CRS) FY07–10 FFP-A-00-07-00008 1Madagascar ADRA FY04–09 FFP-A-00-03-00096 1
CARE FY03–09 FFP-A-00-03-00078 1CRS FY03–08 FFP-A-00-03-00089 1
Malawi I-LIFE Consortium (CRS) FY05–09 FFP-A-00-04-00066 1Mauritania WV FY01–07 FFP-A-00-01-00044 1Mozambique ADRA FY02–08 FFP-A-00-02-00008 1
AFRICARE FY02–08 FFP-A-00-00-00013 1CARE FY02–08 FFP-A-00-02-00014 1FH FY02–08 FFP-A-00-02-00010 1SC FY02–08 FFP-A-00-02-00009 1WV FY02–08 FFP-A-00-02-00012 1
Nicaragua ADRA FY02–09 FFP-A-00-02-00002 1 PD-ACO-867CRS FY02–09 FFP-A-00-02-00004PCI FY02–09 FFP-A-00-02-00005SC FY02–09 FFP-A-00-02-00003
Niger AFRICARE FY00–07 FFP-A-00-00-00087 1Rwanda ACDI/VOCA/AFRICARE FY00–05 FFP-A-00-00-00037 1 PD-ACD-646
ACDI/VOCA/AFRICARE FY05–10 FFP-A-00-04-00073 1CRS FY00–09 FFP-A-00-00-00086 1 PD-ACD-647WV FY04–09 FFP-A-00-04-00084 1
Senegal/Gambia CRS FY02–07 FFP-A-00-02-00029 1Sierra Leone CARE (AFRICARE, CRS, WV) FY04–07 FFP-A-00-04-00020 1 PD-ACN-868
CARE (AFRICARE, CRS, WV) FY07–10 FFP-A-00-07-00007 1 PD-ACR-358Uganda ACDI/VOCA FY02–06 FFP-A-00-02-00016 1 PD-ACI-108
AFRICARE FY02–06 FFP-A-00-02-00073 1 PD-ACG-740CRS FY02–06 FFP-A-00-02-00006 1 PD-ACG-739SC FY03–09 FFP-A-00-03-00086 1WV FY03–09 FFP-A-00-03-00079 1
Zambia LOL FY04–09 FFP-A-00-04-00001 1 PD-ACM-615
Performance Management

9-22
Bibliography for Chapter 9Bergeron, Gilles; Deitchler, Megan; Bilinsky, Paula; and Swindale, Anne. 2006a. “Monitoring and Evaluation Framework for Title II Development-Oriented Projects.” Technical Note No. 10. http://www.fantaproject.org/downloads/pdfs/TN10_MEFramework.pdf.
Bergeron, Gilles; Swindale, Anne; Deitchler, Megan; and Bilinsky, Paula. 2006b. “Evaluating Title II Development-Oriented Multi-Year Assistance Projects.” Technical Note No. 11. http://www.fantaproject.org/downloads/pdfs/TN11_MYAP.pdf.
Bonnard, Patricia. 2002. “Title II Evaluation Scopes of Work.” Technical Note No. 2. http://www.fantaproject.org/downloads/pdfs/tn2SOW.pdf.
GAO. 2009. “USAID Is Taking Actions to Improve Monitoring and Evaluation of Nonemergency Food Aid, but Weaknesses in Planning Could Impede Efforts.” http://www.gao.gov/products/GAO-09-980.
Swindale, Anne; Deitchler, Megan; Cogill, Bruce; and Marchione, Thomas. 2004. “The Impact of Title II Maternal and Child Health and Nutrition Programs on the Nutritional Status of Children.” USAID/FFP Occasional Paper No. 4. http://www.fantaproject.org/downloads/pdfs/ffpOP4.pdf.
USAID. 2009. Two Decades of Progress: USAID’s Child Survival and Maternal Health Programs. Washington, DC: USAID.
USAID. 2010. Striving for a Healthy Future. Global Health and Child Survival Report to Congress, Fiscal Year 2009. Washington, DC: USAID.
USAID. 2011. Evaluation Policy. Washington, DC: BureauforPolicy,PlanningandLearning,OfficeofLearning, Evaluation and Research, USAID.
USAID/FFP. 2005. Strategic Plan for 2006-2010.Washington, DC: USAID.
USAID/FFP. 2007. “New Reporting Requirements for Food for Peace.” FFPIB 07-02.
USAID/FFP. 2009a. “Monitoring and Evaluation Responsibilities of Food for Peace Multi-Year Assistance Programs Awardees.” FFPIB 09-06.
USAID/FFP. 2009b. “Description of Food for Peace Awardee Reporting Requirements.” FFPIB 09-07.
USAID/FFP. 2011a. “Submission of Baseline/Final Evaluation Datasets by Food for Peace Awardees.” FFPIB 11-02.
USAID/FFP. 2011b. “Revision to Food for Peace Standard Indicators Collected in Baseline Surveys and Final Evaluations (Reissuance).” FFPIB 11-03 (Reissued).
USAID/U.S. Department of State. 2010. “Foreign Assistance Standardized Program Structure and Definitions.” http://www.state.gov/documents/organization/141836.pdf.
USAID and USDA. 2011. U.S. International Food Assistance Report 2010. Washington, DC: USAID.
Performance Management