THE SOCIAL AND ECONOMIC VALUE OF GRASSROOTS ...
131
AN ANALYSIS OF THE CONTRIBUTION OF GRASSROOTS FOOTBALL TO THE NATION’S ECONOMY AND WELLBEING PUBLISHED: MARCH 2021 For Public Affairs enquiries, please contact: [email protected] For Media enquiries, please contact: [email protected] THE SOCIAL AND ECONOMIC VALUE OF GRASSROOTS FOOTBALL IN ENGLAND
-
Upload
khangminh22 -
Category
Documents
-
view
0 -
download
0
Transcript of THE SOCIAL AND ECONOMIC VALUE OF GRASSROOTS ...

AN ANALYSIS OF THE CONTRIBUTION OF GRASSROOTS FOOTBALL TO THE NATION’S ECONOMY AND WELLBEING
PUBLISHED: MARCH 2021
For Public Affairs enquiries, please contact: [email protected] For Media enquiries, please contact: [email protected]
THE SOCIAL AND ECONOMIC VALUE OF GRASSROOTS FOOTBALL IN ENGLAND

The Football Association Limited THE SOCIAL AND ECONOMIC VALUE OF GRASSROOTS FOOTBALL IN ENGLAND – SEPTEMBER 20202
PREFACE
The Football Association (The FA) is the not-for-profit governing body of football in England. It is responsible for promoting and developing every aspect of the game, from grassroots to professional.
Each year, 14.1m people play grassroots football in England across all forms and frequencies, with 13.5m people playing regularly1. This makes football the most popular team sport in England for children and adults.
Football has the power to achieve significant positive change for individuals, through improving mental, physical and social wellbeing. Therefore, The FA continues to invest in developing an understanding of the wider benefits of grassroots football for individuals, communities and the nation.
This report evidences how football in England can act as a vehicle through which societal challenges can be acknowledged, addressed and improved. This report also demonstrates how grassroots football participation in England contributes £10.16bn2,3 to society per annum.
In 2019 The FA published its first social and economic impact report4, demonstrating the contribution of adult grassroots football to the national economy and individual wellbeing. One year on, in 2020, this report widens and develops our knowledge in areas ranging from mental health benefits in children to physical health benefits in older adults, along with insights into two key enablers to participation: facilities and volunteering.
Such insight is particularly poignant at a time when Covid-19 has disrupted communities across the country. The data used to inform this report was collected pre-Covid-19 and therefore findings reflect the socio-economic contribution of grassroots football before this. However, the economic, health and social benefits of grassroots football described in this report remain crucial. Recent research undertaken by Sport England during Covid-19 found that 63% of people said getting active helped their mental wellbeing during lockdown5.
Despite the disruption caused by Covid-19, the football sector’s response to the crisis – at every level – is testament to the integral place that clubs hold at the heart of communities. The activity of the grassroots game during this difficult time has been nothing short of remarkable. In the face of financial uncertainty and the disappointment of months without play, numerous grassroots clubs and leagues have come together to provide help and support to the NHS and the wider local community.
Opportunities for social interaction are perhaps more important than ever after extended periods of isolation and limited social engagement. This report shows that playing football provides 1.77bn hours of social interaction6 for England’s population each year. That is equivalent to 83 minutes per regular child footballer per week and 185 minutes per regular adult footballer per week. This brings benefits at the community level with, for example, footballers having higher levels of trust than non-footballers. This benefit is greater in those from lower socio-economic groups7.
One of the few positives to take from the pandemic has been how various elite footballers have used their profile and audiences as a platform to push for social change. Football should be proud of these outstanding ambassadors for the game and for the country.
The bedrock of what The FA does lies in grassroots football, together with the 50+ County FAs who work tirelessly in our local communities. Our collective ambition is to make football inclusive, safe and fun for all – regardless of age, gender, gender identity, sexual orientation, ethnicity, religion or belief, ability or disability or playing standard – and in so doing, positively impact society. Progress has been made by English football but we still have much more to do to ensure equal opportunities in both grassroots football and elite football, as well as in wider society.
Grassroots football is changing and more exciting than ever, with developing formats and opportunities to get
1 9m adults (The FA) and 4.5m children (Sport England) play regular football. ‘Regular’ adult footballers defined as playing within the last month (The FA). ‘Regular’ defined as playing once within the last week for children (Sport England).2 Portas Consulting Socio-economic model. Combined socio-economic value of adult and children’s grassroots football. These figures are based on the value of regular football (adults: playing within the last month; children: playing within the last week) against reference group of rest of population, including those who play other sports and those who play no sports, and include both the male and female game. All monetary values are based on primary analysis or academic research with appropriate socio-demographic controls. See Appendix 3 for further details. 3 Note this value does not include the effects of injuries due to limited data availability for the grassroots game.4 The FA (2019): The Social and Economic Value of Adult Grassroots Football in England: http://www.thefa.com/news/2019/jul/09/social-and-economic-value-of-adults-grassroots-football-in-england-0907195 Sport England (2020). Exploring attitudes and behaviors in England during the COVID-19 pandemic6 Social interaction hours are defined an as time spent in an exchange between two or more people. The average regular child grassroots footballer plays 83 minutes per week (Sport England, 2019. Active Lives Children and Young People Survey Academic Year 2018/19). The average regular adult grassroots footballer plays 185 minutes per week (The FA Participation Tracker November 2019 – February 2020). Calculation assumes all time spent playing football involves interacting with others.7 Based on OLS regression analysis comparing self-rated trust in regular adult footballers to reference group of the rest of the population, controlling for socio-demographic factors. See page 35 for further details.

The Football Association Limited THE SOCIAL AND ECONOMIC VALUE OF GRASSROOTS FOOTBALL IN ENGLAND – SEPTEMBER 2020 3
8 Based on OLS regression analysis comparing self-rated individual development in regular adult footballers to reference group of the rest of the population, controlling for socio-demographic factors. The FA Participation Tracker Survey (November 2019 – February 2020). See page 39 for further details.9 21.8% of regular adult footballers are BAME and 10.8% of adults in England are BAME. The FA Participation Tracker Survey (March 2019-February 2020).
involved. This season we saw the number of women and girls playing football in England reaching 3.4m, confirming the achievement of The FA’s target to double female participation in the three years from 2017 to 2020. This achievement is as much about impact on the pitch as off it; our findings show that the benefits of regular football on confidence and communication are twice as great in women than men8. Grassroots football is also diverse. There is double the representation of BAME players in adult grassroots football than representation in wider society.9
The FA hopes this report is useful to researchers, academics, government officials and any members of the public who may be interested in the benefits of grassroots football FOR ALL.
Note: Unless otherwise stated, all figures quoted throughout this report are made on a per annum basis.
Mark Bullingham Chief Executive, The FA
Baroness Sue Campbell DBE Director of Women’s Football, The FA
James Kendall Director of Football Development, The FA

The Football Association Limited THE SOCIAL AND ECONOMIC VALUE OF GRASSROOTS FOOTBALL IN ENGLAND – SEPTEMBER 20204

The Football Association Limited THE SOCIAL AND ECONOMIC VALUE OF GRASSROOTS FOOTBALL IN ENGLAND – SEPTEMBER 2020 5
i) Portas Consulting Socio-economic model. Combined socio-economic value of children’s and adult grassroots football. These figures are based on the value of regular football (adults: playing within the last month; children: playing within the last week) against reference group of rest of population, including those who play other sports and those who play no sports. Economic value comprises £2.7bn of workforce contribution, £1.72bn of volunteering value and £3.32bn of participant consumption. Healthcare savings comprise £525m direct savings (cost savings for the NHS, such as preventing treatment and public social care costs) and £1.1bn indirect savings (wider societal cost savings, for example improving productivity in the workplace and reducing informal care) and are based on primary analysis or academic research with controls for socio-demographic factors. Social value comprises £777m of GDP growth annually through improved educational performance and £6.5m savings through juvenile crime reduction. Based on the links between improved academic attainment, reduced crime and sport participation in children in academic research, controlling for socio-demographic factors. See Chapters 3 and 4 and Appendix 3. ii) Aged 5-18. iii) Portas Consulting socio-economic model. Based on the number of active regular football participants and primary analysis or academic research showing the reduced odds of developing physical or mental disorders in active individuals, controlling for socio-demographic factors. iv) Descriptive analysis of The FA Participation Tracker Survey. Children aged 14-18. Results are statistically significant at the 1% probability level. See Chapter 4 and Appendix 5. v) Aged 19+. vi) Statistically significant results from regression analysis of regular football participation in The FA Participation Tracker Survey, controlling for socio-demographic factors. See Chapter 4 and Appendix 9. vii) Walking Football is used as a proxy to analyse the benefits of participation in older adults: 91% of participants surveyed were aged 50+ (note: not nationally representative) and so research in Chapter 5 is focused on this age group. Note the socio-economic value of grassroots football for older adults is included in the ‘adults’ figures here and in Chapter 4. viii) The FA Walking Football Survey. See Chapter 5 and Appendix 11. ix) The FA Walking Football Survey. The average Walking Football participant surveyed plays for 118 minutes per week. See Chapter 5 and Appendix 11. x) The FA and Sport England (2019). See Chapter 6.1. xi) Joint investment over the next 10 years by The FA, Sport England and Premier League through the National Football Facilities Strategy (NFFS), delivered by the Football Foundation. Over £96m is directed at the ten most deprived areas. See Chapter 6.2 and Appendix 13. Note: figures may not sum due to rounding.
£7.74bn
direct economic valuei
£1.62bn
total healthcare savingsi
£780m
social valuei
THE SOCIAL AND ECONOMIC VALUE OF GRASSROOTS FOOTBALL IN ENGLAND: AN INFOGRAPHIC SUMMARY
13.5m
Childrenii Adultsv Older adultsvii
people across England play football regularly, contributing
to society each yeari. This includes:
Childhood football participation contributes to the reduction of
Adult football participation contributes to the reduction of
Walking football is an important offering for older adults. Of players surveyed:66.5k cases
213.5k cases203.3k cases 88%
74%65%
report improved mobility or co-ordination.
agree it has provided them with a sense of belonging.
say it provides them with a sense of purposevii.
of depression and anxietyiii, and
of childhood obesityiii.
Children who play football are more confident and more resilient than those who do not play sportiv.
of physical and mental health disorders, including the reduction of chronic disease, depression and anxietyiii.
Adults who play regular football are also happier than non-footballers. This impact is three times greater in adults from low socio-economic groups compared to high socio-economic groupsvi. These benefits are achieved through
approximately two hours per week of social interaction that individuals receive on average through playingix.
This is supported by
volunteersx1.4m & £1bn investment into facilities by the National Football Facilities
Strategy, of which 10% is in the 10 most deprived areas in Englandxi.
£10.16bn

The Football Association Limited THE SOCIAL AND ECONOMIC VALUE OF GRASSROOTS FOOTBALL IN ENGLAND – SEPTEMBER 20206
CONTENTS
PREFACE 2
AN INFOGRAPHIC SUMMARY 5
EXECUTIVE SUMMARY 9
1. CONTEXT 13
1.1. THE FOOTBALL ASSOCIATION 13
1.2. PURPOSE OF THIS REPORT 14
1.3. THE IMPACT OF COVID-19 15
2. METHODOLOGY AND APPROACH 17
2.1. OVERVIEW 17
2.2. QUANTIFYING THE BENEFITS OF REGULAR GRASSROOTS FOOTBALL FOR CHILDREN AND ADULTS 18
2.3. GENERATING ADDITIONAL INSIGHTS INTO OLDER ADULTS THROUGH WALKING FOOTBALL 19
2.4. DEVELOPING SUPPLEMENTARY INSIGHTS INTO TWO KEY ENABLERS OF PARTICIPATION 19
2.5. FURTHER CONSIDERATIONS 20
3. CHILDREN 22
3.1. OVERVIEW 22
3.2. ECONOMIC IMPACT 23
3.3. HEALTH IMPACT 24
3.4. SOCIAL IMPACT 27
4. ADULTS 31
4.1. OVERVIEW 31
4.2. ECONOMIC IMPACT 32
4.3. HEALTH IMPACT 33
4.4. SOCIAL IMPACT 38
5. OLDER ADULTS 43
5.1. WHAT IS WALKING FOOTBALL AND HOW DOES IT ENGAGE OLDER ADULTS? 44
5.2. THE HEALTH BENEFITS OF WALKING FOOTBALL 45
5.3. THE SOCIAL BENEFITS OF WALKING FOOTBALL 46

The Football Association Limited THE SOCIAL AND ECONOMIC VALUE OF GRASSROOTS FOOTBALL IN ENGLAND – SEPTEMBER 2020 7
6. TWO KEY ENABLERS OF PARTICIPATION: VOLUNTEERS AND FACILITIES 49
6.1. THE IMPACT OF VOLUNTEERING 49
6.2. THE IMPACT OF FACILITIES 53
7. PROJECT TEAM 58
8. ACADEMIC PANEL 59
9. APPENDICES 61
APPENDIX 1 – KEY DATASETS 61
APPENDIX 2 – TECHNICAL NOTE: OLS REGRESSION ANALYSIS 66
APPENDIX 3 – THE SOCIO-ECONOMIC MODEL 67
APPENDIX 4 – DEMOGRAPHIC BREAKDOWN OF FOOTBALL PARTICIPANTS 73
APPENDIX 5 – FOOTBALL PARTICIPANT SPEND 77
APPENDIX 6 – CHILDREN’S FOOTBALL AND HEALTH AND SOCIAL OUTCOMES ANALYSIS 80
APPENDIX 7 – ADULT FOOTBALL AND HEALTHY BEHAVIOUR ANALYSIS 84
APPENDIX 8 – ADULT FOOTBALL AND GENERAL HEALTH AND WELLBEING ANALYSIS 94
APPENDIX 9 – ADULT FOOTBALL SOCIAL OUTCOME ANALYSIS 101
APPENDIX 10 – TECHNICAL NOTE: WELLBEING VALUATION 115
APPENDIX 11 – WALKING FOOTBALL 118
APPENDIX 12 – VOLUNTEERING 121
APPENDIX 13 – THE FOOTBALL FOUNDATION HUBS PROGRAMME 121
APPENDIX 14 – BREAKDOWN OF SOCIO-ECONOMIC IMPACT BY LOCAL AREA 123

The Football Association Limited THE SOCIAL AND ECONOMIC VALUE OF GRASSROOTS FOOTBALL IN ENGLAND – SEPTEMBER 20208

The Football Association Limited THE SOCIAL AND ECONOMIC VALUE OF GRASSROOTS FOOTBALL IN ENGLAND – SEPTEMBER 2020 9
EXECUTIVE SUMMARY
10 Financial investment is 2018/19 actuals as current budgeted figures are under internal review due to the ongoing Covid-19 crisis (see Chapter 2).11 9m adults (The FA) and 4.5m children (Sport England) play regular football. ‘Regular’ adult footballers defined as playing within the last month (The FA). ‘Regular’ defined as playing once within the last week for children (Sport England).12 Sport England (2020). Exploring attitudes and behaviours in England during the Covid-19 pandemic. 63% of people surveyed said getting active helped their mental wellbeing during lockdown.13 Portas Consulting Socio-economic model. Combined socio-economic value of adult and children’s grassroots football. These figures are based on the value of regular football (adults: playing within the last month; children: playing within the last week) against reference group of rest of population, including those who play other sports and those who play no sports, and include both the male and female game. All monetary values are based on primary analysis or academic research with appropriate socio-demographic controls. See Appendix 3 for further details. 14 Note this value does not include the effects of injuries due to limited data availability for the grassroots game.15 Portas Consulting Socio-economic model. Combined economic value of adult and children’s grassroots football. Tax value based on 20% VAT paid on £2.7bn participant expenditure on adult grassroots football and 20% income tax contribution from ‘additional’ workers in adult and children’s grassroots football. All wages to coaches and referees are assumed to fall under the minimum tax bracket. See Appendix 3 for further details. 16 Portas Consulting Socio-economic model. Combined value of the workforce in adult and children’s grassroots football. Value in direct GVA terms. This does not account for ‘counterfactual deadweight’ (the situation in the absence of grassroots football) or displacement factors (the fact that jobs in the football sector could be taking away jobs in other sectors). See Appendix 3 for more details.17 Portas Consulting Socio-economic model. Combined £1.10Bn value of salary-equivalent hours dedicated by adult volunteers and £615M wellbeing value of adult volunteers (calculated with the wellbeing valuation approach – see Appendix 12) who volunteer in adult and children’s grassroots football. See Appendix 3 for more details.18 Portas Consulting Socio-economic model. Combined value of participant and familial expenditure in adult and children’s grassroots football. Figure represents direct value of expenditure of regular footballers and the indirect benefits to upstream services. See Appendix 3 for more details.19 Portas Consulting Socio-economic model. All monetary values are based on primary analysis or academic research with appropriate socio-demographic controls. See Appendix 3 for further details. Direct savings are cost savings for the NHS, such as preventing treatment and public social care costs. Indirect savings are wider societal costs savings, for example improving productivity in the workplace and reducing informal care.20 Portas Consulting Socio-economic model. Based on the links between improved academic attainment, reduced crime and sport participation in children in academic research, controlling for socio-demographic factors. See Chapter 3 and Appendix 3 for further details.21 Social interaction hours are defined an as time spent in an exchange between two or more people. The average regular child grassroots footballer plays 83 minutes per week (Sport England, 2019. Active Lives Children and Young People Survey Academic Year 2018/19). The average regular adult grassroots footballer plays 185 minutes per week (The FA Participation Tracker November 2019 – February 2020). Calculation assumes all time spent playing football involves interacting with others.22 Based on OLS regression analysis comparing self-rated trust in regular adult footballers to reference group of the rest of the population, controlling for socio-demographic factors. See page 38 for further details.23 Descriptive analysis of the FA Participation Tracker (November 2019 – February 2020) comparing self-rated life skills in children aged 14-18 who play regular football to children who have not played sport in the last month. All results are statistically significant at the 1% probability level. See page 29 for further details.24 Based on OLS regression analysis comparing self-rated individual development levels in regular adult footballers to reference group of the rest of the population using data from The FA Participation Tracker, controlling for socio-demographic factors. See page 39 for further details25 Descriptive analysis of the FA Participation Tracker (November 2019 – February 2020). See page 37 for further details
The Football Association (The FA) plays a leadership role in the provision of grassroots football and in recent years has invested c. £80m annually in its development10. Football is the most popular team sport in England for children, adults and older adults, with 13.5m people playing regularly11.
In 2019, The FA published a report demonstrating the social and economic value of adult grassroots football. This report expands on those findings to quantify this value across the entire lifetime of a player, from childhood participation through to football in later life. It also explores the impact of the broad support network of volunteers and facilities. While the findings in this report are based on football participation before Covid-19, the current climate highlights the importance of physical activity for maintaining positive mental and physical health12. There is therefore a continued need to demonstrate the full contribution of grassroots football to our economy and to the wellbeing of the nation.
Grassroots football participation in England contributes £10.15bn13,14, to society, including:
• Direct economic value of £7.74bn, with £670m15 of this going direct to the Exchequer via tax. This includes:
– £2.70bn of workforce contribution;16
– £1.72bn of volunteering value;17
– £3.32bn of participant consumption18
• Healthcare savings through disease reduction of over £1.62bn, of which £525m is direct savings for the NHS19.
• Social value totaling over £780m through educational improvement and youth crime reduction20.
Playing football provides 1.77bn hours of social interaction21 for England’s population each year. This brings benefits at the community level: for example, footballers have higher levels of trust than non-footballers – and this benefit is greater in those from lower socio-economic groups (SEGs)22.These social interactions also provide opportunities for individual development across all ages:
• Children who play football have higher self-rated leadership, confidence, communication and resilience levels compared to children who do not play sport23.
• Regular adult footballers report significantly higher leadership, confidence and communication skills compared to adults who do not play football.24
– These benefits are greatest in those who play 11-a-side football;
– The impact on confidence and communication is twice as great in women than men.
• 58% of adult footballers with a healthy diet agree that football has a direct influence on their healthier food choices.25

The Football Association Limited THE SOCIAL AND ECONOMIC VALUE OF GRASSROOTS FOOTBALL IN ENGLAND – SEPTEMBER 202010
Football contributes to improving the physical and mental wellbeing of 2.9m children and 8.2m adults26.
• Boys and girls who are physically active and play football have 39% and 20% decreased odds of obesity respectively27. This is linked to a reduction of 213,500 cases of childhood obesity28.
• Children who regularly play team sports such as football are significantly happier and have higher life satisfaction than those who do not29. By meeting the physical activity guidelines, academic research shows they also have decreased odds of depression and anxiety30.
• Adults who play regular football are also happier than non-footballers. This benefit is three times greater in adults from low SEGs compared to high SEGs31.
• Adult annual football participation is associated with the prevention of 203,300 cases of physical and mental health disorders, including the reduction of chronic disease, depression and anxiety32.
Walking Football is a specially adapted form of the game with a unique ability to engage older adults and those who are less able to take part in full-paced football – enabling the continuation of football’s benefits into later life. The new FA Walking Football Survey33 found it provides significant health and social benefits for older participants, including those with disabilities:
• 91% of Walking Football participants surveyed are over the age of 50 (with 15% over 70) and 29% have a disability;
• 91% of participants surveyed say it has improved their stamina and 88% report improved mobility or co-ordination;
• 75% of Walking Football participants agree it has provided them with a sense of belonging and 65% say it provides them with a sense of purpose. This is achieved through the ~2 hours per week of social interaction that individuals receive on average through playing.
EXECUTIVE SUMMARY (CONTINUED)
2665% of children and 91% of adults who play football meet the Chief Medical Officers’ (CMO) guidelines and so are ‘physically active’. The CMO guidelines recommend children aged 5-18 should take part in an average of at least 60 minutes physical activity each day across the week, and adults aged 19+ should take part in an at least 150 ‘moderate intensity equivalent minutes’ of physical activity per week. 27University of England. UCL Institute of Education. Centre for Longitudinal Studies, Millennium Cohort Study: Sixth Survey, 2015-2016. 6th Edition. Colchester, Essex: UK Data Archive, March 2007. SN: 4683. Calculated using logistic regression analysis, controlling for socio-demographic factors. 28Portas Consulting socio-economic model. See page 24 and Appendix 3 for further details. 29Based on OLS regression analysis comparing self-rated wellbeing levels in children aged 11-16 who play team sport compared to reference group of the rest of the population using data from Sport England, Active Lives Children and Young People Survey Academic Year 2018/19, controlling for socio-demographic factors. See page 26 for further details30Soyeon Ahn, PhD, Alicia L. Fedewa, PhD (2011) A Meta-analysis of the Relationship Between Children’s Physical Activity and Mental Health, Journal of Pediatric Psychology, Volume 36, Issue 4, Pages 385–39731Based on OLS regression analysis comparing self-rated wellbeing levels in regular adult footballers to reference group of the rest of the population using data from The FA Participation Tracker (November 2019 – February 2020), controlling for socio-demographic factors. See page 35 for further details.32Portas Consulting socio-economic model. See page 31 and Appendix 3 for further details. 33The FA Walking Football Survey. See Appendix 13 for further details.

The Football Association Limited THE SOCIAL AND ECONOMIC VALUE OF GRASSROOTS FOOTBALL IN ENGLAND – SEPTEMBER 2020 11
EXECUTIVE SUMMARY (CONTINUED)
None of these benefits could be achieved without the support of a wide range of elements across the country. This study has focused on two such factors – volunteers and facilities:
• Approximately 1.4m people volunteer in grassroots football across England annually, contributing £1.10bn in economic value34 plus £625m in individual wellbeing value35. Each volunteer supports the participation of
~10 people36 . – The average league or club official dedicates
12 hours per week to grassroots football, compared to two hours per week for the average volunteer in any sector. The top two reasons they started volunteering were to give back to their club and community.37
– Facility provision is one of the biggest barriers to football participation. The FA is therefore funding a third of the Football Foundation’s £1bn investment into grassroots facilities over the next ten years, with 10% directed at the 10 most deprived areas in England38. A critical element of delivery is the Football Foundation Hubs programme, whose high-quality facilities almost eliminate match cancellations, provide better playing experiences and generate significant socio-economic impact in their local area.
34Portas Consulting Socio-economic model. Combined £1.10bn value of salary-equivalent hours dedicated by adult volunteers who volunteer in adult and children’s grassroots football. See Appendix 3 for further details.35Calculated with the wellbeing valuation approach (Appendix 12). Based on the wellbeing value of a general volunteer and number of grassroots volunteers aged 16+. See Chapter 6.1 and Appendix 12 for further details. 361.4M volunteers and 13.5M regular players in grassroots football. 37The FA Volunteering Workforce Survey (2018). n=1667 (1,037 general volunteers, 630 key club and league officials). All respondents are aged 18+. Respondents are assumed be representative of the whole grassroots volunteer landscape.38Over £96M is directed at the ten most deprived areas. The ten areas included are the most deprived Local Authorities based on the proportion of neighbourhoods in the most deprived 10% nationally from the Ministry of Housing, Communities & Local Government’s report – The English Indices of Deprivation 2019: Middlesbrough, Liverpool, Knowsley, Kingston upon Hull, Manchester, Blackpool, Birmingham, Burnley, Blackpool with Darwen. See Appendix 13 for details.

The Football Association Limited THE SOCIAL AND ECONOMIC VALUE OF GRASSROOTS FOOTBALL IN ENGLAND – SEPTEMBER 202012
£482mNorth East
£993mYorkshire & Humberside
£872mEast Midlands
£1.12bnEast of England
£1.62bnLondon
£1.66bnSouth East
£1.01bnSouth West
£1.07bnWest Midlands
£1.32bnNorth West
GEOGRAPHIC BREAKDOWN OF SOCIO-ECONOMIC VALUE
The socio-economic value of grassroots football to regions and Local Authorities across England is calculated based on the number of people who live in each region or Local Authority using ONS data. The analysis assumes the distribution of regular football players by geography is equal to the distribution of population by geography. This approach was taken as Local Authority sample size in The FA Participation Tracker is insufficient to analyse the distribution of regular football players at the local level. However, the pattern of distribution of regular football players at the regional level is similar to the distribution of population, providing confidence in the assumption. Note some Local Authorities have been grouped due to the format of the ONS data. See Appendix 14 for further details.

The Football Association Limited THE SOCIAL AND ECONOMIC VALUE OF GRASSROOTS FOOTBALL IN ENGLAND – SEPTEMBER 2020 13
1. CONTEXT
The Football Association (The FA) is the not-for-profit governing body of football in England.
Its principal revenue streams are from broadcasting rights and sponsorship associated with the England teams and The Emirates FA Cup, as well as events held at Wembley Stadium connected by EE. Any surplus is then invested back into football. While revenue streams fluctuate and so accordingly must The FA’s return to football, in recent years The FA has typically invested £80m annually in grassroots football39.
This investment enables 14.1m people each year across England to play grassroots football across all forms and frequencies, with 13.5m people playing regularly40. This makes football the most popular team sport in England for children, adults and older adults.
The FA plays a leadership role in the provision of grassroots football. It governs the rules of the game and leads the research, development and implementation of national strategies for participation, facilities, volunteering and other areas. It also works closely with
39Financial investment is 2018/19 actuals as current budgeted figures are under internal review due to the ongoing Covid-19 crisis (see Chapter 2). 409m adults (The FA) and 4.5m children (Sport England) play regular football. ‘Regular’ adult footballers defined as playing within the last month (The FA). ‘Regular’ defined as playing once within the last week for children (Sport England).
the network of County FAs, who provide local insight and expertise and are responsible for developing football on the ground.
The FA’s remit covers the entire grassroots landscape:
13.5m people play football regularly in Englandi
Football is the most popular team sport for children and adults:
- 4.5m children aged 5-18 play regular football – 67% of boys and 30% of girlsii.
- 9m adults aged 19+ play regularlyiii.
Grassroots football is diverse:- There is double the representation of BAME players in adult
grassroots football than there is in wider societyiv.
- Football has higher regular participation rates amongst lower SEGs than other team sports in childrenv and adultsvi.
i) ‘Regular’ adult footballers defined as playing within the last month (The FA). ‘Regular’ defined as playing once within the last week for children (Sport England).ii) Sport England (2019). Active Lives Children and Young People Survey Academic Year 2018/19. Includes ‘informal’ football. iii) The FA Participation Tracker Survey (March 2019-February 2020)iv) 21.8% of regular adult footballers are BAME and 10.8% of adults in England are BAME. The FA Participation Tracker Survey (March 2019-February 2020)v) Sport England (2019). Active Lives Children and Young People Survey Academic Year 2018/19. SEG group based on family affluence score (FAS)*. 35% of children aged 5-16 from lower SEGs play regular football, compared to 32% across
all other ‘team sports’ as categorised by Sport England. The difference in participation rates between higher and lower SEGs is 17% for football, compared to 37% across all other ‘team sports’ as categorised by Sport England. This difference is statistically significant at the 1% probability level.
vi) Sport England (2019). Active Lives Adult Survey 2018/19. SEG group based on the Index of Multiple Deprivation (IMD)**. The difference in participation rates between higher SEGs and lower SEGs is -15% for football (a higher proportion of lower SEGs play football compared to higher SEGs), compared to 3% across all other ‘team sports’ as categorised by Sport England. This difference is statistically significant at the 1% probability level.
*FAS is an indicator of social status. Children are placed on a scale of 0-13 depending on answers to a series of questions about household possessions and expenses. Low FAS groups (equivalent to ‘lower SEGs’) defined as a score of 0-6 and high FAS (equivalent to ‘higher SEGs’) defined as a score of 11-13, as defined by Sport England.
**IMD is a relative measure of deprivation assigned according to seven domains including income, education and housing. Low IMD deciles (equivalent to ‘lower SEGs’) defined as the two most deprived deciles, high IMD deciles (equivalent to ‘higher SEGs’) defined as the two least deprived deciles.
1.1. THE FOOTBALL ASSOCIATION

The Football Association Limited THE SOCIAL AND ECONOMIC VALUE OF GRASSROOTS FOOTBALL IN ENGLAND – SEPTEMBER 202014
The FA continues to develop an understanding of the wider benefits of grassroots football for individuals, communities and the nation. Last year, the first report of its kind was published41, demonstrating the contribution of adult grassroots football to the national economy and individual wellbeing. This contributed to a growing evidence base alongside significant studies such as the UEFA GROW SROI (social return on investment) model, which quantified the impact of participation on economic, social, health and performance outcomes for seven national associations42.
The purpose of this report is to further develop knowledge of the impact of grassroots football such that, where appropriate, more informed decisions can be made by all stakeholders regarding provision and benefits. Additionally, we hope this report is useful to consumer researchers, academics and any members of the public who may be interested in the benefits of grassroots football.
This report builds on last year’s findings to quantify a broader impact across the entire grassroots football landscape. For example, by:
• Capturing the value of children’s grassroots football participation, in addition to adults.
• Investigating the benefits of football to older adults through the lens of Walking Football. Insights were developed through a groundbreaking new survey of Walking Football participants which, to The FA’s knowledge, is the largest of its kind in Europe.
• Expanding the economic outcomes to capture the value of volunteer hours and those employed in football.
• Expanding the health outcomes to analyse case reductions in over 10 different disease groups. This expansion drives the significantly higher healthcare savings compared to last year’s report, which only captured savings through reduced GP visits.
41The FA (2019): The Social and Economic Value of Adult Grassroots Football in England42http://uefadirect.uefa.com/183/en/30-143Wellbeing Valuation is measured as the equivalent amount of income a person would need to make up for the wellbeing they gain from playing regular football. See Appendix 10 for further details.44Note the analysis was re-run on the new dataset for triangulation purposes. This showed that the value obtained in the 2019 report and the value that would have been obtained though this method in the 2020 report are not significantly different, giving greater confidence in the validity of the results. An alternative calculation using life satisfaction was investigated, but following academic review was also deemed unsuitable for inclusion due to limitations in the sample and the magnitude of the result. A discussion of this and an illustration of the calculation and relevant findings have been included in Appendix 10.
1. CONTEXT (CONTINUED)
• Removing the Wellbeing Valuation method43 for health impacts due to overlaps with the new health metrics44.
• Expanding the social outcomes to enable more detailed assessment of the benefits of football to communities and individuals.
• Exploring the impact of football volunteers and facilities.
The impact of football participation in children and adults, including older adults, forms the majority of the report (Chapters 3-5). This is supplemented in Chapter 6 by the assessment of two critical enablers of participation: volunteers and facilities (the latter using the Football Foundation Hubs programme as a proxy). Conclusions for these leverage case studies and interviews to provide tangible examples of football’s impact.
Note: this report is based on the football participation that took place in the period of March 2019 to February 2020, and all annualised impacts are for this time period unless otherwise stated. Insights into the benefits of this participation were mostly derived from targeted use of The FA Participation Tracker survey during November 2019 to February 2020 (see Chapter 2).
1.2. PURPOSE OF THIS REPORT

The Football Association Limited THE SOCIAL AND ECONOMIC VALUE OF GRASSROOTS FOOTBALL IN ENGLAND – SEPTEMBER 2020 15
1. CONTEXT (CONTINUED)
The data used to inform this report was collected pre-Covid-19 and therefore findings reflect the socio-economic contribution of grassroots football before Covid-19.
The economic, health and social benefits of grassroots football described in this report remain crucial to society. A recent research report45 found that 79% of people surveyed stated that their quality of life has been reduced because of Covid-19 and levels of all measures of wellbeing are at their lowest since records began in the UK. Research undertaken by Sport England during Covid-19 found that 63% of people said getting active helped their mental wellbeing during lockdown46.
Research has also highlighted inequalities in physical activity. A Sport England survey found that 27% of people from lower SEGs are doing more activity during the pandemic than before, compared to 39% of people from higher SEGs47. 68% of children from lower socio-economic groups surveyed by StreetGames said they became less active during lockdown48. Football has higher regular participation rates amongst lower SEGs than other team sports in children49 and adults50.
Despite the disruption caused by Covid-19, the football sector’s response to the crisis – at every level – is testament to the integral place that clubs hold at the heart of communities. The activity of the grassroots game during this difficult time has been nothing short of remarkable. In the face of financial uncertainty and the disappointment of months without play, numerous grassroots clubs and leagues have come together to provide help and support to the NHS and the wider local community. The FA commends their response. This activity has included setting up food banks, providing and delivering hot meals, delivering facemasks, donating medical supplies, contributing funds to the NHS, and a whole range of other enterprising initiatives, as well as fun online activities to keep fans’ spirits up.
In addition to demonstrating the full contribution of grassroots football to our economy and to the wellbeing
of the nation, The FA is providing financial support and guidance across grassroots football.
In May, the Football Foundation, which is funded by The FA, Premier League and the Government (via Sport England), launched the Pitch Preparation Fund to provide clubs with grant funding to ready their pitches for the return of football. The £7m scheme has provided financial support to 2,902 clubs and organisations which will allow 9,588 football pitches to be made match-fit, benefiting 33,153 football teams in the grassroots, non-league and women’s game, as well as Welsh Cymru Premier League.
The FA, Premier League and Government’s Football Foundation has also created a new £1.69m Club Preparation Fund for clubs needing to modify their facilities ahead of the new season to:
• Promote good hygiene;
• Keep facilities and equipment clean;
• Maintain social distancing and avoid congestion.
This is in the form of a grant available to clubs operating a clubhouse building within the National League System, Women’s Pyramid, Welsh Premier League and grassroots football.
There has been a huge national effort to re-start the grassroots game as soon as Government guidance allowed. The scale of this effort further testifies to the importance of football to the wellbeing of the nation.
45Simetrica-Jacobs and LSE (2020). The Wellbeing Costs of COVID-19 in the UK.46Sport England (2020). Exploring attitudes and behaviours in England during the COVID-19 pandemic47Sport England (2020). Exploring attitudes and behaviours in England during the COVID-19 pandemic48Street Games (2020). Youth Voice Research: Covid-19 & Lockdown49Sport England (2019). Active Lives Children and Young People Survey Academic Year 2018/19. SEG group based on family affluence score (FAS)*. 35% of children aged 5-16 from lower SEGs play regular football, compared to 32% across all other ‘team sports’ as categorised by Sport England. The difference in participation rates between higher and lower SEGs is 17% for football, compared to 37% across all other ‘team sports’ as categorised by Sport England. This difference is statistically significant at the 1% probability level. *Note FAS is an indicator of social status. Children are placed on a scale of 0-13 depending on answers to a series of questions about household possessions and expenses. Low FAS groups (equivalent to ‘lower SEGs’) defined as a score of 0-6 and high FAS (equivalent to ‘higher SEGs’) defined as a score of 11-13, as defined by Sport England.50Sport England (2019). Active Lives Adult Survey 2018/19. SEG group based on the Index of Multiple Deprivation (IMD)*. The difference in participation rates between higher SEGs and lower SEGs is -15% for football (a higher proportion of lower SEGs play football compared to higher SEGs), compared to 3% across all other ‘team sports’ as categorised by Sport England. This difference is statistically significant at the 1% probability level. *Note IMD is a relative measure of deprivation assigned according to seven domains including income, education and housing. Low IMD deciles (equivalent to ‘lower SEGs’) defined as the two most deprived deciles, high IMD deciles (equivalent to ‘higher SEGs’) defined as the two least deprived deciles.
1.3. THE IMPACT OF COVID-19

The Football Association Limited THE SOCIAL AND ECONOMIC VALUE OF GRASSROOTS FOOTBALL IN ENGLAND – SEPTEMBER 202016

The Football Association Limited THE SOCIAL AND ECONOMIC VALUE OF GRASSROOTS FOOTBALL IN ENGLAND – SEPTEMBER 2020 17
51The CMO guidelines recommend children aged 5-18 should take part in an average of at least 60 minutes physical activity each day across the week, and adults aged 19+ should take part in an at least 150 ‘moderate intensity equivalent minutes’ of physical activity per week.
2. METHODOLOGY AND APPROACH
Throughout the report, findings are based on a combination of analysis from primary datasets and secondary research from academic literature. Key datasets used across the chapters are listed as follows:
• The FA Participation Tracker dataset is a national survey run by The FA every month, capturing football and non-football participants. Within circa 1,200 respondents each month, it enables nationally representative and robust statistical analysis and is the largest regular participation tracker for any National Governing Body of sport in England. The primary target audience is people aged 16+, with supplementary data collected for children aged 14-15. In this report it is therefore predominantly used in the adult chapter to understand the national football participation landscape and the health and social benefits of grassroots football participation in adults aged 19+.
• The Active Lives Adult Survey collects information across England about individuals aged 16+, including their level of physical activity and their participation in a range of sport and recreational activities, including football. This enables analysis of physical activity rates, aligned to the Chief Medical Officer’s (CMO) guidelines51 (see Appendix 3), and football participation rates in adults and children aged 16-18.
• The Active Lives Children and Young People Survey is run in parallel to the Active Lives Adult Survey but collects data from children aged 5-16 in schools. Data from the survey is used in this report throughout the chapter on Children (Chapter 3) to understand football participation, physical activity and the benefits of grassroots football participation on health and social wellbeing measures.
Full descriptions of the datasets used are provided in Appendix 1. Academic research used is cited throughout the report.
The FA appointed Portas Consulting Ltd to analyse and interpret the above data to understand the impact of grassroots football using rigorous statistical analysis and socio-economic modelling and to support the writing of the report. The FA also appointed Dr. Ricky Lawton (Director of Research and Analysis at Simetrica-Jacobs on behalf of Jump Projects) to act as special technical advisor on elements not relating to the Portas Consulting socio-economic model. An academic panel consisting of Dr. Justin Davis Smith (Cass Business School), Dr. Charlie Foster (University of Bristol), Professor Carol Holland (Lancaster University) and Michael Kitson (University of Cambridge) reviewed the work. For further information on the project team and academic panel, please see Chapters 7 and 8.
The methodology used varies across the different sections of the report as follows:
• The benefits of regular grassroots football for children and adults were primarily analysed using OLS regression analysis and the Portas Consulting Socio-economic Model – see Chapters 3 and 4.
• Additional insights into the benefits of football participation for older adults were developed through a separate survey using Walking Football as a proxy – see Chapter 5.
• Supplementary insights into two key enablers of participation – volunteering and facilities – were developed using mostly a mixture of proprietary data and case studies – see Chapter 6.
2.1. OVERVIEW

The Football Association Limited THE SOCIAL AND ECONOMIC VALUE OF GRASSROOTS FOOTBALL IN ENGLAND – SEPTEMBER 202018
2. METHODOLOGY AND APPROACH (CONTINUED)
52Note this age split aligns with the age split in the CMO’s guidelines for physical activity.53‘Regular’ adult footballers defined as playing within the last month (The FA). Children: ‘regular’ defined as playing once within the last week (Sport England).54Fujiwara. et al (2014). Quantifying the Social Impacts of Culture and Sport. DCMS Research Paper. 55The outcomes of ‘crude’ or descriptive analysis are not used to inform monetary valuation. Arem H, Moore SC, Patel A, et al. Leisure Time Physical Activity and Mortality: A Detailed Pooled Analysis of the Dose-Response Relationship.
JAMA Intern Med. 2015;175(6):959–967. doi:10.1001/jamainternmed.2015.053356DCMS (2015). Sporting Future: A New Strategy for an Active Nation57Note the Wellbeing Valuation method can be used in this instance as no health outcomes are quantified for volunteers 58Direct savings are savings to the NHS from activities such as reducing treatment and public social care costs. Indirect savings are wider societal costs savings, for example improving productivity in the workplace and reducing informal care.
This report captures the benefits of grassroots football participation in children (aged 5-18) and adults (aged 19+) using three approaches52:
• Analysing primary datasets to assess the statistical association between grassroots football and a range of health and social measures. Where possible, this is conducted using detailed Ordinary Least Squares (OLS) regression analysis to isolate the effects specific to football (see Appendix 2).
• Quantifying the value of ‘regular’53 grassroots football participation using a socio-economic model (see Appendix 3). In line with previous academic and government studies54, all monetary values are based on primary analysis or academic research that control for socio-demographic factors55.
• Providing additional insights from academic research, case studies and individual interviews.
Sources for figures presented throughout this report are captured in the footnotes on each page. Further details on sources and methodologies are provided in the Appendix.
Note: Due to data availability it was not possible to conduct OLS regression analysis on childhood football participation. Instead, OLS regression analysis was conducted on team sport participation and findings are presented in the terms of ‘team sport such as football’. The benefits of team sport are assumed to apply to football.
The Government’s Department for Digital, Culture, Media and Sport (DCMS) Sporting Future strategy advocates that the impact of sport should be measured across five fundamental outcomes56:
• Economic development (impact on GDP);• Physical health (physical activity);• Mental health (subjective wellbeing);• Individual development (self-efficacy, skills, employment);• Community development (social cohesion, social trust).
The three metrics used in this report to quantify the socio-economic benefits of grassroots football are closely aligned to the above DCMS priorities. In summary:
Economic impact
• Grassroots football contributes directly to the economy through expenditure by regular footballers (e.g. membership, travel costs); value of volunteer hours; and wages of workers. This is quantified using a socio-economic model (see Appendix 3).
• The monetary value of the improved wellbeing associated with volunteering is also quantified using the Wellbeing Valuation method (see Appendix 10 and Appendix 12)57.
Health impact
• Through contributing to physical activity levels, grassroots football provides health benefits for regular participants through disease reductions. This, and the associated healthcare savings, are quantified using a socio-economic model (see Appendix 3). Healthcare savings are split into direct NHS saving, and wider indirect savings to society 58.
• The report also uses OLS regression analysis to capture the association between football participation in The FA Participation Tracker (adults) or team sport participation in the Active Lives Children and Young People Survey (children) and mental wellbeing outcomes, such as happiness and life satisfaction Appendix 2).
Social impact
• The socio-economic model captures the contribution of grassroots football to:
– Improved educational attainment and contribution to GDP;
– Hours of social interaction; – Juvenile crime reduction and associated cost reductions.
• The report also uses OLS regression analysis to capture the association between football participation The FA Participation Tracker (adults) or team sport participation in the Active Lives Children and Young People Survey (children) and social outcomes such as social trust and life skills.
2.2. QUANTIFYING THE BENEFITS OF REGULAR GRASSROOTS FOOTBALL FOR CHILDREN AND ADULTS

The Football Association Limited THE SOCIAL AND ECONOMIC VALUE OF GRASSROOTS FOOTBALL IN ENGLAND – SEPTEMBER 2020 19
2. METHODOLOGY AND APPROACH (CONTINUED)
Walking Football is used as a proxy to analyse the benefits of participation in older adults. The Walking Football Chapter (Chapter 5) combines evidence from academic research, cited throughout the chapter, with primary analysis of propriety data from The FA Walking Football survey and interviews with players.
.59Jump (2019). Happy Days
To The FA’s knowledge, the Walking Football survey is the largest of its kind in Europe. Data was collected from over 900 respondents to understand the motivations for and impact of playing Walking Football. See the Walking Football chapter and Appendix 11 for survey results and methodology.
2.3. GENERATING ADDITIONAL INSIGHTS INTO OLDER ADULTS THROUGH WALKING FOOTBALL
2.4. DEVELOPING SUPPLEMENTARY INSIGHTS INTO TWO KEY ENABLERS OF PARTICIPATION
Volunteering
The benefits of volunteering in grassroots football presented in this report were identified using three areas of research and analysis:
• The value of volunteering to society as quantified by a socio-economic model (as above);
• The monetary value of social wellbeing impact through volunteering using the ‘Wellbeing Value’ equivalent income method59;
• Additional insights into the benefits of volunteering from The FA propriety data, academic research and qualitative interviews.
Note: Where possible, the benefits of volunteering presented are specific to football. Otherwise, the benefits of general volunteering are assumed to apply to football, as detailed in the footnotes throughout Chapter 6.
Facilities
The impact of facilities was demonstrated using the Football Foundation Hubs programme as a proxy, with a specific focus on the Sheffield and Liverpool hubs due to available data. The impact on local football provision and communities was assessed using propriety data from The FA, Football Foundation and Pulse Fitness (see Appendix 13). In addition, the impact of football participation on local communities has been quantified using a socio-economic model (as above). This was supplemented with case studies and interviews.

The Football Association Limited THE SOCIAL AND ECONOMIC VALUE OF GRASSROOTS FOOTBALL IN ENGLAND – SEPTEMBER 202020
2. METHODOLOGY AND APPROACH (CONTINUED)
Evidence presented in this report and used in the model is largely correlative rather than causative. Determining causality between sport participation or physical activity and health/social outcomes is complex, particularly with more subjective measures such as wellbeing. This is because establishing causality requires a specific experimental design (a randomised control trial), while current available studies and datasets, such as The FA Participation Tracker and Active Lives surveys, are typically observational in nature.
In line with best practice, analysis controls for potentially confounding variables (such as socio-economic status and gender) to better isolate the impact of football. This is the most rigorous approach given the nature of the data60. Where academic research is used within the model, studies that also control for potentially confounding variables are used. All contributions
assigned to a monetary value are based on such primary analysis or academic research with controls for socio-demographic factors.
Nevertheless, the aggregate values of grassroots football reported in this study are likely an underestimate for the following reasons:
• The socio-economic model predominantly captures the value of individuals who play regular football, with less insight into the value of those who play less regularly61.
• Regular footballers are compared to a reference group of the rest of the population (including those who play other sport), rather than making comparisons with those who do not engage in sport.
60Fujiwara. et al (2014). Quantifying the Social Impacts of Culture and Sport. DCMS Research Paper. 61‘Regular’ adult footballers defined as playing within the last month (The FA). Children: ‘regular’ defined as playing once within the last week (Sport England).
2.5. FURTHER CONSIDERATIONS

The Football Association Limited THE SOCIAL AND ECONOMIC VALUE OF GRASSROOTS FOOTBALL IN ENGLAND – SEPTEMBER 2020 21
THE BENEFITS OF FOOTBALL PARTICIPATION FOR CHILDREN
i) Based on OLS regression analysis comparing self-rated wellbeing and trust levels in children aged 11-16 who regularly play team sport compared to reference group of the rest of the population using data from Sport England, Active Lives Children and Young People Survey Academic Year 2018/19, controlling for socio-demographic factors. See Chapter 2 for further details regarding the use of team sport and football participation. ii) Descriptive analysis of the FA Participation Tracker Survey. All results statistically significant at the 1% probability level. iii) Portas Consulting Socio-economic model. All monetary values are based on primary analysis or academic research with appropriate socio-demographic controls. See Appendix 3 for further details. iv) Portas Consulting Socio-economic model. Value in direct GVA terms v) Portas Consulting Socio-economic model. Combined £767bn value of salary-equivalent hours dedicated by adult volunteers and £428m wellbeing value of adult volunteers in children’s grassroots football. vi) Portas Consulting Socio-economic model. Combined direct value of participant (aged 14-18) and familial expenditure (spending by parents on children aged 8-15) in children’s grassroots football and indirect benefits to upstream services. vii) Portas Consulting Socio-economic model. Based on the impact of phsyical activity on disease in primary analysis and academic literature, controlling for socio-demograhic factors. See Appendix 3 for further details. viii) Portas Consulting Socio-economic Model. See Appendix 3 for further details ix) Portas Consulting Socio-economic model. Based on the link between improved academic attainment and sport participation in children in academic research, controlling for socio-demographic factors. See Appendix 3 for further details. x) Portas Consulting Socio-economic Model. Based on the link between reduced risk of juvenile crime and sport participation in children in academic research, controlling for socio-demographic factors. See Appendix 3 for further details.Note figures may not sum due to rounding
Playing football regularly is associated with:
Economic Health Social
£560mis generated by the
£76.5min savings for the NHSvii from
323mhours of positive social interactionviii
213.5kfewer cases of obesityvii and £777m
growth in GDP through improved education outcomesix66.5k
fewer cases of depression and anxietyvii £6.5m
savings through crime reductionx
290.5k people employed in children’s grassroots footballiv
£1.20bnof value is generated by volunteersv
£660min participant consumptionvi
Greater confidence, resilience and leadershipii
12% increase in life satisfactioni
12% increase of life worthinessi
6% increase in happiness ratingi
5% greatertrusti
Total value of £3.28bn……with 4.49m children playing football regularly in Englandiii

The Football Association Limited THE SOCIAL AND ECONOMIC VALUE OF GRASSROOTS FOOTBALL IN ENGLAND – SEPTEMBER 202022
3. CHILDREN
Over a third of children (aged 5-1862) in England play football each week on average, making it the most popular team sport for children63.
• Each week 67% of boys and 29% of girls aged 5-18 participate in football – a total of 4.49m64.
• Football has higher participation amongst lower socioeconomic groups65 than other team sports.
• Children are 81% more likely to play football if their parents play football66.
This participation provides benefits to children and young people as well as the communities that they grow up in, contributing £3.28bn in social and economic value to society each year in England. This includes £2.42bn of economic value, £76.5m in healthcare savings and £784m in social benefits67.
Participation in football can positively impact the physical and mental wellbeing of children, improve their development and help them become happier and healthier adults.
• Children who regularly play team sports such as football are significantly happier and have higher life satisfaction than those who do not – with greater benefits reported in lower SEGs68.
• Children who play football are also more confident, resilient and less likely to take part in criminal activity than those who do not play sport69.
• Child football participants are also more likely to interact with individuals from different social groups and trust people in their community70.
Further details of the above and other outcomes are described in detail in the remainder of this chapter.
62The definition of ‘children’ used throughout this report is ages 5-18 unless otherwise stated63Sport England (2019). Active Lives Children and Young People Survey Academic Year 2018/1964Sport England (2019). Active Lives Children and Young People Survey Academic Year 2018/19. Includes ‘informal’ football.65Socio-economic groups are “constructed to measure the employment relations and conditions of occupations…these are central to showing the structure of socio-economic positions in modern societies and helping to explain variations in social behaviour and other social phenomena”. The Office for National Statistics. https://www.ons.gov.uk/methodology/classificationsandstandards/otherclassifications/thenationalstatisticssocioeconomicclassificationnssecrebasedonsoc201066The FA Participation Tracker (November 2019 – February 2020). Linear regression analysis statistically significant at the 1% significance level. See Appendix 6 for a full breakdown of regression results.67Portas Consulting Socio-economic Model. All monetary values are based on primary analysis or academic research with appropriate socio-demographic controls. See Appendix 3 for further details.68Refer to page 26 for further details.69Refer to page 29 for further details.70Refer to page 28 for further details.
3.1. OVERVIEW

The Football Association Limited THE SOCIAL AND ECONOMIC VALUE OF GRASSROOTS FOOTBALL IN ENGLAND – SEPTEMBER 2020 23
4.49m children play football on average each week in England. This participation contributes £2.42 billion to the economy per annum (see Figure 1)71.
Workforce Contribution
Total economic contribution to Engalnd
Of which £30m is tax contribution to the Exchequer
Volunteering Value Participant Consumption
£660m£560m £1.20bn
£2.42bn p.a
Figure 1: Total economic contribution of children’s grassroots football to the economy. This includes workforce and volunteer contributions as well as participant consumption. All values stated on an annual basis.
71Portas Consulting Socio-economic Model. See Appendix 3 for further details72Portas Consulting Socio-economic model. Value in direct GVA terms. This does not account for ‘counterfactual deadweight’ (the situation in the absence of grassroots football) or displacement factors (the fact that jobs in the football sector could be taking away jobs in other sectors). See Appendix 3 for further details.73Based on income tax contribution from additional workers in the sport sector. Wages to coaches and referees are assumed to fall under the minimum tax bracket.74Includes adults who volunteer in children’s football and children who are volunteers in football. See Chapter 6 for details75Portas Consulting Socio-economic Model. Value of salary-equivalent hours dedicated by adult volunteers in children’s grassroots football. See Appendix 3 for further details76See Chapter 6 for further details. Calculated with the wellbeing valuation approach (see Appendix 10 and Appendix 12). Based on the wellbeing value of a general volunteer and number of grassroots volunteers aged 16+. Note there is scope for further research into wellbeing value of sports volunteers.77Portas Consulting Socio-economic Model. Combined direct value of participant (aged 14-18) and familial expenditure (spending by parents on children aged 8-15) in children’s grassroots football and indirect benefits to upstream services. See Appendices 3 and 5 for further details78The FA Participation Tracker. See Appendix 5 for full breakdown of participant expenditure. Note a 42% reduction is applied to the annual kit and equipment costs figure to account for imports in the socio-economic model (ONS).79Halifax (2017).
• £560m is generated by the 290,500 people who are employed in children’s football72. £30m of this value is tax contribution to the Exchequer73.
• An additional £1.20bn of value is created through volunteers in children’s grassroots football74,75. This includes £428m of social wellbeing value generated through the positive impact volunteering in children’s grassroots football has on individual wellbeing in adults76.
• Of the £660m participant consumption total, £380m is direct economic value generated through parental spend on children playing football77.
– Each month the average family spends £8.50 per football-playing child78. For context, each month the average family spends £45 per child on all leisure activities and hobbies79.
3. CHILDREN (CONTINUED)
3.2. ECONOMIC IMPACT

The Football Association Limited THE SOCIAL AND ECONOMIC VALUE OF GRASSROOTS FOOTBALL IN ENGLAND – SEPTEMBER 202024
Physical activity has significant benefits for children’s physical and mental wellbeing – including improvements to metabolic function and bone strength and a reduced risk of depression and anxiety (see remainder of chapter).
The UK CMO physical activity guidelines recommend that children aged 5-18 achieve an average of at least 60 minutes of physical activity every day across the week in order to experience these benefits.
• 64.9% of children who play football meet these guidelines and so are physically active80. This means football contributes to improving the physical and mental wellbeing of 2.9m children.
Physical wellbeingChildhood football participation contributes to a reduction of 213,500 cases of childhood obesity, a cost reduction for the NHS of over £8.8m per annum81.
• A record 1.7m children in England are currently classified as obese or severely obese82.
• Football helps address this obesity crisis: boys and girls who are physically active through football have 39% and 20% decreased odds of obesity83 respectively.
The reduction in childhood obesity will lead to further significant future savings for the NHS (see Figure 3).
• Obese children are up to twice as likely to die before age 55 than their slimmer peers84. 88% of obese children will go on to become obese adults85.
• Based on the current growth in obesity rates, the annual cost of obesity to the NHS will rise to £7.5bn by 2030. By preventing these 213,900 cases now it will prevent 188,200 children becoming obese adults, which could save over £511m per year86,87.
Which saves the NHS over
£8.8m per year
Childhood football contibutes to a reduction of
213,500cases of obesity
80Sport England (2019). Active Lives Children and Young People Survey Academic Year 2018/19. Based on the number of football participants (at least once a week) who were also deemed physically active.81Portas Consulting Socio-economic Model. Based on the number of regular footballers who are physically active and primary cohort analysis showing the reduced risk of developing obesity in active individuals, controlling for socio-demographic factors. See Appendix 3 for further details82NHS Digital. National Child Measurement Programme, England 2018/19 School Year83University of England. UCL Institute of Education. Centre for Longitudinal Studies, Millennium Cohort Study: Sixth Survey, 2015-2016. 6th Edition. Colchester, Essex: UK Data Archive, March 2007. SN: 4683. Calculated using logistic regression analysis, controlling for socio-demographic factors.84Franks, PW. et al. (2010). Childhood obesity, other cardiovascular risk factors, and premature death. New England Journal of Medicine, 362(6): 485-493.85Ward, ZJ et al. (2017). Simulation of Growth Trajectories of Childhood Obesity into Adulthood. N Engl J Med, 377:2145-215386Portas Consulting Socio-economic model. All monetary values are based on primary analysis or academic research with appropriate socio-demographic controls. See Appendix 3 for further details. Direct savings are savings to the NHS from activities such as reducing treatment and public social care costs. Indirect savings are wider societal costs savings, for example improving productivity in the workplace and reducing informal care.87Public Health England (2017) Health matters: obesity and the food environment. This cost includes overweight and obesity related ill-health. Childhood costs calculated from NHS England admitted patient care statistics. Future costs have accounted for future discounting of benefits. See Appendix 3 for details.
3.3. HEALTH IMPACT
3. CHILDREN (CONTINUED)

The Football Association Limited THE SOCIAL AND ECONOMIC VALUE OF GRASSROOTS FOOTBALL IN ENGLAND – SEPTEMBER 2020 25
£8.8m 88%
£93m £418m
Direct (NHS) savingsof obese childrenbecome obese adults
Indirect societalsavings
Direct (NHS)savings
Figure 3: Total monetary impact of childhood obesity cases in England associated with general physical activity and physical activity in the football population. Assuming 88% of all childhood obesity cases become obese adults by preventing these 213,500 cases now, it will prevent 187,900 children becoming obese adults. The cost per case of adulthood obesity is much higher as the most significant health consequences of childhood obesity do not manifest until adulthood (WHO).
Research shows that childhood football participation lowers the risk of poor health and disability in adulthood by improving childhood cardiometabolic and bone health.
• In 2000, the first cases of type II diabetes were reported in children and there are now over 6,800 children being treated for type II diabetes in England and Wales88. Being physically active through football reduces the likelihood of a poor cardiometabolic risk score, which is a precursor for both type II diabetes and cardiovascular disease89.
• 1 in 2 girls and 1 in 5 boys will suffer from osteoporosis during adulthood90. Impact sports – such as football – strengthen bone and muscles in childhood91 by contributing to a higher bone mineral content for boys (9% higher) and girls (17%)92, compared to inactive children. For context, a 10% increase in adult bone mineral density reduces the risk of osteoporotic fracture by 50%93.
Research also demonstrates that boys and girls who play football, through being more active in childhood, are up to 19x and 7x more likely to become active adults respectively94.
• The link between childhood and adult activity is stronger for children who participate in organised sports such as football, as this improves physical literacy and habit formation95.
• Being active over a lifetime drastically reduces the risk of developing multiple diseases in adulthood, such as heart disease, dementia and cancer96.
88Diabetes UK89Magnussen, C. G. et al. (2016). Continuous and dichotomous metabolic syndrome definitions in youth predict adult type 2 diabetes and carotid artery intima media thickness: the Cardiovascular Risk in Young Finns Study. The Journal of paediatrics, 171: 97-103.90International Osteoporosis Foundation91Hagman, M. et al. (2018). Bone mineral density in lifelong trained male football players compared with young and elderly untrained men. Journal of sport and health science, 7(2): 159-16892Bailey, DA. et al. (1999). A six‐year longitudinal study of the relationship of physical activity to bone mineral accrual in growing children: the university of Saskatchewan bone mineral accrual study. Journal of bone and mineral research, 14(10); 1672-1679.93Cummings, SR. et al. (1993). Bone density at various sites for prediction of hip fractures. The Lancet, 341(8837), 72-75.94Compared to inactive children95Telama R. et al (2009) Tracking of physical activity from childhood to adulthood: a review. Obesity Facts, 2(3):187–9596Refer to Chapter 4 for further details. Lee, IM. et al. (2012). Effect of physical inactivity on major non-communicable diseases worldwide: an analysis of burden of disease and life expectancy. The lancet, 380(9838); 219-229.
3. CHILDREN (CONTINUED)
The Football Association Limited THE SOCIAL AND ECONOMIC VALUE OF GRASSROOTS FOOTBALL IN ENGLAND – SEPTEMBER 202026
3. CHILDREN (CONTINUED)
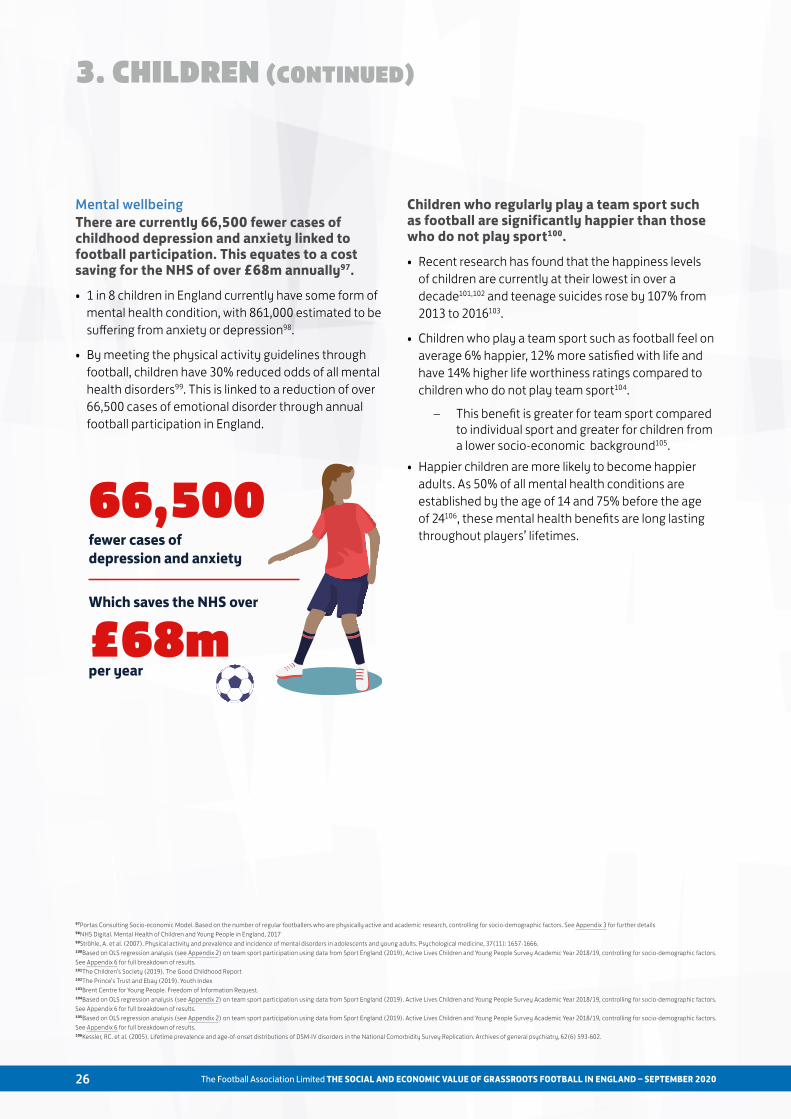
Mental wellbeingThere are currently 66,500 fewer cases of childhood depression and anxiety linked to football participation. This equates to a cost saving for the NHS of over £68m annually97.
• 1 in 8 children in England currently have some form of mental health condition, with 861,000 estimated to be suffering from anxiety or depression98.
• By meeting the physical activity guidelines through football, children have 30% reduced odds of all mental health disorders99. This is linked to a reduction of over 66,500 cases of emotional disorder through annual football participation in England.
Which saves the NHS over
£68m per year
66,500fewer cases of depression and anxiety
Children who regularly play a team sport such as football are significantly happier than those who do not play sport100.
• Recent research has found that the happiness levels of children are currently at their lowest in over a decade101,102 and teenage suicides rose by 107% from 2013 to 2016103.
• Children who play a team sport such as football feel on average 6% happier, 12% more satisfied with life and have 14% higher life worthiness ratings compared to children who do not play team sport104.
– This benefit is greater for team sport compared to individual sport and greater for children from a lower socio-economic background105.
• Happier children are more likely to become happier adults. As 50% of all mental health conditions are established by the age of 14 and 75% before the age of 24106, these mental health benefits are long lasting throughout players’ lifetimes.
97Portas Consulting Socio-economic Model. Based on the number of regular footballers who are physically active and academic research, controlling for socio-demographic factors. See Appendix 3 for further details98NHS Digital. Mental Health of Children and Young People in England, 201799Ströhle, A. et al. (2007). Physical activity and prevalence and incidence of mental disorders in adolescents and young adults. Psychological medicine, 37(11): 1657-1666.100Based on OLS regression analysis (see Appendix 2) on team sport participation using data from Sport England (2019), Active Lives Children and Young People Survey Academic Year 2018/19, controlling for socio-demographic factors. See Appendix 6 for full breakdown of results.101The Children’s Society (2019). The Good Childhood Report102The Prince’s Trust and Ebay (2019). Youth Index103Brent Centre for Young People. Freedom of Information Request. 104Based on OLS regression analysis (see Appendix 2) on team sport participation using data from Sport England (2019). Active Lives Children and Young People Survey Academic Year 2018/19, controlling for socio-demographic factors. See Appendix 6 for full breakdown of results. 105Based on OLS regression analysis (see Appendix 2) on team sport participation using data from Sport England (2019). Active Lives Children and Young People Survey Academic Year 2018/19, controlling for socio-demographic factors. See Appendix 6 for full breakdown of results.106Kessler, RC. et al. (2005). Lifetime prevalence and age-of-onset distributions of DSM-IV disorders in the National Comorbidity Survey Replication. Archives of general psychiatry, 62(6) 593-602.

The Football Association Limited THE SOCIAL AND ECONOMIC VALUE OF GRASSROOTS FOOTBALL IN ENGLAND – SEPTEMBER 2020 27
3. CHILDREN (CONTINUED)
760,000 young people aged 16-24 in the UK are not in education, employment or training (NEET)107. These individuals are more likely to become homeless, involved in crime and misuse drugs108. Despite a downward trend in recent years, youth crime is still prevalent: over 4,500 knife and offensive weapons’ offences were committed by children in England and Wales in 2018/19109.
Childhood football participation helps address these societal challenges by supporting children’s development, both as individuals and as part of their community (see Figure 5).
Figure 5: Total social value contribution of children’s grassroots football to society across education, crime, social cohesion and individual development.
107Office for National Statistics (2019). Young people not in education, employment or training (NEET).108Public Health England (2014) Local action on health inequalities: Reducing the number of young people not in employment, education or training (NEET). https://assets.publishing.service.gov.uk/government/uploads/system/uploads/attachment_data/file/356062/Review3_NEETs_health_inequalities.pdf109Ministry of Justice and Youth Justice Board for England and Wales. Youth Justice Annual Statistics 2018-19
Education
£777mContribution to GDP growth
through improved educational outcomes
Social cohesion
Hours social interaction
Higher levels of social trust
323m5%
Individual development
Leadership, confidence and resilience
Future earnings
Crime
Reductions injuvenile crime
o�ences
Savings to society
1,200
£6.5m
3.4. SOCIAL IMPACT

The Football Association Limited THE SOCIAL AND ECONOMIC VALUE OF GRASSROOTS FOOTBALL IN ENGLAND – SEPTEMBER 202028
3. CHILDREN (CONTINUED)
Educational performanceAnnual childhood football participation across England currently supports £777m of GDP growth through improved educational performance110,111.
• Academic research shows that regular sport participation – such as football – is positively associated with improved educational performance112,113. On a national scale this translates into GDP growth114.
Social cohesion Playing football provides 323m hours of social interaction (defined as time spent in an exchange with two or more people) for children in England115. Children who play a team sport such as football report higher levels of trust than those who do not play sport116.
• Data from the World Values Survey has shown that communities are facing issues with trust and social cohesion117. 45% of children aged 10-15 years feel lonely ‘often’ or ‘some of the time’118. There is a trust deficit amongst young people, with those from lower SEGs being 23% less likely to trust in people in their neighbourhoods compared to those from higher SEGs119.
• Football provides children with opportunities to build relationships and trust amongst their peers and society:
– Children who play team sport report 5% higher trust levels compared to the general population120.
– 73% of children who play regular football agree that they interact with people from different social groups compared to 41% of non-sport participants121.
Crime reductionAnnual childhood football participation is linked to the reduction of over 1,200 juvenile crimes, generating £6.5m in savings to society122,123.
• This reduces the burden that juvenile crime and antisocial behaviour places on individuals and society: juvenile crime is estimated to cost the UK economy up to £11Bn every year124 and 21% of knife crime offenders are under the age of 17125.
• The current calculated value of football to society through crime preventions is an underestimate as it does not account for reoffending rates or targeted sport programmes.
– For example, one youth sport programme was found to reduce the incidence of crime in local areas by as much as 66%126.
110Portas Consulting Socio-economic model. Based on the link between improved academic attainment and sport participation in children in academic research, controlling for socio-demographic factors. See Appendix 3 for further details Calculation assumes all time spent playing football involves interacting with others.111Note: Impact on GDP begins when children reach working age112Booth, J. N. et al. (2014). Associations between objectively measured physical activity and academic attainment in adolescents from a UK cohort. Br J Sports Med 48(3): 265-270.113Lipscomb, S. (2007). Secondary school extracurricular involvement and academic achievement: A fixed effects approach. Economics of Education Review, 26(4): 463-472.114OECD (2010). The High Cost of Low Educational Performance. The Long-Run Economic Impact of Improving PISA Outcomes 115Portas Consulting Socio-economic Model. See Appendix 3 for further details116Based on OLS regression analysis (see Appendix 2) on team sport participation using data from Sport England (2019). Active Lives Children and Young People Survey Academic Year 2018/19, controlling for socio-demographic factors. See Appendix 6 for full breakdown of results.117The World Value Survey (2019) http://www.worldvaluessurvey.org/118Office for National Statistics (2018). Children’s and young people’s experiences of loneliness 119Sported (2019). In Sport, We Trust 120Based on OLS regression analysis (see Appendix 2) on team sport participation using data from Sport England (2019). Active Lives Children and Young People Survey Academic Year 2018/19, controlling for socio-demographic factors. See Appendix 6 for full breakdown of results. Descriptive analysis of The FA Participation Tracker November 2019 – February 2020: 49% of children aged 14-18 who play football report that they trust those in their local area compared to 38% of non-sport participants.121Descriptive analysis of The FA Participation Tracker November 2019 – February 2020. Children aged 14-18 who have played football in the last month (n=456) vs children who have not played any sport in the last month (n=44). See Appendix 6 for full breakdown of results. Results are statistically significant at the 1% probability level.122Portas Consulting Socio-economic Model. Based on the link between reduced risk of juvenile crime and sport participation in children in academic research, controlling for socio-demographic factors. See Appendix 3 for further details.123This is likely an underestimate as it does not account for re-offending or the value of targeted sport programmes124National Audit Office (2010). The youth justice system in England and Wales: Reducing Offending by Young People 125Allen, G. (2019) Knife crime in England and Wales. House of Commons Briefing Paper 126Laureus Sport for Good Foundation (2012) – Teenage Kicks: The Value of Sport in Tackling Youth Crime.

The Football Association Limited THE SOCIAL AND ECONOMIC VALUE OF GRASSROOTS FOOTBALL IN ENGLAND – SEPTEMBER 2020 29
3. CHILDREN (CONTINUED)
Individual development Girls who play football report a higher level of confidence than girls who do not play sport127.
• Girls are more likely to have issues with self-perceptions and confidence than boys, with one in five girls aged 11-18 reporting they are lacking in confidence128.
• Research shows that 58% of female footballers aged 13-17 said football had helped them overcome a lack of self-confidence, compared to 51% of girls who played other sports129.
Football helps children to develop lifelong social and emotional skills130:
• Children who play a team sport such as football report significantly higher self-efficacy compared to children who do not play team sport131.
• Children who play football have higher self-rated leadership, confidence, communication and resilience levels compared to children who do not play sport132.
• Research shows that these skills are linked to wellbeing and earnings in employability in adulthood133. Young graduates who take part in sport earn on average £6,344 more than those who do not play sport134.
127The FA Participation Tracker November 2019 – February 2020. 72% of girls aged 14-18 who play regular football (n=163) rate their confidence as good compared to 60% of girls who played no sport in the last month (n=28). Results are statistically significant at the 5% probability level128Women in Sport and Youth Sport Trust (2017). Girls Active129Based on a survey of 4,128 girls. Statistically significant difference. Appleton (2017) The Psychological and Emotional Benefits of Playing Football on Girls and Women in Europe. UEFA. 130Research from The Government Social Mobility and Child Poverty (SMCP) Commission defines social and emotional skills across five categories: self-perceptions and self-awareness; motivation; self-control; social skills and resilience.131Based on OLS regression analysis (see Appendix 2) on team sport participation using data from Sport England (2019). Active Lives Children and Young People Survey Academic Year 2018/19, controlling for socio-demographic factors. See Appendix 6 for full breakdown of results.132Descriptive analysis of The FA Participation Tracker November 2019 – February 2020. 61% of children aged 14-18 who play football regularly rate (n=456) their leadership as ‘good’ compared to 36% children who have not played sport in the last month (n=44). The equivalent statistics for confidence are: 72% (football participants) and 40% (non-sport participants); communication: 70% (football participants) and 47% (non-sport participants); resilience: 67% (football participants) and 44% (non-sport participants). See Appendix 6 for full breakdown of results. Results are statistically significant at the 1% probability level.133Feinstein, L. (2015) Social and Emotional Learning: Skills for Life and Work134Griffiths et al (2017) The impact of engagement in sport on graduate employability: implications for higher education policy and practice
Case Study Benjamin Rosser, the Pythian ClubBenjamin Rosser worked for Nottinghamshire Police for 10 years before becoming a charity worker to help young people move away from a life of gang crime. He founded The Pythian Club, which works in New Basford and has been driving young people away from crime by offering football, boxing and music opportunities since 2014. The project focuses on driving social cohesion through positive role models and inclusive activities and it has successfully worked with around 600 young people over the last 6 years.
Benjamin won The FA and McDonald’s Grassroots Football Award Community Project of The Year Award 2018.
www.thepythianclub.co.ukNottinghamshire FA

The Football Association Limited THE SOCIAL AND ECONOMIC VALUE OF GRASSROOTS FOOTBALL IN ENGLAND – SEPTEMBER 202030
THE BENEFITS OF FOOTBALL PARTICIPATION FOR ADULTS
i) Based on OLS regression analysis comparing self-rated individual development in regular adult footballers to a reference group of the rest of the population from The FA Participation Tracker Survey, controlling for socio-demographic factors. ii) Portas Consulting Socio-economic model. All monetary values are based on primary analysis or academic research with appropriate socio-demographic controls. See Appendix 3 for further details iii) Portas Consulting Socio-economic model. Value in direct GVA terms. iv) Portas Consulting Socio-economic Model. Includes £328M value of salary-equivalent hours dedicated by volunteers and £187M of social wellbeing value generated through the positive impact volunteering has on individual wellbeing in adults. v) Portas Consulting Socio-economic model. Figure represents direct value of expenditure of regular footballers and the indirect benefits to upstream services. vi) Portas Consulting Socio-economic model. Based on the impact of phsyical activity on across 10 different disease groups in academic literature, controlling for socio-demograhic factors, and The FA Participation Tracker. See Appendix 3 for further details. vii) Portas Consulting Socio-economic Model. See Appendix 3 for further details. viii) The FA Participation Tracker.Note figures may not sum due to rounding
Regular adult footballers are more likely to bei:
Economic Health Social
£2.15bnis generated by the
£76.5min savings for the NHSvii from
1.45bnhours of social interaction through footballviii
203.5k fewer cases of chronic diseasesvi 57%
believe that football sessions in their local area help to reduce the levels of crime and antisocial behaviour in the communityviii
58% of footballers with a healthy diet agree that football has a direct influence on their food choicesvi
230kpeople employed in adult grassroots footballiii
£520mof value is generated by volunteersiv
£2.66bnin participant consumptionv
Total value of £6.87bn……with 9m adults playing football regularly in Englandii
Happy Confident Resilient Trusting

The Football Association Limited THE SOCIAL AND ECONOMIC VALUE OF GRASSROOTS FOOTBALL IN ENGLAND – SEPTEMBER 2020 31
4. ADULTS
Over 20% of all adults (aged 19+135) in England played football at least once in the last month136, making it the most popular team sport for adults137.
• Each month 32% of men and 10% of women participate in football across England138.
The 9m adults playing regular grassroots football across England contribute at least £6.87bn in economic, health and social value per annum139,140.
Physical activity through football participation has significant health benefits and is associated with the prevention of 203,300 cases of physical and mental health disorders each year141.
Regular adult football players also have higher self-reported general health than those who do not play football142 and have indicated that football influences their wider healthy lifestyle choices. For example, 65%
of regular footballers who smoke agree that playing football makes them more likely to quit, and 58% of regular footballers with a healthy diet agree that football directly influences their healthier food choices143.
Football participation is linked to greater social interactions, happiness and trust across individuals and communities (further details throughout chapter). Compared to those who do not play football, adults who play regular football are more likely to:
• Be happy144;
• Be confident and resilient145;
• Be more likely to trust those around them146.
Further details of the above and other outcomes are described in detail in the remainder of this chapter.
135The definition of ‘adults’ used throughout this report is ages 19+ unless otherwise stated136The FA Participation Tracker (March 2019 – February 2020)137Sport England (2019). Active Lives Adult Survey 2018/19. Football is the most popular team sport for adults aged 19+ when genders are combined. It is the most popular team sport for men aged 19+ and the second most popular for women aged 19+ behind netball. 138The FA Participation Tracker (March 2019 – February 2020)139Portas Consulting Socio-economic Model. All monetary values are based on primary analysis or academic research with appropriate socio-demographic controls. See Appendix 3 for further details140Note total currently does not include any monetary value from the wellbeing valuation.141Portas Consulting Socio-economic Model. See page 33 and Appendix 3 for further details142Refer to page 34 for further details.143Refer to page 37 for further details.144Refer to page 35 for further details.145Refer to page 39 for further details.146Refer to page 38 for further details.
4.1. OVERVIEW

The Football Association Limited THE SOCIAL AND ECONOMIC VALUE OF GRASSROOTS FOOTBALL IN ENGLAND – SEPTEMBER 202032
4. ADULTS (CONTINUED)
On average, 9m adults play football each month in England. This participation contributes £5.33 billion to the economy per annum, of which £640M is direct tax contribution to the Exchequer147,148, (see Figure 6).
• £2.15bn is generated by the 230,000 people who are employed in adult grassroots football149,150.
• Volunteers drive value due to the time they invest in volunteering and the benefits to their individual wellbeing. The total value of volunteers in adult’s grassroots football is £520m151,152.
• The £2.66bn generated via participant consumption is based on the average football player spending on average £220 per year on playing football153,154.
– 27% of this is spent on socialising with teammates155.
– There are different spending patterns across the various formats of the game. Regular 11-a-side participants spend on average 28% more per year than the average regular footballer at £257. This is partly due to a higher amount spent on socialising than other formats.
Figure 6: Total economic contribution of adult grassroots football to the economy. This includes workforce and volunteer contributions as well as participant consumption.
147Portas Consulting Socio-economic Model. Value in direct GVA terms. This does not account for ‘counterfactual deadweight’ (the situation in the absence of grassroots football) or displacement factors (the fact that jobs in the football sector could be taking away jobs in other sectors). See Appendix 3 for further details.148Based on income tax contribution from additional workers in the sport sector and 20% VAT paid on expenditure on adult grassroots football. Wages to coaches and referees are assumed to fall under the minimum tax bracket. 149Portas Consulting Socio-economic Model. See Appendix 3 for further details. Includes £328M value of salary-equivalent hours dedicated by volunteers and £187M of social wellbeing value generated through the positive impact volunteering has on individual wellbeing in adults, calculated with the wellbeing valuation approach (see Appendix 10 and Appendix 12). Based on the wellbeing value of a general volunteer and number of grassroots volunteers aged 16+. Note there is scope for further research into wellbeing value of sports volunteers.150‘Employed’ includes coaches, referees and additional workers such as grassroots football management, leisure centre workers and groundspeople. 151Portas Consulting Socio-economic Model. Combined direct value of participant expenditure in adult children’s grassroots football and indirect benefits to upstream services See Appendix 3 for further details152Includes adults and children who volunteer in adult’s football. See Chapter 6 for details153Portas Consulting Socio-economic Model. See Appendix 3 for further details154Note: A 42% reduction is applied to the annual kit and equipment costs figure to account for imports in the socio-economic model (ONS). The average regular player therefore contributes £201 to the national economy through expenditure.155The FA Participation Tracker. 20% is spent on kit & equipment, 18% on transport, 18% on match fees, and 16% on membership fees. See Appendix 5 for full breakdown of participant expenditure.
Workforce Contribution
Total economic contribution to Engalnd
Of which £640m is tax contribution to the Exchequer
Volunteering Value Participant Consumption
£2.66bn£2.15bn £520m
£5.33bn p.a
4.2. ECONOMIC IMPACT

The Football Association Limited THE SOCIAL AND ECONOMIC VALUE OF GRASSROOTS FOOTBALL IN ENGLAND – SEPTEMBER 2020 33
4. ADULTS (CONTINUED)
Physical activity has significant benefits to individuals’ physical and mental wellbeing156, including a reduction in the risk of developing chronic disease and mental disorders such as depression and anxiety. The UK’s Chief Medical Officer recommends that adults must achieve an average of at least 150 ‘moderate intensity equivalent minutes’ of physical activity per week157 in order to obtain these benefits.
91% of adults who play football meet the full CMO guidelines and so are ‘physically active’158.
This means that football contributes to improving the physical and mental wellbeing of 8.2m adults159.
Small but statistically significant health benefits have also been seen in individuals that are ‘fairly active’ and are doing between 30 to 149 moderate intensity equivalent minutes of physical activity per week160. 8% of adults (747,000 people) who play football are doing between 30-149 minutes per week and so are fairly active161.
Adult football participation in England is associated with the prevention of 203,500 cases of physical and mental health disorders at an overall direct saving to health systems of £450m and indirect savings to society of £1.12bn162 (see Figure 7 and further details below).
Figure 7: Total physical and mental wellbeing impact from adult grassroots football. Direct savings are savings to the NHS from activities such as reducing treatment and public social care costs. Indirect savings are wider societal costs savings, such as improving productivity in the workplace and reducing informal care. See Appendix 3 for further details.
156Booth, F. W., Roberts, C. K., & Laye, M. J. (2012). Lack of exercise is a major cause of chronic diseases. Comprehensive Physiology, 2(2), 1143–1211. https://doi.org/10.1002/cphy.c110025157The Chief Medical Officer recommends individuals do at least 150 mins of moderate intensity or 75 mins of vigorous intensity physical activity per week, or a combination of both.158Active Lives Survey 2018-19. Based on the number of football participants (at least once per month), who were also deemed physically active159This does not account for ‘counterfactual deadweight’ (the situation in the absence of grassroots football) or displacement factors. See Appendix 3 for further details.160Wen CP, Wai JPM, Tsai MK, et al. (2011). Minimum amount of physical activity for reduced mortality and extended life expectancy: a prospective cohort study. Lancet. 6736(11)60749-6.161Active Lives Survey 2018-19. Based on the number of football participants (at least once per month), who were also deemed physically active162Portas Consulting Socio-economic Model. Based on academic research with appropriate socio-demographic controls. Direct savings are savings to the NHS from activities such as reducing treatment and public social care costs. Indirect savings are wider societal costs savings, such as improving productivity in the workplace and reducing informal care. See Appendix 3 for further details.
Physical health Mental health
141,300 62,200Fewer cases of chronic health disorders
Fewer cases of mental health disorders
In direct healthcare savings
In direct healthcare savings
In indirect healthcare savings
In indirect healthcare savings
£372m £78m£340m£772m
4.3. HEALTH IMPACT

The Football Association Limited THE SOCIAL AND ECONOMIC VALUE OF GRASSROOTS FOOTBALL IN ENGLAND – SEPTEMBER 202034
4. ADULTS (CONTINUED)
Physical wellbeingAdult football participation is associated with the reduction of 141,300 cases of chronic diseases, a cost decrease for the NHS of over £372m163 (see Figure 8 and further details below).
HEALTHSAVINGS
£372m
CoronaryHealth Disease
StrokeDementia
Type 2Diabetes
BreastCancer
ColonCancer
UterineCancer
OsteoporoticFractures
£7.9m
£22.3m£70m
£104m
£1.1m
£8.2m
£0.7m
£158m
Figure 8: Breakdown of NHS cost savings associated with football participation across eight disease groups.
• 15m adults in England are currently suffering from at least one chronic health condition164. Long-term conditions are more prevalent in more deprived groups (people in the lowest social class have a 60% higher prevalence than those in the highest social class and 30% greater severity of disease165).
• However, by meeting the CMO physical activity guidelines, individuals can reduce the risk of developing these conditions by around 25%166. Physical activity through football is therefore an important tool for addressing the rising levels of chronic conditions. This is reflected in Figure 9, where ‘good’ self-rated health is 41%pt higher in regular football participants compared to those who do not play any sport and 11%pt higher than those that play individual sport167.
72% 72%
61%
31%
FOOT
BALL
TEAM
SPO
RT
INDI
VIDU
AL S
PORT
NO
SPOR
T
Figure 9: Proportion of participants with ‘good’ self-reported health by sport type. Participation based on individuals that have played within the last month
163Portas Consulting Socio-economic Model. Based on the reduced risk of developing chronic disease in physically active adults across eight different disease groups in academic literature, controlling for socio-demographic factors. See Appendix 3 for further details164The Kings Fund (2012) Long-term conditions and multi-morbidity165Department of Health (2012). Long-term conditions compendium of Information: 3rd edition166Lee, I. M., et al (2012). Effect of physical inactivity on major non-communicable diseases worldwide: an analysis of burden of disease and life expectancy. Lancet (London, England), 380(9838), 219–229167Descriptive analysis of the The FA Participation Tracker November 2019 – February 2020. Adults aged 19+. Regular football participants (n=846), regular team sport participants (n=644), regular individual sport participants (n=2937, individuals who have not played sport in the last month (n=918). Results are statistically significant at the 1% probability level.

The Football Association Limited THE SOCIAL AND ECONOMIC VALUE OF GRASSROOTS FOOTBALL IN ENGLAND – SEPTEMBER 2020 35
4. ADULTS (CONTINUED)
Annual adult football participation is associated with the reduction of over 42.7m osteoporotic fractures, of which 34% are in women168.
• One in three women and one in five men over the age of 50 will suffer from an osteoporotic fracture during their lifetime169. This costs the NHS approximately £1.7bn every year in hospital admissions170.
• Women spend more days in hospital due to osteoporosis than many other diseases including diabetes, heart attacks and breast cancer171.
• The weight-bearing and impactful nature of football supports the strengthening of muscles and bones, contributing to a reduction in osteoporotic fractures172.
Regular footballers are healthier than non-footballers, contributing to £62m in NHS savings through reduced GP visits173.
• Adults who play regular football report 6% higher levels of overall health compared to adults who do not play football174.
• Healthier people are less likely to visit their local GP175. Through improving participants’ overall health, grassroots football contributes to reducing 1.68 million GP visits, saving the NHS £62m176,177.
Mental wellbeing1 in 4 adults in England currently have some form of mental health condition. Depression and anxiety are the most prevalent mental health disorders and major depression is thought to be the second leading cause of disability179.
Stress, depression and anxiety are also the leading cause of workplace productivity losses each year, accounting for 75% of the overall burden180.
Regular footballers are happier than those who do not play football.
• Adults who play regular football report 5% higher happiness and life satisfaction levels compared to those who do not play football181,182.
• This impact is three times greater for adults from lower SEGs compared to a higher SEGs183.
168Portas Consulting Socio-economic Model. See Appendix 3 for further details. Note this is likely an underestimate as analysis is based on the impact of adult participation. Weight-bearing activity has the greatest impact during childhood when bones are forming. This greater benefit is not captured in this analysis. See Chapter 3.3 for further details169International Osteoporosis Society, Osteoporosis Facts and Statistics170National Osteoporosis Society (2017) NHS RightCare scenario: The variation between sub-optimal and optimal pathways. Susan’s Story: Osteoporosis. Figure adjust for inflation from 2013-2019. Bank of England Inflation Calculator171International Osteoporosis Society, Osteoporosis Facts and Statistics172Multani, N.K., Kaur, H. & Chahal, A (2011) Impact of Sporting activities on Bone Mineral Density. Journal of Exercise Science & Physiotherapy, 7(2), 103-109173Based on regular footballers having a 10.3% increased likelihood of good health (FA Participation Tracker. See Appendix 8). Calculated using the methodology outlined in The FA (2019): The Social and Economic Value of Adult Grassroots Football in England.174Based on OLS regression analysis (see Appendix 2) on regular football participation using data from The FA Participation Tracker November 2019-February 2020, controlling for socio-demographic factors. See Appendix 8 for full breakdown of results.175Fujiwara et al (2015). Further analysis to value the health and educational benefits of sport & culture. Department for Culture Media & Sport Research Paper.176Based on regular footballers having a 10.3% increased likelihood of good health (FA Participation Tracker. See Appendix 8). Calculated using the methodology outlined in The FA (2019): The Social and Economic Value of Adult Grassroots Football in England.177Note these savings are also captured in direct healthcare savings through chronic disease reduction so are not additive.178Public Health England179Whiteford, H. A. et al. (2013) Global burden of disease attributable to mental and substance use disorders: findings from the Global Burden of Disease Study 2010. The Lancet. 382 (9904). pp. 1575-1586.180Labour Force Survey 2018-19181Based on OLS regression analysis (see Appendix 2) on regular football participation using data from The FA Participation Tracker November 2019-February 2020, controlling for socio-demographic factors. See Appendix 8 for full breakdown of results.182Playing regular football also has a positive association with an individual’s life satisfaction, equivalent to an increase in average annual income as calculated through the wellbeing valuation method. See Appendix 10 for further details.183Based on disaggregated OLS regression analysis (see Appendix 2) on regular football participation using data from The FA Participation Tracker November 2019-February 2020, controlling for socio-demographic factors. See Appendix 8 for full breakdown of results.

The Football Association Limited THE SOCIAL AND ECONOMIC VALUE OF GRASSROOTS FOOTBALL IN ENGLAND – SEPTEMBER 202036
4. ADULTS (CONTINUED)
Overall, adult football participation is linked to the reduction of 62,200 cases of depression and anxiety. This equates to a cost reduction for the NHS of £78m per annum184.
ADULT FOOTBALL PARTICIPATION IS LINKED TO THE REDUCTION OF:
WHICH SAVES THE NHS OVER
fewer cases of depression fewer cases of anxiety28,200
per year£78m
34,000
• By meeting the physical activity guidelines, adults have a decreased risk of emotional disorders such as anxiety and depression. This annual participation is linked to the reduction of 62,200 cases in physically active and fairly active football participants185
Case Study Follo FCFollo FC won The FA and McDonald’s Grassroots Football Awards Project of the Year Award in 2019. It is a football club formed by – and for – fathers who have suffered the loss of a child.
The club is entirely inclusive of all abilities and walks of life, but members share a common grief and respect for one another. Follo’s aim is to use football as part of the grieving and healing process, but also to raise awareness of mental health issues. They speak to people at matches and use social media to create a platform for other men to get in touch and open up about their loss. The club ethos is ‘We may have lost, but we are all winners’.
Manchester FA
184Portas Consulting Socio-economic Model. Based on academic research with appropriate socio-demographic controls. See Appendix 3 for further details185Portas Consulting Socio-economic Model. See Appendix 3 for further details

The Football Association Limited THE SOCIAL AND ECONOMIC VALUE OF GRASSROOTS FOOTBALL IN ENGLAND – SEPTEMBER 2020 37
4. ADULTS (CONTINUED)
Healthy behavioursFootball has broader benefits to participants’ health due to its effect on healthy lifestyle choices186:
• Regular football participants report healthier diets compared to non-football participants187.
– 58% of regular footballers with a healthy diet agree that football has a direct influence on their healthier food choices188.
• 52% of regular footballers who smoked in the past agree that participating in football made them more likely to quit189.
• Although regular football players have higher rates of smoking compared to non-sport participants190, 65% agree that taking part in football makes them more likely to quit191.
of regular footballers with a healthy diet agree
that football has a direct influence on their food choices
58%
186The FA Participation Tracker November 2019 – February 2020. The impact on alcohol consumption was also explored but the relationship was found to be non-significant.187Based on OLS regression analysis (see Appendix 2) on regular football participation using data from The FA Participation Tracker November 2019-February 2020, controlling for socio-demographic factors. See Appendix 7 for full breakdown of results.188The FA Participation Tracker November 2019 – February 2020. Adults aged 19+ who answered drinking and diet questions (n=1962) 189The FA Participation Tracker November 2019 – February 2020. Adults aged 19+ who play football and previously smoked (n=434) 190Based on OLS regression analysis (see Appendix 2) on regular football participation using data from The FA Participation Tracker November 2019-February 2020, controlling for socio-demographic factors. See Appendix 7 for full breakdown of results.191The FA Participation Tracker November 2019 – February 2020. Adults aged 19+ who play football and smoke (n=137)

The Football Association Limited THE SOCIAL AND ECONOMIC VALUE OF GRASSROOTS FOOTBALL IN ENGLAND – SEPTEMBER 202038
Adult grassroots football has a positive impact on community and individual development, with greater benefits amongst lower socioeconomic groups (see below).
Community developmentPlaying football provides 1.45bn hours of social interaction for adults in England per annum192.
• Loneliness and trust are significant challenges for communities. Almost 1 in 5 people report that they always or often feel lonely and only 45% of individuals believe that people can usually be trusted193.
• The 9m adults who play football have more social interactions and feel more socially connected compared to those who do not play football194.
Adult grassroots football improves trust and perceived behaviour195. This impact is twice as great in individuals from lower SEGs compared to higher SEGs196.
• Adults who play regular football report significantly higher trust levels compared to non-footballers.
• 57% of regular footballers also believe that football sessions in their local area help to reduce the levels of crime and antisocial behaviour in the community197.
Case Study Surrey FA and the Twinning ProjectSurrey FA partnered with the Twinning Project to deliver recreational football to women at HM Prison Downview.
The Twinning Project delivered a six-week introductory coaching course for cohorts of 10-12. Surrey FA then organised for players from its Women’s Flexi-League to visit and hosted an event comprising a classroom and Q&A session followed by a tournament where the inmates could put the skills they’d learned into practice.
Numerous inmates demonstrated a desire to play football upon their release from prison and enquired as to local clubs they could connect with. Upon release, the prison will provide relevant contact details of County FAs to create opportunities for these women to play.
Following the event, women from Surrey FA’s Flexi-League have since proactively connected with HM Prison Downview to organise further tournaments.
192Portas Consulting Socio-economic Model. See Appendix 3 for further details193Phillips, D., Curtice, J., Phillips, M. and Perry, J. (eds.) (2018), British Social Attitudes: The 35th Report, London: The National Centre for Social Research194Based on OLS regression analysis (see Appendix 2) on regular football participation using data from The FA Participation Tracker November 2019-February 2020, controlling for socio-demographic factors. See Appendix 9 for full breakdown of results.195Portas Consulting Socio-economic Model. See Appendix 3 for further details196Based on OLS regression analysis (see Appendix 2) on regular football participation using data from The FA Participation Tracker November 2019-February 2020. See Appendix 9 for full breakdown of results.197The FA Participation Tracker November 2019 – February 2020. Adults aged 19+ who play football (n=968)
4. ADULTS (CONTINUED)
4.4. SOCIAL IMPACT

The Football Association Limited THE SOCIAL AND ECONOMIC VALUE OF GRASSROOTS FOOTBALL IN ENGLAND – SEPTEMBER 2020 39
4. ADULTS (CONTINUED)
Individual developmentAdult football participation drives a positive impact on the confidence, communication and leadership skills of individuals.
• Regular footballers feel 7% more confident compared to adults who do not play football198.
– This benefit is twice as great as the increase in confidence for adults who play individual sport199.
• Adults who play regular football also report higher leadership and communication skills compared to adults who do not play football200.
– These impacts are greatest in those who play 11-a-side football compared to other formats of the game201.
• The benefits of regular football on confidence and communication are twice as great in women compared to men202.
198Based on OLS regression analysis (see Appendix 2) on regular football participation using data from The FA Participation Tracker November 2019-February 2020, controlling for socio-demographic factors. See Appendix 9 for full breakdown of results.199Based on disaggregated OLS regression analysis (see Appendix 2) on regular football participation using data from The FA Participation Tracker November 2019-February 2020, controlling for socio-demographic factors. See Appendix 9 for full breakdown of results.200Based on OLS regression analysis (see Appendix 2) on regular football participation using data from The FA Participation Tracker November 2019-February 2020, controlling for socio-demographic factors. Adults who play football report 3% higher communication and leadership levels compared to adults who do not play football. See Appendix 9 for full breakdown of results.201Based on disaggregated OLS regression analysis (see Appendix 2) on regular football participation using data from The FA Participation Tracker November 2019-February 2020, controlling for socio-demographic factors. See Appendix 8 for full breakdown of results.202Based on disaggregated OLS regression analysis (see Appendix 2) on regular football participation using data from The FA Participation Tracker November 2019-February 2020, controlling for socio-demographic factors. See Appendix 8 for full breakdown of results.
The Football Association Limited THE SOCIAL AND ECONOMIC VALUE OF GRASSROOTS FOOTBALL IN ENGLAND – SEPTEMBER 202040

The Football Association Limited THE SOCIAL AND ECONOMIC VALUE OF GRASSROOTS FOOTBALL IN ENGLAND – SEPTEMBER 2020 41
4. ADULTS (CONTINUED)
Source: The FA Walking Football Surveyi) Descriptive analysis. Average self-rated happiness scores of male Walking Football participants aged 50+ (The FA Walking Football Survey) is 15% higher than the average happiness scores of male non-football players aged 50+ (The FA Participation Tracker Survey). Average self-rated life satisfaction scores of male Walking Football participants aged 50+ (The FA Walking Football Survey) is 24% higher than the average life satisfaction scores of male non-football players aged 50+ (The FA Participation Tracker Survey). Results are statistically significant at the 1% probability level.
of Walking Footballparticipants say that Walking Football has
improved their mobility or co-ordination
of Walking Footballparticipants say that playing Walking Football allows them to interact with people from
different social groups
of Walking Footballparticipants agree that it has provided them with a
sense of belonging
of Walking Footballparticipants say that
playing Walking Football has had a positive impact
on any feelings of isolation
of Walking Footballparticipants say that
Walking Football provides them with a sense of purpose
higher levels of happiness than non-participantsi
88%
86%
74%
36%
65%
15%
THE BENEFITS OF WALKING FOOTBALL PARTICIPATION FOR OLDER ADULTS
“It has helped me get back to a fairly decent level of fitness: I am now 5 years post-chemo having had bowel cancer. It also helped me recover quickly this year from a hernia operation.”
MALE, AGED 68
“I have met many new friends, not just in the local area but from all over. I am proud to say I represented my country at over 70 and hope to do so for years to come. The social aspect is a huge area to enjoy at all levels.”
MALE, AGED 71
“I’ve made new friends in a fun friendly environment playing a sport I love but thought I’d never be able to play again. Being part of a team again has made me feel more positive and given me more self-confidence.”
FEMALE, AGED 51
“I was depressed and my mental health was low after I had to give up 11-a-side football through injury. I was grieving for football. Finding Walking Football gave me back that happy feeling. I have new friends and the love and enjoyment is back in my life.”
FEMALE, AGED 50
“Walking Football for me is so important on many levels. To improve my health and fitness – but also to get out, I’m a bit quiet but in the game I’m building my confidence in communicating and working as a team.”
FEMALE, AGED 40
“I love it and hate to miss even one session. It’s what I’ve been looking for... meeting new friends and keeping fit and healthy at the same time.”
FEMALE, AGED 45

The Football Association Limited THE SOCIAL AND ECONOMIC VALUE OF GRASSROOTS FOOTBALL IN ENGLAND – SEPTEMBER 202042

The Football Association Limited THE SOCIAL AND ECONOMIC VALUE OF GRASSROOTS FOOTBALL IN ENGLAND – SEPTEMBER 2020 43
5. OLDER ADULTS
Football is the most popular team sport for adults aged 55+, bringing health and social benefits to a relatively inactive age group203. This chapter explores these benefits by analysing the impact of Walking Football, chosen for its unique ability to engage this older demographic204. The participant quotes throughout this chapter are from The FA Walking Football Survey.
We welcome this new report from The FA, which highlights the benefits of Walking
Football and the impact it can have on the lives of older people. Physical activity is a key contributor to our health and wellbeing at all ages and finding a physical activity that we enjoy can make a huge difference to our lives. For many people, Walking Football offers an accessible way to participate in a game they love but never have expected to play
again due to increasing physical challenges as they age. Walking Football not only encourages people to be more physically active but also provides an opportunity to bring people together and build friendships, helping to tackle the devastating loneliness being faced by many older people. We’re delighted to be working in partnership with The FA and Sport England to develop a programme of Walking Football activities across the country that will enable more people to take part in and enjoy the game.
Steph Harland, CEO Age UK
203Sport England (2019). Active Lives Adult Survey 2018/19. Football is the most popular team sport for men aged 55+ and women aged 55+ when genders are combined. It is the second most popular team sport for men aged 55+ behind cricket and the second most popular for women aged 55+ behind netball. Relatively inactive compared to under 55s.204Note Walking Football is not aimed exclusively at older adults and 9% of players surveyed were under the age of 50. See Appendix 11 for further details.
Photo: Simon Roe Photography

The Football Association Limited THE SOCIAL AND ECONOMIC VALUE OF GRASSROOTS FOOTBALL IN ENGLAND – SEPTEMBER 202044
Walking Football is a ‘slower version of the beautiful game’ that, through specific adaptations, enables older adults to engage with football and be physically active.
• Walking Football is tailored to allow those who are not able to take part in full-paced football to continue playing205: 92% of participants surveyed said it allows them to keep playing football. It also provides opportunities for engaging men and women who are new to football.
• The format is suitable for men and women of all ages and abilities: 91% of Walking Football participants surveyed are over the age of 50 (with 15% over 70) and 29% have a disability206.
• This older demographic face significant health and social challenges. Over half of people aged 50 and over have a long-standing illness or disability207 and 31% of people aged over 50 report feeling lonely ‘often’ or ‘some of the time’208.
• Walking Football helps tackle these challenges as it keeps players fit, active and social (see below).
– “It’s fun, fitness and friendship.” – Walking Football participant. Female, 49
5.1. WHAT IS WALKING FOOTBALL AND HOW DOES IT ENGAGE OLDER ADULTS?
205See Appendix 11 for further details on the rules of Walking Football. 206The FA Walking Football Survey.207Age UK Analysis (June 2020) of English Longitudinal Study of Ageing Wave 8 (2016-17). The question asked is “Do you have any long-standing illness, disability or infirmity? Long-standing means anything that has troubled you over a period of time, or that is likely to affect you over a period of time.” 53.27% (with a 95% confidence interval of between 51.48% and 55.04%) of respondents answered yes.208Age UK (2018). All the Lonely People: Loneliness in Later Life.

The Football Association Limited THE SOCIAL AND ECONOMIC VALUE OF GRASSROOTS FOOTBALL IN ENGLAND – SEPTEMBER 2020 45
5. OLDER ADULTS (CONTINUED)
Walking Football helps keep men and women fit and active. 91% of Walking Football participants surveyed say it has improved their stamina209.
• The prevalence of chronic health conditions is on the rise: by 2035, it is estimated that nearly 70% of over 65s will have two or more chronic health conditions210.
– Walking Football provides 80% of the recommended weekly physical activity minutes for participants211. By being more active, Walking Football participants are at a lower risk of developing chronic conditions212.
• 88% of Walking Football participants surveyed say it has improved their mobility or co-ordination213 – an important benefit as poor mobility is strongly linked to frailty214. Frail individuals have three times higher healthcare costs than the general population215.
• 61% of participants surveyed say it has improved their memory or concentration216, which could slow the gradual decline of cognitive function typical with age217.
– “Playing football is the only sport and exercise I have ever enjoyed, and to be able to play it now with my knee injuries, gives me so much joy.” – Walking Football participant. Male, 52.
Walking Football improves the mental wellbeing of those who play.
• Walking Football participants surveyed report higher levels of happiness and life satisfaction than non-participants218.
– “Attending Walking Football is the only time during the week that I do not have to worry about ageing parents, family problems, work issues and financial strains. It’s my time to go back to the happy me.” – Walking Football participant. Male, 51219.
Case Study Spreading positivity through Walking FootballJoy had poor physical and mental health but Walking Football has helped to turn that around.
She found a men’s Walking Football session in Lincoln and played there for two years, before going on to set up two of her own sessions with a cohort of more than 10 women now playing on a weekly basis.
It gave Joy her first chance in life to play football. She was inspired to get more women playing and she is now so invested that she goes across the county to grow the female Walking Football player network to benefit women such as herself. She has even been selected for the England Women Walking Football squad.
209The FA Walking Football Survey. The survey received 995 responses, of which 935 were Walking Football participants.210Kingston, A. et al. (2018). Projections of multi-morbidity in the older population in England to 2035: estimates from the Population Ageing and Care Simulation (PACSim) model. Age and ageing, 47(3), 374-380.211The average Walking Football participant surveyed plays for 118 minutes per week. The CMO’s physical activity guidelines for adults are at least 150 minutes of physical activity per week. 212Physical activity is associated with a significantly reduced risk of chronic diseases in adults (see Chapter 4).213The FA Walking Football Survey. See Appendix 13.214Fallah, N. et al (2011). Transitions in frailty status in older adults in relation to mobility: a multistate modelling approach employing a deficit count. Journal of the American Geriatrics Society, 59(3), 524-529.s215Enhancing the Quality of Life for People Living with Long Term Conditions, NHS England. https://psnc.org.uk/wp-content/uploads/2018/02/Infographic-FINAL.pdf 216The FA Walking Football Survey. See Appendix 13.217Harada, C. N., Natelson Love, M. C., & Triebel, K. L. (2013). Normal cognitive aging. Clinics in geriatric medicine, 29(4), 737–752. 218Average self-rates happiness scores of male Walking Football participants aged 50+ (Walking Football Survey) is 24%pt higher than the average happiness scores of male non-football players aged 50+ (FA Participation Tracker Survey). Results are statistically significant at the 1% probability level.219Harada, C. N., Natelson Love, M. C., & Triebel, K. L. (2013). Normal cognitive aging. Clinics in geriatric medicine, 29(4), 737–752.
5.2. THE HEALTH BENEFITS OF WALKING FOOTBALL

The Football Association Limited THE SOCIAL AND ECONOMIC VALUE OF GRASSROOTS FOOTBALL IN ENGLAND – SEPTEMBER 202046
5. OLDER ADULTS (CONTINUED)
Walking Football can help combat loneliness and unwanted isolation: 75% of Walking Football participants surveyed say it provides them with a sense of belonging.
• The number of people aged 50 and over in England suffering from persistent loneliness is projected to reach two million by 2026220. These people are more likely to also suffer from chronic cardiovascular conditions, dementia and depression221,222,223.
• Walking Football provides almost two hours of social interaction per participant each week on average224.
– 85% of people surveyed say playing Walking Football has improved their levels of social activity and 42% say it helps them connect with their community225.
– “I’ve made more friends, more good friends, thanks to Walking Football than in the rest of my life put together.” – Walking Football participant. Male, 71.
• The result is reduced feelings of isolation and hopelessness for Walking Football players. 75% of players surveyed say Walking Football provides them with a sense of belonging and 65% say it provides them with a sense of purpose226.
– “Being part of a team has made me feel more positive and given me more self-confidence.” – Walking Football participant. Female, 51.
Case Study Bristol United Walking Football ClubBristol United Walking Football Club is a community project that has expanded with huge success.
Originally aimed at bringing together male rival fans of Bristol City FC and Bristol Rovers FC, its popularity has seen it add a female session, a disability session and a second open session at another venue.
Not only does the club get people active, it also promotes the social side of the game through post-game drinks and club events. This has helped bring people together and tackles loneliness – one of the big societal challenges facing this age group.
220Age UK (2018). All the Lonely People: Loneliness in Later Life.221Valtorta, N. K. et al. (2016). Loneliness and social isolation as risk factors for coronary heart disease and stroke: systematic review and meta-analysis of longitudinal observational studies. Heart, 102(13), 1009-1016.222Cacioppo J. T. et al (2006). Loneliness as a specific risk factor for depressive symptoms: cross-sectional and longitudinal analyses. Psychology and Aging, 21 (1), 140-51.223James B. D. et al (2011). Late-life social activity and cognitive decline in old age. Journal of the International Neuropsychological Society, 17 (6), 998-1005.224The FA Walking Football Survey. See Appendix 13.225The FA Walking Football Survey. See Appendix 13.226The FA Walking Football Survey. See Appendix 13.
5.3. THE SOCIAL BENEFITS OF WALKING FOOTBALL
Credit: Alex Rotas
– “I’ve made more friends, more good friends, thanks to Walking Football than in the rest of my life put together.” – Walking Football participant. Male, 71.
• The result is reduced feelings of isolation and hopelessness for Walking Football players. 75% of players surveyed say Walking Football provides them with a sense of belonging and 65% say it provides them with a sense of purpose226.
– “Being part of a team has made me feel more positive and given me more self-confidence.” – Walking Football participant. Female, 51.

The Football Association Limited THE SOCIAL AND ECONOMIC VALUE OF GRASSROOTS FOOTBALL IN ENGLAND – SEPTEMBER 2020 47
5. OLDER ADULTS (CONTINUED)
THE FA’S AIM IS TO SUSTAINABLY SUPPORT WALKING FOOTBALL’S CONTINUED GROWTH, ENSURING IT IS SAFE AND ENJOYABLE FOR EVERYONE, NOW AND LONG INTO THE FUTURE.
THE FA, AGE UK AND SPORT ENGLAND PARTNERSHIP
The FA, Age UK and Sport England are joining together in an exciting partnership to promote and support Walking Football for older people across England. The partnership will work towards the shared goals and harness the strengths of the three organisations: The FA’s understanding of football, its reputation and connections in the community; Age UK’s experience, reach, capacity and knowledge of how best to engage older people in physical activity; Sport England’s understanding of challenges, incentives and cognisance of the wellbeing benefits of engaging older people in physical activity.
The partnership aims to create at least 100 local Walking Football groups across England, co-ordinated and delivered by Age UK, supported by The FA’s local infrastructure and underpinned with Sport England’s knowledge and focus. It will be focused on achieving three main objectives:
Work across diverse communities to extend the player pathway with a focus on the most disadvantaged.
Improve the physical and mental wellbeing of participants and support independent living.
Create lasting impact by building solid foundations grounded in strong participant insight and engagement.
INCLUSIVITY WELLBEING SUSTAINABILITY

The Football Association Limited THE SOCIAL AND ECONOMIC VALUE OF GRASSROOTS FOOTBALL IN ENGLAND – SEPTEMBER 202048

The Football Association Limited THE SOCIAL AND ECONOMIC VALUE OF GRASSROOTS FOOTBALL IN ENGLAND – SEPTEMBER 2020 49
6. TWO KEY ENABLERS OF PARTICIPATION: VOLUNTEERS AND FACILITIES
Chapters 3-5 describe the economic, health and social benefits of football participation throughout the lifecycle of a player. This participation would not be possible without various ‘enablers’, which collectively provide the opportunities and support required across the country for football to be played each week. Enablers range from football programmes and league and competition structures to technology and administrative services provided by County FAs. In this chapter, the focus is on volunteers and facilities, the latter using the Football Foundation Hubs Programme as an example. Note that the monetary impact described in this chapter is also captured in Chapters 3-5 and so is not additive.
Volunteers underpin grassroots football in England – they are fundamental to the delivery of the game each week across the country. This chapter aims to quantify some of the main benefits that volunteering brings to the country, local communities and the volunteers themselves.
The national benefits of volunteeringApproximately 1.4m people volunteer in grassroots football across England.
• Volunteers are crucial for grassroots football. The 1.4m volunteers who support the beautiful game include:
– 70,000 named club and league officers227; – Over 500,000 ‘general’ adult volunteers228; – Approximately 800,000 children who volunteer229.
• 27% of adult volunteers are women230.
• Volunteers provide an economic contribution of £1.10bn each year to society231 (see Chapters 3 and 4), as well as positively impacting their communities and personal wellbeing (see below).
227Aged 16+. Chair, Secretary, Welfare Officer or Treasurer. The FA.228Aged 16+. Includes other league and club officers (for example fixtures secretaries, referee officials) and other informal roles. The FA. 229Aged 10-16. Sport England (2019). Active Lives Children and Young People Survey Academic Year 2018/19.230The FA Volunteering Workforce Survey (2018). n=1667 (1,037 general volunteers, 630 key club and league officials). All respondents are aged 18+. Respondents are assumed be representative of the whole grassroots volunteer landscape.231Note value is captured in Chapters 3 and 4 and is not additive. Portas Consulting Socio-economic Model. Value of salary-equivalent hours dedicated by adult volunteers. No monetary value is applied to the hours dedicated by volunteers under aged 16. See Appendix 3 for further details.232The FA Volunteering Workforce Survey (2018). 233Join in (2014). Hidden Diamonds. Retrieved from https://www.sportandrecreation.org.uk/pages/volunteering-research
6.1. THE IMPACT OF VOLUNTEERING
The community benefits of volunteering 81% of football volunteers surveyed started volunteering to give something back to their community and 84% started to give something back to their club232.
• People who volunteer in sport have four times higher social trust levels compared to those who do not volunteer in sport233.
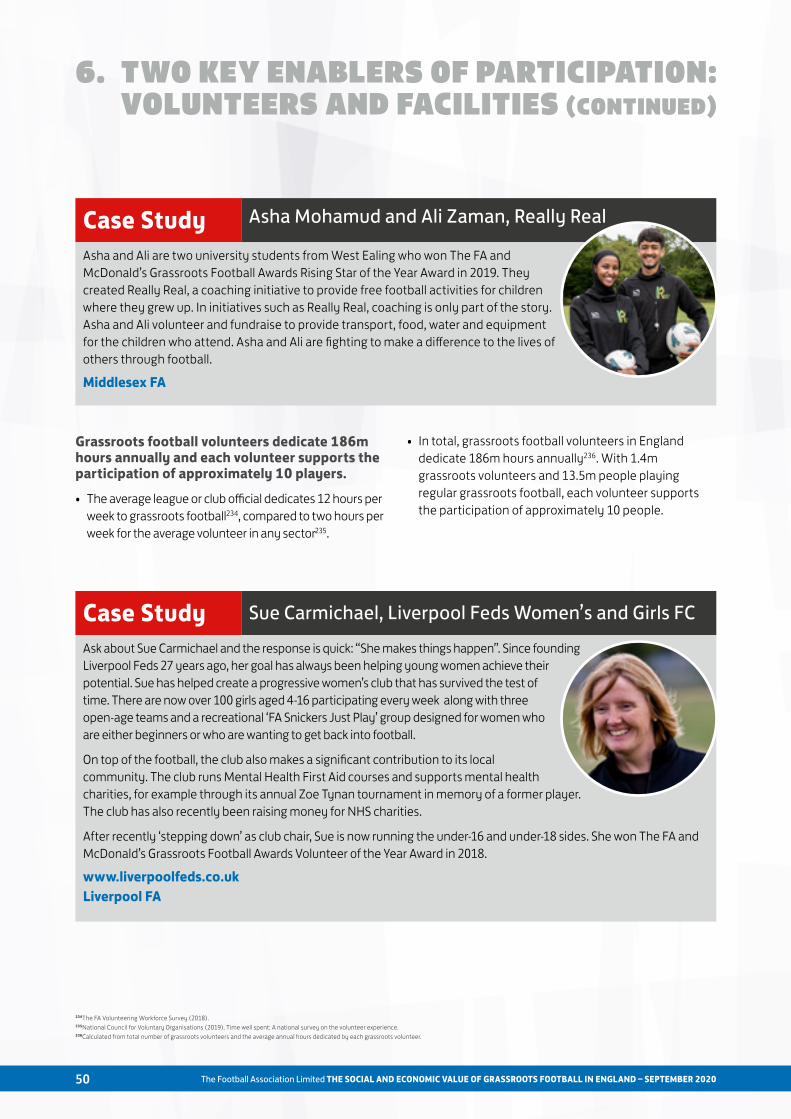
The Football Association Limited THE SOCIAL AND ECONOMIC VALUE OF GRASSROOTS FOOTBALL IN ENGLAND – SEPTEMBER 202050
6. TWO KEY ENABLERS OF PARTICIPATION: VOLUNTEERS AND FACILITIES (CONTINUED)
Case Study Asha Mohamud and Ali Zaman, Really Real
Asha and Ali are two university students from West Ealing who won The FA and McDonald’s Grassroots Football Awards Rising Star of the Year Award in 2019. They created Really Real, a coaching initiative to provide free football activities for children where they grew up. In initiatives such as Really Real, coaching is only part of the story. Asha and Ali volunteer and fundraise to provide transport, food, water and equipment for the children who attend. Asha and Ali are fighting to make a difference to the lives of others through football.
Middlesex FA
Case Study Sue Carmichael, Liverpool Feds Women’s and Girls FCAsk about Sue Carmichael and the response is quick: “She makes things happen”. Since founding Liverpool Feds 27 years ago, her goal has always been helping young women achieve their potential. Sue has helped create a progressive women’s club that has survived the test of time. There are now over 100 girls aged 4-16 participating every week along with three open-age teams and a recreational ‘FA Snickers Just Play’ group designed for women who are either beginners or who are wanting to get back into football.
On top of the football, the club also makes a significant contribution to its local community. The club runs Mental Health First Aid courses and supports mental health charities, for example through its annual Zoe Tynan tournament in memory of a former player. The club has also recently been raising money for NHS charities.
After recently ‘stepping down’ as club chair, Sue is now running the under-16 and under-18 sides. She won The FA and McDonald’s Grassroots Football Awards Volunteer of the Year Award in 2018.
www.liverpoolfeds.co.ukLiverpool FA
Grassroots football volunteers dedicate 186m hours annually and each volunteer supports the participation of approximately 10 players.
• The average league or club official dedicates 12 hours per week to grassroots football234, compared to two hours per week for the average volunteer in any sector235.
• In total, grassroots football volunteers in England dedicate 186m hours annually236. With 1.4m grassroots volunteers and 13.5m people playing regular grassroots football, each volunteer supports the participation of approximately 10 people.
234The FA Volunteering Workforce Survey (2018).235National Council for Voluntary Organisations (2019). Time well spent: A national survey on the volunteer experience. 236Calculated from total number of grassroots volunteers and the average annual hours dedicated by each grassroots volunteer.

The Football Association Limited THE SOCIAL AND ECONOMIC VALUE OF GRASSROOTS FOOTBALL IN ENGLAND – SEPTEMBER 2020 51
6. TWO KEY ENABLERS OF PARTICIPATION: VOLUNTEERS AND FACILITIES (CONTINUED)
The individual benefits of volunteeringVolunteering supports personal development in young people:
• For young people, research shows that volunteering in football contributes both to the economy and their futures. Volunteering develops employability skills such as resilience, leadership and communication237.
• Research shows that 64% of employers agree that volunteering experience is important for the workplace238.
Volunteering in grassroots football has a positive impact on individual wellbeing, with a social wellbeing value of £625m per annum239.
• 83% of football volunteers surveyed say they find their work personally rewarding240.
• Sport volunteers have 10% higher emotional wellbeing levels and are 18% more likely to feel proud of themselves compared to those who do not volunteer in sport241.
237The benefits of general volunteering are assumed to apply to volunteering in grassroots football. Sources: Institute for Employment Studies (2011). Volunteering: Supporting Transitions; Gaskin, K. (2004). Young People Volunteering and Civic Service. A Review of Literature. A report for the Institute for Volunteering Research; Williams, J. (2017). Involving young people in volunteering. What works? The Careers and Enterprise Company.238Greater London Authority (2017). Volunteering and the workplace. 239Also captured in Chapters 3 and 4. Calculated with the wellbeing valuation approach (see Appendix 10 and Appendix 12). Based on the wellbeing value of a general volunteer and number of grassroots volunteers aged 16+. Note there is scope for further research into wellbeing value of sports volunteers. 240The FA Volunteering Workforce Survey (2018).241Join in (2014). Hidden Diamonds. Retrieved from https://www.sportandrecreation.org.uk/pages/volunteering-research

The Football Association Limited THE SOCIAL AND ECONOMIC VALUE OF GRASSROOTS FOOTBALL IN ENGLAND – SEPTEMBER 202052

The Football Association Limited THE SOCIAL AND ECONOMIC VALUE OF GRASSROOTS FOOTBALL IN ENGLAND – SEPTEMBER 2020 53
6. TWO KEY ENABLERS OF PARTICIPATION: VOLUNTEERS AND FACILITIES (CONTINUED)
Via the Football Foundation, the National Football Facilities Strategy (NFFS) is directing £1bn242 of investment into grassroots football facilities over the next 10 years.
The funding partners of the Football Foundation are The FA, Premier League and the Government (via Sport England).
• Facility provision is one of the biggest barriers to football participation243.
• The Football Foundation’s funding partners have shared a 10-year vision for developing football facilities in the form of the NFFS, to be delivered by the Football Foundation.
• The NFFS is a major commitment to transform the facilities landscape by delivering:
– 1,000 new 3G football turf pitches (FTPs): in a mix of sizes and settings, dependent upon local needs. All are aimed at enhancing the quality of the playing experience.
– 20,000 improved natural-turf pitches: to help ensure games get played week in week out and improve player experience. The FA is working to improve data availability in order to outline the social return on investment from the provision of good quality grass pitches.
– 1,000 new changing pavilions/clubhouses: all linked to priority sites.
– Small-sided facilities: to grow the small-sided game for teams and leagues, recreational and informal play.
• The NFFS is targeting investment at areas of high demand and high deprivation. £189m (19%) will be directed at these areas of greatest need244.
242This figure could increase to £2m subject to the Conservative party’s pledge to invest an additional £550m in grassroots football (+ matched funding) made during the election campaign.243The FA Grassroots Survey.244Assigned by a combination of deprivation (IMD scale) and demand (The FA and Football Foundation): Leeds, Cornwall, County Durham, Greenwich, Central Bedfordshire, Birmingham, Newcastle upon Tyne, Warrington, North East Lincolnshire.
6.2. THE IMPACT OF FACILITIES

The Football Association Limited THE SOCIAL AND ECONOMIC VALUE OF GRASSROOTS FOOTBALL IN ENGLAND – SEPTEMBER 202054
With the primary focus of this study being on the benefits of football participation to children and adults, the assessment of the vast impact that facilities have was concentrated on just the Football Foundation Hubs programme, delivered by the Football Foundation. This was deemed an appropriate proxy for this report as the programme forms a key strand of the objective to build 1,000 new FTPs and caters for all formats and age groups playing the game. Note: 2019 is the time period analysed due to data availability.
What is the Football Foundation Hubs programme?The Football Foundation Hubs programme (previously known as the Parklife programme) represents a new model of investment for football facilities.
• The programme delivers accessible facility ‘hubs’ at the heart of urban communities in partnership with Local Authorities.
• Hub sites increase the number and flexibility of playing opportunities. Each site contains multiple FTPs245, which can accommodate more than 10 times the volume of football compared to a well-maintained grass pitch246.
• There are currently 13 hubs across the country, with 10 more in development247. The first nine hubs have recorded 189,000 registrations and over 1.1m football visits248 since opening. Two of the more established hub networks are located in Sheffield249 and Liverpool250 and drive significant benefits to local communities (see below).
6. TWO KEY ENABLERS OF PARTICIPATION: VOLUNTEERS AND FACILITIES (CONTINUED)
The contribution of Football Foundation Hubs to football in Sheffield and Liverpool 82,500 people played football at the Sheffield and Liverpool hubs in 2019251. 25% of these players were female.
• Hubs play a vital role in local grassroots football – there were 690,000 football visits across all sites over the year.
• Over 50,000 adults played at Sheffield and Liverpool hub sites in 2019252,253. That’s 24% of the football playing population in these cities254.
• The Sheffield and Liverpool hubs bring different parties together from the across the football landscape and beyond255. For example:
– 25% of players at hubs are female256. This participation is supported by various targeted initiatives including female beginner football festivals, recreational programmes like Wildcats, and female clubs and leagues hosted at the sites.
– Both hubs run inclusion programmes, including Walking Football, LGBT football and disability football.
– There are also multi-sport options, for example 15 hours of rugby per week is delivered at one of the Liverpool sites.
245See Appendix 13 for further details. 246FTPs can accommodate up to 85 hours of football per week (Football Foundation). The equivalent figure for a well-maintained grass pitch is six (Institute of Groundsmanship).247Of the 13 sites built: 11 are fully open, one has partially opened and one has been delayed due to Covid-19.248The Football Foundation. Data correct as of December 2019. 249Delivered by £14.3m capital investment. Contains six FTPs, seven grass pitches, three pavilions and one gym between three sites.250Delivered by £21m capital investment. Contains 12 FTPs, 12 grass pitches, four pavilions and two gym between three sites.251Sheffield hubs scans (visitor) data (2019), Pulse Fitness; Liverpool hubs scans (visitor) data (2019), Pulse Fitness. Calculated from the number of unique visitors at each site. See Appendix 13 for methodology.252Sheffield hubs scans (visitor) data, Pulse Fitness; Liverpool hubs scans (visitor) data, Pulse Fitness. Calculated from the number of unique visitors at each site. See Appendix 13 for methodology. 253Note data only 10 months of data available for Sheffield and Liverpool Jeffrey Humble sites. In these cases, the number of unique visitors over 12 months was calculated from the average number of unique visitors per month.254The FA Participation Tracker, March 2019 – February 2020. Liverpool: Participation rate = 29.7% of 394k adults (n = 182); Sheffield: Participation rate = 14.9% of 458k adults (n = 304).255Additional recreational programmes include: Turn up and play youth sessions, Soccercise, advanced coaching sessions, BTEC education programme, coach and referee education, holiday courses, 5-aside, 7-a-side and 9-a-side adult leagues. 256Across all ages. The FA Participation Tracker. Sport England (2019) Active Lives Survey 2018/19.

The Football Association Limited THE SOCIAL AND ECONOMIC VALUE OF GRASSROOTS FOOTBALL IN ENGLAND – SEPTEMBER 2020 55
6. TWO KEY ENABLERS OF PARTICIPATION: VOLUNTEERS AND FACILITIES (CONTINUED)
High-quality artificial surfaces and management at Football Foundation Hubs enable higher levels of participation through fewer match cancellations and year-round access to facilities.• By the end of the first year of operations, the number
of cancellations at the Sheffield location dropped from 146 to zero257 and last year there were no lost fixtures due to poor weather258. Only five days of fixtures have been postponed across the Liverpool sites in the last two years259.
• Year-round access is enabled by FTPs, which are playable even during winter months260.
• For context, 1 in 6 affiliated football matches are cancelled each year across the country – with over half of games postponed due to pitch conditions261.
Overall, the Football Foundation Hubs create better playing experiences.
• The playing experience has improved significantly at the Sheffield hub since opening.
– For example, player satisfaction has increased by 78% and feelings of value for money have increased by 25%262.
The contribution of Football Foundation Hubs to local communities in Sheffield and Liverpool In 2019, the Sheffield and Liverpool Football Foundation Hubs generated £16.2m263 in socio-economic value for local communities through football provision.• With a combined capital investment of £35.5m to
build the seven sites across both cities, this represents a capital payback period of just over two years and a social return on investment (SROI) of 4.4 times the initial investment264.
• £12.4m is generated through the economic contribution of participants, volunteers and the value of over 200 people employed at the Sheffield and Liverpool sites265,266.
257Sheffield hubs, Pre-migration review: 146 registered postponements from 7 clubs across 32 teams in 2015/16 season compared to zero registered postponements in 2016/17 season. Note 13 days were lost due to snow but fixtures were made up during spare capacity and all were completed.258Pulse Fitness.259Pulse Fitness.260Participation across the two hubs is ~2x higher during winter months than summer months, when affiliated football pauses for the off-season. This seasonal effect is greater than for general football participation.261‘Pitch conditions’ were identified as the reason for postponement for 62% of postponed games in 2017/18. Based on number of postponed games that have reasons captured for why they were postponed. The FA.262Sport Industry Research Centre. Sheffield hubs, Year 1 report, 2017. See Appendix 13 for further details. 263Based on providing 21,700 players with regular football (defined as those who played at least once a month at a Football Foundation Hub site during 2019). Note this is likely an underestimate as it does not capture the value of non-regular participation or participation of Football Foundation Hub players at other sites. Value is not additive to total value in Chapters 3 and 4. Calculated using the Portas Consulting Socio-economic Model. See Appendix 3 and Appendix 13 for further details. 264Calculated by dividing one year of socio-economic value by an annualised capital investment figure (total capital investment of £35M spread over the anticipated investment lifetime of 16 years – based on two carpet cycles of 8 years each as defined in the hub business plans). The FA. Note an assumed 40% discount was applied to the socio-economic value to account for the fact that ‘counterfactual deadweight’ (the situation in the absence of the facilities) or displacement factors (the socio-economic benefits through facilities may be offset by reductions elsewhere) have not been applied.265Based on providing 21,700 players with regular football. Calculated using the Portas Consulting Socio-economic Model. See Appendix 3 and Appendix 13 for further details.266Employment value also includes wider employment, such as coaches and referees.

The Football Association Limited THE SOCIAL AND ECONOMIC VALUE OF GRASSROOTS FOOTBALL IN ENGLAND – SEPTEMBER 202056
6. TWO KEY ENABLERS OF PARTICIPATION: VOLUNTEERS AND FACILITIES (CONTINUED)
• £2.4m of this value is in the form of physical and mental wellbeing benefits267. In addition:
– 92% of users at NFFS sites including Football Foundation Hubs take part in physical activity each week, compared to the national average of 75%268.
– 52% of users at NFFS sites including Football Foundation Hubs agree that using the site has increased their overall health269. Through improving participants’ overall health, the sites contributed to reducing 4,500 GP visits in Sheffield and Liverpool270.
– Users at similar sites to Football Foundation Hubs report significantly higher levels of life satisfaction and lower anxiety levels than the national average271.
• £1.4m of this value is through social community contribution272.
– The Sheffield and Liverpool provided 2.8M hours of social interaction for players last year273.
The Sheffield and Liverpool sites contributed a further £3.1m to their local communities in 2019 through football and other revenue-generating activities.
• The revenue-generating facilities unique to the Football Foundation Hub concept provided a further £3.1m274 at the Sheffield and Liverpool sites.
• In addition to the core football offering, hubs offer a range of wider community services including:
– Gyms: Football Foundation Hubs run a successful football and fitness model. Over 3,660 people are registered at the Sheffield and Liverpool gyms275.
– Education programmes: Hubs host a range of programmes including joint football-education certificates, BTEC courses and language classes.
– Community events including elderly movie nights, mental health services and anti-knife crime events.
267Calculated using the Portas Consulting Socio-economic Model. See Appendix 3 and Appendix 13 for further details.268MTM Sport / Football Foundation NFFS Survey across 5 sites including Liverpool Jericho Lane (n=2,262) Q1: ‘In the past week, on how many days have you done a total of 30 minutes or more of physical activity, which was enough to raise your breathing rate?’ National average from the Active Lives Adult Survey (2018/19).269MTM Sport/Football Foundation NFFS Survey across 5 sites including Liverpool Jericho Lane. 270Based on regular footballers having a 10.3% increased likelihood of good health (FA Participation Tracker. See Appendix 8) Calculated using the methodology outlined in The FA (2019): The Social and Economic Value of Adult Grassroots Football in England.271MTM Sport / Football Foundation NFFS Survey across 5 sites including Liverpool Jericho Lane. National average from the Active Lives Adult Survey (2018/19)272Through educational improvement and crime reduction (as in Chapter 3). Calculated using the Portas Consulting Socio-economic Model. See Appendix 3 and Appendix 13 for further details.273Calculated using the Portas Consulting Socio-economic Model. See Appendix 3 and Appendix 13 for further details.274Revenue is aggregated across all sites and annualised to provide an indicative per annum figure. Data provided by Pulse Fitness. See Appendix 13 for a breakdown by revenue type. 275Data provided by Pulse Fitness.

The Football Association Limited THE SOCIAL AND ECONOMIC VALUE OF GRASSROOTS FOOTBALL IN ENGLAND – SEPTEMBER 2020 57
6. TWO KEY ENABLERS OF PARTICIPATION: VOLUNTEERS AND FACILITIES (CONTINUED)
Case Study Lisa Saleh, AFC Warner ColtsWhen Lisa Saleh’s children started playing for AFC Warner Colts, she never imagined that a few years later she’d be joining them.
Yet that is exactly what has happened. Every week Lisa heads down to one of the Football Foundation-funded hub sites in Liverpool, usually Jericho Lane, to meet her team mates for training or matches.
After losing her business, Lisa was stuck in a rut and struggling with her mental health, particularly anxiety. Initially she tried the gym on the recommendation of her doctor, but found it wasn’t for her. That’s when she turned to football.
After becoming involved with the AFC Warner Colts’ ladies team Lisa’s confidence sky rocketed. Her motivation returned and she has since secured a new job, all while making a host of new friends in the team.
“If I hadn’t started playing in the women’s team, I wouldn’t have got the job I’ve got now. Getting out and playing football, and mixing with all the women, it motivated me. Joining this team is definitely the best thing I’ve ever done for my mental health.” – Lisa Saleh
The side of football Lisa enjoys most is the social element. She loves spending time with her teammates and also appreciates that she can fit in training around her children’s lives.
Lisa is also a firm believer that better facilities have led to growth of the women’s game. Sites such as Jericho Lane offer changing rooms, toilets and a café, turning it into a community space as well as a sporting one.
“Some women don’t want to go and get changed on a muddy field in the park, but here you’ve got toilets, there’s an area to sit and have a coffee and a chat, so it’s not just about playing football; it’s the social aspect of it too.” – Lisa Saleh
Lisa doesn’t play football every week and she admits that her physical fitness is still improving. But that is why football works so well for her; it fits in with her lifestyle. It was a leap of faith for her, but one that she’ll never regret.
“If any woman out there is thinking, shall I go and join a football team, all I can I say to you is, yes. You’ll never look back.” – Lisa Saleh

The Football Association Limited THE SOCIAL AND ECONOMIC VALUE OF GRASSROOTS FOOTBALL IN ENGLAND – SEPTEMBER 202058
7. PROJECT TEAM
Lottie Birdsall-StrongTeam LeadThe Football Association
Harriet JowettThe Football Association
Portas Consulting Ltd was appointed to conduct data analysis, perform socio-economic modelling and to write the report.
Portas Consulting is the leading management consultancy dedicated to sport and physical activity.
Working with governments, sports bodies and corpo-rates, Portas provides independent advice to senior leaders on their most critical and complex challenges across the globe. Contributing staff include Charlie Cowen, Jack Barber, Elena Portas, Viola Lough, Harry Wells, Neel Rajani and Clare Bowyer.
Dr. Ricky Lawton was appointed as a special technical advisor on elements not relating to the Portas Consulting socio-economic model. He is Director of Research and Analysis at Simetrica-Jacobs (on behalf of Jump Projects), a research consultancy specialising in policy evaluation for public, private and not-for-profit sectors.

The Football Association Limited THE SOCIAL AND ECONOMIC VALUE OF GRASSROOTS FOOTBALL IN ENGLAND – SEPTEMBER 2020 59
8. ACADEMIC PANEL
A panel of academic experts was engaged to review the data sources, modelling methodology and communication of findings in the report. The members of this panel are listed below in alphabetical order:
Justin Davis Smith CBE is a Senior Lecturer at Cass Business School, where he leads a masters’ programme on voluntary sector management. Prior to this, he was chief executive of Volunteering England and director of the Institute
for Volunteering Research. He was chief consultant to the UN on the international year of volunteering and author of the volunteering strategy for the 2012 Olympic and Paralympic Games. He is a Trustee of the Watford FC Community Sports and Education Trust.
Professor Carol Holland is a Professor in Ageing within the Division of Health Research at Lancaster University, and Director of the Centre for Ageing Research (C4AR). She is a psychologist who focuses on applied impacts of
cognitive and health psychology of ageing and models of frailty. She has an interest in the multidimensional impacts of social and physical engagement and activity on wellbeing and cognitive function in later life.
Dr Charlie Foster OBE is one of the UK’s leading epidemiologists for physical activity and health. He was the lead author for the 2019 UK Chief Medical Officers’ Physical Activity Guidelines and advises the UK Government on physical activity and
sports policy. He is the Head of the Centre for Exercise, Nutrition and Health Sciences at Bristol University.
Michael Kitson is University Senior Lecturer in International Macroeconomics at Cambridge Judge Business School; Director of the Cambridge MBA; Assistant Director of the Centre for Business Research, Cambridge; and Fellow of
St Catharine’s College, Cambridge. He was also an advisor for The FA’s 2019 report: The Social and Economic Value of Adult Grassroots Football in England

The Football Association Limited THE SOCIAL AND ECONOMIC VALUE OF GRASSROOTS FOOTBALL IN ENGLAND – SEPTEMBER 202060

The Football Association Limited THE SOCIAL AND ECONOMIC VALUE OF GRASSROOTS FOOTBALL IN ENGLAND – SEPTEMBER 2020 61
9. APPENDICES
The FA Participation Tracker
The FA Participation Tracker is run by The FA to understand trends in football participation and the motivations and outcomes for people who play football.
The FA Participation Tracker engages both football and non-football participants aged 14+ across England via a 15-minute online quantitative survey. Fieldwork is conducted every month continuously (sample recruited via panel sample). Weightings are required to reduce the risk of bias in survey estimates and are produced to make the weighted achieved sample match the population
as closely as possible. Weightings are calculated based on the demographic breakdowns of the population as reported by the Office for National Statistics276 and account for age, gender, geography, ethnicity and socio-economic group.
The FA Participation Tracker was redesigned in October 2019 to include a series of questions around mental and social wellbeing. Wellbeing insights are derived from analysis of responses collected between November 2019 and February 2020, capturing data from 4,803 respondents. The measures analysed in this report are:
Variable Question asked
Current smoking status Do you currently smoke a cigarette, a cigar or a pipe? We are referring here to tobacco cigarettes, not e-cigarettes or other vaping devices that use e-liquids.
Influence of football on likelihood of quitting To what extent do you agree or disagree with the following statement: 'Taking part in football makes me more likely to quit smoking'?
Past smoking status Have you ever smoked?
Influence of football on quitting smoking To what extent do you agree or disagree with the following statement: 'Taking part in football made me more likely to quit smoking'?
Alcohol consumption How often have you had an alcoholic drink of any kind during the last 12 months?
Influence of football on alcohol consumption To what extent do you agree that playing football makes you more likely to consume more alcohol?
Self-rated diet On a scale of 0-10 how would you rate your diet with 0 being very unhealthy and 10 being very healthy?
Influence of football on diet To what extent do you agree that playing football encourages you to have healthier food choices?
Life satisfaction Overall, how satisfied are you with your life nowadays?
Worthwhile Overall, to what extent do you feel that the things you do in your life are worthwhile?
Happiness Overall, how happy did you feel yesterday?
Anxiousness* On a scale where 0 is 'not at all anxious' and 10 is 'completely anxious', overall, how anxious did you feel yesterday?
General health How is your health in general? Please give your answer on a scale of 1 to 5 where 1 is ‘Very good’ and 5 is ‘Very bad’
GP visits In the last 12 months, how many times have you visited your GP?
Life’s challengesYour ability to cope with life’s challenges - We’re now going to show you a number of statements and we’d like you to answer each based on how you would rate yourself in each of these areas.
Overall confidence Your overall confidence - We’re now going to show you a number of statements and we’d like you to answer each based on how you would rate yourself in each of these areas.
276Office for National Statistics (2019). United Kingdom mid-year population estimates.
APPENDIX 1 – KEY DATASETS

The Football Association Limited THE SOCIAL AND ECONOMIC VALUE OF GRASSROOTS FOOTBALL IN ENGLAND – SEPTEMBER 202062
Variable Question asked
Communication skillsYour communication skills - We’re now going to show you a number of statements and we’d like you to answer each based on how you would rate yourself in each of these areas.
ResilienceYour resilience (If you find something difficult you keep trying until you can do it) - We’re now going to show you a number of statements and we’d like you to answer each based on how you would rate yourself in each of these areas.
Leadership skillsYour leadership skills - We’re now going to show you a number of statements and we’d like you to answer each based on how you would rate yourself in each of these areas.
TrustMost people who live in my local area can be trusted - To what extent do you agree or disagree with the following statements?
Social interactionsI interact with people from different social groups (e.g. older or younger than me, from a different culture or race, from a different neighbourhood). - To what extent do you agree or disagree with the following statements?
Community connectionI am well connected to my community (e.g. volunteering, helping people with physical disabilities) - To what extent do you agree or disagree with the following statements?
Influence of football on community crimeFootball helps to reduce crime in my community - To what extent do you agree or disagree with the following statements?
Influence of football on community anti-social behaviourFootball helps to reduce anti-social behaviour in my community - To what extent do you agree or disagree with the following statements?
9. APPENDICES (CONTINUED)
*Anxiety has not been included in the reported figures due to the Covid-19 pandemic, which caused an increase in surveyed anxiety levels in the month of February.
The primary target audience of the survey is people aged 16+, with supplementary data collected for children aged 14-15. In this report it is therefore predominantly used in Chapter 4 to understand the national football participation landscape and the benefits of grassroots football participation on health and social wellbeing measures in adults aged 19+.
To prevent potential seasonality bias, football participation analysis uses responses collected between March 2019 and February 2020 (14,597 responses). For the purpose of this report, a respondent is defined as a ‘regular’ football participant if they have played football within the last month.
The Active Lives Adult Survey (2018-19)The Active Lives Survey was conducted by Ipsos MORI on behalf of Sport England which commissioned the survey with additional funding from Public Health England, the Department for Transport and Arts Council England.
The data presented were collected between May 2018 and May 2019 in England. The data were collected
using an CAWI online questionnaire and a paper self-completion questionnaire. The questionnaire can be completed by members of the public aged 16 or over and is available through both online and paper versions. Valid responses which could be used for analysis were received from 177,876 people in total. The Active Lives Survey is a ‘push-to-web’ survey involving four postal mail-outs designed to encourage participants to complete the survey online.
For the Active Lives Survey, the weights correct for the disproportionate selection of addresses across Local Authorities and for the selection of adults and youths within households. They also adjust the achieved sample by month to control for seasonality. In addition, by weighting to population estimates and national estimates from the Office for National Statistics, the weights should also reduce bias in the survey estimates. See Active Lives Technical Report for more information on weighting.

The Football Association Limited THE SOCIAL AND ECONOMIC VALUE OF GRASSROOTS FOOTBALL IN ENGLAND – SEPTEMBER 2020 63
9. APPENDICES (CONTINUED)
The report also analyses the time spent doing various types of sport and being active278 in the last week. In the analysis, specific activities have been grouped together into composites to look at groups of sports or disciplines. Sport England report sport participation according to the proportion of people who report playing a sport at least twice in the past 28 days. In order to remain consistent throughout this report, an adult is defined as a ‘regular’ football participant if they have played football at least once within the past 28 days.
Ethnicities have also been grouped based on standard ONS breakdowns:
• White includes White British, Gypsy or Irish traveller, Irish and any other White (e.g. Polish)
• Asian includes South Asian (Indian, Pakistani, Bangladeshi), Chinese and any other Asian (e.g. Korean, Japanese)
• Black includes African, Caribbean and any other Black (e.g. Black American, Black European)
• Mixed/Other includes individuals of multiple ethnic groups (e.g. White and Black Caribbean), Arab and any other ethnicities (e.g. Polynesian)
In this report, the Active Lives Adult survey serves as the primary dataset for analysing physical activity rates in adults aged 19+.
Active Lives Children and Young People Survey (2018-19)The Active Lives Children and Young People Survey was conducted by Ipsos MORI on behalf of Sport England, which commissioned the survey to inform both their own strategy and the strategies of the Department for Digital, Culture, Media and Sport (DCMS), the Department for Education (DfE) and the Department of Health and Social Care (DHSC). The survey captures children across England aged 5-16.
The data presented here were collected between September 2018 and July 2019 (2018/19 academic year) in England. The data were collected using CAWI online questionnaires administered in schools. There were three types of questionnaire: 1) Short simple questionnaire for pupils in year 1-2 (age 5-7); 2) Questionnaires for pupils in year 3-11 (age 7-15/16) and
parents of pupils in year 1-2; 3) Questionnaire for one teacher in each school (most often the PE lead but also heads, deputies and other teachers).
The survey design is schools based. A sample of schools was drawn from the Department for Education list of schools (Edubase 2017/18). For the Active Lives Children and Young People Survey, weights correct for non-response by schools. More information on weighting can be found in the Active Lives Children and Young People 2018/19 Technical Note.
Data are presented for childhood physical activity and football participation. The first category includes pupils who meet the CMO guidelines for young people to do on average 60 minutes of activity a day across the week. The second category includes children who have played football in the last week. For the purpose of this report, a child is defined as a ‘regular’ football participant if they have played any form of football within the past week.
Analysis also focuses on composite activity groupings to understand how children engage in physical activity. The composite measures used in the report are:
278The Chief Medical Officer defines an active adult as someone who completes 150+ moderate intensity equivalent (MIE) minutes of physical activity per week.

The Football Association Limited THE SOCIAL AND ECONOMIC VALUE OF GRASSROOTS FOOTBALL IN ENGLAND – SEPTEMBER 202064
Composite Activities included
Football Football, Kicking a ball about (‘informal’ football)
Team sportFootball, Netball, Hockey, Cricket, Rugby, Baseball, Softball, Rounders, Basketball, Dodgeball, Benchball, Volleyball, Lacrosse, Handball, King ball, Korfball, Roller hockey, Other team sport
Individual sport Racket, Combat, Athletics, Swimming, Gymnastics, Adventure, Motor, Water sports, Horse riding, Golf, Ice skating
Active play
Kicking a ball about, Skateboarding, roller skating/blading, Frisbee, throwing and catching or skipping, playing it, tag, chase, sardines or other running games, Climbing or swinging in the playground, garden or park, Other active play, Hula hooping
Walking for leisure Going for a walk
Fitness activities Gym or fitness (fitness class e.g. yoga, or using exercise machines e.g. rowing machine, exercise bike, running machine), Other fitness or gym
Active Travel Walking for travel: Walking to get to school or other places; Cycling for travel: Cycling to get to school or other places; Riding a scooter
Dance Dancing
Ethnicities are grouped based on standard ONS breakdowns (as above).
The Active Lives Children and Young People Survey also captures a range of self-reported variables which measure respondents’ wellbeing. The wellbeing measures analysed in this report are:
Wellbeing / social variable Question asked Age group captured
Happiness “How happy did you feel yesterday?” (0-10 scale) Years 3-11 (Aged 7-16)
Life worthiness “To what extent are the things you do in your life worthwhile?” (0-10 scale) Years 7-11 (Aged 11-16)
Life satisfaction “How satisfied with life nowadays?” (0-10 scale) Years 7-11 (Aged 11-16)
Self efficacy “If I find something difficult, I keep trying until I can do it” Years 3-11 (Ages 7-16)
Social Trust “How much do you feel you can trust people who are a similar age to you?” (1-4 scale) Years 3-11 (Ages 7-16)
9. APPENDICES (CONTINUED)
More information on these can be found in the Active Lives Children and Young People 2018/19 Year 2 Data User Guide.
In this report, the Active Lives Children Survey serves as the primary dataset for understanding physical activity and football participation in children aged 5-16, and how this links to wellbeing outcomes.

The Football Association Limited THE SOCIAL AND ECONOMIC VALUE OF GRASSROOTS FOOTBALL IN ENGLAND – SEPTEMBER 2020 65
Limitations and mitigations
Limitation: The Chief Medical Officer’s guidelines currently recommend children between the ages of 5-18 do an average of 60 minutes of physical activity per day across the week. However, there is no dataset that measures physical activity against these guidelines across the full age range 5-18. The Active Lives Children and Young People Survey only accounts for children up to age 16, whereas the adult survey starts at the age of 16.
Mitigation: Both Active Lives Children and Young People (5-16) and Active Lives Surveys (16-18) are used to measure sports participation and physical activity. Both datasets report the total number of Moderate Intensity Equivalent minutes of activity across the week so the threshold for physically active individuals can be set manually at 420 minutes. However, due to the different collection methods of the two surveys, different levels of physical activity and sport participation are shown at age 16. The trend seen in the Active Lives Survey for 16-18 years old is used to project a continuation of the physical activity rate seen at age 16 in the Active Lives Children and Young People Survey. The average activity level across the whole population of 5-18 year olds is then determined from a weighted average using population sizes from ONS. The extrapolated values for 17 and 18 years old are only used in the outcome modelling sections and are removed for the driver’s analysis.
Limitation: Active Lives datasets are vulnerable to individuals over-reporting physical activity levels.
Mitigation: Analysis removes outliers who are assumed to over-report their physical activity levels. In line with Sport England definitions, a respondent is classified as an outlier if they report as completing over 12 hours of physical activity on a weekday or over 9 hours of physical activity on a weekend.
Limitation: Weights cannot be calculated for transgender respondents in The FA Participation Tracker as the most recent Office for National Statistics population data do not include population data on individuals who identify as transgender279.
Mitigation: Transgender individuals are excluded from the football participation and wellbeing analysis.
The FA has developed an inclusive policy which is supportive of and welcoming to trans people in football and ensures fair competition and safety of all those on the field. This policy sets out The FA’s position on the involvement of transgender and transsexual people playing football, which is governed by The FA. The FA is committed to inclusion and achieving football For All280. Please see more information regarding this policy on The FA website281.
The Office for National Statistics (ONS) is proposing to ask a question on the topic of gender identity for the first time in a census in 2021282. For more information please refer to ONS283.
Limitation: Sport participation can vary significantly across months due to seasonality effects.
Mitigation: The Active Lives Surveys collects data throughout the school year. Adult football participation rates were analysed from 12 months of data collected from March 2019 to February 2020.
Limitation: All surveys only account for those who replied to the survey.
Mitigation: The respondents are assumed to be a representative random sample of the larger population of interest and this survey is used as the basis for physical activity rates of England and any sub-group of the population. Where possible, analysis is weighted to make the weighted achieved sample match the population as closely as possible.
279Office for National Statistics (2019). United Kingdom mid-year population estimates.280http://www.thefa.com/about-football-association/for-all281http://www.thefa.com/-/media/files/thefaportal/governance-docs/equality/lgbt/frequently-asked-questions.ashx282https://www.ons.gov.uk/census/censustransformationprogramme/questiondevelopment/genderidentity/guidanceforquestionsonsexgenderidentityandsexualorientationforthe2019censusrehearsalforthe2021census#guidance-for-the-gender-identity-question-for-the-2019-rehearsal283https://www.ons.gov.uk/census/censustransformationprogramme/questiondevelopment/genderidentity/guidanceforquestionsonsexgenderidentityandsexualorientationforthe2019censusrehearsalforthe2021census#guidance-for-the-gender-identity-question-for-the-2019-rehearsal.
9. APPENDICES (CONTINUED)

The Football Association Limited THE SOCIAL AND ECONOMIC VALUE OF GRASSROOTS FOOTBALL IN ENGLAND – SEPTEMBER 202066
Ordinary Least Squares (OLS) regression analysis is conducted to investigate the relationship between regular football participation and wellbeing / social outcomes.
Aims and objectives
Much of the research in the sporting sector uses simple analysis tests to assess statistically significant differences between outcome variables. Analysis at this level can indicate key differences between groups but does not allow us to state with high statistical confidence that football is the key factor for driving these outcomes.
The 2014 DCMS report quantifying the impact of sports participation stated that: ‘Essential to this process is the ability to control for as many of the determinants of a given outcome as possible using regression analysis. It is the optimal method given the nature of the data284.
OLS allows us to adjust for factors that may affect wellbeing measures to better isolate the benefits of football participation.
Methodology OLS regression analysis is used to investigate the associations between sport participation (e.g. regular football participation) and wellbeing / social outcomes, whilst holding other factors (control variables) constant. Due to the cross-sectional nature of the data, causality cannot be claimed. However, this methodology allows us to better isolate the link between our variables of interest (as listed in Appendix 3) by including control variables in an Ordinary Least Squares (OLS) regression equation.
Furthermore, we can investigate how the association between wellbeing outcomes and considered sport factors varies by gender and socio-economic class. This is achieved with the help of regression models with interaction terms related to such demographic factors.
Active Lives Children and Young People Survey (2018/19) OLS regression analysis conducted on the Active Lives Children and Young People Survey (see Appendix 1) is used to investigate the association between team sport participation and mental wellbeing outcomes in children aged 5-16 (see Chapter 3)285.
The data allows us to control for the following characteristics:
• Gender• Age • Family Affluence Score286 (FAS - a broad indicator of
social status)• Index of Multiple Deprivation287 (IMD - a broad
indicator of social status)• Ethnicity • Disability• Area of residence • Participation in other sports
For full results of regression analysis see Appendix 6.
The FA Participation TrackerOLS regression analysis is conducted on The FA Participation Tracker survey (see Appendix 1) to investigate the association between football participation and a range of wellbeing and social outcomes in adults (see Chapter 4).
The data allows us to control for the following characteristics:
• Gender• Age • Household income • Socio-economic grade (a broad indicator of social
status) • Ethnicity • Religion• Employment status• Whether the respondent has dependent children • Area of residence • Participation in other sports
For full results of regression analysis see Appendix 8 and Appendix 9.
9. APPENDICES (CONTINUED)
APPENDIX 2 – TECHNICAL NOTE: OLS REGRESSION ANALYSIS
284Fujiwara. et al (2014). Quantifying the Social Impacts of Culture and Sport. DCMS Research Paper.285Note: OLS regression on children could not be conducted on The FA Participation Tracker survey due to low sample size.286Respondents are placed on a scale of 0-20 depending on answers to a series of questions about household possessions and expenses. 287Matched on geography based on school location.

The Football Association Limited THE SOCIAL AND ECONOMIC VALUE OF GRASSROOTS FOOTBALL IN ENGLAND – SEPTEMBER 2020 67
The socio-economic model was developed by Portas Consulting to quantify the economic, health and social benefits associated with regular football participation in children aged 5-18 and adults aged 19+. The socio-economic model and underlying analysis build on methods initially developed through Portas’ Active Citizens Worldwide (ACW) initiative and is based on an extensive literature review. In line with previous academic and government studies288, all monetary values are based on primary analysis or academic research that control for socio-demographic factors289. For additional information on methodology and assumptions, please contact Portas Consulting.
This section of the Appendix is split into three sub-sections:
• Children chapter – the methodology underpinning the socio-economic modelling of the impact of grassroots football participation in children aged 5-18.
• Adult chapter – the methodology underpinning the socio-economic modelling of the impact of grassroots football participation in adults aged 19+.
• Limitations and mitigations – within the economic, health and social components of the socio-economic modelling.
Children Chapter
The Children Chapter of the main report (Chapter 3) demonstrates the benefits of regular grassroots football participation for children aged 5-18.
Since The FA Participation Tracker survey only captures children aged 14-18, the socio-economic model uses the Active Lives Children and Young People Survey as the key dataset used to obtain football participation and physical activity rates for children. In line with the data collected in the Active Lives Children and Young People Survey, regular footballers are defined as children who have played once within the last week and includes children who play ‘informal’ football. See Appendix 1 for further details on the Active Lives Children and Young People Survey.
i) Economic impact This report quantifies three ways in which children’s participation in grassroots football contributes to the economy: participant consumption, volunteering value and workforce contribution. Participant consumption is defined as the direct value of expenditure by regular participants in children’s grassroots football (e.g. membership, travel costs) and the indirect benefits to upstream industries involved in the production of sports goods and services290. Volunteering value represents the salary equivalent value of hours worked adult ‘formal’ volunteers and adult ‘general’ volunteers291,292. No monetary value is applied to the hours dedicated by volunteers under aged 16. Workforce contribution is defined in direct Gross Value Added (GVA) terms as the economic value generated through the workforce required to support participation. The value is based on estimates of the hourly value of referees and coaches and the value of the current ‘additional’ workforce dedicated to football293,294.
70% of volunteer and referee time is assumed to be dedicated to children’s grassroots football in line with the 7:3 team split between children and adult’s grassroots teams in England295. All coaches are assumed to work in children’s grassroots football.
The tax contribution of children’s grassroots football to the Exchequer is calculated based on income tax contribution from ‘additional’ workers. Wages to coaches and referees are assumed to fall under the minimum tax bracket.
288Fujiwara. et al (2014). Quantifying the Social Impacts of Culture and Sport. DCMS Research Paper. 289The outcomes of ‘crude’ or descriptive analysis are not used to inform monetary valuation. Arem H, Moore SC, Patel A, et al. Leisure Time Physical Activity and Mortality: A Detailed Pooled Analysis of the Dose-Response Relationship. JAMA Intern Med. 2015;175(6):959–967. doi:10.1001/jamainternmed.2015.0533290Based on the average annual spend of regular footballers aged 14-18 and average familial spend of parents per football-playing child aged 8-15. Refer to Appendix 5 for further details on expenditure in children’s grassroots football. 291‘Formal’ volunteers defined as named club and league officers (e.g. treasurers, chairpersons). ‘Informal’ volunteers defined as other general volunteers (e.g. parents supporting training sessions).292The total value of volunteering in the main report also includes the monetary value of social wellbeing impact through volunteering using the ‘Wellbeing Value’ equivalent income method. See Appendices 10 and 12 for further details.293E.g. groundspeople, leisure centre workers 294Note: This does not account for ‘counterfactual deadweight’ (the situation in the absence of grassroots football) or displacement factors (the fact that jobs in the football sector could be taking away jobs in other sectors)295The FA.
9. APPENDICES (CONTINUED)
APPENDIX 3 – THE SOCIO-ECONOMIC MODEL

The Football Association Limited THE SOCIAL AND ECONOMIC VALUE OF GRASSROOTS FOOTBALL IN ENGLAND – SEPTEMBER 202068
Data from The FA used to inform the socio-economic model is presented in the table below:
296The FA Grassroots Workforce strategy 297The FA Volunteering Workforce Survey (2018). n=1667 (1,037 general volunteers, 630 key club and league officials). All respondents are aged 18+. Respondents are assumed be representative of the whole grassroots volunteer landscape298The FA Grassroots Workforce strategy 299Number of active registered coaches. Source: The FA300Mean hours spent per week on tasks associated with coaching role, including training and matchday activities, liaising with players, admin and logistics. Source: The FA National Grassroots Coaching Survey (2020). Total sample size n = 3011. Active coaches sample size n = 2358.301Not all coaches are paid. Calculation assumes an unpaid have a salary-equivalent value per hour as a paid coach302Number of registered referees in 2019. Source: The FA 303Calculated using the annual number of grassroots matches and the proportion grassroots matches that are officiated (The FA)
Section Description Value
Volunteering Number of adult ‘formal’ volunteers in grassroots football 70,000296
Volunteering Average weekly hours spent volunteering by a ‘formal’ volunteer in grassroots football 12297
Volunteering Number of adult ‘general’ volunteers in grassroots football 500,000298
Workforce contribution Number of ‘coaches’ in grassroots football 115,000299
Workforce contribution Average weekly number of hours dedicated by a grassroots coach 8.38300
Workforce contribution Average coaching wage per hour 15301
Workforce contribution Number of referees in grassroots football 27,541302
Workforce contribution Average annual number of matches officiated per referee 25303
Workforce contribution Average referee wage per match £15 (children’s matches); £27 (adult matches)
9. APPENDICES (CONTINUED)

The Football Association Limited THE SOCIAL AND ECONOMIC VALUE OF GRASSROOTS FOOTBALL IN ENGLAND – SEPTEMBER 2020 69
ii) Health impact Using the impact of physical activity on a given disease and the levels of childhood physical activity304 in England, it is possible to estimate the contribution of physical activity to reducing the prevalence of diseases (and associated outcomes such as healthier lives, economic benefits etc.) by gender. The contribution of football can then be calculated based on the proportion of active children who play football.
The socio-economic model defines the impact of physical activity on children’s health as the contribution to the reduction in number of cases of a disease and the associated healthcare savings for obesity, depression and anxiety. The impact of physical activity on developing obesity is based on primary analysis of the Millennium Cohort Survey. The impact of physical activity on developing depression and anxiety is based on academic research from an extensive literature review. In both cases, controls for socio-demographic factors are applied.
Healthcare savings are estimated using data on the cost and prevalence of each disease in England.
The cost per case of childhood obesity is calculated from Public Health England’s estimated direct cost of obesity to the NHS in 2014-15305. Since 88% of obese children are predicted to become obese adults306, the future impact of these current case savings is calculated based on the adulthood cost of obesity. Healthcare savings are quantified in terms of ‘direct’ cost savings for the NHS, such as preventing treatment and public social care costs, and ‘indirect’ cost savings, such as improving productivity in the workplace and reducing informal care307. All cost calculations are adjusted for inflation based on Bank of England figures for 2019. Where future cost implications are implied, all figures are adjusted with a future discounting rate of 1.5%308.
iii) Social impact Education
Several studies in Europe show modest positive associations between physical activity, sport participation and educational attainment, including one large study conducted in the UK309. This is modelled to determine the contribution of childhood football participation to GDP growth owing to improved educational performance. This value is based on academic research from an extensive literature review, controlling for socio-demographic factors.
Crime
Sport participation is recognised as a deterrent for juvenile crime through creating a time diversion, improving behaviour and providing opportunities for positive relationships to develop. Using the negative association between sport participation and crime, the contribution of childhood football participation to juvenile crime reduction in England can be modelled. Crime savings are estimated using data on the cost and prevalence of juvenile crime in England adjusted for inflation310.
Social interactions
The current contribution of grassroots football to children’s social interaction is calculated from the total number of hours of regular football played by children in England (Active Lives Survey, Children and Young People 2018/19).
304Proportion of children who meet the Chief Medical Officer’s guidelines of an average of at least 60 minutes of physical activity every day across the week305Public Health England: https://www.gov.uk/government/publications/health-matters-obesity-and-the-food-environment/health-matters-obesity-and-the-food-environment--2306Ward, ZJ et al. (2017). Simulation of Growth Trajectories of Childhood Obesity into Adulthood. N Engl J Med, 377:2145-2153307Note no indirect cost to the wider society is calculated for childhood obesity as this impact is associated with economic impact through lost productivity and absenteeism in the workplace308Future discounting rate also known as the social time preference rate is outlined in HM Treasury (2018) The Green Book: Central Government Guidance on Appraisal and Evaluation. 309Booth, J. N. et al. (2014). Associations between objectively measured physical activity and academic attainment in adolescents from a UK cohort. Br J Sports Med 48(3): 265-270.310This value is based on academic research from an extensive literature review, controlling for socio-demographic factors.
9. APPENDICES (CONTINUED)

The Football Association Limited THE SOCIAL AND ECONOMIC VALUE OF GRASSROOTS FOOTBALL IN ENGLAND – SEPTEMBER 202070
Adult Chapter
The Adult Chapter of the main report demonstrates the benefit of regular grassroots football participation for adults aged 19+.
The socio-economic model uses The FA Participation Tracker survey to obtain football participation rates for adults and the Active Lives Survey to obtain physical activity rates for adults. See Appendix 1 for further details of these surveys.
As for childhood outcomes, where primary data sets were not available for some metrics, a literature review was conducted in PubMed and Web of Science databases for data up until January 2020.
i) Economic impact The main report quantifies three main ways in which adult participation in grassroots football contributes to the economy: participant consumption, the value of volunteering and workforce contribution. For each, the calculations follow the same methodology as for calculating the economic value of children’s participation in grassroots football311.
20% VAT is applied to the total value of participant consumption to calculate the tax contribution of expenditure in adult grassroots football312. This is added to the income tax value of ‘additional’ workers in adult grassroots football to calculate the tax contribution to the Exchequer. Wages to coaches and referees are assumed to fall under the minimum tax bracket.
ii) Health impact Physical inactivity is strongly associated with an increased risk of developing multiple non-communicable diseases313,314. Using data for the impact of different levels of physical activity on a given disease and the levels of adult physical activity (the proportion of adults who are ‘fully active’315 and ‘fairly active’316 in England), it is possible to estimate the contribution of physical activity to reducing the prevalence of diseases by
gender (and associated outcomes such as healthier lives, economic benefits etc.). The contribution of football can then be calculated based on the proportion of ‘fully active’ and ‘fairly active’ adults who play football.
The socio-economic model defines the impact of physical activity on adult health as the contribution to the reduction in number of cases of a disease and the associated healthcare savings across ten diseases (Coronary Heart Disease, Stroke, Type II Diabetes, Breast Cancer, Endometrial Uterine Cancer, Colon Cancer, Osteoporosis, Dementia, Depression and Anxiety). These diseases were identified from the literature review where a consistent and strong relationship was observed. The impact of physical activity on developing each disease is based on academic research from an extensive literature review. All studies control for socio-demographic factors and results were statistically significant.
The socio-economic model calculates both the direct healthcare costs and indirect societal cost of adulthood disease317. These are calculated using published total cost of disease studies and divided by the prevalence of the disease during the year of publication. All figures are converted to GBP and adjusted for inflation based on Bank of England published figures where necessary.
iii) Social impact The current contribution of grassroots football to adult social interaction is calculated using the total number of hours of regular football played by adults in England. The average number of minutes played by adults is calculated from The FA Participation Tracker survey (November 2019 to February 2020). A cap has been applied to remove outliers318 from this analysis.
311This value is based on academic research from an extensive literature review, controlling for socio-demographic factors.312Participant consumption is based on the average annual spend of regular footballers aged 19+. Refer to Appendix 5 for further details on individual expenditure in adult grassroots football. 313It is assumed that no VAT is paid on children’s expenditure.314Booth, F.W et al (2012) Lack of exercise is a major cause of chronic diseases. Comprehensive Physiology, 2(2), pp.1143-1211.315Lee, I.M. et al and Lancet Physical Activity Series Working Group, (2012.) Effect of physical inactivity on major non-communicable diseases worldwide: an analysis of burden of disease and life expectancy. The lancet, 380(9838), pp.219-229.316The proportion of adults who meet the Chief Medical Officer’s guidelines of 150 minutes of physical activity per week.317The proportion of adults who take part in 30-149 minutes of physical activity per week.318Direct savings are savings to the NHS from activities such as reducing treatment and public social care costs. Indirect savings are wider societal costs
9. APPENDICES (CONTINUED)

The Football Association Limited THE SOCIAL AND ECONOMIC VALUE OF GRASSROOTS FOOTBALL IN ENGLAND – SEPTEMBER 2020 71
Limitations and mitigations
i) Economic modellingLimitation: Limited data available regarding the proportion of volunteer, coach and referee time that is dedicated to children’s grassroots football compared to adult grassroots football.
Mitigation: The ratio of children’s grassroots teams to adult grassroots teams in England (7:3)319 is used as a proxy to estimate the proportion of volunteer and referee time that is dedicated to children’s football. All coaches are assumed to work in children’s grassroots football.
ii) Health modellingLimitation: The monetary value assigned to the health benefits of football participation are in the form of secondary benefits to the Exchequer. Such secondary benefits may be subject to overestimation through double counting, leakage, and the fact that some proportion of these benefits will be transfers from one part of the Exchequer to another part of the Exchequer
Mitigation: The cost savings approach is a widely used approach to quantify the health benefit of physical activity and sport320.
Limitation: The selection of certain diseases will underreport the true cost of physical inactivity by an unknown amount as physical activity is linked to a reduction in a range of diseases not accounted for in the model. In addition, as physical activity is self-reported the health benefits are likely to include a degree of inaccuracy as there is evidence that this can both overreport physical activity and underreport physical inactivity.
Mitigation: The model is conservative and only includes diseases which are shown to have a statistically significant correlation with physical activity.
Limitation: Inconsistency in the impact data: as studies on the impact of physical inactivity on non-communicable diseases do not all use the same physical
31970% of all grassroots teams are children’s teams. The FA320The Commonwealth Secretariat (2019) Measuring the contribution of sport, physical education and physical activity to the Sustainable Development Goals
activity benchmark as has been used in this analysis the estimation of the impact will be slightly different. There is also scope for further research into how impact varies between people of different backgrounds.
Mitigation: Consistent data is used where possible; where inconsistent, the most appropriate data has been used.
Limitation: Lack of gender-specific physical activity impact data on some diseases in academic literature.
Mitigation: Where this is the case the model assumes the physical activity impact is the same for males and females.
Limitation: Reported indirect costs from academic studies do not always include the same parameters (e.g. lost productivity, early mortality and informal care) therefore the indirect valuation is not fully comprehensive.
Mitigation: The model uses the most up to date disease costs and ensures where possible that all disease groups are aligned.
Limitation: Some academic studies looking at the benefits of sport participation and health outcomes may include some aspects of reverse causality.
Mitigation: The model uses longitudinal studies that adjust for any socio-demographic factors and underlying health conditions to minimise the impact of reverse causality.
Limitation: Many chronic diseases are intrinsically linked by the same physiological disease mechanisms and therefore the impact of physical activity on these separate diseases could be double counting
Mitigation: Double counting is minimised by selecting studies that adjust for any underlying health issues or removing those individuals from the data set to ensure the reduced risk is attributable to physical activity. Only the costs for the specific disease are included in the model, not any wider complications that are associated with other disease groups.
9. APPENDICES (CONTINUED)

The Football Association Limited THE SOCIAL AND ECONOMIC VALUE OF GRASSROOTS FOOTBALL IN ENGLAND – SEPTEMBER 202072
9. APPENDICES (CONTINUED)
iii) Social modelling Limitation: Limited academic research available on link between football participation in children and improvement in education attainment / reduced risk of crime.
Mitigation: The associations between sport participation and academic attainment / reduced risk of crime are assumed to apply to football.
Limitation: The economic benefits of improvements in education accrue when individuals reach working age.
Mitigation: The model uses an internationally recognised methodology described by the OECD (2010). The Fact that benefits are accrued when children reach working age is noted in the report.

The Football Association Limited THE SOCIAL AND ECONOMIC VALUE OF GRASSROOTS FOOTBALL IN ENGLAND – SEPTEMBER 2020 73
Table 4.1: Proportion of socio-demographic groups who play football. Active Lives Children and Young People survey data.
Number of respondents Regular football participant Physically active Football’s contribution to physical activity
TOTAL 51.5% 46.3% 68.6%
Boys 49,050 69.5% 50.1% 85.7%
Girls 54,446 33.4% 42.54% 48.0%
Age
5 1,105 50.08% 48.51% 65.55%
6 2,250 55.06% 52.54% 65.34%
7 5,999 51.29% 45.34% 71.08%
8 10,919 56.66% 41.26% 74.39%
9 12,008 55.63% 46.05% 74.66%
10 13,471 59.65% 49.04% 77.59%
11 12,382 58.17% 50.68% 76.51%
12 12,794 52.19% 49.79% 68.29%
13 13,453 47.54% 46.03% 64.25%
14 11,628 44.87% 43.36% 62.73%
15 9,965 38.35% 40.24% 54.48%
16 3,127 37.99% 37.41% 52.96%
Ethnicity
White 79,012 51.2% 48.0% 67.3%
Black 3,692 57.4% 43.5% 75.1%
Asian 8,332 52.0% 38.8% 73.0%
Other 3,912 48.4% 39.9% 70.0%
Mixed 6,344 52.7% 47.5% 69.2%
FAS
Low 79,012 51.2% 48.0% 67.3%
Medium 3,692 57.4% 43.5% 75.1%
High 8,332 52.0% 38.8% 73.0%
Note: Includes informal football. ‘Regular’ defined as playing within the past week Data representative of children aged 5-16. Weighted averages are used to calculate aggregate football participation and physical activity rates for children aged 5-18. See Appendix 1 for further details.
9. APPENDICES (CONTINUED)
APPENDIX 4 – DEMOGRAPHIC BREAKDOWN OF FOOTBALL PARTICIPANTS

The Football Association Limited THE SOCIAL AND ECONOMIC VALUE OF GRASSROOTS FOOTBALL IN ENGLAND – SEPTEMBER 202074
Table 4.2: Children’s football and other sport participation by socio-demographic group. Active Lives Children and Young People survey data
Regular football participant
Regular team sport participant
Regular individual sport participant
Non-sport participant
Number of respondents 56,215 70,640 78,932 17,232
Boys 64.0% 56.5% 45.8% 41.1%
Girls 29.9% 36.9% 48.3% 49.8%
Age
5 5.0% 3.4% 6.1% 4.1%
6 10.7% 6.9% 11.5% 8.3%
7 8.6% 7.5% 9.3% 7.7%
8 10.4% 10.2% 10.2% 7.2%
9 10.0% 10.1% 10.1% 7.0%
10 10.9% 11.2% 10.2% 6.8%
11 9.8% 10.2% 9.0% 6.7%
12 8.4% 9.5% 8.2% 7.4%
13 7.9% 9.4% 7.8% 9.1%
14 6.9% 8.1% 6.5% 10.8%
15 6.7% 8.2% 6.5% 15.2%
16 2.5% 2.8% 2.4% 6.9%
Ethnicity
White 68.0% 67.7% 70.0% 64.5%
Black 4.4% 4.4% 3.6% 4.3%
Asian 8.6% 8.8% 7.8% 10.3%
Other 3.5% 3.5% 3.6% 4.3%
Mixed 6.4% 6.3% 6.3% 6.4%
FAS
Low 18.5% 17.3% 17.8% 29.2%
Medium 52.9% 52.2% 52.8% 50.8%
High 24.1% 25.9% 25.0% 14.5%
Note: Includes informal football. ‘Regular’ defined as playing within the past week Data representative of children aged 5-16. Weighted averages are used to calculate aggregate football participation and physical activity rates for children aged 5-18. See Appendix 1 for further details. Demographic groups do not sum to 100% due to missing data and respondents answering ‘prefer not to say’.
9. APPENDICES (CONTINUED)

The Football Association Limited THE SOCIAL AND ECONOMIC VALUE OF GRASSROOTS FOOTBALL IN ENGLAND – SEPTEMBER 2020 75
Table 4.3: Proportion of socio-demographic groups who play football. Active Lives Children and Young People survey data. The FA participation tracker has been developed with The FA’s Diversity and Inclusion team to ensure best practice. Note some elements do not sum to 100% as respondents could answer ‘prefer not to say’.
Number of respondents Total football Total football (last four weeks)
TOTAL 14,599 23.9% 20.7%
Male 5,659 37.3% 32.2%
Female 6,036 11.2% 9.8%
Age group
19-34 3,330 50.2% 43.6%
35-44 2,242 31.1% 27.6%
45-54 2,114 15.2% 12.6%
55+ 4,009 3.0% 2.5%
Ethnicity
White 10,506 21.1% 18.3%
BAME 1,031 43.0% 38.5%
SEG
AB 1,695 28.2% 25.2%
C1C2 1,638 25.4% 21.7%
DE 665 17.4% 14.8%
9. APPENDICES (CONTINUED)

The Football Association Limited THE SOCIAL AND ECONOMIC VALUE OF GRASSROOTS FOOTBALL IN ENGLAND – SEPTEMBER 202076
Table 4.4: Breakdown of adult football and other sport participation by socio-demographic group. The FA Participation Tracker (March 2019-February 2020) The FA participation tracker has been developed with The FA’s Diversity and Inclusion team to ensure best practice. Note some elements do not sum to 100% as respondents could answer ‘prefer not to say’.
Play football (last 12 months)
Play football(last four weeks)
Team sport (last 12 months)
Team sport (last four weeks)
Individual sport (last 12 months)
Individual sport (last four weeks)
Non-sport participant
Number of respondents 2537 2349 2066 653 4031 2929 8753
Male 71.5% 71.1% 57.3% 65.5% 50.6% 48.4% 48.7%
Female 28.5% 28.9% 42.7% 34.5% 49.4% 51.6% 51.3%
Age group
19-34 60.9% 61.4% 48.2% 66.0% 28.6% 33.6% 28.3%
35-44 23.7% 24.0% 24.1% 23.2% 18.7% 20.2% 18.3%
45-54 10.6% 10.2% 14.0% 7.9% 17.4% 17.3% 17.6%
55+ 4.7% 4.4% 13.7% 2.8% 35.3% 28.9% 35.8%
Ethnicity
White 77.4% 76.8% 80.4% 73.3% 87.0% 85.2% 88.6%
BAME 21.3% 21.8% 18.1% 25.1% 11.4% 13.1% 10.1%
SEG
AB 31.1% 31.8% 30.3% 36.3% 27.4% 28.5% 25.1%
C1C2 47.7% 47.1% 47.4% 47.1% 46.0% 48.8% 44.5%
DE 21.2% 21.1% 22.2% 16.6% 26.6% 22.7% 30.4%
Table 4.5: Adult football participation and physical activity levels. Active Lives Adult Survey
Football participants who are active
Football participants who are fairly active
Active individuals who play football
Fairly active individuals who play football
Football participants who are active through football only
Football participants who are active through football only
Male 90.2% 8.6% 11.4% 11.4% 47.3% 47.7%
Female 93.2% 5.1% 1.3% 1.3% 44.2% 42.0%
TOTAL 90.5% 8.3% 6.4% 6.4% 47.0% 47.2%
9. APPENDICES (CONTINUED)

The Football Association Limited THE SOCIAL AND ECONOMIC VALUE OF GRASSROOTS FOOTBALL IN ENGLAND – SEPTEMBER 2020 77
9. APPENDICES (CONTINUED)
Table 5.1: Adult individual participant spend by type and format. The FA Participation Tracker (November 2019 – February 2020)
Casual kickabout with friends or family (last four weeks)
Small-sided (5/6/7-a-side-football) (last four weeks)
11-a-side football (last four weeks)
Overall regular footballers (last four weeks)
Number of respondents 498 532 237 846
Annual membership fees to play football for a team/club
£31.27 £36.81 £46.48 £34.38
Match or training fees over the course of a year (any form of competition)
£31.92 £47.61 £50.45 £40.22
Travel and public transport costs to fixtures
£40.30 £41.96 £54.27 £40.48
Annual kit and equipment costs £41.54 £47.48 £53.36 £44.52
Amount spent socialising with team mates
£51.81 £64.37 £75.72 £60.41
TOTAL £196.83 £238.24 £280.28 £220.01
TOTAL (after adjustment for sports sector multiplier)
£179.44 £218.36 £257.94 £201.37
APPENDIX 5 – FOOTBALL PARTICIPANT SPEND

The Football Association Limited THE SOCIAL AND ECONOMIC VALUE OF GRASSROOTS FOOTBALL IN ENGLAND – SEPTEMBER 202078
Table 5.2: Child (aged 14-18) individual participant spend by type and format. The FA Participation Tracker (November 2019 – February 2020)
Casual kickabout with friends or family (last four weeks)
Small-sided (5/6/7-a-side-football) (last four weeks)
11-a-side football (last four weeks)
Overall regular footballers (last four weeks)
Number of respondents 299 221 185 456
Annual membership fees to play football for a team/club
£36.02 £46.39 £70.57 £44.21
Match or training fees over the course of a year (any form of competition)
£33.94 £35.13 £46.72 £31.05
Travel and public transport costs to fixtures
£26.03 £31.92 £38.73 £27.34
Annual kit and equipment costs £46.01 £58.59 £71.61 £54.44
Amount spent socialising with team mates
£26.77 £37.92 £38.50 £29.13
TOTAL £181.95 £211.50 £269.58 £188.19
TOTAL (after adjustment for sports sector multiplier)
£143.16 £187.95 £233.89 £157.07
9. APPENDICES (CONTINUED)

The Football Association Limited THE SOCIAL AND ECONOMIC VALUE OF GRASSROOTS FOOTBALL IN ENGLAND – SEPTEMBER 2020 79
Table 5.3: Familial spend of parents on football per child, FA Participation Tracker (November 2019-February 2020)
Families with a parental football participant
Families who have no parental football participants
Overall
Number of respondents 467 344 811
Annual membership fees to play football for a team/club
£36.07 £36.59 £36.30
Match or training fees over the course of a year (any form of competition)
£33.22 £26.76 £30.40
Travel and public transport costs to fixtures
£33.44 £29.08 £31.53
Annual kit and equipment costs £41.57 £34.87 £38.65
TOTAL £144.31 £127.30 £136.87
Annual kit and equipment costs £108.20 £95.44 £102.62
TOTAL (after adjustment for sports sector multiplier)
£131.30 £115.12 £124.67
Average spend per child (after adjustment for sports sector multiplier)
£93.47 £86.32 £93.47
9. APPENDICES (CONTINUED)

The Football Association Limited THE SOCIAL AND ECONOMIC VALUE OF GRASSROOTS FOOTBALL IN ENGLAND – SEPTEMBER 202080
Table 6.1: Descriptive statistics. Football participation and social outcomes in children aged 14-18. The FA Participation Tracker (November 2019-February 2020).
Football Casual Small-sided
11-a-side Team sport Individual sport
Non-sport TOTAL
Total Sample Size 456 320 234 193 501 806 44 892
Males
Most people who live in my local area can be trusted
48.5% 49.1% 48.5% 56.6% 46.7% 43.1% 31.7% 43.6%
I interact with people from different social groups321
69.4% 74.4% 77.1% 71.0% 71.0% 71.4% 37.2% 69.3%
I am well connected to my community322 40.5% 37.4% 50.0% 48.2% 43.6% 36.2% 5.1% 34.3%
Football helps to reduce crime in my community
51.9% 47.1% 57.1% 63.2% 46.3% 39.9% 22.0% 38.4%
Football helps to reduce anti-social behaviour in my community
57.7% 51.0% 65.8% 67.2% 49.1% 47.3% 16.9% 45.2%
321older or younger than me, from a different culture or race, from a different neighbourhood332volunteering, helping people with physical disabilities
9. APPENDICES (CONTINUED)
APPENDIX 6 – CHILDREN’S FOOTBALL AND HEALTH AND SOCIAL OUTCOMES ANALYSIS

The Football Association Limited THE SOCIAL AND ECONOMIC VALUE OF GRASSROOTS FOOTBALL IN ENGLAND – SEPTEMBER 2020 81
Football Casual Small-sided
11-a-side Team sport Individual sport
Non-sport TOTAL
Total sample size 456 320 234 193 501 806 44 892
Females
Most people who live in my local area can be trusted
56.8% 49.5% 63.2% 57.6% 49.2% 48.1% 28.2% 47.1%
I interact with people from different social group*
79.7% 68.4% 84.4% 82.0% 75.2% 71.2% 43.8% 69.5%
I am well connected to my community 45.7% 44.2% 56.4% 55.7% 37.5% 30.9% 26.5% 30.5%
Football helps to reduce crime in my community
53.0% 57.2% 68.2% 64.0% 35.3% 28.0% 5.4% 27.8%
Football helps to reduce anti-social behaviour in my community
67.5% 71.1% 80.3% 76.0% 43.8% 39.6% 3.3% 38.4%
TOTAL
Most people who live in my local area can be trusted
51.1% 49.2% 53.3% 56.8% 48.0% 45.6% 29.8% 45.3%
I interact with people from different social groups
72.6% 72.1% 79.4% 73.6% 73.2% 71.3% 40.8% 69.4%
I am well connected to my community 42.1% 39.9% 52.1% 49.9% 40.4% 33.5% 16.9% 32.4%
Football helps to reduce crime in my community
52.3% 50.9% 60.7% 63.4% 40.6% 33.9% 12.9% 33.2%
Football helps to reduce anti-social behaviour in my community
60.8% 58.5% 70.5% 69.2% 46.3% 43.4% 9.4% 41.9%
Table represents proportion of respondents who agree with the statement. Note due to sample sizes a full regression analysis was not possible in this case.
9. APPENDICES (CONTINUED)

The Football Association Limited THE SOCIAL AND ECONOMIC VALUE OF GRASSROOTS FOOTBALL IN ENGLAND – SEPTEMBER 202082
Table 6.2: Descriptive statistics. Football participation and social outcomes in children aged 14-18. The FA Participation Tracker (November 2019-February 2020).
Football Casual Small-sided
11-a-side Team sport Individual sport
Non-sport TOTAL
Total sample size 456 320 234 193 501 806 44 892
Males
Your ability to cope with life’s challenges
70.3% 72.4% 73.7% 75.7% 68.3% 63.5% 33.2% 61.6%
Your overall confidence 71.1% 67.8% 73.1% 76.4% 68.2% 59.7% 34.3% 58.6%
Your communication skills 66.2% 68.0% 68.6% 76.0% 66.1% 60.2% 33.8% 59.8%
Your resilience323 71.5% 66.7% 76.8% 71.7% 66.8% 61.2% 33.2% 59.9%
Your leadership skills 58.0% 57.6% 64.5% 66.3% 62.8% 52.7% 16.9% 50.5%
Females
Your ability to cope with life’s challenges
69.1% 60.9% 79.0% 69.8% 62.1% 55.6% 47.3% 55.4%
Your overall confidence 72.3% 64.1% 72.7% 73.5% 54.3% 51.1% 45.4% 51.0%
Your communication skills 79.0% 70.3% 85.6% 84.6% 72.1% 64.4% 57.9% 63.4%
Your resilience 57.2% 59.2% 66.7% 51.3% 60.8% 59.1% 52.8% 57.8%
Your leadership skills 67.8% 59.1% 76.5% 62.4% 54.4% 48.5% 51.1% 49.0%
TOTAL
Your ability to cope with life’s challenges
69.9% 68.1% 75.4% 74.3% 65.1% 59.5% 40.9% 58.5%
Your overall confidence 71.5% 66.4% 72.9% 75.8% 61.0% 55.4% 40.4% 54.9%
Your communication skills 70.2% 68.9% 74.1% 78.0% 69.2% 62.3% 47.1% 61.5%
Your resilience 67.0% 63.9% 73.5% 67.0% 63.7% 60.1% 43.9% 58.8%
Your leadership skills 61.1% 58.2% 68.4% 65.4% 58.5% 50.6% 35.7% 49.8%
Table represents proportion of respondents who self-rated each social skill as ‘good’, where ‘good is defined as 4 or 5 on a 5-point scale.
323If you find something difficult you keep trying until you can do it
9. APPENDICES (CONTINUED)

The Football Association Limited THE SOCIAL AND ECONOMIC VALUE OF GRASSROOTS FOOTBALL IN ENGLAND – SEPTEMBER 2020 83
Table 6.3 Regression table. Association between sport participation and wellbeing/social outcomes in children (controlling for socio-demographic factors). Active Lives Children and Young People SurveyThere is a consistent positive association between team sport participation and wellbeing/social outcomes in children in the Active Lives Children and Young People Survey. Results can be interpreted in the following way:
• Team sport participation is associated with a:– 5.5% increase in happiness rating;– 12.0% increase in life satisfaction rating;– 13.6% increase if life worthiness rating;– 4.0% increase self-efficacy rating;– 4.8% increase in social trust rating.
• The benefit of team sport participation is greater than individual sport participation for happiness, life satisfaction, life worthiness and social trust.
• The benefit of team sport participation is greater for children with a low FAS compared to children with a high FAS for all give wellbeing/social outcomes.
Team sport v. other Individual sport v. other
Happiness
TOTAL 0.359 *** 0.292 ***
High FAS 0.276 *** 0.270 ***
Medium FAS 0.369 ** 0.272 N/S
Low FAS 0.421 ** 0.337 N/S
Life satisfaction
TOTAL 0.393 *** 0.247 ***
High FAS 0.262 *** 0.221 ***
Medium FAS 0.419 ** 0.275 N/S
Low FAS 0.461 ** 0.160 N/S
Life worthiness
TOTAL 0.455 *** 0.327 ***
High FAS 0.373 *** 0.389 ***
Medium FAS 0.457 N/S 0.306 N/S
Low FAS 0.541 ** 0.275 N/S
Self-efficacy
TOTAL 0.093 *** 0.111 ***
High FAS 0.079 *** 0.119 ***
Medium FAS 0.095 N/S 0.114 N/S
Low FAS 0.109 ** 0.084 **
Social trust
TOTAL 0.036 *** 0.020 ***
High FAS 0.035 N/S 0.024 N/S
Medium FAS 0.035 ** 0.014 N/S
Low FAS 0.040 * 0.031 N/S
Notes: Table represents OLS regression Co-efficients for column headings vs other (e.g. team sport participations vs non-team sport participations). Legend: *** significance at <1%, ** significance at <5%, *significance at <10%
9. APPENDICES (CONTINUED)

The Football Association Limited THE SOCIAL AND ECONOMIC VALUE OF GRASSROOTS FOOTBALL IN ENGLAND – SEPTEMBER 202084
APPE
NDI
X 7
– AD
ULT
FOOT
BALL
AN
D HE
ALTH
Y BE
HAVI
OUR
ANAL
YSIS
Tabl
e 7.
1: R
egre
ssio
n ta
ble.
Ass
ocia
tion
betw
een
adul
t par
ticip
atio
n in
diff
eren
t for
mat
s of f
ootb
all a
nd sp
ort t
ypes
, and
hea
lthy
beha
viou
r que
stio
ns (c
ontr
ollin
g fo
r soc
iode
mog
raph
ic fa
ctor
s and
whe
ther
the
indi
vidu
al d
oes a
ny o
ther
spor
t). T
he F
A Pa
rtic
ipat
ion
Trac
ker (
Nov
embe
r 201
9-Fe
brua
ry 2
020)
Tota
l fo
otba
llPl
ay fo
otba
ll (L
ast 1
2 m
onth
s)Pl
ay fo
otba
ll (la
st m
onth
)Ca
sual
Smal
l-sid
ed11
-a-si
deTe
am
(Las
t 12
mon
ths)
Indi
vidua
l (L
ast 1
2 m
onth
s)Te
am
(last
mon
th)
Indi
vidua
l (la
st m
onth
)No
n-sp
ort
part
icipa
nts
Curre
nt
Smok
ing
TOTA
L0.
094
**0.
080
**0.
073
**0.
082
**0.
062
*0.
124
**0.
014
N/S
0.06
0N/
S0.
163
***-0
.135
N/S
-0.2
28*
Men
0.11
3N/
S0.
098
N/S
0.08
9N/
S0.
124
**0.
066
N/S
0.12
9N/
S0.
030
N/S
0.05
9N/
S0.
184
N/S
-0.1
36N/
S-0
.226
N/S
Wom
en0.
044
N/S
0.03
2N/
S0.
028
N/S
-0.0
41N/
S0.
048
N/S
0.10
4N/
S-0
.012
N/S
0.06
4N/
S0.
117
*-0
.135
N/S
-0.2
32*
SEG
– AB
0.06
5N/
S0.
065
N/S
0.06
5N/
S0.
065
N/S
0.06
5N/
S0.
065
N/S
0.06
5N/
S0.
065
0.20
7*
N/S
0.06
5N/
S0.
065
N/S
SEG
– C1
C20.
105
N/S
0.10
5N/
S0.
105
N/S
0.10
5N/
S0.
105
N/S
0.10
5N/
S0.
105
N/S
0.10
5N/
S0.
105
N/S
0.10
5N/
S-0
.2048
7N/
S
SEG
– DE
0.
096
N/S
0.09
4N/
S0.
082
N/S
0.12
0N/
S0.
058
N/S
0.19
9N/
S-0
.007
N/S
0.06
5N/
S0.
165
N/S
-0.1
06N/
S-0
.237
N/S
Have
yo
u eve
r sm
oked
?
TOTA
L-0
.005
N/S
-0.0
11N/
S0.
019
N/S
0.06
2N/
S0.
014
N/S
0.00
5N/
S0.
007
N/S
0.11
7N/
S-0
.022
N/S
-0.1
61N/
S-0
.107
N/S
Men
-0.0
24N/
S-0
.028
N/S
0.00
8N/
S0.
089
N/S
-0.0
43**
-0.0
13N/
S-0
.025
N/S
0.07
1**
-0.0
32N/
S-0
.182
N/S
-0.0
81N/
S
Wom
en0.
045
N/S
0.03
4N/
S0.
047
N/S
0.00
0N/
S0.
238
**0.
095
N/S
0.05
6N/
S0.
209
N/S
-0.0
03N/
S-0
.113
N/S
-0.1
52N/
S
SEG
– AB
0.10
4N/
S0.
104
N/S
0.10
4N/
S0.
104
N/S
0.10
4N/
S0.
104
N/S
0.10
4N/
S0.
104
0.14
0N/
SN/
S0.
104
N/S
0.10
4N/
S
SEG
– C1
C2-0
.068
**-0
.068
**-0
.068
**-0
.068
**-0
.068
**-0
.068
**-0
.068
**-0
.068
**-0
.068
**-0
.068
**-0
.086
*
SEG
– DE
0.
035
N/S
0.02
5N/
S0.
046
N/S
0.17
8N/
S0.
033
N/S
-0.0
48*
-0.0
81**
0.00
7**
-0.0
84N/
S-0
.206
*-0
.064
*
9. APPENDICES (CONTINUED)

The Football Association Limited THE SOCIAL AND ECONOMIC VALUE OF GRASSROOTS FOOTBALL IN ENGLAND – SEPTEMBER 2020 85
Tota
l fo
otba
llPl
ay fo
otba
ll (L
ast 1
2 m
onth
s)Pl
ay fo
otba
ll (la
st m
onth
)Ca
sual
Smal
l-sid
ed11
-a-si
deTe
am
(Las
t 12
mon
ths)
Indi
vidua
l (L
ast 1
2 m
onth
s)Te
am
(last
mon
th)
Indi
vidua
l (la
st m
onth
)No
n-sp
ort
part
icipa
nts
How
of
ten
have
you
had
an
alco
holic
dr
ink
durin
g th
e la
st 1
2 m
onth
s?
Tota
l0.
227
N/S
0.15
3N/
S0.
190
N/S
0.22
2N/
S0.
278
*0.
190
N/S
0.14
3N/
S0.
477
N/S
0.18
2N/
S-0
.694
N/S
-0.6
37N/
S
Men
0.27
0N/
S0.
180
N/S
0.23
7N/
S0.
312
N/S
0.28
6N/
S0.
193
N/S
0.07
3N/
S0.
429
N/S
0.14
8N/
S-0
.773
N/S
-0.5
68N/
S
Wom
en0.
116
N/S
0.08
7N/
S0.
065
N/S
-0.0
29N/
S0.
250
N/S
0.16
2N/
S0.
213
N/S
0.65
7N/
S0.
243
N/S
-0.5
55N/
S-0
.769
N/S
SEG
– AB
0.31
7N/
S0.
317
N/S
0.31
7N/
S0.
317
N/S
0.31
7N/
S0.
317
N/S
0.31
7N/
S0.
317
0.16
4N/
SN/
S0.
317
N/S
0.31
7N/
S
SEG
– C1
C20.
053
N/S
0.05
3N/
S0.
053
N/S
0.05
3N/
S0.
053
N/S
0.05
3N/
S0.
053
N/S
0.05
3N/
S0.
053
N/S
0.05
3N/
S-0
.535
N/S
SEG
– DE
0.
594
N/S
0.59
9N/
S0.
652
N/S
0.65
9N/
S0.
916
N/S
0.96
6*
0.39
3N/
S0.
523
N/S
0.64
8N/
S-0
.711
N/S
-0.7
32N/
S
How
w
ould
yo
u rat
e yo
ur
diet
?
Tota
l0.
227
*0.
230
*0.
154
N/S
0.09
4N/
S0.
263
**0.
287
N/S
0.22
0N/
S0.
187
N/S
-0.2
28N/
S-0
.528
N/S
-1.2
22**
Men
0.35
3**
0.35
7**
0.27
5*
0.20
5N/
S0.
376
*0.
358
N/S
0.43
9**
0.17
4N/
S-0
.046
**-0
.495
N/S
-1.2
41N/
S
Wom
en-0
.102
N/S
-0.1
02N/
S-0
.187
N/S
-0.2
29N/
S-0
.154
N/S
-0.2
06N/
S-0
.007
N/S
0.23
0N/
S-0
.545
**-0
.576
N/S
-1.1
90**
SEG
– AB
-0.0
29N/
S-0
.029
N/S
-0.0
29N/
S-0
.029
N/S
-0.0
29N/
S-0
.029
N/S
-0.0
29N/
S-0
.029
0.88
9#N
/AN/
S-0
.029
N/S
-0.0
29N/
S
SEG
– C1
C20.
233
N/S
0.23
3N/
S0.
233
N/S
0.23
3N/
S0.
233
N/S
0.23
3N/
S0.
233
N/S
0.23
3N/
S0.
233
N/S
0.23
3N/
S-1
.234
N/S
SEG
– DE
0.
529
**0.
572
**0.
360
N/S
0.52
8**
0.58
1**
0.63
1N/
S0.
554
**0.
127
N/S
0.02
6**
-0.5
85N/
S-1
.180
N/S
Not
es: T
able
repr
esen
ts O
LS re
gres
sion
Co-e
ffici
ents
for c
olum
n he
adin
gs vs
oth
er (e
.g. r
egul
ar fo
otba
ll par
ticip
ants
vs n
on-re
gula
r foo
tbal
l par
ticip
atio
ns).
Lege
nd: *
** si
gnifi
canc
e at
<1%
, **
signi
fican
ce a
t <5%
, *sig
nific
ance
at <
10%
9. APPENDICES (CONTINUED)

The Football Association Limited THE SOCIAL AND ECONOMIC VALUE OF GRASSROOTS FOOTBALL IN ENGLAND – SEPTEMBER 202086
Tabl
e 7.
2: D
escr
iptiv
e st
atis
tics.
Pro
port
ion
of re
spon
dent
s who
curr
ently
smok
e by
spor
t typ
e an
d fo
otba
ll fo
rmat
. The
FA
Part
icip
atio
n Tr
acke
r (N
ovem
ber 2
019-
Febr
uary
202
0)
Tota
l foo
tbal
lTo
tal f
ootb
all
(last
12
mon
ths)
Tota
l foo
tbal
l (la
st fo
ur w
eeks
)Ca
sual
(t
otal
)Sm
all-s
ided
(t
otal
)11
-a-si
de
(tot
al)
Team
spor
t (la
st 1
2 m
onth
s)In
divid
ual
spor
t (la
st 1
2 m
onth
s)
No sp
ort
(last
12
mon
ths)
Team
spor
t (la
st 1
2 m
onth
s)In
divid
ual
spor
t (la
st fo
ur w
eeks
)
No sp
ort
(last
four
wee
ks)
Num
ber o
f re
spon
dent
s49
648
443
428
630
412
243
915
4037
030
214
5346
4
TOTA
L38
.5%
38.5
%39
.5%
39.5
%40
.0%
49.1
%37
.6%
23.9
%23
.1%
43.4
%24
.6%
20.4
%
Mal
e41
.1%
41.0
%42
.0%
45.8
%41
.6%
49.7
%41
.0%
28.9
%27
.6%
47.1
%29
.6%
23.8
%
Fem
ale
30.2
%30
.4%
31.6
%22
.2%
34.2
%46
.8%
30.5
%19
.1%
20.0
%35
.1%
19.6
%17
.9%
Age g
roup
19-2
436
.0%
36.6
%37
.9%
29.8
%40
.2%
44.6
%36
.4%
29.0
%35
.9%
37.2
%28
.2%
37.2
%
25-3
444
.5%
44.0
%44
.3%
47.2
%46
.0%
50.6
%47
.9%
36.1
%15
.3%
53.8
%36
.7%
10.9
%
35-4
439
.1%
39.0
%40
.8%
38.3
%39
.1%
62.3
%33
.9%
27.0
%26
.8%
41.5
%28
.5%
20.3
%
45-5
425
.8%
25.8
%27
.3%
39.0
%22
.4%
12.3
%16
.3%
22.5
%22
.7%
16.3
%23
.0%
21.1
%
53+
18.1
%19
.3%
21.4
%20
.9%
18.1
%48
.8%
27.0
%11
.0%
22.6
%23
.6%
11.2
%20
.3%
Ethn
icity
Whi
te39
.0%
38.7
%39
.7%
40.0
%39
.3%
49.4
%38
.5%
24.2
%23
.7%
45.0
%24
.9%
21.0
%
BAM
E40
.7%
41.2
%41
.5%
42.7
%45
.3%
48.1
%35
.3%
24.6
%19
.4%
39.4
%25
.1%
15.6
%
SEG
C1C2
40.0
%39
.8%
41.1
%36
.0%
44.9
%47
.5%
37.9
%23
.8%
19.7
%43
.3%
24.2
%18
.2%
AB35
.9%
35.9
%36
.1%
42.1
%33
.4%
49.5
%37
.5%
21.1
%10
.8%
40.6
%21
.2%
9.5%
DE38
.5%
38.9
%40
.6%
45.0
%36
.2%
53.1
%36
.9%
27.4
%30
.9%
50.1
%29
.4%
26.6
%
Not
e: R
espo
nden
ts w
ere
aske
d ‘D
o yo
u cu
rrent
ly sm
oke
a ci
gare
tte,
a ci
gar o
r a p
ipe?
We
are
refe
rring
her
e to
toba
cco
ciga
rett
es, n
ot e
-cig
aret
tes o
r oth
er va
ping
dev
ices
that
use
e-li
quid
s.’
9. APPENDICES (CONTINUED)

The Football Association Limited THE SOCIAL AND ECONOMIC VALUE OF GRASSROOTS FOOTBALL IN ENGLAND – SEPTEMBER 2020 87
Tabl
e 7.
3: D
escr
iptiv
e st
atis
tics:
Pro
port
ion
of re
spon
dent
s who
agr
eed
that
par
ticip
atio
n in
foot
ball
mak
es th
em m
ore
likel
y to
qui
t sm
okin
g. T
he F
A Pa
rtic
ipat
ion
Trac
ker (
Nov
embe
r 201
9-Fe
brua
ry 2
020)
Tota
l foo
tbal
lTo
tal f
ootb
all
(Las
t 12
mon
ths)
Tota
l foo
tbal
l (la
st fo
ur w
eeks
)Ca
sual
(t
otal
)Sm
all-s
ided
(t
otal
)11
-a-si
de
(tot
al)
Num
ber o
f res
pond
ents
154
149
137
9896
48
TOTA
L63
.6%
63.3
%64
.8%
66.8
%64
.2%
67.5
%
Mal
e67
.0%
66.2
%67
.9%
69.7
%68
.4%
76.4
%
Fem
ale
48.8
%50
.1%
51.4
%50
.5%
45.7
%24
.8%
Age g
roup
19-2
477
.2%
79.0
%79
.5%
77.9
%77
.8%
83.4
%
25-3
460
.4%
59.5
%62
.6%
67.1
%62
.0%
59.6
%
35-4
469
.5%
68.5
%69
.2%
83.8
%60
.5%
78.9
%
45-5
432
.0%
32.0
%32
.0%
11.7
%45
.8%
0.0%
53+
24.4
%24
.4%
24.4
%0.
0%47
.8%
0.0%
Ethn
icity
Whi
te64
.0%
63.2
%65
.4%
72.0
%63
.5%
71.7
%
BAM
E62
.0%
63.5
%62
.4%
45.3
%67
.0%
51.3
%
SEG
C1C2
59.5
%58
.9%
59.9
%50
.9%
68.0
%64
.8%
AB71
.9%
71.6
%73
.8%
87.8
%62
.2%
71.4
%
DE63
.7%
63.7
%65
.2%
72.4
%52
.7%
68.3
%
Not
e: R
espo
nden
ts w
ere
aske
d: To
wha
t ext
ent d
o yo
u ag
ree
or d
isagr
ee w
ith th
e fo
llow
ing
stat
emen
t: ‘T
akin
g pa
rt in
foot
ball m
akes
me
mor
e lik
ely
to q
uit s
mok
ing’
? Res
pond
ents
wer
e on
ly
able
to a
nsw
er th
is qu
estio
n if
they
repl
ied
‘yes
’ to
both
‘Do
you
curre
ntly
smok
e a
ciga
rett
e, a
ciga
r or a
pip
e? W
e ar
e re
ferri
ng h
ere
to to
bacc
o ci
gare
ttes
, not
e-c
igar
ette
s or o
ther
vapi
ng
devi
ces t
hat u
se e
-liqu
ids.’
and
‘Do
you
play
foot
ball?
’
9. APPENDICES (CONTINUED)

The Football Association Limited THE SOCIAL AND ECONOMIC VALUE OF GRASSROOTS FOOTBALL IN ENGLAND – SEPTEMBER 202088
Tabl
e 7.
4: D
escr
iptiv
e st
atis
tics:
Pro
port
ion
of sp
ort p
artic
ipan
ts w
ho u
sed
to sm
oke
by sp
ort t
ype
and
foot
ball
form
at. T
he F
A Pa
rtic
ipat
ion
Trac
ker (
Nov
embe
r 201
9-Fe
brua
ry 2
020)
Tota
l foo
tbal
lTo
tal f
ootb
all
(last
12
mon
ths)
Tota
l foo
tbal
l (la
st fo
ur w
eeks
)Ca
sual
(t
otal
)Sm
all-s
ided
(t
otal
)11
-a-si
de
(tot
al)
Team
spor
t (la
st 1
2 m
onth
s)In
divid
ual
spor
t (la
st 1
2 m
onth
s)
No sp
ort
(last
12
mon
ths)
Team
spor
t (la
st 1
2 m
onth
s)In
divid
ual
spor
t (la
st fo
ur w
eeks
)
No sp
ort
(last
four
wee
ks)
Num
ber o
f re
spon
dent
s49
6.00
484.
0043
4.00
286.
0030
4.00
122.
0043
9.00
1540
.00
370.
0030
2.00
1453
.00
464.
00
TOTA
L20
.4%
19.9
%20
.3%
20.6
%22
.6%
17.1
%19
.7%
29.0
%31
.8%
17.2
%28
.2%
33.8
%
Mal
e20
.6%
20.5
%21
.2%
21.8
%21
.0%
17.4
%19
.4%
28.6
%40
.2%
17.1
%28
.1%
39.1
%
Fem
ale
20.0
%18
.2%
17.7
%17
.5%
28.7
%15
.8%
20.5
%29
.3%
25.9
%17
.4%
28.3
%29
.9%
Age g
roup
19-2
422
.1%
21.5
%23
.2%
25.0
%25
.0%
28.7
%23
.1%
23.9
%7.
9%21
.9%
23.0
%18
.2%
25-3
414
.5%
14.6
%14
.8%
14.6
%15
.7%
17.6
%10
.6%
18.2
%19
.7%
9.3%
18.1
%25
.7%
35-4
420
.8%
19.9
%18
.5%
20.5
%22
.8%
6.6%
21.2
%24
.7%
30.2
%15
.3%
24.2
%29
.9%
45-5
430
.8%
30.8
%32
.5%
24.9
%41
.7%
0.0%
30.8
%30
.3%
27.3
%45
.9%
29.5
%29
.8%
53+
44.9
%41
.0%
45.3
%50
.6%
37.8
%0.
0%37
.9%
41.7
%36
.9%
47.6
%41
.0%
39.0
%
Ethn
icity
Whi
te21
.6%
21.6
%22
.3%
22.9
%23
.2%
18.1
%21
.7%
31.6
%33
.0%
18.5
%31
.0%
34.4
%
BAM
E15
.2%
13.7
%13
.7%
11.0
%19
.0%
13.4
%14
.1%
13.3
%10
.0%
14.7
%12
.1%
23.0
%
SEG
C1C2
17.8
%17
.1%
17.4
%18
.7%
20.5
%10
.6%
19.7
%28
.1%
31.3
%16
.5%
27.0
%34
.8%
AB24
.6%
24.3
%25
.1%
21.1
%27
.2%
31.6
%22
.2%
33.1
%25
.0%
19.8
%32
.6%
29.5
%
DE21
.3%
21.0
%20
.7%
25.1
%21
.1%
12.5
%15
.5%
26.4
%35
.2%
13.3
%25
.8%
34.7
%
Not
e: R
espo
nden
ts w
ere
aske
d ‘H
ave
you
ever
smok
ed`.
Resp
onde
nts w
ere
only
abl
e to
ans
wer
this
ques
tion
if th
ey re
plie
d ‘n
o’ to
‘Do
you
curre
ntly
smok
e a
ciga
rett
e, a
ciga
r or a
pip
e? W
e ar
e re
ferri
ng h
ere
to to
bacc
o ci
gare
ttes
, not
e-c
igar
ette
s or o
ther
vapi
ng d
evic
es th
at u
se e
-liqu
ids.’
9. APPENDICES (CONTINUED)

The Football Association Limited THE SOCIAL AND ECONOMIC VALUE OF GRASSROOTS FOOTBALL IN ENGLAND – SEPTEMBER 2020 89
Tabl
e 7.
5: D
escr
iptiv
e st
atis
tics.
Pro
port
ion
of re
spon
dent
s who
agr
eed
that
par
ticip
atio
n in
foot
ball
mad
e th
em m
ore
likel
y to
qui
t sm
okin
g. T
he F
A Pa
rtic
ipat
ion
Trac
ker (
Nov
embe
r 201
9-Fe
brua
ry 2
020)
Tota
l foo
tbal
lTo
tal f
ootb
all
(last
12
mon
ths)
Tota
l foo
tbal
l (la
st fo
ur w
eeks
)Ca
sual
(t
otal
)Sm
all-s
ided
(t
otal
)11
-a-si
de
(tot
al)
Num
ber o
f res
pond
ents
106.
0014
9.00
137.
0098
.00
96.0
048
.00
TOTA
L51
.5%
52.4
%54
.9%
49.6
%56
.1%
66.3
%
Mal
e53
.1%
54.4
%56
.2%
51.8
%58
.5%
69.7
%
Fem
ale
46.3
%45
.3%
49.9
%42
.3%
49.8
%49
.6%
Age g
roup
19-2
479
.1%
77.7
%81
.2%
79.2
%83
.9%
71.7
%
25-3
451
.8%
51.8
%53
.6%
51.1
%59
.8%
57.8
%
35-4
435
.3%
38.0
%41
.6%
28.5
%31
.5%
100.
0%
45-5
443
.4%
43.4
%43
.4%
38.5
%45
.2%
N/A
53+
35.3
%41
.4%
41.4
%18
.9%
50.1
%N/
A
Ethn
icity
Whi
te49
.1%
49.9
%51
.5%
45.8
%51
.1%
59.6
%
BAM
E64
.2%
73.6
%76
.8%
70.8
%75
.9%
100.
0%
SEG
C1C2
52.3
%52
.9%
56.1
%49
.2%
58.7
%75
.3%
AB54
.0%
55.3
%55
.9%
57.5
%57
.8%
60.0
%
DE44
.9%
45.9
%49
.9%
40.8
%44
.2%
70.1
%
Not
e: R
espo
nden
ts w
ere
aske
d: To
wha
t ext
ent d
o yo
u ag
ree
or d
isagr
ee w
ith th
e fo
llow
ing
stat
emen
t: ‘T
akin
g pa
rt in
foot
ball m
ade
me
mor
e lik
ely
to q
uit s
mok
ing’
? Res
pond
ents
wer
e on
ly
able
to a
nsw
er th
is qu
estio
n if
they
repl
ied
‘no’
to ‘D
o yo
u cu
rrent
ly sm
oke
a ci
gare
tte,
a ci
gar o
r a p
ipe?
We
are
refe
rring
her
e to
toba
cco
ciga
rett
es, n
ot e
-cig
aret
tes o
r oth
er va
ping
dev
ices
th
at u
se e
-liqu
ids.’
and
‘yes
’ to
‘Do
you
play
foot
ball?
’
9. APPENDICES (CONTINUED)

The Football Association Limited THE SOCIAL AND ECONOMIC VALUE OF GRASSROOTS FOOTBALL IN ENGLAND – SEPTEMBER 202090
Tabl
e 7.
6: D
escr
iptiv
e st
atis
tics.
Pro
port
ion
of re
spon
dent
s who
are
‘hig
hly
freq
uent
’ drin
kers
by
spor
t typ
e an
d fo
otba
ll fo
rmat
. The
FA
Par
ticip
atio
n Tr
acke
r (N
ovem
ber 2
019-
Febr
uary
202
0)
Tota
l foo
tbal
lTo
tal f
ootb
all
(last
12
mon
ths)
Tota
l foo
tbal
l (la
st fo
ur w
eeks
)Ca
sual
(t
otal
)Sm
all-s
ided
(t
otal
)11
-a-si
de
(tot
al)
Team
spor
t (la
st 1
2 m
onth
s)In
divid
ual
spor
t (la
st 1
2 m
onth
s)
No sp
ort
(last
12
mon
ths)
Team
spor
t (la
st 1
2 m
onth
s)In
divid
ual
spor
t (la
st fo
ur w
eeks
)
No sp
ort
(last
four
wee
ks)
Num
ber o
f re
spon
dent
s47
2.00
458.
0041
2.00
293.
0028
8.00
129.
0048
7.00
1580
.00
355.
0034
2.00
1484
.00
454.
00
TOTA
L12
.4%
11.8
%12
.4%
13.2
%14
.5%
14.9
%12
.8%
10.6
%15
.4%
14.4
%10
.7%
14.2
%
Mal
e13
.3%
12.7
%12
.9%
15.8
%14
.9%
16.4
%13
.7%
12.1
%19
.4%
15.6
%12
.2%
17.6
%
Fem
ale
9.2%
9.2%
10.7
%5.
8%13
.1%
7.0%
11.4
%9.
2%12
.0%
12.4
%9.
2%11
.4%
Age g
roup
19-2
44.
9%4.
9%4.
5%6.
5%3.
1%0.
0%3.
0%4.
4%0.
0%3.
7%4.
7%0.
0%
25-3
417
.3%
16.6
%17
.1%
20.7
%22
.3%
22.6
%17
.3%
10.1
%3.
0%21
.1%
10.5
%2.
3%
35-4
411
.3%
10.8
%11
.0%
10.0
%13
.0%
18.7
%15
.1%
9.8%
7.0%
18.0
%10
.2%
6.0%
45-5
410
.5%
10.5
%11
.1%
4.4%
11.2
%5.
5%16
.7%
14.4
%17
.6%
18.7
%14
.2%
17.9
%
53+
19.0
%19
.0%
21.2
%17
.5%
12.5
%51
.8%
13.5
%12
.0%
19.3
%0.
0%11
.8%
18.7
%
Ethn
icity
Whi
te13
.9%
13.2
%13
.8%
16.1
%15
.6%
17.0
%13
.1%
10.8
%16
.0%
14.4
%10
.8%
15.0
%
BAM
E6.
1%6.
3%6.
9%2.
6%9.
9%6.
1%12
.8%
10.2
%0.
0%15
.6%
10.6
%0.
0%
SEG
C1C2
16.3
%14
.0%
13.9
%21
.4%
16.6
%16
.9%
16.2
%14
.2%
20.6
%17
.8%
14.3
%17
.7%
AB10
.3%
10.3
%11
.3%
7.7%
11.8
%8.
4%9.
8%9.
9%17
.2%
9.3%
9.8%
16.1
%
DE12
.0%
12.9
%13
.2%
16.3
%19
.8%
25.5
%15
.0%
8.1%
11.9
%20
.2%
8.2%
11.0
%
Not
e: ‘H
ighl
y fre
quen
t’ dr
inke
rs cl
assif
ied
as in
divi
dual
s who
say
they
drin
k ‘al
mos
t eve
ry d
ay’ o
r ‘fiv
e or
six d
ays a
wee
k’
9. APPENDICES (CONTINUED)

The Football Association Limited THE SOCIAL AND ECONOMIC VALUE OF GRASSROOTS FOOTBALL IN ENGLAND – SEPTEMBER 2020 91
Tabl
e 7.
7: D
escr
iptiv
e st
atis
tics.
Pro
port
ion
of re
spon
dent
s who
agr
eed
that
par
ticip
atio
n in
foot
ball
mad
e th
em m
ore
likel
y to
co
nsum
e al
coho
l. Th
e FA
Par
ticip
atio
n Tr
acke
r (N
ovem
ber 2
019-
Febr
uary
202
0)
Tota
l foo
tbal
lTo
tal f
ootb
all
(last
12
mon
ths)
Tota
l foo
tbal
l (la
st fo
ur w
eeks
)Ca
sual
(t
otal
)Sm
all-s
ided
(t
otal
)11
-a-si
de
(tot
al)
Num
ber o
f res
pond
ents
472
458
412
293
288
129
TOTA
L32
.5%
32.0
%33
.1%
36.7
%34
.0%
39.4
%
Mal
e32
.3%
31.6
%32
.6%
38.0
%35
.3%
37.6
%
Fem
ale
33.4
%33
.4%
34.7
%33
.2%
29.2
%48
.6%
Age g
roup
19-2
428
.8%
28.8
%30
.0%
30.7
%30
.9%
29.2
%
25-3
442
.4%
41.8
%42
.8%
49.7
%44
.7%
49.3
%
35-4
433
.8%
33.6
%34
.2%
35.5
%35
.1%
43.1
%
45-5
418
.2%
18.2
%19
.7%
18.3
%16
.6%
32.2
%
53+
3.6%
3.6%
0.0%
5.8%
0.0%
0.0%
Ethn
icity
Whi
te34
.6%
33.7
%34
.3%
41.7
%35
.7%
40.8
%
BAM
E23
.4%
24.3
%26
.6%
16.5
%25
.6%
34.6
%
SEG
C1C2
42.2
%40
.6%
42.2
%48
.7%
46.9
%47
.9%
AB25
.4%
24.5
%25
.9%
26.7
%24
.2%
26.3
%
DE37
.9%
40.8
%38
.9%
46.9
%41
.7%
52.2
%
Not
e: R
espo
nden
ts w
ere
aske
d: To
wha
t ext
ent d
o yo
u ag
ree
or d
isagr
ee w
ith th
e fo
llow
ing
stat
emen
t: To
wha
t ext
end
do y
ou a
gree
that
pla
ying
foot
ball m
akes
you
mor
e lik
ely
to co
nsum
e m
ore
alco
hol. R
espo
nden
ts a
re in
clud
ed in
this
tabl
e if
they
ans
wer
ed e
ither
‘Stro
ngly
Agr
ee’ o
r ‘Ag
ree’
.
9. APPENDICES (CONTINUED)

The Football Association Limited THE SOCIAL AND ECONOMIC VALUE OF GRASSROOTS FOOTBALL IN ENGLAND – SEPTEMBER 202092
Tabl
e 7.
8: D
escr
iptiv
e st
atis
tics:
Pro
port
ion
of re
spon
dent
s who
repo
rt h
avin
g a
heal
thy
diet
by
spor
t typ
e an
d fo
otba
ll fo
rmat
. The
FA
Part
icip
atio
n Tr
acke
r (N
ovem
ber 2
019-
Febr
uary
202
0)
Tota
l foo
tbal
lTo
tal f
ootb
all
(last
12
mon
ths)
Tota
l foo
tbal
l (la
st fo
ur w
eeks
)Ca
sual
(t
otal
)Sm
all-s
ided
(t
otal
)11
-a-si
de
(tot
al)
Team
spor
t (la
st 1
2 m
onth
s)In
divid
ual
spor
t (la
st 1
2 m
onth
s)
No sp
ort
(last
12
mon
ths)
Team
spor
t (la
st 1
2 m
onth
s)In
divid
ual
spor
t (la
st fo
ur w
eeks
)
No sp
ort
(last
four
wee
ks)
Num
ber o
f re
spon
dent
s47
2.00
458.
0041
2.00
293.
0028
8.00
129.
0048
7.00
1580
.00
355.
0034
2.00
1484
.00
454.
00
TOTA
L51
.0%
51.4
%50
.7%
50.0
%54
.5%
55.9
%49
.7%
52.0
%40
.9%
48.6
%53
.3%
38.4
%
Mal
e49
.4%
49.9
%49
.5%
47.6
%53
.3%
55.3
%48
.6%
48.9
%41
.2%
47.8
%50
.0%
38.1
%
Fem
ale
56.2
%56
.2%
54.6
%56
.9%
59.1
%59
.1%
51.4
%54
.9%
40.8
%50
.1%
56.5
%38
.7%
Age g
roup
19-2
443
.9%
43.9
%42
.4%
41.1
%43
.6%
43.1
%42
.5%
41.0
%51
.4%
38.2
%42
.9%
30.7
%
25-3
452
.2%
53.5
%52
.9%
54.9
%54
.0%
59.1
%50
.0%
46.4
%20
.7%
49.8
%47
.7%
15.5
%
35-4
454
.3%
54.5
%54
.1%
58.3
%57
.6%
62.6
%56
.2%
50.6
%17
.8%
57.3
%52
.1%
21.4
%
45-5
450
.8%
50.8
%49
.6%
35.7
%64
.6%
58.9
%49
.8%
43.1
%31
.0%
55.7
%43
.6%
32.4
%
53+
58.3
%58
.3%
53.4
%39
.1%
57.7
%77
.8%
51.8
%66
.4%
52.4
%50
.2%
67.4
%51
.3%
Ethn
icity
Whi
te52
.1%
52.1
%51
.8%
51.5
%55
.6%
58.6
%48
.8%
51.3
%41
.7%
47.3
%52
.4%
39.8
%
BAM
E45
.0%
46.7
%43
.9%
42.7
%49
.8%
42.7
%52
.7%
57.6
%16
.7%
51.6
%59
.8%
10.6
%
SEG
C1C2
57.8
%56
.7%
57.6
%55
.4%
56.8
%60
.4%
50.3
%63
.5%
51.7
%48
.5%
64.4
%46
.6%
AB50
.0%
50.6
%49
.8%
46.4
%56
.2%
57.2
%49
.6%
52.8
%43
.7%
51.0
%54
.4%
40.3
%
DE42
.2%
44.4
%39
.5%
52.0
%43
.2%
44.0
%49
.0%
37.2
%34
.7%
43.5
%37
.5%
33.6
%
Not
e: R
espo
nden
ts w
ere
aske
d ‘O
n a
scal
e of
0-1
0 ho
w w
ould
you
rate
you
r die
t with
0 b
eing
very
unh
ealth
y an
d 10
bei
ng ve
ry h
ealth
y?`.
Heal
thy
diet
s wer
e th
ose
that
wer
e ha
d a
scor
e >=
7
9. APPENDICES (CONTINUED)

The Football Association Limited THE SOCIAL AND ECONOMIC VALUE OF GRASSROOTS FOOTBALL IN ENGLAND – SEPTEMBER 2020 93
Tabl
e 7.
9: D
escr
iptiv
e st
atis
tics:
Pro
port
ion
of re
spon
dent
s with
a h
ealth
y di
et w
ho a
gree
d th
at p
artic
ipat
ion
in fo
otba
ll in
fluen
ced
thei
r hea
lthie
r foo
d ch
oice
s. T
he F
A Pa
rtic
ipat
ion
Trac
ker (
Nov
embe
r 201
9-Fe
brua
ry 2
020)
Tota
l foo
tbal
lTo
tal f
ootb
all
(last
12
mon
ths)
Tota
l foo
tbal
l (la
st fo
ur w
eeks
)Ca
sual
(t
otal
)Sm
all-s
ided
(t
otal
)11
-a-si
de
(tot
al)
Num
ber o
f res
pond
ents
244.
0023
8.00
213.
0015
1.00
158.
0075
.00
TOTA
L57
.1%
56.6
%57
.7%
58.9
%59
.2%
60.1
%
Mal
e54
.4%
53.6
%54
.6%
56.1
%57
.5%
55.8
%
Fem
ale
66.1
%66
.1%
67.6
%67
.0%
65.6
%82
.4%
Age g
roup
19-2
454
.8%
54.8
%53
.5%
55.2
%54
.2%
61.6
%
25-3
462
.1%
60.9
%61
.2%
63.8
%67
.8%
69.0
%
35-4
455
.8%
56.0
%59
.0%
65.4
%56
.1%
44.4
%
45-5
449
.6%
49.6
%54
.6%
39.2
%49
.9%
45.0
%
53+
54.5
%54
.5%
49.1
%44
.8%
51.1
%77
.8%
Ethn
icity
Whi
te56
.9%
56.5
%56
.7%
61.1
%57
.1%
58.8
%
BAM
E58
.8%
57.3
%60
.4%
51.6
%69
.5%
64.2
%
SEG
C1C2
62.5
%61
.5%
61.9
%63
.5%
67.0
%60
.5%
AB54
.8%
54.1
%56
.5%
53.9
%57
.5%
66.2
%
DE54
.9%
56.0
%52
.9%
66.1
%48
.3%
45.1
%
Not
e: R
espo
nden
ts w
ere
aske
d: To
wha
t ext
ent d
o yo
u ag
ree
or d
isagr
ee w
ith th
e fo
llow
ing
stat
emen
t: ‘T
akin
g pa
rt in
foot
ball e
ncou
rage
s you
to m
ake
heal
thie
r foo
d ch
oice
s’. R
espo
nden
ts a
re
only
incl
uded
in th
is ta
ble
if th
ey ra
ted
thei
r die
t as h
ealth
y in
Tabl
e 6.
8.
9. APPENDICES (CONTINUED)

The Football Association Limited THE SOCIAL AND ECONOMIC VALUE OF GRASSROOTS FOOTBALL IN ENGLAND – SEPTEMBER 202094
APPE
NDI
X 8
– AD
ULT
FOOT
BALL
AN
D GE
NER
AL H
EALT
H AN
D W
ELLB
EIN
G AN
ALYS
IS
Tabl
e 8.
1: R
egre
ssio
n ta
ble:
Ass
ocia
tion
betw
een
adul
t par
ticip
atio
n in
diff
eren
t for
mat
s of f
ootb
all a
nd sp
ort t
ypes
, and
diff
eren
t he
alth
and
wel
lbei
ng m
easu
res (
cont
rolli
ng fo
r soc
iode
mog
raph
ic fa
ctor
s and
whe
ther
the
indi
vidu
al d
oes a
ny o
ther
spor
t). T
he F
A Pa
rtic
ipat
ion
Trac
ker (
Nov
embe
r 201
9-Fe
brua
ry 2
020)
Ther
e is
a co
nsist
ent p
ositi
ve a
ssoc
iatio
n be
twee
n re
gula
r foo
tbal
l par
ticip
atio
n in
adu
lts a
nd w
ellb
eing
/ so
cial o
utco
mes
in T
he FA
Par
ticip
atio
n Tr
acke
r. Re
sults
can
be in
terp
rete
d in
the
follo
win
g w
ay:
• Re
gula
r foo
tbal
l par
ticip
atio
n is
asso
ciate
d w
ith a
:
– 5%
incr
ease
in lif
e sa
tisfa
ctio
n ra
ting;
– 4%
incr
ease
if lif
e w
orth
ines
s rat
ing;
– 5%
incr
ease
in h
appi
ness
ratin
g;–
6% in
crea
se g
ener
al h
ealth
ratin
g.
• Th
e be
nefit
of r
egul
ar fo
otba
ll par
ticip
atio
n is
grea
ter t
han
indi
vidua
l spo
rt pa
rtic
ipat
ion
for a
ll hea
lth a
nd w
ellb
eing
out
com
es.
• Th
e be
nefit
of r
egul
ar fo
otba
ll par
ticip
atio
n is
grea
ter f
or m
ales
com
pare
d to
fem
ales
for l
ife sa
tisfa
ctio
n, lif
e w
orth
whi
lene
ss a
nd g
ener
al h
ealth
.
• Th
e be
nefit
of r
egul
ar fo
otba
ll par
ticip
atio
n is
grea
ter f
or a
dults
from
low
er SE
Gs co
mpa
red
to a
dults
from
hig
her S
EGs f
or h
ealth
and
wel
lbei
ng o
utco
mes
.
Tota
l fo
otba
llPl
ay fo
otba
ll (la
st 1
2 m
onth
s)Pl
ay fo
otba
ll (la
st m
onth
)Ca
sual
Smal
l-sid
ed11
-a-si
deTe
am
(last
12
mon
ths)
Indi
vidua
l (la
st 1
2 m
onth
s)Te
am (
(last
mon
th)
Indi
vidua
l (la
st m
onth
)No
n-sp
ort
part
icipa
nts
Life satisfaction
TOTA
L0.
292
**0.
247
**0.
332
**0.
299
**0.
236
*0.
390
**0.
169
N/S
-0.4
67N/
S0.
027
N/S
0.10
7N/
S-0
.060
N/S
Men
0.40
2*
0.34
3*
0.41
8N/
S0.
394
N/S
0.24
7N/
S0.
538
**0.
356
**-0
.434
N/S
0.16
8**
0.10
8N/
S-0
.040
N/S
Wom
en0.
007
N/S
-0.0
04N/
S0.
097
N/S
0.02
6N/
S0.
193
N/S
-0.4
95N/
S-0
.061
N/S
-0.5
66N/
S-0
.261
N/S
0.10
5N/
S-0
.093
N/S
SEG
– AB
0.27
1N/
S0.
168
N/S
0.22
5N/
S0.
583
N/S
0.15
6N/
S0.
420
N/S
0.10
8N/
S-0
.314
0.16
4#N
/AN/
S0.
164
N/S
-0.0
75N/
S
SEG
– C1
C20.
016
N/S
-0.0
13N/
S0.
096
N/S
-0.0
15N/
S0.
075
N/S
-0.0
37N/
S0.
021
N/S
-0.5
55N/
S-0
.097
N/S
0.13
1N/
S-0
.058
N/S
SEG
– DE
1.
019
**1.
029
**1.
094
**0.
722
N/S
0.83
7**
1.20
6*
0.54
3*
-0.4
54N/
S0.
382
N/S
-0.0
04N/
S-0
.053
N/S
Life worthwhile
TOTA
L0.
246
**0.
200
*0.
260
**0.
315
**0.
184
N/S
0.32
5**
0.08
7N/
S0.
149
N/S
-0.1
21N/
S-0
.227
N/S
-0.3
25N/
S
Men
0.37
6**
0.31
3**
0.36
5*
0.39
7N/
S0.
218
N/S
0.50
2**
0.19
7N/
S0.
128
N/S
-0.0
17N/
S-0
.289
N/S
-0.2
43N/
S
Wom
en-0
.092
N/S
-0.0
97N/
S-0
.026
N/S
0.08
0N/
S0.
057
N/S
-0.7
31*
-0.0
47N/
S0.
210
N/S
-0.3
34N/
S-0
.109
N/S
-0.4
64N/
S
SEG
– AB
0.00
5N/
S-0
.079
N/S
0.01
2N/
S0.
342
N/S
-0.0
73N/
S0.
294
N/S
-0.0
67N/
S0.
221
0.98
0#N
/AN/
S-0
.271
N/S
-0.2
05N/
S
SEG
– C1
C20.
026
N/S
0.00
1N/
S0.
066
N/S
0.07
7N/
S0.
079
N/S
-0.0
43N/
S-0
.043
N/S
0.06
5N/
S-0
.245
N/S
-0.1
95N/
S-0
.302
N/S
SEG
– DE
1.
073
***1.
051
***1.
085
***0.
882
*0.
915
**1.
124
**0.
515
**0.
213
N/S
0.39
0**
-0.2
31N/
S-0
.416
N/S
9. APPENDICES (CONTINUED)

The Football Association Limited THE SOCIAL AND ECONOMIC VALUE OF GRASSROOTS FOOTBALL IN ENGLAND – SEPTEMBER 2020 95
Tota
l fo
otba
llPl
ay fo
otba
ll (la
st 1
2 m
onth
s)Pl
ay fo
otba
ll (la
st m
onth
)Ca
sual
Smal
l Sid
ed11
-a-si
deTe
am
(last
12
mon
ths)
Indi
vidua
l (la
st 1
2 m
onth
s)Te
am
(last
mon
th)
Indi
vidua
l (la
st m
onth
)No
n-sp
ort
part
icipa
nts
Happiness
TOTA
L0.
245
**0.
215
*0.
296
**0.
354
**0.
124
N/S
0.51
0**
0.13
9N/
S-0
.051
N/S
-0.0
44N/
S-0
.307
N/S
-0.3
42N/
S
Men
0.32
7N/
S0.
292
N/S
0.36
6N/
S0.
426
N/S
0.13
4N/
S0.
608
N/S
0.26
9N/
S-0
.058
N/S
0.03
7N/
S-0
.334
N/S
-0.2
90N/
S
Wom
en0.
029
N/S
0.01
4N/
S0.
105
N/S
0.14
6N/
S0.
085
N/S
-0.0
75N/
S-0
.020
N/S
-0.0
29N/
S-0
.208
N/S
-0.2
58N/
S-0
.431
N/S
SEG
– AB
0.27
1N/
S0.
193
N/S
0.27
9N/
S0.
684
N/S
-0.0
14N/
S0.
541
N/S
-0.0
02N/
S-0
.097
0.18
9#N
/AN/
S-0
.456
N/S
-0.1
40N/
S
SEG
– C1
C2-0
.024
N/S
-0.0
44N/
S0.
073
N/S
-0.0
14N/
S0.
019
N/S
0.12
5N/
S0.
065
N/S
-0.0
32N/
S-0
.061
N/S
-0.1
58N/
S-0
.434
N/S
SEG
– DE
0.
899
**0.
925
**0.
914
**0.
852
N/S
0.65
9**
1.24
0N/
S0.
433
N/S
-0.0
44N/
S0.
093
N/S
-0.4
07N/
S-0
.327
N/S
Self-rated health
TOTA
L0.
219
***0.
192
***0.
199
***0.
161
***0.
223
***0.
180
**0.
118
**0.
081
N/S
0.13
2**
-0.0
48N/
S-0
.336
**
Men
0.27
2**
0.24
0**
0.24
1**
0.21
4**
0.25
8*
0.24
3**
0.18
2**
0.11
7**
0.17
3*
-0.0
01**
-0.3
82*
Wom
en0.
080
N/S
0.06
5N/
S0.
085
N/S
0.00
9N/
S0.
098
N/S
-0.1
95N/
S0.
041
N/S
-0.0
24N/
S0.
046
N/S
-0.1
36N/
S-0
.258
N/S
SEG
– AB
0.11
9*
0.07
9*
0.09
6*
0.18
2*
0.05
7*
0.09
4*
0.02
9*
0.13
30.
084
**
0.02
1*
-0.4
07*
SEG
– C1
C20.
223
N/S
0.19
7N/
S0.
191
N/S
0.13
8N/
S0.
286
N/S
0.14
0N/
S0.
125
N/S
0.07
9N/
S0.
149
N/S
-0.0
53N/
S-0
.330
N/S
SEG
– DE
0.
319
**0.
310
**0.
349
**0.
192
N/S
0.31
9**
0.40
4**
0.19
2*
0.04
8N/
S0.
210
N/S
-0.1
19N/
S-0
.308
N/S
GP visits
TOTA
L0.
080
N/S
0.12
3N/
S0.
289
N/S
0.26
6N/
S0.
385
N/S
2.05
4***
-0.3
70N/
S-0
.681
N/S
1.84
7**
1.53
3N/
S1.
815
N/S
Men
0.03
8N/
S0.
092
N/S
0.32
1N/
S0.
621
N/S
0.25
8N/
S1.
621
**-0
.127
N/S
-0.8
02N/
S2.
215
N/S
1.47
6N/
S1.
871
N/S
Wom
en0.
191
N/S
0.20
6N/
S0.
203
N/S
-0.7
53N/
S0.
847
N/S
4.64
8**
-0.6
68N/
S-0
.326
N/S
1.09
7N/
S1.
639
N/S
1.72
0N/
S
SEG
– AB
0.87
1N/
S0.
847
N/S
1.26
9N/
S2.
579
N/S
0.45
5N/
S4.
366
N/S
-0.2
54N/
S-1
.153
0.21
1N/
SN/
S1.
275
N/S
2.31
1N/
S
SEG
– C1
C2-0
.538
*-0
.469
*-0
.471
*-0
.771
*-0
.251
*0.
837
*-0
.919
*-0
.691
*1.
044
*1.
538
*1.
827
*
SEG
– DE
0.
777
N/S
0.83
6N/
S1.
098
N/S
-0.1
22**
2.12
0N/
S0.
721
**0.
686
N/S
-0.3
44N/
S3.
150
N/S
1.83
0N/
S1.
547
N/S
Not
es: T
able
repr
esen
ts O
LS re
gres
sion
Co-e
ffici
ents
for c
olum
n he
adin
gs vs
oth
er (e
.g. r
egul
ar fo
otba
ll par
ticip
ants
vs n
on-re
gula
r foo
tbal
l par
ticip
atio
ns).
Lege
nd: *
** si
gnifi
canc
e at
<1%
, **
signi
fican
ce a
t <5%
, *sig
nific
ance
at <
10%
9. APPENDICES (CONTINUED)

The Football Association Limited THE SOCIAL AND ECONOMIC VALUE OF GRASSROOTS FOOTBALL IN ENGLAND – SEPTEMBER 202096
Tabl
e 8.
2: D
escr
iptiv
e st
atis
tics.
Pro
port
ion
of re
spon
dent
s who
repo
rt ‘g
ood’
hea
lth a
nd w
ellb
eing
scor
es b
y sp
ort t
ype
and
foot
ball
form
at. T
he F
A Pa
rtic
ipat
ion
Trac
ker (
Nov
embe
r 201
9-Fe
brua
ry 2
020)
Tota
l fo
otba
llTo
tal
foot
ball
(last
12
mon
ths)
Tota
l fo
otba
ll (la
st fo
ur w
eeks
)
Casu
al
(tot
al)
Smal
l-sid
ed
(tot
al)
11-a
-side
(t
otal
)Te
am sp
ort
(last
12
mon
ths)
Indi
vidua
l sp
ort
(last
12
mon
ths)
No sp
ort
(last
12
mon
ths)
Team
spor
t (la
st 1
2 m
onth
s)In
divid
ual
spor
t (la
st fo
ur w
eeks
)
No sp
ort
(last
four
wee
ks)
Num
ber o
f re
spon
dent
s96
8.00
942.
0084
6.00
579.
0059
2.00
251.
0092
6.00
3120
.00
725.
0064
4.00
2937
.00
918.
00
Life satisfaction
TOTA
L51
.0%
51.2
%53
.0%
50.9
%52
.2%
54.0
%49
.9%
52.9
%41
.0%
48.2
%53
.4%
42.2
%
Mal
e52
.4%
52.6
%54
.2%
52.9
%52
.4%
56.4
%52
.2%
52.6
%46
.0%
51.4
%53
.1%
45.9
%
Fem
ale
46.3
%46
.5%
49.3
%45
.3%
51.4
%42
.5%
45.7
%53
.3%
37.2
%41
.5%
53.8
%39
.3%
Age g
roup
19-2
436
.7%
37.4
%40
.2%
31.1
%41
.6%
37.0
%39
.2%
38.5
%31
.8%
34.1
%39
.2%
31.7
%
25-3
452
.7%
52.3
%54
.3%
55.0
%53
.4%
57.3
%48
.0%
48.0
%24
.4%
50.7
%48
.0%
28.2
%
35-4
458
.1%
59.0
%59
.8%
64.4
%54
.8%
62.5
%55
.1%
49.0
%27
.9%
60.6
%49
.7%
32.8
%
45-5
446
.4%
46.4
%48
.4%
35.4
%52
.2%
63.2
%51
.9%
49.0
%29
.7%
44.4
%49
.4%
33.2
%
53+
78.2
%77
.5%
75.0
%73
.3%
77.2
%85
.5%
71.9
%67
.6%
51.5
%61
.1%
68.5
%52
.3%
Ethn
icity
Whi
te51
.7%
51.4
%53
.4%
52.1
%52
.8%
52.9
%50
.9%
53.3
%41
.3%
47.9
%53
.6%
43.0
%
BAM
E48
.9%
50.7
%51
.7%
46.7
%50
.0%
59.6
%47
.1%
51.4
%37
.2%
50.1
%52
.9%
30.0
%
SEG
C1C2
52.5
%51
.6%
52.2
%57
.2%
52.5
%50
.9%
50.6
%60
.8%
54.0
%48
.3%
60.8
%54
.4%
AB50
.2%
50.6
%52
.8%
47.9
%53
.2%
52.0
%51
.0%
54.5
%46
.8%
49.8
%55
.1%
46.7
%
DE50
.7%
52.1
%55
.3%
49.7
%48
.1%
64.8
%46
.1%
41.0
%31
.1%
43.5
%40
.9%
33.3
%
9. APPENDICES (CONTINUED)

The Football Association Limited THE SOCIAL AND ECONOMIC VALUE OF GRASSROOTS FOOTBALL IN ENGLAND – SEPTEMBER 2020 97
Tota
l fo
otba
llTo
tal
foot
ball
(last
12
mon
ths)
Tota
l fo
otba
ll (la
st fo
ur w
eeks
)
Casu
al
(tot
al)
Smal
l-sid
ed
(tot
al)
11-a
-side
(t
otal
)Te
am sp
ort
(last
12
mon
ths)
Indi
vidua
l sp
ort
(last
12
mon
ths)
No sp
ort
(last
12
mon
ths)
Team
spor
t (la
st 1
2 m
onth
s)In
divid
ual
spor
t (la
st fo
ur w
eeks
)
No sp
ort
(last
four
wee
ks)
Num
ber o
f re
spon
dent
s96
8.00
942.
0084
6.00
579.
0059
2.00
251.
0092
6.00
3120
.00
725.
0064
4.00
2937
.00
918.
00
Life worthwhile
TOTA
L55
.3%
55.0
%57
.1%
56.9
%57
.4%
57.0
%54
.0%
58.2
%46
.6%
52.4
%58
.6%
47.7
%
Mal
e57
.0%
56.5
%58
.3%
58.5
%58
.1%
57.8
%54
.4%
56.9
%50
.0%
53.7
%57
.1%
50.6
%
Fem
ale
50.0
%50
.2%
53.4
%52
.4%
55.1
%53
.5%
53.2
%59
.4%
44.0
%49
.7%
60.0
%45
.4%
Age g
roup
19-2
438
.2%
38.4
%40
.5%
34.1
%42
.6%
42.0
%42
.3%
41.4
%35
.8%
40.1
%42
.4%
31.2
%
25-3
455
.9%
54.9
%57
.0%
61.1
%57
.8%
56.9
%51
.5%
52.4
%28
.6%
53.4
%52
.6%
31.1
%
35-4
468
.0%
68.4
%70
.1%
72.8
%67
.4%
74.5
%61
.3%
56.2
%31
.5%
63.2
%57
.2%
34.7
%
45-5
451
.6%
51.6
%54
.2%
42.5
%55
.7%
57.2
%61
.8%
54.6
%36
.3%
59.1
%54
.7%
40.3
%
53+
73.9
%73
.1%
70.1
%78
.6%
69.7
%85
.5%
67.7
%72
.9%
57.4
%53
.3%
73.2
%59
.2%
Ethn
icity
Whi
te56
.6%
56.1
%58
.4%
58.5
%57
.8%
58.4
%54
.8%
58.8
%46
.9%
51.7
%59
.0%
48.5
%
BAM
E51
.5%
51.4
%52
.4%
52.5
%56
.2%
52.7
%52
.1%
55.2
%44
.1%
56.1
%56
.7%
34.9
%
SEG
C1C2
56.1
%55
.3%
56.2
%60
.0%
57.4
%58
.9%
55.0
%64
.5%
64.8
%53
.2%
64.1
%66
.2%
AB54
.7%
54.6
%57
.2%
55.5
%57
.9%
54.3
%53
.7%
59.8
%51
.3%
52.3
%60
.6%
50.1
%
DE55
.8%
55.4
%58
.5%
55.9
%55
.9%
60.6
%53
.1%
47.7
%35
.5%
50.9
%47
.5%
38.3
%
9. APPENDICES (CONTINUED)

The Football Association Limited THE SOCIAL AND ECONOMIC VALUE OF GRASSROOTS FOOTBALL IN ENGLAND – SEPTEMBER 202098
9. APPENDICES (CONTINUED)To
tal
foot
ball
Tota
l fo
otba
ll (la
st 1
2 m
onth
s)
Tota
l fo
otba
ll (la
st fo
ur w
eeks
)
Casu
al
(tot
al)
Smal
l-sid
ed
(tot
al)
11-a
-side
(t
otal
)Te
am sp
ort
(last
12
mon
ths)
Indi
vidua
l sp
ort
(last
12
mon
ths)
No sp
ort
(last
12
mon
ths)
Team
spor
t (la
st 1
2 m
onth
s)In
divid
ual
spor
t (la
st fo
ur w
eeks
)
No sp
ort
(last
four
wee
ks)
Num
ber o
f re
spon
dent
s96
8.00
942.
0084
6.00
579.
0059
2.00
251.
0092
6.00
3120
.00
725.
0064
4.00
2937
.00
918.
00
Happiness
TOTA
L52
.6%
52.4
%53
.6%
54.2
%53
.1%
54.8
%52
.7%
56.7
%47
.2%
50.7
%56
.7%
49.4
%
Mal
e53
.8%
53.6
%54
.6%
55.5
%53
.1%
55.5
%54
.0%
56.4
%53
.8%
52.5
%56
.5%
53.8
%
Fem
ale
48.7
%48
.3%
50.6
%50
.5%
53.2
%51
.4%
50.4
%57
.0%
42.1
%47
.1%
56.9
%45
.9%
Age g
roup
19-2
442
.9%
42.4
%45
.6%
39.5
%45
.7%
46.6
%39
.7%
42.6
%39
.2%
35.5
%42
.6%
45.6
%
25-3
453
.9%
53.2
%54
.7%
56.7
%55
.1%
57.3
%53
.0%
52.0
%25
.2%
56.2
%52
.1%
29.6
%
35-4
459
.0%
60.0
%60
.2%
66.9
%55
.7%
55.7
%57
.3%
51.5
%38
.8%
58.5
%51
.5%
43.2
%
45-5
445
.3%
45.3
%44
.3%
38.7
%47
.7%
56.0
%56
.9%
53.4
%31
.1%
51.4
%52
.9%
37.5
%
53+
70.9
%70
.0%
66.7
%70
.4%
67.8
%85
.5%
72.3
%71
.6%
59.0
%62
.4%
72.1
%60
.0%
Ethn
icity
Whi
te53
.3%
52.9
%54
.1%
56.4
%52
.7%
56.9
%54
.3%
57.0
%47
.0%
51.0
%56
.9%
49.6
%
BAM
E50
.8%
51.7
%52
.8%
46.4
%54
.1%
46.9
%48
.2%
55.7
%59
.1%
51.7
%56
.4%
50.7
%
SEG
C1C2
55.5
%54
.7%
55.6
%58
.8%
55.2
%55
.5%
54.8
%63
.3%
62.0
%53
.6%
63.0
%63
.5%
AB51
.5%
51.4
%53
.0%
52.3
%53
.3%
53.5
%52
.9%
57.3
%52
.1%
50.9
%57
.5%
53.2
%
DE50
.8%
51.2
%52
.0%
52.3
%48
.4%
56.7
%48
.8%
48.3
%37
.3%
44.5
%47
.6%
40.4
%

The Football Association Limited THE SOCIAL AND ECONOMIC VALUE OF GRASSROOTS FOOTBALL IN ENGLAND – SEPTEMBER 2020 99
9. APPENDICES (CONTINUED)To
tal
foot
ball
Tota
l fo
otba
ll (la
st 1
2 m
onth
s)
Tota
l fo
otba
ll (la
st fo
ur w
eeks
)
Casu
al
(tot
al)
Smal
l-sid
ed
(tot
al)
11-a
-side
(t
otal
)Te
am sp
ort
(last
12
mon
ths)
Indi
vidua
l sp
ort
(last
12
mon
ths)
No sp
ort
(last
12
mon
ths)
Team
spor
t (la
st 1
2 m
onth
s)In
divid
ual
spor
t (la
st fo
ur w
eeks
)
No sp
ort
(last
four
wee
ks)
Num
ber o
f re
spon
dent
s96
8.00
942.
0084
6.00
579.
0059
2.00
251.
0092
6.00
3120
.00
725.
0064
4.00
2937
.00
918.
00
General self-reported health
TOTA
L70
.1%
70.2
%71
.8%
70.7
%73
.9%
76.3
%67
.6%
59.5
%28
.8%
72.0
%60
.7%
30.8
%
Mal
e71
.9%
71.9
%73
.6%
74.0
%75
.6%
78.6
%69
.1%
60.5
%26
.1%
72.9
%62
.0%
27.2
%
Fem
ale
64.3
%64
.8%
65.8
%61
.5%
67.7
%65
.0%
64.9
%58
.4%
30.9
%70
.2%
59.5
%33
.6%
Age g
roup
19-2
466
.5%
66.5
%69
.0%
62.4
%70
.6%
71.5
%65
.3%
62.3
%63
.2%
63.5
%64
.1%
45.6
%
25-3
474
.9%
74.7
%76
.5%
78.0
%75
.7%
80.1
%71
.0%
66.0
%36
.9%
75.4
%67
.0%
35.2
%
35-4
471
.9%
72.6
%73
.7%
76.3
%76
.9%
74.7
%71
.9%
59.2
%30
.7%
78.7
%60
.6%
32.0
%
45-5
461
.7%
61.7
%61
.3%
52.8
%68
.1%
75.8
%65
.3%
53.7
%21
.4%
81.4
%55
.5%
24.3
%
53+
56.9
%57
.6%
57.2
%54
.1%
68.8
%66
.2%
50.6
%57
.3%
27.9
%35
.2%
58.0
%30
.9%
Ethn
icity
Whi
te68
.9%
68.8
%70
.9%
69.0
%73
.3%
75.6
%66
.5%
58.0
%27
.9%
70.8
%59
.2%
30.4
%
BAM
E77
.0%
77.2
%76
.8%
81.7
%77
.4%
78.4
%72
.8%
71.4
%59
.0%
76.5
%72
.4%
45.9
%
SEG
C1C2
74.0
%73
.8%
75.4
%78
.7%
72.8
%81
.5%
72.6
%67
.5%
33.9
%73
.4%
68.2
%35
.9%
AB70
.5%
70.5
%71
.5%
71.0
%77
.0%
72.6
%67
.7%
61.2
%33
.8%
72.3
%62
.4%
35.4
%
DE62
.7%
63.2
%66
.2%
57.8
%65
.7%
76.3
%59
.3%
47.0
%22
.7%
68.3
%48
.2%
24.5
%
Not
e: R
espo
nden
ts w
ere
aske
d to
rate
them
selve
s aga
inst
eac
h m
etric
‘On
a sc
ale
of 0
-10
with
0 b
eing
very
poo
r and
10
bein
g ve
ry g
ood`
. ‘Goo
d’ sc
ores
wer
e th
ose
that
wer
e ha
d a
scor
e >=
7

The Football Association Limited THE SOCIAL AND ECONOMIC VALUE OF GRASSROOTS FOOTBALL IN ENGLAND – SEPTEMBER 2020100
Tabl
e 8.
3 Lo
gist
ic re
gres
sion
and
mar
gina
l eff
ects
: Ass
ocia
tion
betw
een
play
ing
foot
ball
regu
larly
and
goo
d he
alth
. (co
ntro
lling
for
soci
odem
ogra
phic
fact
ors a
nd w
heth
er th
e in
divi
dual
doe
s any
oth
er sp
ort)
Co-e
ffic
ient
Mar
gina
l eff
ects
Regu
lar f
ootb
all p
laye
r0.
422
***
0.10
3**
*
Not
e: L
ogist
ic re
gres
sion.
Leg
end:
*** s
igni
fican
ce a
t <1%
, ** s
igni
fican
ce a
t <5%
, *sig
nific
ance
at <
10%
.
9. APPENDICES (CONTINUED)

The Football Association Limited THE SOCIAL AND ECONOMIC VALUE OF GRASSROOTS FOOTBALL IN ENGLAND – SEPTEMBER 2020 101
9. APPENDICES (CONTINUED)
Tabl
e 9.
1: R
egre
ssio
n ta
ble:
Ass
ocia
tion
betw
een
adul
t par
ticip
atio
n in
diff
eren
t for
mat
s of f
ootb
all a
nd sp
ort t
ypes
, and
diff
eren
t in
divi
dual
dev
elop
men
t mea
sure
s (co
ntro
lling
for s
ocio
dem
ogra
phic
fact
ors a
nd w
heth
er th
e in
divi
dual
doe
s any
oth
er sp
ort)
. The
FA
Par
ticip
atio
n Tr
acke
r (N
ovem
ber 2
019-
Febr
uary
202
0)Th
ere
is a
cons
iste
nt p
ositi
ve a
ssoc
iatio
n be
twee
n re
gula
r foo
tbal
l par
ticip
atio
n in
adu
lts a
nd in
divi
dual
dev
elop
men
t out
com
es in
Th
e FA
Par
ticip
atio
n Tr
acke
r. Re
sults
can
be in
terp
rete
d in
the
follo
win
g w
ay:
• Re
gula
r foo
tbal
l par
ticip
atio
n is
asso
ciate
d w
ith a
:–
7% in
crea
se in
self-
rate
d co
nfide
nce;
– 3%
incr
ease
in se
lf-ra
ted
com
mun
icat
ion
skills
;–
3% in
crea
se in
self-
rate
d le
ader
ship
skills
.•
The
bene
fit o
f reg
ular
foot
ball p
artic
ipat
ion
is gr
eate
r tha
n in
divid
ual s
port
part
icip
atio
n fo
r all t
he a
bove
indi
vidua
l dev
elop
men
t out
com
es.
• Th
e be
nefit
of r
egul
ar fo
otba
ll par
ticip
atio
n is
grea
ter f
or fe
mal
es co
mpa
red
to m
ales
for a
ll the
abo
ve in
divid
ual d
evel
opm
ent o
utco
mes
.
• •T
he b
enefi
t of r
egul
ar fo
otba
ll par
ticip
atio
n is
grea
ter f
or a
dults
from
a lo
w SE
G co
mpa
red
to a
dults
from
a h
igh
SEG
for c
omm
unic
atio
n an
d le
ader
ship
.
Tota
l fo
otba
llPl
ay fo
otba
ll (la
st 1
2 m
onth
s)Pl
ay fo
otba
ll (la
st m
onth
)Ca
sual
Smal
l-sid
ed11
-a-si
deTe
am
(last
12
mon
ths)
Indi
vidua
l (la
st 1
2 m
onth
s)Te
am
(last
mon
th)
Indi
vidua
l (la
st m
onth
)No
n-sp
ort
part
icipa
nts
Your ability to cope with life’s challenges
TOTA
L0.
054
N/S
0.03
9N/
S0.
030
N/S
0.11
9**
0.07
7N/
S0.
086
N/S
0.12
8**
0.17
1N/
S-0
.092
N/S
-0.0
67N/
S-0
.225
N/S
Men
0.09
2N/
S0.
069
N/S
0.05
8N/
S0.
162
*0.
109
N/S
0.16
3**
0.13
2N/
S0.
171
N/S
-0.0
63N/
S-0
.071
N/S
-0.2
11N/
S
Wom
en-0
.043
N/S
-0.0
40N/
S-0
.044
N/S
-0.0
06N/
S-0
.041
N/S
-0.3
71**
0.12
4*
0.17
1N/
S-0
.153
*-0
.061
N/S
-0.2
49N/
S
SEG
– AB
-0.0
88N/
S-0
.128
N/S
-0.1
31N/
S0.
162
N/S
-0.0
72N/
S-0
.049
N/S
0.05
2N/
S0.
103
N/S
-0.2
14N/
S-0
.118
N/S
-0.1
18N/
S
SEG
– C1
C20.
044
N/S
0.03
7N/
S0.
012
N/S
0.06
3N/
S0.
072
N/S
0.01
9N/
S0.
077
N/S
0.20
7N/
S-0
.102
N/S
-0.0
34N/
S-0
.246
N/S
SEG
– DE
0.
237
**0.
241
***0.
282
***0.
201
N/S
0.33
7**
0.44
6**
0.31
3**
0.16
8N/
S0.
127
**-0
.070
N/S
-0.2
53N/
S
APPE
NDI
X 9
– AD
ULT
FOOT
BALL
SOC
IAL
OUTC
OME
ANAL
YSIS

The Football Association Limited THE SOCIAL AND ECONOMIC VALUE OF GRASSROOTS FOOTBALL IN ENGLAND – SEPTEMBER 2020102
Tota
l fo
otba
llPl
ay fo
otba
ll (la
st 1
2 m
onth
s)Pl
ay fo
otba
ll (la
st m
onth
)Ca
sual
Smal
l-sid
ed11
-a-si
deTe
am
(last
12
mon
ths)
Indi
vidua
l (la
st 1
2 m
onth
s)Te
am
(last
mon
th)
Indi
vidua
l (la
st m
onth
)No
n-sp
ort
part
icipa
nts
Overall confidence
TOTA
L0.
303
***0.
282
***0.
251
***0.
203
***0.
263
***0.
349
***0.
153
**0.
110
N/S
0.19
9**
-0.3
26N/
S-0
.493
**
Men
0.25
9*
0.23
8*
0.19
8**
0.19
4N/
S0.
181
***0.
353
N/S
0.10
8N/
S0.
100
N/S
0.16
6N/
S-0
.344
N/S
-0.4
58N/
S
Wom
en0.
416
***0.
398
***0.
394
***0.
228
**0.
560
***0.
323
*0.
207
**0.
138
N/S
0.26
5**
-0.2
92N/
S-0
.553
**
SEG
– AB
0.27
3***
0.24
3***
0.19
6***
0.31
2***
0.15
5***
0.28
3***
0.16
5***
0.16
5***
0.20
6***
-0.2
84***
-0.4
99***
SEG
– C1C
20.
326
N/S
0.30
8N/
S0.
272
N/S
0.16
4N/
S0.
325
N/S
0.27
0N/
S0.
144
N/S
0.10
5N/
S0.
172
N/S
-0.3
13N/
S-0
.529
N/S
SEG
– DE
0.27
6N/
S0.
258
N/S
0.26
1N/
S0.
159
N/S
0.26
1N/
S0.
617
*0.
159
N/S
0.07
8N/
S0.
252
N/S
-0.3
99N/
S-0
.445
N/S
Communication skills
TOTA
L0.
102
**0.
081
*0.
099
**0.
060
N/S
0.07
8N/
S0.
284
***0.
169
**0.
012
N/S
-0.0
44N/
S-0
.171
N/S
-0.3
31*
Men
0.08
7N/
S0.
059
N/S
0.06
6N/
S0.
049
N/S
0.03
9*
0.32
5*
0.16
0N/
S0.
007
N/S
-0.0
39N/
S-0
.179
N/S
-0.3
23N/
S
Wom
en0.
142
*0.
138
*0.
189
**0.
093
N/S
0.22
2**
0.04
0N/
S0.
180
**0.
024
N/S
-0.0
53N/
S-0
.157
N/S
-0.3
44*
SEG
– AB
-0.0
02N/
S-0
.019
N/S
0.01
8N/
S0.
062
N/S
-0.1
00N/
S0.
200
N/S
0.10
0N/
S-0
.125
N/S
-0.1
23N/
S-0
.247
N/S
-0.2
21N/
S
SEG
– C1C
20.
077
N/S
0.05
3N/
S0.
050
N/S
-0.0
07N/
S0.
094
N/S
0.18
4N/
S0.
159
N/S
0.03
9N/
S-0
.062
N/S
-0.1
59N/
S-0
.319
N/S
SEG
– DE
0.28
2**
0.27
1**
0.33
0**
0.22
9N/
S0.
328
***0.
624
**0.
258
N/S
0.06
8*
0.12
9**
-0.1
06N/
S-0
.403
*
Resilience
TOTA
L0.
095
**0.
088
*0.
053
N/S
0.08
4*
0.06
7N/
S0.
110
*0.
186
**0.
025
N/S
-0.1
02N/
S0.
156
N/S
-0.1
72N/
S
Men
0.10
3N/
S0.
093
N/S
0.05
8N/
S0.
104
N/S
0.05
7N/
S0.
157
**0.
142
N/S
0.03
9N/
S-0
.133
N/S
0.15
4N/
S-0
.163
N/S
Wom
en0.
075
N/S
0.07
5N/
S0.
037
N/S
0.02
7N/
S0.
101
N/S
-0.1
77N/
S0.
239
***-0
.016
N/S
-0.0
37N/
S0.
160
N/S
-0.1
87N/
S
SEG
– AB
0.03
3N/
S0.
028
N/S
0.01
4N/
S0.
054
N/S
-0.0
17N/
S0.
005
N/S
0.18
6N/
S-0
.065
N/S
-0.1
08N/
S0.
064
N/S
-0.0
04N/
S
SEG
– C1C
20.
062
N/S
0.05
6N/
S-0
.005
N/S
0.07
0N/
S0.
027
N/S
0.06
5N/
S0.
142
N/S
0.01
4N/
S-0
.145
N/S
0.17
0N/
S-0
.174
N/S
SEG
– DE
0.24
7**
0.24
2**
0.25
2**
0.15
8N/
S0.
321
**0.
372
**0.
278
N/S
0.10
0N/
S0.
016
N/S
0.23
9*
-0.2
54**
Leadership Skills
TOTA
L0.
146
**0.
121
**0.
088
*0.
141
**0.
099
*0.
192
**0.
137
**-0
.203
N/S
0.21
4**
-0.1
05N/
S-0
.340
*
Men
0.10
3*
0.06
8**
0.03
2**
0.11
0N/
S0.
045
**0.
199
N/S
0.09
6N/
S-0
.208
N/S
0.18
5N/
S-0
.111
N/S
-0.3
24N/
S
Wom
en0.
259
**0.
262
***0.
240
**0.
231
**0.
293
**0.
151
N/S
0.18
7**
-0.1
86N/
S0.
274
**-0
.093
N/S
-0.3
69*
SEG
– AB
-0.0
55N/
S-0
.092
N/S
-0.1
23N/
S0.
032
N/S
-0.1
53N/
S0.
049
N/S
0.01
5N/
S-0
.356
N/S
0.07
5N/
S-0
.196
N/S
-0.1
77N/
S
SEG
– C1C
20.
148
**0.
131
**0.
081
**0.
109
**0.
124
**0.
139
**0.
116
**-0
.197
**0.
191
**-0
.097
**-0
.325
**
SEG
– DE
0.36
4***
0.34
8***
0.36
8***
0.36
4**
0.44
6***
0.53
7**
0.30
0**
-0.1
05**
0.49
4***
-0.0
10*
-0.4
43**
Not
es: T
able
repr
esen
ts O
LS re
gres
sion
Co-e
ffici
ents
for c
olum
n he
adin
gs vs
oth
er (e
.g. r
egul
ar fo
otba
ll par
ticip
ants
vs n
on-re
gula
r foo
tbal
l par
ticip
atio
ns).
Lege
nd: *
** si
gnifi
canc
e at
<1%
, **.
signi
fican
ce a
t <5%
, *sig
nific
ance
at <
10%
9. APPENDICES (CONTINUED)

The Football Association Limited THE SOCIAL AND ECONOMIC VALUE OF GRASSROOTS FOOTBALL IN ENGLAND – SEPTEMBER 2020 103
Tabl
e 9.
2: R
egre
ssio
n ta
ble.
Ass
ocia
tion
betw
een
adul
t par
ticip
atio
n in
diff
eren
t for
mat
s of f
ootb
all a
nd sp
ort t
ypes
, and
diff
eren
t co
mm
unity
dev
elop
men
t mea
sure
s (co
ntro
lling
for s
ocio
dem
ogra
phic
fact
ors a
nd w
heth
er th
e in
divi
dual
doe
s any
oth
er sp
ort)
. Th
e FA
Par
ticip
atio
n Tr
acke
r (N
ovem
ber 2
019-
Febr
uary
202
0)Th
ere
is a
cons
iste
nt p
ositi
ve a
ssoc
iatio
n be
twee
n re
gula
r foo
tbal
l pa
rtic
ipat
ion
in a
dults
and
indi
vidu
al d
evel
opm
ent o
utco
mes
in T
he F
A Pa
rtic
ipat
ion
Trac
ker.
Resu
lts ca
n be
inte
rpre
ted
in th
e fo
llow
ing
way
:•
Regu
lar f
ootb
all p
artic
ipat
ion
is as
socia
ted
with
a:
– 5%
incr
ease
in so
cial t
rust
;–
3% in
crea
se in
socia
l inte
ract
ion;
– 15
% in
crea
se in
feel
ings
of c
onne
ctio
n to
loca
l com
mun
ities
.•
The
bene
fit o
f reg
ular
foot
ball p
artic
ipat
ion
is gr
eate
r tha
n in
divid
ual s
port
part
icip
atio
n fo
r all t
he a
bove
com
mun
ity d
evel
opm
ent o
utco
mes
.
• Th
e be
nefit
of r
egul
ar fo
otba
ll par
ticip
atio
n is
grea
ter f
or fe
mal
es co
mpa
red
to m
ales
for c
omm
unity
conn
ectio
n an
d gr
eate
r for
mal
es co
mpa
red
to
fem
ales
for s
ocia
l tru
st.
• Th
e be
nefit
of r
egul
ar fo
otba
ll par
ticip
atio
n is
grea
ter f
or a
dults
from
a lo
w SE
G co
mpa
red
to a
dults
from
a h
igh
SEG
for a
ll the
abo
ve co
mm
unity
de
velo
pmen
t out
com
es.
Tota
l fo
otba
llPl
ay fo
otba
ll (la
st 1
2 m
onth
s)Pl
ay fo
otba
ll (la
st m
onth
)Ca
sual
Smal
l-sid
ed11
-a-si
deTe
am
(last
12
mon
ths)
Indi
vidua
l (la
st 1
2 m
onth
s)Te
am (l
ast
mon
th)
Indi
vidua
l (la
st m
onth
)No
n-sp
ort
part
icipa
nts
Most people in my local area can be trusted
TOTA
L0.
168
***0.
119
**0.
136
**0.
108
**0.
160
**0.
250
***0.
089
N/S
0.06
8N/
S0.
084
N/S
-0.2
26N/
S-0
.366
*
Men
0.23
6**
0.17
6**
0.18
8**
0.19
5***
0.18
8N/
S0.
300
**0.
173
**0.
100
N/S
0.18
3***
-0.1
89N/
S-0
.399
N/S
Wom
en-0
.007
N/S
-0.0
32N/
S-0
.005
N/S
-0.1
43N/
S0.
056
N/S
-0.0
51N/
S-0
.014
N/S
-0.0
27N/
S-0
.119
N/S
-0.2
95N/
S-0
.309
N/S
SEG
– AB
0.18
4**
0.12
4**
0.13
2**
0.27
7**
0.09
6**
0.15
4**
0.23
4**
-0.0
11**
0.21
5**
-0.2
87**
-0.2
90**
SEG
– C1C
20.
082
N/S
0.04
0N/
S0.
041
N/S
-0.0
26N/
S0.
125
N/S
0.19
5N/
S0.
003
N/S
0.08
7N/
S-0
.007
N/S
-0.1
90N/
S-0
.379
N/S
SEG
– DE
0.36
9*
0.32
2*
0.39
4**
0.22
7N/
S0.
366
**0.
520
**0.
132
N/S
0.09
6N/
S0.
101
N/S
-0.2
21N/
S-0
.387
N/S
9. APPENDICES (CONTINUED)
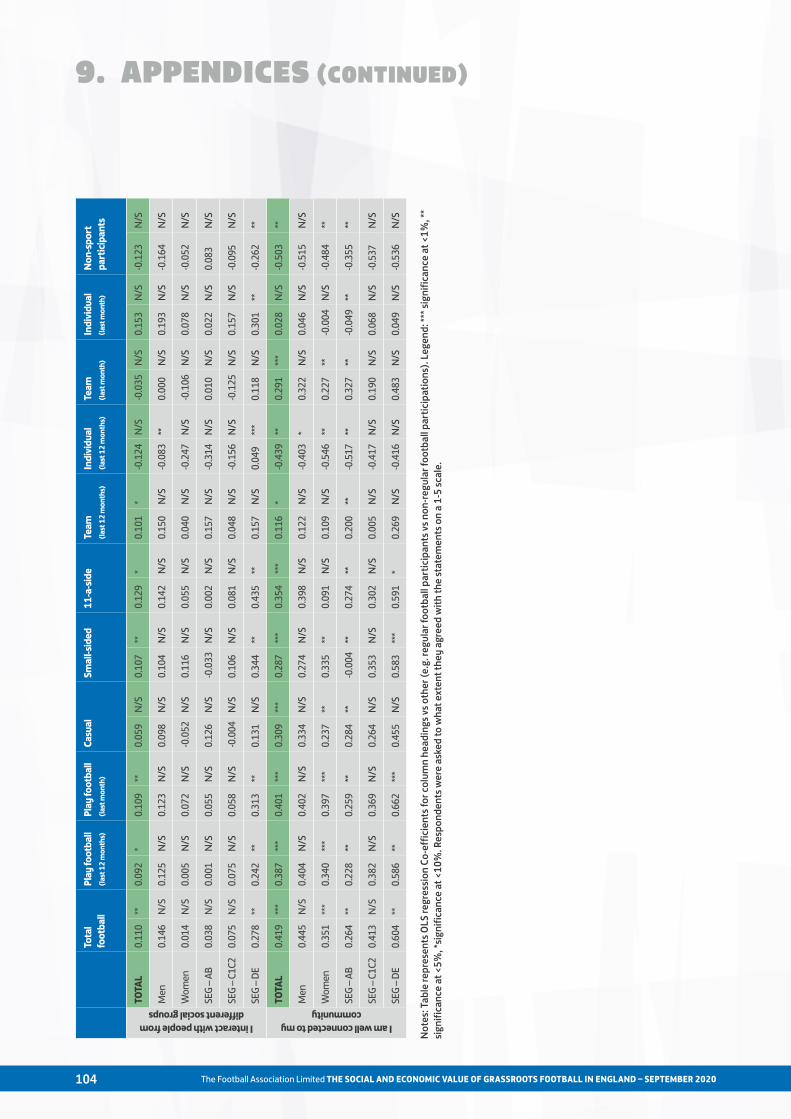
The Football Association Limited THE SOCIAL AND ECONOMIC VALUE OF GRASSROOTS FOOTBALL IN ENGLAND – SEPTEMBER 2020104
Tota
l fo
otba
llPl
ay fo
otba
ll (la
st 1
2 m
onth
s)Pl
ay fo
otba
ll (la
st m
onth
)Ca
sual
Smal
l-sid
ed11
-a-si
deTe
am
(last
12
mon
ths)
Indi
vidua
l (la
st 1
2 m
onth
s)Te
am
(last
mon
th)
Indi
vidua
l (la
st m
onth
)No
n-sp
ort
part
icipa
nts
I interact with people from different social groups
TOTA
L0.
110
**0.
092
*0.
109
**0.
059
N/S
0.10
7**
0.12
9*
0.10
1*
-0.1
24N/
S-0
.035
N/S
0.15
3N/
S-0
.123
N/S
Men
0.14
6N/
S0.
125
N/S
0.12
3N/
S0.
098
N/S
0.10
4N/
S0.
142
N/S
0.15
0N/
S-0
.083
**0.
000
N/S
0.19
3N/
S-0
.164
N/S
Wom
en0.
014
N/S
0.00
5N/
S0.
072
N/S
-0.0
52N/
S0.
116
N/S
0.05
5N/
S0.
040
N/S
-0.2
47N/
S-0
.106
N/S
0.07
8N/
S-0
.052
N/S
SEG
– AB
0.03
8N/
S0.
001
N/S
0.05
5N/
S0.
126
N/S
-0.0
33N/
S0.
002
N/S
0.15
7N/
S-0
.314
N/S
0.01
0N/
S0.
022
N/S
0.08
3N/
S
SEG
– C1C
20.
075
N/S
0.07
5N/
S0.
058
N/S
-0.0
04N/
S0.
106
N/S
0.08
1N/
S0.
048
N/S
-0.1
56N/
S-0
.125
N/S
0.15
7N/
S-0
.095
N/S
SEG
– DE
0.27
8**
0.24
2**
0.31
3**
0.13
1N/
S0.
344
**0.
435
**0.
157
N/S
0.04
9***
0.11
8N/
S0.
301
**-0
.262
**
I am well connected to my community
TOTA
L0.
419
***0.
387
***0.
401
***0.
309
***0.
287
***0.
354
***0.
116
*-0
.439
**0.
291
***0.
028
N/S
-0.5
03**
Men
0.44
5N/
S0.
404
N/S
0.40
2N/
S0.
334
N/S
0.27
4N/
S0.
398
N/S
0.12
2N/
S-0
.403
*0.
322
N/S
0.04
6N/
S-0
.515
N/S
Wom
en0.
351
***0.
340
***0.
397
***0.
237
**0.
335
**0.
091
N/S
0.10
9N/
S-0
.546
**0.
227
**-0
.004
N/S
-0.4
84**
SEG
– AB
0.26
4**
0.22
8**
0.25
9**
0.28
4**
-0.0
04**
0.27
4**
0.20
0**
-0.5
17**
0.32
7**
-0.0
49**
-0.3
55**
SEG
– C1C
20.
413
N/S
0.38
2N/
S0.
369
N/S
0.26
4N/
S0.
353
N/S
0.30
2N/
S0.
005
N/S
-0.4
17N/
S0.
190
N/S
0.06
8N/
S-0
.537
N/S
SEG
– DE
0.60
4**
0.58
6**
0.66
2***
0.45
5N/
S0.
583
***0.
591
*0.
269
N/S
-0.4
16N/
S0.
483
N/S
0.04
9N/
S-0
.536
N/S
Not
es: T
able
repr
esen
ts O
LS re
gres
sion
Co-e
ffici
ents
for c
olum
n he
adin
gs vs
oth
er (e
.g. r
egul
ar fo
otba
ll par
ticip
ants
vs n
on-re
gula
r foo
tbal
l par
ticip
atio
ns).
Lege
nd: *
** si
gnifi
canc
e at
<1%
, **
signi
fican
ce a
t <5%
, *sig
nific
ance
at <
10%
. Res
pond
ents
wer
e as
ked
to w
hat e
xten
t the
y ag
reed
with
the
stat
emen
ts o
n a
1-5
scal
e.
9. APPENDICES (CONTINUED)

The Football Association Limited THE SOCIAL AND ECONOMIC VALUE OF GRASSROOTS FOOTBALL IN ENGLAND – SEPTEMBER 2020 105
Tabl
e 9.
3: D
escr
iptiv
e st
atis
tics.
Pro
port
ion
of re
spon
dent
s who
repo
rt ‘g
ood’
self-
repo
rted
indi
vidu
al d
evel
opm
ent m
easu
res b
y sp
ort
type
and
foot
ball
form
at. T
he F
A Pa
rtic
ipat
ion
Trac
ker (
Nov
embe
r 201
9-Fe
brua
ry 2
020)
Tota
l fo
otba
llTo
tal
foot
ball
(last
12
mon
ths)
Tota
l fo
otba
ll (la
st fo
ur w
eeks
)
Casu
al
(tot
al)
Smal
l-sid
ed
(tot
al)
11-a
-side
(t
otal
)Te
am sp
ort
(last
12
mon
ths)
Indi
vidua
l sp
ort
(last
12
mon
ths)
No sp
ort
(last
12
mon
ths)
Team
spor
t (la
st 1
2 m
onth
s)In
divid
ual
spor
t (la
st fo
ur w
eeks
)
No sp
ort
(last
four
wee
ks)
Num
ber o
f re
spon
dent
s96
8.00
942.
0084
6.00
579.
0059
2.00
251.
0092
6.00
3120
.00
725.
0064
4.00
2937
.00
918.
00
Ability to cope with life’s challenges
TOTA
L58
.0%
58.3
%59
.0%
61.1
%60
.0%
63.4
%58
.5%
58.1
%46
.8%
56.4
%59
.0%
46.2
%
Mal
e58
.7%
58.8
%59
.7%
61.7
%61
.3%
66.6
%58
.2%
59.0
%48
.4%
57.7
%59
.6%
47.8
%
Fem
ale
55.8
%56
.6%
56.8
%59
.4%
54.9
%47
.8%
59.0
%57
.4%
45.5
%53
.9%
58.4
%44
.9%
Age g
roup
19-2
449
.8%
50.3
%54
.5%
48.7
%50
.0%
53.5
%52
.3%
50.6
%34
.2%
50.9
%52
.2%
30.7
%
25-3
459
.0%
59.3
%59
.7%
64.4
%61
.8%
66.8
%58
.0%
54.2
%34
.2%
58.2
%54
.6%
34.3
%
35-4
462
.5%
62.5
%61
.9%
72.7
%62
.0%
60.1
%57
.0%
53.9
%39
.3%
57.8
%54
.5%
40.0
%
45-5
454
.3%
54.3
%52
.4%
44.1
%57
.1%
79.8
%64
.9%
53.5
%43
.8%
61.7
%54
.4%
43.2
%
53+
73.9
%75
.1%
74.6
%67
.7%
85.7
%82
.2%
75.2
%69
.8%
52.3
%62
.7%
70.8
%52
.9%
Ethn
icity
Whi
te57
.8%
57.8
%58
.8%
62.5
%59
.6%
62.7
%58
.4%
57.5
%46
.7%
55.4
%58
.3%
46.6
%
BAM
E58
.5%
58.6
%59
.1%
54.7
%62
.0%
67.0
%58
.3%
63.0
%49
.4%
59.5
%64
.1%
38.3
%
SEG
C1C2
57.4
%57
.0%
58.1
%66
.3%
57.4
%62
.5%
60.4
%63
.5%
64.8
%56
.7%
63.7
%63
.2%
AB60
.5%
61.0
%61
.5%
60.9
%63
.0%
64.3
%58
.8%
60.9
%50
.1%
57.2
%61
.5%
50.3
%
DE51
.5%
51.9
%53
.5%
54.0
%54
.6%
62.6
%54
.6%
46.5
%37
.0%
54.1
%47
.9%
35.9
%
9. APPENDICES (CONTINUED)

The Football Association Limited THE SOCIAL AND ECONOMIC VALUE OF GRASSROOTS FOOTBALL IN ENGLAND – SEPTEMBER 2020106
Tota
l fo
otba
llTo
tal
foot
ball
(last
12
mon
ths)
Tota
l fo
otba
ll (la
st fo
ur w
eeks
)
Casu
al
(tot
al)
Smal
l-sid
ed
(tot
al)
11-a
-side
(t
otal
)Te
am sp
ort
(last
12
mon
ths)
Indi
vidua
l sp
ort
(last
12
mon
ths)
No sp
ort
(last
12
mon
ths)
Team
spor
t (la
st 1
2 m
onth
s)In
divid
ual
spor
t (la
st fo
ur w
eeks
)
No sp
ort
(last
four
wee
ks)
Num
ber o
f re
spon
dent
s96
8.00
942.
0084
6.00
579.
0059
2.00
251.
0092
6.00
3120
.00
725.
0064
4.00
2937
.00
918.
00
Overall confidence
TOTA
L61
.4%
61.2
%61
.8%
60.6
%64
.1%
71.4
%59
.5%
52.2
%39
.8%
63.1
%53
.3%
38.7
%
Mal
e62
.7%
62.3
%62
.6%
63.9
%64
.4%
72.0
%61
.0%
58.1
%49
.6%
63.5
%58
.9%
47.5
%
Fem
ale
57.2
%57
.6%
58.9
%51
.1%
63.1
%68
.5%
56.8
%46
.6%
32.3
%62
.2%
47.8
%31
.8%
Age g
roup
19-2
457
.3%
57.4
%58
.7%
50.6
%65
.1%
69.0
%58
.1%
46.3
%30
.2%
61.8
%48
.4%
17.9
%
25-3
464
.3%
63.4
%63
.1%
66.1
%64
.3%
72.7
%62
.5%
53.8
%20
.5%
70.0
%54
.3%
24.1
%
35-4
464
.1%
64.4
%65
.9%
66.6
%64
.1%
70.3
%54
.8%
45.0
%21
.8%
58.3
%46
.6%
20.4
%
45-5
448
.3%
48.3
%47
.3%
42.2
%51
.3%
70.7
%54
.9%
42.3
%36
.1%
48.6
%43
.3%
34.9
%
53+
71.8
%73
.0%
74.3
%64
.5%
88.6
%82
.2%
71.8
%64
.7%
49.1
%64
.7%
65.2
%50
.4%
Ethn
icity
Whi
te59
.8%
59.4
%59
.7%
59.0
%62
.8%
71.5
%58
.6%
51.5
%40
.4%
62.0
%52
.4%
39.5
%
BAM
E68
.0%
68.3
%69
.8%
67.4
%69
.8%
70.4
%62
.4%
59.5
%28
.9%
66.6
%60
.6%
23.9
%
SEG
C1C2
65.4
%65
.1%
65.0
%70
.8%
65.1
%75
.4%
65.0
%59
.4%
49.3
%66
.4%
59.3
%51
.3%
AB64
.3%
64.1
%65
.0%
60.3
%68
.7%
70.7
%62
.4%
54.5
%42
.4%
65.7
%55
.8%
39.6
%
DE45
.9%
45.4
%46
.2%
45.6
%47
.0%
65.9
%43
.7%
39.5
%34
.0%
50.0
%40
.6%
32.8
%
9. APPENDICES (CONTINUED)

The Football Association Limited THE SOCIAL AND ECONOMIC VALUE OF GRASSROOTS FOOTBALL IN ENGLAND – SEPTEMBER 2020 107
Tota
l fo
otba
llTo
tal
foot
ball
(last
12
mon
ths)
Tota
l fo
otba
ll (la
st fo
ur w
eeks
)
Casu
al
(tot
al)
Smal
l-sid
ed
(tot
al)
11-a
-side
(t
otal
)Te
am sp
ort
(last
12
mon
ths)
Indi
vidua
l sp
ort
(last
12
mon
ths)
No sp
ort
(last
12
mon
ths)
Team
spor
t (la
st 1
2 m
onth
s)In
divid
ual
spor
t (la
st fo
ur w
eeks
)
No sp
ort
(last
four
wee
ks)
Num
ber o
f re
spon
dent
s96
8.00
942.
0084
6.00
579.
0059
2.00
251.
0092
6.00
3120
.00
725.
0064
4.00
2937
.00
918.
00
Communication skills
TOTA
L67
.4%
67.1
%68
.1%
66.4
%68
.8%
72.9
%69
.2%
67.9
%56
.4%
67.6
%68
.5%
56.3
%
Mal
e66
.2%
65.6
%66
.1%
65.2
%66
.2%
74.6
%67
.8%
66.2
%56
.4%
66.2
%66
.8%
55.6
%
Fem
ale
71.6
%71
.9%
74.6
%69
.8%
78.2
%64
.4%
71.6
%69
.6%
56.4
%70
.3%
70.3
%56
.8%
Age g
roup
19-2
457
.5%
57.4
%59
.2%
50.5
%59
.4%
64.0
%60
.0%
56.5
%45
.8%
56.7
%57
.4%
41.3
%
25-3
469
.1%
68.6
%69
.2%
69.4
%69
.6%
76.2
%71
.8%
66.5
%34
.1%
71.8
%66
.3%
42.5
%
35-4
473
.8%
73.2
%75
.1%
79.0
%71
.6%
78.2
%70
.3%
65.0
%45
.0%
74.1
%66
.4%
43.7
%
45-5
462
.8%
62.8
%60
.7%
59.3
%64
.2%
66.8
%70
.2%
64.5
%56
.1%
62.8
%66
.2%
53.5
%
53+
77.9
%79
.2%
79.2
%69
.0%
100.
0%82
.2%
81.6
%77
.8%
63.1
%78
.8%
77.8
%65
.1%
Ethn
icity
Whi
te66
.5%
66.1
%67
.2%
66.8
%67
.9%
73.7
%69
.1%
67.7
%56
.6%
67.3
%68
.4%
56.3
%
BAM
E73
.2%
73.1
%74
.3%
67.5
%72
.5%
70.7
%71
.5%
70.6
%54
.6%
70.6
%70
.5%
56.0
%
SEG
C1C2
69.0
%68
.7%
70.4
%73
.2%
67.9
%74
.9%
72.0
%74
.6%
71.8
%70
.4%
74.7
%70
.9%
AB67
.8%
67.2
%67
.4%
63.9
%70
.0%
71.6
%69
.3%
68.6
%57
.6%
66.7
%69
.3%
57.4
%
DE63
.8%
64.1
%66
.5%
63.0
%66
.3%
72.6
%64
.3%
58.9
%49
.3%
64.3
%59
.5%
49.6
%
9. APPENDICES (CONTINUED)

The Football Association Limited THE SOCIAL AND ECONOMIC VALUE OF GRASSROOTS FOOTBALL IN ENGLAND – SEPTEMBER 2020108
Tota
l fo
otba
llTo
tal
foot
ball
(last
12
mon
ths)
Tota
l fo
otba
ll (la
st fo
ur w
eeks
)
Casu
al
(tot
al)
Smal
l-sid
ed
(tot
al)
11-a
-side
(t
otal
)Te
am sp
ort
(last
12
mon
ths)
Indi
vidua
l sp
ort
(last
12
mon
ths)
No sp
ort
(last
12
mon
ths)
Team
spor
t (la
st 1
2 m
onth
s)In
divid
ual
spor
t (la
st fo
ur w
eeks
)
No sp
ort
(last
four
wee
ks)
Num
ber o
f re
spon
dent
s96
8.00
942.
0084
6.00
579.
0059
2.00
251.
0092
6.00
3120
.00
725.
0064
4.00
2937
.00
918.
00
Resilience
TOTA
L67
.0%
66.9
%67
.1%
67.9
%67
.7%
70.1
%68
.2%
66.2
%52
.9%
67.7
%67
.6%
51.3
%
Mal
e66
.8%
66.5
%66
.5%
68.2
%67
.2%
72.9
%66
.2%
65.8
%53
.4%
65.7
%66
.8%
52.3
%
Fem
ale
67.5
%68
.4%
69.0
%67
.0%
69.6
%56
.9%
71.7
%66
.7%
52.5
%71
.8%
68.3
%50
.6%
Age g
roup
19-2
457
.5%
58.1
%58
.7%
51.5
%63
.5%
65.5
%59
.3%
58.5
%31
.8%
58.5
%60
.8%
25.2
%
25-3
470
.3%
70.2
%70
.7%
73.7
%71
.3%
74.7
%70
.9%
64.7
%35
.3%
73.2
%66
.0%
34.7
%
35-4
471
.3%
70.6
%70
.4%
78.6
%67
.8%
54.8
%68
.8%
64.6
%44
.2%
69.5
%65
.8%
42.9
%
45-5
460
.8%
60.8
%58
.7%
55.5
%53
.4%
88.4
%64
.5%
61.4
%51
.9%
64.9
%62
.3%
51.7
%
53+
75.8
%77
.1%
76.8
%67
.0%
88.6
%10
0.0%
87.1
%74
.7%
59.2
%79
.8%
75.9
%59
.2%
Ethn
icity
Whi
te66
.0%
65.9
%66
.0%
68.5
%66
.0%
70.0
%68
.7%
65.7
%52
.9%
67.0
%66
.9%
51.8
%
BAM
E72
.7%
72.5
%72
.9%
67.7
%74
.9%
72.0
%68
.2%
73.1
%49
.8%
72.5
%74
.3%
40.6
%
SEG
C1C2
68.4
%68
.2%
68.6
%71
.5%
67.5
%65
.7%
69.9
%71
.2%
70.2
%67
.9%
71.5
%68
.1%
AB68
.5%
68.6
%68
.3%
69.3
%69
.2%
72.9
%69
.2%
67.8
%57
.4%
69.3
%69
.2%
54.7
%
DE59
.7%
59.8
%60
.9%
58.4
%63
.0%
71.1
%62
.9%
57.4
%42
.3%
63.4
%59
.4%
41.7
%
9. APPENDICES (CONTINUED)

The Football Association Limited THE SOCIAL AND ECONOMIC VALUE OF GRASSROOTS FOOTBALL IN ENGLAND – SEPTEMBER 2020 109
Tota
l fo
otba
llTo
tal
foot
ball
(last
12
mon
ths)
Tota
l fo
otba
ll (la
st fo
ur w
eeks
)
Casu
al
(tot
al)
Smal
l-sid
ed
(tot
al)
11-a
-side
(t
otal
)Te
am sp
ort
(last
12
mon
ths)
Indi
vidua
l sp
ort
(last
12
mon
ths)
No sp
ort
(last
12
mon
ths)
Team
spor
t (la
st 1
2 m
onth
s)In
divid
ual
spor
t (la
st fo
ur w
eeks
)
No sp
ort
(last
four
wee
ks)
Num
ber o
f re
spon
dent
s96
8.00
942.
0084
6.00
579.
0059
2.00
251.
0092
6.00
3120
.00
725.
0064
4.00
2937
.00
918.
00
Leadership
TOTA
L60
.7%
60.1
%60
.1%
62.1
%60
.6%
68.5
%61
.1%
48.4
%28
.9%
65.9
%49
.6%
28.9
%
Mal
e59
.8%
58.9
%59
.0%
61.5
%59
.6%
67.2
%61
.3%
52.5
%35
.2%
65.9
%53
.9%
33.5
%
Fem
ale
63.6
%64
.2%
63.8
%63
.8%
64.4
%75
.1%
60.9
%44
.4%
24.1
%65
.8%
45.4
%25
.4%
Age g
roup
19-2
456
.8%
57.1
%58
.2%
53.6
%59
.8%
72.0
%60
.1%
50.9
%12
.9%
58.6
%52
.5%
17.1
%
25-3
464
.1%
63.2
%62
.6%
67.6
%61
.4%
68.6
%65
.0%
56.4
%25
.8%
71.3
%57
.7%
25.8
%
35-4
467
.3%
66.6
%66
.9%
71.0
%65
.6%
71.0
%63
.7%
48.4
%25
.9%
71.4
%50
.1%
22.8
%
45-5
440
.5%
40.5
%37
.6%
42.1
%39
.2%
60.7
%51
.2%
40.5
%29
.2%
49.8
%41
.8%
28.6
%
53+
60.2
%60
.1%
62.2
%49
.8%
78.4
%31
.5%
54.1
%46
.5%
30.9
%65
.1%
46.8
%32
.6%
Ethn
icity
Whi
te58
.4%
57.8
%58
.0%
60.9
%57
.7%
69.5
%59
.4%
46.9
%29
.4%
63.3
%48
.0%
29.7
%
BAM
E71
.9%
71.4
%70
.7%
70.0
%73
.6%
65.8
%68
.1%
60.3
%19
.5%
75.1
%61
.4%
13.9
%
SEG
C1C2
63.3
%62
.6%
63.0
%66
.4%
59.9
%71
.8%
64.1
%57
.7%
49.4
%66
.3%
58.2
%48
.9%
AB61
.8%
61.2
%60
.5%
61.9
%62
.1%
66.8
%63
.2%
49.8
%32
.2%
65.9
%50
.7%
32.8
%
DE52
.9%
52.6
%53
.7%
56.1
%57
.0%
67.1
%51
.5%
35.0
%18
.1%
64.9
%37
.1%
17.6
%
Not
e: R
espo
nden
ts w
ere
aske
d to
rate
them
selve
s aga
inst
eac
h in
divi
dual
dev
elop
men
t ski
ll fro
m ve
ry g
ood
to ve
ry p
oor (
1-5
scal
e). ‘G
ood’
scor
es w
ere
thos
e th
at w
ere
had
a sc
ore
>=4
9. APPENDICES (CONTINUED)

The Football Association Limited THE SOCIAL AND ECONOMIC VALUE OF GRASSROOTS FOOTBALL IN ENGLAND – SEPTEMBER 2020110
Tabl
e 9.
4: D
escr
iptiv
e st
atis
tics.
Pro
port
ion
of re
spon
dent
s who
agr
ee w
ith co
mm
unity
dev
elop
men
t sta
tem
ents
by
spor
t typ
e an
d fo
otba
ll fo
rmat
. The
FA
Part
icip
atio
n Tr
acke
r (N
ovem
ber 2
019-
Febr
uary
202
0)
Tota
l fo
otba
llTo
tal
foot
ball
(last
12
mon
ths)
Tota
l fo
otba
ll (la
st fo
ur w
eeks
)
Casu
al
(tot
al)
Smal
l-sid
ed
(tot
al)
11-a
-side
(t
otal
)Te
am sp
ort
(last
12
mon
ths)
Indi
vidua
l sp
ort
(last
12
mon
ths)
No sp
ort
(last
12
mon
ths)
Team
spor
t (la
st 1
2 m
onth
s)In
divid
ual
spor
t (la
st fo
ur w
eeks
)
No sp
ort
(last
four
wee
ks)
Num
ber o
f re
spon
dent
s96
8.00
942.
0084
6.00
579.
0059
2.00
251.
0092
6.00
3120
.00
725.
0064
4.00
2937
.00
918.
00
Most people in my local area can be trusted
TOTA
L49
.8%
49.4
%50
.9%
48.6
%52
.3%
56.2
%48
.1%
47.7
%41
.2%
50.1
%48
.2%
41.1
%
Mal
e59
.8%
58.9
%59
.0%
61.5
%59
.6%
67.2
%61
.3%
52.5
%35
.2%
65.9
%53
.9%
33.5
%
Fem
ale
63.6
%64
.2%
63.8
%63
.8%
64.4
%75
.1%
60.9
%44
.4%
24.1
%65
.8%
45.4
%25
.4%
Age g
roup
19-2
441
.6%
42.2
%45
.7%
38.7
%46
.4%
53.3
%40
.2%
40.0
%44
.1%
38.6
%40
.7%
36.5
%
25-3
453
.4%
52.7
%53
.8%
54.8
%57
.0%
54.6
%52
.2%
42.9
%26
.3%
57.2
%43
.3%
26.0
%
35-4
451
.2%
50.5
%52
.0%
52.8
%48
.2%
64.8
%47
.7%
42.7
%29
.0%
51.1
%43
.1%
31.5
%
45-5
444
.8%
44.8
%43
.3%
31.4
%48
.8%
41.2
%50
.4%
45.8
%29
.3%
51.4
%46
.8%
30.2
%
53+
63.2
%62
.0%
62.1
%53
.5%
70.5
%10
0.0%
53.4
%59
.0%
50.7
%56
.7%
59.1
%51
.6%
Ethn
icity
Whi
te51
.2%
50.7
%52
.3%
49.5
%54
.4%
60.4
%49
.8%
48.5
%42
.0%
51.5
%48
.9%
41.9
%
BAM
E44
.0%
43.2
%44
.5%
45.2
%44
.4%
40.3
%41
.9%
41.7
%27
.3%
45.5
%42
.9%
19.5
%
SEG
C1C2
57.2
%56
.4%
57.9
%63
.8%
57.2
%57
.3%
57.4
%55
.2%
53.2
%58
.8%
55.4
%52
.3%
AB46
.5%
46.1
%46
.9%
42.0
%51
.0%
51.4
%46
.2%
48.3
%44
.1%
47.4
%49
.0%
42.4
%
DE47
.4%
47.3
%50
.4%
44.1
%47
.2%
66.6
%37
.8%
38.2
%34
.1%
39.4
%37
.7%
35.5
%
9. APPENDICES (CONTINUED)

The Football Association Limited THE SOCIAL AND ECONOMIC VALUE OF GRASSROOTS FOOTBALL IN ENGLAND – SEPTEMBER 2020 111
Tota
l fo
otba
llTo
tal
foot
ball
(last
12
mon
ths)
Tota
l fo
otba
ll (la
st fo
ur w
eeks
)
Casu
al
(tot
al)
Smal
l-sid
ed
(tot
al)
11-a
-side
(t
otal
)Te
am sp
ort
(last
12
mon
ths)
Indi
vidua
l sp
ort
(last
12
mon
ths)
No sp
ort
(last
12
mon
ths)
Team
spor
t (la
st 1
2 m
onth
s)In
divid
ual
spor
t (la
st fo
ur w
eeks
)
No sp
ort
(last
four
wee
ks)
Num
ber o
f re
spon
dent
s96
8.00
942.
0084
6.00
579.
0059
2.00
251.
0092
6.00
3120
.00
725.
0064
4.00
2937
.00
918.
00
I interact with people from different social groups
TOTA
L71
.2%
70.8
%71
.9%
71.8
%72
.9%
74.9
%72
.2%
70.1
%54
.0%
72.4
%71
.1%
53.6
%
Mal
e59
.8%
58.9
%59
.0%
61.5
%59
.6%
67.2
%61
.3%
52.5
%35
.2%
65.9
%53
.9%
33.5
%
Fem
ale
63.6
%64
.2%
63.8
%63
.8%
64.4
%75
.1%
60.9
%44
.4%
24.1
%65
.8%
45.4
%25
.4%
Age g
roup
19-2
467
.3%
67.2
%69
.9%
61.6
%70
.5%
67.4
%69
.5%
69.6
%73
.5%
65.5
%71
.0%
57.3
%
25-3
473
.9%
73.6
%74
.6%
77.4
%77
.3%
80.2
%74
.7%
71.0
%53
.9%
76.8
%71
.8%
51.8
%
35-4
474
.4%
73.8
%74
.6%
79.1
%71
.8%
71.5
%70
.6%
70.7
%45
.8%
73.7
%71
.9%
45.6
%
45-5
461
.3%
61.3
%59
.3%
54.6
%61
.4%
69.4
%68
.2%
66.2
%58
.9%
66.9
%67
.5%
57.8
%
53+
71.7
%70
.8%
72.6
%68
.9%
77.6
%10
0.0%
80.2
%71
.5%
53.1
%85
.4%
72.3
%54
.2%
Ethn
icity
Whi
te71
.0%
70.6
%71
.4%
71.3
%72
.3%
75.1
%73
.7%
70.2
%53
.7%
73.6
%71
.2%
54.1
%
BAM
E73
.3%
73.2
%74
.7%
76.3
%75
.0%
73.6
%67
.7%
70.4
%66
.4%
69.4
%71
.7%
48.2
%
SEG
C1C2
69.1
%68
.6%
70.8
%73
.3%
67.3
%72
.4%
72.2
%70
.1%
67.1
%71
.3%
70.5
%65
.4%
AB71
.2%
71.1
%71
.5%
70.7
%74
.8%
72.5
%73
.6%
72.0
%57
.6%
73.8
%73
.4%
55.6
%
DE74
.6%
73.9
%75
.3%
72.7
%77
.3%
85.5
%68
.9%
65.9
%45
.9%
70.8
%67
.0%
47.2
%
9. APPENDICES (CONTINUED)

The Football Association Limited THE SOCIAL AND ECONOMIC VALUE OF GRASSROOTS FOOTBALL IN ENGLAND – SEPTEMBER 2020112
Tota
l fo
otba
llTo
tal
foot
ball
(last
12
mon
ths)
Tota
l fo
otba
ll (la
st fo
ur w
eeks
)
Casu
al
(tot
al)
Smal
l-sid
ed
(tot
al)
11-a
-side
(t
otal
)Te
am sp
ort
(last
12
mon
ths)
Indi
vidua
l sp
ort
(last
12
mon
ths)
No sp
ort
(last
12
mon
ths)
Team
spor
t (la
st 1
2 m
onth
s)In
divid
ual
spor
t (la
st fo
ur w
eeks
)
No sp
ort
(last
four
wee
ks)
Num
ber o
f re
spon
dent
s96
8.00
942.
0084
6.00
579.
0059
2.00
251.
0092
6.00
3120
.00
725.
0064
4.00
2937
.00
918.
00
I am well connected to my community
TOTA
L42
.4%
42.0
%43
.1%
46.6
%41
.8%
48.4
%39
.4%
29.3
%14
.2%
44.2
%30
.2%
14.3
%
Mal
e59
.8%
58.9
%59
.0%
61.5
%59
.6%
67.2
%61
.3%
52.5
%35
.2%
65.9
%53
.9%
33.5
%
Fem
ale
63.6
%64
.2%
63.8
%63
.8%
64.4
%75
.1%
60.9
%44
.4%
24.1
%65
.8%
45.4
%25
.4%
Age g
roup
19-2
440
.0%
40.3
%43
.4%
38.4
%41
.6%
47.4
%37
.8%
32.7
%39
.6%
40.0
%34
.4%
22.0
%
25-3
448
.8%
48.3
%49
.0%
55.8
%48
.2%
52.7
%46
.3%
38.4
%9.
4%50
.5%
38.8
%12
.5%
35-4
444
.2%
43.6
%43
.9%
52.3
%40
.7%
44.7
%40
.9%
29.3
%10
.7%
48.0
%30
.5%
11.5
%
45-5
426
.1%
26.1
%25
.9%
26.7
%24
.8%
34.2
%28
.7%
21.6
%12
.6%
29.6
%22
.1%
13.5
%
53+
26.5
%25
.3%
25.9
%16
.6%
30.4
%50
.7%
25.2
%26
.3%
14.8
%16
.2%
26.9
%15
.0%
Ethn
icity
Whi
te42
.0%
41.2
%42
.5%
45.9
%41
.8%
51.5
%39
.9%
28.2
%13
.8%
45.7
%29
.0%
14.0
%
BAM
E44
.5%
45.1
%45
.5%
53.0
%42
.1%
35.0
%37
.7%
38.8
%23
.6%
39.9
%39
.9%
20.1
%
SEG
C1C2
46.8
%45
.8%
47.4
%54
.8%
41.4
%51
.8%
46.6
%35
.7%
26.4
%49
.7%
35.9
%26
.3%
AB40
.7%
40.3
%40
.8%
43.7
%42
.1%
45.2
%35
.4%
29.1
%14
.0%
40.0
%30
.0%
14.3
%
DE40
.0%
40.5
%42
.4%
42.5
%41
.6%
50.4
%37
.3%
22.8
%9.
5%44
.2%
24.1
%9.
6%
Not
e: R
espo
nden
ts w
ere
aske
d to
rate
thei
r agr
eem
ent w
ith e
ach
stat
emen
t fro
m st
rong
ly a
gree
to st
rong
ly d
isagr
ee (1
-5 sc
ale)
. Res
ults
are
incl
uded
for s
trong
ly a
gree
and
agr
ee.
9. APPENDICES (CONTINUED)

The Football Association Limited THE SOCIAL AND ECONOMIC VALUE OF GRASSROOTS FOOTBALL IN ENGLAND – SEPTEMBER 2020 113
Tabl
e 9.
5: D
escr
iptiv
e st
atis
tics.
Pro
port
ion
of re
spon
dent
s who
agr
ee th
at fo
otba
ll im
prov
es co
mm
unity
dev
elop
men
t out
com
es b
y fo
otba
ll fo
rmat
. The
FA
Part
icip
atio
n Tr
acke
r (N
ovem
ber 2
019-
Febr
uary
202
0)
Tota
l foo
tbal
lTo
tal f
ootb
all
(last
12
mon
ths)
Tota
l foo
tbal
l (la
st fo
ur w
eeks
)Ca
sual
(t
otal
)Sm
all-s
ided
(t
otal
)11
-a-si
de
(tot
al)
Num
ber o
f res
pond
ents
548.
0052
8.00
495.
0032
5.00
351.
0015
6.00
Football helps to reduce crime in my local area
TOTA
L56
.7%
56.1
%58
.3%
57.0
%59
.5%
60.6
%
Mal
e59
.8%
58.9
%59
.0%
61.5
%59
.6%
67.2
%
Fem
ale
63.6
%64
.2%
63.8
%63
.8%
64.4
%75
.1%
Age g
roup
19-2
457
.8%
58.0
%62
.1%
51.4
%61
.5%
64.0
%
25-3
460
.9%
59.8
%61
.0%
64.4
%64
.7%
61.7
%
35-4
460
.2%
59.3
%62
.2%
60.0
%59
.1%
61.8
%
45-5
433
.3%
33.3
%34
.1%
36.2
%38
.6%
40.5
%
53+
50.4
%50
.9%
52.3
%42
.4%
54.5
%51
.7%
Ethn
icity
Whi
te56
.6%
56.0
%58
.2%
58.2
%58
.5%
62.5
%
BAM
E58
.0%
56.8
%58
.1%
52.2
%64
.8%
52.2
%
SEG
C1C2
63.2
%62
.8%
65.4
%68
.0%
60.6
%61
.0%
AB53
.0%
51.9
%54
.3%
50.7
%59
.1%
59.4
%
DE57
.3%
57.2
%58
.1%
57.5
%59
.0%
62.8
%
9. APPENDICES (CONTINUED)

The Football Association Limited THE SOCIAL AND ECONOMIC VALUE OF GRASSROOTS FOOTBALL IN ENGLAND – SEPTEMBER 2020114
Tota
l foo
tbal
lTo
tal f
ootb
all
(last
12
mon
ths)
Tota
l foo
tbal
l (la
st fo
ur w
eeks
)Ca
sual
(t
otal
)Sm
all-s
ided
(t
otal
)11
-a-si
de
(tot
al)
Num
ber o
f res
pond
ents
548.
0052
8.00
495.
0032
5.00
351.
0015
6.00
Football helps to reduce anti-social behaviour in my local area
TOTA
L56
.8%
56.2
%58
.0%
57.4
%57
.2%
62.7
%
Mal
e59
.8%
58.9
%59
.0%
61.5
%59
.6%
67.2
%
Fem
ale
63.6
%64
.2%
63.8
%63
.8%
64.4
%75
.1%
Age g
roup
19-2
455
.0%
54.8
%57
.3%
49.4
%56
.3%
69.7
%
25-3
460
.7%
59.8
%61
.3%
63.4
%61
.5%
62.7
%
35-4
462
.8%
61.9
%63
.3%
65.4
%59
.5%
63.4
%
45-5
434
.1%
34.1
%36
.0%
32.5
%36
.8%
28.9
%
53+
51.8
%52
.4%
54.0
%49
.2%
57.0
%85
.5%
Ethn
icity
Whi
te56
.3%
55.8
%57
.9%
57.4
%56
.2%
61.0
%
BAM
E61
.7%
60.3
%60
.0%
60.5
%62
.1%
70.6
%
SEG
C1C2
61.4
%61
.0%
62.9
%64
.8%
57.0
%65
.4%
AB54
.1%
53.2
%55
.5%
52.1
%57
.3%
58.3
%
DE57
.4%
57.0
%56
.7%
60.8
%57
.4%
69.1
%
Not
e: R
espo
nden
ts w
ere
aske
d to
rate
thei
r agr
eem
ent w
ith e
ach
stat
emen
t fro
m st
rong
ly a
gree
to st
rong
ly d
isagr
ee (1
-5 sc
ale)
. Res
ults
are
incl
uded
for s
trong
ly a
gree
and
agr
ee.
9. APPENDICES (CONTINUED)

The Football Association Limited THE SOCIAL AND ECONOMIC VALUE OF GRASSROOTS FOOTBALL IN ENGLAND – SEPTEMBER 2020 115
The Wellbeing Valuation (WV) approachPrevious research by DCMS and Simetrica324 has shown it is possible to value a person’s improved wellbeing from playing sport. This approach to valuing ‘non-market’ outcomes is known as the Wellbeing Valuation (WV) approach325. In line with HM Treasury Green Book (2018), the WV approach investigates how the non-market outcome changes people’s wellbeing, under the assumption that the same change in wellbeing could have been achieved by a change in the respondent’s household income (using an instrument for income obtained from the British Household Panel Survey)326. This constitutes a valuation of the ‘primary benefits’ of regular football to the individual. The steps to this analysis are:
• Establish in the data whether playing grassroots football regularly is associated with increases a person’s wellbeing (analysis of The FA Participation Tracker data show that it is – see above).
• Establish whether an increase in a person’s income also produces an increase in wellbeing (using evidence from instrumental variables within large national datasets like the British Household Panel Survey).
• Establish how much money would need to be paid to that person to make up the same increase in wellbeing as playing football regularly. This assumes that an individual’s wellbeing increases along the same (linear) scale, regardless of whether it comes from playing football, increasing income, or some other factor in their life (this is an established assumption within the academic literature327).
• Attribute this value to playing football as representative of the improvement in wellbeing experienced by all those who play regular football in England.
In summary, by comparing the wellbeing association with the outcome of interest (playing football) to the wellbeing association with income, it is possible to identify what sum of money should be given to (or taken away from) the average respondent to make them as well-off as they were/would have been without playing football. This is then taken to be the monetary wellbeing
value of the outcome of interest, in this case playing regular football.
These are benefits to the individual’s quality of life and are additional to any economic/expenditure impact. Expenditure and wellbeing values are additive as expenditure is not factored into wellbeing regression. As there are no controls for expenditure within the regression it can be assumed that the individual has already internalised the wellbeing they gain from football through their expenditure (in terms of preference satisfaction). This means the wellbeing uplift identified in the data is the residual benefit that football provides over and above these satisfied preferences for playing.
Use of WV in this reportAs noted in The FA’s previous study328, the WV method is commonly used in combination with data on life satisfaction levels (as a measure of overall evaluative wellbeing). However, at the time of the study The FA Participation Tracker survey did not include the required question on life satisfaction.
Instead, Jump Projects (now Jump X Simetrica) followed Vine et al329 in using self-reported general health to estimate the equivalent amount of income that would be required to compensate for the health improvement associated with playing football regularly.
The redesign of The FA Participation Tracker survey as part of this study (see Appendix 1) now includes the required question on life satisfaction, enabling two Wellbeing Valuation calculations to be conducted. These were performed by Dr Ricky Lawton, with regression inputs provided by Portas Consulting:
1. Football v. Other (general health) – the average health-effect associated with playing regular football compared to those playing other sports
2. Football v. Other (life satisfaction) – the average life satisfaction-effect associated with playing regular football compared to those playing other sports
324Fujiwara et al. Quantifying and Valuing the Wellbeing Impacts of Culture and Sport: Research publication to assess the wellbeing impacts of culture and sport (DCMS 2014): https://assets.publishing.service.gov.uk/government/uploads/ system/uploads/attachment_data/file/304899/Quantifying_and_valuing_the_wellbeing_impacts_of_sport_and_culture.pdf325Daniel Fujiwara, “A General Method for Valuing Non-Market Goods Using Wellbeing Data: Three-Stage Wellbeing Valuation,” in CEP Discussion Paper No 1233 (London, UK: Centre for Economic Performance, London School of Economics, 2013), 1–29, http://cep.lse.ac.uk/_new/publications/series.asp?prog=CEP; Daniel Fujiwara and Paul Dolan, “Happiness-Based Policy Analysis,” in Oxford Handbook of Wellbeing and Public Policy, ed. M Adler and M Fleurbaey, 2015326https://www.iser.essex.ac.uk/bhps/.327Ada Ferrer-i-Carbonell and Paul Frijters, “How Important Is Methodology for the Estimates of the Determinants of Happiness?” The Economic Journal 114, no. 497 (July 1, 2004): 641–59, https://doi.org/10.1111/j.1468-0297.2004.00235.x.328The FA (2019): The Social and Economic Value of Adult Grassroots Football in England329https://www.hact. org.uk/sites/default/files/uploads/Archives/2017/01/Valuing%20Housing%20and%20Local%20Environment%20Improvements%20-%20Jan%202017.pdf
9. APPENDICES (CONTINUED)
APPENDIX 10 – TECHNICAL NOTE: WELLBEING VALUATION

The Football Association Limited THE SOCIAL AND ECONOMIC VALUE OF GRASSROOTS FOOTBALL IN ENGLAND – SEPTEMBER 2020116
9. APPENDICES (CONTINUED)
The first calculation, using general health, has been conducted for continuity with the 2019 study and to provide a direct comparison to the value previously quantified. However, this has not been included in the headline findings of the report as general health has significant overlap with the new metrics included throughout the rest of the report.
The second calculation, using life satisfaction, does not overlap and so is a more suitable metric for this study. However, following academic review the output value generated through this calculation has also been deemed unsuitable for inclusion in the report due to the magnitude of the result. It is thought that limitations in the sample may contribute to a wellbeing value that is higher than expected. The value has therefore not been included in the headline economic impact to ensure it remains a conservative estimate of the contribution of grassroots football to the economy.
Calculation 1: Football v. Other (general health)The regression for this calculation takes the average health-effect associated with playing regular football (+0.199 on a general health scale of 1-5, significant at 99% confidence level) compared to those playing other sports. In other words, those who play football on average report higher general health, after holding constant demographic factors known to drive health outcomes. This co-efficient can then be used when estimating the equivalent income that would leave a footballer with the same level of welfare if they were unable to play football using the WV method.
Playing regular football has a positive association with an individual’s general health, compared to those who do not play football (but do play other sports) and controlling for whether individuals play other sports in addition to football. This is equivalent to an average annual income boost of £1,066 per person. Note: this the value over and above the costs of participating.
This result can be compared to The FA’s previous study, where the average health-effect associated with playing regular football was +0.260 on a general health scale of 1-5, significant at 99% confidence level (compared to those playing other sports). This was equivalent to £1,385 wellbeing value per person per year.
This comparison shows that there is good consistency across the two evaluation periods, with slightly higher general health benefits recorded in the 2019 report (£1,385) than in the 2020 report (£1,066). This may be caused by seasonal effects (the two evaluations had to use different months of data from The FA Participation Tracker survey due to the time periods that the surveys were run) and regression to the mean effects (whereby average outcome levels measured year-on-year may naturally fluctuate up and down).

The Football Association Limited THE SOCIAL AND ECONOMIC VALUE OF GRASSROOTS FOOTBALL IN ENGLAND – SEPTEMBER 2020 117
Calculation 2: Football v. Other (life satisfaction)The regression for this calculation takes the average life satisfaction-effect associated with playing regular football (+0.332 on a life satisfaction scale of 0-10, significant at 99% confidence level) compared to those playing other sports. In other words, those who play football on average report higher life satisfaction, after holding constant demographic factors known to drive wellbeing outcomes, including in this case general health. This co-efficient can then be used when estimating the equivalent income that would leave a footballer with the same level of welfare if they were unable to play football using the WV method.
Playing regular football has a positive association with an individual’s life satisfaction, compared to those who do not play football (but do play other sports) and controlling for whether individuals play other sports in addition to football. This is equivalent to an average annual income boost of £4,971 per person. While expected to be higher than the general health value330, this is a high valuation estimate, comparable to the effect of moving from unemployment to employment (which the wellbeing literature shows is one of the most impactful experiences on people’s wellbeing). Caution is therefore urged in applying this life satisfaction value. It may be that the sample is subject to self-selection of people who were already more likely to engage in sporting activity, which may be expected to be associated with certain psychological characteristics that are endogenous to wellbeing. These high life satisfaction values suggest that further variables should be considered in the modelling, to overcome omitted variable bias and control for possible selection factors.
However, after controlling for such additional factors, whilst an impact on life satisfaction for regular football players is observed, this was deemed insignificant (p>0.1) – see Table 10.1.
Table 10.1: Association between regular football participation (at least once within the last month) and life satisfaction for each additional control variable.
Co-efficient P value
Reference* 0.332 0.005
Volunteering 0.374 0.005
GP visits 0.291 0.002
General self-reported health 0.102 0.348
*Reference value from Table 8.1
330As the general health approach only includes health impacts whilst life satisfaction includes a wider range of factors such as improved confidence and social relations.
9. APPENDICES (CONTINUED)

The Football Association Limited THE SOCIAL AND ECONOMIC VALUE OF GRASSROOTS FOOTBALL IN ENGLAND – SEPTEMBER 2020118
About Walking Football
The rules of Walking Football follow those of general football but are tailored to allow those who are not able to take part in full-paced football to continue playing. Key differences are listed below331:
• Small-sided teams (5-7 a side);
• No running or jogging, with or without the ball;
• Played to minimal contact only; no slide tackles or tackling from behind;
• The ball must not pass over head height;
• All free kicks are indirect.
Walking Football Survey Technical Report
The physical wellbeing, mental wellbeing and social benefits of physical activity for older adults is well documented. However, little information exists for the benefits of Walking Football specifically. To address this, The FA has conducted the largest qualitative and quantitative survey of Walking Football participants in Europe332.
The survey received 995 responses, of which 935 were Walking Football participants. The survey collected socio-demographic information for all respondents and, while not nationally representative of all Walking Football clubs and participants, the sample size was sufficient for robust analysis. The Walking Football survey respondents were also asked questions about their motivations for playing Walking Football, and the impact of playing Walking Football on various social and health measures. The data clearly demonstrates the positive impact of Walking Football. Full tables of results are presented in the following tables333.
331The FA has published a set of Laws for Walking Football. The full details of these laws are available at http://www.thefa.com/-/media/thefacom-new/files/get-involved/2018/walking-football-revised-laws-of-the-game.ashx 332To The FA’s knowledge.333The FA Walking Football Survey is a focus group and therefore not nationally representative. Data presented in data tables are unweighted percentages.
9. APPENDICES (CONTINUED)
APPENDIX 11 – WALKING FOOTBALL

The Football Association Limited THE SOCIAL AND ECONOMIC VALUE OF GRASSROOTS FOOTBALL IN ENGLAND – SEPTEMBER 2020 119
9. APPENDICES (CONTINUED)
Table 11.1: Demographic breakdown of Walking Football participantsTotal survey sample size = 995. The figures in the table represent the demographic breakdown of football participants only (n=935)
Demographic characteristic Total football
Gender -
Male 80.11%
Female 14.01%
Other 5.88%
Age group
18-39 2.57%
40-49 6.10%
50-59 26.55%
60-69 49.46%
70-79 14.78%
80+ 0.54%
Ethnicity
White 97.86%
Asian 0.32%
Other 1.82%
Region
East Midlands 9.84%
East of England 11.66%
None of the above 2.14%
North East 2.99%
North West 8.13%
South East 18.61%
South West 28.77%
West Midlands 6.74%
Yorkshire & the Humber 6.95%
London 4.17%
Type of area
Urban 71.12%
Rural 26.42%
Don't know 2.46%
Disability status
Yes 28.98%
No 67.59%
Prefer not to say 3.42%

The Football Association Limited THE SOCIAL AND ECONOMIC VALUE OF GRASSROOTS FOOTBALL IN ENGLAND – SEPTEMBER 2020120
Table 11.2: Motivations for starting Walking Football
Reason for starting Walking Football
% who selected reason
To keep fit and healthy 73.48%
To improve my physical health 66.74%
To be able to keep playing football 66.10%
To get back into football 56.15%
To meet new people 54.44%
For the wider social benefits 31.55%
It was recommended by a friend 24.81%
To try something different 24.06%
It is accessible 16.47%
For something to do 15.72%
To recover from an injury 5.67%
Note: respondents were able to select multiple options.
Table 11.3: Health impact of Walking Football
Health measure % of respondents who said that Walking Football has had a positive impact
Your stamina levels 90.91%
Your mobility 82.46%
Your co-ordination 76.90%
Your concentration 60.43%
Your memory retention 38.61%
Table 11.4: Social impact of Walking Football – 1
Social statement: Playing Walking Football…
% of respondents agreed with statement
… allows me to keep playing football, I would not otherwise be able to keep playing
92.3%
…allows me to interact with people from different social groups (i.e. older or younger than me, from a different culture or race, from a different neighbourhood)
85.88%
…provides me with a sense of belonging 74.44%
…is inclusive of individuals with disabilities 71.76%
…helps me to connect to my community (e.g. volunteering, helping people with disabilities)
41.71%
…makes me more trusting of people who live in my local area 24.28%
Table 11.5: Social impact of Walking Football – 2
Social measure % of respondents who said that Walking Football has had a positive impact
Your levels of social activity 84.60%
Your socialisation with friends 79.68%
Your overall confidence 67.91%
Your sense of purpose 64.81%
Your communication skills 53.48%
Your ability to cope with life's challenges 47.38%
Any feelings of isolation 35.61%
9. APPENDICES (CONTINUED)

The Football Association Limited THE SOCIAL AND ECONOMIC VALUE OF GRASSROOTS FOOTBALL IN ENGLAND – SEPTEMBER 2020 121
Social Wellbeing Value
Volunteering is associated with improved mental and social wellbeing. This is particularly true for volunteering in sport334. By applying a monetary value to the improved wellbeing associated with volunteering (£1,095)335, the annual social wellbeing value of grassroots football
volunteers can be calculated. This is applied only to adult volunteers. No monetary value is applied to the hours dedicated by volunteers under aged 16. For technical details the Wellbeing Valuation method, see Appendix 10.
The National Football Facilities Strategy (NFFS)
The NFFS is a 10-year strategy to improve football facility provision in England – one of the biggest issues affecting people in the grassroots game336. The strategy is delivered through the Football Foundation and is funded by The FA, Sport England and the Premier League.
~90% of the £1bn investment is guided by 326 Local Football Facility Plans (LFFPs)337. These are live documents, developed in collaboration with County FAs, Local Authorities, community and professional football clubs, community trusts and other local groups, which capture current football facility assets and identify investment priorities in each Local Authority area. Each plan:
• Sets a 10-year vision to transform local football facilities;
• Identifies priority projects to be delivered;
• Acts as an investment portfolio for projects that require funding;
• Is updated regularly338.
To calculate the value of LFFP funding into the ten most deprived areas in England339 and the ten areas of greatest need340, the average cost per project341 is applied to the number of planned projects in each area342.
Average costs per project:
• Grass pitch improvement: £35,000;
• FTP construction: £805,000;
• Small-sided pitch construction: £125,000;
• Changing room/pavilion construction: £632,500.
334Jump (2019). Happy Days. The wellbeing benefit associated with general volunteering is assumed to apply to volunteering in grassroots football.335Jump (2019). Happy Day.s336The FA Grassroots Survey.337The Football Foundation.338https://localplans.footballfoundation.org.uk/339The ten areas included are the most deprived Local Authorities based on the proportion of neighbourhoods in the most deprived 10% nationally from the Ministry of Housing, Communities & Local Government’s report – The English Indices of Deprivation 2019: Middlesbrough, Liverpool, Knowsley, Kingston upon Hull, Manchester, Blackpool, Birmingham, Burnley, Blackpool with Darwen.340Assigned by a combination of deprivation (IMD scale) and demand (FA and Football Foundation): Leeds, Cornwall, County Durham, Greenwich, Central Bedfordshire, Birmingham, Newcastle upon Tyne, Warrington, North East Lincolnshire. 341The Football Association.342https://localplans.footballfoundation.org.uk/
9. APPENDICES (CONTINUED)
APPENDIX 12 – VOLUNTEERING
APPENDIX 13 – THE FOOTBALL FOUNDATION HUBS PROGRAMME

The Football Association Limited THE SOCIAL AND ECONOMIC VALUE OF GRASSROOTS FOOTBALL IN ENGLAND – SEPTEMBER 2020122
Calculating the number of players at the Sheffield and Liverpool Hub sites
The number of unique visitors at each site is obtained from scans data, showing a total of 98,590 unique visitors in across the Sheffield and Liverpool sites in 2019343,344.
Pulse provided ratios of the number of unique players out of the total unique visitors, which depend on their arrival time at the sites. This assumes:
• All visitors before 4pm on a weekday are players as they are pay and play;
• 80% of weekday evening visitors play football;
• 75% of visitors on the weekend play football.
Applying these assumptions to the number of unique visitors and the time of visiting for each unique visitor gives the annual number of players as 82,526 and the number of spectators as 16,063. Of the unique players345:
• 51,100 (62%) are adults (aged 19+), while 31,400 (38%) are children aged 5-18346;
• 20,625 (25%) are female (across all ages).
Understanding the improvement in the player experience at Football Foundation Hub Sites
In 2017, The Sport Industry Research Centre (SIRC) carried out research into the Sheffield sites347. Players, managers and coaches were interviewed at the end of their inaugural season at the sites (n=222) and responses were compared to the pre-migration survey. The survey revealed that, since opening Sheffield, the following have greatly increased for participants:
• Player satisfaction (from 5.0/10 to 8.9/10);
• Perceived value for money per match (from 3.4/5 to 4.3/5);
• Perceived value for money per training (from 3.5/5 to 4.3/5);
• Net Promoter Score (from -43 to +67).
Calculating the contribution of the Sheffield and Liverpool hubs to the local economy
The annual socio-economic value of the Sheffield and Liverpool hub sites is calculated by applying the number of regular players across the two sites (21,685) to a socio-economic value model (see Methodology Chapter and Appendix 3).
In order to calculate the socio-economic value of the sites, the number of ‘regular’ players (defined as those who play at their local site at least once a month) is first calculated:
• There were 98,590 visitors to the Sheffield and Liverpool sites in 2019, of which 82,526 were players and 16,063 were spectators (see above);
• 95% of spectators are assumed to spectate less than once a month;
• Applying this assumption to the visitor data gives a total of 21,685 regular players at the Sheffield and Liverpool sites. This is equivalent to 26% of the total players in 2019.
Applying the number of regular players at the Sheffield and Liverpool hubs to a socio-economic model gives a local socio-economic value of £16.2m348. This comprises:
• £12.4m direct economic value: economic contribution of participants, volunteers and the value of over 200 people employed at the Sheffield and Liverpool sites;
• £2.4m health savings through physical and mental wellbeing benefits;
• £1.4m social value and 2.8m hours of social interaction.
See Appendix 3 for further details on the socio-economic model.
The revenue-generating facilities unique to the Football Foundation Hub concept provided £3.1m349 to the local economy in Sheffield and Liverpool in 2019 through the following services:
• Football revenue (kids football camps, pay and play) = £1.7m;• Café and bar revenue = £720,000;• Gym revenue350 = £680,000.
343Sheffield hubs scans (visitor) data, extern Fitness; Sheffield hubs scans (visitor) data, Pulse Fitness. Calculated from the number of unique visitors at each site.344Note data only 10 months of data available for Sheffield and Liverpool Jeffrey Humble sites. In these cases, the number of unique visitors over 12 months was calculated from the average number of unique visitors per month.345Assumes player age and gender split is consistent with visitor age and gender split.346Note: some children may be registered under their parents’ names. 347Sport Industry Research Centre. Sheffield hubs, Year 1 report, 2017.348Note this is likely an underestimation as it does not capture players who do not play regularly at the hubs, but play additional football elsewhere.349Pulse Fitness.350One Sheffield site and two Liverpool sites contain a gym.
9. APPENDICES (CONTINUED)

The Football Association Limited THE SOCIAL AND ECONOMIC VALUE OF GRASSROOTS FOOTBALL IN ENGLAND – SEPTEMBER 2020 123
The socio-economic value of grassroots football to regions and Local Authorities across England is calculated based on the number of people who live in each region or Local Authority using ONS data. The analysis assumes the distribution of regular football players by geography is equal to the distribution of population by geography351.
Table 14.1: The socio-economic value of adult and children’s grassroots football in England by geographical area
Note: Figures may not sum as distribution of football players is rounded to two decimal places and socio-economic value is rounded to the nearest integer.
Geographical area (region or local authority)
Distribution of regular football players
Socio-economic value of grassroots football (£)
North East 4.74% 481,590,162
County Durham 0.94% 95,615,617
Darlington 0.19% 19,264,573
Gateshead 0.36% 36,445,637
Hartlepool 0.17% 16,894,448
Middlesbrough 0.25% 25,429,244
Newcastle upon Tyne 0.54% 54,621,107
North Tyneside 0.37% 37,502,273
Northumberland 0.57% 58,158,979
Redcar and Cleveland 0.24% 24,738,408
South Tyneside 0.27% 27,232,271
Stockton-on-Tees 0.35% 35,596,613
Sunderland 0.49% 50,090,993
Geographical area (region or local authority)
Distribution of regular football players
Socio-economic value of grassroots football (£)
North West 13.04% 1,324,167,002
Allerdale 0.17% 17,633,624
Barrow-in-Furness 0.12% 12,093,952
Blackburn with Darwen 0.27% 27,001,391
Blackpool 0.25% 25,152,549
Bolton 0.51% 51,866,783
Burnley 0.16% 16,038,930
Bury 0.34% 34,449,789
Carlisle 0.19% 19,602,776
Cheshire East 0.68% 69,291,353
Cheshire West and Chester 0.61% 61,881,374
Chorley 0.21% 21,323,191
Copeland 0.12% 12,298,497
Eden 0.09% 9,605,501
Fylde 0.14% 14,570,679
Halton 0.23% 23,342,307
Hyndburn 0.14% 14,618,118
Knowsley 0.27% 27,211,708
Lancaster 0.26% 26,341,580
351Local Authority sample size in The FA Participation tracker is insufficient to analyse the distribution of regular football players at the local level. However, the pattern of distribution of regular football players at the regional level is similar to the distribution of population, providing confidence in the assumption. Note some Local Authorities have been grouped due to the format of the ONS data.
9. APPENDICES (CONTINUED)
APPENDIX 14 – BREAKDOWN OF SOCIO-ECONOMIC IMPACT BY LOCAL AREA

The Football Association Limited THE SOCIAL AND ECONOMIC VALUE OF GRASSROOTS FOOTBALL IN ENGLAND – SEPTEMBER 2020124
Geographical area (region or local authority)
Distribution of regular football players
Socio-economic value of grassroots football (£)
North West 13.04% 1,324,167,002
Liverpool 0.88% 89,834,243
Manchester 0.98% 99,721,669
Oldham 0.42% 42,768,677
Pendle 0.16% 16,614,687
Preston 0.25% 25,817,952
Ribble Valley 0.11% 10,982,663
Rochdale 0.40% 40,117,527
Rossendale 0.13% 12,893,554
Salford 0.46% 46,687,139
Sefton 0.49% 49,857,408
South Lakeland 0.19% 18,955,230
South Ribble 0.20% 19,983,367
St. Helens 0.32% 32,572,989
Stockport 0.52% 52,926,125
Tameside 0.40% 40,853,637
Trafford 0.42% 42,812,688
Warrington 0.37% 37,881,240
West Lancashire 0.20% 20,617,926
Wigan 0.58% 59,282,353
Wirral 0.58% 58,443,430
Wyre 0.20% 20,218,395
Geographical area (region or local authority)
Distribution of regular football players
Socio-economic value of grassroots football (£)
Yorkshire and the Humber 9.78% 992,596,753
Barnsley 0.44% 44,528,413
Bradford 0.96% 97,362,006
Calderdale 0.38% 38,141,160
Craven 0.10% 10,306,979
Doncaster 0.55% 56,257,107
East Riding of Yorkshire 0.61% 61,539,023
Hambleton 0.16% 16,521,252
Harrogate 0.29% 29,009,865
Kingston upon Hull, City of 0.46% 46,857,413
Kirklees 0.78% 79,326,507
Leeds 1.41% 143,062,315
North East Lincolnshire 0.28% 28,781,149
North Lincolnshire 0.31% 31,077,141
Richmondshire 0.10% 9,691,540
Rotherham 0.47% 47,873,465
Ryedale 0.10% 9,989,158
Scarborough 0.19% 19,617,026
Selby 0.16% 16,345,567
Sheffield 1.04% 105,492,762
Wakefield 0.62% 62,826,719
York 0.37% 37,990,187
9. APPENDICES (CONTINUED)

The Football Association Limited THE SOCIAL AND ECONOMIC VALUE OF GRASSROOTS FOOTBALL IN ENGLAND – SEPTEMBER 2020 125
Geographical area (region or local authority)
Distribution of regular football players
Socio-economic value of grassroots football (£)
East Midlands 8.59% 872,279,705
Amber Valley 0.23% 23,114,494
Ashfield 0.23% 23,073,188
Bassetlaw 0.21% 21,186,647
Blaby 0.18% 18,312,735
Bolsover 0.14% 14,531,357
Boston 0.12% 12,657,443
Broxtowe 0.20% 20,568,683
Charnwood 0.33% 33,522,843
Chesterfield 0.19% 18,921,320
Corby 0.13% 13,026,310
Daventry 0.15% 15,503,217
Derby 0.46% 46,410,805
Derbyshire Dales 0.13% 13,045,610
East Lindsey 0.25% 25,563,984
East Northamptonshire 0.17% 17,050,292
Erewash 0.20% 20,810,025
Gedling 0.21% 21,265,471
Harborough 0.17% 16,920,422
High Peak 0.16% 16,714,614
Hinckley and Bosworth 0.20% 20,406,887
Kettering 0.18% 18,357,829
Leicester 0.63% 63,893,095
Lincoln 0.18% 17,911,041
Mansfield 0.19% 19,717,314
Melton 0.09% 9,236,815
Newark and Sherwood 0.22% 22,081,667
North East Derbyshire 0.18% 18,301,191
North Kesteven 0.21% 21,088,524
Geographical area (region or local authority)
Distribution of regular football players
Socio-economic value of grassroots football (£)
East Midlands 8.59% 872,279,705
North West Leicestershire 0.18% 18,688,817
Northampton 0.40% 40,513,991
Nottingham 0.59% 60,046,782
Oadby and Wigston 0.10% 10,284,071
Rushcliffe 0.21% 21,497,794
Rutland 0.07% 7,201,826
South Derbyshire 0.19% 19,347,185
South Holland 0.17% 17,139,036
South Kesteven 0.25% 25,689,705
South Northamptonshire 0.17% 17,043,618
Wellingborough 0.14% 14,377,137
West Lindsey 0.17% 17,255,919
Geographical area (region or local authority)
Distribution of regular football players
Socio-economic value of grassroots football (£)
West Midlands 10.54% 1,070,350,932
Birmingham 2.03% 205,954,870
Bromsgrove 0.18% 18,016,019
Cannock Chase 0.18% 18,174,929
Coventry 0.66% 67,013,038
Dudley 0.57% 58,007,825
East Staffordshire 0.21% 21,600,608
Herefordshire, County of 0.34% 34,776,448
Lichfield 0.19% 18,895,346
Malvern Hills 0.14% 14,195,139
Newcastle-under-Lyme 0.23% 23,347,899
North Warwickshire 0.12% 11,771,983
Nuneaton and Bedworth 0.23% 23,427,624
Redditch 0.15% 15,378,939
9. APPENDICES (CONTINUED)

The Football Association Limited THE SOCIAL AND ECONOMIC VALUE OF GRASSROOTS FOOTBALL IN ENGLAND – SEPTEMBER 2020126
Geographical area (region or local authority)
Distribution of regular football players
Socio-economic value of grassroots football (£)
West Midlands 10.54% 1,070,350,932
Rugby 0.19% 19,649,132
Sandwell 0.58% 59,244,114
Shropshire 0.57% 58,285,602
Solihull 0.38% 39,028,424
South Staffordshire 0.20% 20,280,625
Stafford 0.24% 24,761,857
Staffordshire Moorlands 0.17% 17,755,197
Stoke-on-Trent 0.46% 46,243,598
Stratford-on-Avon 0.23% 23,466,405
Tamworth 0.14% 13,834,028
Telford and Wrekin 0.32% 32,441,135
Walsall 0.51% 51,493,047
Warwick 0.26% 25,929,423
Wolverhampton 0.47% 47,502,975
Worcester 0.18% 18,257,901
Wychavon 0.23% 23,346,456
Wyre Forest 0.18% 18,270,347
Geographical area (region or local authority)
Distribution of regular football players
Socio-economic value of grassroots football (£)
East 11.08% 1,124,830,445
Cambridge 0.22% 22,510,418
Castle Point 0.16% 16,301,556
Central Bedfordshire 0.51% 52,064,835
Chelmsford 0.32% 32,176,706
Colchester 0.35% 35,120,062
Dacorum 0.27% 27,915,350
East Cambridgeshire 0.16% 16,204,875
East Hertfordshire 0.27% 27,010,770
East Suffolk 0.44% 44,996,486
Epping Forest 0.23% 23,753,381
Fenland 0.18% 18,371,177
Great Yarmouth 0.18% 17,917,714
Harlow 0.15% 15,704,696
Hertsmere 0.19% 18,924,747
Huntingdonshire 0.32% 32,100,046
Ipswich 0.24% 24,695,659
King's Lynn and West Norfolk 0.27% 27,305,683
Luton 0.38% 38,429,219
Maldon 0.12% 11,711,016
Mid Suffolk 0.18% 18,740,043
North Hertfordshire 0.24% 24,092,666
North Norfolk 0.19% 18,909,956
Norwich 0.25% 25,355,831
Peterborough 0.36% 36,482,433
Rochford 0.16% 15,758,988
South Cambridgeshire 0.28% 28,695,111
South Norfolk 0.25% 25,411,206
Southend-on-Sea 0.33% 33,031,141
St Albans 0.26% 26,777,005
Geographical area (region or local authority)
Distribution of regular football players
Socio-economic value of grassroots football (£)
East 11.08% 1,124,830,445
Babergh 0.16% 16,600,978
Basildon 0.33% 33,765,988
Bedford 0.31% 31,257,516
Braintree 0.27% 27,525,921
Breckland 0.25% 25,246,705
Brentwood 0.14% 13,892,650
Broadland 0.23% 23,589,962
Broxbourne 0.17% 17,546,683
9. APPENDICES (CONTINUED)
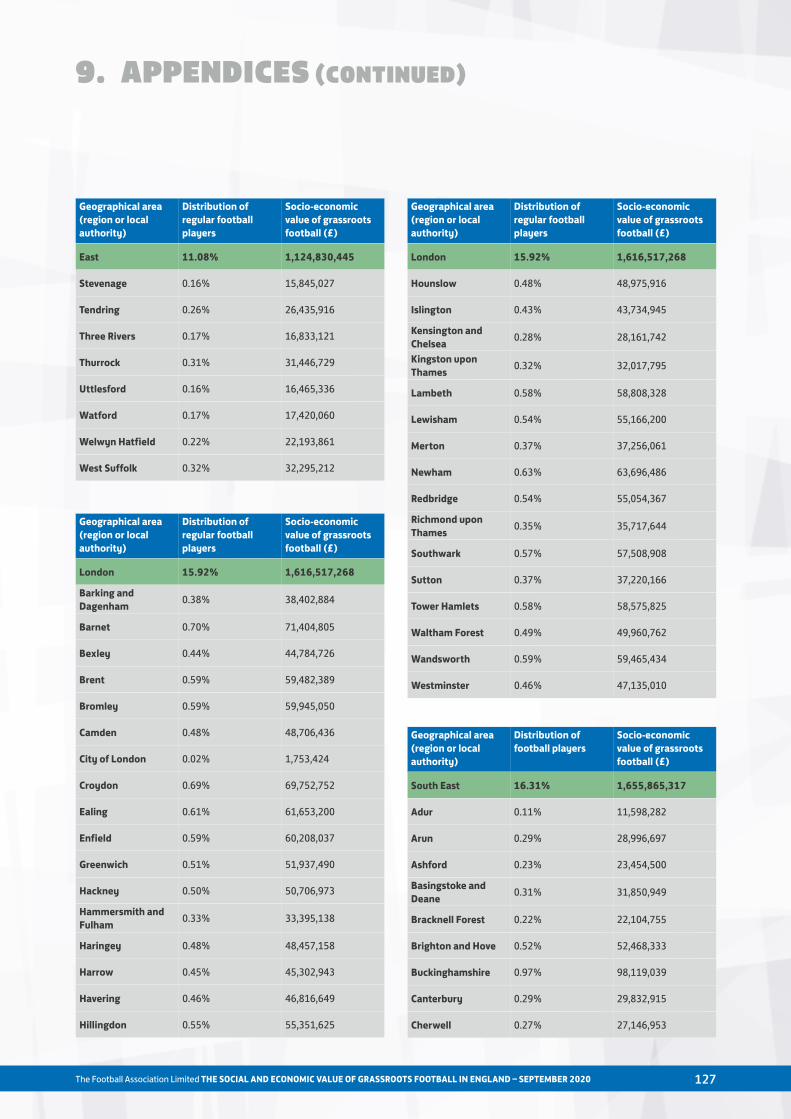
The Football Association Limited THE SOCIAL AND ECONOMIC VALUE OF GRASSROOTS FOOTBALL IN ENGLAND – SEPTEMBER 2020 127
Geographical area (region or local authority)
Distribution of regular football players
Socio-economic value of grassroots football (£)
East 11.08% 1,124,830,445
Stevenage 0.16% 15,845,027
Tendring 0.26% 26,435,916
Three Rivers 0.17% 16,833,121
Thurrock 0.31% 31,446,729
Uttlesford 0.16% 16,465,336
Watford 0.17% 17,420,060
Welwyn Hatfield 0.22% 22,193,861
West Suffolk 0.32% 32,295,212
Geographical area (region or local authority)
Distribution of football players
Socio-economic value of grassroots football (£)
South East 16.31% 1,655,865,317
Adur 0.11% 11,598,282
Arun 0.29% 28,996,697
Ashford 0.23% 23,454,500
Basingstoke and Deane 0.31% 31,850,949
Bracknell Forest 0.22% 22,104,755
Brighton and Hove 0.52% 52,468,333
Buckinghamshire 0.97% 98,119,039
Canterbury 0.29% 29,832,915
Cherwell 0.27% 27,146,953
Geographical area (region or local authority)
Distribution of regular football players
Socio-economic value of grassroots football (£)
London 15.92% 1,616,517,268
Barking and Dagenham 0.38% 38,402,884
Barnet 0.70% 71,404,805
Bexley 0.44% 44,784,726
Brent 0.59% 59,482,389
Bromley 0.59% 59,945,050
Camden 0.48% 48,706,436
City of London 0.02% 1,753,424
Croydon 0.69% 69,752,752
Ealing 0.61% 61,653,200
Enfield 0.59% 60,208,037
Greenwich 0.51% 51,937,490
Hackney 0.50% 50,706,973
Hammersmith and Fulham 0.33% 33,395,138
Haringey 0.48% 48,457,158
Harrow 0.45% 45,302,943
Havering 0.46% 46,816,649
Hillingdon 0.55% 55,351,625
Geographical area (region or local authority)
Distribution of regular football players
Socio-economic value of grassroots football (£)
London 15.92% 1,616,517,268
Hounslow 0.48% 48,975,916
Islington 0.43% 43,734,945
Kensington and Chelsea 0.28% 28,161,742
Kingston upon Thames 0.32% 32,017,795
Lambeth 0.58% 58,808,328
Lewisham 0.54% 55,166,200
Merton 0.37% 37,256,061
Newham 0.63% 63,696,486
Redbridge 0.54% 55,054,367
Richmond upon Thames 0.35% 35,717,644
Southwark 0.57% 57,508,908
Sutton 0.37% 37,220,166
Tower Hamlets 0.58% 58,575,825
Waltham Forest 0.49% 49,960,762
Wandsworth 0.59% 59,465,434
Westminster 0.46% 47,135,010
9. APPENDICES (CONTINUED)

The Football Association Limited THE SOCIAL AND ECONOMIC VALUE OF GRASSROOTS FOOTBALL IN ENGLAND – SEPTEMBER 2020128
Geographical area (region or local authority)
Distribution of football players
Socio-economic value of grassroots football (£)
South East 16.31% 1,655,865,317
Chichester 0.22% 21,848,623
Crawley 0.20% 20,275,755
Dartford 0.20% 20,311,288
Dover 0.21% 21,307,859
East Hampshire 0.22% 22,061,285
Eastbourne 0.18% 18,712,987
Eastleigh 0.24% 24,095,192
Elmbridge 0.24% 24,674,375
Epsom and Ewell 0.14% 14,543,082
Fareham 0.21% 20,965,508
Folkestone and Hythe 0.20% 20,381,635
Gosport 0.15% 15,302,640
Gravesham 0.19% 19,289,104
Guildford 0.26% 26,875,489
Hart 0.17% 17,509,526
Hastings 0.16% 16,713,712
Havant 0.22% 22,766,911
Horsham 0.26% 25,936,278
Isle of Wight 0.25% 25,571,920
Lewes 0.18% 18,626,948
Maidstone 0.31% 30,993,086
Medway 0.49% 50,244,492
Mid Sussex 0.27% 27,240,568
Milton Keynes 0.48% 48,603,261
Mole Valley 0.16% 15,736,802
New Forest 0.32% 32,482,982
Oxford 0.27% 27,499,406
Portsmouth 0.38% 38,763,453
Reading 0.29% 29,181,040
Geographical area (region or local authority)
Distribution of football players
Socio-economic value of grassroots football (£)
South East 16.31% 1,655,865,317
Reigate and Banstead 0.26% 26,830,396
Rother 0.17% 17,330,414
Runnymede 0.16% 16,129,839
Rushmoor 0.17% 17,063,279
Sevenoaks 0.21% 21,780,261
Slough 0.27% 26,973,072
South Oxfordshire 0.25% 25,623,508
Southampton 0.45% 45,548,253
Spelthorne 0.18% 18,009,345
Surrey Heath 0.16% 16,108,374
Swale 0.27% 27,071,016
Tandridge 0.16% 15,896,254
Test Valley 0.22% 22,756,089
Thanet 0.25% 25,599,157
Tonbridge and Malling 0.23% 23,837,075
Tunbridge Wells 0.21% 21,414,822
Vale of White Horse 0.24% 24,532,240
Waverley 0.22% 22,786,392
Wealden 0.29% 29,126,026
West Berkshire 0.28% 28,580,392
West Oxfordshire 0.20% 19,957,213
Winchester 0.22% 22,521,421
Windsor and Maidenhead 0.27% 27,312,718
Woking 0.18% 18,180,521
Wokingham 0.30% 30,865,561
Worthing 0.20% 19,944,045
9. APPENDICES (CONTINUED)

The Football Association Limited THE SOCIAL AND ECONOMIC VALUE OF GRASSROOTS FOOTBALL IN ENGLAND – SEPTEMBER 2020 129
Geographical area (region or local authority)
Distribution of football players
Socio-economic value of grassroots football (£)
South West 9.99% 1,014,553,601
Bath and North East Somerset 0.34% 34,863,208
Bournemouth, Christchurch and Poole 0.70% 71,307,763
Bristol, City of 0.82% 83,581,549
Cornwall 1.01% 102,737,537
Dorset 0.67% 68,273,317
Isles of Scilly 0.00% 401,154
North Somerset 0.38% 38,789,969
Plymouth 0.47% 47,276,244
South Gloucestershire 0.51% 51,423,602
Swindon 0.39% 40,078,025
Torbay 0.24% 24,578,596
Wiltshire 0.89% 90,191,745
East Devon 0.26% 26,385,952
Exeter 0.23% 23,702,155
Mid Devon 0.15% 14,846,833
North Devon 0.17% 17,522,513
South Hams 0.15% 15,693,332
Teignbridge 0.24% 24,199,629
Torridge 0.12% 12,313,649
West Devon 0.10% 10,064,194
Cheltenham 0.21% 20,978,675
Cotswold 0.16% 16,208,843
Forest of Dean 0.15% 15,654,912
Gloucester 0.23% 23,291,441
Stroud 0.21% 21,638,486
Tewkesbury 0.17% 17,139,036
Mendip 0.21% 20,848,986
Sedgemoor 0.22% 22,218,211
Somerset West and Taunton 0.28% 27,978,842
South Somerset 0.30% 30,365,201
9. APPENDICES (CONTINUED)

The Football Association Limited THE SOCIAL AND ECONOMIC VALUE OF GRASSROOTS FOOTBALL IN ENGLAND – SEPTEMBER 2020130

19555