The Grassroots of Green Revolution - The University of Vermont
292
-
Upload
khangminh22 -
Category
Documents
-
view
0 -
download
0
Transcript of The Grassroots of Green Revolution - The University of Vermont


The Grassroots of a Green Revolution

This Page Intentionally Left Blank

The Grassroots of a Green Revolution
Polling America on the Environment
Deborah Lynn Guber
The MIT Press
Cambridge, Massachusetts
London, England
( 2003 Massachusetts Institute of Technology
All rights reserved. No part of this book may be reproduced in any form by anyelectronic or mechanical means (including photocopying, recording, or informa-tion storage and retrieval) without permission in writing from the publisher.
This book was set in Sabon on 3B2 by Asco Typesetters, Hong Kong.Printed and bound in the United States of America.
Library of Congress Cataloging-in-Publication Data
Guber, Deborah Lynn.The grassroots of green revolution : polling America on the environment /Deborah Lynn Guber.p. cm.
Includes bibliographical references and index.ISBN 0-262-07238-6 (hc. : alk. paper) — ISBN 0-262-57160-9 (pbk. : alk.paper)1. Environmentalism—United States—Public opinion—History—20thcentury. 2. Environmental protection—United States—Public opinion—History—20th century. 3. Public opinion—United States. I. Title.GE197 .G84 2003363.7 00525—dc21 2002070329

For my parents,
for reasons more than words can say.
And for my nephew Ethan,
who reminds me
so much of his mother.

This Page Intentionally Left Blank

Contents
Acknowledgments ix
Introduction: Environmental Concern and the Politics of Consensus 1
I Attitudes 17
1 Direction: Do Americans Favor Environmental Protection? 19
2 Strength: How Deep Is Public Commitment to the
Environment? 37
3 Stability: Have Environmental Attitudes Changed over Time? 57
4 Distribution: Is Environmentalism Elitist? 71
5 Constraint: Are Environmental Attitudes Inconsistent? 89
II Behavior 103
6 The Ballot Box I: Issue Voting and the Environment in Presidential
Elections 105
7 The Ballot Box II: Environmental Voting on Statewide Ballot
Propositions 125
8 The Marketplace: Motivating the Citizen-Consumer 153
Conclusion: Rethinking Environmentalism 175
Appendix: A Note on Data Sources 189
Notes 205
References 245
Index 273

This Page Intentionally Left Blank

Acknowledgments
As with almost any project that demands a level of dedication best mea-
sured in years, the evolution of this book has followed a long and circu-
itous path. While I was a graduate student at Yale University in the
mid-1990s, a project that was conceived of initially as a seminar paper
quickly grew into a series of conference presentations and finally into a
doctoral dissertation. With the invaluable input of academic advisors,
panel discussants, anonymous manuscript referees, faculty colleagues,
and students, that work eventually matured into a series of articles pub-
lished in scholarly journals, which were transformed yet again with fresh
data and better ideas into what appears on paper here. Any remaining
errors are, of course, mine alone.
I laud the efforts of Clay Morgan, Sara Meirowitz, and Deborah
Cantor-Adams at the MIT Press. Their collective and keen attention to
detail has improved this manuscript in a myriad of ways. I am indebted
to Riley E. Dunlap and Christopher J. Bosso for their detailed comments
and enthusiastic suggestions. Without their guidance this project would
be far less satisfying. I am grateful also to my colleagues at the University
of Vermont for creating an atmosphere in which I have felt challenged
intellectually and welcomed personally. In particular, I would like to
thank Candace Smith and Carol Tank-Day for their gracious adminis-
trative support; Howard Ball, Phillip Cooper, and Robert Taylor for
their willingness to read my manuscript while it was in various stages of
disorder; Caroline Beer, for her methodological and statistical savvy;
Frank Bryan for his lightning wit and boundless wisdom; Gregory Gause
for countless hours of advice, much of which (to my discredit) I did not

follow; and Robert Kaufman, who likes to think of himself as my tor-
mentor but who is in secret one of the nicest men I know.
I would also like to recognize those teachers who have inspired me
throughout the years to think hard and work harder and who have
been mentors in the truest sense of the word, including John Salamone,
Donald C. Baumer, Roger T. Kaufman, Catherine Rudder, Donald P.
Green, John P. Wargo, and Sarah McMahon. And finally, I am grateful
beyond words to family and friends who persevered alongside me in this
journey, most especially to those two who did not live to see its end. By
supporting me always with great forbearance and a healthy sense of
humor, this book is in many ways yours as well as mine.
x Acknowledgments

The Grassroots of a Green Revolution

This Page Intentionally Left Blank

Introduction
Environmental Concern and the Politics of
Consensus
In the main, the notion of consensus has sprung from the inventive minds oftheorists untainted by acquaintance with mass attitudes.
—V. O. Key, Jr.1
In the generation that has passed since the first Earth Day in 1970, envi-
ronmentalism has become woven into the fabric of American life. Con-
cern for environmental quality has spawned extraordinary changes in
how we think, work, and recreate, in what we buy, and how we govern.
Words like ‘‘ecology,’’ ‘‘acid rain’’ and ‘‘global warming’’ have become
common in the lexicon of our language, sorting newspapers, bottles,
and cans into bins a daily household ritual. Indeed, society has been so
altered by environmentalism it is easy to overlook the distance of thirty
years, backwards in time to the nascent social movement that was, and
forward again to the mature evolution of science and law it has become.
Today, environmentalism is a part of our popular culture and a re-
flection of modern sensibility, reinforced by what we read, see, and hear
in books and magazines, on television, and at the movie theater. Our
collective consciousness has been raised by the writings of those Charles
Rubin calls ‘‘popularizers,’’ including Rachel Carson, Barry Commoner,
Paul Ehrlich, and the Club of Rome.2 The authors of children’s books
promote environmental themes,3 product placements on popular televi-
sion shows send subtle environmental cues,4 motion pictures like Erin
Brockovich and A Civil Action remind us of what we fear and who we
should blame.5 As one newspaper columnist wryly observed, ‘‘Mother-
hood and apple pie, baseball and the flag—all may be subjects of con-
troversy. But the environment is almost beyond debate these days.’’6

V. O. Key, arguably the founding father of modern scholarship on
public opinion, had a word for such a pattern. He called it (simply
enough) consensus, although he also warned that it was a ‘‘nebulous
term’’ with many meanings, full of uncertainty, with the potential to ob-
scure as much as it illuminates.7 For Key, however, identifying the pres-
ence or absence of consensus was only the first step, and a relatively
straightforward one at that, at least in comparison to the true task of
determining its impact on the political system. While he found that under
some conditions overwhelming public agreement on an issue performed
a ‘‘decisive’’ function, forcing change in existing policies and programs,
at other times its influence was less pronounced. In some cases, he
speculated, the function of consensus was merely ‘‘supportive’’ of gov-
ernment; on other occasions it was surprisingly ‘‘permissive,’’ allowing
government to act largely without fear of popular dissent or electoral
reprisal. In some ways, too, the appearance of consensus might even be
‘‘contrived’’ to suit political needs and purposes. The product of many
different things, all consensus was not created equal.
Within that context, acknowledging that public attitudes on the envi-
ronment approach consensus is clearly not enough. Given the need to
translate words into action, to use the word consensus (even judiciously)
reveals little about its long-term political impact, at least from the
bottom up. On that note, confusion abounds. Since 1970, surveys have
demonstrated widespread public concern for a growing list of environ-
mental problems, including air and water pollution, nuclear power,
energy conservation, deforestation, and urban sprawl. Public opinion
polls likewise show that the environmental movement has earned the
sympathetic support of a large majority of Americans, many of whom
claim the label environmentalist as their own. But what do the numbers
that underlie such research ultimately mean? Is environmentalism a
shallow consensus likely to soften in the face of ambivalence, as Ameri-
can voters and consumers experience the costs of reform firsthand? Is it
an enduring social concern or a fleeting political fashion subject to the
nature-of-the-times as the economy shifts from prosperity into recession?
Does growing support for environmental protection indicate a funda-
mental shift in American values and lifestyles, or is it merely an uncon-
troversial ‘‘motherhood’’ issue that engenders automatic support without
personal commitment or lasting political consequences?
2 Introduction

Satisfying answers are not immediately apparent—to environmen-
talists committed to translating public sympathy into political currency,
politicians held responsible for answering constituent demands, scientists
and policymakers frustrated by public misperceptions and misdirected
fears, marketing executives charged with identifying and satisfying envi-
ronmentally concerned consumers, or academics who continue to dis-
agree. No one quite seems to know what to make of the environment.
The State of the Movement
If the celebrations marking the thirtieth anniversary of Earth Day are any
indication, the news for environmentalists is both good and bad. Envi-
ronmental causes resonate with most Americans, to be sure—83 percent
of those polled in an April 2000 Gallup poll readily agreed with the
broadest goals of the environmental movement—but when asked to rate
their own commitment to the cause, just 16 percent said they were
‘‘active participants,’’ while more than half admitted they were sympa-
thetic but uninvolved.10 These statistics run parallel with broader trends
in declining membership among some national environmental organi-
zations since 1990.9
Moreover, when asked to rate the seriousness of various problems
on the national agenda in a comparative sense, respondents ranked the
environment well behind other issues and concerns, including drug use,
crime and violence, health care, and homelessness. If Americans are
environmentalists, Hal Rothman suspects they are ‘‘half-hearted’’ ones,
at best, and are unwilling to face difficult choices and altered lifestyles. In
fact, he writes in The Greening of a Nation? (1998) that the contempo-
rary environmental movement has become, ironically, a ‘‘victim of its
own successes.’’ By finding appeal in popular culture, he warns, it has
become too easy, to pay ‘‘lip service to the concepts of environmental-
ism without engaging in the behaviors necessary to turn concepts into
action.’’10
Motivating and sustaining the political activism of average Americans
has been an uphill battle for the environmental movement from the start.
Communicating the complex nature of environmental destruction to a
lay public that is not expert in science and technology required ‘‘popu-
larizers’’ like Rachel Carson and Barry Commoner to resort to stories
Introduction 3

and simplifications. According to Charles Rubin, the unintended conse-
quence of this approach was to create a ‘‘public taste’’ for grand tales of
ecological disaster. Books like Carson’s Silent Spring (1962) and Com-
moner’s The Closing Circle (1971), he says, became
the intellectual equivalent of a gothic romance, with a large cast of characters,involuted relationships, and a lurking menace. But the public’s ability to appre-ciate the delicate balances and interrelationships of political and social structureshas undergone a corresponding debasement, evident in rampant sloganeering,shameless emotionalism, and mindless panic and pessimism whenever ‘‘what iswrong with our society’’ comes under discussion. In this realm, only the crudestmorality tales satisfy. Carson and Commoner have alerted us to matters that maywell demand our attention. But they have done so at the cost of our ability togive that attention in a thoughtful way.11
In short, by downplaying environmental progress and by using exagger-
ated doomsday warnings to motivate public awareness and concern, the
environmental movement has sacrificed its own credibility by giving in to
the politics of chicken little.12
It is a common complaint among recent critics of the environmental
movement, one voiced by Mark Dowie in Losing Ground (1995) and
even more forcefully by Gregg Easterbrook in A Moment on the Earth
(1995) and Bjorn Lomborg in The Skeptical Environmentalist (2001),
but it is, in many ways, difficult to deny.13 As David Brower, former
executive director of the Sierra Club, remarked in an Earth Day 2000
interview: ‘‘All I’ve done in my career is slow the rate at which things get
worse. Basically, that’s all the environmental movement has done during
the past thirty years.’’14 Or as Donella Meadows, of Limits to Growth
fame, recently wrote in her syndicated newspaper column: ‘‘If in the 30
Earth Day celebrations since 1970, the human population and economy
have become any more respectful of the Earth, the Earth hasn’t noticed.’’
Ultimately, she too refuses to give in to the ‘‘die-hard optimists.’’15
In the end, the occasion marked by both Brower and Meadows—the
annual celebration of Earth Day—is a prime example of the fundamental
tension between popularity and ideology.16 While environmentalists
continue to blame many of the earth’s problems on rampant over-
consumption, organizers of recent Earth Day events were nonetheless
quick to offer T-shirts, tote bags, coffee mugs, solar calculators, and
hemp backpacks for sale to an appreciative audience, the gross sum of
4 Introduction

which prompted some observers to complain that Earth Day had become
little more than a commercial occasion, overrun by ‘‘vacuous celebri-
ties.’’17 In the past, too, others have noted the hypocrisy of allowing
polluters the privilege of ‘‘greenwashing’’ their records by signing on as
corporate sponsors of Earth Day events.18 Following Earth Day 1990 in
New York City, during which two hundred thousand people gathered in
Central Park, creating almost forty-five tons of garbage, Rothman com-
plained, ‘‘It is entirely possible that the planet might have been better off
if they had just stayed home.’’19
The Political Arena
If environmentalists have struggled in a public relations war, politicians
have not fared much better in gauging their voting leeway on an issue
marked by a combination of chronic low salience and high issue sup-
port.20 It was low salience that led the Reagan administration in the
early 1980s to assume that the public would be willing to back away
from strict environmental regulations to revitalize the economy. Yet
environmental concern and public furor soon galvanized over political
appointees such as James Watt and Anne Burford, eventually forcing
Reagan to change course by substituting administrators more sensitive to
environmental causes.
After a sustained period of public outrage, however, the environment
failed to materialize as a significant issue during Reagan’s campaign for
reelection in 1984. Looking at his meager environmental record, his un-
rivaled attention to deregulation and economic growth, and the lingering
controversy over his appointments of Watt and Burford, many environ-
mentalists believed the Reagan record would lead to political liability
at the ballot box.21 Even though polls suggested that voters were both
aware and disapproving of Reagan’s record on the environment, in the
end the issue had little effect on his political success.22
Nearly every politician on the national scene has had to contend with
the public’s mixed signals on the environment ever since. Campaigning
for president in 1988, Republican candidate George Bush pledged to be
an ‘‘environmental president’’ in the grand tradition of Teddy Roosevelt,
and yet during an economic slump just four years later Bush seemed to
Introduction 5

reverse course, insisting instead that it was ‘‘time to put people ahead
of owls.’’23 Even Al Gore, whose strong environmental convictions
made him an attractive running mate for Democrats in 1992, has since
turned cautious, tempering his environmental views during his own
quest for the White House during the 2000 presidential campaign.24 As
The Economist noted: ‘‘Despite his talk of bold measures and radical
solutions . . . what he offers is virtue without sacrifice. As a political pro-
gramme this is hard to beat,’’ but it does little to help the environment.25
Gore’s political dithering notwithstanding, Republicans have tradi-
tionally faced the most significant ideological challenge on environmental
issues.26 An overwhelming number of Americans favor environmental
protection through government intervention in the market economy,
a principle resisted by fiscal conservatives. At the same time, however,
‘‘a strong backlash’’ has developed against environmental regulations
that are viewed as ‘‘intrusive, bureaucratic, and overly protective,’’
opening to the door to an odd triangulation.27 Following a Republican
sweep in Congress in 1994, the new partisan majority was quick to pro-
pose cuts in the budget for the U.S. Environmental Protection Agency
and amendments that would have weakened the Clean Water Act and
the Endangered Species Act. Republicans moved to safeguard private
property rights, close parts of the national park system, and increase oil
drilling in the Arctic National Wildlife Refuge. Yet under pressure not
long after, House Speaker Newt Gingrich (Republican-Georgia) sought a
rapid public relations retreat, admitting that Republican proposals were
in fact ‘‘strategically out of position on the environment.’’28
Understanding Risk
Confusion and frustration over the political impact of environmental
concern extends well beyond the strategies used by candidates to win
elections. Given the need to justify federal regulatory decisions on the
basis of science, it also includes the growing field of risk communication.
‘‘Any one of us might be harmed by almost anything,’’ writes Stephen
Breyer in Breaking the Vicious Circle (1993)—‘‘a rotten apple, a broken
sidewalk, an untied shoelace, a splash of grapefruit juice, a dishonest
lawyer.’’29 It is, of course, the responsibility of government (and by ex-
6 Introduction

tension the experts they employ) to decide which of those multitude of
risks merit regulation and which do not. According to Breyer, however,
several factors intrude on our ability to rank those risks wisely, not
the least of which involve public misperceptions and exaggerated fears,
factors he says ‘‘impede rational understanding.’’30
Scholars have long recognized that public perceptions of risk often
collide with what experts judge to be objective probabilities of harm.
While scientists cite motor vehicle use, smoking, and alcohol consump-
tion as three of the riskiest activities of modern life, lay people instead
believe nuclear power to top that list, often underestimating fatalities
caused by less ‘‘dramatic’’ accidents and diseases, while overemphasizing
the magnitude of danger to be found in new technologies.31
The same gap between the concerns of average Americans and those
of policymakers can be found across a wide range of environmental
problems. While environmentalists promote global warming, ozone de-
pletion, deforestation, and loss of habitat for endangered wildlife, re-
spondents in public opinion polls are far more likely to worry about
mainstay issues like air and water pollution. As Jonathan Rauch, a
columnist for the National Journal, recently observed: ‘‘The public’s
priorities almost perfectly invert the environmental movement’s prior-
ities. Perversely, the aspirations of Gore-era environmentalism are now
blocked by the public’s commitment to Nixon-era environmentalism.’’32
In the end, this disjunction has significant consequences for policy-
makers. According to Breyer, without better risk communication from
the top down, public attitudes toward environmental risks often remain
stubborn and unyielding, warping political priorities and pressuring
scarce resources of time and money into all the wrong places.33
In Search of the Green Consumer
While environmentalists measure support for the environment using
membership rolls, politicians rely on votes, and scientific experts depend
on public trust, corporate America has hoped to translate rising envi-
ronmental concern into increased sales in the marketplace. Driven by the
desire of American businesses to exploit consumer demand, great effort
over the past two decades has been spent on identifying and targeting
Introduction 7

the ‘‘ecologically concerned consumer.’’ Despite what some environmen-
talists feel is an obvious oxymoron, today’s eco-market offers an un-
usually diverse collection of products and services—from phosphate-free
detergents and recycled paper products, to electric cars, environmen-
tally responsible mutual funds, solar mosquito repellents, and herbal flea
collars.34
The results have been decidedly mixed, despite the involvement of visi-
ble corporate giants like Proctor & Gamble, Wal-Mart, and McDonald’s.
While most studies find that deep commitment to the environment is
concentrated in the hands of a privileged few—ranging from 5 to 25
percent of the U.S. population, depending on the stringency of the
criteria used35—public willingness to purchase certain environmentally
friendly products runs surprisingly deep, even at slightly higher cost. A
1992 survey, for example, found that nearly three-quarters of consumers
were ‘‘at least sometimes’’ influenced by environmental claims in the
marketplace, and most appeared willing to pay at least 5 percent more
for products known to be environmentally safe.36
While some have welcomed environmentalism as ‘‘the political, eco-
nomic, and social trend of the ’90s,’’ others suspect that when pressed
Americans fail to put their money where their mouth is.37 For example,
despite evidence that many Americans prefer and indeed are willing
(when asked in surveys) to pay a premium price for environmentally safe
products, Universal Product Code (UPC) scanner data and panel studies
that trace actual buying behavior often paint a more lackluster picture.
The ‘‘Study of Media and Markets’’ by Simmons Market Research
Bureau finds that the products that consumers purchase ‘‘most often’’
(such as aerosol sprays and radial tires) are frequently at odds with their
environmental preferences and their stated willingness to purchase sub-
stitutes.38 As one observer put it, environmental concern alone does not
always ‘‘make the cash register ring.’’39
Getting It Right
The four brief vignettes presented above crisscross a wide range of
experiences and disciplines, and yet all illustrate the importance of
8 Introduction

achieving a better understanding of public opinion on environmental
issues.
First and foremost, to study the success of the environmental move-
ment from the bottom up means confronting a movement that is, para-
doxically, both strong and weak. Widespread and well-meaning public
concern at the grassroots level has become one of the most impressive
findings in recent survey research, and yet it is a resource environ-
mentalists have been unable (or unwilling) to capitalize on fully. On the
one hand, the discomfort some environmentalists feel toward the ideo-
logical impurity of their rank and file leads, at times, to evangelical and
exclusionary rhetoric. On the other, motivating public outrage by instill-
ing fear seems a short-sighted solution to a long-range problem, one that
ultimately risks the credibility of the movement itself and leaves sym-
pathetic supporters feeling demoralized about the insignificance of their
efforts.
As Matt Ridley and Bobbi Low remind us, ‘‘At the center of all envi-
ronmentalism lies a problem: whether to appeal to the heart or to the
head—whether to urge people to make sacrifices on behalf of the planet
or to accept that they will not, and instead rig the economic choices so
that they find it rational’’ to behave responsibly in any event.40 Environ-
mentalists, they believe, will never achieve their goals simply by occupy-
ing the moral high ground. If they are to motivate and mobilize latent
support among average Americans, environmentalists need to become
more proficient at communicating with the public by first understanding
the root of its concerns.41
Second, politicians unsure of whether to court, fear, or ignore the
‘‘green’’ vote would also do well to scrutinize the factors that underlie
public attitudes toward the environment. As politicians from both sides
of the political fence learn to embrace the environmental issue as their
own, the ability to harness latent public concern seems likely to become
an increasingly important political and electoral skill, creating, in Chris-
topher Bosso’s words, ‘‘opportunities for leadership that may or may not
be exploited.’’42 While motivating environmentally conscious voters at
the ballot box may not be easy or fail-safe, it is surely a strategy worth
research and investigation, especially in close races, where victory is won
at the margins.
Introduction 9

On other political fronts, as the arena of science and policymaking
becomes ever more democratic, the need for effective risk communication
between experts and the lay public likewise becomes critical. Faced with
a public that is unable to distinguish good science from ‘‘junk science,’’
the political process designed to mediate between both sources of in-
formation is frequently plagued by uncertainty and distrust. As Breyer
notes, ‘‘To change public reaction, one would either have to institute
widespread public education in risk analysis or generate greater public
trust in some particular group of experts or the institutions that employ
them.’’43 But to achieve either goal requires a firm understanding of how
attitudes develop and how they adapt in response to new knowledge and
information.
Finally, understanding environmental attitudes as a stimulus to
marketplace behavior is clearly important to Madison Avenue, where
advertisers struggle to hone and refine their environmental messages on
product labels. With a number of visible false starts and missteps, cor-
porations looking to expand their markets further need to understand
more than narrow consumer preferences. Given that many environmen-
tal issues span the chasm between public and private, blurring lines of
distinction between citizen and consumer, political attitudes toward the
environment will likely become important in understanding individual
economic decisions.
The Academic Divide
Given increased attention and a continued state of controversy, it might
seem reasonable to assume that in the academic disciplines considerable
progress already has been made toward understanding the origins and
importance of public opinion on environmental issues. ‘‘Instead,’’ as
Kent Van Liere and Riley Dunlap deplore, even on relatively simple
questions, such as the social and demographic bases of environmental
concern, ‘‘one finds considerable dissensus with respect to both the evi-
dence itself and its interpretation.’’44
For instance, in Progress and Privilege: America in the Age of
Environmentalism (1982), William Tucker insists that ‘‘At heart,
10 Introduction

environmentalism favors the affluent over the poor, the haves over the
have-nots.’’45 Yet Mark Sagoff disagrees, despite a lingering misper-
ception, and argues that environmentalism ‘‘serves as a common rallying
ground for groups usually thought to be at odds with one another: edu-
cated professionals and the lower middle class; affluent suburbanites and
inhabitants of small towns in the American heartland.’’46 As such, he
adds, environmentalism represents an entirely new breed of populism.
Strengthened by cross-cutting cleavages, it is a movement centered not
on elitist principles but rather around a sense of community and the
integrity of place.
Other disagreements continue to be fought in the pages of scholarly
books and journals as well. A few examples illustrate the point:
. David Gelernter contends that ‘‘There is no such thing on the politicalscene as an ‘anti-environmentalist,’ no cogent intellectual position by
that name,’’47 and yet Jacqueline Vaughn Switzer charts a growing
ideological challenge from the grassroots—a resentment and distrust of
political and environmental leaders that she believes amounts to an
effective ‘‘green backlash.’’48
. Anthropologists Willett Kempton, James Boster, and Jennifer Hartley
believe that environmental activists ‘‘have more or less the same beliefs
as other Americans,’’ despite media stereotypes to the contrary.49
Richard Ellis and Fred Thompson, however, disagree. They find that
‘‘Americans do not behave more like environmental activists because
culturally they are quite unlike them.’’ To suppose otherwise, they say, is
to ‘‘miss the rival value systems that undergird environmental policy
debates.’’50
. Laura Lake comments on the ‘‘depth and longevity of the environ-
mental mandate,’’51 and yet polling expert William Schneider speculates
that ‘‘because the consensus is so broad, it is not likely to have much
impact on politics.’’52 Like Lake, Riley Dunlap insists that success on key
environmental initiatives and referendums proves that Americans are
willing to take a stand on environmental issues, especially when elected
representatives fail to do so,53 but in Earth Rising (2000) Philip Shabec-
off notes that the environment has been a ‘‘minor, rather ineffectual
player in the electoral process.’’54
Introduction 11

In short, despite a growing field of academic expertise spanning poli-
tics, economics and the sciences, few uncontested answers have emerged
to a ever growing laundry list of questions.
An Overview of This Book
‘‘To speak with precision of public opinion,’’ said V. O. Key, is a task
not unlike coming to grips with the Holy Ghost.‘‘55 This book faces that
challenge head on—by exploring the ironies, myths, inconsistencies, and
tensions that characterize public thinking on environmental issues. To
reach that goal, the essays that follow use original analyses of public
opinion polls to break the problem into component parts—into those
descriptive pieces Key referred to as ‘‘properties’’ or ‘‘qualities’’ of public
opinion. Then, much like a jigsaw puzzle, the conclusion of this book
reassembles those pieces back into a coherent whole, one that ultimately
weighs the significance of environmental concern in the arena of U.S.
politics and policy and provides some pragmatic advice for decision
makers. It proceeds in the following order.
Direction
Chapter 1 opens with the deceptively simple task of characterizing the
direction of public attitudes on environmental issues. Surely we might
expect clear answers and little variance here, since a preponderance of
surveys demonstrate that almost ‘‘everybody is an environmentalist these
days.’’56 But in the end, results are surprisingly complex, demonstrating
that while environmental consensus exists on the idea of environmental
protection, it does not always extend to the means used to achieve those
goals. Conclusions here also reinforce the need to pay careful attention
to potential biases embedded in survey questions and design, particularly
in those polls sponsored by organizations with a vested interest in the
outcome.
Strength
The direction of opinion is refined further by adding attitude strength
into the mix in chapter 2. A crucial consideration to early scholars such
as James Bryce and A. Lawrence Lowell, as well as to more modern
12 Introduction

academics like V. O. Key, Howard Schuman, and Stanley Presser, the
question of intensity, says Key, clearly ‘‘puts us on the trail of a signifi-
cant aspect of the place of opinion in the governing process.’’57 Using
measures of willingness-to-pay (WTP) as well as counterarguments and
trade-offs that force respondents to consider the costs of achieving envi-
ronmental goals relative to other priorities, survey data here largely con-
firm what scholars have suspected all along: Americans are quick to
embrace environmental issues but reluctant to accept the consequences
of their demands.
Stability
To probe the limits of popular support further, chapter 3 tracks the
aggregate stability of environmental attitudes over time, especially in the
face of economic recession and rising energy costs. Here survey data are
used to explore the conventional wisdom that public enthusiasm for the
environment is transient and that it responds to trends in the business
cycle, rising policy costs, media attention, or simple boredom as new
issues rise to complete for scarce public attention.58
Distribution
The distribution of public opinion on the environment among social and
demographic groups is described in chapter 4, revisiting long-standing
debates about the elitist character of the environmental movement and
its key supporters.59 Factors such as age, education, income, race, gen-
der, and partisanship are all used in empirical models to explain variance
in a variety of measures of environmental concern, ultimately with little
effect. Making up in breadth what it lacks in depth, environmentalism on
the surface appeals to nearly everyone.
Constraint
Taken together, do all of these pieces suggest (at least in nascent stages)
the development of a fundamentally new social paradigm or belief
system—one that might grow in commitment with time and patience?
Chapter 5 draws attention to that issue by examining the consistency of
environmental attitudes—what Key called ‘‘interrelations of opinion.’’60
Scholars have long puzzled over low correlations between different
Introduction 13

environmental measures used in surveys, with some suggesting that
public attitudes on the environment are rather crude, disconnected, and
narrowly focused.61 Yet after developing a more sophisticated model
to test the dimensionality of environmental concern, results presented in
this chapter largely demonstrate the opposite. Although notably lacking
in knowledge and sophistication, public opinion on the environment is
surprisingly consistent and ‘‘constrained.’’62
Behavior
Part II of the book moves one step further toward understanding the real
impact of consensus by exploring the link between public opinion and
political behavior. Chapter 6 examines the impact of environmental atti-
tudes on American political parties and their candidates. That focus is
expanded in chapter 7 to include other electoral arenas and political
forums, including statewide referendums and initiatives. Finally, chapter
8 examines the impact of environmental concern on consumer decisions
in the marketplace. That Americans prefer activism on the consumer
front is surprising to scholars, perhaps, but this pattern of behavior
reveals much about the factors that motivate citizens to act in an envi-
ronmentally responsible way.
‘‘In its most uncomplicated form,’’ wrote Key, ‘‘ ‘consensus’ means an
overwhelming public agreement upon a question of public policy.’’ Yet,
he added, it is also a ‘‘magic word’’ full of the uncertainty of interpreta-
tion.63 With high issue support but low intensity of belief, with broad
appeal but narrow participation, and with consistent opinions nonethe-
less ungrounded by clear knowledge and understanding, the long-term
success of the U.S. environmental movement from the bottom up re-
mains unclear. Growing environmental consensus may force elected offi-
cials from both sides of the political fence into action, but it might also
allow political leaders a considerable degree of latitude in designing en-
vironmental policies free from a watchful public eye. Sympathetic public
support may invest the environmental movement with valuable political
currency, but an environmental consensus based on broad symbolism
alone might prove to be shallow and manipulable in the long run,
endangering the legitimacy and political base of environmentalists who
place too much faith in public mandates and grassroots support.
14 Introduction

Ultimately, the importance of these lingering, unresolved issues ensure
that the legacy of American environmentalism will be determined not
only by the success of its legislative record but also by its ability to per-
suade average citizens to change their voting patterns, buying habits, and
lifestyles. As Pogo the Possum once said in a famous cartoon: ‘‘We have
met the enemy and he is us.’’ Whether or not those enemies have in fact
become allies in the shadow of this ‘‘great environmental awakening’’
will be a matter debated throughout the coming pages.64
Introduction 15

This Page Intentionally Left Blank

IAttitudes

This Page Intentionally Left Blank
1Direction: Do Americans Favor
Environmental Protection?
In 1997, with world leaders about to meet in Kyoto, Japan, for final
negotiations on an accord to reduce emissions of greenhouse gases, the
Pew Research Center for the People and the Press sponsored a poll
to determine where American thinking on the topic stood. The results
seemed remarkable: with a majority of those polled backing interna-
tional standards, a columnist for the Los Angeles Times said the survey
‘‘left business lobbyists stunned and environmentalists gloating.’’1 Even
more significant was evidence that respondents were willing to accept
higher gasoline prices as well—from five to twenty-five cents higher per
gallon—in return for steps taken to counter the threat. In astonished re-
sponse, the Atlanta Journal and Constitution joined a chorus in the news
media in declaring that Americans were willing at long last ‘‘to reach
into their pocketbook to help reduce global warming.’’2
Support for increasing gasoline prices notwithstanding, high levels of
public support for environmental protection should come as no surprise.
As former EPA administrator Carol Browner once put it, ‘‘I have yet to
meet a member of the public who thinks their air is too clean or their
water is too safe.’’3 Yet while it may be tempting to diminish the signifi-
cance and popularity of environmental concern by believing it represents
little more than the political equivalent of ‘‘motherhood and apple pie’’
—a goal so infused with social desirability that it is nearly impossible to
oppose—public opinion polls over the past thirty years have been ada-
mant, demonstrating time and again that the environmental movement
has earned the genuine sympathy of a large majority of Americans. Like
the Pew Research Center poll on global warming, it is a conclusion well
charted by newspaper headlines from around the country, including:

Environment Is a Big Concern for Californians, Poll Shows4
Voters Support Rules on Pollution; GOP Attacks Not Popular5
Polls Show Texans Wanting to Recycle6
Wilderness Expansion Backed; 80 Percent Favor Land Protection in
Colorado Poll7
In response to such overwhelming numbers, the director of the White
House Office of Management and Budget Richard Darman acknowl-
edged in 1990 that, at heart, ‘‘we are all environmentalists. The President
is an environmentalist, Republicans and Democrats are environmen-
talists. Jane Fonda and the National Association of Manufacturers,
Magic Johnson and Danny DeVito, Candice Bergen and the Golden
Girls, Bugs Bunny and the cast of Cheers are all environmentalists.’’8 In
this sense, to begin an analysis of public attitudes on the environment
with an extended discussion of a single characteristic—the ‘‘direction’’ of
opinion—might seem needless and simplistic, even a bit wasteful of time
and effort. At least this much is apparent: Americans are worried about
the health of the natural environment and want to see something done to
protect it. The tenacity of those beliefs might be questioned, and the
willingness of citizens to translate concern into commitment might be
doubted, but it hardly seems controversial to suppose (under the best of
intentions) that ‘‘everybody is an environmentalist these days.’’9
In reality, however, survey research on the environment is rarely in-
disputable, even on deceptively simple questions. High margins of sup-
port and strong expressions of concern can, at times, mask considerable
disagreement surrounding the means used to achieve policy goals. Sec-
ondhand reports of poll results in the popular press can remove data
results from their original context, allowing environmental concern to
appear more impressive than it is. Finally, biased and misleading ques-
tions administered to unsuspecting respondents by groups with a vested
interest in the outcome can so alter environmental responses that the
results say more in the end about the mechanics of the poll itself than the
subject it attends.10
Given that the foundation of this book is built piece by piece on evi-
dence drawn from national public opinion polls, an initial note of warn-
ing about distinguishing good data and fair reporting from bad is clearly
20 Chapter 1

warranted. The purpose of this chapter is to confront each of these issues
up front and early on and to identify (and avoid) red flags that have the
potential to mislead even the most cautious reader. The close of this
chapter then applies those lessons to a specific and detailed case, return-
ing to the debate over global warming in the months leading up to the
Kyoto Protocol, demonstrating that when it comes to the environment,
public opinion is not always what it seems.
The Boundaries of Consensus
While V. O. Key was perhaps the first scholar to recognize the signifi-
cance of opinion consensus in American politics, anthropologists Willett
Kempton, James Boster, and Jennifer Hartley were the team that deep-
ened its cultural meaning and applied the term in a vigorous manner to
the environment. In Environmental Values in American Culture (1995),
they argue that ‘‘Americans share a common set of environmental beliefs
and values’’ and that on environmental issues there is, in fact, a single
consensus with only ‘‘one set of culturally agreed upon answers.’’11
Their conclusions are based on an ambitious study combining open-
ended interviews with a fixed-form questionnaire administered to a small
group of respondents (n ¼ 142). Divided into five diverse categories in-
tended to represent a continuum of opinion, two groups were composed
of self-avowed environmentalists (members of Earth First! and the Sierra
Club), two represented occupations harmed by environmental legislation
(dry cleaners and unemployed sawmill workers), and a final group was
drawn from members of the general public in California.
While these groups might be expected to view the environment and
human interactions with it in very different ways, Kempton and his col-
leagues find instead a surprising pattern of agreement. For instance,
strong majorities in all five groups agreed that ‘‘there is a need to protect
the environment because humans depend upon it,’’ rejecting claims that
environmental protection is either excessive or unnecessary.12 Members
of these groups also expressed an understanding of limited resources,
fragile interdependencies in nature, and the dangers of disrupting natural
processes, believing in the end that ‘‘it is more costly to fix problems than
it is to prevent them in the first place.’’13
Direction 21

Despite the statistical limitations of their small sample, the conclusions
reached by Kempton, Boster, and Hartley are hardly surprising. In fact,
the shared values and beliefs they identify, which they say are ‘‘now
closely tied to many other deep value systems in American culture,’’ are
those that would seem to underlie and explain recent trends in national
polls on environmental topics.14 For example,
. Of those surveyed in an April 2000 Gallup poll, 83 percent agreed withthe goals of the environmental movement, although a majority feared
that only ‘‘some progress’’ had been made toward their resolution;
. 71 percent said they personally were either active in or sympathe-tic to the environmental movement (notably, only 5 percent were
‘‘unsympathetic’’);
. In the same poll, 55 percent felt that environmental problems overallwere either ‘‘very’’ serious or ‘‘extremely’’ serious (just 5 percent said
‘‘not serious at all’’). Concern for nearly a dozen different environmental
issues, including air and water pollution, ranked high, as well, with
majorities reporting that they worried ‘‘a great deal’’ about most;
. Finally, despite thirty years of environmental legislation and regu-
lation, 58 percent told Gallup that the U.S. government was currently
doing ‘‘too little’’ to resolve those problems (merely 10 percent said it
was doing ‘‘too much’’);15
In general, the asymmetry of those results appears consistent with
Kempton, Boster, and Hartley’s claim that there is no ‘‘coherent and
consistent antienvironmental position’’ in American politics today.16
Survey respondents do disagree at times—as do unemployed sawmill
workers, dry cleaners, and environmental activists—but dissension, they
say, generally arises over the ‘‘relative ranking’’ of environmental goals
in comparison to other social values and priorities ‘‘rather than dis-
agreement on the values themselves.’’17
It is a distinction with which Richard Ellis and Fred Thompson ini-
tially agree. In writing their own study of culture and the environment in
the Pacific Northwest, they confirm that ‘‘it is not that activists want en-
vironmental amenities that the general public does not want—quite the
contrary. Both want cleaner air and water, wilderness and species pres-
22 Chapter 1

ervation, habitat protection, and a healthier, safer earth.’’ Yet given that
the essence of politics is often defined by the need to make difficult
choices, they add that it is equally important to acknowledge that groups
often disagree over the means used to achieve those goals.18
In short, how far does cultural consensus on the environment extend?
Shared agreement, after all, is easier to achieve when survey questions
‘‘do not require choices between conflicting values,’’ something Kemp-
ton, Boster and Hartley do admit.19 Yet several of the measures they
developed seem almost destined to generate agreement, including:
7. People have a right to clean air and clean water. . . .
27. We have a moral duty to leave the earth in as good or better shape
than we found it. . . .
109. Nature may be resilient, but it can absorb only so much
damage. . . .
111. Working to try to prevent environmental damage for the future is
really part of being a good parent.
In failing to press respondents further in their beliefs, Bron Taylor won-
dered whether Kempton and his colleagues had perhaps ‘‘made too
much of respondent agreement with their survey propositions,’’ perhaps
using their results to show ‘‘little more than a recitation of empty truisms
that bear little relation to environmental action.’’20
An extensive battery of questions included in the National Opinion
Research Center’s (NORC) General Social Survey (GSS) in 1994 suggests
that Taylor’s criticisms might be pointed in the right direction. Ameri-
cans are genuinely concerned about the environment, and most appear
willing to accept some form of government regulation and intervention
in business and private decisions to aid in its protection. But as attention
shifts from the general to the specific, consensus stops there. When con-
fronted directly with the cost of protecting the environment—either
through higher prices, increased taxes, or a reduction in the standard of
living—respondents are plainly divided (see table 1.1).
Among the three considerations outlined in table 1.1—higher prices,
higher taxes, and cuts in the standard of living, the issue of taxation is
perhaps the most telling. A majority of those polled thought that ‘‘too
Direction 23

little’’ was being spent by the government to protect the environment (61
percent), and yet only a third were willing to pay ‘‘much higher taxes’’ to
fund those efforts. Pushed still further, respondents were divided, too,
about the priority that environmental issues should be given relative to
economic progress and prosperity—for instance, ‘‘We worry too much
about the future of the environment and not enough about prices and
jobs today.’’ Cultural consensus, it seems, does not always lead to polit-
ical consensus.
Setting Priorities, Balancing Goals
While differentiating the means of public policy from its ends clearly
matters when polling Americans on the environment, the disagreement
that Kempton and his colleagues find over the ranking of environmental
Table 1.1Attitudes toward Environmental Costs and Trade-offs
Question Agree Neutral Disagree
We worry too much about the future ofthe environment and not enough aboutprices and jobs today.
42% 14% 44%
People worry too much about humanprogress harming the environment.
37 15 48
To protect the environment, Americaneeds economic growth.
45 26 44
Question Willing Neutral Unwilling
How willing would you be to paymuch higher prices to protect theenvironment?
47 24 28
And how willing would you be to paymuch higher taxes to protect theenvironment?
34 21 44
And how willing would you be toaccept cuts in your standard of living toprotect the environment?
32 23 45
Source: NORC General Social Survey (1994).
24 Chapter 1
issues relative to other things raises a second caveat as well—whether it
is more important in survey research to weigh the nominal support an
issue receives or the rank order into which it is placed. A short example
illustrates the difference.
In the winter of 1996, a consortium of research foundations called the
Consultative Group on Biological Diversity (CGBD) sponsored a public
opinion poll to gather information on American attitudes toward loss of
species and their habitats, as well as toward the environment in gen-
eral.21 At first glance, the results of that survey were clearly impressive.
On a scale ranging from one to ten, the mean priority that respondents
placed on ‘‘protecting the environment’’ was a definitive eight, and when
asked about maintaining biological diversity in particular, an over-
whelming 87 percent of those polled felt it was an important goal.22
Both conclusions, however, are less convincing when returned to their
original context. In this case, the questionnaire developed for the CGBD
asked respondents to rate the priority of environment protection, as well
as other issues, including crime, health care, public education, and the
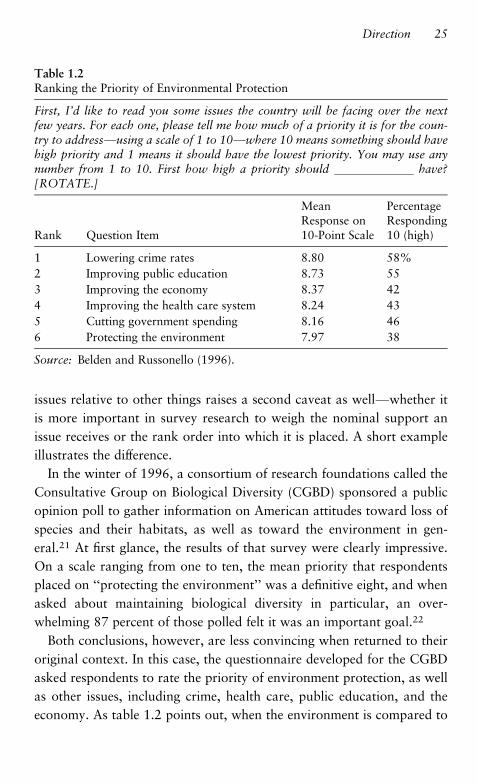
economy. As table 1.2 points out, when the environment is compared to
Table 1.2Ranking the Priority of Environmental Protection
First, I’d like to read you some issues the country will be facing over the nextfew years. For each one, please tell me how much of a priority it is for the coun-try to address—using a scale of 1 to 10—where 10 means something should havehigh priority and 1 means it should have the lowest priority. You may use anynumber from 1 to 10. First how high a priority should have?[ROTATE.]
Rank Question Item
MeanResponse on10-Point Scale
PercentageResponding10 (high)
1 Lowering crime rates 8.80 58%
2 Improving public education 8.73 55
3 Improving the economy 8.37 42
4 Improving the health care system 8.24 43
5 Cutting government spending 8.16 46
6 Protecting the environment 7.97 38
Source: Belden and Russonello (1996).
Direction 25

those topics, its average score on a ten-point scale is far less imposing,
actually ranking last on the list in descending order. This result has been
replicated time and again by other polls under similar conditions.23
Likewise, concern for the seriousness of species loss seems solid—a
credible 6.9 on a ten-point scale—until that issue also is placed beside
other environmental problems, including air and water pollution, popu-
lation growth, and toxic waste disposal (see table 1.3). In the end, a fair
interpretation of the poll would need to note that plant and animal
extinctions ranked near the bottom of a list of environmental problems,
which themselves rank at the bottom of a broader list of social priorities.
Americans are concerned about the environment, to be sure, but they
often find other issues more pressing and immediate. In politics, of
course, it is the latter that forces action.
Table 1.3Ranking Public Concern for Biodiversity
Thinking specifically about environmental issues, please tell me how seriousa problem you think each of the following is, using a scale of 1 to 10 where1 means something is not a problem at all and 10 means it is a very seriousproblem.
Question
MeanResponse on10-PointScale
PercentageResponding10
Toxic waste in the United States 7.85 36%
Loss of rain forests 7.70 35
The rate at which land is being developedand places in nature are being lost
7.66 33
Rate of growth of the world’s population 7.41 29
Air quality in the United States 7.24 24
Water quality in the United States 7.24 25
Overconsumption of resources in theUnited States
7.24 23
The rate at which plant and animal speciesare becoming extinct
6.89 25
Acid rain in the United States 6.36 14
Global climate change 6.20 15
Source: Belden and Russonello (1996).
26 Chapter 1

Loading the Dice
Finally, while survey results like those cited above can be taken out of
context by the news media and can unintentionally mislead readers,
some surveys are deliberately designed to do so.24 Consider the experi-
ence of Rolla Williams, an outdoor staff writer for the San Diego Union-
Tribune, who in 1987 received a questionnaire in the mail from the
Sierra Club. Among the questions posed in that survey were these:
Our nation is still blessed with millions of acres of public lands, including road-less wilderness areas, forests, and range lands. Land developers, loggers, andmining and oil companies want to increase their operations on these public lands.Do you think these remaining pristine areas of your public lands should be pro-tected from such exploitation?
Sulphur dioxide from industrial smokestacks has caused the phenomenon calledacid rain. This rapidly growing threat to our forests, lakes, and human health hasalready killed thousands of lakes in the United States and Canada. The adminis-tration in Washington has argued that we don’t know enough about the problemto devise an appropriate remedy. The Sierra Club views acid rain as one of themost serious environmental problems facing us today. What priority would yougive to attacking this problem?
As Williams notes, ‘‘How does one answer’’ such questions? Given the
survey’s failure to reflect the complex realities of environmental policy,
he wryly suggests that that the Sierra Club ‘‘hire the Gallup Organization
to draw up its next questionnaire and remove every vestige of the bias’’
found within it.25
Scholars, of course, have long recognized that the way questions
are asked in surveys matters.26 Unbalanced assertions, double-barreled
questions, and leading phrases all have the potential to introduce re-
sponse sensitivity. Identifying those problems (and their complementary
solutions) is easier, perhaps, through comparison. In a 1989 cross-
national study of environmental attitudes administered by Louis Harris
and Associates, respondents in sixteen countries were asked a lengthy
number of questions that included the following:27
4. How concerned are you that ? Are you very concerned, some-what concerned, not very concerned, or not at all concerned? [ROTATE.]
1) The air you breathe is becoming less healthy;
2) The water you drink is becoming less safe and a danger to health;
3) Lakes and rivers are being polluted by man-made chemicals from industry;
Direction 27

5) The chemicals used to control pests and weeds are making food and watersupplies unsafe;
9) Radiation from nuclear power plants will escape and kill thousands of people;
11) Dangerous chemicals are being dumped by industry without taking safetyprecautions to protect people from being poisoned;
Text provided in table 1.4 pairs the Harris questions as closely as
possible to those used in a standard Gallup battery that same year. The
differences in language and syntax are instantly apparent.
In using active verbs that include both present and future tenses, the
questions developed by Harris do not use a neutral tone to ask respon-
dents to assess their concerns but rather to respond to problems that are
presumed to be both real and threatening. For instance, while Gallup
inquires about personal worry about the ‘‘contamination of soil and
water by toxic waste,’’ Harris asks respondents how concerned they are
that ‘‘dangerous chemicals are being dumped by industry without taking
safety precautions to protect people from being poisoned.’’ Under those
conditions it is not surprising that majorities in all countries responded
to the Harris questions by saying that they were not only concerned but
‘‘very concerned’’ about those particular issues.
Despite a clear bias, data results from the Harris study were widely
disseminated to the news media. In commenting about the poll’s release
at the time, Mostafa Tolba, executive director of the United Nations
Environment Programme (UNEP) said, ‘‘We are very encouraged to see
the strength and the depth of support for both national and multina-
tional environment programmes. We have a clear mandate for our work.
I hope the survey will be seen as a call to action.’’28
Politics, the Polls, and Global Warming
Up to this point, three warnings about measuring the direction of envi-
ronmental concern in public opinion polls have been noted:
. The importance of distinguishing support for policy ends from policy
means;
. The advantage of weighing the implied rank of social priorities in ad-dition to their nominal value; and
. The need to consider potential biases in question wording and format.
28 Chapter 1

Table 1.4A Comparison of Question Wording
Gallup Organization Louis Harris and Associates
[P]lease tell me if you personallyworry about this problem a greatdeal, a fair amount, only a little, ornot at all.
How concerned are you that? Are you very
concerned, somewhat concerned,not very concerned, or not at allconcerned?
Pollution of drinking water The water you drink is becoming lesssafe and a danger to health.
Pollution of rivers, lakes, andreservoirs
That lakes and rivers are beingpolluted by man-made chemicalsfrom industry.
Contamination of soil and water bytoxic waste
Dangerous chemicals are beingdumped by industry without takingsafety precautions to protect peoplefrom being poisoned.
Air pollution The air you breathe is becoming lesshealthy.
Contamination of soil and water byradioactivity from nuclear facilities
Radiation from nuclear power plantswill escape and kill thousands ofpeople.
The ‘‘greenhouse effect’’ or globalwarming
Chemicals from factories and carsare going into the atmosphere andmaking the climate worse.
Extinction of plant and animalspecies
Many types of animals, birds, fish,insects, and plants are dying off.
Acid rain Chemicals from industries andfactories are causing acid rain, whichis killing forests and life in manylakes.
Source: Gallup Organization (April 3–9, 2000) (n ¼ 1;004); Louis Harris andAssociates, Inc. (1989).
Direction 29

When combined, how severely can these complications influence our
understanding of public support for environmental protection? A return
to the issue of global warming provides the answer.
In August 1997, several months before the results of the Pew Research
Center poll reached the news media, the World Wildlife Fund (WWF)
sponsored a survey of its own on the ‘‘greenhouse effect.’’ Interviewing
eight hundred registered voters nationwide, the press release accom-
panying the WWF poll results stated that the poll had revealed ‘‘great
enthusiasm for international efforts to address global warming.’’ Reject-
ing the belief that reducing carbon emissions would disrupt the economy
and cost jobs, respondents demanded instead that political leaders ‘‘act
immediately’’ on the issue.29
While these results at first glance appear consistent with the Pew study
and with a host of other similar surveys conducted in the months leading
up to the Kyoto Protocol in Japan, a number of problems come into
play.
Policy Discord
Most polls conducted during the summer and fall of 1997 found high
levels of public concern for the issue of global warming, and the WWF
poll was no exception to that rule. Asked ‘‘how serious a threat’’ they
thought global warming was at that time, 45 percent of those responding
believed it was ‘‘somewhat’’ serious, while an additional 29 percent
categorized it as ‘‘very serious.’’ Only 7 percent felt it was ‘‘not serious at
all.’’30 In response, the World Wildlife Fund concluded: ‘‘Despite the
conventional wisdom that only radical environmentalists and science fic-
tion fanatics are concerned about global warming, our recent survey
reveals that the American public believes global warming is real and
represents a serious threat.’’31
That community of opinion, however, did not extend to the policies
proposed to address the problem. Available data suggest two reasons
why. First, while public concern is significant, there can be genuine
ideological differences of opinion on issues of public policy, which in
the environmental field often revolve around the degree of government
intervention in the market economy. For example, the WWF survey
asked,
30 Chapter 1

In trying to reduce the threat of global warming, do you think we should relymainly on strict regulations to limit emissions of carbon dioxide, or do you thinkwe should rely mainly on incentives that will cause the free market to discouragecarbon dioxide pollution—or don’t you have an opinion on this?
In response to that question, 37 percent of respondents favored govern-
ment regulations, while 32 percent preferred free-market options and
incentives. Yet the high proportion of ‘‘don’t know’’ responses to the
question (the remaining 30 percent) suggests a second explanation as
well—that the WWF survey contributed to response instability by asking
average citizens to evaluate scientific conditions and complex policy
proposals about which they had little knowledge, experience, or infor-
mation. It is a point well reinforced by the battery of questions outlined
in table 1.5, where lay respondents were asked to judge ‘‘how likely’’
specific problems were to occur as a result of global warming trends.32
In truth, most Americans know little about climate change.33 The Pew
Research Center survey wisely asked respondents, based on what they
had heard or read (if anything), how they would describe the ‘‘green-
house effect.’’ More than a third of those polled (38 percent) could not
define the concept even in the vaguest of terms, identifying it instead,
when presented with a close-ended list of options, as either a ‘‘new
advance in agriculture’’ or a ‘‘new architectural style’’ rather than an
‘‘environmental danger.’’34 A similar result occurred in the NORC 1994
General Social Survey (GSS), where more than half of those polled (55
percent) believed, incorrectly, that the greenhouse effect was caused by a
hole in the earth’s atmosphere.35
Those results are more understandable, perhaps, when compared to
the attention people paid to a variety of news stories that year. Solid
majorities in the Pew study reported that they had followed ‘‘Iraq’s re-
fusal to let Americans participate in weapons inspections’’ (76 percent)
closely, the Massachusetts murder trial of British au pair Louise Wood-
ward (65 percent), the ups and downs of the stock market (61 percent),
and even the flooding produced by the weather phenomenon, El Nino
(62 percent). In contrast, just a third said the same about the debate over
global warming (ranking lowest on a list of eleven news topics), despite a
renewed concentration of media attention in the months leading up to
the Kyoto Protocol.36
Direction 31

Table 1.5Public Opinion on Global Warming
I’m going to list some specific problems that some people say could happen as aresult of global warming. After each, please tell me how likely you think thatproblem is to occur as a result of global warming. Is that problem almost certainto happen [4], very likely [3], somewhat likely [2], not too likely [1], or not likelyat all [0] to occur as a result of global warming? If you are not sure how you feelabout a particular item, please say so, and we will go on.
QuestionMean likelihoodof happening
More extreme weather conditions, such as drought,blizzards, and hurricanes
2.41
Longer and hotter heat waves leading to more heat-related deaths
2.36
Crop failures, food shortages, and famine caused bydroughts and floods
2.34
Melting ice caps and glaciers causing the sea level torise and the flooding of coastal communities
2.34
Disruption of our fragile ecological balance threateningthe web of life
2.25
Destruction of natural habitats, including oceans andnational parks like Glacier National Park and theEverglades
2.22
Increased incidences of asthma and other respiratoryproblems
2.19
Extinction of certain animal species like polar bearsand sea turtles
2.19
The spread of infectious diseases 1.76
Increased populations of pests and vermin, such asroaches, termites, and rats
1.74
Source: World Wildlife Fund (1997a).Note: The above battery was asked only of respondents in split sample B.n ¼ 800.
32 Chapter 1

With that deficit of attention and information in mind, the complex-
ity of the issues raised in the WWF survey is particularly striking. For
example, respondents in the poll were asked to consider the following
question:
I’m going to list some of the specific proposals that have been made to decreasethe use of oil, coal, and gasoline in order to reduce the threat of global warming.For each item I read, please tell me if you favor or oppose each one. If you aren’tsure how you feel about any specific item, just say so and we will go on. . . .Have the United Nations establish a worldwide limit on carbon dioxide emis-
sions that is lower than current levels. Each U.N. member country would beallocated the right to discharge a certain amount of carbon dioxide pollution.Countries could buy and sell these pollution rights to one another. This wouldallow them to choose between reducing their carbon dioxide emissions or payingto continue to pollute.
As Michael Traugott and Paul Lavrakas explain, many respondents
find it difficult to answer complex, policy-driven questions that reach
beyond their own knowledge and life experience. The responses to mea-
sures such as these, they say, are not very informative in the end because
they might represent little more than ‘‘a respondent’s pure guess about
what the question means.’’37
A broader comparison of questions used by various polling organi-
zations in 1997 illustrates a similar point. In each case, while an Ameri-
can decision about how to respond in Kyoto hung in the balance,
respondents were asked a variant of the same basic question: should the
United States take immediate action on global warming or not? The
results were decidedly inconsistent.
In the World Wildlife Fund survey, 56 percent of those polled urged
President Clinton to ‘‘take action on global warming now,’’ but an equal
number in an NBC News/Wall Street Journal study believed that ‘‘more
research is necessary before we take action’’ (59 percent). In a CBS
News/New York Times poll, 81 percent said steps to counter the effects
of global warming should be taken ‘‘right away,’’ but Charlton Research
Company (1997) counted 78 percent who believed that the United States
should ‘‘wait to make any treaty commitments’’ and pursue only ‘‘vol-
untary programs’’ instead.38 Underscored by a lack of knowledge and
information, the nature of the options given to participants in each of
these cases made all the difference in the world.
Direction 33
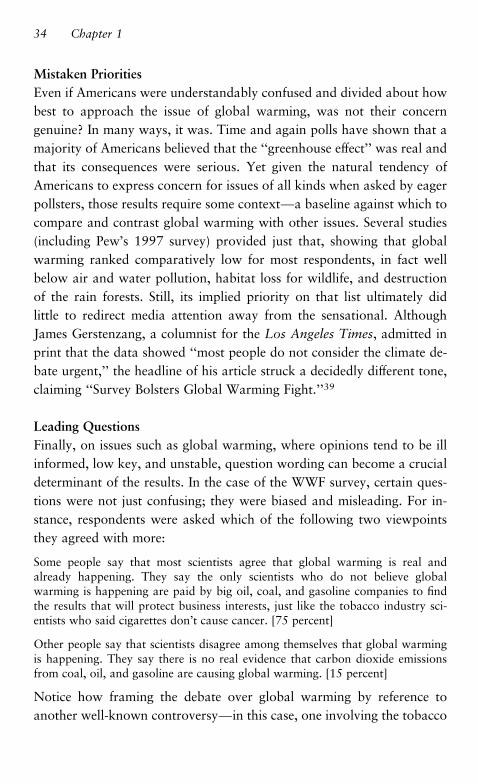
Mistaken Priorities
Even if Americans were understandably confused and divided about how
best to approach the issue of global warming, was not their concern
genuine? In many ways, it was. Time and again polls have shown that a
majority of Americans believed that the ‘‘greenhouse effect’’ was real and
that its consequences were serious. Yet given the natural tendency of
Americans to express concern for issues of all kinds when asked by eager
pollsters, those results require some context—a baseline against which to
compare and contrast global warming with other issues. Several studies
(including Pew’s 1997 survey) provided just that, showing that global
warming ranked comparatively low for most respondents, in fact well
below air and water pollution, habitat loss for wildlife, and destruction
of the rain forests. Still, its implied priority on that list ultimately did
little to redirect media attention away from the sensational. Although
James Gerstenzang, a columnist for the Los Angeles Times, admitted in
print that the data showed ‘‘most people do not consider the climate de-
bate urgent,’’ the headline of his article struck a decidedly different tone,
claiming ‘‘Survey Bolsters Global Warming Fight.’’39
Leading Questions
Finally, on issues such as global warming, where opinions tend to be ill
informed, low key, and unstable, question wording can become a crucial
determinant of the results. In the case of the WWF survey, certain ques-
tions were not just confusing; they were biased and misleading. For in-
stance, respondents were asked which of the following two viewpoints
they agreed with more:
Some people say that most scientists agree that global warming is real andalready happening. They say the only scientists who do not believe globalwarming is happening are paid by big oil, coal, and gasoline companies to findthe results that will protect business interests, just like the tobacco industry sci-entists who said cigarettes don’t cause cancer. [75 percent]
Other people say that scientists disagree among themselves that global warmingis happening. They say there is no real evidence that carbon dioxide emissionsfrom coal, oil, and gasoline are causing global warming. [15 percent]
Notice how framing the debate over global warming by reference to
another well-known controversy—in this case, one involving the tobacco
34 Chapter 1

industry—compromises the tone and content of the question. Here,
respondents were encouraged to equate two issues that may (or may not)
share an objective similarity. As Karlyn Bowman points out, aside from
potentially skewing the results, questions like those above also ‘‘under-
mine the credibility of the polling profession’’ and lend credence to the
unfortunate belief that survey research does more to shape public opin-
ion than to measure it.40
Solid Ground
Given all of these difficulties, where do Americans stand on the issue of
global warming? As Bowman argues, the answer is to be found in the
consistency of responses across multiple questions administered by dif-
ferent polling organizations over time. Those areas of agreement suggest
that a majority of people believe that global warming is a real phenome-
non with serious environmental consequences, but the concern they feel
fails to reach a level of alarm, which may help to explain why citizens are
so undecided about the pace of government efforts to reduce emissions of
greenhouse gases. John Immerwahr offers an additional insight as well.
On the issue of global climate change, he says, Americans ‘‘run into brick
walls, characterized by lack of clear knowledge, seemingly irreversible
causes, and a problem with no real solution.’’ As a result, respondents
are ‘‘eager for a solution but unsure of which way to go,’’ often pre-
ferring to wait and see before committing U.S. resources and taxpayer
dollars to a painful, corrective course of action.41
Conclusions
To observe the direction of public opinion is to start at the very begin-
ning, to reduce the study of environmental attitudes down to its barest
essentials.42 At first glance, it might appear to be little more than the
challenge of delineating a rough dichotomy—either Americans are con-
cerned about the environment, or they are not. But as this chapter has
argued, the appearance of consensus in surveys tends to coexist along-
side expressions of genuine ambivalence. It is an uneasy combination
that paints a complicated picture.
Direction 35
For example, as the debate over global warming shows, Americans
care about the environment but frequently send mixed signals to policy-
makers by placing priority on other issues. Moreover, shared agreement
on environmental values and concerns often fails to extend to the means
used to achieve those goals. In some cases, taxpayers may be reluctant
to accept fiscal responsibility for their demands; in others they seem to
cleave over larger ideological debates surrounding governments and
markets. Americans, too, know little about the intricacies of public pol-
icy, and so when they are asked to evaluate political choices, their
responses can be unstable and contingent on the manner in which ques-
tions are phrased in surveys. In a way, all of these factors help to explain
lingering perceptions of environmental consensus. As long as dialogue
focuses on broad goals, diverse populations can be unified by a similarity
of experience without necessarily agreeing on what steps should be taken
to ensure environmental quality.
In the end, however, perception alone is insufficient, even in politics.
Each of these findings underscores a certain poverty of language,
demanding careful analysis. While the natural tendency of the news
media is to simplify and condense, a firm understanding of public opin-
ion is defined by far more than a single characteristic. Attitudes may be
clustered or divided in their direction, but so too are they sorted and
shaped on a mass scale by other properties, enumerated by V. O. Key to
include (among others) strength, stability, distribution, and constraint—
all of which provide the building blocks of the chapters to come.43
36 Chapter 1

2Strength: How Deep Is Public Commitment
to Environmental Protection?
In 1900, while writing the second volume of his classic book The Amer-
ican Commonwealth, James Bryce insisted that the term public opinion
referred to something greater than the sum of its parts. He saw it as an
interactive consensus, the endpoint of a lengthy process of social and
political debate. For Bryce, to count only the number of citizens who
aligned themselves directionally on either side of an issue (weighing each
of those opinions equally) meant missing an important part of the pic-
ture. Even in an era long before the advent of modern survey research,
scholars recognized that there was an important distinction to be made.
As A. Lawrence Lowell argued in 1913, ‘‘One man who holds his belief
tenaciously counts for as much as several men who hold theirs weakly,’’
for as he reasoned, ‘‘individual views are always to some extent weighed
as well as counted.’’1
Today, our ability to weigh opinions using the science of social re-
search is greater than ever before, but the political consequences of that
simple insight still resonate. V. O. Key, for instance, noted that ‘‘as
influences work themselves out through political processes, the qualities
of an opinion, as well as the numbers who hold it, enter into the equa-
tion,’’ including first and foremost the notion of attitude strength. ‘‘It
requires no monstrous stretch of the imagination,’’ he said, ‘‘to suppose
that this fact seeps through the mechanisms of communication and in
one way or another affects the course of political action.’’2 Key believed
that under some conditions passionate attitudes had the ability to mag-
nify small numbers, while at other times lukewarm commitment could
dampen the significance of widespread support.

For the contemporary environmental movement, of course, the paral-
lel is unmistakable and rather vexing. While most Americans are broadly
sympathetic to environmental goals, scholars have long cautioned that
those attitudes may be weakly held.3 As a result, environmentalists
looking to capitalize on grassroots support politically are faced with the
constant challenge of energizing their base. They must, after all, convince
average citizens, already overwhelmed by the demands of daily life, that
environmental problems are worthy of scarce energy and attention and
that they should not just care about the environment but care deeply. In
that vein, gauging attitude strength is important to far more than the
study of public opinion alone. It becomes a necessary ingredient in a
viable political strategy.
With those stakes in mind, differentiating between numbers and in-
tensity will be the foremost challenge of this chapter. While it is one that
highlights (yet again) the difficulty scholars have in polling Americans on
the environment—not only on the subject of what they think, but also
how they behave—one basic point survives a multitude of complaints
about question wording and survey design. Despite Americans’ reservoir
of good will and honest concern, when pressed, their commitment to
environmental protection is equivocal when and where it matters most.
Measuring Attitude Strength
The development of valid and reliable measures of attitude strength has
generated a great deal of experimentation in the field of survey research,
and yet it is a concept that remains problematic in practice, especially on
issues like the environment, where social desirability biases loom large.4
In Questions and Answers in Attitude Surveys (1981), Howard Schuman
and Stanley Presser explore the problem of attitude strength by reference
to two subjective qualities in particular—intensity and centrality.5 In-
tensity, they note, refers to a ‘‘strength of feeling,’’ while centrality is
defined by a sense of ‘‘importance.’’ A third category can be added to
the mix as well, something Schuman and Presser label conviction of
opinion, where counterarguments and paired comparisons (or trade-offs)
are introduced. Each of these factors, individually and in combination, is
explored below using a number of recent environmental polls.
38 Chapter 2
Intensity of Opinion
The most direct way to measure attitude intensity (or strength of feeling)
is perhaps through the use of standard degree-of-concern items that are
capable of sifting black and white responses to complex problems into
several different shades of gray. It is a common technique that has been
used by the Gallup Organization in its environmental battery since 1989.
In those questionnaires, respondents are asked if they personally worry
‘‘a great deal,’’ ‘‘a fair amount,’’ ‘‘only a little,’’ or ‘‘not at all’’ about
each of a number of environmental problems. The distribution of those
responses across categories, as found in a March 2001 version of that
survey, is shown in table 2.1. The results tallied there suggest that
Americans do harbor serious anxiety about the environment. In fact, on
many of the issues described by Gallup, a majority of those polled
gravitated toward the high end of the scale.
As straightforward as this approach may seem, however, it is not
without critics. Arthur Sterngold, Rex Warland, and Robert Herrmann
argue that degree-of-concern items often contain unstated assumptions.
By presuming that people are (or should be) concerned about the subject
at hand, respondents can be subtly led by unbalanced questions to
‘‘accommodate this expectation by overstating their actual concerns.’’ In
a split-ballot experiment testing their hypothesis, Sterngold and his col-
leagues found that groups receiving an initial filter question gave roughly
double the percentage of ‘‘not concerned’’ responses, while those with
genuine concern were less likely to place themselves at the upper end
of the response scale.6 When these issues of question format are paired
with the natural tendency of environmental issues to fall prey to social
desirability biases, Everett Carll Ladd and Karlyn Bowman express
skepticism about expressions of concern that come free of consequence.
‘‘Viewed in isolation,’’ they say, ‘‘the results to these questions seem to
suggest enormous concern. In fact they merely show that many people
do not like pollution.’’7
While Ladd and Bowman’s criticism may be accurate, they overlook
other important inferences on attitude strength that can be found in
lengthy batteries like those used by Gallup. For example, biases that
press respondents to inflate their true sense of environmental concern
may be worrisome, but they should leave comparisons between issues
Strength 39

virtually unaffected, and as chapter 1 notes, comparison is a useful tool
indeed.8 For example, on several issues included in the Gallup study,
respondents shifted collectively toward the moderate range of the scale,
most notably on threats that are (at least relative to pollution) more
controversial within the scientific community and less visible to the
untrained eye, including ozone depletion, global warming, and acid rain.
It may be difficult in the end to judge precisely how concerned Americans
are about the environment by reference to the environment alone, but it
seems reasonable to use those measures to speak in terms of ‘‘more’’ or
‘‘less.’’
Table 2.1Concern for Thirteen Environmental Problems
I’m going to read you a list of environmental problems. As I read each one,please tell me if you personally worry about this problem a great deal [4], a fairamount [3], only a little [2], or not at all [1]. First, how much do you personallyworry about? [RANDOM ORDER]
QuestionNot atall
Only alittle
A fairamount
A greatdeal
Pollution of drinking water 2% 9% 26% 62%
Pollution of rivers, lakes, and reservoirs 2 11 29 58
Contamination of soil and water bytoxic waste
3 13 28 56
Air pollution 4 15 34 47
Contamination of soil and water byradioactivity from nuclear facilities
11 20 22 47
Urban sprawl and loss of open spaces 9 20 35 46
The loss of natural habitat for wildlife 4 17 33 46
The loss of tropical rain forests 8 16 31 45
Damage to the earth’s ozone layer 9 17 29 45
Ocean and beach pollution 4 17 35 43
Extinction of plant and animal species 8 20 31 42
The ‘‘greenhouse effect’’ or globalwarming
13 22 31 34
Acid rain 17 27 29 28
Source: Gallup Organization (March 5–7, 2001).Notes: n ¼ 1;060 adults nationwide. Margin of errore3 percentage points.
40 Chapter 2

A related (but less hazardous) technique for measuring attitude inten-
sity is the traditional Likert scale, where participants are asked to react
to a given statement by attaching themselves to a well-balanced response
format that includes labels such as ‘‘strongly agree,’’ ‘‘somewhat agree,’’
‘‘somewhat disagree,’’ and ‘‘strongly disagree,’’ often accompanied by a
neutral position that serves as midpoint.9 A good illustration of that
technique is a question asked below of respondents (both with and
without the Likert format) by Wirthlin Worldwide and CBS News/New
York Times, respectively:10
[Please tell me whether you agree or disagree with the following statement:] Pro-tecting the environment is so important that requirements and standards cannotbe too high, and continuing environmental improvements must be made regard-less of cost.
Wirthlin Worldwide (1998)
Strongly agree 31%
Somewhat agree 32
Somewhat disagree 21
Strongly disagree 15
Don’t know —
CBS/New York Times (1997)
Agree 57%
Disagree 36
Don’t know 7
Note how dramatically different the results of these two surveys seem,
and yet they are entirely consistent. Roughly the same proportion of
respondents align themselves directionally on either side of the issue, and
yet the addition of a Likert-type response scale in the Wirthlin poll
introduces a sense of weakened resolve and genuine ambivalence. At
length, questions of this kind are preferable to directional formats and
standard degree-of-concern items because they are more demanding and,
as such, less susceptible to well-meaning exaggeration.
Centrality of Opinion
While a more pragmatic picture begins to emerge in the Wirthlin study,
it is important to recognize that the placement of an opinion along an
ordinal response scale is not a sole indicator of attitude strength. As
Schuman and Presser write, measures of intensity often fail to represent
Strength 41

the level of subjective importance that individuals place on the issue at
hand.11 They argue that the ‘‘centrality’’ of attitudes should be consid-
ered independently. Given all of the potential biases outlined earlier, one
popular way to do that is to rely on unprompted, open-ended answers to
questions that ask respondents to name the nation’s ‘‘most important
problem.’’ Under those conditions, the environment fares badly indeed: it
is mentioned by just 2 percent of those polled in an April 2000 Gallup
poll—a figure not appreciably higher or lower than that found in most
other surveys over the past thirty years.
As Riley Dunlap argues, however, ‘‘most important problem’’ ques-
tions can be problematic indictors of attitude strength.12 Some scholars
find that responses are particularly susceptible to news coverage. Given
that media attention to environmental issues is not generally high (dis-
asters like the Exxon Valdez oil spill notwithstanding), trends in those
questions may simply reflect the influence of media agenda setting.13 In
addition, as Robert Cameron Mitchell writes, ‘‘Mass salience is transi-
tory for all but the most momentous issues such as war or depression,’’
making the format unsuitable for less dramatic events.14 In short, if
degree-of-concern items make it too easy for respondents to express
worry about almost anything, ‘‘most important problem’’ questions seem
to err on the side of stringency.
In response, Dunlap once again promotes the use of comparison, citing
close-ended response formats as a ‘‘more sensible’’ solution.15 As table
2.2 shows, survey results in this area are more favorable to the environ-
ment, but regardless of the design, environmental issues ‘‘still fail to
reach the very top of the list.’’16 Quite simply, in weighing an accu-
mulation of evidence, Ladd and Bowman come to the conclusion that
‘‘other problems are far more urgent than the environment for Ameri-
cans today.’’17
Conviction of Opinion
While measures of intensity and centrality can be important indicators of
attitude strength (or weakness), the inherent social desirability of envi-
ronmental goals encourages the use of a third assortment of questions as
well, commonly referred to as paired comparisons or ‘‘trade-offs.’’18
42 Chapter 2

Consistent with Schuman and Presser’s definition of conviction of opin-
ion, this approach is designed to examine the ease at which citizens
are influenced by counterarguments and opposing goals, all of which
force them to consider the very real costs associated with protective
environmental policies.19 For example, in nearly every year since
1984 the Gallup Organization has asked respondents the following
question:20
With which one of these statements about the environment and the economy doyou most agree?
A. Protection of the environment should be given priority, even at the risk ofcurbing economic growth; [67 percent]
B. Economic growth should be given priority, even if the environment suffers tosome extent. [28 percent]
This is an improvement, perhaps, considering Ladd and Bowman’s initial
criticism regarding degree-of-concern items, and yet trade-off questions
also earn their disapproval. As they explain, because most people ‘‘firmly
believe that we can have both a clean environment and economic
Table 2.2Perceived Seriousness of Various Social Issues
Next, I am going to read a list of problems currently facing our country. Foreach one, please tell me how serious of a problem you consider it to be for ourcountry—extremely serious [4], very serious [3], somewhat serious [2], or notserious at all [1]. [0 ¼ no opinion] [RANDOM ORDER].
Rank Question item
Meanresponse onitem scale
Percentageresponding‘‘extremelyserious’’
1 Drug use 3.19 38%
2 Crime and violence 3.14 33
3 Poor health care 2.91 29
4 Hunger and homelessness 2.86 24
5 Environmental problems 2.65 17
6 Racial conflict 2.62 18
7 Illegal immigration 2.48 15
Source: Gallup Organization (April 3–9, 2000).Notes: n ¼ 1;004 adults nationwide. Margin of errore3 percentage points.
Strength 43

growth, questions that ask Americans to choose between one and the
other are highly misleading.’’21
To demonstrate their point, consider the following pair of questions
asked of split half-samples in a 1994 Cambridge Research Reports In-
ternational poll:22
Which of these two statements comes closer to your opinion?
We must be prepared to sacrifice environmental quality for economic growth,or we must sacrifice economic growth in order to preserve and protect theenvironment.’’
Sacrifice economic growth 53%
Sacrifice environmental quality 23
Don’t know 24
Which of these two statements is closer to your opinion?
There is no relationship between economic growth and the quality of the envi-ronment. Indeed, we can have more and more goods and services and also acleaner world, or we cannot have both economic growth and a high level of en-vironmental quality. We must sacrifice one or the other.
Can have both 67%
Cannot have both 25
Don’t know 8
Given that each measure offers a very different answer to the same
underlying issue, Ladd argues that trade-off questions often present
respondents with forced choices that offer ‘‘nothing more than differing
pieces of one basic value that the public wants, and believes it possible to
attain.’’23
Still, Ladd’s criticism overstates a limited point. Trade-off questions do
force an unpleasant choice that most respondents (naturally) hope to
avoid, but issues involving competing values are not always escapable.
As Scott Keeter notes, politics is precisely about the kinds of choices re-
quired by trade-off questions, and ‘‘while the public is not well equipped
to make elaborate calculations of the costs and benefits of particular
environmental policies,’’ those comparisons remain one of the most rig-
orous ways of determining ‘‘how the public ranks certain values.’’24
In short, answers to trade-off questions speak not simply to the au-
thenticity of the options offered but to the conviction with which citizens
hold their environmental beliefs. While Ladd and Bowman fear that
confusion over the real intent of the question means ‘‘it is impossible
44 Chapter 2

to know what to make of the answers given,’’ Schuman and Presser’s
extensive experiments on question wording and format suggest other-
wise.25 They write that one of the ‘‘clearest findings’’ of their work ‘‘is
the extent to which people, once they have agreed to be interviewed,
accept the framework of questions’’ that they are offered and ‘‘try
earnestly’’ to work within it.26
More and Better through Combination
While measuring attitude strength can be difficult, as each of the above
examples testifies, it is not an impossible task, especially when the most
promising elements of intensity, centrality, and conviction are combined
deliberately and skillfully into a single survey. This was surely the case in
the 1996 National Election Study (NES). Using a seven-point numerical
scale, respondents in the pre-election poll were asked to place themselves
on a continuum anchored on each end by desirable goals described as
‘‘protecting the environment’’ and ‘‘maintaining jobs and our standard of
living.’’ This formulation minimizes several of the dangers noted above.
First and foremost, in contrast to standard degree-of-concern items,
the advantage of environmental protection in terms of social desirability
is to some degree neutralized in this measure through direct comparison
to another advantageous goal, economic prosperity. Moreover, both
goals were worded in a reasonable way, one that average Americans
were likely to comprehend without reference to complex policy options
or debates.
Second, while trade-off questions can be criticized for presenting false
choices, the odd-numbered scale allows an implied midpoint representing
a position of neutrality and moderation in choosing between two goals
that respondents may very well have believed could be achieved in
tandem.
Finally, two questions asked immediately following the initial scale
offer additional insights. The first asked respondents how certain they
were of their position on the scale, and the second, using a Likert-type
response format, asked how ‘‘important’’ the issue was to them. In this
context, the former question speaks to attitude crystallization, while the
latter becomes an effective indicator of centrality and yet one not as
unfairly demanding as the typical ‘‘most important problem’’ question.
Strength 45

Although not startling, one of the most meaningful conclusions to be
drawn about attitude strength on the environment can be found in the
combination of these three items. While in most degree-of-concern ques-
tions respondents cluster toward the extreme, nearly two-thirds of those
polled by NES gravitated to the middle range of the issue scale—outlined
in table 2.3—creating a distribution that has all the appearance of a bell
curve.
As might be expected, respondents falling to the center of the scale
were also somewhat less sure of their position and found the issue to be
of less importance to them personally.27 In short, all three questions
Table 2.3Exploring Attitude Strength on the Environment
[ Issue position:] Some people think it is important to protect the environmenteven if it costs some jobs or otherwise reduces our standard of living. (Supposethese people are at one end of the scale, at point number 1.) Other people thinkthat protecting the environment is not as important as maintaining jobs and ourstandard of living. (Suppose these people are at the other end of the scale, atpoint number 7.) And, of course, some other people have opinions somewhere inbetween, at points 2, 3, 4, 5, or 6. Where would you place yourself on this scale,or haven’t you thought much about this? [V960523]
[ Issue certainty:] How certain are you of your opinion on this scale: (1) not verycertain, (2) pretty certain, or (3) very certain? [V960524]
[ Issue importance:] How important is this issue to you: (5) extremely important,(4) very important, (3) somewhat important, (2) not too important, or (1) notimportant at all? [V960525]
Rank Issue PositionAligned onscale
Meancertainty
Meanimportance
1 Protect environment, even if itcosts jobs, standard of living
11.6% 2.78 4.46
2 15.7 2.51 4.13
3 20.2 2.31 3.74
4 27.8 2.17 3.51
5 14.0 2.25 3.47
6 6.9 2.49 3.78
7 Jobs, standard of living moreimportant than environment
3.9 2.77 4.02
Source: National Election Study (1996).
46 Chapter 2

reinforce the same basic point: Americans may be concerned about
the environment, but many are ambivalent and unresolved about how
strongly those issues should be addressed when other values enter into
the equation.
From Words to Action
The difficulties that researchers encounter in finding suitable measures
of attitude strength suggest one glaring omission from the list above. As
the popular adage reminds us, ‘‘talk is cheap,’’ and so those who feel
strongly about something are often urged to put ‘‘their money where
their mouth is.’’28 The same might be said of the public’s commitment to
environmental protection. Why not, then, look beyond mere words to
the realm of action and judge the depth of concern by our collective
willingness to act on our stated beliefs as voters, consumers, or political
activists? Unfortunately, this approach is no less difficult (or controver-
sial) to navigate.
Contingent Valuation
Valuing the environment by reference to behavior is a difficult task for
one essential reason: the objects at hand include collective, rather than
private, goals. While certain environmental goods can be priced in indi-
rect ways by measuring property values or travel costs to recreational
areas, most environmental resources (such as clear air or water) are sel-
dom, if ever, exchangeable in the open marketplace.29 Economists cau-
tion, too, that such studies are likely to underestimate environmental
preferences by accounting for use alone, dismissing as intangible other
option or existence values.30
Recent trends in environmental economics, however, have wrestled
with the measurement of intangible factors through the use of contingent
valuation studies. Rather than attempting to observe actual market be-
havior using monetary measures, contingent valuation extracts personal
preferences through polling by creating hypothetical conditions under
which respondents state their ‘‘willingness-to-pay’’ (WTP) for an infinite
variety of environmental goods, ranging from park land to sea birds.31
Strength 47

But, with that said, of course, the attempt to move from words into
action ultimately returns us to square one—that is, to the problems and
constraints of survey research.
Not surprisingly, results from these efforts have been decidedly mixed.
While the NORC General Social Survey (GSS) found that strong major-
ities supported increased spending for environmental protection, those
numbers grew soft when attention turned to specifics, including reference
to a higher tax burden. Although 72 percent of those polled in a 1993
Louis Harris poll expressed willingness to ‘‘pay somewhat higher taxes’’
provided ‘‘the money would be spent to protect the environment and
prevent air and water pollution,’’ just 34 percent were equally willing in
a similar GSS question asked a short time later.32 The key difference in
the that case was probably the latter’s substitution of the phrase ‘‘much
higher taxes,’’ even though both questions were notably ambiguous as to
cost.
In a similar comparison, Cambridge Reports Research International
found in 1994 that 40 percent of respondents were willing to some
degree to pay 5 percent more in higher taxes in order to ‘‘better protect
the environment.’’ Just two years before, however, the polling firm of
Yankelovich, Clancy, Shulman found a much stronger 64 percent willing
to pay $200 for the same purpose.33 Even though the dollar amount
required in each scenario was similar for a typical American family, the
contrast in results was likely due to the uncertainty in which cost was
expressed in the Cambridge study. Quite simply, respondents might have
judged a 5 percent increase in taxes to be either high or low, but the
figure probably had little concrete meaning to them.
Finally, two polls conducted on the topic of global warming in 1997
show how inconsistent responses can be on willingness-to-pay higher
gasoline prices. While Princeton Survey Associates found respondents
split, with 51 percent willing to pay twelve cents more, a Pew Research
Center poll found an even stronger proportion (60 percent) willing to
accept an increase of twenty-five cents.34
As each of these examples suggests, the concept of contingent valua-
tion is in itself fraught with potential problems. Respondents find it dif-
ficult to react to hypothetical situations. Without any real-world frame
of reference, they are unlikely to know the true cost of incremental
48 Chapter 2

improvements in environmental quality and therefore may be unable to
choose a level of monetary support that is compatible with their prefer-
ences.35 As others argue, too, ‘‘subtle changes in question order and
wording can affect the nature of the responses,’’36 leading at times to
exaggerated ‘‘green generosity,’’ or alternatively, to ‘‘free riding’’ when
the contributions of others are anticipated.37 Finally, it is important to
note that willingness to pay seldom represents an eagerness to do so. As
Ladd reasons, responses to hypothetical questions regarding spending
and taxation must not be understood ‘‘literally’’ but rather as an entirely
‘‘symbolic’’ commitment to environmental protection.38
Self-Reported Behavior
To gauge public commitment in ways that move beyond symbolism, a
somewhat different approach is needed, one that refocuses attention not
on support for collective public outcomes but rather on private, individ-
ual decisions. The latter point is addressed in an April 2000 Gallup poll
(see table 2.4). In that questionnaire, respondents were asked which of a
series of environmental tasks they had participated in ‘‘in the past year.’’
While the results of that list are initially impressive, at least one note of
warning is necessary. From a methodological standpoint, the validity
and reliability of self-reported behavior can be at risk when respondents
exaggerate or misrepresent their participation in certain activities.39 As
Stanley Presser writes, ‘‘People like to see themselves as good citizens
or, more generally, to present themselves in a socially desirable light.’’40
Given recent evidence that environmentalism is viewed as an important
element of good citizenship, that general criticism seems valid here.41
Despite an admitted degree of uncertainty, however, the Gallup data
can be defended for two reasons. First, results indicate only what indi-
viduals and their family members have done ‘‘in the past year,’’ not what
activities they regularly participate in. In this sense, high frequencies
that accumulate behavior over an extended period of time are not
unexpected. Moreover, even if participation is overreported by eager
respondents, the relative rank of activities (similar to that of environ-
mental concern and issue salience) remains less affected. And it is, in fact,
that rank that leads to the most compelling and transparent conclusion
of all. Quite simply, Americans are more like to act ‘‘green’’ when there
Strength 49

is a tangible incentive to do so and when the need for personal sacrifice is
slight.42
For example, the most frequent task reported to Gallup involved
recycling ‘‘newspapers, glass, aluminum, motor oil, or other items.’’
Nearly all of those interviewed (a staggering 90 percent) reported that
they had recycled those products within the past few years, but it is im-
portant to keep in mind that recycling is now mandatory in many cities
and municipalities, often with curbside pick-up—a basic fact that stands
Table 2.4Self-Reported Participation in Thirteen Environmentally-Responsible Activities
Which of the following, if any, have you, yourself, done in the past year?
Question Yes, have done
Voluntarily recycled newspapers, glass, aluminum, motoroil, or other items
90%
Avoided using certain products that harm the environment 83
Tried to use less water in your household 83
Reduced your household’s use of energy 83
Bought some product specifically because you thought itwas better for the environment than competing products
73
Contributed money to an environmental, conservation, orwildlife preservation group
40
Signed a petition supporting an environmental group orsome environmental-protection effort
31
Voted for or worked for candidates because of theirposition on environmental issues
28
Attended a meeting concerning the environment 20
Contacted a public official about an environmental issue 18
Been active in a group or organization that works toprotect the environment
15
Contacted a business to complain about its products orpolicies because they harm the environment
13
Bought or sold stocks based on the environment record ofthe companies
9
Source: Gallup Organization (April 3–9, 2000).Note: n ¼ 1;004.
50 Chapter 2

at odds with Gallup’s use of the term ‘‘voluntarily.’’43 As some scholars
point out, policies such as this are a form of forced behavior change.44 In
other states, such as Maine and Vermont, consumers are reimbursed a
small deposit fee after bottles are emptied and returned to community
redemption centers. Some families, of course, recycle household waste
out of a genuine concern for the environment or an intrinsic sense of
personal satisfaction,45 but others undoubtedly do so because of a
financial incentive or a need to comply with local ordinances.46 Both are
clearly factors that suggest that recycling cannot be seen as a full reflec-
tion of the public’s commitment to environmental protection.
Notice, too, that the Gallup survey asked respondents about whether
they had ‘‘tried to use less water’’ or whether they had reduced their
household’s use of energy. The motivation of respondents in performing
these tasks is equally unclear. As efforts that conserve natural resources,
both could be considered environmentally friendly, and yet the financial
benefits that respondents receive by reducing the costs of household util-
ities are not trivial. In the end, it seems fair to say that environmentalism
in practice is frequently a by-product of activities that are justified by
other rewards. Faced with rising expenses, Americans have learned that
it often pays to be green. But if such is the case, environmentally re-
sponsible behavior may depend on the presence (or absence) of those
cues, signaling little about attitude strength and conviction.
Understanding Ambivalence
Given the challenges of survey research, the argument presented in this
chapter so far has been necessarily circuitous, and yet data from a wide
variety of sources using different formats and techniques all seem to
point to the same basic conclusion. High expressions of support not-
withstanding, actual public commitment to the environment is limited,
especially when personal sacrifice and competing priorities are brought
to mind. In this respect, of course, the environment is truly no different
than any other political issue. Public support is never unconditional, nor
are Americans ever anxious to assume the financial burden of their
demands, even on issues they care about.47 Yet in commenting on recent
Strength 51

trends in environmental conditions, Ed Ayres of the Worldwatch Insti-
tute writes, when ‘‘plotted on graphs, they look like heart attacks,’’ and
so, he wonders, ‘‘why are we not astonished?’’48 Why do Americans not
express environmental concern with greater depth and resolve, especially
given their belief that these problems are both real and dangerous?
First, perhaps average citizens fail to take a more intense personal
interest in the environment because they trust that those problems are
being satisfactorily addressed by others, including policymakers and
business leaders. Mitchell finds this explanation entirely ‘‘plausible’’
given increased government funding for environmental regulation since
1970.49 In general, however, while levels of satisfaction with government
involvement on the environment have risen somewhat over the past de-
cade, many Americans remain cautious and pessimistic.50 For example,
in the April 2000 Gallup poll cited extensively in this chapter, 64 percent
of those polled believed that ‘‘only some progress’’ had been made in
dealing with environmental problems, while 60 percent had ‘‘only some
optimism’’ that those issues would be ‘‘well under control’’ within the
next twenty years.51 In this context, the seeming intractability of envi-
ronmental problems may be to blame. As Mitchell argues, people often
feel that there is ‘‘nothing they can do about the problem despite the
strength of their feelings,’’52 a factor that can lead to resignation rather
than forward momentum.53
Second, perhaps environmental issues are too far removed from per-
sonal experience to motivate greater depth of concern.54 As Philip Sha-
becoff reasons, ‘‘The environment is not usually an issue of high political
salience, but when the quality of their air and water and the health of
their children are threatened, Americans can be roused to anger.’’55 Data
available in the 1995 pilot of the National Election Study (NES), how-
ever, find surprisingly little support for that logic. Concern for local air
quality may indeed motivate Americans to support government efforts to
combat air pollution, but respondents overall were far more likely to
complain about air and water quality nationwide than they were about
their own communities, as table 2.5 shows.56 That result finds additional
support in Robert Rohrschneider’s work cross-nationally, which shows
that self-interest plays a diminished role in understanding public atti-
tudes on the environment.56
52 Chapter 2

Finally, given that Americans tend to place priority on immediate
concerns over long-term uncertainties, an added cause of weak attitude
strength may be the distant time horizon perceived on many environ-
mental threats, such as global warming and ozone depletion. This inter-
esting hypothesis receives some support in table 2.6. For instance, as
noted earlier, just 2 percent of those responding in the Gallup study cited
the environment or related pollution concerns as one of the nation’s
‘‘most important problems,’’ and only 1 percent did the same in refer-
ence to their own community. When attention is directed twenty-five
years into the future, however, 14 percent of those polled volunteered
environmental concerns, pushing the environment to the top of the list.
In other words, as David Helvarg notes, ‘‘environmentalism is, if not
moving to the front burner, at least heating up the back of the stove.’’57
Conclusions
To say that environmental issues are embraced by a majority of Amer-
icans is hardly a controversial statement. Scholars have long noted
Table 2.5National vs. Local Differences in Environmental Concern
Overall, how would you rate the air quality in . . .
Response Our nation Your local community
Very good 5.9% 29.1%
Fairly good 59.7 48.6
Fairly bad 26.9 15.1
Very bad 7.6 7.2
Source: National Election Pilot Study (1995).
Overall, how would you rate the safety of drinking water in . . .
Response Our nation Your local community
Very good 11.2% 34.8%
Fairly good 56.2 44.3
Fairly bad 26.0 14.5
Very bad 6.6 6.4
Source: National Election Pilot Study (1995).
Strength 53

that the environment has become a consensual issue, perhaps to the
point of defining a new cultural norm.58 There are few obvious anti-
environmentalists today, and no major bloc of voters opposed to envi-
ronmental protection.59 Yet where we might presume black and white
there are, in reality, only shades of gray. The real question is no longer
whether Americans side with environmentalism but rather what kind of
commitment they bring to the table.
Unfortunately, as the introductory chapters caution, the power of
overwhelming numbers is not always what it seems. Diffused by survey
research that asks the right questions, public resolve on the environment
seems weakened by ambivalence, conflict, and contradiction, especially
when the inherent social desirability of those issues is countered by other
equally important goals in ways that imitate political reality. This con-
clusion is consistent with the way in which a majority of Americans de-
scribe themselves in polls—as ‘‘sympathetic, but not active’’ within the
environmental movement.60
Table 2.6Ranking Important Problems: Locally, Nationally and in the Future
What do you think is the most important problem facing . . .
Issue
Ournationtoday
Yourcommunitytoday
Our nation25 yearsfrom now
Environment/pollution 2% 1% 14%
Crime/violence/guns 17 19 7
Decline in morals/ethics 13 3 8
Education/schools 11 17 6
Dissatisfaction with government 11 2 2
Economic concerns 10 12 9
Health care 6 3 3
Poverty/homelessness 6 1 3
Drugs/alcohol abuse 5 10 3
Source: Gallup Organization (May 23–24, 2000) (n ¼ 1;032); and April 3–9,2000 (n ¼ 1;004).Note: All responses are open-ended. Question wording for community concernsincluded the phrase ‘‘worst problem’’ rather than ‘‘most important problem.’’Items in list do not add to 100 because some issues with a small number ofresponses were excluded.
54 Chapter 2

In the end, that fact should not be ignored, either by survey re-
searchers or by political activists who seek to use polling results to pres-
sure government and business leaders into forming protective
environmental policies. ‘‘In the United States,’’ writes Mark Dowie,
‘‘ecology is a household word and almost everyone is an environ-
mentalist,’’ but a consensus based on words alone may prove to be shal-
low and transient in the long run, endangering the legitimacy and
political base of environmentalists who place too much faith in public
mandates and grassroots support.61
Strength 55

This Page Intentionally Left Blank

3Stability: Have Environmental Attitudes
Changed over Time?
In a well-known article titled ‘‘Up and Down with Ecology,’’ published
in 1972, just two years after the first observance of Earth Day, Anthony
Downs compared public opinion on the environment to a broader con-
cept he labeled the issue-attention cycle. For Downs, it was a pattern
defined by the mercurial tendency of Americans to shift notice from one
problem to the next. ‘‘Public attention rarely remains sharply focused
upon any one domestic issue for very long,’’ he said, ‘‘even if it involves a
continuing problem of crucial importance to society.’’1 Instead, Downs
cautioned that most issues populating the public agenda follow a pre-
dictable and nearly inevitable orbit that is marked initially by ‘‘alarmed
discovery’’ and ‘‘euphoric enthusiasm’’ but later by the reality of rising
policy costs, which brings with it discouragement and declining sup-
port.2 Declaring that public interest in the environment was already
midway through that cycle, his message to environmentalists was clear.
It might be ‘‘possible to accomplish some significant improvements in
environmental quality,’’ but only if ‘‘those seeking them work fast.’’3
Given the wisdom of hindsight, of course, Downs’s forecast seems
decidedly mistaken or at the very least premature. Interest in environ-
mental issues has not fallen off the political map but in truth it has not
remained constant and unwavering either, at times shifting around de-
finitive peaks and troughs. For example, in the early 1970s Hazel Erskine
acclaimed ‘‘a miracle of public opinion,’’ writing that ‘‘ecological issues
have burst into American consciousness’’ with ‘‘unprecedented speed
and urgency.’’4 Within a few short years, however, most scholars con-
firmed a rapid retreat.5 A renewal of environmental concern in the late-
1980s followed (one that to some constituted a ‘‘second miracle’’),6 but

just a few years later poll watchers pointed to evidence of decline, noting
that ‘‘acute concern’’ had eroded once again and that environmental
issues had progressed to the midpoint of yet another life cycle.7
Within this fluctuation there is, perhaps, an inference to be drawn. If
trends in support for environmental protection periodically decline for
extended lengths of time (for any number of imaginable reasons), envi-
ronmentalism may be little more than a political fad or fashion subject to
the nature-of-the-times. We might suspect that near consensus on envi-
ronmental issues is due, possibly, to the fiscal generosity that accom-
panies economic prosperity or to the subliminal message of media
agenda setting rather than to honest public concern.8
In part, those doubts seem reasonable in light of scholars’ long-
standing tendency to assess the quality of American public opinion by
wider reference to the characteristics described by Downs—to attributes
that, in V. O. Key’s words, ‘‘speak of the volatility of public opinion,
its whimsicality, its sluggishness, its stability, its erraticism, and its un-
predictability.’’9 Indeed, the very definition of attitude found in most
textbooks requires that citizens develop a ‘‘learned predisposition to re-
spond’’ that is largely consistent and stable when subject to scientific
measurement.10 Whether a majority of Americans meet that threshold on
issues like the environment is frequently challenged. While some com-
plain that opinion change over time consists of little more than white
noise,11 others counter that policy preferences are remarkably stable,
characterized by change that is slow, steady, and, most important of all,
explicable.12
Addressing the accuracy of these competing claims forms the basis of
this chapter. In concentrating on the stability of opinion, it is a plan that
moves focus to a broad landscape, one described not simply by cross-
sectional slices of public opinion at static moments in time but rather by
dynamic shifts within an aggregated public across time. As a result, an
appropriate goal is twofold—to categorize the nature of change in envi-
ronmental attitudes and then to explain deviations from that course in
a powerful but ultimately parsimonious model that uses four sets of
variables—cohort replacement, economic conditions, federal spending,
and media attention.
58 Chapter 3

Tracking Trends in Environmental Attitudes
To study the aggregate stability of public opinion requires that at least
two elements be in place.13 First, trends in identically worded questions
asked by major polling organizations must be identified and compiled
(no small task in a profession that at times prizes responsiveness to new
events over long-term continuity). This criterion is necessary to ensure
that change in attitude alone is measured and not some lesser variation
in question format, wording, or design.14
Second, an accompanying theory of change must be defined and tested
against the evidence. As D. Garth Taylor writes, on that count there
seem to be several possible models.15 For example, under some con-
ditions public opinion might be constant. That is, it might exhibit little
real change, where differences from one datum to the next are not sta-
tistically different from zero. In analyzing 137 attitudinal trends found in
the NORC General Social Survey (GSS), Tom Smith finds that 34 per-
cent of issues qualify under those conditions.16
A second model identifies a pattern of linear change that either in-
creases or decreases over time at a slow, steady, and reliable rate, often
due to cohort replacement or to broader structural changes such as edu-
cational attainment or labor-force participation. According to Smith, 41
percent of GSS trends demonstrate either clear linearity or a significant
linear component (one where unexplained variance is still present). Two
final theories recognize the potential of short-term, nonlinear change. In
some cases, shifts in opinion might be cyclical, paired with repetitive
market trends or election schedules.17 In others, change might be epi-
sodic, charting sudden and erratic shifts based on events of unique public
significance, such as war, assassination, or depression.18
Each of these models seems intuitively plausible when applied to the
environment. The natural replacement of one birth cohort with another
might certainly create linear growth in environmental concern, particu-
larly among generations first socialized to the dangers of environmental
degradation in the years since 1970.19 Cyclical change might likewise
be produced by any number of factors, including economic conditions
like unemployment or inflation or even the scientific discovery of new
Stability 59

environmental problems, where progress in some areas is quickly offset
by the emergence of other pressing concerns, allowing Downs’s issue-
attention cycle to repeat itself time and again.20 Finally, event-driven
models might produce opinion bounce due to environmental disasters
that are well publicized by the press, such as those that occurred at
Love Canal, Three Mile Island, Bhopal, Chernobyl, or Prince Edward
Sound in 1989, where massive quantities of oil were spilled by the
Exxon Valdez.
To identify which model (or combination of models) is best suited to
environmental attitudes, long-term trends in five survey questions—all
composed of at least ten observations each between 1973 and 1999—are
graphed in figure 3.1.21 Chief among them is a popular measure of sup-
port for spending on ‘‘improving and protecting the environment’’ asked
annually, with few exceptions, in the NORC General Social Survey
(GSS). Despite differences in question wording and intent, those five
trends seem to confirm a common result. Interest in environmental pro-
tection declined or remained stagnant in the 1970s, rose to record
levels between 1987 and 1991, and then descended again in the years
that followed, corroborating the work of many other observers in the
field.22
But how might that visual conclusion be formalized by way of the
theoretical models outlined earlier? That question is easier to answer
when focusing on one trend at a time, most appropriately the longest
trend available, which is the GSS spending measure. A close look at that
data shows that the magnitude of change in the percentage of respon-
dents who believed that ‘‘too little’’ was being spent on the environment
in each year in which the question was asked is small, even incremental.
Movement on a wider scale is evident, however, when successive obser-
vations of that variable are regressed against time, as shown in figure
3.2. The graphical display there suggests that an underlying linear trend
drives public attitudes on the environment, with a rate of change of
nearly four percentage points per annum.23 Yet even more apparent are
cyclical deviations from that trend that remain unexplained in estimating
the equation.24 Indeed, this cycle moves with remarkable regularity,
deviated by no obvious outliers that might point instead to forces that
60 Chapter 3

are random and erratic. Studying that duel pattern further requires a
more sophisticated model, as well as a clearer sense of causality.
Explaining Opinion Change
V. O. Key writes that ‘‘stability of opinion both in idea and in fact can be
understood only in relation to the stimuli’’ that affect it.25 That conclu-
sion, for him, drew natural attention to a series of issues, problems, and
cues, the most promising of which for present purposes are cohort re-
placement, economic conditions, federal spending, and media attention.
Figure 3.1Trends in Support for Environmental Protection, 1973 to 1999Note: All missing values have been interpolated in order to provide an uninter-rupted time series. See appendix for question wording.
Stability 61
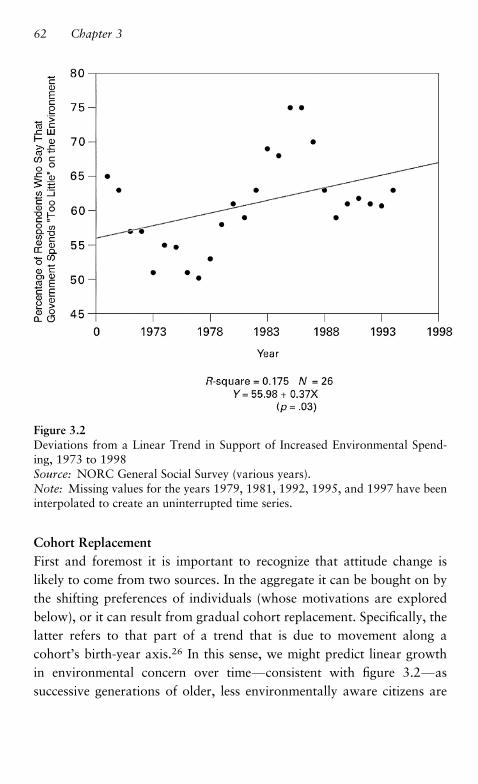
Cohort Replacement
First and foremost it is important to recognize that attitude change is
likely to come from two sources. In the aggregate it can be bought on by
the shifting preferences of individuals (whose motivations are explored
below), or it can result from gradual cohort replacement. Specifically, the
latter refers to that part of a trend that is due to movement along a
cohort’s birth-year axis.26 In this sense, we might predict linear growth
in environmental concern over time—consistent with figure 3.2—as
successive generations of older, less environmentally aware citizens are
Figure 3.2Deviations from a Linear Trend in Support of Increased Environmental Spend-ing, 1973 to 1998Source: NORC General Social Survey (various years).Note: Missing values for the years 1979, 1981, 1992, 1995, and 1997 have beeninterpolated to create an uninterrupted time series.
62 Chapter 3

replaced by those who are younger and more conscious of environmental
degradation, especially in the years following the creation of a modern
environmental movement.27
Economic Conditions
Scholars have long argued, too, that policy preferences are shaped over
time by economic conditions and expectations.28 In fact, on the envi-
ronment there is evidence that public concern is conditioned by the
business cycle, rising in social priority during periods of prosperity and
falling when times turn hard.29 As one journalist explains from the van-
tage point of early 1992,
When times get tough, the questions facing environmentalists get even tougher.And these days, economic anxieties and shifting political winds are threatening toproduce a green-out effect that could make tree huggers feel as endangered as theCalifornia condor. Epochal events such as the Gulf War and the collapse of theSoviet Union have pushed most domestic ecological concerns off the front pages.The recession has prompted many people to question the costs of environ-mentalism and made it harder for preservation groups to raise money and boostmembership. In the presidential campaign, saving the planet has become anorphaned issue. No savvy candidate would dwell on ozone depletion and theneed for biodiversity when voters are worrying about whether they’ll have a jobnext year or be able to pay their medical bills.30
Based on that advice, it is not surprising that then-incumbent George
H. W. Bush—who just four years earlier in better times had pledged to
be the ‘‘environmental president’’—decided that an election year turn-
about was needed, telling voters on the campaign trail that year that it
was now time to ‘‘put people ahead of owls.’’31
According to Euel Elliott, James Regens, and Barry Seldon, downturns
in the economy are potentially devastating for environmentalists in pur-
suit of political goals, even more so given that perceptions of economic
conditions are often as important as the statistics themselves.32 They
argue that ‘‘to the degree economic growth is modest, hard-won gains
obtained by the environmental movement, as well as advances in envi-
ronmental protection, may be in serious jeopardy if implicit trade-offs
between economic performance and environmental quality dominate the
policy agenda.’’33
Stability 63

Federal Spending
A third possible factor explaining temporal shifts in environmental
opinion associates those trends with satisfaction with current efforts and
expense. As chapter 2 notes, once public outrage succeeds in inducing
government to assume responsibility for improving environmental qual-
ity, citizens may be likely to feel a sense of satisfaction in the belief that
the problem ‘‘is being taken care of.’’34 In response to actual government
spending, therefore, Christopher Wlezien believes that the public behaves
much like a thermostat, adjusting ‘‘its preferences for ‘more’ or ‘less’
policy in response to policy outputs themselves.’’35
Media Attention
Finally, public responsiveness to external factors like economic con-
ditions and federal spending is communicated (and to some extent
mediated for) the public by the news media.36 As Benjamin Page and his
colleagues write, when it comes to acquiring political information ‘‘most
people rely heavily upon the cheapest and most accessible source’’ avail-
able to them, including television, radio, newspapers, and magazines.37
That dependence is significant here because studies show that media
coverage on the environment tends to be event oriented, rising and
declining in a pattern that closely matches the public mood, a fact that
has encouraged some scholars to go still further in attributing cause. For
example, in summarizing published scholarship in the field, Stuart Allan,
Barbara Adam, and Cynthia Carter note that concern for unemployment
and inflation displaced environmental issues from the news agenda in the
1970s, helping to precipitate a rapid decline in policy support among
average Americans ‘‘once the reinforcing and sustaining influence of the
mass media disappeared.’’38
In Search of a Model
Our primary interest here is to understand why environmental attitudes
change over time—specifically, why aggregate changes occur in the per-
centage of those who believe that ‘‘too little’’ is being spent on ‘‘improv-
ing and protecting the environment,’’ as measured annually by the
NORC General Social Survey (GSS) between 1973 and 1998.39 In the
64 Chapter 3

language of basic statistics (as in algebra), that pooled set of data is con-
sidered a dependent variable—that is, a variable whose value is deter-
mined by the presence or degree of one or more independent variables,
which in this case include those described above (cohort replacement,
economic conditions, federal spending, and media attention).
Incorporating four highly reasonable expectations of opinion change
into a formal model subject to empirical testing, however, is not as easy
as it might appear, but it is necessary if the relative contributions of each
are to be isolated and disentangled. The approach used to accomplish
that goal, called multivariate regression analysis, is popular in many dis-
ciplines, and is accessible to most readers with at least some statistical
training.40 An added wrinkle must be dealt with here, however. Since the
pooled GSS data construct a time-series, the problem of autocorrelation
must be confronted before estimating any model. This term is used by
scholars to refer to a condition in which the error terms corresponding to
different points in time are correlated with one another. As basic econo-
metrics textbooks are quick to point out, failing to acknowledge a lack
of independence can lead to an overestimation of regression coefficients
and of a model’s explanatory strength.41
One possible corrective for autocorrelation is to take first differences
of variables on both sides of the equation. By subtracting each datum in
the series from its predecessor, the series is detrended and made station-
ary. According to Gary King, however, that approach can ‘‘cancel out’’
important systematic components in the data, so much so that ‘‘models
based on differenced series tend to fit less and have higher standard
errors and less stable coefficient values.’’42 Given those concerns, Robert
Durr argues that ‘‘prewhitening’’ techniques such as these can be akin to
‘‘throwing out the baby with the bathwater,’’ especially since alternatives
are widely available.44 As he recommends, empirical results are gen-
erated instead using a first-order autoregressive error model found in the
statistical program SAS, the results of which produce a fully acceptable
Durbin-Watson statistic.45
One last set of difficult decisions involves the operationalization and
measurement of the independent variables used in the equation. Cohort
replacement, for instance, is a complex process not easily reflected in an
aggregate time-series.45 Still, the possibility is explored here by including
Stability 65

the percentage of GSS respondents born after 1945 as an independent (or
explanatory) variable in a multivariate regression—a technique that is
explained in greater detail below. As might be expected, that proportion
increases over time in a linear fashion as younger birth cohorts, social-
ized to the significance of the environmental movement, are gradually
added to the survey population.
The remaining variables in the equation all attempt to capture cyclical
or episodic deviations from that underlying trend, including a dummy
variable that offers statistical control for the presence of Democratic
or Republican presidential administrations. Two measures representing
objective economic conditions widely reported to the public (annual
measures of unemployment and inflation) are also included, as is one
subjective factor, the Conference Board’s Index of Consumer Confi-
dence. Constructed from a survey of 5,000 households, the latter is an
important measure of the public’s mood on business conditions and the
labor market.
Finding an appropriate indicator of government spending on the envi-
ronment presented an especially difficult challenge.46 Two possible sta-
tistical series were rejected for use here. One, preferred by Euel Elliott
and his colleagues, is the Pollution Abatement Costs and Expenditures
survey (PACE), but its selective focus suggests that it is too narrow for
our present purposes.47 The PACE index is casually flawed for one ad-
ditional reason as well. It primarily tracks capital and operating costs
incurred by manufacturers in the private sector, while the question asked
by the General Social Survey implies a political and social choice better
represented by government spending. A second plausible measure of
spending on the environment is found in the U.S. Environmental Protec-
tion Agency’s (EPA) extensive report, Environmental Investments: The
Cost of a Clean Environment, published in 1990.48 Like the PACE sur-
vey, however, measures developed in that report are limited to pollution-
control costs. Moreover, given its date of publication, estimates for the
years 1990 through 2000 are not firm but rather are linearly extrapo-
lated based on shifting assumptions about a variety of implementation
scenarios. To avoid these difficulties, federal budget expenditures item-
ized under the broad category natural resources and the environment are
66 Chapter 3

used here instead. Those figures are adjusted for inflation and lagged one
year on the understanding that some length of time is necessary for
alterations in spending priorities to be noted by a lay public.
Finally, since no content analysis of media attention to environmental
issues could be found extending backward in time nearly thirty continu-
ous years, one was created for this purpose by counting the number of
news stories indexed each year under the headings Environmental Policy
and Environmental Movement by the Readers’ Guide to Periodical Lit-
erature. That number ranges in value from a low of forty-eight articles in
1979 to a high of 240 in 1992.
Model Estimation
With several concerns now resolved, final data results are reported in
table 3.1. As expected, the gradual shift of birth cohorts has a positive,
linear impact on support for environmental spending over time, con-
firming the intuition of Samuel Hays and others. Yet it is important to
note that generational change remains a force challenged and at times
offset by movement in other arenas. For example, it is clear that eco-
nomic conditions dampen public enthusiasm for policy efforts.49 Holding
all else constant, a one percentage point increase in the annual rate of
unemployment depresses public support by more than four percentage
points. Put another way, the isolated difference in public opinion be-
tween a period of high unemployment (1982) and one of low (1998)
could be twenty percentage points or more—certainly a large enough
shift to exert pressure on the spending priorities of Washington
lawmakers.50
Second, while federal budget expenditures are a statistically significant
predictor of public attitudes toward spending on the environment, its
impact is surprisingly small, even with hypothetically large increases in
funding. The failure of that ‘‘thermostat’’ to register more clearly may
well be a consequence of imperfect information. ‘‘After all,’’ as Wlezien
notes, ‘‘there is reason to think that specific information about appro-
priations for these programs is not regularly and widely available to the
public.’’51 More powerful, it seems, is the partisan identity of presiden-
Stability 67

Table 3.1Autoregressive Model Explaining Trends in Support of Increased EnvironmentalSpending, 1973 to 1998
[Dependent Variable:] We are faced with many problems in this country, none ofwhich can be solved easily or inexpensively. I’m going to name some of theseproblems, and for each one I’d like you to tell me whether you think we’respending too much money on it, too little money, or about the right amount on. . . improving and protecting the environment.
Independent variablesYule-Walkerestimate
Standarderror
Percentage of GSS respondents born after 1945 0.744** 0.222
Unemployment rate, seasonally adjusted,expressed as a percentage of the total labor force
�4.485*** 0.952
Rate of inflation, as measured by percentagechange in the Consumer Price Index
�0.889* 0.378
Index of Consumer Confidence (1985 ¼ 100) �0.077 0.058
Federal budget outlays for natural resources andthe environment, lagged one year (in millions of1996 dollars)
�0.002** 0.001
Dummy variable for presidential administration(0 ¼ Democrat, 1 ¼ Republican)
6.291** 1.885
Number of news media articles on environmentalpolicy and the environmental movement indexedby the Readers’ Guide to Periodical Literature
0.040* 0.018
Intercept 78.642 13.560
R-square ¼ 0.88
Durbin-Watson ¼ 2.06 (probability ¼ 0.13)
Number of cases ¼ 26
Sources: NORC General Social Survey (various years).Notes: Missing values in the dependent variable for the years 1979, 1981, 1992,1995, and 1997 were interpolated to provide an uninterrupted time series.*p < :05.**p < :01.***p < :001.
68 Chapter 3

tial administrations, which may serve a comparable function using far
simpler means by providing the public with a shorthand cue to the
incumbent’s ideological commitment to environmental protection. Net of
other effects, results there suggest that respondents are far more likely to
believe that ‘‘too little’’ is being spent on the environment when Repub-
lican presidents are in charge—a perception (interestingly enough) that is
not always borne out in fact.52
Third, data results indicate that media attention to environmental
policy and the environmental movement itself can produce small-scale
changes in public attitudes, most likely through the power and influence
of agenda setting. Given the tendency of news coverage to follow the ebb
and flow of major environmental disasters like Chernobyl and the Exxon
Valdez, it is not difficult to imagine a scenario in which an additional
one hundred articles published in major news magazines in a given year
increase public support, holding all else constant, by four percentage
points.53
One final conclusion on a broader scale also seems warranted. Given
the overall fit of the model and its ability to explain an overwhelming
proportion of the variance observed using relatively few regressors, the
data speak to lingering controversy over the stability of mass attitudes.
While some scholars continue to view opinion as ‘‘unreliable chaff’’ with
little ‘‘substantial grain to measure,’’ results here confirm instead the
sentiment of Tom Smith, who argues that most change is intelligible over
time, driven by events of social, political, and economic importance. In-
deed, as he writes, there seems to be ‘‘neither chaos nor a chimera, but
rather order and a map of reality.’’54
Conclusions
Most early studies of environmental attitudes found the ‘‘social mood of
consensus’’ following the first Earth Day in 1970 to be ‘‘substantially
superficial,’’ leading scholars to predict ‘‘a rapid, general retreat from
hard-nosed environmental reform’’ as soon as the costs of conservation
and regulation became apparent. Others, too, argued that under the
pressure of a struggling economy and a serious energy crisis, concern for
Stability 69

environmental issues would inevitably (and understandably) weaken.
The basic facts that underscore each of those arguments receive solid
support in this chapter.
Just as important, however, is the often overlooked ability of public
opinion to find rejuvenation. Unexpected environmental events and dis-
asters reported by the news media, as well as the continued discovery of
new sources of environmental degradation by scientists, likely has helped
to sustain long-term interest, allowing the environment to avoid the pol-
icy fate of Downs’s issue-attention cycle by recharging public attention
and enthusiasm time and again.55
Still, a pattern of attitudinal peaks and troughs over the past thirty
years suggests that environmental concern remains conditional, rising
and falling in response to economic conditions, policy costs, media at-
tention, or even outright public boredom. Within that cycle an unspoken
assumption also exists—namely, that public support for the environment
is more a political fad or fashion subject to the nature-of-the-times, than
it is a valued partner in the environmental movement. Yet to reach that
far in a normative direction based on evidence of opinion change alone
seems premature for several reasons.
First, as James Stimson argues, shifting policy preferences on a wide
variety of issues tend to move together over time, closely following the
undulations in environmental attitudes observed here.56 In other words,
the factors that influence public opinion on the environment do not exist
in a political or social vacuum. Support for new policy initiatives may
weaken during economic downturns, but it appears to do so across the
board. As such, temporal shifts need not indicate a change in the relative
priority placed by the public on environmental protection.57
Finally, the movement of environmental attitudes in response to exog-
enous forces may worry environmentalists intent on preserving popular
support, but the order and predictability of those changes compensate, in
part, by highlighting well-defined ‘‘policy windows’’ or moments that are
more (or less) ripe for opportunity.58 As Robert Durr notes, that knowl-
edge ‘‘offers considerable strategic guidance’’ to lobbyists and lawmakers
alike,59 allowing savvy environmentalists to maximize political gains
during periods of high, salient support and to brace areas of vulnerability
during less advantageous times.
70 Chapter 3

4Distribution: Is Environmentalism Elitist?
Fluctuating trends in environmental concern over the past thirty years
have led to a growing recognition that environmental issues and eco-
nomic interests remain intertwined, increasingly (and uncomfortably) so
on matters of social justice.1 For example, some argue that communities
of color are disproportionately burdened by environmental risk in the
form of landfills and incinerators.2 Others say that a concern with urban
sprawl and open space reflects the ‘‘selfish downside of democracy,’’
where decisions are made by a middle class intent on preserving its own
quality of life at the expense of others through the use of exclusionary
zoning.3
The potential for conflicts such as these to unleash ‘‘thorny issues’’ of
elitism seems very real, especially if average Americans view environ-
mental issues differently based on their social, political, and economic
standing.4 As Philip Shabecoff warns in Earth Rising (2000), a weight of
tradition within the environmental movement has made it reluctant ‘‘to
embed itself in the workday human community—where people live,
worry about their jobs, send their children to school, go to church and
synagogue and mosque, and are exposed to myriad social as well as
physical insults in their environment.’’ As a result, the popular image of
an environmentalist remains that of a ‘‘backpacker and a tree-hugger,’’
someone concerned mainly with wildlife protection and wilderness pres-
ervation.5 It is a dogmatic perception that seems to invite little common
ground.
In contrast, however, some argue that in recent years pressure exerted
on the movement from the bottom up has succeeded in bringing ‘‘Earth

Day back down to earth.’’6 As Mark Sagoff maintains, today’s environ-
mentalism ‘‘serves as a common rallying ground for groups usually
thought to be at odds with one another: educated professionals and the
lower middle class; affluent suburbanites and inhabitants of small towns
in the American heartland.’’7 For these reasons, he believes that a more
inclusive environmental agenda has spanned the chasm between a society
of ‘‘haves’’ and ‘‘have nots,’’ creating an entirely new breed of populism
in the process.
Deciding which of those two competing views is more accurate in the
end remains open to debate but ironically enough, not for lack of effort.
Understanding the dynamics of environmental concern by reference to its
political and demographic base has long been a challenge for scholars. In
fact, it would not be unfair to suppose that in the field of public opinion
on the environment, no single issue has generated as much energy or
attention. Yet in spite of that research, empirical results have been sur-
prisingly mixed. While some studies confirm that environmental values
and beliefs lead to familiar cleavages based on age, education, income,
gender, and partisanship,8 others argue that polarization has been greatly
exaggerated, pointing out that those factors (in sum) rarely account for
more than 10 to 15 percent of the variance observed.9
Ironically, a multitude of contradictions and discrepancies in the field
seem best explained by reference to a now familiar problem. Careful
comparisons between results and also methodologies appear to indicate
that the importance of demographic predictors varies, depending heavily
on the way in which environmental issues are framed in question-
naires.10 Without keen attention, then, to issues of measurement and to
theories about underlying causes, it should come as no surprise that
numbers alone ‘‘do little to clarify the picture’’ and in some respects
serve only to ‘‘muddy it’’ further.14
This chapter intends to revisit long-standing charges of environmen-
tal elitism through the corrective lens of those two issues.12 The first
step involves clarifying theoretical expectations regarding various social,
political, and economic groups toward the environment. The second step
involves formalizing those relationships in a series of multivariate re-
gression models that allow the influence of each group trait to be isolated
from those that remain.13
72 Chapter 4
Demographic Expectations
If it is reasonable to suppose that environmental issues are interpreted
and prioritized in different ways by different people, what cleavages pre-
dominate? Six political and demographic predictors, in particular, have
received extensive attention in published scholarship on environmental
attitudes—age, education, income, race, gender, and partisanship.
Age
A respondent’s age has been called the ‘‘strongest and most consistent
predictor of environmental concern’’ for reasons solidly grounded in
theories of opinion formation and value change.14 As Samuel Hays
explains in Beauty, Health, and Permanence (1987), the age variable
matters because it relates to differences in the shared life experiences of
birth cohorts.15 Like Hays, studies here often emphasize the ripe devel-
opment of younger ecology-minded generations since 1970—those
socialized into a world newly shaped by a recognition of environmental
degradation and ‘‘limits to growth.’’ In this sense, the rise of environ-
mentalism joins, in Ronald Inglehart’s words, a ‘‘post-materialist’’
agenda focused on quality-of-life concerns.19 Spurred by satisfaction
with economic well-being, this trend is manifested slowly in polls by co-
hort replacement as one generation succeeds another in adult society.17
Education
Expectations regarding educational differences in environmental atti-
tudes are also clear in the literature. According to many scholars, higher
levels of education increase cognitive skills and support an awareness of
public affairs, both of which give individuals a greater interest in and
ability to comprehend complex environmental problems.18 Respondents
with higher levels of education also seem better able to translate concern
into effective action because of an availability of resources, the likelihood
of organizational affiliations, or a heightened sense of personal and
political efficacy.19
Income
Measures of income and wealth constitute a third possible determinant
of environmental concern. Charges of elitism, after all, have remained a
Distribution 73

constant theme among critics of the U.S. environmental movement over
the past thirty years.20 With its strong attack on unbridled economic
growth and the exploitation of natural resources beyond the limits of
sustainability, environmentalism has led some to argue that the move-
ment harbors an inherent asceticism that is unresponsive to the economic
needs of those less privileged.21 This belief finds justification in Ingle-
hart’s theory of postmaterialism and in A. H. Maslow’s hierarchy of
needs, both of which suppose that concern for higher-order issues like
the environment develops only after basic economic needs are satisfied.22
To put it bluntly: ‘‘Struggling inner-city communities rarely have had the
time, or the inclination, to save the whales.’’23
Race
Fourth, low participation of minorities in the environmental movement
and a suspected ‘‘concern gap’’ between black and white respondents
have led some researchers to label environmentalism a ‘‘secular religion
of the white middle class.’’24 As Robert Bullard contends in Dumping in
Dixie (1990), mainstream environmental groups have tended to stress
nonhuman issues such as wilderness and wildlife preservation and re-
source conservation, which are not issues of high priority to communities
of color, particularly those inhabited by low-income urban residents with
little leisure time and inadequate transportation to recreational areas.25
Although environmental health threats would seem to affect all urban
poor (black and white alike), some argue that minority groups suffer
from institutional barriers that block residential mobility, including dis-
crimination in local housing markets.26
Gender
Research on gender as a predictor of environmental concern represents
another prodigious area of research.27 Many scholars suggest that
women are more environmentally concerned than men based on their
maternal socialization as family nurturers and care givers.28 Others,
too, argue that women tend to feel a heightened vulnerability to envi-
ronmental risk,29 especially when attention is focused on new tech-
nologies,30 or on local hazards that impact public health and safety, such
as toxic waste disposal and nuclear power.31 Moreover, given that many
74 Chapter 4

women retain a traditional role in assuming household duties and mak-
ing consumptive decisions for their families, gender differences also seem
apparent when examining willingness to purchase environmentally re-
sponsible products in the marketplace.
Partisanship
Finally, critics have long argued that environmental priorities remain
firmly entrenched to the left of a ‘‘deep ideological divide’’ that separates
environmentalism from a commitment to personal liberty, property
rights, and technological optimism.32 It is not surprising, then, to find
that political ideology and partisan identification are each a ‘‘highly
consistent predictor’’ of environmental concern.33 After all, environmen-
tal regulation is commonly opposed by political conservatives who object
to its financial cost and to an expansion of government interference in
the market economy. Many, too, remain cautious about expansions of
federal and state bureaucracy that oversee and complicate private land-
use decisions or create additional layers of ‘‘red tape.’’ For all of these
reasons, scholars expect environmental attitudes to be closely associated
with liberal Democratic views.
The Measurement Quandary
Conventional wisdom and theoretical expectations notwithstanding, the
empirical record on political and demographic predictors of environ-
mental concern is mixed. Kent Van Liere and Riley Dunlap have ‘‘confi-
dence in concluding that younger, well-educated, and politically liberal
persons tend to be more concerned about environmental quality than
their older, less educated, and politically conservative counterparts.’’34
Yet given an accumulation of weak results, that degree of assurance is
rarely shared by others, one of whom notes that the field remains an
‘‘unsettled research area.’’35
Why should the correlates of environmental concern appear inconsis-
tent across studies? The primary reason is methodological, according
to Stephen Klineberg, Matthew McKeever, and Bert Rothenbach, who
argue that ‘‘the determinants of environmental concern vary greatly
depending on the wording and framing of the questionnaire itself.’’36
Distribution 75

Theirs is a reasonable explanation that appears even more likely when a
full menu of environmental measures used in surveys is considered. For
example, while some scholars look to public perceptions of the serious-
ness of environmental problems,37 others prefer support for government
spending,38 knowledge about environmental issues,39 environmental
policy preferences,40 or self-reported involvement in environmentally re-
sponsible activities, such as recycling or energy conservation.41 They
argue that each of these measures introduces different costs and trade-
offs into the minds of survey participants, stimulating inconsistent
responses. Questions focused on government policy, including issues like
taxes and spending, are likely to confound environmental concern with
political ideology. An emphasis on voting and volunteer work might
confuse environmental support with a more general and obvious rela-
tionship between socioeconomic status and political participation.42 A
reliance on marketplace activities could privilege income variables, con-
fusing willingness-to-pay with the ability to do so. For all of these rea-
sons, it should come as no surprise that it may matter greatly ‘‘how
environmental concern is measured.’’43
A ‘‘New Class’’ or a New Consensus?
When concerns about the environment are being surveyed, careful at-
tention must be paid both to the theories that underscore the utility of
certain independent (or explanatory) variables like income, education,
and partisanship and also (as Klineberg and his colleagues suggest) to the
way in which dependent variables are framed. With those joint issues in
mind, the analysis that follows revisits the long-standing debate over the
political and demographic bases of environmental concern by compara-
tive reference to four different factors—perceptions of environmental
danger, environmental policy preferences, strength of feeling toward
environmentalists, and self-reported participation in environmentally re-
sponsible activities.
Perceptions of Environmental Danger
As noted previously in chapter 2, the most elementary way of measuring
public attitudes toward environmental protection is to ask citizens to
76 Chapter 4

evaluate the depth of their feelings directly, often using a scaled response
format. This approach was used in the 1994 NORC General Social
Survey (GSS), where respondents were asked how dangerous they
thought a number of environmental problems were ‘‘in general’’ and for
‘‘you and your family,’’ including air and water pollution, nuclear
power, pesticide use, and the greenhouse effect.44 For present purposes,
responses to the first set of questions were summed into an additive scale
of increasing environmental concern ranging in value from six to thirty
points. Responses to the second set of questions were also summed into
an additive scale of equal length, focusing instead on personal percep-
tions of environmental danger. As in chapter 3, the effects of a series of
demographic and political variables were isolated using a multivariate
regression model, with the outcome recorded in table 4.1.
First, in terms of issue framing, the difference between these two scales
is potentially significant when they are used as dependent variables. We
might, for example, expect affluent respondents to express concern for
the environment in general, but due to the quality of their own sur-
roundings believe those issues to present little direct risk to themselves.
Based on theories of gender socialization and perceived vulnerability to
risk, we might also expect to find differences between men and women to
be stronger when environmental dangers are defined in personal terms.
Those expectations, however, fail to materialize. While each set of ques-
tions might seem to tap different emotions and considerations, the scales
themselves are extraordinarily correlated (with a Pearson’s r of .91),
which suggests that respondents fail to see a meaningful distinction be-
tween the impact those problems have on the environment in general and
on their own personal lives.
As for the comparative importance of various social and demographic
traits, age, education, gender, and partisanship all move in expected
directions, and all easily reach conventional levels of what scholars call
‘‘statistical significance’’—a standard often used to express the degree of
confidence we have in a relationship between two variables.45 In this
sense, current results confirm the work of others who argue that envi-
ronmental concern is somewhat stronger (in a relative sense) among the
well educated, women, liberals, and Democrats.
Distribution 77

Table 4.1Explaining Variance in Perceptions of Environmental Danger
Model 1General perceptions ofenvironmental danger
Model 2Personal perceptions ofenvironmental danger
Independent variablesSlopecoefficient
Standarderror
Slopecoefficient
Standarderror
Age cohort:
Born after 1971 1.00 0.71 1.18 0.77
Born 1959–1971 0.65* 0.32 1.03** 0.35
Born 1946–1958 0.90** 0.32 1.28*** 0.34
Born before 1946 0.00 — 0.00 —
Education 0.15** 0.05 0.09 0.05
Income �0.10*** 0.03 �0.13*** 0.03
Race
Black 0.49 0.43 1.21** 0.47
Other 1.61* 0.66 1.75* 0.70
White 0.00 — 0.00 —
Gender
Female 1.28*** 0.26 1.26*** 0.28
Male 0.00 — 0.00 —
Party identification 0.17* 0.07 0.17* 0.07
Political ideology 0.29** 0.10 0.31** 0.11
Intercept 17.69 0.78 17.72 0.83
Mean on additive scale 21.46 20.58
Number of cases 921 922
R-square 0.102 0.113
Source: NORC General Social Survey (1994).Notes: All estimates were obtained using ordinary least squares. See appendixfor question wording and scale construction.*p < :05.**p < :01.***p < :001.
78 Chapter 4

Probing further, however, reveals several surprises. While some
scholars predict a linear relationship between age and environmental
concern, results segmented into birth cohorts demonstrate a single ledge
dividing those over the age of fifty from their younger counterparts. In
other words, data confirm that respondents who came of age after 1970
have been more effectively socialized as a group into the mainstream
environmental movement than have their parents and grandparents but
that little added growth has occurred since that time.
Second, while income coefficients are statistically significant in both
equations, its direction defies conventional wisdom in the sense that low-
income respondents are more likely to see environmental problems as
dangerous. While Mary Douglas and Aaron Wildavsky argue in Risk
and Culture (1982) that environmentalism hobbles economic growth
and that environmental regulations fail to serve the interests of the lower
middle class,46 empirical results here suggest those assumptions are false,
perhaps because lower-middle-class families are frequently the victims of
environmental pollution.47
Finally, while previous work has noted a racial gap on environmental
attitudes, results are also somewhat surprising in suggesting that minor-
ity respondents are more responsive to environmental risks, especially
when those issues hit close to home. Perhaps as Robert Bullard and
others in the burgeoning field of environmental justice note, people of
color (like those of low income) are more likely to experience pollu-
tion firsthand and therefore develop a heightened sensitivity to those
concerns.48
In the end, however, the practical consequence of group differences in
both equations should not be overemphasized for two reasons. Slope
coefficients (while statistically significant) are, in a substantive sense,
small in size relative to the distance of the scale used. To place that criti-
cism into an appropriate context, recall that the additive scales employed
in each model range in value from six to thirty points. Holding all else
constant, then, a respondent who embraces a strong liberal ideology
would differ from a strong conservative by less than two points across
six survey items, hardly a monumental difference of opinion. Moreover,
the percentage of variance in environmental concern explained by these
Distribution 79

variables in sum total remains rather poor, weighing in at just 10 percent
and 11 percent respectively.49 Ironically, in this case the failure of the
model to provide a better fit reinforces the most important insight of all.
Minor variations in degree notwithstanding, nearly everyone is con-
cerned about the environment.
Environmental Policy Preferences
A second method of gauging environmental concern often involves ask-
ing respondents in surveys whether they support increased government
spending and taxation for environmental programs. Like above, data for
this test were drawn from the 1994 NORC General Social Survey (GSS),
where respondents were questioned as to whether they felt that spend-
ing on ‘‘improving and protecting the environment’’ was currently ‘‘too
little,’’ ‘‘about the right amount,’’ or ‘‘too much.’’ They were likewise
asked to gauge their willingness-to-pay ‘‘much higher taxes’’ for envi-
ronmental purposes. Each of those measures was independently re-
gressed on the same set of political and demographic characteristics
used above, this time for statistical reasons using a technique known as
ordered probit.50
While we might expect cleavages between social groups to be more
pronounced here given an increased demand for commitment and sacri-
fice, results are much the same. Once again, younger birth cohorts are
somewhat more likely to support policy efforts, and education and in-
come have expected effects on taxation. As table 4.2 demonstrates,
however, cleavages based on party identification and political ideology
dominate environmental policy preferences. As Klineberg and his col-
leagues note, the strength of those relationships is hardly surprising and
likely reflects the way in which these issues are framed in the GSS ques-
tionnaire. By relating environmental protection to government spending
and taxation, environmental concern becomes cognitively linked to po-
litical ideology and long-standing beliefs about the proper role of the
government sector. In fact, ‘‘the consistent differences between liberals
and conservatives on these items,’’ they write, ‘‘may have at least as
much to do with the reactions to increased government intervention in
general as with differences in their concerns about environmental issues
per se.’’51
80 Chapter 4

Table 4.2Explaining Variance in Environmental Policy Preferences
Model 1Support for increasedenvironmental spending
Model 2Willingness to pay highertaxes
Independent variablesProbitcoefficient
Standarderror
Probitcoefficient
Standarderror
Age cohort:
Born after 1971 0.46* 0.20 0.47* 0.18
Born 1959–1971 0.64*** 0.09 �0.01 0.08
Born 1946–1958 0.55*** 0.09 �0.08 0.08
Born before 1946 0.00 — 0.00 —
Education 0.01 0.01 0.05*** 0.01
Income �0.01 0.01 0.01* 0.01
Race
Black 0.07 0.12 �0.23* 0.10
Other 0.08 0.19 0.11 0.16
White 0.00 — 0.00 —
Gender
Female 0.03 0.07 0.02 0.06
Male 0.00 — 0.00 —
Party identification 0.11*** 0.02 0.06** 0.02
Political ideology 0.08** 0.03 0.10*** 0.03
Intercept 1 �0.82 0.21 �3.15 0.21
Intercept 2 1.19 0.05 1.26 0.06
Intercept 3 — — 1.85 0.07
Intercept 4 — — 2.71 0.08
Number of cases 1,254 1,141
Log-likelihood �1010.70 �1666.17
Source: NORC General Social Survey (1994).Note: See appendix for question wording.*p < :05.**p < :01.***p < :001.
Distribution 81

Strength of Feeling toward Environmentalists
A third way of operationalizing environmental concern focuses on the
feelings respondents have towards environmentalists, as opposed to the
issues they support or the government policies designed to address those
problems. Scholars have long argued that group identification is vital
in understanding the development of social identity.52 Indeed, in The
American Voter (1960), Angus Campbell and his team point out that
psychological attachments to groups ‘‘can become reference points for
the formation of attitudes and decisions about behavior.’’53
To explore whether those considerations matter, data were selected
from the 1996 National Election Study (NES) where respondents were
asked to react to the term environmentalists by reference to a ‘‘feeling
thermometer.’’ Tapping affective (as opposed to cognitive) evaluations,
movement up (positive) and down (negative) the scale was used to express
feelings of warmth or coolness toward the object in question.
Not surprisingly, environmentalists fared well on the thermometer
scale overall, rating an average score of 63, well above that obtained for
labor unions, big business, or the federal government in Washington—
all typical competitors in the arena of environmental politics. More
significant than magnitude or rank, however, is the fact that no signifi-
cant differences in opinion emerge between social and demographic
groups listed in table 4.3, except for two—party identification and politi-
cal ideology.
To simplify that result, differences in means between party identifiers
are highlighted graphically in figure 4.1 in comparison to the overall
distribution of responses received. While Klineberg, et al. suspect that
political variables have less impact on questions that look beyond issues
of government intervention, the continued strength of those variables in
this context (both statistically and substantively) suggest that the term
environmentalist retains a clear political context and connotation that
may limit its appeal. In the end, those relationships likely reflect the dif-
ficulties that citizens have in separating the environment as an issue from
the policies used to protect it.
82 Chapter 4

Self-Reported Environmentally Responsible Behaviors
One final test of the demographic correlates of environmental concern
focuses attention back on the 1994 NORC General Social Survey (GSS),
which at the close of its environmental battery measured to extent to
which individuals were willing to act on their environmental beliefs.
Respondents were asked how often they make a ‘‘special effort’’ to sort
glass, plastic, and paper items for recycling and how frequently they
Table 4.3Explaining Variance in Feelings toward Environmentalists
Independent variables Slope coefficient Standard error
Age:
Born after 1971 1.28 2.49
Born 1959–1971 0.33 1.39
Born 1946–1958 0.07 1.41
Born before 1946 0.00 —
Education �0.08 0.38
Income �0.00 0.11
Race:
Black 0.72 2.12
Other 5.51 3.60
White 0.00 —
Gender:
Female 0.00 —
Male 1.91 1.12
Party identification 1.85*** 0.33
Political ideology 3.30*** 0.51
Intercept 42.48 2.62
Mean on thermometer scale ¼ 63.41
Number of cases ¼ 1,082
R-square ¼ 0.162
Source: National Election Study (1996).Notes: All estimates were obtained using ordinary least squares. See appendixfor question wording.*p < :05.**p < :01.***p < :001.
Distribution 83

purchase fruits and vegetables grown without the use of pesticides or
chemicals. Respondents, too, were asked how often they ‘‘cut back on
driving a car for environmental reasons.’’ Using a four-point response
format to grade the frequency of participation in these activities (ranging
from ‘‘never’’ to ‘‘always’’), answers were summed into an additive scale
of economic behavior that was regressed once again on the same set of
political and demographic characteristics used above.
In addition, the GSS questioned respondents about their current and
past patterns of political activism. They were asked whether they were a
member of ‘‘any group whose main aim is to preserve and protect the
environment’’ and whether they had signed an environmental petition,
given money to an environmental group, or taken part in a protest or
Figure 4.1Partisan Comparisons on Feelings toward EnvironmentalistsSource: National Election Study (1996).Note: See appendix for question wording.
84 Chapter 4

demonstration about an environmental issue in the last five years. Given
yes or no answers to each of these questions, a four-point additive scale
was created and regressed one final time on an identical set of charac-
teristics using an ordered probit model. Results for both of these equa-
tions are reported in table 4.4, and seem to warrant several conclusions.
First, although environmental concern and support for government
spending are both stronger, on average, among younger age cohorts,
those respondents are significantly less likely to recycle, buy organic
produce, or cut back on the use of an automobile. Second, education
clearly influences participation in environmentally responsible activities
across the board, confirming that while respondents at all levels of edu-
cation are concerned about environmental impacts close to home, those
with higher degrees are better equipped to translate that concern into
effective action. Third, minority respondents are somewhat more con-
cerned about the environment than their white counterparts, but they are
less likely to participate in both forms of environmentally responsible
behavior, confirming previous work on barriers to participation offered
by Paul Mohai and others.54
Fourth, despite the fact that some GSS measures (such as environmen-
tal membership and contributions to environmental groups) require an
ability to pay in addition to a willingness to do so, results by and large
fail to show income differences for reasons that may have much to do
with the specific nature of the questions asked. For example, as noted in
chapter 2, recycling demands more time than money, especially with
convenient curbside pickup in many communities, and while organic
produce demands a premium price tag in most supermarkets, cutting
back on the use of an automobile can help to reduce energy and trans-
portation costs, especially in areas where public transportation is readily
available.
Finally, while ideology has a strong impact on political activism, those
cues fail to materialize for individual economic behavior. In other words,
while political conservatives seem reluctant to support liberal environ-
mental policies, they are not unwilling to take other steps to preserve and
protect the environment, especially when those activities are compatible
with conservative views that promote laissez-faire or market-based ap-
proaches to environmental management.
Distribution 85

Table 4.4Explaining Variance in Environmental Behavior
Model 1Economic behavior
Model 2Political activism
Independentvariables
OLS slopecoefficient
Standarderror
Ordered probitcoefficient
Standarderror
Age cohort:
Born after 1971 �0.83* 0.33 0.09 0.21
Born 1959–1971 �0.86*** 0.15 0.02 0.09
Born 1946–1958 �0.26 0.15 0.24** 0.09
Born before 1946 0.00 — 0.00 —
Education 0.10*** 0.02 0.11*** 0.01
Income �0.01 0.01 0.01 0.01
Race:
Black �0.40* 0.20 �0.58*** 0.13
Other 0.71* 0.30 �0.11 0.18
White 0.00 — 0.00 —
Gender:
Female 0.28* 0.12 �0.04 0.07
Male 0.00 — 0.00 —
Party identification 0.04 0.03 0.04 0.02
Political ideology 0.10* 0.05 0.15*** 0.03
Intercept 1 4.81 0.38 �5.26 0.30
Intercept 2 — — 1.06 0.15
Intercept 3 — — 1.88 0.16
Intercept 4 — — 2.56 0.16
Number of cases ¼ 999/1093 R-square ¼ 0.074 Log-likelihood ¼ �1090:32
Source: NORC General Social Survey (1994).Notes: See appendix for question wording.*p < :05.**p < :01.***p < :001.
86 Chapter 4

Conclusions
Accusations of elitism are as old as the environmental movement itself
and have become a fierce weapon in the war over protective environ-
mental policies. Some critics insist that the priorities of the environmen-
tal movement remain dangerously entrenched to the left of a ‘‘deep
ideological divide’’ and stand at odds against prized American values like
personal liberty, property rights, and technological optimism.55 Still
others, such as William Tucker in Progress and Privilege (1982), contend
that environmentalism ‘‘favors the affluent over the poor, the haves over
the have-nots’’ and that it ‘‘hobbles economic growth’’ and constrains
‘‘other people’s economic opportunities.’’56
Yet as William Schneider notes, to assume that this viewpoint extends
to mass politics represents a ‘‘serious miscalculation.’’57 As data pre-
sented in this chapter show, demographic factors once thought to be
predictive of environmentalism (such as age, education, and income) no
longer characterize the distribution of environmental attitudes in the
United States very well.58 When actual disagreement among respondents
is distinguished from artificial variance introduced through question
wording and survey design, partisanship and ideology remain the only
consistent cleavages dividing Americans in their opinions on the envi-
ronment, and even when taken together those models rarely account for
more than a small fraction of the variance observed.59 To assume, then,
that environmental concern represents the privilege of a ‘‘new class’’ of
social and economic elites (as Tucker does) is to misjudge the breadth of
its appeal. Because of the wide scope of environmental problems, from
wilderness and wildlife preservation to air pollution and water contami-
nation, environmentalism is valued by nearly everyone.
In the end, of course, that basic truth represents an important victory
for environmentalists, one that in Robert Gottlieb’s words expands the
definition of environmentalism and ‘‘broadens the possibilities for social
and environmental change.’’60 A growing link between populism and the
environmental movement not only lends credibility to the claim that
environmentalists represent the public interest; it suggests that those
values may have the power and potential with time to develop into a
fundamentally new social paradigm or belief system.61
Distribution 87

This Page Intentionally Left Blank

5Constraint: Are Environmental Attitudes
Inconsistent?
When published in 1964, Philip Converse’s influential article on ‘‘The
Nature of Belief Systems in Mass Publics’’ offered an extraordinarily
bleak view of public opinion.1 In it he stressed the importance of internal
consistency or ‘‘constraint’’ among different attitudes, arguing that with-
out a true anchoring mechanism—such as ideology—the events of polit-
ical life could become a confusing array of disconnected facts.2 But in
place of the logical coherence he prized, Converse found mainly chaos.
In pointing to what seemed like clear evidence in surveys, he confessed in
the end that large portions of the American electorate not only failed his
test, many lacked meaningful beliefs at all, ‘‘even on issues that have
formed the basis for intense political controversy.’’3 It was, as one team
of scholars later put it, as if respondents in polls ‘‘indulge interviewers by
politely choosing between the response options put in front of them—
but choosing in an almost random fashion.’’4
Today, the evidence cited by Converse is considered one of the most
unsettling findings in modern research on public opinion, opening the
door to a firestorm of controversy.5 But it is also a topic that underscores
an important gap in our analysis of the environment so far. By focusing
on characteristics such as direction, strength, stability and distribution,
a wide range of survey instruments has been considered but almost
always independently, one issue at time. According to V. O. Key that
means that ‘‘an important aspect of public opinion is obscured,’’ one
that rightly demands equal attention be paid to cognitive relationships
between attitudes.6
On that count, the stakes could not be higher. For environmentalists
convinced that social values are at ‘‘the root of the ecological crisis,’’7

growing environmental concern would seem to give hope that a major
transformation is at hand ‘‘in the American public’s beliefs about how
the world works physically, socially, economically, and politically.’’8 Yet
finding persuasive evidence in support of that claim is difficult. When
it comes to attitude consistency, survey researchers have long puzzled—
as Converse did—over low correlations between different measures of
environmental concern, at times suggesting that public demands weave a
veritable crazy quilt of conflicting ideas and desires.
Why should various survey instruments appear idiosyncratic? In part,
the answer could be one of faulty survey design. Perhaps lenient ques-
tionnaires too readily encourage respondents to proclaim themselves
environmentalists, only to back away from environmental goals when
painful trade-offs and behavioral commitments are brought to mind. As
data presented in this book have suggested already, Americans are sym-
pathetic to environmental problems, but most remain unwilling to act on
their beliefs either as voters, consumers, or political activists.9 A con-
tinued gap between attitudes and behavior—between what Americans
say and what they do—is consistent with the criticism that people lack a
strong underlying orientation toward the environment, and that surveys
that purport to measure environmental attitudes find little more than
‘‘doorstep opinions’’ conditioned by social desirability.10
Second, the reason could lie in the structure of environmental opinion
itself. Based on ideology, it might be reasonable for some respondents to
oppose government policies on environmental issues they nonetheless
care deeply about. Others might react to environmental conditions in
their own local communities by expressing concern for a singular issue,
such as water pollution or toxic waste disposal, without being swayed by
others that fall into the environmental rubric. In other words, attitudes
toward the environment could be truly multidimensional, ‘‘splintered,’’
as Lance deHaven-Smith says, ‘‘into a number of separate and narrowly
focused belief systems,’’ where individual issues are dealt with in terms of
unique symbols and reference points.11
One final possibility remains, consistent with several themes developed
so far. When observing cognitive inconsistency, is attitude or methodol-
ogy to blame? Scholars have long recognized that survey instruments
measure opinions imperfectly for a variety of reasons that are both
mundane and accidental, creating a problem known as measurement
90 Chapter 5

error. Mathematics demonstrate that when those errors become system-
atic, the correlations observed between survey items can be misleading,
even inaccurate. In the end, all are possibilities that are explored (and
compensated) in detail below.12
The Dimensionality Problem Defined
The first generation of articles on environmental attitudes began to ap-
pear in academic journals soon after the first Earth Day in 1970. Because
the field was new and because survey researchers were developing ques-
tionnaires independently and administering them locally, they tended to
word questions in ways that were very different. While some studies
measured attitudes toward specific environmental problems, such as
air pollution or wildlife protection,13 others choose to examine support
for government spending,14 knowledge about environmental issues,15
preferences for environmental policy,16 or self-reported participation in
environmentally responsible activities, like recycling or energy conserva-
tion.17 With few exceptions, most studies treated issues on that diverse
list as indicators of the same underlying trait, something broadly termed
environmental concern.18 Since that time, however, a second generation
of articles in the field has noted (and struggled with) low correlations
between measures, drawing considerable attention to issues of measure-
ment and finally to the question of dimensionality itself. It is a debate
that strikes to the heart of Kent Van Liere and Riley Dunlap’s question:
‘‘Does it make a difference how environmental concern is measured?’’19
For most scholars, the answer has been a resounding ‘‘yes.’’20 Many
argue that environmental attitudes are issue-specific, and that the same
thoughts and ideas are not being tapped in each case.21 One research
team found a strong relationship among five attitudinal scales (with cor-
relation coefficients ranging from .53 to .81),22 but a majority of studies
suggest instead that environmental items factor into two or more unique
dimensions, at times supported by different cultural and socioeconomic
groups.23
Broader studies attempting to quantify a paradigm shift that is more
sensitive to the needs of the natural environment have reached a similar
impasse. Van Liere and Dunlap chart a major shift in social values and
beliefs away from what they term the ‘‘dominant social paradigm’’
Constraint 91

(DSP)—one centered around abundance and progress, devotion to
growth and prosperity, faith in science and technology, and commitment
to a laissez-faire economy.24 They believe that public attention to poten-
tially catastrophic trends has undermined the assumptions of the DSP,
pushing social norms in the direction of a ‘‘new environmental para-
digm’’ (NEP) that comes to grips with limits to growth, the balance of
nature, and the finite availability of natural resources.25 Using survey
data from Washington state, they demonstrate that all twelve items in
their battery of questions cluster strongly together into a coherent and
logical belief system.26
Unfortunately, several attempts to replicate those results have failed.
In using identical measures on two additional Iowa samples, one team
concludes that the NEP items are not singular but rather break down
into three distinct dimensions they identify as ‘‘balance of nature,’’
‘‘limits to growth,’’ and ‘‘man over nature.’’27 In using a more sophisti-
cated model, Jack Geller and Paul Lasley confirm neither outcome,
arguing instead in favor of a three-factor, nine-item model truncated
from the original.28 Still other attempts have asserted that the scale
breaks down into two, three, or even four dimensions.29 It is a problem,
in part, that recently prompted Dunlap and his colleagues to develop a
new and ‘‘improved measuring instrument.’’30
Given countless studies such as these that underscore the inconsistency
of environmental attitudes, some students of mass belief systems have
gone one step further by viewing multidimensionality as lack of con-
straint. Much as Converse did, they suggest that public attitudes on the
environment are not rooted in abstract philosophical or ideological
principles but are instead rather crude and disconnected, ‘‘splintered into
a plethora of narrowly focused perspectives.’’31 If true, this conclusion
challenges not only the validity of many of the environmental measures
used in surveys but also the very existence and utility of a concept
broadly termed environmentalism in American mass politics.
Methodological Considerations
While previous research has highlighted the incongruous nature of public
attitudes on the environment, the methodology of some of this literature
92 Chapter 5

is problematic for several reasons. With the exception of studies on the
new environmental paradigm (NEP) scale, most researchers have used
independent question wording that hinders direct comparison. The sam-
ples used in many surveys also have been small, regionally based, and
self-administered.32 The data explored in this chapter offer improvement
in both respects. Not only does the Gallup Organization provide a well-
drawn national sample, avoiding the self-selection bias found in most
mail surveys, but each of the questions used was repeated using identical
wording at least six times since 1989, allowing for replication to test the
robustness of results.
Second, most work on the dimensionality of environmental concern
overlooks the importance of measurement error—a term that refers to
a number of related and potentially serious problems. In some cases,
pollsters may unwittingly commit errors in coding; in others, respon-
dents may interpret the questions posed to them in idiosyncratic ways or
find that they are unable to communicate their views accurately given
the crudeness of the response categories presented.33 Errors in measure-
ment that occur randomly, such as these, tend to attenuate correlations
between survey instruments. In other words, it generates correlation
coefficients that are weaker than they should be.
In most previous studies on environmental attitudes, however, a far
more pressing problem looms since batteries of questions tend to be used
in close proximity using an identical response format.34 Given that the
same approach is used here for lack of a better alternative, some ex-
planation (and correction) is required. Recall, for example, that in the
Gallup study (March 5–7, 2000) introduced in chapter 2, respondents
were asked if they personally worried ‘‘a great deal,’’ ‘‘a fair amount,’’
‘‘only a little,’’ or ‘‘not at all’’ about each of a number of environmental
problems. While the subject changes in each variation of the ques-
tion, the appropriate set of responses remains static. An accumulation
of experience in the field of survey research has shown that under
those conditions respondents have a tendency to anchor themselves
along the response continuum, answering each subsequent question in
that battery relative to some personal reference point.35 The ensuing
problem—formally described as error covariance—is an important one
since mathematics demonstrates that results contaminated by nonran-
Constraint 93

dom measurement errors are unpredictable. The correlations calculated
between different survey questions can be either larger or smaller than
the true correlation, and may even be of the wrong sign.36
In short, when the likelihood of measurement error is introduced into
the issue of attitude constraint on the environment, two oddly opposing
possibilities arise. If correlations between survey questions are due to
their close proximity and common response format alone, a strong rela-
tionship may shatter when those errors are purged from the data. On the
other hand, it is plausible for measurement error to have an opposite ef-
fect. It might cause attitudes to appear multidimensional when in reality
the relationship between different environmental opinions is highly con-
strained. Since the possibility of nonrandom measurement error cannot
be accommodated by looking at correlation coefficients alone, a tech-
nique known as confirmatory factor analysis is used here instead. Flexi-
ble enough to allow different sources of error to be estimated and
controlled, it is an ideal approach for this situation.37
In general, the term factor analysis refers to a family of data reduction
techniques designed to remove redundancy from a set of interrelated
variables by clustering them together into common elements, called
factors.38 It tells researchers, in part, ‘‘what tests or measures belong
together’’—that is, ‘‘which ones virtually measure the same thing.’’39
The approach adopted in this chapter can be described as confirmatory
because it allows for the development of empirical models that test and
compare alternative hypotheses using standard goodness-of-fit statistics.
Using prior knowledge and theoretical expectation as a guide, the goal is
to determine the number of factors that underlie a given set of survey
instruments—one, two, three, or more in the case of the NEP scale—and
to record the strength with which those elements are related to one
another.
Data Analysis
In a practical sense, the issue of dimensionality can be broken down into
at least two component parts. The first addresses the consistency of
responses across different environmental problems. If a respondent is
concerned about air pollution, for example, are they likely to feel con-
94 Chapter 5
cern for other environmental issues as well, such as water pollution, acid
rain, and global warming? A second question regarding the dimension-
ality of environmental attitudes is wider in scope and potentially more
significant, highlighting the relationship between different idea-elements
thought to define the concept of environmentalism. Those elements
might include the degree to which Americans worry about the serious-
ness of environmental problems, their preferences on environmental pol-
icy, and their willingness to identify themselves as active or sympathetic
members of the environmental community.
To examine the consistency of environmental attitudes across mea-
sures such as these, data for this chapter were drawn from a March 2001
study administered by the Gallup Organization. Recall once again that
within a lengthy battery of environmental questions, respondents were
asked whether they personally worry ‘‘a great deal,’’ ‘‘a fair amount,’’
‘‘only a little,’’ or ‘‘not at all’’ about thirteen different environmental
issues, ranging from air pollution to the deforestation of tropical rain
forests. In addition, respondents were asked to express their support for
(or opposition to) eight specific environmental policy proposals, includ-
ing ‘‘expanding the use of nuclear energy,’’ ‘‘opening up the Alaskan
Arctic Wildlife Refuge for oil exploration,’’ and ‘‘spending more gov-
ernment money on developing solar and wind power.’’ Finally, survey
participants were asked by Gallup if they thought of themselves as
‘‘an active participant in the environmental movement’’ or as merely
‘‘sympathetic toward the environmental movement, but not active.’’
The close-ended response format for this question also included a posi-
tion of neutrality and one that was admittedly ‘‘unsympathetic’’ to the
environment.40
Selection of Variables
It should be noted from the outset that some variables included in the full
Gallup battery were discounted from analysis here for several reasons.41
The first decision was essentially a pragmatic one. A smaller subset of
variables made model identification and convergence more manageable
and ultimately the results more parsimonious. Second, to test the consis-
tency of environmental beliefs, two strong and competing models had
to be developed to group clusters of variables based on instinct and
Constraint 95
expectation. Some variables fit that purpose more naturally than others.
For instance, attitudes toward air and water pollution, along with acid
rain, most likely contain common elements whereby all three indicate
(and jointly measure) concern for environmental pollution. Issues such
as ozone depletion, deforestation, and the ‘‘greenhouse effect’’ would
seem to represent a broader concern for global environmental problems.
Some issues, such as urban sprawl, were excluded from both models be-
cause they seemed to bring to mind considerations that were substan-
tially different.
Third, given the importance of test statistics in discriminating be-
tween competing models, variables with degrees of non-normality severe
enough to cause problems were excluded from consideration also. Con-
firmatory factor analysis requires a number of strict distributional as-
sumptions. Non-normality in the form of excessive skewness or kurtosis
can threaten the validity of significance tests and goodness-of-fit statis-
tics, such as chi-square.42
Finally, variables were chosen with replication in mind. Gallup’s bat-
tery of environmental concern items has changed slightly in its many
permutations since 1989, mainly through the addition of new items.
To allow direct comparison with previous work (which enhances the
robustness of results), only variables that are repeated in all versions of
the study since 1989 are included here.
A Comparison of Two Models
With the above decision rules in place, the following analysis concen-
trates initially on a subset of six environmental problems. Descriptive
statistics for these variables appear in table 5.1. To gauge the strength of
the relationship between each set of issues, two models are compared. In
the first, environmental concern is viewed as ‘‘multidimensional’’ and is
represented by two factors. One uses three survey items to target concern
for environmental pollution, while the other uses an additional three to
weigh global environmental problems. An alternative ‘‘unidimensional’’
model posits that all six measures are indicators of the same underlying
trait—that is, that all six questions essentially measure the thing. Because
all of the issues in Gallup’s degree-of-concern battery employ the same
response format, measurement error also must be incorporated into each
96 Chapter 5

model. By estimating error variances for each variable in addition to a
single error covariance term, correlations between factors can be effec-
tively purged of random mistakes and systematic biases.
Empirical results for both models are displayed visually (and for sake
of a general audience in a somewhat simplified form) in figure 5.1. Two
conclusions merit special attention. First, reducing the data down to a
single factor is largely successful. Results based on confirmatory factor
analysis can be evaluated and compared based on the overall fit of each
model using a variety of statistics, such as the ratio of chi-square to
degrees of freedom.43 That test reveals an acceptable fit for both models,
as well as equal and impressive goodness-of-fit indices,44 and sufficient
Table 5.1Correlation Matrix for Thirteen Measures of Environmental Concern
I am going to read you a list of environmental problems. As I read each one,please tell me if you personally worry about this problem a great deal [4], a fairamount [3], only a little [2], or not at all [1].
Mean
Correlation withan additive scaleof all items
V1 Ocean and beach pollution 3.15 0.74
V2 Air pollution 3.23 0.77
V3 Acid rain 2.70 0.79
V4 Damage to the earth’s ozone layer 3.10 0.84
V5 The loss of tropical rain forests 3.13 0.75
V6 The ‘‘greenhouse’’ effect or global warming 2.86 0.83
Item Intercorrelations
V1 V2 V3 V4 V5 V6
V1 1.00
V2 0.56 1.00
V3 0.49 0.54 1.00
V4 0.52 0.60 0.58 1.00
V5 0.51 0.47 0.49 0.54 1.00
V6 0.49 0.54 0.60 0.72 0.53 1.00
Source: Gallup Organization (March 5–7, 2001).Note: Given a listwise deletion of missing values used throughout, the effectivesample size is 1,019 adults nationwide.
Constraint 97

Figure 5.1Is Environmental Concern Multidimensional?Source: Gallup Organization (March 5–7, 2001).Note: n ¼ 1;019 adults nationwide. A listwise deletion of missing values is used throughout. Since survey questionscontain some degree of measurement error, error variances for each variable were estimated, and a single error cova-riance was designed to purge the data of response set bias. See table 2.1 for question wording.
98 Chapter 5

root mean square residuals, all of which suggest that the multidimen-
sional version fails to offer new information or significant improvement.45
Finally, and most important of all, the estimated correlation between
the two traits of interest—concern for environmental pollution and con-
cern for global environmental problems—is an impressive .84. Indeed,
that result is persuasive not merely because of its objective strength but
because of its relative improvement over initial correlations between
survey questions (where correlation coefficients averaged just .55). That
difference in strength can apparently be attributed to the damaging con-
sequences of measurement error. For example, if no errors in measure-
ment are assumed—that is, if we assume that environmental attitudes are
communicated perfectly by respondents—the correlation between traits
using the same model is .65. If random errors alone are assumed, the
same correlation rises to .77. In this case, given the added effect of a
common response set, modest relationships between variables are trans-
formed, highlighting the extent to which Americans possess a single uni-
fying orientation toward the environment.46
A Broader Model of Environmental Attitudes
In addition to questioning respondents about their personal concern for
a variety of environmental problems, the March 2001 Gallup study also
included a series of measures on environmental policy preferences, as
well as a single question probing the willingness of respondents to iden-
tify themselves with the environmental movement. As a final step in
testing the dimensionality of public attitudes on the environment, the re-
lationship between these broader idea-elements is examined below using
the same strategies and techniques.47
As results for this model demonstrate in figure 5.2, correlations be-
tween these three factors are also quite high, especially relative to those
produced under unreasonable measurement assumptions. Concern for
environmental issues correlate with environmental policy preferences at
.67. Correlations between environmental self-identification and concern
and between self-identification and policy preferences measure .51 and
.49, respectively. In this case, the presence of both random and non-
random measurement error produced correlation coefficients that were
just 60 to 70 percent of their true value.48 Clearly, as with the two
Constraint 99
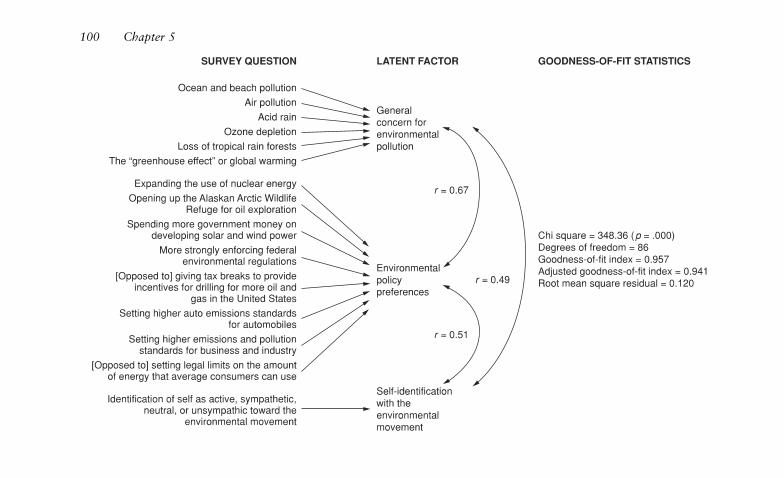
100 Chapter 5

models reported earlier, ‘‘corrected’’ correlations obtained using confir-
matory factor analysis result in a substantially different (and more hope-
ful) view of the consistency of environmental attitudes across multiple
measures.
Conclusions
Students of environmental opinion have long tried to understand why
different measures of environmental attitudes fail to correlate more
strongly, going so far as to argue that assumptions about unidimension-
ality are both ‘‘unwarranted and misleading.’’49 While that issue might
be considered little more than a narrow methodological curiosity, it is
work that in recent years has gained increased importance by intersecting
with studies on mass environmental belief systems, with the two together
suggesting that public attitudes on the environment are rather crude,
disconnected, and narrowly focused.50
Yet the dimensionality problem may, at least in part, be an artifact of
faulty methodology. As data presented in this chapter demonstrate, var-
ious measures of environmental concern are not as unrelated as previous
studies suspect. By using confirmatory factor analysis to control for both
random and nonrandom sources of measurement error, not only can the
environmental battery used by Gallup be reduced to relatively few
dimensions; those dimensions are themselves strongly correlated.
When studying environmental attitudes, then, does it truly ‘‘make a
difference how it’s measured’’?51 Of course, the answer is yes. Despite
strong correlations between factors, current results underscore the im-
g Figure 5.2Are Different Types of Environmental Attitudes Related?Source: Gallup Organization (March 5–7, 2001).Notes: n ¼ 1;019 adults nationwide. A listwise deletion of missing values is usedthroughout. Since survey questions contain some degree of measurement error,error variances for each variable were estimated, in addition to a single errorcovariance term for each battery designed to purge the data of response set bias.To achieve model identification, the error variance for Gallup’s measure of self-identification was fixed so that its reliability was equivalent to its Cronbach’scoefficient alpha.
Constraint 101

portance of measurement assumptions in survey design and data analy-
sis. Consistent with a growing body of research that has demonstrated
the importance of controlling for systematic response biases when
evaluating political and psychological attitudes,52 data results here dem-
onstrate how errors in measurement can effectively disguise strong cor-
relations between various environmental measures that might otherwise
appear modest or inconsistent.
More important, however, empirical results in this chapter raise
important questions about the existence and sophistication of mass en-
vironmental belief systems. If, as Lance deHaven-Smith suggests, mul-
tidimensionality should be viewed as lack of constraint, evidence of
attitude stability across multiple measures seems to offer compelling
evidence that public attitudes on the environment have matured into a
logical, structured, and constrained belief system. Considerable care,
however, should be taken in drawing conclusions about the quality and
sophistication of those beliefs.53 Given that most attitudes on complex
environmental issues can be represented by relatively few dimensions,
the models developed here may signify only that it is ‘‘cognitively eco-
nomical’’ for people to reduce those concerns into a general environ-
mental orientation, regardless of knowledge or clear reasoning.54 In
other words, as Christopher Achen warns, a ‘‘certain stability of view-
point is a necessary, but hardly sufficient condition for political under-
standing.’’55 In the end, consistent attitudes on the environment may
suggest that Americans are increasingly willing to express concern for
environmental quality, but dimensionality alone may say little about
their readiness to become active, well-informed participants in the envi-
ronmental movement.
102 Chapter 5

IIBehavior

This Page Intentionally Left Blank

6The Ballot Box I: Issue Voting and the
Environment in Presidential Elections
In 1980, in response to a long-standing debate about the role that issues
play in presidential campaigns, Edward Carmines and James Stimson
described what they called ‘‘two faces’’ of issue voting.1 On the one
hand, they said, some topics on the political agenda were especially
‘‘hard’’ for voters to comprehend, in particular those that were little
known, or that demanded sophisticated calculation or technical ex-
pertise. On the other were issues that were ‘‘easy’’ in comparison, those
to which reactions were naturally symbolic and emotional; those that
invited a ‘‘gut response’’ to long familiar issues, where the ends of public
policy were in question rather than its means—in short, issues very much
compatible with popular thinking about the environment.
Since Carmines and Stimson believed that ‘‘easy’’ issues impose fewer
cognitive demands on voters, their typology suggests that voting based
on the environment is possible, even likely. But to the contrary, scholars
have long noted the near absence of those issues in national political
campaigns.2 In fact, environmental failures at the ballot box seemed so
transparent in the 1980s and 1990s that scholars and political pundits
alike seemed ready to dismiss the subject as a political ‘‘paper tiger’’ that
was long on talk but short on action.3 As one critic quipped,
Forget the hundreds of polls showing that 80 percent of Americans would walkover their grandmothers’ graves to save a tree. No other lobby has been asroutinely and overwhelmingly rejected at the polls during the past six yearsas has the environmental movement. When will Washington realize that theGreen Emperor has no clothes?4
Expectation and conventional wisdom aside, however, there has been
remarkably little systematic study of environmental preferences as an in-

fluence on electoral choice. With only limited survey data available, the
few studies to address environmental voting in the United States do more
to report a deficiency than to explain why it should be the case.5 Yet it is
a topic rich in opportunity. With a Republican-led legislature since 1994
scaling back wildlife protection and pollution control laws, an increasing
number of poll watchers in the popular press have predicted that the
environment will emerge at long last as a potent political weapon for
Democrats, in particular one that can be used as a ‘‘wedge’’ issue to
attract young, socially moderate voters away from the Republican
Party.6 Using a new series of variables introduced in the 1996 and 2000
National Election Studies, this chapter tests the potential of that claim
by measuring the electoral impact of environmental issues on American
political parties and their candidates.
Theory and Background
As Carmines and Stimson aptly point out, the study of issue voting has
been ‘‘infused with normative considerations’’ from the start.7 Voters
who cast ballots based on their own personal policy preferences relative
to those of party candidates are often assumed to make decisions that are
rational, wise and sophisticated.8 Likewise, issue voting would seem to
ensure an active link between the views of citizens and those of elected
officials in a way that ultimately enhances popular sovereignty and col-
lective responsibility. By nearly every account, however, environmental
issues fail to provide that link in satisfactory fashion. ‘‘So far,’’ as Philip
Shabecoff writes,
environmentalism has had remarkably little impact on electoral politics, particu-larly at the national level. Although people might care a great deal about theenvironment, they have not, at least in the past, voted for candidates largely be-cause of environmental records or positions.9
The consequences of that deficiency, at least on the surface, seem clear.
Without an electoral disincentive, scholars argue that congressional roll
call votes on environmental policies are virtually unaffected by con-
stituents’ environmental demands.10 Votes on environmental issues in
Congress tend to split along a strong partisan divide, despite a growing
106 Chapter 6

consensus in the mass public that cuts across party lines.11 Even more
troubling is evidence that shows that policy divergence on environmental
issues between Democrats and Republicans has grown wider still in
recent years in both the U.S. House of Representatives and the U.S.
Senate.12 It is a trend, according to some, that suggests a troublesome
‘‘gap between the policy preferences of the electorate and the actions of
elected representatives.’’13
In the past, it was nearly impossible to study issue voting and the en-
vironment among average Americans because of a paucity of data. That
problem is rectified in this chapter using a new battery of questions
developed for the 1996 National Election Study. But certain theoretical
issues must be broached first. For example, why might environmental
issues falter in national campaigns despite honest and enduring public
concern? At least three reinforcing (and times conflicting) possibilities are
explored here—issue salience, perception of candidate differences, and
partisan loyalty.
Issue Salience
First, perhaps environmental issues fail to influence American voters be-
cause their preferences lack a requisite degree of intensity or personal
importance. John Zaller notes this very possibility in arguing that the
weak impact of the environment on candidate evaluations in the 1991
NES Pilot Study might have been an ‘‘artifact’’ of low salience during a
year understandably dominated by foreign policy concerns during the
Persian Gulf War.14 If true, Zaller’s conclusion suggests that environ-
mental issues might generate a stronger political punch if and when
Americans become convinced that the nation’s environment is in crisis.
Recent articles in the popular press that report on the public’s growing
dissatisfaction with the environmental priorities of Republican law-
makers in Congress follow this same logic.15
Empirical evidence on issue salience among scholars, however, is
decidedly mixed. Howard Schuman and Stanley Presser argue that voters
who consider an issue to be ‘‘important’’ are more likely to translate
their convictions into political action.16 Yet others find that ‘‘salience
plays a substantial but not overwhelming role in determining candidate
The Ballot Box I 107

evaluations’’ and that it ‘‘cannot be deemed the sole or even the domi-
nant factor’’ in understanding electoral choice.17 Other factors must be
considered as well.
Perception of Candidate Differences
A second possible explanation for why environmental issues falter in
national campaigns recognizes that the likelihood of an issue vote
depends on the ability of citizens to distinguish between the policy posi-
tions of the candidates.18 In The American Voter (1960), Angus Camp-
bell and his colleagues argue that for issue positions to influence
individual vote choice, several cumulative conditions must be met.19 The
first condition is largely cognitive: the voter must be aware of the exis-
tence of an issue like the environment and must have formed an opinion
about it. Not surprisingly, some minimal intensity of feeling (or salience)
defines the second condition. Equally important, however, is the third—
that is, the voter’s ability to discriminate accurately between the policy
positions of the two parties or their candidates. Without the latter they
write, the issue can have ‘‘no meaningful bearing on partisan choice.’’20
Given a low degree of voter interest and even lower levels of political
knowledge and sophistication, Campbell, Converse, Miller, and Stokes
find that most voters fail to perceive party differences, even on important
matters of public policy. Still, a number of scholars have contradicted
that basic finding, arguing instead that issues increase in power when
candidates actively articulate their policy alternatives, as during the
Vietnam War.21 In other words, clarity regarding political issues seems
to depend on clarity of choice. If voters perceive few differences between
candidates on matters of environmental policy, they may be forced to
decide based on other issues or considerations.22
Partisan Loyalty
A third and final reason why environmental issues fail to impact voting
behavior may be the elemental power of partisanship and its ability to
condition which candidate voters see as most capable of handling envi-
ronmental problems. For example, some find that judgments of party
competence—central to the logic of issue voting—change slowly in re-
sponse to new information and are clearly constrained by prior beliefs
108 Chapter 6

and long-standing partisan commitments.23 That logic has a clear impli-
cation here. Since voting ‘‘green’’ often demands that loyal Republicans
cross party lines to vote for liberal political candidates or strict regula-
tory policies, some voters may be reluctant to make those decisions on
ideological grounds.
Understanding Vote Choice
For the first time in 1996, the National Election Study (NES) devoted an
extensive battery of questions to environmental issues. The goal, as one
pair of scholars put it, was to ‘‘embed the study of the environment in
the broader context of national politics and to unpack the political con-
sequences of the environment on the ways that citizens evaluate candi-
dates and make vote choices in national elections.’’24 By including
measures that tap perceptions of environmental quality, the placement of
candidates along issue scales, the ability of parties and their candidates
to handle environmental problems, and the general importance of envi-
ronmental issues to voters, the data set is ideally suited to the issues
raised here.
The NES is uniquely valuable for one additional reason as well. With
parallel instrumentation across many measures, the study allows for
direct comparisons to be made between environmental issues and other
social, economic, and political concerns, including poverty, health care,
abortion, national defense, and so on. The extent to which environmen-
tal attitudes are similar to (or different from) opinions on other issues
may help us to understand its electoral potential.
A Democratic Strength
First and foremost, data drawn from the 1996 National Election Study
are unambiguous on one point. By all accounts and measures, the envi-
ronment is a strong issue for the Democratic Party and its candidates. As
table 6.1 indicates, although respondents (understandably) have some
tendency to see their own party as best able to handle the ‘‘problem of
pollution and the environment,’’ a significant number of Republicans—
35 percent of weak identifiers and 27 percent of strong—believe that the
Democratic Party would do a ‘‘better job’’ in that area nevertheless.
The Ballot Box I 109

Numbers of nearly identical strength appear when Bill Clinton is con-
sidered as a presidential candidate, independent of his party affiliation.
Interestingly enough, data that follow in table 6.2 demonstrate that
among Republicans alone, the perceived strength of the Democratic
Party on environmental policy outranks all other issues used on the NES
questionnaire. Respondents were asked to rate party competence on a
range of social and economic problems, including poverty, health care,
welfare, crime, foreign affairs, and the budget deficit. While few Repub-
lican identifiers placed greater relative faith with the Democrats in ‘‘han-
dling the nation’s economy’’ or ‘‘keeping out of war,’’ 31 percent sided
with the Democratic Party on the environment. Both of these compara-
tive factors—across issues and among partisan groups—suggest that the
latent potential for vote defection on environmental issues might well
exceed other policy arenas. As David Mastio writes, it is a weakness that
should be troubling to the Republican party:
Whether public opinion is out of touch with reality or not, the political fact isthat to win national elections, Republicans need the votes of millions of people
Table 6.1Party Performance on Pollution and the Environment
Which do you think would do a better job of handling the problem of pollutionand the environment—the Democrats, the Republicans, or wouldn’t there be anydifference between them?
Partisan IdentificationDemocraticParty
NoDifference
RepublicanParty
Strong Democrat 71.8% 24.7% 3.5%
Weak Democrat 48.3 46.6 5.1
Independent Democrat 51.4 43.9 4.7
Independent 29.1 57.0 13.9
Independent Republican 28.1 53.7 18.3
Weak Republican 35.0 47.0 18.0
Strong Republican 27.0 40.5 32.4
Source: National Election Study (1996).Notes: Number of cases ¼ 842Chi-square ¼ 134.5 (p ¼ 0:001)Degrees of freedom ¼ 12Gamma ¼ 0.400
110 Chapter 6

whose stated commitment to environmental protection is fully in line with suchfar-left groups as the Natural Resources Defense Council and Greenpeace. In noother arena of public debate have Republicans and conservatives let themselvesbe so thoroughly whipped for so long without stopping to figure out what wentwrong.25
The Democratic advantage on the environment, however, is not as
strong as it initially appears. An entirely different picture emerges when
environmental issues are added into two regression models that statisti-
cally weigh the influence of the environment alongside other issues that
compete for scarce energy and attention. The dependent variable used in
each equation is simple but powerful. In 1996, the NES questionnaire
asked respondents to evaluate each of the presidential candidates by ref-
erence to a ‘‘feeling thermometer.’’ Ranging in value from 0 to 100, the
scale has been used consistently over the past thirty years to measure the
degree to which respondents feel ‘‘warmly’’ or ‘‘coolly’’ toward political
groups and personalities—in this case, toward President Bill Clinton and
his Republican challenger, Bob Dole. By regressing each thermometer
scale on a series of variables in table 6.3, results show that environmental
Table 6.2Democratic Party Strengths among Republican Voters
Republicans who believethe Democratic Partywould do a better job
Handling the problem of pollution andthe environment
31.1%
Handling the problem of poverty 23.5
Making health care more affordable 20.1
Reforming the welfare system 9.5
Handling foreign affairs 7.0
Handling the budget deficit 6.5
Dealing with the crime problem 6.1
Handling the nation’s economy 4.3
Keeping out of war 3.9
Source: National Election Study (1996).Note: All questions were asked of random half samples, leading to relativelysmall sample sizes ranging from 228 to 231 respondents. All Republicans self-identified as such in v960420. No Independent ‘‘leaners’’ were included.
The Ballot Box I 111

Table 6.3Factors Influencing the Evaluation of 1996 Presidential Candidates
Independent Variables Bill Clinton Bob Dole
Political variables:
Partisan identification �6.53*** (0.42) 4.06*** (0.39)
Political ideology �2.57*** (0.66) 2.79*** (0.63)
Issue positions:
Environment/economy 0.24 (0.49) 0.21 (0.46)
Government health insurance �0.98* (0.44) 0.77 (0.42)
Guaranteed job/standard of living �0.51 (0.52) 0.10 (0.49)
Services/spending �2.56*** (0.54) 0.96 (0.50)
Aid to blacks 0.03 (0.52) �0.91 (0.49)
Reduce crime �0.35 (0.39) �0.12 (0.37)
Women’s rights �0.55 (0.45) 0.45 (0.43)
Defense spending �0.40 (0.54) 1.18* (0.51)
Abortion rights 1.06 (0.58) �1.09 (0.55)
State of the nation’s economy �3.95*** (0.49) 1.26** (0.46)
Demographic characteristics:
Age 0.00 (0.04) 0.11** (0.04)
Education �0.83 (0.47) 0.37 (0.44)
Income �0.20 (0.13) 0.31* (0.12)
Gender �1.03 (1.33) �0.24 (1.25)
Race 4.33 (2.35) 4.60* (2.22)
Intercept 119.92 (5.32) 8.84 (5.03)
Mean ‘‘feeling thermometer’’ score 59.3 51.8
Number of cases 891 888
R-square .609 .409
Source: National Election Study (1996).Note: All estimates were obtained using ordinary least squares (OLS) regression.Standard errors appear in parentheses. See appendix for question wording.*p < :05.**p < :01.***p < :001.
112 Chapter 6
policy preferences all but disappear among a sea of competing issues and
influences, including controls for partisan identification and political
ideology. In short, despite more stable foreign policies and a strong na-
tional economy in 1996, both models largely confirm Zaller’s belief that
environmental issues ‘‘carry relatively little political weight, in that they
add little or nothing to our ability to explain’’ political attitudes and
outcomes.26 The remaining analysis in this chapter is devoted to under-
standing why that should be the case, focusing on the three theories
outlined earlier.
Why Americans Fail to Vote ‘‘Green’’
Recall that a substantial body of literature in the field of political psy-
chology posits issue voting as the end result of a cumulative process
of conditions that citizens either succeed (or fail) to meet.27 If that is
the case, perhaps environmental issues do not influence electoral behav-
ior because comparatively few respondents see differences between the
candidates’ positions on the environment or because those concerns fail
to matter to them personally with enough intensity to override long-
standing partisan commitments.
The first suspicion, at least, is easily confirmed. NES data show that
while the average voter in 1996 had more in common with President
Clinton on the environment than his Republican challenger, most saw
relatively small differences between the two major-party candidates.
Respondents were asked to consider a seven-point issue scale, where a
value of one represented the belief that ‘‘it is important to protect the
environment even if it costs jobs or otherwise reduces our standard of
living.’’ A score of seven selected at the opposite end of the continuum
meant that ‘‘protecting the environment is not as important’’ as eco-
nomic interests, with numbers falling in between representing a variety of
compromise positions. A second, similar question was used to rate com-
mitment to environmental regulations that place a burden on business,
while several others were used to gauge policy preferences on a range of
non-environmental issues, including government health insurance, crime,
and defense spending. On each of these topics respondents ultimately
were asked not only to place themselves along a seven-point scale but
to place both of the major-party presidential candidates as well. The
The Ballot Box I 113

combination of those three items creates a perception of distance,
not just between candidate and respondent but between the candidates
themselves—something Carmines and Stimson call a ‘‘spatial map.’’28
As table 6.4 demonstrates, at least in comparison to other issues,
those responding to both environmental questions placed the candidates
within minor distance from one another, with President Clinton (on
average) slightly left of center, and Senator Dole at a nearly equal dis-
tance to the right. Only on the topics of women’s rights and defense
spending were the candidates’ positions any less distinct. Indeed, a sig-
nificant number of those polled were ‘‘not very certain’’ at all of where
Clinton (30 percent) or Dole (40 percent) stood on the subject. If issue
voting depends on clarity of choice, the environment would seem to be at
a sure disadvantage.29
The low salience of environmental issues seems likely to create an ob-
stacle to voting as well. When respondents were asked whether a specific
subset of topics was important to them personally, just 18 percent stated
that the scale balancing economic and environmental goals was ‘‘ex-
tremely important,’’ a number that once again ranks low in both an
absolute sense and a relative sense (virtually tied with defense spending
at the bottom of the list).
Table 6.4Average Perceptions of the Candidates’ Issue Positions, 1996
Issue SelfBillClinton
BobDole
Distancebetweencandidates
Environment/economy 3.53 3.47 4.55 1.08
Environmental regulation 3.42 3.24 4.57 1.33
Government health insurance 3.97 2.86 5.08 2.22
Guaranteed job/standard of living 4.46 3.27 5.09 1.82
Services/spending 4.11 3.09 4.86 1.77
Aid to blacks 4.82 3.32 5.00 1.68
Reduce crime 4.46 3.70 5.10 1.40
Women’s rights 2.25 2.18 3.38 1.20
Defense spending 4.02 3.95 4.65 0.70
Source: American National Election Study (1996).Note: For question wording on seven-point issue scales, refer to the appendix.
114 Chapter 6

To demonstrate the combined power of these first two factors—low
issue salience on the one hand, and an inability to perceive strong differ-
ences between the candidates on the other—table 6.5 summarizes a
series of logical conditions necessary for issue voting.30 At the most basic
level, of course, respondents must be familiar enough with an issue to
place themselves comfortably on a seven-point scale. While nearly all of
those polled by the NES met the first requirement, steadily smaller num-
bers were able to place themselves and both major-party candidates for
president on the same scale, fewer still in a way that identified any accu-
rate difference between them. In the end, among those who could, fewer
than 10 percent considered the issue of jobs and the environment to be
‘‘extremely important,’’ once again ranking lowest among a list of five
topics. Especially in acknowledging that those final figures represent not
Table 6.5Percent of Respondents Meeting Various Criteria for Issue Voting
Cumulative criteriafor issue voting
Services/spending
Abor-tion
Aid toblacks
Defensespending
Environment/economy
Placed self on issuescale
85.5% 99.4% 91.1% 86.4% 85.2%
Placed self, Clinton,and Dole on issuescale
79.9 80.9 78.6 76.8 75.1
Placed self and sawdifference betweenClinton and Dole onissue scale
71.6 66.6 63.8 65.6 57.8
Placed self and sawClinton as moreliberal than Dole onissue scale
61.8 57.9 57.2 45.4 46.0
Placed self and sawClinton as moreliberal than Dole onan issue respondentthinks is ‘‘extremely’’important
19.4 19.1 14.1 9.9 9.6
Source: American National Election Study (1996).Note: For question wording on seven-point issue scales, refer to the appendix.
The Ballot Box I 115

the act of issue voting itself but rather its realistic potential, the environ-
ment fares poorly indeed.
One final and complicating factor needs to be considered as well.
Perhaps environmental issues fail to impact the vote for president be-
cause of the tendency of those concerns to cut across traditional (and
more powerful) cleavages, including partisan identification. To address
that possibility demands that candidate and party effects be isolated from
the impact of the issue itself on vote choice. This is an undeniably diffi-
cult task. Still, in a similar study of abortion attitudes, Kevin Smith
argues that issue voting can be disentangled successfully from other
influences in cases where policy preferences and party loyalty are in
conflict.31 In other words, if an issue is politically potent, voters with the
same party identification but opposite extremes of opinion should dis-
play different voting patterns.
To see if that expectation holds true, figure 6.1 visually plots the in-
teraction of partisanship and environmental policy preferences in de-
termining vote choice. Here, for the sake of simplicity, a postelection
measure of the vote is viewed as a dichotomous preference between Bill
Clinton and Bob Dole, with probabilities calculated from separate re-
gression models run for each group of partisan identifiers. As a visual
comparison of the slopes of each regression line makes clear, Repub-
licans were more likely to vote for Clinton when their position on the
environment/economy scale favored environmental issues. Despite the
role of partisanship in shaping and filtering political information, Re-
publican voters were not blind to Clinton’s environmental stance, espe-
cially when that issue was one they felt strongly about.
Yet neither were voters especially inclined to cast ballots in the end
that opposed either party simply out of environmental concern. When
different extremes of opinion are compared, it is striking how willing
Democrats were to vote for Clinton regardless of their environmental
preferences. Among Republicans who strongly supported the environ-
ment, the issue had somewhat greater effect, lifting their probability of
voting Democratic, but ultimately falling short. Why? Because the true
impact of environmental preferences on the vote depends on intercepts—
that is, on the starting points of individual voters. In this case Repub-
licans were, a priori, more predisposed against Clinton for other reasons.
116 Chapter 6

Figure 6.1Partisanship and the Environment in the 1996 Presidential ElectionSource: National Election Study (1996).Note: By combining responses to variables v960523 and v960525, the inde-pendent variable used in this graph indicates both the direction and intensityof preferences along the environment/economy scale. See appendix for questionwording.
The Ballot Box I 117

His environmental positions may have made him a somewhat more
attractive candidate to moderate Republicans, but in this case it appears
not to have persuaded many to cross party lines.
The true impact of environmental issues, then, seems to lie not with
partisan voters but rather with self-proclaimed Independents. For them,
the environment may have been a crucial issue in 1996, one that pushed
moderates in favor of casting a vote for Clinton when and if they
prioritized environmental protection over the state of the economy.32
Environmental concern may never supplant the deep anchor of partisan-
ship, but for ‘‘swing’’ voters less attached to party, it may provide an
important source of differentiation between candidates, if those policy
differences are clearly articulated. In some elections and under some
conditions, therefore, the electoral impact of environmentalism might be
strong enough to cause a meaningful shift at the margins.
The 2000 Presidential Campaign
If environmental issues had yet to take center stage in a national cam-
paign by 1996, the race for president four years later offered envi-
ronmentalists a hint of something more promising. The Democratic
candidate was Al Gore, President Clinton’s heir-apparent, a self-styled
environmentalist, and the author of Earth in the Balance (1992). But
despite Gore’s credentials and his past willingness to use the bully pulpit
to champion environmental causes, political observers were struck
largely by the quiet irony of Gore’s campaign. Under fire on one side
from environmentalists who believed that Clinton administration policies
had not gone far enough and on the other by critics who labeled the
views expressed in his book extremist, Gore allowed political caution to
temper his environmental positions, relegating the issue to ‘‘the margins
of his race for the White House.’’33
The Republican nominee, Governor George W. Bush of Texas, son of
the man who in 1988 had pledged to be ‘‘the environmental president,’’
made promises of his own in a series of speeches delivered at national
parks in the Pacific Northwest. But the issue never quite emerged, as
some hoped it would, as the ‘‘sleeper’’ issue of the presidential cam-
paign.34 What attention the environment did receive seemed focused in-
118 Chapter 6

stead on Ralph Nader’s run for the White House as a third-party candi-
date, and his dogged pursuit of at least 5 percent of the popular vote—
enough to secure federal funding for the Green Party in 2004. That
Nader’s support ultimately fell well short of his goal (just 2.7 percent of
the vote nationwide) suggests that the environment, once again, failed to
live up to its potential.
While the National Election Study did not replicate in full the envi-
ronmental battery used in 1996, data for the year 2000 offer at least
some perspective on the campaign and its candidates.35 First, despite the
presence of both Nader and Gore in the race—men whose political rep-
utations were based, in no small part, on their environmental records—
there is little evidence to suggest that the salience of environmental issues
was any higher in 2000 than it had been four years earlier. When asked,
just twenty-three respondents cited environmental issues as the single
‘‘most important problem’’ facing the nation. Amounting to less than 3
percent of the total, that statistic is virtually identical to the one obtained
in 1996.
Measuring salience in more specific ways is difficult but no more
favorable. Respondents in 1996 were asked to rate how important the
issue of jobs and the environment was to them (only 18 percent consid-
ered it to be ‘‘extremely important’’). In 2000, participants were asked
the same question but in relation to environmental regulations placed on
business instead. Without identical question wording, comparison be-
tween the two may be little more than speculative. In absolute terms,
however, it can be said that the numbers remained weak, with just 12
percent believing that the subject was ‘‘extremely important.’’
Yet while the salience of the environment remained ironically low in
2000, keen divisions on policy did emerge between the two major-party
candidates. Nader may have complained bitterly throughout the cam-
paign that there was little substantive difference between Bush and Gore
on the issues,36 but in reality, as the editorial desk at the New York
Times pointed out, ‘‘the Texas governor and the vice president offer[ed]
as stark a choice on the environment as was ever put on view in a presi-
dential contest.’’37 As figure 6.2 visually demonstrates, the average dif-
ference that NES respondents perceived between the candidates on jobs
and the environment was greater relative to the pairing of Clinton and
The Ballot Box I 119

Dole in 1996. Without the cognitive spark that salience provides, how-
ever, policy differences appear to be a necessary but hardly sufficient
condition for voting green.
Finally, the weight of partisan tradition, as in the past, also played
a role in shaping (and in some ways limiting) the outcome of the
2000 presidential campaign. While most Democrats and Republicans
remained loyal to their preferred party regardless of their environmental
preferences, Independents found Gore a less attractive candidate than
Clinton overall for a multitude of reasons that had little to do with the
environment. Voters in 2000 also continued to adhere to well-established
voting patterns that consider ballots cast for a third-party candidate to
be a ‘‘wasted’’ vote, leading many of those who were sympathetic to
Nader to abandon him in the end because of what he later termed the
‘‘cold-feet factor.’’38
Given the benefit of hindsight, the greatest impact that the environ-
ment had on the 2000 presidential campaign may have been largely
unintended. With a protracted outcome determined by an amalgam of
state results in the Electoral College—with some help from the U.S.
Supreme Court—Nader’s small fraction of the vote failed to achieve his
Figure 6.2A Comparison of Candidate Issue Positions on the Environment and the Econ-omy in the 1996 and 2000 Presidential CampaignsSource: National Election Study (1996): v960526, v960529 and National Elec-tion Study (2000): v000714, v000719.Note: See appendix for question wording.
120 Chapter 6

goal, but it undoubtedly contributed to Gore’s hairbreadth loss. Play-
ing the role of ‘‘spoiler,’’ a shift of just one-half of 1 percent of Nader’s
support in Florida alone could have given Gore the state’s twenty-five
electoral college votes and with it the presidency itself.39 From the
standpoint of the mainstream environmental movement, then, it is not
hard to imagine why Nader’s candidacy was considered by some to be a
‘‘misguided crusade.’’40
Conclusions
Today, public concern for environmental quality stands as one of the
most impressive findings in survey research. Public opinion polls show
that the environmental movement has earned the sympathetic support of
large majorities of Americans, many of whom claim the label environ-
mentalist as their own.41 Yet as Riley Dunlap notes: ‘‘In democracies, the
‘bottom line’ for judging the strength of public opinion is the impact of
that opinion on the electoral process.’’42 If that is the case, the news for
environmentalists is both good and bad.
Environmentalists should take heart in the knowledge that environ-
mental issues can, for certain voters under certain conditions, influence
ballots cast in presidential elections. Although the numbers may be
small, politicians who promote their environmental positions appear to
do so wisely. As Christopher Bosso points out, ‘‘Strong public concern
does not translate automatically into policy responses. It translates only
into opportunities for leadership that may or may not be exploited,’’ a
lesson that Democrats are just beginning to learn.43 In close races where
victory is won at the margins, elite agenda setting by environmental
candidates might well be successful in defining a unique environmen-
tal agenda and in increasing the salience of environmental issues from
the top down—both factors that ultimately shape the likelihood of a
‘‘green’’ vote.
But as Al Gore’s campaign for the presidency in the year 2000 dem-
onstrates, there are dangers and limitations here as well. If the potential
for environmental issues to make a difference at the polls lies mainly with
‘‘swing’’ voters who are less weighted by the anchor of partisanship,
political parties and their candidates sympathetic to environmental issues
The Ballot Box I 121

may find themselves in a Catch-22. Independent voters are, in most
cases, squarely in the middle of the road on matters of environmental
policy and remain so in their general ideological views, so much so that
candidates who promote policy differences with their opponents might
risk being seen as too liberal or too extreme—in effect estranging the
very voters they seek to attract.
Promoting policy differences, then, is risky, but it is also difficult. As
Jedediah Purdy notes, ‘‘Although nearly everyone cares about clear air,’’
the issues Vice President Gore embraced and at which he best succeeded
tended to be ‘‘conducted in the language of parts per million, emission-
control technologies, and cost-benefit analysis.’’44 In other words, they
were the prototypical ‘‘hard’’ issues that Carmines and Stimson say make
issue voting near impossible. With ‘‘no ancient redwoods or endangered
seal pups to provide television images of what was at stake,’’ Gore’s
laudable record did little to ignite public enthusiasm for the environ-
ment or for his candidacy itself.45 Environmentalists may have criticized
George W. Bush’s experience as governor of Texas and doubted his
commitment to environmental protection, but his speeches on the subject
were emotive and ‘‘symbolically perfect’’ nevertheless.46
If a majority of voters are genuinely concerned about the environment,
it stands to reason that few political candidates come out opposed, at
least in principle and in rhetoric, to environmental policies.47 But as
Peter Bragdon and Beth Donovan warn:
If more candidates on both sides of the aisle tout environmental credentials, itmay become more difficult for these groups to draw public distinctions betweenallies and adversaries. As long as candidates like George Bush can win whiletouting environmental credentials that were highly suspect in the environmentalcommunity, politicians may have little incentive to change their behavior.48
In other words, given elections that invite environmental symbolism and
the ‘‘greenwashing’’ of legislative records, pro-environmental candidates
do not necessarily become pro-environmental presidents.49
With or without a strong contingent of active voters, however, there
are other potential ways in which the environmental views of the elec-
torate are represented. Environmental organizations such as the Sierra
Club and the League of Conservation Voters serve as active mediators
between citizens and their elected representatives. By lobbying Congress
122 Chapter 6

directly and by contributing funds to the political campaigns of pro-
environmental candidates, these groups may help to hold representatives
responsible for their legislative actions when and if voters fail to do
so.50 To suppose, then, that elected officials cannot be held accountable
for their environmental policies without a tangible electoral incentive
underestimates the ability of environmental concerns to influence the
public agenda in other ways. As one columnist writes,
Without ever having elected a Green Party candidate to major public office orputting major components of their agenda on a ballot, environmentalists havesucceeded—through agitation, litigation and cajoling friends in high places—inseizing the levers of power and bending the machinery of government to theirwill, turning the movement outside in.51
Finally, since environmental issues are seldom raised in presidential
campaigns, criticism of the environment as a political issue may also re-
flect a continuing misperception of the nature of national elections. As
Michael McCloskey bluntly puts it, ‘‘They are not plebiscites on this
question.’’52 Perhaps, then, we would more fairly judge the environ-
ment’s ‘‘bottom line’’ by looking to other political arenas, such as ballot
initiatives and referendums at the state and local level where environ-
mental issues enjoy greater salience and less competition for room on a
crowded political agenda.53 If a stronger and more direct electoral con-
nection can be found there, it may suggest that the uphill battle faced by
environmentalists is at least half won.
The Ballot Box I 123

This Page Intentionally Left Blank
7The Ballot Box II: Environmental Voting on
Statewide Ballot Propositions
Environmental ballot propositions are often considered bellwethers of
the nation’s willingness to take action on environmental issues, and of
the extent to which U.S. consumers and taxpayers are ready, willing, and
able to pay for costly environmental reform. If the environment’s bottom
line is truly to be judged by its impact on the electoral process, then,
statewide ballot questions appear to present a golden opportunity.1 Not
only do initiatives and referendums provide the purest form of issue vot-
ing that occurs in American politics,2 the process consistently offers citi-
zens greater chance to address environmental issues in a succinct and
direct way, shielded from otherwise dominant influences on electoral
choice, such as partisanship and candidate appeal.3
Yet with an inconsistent record of election day victories and defeats
over the years, scholars have interpreted the environmental scorecard in
very different ways. While some highlight selective success as proof that
Americans are willing to take a stand on environmental issues, especially
when elected representatives fail to do so,4 others insist that high-profile
losses are devastating to the political credibility of the movement itself.5
As one observer bluntly put it immediately following the 1996 election,
in which environmentalists spent millions of dollars to influence the out-
come: ‘‘The environmental movement set out to be the mouse that
roared, but all Americans heard was a squeak.’’6
Explaining the conditions under which environmental issues succeed
(or fail) at the ballot box is an important but undeniably difficult task.
While Laura Lake finds that environmental ballot measures in California
‘‘met with the same or slightly better rates of approval than their non-
environmental counterparts’’ over a ten-year period from 1970 to 1980,

no study has yet attempted a comprehensive review of all environmen-
tal ballot questions over an extended time frame.7 That deficiency is
redressed in this chapter—through analysis of an ambitious list of more
than 370 environmental measures offered in forty-five states between the
years 1964 and 2000 and then through an examination of a broader and
more detailed database of ballot propositions offered in four states over
the same time period. When combined, both methods allow the overall
success rate of environmental proposals to be compared (often favor-
ably) to other issues of social, political, and economic importance, while
providing statistical control for a variety of cross-pressuring factors,
including ballot mechanics and economic conditions. Finally, since the
economy has proven to be an important determinant of the vote, as
have other factors less accessible to measurement on an aggregate
scale (including issue framing and campaign finance), those topics are
explored here using survey data from two prominent and contrasting
case studies—the first is a successful 1986 toxics initiative in California
intended to protect drinking water supplies, and the second is an unsuc-
cessful 1992 Massachusetts recycling initiative. Consistent with David
Magleby’s claim that ‘‘the side that defines the proposition usually wins
the election,’’ both cases demonstrate that the content of a campaign
message (and not simply the media visibility money affords) may be key
to understanding public willingness to pay for protective environmental
policies.8
Direct Democracy and the Environment
At its core, referendum and initiative refer to procedures that permit
voters to cast ballots directly on issues of law, policy, and public expen-
diture. With ancestry extending back to the Greek city-state, through
New England town meetings at the time of the American Revolution, to
the U.S. Progressive movement at the turn of the last century, direct de-
mocracy has evolved and expanded in the United States over the past
hundred years. While there is no procedure for a national referendum, all
states but Delaware now offer opportunities for citizens to cast ballots in
some form on constitutional and/or statutory issues, while just over half
provide a form of popular referendum or initiative whereby citizens
directly challenge existing law or propose new policy.
126 Chapter 7

With the growth of single-issue constituencies since the 1970s, this
latter form of direct legislation has become an ‘‘integral strategy’’ to
lawmaking that is used by political activists to broaden the public
agenda.9 ‘‘Time and again,’’ write Hugh Bone and Robert Benedict, ‘‘the
sponsors [of ballot propositions] have been ahead of the legislature’’ in
proposing changes in liquor laws, welfare benefits, environmental pro-
tection, and government reform. Indeed, the success of many of these
measures at the polls, often by impressive margins, ‘‘can be interpreted to
mean that the legislature was unresponsive to a wide-spread desire’’ for
policy change, allowing controversial issues to bypass government stale-
mate by facing the electorate instead.10
While environmentalists are clearly not alone in their use of ballot
measures to combat legislative inaction, the popularity of such strategies
in many states demonstrates a fundamental compatibility between direct
democracy and the populist, grassroots orientation of the environmental
movement. As such, ballots cast on environmental referendums and ini-
tiatives provide a valuable reading on the relative importance of the
environment to American voters and taxpayers.
Voting Behavior on Ballot Propositions
While most citizens are unlikely to vote green when casting ballots for
political candidates (at least at the national level), voting on statewide
referendums and initiatives presents increased opportunity, as well as an
entirely new set of challenges. For example, voters approach the mam-
moth task of evaluating complex legislation in the absence of usually
dominant cues or economizing devices, such as partisan identification or
candidate evaluations.11 The dilemma faced by many voters is made
even more difficult by the intimidating number of measures offered on
many state ballots and by the technical language used in wording pro-
posals.12 This informational vacuum can lead to risk-averse behavior
and negative voting,13 despite the social desirability of many environ-
mental concerns. As a result, scholars caution that voting behavior on
ballot propositions is more likely to be unstable over the course of an
electoral campaign and more susceptible to advertising and other politi-
cal appeals as voters strive to bring order to chaos.14
The Ballot Box II 127

While voting behavior on ballot propositions may represent ‘‘strik-
ingly idiosyncratic’’ decision making, scholars have attempted to identify
consistent factors that influence proposition success or failure, including
proposition type, ballot position and voter fatigue, election schedules,
and economic conditions.15
Proposition Type
First, many students of state referendums have noted that measures
placed on the ballot by the legislature enjoy a higher rate of success than
those proposed by citizen petition.16 In examining data from twelve
states from 1898 to 1992, David Magleby estimates that 61 percent of
all legislative propositions were approved by voters, while just 37 per-
cent of those proposed directly by the people succeeded on election
day.17 This disparity seems to suggest that voters are more likely to trust
the merits of legislative proposals over those offered by special interest
groups or lobbyists, and to accord elected representatives the ‘‘benefit of
the doubt.’’18 A similar observation has been made with regard to con-
stitutional versus statutory proposals. Eugene Lee argues, for instance,
that voters are more likely to approve changes in policy rather than
changes in state constitutions given that the latter is thought to be more
fundamental and permanent.19
Ballot Position and Voter Fatigue
Second, in the absence of party and candidate cues that help to reduce
information costs for voters, ballot position effects may be more likely as
citizens make use of the limited information contained within the ballot
itself to aid in vote choice.20 Yet while some research shows that the re-
lationship between ballot position and voter approval is ‘‘negative and
statistically strong,’’21 and that proposals appearing at or near the top of
the ballot ‘‘have a distinct edge,’’22 results in this area have been incon-
sistent, and at times contradictory.23
Election Schedules
Third, some evidence suggests that ballot propositions fare better in
presidential-year elections. Voters may be more friendly to measures
during these campaigns because of a heightened sense of issue competi-
128 Chapter 7

tion and interest.24 In addition, more proposals may be offered in those
years if sponsors determine that their signature-gathering efforts will
generate more ‘‘bang for the buck’’ by way of voter interest and turnout.
Economic Conditions
Finally, given the complexity of many ballot issues and voters’ tendency
to rely on easily accessible information when making vote choices, Shaun
Bowler and Todd Donovan find that prevailing economic conditions are
key.25 They argue that the willingness of the electorate to adopt new
policies, particularly bond measures that allocate public funds or incur
indebtedness, is weaker when state economic conditions are poor.
Environmental Ballot Propositions, 1964 to 2000
Gathering data on statewide ballot propositions is an undeniably difficult
task. As many scholars have noted, a comprehensive archive of referen-
dums and initiatives does not exist, even though it is believed that well
over three thousand have been voted upon in state elections, of which at
least fifteen hundred were by citizen initiative.26 Virginia Graham’s
detailed analysis of initiatives is a fine attempt at recording data on one
type of ballot proposition, but is now itself nearly two decades out of
date, and while newly supplemented by an extensive database at the
Initiative and Referendum Institute,27 no comparable study has yet
been made of measures proposed by state legislatures. Moreover, Austin
Ranney argues that ‘‘the disarray of some states’ records makes such a
compilation both costly and time consuming.’’28 Given these difficulties,
it is not surprising that most studies that focus on ballot propositions as
a unit of analysis are limited by time, state or geographic region, or type
of ballot measure considered, and frequently by all of the above in some
combination.29
To obtain data for this chapter, complete lists of ballot questions
offered in statewide elections were requested from election officials in all
forty-nine applicable states over an extended length of time. In all, usable
election results were received from forty-five states for the years 1964
through 2000, although some lists contained incomplete information on
vote totals, while others failed to include recent election results. When-
The Ballot Box II 129

ever possible those gaps were supplemented by data drawn from state
blue books or other published materials.30
The next step involved examining those lists in detail to code for
measures with significant environmental content. That process was like-
wise difficult for several reasons. First, the quality of information pro-
vided by state election offices was inconsistent at best. While some lists
contained lengthy descriptions of each ballot measure drawn from offi-
cial election guides, others included little more than a short word or
phrase that often required additional research. Second, subjective judg-
ments had to be made regarding the definition of an environmental pro-
posal. While most choices were clear, some were not, leading to the
adoption of a rather strict standard. A simple example illustrates the
point. Many referendums conducted during the mid-1970s proposed
an increase in gasoline taxes. While those efforts could be viewed as an
incentive toward the conservation of nonrenewable natural resources,
most were not directly environmental in their intent but were rather
designed to address an OPEC oil crisis abroad and for that reason are
not included here. For similar reasons, measures funding public trans-
portation as well as those regulating hunting, fishing and trapping are
also excluded, despite in the latter case an obvious impact on efforts to
protect certain species of wildlife. In the end, only those measures that
could clearly be perceived as ‘‘environmental’’ by voters, without mixed
messages and confounding factors, and without extensive knowledge
drawn from lengthy voting booklets, were recorded.31
Trends in Environmental Ballot Measures
In all, based on the standards outlined above, more than 370 ballot
measures on environmental subjects were offered to American voters
between 1964 and 2000, and as figure 7.1 demonstrates, that number
has grown over time (somewhat erratically), in large part due to the
increased popularity of citizen-initiated forms of legislation. As figure 7.2
further shows, approval rates for environmental ballot measures appear
to be as good as, if not better than, those for all other subjects. Recall
that in sampling data from twelve states between 1898 through 1992,
David Magleby finds that 61 percent of all legislative proposals suc-
ceeded at the ballot box, while just 37 percent of those proposed by citi-
130 Chapter 7
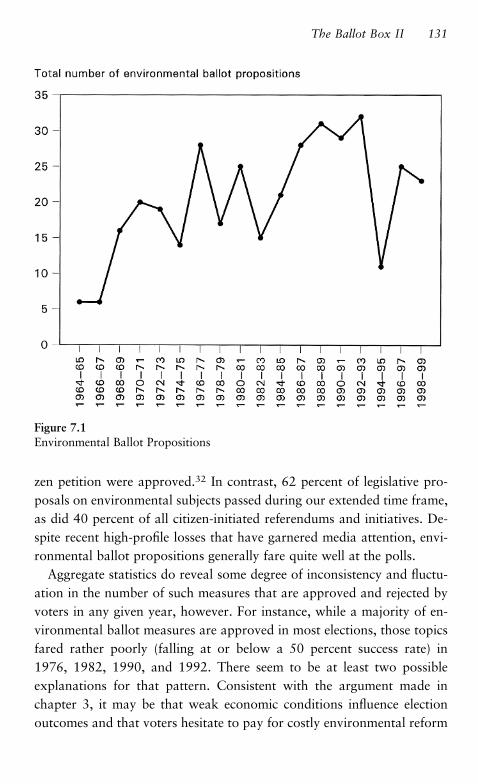
zen petition were approved.32 In contrast, 62 percent of legislative pro-
posals on environmental subjects passed during our extended time frame,
as did 40 percent of all citizen-initiated referendums and initiatives. De-
spite recent high-profile losses that have garnered media attention, envi-
ronmental ballot propositions generally fare quite well at the polls.
Aggregate statistics do reveal some degree of inconsistency and fluctu-
ation in the number of such measures that are approved and rejected by
voters in any given year, however. For instance, while a majority of en-
vironmental ballot measures are approved in most elections, those topics
fared rather poorly (falling at or below a 50 percent success rate) in
1976, 1982, 1990, and 1992. There seem to be at least two possible
explanations for that pattern. Consistent with the argument made in
chapter 3, it may be that weak economic conditions influence election
outcomes and that voters hesitate to pay for costly environmental reform
Figure 7.1Environmental Ballot Propositions
The Ballot Box II 131
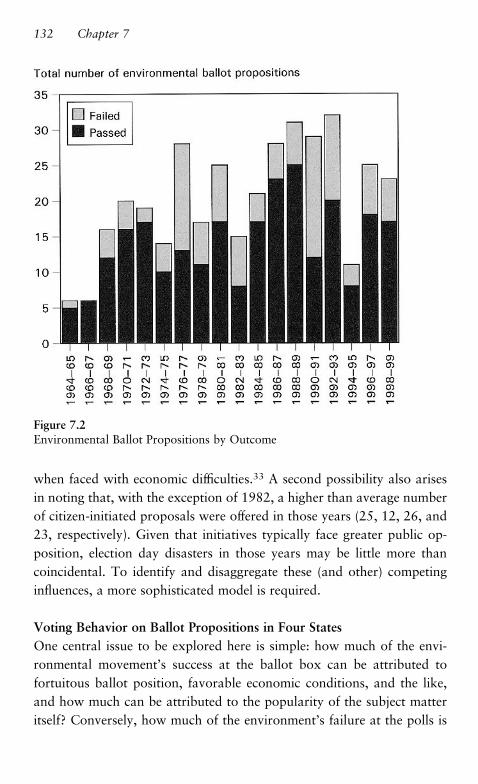
when faced with economic difficulties.33 A second possibility also arises
in noting that, with the exception of 1982, a higher than average number
of citizen-initiated proposals were offered in those years (25, 12, 26, and
23, respectively). Given that initiatives typically face greater public op-
position, election day disasters in those years may be little more than
coincidental. To identify and disaggregate these (and other) competing
influences, a more sophisticated model is required.
Voting Behavior on Ballot Propositions in Four States
One central issue to be explored here is simple: how much of the envi-
ronmental movement’s success at the ballot box can be attributed to
fortuitous ballot position, favorable economic conditions, and the like,
and how much can be attributed to the popularity of the subject matter
itself? Conversely, how much of the environment’s failure at the polls is
Figure 7.2Environmental Ballot Propositions by Outcome
132 Chapter 7
the result of outright bad timing rather than the actual merits of the
proposals? To view referendum voting as ‘‘issue voting’’ demands that
certain key factors (both internal and external to the ballot) be statisti-
cally controlled. It also requires some base line against which to compare
the success rate of environmental measures relative to other issues. With
that in mind, the most appropriate approach is to use multiple regression
analysis to explain election outcomes on both environmental and non-
environmental ballot propositions, distinguishing between the two with
the use of a dummy variable.34
Given that an enormous volume of referendums and initiatives have
appeared on state ballots over the past three decades and that environ-
mental matters constitute (at most) 10 percent of those proposals, an
analysis that attempted to compare all environmental measures alongside
their non-environmental counterparts would be prohibitively large and
time-consuming.35 For that simple and pragmatic reason, complete elec-
tion data from just four states between 1964 and 2000 are used here for
more refined analysis.
To select states that would be broadly representative of the frequency
and form of ballot propositions in the United States, case selection was
geared toward maximizing variance along a wide range of considera-
tions, including geographic location, population density, political ideol-
ogy, and the overall use and popularity of referendum and initiative
procedures. Given those criteria—was well as the always present need
for high-quality available data—the following states were chosen for this
sample:
. Colorado, which is largely Republican in its politics and known most
recently for its controversial right-wing initiatives;
. Massachusetts, which while traditionally Democratic, shifted some-
what politically in the 1990s in the face of serious economic challenges;
. Oregon, which is a prominent center of environmental controversy in
the Pacific Northwest due to, among other things, continued conflict be-
tween the protection of the spotted owl and the forestry industry; and
. South Dakota, a sparsely populated state that has experienced great
economic fluctuation over the past thirty years due to its dependence on
industries like agriculture and mining.
The Ballot Box II 133

Using a data set of nearly five hundred ballot propositions offered to
voters in these four states, regression results for a model of referendum
voting are presented in table 7.1, where the aggregate percentage of votes
cast in favor of each measure is regressed on a series of statistical con-
trols, including the nature and source of the proposal, its position on
the ballot, and the year in which it was offered. Measures of state and
national economic conditions are also included. The results this model
suggest several important conclusions.
First, the importance of certain ballot mechanics is confirmed. Mea-
sures proposed by citizen initiative or petition, for example, receive
markedly less support. Second, while changes in personal income either
at the state or national level have little impact on aggregate vote totals,
the rate of unemployment has a strong, negative, and statistically sig-
nificant effect in both areas. While each of these results replicates and
supports previous work on referendum voting, the dummy variable dif-
ferentiating environmental proposals from all other issues is most im-
portant for our present purposes. With a slope coefficient that is positive
but statistically indistinguishable from zero, results confirm that envi-
ronmental issues, on average, do at least as well as other types of social,
economic, and political subjects, holding all else constant. Once again,
media attention to high-profile losses seem at odds with actual election
results, underestimating the strength of the environment as a ballot issue.
A Closer Look at Environmental Issues on State Ballots
If environmental measures, on average, tend to do as well as other types
of issues on election day, do differences among environmental subjects
help to explain why environmental voting on referendums and initiatives
has traditionally been labeled inconsistent? A disaggregation of environ-
mental proposals by topic in figure 7.3 suggests that they do.
In this case, a complete list of environmental ballot propositions is
used, where the dependent variable represents the aggregate percentage
of votes cast in favor of each question. After controlling once again for
election year, ballot mechanics, and economic conditions, as shown in
table 7.2, certain types of environmental issues do fare better at the polls
than others. Bottle bills and other efforts at recycling, on average, receive
aggregate votes that are nearly nine percentage points lower than the
134 Chapter 7

Table 7.1Proposition Voting in Four States, 1964 to 2000
Independent variablesOLS Slopecoefficient
Standarderror
Environmental proposal (0 ¼ no, 1 ¼ yes) 0.42 2.58
State (dummy variables):
Colorado 3.63 2.49
Massachusetts 8.27** 3.12
Oregon 3.15 3.11
South Dakota 0.00 —
National economic conditions:
Annual unemployment rate, seasonallyadjusted
�2.63** 0.90
Rate of inflation as measured by theConsumer Price Index
�0.19 0.32
Percentage change in per capita disposablepersonal income
0.41 0.64
State economic conditions:
Annual unemployment rate, seasonallyadjusted
�1.07** 0.75
Percentage change in per capita disposablepersonal income
0.29 0.26
Proposition type:
Proposed change (0 ¼ statutory,1 ¼ constitutional)
2.53 1.94
Source of proposal (0 ¼ state legislature,1 ¼ citizen petition)
�4.11* 2.07
Ballot position �0.80 0.58
Ballot position 2 0.02 0.03
Presidential election year (0 ¼ no, 1 ¼ yes) �1.67 1.58
Trend (t1; t2; . . . ; tn) 0.08 0.10
Intercept 56.41 5.56
R-square ¼ 0.13
Number of cases ¼ 495
Notes: *p < :05.**p < :01.***p < :001.
The Ballot Box II 135

base category, while efforts to protect public health and safety through
pesticide regulation, asbestos removal, or product labeling earn votes
that are nearly thirteen percentage points lower. Measures designed to
regulate nuclear power and safety also face significantly greater public
opposition than other environmental causes. Why might these measures,
in particular, fail?
Nuclear Regulation First, despite a high degree of suspicion and con-
cern, voters have reacted in inconsistent ways to measures regulating
nuclear power and safety over the past thirty years, with just 25 percent
of propositions on the subject approved by voters between 1964 and
Figure 7.3Environmental Ballot Propositions by Subject
136 Chapter 7
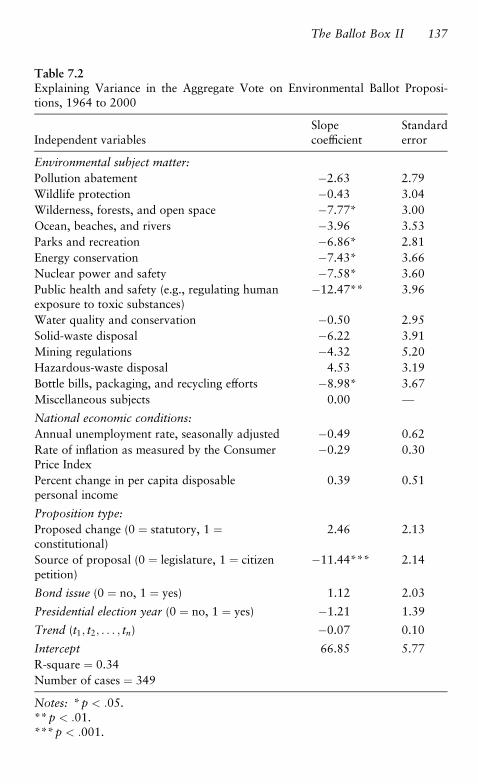
Table 7.2Explaining Variance in the Aggregate Vote on Environmental Ballot Proposi-tions, 1964 to 2000
Independent variablesSlopecoefficient
Standarderror
Environmental subject matter:
Pollution abatement �2.63 2.79
Wildlife protection �0.43 3.04
Wilderness, forests, and open space �7.77* 3.00
Ocean, beaches, and rivers �3.96 3.53
Parks and recreation �6.86* 2.81
Energy conservation �7.43* 3.66
Nuclear power and safety �7.58* 3.60
Public health and safety (e.g., regulating humanexposure to toxic substances)
�12.47** 3.96
Water quality and conservation �0.50 2.95
Solid-waste disposal �6.22 3.91
Mining regulations �4.32 5.20
Hazardous-waste disposal 4.53 3.19
Bottle bills, packaging, and recycling efforts �8.98* 3.67
Miscellaneous subjects 0.00 —
National economic conditions:
Annual unemployment rate, seasonally adjusted �0.49 0.62
Rate of inflation as measured by the ConsumerPrice Index
�0.29 0.30
Percent change in per capita disposablepersonal income
0.39 0.51
Proposition type:
Proposed change (0 ¼ statutory, 1 ¼constitutional)
2.46 2.13
Source of proposal (0 ¼ legislature, 1 ¼ citizenpetition)
�11.44*** 2.14
Bond issue (0 ¼ no, 1 ¼ yes) 1.12 2.03
Presidential election year (0 ¼ no, 1 ¼ yes) �1.21 1.39
Trend (t1; t2; . . . ; tn) �0.07 0.10
Intercept 66.85 5.77
R-square ¼ 0.34
Number of cases ¼ 349
Notes: *p < :05.**p < :01.***p < :001.
The Ballot Box II 137

2000. While Betty Zisk argues in Money, Media and the Grassroots
(1987) that the nuclear accident at Three Mile Island in 1979 probably
influenced voters’ perceptions of nuclear safety, leading to the elec-
toral success of ballot questions in some states that had previously been
defeated by substantial margins, economic arguments regarding loss of
jobs and rising electrical rates for consumers remain potent political
weapons used by opponents to defeat regulatory efforts.36
Public Health and Safety Second, efforts to protect public health and
safety through pesticide regulation, asbestos removal, product labeling,
and the like often face stiff opposition at the polls despite appealing bal-
lot titles and seemingly intense national concern. While the use of some
pesticides is known to have carcinogenic and reproductive effects at high
concentrations, for example, their use is often balanced in political
debates by tangible agricultural benefits that maintain high crop yields,
attractive cosmetic standards, and stable market prices. Moreover, de-
spite the inherent appeal of ‘‘right-to-know’’ campaigns that promise to
alert the public of exposure to toxic chemicals, potentially high costs of
compliance for business and industry lead to complaints that these mea-
sures harm competitiveness and employment.
Bottle Bills and Recycling Efforts Finally, ‘‘bottle bills’’ mandating
deposits on bottles and cans and other recycling efforts designed to reg-
ulate product packaging have traditionally faced opposition from the
beverage industry, as well as voters in many states. Even though states
with deposit-refund systems boast higher than average recycling rates
and reduced curbside litter,37 opponents argue that such measures lead
to job losses and increased prices for consumers, while offering marginal
environmental benefits, at best.38
With that additional background in mind, data results presented here
suggest that economic conditions remain a persuasive factor in referen-
dum voting. While the national rate of unemployment has a strong,
negative impact on voting on all issues, the environmental measures that
fail most frequently seem particularly sensitive to charges of economic
cost and job loss. To better understand the complex relationship between
the economy and the environment in the eyes of the American voter, it is
138 Chapter 7

necessary to refine our focus one last time by concentrating on two case
studies that fall squarely into the typology developed above—one that
succeeded at the polls and one that failed.
Case Study 1: The California Toxics Initiative, 1986
In a state well known for its liberal support of environmental policies,
continued concern over the safety of public drinking water supplies and
ongoing frustration with legislative inaction encouraged environmental
groups to offer a unique solution to California voters during the 1986
general election. Proposition 65—formally known as the Safe Drinking
Water and Toxic Enforcement Act of 1986—was designed to restrict the
release of toxic substances in ‘‘significant amounts’’ into drinking water
if those chemicals were known to cause cancer or birth defects. More-
over, the initiative required California companies to give ‘‘clear and rea-
sonable’’ warning before knowingly exposing the public to harmful
chemicals from a variety of sources, including alcoholic beverages, paint,
dry cleaning fluids, and gasoline. While product labeling was most
clearly intended to inform the public of risky products and activities,
environmentalists also believed that ‘‘the greatest impact’’ of the initia-
tive could be on manufacturers rather than consumers, by ‘‘prodding
them to reformulate products and get hazardous chemicals out of the
environment and the workplace,’’ which would avoid the need for
warning labels altogether.39
Finally, and perhaps most significantly, in permitting citizen lawsuits
to be filed against offending companies, Proposition 65 promised a dra-
matic ‘‘change in the rules about who is responsible for setting safe
chemical exposure levels.’’40 Rather than relying on a massive state and
federal bureaucracy to study scientific evidence and determine safe levels
of exposure—a process that is often excruciatingly slow—Proposition
65 offered an ‘‘innovative legal approach’’ that effectively turned the
regulatory tables by placing the burden of proof on businesses to show
scientifically that the chemicals they use are safe.41
This latter requirement, in particular, solidified a fierce opposition
group to the initiative that included the oil industry, utility companies,
the California state Chamber of Commerce, the Farm Bureau Federation,
The Ballot Box II 139

and the California Manufacturers Association, as well as incumbent
California governor George Deukmejian. In outspending environmental
proponents by a three-to-one margin, ‘‘No on 65’’ groups accumulated a
war chest of nearly $5 million and went so far as to run a full-page ad in
the Wall Street Journal urging companies nationwide to help them ‘‘pre-
vent the second biggest business disaster in California history,’’ in their
opinion, ranking only behind the stock market crash of 1929.42
In presenting their case before California voters, opposition groups
argued that prohibiting toxic discharges in ‘‘significant amounts’’ (defin-
ing significant as ‘‘any detectable amount’’) would essentially ban the use
of many chemicals useful to agriculture and industry, given the sophisti-
cation and sensitivity of current scientific technology.43 The ‘‘No on 65’’
campaign also argued that the initiative was blatantly unfair and ‘‘full
of exemptions,’’ granting immunity to government agencies while creat-
ing still more bureaucratic red tape for private sector businesses.44 As
Deukmejian noted: ‘‘If [the initiative] is genuinely concerned, as pro-
ponents say it is, with the public health, then it shouldn’t matter’’
whether that risk comes from business or government. ‘‘This isn’t an
anti-pollution initiative,’’ he argued; ‘‘it is an anti-business measure’’ that
would place an ‘‘unbearable burden’’ on California businesses and
farmers, while exempting large well-known polluters like the City of Los
Angeles.45 In sum, opponents argued that Proposition 65 would harm
the California economy, drive away jobs, and not ‘‘result in one single
glass of cleaner water.’’46
Understanding Public Attitudes toward Proposition 65
Between July 24 and October 30, 1986, the Field Institute (a nonpartisan
public-policy research organization that collects public opinion data on a
variety of social and political topics within California) conducted a series
of three polls measuring public attitudes toward the upcoming state
election, its candidates, and its ballot propositions.47 Respondents in all
three surveys were asked whether they had ‘‘seen or heard anything
about an initiative, Proposition 65, that will be on the November state-
wide election ballot having to do with toxic substance[s] and drinking
water.’’ Voters who were aware of the measure were then asked how
they might vote based on the information they had already received. All
140 Chapter 7

participants were then read a brief neutral description of the initiative
and asked one final time how they would vote if the election were being
held that day.
Taken together, data results from these three surveys demonstrate
strong public support for Proposition 65. During the summer prior to
the election, 88 percent of those responding supported the initiative after
hearing a brief description of its goals. By the beginning of October, well
into the fall campaign and just one month prior to election day, overall
support remained high at 79 percent. But as figure 7.4 demonstrates, as
the campaign moved forward and information about the initiative be-
came widely available, opposition among voters familiar with the mea-
sure increased substantially, from just 7 percent during the summer
months to nearly 30 percent by the end of October. The more voters
knew about Proposition 65, they more they disliked it.
Figure 7.4Vote Intentions among Informed Voters for Proposition 65Source: Field Institute, California Polls (86-04, 86-05, 86-06).
The Ballot Box II 141

In the end, as table 7.3 confirms, strong support for the measure was
sustained, in no small part, by the positive initial reaction of uninformed
voters. Even after controlling for a variety of social, political, and demo-
graphic factors, including partisan identification and political ideology,
voters who were unfamiliar with Proposition 65 (and who therefore had
no knowledge of negative advertising aimed against it) were much more
likely to favor the measure, probably because of its appealing goals to
‘‘prohibit the discharge of toxic substances into drinking water’’ and to
‘‘require warnings of toxic chemicals exposure.’’ An equally appealing
ballot title on election day also meant that voters heading to the polls
with little or no knowledge of the initiative were likely to support it. As
opponents feared, this strong ‘‘gut reaction’’ contributed to an impres-
sive victory for environmentalists, where the toxics initiative attracted 63
percent of the popular vote. As one industry representative put it, given a
margin of defeat of nearly two to one: ‘‘[W]e sort of got our clocks
cleaned.’’48
Table 7.3Factors Affecting Willingness to Vote for Proposition 65
Independent variablesOrdered probitcoefficient
Standarderror
Age �0.01 0.00
Education �0.09 0.07
Income �0.02 0.04
Partisan identification �0.00 0.04
Political ideology 0.10* 0.05
Race 0.28 0.27
Gender �0.20 0.14
Prior knowledge of proposition 65 �0.62*** 0.15
Intercept 1 1.61 0.36
Intercept 2 0.53 0.07
Log-likelihood ¼ �284:615
Number of cases ¼ 447
Source: Field Institute (September 24–October 2, 1986, n ¼ 1023).Notes: See appendix for question wording.*p < :05.**p < :01.***p < :001.
142 Chapter 7

Why Did Proposition 65 Succeed?
As a strict environmental policy placed before California voters, the im-
portance of Proposition 65’s success cannot be overestimated. It was,
after all, the first fiercely contested environmental ballot measure to suc-
ceed in California since the 1972 Coastal Act,49 and its emphasis on
pollution prevention, rather than cleanup, was both innovative and re-
sourceful given the lethargy and limitations of federal tolerance-setting.
As a bona fide electoral success, however, Proposition 65 would un-
doubtedly be considered a deviant case by Zisk and others who stress the
importance of campaign spending in determining initiative outcomes,
particularly given high and disproportionate spending by opponents to
the issue.50 On these grounds, the success of Proposition 65 clearly
demands attention, as well as explanation.
First, despite a well-funded campaign against the proposal, the mes-
sage that opponents sent to California voters was clearly ill advised. The
‘‘exemptions’’ issue may have convinced some that the toxics initiative
was either inadequate or unfair, but it was the source of that message
ultimately failed to ring true. As one newspaper columnist put it, ‘‘the oil
and chemical companies went on TV to attack the measure as too weak.
Their slogan was: ‘Too many exemptions,’ as if they were the environ-
mentalists.’’51
Second, as California poll data suggest, an appealing ballot title prob-
ably meant that many undecided or uninformed voters would cast bal-
lots in favor of Proposition 65. In this case, broad environmental goals
were described in an appealing manner that very likely encouraged sup-
port based on social desirability alone. This ‘‘standing opinion’’ was
strengthened further by ballot wording that placed clear responsibility
(and potential cost) on big business rather than on consumers themselves.
Finally, while well-financed opponents tried to label the toxics ini-
tiative as a ‘‘simplistic response to a complex issue,’’ California voters
ultimately preferred to view the proposal as a clear-cut health and
quality-of-life issue rather than an intricate political debate over policy
means.52 While such rhetoric may ultimately weaken the sophistication
and potential of issue voting on environmental concerns, this strategy is
fundamentally compatible with the informational vacuum faced by many
citizens in the voting booth.
The Ballot Box II 143

Case Study 2: The Massachusetts Recycling Initiative, 1992
Just four years following a major environmental victory in California,
election day in 1990 was a particularly black Tuesday for environmen-
talists. With voters heading to the polls just six months after the twenty-
fifth anniversary of Earth Day, environmental ballot propositions—the
largest number ever presented to voters in a single election—seemed
likely to ride the crest of record high levels of environmental concern and
awareness. Indeed, as one commentator recalls, ‘‘So strong was the ap-
parent green tide that even many traditional opponents accepted it as
inevitable.’’53 By November, however, the green tide had been crushed to
a mere ripple. Of the twenty-six environmental measures appearing on
state ballots that year, just thirteen passed, prompting newspapers from
coast to coast to carry stories highlighting elections results with colorful
language such as ‘‘flopped,’’ ‘‘massacre,’’ and ‘‘mowed down.’’54 It was,
as one major newspaper put it, a string of ‘‘stunning electoral defeats.’’55
Equally stunning was the nature of many of the defeated measures,
including efforts to ban cancer-causing pesticides, reduce emissions of
greenhouse gases, preserve forest land and habitat for endangered species
of wildlife, and levy taxes on the transportation of hazardous materials.
A toxics initiative in Ohio patterned after California’s popular Proposi-
tion 65 was defeated by a margin of three to one, as was an Oregon
recycling initiative designed to regulate product packaging.
Two years later, with a similar recycling measure pending on the
Massachusetts ballot, the political fortunes of the environmental move-
ment remained uncertain. While traditionally liberal and Democrat in its
politics, Massachusetts was recovering from an economic slump that
year that had produced falling revenues and serious job losses, as well as
a new Republican governor, William Weld. In placing Question 3 on the
ballot, sponsors hoped that a new policy regulating the recycled content
of all product packaging produced in the state would ‘‘close the loop’’ in
the state’s burgeoning recycling program by creating local markets for
the old newspapers, milk bottles, and plastics collected curbside by town
recycling programs.56 Environmental leaders were equally optimistic
that the recycling initiative would help to boost the sagging Massachu-
setts economy by creating new jobs and encouraging resource efficiency.
144 Chapter 7

In endorsing the measure personally, even Governor Weld believed
that the measure would ‘‘be good for the state’s economy as well as its
environment.’’57
Opposition to the initiative, however, came from several well-financed
groups, including packaging companies, the plastics industry, the Amer-
ican Paper Institute, and the Grocery Manufacturers Association, which
together formed a vocal ‘‘No on 3’’ coalition. Over the course of a $6.5
million advertising campaign that outspent environmental sponsors by a
ratio of thirteen to one, opponents argued that consumers were likely to
bear the burden of mandated repackaging, costing families up to $230
dollars per year in higher product prices.58 They also contended that en-
forcement of the initiative would require a costly new state bureaucracy,
burying grocery stores in bureaucratic red tape, while having little im-
pact on the state’s solid-waste problems, given that over 80 percent of
Massachusetts packaging originates outside the state.59
The Voters Respond
How did Massachusetts voters react to Question 3? As figure 7.5 dem-
onstrates, initial reaction to the proposal was overwhelmingly favorable.
As Magleby would predict, however, support weakened considerably
over the course of the election campaign, particularly after negative ad-
vertising began to appear in the mass media in mid-September.60 In a
series of polls conducted by the Boston firm of Marttila & Kiley, Inc., 88
percent of respondents said they were likely to support Question 3 in
February of that year, while by October just 55 percent said they would
do so. During that time, well-financed opponents successfully recast the
recycling issue as a packaging ban, stirring voter concern for jobs and the
economy and voter disapproval of government waste, inefficiency, and
bureaucracy. By election day, Question 3 failed at the polls, winning just
41 percent of the popular vote.
Understanding Public Attitudes toward Question 3
Why did such a drastic reversal of opinion occur over an eight-month
period? Perhaps the best explanation can be found in the February 1992
poll conducted by Marttila & Kiley.61 In interviewing 402 likely Massa-
chusetts voters, pollsters asked respondents how they might vote for the
The Ballot Box II 145

recycling initiative under three different conditions. First, respondents
were asked for their ‘‘initial reaction’’ to a proposal that ‘‘would require
nearly all packaging used in the state to be recyclable or made of recycled
materials.’’ At a later point in the questionnaire, respondents were read a
more detailed description of the initiative and asked which way they
would be inclined to vote ‘‘if the election on this proposal were being
held tomorrow.’’ Immediately following, respondents were asked to re-
act to two batteries of questions—the first grading the importance of
Figure 7.5Trends in Support for the Massachusetts Recycling InitiativeSource: All data are provided by Marttila & Kiley, Inc. Election day data areactual vote totals.Note: Percentages may not add to 100. Remainder answered ‘‘not sure’’ or‘‘refused.’’
146 Chapter 7

various reasons to support the proposal and the second judging the
merits of various reasons to reject it. A final measure of vote intention
was used following discussion of these positive and negative attributes.
As data presented in table 7.4 make clear, a dramatic shift in opinion
can be seen across these three measures due to framing effects that were
designed to test the strength and stability of attitudes toward Question 3.
While 88 percent of those responding were initially favorable to the
proposal, with nearly all continuing to support the measure after hearing
greater detail, just 53 percent of voters felt that they would ‘‘probably
vote yes’’ after being exposed to the political arguments made by both
environmentalists and their critics during the course of the campaign. In
comparing responses to the second and third items, in particular, just 3
percent of voters were more likely to support Question 3 by the end of
the survey, while 38 percent—nearly 2 in 5—felt that their support had
weakened.
What factors most contributed to this downward shift? To compare
vote intentions immediately before and after respondents were experi-
mentally exposed to various political frames, a new variable was created
by calculating the difference between the two measures. This scale ranges
in value from �3 to þ3, where 0 indicates no change in vote intention
between the second and third survey conditions. The presence of a neg-
ative sign means that a respondent’s support for Question 3 weakened,
while a positive sign indicates that their vote intention strengthened. Us-
ing this measure of change as a dependent variable in table 7.5, several
important conclusions can be drawn.
First, while political ideology has a strong impact on initial vote
choice, it appears to have little independent effect on changing voters’
minds either way during the course of the questionnaire, even though
several criticisms made against the initiative in the survey were closely
related to traditional ideological beliefs (such as taxation, bureaucracy,
or regulation). Data also indicate that respondents who voluntarily
recycled or who participated in town recycling programs were not more
likely to support Question 3 in the end, despite the expectation that prior
recycling behavior would have helped to invest Massachusetts voters in
the outcome of Question 3 and in its efforts to create local markets for
recycled materials.
The Ballot Box II 147

Table 7.4Three Variations in Vote Intention for Question 3
Voter Intention YesLeanYes
LeanNo No
Please tell me whether your initial reactionwould be to vote in favor of that proposal orvote against the proposal: a proposal thatwould require nearly all packaging used in thestate to be recyclable or made of recycledmaterials.
87.9% — — 12.1%
Let me describe this proposal in a little moredetail. Packaging accounts for roughly one-third of the total volume of trash disposal inMassachusetts each year. In order to sharplyreduce the amount of trash, this proposalwould required that by July 1, 1996, packag-ing will have to meet one of five standards,by being smaller in size, reusable, recycled,or made of recycled or recyclable materials.Manufacturers and businesses can use anyone of the five standards to meet the newpackaging requirements. If the election on thisproposal were being held tomorrow, wouldyou be inclined to vote yes or no on thisproposal? [ If not sure:] I know you couldchange your mind, but which way are youleaning based on this information?
87.2 5.6 1.0 6.1
[After asking respondents to react to a lengthylist of positive and negative reasons for sup-porting or rejecting the proposal:] Now thatyou have heard some of the practical concernsand reservations about the recycling initiative,I want to see how you feel now: if the electionwere held tomorrow, would you probablyvote yes on this proposal, are you leaningtoward voting yes, are you leaning towardvoting no, or would you probably vote no onthis proposal?
52.8 29.4 7.2 10.6
Source: Marttila & Kiley, Inc. (February 11–23, 1992), n ¼ 402.
148 Chapter 7

Finally, and most important of all, it is clear that positive and negative
frames had an asymmetric effect. While positive evaluations played little
or no role in strengthening vote intentions toward Question 3, reser-
vations expressed against the proposal were a major factor in eroding
public support. A shift in just two categories on each item in the nega-
tive battery (for example from ‘‘minor reservations’’ to ‘‘strong reser-
vations’’) leads to a statistically and substantively significant shift in
vote intention, holding all else constant. When asked in an open-ended
format which of the particular concerns mentioned they considered to
be ‘‘most serious,’’ respondents whose support declined commonly men-
tioned ‘‘loss of jobs’’ (29 percent) and ‘‘cost to consumers’’ (20 percent).
If Massachusetts voters responded disproportionately to negative charges
Table 7.5Factors Affecting Willingness to Vote for Question 3
Independent variablesOrdered probitslope coefficient
Standarderror
Age 0.01 0.03
Education 0.02 0.06
Income 0.06 0.06
Partisan identification 0.08 0.12
Political ideology 0.13* 0.06
Gender 0.29 0.16
Household recycles 0.19 0.18
Additive scale of positive evaluations 0.03 0.02
Additive scale of negative evaluations �0.06*** 0.01
Intercept 1 �0.60 0.80
Intercept 2 0.05 0.02
Intercept 3 0.07 0.03
Intercept 4 1.08 0.11
Intercept 5 1.67 0.16
Log-likelihood ¼ �243:193
Number of cases ¼ 254
Source: Marttila & Kiley, Inc. (February 11–23, 1992), n ¼ 402.Notes: See appendix for question wording and scale construction.*p < :05.**p < :01.***p < :001.
The Ballot Box II 149

against the recycling initiative, therefore, they were particularly sensitive
to these specific economic concerns—ones that were actively exploited
by opponents throughout the initiative campaign.
Why Did Question 3 Fail?
Question 3 failed, in part, because although support for the measure in
early polls was high, it was also soft. As Magleby argues, most voters
begin a campaign knowing little, if anything, about the propositions they
are likely to face on the electoral ballot, and so it is not uncommon to
find widespread opinion change over time as voters gather more infor-
mation about the issues.62 Most commonly for initiatives, he says, that
pattern is one of strong early support followed by defeat, especially when
there is high spending on the negative side of a proposition. The failure
of the Massachusetts recycling initiative clearly seems to fulfill these
expectations.
But as Magleby notes, too, controlling the terms of debate can be key
to understanding eventual success or failure. By reframing the issue at
stake as a packaging ban rather than a pro-recycling policy, opponents
were able to successfully shift public attention away from environmental
concern toward potential economic costs that would presumably be born
by Massachusetts consumers and their families.63 The political context in
which this shift occurred is also important in that it allowed opponents
to simplify the issue at hand and to link public attitudes toward Question
3 to other factors, such as political ideology and long-standing beliefs
about bureaucratic waste and inefficiency. Ultimately, its failure was not
solely the result of lopsided campaign spending and negative advertising,
although certainly those resources helped to inform Massachusetts voters
of alternative positions. Instead, the ‘‘No on 3’’ campaign succeeded be-
cause its content and tone resonated with anxious voters.
Conclusions
Despite a series of notorious disasters in recent decades—including Cali-
fornia’s ‘‘Big Green’’—where complex and innovative environmental pro-
posals went down to electoral defeat, environmentalists continue to insist
that setbacks at the ballot box do not indicate that public commitment
150 Chapter 7

to environmental protection has weakened.64 Yet as Jessica Mathews
freely admits, disappointing election results in the face of evident concern
amounts to a troubling ‘‘discrepancy’’ that must be explained neverthe-
less.65 The analysis presented in this chapter offers several possibilities.
First, despite high-profile losses that attract media attention and the
vocal complaints of some that the environmental movement amounts to
little more than a political ‘‘paper tiger,’’66 environmental referendums
and initiatives do reasonably well at the ballot box. In comparing suc-
cess rates for ballot questions on the environment to questions on all
other issues, environmental proposals on average fare well once the na-
ture and source of those measures are controlled. In other words, the
failure of some environmental issues may be due to the controversial
nature of the initiative process in general, rather than to public protests
against environmental regulation itself. In this sense, it is important to
recognize that the intensity of voters’ feelings does not always reflect
or necessarily represent their political preferences. ‘‘Direct legislation
can,’’ in David Magleby’s words, ‘‘be a most inaccurate barometer of
opinions,’’ especially on issues where voters face a profound vacuum of
information.67
In the absence of typical cues and informational shortcuts, Magleby
and others argue that voters are more dependent on political campaigns
to simplify choice and shape referendum decisions. Indeed, the power
and potential of campaigns are clearly seen in the two case studies
developed here, where in both instances political opponents used power-
ful rhetoric to try to persuade environmentally concerned voters that the
marginal benefits of regulation failed to exceed its economic cost.
By linking the debate over product packaging to preexisting fears
about state unemployment and bureaucratic red tape, political oppo-
nents to Massachusetts’ Question 3 were able to redirect voters’ atten-
tion away from the environmental benefits of the proposal and toward
an acknowledgment of its costs in a way that ultimately undermined
support for the proposal. While an ability to outspend environmentalists
allowed business and industry groups to dominate the airwaves during
the fall of 1992, the effectiveness of their attacks can be clearly seen in a
poll conducted months before. In this sense, money becomes a proxy for
other things that deserve equal attention.
The Ballot Box II 151

Although money is instrumental (of course) in funding polls, campaign
consultants and qualified staff, it cannot always compensate for a poorly
constructed message. By choosing to emphasize the complexity of Prop-
osition 65 in a multimillion dollar advertising campaign, opponents
asked Californians to view a potentially ‘‘easy’’ issue regarding public
health and safety as a ‘‘hard’’ policy debate, something overwhelmed
voters were loathe to do.68 It was a tactical mistake that allowed envi-
ronmentalists to win an unlikely victory as financial underdogs. With a
pro-environmental campaign in Massachusetts six years later that failed
after making many of the same strategic errors, election results in these
two cases seem to underscore the importance of simple and lucid pro-
posals that sympathize with the substantial informational demands
placed on voters.
In the end, evidence suggests that voting green on ballot propositions
is more likely in simple, inexpensive, and low-key campaigns that avoid
uniting political enemies.69 As survey data from the California and
Massachusetts elections attest, initial standing opinions on environmen-
tal issues remain overwhelmingly positive. Given that salience increases
the likelihood of political opposition as well as the probability that
voters will have been exposed to potent negative advertising, environ-
mentalists unable to win the money war might fare better in the long run
by promoting quiet, incremental reform rather than broad, sweeping
changes in environmental law.
152 Chapter 7

8The Marketplace: Motivating the
Citizen-Consumer
With an ambitious electoral record marred by legislative gridlock and the
defeat of key environmental reforms in recent years, public concern has
increasing found new outlets of expression outside the sphere of politics.
Ever since the media success of Earth Day in 1990, American businesses
have welcomed the ‘‘rise of a new consumer’’ who is motivated by
increasing environmental awareness and a willingness to vote at the cash
register, if not always the ballot box, for improved environmental qual-
ity.1 In fact, this burgeoning demand for environmentally safe products,
which exceeded $1.8 billion in sales annually by 1990,2 was called ‘‘the
political, economic, and social trend’’ of the nineties—a force powerful
enough to build bridges and create unlikely alliances between environ-
mentalists and industry.3
The apparent success of environmental efforts in the marketplace is
surprising, however, when compared to the relative impotence of envi-
ronmental issues in U.S. elections.4 Political theorists have long recog-
nized that decisions reached in the voting booth may differ from those
made in the marketplace,5 but private consumptive choice is typically
thought to reflect narrow self-interest. In the political realm, as Cass
Sunstein argues, ‘‘social and cultural norms often press people, as citi-
zens, in the direction of a concern for others or for the public interest.’’6
If those conventions hold, the fact that Americans seem more willing
to buy green than to vote green, suggests an intriguing paradox that
warrants careful attention.
Using survey data from a variety of sources, this chapter explores pat-
terns of behavior among citizens and consumers relative to the environ-
ment. In examining why green consumerism outranks political actions

such as voting, this chapter considers four different explanations—
simple self-interest, political ideology, personal efficacy, and product ad-
vertising. In the end, in a world where politics and economics converge,
those variables are of considerable importance, given that strong public
support for environmental policies may be incapable of protecting the
environment alone without an equal commitment in the marketplace.
A Paradox Defined
Economists and public choice theorists have long viewed voting behavior
as a rational calculus made by thrifty, self-interested taxpayers concerned
only with maximizing their own utility income.7 Yet as Donald Philip
Green notes, the empirical record in support of such a proposition is
slim.8 Time and again, he writes, statistical analyses find that ‘‘personal
costs and benefits are rather poor predictors of how people want gov-
ernment to behave,’’ either in the area of bilingual education,9 affirma-
tive action,10 income redistribution,11 social security,12 or a host of other
social issues and concerns.
A growing number of political theorists have suggested instead that
public spiritedness and altruism serve as important components of mass
political behavior.13 In explaining why the calculus of decision-making
might be different in the marketplace than in the arena of politics, James
Buchanan notes that ‘‘a sense of participation may exert important
effects on the behavior of the individual.’’14 In contributing to a collec-
tive political outcome, he says, there is a rearrangement of the preference
scale, one that encourages citizens to take a greater account of the public
interest. In other words, with the promise of communitarian goals at the
ballot box, we ‘‘adapt not only our actions, but even our desires.’’15
Yet to suppose that political and economic decisions really are differ-
ent in character creates difficulty when we look to apply those behavioral
expectations to issues like the environment. We might expect to see a
decided shift in behavior as we move from the realm of private choice to
that of social choice, and yet often we do not. We might believe, too, that
private consumptive choices made by consumers in the marketplace
would tend to reflect narrow self-interest, while electoral choices made
by citizens in the voting booth would lean toward a broader concern for
154 Chapter 8
the public good. Instead, election results and market reports at times
seem to plot that pattern in reverse.
While few citizens seem to cast ballots for presidential candidates on
the basis of their environmental preferences, generating public support
for statewide environmental initiatives and referendums has likewise
been an uphill challenge for environmental groups, especially those out-
spent by well-funded opposition campaigns.16 Sunstein insists that
Americans ‘‘support government regulation that diverges from their be-
havior as consumers,’’ but election results on ballot propositions in states
like Ohio and Massachusetts suggest an entirely different story. Polls
show that most Americans recycle regularly and are willing to pay more
for products packaged in recycled materials, yet as chapter 7 points out,
voters in those states overwhelmingly rejected initiatives that would have
regulated the recycled content of product packaging.
Environmental concern seems to fare better in the marketplace.
Today’s eco-market represents a diverse collection of products and ser-
vices, ranging from phosphate-free detergents to recycled paper products
and rechargeable batteries.17 While most studies find that deep commit-
ment to the environment is concentrated in the hands of a privileged
few—ranging from 5 to 25 percent of the U.S. population (depending on
the stringency of the criteria used)18—public willingness to purchase
certain environmental products, even at slightly higher cost, appears to
run surprisingly deep. One survey in 1992 found that nearly three-
quarters of consumers were ‘‘at least sometimes’’ influenced by environ-
mental claims in the marketplace, and most appeared willing to pay at
least 5 percent more for products known to be environmentally safe.19
Is the paradox of marketplace success and ballot-box failure simply an
artifact of trying to compare apples and oranges—that is, of trying to
compare in an anecdotal way behaviors that are essentially incompara-
ble? Probably not. It is possible to contrast different forms of environ-
mental behavior directly in public opinion polls, and although such
efforts are rare, the results they produce are telling. In one survey, con-
ducted by Cambridge Reports Research International in July 1993,
respondents were asked to rate how frequently they participated in cer-
tain activities based on their concern for the environment. That list
included multiple measures of consumer choice and one very impor-
The Marketplace 155

tant measure of environmental voting behavior. Consistent with what
scholars have suspected regarding the likelihood of the latter, voting for
a political candidate ‘‘primarily because the candidate took strong envi-
ronmental positions’’ ranked low on the list overall. In fact, as a series of
regression lines plotted in figure 8.1 demonstrate, voting ranked lower
across the board, even among those who strongly identified with the
term environmentalist. Americans, it seems, simply prefer to buy green
rather than vote green.
Figure 8.1A Comparison of ‘‘Green’’ Voting and ‘‘Green’’ Consumer BehaviorSource: Cambridge Reports Research International (July 15–27, 1993).Note: See appendix for question wording.
156 Chapter 8
In Search of Answers
Why do environmental issues seem to violate a reasonable set of behav-
ioral assumptions regarding choices made in the marketplace and in the
voting booth? Why should green consumer behavior be considered a
powerful social and economic force, while identical environmental issues
languish in electoral campaigns? A fully satisfactory answer is not
immediately apparent. An individual’s intensity of concern for the envi-
ronment cannot be a determining factor since it holds constant across
different kinds of behavior at any given point in time. Other easy
answers fail to ring true as well. Aside from information costs, voting for
political candidates with similar environmental viewpoints would appear
to impose little marginal cost on a voter already heading to the polls on
election day. Purchasing environmentally safe products in the market-
place, meanwhile, often demands a premium price tag, as well as a devi-
ation from brand loyalty.20
Perhaps, then, it is because environmental issues must compete for
attention alongside other priorities during crowded election campaigns,
and yet the environmental attributes of a consumer product, such as
paper towels or dish detergent, are similarly experienced alongside other
advertisements that pull consumers in opposite directions. In short, pat-
terns of environmental behavior suggest an intriguing paradox that is
not easily resolved. An answer is sought here by reference to four possi-
ble explanations—self-interest, political ideology, personal efficacy, and
product advertising.
Self-Interest
One potential reason for the high frequency of consumer behavior mea-
sured in recent surveys is simple. Not all green activity in the market-
place can (or should) be considered public-regarding. While individuals
can undertake many different activities that benefit the natural envi-
ronment, those actions may be motivated by a host of factors, including
self-interest, financial and otherwise.21 For example, a 2000 survey con-
ducted by the Gallup Organization asked respondents which activities
they had participated in ‘‘in the past year.’’ As chapter 2 noted, while
most reported that they had recycled glass, plastic, and aluminum cans
The Marketplace 157

(90 percent), recycling is now mandatory in many cities and municipal-
ities, often with curbside pick-up.22 As some scholars point out, activities
such as these are a form of ‘‘forced’’ behavior change.23 In other states,
such as Maine and Vermont, consumers are reimbursed a small deposit
fee after bottles are emptied and returned to community redemption
centers. While some families, of course, recycle household waste out of a
genuine concern for the environment or an intrinsic sense of personal
satisfaction,24 others undoubtedly do so because of a financial incentive
or a need to comply with local ordinances.25 The latter are factors that
clearly question whether recycling should be seen as an honest reflection
of the public’s commitment to environmental protection.
On other occasions, too, the Gallup Organization probed its respon-
dents about whether they had improved their home’s insulation or heat-
ing and air conditioning systems, or whether they cut water use, drove
a more fuel-efficient car, or carpooled with others. The motivation of
respondents in performing these tasks is equally unclear. As efforts that
conserve energy and natural resources, each could be considered envi-
ronmentally friendly, and yet the financial benefits received by reducing
individual energy and transportation costs are not trivial. In short, even
though some scholars view environmental activities like recycling26 and
energy conservation27 as altruistic and public-regarding, that need not be
the case. When it pays to buy green, the influence of self-interest cannot
be overlooked.
Finally, while self-interest is often narrowly defined in monetary terms,
environmental issues relating to the protection of public health and
safety suggest the need for a more inclusive definition. Mark Baldassare
and Cheryl Katz find that respondents who worry about the impact
of environmental problems on their own personal well-being are more
likely to recycle, conserve water, buy environmentally safe products, and
limit their driving to reduce air pollution—an effect not matched in
predictive ability by any other social, political, or demographic trait.28
Another study suggests that choosing to purchase organically grown
fruits and vegetables in the supermarket represents an effort on the part
of some consumers to protect their families against a perceived cancer
risk associated with exposure to pesticides.29 Both of these cases suggest
158 Chapter 8

that certain environmentally responsible activities should be seen as a
variant reflection of self-interest.
In the end, each of these issues suggests a hypothesis that can be tested
empirically using survey data. First, if this set of explanations holds, the
frequency of environmental behavior should be higher when self-interest,
financial or otherwise, is apparent. Second, if green consumerism is
motivated by self-interest, respondents also should be price conscious.
Willingness to pay a premium price for environmentally safe consumer
goods should be rather weak. Moreover, when compared to political
activities like voting, socioeconomic traits such as income should have a
greater impact on consumer behavior, where the incentive to consider
narrow self-interest is at its strongest. Finally, if consumers are swayed
by self-interest rather than the public interest, market choice should be
more strongly motivated by environmental concerns close to home rather
than by a general concern for the environment as a whole.30
Political Ideology
Extensive research on the social bases of environmental concern suggests
a second possible reason for the popularity of green consumerism in
surveys. Scholars have long shown that certain environmental attitudes
are associated with a liberal political ideology—a point reinforced by
empirical results presented in chapter 4 of this book.31 Environmental
regulation is commonly opposed by conservative ideologues because of
its financial cost and the extensive government interference in the mar-
ket economy it requires. Many voters, too, are cautious about expan-
sions of federal and state bureaucracy that oversee private land use
decisions or create additional layers of ‘‘red tape.’’ For these reasons, in
the political realm we would fully expect environmental attitudes and
behaviors to be closely associated with standard measures of liberalism
and conservatism.
In stark contrast, however, the marketplace imposes no such barriers.
In fact, buying green is entirely consistent with the laissez-faire or
market-based approach to environmental protection favored by con-
servatives. In this way, environmental marketing appeals to a wide audi-
ence. Environmentally concerned individuals who are unwilling to cross
The Marketplace 159

party lines to vote for green political candidates or strict regulatory poli-
cies might well find the marketplace a more ideologically compatible
outlet for environmental expression. If this reasoning holds, data should
show that ideological cleavages are relatively weak in the area of con-
sumer behavior, especially when compared to activities that are distinctly
political in nature.
Personal Efficacy
James Buchanan’s seminal essay on individual choice in the voting booth
and the marketplace discusses a third possible reason for the popularity
of green consumerism.32 Environmentally friendly products may appeal
to consumers because their purchase allows greater certainty, respon-
sibility, and control over the outcome. Unlike voters who have only a
single vote to cast, consumers have highly divisible incomes. They are
free to select the combination of goods and services closest to their own
environmental views and (under ideal conditions) can be assured of the
direct and immediate results of their actions.33
Based on their experiences in the marketplace, therefore, we might
expect consumers to be empowered by a stronger sense of personal effi-
cacy. This hypothesis has received support in the literature, albeit indi-
rectly. While some scholars continue to insist that Americans buy green
in direct proportion to their income and education levels,34 many studies
attempting to identify environmentally conscious consumers find that
psychological variables, such as perceptions of efficacy, have far greater
explanatory value.35 If this logic bears out, feelings of personal efficacy
should correlate less strongly with market behavior when compared to
those things that depend upon collective action for their success (such as
joining an environmental group or contributing money to an environ-
mental cause).
Product Advertising
Studies of consumer response to advertising suggest a fourth and final
explanation to our original paradox of the popularity of green consum-
erism and the lack of green success on election day. Consumers in the
marketplace may be willing to purchase environmentally friendly prod-
ucts because of successful marketing efforts that draw their attention in
160 Chapter 8

that direction, through the use of product labeling or even green shelf
tags.36 Evidence here is impressive. Experimental research has found that
environmental labeling is ‘‘significantly more persuasive’’ than more
traditional appeals to cost savings.37 Others likewise argue that under
experimental conditions, the use of an altruistic frame increased respon-
dents’ vote intentions for a container deposit law more than did an ap-
peal to narrow self-interest.38 In examining willingness-to-pay (WTP) for
a variety of consumer goods, another team of scholars finds that the use
of symbolic framing (such as appeals to environmental concern or patri-
otism) decreases price sensitivity and increases the variance of the WTP
function, compared to the presence of instrumental cues alone.39 Given
that symbolic appeals of this nature often outperform instrumental con-
siderations at higher product prices, they contend that environmentally
responsible products may ultimately succeed in the marketplace, even
with a premium price tag, if the purchase of those products can be cog-
nitively linked though advertising to an appealing goal, such as saving
dolphins from tuna nets or preserving a tropical rain forest.
This line of work suggests one final hypothesis—that if consumers buy
green because of the persuasive nature of environmental marketing,
labels that tout products as being environmentally friendly in one way or
another should provide a powerful influence on consumer choice, largely
independent of whatever latent environmental concern individuals bring
with them into the marketplace.
Data Analysis
The explanatory power of each of the factors outlined above is explored
in this chapter, albeit in a somewhat piecemeal fashion, by employing a
variety of datasets for a variety of different purposes. It is an approach
born of necessity. Comparing political and economic behavior on envi-
ronmental issues directly is a difficult task. Because of differences in pur-
pose and scope, few surveys include measures of both kind. High-quality
academic sources of data such as the National Election Study (NES),
have turned their attention to environmental issues only recently and
tend to focus exclusively on measures of political interest. In contrast,
private polling firms hired to administer surveys for business clients often
The Marketplace 161

probe their respondents thoroughly about consumer behavior but ask for
very little information about political activities or partisan viewpoints.
Moreover, because private data are gathered for financial gain, they are
seldom made available to an academic audience for analysis.
Given that no single survey adequately addresses all of the hypotheses
raised in this chapter, three different polls are used here—an April 2000
Gallup poll and a 1993 study conducted by Cambridge Reports Re-
search International (both cited earlier), as well as the 1994 NORC
General Social Survey (GSS). All provide insights into the motivations
that underlie environmental action.
The Influence of Self-Interest
Recall that one possible explanation for the popularity of green con-
sumerism was a simple variant of self-interest. Perhaps Americans take
part in some environmental activities, such as energy conservation, out
of a desire to reduce their own monthly utility bills. That suspicion is
supported in looking at any number of recent polls and surveys.40 For
reasons easily explained by appeals to self-interest, Americans tend to
prefer activities that conserve natural resources while at the same time
save money and expense.
In the April 2000 poll conducted by Gallup cited in chapter 2, re-
spondents were asked which activities they or other members of their
household had done ‘‘in recent years to try to improve the quality of the
environment.’’ Few reported that they had contacted a public official
about the environment (18 percent) or been active in an environmental
organization (15 percent), both activities that are clearly political in
nature. Even among small numbers, unless those actions are grassroots
in nature (that is, directed at a problem of local environmental concern,
such as the siting of a hazardous waste facility in one’s own backyard),
self-interest probably provides a minimal incentive.
In contrast, large majorities in the Gallup study cited their conserva-
tion of energy (83 percent) and water (83 percent). Most reported that
they had bought ‘‘some product specifically because [they] thought it was
better for the environment than competing products’’ (73 percent). In the
end, while the overriding motivation that pushes individuals into action
may be uncertain here, the pattern of responses across activities is telling.
162 Chapter 8

With few exceptions, actions that contain elements of financial self-
interest are more commonly reported than those that do not.41
If green consumerism is indeed private rather than public regarding,
respondents also should be price conscious. Aside from issues like energy
efficiency and water conservation, which tend to reduce monthly house-
hold expenses, willingness to pay a premium price for environmentally
friendly products that offer no tangible financial interest in return should
be weak. Those expectations, however, are only partly confirmed using
data from a 1993 Cambridge Reports Research International poll. Un-
like the April 2000 Gallup survey that questioned respondents in a broad
way about their participation in certain environmental activities ‘‘in the
past year’’ (where answers were coded into a simple yes/no dichotomy),
the Cambridge poll probed a similar national sample of Americans on
the frequency of their behavior, with a particular emphasis on purchases
made in the marketplace. While narrower in its focus than the Gallup
survey, the Cambridge results are significant in that respondents were
pressed to consider the added cost of environmentally safe goods and
services. That unique battery of questions is particularly useful here.
As table 8.1 shows, most respondents in the Cambridge poll seemed
willing to pay a higher price for environmentally friendly products. In-
deed, the distribution of willingness-to-pay shows little variance across
items that range from automobiles and gasoline to detergents and paper
products, with most willing to pay at least 5 percent more. Consumer
support erodes quickly at levels exceeding 5 percent, but the willingness
of many to pay even a small amount more, despite the thrifty tendencies
of the marketplace, suggests that consumer goods may indeed be less
price sensitive when framed in environmental terms.42
Even more remarkable than a willingness to pay for environmental
goods, however, is the extent to which those considerations transcend
typical social and demographic cleavages. While green consumer activity
is more frequent among women, the young, and the well educated, the
effect of household income in two regression equations presented in table
8.2 is statistically indistinguishable from zero. Quite simply, income fails
to explain either the frequency of green consumer purchases or the will-
ingness of some to pay a higher price for those products. Overall, too, all
of these social and demographic factors (which include political ideol-
The Marketplace 163

Table 8.1Willingness to Pay for Environmental Products
Now I am going to read you a list of products. Please tell me how much more you would be willing to pay for each product if itwere environmentally friendly. Would you be willing to pay 5 percent more, 10 percent more, 20 percent more, or at least 30 per-cent more? If you wouldn’t be willing to pay anything more for the product if it were environmentally friendly, please just say so.
Product description No more 5% 10% 20%
At least30%more Mean
Standarddeviation
Paper products made out of recycled paper 23.0% 36.7% 22.0% 10.2% 8.1% 1.45 1.18
Household products such as kitchen andbathroom cleaners
23.8 37.1 23.2 8.8 7.2 1.38 1.15
Garden products such as insecticides andfertilizers
33.2 26.9 22.4 9.7 7.9 1.32 1.25
Plastic packaging or containers made ofrecycled plastic materials
25.5 39.1 20.6 9.5 5.3 1.30 1.11
Detergents 26.4 38.3 21.2 8.9 5.2 1.28 1.11
Automobile 37.5 28.0 21.2 7.2 7.9 1.24 1.23
Plastic packages or containers made withless plastic
27.8 41.1 19.4 7.6 4.1 1.19 1.05
Gasoline 33.7 34.2 20.5 6.0 5.6 1.15 1.12
Source: Cambridge Reports Research International (July 15–27, 1993).
164 Chapter 8

ogy) explain only a tiny fraction of the variance observed in either de-
pendent variable.
In the end, the limited effect of primitive self-interest on environmen-
tal activities in the Cambridge study is largely consistent with Robert
Rohrschneider’s findings cross-nationally. He argues that ‘‘self-interest
concerns are an important force in the economic realm of politics, but
the emergence of non-economic issues in advanced industrialized nations
may diminish the explanatory value of self-interest motives.’’43
Do those same limits apply, however, when self-interest is more
broadly conceived? Non-economic issues like environmental quality may
suggest not that the explanatory value of self-interest has declined in a
post-materialist era but rather that its impact can and should be mea-
sured in new ways. The NORC General Social Survey (GSS) offers an
intriguing and unique test of this idea. In 1993 and again in 1994, the
GSS questionnaire included a lengthy battery of environmental items,
Table 8.2Determinants of Green Consumer Behavior
Model 1Frequency of buyinggreen products
Model 2Willingness to pay morefor green products
Independentvariables
OLS slopeestimate
Standarderror
OLS slopeestimate
Standarderror
Age �0.37 0.26 �1.23*** 0.17
Education 0.11 0.25 0.42** 0.16
Income �0.09 0.19 �0.03 0.12
Race 0.52 1.20 �0.38 0.77
Gender �4.65*** 0.75 �0.54 0.47
Political ideology 0.84* 0.41 1.29*** 0.26
Intercept 36.09 1.72 10.96 1.07
Mean 34.04 10.58
Number of cases 909 888
R-square 0.050 0.103
Source: Cambridge Reports Research International (July 15–27, 1993).Notes: See appendix for question wording.*p < :05.**p < :01.***p < :001.
The Marketplace 165

including six well-paired measures that asked respondents to rate how
dangerous certain environmental problems were to the environment ‘‘in
general’’ and to ‘‘you and your family.’’ The general dimension tapped
by the first question is similar to an emphasis on ‘‘sociotropic’’ con-
cern,44 while the second more specific measure relating environmental
quality to a respondent’s personal well-being seems consistent with a
broader notion of self-interest.45
Which target of environmental concern motivates consumer behavior
—in this case, the frequency with which respondents make a ‘‘special
effort’’ to buy pesticide-free fruits and vegetables? GSS data from 1994
initially show little difference. When asked to rate the danger of pesti-
cides and chemicals used in agriculture, most respondents gave similar
answers to both questions. In fact, the degree of correlation between the
general and specific measures was so high (with a Pearson’s r of .86) that
both could not be included as independent variables in the same regres-
sion equation without causing of a problem known as multicollinear-
ity.46 Instead, a new variable was created by subtracting a respondent’s
general perception of danger from pesticide use from its more personal
component, producing a single scale ranging in value from �4 to þ4.After controlling for household income (which might well influence an
ability to buy organic produce at higher cost), regression results for this
scale (see table 8.3) show that a higher relative degree of personal con-
cern for the dangers of pesticide use does in fact influence the purchase of
pesticide-free fruits and vegetables, but even in this case the influence of
self-interest is surprisingly small.
The Impact of Political Ideology
If self-interest is of limited value in understanding the appeal of envi-
ronmental goods and services, perhaps explanations that focus on the
unique character of the marketplace fare better. While the environmental
battery used by the NORC General Social Survey in 1994 concentrated
on collective action, asking if respondents had signed a petition about
an environmental issue or given money to an environmental cause, the
Cambridge survey administered in 1993 focused almost exclusively on
consumer choice. As noted earlier, the Cambridge poll also added one
comparable measure of political behavior, asking respondents how often
166 Chapter 8

they ‘‘vote for a political candidate primarily because the candidate took
strong environmental positions.’’ Part of the same group of questions
that asked how often they ‘‘buy a product because the label or advertis-
ing said it was environmentally safe or biodegradable,’’ both measures
used here share an identical response format ranging from a low to high
frequency of activity.
Given that, we would expect political ideology to be more predictive
of vote choice, and indeed that is the case. As regression models in table
Table 8.3Personal versus General Concern for the Environment as a Predictor of Con-sumer Behavior
And how often do you make a special effort to buy fruits and vegetables grownwithout pesticides or chemicals?
Independent variable Probit estimateStandarderror
Difference in perceptions of danger frompesticides to ‘‘you and your family’’ (þ)and the environment ‘‘in general’’ (�)
0.15* 0.07
Household income �0.02** 0.01
Intercept 1 �1.08Intercept 2 0.73
Intercept 3 1.63
Source: NORC General Social Survey (1994).Notes: The primary independent variable of interest used in this model is calcu-lated as the numerical difference between responses to two measures. The firstasks ‘‘In general, do you think that pesticides and chemicals used in farming are[extremely (5), very (4), somewhat (3), not very (2), not dangerous at all (1)]?’’The second question reads: ‘‘Do you think that pesticides and chemicals used infarming are [extremely (5), very (4), somewhat (3), not very (2), not dangerous atall (1)] for you and your family?’’ Since these two measures are so highly corre-lated, both could not be included in the same regression equation without therisk of multicollinearity. Instead, general perceptions of environmental dangerwere subtracted from personal concern to create a scale that ranges in value from�4 to þ4. Mean perception of danger to ‘‘you and your family’’ ¼ 3.31. Meanperception of danger to the environment ‘‘in general’’ ¼ 3.35. Pearson’s r (per-sonal, general) ¼ 0.86*p < :05.**p < :01.***p < :001.
The Marketplace 167
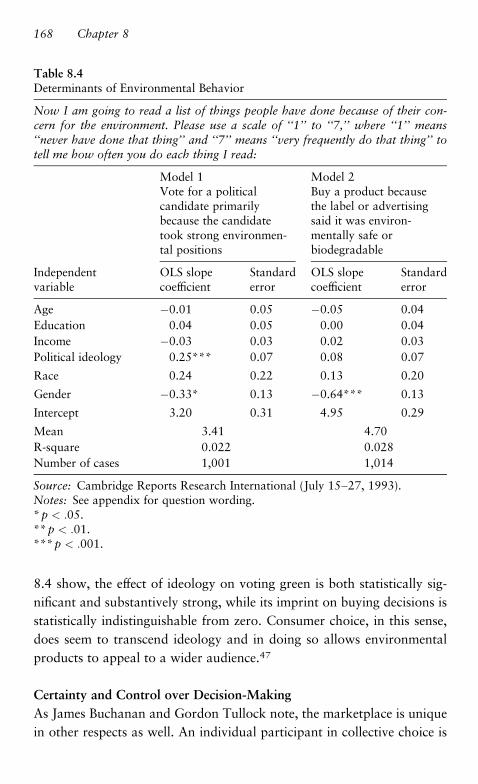
8.4 show, the effect of ideology on voting green is both statistically sig-
nificant and substantively strong, while its imprint on buying decisions is
statistically indistinguishable from zero. Consumer choice, in this sense,
does seem to transcend ideology and in doing so allows environmental
products to appeal to a wider audience.47
Certainty and Control over Decision-Making
As James Buchanan and Gordon Tullock note, the marketplace is unique
in other respects as well. An individual participant in collective choice is
Table 8.4Determinants of Environmental Behavior
Now I am going to read a list of things people have done because of their con-cern for the environment. Please use a scale of ‘‘1’’ to ‘‘7,’’ where ‘‘1’’ means‘‘never have done that thing’’ and ‘‘7’’ means ‘‘very frequently do that thing’’ totell me how often you do each thing I read:
Model 1Vote for a politicalcandidate primarilybecause the candidatetook strong environmen-tal positions
Model 2Buy a product becausethe label or advertisingsaid it was environ-mentally safe orbiodegradable
Independentvariable
OLS slopecoefficient
Standarderror
OLS slopecoefficient
Standarderror
Age �0.01 0.05 �0.05 0.04
Education 0.04 0.05 0.00 0.04
Income �0.03 0.03 0.02 0.03
Political ideology 0.25*** 0.07 0.08 0.07
Race 0.24 0.22 0.13 0.20
Gender �0.33* 0.13 �0.64*** 0.13
Intercept 3.20 0.31 4.95 0.29
Mean 3.41 4.70
R-square 0.022 0.028
Number of cases 1,001 1,014
Source: Cambridge Reports Research International (July 15–27, 1993).Notes: See appendix for question wording.*p < :05.**p < :01.***p < :001.
168 Chapter 8

but one of many decision makers.48 Contributing money to an environ-
mental group offers no guarantee that others will do likewise to a degree
that is sufficient to fund a successful media campaign or a lobbying
effort. There is no longer, as they note, a ‘‘one-to-one correspondence
between individual choice and the final action.’’49 In contrast, control
over (and responsibility for) choices made in the marketplace rest
squarely on the shoulders of the individual. Do considerations such as
these help us to understand why individual choice continues to take pre-
cedence over collective action, even on large, seemingly intractable issues
like the environment, where the ability to effect change at the individual
level seems slim? A return to the 1994 NORC General Social Survey
offers a tentative answer.
The GSS asked respondents about a variety of environmental activ-
ities. Some of these questions focused on involvement in collective
tasks—joining an environmental group, signing an environmental peti-
tion, contributing money to an environmental cause, and so on—while
others were targeted to individual behaviors, such as recycling, buying
pesticide-free produce, and cutting back on the use of a car. The GSS
also asked respondents about the extent to which they agreed with the
following statement: ‘‘It is just too difficult for someone like me to do
much about the environment.’’ Degrees of agreement on this item were
scored high, while degrees of disagreement were scored low.
If the marketplace provides consumers with a greater degree of ratio-
nality and control, feelings of personal efficacy should associate less
strongly with individual behavior, at least when compared to activities
that depend on the active participation of others for their success. Cor-
relations reported in table 8.5 generally support that expectation. Joining
an environmental group, contributing money to an environmental cause,
taking part in an environmental protest, signing a petition about an en-
vironmental issue—all clearly diminish when efficacy is low, with corre-
lation coefficients ranging from �.33 to �.48. The relationship between
efficacy and individual action is far weaker in comparison, ranging from
just �.04 to �.20. In short, while scholars have long suspected that low
perceptions of efficacy are an ‘‘effective deterrent’’ to environmental be-
havior,50 evidence here suggests that actions taken in the marketplace
might help Americans to feel better about their own ability to effect en-
vironmental change.
The Marketplace 169

The Power of Environmental Advertising
One final difference between market choice and social choice remains. As
Donald Philip Green notes, political campaigns ‘‘tend to be two-sided
affairs; and the potency of negative symbols such as bureaucratic waste,
big government, and undeserving beneficiaries’’ can undermine support
for even the worthiest of causes. Product advertising is seldom so con-
tentious.51 Labels that promote a product as being environmentally
friendly have to compete for attention alongside other powerful factors,
including appeals to cost savings and brand loyalty, but rarely is infor-
mation available at time of decision to contest a company’s environ-
mental claims. In other words, because the marketplace lacks the balance
provided by reciprocal debate, we should expect environmental market-
ing to have a stronger impact on consumer choice.
While that underlying logic is supported by a variety of studies that
examine the power of advertising and of environmental marketing in
particular,52 it is a difficult premise to address here given the limits of
Table 8.5Correlations Between Environmental Behavior and Personal Efficacy
Personal Efficacy‘‘It is just too difficultfor someone like me todo much about theenvironment’’
Collective behavior:
Member of environmental group �0.33Signed environmental petition �0.46Contributed money to environmental group �0.48Taken part in environmental protest �0.40Additive scale of collective behavior items �0.43Individual behavior:
Frequency of recycling �0.20Frequency of buying fruits and vegetables grownwithout pesticides and chemicals
�0.04
Cut back on driving car for environmental reasons �0.20Additive scale of individual behavior items �0.17
Source: General Social Survey (1994).Note: All measures of association reported above are gammas.
170 Chapter 8

available survey data. The April 2000 Gallup survey on environmental
attitudes does not address factors such as advertising that should be a
close, proximate influence on market choice. Likewise, since the 1994
NORC General Social Survey contains only a single measure of con-
sumer behavior, little effort is made to better understand the conditions
under which those purchases are made.
The Cambridge Reports Research International poll conducted in July
1993, however, contains a reasonable start. Respondents were asked if
‘‘in just the last week’’ they had ‘‘really read the label on a product to
find out whether or not it is better for the environment.’’ They were also
asked to rate how important environmental labels were to them when
making purchase decisions on household or garden products. The inter-
action of these two variables on the frequency of green consumer be-
havior is plotted visually in figure 8.2. Important here are the differences
in the slope of each regression line, which demonstrate that reading
labels to see if a product is good for the environment seems to work
more effectively on consumers who do not consider environmental
attributes to be particularly important.
Although counterintuitive at first glance, that result, suggests that en-
vironmental marketing—or at least the environmental framing used in
surveys—is exceptionally powerful in the way that it alters the market
preferences of those least committed to the environment. For consumers
who consider environmental attributes to be ‘‘absolutely essential,’’
labels are likely to provide information but little more. Whatever per-
suasion or motivation might be needed to effect a green purchase comes
from the consumer directly and the level of environmental concern they
bring with them into the marketplace. But for those less convinced of the
value of environmental products, that information might well provide a
new and important source of differentiation, subtly directing attention
and increasing the cognitive availability of certain considerations at the
expense of others, such as cost.
Conclusions
With a growing number of businesses jumping on the environmental
bandwagon, green consumerism has emerged as a major social and eco-
The Marketplace 171

nomic force over the past ten years, allowing environmental issues to
expand far beyond the sphere of politics into the daily lives and lifestyles
of the American consumer. Yet while we might view environmental
choices made in the marketplace as an extension of political attitudes
and beliefs, scholars have long cautioned that the actions of voters and
consumers are likely to diverge as conflicting emotions of self-interest
and altruism take their place. The patterns of behavior delineated here,
however, suggest that traditional expectations are at times false or at the
Figure 8.2The Impact of Environmental Labels on Buying GreenSource: Cambridge Reports Research International (July 15–27, 1993).Note: The dependent variable used in this chart is an additive scale created fromeight measures of green consumer behavior. Respondents in this battery wereasked how frequently they do each of a variety of activities on a seven-pointscale, where 7 indicates that they ‘‘very frequently do that thing.’’ Coded answersto these questions were added to create a scale ranging in value from 8 to 56.
172 Chapter 8
very least misplaced when it comes to the environment. Cross-pressured
in many different ways, James Buchanan and Gordon Tullock conclude
simply that ‘‘man is, indeed, a paradoxical animal.’’53 The data pre-
sented in this chapter offer a preliminary step in explaining how and
why.
First, consumer behavior seems to offer fewer barriers and richer
rewards. Loyal Republicans may not be willing to break party ties to
vote for green political candidates or strict regulatory policies, but
choices made in the marketplace are largely shielded from those effects.
Moreover, a market-based approach to environmental regulation is en-
tirely consistent with conservative ideology. By allowing consumers to
look beyond government regulation for solutions to complex environ-
mental problems on issues such as air pollution and solid waste disposal,
environmental products provide Republicans with an alternative way to
express genuine environmental concern.
As James Buchanan notes, too, choices made in the marketplace seem
to offer citizens a greater degree of certainty and rationality. With a
highly divisible source of income, consumers can select the combination
of goods and services closest to their own environmental views and can
be assured of the direct and immediate result of their actions. In contrast,
voters on election day often face a limited number of alternatives, and
given majority rule those casting ballots can never be certain that their
votes will lead to a preferred result. Political pressures may encourage
citizens to weigh the public interest, but the marketplace rewards con-
sumers directly with a palpable sense of efficiency and control.
Finally, the body of evidence offered in this chapter suggests that the
manner in which environmental problems are framed by advertisers and
political opponents may give rise to a different ordering of preferences,
influencing the value that both voters and consumers place on environ-
mental goals relative to other social, economic, and political priorities. In
other words, the way in which environmental issues shape behavior
may be dependent ultimately on the cues or symbols that are cognitively
linked to it.54 Environmental marketing would seem to succeed by
investing private goods with public meaning, by distracting consumer
attention away from considerations of cost, and by exploiting the influ-
The Marketplace 173

ence of the public-minded citizen. While environmental quality is tra-
ditionally viewed as the quintessential public good, those problems in
many ways span the chasm between public and private, blurring lines of
distinction between citizen and consumer in the process. Given Buchanan
and Tullock’s gentle reminder that ‘‘the same individual participates in
both processes,’’55 the fluidity of those boundaries suggests that public
and private decision makers might fare better in the long run by focusing
on the psychology of choice rather than its location.
174 Chapter 8

Conclusion
Rethinking Environmentalism
Perhaps the greatest problem the environmental movement will have to face liesnot in the external world but inside the heads of the American people.
—Philip Shabecoff1
In 1992, in reflecting on the popular appeal of environmental issues
during the course of a presidential campaign that would bring a Demo-
crat to office for the first time in twelve years, along with an avowed
environmentalist as his running mate, Philip Shabecoff wrote that ‘‘vir-
tually every aspect of our personal lives, from the food we eat to the
packages we use, to the way we drive and the fears we have for our
children’s future, has been altered by environmentalism.’’2 Those con-
cerns, of course, have melded into a powerful social movement whose
importance ranks alongside the peace, labor, women’s, civil, and human
rights movements of the past century.3 With a dedicated cadre of
political activists advancing environmental interests in Washington and
abroad, environmental values have led to massive changes in business,
science, education, and law.
Yet in a field increasingly dominated by expertise and bureaucracy,
public opinion—the grassroots of this green revolution—is potentially
no less significant in understanding the path of environmental progress.4
While the legacy of the environmental movement will be measured surely
by its legislative achievements, so too will it surely be judged by its abil-
ity to persuade average Americans to back up their words with action
and to change their voting patterns, buying habits, and lifestyles. To
explore that topic in depth, as this book has done, is to speak to the
meaning and relevance of environmentalism in American politics today.

The purpose of this final chapter is to weave together disparate pieces of
that debate and to draw out its logical consequences, revisiting several
broad themes and questions posed at the outset along the way.
A Poverty of Language
In writing for Smithsonian magazine, John Wiley struck a resonant
chord when he said that ‘‘all of us are environmentalists.’’ There is a
shared reverence for life, he argued, and a love of place that unites ‘‘river
keepers, protesters in treetops, middle-aged birders, children discovering
aquatic invertebrates, tropical biologists, environmental lawyers and
toddlers stumbling after butterflies.’’5 On its face, of course, to believe as
much may seem instinctive (even obvious), for as Wiley is quick to point
out, we would all ‘‘just as soon have clean air and water’’ than not. But
an important message underlies that simple truth nevertheless. Today,
most Americans accept environmental protection as a legitimate cause
for individuals, corporations, and governments alike, and the signifi-
cance of that evolution in attitudes should not be underestimated.6 We
no longer debate whether to protect the environment but rather where,
when, how, under what conditions, and at what expense. The complex-
ity of those new decision rules, however, forces us to wonder, as Wiley
did, about the meaning (and overuse) of the labels we attach. To apply
the term environmentalist equally to all is, in his words, ‘‘to embrace a
poverty of language’’ badly in need of revision.7
Based on the multitude of polling data presented in this book, Ameri-
cans tend to view environmental issues in complex ways not easily
explained using vague and imprecise vocabulary. For instance, to de-
scribe an environmentalist merely as someone who is concerned with the
quality of the natural environment (as many standard dictionaries and
encyclopedias do) seems unhelpful, even tautological. A cultural consen-
sus formed around that singular preference may indeed be a welcome
achievement, but it is unlikely to provide much insight or nuance into the
true nature of public thinking on the environment. To respond fully to
the latter requires that close attention be paid to a broader list of qual-
ities, ones that collectively paint a complicated and at times contradic-
tory picture.
176 Conclusion

For example, while public concern for the environment is strikingly
high, it is neither strong nor salient. Americans place genuine value
and priority on environmental quality, to be sure, but they also support
lowering crime rates, improving public education, and maintaining a
strong economy (among other things), all of which easily surpass the
environment in polls. Data likewise suggest that voters and taxpayers are
sensitive to the costs associated with protective environmental policies,
often preferring a moderate course of action when faced with scientific
uncertainty or when painful choices are forced between the environment
and other equally desirable goals. For these reasons, surveys that mea-
sure commitment to the environment by reference to the environment
alone, without regard to competing priorities and budgetary constraints,
are at best unrealistic and at worst misleading. Public interest in the en-
vironment is sincere and well intentioned, but as with any issue of social
or economic importance, it is not without limits that constrain political
opportunity.
Second, while environmental concern is widespread, behavior is not.
The diversity of issues that now fall under the umbrella of the environ-
mental movement (which range from toxic waste disposal to wilderness
and wildlife protection) create strength in numbers by helping environ-
mentalists seam together an agenda that appeals to people from all walks
of life, with all manner of interest in nature. At the same time, however,
members of this ‘‘sympathetic public’’ often fail to take relatively sim-
ple and inexpensive steps toward environmental action.8 While many
households do recycle and some purchase green products in the market-
place, evidence suggests those decisions are more likely when based on
tangible incentives or when the need for personal sacrifice is slight. Quite
simply, whether rich or poor, black or white, liberal or conservative,
Americans are united in wanting something to be done about the envi-
ronment, but they remain hesitant across the board to include themselves
as a part of that solution.
Third, while the environment has enjoyed remarkable staying power
on the national political agenda over the past thirty years, public com-
mitment to those issues can be somewhat fickle, moving in cycles that
visibly advance and retreat over time. The fact that progress in some
areas has been quickly offset by the emergence of other pressing con-
Conclusion 177

cerns, including in recent years ozone depletion, global warming, and
urban sprawl, has allowed the environmental movement to reinvent itself
and rejuvenate its support time and time again.9 But in the end, the will-
ingness of voters and taxpayers to fund policies designed to address
those problems depends not on anxiety and evidence alone but rather on
a number of unpredictable factors, including media attention and the
health of the national economy.10 Both allow moments of opportunity
but also enforce considerable constraint on those who lobby on behalf of
stronger regulations.
Finally, public attitudes on the environment are surprisingly consistent
across a wide range of survey instruments. Under the best of circum-
stances, this consistency could well mark the development of a new
social paradigm or belief system capable of reordering the relationship
between man and nature. But that assumption is marred for two reasons.
The close entwining of environmental attitudes with economic goals and
conditions suggest that Americans remain firmly committed to both,
including a market economy dedicated to the pursuit of material com-
fort and abundance. Moreover, public opinion at key moments seems
unsupported by factual knowledge, particularly on issues like global
warming that require a degree of technical or scientific judgment.11 Since
answers to questions on environmental topics can be shaped by social
desirability and even altered by the way in which questions are phrased
in surveys, the content and sophistication any new environmental belief
system remains in doubt.
Barriers to Action
Based on attitudes that fall into anomalous patterns, it is not surprising
that widespread environmental concern has failed to translate into
greater public resolve, especially in the voting booth. As Willett Kemp-
ton, James Boster, and Jennifer Hartley write, the ‘‘usual conclusion
drawn from modest environmental actions is that modest actions indi-
cate a modest commitment.’’12 Yet several scholars, including Kempton
and his colleagues, stress instead the existence of certain ‘‘barriers to
action.’’13 When viewed expansively, it is an theory that can give helpful
insight into the body of evidence described above by proposing a simple
178 Conclusion

explanation—that supportive attitudes are a necessary but hardly suffi-
cient condition for environmentally responsible behavior.
One barrier described in this book may be feelings of personal ineffi-
cacy fueled by the sheer enormity (and apparent intractability) of envi-
ronmental problems. ‘‘After all,’’ as Steven Teles writes, ‘‘despite the
appeal of environmentalists to ‘think globally, act locally,’ the former
injunction typically overwhelms the latter.’’15 The chronic low salience
of environmental issues represents a second potential obstacle. It is evi-
dent that most Americans are concerned about the environment, and yet
those issues rarely generate the power and immediacy needed to push
into the top tier of voting preferences. Without a strong sense of effec-
tiveness or the cognitive awareness to ignite it, thoughts and words lose
momentum in the causal chain connecting attitudes to behavior.
Inadequate information represents a third possible impediment to
effective environmental action. According to an annual report card
developed by the National Environmental Education and Training
Foundation (NEETF) in Washington, D.C. (in conjunction with the
Roper Organization), many Americans receive a failing grade in basic
environmental knowledge and persist in perpetuating certain myths and
misconceptions.16 For instance, a surprising number of those polled for
NEETF’s 1998 study thought that ozone-depleting chlorofluorocarbons
came primarily from aerosol spray cans (rather than refrigerators and
air conditioning units), despite a ban on that particular use in 1978. A
majority of respondents also believed that the major benefit of recycling
paper products was to save trees rather than to reduce the volume of
solid waste sent to landfills by consumers. Moreover, just 16 percent
knew that the major source of petroleum pollution in rivers, lakes, and
bays is runoff from residential use rather than spills caused by oil rigs,
tankers, and refineries.17 In each of these cases, more accurate knowl-
edge might press average citizens to personalize environmental risk in
ways that encourage individual responsibility and involvement.18
Finally, as rational choice theorists are quick to point out, envi-
ronmental behavior is often blocked by collective action problems that
allow free riders to enjoy the benefits of environmental protection unen-
cumbered by cost.19 Under those circumstances the importance of finding
tangible incentives to motivate behavior should not be underestimated.
Conclusion 179

According to Matt Ridley and Bobbi Low, ‘‘the environmental move-
ment has set itself an unnecessary obstacle by largely ignoring the fact
that human beings are motivated by self-interest rather than collec-
tive interests,’’20 a point well illustrated by Garrett Hardin’s cautionary
tale—‘‘The Tragedy of the Commons.’’21 Others suspect, too, that par-
ticipation in environmentally responsible activities will remain low re-
gardless of awareness and concern, unless the environment can be linked
to social arrangements, such as curbside recycling programs, that ‘‘help
reduce the costs of compliance and facilitate cooperative action.’’22
Practical Advice
The opening chapter of this book urged that a clear understanding of
public opinion on the environment was necessary for a variety of rea-
sons. Given the empirical efforts made in that direction in the intervening
pages, it seems logical to list the lessons learned, and to attempt to
translate academic evidence into practical advice. One possible response
to that challenge is purely descriptive—to outline in some detail the
boundaries of popular support and the constraints (and opportunities) it
imposes on lobbyists and lawmakers alike. But a second is more pro-
scriptive. It is to insist that energy and attention be committed to ex-
ploring how the ‘‘barriers to action’’ described above might be lowered
in careful and creative ways. The sum of both of those approaches is
detailed next.
Building a Civic Environmentalism
When Gregg Easterbrook published a lengthy book titled A Moment on
the Earth in 1995, he was greeted by a hailstorm of criticism from within
the environmental community. Widely denounced by activists in news-
papers, press releases and radio debates, his plea for optimism in light of
what he considered certain environmental progress, soon caused him
to become, according to one sympathetic reviewer, ‘‘Green Enemy
No. 1.’’23 While some attacked his work directly, arguing that it was
‘‘replete with errors and misinterpretations of the scientific evidence,’’24
others took issue above all with his hopeful tone, insisting that his ‘‘dec-
180 Conclusion

laration of victory’’ over environmental degradation was dangerously
premature.25
The controversy surrounding Easterbrook is an interesting one. As
one newspaper columnist bluntly put it on the eve of Earth Day 2000,
‘‘Environmentalists have one of the great American success stories to tell,
if only they would tell it.’’26 Yet in the competition for public attention,
Easterbrook argues, a rather ‘‘peculiar intellectual inversion has occurred
in which good news about the environment is treated as something that
ought to be hushed over, while bad news is viewed with relief.’’27 In fact,
he insists that environmentalists fear signs of success in the belief that it
might ‘‘dilute the public sense of anxiety’’ that serves for them such a
useful political purpose.28 If a strategy of unrelenting environmental
pessimism is misguided, as Easterbrook believes it is, how should envi-
ronmentalists recapture in mass the excitement and exhilaration of their
cause? Collectively, the results of this book speak to the difficulty of that
task and to the importance of distinguishing rhetoric that leads alter-
nately to what John Immerwahr calls stagnation and engagement.29
One possible response to poll results, says Immerwahr, is to insist
‘‘that the public is apathetic and needs to be awakened to the seriousness
of the consequences of ignoring’’ environmental problems. Consistent
with that understanding, environmentalists might insist on a ‘‘concerted
educational effort to convince the public of the importance of these
issues.’’ But, he says, to do so represents a fundamental miscalculation.
After all, evidence from national surveys suggest that Americans are
concerned about environmental degradation and are persuaded of its
dangers. It is simply that other values compete for scarce energy and
attention, a blunt reality that is at once understandable and stubbornly
pragmatic. Immerwahr warns that exaggerating the seriousness of envi-
ronmental problems to a lay public with the intent of intensifying con-
cern might instead ‘‘increase frustration and apathy rather than build
support,’’ encouraging Americans to believe that those problems are in-
tractable.30 ‘‘[W]hat the public is most skeptical about,’’ he says, ‘‘is not
the existence of problems but our ability to solve them.’’31 Others, too,
warn that environmental rhetoric is likely to fail when ‘‘couched in terms
of sacrifice, selflessness, or, increasingly, moral shame.’’32
Conclusion 181

If getting the message right is paramount for environmentalists intent
on political persuasion, what strategies should they employ? What lan-
guage encourages popular engagement and forward momentum? One
possible model lies in recent attempts to define a new ‘‘civic environ-
mentalism,’’ one that promotes goals that are less elitist and more hope-
ful, focused as much on the pride of ordinary places as on pristine
wilderness. It is, as William Shutkin notes, a movement ‘‘that ultimately
finds a comfortable place for people in nature’’ by focusing on healthy
and sustainable communities that make our environment one worth
living in.33 As he writes, ‘‘the best kind of American environmentalism’’
recognizes that the most viable solutions are often those ‘‘inextricably
linked to social, political, and economic issues,’’ in essence to ‘‘commu-
nity life in its totality.’’34
Political Obstacles and Opportunities
To recognize Shutkin’s sense of community is also, of course, to ac-
knowledge that environmentalists must operate within existing political
realities, needing at times to embrace compromise over ideological purity
in order to get things done. In 1990, California voters overwhelmingly
rejected Proposition 128, a ballot initiative more suitably known as ‘‘Big
Green.’’ While well intentioned, this measure planned to merge numer-
ous environmental issues under one enormous banner. Its goals were
ambitious and complex—among them to ban the use of nearly twenty
cancer-causing pesticides, to prohibit new oil and natural gas drilling
along the California coast, to limit emissions of greenhouse gases, to
outlaw the clear cutting of old-growth redwood forests, and to create a
new elected post of ‘‘environmental advocate’’ to head enforcement of
the law. As accumulated experience on environmental ballot proposi-
tions suggests, however, legislative success is more likely when taken in
small, incremental steps that avoid uniting political enemies.
Politicians seeking elective office are constrained in similar ways by the
narrow range of acceptable positions on the environment they can take,
and by a still narrower audience of uncommitted voters. To use the bully
pulpit to heighten a sense of issue salience from the top down should
reward candidates who promote policy differences with clarity and ag-
gressiveness, especially in state and local campaigns where environmen-
182 Conclusion

tal issues enjoy less competition for room on a crowded political agenda.
But as James Q. Wilson observes, ‘‘It is hard . . . to make a campaign
issue out of a matter when voters tend to be in agreement. No candidate
is going to say that he favors dirty air and polluted water, wants to see
more dolphins killed, or hopes to build a Wal-Mart in the middle of
Yosemite.’’35 As a result, environmental debate tends to be driven by
strongly emotive symbols that are universally agreed upon—a pattern
which does little to inform voters, and even less to influence policy in
ways that matter.
Communicating Risk
Despite the political limits imposed on those who seek to strengthen en-
vironmental laws and regulations, the accomplishments of the movement
itself, at least, seem certain. There is comfort to be found in the success
of the environmental agenda beyond most reasonable expectations. Dis-
jointed laws and outdated technologies may persist, but a variety of sta-
tistical indicators relating to air, water, and land prove that our natural
surroundings are cleaner and healthier than they were a generation ago
because of considerable and combined efforts. But the bad news is that
most Americans are unwilling to believe it.36 Whether because of the
news media’s tendency toward pessimism or the reluctance of activists
to concede success, a majority of those responding to one recent poll
thought that the environmental movement had made only ‘‘minor’’
progress in pursuit of its goals. Sixteen percent insisted that environ-
mental conditions had actually grown worse over the past thirty years.37
Popular views on subjects such as these are, according to Norman
Levitt, ‘‘obstinately impermeable to scientific good sense,’’ creating
problems for experts whose job it is to communicate risk to the general
public.38 For example, since public opinion unsupported by facts fails to
conform to the language of traditional policy analysis, which focuses on
balancing quantifiable costs and benefits, scientists tend to view envi-
ronmental values with an ‘‘uncomfortability bordering on disdain.’’39
Often, when faced with disagreement, advocates attempt to persuade (or
even coerce) people into altering their stubborn perceptions.40 Under
those conditions, it should come as no surprise that risk communication
between experts and the lay public is plagued by distrust on both sides.
Conclusion 183

The answer to that dilemma, according to Supreme Court justice
Stephen Breyer, author of Breaking the Vicious Circle (1993), is to be
found in an insulated science, one protected from the ill-informed de-
mands of citizens who exert pressure on lawmakers to allocate scarce
funds in all the wrong directions.41 Yet as proponents of civic environ-
mentalism argue, ‘‘in many cases the decision to act on environmental
issues cannot be solved by technocratic means’’ alone. If building public
confidence and trust is as important as Breyer insists, perhaps science
should not ‘‘displace democratic participation’’ but rather ‘‘situate it’’
and ‘‘provide it with a realistic context,’’ using expertise to frame issues
in ways average citizens can understand.42
Lessons from the Marketplace
While confusion over the science and politics of the environment con-
tinues, surprising evidence suggests that Americans are motivated in the
marketplace by a growing environmental awareness and a willingness
to vote at the cash register (if not always the ballot box) for improved
environmental quality. Ironically, perhaps it is this ‘‘rise of a new con-
sumer’’ that helps us best in understanding the conditions under which
environmental preferences shape mass behavior and the opportunities
under which those actions can be extended.43
For example, if green consumerism is driven by narrow self-interest, at
least on a limited subset of issues like energy and resource conservation,
perhaps the base motive of self-interest could be expanded into other
areas with similar effect. If a concern for energy conservation or airborne
pollutants demands that drivers economize on gasoline usage, Charles
Schultze argues that
Warnings about the energy crisis, and ‘‘don’t be fuelish’’ slogans are no matchfor higher prices at gas pumps. In most cases the prerequisite for social gains isthe identification not of villains and heroes but of the defects in the incentivesystem that drive ordinary decent citizens into doing things contrary to the com-mon good.44
In practice, that logic might extend not only to gasoline taxes but also to
bottle bills and unit pricing for residential waste disposal. Communities
such as Seattle, Washington, and Loveland, Colorado, have found that
rather than charging a flat rate through property taxes, homeowners can
184 Conclusion

be charged for the volume of trash they dispose, similar to fees for other
public utilities. Once individual households see the link between what
they throw away and what they pay, the hope is that solid waste will
decrease, recycling will increase, and that consumers will buy products
with less packaging in the first place.45
Second, if Americans prefer to buy green rather than vote green, per-
haps mainstream environmental groups should become more involved in
promoting the possibilities of consumer choice. That they do not seems
to reflect the ideological divisions that the market so neatly avoids, at
least as far as average consumers are concerned. Liberal environmental
theory stresses government intervention as the preferred ethical solu-
tion to market failures on public goods.46 It is not surprising, then, that
Richard Ellis and Fred Thompson find that many elite-level environ-
mental activists ‘‘do not trust markets’’ and that they often ‘‘spurn poli-
cies that rely on markets to solve problems.’’47 Yet without an active
environmental voice serving as watchdog-protector, consumers are left to
rely on the environmental product information provided to them by
corporations that exaggerate claims to improve profitability.
Third, if market choice is associated with a stronger sense of personal
effectiveness, perhaps those feelings could be fostered better in the arena
of politics. In Green Culture (1996), Carl Herndl and Stuart Brown sug-
gest that many of the recruitment techniques used by environmental
organizations belie the grassroots reputations those groups enjoy.48 For
instance, in response to the direct-mail solicitations that have grown
popular in recent years, they say, one can either ignore the letter or opt
to send money in support of some environmental cause. But the request
itself generally offers individuals few options for true and valued partici-
pation—the kind of participation that allows consumers to feel good
about their environmental efforts in the marketplace.
Finally, the persuasiveness of environmental labels in shaping (and
sometimes altering) consumer preferences suggests that the way in which
environmental issues translate into action may be contingent, ultimately,
on the cues or symbols that are cognitively linked to it.49 Given that
voters often depend on political campaigns to simplify choice and inform
electoral decisions, it is not surprising that environmental ballot mea-
sures falter when linked to broad symbols such as ‘‘big government,’’
Conclusion 185

‘‘bureaucracy’’ and ‘‘waste.’’50 If environmentalists were to learn a
lesson from Madison Avenue, perhaps it would be to more forcefully
define the terms of debate for voters and candidates alike. Just as in the
marketplace, political rhetoric can be key in shaping public willingness
to pay for costly environmental reform.
Beyond Consensus
V. O. Key once wrote that the idea of consensus was a ‘‘handy crutch’’
for those who seek to describe patterns of public opinion. But it was, he
thought, after much consideration, a term far less useful for that task
than it might appear.51 To take public opinion polls at face value, we
would likely conclude that environmental attitudes approach a national
consensus, one so broad in fact that inaction becomes socially and polit-
ically unimaginable. In reality, however, our collective desire to address
environmental problems has far exceeded the ability of political leaders
to do so.52 Understanding the reasons why brings us full circle.
First, the politics of consensus serves to simplify complex environ-
mental issues and conceal fundamental disagreement over how best to
achieve those goals. Elevated to the status of a ‘‘valence’’ issue, dialogue
tends to focus on shared values, while muting cleavages along ideological
lines that make environmental policies divisive.53 With genuine differ-
ences in opinion that compete over how best to address environmental
problems, the fact that the environment has become a ‘‘political substi-
tute for motherhood’’ invites little more than empty symbolism and
‘‘feel-good’’ rhetoric that ignores the conflicts and painful trade-offs
created.54 As Ted Gup writes in reflecting on the prolonged battle in
the Pacific Northwest over the northern spotted owl, environmental and
economic concerns are not always incompatible, but ‘‘the longer society
lacks the political courage to act, the harder it is to find a solution.’’55
Second, environmental issues that appear to transcend politics displace
decision-making to an elite level, where a different distribution of values
and ideologies obtain.56 Widespread public support surely lends credi-
bility to the claim that environmentalists represent the public interest and
it does provide an image of strength when lobbyists argue for new and
stronger regulations. But in Key’s sense of the term, broad agreement on
186 Conclusion

environmental goals is likely to forge a ‘‘permissive consensus,’’ where
the absence of popular dissent and electoral reprisal allows political
leaders to exercise a considerable degree of latitude in designing envi-
ronmental policies free from a watchful public eye.57
Finally, and perhaps most important of all, the politics of consensus
makes it possible for political actors to speak the language of envi-
ronmentalism while serving their constituents in less authentic ways.
Republican presidential candidate George W. Bush’s speeches on the
importance of the national parks during the 2000 campaign were ‘‘sym-
bolically perfect’’ and ‘‘emotionally charged,’’ according to one colum-
nist, even though Bush’s brand of environmentalism was, in his opinion,
‘‘rather like a Save the Planet sticker on a gas-guzzling SUV.’’58
In the end, the fact that politicians ‘‘greenwash’’ questionable envi-
ronmental credentials, and corporations exaggerate environmental claims
on product labels is troubling, not so much because it occurs, but be-
cause it succeeds. It is unsettling, not only because emotive symbols
invoked through advertising and political campaigns have the power to
persuade as well as to mislead, but also because, quite simply, ‘‘the Earth
does not benefit from symbolic gestures.’’59 Ultimately, the best advice
this book has to offer is to resist the false appearance of consensus in
favor of honest debate and tireless compromise. The result may fall short
of revolution, but it might well be one that fosters public confidence in
genuine environmental progress.
Conclusion 187

This Page Intentionally Left Blank

Appendix
A Note on Data Sources
Nearly all of the data used in this book come from public opinion polls admin-istered to various state and national samples of American adults between 1973and 2001. Because the quality of survey research (and the analysis on which it isbased) is influenced by issues of sample size and selection, as well as questionwording, format, and design, additional information on the data used in severalchapters is detailed here.
Chapter 3
The variables used in figure 3.1 come from a wide variety of sources. Questionwording is as follows:
Government spending on the environment ‘‘too little’’:
‘‘We are faced with many problems in this country, none of which can be solvedeasily or inexpensively. I’m going to name some of these problems, and for eachone I’d like you to tell me whether you think we’re spending too much money onit, too little money, or about the right amount on . . . improving and protectingthe environment.’’
Source: NORC General Social Survey, 1973–1998.
Willing to sacrifice economic growth for environmental protection:
‘‘Which of these two statements is closer to your opinion? We must sacrificeeconomic growth in order to preserve and protect the environment. Or, we mustbe prepared to sacrifice environmental quality for economic growth?’’
Source: Cambridge Reports Research International data from 1976 to 1990 aredrawn from Dunlap and Scarce, ‘‘The Polls,’’ 664; data for 1991 to 1994 comedirectly from Cambridge Reports Research International National Omnibus data-files (September 1991, September 1992, September 1993, and September 1994).
Support environmental protection ‘‘regardless of cost’’:
‘‘Do you agree or disagree with the following statement? Protecting the environ-ment is so important that requirements and standards cannot be too high, andcontinuing environmental improvements must be made regardless of cost?’’

Source: NYT/CBS data from 1981 to 1990 are drawn from Dunlap and Scarce,‘‘The Polls,’’ 664; data from 1992 to 1999 come from Wirthlin Worldwidedatafiles.
Government regulation on the environment ‘‘too little’’:
‘‘In general, do you think there is too much, too little, or about the right amountof government regulation and involvement in the area of environmental protec-tion?’’
Source: Cambridge Reports Research International data from 1982 to 1990 aredrawn from Dunlap and Scarce, ‘‘The Polls,’’ 664; 1991–1994 data come fromCambridge Reports Research International datafiles (September 1991, September1992, September 1993, and September 1994); 1996 to 1999 data come directlyfrom Wirthlin Worldwide datafiles.
Note: Wording used by Wirthlin Worldwide drops the phrase ‘‘In general’’ fromthe beginning of the question.
Environmental laws and regulations not gone far enough:
‘‘There are also different opinions about how far we’ve gone with environmentalprotection laws and regulations. At the present time, do you think environmentalprotection laws and regulations have gone too far, or not far enough, or havestruck about the right balance?’’
Source: Roper data from 1973 to 1990 are drawn from Dunlap and Scarce,‘‘The Polls,’’ 664; 1992 data come directly from Roper datafiles.
Chapter 4
Variables used in tables 4.1, 4.2, and 4.4 are drawn from the 1994 NORC Gen-eral Social Survey. The National Opinion Research Center (NORC) has admin-istered its General Social Survey (GSS) either yearly or biennially since 1972.Datafiles are available through the Roper Center for Public Opinion Research atthe University of Connecticut (hhttp://www.ropercenter.uconn.edui) or the Inter-University Consortium for Political and Social Research (ICPSR) at the Univer-sity of Michigan (hhttp://www.icpsr.umich.edu/GSSi).Question wording and coded responses (in parentheses) are as follows. Origi-
nal variable names appear in brackets.
Dependent Variables
General perceptions of environmental danger:
An additive scale ranging in value from 6 to 30 summed across the items belowusing this question, recoded as follows:
‘‘In general, do you think that is (5) Extremely dangerous forthe environment; (4) Very dangerous; (3) Somewhat dangerous; (2) Not verydangerous; (1) Not dangerous at all for the environment?’’
190 Appendix

Personal perceptions of environmental danger:
An additive scale ranging in value from 6 to 30 summed across the items belowusing this question, recoded as follows:
‘‘And do you think is (5) Extremely dangerous for you and yourfamily; (4) Very dangerous; (3) Somewhat dangerous; (2) Not very dangerous;(1) Not dangerous at all for you and your family?’’
. Air pollution caused by cars [CARSGEN; CARSFAM]
. Nuclear power stations [NUKEGEN; NUKEFAM]
. Air pollution caused by industry [ INDUSGEN; INDUSFAM]
. Pesticides and chemicals used in farming [CHEMGEN; CHEMFAM]
. Pollution of America’s rivers, lakes and reservoirs [WATERGEN; WATERFAM]
. A rise in the world’s temperature caused by the ‘‘greenhouse effect’’ [TEMPGEN;TEMFAM]
Support for increased environmental spending:
‘‘We are faced with many problems in this country, none of which can be solvedeasily or inexpensively. I’m going to name some of these problems, and for eachone I’d like you to tell me whether you think we’re spending too much money onit, too little money, or about the right amount on. . . . Improving and protectingthe environment.’’ [NATENVIR]
Recoded as (1) Too much; (2) About the right amount; (3) Too little.
Willingness to pay higher taxes:
‘‘And how willing would you be to pay much higher taxes in order to protect theenvironment?’’ [GRNTAXES]
Recoded as (1) Not at all willing; (2) Not very willing; (3) Neither willing norunwilling; (4) Fairly willing; (5) Very willing.
Economic behavior:
An additive scale ranging in value from 3 to 12 summed across the followingitems:
. ‘‘How often do you make a special effort to sort glass or cans or plastic orpapers and so on for recycling?’’
Recoded as (1) Never; (2) Sometimes; (3) Often; (4) Always. [RECYCLE]. ‘‘And how often do you make a special effort to buy fruits and vegetablesgrown without pesticides or chemicals?’’
Recoded as (1) Never; (2) Sometimes; (3) Often; (4) Always. [CHEMFREE]. ‘‘And how often do you cut back on driving a car for environmental reasons?’’
Recoded as (1) Never; (2) Sometimes; (3) Often; (4) Always. [DRIVLESS]
Political activism:
An additive scale ranging in value from 0 to 4 summed across the followingitems:
Appendix 191
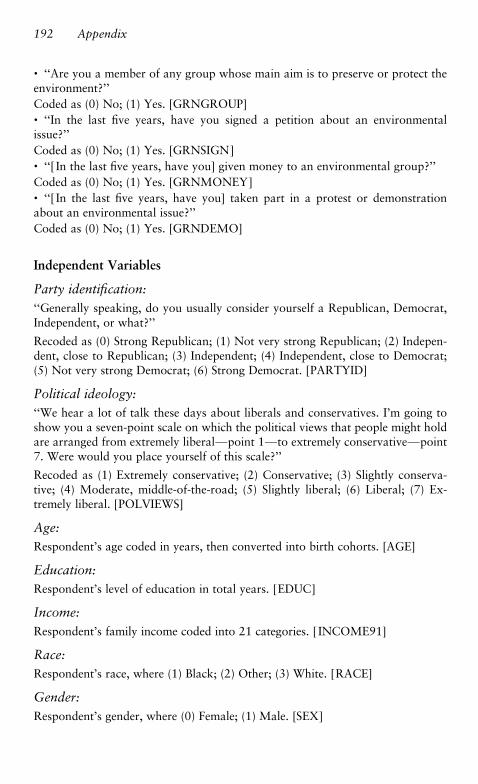
. ‘‘Are you a member of any group whose main aim is to preserve or protect theenvironment?’’
Coded as (0) No; (1) Yes. [GRNGROUP]. ‘‘In the last five years, have you signed a petition about an environmentalissue?’’
Coded as (0) No; (1) Yes. [GRNSIGN]. ‘‘[ In the last five years, have you] given money to an environmental group?’’Coded as (0) No; (1) Yes. [GRNMONEY]. ‘‘[ In the last five years, have you] taken part in a protest or demonstrationabout an environmental issue?’’
Coded as (0) No; (1) Yes. [GRNDEMO]
Independent Variables
Party identification:
‘‘Generally speaking, do you usually consider yourself a Republican, Democrat,Independent, or what?’’
Recoded as (0) Strong Republican; (1) Not very strong Republican; (2) Indepen-dent, close to Republican; (3) Independent; (4) Independent, close to Democrat;(5) Not very strong Democrat; (6) Strong Democrat. [PARTYID]
Political ideology:
‘‘We hear a lot of talk these days about liberals and conservatives. I’m going toshow you a seven-point scale on which the political views that people might holdare arranged from extremely liberal—point 1—to extremely conservative—point7. Were would you place yourself of this scale?’’
Recoded as (1) Extremely conservative; (2) Conservative; (3) Slightly conserva-tive; (4) Moderate, middle-of-the-road; (5) Slightly liberal; (6) Liberal; (7) Ex-tremely liberal. [POLVIEWS]
Age:
Respondent’s age coded in years, then converted into birth cohorts. [AGE]
Education:
Respondent’s level of education in total years. [EDUC]
Income:
Respondent’s family income coded into 21 categories. [ INCOME91]
Race:
Respondent’s race, where (1) Black; (2) Other; (3) White. [RACE]
Gender:
Respondent’s gender, where (0) Female; (1) Male. [SEX]
192 Appendix

Chapter 6
The data used in chapters 4 and 6 are drawn from the 1996 National ElectionStudy, Pre- and Post-Election Surveys (ICPSR 6896), which are available throughthe Center for Political Studies of the Institute for Social Research at the Uni-versity of Michigan (hhttp://www.umich.edu/~nesi). A random sample of 1,523American adults was interviewed nationwide from September 3–November 4,1996, and again from November 6–December 31, 1996.Question wording and coded responses (in parentheses) are as follows. Origi-
nal variable names appear in brackets.
Dependent Variables
Feeling thermometers:
‘‘I’d like to get your feelings toward some of our political leaders and otherpeople who are in the news these days. I’ll read the name of a person and I’d likeyou to rate that person using something we call the feeling thermometer. Ratingsbetween 50 degrees and 100 degrees mean that you feel favorable and warmtoward the person. Ratings between 0 and 50 degrees mean that you don’t feelfavorable toward the person and that you don’t care too much for that person.You would rate the person at the 50 degree mark if you don’t feel particularlywarm or cold toward the person. If we come to a person whose name you don’trecognize, you don’t need to rate the person. Just tell me and we’ll move on tothe next one.’’
. Environmentalists Feeling Thermometer: ‘‘How would you rate environmen-talists?’’ [v961041]. Clinton Feeling Thermometer: ‘‘How would you rate Bill Clinton?’’[v960272]. Dole Feeling Thermometer: ‘‘How would you rate Bob Dole?’’ [v960273]
Independent Variables
Partisan identification:
Summaries of respondent’s partisan identification based on the following seriesof questions:
‘‘Generally speaking, do you usually think of yourself as a Republican, a Demo-crat, an Independent, or what?’’
[ If considers self Republican/Democrat:] ‘‘Would you call yourself a strong[Republican/Democrat] or a not very strong [Republican/Democrat]?’’
[ If considers self independent/no preference/other:] ‘‘Do you think of yourself ascloser to the Republican Party or to the Democratic Party?’’
Appendix 193

Final scale is coded as (0) Strong Democrat; (1) Weak Democrat; (2) Indepen-dent-Democrat; (3) Independent; (4) Independent-Republican; (5) Weak Repub-lican; (6) Strong Republican. [v960420]
Political ideology:
‘‘We hear a lot of talk these days about liberals and conservatives. Here is aseven-point scale on which the political views that people might hold arearranged from extremely liberal to extremely conservative. Where would youplace yourself on this scale, or haven’t you thought much about this?’’
Coded as (1) Extremely liberal; (2) Liberal; (3) Slightly liberal; (4) Moderate;middle of the road; (5) Slightly conservative; (6) Conservative; (7) Extremelyconservative. [v960365]
Environment/economy:
‘‘Some people think it is important to protect the environment even if it costssome jobs or otherwise reduces our standard of living. (Suppose these people areat one end of the scale, at point number 1.) Other people think that protectingthe environment is not as important as maintaining jobs and our standard ofliving. (Suppose these people are at the other end of the scale, at point number 7.)And, of course, some other people have opinions somewhere in between, atpoints 2, 3, 4, 5, or 6. Where would you place yourself on this scale, or haven’tyou thought much about this?’’ [v960523]
Importance of environment/economy:
‘‘How important is this issue to you?’’ [v960525]
Coded as (1) Not important at all; (2) Not too important; (3) Somewhat impor-tant; (4) Very important; (5) Extremely important.
Government health insurance:
‘‘There is much concern about the rapid rise in medical and hospital costs. Somepeople feel there should be a government insurance plan that would cover allmedical and hospital expenses for everyone. (Suppose these people are at one endof a scale, at point 1). Others feel that all medical expenses should be paid byindividuals and through private insurance plans like Blue Cross or some othercompany paid plans. (Suppose these people are at the other end, at point 7). And,of course, some other people have opinions somewhere in between at points 2, 3,4, 5, or 6. Where would you place yourself on this scale, or haven’t you thoughtmuch about this?’’ [v960479]
Guaranteed job/standard of living:
‘‘Some people feel the government in Washington should see to it that everyperson has a job and a good standard of living (Suppose these people are atone end of a scale, at point 1.) Others think the government should just let eachperson get ahead on their own. (Suppose these people are at the other end, at
194 Appendix

point 7.) And, of course, some other people have opinions somewhere in be-tween, at points 2, 3, 4, 5, or 6. Where would you place yourself on this scale, orhaven’t you thought much about this?’’ [v960483]
Services/spending:
‘‘Some people think the government should provide fewer services, even in areassuch as health and education, in order to reduce spending. (Suppose these peopleare at one end of a scale, at point 1.) Other people feel it is important for thegovernment to provide many more services, even if it means an increase inspending. (Suppose these people are at the other end, at point 7.) And, of course,some other people have opinions somewhere in between, at points 2, 3, 4, 5, or6. Where would you place yourself on this scale, or haven’t you thought muchabout this?’’
Note: In order to maintain ideological consistency with the other scales usedhere, this item was recoded in reverse order. [v960450]
Aid to blacks:
‘‘Some people feel that the government in Washington should make every effortto improve the social and economic position of blacks. (Suppose these people areat one end of a scale, at point 1.) Others feel that the government should notmake any special effort to help blacks because they should help themselves.(Suppose these people are at the other end, at point 7.) And, of course, someother people have opinions somewhere in between, at points 2, 3, 4, 5, or 6.Where would you place yourself on this scale, or haven’t you thought muchabout this?’’ [v960487]
Reduce crime:
‘‘Some people say that the best way to reduce crime is to address the socialproblems that cause crime, like bad schools, poverty, and joblessness. (Supposethese people are at one end of a scale, at point 1.) Other people say the bestway to reduce crime is to make sure that criminals are caught, convicted, andpunished. (Suppose these people are at the other end, at point 7.) And, of course,some other people have opinions somewhere in between, at points 2, 3, 4, 5, or6. Where would you place yourself on this scale, or haven’t you thought muchabout this?’’ [v960519]
Women’s rights:
‘‘Recently there has been a lot of talk about women’s rights. Some people feelthat women should have an equal role with men in running business, industry,and government. (Suppose these people are at one end of a scale, at point 1.)Others feel that a woman’s place is in the home. (Suppose these people are at theother end, at point 7.) And, of course, some other people have opinions some-where in between, at points 2, 3, 4, 5, or 6. Where would you place yourself onthis scale, or haven’t you thought much about this?’’ [v960543]
Appendix 195

Defense spending:
‘‘Some people believe that we should spend much less money for defense. (Sup-pose these people are at one end of a scale, at point 1.) Others feel that defensespending should be greatly increased. (Suppose these people are at the other end,at point 7.) And, of course, some other people have opinions somewhere in be-tween, at points 2, 3, 4, 5, or 6. Where would you place yourself on this scale, orhaven’t you thought much about this?’’ [v960463]
Abortion rights:
‘‘There has been some discussion about abortion during recent years. Which oneof the opinions on this page best agrees with your view? You can just tell me thenumber of the opinion you choose: (1) By law, abortion should never be per-mitted; (2) The law should permit abortion only in case of rape, incest, or whenthe woman’s life is in danger; (3) The law should permit abortion for reasonsother than rape, incest, or danger to the woman’s life, but only after the need forthe abortion has been clearly established; (4) By law, a woman should always beable to obtain an abortion as a matter of personal choice.’’ [v960503]
State of the nation’s economy:
‘‘Now thinking about the economy in the country as a whole, would you say thatover the past year the nation’s economy has (1) Gotten better; (3) Stayed aboutthe same; or (5) Gotten worse?’’ [v960385]
Age:
‘‘What is the month, day and year of your birth?’’ [v960605]
The month and year of the respondent’s birth was subtracted from the monthand year of the interview to calculate age in years.
Education:
Summary of respondent’s level of education [v960610], where (1) 8 grades or lessand no diploma or equivalency; (2) 9–11 grades, no further schooling; (3) Highschool diploma or equivalency test; (4) More than 12 years of schooling, nohigher degree; (5) Junior or community college level degree; (6) Bachelor’s leveldegree; (7) Advanced degree.
Income:
‘‘Please look at page 21 of the booklet and tell me the letter of the income groupthat includes the income of all members of your family living here in 1995 beforetaxes. This figure should include salaries, wages, pensions, dividends, interest,and all other income.’’ [v960701]
Coded into 24 categories, ranging in value from a low of ‘‘none or less than$2,999’’ to a high of ‘‘$105,000 and over.’’
Gender:
Respondent’s gender [v960066] is recoded as (0) Female; (1) Male.
196 Appendix

Race:
Respondent’s race [v960067] is recoded as (0) White; (1) Black/American Indian/Alaskan native/Asian or Pacific Islander/Other.
Chapter 7
The data used in figure 7.4 and table 7.3 are drawn from a series of Californiapolls administered in 1986 by the Field Institute. Those polls are availablethrough the University of California and the Roper Center for Public OpinionResearch at the University of Connecticut (hhttp://www.ropercenter.uconn.edui).Adult residents of California were selected by random-digit dialing and theninterviewed by telephone. The first poll (conducted July 24–August 4, 1986) had asample size of 1,028 respondents; the second poll (September 4–October 2) had asample size of 1,028; and the third poll (October 29–30) had a sample size of701. For more information, contact the Field Institute at: 550 Kearney Street, Suite900, San Francisco, CA 94108-2527, or at hhttp://www.field.com/fieldpolli.Question wording and coded responses (in parentheses) are as follows.
Dependent Variables
Vote intention on Proposition 65:
‘‘Proposition 65 would prohibit the discharge of toxic chemicals into drinkingwater and require warnings of toxic chemicals exposure. If you were votingtoday on Proposition 65, would you vote yes or no?’’
Answers are coded as (1) Vote no; (2) Undecided; (3) Vote yes.
Independent Variables
Age:
‘‘May I ask your age please?’’
Coded in years.
Education:
‘‘What is the highest grade or year of school that you have finished and gottencredit for?’’
Answers are coded as (1) 8th grade or less; (2) Some high school; (3) Graduatedfrom high school; (4) Trade/vocational school; (5) 1–2 years of college; (6) 3–4years of college; (7) Graduated from college; (8) 5–6 years of college; (9)Master’s degree; (10) Post-master’s.
Income:
‘‘Now, we don’t want your exact income, but just roughly could you tell me ifyour annual household income before taxes is . . .’’
Appendix 197

Answers are coded as (1) Under $10,000; (2) $10,000–$19,999; (3) $20,000–$29,999; (4) $30,000–39,999; (5) $40,000–$49,999; (6) $50,000–$59,999; (7)$60,000–$69,999; (8) $70,000 or more.
Partisan identification:
‘‘Generally speaking, in politics do you consider yourself a conservative, liberal,middle-of-the-road or don’t you think of yourself in these terms?’’
[ If liberal/conservative:] ‘‘Do you consider yourself a strong or not very strongliberal/conservative?’’
[ If middle-of-the-road:] ‘‘Do you think of yourself as closer to conservatives orcloser to liberals?’’
Answers to this series of questions are coded as (1) Strong conservative; (2) Not astrong conservative; (3) Moderate, closer to conservative; (4) Moderate; (5)Moderate, closer to liberal; (6) Not a strong liberal; (7) Strong liberal.
Political ideology:
‘‘Generally speaking, do you usually consider yourself as a Republican, a Demo-crat, and Independent, or what?’’
[ If Democrat/Republican:] ‘‘Would you call yourself a strong or not very strongRepublican/Democrat?’’ [ If Independent, no preference, other, or don’t know:]‘‘Do you think of yourself as closer to the Republican or the Democratic party?’’
Answers to this series of questions are coded as (1) Strong Republican; (2) Notvery strong Republican; (3) Independent, closer to Republican; (4) Independent;(5) Independent, closer to Democrat; (6) Not very strong Democrat; (7) StrongDemocrat.
Race:
‘‘For classification purposes, we’d like to know what your racial background is.Are you white, black, Asian, or are you a member of some other race?’’
Respondent’s race is coded here as (0) White; (1) Other.
Gender:
Respondent’s gender, coded as (0) Female; (1) Male.
Prior knowledge of Prop. 65:
‘‘Have you seen or heard anything about an initiative, Proposition 65, that willbe on the November statewide election ballot having to do with toxic substancesand exposure restrictions?’’
Answers are coded as (0) Have not heard; (1) Have heard.
Data for figure 7.4, and tables 7.4 and 7.5 come from a 1992 poll conducted byMarttila & Kiley, Inc. Originally designed for the Massachusetts Public InterestResearch Group (MassPIRG), the environmental sponsors of Question 3, thequestionnaire (identified internally as #MK-92110) was administered by tele-phone February 11–13, 1992. A sample of 402 likely Massachusetts voters was
198 Appendix

generated using a random-digit dialing. The sample was stratified accordingto county, and gender quotas were observed. The raw datafile was provided tothe author courtesy of Marttila Communications Group, Inc. (1 Beacon Street,Boston, MA 02108), with the express approval of MassPIRG (29 Temple Place,Boston, MA 02111).Question wording and coded responses (in parentheses) for the variables used
in this book are as follows. The original number of each item on the question-naire is noted in brackets.
Dependent Variables
Vote intention #1:
‘‘Please tell me whether your initial reaction would be to vote in favor of thatproposal or vote against the proposal: A proposal that would require nearly allpackaging used in the state to be recyclable or made of recycled materials.’’[Q11]
Coded as (1) No; (4) Yes.
Vote intention #2:
‘‘Let me describe this proposal in a little more detail. Packaging accounts forroughly one-third of the total volume of trash disposal in Massachusetts eachyear. In order to sharply reduce the amount of trash, this proposal would requirethat by July 1, 1996, packaging will have to meet one of five standards, by beingsmaller in size, reusable, recycled, or made of recycled or recyclable materials.Manufacturers and businesses can use any one of the five standards to meet thenew packaging requirements. If the election on this proposal were being heldtomorrow, would you be inclined to vote yes or no on this proposal?’’
[ If not sure] ‘‘I know you could change your mind, but which way are you lean-ing based on this information?’’ [Q18]
Coded as (1) No; (2) Lean no; (3) Lean yes; (4) Yes.
Vote intention #3:
[After asking respondents to react to a lengthy list of positive and negative rea-sons for supporting/rejecting and proposal]. ‘‘Now that you have heard some ofthe practical concerns and reservations about the recycling initiative, I want tosee how you feel now: If the election were held tomorrow, would you probablyvote yes on this proposal, are you leaning toward voting yes, are you leaningtoward voting no, or would you probably vote no on this proposal?’’ [Q36]
Coded as (1) Probably vote no; (2) Lean no; (3) Lean yes; (4) Yes.
Change in vote intention:
This variable measures change in vote intention on Question 3 after consideringboth positive and negative aspects of the proposal. By subtracting a respondent’sanswer to the second survey condition from their answer to the first, a scale was
Appendix 199

created that ranges in value from �3 to þ3, where 0 indicates no change in vot-ing intention between the second and third question. The presence of a negativesign means that a respondent’s vote intention became less favorable, while apositive sign indicates that their vote intention grew more favorable.
Independent Variables
Age:
‘‘In which category does your age fall?’’ [Q201]
Answers are coded responses as (1) Under 25; (2) 25 to 29; (3) 30 to 34; (4) 35 to39; (5) 40 to 44; (6) 45–49; (7) 50 to 54; (8) 55 to 59; (9) 60 to 64; (10) 65 andover.
Education:
‘‘What was the last grade of school you completed?’’ [Q202]
Answers are coded as (1) Grade school or less; (2) Some high school; (3) Highschool graduate; (4) Vocational/technical; (5) Some college/2-year college; (6)Four-year college graduate; (7) Post-graduate work.
Income:
‘‘For tabulation purposes only, please tell me which of the following incomecategories includes your total family income in 1991 before taxes—just stop mewhen I read the correct category.’’ [Q206]
Answers are coded as (1) Less than $20,000; (2) $20,000–$29,999; (3) $30,000–$39,999; (4) $40,000–$49,999; (5) $50,000–$74,999; (6) $75,000 or over.
Gender:
By observation, coded as (0) Female; (1) Male. [Q206]
Partisan identification:
‘‘Regardless of which party you like better these days, are you currently regis-tered to vote in Massachusetts as a Democrat, Republican, or an Independent?’’[Q203]
Answers are coded as (1) Republican; (2) Independent; (3) Democrat.
Political ideology:
‘‘When it comes to most political issues, do you think of yourself as a liberal, aconservative, or a moderate? (If moderate—Do you think of yourself as closer tobeing liberal or being conservative?)’’ [Q204]
Answers are coded (1) Conservative; (2) Moderate-conservative; (3) Moderate;(4) Moderate-liberal; (5) Liberal.
Household recycles:
‘‘Other than returning bottles and cans for deposit, do you or does your house-hold participate in a recycling program in your community, do you voluntarily
200 Appendix

recycle certain items even though it is not part of a community program, or isn’tyour household involved in recycling yet?’’ [Q15]
Responses are coded (1) Participate in community recycling program or volunta-rily recycle without program; (0) Not involved in recycling.
Additive scale of positive evaluations:
Respondents were asked to react to a battery of nine statements, saying how im-portant each reason was for voting in favor of the proposal: (1) Not very impor-tant; (2) Somewhat important; (3) Very important; or (4) Extremely important.Answers to each of these questions were summed into a scale ranging in valuefrom 9 to 36. Reasons included, among others: ‘‘Jump-starting the economy bycreating new recycling jobs’’; ‘‘reducing our reliance on landfills’’; and ‘‘savingmoney in trash disposal costs.’’ [Q19–Q27]
Additive scale of negative evaluations:
Respondents were asked to react to a battery of eight statements, saying to whatextent each reason gave them reservations about the proposal: (1) No reser-vations; (2) Minor reservations; (3) Fairly strong reservations; or (4) Very strongreservations. Answers to each of these questions were summed into a scale rang-ing in value from 8 to 32. Reservations included, among others: ‘‘Creating awhole new government bureaucracy to enforce new, complicated packagingstandards’’; ‘‘fewer choices for consumers in the supermarket’’; ‘‘banning plasticpackaging used to keep fresh foods fresh and sanitized’’; and ‘‘job losses in plas-tics and packaging industries.’’ [Q28–Q35]
Chapter 8
Data from the Omni Study cited in chapter 8 were provided to the author cour-tesy of Cambridge Reports Research International, 955 Massachusetts Avenue,Cambridge, MA 02139. The survey was administered July 15–27, 1993, to anational sample of 1,250 American adults.Question wording and coded responses (in parentheses) for the variables used
in figure 8.1 and table 8.2 are as follows.
Dependent Variables
Frequency of buying green products:
‘‘Now I’m going to read a list of things people have done because of their con-cern about the environment. Please use a scale of ‘1’ to ‘7,’ where ‘1’ means‘never have done that thing’ and ‘7’ means ‘very frequently do that thing’ to tellme how often you do each thing I read.’’
Individual survey items were coded from 1 to 7. An additive scale was created bysumming responses across the following questions:
Appendix 201

1. Recycle used cans, bottles or paper [Q21];
2. Vote for a political candidate primarily because the candidate took strongenvironmental positions [Q22];
3. Cut back on driving or use public transportation more often [Q23];
4. Buy products made of recycled material whenever possible [Q24];
5. Avoid purchasing certain kinds of products because the packaging is excessiveor environmentally harmful [Q25];
6. Avoid purchasing certain kinds of fresh food because of the chemicals used infood production [Q26];
7. Avoid purchasing products made by a company that pollutes the environment[Q27];
8. Buy products in packages that can be refilled [Q28];
9. Buy a product because the label or advertising said it was environmentallysafe or biodegradable [Q29];
10. Avoid restaurants using plastic foam containers [Q30];
11. Avoid buying products in aerosol containers [Q31].
Willingness to pay more for environmental products:
‘‘Now I am going to read you a list of products. Please tell me how much moreyou would be willing to pay for each product if it were environmentally friendly.If you wouldn’t be willing to pay anything more for the product if it were envi-ronmentally friendly, please just say so.’’
Individual survey items are coded as (0) Wouldn’t pay anything more; (1) 5%more; (2) 10% more; (3) 20% more; (4) at least 30% more. The additive scaleused as a dependent variable in table 8.2 was created by summing responsesacross the following questions:
1. Automobile [Q8];
2. Detergents [Q9];
3. Paper products made out of recycled paper [Q10];
4. Gasoline [Q11];
5. Plastic packaging or containers made of recycled plastic materials [Q12];
6. Plastic packages or containers made with less plastic [Q13];
7. Garden products such as insecticides and fertilizers [Q14];
8. Household products, such as kitchen and bathroom cleaners [Q15].
Independent Variables
Environmental self-identification:
‘‘Using a scale of ‘1’ to ‘7,’ where ‘1’ means ‘do not identify with at all’ and ‘7’means ‘strongly identify with,’ please tell me how much you identify yourselfwith the label ‘environmentalist’.’’ [Q48]
202 Appendix

Age:
Respondent’s age [Q53] as measured in categories, where (1) Ages 18 to 25; (2)Ages 26 to 35; (3) Ages 36 to 45; (4) Ages 46 to 55; (5) Ages 56 to 65; and (6)Over age 65.
Education:
Respondent’s education [Q52] as measured in categories, where (1) Some gradeschool; (2) Some high school; (3) Graduated high school; (4) Technical/vocational school; (5) Some college; (6) Graduated college; and (7) Graduate/professional school.
Income:
‘‘Would you please tell me in which of the categories I read is your total house-hold income—of everyone living in the house?’’ [Q54].
Responses are coded as (1) $0 to $7,999; (2) $8,000 to $11,999; (3) $12,000to $14,999; (4) $15,000 to $19,999; (5) $20,000 to $24,999; (6) $25,000 to$34,999; (7) $35,000 to $49,000; (8) $50,000 to $74,999; (9) $75,000 to$99,999; and (10) $100,000 and over.
Political ideology:
‘‘Would you describe yourself as more of a liberal or more of a conservative?’’[Q55].
Responses are coded as (1) Conservative; (2) Moderate; (3) Liberal.
Race:
Respondent’s race [Q51] is coded dichotomously, where (0) white and (1) black/other.
Gender:
Respondent’s gender [Q50] is coded as (0) female and (1) male.
Appendix 203

This Page Intentionally Left Blank

Notes
Introduction
1. Key, Public Opinion and American Democracy, 550.
2. Rubin, The Green Crusade.
3. The most famous example of children’s environmental literature remains Dr.Seuss’s cautionary tale of the The Lorax (1971), in which the title character‘‘speaks for the trees’’ when a rapacious industrialist sets out to destroy a forestof Truffula trees, leading to widespread environmental devastation. For more, seeSinclair, E for Environment.
4. The television show Murphy Brown was notable for showing its major char-acters recycling bottles and cans in the workplace. The Simpsons is also wellknown for its environmental themes, including the dangers of nuclear power inan episode titled ‘‘Two Cars in Every Garage, Three Eyes on Every Fish.’’ For adiscussion of more subtle environmental cues, see Bernstein, ‘‘Planet Holly-wood,’’ 4; Drum, ‘‘Product Placement Matures into Placement of NonprofitCauses,’’ S27; and Leroux, ‘‘Subliminal Messages,’’ 14.
5. Two major theatrical releases with similar themes, Erin Brockovich (2000)and A Civil Action (1998), draw attention to the health risks associated withenvironmental pollution—the former, to illegal corporate dumping of toxicwaste and the resulting pollution of groundwater; the latter, to the effects of achemical spill near Woburn, Massachusetts.
6. Fenly, ‘‘New Books Tell Children about Environment and Their Future,’’ 5.
7. Key, Public Opinion, 27.
8. Saad and Dunlap, ‘‘Americans Are Environmentally Friendly, but Issue NotSeen as Urgent Problem,’’ 12–18.
9. Dowie, Losing Ground.
10. Rothman, The Greening of a Nation?, 210.
11. In fairness to both sides, however, Rubin’s criticism should be placed tosome extent in an ideological context. His view of early environmental writers

may well reflect his conservative approach to environmental policy. See, Rubin,The Green Crusade, 74.
12. In a Wirthlin Worldwide poll administered in August 1997, 41 percent ofrespondents agreed that environmental groups overstate threats in order to winpublic attention.
13. Dowie, Losing Ground; Easterbrook, A Moment on the Earth; Lomborg,The Skeptical Environmentalist.
14. David Brower, as quoted in Martin, ‘‘Earth Day Report Card—We StillCare, Sort of,’’ A1.
15. In the public relations battle waged between optimism and pessimism on thefuture of the environment, pessimism seems to be winning. In the Gallup Orga-nization’s April 2000 public opinion poll, 64 percent of those surveyed believedthat ‘‘only some progress’’ had been made in dealing with environmental prob-lems over the past few decades. See Saad and Dunlap, ‘‘Americans Are Environ-mentally Friendly’’; see also Meadows, ‘‘Looking Back at 30 Earth Days,’’ B7.
16. Fried, ‘‘U.S. Environmental Interest Groups and the Promotion of Environ-mental Values,’’ 1–2.
17. One of the must public controversies surrounding the celebration of EarthDay 2000 involved the appointment of actor Leonardo DiCaprio as honorarynational chairman. The decision drew attention to a younger audience but alsoled to distractions when Vice President Al Gore’s speech was punctuated by thescreams of teenage girls eager to catch a glimpse of the Titanic star behind thestage. The actor later interviewed President Clinton during a live televisionbroadcast, much to the consternation of seasoned news reporters. The special,Planet Earth 2000, ranked fourth in the Nielson ratings during its time slot. SeeSoskis, ‘‘Green with Envy,’’ 13; Jensen, ‘‘DiCaprio and ‘Planet Earth’ RankFourth in Time Slot,’’ F2.
18. For background, see Russell, ‘‘Corporations Going for the Green,’’ D1; andBegley, Hager, and Wright, ‘‘The Selling of Earth Day,’’ 60. For a harsher opin-ion piece, see Carothers, ‘‘Unwelcome Saviors,’’ 62.
19. Rothman, The Greening of a Nation?, 210.
20. Mitchell, ‘‘Public Opinion and Environmental Politics in the 1970s and1980s,’’ in Vig and Kraft, eds., Environmental Policy in the 1980s.
21. Stanfield, ‘‘Reagan’s Environmental Record Not the Issue It Was Predictedto Be,’’ 1872.
22. Dunlap, ‘‘Polls, Pollution, and Politics Revisited,’’ 34.
23. Vig, ‘‘Presidential Leadership and the Environment,’’ 71.
24. Harris and Nakashima, ‘‘Gore’s Greenness Fades,’’ A1.
25. ‘‘How Green Is Al Gore?,’’ 30.
26. See, for example, Mastio, ‘‘The GOP’s Enviro-Rut,’’ 19.
27. Knickerbocker, ‘‘Americans Go ‘Lite Green,’ ’’ 1.
206 Notes to Introduction
28. Newt Gingrich, quoted in Connelly, ‘‘The Politics of the Environment,’’ H1.See also ‘‘G.O.P. Hears Nature’s Call,’’ and Schroeder, ‘‘Eco-Pragmatism.’’While Republicans have backed away from several obvious proposals to scaleback environmental regulations on business, party members still attach anti-green riders to large-scale spending bills in an attempt to change policy with aminimum of debate (see, for example, Ourlian, ‘‘Anti-Green Measures Are Ridersin the Storm.’’
29. Breyer, Breaking the Vicious Circle, 3.
30. Breyer, Breaking the Vicious Circle, 35.
31. Slovic, ‘‘Perception of Risk.’’
32. Rauch, ‘‘There’s Smoke in the Air, But it Isn’t All Pollution,’’ B1.
33. See, for example, the editorial ‘‘Green Choices, Hard Choices.’’
34. A comprehensive guide to green products can be found online at hhttp://www.buygreen.comi.
35. Schwartz and Miller, ‘‘The Earth’s Best Friends’’; Coddington, Environmen-tal Marketing; Stisser, ‘‘A Deeper Shade of Green.’’
36. Wasik, ‘‘Market Is Confusing, But Patience Will Pay Off,’’ 16; Morris,Hastak, and Mazis, ‘‘Consumer Comprehension of Environmental Advertisingand Labeling Claims.’’
37. Ottman, ‘‘Environmentalism Will Be the Trend of the ’90s,’’ 13.
38. Hume, ‘‘Consumer Doubletalk Makes Companies Wary,’’ GR4; Mantese,‘‘Study Finds Green Confusion,’’ 1; Sims, ‘‘Positive Attitudes Won’t Make CashRegister Ring,’’ 4.
39. In Green Culture Herndl and Brown suggest that many of the recruitmenttechniques used by environmental organizations belie the grassroots reputationsthose groups enjoy. For instance, in response to the direct-mail solicitations thathave grown popular in recent years, they say, one can either ignore the letteror opt to send money in support of some environmental cause. But the requestitself generally offers individuals few options for true and valued participation.Friedman, too, finds that environmental groups that pursue product boycotts areoften more concerned about generating media attention than about acting in themarketplace. See also Friedman, ‘‘On Promoting a Sustainable Future throughConsumer Activism.’’
40. Ridley and Low, ‘‘Can Selfishness Save the Environment?,’’ 70.
41. Shabecoff, Earth Rising.
42. Bosso, ‘‘After the Movement,’’ in Vig and Kraft, eds., Environmental Policyin the 1990s, 33; see also Dunlap, ‘‘Trends in Public Opinion toward Environ-mental Issues.’’
43. Breyer, Breaking the Vicious Circle, 39.
44. For a particularly thorough look at the subject, see also Morrison and Dun-lap, ‘‘Environmentalism and Elitism’’; and Van Liere and Dunlap, ‘‘The SocialBases of Environmental Concern.’’
Notes to Introduction 207

45. Tucker, Progress and Privilege.
46. Sagoff, ‘‘The Great Environmental Awakening.’’
47. Gelernter, ‘‘The Immorality of Environmentalism,’’ 14.
48. Switzer, Green Backlash.
49. Kempton, Boster, and Hartley, Environmental Values in American Culture,211.
50. Ellis and Thompson, ‘‘Culture and the Environment in the Pacific North-west.’’
51. Lake, ‘‘The Environmental Mandate,’’ 232.
52. Schneider, ‘‘Everybody’s An Environmentalist Now,’’ 1062.
53. Dunlap, ‘‘Polls, Pollution, and Politics Revisited.’’
54. Shabecoff, Earth Rising, 113.
55. Key, Public Opinion, 8.
56. Schneider, ‘‘Everybody’s An Environmentalist Now,’’ 1062.
57. Key, Public Opinion, 232. See also Schumann and Presser, Questionsand Answers in Attitude Surveys; Bryce, ‘‘The Nature of Public Opinion,’’ andLowell, ‘‘Public Opinion,’’ both in Janowitz and Hirsch, eds., Reader in PublicOpinion and Mass Communication.
58. Maslow, Motivation and Personality; Inglehart, ‘‘Post-Materialism in anEnvironment of Insecurity’’; Dunlap, ‘‘Public Opinion and Environmental Pol-icy,’’ in Lester, ed., Environmental Politics and Policy; Downs, ‘‘Up and Downwith Ecology.’’
59. See, for example, Kempton, Boster, and Hartley, Environmental Values inAmerican Culture.
60. Key, Public Opinion.
61. deHaven-Smith, ‘‘Environmental Belief Systems,’’ ‘‘Toward a Communica-tive Theory of Environmental Opinion,’’ and Environmental Concern in Floridaand the Nation.
62. The term constraint was first introduced in Converse, ‘‘The Nature of BeliefSystems in Mass Publics,’’ in Apter, ed., Ideology and Discontent.
63. Key, Public Opinion, 28.
64. Sagoff, ‘‘The Great Environmental Awakening.’’
Chapter 1
1. Gerstenzang, ‘‘Survey Bolsters Global Warming Fight,’’ A4. Fifty-five percentof respondents in the Pew Research Center poll—the ‘‘majority’’ referred to inthe text—supported a U.S. joint effort with other countries ‘‘in setting standardsto improve the global environment.’’ An additional 41 percent believed that the
208 Notes to Chapter 1

United States should ‘‘set its own environmental standards independently.’’ SeeThe Pew Research Center for the People & the Press, November 1997 NewsInterest Index, Q23.
2. For example, in addition to stories in several major American newspapers, theresults of the Pew Research Center poll were discussed on National Public Radio(NPR) and picked up by the Associated Press. See Soto, ‘‘Many Favor an Increasein Gas Prices.’’
3. Klein, ‘‘Environment Challenges Public Mood,’’ 4. In ‘‘Culture and theEnvironment in the Pacific Northwest,’’ Ellis and Thompson, too, reinforcethe obvious—that activists and the general public ‘‘want cleaner air and water,wilderness and species preservation, habitat protection, and a healthier, saferearth’’ because these are so obviously desirable (p. 892). It is a natural tendencythat creates problems for pollsters.
4. Martin, ‘‘Environment Is a Big Concern for Californians, Poll Shows,’’ A3.
5. Alpert, ‘‘Voters Support Rules on Pollution,’’ A1.
6. Dawson, ‘‘Poll Shows Texans Wanting to Recycle,’’ 12.
7. Eddy, ‘‘Wilderness Expansion Backed,’’ B6.
8. Richard Darman, quoted in Sagoff, ‘‘The Great Environmental Awakening,’’39, emphasis added.
9. Schneider, ‘‘Everybody’s an Environmentalist Now,’’ 1062.
10. See, for example, Bowman, ‘‘The Rise of Environmentalism.’’
11. Kempton, Boster, and Hartley, Environmental Values in American Culture,211.
12. Kempton, Boster, and Hartley, Environmental Values, 202–203.
13. Kempton, Boster, and Hartley, Environmental Values, Q31.
14. Kempton, Boster, and Hartley, Environmental Values, 114.
15. Saad and Dunlap, ‘‘Americans Are Environmentally Friendly.’’
16. Kempton, Boster, and Hartley, Environmental Values, 211. See also LaTrobe and Acott, ‘‘A Modified NEP/DSP Environmental Attitudes Scale.’’
17. Kempton, Boster, and Hartley, Environmental Values, 209.
18. Ellis and Thompson, ‘‘Culture and the Environment in the Pacific North-west,’’ 892.
19. Kempton, Boster, and Hartley, Environmental Values, 203.
20. A number of measures on the lengthy Kempton questionnaire did proberespondents to consider policy options or economic costs and trade-offs, butthose statements were far more likely to yield disagreement. For instance, whenconfronted with these statements: ‘‘My first duty is to feed my family. The envi-ronment and anything else has to come after that’’—70 percent of sawmillworkers agreed and just 13 percent of Earth First! members agreed. See Taylor,‘‘Environmental Values in American Culture.’’
Notes to Chapter 1 209

21. More information about the Consultative Group on Biological Diversity canbe found at its Web site at hhttp://www.cgbd.org/i.
22. Belden and Russonello, The Ecology, Q6, Q23, combined responses, ‘‘veryimportant,’’ ‘‘somewhat important.’’
23. For example, in an April 2000 Gallup poll, the seriousness of environmentalproblems ranked fifth among seven issues, behind drug use, crime and violence,health care, and homelessness.
24. See, for example, Traugott and Lavrakas, The Voter’s Guide to ElectionPolls, especially chapter 7.
25. See Williams, ‘‘Window to the Wild.’’
26. Schuman and Presser, Questions and Answers in Attitude Surveys; alsoSudman and Bradburn, Asking Questions.
27. Louis Harris and Associates, Inc., Public and Leadership Attitudes to theEnvironment in Four Continents.
28. ‘‘Worldwide Concern about the Environment,’’ 14–15.
29. World Wildlife Fund, Voters Believe Global Warming is a Reality.
30. World Wildlife Fund, ‘‘State of the Climate,’’ Q6, which read:
When cars, electric utilities and some other industries burn oil, coal and gasolinethey release carbon dioxide and other gases into the atmosphere. Some scientistssay these gases trap heat in the atmosphere, causing the earth to warm. They saythis makes the world hotter and increases the chances of all kinds of extremeweather. This effect is called global warming. Generally speaking, how serious ofa threat do you think global warming is today—very serious, somewhat serious,not too serious, or not serious at all? Or don’t you have an opinion on this?
31. World Wildlife Fund, ‘‘State of the Climate.’’
32. Most respondents chose to answer these questions rather than rely (as theywere reminded they could) on a ‘‘don’t know’’ response. This is not surprising,however, when placed in broader context. Research has long shown that peoplecan feel pressured to give responses in a survey context, even on fictitious issues(see, for example, Bishop, Tuchfarber, and Oldendick, ‘‘Opinions on FictitiousIssues’’).
33. Immerwahr, Waiting for a Signal. Apparently the public is not alone in itsstate of confusion. Politicians and newspaper columnists are also frequently mis-informed. See Harris, ‘‘Experts in Everything and Nothing.’’
34. The Pew Research Center for the People & the Press, November 1997 NewsInterest Index, Q7.
35. Combined responses to the variable GRNTEST3 for ‘‘definitely true’’ and‘‘probably true’’ (NORC General Social Survey 1994).
36. The Pew Research Center for the People & the Press, November 1997 NewsInterest Index, Q4, a–k.
210 Notes to Chapter 1

37. Traugott and Lavrakas, The Voter’s Guide to Election Polls, 94.
38. Bowman, ‘‘Polluted Polling on Global Warming.’’
39. Gerstenzang, ‘‘Survey Bolsters Global Warming Fight,’’ A4.
40. In this case, the bias of the World Wildlife Fund question seems particularlyunfortunate since many other survey organizations obtained similar results with-out risking credibility. Seventy-seven percent of respondents in a Ohio State Uni-versity survey funded by the National Science Foundation believed globalwarming ‘‘has been happening,’’ while 74 percent believed that global warmingwas ‘‘real’’ in a Wirthlin Worldwide (1997) survey.
41. Immerwahr, Waiting for a Signal.
42. See, for example, Dunlap, ‘‘Public Opinion and Environmental Policy,’’ inLester, ed., Environmental Politics and Policy; he argues that the direction anddegree of public opinion are the ‘‘most basic concepts of this kind of study’’(p. 123).
42. Key, Public Opinion and American Democracy.
Chapter 2
1. In abbreviated form, the work of both Bryce and Lowell can be found inJanowitz and Hirsch, eds., Reader in Public Opinion and Mass Communication.For the full work of each, see Bryce, The American Commonwealth, Vol. II, andLowell, Public Opinion and Popular Government.
2. Key, Public Opinion and American Democracy.
3. Dunlap, ‘‘Public Opinion in the 1980s’’; see also Shabecoff, Earth Rising.
4. Dunlap and Scarce, ‘‘The Polls’’; also Dunlap, ‘‘Public Opinion and Environ-mental Policy,’’ in Lester, ed., Environmental Politics and Policy.
5. Schuman and Presser, Questions and Answers in Attitude Surveys.
6. The ‘‘filter’’ described by Sterngold, Warland, and Herrmann in ‘‘Do SurveysOverstate Public Concerns?’’ would first ask for an initial expression of concern,pressing forward with additional measures of intensity only if respondents passedthat litmus test—in essence, separating the measurement of direction from inten-sity rather than combining both into a single response format. Given constraintsof time and expense, however, this safeguard is not always adopted in practice(and is, in fact, not used by Gallup in the poll discussed here). For similar viewson the importance of filter questions, see Key, Public Opinion, chapter 9, andSchuman and Presser, Questions and Answers, chapters 9 and 10.
7. Ladd and Bowman, Attitudes toward the Environment, 17, 20.
8. In ‘‘Public Opinion,’’ Dunlap argues that ‘‘ranking procedures’’ can be reli-able indictors of attitude strength and intensity. In Lester, ed., EnvironmentalPolitics and Policy.
Notes to Chapter 2 211

9. Traugott and Lavrakas, The Voter’s Guide to Election Polls.
10. Wirthlin Worldwide National Quorum Survey (1998), Q9.
11. Even though extremity of opinion and intensity of opinion are related (seeSchuman and Presser, Questions and Answers, 233).
12. Including Dunlap, ‘‘Public Opinion,’’ in Lester, ed., Environmental Politicsand Policy, 124–125.
13. Funkhouser, ‘‘The Issues of the Sixties’’; Dunlap, ‘‘Trends in Public OpinionToward Environmental Issues.’’
14. Mitchell, ‘‘Public Opinion and Environmental Politics in the 1970s and1980s,’’ in Vig and Kraft, eds., Environmental Policy in the 1980s.
15. Dunlap, ‘‘Public Opinion,’’ in Lester, ed., Environmental Politics and Policy,128.
16. Dunlap and Scarce, ‘‘The Polls,’’ 653.
17. Ladd and Bowman, Attitudes toward the Environment, 20.
18. Mitchell, ‘‘Public Opinion and Environmental Politics in the 1970s and1980s,’’ in Vig and Kraft, eds., Environmental Policy in the 1980s.
19. Respondents who have little strength of feeling for the environment are pre-sumably those most likely to be influenced by counterarguments because theyhave little commitment to the position in the first place. See Mitchell, ‘‘SilentSpring/Solid Majorities’’ and Public Opinion on Environmental Issues; alsoKeeter, ‘‘Problematical Pollution Polls.’’
20. The Gallup Organization [datafile], April 3–9, 2000 (n ¼ 1;004 adultsnationwide). Margin of errore3 percentage points.
21. Ladd and Bowman, Attitudes toward the Environment, 24; see also Ladd,‘‘What Do Americans Really Think About the Environment?’’
22. Cambridge Reports National Omnibus Survey [datafile], September 1994(n ¼ 1;250 adults nationwide): Q11, Q13.23. Ladd, ‘‘Clearing the Air,’’ 19. See also Keeter (1984).
24. Keeter, ‘‘Problematical Pollution Polls,’’ 274.
25. Ladd and Bowman, Attitudes toward the Environment, 24.
26. Schuman and Presser, Questions and Answers, 298–299.
27. See, for example, Schuman and Presser, Questions and Answers, 173–174.
28. Boudreaux, Meiners, and Zywicki, ‘‘Talk Is Cheap,’’ 765.
29. Smith, ‘‘Can We Measure the Economic Value of Environmental Amen-ities?’’; Hotelling, ‘‘Letter to Director of National Park Service,’’ in An EconomicStudy of the Monetary Evaluation of Recreation in the National Parks; Dwyer,‘‘Economic Benefits of Wildlife-Related Recreation Experiences,’’ in Shaw andZube, eds., Wildlife Values; Schechter, Kim, and Golan, ‘‘Valuing a PublicGood,’’ in Folmer, and ver Ierland, eds., Valuation Methods and Policy Makingin Environmental Economics.
212 Notes to Chapter 2

30. For example, an individual may value the option of using an environmentalresource, such as a national park, at some time in the future above and beyondhow likely they are to use it and thus be willing to pay under conditions ofuncertainty to ensure it will be kept available and unspoiled. In addition, anindividual may value and derive benefit from the mere existence of an environ-mental resource, such as the survival of a particular species of wildlife or thenatural condition of the Grand Canyon. See Bishop, ‘‘Option Value’’; Weisbrod,‘‘Collective-Consumption Services of Individual-Consumption Goods’’; Krutilla,‘‘Conservation Reconsidered’’; Krutilla and Fisher, The Economics of NaturalEnvironments.
31. Mitchell and Carson, Using Surveys to Value Public Goods; Smith, ‘‘Can WeMeasure the Economic Value of Environmental Amenities?’’
32. The 72 percent cited combines two response categories, ‘‘very willing’’ and‘‘somewhat willing.’’ Likewise, the NORC GSS numbers combine similaranswers, ‘‘very willing’’ and ‘‘fairly willing.’’ Louis Harris and Associates (1993),Q4; NORC General Social Survey (1994).
33. Cambridge Reports/Research International (July 1994), Q9; YankelovichClancy Shulman (1992), Q7.
34. Princeton Survey Research Associates (1997), Q39; Pew Research Center(1997), Q75.
35. Boudreaux, Meiners, and Zywicki, ‘‘Talk Is Cheap’’; Fischer, ‘‘Willingnessto Pay as a Behavioral Criterion for Environmental Decision-making.’’
36. Green, Kahneman, and Kunreuther, ‘‘How the Scope and Method of PublicFunding Affect Willingness to Pay for Public Goods,’’ 49.
37. For example, as Sunstein notes in ‘‘Experts, Economists, and Democrats,’’willingness-to-pay to protect spotted owls ‘‘drops significantly’’ when the word-ing of the question values the owl with and in comparison to other species, ratherthan in isolation; see also Fischer, ‘‘Willingness to Pay.’’
38. Ladd, ‘‘Clearing the Air,’’ 11. But, as he argues, this is not different fromother issues, including health care for the uninsured. In general, Americans arenot willing to pay even small amounts for some things they care deeply about.
39. This issue, of course, is not new. Most work on voter turnout and votechoice involves the use of self-reported behavior, which leads to problems ofoverreporting. See Katosh and Traugott, ‘‘The Consequences of Validated andSelf-Reported Voting Measures’’; Silver, Anderson, and Abramson, ‘‘Who Over-reports Voting?’’
40. Presser, ‘‘Can Changes in Context Reduce Vote Overreporting in Surveys?’’
41. Furman and Erdur, ‘‘Are Good Citizens Environmentalists?’’
42. Dunlap and Scarce, ‘‘The Polls,’’ 657.
43. Oskamp, Harrington, Edwards, Sherwood, Okuda, and Swanson, ‘‘FactorsInfluencing Household Recycling Behavior.’’
44. Milbrath, Environmentalists; also Dunlap, ‘‘Public Opinion in the 1980s.’’
Notes to Chapter 2 213

45. De Young, ‘‘Encouraging Environmentally Appropriate Behavior’’ and‘‘Some Psychological Aspects of Recycling.’’
46. Scott Geller, Winett, and Everett, Preserving the Environment.
47. Ladd and Bowman, Attitudes toward the Environment.
48. Ayres, ‘‘The Worldwatch Report,’’ available at hhttp://www.enn.com/enn-features-archive/1999/05/051299/worldwatch_3141.aspi [emphasis added].
49. Mitchell, ‘‘Public Opinion and Environmental Politics’’; Dunlap, ‘‘PublicOpinion.’’ See also Dunlap and Dillman, ‘‘Decline in Public Support for Envi-ronmental Protection.’’
50. For example only 14 percent of those responding in a 1990 Gallup pollbelieved that ‘‘a great deal’’ of progress had been made on environmental issues,while ten years later that number had grown to 26 percent. In both cases, how-ever, a majority (63 percent and 64 percent, respectively) thought that ‘‘onlysome progress’’ had been achieved. See the Gallup Organization (1990), Q18,and (2000), Q43.
51. The Gallup Organization (2000), Q44.
52. Mitchell, ‘‘Public Opinion and Environmental Politics,’’ 55.
53. Immerwahr, Waiting for a Signal.
54. Baldassare and Katz, ‘‘The Personal Threat of Environmental Problemsas Predictor of Environmental Practices’’; Rohrschneider, ‘‘Citizens’ Attitudestoward Environmental Issues.’’
55. Shabecoff, Earth Rising, 38.
56. Rohrschneider, ‘‘Citizens’ Attitudes toward Environmental Issues.’’
57. Helvarg, The War Against the Greens.
58. Kempton, Boster, and Hartley, Environmental Values in American Culture.
59. Dunlap, ‘‘Public Opinion,’’ 12, 32.
60. For example, in the April 2000 Gallup poll cited previously in this chapter,respondents were asked: ‘‘Thinking specifically about the environmental move-ment, do you think of yourself as an active participant in the environmentalmovement [16 percent], sympathetic toward the movement, but not active [55percent], neutral [23 percent], or unsympathetic toward the environmentalmovement [5 percent]?’’
61. Dowie, ‘‘American Environmentalism.’’
Chapter 3
1. Downs, ‘‘Up and Down with Ecology,’’ 38.
2. Downs, ‘‘Up and Down with Ecology,’’ 39; see also Albrecht and Mauss,‘‘The Environment as a Social Problem,’’ in Mauss, ed., Social Problems as SocialMovements.
214 Notes to Chapter 3

3. Downs, ‘‘Up and Down with Ecology,’’ 50.
4. Erskine, ‘‘The Polls,’’ 120.
5. See, for example, Hornback, ‘‘Orbits of Opinion’’; Buttel, ‘‘Class Conflict,Environmental Conflict, and the Environmental Movement’’; Dunlap and Dill-man, ‘‘Decline in Public Support for Environmental Protection’’; Dunlap andVan Liere, ‘‘Further Evidence of Declining Public Concern with EnvironmentalProblems’’; Marsh and Christenson, ‘‘Support for Economic Growth and Envi-ronmental Protection’’; Rosenbaum, The Politics of Environmental Concern;Dunlap, Van Liere, and Dillman, ‘‘Evidence of Decline in Public Concern withEnvironmental Quality’’; Dunlap, ‘‘Public Opinion and Environmental Policy,’’in Lester, ed., Environmental Politics and Policy; Dunlap, ‘‘Trends in PublicOpinion Toward Environmental Issues.’’
6. Dunlap and Scarce, ‘‘The Polls,’’ 652.
7. Stisser, ‘‘A Deeper Shade of Green,’’ 24.
8. Dunlap and Dillman, ‘‘Decline in Public Support for Environmental Protec-tion’’; Marsh and Christenson, ‘‘Support for Economic Growth and Environ-mental Protection’’; see also Albrecht and Mauss, ‘‘The Environment as a SocialProblem.’’
9. Key, ‘‘Public Opinion and American Democracy,’’ 234.
10. Fishbein and Ajzen. 1975. Belief, Attitude, Intention, and Behavior, 6.
11. For a prime example, see Converse, ‘‘The Nature of Belief Systems in MassPublics,’’ in Apter, ed., Ideology and Discontent; see also Smith, ‘‘Is There RealOpinion Change?’’
12. Smith, ‘‘Is There Real Opinion Change?’’; Page and Shapiro, ‘‘Changes inAmericans’ Policy Preferences.’’
13. Note that in the absence of panel studies, aggregate trends remain the onlyviable possibility for judging long-term attitude change.
14. Glenn, ‘‘Trend Studies with Available Survey Data,’’ in Survey Data forTrend Analysis.
15. Taylor, ‘‘Procedures for Evaluating Trends in Public Opinion.’’ See alsoSmith, ‘‘A Compendium of Trends on General Social Survey Questions.’’
16. See Smith, ‘‘Is There Real Opinion Change?’’ One well-known example ofa ‘‘constant’’ model suits Sullivan et al.’s data demonstrating that levels of polit-ical tolerance in the United States have not changed in recent years. See Sullivan,Piereson, and Marcus, Political Tolerance and American Democracy.
17. Smith, ‘‘Cycles of Reform?’’
18. This type of change is sometimes referred to as bounce. Smith, in ‘‘Is ThereReal Opinion Change?,’’ notes that studies of presidential popularity often fit thismold.
19. On the importance of birth cohorts in understanding environmental atti-tudes, see Hays, Beauty, Health, and Permanence; Mohai and Twight, ‘‘Age and
Notes to Chapter 3 215

Environmentalism’’; Buttel, ‘‘Age and Environmental Concern’’; Honnold, ‘‘Ageand Environmental Concern.’’
20. Dunlap, ‘‘Trends in Public Opinion toward Environmental Issues.’’
21. For a detailed description of trends, see Dunlap, ‘‘Trends in Public Opiniontoward Environmental Issues’’; Dunlap and Scarce, ‘‘The Polls’’; also Gillroy andShapiro, ‘‘The Polls.’’
22. For a full summary of that literature, refer to Dunlap, ‘‘Trends in PublicOpinion.’’
23. This result confirms Tom Smith’s conclusion regarding the same variablebetween 1972 and 1977. See Smith, ‘‘Age and Social Change.’’ To put that figurein some perspective, Smith finds in his study of 455 liberal/conservative measuresfrom 1936 to 1985 that linear trends across many different variables averagedjust 1.3 percentage points per annum. See Smith, ‘‘Liberal and ConservativeTrends in the United States since World War II.’’
24. Bear in mind that the proportion of variance in attitudes explained by theequation is quite small (R-square ¼ :175), which means that the bulk—nearly 83percent—remains unexplained using a purely linear model.
25. Key, ‘‘Public Opinion and American Democracy,’’ 235.
26. For a more detailed explanation, refer to Firebaugh and Davis, ‘‘Trends inAnti-Black Prejudice, 1972–1984.’’
27. Kanagy, Humphrey, and Firebaugh, ‘‘Surging Environmentalism.’’
28. For example, see Durr, ‘‘What Moves Policy Sentiment?’’
29. Albrecht and Mauss, ‘‘The Environment as a Social Problem’’; Dunlap andDillman, ‘‘Decline in Public Support for Environmental Protection’’; Marsh andChristenson, ‘‘Support for Economic Growth and Environmental Protection.’’
30. Alexander, ‘‘Gunning for the Greens,’’ 50.
31. Lauter and Jehl, ‘‘Bush, Clinton Clash Over Jobs, Environment,’’ A1.
32. For an intriguing account of the gap between the reality and perception ofeconomic conditions during the 1992 presidential election, see Hetherington,‘‘The Media’s Role in Forming Voters’ National Economic Evaluations in 1992.’’
33. Elliott, Regens, and Seldon, ‘‘Exploring Variation in Public Support forEnvironmental Protection,’’ 51; also Elliott, Seldon, and Regens, ‘‘Political andEconomic Determinants of Individuals’ Support for Environmental Spending.’’
34. See, for example, Dunlap, ‘‘Public Opinion and Environmental Policy,’’90; and Dunlap and Dillman, ‘‘Decline in Public Support for EnvironmentalProtection.’’
35. Wlezien, ‘‘The Public as Thermostat,’’ 981.
36. Karlberg, ‘‘News and Conflict’’; also MacKuen, ‘‘Reality, the Press, andCitizens’ Political Agendas,’’ in Turner and Martin, eds., Surveying SubjectivePhenomena.
216 Notes to Chapter 3

37. Page, Shapiro, and Dempsey, ‘‘What Moves Public Opinion?,’’ 24.
38. Allan, Adam, and Carter, ‘‘Introduction,’’ in Environmental Risks and theMedia, 4. See also Parlour and Schatzow, ‘‘The Mass Media and Public Concernfor Environmental Problems in Canada, 1960–1972.’’
39. Missing values were interpolated in SAS using a cubic spline curve to createan uninterrupted time-series.
40. Readers unfamiliar with basic regression techniques may find the followinghelpful: Berry and Sanders, Understanding Multivariate Research.
41. See Ostrom, Time Series Analysis; also Kennedy, A Guide to Econometrics,chapter 8; and Choudhury, Hubata, and St. Louis, ‘‘Understanding Time-SeriesRegression Estimators.’’
42. King, Unifying Political Methodology, 181.
43. Durr, ‘‘What Moves Policy Sentiment?,’’ 164.
44. The Durbin-Watson statistic tests for the absence of first-order autocor-relation in ordinary least squares (OLS) residuals. With possible values rangingfrom 0 to 4, Durbin-Watson statistics closest to a midpoint of 2 (with proba-bilities that fall outside the conventional range of statistical significance) allowresearchers to accept the null hypothesis that there is no significant correlation. Inthis case the Durbin-Watson of the model presented equaled 2.06 with a proba-bility of 0.13.
45. For example, Kanagy, Humphrey, and Firebaugh, in ‘‘Surging Environ-mentalism,’’ used pooled cross-sectional data to isolate birth cohorts from periodeffects.
46. This same difficulty in finding an appropriations measure commensuratewith the questions used in public opinion polls is noted by Wlezien, ‘‘The Publicas Thermostat,’’ 987.
47. For a more detailed description of the PACE index, see Streitwieser, ‘‘Usingthe Pollution Abatement Costs and Expenditures Micro Data for Descriptive andAnalytic Research.’’
48. Environmental Protection Agency, Environmental Investments. See alsoCarlin, Scodari, and Garner, ‘‘Environmental Investments.’’
49. This result is consistent with Robert Durr’s contention that an ‘‘optimisticeconomic outlook results in greater support for liberal domestic policies.’’ SeeDurr, ‘‘What Moves Policy Sentiment?,’’ 167.
50. See, for example, Page and Shapiro, ‘‘Effects of Public Opinion on Policy.’’
51. Wlezien, ‘‘The Public as Thermostat,’’ 993.
52. For example, between 1973 and 1976, federal budgets under Republicanpresident Richard M. Nixon appropriated (on average) 2.12 percent of totalbudget dollars to natural resources and the environment, followed by 2.40 per-cent under Democrat Jimmy Carter, 1.67 percent under Republican RonaldReagan, 1.39 percent under Republican George H. W. Bush, and 1.41 percentunder Democrat Bill Clinton.
Notes to Chapter 3 217

53. Media attention alone does not always produce increased environmentalconcern. As Daley and O’Neill argue in ‘‘Sad Is Too Mild a Word,’’ contentmatters. In news coverage of the Exxon Valdez oil spill, for example, they arguethat the news media ‘‘naturalised’’ the disaster, directing attention ‘‘away fromthe political arena and into the politically inaccessible realm of technologicalinevitability’’ (p. 53). For another pair of contrasting views on the accuracy ofnews reporting on the environment, refer to Ruben, ‘‘Back Talk’’; and Michaels,‘‘Reporters Cry Wolf about Environment.’’
54. Smith, ‘‘Is There Real Opinion Change?’’
55. Dunlap, ‘‘Trends in Public Opinion toward Environmental Issues.’’
56. Stimson, Public Opinion in America.
57. For additional confirmation of the stable priority accorded to environmentalprotection despite the competition of other issues, refer to Lowe, Pinhey, andGrimes, ‘‘Public Support for Environmental Protection.’’
58. Kingdon, Agendas, Alternatives, and Public Policies.
59. For example, ‘‘One might conclude . . . that efforts at initiating liberal policiesare ill advised during troubled economic times’’ and that external factors like theeconomy ‘‘play a critical role in opening and closing the ‘policy windows’through which the makers and advocates of policy initiatives must move.’’ SeeDurr, ‘‘What Moves Policy Sentiment?,’’ 167.
Chapter 4
1. Anthony, ‘‘Race, Justice, and Sprawl,’’ 97.
2. Bullard, Dumping in Dixie.
3. Easterbrook, ‘‘Suburban Myth,’’ 18.
4. Loth, ‘‘Bringing Earth Day Back Down to Earth,’’ A33.
5. Dowie, Losing Ground, 6.
6. Loth, ‘‘Bringing Earth Day Back Down to Earth,’’ A33.
7. Sagoff, ‘‘The Great Environmental Awakening,’’ 46.
8. Constantini and Hanf, ‘‘Environmental Concern and Lake Tahoe’’; Dillmanand Christenson, ‘‘The Public Value for Pollution Control,’’ in Burch, Cheek, andTaylor, eds., Social Behavior, Natural Resources, and the Environment; Tog-nacci, Weigel, Wideen, and Vernon, ‘‘Environmental Quality’’; Albrecht andMauss, ‘‘The Environment as a Social Problem,’’ in Mauss, ed., Social Problemsas Social Movements; Dunlap, ‘‘The Impact of Political Orientation on Environ-mental Attitudes and Action.’’
9. Ogden, ‘‘The Future of the Environmental Struggle,’’ in Meek and Straayer,eds., The Politics of Neglect; Mitchell, ‘‘Silent Spring/Solid Majorities’’; Lowe,Pinhey, and Grimes, ‘‘Public Support for Environmental Protection’’; Ladd,‘‘Clearing the Air’’; Mohai, ‘‘Public Concern and Elite Involvement in Environ-
218 Notes to Chapter 4

mental-Conservation Issues’’; Samdahl and Robertson, ‘‘Social Determinants ofEnvironmental Concern’’; Dietz, Stern, and Guagnano, ‘‘Social Structural andSocial Psychological Bases of Environmental Concern.’’
10. For an excellent argument on this topic, see Klineberg, McKeever, andRothenbach, ‘‘Demographic Predictors of Environmental Concern.’’
11. Dietz, Stern, and Guagnano, ‘‘Social Structural and Social PsychologicalBases of Environmental Concern,’’ 463.
12. Denton Morrison and Riley Dunlap make a critical distinction between‘‘compositional elitism,’’ which suggests that environmentalists are drawn froman upper socioeconomic status; ‘‘ideological elitism,’’ which argues that environ-mental policy agendas benefit environmentalists at the expense of other groups;and ‘‘impact elitism,’’ where environmental policies have regressive social con-sequences. The specific charge of compositional elitism is what is explored here.See Morrison and Dunlap, ‘‘Environmentalism and Elitism.’’
13. Readers unfamiliar with regression analysis might find the analysis in thischapter confusing at times. A basic primer should help, such as Berry andSanders, Understanding Multivariate Research.
14. Mohai and Twight, ‘‘Age and Environmentalism.’’
15. In other words, the effect of age relates to birth cohorts and not to simplebiological maturity. See Hays, Beauty, Health, and Permanence; Malkis andGrasmick, ‘‘Support for the Ideology of the Environmental Movement.’’ Onmore general theories regarding the importance of birth cohorts, see Ryder, ‘‘TheCohort as a Concept in the Study of Social Change’’; Schuman and Rieger,‘‘Historical Analogies, Generational Effects, and Attitudes toward War.’’
16. Inglehart, ‘‘Post-Materialism in an Environment of Insecurity,’’ 882.
17. It is difficult, however, to distinguish between cohort and period effectswithin a single cross-sectional survey. One recent study that attempts to do justthat argues that specific historical triggers—those that influence birth cohorts inequal measure, including the Chernobyl nuclear disaster and the Exxon Valdezoil spill in Alaska—are more powerful in the end. See Kanagy, Humphrey, andFirebaugh, ‘‘Surging Environmentalism.’’
18. Munton and Brady, ‘‘American Public Opinion and Environmental Pollu-tion,’’ 18; Van Liere and Dunlap, ‘‘The Social Bases of Environmental Concern’’;Albrecht and Mauss, ‘‘The Environment as a Social Problem,’’ 578.
19. Verba and Nie, Participation in America; Milbrath and Goel, Political Par-ticipation; Conway, Political Participation in the United States; Brady, Verba,and Scholzman, ‘‘Beyond SES.’’
20. See, for example, Gottlieb, ‘‘Forcing the Spring’’; and Paehlke, Environmen-talism and the Future of Progressive Politics.
21. Douglas and Wildavsky, Risk and Culture; also, Paehlke, Environmentalismand the Future of Progressive Politics.
Notes to Chapter 4 219

22. As Van Liere and Dunlap reason in ‘‘The Social Bases of EnvironmentalConcern,’’ ‘‘Members of the lower class typically have experienced only poorphysical conditions, and thus are less aware that they live, work, and play inpolluted, overcrowded conditions’’ (p. 184). These theories are often extendedto comparisons between developed and developing countries. See Dunlap andMertig, ‘‘Global Concern for the Environment’’; also Diekmann and Franzen,‘‘The Wealth of Nations and Environmental Concern.’’
23. Loth, ‘‘Bringing Earth Day Back Down to Earth,’’ A33.
24. Richard Rodriguez, quoted in Dowie, Losing Ground, 220. See also Hersheyand Hill, ‘‘Is Pollution a ‘White Thing?’ ’’; Taylor, ‘‘Blacks and the Environ-ment’’; Baugh, ‘‘African-Americans and the Environment.’’
25. As others point out, however, environmental health threats (air pollution, inparticular) are often most severe for these groups. See Bullard, Dumping inDixie.
26. Bullard, Dumping in Dixie, xiv–xv.
27. For a review of that field of research, see Davidson and Freudenburg,‘‘Gender and Environmental Risk Concerns’’; also Zelezny, Chua, and Aldrich,‘‘Elaborating on Gender Differences in Environmentalism.’’
28. Mohai, ‘‘Men, Women, and the Environment’’; also Blocker and Eckberg,‘‘Gender and Environmentalism’’; Gottlieb, ‘‘Forcing the Spring,’’ chapter 6.
29. Bord and O’Connor, ‘‘The Gender Gap in Environmental Attitudes.’’
30. Davidson and Freudenburg, ‘‘Gender and Environmental Risk Concerns.’’
31. See Mohai, ‘‘Men, Women, and the Environment’’; also Nelkins, ‘‘NuclearPower as a Feminist Issue’’; Brody, ‘‘Differences by Sex in Support for NuclearPower’’; Blocker and Eckberg, ‘‘Environmental Issues as Women’s Issues’’; Solo-mon, Tomaskovic-Devey, and Risman, ‘‘The Gender Gap and Nuclear Power’’;also Blocker and Eckberg, ‘‘Gender and Environmentalism.’’
32. The nature of that criticism is outlined by Sagoff, in ‘‘The Great Environ-mental Awakening,’’ but not ultimately supported by him.
33. Dietz, Stern, and Guagnano, ‘‘Social Structural and Social PsychologicalBases of Environmental Concern.’’ See also Buttel and Flinn, ‘‘The Politics ofEnvironmental Concern’’; also Constantini and Hanf, ‘‘Environmental Concernand Lake Tahoe’’; Dillman and Christenson, ‘‘The Public Value for PollutionControl’’; Tognacci et al., ‘‘Environmental Quality’’; Dunlap, ‘‘The Impactof Political Orientation on Environmental Attitudes and Action’’; Van Liereand Dunlap, ‘‘The Social Bases of Environmental Concern’’; and Samdahl andRobertson, ‘‘Determinants of Environmental Concern.’’
34. Van Liere and Dunlap, ‘‘The Social Bases of Environmental Concern,’’ 192.
35. See, for example, Dietz, Stern, and Guagnano, ‘‘Social Structural and SocialPsychological Bases of Environmental Concern’’; also Klineberg, McKeever, andRothenbach, ‘‘Demographic Predictors of Environmental Concern.’’ The effectof race on environmental attitudes is questioned in at least two recent studies:
220 Notes to Chapter 4

Mohai and Bryant, ‘‘Is There a ‘Race’ Effect on Concern for EnvironmentalQuality?’’; and Jones and Carter, ‘‘Concern for the Environment among BlackAmericans.’’ The influence of gender, too, has been refuted by some, includingDietz, Stern, and Guagnano, ‘‘Social Structural and Social Psychological Bases ofEnvironmental Concern’’; and Blocker and Eckberg, ‘‘Environmental Issues asWomen’s Issues.’’
36. Klineberg, McKeever, and Rothenbach, ‘‘Demographic Predictors of Envi-ronmental Concern,’’ 749.
37. Buttel and Flinn, ‘‘The Politics of Environmental Concern’’; Weigel andWeigel, ‘‘Environmental Concern.’’
38. Dillman and Christenson, ‘‘The Public Value for Pollution Control’’; Elliot,Regens, and Seldon, ‘‘Exploring Variation in Public Support for EnvironmentalProtection’’; Elliott, Seldon, and Regens, ‘‘Political and Economic Determinantsof Individuals’ Support for Environmental Spending.’’
39. Maloney, Ward, and Braucht, ‘‘A Revised Scale for the Measurement ofEcological Attitudes and Knowledge.’’
40. Buttel and Flinn, ‘‘The Politics of Environmental Concern.’’
41. Dunlap, Grieneeks, and Rokeach, ‘‘Human Values and Pro-EnvironmentalBehavior,’’ in Conn, ed., Energy and Material Resources; Milbrath, Environ-mentalists; Schwartz and Miller, ‘‘The Earth’s Best Friends’’; Mohai, ‘‘PublicConcern and Elite Involvement in Environmental-Conservation Issues.’’
42. For example, there is much evidence to suggest that relatively affluent, better-educated individuals are more politically active in all issue areas. See Milbrath,Political Participation; also Verba and Nie, Participation in America.
43. Klineberg, McKeever, and Rothenbach, ‘‘Demographic Predictors of Envi-ronmental Concern,’’ 749; see also Van Liere and Dunlap, ‘‘EnvironmentalConcern’’; and Samdahl and Robertson, ‘‘Social Determinants of EnvironmentalConcern.’’
44. It should be noted that NORC has not repeated its battery of General SocialSurvey (GSS) environmental questions since 1994. The data used here, therefore,are the most recent available.
45. Berry and Sanders, Understanding Multivariate Research, 45–49.
46. Douglas and Wildavsky, Risk and Culture.
47. To isolate this possibility more directly, data were broken down by residency,including urban, suburban, small-town, and rural areas, but no independent geo-graphic effects were found. This suggests that income differences could also bethe result of a gap between subjective and objective reality, where low-incomerespondents view environmental risks in personal terms irrespective of their sur-roundings. In this case, the survey context is limiting in that low-income respon-dents cannot be observed under different known environmental conditions.
48. Bullard, Dumping in Dixie.
Notes to Chapter 4 221
49. The R-square of a regression equation measures the explanatory power (or‘‘fit’’) of the model. Ranging in value from 0 to 1, it represents the proportion ofthe variation in the dependent variable ðyÞ that is explained by the independentvariables ðX1 . . .XnÞ in the model. See Berry and Sanders, Understanding Multi-variate Research, 44–45.
50. Ordered probit is necessary here because of the nature of the dependentvariables used. Ordinary least squares regression (OLS) assumes under theGauss-Markov theorem that the dependent variable is continuous and is free totake on any value from negative infinity to positive infinity. While the accuracy ofthis assumption can be questioned on many measures used in survey research, itis especially violated in cases where responses are coded into a small number ofresponse categories. In the 1994 NORC General Social Survey (GSS), for exam-ple, respondents are asked to consider whether spending on the environment iscurrently ‘‘too little,’’ ‘‘about the right amount,’’ or ‘‘too much,’’ coded as 1, 2,and 3, respectively. In this case, since the dependent variable is ordinal, OLS nolonger provides the best linear unbiased estimator. Indeed, it can be shown thatOLS estimates are both biased and inefficient and that they no longer have thesmallest possible sampling variance. To correct for the use of a limited dependentvariable, a nonlinear probability model, such as ordered probit, should be usedto fit the data. While the underlying logic of this approach is much the same asthe logic of approaches used in more basic regression models, slope coefficientsproduced using probit cannot be interpreted simply as the marginal effect of anindependent variable. Some additional calculation is required. Readers unfamil-iar with the technique should refer to Aldrich and Nelson, Linear Probability,Logit, and Probit Models.
51. In other words, ‘‘correlations with political ideology may be less appar-ent when environmental concern is measured in other ways.’’ See Klineberg,McKeever, and Rothenbach, ‘‘Demographic Predictors of Environmental Con-cern,’’ 737.
52. Berelson, Lazarsfeld, and McPhee, Voting; also Campbell, Converse, Miller,and Stokes, The American Voter.
53. Campbell et al., The American Voter, 296.
54. Mohai, ‘‘Black Environmentalism.’’
55. Those arguments are summarized but ultimately refuted by Sagoff in ‘‘TheGreat Environmental Awakening,’’ 44, 46.
56. Tucker, Progress and Privilege, 34–36; Douglas and Wildavsky, Risk andCulture; Sagoff, ‘‘The Great Environmental Awakening,’’ 40.
57. Schneider, ‘‘Everybody’s an Environmentalist Now,’’ 1062.
58. See, for example, Constantini and Hanf, ‘‘Environmental Concern and LakeTahoe’’; Dillman and Christenson, ‘‘The Public Value for Pollution Control’’;Tognacci et al., ‘‘Environmental Quality’’; Albrecht and Mauss, ‘‘The Environ-ment as a Social Problem’’; Dunlap, ‘‘The Impact of Political Orientation onEnvironmental Attitudes and Action.’’
222 Notes to Chapter 4

59. That conclusion is corroborated by Robert Emmet Jones and Riley E. Dun-lap in ‘‘The Social Bases of Environmental Concern’’; also, Klineberg, McKeever,and Rothenbach, ‘‘Demographic Predictors of Environmental Concern.’’
60. Gottlieb, ‘‘Forcing the Spring,’’ 306.
61. See, for example, Kempton, Boster, and Hartley, Environmental Values inAmerican Culture.
Chapter 5
1. Converse, ‘‘The Nature of Belief Systems in Mass Publics,’’ in Apter, ed.,Ideology and Discontent.
2. The notion of attitude consistency (or ‘‘constraint’’) was central to Converse’sthesis, which defined a belief system as a ‘‘configuration of ideas and attitudes inwhich the elements are bound together by some form of constraint or functionalinterdependence.’’ See, for example, Converse, ‘‘The Nature of Belief Systems,’’207.
3. Converse, ‘‘The Nature of Belief Systems,’’ 245.
4. Zaller and Feldman, ‘‘A Simple Theory of the Survey Response,’’ 580.
5. Zaller and Feldman, ‘‘A Simple Theory.’’ For results similar to Converse,‘‘The Nature of Belief Systems,’’ refer to Campbell, Converse, Miller, and Stokes,The American Voter; also McCloskey, ‘‘Consensus and Ideology in AmericanPolitics.’’
6. Key, ‘‘Public Opinion and American Democracy,’’ 153. For more on the im-portance of cognitive consistency theory, see Bennett, ‘‘Consistency among thePublic’s Social Welfare Policy Attitudes in the 1960s.’’
7. Swan, ‘‘Environmental Education.’’
8. Rosenbaum, Environmental Politics and Policy, 305.
9. For further discussion of that ‘‘gap,’’ see Dunlap, ‘‘Polls, Pollution, and Poli-tics Revisited’’; ‘‘Public Opinion and Environmental Policy’’ in Lester, ed., Envi-ronmental Politics and Policy; and ‘‘Public Opinion in the 1980s’’; also Schwartzand Miller, ‘‘The Earth’s Best Friends.’’
10. For a deeper discussion of ‘‘doorstep opinions,’’ see Erikson, Luttbeg, andTedin, American Public Opinion.
11. deHaven-Smith, ‘‘Toward a Communicative Theory of EnvironmentalOpinion,’’ 630.
12. To restate the point more formally, the presence of non-random measure-ment error means that correlations between latent traits of interest may bear littleresemblance to those between observed indicators. See Blalock, ‘‘Some Implica-tions of Random Measurement Error for Causal Inferences,’’ ‘‘Multiple Indica-tors and the Causal Approach to Measurement Error,’’ and ‘‘A Causal Approachto Nonrandom Measurement Errors’’; Achen, ‘‘Mass Political Attitudes and the
Notes to Chapter 5 223

Survey Response’’; Green, ‘‘On the Dimensionality of Public Sentiment towardPartisan and Ideological Groups’’; Green and Citrin, ‘‘Measurement Error andthe Structure of Attitudes.’’
13. Tognacci et al., ‘‘Environmental Quality.’’
14. Dillman and Christenson, ‘‘The Public Value for Pollution Control,’’ inBurch, Cheek, and Taylor, eds., Social Behavior, Natural Resources, and theEnvironment; Marsh and Christenson, ‘‘Support for Economic Growth andEnvironmental Protection, 1973–1975.’’
15. Maloney, Ward, and Braucht, ‘‘A Revised Scale for the Measurement ofEcological Attitudes and Knowledge.’’
16. Buttel and Flinn, ‘‘The Politics of Environmental Concern’’; Buttel andJohnson, ‘‘Dimensions of Environmental Concern.’’
17. Dunlap, Grieneeks, and Rokeach, ‘‘Human Values and Pro-EnvironmentalBehavior,’’ in Conn, ed., Energy and Material Resources; Milbrath, Environ-mentalists; Schwartz and Miller, ‘‘The Earth’s Best Friends.’’
18. Buttel and Flinn, ‘‘The Politics of Environmental Concern’’; Maloney, Ward,and Braucht, ‘‘A Revised Scale for the Measurement of Ecological Attitudes andKnowledge.’’
19. Van Liere and Dunlap, ‘‘Environmental Concern,’’ 652.
20. Most recently, see Klineberg, McKeever, and Rothenbach, ‘‘DemographicPredictors of Environmental Concern,’’ 734.
21. On the weak relationship between various measures of environmental atti-tudes, see Lounsbury and Tornatzky, ‘‘A Scale for Assessing Attitudes towardEnvironmental Quality’’; Albrecht, Bultena, Hoiberg, and Nowak, ‘‘The NewEnvironmental Paradigm Scale’’; Keeter, ‘‘Problematical Pollution Polls’’; Gellerand Lasley, ‘‘The New Environmental Paradigm Scale’’; also Buttel and Johnson,‘‘Dimensions of Environmental Concern’’; Van Liere and Dunlap, ‘‘Environ-mental Concern.’’ It is interesting to note that evidence also suggests that pro-environmental behaviors, such as recycling, carpooling, and energy conservation,are not strongly correlated. For a review of that literature, refer to Mainieri,Barnett, Valdero, Unipan, and Oskamp, ‘‘Green Buying.’’
22. Tognacci et al., ‘‘Environmental Quality.’’
23. Buttel and Johnson, ‘‘Dimensions of Environmental Concern.’’
24. Dunlap and Van Liere, ‘‘The ‘New Environmental Paradigm’ ’’ and ‘‘Com-mitment to the Dominant Social Paradigm and Concern for EnvironmentalQuality.’’
25. Pirages and Ehrlich, Ark II; Catton and Dunlap, ‘‘Environmental Sociol-ogy’’; also Dunlap and Van Liere, ‘‘The ‘New Environmental Paradigm’ ’’; Mil-brath, Environmentalists.
26. Dunlap and Van Liere’s original battery of survey questions included thefollowing twelve statements:
224 Notes to Chapter 5

. We are approaching the limit of the number of people the earth can support.
. The balance of nature is very delicate and easily upset.
. Humans have the right to modify the natural environment.
. Humankind was created to rule over the rest of nature.
. When humans interfere with nature it often produces disastrous consequences.
. Plants and animals exist primarily to be used by humans.
. To maintain a healthy economy we will have to develop a steady-state econ-omy where industrial growth is controlled.. Humans must live in harmony with nature in order to survive.. The earth is like a spaceship with only limited room and resources.. Humans need not adapt to the natural environment because they can remake itto suit their needs.. There are limits to growth beyond which our industrialized society cannotexpand.. Mankind is severely abusing the environment.See Dunlap and Van Liere, ‘‘The ‘New Environmental Paradigm.’ ’’
27. Albrecht et al., ‘‘The New Environmental Paradigm Scale.’’
28. Geller and Lasley, ‘‘The New Environmental Paradigm Scale.’’
29. Pierce, Lovrich, and Tsurutani, ‘‘Culture, Politics and Mass Publics’’; Kuhnand Jackson, ‘‘Stability of Factor Structures in the Measurement of Public Envi-ronmental Attitudes’’; Noe and Snow, ‘‘The New Environmental Paradigmand Further Scale Analysis’’; Scott and Willits, ‘‘Environmental Attitudes andBehavior’’; Roberts and Bacon, ‘‘Exploring the Subtle Relationships betweenEnvironmental Concern and Ecologically Conscious Consumer Behavior.’’
30. Dunlap, Van Liere, Mertig, and Jones, ‘‘Measuring Endorsement of the NewEcological Paradigm.’’
31. deHaven-Smith, ‘‘Toward a Communicative Theory,’’ 194.
32. For example, Dunlap and Van Liere, ‘‘The ‘New Environmental Paradigm’ ’’;Van Liere and Dunlap, ‘‘Environmental Concern’’; Kuhn and Jackson, ‘‘Stabilityof Factor Structures in the Measurement of Public Environmental Attitudes’’;Scott and Willits, ‘‘Environmental Attitudes and Behavior.’’
33. Green and Citrin, ‘‘Measurement Error and the Structure of Attitudes,’’261fn.
34. See, for example, Dunlap and Van Liere, ‘‘The ‘New Environmental Para-digm’ ’’; Geller and Lasley, ‘‘The New Environmental Paradigm Scale.’’
35. Green and Citrin, ‘‘Measurement Error and the Structure of Attitudes.’’
36. For advanced readers, a brief mathematical explanation of measurementerror (and its effects) is offered here. Let
X1i ¼ xi þ d1i
X2i ¼ lxi þ d2i
where
Notes to Chapter 5 225

Xki represents the observed variables,xi is the underlying trait,d1i represents errors in measurement, andl is a scaling coefficient.
Example 1: No measurement error If no measurement error is present,
VARðd1iÞ ¼ VARðd1iÞ ¼ 0Correlation between variables is calculated using the following equation:
rðX1i;X2iÞ ¼COVðX1i;X2iÞffiffiffiffiffiffiffiffiffiffiffiffiffiffiffiffiffiffiffiffiffiffi
VARðX1iÞp
�ffiffiffiffiffiffiffiffiffiffiffiffiffiffiffiffiffiffiffiffiffiffiVARðX2iÞ
p ¼ lVARðxiÞffiffiffiffiffiffiffiffiffiffiffiffiffiffiffiffiffiffiffiVARðxiÞ
p�
ffiffiffiffiffiffiffiffiffiffiffiffiffiffiffiffiffiffiffiffiffiffiffil2 VARðxiÞ
pExample 2: Random measurement error only If random errors in measurementoccur,�where;VARðd1iÞ and VARðd2iÞ > 0;but COVðxi; dkiÞ ¼ COVðd1i; d2iÞ ¼ 0
�
rðX1i;X2iÞ ¼lVARðxiÞffiffiffiffiffiffiffiffiffiffiffiffiffiffiffiffiffiffiffiffiffiffiffiffiffiffiffiffiffiffiffiffiffiffiffiffiffiffiffiffiffiffiffi
VARðxiÞ þ VARðd1iÞp
�ffiffiffiffiffiffiffiffiffiffiffiffiffiffiffiffiffiffiffiffiffiffiffiffiffiffiffiffiffiffiffiffiffiffiffiffiffiffiffiffiffiffiffiffiffiffiffiffil2 VARðxiÞ þ VARðd2iÞ
pNote, because of additional terms in the denominator, the correlation betweenvariables in this example is weaker than it is in example 1. In other words, cor-relations contaminated with random measurement error will be attenuated.
Example 3: Random and nonrandom measurement error
½where;COVðd1i; d2iÞ0 0�
rðX1i;X2iÞ ¼lVARðxiÞ þ COVðd1i; d2iÞffiffiffiffiffiffiffiffiffiffiffiffiffiffiffiffiffiffiffiffiffiffiffiffiffiffiffiffiffiffiffiffiffiffiffiffiffiffiffiffiffiffiffi
VARðxiÞ þ VARðd1iÞp
�ffiffiffiffiffiffiffiffiffiffiffiffiffiffiffiffiffiffiffiffiffiffiffiffiffiffiffiffiffiffiffiffiffiffiffiffiffiffiffiffiffiffiffiffiffiffiffiffil2 VARðxiÞ þ VARðd2iÞ
pWhen nonrandom measurement error is also present, note that the effect on r isless predictable. The correlation in example 3 could be either larger or smallerthan the correlation in example 1 and could even be of the wrong sign, depend-ing on the relative size of the error variance and covariance terms. For morebackground on measurement error and its effects, refer to Blalock, ‘‘Some Impli-cations of Random Measurement Error,’’ ‘‘Multiple Indicators and the CausalApproach to Measurement Error,’’ and ‘‘A Causal Approach to NonrandomMeasurement Errors’’; Achen, ‘‘Mass Political Attitudes and the Survey Re-sponse’’; Green, ‘‘On the Dimensionality of Public Sentiment toward Partisanand Ideological Groups’’; Green and Citrin, ‘‘Measurement Error and the Struc-ture of Attitudes.’’
37. Hayduk, Structural Equation Modeling with LISREL.
38. Kachigan, Multivariate Statistical Analysis.
39. Kerlinger, Behavioral Research, 180.
40. Responses to each of these questions are problematic because of the use ofordinal categories. Although Joreskog and Sorbom, in LISREL 7, recommendthat a polychoric correlation matrix be used with weighted least squares (WLS)under these conditions, that approach holds no special advantage here for several
226 Notes to Chapter 5

reasons. First, polychoric correlation matrices do not alleviate the normalityassumptions required by LISREL (a computer program acronym that stands forLInear Structural RELationships). Rather, the procedure requires the assumptionthat the true underlying variables are distributed multivariate normally and thatthe observed data appear as non-normal only because of poor and arbitraryclassification into categories. Whether that assumption is accurate for most envi-ronmental data is unclear. While the measures used by Gallup in its environ-mental battery are negatively skewed, this may be due to poor cutpoints butmore likely is due to a skewed underlying distribution since Americans seemoverwhelmingly proenvironmental. As Hayduk warns, in Structural EquationModeling, ‘‘if the problematic skewness really does originate from a skewed orotherwise nonmultivariate population distribution, we could be doing more harmthan good by ‘rectifying’ the problem’’ (p. 329).Second, use of any correlation matrix as an input matrix in LISREL leads to a
loss of information about the real scales on which the indicators are based,interfering with the use of goodness-of-fit statistics and test statistics, such as chi-square. Because of this loss of information along the diagonal of the inputmatrix, use of a polychoric correlation matrix can make identification problemsmore severe and model convergence difficult.Finally, a comparison of Pearson’s and polychoric correlations in this case
shows little difference in relative rank. True, Pearson’s correlations are generallyattenuated in comparison to polychoric correlations, but if we are interested inthe rank order of coefficients (which measures correlate more highly than othercoefficients), this information remains essentially the same. Consequently, abivariate OLS regression of Pearson’s correlations on corresponding polychoriccorrelations for the six measures of environmental concern used here yield aslope estimate of .93 and a R-square of .97. For all of these reasons, the use ofmaximum likelihood estimation is still an appropriate strategy.
41. As a preliminary step toward model specification, principal factor analysiswas used on the full set of Gallup degree-of-concern items. Using a scree plot,eigenvalues dropped sharply after extracting the first factor and evened out inconsecutive factors, with the first factor explaining 55 percent of the total vari-ance in all variables. While high factor loadings for these items looked promisingas evidence of near-perfect unidimensionality ranging in value from .63 to .78,those results are at best inconclusive and at worst misleading. Given that allthirteen questions were asked in close proximity using an identical responseformat, it is possible that this common response format drives the high factorloadings observed. To purge estimates of any systematic response bias, confir-matory factor analysis must be used instead.
42. The terms skewness and kurtosis are used by statisticians to characterizea variable’s underlying distribution. Skewness represents the asymmetry of adistribution—that is, whether it leans to the right or to the left. Kurtosis (whichderives from the Greek word for ‘‘bulginess’’) notes the size of a distribution’stails, which can cause a flat or thin appearance. While it is possible to employan alternative estimator (as weighted least squares) if one or both of these
Notes to Chapter 5 227

coefficients suggest non-normality, those techniques are more demanding com-putationally and are not clearly superior in performance. See Bollen, StructuralEquations with Latent Variables; also Hayduk, Structural Equation Modeling.
43. Dividing chi-square by the degrees of freedom used is sometimes suggested asa less biased fit statistic than chi-square itself because of the latter’s sensitivity tosample size. To suggest a good fit of the model to the data, the ratio calculatedshould be small, with values below three considered satisfactory. In this case, themultidimensional model’s chi-square/degree-of-freedom ratio is 2.79. See Bollenand Long, Testing Structural Equation Models.
44. The closer the goodness-of-fit index (GFI) is to 1.00, the better the fit of themodel to the data. The results in this case easily reach conventional levels ofacceptance.
45. A nested chi-square difference test shows that the multidimensional modelfails to provide a statistically significant improvement in fit over the unidimen-sional version. In this case, the unidimensional model is ‘‘nested’’ within themultidimensional model since it can be obtained by constraining one of the freeparameters in the multidimensional model to be fixed—that is, it constrainsthe correlation between factors to be 1. With that in mind, the two models canbe compared for goodness-of-fit using the following test statistic, where w2 ¼w21 � w22 , with df1 � df2 degrees of freedom:
Chi-square Degrees of freedom
Unidimensional model 21.10 8
Multidimensional model �19.51 �7
1.59 1
A chi-square of 1.59 with one degree of freedom is not statistically significant atconventional levels. In other words, relaxing the constraints of the unidimen-sional model does not result in a notable improvement in fit. See Joreskog andSorbom, LISREL 7.
46. While results are not reported in tabular form here, an identical model wasused on a 1991 Gallup sample, and very similar results were obtained (r ¼ 0:91).See Guber, ‘‘Environmental Concern and the Dimensionality Problem.’’
47. Given that only one measure of self-identification was available in the Gallupstudy (March 5–7, 2001), it was necessary to fix the error variance of thisobserved indicator to a predetermined value to achieve model identification. Forthis reason, each variable in the model was examined in conjunction with allremaining variables using a conventional method of reliability assessment(Cronbach’s coefficient alpha), and the error variance for environmental self-identification in LISREL was set to a value that produced an equivalent reliabilitystatistic.
48. In this case, several comparsions are in order. Summary correlations betweenadditive scales created from each battery of questions ranged from just .36 to .43.Confirmatory factor analysis assuming no errors in measurement yielded corre-
228 Notes to Chapter 5

lations within that same range. When random error was estimated, correlationsimproved to between .43 and .58 and finally to between .49 and .67 after con-trolling for nonrandom elements.
49. Buttel and Johnson, ‘‘Dimensions of Environmental Concern,’’ 59.
50. deHaven-Smith, ‘‘Environmental Belief Systems,’’ ‘‘Toward a Communica-tive Theory of Environmental Opinion,’’ and Environmental Concern in Floridaand the Nation.
51. Van Liere and Dunlap, ‘‘Environmental Concern.’’
52. Achen, ‘‘Mass Political Attitudes and the Survey Response’’; Green, ‘‘On theDimensionality of Public Sentiment toward Partisan and Ideological Groups’’;Green and Citrin, ‘‘Measurement Error and the Structure of Attitudes.’’
53. It could be, for example, that truly multidimensional attitudes on the envi-ronment are more sophisticated, indicating that certain respondents are capableof drawing fine distinctions between different and complex environmental issues.
54. Pierce and Lovrich, ‘‘Belief Systems Concerning the Environment,’’ 282.
55. Achen, ‘‘Mass Political Attitudes and the Survey Response,’’ 1231. His criti-cism seems particularly valid here given evidence suggesting that most Americansare ill-informed on environmental issues. For example, the National Environ-mental Education and Training Foundation’s (NEETF) annual ‘‘report card’’ onenvironmental knowledge finds that ‘‘Americans lack the basic knowledge andare unprepared to respond to the major environmental challenges we face in thetwenty-first century’’ (available online at hhttp://www.neetf.org/roper/roper.shtmi).Others, too argue that the ‘‘environmental risks that frighten people most rarelymatter most.’’ See ‘‘Green Choices, Hard Choices,’’ 11; and Rauch, ‘‘There’sSmoke in the Air, But It Isn’t All Pollution,’’ B1. For a more scholarly interpre-tation of the same basic point, refer to Slovic, ‘‘Perception of Risk.’’
Chapter 6
1. Carmines and Stimson, ‘‘The Two Faces of Issue Voting.’’
2. Mitchell, ‘‘Public Opinion and Environmental Politics in the 1970s and1980s,’’ in Vig and Kraft, eds., Environmental Policy in the 1980s, 55; Dunlap,‘‘Polls, Pollution, and Politics Revisited’’ and ‘‘Public Opinion in the 1980s.’’
3. Taylor, ‘‘Campaign Trail Littered with Environmental Wrecks,’’ 7b; Zaller,Report on 1991 Pilot Items on Environment.
4. Taylor, ‘‘Campaign Trail Littered,’’ 7b.
5. In all fairness, it should be noted that both Mitchell, in ‘‘Public Opinion andEnvironmental Politics,’’ and Dunlap, in ‘‘Polls, Polution, and Politics Revisited’’and ‘‘Public Opinion in the 1980s,’’ suggest possible reasons for the weak elec-toral impact of environmentalism, with Mitchell stressing high public supportfor environmental goals in conjunction with low issue salience and Dunlapemphasizing a ‘‘permissive consensus’’ that affords elected officials considerable
Notes to Chapter 6 229

flexibility and independence in pursuing environmental policies. Because of a lackof available data, however, neither is able to examine issue voting on the envi-ronment directly.
6. Kriz, ‘‘The Green Card,’’ 2262, and ‘‘Slinging Earth,’’ 958; Garland, ‘‘ComeWinter,’’ 66; Borosage and Greenberg, ‘‘Why Did Clinton Win?’’; St. Clair, ‘‘TheTwilight of ‘Gang Green,’ ’’ 14; Bedard, ‘‘Vote Green,’’ 9.
7. Carmines and Stimson, ‘‘The Two Faces of Issue Voting,’’ 79.
8. Downs, ‘‘Up and Down with Ecology’’; Nie, Verba, and Petrocik, TheChanging American Voter; Margolis, ‘‘From Confusion to Confusion.’’
9. Shabecoff, ‘‘Shades of Green in the Presidential Campaign,’’ 73–74.
10. Dunlap and Allen, ‘‘Partisan Differences on Environmental Issues.’’
11. For a helpful overview of the literature, see Kamieniecki, ‘‘Political Partiesand Environmental Policy,’’ in Lester, ed., Environmental Politics and Policy;also Cooley and Wandesforde-Smith, eds. Congress and the Environment; Dun-lap and Gale, ‘‘Party Membership and Environmental Politics’’; Dunlap andAllen, ‘‘Partisan Differences’’; Calvert, ‘‘The Social and Ideological Bases of Sup-port for Environmental Legislation.’’
12. Charles R. Shipan, and William R. Lowry, ‘‘Environmental Policy and PartyDivergence in Congress,’’ 245–263.
13. Lake, ‘‘The Environmental Mandate,’’ 230–231.
14. Zaller, Report on 1991 Pilot Items on Environment.
15. Kriz, ‘‘The Green Card’’ and ‘‘Slinging Earth.’’
16. Schuman and Presser, Questions and Answers in Attitude Surveys.
17. Rabinowitz, Prothro, and Jacoby, ‘‘Salience as a Factor in the Impact ofIssues on Candidate Elections.’’
18. While there is some disagreement in the literature regarding the cognitiveprocess of issue voting (‘‘spatial’’ or ‘‘directional’’), both models require thatvoters perceive differences between the candidates on issues that matter to them.See, for example, Downs, An Economic Theory of Democracy; Enelow andHinich, The Spatial Theory of Voting; Rabinowitz and Macdonald, ‘‘A Direc-tional Theory of Issue Voting’’; Macdonald, Rabinowitz, and Listhaug, ‘‘PoliticalSophistication and Models of Issue Voting’’ and ‘‘On Attempting to Rehabilitatethe Proximity Model’’; Westholm, ‘‘Distance versus Direction.’’
19. Campbell, Converse, Miller and Stokes, The American Voter.
20. Campbell et al., The American Voter, 179; see also Carmines and Stimson,‘‘The Two Faces of Issue Voting,’’ 82.
21. Brody and Page, ‘‘Comment’’; Pomper, ‘‘From Confusion to Clarity’’ andVoters’ Choice; also Nie, Verba, and Petrocik, The Changing American Voter.
22. In this sense, the environment may fail to influence individual vote choicebecause it is a ‘‘valence’’ issue—that is, one on which nearly everyone agrees,
230 Notes to Chapter 6

either in practice or in rhetoric. See Stokes, ‘‘Spatial Models of Party Competi-tion.’’ Asked once about his thoughts on Earth Day, former House Speaker NewtGingrich (Republican—Georgia) quipped it was the day when ‘‘Republicansdress up in drag and pretend that they’re environmentalists’’ (Kriz, ‘‘SlingingEarth,’’ 1957).
23. Peffley, Feldman, and Sigelman, ‘‘Economic Conditions and Party Competence.’’
24. Berinsky and Rosenstone, ‘‘Evaluation of Environmental Policy Items on the1995 NES Pilot Study.’’
25. Mastio, ‘‘The GOP’s Enviro-Rut,’’ 19.
26. The choice here of a candidate evaluation scale over a simple vote preferenceis consistent with recent trends in the field and as Rabinowitz et al. (‘‘Salience asa Factor,’’ 45) note, allows ‘‘a range of response rather than being restricted tofor or against.’’ Zaller’s model of environmental preferences in a 1991 NES PilotStudy report takes the same approach; see Zaller, Report on 1991 Pilot Items onEnvironment.
27. For example, Campbell et al., The American Voter; also Aldrich, Sullivan,and Borgida, ‘‘Foreign Affairs and Issue Voting.’’
28. Carmines and Stimson, ‘‘The Two Faces of Issue Voting,’’ 82.
29. Why do voters have difficulty in distinguishing between the policy positionsof the candidates? Perhaps it is because they are not well informed on environ-mental issues. After all, many of those polled in the National Election Study(NES) were ‘‘not very certain’’ of their placement of Bill Clinton (30 percent) orBob Dole (40 percent) on the environment and economy scale. Those respon-dents were, on average, more likely to position the candidates toward the centerof the continuum within close proximity of one another. It is interesting to note,however, that the degree of certainty respondents feel about the candidates’ issuepositions is not strongly related to any factors that seem instinctive or obvious—not to partisanship or education, or to the amount of attention paid to the presi-dential campaign. As a result, this problem may not be easy for candidates torectify.
30. Since this analysis closely follows the work of Aldrich et al., further detail onthe logic of these ‘‘cumulative conditions’’ can be found in ‘‘Foreign Affairs.’’
31. Smith, ‘‘Abortion Attitudes and Vote Choice in the 1984 and 1988 Presi-dential Elections.’’
32. Unfortunately, it is not possible to differentiate between ‘‘true’’ Independentsand more partisan ‘‘leaners’’ in this model. Small sample sizes simply do notpermit a more refined analysis.
33. Harris and Nakashima, ‘‘Gore’s Greenness Fades,’’ A1.
34. Callahan, ‘‘Environment Is ‘Sleeper’ Issue of 2000 Campaign.’’
35. Because of a series of experiments involving question wording and surveyadministration, a fully specified regression model (like that reported in table 6.3)is not possible using 2000 NES data. The sample sizes for that model, using a
Notes to Chapter 6 231

listwise deletion of missing values, are simply too small to support statisticalanalysis.
36. Nieves, ‘‘Conversation/Ralph Nader,’’ D7.
37. ‘‘Mr. Nader’s Electoral Mischief,’’ A34.
38. McFeatters, ‘‘Green Party Candidate Continues to Criticize Bush and, Par-ticularly, Gore,’’ A8. The 2.8 percent of self-reported votes that Nader receivedamong NES respondents in 2000 was a near perfect reflection of his national votetotal. Unfortunately, in public opinion polls small numbers translate into smallsample sizes. In this case, just thirty-three of those polled reported they voted forNader—a subset far too small to support reliable statistical analysis.
39. Official election returns provided by the Federal Election Commission (FEC)indicate that Nader received 97,488 votes in Florida—a state in which GeorgeW. Bush’s official margin of victory was just 537.
40. ‘‘Mr. Nader’s Misguided Crusade,’’ A24.
41. Dunlap and Scarce, ‘‘The Polls.’’
42. Dunlap, ‘‘Public Opinion and Environmental Policy,’’ in Lester, ed., Envi-ronmental Politics and Policy, 130.
43. Bosso, ‘‘After the Movement,’’ in Vig and Kraft, eds. Environmental Policyin the 1990s; also Kriz, ‘‘The Green Card.’’
44. Purdy, ‘‘Planet Bush, Planet Gore,’’ 34.
45. Purdy, ‘‘Planet Bush, Planet Gore,’’ 34.
46. Purdy, ‘‘Planet Bush, Planet Gore,’’ 34.
47. Schneider, ‘‘Everybody’s an Environmentalist Now.’’
48. Bragdon and Donovan, ‘‘Voter’s Concerns Are Turning the Political AgendaGreen,’’ 186.
49. Ridgeway, ‘‘It Isn’t Easy Voting Green,’’ 144–145.
50. Mitchell, ‘‘Public Opinion and the Green Lobby,’’ in Vig and Kraft, eds.,Environmental Policy in the 1990s; Mitchell, Mertig, and Dunlap, ‘‘TwentyYears of Environmental Mobilization,’’ in Dunlap and Mertiq, eds., AmericanEnvironmentalism.
51. Paige, ‘‘The ‘Greening’ of Government,’’ 16.
52. McCloskey, ‘‘A Second-Order Issue,’’ 2.
53. Lake, ‘‘The Environmental Mandate’’; also Kahn and Matsusaka, ‘‘Demandfor Environmental Goods.’’
Chapter 7
1. Dunlap, ‘‘Polls, Pollution, and Politics Revisited,’’ 13.
2. Zisk, Money, Media, and the Grassroots, 161.
3. Magleby, Direct Legislation.
232 Notes to Chapter 7

4. Lake, ‘‘The Environmental Mandate’’; Johnson, ‘‘Citizens Initiate BallotMeasures.’’
5. Taylor, ‘‘Campaign Trail Littered with Environmental Wrecks,’’ 7b.
6. Ridenour, ‘‘The Mouse that Squeaked.’’
7. Lake, ‘‘The Environmental Mandate,’’ 222.
8. Magleby, Direct Legislation, 168.
9. Lee, ‘‘California,’’ in Butler and Ranney, eds., Referendums.
10. Bone and Benedict, ‘‘Perspectives on Direct Legislation,’’ 47.
11. Zisk, Money, Media, and the Grassroots.
12. Magleby, Direct Legislation.
13. Lau, ‘‘Two Explanations for Negativity Effects in Political Behavior.’’
14. Magleby, in Direct Legislation, finds, for instance, that while just 26 percentof all citizens shift their vote intention in candidate elections, 70 percent of voterschange their opinions on ballot measures, most commonly from ‘‘soft’’ earlysupport to outright opposition by election day.
15. Mueller, ‘‘Voting on the Propositions,’’ 1211.
16. Lowenstein, ‘‘Campaign Spending and Ballot Propositions’’; also Bone andBenedict, ‘‘Perspectives on Direct Legislation’’; Magleby, Direct Legislation.
17. Magleby, ‘‘Direct Legislation in the American States,’’ in Butler and Ranney,eds. Referendums around the World, 251.
18. See Zisk, Money, Media, and the Grassroots, 165.
19. Lee, ‘‘California,’’ in Butler and Ranney, eds., Referendums.
20. Magleby, ‘‘Opinion Formation and Opinion Change in Ballot PropositionCampaigns,’’ in Margolis and Mauser, eds., Manipulating Public Opinion, 113;also Bowler, Dovovan, and Happ, ‘‘Ballot Propositions and Information Costs’’;Darcy and McAllister, ‘‘Ballot Position Effects.’’
21. Magleby, Direct Legislation, 54.
22. Baus and Ross, Politics Battle Plan.
23. Zisk, Money, Media, and the Grassroots.
24. Bone and Benedict, ‘‘Perspectives on Direct Legislation,’’ 346.
25. Bowler and Donovan, ‘‘Economic Conditions and Voting on BallotPropositions.’’
26. Rourke, Hiskes, and Zirakzadeh, Direct Democracy and International Poli-tics, 42–43.
27. A database on statewide initiatives from the Initiative and Referendum In-stitute is available online at hhttp://www.iandrinstitute.orgi.
28. Graham, A Compilation of Statewide Initiative Proposals Appearing onBallots through 1976; Ranney, ‘‘The United States of America,’’ in Butler andRanney, eds., Referendums, 80.
Notes to Chapter 7 233

29. For example, Magleby, Direct Legislation; Zisk, Money, Media, and theGrassroots; Bowler and Donovan, ‘‘Economic Conditions and Voting on BallotPropositions.’’
30. Hawaii, South Carolina, Tennessee, and Virginia were unable to providedata on ballot propositions.
31. Also excluded from this analysis were non-environmental measures none-theless supported by environmental groups, including (for example) campaignfinance reform or regulations regarding the initiative process and the number ofsignatures required to certify a petition.
32. Magleby, ‘‘Direct Legislation in the American States,’’ in Butler and Ranney,eds., Referendums around the World, 251.
33. It is also possible that the threat of impending war with Iraq during DesertShield and Desert Storm contributed to voter pessimism in 1990.
34. A dummy variable is a dichotomous variable—that is, one that can take ononly two possible values, 0 and 1. See Berry and Sanders, Understanding Multi-variate Research.
35. The estimate that environmental ballot propositions represent roughly 10percent of the total is based on the author’s own data collected from state elec-tion offices. It is also consistent with complete tallies from the four states exam-ined in this chapter. In Colorado, Massachusetts, Oregon, and South Dakotacombined, 549 ballot questions were offered to voters between 1964 and 2000.Forty-nine of those—or 8.9 percent—were on environmental subjects.
36. Zisk, Money, Media, and the Grassroots.
37. Saffire, ‘‘Has the Time Come for Deposit Legislation?,’’ 25.
38. Zisk, Money, Media, and the Grassroots; Johnson, ‘‘Citizens Initiate BallotMeasures.’’
39. Russell, ‘‘Warnings, Warnings Everywhere,’’ Z12, Z14.
40. Lovett, ‘‘Proposition 65 Comes of Age,’’ 26.
41. Russell, ‘‘Warnings, Warnings Everywhere,’’ Z12.
42. Epstein, ‘‘Campaign to Defeat Proposition 65,’’ 6 (emphasis added); alsoLaVally, ‘‘Proposition 65 Opponents Outspent Successful Foes.’’
43. Locke, ‘‘California Oil Industry Joins Others in Wariness over Proposition65,’’ 8.
44. Locke, ‘‘California Oil Industry Joins Others,’’ 8.
45. Jacobs, ‘‘Prop. 65,’’ 1.
46. Skelton, ‘‘Deukmejian Opposes 3 Controversial Propositions,’’ 3.
47. Field poll data are archived at the University of California and at the RoperCenter for Public Opinion Research at the University of Connecticut. All threepolls (USCA 86-04, USCA 86-05, USCA 86-06) were administered to adult resi-dents of California selected by random-digit dialing. The first (conducted July 24
234 Notes to Chapter 7

to August 4, 1986) had a sample size of 1,028; the second (September 24 toOctober 2, 1986) had a sample size of 1,023; and the last poll (October 29 to 30,1986) had a sample size of 701. For more information on the Field Institute, seehhttp://www.field.com/fieldpolli.
48. Locke, ‘‘Success of Proposition 65,’’ 8.
49. Epstein, ‘‘Campaign to Defeat Proposition 65.’’
50. Zisk, Money, Media, and the Grassroots.
51. Nicholl, ‘‘Son of David and Goliath,’’ 17 (emphasis added).
52. Allswang, California Initiatives and Referendums; also Nicholl, ‘‘Son ofDavid and Goliath.’’
53. Rauber, ‘‘Losing the Initiative?,’’ 20.
54. Lacayo, ‘‘Green Ballots vs. Greenbacks,’’ 44; also Rauber, ‘‘Losing theInitiative?’’
55. Casuso, ‘‘Black Tuesday for Big Green Backers,’’ 6.
56. Allen, ‘‘High Supply, Low Demand Hurt Effort to Recycle,’’ 27.
57. Dumanoski, ‘‘Environment Not Gaining Ground during Campaign,’’ 1 and‘‘Advertising Blitz Erodes Support for Question 3,’’ 17.
58. Allen, ‘‘High Supply’’; Leaversuch, ‘‘Massachusetts Votes Down DrasticMeasure to Reduce Package Waste,’’ 37.
59. Allen, ‘‘High Supply’’; Dumanoski, ‘‘Environment Not Gaining Groundduring Campaign’’ and ‘‘Advertising Blitz Erodes Support for Question 3.’’
60. Magleby, Direct Legislation.
61. Designed for the Massachusetts Public Interest Research Group (MassPIRG),the environmental sponsors of Question 3, the Marttila & Kiley survey (#MK92110) was administered by telephone from February 11 to 13, 1992. A sampleof 402 Massachusetts voters was generated using a random-probability methodthat included unlisted telephone numbers. The sample was stratified according tocounty, and gender quotas were observed. The data used here were provided tothe author courtesy of Marttila Communications Group, Inc. (1 Beacon Street,Boston, MA 02111). See also hhttp://www.masspirg.orgi.
62. Magleby, Direct Legislation.
63. Leaversuch, ‘‘Massachusetts Votes Down Drastic Measure to Reduce Pack-age Waste.’’
64. Gilmore, ‘‘Nation’s Voters Decide to Keep their Wallets Green,’’ A5;Mathews, ‘‘The Big, the Green, the Political,’’ A19.
65. Mathews, ‘‘The Big, the Green, the Political,’’ A19.
66. Taylor, ‘‘Campaign Trail Littered,’’ 7b.
67. Magleby, Direct Legislation, 144.
68. Carmines and Stimson, ‘‘The Two Faces of Issue Voting.’’
69. Zisk, Money, Media, and the Grassroots.
Notes to Chapter 7 235

Chapter 8
1. Carson and Moulden, Green Is Gold, 4.
2. The supply of ‘‘environmentally friendly’’ products appears to be a relativelyrecent phenomenon. While fewer than 2 percent of all new products introducedin 1986 boasted environmental claims, ‘‘green’’ products accounted for morethan 10 percent by 1994. See Winski, ‘‘Big Prizes, But No Easy Answers,’’ GR-3;Gray-Lee, Scammon, and Mayer, ‘‘Review of Legal Standards for EnvironmentalMarketing Claims’’; Scammon and Mayer, ‘‘Agency Review of EnvironmentalMarketing Claims.’’
3. Ottman, ‘‘Environmentalism Will Be the Trend of the ’90s,’’ 13. The mostfamous of these partnerships between a national environmental group and amajor corporation occurred in 1990 between the Environmental Defense Fundand the McDonald’s Corporation. The collaboration produced a Waste Reduc-tion Action Plan that outlined forty-two ways in which the popular restaurantchain could reduce its generation of solid waste, including the substitution ofquilted paper wraps for polystyrene clamshell containers. By 1995 the plan hadgrown to nearly a hundred initiatives, with McDonald’s using its purchasingpower to motivate suppliers to meet those standards, resulting in both corporatecost savings and reduced waste. See Holusha, ‘‘Talking Deals,’’ D2.
4. Mitchell, ‘‘Public Opinion and Environmental Politics in the 1970s and1980s,’’ in Vig and Kraft, eds., Environmental Policy in the 1980s; Dunlap,‘‘Polls, Pollution, and Politics Revisited’’ and ‘‘Public Opinion in the 1980s.’’
5. Buchanan, ‘‘Individual Choice in Voting and the Market’’; Buchanan andTullock, The Calculus of Consent; Wilson and Banfield, ‘‘Public Regardingnessas a Value Premise in Voting Behavior’’ and ‘‘Voting Behavior on MunicipalPublic Expenditures,’’ in Margolis, ed., The Public Economy of Urban Com-munities; Martinez-Vazquez, ‘‘Selfishness versus Public ‘Regardingness’ in VotingBehavior.’’
6. Sunstein, ‘‘Remaking Regulation,’’ 74.
7. Downs, An Economic Theory of Democracy; Deacon and Shapiro, ‘‘PrivatePreference for Collective Goods Revealed through Voting on Referenda.’’
8. Green, ‘‘The Price Elasticity of Mass Preferences,’’ 128.
9. Sears and Huddy, ‘‘Bilingual Education.’’
10. Kinder and Sanders, ‘‘Mimicking Political Debate With Survey Questions.’’
11. Kluegel and Smith, ‘‘Whites’ Beliefs about Blacks’ Opportunity.’’
12. Beck and Dye, ‘‘Sources of Public Opinion on Taxes.’’
13. See, Wilson and Banfield, ‘‘Public Regardingness’’ and ‘‘Voting Behavior onMunicipal Public Expenditures,’’ in Margolis, ed., The Public Economy of UrbanCommunities; also Kelman, What Price Incentives?; Etzioni, The Moral Dimen-sion; Monroe, ‘‘John Donne’s People.’’ Although Wilson and Banfield did notdirectly link their research to public choice theory, their conceptualization of
236 Notes to Chapter 8
‘‘public-regarding’’ versus ‘‘private-regarding’’ behavior parallels the latter’s def-inition of self-interest and altruism. See Wilson and Banfield, ‘‘Public Regarding-ness’’; also Brodsky and Thompson, ‘‘Ethos, Public Choice, and ReferendumVoting,’’ 289.
14. Buchanan, ‘‘Individual Choice,’’ 336.
15. Sunstein, ‘‘Remaking Regulation,’’ 75.
16. Gerlak and Natali, Taking the Initiative, II.
17. A comprehensive guide to green products can be found online at hhttp://www.buygreen.comi.
18. Schwartz and Miller, ‘‘The Earth’s Best Friends’’; Coddington, Environmen-tal Marketing; Stisser, ‘‘A Deeper Shade of Green.’’
19. Morris, Hastak, and Mazis, ‘‘Consumer Comprehension of EnvironmentalAdvertising and Labeling Claims’’; Wasik, ‘‘Market Is Confusing, But PatienceWill Pay Off,’’ 16.
20. Coddington, Environmental Marketing.
21. Some scholars argue, for example, that altruistic behavior is frequentlymotivated by economic behavior. See Holmes, ‘‘Self-Interest, Altruism, andHealth-Risk Reduction.’’
22. Oskamp, Harrington, Edwards, Sherwood, Okuda, and Swanson, ‘‘FactorsInfluencing Household Recycling Behavior.’’
23. Milbrath, Environmentalists; also Dunlap, ‘‘Public Opinion in the 1980s.’’
24. De Young, ‘‘Encouraging Environmentally Appropriate Behavior’’ and‘‘Some Psychological Aspects of Recycling.’’
25. Geller, Winett and Everett, Preserving the Environment.
26. Hopper and Nielsen, ‘‘Recycling as Altruistic Behavior.’’
27. Black, ‘‘Attitudinal, Normative, and Economic Factors.’’
28. Baldassare and Katz, ‘‘The Personal Threat of Environmental Problems as aPredictor of Environmental Practices.’’
29. Dunlap and Beus, ‘‘Understanding Public Concerns about Pesticides.’’
30. Rohrschneider, ‘‘Citizens’ Attitudes toward Environmental Issues.’’
31. Constantini and Hanf, ‘‘Environmental Concern and Lake Tahoe’’; Dillmanand Christenson, ‘‘The Public Value for Pollution Control,’’ in Burch et al.,eds., Social Behavior, Natural Resources, and the Environment; Tognacci etal., ‘‘Environmental Quality’’; Dunlap, ‘‘The Impact of Political Orientation onEnvironmental Attitudes and Action’’; Buttel and Flinn, ‘‘The Politics of Envi-ronmental Concern’’; Van Liere and Dunlap, ‘‘The Social Bases of EnvironmentalConcern’’; Samdahl and Robertson, ‘‘Social Determinants of EnvironmentalConcern.’’
32. Buchanan, ‘‘Individual Choice.’’
Notes to Chapter 8 237

33. That result depends, however, on the truthfulness and accuracy of the envi-ronmental claims made by manufacturers. The mass marketing of environmentalvalues may have popularized terms such as environmentally friendly, biodegrad-able, and ozone safe, but some Americans remain skeptical of the merits of thoseclaims. See Carlson, Grove, and Kangun, ‘‘A Content Analysis of EnvironmentalAdvertising Claims’’; see also Schrum, Lowrey, and McCarty, ‘‘Recycling as aMarketing Problem.’’
34. Schwartz and Miller, ‘‘The Earth’s Best Friends’’; Coddington, Environmen-tal Marketing.
35. Kinnear, Taylor, and Ahmed, ‘‘Ecologically Concerned Consumers’’;Schwepker and Cornwell, ‘‘An Examination of Ecologically Concerned Con-sumers’’; see also Schrum, Lowrey, and McCarty, ‘‘Recycling as a MarketingProblem.’’
36. Popular discount retailers Kmart, Wal-Mart, and Target all have used greenshelf tags to varying degrees in promoting environmentally safe products. SeeHalverson, ‘‘Big Three Take High Road on Environmental Front,’’ 72.
37. Schuhwerk and Lefkoff-Hagius, ‘‘Green or Non-Green?’’
38. See Singhapakdi and LaTour, ‘‘The Link between Social Responsibility Ori-entation, Motive Appeals, and Voting Intention.’’
39. According to Donald Green and Irene Blair, ‘‘instrumental’’ appeals arethose that call attention to the direct benefits of a particular good or policy. Incontrast, ‘‘symbolic’’ appeals draw attention to the gratification an individualmay receive by participating in or expressing support for a given cause or prod-uct. See Green and Blair, ‘‘Framing and the Price Elasticity of Private and PublicGoods.’’
40. Dunlap and Scarce, ‘‘The Polls.’’
41. One such exception is the purchase of a less ‘‘gas guzzling’’ automobile—itranked eighth out of eleven activities in a 1991 Gallup study (April 11–14). In-dustry polling suggests a straightforward explanation. With reasonable gasolineprices, fuel efficiency is simply not a top priority for most consumers. Safety,durability, seating capacity, and style are all factors that in recent years havepushed Americans away from small, lightweight cars toward heavy sport-utilityvehicles, minivans, and pickup trucks (The Gallup Organization, April 11–14,1991 [n ¼ 1007].42. See Green and Blair, ‘‘Framing and the Price Elasticity of Private and PublicGoods.’’
43. See Rohrschneider, ‘‘Citizens’ Attitudes toward Environmental Issues,’’ 364.
44. Kinder and Kiewiet, ‘‘Sociotropic Politics.’’
45. Sears, Lau, Tyler, and Allen, ‘‘Self-Interest vs. Symbolic Politics.’’
46. Multicollinearity is a term used to represent the presence of a relationshipbetween different independent variables. See Berry and Sanders, UnderstandingMultivariate Research, 43–44.
238 Notes to Chapter 8
47. See, for example, Huber, ‘‘How to Love Butterflies and be a Conservative.’’
48. Buchanan and Tullock, The Calculus of Consent, 37.
49. Buchanan and Tullock, The Calculus of Consent, 37.
50. Kinnear, Taylor, and Ahmed, ‘‘Ecologically Concerned Consumers,’’ 24; seealso Ellen, Wiener, and Cobb-Walgren, ‘‘The Role of Perceived Consumer Effec-tiveness’’; Berger and Corbin, ‘‘Perceived Consumer Effectiveness and Faith inOthers.’’
51. Green, ‘‘The Price Elasticity of Mass Preferences,’’ 139.
52. Schuhwerk and Lefkoff-Hagius, ‘‘Green or Non-Green?’’
53. Buchanan and Tullock, The Calculus of Consent, 21.
54. Citrin, Reingold, and Green, ‘‘American Identity and the Politics of EthnicChange’’; Citrin, Reingold, Walters, and Green, ‘‘The ‘Official English’ Move-ment.’’
55. Buchanan and Tullock, The Calculus of Consent, 20.
Conclusion
1. Shabecoff, Earth Rising, 26.
2. Shabecoff, ‘‘Shades of Green in the Presidential Campaign,’’ 73.
3. A strong majority of those polled (83 percent) in an April 2000 poll agreedwith the goals of the environmental movement either ‘‘strongly’’ or ‘‘somewhat,’’ranking it just behind the civil rights (86 percent) and women’s rights (85 per-cent) movements. Respondents were somewhat less sure of its success, however,with just 30 percent believing it had accomplished ‘‘a great deal,’’ compared onceagain to the civil rights movement (50 percent) and the women’s movement (42percent). See Dunlap, ‘‘Americans Have Positive Image of the EnvironmentalMovement’’; see also Mertig and Dunlap, ‘‘Public Approval of EnvironmentalProtection and Other New Social Movement Goals’’; Dowie, ‘‘American Envi-ronmentalism’’ and Losing Ground; and Rubin, The Green Crusade.
4. The phrase ‘‘green revolution’’ in the context of U.S. environmental politics isinspired by Kirkpatrick Sale’s 1993 book of the same name.
5. Wiley, ‘‘Coming to Terms,’’ 28.
6. Purdy, ‘‘Shades of Green,’’ 11. See also Schroeder, ‘‘Clear Consensus, Am-biguous Commitment,’’ 1876.
7. Wiley, ‘‘Coming to Terms,’’ 28.
8. The term sympathetic public is used in Morrison, ‘‘How and Why Environ-mental Consciousness Has Trickled Down,’’ in Schnaiberg, Watts, and Zimmer-mann, eds., Distributional Conflict in Environmental-Resource Policy; see alsoDunlap, ‘‘Public Opinion and Environmental Policy,’’ in Lester, ed., Environ-mental Politics and Policy.
Notes to Conclusion 239

9. Dunlap and Mertig, ‘‘The Evolution of the U.S. Environmental Movementfrom 1970 to 1990.’’
10. The strength of the relationship between environmental attitudes and theeconomy creates an discomforting irony for environmental ideologues. It impliesthat public support for environmental reform is contingent (at least in part)on the very economic growth and prosperity some fear caused those conditionsfrom the start. For a classic argument on this topic, refer to Meadows et al., TheLimits to Growth.
11. For example, the environmental risks that frighten people are rarely the onesthat matter most. See, for example, ‘‘Green Choices, Hard Choices.’’ For moredetailed scholarship, refer to Slovic, ‘‘Perception of Risk.’’
12. Kempton, Boster, and Hartley, Environmental Values in American Culture,220.
13. Kempton, Boster, and Hartley, Environmental Values in American Culture,220; also Wall, ‘‘Barriers to Individual Environmental Action.’’
14. Teles, ‘‘Think Local, Act Local,’’ 28.
15. Schuman and Presser, Questions and Answers in Attitude Surveys; see alsoRabinowitz, Prothro, and Jacoby, ‘‘Salience as a Factor in the Impact of Issues onCandidate Elections.’’
16. The news media might be at least partially responsible for perpetuatingenvironmental myths and misconceptions, but there is spirited disagreementabout whether reporters over- or under-emphasize the seriousness of those prob-lems. For contrasting viewpoints, refer to Michaels, ‘‘Reports Cry Wolf aboutEnvironment’’; and Ruben, ‘‘Back Talk.’’
17. The examples cited above are drawn from the National Environmental Edu-cation and Training Foundation’s (NEETF) 1998 National Report Card onEnvironmental Attitudes, Knowledge, and Behavior. For more information,including an online version of this report, visit the National Environmental Edu-cation and Training Foundation’s Web site at hhttp://www.neetf.orgi.
18. Evidence on this point is mixed. While V. Kerry Smith finds evidence thateducation positively influences environmental action, Riley E. Dunlap is ‘‘skepti-cal that public support for environmental protection will hinge upon lay-personsbecoming highly informed’’ about technical issues like global warming. MatthiasFinger, too, argues that knowledge and information ‘‘predict little of the vari-ability in most forms of environmental behavior.’’ See Smith, ‘‘Does EducationInduce People to Improve the Environment?’’; Finger, ‘‘From Knowledge toAction?’’; Dunlap, ‘‘Lay Perceptions of Global Risk.’’
19. See, in particular, Olson, The Logic of Collective Action.
20. Ridley and Low, ‘‘Can Selfishness Save the Environment?’’
21. Hardin, ‘‘The Tragedy of the Commons.’’
22. Wall, ‘‘Barriers to Individual Environmental Action,’’ 483; see also Sunstein,‘‘Remaking Regulation.’’
240 Notes to Conclusion

23. Goodrich, ‘‘Just a Few Words of Optimism from Green Enemy No. 1,’’ E6.
24. Knickerbocker, ‘‘Is It Wrong to be Optimistic about the Environment?,’’ 14.
25. Mathews, ‘‘Outlook Not So Gloomy,’’ B9.
26. Rauch, ‘‘There’s Smog in the Air, But It Isn’t All Pollution,’’ B01. MarkShields argues that ‘‘the reason no one knows what progress we’ve made is thatthere is a conspiracy between Republicans, who don’t want to admit that gov-ernment works, and Democrats, who don’t want to acknowledge that most ofthe progress occurred under Republican presidents. So they both keep quietabout it.’’ Quoted in ‘‘Environmental Protection: Is the Public Willing to Pay?,’’15.
27. Easterbrook, A Moment on the Earth, xviii.
28. Easterbrook, A Moment on the Earth, xviii. See also Lomborg, The SkepticalEnvironmentalist.
29. Immerwahr, Waiting for a Signal.
30. For example, critics have long argued that environmental education pro-grams in schools serve as a form of political indoctrination, frightening childrenwith inaccurate tales of environmental disaster. For a balanced discussion, seeHungerford and Lewis, ‘‘Is Environmental Education Scaring Our Children toDeath?’’; also Sanera and Shaw, Facts, Not Fear.
31. Immerwahr, Waiting for a Signal.
32. Ridley and Low, ‘‘Can Selfishness Save the Environment?,’’ 77.
33. Quoted in Braile, ‘‘Book Review: The Land that Could Be,’’ Books-3. For farmore detail on the possibilities of ‘‘civic environmentalism,’’ see Shutkin, TheLand That Could Be; also Knopman, Susman, and Landy, ‘‘Civic Environ-mentalism.’’
34. Shutkin, The Land That Could Be, 22.
35. Wilson, ‘‘Why They Don’t Campaign about the Environment.’’ In this sense,environmental protection has become a valence issue, one ‘‘where virtuallyeveryone supports the goal, thus confining potential disagreement to the meansby which these ends can be achieved.’’ See Hibbing and Theiss-Morse, Congressas Public Enemy, 55; also Stokes, ‘‘Spatial Models of Party Competition.’’
36. See, for example, Rauch, ‘‘There’s Smog in the Air,’’ B01.
37. These figures are drawn from a Newsweek poll conducted by Princeton Sur-vey Research Association, April 13 and 14, 2000, with a sample size of 752adults nationwide and a margin of error of plus or minus four percentage points.The wording of the question was this: ‘‘Since the first Earth Day was held thirtyyears ago, how much progress—if any—do you think has been made towardsolving environmental problems?’’ Tabulated responses were 18 percent ‘‘majorprogress,’’ 52 percent ‘‘minor progress,’’ 7 percent ‘‘no progress,’’ 16 percent‘‘gotten worse,’’ and 7 percent ‘‘don’t know.’’ A second study conducted atthe same time by Environmental Defense found even greater pessimism, with amajority believing that conditions had grown worse. Those results (available in
Notes to Conclusion 241

a press release online at hhttp://environmentaldefense.orgi) are also discussedin Kates, ‘‘Has the Environment Improved?’’
38. Norman Levitt, as quoted in Malik, ‘‘Why Science Needs Protection,’’ 13;for Levitt’s full argument, see Levitt, Prometheus Bedeviled.
39. Spangler, Methods, Problems and Issues in Environmental Cost-BenefitAnalysis of Nuclear Power Plant Alternatives, 3.
40. Kasper, ‘‘Perceptions of Risk and Their Effects on Decision Making,’’ andSlovic, Fischhoff, and Lichtenstein, ‘‘Facts and Fears,’’ both in Schwing andAlbers, eds., Societal Risk Assessment.
41. Breyer, Breaking the Vicious Circle. But is Breyer right about the science ofrisk regulation? Are average Americans simply ill-informed, irrational, or incon-sistent in the risks they perceive? Perhaps not. Studies show that people are rea-sonably accurate when asked to estimate fatality rates. The same group thatawards nuclear power low yearly fatality estimates, however, still asserts nuclearpower to be among the riskiest technologies of modern life. In short, whileexperts tend to equate risk with fatality estimates, lay people view risk as some-thing more than just fatality, exposure, or reduced life expectancy. They dependheavily on inferences or heuristics that allow them to connect past experiences oravailable knowledge to the situation at hand, often evaluating risk based on morecomplex criteria, such as involuntary exposure, immediacy, dread consequences,and lack of personal control over harm. See Slovic, Fischhoff, and Lichtenstein,‘‘Facts and Fears,’’ in Schwing and Albers, eds., Societal Risk Assessment, andSlovic, ‘‘Perception of Risk.’’
42. Teles, ‘‘Think Local, Act Local,’’ 28.
43. Carson and Moulden, Green Is Gold.
44. Schultze, The Public Use of Private Interest, 18.
45. Anderson, ‘‘Market Ecology Approach Hailed,’’ C7; Eddy, ‘‘Loveland SetsBar High for Recycling,’’ A17.
46. Kelman, What Price Incentives?
47. Ellis and Thompson, ‘‘Culture and the Environment in the Pacific North-west,’’ 892.
48. Herndl and Brown, Green Culture.
49. Citrin, Reingold, and Green, ‘‘American Identity and the Politics of EthnicChange.’’
50. Magleby, Direct Legislation.
51. Key, Public Opinion and American Democracy, 27.
52. After all, as Jedediah Purdy notes, most environmental laws date from theearliest days of the movement in the 1970s, and no major piece of environmentallegislation has been passed since 1990. To make matters worse, he says, nearly‘‘everyone concedes that the old laws are imperfect, often poorly enforced, andsometimes downright perverse.’’ See Purdy, ‘‘Planet Bush, Planet Gore,’’ 34.
242 Notes to Conclusion

53. For example, as David Broder notes: ‘‘At one level, the environmentalistshave swept away all opposition. The ‘conservation ethic’ has become one of thefixed guiding stars of American politics—a ‘value question’ that permits only oneanswer from anyone who hopes to be part of the public dialogue. . . . The argu-ment is no longer about values. That’s over, and the environmentalists have won.The argument is now about policies. And those with the best evidence and thebest arguments, not just the purest hearts, will prevail.’’ See Broder, ‘‘BeyondFolk Songs and Flowers,’’ B7; see also Schroeder, ‘‘Clear Consensus,’’ 1879.
54. Dowie, ‘‘American Environmentalism,’’ 70.
55. Gup, ‘‘Owl vs. Man,’’ 62.
56. See Lake, ‘‘The Environmental Mandate,’’ 230–231; also Cooley andWandesforde-Smith, eds., Congress and the Environment; Dunlap and Gale,‘‘Party Membership and Environmental Politics’’; Dunlap and Allen, ‘‘PartisanDifferences on Environmental Issues’’; Calvert, ‘‘The Social and Ideological Basesof Support for Environmental Legislation.’’
57. See also Campbell, Converse, Miller, and Stokes, The American Voter.Richard Fenno writes on a similar theme. He argues that ‘‘voting leeway’’ occurswhen constituents given a favorable evaluation of an incumbent’s performanceregardless of their voting record. Fenno, Home Style.
58. Purdy, ‘‘Planet Bush, Planet Gore,’’ 34.
59. Hershkowitz, ‘‘Green vs. Greenbacks,’’ GR10.
Notes to Conclusion 243

This Page Intentionally Left Blank

References
Achen, Christopher. 1975. Mass Political Attitudes and the Survey Response.American Political Science Review, 69: 1218–1231.
Albrecht, Don, Gordon Bultena, Eric Hoiberg, and Peter Nowak. 1982. TheNew Environmental Paradigm Scale. Journal of Environmental Education, 13:39–43.
Albrecht, Stan L., and Armond L. Mauss. 1975. The Environment as a SocialProblem. In Armond L. Mauss, ed., Social Problems as Social Movements (556–605). Philadelphia: Lippincott.
Aldrich, John H., and Forrest D. Nelson. 1984. Linear Probability, Logit, andProbit Models. Beverly Hills: Sage.
Aldrich, John H., John L. Sullivan, and Eugene Borgida. 1989. Foreign Affairsand Issue Voting: Do Presidential Candidates ‘‘Waltz before a Blind Audience?’’American Political Science Review, 83(1): 123–141.
Alexander, Charles P. 1992. Gunning for the Greens. Time (February 3): 50.
Allan, Stuart, Barbara Adam, and Cynthia Carter, eds. 2000. EnvironmentalRisks and the Media. New York: Routledge.
Allen, Scott. 1992. High Supply, Low Demand Hurt Effort to Recycle. BostonGlobe, August 30, 27.
Allswang, John M. 1991. California Initiatives and Referendums, 1912–1990: ASurvey and Guide to the Research. Los Angeles: Edmund G. ‘‘Pat’’ Brown Insti-tute of Public Affairs, California State University.
Alpert, Bruce. 1995. Voters Support Rules on Pollution; GOP Attacks Not Pop-ular. Times-Picayune, July 24, A1.
Anderson, Robert. 1991. Market Ecology Approach Hailed: Conservatives Sup-port Incentives, Not Rules. Seattle Times, August 30, C7.
Anthony, Carl. 1999. Race, Justice, and Sprawl. Forum for Applied Researchand Public Policy, 24: 97.
Ayres, Ed. 1999. The Worldwatch Report: Why Are We Not Astonished?ENNNews (May 12). hhttp://www.enn.com/enn-features-archive/1999/05/051299/worldwatch_3141.aspi.

Baldassare, Mark, and Cheryl Katz. 1992. The Personal Threat of EnvironmentalProblems as Predictor of Environmental Practices. Environment and Behavior,24: 602–616.
Baus, H. M., and W. B. Ross. 1968. Politics Battle Plan. New York: MacmillanPress.
Beck, Paul Allen, and Thomas R. Dye. 1982. Sources of Public Opinion onTaxes: The Florida Case. Journal of Politics, 44: 172–182.
Bedard, Paul. 1998. Vote Green: Democratic Tactics to Win Voters. U.S. News& World Report (October 19): 9.
Begley, Sharon, Mary Hager, and Lynda Wright. 1990. The Selling of Earth Day.Newsweek (March 26): 60.
Belden and Russonello. 1996. The Ecology Poll (USBELDEN96-ECOLOGY)[datafile]. February 29–March 12, n ¼ 2;005. Washington, DC: Belden andRussonello, sponsored by Consultative Group on Biological Diversity.
Bennett, Stephen Earl. 1973. Consistency among the Public’s Social WelfarePolicy Attitudes in the 1960s. American Journal of Political Science, 17: 544–570.
Berelson, Bernard R., Paul F. Lazarsfeld, and William N. McPhee. 1954. Voting:A Study of Opinion Formation in a Presidential Campaign. Chicago: Universityof Chicago Press.
Berger, Ida E., and Ruth M. Corbin. 1992. Perceived Consumer Effectiveness andFaith in Others as Moderators of Environmentally Responsible Behaviors. Jour-nal of Public Policy and Marketing, 11: 79–89.
Berinsky, Adam, and Steven Rosenstone. 1996. Evaluation of EnvironmentalPolicy Items on the 1995 NES Pilot Study. 1995 Pilot Study Reports. Ann Arbor,MI: National Election Studies. hhttp://www.umich.edu/~nes/resources/psreport/abs/95a.htmi.
Bernstein, Sharon. 1992. Planet Hollywood: The Hits and Misses of Television’sEnvironmental Activism. Los Angeles Times, February 16, 4.
Berry, William D., and Mitchell S. Sanders. 2000. Understanding MultivariateResearch: A Primer for Beginning Social Scientists. Boulder, CO: Westview Press.
Bishop, George F., Alfred F. Tuchfarber, and Robert W. Oldendick. 1986.Opinions on Fictitious Issues: The Pressure to Answer Survey Questions. PublicOpinion Quarterly, 50: 240–250.
Bishop, Richard. 1982. Option Value: An Exposition and Extension. Land Eco-nomics, 58: 1–15.
Black, J. S. 1978. Attitudinal, Normative, and Economic Factors in Early Re-sponse to an Energy-Use Field Experiment. Ph.D. dissertation, University ofWisconsin, Madison.
Blalock, Hubert M., Jr. 1965. Some Implications of Random Measurement Errorfor Causal Inferences. American Journal of Sociology, 71: 37–47.
246 References

Blalock, Hubert M., Jr. 1969. Multiple Indicators and the Causal Approach toMeasurement Error. American Journal of Sociology, 75: 264–272.
Blalock, Hubert M., Jr. 1970. A Causal Approach to Nonrandom MeasurementErrors. American Political Science Review, 64: 1099–1111.
Blocker, T. Jean, and Douglas Lee Eckberg. 1989. Environmental Issues asWomen’s Issues: General Concerns and Local Hazards. Social Science Quarterly,70(3): 586–593.
Blocker, T. Jean, and Douglas Lee Eckberg. 1997. Gender and Environ-mentalism: Results from the 1993 General Social Survey. Social Science Quar-terly, 78: 841–858.
Bollen, Kenneth A. 1989. Structural Equations with Latent Variables. NewYork: Wiley.
Bollen, Kenneth A., and J. Scott Long. 1993. Testing Structural EquationModels. Newbury Park, CA: Sage.
Bone, Hugh A., and Robert C. Benedict. 1975. Perspectives on Direct Legislation:Washington State’s Experience, 1914–1973. Western Political Quarterly, 28:30–51.
Bord, Richard J., and Robert E. O’Connor. 1997. The Gender Gap in Environ-mental Attitudes: The Case of Perceived Vulnerability to Risk. Social ScienceQuarterly, 78: 830–840.
Borosage, Robert L., and Stanley B. Greenberg. 1997. Why Did Clinton Win?The American Prospect, no. 31: 17–21. hhttp://epn.org/prospect/31/31-cnt.htmli.
Bosso, Christopher J. 1994. After the Movement: Environmental Activism in the1990s. In Norman J. Vig and Michael E. Kraft, eds., Environmental Policy in the1990s (2nd ed., 31–50). Washington, DC: CQ Press.
Boudreaux, Donald J., Roger E. Meiners, and Todd J. Zywicki. 1999. Talk IsCheap: The Existence Value Fallacy. Environmental Law, 29: 765.
Bowler, Shaun, and Todd Donovan. 1994. Economic Conditions and Voting onBallot Propositions. American Politics Quarterly, 22(1): 27–40.
Bowler, Shaun, Todd Dovovan, and Trudi Happ. 1992. Ballot Propositions andInformation Costs: Direct Democracy and the Fatigued Voter. Western PoliticalQuarterly, 45: 559–568.
Bowman, Karlyn. 1998. Polluted Polling on Global Warming. AEI on the Issues(March). hhttp://www.aei.org/oti/oti8852.htmi.
Brady, Henry E., Sidney Verba, and Kay Lehman Scholzman. 1995. Beyond SES:A Resource Model of Political Participation. American Political Science Review,89(2): 271–285.
Bragdon, Peter, and Beth Donovan. 1990. Voters’ Concerns Are Turning thePolitical Agenda Green. Congressional Quarterly Weekly Report (January 20):186–187.
References 247

Braile, Robert. 2000. Book Review: The Land That Could Be. Boston Globe,May 14, Books-3.
Breyer, Stephen. 1993. Breaking the Vicious Circle: Toward Effective Risk Reg-ulation. Cambridge, MA: Harvard University Press.
Broder, David. 1990. Beyond Folk Songs and Flowers. Washington Post, April22, B7.
Brodsky, David M., and Edward Thompson III. 1993. Ethos, Public Choice, andReferendum Voting. Social Science Quarterly, 74(2): 286–299.
Brody, Charles J. 1984. Differences by Sex in Support for Nuclear Power. SocialForces, 63(1): 209–228.
Brody, Richard A., and Benjamin I. Page. 1972. Comment: The Assessment ofIssue Voting. American Political Science Review, 66: 450–458.
Bryce, James. 1981. The Nature of Public Opinion. In Morris Janowitz and PaulM. Hirsch, eds., Reader in Public Opinion and Mass Communication (3rd ed.,3–9). New York: Free Press.
Buchanan, James M. 1954. Individual Choice in Voting and the Market. Journalof Political Economy, 62: 334–343.
Buchanan, James M., and Gordon Tullock. 1962. The Calculus of Consent:Logical Foundations of Constitutional Democracy. Ann Arbor: University ofMichigan Press.
Bullard, Robert D. 1990. Dumping in Dixie: Race, Class, and EnvironmentalQuality. Boulder, CO: Westview Press.
Burns, Nancy, Donald R. Kinder, Steven J. Rosenstone, Virginia Sapiro, andthe National Election Studies. 2001. National Election Studies, 2000: Pre- / Post-Election Study [dataset]. Ann Arbor: University of Michigan, Center for PoliticalStudies.
Butler, David, and Austin Ranney, eds. 1978. Referendums: A ComparativeStudy of Practice and Theory. Washington, DC: American Enterprise Institute.
Butler, David, and Austin Ranney, eds. 1994. Referendums around the World:The Growing Use of Direct Democracy. Washington, DC: American EnterpriseInstitute.
Buttel, Frederick H. 1975. Class Conflict, Environmental Conflict, and the Envi-ronmental Movement: The Social Bases of Mass Environmental Beliefs, 1968–1974. Ph.D. dissertation, University of Wisconsin, Madison.
Buttel, Frederick H. 1979. Age and Environmental Concern: A MultivariateAnalysis. Youth and Society, 10: 237–256.
Buttel, Frederick H., and William L. Flinn. 1976. Environmental Politics: TheStructuring of Partisan and Ideological Cleavages in Mass Environmental Atti-tudes. Sociological Quarterly, 17: 477–490.
Buttel, Frederick H., and William L. Flinn. 1978. The Politics of EnvironmentalConcern: The Impacts of Party Identification and Political Ideology on Environ-mental Attitudes. Environment and Behavior, 10: 17–36.
248 References

Buttel, Frederick H., and Donald E. Johnson. 1977. Dimensions of Environmen-tal Concern: Factor Structure, Correlates Implications for Research. Journal ofEnvironmental Education, 9: 49–64.
Callahan, Deb. 2000. Environment Is ‘‘Sleeper’’ Issue of 2000 Campaign.Environmental Network News (March 9). hhttp://www.enn.com/enn-features-archive/2000/03/03092000/callahan_10788.aspi.
Calvert, Jerry W. 1979. The Social and Ideological Bases of Support for Envi-ronmental Legislation: An Examination of Public Attitudes and LegislativeAction. Western Political Quarterly, 32: 327–337.
Cambridge Reports Research International. Various years. Omnibus Survey[datafile]. September 1991; September 1992; July 15–27, 1993; September 1993;July 1994, n ¼ 1;250; September 1994, n ¼ 1;250. Cambridge, MA: CambridgeReports Research International.
Campbell, Angus, Philip E. Converse, Warren E. Miller, and Donald E. Stokes.1960. The American Voter. Chicago: University of Chicago Press.
Carlin, Alan, Paul F. Scodari, and Don H. Garner. 1992. Environmental Invest-ments: The Cost of Cleaning Up. Environment, 34: 12–27.
Carlson, Les, Stephen J. Grove, and Norman Kangun. 1993. A Content Analysisof Environmental Advertising Claims: A Matrix Method Approach. Journal ofAdvertising, 22(3): 27–39.
Carmines, Edward G., and James A. Stimson. 1980. The Two Faces of IssueVoting. American Political Science Review, 74: 78–91.
Carson, Patrick, and Julia Moulden. 1991. Green Is Gold: Business Talking toBusiness about the Environmental Revolution. Toronto: HarperBusiness.
Carson, Rachel. 1962. Silent Spring. Boston: Houghton Mifflin.
Casuso, Jorg. 1990. Black Tuesday for Big Green Backers. Chicago Tribune,November 11, 6.
Catton, William R., and Riley E. Dunlap. 1978. Environmental Sociology: ANew Paradigm. American Sociologist, 13: 41–49.
CBS News/New York Times. 1997. Survey [datafile]. November 23–24, n ¼953. New York: CBS and New York Times.
Charlton Research Company. 1997. Research Poll [datafile]. November 17–20,n ¼ 800. Washington, DC: Charlton Research.
Choudhury, Askar H., Robert Hubata, and Robert D. St. Louis. 1999. Under-standing Time-Series Regression Estimators. American Statistician, 53: 342.
Citrin, Jack, Beth Reingold, and Donald P. Green. 1990. American Identity andthe Politics of Ethnic Change. Journal of Politics, 52: 1124–1154.
Citrin, Jack, Beth Reingold, Evelyn Walters, and Donald P. Green. 1990. The‘‘Official English’’ Movement and the Symbolic Politics of Language in theUnited States. Western Political Quarterly, 43: 535–559.
References 249

Coddington, Walter. 1993. Environmental Marketing: Positive Strategies forReaching the Green Consumer. New York: McGraw-Hill.
Commoner, Barry. 1971. The Closing Circle: Nature, Man, and Technology.New York: Knopf.
Connelly, John, 1996. The Politics of the Environment. Atlanta Journal andConstitution, February 4, H1.
Constantini, Edmond, and Kenneth Hanf. 1972. Environmental Concern andLake Tahoe: A Study of Elite Perceptions, Backgrounds, and Attitudes. Environ-ment and Behavior, 4: 209–242.
Converse, Philip E. 1964. The Nature of Belief Systems in Mass Publics. In D. E.Apter, ed., Ideology and Discontent. New York: Free Press.
Conway, M. Margaret. 1991. Political Participation in the United States (2nded.). Washington, DC: Congressional Quarterly Press.
Cooley, Richard, and Geoffrey Wandesforde-Smith, eds. 1970. Congress and theEnvironment. Seattle: University of Washington Press.
Crosby, Lawrence A., James D. Gill, and James R. Taylor. 1981. Consumer/Voter Behavior in the Passage of the Michigan Container Law. Journal of Mar-keting, 45 (Spring): 19–32.
Daley, Patrick, and Dan O’Neill. 1991. Sad Is Too Mild a Word: Press Coverageof the Exxon Valdez Oil Spill. Journal of Communication, 41: 53.
Darcy, R., and Ian McAllister. 1990. Ballot Position Effects. Electoral Studies, 9:5–17.
Davidson, Debra J., and William R. Freudenburg. 1996. Gender and Environ-mental Risk Concerns: A Review and Analysis of Available Research. Environ-ment and Behavior, 28: 302–339.
Dawson, Bill. 1996. Poll Shows Texans Wanting to Recycle. Houston Chronicle,January 3, 12.
Deacon, Robert, and Perry Shapiro. 1975. Private Preference for CollectiveGoods Revealed through Voting on Referenda. American Economic Review, 65(December): 943–955.
deHaven-Smith, Lance. 1988. Environmental Belief Systems: Public Opinion onLand-Use Regulation in Florida. Environment and Behavior, 20: 176–199.
deHaven-Smith, Lance. 1989. Toward a Communicative Theory of Environ-mental Opinion. Environment and Behavior, 21: 630–635.
deHaven-Smith, Lance. 1991. Environmental Concern in Florida and the Nation.Gainsville: University of Florida Press.
De Young, R. 1985–1986. Encouraging Environmentally Appropriate Behavior:The Role of Intrinsic Motivation. Journal of Environmental Systems, 15: 281–292.
De Young, R. 1986. Some Psychological Aspects of Recycling: The Structure ofConservation Satisfactions. Environment and Behavior, 18: 435–449.
250 References

Diekmann, Andreas, and Axel Franzen. 1999. The Wealth of Nations and Envi-ronmental Concern. Environment and Behavior, 31: 540.
Dietz, Thomas, Paul C. Stern, and Gergory A. Guagnono. 1998. Social Structuraland Social Psychological Bases of Environmental Concern. Environment andBehavior, 30: 450–481.
Dillman, Don A., and James A. Christenson. 1972. The Public Value for Pollu-tion Control. In William R. Burch, Jr., Neil H. Cheek, Jr., and Lee Taylor, eds.,Social Behavior, Natural Resources, and the Environment (237–256). NewYork: Harper and Row.
Douglas, Mary T., and Aaron Wildavsky. 1982. Risk and Culture: An Essay onthe Selection of Technical and Environmental Dangers. Berkeley: University ofCalifornia Press.
Dowie, Mark. 1991–1992. American Environmentalism: A Movement CourtingIrrelevance. World Policy Journal, 9(1): 67–92.
Dowie, Mark. 1995. Losing Ground: American Environmentalism at the Closeof the Twentieth Century. Cambridge, MA: MIT Press.
Downs, Anthony. 1957. An Economic Theory of Democracy. New York:Harper.
Downs, Anthony. 1972. Up and Down with Ecology: The Issue-Attention Cycle.The Public Interest, 28 (Summer): 38–50.
Drum, David. 1997. Product Placement Matures into Placement of NonprofitCauses. Variety, 369 (November 17): S27–S28.
Dumanoski, Dianne. 1992a. Advertising Blitz Erodes Support for Question 3.Boston Globe, October 24, 17.
Dumanoski, Dianne. 1992b. Environment Not Gaining Ground during Cam-paign. Boston Globe, October 4, 1.
Dunlap, Riley E. 1975. The Impact of Political Orientation on EnvironmentalAttitudes and Action. Environment and Behavior, 7: 428–454.
Dunlap, Riley E. 1987. Polls, Pollution, and Politics Revisited: Public Opinion onthe Environment in the Reagan Era. Environment, 29 (July–August): 6–11, 32–37.
Dunlap, Riley E. 1989. Public Opinion and Environmental Policy. In James P.Lester, ed., Environmental Politics and Policy: Theories and Evidence (87–135).Durham, NC: Duke University Press.
Dunlap, Riley E. 1991a. Public Opinion in the 1980s: Clear Consensus, Ambig-uous Commitment. Environment, 33(8): 10–15, 32–37.
Dunlap, Riley E. 1991b. Trends in Public Opinion Toward Environmental Issues:1965–1990. Society and Natural Resources, 4: 285–312.
Dunlap, Riley E. 1998. Lay Perceptions of Global Risk: Public Views of GlobalWarming in Cross-National Context. International Sociology, 13: 473–498.
References 251

Dunlap, Riley E. 2000. Americans Have Positive Image of the EnvironmentalMovement. Gallup Poll Monthly, 415 (April): 19–25.
Dunlap, Riley E., and Michael Patrick Allen. 1976. Partisan Differences onEnvironmental Issues: A Congressional Roll-Call Analysis. Western PoliticalQuarterly, 29: 384–397.
Dunlap, Riley E., and Curtis E. Beus. 1992. Understanding Public Concernsabout Pesticides: An Empirical Examination. Journal of Consumer Affairs, 26:418–438.
Dunlap, Riley E., and Don A. Dillman. 1976. Decline in Public Support for En-vironmental Protection: Evidence from a 1970–1974 Panel Study. Rural Sociol-ogy, 41: 382–390.
Dunlap, Riley E., and Richard Gale. 1974. Party Membership and Environmen-tal Politics: A Legislative Roll-Call Analysis. Social Science Quarterly, 55: 670–690.
Dunlap, Riley E., J. Keith Grieneeks, and Milton Rokeach. 1983. Human Valuesand Pro-Environmental Behavior. In W. David Conn, ed., Energy and MaterialResources: Attitudes, Values, and Public Policy (145–168). Boulder, CO: West-view Press.
Dunlap, Riley E., and Angela G. Mertig. 1991. The Evolution of the U.S. Envi-ronmental Movement from 1970 to 1990: An Overview. Society and NaturalResources, 4: 209–218.
Dunlap, Riley E., and Angela G. Mertig. 1995. Global Concern for the Environ-ment: Is Affluence a Prerequisite? Journal of Social Issues, 31: 121–137.
Dunlap, Riley E., and Rik Scarce. 1991. The Polls: Environmental Problems andProtection. Public Opinion Quarterly, 55: 651–672.
Dunlap, Riley E., and Kent D. Van Liere. 1977. Further Evidence of DecliningPublic Concern with Environmental Problems: A Research Note. Western Socio-logical Review, 8: 108–112.
Dunlap, Riley E., and Kent D. Van Liere. 1978. The ‘‘New Environmental Para-digm.’’ Journal of Environmental Education, 4: 10–19.
Dunlap, Riley E., and Kent D. Van Liere. 1984. Commitment to the DominantSocial Paradigm and Concern for Environmental Quality. Social Science Quar-terly, 65(4): 1013–1028.
Dunlap, Riley E., Kent D. Van Liere, and Don A. Dillman. 1979. Evidence ofDecline in Public Concern with Environmental Quality: A Reply. Rural Sociol-ogy, 44: 204–212.
Dunlap, Riley E., Kent D. Van Liere, Angela G. Mertig, and Robert EmmetJones. 2000. Measuring Endorsement of the New Ecological Paradigm: ARevised NEP Scale. Journal of Social Issues, 56: 425–442.
Durr, Robert H. 1993. What Moves Policy Sentiment? American PoliticalScience Review, 87: 158–170.
252 References

Dwyer, John F. 1980. Economic Benefits of Wildlife-Related Recreation Experi-ences. In William W. Shaw and Ervin H. Zube, eds., Wildlife Values (62–69).Tucson: Center for the Assessment of Noncommodity Natural Resource Values.
Easterbrook, Gregg. 1995. A Moment on the Earth: The Coming Age of Envi-ronmental Optimism. New York: Viking.
Easterbrook, Gregg. 1999. Surburban Myth. New Republic (March 15): 18.
Eddy, Mark. 1998. Wilderness Expansion Backed; 80 percent Favor Land Pro-tection in Colorado Poll. Denver Post, April 8, B6.
Eddy, Mark. 1999. Loveland Sets Bar High for Recycling: ‘‘Pay as You Throw’’Plan Gaining Fame. Denver Post, March 7, A17.
Ellen, Pam Scholder, Joshua Lyle Wiener, and Cathy Cobb-Walgren. 1991. TheRole of Perceived Consumer Effectiveness in Motivating Environmentally Con-scious Behaviors. Journal of Public Policy and Marketing, 10(2): 102–117.
Elliott, Euel, James L. Regens, and Barry J. Seldon. 1995. Exploring Variation inPublic Support for Environmental Protection. Social Science Quarterly, 76: 41–52.
Elliott, Euel, Barry J. Seldon, and James Regens. 1997. Political and EconomicDeterminants of Individuals’ Support for Environmental Spending. Journal ofEnvironmental Management, 51: 15–27.
Ellis, Richard J., and Fred Thompson. 1997. Culture and the Environment in thePacific Northwest. American Political Science Review, 91: 885–897.
Enelow, James M., and Melvin J. Hinich. 1984. The Spatial Theory of Voting:An Introduction. Cambridge: Cambridge University Press.
Environmental Protection: Is the Public Willing to Pay? 1995. EPA Journal(Winter): 15.
Environmental Protection Agency. 1990. Environmental Investments: The Costof a Clean Environment. Washington, DC: Environmental Protection Agency.
Epstein, Tom. 1986. Campaign to Defeat Proposition 65. Los Angeles Times,November 27, II-6.
Erikson, Robert S., Norman R. Luttbeg, and Kent L. Tedin. 1991. AmericanPublic Opinion (4th ed.). New York: Macmillan.
Erskine, Hazel. 1972. The Polls: Pollution and Its Costs. Public Opinion Quar-terly, 35: 120–135.
Etzioni, Amitai. 1988. The Moral Dimension. New York: Free Press.
Fenly, Leigh. 1990. ‘‘New Books Tell Children about Environment and TheirFuture.’’ San Diego Union-Tribune, April 15, Books-5.
Fenno, Richard F. 1978. Home Style: House Members in Their Districts. Boston:Little, Brown.
Field Institute. 1986. Field (California) Poll [datafile]. July 24–August 4, 1986(USCA 86-04), n ¼ 1;028; September 24–October 2, 1986, n ¼ 1;023 (USCA
References 253

86-05); October 29–October 30, 1986, n ¼ 701 (USCA 86-06). San Francisco:Field Institute, archived at University of California and at Roper Research Center.
Finger, Matthias. 1994. From Knowledge to Action? Exploring the Relationshipsbetween Environmental Experiences, Learning, and Behavior. Journal of SocialIssues, 50: 141–160.
Firebaugh, Glenn, and Kenneth E. Davis. 1988. Trends in Anti-Black Prejudice,1972–1984: Region and Cohort Effects. American Journal of Sociology, 94:251–272.
Fischer, David W. 1975. Willingness to Pay as a Behavioral Criterion for Envi-ronmental Decision-making. Journal of Environmental Management, 3: 29–41.
Fishbein, Martin, and Icek Ajzen. 1975. Belief, Attitude, Intention, and Behavior:An Introduction to Theory and Research. Reading, MA: Addison-Wesley.
Fried, Amy. 1998. U.S. Environmental Interest Groups and the Promotion ofEnvironmental Values: The Resounding Success and Failure of Earth Day. Envi-ronmental Politics, 7: 1–2.
Friedman, Monroe. 1995. On Promoting a Sustainable Future through Con-sumer Activism. Journal of Social Issues, 51: 197–215.
Funkhouser, G. R. 1973. The Issues of the Sixties: An Exploratory Study in theDynamics of Public Opinion. Public Opinion Quarterly, 33: 62–75.
Furman, Andrzej, and Oguz Erdur. 1999. Are Good Citizens Environmentalists?Human Ecology: An Interdisciplinary Journal, 27: 181–188.
Gallup Organization. Various years. The Gallup Poll [datafile]. April 5–8, 1990,n ¼ 1;223; April 3–9, 2000, n ¼ 1;004; May 23–24, 2000, n ¼ 1;032; March5–7, 2001, n ¼ 1;060. Princeton, NJ: Gallup.
Garland, Susan B. 1996. Come Winter, a Greener Hill? Business Week (April15): 66.
Gelernter, David. 1994. The Immorality of Environmentalism. City Journal(Autumn): 14.
Geller, E. Scott, Richard A. Winett, and Peter B. Everett. 1982. Preserving theEnvironment: Strategies for Behavioral Change. New York: Pergamon.
Geller, Jack M., and Paul Lasley. 1985. The New Environmental Paradigm Scale:A Reexamination. Journal of Environmental Education, 10: 9–12.
Gerlak, Andrea K., and Susan M. Natali. 1993. Taking the Initiative, II. Wash-ington, DC: Americans for the Environment.
Gerstenzang, James. 1997. Survey Bolsters Global Warming Fight. Los AngelesTimes, November 21, A4.
Gillroy, John M., and Robert Y. Shapiro. 1986. The Polls: Environmental Pro-tection. Public Opinion Quarterly, 50: 270–279.
Gilmore, Susan. 1990. Nation’s Voters Decide to Keep Their Wallets Green:Environmental Defeats Blamed on Economy. Seattle Times, November 8, A5.
254 References

Glenn, Norval B. 1975. Trend Studies with Available Survey Data: Opportunitiesand Pitfalls. In Survey Data for Trend Analysis: An Index to Repeated Questionson U.S. National Surveys Held by the Roper Public Opinion Research Center (6–48). Williamstown, MA: Roper Center.
Goodrich, Chris. 1995. Just a Few Words of Optimism from Green EnemyNo. 1. Los Angeles Times, June 16, E6.
GOP Hears Nature’s Call: The Party Scrambles on Environmental Policy. 1996.Time, 146 (March 4), 57.
Gore, Al. 1992. Earth in the Balance: Ecology and the Human Spirit. Boston:Houghton Mifflin.
Gottlieb, Robert. 1993. Forcing the Spring: The Transformation of the AmericanEnvironmental Movement. Washington, DC: Island Press.
Gottlieb, Robert, and Helen Ingram. 1988. The New Environmentalists. TheProgressive, 52: 14–15.
Graham, Virginia. 1978. A Compilation of Statewide Initiative Proposals Ap-pearing on Ballots through 1976. Washington, DC: Congressional ResearchService, Library of Congress.
Gray-Lee, Jason W., Debra L. Scammon, and Robert N. Mayer. 1994. Review ofLegal Standards for Environmental Marketing Claims. Journal of Public Policyand Marketing, 13(1): 155–159.
Green Choices, Hard Choices: The Environmental Risks That Frighten PeopleMost Rarely Matter Most. 1991. The Economist, 318 (March 16): 11.
Green, Donald Philip. 1988. On the Dimensionality of Public Sentiment towardPartisan and Ideological Groups. American Journal of Political Science, 32: 758–780.
Green, Donald Philip. 1992. The Price Elasticity of Mass Preferences. AmericanPolitical Science Review, 86 (March): 128–148.
Green, Donald Philip, and Irene V. Blair. 1995. Framing and the Price Elasticityof Private and Public Goods. Journal of Consumer Psychology, 4(1): 1–32.
Green, Donald Philip, and Jack Citrin. 1994. Measurement Error and the Struc-ture of Attitudes: Are Positive and Negative Judgments Opposites? AmericanJournal of Political Science, 38: 256–281.
Green, Donald Philip, Daniel Kahneman, and Howard Kunreuther. 1994. Howthe Scope and Method of Public Funding Affect Willingness to Pay for PublicGoods. Public Opinion Quarterly, 58: 49–67.
Guber, Deborah Lynn. 1996. Environmental Concern and the DimensionalityProblem: A New Approach to an Old Predicament. Social Science Quarterly,77(3): 644–662.
Gup, Ted. 1990. Owl vs. Man. Time (June 25): 56–62.
Halverson, Richard. 1991. Big Three Take High Road on Environmental Front.Discount Store News, 30 (March 18): 72.
References 255

Hardin, Garrett. 1968. The Tragedy of the Commons. Science (December 13):1243–1248.
Harris, Jack. 1993. Experts in Everything and Nothing. New Scientist, 138: 45.
Harris, John F., and Ellen Nakashima. 2000. Gore’s Greenness Fades: PoliticalCaution Has Tempered His Environmentalism. Washington Post, February 28,A1.
Harris, Louis, and Associates, Inc. 1993. The Harris Poll [datafile]. April 28–May 4, 1993, n ¼ 1;252.
Harris, Louis, and Associates, Inc. 1989. Public and Leadership Attitudes to theEnvironment in Four Continents: A Report of a Survey in Sixteen Countries.New York: Louis Harris and Associates, for the United Nations EnvironmentalProgramme.
Hayduk, Leslie A. 1987. Structural Equation Modeling with LISREL: Essentialsand Advances. Baltimore, MD: Johns Hopkins University Press.
Hays, Samuel P. 1987. Beauty, Health, and Permanence: Environmental Politicsin the United States, 1955–1985. Cambridge: Cambridge University Press.
Helvarg, David. 1994. The War against the Greens: The ‘‘Wise-Use’’ Movement,the New Right, and Anti-Environmental Violence. San Francisco: Sierra ClubBooks.
Herndl, Carl G., and Stuart C. Brown. 1996. Green Culture: EnvironmentalRhetoric in America. Madison: University of Wisconsin Press.
Hershkowitz, Allen. 1991. Green vs. Greenbacks. Advertising Age (January 29):GR10–GR11.
Hetherington, Mark. 1996. The Media’s Role in Forming Voters’ National Eco-nomic Evaluations in 1992. American Journal of Political Science, 40: 372–395.
Hibbing, John R., and Elizabeth Theiss-Morse. 1995. Congress as Public Enemy:Public Attitudes toward American Political Institutions. Cambridge: CambridgeUniversity Press.
Holmes, Thomas. P. 1990. Self-Interest, Altruism, and Health-Risk Reduction:An Economic Analysis of Voting Behavior. Land Economics, 66(2): 140–149.
Holusha, John. 1990. Talking Deals: Unusual Alliance for McDonald’s. NewYork Times, August 9, D2.
Honnold, Julie A. 1984. Age and Environmental Concern: Some Specification ofEffects. Journal of Environmental Education, 16: 4–9.
Hopper, Joseph R., and Joyce McCarl Nielsen. 1991. Recycling as Altruistic Be-havior: Normative and Behavioral Strategies to Expand Participation in a Com-munity Recycling Program. Environment and Behavior, 23: 195–220.
Hornback, Kenneth E. 1974. Orbits of Opinion: The Role of Age in the Envi-ronmental Movement’s Attentive Public, 1968–1972. Ph.D. dissertation, Michi-gan State University, East Lansing.
256 References

Hotelling, H. 1947. Letter to Director of National Park Service. In An EconomicStudy of the Monetary Evaluation of Recreation in the National Parks. U.S.Department of the Interior, National Park Service and Recreational PlanningDivision.
How Green Is Al Gore? 2000. The Economist (April 22): 30.
Huber, Peter. 1996. How to Love Butterflies and Be a Conservative. Forbes, 157(April 22): 216–217.
Hume, Scott. 1991. Consumer Doubletalk Makes Companies Wary: ‘‘Prefer-ring’’ to Buy Green Isn’t Proven by Sales. Advertising Age (October 28): GR4.
Hungerford, Don, and Barbara Lewis. 1997. Is Environmental Education ScaringOur Children to Death? NEA Today, 16: 43.
Immerwahr, John. 1999. Waiting for a Signal: Public Attitudes toward GlobalWarming, the Environment and Geophysical Research. American GeophysicalUnion, Electronic Publication. hhttp://www.agu.org/sci_soc/attitude_study.htmli.
Inglehart, Ronald. 1981. Post-Materialism in an Environment of Insecurity.American Political Science Review, 75: 880–899.
Jacobs, Paul. 1986. Prop. 65: Toxics Calamity or Legal Catalyst? Los AngelesTimes, October 13, 1.
Janowitz, Morris, and Paul M. Hirsch, eds. 1981. Reader in Public Opinion andMass Communication (3rd ed., 3–9). New York: Free Press.
Jensen, Elizabeth. 2000. DiCaprio and ‘‘Planet Earth’’ Rank Fourth in Time Slot.Los Angeles Times, April 24, F2.
Johnson, John Mark. 1990. Citizens Initiate Ballot Measures. Environment,32(7): 4–5, 43–45.
Jones, Robert Emmet, and Lewis F. Carter. 1994. Concern for the Environmentamong Black Americans: An Assessment of Common Assumptions. SocialScience Quarterly, 75(3): 560–579.
Jones, Robert Emmet, and Riley E. Dunlap. 1992. The Social Bases of Envi-ronmental Concern: Have They Changed over Time? Rural Sociology, 57: 28–47.
Joreskog, Karl G., and Dag Sorbom. 1989. LISREL 7: A Guide to the Programand Applications. Chicago: SPSS.
Kachigan, Sam Kash. 1991. Multivariate Statistical Analysis: A Conceptual In-troduction (2nd ed.). New York: Radius Press.
Kahn, M. E., and J. G. Matsusaka. 1997. Demand for Environmental Goods:Evidence from Voting Patterns on California Initiatives. Journal of Law andEconomics, 40: 137–173.
Kamieniecki, Sheldon. 1995. Political Parties and Environmental Policy. In JamesP. Lester, ed., Environmental Politics and Policy: Theories and Evidence (2nded., 146–167). Durham, NC: Duke University Press.
References 257

Kanagy, Conrad L., Craig R. Humphrey, and Glenn Firebaugh. 1994. SurgingEnvironmentalism: Changing Public Opinion or Changing Publics? Social ScienceQuarterly, 75: 804–819.
Karlberg, Michael. 1997. News and Conflict: How Adversarial News FramesLimit Public Understanding of Environmental Issues. Alternatives Journal, 23:22–28.
Kasper, Raphael G. 1980. Perceptions of Risk and Their Effects on DecisionMaking. In Richard C. Schwing and Walter A. Albers Jr., eds., Societal Risk As-sessment: How Safe Is Safe Enough? (71–80). New York: Plenum Press.
Kates, Robert W. 2000. Has the Environment Improved? Environment, 42: FC.
Katosh, John P., and Michael W. Traugott. 1981. The Consequences of Vali-dated and Self-reported Voting Measures. Public Opinion Quarterly, 45: 519–535.
Keeter, Scott. 1984. Problematical Pollution Polls: Validity in the Measurementof Public Opinion on Environmental Issues. Political Methodology, 10: 267–291.
Kelman, Steven. 1981.What Price Incentives? Economists and the Environment.Boston: Auburn House.
Kempton, Willett, James S. Boster, and Jennifer A. Hartley. 1995. EnvironmentalValues in American Culture. Cambridge, MA: MIT Press.
Kennedy, Peter. 1993. A Guide to Econometrics (3rd ed.). Cambridge, MA: MITPress.
Kerlinger, Fred N. 1979. Behavioral Research: A Conceptual Approach. Dallas:Holt, Rinehart, and Winston.
Key, V. O., Jr. 1961. Public Opinion and American Democracy. New York:Knopf.
Kinder, Donald R., and D. Roderick Kiewiet. 1981. Sociotropic Politics: TheAmerican Case. British Journal of Political Science, 11: 129–161.
Kinder, Donald R., and Lynn M. Sanders. 1990. Mimicking Political Debatewith Survey Questions: The Case of White Opinion on Affirmative Action forBlacks. Social Cognition, 8: 73–103.
King, Gary. 1989. Unifying Political Methodology: The Likelihood Theory ofStatistic Inference. Cambridge: Cambridge University Press:
Kingdon, John W. 1984. Agendas, Alternatives, and Public Policies. Boston:Little, Brown.
Kinnear, Thomas C., James R. Taylor, and Sadrudin A. Ahmed. 1974. Ecologi-cally Concerned Consumers: Who Are They? Journal of Marketing, 38: 20–24.
Klein, Gil. 1995. Environment Challenges Public Mood. Tampa Tribune, July22, 4.
Klineberg, Stephen L., Matthew McKeever, and Bert Rothenbach. 1998. Demo-graphic Predictors of Environmental Concern: It Does Make a Difference HowIt’s Measured. Social Science Quarterly, 79: 734–753.
258 References

Kluegel, James R., and Eliot R. Smith. 1982. Whites’ Beliefs about Blacks’Opportunity. American Sociological Review, 47: 518–532.
Knickerbocker, Brad. 1995a. Americans Go ‘‘Lite Green.’’ Christian ScienceMonitor, April 18, 1.
Knickerbocker, Brad. 1995b. Is It Wrong to Be Optimistic about the Environ-ment? Christian Science Monitor, June 13, 14.
Knopman, Debra S., Megan M. Susman, and March K. Landy. 1999. CivicEnvironmentalism: Tackling Tough Land-Use Problems with Innovative Gover-nance. Environment, 41: 24.
Kriz, Margaret E. 1995. The Green Card. National Journal, 27(37): 2262.
Kriz, Margaret. 1996. Slinging Earth. National Journal, 28(17): 958.
Kuhn, Richard G., and Edgar L. Jackson. 1989. Stability of Factor Structures inthe Measurement of Public Environmental Attitudes. Journal of EnvironmentalEducation, 20: 27–32.
Lacayo, Richard. 1990. Green Ballots vs. Greenbacks. Time (November 19): 44.
Ladd, Everett Carll. 1979. The New Lines Are Drawn: Class and Ideology inAmerica. Public Opinion (July–August): 52–53.
Ladd, Everett Carll. 1982. Clearing the Air: Public Opinion and Public Policy onthe Environment. Public Opinion (August–September): 16–20.
Ladd, Everett Carll. 1990. What Do Americans Really Think about the Envi-ronment? Public Perspective, 1(4): 11.
Ladd, Everett Carll, and Karlyn H. Bowman. 1995. Attitudes toward theEnvironment: Twenty-Five Years after Earth Day. Washington, DC: AmericanEnterprise Institute Press.
Lake, Laura M. 1983. The Environmental Mandate: Activists and the Electorate.Political Science Quarterly, 98(2): 215–233.
La Trobe, Helen L., and Tim G. Acott. 2000. A Modified NEP/DSP Environ-mental Attitudes Scale. Journal of Environmental Education, 32(1): 12.
Lau, Richard R. 1985. Two Explanations for Negativity Effects in Political Be-havior. American Journal of Political Science, 29: 119–138.
Lauter, David, and Douglas Jehl. 1992. Bush, Clinton Clash over Jobs, Environ-ment. Los Angeles Times, September 15, A1.
LaVally, Rebecca. 1987. Proposition 65 Opponents Outspent Successful Foes.United Press International, February 5.
Leaversuch, Robert D., ed. 1992. Massachusetts Votes Down Drastic Measure toReduce Package Waste. Modern Plastics, 69(13): 37.
Lee, Eugene. 1978. California. In David Butler and Austin Ranney, eds., Refer-endums: A Comparative Study of Practice and Theory. Washington, DC: Amer-ican Enterprise Institute.
Leroux, Kivi. 1999. Subliminal Messages. E, 10 (July): 14.
References 259

Lester, James P., ed. 1995. Environmental Politics and Policy: Theories and Evi-dence. Durham, NC: Duke University Press.
Levitt, Norman. 1999. Prometheus Bedevilled: Science and the Contradictions ofContemporary Culture. Piscataway, NJ: Rutgers University Press.
Locke, Robert. 1986a. California Oil Industry Joins Others in Wariness overProposition 65. Oil Daily, September 18, 8.
Locke, Robert. 1986b. Success of Proposition 65, Approval of Restriction CloudElection Picture. Oil Daily, November 20, 8.
Lomborg, Bjorn. 2001. The Skeptical Environmentalist: Measuring the RealState of the World. Cambridge: Cambridge University Press.
Loth, Renee. 1991. Bringing Earth Day Back down to Earth: Grass-Roots Acti-vists Tweak ‘‘Elitist’’ Brethren. Boston Globe, April 21, A33.
Lounsbury, J. W., and L. G. Tornatzky. 1977. A Scale for Assessing Attitudestoward Environmental Quality. Journal of Social Psychology, 101: 299–305.
Lovett, Richard A. 1994. Proposition 65 Comes of Age. California Journal(November 1): 25–28.
Lowe, George D., Thomas K. Pinhey, and Michael D. Grimes. 1980. PublicSupport for Environmental Protection: New Evidence from National Surveys.Pacific Sociological Review, 23(4): 423–445.
Lowell, A. Lawrence. 1981. Public Opinion. In Morris Janowitz and Paul M.Hirsch, eds., Reader in Public Opinion and Mass Communication (3rd ed., 10–16). New York: Free Press.
Lowenstein, D. H. 1982. Campaign Spending and Ballot Propositions: RecentExperience, Public Choice Theory and the First Amendment. U.C.L.A. Law Re-view, 29: 505–641.
MacDonald, Stuart Elaine, George Rabinowitz, and Ola Listhaug. 1995. PoliticalSophistication and Models of Issues Voting. British Journal of Political Science,25(4): 453–483.
MacDonald, Stuart Elaine, George Rabinowitz, and Ola Listhaug. 1998. OnAttempting to Rehabilitate the Proximity Model: Sometimes the Patient JustCan’t Be Helped. Journal of Politics, 60(3): 653–690.
MacKuen, Michael B. 1984. Reality, the Press, and Citizens’ Political Agendas.In Charles F. Turner and Elizabeth Martin, eds., Surveying Subjective Phenom-ena. New York: Russell Sage Foundation.
Magleby, David B. 1984. Direct Legislation: Voting on Ballot Propositions in theUnited States. Baltimore: Johns Hopkins University Press.
Magleby, David B. 1989. Opinion Formation and Opinion Change in BallotProposition Campaigns. In M. Margolis and G. Mauser, eds., ManipulatingPublic Opinion (95–115). Belmont, CA: Brooks Cole.
Magleby, David B. 1994. Direct Legislation in the American States. In DavidButler and Austin Ranney, eds.,Referendums around theWorld: TheGrowing Useof Direct Democracy (218–257). Washington, DC: American Enterprise Institute.
260 References

Mainieri, Elaine, G. Barnett, Trisha R. Valdero, John B. Unipan, and StuartOskamp. 1997. Green Buying: The Influence of Environmental Concern onConsumer Behavior. Journal of Social Psychology, 137: 189–204.
Malik, Kenan. 1999. Why Science Needs Protection. The Independent (July 11):13.
Malkis, A., and H. G. Grasmick. 1977. Support for the Ideology of the Environ-mental Movement: Tests of Alternative Hypotheses. Western Sociological Re-view, 8: 25–47.
Maloney, Michael P., Michael P. Ward, and G. Nicholas Braucht. 1975. ARevised Scale for the Measurement of Ecological Attitudes and Knowledge.American Psychologist, 30: 787–790.
Mantese, Joe. 1991. New Study Finds Green Confusion. Advertising Age (Octo-ber 21): 1.
Margolis, Michael. 1977. From Confusion to Confusion: Issues and the Ameri-can Voter (1956–1972). American Political Science Review, 71: 31–43.
Marsh, C. Paul, and James A. Christenson. 1977. Support for Economic Growthand Environmental Protection, 1973–1975. Rural Sociology, 42: 101–107.
Martin, Glen. 2000a. Earth Day Report Card: We Still Care, Sort of. San Fran-cisco Chronicle, April 22, A1.
Martin, Glen. 2000b. Environment Is a Big Concern for Californians, PollShows. San Francisco Chronicle, June 21, A3.
Martinez-Vazquez, Jorge. 1981. Selfishness versus Public ‘‘Regardingness’’ inVoting Behavior. Journal of Public Economics, 15: 349–361.
Marttila & Kiley, Inc. 1992. Survey (MK 92110) [datafile]. February 11–13,n ¼ 402. Boston: Marttila & Kiley, for Massachusetts Public Interest ResearchGroup (Mass PIRG).
Maslow, Abraham H. 1970. Motivation and Personality (2nd ed.). New York:Harper and Row.
Mastio, David. 2000. The GOP’s Enviro-Rut. Policy Review (June): 19.
Mathews, Jessica. 1990. The Big, the Green, the Political. Washington Post,November 16, A19.
Mathews, Jessica. 1995. Outlook Not So Gloomy. Plain Dealer, April 24, B9.
McCloskey, Herbert. 1964. Consensus and Ideology in American Politics.American Political Science Review, 48: 361–382.
McCloskey, Michael. 1987. A Second-Order Issue. Environment, 29: 2.
Meadows, Donella H. 2000. Looking Back at Thirty Earth Days. St. Louis Post-Dispatch, April 25, B7.
Meadows, Donella H., Dennis L. Meadows, Jorgens Randers, and William W.Behrens III. 1972. The Limits to Growth. New York: Universe Books.
Mellman Group. 1997. State of the Climate [datafile]. August 11–14, n ¼ 800.Washington, DC: Mellman, for World Wildlife Fund.
References 261

Mertig, Angela G., and Riley E. Dunlap. 1995. Public Approval of Environmen-tal Protection and Other New Social Movement Goals in Western Europe andthe United States. International Journal of Public Opinion Research, 7: 145–156.
Michaels, Patrick. 1992. Reporters Cry Wolf about Environment. Insight on theNews, 8 (November 23): 20–21.
Milbrath, Lester W. 1965. Political Participation. Skokie, IL: Rand McNally.
Milbrath, Lester W. 1984. Environmentalists: Vanguard for a New Society.Albany: State University of New York Press.
Milbrath, Lester W., and M. L. Goel. 1977. Political Participation (2nd ed.).Chicago: Rand McNally.
Miller, Warren E., Donald R. Kinder, Steven J. Rosenstone, and the NationalElection Studies. 1999. National Election Studies, 1991 Pilot Election Study[dataset]. Ann Arbor: University of Michigan, Center for Political Studies.
Mr. Nader’s Electoral Mischief. 2000. New York Times, October 26, A34.
Mr. Nader’s Misguided Crusade. 2000. New York Times, June 30, A24.
Mitchell, Robert C. 1979. Silent Spring/Solid Majorities. Public Opinion, 2(August–September): 16–20, 55.
Mitchell, Robert C. 1984. Public Opinion and Environmental Politics in the1970s and 1980s. In Norman J. Vig and Michael E. Kraft, eds., EnvironmentalPolicy in the 1980s (57–74). Washington, DC: Congressional Quarterly Press.
Mitchell, Robert C. 1990. Public Opinion and the Green Lobby: Poised for the1990s? In Norman J. Vig and Michael E. Kraft, eds., Environmental Policy in the1990s (81–88). Washington: CQ Press.
Mitchell, Robert C., and Richard T. Carson. 1989. Using Surveys to Value Pub-lic Goods: The Contingent Valuation Method. Baltimore: Johns Hopkins Uni-versity Press, for Resources for the Future.
Mitchell, Robert C., Angela A. Mertig, and Riley E. Dunlap. 1992. TwentyYears of Environmental Mobilization: Trends among National EnvironmentalOrganizations. In Riley E. Dunlap and Angela G. Mertig, eds., American Envi-ronmentalism: The U.S. Environmental Movement, 1970–1990 (11–26). Wash-ington, DC: Taylor & Francis.
Mohai, Paul. 1985. Public Concern and Elite Involvement in Environmental-Conservation Issues. Social Science Quarterly, 66: 820–838.
Mohai, Paul. 1990. Black Environmentalism. Social Science Quarterly, 71(4):744–765.
Mohai, Paul. 1992. Men, Women, and the Environment: An Examination of theGender Gap in Environmental Concern and Activism. Society and NaturalResources, 5: 1–19.
Mohai, Paul, and Bunyan Bryant. 1998. Is There a ‘‘Race’’ Effect on Concern forEnvironmental Quality? Public Opinion Quarterly, 62: 475–477.
262 References

Mohai, Paul, and Ben W. Twight. 1987. Age and Environmentalism: An Elabo-ration of the Buttel Model Using National Survey Evidence. Social ScienceQuarterly, 68: 798–815.
Monroe, Kristen Renwick. 1991. John Donne’s People: Explaining Differencesbetween Rational Actors and Altruists through Cognitive Frameworks. Journalof Politics, 53: 394–433.
Morris, Louis A., Manoj Hastak, and Michael B. Mazis. 1995. Consumer Com-prehension of Environmental Advertising and Labeling Claims. Journal of Con-sumer Affairs, 29: 328–350.
Morrison, Denton E. 1986. How and Why Environmental Consciousness HasTrickled Down. In Allan Schnaiberg, Nicholas Watts, and Klaus Zimmermann,eds., Distributional Conflict in Environmental-Resource Policy (187–220). NewYork: St. Martin’s Press.
Morrison, Denton E., and Riley E. Dunlap. 1986. Environmentalism and Elitism:A Conceptual and Empirical Analysis. Environmental Management, 10: 581–589.
Mueller, John E. 1969. Voting on the Propositions: Ballot Patterns and HistoricalTrends in California. American Political Science Review, 63: 1197–1213.
Munton, Donald, and Linda Brady. 1970. American Public Opinion and Envi-ronmental Pollution. The Behavioral Science Laboratory Research Report. Co-lumbus: Ohio State University.
National Environmental Education and Training Foundation (NEETF). Variousyears. National Report Card on Environmental Attitudes, Knowledge, andBehavior. Conducated by Roper Starch Worldwide. Washington, DC: NEETF.hhttp://www.neetf.orgi.
National Opinion Research Center. 1994. General Social Survey [datafile].n ¼ 1;334. Chicago: NORC, University of Chicago.
National Science Foundation (NSF). 1997. Ohio State University Survey. Sep-tember 1–October 5, n ¼ 688. Sponsored by Resources for the Future, Wash-ington, DC. Arlington, VA: NSF.
NBC News/Wall Street Journal. 1997. Survey [datafile]. October 28–28,n ¼ 1;214. New York.
Nelkins, Dorothy. 1981. Nuclear Power as a Feminist Issue. Environment, 23:14–39.
Nicholl, Jack. 1989. Son of David and Goliath: Employing Strategy, Little Guyswith Initiative Can Beat Big Bucks. Campaigns and Elections (March–April): 16–17.
Nie, Norman, Sidney Verba, and John R. Petrocik. 1976. The Changing Ameri-can Voter. Cambridge, MA: Harvard University Press.
Nieves, Evelyn. 2001. Conversation: Ralph Nader. A Party Crasher’s Lone Re-gret: That He Didn’t Get More Votes. New York Times, February 18, D7.
Noe, Francis P., and Rob Snow. 1990. The New Environmental Paradigm andFurther Scale Analysis. Journal of Environmental Education, 21: 20–26.
References 263

Ogden, D. M., Jr. 1971. The Future of the Environmental Struggle. In Roy L.Meek and John A. Straayer, eds., The Politics of Neglect: The EnvironmentalCrisis (243–250). Boston: Houghton Mifflin.
Olson, Mancur, Jr. 1965. The Logic of Collective Action: Public Goods and theTheory of Groups. Cambridge, MA: Harvard University Press.
Oskamp, Stuart, Maura J. Harrington, Todd C. Edwards, Deborah L. Sherwood,Shawm M. Okuda, and Deborah C. Swanson. 1991. Factors Influencing House-hold Recycling Behavior. Environment and Behavior, 23 (July): 494–519.
Ostrom, Charles W., Jr. 1978. Time Series Analysis: Regression Techniques.Beverly Hills: Sage.
Ottman, Jacquelyn. 1992. Environmentalism Will Be the Trend of the ’90s.Marketing News (December 7): 13.
Ourlian, Robert. 2000. Anti-Green Measures Are Riders in the Storm. NationalJournal, 32 (January 22): 243.
Paehlke, Robert C. 1989. Environmentalism and the Future of Progressive Poli-tics. New Haven: Yale University Press.
Page, Benjamin I., and Robert Y. Shapiro. 1982. Changes in Americans’ PolicyPreferences, 1935–1979. Public Opinion Quarterly, 46: 24–42.
Page, Benjamin I., and Robert Y. Shapiro. 1983. Effects of Public Opinion onPolicy. American Political Science Review, 77: 175–190.
Page, Benjamin I., Robert Y. Shapiro, and Glenn R. Dempsey. 1987. WhatMoves Public Opinion? American Political Science Review, 81: 23–44.
Paige, Sean. 1998. The ‘‘Greening’’ of Government. Insight on the News (De-cember 14): 16.
Parlour, J. W., and S. Schatzow. 1978. The Mass Media and Public Concern forEnvironmental Problems in Canada, 1960–1972. International Journal of Envi-ronmental Studies, 13: 9–17.
Peffley, Mark, Stanley Feldman, and Lee Sigelman. 1987. Economic Conditionsand Party Competence: Processes of Belief Revision. Journal of Politics, 49: 100–121.
Pew Research Center for the People and the Press. 1997. November 1997 NewsInterest Index [datafile]. November 12–16, n ¼ 1;200. Washington, DC: PewResearch Center.
Pierce, John C., and Nicholas P. Lovrich Jr. 1980. Belief Systems Concerning theEnvironment: The General Public, Attentive Publics, and State Legislators. Polit-ical Behavior, 2: 259–286.
Pierce, John C., Nicholas P. Lovrich, and T. Tsurutani. 1987. Culture, Politicsand Mass Publics: Traditional and Modern Supporters of the New Environmen-tal Paradigm in Japan and the United States. Journal of Politics, 49: 54–79.
Pirages, Dennis C., and Paul R. Ehrlich. 1974. Ark II: Social Response to Envi-ronmental Imperatives. San Francisco: Freeman.
264 References

Pomper, Gerald M. 1972. From Confusion to Clarity: Issues and AmericanVoters, 1956–1968. American Political Science Review, 66: 415–428.
Pomper, Gerald M. 1975. Voters’ Choice: Varieties of American Electoral Be-havior. New York: Dodd, Mead.
Presser, Stanley. 1990. Can Changes in Context Reduce Vote Overreporting inSurveys? Public Opinion Quarterly, 54: 587.
Princeton Survey Research Associates (PSRA). Various years. Survey [datafile].November 13–14, 1997, n ¼ 752; April 13–14, 2000, n ¼ 752 (conducted forNewsweek). Princeton, NJ: PSRA.
Purdy, Jedediah. 2000a. Planet Bush, Planet Gore. The American Prospect, 11(October 20): 34.
Purdy, Jedediah. 2000b. Shades of Green. The American Prospect, 11 (January3): 6.
Rabinowitz, George, and Stuart Elaine Macdonald. 1989. A Directional Theoryof Issue Voting. American Political Science Review, 83: 93–121.
Rabinowitz, George, James W. Prothro, and William Jacoby. 1982. Salience as aFactor in the Impact of Issues on Candidate Elections. Journal of Politics, 44:41–63.
Ranney, Austin. 1978. The United States of America. In David Butler and AustinRanney, eds., Referendums: A Comparative Study of Practice and Theory (71–72). Washington, DC: American Enterprise Institute.
Rauber, Paul. 1991. Losing the Initiative? Sierra, 76: 20–24.
Rauch, Jonathan. 2000. There’s Smog in the Air, But It Isn’t All Pollution.Washington Post, April 30, B01.
Ridenour, David A. 1996. The Mouse That Squeaked. National Policy Analysis(November). hhttp://www.nationacenter.inter.net/npa154.htmi.
Ridgeway, James. 1998. It Isn’t Easy Voting Green. Audubon, 100(5): 144–145.
Ridley, Matt, and Bobbi S. Low. 1993. Can Selfishness Save the Environment?Atlantic Monthly, 272 (September): 76–86.
Roberts, James A., and Donald R. Bacon. 1997. Exploring the Subtle Relation-ships between Environmental Concern and Ecologically Conscious ConsumerBehavior. Journal of Business Research, 40(1): 79–89.
Rohrschneider, Robert. 1988. Citizen’s Attitudes Toward Environmental Issues:Selfish or Selfless? Comparative Political Studies, 21: 347–367.
Roper Center for Public Opinion Research. Various years. Survey [datafile].Storrs, CT: Roper Center, University of Connecticut.
Rosenbaum, Walter A. 1977. The Politics of Environmental Concern (2nd ed.).New York: Praeger.
Rosenbaum, Walter A. 1991. Environmental Politics and Policy (2nd ed.).Washington, DC: Congressional Quarterly Press.
References 265

Rosenstone, Steven J., Donald R. Kinder, Warren E. Miller, and the NationalElection Studies. 1998. National Election Studies, 1996: Pre- and Post-ElectionStudy [dataset], 3rd release. Ann Arbor: University of Michigan, Center forPolitical Studies.
Rosenstone, Steven J., Warren E. Miller, Donald R. Kinder, and the NationalElection Studies. 1999. National Election Studies, 1995 Pilot Election Study[datafile]. Ann Arbor: University of Michigan, Center for Political Studies.
Rothman, Hal K. 1998. The Greening of a Nation? Environmentalism in theUnited States since 1945. Orlando, FL: Harcourt Brace College.
Rourke, John T., Richard P. Hiskes, and Cyrus Ernesto Zirakzadeh. 1992. DirectDemocracy and International Politics: Deciding International Issues throughReferendums. Boulder: Rienner.
Ruben, Barbara. 1994. Back Talk. Environmental Action, 25: 11–16.
Rubin, Charles T. 1994. The Green Crusade: Rethinking the Roots of Environ-mentalism. Lanham, MD: Rowman & Littlefield.
Russell, Cristine. 1989. Warnings, Warnings Everywhere.Washington Post, May23, Z12, Z14.
Russell, Sabin. 1990. Corporations Going for the Green. San Francisco Chroni-cle, April 9, D1.
Ryder, Norman B. 1965. The Cohort as a Concept in the Study of SocialChange. American Sociological Review, 30: 843–861.
Saad Lydia, and Riley E. Dunlap. 2000. Americans Are EnvironmentallyFriendly, but Issue Not Seen as Urgent Problem. Gallup Poll Monthly, 415(April): 12–18.
Saffire, David. 1995. Has the Time Come for Deposit Legislation? Beverage In-dustry, 86: 25.
Sagoff, Mark. 1992. The Great Environmental Awakening. The American Pros-pect (Spring): 39–47.
Sale, Kirkpatrick, 1993, The Green Revolution: The American EnvironmentalMovement, 1962–1992. New York: Hill and Wang.
Samdahl, Diane M., and Robert Robertson. 1989. Social Determinants of Envi-ronmental Concern: Specification and Test of the Model. Environment and Be-havior, 21 (January): 57–81.
Sanera, Michael, and Jane S. Shaw. 1999. Facts, Not Fear: Teaching Childrenabout the Environment. Washington, DC: Regnery.
Scammon, Debra L., and Robert N. Mayer. 1995. Agency Review of Environ-mental Marketing Claims: Case-by-Case Decomposition of the Issues. Journal ofAdvertising, 24(2): 33–43.
Schechter, M., M. Kim, and L. Golan. 1989. Valuing a Public Good: Direct andIndirect Valuation Approaches to the Measurement of the Benefits from Pollu-tion Abatement. In H. Folmer, and E. ver Ierland, eds., Valuation Methods andPolicy Making in Environmental Economics. Amsterdam: Elsevier.
266 References

Schneider, William. 1990. Everybody’s An Environmentalist Now. NationalJournal (April 28): 1062.
Schroeder, Christopher H. 2000. Clear Consensus, Ambiguous Commitment.Michigan Law Review, 98: 1876–1915.
Schrum, L. J., Tina M. Lowrey, and John A. McCarty. 1994. Recycling as aMarketing Problem: A Framework for Strategy Development. Psychology andMarketing, 11: 393–416.
Schuhwerk, Melody E., and Roxanne Lefkoff-Hagius. 1995. Green or Non-Green? Does Type of Appeal Matter When Advertising a Green Product? Journalof Advertising, 24(2): 45–54.
Schultze, Charles L. 1977. The Public Use of Private Interest. Washington, DC:Brookings Institution.
Schuman, Howard, and Stanley Presser. 1981. Questions and Answers in Atti-tude Surveys: Experiments on Question Form, Wording, and Context. NewYork: Academic Press.
Schuman, Howard, and Cheryl Rieger. 1992. Historical Analogies, GenerationalEffects, and Attitudes toward War. American Sociological Review, 57: 315–326.
Schwartz, Joe, and Thomas Miller. 1991. The Earth’s Best Friends. AmericanDemographics (February): 26–35.
Schwepker, Charles H., and T. Bettina Cornwell. 1991. An Examination of Eco-logically Concerned Consumers and Their Intentions to Purchase EcologicallyPackaged Products. Journal of Public Policy and Marketing, 10(2): 77–101.
Scott, David, and Fern K. Willits. 1994. Environmental Attitudes and Behavior:A Pennsylvania Survey. Environment and Behavior, 26: 239–260.
Sears, David O., and Leonie Huddy. 1987. Bilingual Education: SymbolicMeaning and Support among Non-Hispanics. Paper presented at the AnnualMeeting of the American Political Science Association. Chicago, IL.
Sears, David O., Richard R. Lau, Tom R. Tyler, and Harris M. Allen Jr. 1980.Self-Interest vs. Symbolic Politics in Policy Attitudes and Presidential Voting.American Political Science Review, 74: 670–684.
Seuss, Dr. 1971. The Lorax. New York: Random House.
Shabecoff, Philip. 1992. Shades of Green in the Presidential Campaign. Issues inScience and Technology, 9: 73–79.
Shabecoff, Philip. 2000. Earth Rising: American Environmentalism in the Twenty-first Century. Washington, DC: Island Press.
Shipan, Charles R., and William R. Lowry. 2001. Environmental Policy andParty Divergence in Congress. Political Research Quarterly, 54(3): 245–263.
Shutkin, William A. 2000. The Land That Could Be: Environmentalism andDemocracy in the Twenty-first Century. Cambridge, MA: MIT Press.
Silver, Brian D., Barbara A. Anderson, and Paul R. Abramson. 1986. WhoOverreports Voting? American Political Science Review, 80: 613–624.
References 267

Sims, Rodman A. 1993. Positive Attitudes Won’t Make Cash Register Ring.Marketing News (June 7): 4.
Sinclair, Patti K. 1992. E for Environment: An Annotated Bibliography ofChildren’s Books with Environmental Themes. New Providence, NJ: Bowker.
Singhapakdi, Anusorn, and Michael S. LaTour. 1991. The Link between SocialResponsibility Orientation, Motive Appeals, and Voting Intention: A Case of anAnti-Littering Campaign. Journal of Public Policy and Marketing, 10: 118–129.
Skelton, George. 1986. Deukmejian Opposes Three Controversial Propositions.Los Angeles Times, September 3, 3.
Slovic, Paul. 1987. Perception of Risk. Science (April 17): 280–285.
Slovic, Paul, Baruch Fischhoff, and Sarah Lichtenstein. 1980. Facts and Fears:Understanding Perceived Risk. In Richard C. Schwing and Walter A. Albers Jr.,eds., Societal Risk Assessment: How Safe Is Safe Enough? (181–214). New York:Plenum Press.
Smith, Kevin B. 1994. Abortion Attitudes and Vote Choice in the 1984 and 1988Presidential Elections. American Politics Quarterly, 22: 354–369.
Smith, Tom W. 1978. Age and Social Change: An Analysis of the Associationbetween Age-Cohorts and Attitude Change, 1972–1977. GSS Social Change Re-port No. 5. Chicago: National Opinion Research Center.
Smith, Tom W. 1979. A Compendium of Trends on General Social SurveyQuestions. NORC Technical Report 15. Chicago: National Opinion ResearchCenter.
Smith, Tom W. 1984. Cycles of Reform? A Summary of Trends since World WarII. Paper presented to the American Sociological Association, San Antonio,August.
Smith, Tom W. 1990. Liberal and Conservative Trends in the United States sinceWorld War II. Public Opinion Quarterly, 54: 479–507.
Smith, Tom W. 1994. Is There Real Opinion Change? GSS Social Change Re-port, No. 36. Chicago: National Opinion Research Center. hhttp://www.icpsr.umich.edu/GSS/rnd1998/reports/s-reports/soc36.htmi.
Smith, V. Kerry. 1990. Can We Measure the Economic Value of EnvironmentalAmenities? Southern Economic Journal, 56: 865–878.
Smith, V. Kerry. 1995. Does Education Induce People to Improve the Environ-ment? Journal of Policy Analysis and Management, 14: 599–604.
Solomon, Lawrence S., Donald Tomaskovic-Devey, and Barbara J. Risman.1989. The Gender Gap and Nuclear Power: Attitudes in a Politicized Environ-ment. Sex Roles, 21: 401–414.
Soskis, Benjamin. 2000. Green with Envy: Hooray for Those Vacuous Celebri-ties. New Republic (May 8): 13.
Soto, Lucy. 1997. Many Favor an Increase in Gas Prices. Atlanta Journal andConstitution, November 21, A21.
268 References

Spangler, M. B. 1980. Methods, Problems, and Issues in Environmental CostBenefit Analysis of Nuclear Power Plant Alternatives. Environmental Impact As-sessment Course, Argonne National Laboratory for the International AtomicEnergy Association, Illinois.
Stanfield, Rochelle L. 1988. It’s Hip to Be Clean. National Journal, 20 (June 4):1510.
St. Clair, Jeffrey. 1997. The Twilight of ‘‘Gang Green.’’ In These Times, 21: 14.
Sterngold, Arthur, Rex H. Warland, and Robert O. Herrmann. 1994. Do Sur-veys Overstate Public Concerns? Public Opinion Quarterly, 58: 255–263.
Stimson, James. 1989. Public Opinion in America: Moods, Cycles, and Swings.Boulder: Westview Press.
Stisser, Peter. 1994. A Deeper Shade of Green. American Demographics (March):24–29.
Stokes, Donald E. 1963. Spatial Models of Party Competition. American Politi-cal Science Review, 57: 368–377.
Streitwieser, Mary L. 1997. Using the Pollution Abatement Costs and Expendi-tures Micro Data for Descriptive and Analytic Research. Journal of Economicand Social Management, 23: 1–25.
Sudman, Seymour, and Norma M. Bradburn. 1982. Asking Questions. SanFrancisco: Jossey-Bass.
Sullivan, John L., James Piereson, and George E. Marcus. 1982. Political Toler-ance and American Democracy. Chicago: University of Chicago Press.
Sunstein, Cass R. 1990. Remaking Regulation. American Prospect, 3: 73–82.
Sunstein, Cass R. 1997. Free Markets and Social Justice. New York: OxfordUniversity Press.
Swan, James A. 1971. Environmental Education: One Approach to Resolving theEnvironmental Crisis. Environment and Behavior, 3: 223–229.
Switzer, Jacqueline Vaughn. 1997. Green Backlash: The History and Politics ofEnvironmental Opposition in the U.S. Boulder: Rienner.
Taylor, Bron. 1997. Environmental Values in American Culture (book review).The Ecologist, 27 (January–February): 38–39.
Taylor, D. Garth. 1980. Procedures for Evaluating Trends in Public Opinion.Public Opinion Quarterly, 44: 86–100.
Taylor, Jerry. 1992. Campaign Trail Littered with Environmental Wrecks. PlainDealer, December 5, 7b.
Teles, Steven. 1996. Think Local, Act Local. New Stateman, 126 (August 22):28.
Tognacci, Louis N., Russell H. Weigel, Marwin F. Wideen, and David T. A.Vernon. 1972. Environmental Quality: How Universal Is Public Concern? Envi-ronment and Behavior, 4: 73–86.
References 269

Traugott, Michael W., and Paul J. Lavrakas. 2000. The Voter’s Guide to Elec-tion Polls (2nd ed.). New York: Chatham House.
Tucker, William. 1982. Progress and Privilege: America in the Age of Environ-mentalism. Garden City, NJ: Anchor/Doubleday.
Van Liere, Kent D., and Riley E. Dunlap. 1980. The Social Bases of Environ-mental Concern: A Review of Hypotheses, Explanations, and Empirical Evi-dence. Public Opinion Quarterly, 44: 181–197.
Van Liere, Kent D., and Riley E. Dunlap. 1981. Environmental Concern: Does ItMake a Difference How It’s Measured? Environment and Behavior, 13: 651–676.
Verba, Sidney, and N. H. Nie. 1972. Participation in America: Political Democ-racy and Social Equality. New York: Harper & Row.
Vig, Norman J. 1994. Presidential Leadership and the Environment: From Rea-gan and Bush to Clinton. In Norman J. Vig and Michael E. Kraft, eds., Envi-ronmental Policy in the 1990s (71–95). Washington, DC: CQ Press.
Vig, Norman J., and Michael E. Kraft, eds. 1994. Environmental Policy in the1990s. Washington, DC: CQ Press.
Wall, Glenda. 1995. Barriers to Individual Environmental Action: The Influenceof Attitudes and Social Experiences. Canadian Review of Sociology and Anthro-pology, 32: 465–489.
Wasik, John. 1992. Market Is Confusing, But Patience Will Pay Off. MarketingNews (October 12): 16.
Weigel, Russell, and Joan Weigel. 1978. Environmental Concern: The Develop-ment of a Measure. Environment and Behavior, 10: 3–15.
Westholm, Anders. 1997. Distance versus Direction: The Illusory Defeat of theProximity Theory of Electoral Choice. American Political Science Review, 91:865–883.
Wiley, John P., Jr. 1998. Coming to Terms. Smithsonian (December): 28.
Williams, Rolla. 1987. Window to the Wild. San Diego Union-Tribune, June 4,B2.
Wilson, James Q. 2000. Why They Don’t Campaign about the Environment.Slate (October 27). hhttp://slate.msn.com/?id=92005i.
Wilson, James Q., and Edward Banfield. 1964. Public Regardingness as a ValuePremise in Voting Behavior. American Political Science Review, 4: 876–887.
Wilson, James Q., and Edward Banfield. 1965. Voting Behavior on MunicipalPublic Expenditures: A Study in Rationality and Self-Interest. In Julius Margolis,ed., The Public Economy of Urban Communities (74–91). Baltimore: JohnsHopkins University Press.
Winski, Joseph M. 1991. Big Prizes, but No Easy Answers. Advertising Age(October 28): GR-3.
270 References

Wirthlin Worldwide. Various years. National Quorum [datafile]. 1996; August21–23, 1997, n ¼ 1;040; September 11–14, 1998, n ¼ 1;010; 1999. McLean,VA.
Wlezien, Christopher. 1995. The Public as Thermostat: Dynamics of Preferencesfor Spending. American Journal of Political Science, 39: 981.
Worldwide Concern about the Environment. 1989. Our Planet 1, no. 2/3: 14–15.
World Wildlife Fund (WWF). 1997a. State of the Climate (USMELL.092997)[datafile]. August 11–14, n ¼ 800. Administered by the Mellman Group. Wash-ington, DC: WWF.
World Wildlife Fund (WWF). 1997b. Voters Believe Global Warming Is a Real-ity. hhttp://www.panda.org/climate_event/poll.htmi. Washington, DC: WWF.
Yankelovich Clancy Shulman. 1992. Survey [datafile]. January 16, n ¼ 1;000.Westport, CT: Yankelovich Clancy Shulman.
Zaller, John. 1992. Report on 1991 Pilot Items on Environment. Ann Arbor,MI: National Election Studies (February 2).
Zaller, John, and Stanley Feldman. 1992. A Simple Theory of the Survey Re-sponse: Answering Questions versus Revealing Preferences. American PoliticalScience Review, 36: 580.
Zisk, Betty H. 1987. Money, Media, and the Grassroots: State Ballot Issues andthe Electoral Process. Newbury Park, CA: Sage.
References 271

This Page Intentionally Left Blank

Index
Note: Page numbers in italic type indicate material that appears in tables orfigures.
Achen, Christopher, 102Acid rain, 1, 27, 40, 95–96Adam, Barbara, 64Advertising, 155, 160–161, 170–171,
173–174, 187, 236n2, 237n17,238n33, 238n36
Age, 13, 62–63, 65–67, 73, 79–80,85, 219n15, 219n17
Air pollution, 2, 7, 22, 26, 34, 48, 52,77, 87, 91, 94–96, 122, 158, 173
Aldrich, John H., 231n30Allan, Stuart, 64American Paper Institute, 145Arctic National Wildlife Refuge
(ANWR), 6, 95Associated Press, 209n2Attitude, definition of, 58. See also
Public opinionAttitude change, sources ofcohort replacement, 58, 61, 62–63,67
economic conditions, 63, 67federal spending, 64, 67media attention, 64, 69Attitude constraint, 89–102Attitude strength, measurement ofbehavior, 47–53centrality, 38, 41–42conviction, 38, 42–44intensity, 38–41
Autocorrelation, 65Ayres, Ed, 52
Baldassare, Mark, 158Ballot propositions, 14, 123, 125–152, 233n14, 234n35
Banfield, Edward, 236–237n13Behavior. See Consumer behavior;Voting behavior
Belden and Russonello, 25–26Belief systems, 13, 87, 89–90, 92,101–102, 178, 223n2. See alsoAttitude constraint; DominantSocial Paradigm (DSP); NewEnvironmental Paradigm (NEP)
Benedict, Robert C., 127Bhopal (India), chemical accident at,60
Biological diversity. See Wildlife,protection of
Bishop, George F., 210n32Blair, Irene, 238n39Bone, Hugh A., 127Borgida, Eugene, 231n30Bosso, Christopher J., 9, 121Boster, James S., 11, 21–24, 178Bottle bills. See RecyclingBowler, Shaun, 129Bowman, Karlyn, 35, 39, 42, 43,44

Bragdon, Peter, 122Breyer, Stephen, 6, 7, 10, 184,242n41
Broder, David, 243n53Brower, David, 4Brown, Stuart C., 185, 207n39Browner, Carol, 19Bryce, James, 12, 37Buchanan, James M., 154, 160, 168,173–174
Bullard, Robert D., 74, 79, 220n25Burford, Anne, 5Bush, George H. W., 5, 63, 122,217n52
Bush, George W., 118–119, 122, 187,232n38
Cambridge Reports ResearchInternational, 44, 48, 155, 162–163, 165–166, 171, 189–190, 201–203
Campaign spending, 126, 143, 150–152
Campbell, Angus, 81, 108Carlson, Les, 238n33Carmines, Edward G., 105–106, 114,122
Carson, Rachel, 1, 3–4Carter, Cynthia, 64Carter, Jimmy, 217n52CBS News/New York Times, 33, 41Charlton Research Company, 33Chernobyl (Ukraine), nuclear accidentat, 60, 69, 219n17
Civic environmentalism, 180–182A Civil Action (film), 1, 205n5Clean Water Act, 6Climate change. See Global warmingClinton, Bill, 33, 110–111, 113–114,116–120, 175, 206n17, 217n52,231n29
Club of Rome, 2, 4Cohorts, birth, 59, 62–63, 65–66, 67,73, 79. See also Age
Commoner, Barry, 1, 3–4Confidence Board, 66
Congress, U.S., 6, 106–107, 122Consensus, 2, 14–15, 21–24, 35–36,53–54, 176, 186–187
Constant model, 59Consultative Group on BiologicalDiversity (CGBD), 25, 210n21
Consumer behavior, 7–8, 10, 14, 83–85, 153–174, 184–186, 224n21,237n17
Contingent valuation, 47–49. See alsoWillingness-to-pay (WTP)
Converse, Philip E., 89–90, 92, 108,208n62, 223n2
Cyclical model, 59–60, 66
Daley, Patrick, 218n53Darman, Richard, 20Deforestation, 2, 7, 34, 95–96Degree-of-concern questions, 39, 41,43, 45–46, 95–98
deHaven-Smith, Lance, 90, 102Democratic Party, 6, 20, 106–107,109–111, 121, 175, 241n26. Seealso Partisan identification
Deukmejian, George, 140DiCaprio, Leonardo, 206n17Dimensionality. See Attitudeconstraint
Dole, Bob, 111, 114, 116, 120,231n29
Dominant Social Paradigm (DSP),91–92
Donovan, Beth, 122Donovan, Todd, 129Douglas, Mary T., 79Dowie, Mark, 4, 55Downs, Anthony, 57–58, 70Dr. Seuss (Theodor Geisel), 205n3Dummy variables, 133–134, 234n34Dunlap, Riley E., 10–11, 42, 75, 91–92, 121, 211n8, 211n42, 219n12,220n22, 224–225n26, 229–230n5,240n18
Durbin-Watson statistic, 65, 217n44Durr, Robert H., 65, 70, 217n49,218n59
274 Index

Earth Day, 1, 3–5, 57, 69, 71–72, 91,144, 153, 206n17, 230–231n22,241n37
Earth First!, 21, 209n20Easterbrook, Gregg, 4, 180–181Economic conditions, 2, 5, 13, 59, 63,
66–67, 69–70, 126, 129, 131–132,134, 138, 144, 147, 149–152, 178,216n32, 240n10
Education, 13, 73, 80, 85Efficacy, 9, 52, 73, 160, 168–169,
173, 179, 185Ehrlich, Paul, 1El Nino, 31Elections. See Voting behaviorElectoral College, 120Elliott, Euel, 63, 66Ellis, Richard J., 11, 22, 185, 209n3Endangered Species Act, 6Energy conservation, 2, 51, 76, 91,
158, 162–163, 184Environmental concern, definition of,
91Environmental Defense, 236n3, 241–
242n37Environmental movementbacklash against, 11, 22elitism of, 10–11, 71–74, 87,219n12
evaluation of, 3–5, 90, 14–15, 121–123, 125, 175–187
influence on popular culture, 1, 3,205nn3–5, 206n17
political impact of, 5–6, 9, 11, 105–123, 125–152, 155–156, 178, 182–183, 186–187
Environmental policy. See also Taxeseconomic impact of, 138, 140, 144–145, 149–150
government spending on, 58, 60, 64,66–67, 91, 217n52
public support for, 13, 23–24, 30–33, 48, 64–65, 80, 91, 99, 240n10
Environmental problemsmedia attention to, 13, 19–20, 28,34, 42, 58, 64, 67, 69–70, 126,
131, 134, 151, 178, 209n2,210n33, 218n53, 240n16priority of, 24–28, 70, 218n57123public knowledge of, 31–33, 35,102, 140–143, 178–179, 229n55,231n29, 241n30, 242n41salience of, 41–42, 107–108, 114–118, 119, 123, 152, 177, 182–183
Environmental Protection Agency(EPA), 6, 19, 66
Environmentalists,definition of, 176public perceptions of, 71, 82self-identification in polls, 2, 95, 99,121, 156, 176, 214n60, 228n47strategies used by, 3–5, 38, 55, 63,70, 152, 180–182, 207n39, 240n10
Episodic model, 59, 66Erin Brokovich (film), 1, 205n5Error covariance. See Measurementerror
Erskine, Hazel, 57Exxon Valdez, 42, 60, 69, 218n53,219n17
Factor analysis, 94, 101, 226n40,227n41, 228–229n48
Farm Bureau Association, 139Federal Election Commission, 232n39Feeling thermometers, 82, 111, 193Fenno, Richard F., 243n57Field Institute, 140, 197–198, 234–235n47
Filter questions, 39, 211n6Finger, Matthias, 240n18Firebaugh, Glenn, 217n45, 219n17Framing, 34–35, 72, 75, 77, 126,147, 149–152, 161, 163, 171, 173
Fuel efficiency, 238n41
Gallup Organization, 3, 22, 27–28,29, 39–40, 40, 42–43, 43, 49–52,50, 54, 93, 95–96, 99, 101, 157,158, 162, 163, 171, 206n15,210n23, 214n50, 214n60, 228n47,238n41, 239n3
Index 275
Gelernter, David, 11Geller, Jack M., 92Gender, 13, 74–75, 77General Social Survey (GSS), 23, 24,
31, 48, 59–60, 62, 64–66, 68, 77,78, 80, 81, 83–85, 162, 165, 166,169, 171, 189–192, 221n44
Gerstenzang, James, 34Gingrich, Newt, 6, 230–231n22Global warming, 7, 19, 21, 28–36,40, 48, 53, 77, 95–96, 144, 178,182, 210n30
Goodness-of-fit statistics, 96–99,228nn43–45
Gore, Al, 6–7, 118–122Gottlieb, Robert, 87Graham, Virginia, 129Green, Donald Philip, 154, 170,238n39
Green consumerism. See Consumerbehavior
Green Party, 119, 123. See alsoPartisan identification
Greenhouse effect. See Globalwarming
Greenpeace, 111Greenwashing, 5, 122, 187Grimes, Michael D., 218n57Grocery Manufacturers Association,145
Grove, Stephen J., 238n33Guber, Deborah Lynn, 228n46Gup, Ted, 186
Hardin, Garrett, 180Harris, Jack, 210n33Hartley, Jennifer A., 11, 21–24, 178Hayduk, Leslie A., 226–227n40Hays, Samuel P., 67, 73, 219n15Helvarg, David, 53Herndl, Carl G., 185, 207n39Herrmann, Robert O., 39, 211n6Hetherington, Mark, 216n32Hibbing, John R., 241n35Holmes, Thomas P., 237n21Humphrey, Craig R., 217n45, 219n17
Ideology, 6, 30–31, 36, 69, 75–76,79–80, 85, 87, 89–90, 109, 113,122, 142, 147, 150, 159–160, 163,166–168, 173, 185–186. See alsoPartisan identification
Immerwahr, John, 35, 181Income, 13, 73–74, 79, 85, 163, 166,221n47
Index of Consumer Confidence, 66Inglehart, Ronald, 73Initiative and Referendum Institute,129, 233n27
Initiatives. See Ballot propositionsInter-University Consortium forPolitical and Social Research(ICPSR), 190, 193
Issue-attention cycle, 57, 60, 70Issue framing. See FramingIssue salience. See SalienceIssue voting, 105–106, 108, 113–116,133, 143, 229–230n5, 230n18. Seealso Voting behavior
Jacoby, William, 231n26Joreskog, Karl G., 226–227n40
Kanagy, Conrad L., 217n45, 219n17Kangun, Norman, 238n33Katz, Cheryl, 158Keeter, Scott, 44Kempton, Willett, 11, 21–24, 178,209n20
Key, V. O., Jr., 1–2, 12–14, 21, 36–37, 58, 61, 89, 186
King, Gary, 65Klineberg, Stephen L., 75–76, 80, 82,222n51
Kmart, 238n36Kurtosis, 96, 227n42Kyoto Protocol (Japan), 19–21, 30–33. See also Global warming
Ladd, Everett Carll, 39, 42–44,213n38
Lake, Laura M., 11, 125Lasley, Paul, 92
276 Index
Lavrakas, Paul J., 33League of Conservation Voters, 122Lee, Eugene, 128Levitt, Norman, 183Likert scales, 41, 45Linear model, 59–60, 66LISREL, 226–227n40Lomborg, Bjorn, 4Louis Harris and Associates, 27–28,
29Love Canal (New York state),
hazardous waste site at, 60Low, Bobbi S., 9, 180Lowe, George D., 218n57Lowell, A. Lawrence, 12, 37
Magleby, David B., 126, 128, 130,145, 150–151, 233n14
Marcus, George E., 215n16Marketing. See AdvertisingMarttila & Kiley, Inc., 145, 198–201,
235n61Maslow, Abraham H., 74Massachusetts, recycling initiative of
1992, 126, 144–152Massachusetts Public Interest Research
Group (MassPIRG), 235n61Mastio, David, 110Mathews, Jessica, 151McCloskey, Michael, 123McDonald’s, 8, 236n3McKeever, Matthew, 75, 222n51Meadows, Donella H., 4, 240n10Measurement error, 90–91, 93–94,
96–97, 99, 101–102, 223n12, 225–226n36, 228–229n48
Media attention to environmentalissues, 13, 19–20, 28, 34, 42, 64,67, 69–70, 126, 131, 134, 151,178, 209n2, 210n33, 218n53,240n16
Michaels, Patrick, 218n53, 240n16Milbrath, Lester W., 221n42Miller, Warren E., 108Mitchell, Robert C., 42, 52, 212n19,
229–230n5
Mohai, Paul, 85Money. See Campaign spendingMorrison, Denton E., 219n12, 239n8Most important problem questions,42, 53
Multicollinearity, 166, 238n46Murphy Brown (television series),205n4
Nader, Ralph, 119–121, 232n38–39National Election Studies (NES), 45,
46, 52, 53, 82, 83–84, 106–107,109–113, 119, 161, 193–197,231n29, 231–232n35, 232n38
National Environmental Educationand Training Foundation (NEETF),179, 229n55, 240n17
National Opinion Research Center.See General Social Survey (GSS)
National Public Radio (NPR), 209n2Natural Resources Defense Council(NRDC), 111
National Science Foundation, 211n40NBC News/Wall Street Journal, 33New Environmental Paradigm (NEP),92–93, 94, 224–225n26
Nixon, Richard, 7, 217n52Nuclear power, 2, 7, 74, 77, 95, 136–138, 205n4. See also Chernobyl;Three Mile Island
O’Neill, Dan, 218n53Oldendick, Robert W., 210n32Ordinary least squares (OLS), 222n50Ozone depletion, 7, 40, 53, 63, 96,178–179
Page, Benjamin I., 64Partisan identification, 13, 75, 80, 82,87, 108–110, 113, 116–122, 125,127, 142, 166–168, 173, 231n32.See also Democratic Party; GreenParty; Ideology, Republican Party
Persian Gulf War, 63, 107, 234n33Pesticides, 77, 84, 136, 138, 144, 158,166, 169, 182
Index 277

Pew Research Center for the Peopleand the Press, 19, 30–31, 34, 48,208–209n1, 209n2
Piereson, James, 215n16Pinhey, Thomas K., 218n57Policy. See Environmental policyPolitical parties. See Democratic Party;Green Party; Republican Party
Polls. See subject of pollPollution. See Air pollution; Waterpollution
Pollution Abatement Costs andExpenditures survey (PACE), 66,217n47
Population growth, 26Presser, Stanley, 13, 38, 41–43, 45,49, 107
Princeton Survey Associates, 48,241n37
Probit analysis, 80, 85, 222n50Proctor & Gamble, 8Proposition 65. See Safe DrinkingWater and Toxic Enforcement Actof 1986
Prothro, James W., 231n26Public opinion, definition of, 37Public opinion, qualities ofconstraint, 13–14, 89–102, 178direction, 12, 19–36, 177distribution, 13, 71–87, 177stability, 13, 57–70, 177strength, 12, 37–55, 177Public opinion, trends in, 59–61Public opinion polls. See subject of
pollPurdy, Jedediah, 122, 242n52
Question 3. See Massachusetts,recycling initiative of 1992
Question wording, importance of, 20,27–28, 33–36, 49, 75–76, 109
R-square, 216n24, 222n49Rabinowitz, George, 231n26Race, 13, 74, 79, 85
Ranney, Austin, 129Rauch, Jonathan, 7Reader’s Guide to Periodical
Literature, 67Reagan, Ronald, 5, 217n52Recycling, 1, 50–51, 76, 83, 85, 91,134, 138, 144–150, 155, 157–158,169, 177, 180, 205n4
Referenda. See Ballot propositionsRegens, James L., 63Regression analysis, 65–66, 133,219n13
Republican Party, 6, 20, 106–107,110, 207n28, 241n26. See alsoPartisan identification
Ridley, Matt, 9, 180Risk, public perceptions of, 6–7, 10,76–80, 138, 179, 183–184,240n11, 242n41
Rohrschneider, Robert, 52, 165Roosevelt, Theodore, 5Roper Center for Public OpinionResearch, 190, 197
Roper Organization, 179Rothenbach, Bert, 75, 222n51Rothman, Hal K., 3, 5Ruben, Barbara, 218n53, 240n16Rubin, Charles T., 1, 4, 205–206n11
Safe Drinking Water and ToxicEnforcement Act of 1986, 126,139–143, 152
Sagoff, Mark, 11, 72, 220n32Sale, Kirkpatrick, 239n4Salience, 41–42, 52, 107–108, 114–119, 121, 123, 152, 177, 179, 182–183, 229n5
SAS statistical software, 65, 217n39Schneider, William, 11, 87Schultze, Charles L., 184Schuman, Howard, 13, 38, 41–43,45, 107
Seldon, Barry J., 63Self-interest, 51–52, 153–154, 157–159, 162–166, 184, 237n21
278 Index

Sex. See GenderShabecoff, Philip, 11, 52, 71, 106, 175Shields, Mark, 241n26Shutkin, William A., 182Sierra Club, 4, 21, 27, 122Simmons Market Research Bureau, 8The Simpsons (television series),
205n4Skewness, 96, 227n42Smith, Kevin B., 116Smith, Tom W., 59, 69, 215n18,
216n23Smith, V. Kerry, 240n18Social desirability, 19, 38–39, 42, 45,
49, 54, 90, 127, 143, 178, 209n3Sorbom, Dag, 226–227n40Sprawl, 2, 71, 96, 178Statistical significance, 77Sterngold, Arthur, 39, 211n6Stimson, James, 70, 105–106, 114,
122Stokes, Donald E., 108, 230–231n22Sullivan, John L., 215n16, 231n30Sunstein, Cass R., 153, 155, 213n37Supreme Court, U.S., 120Switzer, Jacqueline Vaughn, 11
Target (department store), 238n36Taylor, Bron, 23Taylor, D. Garth, 59Taxes, 23–24, 48, 80. See also
Environmental policyTeles, Steven, 179Theiss-Morse, Elizabeth, 241n35Thompson, Fred, 11, 22, 185, 209n3Three Mile Island (Pennsylvania),
nuclear accident at, 60, 138Time-series, analysis of, 65, 217n39Tolba, Mostafa, 28Toxic waste, 26, 28, 74, 90, 144, 162,
177. See also Safe Drinking Waterand Toxic Enforcement Act of 1986
Trade-off questions, 13, 38, 42–46Traugott, Michael W., 33Tuchfarber, Alfred F., 210n32
Tucker, William, 10, 87Tullock, Gordon, 168, 173–174
United Nations EnvironmentProgramme (UNEP), 28
Universal Product Code (UPC), 8
Van Liere, Kent D., 10, 75, 91,220n22, 224–225n26
Variables, independent anddependent, 65
Vietnam War, 108Voting behavior, 5–6, 9, 11, 105–123, 125–156, 178, 229–230n5
Wal-Mart, 8, 183, 238n36Warland, Rex A., 39, 211n6Water pollution, 2, 7, 22, 26, 34, 48,52, 77, 90, 96
Watt, James, 5Weld, William, 144–145Wildavsky, Aaron, 79Wildlife, protection of, 7, 22–23, 25–26, 34, 63, 71, 74, 87, 91, 106,130, 144, 178
Wiley, John P., Jr., 176Williams, Rolla, 27Willingness-to-pay (WTP), 13, 47–49,76, 159, 161, 163, 213n37
Wilson, James Q., 183, 236–237n13Wirthlin Worldwide, 41, 206n12Wlezien, Christopher, 64, 67, 217n46Woodward, Louise, 31World Wildlife Fund (WWF), 30, 32,
33–34, 210n30, 211n40Worldwatch Institute, 52
Yankelovich, Clancy, Shulman, 48
Zaller, John, 107, 113, 231n26Zisk, Betty H., 138, 143
Index 279