the smart flood detector with ultrasonic using iot
86
1 TITLE: THE SMART FLOOD DETECTOR USING ULTRASONIC SENSOR WITH IOT NAME: ID CARD: MUHAMMAD FARIS BIN ABDULGAFAR 08DEP17F1187 DEP5B POLITEKNIK SULTAN SALAHUDDIN ABDUL AZIZ SHAH
-
Upload
khangminh22 -
Category
Documents
-
view
0 -
download
0
Transcript of the smart flood detector with ultrasonic using iot

1
TITLE:
THE SMART FLOOD DETECTOR USING ULTRASONIC
SENSOR WITH IOT
NAME: ID CARD:
MUHAMMAD FARIS BIN
ABDULGAFAR
08DEP17F1187
DEP5B
POLITEKNIK SULTAN SALAHUDDIN ABDUL AZIZ
SHAH

2
THE SMART FLOOD DETECTOR WITH ULTRASONIC USING IOT
MUHAMMAD FARIS BIN ABDUL GAFAR
This Report Is Submitted In Partial Fulfilment Of The
Requirement for Diploma Electronic Engineering (communication)
Jabatan Kejuruteraan Elektrik Politeknik Sultan Salahuddin Abdul Aziz Shah
June 2019

3
ENDORSEMENT
This report is submitted to the Department of Electrical Engineering as a partial fulfilment of the
requirements for the Diploma in Electrical Engineering. The members of the supervisory
committee are as follow:
Supervisor Signature :
Supervisor Name : PUAN ROHANIZA BINTI MOHD ZALI
Date :
Supervisor Signature :
Supervisor Name : PUAN ASLINDA BINTI ZAMAH SHARI
Date :
Supervisor Signature :
Supervisor Name : PUAN ANNAFAEDZATUL BINTI MOHAMMAD AMIN
Date :
Supervisor Signature :
Supervisor Name : PUAN NURUL AKHMAR BINTI KAMARUDDIN
Date :

4
DECLARATION OF ORIGINALITY
I confirm that the project report are submitting entirely my own work and that any material used
from other sources has been clearly identified and properly acknowledged and referenced.
Project Title : The Smart Flood Detector with Ultrasonic using IOT
Signature : ……………………………………….
Name : MUHAMMAD FARIS BIN ABDUL GAFAR
Registration No : 08DEP17F1187
Date : 17.10.2019
Email : [email protected]

5
ACKNOWLEDGEMENT
All the praise and thanks to Allah SWT. I am very thankful to my supervisor Puan Aslinda
Binti Zamah Shari whose encouragement, guidance and support from the initial to the final
level enabled to develop an understanding of the subject.
I would like to express our gratitude and appreciation to all those who gave the possibility to
complete this report. A special thanks to our final year project lecturers
Puan Rohaniza Binti Mohd Zali, Puan Nurul Akhmar binti Kamaruddin and Puan Annafaedzatul
binti Mohammad Amin whose helped stimulating suggestions and encouragement and helped to
complete my project especially in writing this report.
Last but not least, many thanks go to our friend whose have given their full effort in guiding the
team in achieving the goal as well as their encouragement to maintain my progress in track and
gave suggestion about the Flood Detector System. I would like to appreciate the guidance given
by other supervisor as well the panels especially in my project presentation that has improved
my presentation skills by their comment and tips.

6
ABSTRACT
This paper presents the development of a smart flood detector system using the Blynk platform as a
medium of data transmission. This system develops consists of two main segments which are hardware
segment from the ultrasonic sensor and software segment from Blynk apps. Based on two Node MCU
development board integrated using Blynk application (IOS or android). The first Node MCU is placed
at the flood. Transmitter unit consisting of Node MCU, an ultrasonic sensor will detect the water level
during flooding and display it on the Application. Then, the data detected from the ultrasonic sensors will
be sent to the Blynk application via a wireless connection. The data are instantly collected and stored in
a dedicated database for recording purposes. In order to alert the person in charge of the control unit, the
data then will be sent to Node MCU via Blynk Bridge to trigger the buzzer but for this project, a warning
appears in the notification to alert the user of the current situation. Based on the findings, access to the
system between first Node MCU and second Node MCU can be made within less or more than 1 meter.
The findings revealed that the system works well when the data sensed by the ultrasonic sensor display
on the Blynk application.
Keywords- NodeMCU, Ultrasonic Sensor, Android Application (Blynk)

7
ABSTARK
Membentangkan pembangunan sistem pengesan banjir pintar menggunakan platform Blynk sebagai
medium penghantaran data. Sistem ini dibangunkan terdiri daripada dua segmen utama iaitu segmen
perkakasan dari sensor ultrasonik dan segmen perisian dari aplikasi Blynk. Berdasarkan dua papan
pengembangan MCU Node bersepadu menggunakan aplikasi Blynk (IOS atau android). MCU Node
yang pertama diletakkan di banjir. Unit pemancar yang terdiri daripada MCU Node, sensor ultrasonik
akan mengesan paras air semasa banjir dan memaparkannya pada Aplikasi. Kemudian, data yang
dikesan dari sensor ultrasonik akan dihantar ke aplikasi Blynk melalui sambungan tanpa wayar. Data
dikumpulkan dan disimpan dengan serta-merta dalam pangkalan data khusus untuk tujuan rakaman.
Untuk memberi amaran kepada orang yang menjaga unit kawalan, data itu akan dihantar ke MCU Node
melalui jambatan Blynk untuk mencetuskan buzzer tetapi untuk projek ini, satu amaran muncul dalam
pemberitahuan untuk memaklumkan kepada pengguna keadaan semasa. Berdasarkan penemuan, akses
ke sistem antara MCU Node pertama dan MCU Node kedua boleh dibuat dalam jarak kurang dari 1
meter. Penemuan menunjukkan bahawa sistem berfungsi dengan baik apabila data yang dikesan oleh
paparan sensor ultrasonik pada aplikasi Blynk.
Kata kunci- NodeMCU, Sensor Ultrasonik, Aplikasi Android (Blynk)

8
TABLE OF CONTENTS
CONTENT
Figure Number Title Page
ENDORSEMENT 3
DECLARATION OF ORIGINALITY
4
ACKNOWLEDGEMENT
5
ABSTRACT
6
ABSTARK
7
LIST OF FIGURE 8
LIST OF APPENDIX
INTRODUCTION
11

9
1.1 BACKGROUND 11
1.2 PROBLEM STATMENT 12
1.3 OBJECTIVE 12
1.4 SCOPE OF PROJECT 12
1.5 THE IMPORTANT AND IMPACT OF PROJECT 13
1.6 OUTLINE OF PROJECT 13
LITERATURE REVIEW 14
2.1 BACKGROUND 14
2.2 TYEPS OF FLOOD 19
2.3 TYPES OF SENSOR 21
METHODOLOGY 30
3.1 BACKGROUND 30
3.2 PLANNING OF PROJECT THE FLOOD DETECTOR 39
3.3 FLOWCHART THE FLOOD DETECTOR SYSTEM 43
3.4 COLLECTING DATA COMPONENT 47
3.5 COLLECTING DATA SURVEY 51
3.6 SOFTWARE 55

10
RESULTS AND DISCUSSION 64
4.1 ANALYSIS OF PROJECT 64
4.2 RESULT 64
CONCLUSION AND RECOMMENDATION
66
5.1 CONCLUSION 66
5.2 RECOMBINATION 66
REFERENCE 67
APPENDIX
Figure Title page
1 CODING 68
2 PITEX COMPETITION 83
3 MY SUPERVISOR 84
4 PARTNER FINAL YEAR PROJECT 85
5 AUTHOR PROFILE 86

11
CHAPTER 1
INTRODUCTION
1.1 Background
Water is one of the maximum critical fundamental desires for residing beings. Water is an
important part of ordinary life. Due to global environment scenario, water control and
conservation is crucial for human survival. Now-a-days, there were large needs of purchaser
based totally humanitarian tasks that would be rapidly developed the usage of net of factors
(IoT). But our proposal hardware measures water level in actual-time and helps the user to
display the level of the rivers such as Sg Kerian, Hulu Langat and Sg. Rasau, Shah Alam on
the use of android software. Within the previous technique, the user has to check for water
stage sometimes, its miles waste of time.
The proposed system is fully automated. Here human work and time are saved. We proposed
an IoT based water monitoring system from this hardware that measures water level in real-
time. Flood Detector System: an IoT based android application implements IoT with which,
the user can directly monitor the working of sensor to send the data through the smart phone,
from anywhere. The android application is developed to check the level of water and alerting
the user by the level of water reaches the maximum and minimum levels time-to-time.
1.2 Problem Statement
The problem in the disaster management is not lack of technology or existence of the relevant
information. It is often the lack of accessibility of the information. The capability to
efficiently use information technologies to discover and manage information, the ability to
critically evaluate, and appropriately apply such information to solve a problem, are the key
spirit of investigation and determination to find out disaster recovery solutions. Therefore,
the means of identifying, locating and accessing data and determining is crucial for carrying
out efficiently respond to the problem. The Internet technology service is broadly recognized
as a method for distributing information. It is served as two-way communications between
service providers and users. As a result, a large number of web-based applications and
services including web-mapping services have been increasing. The Map service provider,

12
such as Google Map, Google Earth and World Wind, offers the map visualization to the
public. Millions users from all over the world make use of the service which is easy, hasty
and effective. Such web mapping services applications provide directions, interactive maps,
aerial images, bird’s eye view, and 3D images. They are efficient in viewing areas or finding
location(s) in normal situations. However, those services do not function as a real time
disaster-warning tool as a majority. They do not serve for the purpose of natural disaster
warning such as floods alert. The reason is because the procedure involves updated related
data, satellite imagery, land use/land cover, inundated areas and etc. which mostly recorded
by the local organization. Immediate response to a flood event is the key command for
disaster management program. This includes methods for accessing urgent data and prompt
communications in three stages, which are prior to an emergency period, during the phase of
an emergency period, and the post emergency recovery phase. Satellite images are promising
for flood disaster locations due to the frequency of retrieving images. A prompt manner to
detect the inundated areas from the images is also vital.
1.2.1 Stuck in traffic congestion
1.2.2 There are no initial preparation to face the flood
1.3 Objective
1.3.1 To develop the device for flood detection by applying wifi module system
1.3.2 To detect the flood and alert the people living around the flood zone
1.3.3 To develop mobile application that integrate with blynk application to provide
situation information in indentified places
1.4 Scope of project
The scope of this project is focusing at user who use highway or road. This project
also has the limitation:
1.4.1 The Flood Detector cannot give the warning to who are not installed the
application

13
1.5 The important and impact of project
This project has an importance in terms of alert the user about the flood detector.
Besides that this project is also important for the manufacture of a faster and easier
steel system.
1.6 Outline of report
Chapter 1 gave an introduction about the project as well as problem statement, objective
and project scope for project.
Chapter 2 is a literature review where the main part of programmable The Flood
Detector will be describes and understanding all components that will be used for this
project. The purpose of this chapter is to provide an overview the scope of study for
this project.
Chapter 3 is methodology section where the methods or steps that have been used to
build up the Flood Detector. The main component that use in this project is Arduino
software to set up time, display and output to complete the detector Flood.
Chapter 4 is the result and discussion where all the result of the analysis will be shown.
Discussion and observation of the outcome of the research in relation to evidence
obtained from project and theories will be made in this chapter.
Chapter 5 is conclusion for this project, which describe the overall project based on the
observation of the result obtained and summarize the entire project. This chapter also
discuss the recommendation for future planning.

14
CHAPTER 2
LITERATURE REVIEW
2.1 BACKGROUND
A flood is an overflow of water that submerges land that is usually dry.[1] In the sense of
"flowing water", the word may also be applied to the inflow of the tide. Floods are an area of
study of the discipline hydrology and are of significant concern in agriculture, civil
engineering and public health.
Flooding may occur as an overflow of water from water bodies, such as a river, lake, or ocean,
in which the water overtops or breaks levees, resulting in some of that water escaping its usual
boundaries,[2] or it may occur due to an accumulation of rainwater on saturated ground in an
area flood. While the size of a lake or other body of water will vary with seasonal changes
in precipitation and snow melt, these changes in size are unlikely to be considered significant
unless they flood property or drown domestic animals.
Floods can also occur in rivers when the flow rate exceeds the capacity of the river channel,
particularly at bends or meanders in the waterway. Floods often cause damage to homes and
businesses if they are in the natural flood plains of rivers. While riverine flood damage can be
eliminated by moving away from rivers and other bodies of water, people have traditionally
lived and worked by rivers because the land is usually flat and fertile and because rivers
provide easy travel and access to commerce and industry.
Some floods develop slowly, while others can develop in just a few minutes and without visible
signs of rain. Additionally, floods can be local, impacting a neighbourhood or community, or
very large, affecting entire river basins

15
2.1.1 Floods in Kelantan, Terengganu, northern Peninsular
Malaysia expected in November: Disaster agency
Figure 2.1.1
KUALA LUMPUR: Floods are expected in Kelantan, Terengganu and northern Peninsula
Malaysia next month, said the National Disaster Management Agency (NADMA) on
Wednesday (Oct 16).
The agency's announcement came as the northeast monsoon is likely to hit by the end of
October and will last till March next year, based on a forecast by the Malaysian Meteorological
Department.
In a statement following a central disaster management meeting in Putrajaya, NADMA
cautioned that the level of floods is forecast to be almost on par with the floods in 2016 and
2017.
Floods are also expected in Kelantan, Terengganu, Pahang and east Johor in December, while
Johor, Pahang and west Sarawak might experience floods early next year, it added.

16
2.1.2 Understanding Flood Risk in Malaysia through
Catastrophe Modelling
April 18, 2019
Narathip Sutchiewcharn Senior Vice President at Guy Carpenter, Singapore Claudio
Saffioti Catastrophe Model Developer at Guy Carpenter, Singapore
Figure 2.1.2
In mid-December 2014, heavy rains brought by the Northeast Monsoon started to batter vast
stretches of Peninsular Malaysia. Precipitation persisted until the first days of 2015, and
accumulated rainfall in some areas exceeded 1,750 mm, up to six times the amount usually
observed in December.
When flood waters finally started to recede in early January, the extent of the damage became
evident. Over 230,000 people had been evacuated from their homes across five states, and 21
people were killed. According to the International Federation of Red Cross and Red Crescent
Societies, between 500,000 and 1 million people were affected by the event. Economic
losses were in excess of $280 million, and insurance information provider Axco
estimated insured losses to be around $63 million. The most affected states were Pahang,
Terengganu and Kelantan, where floods ravaged about 184,000 hectares of palm
plantations and crippled palm oil production, a vital sector of the Malaysian economy.

17
2.1.3 Puluhan kenderaan ditenggelami air di Sungai Gadut
Oleh Tuty Haryanti Ahmad Rodzi
Figure 2.1.3
SEREMBAN: Puluhan kenderaan ditenggelami air akibat banjir kilat di beberapa kawasan
sekitar Sungai Gadut di sini petang tadi.
Hujan lebat yang bermula kira-kira jam 3 petang itu mengakibatkan laluan di Sungai Gadut,
Jalan Seremban-Tampin, Kawasan Perindustrian Ringan Senawang dan Stesen Sungai Gadut
dinaiki air kira-kira satu meter.
Penolong Pengarah Operasi Jabatan Bomba dan Penyelamat Malaysia (JBPM) Negeri
Sembilan, Ahmad Mukhlis Mokhtar, berkata pihaknya menerima panggilan kecemasan
kejadian itu pada jam 6.24 petang

18
2.1.4 Baling dilanda banjir lagi
Oleh Safuri Kamarudin
Figure 2.1.4
Baling: Seramai 145 mangsa daripada 49 keluarga dipindahkan ke pusat pemindahan
sementara selepas air Sungai Ketil melimpah sehingga menyebabkan banjir di kawasan
penempatan berdekatan.Pegawai Jabatan Kebajikan Masyarakat Baling, Shamsul Izrin
Isahak, berkata hujan lebat lebih lima jam sejak jam 6 petang semalam, menyebabkan Sungai
Ketil kini berada pada paras bahaya.
“Antara kampung yang terjejas ialah Kampung Pantai, Tanjung Merbau dan Lubuk Pedati
dengan air dilaporkan naik antara 0.6 hingga satu meter.“Berikutan itu, pihak berkuasa
mengarahkan penduduk mula berpindah mulai jam 12 tengah malam sehingga 6 pagi tadi,”
katanya ketika dihubungi hari ini.
Semua mangsa kini ditempatkan di Kompleks Rakan Muda Batu 42 (139 mangsa) dan
Dewan Tun Abdul Razak (enam mangsa).
Ini banjir kedua melanda daerah ini, selepas lebih 100 penduduk terpaksa dipindahkan ke
empat pusat pemindahan pada Sabtu lalu, selepas kawasan mereka dinaiki air.

19
2.2 TYPES OF FLOOD
2.2.1 Drain and Sewer Flooding
Sewer floods are not always attributed to the weather. As well as rainfall, they could occur as
a result of a blockage or similar failure within the drainage system. Drain and sewer flooding
may be internal (within a building) or external.
While there may be many different types of floods, they all share one common attribute: the
potential to wreak havoc. Understanding the risks and taking steps to mitigate them is key.
In the UK, there is a national move away from flood defence to flood risk management and
enabling communities to take reasonable responsibility to protect their homes, work places,
businesses and communities.
2.2.2Coastal Flooding
Coastal areas often bear the brunt of severe storms, especially if these have gathered pace
over the oceans. Extreme weather and high tides can cause a rise in sea levels, sometimes
resulting in coastal flooding. Low-lying seaside areas usually have defences against the water
- whether that’s man-made defences or natural barriers such as sand dunes. As global
warming develops, coastal flooding is expected to be a recurring and increasingly severe
problem.
2.2.3River Flooding
River flooding is one of the most common types of inland flood; occurring when a body of
water exceeds its capacity. When a river ‘bursts its banks’ - typically due to high rainfall over
a prolonged period of time - localised flooding can cause considerable damage to surrounding
properties, as well as posing a significant safety threat. To prevent flooding, rivers needs
good defences, especially in flat or populous areas.

20
2.2.4 Flash Flooding
Caused by heavy and sudden rainfall, flash flooding happens when the ground cannot absorb
the water as quickly as it falls. This type of flood usually subsides quickly, but while it lasts
can be fast-moving and dangerous. Flash flooding can be prevented by good drainage
systems and by avoiding over-development on floodplains.
Groundwater Flood
As opposed to flash floods, groundwater flooding takes time to occur. As rain falls over an
extended period, the ground becomes saturated with water until it cannot absorb any more.
When this happens, water rises above the ground’s surface and causes flooding. This type of
flooding can last for weeks or sometimes even months.

21
2.3 TYPES OF SENSOR
2.3.1 Ultrasonic
Figure 2.3.1.
Ultrasonic level sensors are used for non-contact level sensing of highly viscous liquids, as
well as bulk solids. They are also widely used in water treatment applications for pump control
and open channel flow measurement. The sensors emit high frequency (20 kHz to 200 kHz)
acoustic waves that are reflected back to and detected by the emitting transducer.
Ultrasonic level sensors are also affected by the changing speed of sound due to moisture,
temperature, and pressures. Correction factors can be applied to the level measurement to
improve the accuracy of measurement.
Turbulence, foam, steam, chemical mists (vapors), and changes in the concentration of the
process material also affect the ultrasonic sensor’s response. Turbulence and foam prevent the
sound wave from being properly reflected to the sensor; steam and chemical mists and vapors
distort or absorb the sound wave; and variations in concentration cause changes in the amount
of energy in the sound wave that is reflected back to the sensor. Stilling wells and waveguides
are used to prevent errors caused by these factors. Proper mounting of the transducer is required

22
to ensure the best response to reflected sound. In addition, the hopper, bin, or tank should be
relatively free of obstacles such as weldments, brackets, or ladders to minimise false returns
and the resulting erroneous response, although most modern systems have sufficiently
"intelligent" echo processing to make engineering changes largely unnecessary except where
an intrusion blocks the "line of sight" of the transducer to the target. Since the ultrasonic
transducer is used both for transmitting and receiving the acoustic energy, it is subject to a
period of mechanical vibration known as "ringing". This vibration must attenuate (stop) before
the echoed signal can be processed. The net result is a distance from the face of the transducer
that is blind and cannot detect an object. It is known as the "blanking zone", typically 150 mm
to 1 m, depending on the range of the transducer.
The requirement for electronic signal processing circuitry can be used to make the ultrasonic
sensor an intelligent device. Ultrasonic sensors can be designed to provide point level control,
continuous monitoring or both. Due to the presence of a microprocessor and relatively low
power consumption, there is also the capability for serial communication from to other
computing devices making this a good technique for adjusting calibration and filtering of the
sensor signal, remote wireless monitoring or plant network communications. The ultrasonic
sensor enjoys wide popularity due to the powerful mix of low price and high functionality.

23
2.3.2 Vibrating point
Figure 2.3.2
These detect levels of very fine powders (bulk density: 0.02 g/cm3 – 0.2 g/cm3), fine powders
(bulk density: 0.2 g/cm3 – 0.5 g/cm3), and granular solids (bulk density: 0.5 g/cm3 or greater).
With proper selection of vibration frequency and suitable sensitivity adjustments, they can
also sense the level of highly fluidized powders and electrostatic materials.
Single-probe vibrating level sensors are ideal for bulk powder level. Since only one sensing
element contacts the powder, bridging between two probe elements is eliminated and media
build-up is minimized. The vibration of the probe tends to eliminate build-up of material on
the probe element. Vibrating level sensors are not affected by dust, static charge build-up
from dielectric powders, or changes in conductivity, temperature, pressure, humidity or
moisture content. Tuning-fork style vibration sensors are another alternative. They tend to be
less costly, but are prone to material build-up between the tines,

24
2.3.3 Rotating paddle
Figure 2.3.3
Rotating paddle level sensors are a very old and established technique for bulk solid point
level indication. The technique uses a low-speed gear motor that rotates a paddle wheel.
When the paddle is stalled by solid materials, the motor is rotated on its shaft by its own
torque until a flange mounted on the motor contacts a mechanical switch. The paddle can be
constructed from a variety of materials, but tacky material must not be allowed to build up on
the paddle. Build-up may occur if the process material becomes tacky because of high
moisture levels or high ambient humidity in the hopper. For materials with very low weight
per unit volume such as Perlite, Bentonite or fly ash, special paddle designs and low-torque
motors are used. Fine particles or dust must be prevented from penetrating the shaft bearings
and motor by proper placement of the paddle in the hopper or bin and using appropriate
seals.

25
2.3.4 Admittance-type
Figure 2.3.4
An RF admittance level sensor uses a rod probe and RF source to measure the change
in admittance. The probe is driven through a shielded coaxial cable to eliminate the effects of
changing cable capacitance to ground. When the level changes around the probe, a
corresponding change in the dielectric is observed. This changes the admittance of this
imperfect capacitor and this change is measured to detect change of level.

26
2.3.5 Magnetic and mechanical float
Figure 2.3.5
The principle behind magnetic, mechanical, cable, and other float level sensors often involves
the opening or closing of a mechanical switch, either through direct contact with the switch, or
magnetic operation of a reed. In other instances, such as magnetostrictive sensors, continuous
monitoring is possible using a float principle. With magnetically actuated float sensors,
switching occurs when a permanent magnet sealed inside a float rises or falls to the actuation
level. With a mechanically actuated float, switching occurs as a result of the movement of a
float against a miniature (micro) switch. For both magnetic and mechanical float level sensors,
chemical compatibility, temperature, specific gravity (density), buoyancy, and viscosity affect
the selection of the stem and the float. For example, larger floats may be used with liquids with
specific gravities as low as 0.5 while still maintaining buoyancy. The choice of float material
is also influenced by temperature-induced changes in specific gravity and viscosity – changes
that directly affect buoyancy Float-type sensors can be designed so that a shield protects the
float itself from turbulence and wave motion. Float sensors operate well in a wide variety of
liquids, including corrosives. When used for organic solvents, however, one will need to verify
that these liquids are chemically compatible with the materials used to construct the sensor.
Float-style sensors should not be used with high viscosity (thick) liquids, sludge or liquids that

27
adhere to the stem or floats, or materials that contain contaminants such as metal chips; other
sensing technologies are better suited for these applications. A special application of float-type
sensors is the determination of interface level in oil-water separation systems. Two floats can
be used with each float sized to match the specific gravity of the oil on one hand, and the water
on the other. Another special application of a stem type float switch is the installation of
temperature or pressure sensors to create a multi-parameter sensor. Magnetic float switches are
popular for simplicity, dependability and low cost. A variation of magnetic sensing is the "Hall
effect" sensor which utilizes the magnetic sensing of a mechanical gauge's indications. In a
typical application, a magnetism-sensitive "Hall effect sensor" is affixed to a mechanical tank
gauge that has a magnetized indicator needle, so as to detect the indicating position of the
gauge's needle. The magnetic sensor translates the indicator needle position into an electrical
signal, allowing other (usually remote) indication or signalling.
2.3.6 Pneumatic
Figure 2.3.6
Pneumatic level sensors are used where hazardous conditions exist, where there is no electric
power or its use is restricted, or in applications involving heavy sludge or slurry. As the compression
of a column of air against a diaphragm is used to actuate a switch, no process liquid contacts the
sensor's moving parts. These sensors are suitable for use with highly viscous liquids such as
grease, as well as water-based and corrosive liquids. This has the additional benefit of being a
relatively low cost technique for point level monitoring. A variation of this technique is the "bubbler",
which compresses air into a tube to the bottom of the tank, until the pressure increase halts as the
air pressure gets high enough to expel air bubbles from the bottom of the tube, overcoming the
pressure there. The measurement of the stabilized air pressure indicates the pressure at the
bottom of the tank, and, hence, the mass of fluid above.
28
2.3.7 Conductive
Figure 2.3.7
Conductive level sensors are ideal for the point level detection of a wide range of conductive
liquids such as water, and is especially well suited for highly corrosive liquids such as caustic
soda, hydrochloric acid, nitric acid, ferric chloride, and similar liquids. For those conductive
liquids that are corrosive, the sensor’s electrodes need to be constructed from titanium,
Hastelloy B or C, or 316 stainless steel and insulated with spacers, separators or holders of
ceramic, polyethylene and Teflon-based materials. Depending on their design, multiple
electrodes of differing lengths can be used with one holder. Since corrosive liquids become
more aggressive as temperature and pressure increase, these extreme conditions need to be
considered when specifying these sensors.
Conductive level sensors use a low-voltage, current-limited power source applied across
separate electrodes. The power supply is matched to the conductivity of the liquid, with higher
voltage versions designed to operate in less conductive (higher resistance) mediums. The power
source frequently incorporates some aspect of control, such as high-low or alternating pump
control. A conductive liquid contacting both the longest probe (common) and a shorter probe
(return) completes a conductive circuit. Conductive sensors are extremely safe because they
use low voltages and currents. Since the current and voltage used is inherently small, for
personal safety reasons, the technique is also capable of being made "Intrinsically Safe" to meet
international standards for hazardous locations. Conductive probes have the additional benefit
of being solid-state devices and are very simple to install and use. In some liquids and
applications, maintenance can be an issue. The probe must continue to be conductive. If buildup

29
insulates the probe from the medium, it will stop working properly. A simple inspection of the
probe will require an ohmmeter connected across the suspect probe and the ground reference.
Typically, in most water and wastewater wells, the well itself with its ladders, pumps and other
metal installations, provides a ground return. However, in chemical tanks, and other non-
grounded wells, the installer must supply a ground return, typically an earth rod
2.3.8 State dependent frequency monitor
A microprocessor controlled frequency state change detection method uses a low amplitude
signal generated on multiple sensor probes of differing lengths. Each probe has a frequency
separate from all other probes in the array and independently changes state when touched by
water. The state change of the frequency on each probe is monitored by a microprocessor which
can perform multiple water level control functions.
A strength of state dependent frequency monitoring is long term stability of the sensing probes.
The signal strength is not sufficient to cause fouling, degradation, or deterioration of the sensors
due to electrolysis in contaminated water. Sensor cleaning requirements are minimal or
eliminated. Use of multiple sensing rods of different length allows the user to intuitively set up
control switches at various water heights.
The microprocessor in a state dependent frequency monitor can actuate valves and/or large
pumps with very low power consumption. Multiple switch controls can be built in to small
package while providing complex, application specific functionality using the microprocessor.
Low power consumption of the controls is consistent across large and small field applications.
This universal technology is used in applications with wide-ranging liquid quality.

30
2.3.9 Capacitance
Figure 2.3.9
Capacitance level sensors excel in sensing the presence of a wide variety of solids, aqueous
and organic liquids, and slurries.[10] The technique is frequently referred to as RF for the radio
frequency signals applied to the capacitance circuit. The sensors can be designed to sense
material with dielectric constants as low as 1.1 (coke and fly ash) and as high as 88 (water) or
more. Sludges and slurries such as dehydrated cake and sewage slurry (dielectric constant
approx. 50) and liquid chemicals such as quicklime (dielectric constant approx. 90) can also be
sensed.[3] Dual-probe capacitance level sensors can also be used to sense the interface between
two immiscible liquids with substantially different dielectric constants, providing a solid state
alternative to the aforementioned magnetic float switch for the "oil-water interface"
application.
Since capacitance level sensors are electronic devices, phase modulation and the use of higher
frequencies makes the sensor suitable for applications in which dielectric constants are similar.
The sensor contains no moving parts, is rugged, simple to use, and easy to clean, and can be
designed for high temperature and pressure applications. A danger exists from build-up and
discharge of a high-voltage static charge that results from the rubbing and movement of low
dielectric materials, but this danger can be eliminated with proper design and grounding.
Appropriate choice of probe materials reduces or eliminates problems caused by abrasion and
corrosion. Point level sensing of adhesives and high-viscosity materials such as oil and grease

31
can result in the build-up of material on the probe; however, this can be minimized by using a
self-tuning sensor. For liquids prone to foaming and applications prone to splashing or
turbulence, capacitance level sensors can be designed with splashguards or stilling wells,
among other devices.
A significant limitation for capacitance probes is in tall bins used for storing bulk solids. The
requirement for a conductive probe that extends to the bottom of the measured range is
problematic. Long conductive cable probes (20 to 50 meters long), suspended into the bin or
silo, and are subject to tremendous mechanical tension due to the weight of the bulk powder in
the silo and the friction applied to the cable. Such installations will frequently result in a cable
breakage.
2.3.10 Optical interface
Figure 2.3.10
Optical sensors are used for point level sensing of sediments, liquids with suspended solids,
and liquid-liquid interfaces. These sensors sense the decrease or change in transmission of
infrared light emitted from an infrared diode (LED). With the proper choice of construction
materials and mounting location, these sensors can be used with aqueous, organic, and
corrosive liquids.
A common application of economical infrared-based optical interface point level sensors is
detecting the sludge/water interface in settling ponds. By using pulse modulation techniques
and a high power infrared diode, one can eliminate interference from ambient light, operate the
LED at a higher gain, and lessen the effects of build-up on the probe.

32
An alternate approach for continuous optical level sensing involves the use of a laser. Laser
light is more concentrated and therefore is more capable of penetrating dusty or steamy
environments. Laser light will reflect off most solid, liquid surfaces. The time of flight can be
measured with precise timing circuitry, to determine the range or distance of the surface from
the sensor. Lasers remain limited in use in industrial applications due to cost, and concern for
maintenance. The optics must be frequently cleaned to maintain
2.3.11 Microwave
Figure 2.3.11
Microwave sensors are ideal for use in moist, vaporous, and dusty environments as well as in
applications in which temperatures and pressures vary. Microwaves (also frequently described
as RADAR), will penetrate temperature and vapor layers that may cause problems for other
techniques, such as ultrasonic.[3] Microwaves are electromagnetic energy and therefore do not
require air molecules to transmit the energy making them useful in vacuums. Microwaves, as
electromagnetic energy, are reflected by objects with high conductive properties, like metal
and conductive water. Alternately, they are absorbed in various degrees by 'low dielectric' or
insulating mediums such as plastics, glass, paper, many powders and food stuffs and other
solids.
Microwave sensors are executed in a wide variety of techniques. Two basic signal processing
techniques are applied, each offering its own advantages: Pulsed or Time-Domain
Reflectometry (TDR) which is a measurement of time of flight divided by the speed of light,
similar to ultrasonic level sensors, and Doppler systems employing FMCW techniques. Just as
with ultrasonic level sensors, microwave sensors are executed at various frequencies, from

33
1 GHz to 60 GHz.[11] Generally, the higher the frequency, the more accurate, and the more
costly. Microwave is executed non-contact technique or guided. The first is done by monitoring
a microwave signal that is transmitted through free space (including vacuum) and reflected
back, or can be executed as a "radar on a wire" technique, generally known as Guided Wave
Radar or Guided Microwave Radar. In the latter technique, performance generally improves in
powders and low dielectric media that are not good reflectors of electromagnetic energy
transmitted through a void (as in non-contact microwave sensors). But with the guided
technique the same mechanical constraints exist that cause problems for the capacitance (RF)
techniques mentioned previously by having a probe in the vessel.
Non-contact microwave-based radar sensors are able to see through low conductivity
'microwave-transparent' (non-conductive) glass/plastic windows or vessel walls through which
the microwave beam can be passed and measure a 'microwave reflective' (conductive) liquid
inside (in the same way as to use a plastic bowl in a microwave oven). They are also largely
unaffected by high temperature, pressure, vacuum or vibration. As these sensors do not require
physical contact with the process material, so the transmitter /receiver can be mounted a safe
distance above/from the process, even with an antenna extension of several metres to reduce
temperature, yet still respond to the changes in level or distance changes e.g. they are ideal for
measurement of molten metal products at over 1200 °C. Microwave transmitters also offer the
same key advantage of ultrasonic: the presence of a microprocessor to process the signal,
provide numerous monitoring, controls, communications, setup and diagnostic capabilities and
are independent of changing density, viscosity and electrical properties. Additionally, they
solve some of the application limitations of ultrasonic: operation in high pressure and vacuum,
high temperatures, dust, temperature and vapor layers. Guided Wave Radars can measure in
narrow confined spaces very successfully, as the guide element ensures correct transmission to
and from the measured liquid. Applications such as inside stilling tubes or external bridles or
cages, offer an excellent alternative to float or displacement devices, as they remove any
moving parts or linkages and are unaffected by density changes or build up. They are also
excellent with very low microwave reflectivity products like liquid gasses (LNG, LPG, and
Ammonia) which are stored at low temperatures/high pressures, although care needs to be
taken on sealing arrangements and hazardous area approvals. On bulk solids and powders,
GWR offers a great alternative to radar or ultrasonic sensors, but some care needs to be taken
over cable wear and roof loading by the product movement.

34
One perceived major disadvantage of microwave or radar techniques for level monitoring is
the relatively high price of such sensors and complex set up. However, price has reduced
significantly over the last few years, to match those of longer range ultrasonic, with simplified
set up of both techniques also improving ease of use.
2.3.12 Resistive chain
Resistive chain level sensors are similar to magnetic float level sensors in that a permanent
magnet sealed inside a float moves up and down a stem in which closely spaced switches and
resistors are sealed. When the switches are closed, the resistance is summed and converted to
current or voltage signals that are proportional to the level of the liquid.
The choice of float and stem materials depends on the liquid in terms of chemical compatibility
as well as specific gravity and other factors that affect buoyancy. These sensors work well for
liquid level measurements in marine, chemical processing, pharmaceuticals, food processing,
waste treatment, and other applications. With the proper choice of two floats, resistive chain
level sensors can also be used to monitor for the presence of an interface between two
immiscible liquids whose specific gravities are more than 0.6, but differ by as little as 0.1 unit.

35
2.3.13 Magnetoresistive
Figure 2.3.13
Magnetoresistance float level sensors are similar to float level sensors however a permanent
magnet pair is sealed inside the float arm pivot. As the float moves up the motion and location
are transmitted as the angular position of the magnetic field. This detection system is highly
accurate down to 0.02° of motion. The field compass location provides a physical location of
the float position. The choice of float and stem materials depends on the liquid in terms of
chemical compatibility as well as specific gravity and other factors that affect buoyancy of the
float. The electronic monitoring system does not come in contact with the fluid and is
considered intrinsic safety: or explosion proof. These sensors work well for liquid level
measurements in marine, vehicle, aviation, chemical processing, pharmaceuticals, food
processing, waste treatment, and other applications.
Due to the presence of a microprocessor and low power consumption, there is also capability
for serial communication from to other computing devices making this a good technique for
adjusting calibration and filtering of the sensor signal.

36
2.3.14 Hydrostatic pressure
Figure 2.3.14
Hydrostatic pressure level sensors are submersible or externally mounted pressure sensors
suitable for measuring the level of corrosive liquids in deep tanks or water in reservoirs.
Typically, fluid level is determined by the pressure at the bottom of the fluid containment (tank
or reservoir); the pressure at the bottom, adjusted for the density / specific gravity of the fluid,
indicates the depth of the fluid.[3] For these sensors, using chemically compatible materials is
important to assure proper performance. Sensors are commercially available from 10 mbar to
1000 bar.
Since these sensors sense increasing pressure with depth and because the specific gravities of
liquids are different, the sensor must be properly calibrated for each application. In addition,
large variations in temperature cause changes in specific gravity that should be accounted for
when the pressure is converted to level. These sensors can be designed to keep the diaphragm
free of contamination or build-up, thus ensuring proper operation and accurate hydrostatic
pressure level measurements.
For use in open air applications, where the sensor cannot be mounted to the bottom of the tank
or pipe thereof, a special version of the hydrostatic pressure level sensor, a level probe, can be
suspended from a cable into the tank to the bottom point that is to be measured.[3] The sensor

37
must be specially designed to seal the electronics from the liquid environment. In tanks with a
small head pressure (less than 100 INWC), it is very important to vent the back of the sensor
gauge to atmospheric pressure. Otherwise, normal changes in barometric pressure will
introduce large error in the sensor output signal. In addition, most sensors need to be
compensated for temperature changes in the fluid.
2.3.15 Air bubbler
Figure 2.3.15
An air bubbler system uses a tube with an opening below the surface of the liquid level. A fixed
flow of air is passed through the tube. Pressure in the tube is proportional to the depth (and
density) of the liquid over the outlet of the tube.[3]
Air bubbler systems contain no moving parts, making them suitable for measuring the level of
sewage, drainage water, sewage sludge, night soil, or water with large quantities of suspended
solids. The only part of the sensor that contacts the liquid is a bubble tube which is chemically
compatible with the material whose level is to be measured. Since the point of measurement
has no electrical components, the technique is a good choice for classified "Hazardous Areas".

38
The control portion of the system can be located safely away, with the pneumatic plumbing
isolating the hazardous from the safe area.
Air bubbler systems are a good choice for open tanks at atmospheric pressure and can be built
so that high-pressure air is routed through a bypass valve to dislodge solids that may clog the
bubble tube. The technique is inherently "self-cleaning". It is highly recommended for liquid
level measurement applications where ultrasonic, float or microwave techniques have proved
undependable. The system will require constant supply of air during measurement. The end of
the tube should be above certain height to avoid sludge from clogging the tube.
2.3.16 Gamma ray
Figure 2.3.16
A nuclear level gauge or gamma ray gauge measures level by the attenuation of gamma rays
passing through a process vessel[12]. The technique is used to regulate the level of
molten steel in a continuous casting process of steelmaking. The water-cooled mold is
arranged with a source of radiation, such as cobalt-60 or caesium-137, on one side and a
sensitive detector such as a scintillation counter on the other. As the level of molten steel rises
in the mold, less of the gamma radiation is detected by the sensor. The technique allows non-
contact measurement where the heat of the molten metal makes contact techniques and even
many non-contact techniques impractical.

39
CHAPTER 3
METHODOLOGY
3.1 BACKGROUND
The methodology is the method or procedures used for carrying out project in more
specific. These methods are very important to ensure the completion of the project. The
methods that are used including the project planning flow chart and collecting data
components.
In this project, I participate in hardware to build the smart compost bin. Hardware is a
physical part of electronic device. Hardware can touch and feel. It also can be often
categorized into input, output, and storage or processing components. The information
of Smart Compost Bin has been collected according to the method through various
kinds of journal, books and internet which is related to the project. This information has
been used in developing the Smart Compost Bin and complete final report
appropriately.
3.2 PLANNING OF PROJECT THE FLOOD DETECTOR
In ensuring the Flood Detector development can be done appropriately, a project
planning by using a Gantt charts has been prepared. In this Gantt chart, schedule of plan
and subsequently report progress within the project environment has been stated
clearly. Initially, in this project, the scope is defined with the appropriate methods for
completing the project are determined.

40
3.2.1 Gantt chart
This Gantt charts are used in this The Flood Detector project to illustrate the start and
finish dates of the terminal elements and summary elements of a project. A Gantt chart
is used for project management, it is the most popular and useful ways of showing
activities, task or events displayed against time. This Gantt chart has shown the task
that need to be completed within the dateline. Every task need to mark on which number
of week the task done will.
Table 1.0 and 1.1 shows a Gantt chart for two semesters which is semester 4 and
semester 5. It shows the activities need to do every week. In the table, the green colour
for planning and the orange colour is when the activities has been do. In semester 4
there are seven activities need to do in 15 weeks while in semester 5 it has seven
activities in 15 weeks. In semester 5 more focus in build the flood detector project while
in semester 4 it more to planning and design the flood detector project. There are few
activities that had been done in the planning date and few activities are not. From this
Gantt chart, it make every student to be more punctual in time when doing the work.

41
Table 1.0: Gantt chart semester 4
Lecturer Week
Project
Activities
L
W
1
L
W
2
L
W
3
L
W
4
L
W
5
L
W
6
L
W
7
L
W
8
L
W
9
L
W
1
0
L
W
1
1
L
W
1
2
L
W
1
3
L
W
1
4
L
W
1
5
Introduction
to final year
project
Decide a
topic for
final year
project and
problem
Discussion
with
supervisor
Literature
review
Block
diagram
and circuit
design
Presentation
(Mini
Project)
Submitted
proposal

42
Table 1.1: Gantt chart semester 5
Lecturer Week
Project
Activities
L
W
1
L
W
2
L
W
3
L
W
4
L
W
5
L
W
6
L
W
7
L
W
8
L
W
9
L
W
1
0
L
W
1
1
L
W
1
2
L
W
1
3
L
W
1
4
Discussion and
guidance
Build the
model
Testing and
troubleshooting
Improving the
project
Project
presentation
Submit log
book
Submit final
report

43
3.3 FLOWCHART THE FLOOD DETECTOR SYSTEM
Planning flow chart is an important elements in developed Flood Detector system. It
may be included of sequence of actions, materials or services entering or leaving the
process (inputs and outputs), decisions that must be made, people who become
involved, time involved at each step and/or process measurements.
The process described can be a manufacturing process, an administrative or service
process and a project plan. This is a generic tool that can be adapted for a wide variety
of purposes. This flowchart consist of the flow for overall of Flood Detector system.
3.3.1 Overall flowchart
The overall flowchart state the flow of making the the flood detector. The flowchart
consist of from the starting ideas to choose the main project until the finishing of Flood
Detector system. Several test had been done from assembling the components until
finishing the project. The main purpose is to test the components or to avoid short circuit
when running the flood detector. The Flood Detector system had been tested.
While tested there is some unwanted problem occur. The problem need to overcome by
troubleshooting and fix the problem.
The flowchart can be adapted when configure the device as Flood Detector system
using the arduino and mobile device that need to be configure. The process described
can be a manufacturing process, an administrative or service process and a project plan.
This is a generic tool that can be adapted for a wide variety of purposes. This flowchart
consist of the flow for overall of Flood Detector system.

44
Figure 3.3.1: Overall flowchart

45
Figure 3.1 show the overall flowchart of The Flood Detector system. First step is
choosing a project tittle. Then collect information and start buying a component. After
arrange the component. Test the functionality of the component. If the component is
failed when test it, buy or test another component. If all the component are functionality,
go to next step which is configuring device and finishing design the Flood Detector
system. After finishing, do again test for Flood Detector system. If there are no failed
no need to do troubleshooting. If there are failed, the Flood Detector system need to do
some troubleshooting.
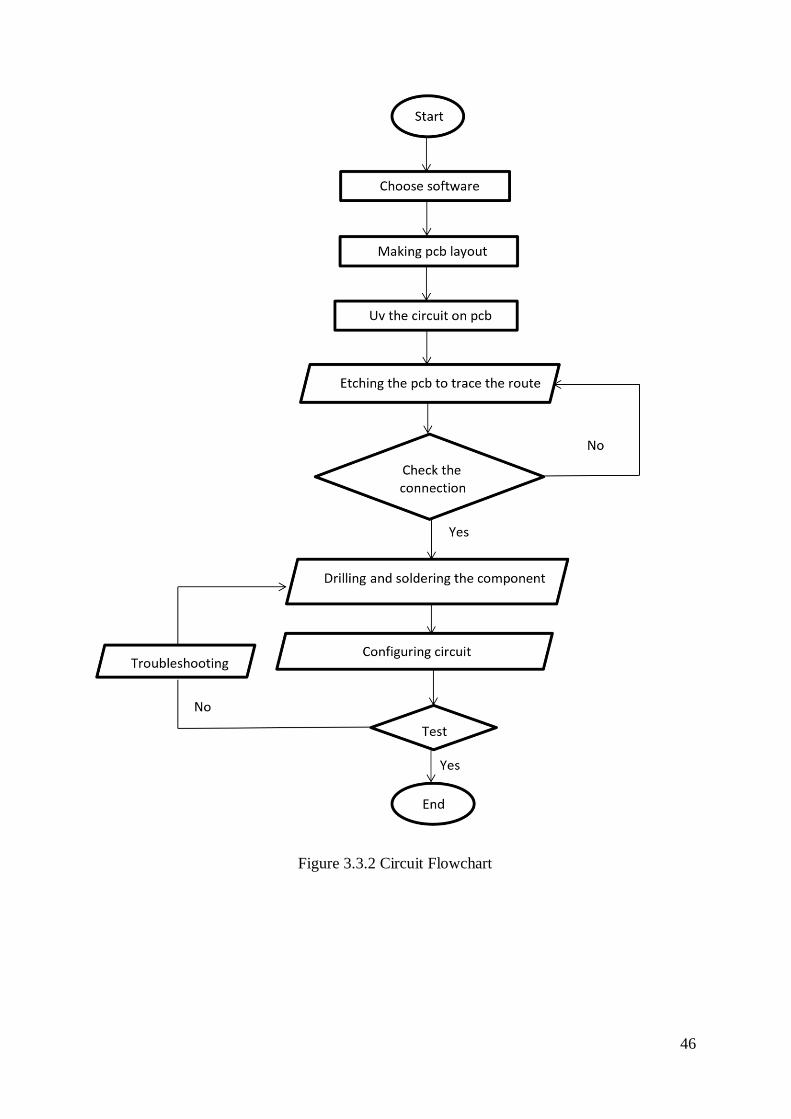
3.3.2 Circuit flowchart
This flowchart is to determine the flow when making the circuit. There are several steps
that need to be done before running the circuit. The circuit mainly needed to run the
Flood Detector system.
Figure 3.2 shows a circuit flowchart. First of all must start with choose a software to
make a circuit for Smart Flood Detector system. Then after finish doing a circuit, make
a pcb layout. Next do a process on pcb and then etching it to trace the route. After finish
an etching process, check the connection whether it true or not. If yes, proceed to next
step which is drilling and soldering the component. If not must go back to previous step
which is etching process. After done drilling and soldering process, go to next step
which is configuring circuit and test the circuit. If the circuit failed, do a
troubleshooting. If the connection is good, so can start to do the Flood Detector system
project.
46
Figure 3.3.2 Circuit Flowchart

47
3.4 COLLECTING DATA COMPONENT
In developed the Flood Detector, the components need to be used in this project must
be selected appropriately compatible with the functions for the project. Each of the
flood detector components on the circuit plays an important role and has its own
function. The size of the components also be in accordance with the design and the
space area that supposed to install it.
3.4.1 THE FLOOD DETECTOR DESIGN

48
3.4.2 WIFI MODULE (ESP8266)
Figure 3.4.2.1
The ESP8266 WIFI module is a self contain SOC with integrated TCP/IP protocol stack
that can give any microcontroller access to a WIFI network. These module is capable
of either hosting an application or offloading all WIFI networking functions from
another application processor. In this project, the wifi module will be use to get access
connection to the hotspot in order to send an email alert or notification for home security
features.
3.4.3 ARDUINO NANO
Figure 3.4.3.1
Arduino is an open-source hardware and software company, project and user community that
designs and manufactures single-board microcontrollers and microcontroller kits for building
digital devices. Its products are licensed under the GNU Lesser General Public License (LGPL)
or the GNU General Public License (GPL),[1] permitting the manufacture of Arduino boards

49
and software distribution by anyone. Arduino boards are available commercially in
preassembled form or as do-it-yourself (DIY) kits.
Arduino board designs use a variety of microprocessors and controllers. The boards are
equipped with sets of digital and analogue input/output (I/O) pins that may be interfaced to
various expansion boards or breadboards (shields) and other circuits. The boards feature serial
communications interfaces, including Universal Serial Bus (USB) on some models, which are
also used for loading programs from personal computers. The microcontrollers can be
programmed using C and C++ programming languages. In addition to using
traditional compiler toolchains, the Arduino project provides an integrated development
environment (IDE) based on the Processing language project.
The Arduino project started in 2005 as a program for students at the Interaction Design Institute
Ivrea in Ivrea, Italy,[2] aiming to provide a low-cost and easy way for novices and professionals
to create devices that interact with their environment using sensors and actuators. Common
examples of such devices intended for beginner hobbyists include
simple robots, thermostats and motion detectors.
The name Arduino comes from a bar in Ivrea, Italy, where some of the founders of the project
used to meet. The bar was named after Arduino of Ivrea, who was the margrave of the March
of Ivrea and King of Italy from 1002 to 1014
3.4.4 Battery
Figure 3.4.4.1
The nine-volt battery, or 9-volt battery, is a common size of battery that was introduced for the
early transistor radios. It has a rectangular prism shape with rounded edges and a polarized
snap connector at the top. This type is commonly used in walkie-talkies, clocks and smoke
detectors.
The nine-volt battery format is commonly available in primary carbon-zinc and alkaline
chemistry, in primary lithium iron disulphide, and in rechargeable form in nickel-cadmium,

50
nickel-metal hydride and lithium-ion. Mercury-oxide batteries of this format, once common,
have not been manufactured in many years due to their mercury content. Designations for this
format include NEDA 1604 and IEC 6F22 (for zinc-carbon) or MN1604 6LR61 (for alkaline).
The size, regardless of chemistry, is commonly designated PP3—a designation originally
reserved solely for carbon-zinc, or in some countries, E or E-block.[1]
Most nine-volt alkaline batteries are constructed of six individual 1.5 V LR61 cells enclosed in
a wrapper.[2] These cells are slightly smaller than LR8D425 AAAA cells and can be used in
their place for some devices, even though they are 3.5 mm shorter. Carbon-zinc types are made
with six flat cells in a stack, enclosed in a moisture-resistant wrapper to prevent drying. Primary
lithium types are made with three cells in series.[3]
9-volt batteries accounted for 4% of alkaline primary battery sales in the United States in 2007,
and 2% of primary battery sales and 2% of secondary battery sales in Switzerland in 2008

51
3.5 COLLECTING DATA SURVEY
Data of project for flood detector using ultrasonic sensor with IOT
This questionnaire was designed to meet the methodology of our study, Smart Flood Detectors
using ultrasound sensors with IoT for the Project course (DEE50102). It aims to study the
extent to which the innovations of our research can be marketed and used by the public to plan
their journey smoothly. All information provided will be kept confidential and will be used for
research purposes only.
SECTION A: DATA DEMOGRAFI RESPONDEN
Q1 : Age for 20 respondents
Figure 3.5.1
0
1
2
3
4
5
6
7
8
9
10
18 tahun ke bawah 19 - 25 tahun 26 - 30 tahun 30 tahun dan keatas
Bila
nga
n r
esp
on
den
Umur
Umur bagi 20 Responden

52
Q2: Jobs for these 20 respondents.
Figure 3.5.2
Q3 : The type of vehicle used in daily life
Figure 3.5.3
0
1
2
3
4
5
6
7
8
9
10
Kakitangan Kerajaan Pekerja Swasta Pelajar Lain - lain
Bila
nga
n r
esp
on
de
n
Jenis pekerjaan
Pekerjaan bagi 20 Responden
0
2
4
6
8
10
12
Motosikal Kereta Lori Lain - lain
Bila
nga
n r
esp
on
den
Jenis kenderaan
Kenderaan yang Digunakan oleh Responden dalam Kehidupan Harian

53
SECTION B: SOALAN KAJIAN
Q4 : Have you ever had problems flooding the road on your way somewhere?
Figure 3.5.4
Q5 : When the road is flooded, do you slow down the lane (Yes) or do you wait for the flood
to recede (No)?
Figure 3.5.5
0
2
4
6
8
10
12
14
Pernah Tidak pernah
Bila
nga
n r
epo
nd
en
Pengalaman
Bilangan Reponden yang Pernah Menghadapi Masalah Banjir di Jalan Raya dalam Perjalanan
ke Suatu Tempat
0
1
2
3
4
5
6
7
8
9
Ya Tidak
Bila
nga
n r
esp
on
den
Bilangan Reponden yang

54
Q6 : What are your suggestions for improving this project so that it can work better?
Figure 3.5.6
Q7 : Do you support the production of this product?
Figure 3.5.7
0
2
4
6
8
10
12
14
16
18
Memberi cadangan Tidak memberi cadangan
Bila
nga
n r
esp
on
den
Bilangan Responden yang Memberi Cadangan Penambahbaikan Projek
0
2
4
6
8
10
12
14
16
18
Menyokong Tidak menyokong
bila
nga
n r
esp
on
den
Bilangan Responden yang Menyokong Penghasilan Projek Ini

55
3.6 SOFTWARE
Software is a set of instructions, data or programs used to operate computers and execute
specific tasks. Opposite of hardware, which describes the physical aspects of a
computer, software is a generic term used to refer to applications, scripts and programs that
run on a device.
3.6.1 Types of Programming Languages
1. Java
Figure 3.6.1.1
Java is a programming language and computing platform first released by Sun Microsystems
in 1995. There are lots of applications and websites that will not work unless you have Java
installed, and more are created every day. Java is fast, secure, and reliable. From laptops to
datacentres, game consoles to scientific supercomputers, cell phones to the Internet, Java is
everywhere

56
2. Phyton
Figure 3.6.1.2
Python is an interpreted, object-oriented, high-level programming language with dynamic
semantics. Its high-level built in data structures, combined with dynamic typing and dynamic
binding, make it very attractive for Rapid Application Development, as well as for use as a
scripting or glue language to connect existing components together. Python's simple, easy to
learn syntax emphasizes readability and therefore reduces the cost of program maintenance.
Python supports modules and packages, which encourages program modularity and code reuse.
The Python interpreter and the extensive standard library are available in source or binary form
without charge for all major platforms, and can be freely distributed.
Often, programmers fall in love with Python because of the increased productivity it provides.
Since there is no compilation step, the edit-test-debug cycle is incredibly fast. Debugging
Python programs is easy: a bug or bad input will never cause a segmentation fault. Instead,
when the interpreter discovers an error, it raises an exception. When the program doesn't catch
the exception, the interpreter prints a stack trace. A source level debugger allows inspection of
local and global variables, evaluation of arbitrary expressions, setting breakpoints, stepping
through the code a line at a time, and so on. The debugger is written in Python itself, testifying
to Python's introspective power. On the other hand, often the quickest way to debug a program
is to add a few print statements to the source: the fast edit-test-debug cycle makes this simple
approach very effective.

57
3. C
Figure 3.6.1.3
C is a procedural programming language. It was initially developed by Dennis Ritchie in the
year 1972. It was mainly developed as a system programming language to write an operating
system. The main features of C language include low-level access to memory, a simple set of
keywords, and clean style, these features make C language suitable for system programming
like an operating system or compiler development.
Many later languages have borrowed syntax/features directly or indirectly from C language.
Like syntax of Java, PHP, JavaScript, and many other languages are mainly based on C
language. C++ is nearly a superset of C language (There are few programs that may compile
in C, but not in C++)
4. Ruby
Figure 3.6.1.4
Ruby is a dynamic, reflective, object-oriented, general-purpose programming language. Ruby
is a pure Object-Oriented language developed by Yukihiro Matsumoto. Everything in Ruby is
an object except the blocks but there are replacements too for it i.e. process and lambda. The
objective of Ruby’s development was to make it act as a sensible buffer between human
programmers and the underlying computing machinery.

58
5. JavaScrpt
Figure 3.6.1.5
JavaScript is one of the world’s most popular programming languages. The reason for this is
quite simply because of its role as the scripting language of the World Wide Web. Today, every
personal computer in the world has a JavaScript interpreter installed on it. JavaScript very often
gets misinterpreted and confused as Java, due to the similarity in name. However, JavaScript
is not interpreted Java. Java is interpreted Java and JavaScript is a different language.

59
6.PHP
Figure 3.6.1.6
PHP (which stands for Hypertext Pre-processor, if you care to know) is often used in
conjunction with dynamic data-heavy websites and app development. It provides a ton of
power and is the beating heart of monster sites like WordPress and Facebook. What's really
cool about PHP is that it's an open-source language, so there are tons of free pre-built modules
that you can grab and modify to get your ideal results. PHP is also on the easy end of the
learning spectrum, simply requiring you to embed the code within HTML. PHP is a must-learn
language for aspiring web developers.

60
7. SQL
Figure 3.6.1.7
SQL is a database query language (SQL stands for Structured Query Language) that's ideal
when talking big data. SQL lets you siphon helpful data from massive databases. Nearly every
app has a backend database, and SQL is the language that helps you interact with that sweet
data. In terms of software development, SQL isn't ever used alone--rather, you invoke SQL
from some other programming knowledge and you have yourself a nice package deal.

61
3.5.2 Types of Application
1. Blynk
Figure 3.6.2.1
Blynk is a new platform that allows you to quickly build interfaces for controlling and
monitoring your hardware projects from your iOS and Android device. After downloading
the Blynk app, you can create a project dashboard and arrange buttons, sliders, graphs, and
other widgets onto the screen.

62
2. Android Studio
Figure 3.6.1.2
Android Studio is the official integrated development environment (IDE)
for Android application development. It is based on the IntelliJ IDEA, a Java integrated
development environment for software, and incorporates its code editing and developer tools

63
3. MIT Inventor
Figure 3.6.1.3
MIT App Inventor is a web application integrated development environment originally
provided by Google, and now maintained by the Massachusetts Institute of Technology (MIT).
64
CHAPTER 4
RESULTS AND DISCUSSION
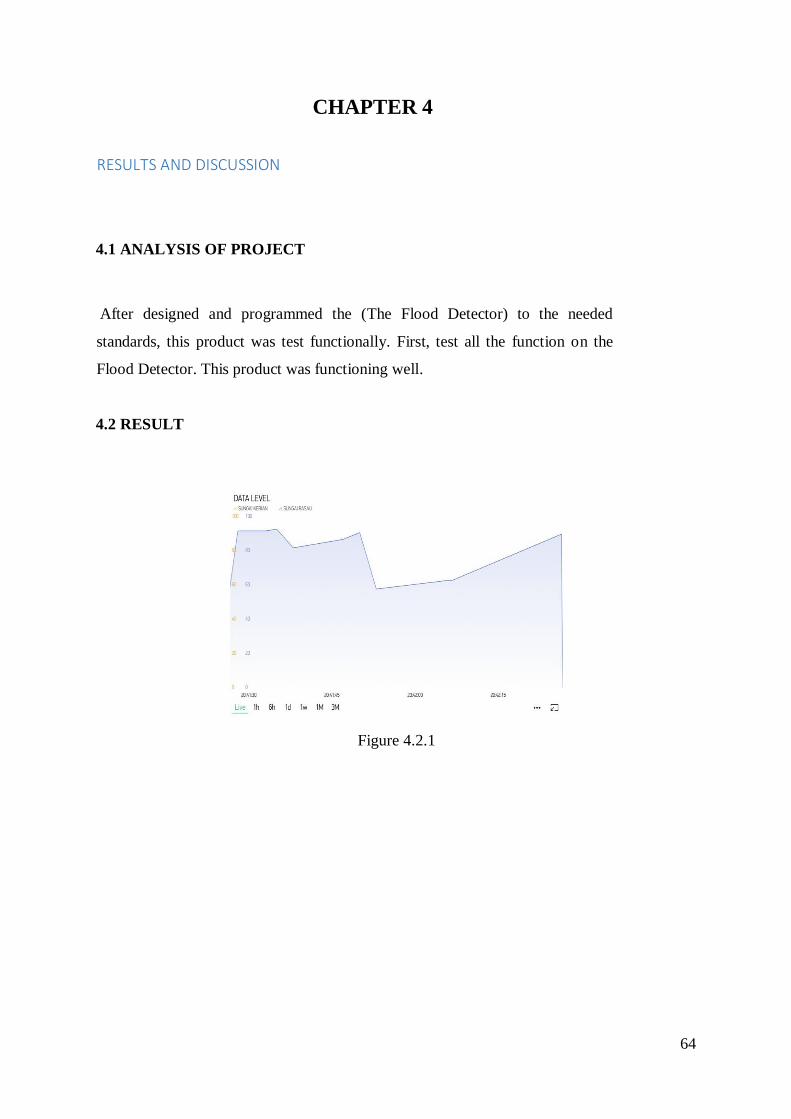
4.1 ANALYSIS OF PROJECT
After designed and programmed the (The Flood Detector) to the needed
standards, this product was test functionally. First, test all the function on the
Flood Detector. This product was functioning well.
4.2 RESULT
Figure 4.2.1

65
Figure 4.2.2
Figure 4.2.3

66
CHAPTER 5
CONCLUSION AND RECOMMENDATION
5.1 CONCLUSION
This project based on the development of a smart flood detector system using ultrasonic sensor
with NodeMCU and Blynk application which also involving LED and LCD display on the
screen in the smart phone. By using the Blynk application, the information can easily be
accessed by the person-in-charge. Transmission of flood information begins at first NodeMcu
then transmitted to the second NodeMCU using the Blynk application. Early notification on
flood monitoring can be seen through the LED and the Notification Alert from the Blynk Apps.
The database of this system is based on the history graph in Blynk application with constantly
updating as long as the hardware is online. During the outdoor test, it shows that the level of
the water is in safety level due to the reading ranging from 50 to 100cm. This water level of
the lake is in safe mode to the nearer residential area according to the weather.
5.2 RECOMMENDATION
As a suggestion, I hope this product can be improved by use a power cord to change the
power source from using a power bank.

67
REFERENCES:
[1] https://www.arduino.cc/en/Tutorial/HomePage
[2] https://www.brinknews.com/19987/
[3] https://www.channelnewsasia.com/news/asia/malaysia-floods-kelantan-terengganu-
northern-peninsula-november-12007844
[4] https://www.bharian.com.my/berita/kes/2019/10/618913/puluhan-kenderaan-
ditenggelami-air-di-sungai-gadut
[5] https://www.envirotech-online.com/news/water-wastewater/9/breaking-news/what-are-
the-different-types-of-floods/31906
[6] https://en.wikipedia.org/wiki/Arduino
[7] https://en.wikipedia.org/wiki/Nine-volt_battery
[9] https://www.python.org/doc/essays/blurb/
[10] https://www.geeksforgeeks.org/c-language-set-1-introduction/
[11] https://medium.com/acellere/is-javascript-a-programming-language-b068b6eda749
[12] https://www.guru99.com/what-is-php-first-php-program.html
[13] https://en.wikipedia.org/wiki/SQL
[14]
https://www.google.com/url?sa=t&rct=j&q=&esrc=s&source=web&cd=3&cad=rja&uact=8
&ved=2ahUKEwig2cDGjbLlAhWn7nMBHYaYC4UQFjACegQICRAJ&url=https%3A%2F
%2Froboindia.com%2Ftutorials%2Fblynk-introduction-
nodemcu%2F&usg=AOvVaw21_Na53ij9RNzrE1jVL956
[15] https://searchmobilecomputing.techtarget.com › definition › Android-Studio
[16] https://en.wikipedia.org › wiki › App_Inventor_for_Android
[17] https://java.com/en/download/faq/whatis_java.xml

68
APPENDIX
1. CODING
Coding of Nano Sensor 1
#include <SoftwareSerial.h>
SoftwareSerial ss(2, 3); //(RX,TX)
#define trigPin1 4
#define echoPin1 5
int Timer=0;
long OldDist=0;
long Level=0;
long Max=100;
void setup() {
pinMode(trigPin1, OUTPUT);
pinMode(echoPin1, INPUT);
Serial.begin(9600);
ss.begin(9600);
delay(2000);
}
void loop() {
long duration1x, distance1, duration2x, distance2, duration3x, distance3, duration4x,
distance4, duration5x, distance5;
digitalWrite(trigPin1, LOW); // Added this line
delayMicroseconds(2); // Added this line
digitalWrite(trigPin1, HIGH);
delayMicroseconds(10); // Added this line
digitalWrite(trigPin1, LOW);
duration1x = pulseIn(echoPin1, HIGH);
distance1 = ((duration1x/2) / 29.1); //* 0.26;
if (OldDist != distance1){
//Serial.println(distance1);

69
}
Timer++;
if (Timer>150){
Level=Max-distance1;
if (Level<0){
Level=0;
}
Timer=0;
Serial.println(Level);
ss.print("*");
ss.print(Level);
ss.println("#");
}
delay(10);
}
Coding of Nano Sensor 2
#include <SoftwareSerial.h>
SoftwareSerial ss(2, 3); //(RX,TX)
#define trigPin1 4
#define echoPin1 5
int Timer=0;
long OldDist=0;
long Level=0;
long Max=100;
void setup() {
pinMode(trigPin1, OUTPUT);
pinMode(echoPin1, INPUT);
Serial.begin(9600);
ss.begin(9600);
delay(2000);
}
void loop() {
long duration1x, distance1, duration2x, distance2, duration3x, distance3, duration4x,
distance4, duration5x, distance5;
digitalWrite(trigPin1, LOW); // Added this line

70
delayMicroseconds(2); // Added this line
digitalWrite(trigPin1, HIGH);
delayMicroseconds(10); // Added this line
digitalWrite(trigPin1, LOW);
duration1x = pulseIn(echoPin1, HIGH);
distance1 = ((duration1x/2) / 29.1); //* 0.26;
if (OldDist != distance1){
//Serial.println(distance1);
}
Timer++;
if (Timer>150){
Level=Max-distance1;
if (Level<0){
Level=0;
}
Timer=0;
Serial.println(Level);
ss.print("*");
ss.print(Level);
ss.println("#");
}
delay(10);
}

71
Coding of Wifi Node 1
//Working with ESP-01
#define BLYNK_PRINT Serial
#include <ESP8266WiFi.h>
#include <BlynkSimpleStream.h>
// Your WiFi credentials.
// Set password to "" for open networks.
const char* ssid = "server";
const char* pass = "12345678";
// You should get Auth Token in the Blynk App.
// Go to the Project Settings (nut icon).
char auth[] = "Bcku5rpvJx7iA__26jLqgak06pHfuHnT";
char server[] = "139.59.206.133";
String DATA="";
int P1=0, P2=0, P3=0, P4=0;
int Rly1=0, Rly2=0, Rly3=0, Rly4=0, Rly5=0;
int led1x=0,led2x=0,led3x=0,led4x=0;
int TotalUse=0;
int TotalAvai=0;
float Temp1=30.1423;
float PH=7;
float Temp2=30.2;
String Flat;
String Flon;
String Temp1x="";
String PHx="";
String Temp2x="";
String Temp1y="";
String PHy="";
String Temp2y="";
String Temp3y="";
String Temp3x="";
String Temp4y="";
String Temp4x="";
int Timer=0;
int Mode=0;
int DataIn=0;
int ALERT=0;
int level=0;
int Alarm=0;

72
WiFiClient wifiClient;
// This function tries to connect to the cloud using TCP
bool connectBlynk()
{
wifiClient.stop();
// return wifiClient.connect(BLYNK_DEFAULT_DOMAIN, BLYNK_DEFAULT_PORT);
return wifiClient.connect(server, BLYNK_DEFAULT_PORT);
}
// This function tries to connect to your WiFi network
void connectWiFi()
{
Serial.print("Connecting to ");
Serial.println(ssid);
if (pass && strlen(pass)) {
WiFi.begin((char*)ssid, (char*)pass);
} else {
WiFi.begin((char*)ssid);
}
while (WiFi.status() != WL_CONNECTED) {
delay(500);
Serial.print(".");
}
}
//-----------------------Manage Virtual Pin---------------------------
BLYNK_WRITE(V10)
{
int pinValue = param.asInt(); // assigning incoming value from pin V1 to a variable
Rly1=pinValue;
// process received value
}
BLYNK_WRITE(V11)
{
int pinValue1 = param.asInt(); // assigning incoming value from pin V1 to a variable
Rly2=pinValue1;
// process received value
}
BLYNK_WRITE(V12)

73
{
int pinValue3 = param.asInt(); // assigning incoming value from pin V1 to a variable
Rly3=pinValue3;
// process received value
}
BLYNK_WRITE(V13)
{
int pinValue4 = param.asInt(); // assigning incoming value from pin V1 to a variable
Rly4=pinValue4;
}
BLYNK_WRITE(V14)
{
int pinValue5 = param.asInt(); // assigning incoming value from pin V1 to a variable
Rly5=pinValue5;
}
//---------------------------------------------------------------------
void setup()
{
// Debug console
Serial.begin(9600);
connectWiFi();
connectBlynk();
Blynk.begin(wifiClient, auth);
}
void loop()
{
WidgetLED led1(V2);
led1.on();
//--------------------------Manage Virtual LED------------------
//-------------------------------------------------------------
// Reconnect WiFi

74
if (WiFi.status() != WL_CONNECTED) {
connectWiFi();
return;
}
// Reconnect to Blynk Cloud
if (!wifiClient.connected()) {
connectBlynk();
return;
}
Blynk.run();
Timer++;
if (Rly1==1){
ALERT=0;
led1.off();
Serial.println("b");
delay(1000);
}
if (Rly2==1){
Serial.println("a");
delay(1000);
}
if (Rly3==1){
Serial.println("c");
delay(1000);
}
if (Timer > 1000){
Timer=0;
}

75
while (Serial.available()) {
// get the new byte:
char inChar1 = (char)Serial.read();
if (inChar1 == '*') {
DataIn++;
}
while (DataIn > 0){
while (Serial.available()) {
// get the new byte:
char inChar = (char)Serial.read();
if (inChar == '*') {
DataIn++;
}
if (inChar != '*' && inChar != '#' && DataIn==1) {
Temp1x+=inChar;
}
if (inChar != '*' && inChar != '#' && DataIn==2) {
Temp2x+=inChar;
}
if (inChar != '*' && inChar != '#' && DataIn==3) {
Temp3x+=inChar;
}
if (inChar != '*' && inChar != '#' && DataIn==4) {
Temp4x+=inChar;
}
if (inChar == '#') {
DataIn=0;
Temp1y=Temp1x; PHy=PHx; Temp2y=Temp2x; Temp3y=Temp3x;
Temp4y=Temp4x;
Temp1x="";
PHx=""; Temp2x=""; Temp3x="";
Blynk.virtualWrite(V0, Temp1y);
level=Temp1y.toInt();
if (level>50 && level <=70){

76
if (Alarm!=1){
Blynk.notify("Flood Alert! Sungai kerian, Hulu langat :MODERATE");
Blynk.setProperty(V2,"color","#E0d612");
}
Alarm=1;
}
if (level>70){
if (Alarm!=2){
Blynk.notify("Flood Alert! Sungai kerian, Hulu langat :DANGER");
Blynk.setProperty(V2,"color","#E01212");
}
Alarm=2;
}
if (level<50){
Blynk.setProperty(V2,"color","#19E012");
Alarm=0;
}
}
}
//*************************************************************************
**********************************************
//*************************************************************************
*********************************************
}
}
}

77
Coding of Wifi Node 2
//Working with ESP-01
#define BLYNK_PRINT Serial
#include <ESP8266WiFi.h>
#include <BlynkSimpleStream.h>
// Your WiFi credentials.
// Set password to "" for open networks.
const char* ssid = "server";
const char* pass = "12345678";
// You should get Auth Token in the Blynk App.
// Go to the Project Settings (nut icon).
char auth[] = "Bcku5rpvJx7iA__26jLqgak06pHfuHnT";
char server[] = "139.59.206.133";
String DATA="";
int P1=0, P2=0, P3=0, P4=0;
int Rly1=0, Rly2=0, Rly3=0, Rly4=0, Rly5=0;
int led1x=0,led2x=0,led3x=0,led4x=0;
int TotalUse=0;
int TotalAvai=0;
float Temp1=30.1423;
float PH=7;
float Temp2=30.2;
String Flat;
String Flon;
String Temp1x="";
String PHx="";
String Temp2x="";
String Temp1y="";
String PHy="";
String Temp2y="";
String Temp3y="";
String Temp3x="";
String Temp4y="";
String Temp4x="";
int Timer=0;
int Mode=0;
int DataIn=0;
int ALERT=0;
int level=0;
int Alarm=0;
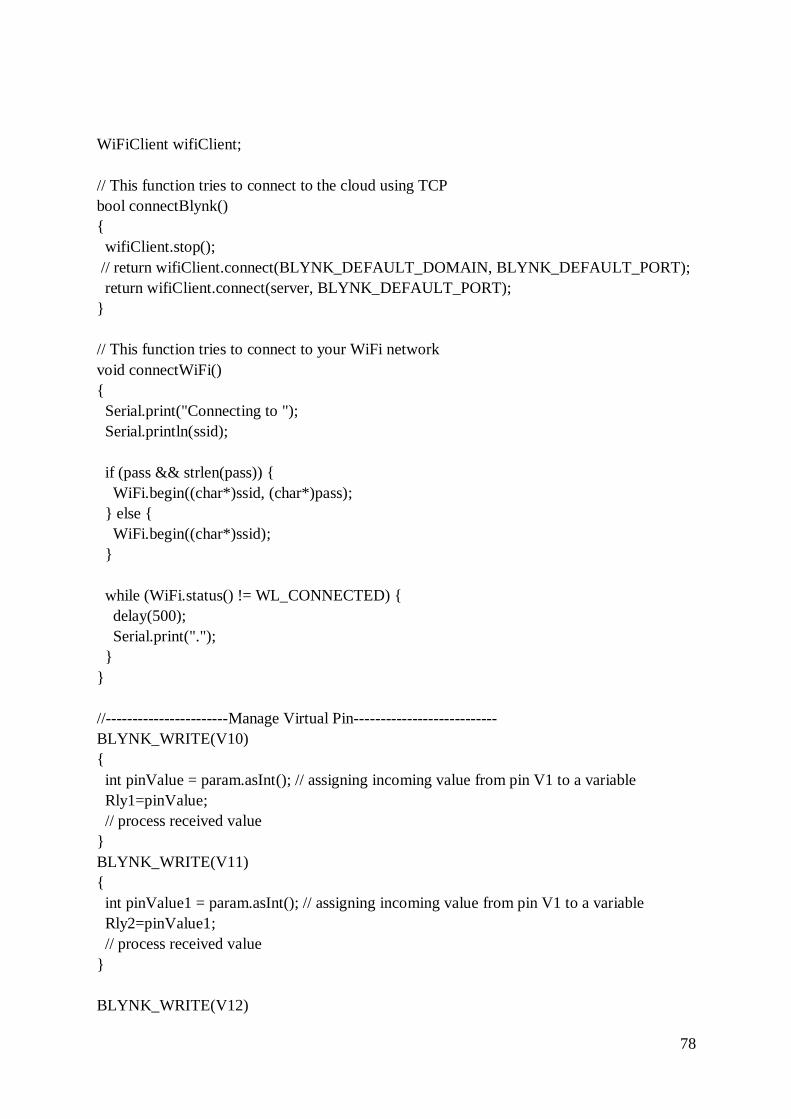
78
WiFiClient wifiClient;
// This function tries to connect to the cloud using TCP
bool connectBlynk()
{
wifiClient.stop();
// return wifiClient.connect(BLYNK_DEFAULT_DOMAIN, BLYNK_DEFAULT_PORT);
return wifiClient.connect(server, BLYNK_DEFAULT_PORT);
}
// This function tries to connect to your WiFi network
void connectWiFi()
{
Serial.print("Connecting to ");
Serial.println(ssid);
if (pass && strlen(pass)) {
WiFi.begin((char*)ssid, (char*)pass);
} else {
WiFi.begin((char*)ssid);
}
while (WiFi.status() != WL_CONNECTED) {
delay(500);
Serial.print(".");
}
}
//-----------------------Manage Virtual Pin---------------------------
BLYNK_WRITE(V10)
{
int pinValue = param.asInt(); // assigning incoming value from pin V1 to a variable
Rly1=pinValue;
// process received value
}
BLYNK_WRITE(V11)
{
int pinValue1 = param.asInt(); // assigning incoming value from pin V1 to a variable
Rly2=pinValue1;
// process received value
}
BLYNK_WRITE(V12)

79
{
int pinValue3 = param.asInt(); // assigning incoming value from pin V1 to a variable
Rly3=pinValue3;
// process received value
}
BLYNK_WRITE(V13)
{
int pinValue4 = param.asInt(); // assigning incoming value from pin V1 to a variable
Rly4=pinValue4;
}
BLYNK_WRITE(V14)
{
int pinValue5 = param.asInt(); // assigning incoming value from pin V1 to a variable
Rly5=pinValue5;
}
//---------------------------------------------------------------------
void setup()
{
// Debug console
Serial.begin(9600);
connectWiFi();
connectBlynk();
Blynk.begin(wifiClient, auth);
}
void loop()
{
WidgetLED led1(V3);
led1.on();
//--------------------------Manage Virtual LED------------------
//-------------------------------------------------------------
// Reconnect WiFi

80
if (WiFi.status() != WL_CONNECTED) {
connectWiFi();
return;
}
// Reconnect to Blynk Cloud
if (!wifiClient.connected()) {
connectBlynk();
return;
}
Blynk.run();
Timer++;
if (Rly1==1){
ALERT=0;
led1.off();
Serial.println("b");
delay(1000);
}
if (Rly2==1){
Serial.println("a");
delay(1000);
}
if (Rly3==1){
Serial.println("c");
delay(1000);
}
if (Timer > 1000){
Timer=0;
}

81
while (Serial.available()) {
// get the new byte:
char inChar1 = (char)Serial.read();
if (inChar1 == '*') {
DataIn++;
}
while (DataIn > 0){
while (Serial.available()) {
// get the new byte:
char inChar = (char)Serial.read();
if (inChar == '*') {
DataIn++;
}
if (inChar != '*' && inChar != '#' && DataIn==1) {
Temp1x+=inChar;
}
if (inChar != '*' && inChar != '#' && DataIn==2) {
Temp2x+=inChar;
}
if (inChar != '*' && inChar != '#' && DataIn==3) {
Temp3x+=inChar;
}
if (inChar != '*' && inChar != '#' && DataIn==4) {
Temp4x+=inChar;
}
if (inChar == '#') {
DataIn=0;
Temp1y=Temp1x; PHy=PHx; Temp2y=Temp2x; Temp3y=Temp3x;
Temp4y=Temp4x;
Temp1x="";
PHx=""; Temp2x=""; Temp3x="";
Blynk.virtualWrite(V1, Temp1y);
level=Temp1y.toInt();
if (level>50 && level <=70){
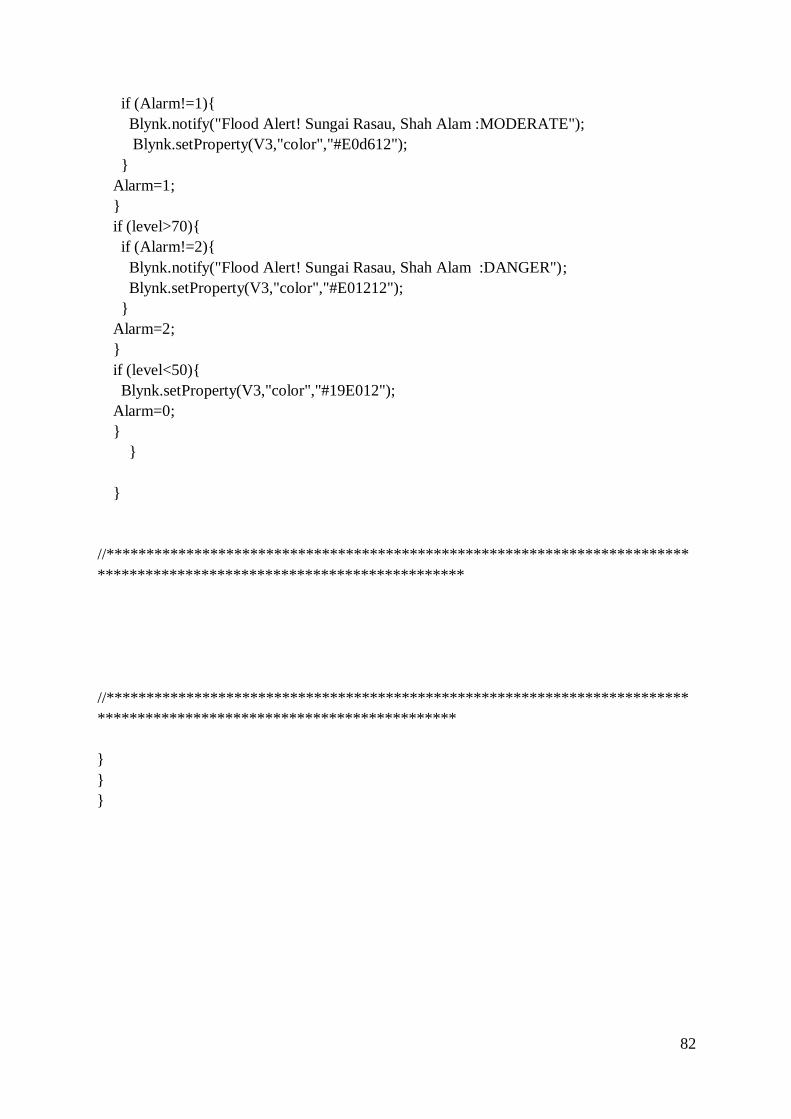
82
if (Alarm!=1){
Blynk.notify("Flood Alert! Sungai Rasau, Shah Alam :MODERATE");
Blynk.setProperty(V3,"color","#E0d612");
}
Alarm=1;
}
if (level>70){
if (Alarm!=2){
Blynk.notify("Flood Alert! Sungai Rasau, Shah Alam :DANGER");
Blynk.setProperty(V3,"color","#E01212");
}
Alarm=2;
}
if (level<50){
Blynk.setProperty(V3,"color","#19E012");
Alarm=0;
}
}
}
//*************************************************************************
**********************************************
//*************************************************************************
*********************************************
}
}
}

83
2. PITEX COMPETITION

84
3. MY SUPERVISOR
Supervisor Name : Puan Aslinda Binti Zamah Shari
Number Tel : 0123352263
85
4. PARTNER FINAL YEAR PROJECT
Partner Group : Muhamad Nasrul Hadi Bin Baharudin
Number Tel : 0176859905
No Reg : 08DEP17F1138
Gmail : [email protected]
86
5. AUTHOR PROFILE
Name : Muhammad Faris Bin Abdul Gafar
No Reg : 08DEP17F1187
Gmail : [email protected]
Number Tel : 0189684046