The Role of Sequences for Incremental Learning
15
The Role of Sequences for Incremental Learning Susanne Wenzel, Wolfgang F¨ orstner [email protected] TR-IGG-P-2009-04 October 22, 2009 Technical Report Nr. 04, 2009 Department of Photogrammetry Institute of Geodesy and Geoinformation University of Bonn Available at http://www.ipb.uni-bonn.de/technicalreports/
Transcript of The Role of Sequences for Incremental Learning
The Role of Sequences for IncrementalLearning
Susanne Wenzel, Wolfgang Forstner
TR-IGG-P-2009-04
October 22, 2009
Technical Report Nr. 04, 2009
Department of PhotogrammetryInstitute of Geodesy and Geoinformation
University of Bonn
Available athttp://www.ipb.uni-bonn.de/technicalreports/


The Role of Sequences for Incremental Learning
Susanne Wenzel
October 22, 2009
Abstract
This report points out the role of sequences of samples for training an incremental learn-ing method. We define characteristics of incremental learning methods to describe theinfluence of sample ordering on the performance of a learned model. Different types ofexperiments evaluate these properties for two different datasets and two different incre-mental learning methods. We show how to find sequences of classes for training just basedon the data to get always best possible error rates. This is based on the estimation ofBayes error bounds.
1.1 Introduction
In this section the goal of learning is identifying and discriminating instances of classes.This requires generative models as they are most descriptive and assure learning of manyclasses. On the other hand one needs discriminative models as they are more efficientin separating classes. We will use both of them, either alone or in combination to useproperties of both models.
Incremental learning is clearly in the scope of eTRIMS. It is impossible to capturethe huge variability of facades with one dataset. Instead we need a continuous learningsystem that is able to improve already learned models using new examples. This processin principle does not stop.
For this purpose there exists a number of incremental learning methods. But one caneasily show that the performance of these methods depends on the order of examples fortraining, also this is not mentioned by most other authors.
Imagine little kids, they are sophisticated incremental learners. They permanentlyincrease their knowledge just by observing their surrounding. But obviously they learnmuch better when examples are presented in a meaningful order.
Therefore teachers design a curriculum for teaching their pupils in the beginning of aschool year. This way they ensure that the topics are presented to the pupils in a wellstructured order depending of the complexity and challenge of each single topic.
Analogously, we want to define curricula for training classification procedures usingincremental learning methods. We want to define good sequences of examples to trainsuch methods such that they always perform best.
For this, we first characterize incremental learning methods regarding the effects ofsample ordering in Section 1.2. Thereafter we propose experiments to explore these effectsand show results for two different types of incremental learning methods and two differenttypes of data in Section 1.3. Finally we propose a method to define suitable class sequencesfor training based on the estimate of bounds of the Bayes error in Section 1.4.
1.2 Characterizing incremental learning methods
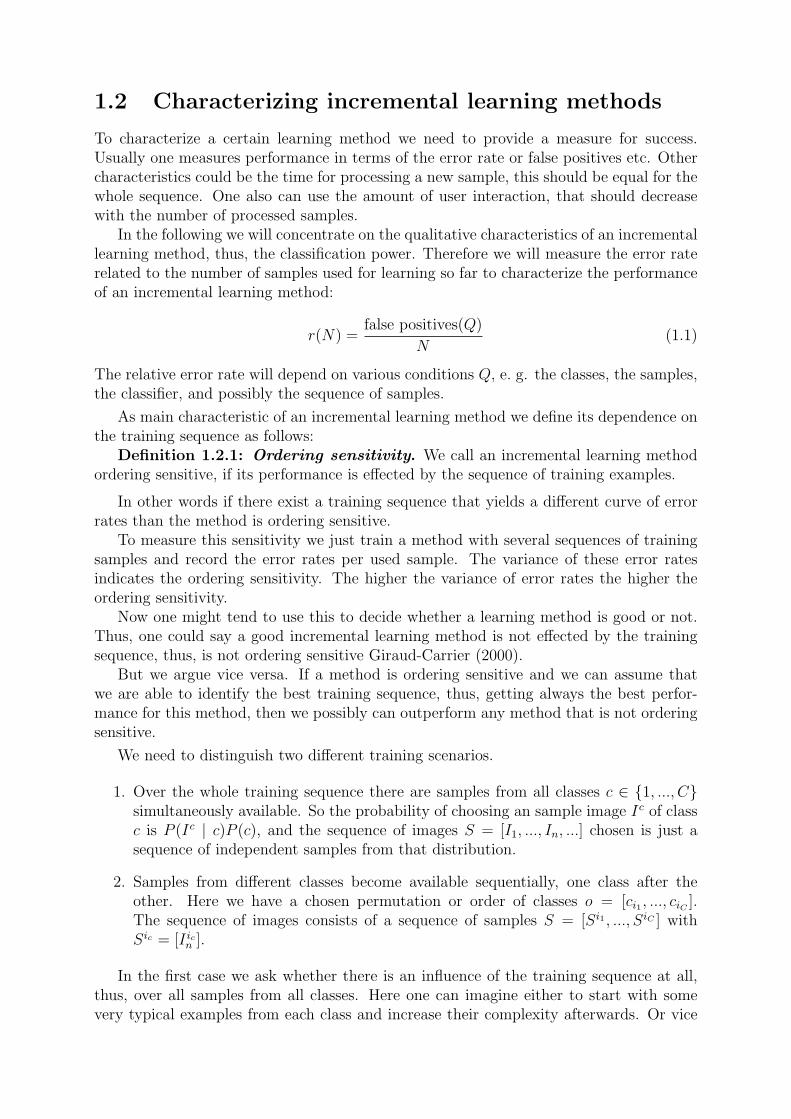
To characterize a certain learning method we need to provide a measure for success.Usually one measures performance in terms of the error rate or false positives etc. Othercharacteristics could be the time for processing a new sample, this should be equal for thewhole sequence. One also can use the amount of user interaction, that should decreasewith the number of processed samples.
In the following we will concentrate on the qualitative characteristics of an incrementallearning method, thus, the classification power. Therefore we will measure the error raterelated to the number of samples used for learning so far to characterize the performanceof an incremental learning method:
r(N) =false positives(Q)
N(1.1)
The relative error rate will depend on various conditions Q, e. g. the classes, the samples,the classifier, and possibly the sequence of samples.
As main characteristic of an incremental learning method we define its dependence onthe training sequence as follows:
Definition 1.2.1: Ordering sensitivity. We call an incremental learning methodordering sensitive, if its performance is effected by the sequence of training examples.
In other words if there exist a training sequence that yields a different curve of errorrates than the method is ordering sensitive.
To measure this sensitivity we just train a method with several sequences of trainingsamples and record the error rates per used sample. The variance of these error ratesindicates the ordering sensitivity. The higher the variance of error rates the higher theordering sensitivity.
Now one might tend to use this to decide whether a learning method is good or not.Thus, one could say a good incremental learning method is not effected by the trainingsequence, thus, is not ordering sensitive Giraud-Carrier (2000).
But we argue vice versa. If a method is ordering sensitive and we can assume thatwe are able to identify the best training sequence, thus, getting always the best perfor-mance for this method, then we possibly can outperform any method that is not orderingsensitive.
We need to distinguish two different training scenarios.
1. Over the whole training sequence there are samples from all classes c ∈ {1, ..., C}simultaneously available. So the probability of choosing an sample image Ic of classc is P (Ic | c)P (c), and the sequence of images S = [I1, ..., In, ...] chosen is just asequence of independent samples from that distribution.
2. Samples from different classes become available sequentially, one class after theother. Here we have a chosen permutation or order of classes o = [ci1 , ..., ciC ].The sequence of images consists of a sequence of samples S = [Si1 , ..., SiC ] withSic = [I ic
n ].
In the first case we ask whether there is an influence of the training sequence at all,thus, over all samples from all classes. Here one can imagine either to start with somevery typical examples from each class and increase their complexity afterwards. Or vice
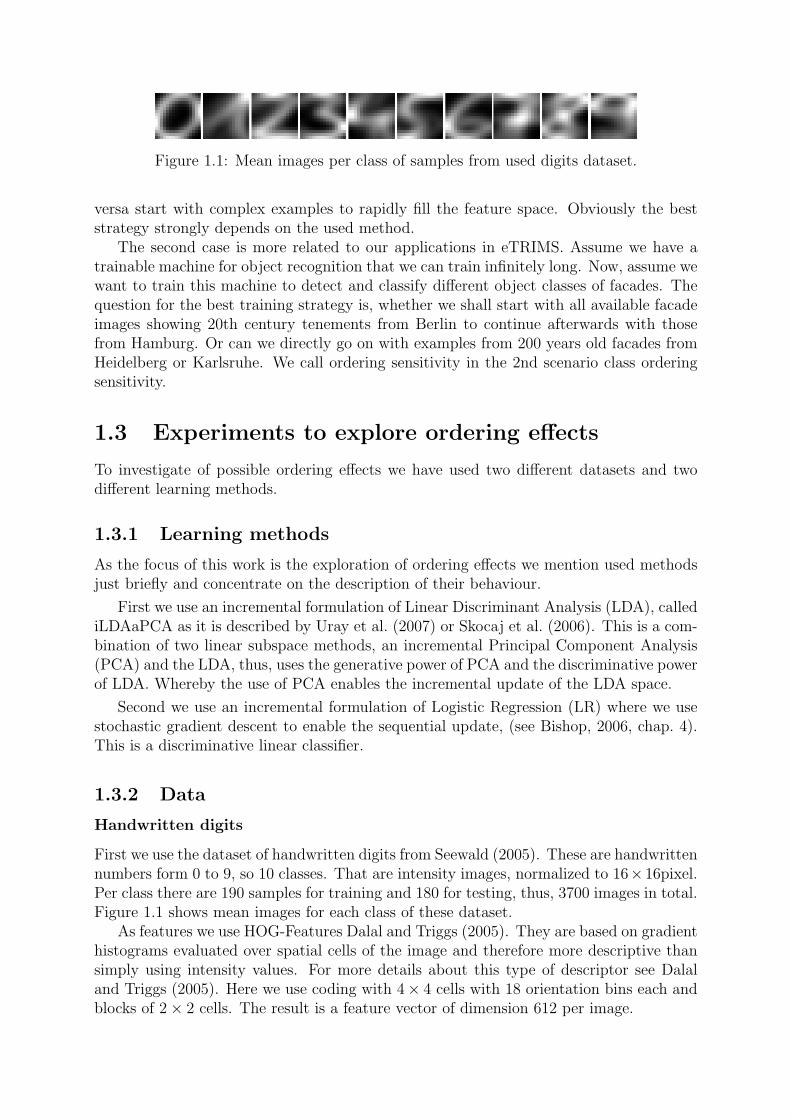
Figure 1.1: Mean images per class of samples from used digits dataset.
versa start with complex examples to rapidly fill the feature space. Obviously the beststrategy strongly depends on the used method.
The second case is more related to our applications in eTRIMS. Assume we have atrainable machine for object recognition that we can train infinitely long. Now, assume wewant to train this machine to detect and classify different object classes of facades. Thequestion for the best training strategy is, whether we shall start with all available facadeimages showing 20th century tenements from Berlin to continue afterwards with thosefrom Hamburg. Or can we directly go on with examples from 200 years old facades fromHeidelberg or Karlsruhe. We call ordering sensitivity in the 2nd scenario class orderingsensitivity.
1.3 Experiments to explore ordering effects
To investigate of possible ordering effects we have used two different datasets and twodifferent learning methods.
1.3.1 Learning methods
As the focus of this work is the exploration of ordering effects we mention used methodsjust briefly and concentrate on the description of their behaviour.
First we use an incremental formulation of Linear Discriminant Analysis (LDA), callediLDAaPCA as it is described by Uray et al. (2007) or Skocaj et al. (2006). This is a com-bination of two linear subspace methods, an incremental Principal Component Analysis(PCA) and the LDA, thus, uses the generative power of PCA and the discriminative powerof LDA. Whereby the use of PCA enables the incremental update of the LDA space.
Second we use an incremental formulation of Logistic Regression (LR) where we usestochastic gradient descent to enable the sequential update, (see Bishop, 2006, chap. 4).This is a discriminative linear classifier.
1.3.2 Data
Handwritten digits
First we use the dataset of handwritten digits from Seewald (2005). These are handwrittennumbers form 0 to 9, so 10 classes. That are intensity images, normalized to 16×16pixel.Per class there are 190 samples for training and 180 for testing, thus, 3700 images in total.Figure 1.1 shows mean images for each class of these dataset.
As features we use HOG-Features Dalal and Triggs (2005). They are based on gradienthistograms evaluated over spatial cells of the image and therefore more descriptive thansimply using intensity values. For more details about this type of descriptor see Dalaland Triggs (2005). Here we use coding with 4× 4 cells with 18 orientation bins each andblocks of 2× 2 cells. The result is a feature vector of dimension 612 per image.

Figure 1.2: Mean images of samples from used window classes together with one typicalexample for each class without normalization. The number of samples per class is notedin brackets.
Windows
Second we use a set of 2269 windows cut out from images of the eTRIMS image database.There are 8 classes with different numbers of samples. The classification is been done bya human.
At the moment the complete set consists of 9500 windows with about 50 differentclasses with wide range of complexity, e. g. degree of occlusion, within class variabilityand so on. Furthermore most of these classes include just few examples. Thus, we collectedthis set of 2269 windows and 8 classes with a sufficient number of samples per class anda restricted degree of complexity of each sample. Figure 1.2. shows one sample per classtogether with the according number of samples. We converted these samples to grayscaleimages and normalized them to 40× 30pixel. We partitioned the set into a training anda test set, including 60% and 40%, respectively.
As features we use HOG-features again. We chose a coding with 5 × 5 cells with 9orientation bins each and again blocks of 2 × 2 cells, thus, getting features of dimension512.
We found this setting optimal by evaluating the bounds of Bayes error for differentsettings of HOG-descriptors. This way we found a decrease of Bayes error coupled with theincrease of cells but almost no dependency on the use of more the 9 orientation bins. Thisis reasonable as windows mainly consists of gradients in horizontal and vertical direction.For more details about the bounds of Bayes error we refer to Section 1.4.
1.3.3 Experiment 1: Sequences including samples from all classes
First we need to know if an incremental learning method is ordering sensitive. Therefore,we just try different sequences of training samples. For each new sample we update thelearned model, evaluate it on the test set and record the error rate. This way we get acurve of error rates depending on the number of used samples. The variance of these errorrates over the whole sequence indicates the sensitivity against the training sequence.
We did this kind of experiment for both mentioned learning methods as well as bothdata sets. Results are shown in Figure 1.3.
In each case we tried 100 different sequences for training with samples randomly chosenfrom all classes. The variances of gray curves, which are the individual curves of error
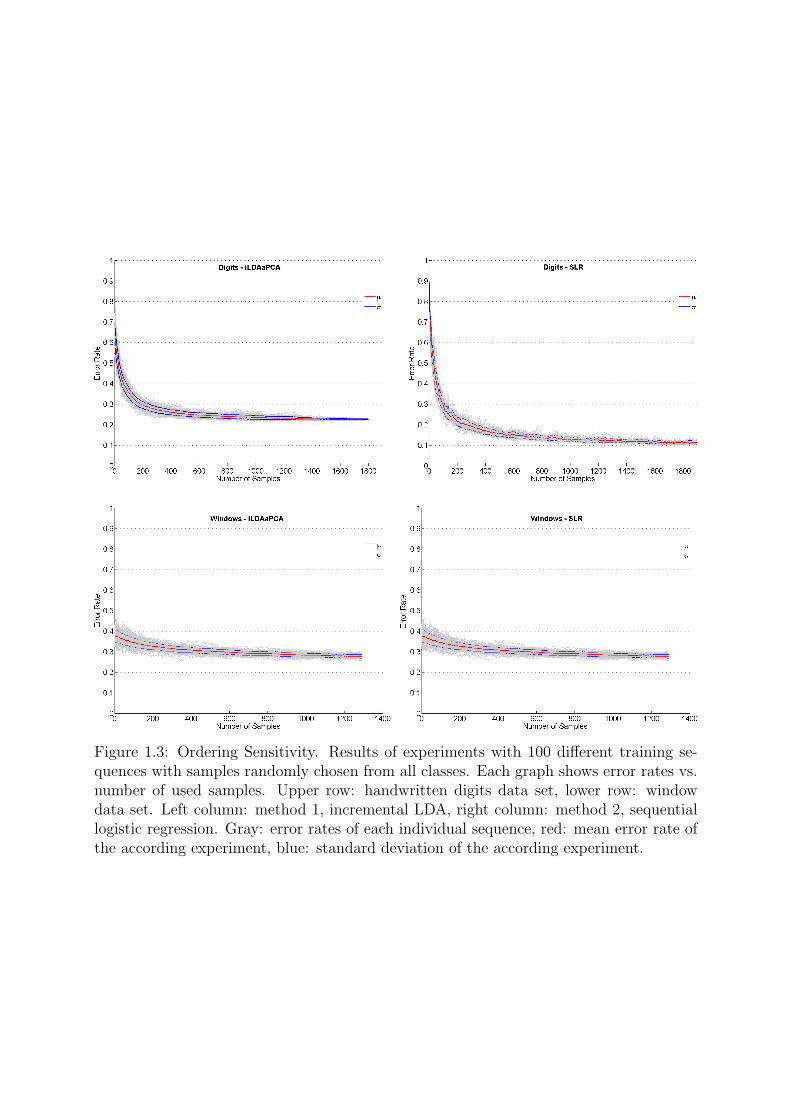
Figure 1.3: Ordering Sensitivity. Results of experiments with 100 different training se-quences with samples randomly chosen from all classes. Each graph shows error rates vs.number of used samples. Upper row: handwritten digits data set, lower row: windowdata set. Left column: method 1, incremental LDA, right column: method 2, sequentiallogistic regression. Gray: error rates of each individual sequence, red: mean error rate ofthe according experiment, blue: standard deviation of the according experiment.
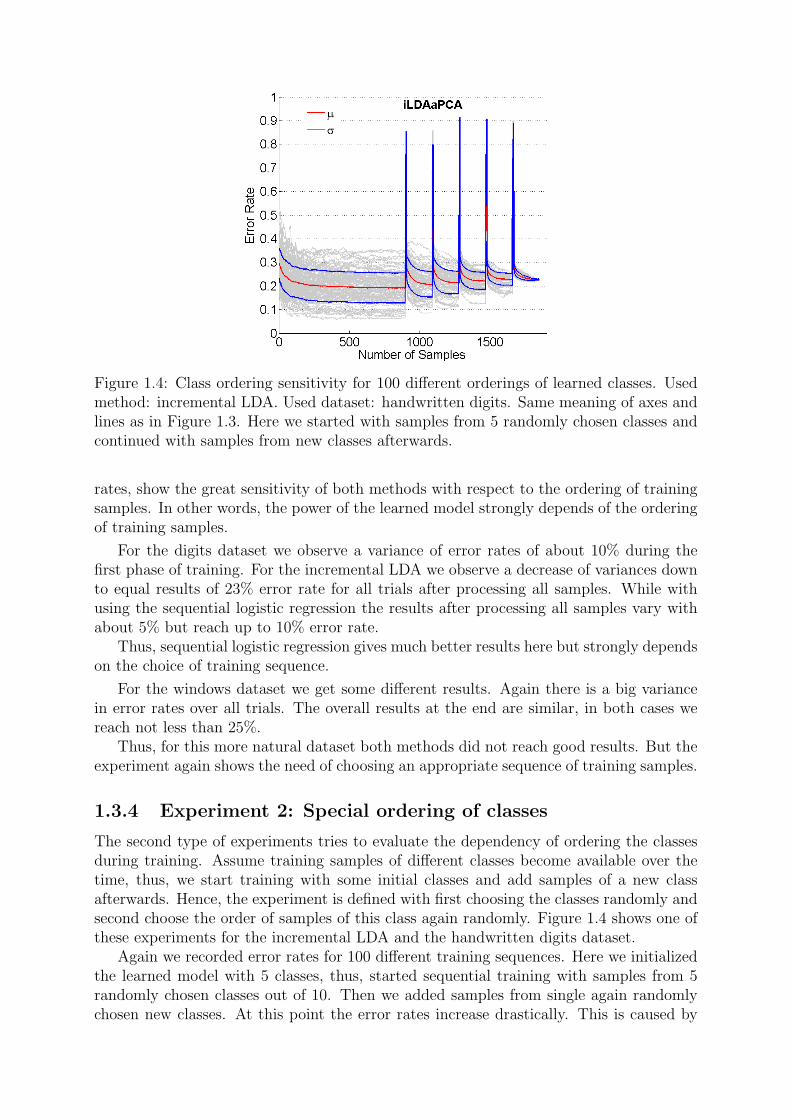
Figure 1.4: Class ordering sensitivity for 100 different orderings of learned classes. Usedmethod: incremental LDA. Used dataset: handwritten digits. Same meaning of axes andlines as in Figure 1.3. Here we started with samples from 5 randomly chosen classes andcontinued with samples from new classes afterwards.
rates, show the great sensitivity of both methods with respect to the ordering of trainingsamples. In other words, the power of the learned model strongly depends of the orderingof training samples.
For the digits dataset we observe a variance of error rates of about 10% during thefirst phase of training. For the incremental LDA we observe a decrease of variances downto equal results of 23% error rate for all trials after processing all samples. While withusing the sequential logistic regression the results after processing all samples vary withabout 5% but reach up to 10% error rate.
Thus, sequential logistic regression gives much better results here but strongly dependson the choice of training sequence.
For the windows dataset we get some different results. Again there is a big variancein error rates over all trials. The overall results at the end are similar, in both cases wereach not less than 25%.
Thus, for this more natural dataset both methods did not reach good results. But theexperiment again shows the need of choosing an appropriate sequence of training samples.
1.3.4 Experiment 2: Special ordering of classes
The second type of experiments tries to evaluate the dependency of ordering the classesduring training. Assume training samples of different classes become available over thetime, thus, we start training with some initial classes and add samples of a new classafterwards. Hence, the experiment is defined with first choosing the classes randomly andsecond choose the order of samples of this class again randomly. Figure 1.4 shows one ofthese experiments for the incremental LDA and the handwritten digits dataset.
Again we recorded error rates for 100 different training sequences. Here we initializedthe learned model with 5 classes, thus, started sequential training with samples from 5randomly chosen classes out of 10. Then we added samples from single again randomlychosen new classes. At this point the error rates increase drastically. This is caused by

the fact that one new sample from a new class is not sufficient to train the model on thisnew class, thus, the evaluation on the test set fails on this class. But by adding moresamples from the new class the model becomes better and the error rates decreases again.The overall performance decreases a bit with every new class as the complexity of theclassification problem increases with the number of classes.
Again we observe a high variability of error rates between different trials with differentclass sequences. During the initialization this goes up to 30%. Again we reach same resultsfor each trial after processing all samples.
Hence, the result of this experiment shows a strong relation between class sequenceand the performance of the learned model. Furthermore, it might be possible to use lesssamples when using the best sequence of classes, as the best possible error rate is alreadyreached after using just a part of available samples.
Of course, at the end we get same results independent of the used training sequence. Ittells: this method behaves well, thus, we have learned the same model after processing allavailable training samples. But on the other hand, with the scenario of life long learningwe will never reach that end, the point, were we have seen all possible examples. Hence,the results of this experiments show the significance of having a curriculum, i. e. weneed to know the best order of examples before starting the training. This way we wouldhave an error rate always on bottom of the graph in Figure 1.4, hence, always reach bestpossible performance.
We are now able to characterize an incremental learning method in the sense of or-dering sensitivity regarding samples from all classes or regarding the order of classes.However, by now we need to know how to define the best sequence for training. The fol-lowing section proposes one criterion to choose a good sequence of classes just dependingon the data.
Up to now we have not found a similar criterion to get best suited within class se-quences.
1.4 How to define a curriculum?
The task now is to find from all permutations of examples the one that produces thebest performance. Related to the property of class ordering sensitivity of an incrementallearning method defined in Section 1.2 we start with a proposal to get good trainingsequences regarding this property.
1.4.1 Curricula on class sequences based on the Bayes error
In order to find criterion for choosing good class sequences for training we considereddifferent measures for separating classes, e. g. distance measures as the Kullback-Leibler-distance or the Bhattacharyya distance. But both assume knowledge about the underlyingclass generating distributions. We do not want to make any assumptions about that.Hence, we looked for criteria that are independent from any assumption about the datadistribution.
The Bayes error is a general measure for the separability of classes that can be esti-mated without any knowledge about the data distribution.
Figure 1.5a illustrates the the Bayes error for two classes with known distributions. Itis given by the common area under the probability densities. It is a measure of separability
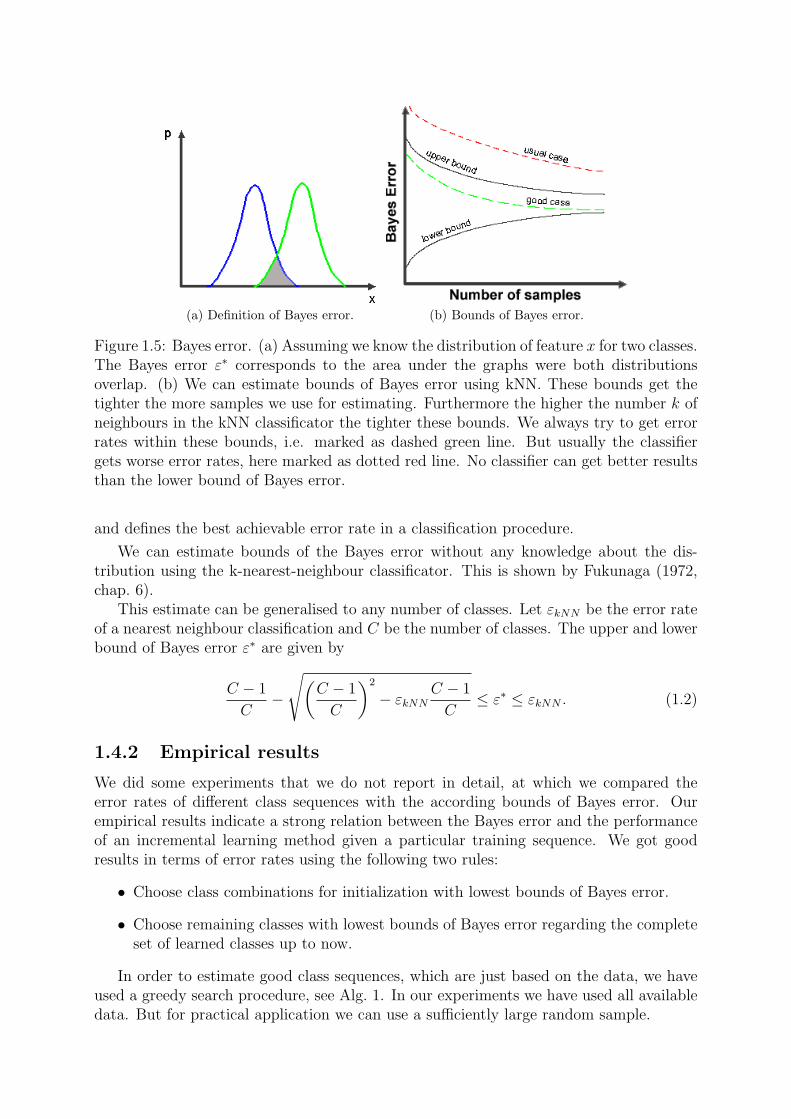
(a) Definition of Bayes error. (b) Bounds of Bayes error.
Figure 1.5: Bayes error. (a) Assuming we know the distribution of feature x for two classes.The Bayes error ε∗ corresponds to the area under the graphs were both distributionsoverlap. (b) We can estimate bounds of Bayes error using kNN. These bounds get thetighter the more samples we use for estimating. Furthermore the higher the number k ofneighbours in the kNN classificator the tighter these bounds. We always try to get errorrates within these bounds, i.e. marked as dashed green line. But usually the classifiergets worse error rates, here marked as dotted red line. No classifier can get better resultsthan the lower bound of Bayes error.
and defines the best achievable error rate in a classification procedure.
We can estimate bounds of the Bayes error without any knowledge about the dis-tribution using the k-nearest-neighbour classificator. This is shown by Fukunaga (1972,chap. 6).
This estimate can be generalised to any number of classes. Let εkNN be the error rateof a nearest neighbour classification and C be the number of classes. The upper and lowerbound of Bayes error ε∗ are given by
C − 1
C−
√(C − 1
C
)2
− εkNNC − 1
C≤ ε∗ ≤ εkNN . (1.2)
1.4.2 Empirical results
We did some experiments that we do not report in detail, at which we compared theerror rates of different class sequences with the according bounds of Bayes error. Ourempirical results indicate a strong relation between the Bayes error and the performanceof an incremental learning method given a particular training sequence. We got goodresults in terms of error rates using the following two rules:
• Choose class combinations for initialization with lowest bounds of Bayes error.
• Choose remaining classes with lowest bounds of Bayes error regarding the completeset of learned classes up to now.
In order to estimate good class sequences, which are just based on the data, we haveused a greedy search procedure, see Alg. 1. In our experiments we have used all availabledata. But for practical application we can use a sufficiently large random sample.

Algorithm 1 Greedy search for best class sequences
Require: (sample, label) pairs (xn, ωc), n = 1 . . . N from all classes c = 1 . . . C with Nc
samples per class, maximum number M < C of classes for initialization, number Kof neighbours for kNN classificator
Ensure: List L of good class sequences1: for i = 2, . . . ,M do2: Estimate Bayes error bounds for all combinations of i classes using kNN classifi-
cation3: Find set si with lowest bound, add it as initialization classes to list element Li
4: Store estimated bound as metadata to list element Li
5: for j = i + 1, . . . M do6: Estimate Bayes error bounds for all combinations of j classes including set si
7: Find set sj with lowest bound, add new class to the list element Li
8: Store estimated bound as metadata to list element Li
9: end for10: end for
The resulting list L consists of pairs of sets {initialization classes, single classes to add}.Thereby the number of initialization classes increases from 2 to any number M of classesthat is still suited to initialise the learning method.
1.4.3 Experiment 3: Confirm best class sequence of classes de-termined from bounds of Bayes error
We evaluated both datasets using the greedy search described in Alg. 1. Resulting listsof good class sequences are shown in Table 1.1 and Table 1.2.
Init. | Init. BE| Add | Sum of BE--------------------+---------+-------------------+----------1 8 | 0.000 | 6 2 4 3 5 9 7 10 | 0.0983 6 | 0.000 | 1 5 4 2 9 7 8 10 | 0.0904 7 | 0.000 | 3 1 5 9 2 6 8 10 | 0.0921 3 6 | 0.001 | 5 4 2 9 7 8 10 | 0.0901 3 5 6 | 0.003 | 4 2 9 7 8 10 | 0.0881 3 4 5 6 | 0.006 | 2 9 7 8 10 | 0.0851 2 3 4 5 6 | 0.009 | 9 7 8 10 | 0.0791 2 3 4 5 7 9 | 0.012 | 6 8 10 | 0.0701 2 3 4 5 6 7 9 | 0.015 | 8 10 | 0.0581 2 3 4 5 6 7 8 9 | 0.018 | 10 | 0.0431 2 3 4 5 6 7 8 9 10| 0.025 | | 0.025
Table 1.1: List of best class sequences for dataset handwritten digits. 1th column: classesfor initialization. 2nd column: lower bound of Bayes error for initialization classes. 3rdcolumn: classes to add sequentially. 4th column: sum of all lower bounds of Bayes errorof this sequence.
To verify this way of getting good class sequences we show the results of some ex-periments, shown in Figure 1.6 and Figure 1.7. Primarily the experiments are defined asdescribed in Section 1.3.4. Again we trained the learning method with different randomlychosen sequences of classes. We started training with samples from a certain number ofclasses and added samples from single classes afterwards.
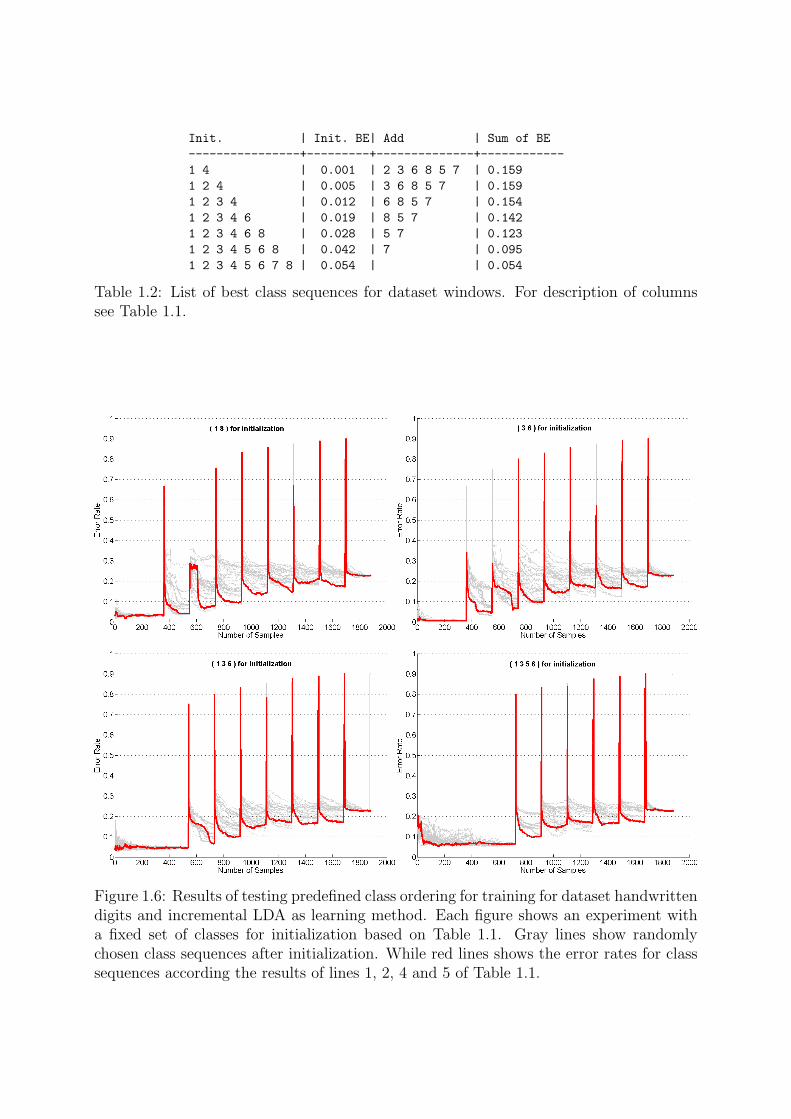
Init. | Init. BE| Add | Sum of BE----------------+---------+--------------+------------1 4 | 0.001 | 2 3 6 8 5 7 | 0.1591 2 4 | 0.005 | 3 6 8 5 7 | 0.1591 2 3 4 | 0.012 | 6 8 5 7 | 0.1541 2 3 4 6 | 0.019 | 8 5 7 | 0.1421 2 3 4 6 8 | 0.028 | 5 7 | 0.1231 2 3 4 5 6 8 | 0.042 | 7 | 0.0951 2 3 4 5 6 7 8 | 0.054 | | 0.054
Table 1.2: List of best class sequences for dataset windows. For description of columnssee Table 1.1.
Figure 1.6: Results of testing predefined class ordering for training for dataset handwrittendigits and incremental LDA as learning method. Each figure shows an experiment witha fixed set of classes for initialization based on Table 1.1. Gray lines show randomlychosen class sequences after initialization. While red lines shows the error rates for classsequences according the results of lines 1, 2, 4 and 5 of Table 1.1.
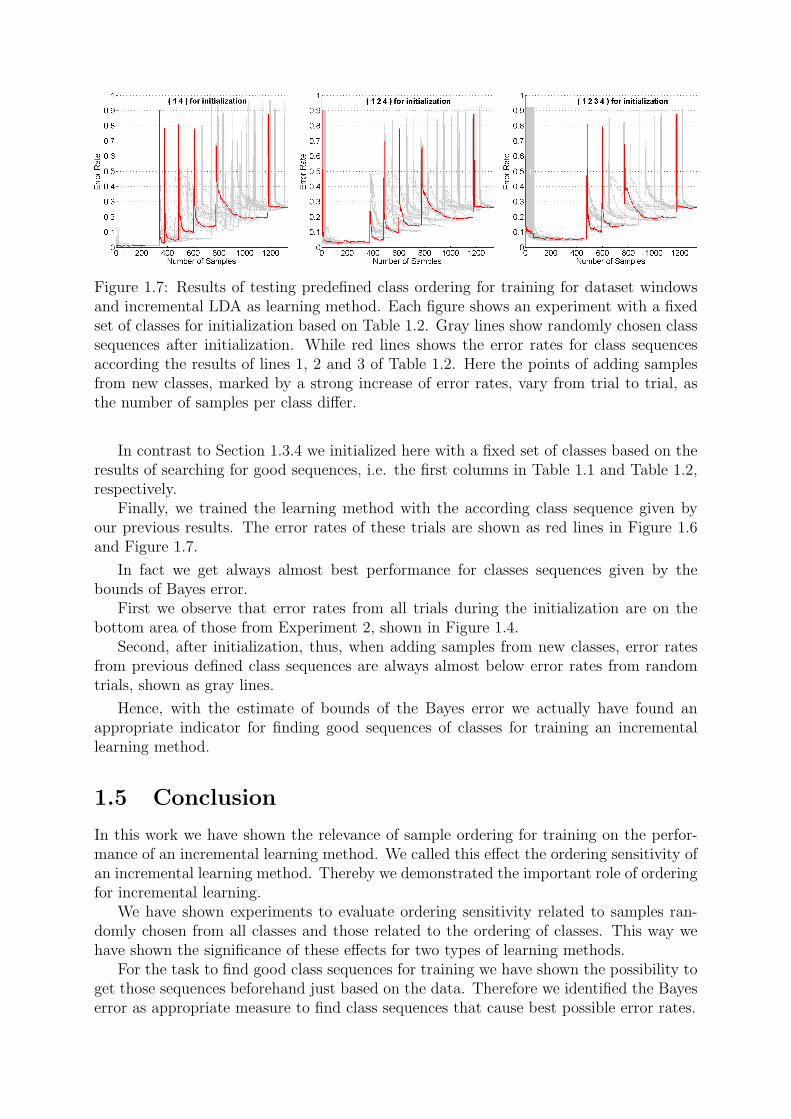
Figure 1.7: Results of testing predefined class ordering for training for dataset windowsand incremental LDA as learning method. Each figure shows an experiment with a fixedset of classes for initialization based on Table 1.2. Gray lines show randomly chosen classsequences after initialization. While red lines shows the error rates for class sequencesaccording the results of lines 1, 2 and 3 of Table 1.2. Here the points of adding samplesfrom new classes, marked by a strong increase of error rates, vary from trial to trial, asthe number of samples per class differ.
In contrast to Section 1.3.4 we initialized here with a fixed set of classes based on theresults of searching for good sequences, i.e. the first columns in Table 1.1 and Table 1.2,respectively.
Finally, we trained the learning method with the according class sequence given byour previous results. The error rates of these trials are shown as red lines in Figure 1.6and Figure 1.7.
In fact we get always almost best performance for classes sequences given by thebounds of Bayes error.
First we observe that error rates from all trials during the initialization are on thebottom area of those from Experiment 2, shown in Figure 1.4.
Second, after initialization, thus, when adding samples from new classes, error ratesfrom previous defined class sequences are always almost below error rates from randomtrials, shown as gray lines.
Hence, with the estimate of bounds of the Bayes error we actually have found anappropriate indicator for finding good sequences of classes for training an incrementallearning method.
1.5 Conclusion
In this work we have shown the relevance of sample ordering for training on the perfor-mance of an incremental learning method. We called this effect the ordering sensitivity ofan incremental learning method. Thereby we demonstrated the important role of orderingfor incremental learning.
We have shown experiments to evaluate ordering sensitivity related to samples ran-domly chosen from all classes and those related to the ordering of classes. This way wehave shown the significance of these effects for two types of learning methods.
For the task to find good class sequences for training we have shown the possibility toget those sequences beforehand just based on the data. Therefore we identified the Bayeserror as appropriate measure to find class sequences that cause best possible error rates.

This way we can achieve always best performance given a particular learning method.Furthermore, we can reduce the number of samples for learning if the error rate duringtraining a particular class does not drop anymore.
Bibliography
Bishop, C. M. (2006). Pattern Recognition and Machine Learning (Information Scienceand Statistics). Springer.
Dalal, N. and Triggs, B. (2005). Histograms of oriented gradients for human detection. In2005 IEEE Computer Society Conference on Computer Vision and Pattern Recognition(CVPR’05), volume 1, pages 886–893. IEEE Computer Society.
Fukunaga, K. (1972.). Introduction to Statistical Pattern Recognition. Academic Press,first edition.
Giraud-Carrier, C. (2000). A note on the utility of incremental learning. AI Communi-cations, 13(4):215–223.
Seewald, A. K. (2005). Digits - a dataset for handwritten digit recognition. TechnicalReport TR-2005-27, Austrian Research Institut for Artificial Intelligence.
Skocaj, D., Uray, M., Leonardis, A., and Bischof, H. (2006). Why to combine reconstruc-tive and discriminative information for incremental subspace learning. In CVWW 2006,Telc, Czech Republic.
Uray, M., Skocaj, D., Roth, P. M., Bischof, H., and Leonardis, A. (2007). IncrementalLDA Learning by Combining Reconstructive and Discriminative Approaches. In BritishMachine Vision Conference BMVC 2007, University of Warwick, UK.