
The role of hydrogen and fuel cells in the global energy system
29
This journal is © The Royal Society of Chemistry 2019 Energy Environ. Sci., 2019, 12, 463--491 | 463 Cite this: Energy Environ. Sci., 2019, 12, 463 The role of hydrogen and fuel cells in the global energy system Iain Staffell, * a Daniel Scamman, b Anthony Velazquez Abad, b Paul Balcombe, c Paul E. Dodds, b Paul Ekins, b Nilay Shah d and Kate R. Ward a Hydrogen technologies have experienced cycles of excessive expectations followed by disillusion. Nonetheless, a growing body of evidence suggests these technologies form an attractive option for the deep decarbonisation of global energy systems, and that recent improvements in their cost and performance point towards economic viability as well. This paper is a comprehensive review of the potential role that hydrogen could play in the provision of electricity, heat, industry, transport and energy storage in a low-carbon energy system, and an assessment of the status of hydrogen in being able to fulfil that potential. The picture that emerges is one of qualified promise: hydrogen is well established in certain niches such as forklift trucks, while mainstream applications are now forthcoming. Hydrogen vehicles are available commercially in several countries, and 225 000 fuel cell home heating systems have been sold. This represents a step change from the situation of only five years ago. This review shows that challenges around cost and performance remain, and considerable improvements are still required for hydrogen to become truly competitive. But such competitiveness in the medium-term future no longer seems an unrealistic prospect, which fully justifies the growing interest and policy support for these technologies around the world. Broader context Hydrogen and fuel cells have arguably suffered a ‘lost decade’ after high expectations in the 2000s failed to materialise. Three factors are enabling the sector to regain momentum. Firstly, improvements in technology and manufacturing mean that systems which cost $60 000 in 2005 are now cost $10 000. Secondly, commercial products are becoming widely available, and significant uptake is occurring in specific sectors such as Japanese microgeneration and US forklift trucks. Thirdly, a strengthened global resolve to mitigate climate change is coupled with increasing realisation that clean power alone is insufficient, due to the complexity of decarbonising heat and transport. This paper provides a comprehensive state-of-the-art update on hydrogen and fuel cells across transport, heat, industry, electricity generation and storage, spanning the technologies, economics, infrastructure requirements and government policies. It defines the many roles that these technologies can play in the near future, as a flexible and versatile complement to electricity, and in offering end-users more choice over how to decarbonise the energy services they rely on. While there are strong grounds for believing that hydrogen and fuel cells can experience a cost and performance trajectory similar to those of solar PV and batteries, several challenges must still be overcome for hydrogen and fuel cells to finally live up to their potential. Introduction Thirty years ago, hydrogen was identified as ‘‘a critical and indispensable element of a decarbonised, sustainable energy system’’ to provide secure, cost-effective and non-polluting energy. 1 Today, energy leaders see hydrogen as the lowest impact and least certain issue facing the global energy system. 2 ‘‘Hydrogen, as a viable alternative fuel, continues to promise much and deliver precious little’’. 3 Yet hydrogen could play a significant role in low-carbon future: 4–8 counterbalancing electricity as a zero-carbon energy carrier that can be easily stored and transported; 9,10 enabling a more secure energy system with reduced fossil fuel dependence; 11,12 with the versatility to operate across the transport, 13,14 heat, 15,16 industry 17 and electricity sectors. 18,19 Together, these account for two-thirds of global CO 2 emissions (Fig. 1). Whilst electricity is proving comparatively easy to decarbonise thanks to the dramatic cost reductions and uptake of renewables, 20 these other sectors must not be forgotten. In the UK for example, a Centre for Environmental Policy, Imperial College London, London SW7 1NE, UK b UCL Institute for Sustainable Resources, University College London, London WC1H 0NN, UK c Sustainable Gas Institute, Imperial College London, SW7 1NA, UK d Centre for Process Systems Engineering, Dept of Chemical Engineering, Imperial College London, London SW7 2AZ, UK. E-mail: i.staff[email protected] Received 19th April 2018, Accepted 9th October 2018 DOI: 10.1039/c8ee01157e rsc.li/ees Energy & Environmental Science REVIEW Open Access Article. Published on 10 December 2018. Downloaded on 1/15/2022 2:36:12 AM. This article is licensed under a Creative Commons Attribution 3.0 Unported Licence. View Article Online View Journal | View Issue
-
Upload
khangminh22 -
Category
Documents
-
view
1 -
download
0
Transcript of The role of hydrogen and fuel cells in the global energy system

This journal is©The Royal Society of Chemistry 2019 Energy Environ. Sci., 2019, 12, 463--491 | 463
Cite this: Energy Environ. Sci.,
2019, 12, 463
The role of hydrogen and fuel cells in the globalenergy system
Iain Staffell, *a Daniel Scamman, b Anthony Velazquez Abad, b
Paul Balcombe, c Paul E. Dodds,b Paul Ekins,b Nilay Shahd and Kate R. Warda
Hydrogen technologies have experienced cycles of excessive expectations followed by disillusion.
Nonetheless, a growing body of evidence suggests these technologies form an attractive option for
the deep decarbonisation of global energy systems, and that recent improvements in their cost and
performance point towards economic viability as well. This paper is a comprehensive review of the
potential role that hydrogen could play in the provision of electricity, heat, industry, transport and
energy storage in a low-carbon energy system, and an assessment of the status of hydrogen in being
able to fulfil that potential. The picture that emerges is one of qualified promise: hydrogen is well
established in certain niches such as forklift trucks, while mainstream applications are now forthcoming.
Hydrogen vehicles are available commercially in several countries, and 225 000 fuel cell home heating
systems have been sold. This represents a step change from the situation of only five years ago. This
review shows that challenges around cost and performance remain, and considerable improvements are
still required for hydrogen to become truly competitive. But such competitiveness in the medium-term
future no longer seems an unrealistic prospect, which fully justifies the growing interest and policy
support for these technologies around the world.
Broader contextHydrogen and fuel cells have arguably suffered a ‘lost decade’ after high expectations in the 2000s failed to materialise. Three factors are enabling the sector toregain momentum. Firstly, improvements in technology and manufacturing mean that systems which cost $60 000 in 2005 are now cost $10 000. Secondly,commercial products are becoming widely available, and significant uptake is occurring in specific sectors such as Japanese microgeneration and US forklifttrucks. Thirdly, a strengthened global resolve to mitigate climate change is coupled with increasing realisation that clean power alone is insufficient, due to thecomplexity of decarbonising heat and transport. This paper provides a comprehensive state-of-the-art update on hydrogen and fuel cells across transport, heat,industry, electricity generation and storage, spanning the technologies, economics, infrastructure requirements and government policies. It defines the manyroles that these technologies can play in the near future, as a flexible and versatile complement to electricity, and in offering end-users more choice over how todecarbonise the energy services they rely on. While there are strong grounds for believing that hydrogen and fuel cells can experience a cost and performancetrajectory similar to those of solar PV and batteries, several challenges must still be overcome for hydrogen and fuel cells to finally live up to their potential.
Introduction
Thirty years ago, hydrogen was identified as ‘‘a critical andindispensable element of a decarbonised, sustainable energysystem’’ to provide secure, cost-effective and non-polluting energy.1
Today, energy leaders see hydrogen as the lowest impact and
least certain issue facing the global energy system.2 ‘‘Hydrogen,as a viable alternative fuel, continues to promise much anddeliver precious little’’.3
Yet hydrogen could play a significant role in low-carbonfuture:4–8 counterbalancing electricity as a zero-carbon energycarrier that can be easily stored and transported;9,10 enabling amore secure energy system with reduced fossil fuel dependence;11,12
with the versatility to operate across the transport,13,14 heat,15,16
industry17 and electricity sectors.18,19 Together, these account fortwo-thirds of global CO2 emissions (Fig. 1).
Whilst electricity is proving comparatively easy to decarbonisethanks to the dramatic cost reductions and uptake of renewables,20
these other sectors must not be forgotten. In the UK for example,
a Centre for Environmental Policy, Imperial College London, London SW7 1NE, UKb UCL Institute for Sustainable Resources, University College London,
London WC1H 0NN, UKc Sustainable Gas Institute, Imperial College London, SW7 1NA, UKd Centre for Process Systems Engineering, Dept of Chemical Engineering,
Imperial College London, London SW7 2AZ, UK. E-mail: [email protected]
Received 19th April 2018,Accepted 9th October 2018
DOI: 10.1039/c8ee01157e
rsc.li/ees
Energy &EnvironmentalScience
REVIEW
Ope
n A
cces
s A
rtic
le. P
ublis
hed
on 1
0 D
ecem
ber
2018
. Dow
nloa
ded
on 1
/15/
2022
2:3
6:12
AM
. T
his
artic
le is
lice
nsed
und
er a
Cre
ativ
e C
omm
ons
Attr
ibut
ion
3.0
Unp
orte
d L
icen
ce.
View Article OnlineView Journal | View Issue

464 | Energy Environ. Sci., 2019, 12, 463--491 This journal is©The Royal Society of Chemistry 2019
heat and transport are expected to decarbonise at just one-thirdthe rate of electricity production, with emissions falling 24%compared to 68% over the coming 15 years.21,22 Solutions aredesperately needed to make transport and buildings sustainablethat are cost-effective and appealing to consumers. Hydrogenand fuel cell technologies offer greater personal choice in thetransition to a low-carbon economy, given their similar perfor-mance, operation and consumer experience to fossil-fuelledtechnologies. They also provide valuable insurance againstthe possibility of other vaunted technologies failing to deliver,such as carbon capture and storage, bioenergy and hybridheat pumps.
Hydrogen and fuel cells are seeing a resurgence in interest:large-scale production of fuel cell vehicles has begun, andhundreds of thousands of homes are now heated and poweredby fuel cells.5 A key difference since the last hydrogen ‘‘hypecycle’’24 in the 2000s is that manufacturing scale up and costdecreases mean hydrogen and fuel cells are being commercia-lised in several sectors, from portable electronics and backuppower to fork-lift trucks.25,26 Meanwhile, energy systems analyseshave become more sophisticated in identifying the complexity ofdecarbonising heat and transport via full electrification, andthus the need for a flexible and storable energy vectors.27–30
Thirteen international corporations recently formed theHydrogen Council ‘‘to position hydrogen among the key solu-tions of the energy transition’’.6 Doing so involves challengesaround its complexity and diversity:
(1) Hydrogen can be produced from many feedstocks andprocesses, with varying greenhouse gas and other emissions,costs and infrastructural requirements;
(2) Hydrogen can be used in many ways, including withoutfuel cells, whilst fuel cells can operate using fuels other thanhydrogen;
(3) Hydrogen and fuel cells can contribute in many waysspanning the whole energy system;
(4) Hydrogen infrastructure may be costly, but pathwaysinclude several low-cost incremental routes that ‘piggy-back’off established networks, which are often neglected.
In March 2017, the UK’s Hydrogen and Fuel Cell SupergenHub published a white paper that systematically assessed thecurrent status and future prospects of hydrogen and fuel cellsin future energy systems.31 This article synthesises and updates
that white paper, broadening its scope to a global focus. Itbuilds upon previous holistic reviews of hydrogen and fuelcells,32–34 and takes the novel approach of considering how theymight be integrated together across the energy system.
This review covers the following:� The transport sector, both personal vehicles and larger
heavy-duty freight and public transit vehicles;�Heat production for residential, commercial and industrial
users;� Electricity sector integration, balancing intermittent renew-
able energy;� Infrastructure needs, options for using existing gas grids,
compression and purity requirements; and� Policy challenges, global support and targets for hydrogen
and fuel cells.
Transportation
The suitability of hydrogen and fuel cells varies between trans-port modes and reflects the diverse nature of the transportsector, which spans land, sea and air, plus freight and passengers,as shown in Fig. 2. Nearly half of energy demand for globaltransport is from light duty vehicles and the number of passengercars worldwide is expected to rise from 1 to 2.5 billion by 2050.35
The UK must halve its transport CO2 emissions between2015 and 2030 to meet national carbon budget commitments.22
Emissions have increased though, and the share of renewableenergy in UK transport has fallen to 4.2% versus a target of 10%,36
bringing calls for stronger action.37 Hydrogen represents one ofthree main options for low-carbon transport alongside biofuelsand electric vehicles (EVs). Hydrogen avoids the land-use andair quality impacts of biofuels, and the limited range and long
Fig. 1 Global greenhouse gas emissions in 2014, broken down by sectorand by major countries. Data from CAIT.23
Fig. 2 Breakdown of energy usage in the transport sector globally in 2015.The outer ring gives the share of individual modes. ‘‘Other’’ is primarilypassenger rail and air freight. The middle and inner rings aggregate theseuses by mode and function. Data from EIA.35 Total consumption was110 million TJ in 2015 worldwide, equivalent to 37 kW h per person per dayin OECD countries and 7 kW h in non-OECD countries.
Review Energy & Environmental Science
Ope
n A
cces
s A
rtic
le. P
ublis
hed
on 1
0 D
ecem
ber
2018
. Dow
nloa
ded
on 1
/15/
2022
2:3
6:12
AM
. T
his
artic
le is
lice
nsed
und
er a
Cre
ativ
e C
omm
ons
Attr
ibut
ion
3.0
Unp
orte
d L
icen
ce.
View Article Online

This journal is©The Royal Society of Chemistry 2019 Energy Environ. Sci., 2019, 12, 463--491 | 465
recharging times associated with EVs.5 However, electric carsare several years ahead of hydrogen in terms of maturity due totheir lower costs and readily-available infrastructure. Plug-inelectric vehicles now account for 30% of new vehicle sales inNorway and 2% in the UK.38,39
In addition to tackling climate change, hydrogen vehiclescan improve air quality. This is an urgent priority with over halfa million premature deaths per year across Europe due toparticulates and NOx emissions.40,41 The direct cost of airpollution due to illness-induced loss of production, healthcare,crop yield loss and damage to buildings is around h24b per yearacross Europe with external costs estimated to be h330–940bper year.42 92% of the world’s population are exposed to airquality levels that exceed World Health Organisation limits.43,44
Major cities have recently announced bans on all diesel-powered cars and trucks by 2025,45 and UK and France haveannounced nationwide bans on all pure combustion vehiclesby 2040.46,47
Hydrogen powertrains
Conventional internal combustion engines can be modified torun on pure hydrogen (‘HICEs’) and could see early deploymentas they are substantially cheaper than fuel cells. However, hydro-gen combustion is less efficient than a fuel cell and releases NOx,hence is not expected to play a significant long-term role intransport. Hydrogen can be blended with natural gas (‘hythane’)or diesel in dual-fuel vehicles; or it is possible to switch betweenboth in bi-fuel powertrains. This allows the use of existinginfrastructure, but these are not zero-emission and couldeventually be displaced by lower-carbon options.48
Fuel cell electric vehicles (FCEVs) predominantly use PEMfuel cells, offering high efficiency, high power density and cold-start capabilities.49 A 60 kW fuel cell is typical for Europeancars,50 which is substantially larger than for residential fuelcells (B1 kW). Competing powertrains includes conventionalinternal combustion engines (ICEs), battery electric vehicles(BEVs) and plug-in hybrid vehicles (PHEVs, also known asrange-extender EVs), which allow most journeys to be com-pleted using a battery, and switch to the engine or fuel cell forless-frequent longer journeys.51
Hydrogen powertrains are compared to alternatives inTable 1, and differ in the following ways:49,52
(1) Capital cost: FCEVs have higher capital and operatingcost than BEVs today: $60–75k for the Toyota Mirai or Hyundaiix3553,54 versus $25–30k for the Renault Zoe or Nissan Leaf.55,56
However, FCEVs have the potential for considerable cost reductionas manufacturing volumes rise, and could end up as cheaperalternatives.5,50
(2) Range and refuelling time: FCEVs have longer drivingranges and shorter refuelling times than BEVs, comparable toconventional vehicles (ca. 500 miles and 3 minutes).49 Thepower-hungry computers and sensors in driverless cars willimpact BEV range more than FCEV,57 as does the air condition-ing/heating for vehicles in hot/cold regions.
(3) Infrastructure requirements: hydrogen filling stationscan serve substantially more vehicles than EV chargers, and a
wider radius due to greater FCEV range.58 Hydrogen refuellers arecurrently more expensive than electric charging posts: around$1.5m versus o$1000 for slow chargers,4,59–61 although costs areexpected to fall by two-thirds once the technology matures.7,48
(4) Lifetime: battery lifetimes are affected by local climate,overcharging, deep discharge and high charging/dischargingrates;62 Tesla expect batteries to last 10–15 years, yet most BEVsare o5 years old so such lifetimes are unproven.51 In contrastto batteries, hydrogen tanks can undergo fast refilling andfrequent, deep discharging without compromising lifetime,and fuel cell stacks are expected to outlive other drivetraincomponents.63
(5) User experience: FCEVs offer a smoother driving experi-ence than ICEs (quieter, less vibration and no gear shifting).64
However, hydrogen tanks are large and inconveniently shaped,potentially restricting luggage space.
(6) Emissions: FCEVs have zero emissions at point of useand are low-carbon at the point of production if made fromrenewable-powered electrolysis, biomass or fossil fuels withCCS. The same is true for BEVs, whereas there is limiteddecarbonisation potential for ICEs. Blending biofuels withpetrol and diesel can reduce CO2 emissions, but not improvelocal air quality.
(7) Network requirements: FCEVs and refuelling infrastruc-ture can avoid the electricity network upgrades required forsignificant BEV penetration, and offer valuable grid-balancingservices.
(8) Safety: FCEVs have comparable, but different, safetyconsiderations to BEVs and ICEs. Hydrogen is flammable (moreso than petrol) but hydrogen fires can cause little damage to thevehicle due to their localised nature.49
Passenger cars
Deep decarbonisation of transport must focus on private cars,which account for around half of the global transport sector(Fig. 2). FCEVs are currently expensive, but several analysessuggest cost reductions from mass-production could see theirtotal cost of ownership (TCO) converging with other principalpowertrains by 2030 (Fig. 3).4,7,13,50,65,66
Platinum is a key contributor to capital cost, as mid-sizedfuel cell vehicles require ten times more (circa 30 g) than a
Table 1 Comparative performance of primary drivetrains. Symbols givea qualitative comparison between different performance metrics (low/medium/high). Data from ref. 49
ICE FCEV BEV
Lower is better Current capital cost $ $ $ $ $ $Fuel cost $ $ $ $ $ $Maintenance costs $ $ $ $ $Infrastructure needs $ $ $ $ $ $Emissions
Higher is better Efficiency * * * * * *Range * * * * * * *Refuelling speed * * * * * * *Lifetime * * * * * * * *Acceleration * * * * * * * *
Energy & Environmental Science Review
Ope
n A
cces
s A
rtic
le. P
ublis
hed
on 1
0 D
ecem
ber
2018
. Dow
nloa
ded
on 1
/15/
2022
2:3
6:12
AM
. T
his
artic
le is
lice
nsed
und
er a
Cre
ativ
e C
omm
ons
Attr
ibut
ion
3.0
Unp
orte
d L
icen
ce.
View Article Online

466 | Energy Environ. Sci., 2019, 12, 463--491 This journal is©The Royal Society of Chemistry 2019
diesel autocatalyst.67 Strong progress has been made on reduc-ing platinum content: Daimler cut 90% since 2009 and Toyotatarget a 50% reduction from current levels,68 which will proveessential for volume scale-up.67
Passenger FCEVs are believed to require production volumesof around 100 000 units per year (and hence considerablefinancial support) to approach cost parity. With global passengercar sales of B70 million per year, this small penetration repre-sents a sizeable market.69 If cost parity is achieved, other keyaspects relating to user experience may make FCEVs favourable:78% of automotive executives believe faster refuelling will makeFCEVs the breakthrough for electric mobility, whilst BEV rechar-ging times will remain an insuperable obstacle to acceptance.70
Deployment could be accelerated by targeting powertrainconfigurations with smaller initial hurdles. These include range-extender EVs (FC RE-EVs), where smaller stacks (o20 kW) andlower fuel consumption mean FC RE-EVs can be competitive atsmaller volumes.7
Toyota, Hyundai and Honda now produce FCEV passengervehicles, with Audi, Mercedes-Benz and others expected tofollow suit.71,72 Whilst FCEVs are offered in only a few countriesdue to infrastructure requirements, around 3000 FCEVs havebeen sold to date (see Policy challenges section). Deployment isexpected to accelerate, with the Hydrogen Council pledging toinvest $1.75 billion p.a.73 The majority of automobile executivesidentified FCEVs as the most important trend up to 2025.70
Longer term, the IEA concludes that FCEV sales could reach8 million by 2030 in developed nations, and 150 million salesand a 25% share of road transport by 2050.4
Refuelling stations
A complication for passenger vehicles is the need for extensiveexpansion of refuelling infrastructure to offer the reach andfreedom of conventional vehicles.58 Battery electric vehicles facethis to a lesser extent due to the lower cost of electric chargers:the UK has rapidly developed 5000 electric charging locations torival its 8500 petrol stations, compared to just 15 hydrogenstations74,75 While 15 hydrogen dispensers could deliver com-parable throughput to 900 BEV fast-chargers, they do not offerthe same geographic coverage and convenience.
Globally, there are 330 hydrogen refilling stations as of 2018,half of which are in Japan and the US76 (Fig. 4). The variousEuropean H2Mobility programs have suggested a rollout ofrefuelling stations at critical locations, with a network of 65refuelling stations for the UK by 2020 to start the market,growing to 1150 stations by 2030 to cover the whole country.77
The Hydrogen Council targets 3000 refilling stations globally by2025, sufficient to provide hydrogen for about 2 million FCEVs,after which refuelling infrastructure should be self-sustaining.66
National roadmaps only target around half this number though(see Section 6.1).
Return-to-base fleets such as delivery vans and taxis, orpassenger cars in a future car-sharing economy will see highutilisation and benefit from single refuelling depots with fast,infrequent refuelling. The requirement for less infrastructurecould enable distribution costs to fall more rapidly than inthe passenger FCEV sector, suggesting deployment in thesesectors should be targeted.7 Urban taxis are another promising
Fig. 3 Total cost of ownership for major powertrains from ref. 50. Hydrogen,electric and fossil-fuelled vehicle lifetime costs are expected to convergeby 2030.
Fig. 4 Map of the hydrogen filling stations currently in operation and planned. The map focusses on the existing stations in the northern hemisphere,a further 8 stations are not plotted. Data from www.h2stations.org by LBST and TUV SUD.76
Review Energy & Environmental Science
Ope
n A
cces
s A
rtic
le. P
ublis
hed
on 1
0 D
ecem
ber
2018
. Dow
nloa
ded
on 1
/15/
2022
2:3
6:12
AM
. T
his
artic
le is
lice
nsed
und
er a
Cre
ativ
e C
omm
ons
Attr
ibut
ion
3.0
Unp
orte
d L
icen
ce.
View Article Online

This journal is©The Royal Society of Chemistry 2019 Energy Environ. Sci., 2019, 12, 463--491 | 467
early market: new London taxis must be zero emission capablefrom 2018,78 and Paris will purchase 60 new FCEV taxis withplans for hundreds more.79
Other road transport
Whilst FCEVs face strong competition from ICE and BEVpassenger cars, they may be the best (and perhaps the only)realistic zero-carbon option for high-utilisation, heavy-dutyroad transport vehicles such as buses and trucks. These aresignificant sectors, accounting for a quarter of transport energyusage (Fig. 2 earlier). Growing calls to minimise urban air andnoise pollution are major drivers for hydrogen bus rollout.64
Back-to-base operation means fewer refuelling stations are neededand are more highly utilised, reducing initial refuelling costs.
Three key differences for heavy-duty transport are low manu-facturing volumes (meaning the cost gap with ICE is smaller),and the need for greater longevity and energy density. The USDOE targets 25 000 hour operating lifetime for fuel cell buses,versus just 8000 for passenger cars.80,81 Greater vehicle weightand driving range mean battery technologies are likely toremain unsuitable outside of urban environments; for example,fuel cell buses consume 10 times more hydrogen per kilometrethan passenger cars – amplifying range limitations.82,83
Fuel cell buses. Fuel cell buses in particular have attractedsignificant attention and are relatively mature, at TechnologyReadiness Level (TRL) 7.84 On-board tanks typically holdaround 40 kg of hydrogen stored in the bus roof,48 and reducedspace restrictions mean this can be stored at 350 bar, reducingtank and compression costs. Fuel cell buses may have a 10–20%higher total cost of ownership (TCO) than diesel by 2030, andcould be cheaper if deployed at scale.85
Fuel cell buses have seen substantial early deployment,with 7 million kilometres of operational experience so far inEurope.86 Europe has 83 operating fuel cell buses, with 44 inNorth America.87,88 Toyota is planning to introduce over 100 fuelcell buses before the Tokyo 2020 Olympic Games.89 China hasthe world’s largest bus market,90 with 300 fuel cell buses orderedfor Foshan City (quadrupling the global fleet of hydrogenpowered buses).91 For context, Shenzhen City has electrified itsentire fleet of over 16 000 buses using BEVs.92,93
Good progress is being made with longevity, with fourLondon buses operating more than 18 000 hours.87 Ten busesin California have passed 12 000 hours of operation with onereaching 22 400 hours: close to the DOE’s ultimate target of25 000 hours.80,82 Fuel cell bus availability has exceeded 90% inEurope (versus an 85% target), with refuelling station availabilityaveraging 95%.87
Trucks. Trucks show considerable potential for fuel celladoption as high energy requirements mean few low-emissionalternatives exist. Light goods vehicles with short low-speedjourneys could be managed with batteries and range-extendervehicles;48 however, long-haul heavy vehicles which requirehigh utilisation are likely to require hydrogen. Competitionfrom batteries is nonetheless increasing, with the Tesla Semiexpected to offer 300–500 mile range for B$200 000.94 Costparity of fuel cell trucks with other low-carbon alternatives
could be achieved with relatively low manufacturing volumes.7
Return-to-base delivery vehicles could see lower fuel costs witha single refuelling depot, although long-range HGVs need anadequate refuelling network.
Higher longevity is required than for other applicationsdue to the high mileage expected of trucks, with one programtargeting 50 000 hour stack lifetime.48 High efficiency and lowfuel costs are also essential.4 Kenworth and Toyota are con-sidering hydrogen truck production,95,96 and Nikola is alsodeveloping a long-distance HGV using liquefied hydrogen inthe US.97 Fuel cells are also being developed as Auxiliary PowerUnits (APUs) for HGVs.48 These could power refrigeration unitsand ‘hotel’ loads on stationary HGVs (e.g. cabin heating, cooling,lighting, and electrical devices) to avoid engine idling.98
FCEV trucks have seen lower adoption than buses due to theHGV market being highly cost sensitive with limited governmentsupport or intervention, and highly conservative with haulierswary of being pioneers.48 However, Anheuser-Busch InBev (aninternational drinks company), recently ordered 800 FCEV trucksto be in operation in 2020.99 Interest could grow as diesel trucksbegin to be banned from major city centres.45
Motorbikes. Two-wheeled vehicles are dominant for passen-ger transport in many regions. Intelligent Energy has developeda 4 kW fuel cell system in cooperation with Suzuki,48 now beingtrialled in the UK.100 Their low fuel consumption allows them tobe refuelled using hydrogen canisters from vending machines.FCEV motorbikes could contribute toward air quality and noisepollution targets.
Off-road transport
Trains. Electrification can replace diesel trains but progresshas slowed recently across Europe.48 Hydrogen trains could beused on routes which are difficult or uneconomic to electrifydue to route length or lack of space in urban areas. A fuel-cellpowered train with roof-mounted hydrogen tanks and a rangeof 500 miles has begun testing in Germany,101 and 40 trainscould be in service by 2020.102 Alstom announced plans toconvert a fleet of trains in the UK from electric to hydrogen tonegate the need for line electrification and meet the govern-ment target of eliminating diesel trains by 2040.103
Light rail also presents opportunities for hydrogen, with fuelcell-powered trams being developed and operated in China.7,104
Low volumes mean that hydrogen trains are expected to use thesame stacks and storage tanks as buses and trucks, so costreductions will be consolidated with the automotive sector.Hydrogen powertrains may be 50% more expensive than diesel,but economic viability will depend on lower-cost fuel, andhydrogen costing under $7 per kg.7 One study concludes thatFCEV trains are already cost competitive with diesel trains froma TCO perspective.66
Ships. Marine applications hold promise for hydrogendeployment, with fuel cells already being trialled for propulsionin a handful of projects including ferries.7,48,105 Hydrogen is notexpected to gain traction until after 2030, although the growthof emissions controlled zones (such as the Baltic Sea and urbanports) and hydrogen’s higher efficiency than LNG could drive
Energy & Environmental Science Review
Ope
n A
cces
s A
rtic
le. P
ublis
hed
on 1
0 D
ecem
ber
2018
. Dow
nloa
ded
on 1
/15/
2022
2:3
6:12
AM
. T
his
artic
le is
lice
nsed
und
er a
Cre
ativ
e C
omm
ons
Attr
ibut
ion
3.0
Unp
orte
d L
icen
ce.
View Article Online
468 | Energy Environ. Sci., 2019, 12, 463--491 This journal is©The Royal Society of Chemistry 2019
early niches.48 Most vessels have long lifetimes, are built insmall numbers highly tailored to specific applications; thiscould hamper the rollout of new propulsion systems.7 Withferries potentially consuming 2000 kg of hydrogen per day,cryogenic storage is necessary, and fuel costs are more impor-tant than upfront capital, with hydrogen significantly below$7 per kg needed.7,106 Fuel cells for auxiliary power could beadopted earlier than for propulsion,48 and port vehicles couldalso be early adopters, improving local air quality with a singlerefuelling depot.
Aeroplanes. Aviation is one of the hardest sectors todecarbonise, and reducing emissions from aircraft propulsionhas seen little progress. In 2016 the International Civil AviationOrganization agreed to cap aviation emissions at 2020 levels,but primarily through carbon offsetting rather than low-emissionfuels.107 Some hybrid electric concepts are being studied, thoughemission reductions will be limited.108 Biofuels could be suitabledue to their higher energy density than hydrogen or batteries, butare not completely emission-free and could remain costly withlimited availability. Hydrogen could be used as a propulsion fuel,but needs to be liquefied to supply the required range. Combus-tion turbines are likely to be needed as fuel cells lack the powerrequired for take-off. However the climate benefits of hydrogenfor aviation have been questioned because it produces more thandouble the water vapour emissions of kerosene; water vapour athigh altitudes, although short lived in the atmosphere, causesradiative forcing and thus contributes to net warming.109
Significant hydrogen deployment is thought unlikely before2050 except perhaps for small or low-flying aircraft.48 Hencemuch work remains on developing options for low-emissionaircraft propulsion.
Other aviation-based sectors are more promising. Fuel cellshave been tested for aircraft auxiliary power units and fortaxiing aircraft to/from airport terminals.110 There is an increasingmotivation to improve air quality around airports and fuel cellscould play an important role in powering ground vehicles andbuses in the next 10 to 20 years,48 aided by the need for a lownumber of refuelling stations experiencing high utilisation.Unmanned aerial vehicles (UAVs) are also attracting consider-able interest for both civilian and military applications.7 Fuelcell UAVs are quieter, more efficient, and have lower vibrationand infrared signatures than fossil fuel-powered UAVs, and arelighter than battery systems, offering longer range. Fuel cellUAVs are currently considerably more expensive than batteryUAVs; but the cost gap will close with manufacturing volume,and fuel cells retain the advantage in long-duration or highenergy applications.7
Forklift trucks and others. Other promising applicationsinclude forklift trucks, with around 12 000 fuel cell units deployedin the US and a handful elsewhere.111 Plug Power supplies 85%of FC forklifts in the US.112 The zero emissions from FC forkliftsallow them to operate indoors, and their faster refuelling thanbatteries can lead to TCO savings of 24% in a typical highthroughput warehouse.113 FC forklifts also have a wide tem-perature range, capable of operating in temperatures as lowas �40 1C. PEMFCs are most widely used with longer lifetimes,
but direct methanol fuel cells (DMFCs) are also found in lowerusage applications with shorter lifetimes and lower cost ofownership.112 Fuel cells could also see adoption in agriculturalequipment such as tractors114 and recreational applicationssuch as caravan APUs and golf carts, one of the few sectors thatare proving profitable.90
Heat and industry
Heat and hot water accounts for 60–80% of final energy consump-tion in residential and commercial buildings across Europe.115,116
Emissions from heating need to be reduced rapidly and largelyeliminated by 2050; however, the heat sector is proving hard todecarbonise for several reasons:117,118
(1) Heating is the largest energy demand in many temperatecountries and presents a problem of scale;
(2) Requirements are diverse, ranging from dispersed lowtemperature space heating to large high-temperature industrialloads, with no one solution capable of meeting all heat demands;
(3) Heat demand varies daily and seasonally, requiringhighly flexible supply;119
(4) Fossil heating fuels provide this flexibility at a lower costthan low-carbon alternatives less competitive and risk increas-ing energy poverty.120
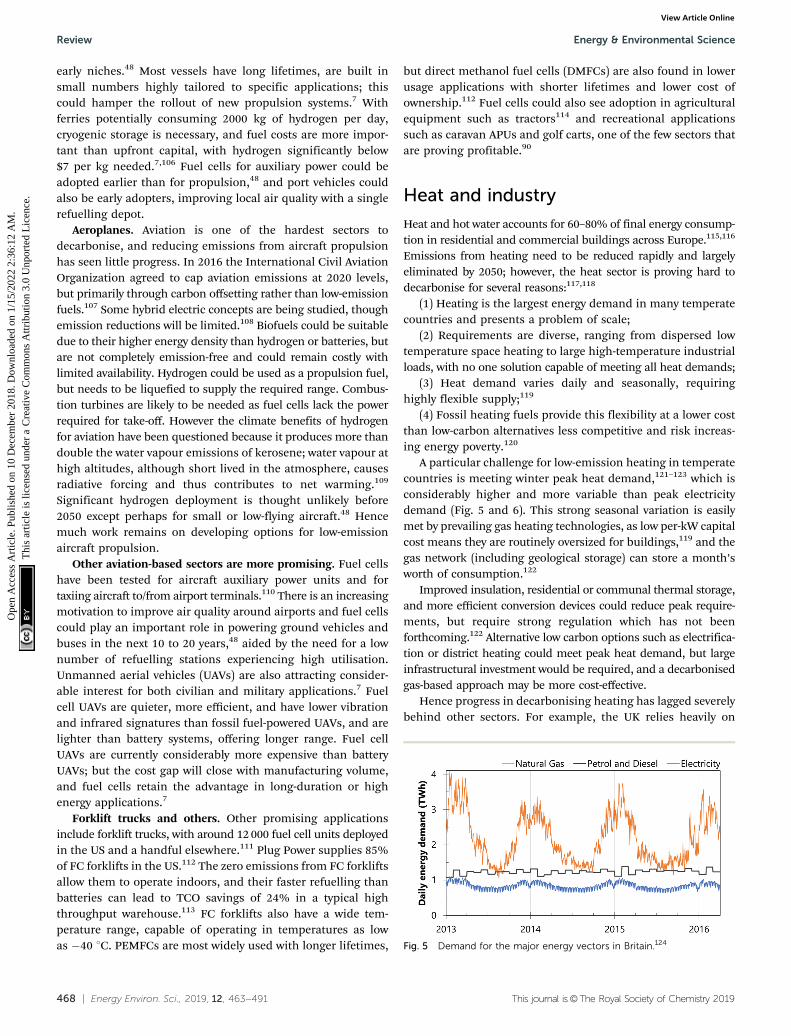
A particular challenge for low-emission heating in temperatecountries is meeting winter peak heat demand,121–123 which isconsiderably higher and more variable than peak electricitydemand (Fig. 5 and 6). This strong seasonal variation is easilymet by prevailing gas heating technologies, as low per-kW capitalcost means they are routinely oversized for buildings,119 and thegas network (including geological storage) can store a month’sworth of consumption.122
Improved insulation, residential or communal thermal storage,and more efficient conversion devices could reduce peak require-ments, but require strong regulation which has not beenforthcoming.122 Alternative low carbon options such as electrifica-tion or district heating could meet peak heat demand, but largeinfrastructural investment would be required, and a decarbonisedgas-based approach may be more cost-effective.
Hence progress in decarbonising heating has lagged severelybehind other sectors. For example, the UK relies heavily on
Fig. 5 Demand for the major energy vectors in Britain.124
Review Energy & Environmental Science
Ope
n A
cces
s A
rtic
le. P
ublis
hed
on 1
0 D
ecem
ber
2018
. Dow
nloa
ded
on 1
/15/
2022
2:3
6:12
AM
. T
his
artic
le is
lice
nsed
und
er a
Cre
ativ
e C
omm
ons
Attr
ibut
ion
3.0
Unp
orte
d L
icen
ce.
View Article Online

This journal is©The Royal Society of Chemistry 2019 Energy Environ. Sci., 2019, 12, 463--491 | 469
natural gas and is likely to miss its 2020 target for renewableheat.36,125 It may only achieve emission reductions from buildingsand industry of around 20% by 2030, compared to an overalltarget of 57%.22 Natural gas is currently a cheap, convenient andrelatively clean alternative to coal and oil, and is the dominantfuel for heating in many counties, as shown in Fig. 7. Electric heatpumps are well established in Asia, America and parts of Europe,with over a billion systems heating homes;126 whilst districtheating is widely used in Russia and Scandinavia.127
Options for low-carbon heat
Five main options have been proposed for decarbonising heatglobally,122,128–131 as summarised in Table 2 and below. Most ofthese have gained traction in specific countries, but none arewidely used on a global scale. The main options are:
(1) Demand reduction. Insulation, higher efficiency devicesand changing demand behaviour (e.g. via smart meters andpricing) can all reduce heating energy demand. Residential heatconsumption could fall 20% by 2050,122 which is a valuablecontribution and an enabler for other low-carbon heating tech-nologies, but insufficient in isolation. Barriers to greater reductioninclude 80–90% of the 2050 housing stock having already beenbuilt in developed countries;125 some properties being unsuitablefor retrofitted insulation; and household size (people per building)shrinking due to lifestyle choices.132
(2) Green gas. Natural gas could be replaced by a low-carbongases, utilising the existing gas network assets and potentiallyreducing costs and disruption.133 Biogases can be generated byanaerobic digestion or gasification of waste, sewage, landfillgas, energy crops, etc. However, barriers to large-scale deliveryinclude: resource availability and priority (it could be used invarious energy/product routes); emission reduction potential; localemissions; and gas quality. The UK Bioenergy Strategy thereforelimits heating uptake to 15%.122 An alternative is hydrogen, whichcan be injected into the existing gas network in small quantities,or the existing gas network can be converted to distribute 100%hydrogen rather than natural gas (Section 5.4).
(3) Electrification. Heat pumps are widely used in manycountries, and globally could deliver an 8% reduction in CO2
emissions if widely adopted.126 However, their low-grade heatand limited output may not meet peak winter demand andconsumer preferences, and high uptake may force electricitynetwork upgrades.29 High upfront costs restrict uptake, althoughthese might fall as rollout progresses. Nevertheless, heat pumpsmay play an important role, particularly for rural homes tooremote for district heating or gas networks, which use expensivehigh carbon fuels such as heating oil, and with space for largersystems.133 Electric heating is also well suited to high densityurban housing blocks where gas is not allowed for fire safety,and space heating requirements are lower.133
(4) Heat networks. District heating is only commonplace in ahandful of countries, which typically combine a cold climatewith an acceptance of collective solutions. It has the potentialto provide 10–20% of residential heat by 2050 in denselypopulated countries such as the UK.122,135 Retrofitted heatnetworks are capital-intensive and disruptive to install, andheat losses limit transmission distances to around 30 km.136
They are best suited to urban new-build, but offer 30% lowerheating costs than gas boilers.121 They can use geothermal heat orwaste heat from industry and data centres. Large district heatingCHP schemes are cheaper and more efficient than individualresidential systems.
(5) Onsite renewables. Modern renewable energy produces9% of the world’s heat, nine-tenths of which is biomass, andthe remainder solar thermal and geothermal.20 However, thereare concerns over the limited availability and high localisedemissions of biomass, poor matching between solar thermalproduction and demand,122,137 and cost and performance penaltiesof small-scale residential systems.138
Each low carbon heating technology exhibits barriers oruncertainties associated with technical feasibility, cost, suitability
Fig. 6 Variation in British household heat demand between classes ofhousing for an average year. Heat demand includes space and waterheating. Consumption is strongly temperature-dependent and winterpeaks can be much higher in a cold year.123
Fig. 7 The share of fuels used for domestic heating in ten countries,estimated using the DESSTINEE model132 with data from the IEA.134
Biomass includes both traditional (wood, dung) and modern (wood andmiscanthus products); heat is generated off-site and sold to users; elec-tricity includes both traditional (resistance and night-storage heaters) andmodern (heat pumps).
Energy & Environmental Science Review
Ope
n A
cces
s A
rtic
le. P
ublis
hed
on 1
0 D
ecem
ber
2018
. Dow
nloa
ded
on 1
/15/
2022
2:3
6:12
AM
. T
his
artic
le is
lice
nsed
und
er a
Cre
ativ
e C
omm
ons
Attr
ibut
ion
3.0
Unp
orte
d L
icen
ce.
View Article Online

470 | Energy Environ. Sci., 2019, 12, 463--491 This journal is©The Royal Society of Chemistry 2019
across regions and building types, user acceptance and safety.Individual countries are often dominated by a single technology.The UK has an 84% penetration of gas, although this is a recentdevelopment (Fig. 8). In the US, 97% of new family homes areeither heated by natural gas or electricity.139 Previous studieshave therefore focussed on widespread rollout of a single tech-nology to meet decarbonisation needs.140
However, a portfolio of complementary heating technologiesused to be more prevalent, and is now regaining recognition.123
For example fuel cell CHP systems can export electricity to thegrid at the same time as heat pumps consume it; a UK casestudy found that a 50% penetration of fuel cell micro-CHP
could completely offset the electrical demand from a 20%penetration of heat pumps.123 The UK recognises the lack ofconsensus on the optimal technology mix to deliver the requiredlong-term changes, and the need to thoroughly re-assess theevidence and test different approaches.121 This technology mixcould vary according to regional availability and building typeand provide a hedge against uncertainties over technology feasi-bility and fuel price.
Hydrogen and fuel cell technologies
Until recently, most energy systems and building stock modelsdid not include hydrogen and fuel cell technologies for meetingdecarbonisation targets.123 However, recent studies have iden-tified hydrogen as having an important role in decarbonisingheat,122,142 able to provide the majority of UK heat demand by2050.48 There are several H2FC technologies to deliver heating.
Hydrogen boilers. Existing gas boilers and furnaces can runon hydrogen mixtures at low levels (see Section 5.4). Althoughhigh concentrations have a similar Wobbe index to natural gas,different burner tips are required due to hydrogen’s higherflame speed.143 Catalytic boilers are also under development,which eliminate NOx formation48 but are less powerful andrequire higher purity hydrogen.144 Consequently, a changeover tohydrogen would require wholesale refitting of either appliancesor components within appliances. Such a wholesale refitting ofappliances is not unprecedented: many countries have switchedfrom town gas to natural gas in recent decades, with the UKreplacing 40 million appliances, at a cost of d8b in 2015 money,over an 11 year conversion programme.144
Fuel cell CHP. Combined heat and power (CHP) systems co-produce electricity and heat at high efficiencies via engines or
Table 2 Summary of the decarbonisation options for heat
Advantages Disadvantages
Demandreduction
+ Insulation and more efficient devices raise consumerawareness
� Low turnover rate of building stock
+ Reduction to energy bills � Difficulty retrofitting existing buildings+ Low-regret option � Consumer indifference/apathy
Green gas + High customer satisfaction/familiarity � Gas is difficult to decarbonise+ Low cost for gas appliances � Limited availability and need for cleaning+ Easily meets peak demand � Hydrogen networks unproven, with uncertain availability,
costs and safety implications+ Low conversion cost and disruption
Electrification + Proven and widely used in many countries � Could necessitate power system upgrades+ Benefits from further decarbonisation of electricitysystems
� Difficulty meeting peak demand without greater buildingthermal efficiency.
+ Well suited to countries with mild winters � Higher cost, higher space requirements+ Good option for remote rural properties not on gas or heatnetworks
� May require heat storage
� Performance sensitive to installation quality
Heat networks + Proven and widely used in some countries � High conversion cost and disruption+ Could meet B10–20% of UK heating needs � Heat cannot be transported long distances+ Good option for new-builds and densely-populated regions � Needs low-carbon heat sources
� User scepticism
Onsiterenewables
+ Use local energy sources � Small schemes less cost-effective+ Reduces network dependence and upgrade requirements � Limited availability and high emissions (biomass)
� Poor match to demand (solar thermal)
Fig. 8 The mix of heating technologies used in UK households overforty years.141
Review Energy & Environmental Science
Ope
n A
cces
s A
rtic
le. P
ublis
hed
on 1
0 D
ecem
ber
2018
. Dow
nloa
ded
on 1
/15/
2022
2:3
6:12
AM
. T
his
artic
le is
lice
nsed
und
er a
Cre
ativ
e C
omm
ons
Attr
ibut
ion
3.0
Unp
orte
d L
icen
ce.
View Article Online

This journal is©The Royal Society of Chemistry 2019 Energy Environ. Sci., 2019, 12, 463--491 | 471
fuel cells and may use a variety of fuels.32 The balance betweenelectrical and thermal generation varies between technologies(Fig. 9). Combustion devices (IC engines and Stirling engines)generate more heat than electricity so are better suited to largebuildings with high heat loads, but release particulates andNOx.146
All CHP technologies offer greater combined efficiency thanthe ‘traditional frontier’ of using average power stations andcondensing gas boilers. Only fuel cell CHP can exceed theefficiency of the ‘all-electric frontier’ of using the best com-bined-cycle gas power stations with the best ground-source heatpumps.145 Fuel cell CHP systems have higher electrical effici-ency and lower emissions (Table 3) than other CHP. PEMFCsand SOFCs are typically used for domestic systems, and SOFCs,PAFCs and MCFCs for larger commercial systems.123 Giventheir higher power-to-heat ratio, fuel cells are more suitablefor well-insulated buildings with lower heat loads. FC-CHPs arecurrently expensive, but costs have halved in the last six yearsand lifetimes have grown with increasing rollout in Japan andalso more recently in Europe.147 Existing CHP systems mostlyoperate on natural gas, but could switch to hydrogen if avail-able with little modification (or even simplification).
Fig. 10 visualises how prices are falling with increaseduptake for some technologies (residential PEMFCs in Asia),
but have stagnated for others (large MCFC and SOFCs in the US).Prices are converging at around $10 000 per kW; a price pointwhich solar PV modules reached in 1990.148 Other issues such asproduct lifetime and reliability have improved significantly, to theextent that a fuel cell CHP unit is now equivalent in both theserespects to a modern gas-fired boiler.149–154
Other technologies. Other heat technology options includegas-driven heat pumps (GDHPs), where the heat pump ispowered by an engine, which could run on hydrogen. GDHPscurrently achieve energy savings of 26–43% compared to con-densing boilers, and avoid upstream complications from increasedelectricity demand.122
Tens of thousands of non-residential GDHPs have been soldacross Europe and Asia; costs are currently high, but shouldcome down significantly.122,123 Hybrid heat pumps are anotheroption, with electric heat pumps providing the majority(60–95%) of a building’s annual heat demand, but with a gasboiler retained for meeting peak demand.122 Several studies haveidentified hybrid heat pumps as suitable for many buildingsin 2050;48,122,123 though such systems require additional capital
Fig. 9 Thermal and electrical efficiencies of CHP devices.145 The ‘thermalefficiency’ of heat pumps is their coefficient of performance (COP)126
multiplied by the efficiency of power generation.
Table 3 At-a-glance summary of fuel cell CHP performance145,161
PEMFC SOFC PAFC MCFC
Application Res Res/Com Com ComElectrical capacity (kW) 0.75–2 0.75–250 100–400 300+Thermal capacity (kW) 0.75–2 0.75–250 110–450 450+Electrical efficiencya (LHV) 35–39% 45–60% 42% 47%Thermal efficiencya (LHV) 55% 30–45% 48% 43%Expected lifetime (‘000 hours) (years) 60–80 20–90 80–130 20
10 3–10 15–20c 10c
Degradation rateb (per year) 1% 1–2.5% 0.5% 1.5%
Res: residential. Com: commercial. a Rated specifications when new. b Loss of peak power and efficiency. c Requires an overhaul of the fuel cellstack half-way through the operating lifetime.
Fig. 10 Learning curves fitted to historic prices of Japanese and Koreanresidential PEMFCs,147,155,156 American SOFCs and MCFCs.157,158 The yearfor the first and last data point in each series is shown. Each doubling inproduction has seen prices fall by 16% for EneFarm in Japan; by 21% forKorean residential PEM generators; by 5% for 250 kW-class MCFCs in theUS; and increase by 2% for 200 kW-class SOFCs in the US.
Energy & Environmental Science Review
Ope
n A
cces
s A
rtic
le. P
ublis
hed
on 1
0 D
ecem
ber
2018
. Dow
nloa
ded
on 1
/15/
2022
2:3
6:12
AM
. T
his
artic
le is
lice
nsed
und
er a
Cre
ativ
e C
omm
ons
Attr
ibut
ion
3.0
Unp
orte
d L
icen
ce.
View Article Online
472 | Energy Environ. Sci., 2019, 12, 463--491 This journal is©The Royal Society of Chemistry 2019
expenditure and connection to both electric and gas networks.Wall-mounted fires are waning in popularity, but several hydrogen-powered fireplaces have been designed.144
There is considerable scope for hydrogen usage as a cookingfuel, with burners and barbecues under development today.123
Hydrogen for cooking will need food-safe odorants and colourants,and will alter cooking times as hydrogen produces about 60%more water vapour than natural gas when burnt.144
Residential and commercial heating
Residential fuel cells have seen significant uptake, and nowhave the largest market share for micro-CHP systems,7 withover 225 000 systems installed globally (see Section 6.1).PEMFCs are the dominant technology with high efficiency,durability, reliability, rapid start-up and shut-down, part-loadcapability and operating temperatures of around 80 1C.32,123
Their electrical efficiency is lower than other fuel cells (B35%),but with higher thermal efficiencies (55%).147 Their low-tempe-rature heat output makes them suitable for individual buildings.About 7% of Japan’s systems are SOFCs,159 which tend to runconstantly as start-up and shut-down times can exceed 12 hours.123
They have higher electrical efficiency (B40–60%), greater fuelflexibility, reduced purity requirements, reduced catalyst costsdue to higher operating temperatures, and higher temperatureheat which is more suitable for existing building stock withsmaller radiators.7
The cost of residential systems is dominated by capital andstack replacement costs, with small systems used to maximiseutilisation.48 Fuel cell micro-CHP could be cost competitivewith other heating technologies between 2025–2050,123,160 withfuel costs becoming dominant. Larger multi-family home andcommercial units (2–20 kWe) could be competitive at smallerproduction volumes, but have a smaller market.7
CHP systems are also popular in the commercial sector,with 100s of MWs installed globally, primarily in the US andSouth Korea.7 MCFC and PAFC fuel cells dominate commercialsystems with stable operation, cheaper catalysts and highefficiencies, although their complex subsystems do not scaledown well for smaller applications (e.g. needing to remainheated whilst off to prevent electrolyte freezing). MCFCs havehigher electrical efficiencies (450%) with correspondinglylower heat production; however, they are inflexible with shortlifetimes (20 000 hours) and high degradation rates due tocorrosive electrolytes (Table 3). Their reliance on carbon dioxidefor fundamental electrode reactions also make them unsuitablefor operating on hydrogen,48 but opens up new possibilities forcarbon capture and storage.162 PAFCs have a lower electricalefficiency than MCFCs but a higher thermal and overall effi-ciency (Table 3). They last longer (80 000–130 000 hours) withlower degradation rates and are more flexible, giving scope forload-following capability.7 PAFCs could potentially be cost-competitive with ICE-CHP by 2025 at relatively low productionlevels of 100 units per year.7
FC-CHP systems are quiet and low-emission making themideal for urban areas.120 Fuel costs are a major component ofthe Total Cost of Ownership (TCO), driving improvements
in efficiency.7 PEMFC and SOFC also see some uptake in com-mercial applications.
Industry
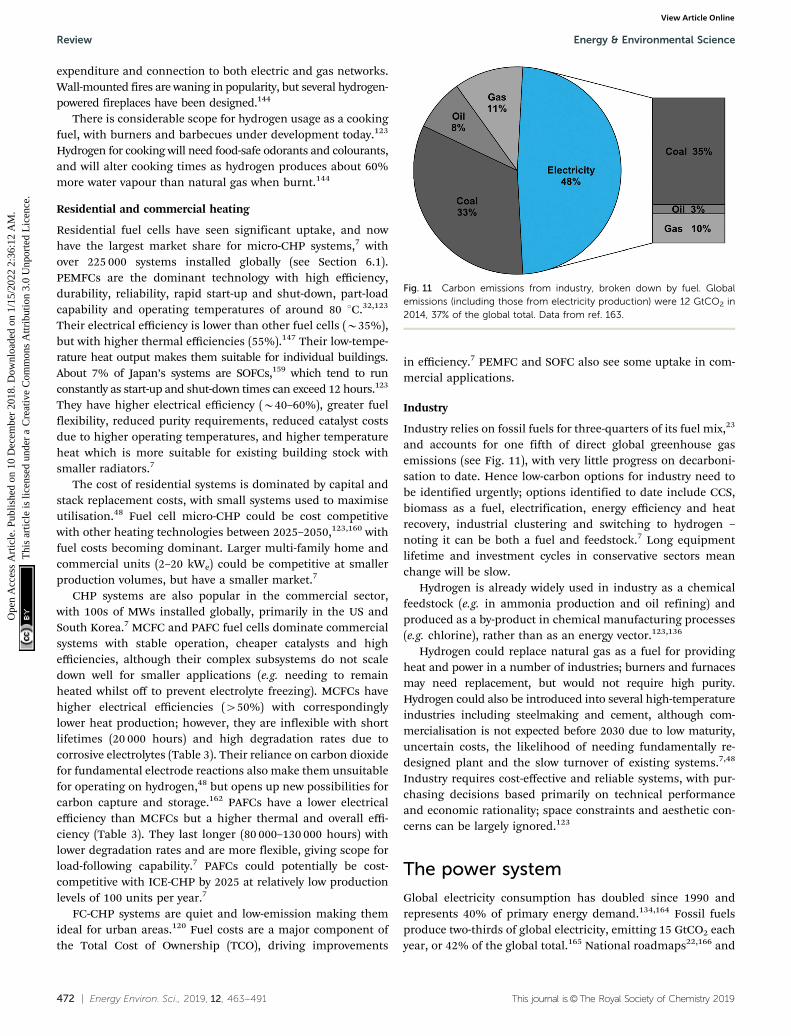
Industry relies on fossil fuels for three-quarters of its fuel mix,23
and accounts for one fifth of direct global greenhouse gasemissions (see Fig. 11), with very little progress on decarboni-sation to date. Hence low-carbon options for industry need tobe identified urgently; options identified to date include CCS,biomass as a fuel, electrification, energy efficiency and heatrecovery, industrial clustering and switching to hydrogen –noting it can be both a fuel and feedstock.7 Long equipmentlifetime and investment cycles in conservative sectors meanchange will be slow.
Hydrogen is already widely used in industry as a chemicalfeedstock (e.g. in ammonia production and oil refining) andproduced as a by-product in chemical manufacturing processes(e.g. chlorine), rather than as an energy vector.123,136
Hydrogen could replace natural gas as a fuel for providingheat and power in a number of industries; burners and furnacesmay need replacement, but would not require high purity.Hydrogen could also be introduced into several high-temperatureindustries including steelmaking and cement, although com-mercialisation is not expected before 2030 due to low maturity,uncertain costs, the likelihood of needing fundamentally re-designed plant and the slow turnover of existing systems.7,48
Industry requires cost-effective and reliable systems, with pur-chasing decisions based primarily on technical performanceand economic rationality; space constraints and aesthetic con-cerns can be largely ignored.123
The power system
Global electricity consumption has doubled since 1990 andrepresents 40% of primary energy demand.134,164 Fossil fuelsproduce two-thirds of global electricity, emitting 15 GtCO2 eachyear, or 42% of the global total.165 National roadmaps22,166 and
Fig. 11 Carbon emissions from industry, broken down by fuel. Globalemissions (including those from electricity production) were 12 GtCO2 in2014, 37% of the global total. Data from ref. 163.
Review Energy & Environmental Science
Ope
n A
cces
s A
rtic
le. P
ublis
hed
on 1
0 D
ecem
ber
2018
. Dow
nloa
ded
on 1
/15/
2022
2:3
6:12
AM
. T
his
artic
le is
lice
nsed
und
er a
Cre
ativ
e C
omm
ons
Attr
ibut
ion
3.0
Unp
orte
d L
icen
ce.
View Article Online

This journal is©The Royal Society of Chemistry 2019 Energy Environ. Sci., 2019, 12, 463--491 | 473
international modelling studies128,167,168 agree that electricityshould be rapidly decarbonised during the 2020s and thenpush forwards the decarbonisation of transport and heatingthrough electrification.
Unlike other sectors, electricity generation has available arange of low-, zero- and even negative-carbon alternatives alreadyavailable. The IPCC recommends that low-carbon generation risefrom around 30% of total generation today to over 80% by2050.169 This radical shift appears feasible: Fig. 12a shows thatwind and solar power have seen ten-fold growth over the lastdecade to total 665 GW: 11% of global generating capacity.164
Wind and solar power are forms of intermittent renewableenergy: their output cannot be fully controlled or predicted as theyrely upon the weather. Balancing supply and demand requiresnew solutions if electricity systems are to fully decarbonise whilstmaintaining current levels of cost and reliability. Electricity hasthe fundamental constraint that supply must always balancedemand,170 and system reliability is paramount as outagescause severe economic and social damage.171 At the same time,electricity demand is anticipated to grow in both developingand developed countries, as the rise of electric vehicles andelectric heating will exceed even the most stringent efficiencymeasures.132 This will raise demand during cold winterevenings, when demand is already highest in temperate countries,thus adding to the difficulties of maintaining secure, affordableand clean electricity.
Hydrogen technologies are able to assist with both theintegration and expansion of low-carbon electricity generationand with the electrification of heating and transport sectors.Power generation from hydrogen is gaining ground – global capacityreached the milestone of 1 GW in 2015, as seen in the bottom rightcorner of Fig. 12a. Fig. 12b shows that the installed capacityof stationary fuel cells has grown by 25% per year. If this
were maintained, fuel cells would reach 10 GW capacity in 2025,and 30 GW in 2030. However despite this growth, no company hasyet turned a profit through sale of stationary fuel cells.176
Electricity generation
Fuel cells can benefit the electricity system in several ways: theyare flexible, controllable, typically co-located with demand(minimising losses in transmission and distribution), andlikely to generate when demand for electricity is highest if usedfor combined heat and power (thus helping to cope with peakdemand). Additionally, hydrogen feedstock may be producedfrom power-to-gas, providing the large-scale long-term storagerequired to shift electricity from times of renewable surplus tothose of shortfall.
It is important to note that the decarbonisation potentialdepends on the hydrogen feedstocks and supply chains. Any useof fossil fuel-derived natural gas to produce hydrogen (withoutCCS) will necessarily lead to carbon emissions that are at least atthe level of a new CCGT power station.
Peak generation. With changes to turbine design, existinggas turbines can be converted to burn hydrogen rather thannatural gas.177 This is the hydrogen equivalent of business asusual: it allows grid operators continued access to low-costthermal peaking plant and to operate much as they do now.Lack of hydrogen delivery infrastructure is an impediment,so the ETI suggests a system of on-site production and storage:a small steam-methane reformer (SMR) equipped with carboncapture and storage (CCS), a salt cavern for storage and a largeopen-cycle gas turbine (OCGT).178 The other key disadvantage isthe low efficiency of combustion relative to electrochemicalconversion (35–40% vs. 40–60%), giving high operating costs.
A key advantage of fuel cells is that they retain their perfor-mance at smaller scales. Parasitic loads and thermal losses mean
Fig. 12 Installed power generation capacity worldwide over the last 25 years (left),164,172 and global installed power capacity of stationary fuel cells(power-only and micro-CHP) (right).173–175 Annual growth rates since 2000 has been 52% for solar, 25% for fuel cells, 24% for wind, and 1–5% for othertechnologies.
Energy & Environmental Science Review
Ope
n A
cces
s A
rtic
le. P
ublis
hed
on 1
0 D
ecem
ber
2018
. Dow
nloa
ded
on 1
/15/
2022
2:3
6:12
AM
. T
his
artic
le is
lice
nsed
und
er a
Cre
ativ
e C
omm
ons
Attr
ibut
ion
3.0
Unp
orte
d L
icen
ce.
View Article Online

474 | Energy Environ. Sci., 2019, 12, 463--491 This journal is©The Royal Society of Chemistry 2019
the efficiency of other small-scale gas generators is at least aquarter lower than their larger (410 MW) equivalents.179,180 Incontrast, fuel cells can deliver electrical efficiencies that arecomparable to the best combined-cycle gas power stations (B60%)from several hundred kW down to 1 kW residential units.145,181
Small, modular units can be co-located with centres of demand,saving on transmissions losses of around 7% in America andEurope,134 and allowing fuel cells to provide ancillary services tothe grid operator.
Power-only and backup fuel cells. Power-only fuel cell systems(i.e. without combined heat and power) are gaining popularity,particularly with American technology firms and multinationalsseeking a green image. The units deliver cheaper electricity thanlocal utilities (8–10 b per kW h versus 14 b per kW h),182 andallow a move away from diesel engines as an uninterruptablepower supply.
The Bloom Energy Server is a high-profile example, a 200 kWSOFC module that runs on either natural gas or bio-gas with anefficiency of 50–60%.181 The first commercial units wereinstalled at Google in 2008, and units can now be leased foreither 10 or 15 years.183 Bloom’s announced contracts outstripthose of its three largest competitors combined.184
Energy Servers have received large subsidies from US greengeneration incentives (e.g. $200 million in California in 2010),185
but carbon savings are relatively low. The carbon intensity ofSOFC using natural gas is 350–385 gCO2 kW h�1,181 compared tonew combined-cycle gas turbines at 360–390 gCO2 kW h�1, orthe average British electricity mix at below 250 g kW h�1.186
Power-only fuel cells therefore match the best conventionalproduction technology, but require decarbonised fuel sourcesto offer further carbon savings. For comparison, the carbonintensity of electricity from fuel-cell CHP (with a credit forco-produced heat) with natural gas feedstock is in the range240–290 gCO2 kW h�1,119 lower than the average electricity mixin most large countries.
Vehicle-to-grid. Electrification of the transport sector has thepotential to exacerbate the peak power problem if the chargingof vehicle batteries is unmanaged.187,188 The use of FCEVsrather than BEVs removes this issue, whilst also potentiallydelivering additional benefits. Private vehicles spend around95% of the time parked, and so a large fleet of electric vehicleswould provide grid operators with a reliable resource to callupon.187
Vehicle-to-grid (V2G) describes a system for communicationwith electric vehicles, allowing grid operators and utilities toaccess the energy stored within electric vehicles to meet demandand provide other grid services.189 In this system FCEV might beable to act as a distributed source of peak power and spinningreserve,190 though studies indicate that the economics for thisscenario are marginal under current market conditions.191,192
The increasing value of balancing services as electricity systemsmove towards more variable renewables may radically alter thisin the future.193
A key barrier for drivers is the fear of being left ‘out of gas’when an unexpected or emergency need to travel arises.194 This‘range anxiety’ is a key issue for BEVs due to range limitations,
but not so for FCEVs as they could use their hydrogen tank forfurther top-up. For example, the Toyota Mirai, holds 5 kg ofhydrogen, or 600 MJ of chemical energy (LHV basis). If thiscould be converted with 50% efficiency, then half a fuel tankwould yield 40 kW h of electricity. With current battery tech-nologies, the lifetime of a BEV would be reduced throughparticipation in V2G, since additional charge/discharge cyclesdegrades the battery. Even with current lifetimes, it is expectedthat the fuel cell stacks would not be a chief determinant oflifetime in FCEVs.190,194
Electricity storage
With growing deployment of variable renewables and distributedgeneration, flexibility and control to balance supply and demandbecomes increasingly valuable. There are already several tech-nologies in various stages of maturity that allow the temporalshifting of electrical energy over time periods of hours to afew days (e.g. pumped hydro, batteries and compressed airelectrical storage (CAES)). None of these can provide spatialredistribution of energy or storage on the week-month time-scale that is required for balancing the output from windgeneration.195,196 Hydrogen technologies have the potential tomeet both these needs.
Power-to-gas (P2G) refers to the process of converting excesselectrical energy into storable chemical energy in the form ofeither hydrogen or grid-compatible methane – a key form of‘sector coupling’. Surplus electricity is used to power hydrogenproduction via water electrolysis. The resulting gas may then bestored and used when required, for instance by a fuel cell, orundergo further processing to produce methane, also known assynthetic natural gas (SNG). Equally, it can then be convertedback to electricity or used to displace demand for natural gas inthe heating (and power) sector, or indeed for transport. Thereare two commercially available processes for water electrolysis:alkaline electrolysis cells (AEC) and polymer electrolyte mem-branes (PEMEC); while solid oxide (SOEC) offers the possibilityof high efficiency but are still at a development stage.197 Thesetechnologies are described later in Section 5.1, and their marketuptake is shown in Fig. 13. Globally, 30% of P2G pilot plantsnow use PEMEC,198 and with rapid growth, prices are likely tofall to those of AEC by 2030.199,200
Power-to-hydrogen or power-to-methane? Hydrogen is superiorto methane in terms of both process cost and simplicity.201 In itsmost basic implementation, the process is being used to providefuel for the rapidly-growing numbers of hydrogen filling stations.It is also the process in use in the majority of larger-scale P2Gdemonstration projects.202 In the absence of a hydrogen distribu-tion network, one key issue is the storage of the gas once it hasbeen produced. From the range of alternatives,203,204 storage inhigh pressure tanks is currently the favoured option. Anothersolution is to inject the resulting hydrogen into the natural gasnetwork, although blending may be limited to 10–20% at most asexplained in Section 5.4.4.
Onward conversion of the hydrogen to methane is a lessefficient and significantly more complex process. Methanationof hydrogen is achieved via either a catalytic207 or a biological
Review Energy & Environmental Science
Ope
n A
cces
s A
rtic
le. P
ublis
hed
on 1
0 D
ecem
ber
2018
. Dow
nloa
ded
on 1
/15/
2022
2:3
6:12
AM
. T
his
artic
le is
lice
nsed
und
er a
Cre
ativ
e C
omm
ons
Attr
ibut
ion
3.0
Unp
orte
d L
icen
ce.
View Article Online

This journal is©The Royal Society of Chemistry 2019 Energy Environ. Sci., 2019, 12, 463--491 | 475
process,208 and requires a source of CO or CO2, plus compres-sion and storage of the hydrogen feedstock. Overall, power-tomethane has an efficiency in the range 49–65%, while power-to-hydrogen achieves efficiencies in the range 51–77%.209,210 Theroundtrip efficiency of a power-to-hydrogen-to-power process isin the range 34–44%, while for power-to-methane-to-power it isonly 30–38%.210 Estimates indicate that the levelised cost ofpower-to-methane is 15–30% more than for simple conversionto hydrogen.198 The advantage of power-to-methane is theability to feed directly into existing gas infrastructure. Globally,the energy storage capacity of the natural gas network is inexcess of 3600 TW h,211 approximately three times the globalproduction from wind and solar power combined in 2016.164
The source of CO or CO2 is obviously central to whether power-to-methane aids carbon emission reductions: only carbonderived from biomass or direct air capture will be carbonneutral. There is a growing number of power-to-methane pilotprojects in progress globally,212 with Europe leading the way indriving forwards development of the technology.
Economics of power-to-gas. Several modelling studies haveconsidered the economics of P2G under differing assumptionsand scenarios.198,203,213,214 Several authors conclude that P2G isnot profitable at present, nor in the near-term: the costs are toohigh and the regulatory environment is unhelpful.198,215–220
However, the studies show that P2G significantly reduces theneed for curtailment of renewables215,218 and that, where theresulting hydrogen is injected into the gas grid, further benefitsmay be gained from reduced costs and improved performanceof both the gas and electricity grids.216,218 The potential toexploit multiple revenue streams (e.g. selling H2, CH4 or O2,providing ancillary services, heating, exploiting carbon levies,frequency control) improves the chances of profitability,198
as does operating the plant so that it only uses renewableenergy that would otherwise have been curtailed. The commonmessage is that falling electrolysis costs and altered nationalregulatory frameworks should render P2G profitable within10–15 years.219
Looking further ahead, several authors have examined therole that P2G might play in future national electricity marketswith very high penetration of renewables. All studies indicatethat P2G could play a pivotal role in balancing electricitysystems once the penetration of VRE exceeds about 80%, inspite of the high cost and low efficiency.209,217,221 With invest-ment in hydrogen infrastructure, or increasing local demandfor hydrogen, high-renewables scenarios envisage hundreds ofGW of installed P2G capacity by the 2050s.
Hydrogen infrastructure
The development of hydrogen infrastructure is an importantbarrier to the widespread uptake of H2FC technologies. Thereis a perception that an all-encompassing ‘hydrogen economy’must be established with enormous cost and duplication ofexisting energy infrastructure.222–224 However, numerous pro-duction and distribution pathways exist, as summarised inFig. 14, and include several incremental steps which do notrequire a wholesale infrastructure transformation. Developinga cost-efficient infrastructure from these options that may evolveover time with developing demand is a significant challenge.225
The upper half of Fig. 14 depicts centralised productionmethods that rely on new distribution networks, synonymouswith the ‘hydrogen economy’ vision. Incremental and lessinfrastructurally-intensive routes also exist (the lower half ofthe figure), which utilise existing gas or electricity networksand reduce large up-front costs, albeit at the expense of lowerefficiency. Indeed, H2Mobility concluded that only 60 smallrefuelling stations with onsite hydrogen production would besufficient to supply most of the UK population in the early stagesof a transition to fuel cell vehicles, with additional infrastructuredeployed as demand increased.77 This suggests that infra-structure development might not be as challenging as somehave suggested.
Hydrogen production
Producing cost-competitive low-carbon hydrogen at a range ofscales is arguably the greatest barrier to developing the hydro-gen energy system.226 Approximately 45–65 Mt year�1 hydrogenis produced globally as feedstock for chemical and petro-chemical industries, equivalent to 5.4–7.8 EJ, or B1% of Globalenergy supply.227–230 Around half of this is produced by steamreforming natural gas, 30% from partial oxidation of crudeoil products, 18% from coal gasification, and 4% from waterelectrolysis. Several emerging hydrogen production routesare at earlier stages of development,226 including high-tem-perature steam electrolysis,206,231 solar thermo-chemical watersplitting (artificial photosynthesis)232,233 and biological hydro-gen production.234,235
Fossil fuels and biomass. Reforming is the conversion ofhydrocarbons and steam into hydrogen and carbon monoxide(known as syngas). It produces relatively pure hydrogen withhigh efficiency, but is a slow endothermic reaction, and so doesnot react well to transient or stop/start cycling.236
Fig. 13 Total installed power in existing power-to-gas pilot plants. Datafrom ref. 202, 205 and 206.
Energy & Environmental Science Review
Ope
n A
cces
s A
rtic
le. P
ublis
hed
on 1
0 D
ecem
ber
2018
. Dow
nloa
ded
on 1
/15/
2022
2:3
6:12
AM
. T
his
artic
le is
lice
nsed
und
er a
Cre
ativ
e C
omm
ons
Attr
ibut
ion
3.0
Unp
orte
d L
icen
ce.
View Article Online

476 | Energy Environ. Sci., 2019, 12, 463--491 This journal is©The Royal Society of Chemistry 2019
Partial oxidation is the incomplete combustion of a fuel-richmixture to produce syngas. It is more versatile than reforming,allowing a greater range of fuels to be used, and proceeds morerapidly with no need for external heat input (allowing for smallerreactors); however, the hydrogen yield is lower (meaning morehydrocarbon feedstock is required), and the resulting gasrequires additional cleaning.237
Gasification is the process of partially combusting coal orbiomass at high temperature and pressure to produce syngas.This gives a faster reaction than steam reforming, but hashigher costs as the solid fuel requires pre-treatment and theresulting syngas requires greater treatment.197
The vast majority of hydrogen is produced from fossil fuels,with CO2 emission intensities depending on the feedstock andconversion efficiency.238 Carbon capture and storage (CCS) couldbe feasible for large centralised production and could potentiallydeliver negative CO2 emissions when using bioenergy feed-stocks.239,240 This relies on CCS maturing to the point ofwidespread rollout after ‘a lost decade’241,242 and on widersustainability issues surrounding bioenergy supply-chains beingcarefully managed.243,244
Water electrolysis. Alkaline electrolysis cells (AEC) are theincumbent technology with a 100 year history, but polymer
electrolyte membrane (PEMEC) are rapidly reaching maturityand are of particular interest for power-to-gas applications, whilesolid oxide electrolysers are transitioning from the laboratory tothe demonstration phase.200,208,245,246
Alkaline electrolysers are the most mature, durable andcheapest technology.247 A direct voltage current is appliedbetween an anode and a cathode submerged in an alkalineelectrolyte. Units can be several MW in size, but have a limitedoperating range (from a minimum of 20–40% to 150% of designcapacity) and slow start-times.203,205,208 With growing interestin integration with renewable energy, development aims toimprove its dynamic operation.199,245
PEM systems were introduced in the 1960s and becamecommercialised in the last decade.200 They have faster responseand start-up and a wider dynamic range (0–200%), moresuitable for intermittent power supply.205,246 They have higherpower density (and thus are smaller) due to their solid plasticelectrolyte,248 and have a high-pressure output (e.g. 80 bar)reducing the energy required for compression downstream.However, capital costs are currently approximately twice thoseof AEC,199,200,249 and cell lifetimes need to improve.202,208
Solid oxide electrolysers (SOEC) use a solid ceramic electro-lyte and operate at very high temperatures (700–900 1C),
Fig. 14 Hydrogen delivery pathways discussed in this paper. This diagram is simplified and non-exhaustive, and serves to highlight the diversity ofoptions at each stage of the system.
Review Energy & Environmental Science
Ope
n A
cces
s A
rtic
le. P
ublis
hed
on 1
0 D
ecem
ber
2018
. Dow
nloa
ded
on 1
/15/
2022
2:3
6:12
AM
. T
his
artic
le is
lice
nsed
und
er a
Cre
ativ
e C
omm
ons
Attr
ibut
ion
3.0
Unp
orte
d L
icen
ce.
View Article Online

This journal is©The Royal Society of Chemistry 2019 Energy Environ. Sci., 2019, 12, 463--491 | 477
enabling higher electrical efficiencies than other electro-lysers.248,250 Material degradation and lifetimes are criticalshortcomings that must be improved.200,251–253
Capital costs for electrolysers are high, around $1300 per kWfor AEC and $2500 per kW for PEMEC,200 although these aredeclining rapidly,249 whereas variable costs are governed by theelectricity source. They also have high fuel costs for electricity,although the growing prospects of overproduction from inter-mittent renewables means zero (or negative) electricity pricesare becoming more common.254
Production efficiency. Table 4 summarises the nominalefficiency and energy requirements for different hydrogenproduction methods. Early demonstrations have seen muchlower efficiencies in practice though. For example, hydrogenproduction efficiency at dozens of filling stations in Californiaand Japan averaged 55.8 � 8.4% efficiency from natural gas,255
while electrolysers averaged 55.9 � 3.5% LHV (for thosewith 44 operating hours per day).256–260
Trade-offs. Of the various production routes, there aremultiple trade-offs between scale of production, cost and GHGemissions. Natural gas, oil, and coal-derived hydrogen is lowestcost at large scales, but has poor environmental credentials.If CCS can be deployed, hydrogen from natural gas exhibitsrelatively low emissions with costs that will depend on theavailable CCS infrastructure.261 However, GHG emissions maystill be significant and will be governed by the carbon capturerate, and the embodied upstream supply chain emissions.262
Methane emissions from shale gas productions vary widelybetween sites and are a key contributor to total global warmingpotential.263 Biomass gasification may also offer large scalecentralised hydrogen production, but at a higher capital cost.261
Emissions are significantly lower than hydrogen from naturalgas, but are again non-negligible and are largely dependent onthe biomass feedstock. Hydrogen production from electrolysisis highest cost but is more suitable for small-scale generationgiven the modular nature of electrolysers. Total greenhouse gasemissions may be very low if supplied with low-carbon electri-city (e.g. combined with offshore wind), and so electrolysisrepresents a key technology if cost profiles improve.
Hydrogen compression
Hydrogen is produced at a range of pressures across the differentoptions and can be generated up to 15–80 bar by high-pressureelectrolysers.264 Hydrogen pipelines typically operate at suchpressures, with regularly-spaced pipeline compressors used tomaintain pressure over long distances. For storage, hydrogenmust either be compressed or liquefied to obtain sufficient
energy density. Highly-compressed gas is currently the preferredoption for onboard vehicle storage, avoiding the expense andboil-off losses of liquefaction, the conversion losses of syntheticfuels such as ethanol and the technological immaturity ofhydrogen carriers such as hydrides. Refuelling stations storehydrogen in in high-pressure tanks (825–950 bar) to allow fastrefuelling despite the pressure drop across the dispenser.265
Compressed hydrogen also needs cooling to �20 to �40 1C toavoid overheating the vehicle’s tank.161
The energy penalty of compression to 875 bar is significant;estimated as 2.67 kW h kg�1 from 20 bar.31,266 This meansabout 7% of the hydrogen’s energy content is lost in refuelling a700-bar vehicle. Standard compressor efficiency is around 70%,and while the US DOE has targeted 80% compressor efficiencyby 2020, this is still low compared to some other compressortechnologies.265 While this is notably less than required forliquefaction, it still adds appreciably to the cost and carbonintensity of the resulting fuel. Compression costs are significantbut not prohibitive, adding around $1.50 per kg for pipeline andonsite production, or $0.40 per kg from tube trailers.265 Theseare not expected to change dramatically due to mature compres-sor technology.267
Mechanical compressors are the most mature technology forhydrogen, although they suffer poor reliability and are a leadingcause of downtime in hydrogen refilling stations.265,268 Withinthis category, centrifugal compressors are used in centralisedproduction and pipelines, and piston compressors are used forhigh-pressure refuelling stations.269 Electrolysis can generatehydrogen at pressures up to 200 bar with higher efficiency thanmechanical technologies.264 Less mature technologies includeelectrochemical, ionic and hydride compressors (Table 5).31
Liquefaction. Liquefaction of hydrogen greatly increases itsenergy density, allowing large-scale transport by road tanker orship which is particularly attractive for long distances wherepipelines are not economically feasible.48 Over 90% of merchanthydrogen is transported as liquid in the US, indicating thematurity of liquefaction technology.270
Liquefaction consumes considerably more energy than com-pression, as seen in Table 6. The US’s 2020 target for the energyconsumption of large-scale liquefaction is 11 kW h kg�1, withthe potential to reduce to 6 kW h kg�1 in the long-term.270 Alllarge-scale hydrogen liquefaction plants are based on the pre-cooled Claude system and while several alternate designs have beenproposed, ‘‘they are still neither more efficient nor realistic’’.274 Forcontext, 11 kW h is one third of the LHV content of a kg of fuel, so ifthe electricity input is produced with 50% efficiency, liquefactionadds 0.66 units of primary energy consumed per unit of deliveredhydrogen.
Hydrogen purity
The ISO 14687-2 standard for transport PEMFCs requires99.97% purity hydrogen,275 and all fuel cell systems havetightly-controlled specifications on input purity to preserve celllifetimes (Table 7). High temperature SOFCs and MCFCs havethe advantage of being the most fuel-flexible technologies, insome cases able to use methane and carbon monoxide directly
Table 4 The efficiency and energy consumption of hydrogen productionpathways. Data from ref. 161, 200 and 208
Efficiency (LHV)Energy requirement(kW h per kgH2)
Methane reforming 72% (65–75%) 46 (44–51)Electrolysis 61% (51–67%) 55 (50–65)Coal gasification 56% (45–65%) 59 (51–74)Biomass gasification 46% (44–48%) 72 (69–76)
Energy & Environmental Science Review
Ope
n A
cces
s A
rtic
le. P
ublis
hed
on 1
0 D
ecem
ber
2018
. Dow
nloa
ded
on 1
/15/
2022
2:3
6:12
AM
. T
his
artic
le is
lice
nsed
und
er a
Cre
ativ
e C
omm
ons
Attr
ibut
ion
3.0
Unp
orte
d L
icen
ce.
View Article Online

478 | Energy Environ. Sci., 2019, 12, 463--491 This journal is©The Royal Society of Chemistry 2019
as a fuel. PAFCs are tolerant to around 1% CO; however, the Ptcatalyst in the PEMFC is easily poisoned, and so the CO presentin syngas must be removed or converted. Sulphur is a criticalpoison to all fuel cells, which is problematic due to its use as anodourant in natural gas for safety reasons.
Hydrogen from electrolysis. Hydrogen produced from waterelectrolysis is typically pure enough for FCEV applications, asrecombination catalysts remove oxygen that crosses the mem-brane.276,277 The main contaminant is water vapour which,although required for fuel cell humidification, corrodes anderodes the compressing, storing and transporting equipment.It can also freeze in cold temperatures, damaging pipework andvalves. Electrolysers therefore normally include dryers, typicallyregenerative desiccant towers, which are low-cost with lowpower consumption. However regeneration either involves
electrical heating, or sending some dry gas back throughthe wet tower to pick up the accumulated moisture, typicallyreducing yield by around 10%, though there is scope forreducing this.278
Hydrogen from steam methane reforming. Hydrogen fromreformed natural gas needs several clean-up stages if used inlow-temperature fuel cells, as shown in Fig. 15. Pressure-swingadsorption (PSA) is the incumbent technology for separatinghydrogen from carbon dioxide and other contaminants, andis capable of achieving hydrogen purities of 499.9% at theexpense of loss of yield.238,279 Hydrogen purification costs fromSMR have been estimated as $0.70 per kg, projected to fall to$0.40 per kg in 2025.7
An alternative to PSA is pressure-driven diffusion membranes,typically palladium-based. Current palladium filters achieve
Table 5 Advantages and disadvantages of compression technologies
Technology Advantages Disadvantages
Mechanical265,268,269 + Commercially available – Low efficiency (B70%) and expensive+ Wide operating range – Poor reliability due to many moving parts
– Regular maintenance due to start-ups– Purification due to oil contamination
High-pressure electrolysis246,264 + High efficiency – Strong materials needed (increasing cost)+ Production at 50–200 bar – Increased cross-over and back-diffusion losses+ High temperature reduces energy use – Long start-up times requires stable supply
Electrochemical7,271,272 + High efficiency – Strong materials needed (increasing cost)+ 1000 bar demonstrated – Back-diffusion and resistive losses+ High reliability (no moving parts) – Trade-off against throughput and efficiency+ Pure output (no oil contamination) – Pure inlet required and needs drying
Ionic273 + Low contamination – Expensive and unproven+ High efficiency – Limited throughput to avoid foaming+ Reliable (few moving parts)
Hydride246 + Compact, reversible – Expensive and unproven+ Reliable (few moving parts) – Heavy
Table 6 The efficiency and energy consumption of hydrogen distributionpathways, assuming production at 20 bar. Data from ref. 161 and 208. Theenergy penalty is measured relative to the LHV energy content of hydro-gen, and assumes electricity is produced with 50% efficiency (generationplus distribution)
Energy penalty(vs. LHV)
Electricity requirement(kW h per kgH2)
Compression to 500 bar(including cooling)
15% (12–24%) 2.6 (2–4)
Compression to 900 bar(including cooling)
21% (18–30%) 3.5 (3–5)
Liquefaction 78% (66–90%) 13 (11–15)
Table 7 Summary of fuel tolerance for different fuel cell types. Data fromref. 151 and 236
Sulphur (S, H2S) Carbon monoxide (CO) Ammonia (NH3)
PEMFC o0.1 ppm o10–100a ppm PoisonPAFC o50 ppm o0.5–1% o4%MCFC o1–10 ppm Fuel o1%SOFC o1–2 ppm Fuel o0.5%
a Standard Pt anode catalysts can only withstand CO concentrations upto 10 ppm, and PtRu alloys up to 30 ppm. These limits can be extendedby bleeding air into the anode and using alternative bi-layer catalysts.
Fig. 15 An overview of fuel processing for fuel cell systems. Each stage ishighlighted in bold, and given with the most common methods that areused; for each stage, the primary method is highlighted in italics. A descrip-tion of each stage is given at the far left, along with the ideal reactions for theprimary method. Indicative ranges of gas composition after each stage aregiven to the right. Following the stages down from natural gas to each typeof fuel cell on the right indicates which processing stages are required. Datafrom ref. 147 and 151.
Review Energy & Environmental Science
Ope
n A
cces
s A
rtic
le. P
ublis
hed
on 1
0 D
ecem
ber
2018
. Dow
nloa
ded
on 1
/15/
2022
2:3
6:12
AM
. T
his
artic
le is
lice
nsed
und
er a
Cre
ativ
e C
omm
ons
Attr
ibut
ion
3.0
Unp
orte
d L
icen
ce.
View Article Online

This journal is©The Royal Society of Chemistry 2019 Energy Environ. Sci., 2019, 12, 463--491 | 479
exceptionally high purity but are expensive, require a 400 1Coperating temperature and a pressure differential of 10–15 bar,280
reduce yield by 3–5%, and can suffer short lifetimes. One studyfound a palladium-based separation system that is potentiallycheaper than PSA280 and further research is required to deter-mine potential for diffusion membranes and electrochemicalcompressors.7
Hydrogen from pipelines and storage. Hydrogen extractedfrom pipelines and/or salt-cavern storage requires onsite cleaningbefore FCEV usage to remove lubricants, odourants, colourants,debris or dust acquired. Odourants are likely needed to warnagainst leaks; cyclohexene has been found to be compatiblewith fuel cell technology in Japan, but is described as havingtoo pleasant a smell and lacking the stench of current EUodourants.144,238 A colourant may also be required to warn usersof fires, as hydrogen burns with a colourless flame; an extremelydilute strontium solution is being considered.281 It may be thatPSA or activated carbon filters would be appropriate for onsitepurification. The cost of cleaning hydrogen from pipelines iscurrently an unknown and requires further work.282
Hydrogen distribution
There are typically three routes for hydrogen distribution, thesuitability of which depends on the size of demand and thetransportation distance (Table 8). Compressed hydrogen trans-port via tube trailers is likely to assist initial rollout, whereaspipelines are better suited for mass deployment. Pipelinescould provide scalability if heat, power and industry convertedto hydrogen as well as transport. Liquefaction could be used forinternational shipping of bulk hydrogen; distribution of lique-fied hydrogen by road could be restricted to a few heavy-dutytransport sectors.
Gas tube trailers. An option for low demand, such as duringinitial rollout, is distributing hydrogen from centralised produc-tion facilities as a compressed gas in tube trailers. This is well-established, and large trailers for FCEV refuelling hold 1000 kgcapacity at 500 bar.7 The trailer can be parked at the refuellingstation to refuel vehicles directly, reducing onsite storage andcompression requirements as compression begins from a muchhigher starting pressure. However, this uses valuable surface spaceat the refuelling station and delays the trailer’s return for its nextload. Tube trailers become less economic as demand rises andover long distances,48 but remain an attractive near-term solutionfor its lower infrastructure cost and risk.283 Longer term it couldstill present the best option for remote or low-demand areas.48
Liquid hydrogen tankers. Liquid hydrogen tanker capa-cities are typically 2000–7500 kg and have greater density than
compressed storage.48 This would likely pose additional safetyrestrictions, as applied to industrial sites using hydrogen.48
Despite early interest in using liquid hydrogen for vehicles,boil-off results in high storage losses for low-utilisation vehiclesand is potentially unsafe for parking in enclosed spaces.284 Whilelower density compressed hydrogen offers sufficient range forpersonal vehicles, heavy-duty transport sectors (e.g. trucks andships) may still be better served by liquid hydrogen.13
Gas pipelines. Pipelines are regarded as the most efficientmethod of transporting large quantities of hydrogen over shortdistances.48 Around 3000 km of high-pressure hydrogen pipelinesare already in use in Europe and North America for industrialprocesses.48 However, high costs prevent further pipeline develop-ment until sizeable and consistent demand for hydrogen can beassured.
Low initial utilisation and high upfront costs are likely tohinder financing.48 Existing high-carbon steel natural gas pipe-lines might fail if repurposed due to hydrogen embrittlement,so new high-grade steel construction would be required.285
Embrittlement is not a concern at lower pressures286 and newerpolythene natural gas pipes being installed across the UK andEurope are hydrogen compatible.287 These polythene pipes arecurrently limited to 7 bar, but larger plastic pipes up to 17 barhave been proposed.48 Hydrogen pipelines have long lifetimes(50–100 years), although the rate of embrittlement in steelpipelines can make this difficult to predict.48
Blending hydrogen into natural gas. Hydrogen can be safelymixed in small quantities with natural gas and injected into theexisting gas network, but administrative and technical con-straints limit the permissible fraction of hydrogen. The level ofhydrogen that could be safely added depends on the distributionsystem and end-use appliances. The UK and US have amongst thelowest legal limits of any country at 0.1%, compared to 10–12%(by volume) in Germany and the Netherlands (Fig. 16, left).
Current research aims to refine this range of allowableinjections.280,288–291 A Dutch study concluded that off-the shelfgas appliances operated with no serious problems with up to20% hydrogen blends by volume.292 Similarly, the Health andSafety Laboratory concluded that 20% hydrogen was unlikely toharm the UK gas network or most appliances, although theidentification and modification of vulnerable appliances isrequired for concentrations above 10%.143 The different com-bustion characteristics of hydrogen may interact differentlyacross the wide range of gas appliances in use, many installeddecades ago.
Even if limits were relaxed, a 20% blend would representonly 7% hydrogen by energy content, due to its lower densitythan methane. The share of hydrogen by energy content (EH) iscalculated from the volume percentage (or mole fraction) ofhydrogen (VH) and methane (VM) as in eqn (1):
EH ¼11:88VH
11:88VH þ 39:05VM(1)
where 11.88 and 39.05 are the volumetric HHV energy con-tent of hydrogen and methane respectively (MJ m�3),293 andVM = 1 � VH by definition.
Table 8 Qualitative overview of hydrogen transmission and distributiontechnologies for the transport sector4
Distribution route CapacityTransportdistance
Energyloss
Fixedcosts
Variablecosts
On-site production Low Zero Low Low HighGaseous tube trailers Low Low Low Low HighLiquefied tankers Medium High High Medium MediumHydrogen pipelines High High Low High Low
Energy & Environmental Science Review
Ope
n A
cces
s A
rtic
le. P
ublis
hed
on 1
0 D
ecem
ber
2018
. Dow
nloa
ded
on 1
/15/
2022
2:3
6:12
AM
. T
his
artic
le is
lice
nsed
und
er a
Cre
ativ
e C
omm
ons
Attr
ibut
ion
3.0
Unp
orte
d L
icen
ce.
View Article Online

480 | Energy Environ. Sci., 2019, 12, 463--491 This journal is©The Royal Society of Chemistry 2019
The direct carbon emissions savings of a 20% (volume)hydrogen blend would be 13 gCO2 per kW h (Fig. 16, right),so hydrogen injection alone could not achieve deep decarboni-sation of the gas network. That said, this amount of hydrogenblending would deliver most of the decarbonisation required inUK buildings to 2030 (a 10% reduction on 2015 emissions),22
not accounting for upstream hydrogen supply chain emissions.Converting the natural gas network to hydrogen. An alter-
native to blending is complete conversion of existing natural gasdistribution networks to distribute hydrogen. Consumer satis-faction with gas heating indicates this could be a popular low-carbon choice;294 although the UK is among the only countriesactively considering this option, e.g. with the Leeds H21 project238
or in the North of England.295,296 In the 1970s, Britain convertedfrom town gas to natural gas progressively over 11 years, with allnetworks converted in parallel.297 Early desk studies have shownthat conversion back to hydrogen could be technically feasibleand economically viable.15,238 Such a switch would likely take10–20 years, with appliances in every building being system-atically converted or replaced and careful planning to ensurecontinuity of supply.238
Gradual conversion of the heating stock as products reachtheir end of life; with a roll-out of 1 million properties a year ata cost of $$5000 per house is considered feasible.48 Thistransition period may require ‘‘hydrogen-ready’’ boilers capableof running on both natural gas and hydrogen. While this isthought of as uneconomical,144 it was used in the gradual roll-out of digital television and in plans for ‘‘CCS-ready’’ powerstations.298 Legislating for standardised backplates for all newboilers would greatly reduce the cost and time required for sucha conversion.299
Hydrogen storage
Bulk storage. Large-scale hydrogen storage is one of the fewlow-carbon solutions to balance long-term intermittency inelectricity generation from wind and solar power, especiallyin relation to inter-seasonal shifts (see Section 4.2).214,300 Aswith compressed air energy storage (CAES), hydrogen can bestored in compressed form in underground salt caverns.301
Hydrogen offers energy densities of 280 kW h m�3 – 100 timesgreater than for compressed air.48 A limited number of regionshave suitable salt deposits, but several chemical and refinerycomplexes have used substantial hydrogen salt cavern storagefacilities since the 1960s.48 Operational projects include a 24 GWh facility in the UK and an 83 GW h facility in Texas.302 Hydrogenis currently the only low-carbon technology able to store over100 GW h and operate over a timescale of weeks or even months,although this is countered by low round-trip efficiency and highequipment costs.302,303
If hydrogen were delivered by pipeline for heat and electricityprovision, line-packing (using the compressibility of gas withinthe network) combined with geologic storage could balancesupply and demand. However, significant high-pressure decen-tralised storage is required for transport applications due tospace constraints, particularly at refuelling stations and on-board vehicles. Higher pressures increase tank material andcompressor specifications, compression work requirementsand safety measures such as minimum separation distances atforecourts. Low (B45 bar) and medium pressure (200–500 bar)pressure vessels are common in industry, but high pressuretubes and tanks (700–1000 bar) are almost exclusively used forFCEVs and refilling stations, and are currently produced in lowquantities.48 Hydrogen tanks at refuelling stations have higherpressures than in FCEVs (e.g. 925 vs. 700 bar) to allow rapidrefuelling without requiring a slow compressor to fill vehicletanks. Compressed hydrogen gas has only 15% the energydensity of petrol, so refuelling stations require more physicalspace to supply the same amount of fuel. This could be offset byusing underground storage at refuelling stations to reducesurface land usage in densely populated urban areas. Even thenit is possible that many existing urban refuelling stations wouldnot be suitable for hydrogen if they were remote from the high-pressure hydrogen network.48
Alternative hydrogen carriers. Hydrogen can also be distri-buted in the form of fuels such as ethanol, CNG or ammonia,305
which can be low-carbon if produced from biomass or non-fossil fuel sources. These could offer low-pressure, high-volume energy carriers similar to those used extensively today.
Fig. 16 Limits on hydrogen blending into national gas grids around the world, using data from ref. 304 (left); and the relationship between energycontent, carbon savings and hydrogen injection mixtures (right).
Review Energy & Environmental Science
Ope
n A
cces
s A
rtic
le. P
ublis
hed
on 1
0 D
ecem
ber
2018
. Dow
nloa
ded
on 1
/15/
2022
2:3
6:12
AM
. T
his
artic
le is
lice
nsed
und
er a
Cre
ativ
e C
omm
ons
Attr
ibut
ion
3.0
Unp
orte
d L
icen
ce.
View Article Online

This journal is©The Royal Society of Chemistry 2019 Energy Environ. Sci., 2019, 12, 463--491 | 481
However, biomass availability is limited and synthetic fuelsare costly and difficult to produce, so these options are notcurrently under widespread consideration.
A number of alternative hydrogen carriers with lowertechnology-readiness levels are currently under investigation.Solid carriers including metal hydrides are already establishedin a few niche applications including submarines and scooters.48
They operate at low pressure and hence require lower safetyrestrictions and separation distances than highly-compressed orliquefied hydrogen, making them attractive in densely-populatedareas. Their gravimetric energy density (around 3% hydrogen byweight) is comparable to compressed gas at 500 bar.306 Boro-hydrides are a promising option being researched, potentiallyoffering over 10 wt% storage.307,308
Energy is released during charging (i.e. hydrogenation), butenergy input of about 30% is required during discharging.48
Hydrides have cheaper system components (e.g. a small com-pressor, a heater for discharging) than for compressed or liquefiedhydrogen storage. Slow charging and discharging rates limit theirsuitability for on-board applications, meaning that the hydrogenmust be released from the hydrides at the refuelling stations andcompressed for on-board storage.
Liquid organic hydrogen carriers (LOHCs) attain densities of6 wt%, and like hydrides they offer low pressure operation andimproved safety.48 Around 25% of the energy content of hydro-gen is required to release the fuel, though this could be offset ifthe equivalent amount of energy released during hydrogenationcould be captured.309 Catalysts can be employed to speed upthe reactions, potentially enabling their usage on-board vehicleshence avoiding compression requirements. Recently, discardedcigarette butts were discovered to hold over 8 wt% hydrogenafter thermal processing, potentially creating a new class ofhydrogen store from a toxic waste product.310
For comparison, 700 bar compressed hydrogen tanks offer5.7 wt% hydrogen storage (using the Toyota Mirai as an example).311
The DOE target improvement to 7.5 wt% at a cost reduction from$$33 per kW h at present to $$8 per kW h.312
Policy challengesInternational policy context
Globally, relatively few energy policies apply directly to H2FCtechnologies. Policies aimed at reducing GHG emissions suchas feed-in tariffs focus on renewables and exclude non-greenhydrogen, while policies that tackle energy affordability gener-ally exclude hydrogen and fuel cells due to their current highcosts.31
This is slowly changing, as some countries extend theirpolicies to include H2FC technologies. For example, Europeanhydrogen refuelling infrastructure is now promoted under theAlternative Fuels Infrastructure Directive,313 and while thecurrent Renewable Energy Directive (RED) accepts renewablebiofuels and bioliquids that save at least 60% GHG emissions,hydrogen is excluded.314 However, the revised RED will bebroadened to include hydrogen from 2021, with pathwayssaving 70% GHG emissions being classified as a renewable fuelof non-biological origin,315,316 which may encourage countries togive policy support to hydrogen supply chains. Support existsin the US, with eight federal programs having some scope topromote H2FC uptake, although individual states define thesupporting mechanisms, meaning FCEV rebates range fromzero to $$5000 per vehicle.317
Table 9 summarises the national targets for H2FC technologyuptake in six leading countries, and Table 10 compares the levelof financial support provided to achieve these. Whilst these
Table 9 Summary of hydrogen and fuel cells uptake targets. Data from ref. 325, 334 and 340
Country
CHP Fuel cell cars Refuelling stations
2020 2030 2020 2025 2030 2020 2025 2030
Japan 1.4m 5.3m 40 000 200 000 800 000 160 320 900Germany — 100% ZEVa by 2040 400 —China — 3000b 50 000 1m 100 1000 —US — 0 3.3m — 100c — —South Korea — 1.2 MW 10 000 100 000 630 000 100 210 520UK — 100% ZEVa by 2040 30 150 —
a Zero emission vehicle. b Shanghai only. c California only.
Table 10 Summary of the support offered in various countries for hydrogen and fuel cells in 2017. Data from ref. 317, 325, 334 and 341–350. Valuesgiven in 2016 US Dollars, converted as f102 = h0.75 = CNY 3.5 = KRW 894 = d0.69 = $1
Country Residential CHP Fuel cell vehicles Refuelling
Japan $93m $700–1700 per unit $147m $61mGermany $13 600 per unit $4000 per vehicle $466mChina — $1700 per kW (up to $57 000 per vehicle) $1.1m per unitUS $1000 per unit (up to $3000 per kW
for larger systems)Up to $13 000 per vehicle 30% of cost (up to $30 000)
(California $100m up to 2023)South Korea $5.3m $5.4m (up to $31 000 per vehicle)UK — $33m (60% of cost for refuelling)
Energy & Environmental Science Review
Ope
n A
cces
s A
rtic
le. P
ublis
hed
on 1
0 D
ecem
ber
2018
. Dow
nloa
ded
on 1
/15/
2022
2:3
6:12
AM
. T
his
artic
le is
lice
nsed
und
er a
Cre
ativ
e C
omm
ons
Attr
ibut
ion
3.0
Unp
orte
d L
icen
ce.
View Article Online

482 | Energy Environ. Sci., 2019, 12, 463--491 This journal is©The Royal Society of Chemistry 2019
demonstrate ambition towards FCEV uptake, incentives aresmaller than for other technologies. For example, the UK budgetfor hydrogen transport projects is d23m, while the funding forBEV recharging and manufacturing infrastructure is d646m.318
Additionally, the UK supports only biogas combustion micro-CHP devices rather than fuel cell CHP, whilst there is support forbattery electric vehicles but not fuel cell vehicles.319
Policy support for H2FC technologies are driven by variousnational priorities, including air quality, climate change,31 energysecurity,320 affordability and economic growth.321 US policy isdriven by the need to improve air quality due to transportation;thus there are no national targets for deploying fuel cells instationary applications. China aims to reduce severe urbanair quality issues and boost economic growth through manu-facturing fuel cells as part of the ‘‘Made in China 2025’’strategy.322 In Japan, hydrogen is promoted to provide energysecurity through improving efficiency, to support nationalindustries and revitalise regional economies and reduce environ-mental burdens.323
Japan envisions a three stage transition to a hydrogensociety: promoting FCEVs, hydrogen production and residentialfuel cells (currently); developing and integrating hydrogensupply chains into the energy system (by 2030); and finallyestablishing a carbon-free hydrogen supply by 2040.324 Incontrast, the main driver in Europe is reducing GHG emissions,with hydrogen also seen as a critical part of the industrialstrategy of countries such as the UK.325 The UK and France planto halt the sale of new petrol and diesel cars from 2040326,327
and the Netherlands from 2030.328 Norway aims to replace salesof diesel cars with electric and hydrogen passenger cars from2025.329
Current market size
Evidently, countries that have provided stronger incentives andbroader strategies (Table 10) have seen greater uptake of H2FCtechnologies, as shown in Table 11. Fuel cell vehicles are anarea where the US is leading, with 2750 FCEVs sold as of 2017,more than in Japan and Europe combined.330,331 China’s stanceon fuel cells could have global implications;90 its 2016 Fuel CellVehicle Technology Roadmap includes a modest target for 5000FCEVs in 2020 but a scale of millions in 2030.332
Fig. 17 illustrates the extent to which Japan is leading fuelcell CHP rollout: South Korea and Europe trail by a decade, andthe US has seen very limited uptake. In 2012, fuel cells outsoldengine-based micro-CHP systems for the first time, taking 64%of the global market.333 Japan has deployed 98% of the world’sresidential fuel cell systems with over 223 000 systems sold as of
October 2017.334,335 The dotted lines in Fig. 17 indicate theJapanese government’s target of 1.4 million fuel cells installedby 2020,336 although Bloomberg forecast that only a quarter ofthis target will be reached as subsidies have fallen too quickly tooffset high costs and competition from rooftop solar. Toshibarecently exited the industry, leaving only two EneFarm manu-facturers.337 The European Union originally anticipated 50 000systems by 2020, but only 1046 systems were installed in theene.field project,338 and 2650 additional units will be installedby 2021 as part of the PACE demonstration.339
Strong policy signals can evidently yield substantial benefits,as seen by the uptake of home heating systems and vehiclesdeployed in Japan, and the strength of Japanese manufacturers.Demonstration projects that enable learning-by-doing throughmanufacturing scale-up have been necessary for decreasingthe price of H2FC technologies as with other technologies.However, the scale of such demonstration programmes hasarguably been trivial outside of Japan. For context, the twolargest demonstration projects in Europe (ene.field andPACE) target just 3% the number of households that receivedsolar PV panels in Germany’s 100 000 roofs programme over adecade ago.353
Policy drivers for hydrogen and fuel cells
The drivers for promoting hydrogen and fuel cells in energypolicy relate to improving the reliability, efficiency and securityof the energy system, reducing environmental impacts, anddeveloping new low-carbon industries, with their associated
Table 11 Summary of hydrogen and fuel cells uptake as of 2018. Data from ref. 76, 331, 334, 340, 351 and 352
Country CHP units Fuel cell vehicles Refuelling stations Forklift trucks
Japan 223 000 1800 cars 90 21Germany 1200 467 cars, 14 buses 33 16China 1 60 cars, 50 buses 36 N/AUS 225 MW 2750 cars, 33 buses 39 public, 70 total 11 600South Korea 177 MW 100 cars 11 N/AUK 10 42 cars, 18 buses 14 2
Fig. 17 Cumulative number of residential micro-CHP systems installed todate (solid lines) and near-term projections (dotted lines). Data fromref. 16, 339, 355 and 356.
Review Energy & Environmental Science
Ope
n A
cces
s A
rtic
le. P
ublis
hed
on 1
0 D
ecem
ber
2018
. Dow
nloa
ded
on 1
/15/
2022
2:3
6:12
AM
. T
his
artic
le is
lice
nsed
und
er a
Cre
ativ
e C
omm
ons
Attr
ibut
ion
3.0
Unp
orte
d L
icen
ce.
View Article Online
This journal is©The Royal Society of Chemistry 2019 Energy Environ. Sci., 2019, 12, 463--491 | 483
employment opportunities and skills. The potential of H2FCtechnologies to contribute to all the dimensions of sustainabledevelopment (environmental, social and economic) arguablyjustifies their systematic and long-term policy support.
Several European countries are working to define greenhydrogen standards, showing a concern for the climate benefitsfrom fuel cells rather than just the level of uptake.354 Somestandards focus on hydrogen from renewable sources, othersinclude hydrogen from low-carbon sources (including nuclearand CCS). These differences must be resolved if a pan-Europeanor global certification scheme is to be agreed.31
A changing climate, natural disasters, war and cyber-securityflaws can have extreme impacts on energy supply chains.320 H2FCtechnologies can support the electricity system in balancingweather-dependent renewables, and hydrogen can improvenational energy self-reliance, as it has numerous production path-ways. Hydrogen can also be produced anywhere, which makes itparticularly attractive to oil-deficient countries as one of theprincipal alternative fuels with a considerable potential for long-term substitution of oil and natural gas.313
Hydrogen and fuel cells are currently more expensive inmost applications than their low-carbon competitors. However,they possess some superior characteristics to these competitors,which could aid the public acceptability of decarbonising personalenergy use. The steep cost reductions seen for fuel cells in Asia (seeSection 3.2) suggest that programmes to support for research,development and deployment can significantly influence theeconomic viability of H2FC technologies. Japan’s Hydrogen andFuel Cell Roadmap, the US DOE Hydrogen and Fuel Cells Pro-gram, and Europe’s Fuel Cells and Hydrogen Joint Undertaking(FCH-JU) are prominent examples.
Conclusions
Hydrogen has fallen in and out of favour since the oil shocksof the 1970s and remains a marginal energy system option.However, mainstream products are now emerging: Honda,Toyota and Hyundai have launched the first mass-producedhydrogen fuel cell vehicles, and fuel cells now heat 225 000 homes.Early-mover companies, notably in Japan, are beginning to seelucrative export opportunities.
Hydrogen can play a major role alongside electricity in thelow-carbon economy, with the versatility to provide heat, trans-port and power system services. It does not suffer the funda-mental requirement for instantaneous supply-demand balancing,and so enables complementary routes to deeper decarbonisationthrough providing low carbon flexibility and storage. Thenumerous hydrogen production, distribution and consumptionpathways present complex trade-offs between cost, emissions,scalability and requirements for purity and pressure; but pro-vide a multitude of options which can be exploited dependingon local circumstances (e.g. renewable energy or suitable sitesfor CO2 sequestration).
Hydrogen and fuel cells are not synonymous; they can bedeployed in combination or separately. Fuel cells can operate
on natural gas, which avoids combustion and thus 90% ofairborne pollutants. Hydrogen can be burnt in engines andboilers with no direct CO2 and near-zero NOx emissions. Whenused together, hydrogen fuel cells are zero-emission at the pointof use, with overall emissions dependent on the fuel productionmethod (as with electricity).
Fuel cell vehicle costs are high relative to battery electricvehicles, but with mass production they can achieve parity by2025–2030. Driving range and refuelling time are significantlybetter than premium electric vehicles, which is particularlyadvantageous for buses, heavy goods and other highly-utilisedvehicles. As with electric vehicles and unlike biofuels, fuel cellvehicles can tackle urban air quality problems by producingzero exhaust emissions. This has the potential to drive deploy-ment in cities, railways, airports, seaports and warehouses.
Innovations in heat decarbonisation lag behind othersectors as heat pumps, district heating and burning biomassface multiple barriers. Households are accustomed to powerful,compact, rapid response heating systems, which can be modifiedto use hydrogen. Fuel cell combined heat and power can operateon today’s natural gas network, albeit with limited carbon savings.Hydrogen presents various options for decarbonising this networkin the longer term.
Hydrogen technologies can support low-carbon electricitysystems dominated by intermittent renewables and/or electricheating demand. Fuel cells provide controllable capacity thathelpfully offsets the additional peak demand of heat pumps. Inaddition to managing short-term dynamics, converting electri-city into hydrogen or other fuels (power-to-gas) could providethe large-scale, long-term storage required to shift renewableelectricity between times of surplus and shortfall.
Hydrogen applications and the supporting infrastructuremay be installed incrementally and simultaneously, with caretaken to avoid potentially high-regret investments early on.Existing electricity and gas infrastructures can be used foron-site hydrogen production in distributed refilling stationsand fuel cell heating. Focussing on specific users such as captivevehicle fleets (e.g. urban buses with central refuelling depots)could provide the high utilisation and demand certainty neededfor investment. Given the diversity of decarbonisation pathways,a clear strategy will reduce the costs of introducing hydrogen andfuel cell technologies.
Successful innovation requires focused, predictable andconsistent energy policy, which is probably the single greatestchallenge in realising the hydrogen and fuel cell potential.Stop-go policies, and frequent, unexpected policy changesundermine the confidence that businesses and industry needto make long-term investments in low-carbon technologies suchas hydrogen and fuel cells. Countries should develop a systemof policy support for hydrogen and fuel cell technologies thatoffers the long-term stability needed for large, transformativeinvestments to be made. Policy reviews, decision points andmilestones in a support programme should be announced wellin advance, with ongoing support conditional on meetingreasonable performance and cost targets. Given such sustainedsupport, and the technological progress in hydrogen and fuel
Energy & Environmental Science Review
Ope
n A
cces
s A
rtic
le. P
ublis
hed
on 1
0 D
ecem
ber
2018
. Dow
nloa
ded
on 1
/15/
2022
2:3
6:12
AM
. T
his
artic
le is
lice
nsed
und
er a
Cre
ativ
e C
omm
ons
Attr
ibut
ion
3.0
Unp
orte
d L
icen
ce.
View Article Online

484 | Energy Environ. Sci., 2019, 12, 463--491 This journal is©The Royal Society of Chemistry 2019
cells in recent years, there are strong grounds for believing thathydrogen and fuel cells can experience a cost and performancetrajectory similar to those of solar PV and batteries, and in themedium term provide another important and complementarylow-carbon option with versatility to be deployed in multipleuses across the energy system.
Conflicts of interest
There are no conflicts to declare.
Acknowledgements
We thank the Engineering and Physical Sciences ResearchCouncil for funding this work via the H2FC Supergen HubEP/J016454/1 and EP/P024807/1.
Notes and references
1 US Department of Energy, The Green Hydrogen Report,NREL, 1995.
2 World Energy Council, World Energy Issues Monitor, 2017.3 N. Cackett, Honda Clarity FCV review, https://www.autocar.
co.uk/car-review/honda/clarity-fcv.4 International Energy Agency, Technology Roadmap: Hydrogen
and Fuel Cells, Paris, 2015.5 N. P. Brandon and Z. Kurban, Philos. Trans. R. Soc., A, 2017,
375, 1–17.6 Hydrogen Council, Hydrogen scaling up: a sustainable path-
way for the global energy transition, 2017.7 D. Hart, J. Howes, B. Madden and E. Boyd, Hydrogen and
Fuel Cells: Opportunities for Growth. A Roadmap for the UK,E4Tech and Element Energy, 2016.
8 E. S. Hanley, J. P. Deane and B. P. O. Gallachoir, RenewableSustainable Energy Rev., 2018, 82, 3027–3045.
9 M. Pudukudy, Z. Yaakob, M. Mohammad, B. Narayananand K. Sopian, Renewable Sustainable Energy Rev., 2014, 30,743–757.
10 T. Abbasi and S. A. Abbasi, Renewable Sustainable EnergyRev., 2011, 15, 3034–3040.
11 J. W. Sheffield and Ç. Sheffield, Assessment of Hydrogen Energyfor Sustainable Development, Springer Netherlands, 2007.
12 S. Dunn, Int. J. Hydrogen Energy, 2002, 27, 235–264.13 Coalition study, A portfolio of power-trains for Europe: a fact-
based analysis, McKinsey & Company, 2010.14 J. Tollefson, Nature, 2010, 464, 1262–1264.15 P. E. Dodds and S. Demoullin, Int. J. Hydrogen Energy, 2013,
38, 7189–7200.16 P. E. Dodds, I. Staffell, A. D. Hawkes, F. Li, P. Grunewald,
W. McDowall and P. Ekins, Int. J. Hydrogen Energy, 2015,40, 2065–2083.
17 T. A. Napp, A. Gambhir, T. P. Hills, N. Florin and P. S. Fennell,Renewable Sustainable Energy Rev., 2014, 30, 616–640.
18 M. Ball and M. Weeda, Int. J. Hydrogen Energy, 2015, 40,7903–7919.
19 S. Samsatli, I. Staffell and N. J. Samsatli, Int. J. HydrogenEnergy, 2016, 41, 447–475.
20 REN21, Renewables Global Status Report, 2017.21 DECC, Provisional UK greenhouse gas emissions national
statistics 2015, 2016.22 CCC, The Fifth Carbon Budget: The next step towards a low-
carbon economy, 2015.23 World Resources Institute, CAIT Climate Data Explorer,
http://cait.wri.org.24 S. Bakker, Energy Policy, 2010, 38, 6540–6544.25 E4Tech, The Fuel Cell Industry Review, 2017.26 T. Wilberforce, A. Alaswad, A. Palumbo, M. Dassisti and
A. G. Olabi, Int. J. Hydrogen Energy, 2016, 41, 16509–16522.27 G. Strbac, M. Aunedi, D. Pudjianto, F. Teng, P. Djapic,
R. Druce, A. Carmel and K. Borkowski, Value of Flexibility ina Decarbonised Grid and System Externalities of Low-CarbonGeneration Technologies, NERA Economic Consulting, 2015.
28 KPMG, 2050 Energy Scenarios: The UK Gas Networks role in a2050 whole energy system, KPMG, 2016.
29 I. Staffell and S. Pfenninger, Energy, 2018, 145, 65–78.30 S. Collins, P. Deane, B. O. Gallachoir, S. Pfenninger and
I. Staffell, Joule, 2018, 2, 1–15.31 I. Staffell, P. Dodds, D. Scamman, A. Velazquez Abad,
N. M. Dowell, K. Ward, P. Agnolucci, L. Papageorgiou,N. Shah and P. Ekins, The Role of Hydrogen and Fuel Cellsin Future Energy Systems, H2FC Supergen, 2017.
32 A. Hawkes, I. Staffell, D. Brett and N. Brandon, EnergyEnviron. Sci., 2009, 2, 729–744.
33 M. Momirlan and T. N. Veziroglu, Renewable SustainableEnergy Rev., 2002, 6, 141–179.
34 K. Mazloomi and C. Gomes, Renewable Sustainable EnergyRev., 2012, 16, 3024–3033.
35 Energy Information Administration, International EnergyOutlook, 2017.
36 ECC Select Committee, Government to miss 2020 renewableenergy targets, 2016.
37 CCC, Meeting Carbon Budgets – 2016 Progress Report toParliament, 2016.
38 Norsk Elbil Forening, Elbilsalget: Ned i fjor – venter ny veksti år, http://elbil.no/elbilsalget-ned-i-fjor-venter-ny-vekst-i-ar/.
39 Next Greencar, Electric car market statistics, http://www.nextgreencar.com/electric-cars/statistics/.
40 EEA, Air quality in Europe—2016 report, European Environ-ment Agency, Luxembourg, 2016.
41 D. D. Heather Walton, S. Beevers, M. Williams, P. Watkissand A. Hunt, Understanding the Health Impacts of AirPollution in London, King’s College London, London, 2015.
42 European Commission, A Clean Air Programme for Europe,2013.
43 WHO, Country estimates on air pollution exposure and healthimpact, 2016.
44 UN, Transforming our world: the 2030 Agenda for SustainableDevelopment, United Nations General Assembly, New York,2015.
45 M. McGrath, Four major cities move to ban diesel vehicles by2025, BBC News, 2016.
Review Energy & Environmental Science
Ope
n A
cces
s A
rtic
le. P
ublis
hed
on 1
0 D
ecem
ber
2018
. Dow
nloa
ded
on 1
/15/
2022
2:3
6:12
AM
. T
his
artic
le is
lice
nsed
und
er a
Cre
ativ
e C
omm
ons
Attr
ibut
ion
3.0
Unp
orte
d L
icen
ce.
View Article Online

This journal is©The Royal Society of Chemistry 2019 Energy Environ. Sci., 2019, 12, 463--491 | 485
46 DEFRA, Plan for roadside NO2 concentrations published,2017, https://tinyurl.com/defra-no2.
47 Reuters, France to end sale of diesel and gasoline vehicles by2040, 2017, https://tinyurl.com/reuters-france-diesel-ban.
48 D. Hart, J. Howes, F. Lehner, P. Dodds, N. Hughes, B. Fais,N. Sabio and M. Crowther, Scenarios for deployment ofhydrogen in contributing to meeting carbon budgets and the2050 target, 2015.
49 B. G. Pollet, I. Staffell and J. L. Shang, Electrochim. Acta,2012, 84, 235–249.
50 P. E. Dodds and P. Ekins, Int. J. Hydrogen Energy, 2014, 39,13941–13953.
51 A. Stewart and T. Dodson, Low carbon cars in the 2020s:Consumer impacts and EU policy implications, ElementEnergy, Brussels, 2016.
52 G. J. Offer, D. Howey, M. Contestabile, R. Clague and N. P.Brandon, Energy Policy, 2010, 38, 24–29.
53 Autocar, Hyundai ix35 Fuel Cell review, 2015, https://tinyurl.com/autocar-ix35.
54 Green Car Reports, Toyota Mirai Priced At $57,500,With $499 Monthly Lease, 2016, https://tinyurl.com/greencar-mirai.
55 Renault, ZOE – Models & prices, 2018, https://www.renault.co.uk/vehicles/new-vehicles/zoe-250/models-and-prices.html.
56 Nissan, 2017 Leaf Specs, 2017, https://www.nissanusa.com/electric-cars/leaf/versions-specs/version.s.html.
57 Bloomberg, Driverless Cars Are Giving Engineers a FuelEconomy Headache, 2017, https://tinyurl.com/y92aqxu2.
58 J. Alazemi and J. Andrews, Renewable Sustainable EnergyRev., 2015, 48, 483–499.
59 M. Melaina and M. Penev, Hydrogen Station Cost Estimates,NREL, 2013.
60 Cleantech Canada, Ontario to get first public hydrogenfueling stations as feds shell out $1.6M, 2017, https://tinyurl.com/yaj7kgxv.
61 Rolec, Rolec Electric Vehicle Charging Stations, 2017, http://www.rolecserv.com/ev-charging.
62 M. M. Kabir and D. E. Demirocak, Int. J. Energy Res., 2017,41, 1963–1986.
63 D. Scamman, M. Newborough and H. Bustamante, Int.J. Hydrogen Energy, 2015, 40, 13876–13887.
64 H. Ammermann, Y. Ruf, S. Lange, D. Fundulea andA. Martin, Fuel Cell Electric Buses – Potential for SustainablePublic Transport in Europe, 2015.
65 J. Marcinkoski, J. Spendelow, A. Wilson andD. Papageorgopoulos, Fuel Cell System Cost – 2015, USDepartment of Energy, 2015.
66 Hydrogen Council, How hydrogen empowers the energytransition, 2017.
67 I. E. L. Stephens, J. Rossmeisl and I. Chorkendorff, Science,2016, 354, 1378.
68 J. Harvey, Platinum’s fuel-cell car bonanza proves elusive,2018, https://tinyurl.com/reuters-fcev-platinum.
69 International Organization of Motor Vehicle Manufacturers,OICA Sales Statistics, 2017, http://www.oica.net/category/sales-statistics/.
70 D. Becker, M. Pawelke, P. Schalk, A. Feege, U. Bergmann,G. Silberg, S. H. Wi, M. Komikado and H.-H. Tran, GlobalAutomotive Executive Survey 2018, KPMG, 2018.
71 L. Mearian, Hydrogen refueling stations for cars to reach5,000 by 2032, in Computerworld, 2017.
72 Toyota, Toyota moves to expand mass-production of fuelcell stacks and hydrogen tanks towards ten-fold increasepost-2020, 2018, https://newsroom.toyota.co.jp/en/corporate/22647198.html.
73 Daimler, New ‘‘Hydrogen Council’’ launches in Davos, 2017.74 Zap-Map, 2017, https://www.zap-map.com/.75 J. Murray, Electric vehicle charge points to outnumber petrol
stations by 2020, say Nissan, The Guardian, Manchester,2016.
76 Ludwig-Bolkow-Systemtechnik and TUV SUD, HydrogenRefuelling Stations Worldwide, 2017, https://www.netinform.de/H2/H2Stations/Default.aspx.
77 UK H2Mobility, Phase 1 Results, London, UK, 2013.78 GLA, Draft Mayor’s Transport Strategy, Greater London
Authority, 2017.79 Cars UK, An extra 60 Hyundai ix35 Hydrogen Fuel Cell taxis
for Paris – will grow to a fleet of hundreds, Cars UK, 2016.80 J. Spendelow and D. Papageorgopoulos, Fuel Cell Bus
Targets, US Department of Energy, 2012.81 J. Marcinkoski, A. Wilson and D. Papageorgopoulos,
On-Road Fuel Cell Stack Durability, US Department ofEnergy, 2016.
82 L. Eudy, M. Post and M. Jeffers, Zero Emission Bay Area(ZEBA) Fuel Cell Bus Demonstration Results: Fifth Report,2016.
83 US Department of Energy, Compare Fuel Cell Vehicles, 2017,http://www.fueleconomy.gov/feg/fcv_sbs.shtml.
84 L. Eudy, M. Post and M. Jeffers, Fuel Cell Buses in U.S.Transit Fleets: Current Status 2016, NREL, Golden, CO,2016.
85 FCH-JU, Urban buses: alternative powertrains for Europe,2012.
86 N. Brahy, Fuel Cell Electric Buses – Potential for SustainablePublic Transport in Europe, 2015.
87 B. Madden, London hydrogen buses and the CHIC project,All-Energy, 2016.
88 T. Hua, R. Ahluwalia, L. Eudy, G. Singer, B. Jermer, N. Asselin-Miller, S. Wessel, T. Patterson and J. Marcinkoski, J. PowerSources, 2014, 269, 975–993.
89 Toyota, Toyota to Start Sales of Fuel Cell Buses under theToyota Brand from Early 2017, 2016.
90 E4Tech, The Fuel Cell Industry Review, 2016.91 N. O. Pearson, China’s Buses Bolster Ballard’s Three-Decade
Quest for Hydrogen, Bloomberg, 2017.92 H. Ximin, ,
Shenzhen Daily, 2017.93 F. Lambert, Shenzhen shows the world how it’s done,
electrifies all public transit with massive fleet of 16,000+electric buses, https://electrek.co/2017/12/28/shenzhen-electrifies-entire-public-transit-fleet-electric-buses/, (accessed1st September, 2018).
Energy & Environmental Science Review
Ope
n A
cces
s A
rtic
le. P
ublis
hed
on 1
0 D
ecem
ber
2018
. Dow
nloa
ded
on 1
/15/
2022
2:3
6:12
AM
. T
his
artic
le is
lice
nsed
und
er a
Cre
ativ
e C
omm
ons
Attr
ibut
ion
3.0
Unp
orte
d L
icen
ce.
View Article Online

486 | Energy Environ. Sci., 2019, 12, 463--491 This journal is©The Royal Society of Chemistry 2019
94 Tesla, Semi, 2017, https://www.tesla.com/semi.95 Kenworth, Kenworth Receives $8.6 Million in Grants for Low-
Emission T680 Day Cab Drayage Truck Projects in California,2016, http://tinyurl.com/zm84j3d.
96 Forbes, Toyota Rolls Out Hydrogen Semi Ahead Of Tesla’sElectric Truck, 2017, https://tinyurl.com/ljs9xke.
97 Nikola Motor Company, Nikola One: Electric Sleeper Semi-Truck, 2016, https://nikolamotor.com/one.
98 A. Velazquez Abad, T. Cherrett and B. Waterson, Int.J. Logist. Res. Appl., 2016, 20, 3–19.
99 Edie, World’s largest brewer orders 800 hydrogen-electrictrucks, 2018, http://www.edie.net/news/6/World-s-largest-brewer-orders-800-hydrogen-electric-trucks/.
100 Intelligent Energy, Met trials hydrogen powered scooters,2017, https://tinyurl.com/yddjx4yl.
101 Alstom, Alstom unveils its zero-emission train Coradia iLintat InnoTrans, 2016.
102 S. Thompson, International Association for Hydrogen EnergyElectronic Newsletter, 2016, vol. 8(6).
103 B. Gerrard, French train giant Alstom set to make UK’s firsthydrogen fleet at British site, Telegraph, 2018, http://www.telegraph.co.uk/business/2018/05/14/french-train-giant-alstom-set-make-uks-first-hydrogen-fleet/.
104 Ballard Power Systems, Ballard Signs Framework Agreementfor Fuel Cell Module Development to Power Trams in China,2015.
105 H. Burley, World’s first hydrogen ferry to be built in Scotland,2018, http://www.scotsman.com/news/world-s-first-hydrogen-ferry-to-be-built-in-scotland-1-4759942.
106 E. Baldassari, Hydrogen-powered ferry? National lab says it’spossible, though costly, East Bay Times, 2016.
107 ICAO, Historic agreement reached to mitigate internationalaviation emissions, International Civil Aviation Organiza-tion, 2016.
108 C. Gonzalez, The Future of Electric Hybrid Aviation, MachineDesign, 2016.
109 IPCC, Climate Change 2013: The Physical Science Basis,Contribution of Working Group I to the Fifth AssessmentReport of the Intergovernmental Panel on Climate Change,Cambridge University Press, 2013.
110 C. Lawson, eTaxi Fuel Cell System – Feasibility for Low CostCarriers, Royal Aeronautical Society, London, 2016.
111 US Department of Energy, Industry Deployed Fuel Cell-Powered Lift Trucks, 2016.
112 M. W. Ahmad Mayyas, S. H. Chan and T. Lipman, Fuel CellForklift Deployment in the US, NREL, 2014.
113 Ballard Power Systems, Economics of Fuel Cell Solutions forMaterial Handling, 2010.
114 New Holland, NH2 Hydrogen Tractor, 2017, http://www.newholland.co.nz/?id=155.
115 International Energy Agency, Energy Technology Perspectives,OECD/IEA, Paris, 2016.
116 B. Lapillonne and K. Pollier, ODYSSEE-MURE: Energy EfficiencyTrends for households in the EU, Enerdata, 2014.
117 M. Chaudry, M. Abeysekera, S. H. R. Hosseini, N. Jenkinsand J. Wu, Energy Policy, 2015, 87, 623–640.
118 N. Eyre, Decarbonising Heat, Oxford Energy Expert Meeting,London, 2016.
119 I. Staffell, I. Hamilton and R. Green, in Domestic Micro-generation: Renewable and Distributed Energy Technologies,Policies and Economics, ed. I. Staffell, D. J. L. Brett,N. P. Brandon and A. D. Hawkes, Routledge, London, 2015.
120 I. Staffell, D. J. L. Brett, N. P. Brandon and A. D. Hawkes,Domestic Microgeneration: Renewable and Distributed EnergyTechnologies, Policies and Economics, Routledge, London,2015.
121 BEIS, Baroness Neville-Rolfe’s speech at Policy Exchange’sHeat Summit, 2016.
122 Z. B. Richard Howard, Too Hot to Handle? How to decarbonisedomestic heating, Policy Exchange, 2016.
123 P. E. Dodds, A. Hawkes, W. McDowall, F. Li, I. Staffell,P. Grunewald, T. Kansara, P. Ekins and P. Agnolucci, Therole of hydrogen and fuel cells in providing affordable, securelow-carbon heat, H2FC SUPERGEN, London, 2014.
124 I. A. Grant Wilson, Front. Energy Res., 2016, 4, DOI: 10.3389/fenrg.2016.00033.
125 CCC, Next steps for UK heat policy, Committee on ClimateChange, 2016.
126 I. Staffell, D. Brett, N. Brandon and A. Hawkes, EnergyEnviron. Sci., 2012, 5, 9291–9306.
127 R. Hanna, B. Parrish and R. Gross, Best practice in heatdecarbonisation policy: a review of the international experi-ence of policies to promote the uptake of low-carbon heatsupply, UKERC Working Paper, 2016.
128 GEA, Global Energy Assessment: Toward a SustainableFuture, Cambridge University Press, 2012.
129 O. Edenhofer, R. Pichs-Madruga, Y. Sokona, E. Farahani,S. Kadner, K. Seyboth, A. Adler, I. Baum, S. Brunner,P. Eickemeier, B. Kriemann, J. Savolainen, S. Schlomer,C. V. Stechow, T. Zwickel and J. C. Minx, Climate Change2014: Mitigation of Climate Change. Contribution of WorkingGroup III to the Fifth Assessment Report of the Intergovern-mental Panel on Climate Change, Cambridge UniversityPress, 2014.
130 European Climate Foundation, Roadmap 2050: A PracticalGuide to a Prosperous, Low Carbon Europe, 2010.
131 Ofgem, Future Insights Series: The Decarbonisation of Heat,2016.
132 T. Boßmann and I. Staffell, Energy, 2015, 90(Part 2),1317–1333.
133 K. MacLean, R. Sansom, T. Watson and R. Gross, Compar-ing the impacts and costs of transitions in heat infrastructure,2016.
134 International Energy Agency, World Energy Balances, ESDSInternational, University of Manchester, 2012.
135 DECC, Heat Networks Investment Project Consultation:Capital Funding For Building Heat Networks, 2016.
136 L. Lidstone, UK Networks Transition Challenges: Heat,Energy Technologies Institute, 2016.
137 I. Staffell, P. Baker, J. P. Barton, N. Bergman, R. Blanchard,N. P. Brandon, D. J. L. Brett, A. Hawkes, D. Infield, C. N.Jardine, N. Kelly, M. Leach, M. Matian, A. D. Peacock,
Review Energy & Environmental Science
Ope
n A
cces
s A
rtic
le. P
ublis
hed
on 1
0 D
ecem
ber
2018
. Dow
nloa
ded
on 1
/15/
2022
2:3
6:12
AM
. T
his
artic
le is
lice
nsed
und
er a
Cre
ativ
e C
omm
ons
Attr
ibut
ion
3.0
Unp
orte
d L
icen
ce.
View Article Online

This journal is©The Royal Society of Chemistry 2019 Energy Environ. Sci., 2019, 12, 463--491 | 487
S. Sudtharalingam and B. Woodman, Proceedings of the ICE– Energy, 2010, 163, 143–165.
138 I. Staffell and I. Hamilton, in Domestic Microgeneration:Renewable and Distributed Energy Technologies, Policies andEconomics, ed. I. Staffell, D. J. L. Brett, N. P. Brandon andA. D. Hawkes, Routledge, London, 2015.
139 US Census Bureau, Annual Characteristics of New Housing,2014.
140 DECC, The Future of Heating: Meeting the challenge, Depart-ment of Energy and Climate Change, 2013.
141 J. Palmer and I. Cooper, United Kingdom housing energy factfile, Department of Energy and Climate Change, 2013.
142 CCC, Meeting Carbon Budgets: Closing the policy gap. 2017Report to Parliament, 2017.
143 J. Hodges, W. Geary, S. Graham, P. Hooker and R. Goff,Injecting hydrogen into the gas network – a literature search,Health and Safety Laboratory, Buxton, 2015.
144 M. Dorrington, M. Lewitt, I. Summerfield, P. Robson andJ. Howes, Desk study on the development of a hydrogen-firedappliance supply chain, Kiwa & E4 Tech, 2016.
145 I. Staffell, Appl. Energy, 2015, 147, 373–385.146 I. Staffell and E. Entchev, in Domestic Microgeneration:
Renewable and Distributed Energy Technologies, Policiesand Economics, ed. I. Staffell, D. J. L. Brett, N. P. Brandonand A. D. Hawkes, Routledge, London, 2015.
147 H. R. Ellamla, I. Staffell, P. Bujlo, B. G. Pollet andS. Pasupathi, J. Power Sources, 2015, 293, 312–328.
148 IRENA, Renewable Energy Technologies: Cost Analysis Series.Volume 1, Issue 4: Solar Photovoltaics, 2012.
149 Panasonic, Launch of New ’Ene-Farm’ Home Fuel Cell Pro-duct More Affordable and Easier to Install, 2013.
150 Y. Nagata, Toshiba Fuel Cell Power Systems B Commercia-lization of Residential FC in Japan, in FCH-JU GeneralAssembly, Brussels, 2013.
151 I. Staffell, PhD thesis, University of Birmingham, 2010.152 K. Kuwaba, Development of SOFC for Residential Use by Aisin
Seiki, in 9th FC Expo., Tokyo, 2013.153 Osaka Gas, Long-term durability data for single-cell, 2012,
http://tinyurl.com/osaka-sofc-longterm.154 A. Ballhausen, BlueGen: Vom Feldversuch in den Markt
(From Field Tests to Market), in NIP General Assembly,Berlin, 2013.
155 I. Staffell and R. Green, Int. J. Hydrogen Energy, 2013, 38,1088–1102.
156 S. Kawamura, IPHE Country Update: Japan, in 28th IPHESteering Committee Meeting, The Hague, Netherlands, 2017.
157 M. Wei, S. J. Smith and M. D. Sohn, Appl. Energy, 2017, 191,346–357.
158 M. Wei, S. H. Chan, A. Mayyas and T. Lipman, in Fuel Cells:Data, Facts, and Figures, ed. D. Stolten, R. C. Samsun andN. Garland, Wiley VCH, 2016.
159 A. Maruta, Japan’s ENE-FARM programme, in Fuel cells: Whyis Austria not taking off?, 2016.
160 R. Berger, Advancing Europe’s energy systems: stationaryfuel cells in distributed generation, European Commission:FCH-JU, 2015.
161 D. Stolten, R. C. Samsun and N. Garland, Fuel Cells – Data,Facts and Figures, Wiley-VCH, Weinheim, 2015.
162 ExxonMobil and FuelCell Energy, Inc., Pursue Novel Tech-nology in Carbon Capture, 2016, https://tinyurl.com/exxon-fuelcell-energy.
163 International Energy Agency, CO2 Emissions from FuelCombustion, 2016.
164 BP, BP Statistical Review of World Energy, 2017.165 International Energy Agency, World Energy Outlook, Paris,
2016.166 Deep Decarbonization Pathways Project, Pathways to deep
decarbonization 2015 report, SDSN – IDDRI, 2015.167 IPCC, Climate Change 2014 – Mitigation of Climate Change.
Contribution of Working Group III to the Fifth AssessmentReport of the Intergovernmental Panel on Climate Change,2014.
168 E. Kriegler, J. P. Weyant, G. J. Blanford, V. Krey, L. Clarke,J. Edmonds, A. Fawcett, G. Luderer, K. Riahi, R. Richels,S. K. Rose, M. Tavoni and D. P. van Vuuren, Clim. Change,2014, 123, 353–367.
169 IPCC, Climate Change 2014. Synthesis Report. Summary forPolicymakers, 2014.
170 R. Green and I. Staffell, Oxf. Rev. Econ. Pol., 2016, 32, 282–303.171 Royal Academy of Engineering, Counting the cost: the economic
and social costs of electricity shortfalls in the UK, 2014.172 Platts, World Electric Power Plants Database, 2016.173 Fuel Cell Today, The Industry Review 2011, 2011.174 U.S. Department of Energy, 2007 Fuel Cell Technologies
Market Report, 2007.175 K.-A. Adamson, The Fuel Cell and Hydrogen Annual Review,
2016, http://tinyurl.com/4ew-fchar.176 E. Wessof, Fuel Cells 2016: ‘Within Striking Distance of
Profiability’, 2016, http://tinyurl.com/zmmkecb.177 P. Chiesa, G. Lozza and L. Mazzocchi, J. Eng. Gas Turbines
Power, 2005, 127, 73–80.178 Energy Technologies Institute, The role of hydrogen storage
in a clean responsive power system, Energy TechnologiesInstitute, Loughborough, UK, 2015.
179 EPA, Catalog of CHP Technologies, US Environmental Protec-tion Agency, 2008.
180 Osaka Gas, Review of Operations, 2012.181 Bloom Energy, ES-5700 Energy Server Data Sheet, 2017,
http://www.bloomenergy.com/fuel-cell/es-5700-data-sheet/.182 New York Times, A Maker of Fuel Cells Blooms in California,
2010, http://tinyurl.com/j5csg7w.183 Bloom Energy, NASAt Technology Comes to Earth, 2017,
http://www.bloomenergy.com/about/company-history/.184 R. Smith, 3 Top Hydrogen Fuel Cell Stocks You Can Buy Right
Now, 2016, http://www.fool.com/investing/2016/11/28/should-you-invest-in-a-fuel-cell-stock.aspx.
185 S. Hardman, A. Chandan and R. Steinberger-Wilckens,J. Power Sources, 2015, 287, 297–306.
186 I. Staffell, Energy Policy, 2017, 102, 463–475.187 S. Letendre, P. Denholm and P. Lilienthal, Electric & Hybrid
Cars: New Load, or New Resource?, in Public UtilitiesFortnightly, 2006.
Energy & Environmental Science Review
Ope
n A
cces
s A
rtic
le. P
ublis
hed
on 1
0 D
ecem
ber
2018
. Dow
nloa
ded
on 1
/15/
2022
2:3
6:12
AM
. T
his
artic
le is
lice
nsed
und
er a
Cre
ativ
e C
omm
ons
Attr
ibut
ion
3.0
Unp
orte
d L
icen
ce.
View Article Online

488 | Energy Environ. Sci., 2019, 12, 463--491 This journal is©The Royal Society of Chemistry 2019
188 EREC, Re-thinking 2050: A 100% renewable energy vision forthe European Union, European Renewable Energy Council,2013.
189 J. Tomic and W. Kempton, J. Power Sources, 2007, 168,459–468.
190 W. Kempton, T. Jasna, L. Steven, B. Alec and L. Timothy,Vehicle-to-Grid Power: Battery, Hybrid, and Fuel Cell Vehiclesas Resources for Distributed Electric Power in California,California Air Resources Board and the California Environ-mental Protection Agency, 2001.
191 W. Kempton and J. Tomic, J. Power Sources, 2005, 144,268–279.
192 T. E. Lipman, J. L. Edwards and D. M. Kammen, EnergyPolicy, 2004, 32, 101–125.
193 G. Strbac, M. Aunedi, D. Pudjianto, P. Djapic, F. Teng,A. Sturt, D. Jackravut, R. Sansom, V. Yufit and N. Brandon,Strategic Assessment of the Role and Value of Energy StorageSystems in the UK Low Carbon Energy Future, Carbon Trust,London, UK, 2012.
194 F. Moura, Driving Energy System Transformation with‘‘Vehicle-to-Grid’’ Power, IIASA, 2006.
195 F. Diaz-Gonzalez, A. Sumper, O. Gomis-Bellmunt andR. Villafafila-Robles, Renewable Sustainable Energy Rev.,2012, 16, 2154–2171.
196 C. M. Grams, R. Beerli, S. Pfenninger, I. Staffell andH. Wernli, Nat. Clim. Change, 2017, 7, 557–562.
197 J. D. Holladay, J. Hu, D. L. King and Y. Wang, Catal. Today,2009, 139, 244–260.
198 D. Parra and M. K. Patel, Int. J. Hydrogen Energy, 2016, 41,3748–3761.
199 L. Bertuccioli, A. Chan, D. Hart, F. Lehner, B. Madden andE. Standen, Study on development of water electrolysis in theEU, 2014.
200 O. Schmidt, A. Gambhir, I. Staffell, A. Hawkes, J. Nelsonand S. Few, Int. J. Hydrogen Energy, 2017, 42, 30470–30492.
201 O. M. Balan, M. R. Buga, A. Brunot, A. Badea andD. Froelich, J. Energy Storage, 2016, 8, 111–118.
202 G. Gahleitner, Int. J. Hydrogen Energy, 2013, 38, 2039–2061.203 M. Gotz, J. Lefebvre, F. Mors, A. M. Koch, F. Graf, S. Bajohr,
R. Reimert and T. Kolb, Renewable Energy, 2016, 85,1371–1390.
204 F. Zhang, P. C. Zhao, M. Niu and J. Maddy, Int. J. HydrogenEnergy, 2016, 41, 14535–14552.
205 G. Reiter, in Fuel Cells – Data, Facts and Figures, ed.D. Stolten, R. C. Samsun and N. Garland, Wiley-VCH,Weinheim, 2015.
206 A. Buttler and H. Spliethoff, Renewable Sustainable EnergyRev., 2018, 82, 2440–2454.
207 P. Sabatier and J. B. Senderens, Comptes Rendus, 1902, 134,514–516.
208 M. Lehner, R. Tichler, H. Steinmuller and M. Koppe,Power-to-Gas: Technology and Business Models, SpringerInternational Publishing, 2014.
209 M. Jentsch, T. Trost, M. Sterner and Eurosolar, 8th Inter-national Renewable Energy Storage Conference and Exhibi-tion (Ires 2013), 2014, vol. 46, pp. 254–261.
210 M. Sterner and M. Jentsch, Energiewirtschaftliche und oko-logische Bewertungeines Windgas-Angebotes, 2011.
211 International Gas Union, Triennium 2009–2012. WorkingCommittee 2: Underground Gas Storage. WOC2 Final Report,2012.
212 M. Bailera, P. Lisbona, L. M. Romeo and S. Espatolero,Renewable Sustainable Energy Rev., 2017, 69, 292–312.
213 M. Kopp, D. Coleman, C. Stiller, K. Scheffer, J. Aichinger andB. Scheppat, Int. J. Hydrogen Energy, 2017, 42, 13311–13320.
214 S. Schiebahn, T. Grube, M. Robinius, V. Tietze, B. Kumarand D. Stolten, Int. J. Hydrogen Energy, 2015, 40, 4285–4294.
215 S. Clegg and P. Mancarella, IET Gener. Transm. Distrib.,2016, 10, 566–575.
216 J. Vandewalle, K. Bruninx and W. D’Haeseleer, EnergyConvers. Manage., 2015, 94, 28–39.
217 H. S. de Boer, L. Grond, H. Moll and R. Benders, Energy,2014, 72, 360–370.
218 M. Qadrdan, M. Abeysekera, M. Chaudry, J. Z. Wu andN. Jenkins, Int. J. Hydrogen Energy, 2015, 40, 5763–5775.
219 W. Vanhoudt, F. Barth, J.-C. Lanoix, J. Neave, P. R. Schmidt,W. Weindorf, T. Raksha, J. Zerhusen and J. Michalski, Power-to-gas: short term and long term opportunities to leveragesynergies between the electricity and transport sectors throughpower-to-hydrogen, Munich, 2016.
220 G. Guandalini, S. Campanari and M. C. Romano, Appl.Energy, 2015, 147, 117–130.
221 FCH-JU, Commercialisation of Energy Storage in Europe,2015.
222 V. A. Goltsov and T. N. Veziroglu, Int. J. Hydrogen Energy,2001, 26, 909–915.
223 National Research Council and National Academy ofEngineering, The Hydrogen Economy: Opportunities, Costs,Barriers, and R&D Needs, The National Academies Press,Washington, DC, 2004.
224 M. Balat and E. Kirtay, Energy Sources, Part A, 2010, 32,863–876.
225 J. A. Turner, Science, 1999, 285, 687–689.226 Royal Society Policy Briefing, Options for producing low-
carbon hydrogen at scale, 2018.227 OECD/IEA, IEA Energy Technology Essentials: Hydrogen
Production & Distribution, 2007.228 A. A. Evers, Actual Worldwide Hydrogen Production, 2008,
http://tinyurl.com/89h9zot.229 MarketsandMarkets, Hydrogen Generation Market – by
Merchant & Captive Type, Distributed & Centralized Genera-tion, Application & Technology – Trends & Global Forecasts(2011–2016), 2011.
230 K. Wawrzinek and C. Keller, Industrial Hydrogen Production &Technology, FuncHy-Workshop, Karlsruhe, Germany, 2007.
231 J. Mougin, Compendium of Hydrogen Energy, WoodheadPublishing, Oxford, 2015, pp. 225–253.
232 C. L. Muhich, B. D. Ehrhart, I. Al-Shankiti, B. J. Ward,C. B. Musgrave and A. W. Weimer, Wiley Interdiscip. Rev.:Energy Environ., 2016, 5, 261–287.
233 D. Yadav and R. Banerjee, Renewable Sustainable EnergyRev., 2016, 54, 497–532.
Review Energy & Environmental Science
Ope
n A
cces
s A
rtic
le. P
ublis
hed
on 1
0 D
ecem
ber
2018
. Dow
nloa
ded
on 1
/15/
2022
2:3
6:12
AM
. T
his
artic
le is
lice
nsed
und
er a
Cre
ativ
e C
omm
ons
Attr
ibut
ion
3.0
Unp
orte
d L
icen
ce.
View Article Online

This journal is©The Royal Society of Chemistry 2019 Energy Environ. Sci., 2019, 12, 463--491 | 489
234 M. Y. Azwar, M. A. Hussain and A. K. Abdul-Wahab,Renewable Sustainable Energy Rev., 2014, 31, 158–173.
235 R. S. Poudyal, I. Tiwari, A. R. Koirala, H. Masukawa,K. Inoue, T. Tomo, M. M. Najafpour, S. I. Allakhverdievand T. N. Veziroglu, Compendium of Hydrogen Energy,Woodhead Publishing, Oxford, 2015, pp. 289–317.
236 D. J. L. Brett, E. Agante, N. P. Brandon, E. Brightman,R. J. C. Brown, M. Manage and I. Staffell, in Functionalmaterials for sustainable energy applications, ed. J. Kilner,S. Skinner, S. Irvine and P. Edwards, Woodhead Publishing,Cambridge, 2012.
237 R. B. Gupta, Hydrogen Fuel, Production, Transport andStorage, CRC Press, 2008.
238 D. Sadler, A. Cargill, M. Crowther, A. Rennie, J. Watt,S. Burton, M. Haines, J. Trapps, M. Hand, R. Pomroy,K. Haggerty, I. Summerfield and M. Evans, H21 Leeds CityGate: 100% hydrogen conversion feasibility study, 2016,http://tinyurl.com/leeds-H21.
239 A. Susmozas, D. Iribarren, P. Zapp, J. Linben and J. Dufour,Int. J. Hydrogen Energy, 2016, 41, 19484–19491.
240 N. H. Florin and A. T. Harris, Chem. Eng. Sci., 2008, 63,287–316.
241 C. v. Hirschhausen, J. Herold and P.-Y. Oei, Economics ofEnergy & Environmental Policy, 2012, 1, 115–123.
242 V. Scott, S. Gilfillan, N. Markusson, H. Chalmers andR. S. Haszeldine, Nat. Clim. Change, 2012, 3, 105.
243 R. Slade, A. Bauen and R. Gross, Nat. Clim. Change, 2014, 4,99–105.
244 R. Matthews, N. Mortimer, J. P. Lesschen, T. J. Lindroos,L. Sokka, A. Morris, P. Henshall, C. Hatto, O. Mwabonje,J. Rix, E. Mackie and M. Sayce, Carbon impacts of biomassconsumed in the EU: quantitative assessment, The EuropeanCommission DG ENER/C1/427, 2015.
245 K. Zeng and D. Zhang, Prog. Energy Combust. Sci., 2010, 36,307–326.
246 M. Carmo, D. L. Fritz, J. Mergel and D. Stolten, Int.J. Hydrogen Energy, 2013, 38, 4901–4934.
247 W. Kreuter and H. Hofmann, Int. J. Hydrogen Energy, 1998,23, 661–666.
248 US Department of Energy, Hydrogen Production: Electrolysis,2016.
249 O. Schmidt, A. Hawkes, A. Gambhir and I. Staffell, Nat.Energy, 2017, 2, 17110.
250 US Department of Energy, Future Central Hydrogen Produc-tion from Solid Oxide Electrolysis, 2015.
251 S. D. Ebbesen, S. H. Jensen, A. Hauch and M. B. Mogensen,Chem. Rev., 2014, 114, 10697–10734.
252 M. A. Laguna-Bercero, J. Power Sources, 2012, 203, 4–16.253 J.-h. Myung, D. Neagu, D. N. Miller and J. T. S. Irvine,
Nature, 2016, 537, 528.254 M. Joos and I. Staffell, Renewable Sustainable Energy Rev.,
2018, 86, 45–65.255 K. Wipke, S. Sprik, J. Kurtz, T. Ramsden, C. Ainscough and
G. Saur, Status of U.S. FCEV and Infrastructure LearningDemonstration Project, in The FY2010 JHFC InternationalSeminar, Tokyo, 2011.
256 National Renewable Energy Laboratory, CDP#13: On-SiteHydrogen Production Efficiency, 2010.
257 National Renewable Energy Laboratory, CDP#60: On-SiteHydrogen Production Efficiency vs. Capacity Utilization, 2010.
258 M. Monde and K. Saito, WG1: Hydrogen Infrastructure, JHFCInternational Seminar, Tokyo, Japan, 2011.
259 J. Tomuro, Hydrogen Stations – JHFC Activities in FY2008,IPHE 11th ILC Meeting, Oslo, Norway, 2009.
260 K. Okazaki, Operation Results and Efficiency Evaluation ofJHFC Hydrogen Stations, The 4th JHFC Seminar, Tokyo, 2005.
261 J. Speirs, P. Balcombe, E. Johnson, J. Martin, N. Brandonand A. Hawkes, Energy Policy, 2018, 118, 291–297.
262 P. Balcombe, J. Speirs, E. Johnson, J. Martin, N. Brandonand A. Hawkes, Renewable Sustainable Energy Rev., 2018,91, 1077–1088.
263 P. Balcombe, N. P. Brandon and A. D. Hawkes, J. CleanerProd., 2018, 172, 2019–2032.
264 R. Hanke-Rauschenbach, B. Bensmann and P. Millet,Compendium of Hydrogen Energy, Woodhead Publishing,Oxford, 2015, pp. 179–224.
265 G. Parks, R. Boyd, J. Cornish and R. Remick, HydrogenStation Compression, Storage, and Dispensing TechnicalStatus and Costs, NREL, Golden, CO, 2014.
266 M. Gardiner, Energy Requirements for Hydrogen Gas Com-pression and Liquefaction as Related to Vehicle Storage Needs,2009.
267 IEA, Technology Roadmap: Hydrogen and Fuel Cells, Inter-national Energy Agency, Paris, France, 2015.
268 LCICG, Technology Innovation Needs Assessment (TINA):Hydrogen for Transport, Low Carbon Innovation Coordina-tion Group, 2014.
269 F. Di Bella, Development of a Centrifugal Hydrogen PipelineGas Compressor, US Department of Energy, 2015.
270 US Department of Energy, Multi-Year Research, Development,and Demonstration Plan. Section 3.2 – Hydrogen Delivery, FuelCell Technologies Office, US Department of Energy, 2015.
271 HyET, 2011.272 L. Lipp, Electrochemical Hydrogen Compressor, EERE, 2016.273 A. Kitchener, Bridging the pressure gap, The Future of CAES
in the UK, London, 2016.274 S. Krasae-in, J. H. Stang and P. Neksa, Int. J. Hydrogen
Energy, 2010, 35, 4524–4533.275 International Organization for Standardization, ISO 14687-
2:2012, https://www.iso.org/standard/55083.html.276 S. A. Grigoriev, P. Millet, S. V. Korobtsev, V. I. Porembskiy,
M. Pepic, C. Etievant, C. Puyenchet and V. N. Fateev,Int. J. Hydrogen Energy, 2009, 34, 5986–5991.
277 H. Ito, N. Miyazaki, M. Ishida and A. Nakano, Int. J. HydrogenEnergy, 2016, 41, 20439–20446.
278 M. Hamdan, High Efficiency Large PEM Electrolyzers, in theH2FC Fair, Hannover Messe, 2014.
279 S. Sircar and T. Golden, Sep. Sci. Technol., 2000, 35,667–687.
280 M. W. Melaina, O. Antonia and M. Penev, Blending Hydro-gen into Natural Gas Pipeline Networks: A Review of KeyIssues, NREL, 2013.
Energy & Environmental Science Review
Ope
n A
cces
s A
rtic
le. P
ublis
hed
on 1
0 D
ecem
ber
2018
. Dow
nloa
ded
on 1
/15/
2022
2:3
6:12
AM
. T
his
artic
le is
lice
nsed
und
er a
Cre
ativ
e C
omm
ons
Attr
ibut
ion
3.0
Unp
orte
d L
icen
ce.
View Article Online
490 | Energy Environ. Sci., 2019, 12, 463--491 This journal is©The Royal Society of Chemistry 2019
281 D. Sadler, A. Cargill, M. Crowther, A. Rennie, J. Watt,S. Burton, M. Haines, J. Trapps, M. Hand, R. Pomroy,K. Haggerty, I. Summerfield and M. Evans, H21 Leeds CityGate: 100% hydrogen conversion feasibility study, 2016.
282 D. Hart, J. Howes, B. Madden and E. Boyd, Hydrogen andFuel Cells: Opportunities for Growth. A Roadmap for the UK,E4Tech and Element Energy, 2016.
283 C. Yang and J. Ogden, Int. J. Hydrogen Energy, 2007, 32,268–286.
284 A. Kotchourko, D. Baraldi, P. Benard, N. Eisenreich,T. Jordan, J. Keller, A. Kessler, J. LaChance, V. Molkov,M. Steen and A. Tchouvelev, State of the art and researchpriorities in hydrogen safety, Joint Research Centre of theEuropean Commission (JRC), 2014.
285 B. C. C. van der Zwaan, K. Schoots, R. Rivera-Tinoco andG. P. J. Verbong, Appl. Energy, 2011, 88, 3821–3831.
286 N. E. Nanninga, Y. S. Levy, E. S. Drexler, R. T. Condon,A. E. Stevenson and A. J. Slifka, Corros. Sci., 2012, 59, 1–9.
287 R. P. Gangloff and B. P. Somerday, Gaseous HydrogenEmbrittlement of Materials in Energy Technologies, WoodheadPublishing, 2012.
288 F. Tabkhi, C. Azzaro-Pantel, L. Pibouleau and S. Domenech,Int. J. Hydrogen Energy, 2008, 33, 6222–6231.
289 V. Reitenbach, L. Ganzer, D. Albrecht and B. Hagemann,Environ. Earth Sci., 2015, 73, 6927–6937.
290 M. Abeysekera, J. Wu, N. Jenkins and M. Rees, Appl. Energy,2016, 164, 991–1002.
291 G. Guandalini, P. Colbertaldo and S. Campanari, Appl.Energy, 2017, 185, 1712–1723.
292 P. E. Dodds and W. McDowall, Energy Policy, 2013, 60,305–316.
293 I. Staffell, The Energy and Fuel Data Sheet, 2011, http://tinyurl.com/energy-fuel-data-sheet.
294 Ispos MORI and Energy Saving Trust, Homeowners’ Will-ingness To Take Up More Efficient Heating Systems, DECC,London, 2013.
295 A. Vaughan, Trial to phase in hydrogen as fuel to begin innorth-west, The Guardian, 2017.
296 Cadent, HyNet North West, https://hynet.co.uk/.297 T. I. Williams, A History of the British Gas Industry, Oxford
University Press, Oxford, UK, 1981.298 The Global Carbon Capture and Storage Institute, CCS
Ready Policy: Considerations and Recommended Practices forPolicymakers.
299 Policy Connect, Next Steps for the Gas Grid, 2017.300 M.-R. d. Valladares, Global trends and outlook for hydrogen,
Inernational Energy Agency, 2017.301 H. L. Ferreira, R. Garde, G. Fulli, W. Kling and J. P. Lopes,
Energy, 2013, 53, 288–298.302 A. Ozarslan, Int. J. Hydrogen Energy, 2012, 37, 14265–14277.303 I. Staffell and M. Rustomji, J. Energy Storage, 2016, 8,
212–225.304 ITM Power, National Grid, Shell, SSE, Scotia Gas Networks
and Kiwa, Power-To-Gas: A UK Feasibility Study, ITM Power,Sheffield, 2013.
305 Nissan, 2016.
306 L. Klebanoff, Hydrogen Storage Technology: Materials andApplications, CRC Press, Boca Raton, FL, 2016.
307 M. B. Ley, L. H. Jepsen, Y.-S. Lee, Y. W. Cho, J. M. Bellostavon Colbe, M. Dornheim, M. Rokni, J. O. Jensen, M. Sloth,Y. Filinchuk, J. E. Jørgensen, F. Besenbacher and T. R. Jensen,Mater. Today, 2014, 17, 122–128.
308 L. E. Klebanoff and J. O. Keller, Int. J. Hydrogen Energy,2013, 38, 4533–4576.
309 Hydrogenious Technologies, Hydrogenious Release BOX,2016.
310 T. S. Blankenship and R. Mokaya, Energy Environ. Sci.,2017, 10, 2552–2562.
311 Toyota, Toyota Mirai technical specifications vs. FCHV-adv, 2014, http://blog.toyota.co.uk/toyota-mirai-technical-specifications-vs-fchv-adv.
312 B. D. James, W. G. Colella and J. M. Moton, HydrogenStorage Cost Analysis, DOE Annual Merit Review, Arlington,VA, 2013.
313 European Commission, DIRECTIVE2014/94/EU on thedeployment of alternative fuels infrastructure, EuropeanCommission, Brussels, 2014.
314 European Commission, DIRECTIVE 2009/28/EC on the pro-motion of the use of energy from renewable sources andamending and subsequently repealing Directives 2001/77/ECand 2003/30/EC, European Commission: Brussels, 2009.
315 European Commission, Proposal for a directive of theeuropean parliament and of the council on the promotion ofthe use of energy from renewable sources (recast), Brussels,European Commission, 2016.
316 European Commission, Directive on the promotion of theuse of energy from renewable sources (recast), EuropeanCommission, Brussels, 2017.
317 US Department of Energy, Federal Laws and Incentives forHydrogen, 2017, http://www.afdc.energy.gov/fuels/laws/HY/US.
318 HM Government and Automotive council UK, IndustrialStrategy: Automotive Sector Deal, 2018.
319 A. Velazquez Abad, MBA Dissertation, University ofSouthampton, 2017.
320 R. Steinberger-Wilckens, J. Radcliffe, N. Al-Mufachi,P. E. Dodds, A. Velazquez Abad, O. Jones and Z. Kurban,The role of hydrogen and fuel cells in delivering energysecurity for the UK, H2FC Supergen, London, UK, 2017.
321 M. J. Smith, O. Alabi, N. Hughes, P. E. Dodds, K. Turnerand J. T. S. Irvine, The economic impact of hydrogen and fuelcells in the UK, H2FC Supergen, London, UK, 2017.
322 Chinese State Council, Made in China 2025, 2015.323 ANRE, Summary of the Strategic Road Map for Hydrogen and
Fuel Cells, METI, 2014.324 METI, Japan’s Energy White Paper, 2017, http://www.meti.
go.jp/english/report/downloadfiles/energy_hakusho_201711.pdf.
325 Df T and OLEV d23 million boost for hydrogen-poweredvehicles and infrastructure, D.f. Transport, O.f.L.E. Vehicles,2017.
326 Defra and DfT, Plan for roadside NO2 concentrations pub-lished in Plan includes an end to the sale of all new
Review Energy & Environmental Science
Ope
n A
cces
s A
rtic
le. P
ublis
hed
on 1
0 D
ecem
ber
2018
. Dow
nloa
ded
on 1
/15/
2022
2:3
6:12
AM
. T
his
artic
le is
lice
nsed
und
er a
Cre
ativ
e C
omm
ons
Attr
ibut
ion
3.0
Unp
orte
d L
icen
ce.
View Article Online

This journal is©The Royal Society of Chemistry 2019 Energy Environ. Sci., 2019, 12, 463--491 | 491
conventional petrol and diesel cars and vans by 2040 and anew Clean Air Fund, 2017.
327 Ministere de la Transition ecologique et solidaire,Mobilites et transports: quelles priorites? 2017.
328 VVD, CDA, D66 and CU, Confidence in the Future.2017–2021 Coalition Agreement, 2017.
329 NEA, Climate mitigation measures up to 2030 – short termclimate effects and health effects, Oslo, 2016.
330 U. Irfan, Lack of Cheap, Clean Hydrogen Slows Fuel-CellCars, in Scientific American, 2016.
331 EERE, Cumulative U.S. Fuel Cell Vehicle Sales, 2017,https://tinyurl.com/eere-fact-17-01.
332 X. Pan, IPHE Country Update March 2017: China, Interna-tional Partnership for Hydrogen and Fuel Cells in theEconomy, Brussels, 2017.
333 Delta-ee, Micro-CHP Annual Roundup, 2012.334 IPHE, 27th Steering Committee Meeting: Country Reports,
2017, http://www.iphe.net/events/meetings/SC_27.html.335 E. Ohira, Private communication of Japanese representative
to the IEA Hydrogen meeting: Naples, 2017.336 I. Hara, Current Status of H2 and Fuel Cell Programs
of Japan, in 20th IPHE Steering Committee Meeting,Fukuoka, Japan, 2013.
337 A. Shimizu, Will Japan’s hydrogen dreams come true?, inBloomberg New Energy Finance, 2017.
338 M. Small, European-wide field trials for residential Fuel Cellmicro-Cogeneration, in FCH-JU Programme Review Days,Brussels, 2017.
339 B. Biebuyck, EU policy & micro-CHP, IPHE, 2016.340 W. Ling, Latest Development of China’s Hydrogen Energy,
in World Hydrogen Energy Conference, Rio de Janeiro,2018.
341 METI, Compilation of the Revised Version of the StrategicRoadmap for Hydrogen and Fuel Cells, 2016.
342 A. Maruta, Japan’s ENE-FARM programme, Technova Inc.,Vienna, 2016.
343 BMVI, Fortsetzung des Nationalen InnovationsprogrammsWasserstoff- und Brennstoffzellentechnologie (NIP) 2016–2026,BMVI, Berlin, 2016.
344 NOW, Hydrogen as an electricity-based clean fuel in trans-port, 2016.
345 P. Rosner and G. Appel, Bosch Fuel Cell System Experience inAustria and Germany, 2016, https://www.energyagency.at/fileadmin/dam_en/pdf/fuelcells/Appel_Rosner.pdf.
346 NOW, Hydrogen as an electricity-based clean fuel in transport,2016, https://www.now-gmbh.de/en/news/press/hydrogen-as-an-electricity-based-clean-fuel-in-transport.
347 B. Acosta Iborra, E. Gupta and L. Seissler, 4th InternationalWorkshop on Hydrogen Infrastructure and Transportation,Report EUR 28242 EN, JRC, Luxemburg, 2016.
348 US Department of Energy, Federal Legislation Supports andAdvances Alternative Fuels, 2016, https://www.afdc.energy.gov/bulletins/2016_10_11_Fed_Advances.html.
349 MOTIE, Korean government to increase the number of eco-friendly cars to one million by 2020, 2015, https://tinyurl.com/MOTIE-2015-12-08.
350 HM Government, Industrial Strategy: Automotive Sector Deal2017, https://tinyurl.com/ybah838e.
351 T. Karlsson, Developments and Drivers for Fuel Cells ElectricMobility, in 2017 International Forum on Electric VehiclePilot Cities and Industrial Development, 2017.
352 US Department of Energy, Hydrogen Fueling Station Loca-tions, 2018, https://www.afdc.energy.gov/fuels/hydrogen_locations.html.
353 U. Dewald and B. Truffer, Industry and Innovation, 2011, 18,285–300.
354 Certifhy, Developing a European Framework for the genera-tion of guarantees of origin for green hydrogen, Hinicio,Brussels, 2016.
355 M. Yamazumi and S. Kawamura, IPHE Country UpdateNovember 2016: Japan, IPHE, 2016.
356 S. Ko, IPHE Country Update May 2016: Korea, IPHE, 2016.
Energy & Environmental Science Review
Ope
n A
cces
s A
rtic
le. P
ublis
hed
on 1
0 D
ecem
ber
2018
. Dow
nloa
ded
on 1
/15/
2022
2:3
6:12
AM
. T
his
artic
le is
lice
nsed
und
er a
Cre
ativ
e C
omm
ons
Attr
ibut
ion
3.0
Unp
orte
d L
icen
ce.
View Article Online