
Impact of variable valve timing on power, emissions and backfire of a bi-fuel hydrogen/gasoline...
29
biblio.ugent.be The UGent Institutional Repository is the electronic archiving and dissemination platform for all UGent research publications. Ghent University has implemented a mandate stipulating that all academic publications of UGent researchers should be deposited and archived in this repository. Except for items where current copyright restrictions apply, these papers are available in Open Access. This item is the archived peer-reviewed author-version of: Impact of variable valve timing on power, emissions and backfire of a bi-fuel hydrogen/gasoline engine S. Verhelst, J. Demuynck, R. Sierens and P. Huyskens In: International Journal of Hydrogen Energy, Volume 35, Issue 9, May 2010, Pages 4399-440 http://dx.doi.org/10.1016/j.ijhydene.2010.02.022 To refer to or to cite this work, please use the citation to the published version: Verhelst, S., Demuynck, J., Sierens, R. & Huyskens, P. (2010). Impact of variable valve timing on power, emissions and backfire of a bi-fuel hydrogen/gasoline engine. INTERNATIONAL JOURNAL OF HYDROGEN ENERGY 35(9). 4399-440 http://dx.doi.org/10.1016/j.ijhydene.2010.02.022.
Transcript of Impact of variable valve timing on power, emissions and backfire of a bi-fuel hydrogen/gasoline...

biblio.ugent.be
The UGent Institutional Repository is the electronic archiving and dissemination platform for all
UGent research publications. Ghent University has implemented a mandate stipulating that all
academic publications of UGent researchers should be deposited and archived in this repository.
Except for items where current copyright restrictions apply, these papers are available in Open
Access.
This item is the archived peer-reviewed author-version of:
Impact of variable valve timing on power, emissions and backfire of a bi-fuel hydrogen/gasoline
engine
S. Verhelst, J. Demuynck, R. Sierens and P. Huyskens
In: International Journal of Hydrogen Energy, Volume 35, Issue 9, May 2010, Pages 4399-440
http://dx.doi.org/10.1016/j.ijhydene.2010.02.022
To refer to or to cite this work, please use the citation to the published version:
Verhelst, S., Demuynck, J., Sierens, R. & Huyskens, P. (2010). Impact of variable
valve timing on power, emissions and backfire of a bi-fuel hydrogen/gasoline
engine. INTERNATIONAL JOURNAL OF HYDROGEN ENERGY 35(9). 4399-440
http://dx.doi.org/10.1016/j.ijhydene.2010.02.022.

1
Impact of variable valve timing on power, emissions and backfire of a bi-fuel hydrogen/gasoline engine
S. Verhelst*, J. Demuynck and R. Sierens
Department of Flow, Heat and Combustion Mechanics
Ghent University
Sint-Pietersnieuwstraat 41, B-9000 Gent, Belgium
P. Huyskens
Karel de Grote University College, Department of Applied Engineering,
Salesianenlaan 30, B-2660, Antwerp, Belgium
*corresponding author: T +32 9 264 3306; F +32 9 264 3590; E-mail [email protected]
Abstract
Hydrogen-fueled internal combustion engines are a possible solution to make transportation more ecological.
Apart from difficulties in production and storage of hydrogen, there are three major bottlenecks in the operation
of hydrogen powered engines: reaching a high power output, reducing NOx emissions at high loads and avoiding
backfire. This paper presents an experimental study of the influence of continuously variable valve timing of the
intake valves on these bottlenecks. Measurements were performed on a four-cylinder engine that can run on
gasoline as well as on hydrogen. The measurements on hydrogen are compared to those on gasoline. For
hydrogen, the effects of the cam phasing were investigated at wide open throttle, where load is controlled by the
quality of the mixture (equivalence ratio) as well as in throttled mode, where load is defined by the quantity of
mixture.
Results show that it is possible to optimize the applied control strategy by using variable valve timing as a means
to increase the range of both the qualitative and quantitative load control methods, which contributes to an easier
switch between both methods.
Keywords: Hydrogen ICE; variable valve timing; bi-fuel; emissions; backfire
*ManuscriptClick here to view linked References
2
Nomenclature
Symbols
n engine speed [rpm]
Qair volumetric air flow [m³/h]
QH2 volumetric hydrogen flow [m³/h]
VS swept volume [m³]
Greek Symbols
ηvol volumetric efficiency [-]
Φ fuel to air equivalence ratio (Φ = 1/λ) [-]
air to fuel equivalence ratio [-]
Abbreviations
BDC bottom dead center
BTDC before top dead center
ca crank angle
CVVT continuously variable valve timing
EGR exhaust gas recirculation
H2ICE hydrogen powered internal combustion engine
ICE internal combustion engine
IT ignition timing
IVO intake valve opening time
LNT lean NOX trap
MAF mass air flow
MBT minimum spark advance for best torque
NOX nitrogen oxides
PFI port fuel injection
TDC top dead center
TP throttle position
TWC three way catalyst
VOP valve overlap period
WOT wide open throttle
3
1 Introduction
The globally increasing awareness about the environment, the therefore increasingly strict environmental
guidelines (e.g. EURO-legislation, Kyoto protocol, limited fleet average CO2 emissions [1],…) and the finiteness
of the fossil fuel reserves drive us to the use of alternative fuels. Hydrogen is one possible way to come to
ecological, (near) zero emission transport. Hydrogen is most commonly associated with fuel cells. Thus far it
seems that affordable fuel cell vehicles will not be available for mass production anytime soon [2]. An appealing
alternative is using hydrogen in internal combustion engines (H2ICEs). The relatively cheap H2ICEs permit the
use of a normal spark ignition engine, a technology known to man for more than a century. Another advantage
can be found in the fact that a hydrogen fueled ICE can easily be used as a bi- or flex-fuel engine and can thus be
used to avoid the well known “chicken or the egg” dilemma. These benefits and experimental research on
hydrogen-fueled ICEs have previously been reviewed by some of the authors [3,4,5].
Important progress has been made in the field of hydrogen fueled ICEs during the last decade. Nevertheless,
some problems still remain. The three major bottlenecks are abnormal combustion, performance and NOX
output. Although measures can be taken to avoid abnormal combustion (surface ignition, backfire, knock,
[3,4,6]), there is no given set of measures with guaranteed success. Backfire (the ignition of the hydrogen-air
mixture during the intake process) can be particularly difficult to predict and is thus the most difficult to control
[7].
For what concerns the other two bottlenecks, they mostly have to be looked at as one, since there is a very strong
power output versus NOX emissions trade-off for H2ICEs. The wide flammability limits of hydrogen-air mixtures
allow lean mixtures resulting in lower combustion temperatures and thus low NOX output. Wide open throttle
(WOT) operation can be applied, regulating power output through varying the equivalence ratio. This avoids
throttle losses and increases engine efficiency. However, using this approach means richer mixtures (lean of
stoichiometric) as the load increases, and correspondingly, increasing combustion temperatures. When going
richer than a certain threshold equivalence ratio, peak cylinder temperatures exceed the NOX formation
temperature and NOX emissions quickly rise to a maximum, which can be higher than that for gasoline
operation. This is due to the higher adiabatic flame temperature and rapid combustion of hydrogen mixtures.
Thus, hydrogen engines can be used at high efficiencies while producing hardly any NOX, but then the engine
load is restricted. For the NOX output not to exceed 100 ppm a certain threshold equivalence ratio should not be
crossed. This threshold equivalence ratio depends on the engine and varies between about λ = 1.8 (Φ = 0.56) and
λ = 2.2 (Φ = 0.45), with λ the air to fuel equivalence ratio and Φ the fuel to air equivalence ratio (Φ = 1/λ). For
loads above the WOT threshold equivalence ratio condition, an approach using stoichiometric mixtures and
throttling is required. Although engine efficiency suffers, exhaust gas aftertreatment is simple using a
conventional three-way catalyst (TWC).
An alternative to the “stoichiometric + throttling”-strategy is to regulate the power output using stoichiometric
mixtures and exhaust gas recirculation (EGR) [8]. Power output is then increased by decreasing the EGR
percentage. This way it is possible to keep controlling the energy content of the mixture in the cylinder
(qualitative control) without the need of a throttle valve (quantitative control) and thus reducing the pumping
losses. In short, this strategy -made possible by the high EGR tolerance of hydrogen mixtures- increases

4
efficiency compared to the “stoichiometric + throttling”-strategy [9]. Nonetheless, the increasing combustion
instability for high EGR percentages can be a practical limit [10].
The easiest way to introduce hydrogen ICEs is by converting a gasoline engine to bi-fuel operation, by mounting
a hydrogen fuel system and gas injectors. Starting from a gasoline engine implies port fuel injection (PFI) of the
hydrogen. Therefore, this paper concentrates on hydrogen PFI engines, although dedicated hydrogen engines
would benefit greatly from direct injection [3, 4, 11,12] and novel concepts for mixture formation have been
reported [13]. Also, work has been published on compression ignition operation on H2 [14].
A PFI hydrogen engine operating stoichiometric at WOT, has a theoretical power deficit of about 18% compared
to a gasoline engine, due to the lower volumetric energy density. In practice, the power deficit can be even higher
if the equivalence ratio has to be limited to avoid abnormal combustion. This can be circumvented by using
variable valve timing, which has been used successfully to enable hydrogen engines to run stoichiometric
without backfire [9], through better scavenging of hot exhaust gases. Huynh T.C. et al [15] found that backfire is
especially affected by the valve overlap period (VOP). By varying the VOP and supercharging they achieved to
get backfireless operation at equal or higher performance than on gasoline. In [8] the authors demonstrate that
supercharging is an appropriate means to increase the power output of H2 PFI engines.
2 Experimental set-up
2.1 Engine
A Volvo four cylinder sixteen valve gasoline engine with a total swept volume of 1783cc and a compression ratio
of 10.3:1 was converted to bi-fuel operation by mounting an additional fuel rail supplying gaseous fuel to 8 (2
per cylinder) Teleflex GSI gas injectors, mounted on the intake manifold [16]. The intake manifold was modified
to avoid any damage if backfire would occur during the hydrogen measurements: a T-type branch pipe was
mounted on the intake manifold with the „straight ahead‟ branch closed by a foam plug and the other branch
leading to the air filter – mass air flow (MAF) sensor – throttle valve assembly, see Fig. 1. Any pressure rise in
the intake manifold due to the occurrence of backfire results in the foam plug being blown out instead of
damaging other components such as the MAF sensor.
The engine has continuously variable valve timing (CVVT) on the intake camshaft, allowing up to 40 degrees
crank angle (°ca) advance of the intake valve opening and closing time. A MoTeC M800 engine control unit is
used to control ignition timing, start of injection, injection duration and intake valve timing. Cylinder pressure
measurements were possible using a spark plug pressure sensor, a piezo-electric Kistler type 6117BFG16. A
piezo-resistive Kistler type 4075A20 sensor placed in the intake manifold close to one of the inlet valves was
used for pegging the cylinder pressure. The crank angle was recorded using a Kistler crank angle encoder type
2613B1.
5
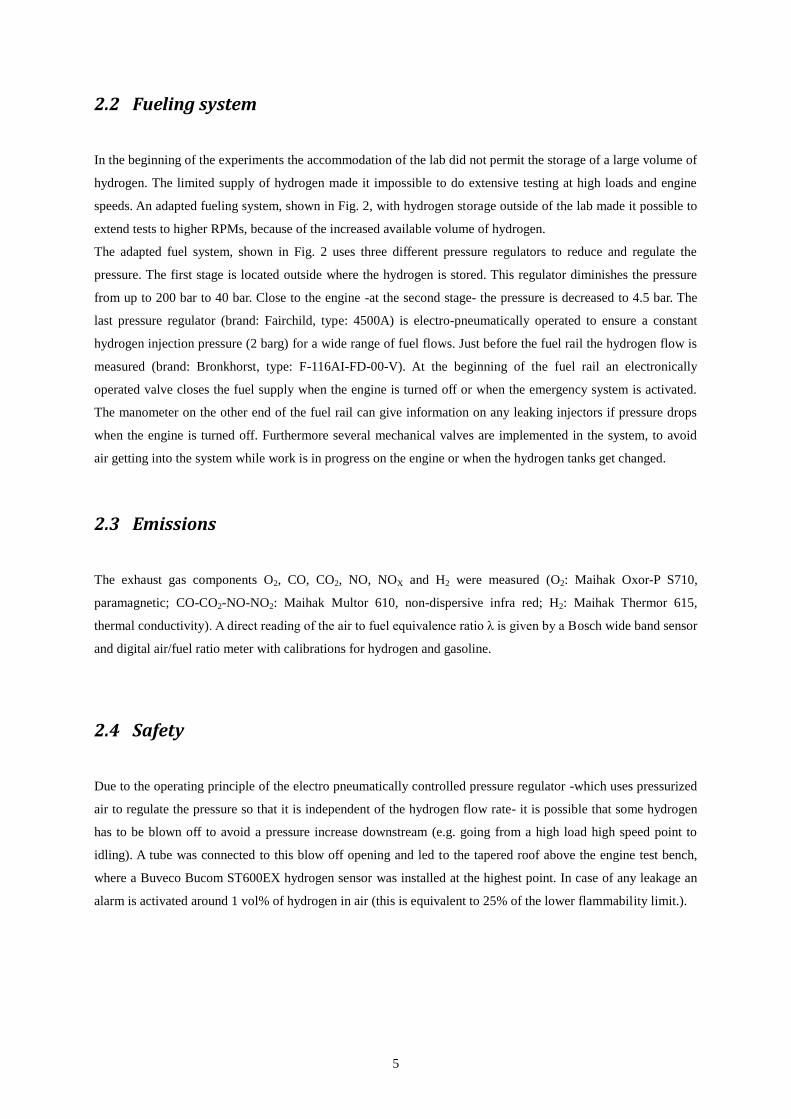
2.2 Fueling system
In the beginning of the experiments the accommodation of the lab did not permit the storage of a large volume of
hydrogen. The limited supply of hydrogen made it impossible to do extensive testing at high loads and engine
speeds. An adapted fueling system, shown in Fig. 2, with hydrogen storage outside of the lab made it possible to
extend tests to higher RPMs, because of the increased available volume of hydrogen.
The adapted fuel system, shown in Fig. 2 uses three different pressure regulators to reduce and regulate the
pressure. The first stage is located outside where the hydrogen is stored. This regulator diminishes the pressure
from up to 200 bar to 40 bar. Close to the engine -at the second stage- the pressure is decreased to 4.5 bar. The
last pressure regulator (brand: Fairchild, type: 4500A) is electro-pneumatically operated to ensure a constant
hydrogen injection pressure (2 barg) for a wide range of fuel flows. Just before the fuel rail the hydrogen flow is
measured (brand: Bronkhorst, type: F-116AI-FD-00-V). At the beginning of the fuel rail an electronically
operated valve closes the fuel supply when the engine is turned off or when the emergency system is activated.
The manometer on the other end of the fuel rail can give information on any leaking injectors if pressure drops
when the engine is turned off. Furthermore several mechanical valves are implemented in the system, to avoid
air getting into the system while work is in progress on the engine or when the hydrogen tanks get changed.
2.3 Emissions
The exhaust gas components O2, CO, CO2, NO, NOX and H2 were measured (O2: Maihak Oxor-P S710,
paramagnetic; CO-CO2-NO-NO2: Maihak Multor 610, non-dispersive infra red; H2: Maihak Thermor 615,
thermal conductivity). A direct reading of the air to fuel equivalence ratio λ is given by a Bosch wide band sensor
and digital air/fuel ratio meter with calibrations for hydrogen and gasoline.
2.4 Safety
Due to the operating principle of the electro pneumatically controlled pressure regulator -which uses pressurized
air to regulate the pressure so that it is independent of the hydrogen flow rate- it is possible that some hydrogen
has to be blown off to avoid a pressure increase downstream (e.g. going from a high load high speed point to
idling). A tube was connected to this blow off opening and led to the tapered roof above the engine test bench,
where a Buveco Bucom ST600EX hydrogen sensor was installed at the highest point. In case of any leakage an
alarm is activated around 1 vol% of hydrogen in air (this is equivalent to 25% of the lower flammability limit.).

6
3 Control strategy used for hydrogen operation
3.1 Strategy
Wide open throttle operation ensures the highest volumetric efficiency, but is only useable at low loads, as for
achieving higher loads it is necessary to use a richer mixture, which causes the NOX output to exceed the
acceptable rate of 100 ppm, as discussed in the introduction. At stoichiometric operation with throttling, NOX
aftertreatment with a TWC is straightforward. However, the region between the threshold equivalence ratio,
where NOX emissions get too high, and stoichiometric is to be avoided, as exhaust gas aftertreatment (to reduce
NOX emissions) in this interval is complex because of the excess of oxygen in the exhaust gas. Lowering the
amount of NOX in the exhaust gas would require lean NOX aftertreatment, such as a Lean NOX Trap (LNT)
[17,18].
Hence, to put a H2ICE to optimum use for efficiency and performance, the control strategy has to include a
switch from lean burn (λ > 2) to stoichiometric operation. The practical implementation of the combination of
quantitative and qualitative mixture control for the test engine is made clear in Fig. 3. Here, it is straightforward
that when load increases lambda has to decrease (at the left hand side of the graph), but at a certain point (λ ≈ 2)
the NOX level transcends the acceptable threshold level of 100 ppm. At this point the engine control strategy has
to leap from WOT qualitative to quantitative throttled (at the right hand side of the graph), where a catalytic
converter can bring the NOX emissions down to an acceptable level. The use of this control strategy was
successfully implemented by BMW in the Hydrogen 7 as described in [19,20]. To get a smooth transition from
one mode to another, throttle position has to be changed very fast to avoid big disparities in power output. This
causes technical difficulties. During the change between the two modes variable valve timing might help to
smoothen out the transition.
3.2 CVVT
The continuously variable valve timing on the engine enables a continuous time phasing of the intake valves.
The valve lift and the total opening time remain fixed. Accordingly, valve timing is a compromise, as the ram
effect which depends on the intake valve closing time will be adverse to the dynamic effects of the exhaust gases
leaving the cylinder, which are dependent on the opening time of the intake valve. For an easier understanding,
Fig. 4 shows the intake and exhaust cam profiles of the test engine and the effects of an advancement of the
intake valve opening time (IVO). The valve timing is also adjustable with the MoTeC programmable motor
management system. The intake valve opening time is adjustable as a function of the load and the speed of the
engine.
The valve timing can be used to influence the power output as a means to get a softer transition between the two
engine operation modes discussed above.
In the results given below, the influence of the CVVT system on, among others, the volumetric efficiency vol
will be discussed. For gaseous fuels it is important to properly define volumetric efficiency. Here, the following
definition is used:

7
With Qair and QH2 the measured air and hydrogen volumetric flow rates, respectively, Vs the swept volume and n
the engine speed.
4 Results
4.1 Gasoline
The influences of the CVVT system were first examined for gasoline to determine a base set to compare the
hydrogen results with. All measurements are for MBT ignition timing, closed loop lambda control (λ = Φ = 1)
and quantitative (throttled) load control. Results of CVVT on gasoline are given qualitatively in the following.
When advancing the intake valve opening time at low loads (small throttle openings or throttle position TP), the
resulting increased valve overlap (see Fig. 4) leads to a higher amount of internal EGR. This is caused by
exhaust gases being pushed back into the inlet manifold when the intake valves open, due to the low gas
momentum in the intake and exhaust manifolds at low loads. During the first part of the intake stroke, the
descending piston draws a mixture of fresh charge and exhaust gases into the cylinder. The higher amount of
internal EGR leads to decreased NOX emissions as peak temperatures are lowered. This is confirmed by the
results, shown in Fig. 5, of NOX and brake torque at 1500 and 2500 rpm. However, at very low IVO
advancement, ignition timing has to be delayed in such a way that its diminishing effect on the NOX production
more than compensates for the effect of the lesser internal EGR, see Fig. 5: 1500 rpm at 4°ca IVO advance. The
engine torque did not vary significantly with intake valve timing, so volumetric efficiency is hardly affected.
This is due to the conflicting trends between higher internal EGR with advanced IVO and, for these low loads,
more fresh charge being pushed back in the intake manifold at the end of the intake phase when IVO is delayed
(delaying the closing of the intake valves due to the fixed opening duration, see Fig. 4). At low engine speeds,
there is a critical amount of EGR above which combustion becomes instable. This poses a limit to the IVO
advancement (and thus the valve overlap). This can be seen in Fig. 5 from the decreased torque at 1500 rpm at an
IVO advance of 40°ca.
At medium loads and low to medium engine speeds, the higher valve overlap (advanced IVO) leads to better
cylinder filling (thus, a higher volumetric efficiency) due to the inertia of the exhaust gases flowing from the
cylinder to the exhaust manifold. The opposing effects of NOX increase at lowered IVO advance and NOX
decrease due to the lower ignition advance, which was also visible for low loads and engine speed, are shown in
Fig. 6 for 2500 rpm.

8
At high loads and low to medium engine speeds the results of the higher volumetric efficiency due to advanced
IVO are even more distinct. This can be seen on the brake torque curve at 2500 rpm in Fig. 7. In this operating
range internal EGR is absent and NOX emissions are not a function of the IVO time.
At higher engine speeds, a compromise is necessary for an optimal volumetric efficiency: early intake valve
opening and thus large valve overlap to use exhaust gas inertia, versus late intake valve closing to use the inertia
of the fresh charge for a better filling at the end of the intake phase (ram effect). This trade-off can be seen on the
brake torque curve at 3500 rpm (Fig. 7) that shows a maximum at an IVO advance of 28°ca.
4.2 Hydrogen
As mentioned before, measurements on hydrogen were limited to 1500rpm at the beginning of the tests (due to
limitations of the hydrogen storage in the lab). The results for these tests were already partly discussed elsewhere
[21].
The adapted fueling system made more extensive testing possible, so measurements were extended to higher
engine speeds. Given that changes have been made to the test setup since the low engine speed experiments,
results will be given and discussed separately to avoid misinterpretation. All measurements reported here are for
MBT ignition timing. Both qualitative load control (varying the equivalence ratio at WOT) and quantitative load
control (throttling at stoichiometric) have been investigated.
4.2.1 Wide open throttle, qualitative control:
Figure 8 shows results at wide open throttle, for a fixed engine speed of 1500 rpm. Here, the air to fuel
equivalence ratio is used to regulate load, with the brake torque increasing as more hydrogen is injected. Brake
torque and NOX emissions are shown as a function of the air to fuel equivalence ratio, for different intake cam
phasing. Advancing IVO at a fixed equivalence ratio leads to a higher brake torque. As injection durations had to
increase to keep the equivalence ratio constant, this means the volumetric efficiency increases with advancing
IVO. This is caused by the low momentum of the fresh charge at low engine speed, meaning it is best to close
the intake valves early so no fresh charge is pushed back in the intake manifold at the end of the intake phase
(see Fig. 4).
NOX emissions have no clear trend with the intake cam phasing. These results are qualitatively similar to the
results at high loads (large throttle openings) and medium speeds on gasoline, see Fig. 7: brake torque increases
with advanced IVO while NOX emissions are relatively unaffected. The threshold equivalence ratio for this
engine is λ ≈ 2 (Φ ≈ 0.5). One would expect the NOX emissions to peak around λ = 1.2 (Φ = 0.83) [4]. This peak
is not visible in the figure as the measurements were done at 0.25 increments in air to fuel equivalence ratios.
An important result to note from Fig. 8 is that it was not possible to run at stoichiometric for the most advanced
intake cam timings. At these timings, backfire occurred. It is not clear what causes this. There is an increased
contact between fresh charge and exhaust gas due to the longer valve overlap, but the injection duration of
hydrogen for these low speeds is such that there is more than enough time to delay the start of injection until
after the exhaust valve closes and still have an end of injection before BDC. Contrary to our findings, Tang et al.

9
at Ford [19] did not find an influence of the intake valve timing on the richest mixture possible for WOT on their
2.0 liter Zetec engine. In their case, the mixture richness was limited (to λ ≈ 1.35 / Φ ≈ 0.74) due to the
occurrence of pre-ignition events.
The gain in torque output with the richer mixtures that are possible with the small intake cam advance, far
outweighs the effects of the intake cam phasing. For example, at λ = 1.5, which is the richest point possible using
the maximum intake cam advance of 40°ca, the brake torque is 83.2 Nm, compared to 70 Nm at 4°ca IVO
advance. However, up until 16°ca IVO advance, stoichiometric operation is possible resulting in a torque output
of 97 Nm (compared to about 120 Nm on gasoline).
4.2.2 Quantitative, throttled engine control:
From Fig. 8 it is clear that the region between stoichiometric mixtures and the threshold equivalence ratio is to
be avoided due to excessive NOX emissions and (oxygen-rich) conditions that prohibit efficient aftertreatment.
When the load demand is higher than that reachable (from the viewpoint of acceptable NOX) with the WOT
qualitative control strategy, one has to switch to a throttled strategy at stoichiometric mixtures as Fig. 3
illustrates.
Figure 9 shows results for stoichiometric mixtures as a function of the throttle position, for a fixed engine speed
of 1500 rpm. Again, an advanced IVO increases the brake torque. This effect is strongest for the larger throttle
openings, as the momentum of the gas (fresh charge or exhaust gas) in the manifolds is higher. The mechanism
by which torque increases is again that less fresh charge is being pushed back in the intake when closing the
intake valve shortly after BDC. For the smaller throttle openings, an advanced IVO leads to higher internal EGR
due to the depression in the intake. At these throttle openings, the conflicting trends between internal EGR and
volumetric efficiency result in a negligible effect of intake cam phasing on torque output. This is analogous to
the low load results on gasoline, see Fig. 5.
Looking at the trends found for gasoline, the effects on NOX emissions for throttled hydrogen operation are
expected to be a decrease in NOX with advancing IVO at the smaller throttle openings, and a negligible effect for
the larger throttle openings. This is confirmed by the results in Fig. 9, where the maximum NOX output is also
reached at 16°ca. The explanation for this phenomenon is the same as was the case at gasoline operation. It can
be seen in Fig. 9 that no results are shown for advanced IVO phasing at the larger throttle openings. This is
because the maximum throttle opening for these IVO timings is limited due to the occurrence of backfire. This is
similar to the limitations on the richest equivalence ratio for advanced IVO in Fig. 8. However, for the throttled
case the benefit of IVO advance on torque is greater than going to a less advanced IVO and WOT (the highest
torque output of 100 Nm is reached at an IVO advance of 28°ca and 80% open throttle, compared to 97 Nm at
16°ca and WOT).
4.2.3 Extension to higher engine speeds
The experiments on the effects of variable intake valve timing were extended to higher engine speeds.
Measurements have been taken at WOT and MBT timing for 2500 rpm and 3500 rpm. For these measurements
the air to fuel equivalence ratio was set as low as possible for maximum torque (around λ = 2) and acceptable
NOX output.

10
At 2500 rpm and increasing IVO advancement the injected amount of hydrogen needed to be lowered for the
NOX emissions not to exceed 100 ppm. At WOT operation and medium to high engine speeds, the inertia of the
exhaust gases is relatively high. During the valve overlap, the inertia of the exhaust gases creates a vacuum that
sucks fresh charge into the cylinder. Thus, a longer valve overlap period leads to a better cylinder filling. This
increase in volumetric efficiency is confirmed by Figs. 10 and 11 and is analogous to the trends seen in gasoline
operation at medium to high loads (Fig. 6 and 7).
Figures 12 and 13 show the effect of intake valve timing on the in-cylinder peak pressure at 2500 rpm. Peak
pressures shown are the average of 100 cycles. One can clearly see on Fig. 13 that for this engine speed the
engine peak pressure reaches a maximum at 28°ca advancement, a 25% increase compared to the peak pressure
at 4°ca advancement. This optimum is caused by the necessity to dilute the mixture at higher IVO advancement,
as stated above, since otherwise the increasing peak pressures would make the engine temperature rise above the
NOX formation temperature. This decrease in energy density of the mixtures at higher IVO advances is
responsible for the lower peak pressures under these working conditions and also accounts for the clearly visible
optimum in torque around 28°ca IVO advancement seen in Fig. 10. So, although torque rises due to increasing
volumetric efficiency for higher IVO advancements, at a certain point the decreasing energy density of the
mixture in the cylinder, due to the higher dilution of the mixture, makes the torque decrease again.
Since the definition of volumetric efficiency (see Section 3.2) takes into account the flow rate of air as well as
the flow rate of hydrogen, a change of the air to fuel ratio does not translate into a direct change of volumetric
efficiency, as an increase of one implies a decrease of the other.
Because the spark plug accommodated with the pressure sensor, was not adapted for hydrogen use (with the heat
range being too high), operation conditions were restricted and the comparison has been limited to λ ≥ 2. The un-
adapted spark plug caused misfires which leads to unburned hydrogen remaining in the cylinder causing backfire
in the following cycle. Figure 14 shows a clear case of misfire in cycle number 9. Figure 15 shows the
occurrence of backfire on a plot of intake manifold pressure versus crank angle. The cycle where backfire occurs
is plotted in bold.
5 Discussion and conclusion
At low engine speeds the advantage of a varying intake valve timing at WOT (qualitative control) is limited, but
allows an extension of the qualitative control range (the range on the lean side of the threshold equivalence ratio)
to slightly higher engine loads. This is advantageous as the brake thermal efficiency is significantly higher for
this load control strategy (with the brake thermal efficiency reaching a maximum of about 35% around λ = 2 for
the four cylinder engine [16]). CVVT had no (measured) effect on the threshold equivalence ratio, implicating
that the region between stoichiometric and the equivalence ratio, which has to be avoided due to complex NOX
aftertreatment, remains alike.
When higher loads are demanded than can be delivered with WOT operation at the threshold equivalence ratio,
one has to switch to stoichiometric operation. Throttling can then be used to regulate the power output. The jump
from qualitative to quantitative operation is not straightforward since one needs to be able to change the TP very
fast for smooth engine behavior. Since Fig. 3 shows that only minor steps are necessary to permit the leap
between the two operation modes, variable valve timing can help smooth out the transition. Additionally, the
ignition timing can be adjusted [18].

11
Results for medium to high engine speeds show that at wide open throttle operation, CVVT can improve
volumetric efficiency by advancing the intake valve opening time. However, at 2500 rpm and 28°ca IVO
advance a clear optimum in torque was found, which can be explained by the high in-cylinder pressures, causing
high temperatures at advanced IVO timings, leading to NOX formation, which can only be prevented by diluting
the mixture, causing the torque to decrease.
Acknowledgements
The authors thank the following MSc students for performing measurements during their end-of-year thesis,
contributing to this work: C. Billiouw, J. De Landtsheere, F. De Smet, P. Maesschalck, S. Martin, N. Rombaut,
A. Trenson and M. Vermeir, The support by the technical staff, K. Chielens, P. De Pue and R. Janssens is also
greatly appreciated.
References
[1] Leading by CO2 example. Editorial, Automotive Engineering International, April 2007.
[2] Fuel Cells. Cover story, Engine Technology International, June 2007.
[3] S. Verhelst, S. Verstraeten, R. Sierens, A critical review of experimental research on hydrogen fueled SI
engines, SAE technical paper nr 2006-01-0430, 2006. Also in SAE 2006 Transactions, Journal of Engines,
pp264-74.
[4] S. Verhelst, T. Wallner, Hydrogen-fueled internal combustion engines, Prog Energy Combust Sci
2009;35:490-527.
[5] S. Verhelst, R. Sierens, Recent Progress in Hydrogen-Fueled Internal Combustion Engines, in: S. Demidov,
J. Bonnet (Eds.), Traffic Related Air Pollution and Internal Combustion Engines, Nova Science Publishers Inc.,
New York, 2009, pp. 211-49.
[6] S. Szwaja, K.R. Bhandary, J.D. Naber, Comparisons of hydrogen and gasoline combustion knock in a spark
ignition engine, Int J Hydrogen Energy 2007;32:5076-87.
[7] X. Liu, F. Liu, L. Zhou, B. Sun, H.J. Schock, Backfire prediction in a manifold injection hydrogen internal
combustion engine, Int J Hydrogen Energy 2008;33:3847-55.
[8] S. Verhelst, P. Maesschalck, N. Rombaut, R. Sierens, Increasing the power output of hydrogen internal
combustion engines by means of supercharging and exhaust gas recirculation, , Int J Hydrogen Energy
2009;34:4406-12.
[9] M. Berckmüller, H. Rottengruber, A. Eder, N. Brehm, G. Elsässer, G. Müller-Alander, C. Schwarz,
Potentials of a charged SI-hydrogen engine, SAE technical paper nr 2003-01-3210, 2003.
[10] S. Verhelst, R. Sierens, Combustion studies for PFI hydrogen IC engines, SAE technical paper nr 2007-01-
3610, 2007.
[11] C.M. White, R.R. Steeper, A.E Lutz., The hydrogen-fueled internal combustion engine: a technical review,
Int J Hydrogen Energy 2006;31:1292-305.
[12] V. Knop, A. Benkenida, S. Jay, O. Colin, Modelling of combustion and nitrogen oxide formation in
hydrogen-fuelled internal combustion engines within a 3D CFD code, Int J Hydrogen Energy 2008;33:5083-97.

12
[13] A.A. Boretti, H.C. Watson, The lean burn direct injection jet ignition gas engine, Int J Hydrogen Energy
2009;34:7835-41.
[14] J.M. Gomes Antunes, R. Mikalsen, A.P. Roskilly, An experimental study of a direct injection compression
ignition hydrogen engine, Int J Hydrogen Energy 2009;34:6516-22.
[15] T.C. Huynh, J.K. Kang, K.C. Noh, J.T. Lee, J.A. Caton, Controlling Backfire for a Hydrogen-Fueled Engine
Using External Mixture Injection, J Eng Gas Turbines Power 2008;130:062804-1-8.
[16] S. Verhelst, P. Maesschalck, N. Rombaut, R. Sierens, Efficiency comparison between hydrogen and
gasoline, on a bi-fuel hydrogen/gasoline engine, Int J Hydrogen Energy 2009;34:2504-10.
[17] M. Touns, P. Menegazzi, P. Rouchon, NOx Trap Model For Lean Burn Engine Control, SAE technical
paper nr 2003-01-2292, 2004.
[18] T. Fujita, S. Ozawa, K. Yamane, Y. Takagi, Y. Goto, M. Odaka, Performance of NOx absorption 3-way
catalysis applied to a hydrogen fueled engine, 15th World Hydrogen Energy Conference, Yokohama, Japan;
2004.
[19] T. Wallner, H. Lohse-Busch, S. Gurski, M. Duoba, W. Thiel, D. Martin, T. Korn, Fuel economy and
emission evaluation of BMW Hydrogen 7 Mono-Fuel demonstration vehicles, Int J Hydrogen Energy
2008;33:7608-18.
[20] G. Kiesgen, M. Klütingen, C. Block, H. Fischer, The New 12 Cylinder Hydrogen Engine in the 7 Series:
The H2 ICE Age Has Begun, SAE technical paper nr 2006-01-0431, 2006.
[21] S. Verhelst, J. De Landtsheere, F. De Smet, C. Billiouw, A. Trenson, S. Sierens, Effects of Supercharging,
EGR and Variable Valve Timing on Power and Emissions of Hydrogen Internal Combustion Engines, SAE
technical paper nr 2008-01-1033, 2008. Also in SAE Intenational Journal of Engines Vol. 1(1), pp. 647-656, 2009.

13
Figure captions
Figure 1. Modified intake of the engine.
Figure 2. The adapted hydrogen storage and fueling system.
Figure 3. The combined qualitative and quantitative control strategy of the hydrogen fueled test engine.
Figure 4. Intake and exhaust valve profiles. Advancing the intake valve timing results in a larger valve overlap.
Figure 5. Brake torque and raw NOX emissions on gasoline, for low loads at low and medium engine speeds, as a
function of intake cam phasing.
Figure 6. Brake torque and raw NOX emissions on gasoline, for medium loads at low and medium engine speeds,
as a function of intake cam phasing.
Figure 7. Brake torque and raw NOX emissions on gasoline, for high loads at medium to high engine speeds, as a
function of intake cam phasing.
Figure 8. Brake torque and NOX emissions on hydrogen, at 1500 rpm and wide open throttle, for different intake
cam phasing, as a function of the equivalence ratio.
Figure 9. Brake torque and NOX emissions on hydrogen, at 1500 rpm, =1, for different intake cam phasing, as a
function of throttle opening.
Figure 10. Brake torque, air to fuel equivalence ratio () and volumetric efficiency on hydrogen (WOT) as
function of IVO advance at 2500 rpm.
Figure 11. Brake torque and volumetric efficiency on hydrogen (WOT) as a function of IVO advance at 3500
rpm.
Figure 12. The influence of IVO advancement on in-cylinder peak pressure at 2500 rpm (on hydrogen, WOT).
Figure 13. Detail of Figure 12 around the cylinder peak pressure.
Figure 14. Cyclic variation in in-cylinder pressure and the effect of misfires due to a failing spark plug for
hydrogen at WOT.
Figure 15. Backfire as a result of misfires for hydrogen at WOT. Intake manifold pressure measurements of 7
consecutive cycles. Backfiring cycle shown in bold.

Figure1Click here to download high resolution image

Pressure regulator
STAGE 1
Pressure regulator
STAGE 2
40 bar
4.5 bar40 bar
Pressure regulator
STAGE 3
FLOW
2 bar
2 bar
H2 H2 H2
Safety valve
AIR IN
Figure2

0
1000
2000
3000
4000
5000
6000
1.01.52.02.53.0
NO
X(p
pm
)
l (-)
0
20
40
60
80
100
20 40 60 80 100
Bra
ke t
orq
ue
(N
m)
TP (%)
NOx emissions
Brake torque
TP=100% (wide open throttle) l=1
low NOX production zoneload control by mixture richness zone to avoid
NOX reduction by TWC
load control by throttling at l=1
INCREASING LOAD
Switch between strategies
Figure3

3
4
5
6
7
8
9
10C
am
p
rofi
le [
mm
]
TDC TDCBDC BDC
0
1
2
-360 -270 -180 -90 0 90 180 270 360
Ca
m p
rofi
le [
mm
]
degree crank angle (°ca)
Intake valve Intake valve (40° advanced) Outlet valve
Figure4

Figure5

Figure6

Figure7

0
20
40
60
80
100
120
0
1000
2000
3000
4000
5000
1 1.5 2 2.5 3 3.5
bra
ke
torq
ue
(N
m)
raw
NO
x e
mis
sio
ns (
pp
m)
air to fuel equivalence ratio (-)
raw NOx at 4°ca IVO advance
raw NOx at 16°ca IVO advance
raw NOx at 28°ca IVO advance
raw NOx at 40°ca IVO advance
Brake torque at 4°ca IVO advance
Brake torque at 16°ca IVO advance
Brake torque at 28°ca IVO advance
Brake torque at 40°ca IVO advance
Figure8

0
10
20
30
40
50
60
70
80
90
100
2500
3000
3500
4000
4500
5000
5500
6000
20 40 60 80 100
bra
ke
to
rqu
e (
Nm
)
raw
NO
x e
mis
sio
ns (
pp
m)
throttle position (opening %)
raw NOx at 4°ca IVO advance
raw NOx at 16°ca IVO advance
raw NOx at 28°ca IVO advance
raw NOx at 40°ca IVO advance
Brake torque at 4°ca IVO advance
Brake torque at 16°ca IVO advance
Brake torque at 28°ca IVO advance
Brake torque at 40°ca IVO advance
Figure9

Figure10

Figure11

10-4
104
105
106
107
log(V) (m³)
log(p
) (P
a)
Figure12

5 5.5 6 6.5 7 7.5 8
x 10-5
3.2
3.4
3.6
3.8
4
4.2
4.4
x 106
V (m³)
pre
ssu
re (
Pa
)
4°ca12°ca16°ca20°ca28°ca32°ca40°ca
Figure13

320 340 360 380 400 420
1
1.5
2
2.5
3
3.5
x 106
°ca
pre
ssure
(P
a)
cycle 1cycle 2cycle 3cycle 4cycle 5cycle 6cycle 7cycle 8cycle 9
Figure14

0 100 200 300 400 500 600 700
1
1.5
2
2.5
3
3.5
x 105
°ca
Inta
ke
ma
nifo
ld p
ressu
re (
Pa
)
Figure15