POTMiner: mining ordered, unordered, and partially-ordered trees
Upload
khangminh22Category
view
5download
0
LUND UNIVERSITY
PO Box 117221 00 Lund+46 46-222 00 00
The Low Load Limit of Gasoline Partially Premixed Combustion (PPC) - Experiments ina Light Duty Diesel Engine
Borgqvist, Patrick
2013
Link to publication
Citation for published version (APA):Borgqvist, P. (2013). The Low Load Limit of Gasoline Partially Premixed Combustion (PPC) - Experiments in aLight Duty Diesel Engine.
Total number of authors:1
General rightsUnless other specific re-use rights are stated the following general rights apply:Copyright and moral rights for the publications made accessible in the public portal are retained by the authorsand/or other copyright owners and it is a condition of accessing publications that users recognise and abide by thelegal requirements associated with these rights. • Users may download and print one copy of any publication from the public portal for the purpose of private studyor research. • You may not further distribute the material or use it for any profit-making activity or commercial gain • You may freely distribute the URL identifying the publication in the public portal
Read more about Creative commons licenses: https://creativecommons.org/licenses/Take down policyIf you believe that this document breaches copyright please contact us providing details, and we will removeaccess to the work immediately and investigate your claim.

The Low Load Limit of Gasoline Partially Premixed Combustion (PPC)
Experiments in a Light Duty Diesel Engine
Patrick Borgqvist
DOCTORAL DISSERTATION
by due permission of the Faculty of Engineering, Lund University, Sweden.
To be defended at M-Building, room M:B. Date 26/4 and time 1000.
Faculty opponent
Professor Hua Zhao, Brunel University

Organization
LUND UNIVERSITY
Document name
DOCTORAL DISSERTATION
Date of issue
Author Patrick Borgqvist
Sponsoring organization KCFP
Title and subtitle
The Low Load Limit of Gasoline Partially Premixed Combustion – Experiments in a Light Duty Diesel Engine
Abstract
The decreasing oil supply, more stringent pollutant legislations and strong focus on decreasing carbon dioxide emissions drives the research of more efficient and clean combustion engines. One such combustion engine concept is Homogeneous Charge Compression Ignition (HCCI) which potentially achieves high efficiency and low NOx and soot emissions. One practical realization of HCCI in SI engines is to use a variable valve train to trap hot residual gases in order to increase the temperature of the fresh charge to auto-ignite around top dead center. The limited operating region of HCCI and lack of immediate control actuator, which makes feedback control of the combustion difficult, are two contributing reasons to change focus from HCCI to gasoline Partially Premixed Combustion (PPC). The advantage with using gasoline is a longer ignition delay which enhances the mixing of the fuel and air before combustion. But the attainable operating region is limited at low load with high octane number fuels and the main part of the thesis is devoted to extending the low load limit of gasoline PPC. The goal is to extend the operating region of the engine towards low load using the variable valve train system, the glow plug and more advanced injection strategies.
The thesis is based on experimental investigations performed in a single cylinder research engine. During the first part of the thesis, results from a fundamental experimental study on HCCI combustion in comparison with SI combustion using different variable valve timing strategies is presented. Residual gas enhanced HCCI with negative valve overlap (NVO) or rebreathing has higher efficiency compared to SI combustion. To extend the operating range of the NVO HCCI engine, a combustion mode switch from SI combustion to HCCI combustion using NVO, was investigated.
In the first gasoline PPC investigation, a comparison between diesel and two gasoline fuels with different octane numbers was performed. It is shown that the low octane number gasoline (69 RON) can be operated without using a high fraction of trapped hot residual gas down to 1 bar IMEPn. But the operating range of the 87 RON gasoline fuel was limited and could be run down to approximately 2 bar IMEPn using a high fraction of trapped hot residual gas. The rest of the gasoline PPC work is devoted to the 87 RON gasoline fuel. Experimental investigations on the effects of the hot residual gas using NVO and rebreathing, more advanced fuel injection strategies and effects of the glow plug are presented.
In order to minimize fuel consumption while maintaining combustion stability, the suggested gasoline PPC low load operating strategy is to use the NVO valve strategy with a fuel injection during NVO at low engine load up to approximately 2 bar IMEPn and then switch to the rebreathing valve strategy using a split main fuel injection strategy at higher engine load.
Key words PPC, low temperature combustion, HCCI, negative valve overlap, rebreathing, low load, glow plug
Classification system and/or index terms (if any)
Supplementary bibliographical information Language English
ISSN and key title 0282-1990
ISBN 978-91-7473-486-7
Recipient’s notes Number of pages
212
Price
Security classification
Signature Date

The Low Load Limit of Gasoline Partially Premixed Combustion (PPC)
Experiments in a Light Duty Diesel Engine
Patrick Borgqvist

Copyright © Patrick Borgqvist
Division of Combustion Engines Department of Energy Sciences Faculty of Engineering Lund University P.O. Box 118 SE-22100 Lund ISBN 978-91-7473-486-7 ISRN LUTMDN/TMHP-13/1091-SE ISSN 0282-1990 Printed in Sweden by Media-Tryck, Lund University Lund 2013

i
List of Papers
Paper 1
Investigation and Comparison of Residual Gas Enhanced HCCI using Trapping (NVO HCCI) or Rebreathing of Residual Gases
Patrick Borgqvist, Per Tunestål, and Bengt Johansson
SAE 2011-01-1772
Paper 2
Investigating Mode Switch from SI to HCCI using Early Intake Valve Closing and Negative Valve Overlap
Anders Widd, Rolf Johansson, Patrick Borgqvist, Per Tunestål, and Bengt Johansson
SAE 2011-01-1775
Paper 3
Gasoline Partially Premixed Combustion in a Light Duty Engine at Low Load and Idle Operating Conditions
Patrick Borgqvist, Per Tunestål, and Bengt Johansson
SAE 2012-01-0687

ii
Paper 4
The Usefulness of Negative Valve Overlap for Gasoline Partially Premixed Combustion, PPC
Patrick Borgqvist, Martin Tuner, Augusto Mello, Per Tunestål, and Bengt Johansson
SAE 2012-01-1578
Paper 5
The Low Load Limit of Gasoline Partially Premixed Combustion Using Negative Valve Overlap
Patrick Borgqvist, Öivind Andersson, Per Tunestål, and Bengt Johansson
ICEF2012-92069
Approved for publication in Journal of Engineering for Gas Turbines and Power
Paper 6
Comparison of Negative Valve Overlap (NVO) and Rebreathing Valve Strategies on a Gasoline PPC Engine at Low Load and Idle Operating Conditions
Patrick Borgqvist, Per Tunestål, and Bengt Johansson
SAE 2013-01-0902
Other Publications
HCCI Heat Release Data for Combustion Simulation, Based on Results from a Turbocharged Multi Cylinder Engine
Thomas Johansson, Patrick Borgqvist, Bengt Johansson, Per Tunestål, and Hans Aulin
SAE 2010-01-1490

iii
Transient Control of Combustion Phasing and Lambda in a 6-Cylinder Port-Injected Natural-Gas Engine
Mehrzad Kaiadi, Magnus Lewander, Patrick Borgqvist, Per Tunestål, and Bengt Johansson
ICES2009-76004
Internal Combustion Engine Mode Switch Control Using LabVIEW Real-Time and FPGA
Patrick Borgqvist
A control system case study presented at NI-Days 2010 in Stockholm, Sweden. Winner of Swedish Graphical System Design Achievement Award 2010.

iv

v
Abstract
The decreasing oil supply, more stringent pollutant legislations and strong focus on decreasing carbon dioxide emissions drives the research of more efficient and clean combustion engines. One such combustion engine concept is Homogeneous Charge Compression Ignition (HCCI) which potentially achieves high efficiency and low NOx and soot emissions. One practical realization of HCCI in SI engines is to use a variable valve train to trap hot residual gases in order to increase the temperature of the fresh charge to auto-ignite around top dead center. The limited operating region of HCCI and lack of immediate control actuator, which makes feedback control of the combustion difficult, are two contributing reasons to change focus from HCCI to gasoline Partially Premixed Combustion (PPC). The advantage with using gasoline is a longer ignition delay which enhances the mixing of the fuel and air before combustion. But the attainable operating region is limited at low load with high octane number fuels and the main part of the thesis is devoted to extending the low load limit of gasoline PPC. The goal is to extend the operating region of the engine towards low load using the variable valve train system, the glow plug and more advanced injection strategies.
The thesis is based on experimental investigations performed in a single cylinder research engine. During the first part of the thesis, results from a fundamental experimental study on HCCI combustion in comparison with SI combustion using different variable valve timing strategies is presented. Residual gas enhanced HCCI with negative valve overlap (NVO) or rebreathing has higher efficiency compared to SI combustion. To extend the operating range of the NVO HCCI engine, a combustion mode switch from SI combustion to HCCI combustion using NVO, was investigated.
In the first gasoline PPC investigation, a comparison between diesel and two gasoline fuels with different octane numbers was performed. It is shown that the low octane number gasoline (69 RON) can be operated without using a high fraction of trapped hot residual gas down to 1 bar IMEPn. But the operating range of the 87 RON gasoline fuel was limited and could be run down to approximately 2 bar IMEPn using a high fraction of trapped hot residual gas.
The rest of the gasoline PPC work is devoted to the 87 RON gasoline fuel. Experimental investigations on the effects of the hot residual gas using NVO and rebreathing, more advanced fuel injection strategies and effects of the glow plug are presented.

vi
In order to minimize fuel consumption while maintaining combustion stability, the suggested gasoline PPC low load operating strategy is to use the NVO valve strategy with a fuel injection during NVO at low engine load up to approximately 2 bar IMEPn and then switch to the rebreathing valve strategy using a split main fuel injection strategy at higher engine load.

vii
Popular Summary in Swedish
Utökning av arbetsområdet för en motor med partiellt förblandad förbränning
Förbränningsmotorn med inre förbränning har funnits i över hundra år. Förbränningsmotorn har fördel av att det är en tillförlitlig, kompakt och relativt billig kraftkälla. Den finns i många olika utföranden och storlekar och finns i allt ifrån modellflygplan till transportfartyg. Bilindustrin domineras av ottomotorn och dieselmotorn. Ottomotorn i kombination med en trevägskatalysator anses vara en ren motor med låga utsläpp av giftiga förbränningsprodukter som obrända kolväten, kolmonoxid och kväveoxider. Problemet med ottomotorn är att bränsleförbrukningen är relativt hög. Dieselmotorn har lägre bränsleförbrukning jämfört med ottomotorn men problemet är istället utsläppen av giftiga förbränningsprodukter av framförallt partiklar och kväveoxider. En annan viktig aspekt, oavsett motortyp, är koldioxidutsläppen som minskas genom lägre bränsleförbrukning.
I takt med stigande oljepriser ökar efterfrågan på motorer med lägre bränsleförbrukning samtidigt som fordonstillverkarna brottas med allt hårdare lagkrav på rening av förbränningsprodukterna. Rening av förbränningsprodukter kan i stor utsträckning göras i avgasröret men problemet är kostnaden av efterbehandlingssystemen. Ett alternativ är att istället påverka förbränningen inne i motorn så att andelen giftiga avgasprodukter i utsläppen minskar. Utmaningen är att hitta ett förbränningskoncept som ger både låg bränsleförbrukning, låga utsläpp och som täcker hela motorns arbetsområde. Ett koncept som har studerats flitigt i motorforskningssammanhang är HCCI som bygger på kompressionsantändning av förblandat bränsle och luft. Fördelen med HCCI är låg bränsleförbrukning i kombination med låga utsläpp av framförallt sotpartiklar och kväveoxider. En nackdel är att förbränningen är svårare att styra och att arbetsområdet är mer begränsat.
Ett praktiskt sätt att realisera denna typ av koncept är att använda ett system för variabla ventiltider och hålla kvar en stor del av de varma avgaserna inne i cylindern. Värmen från avgaserna höjer temperaturen på bränsle- och luftblandningen till självantändning efter kompression. Oftast används en strategi som heter NVO, eller negativt ventilöverlapp. Ett alternativ till NVO är rebreathing där avgaserna först släpps ut och sen sugs tillbaka igen. Fördelen med denna strategi är att man undviker

viii
att komprimera de varma avgaserna under gasväxlingen vilket ger lägre värmeförluster. Den inledande studien i avhandlingen innehåller en studie och jämförelse mellan olika ventilstyrda HCCI strategier och ottoförbränning. HCCI koncepten ger signifikant lägre bränsleförbrukning även då ottoförbränningen körs utan trottel. Problemet är det begränsade arbetsområdet. För att utöka arbetsområdet mot lägre last kan man köra motorn med ottoförbränning på låga laster och sen växla förbränningskoncept till HCCI på lite högre laster. En studie i avhandlingen är gjord där två olika styrstrategier för förbränningen i HCCI efter strategiväxlingen har studerats. En modellbaserad styrstrategi ger ett något mjukare förlopp jämfört med den enklare PI regulatorn.
Ett annat förbränningskoncept, kring vilket den största delen av den här avhandlingen är uppbyggd, är partiellt förblandad förbränning med bensin, eller bensin PPC (partially premixed combustion). Syftet med det högoktaniga bränslet är att öka tändfördröjningen, det vill säga tiden mellan bränsleinsprutning och antändning. Detta ger mer tid för bränslet och luften att blandas vilket undertrycker bildningen av sotpartiklar. Recirkulerade avgaser, EGR, används för att få ner bildningen av kväveoxider och kan även användas för att få längre tändfördröjning. PPC med diesel använder höga halter av EGR för att få längre tändfördröjning. Ett sätt att skilja mellan PPC-förbränning och traditionell dieselförbränning är att allt bränsle ska vara insprutat innan det antänds. Problemet med bensin PPC är att arbetsområdet är begränsat på låga laster med högoktaniga bränslen. Förbränningsstabiliteten minskar och utsläpp av obrända kolväten och kolmonoxid ökar. Målet med avhandlingen är att utöka motorns arbetsområde på låga varvtal och laster mot tomgång. Undersökningar har gjorts med variabla ventiltider, bränsleinsprutningsstrategier och glödstift. Syftet är att undersöka hur olika strategier påverkar förbränningsstabiliteten och utsläpp av kolväten. Två olika ventilstrategier för att fånga varma avgaser har studerats. Syftet är samma som med HCCI, det vill säga att få upp temperaturen inne i cylindern. Både NVO och rebreathing har använts. Studien visar att det går att utöka arbetsområdet med framförallt de variabla ventiltiderna och bränsleinsprutningsstrategin. Glödstiftet får en mindre påverkan i kombination med ventilsystemet. Beroende på val av ventilstrategi kan en mer optimal bränslestrategi väljas och olika kombinationer ger olika fördelar. På de allra lägsta lasterna ger en ventilstrategi med NVO i kombination med bränsleinsprutning under gasväxlingen bäst förbränningsstabilitet. På lite högre laster är det en fördel att växla till rebreathing för att få lägre bränsleförbrukning.

ix
Acknowledgements
I would like to thank the Centre of Competence for Combustion Processes (KCFP) for financing my project. There are many people who have contributed to this work but unfortunately too little space to mention all. I am grateful to you all.
First, I would like to thank my supervisor Per Tunestål for his support, and many hours of valuable discussions and feedback. Bengt Johansson, who accepted me here as a PhD student and for all the help and feedback. Rolf Johansson, for introducing me to Bengt Johansson and Per Tunestål and made my internship at Toyota in Japan possible before I started as a PhD student. I would like to acknowledge Martin Tuner and Augusto Mello who made the AVL Boost model simulations. Öivind Andersson, for many interesting discussions and help with the experimental planning in the fuel injection strategy investigation.
Special thanks to Bill Cannella from Chevron for supplying the gasoline fuels that were used in the PPC experiments. Urban Carlsson and Anders Höglund at Cargine Engineering, for supplying and helping me with the valve train system. Håkan Persson at Volvo Cars, for engine hardware support. To Pelle Steen at National Instruments for the LabVIEW support.
To all the technicians in the lab during my time at the division, Kjell Jonholm, Mats Bengtsson, Anders Olsson, Tommy Petersen, Bertil Andersson, Tom Hademark, for helping me out with the engine hardware and keeping the engine running. Krister Olsson for his help with computers and for sharing my programming interest. Thomas Johansson, our new lab manager, for his help in the lab and also for being a friend.
I would also like to thank all my colleges during my time at the division. Thanks for all your support.
Last but not least, I would like to thank my wife Jenny for her patience, especially during the last couple of months before printing the thesis. Without her support this would not have been possible. To my daughter Lilly, for reminding me about what is important. To my parents and brothers and sisters, for all your support.

x
Nomenclature
ATDC After Top Dead Center
BMEP Break Mean Effective Pressure
BTDC Before Top Dead Center
CA10 Crank Angle 10 % burned
CA50 Crank Angle 50 % burned
CA90 Crank Angle 90 % burned
CAD Crank Angle Degree
CAI Controlled Auto Ignition
CO Carbon Monoxide
CO2 Carbon Dioxide
COV Coefficient of Variation
DOE Design of Experiments
EGR Exhaust Gas Recirculation
EIVC Early Intake Valve Closing
FMEP Friction Mean Effective Pressure
FSN Filter Smoke Number
GDCI Gasoline Direct Injection Compression Ignition
HC Hydro Carbon emissions
HCCI Homogeneous Compression Ignition
IMEP Indicated Mean Effective Pressure
IVC Intake Valve Closing
LHV Lower Heating Value
LIVC Late Intake Valve Closing

xi
LTC Low Temperature Combustion
MK Modulated Kinetics
MON Motor Octane Number
NOx Nitrogen Oxide
NVO Negative Valve Overlap
p Pressure
PM Particulate Matter
PMEP Pump Mean Effective Pressure
PPC Partially Premixed Combustion
rc Compression ratio
Reb Rebreathing
RON Research Octane Number
RPM Revolutions Per Minute
SACI Spark Assisted Compression Ignition
SCR Selective Catalytic Reduction
SI Spark Ignition
SOC Start of Combustion
SOI Start of Injection
STD Standard Deviation
T Temperature
TDC Top Dead Center
V Volume
VVT Variable Valve Timing
λ Relative air-fuel ratio
γ Specific heat ratio

xii
Table of Content
1 Introduction 1 1.1 Background 1 1.2 Objective 2 1.3 Method 3 1.4 Contribution 3
2 Low Temperature Combustion Concepts (LTC) 4 2.1 HCCI 4 2.2 Controlled Auto Ignition (CAI) 5 2.3 Partially Premixed Combustion (PPC) 6 2.4 Gasoline PPC 8
3 Combustion Engine Analysis 10 3.1 Mean Effective Pressures 10 3.2 Efficiencies 13 3.3 Heat Release 15 3.4 Cycle-to-Cycle Variations 17
4 Experimental Apparatus 18 4.1 Engine and Auxiliary Equipment 18 4.2 Engine Control System 23 4.3 Post Processing 27 4.4 Real-Time System Heat Release Calculation 30 4.5 Calculations of Start of Injection and Ignition Delay 31
5 Results 32 5.1 HCCI Results 32
5.1.1 Publications 32 5.1.2 Part Load Concepts (Paper 1) 34 5.1.3 Mode Switching from SI to HCCI (Paper 2) 37 5.1.4 Summary 40
5.2 Low Load Gasoline PPC Results 40 5.2.1 Introduction 40

xiii
5.2.2 Fuel Comparisons (Paper 3) 42 5.2.3 Hot Residual Gas (Papers 4 and 6) 51 5.2.4 Fuel Injection Strategies (Papers 5 and 6) 66 5.2.5 Glow Plug (Paper 4) 80 5.2.6 Putting it all Together (Paper 6) 80
6 Summary 86
7 Future Work 88
8 References 89
9 Summary of Papers 95 Paper 1 95 Paper 2 95 Paper 3 96 Paper 4 96 Paper 5 97 Paper 6 97 Publication Errata 98

xiv

1
1 Introduction
1.1 Background
The internal combustion engine has been used to power vehicles for more than a hundred years. It is a robust and affordable power generator with a high power to weight ratio which makes it very useful for transportation applications. One problem is the increasing price and decreasing supply of oil which drives the demand for more efficient engines. Another problem is the environmental impact from pollutants. Local emissions, such as carbon monoxide (CO), unburned hydrocarbons (HC), nitrogen oxide (NOx), and particulate matter (PM) are harmful for both the environment and the public health. One strategy is to apply some sort of after-treatment such as a three-way catalyst, particulate filter, selective catalytic reduction (SCR) systems or oxidizing catalyst depending on the targeted emissions and demand from the combustion concept. The global carbon dioxide (CO2) emissions are not handled by the after-treatment system and have to be reduced through lower fuel consumption of more fuel efficient engines.
The transportation market is dominated by spark ignition (SI) engines and diesel engines. The conventional spark ignition engine is relatively clean because it is usually operated with a three-way catalyst which simultaneously reduces CO, NOx and HC emissions. But the efficiency is lower compared to diesel. The lower efficiency is partly because the intake air has to be throttled to control load. The diesel engine efficiency is high compared to the SI engine but the problem is instead the NOx and soot emissions. A three-way catalyst cannot be used because it is operated lean. NOx emissions can be reduced by using recycled exhaust gases (EGR) or SCR, or both. Soot can be removed with particulate filters.
After-treatment systems are generally expensive and there is a need for more advanced combustion concepts that simultaneously achieves high efficiency in combination with cleaner combustion. One such combustion concept aimed towards this goal is gasoline partially premixed combustion (PPC).

2
The European emissions standards are shown in Table 1. Emissions are tested over the NEDC chassis dynamometer procedure. A part of the procedure is an urban driving cycle (ECE), which was devised to represent city driving conditions. It is characterized by low vehicle speed, low engine load, and low exhaust gas temperature [1]. The challenges with the gasoline PPC concept are the auto-ignition problems with higher octane number fuels and HC and CO emissions at low load and engine speed operating conditions. Due to the low exhaust gas temperature at low load, after treatment of HC and CO will be a challenge using a standard oxidizing catalyst alone. Low combustion efficiency itself is a problem because it increases the fuel consumption. Hence there is a need to reduce HC and CO emissions as much as possible before they are emitted into the exhaust pipe.
Table 1. EU emissions standards for passenger cars (Compression Ignition, Diesel) [1]
Stage Date CO
(g/km)
HC
(g/km)
HC+NOx (g/km)
NOx (g/km)
PM
(g/km)
PN
(#/km)
Euro 4 2005.01 0.5 - 0.3 0.25 0.025 -
Euro 5a 2009.09 0.5 - 0.23 0.18 0.005 -
Euro 5b 2011.09 0.5 - 0.23 0.18 0.005 6.0×10¹¹
Euro 6 2014.09 0.5 - 0.17 0.08 0.005 6.0×10¹¹
1.2 Objective
The research was performed during two different projects. In the beginning of this work, the project was named Spark Assisted Compression Ignition (SACI). The focus of the project changed from SACI to light-duty gasoline PPC in 2010. As part of the SACI project, the goal was to characterize and compare the effects of different variable valve train strategies on HCCI combustion and SI combustion. A SI to HCCI combustion mode switch strategy was designed, implemented and evaluated. The goal was to achieve a smooth transition from SI to HCCI. A focus on low load investigation utilizing the variable valve train was maintained when the project changed from SACI to gasoline PPC. The main work of the thesis was performed as part of the Gasoline PPC Light Duty Project. The goal was to extend the operating range of the engine with high octane number fuels using the variable valve train system, the glow plug and more advanced injection strategies. The engine speed was kept low and the goal was to reach idle operating condition.

3
1.3 Method
This work is based on experimental measurements on a single cylinder engine. The main source of information is the in-cylinder pressure, which is used to calculate the net and gross indicated mean effective pressures and heat release rate. A control system was developed in National Instruments LabVIEW that permitted control of the main variables, the valve timings and fuel injections, as well as data acquisition of in-cylinder pressure, valve lift curves, and fuel injection command signal, on the same system. A part of this work also used an engine simulation tool, AVL BOOST, to extract information on in-cylinder temperature and residual gas fraction. The post-processing of the data was made with Matlab.
1.4 Contribution
The first part of the thesis includes investigations of residual HCCI using negative valve overlap and rebreathing in comparison to SI combustion at part load operating conditions. It also includes an investigation of HCCI combustion control strategies in connection to combustion mode switching from SI to HCCI. The main part of the thesis is focused on the gasoline PPC combustion concept. Gasoline PPC is a promising combustion concept which has shown great potential for high efficiency and low soot and NOx emissions. While there are advantages at high load operation with high octane number fuel there are problems with ignitability at low load operation. The main contribution of the thesis is that it is more in depth investigation on the extension of low load operation with gasoline PPC. Different parametrical studies on the effects of the variable valve train, injection strategies and glow plug have been performed. It was shown that it is possible to extend the low load operating region using primarily the variable valve train system and more advanced fuel injection strategies. A comparison between two different valve strategies, NVO and rebreathing, has been performed. The result is a suggested low load gasoline PPC operating strategy with different valve and fuel injection strategies depending on engine load.

4
2 Low Temperature Combustion Concepts (LTC)
Low temperature combustion (LTC) has gained popularity in the last decade because of the possibility to combine high efficiency with low engine-out emissions of NOx and soot. There are many different kinds of LTC and the following sections provide a brief overview of the ones that are relevant for the work in this thesis.
2.1 HCCI
The HCCI combustion concept is based on compression ignition of a pre-mixed charge by using either port fuel injection or early direct injection to obtain a homogeneous mixture of fuel and air. The fuel is auto-ignited after compression from increased pressure and temperature. The charge ignites in several locations simultaneously where the local temperature is higher or where the mixture is richer so that the conditions are more favorable for the chemical reactions to occur [2]. There is no global flame propagation and the combustion rate is fast [3]. The soot formation zones are avoided because the combustion is fairly homogeneous. NOx formation is avoided since the mixture is diluted with either air or EGR which lowers the combustion temperature. A high dilution level also keeps the pressure rise rate at an acceptable level. The efficiency is generally high because of the fast combustion which, by having the combustion phasing close to TDC, increases the expansion ratio. Also because the HCCI engine is operated without a throttle, the pumping losses are reduced in comparison to the SI engine at part load. But there are some drawbacks and limitations with HCCI. The power density is low because of the required dilution level. The emissions of CO and HC increase from incompletely oxidized fuel [4]. The operating range is limited. HCCI combustion is also difficult to control due to lack of an immediate control actuator such as a spark plug which is used in the SI engine. A lot of work has been performed to address the different problems with HCCI. In a work by Christensen et al. [5] supercharging in combination with EGR was used on a single cylinder heavy duty engine fueled with natural gas and isooctane to extend the high load limit of HCCI. Load as high as 16 bar IMEPg was reported. High load

5
operation up to 16 bar BMEP was reported by Olsson et al. [6] on a dual fuel turbo charged 6-cylinder truck engine. Examples of strategies to control HCCI combustion include heating of the intake temperature [7], variable compression ratio [8], or using dual fuels with different auto ignition properties [9].
There are different ways to realize HCCI combustion and cope with the practical limitations of HCCI. As a result two main branches emerged. The first is usually implemented in SI engines, where HCCI is achieved by reusing the hot residual gases from the previous cycle to auto-ignite the fresh fuel/air charge. This type of combustion is often referred to as CAI (Controlled Auto Ignition) combustion. The second branch is more closely related to the diesel engine and is referred to as partially premixed combustion, PPC. With PPC, the fuel is injected late compared to HCCI and combustion timing is controlled with the fuel injection timing. The charge is however still sufficiently premixed in order to reduce soot emissions and it is usually diluted with EGR to simultaneously reduce NOx emissions.
2.2 Controlled Auto Ignition (CAI)
Using negative valve overlap (NVO) is one way to achieve HCCI combustion. The exhaust valves are closed early and a large fraction of hot residual gas is trapped in the cylinder. The hot residual gas elevates the temperature of the fresh charge to have auto ignition around TDC. The strategy was proposed by Willand et al.[10] in 1998 and the first results were shown by Lavy et al. [11] in 2000. An alternative to using NVO is to rebreathe the exhaust gas during the intake stroke. This can be done in different ways, for example by delaying the exhaust valve closing or reopening the exhaust valves later during the intake stroke [12]. The advantage with rebreathing compared to NVO is that recompression of the exhaust gas is avoided. Recompression of the exhaust gas introduces additional heat losses and thus lowers the efficiency of the engine.
One problem with CAI is the limited operating region. At low engine load, the auto-ignition can be further enhanced by using a spark plug [13] [14]. This is called Spark Assisted Compression Ignition (SACI). The slowly propagating flame increases the temperature and triggers the HCCI combustion. SACI can be useful when performing mode switches from SI to HCCI and back. A combustion mode switch to SI combustion can be used to cover the entire operating region of the engine. A mode switch strategy on a camless port-fuel injected engine was developed by Koopmans et al. [15] on both a single cylinder engine and a multi cylinder engine. The mode transition from SI mode to HCCI mode could be made within one engine cycle. Milovanovic et al. [16] presented a mode switch investigation from SI mode to HCCI mode within one cycle using valve profile switching. Fuel was port-fuel injected. Kakuya et al. [17] developed a mode switch strategy on a multi-cylinder direct

6
injected engine from SI mode to HCCI mode. Before complete transition to HCCI mode an intermediate step was taken in order to suppress IMEP fluctuations by controlling A/F ratio and EGR rate with assistance from spark and double fuel injection. Kitamura et al. [18] investigated an HCCI ignition timing model and applied it to combustion mode switching from Otto-Atkinson SI mode (intake valve closing timing occurring late during the compression stroke) to HCCI mode on a port fuel injected multi-cylinder engine. Zhang et al. [19] demonstrated a mode switch from SI mode to HCCI mode using spark timing, effective compression ratio and residual gas fraction adjustments for control during the transition. A control oriented model of HCCI mode transition was proposed and evaluated by Shaver et al. in [20].
If a direct injection system is used there are additional degrees of freedom to control the combustion. The low load limit can be extended by injecting a portion of the fuel during the NVO to influence also the main combustion. Fuel injection during NVO was first proposed by Willand et al. [10] and experimental results were reported by Urushihara et al. [21] and Koopmans et al.[22]. Berntsson et al. [23] used a SI stratified charge fuel injection, together with a pilot injection prior to the NVO TDC and a main injection after the NVO TDC, to expand the low load HCCI operational range. Yun et al. [24] extended the HCCI operating range to idle condition, 0.85 bar IMEPn at 800 rpm, using a combination of NVO, multiple injections and two spark ignition events, one during NVO and one during the compression stroke. Johansson et al. [25] extended the operating region of a light duty multi cylinder turbocharged NVO HCCI engine. An operating region from 1 to 6 bar IMEPn between 1000 and 3000 rpm was reported.
In the thesis, a comparison between different residual HCCI strategies using NVO and rebreathing in comparison to SI combustion is presented. Control strategies for HCCI combustion after mode switch from SI are also evaluated.
2.3 Partially Premixed Combustion (PPC)
PPC combustion is a combination of traditional diesel combustion and HCCI. With PPC, the fuel injection is complete before start of combustion to promote mixing of fuel and air but the charge is not homogeneous. Long ignition delays can be achieved by high fractions of cooled EGR and lower compression ratios. This concept was used by Nissan and is called Modulated Kinetics (MK) [26]. The advantage is that soot and NOx emissions are low. Miles et al. [27] depicted a postulated path for late-injection MK-like combustion in a phi-T diagram and this is shown as the black arrows in Figure 1. The white unfilled arrow shows the path for conventional diesel combustion without EGR. The goal is to suppress combustion temperatures to simultaneously avoid soot and NOx formation. Toyota used high EGR rates with an advanced injection to suppress both soot and NOx with the smokeless rich diesel combustion

7
concept [28]. The term PPC was used to characterize the combustion mode with a combination of high EGR ratio and low compression ratio to achieve low simultaneous soot and NOx emissions up to 15 bar IMEP in a work by Noehre et al. [29]. The problem with diesel PPC is that it is difficult to achieve a premixed charge at high load conditions even with a high level of EGR. EGR levels of over 70% to suppress NOx and soot were reported. A high level of EGR leads to reduced combustion efficiency. If a lower compression ratio is used, this also results in lower efficiency.
Toyota developed a different concept which is called Uniform Bulky Combustion System (UNIBUS) [30]. Instead of using high EGR levels, Toyota used a split injection in the part-load operating region. The first injection is used to start the low temperature reactions and an injection close to TDC is used to control the ignition of the remaining combustion.
Figure 1. Homogeneous reactor simulation results after 2 ms giving soot and NOx formation zones in a Φ-T map. The solid lines show the adiabatic flame temperatures at 21% and 15% ambient oxygen concentration [27].

8
2.4 Gasoline PPC
Using gasoline instead of diesel has the potential to extend the high load region without using excessive EGR levels and a lower compression ratio. This combustion concept is referred to as gasoline PPC. Kalghatgi introduced the concept of gasoline partially premixed combustion in 2006 [31]. Experiments were performed in a 2.0 L single cylinder engine with a compression ratio of 14 at an engine speed of 1200 rpm. The gasoline fuel was a commercial gasoline with 94.7 RON and 85.9 MON. The ignition delay was longer for gasoline compared to diesel and much higher IMEP could be attained with gasoline for a given intake pressure and EGR level while maintaining lower NOx and smoke emissions. The highest IMEP that could be reached with gasoline was 14.86 bar with soot level 0.36 FSN and ISNOx level of 1.21 g/kWh. It was also observed that the engine could be run with gasoline in PPC mode at conditions where it could not be run with early injection in HCCI mode either because of failure to auto-ignite or because of excessive pressure rise rates. Different fuel injection strategies were investigated by Kalghatgi et al. in [32]. With gasoline, a pilot injection early during the compression stroke enabled higher IMEP because of a lower maximum heat release rate and enabled retarded combustion phasing with low cyclic variation. 15.95 bar IMEP with soot below 0.07 FSN was reported. To get the same smoke with diesel IMEP had to be below 6.5 bar.
At Lund University, Manente et al. [33] [34] developed a gasoline PPC strategy using a variety of gasoline fuels with different octane numbers in a single cylinder heavy-duty engine. The engine was run with 50 % EGR and was boosted to maintain λ around 1.5. Gross indicated efficiencies up to 57 % with low NOx emissions, soot levels below 0.5 FSN as well as low HC and CO emissions were reported. Light duty experiments were reported in [35]. A triple injection strategy was used with gasoline to control engine load and avoid excessive pressure rise rates. For the load sweep between 6 and 17 bar IMEPg, gross indicated efficiencies above 45 %, NOx between 2 and 17 ppm, and soot below 0.05 FSN was reported. The gross indicated efficiency was 10 % higher with diesel compared to gasoline but the soot level increased up to 9 FSN for diesel while it was always below 0.01 FSN for gasoline. By running the engine with approximately 50 % EGR and λ around 1.5, the combustion temperature stays between 1500 and 2000 K. This is the operating region where emissions of CO, HC and NOx are suppressed simultaneously. More details on the gasoline PPC strategy from Lund can be found in [36].
At Delphi Corporation, Sellnau et al. [37] [38] achieved higher efficiency with 91 RON pump fuel gasoline compared to diesel in a single cylinder light duty Hydra engine with the gasoline direct injection compression ignition (GDCI) strategy. At operating condition 6 bar IMEP at 1500 rpm, using a triple injection strategy, an indicated thermal efficiency of 46.2 %, which was 8 % better compared to the diesel tests, was reported. At low load operating conditions, 2 bar IMEP at 1500 rpm, a

9
rebreathing valve strategy was used to extend the low load limit. At higher loads, late intake valve closing was used to reduce cylinder pressure and temperature and increase the ignition delay.
One important aspect with gasoline PPC is the auto-ignition properties of the fuel. Hildingsson et al. [39] investigated different gasoline fuels in a light duty engine with 16:1 compression ratio using a single injection strategy at both a low load and engine speed operating condition (4 bar IMEP/1200 rpm) and higher engine load and engine speed operating conditions (10 bar IMEP / 2000 and 3000 rpm). It was argued that the optimum fuel might be in the 75 to 85 RON range for the engine compression ratio in the investigation. Lower octane number fuels loose the ignition delay advantage over diesel at high load while higher octane number fuels will have difficulties to ignite at low load. Lewander et al. [40] showed that it was possible to extend the high load limit with PPC combustion with a multi-cylinder heavy-duty engine using gasoline to cover 50% of the heavy-duty engine nominal operating region.
One alternative strategy to gasoline PPC is the Reactivity Controlled Compression Ignition (RCCI) strategy which was developed at University of Wisconsin – Madison [41] [42]. A blend of gasoline and diesel was used to control combustion phasing and heat release rate. The gasoline fuel was port injected and the diesel fuel was directed injected. The idea is to adjust the auto-ignition properties of the fuel mixture depending on engine speed and load. Olsson et al. also used a dual fuel strategy with HCCI combustion using a mixture of ethanol and n-heptane in [6] and isooctane and n-heptane in [9] to control the combustion timing. The difference in this work is that both fuels were port injected and thus creating a more homogeneous mixture.
One of the problems with gasoline PPC is the combustion stability and combustion efficiency at low load. Solaka et al. [43] could extend the low load limit of a single cylinder light duty engine at 1500 rpm engine speed down to 2 bar IMEPg using boosted inlet air. The absolute inlet pressure at 2 bar IMEPg was approximately 2 bar for the fuels with the highest RON (88.6 and 87.1) with 53 % EGR level. HC and CO emissions were higher with the higher RON value gasoline fuels.
The advantage with higher octane number fuels are seen at high load operating conditions. At low load, the high octane number fuels are difficult to ignite and the emissions of HC and CO are high. The main work of the thesis is devoted to extending the low load limit with gasoline in a single cylinder light duty engine.

10
3 Combustion Engine Analysis
There are different approaches of experimental combustion engine research depending on the purpose of the research. This work is mainly based on results from a single cylinder engine. Single cylinder engine research is useful to get a basic understanding of the combustion process and effects of individual parameters, for example fuel injection timings on combustion and engine performance. Experimental work on a single cylinder engine is a good starting point before moving on to optical diagnostics or multi-cylinder experiments. Optical engines permit visual access to the combustion chamber and the combustion process can be studied in detail. Multi-cylinder experiments provide a closer representation of actual production type engine results.
The results that are presented in this work are based on in-cylinder pressure measurements. The in-cylinder pressure is used to calculate the net and gross indicated mean effective pressures and heat release rate. This section gives the definitions and short descriptions of the analytical tools (equations) that are used in this work.
3.1 Mean Effective Pressures
To be able to compare engines of different sizes running at different speeds, normalized quantities are used. This is achieved by comparing the performance per cycle normalized with the displacement volume. The result is the mean effective pressures with the unit Pascal, (Pa), which is normally presented as kPa, MPa or bar. Mean effective pressures are used to compare as well as visualize the energy flow through the engine from the supplied fuel to the output power as shown in the Sankey diagram in Figure 2.

11
Figure 2. Sankey diagram of mean effective pressures.
The starting point is the supplied fuel energy which gives the fuel mean effective pressure according to:
𝐹𝑢𝑒𝑙𝑀𝐸𝑃 =𝑚𝑓 ∙ 𝑄𝐿𝐻𝑉
𝑉𝑑 (3.1)
where mf is the mass of fuel supplied per cycle, QLHV is the lower heating value of the fuel, and Vd is the displacement of the engine.
QemisMEP represents the energy loss due to incomplete combustion. The heat released mean effective pressure, QhrMEP, is the ratio between QHR which is the heat released during combustion and the displacement volume.
𝑄ℎ𝑟𝑀𝐸𝑃 =𝑄𝐻𝑅𝑉𝑑
(3.2)
Energy from the heat released after combustion that is not converted to work can be separated into two different losses. QhtMEP is the energy losses due to heat transfer to cylinder walls and QexhMEP is the energy lost with the exhaust flow due to elevated temperature and pressure.

12
The indicated mean effective pressure, IMEP, is the energy that is converted into work on the piston, WC, divided by the displacement volume according to:
𝐼𝑀𝐸𝑃 =𝑊𝐶
𝑉𝑑=∮𝑝𝑑𝑉𝑉𝑑
(3.3)
Two different definitions of IMEP are commonly used depending on whether the entire cycle is used or if the gas exchange process is excluded. If the entire cycle is used, IMEPn (net IMEP) is obtained, and if the gas exchange process is excluded IMEPg (gross IMEP) is obtained. The difference between IMEPg and IMEPn is called PMEP, according to:
𝑃𝑀𝐸𝑃 = 𝐼𝑀𝐸𝑃𝑔 − 𝐼𝑀𝐸𝑃𝑛 (3.4)
PMEP represents the pumping losses during the gas exchange process.
From engine torque measurements, T, the brake mean effective pressure, BMEP, can be calculated according to:
𝐵𝑀𝐸𝑃 =4𝜋𝑇𝑉𝑑
(3.5)
The difference between IMEPn and BMEP is the friction mean effective pressure.
𝐹𝑀𝐸𝑃 = 𝐼𝑀𝐸𝑃𝑛 − 𝐵𝑀𝐸𝑃 (3.6)

13
3.2 Efficiencies
The efficiencies are calculated as shown in the flow chart, Figure 3, with the mean effective pressures defined in the previous section.
Figure 3. Mean effective pressure and efficiencies flow chart.
The combustion efficiency, ηc, reflects how much of the fuel energy that is converted into heat:
𝜂𝑐 =𝑄ℎ𝑟𝑀𝐸𝑃𝐹𝑢𝑒𝑙𝑀𝐸𝑃
= 1 −𝑄𝑒𝑚𝑖𝑠𝑀𝐸𝑃𝐹𝑢𝑒𝑙𝑀𝐸𝑃
(3.7)
The combustion efficiency can be estimated from the incomplete combustion products in the exhaust divided by the supplied fuel heat according to:
𝜂𝑐 = 1 −∑ 𝑚𝑖 ∙ 𝑄𝐿𝐻𝑉,𝑖𝑖
𝑚𝑓 ∙ 𝑄𝐿𝐻𝑉,𝑓 (3.8)

14
where mi is the mass of the combustion product, QLHV,i is the lower heating value of the combustion product, mf is the fuel mass and QLHV,f is the lower heating value of the fuel.
The thermodynamic efficiency, ηth, is the ratio between IMEPg and QhrMEP and represents the efficiency of converting released heat to indicated work.
𝜂𝑡ℎ =𝐼𝑀𝐸𝑃𝑔𝑄ℎ𝑟𝑀𝐸𝑃
= 1 −𝑄ℎ𝑡𝑀𝐸𝑃 + 𝑄𝑒𝑥ℎ𝑀𝐸𝑃
𝑄ℎ𝑟𝑀𝐸𝑃 (3.9)
The gas exchange efficiency, ηge, is defined as the ratio between the indicated work for the entire cycle and the closed cycle without the gas exchange process.
𝜂𝑔𝑒 =𝐼𝑀𝐸𝑃𝑛𝐼𝑀𝐸𝑃𝑔
= 1 −𝑃𝑀𝐸𝑃𝐼𝑀𝐸𝑃𝑔
(3.10)
The gross indicated efficiency is defined as:
𝜂𝑖,𝑔 =𝐼𝑀𝐸𝑃𝑔
𝐹𝑢𝑒𝑙𝑀𝐸𝑃
(3.11)
The net indicated efficiency is defined as:
𝜂𝑖,𝑛 =𝐼𝑀𝐸𝑃𝑛
𝐹𝑢𝑒𝑙𝑀𝐸𝑃
(3.12)
Finally, the mechanical efficiency accounts for the friction from piston rings, bearings, auxiliary equipment and more.
𝜂𝑚𝑒𝑐ℎ =𝐵𝑀𝐸𝑃𝐼𝑀𝐸𝑃𝑛
= 1 −𝐹𝑀𝐸𝑃𝐼𝑀𝐸𝑃𝑛
(3.13)

15
3.3 Heat Release
By performing heat release calculations qualitative information on the burn profile and quantitative information such as combustion timing and combustion duration can be calculated.
The heat release analysis in this work is based on a single zone model which utilizes the first law of thermodynamics for a system as shown in (3.14). The thermal energy release from combustion, 𝜕𝑄, is given by the sum of the change in internal energy, 𝜕𝑈, the work done by the system, 𝜕𝑊, the heat transfer to the cylinder walls, 𝜕𝑄𝐻𝑇, and the energy losses due to crevice flows, 𝜕𝑄𝑐𝑟.
𝜕𝑄 = 𝜕𝑈 + 𝜕𝑊 + 𝜕𝑄𝐻𝑇 + 𝜕𝑄𝑐𝑟 (3.14)
Using the equation of state, assuming the cylinder content to be an ideal gas and that the trapped mass is constant, the thermal energy release per unit crank angle, θ, or heat release rate is given by:
𝑑𝑄𝑑𝜃
=𝛾
𝛾 − 1𝑝𝑑𝑉𝑑𝜃
+1
𝛾 − 1𝑉𝑑𝑝𝑑𝜃
+𝑑𝑄𝐻𝑇𝑑𝜃
+𝑑𝑄𝐶𝑟𝑒𝑣𝑖𝑐𝑒
𝑑𝜃 (3.15)
Where V and p are the cylinder volume and pressure, γ is the ratio of specific heats Cp/Cv. The heat transfer to the cylinder walls is estimated with a zero-dimensional model according to (3.16). The temperature of the gas, Tg, is assumed to be homogeneous and the wall surface temperature, Tw, is assumed to be constant. The wall area, Aw, is the sum of the cylinder head, piston crown and exposed cylinder liner area.
𝑑𝑄𝐻𝑇𝑑𝑡
= ℎ𝐴𝑤(𝑇𝑔 − 𝑇𝑤) (3.16)
The heat transfer coefficient, h, is estimated by the relationship introduced by Woschni [44]. This is based on a Nusselt-Reynolds relationship according to:
ℎ = 𝐶𝐵−0.2𝑝0.8𝑇−0.55𝑤0.8 (3.17)
C is an engine specific constant, B is the engine bore, p and T are the cylinder pressure and temperature, and w is a characteristic gas velocity, which is defined according to

16
𝑤 = 𝐶1𝑆𝑝 + 𝐶2 �𝑉𝑑𝑉𝑟� �𝑝 − 𝑝𝑚𝑜𝑡
𝑝𝑟�𝑇𝑟 (3.18)
C1 and C2 are correlation coefficients that must be tuned for the individual engine. Sp is the mean piston speed, Vd is the displacement volume, and Vr, pr, Tr are the reference volume, pressure and temperature, respectively, reflecting in-cylinder conditions at IVC. The cylinder pressure is p, and pmot is the calculated motored pressure.
From the cumulative heat release it is possible to calculate different parameters. Figure 4, which is from Per Tunestål’s doctoral thesis [45], shows the definitions of the most commonly used parameters. The crank angle of 50 % cumulated heat release, CA50, is used as a measure of combustion timing. The combustion duration is calculated as the difference between 90 and 10 % cumulative heat release (CA90 – CA10). The reason is that these parameters are considered more robust and less sensitive to measurement and model uncertainties compared to for example CA1 and CA99.
Figure 4. Definitions of some heat release based cycle parameters [45].

17
3.4 Cycle-to-Cycle Variations
COV of IMEP is a commonly used measure of the cyclic variability between different cycles derived from the pressure trace data [46]. An operating point with high cyclic variability is considered as unstable. COV of IMEP is calculated by dividing the standard deviation of IMEP by the mean IMEP. Similarly to [47] the standard deviation of IMEP is used as a measure of combustion stability instead of COV of IMEP. The reason is that the experiments are performed at low load and engine speed. At low load, COV is generally high due to the division by a low mean IMEP. Also, a change in mean IMEP will have a large influence on COV for the same reason. 500 consecutive cycles have been saved at each operating point to calculate IMEP and the standard deviation of IMEP.

18
4 Experimental Apparatus
A brief description of the experimental engine, auxiliary equipments and measurement devices, including the engine control system, is given in this section.
4.1 Engine and Auxiliary Equipment
The experimental engine is based on a Volvo D5 light duty diesel engine. The engine specifications can be seen in Table 2. It is run on only one of the five cylinders and is equipped with a fully flexible pneumatic valve train system supplied by Cargine Engineering. The engine speed is controlled with a 30 kW AC motor used as dynamometer to both motor and brake the engine.
Table 2. Engine specifications.
Displacement (one cylinder) 0.48 Liters Stroke 93.2 mm Bore 81 mm Compression ratio 16.5:1 Number of Valves 4 Valve train Fully flexible
The Cargine valve train system was first demonstrated by Trajkovic et al. [48]. The Cargine system has also been used by Håkan Persson [49]. The actuators are sufficiently small to be fitted directly on top of the valve stem. But to allow space for the fuel injector, the valve actuators were placed on an elevated plate above the fuel injector and were connected to the valve stems with push-rods. Maximum valve lift was set to approximately 5 mm by installing mechanical stoppers (hollow metal cylinders) between the cylinder head and the valve spring retainer. The valve lift profiles are measured using MicroStrain displacement sensors installed below the valve actuator. The displacement sensor measures the horizontal distance to a cone shaped skirt which moves up and down with the valve and gives a varying horizontal distance with valve lift. The Cargine actuators also have a simpler contact sensor

19
which is used to detect the crank angle of 1 mm valve lift opening. The dynamic range of the sensor (difference in volts between the sensor reading at minimum and maximum valve lift) is different for each sensor. The valve lift profile is calculated by assuming a linear correlation between the maximum and minimum sensor output and the known maximum valve lift. The calculated valve lift profile crank angles at 1 mm valve lift is in good agreement with the output of the simpler contact sensor. The valve lift profile calculation has also been verified by measuring the valve lift from below the cylinder head using a Wenglor YP06MGV80 reflex sensor measuring directly on the valve face. A photograph of the Microstrain displacement sensor and an example of calculated valve lift curves are shown in Figure 5. The lift profiles of the pneumatic valve train is different compared to a more conventional cam shaft controlled system.
Figure 5. The MicroStrain displacement sensor with signal amplifier (left image) and calculated valve lift curve examples (right image).
The actuators work with pressurized air to lift the valve. The air supply is controlled with two solenoids and a pressurized hydraulic circuit is used to achieve a stable and constant valve lift. The valve timings are controlled by activating the solenoids. This is managed by the engine control system. The performance of the valve system is based on the supplied air pressure and the force of the valve springs, independent of engine speed. The air pressure was kept between 3 and 4 bar gauge (4 and 5 bar absolute) and the hydraulic pressure was kept at 4 bar gauge (5 bar absolute). At 800 rpm the opening and closing ramp of the valve is approximately 20 CAD from 0 to 5 mm valve lift. At increased engine speed the valve lift profile would be closer to a more traditional valve lift curve. The valve lift profile can be changed, but only to a limited extent and not in real-time. The air pressure can be moderated to change the valve opening speed but the valve closing speed is dependent on the spring properties.
-200 -150 -100 -50 0 50 100 150 200
0
1
2
3
4
5
6
Crank Angle [CAD]
Val
ve L
ift [m
m]

20
Photographs of the experimental engine and the two different piston crowns that were used are shown in Figure 6. The modified piston was machined at the department and mounted on top of a machined Volvo D5 piston with three screws. The purpose of the design was to enable valve clearance at top dead center with the Cargine valve train system. It is not expected that the combustion chamber geometry is optimal for any of the combustion processes investigated in the thesis. The modified piston crown was used in Paper 1 and 2 and in an introductory low NVO setting comparison study in Paper 3. The rest of the presented results, which cover the PPC results of the thesis, have been measured with the standard piston crown. The compression ratio with both pistons is 16.5:1.
Figure 6. The experimental engine (left image), the modified piston crown (upper right image) and the standard Volvo D5 piston (lower right image).
A minimum NVO setting had to be used with the standard piston crown in order to avoid hitting the piston with the valves. A minimum NVO setting of 60 CAD was selected to also include a small margin. The conclusion from the low NVO setting comparison study in Paper 3 was that the differences between the lower NVO case (10 CAD) and the 60 CAD NVO case were minor.

21
The engine is equipped with both a port fuel injector and a direct injection system. The direct injection system is a common rail system with a 5 hole nozzle solenoid injector. The umbrella angle is 140 degrees and the nozzle hole diameters are 0.159 mm. For the low engine load and engine speed operating points in the thesis, the common rail pressure was relatively low, 400-500 bar.
During the measurements for Paper 1 and Paper 2, an 8 mm thread NGK ER8EH spark plug was installed in the glow plug hole. The spark plug was fitted and fixated using a custom made insulator. This is the same spark plug configuration that has previously been used by Håkan Persson [49]. The spark plug was replaced by a glow plug when the focus of the project changed from HCCI/SACI to PPC.
The engine was operated at ambient pressure and no boosted air. The inlet temperature was controlled with a heater in the intake manifold. If nothing else is stated, the inlet temperature was kept at 40 °C. External EGR was used only in Paper 3 and was produced by pumping back the exhaust gases from the exhaust manifold to the inlet with a screw type compressor.
An overview of the engine control system hardware components and measurement apparatus is shown in Figure 7. The engine control system consists of two separate computers that are controlled from the same LabVIEW project. The host computer is a standard desktop PC running Windows. The real-time system consist of a National Instrument PXI-8110 (embedded controller with a 2.26 GHz Quad-Core CPU), PXI-7853R (Multifunction reconfigurable I/O (RIO) with Virtex-5 LX85 FPGA), and a PXI-6251 multifunctional data acquisition (DAQ) card. Most of the physical wires are connected to the real-time computer which is situated in the test-cell. The exceptions are the thermocouples, which are connected directly to the Hewlett Packard 34970A DAQ/switch unit (data logger) situated in the control room, and the instruments that use serial port communication (the fuel balance and soot meter).
Thermocouples are used to measure the temperature of the intake, exhaust, fuel, oil, and cooling water. The oil and cooling water temperatures were kept constant at 85 °C and 80 °C respectively. The cylinder pressure is measured with a Kistler6053CC60 piezo-electric pressure transducer fitted through a cooling channel and merged between the intake and exhaust valves. The absolute pressures in the intake and exhaust manifolds are measured with a Keller PAA-23S absolute pressure sensor. Crank angle pulses and a synchronization pulse (one per revolution) are generated by a Leine-Linde crank angle encoder with resolution 5 pulses per crank angle. The air flow is measured with a Bronkhorst F-106AI-AGD-02-V air-flow meter and the fuel flow is calculated by recording the fuel tank mass placed on the Sartorius CP 8201 precision balance. The time difference between each fuel balance reading was recorded by the control system and used to calculate the fuel mass flow. A linear correlation between the fuel injector opening duration and the calculated fuel flow was assumed. This was found to be in close agreement with the measured fuel flows. The

22
calculated fuel mass flow was used regularly to calibrate the fuel injector. The fuel injector was recalibrated for each fuel injection strategy. At least four measurement points were taken for each calibration. For the PPC measurements, given the low engine speed and load, a total measuring time of at least 8 minutes was used to ensure adequate fuel-flow calculations.
Figure 7. Overview of the engine control system and measurement apparatus.
The HC, CO, CO2 and NOx emissions are measured with a Horiba Mexa 7500 gas analyzer system. Soot is measured with an AVL 415 smoke meter. There is also a lambda sensor with an Etas LA3 module but it is mainly used for complementary monitoring in real-time. In Papers 1-3, the air-fuel ratio and relative air-fuel ratio, λ, were calculated from the measured exhaust gas composition, basically following the same procedure as described in Heywood [46]. After completion of Paper 3, the calculated air- and fuel-flows were used to calculate the air-fuel ratio. In Paper 3, cold/external EGR was used and produced by pumping back exhaust gas from the exhaust manifold to the inlet with a screw type compressor. The EGR ratio is calculated as the inlet CO2 fraction divided by the exhaust CO2 fraction. The inlet CO2 fraction was measured with a Horiba Mexa 554JE system. The exhaust gases were cooled down before reaching the intake manifold.
Real-time system Host computer
TCPIP
Data logger
Experimental engine and measurement equipment
Fuel balance
• Horiba gas-analyzers
• AVL 415 smoke meter
• lambda sensor
NI RIO (FPGA)
Multifunctional DAQ
Air-flow meter
In-cylinder pressure sensor
Thermocouples
Absolute-pressure sensors
Desktop PC

23
4.2 Engine Control System
An introduction and brief description of the LabVIEW based engine control system is given in this section. The LabVIEW based engine control system has been used to collect all of the experimental results presented in this thesis. The design and LabVIEW programming of the system was performed by the author. A short presentation of the system was given as part of a case study presented during NIDays 2010 in Stockholm. The case study was awarded with the NIDays Graphical System Design Achievement Award. The main front panel of the engine control system is shown in Figure 8.
Figure 8. Front panel of the real-time control system.
There were a number of reasons for starting to work with LabVIEW. First, in the early phase of the project, the engine control system was divided amongst different subsystems, and computers, and no communication between them. The in-cylinder pressure traces were recorded at one station, the valves were controlled from a stand-alone system and the data logging of the fuel, emissions and thermocouples were handled with a third, independent, system. In order to be suitable for feedback control, the different subsystems were merged to a single system, with direct access to all of the measured quantities and control actuators. LabVIEW was chosen because it was relatively easy to include all of the subsystems in a single LabVIEW project. Another

24
reason for choosing LabVIEW was the FPGA (field-programmable gate array) hardware support and that programming of the FPGA can be performed easily in LabVIEW. The FPGA program runs more or less independently within the engine control system which offers many advantages as will be discussed later.
LabVIEW is not the only solution available and used for engine control system applications. MathWorks offers the xPC Target platform, which is a real-time software environment that runs Simulink models and connects them with the real world [50]. Graphical modeling with Simulink is possible also with the dSPACE systems. A dSPACE system was used by Hans Aulin [51] at the same department as the author in Lund. And Petter Strandh, also at the department in Lund, developed a control system in C++ including Simulink generated controllers [52].
LabVIEW (G programming) is a graphical programming language which is programmed by wiring graphical icons. The programming language includes standard programming concepts found in most traditional programming languages, including loops, variables, data types and event handling. The starting point of the program is normally the measured data and the execution of the code progresses through connected wires in a data flow fashion, which is different from more traditional procedural approaches. More information on LabVIEW can be found on National Instrument’s web page1
Working with LabVIEW is not without difficulties. There are programming tasks that are more easily carried out in text-based programming languages, for example, more advanced operations on String data types. But the opposite is also true, there are programming tasks that are more easily handled in LabVIEW, for example, data acquisition and creating multiple tasks (threads) executing in parallel.
.
The graphical programming is intuitive to start to work with and it is relatively easy to get a basic data acquisition platform up and running. But a larger control system requires careful planning and it is important to think in advance how the different subtasks interact and communicate. This is generally true for most programming applications. If not, in worst case, you end up with a single virtual instrument (LabVIEW program) covering literally a large area of wires and icons that is impossible to overlook. It is important to split up the control task into different subtasks. This makes the control system easier to overview and performance is potentially improved because it enables different processes to execute in parallel. An example of how this can look is shown in Figure 9, where three different control loops, each handling a specific task, is shown. But even with careful planning and design, it will often be necessary to add a new block into an existing LabVIEW code
1 www.ni.com

25
which often means that more program area needs to be made available. This is often cumbersome and the LabVIEW code tends to occupy an increasing amount of code area. In a more traditional programming language, inserting new code is simply achieved by pressing the enter key to create a new line.
Figure 9. LabVIEW block diagram screenshot of the engine control system.
The LabVIEW engine control system task is split up into different subtasks that execute either on the host computer, the real-time target (PXI computer), or on the FPGA chip. The host computer handles the graphical user interface (GUI) and transmits user inputs to the rest of the system. The real-time target handles communication and data acquisition from the FPGA and the multifunctional DAQ hardware. It also has separate loops for heat release calculation and engine control, common rail pressure control, saving data, and Cargine valve train system control. Some loops of the control system are event driven, meaning that a loop is executed only if it is triggered by an event, for example, at completion of a new engine cycle. And the other loops execute at a predefined rate in time. The real-time target has a dedicated real-time operating system (LabVIEW Real-time). What makes a real-time

26
operating-system different is that it ensures that programs run with consistent timings according to priorities that are set by the programmer. A separate real-time computer is optional and the control system can easily be modified to run on a single desktop PC depending on the performance requirement of the control system. This has to be decided from case to case.
The FPGA chip is a part of the PXI-7853R hardware module in the real-time target, but the FPGA software runs on the FPGA hardware more or less independently of the rest of control system. Programming of the FPGA software is also made in LabVIEW. An FPGA LabVIEW block diagram example is shown in Figure 10. Unlike processors, FPGAs are truly parallel in nature and are made up of a finite number of predefined resources with programmable interconnects [53]. A more comprehensive description of the FPGA chip is included in Carl Wilhelmsson’s doctoral thesis [54]. In the LabVIEW engine control system, the FPGA is used to handle more computationally simple tasks but with high execution rates. The time base of the FPGA control loops is the crank angle encoder which generates 5 pulses per crank angle degree. For the crank angle triggered FPGA software loops, at engine speed 800 rpm, this corresponds to a loop execution rate of 24000 iterations per second. In comparison, the software loops on the real-time target, typically runs at an execution rate of 5-30 iterations per second.
The FPGA is used for many different tasks of the engine control system. The FPGA is used to send digital and analog signals to different engine actuator drivers at predetermined crank angles or with a fixed frequency. Such drivers include the Cargine system valve train driver to the solenoids, the fuel injector driver, and the driver to the high pressure fuel supply pump for the common rail. The FPGA is also used to sample the in-cylinder pressure and valve lift curves at the same sampling rate as the crank angle encoder, 5 samples per crank angle degree. One advantage with a programmable sampling task is that it can be programmed specifically for the engine to automatically recover from measurement errors due to, for example, noise on the crank angle encoder signals. It is also straightforward to include logical signals, for example, whether or not the pulse to the fuel injector driver is high or not, together with the sampled signals to be shown in the GUI or recorded on the hard drive at the same sample rate as the in-cylinder pressure trace. This can be useful in the post-processing of the data and calculation of, for example, the ignition delay. Since the FPGA is run more or less independently of other parts of the control system it can also be used to implement automatic safety features such as automatic shut down of the fuel injection, for example, if communication is lost with the real-time target or if the pressure rise rate is too high.

27
Figure 10. LabVIEW Block diagram of a small part of the FPGA LabVIEW code.
4.3 Post Processing
The post processing of the data is made with Matlab. Engine performance in terms of engine load can be calculated directly from the measured in-cylinder pressure and calculated volume. Since the experiments in this work have been performed on a single cylinder engine, adequate torque measurements for calculation of BMEP were unavailable.
The heat release calculations are dependent on the initial conditions of temperature, pressure and residual gas fraction. For an engine with more conventional valve timings the residual gas fraction can be assumed to be low and the initial charge temperature can be estimated from the inlet temperature. When the engine is operated with a high fraction of trapped residual gases, the initial in-cylinder temperature is increased and the ratio of specific heats, γ, is lower. Accurate estimates of the in-cylinder temperature and residual gas fraction is difficult to obtain and simplifications have to be made.
The method used in this work is a combination of residual gas fraction and temperature estimation and automated heat release calibration by means of parameter tuning. The main tuning parameter is the specific heat ratio. A rough estimation of the

28
residual gas fraction and in-cylinder temperature at intake valve closing timing can be calculated from the air-flow, exhaust temperature and exhaust gas composition measurements. A simplification can be made by assuming that the fresh charge has the same density in the cylinder as in the intake manifold. The rest of the displaced volume is then assumed to contain trapped residuals with the same temperature as the exhaust temperature. This was used to get a rough estimate of the initial charge temperature at intake valve closing timing.
There are two additional parameters that need to be estimated in order to calculate the heat release rate. This method was inspired by the work by Tunestål [55]. The first parameter is the unknown offset, Δp, between the measured pressure, pm, and actual in-cylinder pressure, p.
𝑝 = 𝑝𝑚 + ∆𝑝 (4.1)
The second parameter is the specific heat ratio, γ. It is assumed that there is a linear relationship between the specific heat ratio and the cylinder temperature, T. The specific heat ratio is approximated with
𝛾 ≅ 𝜅0 + 𝑘 ∙ (𝑇 − 𝑇𝑟𝑒𝑓)/1000 (4.2)
The estimated temperature at intake valve closing timing is chosen as reference temperature, Tref. A straight line fit approximation as function of the mean charge temperature was used by Gatowski et al. [56]. This specific heat ratio calculation expression was included in an evaluation by Egnell [57] and also in a work by Ceviz et al. [58].
The parameters κ0 and Δp are estimated from the measured cylinder pressure and calculated volume using linear least square and (3.15). Note that κ0 is used instead of γ0 since the estimated parameter is not necessarily the true thermodynamic specific heat ratio. A background on least-squares estimation is given in for example Johansson [59]. The assumption is that the parameter estimation interval in crank angles is sufficiently short so that the heat transfer term can be omitted and the total rate of heat released is zero. If the energy loss term by crevice flows is also omitted, (3.15) can be simplified to
𝑑𝑄𝑑𝜃
=𝜅0
𝜅0 − 1(𝑝𝑚 + ∆𝑝)
𝑑𝑉𝑑𝜃
+1
𝜅0 − 1𝑉𝑑𝑝𝑚𝑑𝜃
= 0 (4.3)

29
where the pressure, p, has been replaced with (4.1) and γ with κ0 from (4.2). This expression can be reformulated to be more suitable for linear least squares estimation of κ0 and Δp according to
𝜅0𝑝𝑚𝑑𝑉𝑑𝜃
+ 𝜅0∆𝑝𝑑𝑉𝑑𝜃
= −𝑉𝑑𝑝𝑚𝑑𝜃
(4.4)
Note that the resulting least squares estimates are the parameters κ0 and κ0Δp. The pressure offset Δp is easily obtained by dividing the second estimated parameter κ0Δp with the first κ0. A suitable estimation interval during the cycle needs to be selected. Selecting a suitable interval length is a trade-off between a sufficiently short interval for the zero rate of heat released assumption to hold but sufficiently long to obtain reasonable statistics for the least squares estimation. The length of the interval was empirically chosen to 40 crank angle degrees. The interval starting point should be set to early during the compression stroke for basically the same reasons. Since the simplification was made to omit the heat transfer term in (4.3), selecting a relatively late starting point will include more of the heat transfer losses in the estimation of κ0. The starting point of the interval was empirically chosen to -100 CAD ATDC.
The remaining tuning parameter is k from (4.2). During the early stages of the experimental work the parameter k was manually tuned for each measurement point. But this soon turned out to be time consuming and the results were potentially biased with respect to the operator who for each case needs to make a manual decision on the value of the tuning parameter. Instead a cost function was designed to be minimized with respect to the k parameter according to
𝑚𝑖𝑛𝑘
��𝑑𝑄(𝜃𝑏)2𝜃𝑏
+ �𝑑𝑄(𝜃𝑎)2𝜃𝑎
� (4.5)
Two intervals are selected, θb and θa, before and after combustion, where it can be assumed that the rate of heat release is zero. This is normally true before fuel injection in a direct injection engine and late during the expansion stroke, sufficiently long after the crank angle of maximum accumulated heat released. There are applications where it is assumed that the heat release rates during similar intervals are not zero. A similar cost function was used in a work by Tunestål [60] about TDC estimation from motored cylinder pressure data where a nonzero, constant, heat release rate reference level was used. The difference in this work is that a heat transfer term is included explicitly in the calculation of dQ.

30
The main purpose of this final step is to have an unbiased estimate of the remaining tuning parameter with respect to the operator. In principle, this is a similar procedure that initially was carried out manually. After completion of the automated heat release calculation, each operating point was manually inspected to make sure that the algorithm produced reasonable results with respect to the overall shape of the heat release curve and maximum value of the accumulated heat released.
The motivation for using this method is that it is a standardized procedure capable of handling the large variations of in-cylinder conditions with respect to residual gas fraction in reasonable time and with a reasonable effort. Some tuning parameters are inevitable due to the many uncertainties and the simplified nature of the model but an effort was made to include also more conventional established methods, such as the Woschni [44] heat transfer coefficient estimation. The main parameters of interest that are extracted from the accumulated heat release curve are the crank angles of 10, 50 and 90% of accumulated heat released. These parameters are relatively robust with respect to calculation errors of peak accumulated heat release.
4.4 Real-Time System Heat Release Calculation
The real-time calculation of the accumulated net heat release was designed with emphasis on real time performance. In real-time applications computation time also needs to be considered. A simpler heat release method was adopted in the real-time system compared to the more complex method that was used in the post processing. In the simplified heat release calculation the inlet pressure was used for pressure trace pegging, the specific heat ratio, γ, was assumed constant the heat loss and crevice loss terms in Eq. (3.15) are omitted. Tunestål [45] derived a preintegrated form of Eq. (3.15) with omitted heat loss and crevice loss terms which has the numerical benefit of not having to calculate and include the pressure derivative. The simplified preintegrated version of Eq. (3.15), Qs, is shown in Eq. (4.6). Avoiding the pressure derivative calculation can be beneficial because the noise of the pressure input tends to be amplified. The preintegrated heat release equation is used in the control system.
𝑄𝑠(𝜃) =1
𝛾 − 1[𝑝(𝜃)𝑉(𝜃)− 𝑝(𝜃0)𝑉(𝜃0)] + � 𝑝(𝜃)
𝑑𝑉𝑑𝜃
𝑑𝜃𝜃
𝜃0 (4.6)
The parameter of interest in real-time, while operating the engine, is the combustion timing, defined as crank angle of 50 % accumulated heat released. Using a simplified heat-release calculation for CA50 estimation gives almost the same accuracy as using a more complete heat-release calculation [61].

31
4.5 Calculations of Start of Injection and Ignition Delay
The binary fuel control signal was recorded in the control system simultaneously with the pressure trace and valve lift curves. The signal is connected to a fuel injector driver which in turn is connected to the fuel injector. The problem is that there is an unknown time delay from the rising edge of the fuel control signal from the FPGA to when fuel is actually injected. An attempt was made to estimate the time delay based on heat-release data. The assumption was that fuel is injected just before the rate of heat release curve becomes negative. This is the first indication of fuel vaporization. The injection time delay was pre-determined and was kept constant, 400 μs or approximately 2 CAD at 800 rpm. Values of injection delays in common rail system ranging from 0.30 to 0.75 ms have been reported [62]. The injection time delay was used to adjust the start of injection timing for the ignition delay calculations. The ignition delay is defined as the crank angle difference between 10% accumulated heat release and start of injection. If not stated otherwise, the mentioned start of injection timings in the thesis will refer to the settings that were set in the control system, without the time delay compensation. But the time delay compensation is included in the calculated ignition delays.

32
5 Results
5.1 HCCI Results
In the beginning of this work, the associated project was named Spark Assisted Compression Ignition (SACI). But after Manente et al. [33] [34] developed the gasoline PPC strategy during 2009-2010, the focus of this project changed from SACI to light-duty gasoline PPC. This section gives a summary of the results that were collected before changing the focus of the project to gasoline PPC.
5.1.1 Publications
The results in this section are based on two articles. The first article (Paper 1) is “Investigation and Comparison of Residual Gas Enhanced HCCI using Trapping (NVO HCCI) or Rebreathing of Residual Gases”, which was presented by the author at the SAE International Powertrains, Fuels and Lubricants Meeting, 2011, in Kyoto, Japan. The experiments were planned, carried out and post-processed by the author. The article was written by the author. The work was supervised by Per Tunestål and Bengt Johansson who both provided valuable feedback. The second article (Paper 2) is “Investigating Mode Switch from SI to HCCI using Early Intake Valve Closing and Negative Valve Overlap”, which was presented by Anders Widd at the same conference as the first article. Both the author and Anders Widd planned and performed the engine experiments and wrote the paper. Anders Widd was responsible for the controller design and evaluation. The author was responsible for the LabVIEW implementations and post-processing of the data. This work was supervised by Rolf Johansson, Per Tunestål and Bengt Johansson.
The objectives were to get qualitative comparisons of different HCCI and SI combustion strategies with the variable valve train and investigation of SI to HCCI mode switch at low engine load. One of the problems with HCCI is the limited attainable operating region. One example of attainable operating region of an engine running in HCCI mode with trapped residual gases using NVO is shown in Figure 11. This figure is from Håkan Persson’s doctoral thesis [49]. Similar operating ranges were reported by Zhao et al. [63] and Allen et al. [64]. Basically, high engine load operation is limited by excessive pressure rise rates and low engine load operation is limited by insufficient temperature for auto ignition. At the low load limit in Figure

33
11, the engine was operated with spark assistance which enabled a small extension of the low load operating limit. But one drawback with spark assistance is that the typical SI combustion fluctuations are introduced [65]. In order to cover the entire operating range, one strategy is to run the engine in SI mode past the high and low load operating limits of HCCI. A suitable mode switch strategy should be used to ensure a smooth transition between SI and HCCI.
Figure 11. Operating range of NVO HCCI [49].
For the experiments presented in Paper 1 and Paper 2, the single cylinder engine was equipped with a spark plug in place of the glow plug. The fuel used was commercial Swedish gasoline (RON 95) and was port injected. The valve opening rate of the variable valve train system is fast compared to a conventional camshaft system at these relatively low engine speeds (1500 and 2000 rpm), and could not be controlled in real-time. In order to be able to operate the engine with maximum flexibility of the variable valve train system, the original Volvo D5 piston was replaced with a piston crown with 5 mm deep valve pockets. The purpose of the design was to have valve clearance at top dead center. No attempts were made to quantify the flow structures during compression. Also the compression ratio is high (16.5:1) in comparison to what is usually associated with a CAI engine (10-12:1). It is not expected that this combustion chamber geometry is optimal for any of the combustion processes in these investigations. This piston crown was used mainly for these two articles. For the rest of the work, the standard Volvo D5 piston was used.
An advantage with a fully flexible variable valve train system for the SI combustion is that the engine can be operated without the throttle. Engine load can then be controlled

34
with the valve timings or valve lift or both. This potentially results in higher efficiency compared to when a throttle is used because of the gain in gas-exchange efficiency at low and part-load operating conditions. A second advantage is that the intake and exhaust valves as control actuators are expected to be faster compared to a conventional throttle. This is an advantage for the mode switch strategy which potentially can be made faster and smoother.
5.1.2 Part Load Concepts (Paper 1)
The results that are presented in the first investigation were taken at steady state operating conditions. Any improvements in fuel consumption do not necessarily reflect numbers that would be obtained if it would be possible to drive a complete drive cycle. The load ranges used in this study are based on the attainable operating region for HCCI combustion. Conclusions drawn from the relative improvements of the SI cases are also drawn within this narrow interval and would perhaps have been somewhat different, if the engine load range had been wider.
The valve lift curves for the strategies included in the investigation can be found in Paper 1. The SI throttle case was operated with as close to conventional valve timings as possible and with a throttle to control load with stoichiometric combustion. The SI LIVC and EIVC cases were operated stoichiometric with late and early intake valve closing to control load. The HCCI cases, NVO, Reb1, Reb2 and heater, were operated with lean combustion. The NVO case was run with a negative valve overlap to trap hot residual gas. In the Reb1 case, the exhaust valves were kept open during and after the gas exchange top dead center to reinduct hot exhaust gas. In the Reb2 case, the exhaust valve was opened again later during the intake stroke, around intake valve closing timing, which occurred earlier during the intake stroke. In these cases, the combustion timing was automatically controlled using a PI controller with the exhaust valve timings as the main control actuator. In the HCCI heater case, the more conventional valve timings were used and combustion timing was manually controlled with the inlet temperature. The combustion-, thermodynamic-, gas-exchange- and net indicated efficiencies are shown in Figure 12.

35
Figure 12. Combustion, thermodynamic, gas-exchange and net indicated efficiencies for the different SI and HCCI cases.
The HCCI cases have higher net indicated efficiency compared to the SI cases. This can mainly be attributed to the higher thermodynamic efficiency explained by the higher expansion ratio. The NVO HCCI case has low gas-exchange efficiency compared to the other HCCI cases. And the HCCI heater case has low combustion efficiency. The HCCI cases with the highest net indicated efficiency are the rebreathing cases. At engine speed 1500 rpm, there is only a small improvement with the EIVC SI strategy compared to the throttled case. Results from only one engine speed are shown here. More results and discussions are found in the article. In short
2 2.5 3 3.5 4 4.5 580
82
84
86
88
90
92
94
96
98
100
IMEPnet [bar]
Com
bust
ion
Effi
cien
cy [%
]
1500 rpm
SI throttleSI LIVCSI EIVCHCCI NVOHCCI Reb 1HCCI Reb 2HCCI heater
2 2.5 3 3.5 4 4.5 530
35
40
45
50
55
IMEPnet [bar]Th
erm
odyn
amic
Effi
cien
cy [%
]
1500 rpm
SI throttleSI LIVCSI EIVCHCCI NVOHCCI Reb 1HCCI Reb 2HCCI heater
2 2.5 3 3.5 4 4.5 578
80
82
84
86
88
90
92
94
96
98
100
IMEPnet [bar]
Gas
-Exc
hang
e E
ffici
ency
[%]
1500 rpm
SI throttleSI LIVCSI EIVCHCCI NVOHCCI Reb 1HCCI Reb 2HCCI heater
2 2.5 3 3.5 4 4.5 526
28
30
32
34
36
38
40
42
44
IMEPnet [bar]
Net
Indi
cate
d E
ffici
ency
[%]
1500 rpm
SI throttleSI LIVCSI EIVCHCCI NVOHCCI Reb 1HCCI Reb 2HCCI heater

36
summary, for the higher engine speed case, 2000 rpm, the differences between the LIVC and EIVC SI cases net indicated efficiencies were found to be larger. The LIVC SI strategy resulted in higher net indicated efficiency compared to the throttled case and the EIVC SI case had lower efficiency compared to the throttled case for which the net indicated efficiency did not change with increasing engine speed. The relatively high compression ratio is expected to give higher thermodynamic efficiencies but lower combustion efficiencies due to increased fuel mass in crevices. An HCCI displacement study by Hyvönen et al. [66], also included a comparison between two SI cases, run on the same base engine with 0.5 dm3 cylinder displacement, with high (18:1) and standard (9.5:1) compression ratio. The high compression ratio SI case had highest net indicated efficiency due to higher thermodynamic efficiency. The net indicated efficiency was 28-32 % at 2-4 bar BMEP for the high compression ratio case in the study, which is in agreement with the SI cases results from Paper 1.
The steep pressure rise rates on the high load limit of the HCCI cases are clearly seen in Figure 13. Steep pressure rise rates result in acoustic noise and can also potentially cause damage to the engine hardware. The pressure rise rate increase with engine load is relatively fast, especially if compared to the SI cases. At the high load limit of the residual gas enhanced HCCI cases, the residual gas fraction temperature is higher and a lower fraction of residual gas is needed to initiate auto-ignition at the desired combustion phasing. A lower fraction of trapped residual gas means less dilution and steeper pressure rise rates. Low engine load operation with the residual gas enhanced HCCI cases is limited by insufficient residual gas temperature. At the low load limit of the residual gas enhanced HCCI strategies the combustion efficiency, Figure 12, decreases with decreasing engine load which results in increasing HC and CO emissions. COV of IMEP, Figure 13, is a measure of combustion instability and increases with decreasing engine load with the residual gas enhanced HCCI cases. There is also a significant increase of COV of IMEP with the EIVC SI strategy. The reason is most likely that the combustion chamber is not optimal for this strategy. The combustion duration was the longest in comparison to the other cases which indicates low in-cylinder turbulence, hence slow flame propagation [67].

37
Figure 13. Pressure derivative (measure of pressure rise rate) and COV of IMEP for the different HCCI and SI cases.
5.1.3 Mode Switching from SI to HCCI (Paper 2)
Mode switching from SI to HCCI was investigated in Paper 2. Following the nomenclature of Paper 1, the investigation was made with a combustion mode transition from SI EIVC to HCCI NVO. The transition could be made within a few cycles before the engine load and combustion timing controllers were activated. The rate of heat released curves during a combustion mode transition is shown in Figure 14. Two different control strategies were compared. The first strategy was to use two PI controllers, one for engine load and one for combustion timing (CA50). The second strategy was a model based state feedback controller governing both NVO and fuel injection duration to control combustion timing and engine load. The details can be found in Paper 2.
Since the engine was operated port fuel injected, the first problem was to burn off the residual fuel in the inlet manifold. Since the efficiency with the HCCI combustion strategy is significantly higher, less fuel is needed for the same engine load after the transition. And the amount of fuel remaining in the inlet alone was sufficient to sustain combustion for one cycle. Also the residual gas temperature from SI combustion is significantly higher compared to HCCI operation at the same operating point. An initial mode switch sequence was investigated by testing different intake valve closing timings and NVO combinations in order to avoid misfiring and excessive pressure rise rates during the transition.
2 2.5 3 3.5 4 4.5 50
1
2
3
4
5
6
7
8
9
IMEPnet [bar]
Pre
ssur
e D
eriv
ativ
e [b
ar/C
AD
]1500 rpm
SI throttleSI LIVCSI EIVCHCCI NVOHCCI Reb 1HCCI Reb 2HCCI heater
2 2.5 3 3.5 4 4.5 50
1
2
3
4
5
6
7
IMEPnet [bar]C
OV
IME
P [%
]
1500 rpm
SI throttleSI LIVCSI EIVCHCCI NVOHCCI Reb 1HCCI Reb 2HCCI heater

38
Figure 14. Rate of heat-released curves during a combustion mode transition from SI to HCCI combustion.
After the transition, the engine load and combustion timing controllers were activated as soon as possible. The engine load and combustion timing, starting in SI mode in open loop, and then switching to HCCI for the two different HCCI control strategies are shown in and Figure 15 and Figure 16. The model-based approach provided a smoother transient and could be activated one cycle earlier compared to the PI controllers. The PI controllers generated ringing in both outputs following the mode switch, particularly in engine load (IMEPnet). The main benefit of the model state feedback controller is that the interference between the control objectives can be avoided. Looking more closely at the NVO signal of the PI controller, Figure 15, compared to the state feedback controller in Figure 16, there is a longer oscillating behavior on the NVO signal which is a response to the effects originating from the load controller.
-20 -10 0 10 20 30 40 500
20
40
60
80
100
Crank angle [CAD]
Hea
t-rel
ease
rate
[J/C
AD
]
cycle -1cycle 0cycle 1cycle 2cycle 3,4

39
Figure 15. Engine load (IMEPnet) and combustion timing (CA50) starting in SI mode and then switching to HCCI with the PI controllers.
Figure 16. Engine load (IMEPnet) and combustion timing (CA50) starting in SI mode and then switching to HCCI with the model-based controller.
One limitation of this work was the port fuel injection. With a direct injection system, the intermediate step during the transition to burn off the residual fuel from the intake manifold would be avoided. And it is expected that the response time from fuel injection to engine load is faster since intake manifold wall wetting is avoided. The model would be improved further by monitoring the states from the SI combustion mode. This information could be used by an intermediate model-based controller that would determine proper valve and fuel injection parameters during the transition.
20 40 60 80 100 120 140 160 180 2003
3.5
4
cycleIM
EP
net [
bar]
20 40 60 80 100 120 140 160 180 2000
1
2
3
Fuel
act
uato
r [m
s]
20 40 60 80 100 120 140 160 180 2000
5
10
15
20
25
cycle
CA
50 [C
AD
]
20 40 60 80 100 120 140 160 180 2000
50
100
150
200
NV
O [C
AD
]20 40 60 80 100 120 140 160 180 200
3
3.5
4
cycle
IME
Pne
t [ba
r]
20 40 60 80 100 120 140 160 180 2000
1
2
3
Fuel
act
uato
r [m
s]
20 40 60 80 100 120 140 160 180 2000
5
10
15
20
25
cycle
CA
50 [C
AD
]
20 40 60 80 100 120 140 160 180 2000
50
100
150
200
NV
O [C
AD
]

40
5.1.4 Summary
Combustion mode switch is a challenge and there is a strong motivation for extending the attainable HCCI region as much as possible. The limited operating region of HCCI and lack of immediate control actuator, which makes feedback control of the combustion difficult, are two contributing reasons to change focus from spark assisted HCCI to gasoline PPC. However, running a diesel engine on gasoline is not without challenges. The problem with low load engine operation remains and the rest of this work is devoted to extending the low load limit of gasoline PPC.
5.2 Low Load Gasoline PPC Results
5.2.1 Introduction
One way to characterize PPC combustion is that the fuel injection event is complete before start of combustion giving a positive mixing period [40]. Using gasoline, this is achieved through the inherent resistance to auto-ignition, the higher the RON the longer the ignition delay [43]. The attainable operating region plotted against fuel octane number (RON) is shown in Figure 17. The experiments were performed by Manente et al. [34] in a heavy duty engine. The minimum attainable load clearly increases as a function of fuel octane number (RON).
Figure 17. PPC operating region from heavy duty experiments [34].
20 30 40 50 60 70 80 90 1000
5
10
15
20
25
RON [-]
IME
P g
ross
[bar
]

41
One of the major problems with gasoline in comparison to diesel at low load operating conditions is the higher emission levels of HC and CO [31] [39]. A low load investigation with different gasoline fuels was performed by Solaka et al. [43] in a similar light duty single cylinder engine configuration as used in this thesis. One of the main differences was that a conventional camshaft was used and that the engine was heavily boosted. It was shown also by Solaka et al. that higher RON value fuels gave higher levels of CO and HC. The CO and HC yield predicted by homogeneous reactor simulations at constant temperature and pressure for various equivalence ratios and temperatures are shown in Figure 18. The figure is from a work by Kim et al. [68]. Since most of the experiments in the thesis were taken at low load operating conditions with a higher octane number gasoline, the region of interest for the results is dominantly on the lean side at relatively low temperatures. With a long ignition delay of the fuel, the local mixture strength approaches the global mixture strength, which is lean. In Figure 18, lean regions resulting in a high CO yield can be seen for temperatures between approximately 800 and 1400 K. The HC yield is also high at lean conditions with temperatures below approximately 1200 K. Below 800 K the fuel does not ignite which results in 100 % HC. At temperatures between approximately 1200 and 1400 K, on the lean side, HC oxidation is almost complete but there is still a high CO yield which is explained by the slow kinetics of CO oxidation compared to the HC oxidation [68].
Figure 18. CO and HC yield at 2.0 ms as a function of equivalence ratio and temperature obtained from a homogeneous reactor simulation of an n-heptane-air mixture [68].
The main focus of the thesis is to improve the combustion efficiency and stability in the previously unattainable low load operating region with high octane number fuels. The experimental data was collected at a low engine speed, 800 rpm, with the goal to reach idle engine load operating conditions. The potential of a variable valve train system in combination with different fuel injection strategies and the effect of the

42
glow plug are investigated. The variable valve train system is used to trap hot residual gas which elevates the temperature of the subsequent cycle. Another effect of an increased residual gas fraction is increased levels of stratification of temperature and internal EGR distribution [69] which is also influenced by the valve strategy, for example NVO or rebreathing [12]. But the global air-fuel ratio becomes lower with an increased residual gas fraction which means that the available oxygen concentration is reduced. The temperature increase furthermore depends on the residual gas temperature which is relatively low at low load operating conditions. Also, the potential temperature increase at time of combustion, given by an elevated initial charge temperature, is reduced by an increased heat capacity of the cylinder charge. The effects of recycled burned gases on CAI combustion have been summarized in a work by Zhao et al. [70].
Using VVT to trap hot residual gases is usually associated with CAI combustion concepts and has been reported by several authors. The question is if similar strategies can be used on a diesel engine operated with gasoline in order to extend the attainable operating region. The context of this work is gasoline PPC which is operated with a higher compression ratio compared to more conventional CAI configurations. Most of the fuel is injected late during the compression stroke to achieve a less homogeneous mixture compared to HCCI. There is a glow plug instead of a spark plug. A more stratified mixture is essential for combustion to occur as demonstrated by Kalghatgi et al. [31] and Hildingsson et al. [39]. It was demonstrated that if the same amount of gasoline fuel was injected early at the same conditions with fully premixed, HCCI conditions, ignition might not occur at all. A similar result was reported in a work by Weall et al. [71] in a light duty multi cylinder engine. Auto-ignition of the European 95 RON gasoline did not occur with HCCI combustion using an advanced injection earlier than 50 CAD BTDC despite using 0.95 bar boost and 95 °C inlet temperature.
5.2.2 Fuel Comparisons (Paper 3)
The results in this section are taken from Paper 3, “Gasoline Partially Premixed Combustion in a Light Duty Engine at Low Load and Idle Operating Conditions”, which was presented by the author at the SAE World Congress, 2012, in Detroit. The experiments were planned, carried out and post-processed by the author. The article was written by the author. The work was supervised by Per Tunestål and Bengt Johansson who both provided valuable feedback. Complementary data analysis has been performed to provide additional insights and clarifications of the results.
This was the first low load gasoline PPC investigation. The objective of this investigation was to compare different fuels, with different RON values, at low engine load and engine speed operating conditions. The goal is to reach idle operating conditions. The selected fuels were diesel, 69 RON gasoline and 87 RON gasoline.

43
Some of the fuel properties are listed in Table 3. The gasoline fuels were supplied by Chevron Corporation and were taken from different streams of an oil refinery.
Table 3. Fuel properties.
Fuel RON MON LHV [MJ/kg]
A/F stoich
Diesel MK1 n.a. 20 43.15 14.9
Gasoline 69 RON 69 66 43.80 14.68
Gasoline 87 RON 87 81 43.50 14.60
Two separate investigations, with different experimental conditions, have been performed. The first investigation is with varying engine load and the second investigation is with varying NVO. The EGR level was set differently in the two investigations. In the varying engine load investigation, EGR was set for each engine load to suppress NOx emissions to 20 ppm which corresponds to a NOx emission index of approximately 1 g/kg fuel. This limit is a compromise between NOx suppression and combustion efficiency. The EGR settings for the varying engine load cases are shown in the left diagram in Figure 19. A single fuel injection strategy was used for all cases. The common rail pressure was constant at 500 bar for all measurements. For the diesel and 69 RON gasoline cases combustion timing, CA50, was kept constant around 5 CAD. For the 87 RON gasoline case this was not achievable given the long ignition delay. Instead the fuel injection timing was kept constant at -22 CAD. It could not be set earlier because of a significant increase in HC emissions from fuel trapped in squish and crevice volumes. As a result, CA50 was retarded from 6 CAD ATDC at 1.8 bar IMEPn to 8 CAD ATDC at 2.8 bar IMEPn.
In the varying NVO investigation, the EGR level was determined at the minimum NVO operating conditions (60 CAD) for the diesel and 69 RON gasoline cases. The EGR level was then decreased as NVO increased to maintain a constant lambda. In the case of the 87 RON gasoline, EGR was set to match the settings of the diesel and gasoline cases. The EGR settings for the varying NVO cases are shown in the right diagram in Figure 19. The fuel injection strategies for the different cases were the same as with the varying load cases. The engine load was set to 2 bar IMEPg at the 60 CAD NVO case and the injected fuel amount was then kept constant.

44
Figure 19. settings used for the different fuels with varying engine load (left) and NVO (right).
After the article was published, it was discovered that CO instrument readings above a certain value were unreliable. Further analysis showed that the gas-analyzer measurement computer kept sending out values above the actual saturation limit. The real saturation limit is 10000 ppm but the system would report values up to 20000 ppm, which the author at the time mistakenly interpreted as the saturation limit of the instrument. In the paper, this will affect the calculations of the combustion efficiency, thermodynamic efficiency and lambda calculations of the gasoline results. Both combustion efficiency and lambda calculations of the gasoline results are affected because these are based on the exhaust gas composition. The thermodynamic efficiency is affected because it is calculated from the gross indicated efficiency and the combustion efficiency using the expressions: 𝜂𝑡ℎ = 𝜂𝑖,𝑔/𝜂𝑐. After this discovery was made, an air-flow meter was installed and used together with the fuel-flow calculations to calculate lambda. Additionally, CO readings above 10000 ppm were corrected in the post-processing to 10000 ppm. Operating points with saturated CO readings are clearly indicated in Papers 4-6. The combustion efficiency and lambda calculations that are presented in this section have been recalculated using the correct saturation limit of the CO instrument.
The lambda values are shown in Figure 20. Both the original values, from Paper 3, and the recalculated values using the correct saturation limit of the CO measurement instrument, are shown. In the diesel cases, the CO instrument was not saturated and did not have to be recalculated. Note that the recalculated lambda values do not show the actual correct lambda values. They have only been modified to show how the calculations would have looked if the correct saturation limit of the CO instrument would have been applied. In the varying fuel cases, EGR, and not lambda, was the
0.5 1 1.5 2 2.5 3 3.510
20
30
40
50
60
70
80
90
IMEPnet [bar]
EG
R [%
]
Diesel, NVO 60Diesel, NVO 180RON 69 Gasoline, NVO 60RON 69 Gasoline, NVO 180RON 87 Gasoline, NVO 180
50 100 150 200 2500
10
20
30
40
50
60
70
80
90
100
NVO [CAD]
EG
R [%
]
DieselRON 69 GasolineRON 87 Gasoline

45
main control parameter used to suppress NOx. In the varying NVO cases, the goal was to keep a constant lambda with varying NVO by decreasing EGR with NVO. After updating the lambda calculations, it now appears as if there is a small decrease in lambda with NVO. But again, it should be stressed that the correct lambda is unknown. The same EGR settings were used for all fuels at the different NVO settings which implies that the assumption that lambda was kept constant is not unreasonable.
Figure 20. Recalculated (solid) and original (dashed) lambda values with varying engine load (left) and NVO (right).
The ignition delay with varying engine load and NVO for the different fuels is shown in Figure 21. The ignition delay increases with fuel RON. The effect of NVO on ignition delay in these cases was found to be relatively small. There is a small decrease of the ignition delay as EGR is gradually replaced with trapped hot residual gases which can be explained by an increased temperature.
The ignition delay becomes longer with increasing engine load which was an unexpected result. The effect is more clearly seen with the gasoline fuels. In the 87 RON fuel case, fuel injection timing was constant and the longer ignition delay can be explained by that the EGR fraction was increased. EGR was adjusted for each measurement point, for all fuels and NVO settings, to suppress NOx to 20 ppm. A higher EGR fraction reduces the available oxygen concentration and increases the heat capacity which increases the ignition delay [72]. For the diesel and 69 RON gasoline cases there is a small decrease of EGR to suppress NOx with increasing load which was unexpected. The collected data alone does not provide sufficient information to explain these trends. Instead, two different suggestions to explain these trends are given.
0.5 1 1.5 2 2.5 3 3.51.2
1.4
1.6
1.8
2
2.2
2.4
2.6
2.8
3
3.2
IMEPnet [bar]
Lam
bda
[-]
Diesel, NVO 60Diesel, NVO 180RON 69 Gasoline, NVO 60RON 69 Gasoline, NVO 180RON 87 Gasoline, NVO 180
50 100 150 200 2501
1.5
2
2.5
NVO [CAD]
Lam
bda
[-]
DieselRON 69 GasolineRON 87 Gasoline

46
As load is increased the ignition delay becomes shorter due to an increased charge temperature at injection timing from increased residual gas and wall temperatures [46]. But there are also competing factors that could contribute to a longer ignition delay. First, CA50 was constant and the fuel injection timing was advanced (not retarded as stated in Paper 3) by 2.6 CAD for the 69 RON gasoline cases and 1.6 CAD for the NVO 60 CAD diesel case, from 1 bar IMEPn to 3 bar IMEPn. The 180 CAD NVO diesel case was only measured up to 2.3 bar IMEPn but the trend was the same as the NVO 60 CAD case. The in-cylinder pressure and temperature is lower when fuel is injected earlier which results in a longer ignition delay [43]. But the difference in injection timing is small in these cases. The second contributing factor could be a decreased temperature from increased vaporization of a larger amount of injected fuel. This explanation was suggested in paper 3 as the more reasonable explanation.
Figure 21. Ignition delay at varying engine load (left) and NVO (right) for the different fuels.
The NOx emissions are shown in Figure 22. In the varying load cases (left diagram), NOx was suppressed using EGR. In the varying NVO cases (right diagram), there is an increase in NOx when EGR is replaced with hot internal EGR due to increased temperature. The NOx sensitivity to temperature is well established and understood from the Zeldovich mechanism [46]. The soot emissions, Figure 23, are high for diesel compared to gasoline which is explained by the short ignition delay. A short ignition delay gives less time for fuel and air to mix prior to combustion which results in more fuel rich zones. There is also a significant difference between the NVO 60 CAD and NVO 180 CAD cases for the diesel fuel. This can be explained by the lower lambda for the 180 CAD NVO case which indicates that the amount of available oxygen is lower. Since the trapped hot residual gas fraction is higher, the total EGR fraction would have to be increased in order to suppress NOx emissions. It should again be
0.5 1 1.5 2 2.5 3 3.50
5
10
15
20
25
IMEPnet [bar]
Igni
tion
Del
ay (C
A10
-SO
I) [C
AD
]
Diesel, NVO 60Diesel, NVO 180RON 69 Gasoline, NVO 60RON 69 Gasoline, NVO 180RON 87 Gasoline, NVO 180
50 100 150 200 2500
5
10
15
20
25
30
NVO [CAD]
Igni
tion
Del
ay (C
A10
-SO
I) [C
AD
]
DieselRON 69 GasolineRON 87 Gasoline

47
noted that the EGR level was set differently for the varying NVO and varying load investigations. This is the reason why the trends in soot emissions are different between the two investigations.
When the article was written, the reason for the soot and NOx emissions behavior of the 87 RON gasoline case with varying NVO was not completely understood. The recalculation of the lambda values showed that the lambda calculations were unreliable. The recalculated lambda values of the 87 RON gasoline became higher as a result of the new imposed saturation limit. But in reality, the lambda values are probably much lower, and possibly also lower than the previously calculated values. The low NOx values and higher soot emissions of the 87 RON gasoline case with varying NVO are then explained by a lower temperature and global air-fuel ratio because of the combination of EGR and a high residual gas fraction.
Figure 22. NOx emissions at varying engine load (left) and NVO (right) for the different fuels.
0.5 1 1.5 2 2.5 3 3.50
5
10
15
20
25
30
IMEPnet [bar]
NO
x em
issi
ons
[ppm
]
Diesel, NVO 60Diesel, NVO 180RON 69 Gasoline, NVO 60RON 69 Gasoline, NVO 180RON 87 Gasoline, NVO 180
50 100 150 200 2500
10
20
30
40
50
60
NVO [CAD]
NO
x em
issi
ons
[ppm
]
DieselRON 69 GasolineRON 87 Gasoline

48
Figure 23. Soot emissions at varying engine load (left) and NVO (right) for the different fuels.
The standard deviation of IMEPn, Figure 24, is used as a measure of combustion instability. It is seen that the standard deviation of IMEPn is higher with gasoline compared to diesel at low load. Since CA50 was the same for diesel and the 69 RON gasoline cases, one possible explanation is the difference in ignition delay. A longer premixing period before combustion occurs increases the sensitivity to the local in-cylinder conditions and variations.
The change of standard deviation in IMEPn with NVO is minor for the diesel and 69 RON gasoline cases. A more significant effect is seen with the 87 RON gasoline case. In this case, fuel injection timing and not CA50 is constant. The standard deviation in IMEPn follows the trend in CA50 in this case, as seen in Figure 25.
0.5 1 1.5 2 2.5 3 3.50
0.1
0.2
0.3
0.4
0.5
0.6
0.7
IMEPnet [bar]
soot
[FS
N]
Diesel, NVO 60Diesel, NVO 180RON 69 Gasoline, NVO 60RON 69 Gasoline, NVO 180RON 87 Gasoline, NVO 180
50 100 150 200 2500
0.02
0.04
0.06
0.08
0.1
0.12
0.14
0.16
0.18
0.2
NVO [CAD]
soot
[FS
N]
DieselRON 69 GasolineRON 87 Gasoline

49
Figure 24. Standard deviation of IMEPn at varying engine load (left) and NVO (right) for the different fuels.
Figure 25. CA50 at varying engine load (left) and NVO (right) for the different fuels.
The combustion efficiency is shown in Figure 26. The exact magnitudes of the combustion efficiency of the CO-saturated gasoline cases remain unknown. The variations that are still seen on the combustion efficiency on the recalculated combustion efficiencies are from the HC emissions. It is still clearly seen that the combustion efficiency is significantly lower with gasoline compared to diesel.
0.5 1 1.5 2 2.5 3 3.50
0.05
0.1
0.15
0.2
0.25
IMEPnet [bar]
std
IME
Pne
t [ba
r]
Diesel, NVO 60Diesel, NVO 180RON 69 Gasoline, NVO 60RON 69 Gasoline, NVO 180RON 87 Gasoline, NVO 180
50 100 150 200 2500
0.05
0.1
0.15
0.2
0.25
0.3
NVO [CAD]st
d IM
EP
net [
bar]
DieselRON 69 GasolineRON 87 Gasoline
0.5 1 1.5 2 2.5 3 3.50
1
2
3
4
5
6
7
8
9
10
IMEPnet [bar]
CA
50 [C
AD
]
Diesel, NVO 60Diesel, NVO 180RON 69 Gasoline, NVO 60RON 69 Gasoline, NVO 180RON 87 Gasoline, NVO 180
50 100 150 200 2500
1
2
3
4
5
6
7
8
9
10
NVO [CAD]
CA
50 [C
AD
]
DieselRON 69 GasolineRON 87 Gasoline

50
Figure 26. Combustion efficiency at varying engine load (left) and NVO (right).
The thermodynamic efficiency, Figure 27, reflects the efficiency to convert the released heat to indicated work (not mechanical work as was stated in Paper 3). The fraction of heat which is not converted to indicated work is lost either as heat losses through cylinder walls or through the exhaust. It is shown here to give the updated thermodynamic efficiency calculation as a complement to the other selected results.
Figure 27. Thermodynamic efficiency at varying engine load (left) and NVO (right).
0.5 1 1.5 2 2.5 3 3.560
65
70
75
80
85
90
95
100
IMEPnet [bar]
Com
bust
ion
Effi
cien
cy [%
]
Diesel, NVO 60Diesel, NVO 180RON 69 Gasoline, NVO 60RON 69 Gasoline, NVO 180RON 87 Gasoline, NVO 180
50 100 150 200 25060
65
70
75
80
85
90
95
100
NVO [CAD]
Com
bust
ion
Effi
cien
cy [%
]
DieselRON 69 GasolineRON 87 Gasoline
0.5 1 1.5 2 2.5 3 3.530
32
34
36
38
40
42
44
46
48
50
IMEPnet [bar]
Ther
mod
ynam
ic E
ffici
ency
[%]
Diesel, NVO 60Diesel, NVO 180RON 69 Gasoline, NVO 60RON 69 Gasoline, NVO 180RON 87 Gasoline, NVO 180
50 100 150 200 25020
25
30
35
40
45
NVO [CAD]
Ther
mod
ynam
ic E
ffici
ency
[%]
DieselRON 69 GasolineRON 87 Gasoline

51
The main result from this first low load gasoline PPC investigation was that the 69 RON gasoline fuel could be run down to 1 bar IMEPn engine load without trapped hot residual gases. The minimum attainable load with the 87 RON gasoline fuel was approximately 1.8 bar IMEPn (or 2 bar IMEPg) with a significant fraction of trapped hot residual gases. The effect of NVO on combustion stability (standard deviation in IMEPn) was found to be the most positive with the 87 RON gasoline fuel because CA50 was advanced in response to the decreasing EGR and increasing NVO.
After this initial investigation, it was decided to focus on the 87 RON gasoline fuel and try to extend the low load limit as far as possible using the variable valve train system, more advanced injection strategies and the glow plug. EGR will not be used because NOx emissions are not the main problem at low load operating conditions. The main problem is the ignitability, combustion stability and combustion efficiency.
5.2.3 Hot Residual Gas (Papers 4 and 6)
The results in this section are taken from Papers 4 and 6. Paper 4, “The Usefulness of Negative Valve Overlap for Gasoline Partially Premixed Combustion, PPC”, which was presented by the author at the SAE 2012 International Powertrains, Fuels & Lubricants Meeting, 2012, in Malmö. The experiments were planned, carried out and post-processed by the author. The article was written by the author. Martin Tuner and Augusto Mello did the AVL Boost engine simulations. The work was supervised by Per Tunestål and Bengt Johansson who both provided valuable feedback. Paper 6, “Comparison of Negative Valve Overlap (NVO) and Rebreathing Valve Strategies on a Gasoline PPC Engine at Low Load and Idle Operating Conditions”, has been submitted and approved for publication at the SAE World Congress, 2013, in Detroit. The experiments were planned, carried out and post-processed by the author. The article was written by the author. Per Tunestål and Bengt Johansson supervised the work. Complementary data analysis has been performed to provide additional insights and clarifications of the results.
The objective was to investigate potential benefits using hot residual gas and the glow plug with the 87 RON gasoline fuel in more detail. Two different valve strategies have been evaluated and compared. A NVO valve strategy has been used more extensively; a rebreathing valve strategy has been used for comparison. The question is if similar improvements can be seen with the rebreathing valve strategy compared to the NVO valve strategy. The motivation is that a rebreathing valve strategy potentially has higher efficiency compared to NVO since it avoids recompression of the trapped residual gases. The recompression of the residual gas results in lower gas-exchange efficiency. This can be understood from the definition of the gas-exchange efficiency, given in (3.10). The recompression of the residual gas results in a lower IMEPn due to

52
heat losses which in turn lowers the gas-exchange efficiency. The potential drawback with rebreathing is that the elevated temperature at intake valve closing timing could be lower with rebreathing compared to NVO due to additional cooling in the exhaust manifold of the residual gas [12]. However, recompression of the residual gas during NVO results in heat losses which reduce the in-cylinder temperature also for the NVO case.
If not stated otherwise, the glow plug was continuously on in these investigations. The motivation is that this is an investigation at low engine loads with the goal to extend the low load limit as much as possible with the available tools. Had the glow plug not been used, the remaining question would have been about the additional benefits from the glow plug. These are now included in the results. The effects from the glow plug in relation to the trapped residual gases on combustion stability and efficiency are shown and discussed in the Glow Plug section.
The combustion timing, CA50, is one of the most important parameters regarding engine performance in terms of efficiency, stability and emissions. The problem with the long ignition delay of the 87 RON gasoline fuel was that CA50 could not be set sufficiently early using the fuel injection timing as control actuator alone. Therefore, the ignition delay is considered as one of the more important parameters. A limit was set on the earliest possible main fuel injection timing in order to avoid excessive HC emissions from trapped fuel in squish and crevice volumes. The consequence was that the fuel injection timing was kept constant, with few exceptions, at 22 CAD BTDC. The exceptions were at the highest measured engine load operating conditions, at NVO 120-200 CAD and rebreathing 50-70 CAD, and with the glow plug on. In these cases the fuel injection was set later to 18-15 CAD BTDC in order to have combustion timing after TDC. The common rail pressure was constant at 500 bar for all measurements.
The valve lift curves of the NVO and rebreathing valve strategies are shown in Figure 28. With the rebreathing valve strategy, residual gas is reinducted during the intake stroke. The exhaust valves are reopened at 30 CAD ATDC. A minimum NVO of 60 CAD had to be used in order to avoid hitting the piston. This had to be used also for the rebreathing strategy. The consequence is that the 0 CAD rebreathing setting is the same as the 60 CAD NVO setting. With the control system setup that was used, there was also a limit on the shortest possible valve open duration to ensure stable operation of the valves. The lowest rebreathing setting that could be used was 50 CAD. The maximum NVO setting that was used is 220 CAD and the maximum rebreathing that was used is 110 CAD. By comparing the measured air flows it was observed that the rebreathing setting of 110 CAD does not decrease the amount of inducted air to the same extent as NVO 220 CAD. If it is assumed that the measured air flow is directly connected to the residual gas fraction, the residual gas fraction that is obtained with 110 CAD rebreathing corresponds to a setting of approximately 205 CAD NVO.

53
Figure 28. NVO (left) and rebreathing (right) valve strategies valve lift curves.
The results will be presented in contour plots against engine load and variable valve timing settings. Contour plots were preferred because it easy to see the overall trends and variations with the two investigated parameters. The disadvantage with contour plots is that it is more difficult to extract the exact numbers at specific operating points. The contour plots were generated in Matlab with the commands contourf and TriScatteredInterp using linear interpolation. The magenta colored circles show the measurement points.
A 1-D engine simulation tool, AVL Boost, was used to determine the residual gas fractions and in-cylinder temperatures with the NVO valve strategy at different NVO and engine load operating conditions. The AVL Boost model implementation details are given in Paper 4. The simulated residual gas mass fraction results and in-cylinder temperature at intake valve closing timing are shown in Figure 29. It is seen that the residual gas mass fraction is increased from approximately 10 to 50 % and the IVC temperature is increased by approximately 50 K from the lowest to the highest NVO settings.
The ignition delay, defined as the difference in crank angle between the crank angle of 10% accumulated heat release and the start of injection is shown in Figure 30. It is shown for both the NVO (left diagram) and the rebreathing (right diagram) valve strategies. The observation from the comparison between the valve strategies is that similar trends are seen regardless of valve strategy. Three operating regions are identified as follows. At relatively high engine loads, from approximately 3 bar IMEPg, there is an intermediate setting of NVO, 120 to 200 CAD, and 50 to 70 CAD rebreathing, where the ignition delay is the shortest. The ignition delay is significantly
-200 -100 0 100 200 300 400 5000
10
20
30
40
50
60
Crank Angle [CAD]
Pre
ssur
e [b
ar] /
Val
ve L
ift [a
.u.]
PressureIntake ValveExhaust Valve
-200 -100 0 100 200 300 400 5000
5
10
15
20
25
30
35
40
45
50
55
Crank Angle [CAD]P
ress
ure
[bar
] / V
alve
Lift
[a.u
.]
PressureIntake ValveExhaust Valve
NVO
Minimum possible NVO
Rebreathing
Second exhaustvalve opening

54
shorter in this region compared to the lower engine load operating conditions. The ignition delay is relatively independent of the increased residual gas fraction at engine loads below 3 bar IMEPg and moderate NVO/rebreathing. The ignition delay is long with both the highest setting of NVO and rebreathing.
Figure 29. AVL Boost model results of the residual gas mass fraction and in-cylinder temperature at intake valve closing timing.
Figure 30. Ignition delay with the NVO (left) and rebreathing valve strategies (right).
NVO [CAD]
IMEP
gros
s [b
ar]
Residual Gas Mass Fraction [%]
60 80 100 120 140 160 180 200 2201.8
2
2.2
2.4
2.6
2.8
3
3.2
3.4
10
15
20
25
30
35
40
45
50
NVO [CAD]
IMEP
gros
s [b
ar]
Temperature at IVC [K]
60 80 100 120 140 160 180 200 2201.8
2
2.2
2.4
2.6
2.8
3
3.2
3.4
335
340
345
350
355
360
365
370
375
380
385
NVO [CAD]
IMEP
gros
s [b
ar]
NVO: Ignition Delay (CA10-SOI) [CAD]
60 80 100 120 140 160 180 200 2201.8
2
2.2
2.4
2.6
2.8
3
3.2
3.4
14
16
18
20
22
24
Rebreathing [CAD]
IMEP
gros
s [b
ar]
Rebreathing: Ignition Delay (CA10-SOI) [CAD]
0 20 40 60 80 1001.8
2
2.2
2.4
2.6
2.8
3
3.2
3.4
14
16
18
20
22
24

55
The significant change of the ignition delay at the high engine load operating conditions can be explained by the difference in fuel injection timings and the glow plug. As mentioned before, the fuel injection timings were adjusted at the highest measured engine load operating conditions, at NVO 120-200 CAD, from 22 CAD BTDC to 18-15 CAD BTDC. These operating conditions are indicated in Figure 30 with enclosed ‘x’ in the magenta colored circles. The reason was to have combustion timing no earlier than 2 CAD ATDC. This had to be done only for the cases when the glow plug was turned on. When the glow plug was turned off, Figure 31, combustion timing, CA50, was close to 2 CAD ATDC at the corresponding high load operating conditions, but it was never earlier than 2 CAD ATDC.
Figure 31. Combustion timing, CA50, with the NVO valve strategy and the glow plug turned off.
The ignition delay, using the NVO valve strategy, and with the glow plug turned off, is shown in the left diagram of Figure 32. The right diagram shows the calculated difference of the ignition delay between the cases with the glow plug turned off and the cases with the glow plug turned on. The same overall trend as in the left diagram in Figure 30 is also seen when the glow plug is turned off. The difference at low load operating conditions is relatively small, 1-2 CAD. But above 3 bar IMEPg, there is a region with a large difference between when the ignition delay is turned off compared to when it is turned on. This can now be explained by the fuel injection timing retard when the glow plug was on. The effect of fuel-injection timing on combustion phasing is complicated when the ignition delay is long. The direct connection between the fuel injection timing and CA50 is weaker and the combustion is closer to HCCI combustion than PPC. Figure 33 shows an operating point without the glow plug, at 3 bar IMEPg and 180 CAD NVO, where the fuel-injection timing has to be retarded
NVO [CAD]
IME
Pgr
oss
[bar
]
Glow Plug OFF: CA50 [CAD]
60 80 100 120 140 160 180 200 2201.8
2
2.2
2.4
2.6
2.8
3
3.2
3.4
3
4
5
6
7
8
9

56
beyond -18 CAD ATDC before the combustion phasing becomes retarded. It would have been interesting to also include the fuel injection timing as a variable in the experiments but the number of variables in the experiments had to be reduced to save time and it was decided to keep the fuel injection timing constant. Additional analysis of the ignition delay is presented in a separate Ignition Delay Model section.
Figure 32. Ignition delay with the NVO valve strategy and the glow plug turned off (left) and the ignition delay difference between cases with the glow plug off and the cases with the glow plug turned on (right).
Figure 33. Effect of fuel injection timing on CA50.
NVO [CAD]
IMEP
gros
s [b
ar]
Glow Plug OFF: Ignition Delay (CA10-SOI) [CAD]
60 80 100 120 140 160 180 200 2201.8
2
2.2
2.4
2.6
2.8
3
3.2
3.4
20
20.5
21
21.5
22
22.5
23
23.5
24
24.5
25
NVO [CAD]
IMEP
gros
s [b
ar]
Ignition Delay Difference: Glow Plug OFF-Glow Plug ON
60 80 100 120 140 160 180 200 2201.8
2
2.2
2.4
2.6
2.8
3
3.2
3.4
1
2
3
4
5
6
-22 -21 -20 -19 -18 -17 -16 -15 -143.5
4
4.5
5
5.5
6
6.5
7
SOI [CAD]
CA
50 [C
AD
]
NVO: 180 CADIMEPgross: 3 barGlow plug off

57
The combustion instability, measured as the standard deviation in IMEPn for both the NVO and rebreathing valve strategies are shown in Figure 34. Unburned hydrocarbon emissions and CO emissions are shown in Figure 35 and Figure 36. The saturated CO emissions values, 10000 ppm, have been colored grey in the figures. The optimal NVO and rebreathing settings, with respect to combustion stability, HC and CO emissions, were found to be around 180 and 70 CAD respectively. For a given engine load, this is where the combustion timing, Figure 37, is the most advanced. Since the fuel injection timing is constant, a longer ignition delay results in more retarded combustion timing. But the resulting CA50 is not explained by the ignition delay alone. It is the ignition delays in combination with the combustion duration, Figure 38, that result in the combustion timing that are seen in Figure 37.
The effects of hot residual gases on CAI combustion was summarized in a work by Zhao et al. [70]. The effects of increasing trapped residual gas can explain the observed trends on the combustion duration. The combustion duration becomes shorter with increased residual gas fraction because of increased temperature. The combustion duration is extended because of increased heat capacity and reduced oxygen concentration at very high residual gas fraction levels. With moderate residual fractions the temperature effect is dominant and the combustion duration is decreased. At the highest settings of NVO and rebreathing the heat capacity and reduced oxygen effects become more apparent and the combustion duration becomes longer. Shortest combustion durations are seen around NVO 180 CAD and rebreathing 70 CAD.
If the standard deviation of IMEPn is limted to 0.2 bar, the extension of the low load limit using hot residual gas can be quantified. With the lowest settings of NVO and rebreathing, the low load limit would be reached already at approximately 3.2-3.3 bar IMEPg. With the optimum settings of NVO and rebreathing, the low load limit can be extended down to approximately 2.2 bar IMEPg. The temperature increase, according to the AVL Boost model, with the NVO strategy from 60 to 180 CAD NVO is approximately 30-40 K.
The HC and CO emissions correlate with the combustion timing. At later combustion timings there is less time to fully oxidize the fuel. Also, the peak combustion temperature is lower. Both time and temperature is needed to fully oxidize the fuel and intermediate species, for example CO. High amounts of CO are produced because of insufficient temperature and time to be fully converted to CO2. This is in agreement with the opening discussions on sources of HC and CO emissions in the introduction to the PPC Results. The CO measurement instrument was saturated from approximately 3.2 bar IMEPg with the lowest NVO and rebreathing settings and from approximately 2.5-2.6 bar IMEPg with higher NVO and rebreathing settings.
Note that the unit of the unburned hydrocarbon emissions in Figure 35 is ppm, which was calculated from the gas-analyzer by dividing the measured quantity, with unit ppmC1, by the number of carbon atoms in the fuel molecules, 7.2. The measured

58
quantities from the gas-analyzer are easily obtained by multiplying the numbers of the color bar by 7.2. This can also be used for the unburned hydrocarbon emissions in Paper 5 and Paper 6 to obtain the corresponding ppmC1 quantities.
Figure 34. Combustion instability, measured as standard deviation of IMEPn, with the NVO (left) and rebreathing (right) valve strategies.
Figure 35. Unburned hydrocarbon emissions with the NVO (left) and rebreathing (right) valve strategies. If multiplied by number of carbon atoms in the fuel molecules, 7.2, the corresponding quantities with the unit ppmC1 are obtained.
NVO [CAD]
IMEP
gros
s [b
ar]
NVO: std IMEPnet [bar]
60 80 100 120 140 160 180 200 2201.8
2
2.2
2.4
2.6
2.8
3
3.2
3.4
0.15
0.2
0.25
0.3
0.35
0.4
Rebreathing [CAD]
IMEP
gros
s [b
ar]
Rebreathing: std IMEPnet [bar]
0 20 40 60 80 1001.8
2
2.2
2.4
2.6
2.8
3
3.2
3.4
0.15
0.2
0.25
0.3
0.35
0.4
NVO [CAD]
IMEP
gros
s [b
ar]
NVO: Unburned Hydrocarbon Emissions [ppm]
60 80 100 120 140 160 180 200 2201.8
2
2.2
2.4
2.6
2.8
3
3.2
3.4
100
150
200
250
300
350
400
450
500
Rebreathing [CAD]
IMEP
gros
s [b
ar]
Rebreathing: Unburned Hydrocarbon Emissions [ppm]
0 20 40 60 80 1001.8
2
2.2
2.4
2.6
2.8
3
3.2
3.4
100
150
200
250
300
350
400
450
500

59
Figure 36. CO emissions with the NVO (left) and rebreathing (right) valve strategies.
Figure 37. Combustion timing, CA50, with the NVO (left) and the rebreathing (right) valve strategies.
NVO [CAD]
IMEP
gros
s [b
ar]
NVO: CO emissions [ppm]
60 80 100 120 140 160 180 200 2201.8
2
2.2
2.4
2.6
2.8
3
3.2
3.4
1000
2000
3000
4000
5000
6000
7000
8000
9000
10000
Rebreathing [CAD]
IMEP
gros
s [b
ar]
Rebreathing: CO emissions [ppm]
0 20 40 60 80 1001.8
2
2.2
2.4
2.6
2.8
3
3.2
3.4
1000
2000
3000
4000
5000
6000
7000
8000
9000
10000
NVO [CAD]
IMEP
gros
s [b
ar]
NVO: CA50 [CAD]
60 80 100 120 140 160 180 200 2201.8
2
2.2
2.4
2.6
2.8
3
3.2
3.4
2
3
4
5
6
7
8
9
Rebreathing [CAD]
IMEP
gros
s [b
ar]
Rebreathing: CA50 [CAD]
0 20 40 60 80 1001.8
2
2.2
2.4
2.6
2.8
3
3.2
3.4
2
3
4
5
6
7
8
9

60
Figure 38. Combustion duration, with the NVO (left) and the rebreathing (right) valve strategies.
The conclusion is that the rebreathing valve strategy has similar improving effects as the NVO valve strategy at low load. The same overall trends in improvements of combustion stability, HC and CO emissions are seen with rebreathing as with NVO. Based on the air flow measurements, the optimal rebreathing setting 70 CAD gives the same reduced air flow as the NVO 160 CAD. The optimal NVO setting 180 CAD would match a rebreathing setting of 80 CAD which unfortunately was not measured. But the implication is that similar levels of trapped residual gas give approximately the same improving effects of the combustion. It can then be assumed that the temperature increase is approximately the same for both strategies.
Unfortunately time did not permit to simulate also the rebreathing results. An adequately tuned engine simulation model could be useful to extract residual gas fraction and temperature data also for the rebreathing cases. This is left as future work. It could also be interesting to investigate and see if there are any differences in in-cylinder temperature and internal EGR distribution between the valve strategies using optical diagnostics or CFD modeling. A modeling approach was used for HCCI combustion in a work by Babajimopoulos et al. [73] and it was concluded that a rebreathing strategy yields a more homogeneous composition compared to using negative valve overlap at high residual gas fraction levels.
The gas-exchange efficiency is shown in Figure 39, and the net indicated efficiency is shown in Figure 40. As expected, the gas-exchange efficiency is higher with the rebreathing strategy compared to the NVO strategy. The net-indicated efficiency is shown versus IMEPn rather than IMEPg because it more clearly shows the effect of the gas-exchange efficiency with varying NVO. The net indicated efficiency is generally higher with rebreathing compared to NVO. This is due to the higher gas-exchange efficiency with the rebreathing strategy. But the net-indicated efficiency
NVO [CAD]
IMEP
gros
s [b
ar]
NVO: Combustion Duration (CA90-CA10) [CAD]
60 80 100 120 140 160 180 200 2201.8
2
2.2
2.4
2.6
2.8
3
3.2
3.4
4
5
6
7
8
9
10
11
12
13
Rebreathing [CAD]
IMEP
gros
s [b
ar]
Rebreathing: Combustion Duration (CA90-CA10) [CAD]
0 20 40 60 80 1001.8
2
2.2
2.4
2.6
2.8
3
3.2
3.4
4
5
6
7
8
9
10
11
12
13

61
with the NVO strategy is not completely dominated by the decrease in gas-exchange efficiency. With increasing NVO there is also an increase in combustion efficiency, as indicated by the decrease of unburned hydrocarbon and CO emissions. With the rebreathing strategy, the highest efficiency is found at the optimum rebreathing setting. This is where the combustion phasing is the most advanced, the combustion stability is the highest and HC emissions are the lowest.
Figure 39. Gas-exchange efficiency with the NVO (left) and the rebreathing (right) valve strategies.
Figure 40. Net-indicated efficiency with the NVO (left) and the rebreathing (right) valve strategies.
NVO [CAD]
IMEP
gros
s [b
ar]
NVO: Gas-Exchange Efficiency [%]
60 80 100 120 140 160 180 200 2201.8
2
2.2
2.4
2.6
2.8
3
3.2
3.4
84
86
88
90
92
94
96
Rebreathing [CAD]
IMEP
gros
s [b
ar]
Rebreathing: Gas-Exchange Efficiency [%]
0 20 40 60 80 1001.8
2
2.2
2.4
2.6
2.8
3
3.2
3.4
84
86
88
90
92
94
96
NVO [CAD]
IMEP
net [
bar]
NVO: Net Indicated Efficiency [%]
60 80 100 120 140 160 180 200 220
1.6
1.8
2
2.2
2.4
2.6
2.8
3
3.2
25
30
35
40
Rebreathing [CAD]
IMEP
net [
bar]
Rebreathing: Net Indicated Efficiency [%]
0 20 40 60 80 100
1.6
1.8
2
2.2
2.4
2.6
2.8
3
3.2
25
30
35
40

62
Ignition Delay Model An attempt is made to model the ignition delay to see how well the trends are captured by the model and to get a quantitative estimate of the contribution of each factor in the model. According to literature [74], the ignition delay can often be correlated to temperature, equivalence ratio, and pressure according to
𝜏𝑖𝑑 = 𝐶𝑒 ∙ �𝑃𝑃0�𝑎∙ 𝜙𝑏 ∙ 𝑒𝐸𝑎 𝑅𝑇𝑎���⁄ (5.1)
The unit of the ignition delay, 𝜏𝑖𝑑, is milliseconds, but it is easily converted to crank angles. Ce, a and b are empirically determined constants. P is the ambient pressure and P0 is a reference pressure. 𝜙 is the equivalence ratio. 𝑇𝑎��� is the estimated average temperature and 𝐸𝑎 𝑅⁄ is an apparent activation energy where R is the universal gas constant. In a work by Kook et al. [72], the ignition delay was found to be effectively predicted with
𝜏𝑖𝑑 = 𝐴 ∙ �̅�−𝑛 ∙ 𝑋𝑂2−𝑚 ∙ 𝑒𝐸𝑎 𝑅𝑇𝑎���⁄ , 𝐸𝑎 𝑅 = 3242.4⁄ 𝐾 (5.2)
where A, n and m are constants dependent on fuel and airflow characteristics, p is the ambient pressure, 𝑋𝑂2 is the oxygen concentration. The ignition delay model in (5.1) was preferred in this work because the available in-cylinder oxygen concentration is unknown. The main trends are assumed to be captured also with the measured equivalence ratio. The expected behavior is that the ignition delay becomes longer when the equivalence ratio is increased in response to the reduced available oxygen concentration and increased heat capacity from increased NVO. The model is fitted to the ignition delay data without the glow plug. The temperature, 𝑇𝑎���, is estimated by fitting a second order regression model from the AVL Boost simulation model temperature at start of fuel injection timing according to
𝑇𝑎��� = 𝑘1 ∙ 𝑁𝑉𝑂2 + 𝑘2 ∙ 𝑁𝑉𝑂 + 𝑘3 ∙ 𝐼𝑀𝐸𝑃𝑔2 + 𝑘4 ∙ 𝐼𝑀𝐸𝑃𝑔 + 𝑘5 (5.3)
The reason is that a corresponding engine simulations data set with the glow plug off is unavailable. It is assumed that the temperature data at crank angle of start of fuel injection is valid also for the entire data set without the glow plug. The pressure, P, is extracted from the measured in-cylinder pressure at start of fuel injection. The equivalence ratio is calculated from the measured air- and fuel-flows. Selecting reasonable values for the empirical constants a and b in (5.1) was done after some considerations. Reasonable model agreement with the measured data could be achieved over a wide interval of empirical constants, a and b. But the estimated influence of the individual model factors would change depending on how the

63
parameters were selected. It was instead decided to set the parameter a to -1. This value was used in the work by Kook et al. [72] with the motivation that this constant is typically close to -1. This is the n parameter in (5.2). The remaining empirical constants, Ce and b are selected based on the best model fit to the measured ignition delays.
The apparent activation energy, 𝐸𝑎 𝑅⁄ , is estimated by taking the logarithm of (5.1) and rewriting the equation according to
𝑙𝑜𝑔 �𝜏𝑖𝑑 ∙ �𝑃𝑃0�−𝑎
∙ 𝜙−𝑏� = 𝐸𝑎 𝑅⁄ ∙1𝑇𝑎���
+ 𝑙𝑜𝑔 𝐶𝑒 (5.4)
Figure 41 shows the left side of (5.4) plotted against 1/𝑇𝑎���. The estimated slope of a line fitted to the data is taken as the apparent activation energy estimate. A value of 2457.9 K was found. The result can be seen in Figure 42. The corresponding measured ignition delays are shown in Figure 32. It can be seen that there is a reasonable agreement between the model and the measured ignition delay and that the overall trends are captured by the ignition delay model, (5.1). There is an intermediate NVO setting where the ignition delay is the shortest and the ignition delay is long at the highest NVO settings.
Figure 41. Correlation of ignition delay with average pressure, temperature and equivalence ratio.
1.05 1.1 1.15 1.2 1.25x 10⁻³
4.6
4.65
4.7
4.75
4.8
4.85
4.9
4.95
1/Ta
log(τ id
(P/P
0)-aφ-b
)
Ea/R = 2457.9 K
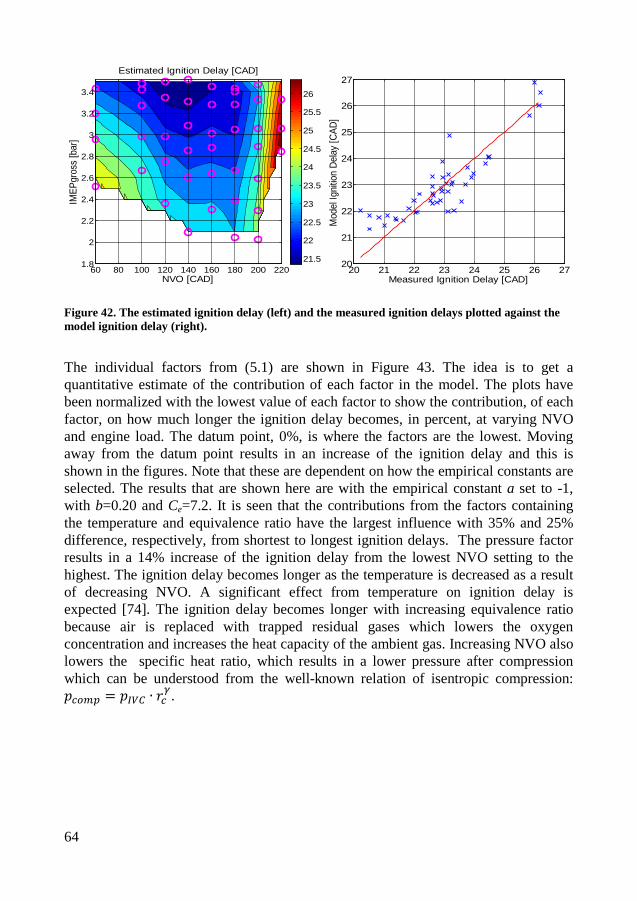
64
Figure 42. The estimated ignition delay (left) and the measured ignition delays plotted against the model ignition delay (right).
The individual factors from (5.1) are shown in Figure 43. The idea is to get a quantitative estimate of the contribution of each factor in the model. The plots have been normalized with the lowest value of each factor to show the contribution, of each factor, on how much longer the ignition delay becomes, in percent, at varying NVO and engine load. The datum point, 0%, is where the factors are the lowest. Moving away from the datum point results in an increase of the ignition delay and this is shown in the figures. Note that these are dependent on how the empirical constants are selected. The results that are shown here are with the empirical constant a set to -1, with b=0.20 and Ce=7.2. It is seen that the contributions from the factors containing the temperature and equivalence ratio have the largest influence with 35% and 25% difference, respectively, from shortest to longest ignition delays. The pressure factor results in a 14% increase of the ignition delay from the lowest NVO setting to the highest. The ignition delay becomes longer as the temperature is decreased as a result of decreasing NVO. A significant effect from temperature on ignition delay is expected [74]. The ignition delay becomes longer with increasing equivalence ratio because air is replaced with trapped residual gases which lowers the oxygen concentration and increases the heat capacity of the ambient gas. Increasing NVO also lowers the specific heat ratio, which results in a lower pressure after compression which can be understood from the well-known relation of isentropic compression: 𝑝𝑐𝑜𝑚𝑝 = 𝑝𝐼𝑉𝐶 ∙ 𝑟𝑐
𝛾.
NVO [CAD]
IMEP
gros
s [b
ar]
Estimated Ignition Delay [CAD]
60 80 100 120 140 160 180 200 2201.8
2
2.2
2.4
2.6
2.8
3
3.2
3.4
21.5
22
22.5
23
23.5
24
24.5
25
25.5
26
20 21 22 23 24 25 26 2720
21
22
23
24
25
26
27
Measured Ignition Delay [CAD]
Mod
el Ig
nitio
n De
lay
[CAD
]

65
Figure 43. Relative variation of the factors in (5.1). The contour plots show the contribution from each factor on how much longer the ignition delay becomes with varying NVO and engine load.
An attempt has been made to capture the overall trends with varying NVO and engine load using a relatively simple but established ignition delay model. It was used to show that the overall trends on the ignition delay can be explained by the changes in temperature, pressure and equivalence ratio from varying NVO and engine load. The estimation procedure is not perfect and it is influenced by how the empirical constants are selected. A suggested improvement is to use a different data set to calibrate the model with known reference conditions. This can be achieved by, for example, using external EGR, instead of trapped residuals, and to control the inlet temperature with the air heater. More accurate temperature data can be obtained by performing complementary engine simulations in AVL Boost instead of using a regression model. A potential practical application for this relatively simple ignition delay model is as
NVO [CAD]
IMEP
gros
s [b
ar]
Relative Variation in eEa/RT [%]
60 80 100 120 140 160 180 200 2201.8
2
2.2
2.4
2.6
2.8
3
3.2
3.4
5
10
15
20
25
30
35
NVO [CAD]
IMEP
gros
s [b
ar]
Relative Variation in φb [%]
60 80 100 120 140 160 180 200 2201.8
2
2.2
2.4
2.6
2.8
3
3.2
3.4
5
10
15
20
NVO [CAD]
IME
Pgr
oss
[bar
]
Relative Variation in (P/PO)a [%]
60 80 100 120 140 160 180 200 2201.8
2
2.2
2.4
2.6
2.8
3
3.2
3.4
2
4
6
8
10
12
14

66
part of an engine control system. If the model parameters are adequately tuned over the different engine operating regions, alternatively using variable parameters, the model might be used to predict the ignition delay at varying fuel injection timings. Lewander et al. [75] designed a model predictive control strategy for a heavy duty engine operated in PPC mode. One of the model constraints was that the ignition delay has to be sufficiently long to ensure a positive mixing period. The model in Lewander’s work was a black box model with model parameters derived from system identification. It shows a potential application for an ignition delay model.
5.2.4 Fuel Injection Strategies (Papers 5 and 6)
The results in this section are taken from Papers 5 and 6. Paper 5, “The Low Load Limit of Gasoline Partially Premixed Combustion Using Negative Valve Overlap”, was presented by the author at the ASME 2012 Internal Combustion Engine Division Fall Technical Conference, in Vancouver. The experiments were planned, carried out and post-processed by the author. The article was written by the author. Öivind Andersson supervised the experimental planning of the split main fuel injection strategy optimization using Design of Experiments and provided valuable feedback. The work was also supervised by Per Tunestål and Bengt Johansson who both provided valuable feedback. The NVO fuel injection strategy results are taken from Paper 6.
In the previous section, results using a rebreathing valve strategy were presented as an alternative to the NVO valve strategy. The motivation is that the net indicated efficiency is higher with rebreathing compared to NVO. In the first part of this section, more advanced fuel injection strategies are evaluated and compared. The intention is to see if NVO can be substituted with a more advanced fuel injection strategy. In the second part, an opportunity that is available with NVO is to add a fuel injection during NVO to see if the low load limit can be extended further.
As in the previous section, no external EGR is used, the fuel is the 87 RON gasoline and the glow plug is kept on. The different fuel injection strategies from Paper 5 are shown in Figure 44. A single fuel injection strategy is used as reference. The subjects of investigation are a split main fuel injection strategy, with optimized fuel injection timings and duration. And the other two fuel injection strategies are the single and split main fuel injection strategies with a pilot injection during the compression stroke. The common rail pressure was constant 400 bar for all measurements. Up until this point, no investigations had been performed on the effects of the common rail pressure. The reason for lowering the rail pressure from 500 bar to 400 bar was that a pre-investigation on the effect of the rail pressure showed a small improvement on unburned hydrocarbon emissions with the lower common rail pressure. Benefits in combustion stability and lower HC and CO emissions with a lower injection pressure with gasoline were also reported by Hildingsson et al. in [76].

67
The optimization of the split main fuel injection strategy was done using Design of Experiments (DoE). A central composite design based on a two-level full factorial design with superimposed axial and center points was chosen for the experiments. A more detailed description of this design and properties can be found in [77]. The experimental factors were NVO, the fuel mass ratio between the two injections and the fuel injection separation in crank angles. The standard deviation of IMEPn and combustion efficiency was chosen as output variables and fitted to separate second order regression models. The details are given in Paper 5. From the analysis of the regression models the following conclusions were made: 1) a large fraction of the fuel should be injected with the first fuel injection. 2) A high NVO setting results in improved combustion efficiency but the lowest standard deviation of IMEPn was found for approximately 160 CAD NVO. 3) A too short or a too long separation between the fuel injections should be avoided.
Figure 44. The fuel injection signal from the engine control system for the different injection strategies. The different fuel injection strategies were used at decreasing engine loads. The fuel injection strategies were evaluated with both a low (60 CAD) and a high (200 CAD)
-60 -50 -40 -30 -20 -10 00
0.5
1
Fuel
Inj.
[a.u
.]
Single Inj.
-60 -50 -40 -30 -20 -10 00
0.5
1
Fuel
Inj.
[a.u
.]
Split Main
-60 -50 -40 -30 -20 -10 00
0.5
1
Fuel
Inj.
[a.u
.]
Single Inj. with Pilot
-60 -50 -40 -30 -20 -10 00
0.5
1
Fuel
Inj.
[a.u
.]
Split Main with Pilot
Crank Angle [CAD]

68
setting of NVO. A 200 CAD NVO setting was preferred over the 160 CAD NVO setting given the additional improvement in combustion efficiency. The standard deviation and combustion efficiency for the single injection strategy compared to the split main injection strategy are shown in Figure 45. And the corresponding figures in comparison with the single injection with pilot strategy are shown in Figure 46. It is seen that the combustion stability and combustion efficiency are significantly improved with a split main injection strategy compared to a single injection strategy when NVO is low. In the cases with high NVO setting, no significant improvements are observed with the split main fuel injection strategy. And the high NVO cases, regardless of fuel injection strategy, have lower standard deviation in IMEPn and higher combustion efficiency compared to the low NVO cases.
In the case with a pilot injection compared to the single injection strategy, a significant improvement in combustion stability with the low NVO case is observed. The improvement is better also compared to the split main fuel injection strategy. Also the combustion efficiency is improved in the low NVO case. But no significant improvements are observed with the high NVO cases. The combustion efficiency is lower with the high NVO cases when a pilot injection is added. This is most likely because of trapped fuel in crevice volumes. No additional improvements or findings were observed when a pilot injection is added to the split main injection strategy compared to the single injection strategies. The details are found in Paper 5. The conclusions are that a single injection with a pilot strategy has comparably low standard deviation in IMEPn without using a large fraction of trapped hot residual gas over an extended operating region compared to a single injection strategy. The combustion efficiency is significantly improved with a large fraction of trapped hot residual gases and could not be substituted for a more advanced fuel injection strategy.
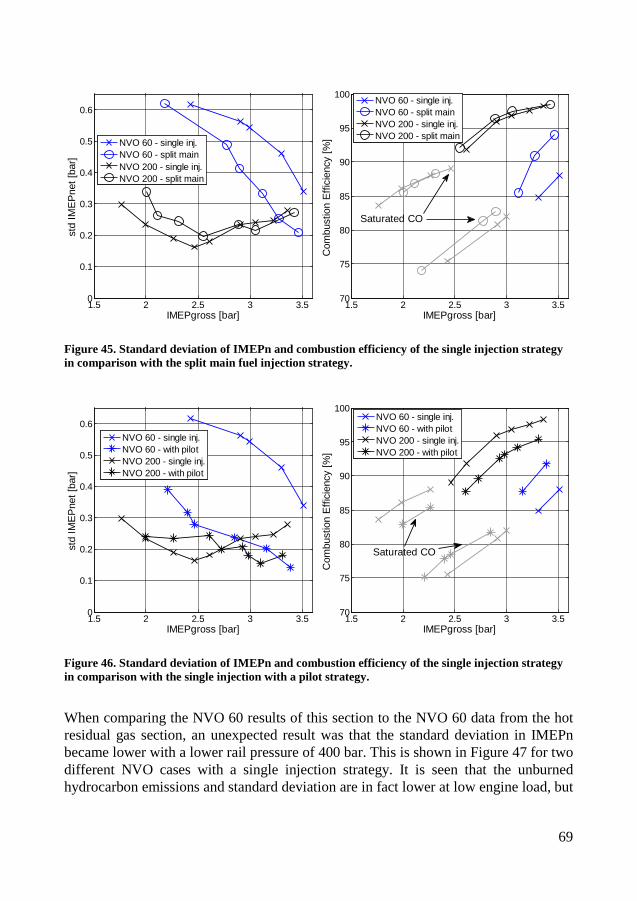
69
Figure 45. Standard deviation of IMEPn and combustion efficiency of the single injection strategy in comparison with the split main fuel injection strategy.
Figure 46. Standard deviation of IMEPn and combustion efficiency of the single injection strategy in comparison with the single injection with a pilot strategy.
When comparing the NVO 60 results of this section to the NVO 60 data from the hot residual gas section, an unexpected result was that the standard deviation in IMEPn became lower with a lower rail pressure of 400 bar. This is shown in Figure 47 for two different NVO cases with a single injection strategy. It is seen that the unburned hydrocarbon emissions and standard deviation are in fact lower at low engine load, but
1.5 2 2.5 3 3.50
0.1
0.2
0.3
0.4
0.5
0.6
IMEPgross [bar]
std
IME
Pne
t [ba
r]
NVO 60 - single inj.NVO 60 - split mainNVO 200 - single inj.NVO 200 - split main
1.5 2 2.5 3 3.570
75
80
85
90
95
100
IMEPgross [bar]C
ombu
stio
n E
ffici
ency
[%]
NVO 60 - single inj.NVO 60 - split mainNVO 200 - single inj.NVO 200 - split main
Saturated CO
1.5 2 2.5 3 3.50
0.1
0.2
0.3
0.4
0.5
0.6
IMEPgross [bar]
std
IME
Pne
t [ba
r]
NVO 60 - single inj.NVO 60 - with pilotNVO 200 - single inj.NVO 200 - with pilot
1.5 2 2.5 3 3.570
75
80
85
90
95
100
IMEPgross [bar]
Com
bust
ion
Effi
cien
cy [%
]
NVO 60 - single inj.NVO 60 - with pilotNVO 200 - single inj.NVO 200 - with pilot
Saturated CO

70
only for the high NVO cases. One reason could be that the lower rail pressure results in poor atomization of the fuel when the in-cylinder temperature is low which results in a longer ignition delay and retarded CA50 due to over-mixed fuel. With increased NVO, the in-cylinder temperature is increased and vaporization of the fuel is enhanced. No experiments that can better explain this behavior have been performed since it is outside the scope of this thesis. The consequence, for the low NVO cases, is that a more detailed investigation on the effect of the common rail pressure in combination with more advanced injection strategy is needed. This is left as future work. The main results of the thesis are focused on using high settings of NVO or rebreathing, and a positive effect of a lower rail pressure has been observed in these cases at low load.
Figure 47. Effects of common rail pressure and NVO on standard deviation in IMEPn and unburned hydrocarbon emissions. If the unburned hydrocarbon emissions are multiplied by number of carbon atoms in the fuel molecules, 7.2, the corresponding quantities with the unit ppmC1 are obtained.
In the second investigation, fuel is injected during the NVO to try to extend the low load limit further. This strategy has been used by several authors and is usually associated with the CAI concept. The main differences compared to the investigation in the thesis, as mentioned in the introduction, are the higher compression ratio, common rail direct injection system with late injection timings and the glow plug.
Urushihara et al. [21] showed that it was possible to extend the lean limit of HCCI by injecting a portion of the fuel in the NVO. The idea was to change the chemical composition of the fuel injected into the NVO, which was referred to as fuel reformation. Koopmans et al. [22] investigated the effects of lambda and injected fuel amount during NVO. Provided that the auto-ignition temperature is reached,
1.5 2 2.5 3 3.5 40.1
0.2
0.3
0.4
0.5
0.6
0.7
0.8
IMEPgross [bar]
std
IME
Pne
t [ba
r]
NVO 60: 500 barNVO 60: 400 barNVO 200: 500 barNVO 200: 400 bar
1.5 2 2.5 3 3.5 4100
200
300
400
500
600
700
IMEPgross [bar]
Unb
urne
d H
ydro
carb
aon
Em
issi
ons
[ppm
]
NVO 60: 500 barNVO 60: 400 barNVO 200: 500 barNVO 200: 400 bar

71
combustion in the gas-exchange results in an elevated temperature of the sub-sequent main combustion event. The heat release during NVO depends on both the oxygen level and injected fuel mass. An optimal lambda could be found that gave the most advanced combustion phasing. A too lean mixture leads to a lower temperature at the main combustion event due to cooling from excess air and a too rich mixture limits the NVO heat release and consequently lowers the temperature for the main combustion. Waldman et al. [78] investigated the effect of NVO injection timing and fraction of fuel injected into the NVO. Both parameters were found to affect the main combustion timing, emissions and combustion stability. An optimum, load dependent, NVO fuel ratio and timing with respect to fuel consumption and emissions was found. In a work by Aroonsrisopon et al. [79], a multizone, 2D CFD simulation with chemistry, was performed, during the NVO, with varying NVO injection fuel amount and timing. It was shown that both the thermal effect (temperature increase from the NVO heat-release) and the chemical effect (fuel reformation) can be used to promote the main combustion. For conditions where there was no significant heat release during NVO, the chemical effect still had an impact on the main combustion timing. Cao et al. [80] used a multi-cycle 3D engine simulation program to study the thermal and chemical effects of the injection timings of a single injection strategy, and split injection ratios using a double injection strategy. For the single injection strategy, the thermal effect associated with injection during the negative valve overlap was found to have a dominating effect on advancing the start of main combustion. The chemical effect is secondary and it was found to promote the first stage ignition during the compression stroke. For the split injection strategy the best engine performance was obtained with a 50/50 split injection ratio. Berntsson et al. [81] investigated the effects of NVO and main fuel injection ratios in both a multi-cylinder and an optical engine. The changes in combustion phasing were attributed to the heat generated during NVO which increases the compression temperature. Fitzgerald et al. [82] observed that the chemical effects are the most prominent for NVO fuel injections later than 30 CAD BTDC. This was attributed to piston wetting followed by rich combustion from pool fires which can be expected to have an impact on the chemical composition.
The NVO fuel injection strategy used in the thesis is shown in Figure 48. A split injection strategy is used with a constant fuel amount during the NVO at a constant timing -5 CAD ATDC. For the limited load range that is investigated, the proportions between the two fuel injections are on average approximately 50/50. The estimated variation in fuel distribution is from approximately 60/40 at the lowest engine load to approximately 40/60 at the highest engine load. The main fuel injection timing was kept constant at 22 CAD BTDC when possible. The exception was with the higher setting of NVO, 200 and 220 CAD, where the fuel injection was set later to 13-14 CAD BTDC in order to have combustion timing after TDC. The NVO injection timing was optimized with respect to unburned hydrocarbon emissions, combustion stability and net indicated efficiency. The details can be found in Paper 6.

72
Figure 48. The NVO fuel injection strategy.
The temperature and pressure during NVO are shown in Figure 49. The data was extracted from the NVO data set in the Hot Residual Gas section. Even though the NVO fuel injection was not used in the simulated cases, it is assumed that the figures are still representative of the high pressures and temperatures that are obtained during the gas-exchange also when the NVO fuel injection strategy is applied. The temperatures are the maximum temperature during NVO from the Boost simulation model and the pressure is taken as the maximum measured pressure during NVO. The temperature at start of combustion, from the Boost simulations, and the relative air fuel ratio, lambda, which was calculated from measured air- and fuel-flow, are shown in Figure 50. The auto-ignition temperature (temperature at start of combustion) varies with NVO from 840 K to 910 K, from 60 CAD to 220 CAD NVO. From 180 CAD NVO, the NVO temperature becomes higher than auto-ignition temperature. At the high NVO settings, from approximately 200 CAD and above, the temperature and pressure are sufficiently high for the rate of heat release during NVO to become detectable, as seen in Figure 51. This is an indication that there will be a temperature increase (thermal effect) for the subsequent main combustion event. Changing NVO affects both the temperature, and oxygen availability. The air-fuel ratio is on the lean side but is close to stoichiometric at the highest NVO setting, 220 CAD. This means that the potential temperature increase could be limited by the oxygen supply. Reducing NVO will increase the amount of available oxygen but will decrease the temperature and pressure during NVO. The chemical effects of the NVO injection could also be of importance. It is however difficult to distinguish between chemical and thermal effects without using a more detailed simulation code and this is outside the scope of the thesis.
-200 -100 0 100 200 300 400 5000
5
10
15
20
25
30
35
40
45
50
Crank Angle [CAD]
Pressure [bar]Valve Lift [a.u.]Fuel Indicator [a.u.]

73
Figure 49. Maximum temperature during NVO from the Boost model simulations, without the NVO injection (left) and measured maximum pressure during NVO from the same data set (right).
Figure 50. Temperature at start of combustion from the Boost model simulations, without the NVO injection (left) and the relative air fuel ratio with the NVO injection strategy (right).
NVO [CAD]
IMEP
gros
s [b
ar]
Maximum Temperature at NVO [K]
60 80 100 120 140 160 180 200 2201.8
2
2.2
2.4
2.6
2.8
3
3.2
3.4
600
650
700
750
800
850
900
950
1000
NVO [CAD]IM
EPgr
oss
[bar
]
Maximum Pressure at NVO [bar]
60 80 100 120 140 160 180 200 2201.8
2
2.2
2.4
2.6
2.8
3
3.2
3.4
4
6
8
10
12
14
16
18
20
NVO [CAD]
IMEP
gros
s [b
ar]
Temperature at SOC [K]
60 80 100 120 140 160 180 200 2201.8
2
2.2
2.4
2.6
2.8
3
3.2
3.4
840
850
860
870
880
890
900
910
NVO [CAD]
IMEP
gros
s [b
ar]
Lambda [-] (NVO Injection)
60 80 100 120 140 160 180 200 220
1.6
1.8
2
2.2
2.4
2.6
1.2
1.4
1.6
1.8
2
2.2
2.4
2.6
2.8

74
Figure 51. Rate of heat release during NVO (left) and subsequent main combustion (right) with varying settings of NVO.
The resulting ignition delay, combustion duration, CA50, combustion instability, unburned hydrocarbon emissions, soot emissions, and net indicated efficiency, for the NVO injection strategy, are shown from Figure 52 to Figure 55. There is a significant impact of the NVO injection on the ignition delay above 180 CAD NVO. This is explained by the thermal and chemical effects of the NVO injection, as discussed previously. The shortest combustion durations are observed at 180-200 CAD NVO settings. The combustion duration does not show similar trends as the ignition delay. The combustion duration becomes shorter with NVO as a result of the increased temperature but becomes longer due to increased heat capacity and reduced oxygen concentration at the high NVO settings [70]. The resulting combustion timing, CA50, is dominated by the effect of the shorter ignition delay and the combustion stability is significantly improved at the highest NVO settings. Also the unburned hydrocarbon emissions are improved. The unburned hydrocarbon emissions are generally high which can be explained by trapped fuel in crevice and squish volumes from the NVO injection. Soot emissions are high with the highest NVO setting. This is where the ignition delay is short and the air fuel ratio is low. If the oxygen concentration becomes too low during the negative valve overlap it can be assumed that large quantities of soot are formed during the NVO.
The net indicated efficiency is low at the high NVO settings. One explanation is that, even though combustion stability is improved and unburned hydrocarbon emissions become lower, the gas-exchange efficiency is significantly reduced with NVO. Another contribution could be from increased heat losses during NVO due to the elevated temperature from the heat release also during NVO.
-40 -20 0 20 40-5
0
5
10
15
Crank Angle (Gas-Exchange TDC) [CAD]
Rate
of H
eat R
elea
se [J
/CAD
]Effect of NVO
NVO 140NVO 180NVO 200NVO 220
-40 -20 0 20 40
0
10
20
30
40
50
60
Crank Angle [CAD]
Rate
of H
eat R
elea
se [J
/CAD
]
Effect of NVO
NVO 140NVO 180NVO 200NVO 220

75
Figure 52. Ignition delay (left) and combustion duration (right) with the NVO Injection strategy.
Figure 53. Combustion timing, CA50, (left) and combustion instability, measured as standard deviation in IMEPn (right), with the NVO injection strategy.
NVO [CAD]
IMEP
gros
s [b
ar]
Ignition Delay (CA10-SOI) [CAD] (NVO Injection)
60 80 100 120 140 160 180 200 220
1.6
1.8
2
2.2
2.4
2.6
8
10
12
14
16
18
NVO [CAD]
IMEP
gros
s [b
ar]
Combustion Duration (CA90-CA10) [CAD] (NVO Injection)
60 80 100 120 140 160 180 200 220
1.6
1.8
2
2.2
2.4
2.6
8
9
10
11
12
13
NVO [CAD]
IMEP
gros
s [b
ar]
CA50 [CAD] (NVO Injection)
60 80 100 120 140 160 180 200 220
1.6
1.8
2
2.2
2.4
2.6
1
2
3
4
5
6
NVO [CAD]
IMEP
gros
s [b
ar]
std IMEPnet [bar] (NVO Injection)
60 80 100 120 140 160 180 200 220
1.6
1.8
2
2.2
2.4
2.6
0.1
0.15
0.2
0.25
0.3

76
Figure 54. . Unburned hydrocarbon (left) and soot emissions (right) with the NVO injection strategy. If the ppm numbers of the unburned hydrocarbon emissions are multiplied with the number of carbons in the fuel, 7.2, the corresponding quantities with the unit ppmC1 are obtained.
Figure 55. Net indicated efficiency with the NVO injection strategy.
The effect of the NVO injection timing and main injection timing on ignition delay, combustion timing, and soot are shown in Figure 56. The operating point is at NVO 220 CAD with approximately 50/50 split injection fuel ratio between the NVO injection and the main injection. When the NVO injection timing was varied, the main injection timing remained constant at -22 CAD ATDC. And when the main injection timing was varied, the NVO injection timing was constant at -5 CAD ATDC. The numbers in the figures show the soot emissions. The combustion timing, CA50, is significantly affected by the NVO injection timing from -10 CAD ATDC. At later
NVO [CAD]
IMEP
gros
s [b
ar]
HC emissions [ppm] (NVO Injection)
60 80 100 120 140 160 180 200 220
1.6
1.8
2
2.2
2.4
2.6
350
400
450
500
550
600
650
700
NVO [CAD]
IMEP
gros
s [b
ar]
soot [FSN] (NVO Injection)
60 80 100 120 140 160 180 200 220
1.6
1.8
2
2.2
2.4
2.6
0
0.1
0.2
0.3
0.4
0.5
0.6
0.7
0.8
NVO [CAD]
IME
Pne
t [ba
r]
Net Indicated Efficiency [%] (NVO Injection)
60 80 100 120 140 160 180 200 220
1.4
1.6
1.8
2
2.2
2.4
2.6
26
27
28
29
30
31
32
33

77
NVO injection timings the NVO heat release is lower which reduces the temperature of the main combustion. Only a small quantity of soot was detected with the earliest NVO injection timings. The main injection timing has a significant effect on the soot emissions. Retarding the main injection timing reduces the mixing time of the main injection fuel before start of combustion which is seen from the decreasing ignition delay in the right diagram in Figure 56. At the latest main injection timing, the NVO injection fuel is already ignited and the calculated ignition delay becomes negative because it is calculated from the main fuel injection timing. Soot is increased as the ignition delay becomes shorter and the mixing time of the main injection fuel is decreased. This shows that the main injection timing can be used to control also the soot emissions. If the main injection timing is advanced there is a potential for soot reduction.
Figure 56. Effect of NVO injection timing (left) and main injection timing (right) at a 220 CAD NVO operating point with 50/50 split injection fuel ratio. The numbers show the soot emissions.
Finally, the effect of a reduction of the amount of fuel in the NVO injection is investigated. The operating point is 220 CAD NVO and two cases with different fuel ratios between the two injections are investigated. The first case is the same as has been shown previously, with a constant amount of fuel injected in the NVO. The fuel distribution is on average approximately 50/50 percent between the two injections. The estimated variation in fuel distribution is from approximately 60/40 at the lowest engine load to approximately 40/60 at the highest engine load. The second case is with a reduced amount of fuel in the NVO injection. The amount of injected fuel in NVO is constant also in the second case. The fuel distribution is on average approximately 30/70 between the two injections. The resulting fuel distribution variation of the second case is from approximately 35/65 at the lowest load to approximately 25/75 at the highest load. The ignition delay and combustion timing of the two different cases
-25 -20 -15 -10 -5 00
1
2
3
4
5
6
NVO Injection Timing [CAD]
CA50
[CAD
]
-25 -20 -15 -10 -5 0
0
5
10
15
20Ig
nitio
n De
lay
(CA1
0-SO
I) [C
AD]
CA50Ign. Del.
-20 -15 -100
1
2
3
4
5
6
Main Injection Timing [CAD]
CA50
[CAD
]
-20 -15 -10
0
5
10
15
20
Igni
tion
Dela
y (C
A10-
SOI)
[CAD
]
CA50Ign. Del.0.03 FSN 0.06 FSN 0 FSN
0 FSN
0 FSN
0 FSN
0 FSN
0.08 FSN
0.47 FSN
0.14 FSN

78
at varying engine load are shown in Figure 57. The ignition delay becomes significantly longer and the combustion phasing is retarded when the amount of fuel in the NVO injection is reduced. One explanation is the lower temperature from the NVO heat release. Since a lower amount of fuel is injected it can be expected that the potential temperature increase is reduced.
Figure 57. Effect of fuel distribution between the NVO and main fuel injections on ignition delay and combustion timing. The legend shows the approximate fuel distributions in percent between the two injections. The amount of fuel in the NVO was constant and the amount of fuel in the main injection was used to control engine load.
The combustion instability and unburned hydrocarbon emissions are shown in Figure 58 and the soot emissions are shown in Figure 59. The combustion is more stable with the higher NVO injection ratio but the difference becomes smaller with increasing engine load. The advantage with a lower fraction of NVO injection is that the unburned hydrocarbon emissions are reduced because a lower amount of fuel is trapped in squish and crevice volumes. And the soot emissions are significantly reduced. This investigation shows that also the fuel distribution can be used to reduce the soot emissions while maintaining a similar level of combustion stability, especially as load is increased.
1.4 1.6 1.8 2 2.2 2.4 2.6 2.86
8
10
12
14
16
18
20
22
IMEPgross [bar]
Igni
tion
Dela
y (C
A10-
SOI)
[CAD
]
NVO 220 CAD, Effect of NVO Fuel Distribution
50/5030/70
1.4 1.6 1.8 2 2.2 2.4 2.6 2.80
1
2
3
4
5
6
7
IMEPgross [bar]
CA50
[CAD
]
NVO 220 CAD, Effect of NVO Fuel Distribution
50/5030/70

79
Figure 58. Effect of fuel distribution between the NVO and main fuel injections on standard deviation of IMEPn and unburned hydrocarbon emissions. The legend shows the approximate fuel distributions in percent between the two injections. The amount of fuel in the NVO was constant and the amount of fuel in the main injection was used to control engine load.
Figure 59. Effect of fuel distribution between the NVO and main fuel injections on soot. The legend shows the approximate fuel distributions in percent between the two injections. The amount of fuel in the NVO was constant and the amount of fuel in the main injection was used to control engine load.
1.4 1.6 1.8 2 2.2 2.4 2.60.05
0.1
0.15
0.2
0.25
0.3
0.35
0.4
IMEPgross [bar]
std
IMEP
net [
bar]
NVO 220 CAD, Effect of NVO Fuel Distribution
50/5030/70
1.4 1.6 1.8 2 2.2 2.4 2.6250
300
350
400
450
500
IMEPgross [bar]
Unbu
rned
Hyd
roca
rbon
Em
issio
ns [p
pm]
NVO 220 CAD, Effect of NVO Fuel Distribution
50/5030/70
1.4 1.6 1.8 2 2.2 2.4 2.6 2.80
0.1
0.2
0.3
0.4
0.5
0.6
0.7
0.8
0.9
1
IMEPgross [bar]
soot
[FS
N]
NVO 220 CAD, Effect of NVO Fuel Distribution
50/5030/70

80
5.2.5 Glow Plug (Paper 4)
The next topic is on the effect of the glow plug. Since the glow plug was kept on in the previous investigations with the 87 RON gasoline fuel in the Hot Residual Gas and Fuel Injection Strategies sections, the question is what would be the difference if the glow plug had been turned off. The combustion instability and combustion efficiency for two cases, with and without the glow plug, are shown in Figure 60. The observation was that the glow plug has an improving effect on both combustion stability and combustion efficiency. But as NVO is increased, the additional improvement from the glow plug becomes less significant and the differences can be expected to be small.
Figure 60. Effect of glow plug on combustion instability (left) and combustion efficiency with varying NVO.
5.2.6 Putting it all Together (Paper 6)
As a summary of what have been shown and discussed up to this point, the different valve and fuel injection strategies are put together and compared in terms of efficiency and emissions. The most optimum settings in terms of valve timings and fuel injection settings have been selected. The effects of the individual parameters have been discussed in previous sections. This is similar to what was shown in Paper 6. The results from Paper 6 are complemented with results using the split main fuel injection strategy for the NVO case and also for the rebreathing case. A separate split main fuel injection strategy optimization, similar to what was used with NVO in Paper 5, has been performed also with the rebreathing valve strategy. The optimum fuel injection
60 80 100 120 140 160 180 200 2200.1
0.15
0.2
0.25
0.3
0.35
0.4
0.45
0.5
NVO [CAD]
std
IME
Pne
t [ba
r]
With Glow PlugWithout Glow Plug
60 80 100 120 140 160 180 200 22065
70
75
80
85
90
95
100
NVO [CAD]
Com
bust
ion
Effi
cien
cy [%
]
With Glow PlugWithout Glow Plug
Saturated CO

81
timings did not change significantly with rebreathing compared to NVO. In papers 4 and 6, there was a clear indication that an optimum NVO and rebreathing setting existed. The split main injection strategy with NVO was run again but with the optimum settings of NVO. Also, the NVO fuel injection strategy is complemented with the results showing the effect of a lower fraction of the fuel injected in the NVO. A more detailed summary of the different strategy settings are shown in Table 4.
Table 4. A summary of the different valve and fuel injection strategies.
Name Injection Strategy rail pressure [bar]
Valve strategy setting
NVO sing. inj.
Single injection 500 NVO 180 CAD
NVO split main
Split main injection 400 NVO 180 CAD
NVO inj. 220 NVO (50/50)
NVO injection, 50/50 approximate fuel distribution
400 NVO 220 CAD
NVO inj. 220 NVO (30/70)
NVO injection, 30/70 approximate fuel distribution
400 NVO 220 CAD
NVO inj. 200 NVO (50/50)
NVO injection, 50/50 approximate fuel distribution
400 NVO 200 CAD
Reb. sing. inj.
Single injection 500 Rebreathing 70 CAD
Reb. split main
Split main injection 400 Rebreathing 70 CAD

82
The result is shown here against IMEPn instead of IMEPg. The reason is that this is closer to BMEP which measures the actual work output of the engine. The results plotted against IMEPg are shown in Paper 6. The reason for generally having favored IMEPg is that this shows the results with focus on the main combustion event which makes the comparison between the NVO and rebreathing strategy clearer. This is because there is a significant difference in gas-exchange efficiency, with a high setting of NVO, which results in a lower IMEPn for NVO compared to rebreathing.
The combustion instability and unburned hydrocarbon emissions are shown in Figure 61. It is seen that there is a significant improvement at low load with the NVO injection strategy compared to the other strategies. At higher engine load, from approximately 2.2 bar IMEPn, the split main fuel injection strategy in combination with either rebreathing or NVO has the best combustion stability. There is a clear increase of unburned hydrocarbon emissions with decreased engine load regardless of valve and fuel injection strategy. The CO emissions remained saturated at 10000 ppm for all strategies up to approximately 2 to 2.5 bar IMEPn depending on strategy as shown in Figure 62.
Figure 61. A compilation of the combustion instability and unburned hydrocarbon emissions for the different valve and fuel injection strategies. The approximate NVO injection fuel distribution between the NVO and main injections are indicated in the parentheses.
1 1.5 2 2.5 3 3.50.05
0.1
0.15
0.2
0.25
0.3
0.35
0.4
IMEPnet [bar]
std
IME
Pne
t [ba
r]
NVO, sing. inj.NVO, split mainNVO inj. 220 NVO (50/50)NVO inj. 220 NVO (30/70)NVO inj. 200 NVO (50/50)Reb, sing. inj.Reb, split main
1 1.5 2 2.5 3 3.50
100
200
300
400
500
600
700
800
IMEPnet [bar]
Unb
urne
d H
ydro
carb
on E
mis
sion
s [p
pm]
NVO, sing. inj.NVO, split mainNVO inj. 220 NVO (50/50)NVO inj. 220 NVO (30/70)NVO inj. 200 NVO (50/50)Reb, sing. inj.Reb, split main

83
Figure 62. The CO emissions for the different valve and fuel injection strategies. The approximate NVO injection fuel distribution between the NVO and main injections are indicated in the parentheses.
The NOx and soot emissions are shown in Figure 63. The NOx emissions are low when the engine load is sufficiently low. No external EGR has been used in this investigation but it is expected to be required at the higher engine load operating conditions. The soot emissions are high when the NVO injection strategy is used with the highest NVO setting of 220 CAD and a 50/50 percent fuel distribution between the NVO and main fuel injection. As shown previously, there are different means to reduce soot emissions, for example, changing the main injection timing and reduce the amount of fuel injected in NVO. In Figure 63, also selecting a lower NVO is shown to reduce the soot emissions. This was seen also in Figure 54.
1 1.5 2 2.5 3 3.50
1000
2000
3000
4000
5000
6000
7000
8000
9000
10000
11000
IMEPnet [bar]
CO
em
issi
ons
[ppm
]
NVO, sing. inj.NVO, split mainNVO inj. 220 NVO (50/50)NVO inj. 220 NVO (30/70)NVO inj. 200 NVO (50/50)Reb, sing. inj.Reb, split main

84
Figure 63. The NOx and soot emissions for the different valve and fuel injection strategies. The approximate NVO injection fuel distribution between the NVO and main injections are indicated in the parentheses.
Finally, the net indicated efficiency is shown in Figure 64. As previously shown, the rebreathing strategy has the highest net indicated efficiency compared to the NVO strategies. There is a significant decrease in efficiency with decreasing engine load which is attributed mainly to the decrease in combustion efficiency, which is indicated by an increase in HC and CO emissions.
Figure 64. The net indicated efficiency for the different valve and fuel injection strategies. The approximate NVO injection fuel distribution between the NVO and main injections are indicated in the parentheses.
1 1.5 2 2.5 3 3.50
100
200
300
400
500
600
IMEPnet [bar]
NO
x em
issi
ons
[ppm
]
NVO, sing. inj.NVO, split mainNVO inj. 220 NVO (50/50)NVO inj. 220 NVO (30/70)NVO inj. 200 NVO (50/50)Reb, sing. inj.Reb, split main
1 1.5 2 2.5 3 3.50
0.1
0.2
0.3
0.4
0.5
0.6
0.7
0.8
0.9
1
IMEPnet [bar]
soot
[FS
N]
NVO, sing. inj.NVO, split mainNVO inj. 220 NVO (50/50)NVO inj. 220 NVO (30/70)NVO inj. 200 NVO (50/50)Reb, sing. inj.Reb, split main
1 1.5 2 2.5 3 3.522
24
26
28
30
32
34
36
38
40
42
IMEPnet [bar]
Net
Indi
cate
d E
ffici
ency
[%]
NVO, sing. inj.NVO, split mainNVO inj. 220 NVO (50/50)NVO inj. 220 NVO (30/70)NVO inj. 200 NVO (50/50)Reb, sing. inj.Reb, split main

85
From these results it can be seen that there is not a single valve and fuel injection strategy that is optimal for combustion stability, emissions and efficiency. One suggestion is to operate the engine with the rebreathing strategy, with split main fuel injection, at the higher engine loads, from approximately 2 bar IMEPn and higher, and use NVO with the NVO injection strategy at low engine load. The NVO strategy could be used as an intermediate strategy so that the residual gases are gradually replaced from being re-inducted to becoming trapped. The NVO injection is turned on once a sufficiently high NVO setting has been reached.
At higher engine loads, the variable valve train system will be less useful. The amount of hot residual gas should be decreased, as load is increased, and be replaced with cooled EGR to suppress NOx emissions.
The challenge for the engine control system is to manage the transition between NVO and rebreathing. And another control challenge is to optimize the NVO fuel injection parameters in order to reduce soot emissions and maximize combustion stability. Design, implementation and evaluation of a suitable low load gasoline PPC control strategy is left as future work.

86
6 Summary
During the first part of the thesis, a fundamental experimental study on HCCI combustion in comparison with SI combustion using different variable valve timing strategies was performed. Residual gas enhanced HCCI with NVO or rebreathing has higher efficiency compared SI combustion. A rebreathing strategy gave the best net indicated efficiency of all strategies over the limited operating region in the investigation. To extend the operating range of the NVO HCCI engine, one alternative is to operate the engine in SI mode at low and high engine load. A combustion mode switch from SI to NVO HCCI was demonstrated. Two different HCCI combustion controllers, which were activated after the mode switch, have been compared. A model-based controller gave a smoother transient and could be activated one cycle earlier compared to the simpler PI controllers.
The limited operating region of HCCI and lack of immediate control actuator, which makes feedback control of the combustion difficult, are two contributing reasons to change focus from HCCI to gasoline PPC. The PPC combustion concept is associated with diesel engines. The ignition delay is longer compared to conventional diesel combustion which enhances the mixing of the fuel and air prior to combustion. The fuel and air becomes partially premixed but is not homogeneous. A longer ignition delay can be obtained by using a high fraction of EGR or a high octane number fuel, for example gasoline. One advantage with PPC compared to conventional diesel combustion is reduced soot emissions. One advantage over HCCI combustion is that the fuel injection timing can be used to control the combustion phasing. And an additional advantage is that the high load operating range is covered.
Running a diesel engine on gasoline is not without challenges. The attainable operating region is limited at low load and the main part of the thesis was devoted to extending the low load limit of gasoline PPC. The goal was to extend the operating region of the engine with high octane number fuels using the variable valve train system, the glow plug and more advanced injection strategies. The engine speed was kept low and the goal was to reach idle operating condition.
In the first gasoline PPC experimental study, a comparison between diesel and two gasoline fuels with different octane numbers were performed. The combustion efficiency and combustion stability was lower for gasoline compared to diesel. The low octane number gasoline (69 RON) could be operated with the minimum NVO setting down to 1 bar IMEPn. But the operating range of the 87 RON gasoline fuel

87
was limited and could be run down to approximately 2 bar IMEPn using a high fraction of trapped hot residual gas.
The rest of the work was devoted to the 87 RON gasoline fuel. The problem with the long ignition delay of the 87 RON gasoline fuel was that the combustion timing, CA50, could not be set sufficiently early using the fuel injection timing as control actuator alone. The late CA50 results in high emissions of unburned hydrocarbons and low combustion stability. The low load limit could be extended using either NVO or rebreathing from approximately 3.2-3.3 bar IMEPg down to approximately 2.2 bar IMEPg with the optimum settings of NVO and rebreathing. The rebreathing valve strategy has similar improving effects as the NVO valve strategy at low load. The advantage with the rebreathing valve strategy compared to the NVO strategy is improved efficiency because recompression of the hot residual gas is avoided.
The measured ignition delays with the 87 RON gasoline fuel were fitted to a simple empirical ignition delay model. It was found that the overall trends from changes of temperature, pressure and equivalence ratio could be captured by the simple model. A suggested potential practical application is as part of an engine control system.
More advanced fuel injection strategies were investigated. The objective of the first investigation was to see if the dependency on NVO could be reduced using a more advanced fuel injection strategy. The conclusions were that a single injection with a pilot during the compression stroke has comparably low standard deviation in IMEPn without using a large fraction of trapped hot residual gas over an extended operating region compared to a single injection strategy. The combustion efficiency is significantly improved with a large fraction of trapped hot residual gases and could not be substituted for a more advanced fuel injection strategy. It was also observed that the lower common rail pressure, 400 bar, had a deteriorating effect on combustion stability with the low NVO setting in contrast to the result with high NVO setting at low engine load. In the second investigation a portion of the fuel was injected during NVO. The combustion stability was significantly improved when NVO was sufficiently high. The penalty was a significant increase in soot emissions. The soot emissions could be reduced by advancing the main injection timing or reducing the amount of fuel injected in the NVO.
The effect of the glow plug was found to be relatively small compared to the trapped hot residual gases. The observation was that the glow plug had an improving effect on both combustion stability and combustion efficiency but the effect was more apparent at low NVO settings.
The suggested gasoline PPC low load operating strategy is to use NVO with a NVO injection strategy at low engine load up to approximately 2 bar IMEPn and then switch to the rebreathing valve strategy using a split main fuel injection strategy at higher engine load.

88
7 Future Work
A number of parameters have been evaluated in the experiments for the different strategies in the thesis. There is room for additional improvements that could be made regarding the optimization of the different parameters that were used, for example, fuel injection timing, common rail pressure and NVO injection fuel distribution. There are additional parameters that have not been used in this investigation, for example, inlet air pressure and temperature, which might provide additional benefits if applicable at low engine load operating conditions.
It could also be interesting to investigate the effect of an increased inlet temperature alone, without using the residual gas. One practical application is to use the exhaust heat to raise the temperature of the inlet directly similarly to a fast thermal management system [83].
A low load gasoline PPC strategy has been suggested. The next step is to develop and implement suitable controllers that automatically switch between valve and fuel injection strategy depending on engine load.
An engine simulation tool, AVL Boost, was used to extract temperature and residual gas fractions of the NVO strategy. In order to compare the two strategies in more detail, engine simulations of the rebreathing data could also be made.
To get a deeper understanding of the combustion processes and effects of the different parameters, it would be useful to perform optical diagnostics and CFD simulations. From such investigations it would be possible to quantify the effects of local variations of, for example, fuel and residual gas distribution, from varying residual gas fractions, valve strategy and fuel injection timings.
To extend the low load further, it could be interesting to also investigate the effect of a spark plug, similar to what was shown in work by Yun et al. [24].

89
8 References
[1] “Emission Standards – European Union – Cars and Light Trucks”, www.dieselnet.com/standards/eu/ld.php
[2] Richter, M., Engström, J., Franke, A., Aldén, M. et al., "The Influence of Charge Inhomogeneity on the HCCI Combustion Process," SAE Technical Paper 2000-01-2868, 2000, doi:10.4271/2000-01-2868
[3] Hultqvist, A., Christensen, M., Johansson, B., Richter, M. et al., "The HCCI Combustion Process in a Single Cycle - Speed Fuel Tracer LIF and Chemiluminescence Imaging," SAE Technical Paper 2002-01-0424, 2002, doi:10.4271/2002-01-0424
[4] Christensen, M., Einewall, P., and Johansson, B., “Homogeneous Charge Compression Ignition (HCCI) using Iso-octane, Ethanol and Natural Gas – A Comparison with Spark Ignition”, SAE Technical Paper 972874
[5] Christensen, M. and Johansson, B., "Supercharged Homogeneous Charge Compression Ignition (HCCI) with Exhaust Gas Recirculation and Pilot Fuel," SAE Technical Paper 2000-01-1835, 2000, doi:10.4271/2000-01-1835
[6] Olsson, J., Tunestål, P., Haraldsson, G., and Johansson, B., "A Turbo Charged Dual Fuel HCCI Engine," SAE Technical Paper 2001-01-1896, 2001, doi:10.4271/2001-01-1896
[7] Martinez-Frias, J., Aceves, S., Flowers, D., Smith, J. et al., "HCCI Engine Control by Thermal Management," SAE Technical Paper 2000-01-2869, 2000, doi:10.4271/2000-01-2869
[8] Haraldsson, G., Tunestål, P., Johansson, B., and Hyvönen, J., "HCCI Combustion Phasing in a Multi Cylinder Engine Using Variable Compression Ratio," SAE Technical Paper 2002-01-2858, 2002, doi:10.4271/2002-01-2858
[9] Olsson, J., Tunestål, P., and Johansson, B., "Closed-Loop Control of an HCCI Engine," SAE Technical Paper 2001-01-1031, 2001, doi:10.4271/2001-01-1031
[10] Willand, J., Nieberding, R., Vent, G., and Enderle, C., "The Knocking Syndrome - Its Cure and Its Potential," SAE Technical Paper 982483, 1998, doi:10.4271/982483
[11] Lavy, J., Dabadie, J., Angelberger, C., Duret, P. et al., "Innovative Ultra-low NOx Controlled Auto-Ignition Combustion Process for Gasoline Engines: the 4-SPACE Project," SAE Technical Paper 2000-01-1837, 2000, doi:10.4271/2000-01-1837
[12] Lang, O., Salber, W., Hahn, J., Pischinger, S. et al., "Thermodynamical and Mechanical Approach Towards a Variable Valve Train for the Controlled Auto Ignition Combustion Process," SAE Technical Paper 2005-01-0762, 2005, doi:10.4271/2005-01-0762

90
[13] Koopmans, L. and Denbratt, I., "A Four Stroke Camless Engine, Operated in Homogeneous Charge Compression Ignition Mode with Commercial Gasoline," SAE Technical Paper 2001-01-3610, 2001, doi:10.4271/2001-01-3610
[14] Persson, H., Hultqvist, A., Johansson, B., and Remón, A., "Investigation of the Early Flame Development in Spark Assisted HCCI Combustion Using High Speed Chemiluminescence Imaging," SAE Technical Paper 2007-01-0212, 2007, doi:10.4271/2007-01-0212
[15] Koopmans, L., Ström, H., Lundgren, S., Backlund, O. et al., “Demonstrating a SI-HCCI-SI Mode Change on a Volvo 5-Cylinder Electronic Valve Control Engine,” SAE Technical Paper 2003-01-0753, 2003, doi:10.4271/2003-01-0753
[16] Milovanovic, N., Blundell, D., Gedge, S., and Turner, J., “SI-HCCI-SI Mode Transition at Different Engine Operating Conditions,” SAE Technical Paper 2005-01-0156, 2005, doi:10.4271/2005-01-0156
[17] Kakuya, H., Yamaoka, S., Kumano, K., and Sato, S., “Investigation of a SI-HCCI Combustion Switching Control Method in a Multi-Cylinder Gasoline Engine,” SAE Technical Paper 2008-01-0792, 2008, doi:10.4271/2008-01-0792
[18] Kitamura, T., Takanashi, J., Urata, Y., and Ogawa, K., “A Study on Ignition Timing and Combustion Switching Control of Gasoline HCCI Engine,” SAE Technical Paper 2009-01-1128, 2009, doi:10.4271/2009-01-1128
[19] Zhang, Y., Xie, H., Zhao, H., “Investigation of SI-HCCI Hybrid Combustion and Control Strategies for Combustion Mode Switching in a Four-Stroke Gasoline Engine,” Combustion Science and Technology, 2009, 181:5, 782-799
[20] Shaver, G. M., Roelle, M. J., Gerdes, J. C., “Modeling cycle-to-cycle dynamics and mode transition in HCCI engines with variable valve actuation,” Control Engineering Practice, Volume 14, Issue 3, March 2006, Pages 213-222, ISSN 0967-0661, 10.1016/j.conengprac.2005.04.009
[21] Urushihara, T., Hiraya, K., Kakuhou, A., and Itoh, T., "Expansion of HCCI Operating Region by the Combination of Direct Fuel Injection, Negative Valve Overlap and Internal Fuel Reformation," SAE Technical Paper 2003-01-0749, 2003, doi:10.4271/2003-01-0749
[22] Koopmans, L., Ogink, R., and Denbratt, I., "Direct Gasoline Injection in the Negative Valve Overlap of a Homogeneous Charge Compression Ignition Engine," SAE Technical Paper 2003-01-1854, 2003, doi:10.4271/2003-01-1854
[23] Berntsson, A. and Denbratt, I., "Optical study of HCCI Combustion using NVO and an SI Stratified Charge", 2007, doi:10.4271/2007-24-0012
[24] Yun, H., Wermuth, N., and Najt, P., "Development of Robust Gasoline HCCI Idle Operation Using Multiple Injection and Multiple Ignition (MIMI) Strategy," SAE Technical Paper 2009-01-0499, 2009, doi:10.4271/2009-01-0499
[25] Johansson, T., Johansson, B., Tunestål, P., and Aulin, H., ”Turbocharging to Extend HCCI Operating Range in a Multi Cylinder Engine- Benefits and Limitations,” FISITA2010/F2010A037
[26] Kimura, S., Aoki, O., Ogawa, H., Muranaka, S. et al., "New Combustion Concept for Ultra-Clean and High-Efficiency Small DI Diesel Engines," SAE Technical Paper 1999-01-3681, 1999, doi:10.4271/1999-01-3681
91
[27] Miles, P. C., Choi, D., Pickett, L. M., Singh, I. P., Henein, N., Rempelewert, B. H., Yun, H., and Reitz, R. D., “Rate-Limiting Processes in Late-Injection, Low Temperature Diesel Combustion Regimes”, Thisel, Valencia, Spain 2004
[28] Akihama, K., Takatori, Y., Inagaki, K., Sasaki, S. et al., "Mechanism of the Smokeless Rich Diesel Combustion by Reducing Temperature," SAE Technical Paper 2001-01-0655, 2001, doi:10.4271/2001-01-0655
[29] Noehre, C., Andersson, M., Johansson, B., and Hultqvist, A., "Characterization of Partially Premixed Combustion," SAE Technical Paper 2006-01-3412, 2006, doi:10.4271/2006-01-3412
[30] Hasegawa, R. and Yanagihara, H., "HCCI Combustion in DI Diesel Engine ," SAE Technical Paper 2003-01-0745, 2003, doi:10.4271/2003-01-0745
[31] Kalghatgi, G., Risberg, P., and Ångström, H., "Advantages of Fuels with High Resistance to Auto-ignition in Late-injection, Low-temperature, Compression Ignition Combustion," SAE Technical Paper 2006-01-3385, 2006, doi:10.4271/2006-01-3385
[32] Kalghatgi, G., Risberg, P., and Ångström, H., "Partially Pre-Mixed Auto-Ignition of Gasoline to Attain Low Smoke and Low NOx at High Load in a Compression Ignition Engine and Comparison with a Diesel Fuel," SAE Technical Paper 2007-01-0006, 2007, doi:10.4271/2007-01-0006
[33] Manente, V., Johansson, B., Tunestal, P., and Cannella, W., “Effects of Different Type of Gasoline Fuels on Heavy Duty Partially Premixed Combustion,” SAE Int. J. Engines 2(2):71-88, 2010, doi:10.4271/2009-01-2668
[34] Manente, V., Zander, C., Johansson, B., Tunestal, P. et al., “An Advanced Internal Combustion Engine Concept for Low Emissions and High Efficiency from Idle to Max Load Using Gasoline Partially Premixed Combustion,” SAE Technical Paper 2010-01-2198, 2010, doi:10.4271/2010-01-2198
[35] Manente, V., Johansson, B., Tunestal, P., Sonder, M., Serra, S., ”Gasoline Partially Premixed Combustion: High Efficiency, Low NOx and Low Soot by using an Advanced Combustion Strategy and a Compression Ignition Engine”, FCE09, Istanbul, Turkey, 2009
[36] Manente, V., “Gasoline Partially Premixed Combustion – An Advanced Internal Combustion Engine Concept Aimed to High Efficiency, Low Emissions and Low Acoustic Noise in the Whole Load Range”, Doctoral Thesis, Lund, 2010, ISBN 978-91-628-8144-3
[37] Sellnau, M., Sinnamon, J., Hoyer, K., and Husted, H., "Gasoline Direct Injection Compression Ignition (GDCI) - Diesel-like Efficiency with Low CO2 Emissions," SAE Int. J. Engines 4(1):2010-2022, 2011, doi:10.4271/2011-01-1386
[38] Sellnau, M., Sinnamon, J., Hoyer, K., and Husted, H., "Full-Time Gasoline Direct-Injection Compression Ignition (GDCI) for High Efficiency and Low NOx and PM," SAE Int. J. Engines 5(2):300-314, 2012, doi:10.4271/2012-01-0384
[39] Hildingsson, L., Kalghatgi, G., Tait, N., Johansson, B. et al., "Fuel Octane Effects in the Partially Premixed Combustion Regime in Compression Ignition Engines," SAE Technical Paper 2009-01-2648, 2009, doi:10.4271/2009-01-2648

92
[40] Lewander, M., , “Characterization and Control of Multi-Cylinder Partially Premixed Combustion”, Doctoral Thesis, Lund, 2011, ISBN 978-91-7473-148-4
[41] Kokjohn, S., Hanson, R., Splitter, D., and Reitz, R., "Experiments and Modeling of Dual-Fuel HCCI and PCCI Combustion Using In-Cylinder Fuel Blending," SAE Int. J. Engines 2(2):24-39, 2010, doi:10.4271/2009-01-2647
[42] Hanson, R., Kokjohn, S., Splitter, D., and Reitz, R., "An Experimental Investigation of Fuel Reactivity Controlled PCCI Combustion in a Heavy-Duty Engine," SAE Int. J. Engines 3(1):700-716, 2010, doi:10.4271/2010-01-0864
[43] Solaka, H., Aronsson, U., Tuner, M., and Johansson, B., "Investigation of Partially Premixed Combustion Characteristics in Low Load Range with Regards to Fuel Octane Number in a Light-Duty Diesel Engine," SAE Technical Paper 2012-01-0684, 2012, doi:10.4271/2012-01-0684
[44] Woschni, G., “A Universally Applicable Equation for the Instantaneous Heat Transfer Coefficient in the Internal Combustion Engine”, SAE Trans. 76, SAE Technical Paper 670931, 1967
[45] Tunestål, P., “Estimation of the In-Cylinder Air/Fuel Ratio of an Internal Combustion Engine by the Use of Pressure Sensors”, ”, Doctoral Thesis, Lund University, Faculty of Engineering, 2001
[46] Heywood, J., “Internal Combustion Engine Fundamentals”, MacGraw-Hill, ISBN 0-07-100499-8, 1988
[47] Johansson, T., “Turbocharged HCCI Engine – Improving Efficiency and Operating Range”, Doctoral Thesis, Lund, 2010, ISBN 978-91-7473-061-6
[48] Trajkovic, S., Milosavljevic, A., Tunestål, P., and Johansson, B., "FPGA Controlled Pneumatic Variable Valve Actuation," SAE Technical Paper 2006-01-0041, 2006, doi:10.4271/2006-01-0041
[49] Persson, H., “Spark Assisted Compression Ignition SACI”, Doctoral Thesis, Lund, 2008, ISBN 978-91-628-7578-7
[50] “xPC Target - Perform hardware-in-the-loop simulation and real-time rapid control prototyping”, viewed 2013-01-08, http://www.mathworks.se/products/xpctarget/
[51] Aulin, H., “Turbo Charged Low Temperature Combustion – Experiments, Modeling and Control”, Doctoral Thesis, Lund, 2011, ISSN 0282-1990, ISRN LUMDN/TMHP--11/1078—SE
[52] Strandh, P., “HCCI Operation – Closed loop combustion control using VVA or dual fuel”, Doctoral Thesis, Lund, 2006, ISBN 978-91-628-6845-1
[53] “FPGA Fundamentals”, viewed 2013-01-08, http://www.ni.com/white-paper/6983/en
[54] Wilhelmsson, C., “Embedded Systems and FPGAs for Implementation of Control Oriented Models – Applied to Combustion Engines”, Doctoral Thesis, Lund, 2009, ISBN 978-91-628-7957-0
[55] Tunestål, P., “Self-tuning gross heat release computation for internal combustion engines”, Control Engineering Practice, 1(17), Nov, pp. 518-524, 2009
[56] Gatowski, J., Balles, E., Chun, K., Nelson, F. et al., “Heat Release Analysis of Engine Pressure Data,” SAE Technical Paper 841359, 1984, doi:10.4271/841359

93
[57] Egnell, R., “Combustion Diagnostics by Means of Multizone Heat Release Analysis and NO Calculation”, SAE Technical Paper 981424, 1998
[58] Ceviz, M.A., Kaymaz, İ., “Temperature and air–fuel ratio dependent specific heat ratio functions for lean burned and unburned mixture,” Energy Conversion and Management, Volume 46, Issues 15–16, September 2005, Pages 2387-2404, ISSN 0196-8904, 10.1016/j.enconman.2004.12.009
[59] Johansson, R., “System Modeling and Identification”, Prentice Hall, Englewood Cliffs, New Jersey, 1993
[60] Tunestål, P., “Model Based TDC Offset Estimation from Motored Cylinder Pressure Data,” 2009 IFAC Workshop on Engine and Powertrain Control, 2009
[61] Bengtsson, J., Strandh, P., Johansson, R., Tunestål, P. and Johansson, B., “Closed-loop combustion control of homogeneous charge compression ignition (HCCI) engine dynamics,” Int. J. Adapt. Control Signal Process., 18: 167–179, 2004, doi: 10.1002/acs.788
[62] Khair, M. K., Jääskeläinen, H., ”Combustion in Diesel Engines”, www.DieselNet.com
[63] Zhao, H., Li, J., Ma, T., and Ladommatos, N., “Performance and Analysis of a 4-Stroke Multi-Cylinder Gasoline Engine with CAI Combustion,” SAE Technical Paper 2002-01-0420, 2002, doi:10.4271/2002-01-0420
[64] Allen, J. and Law, D., “Variable Valve Actuated Controlled Auto-Ignition: Speed Load Maps and Strategic Regimes of Operation,” SAE Technical Paper 2002-01-0422, 2002, doi:10.4271/2002-01-0422
[65] Hyvönen, J., Haraldsson, G., and Johansson, B., "Operating Conditions Using Spark Assisted HCCI Combustion During Combustion Mode Transfer to SI in a Multi-Cylinder VCR-HCCI Engine," SAE Technical Paper 2005-01-0109, 2005, doi:10.4271/2005-01-0109
[66] Hyvönen, J., Wilhelmsson, C., and Johansson, B., “The Effect of Displacement on Air-Diluted Multi-Cylinder HCCI Engine Performance,” SAE Technical Paper 2006-01-0205, 2006, doi:10.4271/2006-01-0205
[67] Johansson, B. and Olsson, K., “Combustion Chambers for Natural Gas SI Engines Part I: Fluid Flow and Combustion,” SAE Technical Paper 950469, 1995, doi:10.4271/950469
[68] Kim, D., Ekoto, I., Colban, W., and Miles, P., "In-cylinder CO and UHC Imaging in a Light-Duty Diesel Engine during PPCI Low-Temperature Combustion," SAE Int. J. Fuels Lubr. 1(1):933-956, 2009, doi:10.4271/2008-01-1602
[69] Rothamer, D., Snyder, J., Hanson, R., Steeper, R., Fitzgerald, R., "Simultaneous imaging of exhaust gas residuals and temperature during HCCI combustion," Proceedings of the Combustion Institute, Volume 32, Issue 2, 2009, Pages 2869-2876, ISSN 1540-7489, 10.1016/j.proci.2008.07.018
[70] Zhao, H., Peng, Z., Williams, J., and Ladommatos, N., "Understanding the Effects of Recycled Burnt Gases on the Controlled Autoignition (CAI) Combustion in Four-Stroke Gasoline Engines", SAE Technical Paper 2001-01-3607, 2001, doi:10.4271/2001-01-3607

94
[71] Weall, A. and Collings, N., "Gasoline Fuelled Partially Premixed Compression Ignition in a Light Duty Multi Cylinder Engine: A Study of Low Load and Low Speed Operation," SAE Int. J. Engines 2(1):1574-1586, 2009, doi:10.4271/2009-01-1791
[72] Kook, S., Bae, C., Miles, P., Choi, D. et al., "The Influence of Charge Dilution and Injection Timing on Low-Temperature Diesel Combustion and Emissions," SAE Technical Paper 2005-01-3837, 2005, doi:10.4271/2005-01-3837
[73] Babajimopoulos, A., Lavoie, G., and Assanis, D., "Modeling HCCI Combustion With High Levels of Residual Gas Fraction - A Comparison of Two VVA Strategies," SAE Technical Paper 2003-01-3220, 2003, doi:10.4271/2003-01-3220
[74] McAllister, S., Chen, J., Fernandez-Pello, A. C., ”Fundamentals of Combustion Processes”, Springer, ISBN 978-1-4419-7942-1, 2011
[75] Lewander, M., Johansson, B., Tunestål, P., Keeler, N., Milovanovic, N., Bergstrand, P., ”Closed Loop Control of a Partially Premixed Combustion Engine using Model Predictive Control Strategies”, AVEC’08 Proceeding 006
[76] Hildingsson, L., Johansson, B., Kalghatgi, G., and Harrison, A., "Some Effects of Fuel Autoignition Quality and Volatility in Premixed Compression Ignition Engines," SAE Int. J. Engines 3(1):440-460, 2010, doi:10.4271/2010-01-0607
[77] Box, G., E. P., Hunter, J. S., Hunter, W., G., “Statistics for Experimenters: Design, Innovation, and Discovery”, Second Edition, Wiley-Interscience, ISBN-13: 978-0471718130, 2005
[78] Waldman, J., Nitz, D., Aroonsrisopon, T., Foster, D. et al., "Experimental Investigation into the Effects of Direct Fuel Injection During the Negative Valve Overlap Period in an Gasoline Fueled HCCI Engine", SAE Technical Paper 2007-01-0219, 2007, doi:10.4271/2007-01-0219
[79] Aroonsrisopon, T., Nitz, D., Waldman, J., Foster, D. et al., "A Computational Analysis of Direct Fuel Injection During the Negative Valve Overlap Period in an Iso-Octane Fueled HCCI Engine", SAE Technical Paper 2007-01-0227, 2007, doi:10.4271/2007-01-0227
[80] Cao, L., Zhao, H., and Jiang, X., "Investigation into Controlled Auto-Ignition Combustion in a GDI Engine with Single and Split Fuel Injections", SAE Technical Paper 2007-01-0211, 2007, doi:10.4271/2007-01-0211
[81] Berntsson, A., Andersson, M., Dahl, D., and Denbratt, I., "A LIF-study of OH in the Negative Valve Overlap of a Spark-assisted HCCI Combustion Engine", SAE Technical Paper 2008-01-0037, 2008, doi:10.4271/2008-01-0037
[82] Fitzgerald, R. and Steeper, R., "Thermal and Chemical Effects of NVO Fuel Injection on HCCI Combustion", SAE Int. J. Engines 3(1):46-64, 2010, doi:10.4271/2010-01-0164
[83] Haraldsson, G., Tunestål, P., Johansson, B., and Hyvönen, J., "HCCI Closed-Loop Combustion Control Using Fast Thermal Management," SAE Technical Paper 2004-01-0943, 2004, doi:10.4271/2004-01-0943

95
9 Summary of Papers
Paper 1
Investigation and Comparison of Residual Gas Enhanced HCCI using Trapping (NVO HCCI) or Rebreathing of Residual Gases
Patrick Borgqvist, Per Tunestål, and Bengt Johansson
SAE 2011-01-1772, presented by the author at the SAE International Powertrains, Fuels and Lubricants Meeting, 2011, in Kyoto, Japan.
The objectives were to get qualitative comparisons of different HCCI and SI combustion strategies with the variable valve train in terms of efficiencies. The load range was selected based on the attainable operating region for HCCI combustion which was narrow.
The author planned and performed the engine experiments, post-processed the data and wrote the article. The work was supervised by Per Tunestål and Bengt Johansson who both provided valuable feedback.
Paper 2
Investigating Mode Switch from SI to HCCI using Early Intake Valve Closing and Negative Valve Overlap Anders Widd, Rolf Johansson, Patrick Borgqvist, Per Tunestål, and Bengt Johansson
SAE 2011-01-1775, presented by Anders Widd at the SAE International Powertrains, Fuels and Lubricants Meeting, 2011, in Kyoto, Japan.
A mode switch strategy from SI to HCCI combustion was demonstrated at low engine load. Combustion mode switch is used to be able to operate the engine beyond the limited operating region of HCCI combustion. Two different control strategies for the HCCI combustion, activated after the mode switch, were compared.
Both the author and Anders Widd planned and performed the engine experiments and wrote the paper. Anders Widd was responsible for the controller design and

96
evaluation. The author was responsible for the LabVIEW implementations and post-processing of the data. This work was supervised by Rolf Johansson, Per Tunestål and Bengt Johansson.
Paper 3
Gasoline Partially Premixed Combustion in a Light Duty Engine at Low Load and Idle Operating Conditions
Patrick Borgqvist, Per Tunestål, and Bengt Johansson
SAE 2012-01-0687, presented by the author at the SAE World Congress, 2012, in Detroit.
This was the first low load gasoline PPC investigation. The objective of this investigation was to compare different fuels, with different RON values, at low engine load and engine speed operating conditions. The goal is to reach idle operating conditions. It was possible to operate the engine at the lowest load with the 69 RON gasoline fuel but the attainable low load operating region of the 87 RON gasoline fuel was limited.
The author planned and performed the engine experiments, post-processed the data and wrote the article. The work was supervised by Per Tunestål and Bengt Johansson who both provided valuable feedback.
Paper 4
The Usefulness of Negative Valve Overlap for Gasoline Partially Premixed Combustion, PPC
Patrick Borgqvist, Martin Tuner, Augusto Mello, Per Tunestål, and Bengt Johansson
SAE 2012-01-1578, presented by the author at the SAE 2012 International Powertrains, Fuels & Lubricants Meeting, 2012, in Malmö
After Paper 3, the focus of the investigations shifted towards extending the attainable low load operating of the 87 RON gasoline fuel. In this investigation the effects of negative valve overlap and the glow plug was investigated. An engine simulation model was used to retrieve information about the residual gas fraction and in-cylinder temperature. The low load limit with the 87 RON gasoline fuel could be extended using NVO. The glow plug was found to have only a small effect in combination with the variable valve train system.

97
The author planned and performed the engine experiments, post-processed the data and wrote the article. Martin Tuner and Augusto Mello did the AVL Boost engine simulations. The work was supervised by Per Tunestål and Bengt Johansson who both provided valuable feedback.
Paper 5
The Low Load Limit of Gasoline Partially Premixed Combustion Using Negative Valve Overlap
Patrick Borgqvist, Öivind Andersson, Per Tunestål, and Bengt Johansson
ICEF2012-92069, presented by the author at the ASME 2012 Internal Combustion Engine Division Fall Technical Conference, in Vancouver.
The objective of this study was to evaluate more advanced fuel injection strategies in combination with NVO towards the low load limit of gasoline PPC using the 87 RON gasoline fuel. The objective was to see if the NVO requirement could be reduced with a more advanced fuel injection strategy. It was found that the combustion stability could be improved with a single injection with a pilot strategy with a low NVO setting compared to the high NVO setting. But the combustion efficiency remained low compared to the high NVO cases.
The author performed the engine experiments, post-processed the data and wrote the article. Öivind Andersson supervised the experimental planning of the split main fuel injection strategy optimization and provided valuable feedback. The work was also supervised by Per Tunestål and Bengt Johansson who both provided valuable feedback.
Paper 6
Comparison of Negative Valve Overlap (NVO) and Rebreathing Valve Strategies on a Gasoline PPC Engine at Low Load and Idle Operating Conditions
Patrick Borgqvist, Per Tunestål, and Bengt Johansson
SAE 2013-01-0902, the article was submitted and approved for publication at the SAE World Congress, 2013, in Detroit.
A comparison with a rebreathing valve strategy compared to NVO was performed and it was found that similar improvements on combustion stability and unburned hydrocarbon emissions could be achieved towards low load when the same fuel

98
injection strategy is used. The motivation for using a rebreathing strategy is that the engine efficiency becomes higher. A NVO fuel injection strategy was also evaluated to further extend the low load limit of gasoline PPC. A comparison of the different valve and fuel injection strategies towards low load was given. And it was concluded that the optimal gasoline PPC fuel injection strategy at low load would be to operate the engine with NVO and a NVO fuel injection at the lowest load and switch to the rebreathing strategy when possible to improve the efficiency of the engine.
The author planned and performed the engine experiments, post-processed the data and wrote the article. The work was supervised by Per Tunestål and Bengt Johansson who both provided valuable feedback.
Publication Errata
In Paper 1, Appendix C, the unit of the HC emissions is shown as ppm. The correct unit of the HC emissions here is ppmC1.
In Paper 4, page 14, the injection timing was advanced to keep combustion timing constant, not retarded as stated in the paper.
In Paper 3, page 16, the thermodynamic efficiency is the fraction of the heat released having resulted in indicated work, not mechanical work as stated in the paper.
In Paper 5, page 3, right column, the fuel injection timing of the first fuel injection event is constant -22 CAD ATDC, not BTDC.
In Paper 5, page 5, left column, the pilot injection timing is -60 CAD ATDC, not BTDC.
Copyright © 2022 FDOKUMEN