
The role of calcium on deposit chemistry and corrosion ... - Doria
100
Jon Forstén, 37890 Laboratory of Molecular Science and Engineering Supervisors: Emil Vainio D.Sc, and docent Patrik Yrjas Faculty of Natural Science and Technology Åbo Akademi University 2019 The role of calcium on deposit chemistry and corrosion in fluidized bed combustion of biomass
-
Upload
khangminh22 -
Category
Documents
-
view
1 -
download
0
Transcript of The role of calcium on deposit chemistry and corrosion ... - Doria
Jon Forstén, 37890
Laboratory of Molecular Science and
Engineering
Supervisors: Emil Vainio D.Sc, and docent
Patrik Yrjas
Faculty of Natural Science and Technology
Åbo Akademi University
2019
The role of calcium on deposit chemistry
and corrosion in fluidized bed combustion
of biomass
Abstract
Forstén Jon: The role of calcium on deposit chemistry and corrosion in fluidized bed combustion of biomass,
Master’s Thesis in Chemical Engineering, Faculty of Science and Engineering at Åbo Akademi University, Turku
2019
Increased interest in combustion of fuel mixtures containing calcium-rich sludges has created a need for a
more detailed understanding of calcium behavior in fluidized bed boilers, as calcium may have an impact,
both on high-temperature corrosion in the superheater region, and on low-temperature corrosion in the
cold-end of the boiler. A higher calcium content in the fly ash may lead to a decreased sulfation of alkali
chlorides and thus increase their accumulation in superheater deposits. In the colder end, the formation of
hygroscopic calcium chloride has been shown to cause corrosion by forming wet deposits.
The objective of the research was to clarify the role of calcium on deposit chemistry and corrosion, from the
superheater region to the cold-end in fluidized bed boilers. In order to achieve the objective, short-term
deposit probe measurements were carried out in a full-scale BFB boiler, firing a calcium-rich fuel mixture, to
study the behavior of calcium at various temperatures. Measurements were conducted before the secondary
superheater, at the primary superheater, and the air preheater. The analysis methods SEM/EDX, TGA, and
XRD, were utilized when analyzing the deposit samples obtained during the measurement campaign. The
rate of deposit build-up and a corrosion rate index was also determined for the probe rings exposed in the
superheater region. The data received from these methods were analyzed separately for all measurement
locations.
The deposit collected in the superheater region can be described as somewhat aggressive, as a relatively high
share of chlorine was detected, in comparison to the chlorine content in the fuel mixture. Visual signs of
corrosion were observed on the X10CrMoVNb9-1 material at material temperatures between 525-550 °C at
the measurement point just below the secondary superheater and 450 °C at the measurement point by the
primary superheater. Iron chlorides were also detected in all of the samples collected in the superheater
region. Based on spot analyses conducted on flakes detached from the ring surfaces, and XRD-analyses, the
corrosion was alkali induced.
The significant amounts of alkali chlorides present in the deposit is a direct consequence of the incomplete
sulfation of alkali chlorides in the freeboard. This is partly caused by the high amount of calcium, that captures
the gaseous sulfur species. The high accumulation of alkali chlorides highlights the invalidity of the S/Cl fuel
molar ratio in this case and shows that there is indeed an increased corrosion risk when firing fuel mixtures
containing a high amount of calcium. In addition to sodium and potassium chlorides, there were indications
of the presence of CaCl2 at the primary superheter region. The amounts of chlorine in the cold-end deposit
were low, however, still significant compared to the fuel content. Some corrosion was observed, and it was
found to be caused by hygroscopic deposits at 80°C. At higher temperatures, up to 120°C (the highest
temperature tested), corrosion was not observed. There were indications of CaCl2 in the deposit, although
the XRD-analysis could not confirm its presence. As other hygroscopic salts, such as NH4Cl, could have
possibly caused corrosion as well, the role of CaCl2 on corrosion in this work remains unclear.
Svenska sammanfattning - Kalciumets roll i samband med
beläggningsbildning och korrosion vid förbränning av biomassa i
fluidiserade bäddar
Den 1 januari 2011 trädde en ny lag i kraft som omfattar beskattningen av avfall som förs till en
avstjälpningsplats. För varje ton avfall som förs till avstjälpningsplatsen är skatten 70 euro. Sedan
den nya avfallsskattelagen trädde i kraft har intresset för samförbränning av diverse biobränslen
tillsammans med olika avfallsslam i fluidiserade bäddpannor ökat (1126/2010). En av orsakerna till
detta är deras potential att fungera som bränsleadditiv. I Finland ligger det stor fokus på
användningsmöjligheterna av slam som produceras inom skogsindustrin. Dessa slam tenderar att
innehålla höga mängder kalcium och kunde fungera som ersättare till kalciumbaserade additiv.
Användning av additiv ss. kalksten eller bränslen med höga kalciumhalter är typiska metoder för att
binda svavel i rökgasen. Det har även visat sig att kalcium kan ha en inverkan på korrosion av
överhettare såväl som korrosion på värmeväxlarkomponenter i den kallare ändan av rökgaskanalen.
Eftersom kalcium uppfångar SO2 och SO3, kan en ökad mängd kalcium i bränslet leda till försämrad
sulfatering av alkaliklorider och således öka risken för högtemperaturkorrosion (Anthony &
Granatstein, 2000). Nyligen publicerad forskning har visat att hygroskopisk kalciumklorid orsakar
korrosion genom att bilda fuktiga beläggningar i den kallare ändan av rökgaskanalen (Vainio et al.,
2016). Målet med denna studie är att utöka förståelsen för kalciumets roll inom beläggningskemi
och korrosion vid förbränningen av bränslen med höga kalciumhalter i bubblande fluidiserade
bäddpannor (BFB).
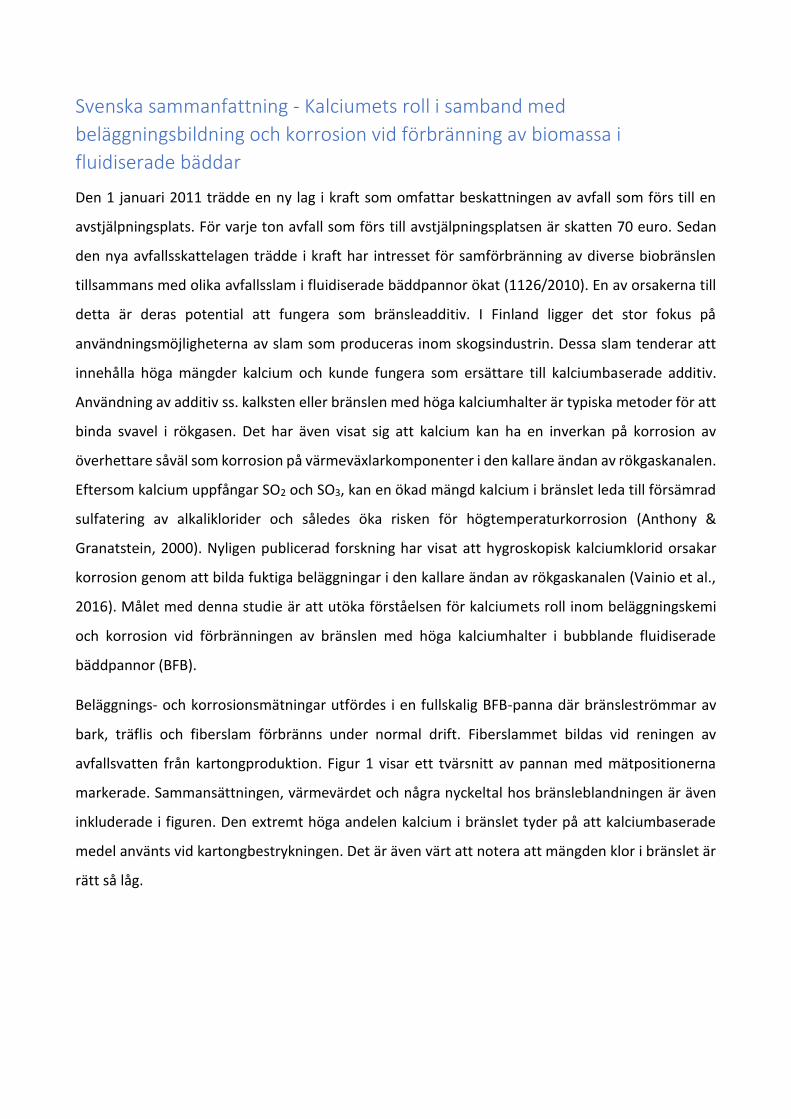
Beläggnings- och korrosionsmätningar utfördes i en fullskalig BFB-panna där bränsleströmmar av
bark, träflis och fiberslam förbränns under normal drift. Fiberslammet bildas vid reningen av
avfallsvatten från kartongproduktion. Figur 1 visar ett tvärsnitt av pannan med mätpositionerna
markerade. Sammansättningen, värmevärdet och några nyckeltal hos bränsleblandningen är även
inkluderade i figuren. Den extremt höga andelen kalcium i bränslet tyder på att kalciumbaserade
medel använts vid kartongbestrykningen. Det är även värt att notera att mängden klor i bränslet är
rätt så låg.
Figur 1. Ett tvärsnitt av BFB-pannan med mätpositionerna markerade.
Rökgastemperaturerna under mätningarna och egenskaperna för
bränsleblandningen är även inkluderade.
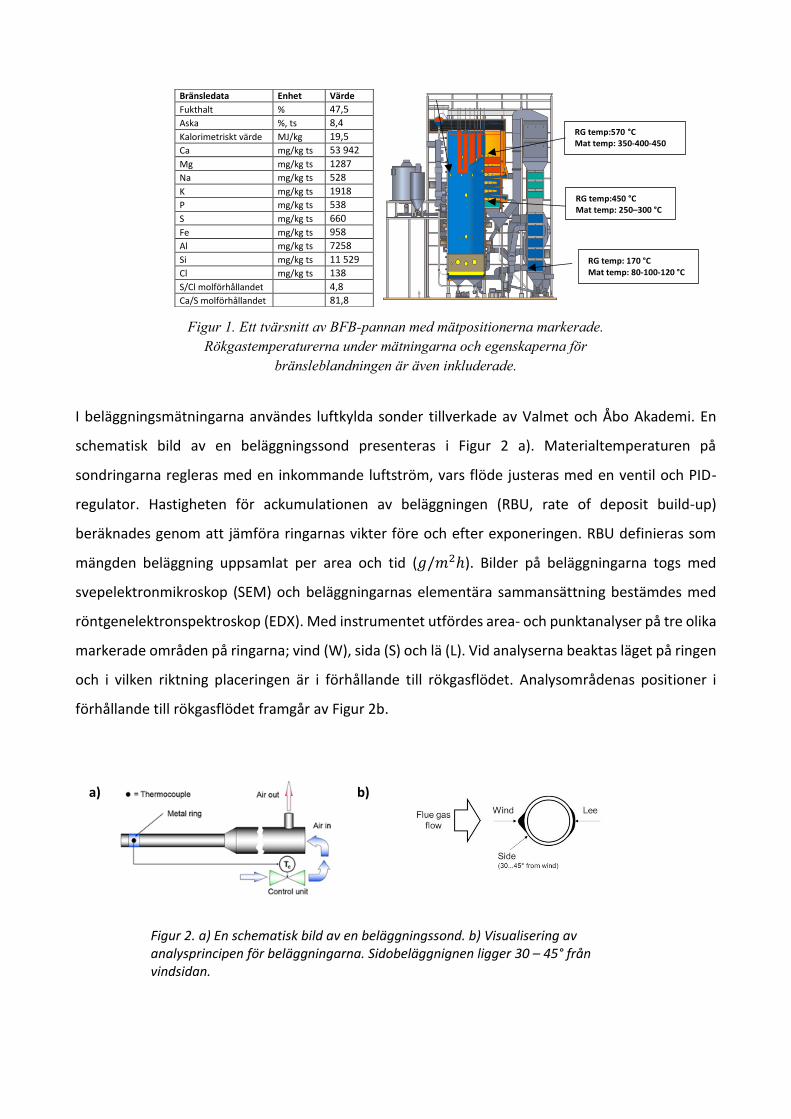
I beläggningsmätningarna användes luftkylda sonder tillverkade av Valmet och Åbo Akademi. En
schematisk bild av en beläggningssond presenteras i Figur 2 a). Materialtemperaturen på
sondringarna regleras med en inkommande luftström, vars flöde justeras med en ventil och PID-
regulator. Hastigheten för ackumulationen av beläggningen (RBU, rate of deposit build-up)
beräknades genom att jämföra ringarnas vikter före och efter exponeringen. RBU definieras som
mängden beläggning uppsamlat per area och tid (𝑔/𝑚2ℎ). Bilder på beläggningarna togs med
svepelektronmikroskop (SEM) och beläggningarnas elementära sammansättning bestämdes med
röntgenelektronspektroskop (EDX). Med instrumentet utfördes area- och punktanalyser på tre olika
markerade områden på ringarna; vind (W), sida (S) och lä (L). Vid analyserna beaktas läget på ringen
och i vilken riktning placeringen är i förhållande till rökgasflödet. Analysområdenas positioner i
förhållande till rökgasflödet framgår av Figur 2b.
Figur 2. a) En schematisk bild av en beläggningssond. b) Visualisering av analysprincipen för beläggningarna. Sidobeläggnignen ligger 30 – 45° från vindsidan.
Bränsledata Enhet Värde
Fukthalt % 47,5
Aska %, ts 8,4
Kalorimetriskt värde MJ/kg 19,5
Ca mg/kg ts 53 942
Mg mg/kg ts 1287
Na mg/kg ts 528
K mg/kg ts 1918
P mg/kg ts 538
S mg/kg ts 660
Fe mg/kg ts 958
Al mg/kg ts 7258
Si mg/kg ts 11 529
Cl mg/kg ts 138
S/Cl molförhållandet 4,8
Ca/S molförhållandet 81,8
RG temp:570 °C Mat temp: 350-400-450
°C
RG temp:450 °C Mat temp: 250–300 °C
RG temp: 170 °C Mat temp: 80-100-120 °C
a) b)

I Figur 3 visas de beräknade RBU-värdena och rökgastemperaturen för alla mätningar inom
överhettarområdet. Vanligtvis betraktas RBU-värden som överskrider 20 g/m2h som problematiska
(Skrifvars, 2005). De uppmätta RBU-värdena är avsevärt lägre än denna gräns och kan därmed
beskrivas som mycket låga. Under mätningarna drevs pannan på låg last, vilket resulterade i lägre
rökgastemperaturer. Enligt Figur 3 har rökgastemperaturen varit under smältpunkten för ren
kalium- och natriumklorid (Haynes, 2014). De låga rökgastemperaturerna har därmed sannolikt haft
en inverkan på den låga ackumulationen av beläggning under mätningarna. Dessutom har Scala
(2006, 2008) påvisat att en stor andel kalcium kan höja smältpunkten för askpartiklarna i rökgasen,
vilket också kan ha varit en orsak till den låga beläggningsbildningen.
Figur 3. Beräknade RBU-värden för beläggningsproven som uppsamlats i överhettarområdet.
Areaanalyserna från beläggningsproven som uppsamlades före den sekundära överhettaren, vid
den primära överhettaren och vid luftförvärmaren presenteras i Figur 4. I analyserna har främst
förekomsten av natrium, kalium, klor, järn, svavel och kalcium beaktats och endast deras andelar i
beläggningsproven presenteras i Figur 4.
0
100
200
300
400
500
600
700
800
0
5
10
15
20
25
550°C 525°C 525°C 500°C 450°C 450°C 400°C 400°C
Ringmaterial temp.
Rö
kgas
tem
pe
ratu
r (°
C)
RB
U (
g/m
2h
)
Hastigheten för beläggningsbildning (RBU)

Enligt resultaten i Figur 4 domineras beläggningarna av olika kalciumföreningar. Kalcium
förekommer ofta som oxid, karbonat eller sulfat i flygaska men det är svårt att fastställa vilka former
som dominerar utgående från den elementära sammansättningen. I Figur 5a presenteras de
elementära andelarna av kalcium och svavel samt molförhållandet mellan syre och kalcium för att
klargöra i vilken kemisk form kalcium är. Eftersom andelen svavel i beläggningen var låg, var den
teoretiskt maximala andelen kalciumsulfat i beläggningen även låg. Molförhållandet mellan syre och
kalcium tyder på högre sannolikhet för en beläggning med högre andel av kalciumkarbonat.
I Figur 5b ges mängderna klor i beläggningar tagna vid primära och sekundära överhettarna och vid
luftförvärmaren. Ackumulationen av klor i beläggningen var klart högre i överhettarområdet.
Klorhalterna i beläggningarna tagna vid luftförvärmaren var mycket lägre, men i förhållande till
klorandelen i bränslet är mängderna ändå ansenliga. Korrosion till följd av den höga ackumulationen
av klor observerades på ytan av ringarna som bestod av materialet X10CrMoVNb9-1. Visuellt kunde
korrosionen tydligast observeras vid materialtemperaturerna 525 °C och 550 °C för de ringar som
exponerades vid den sekundära överhettaren och vid materialtemperaturen 450 °C för de ringar
som exponerades vid den primära överhettaren. Beläggningarna kan allmänt karaktäriseras som
något aggressiva, eftersom höga halter av klor detekterades i förhållande till den låga mängden klor
i bränslet. Baserat på SEM/EDX areaanalyser och punktanalyser, kan det antas att kloret förekom
som alkaliklorider. Förekomsten av klor tenderade att vara högre på sidan av ringen, oberoende av
mätposition.
FIgur 5. a) Andelarna av kalcium och svavel i beläggningen i atomprocent. Molförhållandet mellan syre och
kalcium är även inkluderat. b) Andelen klor detekterat på sidopositionen av sondringarna.
Ett av mätningarnas syften var att analysera förekomsten av det hygroskopiska saltet kalciumklorid.
Utifrån molförhållandena i areaanalyserna kunde dess förekomst inte bestyrkas, men punktanalyser
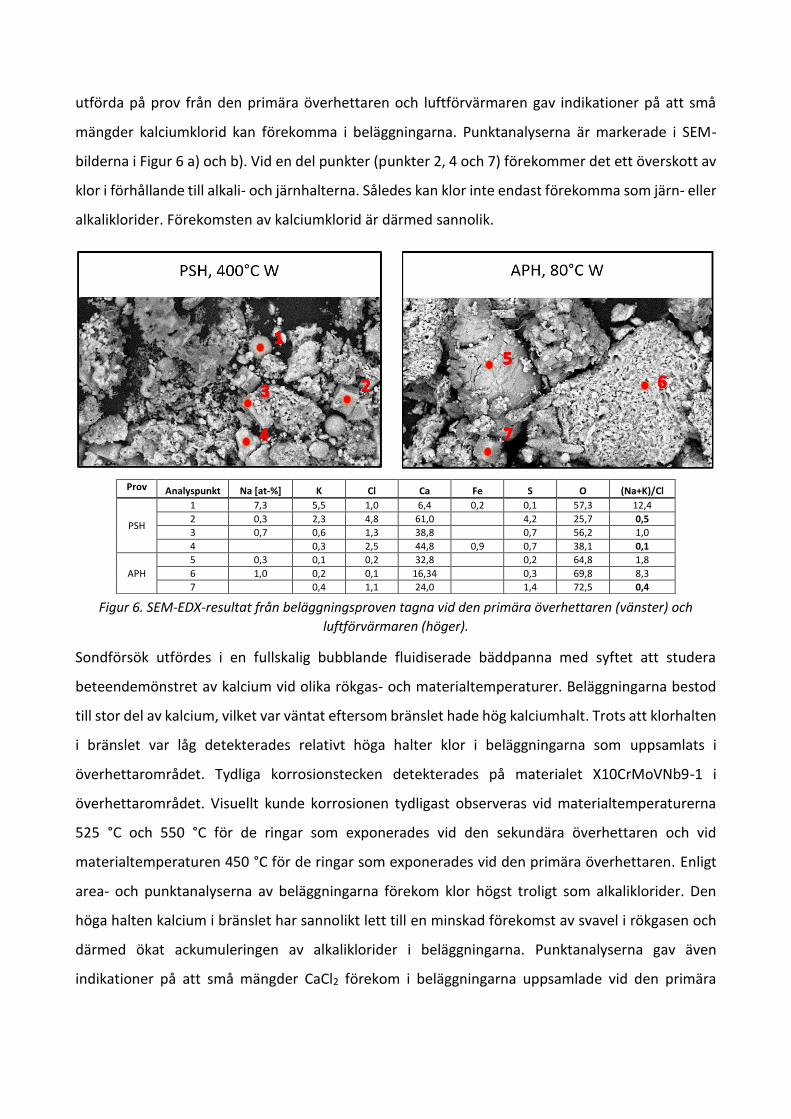
utförda på prov från den primära överhettaren och luftförvärmaren gav indikationer på att små
mängder kalciumklorid kan förekomma i beläggningarna. Punktanalyserna är markerade i SEM-
bilderna i Figur 6 a) och b). Vid en del punkter (punkter 2, 4 och 7) förekommer det ett överskott av
klor i förhållande till alkali- och järnhalterna. Således kan klor inte endast förekomma som järn- eller
alkaliklorider. Förekomsten av kalciumklorid är därmed sannolik.
Figur 6. SEM-EDX-resultat från beläggningsproven tagna vid den primära överhettaren (vänster) och
luftförvärmaren (höger).
Sondförsök utfördes i en fullskalig bubblande fluidiserade bäddpanna med syftet att studera
beteendemönstret av kalcium vid olika rökgas- och materialtemperaturer. Beläggningarna bestod
till stor del av kalcium, vilket var väntat eftersom bränslet hade hög kalciumhalt. Trots att klorhalten
i bränslet var låg detekterades relativt höga halter klor i beläggningarna som uppsamlats i
överhettarområdet. Tydliga korrosionstecken detekterades på materialet X10CrMoVNb9-1 i
överhettarområdet. Visuellt kunde korrosionen tydligast observeras vid materialtemperaturerna
525 °C och 550 °C för de ringar som exponerades vid den sekundära överhettaren och vid
materialtemperaturen 450 °C för de ringar som exponerades vid den primära överhettaren. Enligt
area- och punktanalyserna av beläggningarna förekom klor högst troligt som alkaliklorider. Den
höga halten kalcium i bränslet har sannolikt lett till en minskad förekomst av svavel i rökgasen och
därmed ökat ackumuleringen av alkaliklorider i beläggningarna. Punktanalyserna gav även
indikationer på att små mängder CaCl2 förekom i beläggningarna uppsamlade vid den primära
Prov Analyspunkt Na [at-%] K Cl Ca Fe S O (Na+K)/Cl
PSH
1 7,3 5,5 1,0 6,4 0,2 0,1 57,3 12,4
2 0,3 2,3 4,8 61,0 4,2 25,7 0,5
3 0,7 0,6 1,3 38,8 0,7 56,2 1,0
4 0,3 2,5 44,8 0,9 0,7 38,1 0,1
APH
5 0,3 0,1 0,2 32,8 0,2 64,8 1,8
6 1,0 0,2 0,1 16,34 0,3 69,8 8,3
7 0,4 1,1 24,0 1,4 72,5 0,4
överhettaren och vid luftförvärmaren. I korrosionsmätningarna vid luftförvärmaren observerades
korrosion på 16Mo3 vid 80 °C medan ingen korrosion noterades vid 100 °C och 120 °C.
Referenser
[1] A.L. Elled, K.O. Davidsson, L.E. Åmand. Sewage sludge as a deposit inhibitor when co-fired with
high potassium fuels. Biomass Bioenergy, 34 (2010), Pages 1546-1554
[2] E.J. Anthony, D.L. Granatstein. Sulfation phenomena in fluidized bed combustion systems.
Progress in Energy and Combustion Science, Volume 27 (2) (2001), Pages 215-236.
[3] E. Vainio, H. Kinnunen, T. Laurén, A. Brink, P. Yrjas, N. DeMartini. Low-temperature corrosion
in co-combustion of biomass and solid recovered fuels. Fuel, 184 (2016), Pages 957-965.
[4] Bengt-Johan Skrifvars, Patrik Yrjas, Tor Lauren, Mikko Hupa and Martin Dittrich, The Åbo
Akademi Database: Ash Behavior Measurements in Full-Scale Boilers, 18th International
Conference on Fluidized Bed Combustion Toronto, Ontario, Canada, May 22–25, 2005.
[5] Stanislav V. Vassilev, David Baxter, Christina G. Vassileva, An overview of the behaviour of
biomass during combustion: Part I. Phase-mineral transformations of organic and inorganic
matter, Fuel, Volume 112 (2013), Pages 391-449
[6] F. Scala, R. Chirone, Characterization and early detection of bed agglomeration during the
fluidized bed combustion of olive husk, Energy & Fuels, Volume 20 (2006), Pages 120–132.
[7] F. Scala, R. Chirone, An SEM/EDX study of bed agglomerates formed during fluidized bed
combustion of three biomass fuels, Biomass Bioenergy, Volume 32 (2008), Pages 252–266.

Preface
This master’s thesis was carried out as a collaboration between the Energy R&D department at Valmet Technologies Oy, and the Molecular Science and Engineering at Åbo Akademi University. The completion of this thesis signals the end to a one-and-half-year-stay at the R&D department in Tampere, and I would like to thank all my co-workers for the fun coffee breaks, lunches, and of course, working experiences.
I would like to extend my deepest gratitude to the supervisors of this thesis, Hanna Kinnunen from Valmet Technologies Oy, and Emil Vainio and Patrik Yrjas from Åbo Akademi University. Hanna has coordinated this research with honor and provided valuable support throughout this entire time, despite working a demanding full-time job and a doctoral thesis at the same time. Emil’s level of expertise, especially in the untouched field of low-temperature corrosion, was crucial for the outcome of this thesis. Patrik, I wish to thank for reading and commenting on my thesis, and for helping me to improve the quality of my text.
I wish to thank the combustibility team members, Jaakko Tamminen and Davide Fantozzi, for engaging in discussions and providing insightful thoughts on various topics regarding the thesis. I am also grateful to Sonja Enestam, my boss, for providing me with the topic of my master thesis, and the opportunity to develop myself in this team of highly-skilled professionals.
Bomhus Energi AB is gratefully acknowledged for the possibility to carry out the measurements and for the good and helpful co-operation. I would also like to extend my sincere thanks to Linus Silvander and Markus Carlborg, for the SEM- and XRD-analyses conducted on the deposit samples, and to Borås University for providing fractionation references.
Finally, I would like to thank the friends I have made during my student years, my close group of friends back in Helsinki and my family for good moments and support during my years of studies.

1. Contents 1. Introduction ............................................................................................................................................. 12
2. Fluidized bed boilers ................................................................................................................................ 13
2.1 BFB ................................................................................................................................................... 14
2.2 CFB ................................................................................................................................................... 16
3. Fuel analysis methods and backgrounds ................................................................................................. 17
3.1 Standard fuel analysis ...................................................................................................................... 18
3.2 Chemical fractionation .................................................................................................................... 18
3.3 Wood ............................................................................................................................................... 19
3.4 Bark .................................................................................................................................................. 20
3.5 Sludge .............................................................................................................................................. 22
3.5.1 Sludge from pulp and paper mills ............................................................................................ 23
3.5.2 Sewage sludge ......................................................................................................................... 29
3.5.3 Summary of sludges ................................................................................................................ 30
4. Ash behavior ............................................................................................................................................ 32
4.1 Ash formation in fluidized bed combustion .................................................................................... 32
4.2 Deposit formation ........................................................................................................................... 34
4.3 Reactivity of calcium in fly ash ........................................................................................................ 35
4.3.1 Sulfation ................................................................................................................................... 35
4.3.2 Reactions with phosphorus ..................................................................................................... 36
4.3.3 Carbonation ............................................................................................................................. 36
4.3.4 Reaction of HCl with calcium compounds ............................................................................... 37
4.4 High-temperature corrosion............................................................................................................ 39
4.4.1 The role of calcium chloride .................................................................................................... 40
4.4.2 Prediction of corrosion ............................................................................................................ 41
4.5 Low-temperature corrosion at air preheaters ................................................................................ 42
5. Experimental ............................................................................................................................................ 45
5.1 Background ...................................................................................................................................... 45
5.2 Test site............................................................................................................................................ 46
5.3 Method ............................................................................................................................................ 47
5.4 Deposit analysis ............................................................................................................................... 48
5.4.1 Rate of deposit build-up (RBU) ................................................................................................ 48
5.4.2 Corrosion rate index (CRI) ....................................................................................................... 48
5.4.3 SEM-EDX (Scanning electron microscope, energy-dispersive X-ray) ....................................... 48
5.4.4 XRD (X-Ray diffraction) ............................................................................................................ 49
5.4.5 TGA-DTA (Thermogravimetric analysis-Differential thermal analysis) .................................... 49

5.5 Fuel and ash analysis ....................................................................................................................... 49
6. Results and Discussion ............................................................................................................................. 54
6.1 Secondary superheater area (SSH) .................................................................................................. 54
6.2 Primary superheater measurements............................................................................................... 64
6.3 Low-temperature measurements ................................................................................................... 75
7. Conclusions .............................................................................................................................................. 89
8. References ............................................................................................................................................... 91
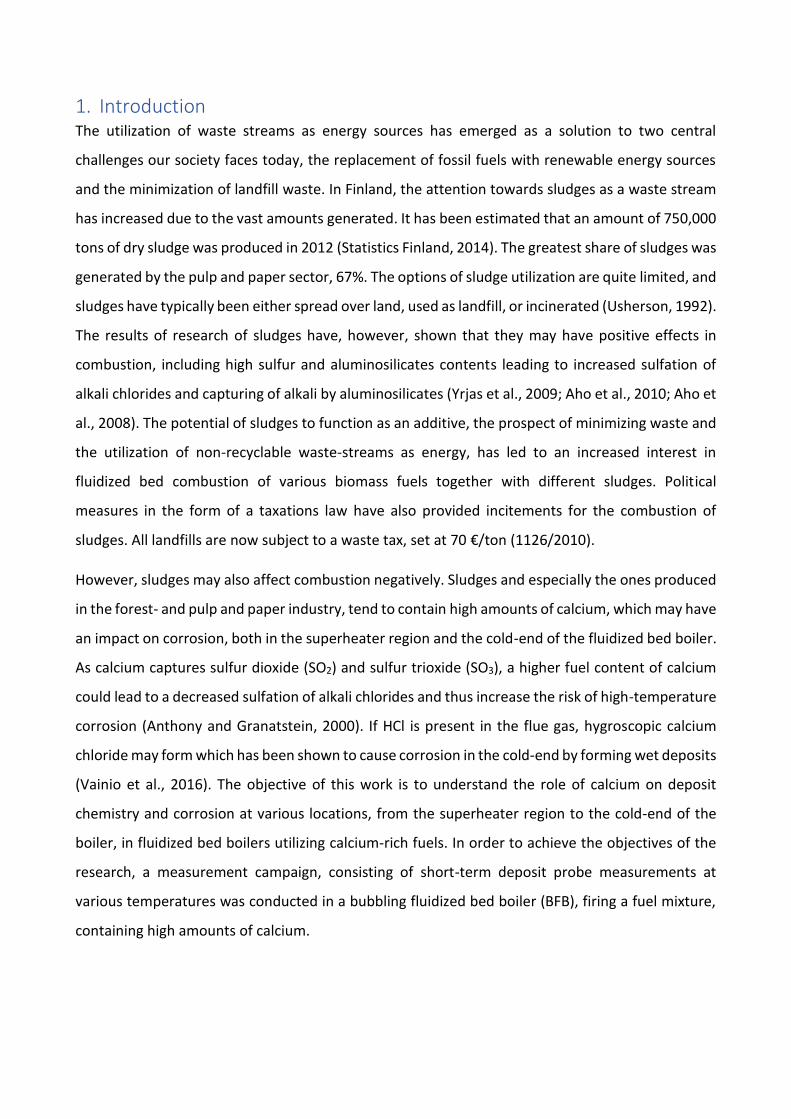
1. Introduction The utilization of waste streams as energy sources has emerged as a solution to two central
challenges our society faces today, the replacement of fossil fuels with renewable energy sources
and the minimization of landfill waste. In Finland, the attention towards sludges as a waste stream
has increased due to the vast amounts generated. It has been estimated that an amount of 750,000
tons of dry sludge was produced in 2012 (Statistics Finland, 2014). The greatest share of sludges was
generated by the pulp and paper sector, 67%. The options of sludge utilization are quite limited, and
sludges have typically been either spread over land, used as landfill, or incinerated (Usherson, 1992).
The results of research of sludges have, however, shown that they may have positive effects in
combustion, including high sulfur and aluminosilicates contents leading to increased sulfation of
alkali chlorides and capturing of alkali by aluminosilicates (Yrjas et al., 2009; Aho et al., 2010; Aho et
al., 2008). The potential of sludges to function as an additive, the prospect of minimizing waste and
the utilization of non-recyclable waste-streams as energy, has led to an increased interest in
fluidized bed combustion of various biomass fuels together with different sludges. Political
measures in the form of a taxations law have also provided incitements for the combustion of
sludges. All landfills are now subject to a waste tax, set at 70 €/ton (1126/2010).
However, sludges may also affect combustion negatively. Sludges and especially the ones produced
in the forest- and pulp and paper industry, tend to contain high amounts of calcium, which may have
an impact on corrosion, both in the superheater region and the cold-end of the fluidized bed boiler.
As calcium captures sulfur dioxide (SO2) and sulfur trioxide (SO3), a higher fuel content of calcium
could lead to a decreased sulfation of alkali chlorides and thus increase the risk of high-temperature
corrosion (Anthony and Granatstein, 2000). If HCl is present in the flue gas, hygroscopic calcium
chloride may form which has been shown to cause corrosion in the cold-end by forming wet deposits
(Vainio et al., 2016). The objective of this work is to understand the role of calcium on deposit
chemistry and corrosion at various locations, from the superheater region to the cold-end of the
boiler, in fluidized bed boilers utilizing calcium-rich fuels. In order to achieve the objectives of the
research, a measurement campaign, consisting of short-term deposit probe measurements at
various temperatures was conducted in a bubbling fluidized bed boiler (BFB), firing a fuel mixture,
containing high amounts of calcium.
2. Fluidized bed boilers Before the energy crisis in the late seventies, fluidized bed technology had primarily been used in
different physical and chemical processes, such as coal gasification, catalytic cracking, or mixing
processes (Oka, 2003). The information that had been gained during the research of these processes
provided a good platform for developing the fluidized bed combustion technology. During the
beginning of the energy crisis, the research intensified as great potential was seen in the technology.
The main advantages of the technology were particularly: the ability to fire a wide range of fuels,
the high combustion efficiency achieved at low combustion temperatures, and the high heat
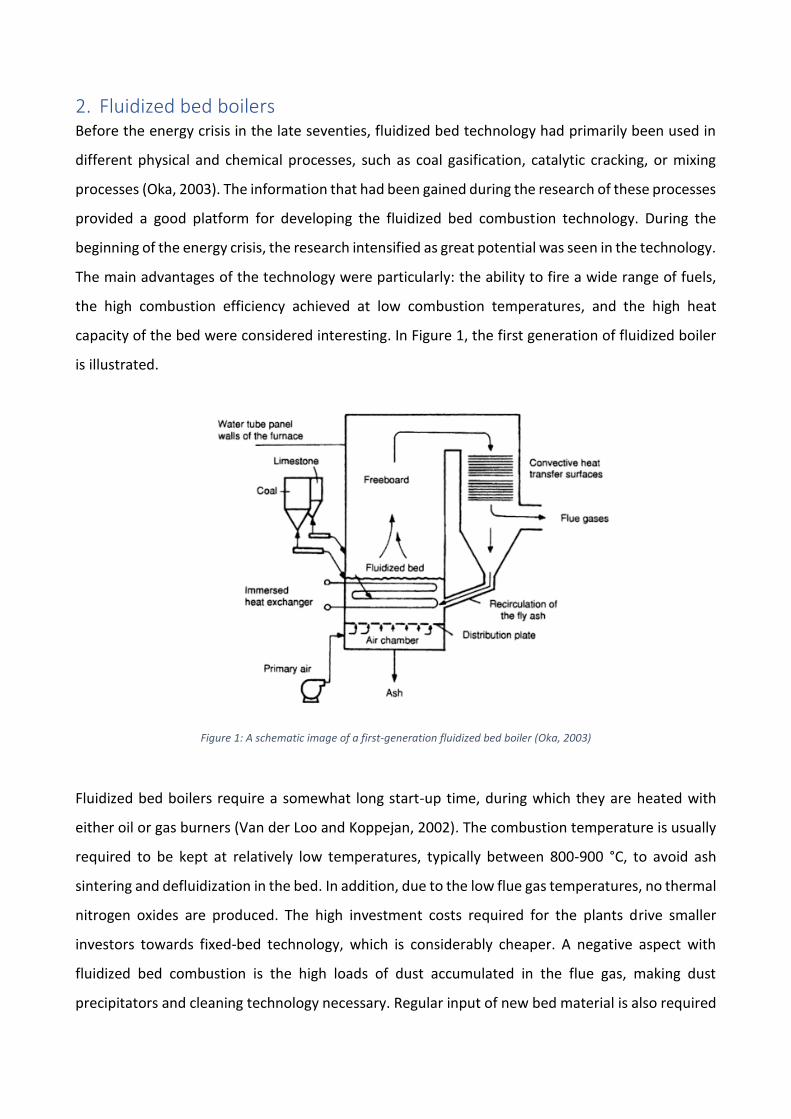
capacity of the bed were considered interesting. In Figure 1, the first generation of fluidized boiler
is illustrated.
Figure 1: A schematic image of a first-generation fluidized bed boiler (Oka, 2003)
Fluidized bed boilers require a somewhat long start-up time, during which they are heated with
either oil or gas burners (Van der Loo and Koppejan, 2002). The combustion temperature is usually
required to be kept at relatively low temperatures, typically between 800-900 °C, to avoid ash
sintering and defluidization in the bed. In addition, due to the low flue gas temperatures, no thermal
nitrogen oxides are produced. The high investment costs required for the plants drive smaller
investors towards fixed-bed technology, which is considerably cheaper. A negative aspect with
fluidized bed combustion is the high loads of dust accumulated in the flue gas, making dust
precipitators and cleaning technology necessary. Regular input of new bed material is also required
as a small fraction of the bed material is lost with the ash or changed on purpose to minimize
agglomeration.
When speaking of fluidized bed boilers, two modes of fluidization are usually distinguished based
on the velocity of the primary air flow (e.g Van der Loo and Koppejan, 2002). Boilers with a lower
inlet air velocity are in the bubbling fluidization mode, while boilers with a higher fluidization
velocity are in the circulating fluidization mode.
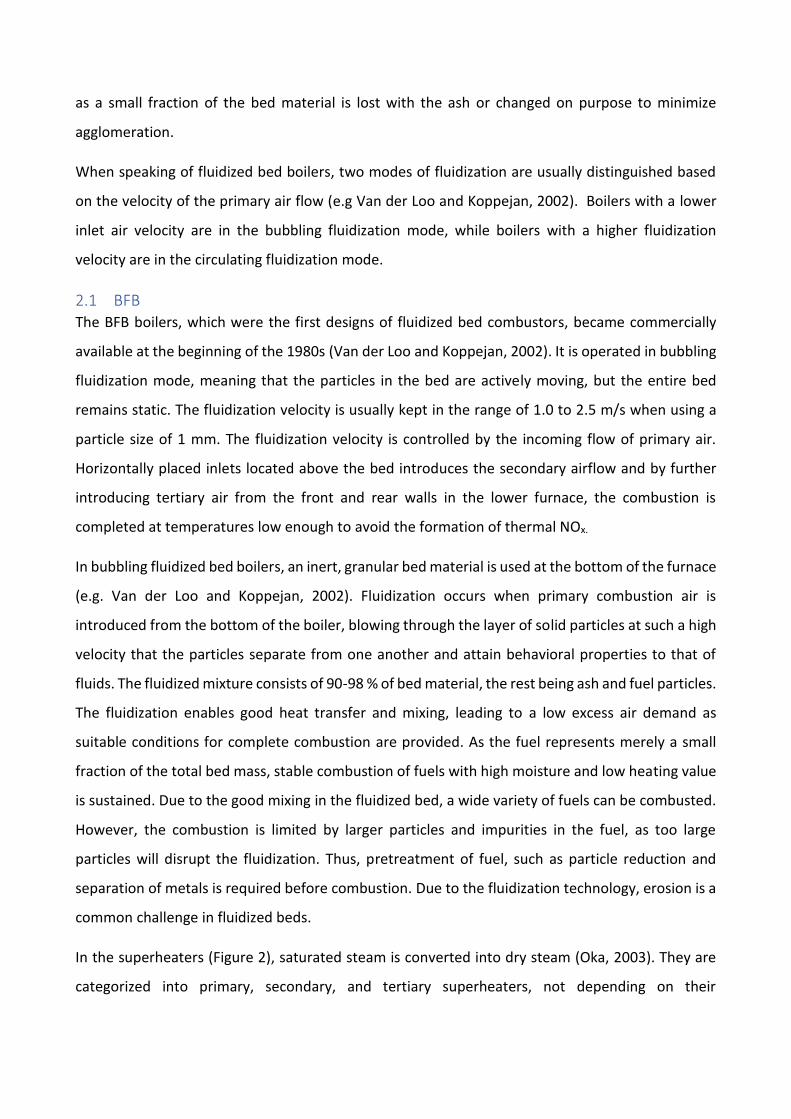
2.1 BFB The BFB boilers, which were the first designs of fluidized bed combustors, became commercially
available at the beginning of the 1980s (Van der Loo and Koppejan, 2002). It is operated in bubbling
fluidization mode, meaning that the particles in the bed are actively moving, but the entire bed
remains static. The fluidization velocity is usually kept in the range of 1.0 to 2.5 m/s when using a
particle size of 1 mm. The fluidization velocity is controlled by the incoming flow of primary air.
Horizontally placed inlets located above the bed introduces the secondary airflow and by further
introducing tertiary air from the front and rear walls in the lower furnace, the combustion is
completed at temperatures low enough to avoid the formation of thermal NOx.
In bubbling fluidized bed boilers, an inert, granular bed material is used at the bottom of the furnace
(e.g. Van der Loo and Koppejan, 2002). Fluidization occurs when primary combustion air is
introduced from the bottom of the boiler, blowing through the layer of solid particles at such a high
velocity that the particles separate from one another and attain behavioral properties to that of
fluids. The fluidized mixture consists of 90-98 % of bed material, the rest being ash and fuel particles.
The fluidization enables good heat transfer and mixing, leading to a low excess air demand as
suitable conditions for complete combustion are provided. As the fuel represents merely a small
fraction of the total bed mass, stable combustion of fuels with high moisture and low heating value
is sustained. Due to the good mixing in the fluidized bed, a wide variety of fuels can be combusted.
However, the combustion is limited by larger particles and impurities in the fuel, as too large
particles will disrupt the fluidization. Thus, pretreatment of fuel, such as particle reduction and
separation of metals is required before combustion. Due to the fluidization technology, erosion is a
common challenge in fluidized beds.
In the superheaters (Figure 2), saturated steam is converted into dry steam (Oka, 2003). They are
categorized into primary, secondary, and tertiary superheaters, not depending on their

chronological order but on the steam temperature level at their location. The steam temperature
in the tertiary superheater is the highest. The temperature level of steam is managed by
attemperators located between superheaters, in which steam and water are mixed. The energy in
the steam flowing from the superheaters is then either converted into electricity or medium- or low-
pressure steam. After the superheaters, the flue gas reaches the economizers. The purpose of the
economizer is to utilize as much of the remaining heat content as possible of the flue gas, by pre-
heating the feed-water. Simultaneously the flue gas is cooled.
Figure 2: A cross-section of a bubbling fluidized bed boiler, courtesy of Valmet Technologies Oy.
Typical investors in BFB-technology are plants operating above a capacity of 20 MWth and up to 400
MWth (Courtesy of Valmet Technology Oy). The considered advantages with BFB is the possibility
to operate the boiler using a wider range of particle size in the bed material, as well as firing fuels
with varying moisture content (Oka, 2003). The combustion of fuel mixtures or co-firing different
fuels is one of the more important characteristics of the fluidized bed technology. Although the BFB
was a revelation when commercialized, dominating conventional coal firing and liquid and gas firing,
there existed some flaws with the technology, which made room for improvement. The heat
generation per unit area for BFB furnaces was considered limited when burning highly volatile fuels.
Some of the flaws are more associated with designing furnaces of larger scale, such as difficulties
with lateral fuel mixing. Larger scale boilers are more challenging to build, due to the required
number of fuel-feeding points needed to provide proper lateral mixing. The operation of BFB
furnaces at partial load, which has long been a major disadvantage for BFB furnaces, has been solved
by either splitting or staging the bed. Substantial reduction of erosion remains a challenge in second-
generation units.
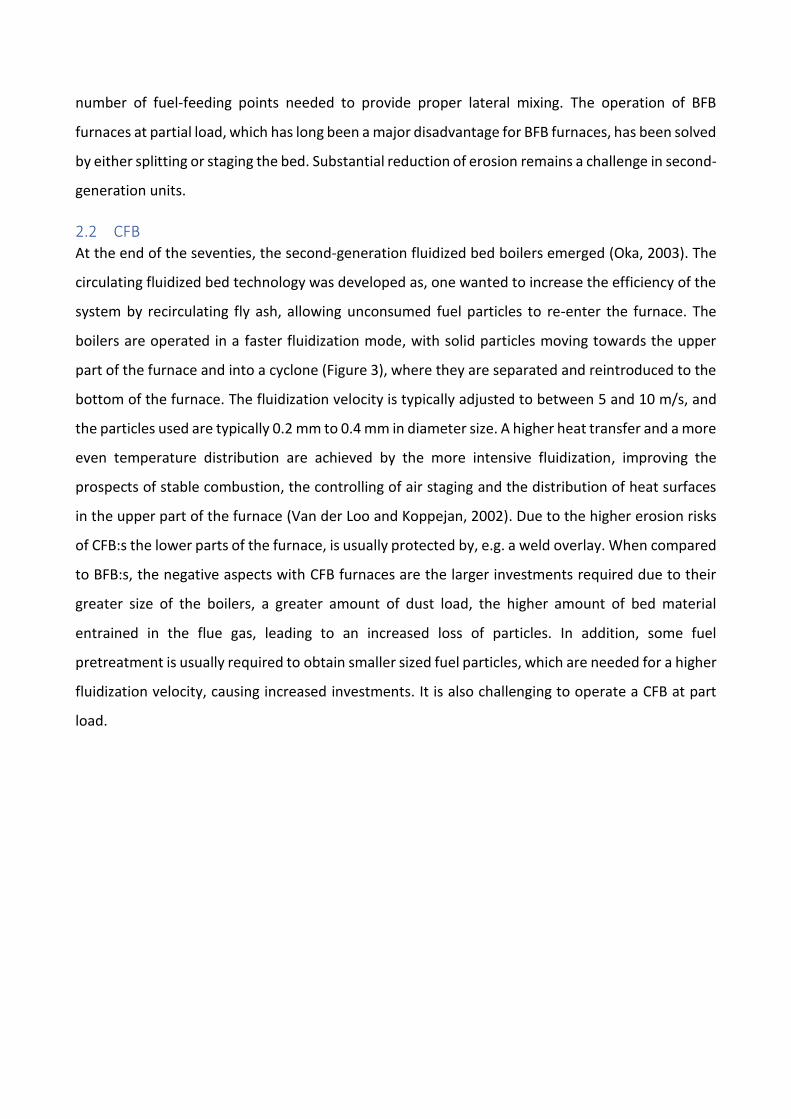
2.2 CFB At the end of the seventies, the second-generation fluidized bed boilers emerged (Oka, 2003). The
circulating fluidized bed technology was developed as, one wanted to increase the efficiency of the
system by recirculating fly ash, allowing unconsumed fuel particles to re-enter the furnace. The
boilers are operated in a faster fluidization mode, with solid particles moving towards the upper
part of the furnace and into a cyclone (Figure 3), where they are separated and reintroduced to the
bottom of the furnace. The fluidization velocity is typically adjusted to between 5 and 10 m/s, and
the particles used are typically 0.2 mm to 0.4 mm in diameter size. A higher heat transfer and a more
even temperature distribution are achieved by the more intensive fluidization, improving the
prospects of stable combustion, the controlling of air staging and the distribution of heat surfaces
in the upper part of the furnace (Van der Loo and Koppejan, 2002). Due to the higher erosion risks
of CFB:s the lower parts of the furnace, is usually protected by, e.g. a weld overlay. When compared
to BFB:s, the negative aspects with CFB furnaces are the larger investments required due to their
greater size of the boilers, a greater amount of dust load, the higher amount of bed material
entrained in the flue gas, leading to an increased loss of particles. In addition, some fuel
pretreatment is usually required to obtain smaller sized fuel particles, which are needed for a higher
fluidization velocity, causing increased investments. It is also challenging to operate a CFB at part
load.
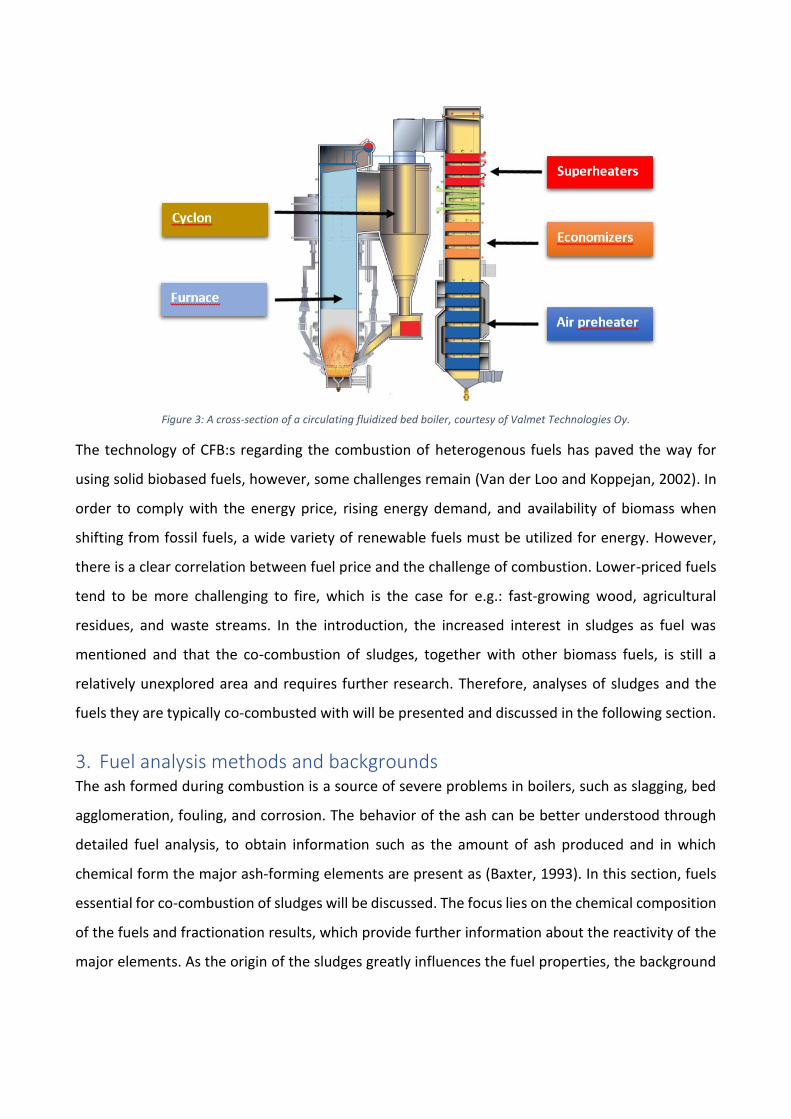
Figure 3: A cross-section of a circulating fluidized bed boiler, courtesy of Valmet Technologies Oy.
The technology of CFB:s regarding the combustion of heterogenous fuels has paved the way for
using solid biobased fuels, however, some challenges remain (Van der Loo and Koppejan, 2002). In
order to comply with the energy price, rising energy demand, and availability of biomass when
shifting from fossil fuels, a wide variety of renewable fuels must be utilized for energy. However,
there is a clear correlation between fuel price and the challenge of combustion. Lower-priced fuels
tend to be more challenging to fire, which is the case for e.g.: fast-growing wood, agricultural
residues, and waste streams. In the introduction, the increased interest in sludges as fuel was
mentioned and that the co-combustion of sludges, together with other biomass fuels, is still a
relatively unexplored area and requires further research. Therefore, analyses of sludges and the
fuels they are typically co-combusted with will be presented and discussed in the following section.
3. Fuel analysis methods and backgrounds The ash formed during combustion is a source of severe problems in boilers, such as slagging, bed
agglomeration, fouling, and corrosion. The behavior of the ash can be better understood through
detailed fuel analysis, to obtain information such as the amount of ash produced and in which
chemical form the major ash-forming elements are present as (Baxter, 1993). In this section, fuels
essential for co-combustion of sludges will be discussed. The focus lies on the chemical composition
of the fuels and fractionation results, which provide further information about the reactivity of the
major elements. As the origin of the sludges greatly influences the fuel properties, the background
of all fuels will be discussed. An attempt to clarify the differences between sludges and their fuel
properties will also be made, as the definition of different sludge streams is somewhat vague.
Most of the sludges brought up in this work, originate from different processes in the wood- and
paper industry. They are typically combusted close to their production facility, together with other
forest residues. Therefore, wood and bark of common species in the Nordic countries and
eucalyptus, which is growing more and more popular, are included in this section to represent
examples of wood-based fuels.
3.1 Standard fuel analysis Standard fuel characterization of new fuels typically consists of proximate, ultimate, and elemental
analyses. The determination of the fuels' calorific value is also normally included. Proximate analysis
yields information about the amounts of moisture, volatile matter, ash, and fixed carbon content in
the fuel, while ultimate analysis refers to the content of carbon, hydrogen, nitrogen, sulfur, chlorine
and oxygen, including also moisture and ash. In addition, often the determination of the major (Al,
Ca, Fe, Mg, P, K, Si, Na, Mn and Ti) and minor (As, Ba, Cd, Co, Cr, Cu, Hg, Mn, Mo, Ni, Pb, Sb, V, Zn)
ash-forming elements present is of high interest.
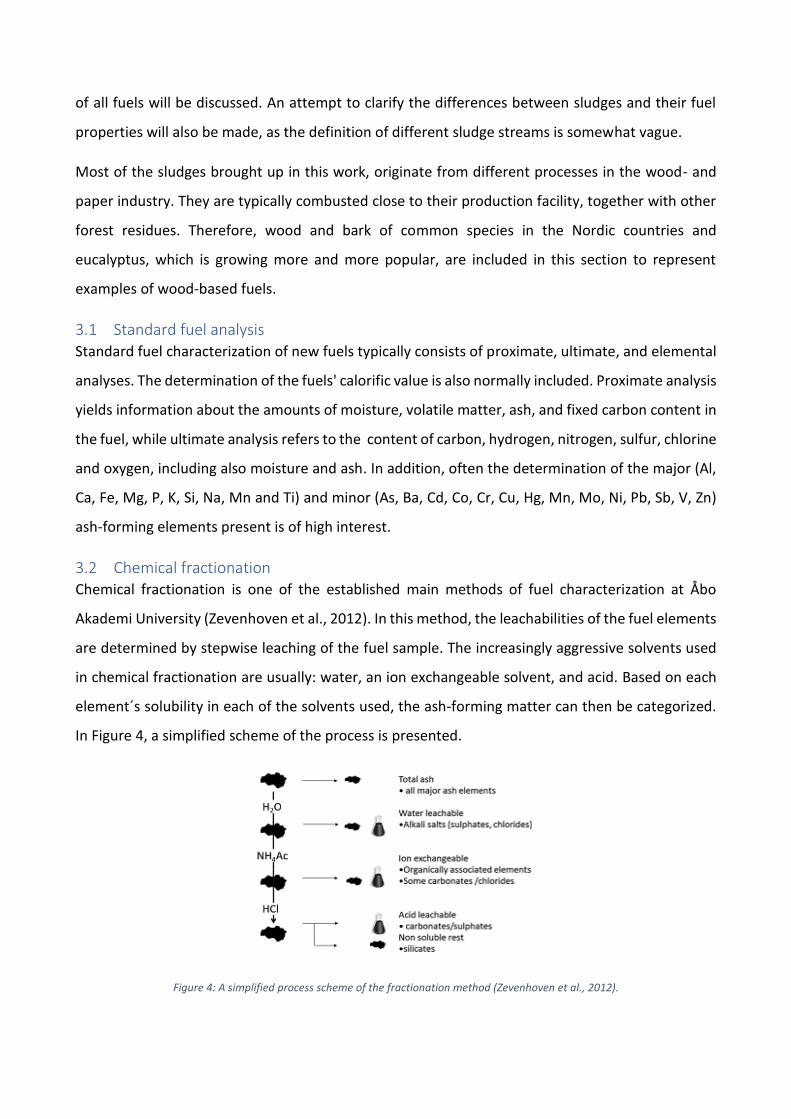
3.2 Chemical fractionation Chemical fractionation is one of the established main methods of fuel characterization at Åbo
Akademi University (Zevenhoven et al., 2012). In this method, the leachabilities of the fuel elements
are determined by stepwise leaching of the fuel sample. The increasingly aggressive solvents used
in chemical fractionation are usually: water, an ion exchangeable solvent, and acid. Based on each
element´s solubility in each of the solvents used, the ash-forming matter can then be categorized.
In Figure 4, a simplified scheme of the process is presented.
Figure 4: A simplified process scheme of the fractionation method (Zevenhoven et al., 2012).
Ash forming matter is generally categorized into four groups, depending on its chemical form. These
categories are organically bound matter, dissolved salts, excluded minerals, and included minerals
(Reid, 1984). Metal cations of K, Na, Mn, Ca, Mg, Fe, and Al can be bound to anionic organic groups
in biomass. These metals are often capable of undergoing ion-exchange with ammonium acetate.
Elements recurrently detected in the organic phase are sulfur, which is present as bridges between
organic molecules in several amino acids (Baxter, 1994). Calcium has a similar role in the cell wall of
plants. Phosphorus is also known to be present in various organic forms (Brinch-Pedersen et al.,
2002; Marschner, 2011; Skrifvars et al., 1998).
The moisture or fluids in biomass typically contain cations, such as K+, Na+ and Ca2+, and anions such
as Cl-, HPO42-, H2PO4
2-, SO42- and Si(OH)3O- (Zevenhoven et al., 2012). The elements in the fluids may
also be present in a solid form if the biomass is dried but will remain soluble in water. Biomass or
organic residues typically have a higher moisture content, compared to fossil fuels and inorganic
waste.
Inorganic structures formed by natural precipitation in biomass is referred to as included minerals.
Common examples of these are silica, calcium oxalate, and Fe2(SO4)3 and FePO4. These minerals
typically demonstrate poor solubility during fractionation. Precipitated silica is insoluble even in acid
and thereby is found in the rest fraction (Franceschi and Nakata, 2005). Included minerals of calcium
are mostly soluble in acids. However, the solubility of calcium oxalate may vary as it can be present
in various crystal structures (Pontoppidan et al., 2007). Excluded inorganic calcium exists as calcium
silicates and calcium aluminosilicates in sand and clay material, usually present as contaminations
in the fuel. These compounds typically remain insoluble.
3.3 Wood Forests cover more than 70 % of the total land area of Finland (Ministry of Agriculture and Forestry,
2019). As forests are the main natural resource in Finland, the forest industry has through the years
become a vital part of the national economy. In 2018 a total of 78 million m3 of wood was harvested
in Finland. Of this only 11 % was utilized directly as energy in the heating of houses and farms. Most
of the wood-based fuels combusted in power plants are residues from the forest industry, such as
wood chips, sawdust, and bark. Sawdust can also be used in the production of pellets and briquettes.
Wood-based fuels can be combusted without any challenges (Stromberg and Herstad Svard, 2012).
The nature of the ash is not aggressive, and the ash does not typically cause corrosion. The fuel

generates a low amount of ash, which has a high melting temperature and therefore leads to low
amounts of deposit build-up on heat exchanger components. Fractionation results from the wood
of spruce, pine, and birch are presented in Figure 5. These species of wood were chosen as they are
the most common in the Nordic countries. The fractionation data of the pine was obtained from the
Fractionation Database of Valmet Technologies Oy. The data of the spruce (Sample ID: 90) and birch
(Sample ID: 221) were obtained from the Fractionation Database of Åbo Akademi University.
Figure 5: Fractionation results from the stem wood of the species spruce (nr. 1), pine (nr. 2) and birch (nr. 3).
Overall, the concentrations of main ash-forming elements detected were quite low. The elements
present in the highest concentrations were calcium, potassium, and silicon. Calcium was found to
be soluble mainly in the organic and water phase. A small portion of calcium in the spruce was also
found in the acidic phase. Potassium was mainly present in an easily soluble form, although the
concentrations are so low that it cannot be considered a challenge for combustion. Silicon was
primarily insoluble. The concentration of chlorine was low in all samples.
3.4 Bark A significant amount of the total tree weight consists of bark, around 10%, meaning that bark is a
rather large residue stream for forest industries (Senelwa and Sims, 1999). As a fuel, the
characteristics of bark differ somewhat from that of wood. There are typically more ash forming
compounds in bark compared to wood, which naturally results in a higher ash content for bark.
Especially, calcium belongs to this group of elements (Werkelin et al., 2010). Surplus of calcium in
0
200
400
600
800
1,000
1,200
1 2 3 1 2 3 1 2 3 1 2 3 1 2 3 1 2 3 1 2 3 1 2 3 1 2 3 1 2 3 1 2 3
Si Al Fe Mn Ca Mg P Na K S Cl
mg/
kg d
ry f
ue
l
Wood Fractionation results
Leached in H2O Leached in Acetate Leached in Acid Rest fraction Untreated
the tree is usually transported to the outer parts of the wood and precipitated as calcium oxalate in
the inner part of the bark. Challenges with the leachability of calcium oxalate have however been
reported (Werkelin, 2010). It is suspected that the non-leached fraction of Ca consisted of calcium
oxalate, which did not dissolve in acid. However, the non-leached Ca-fraction corresponded to less
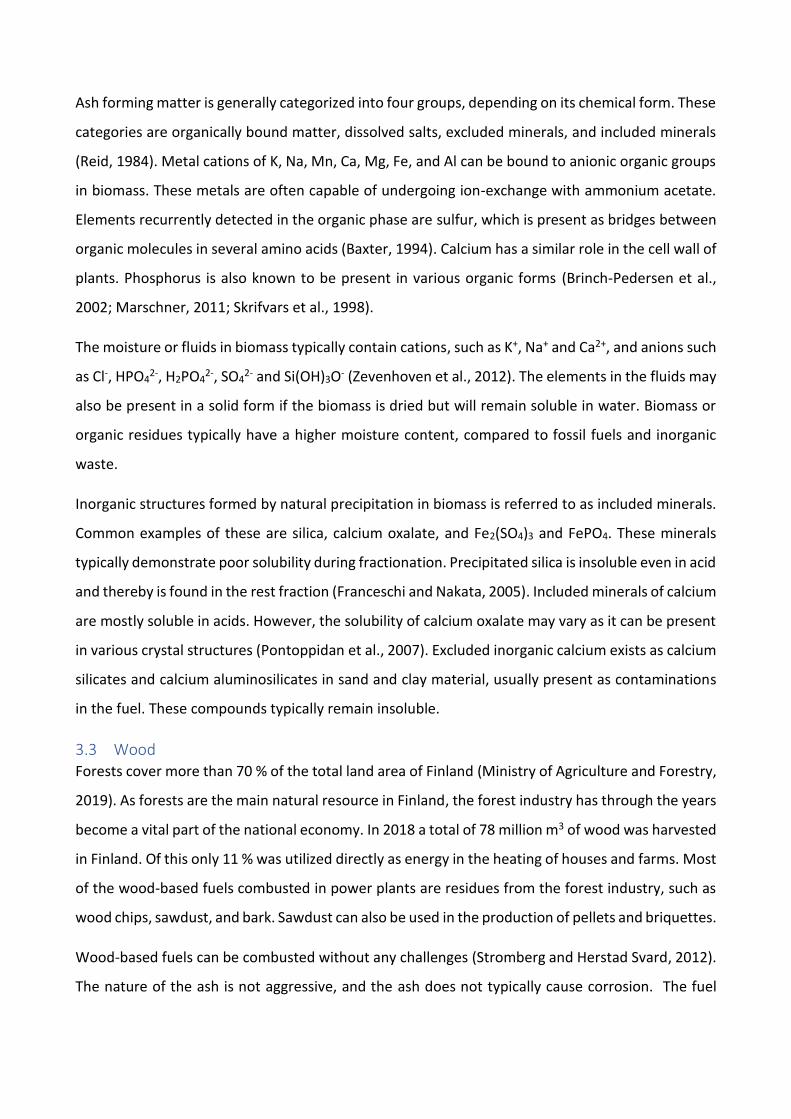
than 10% of the acid leached fraction. In Figure 6, fractionation results of bark from spruce, pine,
birch, and eucalyptus are presented. The eucalyptus species was also added as the production of
eucalyptus pulp has increased. Eucalyptus bark also contains high amounts of calcium. The
fractionation data of the pine and eucalyptus bark was obtained from the Fractionation Database
of Valmet Technologies Oy. The data of the spruce (Sample ID: 67) and birch bark (Sample ID: 79)
were obtained from the Fractionation Database of Åbo Akademi University.
Figure 6: Fractionation results from the bark of spruce (nr. 1), pine (nr. 2), birch (nr. 3) and eucalyptus (nr. 4).
The fractionation results in Figure 6 show that the ash content of bark is higher, compared to stem
wood (Figure 5). The bark ash consisted mainly of calcium and potassium. For the eucalyptus bark,
one can recognize the same pattern, which became apparent in the research made by Werkelin et
al. (2012). It appears that the major part of calcium is dissolved in acid, much likely as calcium
oxalate (Handbook of combustion, Vol 4). However, the amount of Ca in the rest fraction is much
more significant. It is unclear if differences of calcium solubility have an impact on the behavior of
calcium particles during combustion.
3.5 Sludge The solid remains of wastewater streams from industrial and municipal sources are called sludges
(Tchobanoglous & Burton, 1991). Their disposal is problematic due to several reasons. If released
into water, the oxygen available to the aquatic environment would be reduced as it is consumed
during the breakdown of the organic material in sludge. The high content of pathogens and toxic
elements poses a danger to human beings, flora, and fauna as well. Sewage sludge is typically more
harmful, but high levels of legionella have also been detected in samples taken during the biological
treatment of wastewater from pulp and paper mills (Allestam et al., 2006). Additionally, the high
nutrient content of sludges could lead to the overpowering growth of aquatic plants. Because of
their harmful nature, the processing of sludges is conducted to improve both chemical and physical
characteristics, making future handling and disposal more comfortable and environmentally
friendly.
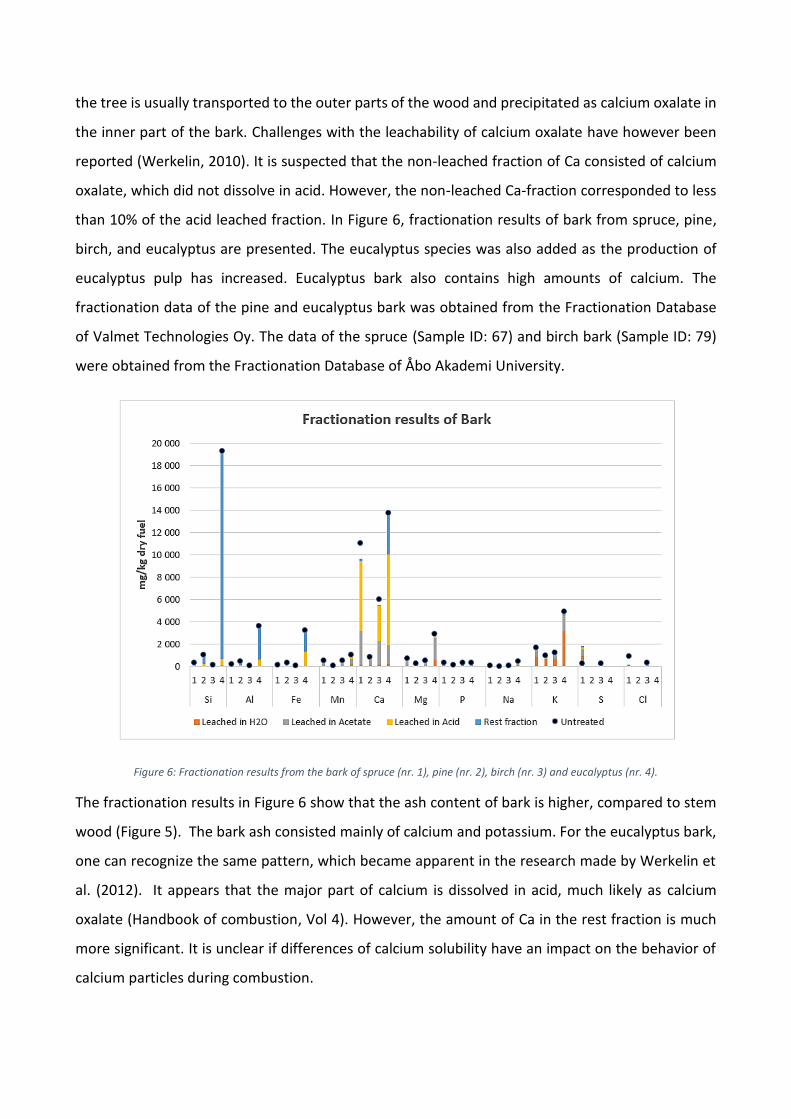
The water treatment of sludges is a process conducted in several stages. During these stages,
sludges with different characteristics are formed and separated into different waste streams. The
process can vary from plant to plant, but the treatment is typically conducted in three stages. In
Figure 7, a simplified overview of the treatment process of wastewater is presented.
Figure 7: A simplified process scheme of the wastewater treatment process (Stromberg and Herstad Svard, 2012).
In the first stage, primary sludge is produced when solids and floating materials are separated from
the wastewater in sedimentation tanks (Tchobanoglous et al., 1991). The wastewater which has
undergone primary treatment still contains nutrients, organic matter, and colloidal particles that
need to be removed during a secondary treatment process. The most common type of process is
the activated sludge process, where added micro-organisms accomplish the decomposition of

organic content and removal of nutrients. The micro-organisms consume the nutrients in the
wastewater during the decomposition of organic content and colloidal particles. The decomposition
can be of aerobic, anaerobic nature, or a hybrid of those two. A sludge is then formed when the
micro-organisms increase in size and number. The sludge created during this stage consists of
biomass, which is formed when micro-organisms break down organic matter. In some treatment
systems, the wastewater is chemically processed in a third stage to improve the characteristics of
the wastewater further. The objective of this type of water treatment is typically to reduce toxicity,
suspended solids, and organic matter, as well as to clarify the liquid. Ternary sludge is produced
during the treatment when particulate matter is removed from the wastewater by utilizing chemical
coagulation and precipitation.
The sludge-streams formed during the wastewater treatment is much diluted and requires further
treatment to improve handling and combustibility. However, the poor dewatering properties of
sludges makes it challenging to lower their water content (McGhee and Steel, 1991). By utilizing
conventional dewatering methods such as thickening and mechanical dewatering, the moisture
content can be lowered to approximately 75 % (Manzel, 1989). Additives are required to decrease
the moisture content further. Stabilization and conditioning of sludges, which are used to remove
pathogens and decrease toxicity, are other popular methods for sludge treatment, but they are
more often utilized for sewage sludges.
3.5.1 Sludge from pulp and paper mills
The sludge-streams formed during the different stages of wastewater treatment in the pulp- and
paper industry are fiber sludge, bio-sludge, and chemical sludge (Stromberg and Herstad Svard,
2012). These sludges may either be combusted as a sludge mixture or as separate streams. An
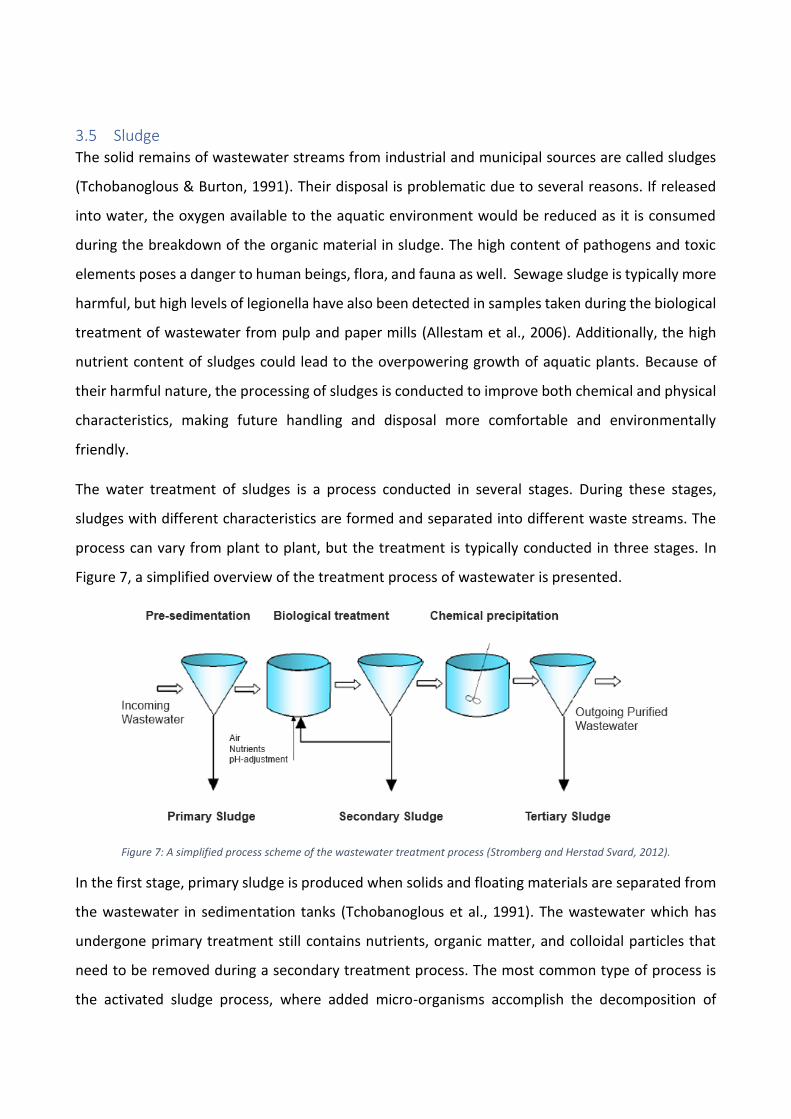
amount of 560 000 tons of dry sludge per year is estimated to be produced in the Swedish forest
industry. The size of the different fractions can be observed in Table 1.
Table 1: The yearly production of sludge streams in Sweden (Stromberg and Herstad Svard, 2012).
Stream Tons of dry substance/year
Fiber sludge 186 000
Chemical sludge 42 000
Bio-sludge 72 000
De-inking sludge 185 000
Others 74 000
Total 560 000
The sludge-streams are challenging to compare, as the chemical and physical properties of the
sludges are dependent on the type of industrial process the wastewater originates from and the raw
material used, the stage of wastewater treatment they are produced in and the treatment the
sludge receives after production. The use of recycled fiber as a raw material in the process generally
leads to a higher volume of waste (Scott and Smith, 1995). The characteristics of the sludges will be
discussed separately. Other sludge streams are also known, but there is limited data available on
them.
3.5.1.1 Fiber sludge
The sludge recovered from the primary treatment of wastewater from pulp and paper mills is
typically rich in fiber and is therefore referred to as fiber sludge. Due to its fibrous nature, it is
generally easier to handle in comparison to other sludge streams, although this may vary. As the
primary treatment is conducted without the addition of chemicals, the ash content of pure fiber
sludge is generally low. However, the ash content can increase if the wastewater contains chemicals
from the process stage during which wastewater is generated. Examples of these are coating agents
and filler material used in paper production. Fiber sludge is generally easier to dewater and is
therefore included in sludge mixtures with chemical and bio-sludge to improve their dewatering
characteristics. Figure 8 presents an estimation of the amounts of the main ash forming elements
in fiber sludges. The data was obtained from “The fuel handbook 2012” (Stromberg and Herstad
Svard, 2012) and represent the mean values from several fiber sludges in Sweden.
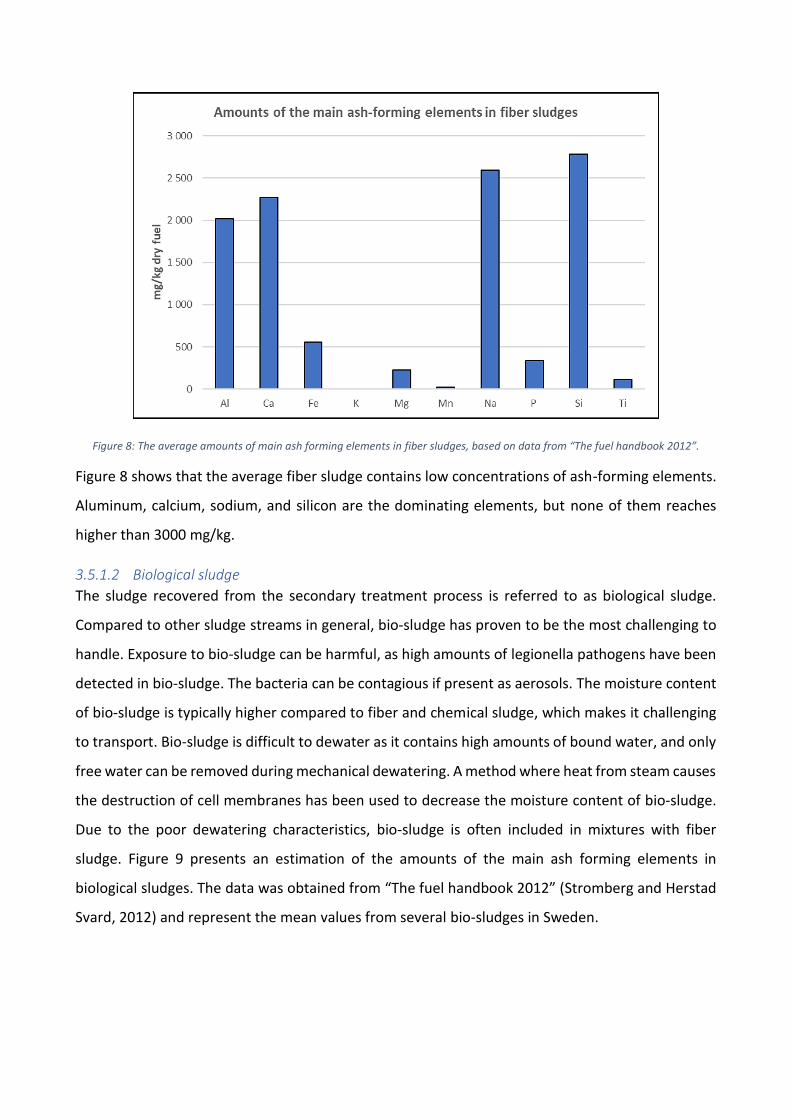
Figure 8: The average amounts of main ash forming elements in fiber sludges, based on data from “The fuel handbook 2012”.
Figure 8 shows that the average fiber sludge contains low concentrations of ash-forming elements.
Aluminum, calcium, sodium, and silicon are the dominating elements, but none of them reaches
higher than 3000 mg/kg.
3.5.1.2 Biological sludge
The sludge recovered from the secondary treatment process is referred to as biological sludge.
Compared to other sludge streams in general, bio-sludge has proven to be the most challenging to
handle. Exposure to bio-sludge can be harmful, as high amounts of legionella pathogens have been
detected in bio-sludge. The bacteria can be contagious if present as aerosols. The moisture content
of bio-sludge is typically higher compared to fiber and chemical sludge, which makes it challenging
to transport. Bio-sludge is difficult to dewater as it contains high amounts of bound water, and only
free water can be removed during mechanical dewatering. A method where heat from steam causes
the destruction of cell membranes has been used to decrease the moisture content of bio-sludge.
Due to the poor dewatering characteristics, bio-sludge is often included in mixtures with fiber
sludge. Figure 9 presents an estimation of the amounts of the main ash forming elements in
biological sludges. The data was obtained from “The fuel handbook 2012” (Stromberg and Herstad
Svard, 2012) and represent the mean values from several bio-sludges in Sweden.
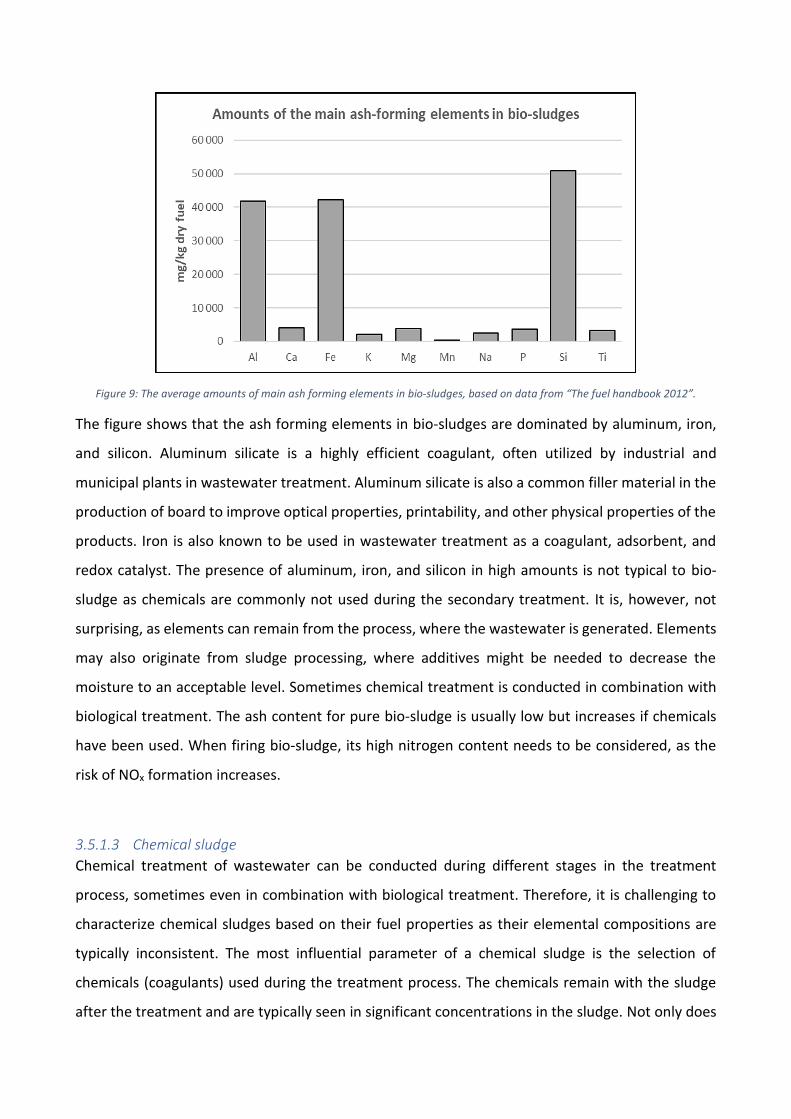
Figure 9: The average amounts of main ash forming elements in bio-sludges, based on data from “The fuel handbook 2012”.
The figure shows that the ash forming elements in bio-sludges are dominated by aluminum, iron,
and silicon. Aluminum silicate is a highly efficient coagulant, often utilized by industrial and
municipal plants in wastewater treatment. Aluminum silicate is also a common filler material in the
production of board to improve optical properties, printability, and other physical properties of the
products. Iron is also known to be used in wastewater treatment as a coagulant, adsorbent, and
redox catalyst. The presence of aluminum, iron, and silicon in high amounts is not typical to bio-
sludge as chemicals are commonly not used during the secondary treatment. It is, however, not
surprising, as elements can remain from the process, where the wastewater is generated. Elements
may also originate from sludge processing, where additives might be needed to decrease the
moisture to an acceptable level. Sometimes chemical treatment is conducted in combination with
biological treatment. The ash content for pure bio-sludge is usually low but increases if chemicals
have been used. When firing bio-sludge, its high nitrogen content needs to be considered, as the
risk of NOx formation increases.
3.5.1.3 Chemical sludge
Chemical treatment of wastewater can be conducted during different stages in the treatment
process, sometimes even in combination with biological treatment. Therefore, it is challenging to
characterize chemical sludges based on their fuel properties as their elemental compositions are
typically inconsistent. The most influential parameter of a chemical sludge is the selection of
chemicals (coagulants) used during the treatment process. The chemicals remain with the sludge
after the treatment and are typically seen in significant concentrations in the sludge. Not only does
the added chemicals remain with the sludge, but the choice of coagulant could have an impact on
the sulfur and chlorine concentrations as well. On average, the moisture content of chemical sludge
is lower compared to biological sludge, although it can still be high if it contains organic matter.
Fiber sludge is usually incorporated into chemical sludge to improve its poor dewatering capabilities.
Figure 10 presents an estimation of the amounts of the main ash forming elements in chemical
sludges. The data was obtained from “The fuel handbook 2012” (Stromberg and Herstad Svard,
2012) and represent the mean values from several chemical sludges in Sweden.
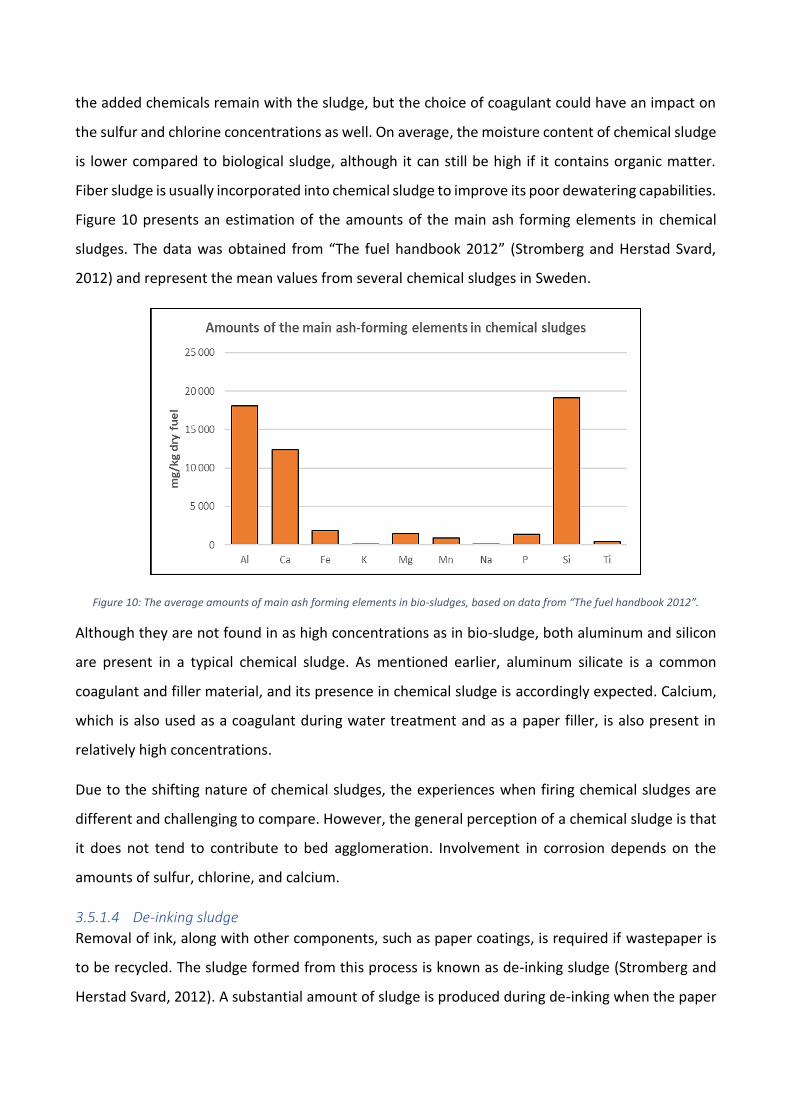
Figure 10: The average amounts of main ash forming elements in bio-sludges, based on data from “The fuel handbook 2012”.
Although they are not found in as high concentrations as in bio-sludge, both aluminum and silicon
are present in a typical chemical sludge. As mentioned earlier, aluminum silicate is a common
coagulant and filler material, and its presence in chemical sludge is accordingly expected. Calcium,
which is also used as a coagulant during water treatment and as a paper filler, is also present in
relatively high concentrations.
Due to the shifting nature of chemical sludges, the experiences when firing chemical sludges are
different and challenging to compare. However, the general perception of a chemical sludge is that
it does not tend to contribute to bed agglomeration. Involvement in corrosion depends on the
amounts of sulfur, chlorine, and calcium.
3.5.1.4 De-inking sludge
Removal of ink, along with other components, such as paper coatings, is required if wastepaper is
to be recycled. The sludge formed from this process is known as de-inking sludge (Stromberg and
Herstad Svard, 2012). A substantial amount of sludge is produced during de-inking when the paper
contains higher fractions of non-cellulosic compounds. De-inking sludges are easy to dewater and,
therefore generally trouble-free to handle before combustion. However, the high amounts of ash
formed when firing de-inking sludges results in increased demands of ash handling. The amount of
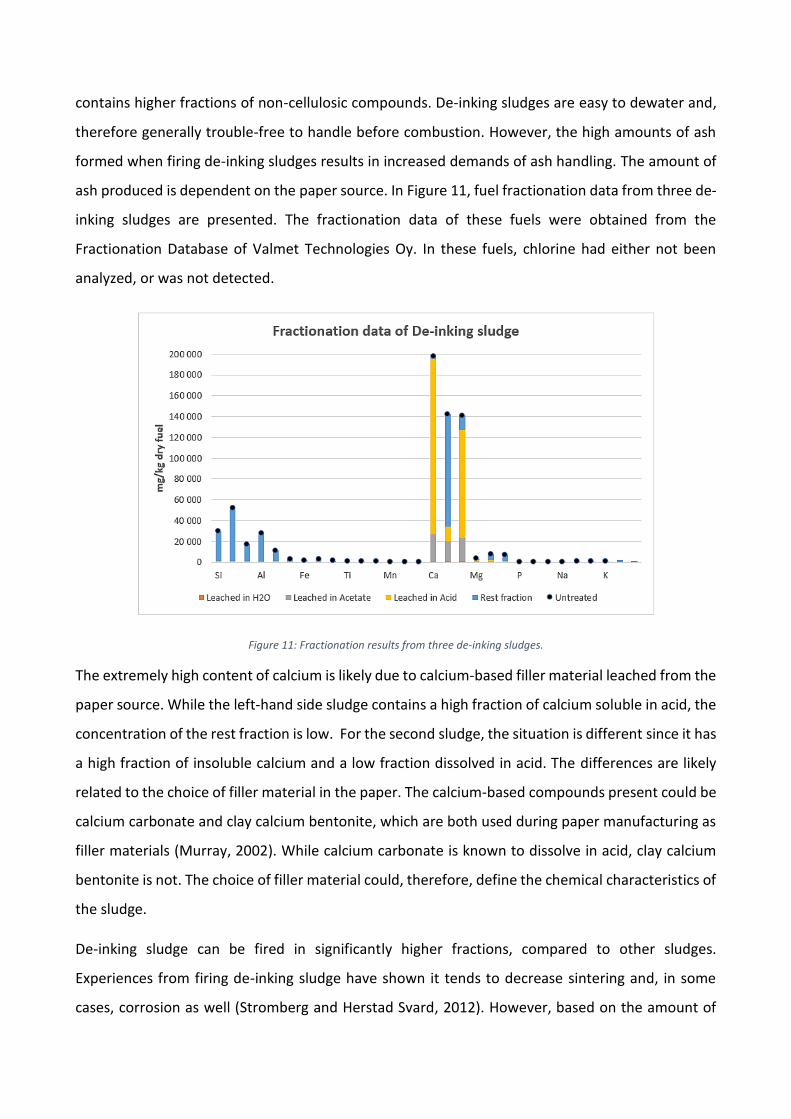
ash produced is dependent on the paper source. In Figure 11, fuel fractionation data from three de-
inking sludges are presented. The fractionation data of these fuels were obtained from the
Fractionation Database of Valmet Technologies Oy. In these fuels, chlorine had either not been
analyzed, or was not detected.
Figure 11: Fractionation results from three de-inking sludges.
The extremely high content of calcium is likely due to calcium-based filler material leached from the
paper source. While the left-hand side sludge contains a high fraction of calcium soluble in acid, the
concentration of the rest fraction is low. For the second sludge, the situation is different since it has
a high fraction of insoluble calcium and a low fraction dissolved in acid. The differences are likely
related to the choice of filler material in the paper. The calcium-based compounds present could be
calcium carbonate and clay calcium bentonite, which are both used during paper manufacturing as
filler materials (Murray, 2002). While calcium carbonate is known to dissolve in acid, clay calcium
bentonite is not. The choice of filler material could, therefore, define the chemical characteristics of
the sludge.
De-inking sludge can be fired in significantly higher fractions, compared to other sludges.
Experiences from firing de-inking sludge have shown it tends to decrease sintering and, in some
cases, corrosion as well (Stromberg and Herstad Svard, 2012). However, based on the amount of
calcium present in the de-inking sludges investigated (Figure 11), the combustion of some de-inking
sludges could lead to corrosion. The extreme amounts of calcium present in de-inking sludges may
result in close to a complete desulfurization and, therefore, a decreased sulfation effect of
potassium- and sodium chloride. However, the choice of a paper filler that contains insoluble
calcium may impact on this type of behavior.
3.5.2 Sewage sludge
Sewage sludge is a by-product produced from wastewater treatment of municipal and industrial
waste, which has been transported to the treatment plant via sewers. A yearly mass of eight million
tons of sewage sludge has been estimated to be produced inside the EU (Wzorek, 2012). The same
treatment process is utilized as in the treatment of wastewater from pulp and paper mills, a
combination of mechanical, biological, and chemical treatment. However, the emphasize is stronger
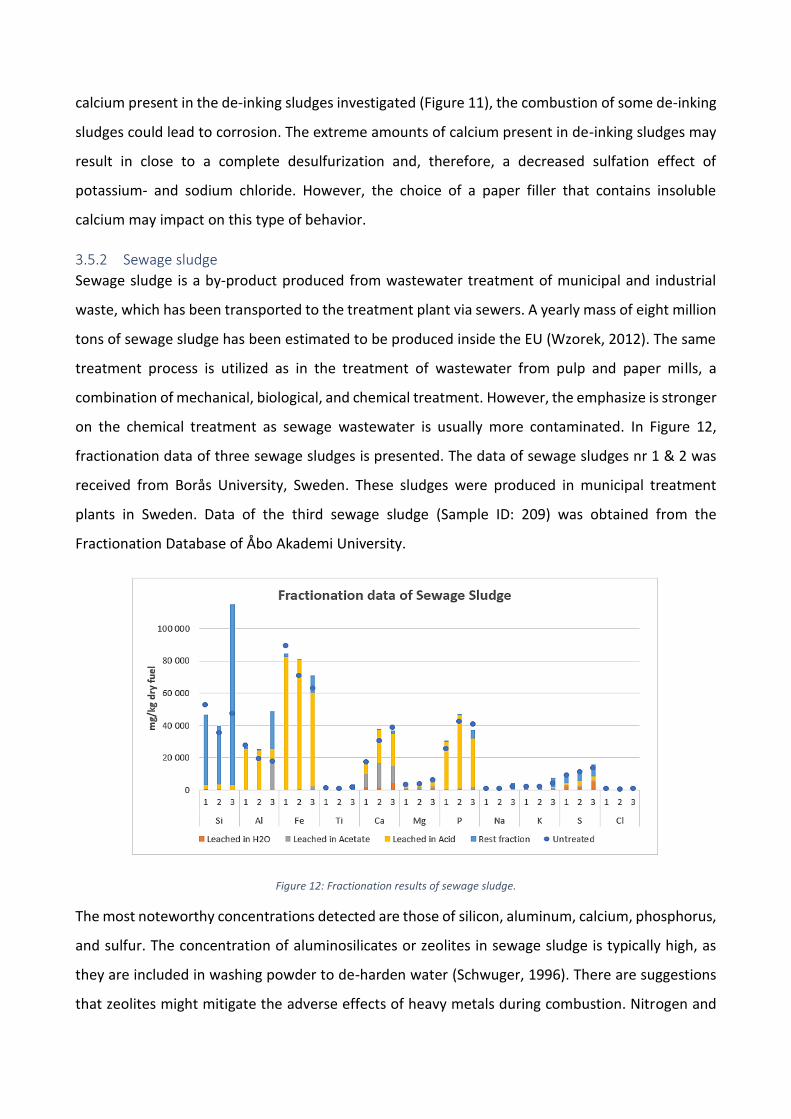
on the chemical treatment as sewage wastewater is usually more contaminated. In Figure 12,
fractionation data of three sewage sludges is presented. The data of sewage sludges nr 1 & 2 was
received from Borås University, Sweden. These sludges were produced in municipal treatment
plants in Sweden. Data of the third sewage sludge (Sample ID: 209) was obtained from the
Fractionation Database of Åbo Akademi University.
Figure 12: Fractionation results of sewage sludge.
The most noteworthy concentrations detected are those of silicon, aluminum, calcium, phosphorus,
and sulfur. The concentration of aluminosilicates or zeolites in sewage sludge is typically high, as
they are included in washing powder to de-harden water (Schwuger, 1996). There are suggestions
that zeolites might mitigate the adverse effects of heavy metals during combustion. Nitrogen and
phosphorus are effectively removed from the sludge by coagulation during the chemical treatment,
which explains the high concentrations of phosphorus. Due to the high content of iron, an iron-
based coagulant is likely used. Ferric chloride or sulfate and ferrous sulfate are all widely used for
phosphorus removal (Stromberg and Herstad Svard, 2012). Calcium is also found in relatively high
concentrations and may originate from the stabilization of sludge with calcium-based agents
(Tchobanoglous and Burton, 1991). During stabilization, calcium may react with carbonates in the
sludge, which could explain the high fraction of calcium soluble in the acid phase. Zeolites undergo
several ion-exchanges in the washing water, where sodium cations are usually replaced with either
calcium, magnesium, or potassium cations (Pettersson et al., 2008). Organic calcium is also found in
high concentrations, which is expected due to the amount of organic waste accumulating in the
sewers. The fraction of calcium dissolved in the water phase is significant compared to previous
sludges, around 10 % for sewage sludges nr. 1 & 2.
The combustion of sewage sludge as a primary fuel is not feasible (Stromberg and Herstad Svard,
2012). Co-combustion of lower fractions of sewage sludge together with biomass is, on the other
hand, considered interesting. Although the ash content of sewage sludge is high, the characteristics
of the ash species are generally regarded as positive. The melting temperatures of ash particles are
increased by the high content of aluminum and calcium, and therefore improve the operational
conditions in the furnace by decreasing bed agglomeration problems. Sewage sludge has also shown
tendencies to hinder corrosion by reducing the number of corrosive ash species in deposits. Sulfur,
which is present in high amounts in sewage sludge, is known to react with alkali species and could,
therefore, be a source for corrosion reduction. Phosphorus is also known to react with alkali but
does so less when calcium is also present. The properties of sewage sludge ash may be negatively
affected by a higher presence of heavy metals (Stromberg and Herstad Svard, 2012). However, the
high content of zeolites could potentially mitigate the harmful effects of heavy metals in combustion
processes (Pettersson et al., 2008).
3.5.3 Summary of sludges
A summary of the characteristics of the sludges presented in the above chapters is shown in Table
2.
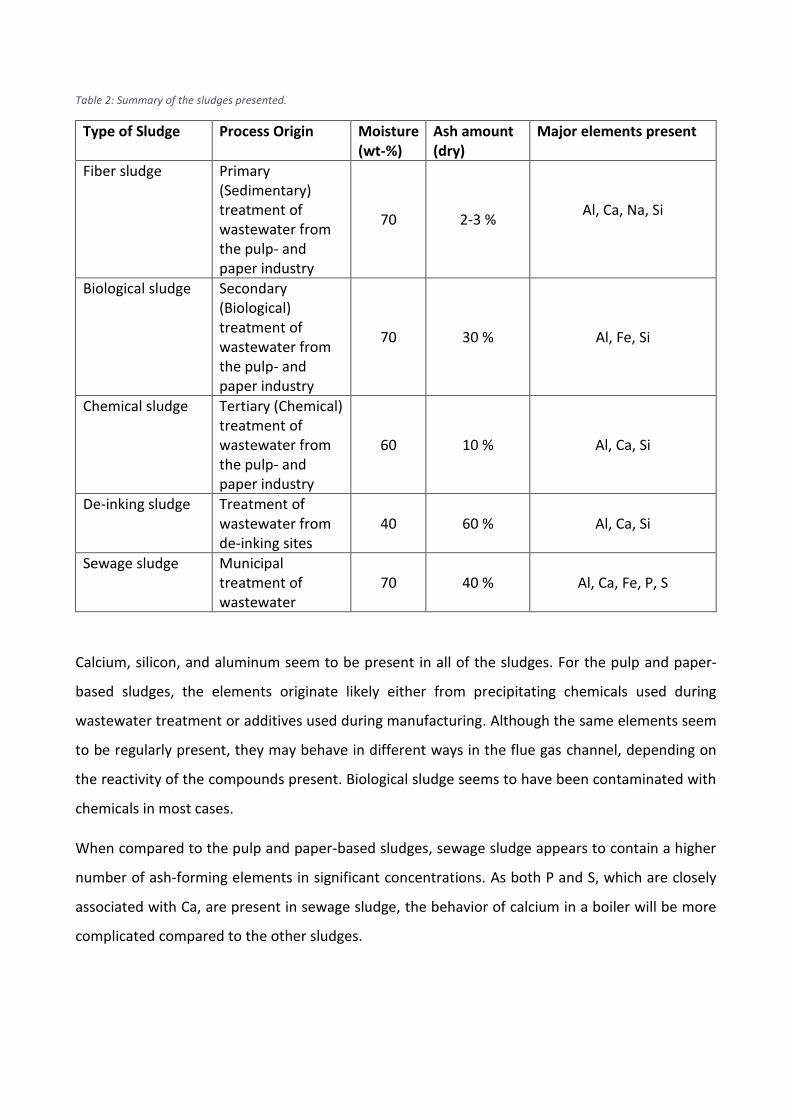
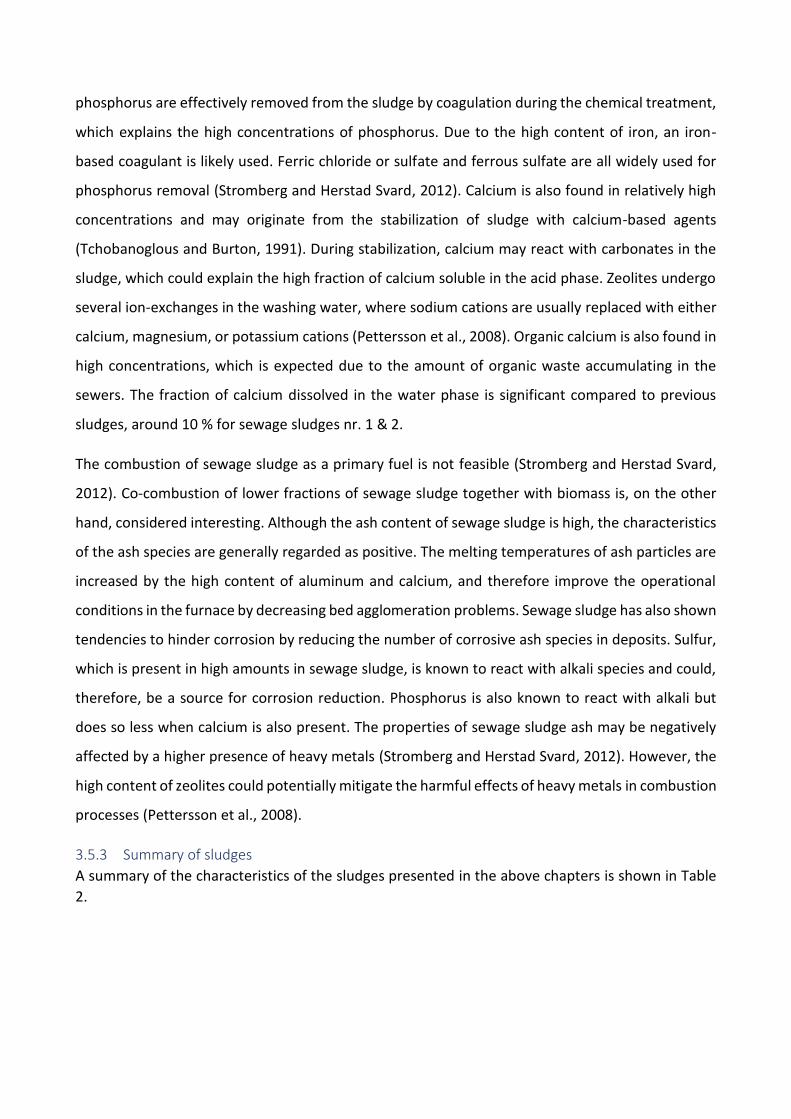
Table 2: Summary of the sludges presented.
Type of Sludge Process Origin Moisture (wt-%)
Ash amount (dry)
Major elements present
Fiber sludge Primary (Sedimentary) treatment of wastewater from the pulp- and paper industry
70 2-3 % Al, Ca, Na, Si
Biological sludge Secondary (Biological) treatment of wastewater from the pulp- and paper industry
70 30 % Al, Fe, Si
Chemical sludge Tertiary (Chemical) treatment of wastewater from the pulp- and paper industry
60 10 % Al, Ca, Si
De-inking sludge Treatment of wastewater from de-inking sites
40 60 % Al, Ca, Si
Sewage sludge Municipal treatment of wastewater
70 40 % Al, Ca, Fe, P, S
Calcium, silicon, and aluminum seem to be present in all of the sludges. For the pulp and paper-
based sludges, the elements originate likely either from precipitating chemicals used during
wastewater treatment or additives used during manufacturing. Although the same elements seem
to be regularly present, they may behave in different ways in the flue gas channel, depending on
the reactivity of the compounds present. Biological sludge seems to have been contaminated with
chemicals in most cases.
When compared to the pulp and paper-based sludges, sewage sludge appears to contain a higher
number of ash-forming elements in significant concentrations. As both P and S, which are closely
associated with Ca, are present in sewage sludge, the behavior of calcium in a boiler will be more
complicated compared to the other sludges.
4. Ash behavior
4.1 Ash formation in fluidized bed combustion The formation of ash is a complex process, in which a fuel particle goes through several stages,
where both its physical and chemical composition is gradually altered. The processes may also
overlap as different areas on the fuel particles react in different ways to the combustion
environment. When a fuel particle enters the furnace, its temperature will quickly rise, which will
cause water evaporation and, consequently, drying of the particle. When the particle is dry, it will
start to pyrolyze, meaning that organic content is volatilized. During this stage, the gases are ignited
and burned with a visible flame. Highly reactive ash-elements will also be released. Char is the part
of the particle remaining when all volatile species have been released. In the final stage of
combustion, the char is combusted and then reduced to ashes (Reid, 1984; Zevenhoven-
Onderwater, 2001).
Figure 13: A simplified scheme of the ash formation process (Flagan, 1984).
Two types of ashes are typically distinguished when referring to ashes. Bottom ash consists of larger
particles which remain in the bed before they are collected through the bottom of the boiler. Fly
ash consists of smaller sized particles, which are transported from the furnace upwards to the
second pass with the flue gas. The temperature of the flue gas decreases as it is transported through
the flue gas channel, causing condensation of volatile species as the flue gas becomes
supersaturated. Condensation of compounds on fly ash particles or heat exchangers is referred to
as heterogeneous condensation, while the condensation of submicron particles is referred to as

homogeneous condensation. The distribution between bottom ash and fly ash is influenced by the
boiler design, and the sizes and densities of the ash particles (Haynes et al., 1982).
Differences in formation mechanisms force the fly ash particles into different fractions. More
reactive elements in the fuel particle can be volatilized during the beginning of the combustion
process. The released gaseous species can then react through gas-gas or gas-solid reactions to form
aerosols or fine ash particles. The larger ash particles tend to either remain in the bed or fragment
into smaller particles during fluidization. If fragmented into a small enough size, they are entrained
in the flue gases. Smaller particles can also remain in the bed if deposited on larger particles of ash
or bed material.
The reactivity of ash-forming elements, as determined by the fractionation method, gives us an
indication of what kind of particles will form during combustion. In biomass, alkaline metals (e.g. Na
and K) are often present as compounds soluble in water and/or acetate. These compounds are
highly reactive and will thus rapidly volatilize during combustion. Formation of submicron ash
particles through condensation, nucleation, and coagulation will also occur. Calcium in biomass is
regarded reactive when soluble either in water, acetate, or acid. As opposed to reactive alkali,
reactive calcium does not volatilize and is therefore found both in the coarse fraction of fly ash and
in the bottom ash (Barrosso et al., 2007; Heinzel et al., 1998). Organically associated calcium will
quickly oxidize and form particles of smaller size in the flue gas. Examples of calcium-based
compounds soluble in acid are calcium oxalate (CaC2O4) and carbonate (CaCO3). It may, however,
be risky to consider all CaC2O4 as reactive, since some CaC2O4 has also been suspected to remain in
the rest fraction (Werkelin et al., 2012). When introduced to high temperatures in the furnace,
CaC2O4 undergoes a series of reactions, where it forms CaCO3 and finally calcium oxide CaO
according to Reaction 1.
𝐶𝑎𝐶𝑂3 → 𝐶𝑎𝑂 + 𝐶𝑂2 (1)
The reactivity of acid leached calcium carbonate has not been directly discussed, although its
behavior is likely similar to that of CaC2O4, as it is converted to calcium carbonate between 400-500
°C. When calcium carbonate has been injected as an additive into the boiler rather than as a fuel
component, calcium oxide is also rapidly formed. The formed oxide particles are, however of greater
size, which makes them less reactive, as they have a smaller specific surface area. The rest fraction

typically contains calcium silicates, which are known to be inert and therefore insoluble in any of
the solvents used in fractionation (Zevenhoven et al., 2012).
4.2 Deposit formation The accumulation of (ash) deposits is mainly classified into either slagging or fouling (Bryers, 1996).
Slagging refers to deposits formed on surfaces in the furnace. When given enough time the slagging
deposits typically form two different layers; the inner layer is more fine-grained, while the outer
layer is molten or partly molten. The chemical content of slagging is typically high in alkali and silica
compounds. Fouling refers to deposition formed by fly ash particles in the flue gas channel. The
inner layer of fouling deposits consists of volatile ash components, such as alkali salts, which form a
sticky surface due to their lower melting temperature, making it possible for larger particles to stick
to the surface (Frandsen, 2010).
Research on transportation mechanisms of ash particles towards the surfaces of heat exchangers
and the mechanisms of adhesion have widely been studied. Ash particles are mainly transported by
four different mechanisms to surfaces where they are then deposited; by diffusion, thermophoresis,
inertial impaction, or chemical reactions with the deposit layer (Baxter, 1993). Transportation by
means of diffusion can be induced by condensation (due to the removal) of ash species from the
flue gas surrounding the heat transfer surface. Condensation can occur in the flue gas when small
particles are formed by nucleated gaseous matter, or directly on the steel surface or on the surface
of a formed deposit (Frandsen, 2010). The phenomenon known as thermophoresis is the force that
drives a flow from a space with a higher temperature towards a colder. Larger ash particles become
attached to the heat exchanger surface by inertial impaction. The excessive momentum of larger
particles in the flue gas, causes them to collide with the heat exchanger tubes instead of following
the gas flow around them. The adhesion of the particles relies on particle viscosity, the velocity of
the flue gas, size, and density.
4.3 Reactivity of calcium in fly ash The need for a better understanding of calcium impact on deposit chemistry and corrosion both in
the superheater region and in the cold-end of the flue gas channel has been raised earlier in this
work. In order to fully understand the behavior of calcium in the flue gas, the mechanisms of typical
calcium reactions must first be analyzed. In this section, the main flue gas reactions involving calcium
will be presented and discussed, based on available data and experiences.
4.3.1 Sulfation
The reaction between sulfur and calcium during combustion is mostly associated with SO2 capture,
which occurs according to the overall Reaction 2, where CaO reacts under oxidizing conditions to
form calcium sulfate (CaSO4). The reaction is significant for the boiler operation because lower sulfur
emissions can be reached with a higher calcium concentration in the furnace. Thus, injection of
limestone or co-combustion of fuels with high sulfur content together with high calcium containing
fuels is typically conducted to reduce sulfur emissions. However, sulfur capture could have an
impact on corrosion, as it leads to a lower availability of sulfur for the sulfation of alkali chlorides.
𝐶𝑎𝑂 + 𝑆𝑂2 + 0.5 𝑂2 → 𝐶𝑎𝑆𝑂4 (2)
In addition to CaSO4, other compounds can also form in the reactions between sulfur and calcium
(Anthony and Granatstein, 2000). The outcome depends mainly on temperature and the partial
pressures of 𝑆𝑂2 and 𝑂2. In oxidizing conditions, calcium sulfite (CaSO3) is also formed, although it
becomes thermally unstable at temperatures above 700 °C. In reducing conditions, calcium sulfide
(CaS) can be formed as described by Reaction 3. Nevertheless, in the presence of sulfur, CaSO4 is
the main calcium compound formed at normal furnace temperatures in fluidized bed boilers (800-
950 °C).
𝐶𝑎𝑂 + 𝑆𝑂2 → 𝐶𝑎𝑆 +3
2 𝑂2 (3)
Different reaction mechanisms have been suggested for the formation of CaSO4 (Moss, 1970; Moss
1975). Calcium and sulfur can either first react to form CaSO3 as an intermediate, or sulfur is first
oxidized to SO3 before it reacts with calcium oxide to form CaSO4. Thus, CaSO4 is either formed
through reactions 4 and 5 or through reactions 6 and 7. Further research of the reaction series is
however still required, as researchers disagree over which the dominant route is. While some has
preferred formation of CaSO4 through the latter route (Lin, 1994; Schouten et al. 1995; Schouten
1989), others have argued that SO3 is unlikely to be present in significant concentrations in the
furnace during normal fluidized bed conditions (Anthony and Granatstein, 2000).
𝐶𝑎𝑂 + 𝑆𝑂2 → 𝐶𝑎𝑆𝑂3 (4)
𝐶𝑎𝑆𝑂3 + 0.5 𝑂2 → 𝐶𝑎𝑆𝑂4 (5)
𝑆𝑂2 + 0.5 𝑂2 → 𝑆𝑂3 (6)
𝐶𝑎𝑂 + 𝑆𝑂3 → 𝐶𝑎𝑆𝑂4 (7)
Sulfur capture by calcium in the fuel or in additives is an effective way of mitigating SO2 emissions
in fluidized bed combustion. However, at higher temperatures, SO2 can become available through
the decomposition of CaSO4. Significant decomposition of CaSO4 is, however, not expected at
temperatures below 1000 °C.
4.3.2 Reactions with phosphorus
Limited research has been conducted on the reactions between calcium and phosphorus during
combustion. Although their relationship is poorly understood, it is well established that they are,
much like sulfur and calcium, closely associated. Together they form compounds of calcium
phosphates, which are stable components with a high melting temperature (Lindström et al., 2007).
A mechanism for the reaction has not been acknowledged, although it has been suggested that
phosphorus is volatilized and forms orthophosphates in the flue gas, which then reacts with calcium
to produce calcium phosphates (Beck and Unterberger, 2006). Beck and Unterberger suggested that
calcium phosphates are formed either by condensation of phosphates on the surface of calcium
particles or through a physical process that leads to the formation of small particles of calcium
phosphates. Phosphorus and sulfur compete over calcium, leading to decreased formation of
calcium sulfate in the furnace. The phenomenon has been observed when firing fuel mixtures
containing sewage sludge, which are rich in phosphorus (Åmand and Leckner, 2004).
4.3.3 Carbonation
The reversible reaction of calcination, or carbonation proceeds according to Reaction 8. The reaction
is exothermic and thus the activity of the reaction is favored by low temperatures. Carbonation
typically becomes active below 800 °C, however when the temperature decreases below 600 °C the
reaction rate becomes slow. Therefore, the active window of carbonation is between 600-800 °C.
Carbonation can lead to sintering of deposits in the flue gas channel, causing the formation of hard
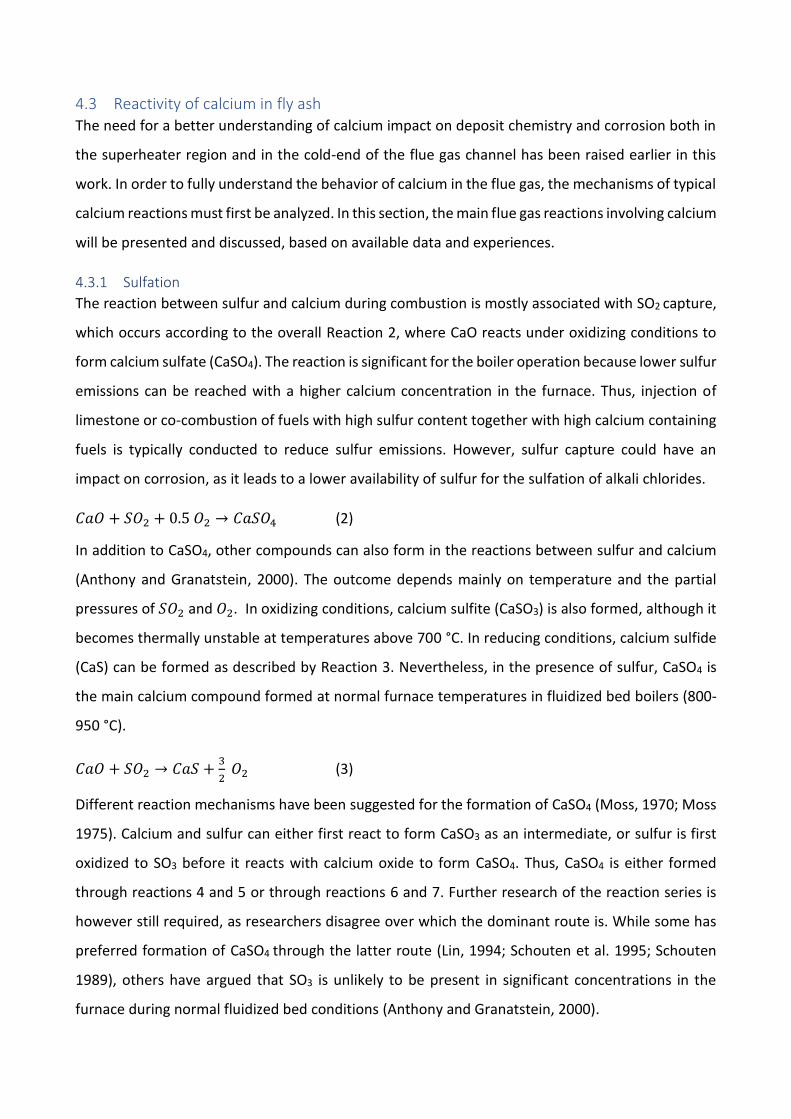
deposits. The stability of CaCO3 vs. CaO is presented in Figure 14.
𝐶𝑎𝑂 + 𝐶𝑂2 → 𝐶𝑎𝐶𝑂3 (8)
Figure 14: The stabilities of calcium carbonate and calcium oxide as a function of the partial pressue of CO2 and temperature. (as calculated by Partanen, 2004).
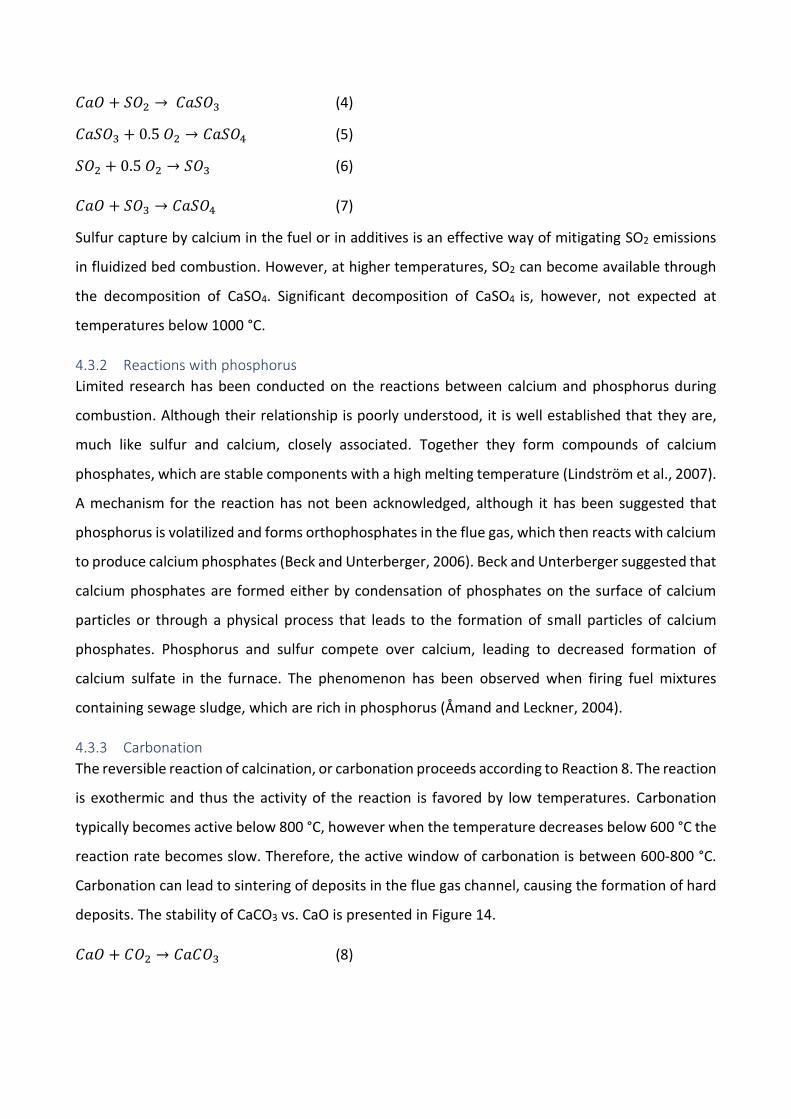
4.3.4 Reaction of HCl with calcium compounds
Chlorides tend to form troublesome compounds during combustion, and CaCl2 is no different. It may
cause fouling in BFB boilers and contribute to corrosion, both in the superheater region and cold
end of the boiler. Calcium chloride is formed according to the overall reactions 9, 10 and 11.
Reaction 10 is dependent on the carbonization of CaO, according to Reaction 8.
𝐶𝑎𝑂 + 2 𝐻𝐶𝑙 < −> 𝐶𝑎𝐶𝑙2 + 𝐻2𝑂 (9)
𝐶𝑎𝐶𝑂3 + 2 𝐻𝐶𝑙 < −> 𝐶𝑎𝐶𝑙2 + 𝐻2𝑂 + 𝐶𝑂2 (10)
𝐶𝑎(𝑂𝐻)2 + 2 𝐻𝐶𝑙 < −> 𝐶𝑎𝐶𝑙2 + 2𝐻2𝑂 (11)
Kosnyrev noticed the formation of calcium hydroxichloride (CaClOH) and the reaction of HCl with
calcium compounds and suggested that it acts as an intermediate during the formation of CaCl2
(Kosnyrev et al., 1981 & 1990). A further study of CaClOH reported that the intermediate itself is
stable only under certain circumstances (Partanen, 2004). However, the intermediate may form
easily and could, therefore, have a significant impact on CaCl2 formation. A structure for the
compound, which can be seen in Figure 15, was suggested by Partanen, 2004.
Figure 15: The structure of CaClOH as suggested by Partanen, 2004.
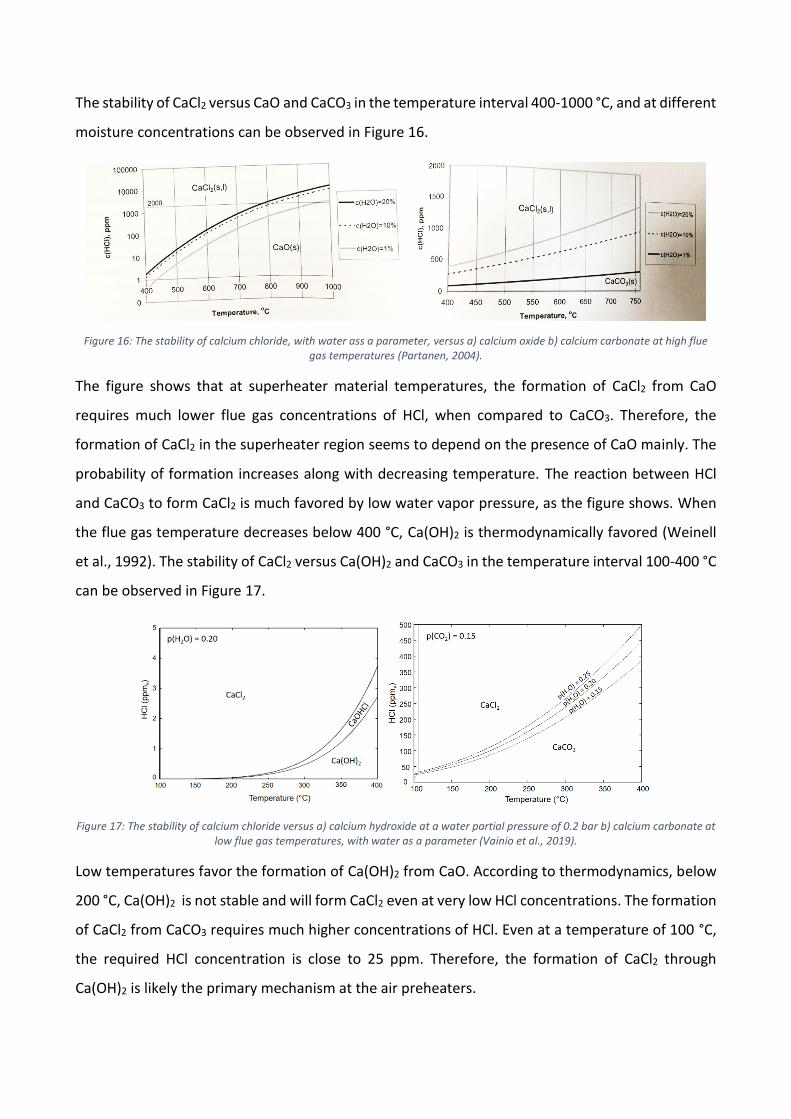
The stability of CaCl2 versus CaO and CaCO3 in the temperature interval 400-1000 °C, and at different
moisture concentrations can be observed in Figure 16.
Figure 16: The stability of calcium chloride, with water ass a parameter, versus a) calcium oxide b) calcium carbonate at high flue gas temperatures (Partanen, 2004).
The figure shows that at superheater material temperatures, the formation of CaCl2 from CaO
requires much lower flue gas concentrations of HCl, when compared to CaCO3. Therefore, the
formation of CaCl2 in the superheater region seems to depend on the presence of CaO mainly. The
probability of formation increases along with decreasing temperature. The reaction between HCl
and CaCO3 to form CaCl2 is much favored by low water vapor pressure, as the figure shows. When
the flue gas temperature decreases below 400 °C, Ca(OH)2 is thermodynamically favored (Weinell
et al., 1992). The stability of CaCl2 versus Ca(OH)2 and CaCO3 in the temperature interval 100-400 °C
can be observed in Figure 17.
Figure 17: The stability of calcium chloride versus a) calcium hydroxide at a water partial pressure of 0.2 bar b) calcium carbonate at low flue gas temperatures, with water as a parameter (Vainio et al., 2019).
Low temperatures favor the formation of Ca(OH)2 from CaO. According to thermodynamics, below
200 °C, Ca(OH)2 is not stable and will form CaCl2 even at very low HCl concentrations. The formation
of CaCl2 from CaCO3 requires much higher concentrations of HCl. Even at a temperature of 100 °C,
the required HCl concentration is close to 25 ppm. Therefore, the formation of CaCl2 through
Ca(OH)2 is likely the primary mechanism at the air preheaters.
4.4 High-temperature corrosion
One of the main challenges with boiler operation is corrosion of the furnace, wall tubes, and
superheater tube steel materials, which are located in the hotter part of the boiler. In case corrosion
occurs, it causes significant costs due to unscheduled shutdowns, material replacement, and /or the
use of higher quality materials to avoid corrosion. In 1982, problems due to corrosion were
estimated to cost energy-related industries 122 billion dollars per year (Bhaskaran et al., 2005). It is
therefore essential to pay specific attention to corrosion and every detail of the corrosion
mechanism. It is common knowledge that corrosion in power boilers are mainly caused by chlorine-
containing compounds. Primarily alkali chlorides are associated with increased corrosion rates of
heat exchangers at higher temperatures. Stainless steels are a popular choice as a material for
superheaters, as they are more resistant to corrosion (Folkeson, 2010). However, at high material
temperatures, alkali chlorides may also cause corrosion on stainless steel. Research has shown that
the alkali-cation is responsible for initiating corrosion by reacting with the protective oxide layer to
form chromate, according to Reaction 12 (Lehmusto et al., 2012; Pettersson et al., 2005).
8𝐾𝐶𝑙(𝑠) + 2𝐶𝑟2𝑂3(𝑠) + 5𝑂2 → 4𝐾2𝐶𝑟𝑂4(𝑠) + 4𝐶𝑙2(𝑔) (12)
In conditions with a higher moisture content, reaction with the protective layer can also occur
according to Reaction 13.
2𝐶𝑟2𝑂3 + 8𝐾𝐶𝑙 + 4𝐻2𝑂 + 3𝑂2 → 4𝐾2𝐶𝑟𝑂4 + 8𝐻𝐶𝑙 (13)
The formation of chromate reduces the chromium content in the oxide layer, causing it to lose its
protective characteristics. The corrosion process is then accelerated as chlorine ions can penetrate
the scale. Chlorine induced corrosion is a cycle mechanism during which the protective oxide layer
is continuously degraded. The mechanism is also known as active oxidation (Grabke et al., 1995).
𝑥
2𝐶𝑙2(𝑔) + 𝑀𝑒(𝑠) → 𝑀𝑒𝐶𝑙𝑥(𝑠) (14)
𝑦𝑀𝑒𝐶𝑙𝑥(𝑔) +𝑧
2𝑂2(𝑔) → 𝑀𝑒𝑦𝑂𝑧(𝑠) +
𝑥𝑦
2𝐶𝑙2(𝑔) (15)
Corrosion is typically aggressive when the salt is in a molten phase. Mixtures of salts often have a
lower melting point than pure salts. These are referred to as eutectic mixtures. Because of the more
rapid transportation of ions in the liquid phase, molten phase corrosion can proceed at much faster
rates in comparison to corrosion occurring with solid-state diffusion. Calcium has typically been
classified as a compound that lowers the melting temperature of eutectic mixtures. However, if

compared to alkali metals, their impact on temperature lowering is much less pronounced. In Table
3, the melting temperatures of pure salts and eutectic mixtures containing calcium has been listed.
For comparison, a few compounds containing alkali metals have been included as well. The melting
temperatures have been obtained from the Factsage database and Karlsson (2012).
Table 3: The melting temperatures of pure deposit compounds, some corrosion products, and some eutectic mixtures
Pure deposit compounds Pure Corrosion products Eutectic mixtures
𝐾𝐶𝑙 771 𝐹𝑒𝐶𝑙2 677 𝐶𝑎𝐶𝑙2 − 𝑁𝑎𝐶𝑙 504
𝑁𝑎𝐶𝑙 801 𝐹𝑒𝐶𝑙3 303 𝐶𝑎𝐶𝑙2 − 𝑀𝑔𝐶𝑙2 617
𝐶𝑎𝐶𝑙2 782 𝐶𝑟𝐶𝑙2 820 𝐶𝑎𝐹2−𝐾𝐶𝑎𝐶𝑙3 650
𝑍𝑛𝐶𝑙2 318 𝐶𝑟𝐶𝑙3 1150 𝐶𝑎𝐶𝑙2−𝐹𝑒𝐶𝑙2 585
𝑃𝑏𝐶𝑙2 498 𝑁𝑖𝐶𝑙2 1030 𝐶𝑎𝐶𝑙2−𝑃𝑏𝐶𝑙2 462
𝐾2𝑆𝑂4 1069 𝐾2𝐶𝑟𝑂4 973 𝐶𝑎𝐶𝑙2−𝐶𝐶𝐶 744
𝑁𝑎2𝑆𝑂4 880 𝐾2𝐶𝑟𝑂7 398 𝐶𝑎𝐶𝑙2−𝐶𝐶𝐶 638
𝐶𝑎𝑆𝑂4 1460 𝑁𝑎2𝐶𝑟𝑂4 792 𝐶𝑎𝐶𝑙2−𝐶𝐶𝐶 596
𝐾2𝐶𝑂3 901 𝑁𝑎2𝐶𝑟𝑂7 357 𝐾2𝑆𝑂4−𝑁𝑎2𝑆𝑂4−𝐶𝑎𝑆𝑂4 776
𝑁𝑎2𝐶𝑂3 851 𝐶𝑎𝐶𝑟𝑂4 1020
𝐶𝑎𝐶𝑂3 825
4.4.1 The role of calcium chloride
In a previous study, it has been reported how alkali and alkaline earth metals behave when coming
in contact with the protective oxide layer of a 304L stainless steel at a temperature of 600 °C and an
atmosphere with high moisture content (Karlsson et al., 2012). Based on an XRD analysis, it was
reported that CaCl2 may react with the oxide layer according to Reaction 16. However, the reaction
proved to be limited as only small amounts of chromate ions were detected near the CaCl2. Karlsson
et al. (2012) suggested that the unstable nature of CaCl2 limits the formation of calcium chromate,
due to the rapid formation of CaO according to Reaction 17. Lehmusto et al. (2011) have on the
other hand shown that CaCl2 remains unreactive when exposed to a dry environment in the
temperature range of 400-600 °C. Karlsson et al. (2012) further suggested that calcium oxide, at
600 °C and in a gas with 40% H2O, can react with the protective oxide layer according to Reaction
18 and form Ca2Fe2O5. They also deemed it possible for CaO to be able to react directly with the
protective oxide (Reaction 19), although this is only likely to proceed near the salt deposit, as CaO
was found to be quite immobile. Karlsson et al. (2012) also argued that an oxide layer consisting of
Ca2Fe2O5 might have given rise to a protective behavior.

𝐶𝑟2𝑂3 + 2𝐶𝑎𝐶𝑙2 + 2𝐻2𝑂 +3
2𝑂2 < −> 2𝐶𝑎𝐶𝑟𝑂4 + 4 𝐻𝐶𝑙 (16)
2𝐶𝑎𝐶𝑙2 + 𝐻2𝑂 < −> 𝐶𝑎𝑂 + 2 𝐻𝐶𝑙 (17)
𝐹𝑒2𝑂3 + 2𝐶𝑎𝑂 < −> 𝐶𝑎2𝐹𝑒2𝑂5 (18)
𝐶𝑟2𝑂3 + 𝐶𝑎𝑂 +3
2𝑂2 < −> 2𝐶𝑎𝐶𝑟𝑂4 (19)
4.4.2 Prediction of corrosion
When aiming to prevent corrosion, it is essential to build an understanding of the fuel properties
and the potential risks during combustion. Basic prediction of high-temperature corrosion can be
conducted by observing values of molar ratios between elements involved in essential reactions
from a corrosion and deposit point of view (Stromberg and Herstad Svard, 2012). In this section, the
focus will lie on molar ratios including calcium or molar ratios with elements affected by the
presence of calcium. Furthermore, it is important to remain critical of the fuel indexes as they merely
give an indication of how the fuel could behave in the boiler. When corrosion in the cold-end of the
flue gas channel is better understood, molar ratios predicting low-temperature corrosion can also
be developed.
In the previous chapter, it was stated that corrosion is reduced when alkali metals are present as
sulfates instead of chlorides. Thus, it is of interest to consider the fuels' own theoretical ability to
sulfate its alkali content. The molar ratio between sulfur and chlorine characterizes this ability and
therefore provides an indication of alkali chloride content in the boiler deposits. A higher value (over
four) presents an increased probability of a reduced amount of alkali chlorides. A value below two
is typically considered to be in the risk zone of corrosion.
As sulfur and calcium are closely associated, a higher amount of calcium present in the fuel could
lead to a decreased sulfation of alkali chlorides and thus increase the risk of corrosion. The molar
ratio between sulfur and calcium is, therefore, important as it provides an indication of the fuels'
ability to capture sulfur. A high value of Ca/S indicates that also a higher S/Cl ratio is required for
the sulfation of alkali chlorides. In some cases, it is also necessary to include phosphorus in the molar
ratio between calcium and sulfur, as phosphorus is also closely associated with calcium and can thus
impact the fuel's ability to capture sulfur. However, this is only worth to take into consideration for
fuels containing higher amounts of phosphorus. If the aim is to reduce the accumulation of chlorine
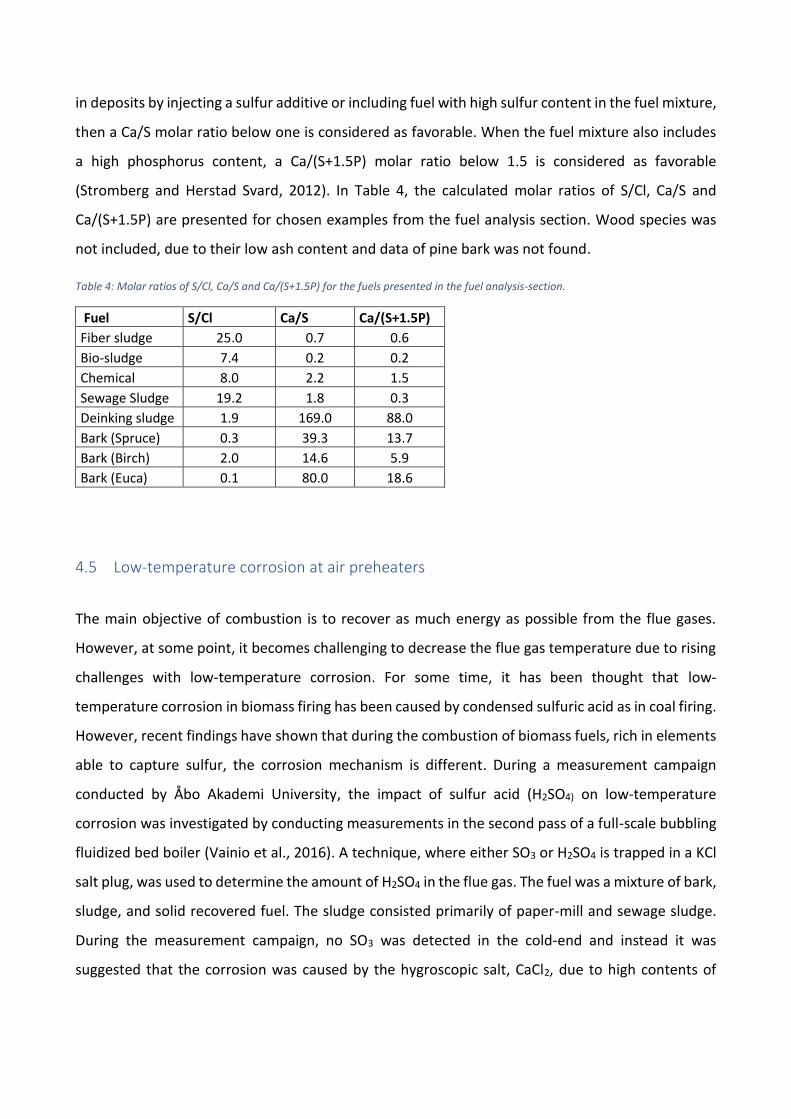
in deposits by injecting a sulfur additive or including fuel with high sulfur content in the fuel mixture,
then a Ca/S molar ratio below one is considered as favorable. When the fuel mixture also includes
a high phosphorus content, a Ca/(S+1.5P) molar ratio below 1.5 is considered as favorable
(Stromberg and Herstad Svard, 2012). In Table 4, the calculated molar ratios of S/Cl, Ca/S and
Ca/(S+1.5P) are presented for chosen examples from the fuel analysis section. Wood species was
not included, due to their low ash content and data of pine bark was not found.
Table 4: Molar ratios of S/Cl, Ca/S and Ca/(S+1.5P) for the fuels presented in the fuel analysis-section.
Fuel S/Cl Ca/S Ca/(S+1.5P)
Fiber sludge 25.0 0.7 0.6
Bio-sludge 7.4 0.2 0.2
Chemical 8.0 2.2 1.5
Sewage Sludge 19.2 1.8 0.3
Deinking sludge 1.9 169.0 88.0
Bark (Spruce) 0.3 39.3 13.7
Bark (Birch) 2.0 14.6 5.9
Bark (Euca) 0.1 80.0 18.6
4.5 Low-temperature corrosion at air preheaters
The main objective of combustion is to recover as much energy as possible from the flue gases.
However, at some point, it becomes challenging to decrease the flue gas temperature due to rising
challenges with low-temperature corrosion. For some time, it has been thought that low-
temperature corrosion in biomass firing has been caused by condensed sulfuric acid as in coal firing.
However, recent findings have shown that during the combustion of biomass fuels, rich in elements
able to capture sulfur, the corrosion mechanism is different. During a measurement campaign
conducted by Åbo Akademi University, the impact of sulfur acid (H2SO4) on low-temperature
corrosion was investigated by conducting measurements in the second pass of a full-scale bubbling
fluidized bed boiler (Vainio et al., 2016). A technique, where either SO3 or H2SO4 is trapped in a KCl
salt plug, was used to determine the amount of H2SO4 in the flue gas. The fuel was a mixture of bark,
sludge, and solid recovered fuel. The sludge consisted primarily of paper-mill and sewage sludge.
During the measurement campaign, no SO3 was detected in the cold-end and instead it was
suggested that the corrosion was caused by the hygroscopic salt, CaCl2, due to high contents of
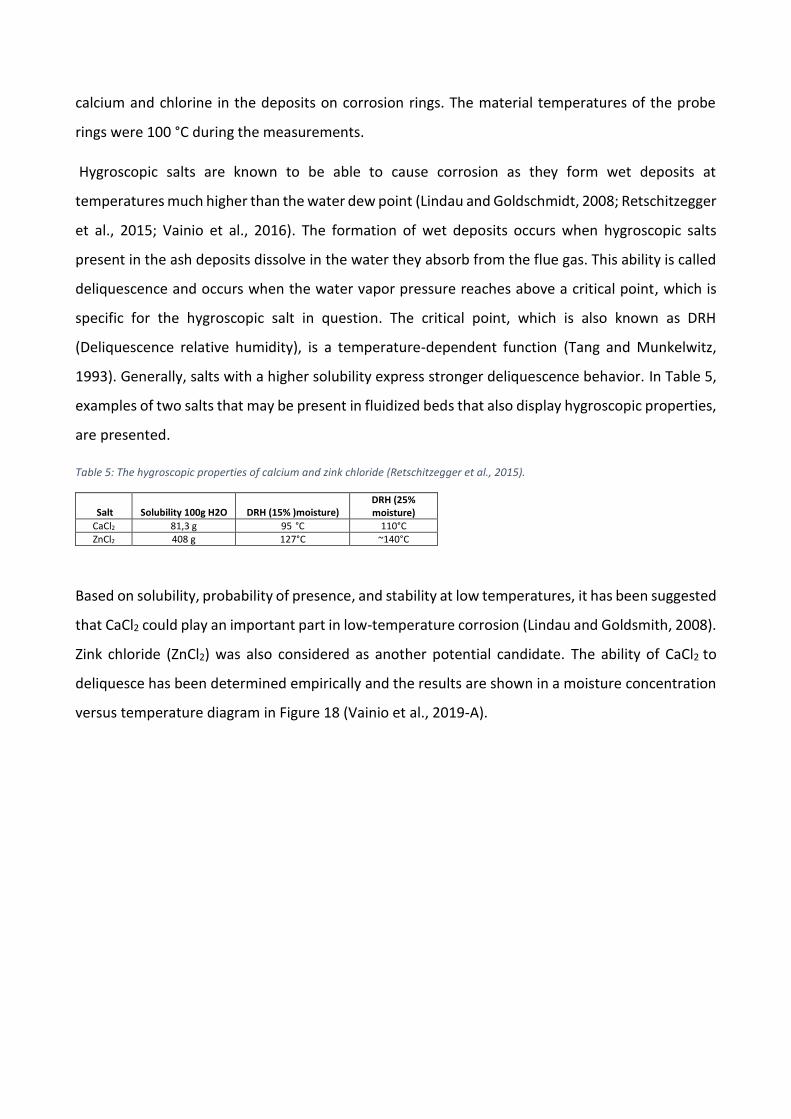
calcium and chlorine in the deposits on corrosion rings. The material temperatures of the probe
rings were 100 °C during the measurements.
Hygroscopic salts are known to be able to cause corrosion as they form wet deposits at
temperatures much higher than the water dew point (Lindau and Goldschmidt, 2008; Retschitzegger
et al., 2015; Vainio et al., 2016). The formation of wet deposits occurs when hygroscopic salts
present in the ash deposits dissolve in the water they absorb from the flue gas. This ability is called
deliquescence and occurs when the water vapor pressure reaches above a critical point, which is
specific for the hygroscopic salt in question. The critical point, which is also known as DRH
(Deliquescence relative humidity), is a temperature-dependent function (Tang and Munkelwitz,
1993). Generally, salts with a higher solubility express stronger deliquescence behavior. In Table 5,
examples of two salts that may be present in fluidized beds that also display hygroscopic properties,
are presented.
Table 5: The hygroscopic properties of calcium and zink chloride (Retschitzegger et al., 2015).
Salt Solubility 100g H2O DRH (15% )moisture) DRH (25% moisture)
CaCl2 81,3 g 95 °C 110°C ZnCl2 408 g 127°C ~140°C
Based on solubility, probability of presence, and stability at low temperatures, it has been suggested
that CaCl2 could play an important part in low-temperature corrosion (Lindau and Goldsmith, 2008).
Zink chloride (ZnCl2) was also considered as another potential candidate. The ability of CaCl2 to
deliquesce has been determined empirically and the results are shown in a moisture concentration
versus temperature diagram in Figure 18 (Vainio et al., 2019-A).
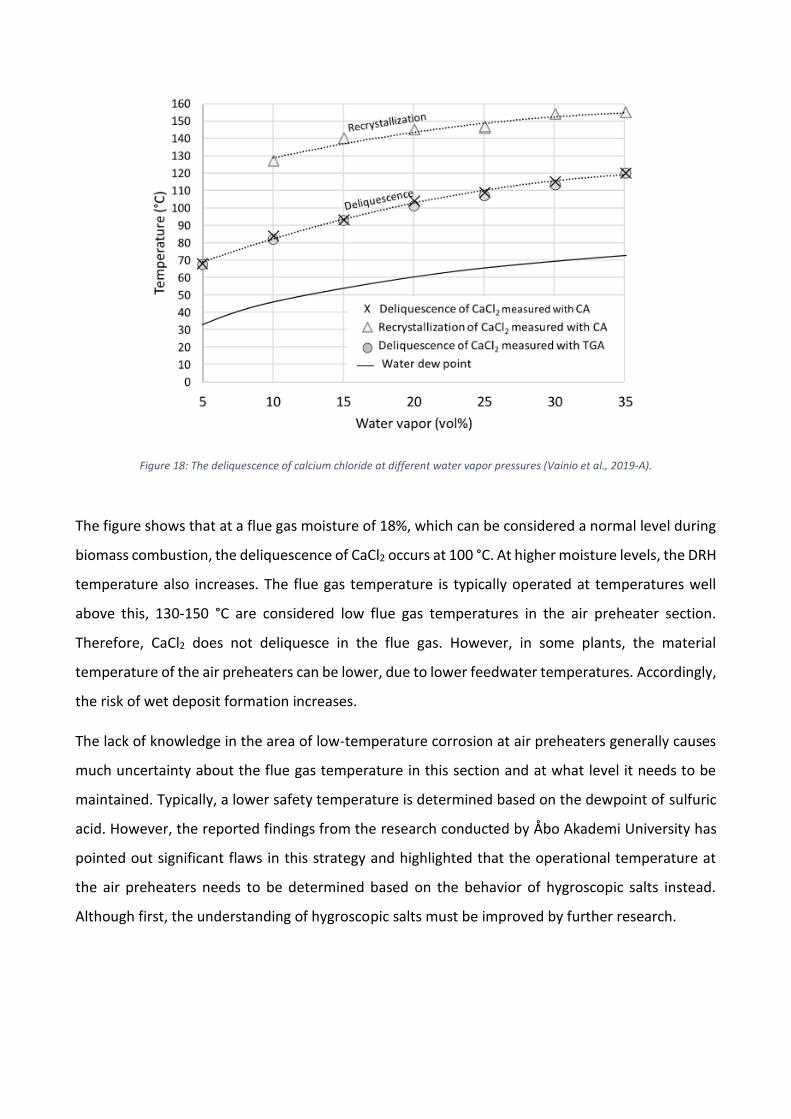
Figure 18: The deliquescence of calcium chloride at different water vapor pressures (Vainio et al., 2019-A).
The figure shows that at a flue gas moisture of 18%, which can be considered a normal level during
biomass combustion, the deliquescence of CaCl2 occurs at 100 °C. At higher moisture levels, the DRH
temperature also increases. The flue gas temperature is typically operated at temperatures well
above this, 130-150 °C are considered low flue gas temperatures in the air preheater section.
Therefore, CaCl2 does not deliquesce in the flue gas. However, in some plants, the material
temperature of the air preheaters can be lower, due to lower feedwater temperatures. Accordingly,
the risk of wet deposit formation increases.
The lack of knowledge in the area of low-temperature corrosion at air preheaters generally causes
much uncertainty about the flue gas temperature in this section and at what level it needs to be
maintained. Typically, a lower safety temperature is determined based on the dewpoint of sulfuric
acid. However, the reported findings from the research conducted by Åbo Akademi University has
pointed out significant flaws in this strategy and highlighted that the operational temperature at
the air preheaters needs to be determined based on the behavior of hygroscopic salts instead.
Although first, the understanding of hygroscopic salts must be improved by further research.
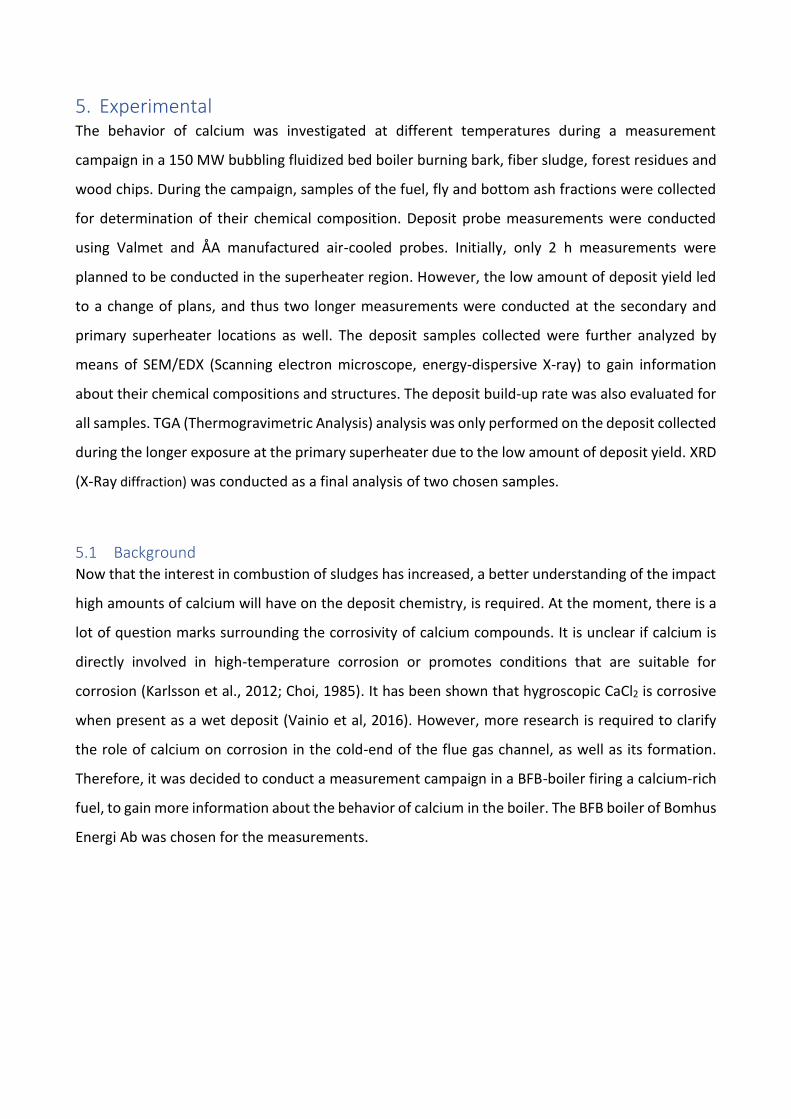
5. Experimental The behavior of calcium was investigated at different temperatures during a measurement
campaign in a 150 MW bubbling fluidized bed boiler burning bark, fiber sludge, forest residues and
wood chips. During the campaign, samples of the fuel, fly and bottom ash fractions were collected
for determination of their chemical composition. Deposit probe measurements were conducted
using Valmet and ÅA manufactured air-cooled probes. Initially, only 2 h measurements were
planned to be conducted in the superheater region. However, the low amount of deposit yield led
to a change of plans, and thus two longer measurements were conducted at the secondary and
primary superheater locations as well. The deposit samples collected were further analyzed by
means of SEM/EDX (Scanning electron microscope, energy-dispersive X-ray) to gain information
about their chemical compositions and structures. The deposit build-up rate was also evaluated for
all samples. TGA (Thermogravimetric Analysis) analysis was only performed on the deposit collected
during the longer exposure at the primary superheater due to the low amount of deposit yield. XRD
(X-Ray diffraction) was conducted as a final analysis of two chosen samples.
5.1 Background Now that the interest in combustion of sludges has increased, a better understanding of the impact
high amounts of calcium will have on the deposit chemistry, is required. At the moment, there is a
lot of question marks surrounding the corrosivity of calcium compounds. It is unclear if calcium is
directly involved in high-temperature corrosion or promotes conditions that are suitable for
corrosion (Karlsson et al., 2012; Choi, 1985). It has been shown that hygroscopic CaCl2 is corrosive
when present as a wet deposit (Vainio et al, 2016). However, more research is required to clarify
the role of calcium on corrosion in the cold-end of the flue gas channel, as well as its formation.
Therefore, it was decided to conduct a measurement campaign in a BFB-boiler firing a calcium-rich
fuel, to gain more information about the behavior of calcium in the boiler. The BFB boiler of Bomhus
Energi Ab was chosen for the measurements.

5.2 Test site The power boiler in which the measurements were conducted is a full-scale BFB with a thermal
efficiency of 150 MW and a steam flow of 57 kg/s at a temperature of 520 °C and a pressure of 120
bar. The boiler is located in the municipality of Gävle in east-central Sweden and produces
electricity, hot water for local district heating, and steam for industrial applications. Waste streams
from the nearby paper production facilities of BillerudKorsnäs AB; bark, wood chips, and fiber sludge
are the primary sources of fuel. The fiber sludge contains high amounts of calcium, which originates
from the packaging board coating process. The chlorine content of the fuel mixture is rather low
(0.14 wt-% d.s).
In Figure 19, a schematic image of the boiler is presented. The boiler itself is equipped with ammonia
injection to reduce the formation of nitrogen oxides. The flue gas passes a catalyst to reduce the
amount of ammonia and nitrogen oxides further. During the measurements, no detection of (SO2)
was made in the flue gas leaving the chimney. The amount of HCl was also low (max. 0.27 ppm).
Figure 19: A schematic image of the boiler with the measurement locations pointed out.
In total, four different locations in the boiler were used as measurement points during the campaign.
Measurements at higher flue gas temperatures were conducted just below the secondary
superheater and at the primary superheater (Figure 19). At these measurement points, the impact
of calcium on high-temperature deposit chemistry and corrosion was studied. Measurements at
locations with lower flue gas temperatures were conducted at the economizer and air preheaters.
In the economizer area, very little deposit was accumulated on the probe rings, and the
FG temp:570 °C Mat temp: 350-400-450
FG temp:700 °C Mat temp: 500-525-550 °C
FG temp:450 °C Mat temp: 250–300 °C
FG temp: 170 °C Mat temp: 80-100-120 °C
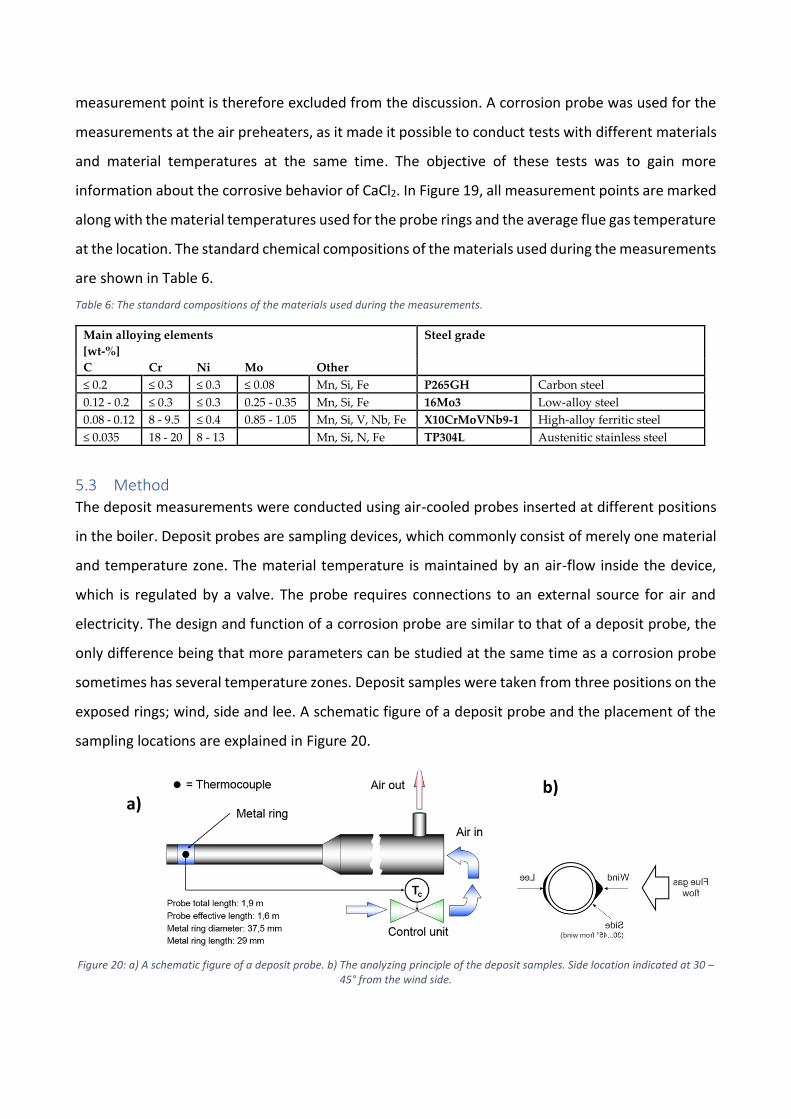
measurement point is therefore excluded from the discussion. A corrosion probe was used for the
measurements at the air preheaters, as it made it possible to conduct tests with different materials
and material temperatures at the same time. The objective of these tests was to gain more
information about the corrosive behavior of CaCl2. In Figure 19, all measurement points are marked
along with the material temperatures used for the probe rings and the average flue gas temperature
at the location. The standard chemical compositions of the materials used during the measurements
are shown in Table 6.
Table 6: The standard compositions of the materials used during the measurements.
Main alloying elements
[wt-%]
Steel grade
C Cr Ni Mo Other
≤ 0.2 ≤ 0.3 ≤ 0.3 ≤ 0.08 Mn, Si, Fe P265GH Carbon steel
0.12 - 0.2 ≤ 0.3 ≤ 0.3 0.25 - 0.35 Mn, Si, Fe 16Mo3 Low-alloy steel
0.08 - 0.12 8 - 9.5 ≤ 0.4 0.85 - 1.05 Mn, Si, V, Nb, Fe X10CrMoVNb9-1 High-alloy ferritic steel
≤ 0.035 18 - 20 8 - 13 Mn, Si, N, Fe TP304L Austenitic stainless steel
5.3 Method
The deposit measurements were conducted using air-cooled probes inserted at different positions
in the boiler. Deposit probes are sampling devices, which commonly consist of merely one material
and temperature zone. The material temperature is maintained by an air-flow inside the device,
which is regulated by a valve. The probe requires connections to an external source for air and
electricity. The design and function of a corrosion probe are similar to that of a deposit probe, the
only difference being that more parameters can be studied at the same time as a corrosion probe
sometimes has several temperature zones. Deposit samples were taken from three positions on the
exposed rings; wind, side and lee. A schematic figure of a deposit probe and the placement of the
sampling locations are explained in Figure 20.
Figure 20: a) A schematic figure of a deposit probe. b) The analyzing principle of the deposit samples. Side location indicated at 30 – 45° from the wind side.
a) b)
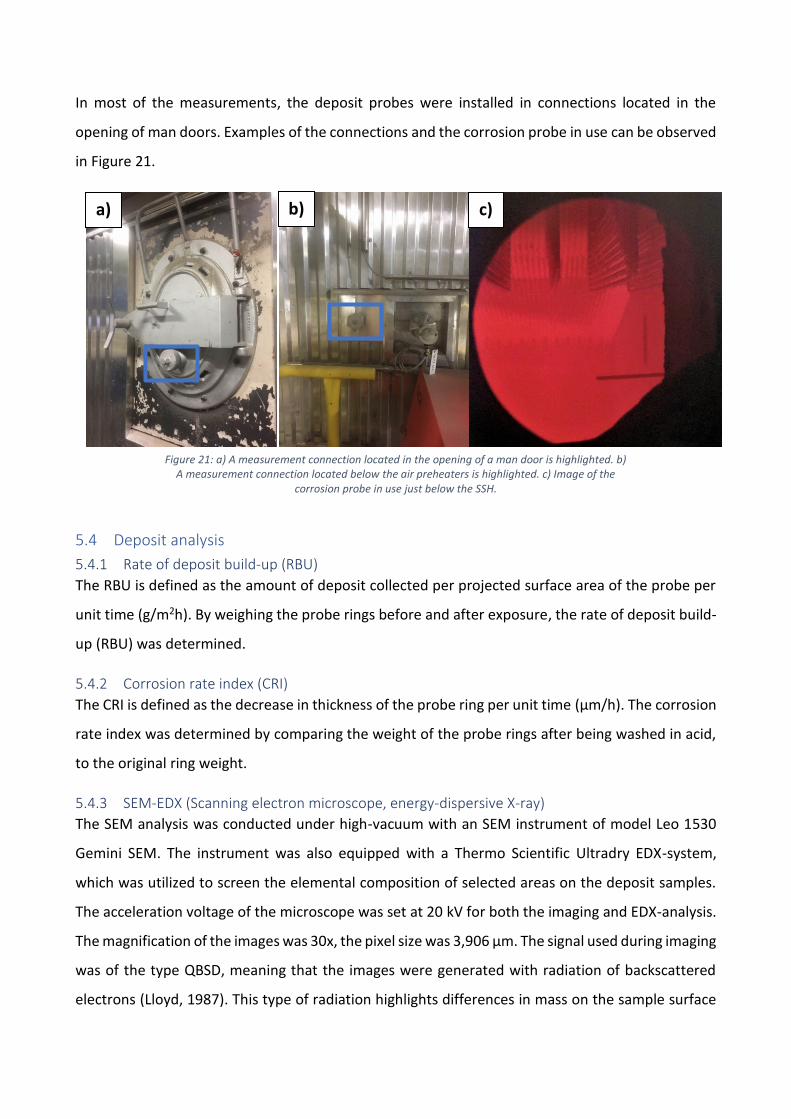
Figure 21: a) A measurement connection located in the opening of a man door is highlighted. b) A measurement connection located below the air preheaters is highlighted. c) Image of the
corrosion probe in use just below the SSH.
In most of the measurements, the deposit probes were installed in connections located in the
opening of man doors. Examples of the connections and the corrosion probe in use can be observed
in Figure 21.
5.4 Deposit analysis
5.4.1 Rate of deposit build-up (RBU)
The RBU is defined as the amount of deposit collected per projected surface area of the probe per
unit time (g/m2h). By weighing the probe rings before and after exposure, the rate of deposit build-
up (RBU) was determined.
5.4.2 Corrosion rate index (CRI)
The CRI is defined as the decrease in thickness of the probe ring per unit time (µm/h). The corrosion
rate index was determined by comparing the weight of the probe rings after being washed in acid,
to the original ring weight.
5.4.3 SEM-EDX (Scanning electron microscope, energy-dispersive X-ray)
The SEM analysis was conducted under high-vacuum with an SEM instrument of model Leo 1530
Gemini SEM. The instrument was also equipped with a Thermo Scientific Ultradry EDX-system,
which was utilized to screen the elemental composition of selected areas on the deposit samples.
The acceleration voltage of the microscope was set at 20 kV for both the imaging and EDX-analysis.
The magnification of the images was 30x, the pixel size was 3,906 µm. The signal used during imaging
was of the type QBSD, meaning that the images were generated with radiation of backscattered
electrons (Lloyd, 1987). This type of radiation highlights differences in mass on the sample surface
a) b)
))
c)
by displaying areas containing heavier molecules with a lighter shade and areas containing lighter
molecules with a darker shade. Only images generated with backscattered electrons will be
displayed in this work.
5.4.4 XRD (X-Ray diffraction)
Two samples in which CaCl2 possibly was identified in the SEM-analyses were were analysed by XRD.
With XRD the phases of the crystalline matter present can be determined by scanning the intensity
of diffracted signals. The analysis was conducted using an instrument of model Bruker AXS D8
Advance powder X-ray diffractometer, which system was operated in 2θ mode utilizing CuKα
radiation. A Våntec-1 linear detector was used to detect the diffracted signal. The phases present
were identified by comparing the diffractograms to the PDF4 database. The weight fractions of the
phases present were then estimated by Rietveld refinement, utilizing crystal data from the inorganic
crystal structure database (ICSD).
5.4.5 TGA-DTA (Thermogravimetric analysis-Differential thermal analysis)
The thermal behavior of a deposit sample collected at the primary superheater was analyzed with
a TGA-apparatus. In the analysis, the sample and a reference sample, which in this case was calcium
carbonate, was heated up to 1000 °C. The weights and the temperature difference between the
samples were also monitored. The objective of the analysis was to increase the understanding of
the deposit composition, by analyzing the phase changes.
5.5 Fuel and ash analysis The typical fuel mixture fired on the site consists of bark, wood chips, forest residues, and fiber
sludge. During the measurement campaign, mainly fiber sludge and bark of birch-wood was fired.
Figure 22: Photographs of dried fiber sludge (left), samples of wood chips, forest residues and bark (center), and a close-up of the bark sample (right). The photographs were taken at the site during the measurement campaign.

Although the sludge is referred to as a fiber sludge at the site the sludge is, in fact, a mixture of
sludge formed during the primary and secondary treatments of wastewater from paperboard
manufacturing at the nearby facility. Sludges collected from other sources could also be included,
for example, sludge from the lime kiln. Mechanical and sun-drying is utilized to lower the moisture
of the sludge. No difficulties with handling the sludge have been experienced.
In Table 7, fuel analysis data for the separate fuels and the fuel mixture are presented. The data of
the fiber sludge was obtained from a fuel analysis conducted on a sample taken during the
measurement campaign. The fuel data of birch bark was obtained from the Fuel Database of Valmet
Technologies Oy. The composition of the fuel mixture was calculated based on the individual fuel
data. The wet fuel share was used for the calculation, because of the small differences in moisture
shares.
Table 7: Some analyses data and properties of the fuel mixture, fiber sludge, and bark.
Fuel mixture (calculated)
Fiber Sludge Bark
Fuel share in mixture wt-%, wet 13 87
Moisture wt-% 47,5 49,6 45,15
Dry solids composition
Carbon, C wt-% ds. 49,82 28.2 53.05
Hydrogen, H wt-% ds. 5,22 3 5,55
Nitrogen, N wt-% ds. 0,31 0,38 0,3
Oxygen, O wt-% ds. 36,20 30,1 37,11
S wt-% ds. 0,05 0,22 0,03
Cl wt-% ds. 0,01 0,039 0,01
Ash content 815°C wt-% ds. 9,28 38,20 3,95
Higher heating value MJ/kg 19,24 9,56 21,02
Major Elements
Ca mg/kg fuel ds 31771 178 012 9919
Mg mg/kg fuel ds 987 2 407 775
Na mg/kg fuel ds 375 1 222 249
K mg/kg fuel ds 1808 879 1947
P mg/kg fuel ds 438 2100 384
Fe mg/kg fuel ds 711 1 986 520
Al mg/kg fuel ds 4022 25 976 742
Si mg/kg fuel ds 7447 32 776 3662
Fuel Indexes
S/Cl molar ratio in the fuel 5 5,6 3
Ca/S molar ratio in the fuel 63,5 178 33,1

Overall the fuel mixture appears to be combustion-friendly. The inclusion of sludge in the fuel
mixture raises the levels of calcium, aluminum, and silicon dramatically. These elements may impact
on the combustion positively by increasing the melting temperature of ash compounds.
Aluminosilicates may also capture alkali and release chlorine into the flue gas, thereby limiting
corrosion. From a corrosion point of view, the molar ratio of the S/Cl ratio can be considered
reasonable. However, the amount of calcium in comparison to sulfur in the fuel mixture is also high,
as the Ca/S molar ratio shows. The high content of calcium available will undoubtedly decrease the
sulfation of alkali chlorides in the flue gas. Therefore, the S/Cl ratio must be regarded with caution.
The amount of alkali in the fuel is considerable.
The sulfur content of the fuel mixture is low, and the chlorine content even lower. Based on the
molar ratio of S/Cl alone, it could be assumed that the fuel is not corrosive. However, the calcium
will most likely react with most of the formed SO2, allowing more chlorine to form potassium
chlorides. Therefore, some alkali chloride deposition is to be expected.
The ash composition of the fuel mixture, presented as atomic percentages of the major elements,
is shown in Table 8. The shares will be used for comparison with SEM/EDX results to clarify the
enrichment of elements in the deposit. The enrichment of chlorine is of particular interest.
Table 8: The atomic shares calculated from the sum of all major ash forming elements in the fuel mixture.
Element At-%
Ca 81.4
Mg 1.53
Na 0.55
K 4.52
P 0.87
S 1.02
Fe 1.34
Al 1.23
Si 7.22
Cl 0.31
In Figure 23, fractionation data of the fiber sludge sample from Bomhus, and of a reference of a
birch bark sample are presented. The fractionation data of the birch bark was obtained from the
Fuel Database of Valmet Technologies Oy. The figures show that most of the alkali content in the
bark is in reactive form, as opposed to alkali in the sludge. Large shares of the most abundant
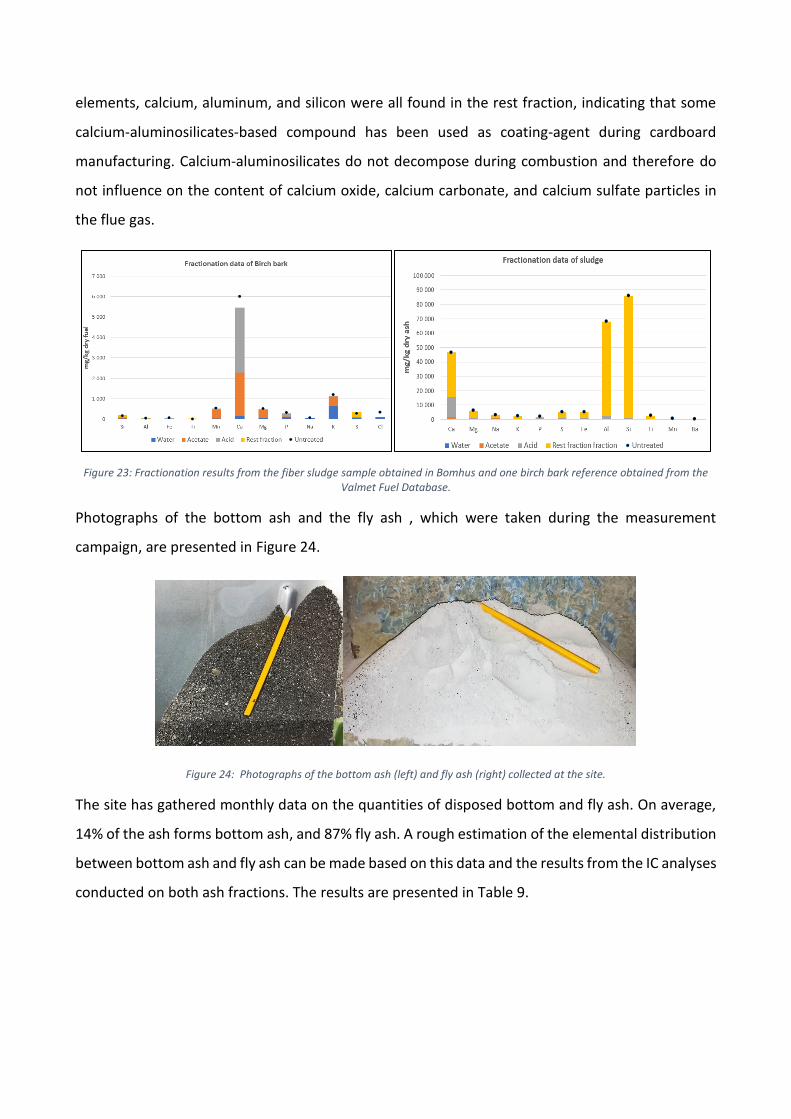
elements, calcium, aluminum, and silicon were all found in the rest fraction, indicating that some
calcium-aluminosilicates-based compound has been used as coating-agent during cardboard
manufacturing. Calcium-aluminosilicates do not decompose during combustion and therefore do
not influence on the content of calcium oxide, calcium carbonate, and calcium sulfate particles in
the flue gas.
Figure 23: Fractionation results from the fiber sludge sample obtained in Bomhus and one birch bark reference obtained from the Valmet Fuel Database.
Photographs of the bottom ash and the fly ash , which were taken during the measurement
campaign, are presented in Figure 24.
Figure 24: Photographs of the bottom ash (left) and fly ash (right) collected at the site.
The site has gathered monthly data on the quantities of disposed bottom and fly ash. On average,
14% of the ash forms bottom ash, and 87% fly ash. A rough estimation of the elemental distribution
between bottom ash and fly ash can be made based on this data and the results from the IC analyses
conducted on both ash fractions. The results are presented in Table 9.
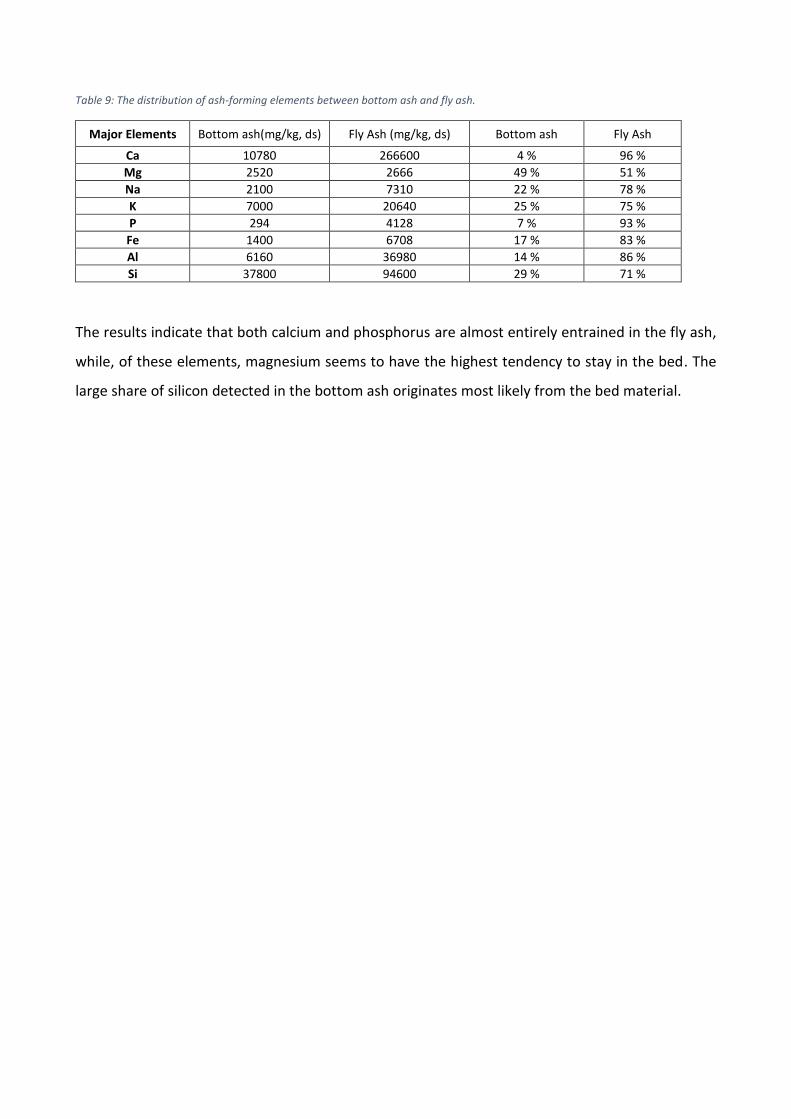
Table 9: The distribution of ash-forming elements between bottom ash and fly ash.
Major Elements Bottom ash(mg/kg, ds) Fly Ash (mg/kg, ds) Bottom ash Fly Ash
Ca 10780 266600 4 % 96 %
Mg 2520 2666 49 % 51 %
Na 2100 7310 22 % 78 %
K 7000 20640 25 % 75 %
P 294 4128 7 % 93 %
Fe 1400 6708 17 % 83 %
Al 6160 36980 14 % 86 %
Si 37800 94600 29 % 71 %
The results indicate that both calcium and phosphorus are almost entirely entrained in the fly ash,
while, of these elements, magnesium seems to have the highest tendency to stay in the bed. The
large share of silicon detected in the bottom ash originates most likely from the bed material.

6. Results and Discussion In this chapter, the results from the measurement campaign, gained by the analysis methods
mentioned in the experimental chapter, will be presented. The results gained from different
measurement points will be discussed separately.
6.1 Secondary superheater area (SSH) The results from the short-term deposit measurements just below the secondary superheater (SSH)
are presented in this section. In addition to the 2 h short-term deposit measurements, a 4 h test
was also conducted with a material temperature of 525 °C. The measurements are listed in Table
10.
Table 10: The tests done in this study just below the SSH.
Sample Material
temperature, °C Material Duration, h
A 550 X10CrMoVNb9-1 2
B 525 X10CrMoVNb9-1 2
C 525 X10CrMoVNb9-1 4
D 500 X10CrMoVNb9-1 2
E 450 X10CrMoVNb9-1 2
The appearances of the exposed rings were similar. On all of the deposit probe rings from this
measurement point, larger particles accumulated likely by inertial impact on the wind side, while
the fine ash particles accumulated on the side and lee position, likely by diffusion or thermophoresis.
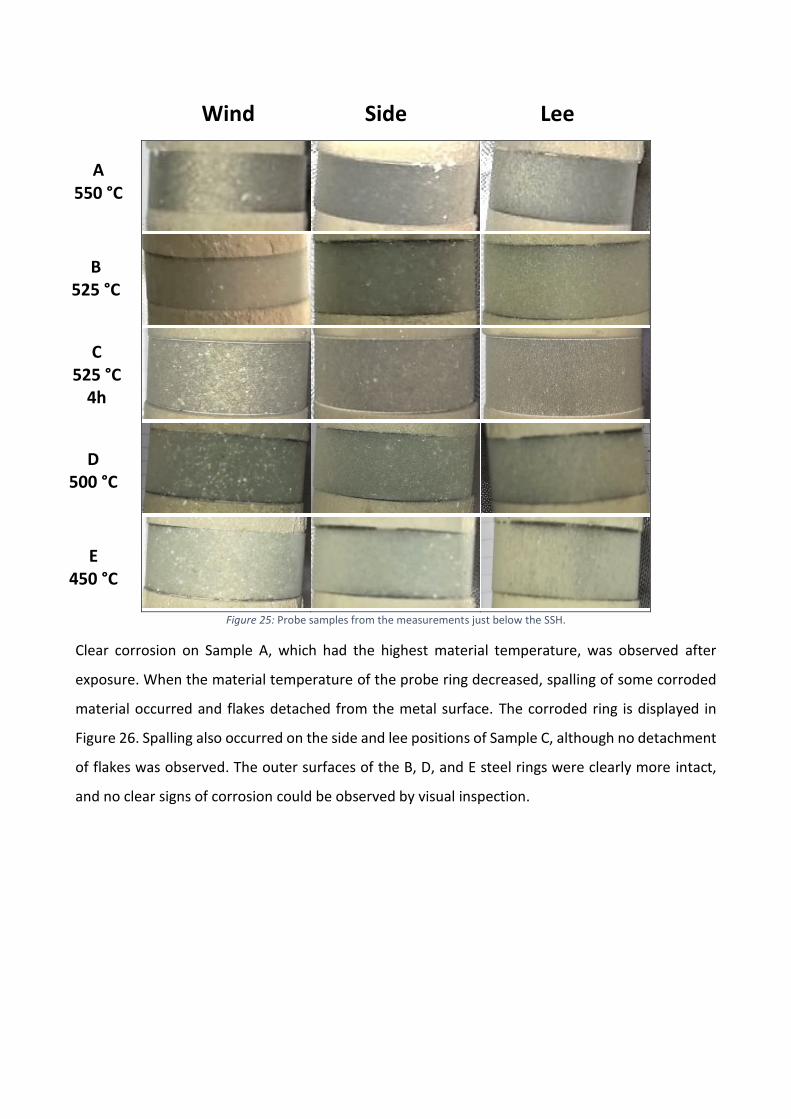
Figure 25: Probe samples from the measurements just below the SSH.
Clear corrosion on Sample A, which had the highest material temperature, was observed after
exposure. When the material temperature of the probe ring decreased, spalling of some corroded
material occurred and flakes detached from the metal surface. The corroded ring is displayed in
Figure 26. Spalling also occurred on the side and lee positions of Sample C, although no detachment
of flakes was observed. The outer surfaces of the B, D, and E steel rings were clearly more intact,
and no clear signs of corrosion could be observed by visual inspection.
A 550 °C
B 525 °C
B 550 °C
Side Wind Lee
C 525 °C
4h
B 550 °C
E 450 °C
B 550 °C
D 500 °C
B 550 °C
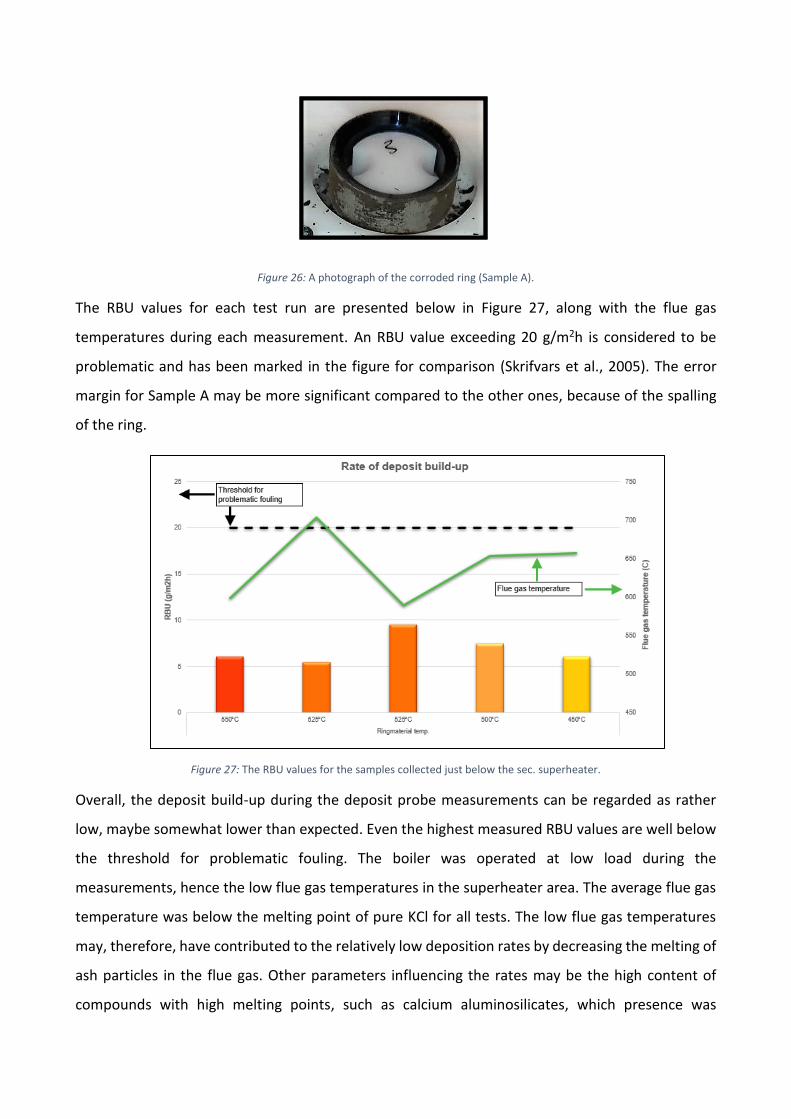
Figure 26: A photograph of the corroded ring (Sample A).
The RBU values for each test run are presented below in Figure 27, along with the flue gas
temperatures during each measurement. An RBU value exceeding 20 g/m2h is considered to be
problematic and has been marked in the figure for comparison (Skrifvars et al., 2005). The error
margin for Sample A may be more significant compared to the other ones, because of the spalling
of the ring.
Figure 27: The RBU values for the samples collected just below the sec. superheater.
Overall, the deposit build-up during the deposit probe measurements can be regarded as rather
low, maybe somewhat lower than expected. Even the highest measured RBU values are well below
the threshold for problematic fouling. The boiler was operated at low load during the
measurements, hence the low flue gas temperatures in the superheater area. The average flue gas
temperature was below the melting point of pure KCl for all tests. The low flue gas temperatures
may, therefore, have contributed to the relatively low deposition rates by decreasing the melting of
ash particles in the flue gas. Other parameters influencing the rates may be the high content of
compounds with high melting points, such as calcium aluminosilicates, which presence was
indicated by the fuel analysis. These compounds are known to have higher melting temperatures in
the range of 1300-1500 °C (anorthite, gehlenite, grossular, gismondite) (Vassilev et al., 2013). The
large share of other calcium compounds in the sludge also contributes to a higher melting
temperature of the fly ash (Scala and Chirone, 2006; Scala and Chirone, 2008). Accordingly, the
inclusion of sludge appears to decrease ash induced problems in the combustion process.
In Figure 28, SEM-images of deposit samples collected during the measurements just below the
secondary superheater are presented. In some cases, the low amount of deposit that was collected
made it challenging to scrape of the sample for SEM/EDX analysis. In all SEM-images, the positions
of area and spot analyses conducted are marked. In the EDX results presented in Figure 29,
elemental oxygen has been excluded from the composition.
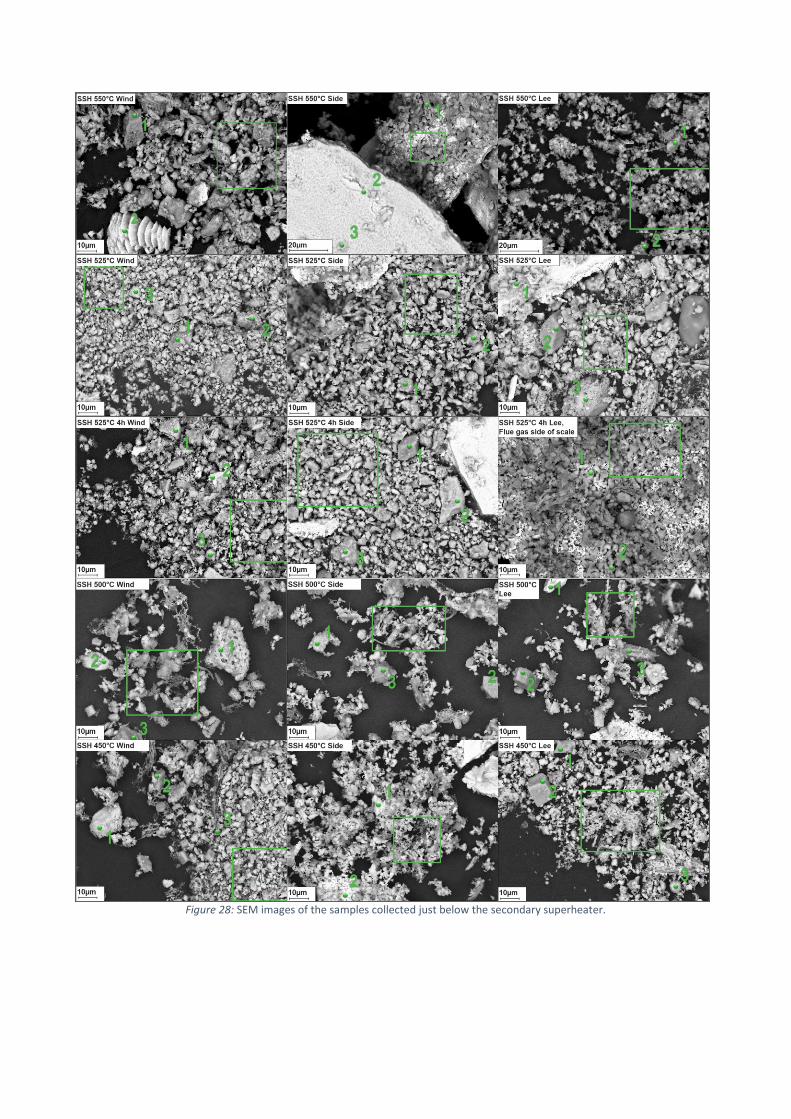
Figure 28: SEM images of the samples collected just below the secondary superheater.
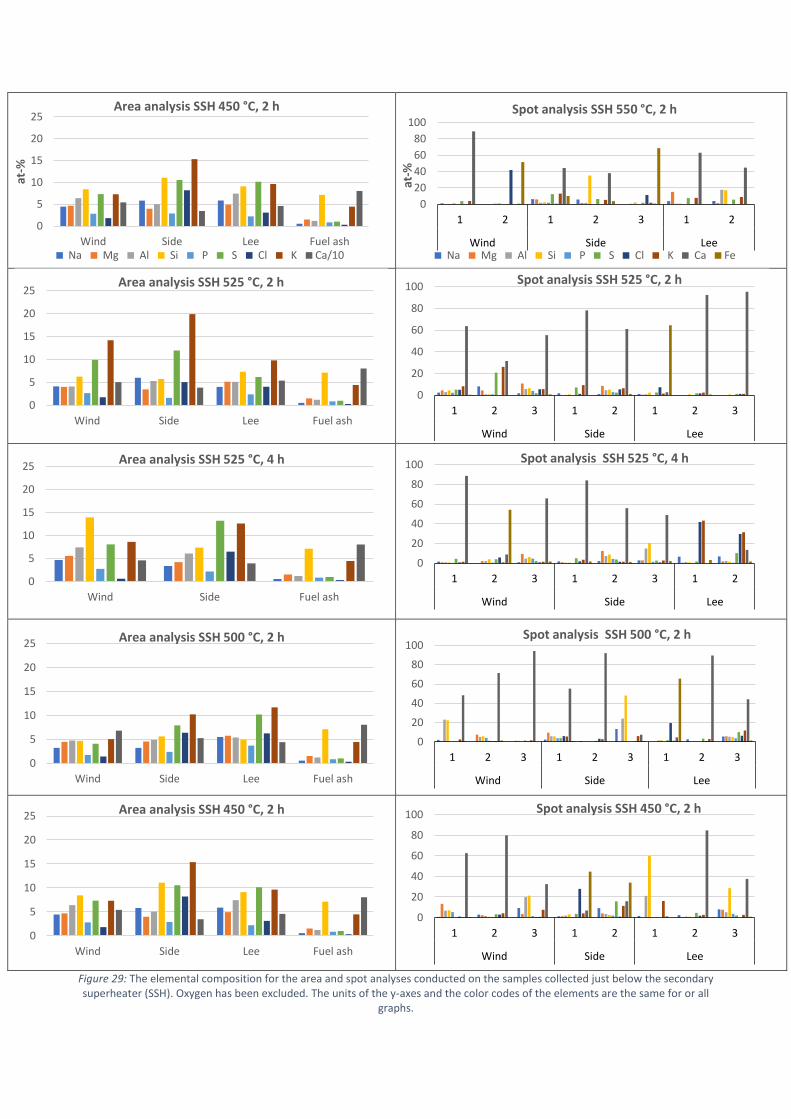
Figure 29: The elemental composition for the area and spot analyses conducted on the samples collected just below the secondary superheater (SSH). Oxygen has been excluded. The units of the y-axes and the color codes of the elements are the same for or all
graphs.
0
5
10
15
20
25
Wind Side Fuel ash
Area analysis SSH 525 °C, 4 h
0
5
10
15
20
25
Wind Side Lee Fuel ash
Area analysis SSH 500 °C, 2 h
0
5
10
15
20
25
Wind Side Lee Fuel ash
Area analysis SSH 450 °C, 2 h
0
20
40
60
80
100
1 2 1 2 3 1 2
Wind Side Lee
at-%
Spot analysis SSH 550 °C, 2 h
Na Mg Al Si P S Cl K Ca Fe
0
20
40
60
80
100
1 2 3 1 2 1 2 3
Wind Side Lee
Spot analysis SSH 525 °C, 2 h
0
20
40
60
80
100
1 2 3 1 2 3 1 2
Wind Side Lee
Spot analysis SSH 525 °C, 4 h
0
20
40
60
80
100
1 2 3 1 2 3 1 2 3
Wind Side Lee
Spot analysis SSH 500 °C, 2 h
0
20
40
60
80
100
1 2 3 1 2 1 2 3
Wind Side Lee
Spot analysis SSH 450 °C, 2 h
0
5
10
15
20
25
Wind Side Lee Fuel ash
at-%
Area analysis SSH 450 °C, 2 h
Na Mg Al Si P S Cl K Ca/10
0
5
10
15
20
25
Wind Side Lee Fuel ash
Area analysis SSH 525 °C, 2 h
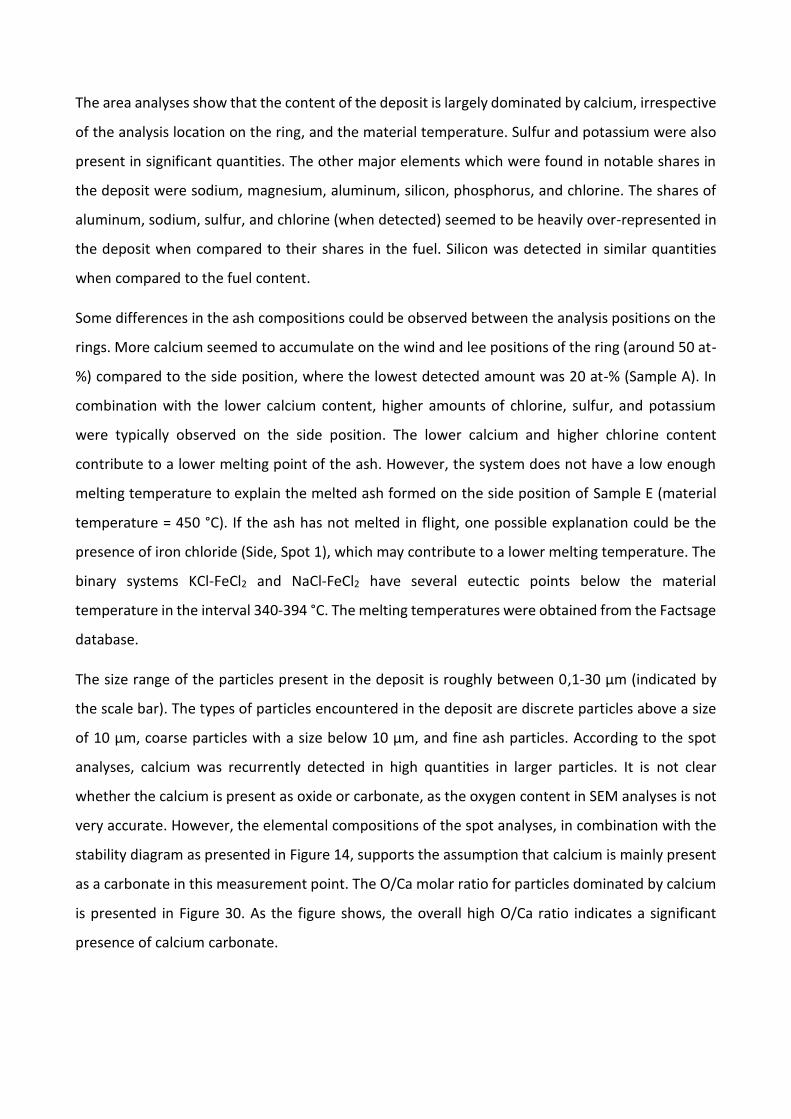
The area analyses show that the content of the deposit is largely dominated by calcium, irrespective
of the analysis location on the ring, and the material temperature. Sulfur and potassium were also
present in significant quantities. The other major elements which were found in notable shares in
the deposit were sodium, magnesium, aluminum, silicon, phosphorus, and chlorine. The shares of
aluminum, sodium, sulfur, and chlorine (when detected) seemed to be heavily over-represented in
the deposit when compared to their shares in the fuel. Silicon was detected in similar quantities
when compared to the fuel content.
Some differences in the ash compositions could be observed between the analysis positions on the
rings. More calcium seemed to accumulate on the wind and lee positions of the ring (around 50 at-
%) compared to the side position, where the lowest detected amount was 20 at-% (Sample A). In
combination with the lower calcium content, higher amounts of chlorine, sulfur, and potassium
were typically observed on the side position. The lower calcium and higher chlorine content
contribute to a lower melting point of the ash. However, the system does not have a low enough
melting temperature to explain the melted ash formed on the side position of Sample E (material
temperature = 450 °C). If the ash has not melted in flight, one possible explanation could be the
presence of iron chloride (Side, Spot 1), which may contribute to a lower melting temperature. The
binary systems KCl-FeCl2 and NaCl-FeCl2 have several eutectic points below the material
temperature in the interval 340-394 °C. The melting temperatures were obtained from the Factsage
database.
The size range of the particles present in the deposit is roughly between 0,1-30 µm (indicated by
the scale bar). The types of particles encountered in the deposit are discrete particles above a size
of 10 µm, coarse particles with a size below 10 µm, and fine ash particles. According to the spot
analyses, calcium was recurrently detected in high quantities in larger particles. It is not clear
whether the calcium is present as oxide or carbonate, as the oxygen content in SEM analyses is not
very accurate. However, the elemental compositions of the spot analyses, in combination with the
stability diagram as presented in Figure 14, supports the assumption that calcium is mainly present
as a carbonate in this measurement point. The O/Ca molar ratio for particles dominated by calcium
is presented in Figure 30. As the figure shows, the overall high O/Ca ratio indicates a significant
presence of calcium carbonate.
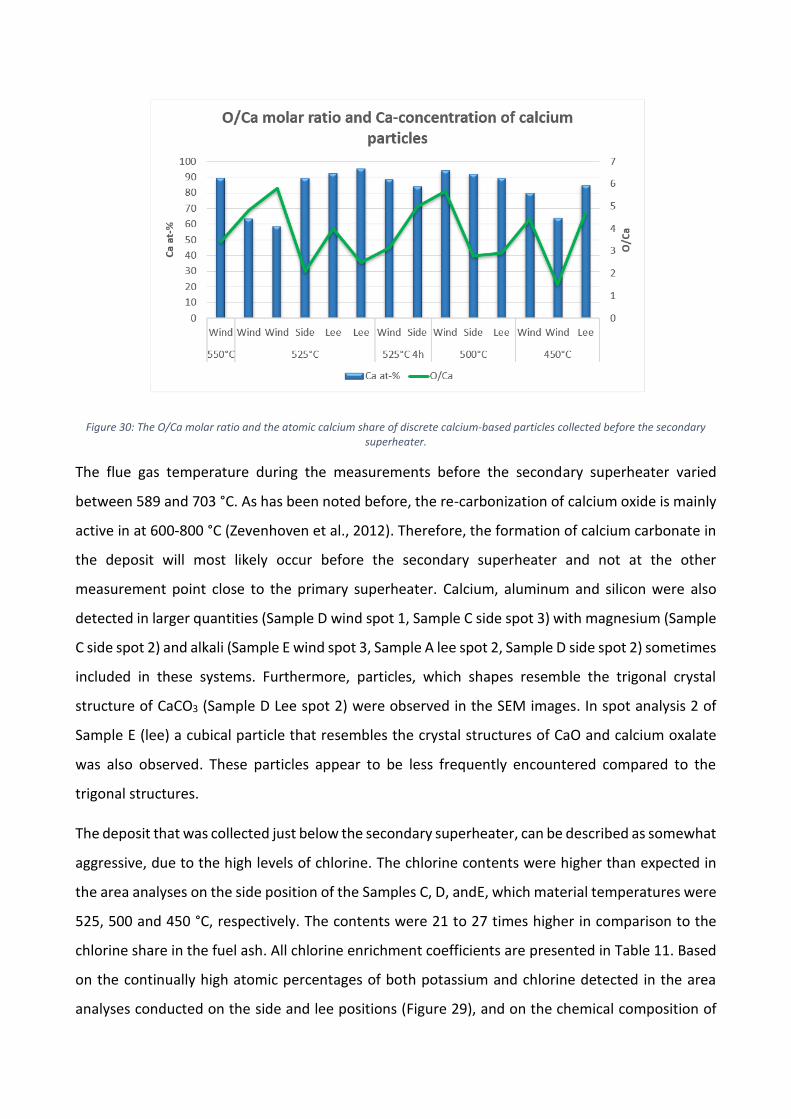
Figure 30: The O/Ca molar ratio and the atomic calcium share of discrete calcium-based particles collected before the secondary superheater.
The flue gas temperature during the measurements before the secondary superheater varied
between 589 and 703 °C. As has been noted before, the re-carbonization of calcium oxide is mainly
active in at 600-800 °C (Zevenhoven et al., 2012). Therefore, the formation of calcium carbonate in
the deposit will most likely occur before the secondary superheater and not at the other
measurement point close to the primary superheater. Calcium, aluminum and silicon were also
detected in larger quantities (Sample D wind spot 1, Sample C side spot 3) with magnesium (Sample
C side spot 2) and alkali (Sample E wind spot 3, Sample A lee spot 2, Sample D side spot 2) sometimes
included in these systems. Furthermore, particles, which shapes resemble the trigonal crystal
structure of CaCO3 (Sample D Lee spot 2) were observed in the SEM images. In spot analysis 2 of
Sample E (lee) a cubical particle that resembles the crystal structures of CaO and calcium oxalate
was also observed. These particles appear to be less frequently encountered compared to the
trigonal structures.
The deposit that was collected just below the secondary superheater, can be described as somewhat
aggressive, due to the high levels of chlorine. The chlorine contents were higher than expected in
the area analyses on the side position of the Samples C, D, andE, which material temperatures were
525, 500 and 450 °C, respectively. The contents were 21 to 27 times higher in comparison to the
chlorine share in the fuel ash. All chlorine enrichment coefficients are presented in Table 11. Based
on the continually high atomic percentages of both potassium and chlorine detected in the area
analyses conducted on the side and lee positions (Figure 29), and on the chemical composition of

some spot analyses with higher chlorine contents (Sample C lee, spots 1 & 2; Sample D lee spot 3),
chlorine seemed to be mainly present as alkali chlorides. At this measurement location, there was
no indication of CaCl2 formation according to the EDX results.
Table 11: Chlorine enrichment coefficients in deposits collected before the secondary superheater.
Sample Position Chlorine enrichment coefficient
A (550 °C)
Wind 4.9
Side No Cl
Lee No Cl
B (525 °C)
Wind 5.7
Side 16.4
Lee 13.1
C (525 °C 4 h)
Wind 2.0
Side 21.1
D (500 °C)
Wind 4.6
Side 20.7
Lee 20.3
E (450 °C)
Wind 5.8
Side 26.5
Lee 10.1
Evidence of corrosion was also found in the deposits. Of all samples, at least one detection of iron
chloride was made. Detached scales from ring A and from the lee position of Ring C were further
examined for details about the corrosion mechanism. SEM images of the scales of Ring A are
presented in Figure 31.
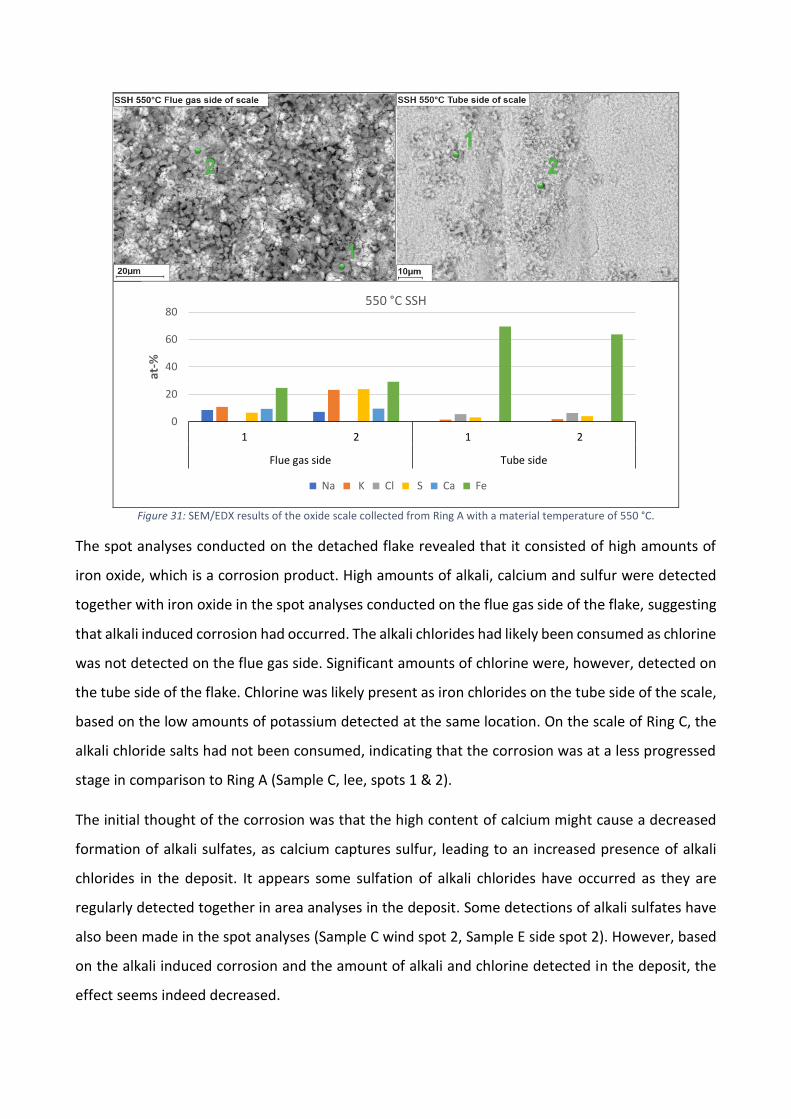
Figure 31: SEM/EDX results of the oxide scale collected from Ring A with a material temperature of 550 °C.
The spot analyses conducted on the detached flake revealed that it consisted of high amounts of
iron oxide, which is a corrosion product. High amounts of alkali, calcium and sulfur were detected
together with iron oxide in the spot analyses conducted on the flue gas side of the flake, suggesting
that alkali induced corrosion had occurred. The alkali chlorides had likely been consumed as chlorine
was not detected on the flue gas side. Significant amounts of chlorine were, however, detected on
the tube side of the flake. Chlorine was likely present as iron chlorides on the tube side of the scale,
based on the low amounts of potassium detected at the same location. On the scale of Ring C, the
alkali chloride salts had not been consumed, indicating that the corrosion was at a less progressed
stage in comparison to Ring A (Sample C, lee, spots 1 & 2).
The initial thought of the corrosion was that the high content of calcium might cause a decreased
formation of alkali sulfates, as calcium captures sulfur, leading to an increased presence of alkali
chlorides in the deposit. It appears some sulfation of alkali chlorides have occurred as they are
regularly detected together in area analyses in the deposit. Some detections of alkali sulfates have
also been made in the spot analyses (Sample C wind spot 2, Sample E side spot 2). However, based
on the alkali induced corrosion and the amount of alkali and chlorine detected in the deposit, the
effect seems indeed decreased.
0
20
40
60
80
1 2 1 2
Flue gas side Tube side
at-%
550 °C SSH
Na K Cl S Ca Fe
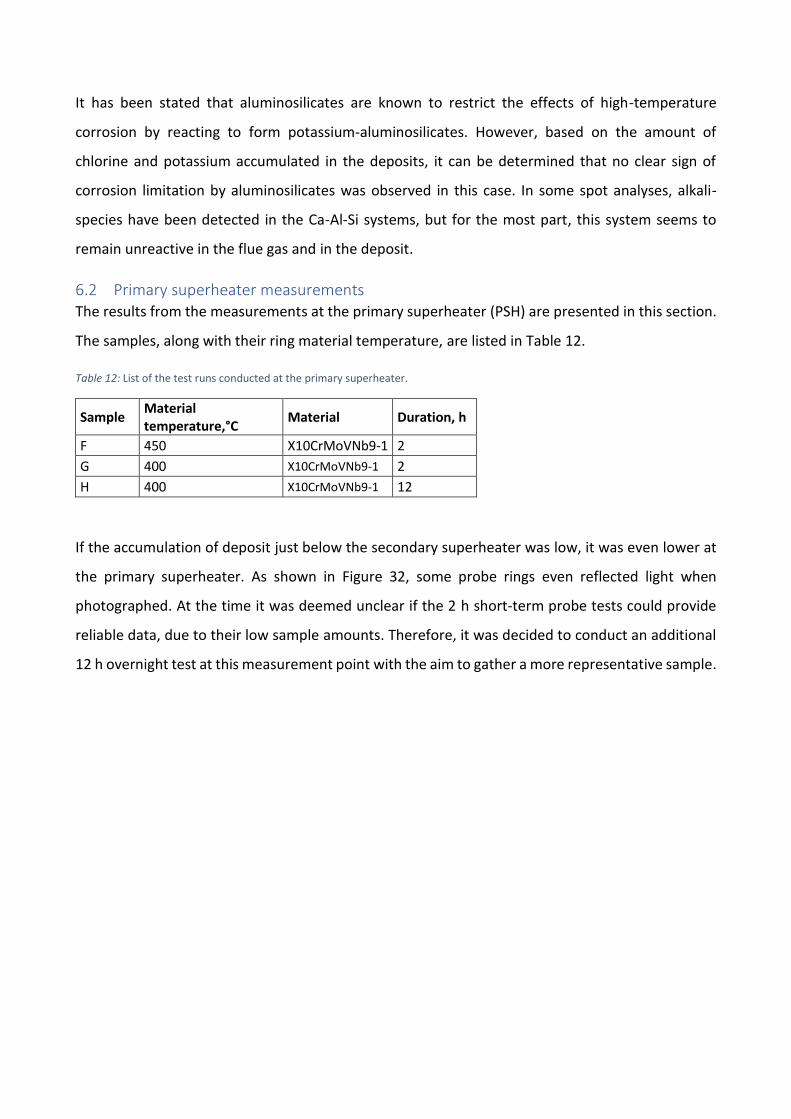
It has been stated that aluminosilicates are known to restrict the effects of high-temperature
corrosion by reacting to form potassium-aluminosilicates. However, based on the amount of
chlorine and potassium accumulated in the deposits, it can be determined that no clear sign of
corrosion limitation by aluminosilicates was observed in this case. In some spot analyses, alkali-
species have been detected in the Ca-Al-Si systems, but for the most part, this system seems to
remain unreactive in the flue gas and in the deposit.
6.2 Primary superheater measurements The results from the measurements at the primary superheater (PSH) are presented in this section.
The samples, along with their ring material temperature, are listed in Table 12.
Table 12: List of the test runs conducted at the primary superheater.
Sample Material temperature,°C
Material Duration, h
F 450 X10CrMoVNb9-1 2
G 400 X10CrMoVNb9-1 2
H 400 X10CrMoVNb9-1 12
If the accumulation of deposit just below the secondary superheater was low, it was even lower at
the primary superheater. As shown in Figure 32, some probe rings even reflected light when
photographed. At the time it was deemed unclear if the 2 h short-term probe tests could provide
reliable data, due to their low sample amounts. Therefore, it was decided to conduct an additional
12 h overnight test at this measurement point with the aim to gather a more representative sample.
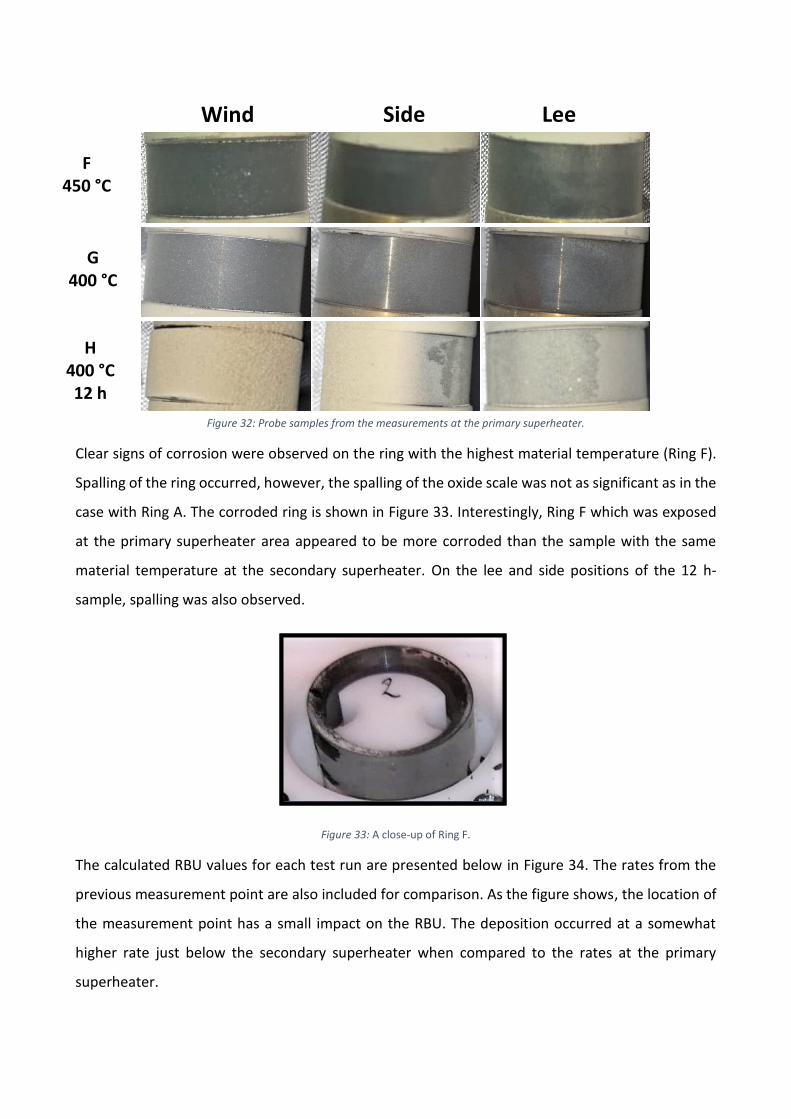
Figure 32: Probe samples from the measurements at the primary superheater.
Clear signs of corrosion were observed on the ring with the highest material temperature (Ring F).
Spalling of the ring occurred, however, the spalling of the oxide scale was not as significant as in the
case with Ring A. The corroded ring is shown in Figure 33. Interestingly, Ring F which was exposed
at the primary superheater area appeared to be more corroded than the sample with the same
material temperature at the secondary superheater. On the lee and side positions of the 12 h-
sample, spalling was also observed.
Figure 33: A close-up of Ring F.
The calculated RBU values for each test run are presented below in Figure 34. The rates from the
previous measurement point are also included for comparison. As the figure shows, the location of
the measurement point has a small impact on the RBU. The deposition occurred at a somewhat
higher rate just below the secondary superheater when compared to the rates at the primary
superheater.
Wind Lee Side
F 450 °C
B 550 °C
G
400 °C
B 550 °C
H 400 °C 12 h
B 550 °C
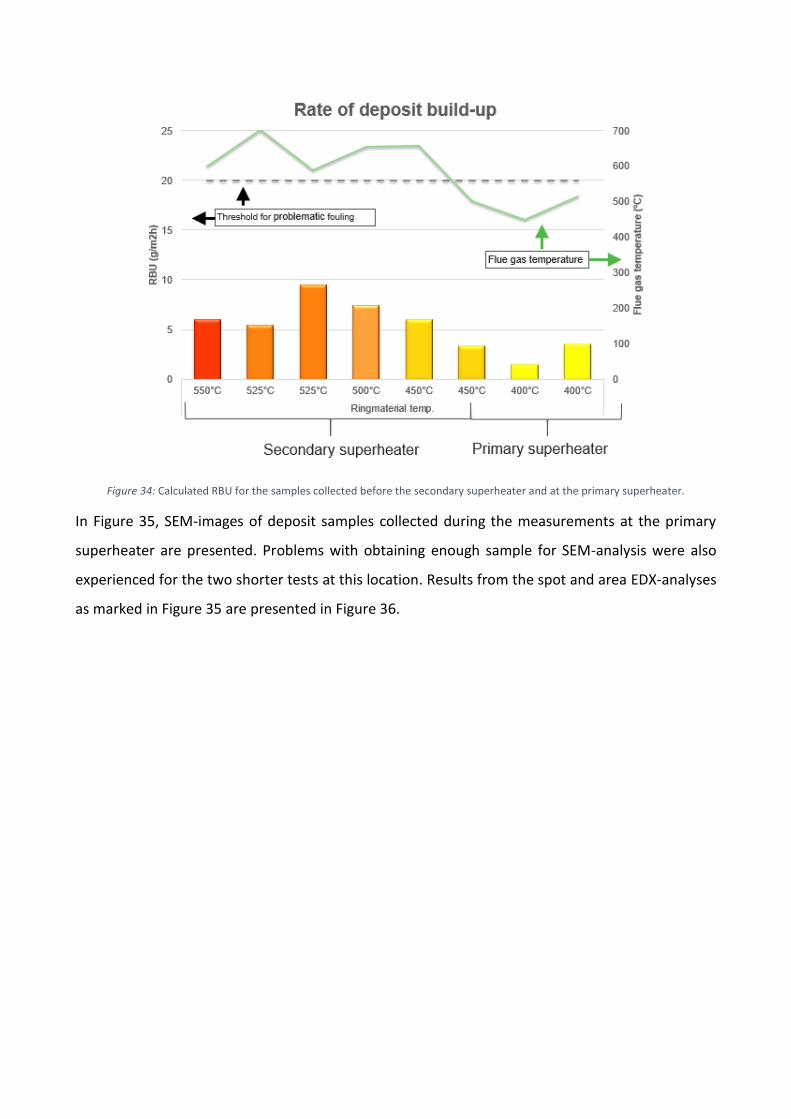
Figure 34: Calculated RBU for the samples collected before the secondary superheater and at the primary superheater.
In Figure 35, SEM-images of deposit samples collected during the measurements at the primary
superheater are presented. Problems with obtaining enough sample for SEM-analysis were also
experienced for the two shorter tests at this location. Results from the spot and area EDX-analyses
as marked in Figure 35 are presented in Figure 36.
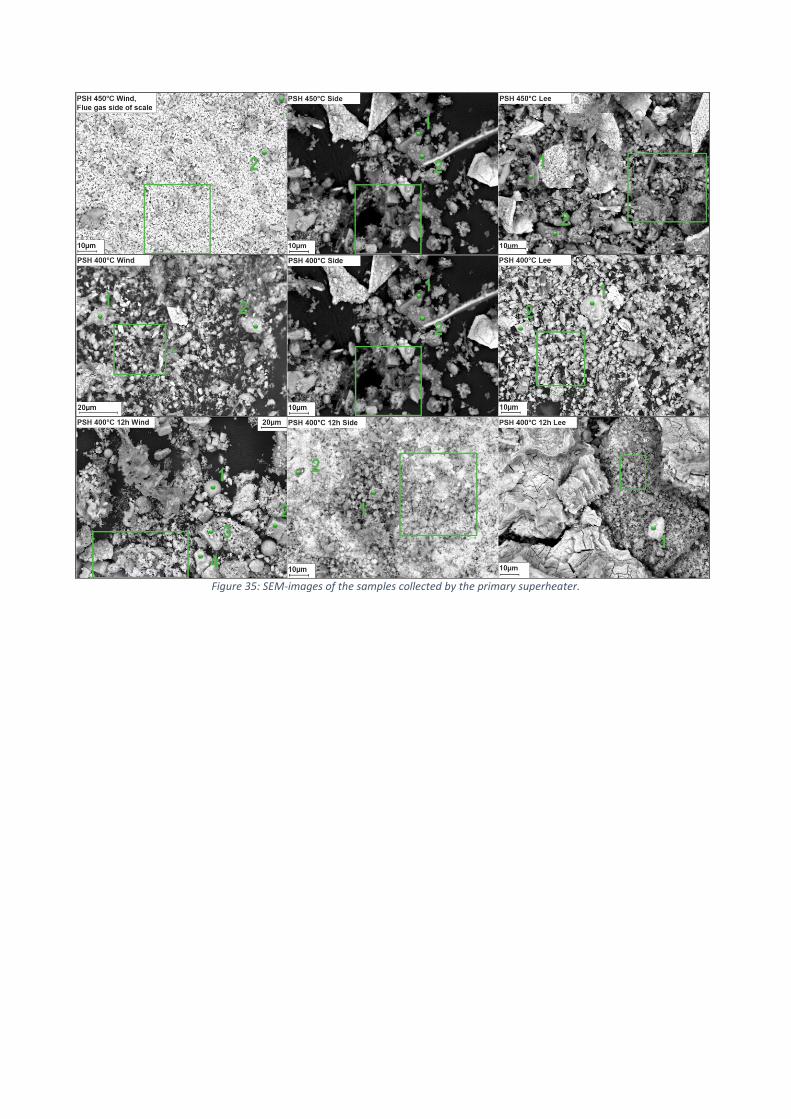
Figure 35: SEM-images of the samples collected by the primary superheater.
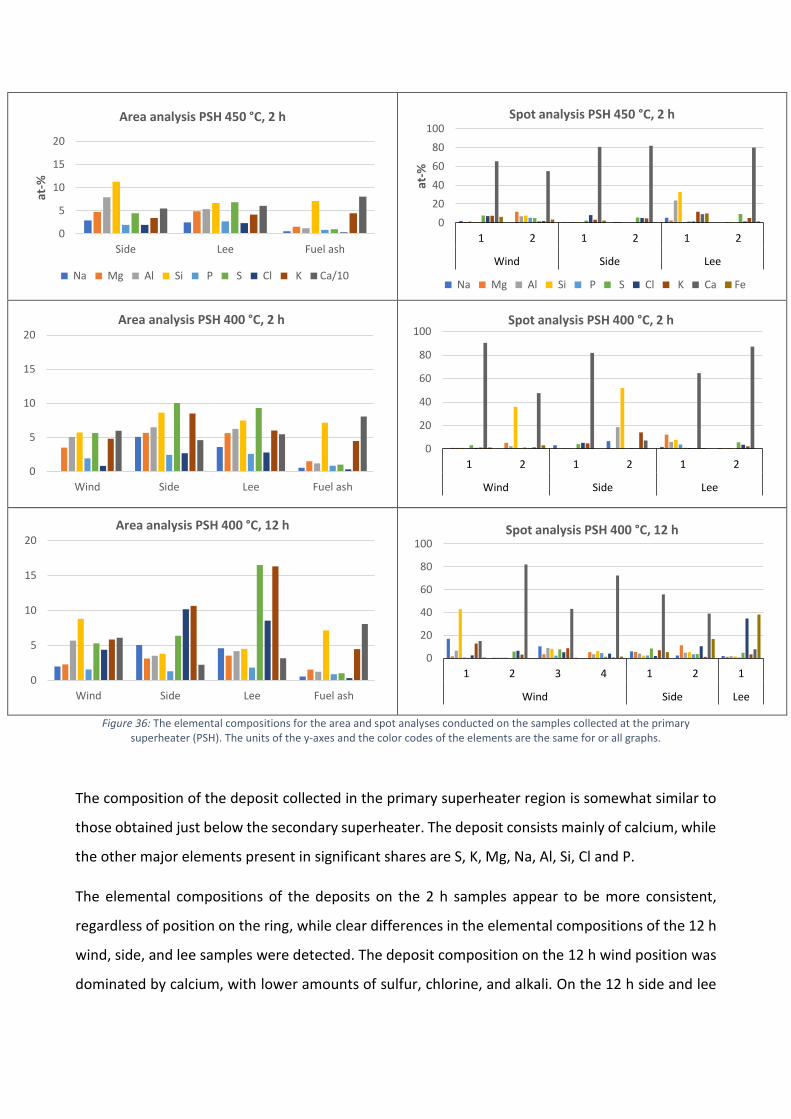
Figure 36: The elemental compositions for the area and spot analyses conducted on the samples collected at the primary
superheater (PSH). The units of the y-axes and the color codes of the elements are the same for or all graphs.
The composition of the deposit collected in the primary superheater region is somewhat similar to
those obtained just below the secondary superheater. The deposit consists mainly of calcium, while
the other major elements present in significant shares are S, K, Mg, Na, Al, Si, Cl and P.
The elemental compositions of the deposits on the 2 h samples appear to be more consistent,
regardless of position on the ring, while clear differences in the elemental compositions of the 12 h
wind, side, and lee samples were detected. The deposit composition on the 12 h wind position was
dominated by calcium, with lower amounts of sulfur, chlorine, and alkali. On the 12 h side and lee
0
5
10
15
20
Side Lee Fuel ash
at-%
Area analysis PSH 450 °C, 2 h
Na Mg Al Si P S Cl K Ca/10
0
20
40
60
80
100
1 2 1 2 1 2
Wind Side Lee
at-%
Spot analysis PSH 450 °C, 2 h
Na Mg Al Si P S Cl K Ca Fe
0
5
10
15
20
Wind Side Lee Fuel ash
Area analysis PSH 400 °C, 12 h
0
20
40
60
80
100
1 2 3 4 1 2 1
Wind Side Lee
Spot analysis PSH 400 °C, 12 h
0
5
10
15
20
Wind Side Lee Fuel ash
Area analysis PSH 400 °C, 2 h
0
20
40
60
80
100
1 2 1 2 1 2
Wind Side Lee
Spot analysis PSH 400 °C, 2 h
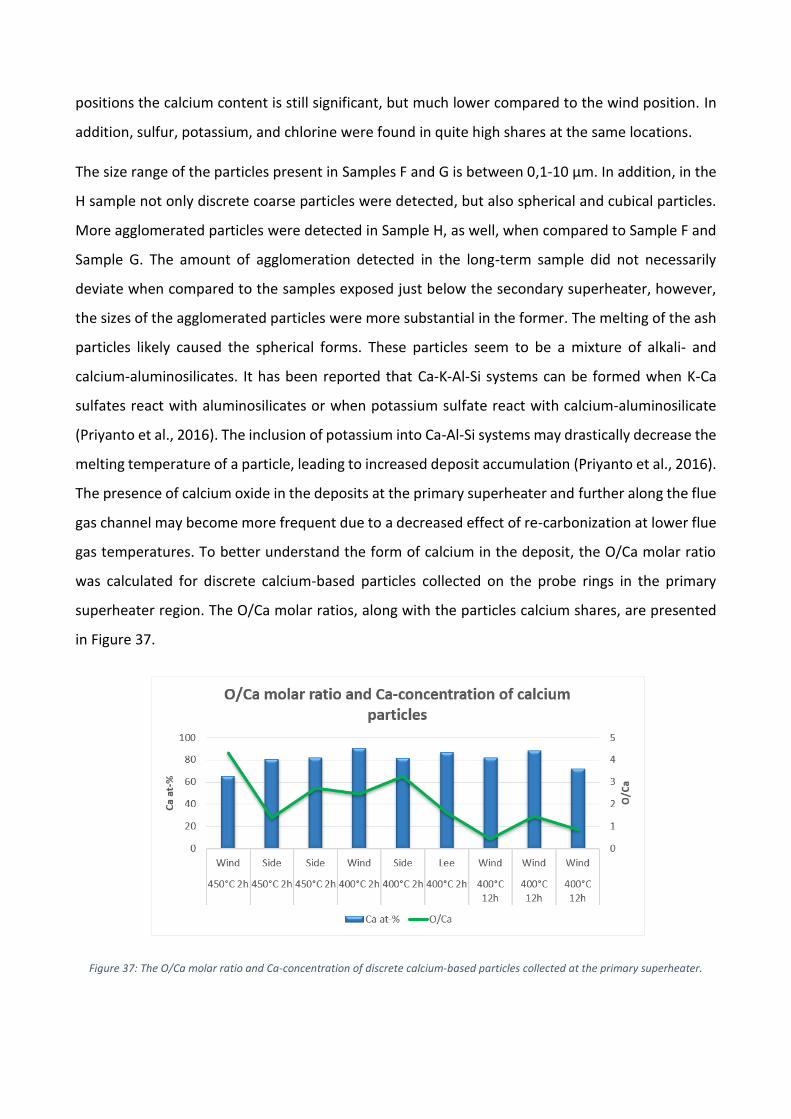
positions the calcium content is still significant, but much lower compared to the wind position. In
addition, sulfur, potassium, and chlorine were found in quite high shares at the same locations.
The size range of the particles present in Samples F and G is between 0,1-10 µm. In addition, in the
H sample not only discrete coarse particles were detected, but also spherical and cubical particles.
More agglomerated particles were detected in Sample H, as well, when compared to Sample F and
Sample G. The amount of agglomeration detected in the long-term sample did not necessarily
deviate when compared to the samples exposed just below the secondary superheater, however,
the sizes of the agglomerated particles were more substantial in the former. The melting of the ash
particles likely caused the spherical forms. These particles seem to be a mixture of alkali- and
calcium-aluminosilicates. It has been reported that Ca-K-Al-Si systems can be formed when K-Ca
sulfates react with aluminosilicates or when potassium sulfate react with calcium-aluminosilicate
(Priyanto et al., 2016). The inclusion of potassium into Ca-Al-Si systems may drastically decrease the
melting temperature of a particle, leading to increased deposit accumulation (Priyanto et al., 2016).
The presence of calcium oxide in the deposits at the primary superheater and further along the flue
gas channel may become more frequent due to a decreased effect of re-carbonization at lower flue
gas temperatures. To better understand the form of calcium in the deposit, the O/Ca molar ratio
was calculated for discrete calcium-based particles collected on the probe rings in the primary
superheater region. The O/Ca molar ratios, along with the particles calcium shares, are presented
in Figure 37.
Figure 37: The O/Ca molar ratio and Ca-concentration of discrete calcium-based particles collected at the primary superheater.

As compared to the samples collected close to the secondary superheater (Figure 30), a clear shift
towards lower O/Ca ratios has occurred at the primary superheater, especially in Sample H (12 h).
The lower molar ratios of O/Ca of discrete calcium particles in combination with the lower flue gas
temperatures suggests a more prominent presence of CaO at the primary superheater.
The chlorine enrichment factors in the deposits collected at the primary superheater are presented
in Table 13. The chlorine enrichment coefficients are based on the chlorine content in the deposit
and in the fuel.
Table 13: Chlorine enrichment coefficients in deposits collected at the primary superheater.
Sample Position Chlorine enrichment coefficient
F (450 °C)
Wind Not enough sample for SEM
Side 6.3
Lee 7.5
G (400 °C)
Wind 2.6
Side 8.7
Lee 9.0
H (400 °C, 12 h)
Wind 14.1
Side 32.9
Lee 27.6
There was a significant difference in the accumulation of chlorine in the short term and long-term
samples. On the short-term samples, the chlorine content was significantly lower than in the long-
term samples, which is clearly pronounced in the side and lee analyses. For the short- term
exposures the chlorine enrichment coefficients at these positions were between 6 and 9. However,
a dramatical change in chlorine content could be observed for the long-term test with chlorine
contents of 10 and 8.5 at-% in the side and lee samples. The chlorine enrichment factors in these
samples were 33 and 27, respectively. In the wind sample of Sample H, the content of chlorine was
much lower but still significant.
Based on the molar ratios between potassium and chlorine in Figure 36 and on detections from the
spot analyses (Sample F wind and side spot 2; Sample G side spot 2, Sample H wind spot 2), chlorine
seemed to be mainly present as alkali chlorides. In some of the spot analyses on the deposits
collected in tests G and H, CaCl2 may also have been present. Two probable observations of CaCl2
were made on sample H (wind spots 2 & 4) and one on sample G (lee spot 2). Based on the locations
of the analyses, the formation of CaCl2 seems to occur on discrete particles of CaO or CaCO3. Other
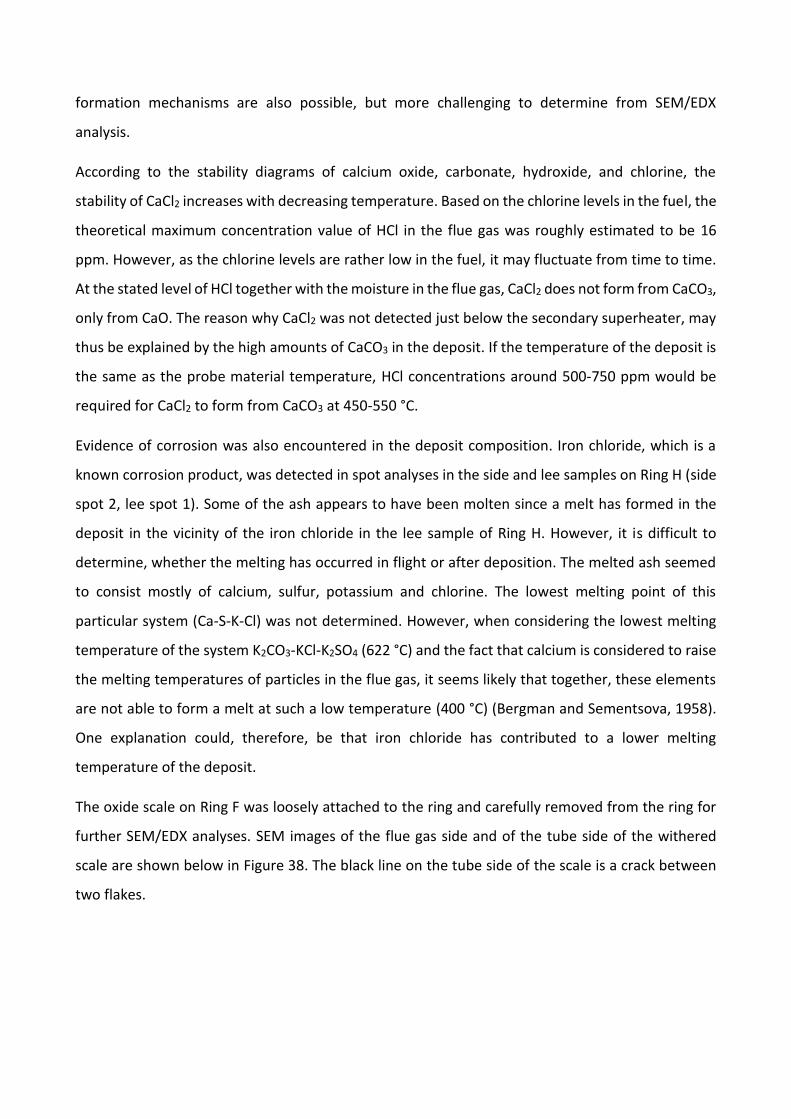
formation mechanisms are also possible, but more challenging to determine from SEM/EDX
analysis.
According to the stability diagrams of calcium oxide, carbonate, hydroxide, and chlorine, the
stability of CaCl2 increases with decreasing temperature. Based on the chlorine levels in the fuel, the
theoretical maximum concentration value of HCl in the flue gas was roughly estimated to be 16
ppm. However, as the chlorine levels are rather low in the fuel, it may fluctuate from time to time.
At the stated level of HCl together with the moisture in the flue gas, CaCl2 does not form from CaCO3,
only from CaO. The reason why CaCl2 was not detected just below the secondary superheater, may
thus be explained by the high amounts of CaCO3 in the deposit. If the temperature of the deposit is
the same as the probe material temperature, HCl concentrations around 500-750 ppm would be
required for CaCl2 to form from CaCO3 at 450-550 °C.
Evidence of corrosion was also encountered in the deposit composition. Iron chloride, which is a
known corrosion product, was detected in spot analyses in the side and lee samples on Ring H (side
spot 2, lee spot 1). Some of the ash appears to have been molten since a melt has formed in the
deposit in the vicinity of the iron chloride in the lee sample of Ring H. However, it is difficult to
determine, whether the melting has occurred in flight or after deposition. The melted ash seemed
to consist mostly of calcium, sulfur, potassium and chlorine. The lowest melting point of this
particular system (Ca-S-K-Cl) was not determined. However, when considering the lowest melting
temperature of the system K2CO3-KCl-K2SO4 (622 °C) and the fact that calcium is considered to raise
the melting temperatures of particles in the flue gas, it seems likely that together, these elements
are not able to form a melt at such a low temperature (400 °C) (Bergman and Sementsova, 1958).
One explanation could, therefore, be that iron chloride has contributed to a lower melting
temperature of the deposit.
The oxide scale on Ring F was loosely attached to the ring and carefully removed from the ring for
further SEM/EDX analyses. SEM images of the flue gas side and of the tube side of the withered
scale are shown below in Figure 38. The black line on the tube side of the scale is a crack between
two flakes.
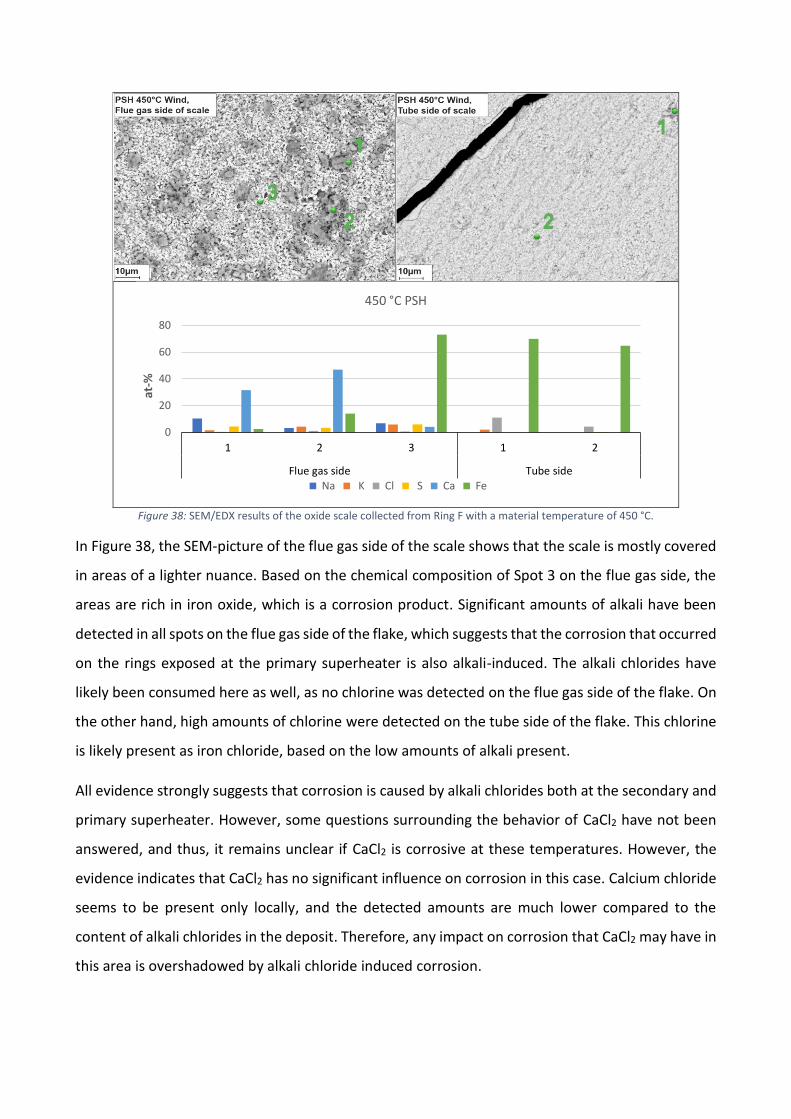
Figure 38: SEM/EDX results of the oxide scale collected from Ring F with a material temperature of 450 °C.
In Figure 38, the SEM-picture of the flue gas side of the scale shows that the scale is mostly covered
in areas of a lighter nuance. Based on the chemical composition of Spot 3 on the flue gas side, the
areas are rich in iron oxide, which is a corrosion product. Significant amounts of alkali have been
detected in all spots on the flue gas side of the flake, which suggests that the corrosion that occurred
on the rings exposed at the primary superheater is also alkali-induced. The alkali chlorides have
likely been consumed here as well, as no chlorine was detected on the flue gas side of the flake. On
the other hand, high amounts of chlorine were detected on the tube side of the flake. This chlorine
is likely present as iron chloride, based on the low amounts of alkali present.
All evidence strongly suggests that corrosion is caused by alkali chlorides both at the secondary and
primary superheater. However, some questions surrounding the behavior of CaCl2 have not been
answered, and thus, it remains unclear if CaCl2 is corrosive at these temperatures. However, the
evidence indicates that CaCl2 has no significant influence on corrosion in this case. Calcium chloride
seems to be present only locally, and the detected amounts are much lower compared to the
content of alkali chlorides in the deposit. Therefore, any impact on corrosion that CaCl2 may have in
this area is overshadowed by alkali chloride induced corrosion.
0
20
40
60
80
1 2 3 1 2
Flue gas side Tube side
at-%
450 °C PSH
Na K Cl S Ca Fe
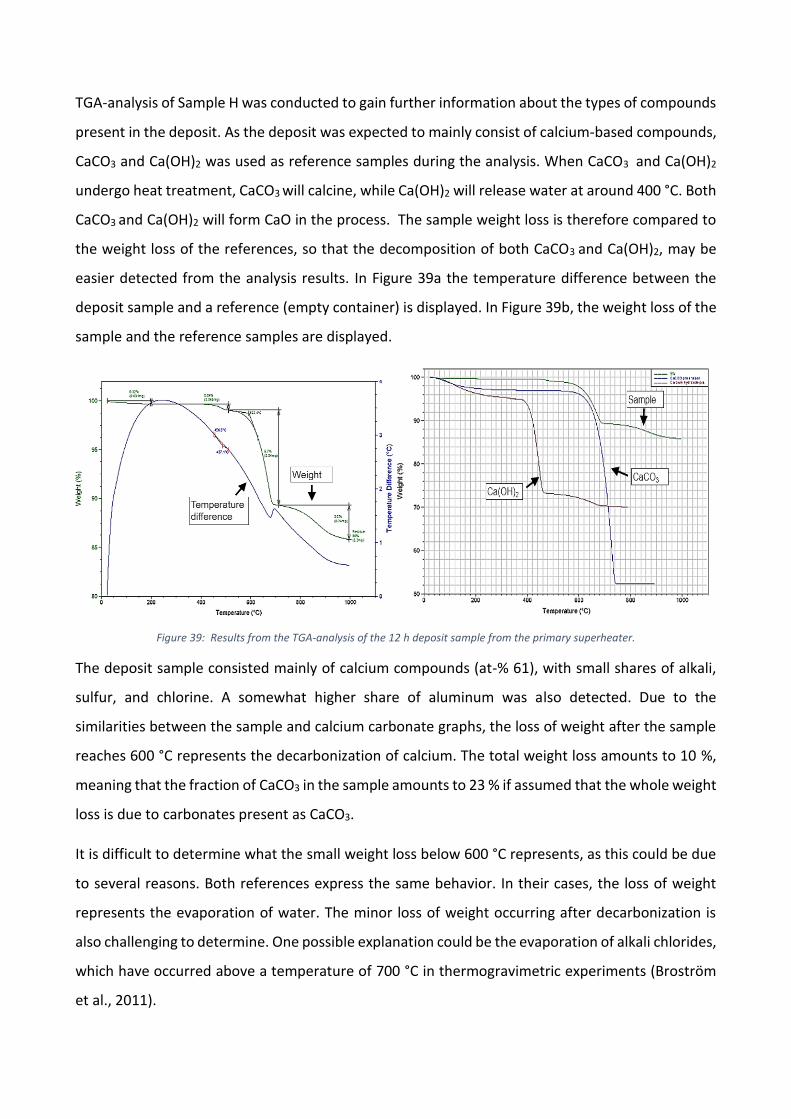
TGA-analysis of Sample H was conducted to gain further information about the types of compounds
present in the deposit. As the deposit was expected to mainly consist of calcium-based compounds,
CaCO3 and Ca(OH)2 was used as reference samples during the analysis. When CaCO3 and Ca(OH)2
undergo heat treatment, CaCO3 will calcine, while Ca(OH)2 will release water at around 400 °C. Both
CaCO3 and Ca(OH)2 will form CaO in the process. The sample weight loss is therefore compared to
the weight loss of the references, so that the decomposition of both CaCO3 and Ca(OH)2, may be
easier detected from the analysis results. In Figure 39a the temperature difference between the
deposit sample and a reference (empty container) is displayed. In Figure 39b, the weight loss of the
sample and the reference samples are displayed.
Figure 39: Results from the TGA-analysis of the 12 h deposit sample from the primary superheater.
The deposit sample consisted mainly of calcium compounds (at-% 61), with small shares of alkali,
sulfur, and chlorine. A somewhat higher share of aluminum was also detected. Due to the
similarities between the sample and calcium carbonate graphs, the loss of weight after the sample
reaches 600 °C represents the decarbonization of calcium. The total weight loss amounts to 10 %,
meaning that the fraction of CaCO3 in the sample amounts to 23 % if assumed that the whole weight
loss is due to carbonates present as CaCO3.
It is difficult to determine what the small weight loss below 600 °C represents, as this could be due
to several reasons. Both references express the same behavior. In their cases, the loss of weight
represents the evaporation of water. The minor loss of weight occurring after decarbonization is
also challenging to determine. One possible explanation could be the evaporation of alkali chlorides,
which have occurred above a temperature of 700 °C in thermogravimetric experiments (Broström
et al., 2011).

Finally, an XRD-analysis was conducted on the 400 °C wind sample. The compounds detected, and
the signal intensities are presented in Table 14. Based on the signal intensities the compounds are
categorized into major (***, >15 wt.-%), minor (**, <15 wt.-%), or trace amounts (*, <5 wt.-%).
Table 14: Results from XRD-analysis on Sample H.
Phase PSH 400 °C Wind
𝐶𝑎𝑂 (lime) *
𝐶𝑎(𝑂𝐻)2 (portlandite) **
𝐶𝑎𝐶𝑂3 (calcite) ***
𝐾2𝐶𝑎(𝐶𝑂3)2 (bütschliite)
𝐾𝐶𝑙 (sylvite) **
𝐾3𝑁𝑎(𝑆𝑂4)2 (aphtitalite) *
𝐶𝑎𝑆𝑂4 (anhydrite) **
𝑀𝑔𝑂 (periclase) *
𝑆𝑖𝑂2 (quartz)
𝐶𝑎2𝑆𝑖𝑂4 (larnite)
𝐶𝑎3𝑀𝑔𝑆𝑖2𝑂8 (merwinite)
𝐶𝑎2𝐴𝑙2𝑆𝑖𝑂7 (gehlenite) ***
𝐶𝑎3𝐴𝑙2𝑂6 *
The XRD analysis provides valuable support as it confirms some of the hypotheses which have been
stated in this work. Previously mentioned evidence has strongly suggested that the corrosion is
caused by alkali chlorides and the detection of KCl in the deposit at the primary superheater
supports this assumption. Traces of K3Na(SO4)2, combined with the detection of minor amounts of
CaSO4, confirms indeed that calcium captures sulfur in the flue gas and thus contributes indirectly
to corrosion by decreasing the sulfation of alkali chlorides. No CaCl2 was detected in the sample,
although the SEM/EDX results suggested it was present at least in minor amounts. The absence of
CaCl2 in the XRD analysis will be further discussed in the part of this work that treats the results from
the cold-end section of the boiler.
The fuel analysis indicated the presence of calcium aluminosilicates in the sludge, which was
confirmed by the strong signals of gehlenite (Ca2Al2SiO7) in the XRD-analyses. Alkali was not found
in any of the aluminosilicate systems detected in the XRD-analysis, and therefore it is concluded that
calcium aluminosilicates do not reduce corrosion by capturing alkali.
After the deposits on the probe rings had been analyzed, the rings were washed in citric
acid. The purpose of the washing was to dissolve all corrosion products in the acidic
solution. An ultrasound bath was used for the washing. In Figure 40a, the washed rings
can be observed. The corrosion rates of the deposit rings were calculated after weighing
the newly rinsed rings, and the results are presented in Figure 40b.
Figure 40: a) A photograph of the rings washed with citric acid, b) Calculated CRI for the samples collected before the sec. superheater and at the prim. superheater.
Judging by the graph in Figure 40, a clear correlation between the corrosion rate and the material
temperature can be observed. At temperatures over and at 500 °C, increased corrosion rates can
be observed. Below 500 °C, the corrosion is less aggressive. A more alloyed superheater material is
used in the secondary superheater region of the boiler, and therefore the real corrosion rates are
likely much lower. However, based on the corrosion rates available, one can conclude that
X10CrMoVNb9-1 is not fit as a secondary superheater material with the fuel mixture used, due to
the high corrosion rates on the sample rings. Sulfur addition would likely be recommended.
6.3 Low-temperature measurements The results from the measurements at the air preheater (APH) are presented in this section. The
samples, along with the type of ring material and material temperature, are listed in Table 15.

Table 15: The sample ID:s for the test run at the air preheater.
Sample Material temperature, °C Material
I 120 16Mo3
J 120 304L
K 100 16Mo3
L 100 304L
M 80 16Mo3
N 80 304L
The flue gas pressure at the air preheaters was below ambient, which made it challenging to obtain
a sample. In Figure 41, the collected deposit on the probe tip can be observed. Most of the deposit
has been removed by the draft in the opening while taking the photo (during the measurement the
opening was covered). Furthermore, during probe removal, the under-pressure in this section of the
boiler led to that most of the deposit was removed from the probe. Accordingly, the RBU values
were not determined for these tests.
Figure 41: Image of the deposit collected on the deposit probe at the air preheater.
In Figure 42a and Figure 42b photographs of the probe before and after exposure at the air
preheater are presented. The exposure time of the test was approximately 48 h. Apparent signs of
corrosion of a low-alloy ferritic steel (16Mo3) were visually observed at a material temperature of
80 °C. The corrosion was likely caused by hygroscopic salts since the probe was covered with a thick
deposit. No corrosion of the rings was observed at material temperatures between 100 and 120 °C.
Deposit

Figure 42: The deposit probe before and after exposure to the flue gas environment at the air preheater.
Short-term corrosion probe tests, with rings of carbon steel (P265GH), were also conducted to
determine the corrosion rate in these conditions. The material temperatures in these tests were
100, 90, and 80 °C. Mild corrosion could be observed on the surface of the probe ring at 80 °C, after
being exposed for 1.5 h (Figure 43). The average flue gas moisture was also at its highest during this
measurement (27.9 %), which may have contributed to the initiation of corrosion. No corrosion was
observed at the higher temperatures, 90 and 100 °C. Thus, the corrosion threshold for the carbon
steel in the test conditions was somewhere between 80 and 90 °C.
Figure 43: The corrosion probe ring after short-term exposure to the air preheater environment.
In Figure 44, SEM-images of deposit samples collected at the air preheater are presented. In all SEM-
images, the locations of both the area and spot analyses are marked. Elemental oxygen was
excluded from the EDX results that are presented in Figure 45.
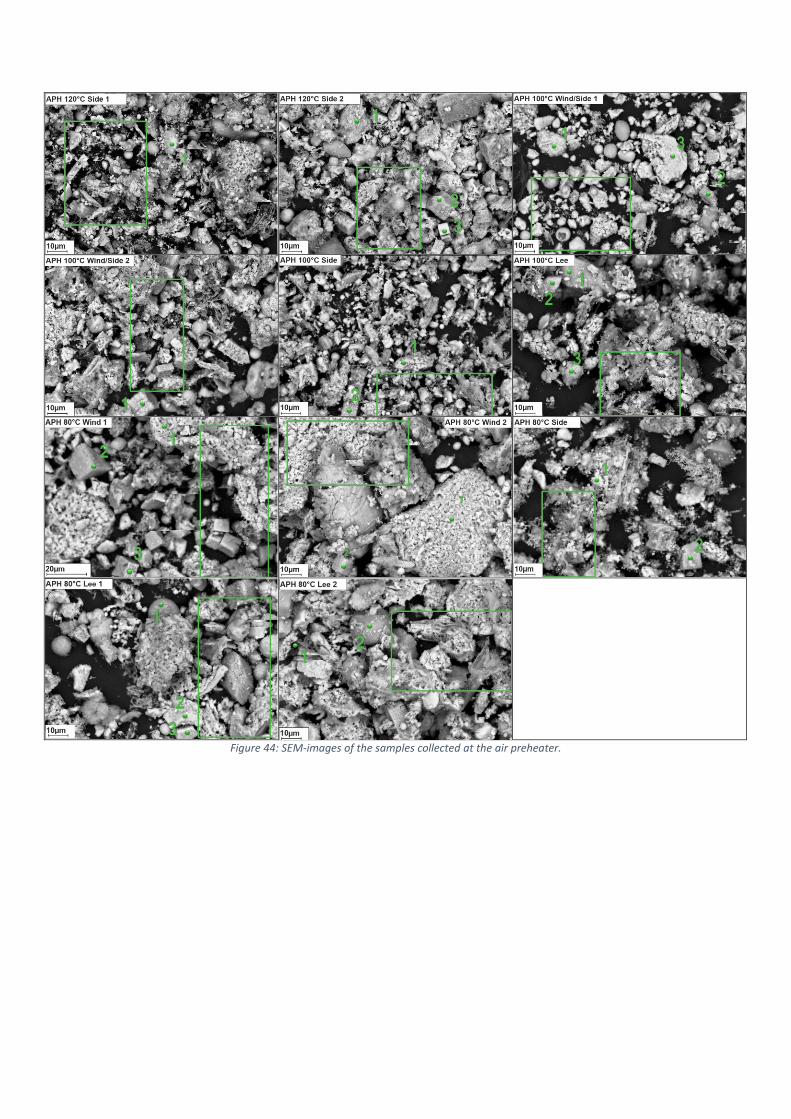
Figure 44: SEM-images of the samples collected at the air preheater.
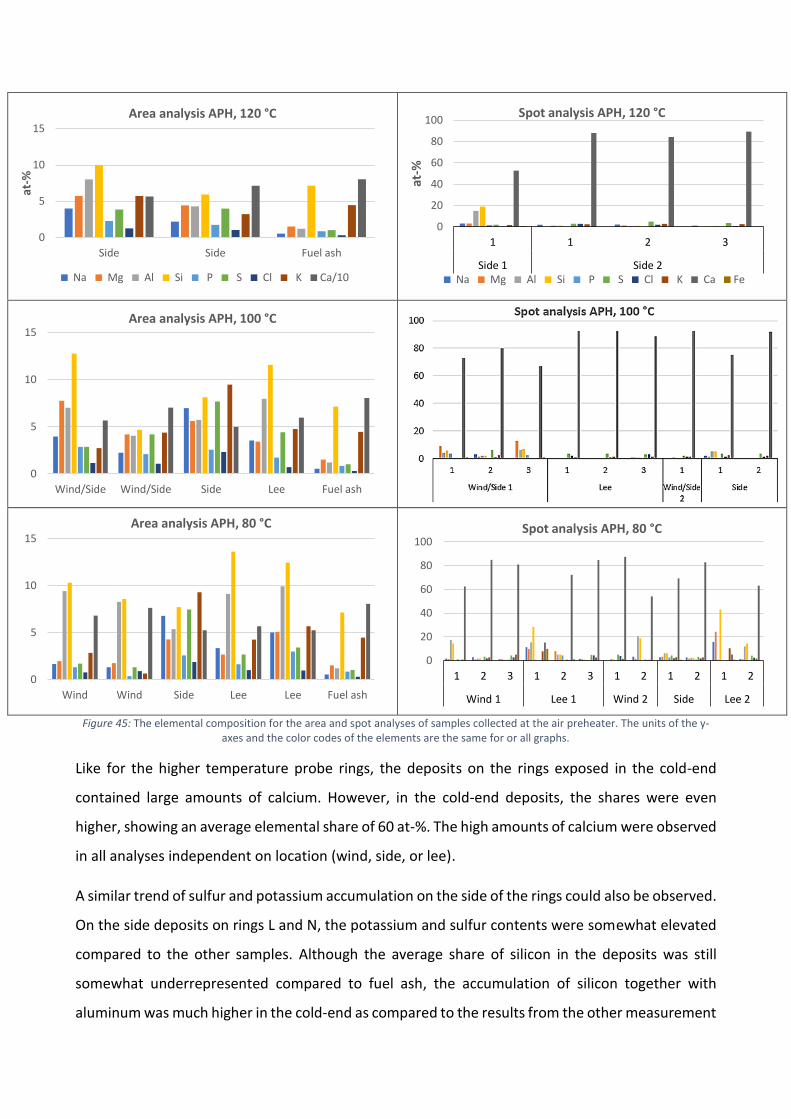
Figure 45: The elemental composition for the area and spot analyses of samples collected at the air preheater. The units of the y-
axes and the color codes of the elements are the same for or all graphs.
Like for the higher temperature probe rings, the deposits on the rings exposed in the cold-end
contained large amounts of calcium. However, in the cold-end deposits, the shares were even
higher, showing an average elemental share of 60 at-%. The high amounts of calcium were observed
in all analyses independent on location (wind, side, or lee).
A similar trend of sulfur and potassium accumulation on the side of the rings could also be observed.
On the side deposits on rings L and N, the potassium and sulfur contents were somewhat elevated
compared to the other samples. Although the average share of silicon in the deposits was still
somewhat underrepresented compared to fuel ash, the accumulation of silicon together with
aluminum was much higher in the cold-end as compared to the results from the other measurement
0
5
10
15
Side Side Fuel ash
at-%
Area analysis APH, 120 °C
Na Mg Al Si P S Cl K Ca/10
0
20
40
60
80
100
1 1 2 3
Side 1 Side 2
at-%
Spot analysis APH, 120 °C
Na Mg Al Si P S Cl K Ca Fe
0
5
10
15
Wind/Side Wind/Side Side Lee Fuel ash
Area analysis APH, 100 °C
0
5
10
15
Wind Wind Side Lee Lee Fuel ash
Area analysis APH, 80 °C
0
20
40
60
80
100
1 2 3 1 2 3 1 2 1 2 1 2
Wind 1 Lee 1 Wind 2 Side Lee 2
Spot analysis APH, 80 °C
locations. The shares are also significantly higher when compared to the sample exposed for 12 h at
the primary superheater. In some area analyses, the contents of sodium and magnesium have been
made (Sample I side, Sample K wind/side, Sample L side, Sample N side & lee). It is noteworthy that
the K/Na ratio is clearly lower in the rings exposed in the cold-end, indicating a higher accumulation
of sodium.
There is a wider particle size range in comparison to the samples from the high-temperature
measurements. Especially larger agglomerated particles have been detected, which can reach sizes
of up to 6 µm. Spot analyses show that some of the larger agglomerated particles are systems of Ca-
Al-SI (Sample M wind spot 1, Sample N wind spot 1). The trigonal crystal structure of calcium
carbonate was not detected. However, the O/Ca ratio calculated from the EDX analyses indicate
that both calcium carbonate and oxide are present as fragmented particles. The presence of cubical
particles was detected in somewhat higher contents compared to the higher temperature samples.
The frequency of detections increased at a material temperature of 80 °C. No hexagonal crystal
structures were detected, although from some angels the calcium crystal structures may look
similar. Especially the cubical and hexagonal particles may be mixed. Spot analyses show that the
compositions of particles of spherical forms are systems of calcium-silicates and calcium-
aluminosilicates, containing varying amounts of magnesium and alkali (Sample M lee spot 1, Sample
N lee spot 1).
In comparison to the levels from the higher temperature deposits, the amount of chlorine at the air
preheater, was much lower. However, the amounts are still significant as compared to the chlorine
content in the fuel. The highest amounts were found on the side positions of Samples L and N. The
corresponding chlorine enrichment coefficients were determined to be 7.5 and 6.0, respectively.
The amounts of chlorine on these samples show that there are prerequisites for corrosion caused
by chlorine-based hygroscopic salts at material temperatures 80 °C and 100 °C in the air preheater
region. All chlorine enrichment coefficients calculated for the deposits collected in the air preheater
region are presented in Table 16.
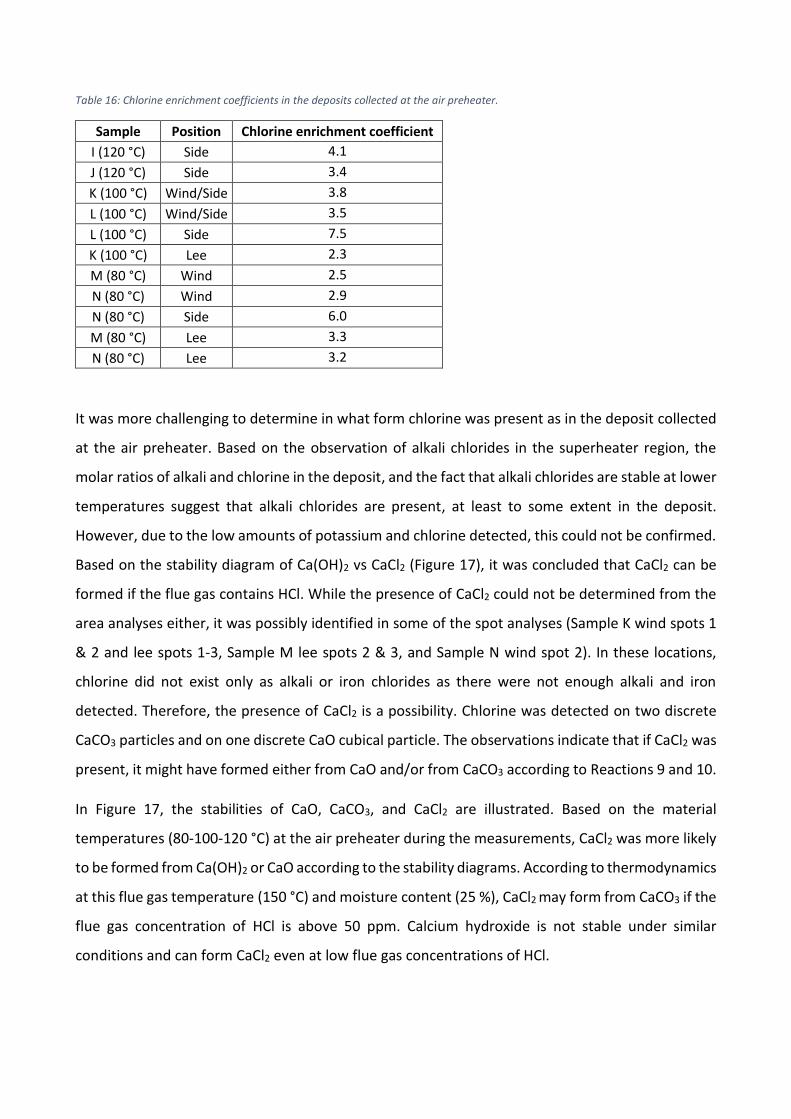
Table 16: Chlorine enrichment coefficients in the deposits collected at the air preheater.
Sample Position Chlorine enrichment coefficient
I (120 °C) Side 4.1
J (120 °C) Side 3.4
K (100 °C) Wind/Side 3.8
L (100 °C) Wind/Side 3.5
L (100 °C) Side 7.5
K (100 °C) Lee 2.3
M (80 °C) Wind 2.5
N (80 °C) Wind 2.9
N (80 °C) Side 6.0
M (80 °C) Lee 3.3
N (80 °C) Lee 3.2
It was more challenging to determine in what form chlorine was present as in the deposit collected
at the air preheater. Based on the observation of alkali chlorides in the superheater region, the
molar ratios of alkali and chlorine in the deposit, and the fact that alkali chlorides are stable at lower
temperatures suggest that alkali chlorides are present, at least to some extent in the deposit.
However, due to the low amounts of potassium and chlorine detected, this could not be confirmed.
Based on the stability diagram of Ca(OH)2 vs CaCl2 (Figure 17), it was concluded that CaCl2 can be
formed if the flue gas contains HCl. While the presence of CaCl2 could not be determined from the
area analyses either, it was possibly identified in some of the spot analyses (Sample K wind spots 1
& 2 and lee spots 1-3, Sample M lee spots 2 & 3, and Sample N wind spot 2). In these locations,
chlorine did not exist only as alkali or iron chlorides as there were not enough alkali and iron
detected. Therefore, the presence of CaCl2 is a possibility. Chlorine was detected on two discrete
CaCO3 particles and on one discrete CaO cubical particle. The observations indicate that if CaCl2 was
present, it might have formed either from CaO and/or from CaCO3 according to Reactions 9 and 10.
In Figure 17, the stabilities of CaO, CaCO3, and CaCl2 are illustrated. Based on the material
temperatures (80-100-120 °C) at the air preheater during the measurements, CaCl2 was more likely
to be formed from Ca(OH)2 or CaO according to the stability diagrams. According to thermodynamics
at this flue gas temperature (150 °C) and moisture content (25 %), CaCl2 may form from CaCO3 if the
flue gas concentration of HCl is above 50 ppm. Calcium hydroxide is not stable under similar
conditions and can form CaCl2 even at low flue gas concentrations of HCl.

Figure 46: Conditions at which CaCl2 may cause corrosion due to the formation of wet deposits. Blue = corrosion risk area. Adapted from Vainio et al., 2016.
In Figure 46, the deliquescence behavior of CaCl2 is visualized in a temperature versus moisture
chart. The blue area marks under which conditions, CaCl2 is present as wet deposits and can cause
corrosion. The dashed line marks the reaching of the water dew point. The horizontal lines represent
the average material temperatures of the probe rings during the measurements. Based on the flue
gas moisture during the measurements, corrosion caused by CaCl2 would have been possible on the
probe rings with a material temperature of 100 °C and 80 °C. However, corrosion was observed only
for the latter. If the cause was CaCl2, it should have absorbed water also at 100 °C. However, the
corrosivity of a deposit containing only some CaCl2 is not well understood. Furthermore, the deposit
is a mixture of several different compounds and the hygroscopicity and corrosivity may not fully
follow the behavior of CaCl2.
A closer examination of the corroded ring reveals that the corrosion was widely spread over the
ring. Typically, the corrosion of hygroscopic salts is more intense on the wind and side positions in
the early stages. This was the case in the short-term experiment at 80 °C (Figure 47). Sadly, no photo
was taken of the sample from the lee position, only from the wind and side positions. In the figure,
a small stripe was observed on the ring, which could be a border between two corroded areas.
40
50
60
70
80
90
100
110
120
130
10 15 20 25 30
Tem
pe
ratu
re (
°C )
Flue gas moisture (%)
Deliquescence of calcium chloride
Deliquescence of CaCl2 Materialtemperature 1 Materialtemperature 2
Materialtemperature 3 Water dew point
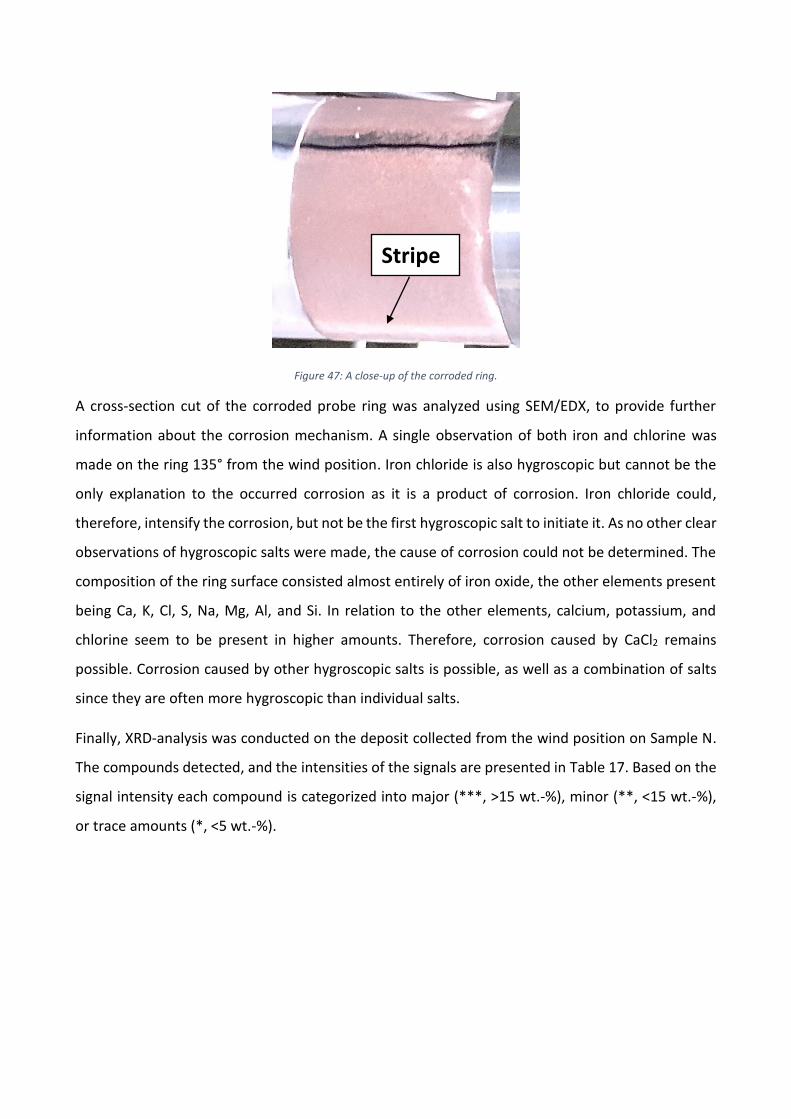
Figure 47: A close-up of the corroded ring.
A cross-section cut of the corroded probe ring was analyzed using SEM/EDX, to provide further
information about the corrosion mechanism. A single observation of both iron and chlorine was
made on the ring 135° from the wind position. Iron chloride is also hygroscopic but cannot be the
only explanation to the occurred corrosion as it is a product of corrosion. Iron chloride could,
therefore, intensify the corrosion, but not be the first hygroscopic salt to initiate it. As no other clear
observations of hygroscopic salts were made, the cause of corrosion could not be determined. The
composition of the ring surface consisted almost entirely of iron oxide, the other elements present
being Ca, K, Cl, S, Na, Mg, Al, and Si. In relation to the other elements, calcium, potassium, and
chlorine seem to be present in higher amounts. Therefore, corrosion caused by CaCl2 remains
possible. Corrosion caused by other hygroscopic salts is possible, as well as a combination of salts
since they are often more hygroscopic than individual salts.
Finally, XRD-analysis was conducted on the deposit collected from the wind position on Sample N.
The compounds detected, and the intensities of the signals are presented in Table 17. Based on the
signal intensity each compound is categorized into major (***, >15 wt.-%), minor (**, <15 wt.-%),
or trace amounts (*, <5 wt.-%).
Stripe
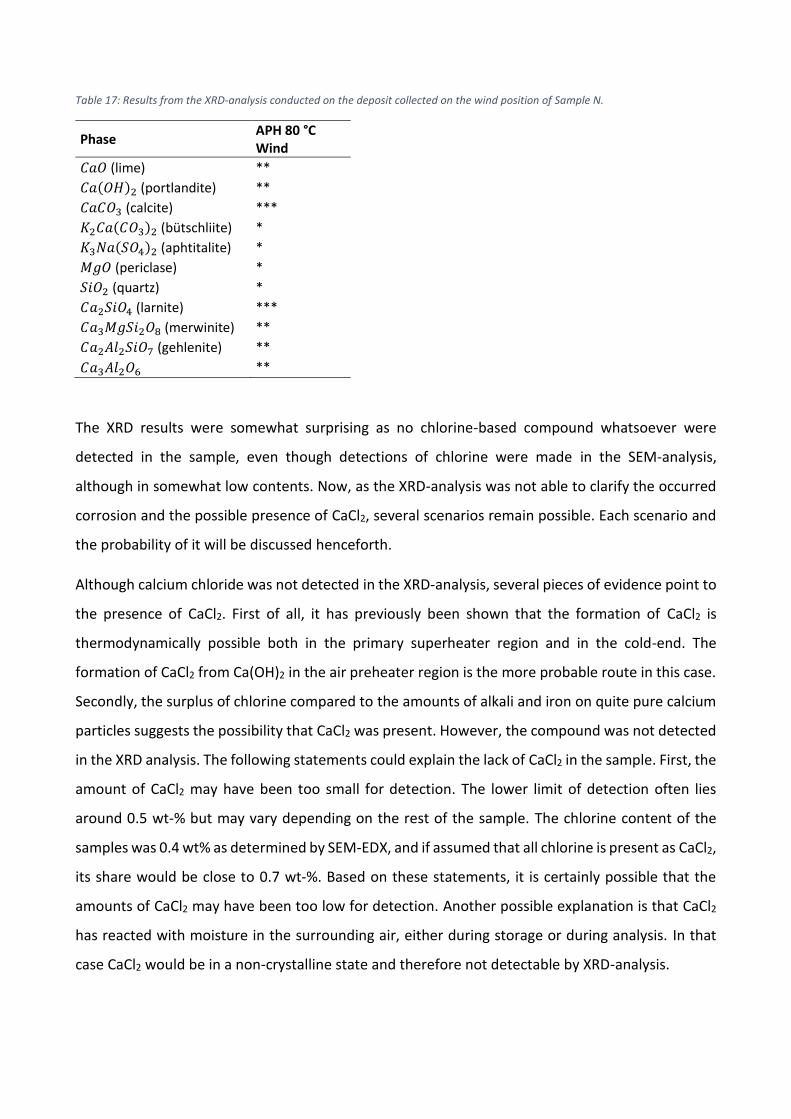
Table 17: Results from the XRD-analysis conducted on the deposit collected on the wind position of Sample N.
Phase APH 80 °C Wind
𝐶𝑎𝑂 (lime) **
𝐶𝑎(𝑂𝐻)2 (portlandite) **
𝐶𝑎𝐶𝑂3 (calcite) ***
𝐾2𝐶𝑎(𝐶𝑂3)2 (bütschliite) *
𝐾3𝑁𝑎(𝑆𝑂4)2 (aphtitalite) *
𝑀𝑔𝑂 (periclase) *
𝑆𝑖𝑂2 (quartz) *
𝐶𝑎2𝑆𝑖𝑂4 (larnite) ***
𝐶𝑎3𝑀𝑔𝑆𝑖2𝑂8 (merwinite) **
𝐶𝑎2𝐴𝑙2𝑆𝑖𝑂7 (gehlenite) **
𝐶𝑎3𝐴𝑙2𝑂6 **
The XRD results were somewhat surprising as no chlorine-based compound whatsoever were
detected in the sample, even though detections of chlorine were made in the SEM-analysis,
although in somewhat low contents. Now, as the XRD-analysis was not able to clarify the occurred
corrosion and the possible presence of CaCl2, several scenarios remain possible. Each scenario and
the probability of it will be discussed henceforth.
Although calcium chloride was not detected in the XRD-analysis, several pieces of evidence point to
the presence of CaCl2. First of all, it has previously been shown that the formation of CaCl2 is
thermodynamically possible both in the primary superheater region and in the cold-end. The
formation of CaCl2 from Ca(OH)2 in the air preheater region is the more probable route in this case.
Secondly, the surplus of chlorine compared to the amounts of alkali and iron on quite pure calcium
particles suggests the possibility that CaCl2 was present. However, the compound was not detected
in the XRD analysis. The following statements could explain the lack of CaCl2 in the sample. First, the
amount of CaCl2 may have been too small for detection. The lower limit of detection often lies
around 0.5 wt-% but may vary depending on the rest of the sample. The chlorine content of the
samples was 0.4 wt% as determined by SEM-EDX, and if assumed that all chlorine is present as CaCl2,
its share would be close to 0.7 wt-%. Based on these statements, it is certainly possible that the
amounts of CaCl2 may have been too low for detection. Another possible explanation is that CaCl2
has reacted with moisture in the surrounding air, either during storage or during analysis. In that
case CaCl2 would be in a non-crystalline state and therefore not detectable by XRD-analysis.
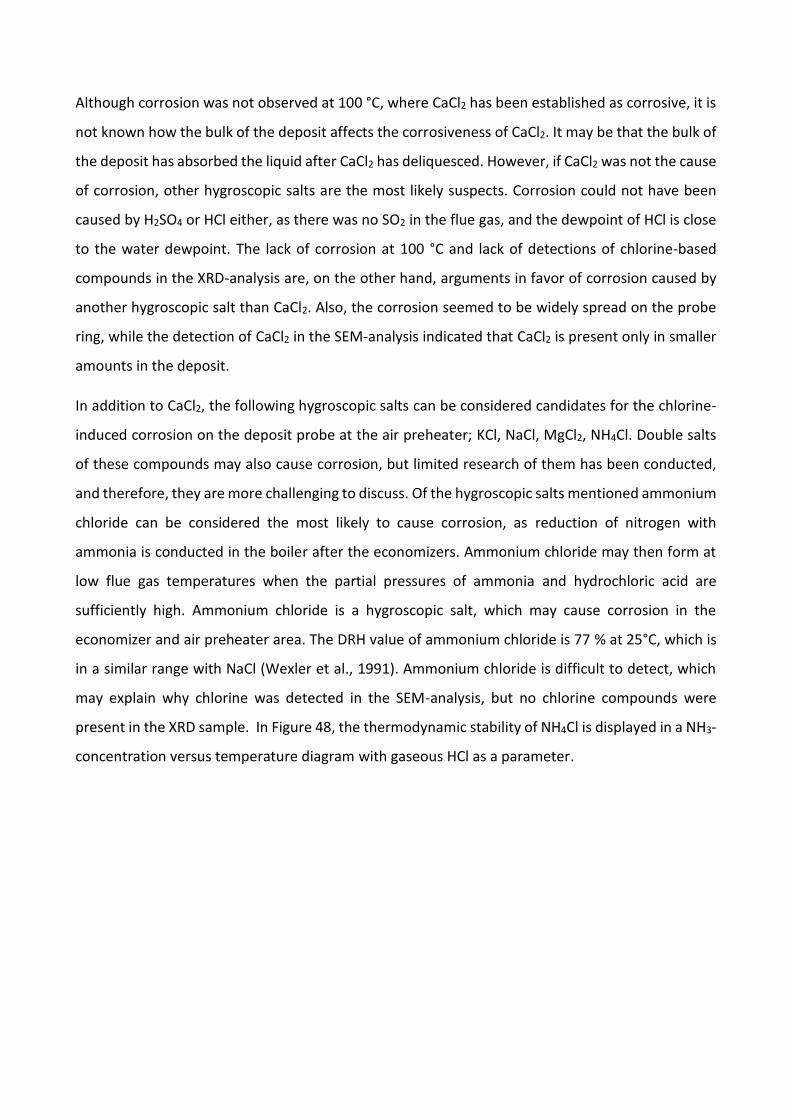
Although corrosion was not observed at 100 °C, where CaCl2 has been established as corrosive, it is
not known how the bulk of the deposit affects the corrosiveness of CaCl2. It may be that the bulk of
the deposit has absorbed the liquid after CaCl2 has deliquesced. However, if CaCl2 was not the cause
of corrosion, other hygroscopic salts are the most likely suspects. Corrosion could not have been
caused by H2SO4 or HCl either, as there was no SO2 in the flue gas, and the dewpoint of HCl is close
to the water dewpoint. The lack of corrosion at 100 °C and lack of detections of chlorine-based
compounds in the XRD-analysis are, on the other hand, arguments in favor of corrosion caused by
another hygroscopic salt than CaCl2. Also, the corrosion seemed to be widely spread on the probe
ring, while the detection of CaCl2 in the SEM-analysis indicated that CaCl2 is present only in smaller
amounts in the deposit.
In addition to CaCl2, the following hygroscopic salts can be considered candidates for the chlorine-
induced corrosion on the deposit probe at the air preheater; KCl, NaCl, MgCl2, NH4Cl. Double salts
of these compounds may also cause corrosion, but limited research of them has been conducted,
and therefore, they are more challenging to discuss. Of the hygroscopic salts mentioned ammonium
chloride can be considered the most likely to cause corrosion, as reduction of nitrogen with
ammonia is conducted in the boiler after the economizers. Ammonium chloride may then form at
low flue gas temperatures when the partial pressures of ammonia and hydrochloric acid are
sufficiently high. Ammonium chloride is a hygroscopic salt, which may cause corrosion in the
economizer and air preheater area. The DRH value of ammonium chloride is 77 % at 25°C, which is
in a similar range with NaCl (Wexler et al., 1991). Ammonium chloride is difficult to detect, which
may explain why chlorine was detected in the SEM-analysis, but no chlorine compounds were
present in the XRD sample. In Figure 48, the thermodynamic stability of NH4Cl is displayed in a NH3-
concentration versus temperature diagram with gaseous HCl as a parameter.
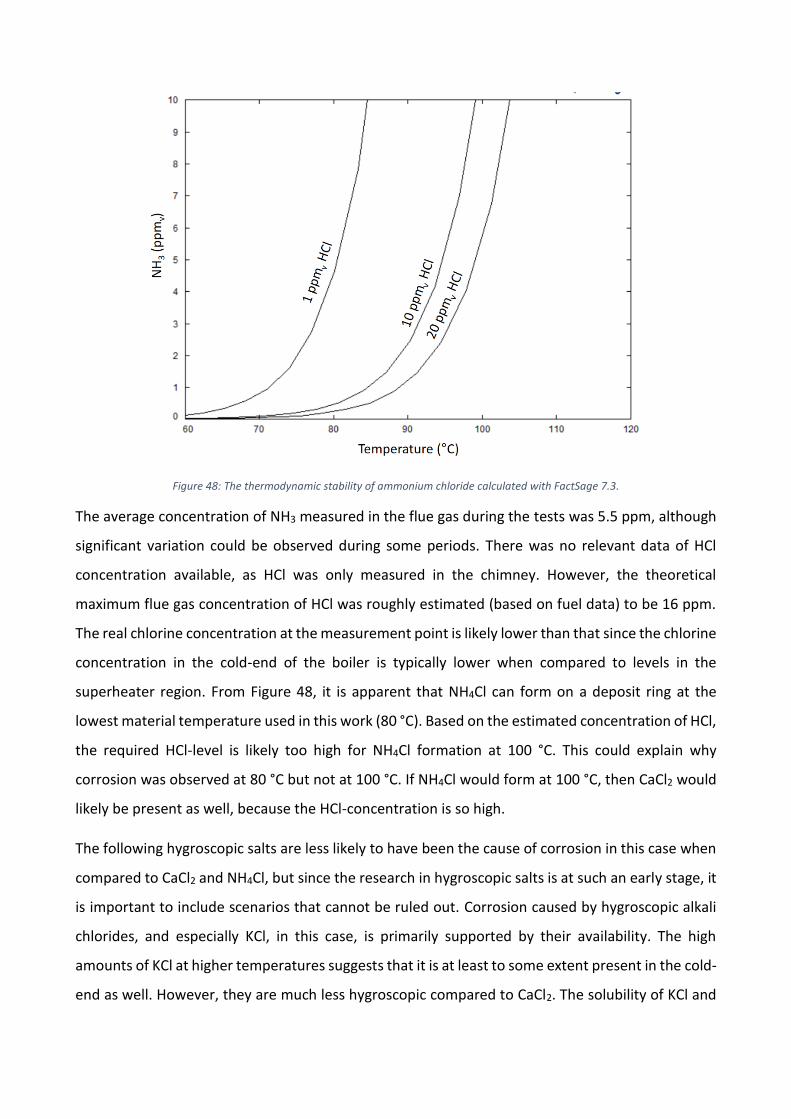
Figure 48: The thermodynamic stability of ammonium chloride calculated with FactSage 7.3.
The average concentration of NH3 measured in the flue gas during the tests was 5.5 ppm, although
significant variation could be observed during some periods. There was no relevant data of HCl
concentration available, as HCl was only measured in the chimney. However, the theoretical
maximum flue gas concentration of HCl was roughly estimated (based on fuel data) to be 16 ppm.
The real chlorine concentration at the measurement point is likely lower than that since the chlorine
concentration in the cold-end of the boiler is typically lower when compared to levels in the
superheater region. From Figure 48, it is apparent that NH4Cl can form on a deposit ring at the
lowest material temperature used in this work (80 °C). Based on the estimated concentration of HCl,
the required HCl-level is likely too high for NH4Cl formation at 100 °C. This could explain why
corrosion was observed at 80 °C but not at 100 °C. If NH4Cl would form at 100 °C, then CaCl2 would
likely be present as well, because the HCl-concentration is so high.
The following hygroscopic salts are less likely to have been the cause of corrosion in this case when
compared to CaCl2 and NH4Cl, but since the research in hygroscopic salts is at such an early stage, it
is important to include scenarios that cannot be ruled out. Corrosion caused by hygroscopic alkali
chlorides, and especially KCl, in this case, is primarily supported by their availability. The high
amounts of KCl at higher temperatures suggests that it is at least to some extent present in the cold-
end as well. However, they are much less hygroscopic compared to CaCl2. The solubility of KCl and
NaCl in water is 35.5g and 36g, respectively and their DRH:s are 85 and 75 % at 25 °C (Weast, 1995;
Greenspan 1977; Li, 2014). Although their DRH has not been defined at higher temperatures, it is
clear that KCl and NaCl deliquesce at much lower temperatures compared to CaCl2 and is, therefore,
less likely to have initiated the formation of wet deposits on the probe rings.
The corrosiveness of alkali chlorides in the cold-end may be affected by the presence of other
hygroscopic salts. Formation of wet deposits in the proximity of alkali chlorides with higher DRH
may raise their solubility and induce corrosion by increasing the presence of chloride ions in the
deposit. The sample also contained minor amounts of the compound K2Ca(CO3)2. The made
detections of this particular double salt in the cold-end and not in the primary superheater region
could point to the crystallization from a water phase, as a formation mechanism. If true, then
calcium, potassium, and carbonate ions have all been present in the wet deposit. While CaCO3 is
poorly soluble in water, K2CO3 is easily soluble and a hygroscopic salt with DRH quite close to CaCl2
(Greenspan, 1977). Since the corrosion mechanism appears to be chlorine-based, it is likely not
initiated by K2CO3. However, the presence of K2CO3 in combination with KCl may create a corrosive
environment. On a further note, CaCl2 requires very dry conditions to crystallize as it shows
hysteresis effect upon drying. That is, a much dryer condition is needed for CaCl2 to recrystallize
than the DRH (Vainio et al., 2019). It may, therefore, be possible that CaCl2 initiates the formation
of wet deposit but crystallizes as something else from the solution when the probe is removed from
the boiler, for example, as CaCO3, which is poorly soluble in water (Onasch et al., 2000).
Traces of the double salt K3Na(SO4)2 was found in the deposit at the air preheater, and also in the
deposit collected at the primary superheater. That the detections were made in both XRD-samples,
indicate that the compound was formed in the flue gas. The salt is however not hygroscopic as
sulfates are poorly soluble in water (Greenspan, 1977; Tang and Munkelwitz, 1993). There are,
however, other hygroscopic salts that may form at high temperatures in the flue gas. Figure 49,
shows that the double salt of calcium and potassium chloride is thermodynamically stable at higher
temperatures. Chlorocalcite (KCaCl3) is known to be hygroscopic and may, therefore, cause
corrosion (Retschitzegger et al., 2015). The hygroscopic properties of KCaCl3 have been estimated
by experimental testing of its solubility in water at 25 °C. Its solubility in water was determined to
be 40 g/100 g H2O, which is far lower than the solubility of CaCl2 (81,3), however, higher than the
solubility of KCl and NaCl. Therefore, the hygroscopicity of KCaCl3 likely lies between the
hygroscopicity of KCl (71°C) and CaCl2 (110 °C) at a flue gas moisture of 25%, although probably

much closer to the hygroscopicity of KCl. As the average material temperature of the rings was
somewhat below 80 °C (For Ring M: 77 °C (±) 2 °C and for Ring N 78 °C (±) 1.5 °C), it may have been
possible for KCaCl3 to deliquesce if present. Based on the melting diagram of Calcium and sodium
chloride, a double salt of these components does not form.
Figure 49: A melting diagram of the KCl-CaCl2 system.
The detection of MgO in the XRD-sample also shows that the formation of MgCl2 is a possibility.
MgO behaves similarly to CaO and will form the corresponding Mg(OH)2 at low flue gas
temperatures, which can form MgCl2 by reacting with HCl in the flue gas. The hygroscopic properties
of MgCl2 are much the same as with CaCl2, with a DRH of 33 at 25 °C (DRH for CaCl2 at 25 °C is 32)
(Greenspan, 1977). However, based on its properties, MgCl2 would also be expected to cause
corrosion at 100 °C.
The formation of the double salts NaMgCl3 and Na2MgCl3 from melting mixtures containing MgCl2
and NaCl is also a possibility (Figure 50). Not much can be said about their hygroscopic properties
due to the scarcity of material available. Nevertheless, as both MgCl2 and NaCl are hygroscopic, the
double salts should display similar behavior. This scenario can be considered less likely as the XRD-
analysis detected magnesium mainly as MgO and Ca3MgSi2O8.

Figure 50: A melting diagram of the MgCl2-NaCl system.
7. Conclusions The impact of calcium on deposit chemistry and corrosion was studied in a full-scale bubbling
fluidized bed boiler firing a fuel mixture of calcium-rich sludge and bark. Short-term deposit
measurements were conducted in the superheater region and in the cold-end of the boiler. Short-
term corrosion measurements were also conducted in the cold-end. As expected by the used fuel
mixture, the content of the deposit was primarily dominated by calcium throughout the boiler.
Figure 51: The detected phases of calcium at the measurement points. The phases at the SSH measurements are based only on the SEM analysis, as no XRD-analysis was conducted on these samples.

Although the rate of deposit build-up was low in the superheater region, the deposits were
characterized to be quite aggressive. Relatively high chlorine contents were detected in the deposits
as compared to the chlorine content in the fuel. Increased corrosion rates for X10CrMoVNb9-1 were
observed with material temperatures between 500-550 °C in the secondary superheater region.
Iron chlorides were also detected on nearly every sample in the superheater region. Deposit spot
analyses showed that the corrosion was most likely alkali-induced. The high accumulation of alkali
chlorides in combination with the decreased sulfation of alkali chlorides showed that when the Ca/S
molar ratio is high, corrosion can occur even when firing fuels with low chlorine contents. There
were also indications of CaCl2 at the primary superheater. However, its role on high-temperature
corrosion remains not fully understood.
In the cold-end deposit, the detections of chlorine were low but still significant compared to the
chlorine content in the fuel. There were indications of CaCl2 in the deposit, although the XRD-
analysis could not confirm its presence. Based on the identification of iron chloride, a known
corrosion product, it can be concluded that the observed corrosion at 80 °C was chlorine induced.
The corrosion was likely caused by chlorine-based hygroscopic deposits, as HCl-induced dew point
corrosion only occurs just above the water dew point. At higher temperatures, up to 120 °C, which
was the highest temperature tested, corrosion was not observed. The lack of corrosion at 90°C and
100 °C was surprising as CaCl2 has been shown to cause corrosion at this temperature. The
contribution of CaCl2 to the observed corrosion remains unclear as corrosion can be initiated by
several other compounds at 80 °C. Therefore, such a low material temperature should be strictly
avoided for heat-exchanger components in the cold-end. On the other hand, the lack of corrosion
at 90°C, 100 °C and 120 °C shows that there is potential to lower the material temperature in the
cold-end. This may be difficult to put into practice, as the content of the incoming fuel is challenging
to monitor, and elevated levels of e.g. chlorine or zinc impurities may lead to corrosion at 100 °C
and above. Nevertheless, there may be a possibility of lowering the present flue gas temperature.
This could be further confirmed, for example, by gathering references from longer-term corrosion
measurements, and by further studies of the hygroscopicity of the deposits.

8. References
Aho, M., Vainikka, P., Taipale, R., & Yrjas, P. Effective new chemicals to prevent corrosion due to
chlorine in power plant superheaters. Fuel, Volume 87(6) (2008), Pages 647-654.
Aho, M., Yrjas, P., Taipale, R., Hupa, M., & Silvennoinen, J. Reduction of superheater corrosion by
co-firing risky biomass with sewage sludge. Fuel, 89(9) (2010), Pages 2376-2386.
Amand, L., & Leckner, B. Reduction of emissions of sulphur and chlorine from combustion of high
volatile waste fuels (sludge) in fluidised bed. Paper presented at the Proceedings of the 3rd
International Conference on Combustion, Incineration/Pyrolysis and Emission Control (3rd i-
CIPEC), 2004, Hangzhou, China, Pages 476-481.
Anthony, E. J., & Granatstein, D. L. Sulfation phenomena in fluidized bed combustion
systems. Progress in Energy and Combustion Science, Volume 27(2) (2001), Pages 215-236.
Barroso, J., Ballester, J., & Pina, A. Study of coal ash deposition in an entrained flow reactor:
Assessment of traditional and alternative slagging indices. Fuel Processing Technology,
Volume 88(9) (2007), Pages 865-876.
Baxter, L. L. A Task 2. Pollutant emission and deposit formation during combustion of biomass
fuels. Lawrence Livermore Laboratory, Berkeley (CA, USA). 1994.
Baxter, L. L. Ash deposition during biomass and coal combustion: A mechanistic approach. Biomass
and Bioenergy, Volume 4(2) (1993), Pages 85-102.
Beck, J., & Unterberger, S. The behaviour of phosphorus in the flue gas during the combustion of
high-phosphate fuels. Fuel, Volume 85(10-11) (2006), Pages 1541-1549.
Bergman, A. G., & Sementsova, A. K. The ternary systems K2Cl2-Na2SO4-Na2CO3 and Na2Cl2-K2SO4-
K2CO3. Zhur.Neorg.Khim, Volume 3(2) (1958), Pages 393-402.
Bhaskaran, R., Palaniswamy, N., Rengaswamy, N. S., & Jayachandran, M. Global cost of corrosion—
A historical review. Corrosion: Materials, Volume 13(2005), Pages 621-628.
Brinch-Pedersen, H., Sørensen, L. D., & Holm, P. B. Engineering crop plants: Getting a handle on
phosphate. Trends in Plant Science, Volume 7(3) (2002), Pages 118-125.
Broström, M., Enestam, S., Backman, R., & Mäkelä, K. Condensation in the KCl–NaCl system. Fuel
Processing Technology, Volume 105 (2013), Pages 142-148.
Bryers, R. W. Fireside slagging, fouling, and high-temperature corrosion of heat-transfer surface
due to impurities in steam-raising fuels. Progress in Energy and Combustion Science,
Volume 22(1) (1996), Pages 29-120.
Choi, S. H., & Stringer, J. (1985). Calcium sulfate-induced corrosion of iron-chromium alloys.
Corrosion Science, Volume, 28(1998), Pages 839-850.
Elled, A., Davidsson, K. O., & Amand, L. Sewage sludge as a deposit inhibitor when co-fired with
high potassium fuels. Biomass and Bioenergy, Volume 34(11) (2010), Pages 1546-1554.
Flagan, R. C., & Sarofim, A. F. Comments on the paper by WT Reid. Progress in Energy and
Combustion Science, Volume 10(1984), Pages 171-175.
Folkeson, N. Chlorine induced corrosion in biomass and waste fired boilers: Laboratory and field
investigations, PhD thesis, Chalmers University of Technology, Gothenburg. 2010. ISBN 978-
91-7385-406-1
Franceschi, V. R., & Nakata, P. A. Calcium oxalate in plants: Formation and function.
Annu.Rev.Plant Biol., Volume 56(2005), Pages 41-71.
Frandsen, F. J. Ash Formation, Deposition and Corrosion when Utilizing Straw for Heat and Power
Production. Technical University of Denmark, Lyngby, Denmark. 2011. ISBN: 978-87-92481-
40-5.
Grabke, H. J., Reese, E., & Spiegel, M. The effects of chlorides, hydrogen chloride, and sulfur
dioxide in the oxidation of steels below deposits. Corrosion Science, Volume, 37(7) (1995),
Pages 1023-1043.
Greenspan, L. Humidity fixed points of binary saturated aqueous solutions. Journal of Research of
the National Bureau of Standards, Volume 81(1) (1977), Pages 89-96.
Hamm, U. Environmental aspects. Handbook of Paper and Board, 2006, Pages 422-445.
Hansen, L. A., Nielsen, H. P., Frandsen, F. J., Dam-Johansen, K., Hørlyck, S., & Karlsson, A. Influence
of deposit formation on corrosion at a straw-fired boiler. Fuel Processing Technology,
Volume 64(1-3) (2000), Pages 189-209.
Haynes, B. S., Neville, M., Quann, R. J., & Sarofim, A. F. Factors governing the surface enrichment
of fly ash in volatile trace species. Journal of Colloid and Interface Science, Volume 87(1)
(1982), Pages 266-278.
Heinzel, T., Maier, J., Baum, J., Spliethoff, H., & Hein, K. Slagging and fouling in dry and molten ash
PFC. Joule III Programme Clean Coal Technology R&D, Volume 5(1998), Pages 1-63.
Higo, T., Sukenaga, S., Kanehashi, K., Shibata, H., Osugi, T., Saito, N., & Nakashima, K. Effect of
potassium oxide addition on viscosity of calcium aluminosilicate melts at 1673–1873 K. ISIJ
International, Volume 54(9) (2014), Pages 2039-2044.
Jenkins, B., Baxter, L. L., Miles Jr, T. R., & Miles, T. R. Combustion properties of biomass. Fuel
Processing Technology, Volume 54(1-3) (1998), Pages 17-46.
Karlsson, S., Pettersson, J., Johansson, L., & Svensson, J. Alkali-induced high temperature corrosion
of stainless steel: The influence of NaCl, KCl and CaCl2. Oxidation of Metals, Volume 78(1-2)
(2012), Pages 83-102.
Kosnyrev, G. T., Desyatnik, V. N., & Nosonova, E. N. Study of transformations in the Ca(OH)2–
CaCl2·2H2O system during thermal dehydration (in russian). Zh Prikl Khim, Volume 63(1)
(1990), Pages 187-190.
Kosnyrev, G. T., Desyatnik, V. N., & Nosonova, E. N. Hydrolysis of calcium chloride during thermal
dehydration of its tetrahydrate (in russian). Deposited doc., SPSTL 1005 Khp-D81.1981.
Lee, Y. Y., & McNallan, M. J. Ignition of nickel in environments containing oxygen and
chlorine. Metallurgical Transactions A, Volume 18(6) (1991), Pages 1099-1107.
Lehmusto, J., Yrjas, P., Skrifvars, B., & Hupa, M. High temperature corrosion of superheater steels
by KCl and K2CO3 under dry and wet conditions. Fuel Processing Technology,
Volume 104(2012), Pages 253-264.
Li, X., Gupta, D., Eom, H., Kim, H., & Ro, C. Deliquescence and efflorescence behavior of individual
NaCl and KCl mixture aerosol particles. Atmospheric Environment, Volume 82(2014), Pages
36-43.
Lin, W. Interactions between SO2 and NOx emissions in fluidised bed combustion of coal, PhD
Thesis, Delft University, The Netherlands, 1994.
Lindau, L., & Goldschmidt, B. Low temperature corrosion in bark fueled small boilers. Värmeforsk
Services AB, Rapport M9-835, 2008.
Lindstrom, E., Sandström, M., Bostrom, D., & Ohman, M. Slagging characteristics during
combustion of cereal grains rich in phosphorus. Energy & Fuels, Volume 21(2) (2007), Pages
710-717.
Liu, H. Biomass fuels for small and micro combined heat and power (CHP) systems: Resources,
conversion and applications. Small and Micro Combined Heat and Power (CHP) Systems, 2011,
Pages 88-122. Woodhead Publishing.
https://doi.org/10.1533/9780857092755.1.88
Lloyd, G. E. Atomic number and crystallographic contrast images with the SEM: A review of
backscattered electron techniques. Mineralogical Magazine, Volume 51(359) (1987), Pages 3-
19.
Manzel, J. Sevar-trocknungsverfahren mit dünnbett. Beiheft Zu Müll Und Abfall, Volume 28 (1989),
Pages 74-81.
Marschner, H. Mineral Nutrition of Higher Plants, 2nd Edition; Academic Press: London, 1995,
Pages 265−277. (ISBN 0-12-473543-6).
Matsuoka, K., Yamashita, T., Kuramoto, K., Suzuki, Y., Takaya, A., & Tomita, A. Transformation of
alkali and alkaline earth metals in low rank coal during gasification. Fuel, Volume 87(6) (2008),
Pages 885-893.
McGhee, T. J., & Steel, E. W. Water supply and sewerage, McGraw-Hill, New York, 1991, Volume
6.
Ministry of Agriculture and Forestry. The forest resources of Finland. 2019. Retrieved from
https://mmm.fi/sv/skogar/skogsbruk/finlands-skogstillgangar
Moss, G. The fluidized desulphation gasifier. Paper presented at the Proceedings of the Second
International Conference on Fluidized Bed, 1970, Pages II6-1-7.
Moss, G. (1975). The mechanisms of sulphur absorption in fluidized beds of lime. Paper presented
at the Institute of Fuel Symposium Series (London), Volume 1 (1975), Pages D2-7.
Murray, H. Industrial clays case study. Mining, Minerals and Sustainable Development, IIED and
WBCSD, Volume 64 (2002), Pages 1-9.
Oka, S. Fluidized bed combustion. Boca Raton, CRC press, 2003.
https://doi.org/10.1201/9780367801267
Onasch, T. B., McGraw, R., & Imre, D. Temperature-dependent heterogeneous efflorescence of
mixed ammonium sulfate/calcium carbonate particles. The Journal of Physical Chemistry A,
Volume 104(46) (2000), Pages 10797-10806.
Partanen, J. Chemistry of HCI and limestone in fluidised bed combustion. PhD thesis, Åbo Akademi
Turku, Finland. 2004. Report number AAA-KTF/PCC-04-1, ISBN 952-12-1287-X.
Partington JR. A text-book of inorganic chemistry. 5th ed. London: Macmillan, 1939.
Pettersson, A., Zevenhoven, M., Steenari, B., & Amand, L. Application of chemical fractionation
methods for characterisation of biofuels, waste derived fuels and CFB co-combustion fly
ashes. Fuel, Volume 87(15-16) (2008), Pages 3183-3193.
https://doi.org/10.1016/j.fuel.2008.05.030
Pettersson, J., Asteman, H., Svensson, J., & Johansson, L. KCl induced corrosion of a 304-type
austenitic stainless steel at 600 C; the role of potassium. Oxidation of Metals, Volume 64(1-2)
(2005), Pages 23-41.
Pontoppidan, K., Pettersson, D., & Sandberg, A. The type of thermal feed treatment influences the
inositol phosphate composition. Animal Feed Science and Technology, Volume 132(1-2)
(2007), Pages 137-147.
Priyanto, D. E., Ueno, S., Sato, N., Kasai, H., Tanoue, T., & Fukushima, H. Ash transformation by co-
firing of coal with high ratios of woody biomass and effect on slagging propensity. Fuel,
Volume 174 (2016), Pages 172-179.
Reid, W. T. The relation of mineral composition to slagging, fouling and erosion during and after
combustion. Progress in Energy and Combustion Science, Volume 10(2) (1984), Pages 159-169.
Retschitzegger, S., Brunner, T., & Obernberger, I. Low-temperature corrosion in biomass boilers
fired with chemically untreated wood chips and bark. Energy & Fuels, Volume 29(6) (2015),
Pages 3913-3921.
Scala, F., & Chirone, R.Characterization and early detection of bed agglomeration during the
fluidized bed combustion of olive husk. Energy & Fuels, Volume 20(1) (2006), Pages 120-132.
Scala, F., & Chirone, R. A SEM/EDX study of bed agglomerates formed during fluidized bed
combustion of three biomass fuels. Biomass and Bioenergy, Volume 32(3) (2008), Pages 252-
266.
Schouten, J. C., & Van den Bleek, C M. Sulfur retention and NOx reduction: The sure model. Coal
science and technology, Volume 22 (1995), Pages 227-257, Elsevier.
Schouten, J. C. Sulfur retention and particle motion during fluidized bed combustion of coal. PhD
Thesis, Technical University of Delft, Delft University Press, The Netherlands, 1988.
Schwuger, M. J. Detergents and the environment, Jülich GmbH, Jülich, Germany: Institute of
Applied Physical Chemistry Research Center. 1996. ISBN 0-8247-9396-X.
Scott, G. M., & Smith, A. Sludge characteristics and disposal alternatives for the pulp and paper
industry. Paper presented at the Tappi International Environmental Conference. 1995.
Page 269.
Senelwa, K., & Sims, R. E. Fuel characteristics of short rotation forest biomass. Biomass and
Bioenergy, Volume 17(2) (1999), Pages 127-140.
Skrifvars, B. J., Blomquist, J. P., Hupa, M., & Backman, R. Predicting the ash behavior during
biomass combustion in FBC conditions by combining advanced fuel analyses with
thermodynamic multicomponent equilibrium calculations. Paper presented at the Pittsburgh
Coal Conference, Pittsburgh, PA (United States). 1998.
Skrifvars, B., Yrjas, P., Laurén, T., Hupa, M., & Dittrich, M. The Åbo Akademi database: Ash
behavior measurements in full-scale boilers. Paper presented at the 18th International
Conference on Fluidized Bed Combustion, 2005, Pages 573-579.
Statistics FInland. Waste statistics. 2014. Retrieved from:
http://www.stat.fi/til/jate/2012/jate_2012_2014-05-15_tie_001_en.html
Stromberg, B., & Herstad Svärd, S. Bränslehandboken 2012 (The Fuel Handbook 2012). Värmeforsk
(Thermal Engineering Research Institute), Stockholm, Sweden.
Tang, I. N., & Munkelwitz, H. R. Composition and temperature dependence of the deliquescence
properties of hygroscopic aerosols. Atmospheric Environment. Part A. General Topics, Volume
27(4) (1993), Pages 467-473.
Tchobanoglous, G.; Burton, F. L & Stensel, H. D. Wastewater Engineering: Treatment, Disposal and
Reuse, 4th ed.; Metcalf & Eddy, McGraw-Hill: New York, 1991. ISBN: 9780070495395.
Usherson, J. Recycled paper and sludge. Resource Recycling, Volume 11(3) (1992), Pages 95-100.
Vainio, E., DeMartini, N., Hupa, L., Amand, L., Richards, T., & Hupa, M. Hygroscopic properties of
calcium chloride and its role on cold-end corrosion in biomass combustion. Energy & Fuels,
Volume 33(11) (2019), Pages 11913-11922
Vainio, E., Kinnunen, H., Laurén, T., Brink, A., Yrjas, P., DeMartini, N. Low-temperature corrosion in
co-combustion of biomass and solid recovered fuels. Fuel, Volume 184 (2016), Pages 957-965.
Van der Loo, S., & Koppejan, H. Handbook of biomass: Combustion and cofiring. Twente University
Press. 2002. ISBN 9036517737.
Vassilev, S. V., Baxter, D., Andersen, L. K., & Vassileva, C. G. An overview of the composition and
application of biomass ash. Part 1. Phase–mineral and chemical composition and
classification. Fuel, Volume 105 (2013), Pages 40-76.
Weast, R. C., Ed. Handbook of Chemistry and Physics, CRC: Boca Raton, FL, 1975.
Weinell, C. E., Jensen, P. I., Dam-Johansen, K., & Livbjerg, H. Hydrogen chloride reaction with lime
and limestone: Kinetics and sorption capacity. Industrial & Engineering Chemistry
Research, Volume 31(1) (1992), Pages 164-171.
Werkelin, J., Skrifvars, B., Zevenhoven, M., Holmbom, B., & Hupa, M. Chemical forms of ash-
forming elements in woody biomass fuels. Fuel, Volume 89(2) (2010), Pages 481-493.
Wexler, A. S., & Seinfeld, J. H. Second-generation inorganic aerosol model. Atmospheric
Environment. Part A.General Topics, Volume 25(12) (1991), Pages 2731-2748.
Wzorek, M). Characterisation of the properties of alternative fuels containing sewage sludge. Fuel
Processing Technology, Volume 104 (2012), Pages 80-89.

Yrjas, P., Aho, M., Zevenhoven, M., Taipale, R., Silvennoinen, J., & Hupa, M. Co-firing of sewage
sludge with bark in a bench-scale bubbling fluidized bed—a study of deposits and emissions.
Paper presented at the Proceedings of the 20th International Conference on Fluidized Bed
Combustion, 2009, Pages 922-929.
Zevenhoven, M., Yrjas, P., Skrifvars, B., & Hupa, M). Characterization of ash-forming matter in
various solid fuels by selective leaching and its implications for fluidized-bed
combustion. Energy & Fuels, Volume 26(10) (2012), Pages 6366-6386.
Zevenhoven-Onderwater, M. Ash-forming matter in biomass fuels. PhD thesis, Åbo Akademi,
Åbo/Turku, Finland. 2001.
Zhang, B., Zhong, Z., Xue, Z., Xue, J., & Xu, Y. Release and transformation of potassium in co-
combustion of coal and wheat straw in a BFB reactor. Applied Thermal Engineering,
Volume 144 (2018), Pages 1010-1016.