The Relationship of Socioeconomic Status and Sex to Body Size, Skeletal Maturation, and Cognitive...
14
The Relationship of Socioeconomic Status and Sex to Body Size, Skeletal Maturation, and Cognitive Status of Guatemala City' Schoolchildren Barry Bogin University of Michigan-Dearbom Robert B. RlacVean Utliaersidad del Valle de Guatemala BOGIN, BA~~Y, and MACVEAN, RODEI~~ D. The Rclationslrip of Socioeconomic Status and Sex to Body Size, Skeletal Maturation, and Cognitive Status of Guatemala City Schoolcl~ildren. CIIILD DEVELOPMENT, 1983, 54, 115-128. Longitutlinal data from a study of child developn~entin Guatemala City were used to describe the influence of socioeconomic status and sex on hysical and cognitive growth status. The correlation between the growth status variables was arso ana- lyzed. The sample included 144 Guatemalan children, 46 of low SES, 52 of middle SES, and 46 of high SES. The children mere students in 5 urban primary schools. 3 physical variables, height, weight, and skeletal age, were ~neas~~recl annually from first to sixth grade. Two cog- nitive variables, general intelligence and reading ability, were measured in grades 1, 3, 4, or 5. Significant differences behveen SES groups existed for all variables. However, the differences in each grade were greater for the cognitive measures than for the ph sical measures. Com- pared with high SES children, middle SES boys md low SES boys andYgirls experienced sig- nificantly greater delayed growth in height than in weight or skeletal age. It is ~ossible that these height delays may result in a permanent reduction in stature. The only consistently sig- nificant sex-related difference \\.as for skeletal age; girls were more mature than boys in each grade. When SES was statistically controlled, there was no significant correlation between hys- correlations for boys. i ical and cognitive growth status for girls and only a few moderate but statistically signi cant Thc study of child growth and maturation maturity. Among these risk factors are malnu- ill the developing nations of the world has he- trition, infcctious disease, and the lack of oppor- come a major focus of research in the past few tunities for psychosocial stinlulation and learn- years. There are at least two reasons for this. ing (Cravioto & DeLicardie 1979; Pollitt & The first is the possibility of testing hypotheses Lewis 1980). The identification and ameliora- based on research carried out in the developed tion of these risk factors are of prime importallce nations 011 populations from different cultural, for successful development of the individual social, and physical environments. The second child. Since national and social economic de- reason is that most of the world's children live velopment will depend on these children, basic in the developing nations. In 1975, approxi- research on child growth is fundamental to suc- mately 1.2 billion children under 15 years (82% cessful national growth as well. of all such children) lived in the less developed countries, while only 275 million (18%) lived In 1963 a study of the physical and cog- in more developed countries ( B ~ ~ ~ ~ ~ 1980). nitive growth status of Guatemala City primary Most of tllese children grow up under impover- scho01 children of high, middle, and low SES ished economic circumstances. Such an environ- was initiated. This study, now conducted by the ment promotes risk factors for impaired physical Universidad del Valle, de Guatemala, focused and cognitive development from conception to on urban children. Since 1948, the population Our sincere appreciation go& to Gabriel Lasker, Joseph Jacobson, and Joel Ager for their advice during the repvation of this ~nnnuscript. We also thank Lindn Siegel and anonymous referees for helpfur criiicisms. This research was supported by the Universidad del Valle de Guatemala. Address for reprints: Dr. Barry Bogin, Department of Behavioral Sciences, Uni- versity of Michigan, Dearborn, Michigan 48128. [Child Dmelopmcnl, 1983.54, 115-128. @ 1983 by the Society for Research in Child Development, Inc. All rights reserved. 0009-3920/83/5406-0019SOl.00]
Transcript of The Relationship of Socioeconomic Status and Sex to Body Size, Skeletal Maturation, and Cognitive...

The Relationship of Socioeconomic Status and Sex to Body Size, Skeletal Maturation, and Cognitive Status of Guatemala City' Schoolchildren
Barry Bogin University of Michigan-Dearbom
Robert B. RlacVean Utliaersidad del Valle de Guatemala
BOGIN, B A ~ ~ Y , and MACVEAN, R O D E I ~ ~ D. The Rclationslrip of Socioeconomic Status and Sex to Body Size, Skeletal Maturation, and Cognitive Status of Guatemala City Schoolcl~ildren. CIIILD DEVELOPMENT, 1983, 54, 115-128. Longitutlinal data from a study of child developn~ent in Guatemala City were used to describe the influence of socioeconomic status and sex on hysical and cognitive growth status. The correlation between the growth status variables was arso ana- lyzed. The sample included 144 Guatemalan children, 46 of low SES, 52 of middle SES, and 46 of high SES. The children mere students in 5 urban primary schools. 3 physical variables, height, weight, and skeletal age, were ~neas~~recl annually from first to sixth grade. Two cog- nitive variables, general intelligence and reading ability, were measured in grades 1, 3, 4, or 5. Significant differences behveen SES groups existed for all variables. However, the differences in each grade were greater for the cognitive measures than for the ph sical measures. Com- pared with high SES children, middle SES boys md low SES boys andYgirls experienced sig- nificantly greater delayed growth in height than in weight or skeletal age. It is ~ossible that these height delays may result in a permanent reduction in stature. The only consistently sig- nificant sex-related difference \\.as for skeletal age; girls were more mature than boys in each grade. When SES was statistically controlled, there was no significant correlation between hys-
correlations for boys. i ical and cognitive growth status for girls and only a few moderate but statistically signi cant
T h c study of child growth and maturation maturity. Among these risk factors are malnu- ill the developing nations of the world has he- trition, infcctious disease, and the lack of oppor- come a major focus of research in the past few tunities for psychosocial stinlulation and learn- years. There are a t least two reasons for this. ing (Cravioto & DeLicardie 1979; Pollitt & T h e first is the possibility of testing hypotheses Lewis 1980). T h e identification and ameliora- based on research carried out in the developed tion of these risk factors are of prime importallce nations 011 populations from different cultural, for successful development of the individual social, and physical environments. The second child. Since national and social economic de- reason is that most of the world's children live velopment will depend on these children, basic in the developing nations. In 1975, approxi- research on child growth is fundamental to suc- mately 1.2 billion children under 15 years (82% cessful national growth as well. of all such children) lived in the less developed countries, while only 275 million (18%) lived I n 1963 a study of the physical and cog-
in more developed countries ( B ~ ~ ~ ~ ~ 1980). nitive growth status of Guatemala City primary Most of tllese children grow u p under impover- scho01 children of high, middle, and low SES ished economic circumstances. Such an environ- was initiated. This study, now conducted by the ment promotes risk factors for impaired physical Universidad del Valle, d e Guatemala, focused and cognitive development from conception to on urban children. Since 1948, the population
Our sincere appreciation go& to Gabriel Lasker, Joseph Jacobson, and Joel Ager for their advice during the repvation of this ~nnnuscript. We also thank Lindn Siegel and anonymous referees for helpfur criiicisms. This research was supported by the Universidad del Valle de Guatemala. Address for reprints: Dr. Barry Bogin, Department of Behavioral Sciences, Uni- versity of Michigan, Dearborn, Michigan 48128.
[Child Dmelopmcnl, 1983.54, 115-128. @ 1983 by the Society for Research in Child Development, Inc. All rights reserved. 0009-3920/83/5406-0019SOl.00]
116 Cliild Development
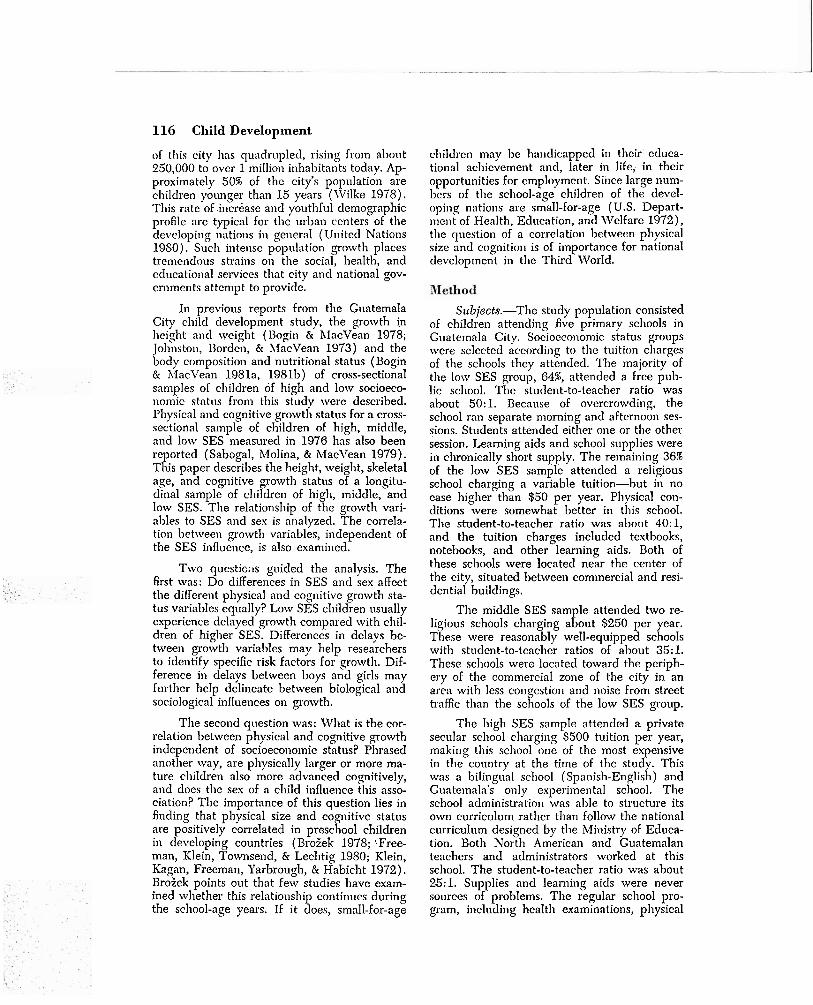
of this city has quadrupled, rising from about 250,000 to over 1 million inhabitants today. Ap- proximately 50% of the city's population are children younger than 15 years (IVilke 1978). This rate of increase and youthful demographic profile are typical for the urban centers of the de\,eloping nations in general (United Nations 1980). Such intense population growth places tremendous strains on the social, health, and educational services that city and national gov- ernments attempt to provide.
In previous reports from the Guatemala City child development study, the growth i.n height m ~ d weight (Bogin & hIacVean 1978; Johnston, I3orden, & hlacVean 1973) and the body composition and nutritional status (Bogin & hlacVean 1981a, 1981b) of cross-sectional samples of children of high and low socioeco- nomic status from this study were described. Physical and cognitive growth status for a cross- sectional sample of children of high, middle, and low SES measured in 1976 has also been reported (Sabogal, hlolina, & MacVean 1979). This paper descril~es the height, weight, skeletal age, and cognitive growth status of a longitu- dinal sample of chilclren of high, middle, and low SES. The relationship of the growth vari- ables to SES and ses is analyzed. The correla- tion 1,etween growth variables, independent of the SES influence, is also examined.
Two questicits guided the analysis. The first was: Do differences in SES and sex affect the different physical and cognitive growth sta- tus variables equally? Low SES children usually experience delayed growth compared with chil- dren of higher SES. Differences in delays be- tween growth varia1)les may help researchers to identify specific risk factors for growth. Dif- ference in delays between boys and girls may further help delineate between biological and sociological influences on gro.rvth.
The second question was: What is the cor- relation between physical and cognitive growth independent of socioeconomic status? Phrased another way, are physically larger or more ma- ture cl~jldren also more advanced cognitively, and does the sex of a child influence this asso- ciation? The importance of this question lies in finding that physical size and cognitive status are positively correlated in preschool children in developing countries (Broiek 1978; free- man, Klein, Townsend, & Lechtig 1980; Klein, Kagan, Freeman, Yarbrough, & Habicht 1972). Broiek points out that few studies have exam- ined whether this relationship continues during the school-age years. If it does, small-for-age
cllildren may I)c harldicapped in thcir cduca- tional achievement and, later in life, in their opportunities for cmployment. Siilce large num- bers of the school-age children of the devel- oping nations are small-for-age (U.S. Depart- I T I C I I ~ of Health, Education, and IVclfare 1972), the question of a correlation between physical size and cognition is of importance for national develop~nent in the Third World.
Subjects.-The study population consisted of children attending five primary schools in Guatemala City. Sociocconomic status groups were selected according to thc tuition cliarges of the schools they attended. The majority of the low SES group, 64%, attended a free pub-
a lo was lic school. The student-to-teacher r t' about 50:l . Because of overcrowding, the school ran separate morning and afternoon ses- sions. Students attended either one or the other session. Learning aids and school supplies were in chronically short supply. The remaining 36% of the low SES sample attended a religious school charging a variable tuition-but in no case higher than $50 per year. Physical con- ditions were somewhat better in this school. The student-to-teacher ratio was nl)out 40:1, and the tuition charges included textbooks, notebooks, and other learning aids. Both of these schools were located near the center of the city, situated between commercial and resi- dential buildings.
The middle SES sample attended two re- ligious schools charging about $250 per year. These were reasonably well-equipped schools with student-to-teacher ratios of about 35:l. These schools werc located toward the periph- ery of the commercial zone of the city in an area with less congestion and noise from street traffic than the schools of the low SES group.
The high SES sample attended a private secular school charging $500 tuition per year, making this school one of the most expensive in the country at the time of the study. This was a bilingual school (Spanish-English) and Guatemala's only experimental school. The school administration was able to structure its o \m curriculum rather than follow the national curriculum designed by the Ministry of Educa- tion. Both North American and Guatemalan teachers and administrators worked at this school. The student-to-teacher ratio was about 25:l. Supplies and learning aids were never sources of problems. The regular school pro- gram, including hcalth examinations, physical

Bogin and MacVean 117
activity, supervised lunches, and progressive education, ensured that these high SES chil- dren were provided with an enriched school environment. The school was at the edge of the city limits on a relatively large, open plot of land. The design of the school grounds afforded minimal external disturbances.
The tuition metl~od of SES grouping was supported by a separate assessment of SES I~nsecl on a con~posite score for parental occu- pation, parental education, and zone of resi- dence in the city for a random sample of 672 families with children in these schools (Cam- peros, Note 1). This composite SES score had a possil,le range of 4-15 points. The mean score for each tuition-based SES group was: high SES = 12.21 -t 3.39, middle SES = 10.18 f-
6.64, low SES = 5.75 + .40. The difference be- tween all hvo-way comparison of these means is significant (11 < .001). Except for students attending the high SES school on scholarships (these students were not included in the pres- ent study), there was no overlap in the range of scorrs for the low and high SES groups. There was some overlap of the middle SES group with both low and high groups.
Comparison of data from this second meth- od of SES assessment with census data for occu- pational and educational levcl for all of Guate- mala City (Alunicipalidad de Guatemala 1972) shows that the high SES and middle SES sam- ples of the present study are representative of these same SES groups for the city as a whole. The low SES sample does not represent a ran- dom sample of the poorest children in the city. hlany poor children, up to 30% in some areas of the city (Roberts 19'73), never attend school. Ilowcver, the low SES children of this study, and their families, are poor. The differences in SES between high and low groups in these Guatemalan samples were greater than those for children from the upper-middle and lower claxses in most North Anicrican cities who have been the subjects of most growth and develop- ment research.
The children were all native speakers of Spanish, had Spanish surnames, and were eth- nically identified as Larli~~os (defined here as Spanish-s eaking Guatemalans with a generally R "\Vestern -oriented life-style and set of values).
Procsdrrre.-Physical and cognitive growth data were collccted during annttal visits t o each school. The time betwecn visits ranged from .98 to 1.07 years, with a mean of 1.02 years. The entire school population present on the days of measurement was examined, and approxi-
mately 93% of the school populations were seen each year.
The present study is based on those chil- dren who entered the first grade between 1963 and 1969, who were measured once a year in each subsequent grade through sixth, and who never repeated a grade. Of the 144 such chil- dren reported on here, 21 11oy.s and 25 girls were of low SES, 27 boys and 25 girls were of middle SES, and 22 boys and 24 girls were of high SES.
Measurement procedures for height and weight were described by Bogin and MacVean ( 1978).
Hand-wrist radiographs were taken with a portable X-ray unit. All exposures were made using a uniform source-to-film distance, expo- sure time, and power output. The Greulich & Pyle (1959) method was used to estimate skel- etal maturity. The same technician took and read all radiographs. In 1976 this technician's reliability was tested Ily blind rereading of 71 randomly chosen radiogra hs, dating frorn 1963 to 1971. The correlation ehveen the two sets of readings was .89.
E A test of general intelligence mid a test of
reading achievement were given during each annual examination. Unfortunately, only in grades 1 and 5 for the reading tests and grades 3 and 4 for the intelligence tests did all three SES groups take the same test. Common tests from these grades are reported here.
The first-grade reading test was the Amer- icano de Guatemala (ADG) level 1. The fifth- grade reading test was the ADG intcrmediate Icvcl. The Americano de Guatemala reading tests were developed by the American School of Guatemala to assess vocabulary and reading comprehension of Guatemalan scl~oolchildren. These instruments are similar to tests in En- glish, I ~ u t they were devclopecl from original materials, not translated from English, in an at- tempt to avoid some linguistic and cultural 1)iases. The coml~ined vocal~ulary and compre- hension raw scores are reported here. Reliabil- ity and validity studies for these tests have not been conducted.
The third-grade intelligence test was the Pintncr Durost elementary Icvel. The fourth- grade intelligence tcst was the Otis Self-admin- istering Test of hflental Ability, intermediate level. These tests are well-known English lan- guage instruments that were translated and adapted to the Spanish language with the au-

118 Child Development
tllorization of the publishers. Only total raw test scores are reported here.
Both the reading and intelligence tests were administered in school classrooms follow- ing the procedures for group testing described in the manuals accompanying each instrument.
Measures.-Height is a measure of cumu- lative growth that reflects long-term genetic and environmental influences on size. Current re- search indicates, however, that during child- hood the environmental influences outweigh the genetic ones (Grculich 1976; Habicht, Mar- torell, Yarbrough, Malina, & Klein 1974; John- ston, Wniner, Thissen, & MacVean 1976). Since the subjects of this study are predominantly of preadolescent age, we assume that any differ- ences in height between SES groups are pri- marily due to environmental factors. Others have made this same argument, stating that height may serve as a sensitive indicator of SES (Tanner 1978) and past nutrition and health history (Waterlow, Buzina, Keller, Lane, Nich- aman, & Tanner 1977).
kveight is a measure of recent growth his- tory. Like height, it is primarily influenced by environmental factors during childhood. Unlike height, weight may serve as an indicator of cur- rent nutrition and health status (Waterlow et al. 1977).
Skeletal age is a measure of physical ma- turity. It stands in contrast to height and weight, which are indicators of physical size (Greulich & Pyle 1959; Roche 1978). Skeletal age is useful in predicting residual growth po- tential (Tanner, Whitehouse, Marshall, Healy, 6( Goldstein 1975) and the timing of matura- tional events such as menarche (Marshall & Limongi 1976). The relationsliip of skeletal age to environmental influences is not completely understood.
Reading ability is a measure of skills spe- cifically taught by schools and, sometimes, rein- forced by the home environment. We consider it to be a measure that predominantly reflects environmental influences. Current research finds that low SES is almost universally linked with poor reading achievement (Pollitt & Lewis 1980).
General intelligence is a measure of sev- eral cognitive skills, some of which are refined and practiced in schools and others in the home and community. Rather than emphasizing the importance of biological or environmental fac- tors we agree with the position that there are genetic, environmental, and interactive influ- ences on general intelligence test scores (Jencks 1972; Scarr 1981).
Results
Means and standard deviations are pre- sented in table 1 for chronological age and the physical measurements taken from grades 1 through 6. Descriptive statistics for the cogni- tive tests taken by all three SES groups are reported for grades 1, 3, 4, and 5. Because sig- nificant differences exist between the mean chronological ages of some of these SES/sex groups, the physical and cognitive data were adjusted by analysis of covariance to statisti- cally remove the effect of age on the growth variables. These age-adjusted data were used in all subsequent analyses.
The means presented in table 1 appear to differ by SES and sex. A repeated-measures multivariate analysis of variance design was used to economically evaluate these data. The repeated-measures MANOVA tested for a sig- nificant effect of SES, sex, and their interaction on the combined physical and cognitive mea- sures for grades l , 3, 4, and 5. The program used, Miami Multivariate Analysis of Variance (Landrum, Ajiri, & Biasatti 1978), also yields a repeated-measures univariate analysis of vari- ance, a canonical correlation coefficient (a mea- sure of the association between the effect of SES or sex and the combined growth mea- sures), and a standardized function coefficient. These coefficients correspond to the canonical weights for the dependent variables. They dif- fer from canonical weights in that they are standardized by the adjusted-error standard de- viations rather than by the raw score deviations (Landrum et al. 1978, pp. 17-18). The abso- lute value of the coefficient may be used to assess the relative importance of the influence of SES and sex on each independent variable (Nie, Hull, Jenkins, Steinbrenner, & Bent 1975). This analysis may be used to answer the first question we posed: Do differences in SES and sex affect physical and cognitive growth sta- tus equally?
Both SES and sex had significant effects on the combined physical and cognitive measures in each grade (repeated-measures MANOVA p's < .01). There was only one significant mul- tivariate interaction, and that occurred in grade 3 (p = .05). The canonical r2 values for the SES effect are: grade 1 = .53, grade 3 = .67, grade 4 = .42, grade 5 = .35. For the sex ef- fect these values are: grade 1 = .16, grade 3 = 26, grade 4 = .17, grade 5 = .lo. These values show that in each grade the proportion of the total variance in the analysis explained by SES was relatively greater than that explained by sex. The variance explained by the significant

TABLE 1
Chronological Skeletal Cognitive ~ r a d e ; SES, Age Height Weight Age Testh
and Sex (Years) (cm) (kg) (Years) (Raw Score) - 1 :
High: Boys.. . . . . . . . 7.50 125.51 26.38 7.11 32.99
(.32) (5.21) (3.47) (.94) (7.22) Girls.. . . . . . . . 7.35 121.01 24.44 7.33 33.17
(. 34) (5.14) (3.43) (.03) (7.10) Middle:
Boys. . . . . . . . . 6.99 120.13 28.83 6.41 27.18 (.44) (5.40) (3.01) (7.38)
Girls. . . . . . . . . 7.22 121 .SO 23.86 7.09 (.99) 27.72 (. 36) (5.15) (3.45) (.95) (7.20)
Low: -- .
Boys.. . . . . . . . 7.40 116.40 21.87 6.06 19.89 (.SO) (5.13) (3.44) (.91) (7.15)
Girls. . . . . . . . . .7.48 115.60 20.86 6.73 14.67
0. ( .59) (5.20) (3.50) (. 95) (7.25)
L ;
High: Boys.. . . . . . . .
Girls. . . . . . . . .
Middle: Boys. . . . . . . . .
Girls. . . . . . . . .
LO\\. : Boys.. . . . . . . .
Girls. . . . . . . . .
3 : - . High:
Boys.. . . . . . . . 9.47 135.76 31.93 9.15 93.10 (6.00)
(.32) 132.96 (5.01) ( .94) (10.23)
Girls. . . . . . . . . 9.37 30.56 9.55 93.57 ( ,341 (5.98) (5.00) ( .93) (10.09)
Middle: Boys.. . . . . . . . 9.01 130.08 30.84 8.51 78.14
(6.29) (.44) 132.87
(5.25) (. 99) (10. 50) Girls.. . . . . . . . 9.26 30.03 9.41 69.71
(.36) (6.00) (5.00) (.95) (10.20) Low:
Boys.. . . . . . . . 9.44 128.11 26.9.5 8.20 65.02 (. 46) (6.00) (5.00) ( .96) (10.13)
Girls.. . . . . . . . 9.52 126.66 26.08 8.97 5.5.60 ( ,591 (6.05) (5.05) (1 .OO) (10.30)
4: Hieh: "-- -
Boys. . . . . . . . .
Girls.
Middle: Boys..
Girls. (.36) (6.30) (6.35) (1 .OO) (8.90)
Low: ~ ~
Boys. . . . . . . . . 10.45 132.49 30.40 9.43 22.04 (. 45) (6.28) (6.32) (1.01) (9.03)
Girls . . . . . . . . . 10.51 132.37 -29.35 10.01 19.09 ( .59) (6.35) (6.40) (1.0C') (9.20)
NOTE.-Numbers in parentheses are standard deviations. The physical and cognitive data were adjusted for the chronological age differences by analysis of covariance.
b Reading and vocabulary comprehension in grades 1 and 5. General intelligence in grades 3 and 4.

120 Chilcl Development
Chronological . Skeletal Cognitive Grade, SES, Age Height LVeight 'I'cst"
and Scs (Sears) ( 4 (kg) (Years) (Raw Score) - -- -- -- - - - - 5 :
High: Uoys.. . . . . . . . 11.38
( I . 08) 11.75 (1.03)
Girls.
Middle: Boys. .
Girls. . . . . . . . .
Low: Boys..
Girls.
6: High:
Uoys..
Girls. . . . . . . . .
Middle: Boys.
Girls. .
Idow: Boys. . . . . . . . .
. . . . . . . . Girls.
interaction in grade 3 is statistically small, r2 = .OS, and, from a practical standpoint, seems to have little importance. Socioeconomic status had a significant effect on each of the D ~ V S ~ C ~ ]
and cognitive measures, the discriminating power of the cognitive measures was relatively greater than those for the physical variables.
To visualize the meaning of the SES and sex influence on the different growth variables, the data are further analyzed in figures 1 through 3. Because each of the growth vari- ables was measured in different units (i.e., cen- timeters, kilograms, years, and raw test scores) it was necessary to transform the data to a common scale for comparative analysis. This transformation was accomplished by computing for each variable the relative delay of the mid- dle and low SES children compared to the high SES children. Relative de!?y (BD) was com- p_uted by formula: RD = (XI - X,)/SD,, where X, =_age-sex-specific mean of the high SES sam-
-
ple, X, = age-sex-specific mean of the middle or low SES sample, and SDI = age-sex-specific standard deviation of the high SES sample.
0 L J
and cognitive measures analyzed separately in every grade (repeated measures ANOVA p's 5 .01). Scs of the child was a significant influence on skeletal age in all grades (p's = .05) and intelligence test scores in grade 3 (p < .001).
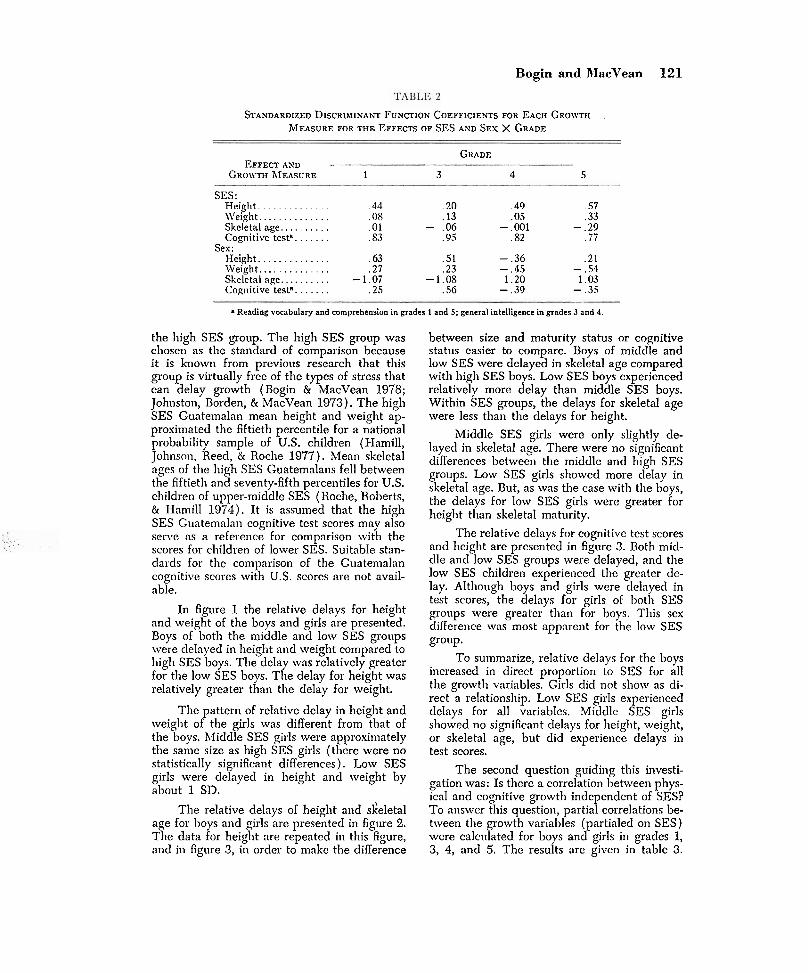
The standardized discriminant function co- efficients are given in table 2. When analyzed for the effect of SES, the cognitive test scores had the largest coefficients. The coefficients for height are the nest largest. When analyzed for the effect of sex, skcletal age had the largest coefficients.
The repeated-measures analysis produced similar results across all four grades. Though SES and sex significantly influenced the growth status variables, the SES effect was more con- sistent in its influence on all variables 2nd ex- plained a greater percentage of total variance. Furthermore, although there were significant differences between SES groups for all physical
This procedure allows for the comparison between variables because it expresses the dif- ference by sex and SES groups in terms of sim- ilar conceptual units, the standard deviation of
Bogin and RlacVean 121
~TANDARDIZED DISCRIMINANT FUNCTION COEFFICIEXTS FOR EACH G R O ~ T H . MEASURE FOR THE EFFECTS OF SES AND SEX X GRADE
GRADE EFFECT AND -
GRO\\,TH AIMSURE 1 3 4 5
SES: Heieht . . . . . . . . . . . . . . .44 .20 .49 .57 " [Veight. . . . . . . . . . . . . . .08 .13 .05 .33 Skeletal age.. . . . . . . . . .01 - .06 - .001 -.29 Cognitive testa. . . . . . . .83 .95 .82 . 7 7
Sex: Height. . . . . . . . . . . . . . .63 .51 - .36 .21 Weight.. . . . . . . . . . . . . .27 .23 - .45 - .54 Skelctal age.. . . . . . . . . -1.07 -1.08 1.20 1.03 Cognitive tests. . . . . . . .25 .56 - .39 - .35
a Reading vocabulary and comprehension in grades 1 and 5 : general intelligence in grades 3 and 4.
the high SES group. The high SES group was chosen as the standard of comparison because it is known from previous research that this group is virtually free of the types of stress that can delay growth (Bogin & MacVean 1978; Johnston, Borden, & MacVean 1973). The high SES Guatemalan mean height and weight ap- proximated the fiftieth percentile for a national probability sample of U.S. children (Hamill, Johnson, Reed, & Roche 1977). Mean skeletal ages of the high SES Guatemalans fell between the fiftieth and seventy-fifth percentiles for U.S. children of upper-middle SES (Roche, Roberts, & Hamill 1974). It is assumed that the high SES Guatemalan cognitive test scores may also serve as a reference for comparison with the scores for children of lower SES. Suitable stan- dards for the comparison of the Guatemalan cognitive scores with U.S. scores are not avail- able.
In figure 1 the relative delays for height and weight of the boys and girls are presented. Boys of both the middle and low SES groups were clelayed in height and weight compared to high SES boys. The delay was relatively greater for the low SES boys. The delay for height was relatively greater than the delay for weight.
The pattern of relative delay in height and weight of the girls was different from that of the boys. hliddle SES girls were approximately the same size as high SES girls (there were no statistically significant differences). Low SES girls were delayed in height and weight by about 1 SD.
The relative delays of height and sceletal age for boys and girls are presented in figure 2. The data for height are repeated in this figure, and in figure 3, in order to make the difference
between size and maturity status or cognitive status easier to compare. 13oys of middle and low SES were delayed in skeletal age compared with high SES boys. Low SES boys experienced relatively more delay than middle SES boys. Within SES groups, the delays for skeletal age were less than the delays for height.
Middle SES girls were only slightly de- layed in skeletal age. There were no significant differences between the middle and high SES groups. Low SES girls showed more delay in skeletal age. But, as was the case with the boys, the delays for low SES girls were greater for Ileight than skeletal maturity.
The relative delays for cognitive test scores and height are presented in figure 3. Both mid- dle and low SES groups were delayed, and the low SES children experienced the greater de- lay. Although boys and girls were delayed in test scores, the delays for girls of both SES groups were greater than for boys. This sex difference was most apparent for the low SES group.
To summarize, relative delays for the boys increased in direct proportion to SES for all the growth variables. Girls did not show as di- rect a relationship. Low SES girls experienced delays for all variables. Middle SES girls showed no significant delays for height, weight, or skeletal age, but did experience delays in test scores.
The second question guiding this investi- gation was: Is there a correlation between phys- ical and cognitive growth independent of SES? To answer this question, partial correlations be- tween the growth variables (partialed on SES) were calculated for boys and girls in grades 1, 3, 4, and 5. The results are given in table 3.

Legend A Ulddle SES H*lghl
U l o w SES Halghl
A Edd) S g ? l @ t
q !+wzES-W*lpht-
BOYS
FIG. I.-Relative delay in height and weight of middle and low SES boys and girls compared with high SES boys and girls.
122
2.5-
2-
- .- 1.5- v
.3 >- - 0 u
f 1- .- - 0 - m IT
0.5-
0
GIRLS
\. 0- , \ ,,--u--o
---a.
A'~-+~,
L A d p - A a- . . '0
-4 \ \ \
'A- - - A - - - - A - - - A
1 2 3 4 5 8
2.5-
2 -
1.5- - - - 5 1-
v & 6 0.5- - 0 -0
0 - O -
w
-0.5-
-I-
-1.5
Grade
Legend A Ulddk Y S h l w l
0 Low SES b l p h t
A zdd) S g !4al@t
0 ~w~ES-Wlpht -
a= cU- -0 - -0- - - - - -0- - - u==-==E
A- ' - -A- - - A -
A LA- A
1 2 ; ' 4 5 6 Grade

Legend A Mlddl* Y.S H.lphl
q Low SES Holght
A S d d l SC_5 Lk&-t>g.
q ~ w ~ S - S k * t o ~ o p -
BOYS
FIG. 2.-Relative delay in height and skeletal age of the middle and low SES boys and girls co~npared with high SES boys and girls.
123
2.5-'
2-
- - c
1.5- I a X - % 0 > 1-
2=
- LL 0
0.5-
0
GIRLS
\-o-o-
: e A d c l \ -0-
Y A - A - - A & \
\ 0 /A- -
\ 0 - - A - - - &
A- \ .. 0 \ \ \
A
1 2 S 4 5 6
2.5-
2-
1.5- - - 7
5 t-
-4
2 0.5-
3 0 - L - O-
d -0.5-
-1-
-La-
Grade
Legend A Mlddl. SES Height
0 Low SES Ha Im
A Sddh S&S SJ.l*d>g?.
k w S E S f k . l . t g o p -
o-"-----n--
0- - - -0- - - 0- - --- -\ - -0- -
-0 A - - - - A - - - A. - - -A- - - .A - - - A A - A
\A- A
1 2 3 4 5 6 Cmde

Legend A Ylddlc SES H.lght
q Low SES h l p h t
A ydd& S F b s n l ( l v ~ h.)
~ w ~ S - + l ~ kst-
Legend A Ulddh SES H.l#lt
q Low SES H.l#lt
A Kddl) b g n n t l v ~ h ~ t
q L_ow~S-Cqplt&a &st-
BOYS
3.5-
3 -
2.5-
5- - 5
2-
- m -0
1.5- > - - 0 - '?
1-
0.5-
0
FIG. 3.-Relative delay in hei ht and cognitive test scores of middle and low SES boys and girls com- pared wyith hidl SPS boys a d girfs.
124
.
/9
/ /' \
\ /
/ ' \
/ \ \
\ b \ \ Lo-0-
\ \
A q A I A 0 \ 0
A* -A-A- \
A
2,. . . A
1 2 3 4 5 6
GIRLS
Grade
4 -
3-
h = 3
w. - v t 1- - - - 0 E
o
-1
D / / \
/ - \ /
/ \ /
/ \
u \ \
/ 4 \
/ b , \ /
\ \ \
/ /
\ h
A' n - o ~ 4 ~ o . \ .u \
A
A-~-A-~
\A- A
1 2 3 4 5 6 Gmde

Bogin and RIacVean 125
CORRELATION AMONG ALI, I'IIYSICAL AWD COGNITIVE ME~\SURES, PAKT~.-\LED
~ ~ E I C I I T SKELETAL I\GE COGNITIVE TEST - -- -- - -- - -- - -- - GRADE Boys Girls Boys Girls Boys Girls
--A -- .-
1 : Height. . . . . . . . . . . . . . . .69** .66** .42** .57** 1 5 .03 \\'cigl~ t . . . . . . . . . . . . . . . . . . . . . .33** .38** .19 . 00 Skclctal age.. . . . . . . . . . . . . . . . . . . . . . .14 - .03
3: Height. . . . . . . . . . . . . . . .52** \\:eight. . . . . . . . . . . . . . . . . . Skeletal age.. . . . . . . . . . . . .
4: Height. . . . . . . . . . . . . . . .58** \Veight . . . . . . . . . . . . . . . . . .
. . . . . . . . . . . . Skeletal age.. 5 :
tIcig11t. . . . . . . . . . . . . . . .61** \\'eight . . . . . . . . . . . . . . . . . . Skeletal age.. . . . . . . . . . . . .
I-Icight, weight, and skeletal age were s i g nificantly and positively correlated in each grade. For the girls, cognitive test scores and the physical measures were not significantly corre1:lted in any grade. The boys showed no siglificant associations between the physical and cognitive growth variables except for the IQ test with height and weight in grade 3 and the reading test with height in grade 5. Though signific:ult, thcse correlation coefficients are rel- atively smaller than those between the physical variables. The T , statistic was used to compare thcse coefficients. The T, tests for significant differences between two elements of a correla- tion matrix I)nsecl on different mensurcments of the S ~ I I ~ I C indivitluals (Steiger 1980). For boys in the third grade, r height/skeletal age versus r height/cognitive test is significantly different (T, = 2.66, p = .01). The r height/weight versus r height/skeletal age difference is almost significant (T, = 1.90, 11 = .08). In the fifth grade r height/~veight and r height/skeletal age are significantly larger than r lieight/cog- nitive test ( T , = 2.68, 11 = .007; T, = 3.16, 1) = .002, respectively).
Discussion The first part of the analysis rclated to the
q~~estion of \\~Iicthcr physical growth and cog- nitive gro\vth were equally affected by SES and sex. The answer is no. Socioeconomic status ex- plained 1)etween 35% and 67% of the variance in these data. Sex accounted for only 107~26%
of the variance. While all growth varia1)les were significantly influenced by SES, the tcst scores for reading and intelligence were most strongly influenced. The differences in school environ- ments described earlier were, probably, major determinants of the test scores.
The only consistent sex-related difference was for skeletal age. The skeletal age difference, girls more mature than I~oys in every grade, is n ncarly universal phenomenon and rellccts the greater biological maturation of girls from pre- natal life to adulthood (Tanner 1978).
The graphic display of the data in figures 1, 2, and 3 adds dctnil to tl~esc findings. For I)oys of middle a t ~ d low SES, relative tlelays for height were greater than delays for weight. The difference between the height and weight de- lays tends to increase from grades 1 to 6. The low SES girls showed nearly equal dclays for Ilcight and weight across all grades. Height is an indicator of past growth history, while weight reflects current growth (Waterlow et al. 1977). Undernourishment and disease are the most probable causes of growth clelays for chil- dren in developing nations (Frisanclio 1978; Scrimshaw, Taylor, Er Gordon 1968). All of the middle and low SES children in this str~dy were healthy enough to enter and complctc primary school without major iliterruptions, Thus, it appcarstthat, during the school years, low SES children, and to a lesser estent, middle SES boys suffered from undernutrition. Caloric un- dernutrition has previously bcen reported for

126 Child Development
low SES children attending public school in Guatemala City (Bogin ' & MacVean 1981b; May & hlcLellan 1972). The decrease in the relative delay in height, and especially weight, of the boys may mean that undernutrition was more severe prior to school entry but improved during the school years. Since the relative de- lays for the low SES girls did not decrease during the scl~ool years, nutritional stress may have continued.
Middle and low SES boys and low SES girls showed greater delays for height than skeletal age. Frisancho (1978) reports that low SES and undernourished populations ". . . cxhibit n drastic reduction . . ." in skeletal ma- turity. He also reports that this delay is greater during childhood than during adolescence. Mal- nourished rural Guatemalan children were found to be delayed in skeletal maturity. But the delay was relatively small compared to the delays in length and weight (hfartorell, Ynr- brough, Klein, & Lechtig 1979). Because skel- etal maturity is highly, and ncgntively, corre- lntcd with residual <growth potential (Tanner et al. 1975), height rednctions experienced by low SES and undernourished children may persist into adulthood.
The relative delays in size and skeletal age were greater for boys than for girls. It has often been reported that the physical growth of boys is a more sensitive indicator of environmental stress tlinn the growth of girls (Biclicki & Char- zewski 1977; Greulich 1976). This was not the case for the delays in cognitive test scores. h4id- dle and low SES girls experienced greater de- lays than their male counterparts. Sabogal et al. (1979) found a similar difference in cognitive tcst scores. Thcir sample was dcrivcd from the same study population as the sample reported here, but theirs was cross-sectional, and the children took different cognitive tests. Thus the sex differences were most likely not a function of the sample or the tcst. Nor can the differ- ences be due to maturity status, since the girls 1v.ere 1n:)re mature than the boys in each grade. The present data cannot provide a reason for this difference. However, it may be that tile snciocult~ual value placed on the type of cog- nitive development associated with formal edu- cation was greater for boys than for girls.
Except for scores in the thircl-grade intelli- gcncc tcst, the rclativc delays for coglition de- crease fro111 grade 1 to 5 for both sexes. This is encouraging, since it may indicate that school- ing had its desired effect. If low and diddle SES children could experience t l ~ e same educa-
tional program as high SES children, the dif- ferences might become further reduced.
When SES was held constant, neither physical size nor skeletal maturity was signif- icantly correlated with cognitive test scores of
'
the girls. Size was associated with tcst scorcs in a few cases for the boys, but most of these asso- ciations were significantly smaller than thc cor- relations Ixtween the physical measures alone.
Garn (1966) reportcd a positive correla- tion between physical size, and the motor and language development of children participating in the Fels Longitudinal Study. He nccountecl for this association by the coadvnncemcnt of physical and psychomotor development during the growth years. As adults, presumably, this association would disappear. Tanner (1969) found an association among IQ, body size, and physical maturity of children and youth in London. Two SES factors, father's occupation and family size, were also correlated with these growth variables. However, the SES factors were not causal to the growth variables. That is, smaller, lowcr IQ children reared in high SES families tended to move down the SES scale as adults, while taller, higher IQ children born to low SES parents tended to move up- ward in SES as adults. The body size/IQ cor- relations persisted into adult life 11ut at lower levels than during childhood. Thus, evidence for both temporary coadvancement and perma- nent association between physical and cognitive growth status was found in this study.
Klein et al. (1972) reported significant associations between physical and cognitive growth status of rural Guatemalan children aged 3-6 years. Similar correlations wcre found in another study of children aged 3-7 years from the same rural villages (Freeman et al. 1980). Mild to moderate malnutrition was en- dcmic among the children of these villages prior to the beginning of these studies. During the study, children received varying quantities and qualities of nutritional supplement a ti on. However, it has recently been reported that, after these same rural children entered school, physical size no longer correlated with cognitive test scores (Klein, Lasky, & Townsend, Note 2). Socioeconomic measures did predict test per- formance. These results parallel those. from the present study. One may conclucle from these studies that, as far as pllysical sizc may serve as a proxy for nutritional status, once children enter school moderate undernutrition has no statistically significant effect on cognitive test performance. The reasons for the lack of corre-

Iation during the school ycars remain to b c de- termined. These Guatemalan studies support other recent analyses that suggest that socio- economic factors are a t least as important (Pol- litt & Lewis 19S0) or more important (Bejar 1951) than nutritional factors in determining school-agc cogiitive performance.
Reference Notes
1. Camperos, A l . M. Relaci6n entre el rendi- miento en lectua en escolares de quinto grado de nivel pri~nario y el estado sociocrlltural de 10s padres. Master's thesis, Universidad del Valle de Guatemala, Gaateniala City, 1975.
2. Klein, R. E.; Lasky, R. E.; & Townsend, J. Early determinants of human development: nutritional factors. Paper presented at the American Association for the Advancement of Science meetings, Washington, D.C., January 1982.
References
Barney, G. 0. The global 2000 report to the presi- d m t . Vol. 1. Washington, D.C.: Government Printing Office, 1980.
Bejar, I. I. Does nutrition cause intc*lligence? A reanalysis of the Cali experiment. Intelligence, 1981, 5, 49-68.
Bielicki, T., & Charze~vski, J. Sex differences in the magnitude of statuml gains of offspring over parents. Hrri~laiz Biology, 1977, 49, 265-277.
Dogin, D. A., & AlacVran, R. B. Gro\vth in hciglit and weight of urban Guatemalan primary school children of low ancl high socioeconomic class. Htrtnan Biology, 1978, 50, 447487.
Bogin, B., & AIacVean, R. B. Nutritional and bio- logical determinants of body fat patterning in urban Guatenialan children. Huinan Biology, 1981, 53, 259-268. ( a )
Dogin, B., & AlacVean, R. B. Body composition and nutritional status of urban Guatemalan children of high and low socioeconomic class. American Journal of Pl~ysical Antlaropology, 1981, 55, 543-551. ( b )
Broiek, 1. Nutrition, malnutrition and behavior. ~IInkal Reoiew of Psychology, 1978, 29, 1 5 6 177.
Cravioto, J., & DeLicardie, E. R. Nutrition, mental development and learning. In I?. Falkner & J. hi. Tanner (Eds.), Huinan growth. Vol. 3. Ncrrrobiology and nrrtritioia. New York: Ple- num, 1979.
Freeman, H. E.; Klein, R. E.; Townsend, J,. W.; & Lechtig, A. Nutrition and cognitive develop- ment among rural Guatemalan children. Amer-
Bogin and RIacVean 127
ican Journal of Public Health, 1980, 70, 1277- 1285.
Frisancho, A. R. Nutritional influences on human growth and. maturation. Yearbook of Physical Anthropology, 1978, 21, 174-191.
Gam, S. M. Body size and its implications. In L. W. Hoffman & hl. L. IIoNman (Eds.), Review of child rleoelopment research. Vol. 2. New York: Russell Sage, 1966.
Greulich, W. W. Some secular changes in the growth of American-born and native Japanese children. American Jor~rnal of Physical Anthro- pology, 1976, 45, 55.3568.
Grer~lich, W. W., & Pyle, I. S. Radiographic atlas of skeletal &uelopment of the hand and wrist (2d ed. ). Stanford, Calif.: Stanford University Press, 1959.
IInbicht, J. P.; Martorell, R.; Yarbrough, C.; Ma- lina, R. M.; & Klein, R. E. Height and weight standards for preschool children. Lancet, 1974, 1, 611-615.
Hamill, P. V. V.; Johnson, C. L.; Reed, R. B.; & Roche, A. F. NCHS growth curves for chil- dren birth-18 years. (Vital and health statis- tics; series 11, no. 165.) JVmhington, D.C.: DIIEW Publications no. (PHs) 78-1650, 1977.
Jencks, C. Ineqnality. New York: Basic, 1972. Johnston, F. E.; Borden, Al.; & MacVean, R. B.
IIeight, weight ancl their growth velocitiec in Guatemalan private school childrcn of high socioeconomic class. Hrrman Biology, 1973, 45, 627-641.
Johnston, F. E.; Wainer, H.; Thissen, D.; & Mac- Venn, R. B. IIercditary and environmental deternlinants of growth in height in a longi- tudinal sample of children and youth of Gua- temalan and European ancestry. Amcrican Jorrnlal of Physical Anthropology, 1976, 44, 469-476.
Klein, R. E.; Kagan, J.; Freeman, H. E.; Yar- brougli, E.; & Ilabicht, J. P. Is big smart? The relation oF gro\vtll to cognition. Joirr~~al of Health and Socinl Behavior, 1972, 13, 219- 225.
Landrum, W. L.; Ajiri, E.; & Biasatti, L. Aliaini ntrrltivariate analysis of cariance or cocariance: MANOVA. Detroit: Wayne State University Computer Sciencc Center, 1978.
hlarshall, W. A., & Liniongi, Y. Skeletal maturity and the of age at menarche. Annals of Hrrman Biology, 1976, 3, 235-243.
hlartorell, R.; Yarbrough, C.; Klcin, R. E.; & Lech- tig, A. hl:~lnctrition, I~otly sizc and skeletal maturation: interre1:ltionships and implications for catch-up growth. Hlrmaia Biology, 1979, 51, 371389.
May, J. M., & McLellan, D. L. The ecology of

128 Child Development
~~,ali~rrtritioiz in Mexico and Cet~tral America. New York: Hafner, 1972.
hlunicipaliclad de Guatemala. Esqueina director de ordenai~~io.rto metropolitano, 1972-2000. Cua- temnla City: Direcci6n cle Plnnificacion,. 1972.
Nie, W. N.; Hull, C. H.; Jenkins, J. G.; Stein- brenner, K.; & Bent, 1). H. Statistical package for the social sciences (2d ecl.). New York: hlcGraw-Hill, 1975.
Pollitt, E., & Lewis, N. Nutrition and educational achievement, I: Malnutrition and behavioral test indicators. Food and Nutrition Bulletin, 1980, 2, 32-35.
Roberts, B. R. Organizing strangers: poor families in G~raternala City. Austin: University of Texas Press, 1973.
Roche, A. F. Bone growth and maturation. In F. Fnlkner & J. hl. Tanner (Eds.), Hrrnlan groruth. Vol. 2. Posti~ntal growth. New York: Plcnr~m, 1978.
Roche, A. F.; Roberts, J.; & Hamill, P. V. V. Skeletal maturity of children G11 years, United States. (Vital and health statistics; series 11, no. 140.) Washington, D.C.: DHE\?' Publications no. (IIRA) 75-1622, 1974.
Sabognl, F.; Molina, B.; & hlacvean, R. B. Desar- rollo fisico y cognoscitivo de ninos guatemal- tecos, en funci6n del nivel socioeconomico y del sexo. Reuista Latinoamericana de Psico- login, 1979, 11, 229-247.
Scnrr, S. IQ: race, social class and individual dif- ferer~ces: new studies of old problems. Hills- dole, N.J.: Erlbaum, 1981.
Scrilnslinw, N. S.; Taylor, C. E.; & Gordon, J. E. Interactions of nutrition and infection. (WHO hlonograph Series, No. 57.) Geneva: World Health Organization, 1968.
Steiger, J. H. Tests for comparing elements of a correlation matrix. Psychological Bulletin, 1980, 87, 245-251.
Tanner, J. M. Relation of body size, intelligence test scores, and social circumstances. In P. H. Mussen, J. Langer, & M. Cogington (E&.), Tre7ld.s and issues in deuelopmcntal psyclzol- ogy. New York: Holt, Rinehart & Winston, 1969.
Tanner, J. M. Fetus into man: physical growth from conception to maturity. Cambridge, Mass.:. Harvard University Press, 1978.
Tanner, J. hl.; Whitehouse, R. H.; Marshall, W. A.; Healy, M. J. R.; & Goldstein, H. As.sessment of skeletal matrrrity and prediction of adult height: T W 2 method. London: Academic Press, 1975.
United Nations. Patterns of urban and rtrral popu- lation growth. (Population studies, No. 68.) New York: UN Department of International Economic and Social Affairs, 1980.
U.S. Department of Health, Education, and Wel- fare. Height and weight of children: socio- economic status. (Vital and health statistics, series 11, No. 119.) Washington, D.C.: DHEW Publication no. (HSM) 73-1601, 1972.
Waterlow, J. C.; Buzina, R.; Keller, W.; Lane, J. M.; Nichaman, M. Z.; & Tanner, J. M. The presentation and use of height and weight data for comparing the nutritional status of groups of children under the age of 10 years. Bulletin of the World Health Organization, 1977, 55, 489-498.
Wilke, J. W. (Ed.). Statistical abstract of Latin America. Los Angeles: UCLA Latin American Center Publications, 1978.