Association of Socioeconomic Status and CKD Among African Americans: The Jackson Heart Study
13
Association of Socioeconomic Status and CKD among African Americans: The Jackson Heart Study Marino A. Bruce, PhD, Meharry Medical College Bettina M. Beech, DrPH, Wake Forest University School of Medicine Errol D. Crook, MD, University of South Alabama Mario Sims, PhD, University of Mississippi Medical Center Sharon B. Wyatt, PhD, RN, FAAN, University of Mississippi Medical Center Michael F. Flessner, MD, PhD, University of Mississippi Medical Center Herman A. Taylor, MD, University of Mississippi Medical Center David R. Williams, PhD, Harvard University Ermeg L. Akylbekova, MS, and University of Mississippi Medical Center T. Alp Ikizler, MD Vanderbilt University Medical Center Abstract Background—Socioeconomic status (SES) is recognized as a key social environmental factor because it has implications for access to resources that help individuals care for themselves and others. Few studies have examined the association of SES with CKD in high-risk populations. Study Design—Single-site longitudinal population-based cohort Corresponding Author: Marino A. Bruce, PhD, Meharry Medical College, Department of Family and Community Medicine, 1005 Dr. DB Todd Jr. Blvd, Nashville, TN 37208, telephone: 615-327-5853, fax: 615-327-5634, [email protected]. Descriptive Text for Online Delivery Hyperlink: Supplementary Table S1 (PDF) About: Association of SES and Low eGFR in the Jackson Heart Study. Financial Disclosures: the authors declare that they have no relevant financial interests. Publisher's Disclaimer: This is a PDF file of an unedited manuscript that has been accepted for publication. As a service to our customers we are providing this early version of the manuscript. The manuscript will undergo copyediting, typesetting, and review of the resulting proof before it is published in its final citable form. Please note that during the production process errors may be discovered which could affect the content, and all legal disclaimers that apply to the journal pertain. Supplementary Material Note: The supplementary material accompanying this article (doi:_______) is available at www.ajkd.org. NIH Public Access Author Manuscript Am J Kidney Dis. Author manuscript; available in PMC 2011 June 1. Published in final edited form as: Am J Kidney Dis. 2010 June ; 55(6): 1001–1008. doi:10.1053/j.ajkd.2010.01.016. NIH-PA Author Manuscript NIH-PA Author Manuscript NIH-PA Author Manuscript
-
Upload
mississippimedical -
Category
Documents
-
view
3 -
download
0
Transcript of Association of Socioeconomic Status and CKD Among African Americans: The Jackson Heart Study

Association of Socioeconomic Status and CKD among AfricanAmericans: The Jackson Heart Study
Marino A. Bruce, PhD,Meharry Medical College
Bettina M. Beech, DrPH,Wake Forest University School of Medicine
Errol D. Crook, MD,University of South Alabama
Mario Sims, PhD,University of Mississippi Medical Center
Sharon B. Wyatt, PhD, RN, FAAN,University of Mississippi Medical Center
Michael F. Flessner, MD, PhD,University of Mississippi Medical Center
Herman A. Taylor, MD,University of Mississippi Medical Center
David R. Williams, PhD,Harvard University
Ermeg L. Akylbekova, MS, andUniversity of Mississippi Medical Center
T. Alp Ikizler, MDVanderbilt University Medical Center
AbstractBackground—Socioeconomic status (SES) is recognized as a key social environmental factorbecause it has implications for access to resources that help individuals care for themselves andothers. Few studies have examined the association of SES with CKD in high-risk populations.
Study Design—Single-site longitudinal population-based cohort
Corresponding Author: Marino A. Bruce, PhD, Meharry Medical College, Department of Family and Community Medicine, 1005 Dr.DB Todd Jr. Blvd, Nashville, TN 37208, telephone: 615-327-5853, fax: 615-327-5634, [email protected] Text for Online DeliveryHyperlink: Supplementary Table S1 (PDF)About: Association of SES and Low eGFR in the Jackson Heart Study.Financial Disclosures: the authors declare that they have no relevant financial interests.Publisher's Disclaimer: This is a PDF file of an unedited manuscript that has been accepted for publication. As a service to our customerswe are providing this early version of the manuscript. The manuscript will undergo copyediting, typesetting, and review of the resultingproof before it is published in its final citable form. Please note that during the production process errors may be discovered which couldaffect the content, and all legal disclaimers that apply to the journal pertain.Supplementary MaterialNote: The supplementary material accompanying this article (doi:_______) is available at www.ajkd.org.
NIH Public AccessAuthor ManuscriptAm J Kidney Dis. Author manuscript; available in PMC 2011 June 1.
Published in final edited form as:Am J Kidney Dis. 2010 June ; 55(6): 1001–1008. doi:10.1053/j.ajkd.2010.01.016.
NIH
-PA Author Manuscript
NIH
-PA Author Manuscript
NIH
-PA Author Manuscript
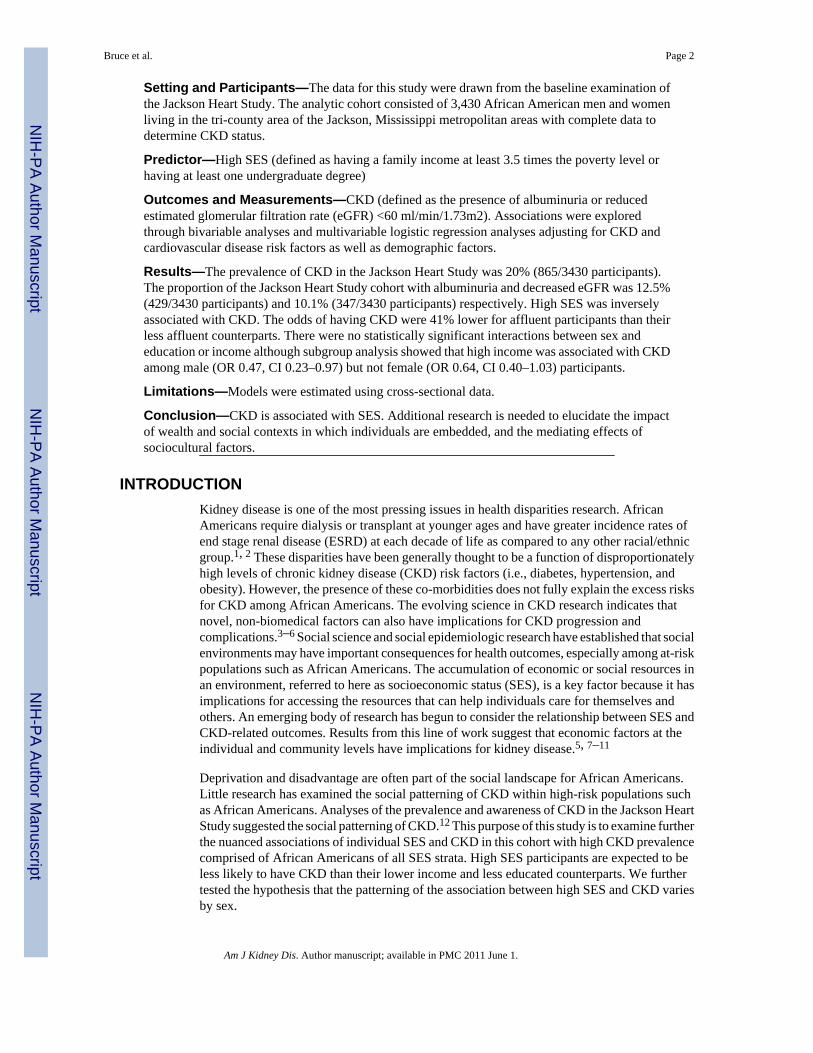
Setting and Participants—The data for this study were drawn from the baseline examination ofthe Jackson Heart Study. The analytic cohort consisted of 3,430 African American men and womenliving in the tri-county area of the Jackson, Mississippi metropolitan areas with complete data todetermine CKD status.
Predictor—High SES (defined as having a family income at least 3.5 times the poverty level orhaving at least one undergraduate degree)
Outcomes and Measurements—CKD (defined as the presence of albuminuria or reducedestimated glomerular filtration rate (eGFR) <60 ml/min/1.73m2). Associations were exploredthrough bivariable analyses and multivariable logistic regression analyses adjusting for CKD andcardiovascular disease risk factors as well as demographic factors.
Results—The prevalence of CKD in the Jackson Heart Study was 20% (865/3430 participants).The proportion of the Jackson Heart Study cohort with albuminuria and decreased eGFR was 12.5%(429/3430 participants) and 10.1% (347/3430 participants) respectively. High SES was inverselyassociated with CKD. The odds of having CKD were 41% lower for affluent participants than theirless affluent counterparts. There were no statistically significant interactions between sex andeducation or income although subgroup analysis showed that high income was associated with CKDamong male (OR 0.47, CI 0.23–0.97) but not female (OR 0.64, CI 0.40–1.03) participants.
Limitations—Models were estimated using cross-sectional data.
Conclusion—CKD is associated with SES. Additional research is needed to elucidate the impactof wealth and social contexts in which individuals are embedded, and the mediating effects ofsociocultural factors.
INTRODUCTIONKidney disease is one of the most pressing issues in health disparities research. AfricanAmericans require dialysis or transplant at younger ages and have greater incidence rates ofend stage renal disease (ESRD) at each decade of life as compared to any other racial/ethnicgroup.1, 2 These disparities have been generally thought to be a function of disproportionatelyhigh levels of chronic kidney disease (CKD) risk factors (i.e., diabetes, hypertension, andobesity). However, the presence of these co-morbidities does not fully explain the excess risksfor CKD among African Americans. The evolving science in CKD research indicates thatnovel, non-biomedical factors can also have implications for CKD progression andcomplications.3–6 Social science and social epidemiologic research have established that socialenvironments may have important consequences for health outcomes, especially among at-riskpopulations such as African Americans. The accumulation of economic or social resources inan environment, referred to here as socioeconomic status (SES), is a key factor because it hasimplications for accessing the resources that can help individuals care for themselves andothers. An emerging body of research has begun to consider the relationship between SES andCKD-related outcomes. Results from this line of work suggest that economic factors at theindividual and community levels have implications for kidney disease.5, 7–11
Deprivation and disadvantage are often part of the social landscape for African Americans.Little research has examined the social patterning of CKD within high-risk populations suchas African Americans. Analyses of the prevalence and awareness of CKD in the Jackson HeartStudy suggested the social patterning of CKD.12 This purpose of this study is to examine furtherthe nuanced associations of individual SES and CKD in this cohort with high CKD prevalencecomprised of African Americans of all SES strata. High SES participants are expected to beless likely to have CKD than their lower income and less educated counterparts. We furthertested the hypothesis that the patterning of the association between high SES and CKD variesby sex.
Bruce et al. Page 2
Am J Kidney Dis. Author manuscript; available in PMC 2011 June 1.
NIH
-PA Author Manuscript
NIH
-PA Author Manuscript
NIH
-PA Author Manuscript

METHODSStudy Population and Measurements
The data for this study were drawn from the baseline examination of the Jackson Heart Study-- a single-site, longitudinal population-based cohort study prospectively investigating thedeterminants of cardiovascular disease (CVD) among African Americans living in the tri-county area (Hinds, Madison, and Rankin counties) of the Jackson, MS metropolitan areas.Baseline data collection occurred between September 2000 and March 2004. Recruitment,sampling, and data collection methods have been described previously.13–16 Recruitmentlimited the age range to 35 to 84 but allowed relatives <35 years and >84 years to enroll inorder to increase the sample power of the family component of the study.17 The total cohortconsists of 5,301 African-American men and women between the ages of 21 and 94. Theinstitutional review boards of the following participating institutions approved the study: theUniversity of Mississippi Medical Center, Jackson State University, and Tougaloo College.All of the participants provided written informed consent.
The baseline examination had three components: a home interview, self-administeredquestionnaires, and a clinic visit. Individuals who had taken any medications two weeks priorto the examination were asked to bring them to the clinic to be coded by a pharmacist usingthe Medispan dictionary with classification according to the Therapeutic Classification System.18 Participants were asked to fast overnight before their clinic visit where anthropometric andseated blood pressure measurements were to be obtained. Venipuncture/urine collections wereperformed according to the National Committee for Clinical Laboratory Standards.13
Study VariablesCKD was defined as the presence of albuminuria or reduced glomerular filtration rate (eGFR)<60 ml/min/1.73m2. The presence of albuminuria was determined by urine albumin-creatinineratio (ACR) based on spot or 24-hour urine values (ACR>30 mg/g). eGFR was estimated usingthe 4-variable Modification of Diet in Renal Disease (MDRD) Study equation [GFR = 186.0· (serum creatinine) −1.154 · age −0.203 · (0.742 if female) · (1.212 if African American)]. Thedefinition of CKD in this study was broader than other studies that defined CKD based solelyon eGFR. Analyses published elsewhere indicate that characteristics of included participantswere similar to those of participants with eGFR alone.12
SES was represented by educational attainment and annual family income. These indicatorstend to have nonlinear relationships with health indices for African Americans; therefore, eachof these variables was represented by a series of dummy variables.19 Educational attainmentwas represented by a four-category variable: whether participants did or did not graduate fromhigh school; attended or graduated from a community, technical, or junior college; or graduatedfrom a four-year undergraduate institution or attained a post-baccalaureate education.Participants who did not complete high school made up the reference category. Annual familyincome was also a four-category variable classified into: low income (< poverty level), lower-middle income (1–1.6 times the poverty level), upper-middle income (1.6–3.5 times the povertylevel), and affluent income (at least 3.5 times the poverty level). Classification was based onthe year of visit, family size, and the number of resident children under 18. FollowingSmith20 and Massey and Eggers,21 income category boundaries were established by U. S.Census estimations. The low income classification was the reference category.
Select demographic factors including age, sex, and marital status (married/not married) werebased on self-reporting during the baseline interview. Health care access was represented bya variable corresponding to a questionnaire item asking participants to rate difficulty of gettinghealth care services as “not difficult at all” (coded 1), “not too hard” (coded 2), “fairly
Bruce et al. Page 3
Am J Kidney Dis. Author manuscript; available in PMC 2011 June 1.
NIH
-PA Author Manuscript
NIH
-PA Author Manuscript
NIH
-PA Author Manuscript

hard” (coded 3), or “very hard” (coded 4). CVD-related risk factors (CVD, hypertension,diabetes, hypercholesterolemia, or BMI) were also accounted for in this analysis. CVD statuswas defined as the presence of coronary heart disease (electrocardiogram-determinedmyocardial infarction or self-reported history of myocardial infarction or angioplasty) orcerebrovascular disease (self-reported history of stroke or carotid endarterectomy orangioplasty). Hypertension status was defined as a measured blood pressure ≥ 140/90 mmHgand/or use of antihypertensive medications.22, 23 Presence of Type 2 diabetes mellitus(diabetes) was determined by a measured fasting glucose of ≥126 mg/dl or use of insulin and/or oral hypoglycemic agents. Presence of hypercholesterolemia was defined as an elevation inmeasured fasting total cholesterol (≥200 mg/dl), LDL-cholesterol (≥160mg/dl) and/or use oflipid-lowering medications. Hypertriglyceridemia was defined as elevated triglyceride levels(≥150 mg/dl) or/and treatment by fenofibrate or gemfibrozil while sex-specific limits (<50 mg/dl for women and <40 mg/dl for men) were used to define low HDL cholesterol levels.24 BMIwas derived by dividing participant weight in kilograms by participant height in meters squared.
Statistical AnalysisStudy population characteristics were described overall by education and income strata,respectively, using mean and standard deviation for continuous variables and proportions forcategorical variables. One-way ANOVA and Chi-square tests were used in descriptive analysesassessing how groups varied across key indicators. Multivariable logistic regression analysiswas used to evaluate the relationship between high SES, co-morbid conditions, demographicfactors, and CKD. “Education only” and “income only” models were also estimated to explorehow the correlations between these components have implications for their respectiverelationships with CKD in the fully adjusted model. It also has been suggested that the socialpatterning of health outcomes for African-American men and women can vary considerably.25–27 Group-specific logistic regression models were estimated to determine if the relationshipbetween high SES and CKD varied by sex. All statistical analyses were conducted with StataSEVersion 10 (www.stata.com).
RESULTSAs previously reported, 1,015 Jackson Heart Study participants completed 24-hour urinecollections.12 Spot urine collections were later added to the protocol (n=2,225); however, asubstantial segment of the study population did not have sufficient urine data to determineCKD status (n=1,792). Other individuals were excluded if they did not have sufficient serumdata to determine CKD status (n=56) or had restricted consent (n=23). The excludedparticipants were somewhat more likely to be older, not married, report more difficulty withhealthcare access, and have lower education and income levels (data not shown). However,the analytic sample closely resembled the overall study sample.12
Table 1 describes the overall and SES-stratified characteristics of the sample. Most participantswere female and married, and the mean age was 54. There was a high prevalence ofhypertension, diabetes, dyslipidemia, and obesity. Approximately one-third of Jackson HeartStudy participants had at least college degrees and one-fourth was affluent.
Higher SES participants were younger, more likely to married, and had easier access to healthcare services than their less educated and less affluent counterparts. The higher SES groupshad substantially lower proportions of individuals with CKD and CKD risk factors than thecorresponding proportions of sample members at lower levels of education and income. Thepatterns for education and income were strikingly similar with the notable exception of sex.The proportion of males was not statistically distinct across education levels. However,members of the higher SES groups were more likely to be male than their counterparts at lowerlevels of income.
Bruce et al. Page 4
Am J Kidney Dis. Author manuscript; available in PMC 2011 June 1.
NIH
-PA Author Manuscript
NIH
-PA Author Manuscript
NIH
-PA Author Manuscript

Table 2 depicts the results from logistic models examining the association between theindependent variables and CKD. Age, marital status, having CVD, diabetes, or hypertension,and being obese were associated with the likelihood of having CKD in each of the equationsreported. In the “education only” and the “income only” models, being affluent and highlyeducated were inversely associated with the likelihood of having CKD. High income was theonly statistically significant SES component in the fully adjusted model. The odds of havingCKD were 41% lower for affluent participants than their poorer counterparts in the full model.
Our tests for interactions between sex and education (p<.9) or income (p<.5) did not yieldstatistically significant results. However, the findings from sex-specific logistic modelspresented in Table 3 suggest that sex has implications for the association between SES andCKD. Being affluent and attending college was inversely associated with the likelihood ofhaving CKD for women as shown in the “education only” and the “income only” models.However, in the full model for female participants, neither of the SES measures was found tobe statistically significant. In contrast, high income was the only SES-related factor found tobe associated with CKD among men. The likelihood of having CKD was approximately 53%lower for affluent male participants compared to their poor male counterparts.
DISCUSSIONThis study extends our initial analyses of indicators of CKD prevalence and awareness12 andprior research that focuses on economic deprivation and its implications for the excess risksfor outcomes such as CKD.7–11, 28 Our research suggests that affluence also has implicationsfor kidney disease among African Americans. As expected, affluent or highly educated AfricanAmerican participants in the Jackson Heart Study had lower risks for CKD relative to theirpoor or less educated counterparts. The results from this study also suggested that the patternsof association between high SES and CKD may differ by sex. Similar to other epidemiologicresearch showing that a lack of economic resources is associated with health outcomes suchas hypertension, diabetes, and CVD,29–38 CKD is socially patterned. Importantly, the findingsfrom this study indicate that the relationship between SES and CKD may not be linear; whileaffluent and educated participants had lower risks of CKD, the likelihood of having CKDamong middle-income participants was not significantly different from their poor counterparts.Similarly, high school and junior college graduates as well as college attendees did not havestatistically distinct risks for CKD relative to study participants who did not graduate fromhigh school. These results suggest that the relationship between SES and health outcomes maybe complicated and require researchers to consider potential non-linear relationships betweeneconomic factors and health conditions such as CKD.
Sex-specific analyses suggested different patterns of CKD risk for men and women withvarying SES. High income was associated with CKD among males but not in females althoughwe found no statistically significant interaction between sex and SES. While speculative, highincomes may provide African American men with access to facilities (e.g., health clubs) orresources (e.g., private medical care) that substantially reduce their risk for CKD relative tolow-income men. Additional research is required to determine how SES-related factors areassociated with sex-related factors with regards to CKD.
The relationship between marital status and CKD was an unexpected finding worth notation.The likelihood of married participants having CKD was significantly lower than theirunmarried counterparts. Classic social science asserts that social relationships affect individualwell being.39 The data are consistent with studies examining the impact of social relations oncardiovascular outcomes. For example, individuals who live alone or have minimal contactwith friends, relatives, or acquaintances have been found to have higher rates of CVD andoverall morbidity and mortality than do persons who are integrated in social networks.40–42
Bruce et al. Page 5
Am J Kidney Dis. Author manuscript; available in PMC 2011 June 1.
NIH
-PA Author Manuscript
NIH
-PA Author Manuscript
NIH
-PA Author Manuscript

The relationship between social relations and kidney disease has not been pursued extensively.43 Research has not determined the degree to which factors such as marriage have implicationsfor the development and progression of CKD. It is not clear how social relationships combinewith other environmental factors to impact the health and the development and progression ofCKD among individuals at risk for CKD. Further research is needed to elucidate these patternsof association.
Despite its contributions to understanding SES patterning of CKD, this study is not withoutlimitations. Our definition of CKD included both albuminuria and low eGFR. A sensitivityanalysis was performed using the IVEware software.44 For those missing urine values,albuminuria status was imputed for those with missing urine values using the SequentialRegression Imputation Method45 and their CKD status was then determined based on bothalbuminuria and eGFR. Association of SES and CKD was then assessed using logisticregression models similar to the main analyses described in the paper. The results were verysimilar to the results reported in Table 2. Analyses of the cohort using low eGFR only (TableS1; available as online supplementary material associated with this article at www.ajkd.org)also yielded similar results to those combining albuminuria and eGFR (Table 2). Higher incomelevels correlated significantly with higher eGFRs. All of the usual limitations of cross-sectionalstudies apply.12 The income and education measures used in the analyses were crude measuresof SES and analyses utilizing more comprehensive measures of individual (e.g., wealth-oriented measures such as home ownership, investment income, or net worth) andneighborhood SES could produce more robust findings.
Some might consider the analysis of an exclusively African American sample to be a limitationarguing diminished usefulness without a comparison group. However, there is evidence thatthe factors associated with African American health outcomes can differ substantially fromother groups.25, 46–49 The results from this study provide deeper insight into CKD among aheterogeneous group of African Americans often masked in comparative studies in which raceor ethnic group membership is represented by a single variable.
High SES was associated with lower risks for CKD among African Americans in the JacksonHeart Study though the results were not linear. As well, the results suggested there may benuanced socioeconomic differences for men and women. Additional research incorporatingmeasures of wealth and other social contextual factors may assist in developing culturally andcontext-specific interventions to help reduce disparities in CKD development and progressionin the short term and eliminate them in the long term.
Supplementary MaterialRefer to Web version on PubMed Central for supplementary material.
AcknowledgmentsSupport: This research was supported by National Institutes of Health (NIH) contracts N01-HC-95170, N01-HC-95171, and N01-HC-95172 that were provided by the National Heart, Lung, and Blood Institute (NHLBI), theNational Center for Minority Health and Health Disparities, and the National Institute of Biomedical Imaging andBioengineering and career development awards from NHLBI to Meharry Medical College (1 K01 HL88735-01; DrBruce) and the University of Mississippi Medical Center (1 K01 HL084682-01; Dr Sims).
References1. Hsu C-Y, Lin F, Vittinghoff E, Shlipak MG. Racial differences in the progression from chronic renal
insufficiency to end-stage renal disease in the United States. J Am Soc Nephrol 2003;14:2902–2907.[PubMed: 14569100]
Bruce et al. Page 6
Am J Kidney Dis. Author manuscript; available in PMC 2011 June 1.
NIH
-PA Author Manuscript
NIH
-PA Author Manuscript
NIH
-PA Author Manuscript

2. Tareen N, Zadshir A, Martins D, Pan D, Nicholas S, Norris K. Chronic kidney disease in AfricanAmerican and Mexican American populations. Kidney Int 2005;68(Supplement 97):S137–S140.
3. Krieger N. The ostrich, the albatross, and public health: an ecosocial perspective--or why an explicitfocus on health consequences of discrimination and deprivation is vital for good science and publichealth practice. Public Health Rep 2001;116(5):419–423. [PubMed: 12042606]
4. Krieger N. Theories for social epidemiology in the 21st century: an ecosocial perspective. Int JEpidemiol 2001;30(4):668–677. [PubMed: 11511581]
5. Norris K, Nissenson AR. Race, gender, and socioeconomic disparities in CKD in the United States. JAm Soc Nephrol Jul;2008 19(7):1261–1270. [PubMed: 18525000]
6. Powe NR. To have and have not: health and health care disparities in chronic kidney disease. KidneyInt 2003;64:763–772. [PubMed: 12846781]
7. Merkin SS, Coresh J, Roux Diez AV, Taylor HA, Powe NR. Area socioeconomic status and progressiveCKD: The Atherosclerosis Risk in Communities (ARIC) Study. Am J Kidney Dis 2005;46(2):203–213. [PubMed: 16112038]
8. Rodriguez RA, Sen S, Mehta K, Moody-Ayers S, Bacchetti P, O’Hare AM. Geography matters:relationships among urban residential segregation, dialysis facilities, and patient outcomes. Ann InternMed Apr 3;2007 146(7):493–501. [PubMed: 17404351]
9. Shoham DA, Vupputuri S, Diez Roux AV, et al. Kidney disease in life-course socioeconomic context:the Atherosclerosis Risk in Communities (ARIC) Study. Am J Kidney Dis 2007;49(2):217–226.[PubMed: 17261424]
10. Tarver-Carr ME, Powe NR, Eberhardt MS, et al. Excess risk of chronic kidney disease among AfricanAmericans versus White subjects in the United States: a population-based study of potentialexplanatory factors. J Am Soc Nephrol 2002;13:2363–2370. [PubMed: 12191981]
11. Volkova N, McClellan W, Klein M, et al. Neighborhood poverty and racial differences in ESRDincidence. J Am Soc Nephrol Feb;2008 19(2):356–364. [PubMed: 18057219]
12. Flessner MF, Wyatt SB, Akylbekova EL, et al. Prevalence and awareness of CKD among AfricanAmericans: the Jackson Heart Study. Am J Kidney Dis Feb;2009 53(2):238–247. [PubMed:19166799]
13. Carpenter MA, Crow R, Steffes M, et al. Laboratory, reading center, and coordinating center datamanagement methods in the Jackson Heart Study. Am J Med Sci Sep;2004 328(3):131–144.[PubMed: 15367870]
14. Fuqua SR, Wyatt SB, Andrew ME, et al. Recruiting African-American research participation in theJackson Heart Study: methods, response rates, and sample description. Ethn Dis Autumn;2005 15(4Suppl 6):S6-18–29. [PubMed: 16317982]
15. Payne TJ, Wyatt SB, Mosley TH, et al. Sociocultural methods in the Jackson Heart Study: conceptualand descriptive overview. Ethn Dis Autumn;2005 15(4 Suppl 6):S6-38–48. [PubMed: 16317984]
16. Taylor HA Jr, Wilson JG, Jones DW, et al. Toward resolution of cardiovascular health disparities inAfrican Americans: design and methods of the Jackson Heart Study. Ethn Dis Autumn;2005 15(4Suppl 6):S6-4–17.
17. Wilson JG, Rotimi CN, Ekunwe L, et al. Study design for genetic analysis in the Jackson Heart Study.Ethn Dis Autumn;2005 15(4 Suppl 6):S6-30–37.
18. Sketris I, Metge C, Ross J, MacCara M. The use of the WHO Health Organization anatomicaltheraputic chemical/defined daily dose methodology in Canada. Drug Inf J 2004;38:1–8.
19. Bruce MA, Thornton MC. It’s my world?: exploring black and white perceptions of personal control.The Sociological Quarterly 2004;45(3):597–612.
20. Smith, JP. Poverty and the family. In: Sandefur, GD.; Tienda, M., editors. Divided Opportunities:Minorities, Poverty, and Social Policy. New York: Plenum; 1988. p. 141-172.
21. Massey DS, Eggers ML. The ecology of inequality: minorities and the concentration of poverty.American Journal of Sociology 1990;95(5):1153–1188.
22. Chobanian AV, Bakris GL, Black HR, et al. The Seventh Report of the Joint National Committee onPrevention, Detection, Evaluation, and Treatment of High Blood Pressure: the JNC 7 report. JAMAMay 21;2003 289(19):2560–2572. [PubMed: 12748199]
Bruce et al. Page 7
Am J Kidney Dis. Author manuscript; available in PMC 2011 June 1.
NIH
-PA Author Manuscript
NIH
-PA Author Manuscript
NIH
-PA Author Manuscript

23. Wyatt SB, Akylbekova EL, Wofford MR, et al. Prevalence, awareness, treatment, and control ofhypertension in the Jackson Heart Study. Hypertension Mar;2008 51(3):650–656. [PubMed:18268140]
24. Taylor H, Liu J, Wilson G, et al. Distinct component profiles and high risk among African Americanswith metabolic syndrome: the Jackson Heart Study. Diabetes Care Jun;2008 31(6):1248–1253.[PubMed: 18332154]
25. Bruce MA, Sims M, Miller S, Elliott V, Ladipo M. One size fits all? Race, gender and body massindex among U.S. adults. J Natl Med Assoc 2007;99(10):1152–1158. [PubMed: 17987919]
26. Courtenay WH, Keeling RP. Men, gender, and health: toward an interdisciplinary approach. J AmColl Health May;2000 48(6):243–246. [PubMed: 10863867]
27. Griffiths S. Men’s health. BMJ Jan 13;1996 312(7023):69–70. [PubMed: 8555922]28. Merkin SS, Roux AV, Coresh J, Fried LF, Jackson SA, Powe NR. Individual and neighborhood
socioeconomic status and progressive chronic kidney disease in an elderly population: theCardiovascular Health Study. Soc Sci Med 2007;65(4):809–821. [PubMed: 17499411]
29. Collins CA. Racism and health: segregation and causes of death amenable to medical intervention inmajor U.S. cities. Ann N Y Acad Sci 1999;896:396–398. [PubMed: 10681933]
30. Diez-Roux AV. Investigating neighborhood and area effects on health. Am J Public Health 2001;91(11):1783–1789. [comment]. [PubMed: 11684601]
31. Diez-Roux AV. Neighborhoods and health: where are we and were do we go from here? Revue dEpidemiologie et de Sante Publique 2007;55(1):13–21. [PubMed: 17320330]
32. Diez-Roux AV, Chambless L, Merkin SS, et al. Socioeconomic disadvantage and change in bloodpressure associated with aging. Circulation 2002;106(6):703–710. [PubMed: 12163431]
33. Diez-Roux AV, Jacobs DR, Kiefe CI. Coronary Artery Risk Developoment in Young Adults S.Neighborhood characteristics and components of the insulin resistance syndrome in young adults:the Coronary Artery Risk Development in Young Adults (CARDIA) Study. Diabetes Care 2002;25(11):1976–1982. [PubMed: 12401742]
34. Diez-Roux AV, Merkin SS, Arnett D, et al. Neighborhood of residence and incidence of coronaryheart disease. N Engl J Med 2001;345(2):99–106. [see comment]. [PubMed: 11450679]
35. Diez-Roux AV, Nieto FJ, Muntaner C, et al. Neighborhood environments and coronary heart disease:a multilevel analysis. Am J Epidemiol Jul 1;1997 146(1):48–63. [PubMed: 9215223]
36. Williams DR. Black-white differences in blood pressure: The role of social factors. Ethn Dis1992;2:126–141. [PubMed: 1467751]
37. Williams DR. Race, socioeconomic status, and health. the added effects of racism and discrimination.Ann N Y Acad Sci 1999;896:173–188. [PubMed: 10681897]
38. Williams DR, Collins C. Racial residential segregation: a fundamental cause of racial disparities inhealth. Public Health Rep 2001;116(5):404–416. [PubMed: 12042604]
39. Durkheim, E. Suicide. New York: Free Press; 1897.40. Brummett BH, Barefoot JC, Siegler IC, et al. Characteristics of socially isolated patients with coronary
artery disease who are at elevated risk for mortality. Psychosom Med 2001;63(2):267–272. [seecomment]. [PubMed: 11292274]
41. Eng PM, Rimm EB, Fitzmaurice G, Kawachi I. Social ties and change in social ties in relation tosubsequent total and cause-specific mortality and coronary heart disease incidence in men. Am JEpidemiol 2002;155(8):700–709. [PubMed: 11943687]
42. Kaplan GA, Salonen JT, Cohen RD, Brand RJ, Syme SL, Puska P. Social connections and mortalityfrom all causes and from cardiovascular disease: prospective evidence from eastern Finland. Am JEpidemiol 1988;128(2):370–380. [PubMed: 3394703]
43. Bruce MA, Beech BM, Sims M, et al. Social environmental stressors, psychological factors, andkidney disease. J Investig Med 2009;57:583–589.
44. Raghunathan, T.; Solenberger, P.; Van Hoewyk, J. IVEware: imputation and variance estimationsoftware. Ann Arbor, MI: Survey Methodology Program, Survey Research Center, Institute for SocialResearch, University of Michigan; 2002.
Bruce et al. Page 8
Am J Kidney Dis. Author manuscript; available in PMC 2011 June 1.
NIH
-PA Author Manuscript
NIH
-PA Author Manuscript
NIH
-PA Author Manuscript
45. Raghunathan T, Lepkowski J, Van Hoewyk J, Solenberger P. A multivariate technique for multiplyimputing missing values using a sequence of regression models. Survey methodology 2001;27(1):85–96.
46. Bruce MA. Inequality and adolescent violence: an exploration of community, family, and individualfactors. J Natl Med Assoc Apr;2004 96(4):486–495. [PubMed: 15101669]
47. Sims M, Sims TH, Bruce MA. Community income, smoking, and birth weight disparities inWisconsin. J Natl Black Nurses Assoc Dec;2007 18(2):16–23. [PubMed: 18318327]
48. Sims M, Sims TL, Bruce MA. Urban poverty and infant mortality rate disparities. J Natl Med Assoc2007;99(4):349–356. [PubMed: 17444423]
49. Sims M, Sims TL, Bruce MA. Race, ethnicity, concentrated poverty, and low birth weight disparities.J Natl Black Nurses Assoc Jul;2008 19(1):12–18. [PubMed: 18807774]
Bruce et al. Page 9
Am J Kidney Dis. Author manuscript; available in PMC 2011 June 1.
NIH
-PA Author Manuscript
NIH
-PA Author Manuscript
NIH
-PA Author Manuscript

NIH
-PA Author Manuscript
NIH
-PA Author Manuscript
NIH
-PA Author Manuscript
Bruce et al. Page 10
Tabl
e 1
Cha
ract
eris
tics o
f Jac
kson
Hea
rt St
udy
Parti
cipa
nts b
y SE
S co
mpo
nent
s
Ana
lysi
s Sam
ple
Edu
catio
n
p*In
com
e
p*1
23
41
23
4
Age
(y)
54.3
± 13
.165
.1 ±
10.
956
.2 ±
12.
849
.3 ±
12.
152
.5 ±
11.
7<.
001
55.1
± 1
5.7
57.0
± 1
3.8
52.4
± 1
2.4
53.4
± 1
1.1
<.00
1
Mal
e (%
)37
.335
.935
.938
.237
.9.7
23.8
32.1
37.6
49.0
<.00
1
Mar
ried
(%)
54.8
42.6
49.4
56.0
62.8
<.00
127
.339
.859
.172
.5<.
001
Hea
lth c
are
acce
ss**
1.4
± 0.
81.
5 ±
0.9
1.5
± 0.
91.
5 ±
0.9
1.3
± 0.
6<.
001
1.9
± 1.
11.
5 ±
0.9
1.3
± 0.
71.
2 ±
0.5
<.00
1
CV
D (%
)10
.421
.812
.27.
96.
1<.
001
17.0
13.6
8.3
6.2
<.00
1
Dia
bete
s (%
)17
.928
.817
.916
.414
.1<.
001
24.1
20.3
18.1
11.6
<.00
1
Hyp
erte
nsio
n (%
)62
.679
.267
.257
.156
.9<.
001
67.6
67.4
61.5
56.7
<.00
1
Hyp
erch
oles
tero
lem
ia (%
)30
.536
.433
.028
.428
.2.0
0130
.030
.131
.530
.4.9
Hyp
ertri
glyc
erid
emia
(%)
6.7
7.6
6.5
8.7
4.5
.001
7.3
6.7
6.9
6.7
.9
BM
I (kg
/m2 )
31.7
± 7
.131
.6 ±
7.1
31.7
± 6
.932
.3 ±
7.5
31.3
± 6
.9.0
0632
.8 ±
8.8
32.0
± 7
.431
.9 ±
7.1
30.8
± 6
.2<.
001
Educ
atio
n (%
)<.
001
<
Hig
h Sc
hool
16.1
34.1
27.0
9.0
2.8
H
igh
Scho
ol19
.927
.727
.518
.39.
9
So
me
Col
lege
30.3
31.4
30.9
39.0
23.1
C
olle
ge D
egre
e33
.56.
814
.733
.864
.2
Inco
me
(%)
<.00
1
Lo
w In
com
e12
.032
.920
.814
.52.
9
Lo
wer
Mid
dle
19.7
42.7
22.8
23.5
10.0
U
pper
Mid
dle
25.7
18.5
29.4
38.8
30.0
H
igh
Inco
me
25.8
5.9
16.1
23.1
57.3
eGFR
dis
tribu
tion
(%)*
**<.
001
<.00
1
>9
040
.5 (1
384)
29.0
38.1
49.1
39.8
39.1
38.4
42.7
40.0
>6
0-<9
049
.8 (1
699)
49.8
51.5
43.8
54.1
42.9
50.3
48.8
55.0
>3
0-<6
08.
5 (2
91)
17.9
9.0
6.6
5.5
14.8
9.7
7.6
4.8
<3
01.
2 (4
1)3.
31.
50.
60.
62.
51.
60.
90.
2
Am J Kidney Dis. Author manuscript; available in PMC 2011 June 1.

NIH
-PA Author Manuscript
NIH
-PA Author Manuscript
NIH
-PA Author Manuscript
Bruce et al. Page 11
Ana
lysi
s Sam
ple
Edu
catio
n
p*In
com
e
p*1
23
41
23
4
Alb
umin
uria
****
(%)
12.5
(429
)19
.914
.210
.210
.0<.
001
13.4
15.9
12.3
8.8
<.00
1
SCr (
mg/
dL)
1.1
± 0.
61.
2 ±
0.9
1.1
± 0.
81.
0 ±
0.5
1.1
± 0.
5<.
001
1.2
± 1.
01.
1± 0
.71.
1 ±
0.5
1.1
± 0.
4.0
2
CK
D**
***
(%)
20.0
(685
)34
.822
.916
.114
.628
.224
.518
.412
.7
Not
es: n
=3,4
30. V
alue
s exp
ress
ed a
s per
cent
, per
cent
(no.
), or
mea
n ±
SD. E
duca
tion
and
Inco
me
leve
ls (1
, 2, 3
, and
4) a
re d
efin
ed in
the
left
colu
mn.
* p tre
nd
**H
ealth
car
e ac
cess
is a
n or
dina
l var
iabl
e w
ith v
alue
s den
otin
g di
ffic
ulty
of g
ettin
g he
alth
car
e se
rvic
es (1
=not
diff
icul
t at a
ll, 2
=not
too
hard
, 3=f
airly
har
d, 4
=ver
y ha
rd)
*** eG
FR e
xpre
ssed
in u
nits
of m
L/m
in/1
.73
m^2
****
albu
min
-cre
atin
ine
ratio
> 3
0
****
* eGFR
<60
or A
CR
>30
Abb
revi
atio
ns: S
Cr,
seru
m c
reat
inin
e; C
VD
, car
diov
ascu
lar d
isea
se; S
ES, s
ocio
econ
omic
stat
us; C
kD, c
hron
ic k
idne
y di
seas
e; B
MI,
body
mas
s ind
ex; e
GFR
, est
imat
ed g
lom
erul
ar fi
ltrat
ion
rate
. Con
vers
ion
fact
ors f
or u
nits
: eG
FR in
mL/
s/1.
73 m
^2, x
0.01
667;
SC
r in
mg/
dL to
mic
rom
ole/
L, x
88.4
.
Am J Kidney Dis. Author manuscript; available in PMC 2011 June 1.

NIH
-PA Author Manuscript
NIH
-PA Author Manuscript
NIH
-PA Author Manuscript
Bruce et al. Page 12
Table 2
Association of SES and CKD in the Jackson Heart Study
Variable Education Only Income Only Full Model
Age (/1 y) 1.03 (1.02 – 1.04) 1.03 (1.02 – 1.04) 1.03 (1.01 – 1.04)
Male 0.96 (0.64 – 1.46) 1.24 (0.69 – 2.21) 1.10 (0.88 – 1.40)
Married 0.75 (0.62 – 0.91) 0.78 (0.62 – 0.97) 0.78 (0.63 – 0.98)
Healthcare Access* 1.04 (0.93 – 1.16) 1.03 (0.91 – 1.17) 1.03 (0.91 – 1.17)
CVD 1.82 (1.41 – 2.35) 1.71 (1.28 – 2.27) 1.70 (1.28 – 2.26)
Diabetes 2.53 (2.05 – 3.11) 2.39 (1.90 – 3.02) 2.40 (1.91 – 3.03)
Hypertension 2.43 (1.88 – 3.15) 2.99 (2.23 – 4.02) 2.99 (2.23 – 4.01)
Hypercholesterolemia 1.16 (0.95 – 1.41) 1.27 (1.02 – 1.57) 1.27 (1.02 – 1.57)
Hypertriglyceridemia 1.28 (0.91 – 1.79) 1.31 (0.91 – 1.90) 1.33 (0.92 – 1.92)
BMI (/1 kg/m2) 1.03 (1.01 – 1.04) 1.02 (1.01 – 1.04) 1.02 (1.01 – 1.04)
Education
< High School 1.00 (ref) 1.00 (ref)
High School 0.88 (0.60 – 1.17) 0.93 (0.68 – 1.29)
Some College 0.77 (0.53 – 1.05) 0.84 (0.61 – 1.17)
College Degree 0.68 (0.47 – 0.94) 0.94 (0.66 – 1.32)
p trend .05 .8
Income
Low Income 1.00 (ref) 1.00 (ref)
Lower Middle 0.88 (0.63 – 1.30) 0.88 (0.65 – 1.20)
Upper Middle 0.78 (0.52 – 1.08) 0.80 (0.57 – 1.11)
High Income 0.58 (0.41 – 0.83) 0.59 (0.40 – 0.87)
p trend .01 .05
Education × Male p value .9 .9
Income × Male p value .5 .5
Note: All variables included in the analysis are listed in the table. Values shown are OR (95% CI).
BMI, body mass index; CI, confidence interval; OR, odds ratio; SES, socioeconomic status; CkD, chronic kidney disease; CVD, cardiovascular disease;ref, reference
*Health care access is an ordinal variable with values denoting difficulty of getting health care services (1=not difficult at all, 2=not too hard, 3=fairly
hard, 4=very hard)
Am J Kidney Dis. Author manuscript; available in PMC 2011 June 1.

NIH
-PA Author Manuscript
NIH
-PA Author Manuscript
NIH
-PA Author Manuscript
Bruce et al. Page 13
Tabl
e 3
Ass
ocia
tion
of S
ES a
nd C
KD
by
Sex
in th
e Ja
ckso
n H
eart
Stud
y
Var
iabl
e
Edu
catio
n O
nly
Inco
me
Onl
yFu
ll M
odel
Men
Wom
enM
enW
omen
Men
Wom
en
Age
(/1
y)1.
03 (1
.02
–1.0
6)1.
03 (1
.02
– 1.
04)
1.04
(1.0
2 –
1.06
)1.
03 (1
.02
– 1.
04)
1.04
(1.0
2 –
1.05
)1.
03 (1
.01
– 1.
04)
Mar
ried
0.71
(0.5
0 –
1.01
)0.
77 (0
.61
–0.9
7)0.
70 (0
.47
–1.0
4)0.
81 (0
.62
– 1.
05)
0.70
(0.4
7 –1
.05)
0.81
(0.6
2 –1
.06)
Hea
lthca
re a
cces
s*1.
14 (0
.92
–1.4
0)1.
00 (0
.88
–1.1
5)1.
08 (0
.86
–1.3
5)1.
00 (0
.85
–1.1
6)1.
09 (0
.87
–1.3
6)1.
00 (0
.85
–1.1
6)
CV
D1.
84 (1
.20
–2.8
1)1.
81 (1
.31
–2.5
1)1.
70 (1
.05
–2.7
5)1.
67 (1
.16
–2.4
0)1.
71 (1
.05
–2.7
7)1.
66 (1
.16
–2.3
8)
Dia
bete
s4.
37 (3
.03
–6.3
0)1.
95 (1
.51
–2.5
2)4.
41 (2
.93
–6.6
4)1.
78 (1
.34
–2.3
7)4.
40 (2
.92
–6.6
3)1.
78 (1
.34
–2.3
7)
Hyp
erte
nsio
n2.
06 (1
.34
–3.1
7)2.
65 (1
.92
–3.6
4)2.
51 (1
.54
–4.1
0)3.
28 (2
.26
–4.7
6)2.
49 (1
.52
–4.0
7)3.
29 (2
.26
–4.7
9)
Hyp
erch
oles
tero
lem
ia1.
12 (0
.79
–1.5
9)1.
18 (0
.93
–1.5
0)1.
15 (0
.78
–1.7
0)1.
34 (1
.03
–1.7
4)1.
17 (0
.79
–1.7
3)1.
34 (1
.03
–1.7
5)
Hyp
ertri
glyc
erid
emia
1.50
(0.9
2 –2
.45)
1.06
(0.6
5 –1
.72)
1.33
(0.7
8 –2
.26)
1.23
(0.7
3 –2
.08)
1.35
(0.7
9 –2
.32)
1.23
(0.7
3 –2
.08)
BM
I (/1
kg/
m2 )
1.06
(1.0
3 –1
.09)
1.02
(1.0
0 –1
.03)
1.06
(1.0
3 –1
.09)
1.01
(0.9
9 –1
.02)
1.06
(1.0
3 –1
.09)
1.01
(0.9
9 –1
.03)
Educ
atio
n
<
Hig
h Sc
hool
1.00
(ref
)1.
00 (r
ef)
1.00
(ref
)1.
00 (r
ef)
H
igh
Scho
ol1.
00 (0
.60
–1.6
7)0.
80 (0
.57
–1.1
2)0.
90 (0
.51
–1.6
1)0.
90 (0
.61
–1.3
3)
So
me
Col
lege
0.78
(.47
–1.
30)
0.73
(0.5
2 –1
.04)
0.81
(0.4
5 –1
.46)
0.85
(0.5
7 –1
.26)
C
olle
ge D
egre
e0.
78
(0.4
7 –1
.30)
0.62
(0.4
4 –0
.87)
1.01
(0.5
5 –1
.89)
0.85
(0.5
6 –1
.31)
p
trend
.6.0
5.8
.9
Inco
me
Lo
w In
com
e1.
00 (r
ef)
1.00
(ref
)1.
00 (r
ef)
1.00
(ref
)
Lo
wer
Mid
dle
0.76
(0.3
9 –1
.46)
0.87
(0.6
1 –1
.24)
0.75
(0.3
9 –1
.45)
0.88
(0.6
2 –1
.27)
U
pper
Mid
dle
0.81
(0.4
2 –1
.55)
0.70
(0.4
9 –1
.02)
0.80
(0.4
1 –1
.56)
0.74
(0.5
0 –1
.09)
H
igh
Inco
me
0.49
(0.2
5 –0
.96)
0.60
(0.4
0 –0
.92)
0.47
(0.2
3 –0
.97)
0.64
(0.4
0 –1
.03)
p
trend
.08
.08
.1.3
Not
e: A
ll va
riabl
es in
clud
ed in
the
anal
ysis
are
list
ed in
the
tabl
e. V
alue
s sho
wn
are
OR
(95%
CI)
.
BM
I, bo
dy m
ass i
ndex
; CI,
conf
iden
ce in
terv
al; O
R, o
dds r
atio
; SES
, soc
ioec
onom
ic st
atus
; CkD
, chr
onic
kid
ney
dise
ase;
CV
D, c
ardi
ovas
cula
r dis
ease
; ref
, ref
eren
ce
* Hea
lth c
are
acce
ss is
an
ordi
nal v
aria
ble
with
val
ues d
enot
ing
diff
icul
ty o
f get
ting
heal
th c
are
serv
ices
(1=n
ot d
iffic
ult a
t all,
2=n
ot to
o ha
rd, 3
=fai
rly h
ard,
4=v
ery
hard
)
Am J Kidney Dis. Author manuscript; available in PMC 2011 June 1.