Influence of Socioeconomic Status on Lung Function and Prediction Equations in Indian Children
17
Pediatric Pulmonology 00:1–9 (2005) Influence of Socioeconomic Status on Lung Function and Prediction Equations in Indian Children P. Sitarama Raju, MBBS, 1 K.V.V. Prasad, MSc, 1 Y. Venkata Ramana, MSc, PhD, 2 N. Balakrishna, MSc, 3 and K.J.R. Murthy, MD 1 * Summary. The present study was carried out to assess the influence of socioeconomic status on lung functions and to suggest prediction equations for Indian children. For this purpose, 2,616 normal, healthy schoolchildren aged between 5-15 years were recruited. Boys were classified into three groups, i.e., high-income (HIG), middle-income (MIG), and low-income (LIG), while girls were classified into HIG and LIG groups, based on socioeconomic status (SES). Height, weight, chest circumference, body surface area (BSA), fat-free mass (FFM), and body fat were assessed. Forced expiratory volume in 1 sec (FEV1), forced vital capacity (FVC), FEV1/FVC ratio, and peak expiratory flow rate (PEFR) were measured. The results, before and after adjustment of physical characteristics, showed that anthropometry, body composition, and lung functions were signi- ficantly higher in HIG compared to MIG and LIG children, while in girls, no differences were ob- served in physical characteristics after adjustments. Multiple linear regression equations were developed to predict FEV1, FVC, and PEFR, using independent variables like age, height, fat-free mass, and SES. It is opined that these equations could be used as Indian reference equations for healthy children based on the SES. Pediatr Pulmonol. 2005; 00:1-9. e2005W "i^ss, Inc. Key words: lung functions; body composition; socioeconomic status; reference equations; spirometry. INTRODUCTION Pulmonary function tests (PFT) are important para- meters widely used to evaluate lung function for various purposes. 1 , 2 Due to ethnic differences in populations, apart from procedural and technical aspects, equations used to predict normal lung function are diverse. , Thus, it is important to improvise appropriate prediction equations as references for a given population, and the American Thoracic Society published guidelines for making such choices. However, the inappropriate use of control data obtained from non-native populations regarding variations in physical fitness and genetic factors is a major cause of misinterpreting PFT results. Besides, probably due to relatively small samples, many of the universally used standardized prediction equations offer less reliability on the extremes of status and age spectrums. These shortcomings can be overcome by defining normal values for different populations. Several studies of lung functions were carried out on children of different age groups in different parts of India and projected the equations for predicting different lung functions, using height, age, weight, FFM, and chest measurements as independent variables. 410 I V Studies carried out in the US and UK reported dif- ferences in lung functions among children of European, Afro-Caribbean, and Indian origin, and used different in- dependent variables for prediction of lung functions. © 2005 Wiley-Liss, Inc. Apart from genetic influence, the physical growth of children depends on socioeconomic status (SES), which influences the quality of pre- and postnatal nutrition, thereby affecting physical growth variables like height or weight. It is an established fact that, due to poor prenatal nutrition, birth weights are lower in low-income popula- tions. 1516 Socioeconomic status, whether measured by education, income, or other indices of social class, has long been known to be associated with different diseases. 17 Socioeconomic differences were shown to exist for a number of diseases, including ischemic heart disease, many types of cancer, and respiratory diseases. , In addition, Government Vemana Yoga Research Institute, Ameerpet, Hyderabad, India. Department of Physiology, National Institute of Nutrition, Hyderabad, India. Department of Statistics, National Institute of Nutrition, Hyderabad, India. *Correspondence to: K.J.R. Murthy, M.D., Government Vemana Yoga Research Institute, 7-1-66 Dharam Karan Road, Ameerpet, Hyderabad 500 016, India. E-mail: [email protected] Received 19 July 2004; Revised 8 October 2004; Accepted 31 October 2004. DOI 10.1002/ppul.20206 Published online in Wiley InterScience (www.interscience.wiley.com ).
Transcript of Influence of Socioeconomic Status on Lung Function and Prediction Equations in Indian Children

Pediatric Pulmonology 00:1–9 (2005)
Influence of Socioeconomic Status on Lung Function and Prediction Equations in Indian Children
P. Sitarama Raju, MBBS,1 K.V.V. Prasad, MSc,1 Y. Venkata Ramana, MSc, PhD,2 N. Balakrishna, MSc,3 and K.J.R. Murthy, MD
1*
Summary. The present study was carried out to assess the influence of socioeconomic status on
lung functions and to suggest prediction equations for Indian children. For this purpose, 2,616
normal, healthy schoolchildren aged between 5-15 years were recruited. Boys were classified into
three groups, i.e., high-income (HIG), middle-income (MIG), and low-income (LIG), while girls were
classified into HIG and LIG groups, based on socioeconomic status (SES). Height, weight, chest
circumference, body surface area (BSA), fat-free mass (FFM), and body fat were assessed.
Forced expiratory volume in 1 sec (FEV1), forced vital capacity (FVC), FEV1/FVC ratio, and peak
expiratory flow rate (PEFR) were measured. The results, before and after adjustment of physical
characteristics, showed that anthropometry, body composition, and lung functions were signi-
ficantly higher in HIG compared to MIG and LIG children, while in girls, no differences were ob-
served in physical characteristics after adjustments. Multiple linear regression equations were
developed to predict FEV1, FVC, and PEFR, using independent variables like age, height, fat-free
mass, and SES. It is opined that these equations could be used as Indian reference equations for
healthy children based on the SES. Pediatr Pulmonol. 2005; 00:1-9. e2005W "i^ss, Inc.
Key words: lung functions; body composition; socioeconomic status; reference equations; spirometry.
INTRODUCTION
Pulmonary function tests (PFT) are important para-
meters widely used to evaluate lung function for various
purposes.1,2 Due to ethnic differences in populations, apart
from procedural and technical aspects, equations used to
predict normal lung function are diverse. , Thus, it is
important to improvise appropriate prediction equations as
references for a given population, and the American
Thoracic Society published guidelines for making such
choices. However, the inappropriate use of control data
obtained from non-native populations regarding variations
in physical fitness and genetic factors is a major cause of
misinterpreting PFT results. Besides, probably due to
relatively small samples, many of the universally used
standardized prediction equations offer less reliability on
the extremes of status and age spectrums. These
shortcomings can be overcome by defining normal values
for different populations.
Several studies of lung functions were carried out on
children of different age groups in different parts of India
and projected the equations for predicting different lung
functions, using height, age, weight, FFM, and chest
measurements as independent variables.410 I V
Studies carried out in the US and UK reported dif-
ferences in lung functions among children of European,
Afro-Caribbean, and Indian origin, and used different in-
dependent variables for prediction of lung functions.
© 2005 Wiley-Liss, Inc.
Apart from genetic influence, the physical growth of
children depends on socioeconomic status (SES), which
influences the quality of pre- and postnatal nutrition,
thereby affecting physical growth variables like height or
weight. It is an established fact that, due to poor prenatal
nutrition, birth weights are lower in low-income popula-
tions.1516
Socioeconomic status, whether measured by
education, income, or other indices of social class, has long
been known to be associated with different diseases.17
Socioeconomic differences were shown to exist for a
number of diseases, including ischemic heart disease, many
types of cancer, and respiratory diseases. , In
addition,
Government Vemana Yoga Research Institute, Ameerpet, Hyderabad,
India.
Department of Physiology, National Institute of Nutrition, Hyderabad,
India.
Department of Statistics, National Institute of Nutrition, Hyderabad, India.
*Correspondence to: K.J.R. Murthy, M.D., Government Vemana Yoga
Research Institute, 7-1-66 Dharam Karan Road, Ameerpet, Hyderabad 500
016, India. E-mail: [email protected]
Received 19 July 2004; Revised 8 October 2004; Accepted 31 October
2004.
DOI 10.1002/ppul.20206 Published online in Wiley InterScience (www.interscience.wiley.com).

2 Raju et al.
despite a general fall in mortality during recent decades, the relative disadvantage of low socioeconomic status continues to increase.
18,20,21
Low birth weight was associated with reduced lung
function,22
and this gap may continue to widen in adult life,
as suggested by Barker et al.23
It had been reported that
lung functions are influenced by physical growth
parameters such as height and weight. Only a few studies
attempted to quantify the effect of socioeconomic status on
indices of lung function.24,25
A study conducted on
Canadian children reported differences in forced expired
volume in 1 sec (FEV1) and forced vital capacity (FVC)
between the highest and lowest socioeconomic categories
of boys only.25
Hence, in the present study, focus was
given to assess the influence of socioeconomic status on
lung functions in Indian children. The study also aimed to
elucidate which anthropometric indices have an influence
on prediction of lung functions. By using easily
measur-able physical parameters, which have a very high
pre-dictability toestimate lung functions, regression
equations were developed and are presented.
MATERIALS AND METHODS
The present study was conducted on 2,688 normal,
healthy boys (n¼1,612) and girls (n¼1,076) aged between
5–15 years. Based on our request, the District Educational
Officer had randomly selected and recom-mended five
schools in Hyderabad, India, which formed the basis of
selection criteria of the subjects in the present study. They
were categorized into three groups based on their
socioeconomic status according to a modified scale
ofKuppuswamy,26
and incomeiscorrectedtothe All India
Consumer Price Index (AICPI) of 1998. These groups are
high-income (social class I), middle-income (social class
II), and low-income (social class IV). This clas-sification
gave equal importance to education, occupation, and
family income for assessment of SES. The boys
represented all three SES groups. On the other hand, girls
were recruited only from HIG and LIG categories. This is
because of observations made on boys from the MIG and
LIG categories, where no differences were found in all
study parameters, and hence girls from the MIG category
were not recruited. Health and socioeconomic status were
recorded using a questionnaire, filled out by the parents of
subjects. Based on the questionnaire and physical
examination, the study excluded 72 children (43 boys and
29 girls) suffering from respiratory diseases or with a
recent history of respiratory infections. Thus, the final
study population was confined to 2,616 subjects. None of
the children smoked or consumed alcohol. A minimum of
40 subjects was recruited in each age group and
socio-economic category. The purpose and objectives of
the study were explained to the subjects, their parents, and
the school management, and their written consent was
obtained. The design and study protocol were approved by
the Ethics Committee of the Institute and conform to the
principles embodied in the Helsinki Declaration.
The anthropometric parameters such as height, weight,
and chest circumference (expired) were recorded. Height
and weight were measured by using a height and weight
machine (Libra, India). Heights were recoded to the nearest
millimeter, and weights to the nearest 0.1 kg were
measured with minimal clothing and after emptying the
bladder. Expired chest circumference was measured to the
nearest millimeter, using fiberglass tape. Fat-fold thickness
was measured at the triceps and subscapular regions to the
nearest 0.2 mm with skin-fold calipers (Holtain Ltd., UK).
Fat-free mass (FFM) and body fat (BF) were estimated
from the sum of the two skin-fold thickness.27
Body
surface area (BSA) was derived using the heights and
weights of the children.28
For best results, the pulmonary function test technique
was explained to each child, and three trials were conducted
a day prior to the actual measurement. Spirometry was
performed according to American Thoracic Society (ATS)
criteria to ensure quality29
Then the children were asked to
perform the test three times, and the best of three results
with less than 5% deviation from one another was used for
analysis. Forced expiratory volume per second (FEV1) and
forced vital capacity (FVC) were measured with a
spirometer (Vitalograph Ltd., UK), and peak expiratory
flow rate (PEFR) was recorded with Wright’s peak flow
meter. Values were corrected for BTPS. FEV1/FVC
percentage was then calculated. The spiro ~j eter was
calibrated every day with a 1-liter standard syringe before
measurements.
Analysis
The SPSS (Windows version 10.0) package was used to
analyze data. Values were indicated as mean ± SD, and
significance was noted at 0.05. The values of anthro-
pometry, body composition, and lung functions of the HIG,
MIG, and LIG groups were compared with each other
using one-way ANOVA and ANCOVA, with a post hoc
test of the LSD method, with and without adjusting
for variables like ag _ height, weight, and FFM. In the first
step of regression analysis, we analyzed the associations of
the study variables by correlation coefficients. In the
second step, parameters were selected that were 1) highly
correlated with lung functions, and 2) used in the devel-
opment of the predictive models for lung functions. The
remaining parameters were not considered in the analysis.
In the third step, several regression models (such as linear,
quadratic, cubic, or logarithmic) were tried for the pre-
diction of FEV1, FVC, and PEFR using age, height, and
FFM as independent variables separately. Then linear
step-wise multiple regression models were selected,
comparing the model’s R2, checking for violation of

assumptions, and

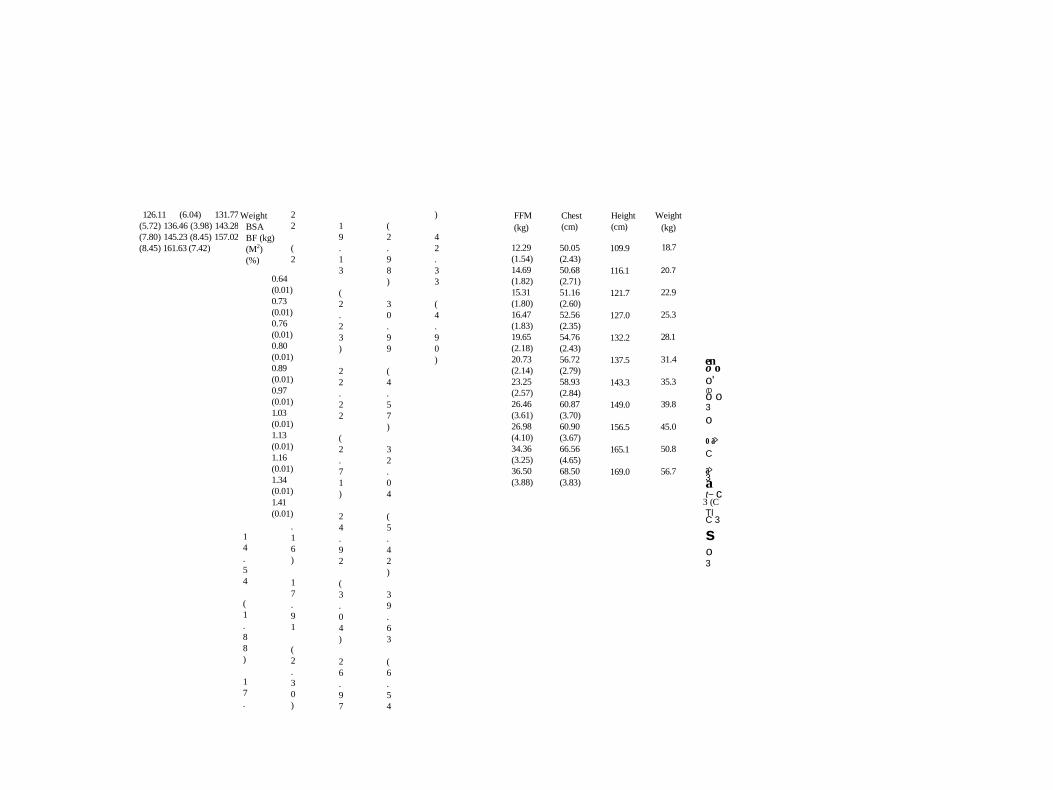
TABLE 1 — Physical Characteristics and Anthropometry in Boys1
HIG(n = 511), MIG(n = 529) LIG(n = 529) NCHS-50th centiles
Age Height Weight BSA years (n) (cm) (kg)
(M2) j
108.00
(4.92)
113.21
(5.18)
118.80
(4.83)
123.10
(6.14)
133.50
(3.44)
135.66
(5.61)
1
3
9
.
6
5
(
6
.
1
7
)
1
4
4
.
7
9
(
4
.
9
8
)
1
5
0
.
2
2
(
5
.
2
1
)
1
5
9
.
4
2
(
8
.
9
5
)
1
6
4
.
4
4
(
5
.
9
1
)
Values
expressed as mean ±
SD.
BF (%)
16.12 (2.46)
14.4
(1.41)
16.75
(4.95)
17.13
(4.24)
18.25
(7.52)
18.44
(7.22)
16.62
(5.09)
19.12
(7.13)
17.54
(8.40)
14.18
(6.44)
18.38
(7.69)
FFM (kg)
14.20
(1.70)
15.13
(1.64)
16.83
(2.47)
18.19
(2.71)
21.44
(2.01)
22.44
(3.04)
24.38
(3.10)
26.51
(3.62)
30.51
(4.82)
34.79
(5.21)
39.23
(4.44)
Chest
(cm)
50.90 (2.83) 50.87 (2.82) 53.80 (3.33) 54.8 (3.58) 57.80 (2.70) 59.27 (4.31) 60.24 (3.47) 62.85 (4.99) 64.88 (4.99) 68.57 (5.85) 72.77 (4.58)
Years (n)
5
(50) 6
(48) 7
(45) 8
(43) 9
(50) 10
(51) 11
(50) 12
(50) 13
(50) 14
(50) 15
(42)
Height
Weight
(cm)
(kg)
106
.26
(4.
34)
112
.40
(3.
76)
116
.71
(6.
88)
120
.29
(5.
90)
124
.90
(4.
43)
132
.26
(5.
66)
137
).9
3
(7.
15)
141
).9
9
(5.
70)
144
.67 (6.39)
155).57
(6.74^
161.53
(6.90)
BSA (M2)
0.69 (0.01) 0.7 (40.01)
0.79 (0.01) 0.84 (0.01) 0.89 (0.01) 0.98 (0.01) 1.06 (0.01) 1.12 (0.01) 1.14 (0.01) 1.33 (0.01) 1.46 (0.01)
BF (%)
15.80
(1.64)
14.11
(2.24)
14.27
(2.51)
15.31
(4.22)
13.84
(2.22)
14.70
(2.84)
14.11
(3.98)
15.10
(5.46)
14.88
(3.99)
14.05
(5.67)
16.44
(6.81)
FFM
(kg)
13.51 (1.24)
14.98
(1.27)
16.4
(2.80)
17.36
(2.35)
19.27
(1.93)
21.82
(3.15)
24.24
(3.82)
26.43
(4.77)
26.54
(3.48)
33.91
(4.15)
38.50
(5.65)
Chest
(cm)
49.92
(2.37)
51.55
(1.56)
52.30
(3.01)
53.74
(3.24)
55.43
(2.58)
57.73
(3.29)
59.83
(3.86)
60.54
(3.53)
61.96
(3.29)
66.38
(5.00)
71.67
(6.28)
Age Height Years (n)
(cm)
1
0
1
.
8
3
(
6
.
4
1
)
1
1
1
.
0
1 (
7
.
4
8
)
1
1
4
.
3
3
(
5
.
4
0
)
1
1
8
.
1
1
(
4
.
7
2
)
16.02
(1.61)
17.35
(1.32)
19.20
(2.72)
20.58
(3.25)
22.38
(2.39)
25.65
(4.12)
28.38
(5.27)
31.32
(6.37)
31.26
(4.46)
39.71
(6.23)
46.63
(9.48)
15.43
(1.64)
14.68
(1.48)
14.41
(2.35)
13.82
(1.98)
14.15
(2.33)
16.49
(4.96)
13.73
(2.45)
14.37
(4.22)
15.47
(4.23)
13.04
(3.98)
13.49
(5.91)
5 (40) 6 (42) 7 (40) 8 (45) 9 (40) 10 (50) 11 (52) 12 (55) 13 (44) 14 (53) 15 (50)
17.00 (2.44)
17.70
(2.08)
20.40
(3.78)
22.10
(3.91)
26.40
(3.42)
27.80
(4.87)
29.30
(4.96)
33.19
(6.28)
37.49
(7.70)
42.99
(8.84)
48.43
(6.46)
0.71
(0.02) 0.75
(0.02) 0.82
(0.02) 0.88
(0.02) 1.00
(0.02) 1.04
(0.01) 1.09
(0.01) 1.17
(0.01) 1.27
(0.02) 1.40
(0.01) 1.51
(0.01)
5 (48) 6 (44) 7 (48)
8 (50) 9 (50) 10 (50) 11 (45) 12 (46) 13 (50) 14 (50) 15 (48)
126.11 (6.04) 131.77
(5.72) 136.46 (3.98) 143.28
(7.80) 145.23 (8.45) 157.02
(8.45) 161.63 (7.42)
Weight
BSA
BF (kg)
(M2)
(%)
1
4
.
5
4
(
1
.
8
8
)
1
7
.
2
2
(
2
.
1
6
)
1
7
.
9
1
(
2
.
3
0
)
1
9
.
1
3
(
2
.
2
3
)
2
2
.
2
2
(
2
.
7
1
)
2
4
.
9
2
(
3
.
0
4
)
2
6
.
9
7
(
2
.
9
8
)
3
0
.
9
9
(
4
.
5
7
)
3
2
.
0
4
(
5
.
4
2
)
3
9
.
6
3
(
6
.
5
4
)
4
2
.
3
3
(
4
.
9
0
)
FFM
(kg)
12.29
(1.54)
14.69
(1.82)
15.31
(1.80)
16.47
(1.83)
19.65
(2.18)
20.73
(2.14)
23.25
(2.57)
26.46
(3.61)
26.98
(4.10)
34.36
(3.25)
36.50
(3.88)
Chest
(cm)
50.05
(2.43)
50.68
(2.71)
51.16
(2.60)
52.56
(2.35)
54.76
(2.43)
56.72
(2.79)
58.93
(2.84)
60.87
(3.70)
60.90
(3.67)
66.56
(4.65)
68.50
(3.83)
Height
(cm)
109.9
116.1
121.7
127.0
132.2
137.5
143.3
149.0
156.5
165.1
169.0
Weight
(kg)
18.7
20.7
22.9
25.3
28.1
31.4
35.3
39.8
45.0
50.8
56.7
en o o o' (D o o 3 o
o a> C
a> 3 a t~ c
3 (C Tl C 3
s o 3
0.64
(0.01)
0.73
(0.01)
0.76
(0.01)
0.80
(0.01)
0.89
(0.01)
0.97
(0.01)
1.03
(0.01)
1.13
(0.01)
1.16
(0.01)
1.34
(0.01)
1.41
(0.01)

3 a.
,'N

TABLE 2—Physical Characteristics and Anthropometry in Girls1
HIG(n = 515) LIG(n = 532) NCHS-50th centiles
Age Age years (n) Height (cm) Weight (kg) BSA (M2) BF (%) FFM(kg) Chest (cm) years (n) Height (cm) Weight (kg) BSA (M2) BF (%) FFM(kgM Chest (cm) Height (cm) Weight (kg)
5 107.43 15.93 0.69 18.71 12.93 49.75 5 99).24 13.80 0.60 19.11 11.15 46.93 108.4 17.7 (44) (5.37) (1.94) (0.06) (1.67) (1.45) (0.63) (50) (5.24) (1.38) (0.04) (2.11) (1.03) (0.49) 6 113.02 18.08 0.76 18.55 14.71 51.75 6 108.46 15.98 0.68 17.77 13.11 49.14 114.6 19.5 (46) (4.48) (1.89) (0.05) (1.62) (1.35) (0.62) (45) (5.35) (1.79) (0.05) (2.39) (1.26) (0.42) 7 118.35 20.21 0.80 18.15 16.48 53.51 7 114.44 18.13 0.74 17.40 14.96 51.11 120.6 21.8 (40) (5.02)
122.06 (2.93)
21.60 (0.07)
0.84 (2.64) (1.94) (0.67) (48) (4.62)
119.88 (1.84)
19.80 (0.05)
0.80 (1.76)
16.62 (1.34)
16.49 (0.50)
52.54 126.4
8 17.66 17.75 55.34 8 24.8 (43) (4.69) (2.61) (0.06) (1-99) (1.82) (0.64) (50) (3.87) (1-59) (0.04) (1.62) (1.14) (0.49) 9 126.66 23.20 0.89 16.86 19.21 56.47 9 125.44 21.99 0.86 16.17 18.40 54.41 132.2 28.5 (40) (4.88) (3.89) (0.08) (2.62) (2.55) (0.68) (42) (5.04) (2.57) (0.06) (1.81) (1.86) (0.54) 10 131.14 25.57 0.95 16.80 21.23 58.12 10 130.32 23.79 0.92 15.57 20.01 56.57 138.3 32.5 (54) (6.15) (3.32) (0.08) (1.89) (2.43) (0.57^ (52) (6.30) (3.55) (0.08) (2.85) (2.44) (0.48) 11 138.13 29.35 1.05 16.88 24.30 61.69 11 137.89 26.14 0.99 14.51 22.23 58.94 144.8 37.0 (50) (7.19) (4.66) (0.10) (2.71) (3.27) (0.60) (50) (5.18) (4.09) (0.08) (3.19) (2.68) (0.49) 12 149.27 37.63 1.23 18.51 30.59 66.75 12 144.19 31.92 1.12 16.20 26.61 ■ 62.38 151.5 41.5 (55) (4.96) (4.12) (0.08) (2.38) (2.68)^ (0.57) (56) (6.62) (5.22) (0.10) (3.23) (3.46) (0.46) 13 152.33 44.64 1.34 21.30 34.90 73.13 13 148.02 36.83 1.21 17.49 30.28 65.98 157.1 14.1 (43) (4.68) (6.80) (0.10) (3.83) (3.62) (0.64) (43) (5.25) (4.87) (0.09) (2.48) (3.30) (0.51) 14 154.89 43.55 1.34 18.99 35.09 72.23 14 149.93 38.06 1.22 17.20 31.2jfl 66.23 160.4 50.3 (55) (4.07) (5.90) (0.09) (3.42) (3.33) (0.577) (51) (6.62) (5.95) (0.20) (3.70) (3.85) (0.49) 15 153.50 42.94 1.36 18.37 34.92 72.37 15 151.16 40.75 1.26 17.05 33.34 67.56 161.8 53.7 (45) (6.00) (5.81) (0.11) (2.99) (3.78) (0.71) (45) (5.19) (6.73) (0.21) (3.52) (3.97) (0.58)

Values expressed as mean ± SD.

A
analyzing the model residuals. Finally, we computed linear
stepwise multiple regression equations separately, using age,
height, FFM, and SES as independent variables for FEV1,
FVC, and PEFR. It was observed that all four independent
variables have a highly significant impact on final regression
equations; hence, all four were used for prediction of lung
functions.
RESULTS
The physical characteristics and body composition of
children belonging to high-, middle-, and low-income
groups are presented in Table 1 (boys) and Table 2 (girls).
The study parameters of subjects between the three groups
were compared with each other to find out the influence of
SES on lung functions and physical characteristics. It was
found that the physical characteristics of the HIG group
were significantly higher than of the children from the
middle- and low-income groups. The differences in physical
characteristics before and after adjustment with age, height,
weight, and FFM are given in Table 3. The ventilatory
functions of boys and girls are given in Tables 4 and 5,
respectively, based on SES. It was observed that values of
FEV1 were lower by 14% and 16.7%, FVC by 14.1% and
16.6%, and PEFR by 9.1% and 8.4% in MIG and LIG boys
when compared to HIG boys, while in girls they were
lowerby14.4% (FEV1), 14% (FVC), and 15.6% (PEFR),
respectively, in the LIG category compared with the HIG
category. PFT parameters were significantly higher in the
HIG of both boys and girls after adjusting for physical
characteristics like age, height, weight, and FFM (Table 6).
We also observed no significant differ-ences among physical
characteristics and lung functions between middle- and
low-income boys. In view of this observation, the study on
girls did not include the MIG. Children were also compared
with National Center of Health Statistics (NCHS) US
standards, and all groups of boys and girls were found to be
lower than the 50th centile regarding height for age, weight
for age, and weight for
TABLE 3—Group Mean Values of Physical Characteristics in Children
1
SES N Age Height Weight FFM
Boys HIG 511 10.33 ± 3.15a 137.28 ± 18.515a (134.8)a 30.26 ± 11.347a (28.4)a 24.87 ± 8.888a (23.0)a MIG 529 9.99 ± 3.14a 132.16 ± 17.834 (133.1) 27.04 ±10.144 (27.6) 22.92 ±8.135 (23.5) LIG 529 10.30 ± 3.16a 131.69 ± 19.538 (133.1) 26.24 ± 9.604 (27.4) 23.43 ± 8.226 (23.5) F value 1.7 14.1 (23.6) 21.4 (21.2) 12.0 (14.3) p value NS 0.001 (0.001) 0.001 (0.001) 0.001 (0.001)
Girls HIG 515 10.07 ± 3.09a 133.89 ± 17.204a (131.2)a 29.57 ± 11.126a (27.2)a 24.03 ± 8.259a (23.4)a LIG 532 9.88 ±2.88a 128.21 ± 17.438 (130.9)a 24.85 ± 8.886 (27.2)a 20.63 ±7.148 (23.3)a F value 2.7 26.8 (1.2) 54.6 (0.01) 46.2 (1.1) p value NS 0.001 (NS) 0.001 (NS) 0.001 (NS)
Socioeconomic Status and Lung Function in Indiar=~| 5
height. A few subjects belonging to the HIG, bothooys and
girls, were comparable to or higher than the 50th centiles
of NCHS standards.
The prediction equations were calculated considering the
correlation coefficients of physical characteristics with
lung functions. It was observed that age, height, weight,
FFM, and BSAwere highly correlated with lung functions.
Highly significant R2 values were found when age, height,
and FFM were used as independent variables for lung
functions, and hence the prediction equations using these
variables were given. Since it was found that lung func-
tions were significantly different after adjustment of
physical characteristics, SES was also considered as an
independent categorical variable to develop common pre-
diction equations for entire groups of boys and girls
separately, such that the influence of SES was also used in
the predictability of lung functions. Hence, separate
equations were given with SES as an independent variable
for boys and girls, respectively. Multiple regression
equa-tions are presented using the three or four
independent variables for both boys and girls (Table 7).
DISCUSSION
Socioeconomic inequalities reflect differences in health
status and were reported to vary between countries.
Intrauterine growth retardation because of
malnourish-ment during pregnancy, associated with low
SES, is prevalent in developing countries.16
In a study
comparing mortality in manual and nonmanual workers in
two British towns, respiratory symptoms and impairment
of lung function were found to differ across social class.31
In a study of 410 male nonsmokers, it was found that the
difference in FEV1 between the highest and the lowest
social class was 400 ml. Several studies were conducted
to assess pulmonary functions in middle-aged adults, and
it is worth remembering that lung function in this age
group may be the result of several mechanisms.32
Reduced
lung function in middle age may result from a

1Values in parentheses are mean values adjusted for other physical characteristics. Superscript variations indicate significant differences of means
between groups.

I
5
6
7
8
9
10
11
12
13
14
15
0.95 0.93 (0.22) (0.20) 1.04 1.00 (0.19) (0.17) 1.25 1.20 (0.30) (0.28) 1.33 1.25 (0.21) (0.20) 1.67 1.52 (0.25) (0.21) 1.79 1.66 (0.30) (0.26) 2.02 1.87 (0.33) (0.29) 2.22 2.01 (0.37) (0.35) 2.44 2.25 (0.35) (0.37)
2.89 2.65 (0.49) (0.46) 3.35 3.10 (0.53) (0.49)
97.47 (3.61) 96.26 (5.78) 96.90
(7.96) 94.03 (3.98) 91.23 (6.61)
93.08 (5.94) 92.24 (3.87) 90.43
(5.59) 92.31 (5.66) 91.95 (4.71)
92.86 (5.26)
176.10 0.77 0.75 (36.67) (0.17) (0.16) 201.60 0.94 0.90 (30.55) (0.22) (0.20) 220.90 1.12 1.09 (56.64) (0.30) (0.22) 241.40 1.26 1.18 (48.19) (0.23) (0.18) 285.00 1.44 1.33
(.U.1SJ 298.80 1.62 1.48 (46.18) (0.29) (0.27)
319.41 1.90 1.71 (45.60) (0.32) (0.30) 338.09 2.01 1.83 (51.09) (0.29) ^0.30) 354.25 2.15 1.93 (62.56) (0.35) (0.29)
427.75 2.56 2.41 (61.54) (0.39) (0.38) 474.30 2.94 2.76 (57.99) (0.57) (0.56)
98.85
(2.60)
96.45
(4.93)
95.44
(4.89)
93.82
(6.14)
92.82
(5.13)
91.21
(4.08)
89.83
(4.15)
91.42
(7.35)
90.55
(6.89)
94.11
(4.56)
93.86
(4.94)
156.73 0.64 0.63 (38.59) (0.22) (0.22) 192.19 0.96 0.93 (38.85) (0.24) (0.21) 201.13 1.05 1.01 (42.91) (0.23) (0.20) 217.28 1.15 1.09 (35.11) (0.24) (0.22) 247.56 1.44 1.32 (38.77) (0.24) (0.22) 276.65 1.63 1.50 (42.18) (0.25) (0.22) 303.60 1.82 1.65 (61.97) (0.25) (0.25) 326.22 1.96 1.80 (47.56) (0.39) (0.35) 327.40 2.02 1.80 (44.52) (0.40) (0.35)
TABLE A—Lung Functions in Boys1
HIG(n = 511) MIG(n = 529) LIG (n = 529)
Age (years) FVC (1) FEVj (1/sec)
FEVj/FVC^c
PEFR (1/min) FVC (1) FEVj (1/sec) FEV!/FVC% PEFR (1/min) FVC (1) FEVj (1/sec) FEV!/FVC% PEFR (1/min)

416.22 2.62 2.42 (64.06) (0.48) (0.46) 458.93 2.79 2.58 (70.92) (0.40) (0.39)
98.71 (2.28)
97.16 (2.91)
95.27 (3.23)
94.83 (4.37)
91.32 (5.48)
92.36 (7.20)
90.81 (4.92)
91.87 (6.11)
89.72 (5.01)
92.33 (5.97)
92.71 (5.30)
136.42
(34.83)
181.93
(35.74)
211.77
(37.83)
212.86
(35.05)
260.52
(37.55)
274.86
(56.26)
296.11
(38.77)
338.26
(58.30)
338.28
(60.50)
420.00
(61.14)
462.35
(60.19)
Values expressed as mean ± SD.

Socioeconomic Status and Lung Function in Indiarzrn 7
TABLE 5—Lung Functions in Girls1
HIG girls (n ¼ 515) LIGgirls(n = 532)
Age
(years) FEV1 (l/sec) FVC (l) FEV1/FVC% PEFR (l/min) FEV1 (l/sec)
FVC (l) FEV1/FVC??) PEFR (l/min)
5 6 7 8 9 10 11 12 13 14 15
0.70 (0.16)
0.94 (0.18)
0.98 (0.15)
1.17 (0.17)
1.28 (0.19)
1.45 (0.23)
1.68 (0.36)
2.01 (0.34)
2.26 (0.43)
2.19 (0.39)
2.31 (0.34)
0.73 (0.18)
0.97 (0.19)
1.03 (0.16)
1.24 (0.20)
1.37 (0.20)
1.53 (0.25)
1.79 (0.38)
2.12 (0.36)
2.40 (0.45)
2.29 (0.40)
2.47 (0.38)
96.68
96.88 95.24
95.14
93.33
94.74
94.21
94.89
94.65
95.76
93.74
(7.02)
(4.54)
(7.12)
(4.81)
(4.60)
(4.72)
(3.48)
(3.87)
(4.02)
(4.04)
(3.48)
149.55
187.72
193.25
212.56
234.50
279.26
312.40
374.91
367.21
380.73
385.43
(36.79)
(35.22)
(35.26)
(32.15)
(37.75)
(43.47)
(50.17)
(35.74)
(38.39)
(41.00)
(51.53)
0.49 (0.14)
0.79 (0.18)
0.96 (0.22)
1.04 (0.17)
1.18 (0.22)
1.31 (0.20)
1.43 (0.25)
1.71 (0.36)
1.89 (0.28)
1.96 (0.31)
2.04 (0.30)
0.51 (0.15)
0.81 (0.20)
1.01 (0.25)
1.10 (0.19)
1.27 (0.23)
1.42 (0.22)
1.54 (0.26)
1.85 (0.37)
1.96 (0.29)
2.01 (0.33)
2.12 (0.36)
96.74
97.84
95.19
94.20
92.80
92.72
92.62
92.53
96.39
97.28
95.78
(8.85)
(4.30)
(4.60)
(5.68)
(7.03)
(5.62)
(5.28)
(7.44)
(4.22)
(3.64)
(4.84)
111.40
134.00
175.00
192.10
213.05
235.87
243.20
284.95
361.09
359.60
370.21
(16.51)
(28.99)
(39.52)
(38.57)
(39.13)
(34.42)
(40.26)
(57.91)
(52.50)
(49.50)
(46.89)
Values are expressed as mean ± SD.
low maximally attained lung function due to either low
lung function at birth or decreased growth of lung function
during childhood and adolescence as a consequence to low
SES.
Lung functions in children were largely overlooked
because of the difficulties in measuring them at clinical
setups, especially in developing countries like India. For
the diagnosis and follow-up of respiratory diseases in
children, lung function tests are essential and important.
Regression equations for predicting lung function tests can
be used based on simple anthropometric indices, which can
be easily measured and used for epidemiolo-gical surveys,
community health programs, and compar-ison with actual
values in clinical setups.
In India, several studies were conducted on
school-children to predict lung functions using
anthropometric variables.4–10
Most of these studies
included children of the local region, with a limited sample
size. In order to project equations applicable to most
regions of India and to the whole population at large, we
selected subjects with different linguistic backgrounds and
different SES who
were settled in Hyderabad, India. The present study com-
prised children from 11 of the 15 official Indian languages
as their mother tongue. Apart from regional variations,
considerable efforts were made to ensure that each age
group consisted of a minimum 40 subjects in each
socio-economic category, in order to get a more reliable
and accurate prediction of lung functions among the
population of the Indian subcontinent. The study on girls
was limited to only the HIG and LIG, since we found no
significant differences between MIG and LIG boys. The
impact of puberty is not considered in the present study.
The present study was undertaken to project generalized
prediction equations for Indian children based on SES. A
few Indian studies4,7,8 considered SES in their subjects.
However, none of them presented the regression equations
or results based on the SES of subjects.
Studies from the UK, China, and Malaysia did not find
any relationship between SES and lung functions in
children. A study conducted on Canadian children reported
differences in FEV1 (—8.1%) and FVC (—8.2%) only
among boys, and between the highest and lowest
TABLE 6—Group Mean Values of Lung Functions in Children1
SES N FEV1 FVC PEFR
Boys HIG 511
529 1.83 ± 0.742a (1.72)a 1.98 ± 0.816a (1.85)a 311.78 ± 102.340a (296.7)a
MIG 1.57 ±0.652 (1.61) 1.70±0711 (1.74) 283.35 ± 101.00 (289.0) LIG 529 1.52 0.653b (1.59)b 1.65 0.724b (1.72)b 285.67 106.544b (294.1)a
F value 29.3 (35.0) 28.3 (32.8) 11.8 (3.9)
p Value 0.001 (0.001) 0.001 (0.001) 0.001 (.02) Girls
HIG 515 1.56±0.615a (1.47)a 1.64 ± 0.653a (1.55)a 283.18 ±92.730a (270.3)a LIG 532 1.29 ±0.518 (1.38) 1.36 ±0.545 (1.46) 232.64 ± 90.609 (245.9)
F value 56.8 (30.4) 54.8 (28.8) 75.5 (83.9) p Value 0.001 (0.001) 0.001 (0.001) 0.001 (0.001)
1Values in parenthesis are mean values-adjusted for age, height, weight, and FFM. Superscript variations indicate

significant differences of means between groups.

8 Rajuetal.
TABLE 7—Regression Equations for Lung Functions1
Dependent variable
Boys (n¼1,569) FEV1
FVC PEFR Girls (n
¼ 1,047) FEV1 FVC
PEFR
Regression equation
1.280 + (0.04043* FFM) + (0.01404* Height) + (0.01584*Age) —
1.5870 + (0.01697* Height) + (0.03863* FFM) + (0.2507* Age)
-155.482 + (2.140* Height) + (4.652* FFM) + (5.336* Age)
1.186 + (0.01482* Height) + (0.02728* FFM) + (0.02436* Age)
-1.285 + (0.01798* Height) + (0.03077* FFM) + (0.02869* Age)
-155.195 + (2.136* Height) + (2.955* FFM) + (8.084* Age) — (12.
(0.0612* SES)
(0.0656* SES)
(0.0441* SES)
(0.0459* SES)
188* SES)
SEE
0.939 2,871 0.2399 0.942 3,064 0.2561 0.907 2,388 43.93
0.915 1,280 0.2359 0.913 1,245 0.2523 0.910 1,186 39.56
1Numbers in bold indicate significance at P<0.001; SES is HIG ¼0, MIG¼1, LIG¼2.
categories of SES, with no differences in physical
char-acteristics in boys and girls.25
Contrary to this, in the
present study, there were significantly large differences
among boys and girls in lung function values between
different categories, and they ranged from 8.4–16.7%.
Highly significant differences were also observed between
physical characteristics like height, weight, and FFM
among different SES categories in both boys and girls.
In Western and developed countries, ethnic variations
are considered for prediction equations. In view of the
large variations in anthropometric and physiological
para-meters between the three different socioeconomic
groups as elucidated in the present study, SES had to be
con-sidered for the evaluation of lung functions in Indian
children. The differences between groups, in the present
study, could be attributed to the intake of highly nutritious
food by HIG category children, which plays an important
role in physical and mental growth as well as immune
status. The lower height, FFM, and lung function indices in
MIG and LIG children may indicate lower lung strength
and may make them susceptible to infections owing to
poor immune strength when compared to HIG children.
Since the living conditions and dietary habits of the
middle- and low-income groups are comparable, no
significant differences among anthropometric and lung
function parameters were found.
The studies conducted on Indian children projected
regression equations for estimating lung function
vari-ables, using age, height, weight, FFM, chest, and BSA
as dependent variables.4–10
The studies conducted on
Western populations used height,11
sitting height,12
sta-ture, FFM/stature,2 and percentage BF
13 as dependent
variables to predict ventilatory functions. In the present
study, a significantly high correlation of lung functions
with age, height, and FFM was observed. However, we
presented regression equations using three or four
para-meters, including SES, as independent variables for
lung function estimations.
An important finding of the present study is the
in-fluence of SES of subjects on lung functions and
physical characteristics. The present study revealed
significant differences in growth variables like height,
weight, FFM,
and lung functions, before and after adjustment of physical
characteristics between the HIG and the other two groups.
Thus, the present study clearly demonstrated the impact of
SES on lung functions in children over and above physical
size. In view of significant differences in physical
characteristics and lung function parameters between high-,
middle-, and low-income groups, it is recommended that
the socioeconomic status of children be taken into account
when evaluating lung functions, especially in the Indian
context and in children of other developing nations, to
arrive at accurate values. Here the authors concur that the
measures of SES in the present study can be reproduced
and are feasible to determine. The authors infer that the
differences between SES categories in physical
characteristics and lung functions may be reduced largely
with nutritional supplementation from the prenatal stage
onward. The equations developed in the present study can
be applied in epidemiological surveys and community
health programs. Finally, we conclude that the regression
equations derived in the present study can be used as
Indian reference quations, keeping in view the large sample
size of the s ~Jy population.
ACKNOWLEDGMENTS
We express our sincere appreciation and gratitude to the
students for participating in the study, their parents, and the
school managements for continuous support and
encouragement, without which the study could not have
been completed successfully. We express our gratitude to
Mr. Gowrinath Shastry, National Institute of Nutrition,
Hyderabad, for critical suggestions in designing the study,
and we sincerely thank Mrs. Subharty for her untiring help
during data collection and preparation of records. We
express our gratitude to Mrs. TV. Phyllis, Central Institute
of English and Foreign Languages, Hyderabad, for
English-language improvements in the manuscript. We
sincerely express our appreciation for the support and
encouragement given by the Director of Vemana Yoga
Research Institute, Mr. M. Venkata Reddy, during the
study. This study was carried out at the Physiology Labo-
ratory, Government Vemana Yoga Research Institute,

A
Ameerpet, Hyderabad, India. M/s Vitalograph, UK, provided graph cards for recording lung function charts. This article does not conflict with the interests of any individuals or firms.
REFERENCES
1. Baum GL, Crapo JD, Celli BR, Carlinsky JB. Textbook of pul-monary diseases. 6th ed. Philadelphia: Lippincott-Raven; 1998;
199p.
2. Becklake M, Crapo RO. Lung function testing: selection of
reference values and interpretive strategies. Am Rev Respir Dis
1991;144:1202–1218.
3. Crapo RO. Pulmonary function testing. N Engl J Med 1994;331:
25–30.
4. Chowgule RV, Shetye VM, Parmar JR. Lung function tests in
normal Indian children. Indian Pediatr 1995;32:185–191.
5. Mallik SK, Jindal SK. Pulmonary function tests in healthy children.
Indian Pediatr 1985;22:677–681.
6. Bhattacharya AK, Banerjee S. Vital capacity in children and young
adults of India. Indian J Med Res 1966;54:62–71.
7. Sharma PP, Gupta P, Deshpande R, Gupta P. Lung function values
in healthy children (10–15 years). Indian J Pediatr 1997; 64:85–91.
8. Nair RH, Kesavachandran C, Sanil R, Srikumar R, Shashidhar S.
Prediction equation for lung functions in south Indian children. Indian
J Physiol Pharmacol 1997;41:390–396.
9. Jain SK, Ramaiah TJ. Lung volumes and mechanics of breathing in
healthy 7–14 year olds. Indian J Chest Dis 1968;10:63–68.
10. Raju PS, Prasad KVV, Ramana YV, Ahmed SK, Murthy KJR.
Study on lung function tests and prediction equations in Indian male
children. Indian Pediatr 2003;40:705–711.
11. Hsu KHK, Jenkins DE, Hsi BP, Bourhofer E, Thompson V,
Tanakawa N, Hsieh GSJ. Ventilatory functions of normal children and
young adults: Mexican-American, white and black. I. Spirometry. J
Pediatr 1979;95:14–23.
12. Hsi BP, Hsu KHK, Jenkins DE. Ventilatory functions of normal
children and young adults: Mexican-American, white and black. III.
Sitting height as a predictor. J Pediatr 1983;102:860– 865.
13. Cotes JE, Dabbs JM, Hall AM, Heywood C, Laurence KM. Sitting
height, fat free mass and body fat as reference variables for lung
function in healthy British children: comparison with stature. Ann
Hum Biol 1979;6:307–314.
14. Patrick JM, Patel A. Ethnic differences in the growth of lung
functions in children: a cross sectional study in inner city Nottingham.
Ann Hum Biol 1986;13:307–315.
15. Thomson AM. Diet in pregnancy. 3. Diet in relation to the course
and outcome of pregnancy. Br J Nutr 1959;13:509–525.
16. Krammer MS. Determinants of low birth weight: methodol-ogical
assessment and meta-analysis. Bull WHO 1987;65:663– 737.
17. Marmot M, Ryff CD, Bumpass LL, Shipley M, Marks NF. Social
inequalities in health: next questions and converging evidence. Soc Sci
Med 1997;44:901–910.
Socioeconomic Status and Lung Function in Indiar=~i 9
18. Prescott E, Vestbo J. Socioeconomic status and chronic obstructive
pulmonary disease. Thorax 1999;54:737-741.
19. Lynch J, Smith GD, Harper S, Hillemeier M. Is income inequality a
determinant of population health? Part 2. U.S. national and regional
trends in income inequality and age- and cause-specific mortality.
Milbank Q 2004;82:355-400.
20. Rona RJ, Mahabir D, Rocke B, Chinn S, Gulliford MC. Social
inequalities and children’s height in Trinidad and Tobago. Eur J Clin
Nutr 2003;57:143-150.
21. Wright CM, Parker L. Forty years on: the effect of deprivation on
growth in two Newcastle birth cohorts. Int J Epidemiol 2004;
33:152-153.
22. Chan KN, Noble-Jamieson CM, Elliman A, Bryan EM, Silver-man
M. Respiratory symptoms in children of low birth weight. Arch Dis
Child 1989;64:1284-1293.
23. Barker DJ, Godfrey KM, Fall C, Osmond C, Winter PD, Shakeen
SO. Relation of birth weight and childhood respiratory infection to
adult lung function and death from chronic airways disease. Br Med
J [Clin Res] 1991;303:671-675.
24. Stebbings JHJ. Chronic respiratory disease among non-smokers
in Hagerstown, Maryland. III. Social class and chronic respiratory
disease. Environ Res 1971;4:213-232. 25. Demissie K, Ernst P, Hanley JA, Locher U, Menzies D, Becklake
MR. Socioeconomic status and lung function among primary
school children in Canada. Am J Respir Crit Care Med 1996;156:
719-723. 26. Mishra D, Singh HP. Kuppuswamy’s socioeconomic status scale—a
revision. Indian J Pediatr 2003;70:273-274.
27. Slaughter MH, Lohman TG, Boileau RA, Horswill CA, Stillman RJ,
Van Loan MD, Bemben DA. Skin fold equation for estimation of
body fatness in children and youth. Hum Biol 1988;60:709-723.
28. Du-Bois D, Du-Bois EF Clinical calorimetry. Fifth paper. The
measurement of the surface area. Arch Intern Med 1915;15:868-876.
29. American Thoracic Society. Standardization of spirometry. Am J
Respir Crit Care Med 1995;152:1107-1136.
30. Mackenbach JP, Kunst AE, Cavelaars AEJM, Groenhof F, Geurts
JJM. Socioeconomic inequalities in morbidity and mortality in
Western Europe. Lancet 1997;349:1655-1659.
31. Burr ML, Holliday RM. Why is chest disease so common in South
Wales? Smoking, social class, and lung function: a survey of elderly
men in two areas. J Epidemiol Community Health 1987;41:140-144.
32. Kerstjens HA, Rijcken B, Schouten JP, Postma DS. Decline of
FEV1 by age and smoking status: facts, figures and fallacies.
Thorax 1997;52:820-827. 33. Lunn JE, Knowelden J, Handyside AJ. Patterns of respiratory
illness in Sheffield infant school children. Br J Soc Prev Med
1976 7-16. ~pl 34. Chen Y, Li WX. The effect of passive smoking on children s
pulmonary function in Shanghai. Am J Public Health 1986;76:
515-518.
35. Azizi BHO, Henry RL. Effects of indoor air pollution on lung
function of primary school children in Kaulalampur. Pediatr
Pulmonol 1990;9:24-29.