The qualitative assessment of responsiveness to environmental challenge in horses and ponies
13
The qualitative assessment of responsiveness to environmental challenge in horses and ponies Fabio Napolitano a, * , Giuseppe De Rosa b , Ada Braghieri a , Fernando Grasso b , Aldo Bordi b , Franc ¸oise Wemelsfelder c a Dipartimento di Scienze delle Produzioni Animali, Universita ` degli Studi della Basilicata, Via dell’Ateneo Lucano 10, 85100 Potenza, Italy b Dipartimento di Scienze zootecniche e Ispezione degli alimenti, Universita ` degli Studi di Napoli ‘‘Federico II’’, Via Universita ` 133, 80055 Portici (NA), Italy c Sustainable Livestock Systems, Scottish Agricultural College, Bush Estate, Midlothian, UK Accepted 12 March 2007 Available online 18 April 2007 Abstract The responsiveness of 10 horses and 10 ponies to environmental challenge (represented by an open field test) was assessed using a qualitative approach based on free choice profiling methodology (FCP), which gives observers complete freedom to choose their own descriptive terms. Data were analysed with generalised Procrustes analysis (GPA), a multivariate statistical technique associated with FCP. A cross-validation of the outcomes of this approach to data recorded through quantitative behaviour analysis, and through a questionnaire given to the animals’ owner/riding instructor, was also performed using principal component analysis (PCA). Twelve undergraduate students generated their own descriptive vocabularies, by watching 20 horse/pony video clips lasting 2.5 min each. GPA showed that the consensus profile explained a high percentage of variation among the 12 observers, and differed significantly from the mean randomised profile ( p < 0.001). Two main dimensions of the consensus profile were identified, explaining 60% and 5.2% of the variation between animals, respectively. The 12 observer word charts interpreting these dimensions were semantically consistent, as they all converged towards the same meaning, albeit using different terms. The most used term to describe the positive end of axis 1 was ‘‘quiet’’, whereas ‘‘attentive’’ was the best positive descriptor of axis 2. The most frequently used descriptors for the negative ends of axes 1 and 2 were ‘‘nervous’’ and ‘‘bored’’, respectively. Thus, axis 1 was labelled as ‘‘quiet/nervous’’ and axis 2 was named as ‘‘attentive/bored’’. A marked effect of animal category was observed on the scores of the animals on the first dimension ( p < 0.001). Horses received significantly higher scores, and were thus assessed as more quiet and calm, than ponies. Conversely, ponies tended to receive lower scores on the second dimension ( p < 0.12), therefore they appeared less curious and www.elsevier.com/locate/applanim Applied Animal Behaviour Science 109 (2008) 342–354 * Corresponding author. Tel.: +39 0971 205078; fax: +39 0971 205099. E-mail address: [email protected] (F. Napolitano). 0168-1591/$ – see front matter # 2007 Elsevier B.V. All rights reserved. doi:10.1016/j.applanim.2007.03.009
-
Upload
independent -
Category
Documents
-
view
0 -
download
0
Transcript of The qualitative assessment of responsiveness to environmental challenge in horses and ponies

The qualitative assessment of responsiveness to
environmental challenge in horses and ponies
Fabio Napolitano a,*, Giuseppe De Rosa b, Ada Braghieri a,Fernando Grasso b, Aldo Bordi b, Francoise Wemelsfelder c
a Dipartimento di Scienze delle Produzioni Animali, Universita degli Studi della Basilicata,
Via dell’Ateneo Lucano 10, 85100 Potenza, Italyb Dipartimento di Scienze zootecniche e Ispezione degli alimenti, Universita degli Studi di Napoli ‘‘Federico II’’,
Via Universita 133, 80055 Portici (NA), Italyc Sustainable Livestock Systems, Scottish Agricultural College, Bush Estate, Midlothian, UK
Accepted 12 March 2007
Available online 18 April 2007
Abstract
The responsiveness of 10 horses and 10 ponies to environmental challenge (represented by an open field
test) was assessed using a qualitative approach based on free choice profiling methodology (FCP), which
gives observers complete freedom to choose their own descriptive terms. Data were analysed with
generalised Procrustes analysis (GPA), a multivariate statistical technique associated with FCP. A
cross-validation of the outcomes of this approach to data recorded through quantitative behaviour analysis,
and through a questionnaire given to the animals’ owner/riding instructor, was also performed using
principal component analysis (PCA). Twelve undergraduate students generated their own descriptive
vocabularies, by watching 20 horse/pony video clips lasting 2.5 min each. GPA showed that the consensus
profile explained a high percentage of variation among the 12 observers, and differed significantly from the
mean randomised profile ( p < 0.001). Two main dimensions of the consensus profile were identified,
explaining 60% and 5.2% of the variation between animals, respectively. The 12 observer word charts
interpreting these dimensions were semantically consistent, as they all converged towards the same
meaning, albeit using different terms. The most used term to describe the positive end of axis 1 was
‘‘quiet’’, whereas ‘‘attentive’’ was the best positive descriptor of axis 2. The most frequently used
descriptors for the negative ends of axes 1 and 2 were ‘‘nervous’’ and ‘‘bored’’, respectively. Thus, axis
1 was labelled as ‘‘quiet/nervous’’ and axis 2 was named as ‘‘attentive/bored’’. A marked effect of animal
category was observed on the scores of the animals on the first dimension ( p < 0.001). Horses received
significantly higher scores, and were thus assessed as more quiet and calm, than ponies. Conversely, ponies
tended to receive lower scores on the second dimension ( p < 0.12), therefore they appeared less curious and
www.elsevier.com/locate/applanim
Applied Animal Behaviour Science 109 (2008) 342–354
* Corresponding author. Tel.: +39 0971 205078; fax: +39 0971 205099.
E-mail address: [email protected] (F. Napolitano).
0168-1591/$ – see front matter # 2007 Elsevier B.V. All rights reserved.
doi:10.1016/j.applanim.2007.03.009

attentive. The results of the PCA showed that the variables from different types of measurement clearly had
meaningful relationships. For instance, the variables with the highest loading on the positive end of axis 1
were all indicative of tractable and docile animals, whereas axis 2 showed high loadings on the positive end
for variables indicating attentive animals. Qualitative behaviour assessment proved to be an appropriate
methodology for the study of horse behavioural responsiveness, in that it provided a multifaceted
characterisation of horse behavioural expression that was in agreement with other quantitative and
subjective assessments of the animals’ behaviour.
# 2007 Elsevier B.V. All rights reserved.
Keywords: Horse; Pony; Behavioural expression; Qualitative measurements; Free choice profiling; Generalised
Procrustes analysis
1. Introduction
The performance of horses in leisure, sport, production, therapy, etc. can be affected by their
response to novel and/or unexpected situations, which therefore affects their suitability for such
tasks. The responsiveness of horses to environmental challenge has been studied both
quantitatively and qualitatively, under various headings such as ‘temperament/personality’,
‘emotionality’, or the development of ‘coping strategies’. These studies have used an array of
experimental techniques, such as open field tests, human handling tests or other types of novelty
tests, and various methods for recording behaviour (Rundgren and Nordin, 1997; Wolff et al.,
1997; Mills, 1998; Anderson et al., 1999; Jezierski et al., 1999; Visser et al., 2001; Hausberger
and Muller, 2002; Seaman et al., 2002; Momozawa et al., 2003). Quantitative methods tend to
record responsiveness through use of ethograms that fragment behaviour into discrete, mutually
exclusive categories of physical movement (e.g. stand, sniff, run); measurements of these
categories can subsequently be re-integrated to identify underlying dimensions of responsiveness
through application of multivariate analysis techniques such as principal component analysis.
Qualitative methods on the other hand tend to assess dimensions of responsiveness more directly
by instructing human observers to integrate perceived details of behaviour and its context into
judgements of an animal’s overall style of behaviour (e.g. timid, bold, friendly, hostile). These
different methods have been applied successfully to characterise responsiveness in farm animal
species such as pigs (Wemelsfelder et al., 2000, 2001) and cattle (Rousing and Wemelsfelder,
2006), however with horses it has been difficult to obtain reliable characterisations that are
consistent across tests (e.g. Mills, 1998; Seaman et al., 2002; Visser et al., 2001). One possible
reason for this may be that the pre-determined categories and measurements scales used by
previous studies to record the horses’ behaviour were not adequate, or not sufficiently clearly
defined to observers, to generate unambiguous results.
To address the conceptualisation of horse responsiveness, it may be useful to invite observers to
create their own descriptive categories and to subsequently use these categories to quantitatively
rate the behaviour of horses in a challenging situation. A free choice profiling (FCP) methodology
suitable for this aim has recently been developed by Wemelsfelder et al. (2000, 2001). This method
makes use of a multivariate statistical technique called generalised Procrustes analysis, which does
not rely on fixed variables to calculate underlying dimensions of responsiveness. The goal of the
present study was to characterise responsiveness to environmental challenge (represented by an
open field test), in horses and ponies using this novel methodology, and to cross-validate the
outcomes of this approach to data recorded through quantitative behaviour analysis, and through a
questionnaire given to the animals’ owner/riding instructor.
F. Napolitano et al. / Applied Animal Behaviour Science 109 (2008) 342–354 343

2. Materials and methods
2.1. Animals
Animal subjects were 10 horses (5 females and 5 castrated males) and 10 ponies (6 females and 4
castrated males), who were usually employed in riding lessons. The animals’ average age was approxi-
mately 17 years, and did not differ between the two equine categories. Both horses and ponies were
individually housed in 2.5 m � 3.5 m indoor pens at night, while during the day they were allocated to
individual outdoor pens and subjected to ordinary riding programmes (2–3 h per day, distributed between
11.00 and 17.00 h).
2.2. Experimental procedures
To assess the animals’ behavioural response to a novel environment, they were subjected to an open field
test. This test was performed in a 10 m � 10 m outdoor paddock, novel to the animals, with earth floor and
open metal fencing. While in this paddock subjects were isolated from tactile and visual contact with
conspecifics, but could receive auditory and olfactory stimuli from other animals. Each animal was confined
individually in the open field for 2.5 min, and their behaviour during this time was video-recorded using a
DVL-157 JVC video camera located 6 m from the test paddock at 3.8 m of height. From this material a video
tape was created containing 20 clips of 2.5 min duration, showing horses and ponies in random order.
2.3. Methods of behaviour assessment
2.3.1. Quantitative behaviour assessment
The behaviour shown by horses and ponies in the 20 video clips was analysed quantitatively by means of
continuous recording technique (accurate to 1 s). The variables recorded are described briefly in Table 1.
2.3.2. Qualitative behaviour assessment
The behaviour of horses and ponies on video was analysed qualitatively using a free choice profiling
(FCP) methodology recently developed for pigs by Wemelsfelder et al. (2000, 2001). Observers for this part
of the study were 12 undergraduate students (8 female and 4 male) studying animal science at the University
of Basilicata (Potenza, Italy), most of whom had little experience with the observation of animals. These
observers were instructed in FCP procedures for qualitative behaviour assessment following Wemelsfelder
et al. (2001). These procedures consisted of two phases. In phase 1 observers generated their own descriptive
F. Napolitano et al. / Applied Animal Behaviour Science 109 (2008) 342–354344
Table 1
Description of behavioural categories recorded during the open field test
Behavioural category Description
Idling (duration) Standing or lying, no overt activity
Exploration (duration) Walking slowly with the neck horizontal often interrupted by stopping and
sniffing the ground or the fence (Seaman et al., 2002)
Sustained walking (duration) Walking energetically looking in front or around (Le Scolan et al., 1997)
Vigilance (duration) Standing still with elevated neck, intently oriented head and ears
(Le Scolan et al., 1997)
Bucking (duration) Leaping upward and arching the back with raised hindlegs
Rolling (duration) Lowering on the knees, rolling on the back and/or the flank and standing again
Kicking (frequency) The body ascends sharply from front to back, hind legs are raised and one
or both are kicked in a posterior direction
Pawing (frequency) Striking repeatedly the ground with the forelimb
Snorting (frequency) Short explosive exhalations from nostrils (Boyd and Houpt, 1994)

vocabularies, by watching the 20 horse/pony video clips, and by writing down during a 1.5 min period after
each clip the terms that in their view adequately sum up the animal’s style of responding to the test situation.
No limit was imposed to the observers on the number of terms to be generated, but this number never
exceeded 40. In phase 2 observers were instructed to use their personal vocabularies to quantitatively score
the responsiveness styles of the same animals. They watched the same videos again in the same order, and
during the 1.5 min period after each clip scored each animal on each term of their vocabulary, using visual
analog scales of 125 mm length (0 mm: attribute absent, 125 mm: attribute very strong). Scores for each
attribute were measured as the distance in millimetres from the 0-point. For further details of this method see
Wemelsfelder et al. (2001).
2.4. Questionnaire
The riding instructor who also owned the horses and ponies and thus knew the animals very well, was
asked to complete a questionnaire for each animal. He was asked to provide information on the animals’ sex,
age, and history at the riding school, and also to score each animal (using visual analog scales as described
above) on a provided list of qualitative attributes for horse responsiveness as suggested by Seaman et al.
(2002) (see Table 2).
2.5. Statistical analyses
2.5.1. Quantitative analysis
The durations, and in case of incidental behaviours the frequencies, of the recorded quantitative
behavioural variables were calculated. A Mann–Whitney U-test was used to investigate whether significant
differences existed between the behaviour of horses and ponies.
2.5.2. Qualitative analysis
The FCP procedures produced 12 data matrices, one for each observer, providing scores for the 20
animals (10 horses and 10 ponies) on the basis of the observers’ personal vocabularies. The concordance
between these matrices was analysed using generalised Procrustes analysis (GPA), a multivariate statistical
technique which does not require fixed variables for its calculation of a consensus. This calculation is
essentially a process of complex pattern recognition; the observer matrices are represented in virtual space
as multi-dimensional configurations, with the number of dimensions for each configuration determined by
the number of terms generated by a particular observer. The 20 animals observed by all observers are placed
F. Napolitano et al. / Applied Animal Behaviour Science 109 (2008) 342–354 345
Table 2
Attributes scored by the equid owner
Tameness
Ease of catching
Ease of foot picking up and trimming
Responsiveness to commands
Excitability
Reactivity to noise
Reactivity to isolation
Reactivity to novel situation
Reactivity to novel objects
Reactivity to unfamiliar humans
Aggressivity
Aggression towards humans
Aggression towards equids

at different positions in the different observer configurations. The concordance between these configurations
is calculated through a complex process of rotation, transformation, aimed at finding a ‘best-fit’ consensus
profile. GPA provides a statistic (called the Procrustes statistic) which indicates the level of consensus (i.e.
the percentage of variation explained between observers) that has been achieved. Whether this consensus is
a significant feature of the data set, or, alternatively, an artefact of the Procrustean calculation procedures, is
determined through a permutation or randomisation test (Dijksterhuis and Heiser, 1995). This procedure
rearranges at random each observer’s scores and produces new permutated data matrices. By applying GPA
to these permutated matrices, a ‘randomised’ profile is calculated. This procedure is repeated 100 times,
providing a distribution of Procrustes statistics indicating how likely it is to find an observer consensus based
on chance alone. Subsequently a one-way t-test is used to determine whether the actual observer consensus
profile falls significantly outside the distribution of randomised profiles.
The calculation of the consensus profile takes place independently of the semantic information
provided by the terminologies chosen by the observers. Semantic interpretation of this consensus profile
takes place after its calculation. Through a principal component analysis (PCA), the number of
dimensions of the consensus profile is reduced to one or more main dimensions explaining the majority
of variation between the observed animals. These dimensions are subsequently interpreted by
correlating them to the original individual observer data matrices. This step of the analysis produces
two-dimensional individual observer interpretative word charts. In each chart, all terms of a particular
observer are correlated with the principal axes of the consensus profile. These observer word charts can
be used for the interpretation of the main dimensions, in that the higher a term correlates with an axis,
the more weight it has as a descriptor for that axis. Each animal (ponies: odd numbers, apart from 20, in
italics; horses: even numbers, apart from 19, in bold) receives a score on each of these main consensus
dimensions; a Mann–Whitney U-test was used to test whether the scores obtained for horses and ponies
differed significantly.
When GPA is performed on groups of animals characterised by marked disparities in terms of breed,
treatment or experience, the analysis tends to show such diversities, whereas more subtle differences may be
overlooked and the assessment of the behaviour of individual animals may become difficult (De Rosa et al.,
2003). Therefore, it was deemed useful to analyse separately each animal category with GPA. However, for
sake of brevity only the results on ponies will be shown.
For a more detailed description of GPA calculation and interpretation procedures see Wemelsfelder et al.
(2000, 2001).
2.5.3. The relationship between quantitative and qualitative data
A principal component analysis (PCA) was used to investigate the relationship between the different
types of data recorded in this study, and to indicate which variables were most closely related (Cooper and
Weekes, 1983). The PCA was based on three sources of information: the scores of the animals on the first
two dimensions of the GPA consensus profile (QA), quantitative behaviour data recorded during the open
field test (QBD), and the scores given by the equids’ owner to the animals (QUE). A correlation matrix was
used and no rotation was applied.
3. Results
3.1. Quantitative behaviour assessment
Table 3 shows the mean durations and frequencies of behaviour for ponies and horses recorded
in the open field test. The duration of bucking and the frequency of kicking were significantly
higher in ponies than in horses ( p < 0.01 and p < 0.05, respectively), and ponies also showed a
tendency to walk longer than horses ( p < 0.06). Horses on the other hand tended to spend more
time showing vigilance behaviour in comparison with ponies ( p < 0.08).
F. Napolitano et al. / Applied Animal Behaviour Science 109 (2008) 342–354346

3.2. Qualitative behaviour assessment
GPA showed that the consensus profile explained a high percentage of variation among the 12
observers, and differed significantly from the mean randomised profile (Procrustes statistic:
78.8%; p < 0.001).
Two main dimensions of the consensus profile were identified, explaining 60% and 5.2% of
the variation between animals, respectively. The 12 observer word charts interpreting these
dimensions were semantically consistent, as they all converged towards the same meaning, albeit
using different terms. As it was impossible to show the word charts of all 12 observers, those of
observers 1 and 12 were chosen as representative (Fig. 1). These charts characterised the first
dimension of the consensus profile with terms ranging from calm/quiet and relaxed/comfortable
(observers 1 and 12, respectively) to nervous/eager for freedom and restless/scared (observers 1
and 12, respectively). The second dimension was described as ranging from attentive/explorative
and interested/curious (observers 1 and 12, respectively) to bored/apathetic and bored/indifferent
(observers 1 and 12, respectively). All these terms displayed correlation coefficients higher than
0.5 with the axes of the consensus profile. To provide an overview of highly correlated terms for
all observers, Table 4 lists for each observer the two terms with the highest positive and negative
correlation with axes 1 and 2. This table shows that nine observers used the term ‘‘quiet’’ to
describe the positive end of axis 1, whereas for five assessors ‘‘attentive’’ was the best positive
F. Napolitano et al. / Applied Animal Behaviour Science 109 (2008) 342–354 347
Table 3
The mean durations (in s), and for incidental behaviours the frequencies ( f), of behaviours recorded during the open field
test
Behavioural category Ponies Horses p value
Idling 5.6 � 4.6 9.3 � 4.6 NS
Exploration 88.2 � 8.8 80.9 � 8.8 NS
Sustained walking 2.8 � 1.2 0.0 � 1.2 0.06
Vigilance 25.4 � 8.6 43.1 � 8.6 0.08
Bucking 7.5 � 2.2 0.0 � 2.2 0.01
Rolling 15.0 � 2.2 11.1 � 3.7 NS
Kicking ( f) 3.0 � 1.2 0.0 � 1.2 0.05
Pawing ( f) 9.2 � 5.1 0.7 � 5.1 NS
Snorting ( f) 5.7 � 1.0 4.1 � 1.0 NS
Table 4
Terms (two for each observer) showing the highest positive and negative correlation with axes 1 and 2 of consensus profile
Positive correlation Negative correlation
Axis 1
Quiet (9), serene (4), calm (3), tolerant (2), tame (1),
tranquil (1), relaxed (1), controlled (1),
patient (1), confident (1)
Nervous (7), restless (4), impatient (3), aggressive (2),
irritated (1), wary (1), stressed (1), intolerant (1),
disturbed (1), energetic (1), gritty (1), scared (1)
Axis 2
Attentive (5), curious (2), explorative (2), cautious (2),
serene (2), strong (2), observing (1), inspecting (1),
alert (1), reserved (1), well-balanced (1), relaxed (1),
eager (1), adapted (1), interested (1)
Bored (4), apathetic (2), uninterested (2), agitated (2),
indifferent (1), unstable (2), maladjusted (1),
suffering (1), bewildered (1), playful (1), controlled (1),
timorous (1), nervous (1), curious (1), grumpy (1),
resigned (1), perplexed (1)

descriptor of axis 2. The most frequently used descriptors for the negative ends of axes 1 and 2
were ‘‘nervous’’ (seven observers) and ‘‘bored’’ (four observers) respectively. Thus, axis 1 was
labelled as ‘‘quiet/nervous’’ and axis 2 was named as ‘‘attentive/bored’’.
Fig. 2 shows the positions of individual animals (horses and ponies) on these two consensus
dimensions. These positions can be semantically interpreted using the word chart of each
assessor. The animal plot was characterised by a reasonably homogeneous distribution of the
F. Napolitano et al. / Applied Animal Behaviour Science 109 (2008) 342–354348
Fig. 1. Word maps of observer 1 (a) and observer 12 (b).
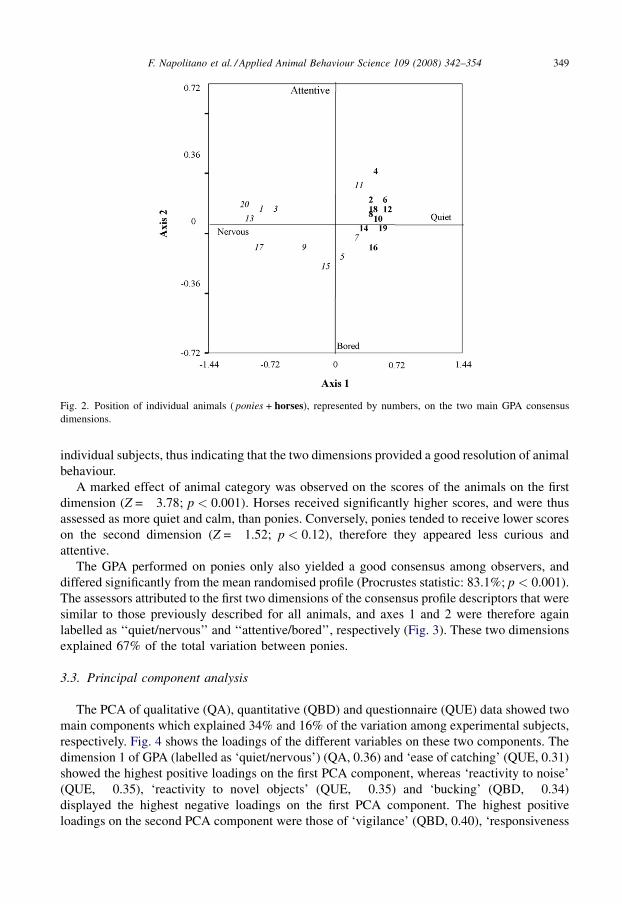
individual subjects, thus indicating that the two dimensions provided a good resolution of animal
behaviour.
A marked effect of animal category was observed on the scores of the animals on the first
dimension (Z = �3.78; p < 0.001). Horses received significantly higher scores, and were thus
assessed as more quiet and calm, than ponies. Conversely, ponies tended to receive lower scores
on the second dimension (Z = �1.52; p < 0.12), therefore they appeared less curious and
attentive.
The GPA performed on ponies only also yielded a good consensus among observers, and
differed significantly from the mean randomised profile (Procrustes statistic: 83.1%; p < 0.001).
The assessors attributed to the first two dimensions of the consensus profile descriptors that were
similar to those previously described for all animals, and axes 1 and 2 were therefore again
labelled as ‘‘quiet/nervous’’ and ‘‘attentive/bored’’, respectively (Fig. 3). These two dimensions
explained 67% of the total variation between ponies.
3.3. Principal component analysis
The PCA of qualitative (QA), quantitative (QBD) and questionnaire (QUE) data showed two
main components which explained 34% and 16% of the variation among experimental subjects,
respectively. Fig. 4 shows the loadings of the different variables on these two components. The
dimension 1 of GPA (labelled as ‘quiet/nervous’) (QA, 0.36) and ‘ease of catching’ (QUE, 0.31)
showed the highest positive loadings on the first PCA component, whereas ‘reactivity to noise’
(QUE, �0.35), ‘reactivity to novel objects’ (QUE, �0.35) and ‘bucking’ (QBD, �0.34)
displayed the highest negative loadings on the first PCA component. The highest positive
loadings on the second PCA component were those of ‘vigilance’ (QBD, 0.40), ‘responsiveness
F. Napolitano et al. / Applied Animal Behaviour Science 109 (2008) 342–354 349
Fig. 2. Position of individual animals ( ponies + horses), represented by numbers, on the two main GPA consensus
dimensions.

F. Napolitano et al. / Applied Animal Behaviour Science 109 (2008) 342–354350
Fig. 3. Position of individual ponies, represented by numbers, on the two main GPA consensus dimensions.
Fig. 4. Principal component analysis performed on quantitative behavioural data (italic), variables obtained from the
qualitative behaviour assessment (underlined), and the questionnaire (bold).

to commands’ (QUE, 0.34) and dimension 2 of GPA (labelled as ‘attentive/bored’) (QA, 0.30),
whereas the highest negative loadings were shown by ‘snorting’ (QBD, �0.37), ‘rolling’ (QBD,
�0.30) and ‘exploration’ (QBD, �0.31). As previously performed for GPA, the positions of the
animals were plotted (Fig. 5) to summarise the assessment of horses and ponies on the basis of all
recorded variables. This time these positions were interpreted using the PCA configuration
(Fig. 4). Given the good correlation of the main GPA dimensions with the PCA axes, we deemed
it reasonable to use the GPA dimension labels to also characterise the PCA axes (axis 1: ‘quiet/
nervous’; axis 2: ‘attentive/bored’).
4. Discussion
Seaman et al. (2002) found a low degree of agreement between data gathered from arena tests
and ratings produced by the farm team leader. By contrast, and in agreement with Le Scolan et al.
(1997) and Momozawa et al. (2003), in the present study the scores given by the riding instructor,
who also owned the animals, matched the data obtained from the open field test. These different
results may well be attributed to the fact that the tests, questionnaires and respondents used in
these different studies were not homogeneous, however we think it is of interest to consider the
coherence between the different types of measure taken in the present study, and particularly the
role played by the qualitative assessment approach in achieving this coherence.
The results of the PCA clearly indicate that the variables from different types of measurement
had meaningful relationships. For instance, the variables with the highest loading on the positive
end of axis 1 (‘quiet’ from QA, ‘ease of catching’ from QUE and ‘exploration’ from QBD) were
all indicative of tractable and docile animals. The negative end of axis 1 on the other hand was
F. Napolitano et al. / Applied Animal Behaviour Science 109 (2008) 342–354 351
Fig. 5. Position of individual animals ( ponies + horses), represented by numbers, on the two main PCA dimensions.

characterised as ‘nervous’ by QA, and correlated highly with variables from QUE suggesting
excitability (e.g. ‘reactivity to novel objects’ and ‘reactivity to noise’) and with dynamic
behaviours recorded during the open field test (e.g. ‘sustained walking’ and ‘bucking’).
The positive end of axis 2 of PCA showed high loadings for variables such as ‘attentive’ (QA),
‘responsiveness to commands’ (QUE), and ‘vigilance’ (QBD), whereas the negative end of this
axis showed high loadings for ‘bored’ (QA), ‘aggressivity to humans’ (QUE), ‘snorting’ (QBD),
‘rolling’ (QBD), and ‘exploration’ (QBD). The relationship between these latter variables is
perhaps less self-evident than the other relationships, however it seems reasonable to suggest that
the term ‘bored’ provided by QA may summarise the response of animals which displayed
aggression, exploration, snorting and rolling. Overall the relationships between the GPA
dimensions and QBD and QUE variables as indicated by PCA appear strong and meaningful
enough to suggest good coherence and agreement between the different types of measurement.
PCA has been widely used to describe temperament and personality of many animal species,
including humans (Sroufe, 1979), monkeys (Stevenson-Hinde et al., 1980), cats (Lowe and
Bradshaw, 2001), sheep (Vandenheede et al., 1998), goats (Lyons et al., 1988), pigs (Spoolder
et al., 1996), cattle (Grignard et al., 2001; de Passille et al., 1995), donkeys (French, 1993) and
horses (Visser et al., 2001). However, these studies relied only on quantitative behavioural data,
whereas in this experiment the PCA combined the information gathered from three different
sources of information.
In many studies where horses were tested in open field conditions, results have been discussed
on the basis of the theory of active and passive copers which describes the animals trying to
escape or remove aversive conditions as active copers and those not responding to aversive
stimuli and waiting for a change as passive copers (Wechsler, 1995). Wechsler (1995) suggested
that only the latter animals are consistent in coping response, whereas the former can use
different strategies in responding to various stimuli. Similar conclusions were reached by
Hessing et al. (1993) in pigs. In addition neither Spoolder et al. (1996) in pigs, nor Seaman et al.
(2002) in horses were able to identify any specific behavioural category. In particular, Spoolder
et al. (1996) suggested that even if these categories exist, they are likely to be more than two,
whereas Seaman et al. (2002) stated that the equine species cannot be categorised into two types
according to the behaviour expressed while tested.
Unlike the theory of active and passive copers, qualitative assessment of horse behavioural
expressions does not rely on two rigid behavioural categories, rather the emotional
responsiveness of horses was interpreted on the basis of their style of interaction with the
environment and animals could be rated in a continuous bidimensional space where a more
thorough assessment could be performed. For example, observer 1 moved from the negative end
of axis 1 (nervous) to the negative end of axis 2 (bored) through the terms ‘annoyed’ and ‘fed up’.
Such terms, albeit similar, possess slightly different meanings, thus they may give additional
information on the behavioural traits of a particular animal, which in turn may allow the
interpretation of more subtle differences among the animals.
Seaman et al. (2002) concluded that although the results of open field tests only reflect on
certain aspects of horse behaviour, some general information can be obtained. In particular, these
authors suggest that horses which are manifestly passive in open field tests are likely to be calmer
and less reactive to novel stimuli, whereas subjects, which are evidently active in arena tests, can
perceive isolation and management practices as more aversive. The qualitative behaviour
assessment in the present study allowed distinguishing relaxed and calm animals (positive end of
axis 1) from those that were more bored and apathetic (negative end of axis 2). In addition, PCA
suggested that the most tractable subjects, at least in this experiment, were not the bored and
F. Napolitano et al. / Applied Animal Behaviour Science 109 (2008) 342–354352

apathetic ones (negative end of axis 2), but the most attentive and responsive to commands
(positive end of axis 2). Thus, the least reliable in terms of nervousness and excitability (negative
end of axis 1) appeared not to be the active and attentive subjects (positive end of axis 2), as
suggested by Seaman et al. (2002), but the passive ones. This difference points towards the
importance of careful and detailed qualitative assessment of the meaning of behaviour patterns
observed under a variety of test conditions.
The analysis of the scores obtained by individual animals in the QA displayed that ponies were
more restless and nervous than horses, whereas the latter were more calm and quiet (axis 1). Such
results were in agreement with those obtained with QBD which indicated a prevalence of
dynamic behaviours (kicking, bucking and sustained walking) in ponies.
The analysis performed only with ponies confirmed the characterisation of the two axes in
terms of calmness and attentiveness. However, the animal plot produced for these animals
analysed separately was characterised by a more thorough distribution of the animals and
allowed a more accurate assessment of differences among individual subjects.
5. Conclusions
Qualitative behaviour assessment proved to be an appropriate methodology for the study of
horse behavioural responsiveness, in that it provided a multifaceted characterisation of horse
behavioural expression that was in agreement with other quantitative and subjective assessments
of the animals’ behaviour. This study indicates that an assessment of horse behaviour based on
the theory of active and passive copers may be insufficient and reductive of the complexity of
horse emotional expressions. A thorough assessment of horse behaviour may be a first step
towards comparative studies aimed to match individual riders with animals presenting the most
appropriate emotional responsiveness.
It would be of interest to evaluate in further studies how qualitative behaviour assessments
performed by non-expert observers of one nationality compare with assessments provided by
observers who are more experienced in the field of horse behaviour, and who have different
nationalities and cultural backgrounds.
Acknowledgments
The authors would like to thank G. Migliori for expert technical assistance. Thanks are also
due to M. Tramontano and E. Capuano (Centro Ippico Montenuovo (CIM), Pozzuoli, NA) for
providing animals and facilities.
References
Anderson, M.K., Friend, T.H., Evans, J.W., Bushong, D.M., 1999. Behavioral assessment of horses in therapeutic riding
programs. Appl. Anim. Behav. Sci. 63, 11–24.
Boyd, L., Houpt, K.A., 1994. Prezwalski’s Horse-The History and Biology of an Endangered Species. State University of
New York Press, New York.
Cooper, R.A., Weekes, A.J., 1983. Data, Models and Statistical Analysis. Barnes and Noble Books, NJ.
De Rosa, G., Napolitano, F., Grasso, F., Bordi, A., Wemelsfelder, F., 2003. The qualitative assessment of water buffalo
(Bubalus bubalis) behaviour. In: Proceedings of the 37th International Congress of the International Society for
Applied Ethology (ISAE), Abano Terme, Italy, June 24–28.
de Passille, A.M., Rushen, J., Martin, F., 1995. Interpreting the behaviour of calves in an open-field test: a factor analysis.
Appl. Anim. Behav. Sci. 45, 201–213.
F. Napolitano et al. / Applied Animal Behaviour Science 109 (2008) 342–354 353

Dijksterhuis, G.B., Heiser, W.J., 1995. The role of permutation test in exploratory multivariate data analysis. Food Qual.
Prefer. 6, 263–270.
French, J.M., 1993. Assessment of donkey temperament and the influence of home environment. Appl. Anim. Behav. Sci.
36, 249–257.
Grignard, L., Boivin, X., Boissy, A., Le Neindre, P., 2001. Do beef cattle react consistently do different handling
situations? Appl. Anim. Behav. Sci. 71, 263–276.
Hausberger, M., Muller, C., 2002. A brief note on some possible factors involved in the reactions of horses to humans.
Appl. Anim. Behav. Sci. 76, 339–344.
Hessing, M.J.C., Hagelso, A.M., van Beek, J.A.M., Wiepkema, P.R., Schouten, W.G.P., Krukow, R., 1993. Individual
behavioural characteristics in pigs. Appl. Anim. Behav. Sci. 37, 285–295.
Jezierski, T., Jaworski, Z., Gorecka, A., 1999. Effects of handling on behaviour and heart rate in konik horses: comparison
of stable and forest reared youngstock. Appl. Anim. Behav. Sci. 62, 1–11.
Le Scolan, N., Hausberger, M., Wolff, A., 1997. Stability over situations in temperamental traits of horses as revealed by
experimental and scoring approaches. Behav. Process. 41, 257–266.
Lowe, S.E., Bradshaw, J.W.S., 2001. Ontogeny of individuality in the domestic cat in the home environment. Anim.
Behav. 61, 231–237.
Lyons, D:M., Price, E.O., Moberg, G.P., 1988. Individual differences in temperament of domestic dairy goats: constancy
and change. Anim. Behav. 36, 1323–1333.
Mills, D.S., 1998. Personality and individual differences in the horse, their significance, use and measurement. Equine
Clin. Behav. 27, 10–13.
Momozawa, Y., Ono, T., Sato, F., Kikusui, T., Takeuchi, Y., Mori, Y., Kusunose, R., 2003. Assessment of equine
temperament by a questionnaire survey to caretakers and evaluation of its reliability by simultaneous behavior test.
Appl. Anim. Behav. Sci. 84, 127–138.
Rousing, T., Wemelsfelder, F., 2006. Social behaviour as a welfare indicator in loose housing system for dairy cows: a
qualitative approach. Appl. Anim. Behav. Sci. 101, 40–53.
Rundgren, M., Nordin, A., 1997. Personality profile and simple learning tests for horses. In: Proceedings of the 48th
Annual Meeting of the European Association for Animal Production. pp. 1–4.
Seaman, S.C., Davidson, H.P.B., Waran, N.K., 2002. How reliable is temperament assessment in the domestic horse
(Equus caballus)? Appl. Anim. Behav. Sci. 78, 175–191.
Spoolder, H.A.M., Burbidge, J.A., Lawrence, A.B., Simmins, P.H., Edwards, S.A., 1996. Individual behavioural
differences in pigs: intra- and inter-test consistency. Appl. Anim. Behav. Sci. 49, 185–198.
Sroufe, L.A., 1979. The coherence of individual development: early care, attachment and subsequent developmental
issues. Am. Psychol. 34, 834–841.
Stevenson-Hinde, J., Stillwell-Barnes, R., Zunz, M., 1980. Subjective assessment of rhesus monkeys over four successive
years. Primates 21, 66–82.
Vandenheede, M., Bouissou, M.F., Picard, M., 1998. Interpretation of behavioural reactions of sheep towards fear-
eliciting situations. Appl. Anim. Behav. Sci. 58, 293–310.
Visser, E.K., Reenen, C.G., van Hopster, H., Schilder, M.B.H., Knaap, J.K., Barneveld, A., Blokhuis, H.J., 2001.
Quantifyng aspects of young horses’ temperament: consistency of behavioural variables. Appl. Anim. Behav. Sci. 74,
241–258.
Wechsler, B., 1995. Coping and coping strategies: a behavioural view. Appl. Anim. Behav. Sci. 43, 123–134.
Wemelsfelder, F., Hunter, E.A., Mendl, M.T., Lawrence, A.B., 2000. The spontaneous qualitative assessment of
behavioural expression in pigs: first explorations of a novel methodology for integrative animal welfare measurement.
Appl. Anim. Behav. Sci. 67, 193–215.
Wemelsfelder, F., Hunter, T.E.A., Mendl, M.T., Lawrence, A.B., 2001. Assessing the whole animal: a free choice profiling
approach. Anim. Behav. 62, 209–220.
Wolff, A., Hausberger, M., Le Scolan, N., 1997. Experimental tests to assess emotionality in horses. Behav. Process. 40,
209–221.
F. Napolitano et al. / Applied Animal Behaviour Science 109 (2008) 342–354354