
The preparation of zinc silicate/ZnO particles and their use as an efficient UV absorber
7
The preparation of zinc silicate/ZnO particles and their use as an efficient UV absorber Peter Podbrs ˇc ˇek a , Goran Draz ˇic ´ b , Alojz Anz ˇlovar a,c , Zorica Crnjak Orel a,c, * a National Institute of Chemistry, Hajdrihova 19, SI 1000 Ljubljana, Slovenia b Department for Nanostructured Materials, Jozˇef Stefan Institute, Jamova 39, SI 1000 Ljubljana, Slovenia c Center of Excellence for Polymer Materials and Technologies, Tehnolosˇki Park 24, 1000 Ljubljana, Slovenia 1. Introduction UV-shielding materials have attracted increasing attention because of the negative effects of UV rays. Many polymer/ inorganic-material-based nanocomposites have been prepared and tested as UV filters. Most commonly, poly(methyl methacry- late) (PMMA) was used as the polymer phase due to its good transparency and other favorable physical and chemical proper- ties. Metal oxides such as TiO 2 [1,2] or ZnO [3–5] were usually added as inorganic fillers, which modified the PMMA’s optical properties in the UV-light region. ZnO is a wide-band-gap semiconductor with strong UV- absorption capabilities [6] and strong room-temperature photo- luminescence properties [7]. However, UV illumination or heat exposure can influence the excitation of the ZnO particles, which leads to the formation of oxygen-active species on their surfaces in the presence of water or OH groups [8–10]. Due to the inevitable presence of water molecules or OH groups on the surface of the ZnO particles, oxygen-active species can be formed as well in polymer nanocomposites and thus induce their degradation [11,12]. Hong et al. [13] showed that SiO 2 -coated ZnO particles significantly reduced the photocatalytic activity compared to pure ZnO. The hydrothermal and solvothermal preparation methods are, together with evaporation techniques, the most commonly used for ZnO preparation. With the proper choice of reaction conditions, particles of various shapes and sizes can be prepared [14,15]. Podbrscek et al. [6] reported that the Zn/OH atomic ratio of the starting reaction solutions and the reaction media strongly influence the ZnO particle size. By decreasing the OH ion concentration of the starting reaction solutions (in the water medium) or decreasing the water content in the reaction (ethanol/ water) media (at a constant Zn/OH atomic ratio) ZnO particles with a significantly reduced size can be prepared. The major challenge in the synthesis of particles is the continuous preparation of particles with a narrow particle size distribution and controlled shape. Various continuous reactors and their modifications were proposed in order to satisfy these conditions [16,17]. The segmented-flow tubular reactor (SFTR) was presented by Jongen et al. [18]. They showed that the reaction conditions could be easily controlled by the small volume of segments that diminishes the inhomogeneities that appear in batch reactors. In our recent article [6] the formation of a ZnO phase in the presence of silicon was presented. We showed that silicon inhibited the formation of ZnO particles at an early stage of crystal growth by stabilizing the Zn(OH) 2 intermediate phase (amorphous zinc oxide hydrous gel). In this work we present the continuous synthesis (STFR) of amorphous Zn(OH) 2 , zinc silicate/Zn(OH) 2 and zinc silicate gels and their transformation into crystalline ZnO, amorphous/crystalline Materials Research Bulletin 46 (2011) 2105–2111 A R T I C L E I N F O Article history: Received 10 February 2011 Received in revised form 31 May 2011 Accepted 24 June 2011 Available online 2 July 2011 Keywords: A. Oxides B. Sol–gel chemistry D. Optical properties D. Surface properties A B S T R A C T The formation of zinc silicate/ZnO particles synthesized by a two-step method and their incorporation into PMMA is presented. In the first step a segmented-flow tubular reactor was used for the continuous room-temperature preparation of a zinc silicate/Zn(OH) 2 gel that was thermally treated after rinsing and drying in the second step. The same preparation procedure was also employed for the synthesis of pure ZnO and pure zinc silicate particles. It was found that the presence of the zinc silicate phase significantly influenced the final particle size, decreased the degree of crystallization and reduced the particles’ UV absorption capabilities. The reduced photocatalytic activity of the zinc silicate/ZnO particles indicated that the majority of ZnO crystallites were formed inside the zinc silicate matrix. The nanocomposite prepared from zinc silicate/ZnO particles (0.04 wt.%) and PMMA showed high UV shielding and at the same time sufficient transmittance in the visible-light region. ß 2011 Elsevier Ltd. All rights reserved. * Corresponding author at: National Institute of Chemistry, Hajdrihova 19, SI 1000 Ljubljana, Slovenia. Tel.: +386 1 4760 236; fax: +386 1 4760 300. E-mail address: [email protected] (Z.C. Orel). Contents lists available at ScienceDirect Materials Research Bulletin jo u rn al h om ep age: ww w.els evier.c o m/lo c ate/mat res b u 0025-5408/$ – see front matter ß 2011 Elsevier Ltd. All rights reserved. doi:10.1016/j.materresbull.2011.06.037
Transcript of The preparation of zinc silicate/ZnO particles and their use as an efficient UV absorber
Materials Research Bulletin 46 (2011) 2105–2111
The preparation of zinc silicate/ZnO particles and their use as an efficient UVabsorber
Peter Podbrscek a, Goran Drazic b, Alojz Anzlovar a,c, Zorica Crnjak Orel a,c,*a National Institute of Chemistry, Hajdrihova 19, SI 1000 Ljubljana, Sloveniab Department for Nanostructured Materials, Jozef Stefan Institute, Jamova 39, SI 1000 Ljubljana, Sloveniac Center of Excellence for Polymer Materials and Technologies, Tehnoloski Park 24, 1000 Ljubljana, Slovenia
A R T I C L E I N F O
Article history:
Received 10 February 2011
Received in revised form 31 May 2011
Accepted 24 June 2011
Available online 2 July 2011
Keywords:
A. Oxides
B. Sol–gel chemistry
D. Optical properties
D. Surface properties
A B S T R A C T
The formation of zinc silicate/ZnO particles synthesized by a two-step method and their incorporation
into PMMA is presented. In the first step a segmented-flow tubular reactor was used for the continuous
room-temperature preparation of a zinc silicate/Zn(OH)2 gel that was thermally treated after rinsing and
drying in the second step. The same preparation procedure was also employed for the synthesis of pure
ZnO and pure zinc silicate particles. It was found that the presence of the zinc silicate phase significantly
influenced the final particle size, decreased the degree of crystallization and reduced the particles’ UV
absorption capabilities. The reduced photocatalytic activity of the zinc silicate/ZnO particles indicated
that the majority of ZnO crystallites were formed inside the zinc silicate matrix. The nanocomposite
prepared from zinc silicate/ZnO particles (0.04 wt.%) and PMMA showed high UV shielding and at the
same time sufficient transmittance in the visible-light region.
� 2011 Elsevier Ltd. All rights reserved.
Contents lists available at ScienceDirect
Materials Research Bulletin
jo u rn al h om ep age: ww w.els evier .c o m/lo c ate /mat res b u
1. Introduction
UV-shielding materials have attracted increasing attentionbecause of the negative effects of UV rays. Many polymer/inorganic-material-based nanocomposites have been preparedand tested as UV filters. Most commonly, poly(methyl methacry-late) (PMMA) was used as the polymer phase due to its goodtransparency and other favorable physical and chemical proper-ties. Metal oxides such as TiO2 [1,2] or ZnO [3–5] were usuallyadded as inorganic fillers, which modified the PMMA’s opticalproperties in the UV-light region.
ZnO is a wide-band-gap semiconductor with strong UV-absorption capabilities [6] and strong room-temperature photo-luminescence properties [7]. However, UV illumination or heatexposure can influence the excitation of the ZnO particles, whichleads to the formation of oxygen-active species on their surfaces inthe presence of water or OH groups [8–10]. Due to the inevitablepresence of water molecules or OH groups on the surface of theZnO particles, oxygen-active species can be formed as well inpolymer nanocomposites and thus induce their degradation[11,12]. Hong et al. [13] showed that SiO2-coated ZnO particlessignificantly reduced the photocatalytic activity compared to pureZnO.
* Corresponding author at: National Institute of Chemistry, Hajdrihova 19, SI
1000 Ljubljana, Slovenia. Tel.: +386 1 4760 236; fax: +386 1 4760 300.
E-mail address: [email protected] (Z.C. Orel).
0025-5408/$ – see front matter � 2011 Elsevier Ltd. All rights reserved.
doi:10.1016/j.materresbull.2011.06.037
The hydrothermal and solvothermal preparation methods are,together with evaporation techniques, the most commonly usedfor ZnO preparation. With the proper choice of reaction conditions,particles of various shapes and sizes can be prepared [14,15].Podbrscek et al. [6] reported that the Zn/OH atomic ratio of thestarting reaction solutions and the reaction media stronglyinfluence the ZnO particle size. By decreasing the OH� ionconcentration of the starting reaction solutions (in the watermedium) or decreasing the water content in the reaction (ethanol/water) media (at a constant Zn/OH atomic ratio) ZnO particles witha significantly reduced size can be prepared.
The major challenge in the synthesis of particles is thecontinuous preparation of particles with a narrow particle sizedistribution and controlled shape. Various continuous reactors andtheir modifications were proposed in order to satisfy theseconditions [16,17]. The segmented-flow tubular reactor (SFTR)was presented by Jongen et al. [18]. They showed that the reactionconditions could be easily controlled by the small volume ofsegments that diminishes the inhomogeneities that appear inbatch reactors.
In our recent article [6] the formation of a ZnO phase in thepresence of silicon was presented. We showed that siliconinhibited the formation of ZnO particles at an early stage ofcrystal growth by stabilizing the Zn(OH)2 intermediate phase(amorphous zinc oxide hydrous gel).
In this work we present the continuous synthesis (STFR) ofamorphous Zn(OH)2, zinc silicate/Zn(OH)2 and zinc silicate gels andtheir transformation into crystalline ZnO, amorphous/crystalline
P. Podbrscek et al. / Materials Research Bulletin 46 (2011) 2105–21112106
zinc silicate/ZnO and amorphous zinc silicate nanoparticles. Thesamples that exhibited sufficient UV-absorbing properties wereincorporated into a PMMA matrix (forming nanocomposites) andtheir optical and thermal properties were tested.
2. Experimental procedure
Aqueous (AQ) solutions (MilliQ water, Millipore) of zinc nitratehexahydrate (Zn(NO3)2�6H2O, Sigma–Aldrich, 98%) and sodiumhydroxide (NaOH, Merck, 99%) were used as the source material forall the synthesis reactions. In experiments where silicon was usedas a reactant, a predetermined amount of TEOS (C8H20O4Si, Sigma–Aldrich, 98%) was mixed into the NaOH AQ solution under ultra-sound agitation in order to produce a soluble silicon-ionic species.
PMMA nanocomposites were prepared from methyl methacry-late monomer – MMA (C5H8O2, technical) with 1,10-azobis(1-cyclohexanecarbonitrile) – AIBN (C14H20N4, Aldrich, 98%) as aninitiator.
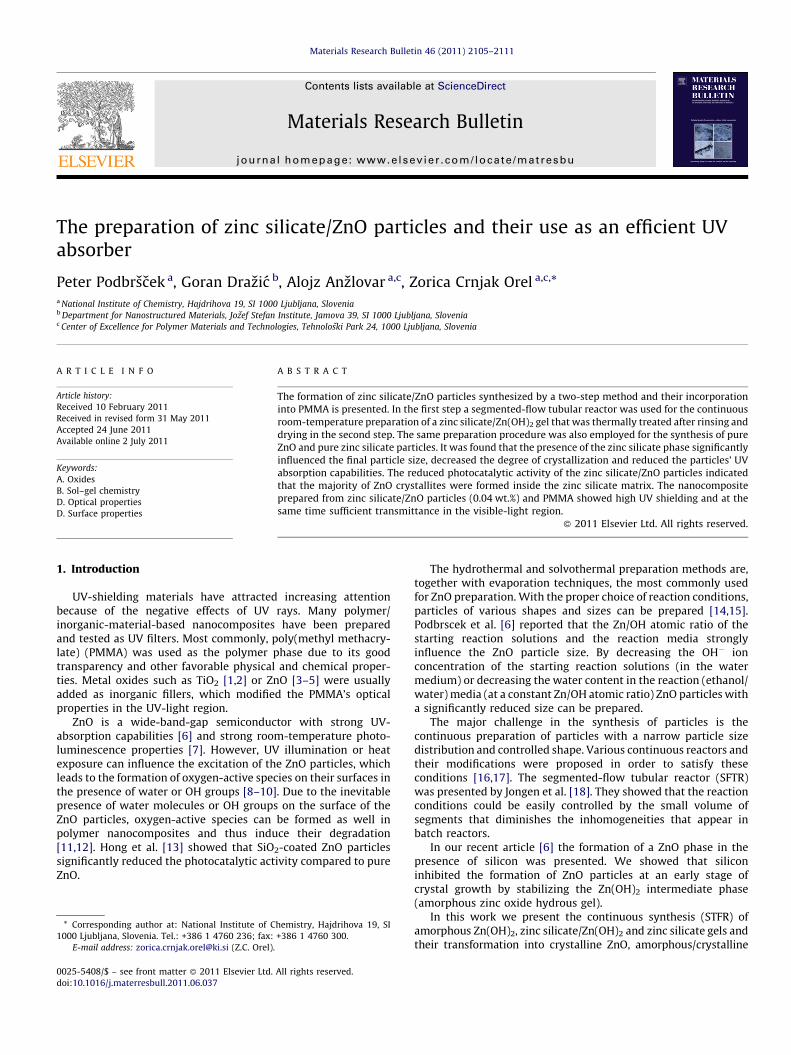
The segmented-flow tubular reactor (SFTR) (Fig. 1) used in ourexperiments consisted of a microprocessor-controlled dispensingpump (REGLO Digital MS-4/6, Ismatec), two inlet 1.52-mm-IDPharMed Ismaprene tubes for the AQ phase, one inlet 1.02-mm-IDPharMed Ismaprene tube for the gas phase, a Y connector, a Tconnector, a 1880-mm-long PTFE 1-mm-ID tube and a LaudaEcoline Staredition E312 thermostated bath. Complete mixing ofthe inlet reactants was assumed, based on the pulsed operation ofthe dispensing pump. The accumulation of the precipitatedproduct in the reactor tube was minimized with the segmentedflow. The gas phase, which was introduced into the reactor soonafter the initial reactants were mixed together, acted as a plug thatpushed the reaction products out of the reactor and at the sametime packed gel into few-mm-large tubular particles (as presentedin Fig. 1). The choice of an Ar gas phase instead of any other gas orliquid phase was based on its inert nature and its simple separationfrom the reaction suspension in the reactor outlet.
2.1. Particle preparation
Sample U1 was prepared by introducing 0.1-M Zn(NO3)2 and 0.1-M NaOH AQ solutions into the thermostated (25 8C) SFTR at 2.1 ml/min (the total starting reaction solution flow rate was 4.2 ml/min).The Ar gas-phase flow rate was adjusted to 1 ml/min. Samples U2,U3, U4, U5 and U6 were prepared in a similar way, except that apredetermined amount of TEOS was added to the starting 0.1-MNaOH AQ solution so that the Si concentration in the NaOH AQsolution was 0.0005 M, 0.002 M, 0.004 M, 0.008 M and 0.02 M,respectively.
In the outlet of the SFTR, the reaction suspension wasaccumulated in the vessel containing the MilliQ water in orderto dilute the reaction suspension and thus prevent any further
Fig. 1. Scheme of segmented-flow tubular reactor (SFTR).
reaction. The obtained gel product was in the shape of few-mm-large tubular particles that deposited on the bottom of the vessel.The water solution above the gel product was, at the end of thesynthesis reaction, simply removed by decantation and theremaining gel suspension was filtered (0.2 mm Millipore filter),washed three times with 20 ml of MilliQ water and dried invacuum (�10 mbar) at 28 8C for 24 h. After drying, the sampleswere thermally treated at 300 8C for 40 min in air.
2.2. PMMA nanocomposite preparation
ZnO or zinc silicate/ZnO PMMA nanocomposites were synthe-sized by MMA chain polymerization between glass plates in thebulk [5]. An initiator AIBN (0.0163 mol.%) was first dissolved in theMMA solution and then 0.04 wt.% of sample U1 (ZnO) or sample U2(zinc silicate/ZnO) was suspended in it. The solution was sonicatedfor 20 min and then transferred into the glass plate mould andsonicated for an additional 5 min. The glass mould was put into thewater bath and the MMA was polymerized for 20 h at 75 8C. Afterpolymerization, the moulds were taken from the bath and PMMAsheets with a thickness of 4 mm were separated from the glassplate moulds.
2.3. Characterization
The structures of the samples were studied using a Jeol 2010FEG STEM and a Jeol 2100 TEM microscope operating at 200 kVand equipped with EDX detectors for the compositionalanalyses. SEM micrographs were taken with a Zeiss Supra35VP scanning field-emission electron microscope (FESEM) withan EDX analyzer. The crystallinity and the particle size of thesamples were determined from XRD patterns obtained with anX-ray powder diffractometer PANalytical X’Pert PRO (radiationwavelength Cu Ka1 = 1.5406 A). The FT-IR spectra were recordedon a Bruker Model IFS 66/S spectrometer in the spectral rangefrom 4000 cm�1 to 400 cm�1 with a spectral resolution of4 cm�1 in the transmission mode using the KBr technique. TheUV–VIS absorption spectra of the powder samples wererecorded using a Perkin Elmer Lambda 950 double-beamspectrophotometer with a resolution of 1 nm in the wavelengthinterval from 700 nm to 250 nm (the powder samples weredispersed in MilliQ water, which was also used as a referenceblank solution). The UV–VIS transmittance spectra of the PMMAnanocomposites were recorded using a Perkin Elmer Lambda950 double-beam spectrophotometer equipped with an inte-grating sphere (resolution of 1 nm) in the wavelength intervalfrom 800 nm to 250 nm. The TGA and DSC measurements of theZn(OH)2 were simultaneously performed on a SDT 2960 system(TA instruments Inc.) in the temperature interval from 20 8C to450 8C, with a heating rate of 10 8C/min in a N2 atmosphere. TheTG analyses of the pure PMMA and PMMA nanocomposites wereperformed on a Netzsch STA 449 C/6/G Jupiter-QMS 403 Canalyzer in the temperature interval from 50 8C to 600 8C with aheating rate of 10 8C/min in an atmosphere of air. The specificsurface area of the samples was determined with a Tristar 3000automated gas-adsorption analyzer (Micromeritics InstrumentCo.). The samples were dried and degassed at 110 8C. Theanalyzer performs a fully automatic analysis in ultra-high purityN2 (99.9995), collects data and performs calculations to obtainthe BET surface area. The photocatalytic activity of the sampleswas determined with a quantitative analysis of the UV–VISabsorption spectra (at 380 nm) of a UV-irradiated (UV lightsource spectrum: from 350 nm to 410 nm – Gaussian spectrum)resazurin AQ suspension [19]. The resazurin AQ suspensioncontained 40 mg of the U1, U2 or U6 sample and wasthermostated at 20 8C.

Fig. 3. (a) XRD pattern of Zn(OH)2 (arrows denote (according to PDF 1-89-510) the
positions of the reflection planes of crystalline ZnO) and (b) UV–VIS absorption
spectrum of Zn(OH)2.
P. Podbrscek et al. / Materials Research Bulletin 46 (2011) 2105–2111 2107
3. Results and discussion
The reaction suspension prepared at room temperature (in thebatch reactor) from equimolar AQ solutions of Zn(NO3)2 and NaOHconsists of a very low density Zn(OH)2 gel. In order to obtain theZn(OH)2 it is necessary to separate the gel from the mother liquor,rinse and then dry it.
The SFTR offers a new method for the continuous preparationand separation of Zn(OH)2 gel from the mother liquor. The so-prepared Zn(OH)2 gel is composed of �10 wt.% of Zn(OH)2.
The Zn(OH)2 gel was, for the purposes of further characteriza-tion, frozen with liquid N2 and lyophilized for 118 h. The obtainedZn(OH)2 presented in Fig. 2 is composed of �20-nm-sized sphericalparticles that were connected together into a 3D network. The XRDpattern of the Zn(OH)2 presented in Fig. 3(a) shows a lack ofdiffraction peaks and an increased background, which indicate anamorphous structure. The partial conversion of amorphousZn(OH)2 into crystalline ZnO during the separation from themother liquor and lyophilization and thus the formation of few-nm-large crystalline areas inside the amorphous Zn(OH)2 3Dstructure were excluded based on the UV–VIS absorptionmeasurement (Fig. 3(b)). In the UV–VIS absorption spectrum ofthe Zn(OH)2 AQ suspension no characteristic ZnO band-gapabsorption (from 370 nm to �340 nm [6]) was observed.
Amorphous Zn(OH)2 was simultaneously analyzed by TGA–DSC(Fig. 4). The thermal decomposition of the amorphous Zn(OH)2
proceeded in one step, which started at �428 C and ended at�450 8C. In the temperature interval from 23 8C up to �42 8C themoisture was most likely removed from the Zn(OH)2 surface. Thetotal weight loss from 42 8C up to 450 8C was 18.05 wt.%, which iscomparable with the theoretical weight loss during the Zn(OH)2-to-ZnO conversion (18.11 wt.%). The DSC analysis shows a smallendothermic peak in the temperature interval from 23 8C to 72 8C,corresponding mainly to moisture removal from the Zn(OH)2
surface and partial Zn(OH)2 dehydration; meanwhile, the largeendothermic peak in the temperature interval from 72 8C to 165 8Ccorresponds completely to Zn(OH)2 dehydration. The amorphousZnO started to crystallize, according to the small exothermic DSCpeak, in the temperature interval from 233 8C to 357 8C.
In order to produce silicon-phase/ZnO particles, a silicon sourceneeded to be introduced into the starting reaction solution. The Si/Zn at. ratio in the reaction mixture was 0.005, 0.02, 0.04, 0.08 and0.2 for the samples U2, U3, U4, U5 and U6, respectively. The TEOShydrolysis is known as a nucleophilic substitution reaction, wherethe OH� replaces the ethoxy groups [20]. Dingsøyr and Christy [21]showed that a TEOS hydrolysis in an alkaline AQ medium inhibitssilica formation and produces a soluble silicon-ionic species
Fig. 2. SEM micrograph of Zn(OH)2.
instead. In order to confirm the validity of these results under ourexperimental conditions we performed a test experiment where a0.02-M concentration of TEOS was prepared in a 0.1-M NaOH AQsolution (the same TEOS concentration as for sample U6) andintroduced into the SFTR together with pure water instead of theZn(NO3)2 AQ solution. An analysis of the reaction suspensioncollected at the outlet of the SFTR revealed that no solid productwas obtained.
The morphology of all the samples before calcination is similarto the morphology presented in Fig. 2. It was expected that thesamples obtained after the synthesis and drying would possess acompletely amorphous structure. The IR spectra of the samples U1,U2, U3, U4, U5 and U6 before (after synthesis-drying) and after thecalcination are presented in Fig. 5.
Sample U1 (after synthesis-drying) shows broad absorbance inthe region from 1200 cm�1 up to 800 cm�1 and the band at485 cm�1. It is known from the literature [22,23] that ZnOHbending and OH twisting vibrations are observed in the regionfrom 1050 cm�1 up to 715 cm�1. The band in the region from600 cm�1 to 430 cm�1 could be assigned to the Zn–OH translationmode [24]. With increasing silicon content in the starting reactionsolutions the obtained samples (U2, U3, U4, U5, U6) show the wellpronounced band at 916 cm�1, which is attributed to Si–O–Znnetwork formation [25]. The bands at 485 cm�1 (observed in the IRspectrum of sample U1) become broader with increasing silicon
Fig. 4. TG (–), DTG (- - -) and DSC (inset) analysis of amorphous Zn(OH)2.

Fig. 5. FT-IR spectra of samples (a) U1, (b) U2, (c) U3, (d) U4, (e) U5 and (f) U6 after (I)
synthesis-drying and (II) calcination (300 8C, 40 min). The sample U6 was
additionally thermally treated (60 min) at (g) 550 8C and (h) 800 8C.
Fig. 6. XRD diffractograms of samples (a) U1, (b) U2, (c) U3, (d) U4, (e) U5 and (f) U6
after calcination (300 8C, 40 min). The sample U6 was additionally thermally
treated (60 min) at (g) 550 8C and (h) 800 8C (diffraction peaks positions of ZnO and
Zn2SiO4 correspond to PDF 1-89-510 and PDF 37-1485, respectively).
P. Podbrscek et al. / Materials Research Bulletin 46 (2011) 2105–21112108
concentration and shift to higher wave numbers. According to Linand Shen [26], zinc silicate (Si–O–Zn linkage) has a lowerfrequency for Si–O stretching and a higher frequency for Zn–Ostretching, compared to pure SiO2 (e.g., 1096 cm�1) and ZnO (e.g.,485 cm�1).
After calcination of the sample U1, a well pronounced band at485 cm�1 was obtained, which indicates the presence of ZnO [27].The differences between the bands’ positions denoting ZnO for thesamples U1 (485 cm�1), U2 (450 cm�1), U3 (435 cm�1) and U4(445 cm�1) (after calcination) could arise, according to Andres-Verges et al. [28], due to the different shape of the ZnO particles.The broadening and shifting of the bands to higher wave numbersof samples U5 (485 cm�1) and U6 (560 cm�1) (after calcination)can be attributed to the presence of the zinc silicate phase, whichhas a higher frequency for Zn–O stretching. The positions of thebands at 926 cm�1 for samples U2, U3, U4, U5, U6 (aftercalcination) were only slightly changed compared to the corre-sponding band positions of the samples before calcination, whichindicates that the zinc silicate phase did not significantly change
during the calcination. No bands indicating the presence of ZnO(Fig. 5(f) [II]) were observed for the sample U6 (after thecalcination).
The sample U6 (after calcination) was additionally thermallytreated (60 min, air atmosphere) at 550 8C (Fig. 5(g) [II]) and800 8C (Fig. 5(h) [II]) in order to determine the approximatetemperature interval for zinc silicate crystallization. The changesin the FT-IR spectrum of sample U6 were observed only afterthermal treatment at 800 8C (Fig. 5 [II]). The wide band at926 cm�1 split into four bands at 872 cm�1, 907 cm�1, 935 cm�1
and 980 cm�1, which corresponded to symmetric and asymmetricstretching of the SiO4 tetrahedron [26]. Additionally, three newbands were observed at 462 cm�1, 580 cm�1 and 602 cm�1, whichcould be attributed to the asymmetric deformation of SiO4
tetrahedron, symmetric stretching of the ZnO4 tetrahedron andasymmetric stretching of the ZnO4 tetrahedron, respectively [26].The existence of new bands indicated that the amorphous zincsilicate crystallized into the Zn2SiO4 phase (willemite), which is inaccordance with Takesue at al. [29]. The absence of a band at1096 cm�1 in the FT-IR spectra of all the samples confirms that nosilica was formed during the preparation of the samples.
The XRD analyses of the samples U1, U2, U3, U4, U5 and U6(after calcination) are presented in Fig. 6. The diffraction peaks ofthe samples U1, U2, U3, U4 and U5 indicate that the samples arecomposed of only one crystalline phase, i.e., ZnO (PDF 1-89-510),while the diffractogram of sample U6 (Fig. 6(f)) does not showany diffraction peaks. After an additional thermal treatment ofsample U6 at 800 8C (60 min) the formation of the Zn2SiO4 (PDF37-1485) and ZnO (PDF 1-89-510) phases were observed, whichis in accordance with the results of the FT-IR spectroscopyanalysis.
The crystallite sizes of the samples U1, U2, U3, U4 and U5 weredetermined from the line broadening of the (1 0 0) reflection of theXRD pattern using Scherrer’s formula [3]. It was observed (Fig. 7)that the average ZnO crystallite size of the samples decreases withthe increasing silicon content in the starting reaction solutionsfrom 49 nm in sample U1 to 4.5 nm in sample U5, meanwhile thesample U6 exhibited only an amorphous structure.
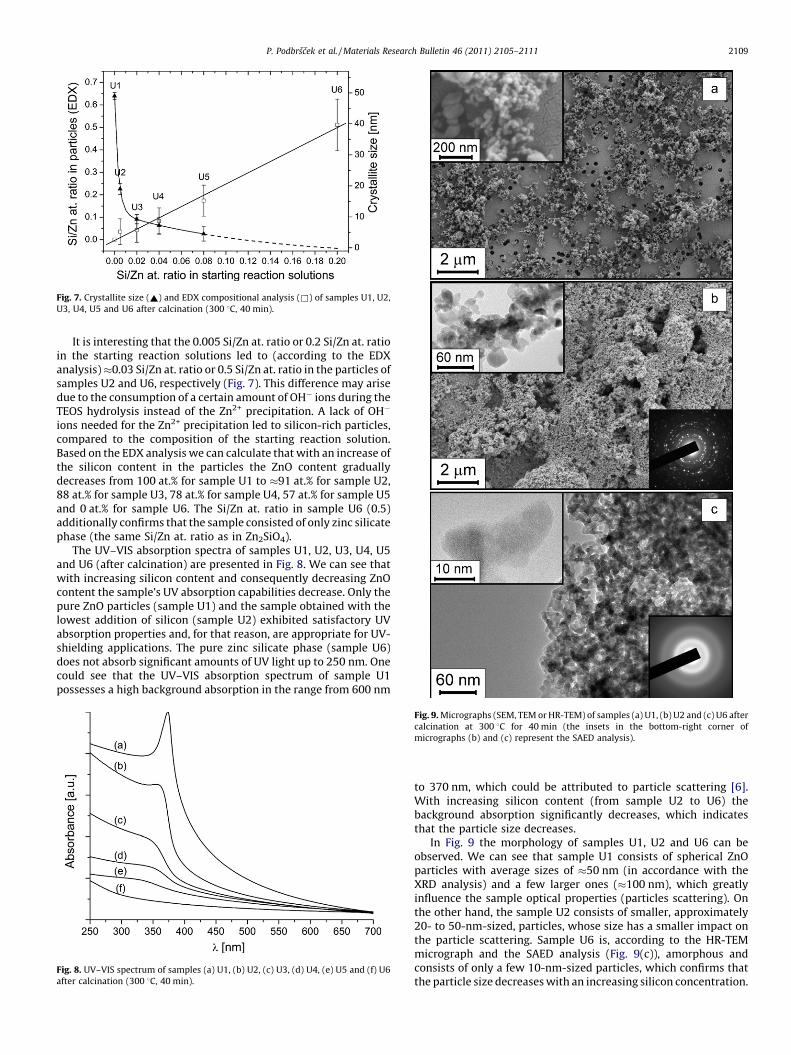
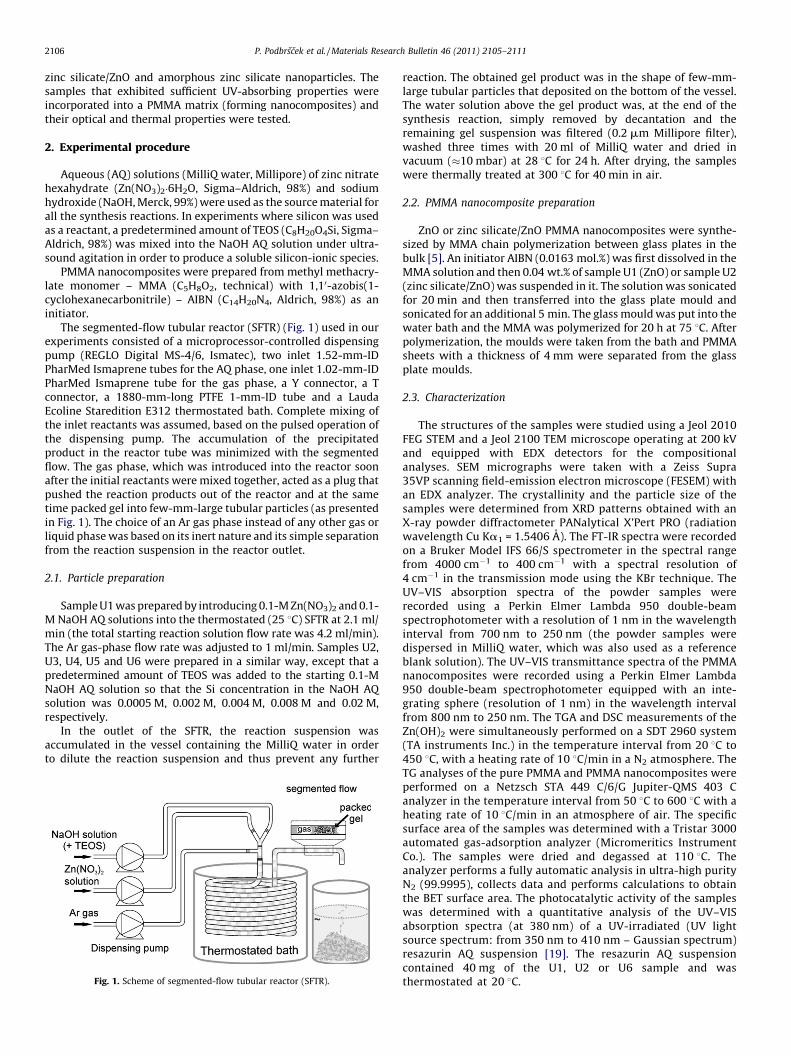
Fig. 7. Crystallite size (~) and EDX compositional analysis (&) of samples U1, U2,
U3, U4, U5 and U6 after calcination (300 8C, 40 min).
P. Podbrscek et al. / Materials Research Bulletin 46 (2011) 2105–2111 2109
It is interesting that the 0.005 Si/Zn at. ratio or 0.2 Si/Zn at. ratioin the starting reaction solutions led to (according to the EDXanalysis) �0.03 Si/Zn at. ratio or 0.5 Si/Zn at. ratio in the particles ofsamples U2 and U6, respectively (Fig. 7). This difference may arisedue to the consumption of a certain amount of OH� ions during theTEOS hydrolysis instead of the Zn2+ precipitation. A lack of OH�
ions needed for the Zn2+ precipitation led to silicon-rich particles,compared to the composition of the starting reaction solution.Based on the EDX analysis we can calculate that with an increase ofthe silicon content in the particles the ZnO content graduallydecreases from 100 at.% for sample U1 to �91 at.% for sample U2,88 at.% for sample U3, 78 at.% for sample U4, 57 at.% for sample U5and 0 at.% for sample U6. The Si/Zn at. ratio in sample U6 (0.5)additionally confirms that the sample consisted of only zinc silicatephase (the same Si/Zn at. ratio as in Zn2SiO4).
The UV–VIS absorption spectra of samples U1, U2, U3, U4, U5and U6 (after calcination) are presented in Fig. 8. We can see thatwith increasing silicon content and consequently decreasing ZnOcontent the sample’s UV absorption capabilities decrease. Only thepure ZnO particles (sample U1) and the sample obtained with thelowest addition of silicon (sample U2) exhibited satisfactory UVabsorption properties and, for that reason, are appropriate for UV-shielding applications. The pure zinc silicate phase (sample U6)does not absorb significant amounts of UV light up to 250 nm. Onecould see that the UV–VIS absorption spectrum of sample U1possesses a high background absorption in the range from 600 nm
Fig. 8. UV–VIS spectrum of samples (a) U1, (b) U2, (c) U3, (d) U4, (e) U5 and (f) U6
after calcination (300 8C, 40 min).
Fig. 9. Micrographs (SEM, TEM or HR-TEM) of samples (a) U1, (b) U2 and (c) U6 after
calcination at 300 8C for 40 min (the insets in the bottom-right corner of
micrographs (b) and (c) represent the SAED analysis).
to 370 nm, which could be attributed to particle scattering [6].With increasing silicon content (from sample U2 to U6) thebackground absorption significantly decreases, which indicatesthat the particle size decreases.
In Fig. 9 the morphology of samples U1, U2 and U6 can beobserved. We can see that sample U1 consists of spherical ZnOparticles with average sizes of �50 nm (in accordance with theXRD analysis) and a few larger ones (�100 nm), which greatlyinfluence the sample optical properties (particles scattering). Onthe other hand, the sample U2 consists of smaller, approximately20- to 50-nm-sized, particles, whose size has a smaller impact onthe particle scattering. Sample U6 is, according to the HR-TEMmicrograph and the SAED analysis (Fig. 9(c)), amorphous andconsists of only a few 10-nm-sized particles, which confirms thatthe particle size decreases with an increasing silicon concentration.
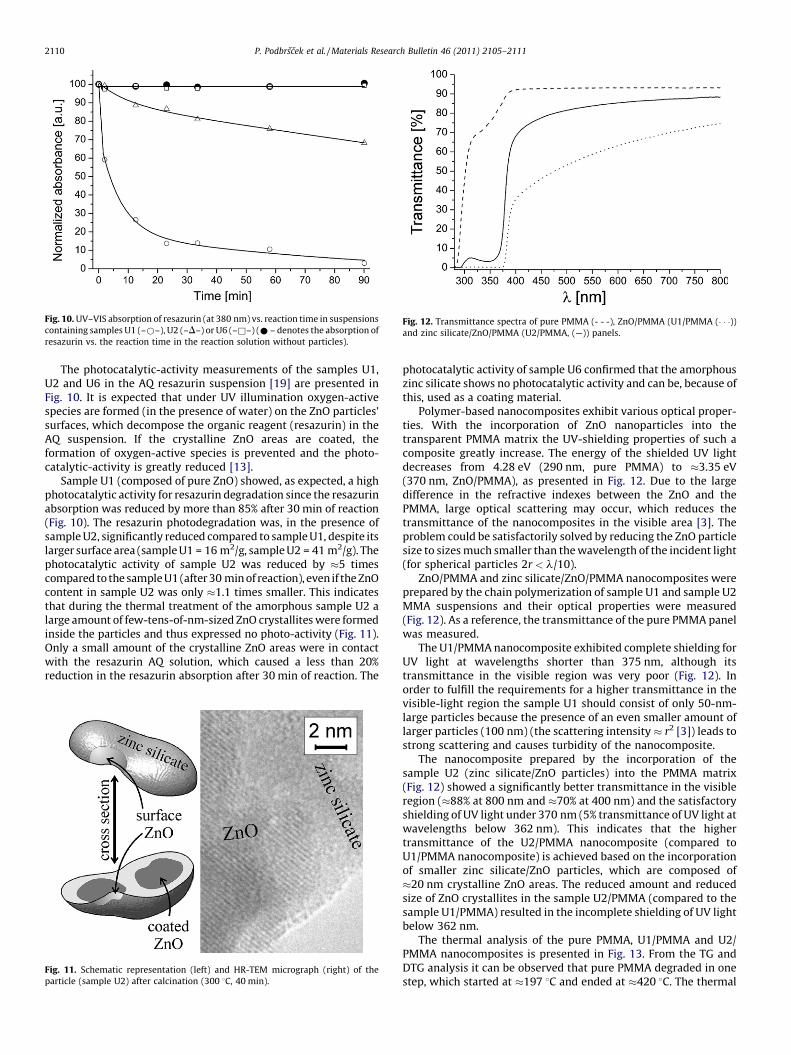
Fig. 10. UV–VIS absorption of resazurin (at 380 nm) vs. reaction time in suspensions
containing samples U1 (–*–), U2 (–D–) or U6 (–&–) (* – denotes the absorption of
resazurin vs. the reaction time in the reaction solution without particles).
Fig. 12. Transmittance spectra of pure PMMA (- - -), ZnO/PMMA (U1/PMMA (� � �))and zinc silicate/ZnO/PMMA (U2/PMMA, (—)) panels.
P. Podbrscek et al. / Materials Research Bulletin 46 (2011) 2105–21112110
The photocatalytic-activity measurements of the samples U1,U2 and U6 in the AQ resazurin suspension [19] are presented inFig. 10. It is expected that under UV illumination oxygen-activespecies are formed (in the presence of water) on the ZnO particles’surfaces, which decompose the organic reagent (resazurin) in theAQ suspension. If the crystalline ZnO areas are coated, theformation of oxygen-active species is prevented and the photo-catalytic-activity is greatly reduced [13].
Sample U1 (composed of pure ZnO) showed, as expected, a highphotocatalytic activity for resazurin degradation since the resazurinabsorption was reduced by more than 85% after 30 min of reaction(Fig. 10). The resazurin photodegradation was, in the presence ofsample U2, significantly reduced compared to sample U1, despite itslarger surface area (sample U1 = 16 m2/g, sample U2 = 41 m2/g). Thephotocatalytic activity of sample U2 was reduced by �5 timescompared to the sample U1 (after 30 min of reaction), even if the ZnOcontent in sample U2 was only �1.1 times smaller. This indicatesthat during the thermal treatment of the amorphous sample U2 alarge amount of few-tens-of-nm-sized ZnO crystallites were formedinside the particles and thus expressed no photo-activity (Fig. 11).Only a small amount of the crystalline ZnO areas were in contactwith the resazurin AQ solution, which caused a less than 20%reduction in the resazurin absorption after 30 min of reaction. The
Fig. 11. Schematic representation (left) and HR-TEM micrograph (right) of the
particle (sample U2) after calcination (300 8C, 40 min).
photocatalytic activity of sample U6 confirmed that the amorphouszinc silicate shows no photocatalytic activity and can be, because ofthis, used as a coating material.
Polymer-based nanocomposites exhibit various optical proper-ties. With the incorporation of ZnO nanoparticles into thetransparent PMMA matrix the UV-shielding properties of such acomposite greatly increase. The energy of the shielded UV lightdecreases from 4.28 eV (290 nm, pure PMMA) to �3.35 eV(370 nm, ZnO/PMMA), as presented in Fig. 12. Due to the largedifference in the refractive indexes between the ZnO and thePMMA, large optical scattering may occur, which reduces thetransmittance of the nanocomposites in the visible area [3]. Theproblem could be satisfactorily solved by reducing the ZnO particlesize to sizes much smaller than the wavelength of the incident light(for spherical particles 2r < l/10).
ZnO/PMMA and zinc silicate/ZnO/PMMA nanocomposites wereprepared by the chain polymerization of sample U1 and sample U2MMA suspensions and their optical properties were measured(Fig. 12). As a reference, the transmittance of the pure PMMA panelwas measured.
The U1/PMMA nanocomposite exhibited complete shielding forUV light at wavelengths shorter than 375 nm, although itstransmittance in the visible region was very poor (Fig. 12). Inorder to fulfill the requirements for a higher transmittance in thevisible-light region the sample U1 should consist of only 50-nm-large particles because the presence of an even smaller amount oflarger particles (100 nm) (the scattering intensity � r2 [3]) leads tostrong scattering and causes turbidity of the nanocomposite.
The nanocomposite prepared by the incorporation of thesample U2 (zinc silicate/ZnO particles) into the PMMA matrix(Fig. 12) showed a significantly better transmittance in the visibleregion (�88% at 800 nm and �70% at 400 nm) and the satisfactoryshielding of UV light under 370 nm (5% transmittance of UV light atwavelengths below 362 nm). This indicates that the highertransmittance of the U2/PMMA nanocomposite (compared toU1/PMMA nanocomposite) is achieved based on the incorporationof smaller zinc silicate/ZnO particles, which are composed of�20 nm crystalline ZnO areas. The reduced amount and reducedsize of ZnO crystallites in the sample U2/PMMA (compared to thesample U1/PMMA) resulted in the incomplete shielding of UV lightbelow 362 nm.
The thermal analysis of the pure PMMA, U1/PMMA and U2/PMMA nanocomposites is presented in Fig. 13. From the TG andDTG analysis it can be observed that pure PMMA degraded in onestep, which started at �197 8C and ended at �420 8C. The thermal

Fig. 13. TG, DTG curves of pure PMMA (US, (- - -)), ZnO/PMMA (U1, (� � �)) and zinc
silicate/ZnO/PMMA (U2, (—)).
P. Podbrscek et al. / Materials Research Bulletin 46 (2011) 2105–2111 2111
degradation of the U2/PMMA nanocomposite also proceeded in onestep, which started at �225 8C and ended at �420 8C. This indicatesthat the presence of zinc silicate/ZnO particles caused an almost28 8C delay in the starting temperature of the PMMA thermaldegradation. Inorganic filler particles have, according to Liufu et al.[10], a higher thermal conductivity as well as a greater heat capacitythan the polymer phase and are, because of this, able to absorb heatfrom the surroundings and retard the direct impact on the polymer.The thermal degradation of the U1/PMMA nanocomposite wasdifferent and proceeded in two steps. The first weight loss wasobserved in the temperature interval from �217 8C to �325 8C andthe second from �325 8C to �430 8C. This indicates that thedecomposition mechanism had changed due to the establishment ofa chemical interaction between the filler ZnO particles and thepolymer phase, which stabilized the PMMA degradation attemperatures higher than 325 8C [10]. The ZnO crystallites were,in the U2/PMMA nanocomposite, mixed with zinc silicate andconsequently less ZnO crystallites were available for the interactionwith PMMA. Because of that the interaction could not be clearlydetected from the TG analysis and the nanocomposite basicallydegraded in a single step (Fig. 13; decreased degradation rate of U2/PMMA could be observed in the range from 340 8C to 400 8C). Thedifferences in the starting degradation temperatures of the U1/PMMA and U2/PMMA nanocomposites could be attributed to thepresence of hydroxyl groups on the ZnO surface that catalyze thethermal degradation of the polymer phase [30].
The activation energies in the primary weight-loss region (30 8Cinterval) for the degradation of the pure PMMA, U1/PMMA and U2/PMMA nanocomposites were determined using dynamic weight-loss data from the TG [10,31]. We showed that the incorporation ofthe ZnO (sample U1) or the zinc silicate/ZnO (sample U2) particlesinto the PMMA matrix increased the apparent activation energy forthe degradation of PMMA by �50 kJ/mol or �70 kJ/mol, respec-tively. The highest activation energy and consequently the highestdegradation temperature of the U2/PMMA nanocomposite can beattributed to the small zinc silicate/ZnO particles inside the PMMAmatrix, which were inert and did not catalyze its degradation.
4. Conclusions
Six different samples of ZnO, zinc silicate/ZnO and zinc silicatewere prepared with a two-step synthesis reaction that includedthe synthesis of gel products in zinc-hydroxide–water and zinc-hydroxide–silicon–water systems and their drying in the first stepwith further calcination in the second step. The STFR has proved tobe useful for the preparation and densification of Zn(OH)2, zincsilicate/Zn(OH)2 and zinc silicate gels, which were, at the end of the
synthesis reaction, simply separated from the mother liquor andwashed. We showed that amorphous Zn(OH)2 starts to dehydratein the temperature interval from �50 8C to �165 8C and crystallizein the temperature interval from �230 8C to �360 8C. Theintroduction of silicon into the starting reaction solutions causedthe formation of an amorphous zinc silicate phase, which stronglyinfluenced on the particle size after the calcination. With anincreasing silicon concentration the particle size and the ZnOcontent decreased. A well distributed amorphous zinc silicatephase prevented the growth of large ZnO crystalline areas and thusonly a-few-tens-of-nm ZnO crystallites were obtained. The ZnOand zinc silicate/ZnO were incorporated into the PMMA nano-composites and their UV-shielding abilities and thermal stabilitywere tested. We demonstrated that the zinc silicate/ZnO/PMMAnanocomposite exhibited, due to the small ZnO crystallites,sufficient transmittance in the visible-light region and high UV-shielding abilities. The presence of zinc silicate/ZnO particles in thePMMA nanocomposite improved its thermal stability in thetemperature interval from 200 8C to 227 8C.
Acknowledgments
The authors gratefully acknowledge the financial support of theMinistry of Higher Education, Science and Technology of theRepublic of Slovenia (Project Novapol of MNT-ERA.NET), and theSlovenian Research Agency (Programme P1-0030).
References
[1] A.H. Yuwono, J.M. Xue, J. Wang, H.I. Elim, W. Ji, Y. Li, T.J. White, J. Mater. Chem. 13(2003) 1475–1479.
[2] A. Laachachi, M. Ferriol, M. Cochez, D. Ruch, J.M. Lopez-Cuesta, Polym. Degrad.Stab. 93 (2008) 1131–1137.
[3] M.M. Demir, K. Koynov, U. Akbey, C. Bubeck, I. Park, I. Lieberwirth, G. Wegner,Macromolecules 40 (2007) 1089–1100.
[4] A. Anzlovar, Z.C. Orel, M. Zigon, Eur. Polym. J. 46 (2010) 1216–1224.[5] J.A. Paramo, Y.M. Strzhemechny, A. Anzlovar, M. Zigon, Z.C. Orel, J. Appl. Phys. 108
(2010) 3466773, doi:10.1063/1.3466773.[6] P. Podbrscek, G. Drazic, J.A. Paramo, Y.M. Strzhemechny, J. Macek, Z.C. Orel,
CrystEngComm 12 (2010) 3071–3079.[7] M. Bitenc, P. Podbrscek, Z.C. Orel, M.A. Cleveland, J.A. Paramo, R.M. Peters, Y.M.
Strzhemechny, Cryst. Growth Des. 9 (2009) 997–1001.[8] Y. Yamamoto, N. Imai, R. Mashima, R. Konaka, M. Inoue, W.C. Dunlap, Method
Enzymol. 319 (2000) 29–37.[9] S. Sato, J. Phys. Chem. 87 (1983) 3531–3537.
[10] S.C. Liufu, H.N. Xiao, Y.P. Li, Polym. Degrad. Stab. 87 (2005) 103–110.[11] A. Laachachi, D. Ruch, F. Addiego, M. Ferriol, M. Cochez, J.M.L. Cuesta, Polym.
Degrad. Stab. 94 (2009) 670–678.[12] R. Yang, P.A. Christensen, T.A. Egerton, J.R. White, Polym. Degrad. Stab. 95 (2010)
1533–1541.[13] R.Y. Hong, T.T. Pan, J.Z. Qian, H.Z. Li, Chem. Eng. J. 119 (2006) 71–81.[14] M. Bitenc, Z.C. Orel, Mater. Res. Bull. 44 (2009) 381–387.[15] W.J. Li, E.W. Shi, W.Z. Zhong, Z.W. Yin, J. Cryst. Growth 203 (1999) 186–196.[16] M.N. Kashid, L. Kiwi-Minsker, Ind. Eng. Chem. Res. 48 (2009) 6465–6485.[17] C.H. Chang, B.K. Paul, V.T. Remcho, S. Atre, J.E. Hutchison, J. Nanopart. Res. 10
(2008) 965–980.[18] N. Jongen, M. Donnet, P. Bowen, J. Lemaitre, H. Hofmann, R. Schenk, C. Hofmann,
M. Aoun-Habbache, S. Guillemet-Fritsch, J. Sarrias, A. Rousset, M. Viviani, M.T.Buscaglia, V. Buscaglia, P. Nanni, A. Testino, J.R. Herguijuela, Chem. Eng. Technol.26 (2003) 303–305.
[19] P. Evans, S. Mantke, A. Mills, A. Robinson, D.W. Sheel, J. Photochem. Photobiol. A188 (2007) 387–391.
[20] A. Vanblaaderen, J. Vangeest, A. Vrij, J. Colloid Interface Sci. 154 (1992) 481–501.[21] E. Dingsøyr, A.A. Christy, Prog. Colloid Polym. Sci. 116 (2000) 67–73.[22] O.K. Srivastava, E.A. Secco, Can. J. Chem. 45 (1967) 585–588.[23] V.I. Sumin de Portilla, Am. Mineral. 61 (1976) 95–99.[24] J.T. Kloprogge, L. Hickey, R.L. Frost, J. Raman Spectrosc. 35 (2004) 967–974.[25] J.C. Hurt, C.J. Phillips, J. Am. Ceram. Soc. 53 (1970) 269–273.[26] C.C. Lin, P. Shen, J. Non-Cryst. Solids 171 (1994) 281–289.[27] H.D. Lutz, C. Jung, R. Mortel, H. Jacobs, R. Stahl, Spectrochim. Acta A 54 (1998)
893–901.[28] M. Andres-Verges, A. Mifsud, C.J. Serna, J. Chem. Soc. Faraday Trans. 86 (1990)
959–963.[29] M. Takesue, H. Hayashi, R.L. Smith, Prog. Cryst. Growth Charact. Mater. 55 (2009)
98–124.[30] I.C. Mcneill, M.H. Mohammed, Polym. Degrad. Stab. 48 (1995) 189–195.[31] T.C.K. Yang, S.S.Y. Lin, T.H. Chuang, Polym. Degrad. Stab. 78 (2002) 525–532.