Optimisation of shock absorber process parameters using ...
10
ORIGINAL RESEARCH Open Access Optimisation of shock absorber process parameters using failure mode and effect analysis and genetic algorithm Arokiasamy Mariajayaprakash 1* , Thiyagarajan Senthilvelan 2 and Krishnapillai Ponnambal Vivekananthan 3 Abstract The various process parameters affecting the quality characteristics of the shock absorber during the process were identified using the Ishikawa diagram and by failure mode and effect analysis. The identified process parameters are welding process parameters (squeeze, heat control, wheel speed, and air pressure), damper sealing process parameters (load, hydraulic pressure, air pressure, and fixture height), washing process parameters (total alkalinity, temperature, pH value of rinsing water, and timing), and painting process parameters (flowability, coating thickness, pointage, and temperature). In this paper, the process parameters, namely, painting and washing process parameters, are optimized by Taguchi method. Though the defects are reasonably minimized by Taguchi method, in order to achieve zero defects during the processes, genetic algorithm technique is applied on the optimized parameters obtained by Taguchi method. Keywords: Ishikawa diagram; FMEA; Taguchi method; Genetic algorithm Introduction Shock absorber is one of the major components used in automobiles. It is used to absorb vibrations when the vehicle is moving. Otherwise, those vibrations will affect the vehicle and the rider. The defects which occurred during the process affect the quality of the shock ab- sorber. In order to minimize the defects and improve the quality, the following tools are employed. First, the cause and effect diagram or Ishikawa diagram is used for identifying the parameters that may affect the quality of the shock absorber during the process. Then, failure mode and effect analysis (FMEA) tool is applied to find out the most significant process parameters that may affect the quality of the shock absorber. Finally, Taguchi method is used to optimize the process parameters. Taguchi method is an efficient and powerful tool that can reduce the experimental trials necessary to deter- mine the optimal conditions. It has been widely used in many different fields (Liu et al. 2010). Tsai et al. (2008) used Taguchi's design of experiments to identify the optimal abrasive jet polishing parameters when applied to the polishing of electrical-discharged- machined SKD 61 mold steel specimens. This paper shows that the analysis of variance (ANOVA) provides an indication of the significance of the individual control factors. Mahapatra and Chaturvedi (2009) proved that Taguchi's experimental design is a simple and systematic way of analyzing a complex process with less experimen- tal design. In this paper, test parameters are optimized for mini- mum wear by Taguchi method. Ganapathy et al. (2009) optimized the operating parameters in Jatropha biodiesel engine by Taguchi method. In this paper, it is proved that signal-to-noise (S/N) ratio is used to optimize the various input parameters of the model. This paper shows that the Taguchi ap- proach-based thermodynamic model has improved the performance parameters slightly. Pishbina et al. (2010) investigated the effects of processing parameters, inclu- ding suspension concentration, pH, and electric field by Taguchi's design of experiment (DOE) approach in elec- trophoretic deposition of bioglass suspension. Momeni * Correspondence: [email protected] 1 Department of Mechanical Engineering, Rajiv Gandhi College of Engineering and Technology, Kirumabakkam, Puducherry 607402, India Full list of author information is available at the end of the article © 2013 Mariajayaprakash et al.; licensee Springer. This is an Open Access article distributed under the terms of the Creative Commons Attribution License (http://creativecommons.org/licenses/by/2.0), which permits unrestricted use, distribution, and reproduction in any medium, provided the original work is properly cited. Mariajayaprakash et al. Journal of Industrial Engineering International 2013, 9:18 http://www.jiei-tsb.com/content/9/1/18
-
Upload
khangminh22 -
Category
Documents
-
view
2 -
download
0
Transcript of Optimisation of shock absorber process parameters using ...

Mariajayaprakash et al. Journal of Industrial Engineering International 2013, 9:18http://www.jiei-tsb.com/content/9/1/18
ORIGINAL RESEARCH Open Access
Optimisation of shock absorber processparameters using failure mode and effect analysisand genetic algorithmArokiasamy Mariajayaprakash1*, Thiyagarajan Senthilvelan2 and Krishnapillai Ponnambal Vivekananthan3
Abstract
The various process parameters affecting the quality characteristics of the shock absorber during the process wereidentified using the Ishikawa diagram and by failure mode and effect analysis. The identified process parameters arewelding process parameters (squeeze, heat control, wheel speed, and air pressure), damper sealing processparameters (load, hydraulic pressure, air pressure, and fixture height), washing process parameters (total alkalinity,temperature, pH value of rinsing water, and timing), and painting process parameters (flowability, coating thickness,pointage, and temperature). In this paper, the process parameters, namely, painting and washing processparameters, are optimized by Taguchi method. Though the defects are reasonably minimized by Taguchi method,in order to achieve zero defects during the processes, genetic algorithm technique is applied on the optimizedparameters obtained by Taguchi method.
Keywords: Ishikawa diagram; FMEA; Taguchi method; Genetic algorithm
IntroductionShock absorber is one of the major components used inautomobiles. It is used to absorb vibrations when thevehicle is moving. Otherwise, those vibrations will affectthe vehicle and the rider. The defects which occurredduring the process affect the quality of the shock ab-sorber. In order to minimize the defects and improvethe quality, the following tools are employed. First, thecause and effect diagram or Ishikawa diagram is used foridentifying the parameters that may affect the quality ofthe shock absorber during the process. Then, failuremode and effect analysis (FMEA) tool is applied to findout the most significant process parameters that mayaffect the quality of the shock absorber. Finally, Taguchimethod is used to optimize the process parameters.Taguchi method is an efficient and powerful tool thatcan reduce the experimental trials necessary to deter-mine the optimal conditions. It has been widely used inmany different fields (Liu et al. 2010).
* Correspondence: [email protected] of Mechanical Engineering, Rajiv Gandhi College of Engineeringand Technology, Kirumabakkam, Puducherry 607402, IndiaFull list of author information is available at the end of the article
© 2013 Mariajayaprakash et al.; licensee SpringCommons Attribution License (http://creativecoreproduction in any medium, provided the orig
Tsai et al. (2008) used Taguchi's design of experimentsto identify the optimal abrasive jet polishing parameterswhen applied to the polishing of electrical-discharged-machined SKD 61 mold steel specimens. This papershows that the analysis of variance (ANOVA) providesan indication of the significance of the individual controlfactors. Mahapatra and Chaturvedi (2009) proved thatTaguchi's experimental design is a simple and systematicway of analyzing a complex process with less experimen-tal design.In this paper, test parameters are optimized for mini-
mum wear by Taguchi method. Ganapathy et al. (2009)optimized the operating parameters in Jatropha biodieselengine by Taguchi method.In this paper, it is proved that signal-to-noise (S/N)
ratio is used to optimize the various input parametersof the model. This paper shows that the Taguchi ap-proach-based thermodynamic model has improved theperformance parameters slightly. Pishbina et al. (2010)investigated the effects of processing parameters, inclu-ding suspension concentration, pH, and electric field byTaguchi's design of experiment (DOE) approach in elec-trophoretic deposition of bioglass suspension. Momeni
er. This is an Open Access article distributed under the terms of the Creativemmons.org/licenses/by/2.0), which permits unrestricted use, distribution, andinal work is properly cited.
WASHING PAINTING
Improper Frequency of change
Presence of oil/grease
1. wrong parameters 2. improper preparation
of solvent
1. flowability 2. coating thickness
1. paint not adhering 2. rust 3. corrosion
1. pointage 2. temperature
ball sizing
1. concentricity 2. cylinder bend checking
setup not correct
poor surface finish
improper cleaning
1.breakage 2. burrs
cylinder not
ball sized
1. concentricity more than specification 2. wrong jaws 3. worn out jaws
DIMENSIONING INSPECTION/ CHECKING
POLISHING
bad stone condition
DEFECTS IN
SHOCK ABSORBER
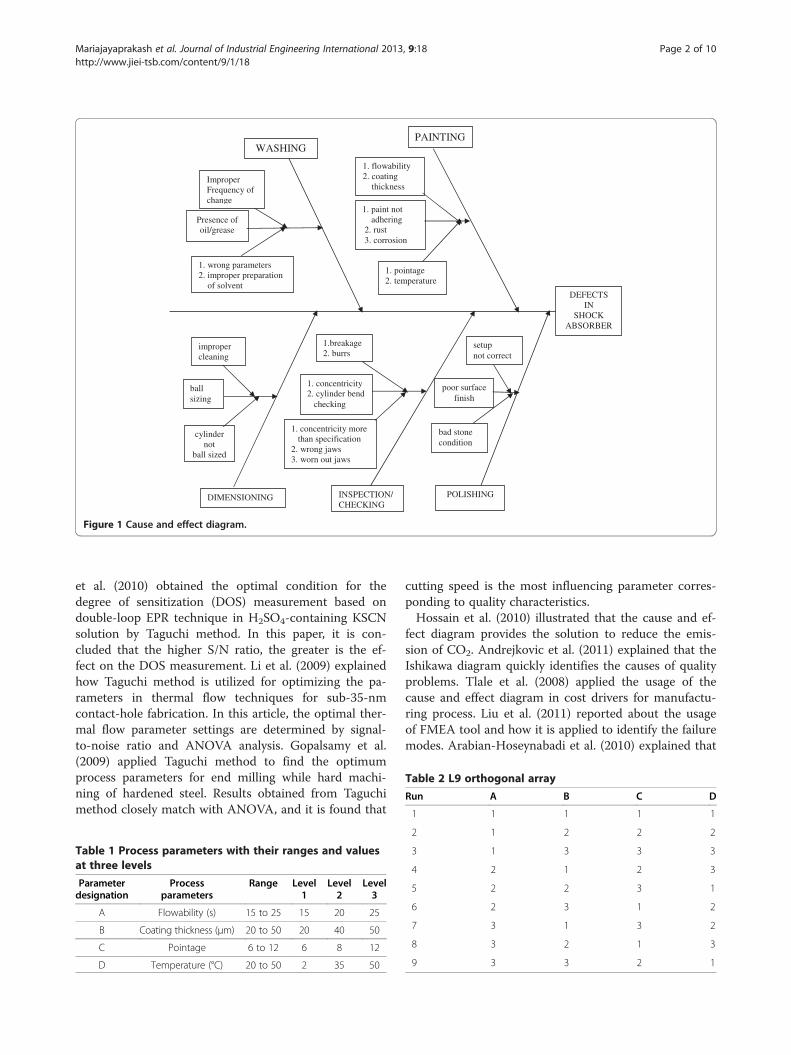
Figure 1 Cause and effect diagram.
Table 2 L9 orthogonal array
Run A B C D
1 1 1 1 1
Mariajayaprakash et al. Journal of Industrial Engineering International 2013, 9:18 Page 2 of 10http://www.jiei-tsb.com/content/9/1/18
et al. (2010) obtained the optimal condition for thedegree of sensitization (DOS) measurement based ondouble-loop EPR technique in H2SO4-containing KSCNsolution by Taguchi method. In this paper, it is con-cluded that the higher S/N ratio, the greater is the ef-fect on the DOS measurement. Li et al. (2009) explainedhow Taguchi method is utilized for optimizing the pa-rameters in thermal flow techniques for sub-35-nmcontact-hole fabrication. In this article, the optimal ther-mal flow parameter settings are determined by signal-to-noise ratio and ANOVA analysis. Gopalsamy et al.(2009) applied Taguchi method to find the optimumprocess parameters for end milling while hard machi-ning of hardened steel. Results obtained from Taguchimethod closely match with ANOVA, and it is found that
Table 1 Process parameters with their ranges and valuesat three levels
Parameterdesignation
Processparameters
Range Level1
Level2
Level3
A Flowability (s) 15 to 25 15 20 25
B Coating thickness (μm) 20 to 50 20 40 50
C Pointage 6 to 12 6 8 12
D Temperature (°C) 20 to 50 2 35 50
cutting speed is the most influencing parameter corres-ponding to quality characteristics.Hossain et al. (2010) illustrated that the cause and ef-
fect diagram provides the solution to reduce the emis-sion of CO2. Andrejkovic et al. (2011) explained that theIshikawa diagram quickly identifies the causes of qualityproblems. Tlale et al. (2008) applied the usage of thecause and effect diagram in cost drivers for manufactu-ring process. Liu et al. (2011) reported about the usageof FMEA tool and how it is applied to identify the failuremodes. Arabian-Hoseynabadi et al. (2010) explained that
2 1 2 2 2
3 1 3 3 3
4 2 1 2 3
5 2 2 3 1
6 2 3 1 2
7 3 1 3 2
8 3 2 1 3
9 3 3 2 1
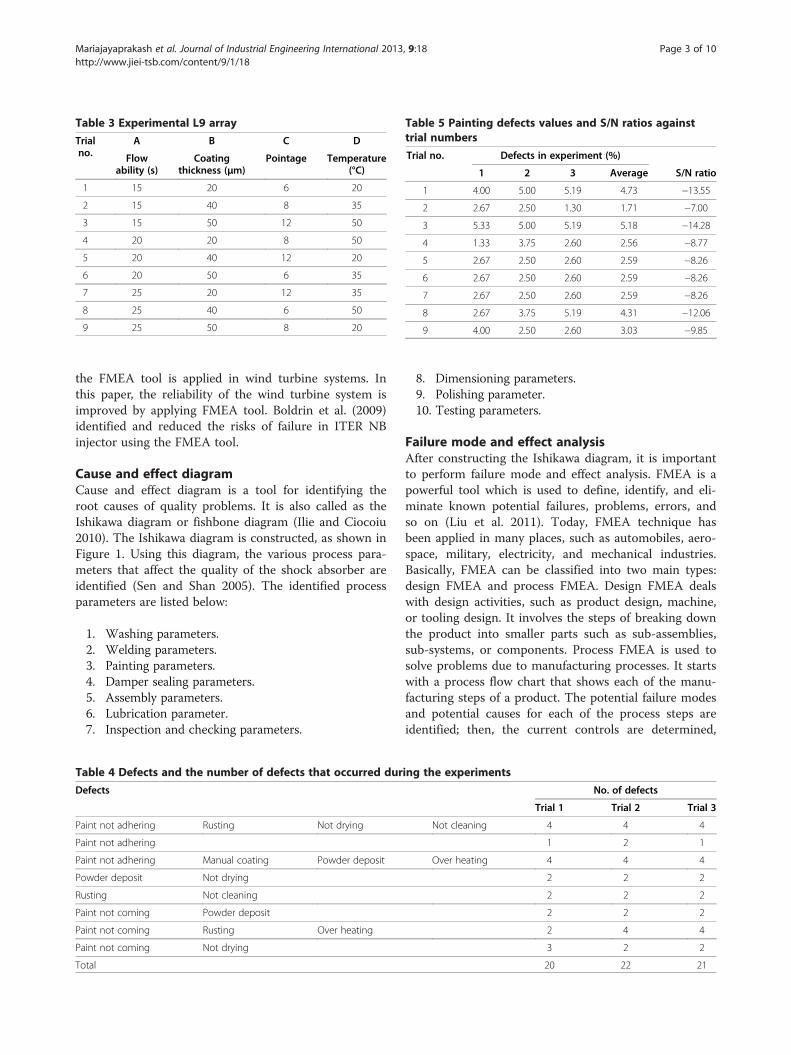
Table 3 Experimental L9 array
Trialno.
A B C D
Flowability (s)
Coatingthickness (μm)
Pointage Temperature(°C)
1 15 20 6 20
2 15 40 8 35
3 15 50 12 50
4 20 20 8 50
5 20 40 12 20
6 20 50 6 35
7 25 20 12 35
8 25 40 6 50
9 25 50 8 20
Table 5 Painting defects values and S/N ratios againsttrial numbers
Trial no. Defects in experiment (%)
1 2 3 Average S/N ratio
1 4.00 5.00 5.19 4.73 −13.55
2 2.67 2.50 1.30 1.71 −7.00
3 5.33 5.00 5.19 5.18 −14.28
4 1.33 3.75 2.60 2.56 −8.77
5 2.67 2.50 2.60 2.59 −8.26
6 2.67 2.50 2.60 2.59 −8.26
7 2.67 2.50 2.60 2.59 −8.26
8 2.67 3.75 5.19 4.31 −12.06
9 4.00 2.50 2.60 3.03 −9.85
Mariajayaprakash et al. Journal of Industrial Engineering International 2013, 9:18 Page 3 of 10http://www.jiei-tsb.com/content/9/1/18
the FMEA tool is applied in wind turbine systems. Inthis paper, the reliability of the wind turbine system isimproved by applying FMEA tool. Boldrin et al. (2009)identified and reduced the risks of failure in ITER NBinjector using the FMEA tool.
Cause and effect diagramCause and effect diagram is a tool for identifying theroot causes of quality problems. It is also called as theIshikawa diagram or fishbone diagram (Ilie and Ciocoiu2010). The Ishikawa diagram is constructed, as shown inFigure 1. Using this diagram, the various process para-meters that affect the quality of the shock absorber areidentified (Sen and Shan 2005). The identified processparameters are listed below:
1. Washing parameters.2. Welding parameters.3. Painting parameters.4. Damper sealing parameters.5. Assembly parameters.6. Lubrication parameter.7. Inspection and checking parameters.
Table 4 Defects and the number of defects that occurred dur
Defects
Paint not adhering Rusting Not drying
Paint not adhering
Paint not adhering Manual coating Powder deposit
Powder deposit Not drying
Rusting Not cleaning
Paint not coming Powder deposit
Paint not coming Rusting Over heating
Paint not coming Not drying
Total
8. Dimensioning parameters.9. Polishing parameter.10. Testing parameters.
Failure mode and effect analysisAfter constructing the Ishikawa diagram, it is importantto perform failure mode and effect analysis. FMEA is apowerful tool which is used to define, identify, and eli-minate known potential failures, problems, errors, andso on (Liu et al. 2011). Today, FMEA technique hasbeen applied in many places, such as automobiles, aero-space, military, electricity, and mechanical industries.Basically, FMEA can be classified into two main types:design FMEA and process FMEA. Design FMEA dealswith design activities, such as product design, machine,or tooling design. It involves the steps of breaking downthe product into smaller parts such as sub-assemblies,sub-systems, or components. Process FMEA is used tosolve problems due to manufacturing processes. It startswith a process flow chart that shows each of the manu-facturing steps of a product. The potential failure modesand potential causes for each of the process steps areidentified; then, the current controls are determined,
ing the experiments
No. of defects
Trial 1 Trial 2 Trial 3
Not cleaning 4 4 4
1 2 1
Over heating 4 4 4
2 2 2
2 2 2
2 2 2
2 4 4
3 2 2
20 22 21

Table 6 Average values of painting defects and S/N ratios at different levels
Factors Level 1 Level 2 Level 3
Painting defects S/N ratios Painting defects S/N ratios Painting defects S/N ratios
A 4.02 −11.61 2.58 −8.43 3.16 −10.06
B 3.29 −10.19 2.87 −9.10 3.60 −10.80
C 3.73 −11.29 2.58 −8.54 3.45 −10.27
D 3.45 −10.55 2.45 −7.84 3.87 −11.70
Mariajayaprakash et al. Journal of Industrial Engineering International 2013, 9:18 Page 4 of 10http://www.jiei-tsb.com/content/9/1/18
followed by the effects of failures on the manufacturingline operators and product end-users. The risks of theseeffects are then assessed accordingly. FMEA is carriedout by a cross-functional team of experts from variousdepartments FMEA is conventionally carried out by ateam of engineers. Using their knowledge and past data,risk priority number (RPN) value is assigned for eachfailure component (Zhang and Chu 2011). RPN is theproduct of the occurrence (o), severity (s), and detection(d) of a failure. The three risk factors are evaluated usinga ten-point scale. Failure modes with higher RPN valuesare assumed to be more important and are given higherpriorities than those with lower RPN values (Wang et al.2009). In this paper, washing and painting process pa-rameters are having higher RPN values. Hence, thesetwo process parameters are considered as the most sig-nificant process parameters.
Taguchi methodTaguchi method is an efficient tool for acquiring optimalprocess parameters. In this method, the number of ex-periments is reduced. In this method, two importanttools are used: (1) orthogonal array and (2) signal-to-noise ratio (Gologlu and Sakarya 2008). First, experimentparameter factors and their levels are selected. In thisstudy, four painting process parameters are used as con-trol factors, and each parameter is designed to have
A1 A2 A3 B1 B2 B3 C1 C2 C3 D1 D2 D3
2.4
2.6
2.8
3.0
3.2
3.4
3.6
3.8
4.0
4.2
% o
f d
e f
e c
t s
P a r a m e t e r l e v e l s
Figure 2 Average values of painting process defects for eachparameter at different levels.
three levels (Kilickap 2010). The selected process para-meters, ranges, and their levels are shown in Table 1.
Selection of orthogonal arrayAn orthogonal array for process design is applied on theknowledge of control factors and levels. The number ofexperiments can be reduced using orthogonal array (Yenet al. 2011). The degrees of freedom for the orthogonalarray should be greater than or at least equal to thosefor the process parameters. In this study, L9 orthogonalarray having eight degrees of freedom is selected (Anawaand Olabi 2008). This orthogonal array has four columnsand nine experiment runs, and it is shown in Table 2.
Conducting the experimentAfter selecting the orthogonal array, the factors at diffe-rent levels are assigned for each trial. The assigned ex-perimental array is shown in Table 3. The experimentsare conducted by single randomization technique. Eachexperiment is repeated three times for the same set offparameters (Ross 1988; Mohamed et al. 2008). In eachtrial, the defects occurring are recorded, and it is shownin Table 4. In this work, the defects that occur duringthe welding, washing, painting, and tamper sealing pro-cess are considered. The percentage of the defects foreach repetition was calculated using the given formula,and then, the average of the defects was determined foreach trial condition, and it was shown in Table 5.
A1 A2 A3 B1 B2 B3 C1 C2 C3 D1 D2 D3
-12.0
-11.5
-11.0
-10.5
-10.0
-9.5
-9.0
-8.5
-8.0
-7.5
S /
N R
a t
i o
P a r a m e t e r l e v e l s
Figure 3 Average values of S/N ratio for each parameter atdifferent levels.
Percentage of defects ¼ No: of defects occuring due to painting processTotal no: of defects in the process welding; washing; painting; and Damper sealingð Þ
Mariajayaprakash et al. Journal of Industrial Engineering International 2013, 9:18 Page 5 of 10http://www.jiei-tsb.com/content/9/1/18
S/N ratioTaguchi technique utilizes the signal-to-noise ratio ap-proach to measure the quality characteristic deviatingfrom the desired value. S/N ratio is used as an objectivefunction for optimizing parameters. (Prihandana et al.2009). Control factors are easily adjustable, and it is setby the manufacturer. These factors are most importantin determining the quality characteristics. Noise factorsare difficult, impossible, or expensive to control (wea-ther, temperature, humidity, etc.). The S/N ratio is theratio of mean (signal) to the standard deviation (noise).There are several S/N ratios available depending on thetype of characteristics (Mahapatra et al. 2008; Moshatet al. 2010).
(1) smaller is better
η ¼ −10 log 1=nXn
i¼1
yi2 ;
(2) nominal is the best
η ¼ 10 log 1=nXn
i¼1
μ2=σ2;
(3) higher is better.
η ¼ −10 log 1=nXn
i¼1
1=yi2 ;
where, η = S/N ratio, yi = value of quality characteristicat ith setting, μ = mean, n = total number of trial runs atith setting, and σ = standard deviation.In this study, in order to minimize the defects, smaller
is better S/N ratio is chosen. Smaller is better S/N ratiosare computed, and the values are recorded in Table 5.The main objective of shock absorber process is to
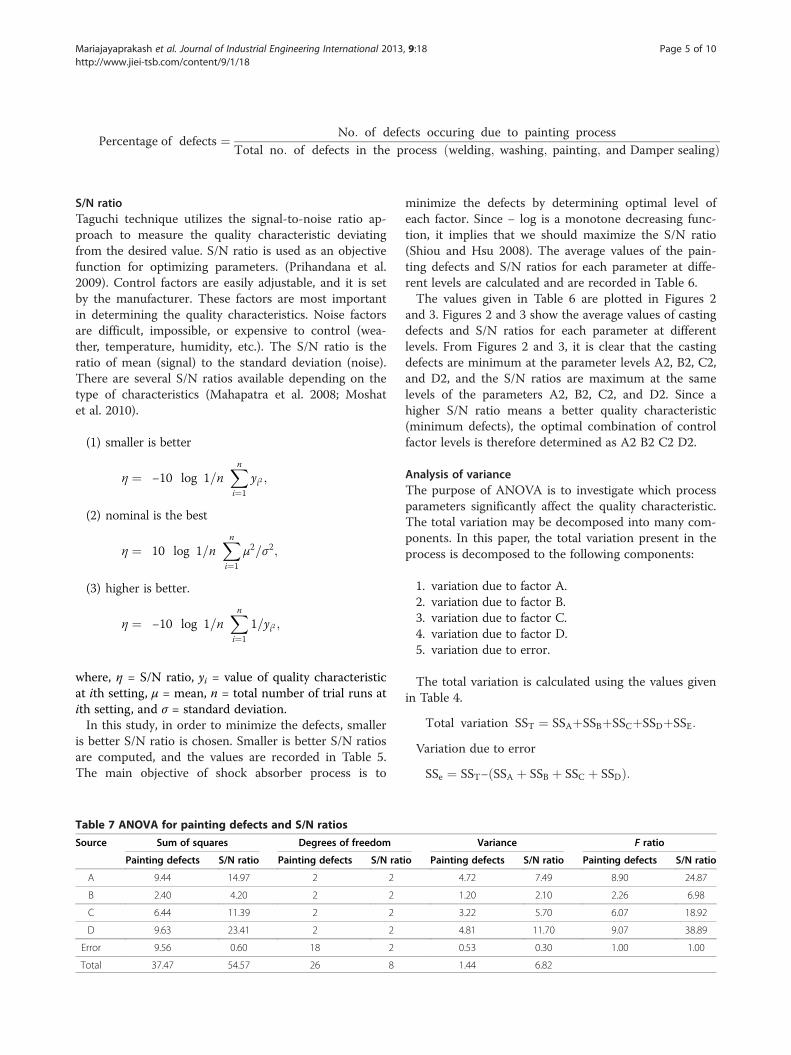
Table 7 ANOVA for painting defects and S/N ratios
Source Sum of squares Degrees of freedom
Painting defects S/N ratio Painting defects S/N rat
A 9.44 14.97 2 2
B 2.40 4.20 2 2
C 6.44 11.39 2 2
D 9.63 23.41 2 2
Error 9.56 0.60 18 2
Total 37.47 54.57 26 8
minimize the defects by determining optimal level ofeach factor. Since − log is a monotone decreasing func-tion, it implies that we should maximize the S/N ratio(Shiou and Hsu 2008). The average values of the pain-ting defects and S/N ratios for each parameter at diffe-rent levels are calculated and are recorded in Table 6.The values given in Table 6 are plotted in Figures 2
and 3. Figures 2 and 3 show the average values of castingdefects and S/N ratios for each parameter at differentlevels. From Figures 2 and 3, it is clear that the castingdefects are minimum at the parameter levels A2, B2, C2,and D2, and the S/N ratios are maximum at the samelevels of the parameters A2, B2, C2, and D2. Since ahigher S/N ratio means a better quality characteristic(minimum defects), the optimal combination of controlfactor levels is therefore determined as A2 B2 C2 D2.
Analysis of varianceThe purpose of ANOVA is to investigate which processparameters significantly affect the quality characteristic.The total variation may be decomposed into many com-ponents. In this paper, the total variation present in theprocess is decomposed to the following components:
1. variation due to factor A.2. variation due to factor B.3. variation due to factor C.4. variation due to factor D.5. variation due to error.
The total variation is calculated using the values givenin Table 4.
Total variation SST ¼ SSAþSSBþSSCþSSDþSSE:
Variation due to error
SSe ¼ SST− SSA þ SSB þ SSC þ SSDð Þ:
Variance F ratio
io Painting defects S/N ratio Painting defects S/N ratio
4.72 7.49 8.90 24.87
1.20 2.10 2.26 6.98
3.22 5.70 6.07 18.92
4.81 11.70 9.07 38.89
0.53 0.30 1.00 1.00
1.44 6.82

Table 8 ANOVA for painting defects, including percent contribution
Source Sum of squares Degrees of freedom Variance F ratio Expected SS' Percent contribution (P)
A 9.44 2 4.72 8.90 6.94 18.52
B 2.40 2 1.20 Pooled (2.6)
C 6.44 2 3.22 6.07 6.44 17.19
D 9.63 2 4.81 9.07 9.63 25.69
Error (pooled) 9.56 18 0.53 1.00 14.46 38.60
Total 37.47 26 1.44 37.47 100.00
Mariajayaprakash et al. Journal of Industrial Engineering International 2013, 9:18 Page 6 of 10http://www.jiei-tsb.com/content/9/1/18
Total degrees of freedom
υT ¼ υA þ υB þ υC þ υD þ υeð Þυe ¼ υT− υA þ υB þ υC þ υDð Þ
¼ 26– 2þ 2þ 2þ 2ð Þ¼ 18 :
The results of ANOVA are shown in Table 7. In Table 7,it is clear that the parameters A, C, and D significantlyaffect both mean and variation in the painting defects.Once the experiment has been conducted, the ANOVA
is carried out using the results of the experiments. The sig-nificant factors and/or their interactions were identified,graphs were plotted for various trial conditions, and the pa-rameters which significantly influence the mean and vari-ation in the shock absorber defects were determined.However, the results obtained so far are not sufficientenough to find the optimum parameters in order tominimize the requirement of some more information toconclude with an optimum parameter set. These sets of in-formation are obtained using the interpretation methodsavailable in the literature (Syrcos 2002).
Percent contributionPercent contribution is the function of the sum of squaresof each significant item. Percent contribution to the total
1 2 3 4
0
5
10
15
20
25
30
35
40
Number of variables
Current B
est In
div
idual
Figure 4 Evaluation of generations for paintingprocess optimization.
sum of square can be used to evaluate the importance of achange in the process parameter on these quality charac-teristics (Lakshminarayan and Balasubramanian 2008;Gopalsamy et al. 2009). It is calculated using the formulaegiven below:
Percent contribution Pð Þ ¼ SS’A=SSTð Þ � 100SS’A ¼ SSA– υeð Þ υAð ÞVA ¼ VA’þ V error;
where VA’ is the expected amount of variation due solelyto factor A given below:
VA ¼ SSA=υA;
VA’ ¼ SS’A=υA:
Estimating the meanFrom Table 8, it is clear that factor B has the least effecton the quality characteristic. In order to prevent over es-timation, factor B is not considered, and the estimationof mean for painting defects is calculated by the follo-wing equation (Li et al. 2009):
� ¼ T þ A2−Tð Þ þ C2−Tð Þ þ D2−Tð Þ;
0 100 200 300 400 500 600-0.2
0
0.2
0.4
0.6
0.8
1
1.2
Generation
Fitn
ess
Val
ue
Best fit
Figure 5 Best individual values obtained by GA for paintingprocess optimisation.

Table 9 Optimisation results obtained by Taguchimethod and GA
Flowability(s)
Coatingthickness(μm)
Pointage Temperature(°C)
Percentageof defects
Taguchimethod
20 40 8 35 0.83
Geneticalgorithm
24 40 8 31 0.001
Table 11 Washing defect values and S/N ratio againsttrial numbers
Trial no. Defects in experiment (%)
1 2 3 Average S/N ratio
1 4.00 2.50 3.90 3.47 −10.96
2 1.33 2.50 1.30 1.71 −5.10
3 2.67 2.50 2.60 2.59 −8.27
4 1.33 2.50 1.30 1.71 −5.10
5 1.33 1.25 1.30 1.29 −2.24
6 1.33 1.25 1.30 1.29 −2.24
7 1.33 1.25 1.30 1.29 −2.24
8 1.33 1.25 2.60 1.73 −5.27
9 1.33 3.75 2.60 2.56 −8.77
Mariajayaprakash et al. Journal of Industrial Engineering International 2013, 9:18 Page 7 of 10http://www.jiei-tsb.com/content/9/1/18
where T is the average values of painting defects atdifferent levels.The mean for a selected trial condition for parameters
at A2, B2, C2, and D2 is 1.11.
Confidence interval around the estimated meanAn important step in Taguchi's optimization techniqueis to conduct confirmation experiments for validatingthe predicted values. Thus, a 95% confidence interval(CI) for the predicted mean of optimum quality charac-teristic on a confirmation test is estimated using the fol-lowing two equations (Wu and Gu 2010):
CI3 ¼ F α; 1; υeð ÞVe 1=ηeff þ 1=rð Þ½ �1=2 and
η eff ¼ N=ð1þ total DOF associated in the estimate
of meanÞ;
where α is the level of risk,Ve is the error variance, νe isthe degrees of freedom for the error, η eff is the effectivenumber of replications, and r is number of test trials.Using the values in Table 5, the CI was calculated as
follows:
η eff ¼ N=1þ total DOF associated in the estimate of meanð Þ¼ 27= 1þ 2ð Þ¼ 9;
α ¼ 1−confidence limits 95%ð Þ¼ 0:05;
F ratio ¼ 1; 0:05; 18ð Þ¼ 4:41 tabulatedð Þ;
Confidence interval CI3 = ±1.02.The 95% confidence interval of the predicted optimum
of the shock absorber defect is 0.09 < 1.11 < 2.13.
Table 10 Process parameters with their ranges and values at
Parameter designation Process parameters R
A Total alkalinity (g/l) 40
B Temperature (°C) 45
C Rinsing water (pH) 5.5
D Timing (min) 0
Confirmation experimentsThree confirmation experiments were conducted at theoptimum setting of the process parameters. The flow-ability was set at the second level (A2), coating thicknessat the second level (B2), wheel speed at the second level(C2), and air pressure was kept at the second level (D2).The average of the respondent defects in each ex-periment is found to be 0.83%; the result was within theCI of the protected optimum of the casting defects.The confirming experiments results gave 0.83% < 2.13%(maximum of CI). Therefore, the selected parameters aswell as their appropriate levels are significant enough toobtain the desired result.
Optimisation by genetic algorithmSince the conventional methods of optimization do notwork well, non-traditional optimization techniques suchas genetic algorithm (GA), simulated annealing, scattersearch algorithm, and ant colony algorithm have beenwidely applied to obtain better solution in the manufactu-ring industries. In this research work, genetic algorithmmethod has been applied on the process parameters whichare earlier optimized by Taguchi method in order to ob-tain better solution. GA is a computerized search andoptimization algorithm based on the mechanics of naturalgenetics and natural selection (Tewari et al. 2012). Geneticalgorithm is mainly composed of three operators: repro-duction, crossover, and mutation. In GA, the first step isto generate initial population of individuals randomly. Theindividuals in the genetic space are called chromosome. Acollection of genes is called as chromosome, and the
three levels
ange Level 1 Level 2 Level 3
to 80 40 70 80
to 75 45 60 75
to 8.5 5.5 6.5 8.5
to 25 5 15 25

Table 12 Average values of washing process defects andS/N ratio at different levels
Factors Level 1 Level 2 Level 3
Washingdefects
S/Nratios
Washingdefects
S/Nratios
Washingdefects
S/Nratios
A 2.59 −8.11 1.43 −3.19 1.86 −5.43
B 2.16 −6.10 1.58 −4.20 2.15 −6.43
C 2.16 −6.16 2.00 −6.32 1.73 −4.25
D 2.44 −7.32 1.43 −3.19 2.00 −6.21
0 100 200 300 400 500 6000
0.1
0.2
0.3
0.4
0.5
0.6
0.7
0.8
0.9
1
Generation
Fitn
ess
Val
ue
Best fit
Figure 6 Evaluation of generations for washingprocess optimization.
Mariajayaprakash et al. Journal of Industrial Engineering International 2013, 9:18 Page 8 of 10http://www.jiei-tsb.com/content/9/1/18
chromosome potential is called its fitness function, whichis evaluated by the objective function. In the selectionprocess, low fitness chromosomes are eliminated usinghigh-fitness chromosomes (Hafshejani et al. 2012). How-ever, selection alone does not produce any new individualsinto the population. Hence, cross over and mutation ope-rations are involved. Crossover is the process for ex-changing genes between two chromosomes using theone-point crossover, two-point crossover, or homologuecrossover. In mutation, the genes may occasionally be al-tered, i.e., in binary code genes changing genes code from0 to 1 or vice versa. The new population generated under-goes the further selection, crossover, and mutation till thetermination criterion is not satisfied.In this research work, through the application of
MINITAB and based on Taguchi's orthogonal array, amathematical model has been developed. The model hasbeen used as objective function in the genetic algorithm.The objective function and constraints of the paintingprocess are defined as follows:
Y ¼ 3:72−0:095Aþ 0:0057B−0:2123C þ 0:0018D:
Minimize: Y (A, B, C, D).Constraints:
� Bounds on flowability (s): 15 ≤ A ≤ 25.� Bounds on coating thickness (μm): 35 ≤ B ≤45.� Bounds on pointage: 6 ≤ C ≤ 10.� Bounds on temperature (°C): 30 ≤ D ≤ 40.
The problem of genetic algorithm has been solved usingMATLAB. The parameters used in GA are population
Table 13 S/N ratios for washing process defects, including pe
Source Sum of squares Degrees of freedom Var
A 36.25 2.00 1
B 8.54 2.00 4
C 7.85
D 27.30 2.00 1
Error (pooled) 0.32 2.00 0
Total 80.26 8.00 3
size - 100, cross over probability - 0.9, mutation pro-bability - 0.1 and the number of generations - 600.The evaluation of generations and the best valuesobtained by GA are shown in Figures 4 and 5. Con-firmation experiments have been conducted using theoptimized parameters. It has been observed that thepercentage of defects during the painting process isbetter than Taguchi method.
Results and discussionThe shock absorber experiments have been conducted,and subsequently, ANOVA is carried out using theresults obtained from the experiments. Nevertheless,interpretation methods are used to obtain the per-cent contribution of each parameter and optimumlevels of each parameter, and GA technique is ap-plied on the parameters which have been optimizedby Taguchi method:
1. The percent contribution of each parameter to thevariation of painting defects and optimum parameter(under economic condition) is shown in Table 8.
2. The optimum levels of various parameters forminimum painting defects of shock absorberobtained by Taguchi method and genetic algorithmare shown in Table 9.
3. The predicted range of optimum painting defects is0.09 < 1.11 < 2.13.
rcent contribution
iance F ratio Expected SS' Percent contribution (P)
8.13 112.84 35.93 33.20
.27 26.58 8.22 7.59
3.65 84.97 26.98 24.93
.16 1.00 37.10 34.28
6.21 225.39 108.23 100.00

1 2 3 40
10
20
30
40
50
60
70
80
Number of variables
Cur
rent
Bes
t Ind
ivid
ual
Figure 7 Best individual values obtained by GA for washingprocess optimisation.
Mariajayaprakash et al. Journal of Industrial Engineering International 2013, 9:18 Page 9 of 10http://www.jiei-tsb.com/content/9/1/18
In the same manner, calculations are carried out, andoptimum values are found for washing process (Tables 10,11, 12, and 13).The mean for a selected trial condition for parameters
at A2, B2, C3, and D2 is 0.90.The 95% confidence interval of the predicted optimum
of the shock absorber defect is 0.13 < 0.90 < 1.67Furthermore, to optimize the results of washing pro-
cess, GA technique has been applied using the objectivefunction and constraints as given below:
Y ¼ 4:73−0:034A−0:012B−0:110C−0:0248D:
Minimize: Y (A, B, C, D).Constraints:
� Bounds on total alkalinity (g/l): 65 ≤ A ≤ 75.� Bounds on temperature (°C): 55 ≤ B ≤ 65.� Bounds on pH value of rinsing water: 6 ≤ C ≤ 10.� Bounds on timing (s): 5 ≤ D ≤ 15.
The evaluation of generations and the best values ob-tained by GA for washing process are shown in Figures 6and 7. The optimized parameters obtained by Taguchimethod and GA are shown in Table 14.From the abovementioned analysis, it is observed that
the percentage of defects drastically reduced after ap-plying genetic algorithm technique in both painting andwashing processes.
Table 14 Optimisation results obtained by Taguchimethod and GA
Totalalkalinity
(g/l)
Temperature(°C)
Rinsingwater(pH )
Timing(s)
Percentageof defects
Taguchimethod
70 60 7.5 10 1
Geneticalgorithm
72 64 10 13 0.004
ConclusionsWhile the Taguchi method is an effective techniqueto achieve the optimum process parameters of shockabsorber, the genetic algorithm technique, however,gives better solutions than Taguchi method to achievethe optimum process parameters of shock absorber.From the present study, the following results havebeen arrived.
1. Ishikawa diagram or cause and effect diagram is veryeffective to sort out all the possible causes affectingthe quality of shock absorber.
2. Conventional FMEA has been applied to identify themost significant parameters (painting and washingprocesses) affecting the quality of the shockabsorber.
3. It has been observed that the parameters pointage(painting) and timing (washing) significantly affectthe quality of the shock absorber, which can beconfirmed with the help of percent contribution.
4. The optimum range of the shock absorber defectshas been predicted by the 95% confidenceinterval. The optimum range of painting processis 0.09 < 1.02 < 2.13 and washing process is0.13 < 0.90 < 1.67.
5. The optimum levels of flowability, coating thickness,pointage, and temperature for painting process andtotal alkalinity, temperature, PH value of rinsingwater, and timing for washing process wereestimated.
6. The percentage of painting defects and washingdefects obtained by Taguchi method are 0.83 and 1,respectively. After applying the genetic algorithmtechnique, the percentage of painting defects andwashing defects had been drastically reduced to0.001 and 0.004, respectively.
Abbreviationsα: Level of risk; μ: Mean; η eff: Effective number of replications;ANOVA: Analysis of variance; CI: Confidence interval; DOE: Design ofexperiments; F(α, 1, νe): F ratio required at the level of risk; kA: Number oflevels for factor A; M: Overall mean percentage defects; n: Total number ofexperiments; N: Number of trials; P: Percent contribution; r: Number of testsin a trial; SS: Sum of square; T: Average values of defects at different levels;ν: Degrees of freedom; νA: Degrees of freedom for factor A; νe: Degrees offreedom for the error; νLN: Total degrees of freedom of the availableorthogonal array; νrequired: Total degrees of freedom required; V′: Expectedamount of variation; Ve: Error variance; Vfactor: Variance of factor; yi: Responsevalue of observation in the ith test.
Competing interestsThe authors declare that they have no competing interests.
Authors’ contributionsAMJP carried out the literature study reviews, design, and experimental work.TSV worked on the computations. KPV helped to perform the experimentalwork. All authors read and approved the final manuscript.

Mariajayaprakash et al. Journal of Industrial Engineering International 2013, 9:18 Page 10 of 10http://www.jiei-tsb.com/content/9/1/18
AcknowledgmentsThe authors would like to thank the editor and anonymous reviewers fortheir valuable and constructive comments, which have led to a significantimprovement in the manuscript.
Author details1Department of Mechanical Engineering, Rajiv Gandhi College of Engineeringand Technology, Kirumabakkam, Puducherry 607402, India. 2Department ofMechanical Engineering, Pondicherry Engineering College, Pillaichavady,Puducherry 605014, India. 3TENNECO Automotive India private Limited,Mettupalayam, Puducherry 605009, India.
Received: 23 June 2012 Accepted: 7 May 2013Published: 15 July 2013
ReferencesAnawa EM, Olabi AG (2008) Using Taguchi method to optimize welding pool of
dissimilar laser welded components. Optics & Laser Technology 40(2):379–388Andrejkovic M, Hajduova L, Mixtaj E, Weiss R (2011) Improvement of processes in
metallurgy company. Metalurgija 50(2):141–144Arabian-Hoseynabadi H, Oraee H, Tavner PJ (2010) Failure modes and effects
analysis (FMEA) for wind turbines. Elect Power and Energy Syst 32:817–824Boldrin M, De Lorenzi A, Fiorentin A, Marcuzzi D, Peruzzo S, Pomaro N, Rigato W,
Serianni G (2009) Potential failure mode and effects analysis for the ITER NBinjector. Fusion Eng and Design 84:466–469
Ganapathy T, Murugesan K, Gakkhar RP (2009) Performance optimization ofJatropha bio diesel engine model using Taguchi approach. Appl Energy86(11):2476–2486
Gologlu C, Sakarya N (2008) The effects of cutter path strategies on surfaceroughness of pocket milling of 1.2738 steel based on Taguchi method.J Mater Process Technol 206(1–3):7–15
Gopalsamy BM, Mondal B, Ghosh S (2009) Taguchi method and ANOVA: anapproach for process parameters optimization of hard machining whilemachining hardened steel. J Sci Ind Res 68(8):686–695
Hafshejani KF, Valmohammadi C, Khakpoor A (2012) Retracted: using geneticalgorithm approach to solve a multi-product EPQ model with defectiveitems, rework, and constrained space. J Ind Eng Int 8(27):1–7
Hossain KA, Khan F, Hawboldt K (2010) Susdesign - an approach for a sustainableprocess system design and its application to a thermal power plant.Appl Thermal Energy 30(14–15):1896–1913
Ilie G, Ciocoiu CN (2010) Application of fishbone diagram to determine the riskof an event with multiple causes. Manag Res Pract 2(1):1–20
Kilickap E (2010) Optimization of cutting parameters on delamination based onTaguchi method during drilling of GFRP composite. Expert Syst Appl37(8):6116–6122
Lakshminarayanan AK, Balasubramanian V (2008) Process parameters optimisationfor friction stir welding of RDE- 40 aluminium alloy using Taguchi technique.Trans Non-ferrous Metals Soc China 18(3):548–554
Li TS, Chen SH, Chen HL (2009) Thermal-flow techniques for sub-35 nmcontact-hole fabrication using Taguchi method in electron-beamlithography. Microelectron Eng 86:2170–2175
Liu Y-T, Changa W-C, Yamagata Y (2010) A study on optimal compensationcutting for an aspheric surface using the Taguchi method. CIRP J Manuf SciTechnol 3(1):40–48
Liu H-C, Liu L, Bian Q-H, Lin Q-L, Dong N, Peng Cheng X (2011) Failure modeand effects analysis using fuzzy evidential reasoning approach and greytheory. Expert Syst Appl 3(8):4403–4415
Mahapatra SS, Chaturvedi V (2009) Modelling and analysis of abrasive wearperformance of composites using Taguchi approach. Int J Eng Sci Technol1(1):123–135
Mahapatra SS, Patnaik A, Satapathy A (2008) Taguchi method applied toparametric appraisal of erosion behavior of GF-reinforced polyestercomposites. Wear 265(1–2):214–222
Mohamed H, Hisyam Lee M, Sarahintu M, Salleh S, Sanugi B (2008) Identifyingfactors affecting data delivery performance in mobile ad-hoc networkrouting protocol using a systematic approach. Matematika 24(1):43–51
Momeni M, Moayed MH, Davoodi A (2010) Tuning DOS measuring parametersbased on double-loop EPR in H2SO4 containing KSCN by Taguchi method.Corros Sci 52(8):2653–2660
Moshat S, Datta S, Bandyopadhyay A, Pal P (2010) Optimization of CNC endmilling process parameters using PCA-based Taguchi method. Int J Eng SciTechnol 2(1):92–102
Pishbina F, Simchi A, Ryana MP, Boccaccini AR (2010) A study of theelectrophoretic deposition of Bioglass® suspensions using the Taguchiexperimental design approach. J Eur Ceramic Soc 30(14):2963–2970
Prihandana GS, Mahardika M, Hamdi M, Wong YS, Kimiyuki M (2009) Effect ofmicro-powder suspension and ultrasonic vibration of dielectric fluid inmicro-EDM Processes -Taguchi approach. Int J Mach Tools Manuf49(12–13):1035–1041
Ross PJ (1988) Taguchi techniques for quality engineering. McGraw Hill,New York
Sen M, Shan HS (2005) Analysis of hole quality characteristics in the electro jetdrilling process. Int J Mach Tools Manuf 45(15):1706–1716
Shiou FJ, Hsu CC (2008) Surface finishing of hardened and tempered stainlesstool steel using sequential ball grinding, ball burnishing and ball polishingprocesses on a machining centre. J Mat Process Tech 205(1–3):249–258
Syrcos GP (2002) Die casting process optimization using Taguchi methods.J Mater Process Technol 135:68–74
Tewari PC, Khanduja R, Gupta M (2012) Performance enhancement forcrystallization unit of a sugar plant using genetic algorithm technique.J Ind Eng Int 8(1):1–7
Tlale NS, Steyn JL, Govender S (2008) Technical cost modelling for a novelsemi-solid metal (SSM) casting processes for automotive componentmanufacturing. In: International Association for Management of Technology.Nice, pp 1–20. 17–19 September 2008
Tsai FC, Yan BH, Kuan CY, Huang FY (2008) A Taguchi and experimentalinvestigation into the optimal processing conditions for the abrasive jetpolishing of SKD61 mold steel. Int J Mach Tools Manuf 48(7–8):932–945
Wang Y-M, Chin K-S, Poon GKK, Yang J-B (2009) Risk evaluation in failure modeand effects analysis using fuzzy weighted geometric mean. Expert Syst Appl36(2):1195–1207
Wu H-W, Gu HW (2010) Analysis of operating parameters considering floworientation for the performance of a proton exchange membrane fuel cellusing the Taguchi method. J Power Sources 95(11):3621–3630
Yen Y-T, Fang T-H, Lin Y-C (2011) Optimization of screen-printing parameters ofSN9000 ink for pinholes using Taguchi method in chip on film packaging.Robotics Comput Integrated Manuf 27(3):531–537
Zhang Z, Chu X (2011) Risk prioritization in failure mode and effects analysisunder uncertainty. Expert Syst Appl 38(1):206–214
doi:10.1186/2251-712X-9-18Cite this article as: Mariajayaprakash et al.: Optimisation of shockabsorber process parameters using failure mode and effect analysis andgenetic algorithm. Journal of Industrial Engineering International 2013 9:18.
Submit your manuscript to a journal and benefi t from:
7 Convenient online submission
7 Rigorous peer review
7 Immediate publication on acceptance
7 Open access: articles freely available online
7 High visibility within the fi eld
7 Retaining the copyright to your article
Submit your next manuscript at 7 springeropen.com