A New Design Model of an MR Shock Absorber for Aircraft ...
19
applied sciences Article A New Design Model of an MR Shock Absorber for Aircraft Landing Gear Systems Considering Major and Minor Pressure Losses: Experimental Validation Byung-Hyuk Kang 1 , Jai-Hyuk Hwang 2 and Seung-Bok Choi 3, * Citation: Kang, B.-H.; Hwang, J.-H.; Choi, S.-B. A New Design Model of an MR Shock Absorber for Aircraft Landing Gear Systems Considering Major and Minor Pressure Losses: Experimental Validation. Appl. Sci. 2021, 11, 7895. https://doi.org/ 10.3390/app11177895 Academic Editors: Antonio Concilio, Salvatore Ameduri, Ignazio Dimino, Vikram G. Kamble and Rosario Pecora Received: 2 August 2021 Accepted: 24 August 2021 Published: 27 August 2021 Publisher’s Note: MDPI stays neutral with regard to jurisdictional claims in published maps and institutional affil- iations. Copyright: © 2021 by the authors. Licensee MDPI, Basel, Switzerland. This article is an open access article distributed under the terms and conditions of the Creative Commons Attribution (CC BY) license (https:// creativecommons.org/licenses/by/ 4.0/). 1 Department of Mechanical Engineering, Inha University, Incheon 22212, Korea; [email protected] 2 School of Aerospace and Mechanical Engineering, Korea Aerospace University, Goyang 10540, Korea; [email protected] 3 Department of Mechanical Engineering, The State University of New York, Korea (SUNY Korea), Incheon 21985, Korea * Correspondence: [email protected] Featured Application: Aircraft Shock Absorber with Controllable Damping Force. Abstract: This work presents a novel design model of a magnetorheological (MR) fluid-based shock absorber (MR shock absorber in short) that can be applied to an aircraft landing gear system. When an external force acts on an MR shock absorber, pressure loss occurs at the flow path while resisting the fluid flow. During the flow motion, two pressure losses occur: the major loss, which is proportional to the flow rate, and the minor loss, which is proportional to the square of the flow rate. In general, when an MR shock absorber is designed for low stroke velocity systems such as an automotive suspension system, the consideration of the major loss only for the design model is well satisfied by experimental results. However, when an MR shock absorber is applied to dynamic systems that require high stroke velocity, such as aircraft landing gear systems, the minor loss effect becomes significant to the pressure drop. In this work, a new design model for an MR shock absorber, considering both the major and minor pressure losses, is proposed. After formulating a mathematical design model, a prototype of an MR shock absorber is manufactured based on the design parameters of a lightweight aircraft landing gear system. After establishing a drop test for the MR shock absorber, the results of the pressure drop versus stroke/stroke velocity are investigated at different impact energies. It is shown from comparative evaluation that the proposed design model agrees with the experiment much better than the model that considers only the major pressure loss. Keywords: magnetorheological (MR) fluid; MR shock absorber; aircraft landing gear; valve path; major and minor pressure losses; impact energy 1. Introduction The landing gear system of an aircraft consists of the main landing gear and the nose gear. The nose gear is mainly located under the nose of the aircraft. The role of the nose gear is steering the aircraft during takeoff, landing, and taxiing and is not used for direct impact energy dissipation during landing. The main landing gear braces the aircraft’s fuselage by dissipating most of the impact energy generated by the weight and sink speed of the aircraft during landing. For a stable landing, the shock absorbers of the main landing gear must be designed to dissipate sufficient shock energy. An oleo-pneumatic shock absorber (abbreviated as oleo-strut) is the most popular one used in modern aircraft landing gear systems. A structure called a metering pin is used inside the oleo-strut to vary the orifice area, and hence the damping force, in response to the piston displacement. Because the oleo-strut is the passive damper, its performance is limited. Therefore, the research on active and semi-active shock absorbers for the aircraft landing gear systems is Appl. Sci. 2021, 11, 7895. https://doi.org/10.3390/app11177895 https://www.mdpi.com/journal/applsci
-
Upload
khangminh22 -
Category
Documents
-
view
1 -
download
0
Transcript of A New Design Model of an MR Shock Absorber for Aircraft ...

applied sciences
Article
A New Design Model of an MR Shock Absorber for AircraftLanding Gear Systems Considering Major and Minor PressureLosses: Experimental Validation
Byung-Hyuk Kang 1 , Jai-Hyuk Hwang 2 and Seung-Bok Choi 3,*
�����������������
Citation: Kang, B.-H.; Hwang, J.-H.;
Choi, S.-B. A New Design Model of
an MR Shock Absorber for Aircraft
Landing Gear Systems Considering
Major and Minor Pressure Losses:
Experimental Validation. Appl. Sci.
2021, 11, 7895. https://doi.org/
10.3390/app11177895
Academic Editors: Antonio Concilio,
Salvatore Ameduri, Ignazio Dimino,
Vikram G. Kamble and
Rosario Pecora
Received: 2 August 2021
Accepted: 24 August 2021
Published: 27 August 2021
Publisher’s Note: MDPI stays neutral
with regard to jurisdictional claims in
published maps and institutional affil-
iations.
Copyright: © 2021 by the authors.
Licensee MDPI, Basel, Switzerland.
This article is an open access article
distributed under the terms and
conditions of the Creative Commons
Attribution (CC BY) license (https://
creativecommons.org/licenses/by/
4.0/).
1 Department of Mechanical Engineering, Inha University, Incheon 22212, Korea; [email protected] School of Aerospace and Mechanical Engineering, Korea Aerospace University, Goyang 10540, Korea;
[email protected] Department of Mechanical Engineering, The State University of New York, Korea (SUNY Korea),
Incheon 21985, Korea* Correspondence: [email protected]
Featured Application: Aircraft Shock Absorber with Controllable Damping Force.
Abstract: This work presents a novel design model of a magnetorheological (MR) fluid-based shockabsorber (MR shock absorber in short) that can be applied to an aircraft landing gear system. When anexternal force acts on an MR shock absorber, pressure loss occurs at the flow path while resisting thefluid flow. During the flow motion, two pressure losses occur: the major loss, which is proportional tothe flow rate, and the minor loss, which is proportional to the square of the flow rate. In general, whenan MR shock absorber is designed for low stroke velocity systems such as an automotive suspensionsystem, the consideration of the major loss only for the design model is well satisfied by experimentalresults. However, when an MR shock absorber is applied to dynamic systems that require highstroke velocity, such as aircraft landing gear systems, the minor loss effect becomes significant to thepressure drop. In this work, a new design model for an MR shock absorber, considering both themajor and minor pressure losses, is proposed. After formulating a mathematical design model, aprototype of an MR shock absorber is manufactured based on the design parameters of a lightweightaircraft landing gear system. After establishing a drop test for the MR shock absorber, the results ofthe pressure drop versus stroke/stroke velocity are investigated at different impact energies. It isshown from comparative evaluation that the proposed design model agrees with the experimentmuch better than the model that considers only the major pressure loss.
Keywords: magnetorheological (MR) fluid; MR shock absorber; aircraft landing gear; valve path;major and minor pressure losses; impact energy
1. Introduction
The landing gear system of an aircraft consists of the main landing gear and the nosegear. The nose gear is mainly located under the nose of the aircraft. The role of the nosegear is steering the aircraft during takeoff, landing, and taxiing and is not used for directimpact energy dissipation during landing. The main landing gear braces the aircraft’sfuselage by dissipating most of the impact energy generated by the weight and sink speedof the aircraft during landing. For a stable landing, the shock absorbers of the mainlanding gear must be designed to dissipate sufficient shock energy. An oleo-pneumaticshock absorber (abbreviated as oleo-strut) is the most popular one used in modern aircraftlanding gear systems. A structure called a metering pin is used inside the oleo-strut tovary the orifice area, and hence the damping force, in response to the piston displacement.Because the oleo-strut is the passive damper, its performance is limited. Therefore, theresearch on active and semi-active shock absorbers for the aircraft landing gear systems is
Appl. Sci. 2021, 11, 7895. https://doi.org/10.3390/app11177895 https://www.mdpi.com/journal/applsci

Appl. Sci. 2021, 11, 7895 2 of 19
being undertaken through several different approaches. A magnetorheological (MR) fluidshock absorber is an attractive candidate to achieve optimal landing performance in almostall landing conditions. In general, a valve mechanism for the fluid flow is used for the MRshock absorber [1]. It is well known that MR fluid reacts to the magnetic field as a mixtureof carbonyl-iron powder (CIP) and silicone oil. In the presence of the magnetic field, the in-fluid CIP particles are aligned in the direction of the magnetic field to form chain structures.The structure creates yield stress, resisting the flow of the MR fluid, which is a characteristicof the Bingham-plastic flow [2,3]. Thanks to the Bingham-plastic characteristics in responseto the magnetic field, it is possible to achieve the desired damping force, resisting thefluid flow by controlling the magnetic field. Therefore, MR fluid is being actively usedfor several dynamic devices or systems that require a controllable damping force underdifferent operating conditions. These systems include seismic dampers in civil structures,vehicle suspension systems, seat dampers, and lateral dampers for trains. In order toaccurately predict the pressure drop (or damping force) of an MR shock absorber, severaldesign models have been proposed so far [4–8].
One of the critical design parameters of MR shock absorbers is to determine the gap(or flow path) in which the flow resistance of the MR fluid is controlled by the magneticcore. In the flow path, two occur: the major pressure loss and the minor pressure loss.The major loss is caused by the fluid’s dynamic viscosity generating a hydraulic resistanceforce in the gap. On the other hand, the minor loss is caused by inertia due to the densityof the fluid generated in the inlet and outlet of the gap, which sharply bents the flowpath and the developing region. The faster the operating speed of the MR shock absorber,the greater the effect of the minor loss because it is sensitive to the fluid velocity. Inprevious works on the design of MR shock absorbers, only the major pressure loss hasbeen considered because the application systems are operated in the low operating speedrange (or low stroke velocity), which is less than 0.5 m/s. Recently, several works onMR shock absorbers applicable to aircraft landing gear systems have been proposed. Insome works [9,10], MR shock absorbers for aircraft landing gear systems were designed,analyzed, and experimentally validated under low-frequency conditions, and showedsuitable damping force. An aircraft landing gear system with an MR shock absorber wasdesigned, and the landing performance via the skyhook controller was evaluated in [11].Robust adaptive control was proposed for the aircraft landing gear system equipped withan MR damper based on the adaptive hybrid control and sliding mode control algorithmto take account of the parameter uncertainties [12]. Moreover, the authors of this workformulated a full-scale aircraft model with 6-DOF dynamics integrated with an MR shockabsorber and evaluated the landing performance through the modified skyhook controllerand the inverse model of the mechanical energy [13,14]. However, only the major pressureloss was considered in these works.
Consequently, the technical contribution of this work is to propose a novel mathe-matical design model for an MR shock absorber, which can be applicable to high-speedoperating systems, including aircraft landing gear systems, by considering both the majorand minor pressures losses. As a first step to achieve this target, a structural configura-tion of an MR shock absorber for the aircraft landing gear system is presented, and itsworking principle is explained. The governing equations of motions are then derived,considering the pressure drop and damping force at compression and rebound conditions.Subsequently, a prototype of the MR shock absorber is designed and manufactured on thebasis of the governing equations of motions and the design parameters of a commerciallightweight aircraft landing gear system. To validate the proposed design model, a droptest, which can generate a high stroke velocity of 2.5 m/s, is established, and the results onthe pressure drop versus the stroke/stroke velocity are experimentally measured at variousimpact energy conditions representing different stroke velocities. The results achievedfrom the design models considering the major loss only, the major and minor loss, and theexperiment are compared to validate an excellent agreement of the proposed design modelwith the experiment.

Appl. Sci. 2021, 11, 7895 3 of 19
2. Mathematical Modeling for Aircraft MR Shock Absorber2.1. Damping Force of MR Shock Absorber
Figure 1 shows the basic configuration of an aircraft landing gear system and a lumpeddiagram of the MR shock absorber. For MR shock absorbers, not only the pneumatic andhydraulic force of the oleo-strut, but also the controllable MR force, are added. MR forcecan change the damping force depending on the input current generated by the controller,which is effective for landing performance. There are several different types of MR shockabsorber that can be devised for landing gear systems. In this work, a cylindrical tube type,shown in Figure 2, is proposed.
Appl. Sci. 2021, 11, x FOR PEER REVIEW 3 of 21
from the design models considering the major loss only, the major and minor loss, and the experiment are compared to validate an excellent agreement of the proposed design model with the experiment.
2. Mathematical Modeling for Aircraft MR Shock Absorber 2.1. Damping Force of MR Shock Absorber
Figure 1 shows the basic configuration of an aircraft landing gear system and a lumped diagram of the MR shock absorber. For MR shock absorbers, not only the pneu-matic and hydraulic force of the oleo-strut, but also the controllable MR force, are added. MR force can change the damping force depending on the input current generated by the controller, which is effective for landing performance. There are several different types of MR shock absorber that can be devised for landing gear systems. In this work, a cylindri-cal tube type, shown in Figure 2, is proposed.
Figure 1. Configuration of aircraft landing gear and MR shock absorber.
(a)
Figure 1. Configuration of aircraft landing gear and MR shock absorber.
The left of the diagram is the direction of the aircraft fuselage, and the right is thedirection of the ground where the tire and wheel are located. The inside of the shockabsorber is divided into an upper chamber, a lower chamber, and a gas chamber, withthe MR valve and separator as boundaries. The upper and lower chambers are filledwith MR fluid, and the gas chamber can be filled with air or nitrogen. Figure 2b shows afree-body diagram of the internal pressure and the external force acting on the MR shockabsorber. From the figure, the main strut of the MR shock absorber is fixed to the aircraftfuselage, and the piston makes a relative motion depending on the stroke displacement,s, by the ground reaction. The external force in the direction of the piston axis is called astrut force, FS. When the strut force is applied, the MR fluid flows through the MR valvebased on the relative motion of the piston, and the damping force is generated to resistthe strut force. In addition, the flow causes a change in the amount of fluid in the lowerchamber, and the separator induces a pressure change in the gas chamber while makingrelative movements inside the piston to compensate for the changing fluid volume and thepneumatic pressure increases. The upper, lower, and gas chamber pressures are definedas P1, P2, and Pgas, respectively. The MR shock absorber is a form in which a damperand a spring are combined. In other words, the difference between P1 and P2 generates adamping force responsible for the damper’s function, and Pgas generates the pneumaticpressure, which acts as the gas spring. The difference between P1 and P2 is the pressuredrop, ∆P, which can be expressed as follows:
∆P = P1 − P2 (1)
where P1 and P2 are the pressure of the upper and lower chambers, respectively. UsingEquation (1) and the condition that Pgas is equal to P2 in the quasi-equilibrium state,

Appl. Sci. 2021, 11, 7895 4 of 19
the strut force, Fs, the damping force, Fd, and the pneumatic force, Fgas, are calculated,respectively, as follows:
Fs = Fd + Fgas (2)
Fd =π
4D1
2·∆P (3)
Fgas =π
4D2
2·Pgas (4)
where D1 is the inner diameter of the main strut, D2 is the outer diameter of the piston,and Pgas is the pneumatic pressure. Due to the volume ratio of the separator and thepiston displacements, it is noted that the pneumatic force is expressed as the product of thepneumatic pressure and the cross-sectional area of the outer diameter of the piston, not theinner diameter. In this study, the description of the pneumatic pressure is omitted becausethe pressure drop for the major and minor losses will be focused on.
Appl. Sci. 2021, 11, x FOR PEER REVIEW 3 of 21
from the design models considering the major loss only, the major and minor loss, and the experiment are compared to validate an excellent agreement of the proposed design model with the experiment.
2. Mathematical Modeling for Aircraft MR Shock Absorber 2.1. Damping Force of MR Shock Absorber
Figure 1 shows the basic configuration of an aircraft landing gear system and a lumped diagram of the MR shock absorber. For MR shock absorbers, not only the pneu-matic and hydraulic force of the oleo-strut, but also the controllable MR force, are added. MR force can change the damping force depending on the input current generated by the controller, which is effective for landing performance. There are several different types of MR shock absorber that can be devised for landing gear systems. In this work, a cylindri-cal tube type, shown in Figure 2, is proposed.
Figure 1. Configuration of aircraft landing gear and MR shock absorber.
(a)
Appl. Sci. 2021, 11, x FOR PEER REVIEW 4 of 21
(b)
Figure 2. Schematic diagram of MR shock absorber: (a) configuration; (b) free body diagram.
The left of the diagram is the direction of the aircraft fuselage, and the right is the direction of the ground where the tire and wheel are located. The inside of the shock ab-sorber is divided into an upper chamber, a lower chamber, and a gas chamber, with the MR valve and separator as boundaries. The upper and lower chambers are filled with MR fluid, and the gas chamber can be filled with air or nitrogen. Figure 2b shows a free-body diagram of the internal pressure and the external force acting on the MR shock absorber. From the figure, the main strut of the MR shock absorber is fixed to the aircraft fuselage, and the piston makes a relative motion depending on the stroke displacement, s, by the ground reaction. The external force in the direction of the piston axis is called a strut force, FS. When the strut force is applied, the MR fluid flows through the MR valve based on the relative motion of the piston, and the damping force is generated to resist the strut force. In addition, the flow causes a change in the amount of fluid in the lower chamber, and the separator induces a pressure change in the gas chamber while making relative movements inside the piston to compensate for the changing fluid volume and the pneumatic pressure increases. The upper, lower, and gas chamber pressures are defined as P1, P2, and Pgas, respectively. The MR shock absorber is a form in which a damper and a spring are com-bined. In other words, the difference between P1 and P2 generates a damping force respon-sible for the damper’s function, and Pgas generates the pneumatic pressure, which acts as the gas spring. The difference between P1 and P2 is the pressure drop, ∆𝑃, which can be expressed as follows:
1 2P P PΔ = − (1)
where P1 and P2 are the pressure of the upper and lower chambers, respectively. Using Equation (1) and the condition that Pgas is equal to P2 in the quasi-equilibrium state, the strut force, Fs, the damping force, Fd, and the pneumatic force, Fgas, are calculated, respec-tively, as follows:
s d gasF F F= + (2)
21 Δ
4dπF D P= ⋅ (3)
224gas gas
πF D P= ⋅ (4)
where D1 is the inner diameter of the main strut, D2 is the outer diameter of the piston, and Pgas is the pneumatic pressure. Due to the volume ratio of the separator and the piston displacements, it is noted that the pneumatic force is expressed as the product of the pneu-matic pressure and the cross-sectional area of the outer diameter of the piston, not the inner diameter. In this study, the description of the pneumatic pressure is omitted because the pressure drop for the major and minor losses will be focused on.
Figure 2. Schematic diagram of MR shock absorber: (a) configuration; (b) free body diagram.
2.2. MR Valve Design Considering Pressure Drop of Major and Minor Losses
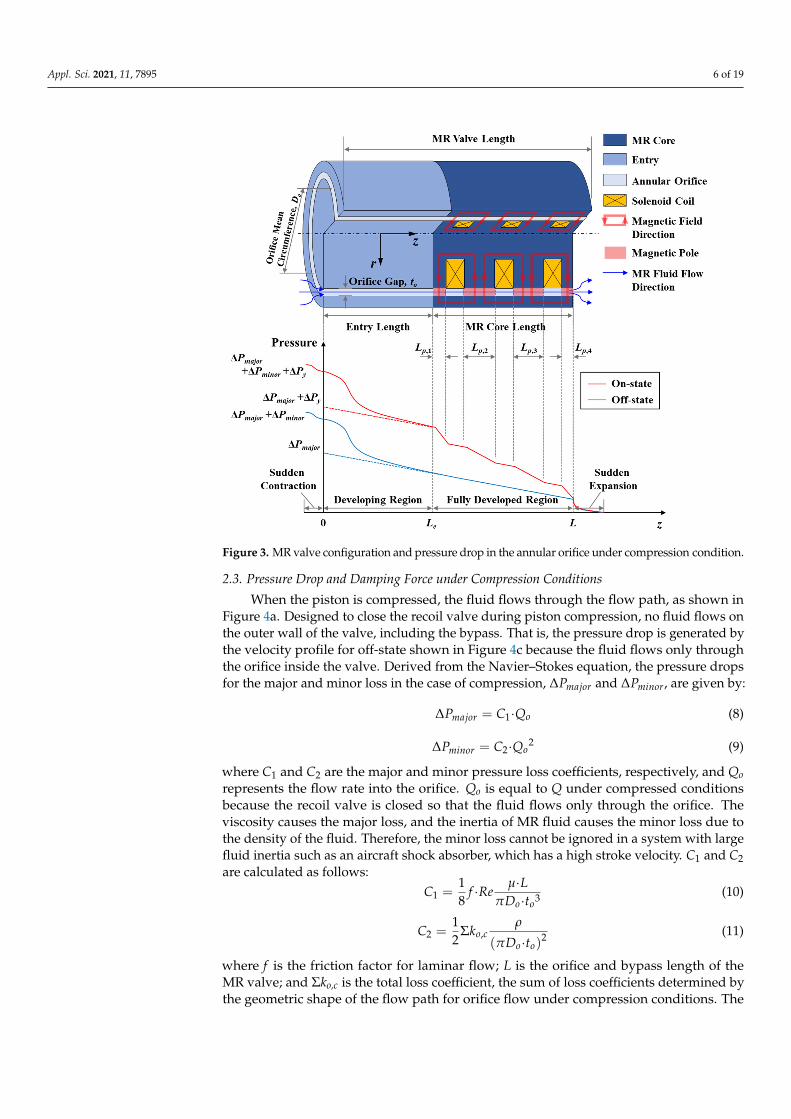
Figure 3 shows the configuration of the MR valve, the magnetic field direction for theinput current, and the pressure drop curves inside the orifice along the z-axis. MR valvesare divided into entry and MR cores. The MR core is a type of electromagnet that causesthe MR fluid to form a magnetic pole by the electric current input of the solenoid coil thatis wound around the MR core. The region where the magnetic field path overlaps the MRfluid in the orifice is defined as the magnetic pole. Low carbon steel is mainly used for theMR core to form the path of a magnetic field well. In Figure 3, the state in which the currentis applied to the coil is described as on-state, and the state with no current is described as
Appl. Sci. 2021, 11, 7895 5 of 19
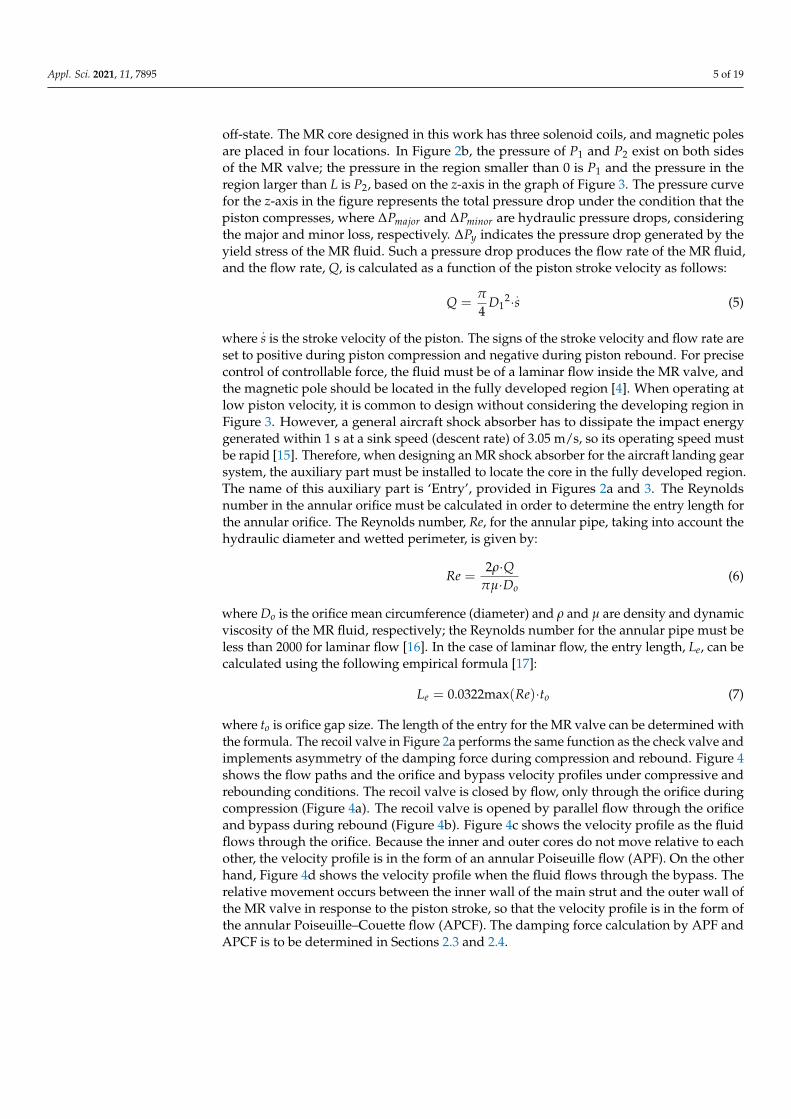
off-state. The MR core designed in this work has three solenoid coils, and magnetic polesare placed in four locations. In Figure 2b, the pressure of P1 and P2 exist on both sidesof the MR valve; the pressure in the region smaller than 0 is P1 and the pressure in theregion larger than L is P2, based on the z-axis in the graph of Figure 3. The pressure curvefor the z-axis in the figure represents the total pressure drop under the condition that thepiston compresses, where ∆Pmajor and ∆Pminor are hydraulic pressure drops, consideringthe major and minor loss, respectively. ∆Py indicates the pressure drop generated by theyield stress of the MR fluid. Such a pressure drop produces the flow rate of the MR fluid,and the flow rate, Q, is calculated as a function of the piston stroke velocity as follows:
Q =π
4D1
2· .s (5)
where.s is the stroke velocity of the piston. The signs of the stroke velocity and flow rate are
set to positive during piston compression and negative during piston rebound. For precisecontrol of controllable force, the fluid must be of a laminar flow inside the MR valve, andthe magnetic pole should be located in the fully developed region [4]. When operating atlow piston velocity, it is common to design without considering the developing region inFigure 3. However, a general aircraft shock absorber has to dissipate the impact energygenerated within 1 s at a sink speed (descent rate) of 3.05 m/s, so its operating speed mustbe rapid [15]. Therefore, when designing an MR shock absorber for the aircraft landing gearsystem, the auxiliary part must be installed to locate the core in the fully developed region.The name of this auxiliary part is ‘Entry’, provided in Figures 2a and 3. The Reynoldsnumber in the annular orifice must be calculated in order to determine the entry length forthe annular orifice. The Reynolds number, Re, for the annular pipe, taking into account thehydraulic diameter and wetted perimeter, is given by:
Re =2ρ·Q
πµ·Do(6)
where Do is the orifice mean circumference (diameter) and ρ and µ are density and dynamicviscosity of the MR fluid, respectively; the Reynolds number for the annular pipe must beless than 2000 for laminar flow [16]. In the case of laminar flow, the entry length, Le, can becalculated using the following empirical formula [17]:
Le = 0.0322max(Re)·to (7)
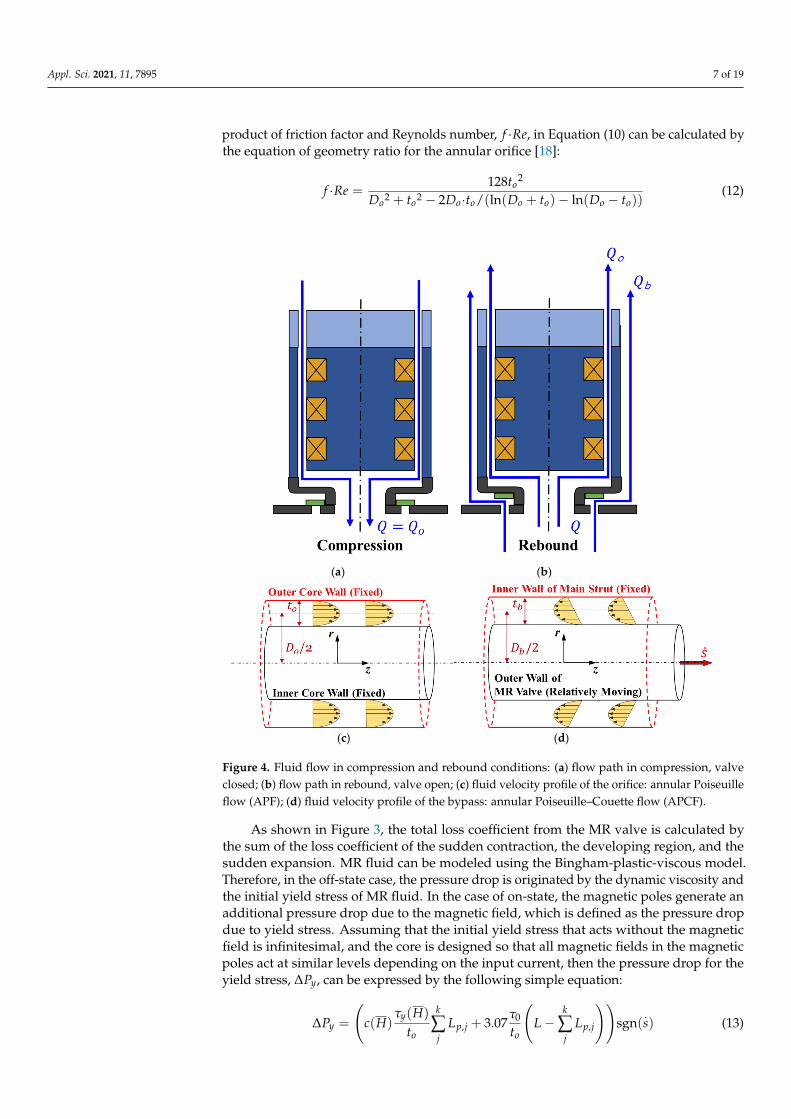
where to is orifice gap size. The length of the entry for the MR valve can be determined withthe formula. The recoil valve in Figure 2a performs the same function as the check valve andimplements asymmetry of the damping force during compression and rebound. Figure 4shows the flow paths and the orifice and bypass velocity profiles under compressive andrebounding conditions. The recoil valve is closed by flow, only through the orifice duringcompression (Figure 4a). The recoil valve is opened by parallel flow through the orificeand bypass during rebound (Figure 4b). Figure 4c shows the velocity profile as the fluidflows through the orifice. Because the inner and outer cores do not move relative to eachother, the velocity profile is in the form of an annular Poiseuille flow (APF). On the otherhand, Figure 4d shows the velocity profile when the fluid flows through the bypass. Therelative movement occurs between the inner wall of the main strut and the outer wall ofthe MR valve in response to the piston stroke, so that the velocity profile is in the form ofthe annular Poiseuille–Couette flow (APCF). The damping force calculation by APF andAPCF is to be determined in Sections 2.3 and 2.4.
Appl. Sci. 2021, 11, 7895 6 of 19
Appl. Sci. 2021, 11, x FOR PEER REVIEW 6 of 21
to each other, the velocity profile is in the form of an annular Poiseuille flow (APF). On the other hand, Figure 4d shows the velocity profile when the fluid flows through the bypass. The relative movement occurs between the inner wall of the main strut and the outer wall of the MR valve in response to the piston stroke, so that the velocity profile is in the form of the annular Poiseuille–Couette flow (APCF). The damping force calculation by APF and APCF is to be determined in Sections 2.3 and 2.4.
Figure 3. MR valve configuration and pressure drop in the annular orifice under compression con-dition.
Figure 3. MR valve configuration and pressure drop in the annular orifice under compression condition.
2.3. Pressure Drop and Damping Force under Compression Conditions
When the piston is compressed, the fluid flows through the flow path, as shown inFigure 4a. Designed to close the recoil valve during piston compression, no fluid flows onthe outer wall of the valve, including the bypass. That is, the pressure drop is generated bythe velocity profile for off-state shown in Figure 4c because the fluid flows only throughthe orifice inside the valve. Derived from the Navier–Stokes equation, the pressure dropsfor the major and minor loss in the case of compression, ∆Pmajor and ∆Pminor, are given by:
∆Pmajor = C1·Qo (8)
∆Pminor = C2·Qo2 (9)
where C1 and C2 are the major and minor pressure loss coefficients, respectively, and Qorepresents the flow rate into the orifice. Qo is equal to Q under compressed conditionsbecause the recoil valve is closed so that the fluid flows only through the orifice. Theviscosity causes the major loss, and the inertia of MR fluid causes the minor loss due tothe density of the fluid. Therefore, the minor loss cannot be ignored in a system with largefluid inertia such as an aircraft shock absorber, which has a high stroke velocity. C1 and C2are calculated as follows:
C1 =18
f ·Reµ·L
πDo·to3 (10)
C2 =12
Σko,cρ
(πDo·to)2 (11)
where f is the friction factor for laminar flow; L is the orifice and bypass length of theMR valve; and Σko,c is the total loss coefficient, the sum of loss coefficients determined bythe geometric shape of the flow path for orifice flow under compression conditions. The
Appl. Sci. 2021, 11, 7895 7 of 19
product of friction factor and Reynolds number, f ·Re, in Equation (10) can be calculated bythe equation of geometry ratio for the annular orifice [18]:
f ·Re =128to
2
Do2 + to2 − 2Do·to/(ln(Do + to)− ln(Do − to))(12)Appl. Sci. 2021, 11, x FOR PEER REVIEW 7 of 21
(a) (b)
(c) (d)
Figure 4. Fluid flow in compression and rebound conditions: (a) flow path in compression, valve closed; (b) flow path in rebound, valve open; (c) fluid velocity profile of the orifice: annular Poiseuille flow (APF); (d) fluid velocity profile of the bypass: annular Poiseuille–Couette flow (APCF).
2.3. Pressure Drop and Damping Force under Compression Conditions When the piston is compressed, the fluid flows through the flow path, as shown in
Figure 4a. Designed to close the recoil valve during piston compression, no fluid flows on the outer wall of the valve, including the bypass. That is, the pressure drop is generated by the velocity profile for off-state shown in Figure 4c because the fluid flows only through the orifice inside the valve. Derived from the Navier–Stokes equation, the pressure drops for the major and minor loss in the case of compression, ∆𝑃 and ∆𝑃 , are given by:
1major oP C QΔ = ⋅ (8)
22minor oP C QΔ = ⋅ (9)
where C1 and C2 are the major and minor pressure loss coefficients, respectively, and Qo represents the flow rate into the orifice. Qo is equal to Q under compressed conditions because the recoil valve is closed so that the fluid flows only through the orifice. The vis-cosity causes the major loss, and the inertia of MR fluid causes the minor loss due to the density of the fluid. Therefore, the minor loss cannot be ignored in a system with large
Figure 4. Fluid flow in compression and rebound conditions: (a) flow path in compression, valveclosed; (b) flow path in rebound, valve open; (c) fluid velocity profile of the orifice: annular Poiseuilleflow (APF); (d) fluid velocity profile of the bypass: annular Poiseuille–Couette flow (APCF).
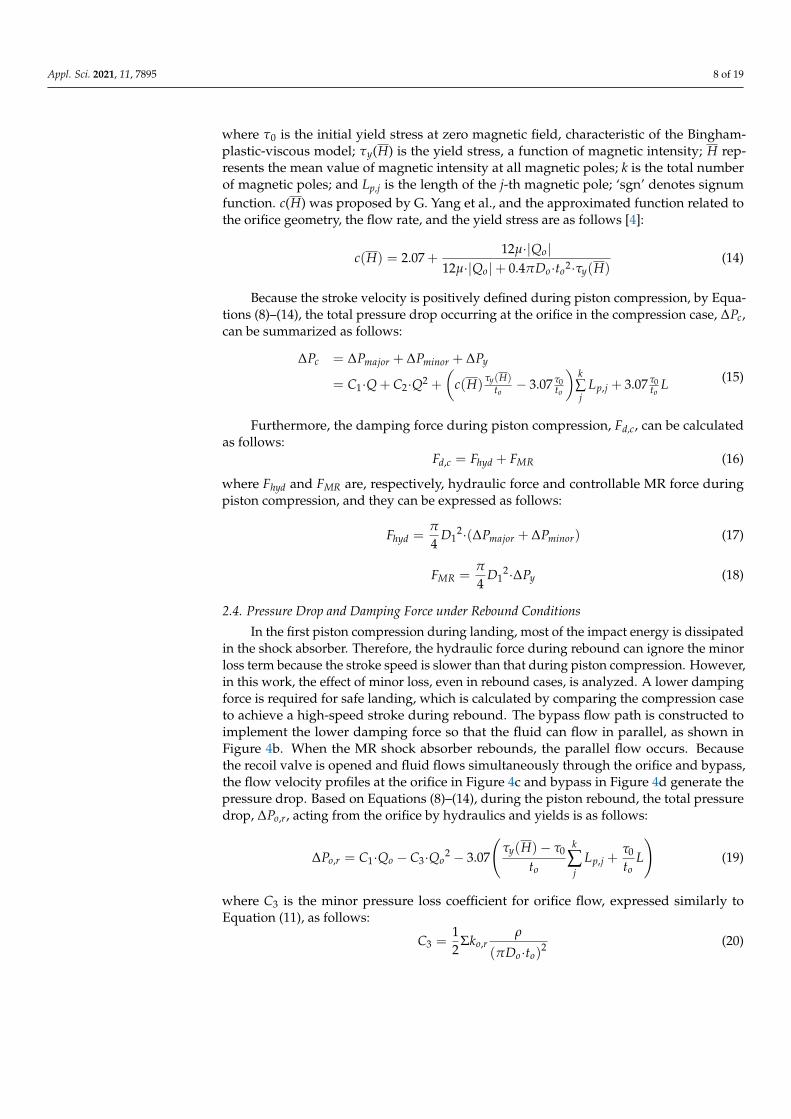
As shown in Figure 3, the total loss coefficient from the MR valve is calculated bythe sum of the loss coefficient of the sudden contraction, the developing region, and thesudden expansion. MR fluid can be modeled using the Bingham-plastic-viscous model.Therefore, in the off-state case, the pressure drop is originated by the dynamic viscosity andthe initial yield stress of MR fluid. In the case of on-state, the magnetic poles generate anadditional pressure drop due to the magnetic field, which is defined as the pressure dropdue to yield stress. Assuming that the initial yield stress that acts without the magneticfield is infinitesimal, and the core is designed so that all magnetic fields in the magneticpoles act at similar levels depending on the input current, then the pressure drop for theyield stress, ∆Py, can be expressed by the following simple equation:
∆Py =
(c(H)
τy(H)
to
k
∑j
Lp,j + 3.07τ0
to
(L−
k
∑j
Lp,j
))sgn(
.s) (13)
Appl. Sci. 2021, 11, 7895 8 of 19
where τ0 is the initial yield stress at zero magnetic field, characteristic of the Bingham-plastic-viscous model; τy(H) is the yield stress, a function of magnetic intensity; H rep-resents the mean value of magnetic intensity at all magnetic poles; k is the total numberof magnetic poles; and Lp,j is the length of the j-th magnetic pole; ‘sgn’ denotes signumfunction. c(H) was proposed by G. Yang et al., and the approximated function related tothe orifice geometry, the flow rate, and the yield stress are as follows [4]:
c(H) = 2.07 +12µ·|Qo|
12µ·|Qo|+ 0.4πDo·to2·τy(H)(14)
Because the stroke velocity is positively defined during piston compression, by Equa-tions (8)–(14), the total pressure drop occurring at the orifice in the compression case, ∆Pc,can be summarized as follows:
∆Pc = ∆Pmajor + ∆Pminor + ∆Py
= C1·Q + C2·Q2 +
(c(H)
τy(H)to− 3.07 τ0
to
)k∑j
Lp,j + 3.07 τ0to
L (15)
Furthermore, the damping force during piston compression, Fd,c, can be calculatedas follows:
Fd,c = Fhyd + FMR (16)
where Fhyd and FMR are, respectively, hydraulic force and controllable MR force duringpiston compression, and they can be expressed as follows:
Fhyd =π
4D1
2·(∆Pmajor + ∆Pminor) (17)
FMR =π
4D1
2·∆Py (18)
2.4. Pressure Drop and Damping Force under Rebound Conditions
In the first piston compression during landing, most of the impact energy is dissipatedin the shock absorber. Therefore, the hydraulic force during rebound can ignore the minorloss term because the stroke speed is slower than that during piston compression. However,in this work, the effect of minor loss, even in rebound cases, is analyzed. A lower dampingforce is required for safe landing, which is calculated by comparing the compression caseto achieve a high-speed stroke during rebound. The bypass flow path is constructed toimplement the lower damping force so that the fluid can flow in parallel, as shown inFigure 4b. When the MR shock absorber rebounds, the parallel flow occurs. Becausethe recoil valve is opened and fluid flows simultaneously through the orifice and bypass,the flow velocity profiles at the orifice in Figure 4c and bypass in Figure 4d generate thepressure drop. Based on Equations (8)–(14), during the piston rebound, the total pressuredrop, ∆Po,r, acting from the orifice by hydraulics and yields is as follows:
∆Po,r = C1·Qo − C3·Qo2 − 3.07
(τy(H)− τ0
to
k
∑j
Lp,j +τ0
toL
)(19)
where C3 is the minor pressure loss coefficient for orifice flow, expressed similarly toEquation (11), as follows:
C3 =12
Σko,rρ
(πDo·to)2 (20)

Appl. Sci. 2021, 11, 7895 9 of 19
where Σko,r is the total loss coefficient for the orifice flow under rebound conditions. Becausethe magnetic field does not act on bypass, the total pressure drop, ∆Pb,r from the bypasscan be expressed by considering only the pressure loss of hydraulic and initial yield stress:
∆Pb,r = C4·(Q−Qo)− C5·(Q−Qo)2 − 3.07
τ0
tbL (21)
where tb is the bypass gap size; C4 and C5 are, respectively, the major and minor pressureloss coefficients for APCF in the bypass. Because MR fluid flows parallel through theorifice and bypass, the coefficients of the major and minor pressure loss of the bypass mustbe considered. Additionally, APCF at the bypass must be considered because APF andannular Couette flow are formed simultaneously by the relative motion of the stroke fromthe inner wall of the main strut and MR valve. Figure 4d illustrates the APCF well. Thecoefficients of major and minor pressure loss for the APCF, C4, and C5, are as follows:
C4 =12µ·L
πDb·tb3 −
24µ·L(πD1·tb)
2 (22)
C5 =12
Σkb,rρ
(πDb·tb)2 (23)
where Db is the bypass mean circumference and Σkb,r is the total loss coefficient for bypassflow under rebound conditions. The pressure drop generated in the orifice and bypassduring rebound is the same; Equation (19) is equal to Equation (21). Through somemathematical expansion, the flow rate of the orifice, Qo,r, and the total pressure drop, ∆Prfor piston rebound are calculated as:
Qo,r =
{a1 +
√a1
2 + a2sgn(C5 − C3) , a2 < 00 , a2 ≥ 0
(24)
∆Pr = C4(Q−Qo,r)− C5(Q−Qo,r)2 − 3.07
τ0
tbL (25)
In the above, the variables a1 and a2 are used to simplify the expression and are definedas follows:
a1 :=2C5·Q− C1 − C4
2(C5 − C3)(26)
a2 :=C4·Q− C5·Q2
C5 − C3+
3.07C5 − C3
(τy(H)− τ0
to
k
∑j
Lp,j +tb − to
tb·toτ0·L
)(27)
If the pressure drop caused by the flow rate is smaller than the pressure drop causedby the yield stress, depending on the magnetic field, a block-up phenomenon occurs inthe orifice [4]. If this occurs, MR fluid does not flow through the orifice and can only flowthrough the bypass. Equation (24) well represents the corresponding phenomenon. Ifonly the major loss is considered in calculating the pressure drop in the rebound case, thequadratic term of the flow rate disappears. Based on Equations (19) and (21), the flow rateof the orifice, Qo,maj, and the total pressure drop, ∆Pr,maj, considering only the major lossfor the piston rebound, can be calculated:
Qo,maj =
C4
C1+C4Q + 3.07
C1+C4
(τy(H)−τ0
to
k∑j
Lp,j +tb−totb ·to
τ0·L)
, Qo,maj < 0
0 , Qo,maj ≥ 0
(28)
∆Pr,maj = C4·(Q−Qo,maj)− 3.07τ0
tbL (29)
Appl. Sci. 2021, 11, 7895 10 of 19
The damping force, Fd,r, taking into account hydraulics and yield stress in the reboundcondition, can be calculated as follows:
Fd,r =π
4D1
2·∆Pr (30)
2.5. Total Pressure Drop and Damping Force
The total pressure drop, ∆Ptotal , and the damping force, Fd, generated in the MR shockabsorber, considering both the major and minor losses, are as follows:
∆Ptotal =
{∆Pc Q ≥ 0∆Pr Q < 0
(31)
Fd =π
4D1
2·∆Ptotal =
{Fd,c
.s ≥ 0
Fd,r.s < 0
(32)
Moreover, the pressure drop, ∆Pmaj, and damping force, Fd,maj, generated in the MRshock absorber, considering only the major loss, are as follows:
∆Pmaj =
{∆Pmajor + ∆Py Q ≥ 0∆Pr,maj Q < 0
(33)
Fd,maj =π
4D1
2·∆Pmaj (34)
3. Design Parameters3.1. Characteristic Evaluation of MR Fluid
The damping force of the aircraft shock absorber utilizing MR fluid is sensitive, notonly to the density of the fluid, but also to the yield stress for the magnetic field and thedynamic viscosity. Therefore, the dynamic viscosity and the yield stress for the MR fluid aremeasured through an MR viscometer. The density is calculated by measuring the mass andvolume and is 3.510 g/cm3 for the MRF-140CG fluid from LORD Corporation. As a resultof measuring via MR viscometer in a temperature environment of 23 degree Celsius, thedynamic viscosity and the initial shear stress of MRF-140CG is estimated to be 0.290 Pa · sand 166.3 Pa, respectively. The yield stress, depending on the magnetic intensity measuredby MR viscometer, is fitted to the following polynomial expression:
τy(H) = −0.005H3+ 0.900H2
+ 298.5H + 166.3 (35)
where the unit of the shear stress and magnetic intensity are Pa and kA/m, respectively.
3.2. Magnetic Analysis for MR Core
Magnetic analysis is performed using the ANSYS MAXWELL program. It refers tothe magnetic flux density-magnetic intensity curve (BH curve) required for the magneticanalysis of the LORD Corporation’s datasheet for MRF-140CG [19]. The correspondingBH curve is used for each material, and the materials of the MR valve and the recoil valveare as follows: inner and outer cores are AISI1008 steel; the entry is aluminum7075-T651;the recoil valve parts are sus304 and aluminum7075-T651; and the coil uses polyesterenameled copper wire (PEW) of AWG27 standard. The magnetic analysis conditions areset as follows: the solution type is magnetic transient; the basic mesh number of the orificeis 15; eddy effects and core loss are activated; and nonlinear residual is set as 10−6. Themagnetic intensity for MRF-140CG, obtained by the magnetic analysis, is curve-fitted, andthe averaged magnetic intensity is determined as a polynomial equation, as follows:
H = −6.057I3 − 0.776I2 + 57.29I (36)
Appl. Sci. 2021, 11, 7895 11 of 19
where I is the input current in Ampere units, and the unit of magnetic intensity is kA/m.
3.3. Minor Pressure Loss Analysis with CFD
It is almost impossible to theoretically calculate the minor pressure coefficients and losscoefficients in Equations (11), (20), and (23). Therefore, to identify the hydraulic resistance,such as the loss coefficient at the design process, direct experiments can be performed,or it is possible to refer to guidebooks experimentally calculated by many researchers forthe duct and pipe flow specifications, as they have specific arbitrary cross-sections [20].However, the loss coefficients for many of the annular MR valves and other parts designedin this study cannot be found in guidebooks. It is also impossible to determine lossesexperimentally in the design process. Consequently, in this work, the designed model’sloss coefficients are estimated using the Fluent program of the ANSYS computational fluiddynamics (CFD) tool. The CFD analysis conditions are set as follows: the solver typeis steady-pressure based; the viscous model is a realizable k-epsilon model with modelconstraints for C2-epsilon, TKE Prandtl number, and TDR Prandtl number set at 1.9, 1,and 1.2, respectively; basic mesh number of the orifice and the bypass are 15; the orificeand the bypass are set as the laminar zone; the solution methods are simple pressure-velocity coupling, least square cell based gradient, standard pressure, second order upwindmomentum, first order upwind turbulent kinetic energy, and first order upwind dissipationrate; the residual of absolute criteria is set as 10−3; the piston stroke speed when the pistonis compressed is 2.50 m/s; and the piston stroke speed when the piston is rebounded is1.33 m/s.
Using Equation (7), the maximum Reynolds number and entry length are calculatedat 1113 and 87.8 mm when the sink speed is 3.05 m/s and the input current is not applied.At the same time, it is confirmed that the entry length is about 85 mm as a result of theCFD analysis, as shown in Figure 5, performed under the same conditions. Based onEquations (11) and (23), the pressure drop calculated by CFD includes both major andminor losses, so the total loss coefficients at the orifice and bypass, Σko and Σkb, can beestimated as follows:
Σko = 2(πDo·to)
2
ρ
(∆PCFD − C1·Qo)
Qo2 (37)
Σkb = 2(πDb·tb)
2
ρ
(∆PCFD − C4(Q−Qo))
(Q−Qo)2 (38)
where ∆PCFD is the CFD result of the pressure drop. Based on the CFD result in Figure 5a,under compression conditions, the entry length and total loss coefficient are set to 85 mmand 2.779, respectively. Through Equations (6) and (7), the Reynolds number and entrylengths of the orifice are calculated under the harshest rebound conditions. The Reynoldsnumber and the entry length of the orifice are 195.31 and 15.41 mm, respectively. The entrylength is 11.85% of the total MR valve length. Calculated based on equations in [21], theReynolds number and the entry length of the bypass are 136.93 and 11.2 mm, respectively.The length of the entry is 8.62% of the total MR valve length. Additionally, under reboundconditions, there is no tendency for additional minor pressure drops in the entry regionfrom Figure 5b. In conclusion, it is assumed that the entry length is short compared tothe length of the total MR valve at the time of the rebound. Therefore, there is no need toconsider the entry regions for the orifice and the bypass under rebound conditions. Thetotal loss coefficients of the orifice and the bypass are calculated regarding Figure 5b andEquations (37) and (38). The flow rate analysis results of the orifice and the bypass by theCFD analysis to calculate the total loss coefficient are as follows: the flow rates of the orificeand the bypass are 1.886 cm3/s and 1.508 cm3/s, respectively, and the total loss coefficientsof the orifice and the bypass are 3.233 and 14.25, respectively.

Appl. Sci. 2021, 11, 7895 12 of 19Appl. Sci. 2021, 11, x FOR PEER REVIEW 13 of 21
(a) (b)
Figure 5. Pressure result calculated with CFD tool, ANSYS Fluent: (a) pressure change along the z-axis, compression condition, flow through the orifice, and comparison with major pressure loss; (b) pressure change along the z-axis, rebound condition, flow through orifice, and bypass simultane-ously.
3.4. Design Parameters for MR Shock Absorber In this work, the design parameters of an MR shock absorber are chosen on the basis
of the lightweight landing gear system of a Beechcraft Baron B55 by considering the weight of 230 kg for each main landing gear. It is noted here that the original weight of the Beechcraft Baron B55 is 680 kg for each main landing gear. Hence, the design param-eters of the prototype are appropriately adjusted, and the pressure drops are confirmed using the proposed design model. Table 1 provides the detailed design specifications of the MR shock absorber designed and manufactured in this work. It is noted that the opti-mization is performed on the design variables for the MR core to set the parameters using the equations in [22]. Based on the magnetic field analysis results and design parameters, the controllable forces are calculated as 0.9025 kN, 1.661 kN, and 2.095 at the input current of 0.5A, 1.0A, and 1.5A, respectively, based on a stroke velocity of 2 m/s.
Table 1. Specifications of MR Shock absorber.
Parameter Symbol Value Unit Orifice diameter Do 43.75 mm
Orifice gap to 2.450 mm Bypass diameter Db 54.60 mm
Bypass gap tb 2.400 mm Length of the orifice and bypass L 130.0 mm
Entry length Le 85.00 mm Length of the pole 1 Lp,1 5.500 mm Length of the pole 2 Lp,2 11.00 mm Length of the pole 3 Lp,3 11.00 mm Length of the pole 4 Lp,4 5.500 mm
Wire diameter of the solenoid coil dcoil 0.361 mm Inner diameter of the solenoid coil Dcoil 20.00 mm
Height of the solenoid coil hcoil 4.000 mm Number of turns of the solenoid coil Nturn 300 -
Inner diameter of the main strut D1 57.00 mm Outer diameter of the piston D2 50.70 mm
Viscosity of MR fluid μ 0.290 Pa·s Density of MR fluid ρ 3.510 g/cm3
Initial yield stress of MR fluid 𝜏 166.3 Pa
Figure 5. Pressure result calculated with CFD tool, ANSYS Fluent: (a) pressure change along the z-axis,compression condition, flow through the orifice, and comparison with major pressure loss; (b) pressurechange along the z-axis, rebound condition, flow through orifice, and bypass simultaneously.
3.4. Design Parameters for MR Shock Absorber
In this work, the design parameters of an MR shock absorber are chosen on the basisof the lightweight landing gear system of a Beechcraft Baron B55 by considering the weightof 230 kg for each main landing gear. It is noted here that the original weight of theBeechcraft Baron B55 is 680 kg for each main landing gear. Hence, the design parametersof the prototype are appropriately adjusted, and the pressure drops are confirmed usingthe proposed design model. Table 1 provides the detailed design specifications of the MRshock absorber designed and manufactured in this work. It is noted that the optimization isperformed on the design variables for the MR core to set the parameters using the equationsin [22]. Based on the magnetic field analysis results and design parameters, the controllableforces are calculated as 0.9025 kN, 1.661 kN, and 2.095 at the input current of 0.5 A, 1.0 A,and 1.5 A, respectively, based on a stroke velocity of 2 m/s.
Table 1. Specifications of MR Shock absorber.
Parameter Symbol Value Unit
Orifice diameter Do 43.75 mmOrifice gap to 2.450 mm
Bypass diameter Db 54.60 mmBypass gap tb 2.400 mm
Length of the orifice and bypass L 130.0 mmEntry length Le 85.00 mm
Length of the pole 1 Lp,1 5.500 mmLength of the pole 2 Lp,2 11.00 mmLength of the pole 3 Lp,3 11.00 mmLength of the pole 4 Lp,4 5.500 mm
Wire diameter of the solenoid coil dcoil 0.361 mmInner diameter of the solenoid coil Dcoil 20.00 mm
Height of the solenoid coil hcoil 4.000 mmNumber of turns of the solenoid coil Nturn 300 -
Inner diameter of the main strut D1 57.00 mmOuter diameter of the piston D2 50.70 mm
Viscosity of MR fluid µ 0.290 Pa·sDensity of MR fluid ρ 3.510 g/cm3
Initial yield stress of MR fluid τ0 166.3 PaProduct of friction factor and Reynolds number for the orifice f ·Re 95.98 -
Total loss coefficient for the orifice, compression Σko,c 2.779 -Total loss coefficient for the orifice, rebound Σko,r 3.233 -Total loss coefficient for the bypass, rebound Σkb,r 14.25 -

Appl. Sci. 2021, 11, 7895 13 of 19
4. Experimental Validation4.1. Experimental Apparatus
The configuration of the drop device, the type of sensors, the DAQ device, and themodel names used in the experiment are shown in Figure 6. The sprung and un-sprungmasses of the constructed drop device are 230 kg and 15 kg, respectively. Experiments arecategorized as follows: off-state pressure measurement with impact energy and pressuremeasurement corresponding to the input current when impact energy is fixed. The impactenergy (IE) can be calculated through the sink speed at the moment of the touchdown ofthe un-sprung mass and the distance to the static equilibrium state:
IE = (ms + mu)(g·z1,eq + 0.5.z1)−mu·g·seq (39)
where ms and mu are sprung and un-sprung masses, respectively; g is the gravity accel-eration and is set to 9.806; z1,eq and seq are sprung mass and piston stroke displacementsfrom the moment of touchdown to the static equilibrium state;
.z1 is the sink speed of the
landing gear system at the moment of touchdown. The sink speed is estimated through thedisplacement and the acceleration of the sprung mass, measured with a laser sensor and anacceleration sensor attached to the sprung mass. In other words, the impact energy is con-verted into the form of the energy dissipated by the pressure loss in the MR shock absorberafter impact, the energy dissipated by the friction between the MR shock absorber and theguide shaft of the drop device, and the elastic potential energy stored in the gas chamberand the tire as a spring energy form. This work compared the dissipated energy due to thepressure loss in the MR shock absorber estimated experimentally and the pressure dropmodel. ∆Ptotal and ∆Pmaj are calculated for the experimentally estimated piston strokevelocities to validate the mathematically modeled pressure drop model. The piston strokevelocity is estimated through stroke displacement, and acceleration is measured via thewire sensor and accelerometers mounted at the sprung and un-sprung masses. ∆Ptotal and∆Pmaj can be calculated by Equations (31) and (33). In this paper, the pressure drop model,calculated by estimated piston stroke velocity, is called the ∆P− .
s model. The pressure dropmodel is constructed in MATLAB, a numerical analysis program. Because the main contentof this paper is a comparison of pressure drop in conformity with the presence or absenceof the minor loss, the simulation on the landing efficiency using the landing gear modelis omitted.
4.2. Comparison of Pressure Drop in Conformity with Impact Energy under Off-State
In this section, the drop test is performed by mounting the aircraft landing gear withthe MR shock absorber onto the drop device to analyze the internal pressure response inconformity with impact energy under off-state conditions. The impact energy is applied andtested at 456.7 J, 937.5 J, and 1538 J. Figure 7 presents the inside pressure drop and estimateddamping force of the MR shock absorber for, respectively, stroke displacement and velocitywhen the landing gear system is freely dropped. ∆Ptotal and ∆Pmaj on the legend are thepressure drop models calculated using Equations (31) and (33) via the stroke velocityestimated through their respective experiments. Experimental data on the legend refers tothe pressure drop measured by the actual measured upper and lower chamber pressures.The initial stroke displacement and velocity start from the origin of the coordinates, asshown in Figure 7. As the compression process progresses, the stroke displacementand velocity, pressure drop, and estimated damping force increase simultaneously. InFigure 7a,c,e, the response of the ∆Pmaj model increases in error compared with the ∆Ptotalmodel as the impact energy increases. To compare the differences, the results of thedissipated energy for the pressure drop models are presented in Table 2. The differencebetween the impact energy and the dissipated energy comes from the elastic potentialenergy conserved through the pneumatic chamber and the tire. In Table 2, as the impactenergy increases, the relative error of the dissipated energy is within 15% for the ∆Ptotalmodel. However, in the ∆Pmaj model, the relative error gradually increases up to 54%. In

Appl. Sci. 2021, 11, 7895 14 of 19
Figure 7b,d,f, as the stroke velocity increases, the difference between the ∆Ptotal model andthe experiment does not increase, whereas the error from the experimental result increasescompared to the ∆Pmaj model; the difference in the slope due to the quadratic term of theflow rate increases as the stroke velocity increases. Table 2 also shows the error resultsnumerically. In addition, Figure 7e,f is suitable for comparing the error of the pressure dropmodels with a maximum rebound speed of about 0.6 m/s after the first compression; theroot mean square (RMS) of errors and relative errors for the experiment and pressure dropmodels are compared using data with a stroke velocity range of −0.1 m/s or less. For the∆Ptotal model, the RMS values for the error and relative error with the experimental dataare 35.69 kPa and 37.95%, respectively; for the ∆Pmaj model, they are 16.22 kPa and 28.92%,respectively. The characteristics of the minor loss are not well displayed during rebound,which resulted in small RMS values of the ∆Pmaj model. In other words, the pressure dropmodel can be simplified as Equations (28) and (29) by considering only the major lossat the time of rebound. In Figure 7e,f, the maximum stroke velocity during the secondcompression is about 0.5 m/s, which is suitable for comparing the error for the pressuredrop model with low-speed compression. The RMS values of the error and relative errorfor the experiment and pressure drop models are compared using data within the strokevelocity range from 0.1 to 0.5 m/s. For the ∆Ptotal model, the RMS values for the errorand relative error with the experimental data are 10.94 kPa and 4.507%, respectively; forthe ∆Pmaj model, they are 45.07 kPa and 15.02%, respectively. Furthermore, the dynamicviscosity and initial yield stress are estimated to be 0.2882 Pa·s and 230.3 Pa as a resultof performing nonlinear least square parameter estimation based on Equation (15) usingthe experimental data, where the estimated values are similar to those measured with theMR viscometer. Because the plastic-viscosity model used in the mathematical modelingis constructed based on the measurement data of the MR viscometer, the error level isgenerally uniform in the low-stroke velocity interval of 0.5 m/s or less. In other words, thedesign formula for the general MR damper considering only the major loss may be usedwithin an error range of 15% or less in the application utilized in the experiment underthe stroke velocity of 0.5 m/s. The maximum pressure drop and the damping force at themaximum compression velocity are compared between the experimental results and thepressure drop models. The RMS of the maximum pressure drop error and relative errorare calculated and compared. For the ∆Ptotal model at the stroke velocity of 0.5 m/s, theRMS values for the error and relative error with the experimental data are 15.49 kPa and4.104%, respectively, and for the ∆Pmaj model they are 54.51 kPa and 14.44%, respectively.Values are 35.13 kPa, 4.997%, 173.1 kPa, and 24.62% in sequence in Figure 7b; 50.79 kPa,2.412%, 1011 kPa, and 48.01% in sequence in Figure 7d; and 426.6 kPa, 12.41%, 2.032 kPa,and 59.12% in sequence in Figure 7f. Therefore, it is necessary to consider the minor loss asthe maximum stroke velocity increases in order to reduce the error.
Table 2. Dissipated energy in MR shock absorber for impact energy; RMS values of error for model-based and measuredpressure data over stroke velocity range of 0.1 m/s or more.
Impact Energy (J)
Dissipated Energy Pressure Drop
Experiment(J)
∆P− .s Model(J)
Relative Error(%)
RMS Error(kPa)
RMS Relative Error(%)
∆Ptotal ∆Pmaj ∆Ptotal ∆Pmaj ∆Ptotal ∆Pmaj ∆Ptotal ∆Pmaj
456.7 276.6 263.5 200.6 4.748 27.46 16.72 109.2 5.650 19.37937.5 737.2 672.5 406.1 8.781 44.92 70.28 419.1 13.54 28.071538 1339 1149 621.2 14.18 53.61 189.5 735.8 11.66 31.72

Appl. Sci. 2021, 11, 7895 15 of 19Appl. Sci. 2021, 11, x FOR PEER REVIEW 15 of 21
Figure 6. Vertical drop test device for performance evaluation of MR shock absorber.
4.2. Comparison of Pressure Drop in Conformity with Impact Energy under Off-State In this section, the drop test is performed by mounting the aircraft landing gear with
the MR shock absorber onto the drop device to analyze the internal pressure response in conformity with impact energy under off-state conditions. The impact energy is applied and tested at 456.7 J, 937.5 J, and 1538 J. Figure 7 presents the inside pressure drop and estimated damping force of the MR shock absorber for, respectively, stroke displacement and velocity when the landing gear system is freely dropped. ∆𝑃 and ∆𝑃 on the legend are the pressure drop models calculated using Equations (31) and (33) via the stroke velocity estimated through their respective experiments. Experimental data on the legend refers to the pressure drop measured by the actual measured upper and lower chamber pressures. The initial stroke displacement and velocity start from the origin of the coordinates, as shown in Figure 7. As the compression process progresses, the stroke displacement and velocity, pressure drop, and estimated damping force increase simulta-neously. In Figure 7a,c,e, the response of the ∆𝑃 model increases in error compared with the ∆𝑃 model as the impact energy increases. To compare the differences, the results of the dissipated energy for the pressure drop models are presented in Table 2. The difference between the impact energy and the dissipated energy comes from the elastic potential energy conserved through the pneumatic chamber and the tire. In Table 2, as the impact energy increases, the relative error of the dissipated energy is within 15% for the ∆𝑃 model. However, in the ∆𝑃 model, the relative error gradually increases up to 54%. In Figure 7b,d,f, as the stroke velocity increases, the difference between the ∆𝑃 model and the experiment does not increase, whereas the error from the experimental result increases compared to the ∆𝑃 model; the difference in the slope due to the quadratic term of the flow rate increases as the stroke velocity increases. Table 2 also shows the error results numerically. In addition, Figure 7e,f is suitable for comparing the error of the pressure drop models with a maximum rebound speed of about 0.6 m/s after the first compression; the root mean square (RMS) of errors and relative errors for the experiment and pressure drop models are compared using data with a stroke velocity range of −0.1 m/s or less. For the ∆𝑃 model, the RMS values for the error and relative error with the experimental data are 35.69 kPa and 37.95%, respectively; for the ∆𝑃
Figure 6. Vertical drop test device for performance evaluation of MR shock absorber.
4.3. Comparison of Pressure Drop and Landing Efficiency in Conformity with Input Current andFixed Drop Height
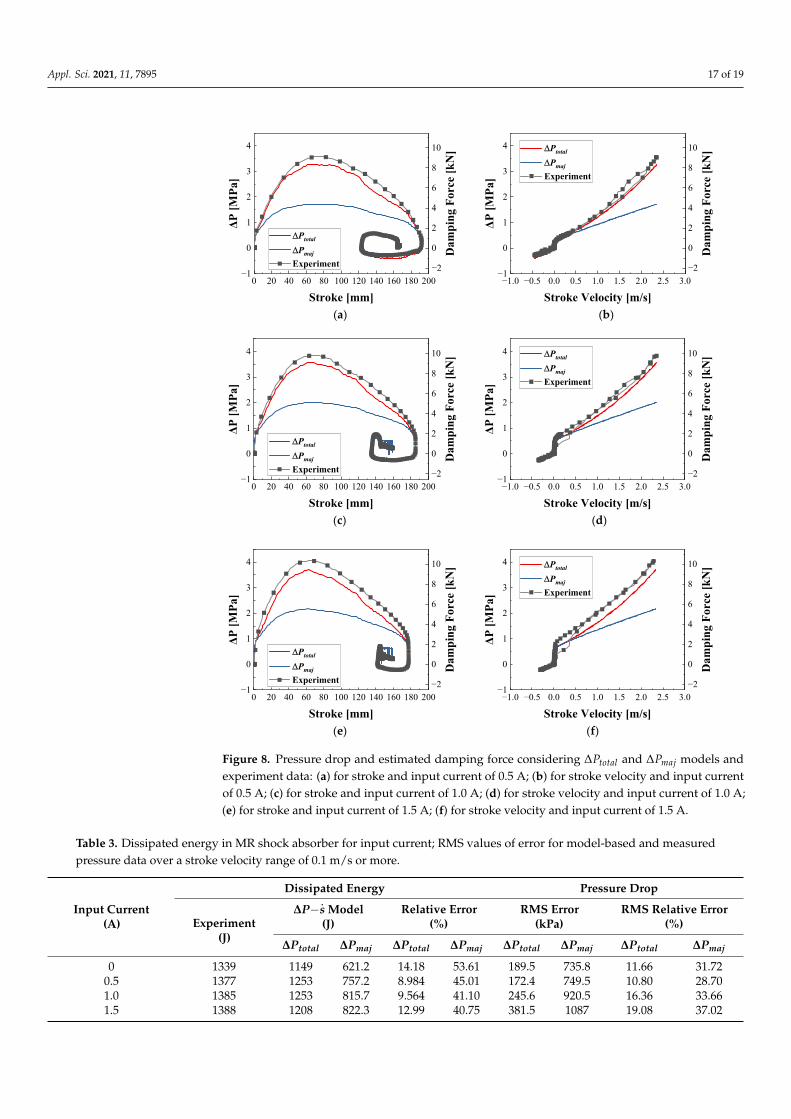
In this section, the response of the MR shock absorber depending on the input currentis analyzed experimentally with the impact energy fixed. The input current is applied 10s before the drop to exclude a time delay with respect to the input current. The impactenergy during touchdown is the same at 1538 J. Figure 8 presents the internal pressure dropof the MR shock absorber in conformity with the input current for the stroke displacementand velocity. As in the case of Figure 7, ∆Ptotal and ∆Pmaj on the legend of Figure 8 arethe pressure drop calculated for the estimated stroke velocity. ‘Experiment’ on the legendis the pressure drop measured through the pressure sensors during the drop test. Whenthe impact energy is constant, the pressure drop in all stroke displacement ranges ofboth the ∆Ptotal and ∆Pmaj models increases as the input current increases. As shown inFigure 8a,c,e, the maximum stroke displacement decreases as the input current increasesdue to the energy dissipated by the additional pressure drop generated by the yield stress.The dissipated energy is calculated in Table 3 for comparison with the input current. As theinput current increases, the dissipated energy for the measured data and the ∆Ptotal modeldoes not change significantly. Because the impact energy does not change, the potentialand kinetic energies do not change, and the dissipated energy also does not. However,the dissipated energy increases as the input current increases in the case of the ∆Pmajmodel. The reason for this is that the area between the ∆Ptotal and ∆Pmaj curve for thestroke decreases as the dissipated energy for the yield stress increases as the input currentincreases, as shown in Figure 8a,c,e. Regardless of all the input currents in Figure 8b,d,f,the ∆Ptotal model does not show a significant difference from the experimental result asthe stroke velocity increases. On the other hand, the error between the ∆Pmaj model-based pressure drop and the experimental result increase depending on the stroke velocityincrease. In Table 3, the RMS values of the error and relative error are calculated over thestroke velocity range of 0.1 m/s or more. The input current and the pressure drop modelsare independent; the RMS errors and relative errors in Table 3 are due to the error of themagnetic analysis. As a result of the experiment, the controllable force is estimated at0.6137 kN, 1.382 kN, and 2.128 kN for 0.5 A, 1.0 A, and 1.5 A, respectively, based on thestroke velocity of 2 m/s. The maximum compression velocity estimated by experimentsfrom 0 A to 1.5 A in 0.5 A units is 2.390 m/s, 2.352 m/s, 2.359 m/s, and 2.338 m/s. Theerror in the estimated velocity occurred due to the friction force of the drop device and MR

Appl. Sci. 2021, 11, 7895 16 of 19
shock absorber, but it tends to decrease as the input current increases. The RMS values ofthe maximum pressure drop error and relative error are compared between the pressuredrop model and the experimentally measured data. For the input current, the RMS valuesof the error and relative error between the experimental data and the ∆Ptotal model and theRMS values of the error and relative error between the experimental data and the ∆Pmajmodel are as follows, in sequence, respectively: 0.3399 MPa, 9.484%, 1.889 MPa, and 52.73%for 0.5 A; 0.3052 MPa, 7.922%, 1.863 MPa, and 48.37% for 1.0 A; and 0.3666 MPa, 9.047%,1.905 MPa, and 47.03% for 1.5 A.
Appl. Sci. 2021, 11, x FOR PEER REVIEW 16 of 21
model, they are 16.22 kPa and 28.92%, respectively. The characteristics of the minor loss are not well displayed during rebound, which resulted in small RMS values of the ∆𝑃 model. In other words, the pressure drop model can be simplified as Equations (28) and (29) by considering only the major loss at the time of rebound. In Figure 7e,f, the maximum stroke velocity during the second compression is about 0.5 m/s, which is suitable for com-paring the error for the pressure drop model with low-speed compression. The RMS val-ues of the error and relative error for the experiment and pressure drop models are com-pared using data within the stroke velocity range from 0.1 to 0.5 m/s. For the ∆𝑃 model, the RMS values for the error and relative error with the experimental data are 10.94 kPa and 4.507%, respectively; for the ∆𝑃 model, they are 45.07 kPa and 15.02%, re-spectively. Furthermore, the dynamic viscosity and initial yield stress are estimated to be 0.2882 Pa∙s and 230.3 Pa as a result of performing nonlinear least square parameter esti-mation based on Equation (15) using the experimental data, where the estimated values are similar to those measured with the MR viscometer. Because the plastic-viscosity model used in the mathematical modeling is constructed based on the measurement data of the MR viscometer, the error level is generally uniform in the low-stroke velocity interval of 0.5 m/s or less. In other words, the design formula for the general MR damper considering only the major loss may be used within an error range of 15% or less in the application utilized in the experiment under the stroke velocity of 0.5 m/s. The maximum pressure drop and the damping force at the maximum compression velocity are compared between the experimental results and the pressure drop models. The RMS of the maximum pres-sure drop error and relative error are calculated and compared. For the ∆𝑃 model at the stroke velocity of 0.5 m/s, the RMS values for the error and relative error with the experimental data are 15.49 kPa and 4.104%, respectively, and for the ∆𝑃 model they are 54.51 kPa and 14.44%, respectively. Values are 35.13 kPa, 4.997%, 173.1 kPa, and 24.62% in sequence in Figure 7b; 50.79 kPa, 2.412%, 1011 kPa, and 48.01% in sequence in Figure 7d; and 426.6 kPa, 12.41%, 2.032 kPa, and 59.12% in sequence in Figure 7f. There-fore, it is necessary to consider the minor loss as the maximum stroke velocity increases in order to reduce the error.
(a) (b)
0 20 40 60 80 100 120 140 160 180 200−0.2
0.0
0.2
0.4
0.6
0.8
ΔP [M
Pa]
Stroke [mm]
ΔPtotal ΔPmaj Experiment
−0.5
0.0
0.5
1.0
1.5
2.0
Dam
ping
For
ce [k
N]
−0.50 −0.25 0.00 0.25 0.50 0.75 1.00−0.2
0.0
0.2
0.4
0.6
0.8
ΔP [M
Pa]
Stroke Velocity [m/s]
ΔPtotal ΔPmaj Experiment
−0.5
0.0
0.5
1.0
1.5
2.0
Dam
ping
For
ce [k
N]
Appl. Sci. 2021, 11, x FOR PEER REVIEW 17 of 21
(c) (d)
(e) (f)
Figure 7. Pressure drop and estimated damping force considering ∆𝑃 and ∆𝑃 models and experimental data: (a) for stroke and impact energy of 456.7 J; (b) for stroke velocity and impact energy of 456.7 J; (c) for stroke and impact energy of 937.5 J; (d) for stroke velocity and impact en-ergy of 937.5 J; (e) for stroke and impact energy of 1538 J; (f) for stroke velocity and impact energy of 1538 J.
Table 2. Dissipated energy in MR shock absorber for impact energy; RMS values of error for model-based and measured pressure data over stroke velocity range of 0.1 m/s or more.
Impact Energy (J)
Dissipated Energy Pressure Drop
Experiment (J)
∆𝑷−𝒔 Model (J)
Relative Error (%)
RMS Error (kPa) RMS Relative Error (%) ∆𝑷𝒕𝒐𝒕𝒂𝒍 ∆𝑷𝒎𝒂𝒋 ∆𝑷𝒕𝒐𝒕𝒂𝒍 ∆𝑷𝒎𝒂𝒋 ∆𝑷𝒕𝒐𝒕𝒂𝒍 ∆𝑷𝒎𝒂𝒋 ∆𝑷𝒕𝒐𝒕𝒂𝒍 ∆𝑷𝒎𝒂𝒋
456.7 276.6 263.5 200.6 4.748 27.46 16.72 109.2 5.650 19.37 937.5 737.2 672.5 406.1 8.781 44.92 70.28 419.1 13.54 28.07 1538 1339 1149 621.2 14.18 53.61 189.5 735.8 11.66 31.72
4.3. Comparison of Pressure Drop and Landing Efficiency in Conformity with Input Current and Fixed Drop Height
In this section, the response of the MR shock absorber depending on the input current is analyzed experimentally with the impact energy fixed. The input current is applied 10 s before the drop to exclude a time delay with respect to the input current. The impact energy during touchdown is the same at 1538 J. Figure 8 presents the internal pressure drop of the MR shock absorber in conformity with the input current for the stroke dis-placement and velocity. As in the case of Figure 7, ∆𝑃 and ∆𝑃 on the legend of Figure 8 are the pressure drop calculated for the estimated stroke velocity. ‘Experiment’ on the legend is the pressure drop measured through the pressure sensors during the drop test. When the impact energy is constant, the pressure drop in all stroke displacement ranges of both the ∆𝑃 and ∆𝑃 models increases as the input current increases. As
0 20 40 60 80 100 120 140 160 180 200−0.5
0.0
0.5
1.0
1.5
2.0
2.5
ΔP [M
Pa]
Stroke [mm]
ΔPtotal ΔPmaj Experiment −1
0
1
2
3
4
5
6
Dam
ping
For
ce [k
N]
−1.0 −0.5 0.0 0.5 1.0 1.5 2.0−0.5
0.0
0.5
1.0
1.5
2.0
2.5ΔP
[MPa
]
Stroke Velocity [m/s]
ΔPtotal ΔPmaj Experiment
−1
0
1
2
3
4
5
6
Dam
ping
For
ce [k
N]
0 20 40 60 80 100 120 140 160 180 200−1
0
1
2
3
4
ΔP [M
Pa]
Stroke [mm]
ΔPtotal ΔPmaj Experiment −2
0
2
4
6
8
10
Dam
ping
For
ce [k
N]
−1.0 −0.5 0.0 0.5 1.0 1.5 2.0 2.5 3.0−1
0
1
2
3
4
ΔP [M
Pa]
Stroke Velocity [m/s]
ΔPtotal ΔPmaj Experiment
−2
0
2
4
6
8
10D
ampi
ng F
orce
[kN
]
Figure 7. Pressure drop and estimated damping force considering ∆Ptotal and ∆Pmaj models andexperimental data: (a) for stroke and impact energy of 456.7 J; (b) for stroke velocity and impactenergy of 456.7 J; (c) for stroke and impact energy of 937.5 J; (d) for stroke velocity and impact energyof 937.5 J; (e) for stroke and impact energy of 1538 J; (f) for stroke velocity and impact energy of1538 J.
Appl. Sci. 2021, 11, 7895 17 of 19
Appl. Sci. 2021, 11, x FOR PEER REVIEW 18 of 21
shown in Figure 8a,c,e, the maximum stroke displacement decreases as the input current increases due to the energy dissipated by the additional pressure drop generated by the yield stress. The dissipated energy is calculated in Table 3 for comparison with the input current. As the input current increases, the dissipated energy for the measured data and the ∆𝑃 model does not change significantly. Because the impact energy does not change, the potential and kinetic energies do not change, and the dissipated energy also does not. However, the dissipated energy increases as the input current increases in the case of the ∆𝑃 model. The reason for this is that the area between the ∆𝑃 and ∆𝑃 curve for the stroke decreases as the dissipated energy for the yield stress increases as the input current increases, as shown in Figure 8a,c,e. Regardless of all the input cur-rents in Figure 8b,d,f, the ∆𝑃 model does not show a significant difference from the experimental result as the stroke velocity increases. On the other hand, the error between the ∆𝑃 model-based pressure drop and the experimental result increase depending on the stroke velocity increase. In Table 3, the RMS values of the error and relative error are calculated over the stroke velocity range of 0.1 m/s or more. The input current and the pressure drop models are independent; the RMS errors and relative errors in Table 3 are due to the error of the magnetic analysis. As a result of the experiment, the controllable force is estimated at 0.6137 kN, 1.382 kN, and 2.128 kN for 0.5 A, 1.0 A, and 1.5 A, respec-tively, based on the stroke velocity of 2 m/s. The maximum compression velocity esti-mated by experiments from 0 A to 1.5 A in 0.5 A units is 2.390 m/s, 2.352 m/s, 2.359 m/s, and 2.338 m/s. The error in the estimated velocity occurred due to the friction force of the drop device and MR shock absorber, but it tends to decrease as the input current increases. The RMS values of the maximum pressure drop error and relative error are compared between the pressure drop model and the experimentally measured data. For the input current, the RMS values of the error and relative error between the experimental data and the ∆𝑃 model and the RMS values of the error and relative error between the experi-mental data and the ∆𝑃 model are as follows, in sequence, respectively: 0.3399 MPa, 9.484%, 1.889 MPa, and 52.73% for 0.5 A; 0.3052 MPa, 7.922%, 1.863 MPa, and 48.37% for 1.0 A; and 0.3666 MPa, 9.047%, 1.905 MPa, and 47.03% for 1.5 A.
(a) (b)
0 20 40 60 80 100 120 140 160 180 200−1
0
1
2
3
4
ΔP [M
Pa]
Stroke [mm]
ΔPtotal ΔPmaj Experiment −2
0
2
4
6
8
10
Dam
ping
For
ce [k
N]
−1.0 −0.5 0.0 0.5 1.0 1.5 2.0 2.5 3.0−1
0
1
2
3
4
ΔP [M
Pa]
Stroke Velocity [m/s]
ΔPtotal ΔPmaj Experiment
−2
0
2
4
6
8
10
Dam
ping
For
ce [k
N]
Appl. Sci. 2021, 11, x FOR PEER REVIEW 19 of 21
(c) (d)
(e) (f)
Figure 8. Pressure drop and estimated damping force considering ∆𝑃 and ∆𝑃 models and experiment data: (a) for stroke and input current of 0.5 A; (b) for stroke velocity and input current of 0.5 A; (c) for stroke and input current of 1.0 A; (d) for stroke velocity and input current of 1.0 A; (e) for stroke and input current of 1.5 A; (f) for stroke velocity and input current of 1.5 A.
Table 3. Dissipated energy in MR shock absorber for input current; RMS values of error for model-based and measured pressure data over a stroke velocity range of 0.1 m/s or more.
Input Current (A)
Dissipated Energy Pressure Drop
Experiment (J)
∆𝑷−𝒔 Model (J)
Relative Error (%)
RMS Error (kPa) RMS Relative Error (%) ∆𝑷𝒕𝒐𝒕𝒂𝒍 ∆𝑷𝒎𝒂𝒋 ∆𝑷𝒕𝒐𝒕𝒂𝒍 ∆𝑷𝒎𝒂𝒋 ∆𝑷𝒕𝒐𝒕𝒂𝒍 ∆𝑷𝒎𝒂𝒋 ∆𝑷𝒕𝒐𝒕𝒂𝒍 ∆𝑷𝒎𝒂𝒋
0 1339 1149 621.2 14.18 53.61 189.5 735.8 11.66 31.72 0.5 1377 1253 757.2 8.984 45.01 172.4 749.5 10.80 28.70 1.0 1385 1253 815.7 9.564 41.10 245.6 920.5 16.36 33.66 1.5 1388 1208 822.3 12.99 40.75 381.5 1087 19.08 37.02
5. Conclusions In this study, a novel design model for an MR shock absorber for an aircraft landing
gear system was proposed, and its effectiveness was experimentally validated. Unlike the conventional model, which features only the major pressure loss, the proposed model was mathematically formulated by considering both the major and minor losses to take ac-count of high-stroke velocity. After deriving the governing equation of motions associated with the pressure drop and damping force, an appropriate size of MR shock absorber was manufactured on the basis of the design parameters of a commercial landing gear system. Because the MR shock absorber for the landing gear is rapidly compressed during a drop, the proposed design model is validated through a drop test, generating different impact energies (stroke velocities). The pressure drop model, with respect to the impact energy and input current, was then compared with the measured result from the drop test. It has
0 20 40 60 80 100 120 140 160 180 200−1
0
1
2
3
4
ΔP [M
Pa]
Stroke [mm]
ΔPtotal ΔPmaj Experiment −2
0
2
4
6
8
10
Dam
ping
For
ce [k
N]
−1.0 −0.5 0.0 0.5 1.0 1.5 2.0 2.5 3.0−1
0
1
2
3
4
ΔP [M
Pa]
Stroke Velocity [m/s]
ΔPtotal ΔPmaj Experiment
−2
0
2
4
6
8
10
Dam
ping
For
ce [k
N]
0 20 40 60 80 100 120 140 160 180 200−1
0
1
2
3
4
ΔP [M
Pa]
Stroke [mm]
ΔPtotal ΔPmaj Experiment −2
0
2
4
6
8
10
Dam
ping
For
ce [k
N]
−1.0 −0.5 0.0 0.5 1.0 1.5 2.0 2.5 3.0−1
0
1
2
3
4
ΔP [M
Pa]
Stroke Velocity [m/s]
ΔPtotal ΔPmaj Experiment
−2
0
2
4
6
8
10
Dam
ping
For
ce [k
N]
Figure 8. Pressure drop and estimated damping force considering ∆Ptotal and ∆Pmaj models andexperiment data: (a) for stroke and input current of 0.5 A; (b) for stroke velocity and input currentof 0.5 A; (c) for stroke and input current of 1.0 A; (d) for stroke velocity and input current of 1.0 A;(e) for stroke and input current of 1.5 A; (f) for stroke velocity and input current of 1.5 A.
Table 3. Dissipated energy in MR shock absorber for input current; RMS values of error for model-based and measuredpressure data over a stroke velocity range of 0.1 m/s or more.
Input Current(A)
Dissipated Energy Pressure Drop
Experiment(J)
∆P− .s Model(J)
Relative Error(%)
RMS Error(kPa)
RMS Relative Error(%)
∆Ptotal ∆Pmaj ∆Ptotal ∆Pmaj ∆Ptotal ∆Pmaj ∆Ptotal ∆Pmaj
0 1339 1149 621.2 14.18 53.61 189.5 735.8 11.66 31.720.5 1377 1253 757.2 8.984 45.01 172.4 749.5 10.80 28.701.0 1385 1253 815.7 9.564 41.10 245.6 920.5 16.36 33.661.5 1388 1208 822.3 12.99 40.75 381.5 1087 19.08 37.02

Appl. Sci. 2021, 11, 7895 18 of 19
5. Conclusions
In this study, a novel design model for an MR shock absorber for an aircraft landinggear system was proposed, and its effectiveness was experimentally validated. Unlike theconventional model, which features only the major pressure loss, the proposed model wasmathematically formulated by considering both the major and minor losses to take accountof high-stroke velocity. After deriving the governing equation of motions associated withthe pressure drop and damping force, an appropriate size of MR shock absorber wasmanufactured on the basis of the design parameters of a commercial landing gear system.Because the MR shock absorber for the landing gear is rapidly compressed during a drop,the proposed design model is validated through a drop test, generating different impactenergies (stroke velocities). The pressure drop model, with respect to the impact energy andinput current, was then compared with the measured result from the drop test. It has beenidentified from the comparative analysis that the pressure drop model considering of boththe major and minor losses show an RMS error of 4.5% compared to the experimentallymeasured pressure drop. On the other hand, in the case of the pressure drop modelconsidering the major loss only, an RMS error of 15% is identified. This result directlyindicates that, when an MR shock absorber is designed for high stroke velocity, both themajor and minor losses should be considered to accurately predict the pressure drop andhence the damping force. Finally, in the near future, the proposed model will be usedto evaluate the landing efficiency of the aircraft landing gear system with an MR shockabsorber in the absence and presence of the feedback controller.
Author Contributions: Conceptualization, J.-H.H., S.-B.C. and B.-H.K.; methodology, J.-H.H. andB.-H.K.; data analysis, B.-H.K.; investigation and validation, S.-B.C. and B.-H.K.; writing—originaldraft preparation, B.-H.K.; writing—review and editing, S.-B.C. All authors have read and agreed tothe published version of the manuscript.
Funding: This work was supported by the Technology Innovation Program (Intelligent landing gearwith variable damping force for 1500 lb class) (10073291) funded by the Ministry of Trade, Industry,and Energy (MOTIE, Korea).
Institutional Review Board Statement: Not applicable.
Informed Consent Statement: Not applicable.
Data Availability Statement: Not applicable.
Conflicts of Interest: The authors declare no conflict of interest.
References1. Nguyen, Q.; Choi, S.; Lee, Y.; Han, M. An analytical method for optimal design of MR valve structures. Smart Mater. Struct. 2009,
18, 095032. [CrossRef]2. Wereley, N.; Cho, J.; Choi, Y.; Choi, S. Magnetorheological dampers in shear mode. Smart Mater. Struct. 2007, 17, 015022.
[CrossRef]3. Carlson, J.; Sproston, J. Controllable fluids in 2000-status of ER and MR fluid technology. In Proceedings of the 7th International
Conference on New Actuators, Bremen, Germany, 19–21 June 2000; pp. 126–130.4. Yang, G.; Spencer, B., Jr.; Carlson, J.; Sain, M. Large-scale MR fluid dampers: Modeling and dynamic performance considerations.
Eng. Struct. 2002, 24, 309–323. [CrossRef]5. Kim, B.-G.; Yoon, D.-S.; Kim, G.-W.; Choi, S.-B.; Tan, A.S.; Sattel, T. Design of a novel magnetorheological damper adaptable to
low and high stroke velocity of vehicle suspension system. Appl. Sci. 2020, 10, 5586. [CrossRef]6. Oh, J.-S.; Jeon, K.; Kim, G.-W.; Choi, S.-B. Dynamic analysis of semi-active MR suspension system considering response time and
damping force curve. J. Intell. Mater. Syst. Struct. 2021, 1045389X20983920. [CrossRef]7. Phu, D.X.; Mien, V.; Choi, S.-B. A New Switching Adaptive Fuzzy Controller with an Application to Vibration Control of a Vehicle
Seat Suspension Subjected to Disturbances. Appl. Sci. 2021, 11, 2244. [CrossRef]8. Wang, X.; Huang, D.; Qin, N.; Chen, C.; Zhang, K. Modeling and Second-Order Sliding Mode Control for Lateral Vibration of
High-Speed Train With MR Dampers. IEEE Trans. Intell. Transp. Syst. 2021, 1–10. [CrossRef]9. Batterbee, D.; Sims, N.; Stanway, R.; Wolejsza, Z. Magnetorheological landing gear: 1. A design methodology. Smart Mater. Struct.
2007, 16, 2429. [CrossRef]

Appl. Sci. 2021, 11, 7895 19 of 19
10. Batterbee, D.C.; Sims, N.D.; Stanway, R.; Rennison, M. Magnetorheological landing gear: 2. Validation using experimental data.Smart Mater. Struct. 2007, 16, 2441. [CrossRef]
11. Han, C.; Kang, B.-H.; Choi, S.-B.; Tak, J.M.; Hwang, J.-H. Control of landing efficiency of an aircraft landing gear system withmagnetorheological dampers. J. Aircr. 2019, 56, 1980–1986. [CrossRef]
12. Luong, Q.V.; Jang, D.-S.; Hwang, J.-H. Robust adaptive control for an aircraft landing gear equipped with a magnetorheologicaldamper. Appl. Sci. 2020, 10, 1459. [CrossRef]
13. Kang, B.-H.; Yoon, J.-Y.; Kim, G.-W.; Choi, S.-B. Landing efficiency control of a six degrees of freedom aircraft model withmagneto-rheological dampers: Part 2—control simulation. J. Intell. Mater. Syst. Struct. 2020, 32, 1045389X20942593. [CrossRef]
14. Yoon, J.-Y.; Kang, B.-H.; Kim, J.-H.; Choi, S.-B. New control logic based on mechanical energy conservation for aircraft landinggear system with magnetorheological dampers. Smart Mater. Struct. 2020, 29, 084003. [CrossRef]
15. Regulations, Federal Aviation. In Part 23 Airworthiness Standards: Normal, Utility, Acrobatic and Commuter Category Airplanes; USGovernment Printing Office: Washington, DC, USA, 1989; Revised January.
16. Jones, O., Jr.; Leung, J. An Improvement in the Calculation of Turbulent Friction in Smooth Concentric Annuli. ASME J. FluidsEng. 1981, 103, 615–623. [CrossRef]
17. Wojtkowiak, J.; Popiel, C.O. Inherently Linear Annular-Duct-Type Laminar Flowmeter. ASME J. Fluids Eng. 2006, 128, 196–198.[CrossRef]
18. Lundgren, T.; Sparrow, E.; Starr, J. Pressure Drop Due to the Entrance Region in Ducts of Arbitrary Cross Section. ASME J. BasicEng. 1964, 86, 620–626. [CrossRef]
19. Lord Technical Data. In MRF-140CG Magneto-Rheological Fluid; Lord Corporation: Cary, NC, USA, 2012.20. Idelchik, I.E. Handbook of Hydraulic Resistance; Hemisphere Publishing Corp.: Washington, DC, USA, 1986.21. Bodoia, J.R.; Osterle, J. Finite difference analysis of plane Poiseuille and Couette flow developments. Appl. Sci. Res. 1961, 10,
265–276. [CrossRef]22. Han, C.; Kim, B.-G.; Kang, B.-H.; Choi, S.-B. Effects of magnetic core parameters on landing stability and efficiency of magne-
torheological damper-based landing gear system. J. Intell. Mater. Syst. Struct. 2020, 31, 198–208. [CrossRef]