Morphological, Physiological and Photophysiological ... - MDPI
Upload
khangminh22Category
view
3download
0
The Physiological and Genetic Factors Underpinning the
Response to Muscle Damaging Exercise
PHILIPP BAUMERT
A thesis submitted in partial fulfilment of the requirements of
Liverpool John Moores University for the degree of Doctor of
Philosophy
December 2018
2
Authors Declaration
I declare that the work in this thesis was carried out in accordance with the regulations of
Liverpool John Moores University. Apart from the help and advice acknowledged, the work
within was solely completed and carried out by the author.
Any views expressed in this thesis are those of the author and in no way represent those of
Liverpool John Moores University and the School of Sport and Exercise Sciences. This
thesis has not been presented to any other University for examination either in the United
Kingdom or overseas. No portion of the work referred to in this research project has been
submitted in support of an application for another degree or qualification of this or any other
university or institute of learning.
Copyright in text of this research project rests with the author. The ownership of any
intellectual property rights, which may be described in this research project, is vested in
Liverpool John Moores University and may not be made available for use to any third parties
without the written permission of the University.
Signed
Date
3
Abstract
It is often observed that there is a high individual variability in the response to exercise-
induced muscle damage (EIMD), even when tested in a homogeneous cohort accounting
for age, sex, ethnicity and physical activity. The response to EIMD is very complex as
several tissues, including skeletal muscle fibres, the extra-cellular matrix (ECM), and
tendon, play a potential role in the damage response. Therefore, the overall aim of this PhD
thesis was to investigate the physiological and genetic factors underpinning the response
to muscle damaging exercise. For that, the following objectives were (i) to comprehensively
assess the physiological mechanisms and recovery pattern of neuromuscular fatigue of the
hamstring muscle group following an intermittent sprint (IS) intervention; (ii) to investigate
inter-individual differences in skeletal muscle repair/recovery after an artificial wounding
(scratch) assay using of primary human skeletal muscle cells in vitro; (iii) to ascertain
whether multiple genetic variations, which are linked to varying tissues, forming a polygenic
profile could distinguish between high and low responders following muscle damage in vivo
and in vitro; and (iv) to assess whether a genetic profile is linked with the response to both
EIMD and chronic resistance exercise. The methodological and analytical approaches
utilised in this thesis identified a number of important, novel and impactful findings.
Following IS, the impaired hamstring muscle function and delayed recovery is probably
caused primarily by damage to the contractile tissue, and participants with a greater force
generating capacity (larger physiological cross-sectional area) of the biceps femoris long
head were less susceptible to hamstring strength loss immediately after IS, providing
evidence that the structure of the muscle protects it against peripheral fatigue/damage. The
in vitro study showed that skeletal muscles with an increased number of stem cells of the
connective tissue (fibroblasts) might have a better capacity to reorganise the complex ECM,
which results in a faster muscle strength recovery after muscle damaging exercise.
However, a larger number of active muscle stem cells (myoblasts) seems to be important
for the latter stage of muscle regeneration. Individuals possessing a non-preferential
genetic profile demonstrated increased rate of muscle damage biomarkers than individuals
4
with a preferential genetic profile. Lastly, we calculated a second polygenic profile which
was linked with both the EIMD and the chronic resistance exercise response. These
polygenic profiles may be used to anticipate an individual’s response/adaptation to EIMD
and to chronic resistance exercise, thus enabling resistance exercise to be prescribed on a
personalised level to improve muscle health and function.
5
Acknowledgements
A person learns only in two ways. By acquiring knowledge and through association with
quality people. Therefore, I would like to acknowledge and thank my brilliant supervisory
team for their continuous support and mentorship throughout my PhD, both on a personal
and professional level. Dr Mark Lake, who cheered my up during tough times and taught
me not to take everything too seriously; Prof Barry Drust, who has shown me to see the
bigger picture of my studies; Prof Claire Stewart, who has helped me with the long term
vision of my projects, and, of course, my Director of Studies, Dr Robert Erskine. Alongside
all the techniques, the most important thing Rob taught me is to have confidence in myself.
Rob, I am grateful for the way in which you gave me support and space in perfect balance
so that I was able to develop personally and as a scientist under your great supervision in
a positive work environment at LJMU.
I would also like to thank the participants for donating their time and effort, and the technical
& office staff members for doing a great job of supporting us students. A special mention
should go to my family, and in particular to my Mum and Dad. I knew I could always rely on
you for help and advice. Further thanks go to all friends and colleagues (especially of the
old post graduate room 1.47 and Sam Temple, who became a close friend and explained
me all the details of UK football during our data collection) that have supported me both
academically and socially throughout my PhD. Without you all, these last four years would
not have been as enjoyable as they have proven to be. No road is long with good company!
I would like to give special thanks to the biomechanics research group, as all of the
biomechanical researchers (e.g. Raihana Sharir, Niels Nedergaard and Jasper Verheul)
have been unbelievable supportive. Finally, I would like to thank Marie-Isabel, who is still
by my side after my PhD, including a long-distance relationship between two different
countries for more than two years. There are not enough words or ways to express how
grateful I am, and I am looking forward to the next chapter of our life, which we will go
through together.
6
Table of Contents
Authors Declaration .......................................................................................................... 2
Abstract ............................................................................................................................ 3
Acknowledgements ........................................................................................................... 5
I List of Figures ..........................................................................................................11
II List of Tables............................................................................................................12
III Abbreviations ...........................................................................................................13
1 General Introduction.................................................................................................15
2 Literature Review: Genetic Variation and Exercise-induced Muscle Damage:
Implications for Athletic Performance and Injury ..............................................................19
2.1 ABSTRACT ......................................................................................................20
2.2 INTRODUCTION ..............................................................................................21
2.3 GENETIC VARIATION AND THE INITIAL PHASE OF EXERCISE-INDUCED
MUSCLE DAMAGE .....................................................................................................23
2.3.1 Alpha-Actinin-3 R577X Polymorphism and the Initial Phase of Exercise-
Induced Muscle Damage .........................................................................................30
2.3.2 Myosin Light Chain Kinase Polymorphisms and the Initial Phase of Exercise-
Induced Muscle Damage .........................................................................................35
2.3.3 Muscle-Specific Creatine Kinase Polymorphisms and the Initial Phase of
Exercise-Induced Muscle Damage ...........................................................................36
2.4 GENETIC VARIATION AND THE SECONDARY PHASE OF EXERCISE-
INDUCED MUSCLE DAMAGE ....................................................................................38
2.4.1 Interleukin-1 Polymorphisms and the Secondary Phase of Exercise-Induced
Muscle Damage .......................................................................................................41
2.4.2 Tumour Necrosis Factor -308 G>A Polymorphism and the Secondary Phase
of Exercise Induced Muscle Damage .......................................................................43
2.4.3 Interleukin-6 –174 G>C Polymorphism and the Secondary Phase of Exercise-
Induced Muscle Damage .........................................................................................45
2.4.4 Chemokine Ligand 2 and Chemokine Receptor Type 2 Polymorphisms and
the Secondary Phase of Exercise-Induced Muscle Damage ....................................47
2.4.5 Osteopontin -66 T>G Polymorphism and the Secondary Phase of Exercise-
Induced Muscle Damage .........................................................................................48
2.5 SKELETAL MUSCLE REMODELLING FOLLOWING EXERCISE-INDUCED
MUSCLE DAMAGE .....................................................................................................50
7
2.5.1 Gene Polymorphisms of the Insulin-like Growth Factor Family and the
Remodelling Following Exercise-Induced Muscle Damage ......................................53
2.6 ADDITIONAL GENE POLYMORPHISMS ASSOCIATED WITH EXERCISE-
INDUCED MUSCLE DAMAGE ....................................................................................56
2.6.1 Angiotensin-I Converting Enzyme Insertion/Deletion Polymorphism .............56
2.6.2 Mitochondrial Superoxide Dismutase 2 Ala16Val Polymorphism ..................59
2.6.3 Solute Carrier Family 30 Member Eight C>T Polymorphism .........................60
2.7 DISCUSSION ...................................................................................................62
2.8 CONCLUSIONS ...............................................................................................64
3 The Physiological and Biomechanical Factors Associated with Neuromuscular
Fatigue of the Hamstrings Following Intermittent Sprints .................................................66
3.1 ABSTRACT ......................................................................................................67
3.2 INTRODUCTION ..............................................................................................68
3.3 METHODS .......................................................................................................71
3.3.1 Participants...................................................................................................71
3.3.2 Experimental Design ....................................................................................72
3.3.3 Maximal Repeated Sprint Protocol ...............................................................73
3.3.4 Maximal Muscle Contraction (MVC)..............................................................74
3.3.5 Hamstring Muscle Voluntary Activation .........................................................75
3.3.6 Hamstring Muscle Group Maximal Compound Muscle Action Potential (Mmax)
76
3.3.7 Involuntary Peak Rate of Isometric Troque Development .............................76
3.3.8 Surface Electromyography and Antagonist Co-activation .............................77
3.3.9 Torque-frequency Relationship .....................................................................78
3.3.10 Delayed Onset Muscle Soreness (DOMS) ................................................78
3.3.11 Blood Samples .........................................................................................79
3.3.12 Serum Interleukin-6 (IL-6) Concentration ..................................................79
3.3.13 Serum Creatine Kinase Activity.................................................................80
3.3.14 Capillary Blood Lactate Concentration ......................................................80
3.3.15 Ultrasound ................................................................................................80
3.3.16 Kinematic and Kinetic Data .......................................................................83
3.3.17 Single-leg Horizontal Hop Landing ............................................................84
3.3.18 Motorised Treadmill Run ...........................................................................85
3.3.19 Data Analysis ............................................................................................86
3.4 RESULTS.........................................................................................................87
3.4.1 Effect of IS-Intervention on Fatigue ..............................................................87
8
3.4.2 Effect of IS-Intervention on MVC, pRTD, Muscle Soreness and Serum
Markers of EIMD ......................................................................................................88
3.4.3 Architecture of the Biceps Femoris Long Head .............................................90
3.4.4 Effect of the IS-Intervention on Lower-Limb Kinematics ................................92
3.5 DISCUSSION ...................................................................................................94
3.5.1 Fatigue Following the Intermittent Sprint Intervention ...................................94
3.5.2 Exercise-Induced Muscle Damage ...............................................................97
3.5.3 Muscle Architecture ......................................................................................99
3.5.4 Kinematic Analyses .................................................................................... 100
3.5.5 Limitations .................................................................................................. 102
3.6 CONCLUSION ............................................................................................... 104
4 Muscle Recovery Rate Following in vitro and in vivo Damage is Related to the
Myoblast:non-Myoblast Ratio Derived from Human Biopsies ......................................... 105
4.1 ABSTRACT .................................................................................................... 106
4.2 INTRODUCTION ............................................................................................ 107
4.3 METHODS ..................................................................................................... 109
4.3.1 Participants................................................................................................. 109
4.3.2 Reagents, Chemicals, and Solvents ........................................................... 110
4.3.3 Muscle Biopsy Procedure ........................................................................... 110
4.3.4 Extraction of Human Muscle-Derived Cells ................................................. 111
4.3.5 Expansion of Extracted Cells ...................................................................... 112
4.3.6 Characterization of Human Muscle-Derived Cells ....................................... 112
4.3.7 Wound-Healing Assay, Migration and Differentiation Analysis .................... 114
4.3.8 Creatine Kinase Activity .............................................................................. 115
4.3.9 Experimental Design of the Intermittent Sprint Intervention in vivo ............. 115
4.3.10 Data Analysis .......................................................................................... 115
4.4 RESULTS....................................................................................................... 116
4.4.1 Comparison of the Muscle Response between the Intermittent Sprint Protocol
and the Muscle Stem Cell Study ............................................................................ 116
4.4.2 Artificial Wound Healing Assay to Investigate Repair and Regeneration
Regarding Sex-related Parameters ........................................................................ 117
4.4.3 Artificial Wound Healing Assay to Investigate Repair and Regeneration
Regarding Myoblast:Fibroblast Ratio ..................................................................... 118
4.5 DISCUSSION ................................................................................................. 122
4.5.1 Comparison of the Muscle Response to the Intermittent Sprint Intervention
and the Artificial Wound Healing Study in vitro ....................................................... 122
4.5.2 Sex-related Outcomes ................................................................................ 124
9
4.5.3 Myoblast:Fibroblast Ratio and the Artificial Wound Healing Assay ............. 124
4.5.4 Limitations .................................................................................................. 126
4.6 CONCLUSION/ PERSPECTIVE ..................................................................... 128
5 Individual and Combined Polymorphisms are Associated with in vivo and in vitro
Muscle Damage in Humans: a Novel Approach to Elucidate the Mechanisms
Underpinning the Response to Exercise-Induced Muscle Damage ................................ 129
5.1 ABSTRACT .................................................................................................... 130
5.2 INTRODUCTION ............................................................................................ 131
5.3 METHODS ..................................................................................................... 134
5.3.1 Cohorts ....................................................................................................... 134
5.3.2 Experimental Design of the G-REX Cohort (in vivo Study) .......................... 134
5.3.3 Muscle Damage Protocol ............................................................................ 135
5.3.4 Maximal Voluntary Contraction (MVC) Torque ............................................ 135
5.3.5 Delayed Onset Muscle Soreness (DOMS) .................................................. 136
5.3.6 Blood Samples ........................................................................................... 136
5.3.7 Serum Creatine Kinase Activity .................................................................. 137
5.3.8 Serum Interleukin-6 (IL-6) Concentration .................................................... 137
5.3.9 Genotyping ................................................................................................. 138
5.3.10 Total Genotype Score (TGS) Calculation ................................................ 140
5.3.11 Muscle Stem Cell Cohort (in vitro Study) ................................................ 141
5.3.12 Muscle Cell Culture................................................................................. 141
5.3.13 Data Analysis .......................................................................................... 141
5.4 RESULTS....................................................................................................... 143
5.4.1 Effect of EIMD-Intervention on Biomarkers According to Sex ..................... 143
5.4.2 Effect of EIMD-Intervention on Biomarkers ................................................. 143
5.4.3 Hardy-Weinberg Equilibrium and Linkage Disequilibrium............................ 144
5.4.4 SNP Associations with Biomarkers of EIMD ............................................... 145
5.4.5 Artificial Wound Healing Model to Assess Repair and Regeneration and
Genetic Variations .................................................................................................. 147
5.4.6 Effect of Total Genotype Score on Biomarkers of EIMD ............................. 148
5.5 DISCUSSION ................................................................................................. 150
5.5.1 Functional Group of SNPs Related to Muscle Soreness ............................. 151
5.5.2 Functional Group of SNPs Related to Delayed Muscle Regeneration ......... 152
5.5.3 No Association of the Polygenic profile on Strength Loss following EIMD ... 154
5.5.4 Limitations .................................................................................................. 157
5.6 CONCLUSION/ PERSPECTIVE ..................................................................... 157
10
6 A common Polygenic Profile Linking the Acute and Chronic Responses to
Resistance Exercise ...................................................................................................... 159
6.1 ABSTRACT .................................................................................................... 161
6.2 INTRODUCTION ............................................................................................ 162
6.3 METHODS ..................................................................................................... 164
6.3.1 General ...................................................................................................... 164
6.3.2 G-REX Cohort ............................................................................................ 165
6.3.3 G-ResisT Cohort ........................................................................................ 165
6.4 RESULTS....................................................................................................... 172
6.4.1 Hardy-Weinberg Equilibrium and Linkage Disequilibrium............................ 172
6.4.2 The Association of the Individual SNPs with the Response to Chronic
Resistance Exercise ............................................................................................... 172
6.4.3 The Correlation between TGS-A and the Response to Chronic Resistance
Exercise ................................................................................................................. 174
6.4.4 A new Polygenic Profile (TGS-C) to Predict the Response to Chronic
Resistance Exercise ............................................................................................... 175
6.4.5 New Polygenic Profiles Regarding Chronic RE Predict the Individual
Response to Acute RE ........................................................................................... 176
6.5 DISCUSSION ................................................................................................. 176
6.5.1 Using TGS-A to Predict the Adaptation to Chronic RE ................................ 177
6.5.2 Using TGS-C to Predict the Adaptation to Chronic RE ............................... 178
6.5.3 Using TGS-C to Predict the Response to Acute RE .................................... 182
6.5.4 Limitations/ Perspective .............................................................................. 183
6.6 CONCLUSION ............................................................................................... 184
7 Thesis Synthesis .................................................................................................... 186
7.1 GENERAL DISCUSSION ............................................................................... 187
7.1.1 The contribution of the non-contractile muscle tissue to the response to EIMD
188
7.1.2 The association between genetic variations and the individual response/
adaptation to acute and chronic RE ....................................................................... 190
7.1.3 Genetic variations expand our understanding of the molecular mechanisms
underpinning the individual response to acute and chronic RE .............................. 191
7.2 THESIS LIMITATIONS ................................................................................... 193
7.3 FUTURE DIRECTIONS .................................................................................. 196
7.4 FINAL CONCLUSION .................................................................................... 198
8 References ............................................................................................................ 200
11
I List of Figures
Figure 2-1 Initial phase of exercise-induced muscle damage. .........................................24
Figure 2-2 Proposed changes in sarcomere structure during stretch-shortening cycle
movements and purely eccentric actions, focussing on α-actinin. ....................................33
Figure 2-3 The secondary phase of muscle damage.. .....................................................39
Figure 2-4 The cycle of skeletal muscle fibre regeneration following exercise-induced
muscle damage. ..............................................................................................................51
Figure 3-1 Longitudinal image of biceps femoris long head, ............................................81
Figure 3-2 Cross-sectional image at 60% muscle length (=100% proximal myotendinous
junction), .........................................................................................................................82
Figure 3-3 Motion capture system ..................................................................................83
Figure 3-4 Torque-frequency relationship. .......................................................................88
Figure 3-5 Comparison of relative maximal voluntary contraction (MVC) loss between
hamstring and quadriceps muscle group .........................................................................90
Figure 3-6 Correlation between physiological cross-sectional area and relative maximum
voluntary contraction (MVC) loss. ....................................................................................91
Figure 3-7 No correlation between physiological cross-sectional area and relative
maximum voluntary contraction (MVC) loss. ....................................................................92
Figure 4-1 Representative images for immunofluorescent staining for desmin of human
muscle cell cultures. ...................................................................................................... 113
Figure 4-2 Inverse correlation between the myoblast:fibroblast ratio, assessed in the
current in vitro study and the change of hamstring MVC torque ..................................... 117
Figure 4-3 Effect of Sex on biochemical aspects of myotube formation via Average CK
activity.. ......................................................................................................................... 118
Figure 4-4 Representative images for cell migration of muscle cells. ............................ 119
Figure 4-5 Inverse correlation between the myoblast:fibroblast ratio and the migration
dynamics of the six male participants ............................................................................. 120
Figure 4-6 Representative images for muscle cell differentiation ................................... 121
Figure 5-1 Main effect for normalised isometric maximal voluntary contraction (MVC)
torque in regard to the polygenic profile. ........................................................................ 149
Figure 5-2 Gene-Interaction effect (polygenic profile x time) for muscle soreness.. ....... 150
Figure 6-1 Correlation between the polygenic profile TGS–C and maximum patellar
tendon force (A) and muscle specific force (B). .............................................................. 175
Figure 6-2 Interaction effect for serum CK activity (of the G-REX cohort). ..................... 176
12
II List of Tables
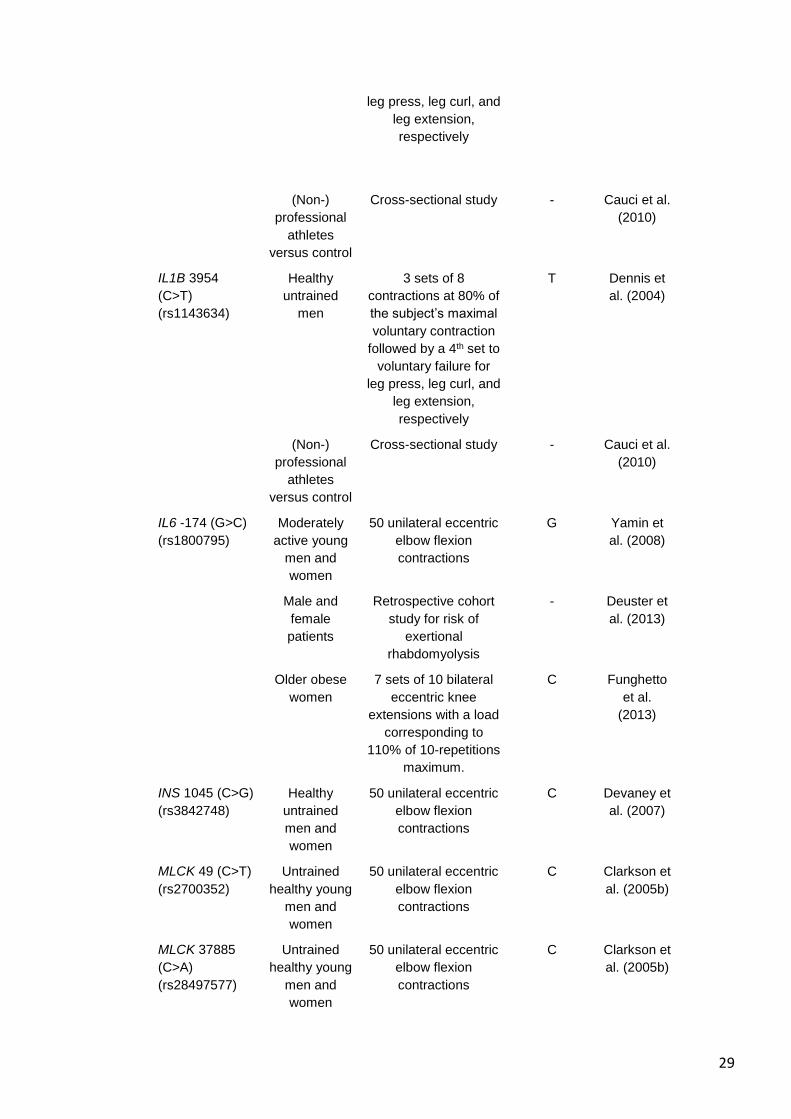
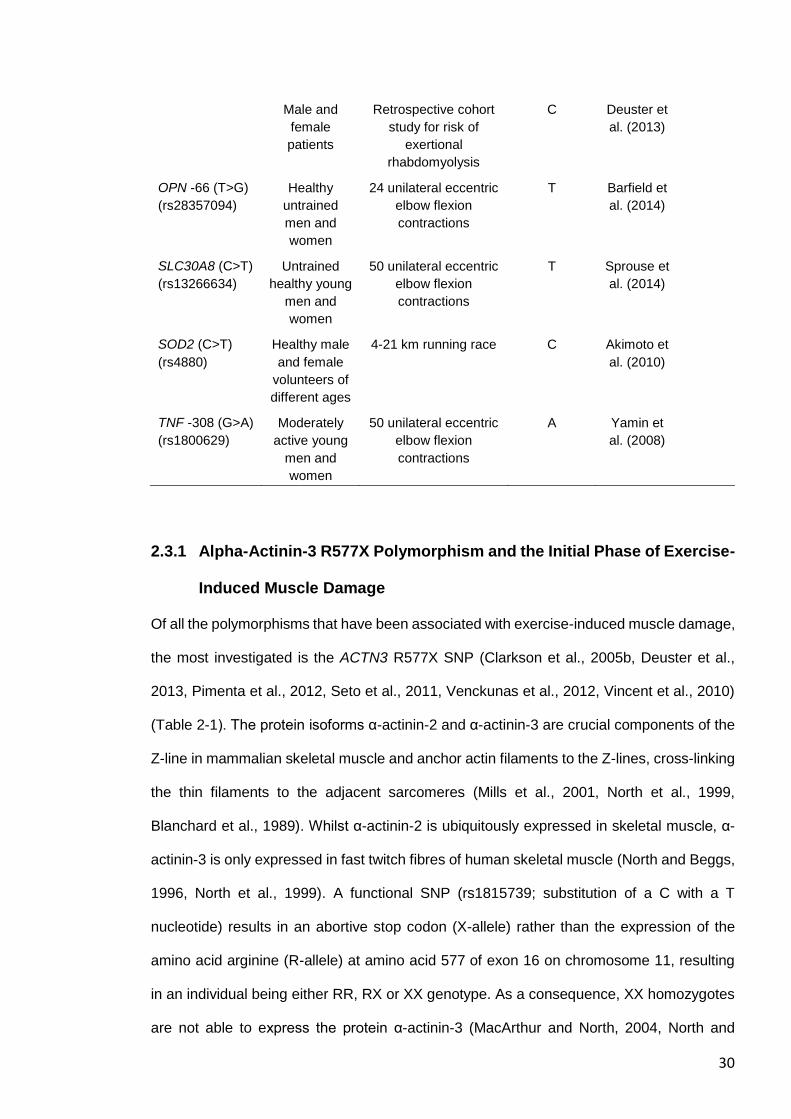
Table 2-1 Gene polymorphisms associated with exercise-induced muscle damage. ....... 26
Table 3-1 Effect of the intermitted sprint-intervention on fatigue Markers (mean ± SD)....87
Table 3-2 Effect of IS-Intervention on EIMD-Biomarkers (mean ± SD). ...........................89
Table 3-3 Architectural parameters of Biceps femoris long head (mean ± SD). ...............91
Table 3-4 Effect of the IS-Intervention on selected kinematics of the Single-Leg Hop
Landing during the Landing Phase (mean ± SD). .............................................................92
Table 3-5 Effect of the IS-Intervention on Kinematics of Treadmill Running (4.17 m s−1)
(mean ± SD). ...................................................................................................................93
Table 4-1 The Effect of Sex on Artificial Wound healing for the first 48 h in vitro. .......... 117
Table 4-2 The Effect of Sex on Artificial Wound Healing Parameters for Day seven and
CK activity at Day ten in vitro. ........................................................................................ 118
Table 4-3 Linear regression analysis between the myoblast:fibroblast ratio and fusion
parameters at day 7 and CK activity at day 10 in vitro. .................................................. 121
Table 5-1 Participant Characteristics of both cohorts (mean ± SD). ............................... 134
Table 5-2 Tested Gene Polymorphisms. ....................................................................... 139
Table 5-3 Values for dependent variables in response to muscle damaging exercise
between sex .................................................................................................................. 144
Table 5-4 SNP interaction with EIMD-intervention following correction for multiple
comparisons. ................................................................................................................. 145
Table 5-5 Main effect for genotype following correction for multiple comparisons. ......... 146
Table 5-6 Main effect for genotype regarding the artificial wound healing model. .......... 147
Table 6-1 Participant Characteristics of the two cohorts (mean ± SD). ....................... 164
Table 6-2 SNP interaction with chronic resistance exercise following correction for
multiple comparisons. .................................................................................................... 173
Table 6-3 Main effect for genotype regarding chronic resistance exercise following
correction for multiple comparisons. ............................................................................... 174
13
III Abbreviations
1-RM One-repetition maximum
ACE Angiotensin-I converting enzyme
ACTN3 Gene that encodes the α-actinin-3 protein
AGT Gene that encodes Angiotensinogen
ANOVA Analysis of variance
CCL2 Chemokine (C-C motif) ligand-2
CCR2 Chemokine (C-C motif) receptor type -2
CE Resistance exercise
CK Creatine kinase
COL Gene that encodes the collagen protein
DES Gene that encodes the desmin protein
DNA Deoxyribonucleic acid
dPT Patellar tendon moment arm
ECM Extracellular matrix
EDTA Ethylenediaminetetraacetic acid
EMG Electromyography
FDR False discovery rate
G-REX Genetics of Recovery after EXercise cohort
G-ResisT Genetics of RESIStance Training cohort
IGF Insulin-like growth factor
IKD Isokinetic dynamometer
IL Interleukin
IS Intermittent sprint
LD Linkage disequilibrium
MRI Magnetic resonance imaging
mRNA Messenger ribonucleic acid
14
MVC Maximal voluntary contraction
MG Moderate genotypes group
MTU Muscle-tendon unit
MYLK Gene that encodes the myosin light chain kinase
MyoD Myogenic differentiation factor
NF-κB Nuclear factor kappa-light-chain-enhancer of activated B cells
NOS Gene that encodes the nitric oxide synthase
NPG Non-preferential genotype group
Pax7 Paired box protein-7
PCSA Physiological cross-sectional area
PG Preferential genotype group
RE Resistance Exercise
ROM Range of motion
ROS Reactive oxygen species
SEM Standard error of mean
SD Standard deviation
SLC30A8 Gene that encodes the solute carrier family 30 (zinc transporter)
member eight protein
SNP Single nucleotide polymorphism
TGS Total genotype score
TNF Tumour necrosis factor
TRIM63 Tripartite Motif Containing 63 gene
TTN Gene that encodes the titin protein
VDR Vitamin D receptor
Wpeak In vivo peak power output
15
1 General Introduction
Sporting success is the result of the relative contributions of nature (heritability) and nurture
(environmental) factors, and the diverse environments of different sports are likely to act as
agents of natural selection (Kujala et al., 2000). The current understanding suggests above
50% of the variance for an elite athlete status can be accounted for by genetic variation (De
Moor et al., 2007, Georgiades et al., 2017). An athlete’s potential to succeed at the highest
level of sport may be determined in part by their physical resilience, such as the capability
to recover, and their responsiveness to training stimuli (Durand-Bush and Salmela, 2002,
Reilly and Williams, 2003). For instance, highly dynamic skills, such as high-speed running
and landing in soccer, require eccentric (muscle lengthening) contractions, in order to
control the deceleration of the joint (Stanton and Purdam, 1989, Padulo et al., 2013). This
can result in ultrastructural muscle damage manifested in Z-line disturbance, as well as
disruption of the extracellular matrix (ECM), which provides structural scaffolding for muscle
remodelling and has an integral role in force transmission (Tidball, 1991, Garg and Boppart,
2016). However, some individuals experience stiff or sore muscles, which typically occurs
24-72 hours after exercise, whilst others do not feel any muscle soreness despite
performing the same relative intensity of exercise. Several factors have been reported,
which contribute to this individual differences, including age (Fielding et al., 1991), ethnic
origin (Sherwood et al., 1996), sex (Sewright et al., 2008), training level (Balnave and
Thompson, 1993), and nutrition (Howatson and Van Someren, 2008). Nonetheless, when
all these factors are taken into account, it still cannot entirely explain the large variation in
the response to exercise-induced muscle damage (EIMD), and a number of investigations
suggest that multiple genetic variations may play a (key) role in influencing a person’s
susceptibility to EIMD (Baumert et al., 2016a). Insufficient recovery of previously fatigued
and damaged muscles, e.g. caused by an exposure to a number of maximal sprints, is
thought to increase muscle injury risk (Malone et al., 2016, Malone et al., 2018, Chumanov
16
et al., 2011, Duhig et al., 2016). Given the impact of such injuries, it is important to
understand their manifestation, in order to minimise their occurrence.
Skeletal muscle regeneration is a complex process that is mediated by muscle stem cells
(i.e. satellite cells). Furthermore, recent investigations have reported an important role for
muscle connective tissue stem cells (known as fibroblasts) during skeletal muscle
regeneration following EIMD (Mackey et al., 2017, Murphy et al., 2011) and muscle injuries
(Joe et al., 2010). However, little is known about the interplay between satellite cells and
muscle fibroblasts regarding skeletal muscle regeneration following physiological EIMD
within the first days, and whether specific genetic polymorphisms influence their dynamics
and impact on skeletal muscle regeneration.
Chronic resistance exercise (RE), i.e. resistance training, is a potent stimulus for increasing
muscle size and strength, which are both important for athletic performance (Harries et al.,
2012, Granacher et al., 2016), and are also increasingly recognised as a cornerstone for
the prevention (e.g. Nordic hamstrings) of muscle (Petersen et al., 2011) and ACL injuries
(Petushek et al., 2018, Webster and Hewett, 2018). However, as the rate of non-contact
injuries is only reduced but still occur in some athletes, it could be suggested that prevention
training has a variable effect on athletes. It is possible that individuals who show a
detrimental response to acute RE (e.g. a high inflammatory response and elevated muscle
soreness), might possess a non-preferential genetic profile, which also leads to an
attenuated adaptation with respect to gains in muscle strength and hypertrophy following
chronic RE, potentially leading to a higher risk of non-contact injuries.
Gene–environment interactions likely account for a large portion of the “missing heritability”
of genetic associations with traits and diseases. In concert with large-scale genome-wide
association studies (GWAS) (Willems et al., 2017, Zillikens et al., 2017), additional studies
with homogenous cohorts and controlling for lifestyle factors and comprehensive phenotype
assessments are necessary to understand the complex interplay between multiple genetic
polymorphisms (i.e. a polygenic profile) and environmental variables affecting athletic
performance (Munafò and Smith, 2018).
17
The experiments, on which this thesis is based, used the strategy of multiple approaches
(triangulation). By using a combination of assessments from different research disciplines,
including genetics, cell biology, muscle physiology and biomechanics, the overarching aim
of this PhD thesis was to investigate the physiological and genetic factors underpinning the
response to EIMD. In the first two experimental chapters, the causes and consequences of
EIMD were comprehensively assessed, whilst the last two experimental chapters
investigated the association between genetic variations and the acute and chronic response
following EIMD. More precisely, the objectives of this PhD thesis were:
1. To characterise the physiological mechanisms underpinning neuromuscular fatigue
and the recovery pattern following intermittent maximal sprints, to acquire a better
understanding of EIMD in an applied setting (Chapter 3).
2. To determine the effect that inter-individual differences in the ratio of skeletal muscle
myoblast to fibroblast composition has on skeletal muscle repair/recovery after an
artificial wounding (scratch) assay using primary human skeletal muscle cells in
vitro, and the association of this ratio with recovery after intermittent maximal sprints
(Chapter 4).
3. To ascertain whether a polygenic profile could distinguish between high and low
responders following a controlled in vivo eccentric exercise (acute resistance
exercise, RE) intervention in previously untrained individuals, and whether those
genetic variations were also associated with the artificial wounding (scratch) assay
in vitro (Chapter 5). This would, therefore, provide a genetic link between in vivo and
in vitro muscle damage, thus potentially shedding new light on the aetiology of
EIMD.
4. To determine whether the polygenic profile associated with acute RE from Chapter
5 could anticipate individual adaptations to chronic RE, in terms of gains in muscle
size and strength (Chapter 6) and
18
5. To ascertain whether a new polygenic profile associated with the adaptations to
chronic RE (gains in muscle size and strength) (Chapter 6) could estimate the
individual responses to acute RE in Chapter 5 (e.g. loss of strength, increase in
soreness, inflammation, etc.). Objectives 4 and 5 have implications for furthering our
understanding of the genetic and physiological mechanisms underpinning and
linking the acute and chronic responses to RE.
19
2 Literature Review: Genetic Variation and Exercise-
induced Muscle Damage: Implications for Athletic
Performance and Injury
Publications resulted from this chapter:
1. Baumert, P., Lake, M. J., Stewart, C. E., Drust, B., & Erskine, R. M. (2016). Genetic
variation and exercise-induced muscle damage: implications for athletic
performance, injury and ageing. European journal of applied physiology, 116(9),
1595-1625.
2. Baumert, P., Lake, M. J., Stewart, C. E., Drust, B., & Erskine, R. M. (2016). Inter-
individual variability in the response to maximal eccentric exercise. European journal
of applied physiology, 116(10), 2055.
20
2.1 ABSTRACT
Prolonged unaccustomed exercise involving muscle lengthening (eccentric) actions can
result in ultrastructural muscle disruption, impaired excitation–contraction coupling,
inflammation and muscle protein degradation. This process is associated with delayed
onset muscle soreness and is referred to as exercise-induced muscle damage. Although a
certain amount of muscle damage may be necessary for adaptation to occur, excessive
damage or inadequate recovery from exercise-induced muscle damage can increase injury
risk. Furthermore, it is apparent that inter-individual variation exists in the response to
exercise-induced muscle damage, and there is evidence that genetic variability may play a
key role. Although this area of research is in its infancy, certain gene variations, or
polymorphisms have been associated with exercise-induced muscle damage (i.e.
individuals with certain genotypes experience greater muscle damage, and require longer
recovery, following strenuous exercise). These polymorphisms include ACTN3 (R577X,
rs1815739), TNF (-308 G>A, rs1800629), IL6 (-174 G>C, rs1800795), and IGF2 (ApaI,
17200 G>A, rs680). Knowing how someone is likely to respond to a particular type of
exercise could help coaches/practitioners individualise the exercise training of their
athletes/patients, thus maximising recovery and adaptation, while reducing overload-
associated injury risk. The purpose of this review is to provide a critical analysis of the
literature concerning gene polymorphisms associated with exercise-induced muscle
damage, and to highlight the potential mechanisms underlying these associations, thus
providing a better understanding of exercise-induced muscle damage.
21
2.2 INTRODUCTION
People who engage in unaccustomed, strenuous physical exercise can experience stiff or
sore muscles, a feeling that is usually apparent for 24-72 hours after exercise. This
phenomenon is known as delayed-onset muscle soreness. Several investigations have
revealed that these unaccustomed eccentric actions, during which the muscle is lengthened
while it is active, provoke stiffer and more tender muscles compared to concentric or
isometric contractions (Armstrong, 1984, Armstrong et al., 1991). These contractions are
strongly associated with damage to skeletal muscle consisting of structural disruption of
sarcomeres, disturbed excitation-contraction coupling and calcium signalling, leading to an
inflammatory response and the activation of several muscle protein degradation pathways.
This process has been referred to as exercise-induced muscle damage (Hyldahl and Hubal,
2014, Peake et al., 2005) and is normally accompanied by swelling, a temporary reduction
in both maximum strength and range of motion (Baird et al., 2012, Brown et al., 1999,
Clarkson et al., 1992). Circulating muscle-specific proteins [e.g. creatine kinase (CK)
myoglobin and α-actin] are commonly used to indicate exercise-induced muscle damage
(Huerta-Alardín et al., 2005, Martinez Amat et al., 2007), whereas tenascin-C is thought to
be an indicator for disruption of the overlying connective tissue and the extracellular matrix
(Flück et al., 2003).
Exercise-induced muscle damage can be divided into the initial damage phase, which
occurs during the exercise bout, and the secondary damage phase, which is linked with the
delayed inflammatory response (Kuipers, 1994, Howatson and Van Someren, 2008). These
phases are eventually followed by muscle remodelling (Flann et al., 2011, Thiebaud, 2012,
Tidball, 2005). Although there is evidence to suggest that a certain amount of muscle
damage is a positive stimulus for muscle restructuring, hypertrophy and strength gains
(Roig et al., 2008), in rare cases, strenuous unaccustomed exercise can lead to exertional
rhabdomyolysis, which is characterized by muscle fibre necrosis (Warren et al., 2002b).
Intracellular muscle contents leak into the circulation and extracellular fluid, which can lead
to kidney failure or even to death (Knochel, 1990, Clarkson et al., 2005b).
22
From the plethora of studies that have investigated exercise-induced muscle damage, it is
apparent that variability in the response to muscle damaging exercise exists between
(Vincent et al., 2010, Clarkson et al., 2005b) and within studies (Nosaka and Clarkson,
1996). Variations between studies can occur due to different study population, age, gender
and a small sample size (Eynon et al., 2013, Toft et al., 2002). However, intra-study
variation within a homogenous cohort warrants further consideration, with evidence to
suggest that genetic variability may play a role. Some genes have common variations in
sequence, known as polymorphisms, which, depending on where this polymorphism occurs
within the gene, can directly affect gene expression and ultimately the amount of protein
produced. The most common type of sequence variation is a single nucleotide
polymorphism (SNP), where one nucleotide substitutes another. Another type of common
sequence variation is the insertion/deletion (indel) polymorphism, in which a specific
nucleotide sequence is present (insertion) or absent (deletion) from the allele. Some
polymorphisms can modify the protein product, thus potentially altering function. It follows,
therefore, that polymorphisms of genes encoding key proteins in the muscle-tendon unit
(such as the ACTN3 R577X SNP) have implications for the ability to recover from strenuous
exercise, thus influencing the risk of injury. This may be particularly relevant in elite athlete
groups, who are known to have different genetic profiles compared to the general population
(Yang et al., 2003, Myerson et al., 1999). Moreover, specific gene polymorphisms (e.g.
COL1A1 rs1800012, COL5A1 rs12722, rs3196378, MMP3 rs679620, rs591058 and
rs650108) have been associated with tendon/ligament injury prevalence (e.g. Achilles
tendinopathy/rupture and anterior cruciate ligament rupture) (Bell et al., 2012, Laguette et
al., 2011, Collins and Raleigh, 2009). However, very little is known about the potential
genetic association with muscle damage and muscle regeneration in response to muscle
damaging exercise or the mechanisms that underpin that association.
Knowing who requires longer to recover from a bout of strenuous exercise, may help
practitioners prescribe personalised exercise medicine to their patients, thus optimising
health and reducing the risk of injury and further muscle wasting. One of the greatest
23
challenges facing exercise genetic research is the investigation of functionally relevant
genetic variation and of their mechanisms of action. The aims of this review are to (i) provide
a critical review of the current literature on exercise-induced muscle damage and, therefore,
to improve our understanding of the different phases of the responses to muscle damaging
exercise; (ii) emphasize those studies that have investigated the association between
genetic variation and muscle damage; and (iii) propose mechanistic explanations that may
underpin these associations.
2.3 GENETIC VARIATION AND THE INITIAL PHASE OF EXERCISE-
INDUCED MUSCLE DAMAGE
Exercise-induced muscle damage can result in damage to the ultrastructure of the muscle
fibre (including Z-line streaming), to the extracellular matrix, and to overextended
sarcomeres and t-tubules of skeletal muscle tissue (Brown et al., 1997b, Kjær, 2004, Friden
and Lieber, 1992, Friden et al., 1981, Friden and Lieber, 2001). Structural disruption of
sarcomeres is thought to be caused by the heterogeneity of sarcomere length (Morgan,
1990) and, consequently, some sarcomeres resist eccentric actions more than others (Allen
et al., 2005, Friden et al., 1981). Prolonged strain causes weaker sarcomeres to be
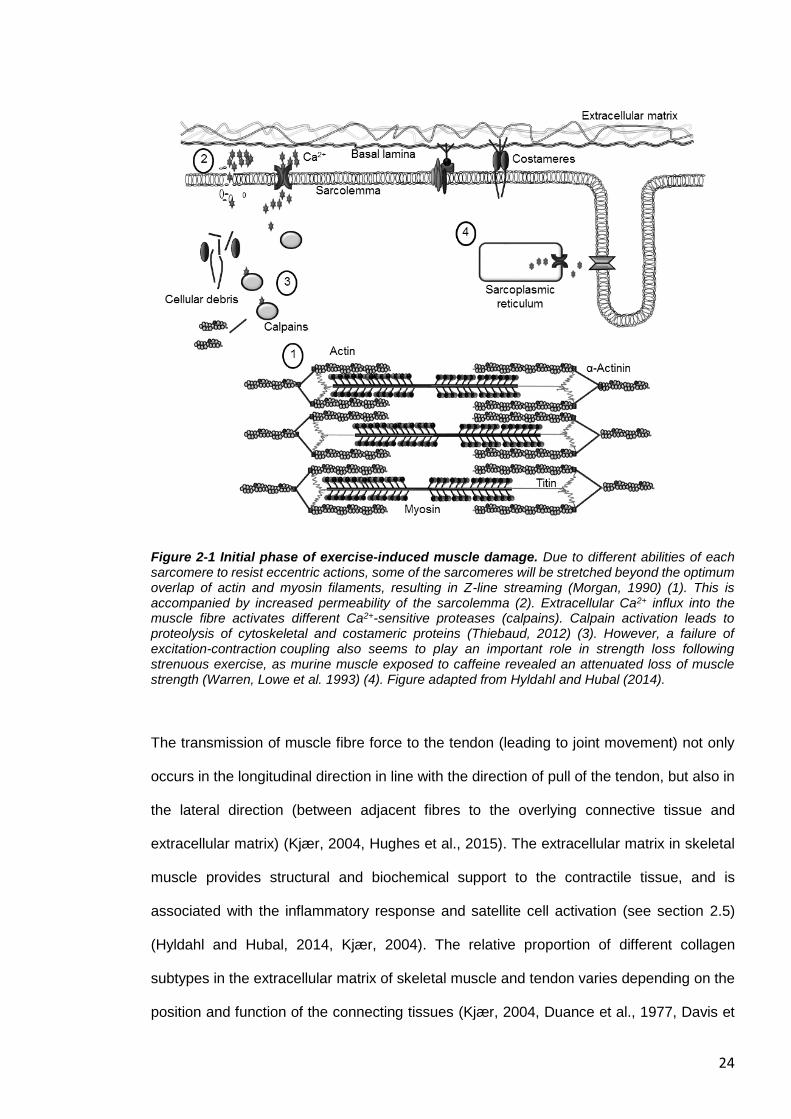
stretched beyond the optimum overlap of actin and myosin filaments (Figure 2-1). This
results in popped sarcomeres and appears as a broadening, smearing or even disruption
of the Z-lines. Interestingly, the thinnest Z-lines are detected in type II muscle fibres, which
generate the highest shortening velocities, while the widest Z-lines are found in slow-twitch
muscle fibres (Knoll et al., 2011). Consequently, fast-twitch fibres are more sensitive than
slow twitch fibres to Z-disk streaming (Proske and Morgan, 2001, Appell et al., 1992). This
mechanical damage is one mechanism by which a prolonged loss of strength occurs
immediately after excessive strain (Cheung et al., 2003, Hyldahl and Hubal, 2014, Friden
and Lieber, 1992).
24
Figure 2-1 Initial phase of exercise-induced muscle damage. Due to different abilities of each sarcomere to resist eccentric actions, some of the sarcomeres will be stretched beyond the optimum overlap of actin and myosin filaments, resulting in Z-line streaming (Morgan, 1990) (1). This is accompanied by increased permeability of the sarcolemma (2). Extracellular Ca2+ influx into the muscle fibre activates different Ca2+-sensitive proteases (calpains). Calpain activation leads to proteolysis of cytoskeletal and costameric proteins (Thiebaud, 2012) (3). However, a failure of excitation-contraction coupling also seems to play an important role in strength loss following strenuous exercise, as murine muscle exposed to caffeine revealed an attenuated loss of muscle strength (Warren, Lowe et al. 1993) (4). Figure adapted from Hyldahl and Hubal (2014).
The transmission of muscle fibre force to the tendon (leading to joint movement) not only
occurs in the longitudinal direction in line with the direction of pull of the tendon, but also in
the lateral direction (between adjacent fibres to the overlying connective tissue and
extracellular matrix) (Kjær, 2004, Hughes et al., 2015). The extracellular matrix in skeletal
muscle provides structural and biochemical support to the contractile tissue, and is
associated with the inflammatory response and satellite cell activation (see section 2.5)
(Hyldahl and Hubal, 2014, Kjær, 2004). The relative proportion of different collagen
subtypes in the extracellular matrix of skeletal muscle and tendon varies depending on the
position and function of the connecting tissues (Kjær, 2004, Duance et al., 1977, Davis et
25
al., 2013). The contractile apparatus is connected to the extracellular matrix by costameres
(structural complexes comprising proteins such as dystrophin, focal adhesion kinase and
integrins) and by intermediate filament proteins, such as desmin (Hughes et al., 2015).
According to Ramaswamy et al. (2011), more than 80% of muscle force is transferred via
this lateral pathway. Thus, costameres, intermediate filament proteins and the extracellular
matrix are considered essential for the integrity of skeletal muscle and the maintenance of
lateral force transmission. Furthermore, they are thought to play an important role in injury
prevention by stabilizing the myofilaments (Lovering and De Deyne, 2004, Stauber et al.,
1990, Hughes et al., 2015). The degradation of cytoskeletal, costameric and extracellular
matrix proteins could negatively influence the lateral transmission of force between adjacent
muscle fibres, which could, at least in part, be the source of the prolonged decrease of
maximum strength seen following strenuous exercise (Raastad et al., 2010).
Activation of Ca2+ proteases (calpains) appears to play an important part in the muscle
damage-repair process. Damage to the sarcolemma results in the accumulation of excess
intracellular Ca2+, which activates different calcium-sensitive proteases, which are mostly
localized at the I band and Z disk regions of myofibrils (Belcastro et al., 1998). The activation
results in proteolysis within minutes of cytoskeletal and costameric proteins (Thiebaud,
2012, Lovering and De Deyne, 2004, Boppart et al., 2008, Zhang et al., 2008, Allen et al.,
2005), and calpain activity is still measurable three days after exercise-induced muscle
damage (Raastad et al., 2010). This intra- and extracellular damage requires the removal
and repair of the damaged proteins, and is therefore followed by an inflammatory response
and by activation of the ubiquitin–proteasome pathway (see section 2.4) (Wei et al., 2005,
Tidball, 2005). However, the loss of strength after eccentric muscle contractions was
reversed by exposing mouse muscles to caffeine (Balnave and Allen, 1995, Warren et al.,
1993). Caffeine facilitates the influx of free intracellular Ca2+ from sarcoplasmic reticulum
into the cytosol of the muscle (Warren et al., 1993, Proske and Morgan, 2001). This
phenomenon cannot be explained by damage to the sarcomere, so it can be concluded that
sarcomere damage is not the only cause of strength loss, as impaired ECC also appears to
26
play a role (Cheung et al., 2003, Hyldahl and Hubal, 2014). Increased permeability of the
sarcolemma, due to damaged muscle fibre structure, metabolic disturbance, and fibre
remodelling, is likely to be the main reason for elevated plasma CK and myoglobin (Kjær,
2004, Baird et al., 2012).
A repeated bout of the same eccentric exercise causes significantly fewer symptoms, such
as a lower sensation of pain and almost no increase in serum CK activity plus faster
recovery of muscle function (Brown et al., 1997a). This well-established phenomenon is
referred to as the repeated bout effect and can last up to six months (Nosaka et al., 2001).
A repeated bout of strength training results in a different expression of genes, which are
involved in pro- and anti-inflammatory responses, leading to reduced inflammation (Gordon
et al., 2012). There is also evidence that the repeated bout effect, at least in part, is based
on restructuring of the muscle after damage (McHugh, 2003). Likewise, extracellular matrix
remodelling is believed to be associated with protection of skeletal muscle against future
damage which is indicated by an increase in gene expression of collagen types I and III and
laminin-β2 (Mackey et al., 2011). This is thought to occur in line with muscle remodelling of
intermediate filaments and the addition of sarcomeres in series (leading to longer fibres)
(Friden et al., 1984, Armstrong, 1990, Hyldahl and Hubal, 2014).
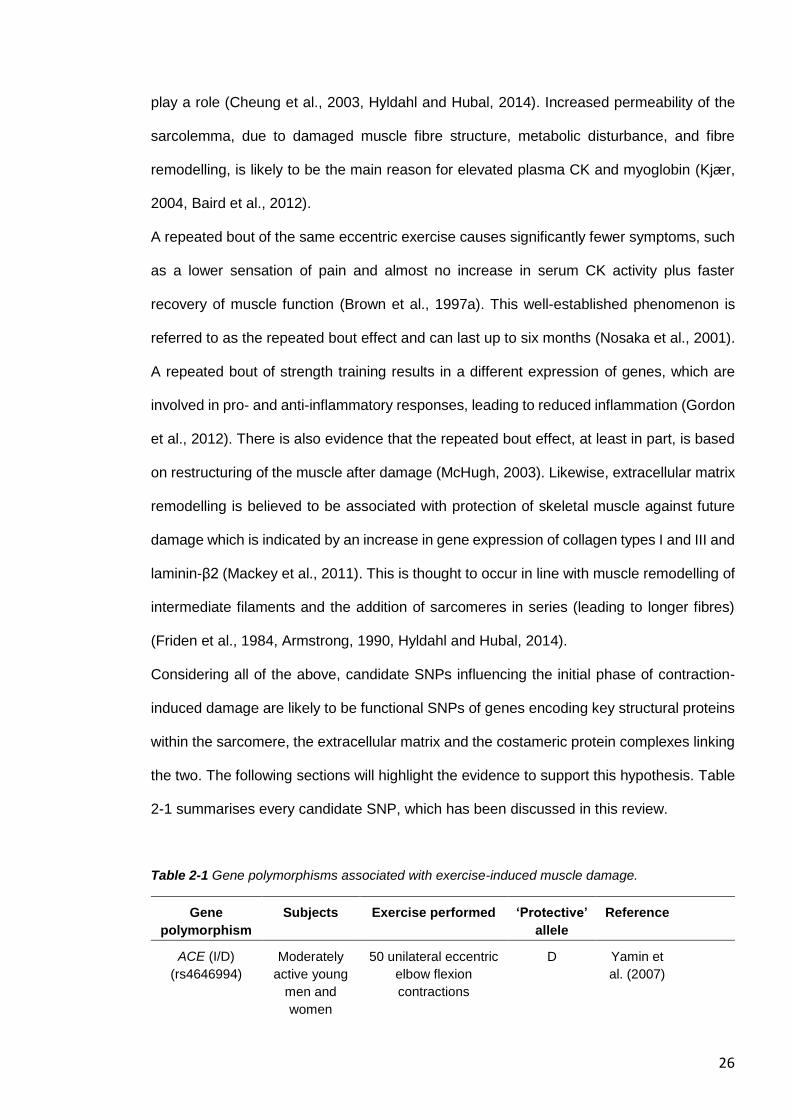
Considering all of the above, candidate SNPs influencing the initial phase of contraction-
induced damage are likely to be functional SNPs of genes encoding key structural proteins
within the sarcomere, the extracellular matrix and the costameric protein complexes linking
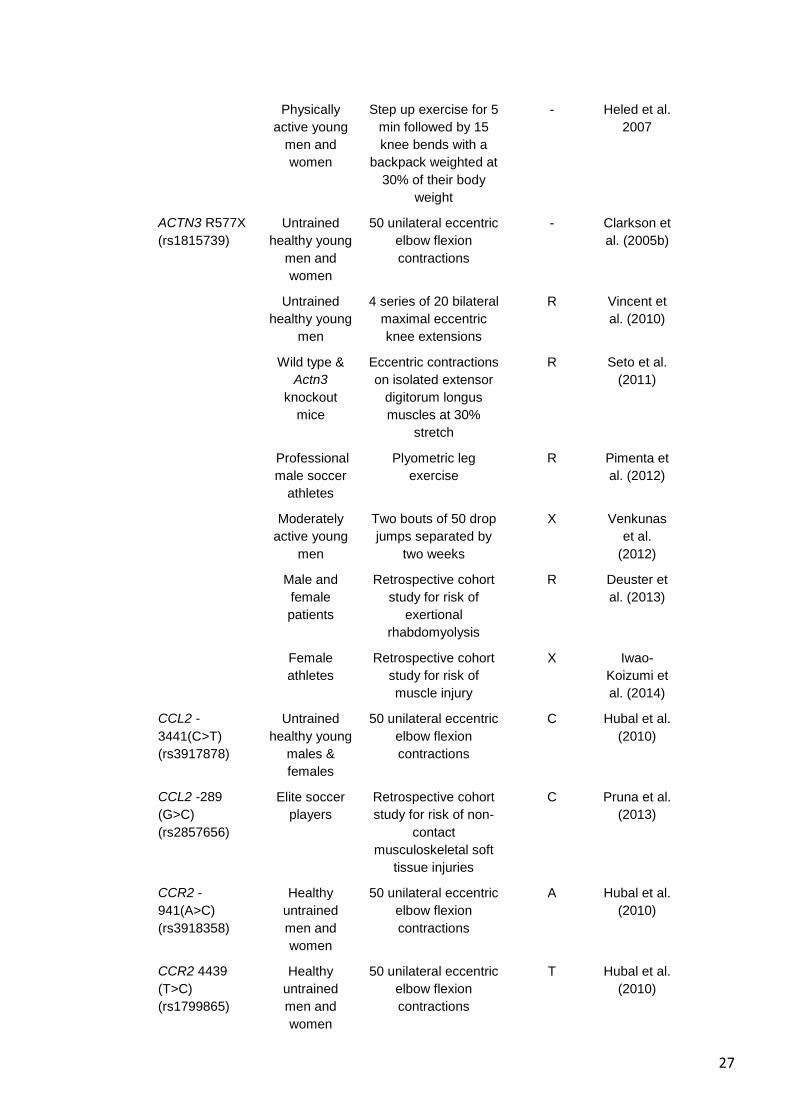
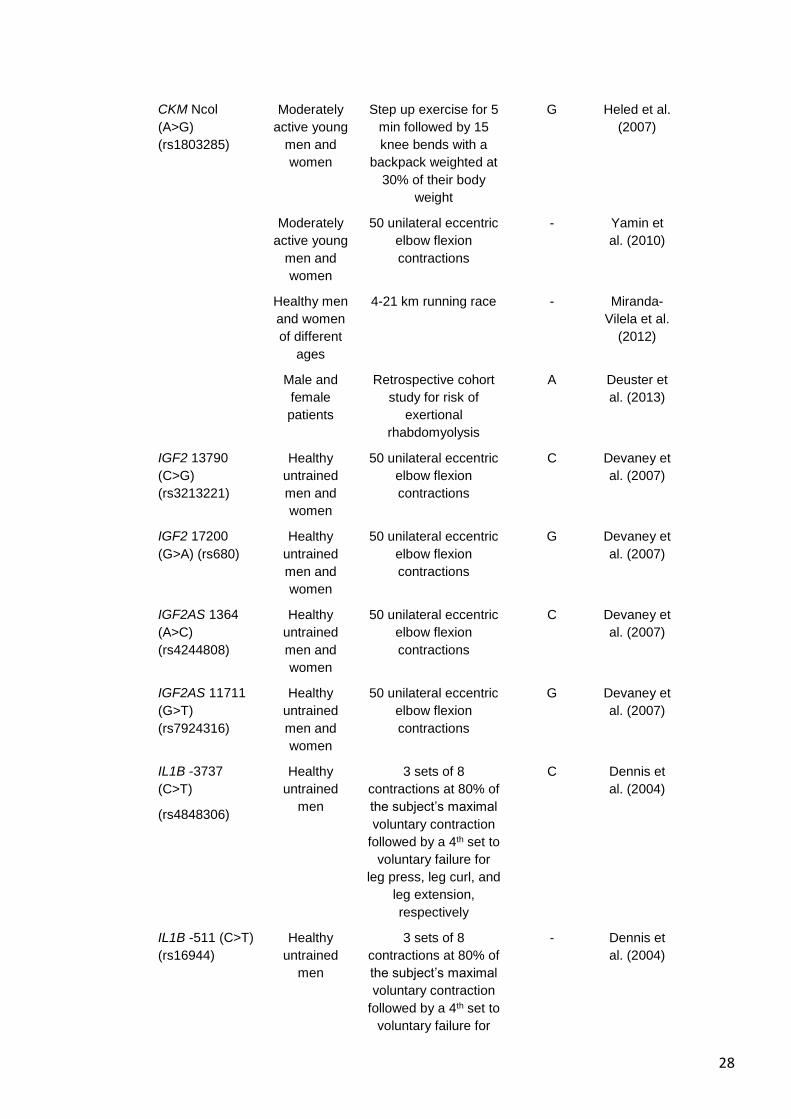
the two. The following sections will highlight the evidence to support this hypothesis. Table
2-1 summarises every candidate SNP, which has been discussed in this review.
Table 2-1 Gene polymorphisms associated with exercise-induced muscle damage.
Gene
polymorphism
Subjects Exercise performed ‘Protective’
allele
Reference
ACE (I/D)
(rs4646994)
Moderately
active young
men and
women
50 unilateral eccentric
elbow flexion
contractions
D Yamin et
al. (2007)
27
Physically
active young
men and
women
Step up exercise for 5
min followed by 15
knee bends with a
backpack weighted at
30% of their body
weight
- Heled et al.
2007
ACTN3 R577X
(rs1815739)
Untrained
healthy young
men and
women
50 unilateral eccentric
elbow flexion
contractions
- Clarkson et
al. (2005b)
Untrained
healthy young
men
4 series of 20 bilateral
maximal eccentric
knee extensions
R Vincent et
al. (2010)
Wild type &
Actn3
knockout
mice
Eccentric contractions
on isolated extensor
digitorum longus
muscles at 30%
stretch
R Seto et al.
(2011)
Professional
male soccer
athletes
Plyometric leg
exercise
R Pimenta et
al. (2012)
Moderately
active young
men
Two bouts of 50 drop
jumps separated by
two weeks
X Venkunas
et al.
(2012)
Male and
female
patients
Retrospective cohort
study for risk of
exertional
rhabdomyolysis
R Deuster et
al. (2013)
Female
athletes
Retrospective cohort
study for risk of
muscle injury
X Iwao-
Koizumi et
al. (2014)
CCL2 -
3441(C>T)
(rs3917878)
Untrained
healthy young
males &
females
50 unilateral eccentric
elbow flexion
contractions
C Hubal et al.
(2010)
CCL2 -289
(G>C)
(rs2857656)
Elite soccer
players
Retrospective cohort
study for risk of non-
contact
musculoskeletal soft
tissue injuries
C Pruna et al.
(2013)
CCR2 -
941(A>C)
(rs3918358)
Healthy
untrained
men and
women
50 unilateral eccentric
elbow flexion
contractions
A Hubal et al.
(2010)
CCR2 4439
(T>C)
(rs1799865)
Healthy
untrained
men and
women
50 unilateral eccentric
elbow flexion
contractions
T Hubal et al.
(2010)
28
CKM Ncol
(A>G)
(rs1803285)
Moderately
active young
men and
women
Step up exercise for 5
min followed by 15
knee bends with a
backpack weighted at
30% of their body
weight
G Heled et al.
(2007)
Moderately
active young
men and
women
50 unilateral eccentric
elbow flexion
contractions
- Yamin et
al. (2010)
Healthy men
and women
of different
ages
4-21 km running race - Miranda-
Vilela et al.
(2012)
Male and
female
patients
Retrospective cohort
study for risk of
exertional
rhabdomyolysis
A Deuster et
al. (2013)
IGF2 13790
(C>G)
(rs3213221)
Healthy
untrained
men and
women
50 unilateral eccentric
elbow flexion
contractions
C Devaney et
al. (2007)
IGF2 17200
(G>A) (rs680)
Healthy
untrained
men and
women
50 unilateral eccentric
elbow flexion
contractions
G Devaney et
al. (2007)
IGF2AS 1364
(A>C)
(rs4244808)
Healthy
untrained
men and
women
50 unilateral eccentric
elbow flexion
contractions
C Devaney et
al. (2007)
IGF2AS 11711
(G>T)
(rs7924316)
Healthy
untrained
men and
women
50 unilateral eccentric
elbow flexion
contractions
G Devaney et
al. (2007)
IL1B -3737
(C>T)
(rs4848306)
Healthy
untrained
men
3 sets of 8
contractions at 80% of
the subject’s maximal
voluntary contraction
followed by a 4th set to
voluntary failure for
leg press, leg curl, and
leg extension,
respectively
C Dennis et
al. (2004)
IL1B -511 (C>T)
(rs16944)
Healthy
untrained
men
3 sets of 8
contractions at 80% of
the subject’s maximal
voluntary contraction
followed by a 4th set to
voluntary failure for
- Dennis et
al. (2004)
29
leg press, leg curl, and
leg extension,
respectively
(Non-)
professional
athletes
versus control
Cross-sectional study - Cauci et al.
(2010)
IL1B 3954
(C>T)
(rs1143634)
Healthy
untrained
men
3 sets of 8
contractions at 80% of
the subject’s maximal
voluntary contraction
followed by a 4th set to
voluntary failure for
leg press, leg curl, and
leg extension,
respectively
T Dennis et
al. (2004)
(Non-)
professional
athletes
versus control
Cross-sectional study - Cauci et al.
(2010)
IL6 -174 (G>C)
(rs1800795)
Moderately
active young
men and
women
50 unilateral eccentric
elbow flexion
contractions
G Yamin et
al. (2008)
Male and
female
patients
Retrospective cohort
study for risk of
exertional
rhabdomyolysis
- Deuster et
al. (2013)
Older obese
women
7 sets of 10 bilateral
eccentric knee
extensions with a load
corresponding to
110% of 10-repetitions
maximum.
C Funghetto
et al.
(2013)
INS 1045 (C>G)
(rs3842748)
Healthy
untrained
men and
women
50 unilateral eccentric
elbow flexion
contractions
C Devaney et
al. (2007)
MLCK 49 (C>T)
(rs2700352)
Untrained
healthy young
men and
women
50 unilateral eccentric
elbow flexion
contractions
C Clarkson et
al. (2005b)
MLCK 37885
(C>A)
(rs28497577)
Untrained
healthy young
men and
women
50 unilateral eccentric
elbow flexion
contractions
C Clarkson et
al. (2005b)
30
Male and
female
patients
Retrospective cohort
study for risk of
exertional
rhabdomyolysis
C Deuster et
al. (2013)
OPN -66 (T>G)
(rs28357094)
Healthy
untrained
men and
women
24 unilateral eccentric
elbow flexion
contractions
T Barfield et
al. (2014)
SLC30A8 (C>T)
(rs13266634)
Untrained
healthy young
men and
women
50 unilateral eccentric
elbow flexion
contractions
T Sprouse et
al. (2014)
SOD2 (C>T)
(rs4880)
Healthy male
and female
volunteers of
different ages
4-21 km running race C Akimoto et
al. (2010)
TNF -308 (G>A)
(rs1800629)
Moderately
active young
men and
women
50 unilateral eccentric
elbow flexion
contractions
A Yamin et
al. (2008)
2.3.1 Alpha-Actinin-3 R577X Polymorphism and the Initial Phase of Exercise-
Induced Muscle Damage
Of all the polymorphisms that have been associated with exercise-induced muscle damage,
the most investigated is the ACTN3 R577X SNP (Clarkson et al., 2005b, Deuster et al.,
2013, Pimenta et al., 2012, Seto et al., 2011, Venckunas et al., 2012, Vincent et al., 2010)
(Table 2-1). The protein isoforms α-actinin-2 and α-actinin-3 are crucial components of the
Z-line in mammalian skeletal muscle and anchor actin filaments to the Z-lines, cross-linking
the thin filaments to the adjacent sarcomeres (Mills et al., 2001, North et al., 1999,
Blanchard et al., 1989). Whilst α-actinin-2 is ubiquitously expressed in skeletal muscle, α-
actinin-3 is only expressed in fast twitch fibres of human skeletal muscle (North and Beggs,
1996, North et al., 1999). A functional SNP (rs1815739; substitution of a C with a T
nucleotide) results in an abortive stop codon (X-allele) rather than the expression of the
amino acid arginine (R-allele) at amino acid 577 of exon 16 on chromosome 11, resulting
in an individual being either RR, RX or XX genotype. As a consequence, XX homozygotes
are not able to express the protein α-actinin-3 (MacArthur and North, 2004, North and
31
Beggs, 1996, North et al., 1999). A sub-section of the population is XX homozygous,
ranging from less than 1 % in African Bantus to 18 % in Europeans, to 25 % in Asian
populations (Mills et al., 2001). Absence of α-actinin-3 does not result in a disease
phenotype due to compensatory up-regulation of α-actinin-2 (North et al., 1999) but there
is evidence that this nonsense SNP affects physical performance (Erskine et al., 2014b,
Niemi and Majamaa, 2005, Clarkson et al., 2005a, Moran et al., 2007).
The ACTN3 XX genotype has been associated with smaller muscle volume (Erskine et al.,
2014b), slower baseline sprint times (Niemi and Majamaa, 2005, Moran et al., 2007), lower
strength (Erskine et al., 2014b, Clarkson et al., 2005a), and lower muscle power (Clarkson
et al., 2005a, Seto et al., 2011, Walsh et al., 2008, Moran et al., 2007, Erskine et al., 2014b).
These findings are supported by Actn3 knock-out mouse models, demonstrating a shift in
the properties of fast muscle fibres towards a more oxidative fast fibre profile, lower muscle
strength, reduced mass and decreased diameter of IIb fibres (Chan et al., 2011, MacArthur
et al., 2008, MacArthur et al., 2007). Strong evidence has been presented that, as a
consequence of the up-regulation of α-actinin-2 in XX homozygotes, more calsarcin-2 is
bound to α-actinin-2 and less to calcineurin (Seto et al., 2013). The binding affinity of
calsarcin-2, which functions as an inhibitor of calcineurin activation, is greater for α-actinin-
2 compared to α-actinin-3. Consequently, a higher level of free calcineurin is able to activate
the downstream signalling of the slow myogenic programme. Given the larger size, higher
force and power generating capacity, and lower fatigue resistance of type II fibres compared
to type I fibres (Bottinelli et al., 1996), the evidence presented by Seto et al. (2013) provides
a mechanistic explanation for the associations between ACTN3 genotype and muscle size,
strength, power, and endurance phenotypes.
Recent investigations have suggested that α-actinin-3 may be evolutionarily optimized for
the minimization of muscle damage (Yang et al., 2003). The majority of the human studies
support the hypothesis that XX homozygotes are more susceptible to strenuous exercise
compared to their RR or RX counterparts (Pimenta et al., 2012, Vincent et al., 2010, Deuster
et al., 2013). For instance, ACTN3 XX homozygotes are approximately three times more
32
likely to develop exertional rhabdomyolysis compared to people of RR or RX genotypes
(Deuster et al., 2013). However, other studies have revealed no differences between
ACTN3 genotypes regarding markers of muscle damage (Clarkson et al., 2005b), or have
shown contrary effects post-exercise (Venckunas et al., 2012) or in muscle injury risk (Iwao-
Koizumi et al., 2014). The cross-sectional study of Clarkson et al. (2005b) revealed no
differences in strength loss but a lower baseline CK activity in the blood in ACTN3 XX
homozygotes compared to carriers of the ACTN3 R-allele. These baseline differences in
CK activity may have been due to ACTN3 genotype-dependent differences in muscle mass
(i.e. smaller muscle volume in XX homozygotes versus R-allele carriers) (Erskine et al.,
2014b).
33
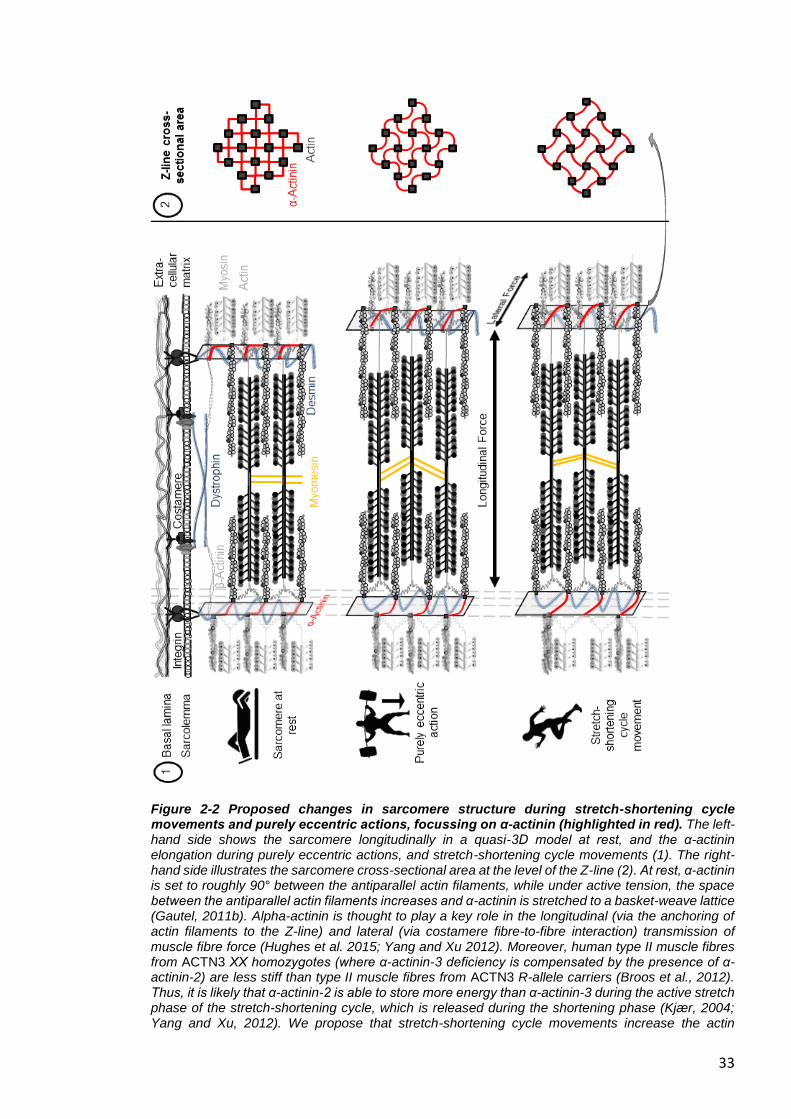
Figure 2-2 Proposed changes in sarcomere structure during stretch-shortening cycle movements and purely eccentric actions, focussing on α-actinin (highlighted in red). The left-hand side shows the sarcomere longitudinally in a quasi-3D model at rest, and the α-actinin elongation during purely eccentric actions, and stretch-shortening cycle movements (1). The right-hand side illustrates the sarcomere cross-sectional area at the level of the Z-line (2). At rest, α-actinin is set to roughly 90° between the antiparallel actin filaments, while under active tension, the space between the antiparallel actin filaments increases and α-actinin is stretched to a basket-weave lattice (Gautel, 2011b). Alpha-actinin is thought to play a key role in the longitudinal (via the anchoring of actin filaments to the Z-line) and lateral (via costamere fibre-to-fibre interaction) transmission of muscle fibre force (Hughes et al. 2015; Yang and Xu 2012). Moreover, human type II muscle fibres from ACTN3 XX homozygotes (where α-actinin-3 deficiency is compensated by the presence of α-actinin-2) are less stiff than type II muscle fibres from ACTN3 R-allele carriers (Broos et al., 2012). Thus, it is likely that α-actinin-2 is able to store more energy than α-actinin-3 during the active stretch phase of the stretch-shortening cycle, which is released during the shortening phase (Kjær, 2004; Yang and Xu, 2012). We propose that stretch-shortening cycle movements increase the actin
34
filament spacing to a greater extent compared to purely eccentric actions, thus elongating α-actinin to become almost completely straight at peak eccentric force. Individuals with α-actinin-3 deficiency (ACTN3 XX homozygotes) might, therefore, benefit from having a more elastic Z-line during stretch-shortening cycle movements compared to R-allele carriers (Broos et al., 2012), resulting in a reduced damage response to stretch-shortening movements (Venckunas et al., 2012). Figure adapted from Gautel (2011b).
Movements with repeated stretch-shortening cycles, eccentric followed by immediate
concentric muscle contraction) (Venckunas et al., 2012) seem to have a different demand
profile for the muscle-tendon unit compared to purely eccentric actions (Figure 2-2) (Seto
et al., 2011, Vincent et al., 2010). Due to the fact that α-actinin is linked to both the
longitudinal and lateral transmission of force (Hughes et al., 2015, Yang and Xu, 2012), we
propose that α-actinin-3 deficiency (XX genotype) with a more elastic Z-line (Broos et al.,
2012) might result in benefits to stretch-shortening cycle movements compared to R-allele
carriers. Although the stretch-shortening cycle includes an eccentric element, contrary to
the type of maximal eccentric contractions typically used in exercise-induced muscle
damage studies, the force and the eccentric phase involved in the active braking phase of
stretch-shortening cycles are generally fast and of short duration (Nicol et al., 2006).
Interestingly, muscle activation decreases with increasing velocity in the eccentric phase
under stretch-shortening cycle conditions (Benoit and Dowling, 2006), which indicates that
other non-contractile (elastic) structures, such as the extracellular matrix/tendon, might
provide an important contribution to the power output by storing energy (Kjær, 2004, Yang
and Xu, 2012). Indeed, a highly compliant elastic musculotendinous system is thought to
elevate the use of elastic strain energy in stretch-shortening cycle movements (Wilson et
al., 1991). Thus, individually performed eccentric actions with greater longitudinal force
transmission might damage the link between the contractile structure and the Z-line, which
might activate the calpain system to a greater extent.
The transmission of muscle fibre force to the tendon may occur faster by the stiffer Z-line
including α-actinin-3 in the longitudinal direction (Hughes et al., 2015, Broos et al., 2012)
and, also, might reduce muscle damage in eccentric actions performed without a stretch-
shortening cycle compared to the α-actinin-3 deficient fibres (Seto et al., 2011, Vincent et
35
al., 2010). Head et al. (2015) revealed a significantly increased sarcoplasmic reticulum Ca2+
pumping and leakage in ACTN3 XX homozygotes, which was probably due to a higher
expression of the specific Ca2+ channel sarco(endo)plasmic reticulum calcium-adenosine-
triphosphatase-1 gene, and of the Ca2+ binding proteins, calsequestrin and sarcalumenin,
in the sarcoplasmic reticulum (Head et al., 2015). Increased dynamics with elevated
intracellular Ca2+ levels during and after exertional muscle damage may lead to increased
cytoskeletal damage and membrane disruption (Zhang et al., 2008, Head et al., 2015,
Quinlan et al., 2010). Muscle damage induced by exclusively performed eccentric actions
might lead to increased desmin degradation (Yu, 2013), which results in fewer connections
with the extracellular matrix and adjacent myofibrils, and could be an explanation for the
higher susceptibility of XX homozygotes in this mode of exercise. Taken together, the
different effect of the ACTN3 R577X SNP in diverse mode of exercises could explain the
fact that studies show mixed results. This may be why there are differences in ACTN3
genotype frequency in short and long distance athletes of stretch-shortening cycle-related
sports (e.g. running) (Yang et al., 2003), whereas both short and long distance athletes in
power sports, commonly carried out without stretch-shortening cycles (e.g. swimming),
show no difference in genotype/allele frequency distribution (Ben-Zaken et al., 2015). This
demonstrates why future studies should not only distinguish between power and endurance
athletes, but should focus on sport-specific movements when investigating the association
with genetic variation.
2.3.2 Myosin Light Chain Kinase Polymorphisms and the Initial Phase of
Exercise-Induced Muscle Damage
Every myosin head is connected with two light chains on the long lever arm, which are
known as the essential and the regulatory light chains. In skeletal and cardiac muscles of
mammals, troponin and tropomyosin have the role of triggering the contraction following the
increase in free cytosolic Ca2+, while the regulatory light chain modulates Ca2+ activation
(Sweeney et al., 1993, Cheung et al., 2003, Lossie et al., 2014). Repeated Ca2+ influx due
36
to muscular contraction activates myosin light chain kinase, and this enzyme
phosphorylates the regulatory light chains. It has been shown that regulatory light chain
phosphorylation results in increased Ca2+ sensitivity (Szczesna et al., 2002), which
increases the rate of force development predominantly in type II muscle fibres (Childers and
McDonald, 2004). This might be the result of an increased number of force-generating
cross-bridges. However, the increased force output by light chain phosphorylation might
also result in elevated muscle damage, which has been shown in skinned fast-twitch fibres
(Childers and McDonald, 2004).
Two different SNPs of the myosin light chain kinase gene [49 (C>T) (rs2700352) and 37885
(C>A) (rs28497577)] have been investigated concerning exercise-induced muscle damage
(Clarkson et al., 2005b). T-allele carriers of the 49 (C>T) SNP have shown increased
baseline strength in comparison to CC carriers but TT homozygotes revealed increased
circulatory levels of the muscle damage biomarkers (CK and myoglobin) following eccentric
exercise. Furthermore, A-allele carriers of the 37885 (C>A) SNP have revealed greater
muscle strength loss and increased plasma CK following strenuous exercise. This is in line
with the findings of Deuster et al. (2013), who showed that exertional rhabdomyolysis cases
are about 5 times more likely for the A-allele of the 37885 (C>A) SNP of the myosin light
chain kinase gene compared to carriers of the C-allele. The mechanisms, however, are
unclear. Clarkson et al. (2005b) suggested that these SNPs may alter regulatory light chain
phosphorylation, thus leading to higher muscle strain and subsequently greater muscle
damage following strenuous exercise.
2.3.3 Muscle-Specific Creatine Kinase Polymorphisms and the Initial Phase
of Exercise-Induced Muscle Damage
The creatine kinase enzyme is expressed in the cytosol and mitochondria of tissues with
high energy consumption (e.g. skeletal muscle fibres). The cytosolic enzyme is composed
of the two subunits muscle type (M) and brain type (B), which provide three different
combination possibilities: CK-BB (predominantly in brain), CK-MB (in cardiac muscle) and
37
CK-MM (in skeletal muscle). Skeletal muscle-specific CK is bound to the M-Line structure
and to the sarcoplasmic reticulum of myofibrils (Wallimann et al., 1992, Brancaccio et al.,
2007). In healthy individuals, most serum CK consists of skeletal muscle CK (Brancaccio et
al., 2007). Creatine kinase can leak from muscle fibres into the circulation following the
mechanical tearing of the sarcolemma and opening of stretch-activated channels following
contraction-induced damage, although the exact mechanism is still unclear (Allen et al.,
2005).
The skeletal muscle CK-encoding gene is located at the 19q13.2–13.3 region of the
chromosome 19 (Nigro et al., 1987). The Ncol (A>G) SNP (rs1803285) of the muscle
creatine kinase gene, is mapped to the 3’ untranslated region, which means it could affect
the localization, translation efficiency and stability of the mRNA, which might mediate the
location and function of the protein (Wilson et al., 1995). Interestingly, the genes for the
ryanodine receptor 1 (Robinson et al., 2006) and myotonic dystrophy protein kinase
(Brunner et al., 1989), which are associated with muscle function and specific myopathies,
are mapped to the same area of chromosome 19. According to Deuster et al. (2013), Ncol
GG homozygotes are present in 28.1 % of African Americans, in 14.2 % of Caucasians,
0 % of Hispanic and 8.3 % of Asian individuals. Investigations of the Ncol SNP of the muscle
creatine kinase gene have revealed different outcomes. In the study of Deuster et al. (2013),
GG homozygotes were reportedly 3.1 times more likely to experience exertional
rhabdomyolysis than carriers of the A-allele. However, Heled et al. (2007) revealed that
NcoI AA homozygotes had a six-fold higher risk of being a high responder of circulating CK
to eccentric exercise than GG or AG genotypes. Other studies do not support a role for the
Ncol SNP of the muscle creatine kinase gene in explaining the CK variability between
individuals (Miranda-Vilela et al., 2012, Yamin et al., 2010). However, the mechanism
remains poorly understood and is confounded by the different methodological designs
implemented by researchers. Furthermore, Heled et al. (2007) and Yamin et al. (2010) have
only investigated CK-response as a marker for muscle damage. Further studies with several
other muscle damage markers such as muscle strength loss and soreness could provide a
38
better physiological/systems-based understanding of the influence of this NcoI SNP on
exertional muscle damage. An additional restriction fragment length polymorphism, the TaqI
SNP of the muscle creatine kinase gene, has been shown to be in strong linkage
disequilibrium with the NcoI SNP (Miranda-Vilela et al., 2012). The TaqI 1-2 genotype has
indicated a lower risk for inflammation after a track event between 4 and 21 km, whereby
the participants could choose their preferential distance. However, no further studies have
been undertaken towards understanding a potential role for this SNP in association with
muscle damage. It is possible that these SNPs change the half-life of the CK enzyme and
the intracellular concentration of CK (Heled et al., 2007). Elevated intracellular CK
concentration might increase calpain activation, thus resulting in greater protein
degradation.
2.4 GENETIC VARIATION AND THE SECONDARY PHASE OF
EXERCISE-INDUCED MUSCLE DAMAGE
The secondary phase of muscle damage is a complex event that has been linked to
inflammation (Schoenfeld, 2010), where leucocytes infiltrate muscles with damaged fibres
and remain there for days or even weeks (Tidball, 2005). Although the results of published
studies are inconsistent (Schneider and Tiidus, 2007), in vitro (Kanda et al., 2013, Suzuki
and Ford, 1999) and in vivo studies (Paulsen et al., 2010) support a role for neutrophils in
muscle damage. It is assumed that neutrophils (Suzuki et al., 1996) migrate to the region
of injury in the early stage of muscle damage (Figure 2-3). Neutrophils contribute to the
degradation of damaged muscle tissue by producing reactive oxygen species (ROS), which
are thought to attract macrophages to the area of trauma (McGinley et al., 2009, Nguyen
and Tidball, 2003).
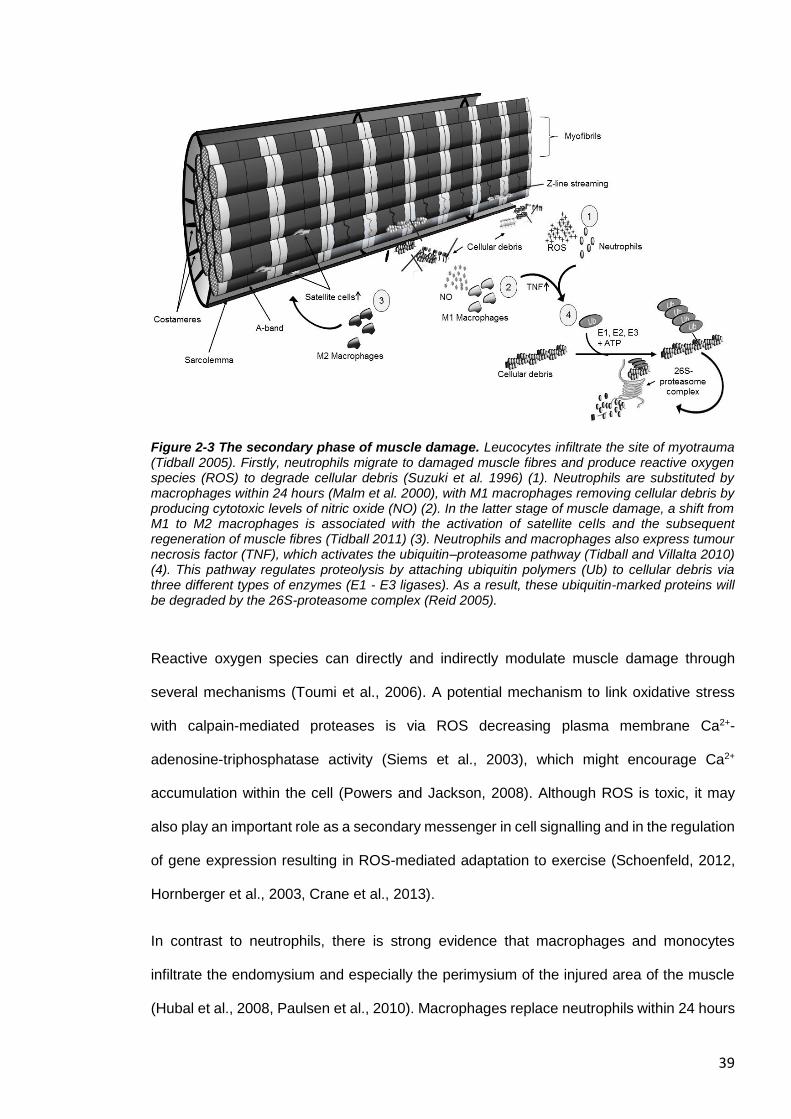
39
Figure 2-3 The secondary phase of muscle damage. Leucocytes infiltrate the site of myotrauma (Tidball 2005). Firstly, neutrophils migrate to damaged muscle fibres and produce reactive oxygen species (ROS) to degrade cellular debris (Suzuki et al. 1996) (1). Neutrophils are substituted by macrophages within 24 hours (Malm et al. 2000), with M1 macrophages removing cellular debris by producing cytotoxic levels of nitric oxide (NO) (2). In the latter stage of muscle damage, a shift from M1 to M2 macrophages is associated with the activation of satellite cells and the subsequent regeneration of muscle fibres (Tidball 2011) (3). Neutrophils and macrophages also express tumour necrosis factor (TNF), which activates the ubiquitin–proteasome pathway (Tidball and Villalta 2010) (4). This pathway regulates proteolysis by attaching ubiquitin polymers (Ub) to cellular debris via three different types of enzymes (E1 - E3 ligases). As a result, these ubiquitin-marked proteins will be degraded by the 26S-proteasome complex (Reid 2005).
Reactive oxygen species can directly and indirectly modulate muscle damage through
several mechanisms (Toumi et al., 2006). A potential mechanism to link oxidative stress
with calpain-mediated proteases is via ROS decreasing plasma membrane Ca2+-
adenosine-triphosphatase activity (Siems et al., 2003), which might encourage Ca2+
accumulation within the cell (Powers and Jackson, 2008). Although ROS is toxic, it may
also play an important role as a secondary messenger in cell signalling and in the regulation
of gene expression resulting in ROS-mediated adaptation to exercise (Schoenfeld, 2012,
Hornberger et al., 2003, Crane et al., 2013).
In contrast to neutrophils, there is strong evidence that macrophages and monocytes
infiltrate the endomysium and especially the perimysium of the injured area of the muscle
(Hubal et al., 2008, Paulsen et al., 2010). Macrophages replace neutrophils within 24 hours
40
and remain present for up to 14 days after exercise (Malm et al., 2000). During the early
stages of muscle damage, there is an increase of M1 macrophages (which express CD68
surface marker but not CD163), supporting the removal of cellular debris by producing
cytotoxic levels of nitric oxide. This is followed by a shift from M1 to M2 macrophages
(CD68−/ CD163+), which promote the activation of satellite cells and the subsequent
regeneration of muscle fibres (see section 2.5) (Mahoney et al., 2008, Kanda et al., 2013,
Tidball and Villalta, 2010, Philippou et al., 2012, Zanou and Gailly, 2013).
Leucocyte accumulation and the following remodelling appear to be gradual processes
regulated by the extent of damage (Paulsen et al., 2010, Paulsen et al., 2012). In an extreme
case of muscle damage, remodelling may become maladaptive characterized by necrosis,
incomplete healing, and fibrotic scar tissue formation (Butterfield, 2010). Cytokines play
particularly well-characterized roles in an orchestrated regulated fashion of the activation
and modulation of the inflammatory response (Paulsen et al., 2012). Recent investigations
revealed that some cytokines are also expressed by skeletal muscle, and are therefore
named myokines (Pedersen et al., 2003). The role of cytokines in the phase of inflammation
following exercise-induced muscle damage is explained in the comprehensive review of
Paulsen et al. (2012). Cytokines are classified as (i) pro-inflammatory cytokines [promoting
inflammation, e.g. interleukin (IL)-1α, IL-1β and tumour necrosis factor (TNF)]; (ii) anti-
inflammatory cytokines (inhibiting inflammation, e.g. IL-10, IL-4 and IL-13) and chemokines
(abbreviated from chemotactic cytokines), which attract leucocytes and other cells to
migrate from the blood to the region of injury [e.g. chemokine (C-C motif) ligand 2 (CCL2)]
(Paulsen et al., 2012, Peake et al., 2005, Suzuki et al., 2002). Muscle cytokine expression
after strenuous exercise is predominantly pro-inflammatory (Peake et al., 2005).
In addition, some cytokines such as IL-6 can act either as a pro- or an anti-inflammatory
agent, depending on the environment (Pedersen and Febbraio, 2008). The majority of
cytokines are released from several cell types including muscle fibres, fibroblasts,
neutrophils, and macrophages, and the expression of cytokines is determined by the mode,
intensity and duration of exercise (Peake et al., 2015). Furthermore, the action patterns of
41
some of these cytokines change during the inflammatory response. These findings make it
difficult to identify the specific roles of each cytokine after exercise-induced muscle damage
(Smith et al., 2008). However, the invading neutrophils and macrophages express TNF at
the early phase of the inflammatory response (Philippou et al., 2012, Tidball and Villalta,
2010, Warren et al., 2002a). Tumour necrosis factor is able to activate the ubiquitin–
proteasome pathway, which is one of the main mechanisms for the cellular protein
degradation in eukaryotic cells (Murton et al., 2008, Li et al., 2005). The ubiquitin–
proteasome pathway regulates proteolysis by attaching ubiquitin polymers to damaged
proteins via three distinct types of enzymes (known as E1 - E3 ligases). Subsequently, the
26S-proteasome complex degrades the ubiquitin-marked protein (Reid, 2005). Tumour
necrosis factor increases the gene expression of the E3 ligases, muscle ring finger 1
(MuRF1) and muscle atrophy F-box (MAFbx; also referred to as Atrogin1) (Li et al., 2005,
Li et al., 2003, Murton et al., 2008, Bodine et al., 2001b). Thus, it is thought that TNF is an
important factor in the instigation of the remodelling process after exertional muscle damage
(Murton et al., 2008).
2.4.1 Interleukin-1 Polymorphisms and the Secondary Phase of Exercise-
Induced Muscle Damage
The interleukin-1 (IL1) family of cytokine genes is located together on chromosome 2, and
includes IL-1α (IL1A), IL-1β (IL1B) and IL-1 receptor antagonist (IL-1Ra; IL1RN) (Dennis et
al., 2004). Interleukin-1α and IL-1β are agonists of the IL-1 receptor type I (IL-1R1) and
promote inflammation. In general, IL-1β acts synergistically with TNF and induces the
expression of several other pro-inflammatory genes (Dinarello, 2009). Following eccentric
exercise in humans, systemic levels of IL-1β increase marginally (Peake et al., 2005), but
there is an increase of local IL-1β levels within skeletal muscle up to 5 days post exercise
(Fielding et al., 1993). In contrast, IL-1Ra acts as an antagonist of IL-1R1, preventing the
binding of IL-1α and IL-1β with IL-1R1, respectively. Instead of IL-1β, IL-1Ra is highly
concentrated in plasma following intense physical exercise (Paulsen et al., 2012). In the
42
absence of IL-1Ra, the activity of IL-1 is unrestricted and leads to increased inflammatory
response (Dinarello, 2009).
Different SNPs of the IL1B gene have been investigated in relation to the response to
exercise and exercise-induced muscle damage: (i) at position -511 (C>T) (rs16944) in the
promoter region (di Giovine et al., 1992); (ii) at position +3954 (C>T) (rs1143634) in exon 5
(TaqI restriction site polymorphism) (Bioque et al., 1995); (iii) at position -3737 (C>T)
(Dennis et al., 2004, Vangsted et al., 2011). Dennis et al. (2004) investigated the
associations of selected IL1 SNPs with the inflammatory response following a single bout
of resistance exercise. Twenty-four sedentary Caucasian males were recruited based on
specific clusters of IL1 SNPs (haplotypes) (+4845 IL1A, +3954 IL1B, -511 IL1B, and -3737
IL1B polymorphisms). Only participants with the IL1B C/C (+3954) or with the T/T (-3737)
genotype showed an increased inflammatory response (changes in inflammatory
associated cytokines and M1 macrophages number) in skeletal muscle. However, the
concentration of macrophages did not change. This leads to the assumption that the
cytokine release by each macrophage is elevated or local production by the skeletal muscle
itself is increased. Individuals with the above-mentioned genotypes, who also carried the
C-allele of the IL1RN +2018 (T>C) SNP, demonstrated a further increase of inflammatory
response following resistance exercise.
Cauci et al. (2010) found that the IL1B +3954 (C>T) SNP, together with the -511 (C>T),
have no influence on athletic phenotype, which is in accordance with the findings that
neither plasma IL-1β nor IL1B mRNA is influenced by physical activity (Petersen and
Pedersen, 2005, Mahoney et al., 2008). In addition, a multi-allelic insertion polymorphism
in intron 2 of the IL-1RN gene (rs380092) contains a variable number tandem repeat of an
86-bp length of DNA (Mansfield et al., 1994). Allele 2 (two repeats of the 86 bp region) of
the IL1RN intron 2 variable number tandem repeat was significantly more frequent in
athletes compared to non-athletes. In addition, there was a higher frequency distribution of
the 1/2 (allele 1 with four repeats and allele 2 with two repeats of the 86 bp region) genotype
variable number tandem repeat IL1RN in high-grade professional athletes than in non-
43
professional athletes. In contrast, the frequency of IL1RN allele 2 homozygotes did not differ
between athletes and non-athletes. Unfortunately, this study has only distinguished
between professional (high-grade), non-professional (medium-grade) athletes, and non-
athletes. Athlete status was not discriminated within the different types of sport, which is
necessary, as different mode of exercises require different physical traits. However, in vitro
investigations showed that the IL1RN allele 2 has been associated with a lower expression
of IL-1Ra (Dewberry et al., 2000), but increased production of the pro-inflammatory cytokine
IL-1β (Santtila et al., 1998). Cauci et al. (2010) suggested that carriers of IL1RN allele-2
displayed a moderate increase of IL-1-dependent inflammation, which results in benefits to
athletic performance. IL1RN allele 2 might support the removal of cellular debris, promoting
a faster recovery. However, IL1RN allele 2 homozygotes may lead to a sharp increase of
inflammation, which negatively influences the recovery or remodelling. Further investigation
is necessary to confirm these findings.
2.4.2 Tumour Necrosis Factor -308 G>A Polymorphism and the Secondary
Phase of Exercise Induced Muscle Damage
Tumour necrosis factor (formerly known as tumour necrosis factor-α) is a pro-inflammatory
cytokine with short half-life and low circulating levels (Reid and Li, 2001, Pedersen, 2011)
and is associated with the occurrence of metabolic disorders (Borst, 2004). Plomgaard et
al. (2005) have shown that TNF infusion in healthy individuals alters insulin signalling
transduction and subsequently induces insulin resistance in skeletal muscle. Like IL-1β,
systemic TNF concentration does not change or is only slightly increased after intense
exercise (Peake et al., 2015). However, local expression of TNF within the skeletal muscle
is significantly elevated after exercise (Peake et al., 2015). Tumour necrosis factor is
associated with up-regulation of catabolic pathways and suppression of protein synthesis
in skeletal muscle (Ling et al., 1997), mediated by NF-κB, which stimulates the ubiquitin-
proteasome pathway (Reid and Li, 2001). This is in line with Tiainen et al. (2012), who have
shown that high plasma levels of TNF are associated with reduced physical performance in
44
men. Furthermore, intravenous infusion of TNF in rats led to a significant drop in systemic
IGF-I and IGF-binding proteins 3 levels, suggesting a negative influence of TNF on the IGF-
system (Llovera et al., 1998).
The minor A-allele of the rare TNF -308 (rs1800629) SNP is associated with increased
plasma TNF concentration (Karimi et al., 2009) and with impaired improvement of physical
performance in older women following physical activity (Pereira et al., 2013). Presumably,
the A-allele is a stronger activator of TNF transcription than the G-allele (Wilson et al.,
1997). To the best of our knowledge, only one study has investigated an association
between the TNF -308 (G>A) SNP and its association with exercise-induced muscle
damage. Interestingly, carriers of the A-allele showed a non-significant (P = 0.06) blunting
of elevated plasma CK following eccentric exercise (Yamin, 2009, Yamin et al., 2008).
However, no AA homozygotes were included in this investigation. The TNF -308 A-allele
was associated with higher plasma TNF concentration and impaired improvements in
physical fitness following chronic exercise in older populations, while in young, healthy
individuals, A-allele carriers demonstrated blunted CK activity in the blood after eccentric
exercise. However, CK activity was measured at the peak activity 96 hours post-exercise
in Yamin et al. (2008). The blunted CK activity of TNF -308 A-allele carriers in the study by
Yamin et al. (2008) might not be attributed to the muscle damage itself but may be caused
by attenuated remodelling, such as myoblast fusion which is accompanied by CK activity
(Zalin, 1972). Due to the fact that membrane damage might be repaired in a short time
(Bansal et al., 2003), other mechanisms should be considered for the prolonged leakage of
CK. Elevated TNF attenuates myoblast fusion and differentiation which might impair the
regeneration of the muscle (Stewart et al., 2004). Subsequently, carriers of the TNF -308
A-allele might have a higher susceptibility to muscle atrophy and sarcopaenia due to the
impaired ability of muscle remodelling. However, Lappalainen (2009) has indicated some
technical limitations of the assay which might have influenced the data interpretation of
Yamin et al. (2008). Further studies are needed, which investigate a potential association
between the TNF -308 SNP and other muscle damage markers.
45
2.4.3 Interleukin-6 –174 G>C Polymorphism and the Secondary Phase of
Exercise-Induced Muscle Damage
Interleukin-6 (IL-6) modulates the release of different cytokines, such as of TNF and IL-1Ra
(Steensberg et al., 2003, Starkie et al., 2003). The human IL6 gene is mapped to
chromosome 7p21–24 with a 303 bp upstream promoter (Fishman et al., 1998). Interleukin-
6 plasma concentration is affected by exercise duration and intensity (Fischer et al., 2004),
and the amount of muscle mass involved (Ostrowski et al., 2000), particularly during weight-
bearing exercise (Catoire and Kersten, 2015). Eccentric exercise induces a delayed peak
and a slower decrease of plasma IL-6 after exercise in comparison to other modes of
exercise, such as running (Fischer, 2006, Pedersen and Fischer, 2007). According to
McKay et al. (2009), IL-6 may play a role as an important signalling molecule associated
with satellite cell proliferation after strenuous exercise. Furthermore, damaged extracellular
matrix might have an effect on IL-6 expression, as IL-6 is involved in collagen synthesis
(Andersen et al., 2011). These findings suggest that the different circulating IL-6 timescale
of prolonged but non-damaging exercise and of eccentric exercise occurs due to a different
source and function of IL-6 expression. Whilst muscle fibres, peritendinous connective
tissue (Langberg et al., 2002) and adipose tissue (Holmes et al., 2004) all express and
release IL-6 into the circulation without activating pro-inflammatory pathways (Pedersen,
2011), eccentric exercise might induce more local IL-6 expression within the skeletal muscle
with pro-inflammatory properties (Nieman et al., 1998, Nieman et al., 2000). The delayed
peak of plasma IL-6 concentration after strenuous eccentric exercise might occur due to
release into the circulation following the mechanical tearing of the sarcolemma and opening
of stretch activated channels due to exertional muscle damage.
A functional −174 G>C SNP (rs1800795) has been detected in the promoter region of the
IL6 gene. The frequency distribution of the G-allele ranges between 45 to 100% in the
worldwide population (Borinskaya et al., 2013) and it is associated with an increased plasma
IL-6 response in healthy people (Bennermo et al., 2004, Fishman et al., 1998, Pereira et
46
al., 2011). The −174 G allele might affect the glucocorticoid receptor and elevate the
transcriptional activation due to its close positioning with the receptor (Yamin et al., 2008,
Rein et al., 1995). This IL6 SNP shows a somewhat ambiguous picture: according to Ruiz
et al. (2010b), both GG and GC genotypes are more frequent in elite power athletes
compared to endurance athletes and to non-athletes. There was no difference between
endurance athletes and the control group, which is in the line with the findings of Yamin et
al. (2008). In young individuals, C-allele carriers of the IL6 SNP presented higher CK values
following eccentric exercise compared with GG homozygotes (Yamin et al., 2008, Yamin,
2009). In power-orientated sports, which are associated with muscle damage during training
or competition, GG homozygotes might have benefits with faster recovery and elevated
satellite cell proliferation in the long term. However, Deuster et al. (2013), who did not
observe any association between this IL6 SNP and exertional rhabdomyolysis, challenge
this conclusion.
Aging-related declines in physical function are associated with chronically elevated
systemic IL-6 concentration (Ershler and Keller, 2000, da Cunha Nascimento et al., 2015).
However, Walston et al. (2005) could not confirm any association between IL6 genotypes
and serum IL-6 in older women. Furthermore, in the study of Funghetto et al. (2013), in
older obese women, plasma CK integral (area under the curve of CK between the different
time points) values were lower and IL-6 integral values were higher for carriers of the C-
allele after eccentric exercise. However, there was only a moderate increase in plasma CK
concentration and no change in IL-6 concentration, probably resulting from the relatively
low intensity of the eccentric exercise protocol used. Of note, the interaction between the
−174 G>C SNP and obesity seems to be a complex one (Joffe et al., 2013). Linkage
disequilibrium of this −174 G/C SNP with several other SNPs on the IL6 gene cannot be
excluded (Qi et al., 2007). In diseased, obese and older populations with chronically
elevated circulating IL-6, an increased IL-6 response might be harmful after eccentric
exercise (Funghetto et al., 2013, Bennermo et al., 2004).
47
In summary, the pattern of circulatory IL-6 and CK levels in association with the IL6 −174
G>C SNP appears to be diametrically opposed. It might be that an elevated IL-6 response
and lower CK levels associated with the G-allele are beneficial due to increased IL-6
production of macrophages (Patel et al., 2010) and satellite cell proliferation (McKay et al.,
2009) in a healthy population following eccentric exercise (Yamin et al., 2008). However,
the G-allele might have a negative effect in those presenting with chronic low-grade
systemic inflammation. Without knowing the actual source of IL-6 expression and its
subsequent pro- or anti-inflammatory effect, cumulative plasma IL-6 concentration is
probably an inaccurate biomarker of muscle damage (Pedersen and Febbraio, 2008). The
influence of the IL6 −174 G>C SNP is not fully clear and needs further investigation,
particularly in conjunction with both local and circulatory measures of IL-6
expression/concentration.
2.4.4 Chemokine Ligand 2 and Chemokine Receptor Type 2 Polymorphisms
and the Secondary Phase of Exercise-Induced Muscle Damage
Like interleukin-6, the chemokine (C-C motif) ligand-2 (CCL2), also known as monocyte
chemoattractant protein 1 (MCP1), can be classified as an exercise factor, as it mediates
systemic changes induced by chronic exercise training (Catoire and Kersten, 2015).
Monocyte chemoattractant protein 1 receptor (CCR2) is one of the major receptors, which
binds CCL2, beside CCL7 and CCL13 (Harmon et al., 2010). CCL2 is mainly expressed
within the interstitial space between myofibres following muscle damaging exercise, and is
co-localized with macrophages and satellite cells in the muscle (Hubal et al., 2008).
Concentric exercise does not influence local CCL2 expression (Hubal et al., 2008).
However, in line with the findings of Warren et al. (2005), that Ccr2-knockout mice have
shown impaired regeneration, inflammation, and fibrotic response following freeze injury, a
strong interaction between CCL2/CCR2 and the immune response after muscle damage is
suggested (Hubal et al., 2008, Yahiaoui et al., 2008). Interestingly, whilst local CCL2 mRNA
expression further increased after a second bout of eccentric exercise in comparison to the
48
first bout (Hubal et al., 2008), systemic response of CCL2 decreased after repeated downhill
running (Smith et al., 2007).
Hubal et al. (2010) investigated several CCL2/CCR2 SNPs in association with exercise-
induced muscle damage in the elbow flexor muscles. Following strenuous exercise, the T-
allele of the CCL2 rs3917878 (C>T) SNP was associated with a delayed recovery of
maximum strength in men and a higher CK response in women (Hubal et al., 2010). C-allele
carriers of the CCR2 (rs3918358) SNP showed a delayed recovery of strength in females,
and the C-allele of the CCR2 (rs1799865) SNP increased soreness in both genders (Hubal
et al., 2010). The significant differences between the alleles of these three SNPs occurred
4–10 days following exertional muscle damage, confirming the action pattern of
CCL2/CCR2 in muscle repair/regeneration. Furthermore, the GG genotype of the CCL2
gene variant (rs2857656), for which significant differences were found in pre-exercise
maximum strength compared to the major C-allele (Harmon et al., 2010), was associated
with the magnitude of muscle injury in professional soccer players (Pruna et al., 2013).
According to Hubal et al. (2010), there were moderate associations between CCL2/CCR2
genotypes and baseline CCL2 activity (as a product of CCL2 expression and the availability
of CCR2). Higher CCL2 activity might be an advantage in the recovery period following
muscle damage in healthy individuals due to its ability to serve as a chemoattractant to
macrophages and its possible activation of satellite cell proliferation (Yahiaoui et al., 2008).
However, further investigation is needed to identify the potential molecular mechanisms
underpinning the influence of each of these SNPs in changing CCL2 activity in response to
muscle damaging exercise in elderly and obese people, in whom chronic systemic
inflammation is already an issue.
2.4.5 Osteopontin -66 T>G Polymorphism and the Secondary Phase of
Exercise-Induced Muscle Damage
The extracellular matrix protein and pro-inflammatory cytokine osteopontin (also known as
secreted phosphoprotein 1) is expressed in numerous cell types including skeletal muscle
49
(Kahles et al., 2014, Zanotti et al., 2011, Giachelli et al., 1998). Whereas the earliest studies
suggested that it had a central role in bone remodelling (Rodan, 1995), subsequent studies
suggest that osteopontin has also a role as a chemoattractant for macrophages (Hirata et
al., 2003), and possibly neutrophils (Yang et al., 2014). Osteopontin is virtually undetectable
in resting skeletal muscle but, after induced muscle damage in mice, osteopontin
expression is elevated 100-times compared to baseline transcription levels (Hoffman et al.,
2013, Hirata et al., 2003).
A common SNP in the transcriptional promoter of the osteopontin gene (-66 T>G,
rs28357094), which overlaps a specificity protein-1 transcription factor-binding site, results
in different phenotypic characteristics (Barfield et al., 2014). The minor G-allele is
associated with an 80% reduction in osteopontin gene expression in vitro (Giacopelli et al.,
2004, Barfield et al., 2014) and with a 17% increase in baseline upper arm muscle volume
in women (Hoffman et al., 2013). Surprisingly, this increased muscle volume did not
influence muscle strength (Hoffman et al., 2013). After exercise-induced muscle damage,
women carrying the G-allele revealed significantly elevated muscle swelling, increased loss
of muscle strength (Barfield et al., 2014) and CK values were elevated in two women with
the rare GG genotype (Hoffman et al., 2013). In contrast, the G-allele was linked with less
grip strength and with more rapid progression in patients with Duchenne muscular
dystrophy (Pegoraro et al., 2011). Further investigations of Barfield et al. (2014) revealed
several enhancer sequences on the osteopontin gene promoter for multiple steroid
hormone-binding sites (i.e. oestrogen receptor, glucocorticoid receptor, vitamin D receptor
and a potential NF-κB binding site). Oestrogen hormone treatment of modified human
myoblasts with the allele-specific osteopontin promoters has shown that the human
myoblasts with the transfected G-allele promoter revealed a threefold increase in
osteopontin gene expression, whereas the T-allele construct was unaffected by oestrogen
treatment. From this, we can infer that there may be an allele-specific interaction between
the oestrogen enhancer and the more proximal specificity protein-1 transcription factor site
leading to a hypothetical model for sexual dimorphism (Barfield et al., 2014). Thus, women
50
with the G-allele seem to be more susceptible to muscle damage. Likewise, a similar allele-
specific interaction between the NF-κB or glucocorticoid binding site and the specificity
protein-1 transcription factor site might explain the association between the G-allele and
Duchenne muscular dystrophy. Barfield et al. (2014) suggest that chronic inflammation
might lead to an augmentation of the pro-inflammatory response, which accelerates the
progress of the disease. However, the study of Barfield et al. (2014) has several limitations.
TT genotype has shown a similar loss of force over time in both the exercised and non-
exercised arm following exertional muscle damage. In addition, due to the low number of
volunteers (n = 6) who completed the eccentric exercise intervention, further investigations
are needed to replicate and verify these findings.
2.5 SKELETAL MUSCLE REMODELLING FOLLOWING EXERCISE-
INDUCED MUSCLE DAMAGE
Skeletal muscle regeneration is a complex process that is mediated by satellite cells, and
in which several factors are activated to regulate muscle remodelling (Kurosaka and
Machida, 2012). Satellite cells are mononucleated muscle stem cells and are located on
the outer surface of the muscle fibre, between the basal lamina and sarcolemma (Hawke
and Garry, 2001). Usually, satellite cells remain quiescent but are activated following
damage (Figure 2-4) (Chambers and McDermott, 1996, Grobler et al., 2004). They
proliferate 24-48 hours later and then do one of three things: (i) return to quiescence and
restore the population of satellite cells; (ii) migrate to the site of injury and support the repair
process by increasing the nuclei-to-cytoplasm ratio; (iii) fuse with other myogenic cells to
form myotubes, thus generating new fibres to replace damaged myofibres (Hawke and
Garry, 2001, Grobler et al., 2004, Tidball and Villalta, 2010, Sharples and Stewart, 2011).
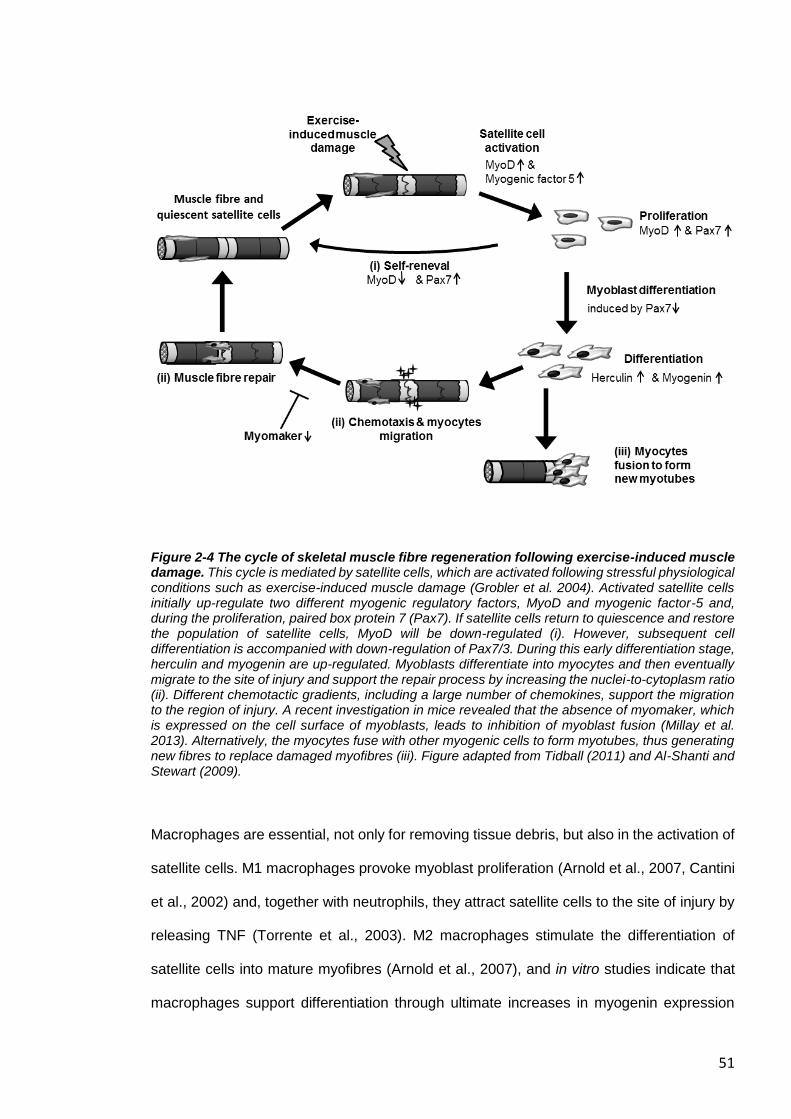
51
Figure 2-4 The cycle of skeletal muscle fibre regeneration following exercise-induced muscle damage. This cycle is mediated by satellite cells, which are activated following stressful physiological conditions such as exercise-induced muscle damage (Grobler et al. 2004). Activated satellite cells initially up-regulate two different myogenic regulatory factors, MyoD and myogenic factor-5 and, during the proliferation, paired box protein 7 (Pax7). If satellite cells return to quiescence and restore the population of satellite cells, MyoD will be down-regulated (i). However, subsequent cell differentiation is accompanied with down-regulation of Pax7/3. During this early differentiation stage, herculin and myogenin are up-regulated. Myoblasts differentiate into myocytes and then eventually migrate to the site of injury and support the repair process by increasing the nuclei-to-cytoplasm ratio (ii). Different chemotactic gradients, including a large number of chemokines, support the migration to the region of injury. A recent investigation in mice revealed that the absence of myomaker, which is expressed on the cell surface of myoblasts, leads to inhibition of myoblast fusion (Millay et al. 2013). Alternatively, the myocytes fuse with other myogenic cells to form myotubes, thus generating new fibres to replace damaged myofibres (iii). Figure adapted from Tidball (2011) and Al-Shanti and Stewart (2009).
Macrophages are essential, not only for removing tissue debris, but also in the activation of
satellite cells. M1 macrophages provoke myoblast proliferation (Arnold et al., 2007, Cantini
et al., 2002) and, together with neutrophils, they attract satellite cells to the site of injury by
releasing TNF (Torrente et al., 2003). M2 macrophages stimulate the differentiation of
satellite cells into mature myofibres (Arnold et al., 2007), and in vitro studies indicate that
macrophages support differentiation through ultimate increases in myogenin expression
52
(Cantini et al., 2002). Activated satellite cells initially up-regulate two different myogenic
regulatory factors, MyoD and myogenic factor-5 (Smith et al., 1994). In the period of
proliferation, the satellite cells express paired box protein 7 (Pax7) and MyoD but those that
return to quiescence to maintain the satellite cell pool only express Pax7 (Tedesco et al.,
2010, Al-Shanti and Stewart, 2009). However, subsequent down-regulation of Pax7/3
induces cell differentiation. The satellite cells exit the cell cycle and enter the early
differentiation stage where myogenic factor 6 (herculin) and myogenin are up-regulated
(Zammit, 2008, Wahl et al., 2008, Le Grand and Rudnicki, 2007). Myoblasts differentiate
into myocytes and then eventually fuse and form multinucleated myofibres (Le Grand and
Rudnicki, 2007). Recent investigations revealed that MyoD and myogenin induce
myomaker gene transcription (Millay et al., 2014, Millay et al., 2013). The absence of
myomaker, which is expressed on the cell surface of myoblasts, leads to inhibition of
myoblast fusion in mice (Millay et al., 2013). However, more information is required to
explain the roles of myomaker in muscle regeneration and recovery following muscle
damaging exercise.
The extracellular matrix provides structural and biochemical support to contractile tissue
and it is associated with the inflammatory response and satellite cell activation (Hyldahl and
Hubal, 2014, Kjær, 2004). Activated satellite cells migrate to the site of injury along the
basal lamina (Hughes and Blau, 1990), a process that is facilitated by the basal lamina
components (i.e. collagen IV, laminin-2 and nidogens) (Goetsch and Niesler, 2011).
Components of the extracellular matrix (collagen I and III, fibronectin and other extracellular
matrix molecules) provide a temporary scaffold to support the migration of the activated
progenitor cells (Goetsch et al., 2013). Different chemotactic gradients, including a large
number of chemokines, also support the migration from the niche towards the site of
myotrauma, and some of these chemokines are released from the extracellular matrix itself
(Griffin et al., 2010, Goetsch et al., 2013). Furthermore, there is evidence that synthesis of
type I, III and probably IV collagen within the endomysium and the perimysium increase
after contraction-induced damage (Mackey et al., 2004, Koskinen et al., 2001).
53
2.5.1 Gene Polymorphisms of the Insulin-like Growth Factor Family and the
Remodelling Following Exercise-Induced Muscle Damage
The complex process of remodelling is influenced by growth factors including insulin-like
growth factor-I (IGF-I) and IGF-II (Duan et al., 2010). In addition to IGF-I (IGF1) and IGF-II
(IGF2), the IGF-system consists of several IGF-binding proteins, the insulin receptor, and
cell surface receptors such as the IGF-I receptor and the IGF-II receptor (Wang et al., 2015).
This system promotes satellite cell differentiation and proliferation (O'Dell and Day, 1998,
Florini et al., 1996, Stewart and Rotwein, 1996b, Stewart et al., 1996, Stewart and Rotwein,
1996a) and is thought to play an important role during exercise-induced muscle hypertrophy
(Sharples and Stewart, 2011, Matheny et al., 2009). For example, transgenic mice
overexpressing Igf-I in skeletal muscle revealed a significant gain in muscle cross-sectional
area vin comparison with wild type mice following chronic muscle overload (Paul and
Rosenthal, 2002). Inactivation of the type 1 Igf receptor inhibits the presence of newly
formed nuclei in exercised transgenic mice (Fernández et al., 2002, Jiao et al., 2013, Wilson
et al., 2003), while maintaining local IGF-I concentration is considered crucial for
maintaining muscle mass and strength with advancing age (Barton-Davis et al., 1998,
Musarò et al., 2001).
Besides their role in hypertrophy, IGFs are crucial in muscle regeneration following exercise
or muscle injury (Jiao et al., 2013, Mackey et al., 2011). Insulin-like growth factor-I acts
mainly in an autocrine and paracrine manner to stimulate satellite cells to proliferate and
differentiate. Different isoforms [IGF-IEa, IGF-IEb (in rat) and IGF-IEc (in human)] of IGF-I
are associated with muscle damage and regeneration. Insulin-like growth factor-IEb and
IGF-IEc are also known as mechano-growth factor, because the mRNA is expressed in
response to overload or damage in skeletal muscle. The expression of mechano-growth
factor is enhanced shortly after muscle damage, which subsequently promotes satellite cell
activation (Hill and Goldspink, 2003). Afterwards, increased expression of IGF-IEa elevates
54
myoblast fusion (Yang and Goldspink, 2002, Jiao et al., 2013). Mechano-growth factor also
promotes the activity of cytoplasmic superoxide dismutase, thus protecting against ROS
during the inflammatory response to muscle damaging exercise (Dobrowolny et al., 2005).
Both IGF-I and IGF-II mRNA increase during myoblast differentiation, but presumably
autocrine IGF-II is the predominant myogenic factor during differentiation due to its
enhanced expression, whilst IGF-II is probably elevated to suppress IGF-I gene expression
via the mTOR pathway (Jiao et al., 2013, Wilson et al., 2003). Marsh et al. (1997) have also
shown an age-dependent decline of IGF2 gene expression following muscle damage in
rats.
As far as we are aware, only Devaney et al. (2007b) have tested the association between
IGF SNPs and exercise-induced muscle damage. Several different SNPs were
investigated, as the IGF2 gene region consists of three genes: IGF2, IGF2 anti sense
(IGF2AS), and the insulin gene (Lee et al., 2005). The following SNPs: IGF2 (17200 G>A,
rs680); IGF2 (13790 C>G, rs3213221); IGF2AS (1364 A>C, rs4244808); IGF2AS (11711
G>T, rs7924316), were significantly associated with exercise-induced muscle damage.
Besides an association between the IGF2 17200 (G>A, rs680) and IGF2 13790 (C>G,
rs3213221) SNPs and soreness (after 3 and 4 days), and CK activity in the blood (both after
7 days) following muscle damaging exercise, every IGF2 SNP investigated was associated
with strenuous exercise-induced muscle strength loss in men. Only the IGF2AS 1364 (A>C,
rs4244808) SNP was associated with strength loss immediately after exertional muscle
damage in both men and women. In contrast, carriers of the insulin gene 1045 (C>G,
rs3842748) SNP have shown an increased CK activity 10 days after exercise-induced
muscle damage only in women.
Varying IGF-I or IGF-II levels potentially caused by these SNPs could modulate satellite cell
activation and differentiation. For instance, the IGF1 cytosine adenine-repeat SNP located
in the promoter region of the IGF-I gene is believed to change circulating IGF-I levels but
the evidence is equivocal (Vaessen et al., 2001, Rosen et al., 1998, DeLellis et al., 2003,
Allen et al., 2002). While Vaessen et al. (2001) suggest IGF-I levels are increased by these
55
SNPs, other investigations found a decrease (Rosen et al., 1998) or no difference in IGF-I
levels (Allen et al., 2002, DeLellis et al., 2003).
It is remarkable that several SNPs of IGF2 were associated with a loss of muscle strength
directly after exertional muscle damage, in particular in men. It seems there must be another
process, whereby the IGF2 gene is involved in the response to muscle damaging exercise
separately from regeneration and differentiation. Here, we would like to highlight a new
hypothesis. Insulin-like growth factor I also plays an important role in the regulation of
protein synthesis, including collagen and myofibrillar protein. Local IGF-IEa and IGF-IEc
mRNA expression is positively correlated with musculotendinous mRNA expression of
COL1A1/3A1 (Boesen et al., 2013, Doessing et al., 2010) and may subsequently increase
collagen synthesis in the extracellular matrix (Hansen et al., 2013). Lower circulating IGF-I
levels induced by IGF SNPs may negatively influence the stability of the extracellular matrix.
Therefore, a subsequent loss in the lateral transmission of force between adjacent muscle
fibres might occur, which could be the source of the decrease in maximum strength
observed immediately after strenuous exercise. Although, to the best of our knowledge, no
direct effect of IGF-II concentration on human extracellular matrix protein synthesis is
known, Keller et al. (1999) has shown that local Igf-II expression increases after injury in
murine muscle. It is therefore possible that IGF-II is linked with exercise-induced muscle
damage in human muscle, and possibly with extracellular matrix integrity. A direct or indirect
influence of IGF-II level on extracellular matrix integrity would, at least in part, explain the
significant strength loss after muscle damaging exercise and the association of the IGF2
13790 (C>G, rs3213221) SNP with the degree of injury in soccer players (Pruna et al.,
2013).
56
2.6 ADDITIONAL GENE POLYMORPHISMS ASSOCIATED WITH
EXERCISE-INDUCED MUSCLE DAMAGE
The following gene polymorphisms have been associated with exercise-induced muscle
damage. However, further investigation is necessary to attribute these polymorphisms to a
specific phase of exercise-induced muscle damage.
2.6.1 Angiotensin-I Converting Enzyme Insertion/Deletion Polymorphism
Angiotensin-I converting enzyme (ACE) has a key role in the interaction between the
kallikrein-kinin and the renin-angiotensin systems (Schmaier, 2003). Angiotensinogen,
which is a precursor protein in the renin-angiotensin system, is produced constitutively and
released into the circulation mainly by the liver (Deschepper, 1994), and can be cleaved by
the protease renin, resulting in the decapeptide angiotensin-I. The dipeptidase ACE
converts angiotensin-I to the octapeptide hormone angiotensin-II, which acts as a
vasoconstrictor (Munzenmaier and Greene, 1996), and induces skeletal muscle
hypertrophy in response to mechanical loading (Gordon et al., 2001). Angiotensin-I
converting enzyme also cleaves the vasodilator bradykinin (Dendorfer et al., 2001), which
supports the increase of arterial blood pressure (Murphey et al., 2000), as well as
Substance P (SP), a protein from the tachykinin family that functions as a neurotransmitter
(released by group III and IV afferent fibres) (Harrison and Geppetti, 2001, Inoue et al.,
1998).
The ACE insertion/deletion (I/D) polymorphism (rs4646994) was the first gene variation to
be investigated in the context of human physical performance-related traits, and is the most
investigated in the renin-angiotensin system (Gayagay et al., 1998, Montgomery et al.,
1998). The insertion (I) allele of a 287 bp Alu sequence within intron 16 on chromosome 17
is linked to lower ACE activity in serum (Rigat et al., 1990) and in cardiac muscle (Phillips
et al., 1993, Danser et al., 1995), and reduced bradykinin degradation (Murphey et al., 2000)
57
compared to carriers of the D-allele. Carriers of the I-allele are associated with greater
endurance capacity (Montgomery et al., 1998, Ma et al., 2013), whereas the D-allele is
associated with greater muscular strength (Williams et al., 2005), and elite power athlete
status (Costa et al., 2009, Nazarov et al., 2001, Woods et al., 2001). However, recent
investigations have observed that this distinction is not considered sufficiently specific to
detect all the phenotypic effects (Lucia et al., 2005, Rankinen et al., 2000, Thompson and
Binder-Macleod, 2006).
The association between the ACE I/D polymorphism and elite athlete status might be
explained by a genotype link with the susceptibility to exertional muscle damage and injury.
To the best of our knowledge, only two studies have investigated the influence of the ACE
I/D polymorphism on contraction-induced damage in humans (Heled et al., 2007, Yamin et
al., 2007). Yamin et al. (2007) observed different concentrations of circulatory CK between
ACE genotypes after eccentric exercise: II homozygotes elicited the highest CK response,
whilst DD homozygotes elicited the lowest plasma CK activity after strenuous exercise. This
suggests that the I-allele is associated with a greater susceptibility to muscle damage, and
the potential mechanism is explained below. However, Heled et al. (2007) could not find
any association between ACE I/D polymorphism and CK response. The different outcome
is probably attributed to the moderate-intensity exercise test and higher activity level and
different ethnicities of the participants in the study of Heled et al. (2007). It should be noted
that only CK level was investigated in both studies, which is only one of several indirect
biomarkers of exercise-induced muscle damage.
In rabbit studies, inhibition of ACE revealed [in combination with neutral endopeptidase
(NEP) inhibitor] elevated muscle damage in a muscle overuse model induced by electrical
stimulation every second day with four sessions in total (Song et al., 2014), which is in line
with the human findings of Yamin et al. (2007). The muscle damage was accompanied by
increased tachykinin, substance P and its preferred receptor neurokinin-1 receptor
expression, which suggests that the tachykinin family may play a role in the inflammatory
processes and pain (Song et al., 2014, Dousset et al., 2007). Substance P is widely
58
expressed in human cells and tissues of the peripheral and central nervous systems but it
is also found in extra neuronal cells and innervated tissues. Substance P and neurokinin-1
receptor have been associated with the inflammatory response in smooth muscle cells and
dermal tissues but not in skeletal muscle (Renzi et al., 2000, Luger, 2002). However,
elevated substance P might result in improved remodelling, as demonstrated in the healing
of a rat Achilles tendon (Bring et al., 2012, Steyaert et al., 2010).
In contrast, angiotensin-II is known to be involved in inflammatory process following muscle
damage. Blocking of the angiotensin-II receptor type 1 improves regeneration of injured
skeletal muscle (Bedair et al., 2008) and supresses ROS production following strenuous
exercise in mice (Sim et al., 2014). Furthermore, nerve growth factor up-regulation through
activation of B2 bradykinin receptors is strongly associated with increased pain sensitivity
(hyperalgesia) (Murase et al., 2010, Babenko et al., 1999). Angiotensin-I converting enzyme
D-allele carriers, which have a decreased bradykinin half-life, might have attenuated nerve
growth factor expression following exertional muscle damage and therefore a decreased
pain sensitivity. Attenuated substance P and bradykinin in the inflammatory process may
explain the high frequency of D-allele carriers among elite strength/power athletes (Costa
et al., 2009). Athletes with the D-allele might feel less pain and therefore might be able to
(i) sustain high-intensity training for longer, (ii) reach the limits of their capacity in
power/strength related competition (ii) or enable them to practise more often due to a
decreased sensitivity to pain. In other sport-specific movements, such as short distance
swimming (<200 m), it is crucial to sustain a high level of intensity accompanied with
exercise-induced muscle burning (Costa et al., 2009, Woods et al., 2001).
Another possibility might be that angiotensin-II indirectly mediates skeletal muscle damage
by influencing angiogenesis in response to exercise (Vaughan et al., 2013). It is well known
that, in a damaged muscle in the days following eccentric exercise, resting capillary blood-
flow is elevated and vasodilatation occurs (Rubinstein et al., 1998). According to Vaughan
et al. (2013), the capillary density of skeletal muscle is lower in untrained carriers of the
ACE I-allele compared to DD homozygotes. Lower capillary density might impair the
59
migration of neutrophils and macrophages as well as of the removal of cellular debris, which
could negatively affect the extent of muscle damage and possibly muscle remodelling.
2.6.2 Mitochondrial Superoxide Dismutase 2 Ala16Val Polymorphism
Strenuous exercise results in oxidative stress, which causes structural damage to muscle
fibres and stimulates an inflammatory response (Gomez-Cabrera et al., 2008), as discussed
in section 2.4. A higher intracellular concentration of antioxidants within a muscle fibre is
thought to protect against the negative impact of ROS (Schoenfeld, 2012, Peake and
Suzuki, 2004). Superoxide dismutase is an antioxidant that protects cells and mitochondria
from free radical damage by converting the anion superoxide into hydrogen peroxide
(Huang et al., 2000). Inhibition of superoxide dismutase causes the accumulation of
superoxide radicals, and can lead to increased damage of mitochondrial membrane and
cell apoptosis (Huang et al., 2000). The Ala16Val (rs4880, C>T) SNP of the mitochondrial
superoxide dismutase gene, has been associated with muscle damage susceptibility. The
T-allele is associated with reduced mitochondrial superoxide dismutase efficiency against
oxidative stress (Shimoda-Matsubayashi et al., 1996). Akimoto et al. (2010) demonstrated
that trained runners of TT genotype had an increased plasma CK concentration after racing
4-21 km. This is in line with Ahmetov et al. (2014), who revealed that TT carriers of the
mitochondrial superoxide dismutase gene were under-represented in power and strength
athletes compared to controls and athletes of low-intensity sports, such as curling players
and shooters. Interestingly, in the study of Ben-Zaken et al. (2013), the frequency of the C-
allele was significantly higher in both endurance and power athletes in comparison to the
control group. At first glance, these studies seem to be inconsistent with one another. On
closer inspection, both studies recruited different types of participants. In the study of
Ahmetov et al. (2014) participants covered a wide range of different sports, whereas in Ben-
Zaken et al. (2013), only track and field related athletes participated: 100 and 200 m
sprinters and long jumpers (power athletes); 5000 m and marathon runners (endurance
athletes). These track and field athletes perform sport-specific movements that is
60
accompanied by stress to the musculoskeletal system through repeated eccentric muscle
contractions performed over long periods of time, which leads to muscle damage. The
inflammation accompanying this damage potentially produces more oxidative stress than
the endurance sports (e.g. swimming) in the study by Ahmetov et al. (2014). Therefore, the
T-allele might impair the protection against oxidative stress due to the lower efficiency of
the mitochondrial superoxide dismutase gene. This may indicate that there is a relationship
between this SNP and level of athletic performance in sports with a potential risk of muscle
damage. Unfortunately, no study has tested the effect of the mitochondrial superoxide
dismutase SNP on exercise-induced muscle damage over the course of time. This could
provide insight into the influence of the mitochondrial superoxide dismutase C>T SNP on
the secondary phase of muscle damage and the subsequent remodelling.
2.6.3 Solute Carrier Family 30 Member Eight C>T Polymorphism
Type 2 diabetes mellitus is associated with disturbed zinc homeostasis and down-regulation
of the solute carrier family 30 (zinc transporter) member eight, the product of the SLC30A8
gene (Somboonwong et al., 2015). Solute carrier family 30 member eight is mainly
expressed in pancreatic islet beta cells and it transports zinc from the cytoplasm into
intracellular vesicles, which is crucial for insulin crystallization, storage, and secretion
(Cheng et al., 2015, Lemaire et al., 2009, Chimienti et al., 2006). The C-allele of the
nonsynonymous SLC30A8 (C>T) SNP (rs13266634) is strongly associated with type 2
diabetes mellitus risk, in particular in European and Asian populations but not in African
populations (Cheng et al., 2015). This SLC30A8 R325W SNP is associated with, amongst
others, decreased fasting systemic insulin and attenuated insulin secretion in response to
glucose intake (Staiger et al., 2007, Sprouse et al., 2014, Kirchhoff et al., 2008).
In recent years, there has been an increase in the number of investigations regarding insulin
resistance and muscle function in people without type 2 diabetes mellitus. Insulin resistance
is not only associated with lower force and muscle mass in individuals with diabetes
(Andreassen et al., 2009, Andersen et al., 2004), but also in healthy people (Gysel et al.,
61
2014). Insulin signalling increases blood flow and protein synthesis at rest, and suppresses
the breakdown of proteins after resistance exercise, thus improving net muscle protein
balance in particular with amino acid delivery and availability (Biolo et al., 1999, Fujita et al.,
2006). Furthermore, exercise-induced muscle damage has been associated with impaired
glycogen synthesis (Costill et al., 1990) and reduced glucose uptake (Nielsen et al., 2015,
Asp et al., 1996), probably due to muscle damage reducing muscle insulin sensitivity
(Kirwan et al., 1991). This could be due to increased TNF expression attenuating insulin
signalling transduction, subsequently inducing insulin resistance in skeletal muscle
(Plomgaard et al., 2005) and supressing the activation of glucose transporter type 4 in
muscle fibres (Asp et al., 1995).
Sprouse et al. (2014) reported that the TT genotype of the SLC30A8 SNP was associated
with lower biomarkers of muscle damage (reduced soreness, strength loss and plasma CK
and myoglobin levels) following eccentric contractions of the elbow flexor muscles in men.
By increasing the catabolic pathway, lower insulin levels can lead to a negative net protein
balance (Woolfson et al., 1979, Sacheck et al., 2007). Therefore, carriers of the SLC30A8
C-allele might need longer times to recover from strenuous exercise. Further studies should
investigate if SLC30A8 genotype-dependent insulin production is associated with the acute
and chronic adaptations to resistance exercise, with regard to muscle protein synthesis and
muscle hypertrophy, respectively.
2.7 POLYGENIC PROFILES ASSOCIATED WITH EXERCISE-
INDUCED MUSCLE DAMAGE
In 2008, (Williams and Folland, 2008) postulated a genetic algorithm, the total genotype
score (TGS), that combine previously associated SNPs regarding a specific phenotypic trait
to estimate the combined effect of SNPs on elite athlete status. Since then, several
computed polygenic profiles have been published to estimate the association of multiple
SNPs on the elite endurance (Ruiz et al., 2009, Grealy et al., 2015, Yoo et al., 2016), and
strength/power (Ruiz et al., 2010a, Hughes et al., 2011, Miyamoto-Mikami et al., 2017)
62
athlete status. It is likely that the accumulation of non-preferential alleles of SNPs, which
are associated with EIMD, accentuate the detrimental response to muscle damaging
exercises. Indeed, recent investigations demonstrated that a TGS, based on seven SNPs
(ACE, rs4340; ACTN3, rs1815739; CKMM, rs1803285; IGF2, rs3213221; IL6, rs1800795;
MLCK, rs28497577; TNF, rs1800629) previously associated with EIMD, was able to
distinguish between high and low responders in terms of CK activity following a race of
amateur marathon runners and triathletes (Del Coso et al., 2017a, Del Coso et al., 2017b).
However, the CK response was not linked with the performance of the athletes, which raises
the questions if CK activity really assesses the magnitude of ultrastructural muscle damage,
and if it does, if the individual muscle damage response is an important factor for an athlete
status in marathon or ironman. The limitation of the majority of these polygenic profiles is
the dependence on former research that investigated individual SNPs on the investigated
phenotypic trait. Future research needs to adapt the genetic algorithm of Williams and
Folland (2008) so that the improved TGS can assess so far unrelated SNPs to phenotypic
traits, i.e. to EIMD, as seen by Yoo et al. (2016) investigating individual endurance training
effects. Further, more research is needed that investigates multiple SNPs forming a
polygenic profile to understand the complex mechanism underlying the individual response
to EIMD-interventions.
2.8 DISCUSSION
Exercise-induced muscle damage provokes a prolonged loss of muscle strength, and both
elevated soreness and circulating muscle-specific protein levels. The grade and actual time-
course of strength loss, soreness and of the inflammation response after exercise is
variable. Several factors that are well documented can influence the response to muscle
damaging exercise, such as exercise mode, intensity or duration (Smith et al., 1989), micro
nutrition (Owens et al., 2014, Bhat and Ismail, 2015, Barker et al., 2013) and muscle (group)
intervention (Clarkson and Hubal, 2002). Nevertheless, within-study variability is often seen
in response to strenuous exercise (Nosaka and Clarkson, 1996).
63
Several studies have reported differences in SNP-specific gene activity resulting in different
expression of the coding proteins, which may influence the susceptibly to exercise-induced
muscle damage (Seto et al., 2011). Individuals, who are high responders to exercise-
induced muscle damage (i.e. demonstrate a greater loss of muscle strength and higher
circulating levels of CK or myoglobin) might have a higher predisposition to injury (Kibler et
al., 1992, Clansey et al., 2012). This is in line with the observation that history of one type
of muscle injury increases the risk of developing other types of muscle injuries (Orchard,
2001, Freckleton and Pizzari, 2013). The same principle may apply to high responders to
exercise-induced muscle damage in a squad of athletes performing the same exercise
training together. High responders, who might need a longer recovery time after a strength
training intervention in comparison to others in the same squad, might have a higher
potential for musculotendinous injuries due to overtraining. Both presumptions may result
in an increased dropout rate of athletes with specific genotype profiles due to higher rates
of (overtraining) injury extending over several years (Kibler et al., 1992). It would be
interesting to investigate if a high responder to exercise-induced muscle damage is a
low/high responder to chronic resistance training.
Association studies can potentially reveal new mechanisms of genes. For instance, several
IGF2 SNPs have been associated with strength loss immediately after muscle damaging
exercise, which cannot exclusively be explained by satellite cell differentiation (Devaney et
al., 2007b). It is interesting that (i) certain genotypes of several IL6 gene SNPs appear to
be beneficial in healthy individuals regarding muscle damage response, but are
disadvantageous in chronic disease and ageing; (ii) sex-specific genotype associations with
exercise-induced muscle damage have been reported (Devaney et al., 2007b, Sprouse et
al., 2014). Further investigations are necessary to uncover genotype–phenotype
interactions and, in particular, the interaction of specific polymorphisms. A specific
polygenic profile might help explain the inter-individual variance in the response to both
acute eccentric damaging exercise and chronic strength training.
64
Moreover, the ACTN3 R577X SNP has been associated with different responses to muscle
damaging exercise, according to the mode of exercise. It is likely that stretch-shortening
cycle-related movements place different demands on the musculotendinous system
compared to exercises, which are performed without stretch-shortening cycles, thus
explaining the equivocal findings concerning the association between this SNP and
exercise-induced muscle damage (see section 2.3.1). Consequently, we recommend that
future studies distinguish between exercise-induced muscle damage caused by eccentric
contractions with or without stretch-shortening cycles. Furthermore, real-world modes of
exercise should be incorporated into studies investigating the genetic association with
exertional muscle damage. Not only will this improve our understanding of the mechanisms
underpinning the deteriorated response of ageing muscle to exercise, but also it will help in
prescribing more practical exercise therapies to poor exercise responders.
2.9 CONCLUSIONS
In summary, whilst several genetic association studies have been performed with individual
SNPs, the current literature does not provide enough detailed information about the
mechanisms underpinning the effect of genetic variation in the context of exercise and
exercise-induced muscle damage. Further, additional genetic exercise studies including the
assessment of multiple genetic polymorphisms (polygenic profile) are necessary to
understand the complex interplay between nature and nurture affecting the response to
exercise-induced muscle damage. This may eventually allow the identification of
individuals, who are at high-risk of developing specific injuries. For instance, those who are
genetically more predisposed to muscle damage, and who require longer to recover from
strenuous exercise, are at greater risk of developing over-use injuries. Knowing how
someone is likely to respond to a particular type of exercise would help coaches tailor the
training and nutrition of their athletes (moving from a one size fits all to an individualised
approach), thus maximising recovery and positive adaptation, and reducing the risk of
injury.

65
66
3 The Physiological and Biomechanical Factors
Associated with Neuromuscular Fatigue of the
Hamstrings Following Intermittent Sprints
67
3.1 ABSTRACT
Introduction We aimed to investigate the physiological and biomechanical factors
associated with neuromuscular fatigue of the hamstrings following intermittent sprints (IS).
Methods Following ultrasound assessment of biceps femoris long head (BFLH) architecture,
20 recreationally active young men completed 15 x 30 m sprints. Quadriceps and hamstring
maximal voluntary contractions (MVC); central (voluntary activation, BFLH EMG) and
peripheral (torque-frequency-relationship) hamstring fatigue; serum CK activity; treadmill
running and SLHL landing kinematics, were assessed before (PRE), immediately after
(POST) and 48 h (POST48) after IS.
Results Quadriceps and hamstring MVC decreased POST with an additional decrease of
hamstring MVC POST48, while leg muscle soreness and CK activity increased over time
(all P<0.05). There was no change in voluntary activation over time (P=0.099) but BFLH
EMG decreased POST (P=0.022). There was an inverse relationship between BFLH PCSA
and % change in hamstring MVC at POST (R2=0.421, P=0.003). Treadmill running
demonstrated decreases in peak knee extension (P=0.047) during the late swing phase at
POST. SLHL kinematics showed increased (i) peak hip flexion (P=0.004); (ii) hip range of
motion in the transverse plane (p=0.025); and (iii) peak knee adduction (P=0.035) during
the landing phase POST, and all kinematic values returned to baseline POST48.
Conclusions Hamstring neuromuscular activation decreases immediately POST IS
(possibly linked to central fatigue). However, the sustained reduction in hamstring MVC
might be caused by ultrastructural muscle damage. Changes in both running and SLHL
kinematics appear to decrease the elongation stress on the hamstrings POST. Therefore,
48 h recovery following IS is insufficient and may increase injury risk. However, a larger
BFLH PCSA appears to protect against hamstring fatigue, thus highlighting the importance
of resistance exercise in reducing hamstring injury risk.
68
3.2 INTRODUCTION
Hamstring muscle strain injury (HSI) is the most frequent injury type in sports (Crema et al.,
2017), particularly those that involve high-speed running, such as soccer (Ekstrand et al.,
2011, Opar et al., 2012, Brooks et al., 2006). Injury rate in professional soccer teams is
positively correlated with financial costs (Ekstrand, 2013), and is inversely correlated with
team success (Eirale et al., 2013, Hägglund et al., 2013). Furthermore, the likelihood to
sustain a HSI during training has increased by 4% per year in soccer since 2001 (Ekstrand
et al., 2016). Therefore, an understanding of HSI is critical to address risk factors in future
and could have important implications for sports clubs and athletes.
Soccer players are required to perform intermittent sprints (IS), which are characterised by
short-duration (<10 s) and relatively longer recovery times (>60 s) between maximal sprint
bouts, which have a different physiological demand compared to repeated-sprint exercises
with shorter recovery times (<60 s) (Bradley et al., 2010, Girard et al., 2011). The majority
of HSIs occur during high-speed running in competition rather than in training and, during
team sport competition, HSIs occur more often towards the end of each half (Ekstrand et
al., 2011, Brooks et al., 2006, Woods et al., 2004). This suggests that fatigue may play a
role in the development of HSI. Neuromuscular fatigue is responsible for acute as well as
prolonged impairment of muscle function for days or even weeks and it can be classified
as central fatigue when the origin is proximal to the neuromuscular junction (e.g. reduction
in motivation), or as peripheral muscle fatigue when the origin is distal to the neuromuscular
junction (e.g. disruption to excitation-contraction coupling, damage to the contractile
proteins, impaired metabolism) (Byrne et al., 2004, Gandevia, 2001). Structurally damaged
muscles exhibit prolonged strength loss and delayed-onset muscle soreness (DOMS) as
well as the release of muscle-specific proteins [e.g. creatine kinase (CK)] into the circulation,
which is referred to as exercise-induced muscle damage (EIMD) (Clarkson and Hubal,
2002).
69
Several investigations have shown that both central and peripheral fatigue contribute to
impaired muscle function in the short term following simulated soccer matches in both
quadriceps (Thomas et al., 2017) and hamstring (Timmins et al., 2014, Marshall et al., 2014)
muscle groups, and that mainly peripheral fatigue explains the prolonged recovery of
muscle function in the quadriceps muscle group (Thomas et al., 2017, Rampinini et al.,
2011). Peripheral fatigue can be assessed in vivo via the torque-frequency relationship, as
it gives an indication of reduced efficiency of the excitation-contraction coupling process,
particularly at lower frequencies (i.e. 10-20 Hz) compared with higher frequencies (i.e. 50-
100 Hz) (Jones, 1996). Intermittent sprints have been shown to induce EIMD in both
quadriceps (Howatson and Milak, 2009) and hamstring muscle groups (Chen et al., 2017,
Verma et al., 2015), resulting in CK release into the circulation over the following days
(Wiewelhove et al., 2015). To the best of our knowledge, however, no studies have
investigated the contribution of both central and peripheral fatigue towards impaired
function of the hamstring muscle group over time following an IS-intervention, which is an
essential part in many team sports, such as soccer.
Congested fixtures and substantial increases in typical match load during the last decade,
including higher amounts of repeated high-speed running (Bush et al., 2015, Wallace and
Norton, 2014), may not allow athletes to fully recover between matches, and poorly
managed training workload together with insufficient recovery of previously fatigued and
damaged muscles (probably caused by IS) is thought to increase HSI risk (Malone et al.,
2016, Malone et al., 2018, Chumanov et al., 2011, Duhig et al., 2016). High-speed running
induces both high muscle activation (Chumanov et al., 2007) and high distal tendon load
(Martin et al., 2018) of the hamstrings in the late swing phase, when the hip is flexed and
the knee extended, suggesting a high muscle lengthening (eccentric) contraction during the
deceleration of the shaft before initial foot contact (Chumanov et al., 2007). Hamstring
muscle activation increases with running speed, and computational models suggest that
the biceps femoris long head (BFLH) is relatively more eccentrically stretched during the late
swing phase of sprinting compared to the other muscles within the hamstring muscle group
70
(Thelen et al., 2005, Chumanov et al., 2007), and this is presumed to be the mechanical
mechanism underlying HSI in sprinting. However, direct measurements of the hamstring
muscle-tendon-complex during (high-speed) running are difficult to perform and the
underlying assumptions of the computational model regarding the contraction mode are
under debate (Shield and Murphy, 2018, Van Hooren and Bosch, 2018). Further, a short
BFLH fascicle length has been suggested to increase HSI risk (Timmins et al., 2016), as a
shorter fascicle length might be more susceptible to being eccentrically overstretched due
to fewer in-series sarcomeres (Brockett et al., 2004). To our knowledge, no study has
investigated the relationship between BFLH architecture including physiological cross-
sectional area (PCSA), which is calculated by the total area of muscle fibres perpendicular
to their long axes (Alexander, 1975), and the hamstring muscle response to exercise-
induced neuromuscular fatigue/damage over time.
Neuromuscular fatigue might cause a number of biomechanical alterations. Exercise-
induced muscle damage within the quadriceps femoris together with the hamstring muscle
group leads to changes in running kinematics (Dutto and Braun, 2004). More precisely,
knee flexion range of motion (ROM) and hip tilt is decreased and hip rotation is increased
in running 48 h after an EIMD-intervention (Paquette et al., 2017, Paschalis et al., 2007).
However, it is not known whether IS influences kinematic patterns initially, and whether this
can lead to prolonged changes in leg kinematics as changes in hip and knee joint motion
(together) potentially reduce additional elongation stress on the hamstring muscles. Further,
neuromuscular fatigue may increase the risk of non-contact anterior cruciate ligament (ACL)
injury (Santamaria and Webster, 2010) as changes in movements (e.g. during landing)
might result in less controlled cushioning knee/hip flexion during stop-tasks. It is debatable
whether specific muscular or biomechanical parameters concerning knee (knee flexion
angle, knee abduction angle and knee abduction moment), hip (hip adduction) and ground
reaction forces might be associated with ACL injury, as the results of different prospective
studies are inconclusive (Sharir et al., 2016, Rafeeuddin et al., 2016).
71
In light of the above considerations and limitations of previous studies, the purpose of the
present study was to comprehensively investigate the physiological mechanisms and
recovery pattern of neuromuscular fatigue to acquire the importance of EIMD in the context
of the physiological response to IS. Using an interdisciplinary approach, the objectives were
to quantify (i) the effect of IS on central and peripheral physiological fatigue parameters,
particularly of the hamstring muscle group; (ii) the contribution of BFLH architecture on
fatigue parameters; and (iii) the consequential effects of IS on knee and hip joint kinematics
during running and single-leg hop landing (SLHL) over time. We hypothesised that (i) central
and peripheral fatigue would both contribute to the immediate loss of muscle function in
both the quadriceps and hamstring muscle groups, but that peripheral factors would mainly
contribute to the sustained loss of muscle function; (ii) BFLH architecture (e.g. fascicle length
and PCSA) would be associated with the response to hamstring fatigue; and that (iii) these
changes would lead to reduced hip flexion and knee extension during the late swing phase
of treadmill running as well as an increased knee flexion during landing (SLHL).
3.3 MATERIALS AND METHODS
3.3.1 Participants
Twenty recreationally active and healthy young male Caucasians (mean ± SD; age 20.3 ±
2.87 years; height 1.79 ± 0.05 m; body mass 75.0 ± 7.89 kg) participated in this study.
Written informed consent was obtained from each participant prior to starting the study,
which complied with the Declaration of Helsinki and was approved by the Research Ethics
Committee of Liverpool John Moores University. Participant enrolment began on January
2016 and continued through September 2016, as there were two waves of recruitment. The
month of the final test was April 2017. Participants were physically active but were excluded
if they had performed strength training of the lower limbs within 6 months prior to
participation in the study or if they performed more than three structured exercise sessions
per week, as determined via physical activity questionnaire (Baecke et al., 1982b). Further
72
exclusion criteria were (i) any lower limb musculoskeletal injury in the past 12 months; and
(ii) age under 18 or above 35 years; as assessed via interview and health questionnaire.
3.3.2 Experimental Design
Participants were required to visit the temperature-controlled laboratory (between 22 and
24°C) on three occasions: (i) familiarisation, (ii) testing day including assessments before
(PRE) and after (POST); and (iii) assessments 48 h (POST48) after the IS-intervention.
Prior to the testing day, participants were familiarised with the assessments as well as with
the IS (by performing 2-3 submaximal sprints) and BFLH architecture of the hamstring
muscle group was assessed via ultrasound. On the test day, participants performed an IS-
protocol of 15 x 30 m sprints to induce neuromuscular fatigue/damage in both the
quadriceps femoris and hamstring muscle groups. All tests were performed at the same
time of the day for each participant. Further, participants were instructed to maintain their
normal routine (including eating habits), to refrain from drinking alcohol and to avoid any
strenuous exercise 48 h prior to testing and throughout the study.
The test battery was always performed in the same order with the right leg of each
participant and comprised (i) venous blood sampling [for analysing serum interleukin-6 (IL-
6) concentration and CK activity]; (ii) hamstrings and quadriceps muscle soreness via visual
analogue scale (VAS); (iii) isometric maximum voluntary contraction (MVC) torque of the
knee-extensors, as well as both voluntary and involuntary [voluntary muscle activation (VA)
and torque-frequency relationship via electrical stimulation] MVC torque of the knee-flexors
together with normalised BFLH EMG (see below); and (iv) single-leg horizontal hop landing
(SLHL) and treadmill running (4.17 m s−1) kinematics of the right leg (8-camera motion
capture system) PRE and POST48 of the repeated maximal sprint protocol. At POST test,
kinematic assessments were performed first followed by the aforementioned order of the
assessment for practical reasons.
73
3.3.3 Maximal Repeated Sprint Protocol
The IS intervention consisted of 15 repetitions of 30 m maximal sprints with a deceleration
zone of 12 m (IS-intervention). The 30 m distance was chosen as the upper average of both
the total sprinting distance (346 ± 115 m) of wide-midfielders and the mean recovery time
(70.2 ± 25.1 s) between sprint bouts in soccer (Bradley et al., 2010, Bradley et al., 2009),
which allows the athlete to maintain the performance of the sprint bouts (Balsom et al.,
1992). Similar protocols have been used elsewhere (Timmins et al., 2014, Chen et al., 2017,
Verma et al., 2015). Prior to the IS-intervention, a five-minute warm-up was performed,
comprising jogging, dynamic stretching and three self-paced 20 m runs at 60%, 80%, 100%
of perceived top speed. During the IS-intervention, the participants were instructed to sprint
maximally (verbal encouragement) and to stop within the deceleration zone. Further, they
were instructed to move slowly back to the start line and to sit on a chair for the remaining
time until the next sprint. The recovery comprised 90 s between repetitions and after every
5th repetition, the participants were allowed to rest for 3 min. Sprinting time during trials was
measured and controlled with timing gates (Brower Timing Systems, Draper, UT, USA),
which were placed on the start and finish line. Participants started 30 cm before the start
line to avoid interfering with timing gates with the arms upon initial acceleration (Buchheit
and Mendez-Villanueva, 2013). Further, heart rate (Polar Oy, Kempele, Finland) and rating
of perceived exertion (RPE) (Borg, 1982) were recorded before and after each repetition.
Water was available ad libitum. Participants were instructed to wear the same footwear for
each testing day. As there was an upsurge in speed of the final sprint, fatigue was assessed
with the performance decrement score using the following formula (Glaister et al., 2008,
Fitzsimons et al., 1993):
𝐹𝑎𝑡𝑖𝑔𝑢𝑒 = (100 𝑋 (𝑡𝑜𝑡𝑎𝑙 𝑠𝑝𝑟𝑖𝑛𝑡 𝑡𝑖𝑚𝑒 ÷ 𝑖𝑑𝑒𝑎𝑙 𝑠𝑝𝑟𝑖𝑛𝑡 𝑡𝑖𝑚𝑒)) − 100
Where total sprint time = sum of time from all 15 sprints; and ideal sprint time = total number
of sprints (15) x fastest repetition sprint time. This decrement score was also used to
quantify fatigue regarding sprinting time, heart rate and RPE.
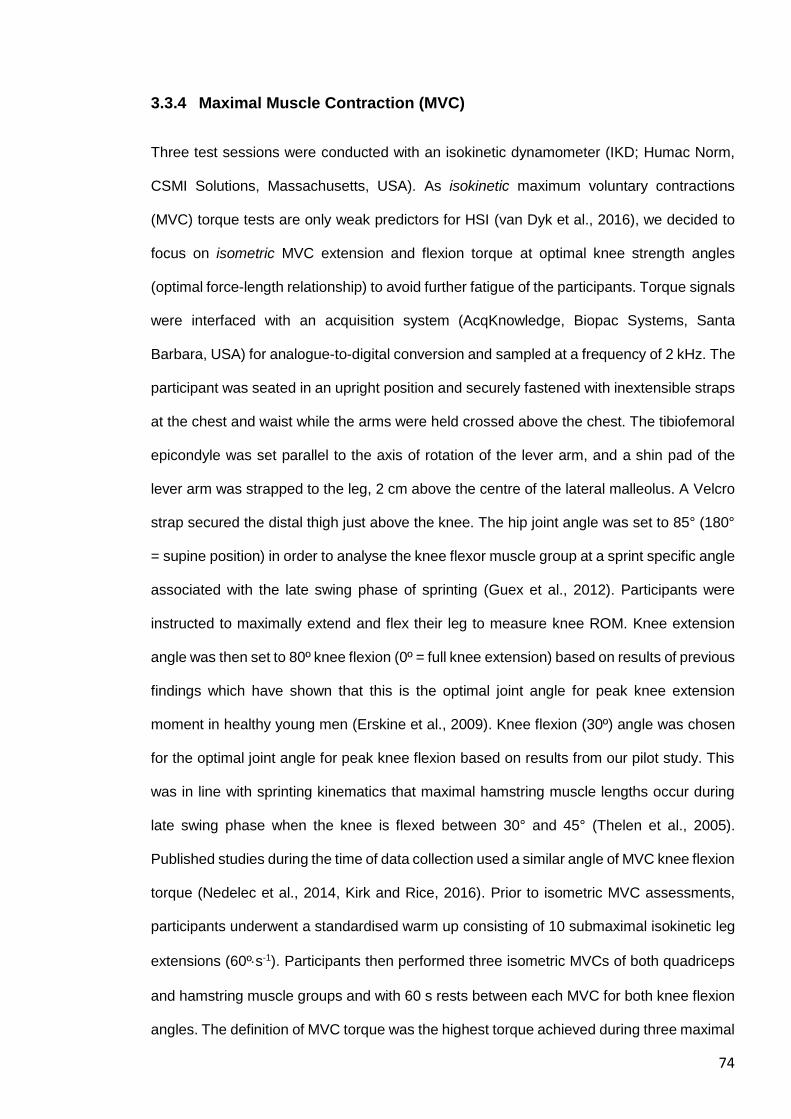
74
3.3.4 Maximal Muscle Contraction (MVC)
Three test sessions were conducted with an isokinetic dynamometer (IKD; Humac Norm,
CSMI Solutions, Massachusetts, USA). As isokinetic maximum voluntary contractions
(MVC) torque tests are only weak predictors for HSI (van Dyk et al., 2016), we decided to
focus on isometric MVC extension and flexion torque at optimal knee strength angles
(optimal force-length relationship) to avoid further fatigue of the participants. Torque signals
were interfaced with an acquisition system (AcqKnowledge, Biopac Systems, Santa
Barbara, USA) for analogue-to-digital conversion and sampled at a frequency of 2 kHz. The
participant was seated in an upright position and securely fastened with inextensible straps
at the chest and waist while the arms were held crossed above the chest. The tibiofemoral
epicondyle was set parallel to the axis of rotation of the lever arm, and a shin pad of the
lever arm was strapped to the leg, 2 cm above the centre of the lateral malleolus. A Velcro
strap secured the distal thigh just above the knee. The hip joint angle was set to 85° (180°
= supine position) in order to analyse the knee flexor muscle group at a sprint specific angle
associated with the late swing phase of sprinting (Guex et al., 2012). Participants were
instructed to maximally extend and flex their leg to measure knee ROM. Knee extension
angle was then set to 80º knee flexion (0º = full knee extension) based on results of previous
findings which have shown that this is the optimal joint angle for peak knee extension
moment in healthy young men (Erskine et al., 2009). Knee flexion (30º) angle was chosen
for the optimal joint angle for peak knee flexion based on results from our pilot study. This
was in line with sprinting kinematics that maximal hamstring muscle lengths occur during
late swing phase when the knee is flexed between 30° and 45° (Thelen et al., 2005).
Published studies during the time of data collection used a similar angle of MVC knee flexion
torque (Nedelec et al., 2014, Kirk and Rice, 2016). Prior to isometric MVC assessments,
participants underwent a standardised warm up consisting of 10 submaximal isokinetic leg
extensions (60ºs-1). Participants then performed three isometric MVCs of both quadriceps
and hamstring muscle groups and with 60 s rests between each MVC for both knee flexion
angles. The definition of MVC torque was the highest torque achieved during three maximal
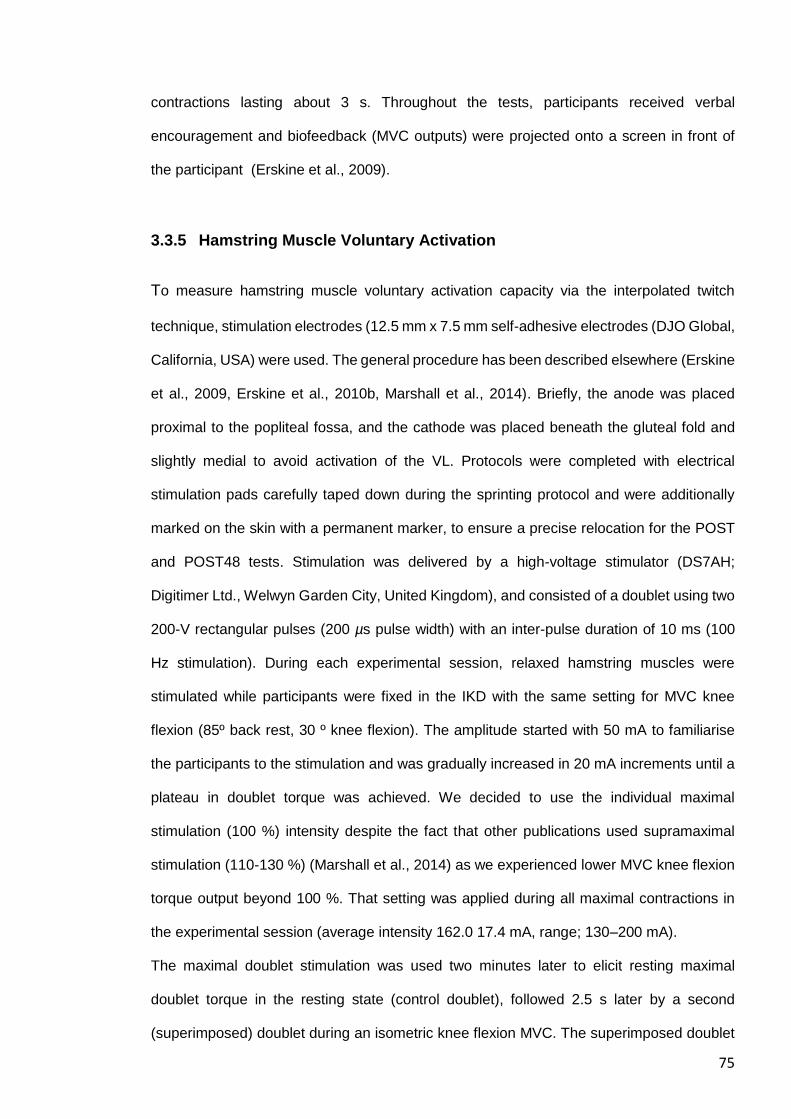
75
contractions lasting about 3 s. Throughout the tests, participants received verbal
encouragement and biofeedback (MVC outputs) were projected onto a screen in front of
the participant (Erskine et al., 2009).
3.3.5 Hamstring Muscle Voluntary Activation
To measure hamstring muscle voluntary activation capacity via the interpolated twitch
technique, stimulation electrodes (12.5 mm x 7.5 mm self-adhesive electrodes (DJO Global,
California, USA) were used. The general procedure has been described elsewhere (Erskine
et al., 2009, Erskine et al., 2010b, Marshall et al., 2014). Briefly, the anode was placed
proximal to the popliteal fossa, and the cathode was placed beneath the gluteal fold and
slightly medial to avoid activation of the VL. Protocols were completed with electrical
stimulation pads carefully taped down during the sprinting protocol and were additionally
marked on the skin with a permanent marker, to ensure a precise relocation for the POST
and POST48 tests. Stimulation was delivered by a high-voltage stimulator (DS7AH;
Digitimer Ltd., Welwyn Garden City, United Kingdom), and consisted of a doublet using two
200-V rectangular pulses (200 µs pulse width) with an inter-pulse duration of 10 ms (100
Hz stimulation). During each experimental session, relaxed hamstring muscles were
stimulated while participants were fixed in the IKD with the same setting for MVC knee
flexion (85º back rest, 30 º knee flexion). The amplitude started with 50 mA to familiarise
the participants to the stimulation and was gradually increased in 20 mA increments until a
plateau in doublet torque was achieved. We decided to use the individual maximal
stimulation (100 %) intensity despite the fact that other publications used supramaximal
stimulation (110-130 %) (Marshall et al., 2014) as we experienced lower MVC knee flexion
torque output beyond 100 %. That setting was applied during all maximal contractions in
the experimental session (average intensity 162.0 17.4 mA, range; 130–200 mA).
The maximal doublet stimulation was used two minutes later to elicit resting maximal
doublet torque in the resting state (control doublet), followed 2.5 s later by a second
(superimposed) doublet during an isometric knee flexion MVC. The superimposed doublet
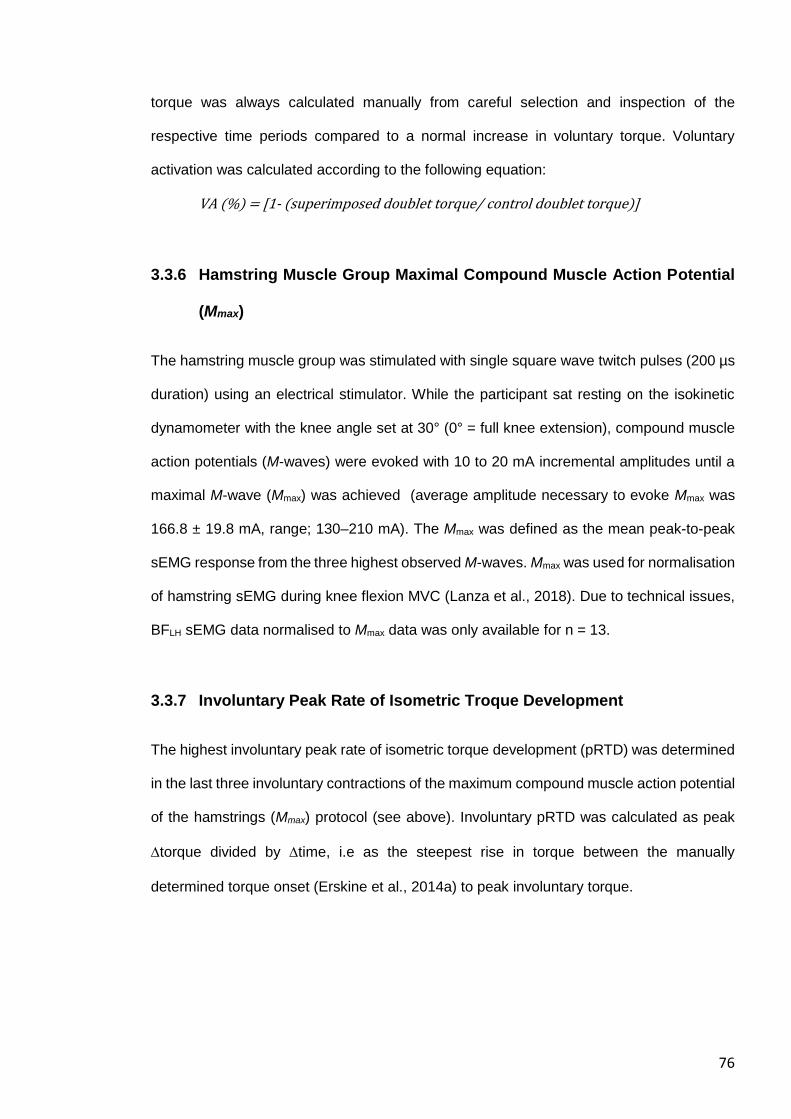
76
torque was always calculated manually from careful selection and inspection of the
respective time periods compared to a normal increase in voluntary torque. Voluntary
activation was calculated according to the following equation:
VA (%) = [1- (superimposed doublet torque/ control doublet torque)]
3.3.6 Hamstring Muscle Group Maximal Compound Muscle Action Potential
(Mmax)
The hamstring muscle group was stimulated with single square wave twitch pulses (200 µs
duration) using an electrical stimulator. While the participant sat resting on the isokinetic
dynamometer with the knee angle set at 30° (0° = full knee extension), compound muscle
action potentials (M-waves) were evoked with 10 to 20 mA incremental amplitudes until a
maximal M-wave (Mmax) was achieved (average amplitude necessary to evoke Mmax was
166.8 ± 19.8 mA, range; 130–210 mA). The Mmax was defined as the mean peak-to-peak
sEMG response from the three highest observed M-waves. Mmax was used for normalisation
of hamstring sEMG during knee flexion MVC (Lanza et al., 2018). Due to technical issues,
BFLH sEMG data normalised to Mmax data was only available for n = 13.
3.3.7 Involuntary Peak Rate of Isometric Troque Development
The highest involuntary peak rate of isometric torque development (pRTD) was determined
in the last three involuntary contractions of the maximum compound muscle action potential
of the hamstrings (Mmax) protocol (see above). Involuntary pRTD was calculated as peak
torque divided by time, i.e as the steepest rise in torque between the manually
determined torque onset (Erskine et al., 2014a) to peak involuntary torque.
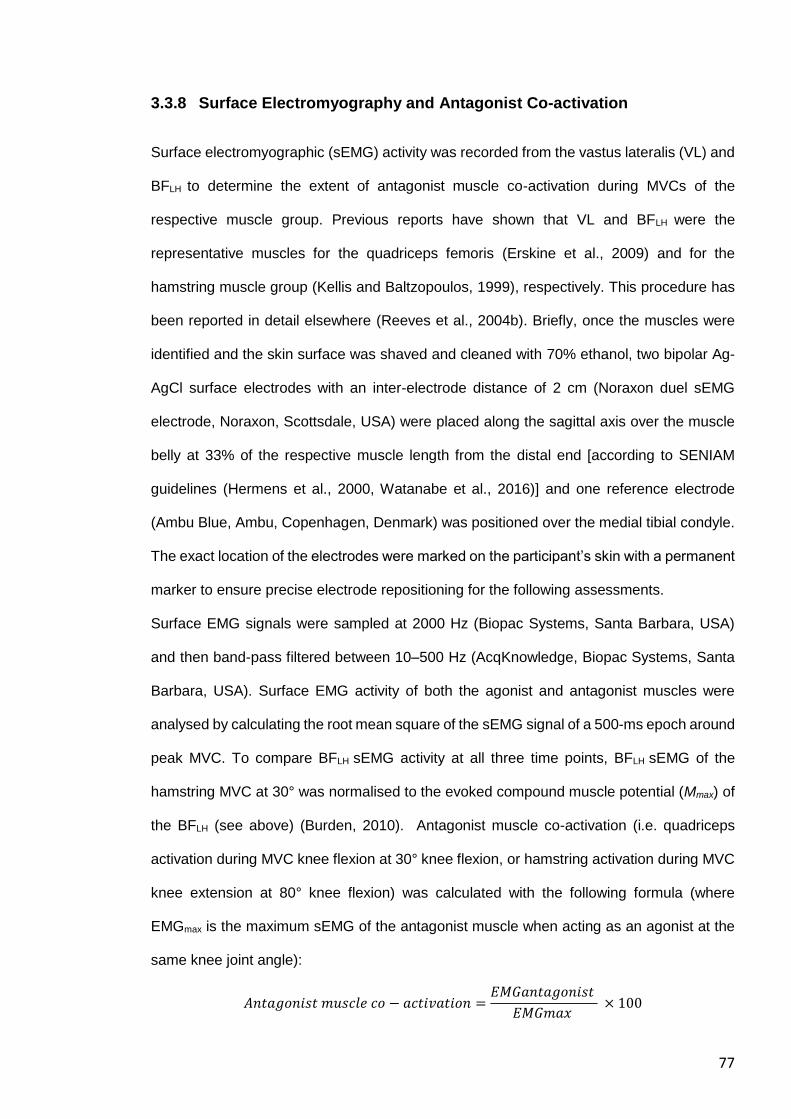
77
3.3.8 Surface Electromyography and Antagonist Co-activation
Surface electromyographic (sEMG) activity was recorded from the vastus lateralis (VL) and
BFLH to determine the extent of antagonist muscle co-activation during MVCs of the
respective muscle group. Previous reports have shown that VL and BFLH were the
representative muscles for the quadriceps femoris (Erskine et al., 2009) and for the
hamstring muscle group (Kellis and Baltzopoulos, 1999), respectively. This procedure has
been reported in detail elsewhere (Reeves et al., 2004b). Briefly, once the muscles were
identified and the skin surface was shaved and cleaned with 70% ethanol, two bipolar Ag-
AgCl surface electrodes with an inter-electrode distance of 2 cm (Noraxon duel sEMG
electrode, Noraxon, Scottsdale, USA) were placed along the sagittal axis over the muscle
belly at 33% of the respective muscle length from the distal end [according to SENIAM
guidelines (Hermens et al., 2000, Watanabe et al., 2016)] and one reference electrode
(Ambu Blue, Ambu, Copenhagen, Denmark) was positioned over the medial tibial condyle.
The exact location of the electrodes were marked on the participant’s skin with a permanent
marker to ensure precise electrode repositioning for the following assessments.
Surface EMG signals were sampled at 2000 Hz (Biopac Systems, Santa Barbara, USA)
and then band-pass filtered between 10–500 Hz (AcqKnowledge, Biopac Systems, Santa
Barbara, USA). Surface EMG activity of both the agonist and antagonist muscles were
analysed by calculating the root mean square of the sEMG signal of a 500-ms epoch around
peak MVC. To compare BFLH sEMG activity at all three time points, BFLH sEMG of the
hamstring MVC at 30° was normalised to the evoked compound muscle potential (Mmax) of
the BFLH (see above) (Burden, 2010). Antagonist muscle co-activation (i.e. quadriceps
activation during MVC knee flexion at 30° knee flexion, or hamstring activation during MVC
knee extension at 80° knee flexion) was calculated with the following formula (where
EMGmax is the maximum sEMG of the antagonist muscle when acting as an agonist at the
same knee joint angle):
𝐴𝑛𝑡𝑎𝑔𝑜𝑛𝑖𝑠𝑡 𝑚𝑢𝑠𝑐𝑙𝑒 𝑐𝑜 − 𝑎𝑐𝑡𝑖𝑣𝑎𝑡𝑖𝑜𝑛 =𝐸𝑀𝐺𝑎𝑛𝑡𝑎𝑔𝑜𝑛𝑖𝑠𝑡
𝐸𝑀𝐺𝑚𝑎𝑥 × 100
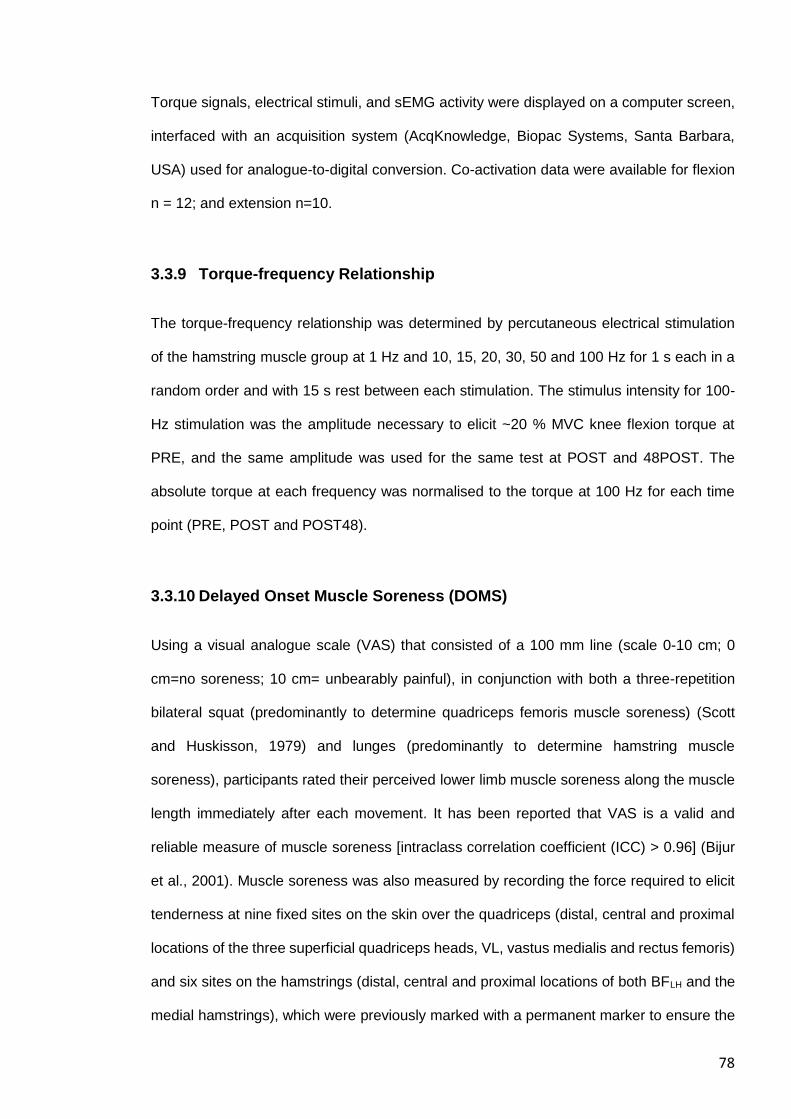
78
Torque signals, electrical stimuli, and sEMG activity were displayed on a computer screen,
interfaced with an acquisition system (AcqKnowledge, Biopac Systems, Santa Barbara,
USA) used for analogue-to-digital conversion. Co-activation data were available for flexion
n = 12; and extension n=10.
3.3.9 Torque-frequency Relationship
The torque-frequency relationship was determined by percutaneous electrical stimulation
of the hamstring muscle group at 1 Hz and 10, 15, 20, 30, 50 and 100 Hz for 1 s each in a
random order and with 15 s rest between each stimulation. The stimulus intensity for 100-
Hz stimulation was the amplitude necessary to elicit ~20 % MVC knee flexion torque at
PRE, and the same amplitude was used for the same test at POST and 48POST. The
absolute torque at each frequency was normalised to the torque at 100 Hz for each time
point (PRE, POST and POST48).
3.3.10 Delayed Onset Muscle Soreness (DOMS)
Using a visual analogue scale (VAS) that consisted of a 100 mm line (scale 0-10 cm; 0
cm=no soreness; 10 cm= unbearably painful), in conjunction with both a three-repetition
bilateral squat (predominantly to determine quadriceps femoris muscle soreness) (Scott
and Huskisson, 1979) and lunges (predominantly to determine hamstring muscle
soreness), participants rated their perceived lower limb muscle soreness along the muscle
length immediately after each movement. It has been reported that VAS is a valid and
reliable measure of muscle soreness [intraclass correlation coefficient (ICC) > 0.96] (Bijur
et al., 2001). Muscle soreness was also measured by recording the force required to elicit
tenderness at nine fixed sites on the skin over the quadriceps (distal, central and proximal
locations of the three superficial quadriceps heads, VL, vastus medialis and rectus femoris)
and six sites on the hamstrings (distal, central and proximal locations of both BFLH and the
medial hamstrings), which were previously marked with a permanent marker to ensure the
79
same measuring position PRE, POST and POST48. At each site, a gradually increasing
force was applied by the investigator with an algometer (FPK/FPN Mechanical Algometer,
Wagner Instruments, Greenwich, USA) with a maximum of 10 kg. Lying in the prone position
with the hip and knee fully extended and muscles relaxed, the participant was asked to
indicate when the sensation of pressure changed to discomfort, and the force at the point
was recorded (Newham et al., 1987).
3.3.11 Blood Samples
A 10 mL blood sample was drawn from an antecubital vein in the forearm and collected into
a serum vacutainer (BD Vacutainer systems, Plymouth, UK). The blood samples were
obtained at each time point and left at 22-24C for 30 min to allow clotting, and then kept
on ice when necessary. Serum samples were centrifuged at 1,300 g for 15 min at 4°C. All
samples were then aliquoted into 1.5 mL microcentrifuge tubes [Axygen (Corning), New
York, USA] and stored at -80C until subsequent analysis (see below).
3.3.12 Serum Interleukin-6 (IL-6) Concentration
Serum samples were assayed for IL-6 concentration using commercially available human
IL-6 enzyme linked immunosorbent assay (ELISA) kits (Quantikine®, R&D systems,
Minneapolis, MN, USA) according to the manufacturer's instructions. Briefly, the serum
samples were thawed and aliquots (200 μL) of each diluted sample, positive control or
standard, with known concentrations of human IL-6 to establish standard values, were
plated on a coated (monoclonal antibody specific for human IL-6) 96-well microtitre plate
for 2 h. After washing, human IL-6 conjugate (200 μL) was added to each well and incubated
for 2 h at room temperature (between 22 and 24C). After the wells were washed, substrate
solution (200 μL) was added to each well at room temperature (between 22 and 24C) and
protected from light. After adding 50 μL of stop solution to each well, the intensity of the
colour produced after 20 min was measured with a Thermo Multiskan Spectrum microplate
80
reader (Thermo Fisher Scientific. Waltham, MA. USA) at 450 nm and values were
calculated with Excel 365 (Microsoft, v. 365, USA) by generating a four-parameter logistic
(4-PL) curve fit. The minimum detectable dose of human IL-6 was 0.70 pg/mL.
3.3.13 Serum Creatine Kinase Activity
Creatine kinase (CK) activity was assayed using a commercially available CK assay
(Catachem Inc., Connecticut, NE, USA), as described in detail elsewhere (Sharples et al.,
2011, Owens et al., 2014). Briefly, 10 μL blood serum were loaded onto a 96-well UV plate.
The CK reaction reagent and diluent (Catachem) were prepared as per the manufacturer’s
instructions and heated for 2 min at 37°C. The reconstituted reagent contained the following
active ingredients: 30 mmol/l PCr, 2 mmol/l ADP, 5 mmol/l AMP, 2 mmol/l NAD, 20 mmol/l
N-acetyl-L-cystine, 3,000 U/l hexokinase, 2,000 U/l G-6-PDH, 10 mmol/l 1 Mg2, 20 mmol/l
D-glucose, 10 mol/l di(adenosine 5=) pentaphosphate, and 2 mmol/l EDTA, buffered to pH
6.7. The reagent mixture was then added to the samples and the change in absorbance
monitored continuously over 20 min in a Thermo Multiskan Spectrum plate reader at a
wavelength of 340 nm.
3.3.14 Capillary Blood Lactate Concentration
All lactate probes were cleaned and calibrated in accordance with the manufacturer’s
instructions. Briefly, Capillary blood samples were taken from the finger-tip Safety-Lancet
Extra 18G needle (Sarstedt; Nümbrecht, Germany) on testing day at rest before and
immediately after the IS-intervention. Blood samples were analysed within 60 seconds of
collection using a portable blood lactate analyser (Arkray Lactate Pro; Kyoto, Japan).
3.3.15 Ultrasound
Architectural parameters of the BFLH were assessed using B-mode ultrasound imaging.
Participants were in the prone position with the hip and knee fully extended and muscles
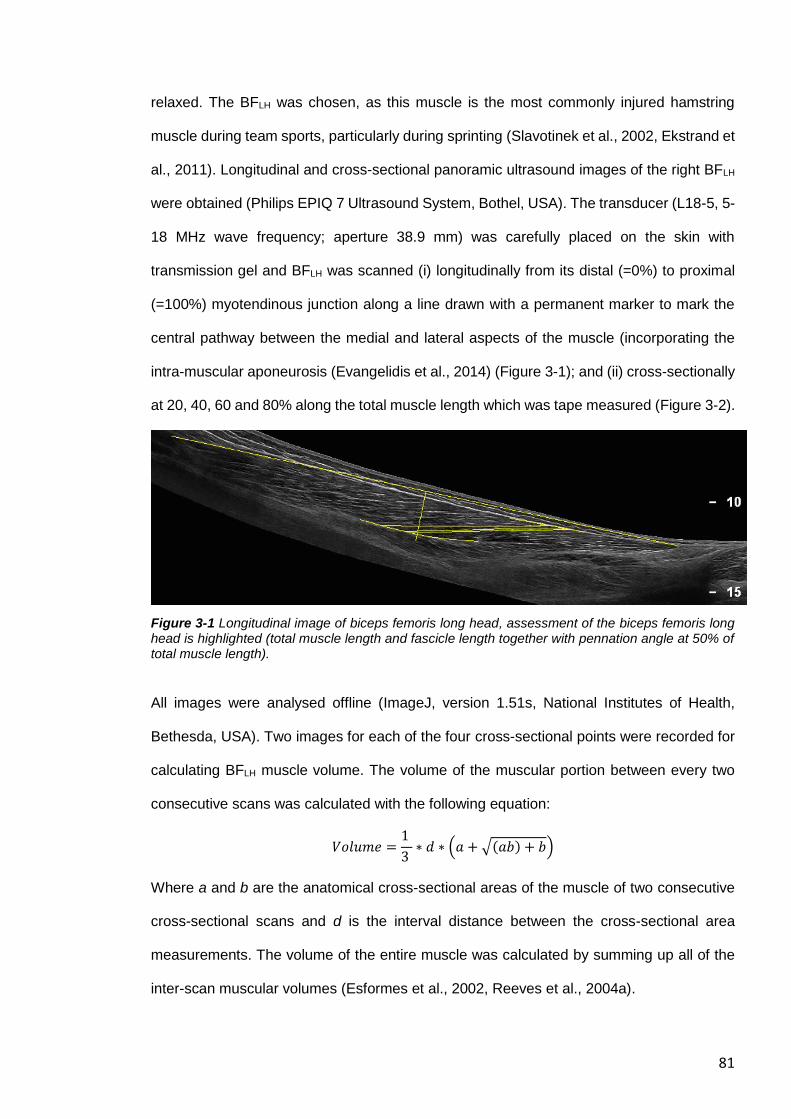
81
relaxed. The BFLH was chosen, as this muscle is the most commonly injured hamstring
muscle during team sports, particularly during sprinting (Slavotinek et al., 2002, Ekstrand et
al., 2011). Longitudinal and cross-sectional panoramic ultrasound images of the right BFLH
were obtained (Philips EPIQ 7 Ultrasound System, Bothel, USA). The transducer (L18-5, 5-
18 MHz wave frequency; aperture 38.9 mm) was carefully placed on the skin with
transmission gel and BFLH was scanned (i) longitudinally from its distal (=0%) to proximal
(=100%) myotendinous junction along a line drawn with a permanent marker to mark the
central pathway between the medial and lateral aspects of the muscle (incorporating the
intra-muscular aponeurosis (Evangelidis et al., 2014) (Figure 3-1); and (ii) cross-sectionally
at 20, 40, 60 and 80% along the total muscle length which was tape measured (Figure 3-2).
Figure 3-1 Longitudinal image of biceps femoris long head, assessment of the biceps femoris long head is highlighted (total muscle length and fascicle length together with pennation angle at 50% of total muscle length).
All images were analysed offline (ImageJ, version 1.51s, National Institutes of Health,
Bethesda, USA). Two images for each of the four cross-sectional points were recorded for
calculating BFLH muscle volume. The volume of the muscular portion between every two
consecutive scans was calculated with the following equation:
𝑉𝑜𝑙𝑢𝑚𝑒 =1
3 ∗ 𝑑 ∗ (𝑎 + √(𝑎𝑏) + 𝑏)
Where a and b are the anatomical cross-sectional areas of the muscle of two consecutive
cross-sectional scans and d is the interval distance between the cross-sectional area
measurements. The volume of the entire muscle was calculated by summing up all of the
inter-scan muscular volumes (Esformes et al., 2002, Reeves et al., 2004a).
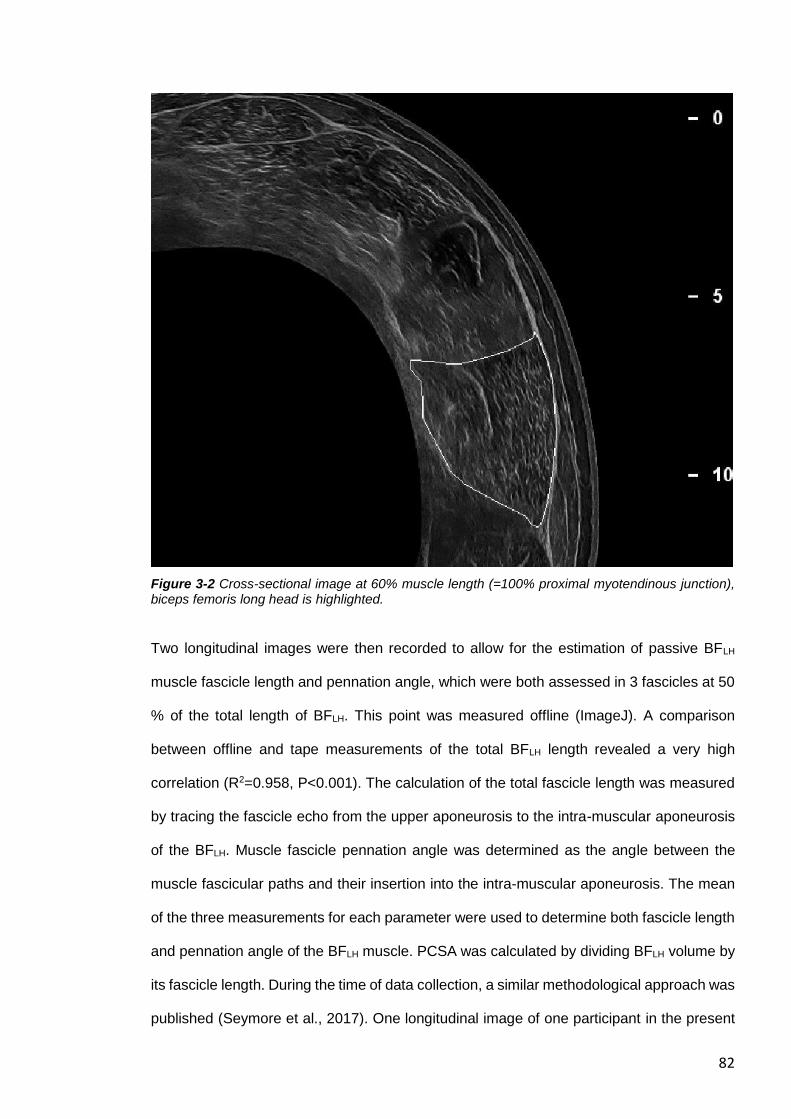
82
Figure 3-2 Cross-sectional image at 60% muscle length (=100% proximal myotendinous junction), biceps femoris long head is highlighted.
Two longitudinal images were then recorded to allow for the estimation of passive BFLH
muscle fascicle length and pennation angle, which were both assessed in 3 fascicles at 50
% of the total length of BFLH. This point was measured offline (ImageJ). A comparison
between offline and tape measurements of the total BFLH length revealed a very high
correlation (R2=0.958, P<0.001). The calculation of the total fascicle length was measured
by tracing the fascicle echo from the upper aponeurosis to the intra-muscular aponeurosis
of the BFLH. Muscle fascicle pennation angle was determined as the angle between the
muscle fascicular paths and their insertion into the intra-muscular aponeurosis. The mean
of the three measurements for each parameter were used to determine both fascicle length
and pennation angle of the BFLH muscle. PCSA was calculated by dividing BFLH volume by
its fascicle length. During the time of data collection, a similar methodological approach was
published (Seymore et al., 2017). One longitudinal image of one participant in the present
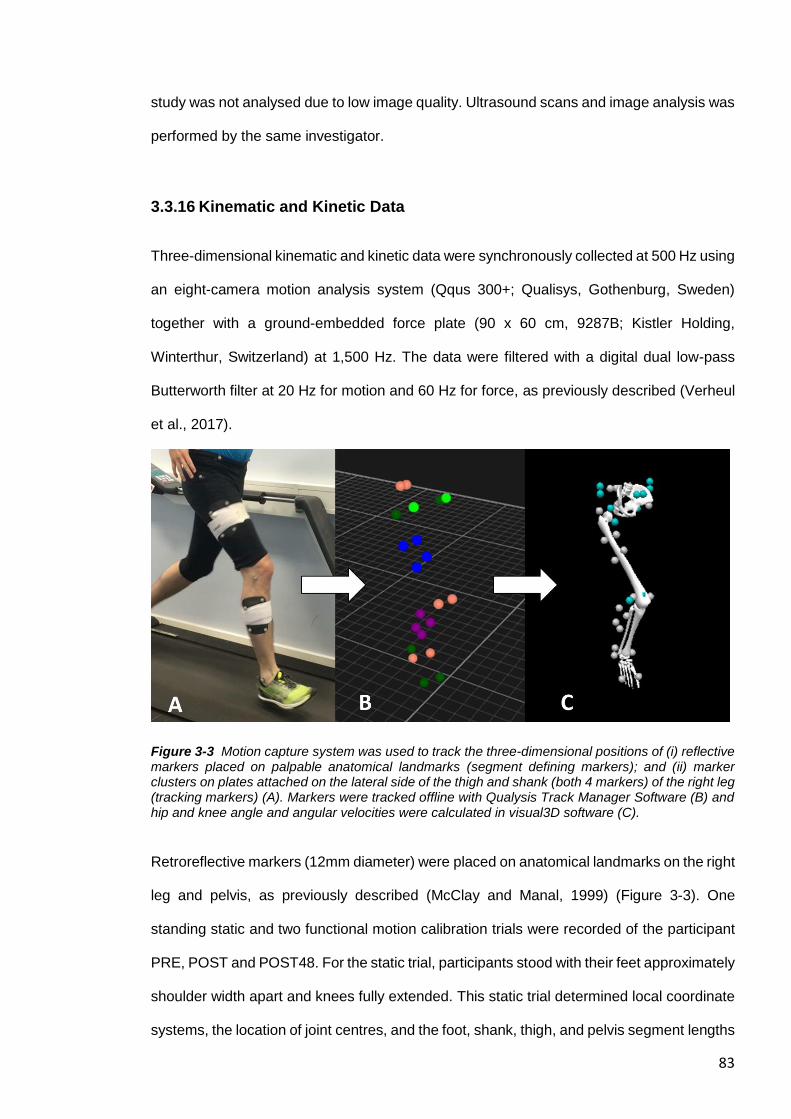
83
study was not analysed due to low image quality. Ultrasound scans and image analysis was
performed by the same investigator.
3.3.16 Kinematic and Kinetic Data
Three-dimensional kinematic and kinetic data were synchronously collected at 500 Hz using
an eight-camera motion analysis system (Qqus 300+; Qualisys, Gothenburg, Sweden)
together with a ground-embedded force plate (90 x 60 cm, 9287B; Kistler Holding,
Winterthur, Switzerland) at 1,500 Hz. The data were filtered with a digital dual low-pass
Butterworth filter at 20 Hz for motion and 60 Hz for force, as previously described (Verheul
et al., 2017).
Figure 3-3 Motion capture system was used to track the three-dimensional positions of (i) reflective markers placed on palpable anatomical landmarks (segment defining markers); and (ii) marker clusters on plates attached on the lateral side of the thigh and shank (both 4 markers) of the right leg (tracking markers) (A). Markers were tracked offline with Qualysis Track Manager Software (B) and hip and knee angle and angular velocities were calculated in visual3D software (C).
Retroreflective markers (12mm diameter) were placed on anatomical landmarks on the right
leg and pelvis, as previously described (McClay and Manal, 1999) (Figure 3-3). One
standing static and two functional motion calibration trials were recorded of the participant
PRE, POST and POST48. For the static trial, participants stood with their feet approximately
shoulder width apart and knees fully extended. This static trial determined local coordinate
systems, the location of joint centres, and the foot, shank, thigh, and pelvis segment lengths
84
of each participant. The functional trials defined functional hip joint centres (Schwartz and
Rozumalski, 2005) and knee joint axes (Robinson and Vanrenterghem, 2012). Kinematic
data were tracked using Qualisys Track Manager Software (Qualisys). Data processing and
analysis were undertaken in Visual3D (C-Motion, Germantown, MD). To examine any
changes between the time points, joint angles were normalised relative to the static trial of
the accompanying time point for minimising the influence of potential slightly different
marker positions between the trials. Lower extremity 3D joint angles and angular velocities
were calculated using an X-Y-Z Cardan angle rotation sequence. Investigated variables
included the knee and hip angles at the instant of landing, peak knee and hip angles, as
well as ROM and time (i) from landing to the peak value (SLHL); and (ii) during stance and
swing phase (treadmill run), for all three planes, were calculated as described in previous
studies (Verheul et al., 2017, Apps et al., 2017).
3.3.17 Single-leg Horizontal Hop Landing
The distance of a maximum unilateral horizontal right leg hop was recorded at PRE with a
measuring tape. Landing kinematics of a single-leg horizontal hop landing (SLHL)
movement were subsequently analysed following an 80% maximal hop on the right leg onto
a force plate. The same distance was used for the following two assessments (POST and
POST48). The first three successful trials were digitised and averaged for each participant.
Jamkrajang et al. (2017) have recently shown that a reduced lower limb model showed
worse agreement for whole-body balance regarding jump tasks, when practised with
swinging arms compared to a full-body model, compared to the full-body model (gold
standard), for which many markers need to be placed on the body. Therefore, the participant
was asked to perform SLHL by holding the arms akimbo and without crossing the knees
when generating forward momentum (to eliminate a backswing). Knee and hip angles at
the instant of landing, peak knee and hip angles, as well as ROM and time from landing to
the peak value, for all three planes, were calculated between the initial contact with the
85
force plate and 200 ms after the landing. The initial contact was determined when the
vertical force exceeded a threshold of 20 N.
3.3.18 Motorised Treadmill Run
Participants ran on a motorised treadmill (HP Cosmos Pulsar; Nussdorf, Germany) for 30 s
at 4.17 m s−1. The selected speed is based on pilot testing demonstrated that 15 km/h was
the fastest speed on a motorized treadmill where the participants still felt comfortable.
Motion analysis data were recorded for the last 10 s of the run and data were analysed for
at least 6 consecutive strides. Peak knee and hip angle data, for all three planes, were
calculated (i) between the initial contact and terminal stance of foot; and (ii) between initial
and terminal swing phase. The touchdown of the foot during the treadmill run was
determined from the kinematic data as occurring at the local minima and the toe-off during
running as the local maxima of the vertical velocity of the head of the fifth metatarsal marker
on the foot (Maiwald et al., 2009).
3.3.19 Reliability of the Current Methods
The test-retest reproducibility for isometric knee extensor MVC is high, with a coefficient of
variation (CV) of 3.9% (Erskine et al., 2009). Likewise, the test-retest reproducibility for
assessing voluntary activation via ITT is also high, with a CV of 2.4% (Marshall et al., 2014).
The test-retest reproducibility for antagonist muscle (hamstring) co-activation (assessed via
sEMG activity in the BFLH) during an isometric knee extension MVC, on the other hand,
has been reported to be quite low, with a CV of 14.39% (Erskine et al., 2009). The test-
retest reproducibility for ultrasonographic measurementis in the middle of the BFLH is high
for measuring muscle length (ICC=0.93; r=0.92), fascicle length (ICC=0.79; 0.55–0.91) and
angle (ICC=0.80; range 0.56–0.91) (Freitas et al., 2018). Using panoramic ultrasound mode
is associated with an excellent ICC 2, k (SEMs): fascicle length, 0.99 (0.11 cm); pennation
86
angle, 0.88 (1.1°); volume, 0.99 (2.07 cm3), and PCSA, 0.99 (0.42 cm2) (Seymore et al.,
2017).
3.3.20 Data Analysis
One-way ANOVAs with repeated-measures were performed to determine whether there
was a significant main effect for time (within subject factor) for the following dependent
variables: MVC torque, voluntary muscle activation, antagonist muscle co-activation,
muscle soreness (VAS-squat, VAS-lunge and algometer), RPE, CK activity, IL-6
concentration, and for kinematics data (hip and knee angle parameters). MVC torque data
were analysed for interactions and main effects for muscle group and time using two-way
mixed design ANOVAs, comparing differences between muscle groups across 3-time
points; PRE, POST, and POST48. For within test comparisons, either, independent t-tests,
or one-way ANOVAs were used where appropriate. For the torque-frequency relationship,
normalised torque at each frequency was analysed using a two-way repeated measures
ANOVA with stimulation frequency and time (PRE, POST and POST48) as the independent
variables. Separate one-way repeated measures ANOVAs were used to determine if the
change in normalised torque was similar across all stimulation frequencies at each time
point. Linear regression analyses were used to analyse the relation between architectural
parameters of the BFLH (volume, fascicle length, fascicle pennation angle and PCSA) and
fatigue biomarkers (relative MVC loss normalised to PRE MVC), serum CK activity, serum
IL-6 concentration, muscle soreness, muscle ROM or changes in ROM during treadmill
running or SLHL). Standard guidelines concerning violation of the sphericity assumption to
adjust the degree of freedom of the F-test by the Huynh-Felt epsilon if epsilon is greater
than 0.75 and to use the more stringent Greenhouse-Geisser adjustment if epsilon is less
than 0.75 were followed (Girden, 1992). Results were expressed as mean ± SD, unless
otherwise stated, with statistical significance set at P<0.05. All MVC data were analysed
with AcqKnowledge software 4.4 (Biopac-Systems Inc., Goleta, USA) and SPSS 23
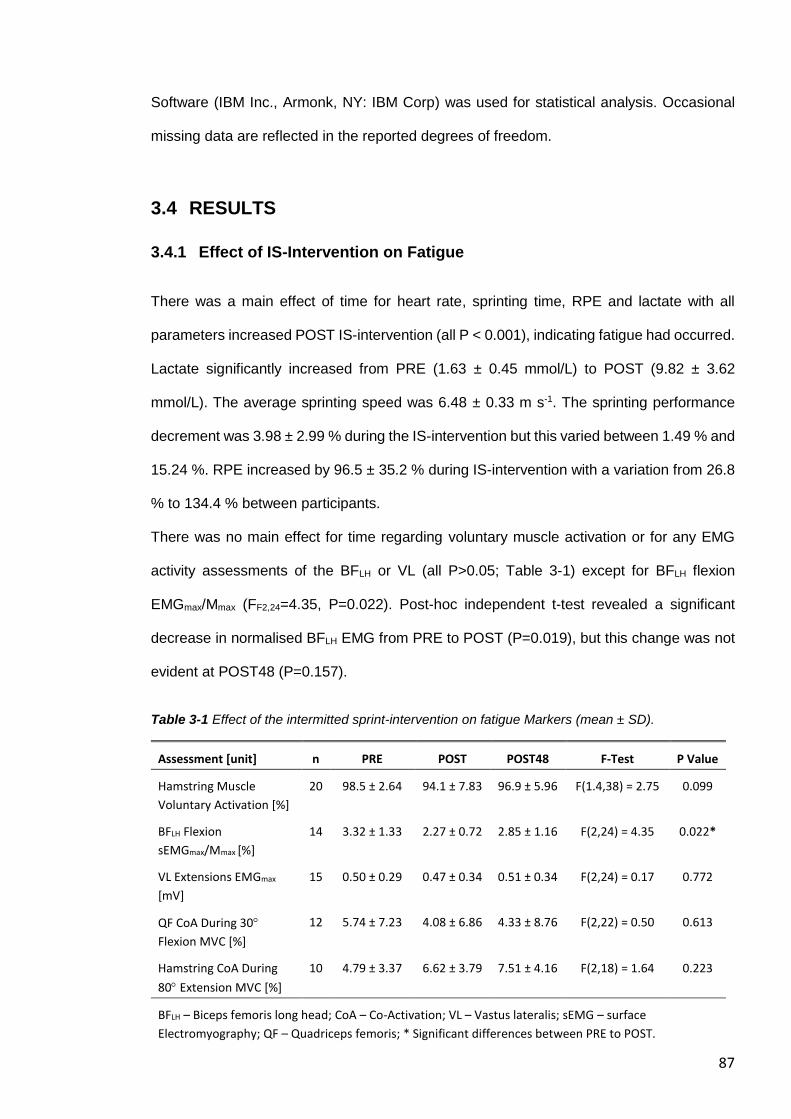
87
Software (IBM Inc., Armonk, NY: IBM Corp) was used for statistical analysis. Occasional
missing data are reflected in the reported degrees of freedom.
3.4 RESULTS
3.4.1 Effect of IS-Intervention on Fatigue
There was a main effect of time for heart rate, sprinting time, RPE and lactate with all
parameters increased POST IS-intervention (all P < 0.001), indicating fatigue had occurred.
Lactate significantly increased from PRE (1.63 ± 0.45 mmol/L) to POST (9.82 ± 3.62
mmol/L). The average sprinting speed was 6.48 ± 0.33 m s-1. The sprinting performance
decrement was 3.98 ± 2.99 % during the IS-intervention but this varied between 1.49 % and
15.24 %. RPE increased by 96.5 ± 35.2 % during IS-intervention with a variation from 26.8
% to 134.4 % between participants.
There was no main effect for time regarding voluntary muscle activation or for any EMG
activity assessments of the BFLH or VL (all P>0.05; Table 3-1) except for BFLH flexion
EMGmax/Mmax (FF2,24=4.35, P=0.022). Post-hoc independent t-test revealed a significant
decrease in normalised BFLH EMG from PRE to POST (P=0.019), but this change was not
evident at POST48 (P=0.157).
Table 3-1 Effect of the intermitted sprint-intervention on fatigue Markers (mean ± SD).
Assessment [unit] n PRE POST POST48 F-Test P Value
Hamstring Muscle
Voluntary Activation [%]
20 98.5 ± 2.64 94.1 ± 7.83 96.9 ± 5.96 F(1.4,38) = 2.75 0.099
BFLH Flexion
sEMGmax/Mmax [%]
14 3.32 ± 1.33 2.27 ± 0.72 2.85 ± 1.16 F(2,24) = 4.35 0.022*
VL Extensions EMGmax
[mV]
15 0.50 ± 0.29 0.47 ± 0.34 0.51 ± 0.34 F(2,24) = 0.17 0.772
QF CoA During 30
Flexion MVC [%]
12 5.74 ± 7.23 4.08 ± 6.86 4.33 ± 8.76 F(2,22) = 0.50 0.613
Hamstring CoA During
80 Extension MVC [%]
10 4.79 ± 3.37 6.62 ± 3.79 7.51 ± 4.16 F(2,18) = 1.64 0.223
BFLH – Biceps femoris long head; CoA – Co-Activation; VL – Vastus lateralis; sEMG – surface
Electromyography; QF – Quadriceps femoris; * Significant differences between PRE to POST.
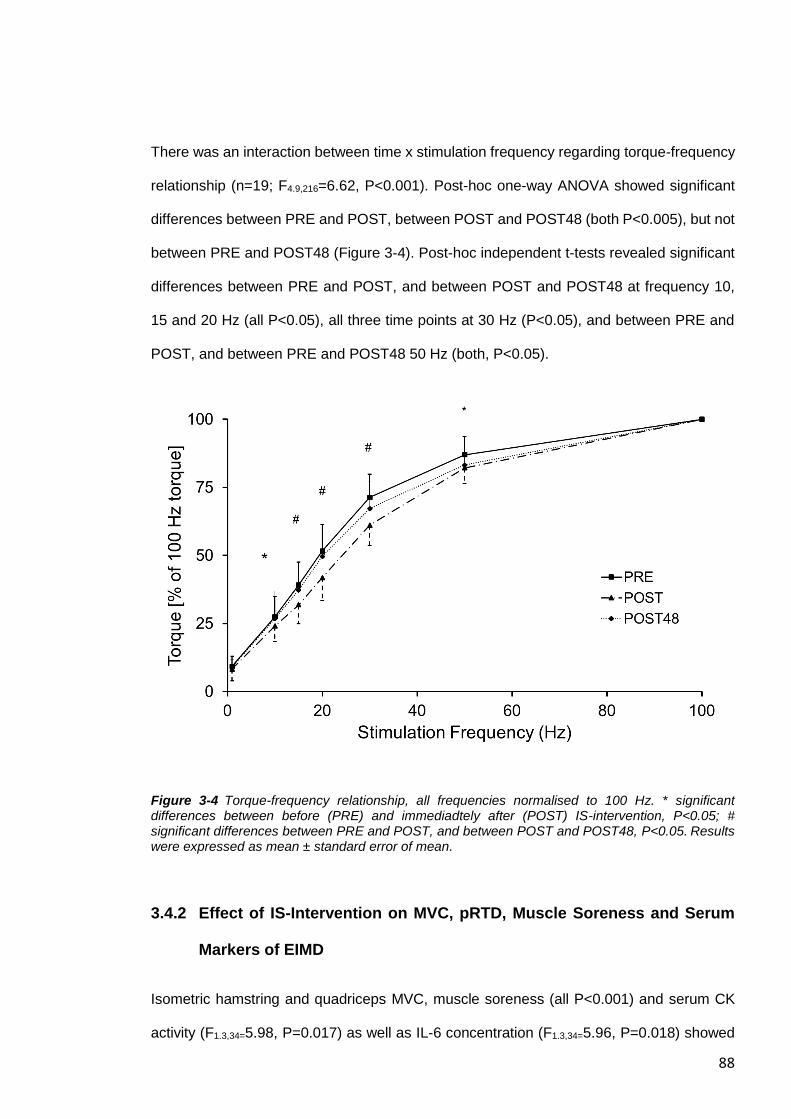
88
There was an interaction between time x stimulation frequency regarding torque-frequency
relationship (n=19; F4.9,216=6.62, P<0.001). Post-hoc one-way ANOVA showed significant
differences between PRE and POST, between POST and POST48 (both P<0.005), but not
between PRE and POST48 (Figure 3-4). Post-hoc independent t-tests revealed significant
differences between PRE and POST, and between POST and POST48 at frequency 10,
15 and 20 Hz (all P<0.05), all three time points at 30 Hz (P<0.05), and between PRE and
POST, and between PRE and POST48 50 Hz (both, P<0.05).
Figure 3-4 Torque-frequency relationship, all frequencies normalised to 100 Hz. * significant differences between before (PRE) and immediadtely after (POST) IS-intervention, P<0.05; # significant differences between PRE and POST, and between POST and POST48, P<0.05. Results were expressed as mean ± standard error of mean.
3.4.2 Effect of IS-Intervention on MVC, pRTD, Muscle Soreness and Serum
Markers of EIMD
Isometric hamstring and quadriceps MVC, muscle soreness (all P<0.001) and serum CK
activity (F1.3,34=5.98, P=0.017) as well as IL-6 concentration (F1.3,34=5.96, P=0.018) showed
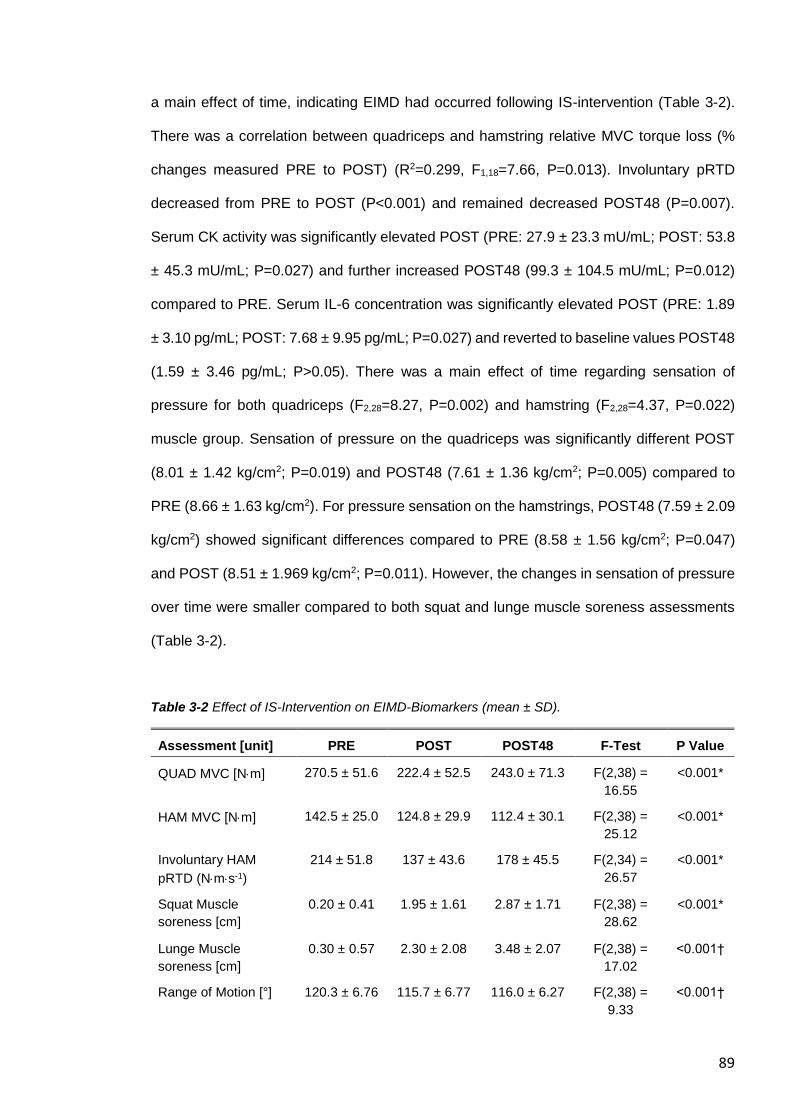
89
a main effect of time, indicating EIMD had occurred following IS-intervention (Table 3-2).
There was a correlation between quadriceps and hamstring relative MVC torque loss (%
changes measured PRE to POST) (R2=0.299, F1,18=7.66, P=0.013). Involuntary pRTD
decreased from PRE to POST (P<0.001) and remained decreased POST48 (P=0.007).
Serum CK activity was significantly elevated POST (PRE: 27.9 ± 23.3 mU/mL; POST: 53.8
± 45.3 mU/mL; P=0.027) and further increased POST48 (99.3 ± 104.5 mU/mL; P=0.012)
compared to PRE. Serum IL-6 concentration was significantly elevated POST (PRE: 1.89
± 3.10 pg/mL; POST: 7.68 ± 9.95 pg/mL; P=0.027) and reverted to baseline values POST48
(1.59 ± 3.46 pg/mL; P>0.05). There was a main effect of time regarding sensation of
pressure for both quadriceps (F2,28=8.27, P=0.002) and hamstring (F2,28=4.37, P=0.022)
muscle group. Sensation of pressure on the quadriceps was significantly different POST
(8.01 ± 1.42 kg/cm2; P=0.019) and POST48 (7.61 ± 1.36 kg/cm2; P=0.005) compared to
PRE (8.66 ± 1.63 kg/cm2). For pressure sensation on the hamstrings, POST48 (7.59 ± 2.09
kg/cm2) showed significant differences compared to PRE (8.58 ± 1.56 kg/cm2; P=0.047)
and POST (8.51 ± 1.969 kg/cm2; P=0.011). However, the changes in sensation of pressure
over time were smaller compared to both squat and lunge muscle soreness assessments
(Table 3-2).
Table 3-2 Effect of IS-Intervention on EIMD-Biomarkers (mean ± SD).
Assessment [unit] PRE POST POST48 F-Test P Value
QUAD MVC [Nm] 270.5 ± 51.6 222.4 ± 52.5 243.0 ± 71.3 F(2,38) =
16.55
<0.001*
HAM MVC [Nm] 142.5 ± 25.0 124.8 ± 29.9 112.4 ± 30.1 F(2,38) =
25.12
<0.001*
Involuntary HAM
pRTD (Nms-1)
214 ± 51.8 137 ± 43.6 178 ± 45.5 F(2,34) =
26.57
<0.001*
Squat Muscle
soreness [cm]
0.20 ± 0.41 1.95 ± 1.61 2.87 ± 1.71 F(2,38) =
28.62
<0.001*
Lunge Muscle
soreness [cm]
0.30 ± 0.57 2.30 ± 2.08 3.48 ± 2.07 F(2,38) =
17.02
<0.001†
Range of Motion [°] 120.3 ± 6.76 115.7 ± 6.77 116.0 ± 6.27 F(2,38) =
9.33
<0.001†
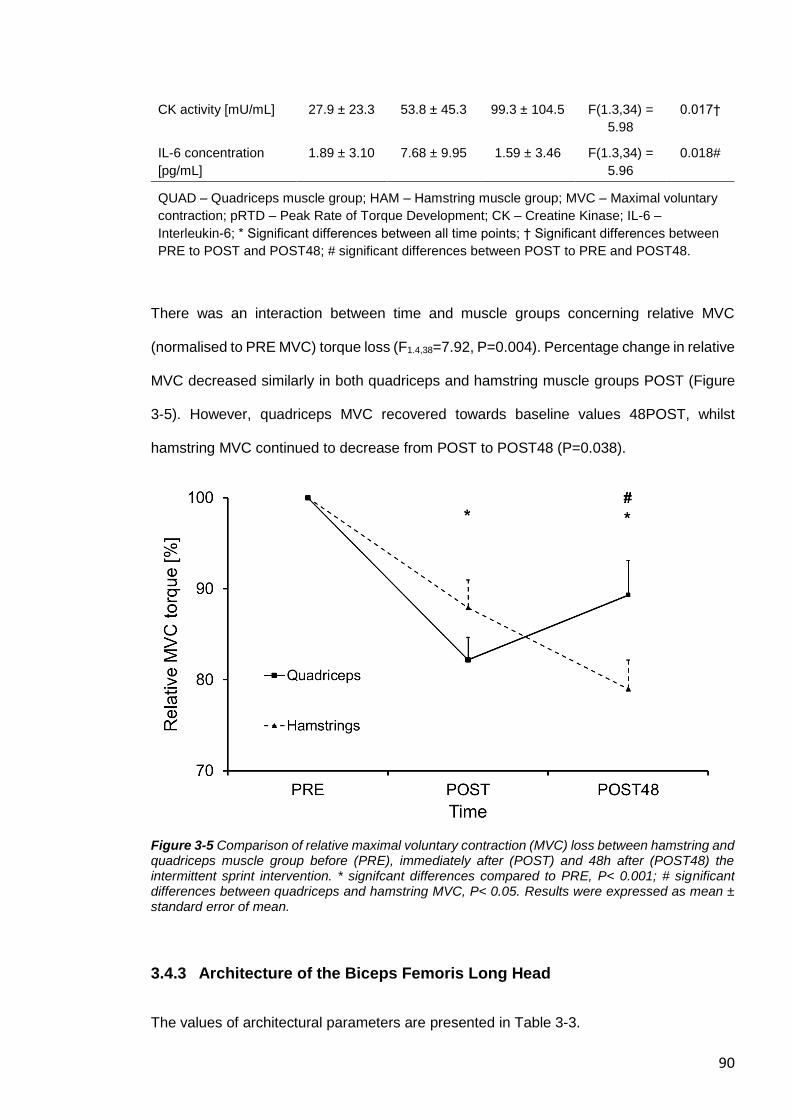
90
CK activity [mU/mL] 27.9 ± 23.3 53.8 ± 45.3 99.3 ± 104.5 F(1.3,34) =
5.98
0.017†
IL-6 concentration
[pg/mL]
1.89 ± 3.10 7.68 ± 9.95 1.59 ± 3.46 F(1.3,34) =
5.96
0.018#
QUAD – Quadriceps muscle group; HAM – Hamstring muscle group; MVC – Maximal voluntary
contraction; pRTD – Peak Rate of Torque Development; CK – Creatine Kinase; IL-6 –
Interleukin-6; * Significant differences between all time points; † Significant differences between
PRE to POST and POST48; # significant differences between POST to PRE and POST48.
There was an interaction between time and muscle groups concerning relative MVC
(normalised to PRE MVC) torque loss (F1.4,38=7.92, P=0.004). Percentage change in relative
MVC decreased similarly in both quadriceps and hamstring muscle groups POST (Figure
3-5). However, quadriceps MVC recovered towards baseline values 48POST, whilst
hamstring MVC continued to decrease from POST to POST48 (P=0.038).
Figure 3-5 Comparison of relative maximal voluntary contraction (MVC) loss between hamstring and quadriceps muscle group before (PRE), immediately after (POST) and 48h after (POST48) the intermittent sprint intervention. * signifcant differences compared to PRE, P< 0.001; # significant differences between quadriceps and hamstring MVC, P< 0.05. Results were expressed as mean ± standard error of mean.
3.4.3 Architecture of the Biceps Femoris Long Head
The values of architectural parameters are presented in Table 3-3.
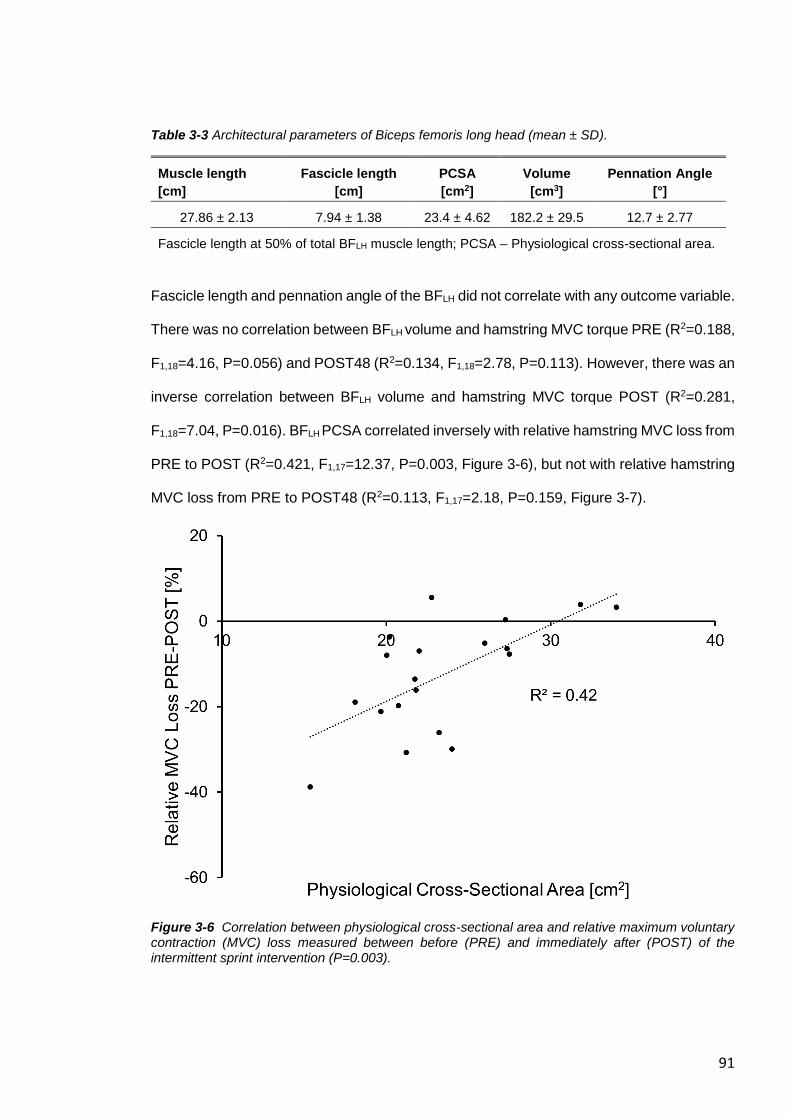
91
Table 3-3 Architectural parameters of Biceps femoris long head (mean ± SD).
Muscle length
[cm]
Fascicle length
[cm]
PCSA
[cm2]
Volume
[cm3]
Pennation Angle
[°]
27.86 ± 2.13 7.94 ± 1.38 23.4 ± 4.62 182.2 ± 29.5 12.7 ± 2.77
Fascicle length at 50% of total BFLH muscle length; PCSA – Physiological cross-sectional area.
Fascicle length and pennation angle of the BFLH did not correlate with any outcome variable.
There was no correlation between BFLH volume and hamstring MVC torque PRE (R2=0.188,
F1,18=4.16, P=0.056) and POST48 (R2=0.134, F1,18=2.78, P=0.113). However, there was an
inverse correlation between BFLH volume and hamstring MVC torque POST (R2=0.281,
F1,18=7.04, P=0.016). BFLH PCSA correlated inversely with relative hamstring MVC loss from
PRE to POST (R2=0.421, F1,17=12.37, P=0.003, Figure 3-6), but not with relative hamstring
MVC loss from PRE to POST48 (R2=0.113, F1,17=2.18, P=0.159, Figure 3-7).
Figure 3-6 Correlation between physiological cross-sectional area and relative maximum voluntary contraction (MVC) loss measured between before (PRE) and immediately after (POST) of the intermittent sprint intervention (P=0.003).
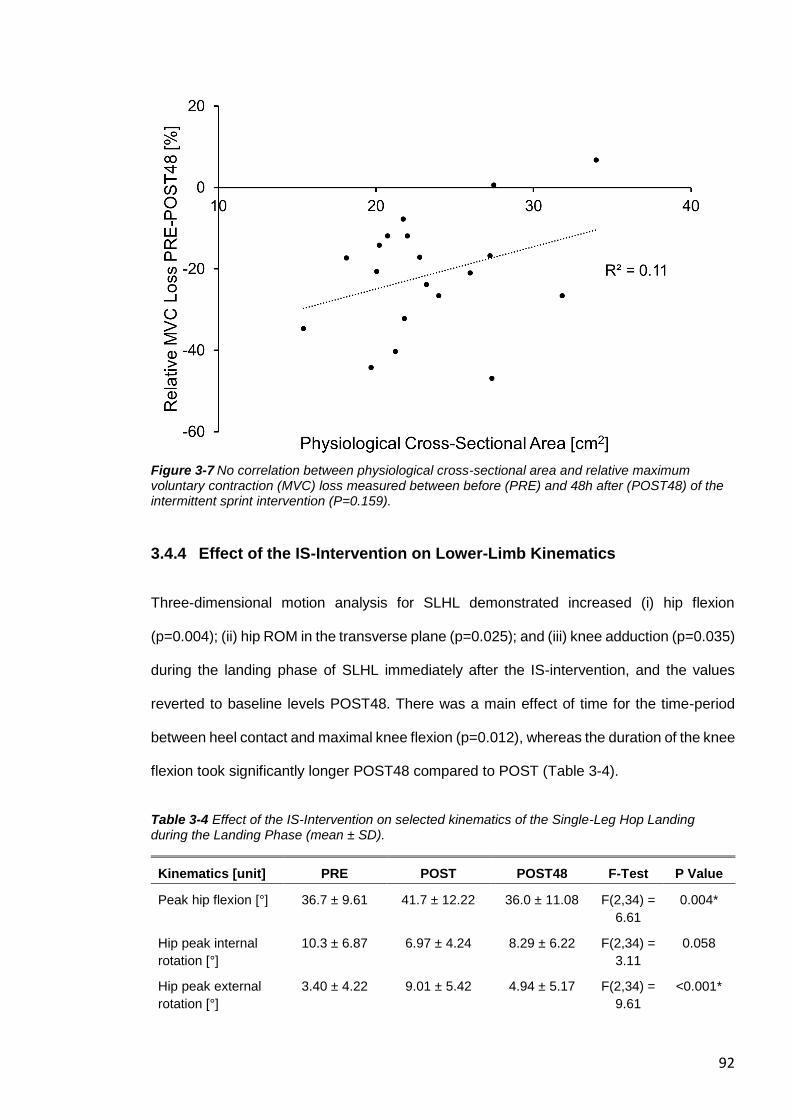
92
Figure 3-7 No correlation between physiological cross-sectional area and relative maximum voluntary contraction (MVC) loss measured between before (PRE) and 48h after (POST48) of the intermittent sprint intervention (P=0.159).
3.4.4 Effect of the IS-Intervention on Lower-Limb Kinematics
Three-dimensional motion analysis for SLHL demonstrated increased (i) hip flexion
(p=0.004); (ii) hip ROM in the transverse plane (p=0.025); and (iii) knee adduction (p=0.035)
during the landing phase of SLHL immediately after the IS-intervention, and the values
reverted to baseline levels POST48. There was a main effect of time for the time-period
between heel contact and maximal knee flexion (p=0.012), whereas the duration of the knee
flexion took significantly longer POST48 compared to POST (Table 3-4).
Table 3-4 Effect of the IS-Intervention on selected kinematics of the Single-Leg Hop Landing during the Landing Phase (mean ± SD).
Kinematics [unit] PRE POST POST48 F-Test P Value
Peak hip flexion [°] 36.7 ± 9.61 41.7 ± 12.22 36.0 ± 11.08 F(2,34) =
6.61
0.004*
Hip peak internal
rotation [°]
10.3 ± 6.87 6.97 ± 4.24 8.29 ± 6.22 F(2,34) =
3.11
0.058
Hip peak external
rotation [°]
3.40 ± 4.22 9.01 ± 5.42 4.94 ± 5.17 F(2,34) =
9.61
<0.001*
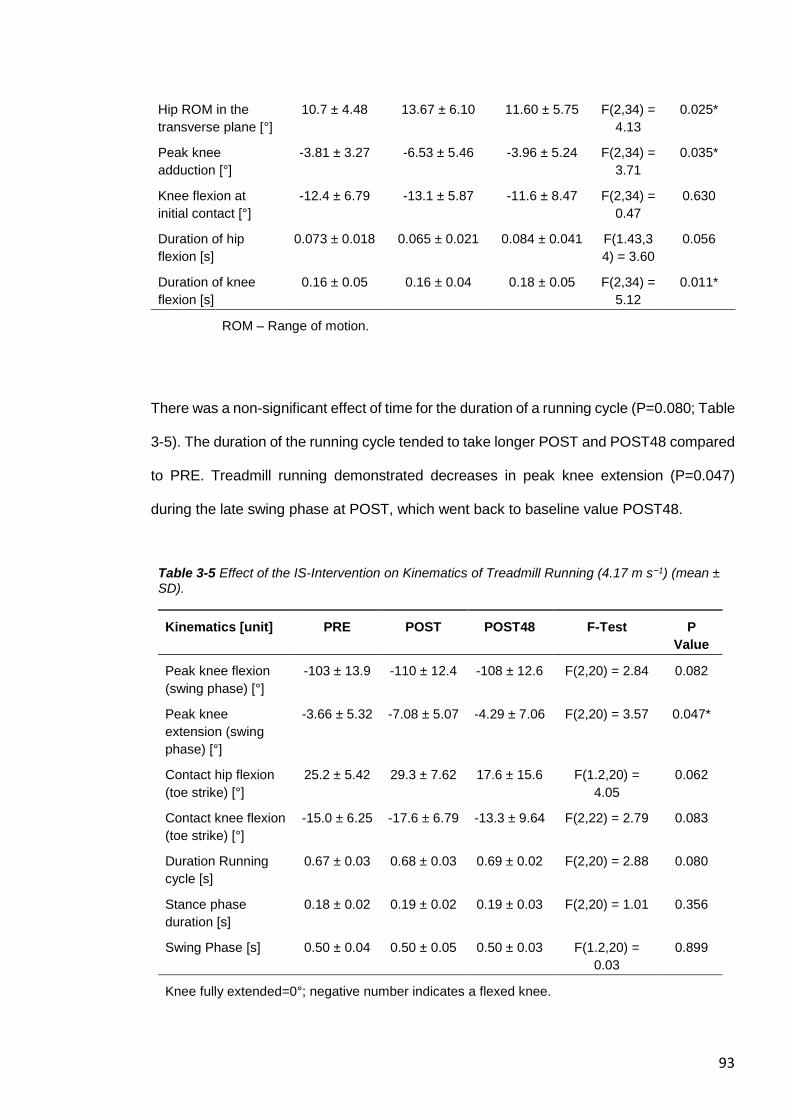
93
Hip ROM in the
transverse plane [°]
10.7 ± 4.48 13.67 ± 6.10 11.60 ± 5.75 F(2,34) =
4.13
0.025*
Peak knee
adduction [°]
-3.81 ± 3.27 -6.53 ± 5.46 -3.96 ± 5.24 F(2,34) =
3.71
0.035*
Knee flexion at
initial contact [°]
-12.4 ± 6.79 -13.1 ± 5.87 -11.6 ± 8.47 F(2,34) =
0.47
0.630
Duration of hip
flexion [s]
0.073 ± 0.018 0.065 ± 0.021 0.084 ± 0.041 F(1.43,3
4) = 3.60
0.056
Duration of knee
flexion [s]
0.16 ± 0.05 0.16 ± 0.04 0.18 ± 0.05 F(2,34) =
5.12
0.011*
ROM – Range of motion.
There was a non-significant effect of time for the duration of a running cycle (P=0.080; Table
3-5). The duration of the running cycle tended to take longer POST and POST48 compared
to PRE. Treadmill running demonstrated decreases in peak knee extension (P=0.047)
during the late swing phase at POST, which went back to baseline value POST48.
Table 3-5 Effect of the IS-Intervention on Kinematics of Treadmill Running (4.17 m s−1) (mean ± SD).
Kinematics [unit] PRE POST POST48 F-Test P
Value
Peak knee flexion
(swing phase) [°]
-103 ± 13.9 -110 ± 12.4 -108 ± 12.6 F(2,20) = 2.84 0.082
Peak knee
extension (swing
phase) [°]
-3.66 ± 5.32 -7.08 ± 5.07 -4.29 ± 7.06 F(2,20) = 3.57 0.047*
Contact hip flexion
(toe strike) [°]
25.2 ± 5.42 29.3 ± 7.62 17.6 ± 15.6 F(1.2,20) =
4.05
0.062
Contact knee flexion
(toe strike) [°]
-15.0 ± 6.25 -17.6 ± 6.79 -13.3 ± 9.64 F(2,22) = 2.79 0.083
Duration Running
cycle [s]
0.67 ± 0.03 0.68 ± 0.03 0.69 ± 0.02 F(2,20) = 2.88 0.080
Stance phase
duration [s]
0.18 ± 0.02 0.19 ± 0.02 0.19 ± 0.03 F(2,20) = 1.01 0.356
Swing Phase [s] 0.50 ± 0.04 0.50 ± 0.05 0.50 ± 0.03 F(1.2,20) =
0.03
0.899
Knee fully extended=0°; negative number indicates a flexed knee.
94
3.5 DISCUSSION
The aim of the current study was to investigate the physiological and biomechanical factors
underpinning impaired physical performance following an IS-intervention. The objectives
were to comprehensively assess (i) the contribution of central and peripheral fatigue on
acute and prolonged decrement in performance in response to a IS-intervention, (ii) whether
BFLH architecture correlated with fatigue indices; and (iii) the consequential effect of fatigue
on lower-limb kinematics of landing (SLHL) and running (treadmill 4.17 m s−1). In line with
our hypotheses, immediate strength loss was associated with lower hamstring EMG activity
(indicating impaired hamstring muscle recruitment) and markers of peripheral fatigue, but
the magnitude and sustained changes in MVC torque over time was predominately
associated with indicators of peripheral fatigue. Muscle damage biomarkers indicated that
the peripheral fatigue might have been predominantly caused by ultrastructural damage
within the hamstring muscle fibres. Further, both central and peripheral fatigue probably
had an impact on the neuromuscular control of running and landing patterns immediately
after the IS-intervention. Contrary to our hypothesis, BFLH fascicle length was not associated
with the extent of hamstring fatigue following the IS-intervention. However, BFLH PCSA
correlated with knee flexor MVC torque change immediately POST, indicating that the non-
contractile structure of the muscle, e.g. the extracellular matrix, might contribute to the
individual variability in the response to muscle damaging exercises.
3.5.1 Fatigue Following the Intermittent Sprint Intervention
The contribution of central and peripheral fatigue has previously been investigated in
studies using a simulated soccer-match as an intervention for the quadriceps muscle group
(Thomas et al., 2017) and hamstring muscle group (Marshall et al., 2014). The investigation
of Thomas et al. (2017) showed that both central and peripheral fatigue contribute to acute
neuromuscular fatigue of the quadriceps muscles but that mainly peripheral fatigue causes
the delayed recovery. Marshall et al. (2014) concluded that impaired hamstring muscle
95
function was mainly caused by central fatigue, which was investigated via twitch
interpolation technique and EMG (normalised to Mmax). Presumably, the different results are
based on varying methodological approaches and different muscle groups studied. Firstly,
simulated soccer match protocols include additional (multidirectional) low and moderate-
speed movements and this is accompanied with less time to rest during the intervention
compared to the current IS-intervention. In line with the current study, Marshall et al. (2014)
showed a decreased activity of normalised BFLH sEMG over time, but no significant changes
in parameters of fatigue detected using the twitch interpolation technique. This discrepancy
might be explained by the fact that voluntary activation via twitch interpolation technique
investigates the summation of all involved hamstring muscles, and the summation showed
no decrease in central fatigue. However, normalised sEMG analyses specific muscles such
as the BFLH in both the current and the study of Marshall et al. (2014). Both studies indicate
that BFLH might fatigue to a greater degree immediately after IS compared to the other
hamstring muscles, as reduced sEMG suggests either a reduction in central activation or
recruitment of motor units affecting BFLH muscle function, or both. For estimated peripheral
fatigue, Marshall et al. (2014) used resting doublet with 100 Hz, but lower physiological
frequencies were not included in the assessment. In human muscle, the torque-frequency
relationship can be used to asses peripheral fatigue, and the effect of fatigue is most evident
when muscles are stimulated at frequencies around 10–30 Hz (Jones, 1996, Bellemare et
al., 1983). Therefore, the impaired muscle function seen in the study of Marshall et al.
(2014) following the soccer match simulation might be not solely based on central fatigue,
as suggested, and a major contribution may have been due to peripheral fatigue as the
current study indicates.
The different results between VA and normalised sEMG of the BFLH suggest that muscle
impairment of BFLH might not be solely caused of central fatigue as other hamstring muscles
would then be affected at the same rate compared with the BFLH. Both the semitendinosus
and BFLH share the same proximal tendon at the ischial tuberosity and there is evidence to
suggest that there is a complex muscle recruitment between these both muscles
96
(Schuermans et al., 2016, Schuermans et al., 2014). Recent investigations revealed that
the BFLH has the highest EMG activity between 15 and 30° of knee flexion angles, while the
other hamstring muscles showed the largest EMG activity between 90 and 105° of knee
flexion, when isokinetic MVCs were performed (Onishi et al., 2002). During the deceleration
of the knee extension in the swing phase of sprinting, it could be speculated that the
semitendinosus and BFLH have their highest EMG activity to different time points during the
late swing phase. The semitendinosus might predominantly contribute to decelerate the
shaft at the initial part of the late swing phase (at the time with a more flexed knee joint).
During the subsequent part of the late swing phase of sprinting, the contribution to
decelerate the shaft shifts from the semitendinosus to the BFLH (when the knee joint extends
until terminal swing). After repeated bouts of high-speed running, the semitendinosus might
fatigue prematurely (Schuermans et al., 2014) and the BFLH would need to substitute the
impaired function of the preceding semitendinosus to decelerate the shaft. To protect the
BFLH against injuries, the reduced neuromuscular activation of the BFLH is accompanied by
changes of the running kinematic strategy as seen in the current study (see below).
However, alterations in neuromuscular coordination of the biarticular BFLH requires further
investigation, as unpublished observations of our laboratory (Lake et al.) demonstrate an
increase of the semitendinosus EMG activity (with a simultaneous decrease of the BFLH
EMG activity) following IS indicating a critical role of the semitendinosus for HSI.
Interestingly, peripheral fatigue (identified via the torque-frequency relationship) revealed in
the current study that frequencies between 10 and 50 Hz were affected immediately after
the IS-intervention, but there was a delayed recovery for higher frequencies. This suggests
that IS might impair fast-twitch muscle fibres to a greater extent compared to slow-twitch
fibres (Henneman et al., 1965, Gregory and Bickel, 2005), which led to an impaired force
generation rather than simply fatiguing the muscle fibres with its consequential effect on the
rate of relaxation at lower frequencies. Initial studies reported a left shift of the torque-
frequency curve after fatiguing exercise, i.e. with the stimulation of the fatigued human
adductor pollicis muscle (Bigland-Ritchie et al., 1983). However, the torque-frequency
97
relationship shifted to the right following IS in the current study, which is in line with other in
vivo strenuous exercise studies (Dundon et al., 2008, Binder-Macleod et al., 1998).
Presumably, investigations including protocols, which causes ultrastructural damage, might
prevent muscle fibres from producing as much force at low frequency stimulation in
comparison to protocols that only fatigue the muscle (and therefore having a greater
influence on rate of relaxation at low frequencies than force production per se). Therefore,
studies causing EIMD might shift the torque-frequency curve to the right rather than to the
left, which might explain the discrepancy between the present study and the study by
(Bigland-Ritchie et al., 1983).
3.5.2 Exercise-Induced Muscle Damage
The average strength loss was similar to other studies regarding both the hamstring (Verma
et al., 2015, Chen et al., 2017) and quadriceps (Howatson and Milak, 2009) muscle groups.
In the current study, both muscle groups showed similar strength loss initially POST and
the hamstring muscle group showed further strength loss POST48 compared to the
quadriceps muscle group. This was accompanied by supressed involuntary pRTD of the
hamstrings, another indicator of peripheral fatigue. These findings suggest that the IS
induced muscle damage to a different extent in each muscle group. Differences in the use
of the muscles in daily activities may make the quadriceps muscles less susceptible to EIMD
compared to the hamstrings (Chen et al., 2011). However, other studies did not show this
additional strength loss for the hamstring muscle group POST48. Different methodological
approaches might partly explain the different outcomes as sprints interspersed with longer
rest intervals, which allows near complete recovery of sprint performance, might induce
more muscle damage and muscle soreness compared to exercises with (submaximal but)
longer high-speed running duration and shorter rest intervals (Wiewelhove et al., 2015,
Balsom et al., 1992). Further, as the participants in the other studies were elite tennis and
football players with training on at least three occasions per week (Verma et al., 2015, Chen
et al., 2017), it could be assumed that these participants were more adapted to regular high-

98
speed running and that this regular sprint exercises might have protected the hamstring
muscles against additional EIMD or inflammatory processes, as chronic sprint exercises
have been shown to protect athletes against HSI (Malone et al., 2018). Interestingly,
involuntary pRTD was slightly recovered POST48 in contrast to the additional decrease of
hamstring MVC. This was similar to results of other studies, which showed a correlated but
disconnected time course between MVC and voluntary pRTD following a muscle-damage
intervention (Molina and Denadai, 2012). Involuntary pRTD might reflect the combined
outcome of neural mechanisms underlying the early phase of MVC torque loss (Jenkins et
al., 2014) as well as peripheral fatigue/damage. The early phase of MVC torque loss may
be partly influenced of the inability to fully activate muscles following EIMD, which is
reflected by the decrease of involuntary pRTD. However, the disconnected recovery
between involuntary pRTD and MVC indicates that predominately peripheral
fatigue/damage might cause the delayed MVC recovery in the later phase of recovery (i.e.
48 h post IS) and that involuntary pRTD, which reflected the early phase of MVC torque
loss, is less affected by ultrastructural muscle damage (Jenkins et al., 2014).Less is known
about the mechanisms of muscle strain injuries other than of the hamstring muscles. High-
speed running leads to substantial activation of the upper thigh muscles, when eccentric
contractions occur to decelerate the lower limb. This happens for the hamstrings during the
late swing phase (= deceleration of the knee extension) (Chumanov et al., 2007) and for
the quadriceps during the early/mid swing phase (= deceleration of hip extension)
(Jönhagen et al., 1996, Mendiguchia et al., 2013). However, quadriceps strain injuries
predominantly occur in the bi-articular rectus femoris (Cross et al., 2004), and it is thought
that injuries typically occur during eccentric contractions, such as during deceleration of
running and during kicking with the kicking leg (Brukner and Connell, 2015, Orchard, 2001).
The likelihood to sustain a quadriceps strain injury is significantly lower compared to HSI
(Ekstrand et al., 2011). If repeated eccentric contractions are one of the main causes for
strain injuries, as indicated of several investigations (Malone et al., 2016, Higashihara et al.,
2010), then the differences might be explained due to different amount of repetitions and of
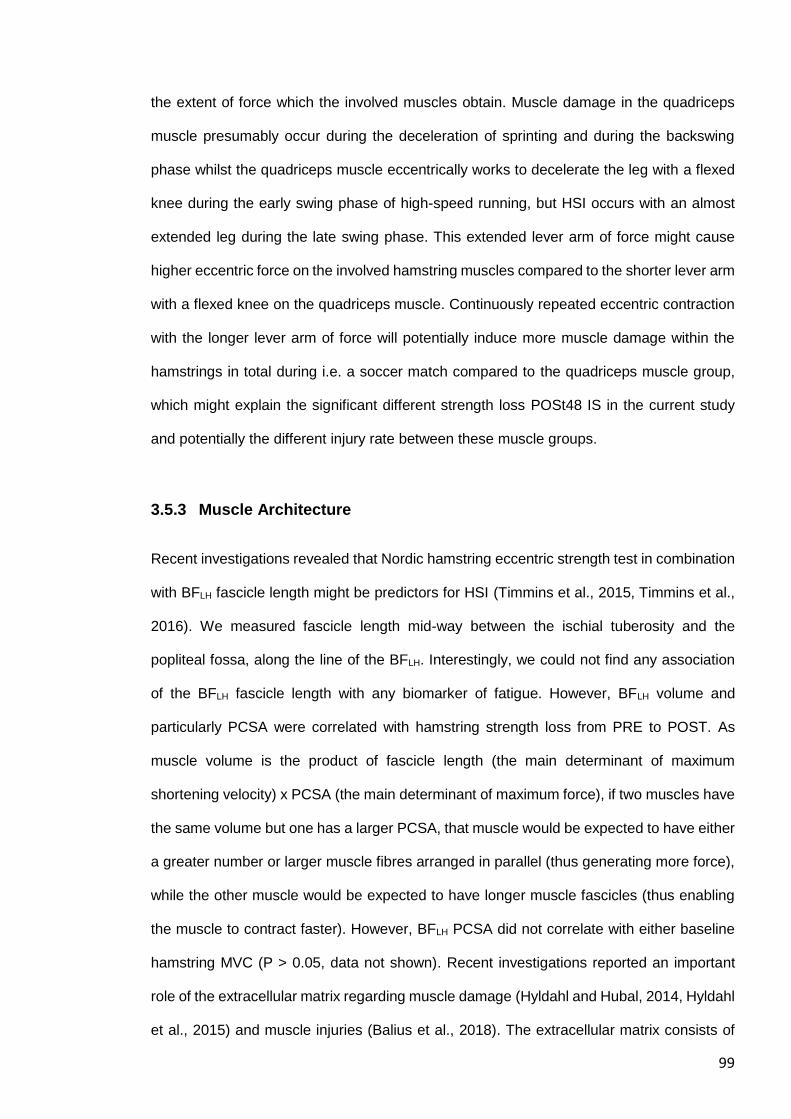
99
the extent of force which the involved muscles obtain. Muscle damage in the quadriceps
muscle presumably occur during the deceleration of sprinting and during the backswing
phase whilst the quadriceps muscle eccentrically works to decelerate the leg with a flexed
knee during the early swing phase of high-speed running, but HSI occurs with an almost
extended leg during the late swing phase. This extended lever arm of force might cause
higher eccentric force on the involved hamstring muscles compared to the shorter lever arm
with a flexed knee on the quadriceps muscle. Continuously repeated eccentric contraction
with the longer lever arm of force will potentially induce more muscle damage within the
hamstrings in total during i.e. a soccer match compared to the quadriceps muscle group,
which might explain the significant different strength loss POSt48 IS in the current study
and potentially the different injury rate between these muscle groups.
3.5.3 Muscle Architecture
Recent investigations revealed that Nordic hamstring eccentric strength test in combination
with BFLH fascicle length might be predictors for HSI (Timmins et al., 2015, Timmins et al.,
2016). We measured fascicle length mid-way between the ischial tuberosity and the
popliteal fossa, along the line of the BFLH. Interestingly, we could not find any association
of the BFLH fascicle length with any biomarker of fatigue. However, BFLH volume and
particularly PCSA were correlated with hamstring strength loss from PRE to POST. As
muscle volume is the product of fascicle length (the main determinant of maximum
shortening velocity) x PCSA (the main determinant of maximum force), if two muscles have
the same volume but one has a larger PCSA, that muscle would be expected to have either
a greater number or larger muscle fibres arranged in parallel (thus generating more force),
while the other muscle would be expected to have longer muscle fascicles (thus enabling
the muscle to contract faster). However, BFLH PCSA did not correlate with either baseline
hamstring MVC (P > 0.05, data not shown). Recent investigations reported an important
role of the extracellular matrix regarding muscle damage (Hyldahl and Hubal, 2014, Hyldahl
et al., 2015) and muscle injuries (Balius et al., 2018). The extracellular matrix consists of
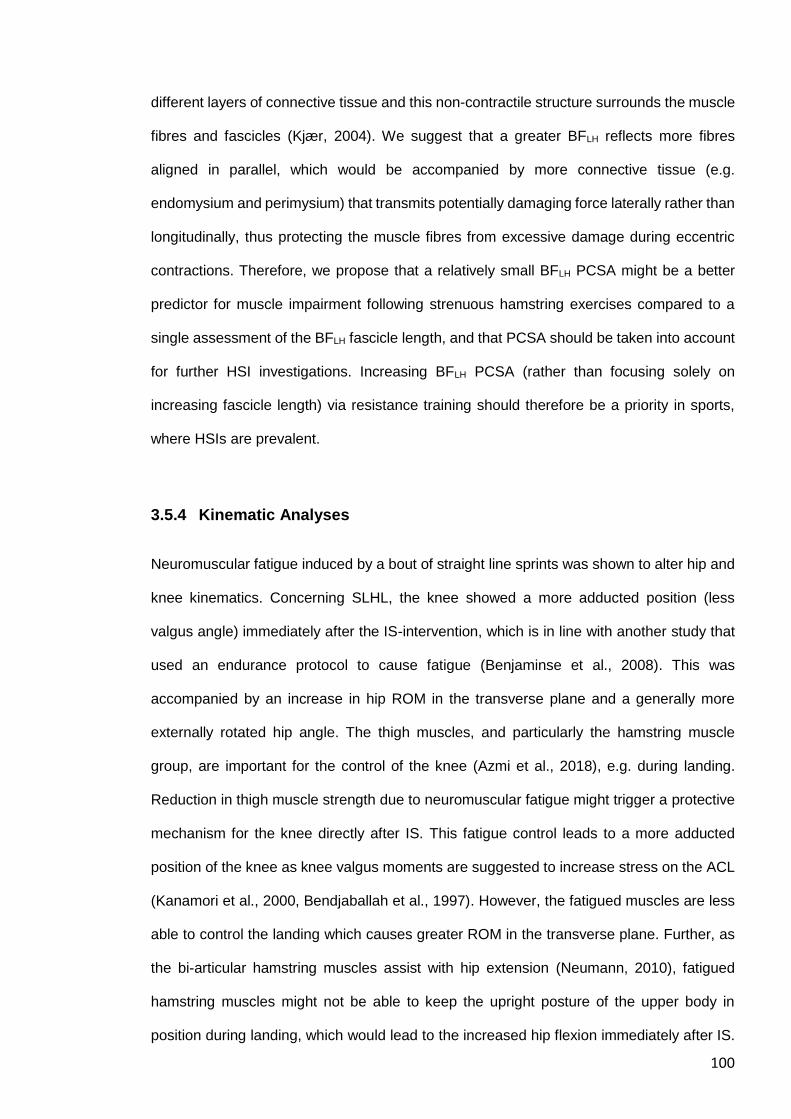
100
different layers of connective tissue and this non-contractile structure surrounds the muscle
fibres and fascicles (Kjær, 2004). We suggest that a greater BFLH reflects more fibres
aligned in parallel, which would be accompanied by more connective tissue (e.g.
endomysium and perimysium) that transmits potentially damaging force laterally rather than
longitudinally, thus protecting the muscle fibres from excessive damage during eccentric
contractions. Therefore, we propose that a relatively small BFLH PCSA might be a better
predictor for muscle impairment following strenuous hamstring exercises compared to a
single assessment of the BFLH fascicle length, and that PCSA should be taken into account
for further HSI investigations. Increasing BFLH PCSA (rather than focusing solely on
increasing fascicle length) via resistance training should therefore be a priority in sports,
where HSIs are prevalent.
3.5.4 Kinematic Analyses
Neuromuscular fatigue induced by a bout of straight line sprints was shown to alter hip and
knee kinematics. Concerning SLHL, the knee showed a more adducted position (less
valgus angle) immediately after the IS-intervention, which is in line with another study that
used an endurance protocol to cause fatigue (Benjaminse et al., 2008). This was
accompanied by an increase in hip ROM in the transverse plane and a generally more
externally rotated hip angle. The thigh muscles, and particularly the hamstring muscle
group, are important for the control of the knee (Azmi et al., 2018), e.g. during landing.
Reduction in thigh muscle strength due to neuromuscular fatigue might trigger a protective
mechanism for the knee directly after IS. This fatigue control leads to a more adducted
position of the knee as knee valgus moments are suggested to increase stress on the ACL
(Kanamori et al., 2000, Bendjaballah et al., 1997). However, the fatigued muscles are less
able to control the landing which causes greater ROM in the transverse plane. Further, as
the bi-articular hamstring muscles assist with hip extension (Neumann, 2010), fatigued
hamstring muscles might not be able to keep the upright posture of the upper body in
position during landing, which would lead to the increased hip flexion immediately after IS.
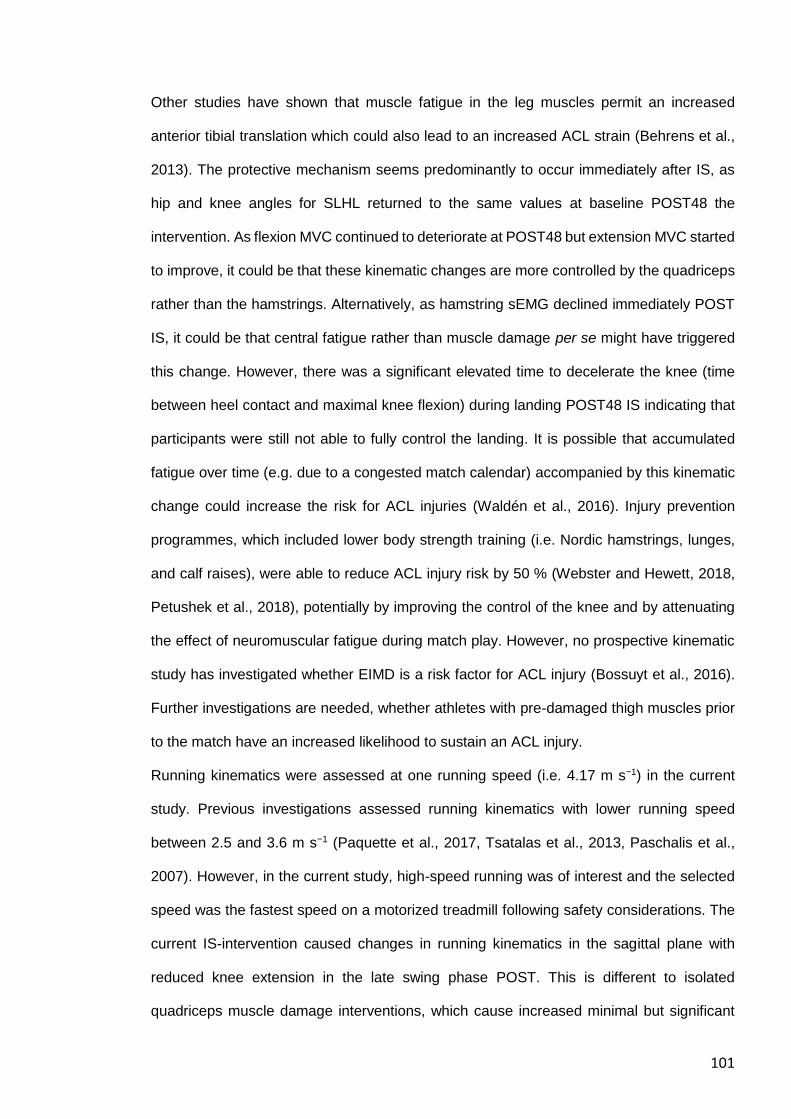
101
Other studies have shown that muscle fatigue in the leg muscles permit an increased
anterior tibial translation which could also lead to an increased ACL strain (Behrens et al.,
2013). The protective mechanism seems predominantly to occur immediately after IS, as
hip and knee angles for SLHL returned to the same values at baseline POST48 the
intervention. As flexion MVC continued to deteriorate at POST48 but extension MVC started
to improve, it could be that these kinematic changes are more controlled by the quadriceps
rather than the hamstrings. Alternatively, as hamstring sEMG declined immediately POST
IS, it could be that central fatigue rather than muscle damage per se might have triggered
this change. However, there was a significant elevated time to decelerate the knee (time
between heel contact and maximal knee flexion) during landing POST48 IS indicating that
participants were still not able to fully control the landing. It is possible that accumulated
fatigue over time (e.g. due to a congested match calendar) accompanied by this kinematic
change could increase the risk for ACL injuries (Waldén et al., 2016). Injury prevention
programmes, which included lower body strength training (i.e. Nordic hamstrings, lunges,
and calf raises), were able to reduce ACL injury risk by 50 % (Webster and Hewett, 2018,
Petushek et al., 2018), potentially by improving the control of the knee and by attenuating
the effect of neuromuscular fatigue during match play. However, no prospective kinematic
study has investigated whether EIMD is a risk factor for ACL injury (Bossuyt et al., 2016).
Further investigations are needed, whether athletes with pre-damaged thigh muscles prior
to the match have an increased likelihood to sustain an ACL injury.
Running kinematics were assessed at one running speed (i.e. 4.17 m s−1) in the current
study. Previous investigations assessed running kinematics with lower running speed
between 2.5 and 3.6 m s−1 (Paquette et al., 2017, Tsatalas et al., 2013, Paschalis et al.,
2007). However, in the current study, high-speed running was of interest and the selected
speed was the fastest speed on a motorized treadmill following safety considerations. The
current IS-intervention caused changes in running kinematics in the sagittal plane with
reduced knee extension in the late swing phase POST. This is different to isolated
quadriceps muscle damage interventions, which cause increased minimal but significant
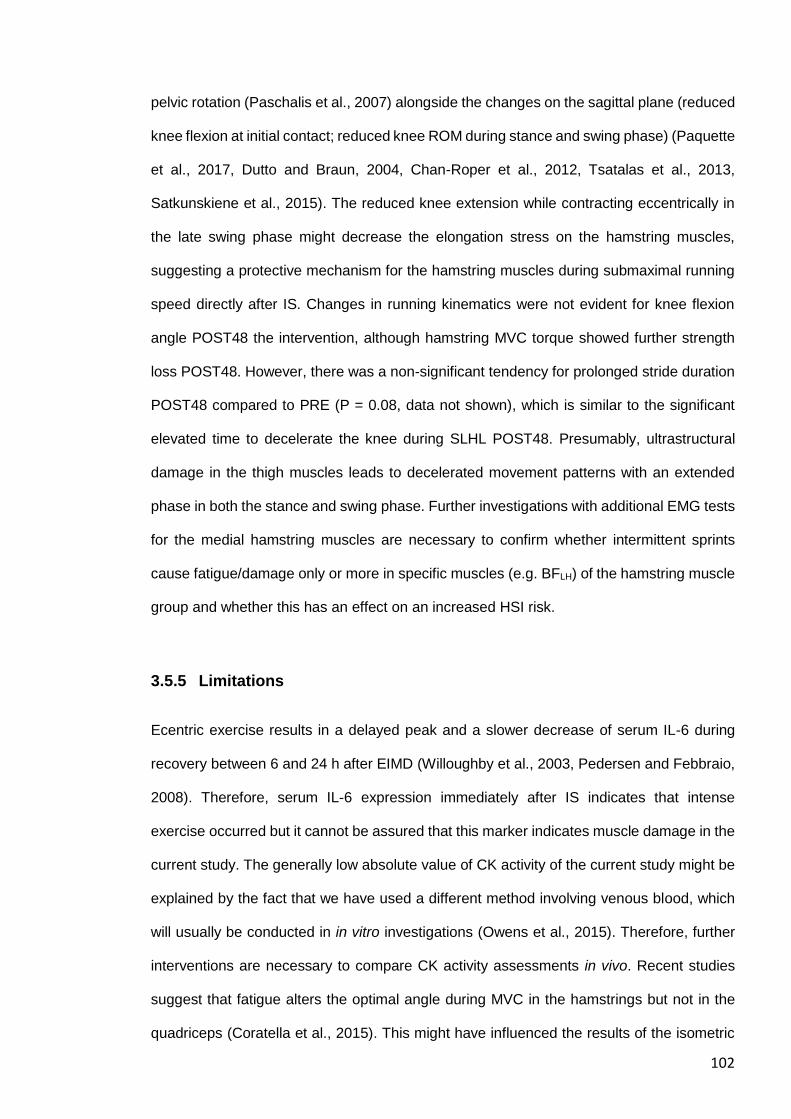
102
pelvic rotation (Paschalis et al., 2007) alongside the changes on the sagittal plane (reduced
knee flexion at initial contact; reduced knee ROM during stance and swing phase) (Paquette
et al., 2017, Dutto and Braun, 2004, Chan-Roper et al., 2012, Tsatalas et al., 2013,
Satkunskiene et al., 2015). The reduced knee extension while contracting eccentrically in
the late swing phase might decrease the elongation stress on the hamstring muscles,
suggesting a protective mechanism for the hamstring muscles during submaximal running
speed directly after IS. Changes in running kinematics were not evident for knee flexion
angle POST48 the intervention, although hamstring MVC torque showed further strength
loss POST48. However, there was a non-significant tendency for prolonged stride duration
POST48 compared to PRE (P = 0.08, data not shown), which is similar to the significant
elevated time to decelerate the knee during SLHL POST48. Presumably, ultrastructural
damage in the thigh muscles leads to decelerated movement patterns with an extended
phase in both the stance and swing phase. Further investigations with additional EMG tests
for the medial hamstring muscles are necessary to confirm whether intermittent sprints
cause fatigue/damage only or more in specific muscles (e.g. BFLH) of the hamstring muscle
group and whether this has an effect on an increased HSI risk.
3.5.5 Limitations
Ecentric exercise results in a delayed peak and a slower decrease of serum IL-6 during
recovery between 6 and 24 h after EIMD (Willoughby et al., 2003, Pedersen and Febbraio,
2008). Therefore, serum IL-6 expression immediately after IS indicates that intense
exercise occurred but it cannot be assured that this marker indicates muscle damage in the
current study. The generally low absolute value of CK activity of the current study might be
explained by the fact that we have used a different method involving venous blood, which
will usually be conducted in in vitro investigations (Owens et al., 2015). Therefore, further
interventions are necessary to compare CK activity assessments in vivo. Recent studies
suggest that fatigue alters the optimal angle during MVC in the hamstrings but not in the
quadriceps (Coratella et al., 2015). This might have influenced the results of the isometric
103
MVC test of the hamstring muscle group. Further studies should confirm these results with
isometric MVCs at different knee joint angles. Peripheral fatigue can be caused by
metabolite perturbations such as the depletion of intramuscular glycogen (Bendiksen et al.,
2012). However, despite the fact that participants were instructed to eat two hours before
arrival, and to avoid strenuous exercise prior to the testing, the current study did not control
for diet or assessed glycogen depletion during the intervention. Although the low decrement
of the sprinting performance, which lasted about 25 min, indicates that glycogen depletion
was potentially only a minor factor which contributed to the impaired muscle function
following IS-intervention, future studies should assess and control the glycogen content of
the muscles before and after IS. Further, we have only measured muscle architecture and
sEMG activity of the BFLH. During data collection, several published investigations (Kellis,
2015, Schuermans et al., 2016, Schuermans et al., 2014) indicated that the other hamstring
muscles might have an impact on hamstring fatigue and, potentially, on HSI risk. We
therefore suggest that further studies conducting IS should also take the other hamstring
muscles into consideration. Other factors, such as skeletal muscle composition (Mackey et
al., 2017) and genetic variation (Baumert et al., 2016a, Baumert et al., 2018) might also
contribute to the prolonged recovery process following EIMD, and large-scale analyses are
required to assess the individual differences between the participants which might be based
on genetic variation. These studies should consider the possible influence of testing
strength at different times of the day on the extent of strength loss. For instance, previous
studies have shown that MVC strength is higher in the evening compared to the morning
(Araujo et al., 2011). However, due to the large numbers required for genetic studies, the
competition for laboratory time, and the availability of the participants, it was necessary for
us to perform our measurements at different times of day (although each participant was
tested at the same time of day for their respective repeated measurements). As the relative
change in strength due to any interaction between the damaging exercise intervention and
their genetic make-up is likely to be the same regardless of the time of day, we do not
consider that this factor confounded our results.
104
3.6 CONCLUSION
Our data provide strong evidence that impaired muscle function following IS is caused
primarily by impaired neuromuscular activation of the BFLH, together with peripheral fatigue
in the hamstrings immediately after the intervention, but the magnitude of fatigue and
delayed recovery 48 h later is probably caused primarily by damage to the skeletal muscle
tissue. Furthermore, BFLH PCSA was inversely related to hamstring strength loss
immediately after IS. The findings provide evidence that the structure of the muscle protects
it against neuromuscular fatigue showing that non-contractile tissue within the muscle, such
as the extracellular matrix, might play an important role in the complex response to muscle
damaging exercises. Impaired thigh muscle function following IS alters hip and knee
kinematics during running and landing immediately after the intermittent sprints, but this
(likely) protective effect is less evident 48 hours after the intervention which may lead to an
increased ACL or hamstring muscle injury risk. We conclude that a 48h recovery period
following sports incorporating IS is insufficient, and might increase injury risk. The practical
implications of this study include the assessment of BFLH PCSA to estimate the
neuromuscular fatigue/damage response to IS in athletes, and the inclusion of hamstring
resistance training to increase hamstring muscle PCSA, thus decreasing injury risk.
.
105
4 Muscle Recovery Rate Following in vitro and in vivo
Damage is Related to the Myoblast:non-Myoblast Ratio
Derived from Human Biopsies
106
4.1 ABSTRACT
Introduction The aim of this study was to objectively assess whether the ratio between
myoblast and fibroblasts was related to recovery rate following damage to human skeletal
muscle in vivo (intermittent sprints) and in vitro (wounding assay), and whether this was
sex-dependent. We hypothesised that a high myoblast:fibroblast ratio would lead to an
accelerated muscle regeneration compared to a lower myoblast:fibroblast ratio, but that this
would be independent of sex.
Methods Myoblast:fibroblast ratio was assessed of Isolated human skeletal muscle-derived
stem cells from biopsies of six young, recreational active male Caucasians in vitro and the
ratio was compared with the muscle damage response of the intermittent sprint intervention
in vivo (Chapter 3). Primary muscle stem cells of an extended group of twelve young,
untrained female and male Caucasian participants were subjected to mechanical wound
injury to investigate the correlation of muscle regeneration regarding their individual
myoblast:fibroblast ratio and sex-differences in vitro.
Results There was an average percentage of 46.8 % myoblasts compared to fibroblasts
(range 13.3-74.5 %). There was no significant differences to any parameters regarding sex
following the artificial wound healing assay (all P>0.05). Cells with a high myoblast:fibroblast
ratio showed a delayed wound closure/ MVC torque recovery within the first 48 h both in
vitro (R2=0.51, P=0.040) and in vivo (R2=0.85, P=0.009), but a better myotube formation
seven days after the scratch assay in vitro.
Conclusion The current results suggest that muscle stem cell characteristics are not
influenced by sex and that fibroblasts are essential for the initial days of wound closure, but
a larger number of myoblasts is crucial for the latter stage of muscle regeneration,
presumably when myoblasts differentiate and fuse to become myotubes indicating that non-
contractile elements of the muscle play an important part in the recovery process following
muscle damage.
107
4.2 INTRODUCTION
Unaccustomed strenuous exercise, particularly, that which involves muscle-lengthening
(eccentric) contractions, can cause exercise-induced muscle damage (EIMD) within the
contractile tissue (Clarkson and Hubal, 2002). Ultrastructural muscle damage is indicated
with Z-line disturbance as well as disruption of the extracellular matrix (ECM), which
provides structural scaffolding for muscle remodelling and has an integral role in force
transmission (Tidball, 1991, Garg and Boppart, 2016). Among several other minor
molecular elements, collagen type I and type III are the main components of the ECM (Davis
et al., 2013), which is connected to the Z-disks of the peripheral myofibrils via costameres
(Jani and Schöck, 2009). In muscle, fibrils of collagen type I are stiff structures and it is
predominantly present in the perimysium (surrounding muscle fascicles), which become
continuous with tendon (Passerieux et al., 2007). Type III collagen fibrils are thinner and
with less stiffer properties compared to type I (Zhang et al., 2005). Both type I and III
collagens are almost equal distributed in the endomysium (surrounding muscle fibres) and
epimysium (surrounding the muscle) (Gillies and Lieber, 2011). It is well established, that
myogenic satellite cells (skeletal muscle stem cells), play a key role in skeletal muscle
regeneration and remodelling after substantial EIMD (Yin et al., 2013, Tidball, 2011).
Following ultrastructural muscle damage, the nuclei in the area of the myotrauma undergo
apoptosis, and activated satellite cells (myoblasts) proliferate and migrate from their niche
along the basal lamina to the injury site before terminally differentiating and fusing into
myotubes (Goetsch et al., 2013).
There is increasing evidence that fibroblasts, the main cell type of muscle connective tissue,
have a critical role in supporting muscle regeneration (Mackey et al., 2017, Murphy et al.,
2011, Joe et al., 2010). Following damage, infiltrating inflammatory cells activate muscle
fibroblasts, which proliferate and migrate to the injury site to produce ECM components in
the area of the myotrauma in an orchestrated and regulated fashion (Mann et al., 2011,
Murphy et al., 2011). This is accompanied with increased proteolytic activity of matrix
metalloproteinase (MMPs) to degrade damaged parts of the ECM and to allow cell migration
108
through the ECM (Mackey et al., 2004). The fine-tuned coordinated resolution and
restructure of the ECM is crucial for healthy muscle remodelling (Mann et al., 2011,
Kragstrup et al., 2011). Interaction of activated satellite cells with fibroblasts helps to
dissolve and reorganise the ECM by supressing the master regulator of collagen
biosynthesis Rrbp1 in the days and weeks after the injury to avoid long lasting unfavourable
fibrosis and to support healthy muscle regeneration (Garg and Boppart, 2016, Fry et al.,
2017). There is an increasing number of investigations into the effect of fibroblasts on
skeletal muscle regeneration following injury, including models such as electrical stimulation
or barium chloride (Mackey et al., 2017, Murphy et al., 2011). However, less is known about
the effect of fibroblasts on the response to physiological EIMD within the first days following
eccentric damage.
Further, there is a high individual variation in the response to EIMD, as some individuals
reveal greater muscle strength loss and perceived muscle soreness compared to others,
who have undergone the same EIMD protocol (Nosaka and Clarkson, 1996, Baumert et al.,
2016b, please see Chapter III). In Chapter 3, we reported that a greater force generating
capacity (larger physiological cross-sectional area) of the biceps femoris long head of the
hamstring muscle group appears to protect the muscle immediately following intermittent
sprints (IS). Potentially external forces can be allocated to a higher number of parallel
sarcomeres in muscles with an higher physiological cross-sectional area, which might
reduce the stress to each individual sarcomere leading to a lower damage response
(Wisdom et al., 2015). However, this relationship was not evident two days after IS,
indicating that the muscle recovery response immediately vs. days after muscle damaging
exercise is differentially controlled. Some (Sewright et al., 2008), but not all human
investigations (Stupka et al., 2001, Hubal and Clarkson, 2009), suggest that the different
response following EIMD could be sex-dependent, potentially due to varying skeletal
muscle properties such as fibre type composition or regeneration efficiency. Animal studies
revealed that male serum enhanced cell proliferation and cell growth compared to female
serum (Lee et al., 2011), and that primary female muscle stem cells appeared to have a
109
slower long-term proliferation kinetics and higher muscle regeneration efficiency compared
to males (Deasy et al., 2007). However, to our knowledge, no studies have investigated
sex-related differences in terms of proliferation and differentiation characteristics in human
primary skeletal muscle cells in vitro. An understanding of the underlying mechanisms of
the individual rate of skeletal muscle regeneration has implications, not only for the
prevention of muscular injury (Larruskain et al., 2017) but also in the context of skeletal-
muscle adaptation such as muscle hypertrophy (Cartee et al., 2016) or wasting (Volaklis et
al., 2015).
Therefore, the main objective of this study was to investigate whether differences in the
myoblast:fibroblast ratio was associated with the in vivo EIMD damage response following
the IS protocol (Chapter 3) in a group of six male Caucasians, which participated in both
studies. A second objective was to investigate whether inter-individual differences in the
ratio between myoblast and fibroblasts affected skeletal muscle repair/recovery within the
initial days after an artificial wounding (scratch) assay in an extended group of 12 young
male and females. A third objective was to investigate whether this variability in the
myoblast:fibroblast ratio was sex-dependent, and whether this led to sex-specific
differences in the rate of muscle repair following mechanical injury. It was hypothesised that
a higher myoblast:fibroblast ratio would be associated with an improved EIMD-response
compared to muscle cells with a lower myoblast:fibroblast ratio following IS in vivo. We
further hypothesised that increased percentage of fibroblasts would show an improved
wound closure, and that sex would not be associated with muscle remodelling in vitro.
4.3 METHODS
4.3.1 Participants
Recreationally active and healthy young female (n = 4; age 25.5 ± 1.29 years; height 1.67
± 0.08 m; body mass 61.40 ± 2.57 kg; mean ± standard deviation) and male (n = 8; age
21.25 ± 4.27 years; height 1.77 ± 0.05 m; body mass 73.78 ± 5.68 kg; mean ± standard
deviation) Caucasian individals participated in this study. Six of the eight males (age 20.5 ±
110
4.68 years; height 1.78 ± 0.05 m; weight 73.49 ± 6.01 kg) also participated in the IS protocol
(see Chapter 3) after the biopsy procedure separated by at least three weeks. Prior to
starting the study, written informed consent and a pre-biopsy screening as approved by a
physician was obtained from each participant, which complied with the Declaration of
Helsinki and was approved by the Research Ethics Committee of Liverpool John Moores
University. Participants were physically active but were excluded if they had performed
strength training of the lower limbs within 6 months prior to participation in the study, as
screened via interview. Further exclusion criteria were (i) any lower limb injury in the past
12 months; and (ii) age under 18 or above 35 years; as assessed via interview and health
questionnaire.
4.3.2 Reagents, Chemicals, and Solvents
Growth media (GM) used for the expansion of human muscle-derived cell populations
consisted of Hams F-10 nutrient mix (Lonza, Basel, Switzerland) with added L-glutamine
(2.5 mM), 10% heat-inactivated fetal bovine serum (hiFBS; Gibco, Thermo Fisher Scientific,
Altincham, UK), 1% penicillin-streptomycin (Life Technologies, Warrington, UK), and 1% L-
Glutamine (Gibco). Differentiation media (DM) consisted of α-MEM (Lonza), 1% hiFBS, 1%
penicillin-streptomycin, and 1% L-glutamine. Phosphate-buffered saline (PBS; Sigma-
Aldrich) was used to wash cell monolayers. Desmin polyclonal rabbit anti-human antibody
(Cat# ab15200, RRID: AB_301744) was used (1:200) from Abcam (Abcam, Cambridge,
UK), and secondary antibody (TRITC polyclonal goat anti-rabbit; Cat# A16101, RRID:
AB_2534775) was used (1:200) from Fisher Scientific.
4.3.3 Muscle Biopsy Procedure
Participants were advised to avoid any strenuous exercise 48 h prior to the biopsy
procedure. Muscle biopsies, from the vastus lateralis muscle of the quadriceps femoris,
were obtained under local anaesthesia, from each participant, using the Weil-Blakesley
111
conchotome technique as described previously (Baczynska et al., 2016). Briefly,
participants rested in a supine position and the incision site was shaved then thoroughly
cleaned with an alcohol swab and Hydrex surgical scrub (ECOLAB Leeds, UK), following
which a sterile sheet was placed above the biopsy site to maintain sterility. To anesthetise
the biopsy site, 1.5 ml of bupivacaine hydrochloride (AstraZeneca, Luton, UK) was
administered at a concentration of 5 mg/ml. After allowing a short time for the anaesthetic
to take effect, a sterile single-use scalpel was used to make a small incision through the
skin and deep muscle fascia. The conchotome was inserted through the incision into the
muscle belly to obtain the muscle biopsy (134 ± 82.7 mg).
4.3.4 Extraction of Human Muscle-Derived Cells
The muscle biopsies analysed in this study were isolated (Blau and Webster, 1981, Crown
et al., 2000) and cultured (Owens et al., 2015) as reported previously. Briefly, biopsy
samples were transferred with precooled GM from the muscle biopsy suite to the sterile
tissue culture hood (Kojair Biowizard Silverline class II hood; Kojair, Vippula, Finland) within
40 min and muscle biopsy samples were washed three times with ice-cold PBS (0.01 M
phosphate buffer, 0.0027 M KCl, and 0.137 M NaCl, pH 7.4, in dH2O). Visible fibrous and
fat tissue were removed using sterile scissor and forceps. Samples were cut in small pieces
(1 mm3) and digested in 5 ml of trypsin-EDTA for 15 min on a magnetic stirring platform at
37°C to dissociate muscle cells. The trypsinisation process was repeated twice.
Supernatant derived following each treatment was collected and pooled with hiFBS at a
concentration of 10% of the total volume to inhibit further protease activity. Cell supernatant
was centrifuged at 450 g for 5 min. Supernatant was discarded and the cell pellet was
resuspended in GM and plated on a T25 cm2 culture flask (Corning, Life Sciences, New
York, USA) for cell population expansion. Culture flasks were previously coated with a 2
mg/l porcine gelatin solution (90–110 g, Bloom; Sigma-Aldrich, Dorset, UK) to support cell
adhesion.
112
4.3.5 Expansion of Extracted Cells
The medium was refreshed on the fourth day after the extraction procedure and
subsequently every 48 h following two brief washes with PBS. Cells were incubated in a
HERAcell 150i CO2 Incubator (Thermo Scientific, Cheshire, UK). T25 cm2 culture flasks
reached 80% confluence after aproximately 10 days and were passaged via trypsinisation.
Cells were counted using Trypan Blue exclusion and re-plated on gelatinised T75 cm2
culture flasks (Nunc, Roskilde, Denmark). The cells were expanded until passage 3 and
then frozen in GM with 10% dimethyl sulfoxide (DMSO) in liquid N2 as a cryopreservant. All
experiments were performed on cells between passages 3 and 6 to avoid potential issues
of senescence (Alsharidah et al., 2013, Foulstone et al., 2004).
4.3.6 Characterization of Human Muscle-Derived Cells
The mixed population of human skeletal muscle-derived myoblast and fibroblasts were
characterised by immunofluorescent staining for the detection of desmin expressed by
myoblasts (desmin positive) and non-myoblasts (desmin negative) to determine the
percentage of myoblasts and fibroblasts (Figure 4-1). Previous investigations have
determined that the non-myoblasts fraction is highly enriched in fibroblasts with up to 99 %
of this fraction being fibroblasts (Agley et al., 2013, Mathew et al., 2011). Therefore, non-
myoblasts (desmin negative) will hereafter be referred to as fibroblasts.
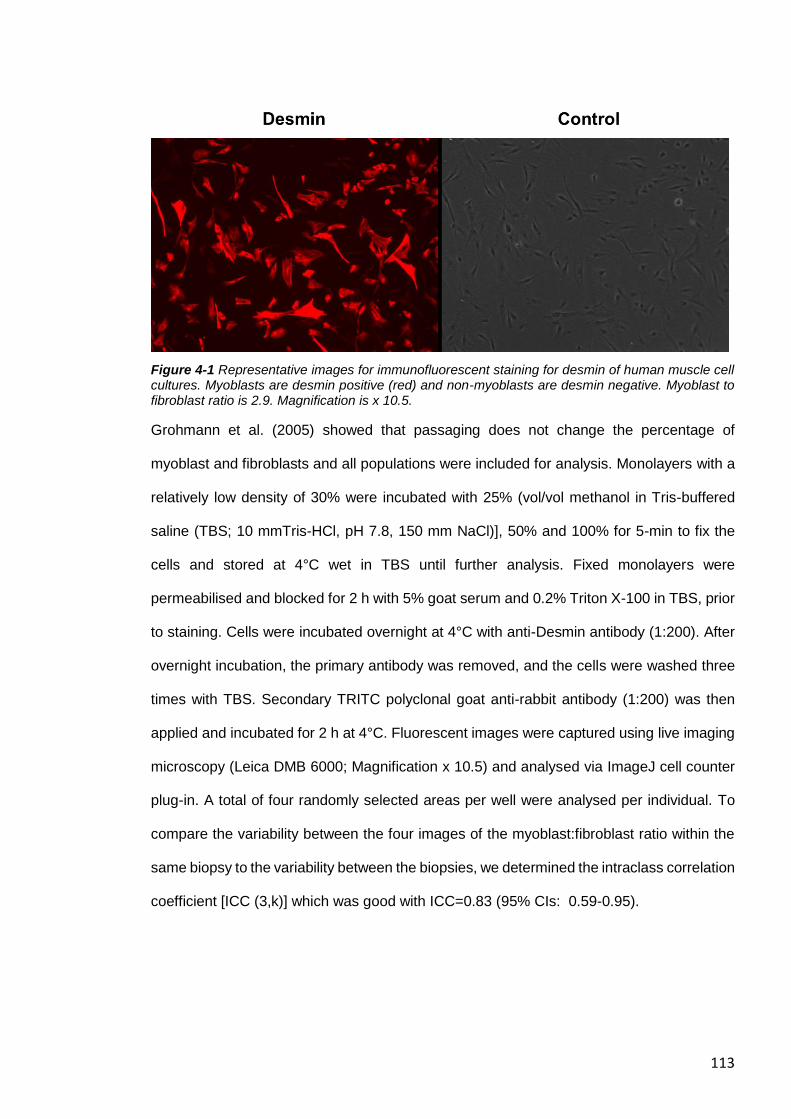
113
Figure 4-1 Representative images for immunofluorescent staining for desmin of human muscle cell cultures. Myoblasts are desmin positive (red) and non-myoblasts are desmin negative. Myoblast to fibroblast ratio is 2.9. Magnification is x 10.5.
Grohmann et al. (2005) showed that passaging does not change the percentage of
myoblast and fibroblasts and all populations were included for analysis. Monolayers with a
relatively low density of 30% were incubated with 25% (vol/vol methanol in Tris-buffered
saline (TBS; 10 mmTris-HCl, pH 7.8, 150 mm NaCl)], 50% and 100% for 5-min to fix the
cells and stored at 4°C wet in TBS until further analysis. Fixed monolayers were
permeabilised and blocked for 2 h with 5% goat serum and 0.2% Triton X-100 in TBS, prior
to staining. Cells were incubated overnight at 4°C with anti-Desmin antibody (1:200). After
overnight incubation, the primary antibody was removed, and the cells were washed three
times with TBS. Secondary TRITC polyclonal goat anti-rabbit antibody (1:200) was then
applied and incubated for 2 h at 4°C. Fluorescent images were captured using live imaging
microscopy (Leica DMB 6000; Magnification x 10.5) and analysed via ImageJ cell counter
plug-in. A total of four randomly selected areas per well were analysed per individual. To
compare the variability between the four images of the myoblast:fibroblast ratio within the
same biopsy to the variability between the biopsies, we determined the intraclass correlation
coefficient [ICC (3,k)] which was good with ICC=0.83 (95% CIs: 0.59-0.95).
114
4.3.7 Wound-Healing Assay, Migration and Differentiation Analysis
For the wound healing assay, 100,000 cells/ml were seeded in gelatinised six-well plates
(Nunc, Roskilde, Denmark)). Cells were expanded as described above until cell monolayers
reached a confluent state, GM was removed, monolayers were washed with PBS and cells
were damaged by a vertical scrape with a 1-ml pipette tip (width of the wound area, mean
± S.E.M.: 896.4 ± 21.24 μm) as our group has reported before (Brown et al., 2017, Owens
et al., 2015, Dimchev et al., 2013). PBS was aspirated, damaged cell monolayers were
washed twice with PBS to remove cell debris and 2 ml DM was added. Monolayers were
imaged with a live imaging microscopy (Leica) for the analysis of cell migration immediately,
24h, 48h and seven days after the wound healing assay. Additional 500 µl DM was added
in each well at day 4. TIF images were exported from Leica Application Suite and loaded
as TIF image stacks in ImageJ with a cell counter plug-in. Cells in the outer and inner
segments were counted (Figure 4-4).
Damaged monolayers were imaged at two sites per well in the wound site immediately post-
damage (0 h). These image coordinates were tracked and stored to allow subsequent
monitoring of the same sites on the wound to this reduce experimental bias. Myotube
formation was captured on day. Captured images were exported as TIFF image files, and
analysed in ImageJ. Muscle cell fusion/differentiation was assessed by myotubes per field
of view and myotube hypertrophy via the assessment of myotube length, myotube diameter
(the average of three diameters along the length of the myotube), myotube area
(determined by manually drawing a line around the sarcolemma of each myotube) and total
myotube number via ImageJ cell counter plug-in. By normalising the pixel scale to the
micron scale of each image, a value expressed as µm2 was obtained for myotube area. A
total of two images per well were analysed and experiments were performed on 12 cell
populations of 12 different individuals.
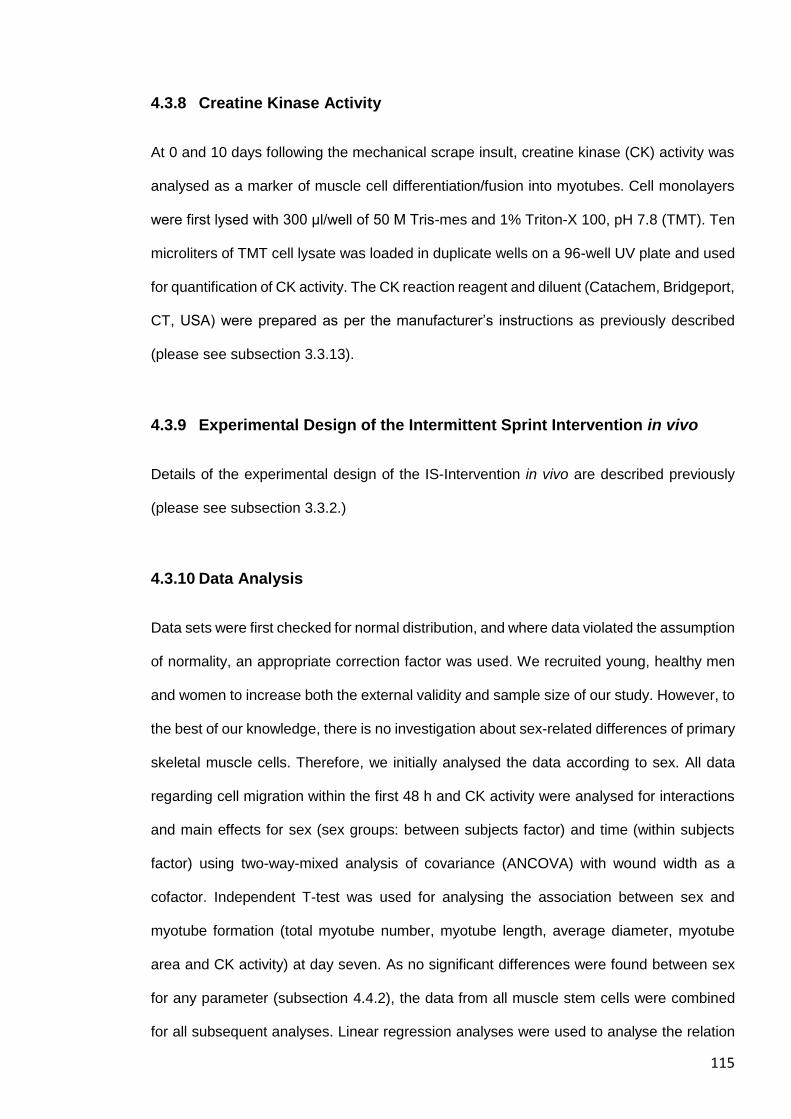
115
4.3.8 Creatine Kinase Activity
At 0 and 10 days following the mechanical scrape insult, creatine kinase (CK) activity was
analysed as a marker of muscle cell differentiation/fusion into myotubes. Cell monolayers
were first lysed with 300 μl/well of 50 M Tris-mes and 1% Triton-X 100, pH 7.8 (TMT). Ten
microliters of TMT cell lysate was loaded in duplicate wells on a 96-well UV plate and used
for quantification of CK activity. The CK reaction reagent and diluent (Catachem, Bridgeport,
CT, USA) were prepared as per the manufacturer’s instructions as previously described
(please see subsection 3.3.13).
4.3.9 Experimental Design of the Intermittent Sprint Intervention in vivo
Details of the experimental design of the IS-Intervention in vivo are described previously
(please see subsection 3.3.2.)
4.3.10 Data Analysis
Data sets were first checked for normal distribution, and where data violated the assumption
of normality, an appropriate correction factor was used. We recruited young, healthy men
and women to increase both the external validity and sample size of our study. However, to
the best of our knowledge, there is no investigation about sex-related differences of primary
skeletal muscle cells. Therefore, we initially analysed the data according to sex. All data
regarding cell migration within the first 48 h and CK activity were analysed for interactions
and main effects for sex (sex groups: between subjects factor) and time (within subjects
factor) using two-way-mixed analysis of covariance (ANCOVA) with wound width as a
cofactor. Independent T-test was used for analysing the association between sex and
myotube formation (total myotube number, myotube length, average diameter, myotube
area and CK activity) at day seven. As no significant differences were found between sex
for any parameter (subsection 4.4.2), the data from all muscle stem cells were combined
for all subsequent analyses. Linear regression analyses were used to analyse the relation
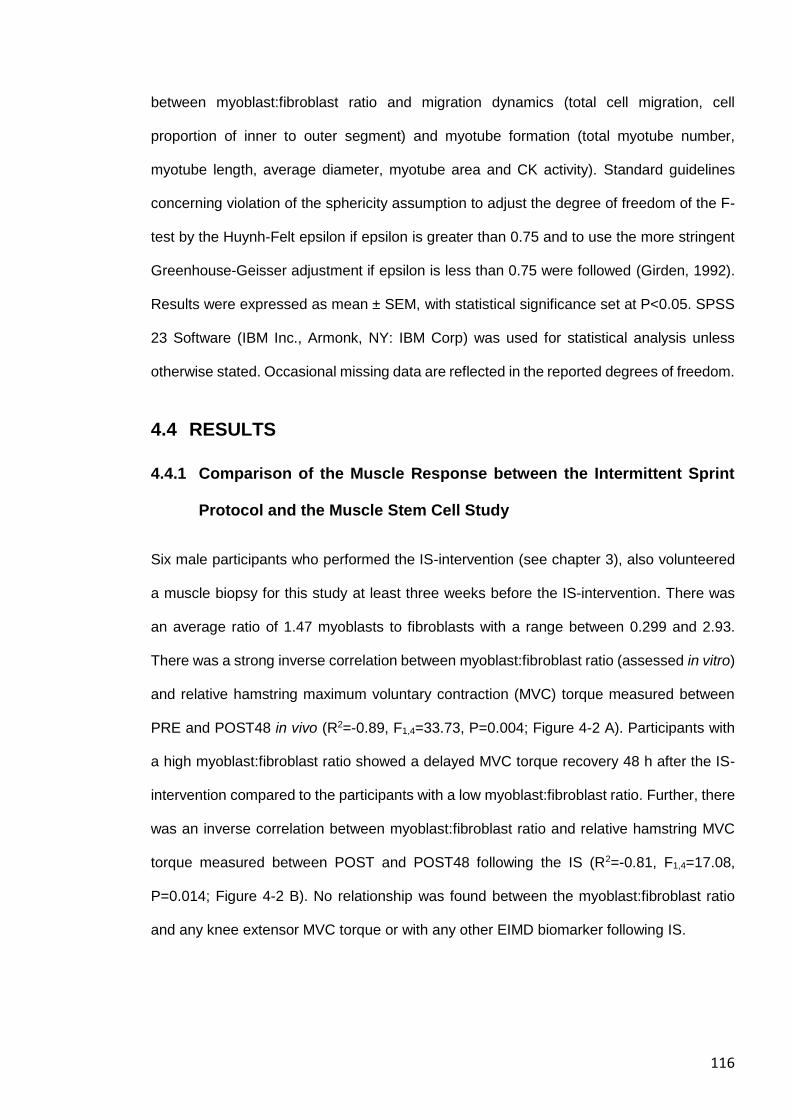
116
between myoblast:fibroblast ratio and migration dynamics (total cell migration, cell
proportion of inner to outer segment) and myotube formation (total myotube number,
myotube length, average diameter, myotube area and CK activity). Standard guidelines
concerning violation of the sphericity assumption to adjust the degree of freedom of the F-
test by the Huynh-Felt epsilon if epsilon is greater than 0.75 and to use the more stringent
Greenhouse-Geisser adjustment if epsilon is less than 0.75 were followed (Girden, 1992).
Results were expressed as mean ± SEM, with statistical significance set at P<0.05. SPSS
23 Software (IBM Inc., Armonk, NY: IBM Corp) was used for statistical analysis unless
otherwise stated. Occasional missing data are reflected in the reported degrees of freedom.
4.4 RESULTS
4.4.1 Comparison of the Muscle Response between the Intermittent Sprint
Protocol and the Muscle Stem Cell Study
Six male participants who performed the IS-intervention (see chapter 3), also volunteered
a muscle biopsy for this study at least three weeks before the IS-intervention. There was
an average ratio of 1.47 myoblasts to fibroblasts with a range between 0.299 and 2.93.
There was a strong inverse correlation between myoblast:fibroblast ratio (assessed in vitro)
and relative hamstring maximum voluntary contraction (MVC) torque measured between
PRE and POST48 in vivo (R2=-0.89, F1,4=33.73, P=0.004; Figure 4-2 A). Participants with
a high myoblast:fibroblast ratio showed a delayed MVC torque recovery 48 h after the IS-
intervention compared to the participants with a low myoblast:fibroblast ratio. Further, there
was an inverse correlation between myoblast:fibroblast ratio and relative hamstring MVC
torque measured between POST and POST48 following the IS (R2=-0.81, F1,4=17.08,
P=0.014; Figure 4-2 B). No relationship was found between the myoblast:fibroblast ratio
and any knee extensor MVC torque or with any other EIMD biomarker following IS.
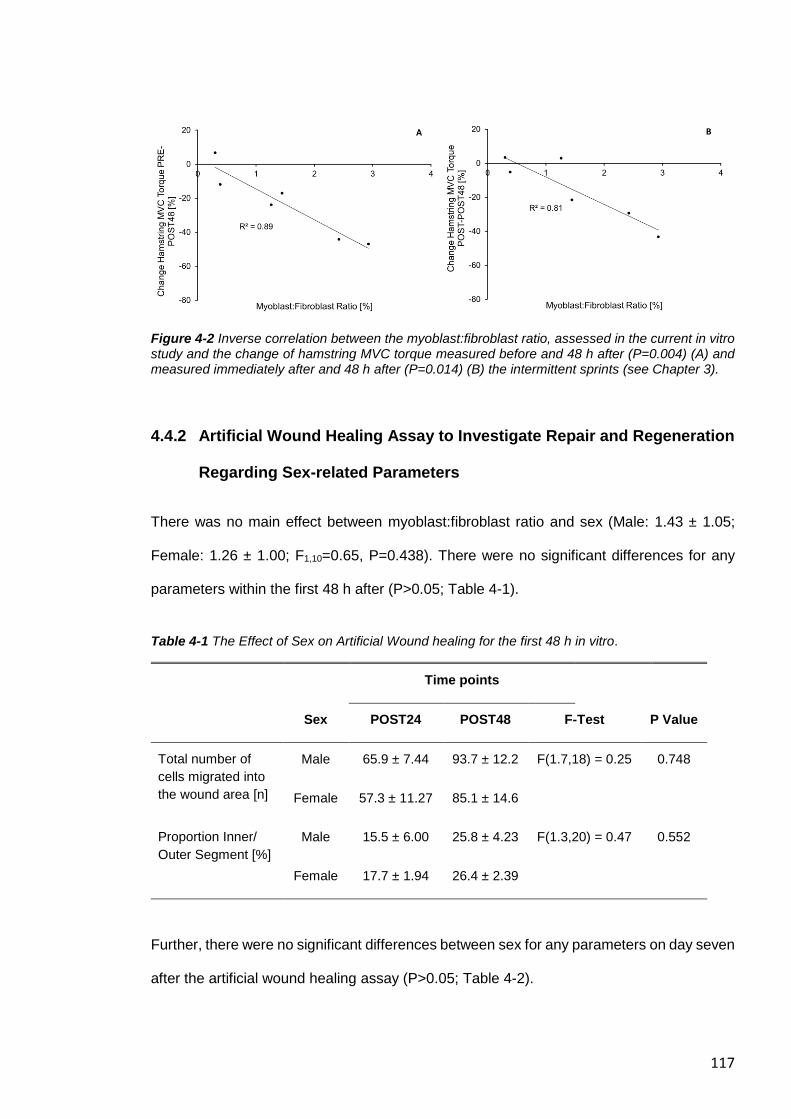
117
Figure 4-2 Inverse correlation between the myoblast:fibroblast ratio, assessed in the current in vitro study and the change of hamstring MVC torque measured before and 48 h after (P=0.004) (A) and measured immediately after and 48 h after (P=0.014) (B) the intermittent sprints (see Chapter 3).
4.4.2 Artificial Wound Healing Assay to Investigate Repair and Regeneration
Regarding Sex-related Parameters
There was no main effect between myoblast:fibroblast ratio and sex (Male: 1.43 ± 1.05;
Female: 1.26 ± 1.00; F1,10=0.65, P=0.438). There were no significant differences for any
parameters within the first 48 h after (P>0.05; Table 4-1).
Table 4-1 The Effect of Sex on Artificial Wound healing for the first 48 h in vitro.
Time points
Sex POST24 POST48 F-Test P Value
Total number of
cells migrated into
the wound area [n]
Male 65.9 ± 7.44 93.7 ± 12.2 F(1.7,18) = 0.25 0.748
Female 57.3 ± 11.27 85.1 ± 14.6
Proportion Inner/
Outer Segment [%]
Male 15.5 ± 6.00 25.8 ± 4.23 F(1.3,20) = 0.47 0.552
Female 17.7 ± 1.94 26.4 ± 2.39
Further, there were no significant differences between sex for any parameters on day seven
after the artificial wound healing assay (P>0.05; Table 4-2).
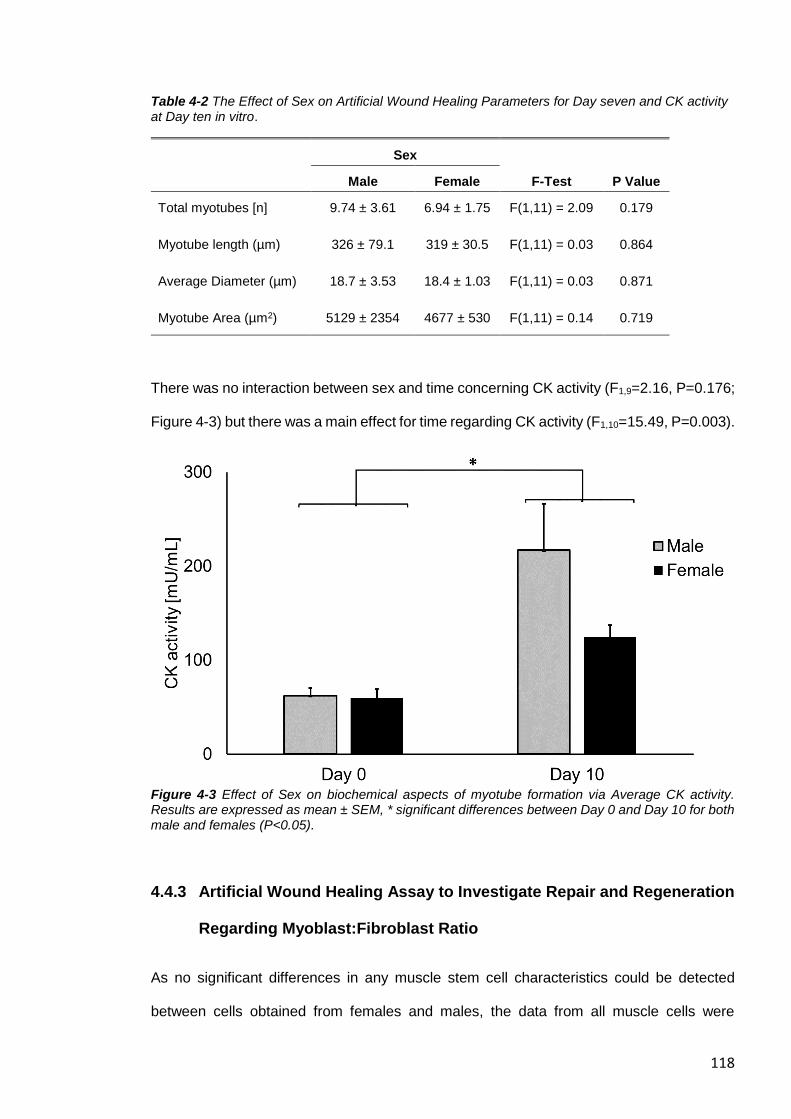
118
Table 4-2 The Effect of Sex on Artificial Wound Healing Parameters for Day seven and CK activity at Day ten in vitro.
Sex
Male Female F-Test P Value
Total myotubes [n] 9.74 ± 3.61 6.94 ± 1.75 F(1,11) = 2.09 0.179
Myotube length (µm) 326 ± 79.1 319 ± 30.5 F(1,11) = 0.03 0.864
Average Diameter (µm) 18.7 ± 3.53 18.4 ± 1.03 F(1,11) = 0.03 0.871
Myotube Area (µm2) 5129 ± 2354 4677 ± 530 F(1,11) = 0.14 0.719
There was no interaction between sex and time concerning CK activity (F1,9=2.16, P=0.176;
Figure 4-3) but there was a main effect for time regarding CK activity (F1,10=15.49, P=0.003).
Figure 4-3 Effect of Sex on biochemical aspects of myotube formation via Average CK activity. Results are expressed as mean ± SEM, * significant differences between Day 0 and Day 10 for both male and females (P<0.05).
4.4.3 Artificial Wound Healing Assay to Investigate Repair and Regeneration
Regarding Myoblast:Fibroblast Ratio
As no significant differences in any muscle stem cell characteristics could be detected
between cells obtained from females and males, the data from all muscle cells were
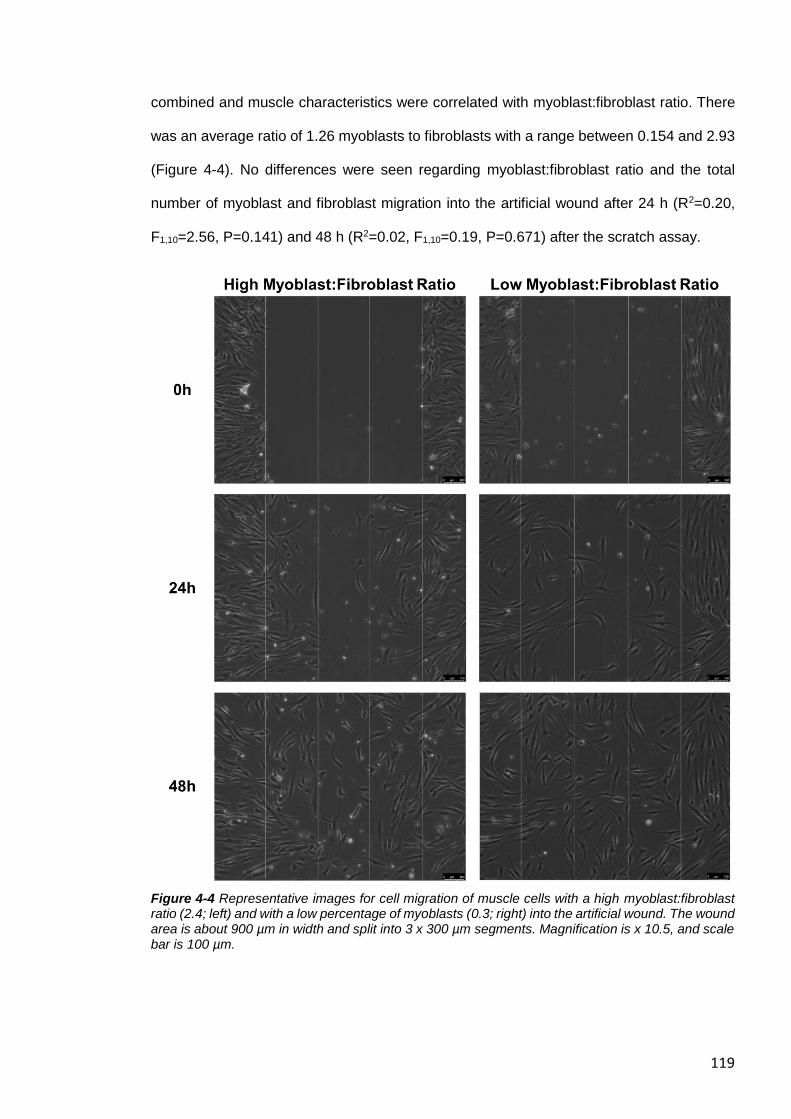
119
combined and muscle characteristics were correlated with myoblast:fibroblast ratio. There
was an average ratio of 1.26 myoblasts to fibroblasts with a range between 0.154 and 2.93
(Figure 4-4). No differences were seen regarding myoblast:fibroblast ratio and the total
number of myoblast and fibroblast migration into the artificial wound after 24 h (R2=0.20,
F1,10=2.56, P=0.141) and 48 h (R2=0.02, F1,10=0.19, P=0.671) after the scratch assay.
Figure 4-4 Representative images for cell migration of muscle cells with a high myoblast:fibroblast ratio (2.4; left) and with a low percentage of myoblasts (0.3; right) into the artificial wound. The wound area is about 900 µm in width and split into 3 x 300 µm segments. Magnification is x 10.5, and scale bar is 100 µm.
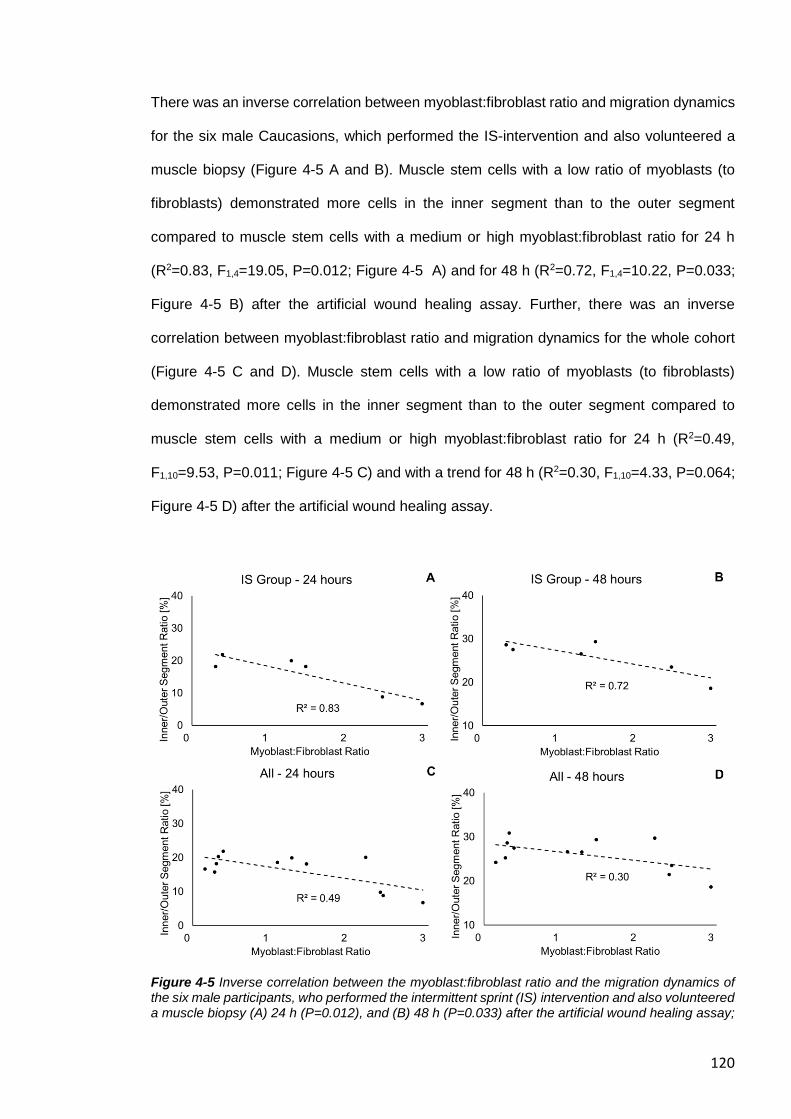
120
There was an inverse correlation between myoblast:fibroblast ratio and migration dynamics
for the six male Caucasions, which performed the IS-intervention and also volunteered a
muscle biopsy (Figure 4-5 A and B). Muscle stem cells with a low ratio of myoblasts (to
fibroblasts) demonstrated more cells in the inner segment than to the outer segment
compared to muscle stem cells with a medium or high myoblast:fibroblast ratio for 24 h
(R2=0.83, F1,4=19.05, P=0.012; Figure 4-5 A) and for 48 h (R2=0.72, F1,4=10.22, P=0.033;
Figure 4-5 B) after the artificial wound healing assay. Further, there was an inverse
correlation between myoblast:fibroblast ratio and migration dynamics for the whole cohort
(Figure 4-5 C and D). Muscle stem cells with a low ratio of myoblasts (to fibroblasts)
demonstrated more cells in the inner segment than to the outer segment compared to
muscle stem cells with a medium or high myoblast:fibroblast ratio for 24 h (R2=0.49,
F1,10=9.53, P=0.011; Figure 4-5 C) and with a trend for 48 h (R2=0.30, F1,10=4.33, P=0.064;
Figure 4-5 D) after the artificial wound healing assay.
Figure 4-5 Inverse correlation between the myoblast:fibroblast ratio and the migration dynamics of the six male participants, who performed the intermittent sprint (IS) intervention and also volunteered a muscle biopsy (A) 24 h (P=0.012), and (B) 48 h (P=0.033) after the artificial wound healing assay;
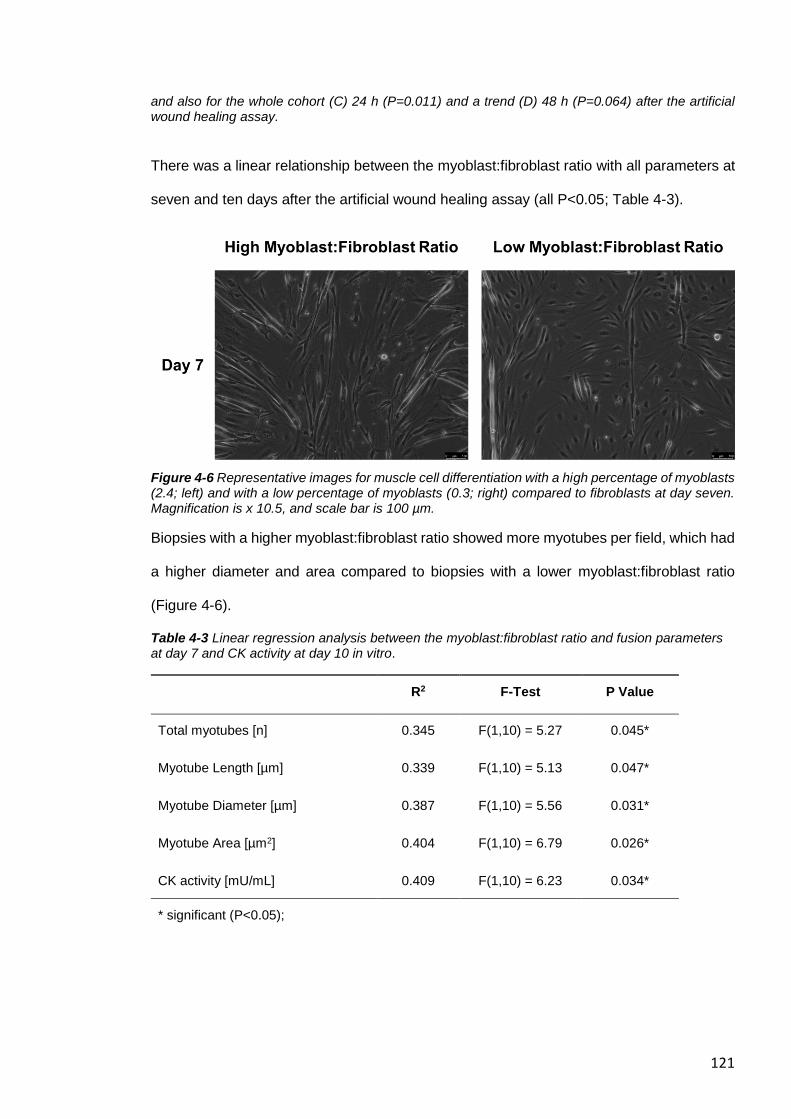
121
and also for the whole cohort (C) 24 h (P=0.011) and a trend (D) 48 h (P=0.064) after the artificial wound healing assay.
There was a linear relationship between the myoblast:fibroblast ratio with all parameters at
seven and ten days after the artificial wound healing assay (all P<0.05; Table 4-3).
Figure 4-6 Representative images for muscle cell differentiation with a high percentage of myoblasts (2.4; left) and with a low percentage of myoblasts (0.3; right) compared to fibroblasts at day seven. Magnification is x 10.5, and scale bar is 100 µm.
Biopsies with a higher myoblast:fibroblast ratio showed more myotubes per field, which had
a higher diameter and area compared to biopsies with a lower myoblast:fibroblast ratio
(Figure 4-6).
Table 4-3 Linear regression analysis between the myoblast:fibroblast ratio and fusion parameters at day 7 and CK activity at day 10 in vitro.
R2 F-Test P Value
Total myotubes [n] 0.345 F(1,10) = 5.27 0.045*
Myotube Length [µm] 0.339 F(1,10) = 5.13 0.047*
Myotube Diameter [µm] 0.387 F(1,10) = 5.56 0.031*
Myotube Area [µm2] 0.404 F(1,10) = 6.79 0.026*
CK activity [mU/mL] 0.409 F(1,10) = 6.23 0.034*
* significant (P<0.05);
122
4.5 DISCUSSION
The purpose of this study was to investigate whether myoblast:fibroblast ratio influences
functional recovery. The aim was objectively assess (i) the relationship between
myoblast:fibroblast ratio and repair/recovery following in vitro/in vivo damage; and (ii) the
association between sex with the response to in vitro wound healing parameters after a
scratch assay in vitro. It was hypothesised that a high myoblast:fibroblast ratio measured in
vitro would be related to improved recovery in vivo following the IS-intervention. Further, it
was hypothesised that a higher myoblast:fibroblast ratio would show an improved wound
closure compared to muscle cells with a low myoblast:fibroblast ratio, and that muscle
remodelling would not be associated with sex differences.
In line with our hypothesis, myoblast:fibroblast ratio was related with muscle
repair/recovery, both in vivo and in vitro, and that there were no significant differences in
any parameters of muscle remodelling of human primary muscle stem cells, which were
obtained of both males and females. However, contrary to our hypothesis, our results
showed an ambiguous picture during the muscle repair process. A high myoblast:fibroblast
ratio showed a delayed wound closure in vitro and a delayed MVC torque recovery following
IS in vivo within the first 48 h, but a better myotube formation at seven days, and higher CK
activity at ten days after the scratch assay.
4.5.1 Comparison of the Muscle Response to the Intermittent Sprint
Intervention and the Artificial Wound Healing Study in vitro
Six of the eight male participants who volunteered a muscle biopsy for this study also
performed an IS-intervention vivo (Chapter 3) at least three weeks after the biopsy
procedure. Comparing the muscle characteristics measured in the current study in vitro and
the response patterns of the physiological EIMD-intervention in vivo (Chapter 3), revealed
a strong inverse correlation between myoblast:fibroblast ratio and the recovery of MVC
torque assessed between baseline and 48 h after IS. Further, there was an inverse
relationship between myoblast:fibroblast ratio and MVC torque recovery (measured
123
between POST and POST48), which provides further evidence that the ECM is important
for recovery of maximum strength. Force produced by the sarcomeres can be transmitted
both longitudinally and laterally to the overlying connective tissues and ECM, and from there
to the tendon, which leads to joint movement (Kjær, 2004, Hughes et al., 2015). Potentially,
ECM remodelling in the initial phase of muscle regeneration is crucial for restoring (lateral)
force transmission. Skeletal muscles with an increased availability of fibroblasts around the
area of myotrauma might have a better capacity to reorganise the complex ECM, which
results in a faster recovery of muscle strength after EIMD. This is also in line with the time
course of muscle connective tissue accumulation within the first 3-5 days (Murphy et al.,
2011), potentially to restore the muscle force transmission capacity, and the recovery of
MVC following EIMD-interventions (Clarkson and Hubal, 2002, Baumert et al., 2018).
However, there was no significant relationship between myoblast:fibroblast ratio and any
other EIMD-related biomarker, such as muscle soreness (Warren et al., 1999) or serum CK
activity (Baird et al., 2012) indicating that these biomarkers might be related to other
damage/repair mechanisms.
Further, there was no relationship between myoblast:fibroblast ratio and any measured
parameters for the quadriceps femoris. A recent study revealed that skeletal muscles of
different origin but with similar physiological functions demonstrate a high similarity of
transcriptome expression patterns (Terry et al., 2018). Skeletal muscles with similar fibre
type compositions were found to have a striking similar transcript expression of up to 99%.
As the fibre type composition is similar between the biceps femoris long head and of the
vastus lateralis (Evangelidis et al., 2016), from which the muscle biopsies were obtained in
the current study, we can assume that the variation of the correlation between
myoblast:fibroblast ratio and the EIMD-response of both hamstring and quadriceps skeletal
muscles might be explained by the severity of ultrastructural damage caused by the IS-
intervention. This is in line with the correlation between MVC torque loss of the hamstring
and quadriceps muscle group (please see section 3.4.2). Increased MVC torque loss of the
124
hamstrings is related with an elevated loss of MVC torque of the quadriceps of the same
participant.
4.5.2 Sex-related Outcomes
Animal studies have often indicated attenuated EIMD susceptibility in female animals
(Amelink and Bär, 1986), and some human in vivo investigations have supported the
observation that there are differences in the response to EIMD between male and females
(Sewright et al., 2008). Further, female primary muscle stem cells of mice demonstrated a
better regeneration capacity compared to male cells (Deasy et al., 2007). However, other
human studies could not replicate these findings (Stupka et al., 2001), and some have
indicated that any potentially sex-related differences might be explained by differences in
muscle fatigability (Wüst et al., 2008) rather than differences in the susceptibility to
ultrastructural muscle damage.
In the current study, human male and female muscle stem cells did not differ in any
parameters regarding the early recovery rates following an artificial wound healing assay.
However, the current study tested CK activity within ten days and only the muscle recovery
capacity within the first seven days, which was similar compared to the results of Deasy et
al. (2007), as different outcomes were mainly evident after 14 days, with female muscle
stem cells exhibiting slightly slower long-term proliferation kinetics but improved
regeneration capacity compared to males. Therefore, the current study suggests that
human muscle stem cells characteristics are similar between male and females regarding
the early recovery rates, but this needs to be confirmed for muscle regeneration capacity in
the long-term, e.g. with population doubling.
4.5.3 Myoblast:Fibroblast Ratio and the Artificial Wound Healing Assay
As no significant differences were found between sex for any parameter, the data from all
primary muscle cells were combined for assessing the effect of myoblast:fibroblast ratio on
125
cellular aspects of muscle regeneration and remodelling. The myoblast:fibroblast ratio
ranged between 13 and 74%, which is in line with current literature (Schäfer et al., 2006,
Owens et al., 2015).
The results of the current study indicated that muscle stem cells with a high
myoblast:fibroblast ratio revealed a delay in the wound closure (less cells migrated to the
inner part of the artificial injury compared to the outer part), in particular 24 h after performing
the scratch assay. However, this effect was less significant 48 h after the protocol. Further,
at day seven, muscle primary cells with a higher myoblast:fibroblast ratio showed an
improved myotube formation. These results suggest that a larger abundance of fibroblasts
has a positive effect at the beginning of muscle repair, but a larger number of myoblasts is
more important for the latter stage of muscle regeneration, when myoblasts differentiate
and fuse to become myotubes.
The contribution of fibroblasts to the early phase of muscle repair has previously been
investigated in animal studies in vivo (Murphy et al., 2011). The amount of muscle ECM
(measured with sirius red) increased to peak levels three days after a barium chloride-
induced injury in mice. This was accompanied with rapid proliferation of muscle fibroblasts
in close proximity to satellite cells and both, the amount of ECM and of muscle fibroblasts,
returned to baseline levels 21 days after the injury. Transgenic mice with Pax7+ satellite
cells deficiency showed dramatically impaired muscle regeneration from day five onwards,
and generated fibrosis after the chemically mediated injury. Further, genetically engineered
mice with Tcf4+ fibroblast deficiency demonstrated a premature activation and
differentiation of Pax7+ satellite cells three days after the barium chloride-induced injury,
which led to a decreased number of satellite cells over the following days. These results
are in line with that of the current study, suggesting the abundance and activity of fibroblasts
and myoblasts play different roles, depending on the time points during muscle repair.
Recent human in vivo investigations confirmed the interdependence of muscle fibroblasts
and satellite cells for a healthy muscle regeneration (Mackey et al., 2017). However, the
time frame of muscle fibroblast accumulation around the regenerating muscle fibres
126
happened at a later time point (30 days) following electrical stimulations compared to
Murphy et al. (2011). Further, expression of collagen I, III, and IV transcripts were
unchanged in the first 48 h following eccentric lengthening contractions, but were increased
27 days later (Hyldahl et al., 2015). Presumably, the different results are based on the
different organisms investigated, varying muscles studied and different injury protocols
used. It can be assumed that involuntary isometric contractions induced by artificial
electrical stimulation potentially damage more proteins, which anchor the actin filaments at
the Z-line (Crameri et al., 2007). However, this involuntary isometric contractions might
damage the muscle ECM to a lesser extent compared to physiological eccentric MVCs
(Crameri et al., 2007) or barium chloride-induced injury (Hardy et al., 2016). That might
explain the delayed fibroblast proliferation (Mackey et al., 2017) and production of
temporary ECM components (Mackey et al., 2004) at the early stage of muscle repair
compared to barium chloride-induced injury in mice (Murphy et al., 2011).
In conclusion, therefore, the current results suggest that fibroblasts might play an important
role in supporting muscle cell migration during muscle regeneration within the first 48 h
following physiological relevant EIMD, when a certain level of ultrastructural damage has
been exceeded and the ECM has been damaged. However, following wound closure, a
higher number of myoblasts will ensure improved myoblast fusion and hypertrophy in vitro.
Future investigations with other in vitro models, e.g. with mechanical stretch-induced injury
of the cells (Clarke and Feeback, 1996, Wozniak et al., 2005), should assess whether
individuals with a high number of fibroblasts (which demonstrated advantages in muscle
regeneration shortly after an acute muscle-damaging intervention) demonstrate an
increased proteolytic activity after elevated fibroblast proliferation, or whether these
individuals tend to develop more fibrotic scar tissue within the muscle in the long term.
4.5.4 Limitations
The current study observed significant differences between human primary muscle cell
composition and skeletal muscle regeneration, but there were no significant differences
127
between sex regarding any parameters. Further research is necessary to confirm these
results with a larger sample size. However, given the scarcity of data that have examined
human muscle stem cell characteristics in association with muscle regeneration, we believe
that our study represents an important advance in our understanding in this area. Further
investigations are necessary to evaluate whether a generally low number of fibroblasts has
a detrimental effect on MVC torque following an EIMD-intervention or whether
myoblast:fibroblast ratio is essential for healthy muscle regeneration in vivo. We assumed
that the myoblast:fibroblast ratio is similar between the vastus lateralis musle (from which
we obtained the muscle biopsy) and the BFLH, as Terry et al. (2018) demonstrated a high
similarity of transcriptome expression patterns in skeletal muscles of rodents, when the
muscles consist of similar fibre type composition and of similar physiological functions, such
as the BFLH (47.1% MHC-I, 35.5% MHC-IIA, and 17.4% MHC-IIX) (Evangelidis et al., 2016)
and the vastus lateralis (49-59% MHC-I, 26-35% MHC-IIA, and 16-28% MHC-IIX)
(Mittendorfer et al., 2005, Taylor et al., 1997). However, gene expression patterns vary
between rodents and human (Su et al., 2002), and there are is a gap of research between
the intra-individual variability of the myoblast:fibroblast ratio between different skeletal
muscles. Therefore, further investigations needs to address this research gap to confirm
our findings. Lastly, we distinguished the primary muscle cells in myoblasts (desmin-
positive) and fibroblasts (desmin-negative), as previous investigations have determined that
the non-myoblast fraction is highly enriched in fibroblasts, with up to 99 % of this fraction
being fibroblasts (Agley et al., 2013, Mathew et al., 2011). For immnunohistochemistry
analysis, we have fixed the cells with a low density of 30%, so that the cells could be easily
distinguished from each other. The ICC (3, k) of 0.83 (95% CIs: 0.59-0.95) indicates a good
reliability for the characterisation and the quantification of myoblasts and fibroblasts.
However, analysing the entire well (instead of sub-sampling random areas of each well)
and additional methodical approaches, such as cell sorting by flow cytometry, could have
improved the accuracy of our myoblast:fibroblast ratio calculation. Future studies may use
128
additional antibodies, such as DAPI (for staining nuclei) and TE7 (for staining fibroblasts),
to validate our findings.
4.6 CONCLUSION/ PERSPECTIVE
The current results suggest that individual muscle stem cell characteristics are not
explicable by differences in sex and that fibroblasts are essential for optimal muscle
regeneration in the initial days following injury. Skeletal muscles with an increased number
of fibroblasts might have a better capacity to reorganise the complex ECM, which results in
a faster MVC torque recovery after EIMD. However, a larger number of myoblasts seems
to be important for the latter stage of muscle regeneration, when myoblasts differentiate
and fuse to become myotubes. The results lead to further scientific questions, such as
whether the individual muscle characteristics, including contraction properties
(physiological cross-sectional area) (Chapter 3), and human primary muscle cell
composition of the current study is associated with genetic variations. In addition, further
investigations are required to demonstrate if varying regeneration capacity within the first
days after EIMD underpinned by the percentage of fibroblasts is correlated with (i) the
likelihood to sustain a muscle injury; and (ii) the individual differences in the response to
prolonged resistance training.
129
5 Individual and Combined Polymorphisms are
Associated with in vivo and in vitro Muscle Damage in
Humans: a Genetic Approach to Elucidate the
Mechanisms Underpinning the Response to Exercise-
Induced Muscle Damage
Publications resulted from this chapter:
1. Baumert, P., G-REX Consortium, Lake, M. J., Drust, B., Stewart, C. E., & Erskine,
R. M. (2017). TRIM63 (MuRF-1) gene polymorphism is associated with biomarkers
of exercise-induced muscle damage. Physiological genomics, 50(3), 142-143.
2. Baumert, P., G-REX Consortium, Stewart, C. E., Lake, M. J., Drust, B., & Erskine,
R. M. (2018). Variations of collagen-encoding genes are associated with exercise-
induced muscle damage. Physiological genomics.
130
5.1 ABSTRACT
Introduction We aimed to test the hypothesis that a combination of selected candidate
SNPs forming a polygenic profile could estimate high and low responders to exercise-
induced muscle damage (EIMD).
Methods Sixty-five young female and male untrained Caucasians performed 120 maximal
eccentric knee-extensions to induce EIMD. Maximal quadriceps strength, range of motion
(ROM), muscle soreness and serum blood biomarkers were assessed before, directly after
and 48 h after the EIMD intervention and participants were genotyped for 20 candidate
SNPs. Significant SNPs were further investigated regarding the muscle recovery following
an artificial wound healing assay in vitro. SNPs that showed a gene-intervention interaction
in vivo, were used to calculate a total genotype score in respect to the acute response
following EIMD (TGS-A) and the cohort was then divided into a “preferential” (PG),
“moderate” (MG), and “non-preferential” (NPG) genetic group.
Results Four SNPs, which showed an interaction/main effect with the EIMD-intervention in
vivo, also demonstrated changes in muscle stem cell characteristics in vitro. Seven SNPs
demonstrated significant interactions in vivo, and these candidate SNPs were used to
compute the TGS-A. There was a main effect for isometric and isokinetic MVC torque
regarding TGS-A (both P<0.001). Individuals of the NPG and MG group were consistently
weaker compared to the PG group (P=0.005), and NPGs demonstrated higher muscle
soreness (P=0.003) and decreased ROM (P=0.006) following the EIMD-intervention,
respectively.
Conclusion Individual and combined candidate SNPs forming a polygenic profile
demonstrated a genotype X intervention interaction to the response to different biomarkers
following EIMD. The striking finding that NPGs regarding the EIMD-intervention also
demonstrate a generally lower muscle strength indicates that a genetically determined
impaired EIMD-response might result in lower muscle quality over time.
131
5.2 INTRODUCTION
Tender and sore muscles following unaccustomed intense exercise is a well-known
phenomenon, and is referred to as delayed onset muscle soreness, or DOMS (Cheung et
al., 2003). Several investigations have revealed that DOMS is mainly induced by eccentric
contractions, i.e. movements that forcibly lengthen the contracting muscle (Armstrong et al.,
1991). It is thought that excessive sarcomere strain due to exercise-induced muscle
damage (EIMD) is the primary cause of muscle injury (Lieber and Fridén, 1999) and poorly
managed training workload (e.g. identical training intensity for all team members of a
football squad) with insufficient recovery between exercise sessions can lead to overuse
muscle injury (Gabbett et al., 2016). In rare cases, over-exertion (e.g. marathon) can lead
to exertional rhabdomyolysis with clinically relevant symptoms, such as compartment
syndrome or renal failure, and can even cause death (Rawson et al., 2017).
The response to EIMD is very complex as several tissues that contribute to the transmission
of force to the bone, including skeletal muscle fibres (Clarkson and Hubal, 2002), the extra-
cellular matrix (ECM) (Hyldahl and Hubal, 2014), and tendon (Hicks et al., 2017), play a
potential role in the damage response. Further, different muscle tissue repair mechanisms
(inflammation, degradation of damaged tissues and muscle remodelling) take part in this
process in a highly coordinated fashion (Tidball, 2011). Therefore, the response to EIMD
can manifest in a variety of symptoms, including prolonged loss of maximal strength,
decreased range of motion (ROM), ultrastructural damage, DOMS, localised inflammation
and release of muscle-specific proteins into the circulatory system [e.g. creatine kinase (CK)
activity, and interleukin-6 (IL-6)], which can be detected for days or even for weeks (Brown
et al., 1999, Baird et al., 2012). All of these variables are considered to be biomarkers of
EIMD.
Previous studies have determined a wide range of inter-individual variability in the response
to EIMD, even when tested in the same human population (Nosaka and Clarkson, 1996).
Investigations in the previous chapters demonstrated that the varying response to EIMD is
potentially based on different muscle characteristics. Improved contractile properties (e.g.
132
larger muscle physiological cross-sectional area) appears to protect against immediate loss
of maximal voluntary contraction (MVC) torque (see Chapter 3), and a relative high
proportion of stem cells of the connective tissue/ECM (fibroblasts) to muscle stem cells
(myoblasts) appear to support the recovery of MVC torque (see Chapter 4) the days after
sprinting-induced muscle damage, respectively. Whilst different muscle characteristics
between different human populations can be explained by factors such as age (Roth et al.,
1999), ethnic origin (Sherwood et al., 1996), training status (Ploutz-Snyder et al., 2001) and
sex (Sewright et al., 2008), there is evidence to suggest that some of this inter-individual
variability might be explained by differences in genetic make-up (Clarkson et al., 2005b,
Ahmetov et al., 2014, Baumert et al., 2016a). Indeed, several single nucleotide
polymorphisms (SNPs), i.e. common variations in the sequence of nucleotides within genes
that encode proteins (i) in skeletal muscle (Baumert et al., 2017, Clarkson et al., 2005b),
tendon and muscle ECM (Baumert et al., 2018, Barfield et al., 2014), or (ii) are related with
the inflammatory response (Funghetto et al., 2013, Ahmetov et al., 2014) have been
associated with changes in various biomarkers of EIMD following eccentric exercise.
Therefore, it is important to understand that any genetic association with damage to the
muscle-tendon unit (MTU) is likely to be polygenic.
To our knowledge, only two studies have investigated a combination of candidate SNPs in
regard to the response to muscle damaging exercises (Del Coso et al., 2017b, Del Coso et
al., 2017a). Both studies investigated the association of a combination of seven candidate
SNPs with plasma CK concentration in applied settings (marathon and half-ironman), i.e.
the exercise is not standardised, thus making it difficult to accurately characterise the
variable response to EIMD. Further, whilst a plethora of genetic association studies have
been performed (Baumert et al., 2016a), only a few studies have investigated the
mechanisms underpinning the effect of genetic variation in the context of exercise and EIMD
(Barfield et al., 2014, Garton et al., 2013, Garton et al., 2018b). Knowledge of both genetic
association with the individual response to strenuous exercise and the underlying
mechanism could help develop individualised exercise training programmes that may be
133
used to optimise physical performance, while maximising recovery, thus reducing the risk
of injury and development of MTU-related disease (van der Horst et al., 2015, Colberg et
al., 2010, Erskine et al., 2010b).
Therefore, the primary aim of this study was to investigate whether a polygenic profile could
distinguish between high and low responders following a controlled eccentric exercise
intervention in previously untrained individuals in vivo. Using a two-level approach, 20
SNPs, which demonstrated a genotype X intervention interaction with the skeletal muscle
(ACTN3 C>T, rs1815739; DES G>C, rs12621188; MYLK G>A, rs2700352; MYLK G>T,
rs28497577; TTN-AS1 A>G, rs1001238; TTN-AS1 G>A, rs3731749), muscle ECM/tendon
(COL1A1 G>T rs1800012; COL1A1 T>C, rs2249492; COL2A1 G>A, rs2070739; COL5A1
T>C, rs12722; MMP3 G>A, rs679620), or with the response following EIMD (AGT C>T,
rs699; CCL2 G>C; IGF2-AS A>C, rs4244808; IL6 C>G, 1800796; NOS3 T>C, rs2070744;
PAX7 G>A, rs485874; TNF T>C rs1799964; TRIM63 A>G, rs2275950; VDR C>T,
rs2228570) were initially investigated on an individual basis for an interaction effect with an
acute bout of maximal eccentric exercise in vivo. SNPs that demonstrated an interaction
with the response to exercise (following correction for multiple comparison) were used to
calculate a “total genotype score” to compute a polygenic profile regarding the acute EIMD
response (TGS-A) (Williams and Folland, 2008). The secondary aim was to further
investigate candidate SNPs, which were found to be significant in the in vivo intervention,
in an in vitro design. We used cultures of primary human skeletal muscle cells to assess
the association of the candidate SNPs on muscle recovery following an artificial wound
healing assay in vitro. We hypothesised that individuals with a non-preferential genetic
(NPG) profile, i.e. those with a low TGS-A, would demonstrate greater muscle damage and
a slower recovery rate in response to maximal eccentric exercise compared to those with a
preferential genetic (PG) profile. More specifically, we hypothesised that NPGs would show
a relatively greater loss of maximal muscle strength and ROM, greater perception of muscle
soreness, and higher concentration/activity of circulating muscle-specific proteins,
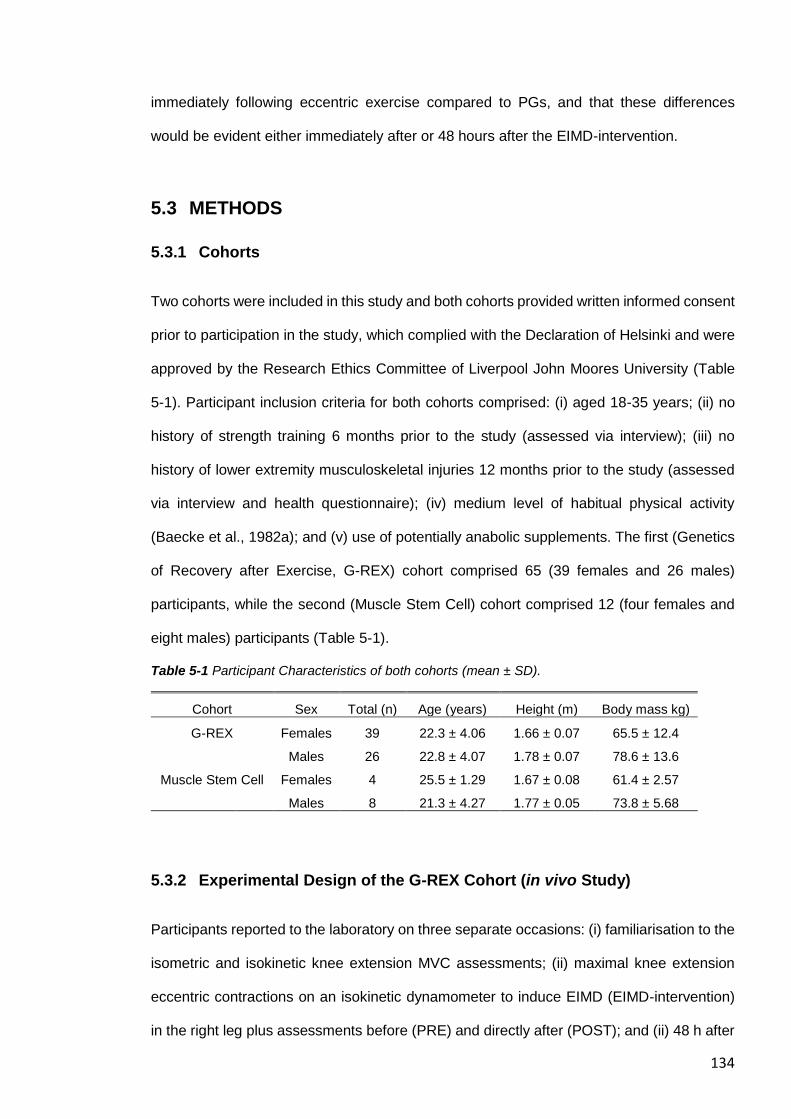
134
immediately following eccentric exercise compared to PGs, and that these differences
would be evident either immediately after or 48 hours after the EIMD-intervention.
5.3 METHODS
5.3.1 Cohorts
Two cohorts were included in this study and both cohorts provided written informed consent
prior to participation in the study, which complied with the Declaration of Helsinki and were
approved by the Research Ethics Committee of Liverpool John Moores University (Table
5-1). Participant inclusion criteria for both cohorts comprised: (i) aged 18-35 years; (ii) no
history of strength training 6 months prior to the study (assessed via interview); (iii) no
history of lower extremity musculoskeletal injuries 12 months prior to the study (assessed
via interview and health questionnaire); (iv) medium level of habitual physical activity
(Baecke et al., 1982a); and (v) use of potentially anabolic supplements. The first (Genetics
of Recovery after Exercise, G-REX) cohort comprised 65 (39 females and 26 males)
participants, while the second (Muscle Stem Cell) cohort comprised 12 (four females and
eight males) participants (Table 5-1).
Table 5-1 Participant Characteristics of both cohorts (mean ± SD).
Cohort Sex Total (n) Age (years) Height (m) Body mass kg)
G-REX Females 39 22.3 ± 4.06 1.66 ± 0.07 65.5 ± 12.4
Males 26 22.8 ± 4.07 1.78 ± 0.07 78.6 ± 13.6
Muscle Stem Cell Females 4 25.5 ± 1.29 1.67 ± 0.08 61.4 ± 2.57
Males 8 21.3 ± 4.27 1.77 ± 0.05 73.8 ± 5.68
5.3.2 Experimental Design of the G-REX Cohort (in vivo Study)
Participants reported to the laboratory on three separate occasions: (i) familiarisation to the
isometric and isokinetic knee extension MVC assessments; (ii) maximal knee extension
eccentric contractions on an isokinetic dynamometer to induce EIMD (EIMD-intervention)
in the right leg plus assessments before (PRE) and directly after (POST); and (ii) 48 h after
135
(POST48) the EIMD-intervention. The assessments of muscle damage indices comprised
isometric and isokinetic MVC torque (assessed via isokinetic dynamometry in the right leg),
right leg muscle soreness [assessed via visual analogue scale (VAS)] and serum samples
(for analysing IL-6 concentration and CK activity). All tests were performed at the same time
point of the day for each participant. Participants were instructed to maintain their normal
dietary behaviour (consumption of purported recovery supplements was not permitted), to
refrain from drinking alcohol and to avoid any strenuous physical activity for at least 48 h
before and throughout the study.
5.3.3 Muscle Damage Protocol
The muscle damage protocol consisted of 12 sets of 10 right leg maximal knee extension
eccentric contractions on an isokinetic dynamometer [either a Humac Norm, CSMI
(Massachusetts, USA) or Biodex Multi-Joint System 3 Pro (Shirley, USA)]. The two
isokinetic dynamometers show similar isometric, concentric and eccentric peak torques with
high to very high reproducibility (Alvares et al., 2015) and each participant performed all
their strength assessments on the same dynamometer. Each set consisting of 10 maximal
repetitions (30 s rest between each set). After every fourth set, the participants rested for
three minutes. The angular velocity was set to 30°/s of eccentric knee contraction (from 30°
to 100° knee flexion angle, with 0° as the extended position) and the participants were
instructed to maximally counteract the knee flexion induced by the dynamometer.
5.3.4 Maximal Voluntary Contraction (MVC) Torque
The participant was seated on the isokinetic dynamometer in an upright position with the
hips flexed to 85º (180 = supine position) and securely fastened with inextensible straps at
the chest and waist whilst the arms were held crossed above the chest. The lateral
tibiofemoral epicondyle was aligned with the axis of rotation of the lever arm, and the bottom
of the lever arm shin pad was strapped to the leg, 2 cm above the centre of the lateral
136
malleolus. Prior to performing MVCs, participants underwent a standardised warm up
consisting of 10 submaximal isokinetic leg extensions (60ºs-1). Participants then performed
three isometric MVCs (lasting 2-3 s and interspersed by 60 s of rest), with the knee joint
angle set at 80º knee flexion (0 = full extension), as this has previously been shown to be
the optimum joint angle for peak knee extension moment in healthy young men (Erskine et
al., 2009). Three isokinetic MVCs (70° ROM, from 30° to 100° knee flexion angle; velocity
60ºs-1) were performed after the isometric MVCs, and the participants were instructed to
perform the MVCs in a continuous fashion. The test-retest reproducibility for isometric knee
extensor MVC is high, with a coefficient of variation (CV) of 3.9% (Erskine et al., 2009).
Throughout the tests, participants received verbal encouragement and biofeedback (MVC
outputs) were projected onto a screen in front of the participant) (Erskine et al., 2009).
5.3.5 Delayed Onset Muscle Soreness (DOMS)
Participants were asked to score their perceived muscle soreness and pain with a visual
analogue scale (VAS) following a bilateral squat. Participants stood with hands on hips with
feet shoulder-width apart and slowly squatted to a standardised chair height of 40 cm (~90
knee flexion) and then rose to a standing position. This was repeated twice more, after
which participants were asked to rate their perceived quadriceps muscle soreness in their
right leg using a VAS (scale 0-10 cm; 0 cm=no soreness; 10 cm=maximal soreness)
(Sellwood et al., 2007).
5.3.6 Blood Samples
Venous blood samples were obtained from all participants (for genotyping purposes) and
serum CK activity and concentration of the inflammatory cytokine interleukin-6 (IL-6) were
determined from a subgroup of 38 participants of the G-REX cohort. All blood samples
drawn from an antecubital vein in the forearm and collected into a 10 ml EDTA vacutainer
(genotyping sample) and serum vacutainer (both BD Vacutainer systems, Plymouth, UK).
137
The genotyping blood sample was taken on just one occasion (familiarisation session).
Serum samples were obtained at each time point and left at temperature controlled
laboratory (between 22 and 24C) for 30 min to allow clotting, and then kept on ice when
necessary. Serum samples were centrifuged at 1300 g for 15 min at 4°C. All samples were
then aliquoted into 1.5 mL microcentrifuge tubes [Axygen (Corning), New York, USA] and
stored at -80C until subsequent analysis (see below).
5.3.7 Serum Creatine Kinase Activity
Creatine kinase (CK) activity was assayed using a commercially available CK assay
(Catachem Inc., Connecticut, NE, USA), as described in detail elsewhere (Sharples et al.,
2011, Owens et al., 2014). Briefly, 10 μL blood serum of the G-REX cohort/cell lysate of the
muscle cell culture study were loaded onto a 96-well UV plate. The CK reaction reagent
and diluent (Catachem) were prepared as per the manufacturer’s instructions and heated
for 2 min at 37°C. The reconstituted reagent contained the following active ingredients: 30
mmol/l PCr, 2 mmol/l ADP, 5 mmol/l AMP, 2 mmol/l NAD, 20 mmol/l N-acetyl-L-cystine,
3,000 U/l hexokinase, 2,000 U/l G-6-PDH, 10 mmol/l 1 Mg2, 20 mmol/l D-glucose, 10 mol/l
di(adenosine 5=) pentaphosphate, and 2 mmol/l EDTA, buffered to pH 6.7. The reagent
mixture was then added to the samples and the change in absorbance monitored
continuously over 20 min in a Thermo Multiskan Spectrum plate reader at a wavelength of
340 nm.
5.3.8 Serum Interleukin-6 (IL-6) Concentration
Serum samples were assayed for IL-6 concentration using commercially available human
IL-6 enzyme linked immunosorbent assay (ELISA) kits (Quantikine®, R&D systems,
Minneapolis, MN, USA) according to the manufacturer's instructions. Briefly, the serum
samples were thawed and aliquots (200 μl) of each diluted sample, positive control or
standard, with known concentrations of human IL-6 to establish standard values, were
138
plated on a coated (monoclonal antibody specific for human IL-6) 96-well microtitre plate
for 2 h. After washing, human IL-6 conjugate (200 μL) was added to each well and incubated
for 2 h at room temperature (between 22 and 24C). After the wells were washed, substrate
solution (200 μL) was added to each well at room temperature (between 22 and 24C) and
protected from light. After adding 50 μL of stop solution to each well, the intensity of the
colour produced after 20 min was measured with a Thermo Multiskan Spectrum microplate
reader (Thermo Fisher Scientific. Waltham, MA. USA) at 450 nm and values were
calculated with Excel 365 (Microsoft, v. 365, USA) by generating a four-parameter logistic
(4-PL) curve fit. The minimum detectable dose of human IL-6 was 0.70 pg/mL.
5.3.9 Genotyping
DNA extraction from whole blood was performed with a QIAamp DNA Blood Mini Kit
(Qiagen, Manchester, UK), following the manufacturer’s QIAamp spin column protocol for
DNA purification from whole blood. Briefly, 20 μL proteinase K (Qiagen) was pipetted into a
1.5 mL microcentrifuge tube. 200 μL of sample and 200 μL of lysis buffer (AL, Qiagen) was
then added and vortexed for 15 s. this was then incubated at 56°C for 10 mins to maximise
DNA yield. Following incubation, 200 μL ethanol (96-100%) was added to the sample and
vortexed for 15 s. This mixture was then transferred to a QIAamp Mini spin column (Qiagen)
within a 2 mL collection tube. This was then centrifuged at 8000 rpm for 1 min before the
mini spin column was transferred to a clean 2 mL collection tube. 500 μL AW1 binding buffer
(Qiagen) was then added to the spin column before being centrifuged again at 8000 rpm
for 1 min. The column was again placed into a clean 2 mL collection tube and 500 μL AW2
wash buffer (Qiagen) was added before centrifuging at 14 000 RPM for 3 min. The column
was then placed into a clean 2 mL collection tube and centrifuged at 14 000 RPM for 1 min.
Finally, the spin column was placed in a fresh 1.5 mL microcentrifuge tube, 200 μL AE wash
buffer (Qiagen) was added to the column and was centrifuged at 8000 RPM for 1 min
following 1 min incubation at room temperature.
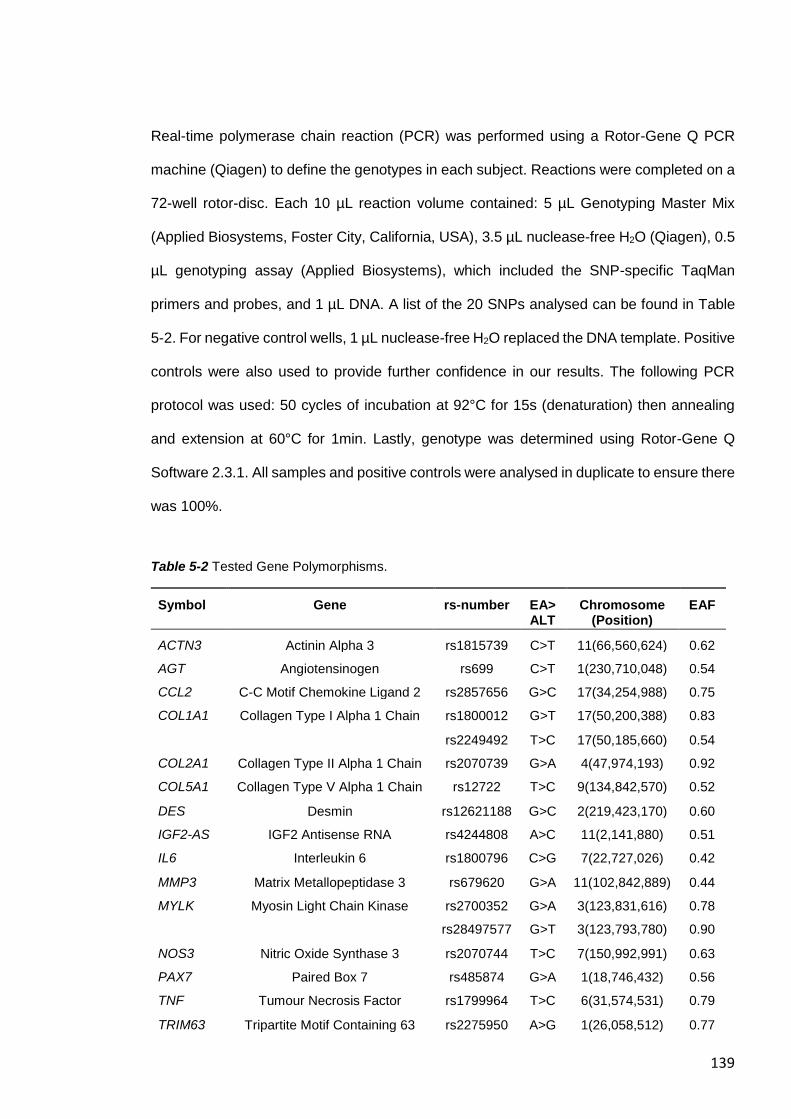
139
Real-time polymerase chain reaction (PCR) was performed using a Rotor-Gene Q PCR
machine (Qiagen) to define the genotypes in each subject. Reactions were completed on a
72-well rotor-disc. Each 10 µL reaction volume contained: 5 µL Genotyping Master Mix
(Applied Biosystems, Foster City, California, USA), 3.5 µL nuclease-free H2O (Qiagen), 0.5
µL genotyping assay (Applied Biosystems), which included the SNP-specific TaqMan
primers and probes, and 1 µL DNA. A list of the 20 SNPs analysed can be found in Table
5-2. For negative control wells, 1 µL nuclease-free H2O replaced the DNA template. Positive
controls were also used to provide further confidence in our results. The following PCR
protocol was used: 50 cycles of incubation at 92°C for 15s (denaturation) then annealing
and extension at 60°C for 1min. Lastly, genotype was determined using Rotor-Gene Q
Software 2.3.1. All samples and positive controls were analysed in duplicate to ensure there
was 100%.
Table 5-2 Tested Gene Polymorphisms.
Symbol Gene rs-number EA>ALT
Chromosome (Position)
EAF
ACTN3 Actinin Alpha 3 rs1815739 C>T 11(66,560,624) 0.62
AGT Angiotensinogen rs699 C>T 1(230,710,048) 0.54
CCL2 C-C Motif Chemokine Ligand 2 rs2857656 G>C 17(34,254,988) 0.75
COL1A1 Collagen Type I Alpha 1 Chain rs1800012 G>T 17(50,200,388) 0.83
rs2249492 T>C 17(50,185,660) 0.54
COL2A1 Collagen Type II Alpha 1 Chain rs2070739 G>A 4(47,974,193) 0.92
COL5A1 Collagen Type V Alpha 1 Chain rs12722 T>C 9(134,842,570) 0.52
DES Desmin rs12621188 G>C 2(219,423,170) 0.60
IGF2-AS IGF2 Antisense RNA rs4244808 A>C 11(2,141,880) 0.51
IL6 Interleukin 6 rs1800796 C>G 7(22,727,026) 0.42
MMP3 Matrix Metallopeptidase 3 rs679620 G>A 11(102,842,889) 0.44
MYLK Myosin Light Chain Kinase rs2700352 G>A 3(123,831,616) 0.78
rs28497577 G>T 3(123,793,780) 0.90
NOS3 Nitric Oxide Synthase 3 rs2070744 T>C 7(150,992,991) 0.63
PAX7 Paired Box 7 rs485874 G>A 1(18,746,432) 0.56
TNF Tumour Necrosis Factor rs1799964 T>C 6(31,574,531) 0.79
TRIM63 Tripartite Motif Containing 63 rs2275950 A>G 1(26,058,512) 0.77
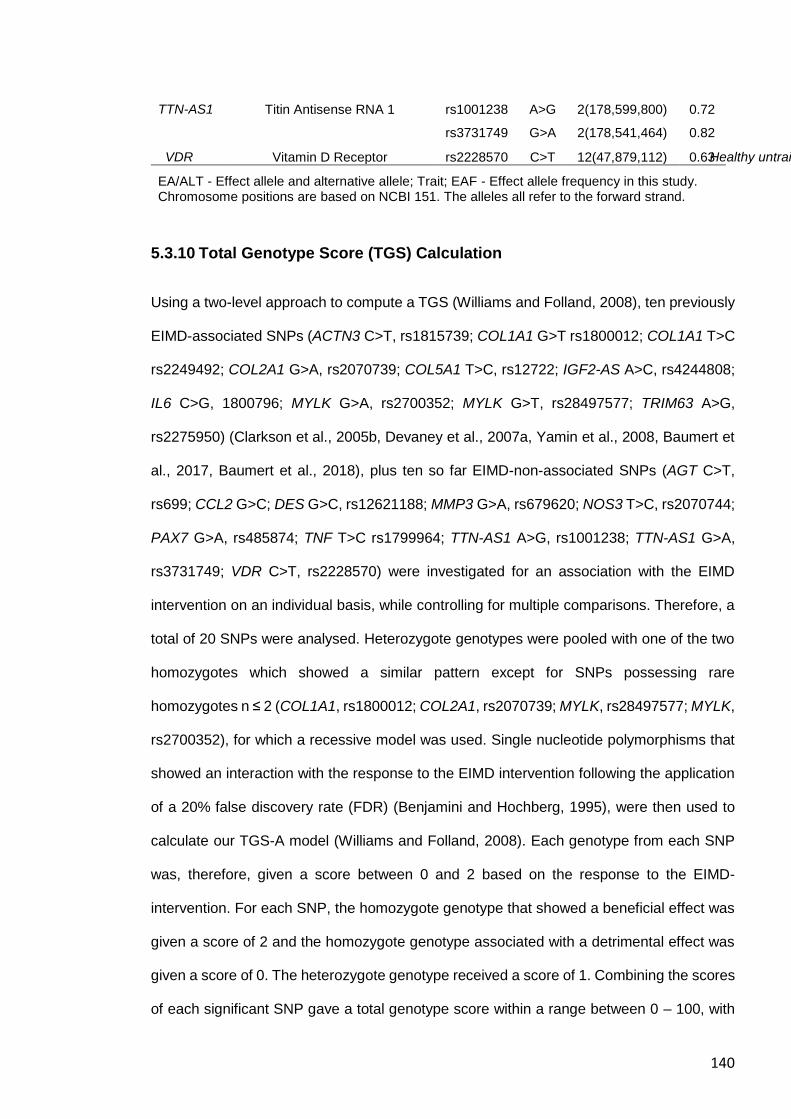
140
TTN-AS1 Titin Antisense RNA 1 rs1001238 A>G 2(178,599,800) 0.72
rs3731749 G>A 2(178,541,464) 0.82
VDR Healthy untrained men and women
Vitamin D Receptor rs2228570 C>T 12(47,879,112) 0.63
EA/ALT - Effect allele and alternative allele; Trait; EAF - Effect allele frequency in this study. Chromosome positions are based on NCBI 151. The alleles all refer to the forward strand.
5.3.10 Total Genotype Score (TGS) Calculation
Using a two-level approach to compute a TGS (Williams and Folland, 2008), ten previously
EIMD-associated SNPs (ACTN3 C>T, rs1815739; COL1A1 G>T rs1800012; COL1A1 T>C
rs2249492; COL2A1 G>A, rs2070739; COL5A1 T>C, rs12722; IGF2-AS A>C, rs4244808;
IL6 C>G, 1800796; MYLK G>A, rs2700352; MYLK G>T, rs28497577; TRIM63 A>G,
rs2275950) (Clarkson et al., 2005b, Devaney et al., 2007a, Yamin et al., 2008, Baumert et
al., 2017, Baumert et al., 2018), plus ten so far EIMD-non-associated SNPs (AGT C>T,
rs699; CCL2 G>C; DES G>C, rs12621188; MMP3 G>A, rs679620; NOS3 T>C, rs2070744;
PAX7 G>A, rs485874; TNF T>C rs1799964; TTN-AS1 A>G, rs1001238; TTN-AS1 G>A,
rs3731749; VDR C>T, rs2228570) were investigated for an association with the EIMD
intervention on an individual basis, while controlling for multiple comparisons. Therefore, a
total of 20 SNPs were analysed. Heterozygote genotypes were pooled with one of the two
homozygotes which showed a similar pattern except for SNPs possessing rare
homozygotes n ≤ 2 (COL1A1, rs1800012; COL2A1, rs2070739; MYLK, rs28497577; MYLK,
rs2700352), for which a recessive model was used. Single nucleotide polymorphisms that
showed an interaction with the response to the EIMD intervention following the application
of a 20% false discovery rate (FDR) (Benjamini and Hochberg, 1995), were then used to
calculate our TGS-A model (Williams and Folland, 2008). Each genotype from each SNP
was, therefore, given a score between 0 and 2 based on the response to the EIMD-
intervention. For each SNP, the homozygote genotype that showed a beneficial effect was
given a score of 2 and the homozygote genotype associated with a detrimental effect was
given a score of 0. The heterozygote genotype received a score of 1. Combining the scores
of each significant SNP gave a total genotype score within a range between 0 – 100, with
141
the best possible polygenic genotype score defined as 100, and the worst possible as 0.
Based on the TGS-A distribution, we divided the cohort into three categories, namely a
“preferential genetic” (PG; high score), “moderate” (MG), and “non-preferential genetic”
(NPG; low score) profile. The thresholds of these three TGS-A groups were determined
according to the �� of the total genotype score ± 1SD (i.e. NPG < �� -1SD; MG ��-1SD to
��+1SD; PG ≥ ��+1SD).
5.3.11 Muscle Stem Cell Cohort (in vitro Study)
Twelve recreationally active and healthy young female Caucasians participated in this
study. Prior to starting the study, a pre-biopsy screening (including venous blood samples
were obtained from all participants for genotyping purposes) as approved by a physician
was obtained from each participant. The following candidate SNPs, which demonstrated a
genotype X intervention interaction with markers of EIMD in the G-REX cohort, were
assessed for parameters in the muscle cell culture study: ACTN3, rs1815739; COL1A1,
rs1800012; COL1A1, rs2249492; COL2A1, rs2070739; COL5A1, rs12722; IGF-AS,
rs4244808; MMP3, rs679620; NOS3, rs2070744; PAX7, rs485874; VDR; rs2228570;
TRIM63, rs2275950; and TTN, rs3731749.
5.3.12 Muscle Cell Culture
The methodological approach has been described in detail in section 4.3.
5.3.13 Data Analysis
Each SNP was tested for compliance with the Hardy-Weinberg equilibrium by using a χ2
test. All parameters were normally distributed according to the Shapiro-Wilk test and by
inspection of the Q-Q plots. Linkage disequilibrium (LD) was analysed via LDlink suite and
data from the 1000 Genomes Project European ancestry populations (Machiela and
Chanock, 2015, Consortium, 2012). Recent investigations revealed that pruning for LD
142
regarding polygenic approaches does not essentially change the results (Vrieze et al.,
2013). Therefore, SNPs with LD were still included in the TGS-A. We recruited young,
healthy men and women to increase both the external validity and sample size of the in vivo
study, and the muscle stem cells did not show significant differences between sex for any
of the investigated parameters (see Chapter 4). However, because there is limited evidence
for sex-specific differences in the response eccentric exercise (Sewright et al., 2008), we
initially analysed the data according to sex. All data were analysed for interactions and main
effects for sex (sex groups: between subjects factor) and time (within subjects factor: PRE,
POST, POST48) using two-way-mixed analysis of variance (ANOVA). As an interaction
was found between sex and time regarding MVC normalised to body mass (please see
below), All subsequent analyses were performed using two-way-mixed analysis of
covariance (ANCOVA), with genotype (genotype groups: between subjects factor), time
(within subjects factor: PRE, POST, and POST48) with sex (male/female) included as a
covariate. For post hoc analyses, either, independent t-tests, or one-way ANOVAs were
used where appropriate. Regarding the primary muscle stem cells study, linear regression
analyses were used to analyse the relation between the following parameters: proportion of
myoblast to fibroblasts, migration dynamics (total cell migration, proportion inner/ outer
segment), and myotube formation (total myotubes, myotube length, average diameter,
myotube area and CK activity). Standard guidelines concerning violation of the sphericity
assumption to adjust the degree of freedom of the F-test by the Huynh-Felt epsilon if epsilon
is greater than 0.75 and to use the more stringent Greenhouse-Geisser adjustment if
epsilon is less than 0.75 were followed (Girden, 1992). All MVC torque values were
normalised to body mass unless otherwise stated and analysed with AcqKnowledge
software 4.4 (Biopac-Systems Inc., Goleta, USA) and SPSS 23 Software (IBM Inc., Armonk,
NY: IBM Corp) was used for statistical analysis. Results were expressed as mean ± SD
except otherwise stated, with statistical significance set at p < 0.05.
143
5.4 RESULTS
5.4.1 Effect of EIMD-Intervention on Biomarkers According to Sex
5.4.1.1 Isometric and Isokinetic MVC
There was an interaction between sex and time for normalised isometric (F2,126=4.13,
P=0.018) and isokinetic MVC torque (F2,126=8.06, P=5.08x10⁻⁴; Table 5-3). Therefore,
subsequent genetic analyses included sex as a co-variate.
5.4.1.2 Muscle Soreness
There was no main effect of sex (F1,63=0.15, P=0.701) and no interaction between sex and
time (F value and P value) following EIMD (F2,126=1.19, P=0.309).
5.4.1.3 Blood Biomarkers
There were no main effect of sex (F1,36=2.77, P=0.105) and no interaction between time and
sex regarding changes in either serum IL-6 concentration (F2,72=0.66, P=0.521) regarding
changes in either serum IL-6 concentration. There were also no main effect of sex
(F1,36=3.51, P=0.069) and no interaction between time and sex regarding serum CK activity
(F2,72=1.67, P=0.202).
5.4.2 Effect of EIMD-Intervention on Biomarkers
Isometric and isokinetic MVC, muscle soreness (all P<0.001) and serum CK activity
(P=0.009) showed a main effect of time, indicating EIMD had occurred (Table 5-3).
Specifically, both isometric and isokinetic MVC decreased pre- to post-EIMD (both P<0.05)
and remained lower than baseline at 48 h post-EIMD (both P<0.05). Muscle soreness and
serum CK activity increased pre- to post-EIMD (both P<0.05) and remained elevated post-
EIMD compared to baseline (both P<0.05). However, serum IL-6 concentration did not show
any changes at POST and POST48 compared to PRE EIMD-intervention (P>0.05).
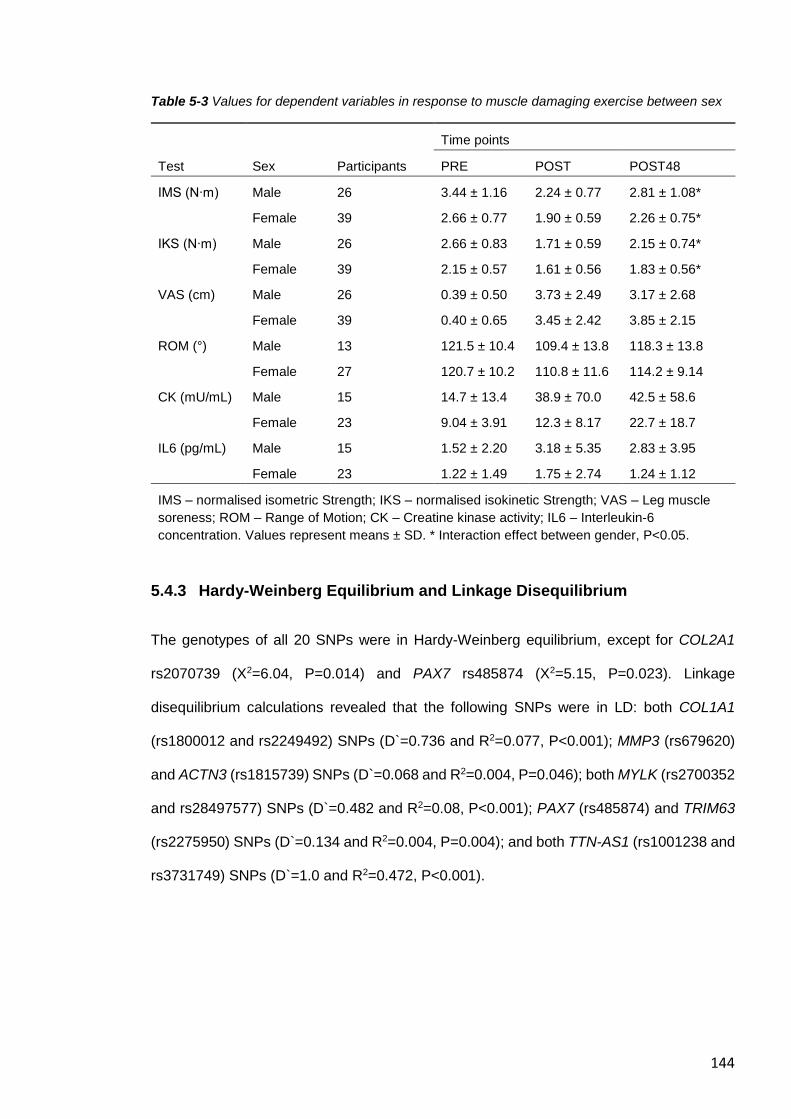
144
Table 5-3 Values for dependent variables in response to muscle damaging exercise between sex
Time points
Test Sex Participants PRE POST POST48
IMS (N∙m) Male 26 3.44 ± 1.16 2.24 ± 0.77 2.81 ± 1.08*
Female 39 2.66 ± 0.77 1.90 ± 0.59 2.26 ± 0.75*
IKS (N∙m) Male 26 2.66 ± 0.83 1.71 ± 0.59 2.15 ± 0.74*
Female 39 2.15 ± 0.57 1.61 ± 0.56 1.83 ± 0.56*
VAS (cm) Male 26 0.39 ± 0.50 3.73 ± 2.49 3.17 ± 2.68
Female 39 0.40 ± 0.65 3.45 ± 2.42 3.85 ± 2.15
ROM (°) Male 13 121.5 ± 10.4 109.4 ± 13.8 118.3 ± 13.8
Female 27 120.7 ± 10.2 110.8 ± 11.6 114.2 ± 9.14
CK (mU/mL) Male 15 14.7 ± 13.4 38.9 ± 70.0 42.5 ± 58.6
Female 23 9.04 ± 3.91 12.3 ± 8.17 22.7 ± 18.7
IL6 (pg/mL) Male 15 1.52 ± 2.20 3.18 ± 5.35 2.83 ± 3.95
Female 23 1.22 ± 1.49 1.75 ± 2.74 1.24 ± 1.12
IMS – normalised isometric Strength; IKS – normalised isokinetic Strength; VAS – Leg muscle
soreness; ROM – Range of Motion; CK – Creatine kinase activity; IL6 – Interleukin-6
concentration. Values represent means ± SD. * Interaction effect between gender, P<0.05.
5.4.3 Hardy-Weinberg Equilibrium and Linkage Disequilibrium
The genotypes of all 20 SNPs were in Hardy-Weinberg equilibrium, except for COL2A1
rs2070739 (X2=6.04, P=0.014) and PAX7 rs485874 (X2=5.15, P=0.023). Linkage
disequilibrium calculations revealed that the following SNPs were in LD: both COL1A1
(rs1800012 and rs2249492) SNPs (D`=0.736 and R2=0.077, P<0.001); MMP3 (rs679620)
and ACTN3 (rs1815739) SNPs (D`=0.068 and R2=0.004, P=0.046); both MYLK (rs2700352
and rs28497577) SNPs (D`=0.482 and R2=0.08, P<0.001); PAX7 (rs485874) and TRIM63
(rs2275950) SNPs (D`=0.134 and R2=0.004, P=0.004); and both TTN-AS1 (rs1001238 and
rs3731749) SNPs (D`=1.0 and R2=0.472, P<0.001).
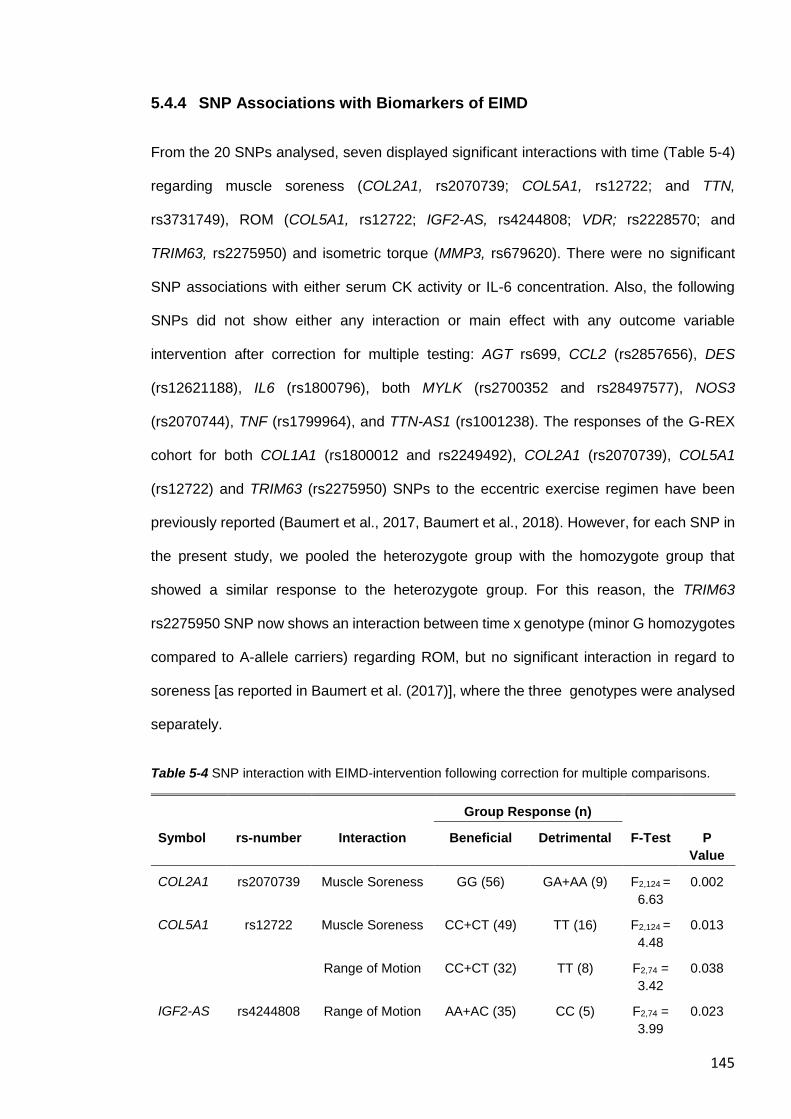
145
5.4.4 SNP Associations with Biomarkers of EIMD
From the 20 SNPs analysed, seven displayed significant interactions with time (Table 5-4)
regarding muscle soreness (COL2A1, rs2070739; COL5A1, rs12722; and TTN,
rs3731749), ROM (COL5A1, rs12722; IGF2-AS, rs4244808; VDR; rs2228570; and
TRIM63, rs2275950) and isometric torque (MMP3, rs679620). There were no significant
SNP associations with either serum CK activity or IL-6 concentration. Also, the following
SNPs did not show either any interaction or main effect with any outcome variable
intervention after correction for multiple testing: AGT rs699, CCL2 (rs2857656), DES
(rs12621188), IL6 (rs1800796), both MYLK (rs2700352 and rs28497577), NOS3
(rs2070744), TNF (rs1799964), and TTN-AS1 (rs1001238). The responses of the G-REX
cohort for both COL1A1 (rs1800012 and rs2249492), COL2A1 (rs2070739), COL5A1
(rs12722) and TRIM63 (rs2275950) SNPs to the eccentric exercise regimen have been
previously reported (Baumert et al., 2017, Baumert et al., 2018). However, for each SNP in
the present study, we pooled the heterozygote group with the homozygote group that
showed a similar response to the heterozygote group. For this reason, the TRIM63
rs2275950 SNP now shows an interaction between time x genotype (minor G homozygotes
compared to A-allele carriers) regarding ROM, but no significant interaction in regard to
soreness [as reported in Baumert et al. (2017)], where the three genotypes were analysed
separately.
Table 5-4 SNP interaction with EIMD-intervention following correction for multiple comparisons.
Group Response (n)
Symbol rs-number Interaction Beneficial Detrimental F-Test P
Value
COL2A1 rs2070739 Muscle Soreness GG (56) GA+AA (9) F2,124 =
6.63
0.002
COL5A1 rs12722 Muscle Soreness CC+CT (49) TT (16) F2,124 =
4.48
0.013
Range of Motion CC+CT (32) TT (8) F2,74 =
3.42
0.038
IGF2-AS rs4244808 Range of Motion AA+AC (35) CC (5) F2,74 =
3.99
0.023
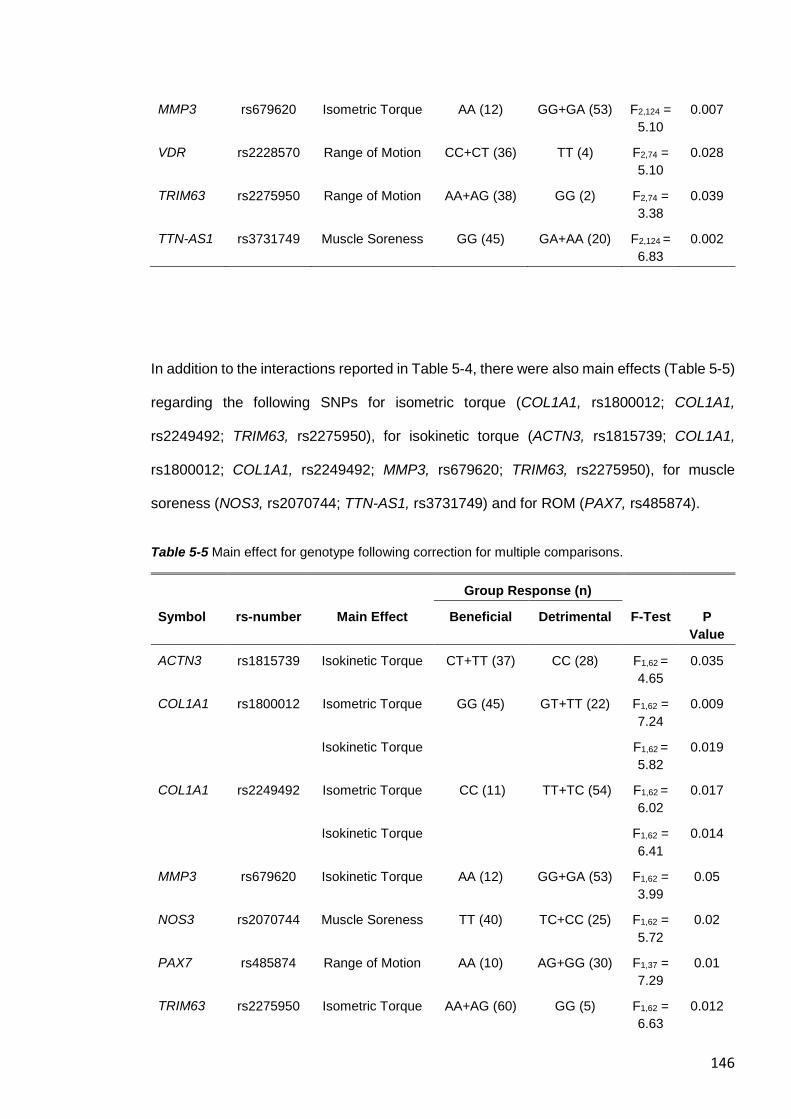
146
MMP3 rs679620 Isometric Torque AA (12) GG+GA (53) F2,124 =
5.10
0.007
VDR rs2228570 Range of Motion CC+CT (36) TT (4) F2,74 =
5.10
0.028
TRIM63 rs2275950 Range of Motion AA+AG (38) GG (2) F2,74 =
3.38
0.039
TTN-AS1 rs3731749 Muscle Soreness GG (45) GA+AA (20) F2,124 =
6.83
0.002
In addition to the interactions reported in Table 5-4, there were also main effects (Table 5-5)
regarding the following SNPs for isometric torque (COL1A1, rs1800012; COL1A1,
rs2249492; TRIM63, rs2275950), for isokinetic torque (ACTN3, rs1815739; COL1A1,
rs1800012; COL1A1, rs2249492; MMP3, rs679620; TRIM63, rs2275950), for muscle
soreness (NOS3, rs2070744; TTN-AS1, rs3731749) and for ROM (PAX7, rs485874).
Table 5-5 Main effect for genotype following correction for multiple comparisons.
Group Response (n)
Symbol rs-number Main Effect Beneficial Detrimental F-Test P
Value
ACTN3 rs1815739 Isokinetic Torque CT+TT (37) CC (28) F1,62 =
4.65
0.035
COL1A1 rs1800012 Isometric Torque GG (45) GT+TT (22) F1,62 =
7.24
0.009
Isokinetic Torque F1,62 =
5.82
0.019
COL1A1 rs2249492 Isometric Torque CC (11) TT+TC (54) F1,62 =
6.02
0.017
Isokinetic Torque F1,62 =
6.41
0.014
MMP3 rs679620 Isokinetic Torque AA (12) GG+GA (53) F1,62 =
3.99
0.05
NOS3 rs2070744 Muscle Soreness TT (40) TC+CC (25) F1,62 =
5.72
0.02
PAX7 rs485874 Range of Motion AA (10) AG+GG (30) F1,37 =
7.29
0.01
TRIM63 rs2275950 Isometric Torque AA+AG (60) GG (5) F1,62 =
6.63
0.012
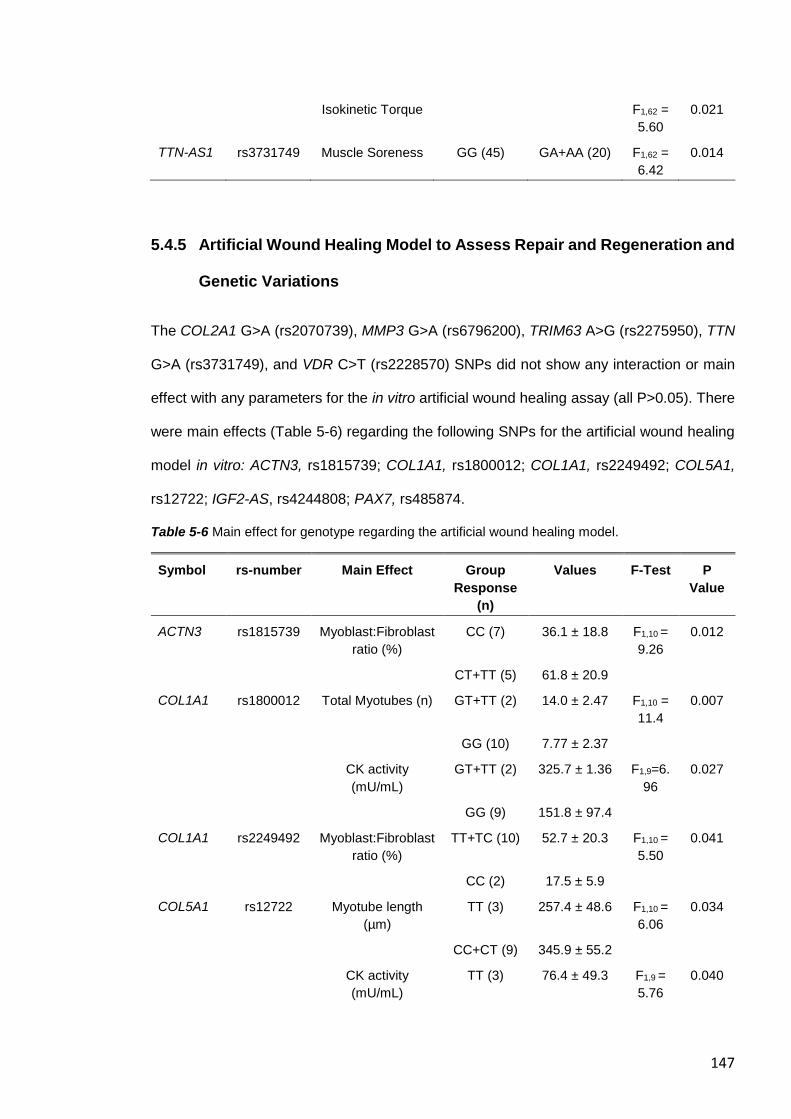
147
Isokinetic Torque F1,62 =
5.60
0.021
TTN-AS1 rs3731749 Muscle Soreness GG (45) GA+AA (20) F1,62 =
6.42
0.014
5.4.5 Artificial Wound Healing Model to Assess Repair and Regeneration and
Genetic Variations
The COL2A1 G>A (rs2070739), MMP3 G>A (rs6796200), TRIM63 A>G (rs2275950), TTN
G>A (rs3731749), and VDR C>T (rs2228570) SNPs did not show any interaction or main
effect with any parameters for the in vitro artificial wound healing assay (all P>0.05). There
were main effects (Table 5-6) regarding the following SNPs for the artificial wound healing
model in vitro: ACTN3, rs1815739; COL1A1, rs1800012; COL1A1, rs2249492; COL5A1,
rs12722; IGF2-AS, rs4244808; PAX7, rs485874.
Table 5-6 Main effect for genotype regarding the artificial wound healing model.
Symbol rs-number Main Effect Group
Response
(n)
Values F-Test P
Value
ACTN3 rs1815739 Myoblast:Fibroblast
ratio (%)
CC (7) 36.1 ± 18.8 F1,10 =
9.26
0.012
CT+TT (5) 61.8 ± 20.9
COL1A1 rs1800012 Total Myotubes (n) GT+TT (2) 14.0 ± 2.47 F1,10 =
11.4
0.007
GG (10) 7.77 ± 2.37
CK activity
(mU/mL)
GT+TT (2) 325.7 ± 1.36 F1,9=6.
96
0.027
GG (9) 151.8 ± 97.4
COL1A1 rs2249492 Myoblast:Fibroblast
ratio (%)
TT+TC (10) 52.7 ± 20.3 F1,10 =
5.50
0.041
CC (2) 17.5 ± 5.9
COL5A1 rs12722 Myotube length
(µm)
TT (3) 257.4 ± 48.6 F1,10 =
6.06
0.034
CC+CT (9) 345.9 ± 55.2
CK activity
(mU/mL)
TT (3) 76.4 ± 49.3 F1,9 =
5.76
0.040
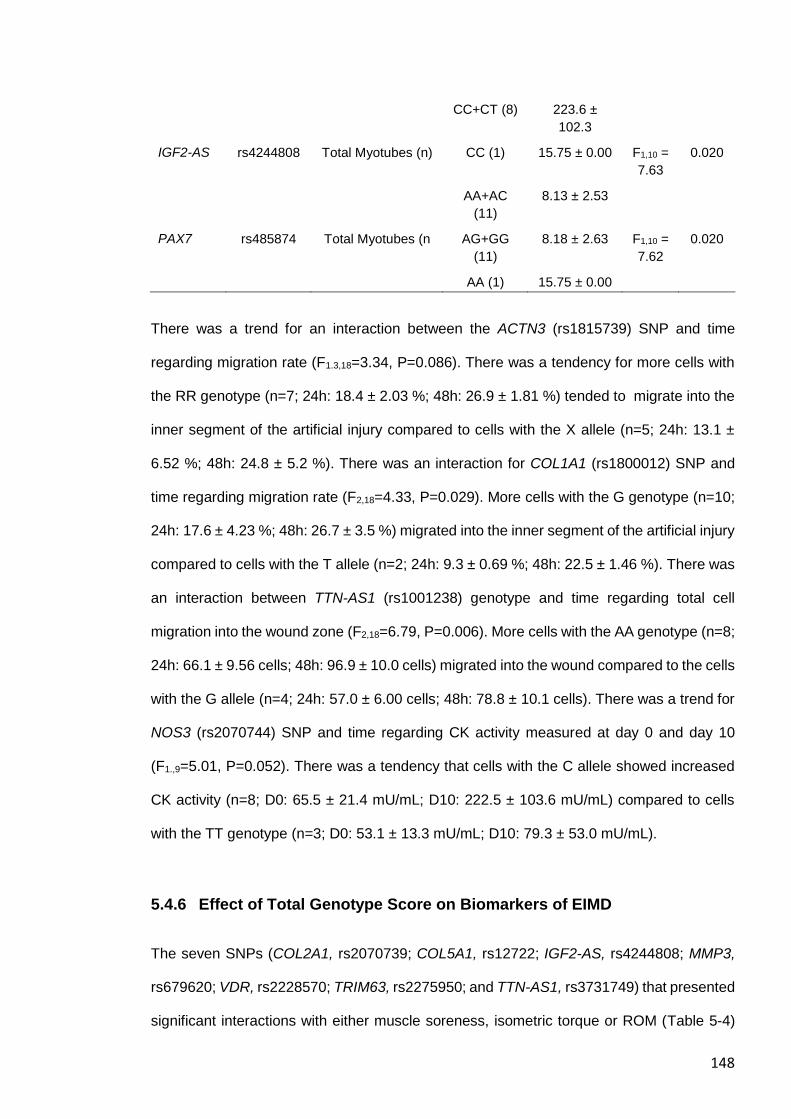
148
CC+CT (8) 223.6 ±
102.3
IGF2-AS rs4244808 Total Myotubes (n) CC (1) 15.75 ± 0.00 F1,10 =
7.63
0.020
AA+AC
(11)
8.13 ± 2.53
PAX7 rs485874 Total Myotubes (n AG+GG
(11)
8.18 ± 2.63 F1,10 =
7.62
0.020
AA (1) 15.75 ± 0.00
There was a trend for an interaction between the ACTN3 (rs1815739) SNP and time
regarding migration rate (F1.3,18=3.34, P=0.086). There was a tendency for more cells with
the RR genotype (n=7; 24h: 18.4 ± 2.03 %; 48h: 26.9 ± 1.81 %) tended to migrate into the
inner segment of the artificial injury compared to cells with the X allele (n=5; 24h: 13.1 ±
6.52 %; 48h: 24.8 ± 5.2 %). There was an interaction for COL1A1 (rs1800012) SNP and
time regarding migration rate (F2,18=4.33, P=0.029). More cells with the G genotype (n=10;
24h: 17.6 ± 4.23 %; 48h: 26.7 ± 3.5 %) migrated into the inner segment of the artificial injury
compared to cells with the T allele (n=2; 24h: 9.3 ± 0.69 %; 48h: 22.5 ± 1.46 %). There was
an interaction between TTN-AS1 (rs1001238) genotype and time regarding total cell
migration into the wound zone (F2,18=6.79, P=0.006). More cells with the AA genotype (n=8;
24h: 66.1 ± 9.56 cells; 48h: 96.9 ± 10.0 cells) migrated into the wound compared to the cells
with the G allele (n=4; 24h: 57.0 ± 6.00 cells; 48h: 78.8 ± 10.1 cells). There was a trend for
NOS3 (rs2070744) SNP and time regarding CK activity measured at day 0 and day 10
(F1.,9=5.01, P=0.052). There was a tendency that cells with the C allele showed increased
CK activity (n=8; D0: 65.5 ± 21.4 mU/mL; D10: 222.5 ± 103.6 mU/mL) compared to cells
with the TT genotype (n=3; D0: 53.1 ± 13.3 mU/mL; D10: 79.3 ± 53.0 mU/mL).
5.4.6 Effect of Total Genotype Score on Biomarkers of EIMD
The seven SNPs (COL2A1, rs2070739; COL5A1, rs12722; IGF2-AS, rs4244808; MMP3,
rs679620; VDR, rs2228570; TRIM63, rs2275950; and TTN-AS1, rs3731749) that presented
significant interactions with either muscle soreness, isometric torque or ROM (Table 5-4)
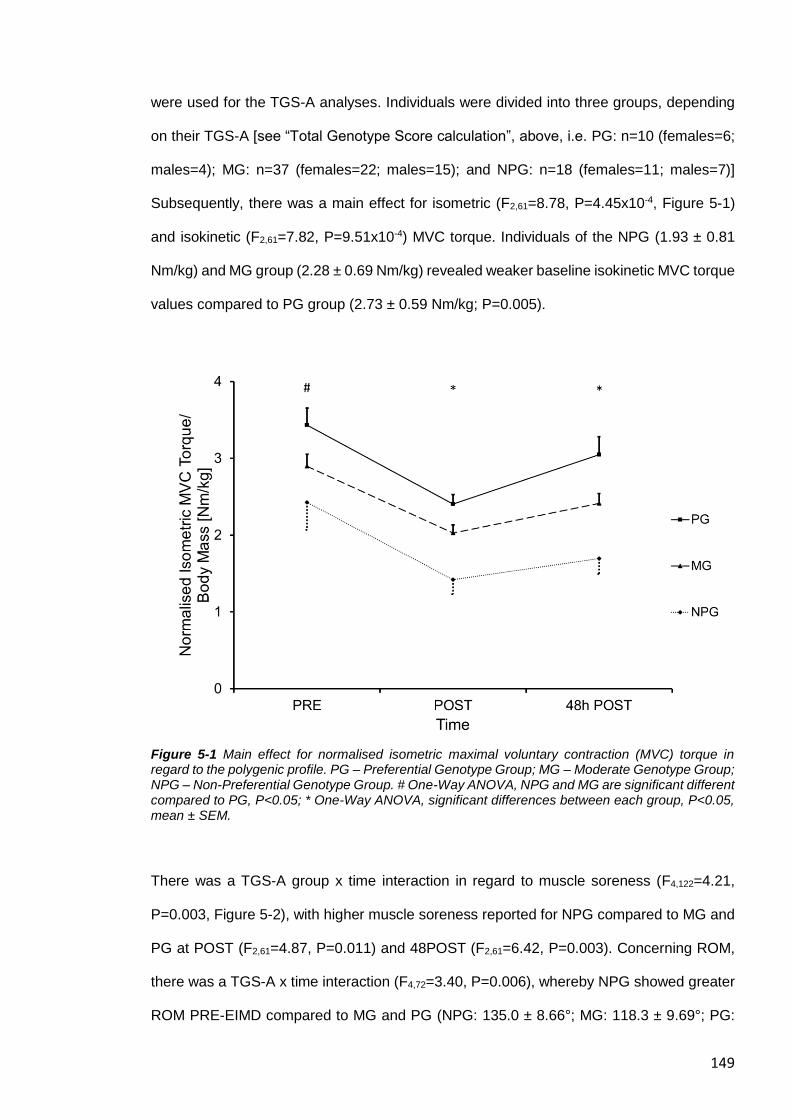
149
were used for the TGS-A analyses. Individuals were divided into three groups, depending
on their TGS-A [see “Total Genotype Score calculation”, above, i.e. PG: n=10 (females=6;
males=4); MG: n=37 (females=22; males=15); and NPG: n=18 (females=11; males=7)]
Subsequently, there was a main effect for isometric (F2,61=8.78, P=4.45x10⁻⁴, Figure 5-1)
and isokinetic (F2,61=7.82, P=9.51x10⁻⁴) MVC torque. Individuals of the NPG (1.93 ± 0.81
Nm/kg) and MG group (2.28 ± 0.69 Nm/kg) revealed weaker baseline isokinetic MVC torque
values compared to PG group (2.73 ± 0.59 Nm/kg; P=0.005).
Figure 5-1 Main effect for normalised isometric maximal voluntary contraction (MVC) torque in regard to the polygenic profile. PG – Preferential Genotype Group; MG – Moderate Genotype Group; NPG – Non-Preferential Genotype Group. # One-Way ANOVA, NPG and MG are significant different compared to PG, P<0.05; * One-Way ANOVA, significant differences between each group, P<0.05, mean ± SEM.
There was a TGS-A group x time interaction in regard to muscle soreness (F4,122=4.21,
P=0.003, Figure 5-2), with higher muscle soreness reported for NPG compared to MG and
PG at POST (F2,61=4.87, P=0.011) and 48POST (F2,61=6.42, P=0.003). Concerning ROM,
there was a TGS-A x time interaction (F4,72=3.40, P=0.006), whereby NPG showed greater
ROM PRE-EIMD compared to MG and PG (NPG: 135.0 ± 8.66°; MG: 118.3 ± 9.69°; PG:
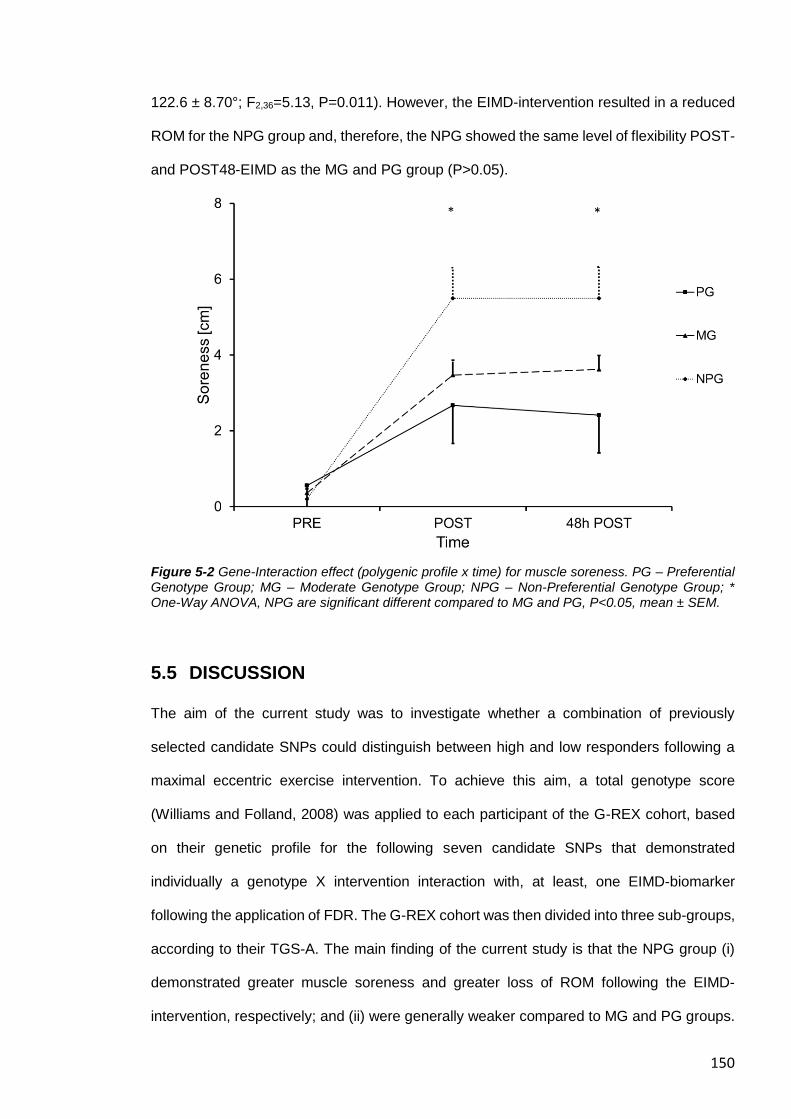
150
122.6 ± 8.70°; F2,36=5.13, P=0.011). However, the EIMD-intervention resulted in a reduced
ROM for the NPG group and, therefore, the NPG showed the same level of flexibility POST-
and POST48-EIMD as the MG and PG group (P>0.05).
Figure 5-2 Gene-Interaction effect (polygenic profile x time) for muscle soreness. PG – Preferential Genotype Group; MG – Moderate Genotype Group; NPG – Non-Preferential Genotype Group; * One-Way ANOVA, NPG are significant different compared to MG and PG, P<0.05, mean ± SEM.
5.5 DISCUSSION
The aim of the current study was to investigate whether a combination of previously
selected candidate SNPs could distinguish between high and low responders following a
maximal eccentric exercise intervention. To achieve this aim, a total genotype score
(Williams and Folland, 2008) was applied to each participant of the G-REX cohort, based
on their genetic profile for the following seven candidate SNPs that demonstrated
individually a genotype X intervention interaction with, at least, one EIMD-biomarker
following the application of FDR. The G-REX cohort was then divided into three sub-groups,
according to their TGS-A. The main finding of the current study is that the NPG group (i)
demonstrated greater muscle soreness and greater loss of ROM following the EIMD-
intervention, respectively; and (ii) were generally weaker compared to MG and PG groups.
151
Contrary to our hypothesis, we could not observe any TGS-A X intervention interaction with
(i) changes in strength regarding our polygenic profile; and (ii) the concentration or activity
of blood-borne biomarkers of EIMD following the intervention, neither on an individual SNP
or polygenic basis. Among the individual SNPs that demonstrated an interaction with the
EIMD-intervention, there were three distinct functional groups regarding the response to the
EIMD-intervention. Here we discuss the potential influence of the individual SNPs that
demonstrated an interaction or main effect with EIMD in vivo and with the wound healing
assay in vitro, as well as the polygenic profile.
5.5.1 Functional Group of SNPs Related to Muscle Soreness
The first functional group of the protein related-SNPs comprise COL2A1 (rs2070739),
COL5A1 (rs12722), and TTN-AS1 (rs3731749). The SNPs are located within genes, which
contribute to the elastic properties of the MTU and may have a crucial role in storing and
releasing energy during fast movements and/or stretch shortening cycles (Turrina et al.,
2013). The strong type II collagen (the pro-alpha-1 chain of type II collagen is encoded by
the COL2A1 gene) fibrils are commonly expressed in cartilage (Gustafsson et al., 2003).
However, chronic stress can induce an upregulation of COL2A1 in tendon, indicating a
(mal)adaptation to chronic overuse training (Archambault et al., 2007). Collagen type V (the
pro-alpha-1 chain of type V collagen is encoded by COL5A1) is predominantly present in
the endomysium (surrounding muscle fibres) and epimysium (surrounding the muscle) of
the muscle ECM (Nakamura et al., 2007). The giant protein titin (encoded by the TTN gene)
extends between the Z-line and the M-line (Bang et al., 2001) and is essential for the
structure and elasticity of the sarcomere. The risk alleles of these three SNPs [A-allele of
COL2A1 (rs2070739); TT genotype of COL5A1 (rs12722); A-allele of TTN-AS1
(rs3731749)] demonstrated an interaction between perceived muscle soreness and time
regarding the EIMD-intervention. In addition, participants of the COL5A1 TT genotype also
reported an impaired recovery of ROM in vivo and decreased myotube length and CK
activity in the artificial wound healing model in vitro compared to the C-allele carriers,
152
presumably due to an elevated fibroblast activity. Fibroblasts are essential for efficient repair
and regeneration of the ECM within muscle and tendon (Goetsch et al., 2003, Davis et al.,
2013, please see Chapter IV). However, the three SNPs might affect the expression
rate/stability of the corresponding gene (Lin et al., 2018, Tarpey et al., 2013, Posthumus et
al., 2011). This appears to negatively influence the elastic components of the MTU with a
subsequent decreased capacity to store and release energy (Stafilidis and Arampatzis,
2007, Turrina et al., 2013). An increased stiffness of the elastic components of the MTU
might increase stress on the contractile components making NPGs more prone to EIMD
during eccentric MVC compared to PGs. Overstretched cytoskeleton/muscle ECM may
result in an increase of extracellular inflammatory mediators, which might trigger the
nociceptor response within the muscle, leading to elevated muscle soreness (Hyldahl and
Hubal, 2014, Hucho and Levine, 2007).
5.5.2 Functional Group of SNPs Related to Delayed Muscle Regeneration
The second functional group of SNPs, which are related to enzymes of the skeletal muscle
catabolic (MMP3, rs679620; TRIM63, rs2275950) and anabolic (VDR, rs2228570; also
referred to as FOK1) signaling pathways, were associated with markers of EIMD 48 h after
the exercise intervention. Matrix metalloproteinases (MMPs) are enzymes which
breakdown components (e.g. collagen) synthesised and secreted by fibroblasts. Fibroblasts
are essential for efficient repair and regeneration of the ECM within muscle and tendon
(Goetsch et al., 2003, Davis et al., 2013, please see Chapter IV). The G-allele of the
missense MMP3 (rs679620) G>A SNP is thought to decrease MMP3 transcription (Foster
et al., 2012, Ye, 2006, Taylor et al., 2008), which might supress the activity to degrade
collagen III and other substrates (Sternlicht et al., 1999). The ubiquitin E3 ligase, muscle
RING finger-1 (MuRF-1, expressed by the TRIM63 gene), plays an important part in muscle
atrophy via the ubiquitin–proteasome pathway (Bodine et al., 2001a). Further, recent
investigations suggest that MuRF-1 interacts with one of titin’s three strain-sensing
locations at the M-line of the sarcomere (Centner et al., 2001, Baumert et al., 2017). Vitamin
153
D and the vitamin D receptor (VDR), are involved in immune function, calcium homeostasis,
bone health and muscle function (Owens et al., 2018). Several polymorphisms within the
VDR gene have been associated with changes in muscle function (Grundberg et al., 2004,
Barr et al., 2010) and with the severity of musculoskeletal injuries in professional football
players (Massidda et al., 2015). (Arai et al., 1997).
It is possible that the preferential alleles of three of these SNPs [A-allele of MMP3
(rs679620); A-allele of TRIM63 (rs2275950); C-allele of VDR (rs22285700)] exert their
beneficial effect by increasing the expression rate of their transcript following EIMD
compared to their corresponding non-preferential alleles (Foster et al., 2012, Ye, 2006,
Taylor et al., 2008) (Arai et al., 1997). The increased response potentially promotes repair
and supports successful skeletal muscle remodeling mirrored by a faster recovery of ROM
(TRIM63 and VDR SNPs) and muscle strength (MMP3 SNP) 48 h following EIMD. Further,
the preferential allele of two of these three SNPs (MMP3 and TRIM63 SNPs) showed
generally higher strength values. Increased gene expression of the preferential alleles and
a subsequent increased degradation activity of the corresponding enzymes after intense
exercises might lead to a better turnover of the target proteins and, therefore, to a higher
stability of the ECM, thus potentially explaining the generally higher strength values of the
G-REX participants. Regarding the VDR SNP, it seems that the non-preferential T-allele
‘protects’ non-exercising individuals against loss of muscle strength and free-fat mass
(Windelinckx et al., 2007, Hopkinson et al., 2008, Roth et al., 2004). The increased VDR
activity of the C-allele might lead to a higher risk of chronic low-grade inflammation resulting
in accelerated muscle strength loss of sedentary elderly. However, the elevated gene
activity supports muscle regeneration following EIMD, i.e. via elevated skeletal muscle
myogenesis (Owens et al., 2015, Stratos et al., 2013). Therefore, in older, sedentary
individuals, the C-allele is likely disadvantageous in terms of muscle function but in
physically active people (young and old), this allele could be beneficial in terms of aiding
the muscle recovery process following exercise.
154
The CC homozygotes of the insulin-like growth factor-II antisense (IGF2-AS; rs4244808)
A>C SNP was the only signalling-related SNP that demonstrated a further reduction in ROM
immediately post EIMD. Expression of IGF2 might not change following an EIMD-
intervention per se but IGF-II concentration might be generally higher in CC homozygotes
(due to lower IFG2-AS gene activity) (Zhao et al., 2017). Increased IGF2 expression might
increase ECM deposition, causing a detrimental ECM structure (Keller et al., 1999, Baumert
et al., 2016a), which is more prone to EIMD (Porter et al., 2002). Further, the CC genotype
revealed a higher number of formed myotubes post damage in vitro, indicating an elevated
sarcomerogenesis. This could lead to more sarcomeres in series (Wisdom et al., 2015),
which potentially explains the generally greater ROM in vivo in CC homozygotes.
5.5.3 No Interaction of the Polygenic profile with Strength Loss following
EIMD
It is thought that muscle force is transmitted predominantly laterally via the perimysium
(surrounding muscle fascicles) to the tendon and ultimately to the bone (Ramaswamy et al.,
2011). Collagen type I is predominantly present in the perimysial tissue, which becomes
continuous with the tendon (Passerieux et al., 2007, Hughes et al., 2015, Gillies and Lieber,
2011). α-Actinin-3 (ACTN3) might play an exceptional role in the MTU, as α-actinin-3
anchors actin to the Z-line, which might play functionally an important role in muscle force
transmission, both longitudinally and laterally (Hughes et al., 2015). The preferential alleles
of the structure-related SNPs [X-allele of ACTN3 (rs1815739); GG homozygotes COL1A1
(rs1800012); and CC homozygotes of COL1A (rs2249492)] showed a main effect for a
greater MVC torque generating capacity in vivo. CC homozygotes of COL1A1 (rs2249492)
demonstrated a higher proportion of fibroblasts to myoblasts in vitro, and COL1A1 GG
homozygotes (rs1800012) showed a lower number of total myotubes, which is
accompanied with decreased CK activity. The beneficial alleles of both COL1A1 SNPs
might have an increased fibroblast activity, which might cause stiffer components and
subsequently lead to better longitudinal and lateral force transmission. Apart from that, the
155
interaction of the COL1A1 SNPs with parameters of the in vitro study further indicates that
that the collagen SNPs do not only effect the function of the tendon, but also of the muscle
ECM. However, the X-allele of the nonsense ACTN3 R577X SNP showed a higher myoblast
to fibroblast ratio in vitro and a non-significant tendency for a greater strength loss following
the EIMD-intervention (unadjusted P = 0.022, data not shown) compared to R-allele
homozygotes, supporting the literature that the X-allele is associated with an increased
susceptibility to muscle damage (Seto et al., 2011, Broos et al., 2018). The absence of the
stiff α-actinin-3 in fast-twitch fibres (Broos et al., 2012, North et al., 1999) might decrease
the stability and rigidity of type II fibres of the X-allele carrier. Intriguingly, others found
increased fibrosis and strength loss of mice with overexpression of ACTN3 after post-natal
gene editing (Garton et al., 2018a), which is in line with our results of a higher ratio of
fibroblast to myoblasts in RR carriers in vitro. It needs further investigation whether this
mirrors a lower amount of a subpopulation of muscle stem cells, which are associated with
slow twitch fibres type I (Biressi and Rando, 2010). That might give a mechanistically
explanation of a lower capability for an increase of muscle mass in these slow twitch fibres
of R-allele carrier and, therefore, an attenuated increase of muscle strength following
chronic resistance training in untrained individuals (Clarkson et al., 2005a).
Nonetheless, the polygenic profile could not detect strength loss following the EIMD-
intervention indicating that the investigated SNPs might not have covered those linked
genes, which encoded proteins are involved in the MVC change after the EIMD-intervention.
The MMP3 (rs679620) SNP was the only individual SNP, which demonstrated an interaction
with MVC measurements. The preferential allele of MMP3 SNP might increase the enzyme
activity to degrade proteins (such as collagen type III within the perimysium) leading to a
higher turnover of ECM proteins. Together with other enzyme-related SNPs such as
TRIM63 (rs2275950), potentially this mechanism results in an increased MTU integrity and
a better force transmission in the long term. However, the interaction effect of the MMP3
SNP was masked when the SNP was combined with the six other SNPs in the polygenic
profile.
156
Recent investigations reported an important role of the ECM regarding muscle injuries and
it seems that appropriate damage to the perimysium differentiates between EIMD and
muscle strains (Balius et al., 2018, Mueller-Wohlfahrt et al., 2012). We therefore
hypothesise that EIMD-interventions induced by an IKD with low-speed eccentric MVC are
potentially not able to cause substantial damage to the stiff components of the perimysium
(such as the collagen type I fibrils), and that the MVC strength loss might be more
associated with damage to structural components of the myofibrillar apparatus, particularly
those involved in the longitudinal force transmission (e.g. titin and nebulin) (Trappe et al.,
2002). In contrast, repeated high external forces involved with high-speed contractions,
such as sprinting might have a greater risk of damage to components of the perimysium
(Chapter 3) compared to the current EIMD-intervention with low eccentric MVCs.
Insufficient recovery of previously damaged muscle fibres might increase the risk of muscle
strains (potentially caused primarily by damage to the perimysium) on a clinically relevant
scale (Malone et al., 2016, Chumanov et al., 2011, Duhig et al., 2016).
The different phenotypic outcomes of the different interventions and of the SNP clusters
might contribute to a deeper understanding of the mechanism of EIMD. The endo- and
epimysium might have an important function to store and release elastic energy and to
protect the remaining MTU from overstretching. SNPs which keep the endo- and epimysium
elastic, might attenuate damage within the MTU. Other SNPs associated with the
activity/function of enzymes, which are linked with the EIMD response, might support the
recovery response (and potentially the maintenance of muscle quality in the long term). The
stiff components of the MTU (e.g. of the perimysium) transmit force and simultaneously are
the major contributor to the passive force of skeletal muscles at high strain (Gillies and
Lieber, 2011). SNPs associated with the integrity of these stiff components might change
the EIMD/muscle strain injury risk.
157
5.5.4 Limitations
We acknowledge that we have recruited both male and female participants and there is
some limited evidence that men and women respond differently to eccentric exercise
(Sewright et al., 2008). However, the majority of studies attempting to address this question
have shown no sex differences in in the susceptibility to ultrastructural muscle damage
(Sayers and Clarkson, 2001, Thompson et al., 1997, Stupka et al., 2001, Wüst et al., 2008).
Furthermore, although our male participants were stronger than our female subjects in both
absolute and relative (to body mass) terms, when the change in MVC at time points POST
and 48POST was reported as a percentage change from baseline MVC, we observed no
difference in strength loss between men and women. We, therefore, used absolute strength
normalised to body mass with the covariate sex, so we were able to analyse strength
differences between genotype/allele for each SNP. Moreover, each of our three polygenic
groups contained a similar ratio of men to women, so it is highly unlikely that any sex
differences influenced the outcome of our results. Finally, serum IL-6 levels did not increase
significantly over time following the muscle damage intervention. Peak serum IL-6 values
were probably not observed as the IL-6 is expected to peak between 6 and 24 hours after
an eccentric-exercise intervention (Willoughby et al., 2003). Therefore, our study may have
benefitted from additional time points for blood analyses to acquire a more comprehensive
and accurate representation of the time course of the serum IL-6 response to our EIMD
intervention.
5.6 CONCLUSION/ PERSPECTIVE
A fundamental challenge for exercise-related science is to determine the high inter-
individual variability in the response to exercise for the development of inexpensive
individualised health management to prevent injuries and diseases. Our study suggests that
seven SNPs in seven different genes, both on an individual and combined (polygenic) basis,
can anticipate the response to muscle-damaging exercises regarding different EIMD-
158
biomarkers (i.e. muscle soreness and ROM). The most striking outcome was that
individuals possessing a non-preferential genetic profile concerning muscle changes in
muscle soreness and ROM were also generally weaker than individuals with a preferential
genetic profile, which is a potentially important clinical finding. Further investigations are
necessary to determine whether NPGs (i) have an increased likelihood to sustain a muscle
injury; (ii) also reveal an attenuated response to chronic resistance training, indicating where
the anabolic signaling pathway may be impaired; (iii) might show change in the activation
of the catabolic signaling pathway; and (iv) whether these differences in strength between
the polygenic groups are further amplified with ageing, where size, strength and quality of
the muscle and of the muscle ECM are diminished and the negative response to EIMD
appears to be augmented (Jiménez-Jiménez et al., 2008, Manfredi et al., 1991). This
knowledge will potentially help to develop personalised health management by providing
the most suitable and effective activity plan specific to an individual as personalised
exercise medicine becomes more widely accepted as an inexpensive health intervention to
prevent injury and disease and maintain/improve physical performance in young and older
individuals.
159
6 A common Polygenic Profile Linking the Acute and
Chronic Responses to Resistance Exercise
It is noted that the neuromuscular physiology data (pre/post training) of the Genetics of
RESIStance Training (G-ResisT) cohort have been published previously (Erskine et al.,
2010a; 2010b; 2011; 2014), and constituted part of Dr Robert Erskine’s PhD Thesis (2010).
To investigate whether the genetic profile identified in Chapter 5 was also associated with
the adaptations to chronic resistance training, the DNA samples from G-ResisT were re-
analysed for the SNPs investigated in Chapter 5. .

160
161
6.1 ABSTRACT
Introduction The study aims were to investigate the hypotheses that (i) a polygenic profile
(total genotype score, TGS) comprising a combination of candidate single-nucleotide
polymorphisms (SNPs) previously associated with the response to acute resistance
exercise (RE) could anticipate high and low responders to chronic RE; and (ii) a new TGS
that demonstrate an interaction with chronic RE could estimate the response to acute RE.
Methods In cohort one (G-REX study, Chapter 5: 65 young, untrained men and women),
maximal quadriceps strength, serum creatine kinase (CK) and interleukin-6 (IL-6) were
measured before, after and 48 h after acute RE. In cohort two (51 young, untrained men),
quadriceps muscle strength and size were assessed before and after nine weeks of chronic
RE. Participants were genotyped for 20 candidate SNPs and TGSs were determined
according to the response/adaptation to acute (TGS-A) and chronic (TGS-C) RE.
Results TGS-A was not associated with any adaptations to chronic RE. However, TGS-C
was associated with changes in strength but not muscle size following chronic RE. TGS-C
was also inversely associated with increases in serum CK and IL-6 following acute RE.
Conclusion A specific combination of genotypes appears to limit the damage/inflammatory
response to acute RE, while also maximising strength gains following chronic RE. This
offers a novel insight into the physiological mechanisms underpinning and linking the acute
and chronic responses to RE. After independent replication, TGS-A and TGS-C may be
used to anticipate an individual’s response/adaptation to acute/chronic RE, thus enabling
RE to be prescribed on a personalised level.
Keywords: resistance training; genetic variations; creatine kinase (CK); interleukin-6 (IL-
6); exercise-induced muscle damage (EIMD); extracellular matrix (ECM)
162
6.2 INTRODUCTION
An acute bout of unaccustomed resistance exercise (RE) that involves muscle-lengthening
(eccentric) maximal voluntary contractions (MVCs) can induce muscle damage (Clarkson
and Hubal, 2002). The exercise-induced muscle damage (EIMD) is reflected by
morphological changes, such as Z-line disturbance, an elevated inflammatory response
including the release of muscle-specific proteins into the circulatory system [e.g. creatine
kinase (CK) activity, and interleukin-6 (IL-6) concentration], and prolonged MVC loss
(Tidball, 1991, Garg and Boppart, 2016). In Chapter 3, we showed that a greater muscle
physiological cross-sectional area (PCSA), which is a measure of the total area of muscle
fibres perpendicular to their long axes (and is therefore the main determinant of maximum
force capacity), protects against immediate MVC loss following acute RE. Chronic RE, i.e.
resistance training, is a potent stimulus for increasing both muscle PCSA and strength
(Harries et al., 2012, Granacher et al., 2016, Erskine et al., 2010b), therefore, there may be
a relationship between the change in muscle PCSA with chronic RE and the ability to resist
the damaging effect of an acute bout of RE.
However, there is a large inter-individual variability in the response to acute RE (Nosaka
and Clarkson, 1996, Damas et al., 2016a, Baumert et al., 2016a, Baumert et al., 2016b) as
well as to chronic RE (Erskine et al., 2010a, Hubal et al., 2005), and recent investigations
suggest that common genetic variations, e.g. single-nucleotide polymorphisms (SNPs),
may play a role in explaining this variability (Harmon et al., 2010, Pistilli et al., 2008, Baumert
et al., 2017, Baumert et al., 2018). In Chapter 5, we demonstrated that a combination of
candidate SNPs (that each showed an interaction with the response to acute RE), can
identify high and low responders to EIMD. Thus, by calculating a “total genotype score”
(TGS) (Williams and Folland, 2008) based on the preferable/non-preferable genotype of
each significantly associated SNP, we discovered that a polygenic profile (TGS-A) was
associated with the variable response to acute RE. Participants with a non-preferable
genetic profile (NPG), i.e. individuals with a low TGS-A, showed higher muscle soreness
and decreased range of motion (ROM) following acute RE, and were generally weaker
163
compared to the preferable polygenic (PG) group. It has been suggested that increased
muscle soreness following an acute bout of unaccustomed RE is linked to an elevated
inflammatory response (Kanda et al., 2013), and that an elevated inflammatory response
with chronic RE might be detrimental for muscle hypertrophy and strength gains (Mayhew
et al., 2009). However, it is not known whether TGS-A NPGs with their genetic
predisposition to an elevated inflammation following acute RE (Chapter 5) also demonstrate
an attenuated adaptation to chronic RE in terms of gains in muscle strength and muscle
size.
Muscle force is predominantly determined by its PCSA (Powell et al., 1984, Close, 1972),
and it is thought that the increase in muscle PCSA following chronic RE is the result of
cumulative increases in myofibrillar muscle protein synthesis in response to each
successive bout of RE (Moore et al. 2009b; Brook et al. 2015). However, there is a
disproportionate increase in muscle strength and size following chronic RE (Erskine et al.,
2014a, Erskine et al., 2010b) and several SNPs have been linked with either chronic
changes in muscle hypertrophy or muscle strength (Li et al., 2014, Harmon et al., 2010).
Only a few investigations have revealed an interaction between certain SNPs and gains in
both muscle mass and muscle strength, i.e. of the muscle-derived cytokine interleukin-15
(Pistilli et al., 2008) and insulin-like growth factor 1 (Kostek et al., 2010) . Further, in recent
years, the extracellular matrix (ECM) within the muscle-tendon unit (MTU) gained attention
for its important role in providing a structural scaffold for muscle remodelling (Mackey et al.,
2017, Murphy et al., 2011) and in transmitting force laterally via the perimysium
(surrounding muscle fascicles) to the tendon and bone (Ramaswamy et al., 2011).
However, it is unknown whether certain SNPs might be associated with muscle ECM
function and whether this might affect the response to chronic RE.
Therefore, the purpose of the current study was to test the hypotheses that (i) NPGs, i.e.
those with a low TGS-A, which demonstrated greater muscle damage and a slower recovery
rate with respect to the response following acute RE (Chapter 5), would also show an
attenuated adaptation to chronic RE; or (ii) whether a different TGS (TGS-C) would be
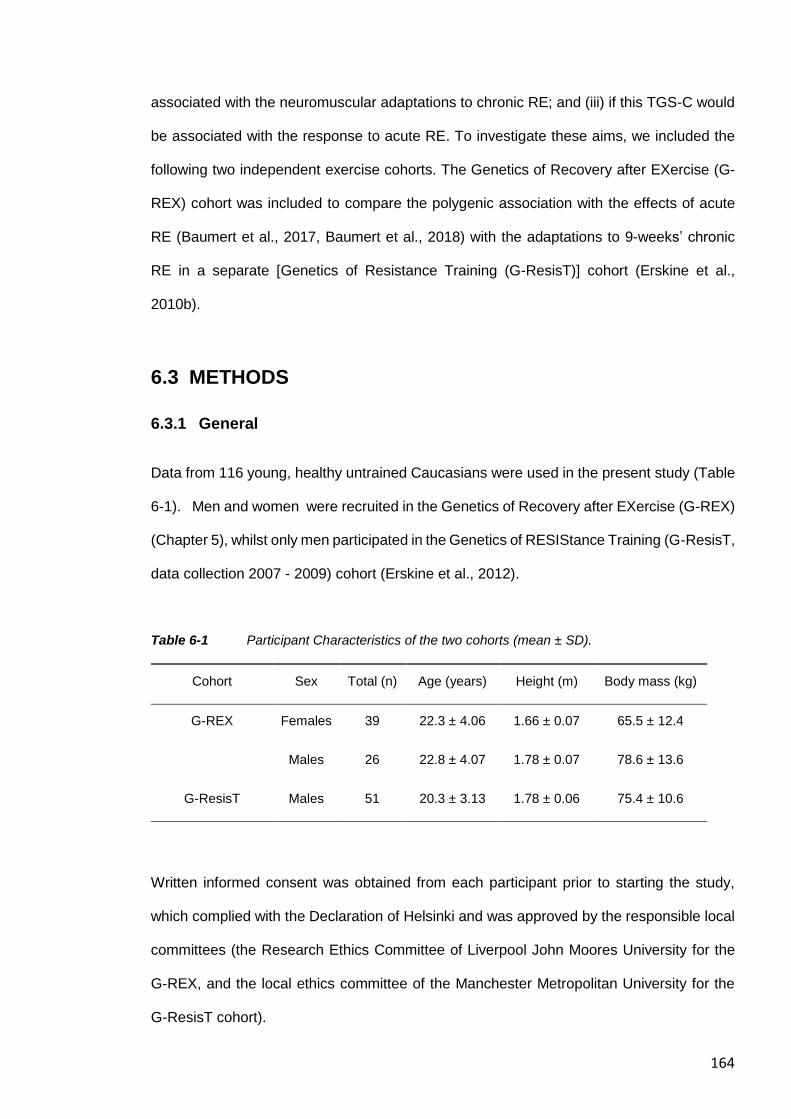
164
associated with the neuromuscular adaptations to chronic RE; and (iii) if this TGS-C would
be associated with the response to acute RE. To investigate these aims, we included the
following two independent exercise cohorts. The Genetics of Recovery after EXercise (G-
REX) cohort was included to compare the polygenic association with the effects of acute
RE (Baumert et al., 2017, Baumert et al., 2018) with the adaptations to 9-weeks’ chronic
RE in a separate [Genetics of Resistance Training (G-ResisT)] cohort (Erskine et al.,
2010b).
6.3 METHODS
6.3.1 General
Data from 116 young, healthy untrained Caucasians were used in the present study (Table
6-1). Men and women were recruited in the Genetics of Recovery after EXercise (G-REX)
(Chapter 5), whilst only men participated in the Genetics of RESIStance Training (G-ResisT,
data collection 2007 - 2009) cohort (Erskine et al., 2012).
Table 6-1 Participant Characteristics of the two cohorts (mean ± SD).
Cohort Sex Total (n) Age (years) Height (m) Body mass (kg)
G-REX Females 39 22.3 ± 4.06 1.66 ± 0.07 65.5 ± 12.4
Males 26 22.8 ± 4.07 1.78 ± 0.07 78.6 ± 13.6
G-ResisT Males 51 20.3 ± 3.13 1.78 ± 0.06 75.4 ± 10.6
Written informed consent was obtained from each participant prior to starting the study,
which complied with the Declaration of Helsinki and was approved by the responsible local
committees (the Research Ethics Committee of Liverpool John Moores University for the
G-REX, and the local ethics committee of the Manchester Metropolitan University for the
G-ResisT cohort).
165
Participants were familiarised with all test procedures and equipment before the baseline
measurements and participant inclusion criteria for the three cohorts comprised: (i) age
between the range of 18–35 yr (18–39 yr for G-ResisT), (ii) no history of strength training 6
months (12 months for the G-ResisT cohort) prior to the study, as determined via physical
activity questionnaire and interview; (iii) no history of lower extremity musculoskeletal
injuries 12 months prior to the study, as assessed via interview; (iv) no use of potentially
anabolic supplements; and (v) considered not to be in ill health (determined by their
responses to a health questionnaire).
6.3.2 G-REX Cohort
Please see Chapter 5 for a detailed methodology regarding these measurements in the G-
REX cohort. In brief, the G-REX separate cohort of 65 untrained young men and women
(G-REX cohort) performed maximum voluntary isometric and isokinetic knee extension
contractions (MVCs) on an isokinetic dynamometer before (PRE), immediately after (POST)
and 48 h after (48POST) performing 120 eccentric knee extension MVCs. Further, at each
time point, a 10 mL venous blood sample was taken from a superficial forearm vein to
measure serum interleukin-6 (IL-6) concentration, creatine kinase (CK) activity, and to
determine genotype of 20 SNPs.
6.3.3 G-ResisT Cohort
6.3.3.1 Experimental Design
Maximum patellar tendon force, quadriceps femoris muscle volume, physiological cross-
sectional area (PCSA), and specific force were determined in the right limb (as described
in method 2 of Ref. 8) before and after 9 wk of high-intensity unilateral knee extension RE
(Erskine et al., 2010b) in 51 previously untrained young healthy men (G-ResisT, a separate
cohort to G-REX). In addition, all participants had blood samples isolated, which were
genotyped for all 20 candidate SNPs (see below).
166
6.3.3.2 Progressive Resistance Exercise
The supervised chronic RE protocol has been described in detail elsewhere (Erskine et al.,
2010b). In summary. The chronic RE intervention comprised a supervised unilaterally knee
extension for three times per week for 9 wk. At the beginning of the training programme,
the maximum training load that could be lifted once only (1-RM) throughout the full range of
knee extension (110° to 20° of knee flexion; 0° full knee extension) was assessed. The 1-
RM was re-evaluated at the start of each week on a standard knee extension machine
(Technogym, Gambettola, Italy) and, therefore, the training intensity progressively
increased throughout the 9 wk of training, as the training intensity was adjusted in relation
to the 1-RM. Each training session consisted of a warm-up set of 10 knee extension
repetitions (40% of 1-RM), which was followed by four sets (2 min rest between each) of 10
repetitions (80% of 1-RM). Each participant completed all 27 training sessions and,
therefore, the compliance with the training protocol was 100%.
6.3.3.3 Maximum Isometric Patellar Tendon Force
The method used to assess maximum patellar tendon force has been explained in detail
elsewhere (Erskine et al., 2009). In brief, participants performed isometric knee extension
maximal voluntary contractions (MVCs) on an isokinetic dynamometer (Cybex Norm, Cybex
International, Ronkonkoma, NY) at optimum knee strength angle (optimal force-length
relationship), which ranged from 70 to 90° knee flexion (0º = full knee extension).
Participants were seated in an upright position and securely fastened with inextensible
straps to the strength-testing chair. The hip joint angle was set to 85° (180° = supine
position). Surface electromyographic (sEMG) activity was recorded from the biceps femoris
long head to determine the extent of antagonist muscle co-activation during MVCs of the
respective muscle group (Reeves et al., 2004a). Two bipolar silver chloride surface
electrodes (Neuroline, Medicotest, Rugmarken, Denmark) were placed 20 mm apart along
the sagittal axis over the muscle belly (the location was recorded on an acetate for further
167
tests) and one reference electrode was positioned over the lateral tibial condyle. The root
mean square of the raw EMG signal was calculated over 1 s around the peak torque during
each maximum voluntary isometric knee extension and flexion at optimum joint angle and
the torque produced by the hamstrings during knee extension was estimated assuming a
linear relationship between torque and EMG activity (Reeves et al., 2004a). The estimated
antagonist torque was obtained at the optimum knee extension joint angle and then used
to calculate the maximum overall knee extension torque. To measure voluntary quadriceps
femoris muscle activation capacity via the interpolated twitch technique (Rutherford et al.,
1986), the participant received a supramaximal twitch (Digitimer stimulator model DS7,
Welwyn Garden City, UK) via two (7.5 cm 12.5 cm) self-adhesive electrodes (Versastim,
Conmed, New York, NY), which were placed distally (anode) and proximally (cathode) over
the quadriceps femoris muscle, once before MVC (control twitch) and once during MVC.
True maximum torque was calculated as
True maximum torque =MVC(C)
1– 𝑡/T
where t is the amplitude of the superimposed twitch, T is the value of the twitch before the
MVC, and MVC(C) is MVC corrected for antagonist muscle co-activation.
The patellar tendon moment arm (dPT) was determined using a 0.2-T magnetic resonance
imaging (MRI) scanner (G-Scan, Esaote Biomedica, Genoa, Italy), as previously described
(Tsaopoulos et al., 2006). Sagittal and coronal-plane knee scans were acquired using a
Turbo 3D T1-weighted sequence (scanning parameters: time of repetition 40 ms; time to
echo 16 ms; matrix 256 x 256; field of view 180 mm x 180 mm; slice thickness 3.4 mm;
interslice gap 0 mm). The participant was in the supine position and the knee fully extended,
when the knee was scanned at rest. Coronal scans were used to identify the appropriate
sagittal scans, which were used to locate the centre of rotation, i.e., the midpoint of the
shortest distance between the two femoral condyles and the tibial plateau, and dPT was
defined as the perpendicular distance between the centre of rotation and the axis of the
patellar tendon (Tsaopoulos et al., 2006). Previously reported ratios of dPT at full extension
(0°knee flexion) to dPT at 70°, 80°, and 90° knee flexion (Baltzopoulos, 1995) were used to
168
calculate dPT at optimum knee joint angle in this study. Subsequently, maximum force
resolved at the patellar tendon was calculated as
Maximum force resolved at the patellar tendon =True maximum torque
𝑑PT
6.3.3.4 Muscle Physiological Cross-sectional Area (PCSA)
Quadriceps femoris muscle PCSA was determined from a method that has been described
in detail previously [method 2 of (Erskine et al., 2009)]. Briefly, femur length, defined as the
distance from the proximal origin of the vastus lateralis muscle to the tibiofemoral contact
point, was assessed by ultrasonography (MyLab25, Esaote Biomedica, Genoa, Italy). The
anatomical cross-sectional area was analysed of each of the four component quadriceps
femoris heads via transverse MRI scans (at 40% femur length from the distal end).
Quadriceps femoris muscle volume was then calculated by adapting a previously described
method (Morse et al., 2007) that incorporated femur length, the anatomical cross-sectional
area of each of the four constituent quadriceps femoris heads and a series of regression
equations. Vastus lateralis muscle fascicle length and pennation angle were measured
during knee extension MVC at optimum knee angle using ultrasonography at 50% of the
muscle length along the midsagittal plane. Dividing quadriceps femoris muscle volume by
vastus lateralis muscle fascicle length provided quadriceps femoris PCSA, as vastus
lateralis fascicle length has been shown to be representative of the fascicle length for the
whole quadriceps femoris muscle group (Erskine et al., 2009).
6.3.3.5 In vivo Muscle Specific Force
The method used to assess in vivo muscle specific force has been explained in detail
elsewhere (Erskine et al., 2009). Briefly, in vivo specific force was determined by dividing
maximum force resolved at the patellar tendon by the reduced quadriceps femoris PCSA,
because quadriceps femoris muscle force is reduced when resolved along the patellar
tendon according to the pennation angle. Therefore, quadriceps femoris PCSA was
169
multiplied by the cosine of vastus lateralis pennation angle, which provided the reduced
quadriceps femoris PCSA.
6.3.3.6 In vivo Peak Power Output
The method used to determine in vivo peak power output (Wpeak) normalised to quadriceps
femoris muscle volume (Wpeak/muscle volume) has been described in detail elsewhere
(Erskine et al., 2011). Briefly, Wpeak of the lower right limb was assessed using a modified
isokinetic cycle ergometer (Lode Standard, Groningen, The Netherlands), driven by a 2.24
kW motor through a variable-speed gearbox and with strain gauges within the pedals
registering the forces at right angles to the top surface of the pedal (Sargeant et al., 1981,
Beelen et al., 1994). The test session started with a 5 min warm-up at a pedal frequency of
90 r.p.m. and with the pedals connected to an external load of 60W. The external cranks
were then connected to the electric motor, the external load set to 0W, and the participant
performed isokinetic sprints at five predetermined, randomly assigned pedal frequencies
(50, 70, 90, 110 and 130 r.p.m.), where the participant attempted (unsuccessfully) to
accelerate the system by exerting maximal force during each revolution. Each sprint lasted
for 6 s and was separated by a 5 min resting period. Although participants performed a two-
legged sprint, Wpeak was calculated in the right (trained) limb only. The calculation of Wpeak
was adapted by a previously described (Beelen et al., 1994) and Wpeak was calculated
according to the following equation:
Wpeak (in watts) = peak tangential force × tangential velocity
Peak tangential force and tangential velocity values were previously calculated by different
equations incorporating the pennation angle of the pedal as well as both, the vertical and
horizontal force and velocity, respectively.
170
6.3.3.7 Blood Sampling
A 10-ml blood sample was drawn into 10-ml EDTA (for genotyping) or serum (for IL-6/CK
analysis in the G-REX cohort only) collection tubes (BD Vacutainer Systems, Plymouth,
UK) from a superficial forearm vein. The whole blood/serum was aliquotted into 2-ml tubes
(Eppendorf AG, Hamburg, Germany) and stored at -80°C until subsequent analysis.
6.3.3.8 DNA Extraction and Determination of Genotypes
DNA extraction was performed either manually (for the G-REX cohort) or with a QIAcube
(Qiagen, Crawley, UK; for the G-ResisT cohort) using the QIAamp DNA Blood Kit (Qiagen,
Crawley, UK), following the QIAamp spin protocol for DNA purification from whole blood.
Genotyping was performed at the Liverpool John Moores University as described previously
(Baumert et al., 2018, please see Chapter V). All samples, plus positive and negative
controls were analysed in duplicate and there was 100% agreement between genotype for
samples from the same participant.
6.3.3.9 Total Genotype Score (TGS) Calculation
Using a two-level approach to calculate a TGS (Williams and Folland, 2008), the 20 SNPs
we investigated in Chapter 5 (ACTN3 C>T, rs1815739; AGT C>T, rs699; CCL2 G>C;
COL1A1 G>T rs1800012; COL1A1 T>C, rs2249492; COL2A1 G>A, rs2070739; COL5A1
T>C, rs12722; DES G>C, rs12621188; IGF2-AS A>C, rs4244808; IL6 C>G, 1800796;
MMP3 G>A, rs679620; MYLK1 G>A, rs2700352; MYLK1 G>T, rs28497577; NOS3 T>C,
rs2070744; PAX7 G>A, rs485874; TNF T>C rs1799964; TRIM63 A>G, rs2275950; TTN-
AS1 A>G, rs1001238; TTN-AS1 G>A, rs3731749; and VDR C>T, rs2228570) were
investigated for an association with the adaptations to chronic RE on an individual basis,
while controlling for multiple comparisons. Heterozygote genotypes were pooled with one
of the two homozygotes that showed a similar pattern except for SNPs possessing rare
homozygotes n ≤ 2 (COL1A1, rs1800012; COL2A1, rs2070739; MYLK1, rs28497577;
MYLK1, rs2700352), in which case a recessive model was used. Single nucleotide
171
polymorphisms that showed an interaction with response particular adaptation to the
chronic RE intervention following the application of a 20% false discovery rate (FDR)
(Benjamini and Hochberg, 1995), were then used to calculate the different TGS (TGS-A,
associated with the response to acute RE and TGS-C, associated with the adaptation to
chronic RE) models (Williams and Folland, 2008). Each genotype from each SNP was,
therefore, given a score between 0 and 2 based on the response to the RE intervention.
For each SNP, the homozygote genotype that showed a beneficial effect was given a score
of 2 and the homozygote genotype associated with a detrimental effect was given a score
of 0. The heterozygote genotype received a score of 1. Combining the scores of each
significant SNP gave a total genotype score within a range between 0 – 100, with the best
possible polygenic genotype score defined as 100, and the worst possible as 0. The
contributions of the different TGSs to the inter-individual variance in the chronic RE-induced
change in maximum patellar tendon force, muscle specific force and in Wpeak were
determined using linear regression analysis. As in Chapter 5, three groups were defined
according to the �� of the TGS ± 1SD, i.e. non-preferential genotypes (NPG) < �� -1SD;
moderate genotypes (MG) = ��-1SD to �� +1SD; and preferential genotypes (PG) ≥ ��+1SD.
6.3.3.10 Data Analysis
Each SNP was tested for compliance with the Hardy-Weinberg equilibrium by using a χ2
test. All parameters were normally distributed according to the Shapiro-Wilk test and by
inspection of the Q-Q plots. Linkage disequilibrium (LD) was analysed via LDlink suite and
data from the 1000 Genomes Project European ancestry populations (Machiela and
Chanock, 2015, Consortium, 2012). Recent investigations revealed that pruning for LD
regarding polygenic approaches does not essentially change the results (Vrieze et al.,
2013). Therefore, SNPs with LD were still included in the TGS. Repeated-measures
analysis of variance (ANOVAs) [within-subjects factor: time (pre- and post-chronic RE);
between-subjects factor: genotype groups (2 group levels)] were used to detect
associations between each SNP and 1-RM, isometric MVC knee joint torque, maximum
172
patellar tendon force, Wpeak, quadriceps femoris muscle PCSA and muscle specific force
before and after training. For post hoc analyses, either, independent t-tests, or one-way
ANOVAs were used where appropriate. Standard guidelines concerning violation of the
sphericity assumption to adjust the degree of freedom of the F-test by the Huynh-Felt
epsilon if epsilon is greater than 0.75 and to use the more stringent Greenhouse-Geisser
adjustment if epsilon is less than 0.75 were followed (Girden, 1992). 1-RM, MVC knee joint
torque, and maximum patellar tendon force were normalised to body mass, unless
otherwise stated, and analysed with AcqKnowledge software 4.4 (Biopac-Systems Inc.,
Goleta, USA). Muscle fascicle length, quadriceps femoris muscle volume and PCSA were
normalised to femur length; and Wpeak was normalised with quadriceps femoris volume.
6.4 RESULTS
6.4.1 Hardy-Weinberg Equilibrium and Linkage Disequilibrium
The genotypes of all 20 SNPs were in Hardy-Weinberg equilibrium, except for COL2A1
rs2070739 (X2=6.04, P=0.014) and PAX7 rs485874 (X2=5.15, P=0.023) in the G-REX
cohort. Linkage disequilibrium calculations revealed that the following SNPs were in LD:
both COL1A1 (rs1800012 and rs2249492) SNPs (D`=0.736 and R2=0.077, P<0.001);
MMP3 (rs679620) and ACTN3 (rs1815739) SNPs (D`=0.068 and R2=0.004, P=0.046); both
MYLK1 (rs2700352 and rs28497577) SNPs (D`=0.482 and R2=0.08, P<0.001); PAX7
(rs485874) and TRIM63 (rs2275950) SNPs (D`=0.134 and R2=0.004, P=0.004); and both
TTN-AS1 (rs1001238 and rs3731749) SNPs (D`=1.0 and R2=0.472, P<0.001).
6.4.2 The Association of the Individual SNPs with the Response to Chronic
Resistance Exercise
From the 20 SNPs analysed with respect to the G-ResisT cohort, eight displayed significant
interactions with time (pre to post chronic RE) after correction for multiple testing (Table
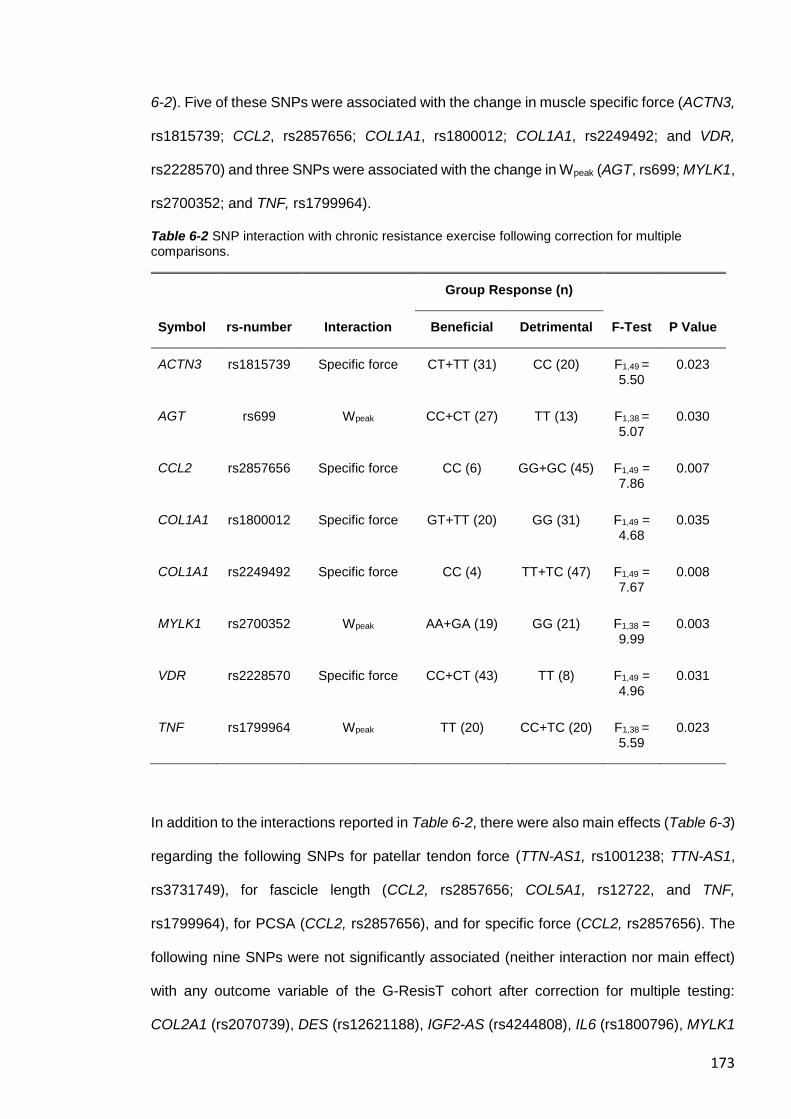
173
6-2). Five of these SNPs were associated with the change in muscle specific force (ACTN3,
rs1815739; CCL2, rs2857656; COL1A1, rs1800012; COL1A1, rs2249492; and VDR,
rs2228570) and three SNPs were associated with the change in Wpeak (AGT, rs699; MYLK1,
rs2700352; and TNF, rs1799964).
Table 6-2 SNP interaction with chronic resistance exercise following correction for multiple comparisons.
Group Response (n)
Symbol rs-number Interaction Beneficial Detrimental F-Test P Value
ACTN3 rs1815739 Specific force CT+TT (31) CC (20) F1,49 = 5.50
0.023
AGT rs699 Wpeak CC+CT (27) TT (13) F1,38 = 5.07
0.030
CCL2 rs2857656 Specific force CC (6) GG+GC (45) F1,49 = 7.86
0.007
COL1A1 rs1800012 Specific force GT+TT (20) GG (31) F1,49 = 4.68
0.035
COL1A1 rs2249492 Specific force CC (4) TT+TC (47) F1,49 = 7.67
0.008
MYLK1 rs2700352 Wpeak AA+GA (19) GG (21) F1,38 = 9.99
0.003
VDR rs2228570 Specific force CC+CT (43) TT (8) F1,49 = 4.96
0.031
TNF rs1799964 Wpeak TT (20) CC+TC (20) F1,38 = 5.59
0.023
In addition to the interactions reported in Table 6-2, there were also main effects (Table 6-3)
regarding the following SNPs for patellar tendon force (TTN-AS1, rs1001238; TTN-AS1,
rs3731749), for fascicle length (CCL2, rs2857656; COL5A1, rs12722, and TNF,
rs1799964), for PCSA (CCL2, rs2857656), and for specific force (CCL2, rs2857656). The
following nine SNPs were not significantly associated (neither interaction nor main effect)
with any outcome variable of the G-ResisT cohort after correction for multiple testing:
COL2A1 (rs2070739), DES (rs12621188), IGF2-AS (rs4244808), IL6 (rs1800796), MYLK1
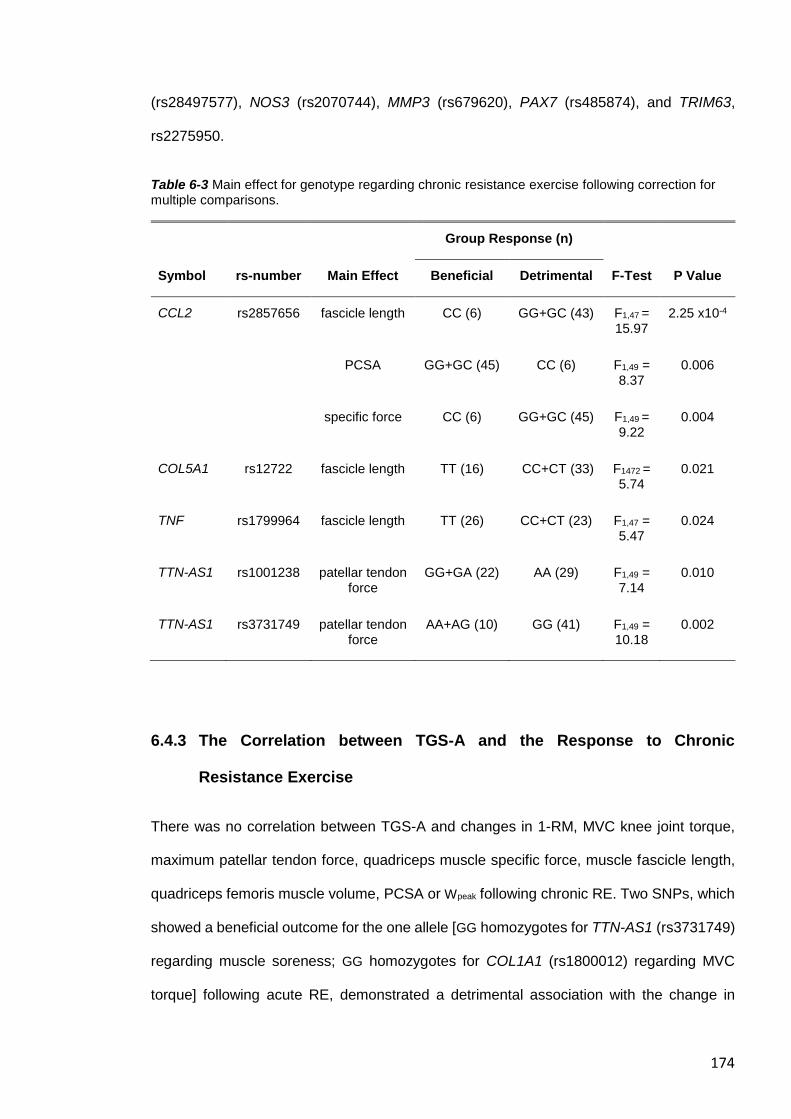
174
(rs28497577), NOS3 (rs2070744), MMP3 (rs679620), PAX7 (rs485874), and TRIM63,
rs2275950.
Table 6-3 Main effect for genotype regarding chronic resistance exercise following correction for multiple comparisons.
Group Response (n)
Symbol rs-number Main Effect Beneficial Detrimental F-Test P Value
CCL2 rs2857656 fascicle length CC (6) GG+GC (43) F1,47 = 15.97
2.25 x10⁻⁴
PCSA GG+GC (45) CC (6) F1,49 = 8.37
0.006
specific force CC (6) GG+GC (45) F1,49 = 9.22
0.004
COL5A1 rs12722 fascicle length TT (16) CC+CT (33) F1472 = 5.74
0.021
TNF rs1799964 fascicle length TT (26) CC+CT (23) F1,47 = 5.47
0.024
TTN-AS1 rs1001238 patellar tendon force
GG+GA (22) AA (29) F1,49 = 7.14
0.010
TTN-AS1 rs3731749 patellar tendon force
AA+AG (10) GG (41) F1,49 = 10.18
0.002
6.4.3 The Correlation between TGS-A and the Response to Chronic
Resistance Exercise
There was no correlation between TGS-A and changes in 1-RM, MVC knee joint torque,
maximum patellar tendon force, quadriceps muscle specific force, muscle fascicle length,
quadriceps femoris muscle volume, PCSA or Wpeak following chronic RE. Two SNPs, which
showed a beneficial outcome for the one allele [GG homozygotes for TTN-AS1 (rs3731749)
regarding muscle soreness; GG homozygotes for COL1A1 (rs1800012) regarding MVC
torque] following acute RE, demonstrated a detrimental association with the change in
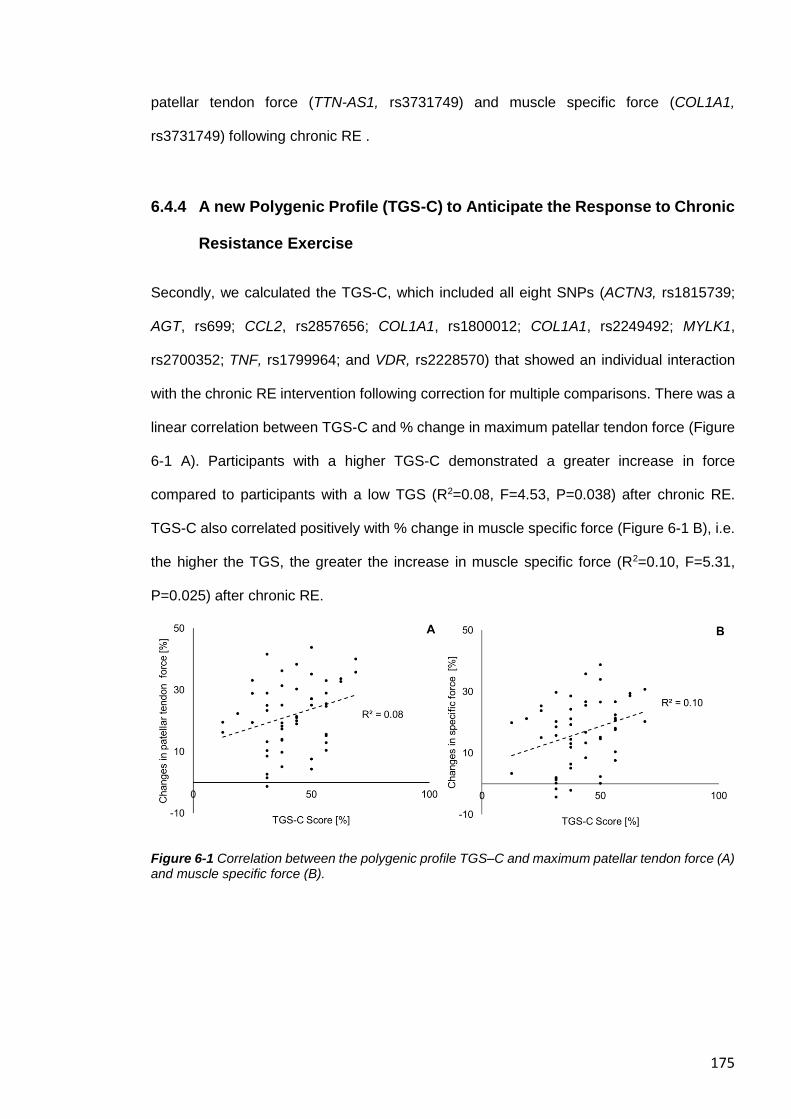
175
patellar tendon force (TTN-AS1, rs3731749) and muscle specific force (COL1A1,
rs3731749) following chronic RE .
6.4.4 A new Polygenic Profile (TGS-C) to Anticipate the Response to Chronic
Resistance Exercise
Secondly, we calculated the TGS-C, which included all eight SNPs (ACTN3, rs1815739;
AGT, rs699; CCL2, rs2857656; COL1A1, rs1800012; COL1A1, rs2249492; MYLK1,
rs2700352; TNF, rs1799964; and VDR, rs2228570) that showed an individual interaction
with the chronic RE intervention following correction for multiple comparisons. There was a
linear correlation between TGS-C and % change in maximum patellar tendon force (Figure
6-1 A). Participants with a higher TGS-C demonstrated a greater increase in force
compared to participants with a low TGS (R2=0.08, F=4.53, P=0.038) after chronic RE.
TGS-C also correlated positively with % change in muscle specific force (Figure 6-1 B), i.e.
the higher the TGS, the greater the increase in muscle specific force (R2=0.10, F=5.31,
P=0.025) after chronic RE.
Figure 6-1 Correlation between the polygenic profile TGS–C and maximum patellar tendon force (A) and muscle specific force (B).
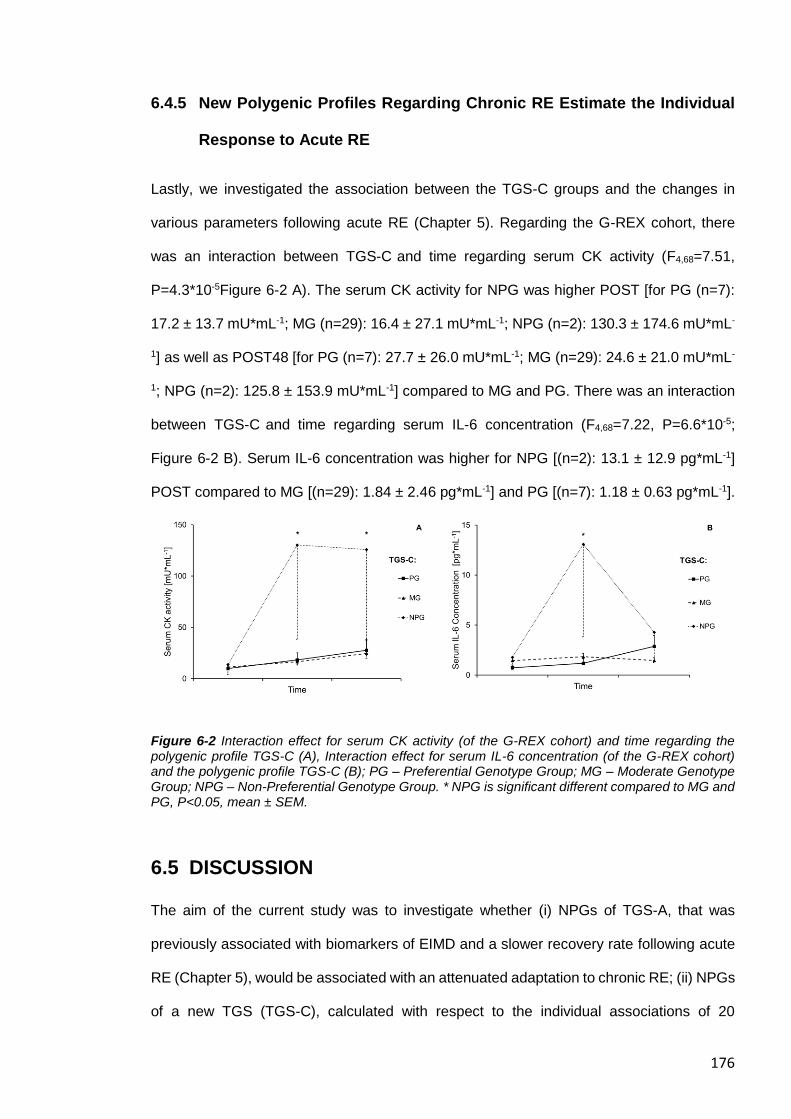
176
6.4.5 New Polygenic Profiles Regarding Chronic RE Estimate the Individual
Response to Acute RE
Lastly, we investigated the association between the TGS-C groups and the changes in
various parameters following acute RE (Chapter 5). Regarding the G-REX cohort, there
was an interaction between TGS-C and time regarding serum CK activity (F4,68=7.51,
P=4.3*10-5Figure 6-2 A). The serum CK activity for NPG was higher POST [for PG (n=7):
17.2 ± 13.7 mU*mL-1; MG (n=29): 16.4 ± 27.1 mU*mL-1; NPG (n=2): 130.3 ± 174.6 mU*mL-
1] as well as POST48 [for PG (n=7): 27.7 ± 26.0 mU*mL-1; MG (n=29): 24.6 ± 21.0 mU*mL-
1; NPG (n=2): 125.8 ± 153.9 mU*mL-1] compared to MG and PG. There was an interaction
between TGS-C and time regarding serum IL-6 concentration (F4,68=7.22, P=6.6*10-5;
Figure 6-2 B). Serum IL-6 concentration was higher for NPG [(n=2): 13.1 ± 12.9 pg*mL-1]
POST compared to MG [(n=29): 1.84 ± 2.46 pg*mL-1] and PG [(n=7): 1.18 ± 0.63 pg*mL-1].
Figure 6-2 Interaction effect for serum CK activity (of the G-REX cohort) and time regarding the polygenic profile TGS-C (A), Interaction effect for serum IL-6 concentration (of the G-REX cohort) and the polygenic profile TGS-C (B); PG – Preferential Genotype Group; MG – Moderate Genotype Group; NPG – Non-Preferential Genotype Group. * NPG is significant different compared to MG and PG, P<0.05, mean ± SEM.
6.5 DISCUSSION
The aim of the current study was to investigate whether (i) NPGs of TGS-A, that was
previously associated with biomarkers of EIMD and a slower recovery rate following acute
RE (Chapter 5), would be associated with an attenuated adaptation to chronic RE; (ii) NPGs
of a new TGS (TGS-C), calculated with respect to the individual associations of 20
177
candidate SNPs with adaptations to chronic RE, would demonstrate attenuated strength
and muscle mass gains; and (iii) NPGs of the TGS-C would demonstrate a greater EIMD
response to acute RE compared to their PG counterparts. Contrary to our first hypothesis,
TGS-A was not related to any chronic RE adaptation. In line with our second hypothesis,
however, TGS-C PGs showed greater adaptations to chronic RE compared to NPGs in
terms of changes in maximum patellar tendon force and muscle specific force. In
accordance with our third hypothesis, NPGs of TGS-C demonstrated a greater inflammatory
response (indicated by IL-6 and CK activity) following acute RE.
6.5.1 Using TGS-A to Anticipate the Adaptation to Chronic RE
It is thought that the accumulation of repeated RE leads to an increase in muscle strength
and mass. Less is known about whether muscle damage following acute RE triggers a
cascade of events that can lead to muscle restructuring, greater strength gains and muscle
hypertrophy (Roig et al., 2008). However, we did not find any association between TGS-A
and chronic RE. The individual response following acute RE might be predominantly caused
by SNPs, which are linked to the elastic components of the MTU (e.g. COL5A1 rs12722,
TTN-AS1 rs3731749) and to inflammation and protein degradation (e.g. TRIM63
rs2275950, MMP3 rs67962). This is in line with recent investigations, which found that
acute RE does not correlate well with the long-term effect of chronic RE regarding both RNA
expression (Phillips et al., 2013, Damas et al., 2018) and myofibrillar protein synthesis
(Damas et al., 2016b). However, there is no investigation that has compared collagen
protein synthesis responses following acute RE and chronic RE. It is thought that the elastic
capabilities of the MTU are essential to protect the muscle fibres from mechanical strain
during eccentric (muscle lengthening) contractions during RE (Gillies and Lieber, 2011,
Turrina et al., 2013). However, as the SNPs are not linked to the stiff perimysium, but to
other parts of the ECM, they might contribute to the force transmission to a lesser extent
and, therefore, might be less relevant for strength gains following chronic RE. SNPs related
to protein degradation pathways might be predominantly important for the capability to
178
repair ultrastructural damage following acute RE (Damas et al., 2016b). Interestingly, a
GWAS study regarding the individual strength in a large cohort of UK residents between 40
- 69 yrs demonstrated significant associations with FBXO32 SNPs (e.g. rs12548263) and a
non-significant trend with SNPs of the TRIM63 gene (e.g. rs3008425 which is in strong LD
with rs2275950) (Willems et al., 2017). Both genes are related to the ubiquitin-proteasome
pathway, providing evidence of SNPs of these genes contributing to the individual
differences in muscle strength over the life span of the general population (Willems et al.,
2017). However, protein degradation pathways might be less linked with strength gains
following chronic RE (Brook et al., 2016, Phillips et al., 2013, Damas et al., 2018). It needs
to be further investigated if this is also true with muscle hypertrophy in humans (Zillikens et
al., 2017, Verbrugge et al., 2018).
6.5.2 Using TGS-C to Estimate the Adaptation to Chronic RE
A new polygenic profile (TGS-C), which was based on the adaption to chronic RE, included
eight candidate SNPs (ACTN3, rs1815739; AGT, rs699; CCL2, rs2857656; COL1A1,
rs1800012; COL1A1, rs2249492; MYLK1, rs2700352; TNF, rs1799964; and VDR,
rs2228570) that showed an individual interaction with the chronic RE intervention. The TGS-
C was able to explain 8 % and 10% of the variability in changes of patellar tendon force and
specific force following chronic RE, respectively. This is quite significant given that the
heritability of maximum muscle strength is 50-70% (De Moor et al., 2007, Georgiades et al.,
2017, Thomis et al., 1998). As one candidate SNP is thought to account for only a small
proportion of the heritability for complex traits (McCarroll et al., 2008), the data presented
including multiple SNPs might be of scientific value to identify larger proportions of the
heritability for RE adaptations. Given the challenges in performing these types of
comprehensive genotype-phenotype interventions, the current study sheds new light on the
complex mechanism underlying the individual response following acute and chronic RE. In
comparison, the most comprehensive investigated human trait is stature, which is relatively
179
easy and quick to assess. About 17 million genetic variations have been implicated in
explaining 56% of the variability for human height, for which the heritability is 60–70% (Yang
et al., 2015). Further, among the individual SNPs that were associated with changes in
strength following chronic RE, there were two distinct clusters.
6.5.2.1 Cluster of SNPs Related to Wpeak
The preferential alleles of three SNPs [C-allele of AGT (rs699); A-allele of MYLK1
(rs2700352); TT genotype of TNF (rs1799964)] showed a beneficial interaction to Wpeak.
The preferential alleles of the myosin light chain kinase 1 (MYLK1), which is expressed in
skeletal muscle stem cells in the early phase of differentiation (Herring et al., 2000), and of
the tumour necrosis factor (TNF) SNPs also demonstrated a non-significant trend for
generally greater quadriceps muscle volume (unadjusted P=0.031, data not shown), and a
generally longer fascicle length in the vastus lateralis, respectively. However, these three
SNPs did not show any interaction to acute RE, although the genes linked to the SNPs are
directly and indirectly associated with muscle wasting related effects (Brink et al., 2001,
Tidball, 2011, Han et al., 2012). Recent investigations demonstrated that muscle stem cell
proliferation and myoblast differentiation is positively regulated by TNF (Zhan et al., 2007,
Yang and Hu, 2018) and by components of the renin–angiotensin system, which is linked
to the AGT gene (which encodes the precursor protein angiotensinogen) (Yoshida et al.,
2014, Johnston et al., 2011, Johnston et al., 2010). Further, MYLK1 contributes to cellular
responses by its scaffolding activity to recruit macromolecular complexes, which might
support the remodelling of the cytoskeleton (Khapchaev and Shirinsky, 2016, Wu et al.,
2003, Levinson et al., 2004, Gautel, 2011a). Since maximal muscle power is a product of
force and contraction velocity, the preferential alleles of these SNPs might affect the
expression rate/stability of the corresponding genes resulting in an improved Wpeak due an
increased number of sarcomeres in parallel (thus increasing force) and in series (thus
increasing contraction velocity).
180
6.5.2.2 Cluster of SNPs Related to Muscle Specific Force
In the current study, individuals carrying the preferable alleles [CC genotype of CCL2
(rs2857656), CC genotype of COL1A1 (rs2249492), the T-allele of COL1A1 (rs1800012),
the C-allele of VDR (rs2228570)] of four SNPs demonstrated an increased muscle specific
force following chronic RE, potentially by an enhanced RNA expression (He et al., 2017,
Mann et al., 2001, Arai et al., 1997). Collagen type I (the pro-alpha-1 chain of type I collagen
is encoded by COL1A1) is the predominant protein in the perimysium, which is thought to
be involved in lateral force transmission (Ramaswamy et al., 2011), and recent
investigations suggest that the CCL2 (Hara et al., 2013, Moore et al., 2005a) and the VDR
(Potter et al., 2013) genes also contribute to changes of collagen type I expression.
Intriguingly, the non-preferential alleles of the COL1A1 (G-allele homozygotes, rs1800012)
and of the VDR (T-allele, rs2228570) SNPs demonstrate higher baseline muscle strength
in untrained cohorts, as seen in the current acute RE and in other studies (Van Pottelbergh
et al., 2001, Windelinckx et al., 2007, Hopkinson et al., 2008, Roth et al., 2004). These non-
preferential alleles of the COL1A1 and the VDR SNPs seem to ‘protect’ against loss of
muscle strength in a non-exercising population in the long term, possibly due to a generally
lower gene expression and, therefore, lower unfavourable ECM deposition. However,
increased gene expression of the preferable alleles of the four SNPs might support the
remodelling of the muscle ECM in active individuals, which subsequently lead to a stiffer
perimysium of the ECM with better force transmission capabilities. The addition of
connective tissue between muscle fibres, especially of the stiff perimysium, might serve to
split muscle fibres up into multiple force generating units, thus increasing the muscle
specific force, i.e. the force per cross-sectional area of muscle (Jones et al., 1989). Further
It is often observed that there is an additional increase of muscle strength compared to
muscle size following chronic RE (Jones et al., 2008), which cannot be entirely explained
by changes in PCSA, neural adaptation, tendon capability (Erskine et al., 2010b), or change
in fibre type composition, or myofibrillar packing after chronic RE (Erskine et al., 2011). The
association between these four SNPs and the muscle ECM indicates that the
181
disproportionate gains in muscle strength and mass could be explained, at least in part, by
muscle ECM remodelling following RE.
Further, individuals carrying the minor X-allele of the nonsense ACTN3 C > T (rs1815739)
SNP, which results in a stop codon rather the expression of the amino acid arginine (R-
allele) (Nowak et al., 1999), also demonstrated an additionally increase in muscle specific
force following chronic RE, and they were generally stronger in the G-REX cohort (Chapter
5). However, the X-allele also showed a non-significant tendency for a greater strength loss
following acute RE (Chapter 5) and a non-significant tendency for a generally lower
quadriceps femoris muscle volume in the G-ResisT cohort (unadjusted P=0.046, data not
shown). Deficiency of α-actinin-3 results in a shift in fast-twitch fibres towards oxidative
metabolism due to an enhanced activation of calcineurin (Seto et al., 2013). As untrained
XX homozygotes tend to have a skeletal muscle fibre type distribution of more (slow) type
I fibres (Ahmetov et al., 2011, Vincent et al., 2007) compared to R-allele carriers, smaller
muscles of untrained X-allele carriers might be based on the generally higher ratio of type I
(smaller CSA) to type II (greater CSA) muscle fibres (Broos et al., 2016, Gilliver et al., 2009,
Vincent et al., 2007). However, calcineurin activity is associated with the increase of CSA
predominantly of type I skeletal muscle fibres in humans following muscle overload (Hudson
and Price, 2013, Sakuma and Yamaguchi, 2010). An increased calcineurin activity of X-
allele carrier, might lead to an enhanced capability to express growth factors (e.g. MyoD)
for muscle remodelling (Sakuma and Yamaguchi, 2010, Vincent et al., 2010), and,
subsequently, in an elevated CSA of type I fibres following chronic RE. The increased
capability of muscle remodelling of X-allele carriers is mirrored by the elevated ratio of
muscle stem cells to stem cells of the connective tissue in vitro compared to RR
homozygotes (Chapter 5), which is in line with other results that found increased fibrosis
and strength loss of mice with overexpression of ACTN3 after post-natal gene editing
(Garton et al., 2018a). The lower ratio of muscle stem cells of R-allele carrier might mirror
a decreased amount of a subpopulation of muscle stem cells of type I fibres (Biressi and
182
Rando, 2010), and, therefore might give a mechanistically explanation of a lower capability
for an increase of CSA in these slow twitch fibres following chronic RE
6.5.3 Using TGS-C to Anticipate the Response to Acute RE
Lastly, we investigated whether TGS-C could estimate high and low responders to acute
RE. TGS-C included all 8 SNPs, which interacted with the response to chronic RE on an
individual basis, and was able to anticipate high responders (NPGs) regarding a larger
increase in serum IL-6 concentration and CK activity in a separate (G-REX) cohort. It was
unexpected that the TGS-C would be associated with serum CK activity and IL-6
concentration following acute RE, as neither serum CK activity nor IL-6 concentration were
associated with any individual SNP or with TGS-A in the G-REX cohort (Chapter 5). It
seems that a high increase in serum CK activity and IL-6 concentration immediately after
acute RE might be associated with attenuated adaptation regarding strength gains.
Moreover, this link between an acute inflammatory/damage response and neuromuscular
adaptations to chronic RE is linked to the same genetic profile. Thus, we provide evidence
that genetic make-up drives the response to acute RE, which influences the longer-term
adaptations to chronic RE.
A common polygenic profile that links both the acute response and chronic adaptation to
RE allows us to speculate about the molecular mechanisms underpinning these
responses/adaptations. The TGS-C consisted of SNPs linked to the muscle ECM and was
associated with CK activity response. It has been suggested that the intramuscular enzyme,
CK, might leak into the circulation particularly in high responders, when the muscle ECM is
disrupted immediately after the exercise (Newham et al., 1983, Baird et al., 2012). Further,
CK might also leak into the blood stream in the days after EIMD, when activated satellite
cells with fibroblasts interact to dissolve and reorganise the muscle ECM with the help of
the proteolytic activity of matrix metalloproteinases (MMPs) for muscle remodelling (Mackey
et al., 2004). An increase in circulating levels of IL-6 during chronic RE has also been
negatively associated with muscle strength (but not with muscle mass) gains in the elderly
183
(Hangelbroek et al., 2018). IL-6 is strongly associated with glucose transport in human
skeletal muscle (Glund et al., 2007) and the delayed peak of IL-6 concentration in the
circulation (Fischer, 2006, Toth et al., 2011) might be an indication of a long lasting demand
for energy to remodel the damaged muscle fibres and the surrounding connective tissue
following acute RE.
6.5.4 Limitations/ Perspective
We acknowledge that the G-REX cohort comprised both male and female participants,
whilst the G-ResisT cohort contained only males. Therefore, we normalised strength
parameters to body mass for the intervention studies and used sex as a covariate for the
G-REX cohort, so we were able to analyse strength differences between the alleles of each
SNP independently of sex. Another limitation was the relatively small number of subjects
included in each cohort. The current investigation suggests that the muscle ECM might play
an important role with respect to the response/adaption to acute/chronic RE. As recent
investigations have revealed that the muscle ECM is involved in the severity of muscle
injuries (Balius et al., 2018), future studies should assess, whether the loading magnitude
of RE, in particular, plays a key role for muscle ECM adaptation with respect to injury
prevention and rehabilitation programmes. Nordic hamstring training might be an effective
injury prevention exercise, as the eccentric component of this exercise modality might lead
to a stiffer muscle ECM. Further studies should investigate SNPs that are linked specifically
to other perimysium-related protein-encoding genes, such as proteoglycans (e.g. decorin
and biglycan) (Nakano et al., 1997, Mercado et al., 2006), different collagen types (e.g. type
XII and XIV) (Listrat et al., 2000, Gillies and Lieber, 2011) and of the ECM-muscle interface
(Grounds et al., 2005).
184
6.6 CONCLUSION
In conclusion, the current study demonstrated that a polygenic profile (TGS-A), which was
based on a cohort performing an acute bout of unaccustomed eccentric RE, cannot
anticipate the neuromuscular adaptations to chronic RE. TGS-A included SNPs that are
linked to genes contributing to the elastic properties of the MTU and to muscle catabolic
signalling pathways. These genes might have a crucial functional role regarding the
response to acute RE, but are less important for long-term gains in muscle strength and
hypertrophy. However, a different polygenic profile (TGS-C), based on a cohort, which
performed chronic RE, was associated with changes in muscle strength (but not muscle
mass), and this polygenic profile was also inversely associated with the muscle damage
response in terms of blood biomarkers (CK activity and IL-6 concentration) following acute
RE. Secondly, SNPs, which were associated with chronic RE, could be categorised into
signalling- and muscle ECM-related (force transmission) clusters, indicating that muscle
hypertrophy and muscle strength gains are, at least in part, based on independent
molecular pathways. Our findings provide strong evidence for a common polygenic profile
that influences both the acute and chronic responses to RE. Specifically, different
combinations of particular genotypes appear to limit the damage response to acute RE,
while maximising the adaptation to chronic RE. Thus, our findings further our understanding
of the molecular mechanisms underpinning and linking the acute and chronic responses
to RE. After independent replication, TGS-A and TGS-C may be used to estimate an
individual’s response/adaptation to acute/chronic RE, thus enabling RE to be prescribed on
a personalised level to improve muscle health and function.
Our findings provide strong evidence for a common polygenic profile that influences both
the acute and chronic responses to RE. Specifically, different combinations of particular
genotypes appear to limit the damage response to acute RE, while maximising the
adaptation to chronic RE. Thus, our findings further our understanding of the molecular
mechanisms underpinning and linking the acute and chronic responses to RE. After
independent replication, TGS-A and TGS-C may be used to anticipate an individual’s
185
response/adaptation to acute/chronic RE, thus enabling RE to be prescribed on a
personalised level to improve muscle health and function.

186
7 Thesis Synthesis
187
7.1 GENERAL DISCUSSION
The overall aim of this thesis was to investigate the physiological and genetic factors
underpinning the response to exercise-induced muscle damage (EIMD). Here, we used a
triangulation approach, where a combination of varying assessments from different
research disciplines, including genetics, cell biology, muscle physiology and biomechanics
was used to systematically investigate the mechanisms underpinning muscle damage and
the variable response to EIMD. The following sections aims to discuss the key outcomes of
the present thesis, the limitation of the investigations and provide practical
recommendations. The outcomes of this thesis, and how they may help practitioners to
prescribe “personalised exercise medicine” to their patients/athletes (thus optimising health
and performance, and reducing the risk of injury), are discussed.
The objectives of this thesis were therefore:
1. To characterise the physiological mechanisms underpinning neuromuscular fatigue
and the recovery pattern following intermittent maximal sprints, to acquire a better
understanding of EIMD in an applied setting (Chapter 3).
2. To determine the effect that inter-individual differences in the ratio of skeletal muscle
myoblast to fibroblast composition has on skeletal muscle repair/recovery after an
artificial wounding (scratch) assay using primary human skeletal muscle cells in
vitro, and the association of this ratio with recovery after intermittent maximal sprints
(Chapter 4).
3. To ascertain whether a polygenic profile could distinguish between high and low
responders following a controlled in vivo eccentric exercise (acute resistance
exercise, RE) intervention in previously untrained individuals, and whether those
genetic variations were also associated with the artificial wounding (scratch) assay
in vitro (Chapter 5). This would, therefore, provide a genetic link between in vivo and
in vitro muscle damage, thus potentially shedding new light on the aetiology of
EIMD.
188
4. To determine whether the polygenic profile associated with acute RE from Chapter
5 could anticipate individual adaptations to chronic RE, in terms of gains in muscle
size and strength (Chapter 6) and
5. To ascertain whether a new polygenic profile associated with the adaptations to
chronic RE (gains in muscle size and strength) (Chapter 6) could estimate the
individual responses to acute RE in Chapter 5 (e.g. loss of strength, increase in
soreness, inflammation, etc.). Objectives 4 and 5 have implications for furthering our
understanding of the genetic and physiological mechanisms underpinning and
linking the acute and chronic responses to RE.
7.1.1 The contribution of the non-contractile muscle tissue to the response
to EIMD
It was identified that immediate strength loss was associated with impaired hamstring
muscle recruitment and markers of peripheral fatigue/damage, but the magnitude and
sustained changes in maximal voluntary contraction (MVC) torque over time was
predominately associated with indicators of peripheral fatigue/damage (Chapter 3; objective
1, see above). The most striking finding was that biceps femoris long head (BFLH) fascicle
length was not associated with the extent of hamstring fatigue between PRE and
immediately POST. This finding was contrary to our hypothesis as fascicle length of the
BFLH (together with Nordic hamstring muscle strength) was previously inversely correlated
with non-contact muscle injury risk (Timmins et al., 2016). Instead, our data showed an
inverse correlation between MVC torque loss and both BFLH muscle volume and (especially)
BFLH physiological cross-sectional area (PCSA). These results indicate that the structure of
the muscle (reflected by PCSA) protects the muscle against EIMD independently of force
due to the fact that baseline hamstring MVC did not correlate with PCSA, and also not with
relative hamstring MVC torque loss (measured between PRE and POST). Recent
investigations reported an important role of the extracellular matrix (ECM) regarding muscle
damage (Hyldahl and Hubal, 2014, Hyldahl et al., 2015) and muscle injuries (Balius et al.,
2018). The ECM consists of different layers of connective tissue and this non-contractive
189
structure surrounds the muscle fibres and fascicles (Kjær, 2004). More parallel fibres might
be accompanied with more cross-sectional muscle ECM content that might have a
protective effect against mechanical stress on the contractile components following
eccentric lengthening contractions. Therefore, our results indicate that BFLH PCSA might be
a better predictor for muscle strains rather than BFLH fascicle length, and we suggest that
future prospective muscle strain studies should assess BFLH PCSA.
As there is a lack of research of both the role of the muscle ECM and of the stem cells of
this connective tissues (fibroblasts), we further analysed the components of the non-
contractile muscle tissue (Chapter 4; objective 2). It was initially hypothesised that a high
myoblast:fibroblast ratio would support muscle recovery in vivo following the IS-intervention
and in the wound healing assay in vitro following the IS-intervention. Surprisingly, a low
myoblast:fibroblast ratio was related with improved knee-flexion MVC torque muscle
repair/recovery following EIMD, both in vitro and in vivo. However, contrary to our
hypothesis, our results showed an ambiguous picture during the muscle repair process. A
high myoblast:fibroblast ratio showed a delayed wound closure within the first 48 h, but a
better myotube formation at seven days, and higher CK activity at ten days after the scratch
assay, and a delayed knee-flexion MVC torque recovery following IS in vivo. The IS-
intervention of Chapter 3 induced muscle damage with a similar underlying mechanism
comparing with incidences, when hamstring muscle strain injuries occur (Ekstrand et al.,
2011, Brooks et al., 2006, Woods et al., 2004). Dynamic (stretch-shortening) movements,
such as IS, might have an additional damaging effect on the muscle ECM beyond traditional
EIMD assessments e.g. with an isokinetic dynamometer, which potentially damage the
myofibrillar content predominantly. Following IS, there was a significantly increased knee-
flexion MVC torque loss POST48 compared to the knee-extension. Interestingly, there was
no significant correlation between the myoblast:fibroblast ratio and knee-extension MVC
torque recovery (between POST and POST48) indicating that a certain damage in the
muscle-tendon unit (MTU) is necessary to trigger fibroblast activation for muscle
regeneration. That leads to the assumption that fibroblasts play an important part during
190
muscle recovery, when the muscle ECM is also involved in the structural damage after
strenuous exercise.
7.1.2 The association between genetic variations and the individual
response/ adaptation to acute and chronic RE
The studies of chapter 3 and 4 revealed high inter-individual differences in the response to
EIMD, despite the homogeneous groups in vivo and in vitro. We next aimed to understand
the functional relevance in terms of whether genetic variations are associated to changes
in the response to EIMD and chronic RE (Chapter 5 and 6; objectives 3, 4 and 5, as outlined
above). We identified that the NPG with the non-preferential polygenic profile of TGS-A (i)
demonstrated greater muscle soreness and greater loss of range of motion following the
EIMD-intervention, respectively; and (ii) were generally weaker compared to moderate
(MG) and PG groups (Chapter 5; objective 3). As all participants performed the same
relative intensity of exercise, these findings gives further evidence that genetic variations
play a role in the individual response to EIMD. However, there was no interaction between
genetic variations and (i) changes in strength; and (ii) the concentration or activity of blood-
borne biomarkers of EIMD following the intervention, neither on an individual SNP or
polygenic basis of TGS-A.
Chronic resistance exercise (RE) is a potent stimulus for increasing strength and muscle
hypertrophy and it is increasingly recognised as a cornerstone for prevention of both muscle
(Petersen et al., 2011) and ACL (Webster and Hewett, 2018, Petushek et al., 2018) injury.
However, as non-contact injury rate is not completely eradicated in some athletes
undertaking chronic RE, it can be suggested that prevention training has a variable effect
on each athlete. However, TGS-A was not related with any adaptation to chronic RE
(Chapter 5 and 6; objective 5). Against that, PGs of the new computed TGS-C showed
increased adaptations to chronic RE in terms of changes in normalised force and muscle
specific force (Chapter 6, objective 4). When the outcome of the G-REX participants
(Chapter 5) were associated with the new TGS-C, NPGs demonstrated a greater
191
inflammatory response following acute RE (Chapter 5 and 6, objective 5). It was unexpected
that the TGS-C would be associated with serum CK activity and IL-6 concentration following
acute RE, as neither serum CK activity nor IL-6 concentration were associated with any
individual SNP or with TGS-A in the G-REX cohort (Chapter 5). These findings imply that a
high increase in serum CK activity and IL-6 concentration immediately after unaccustomed
acute RE might be associated with attenuated adaptation regarding strength gains.
Moreover, this link between an acute inflammatory/damage response and neuromuscular
adaptations to chronic RE is linked to the same genetic profile. Thus, we provide evidence
that genetic make-up drives the response to acute RE, which influences the longer-term
adaptations to chronic RE.
7.1.3 Genetic variations expand our understanding of the molecular
mechanisms underpinning the individual response to acute and
chronic RE
There were several distinct functional groups regarding the response to the acute and
chronic RE (Chapter 5 and 6). Some of the SNPs that were associated with EIMD in Chapter
5 are located within genes, which contribute to the elastic properties of the MTU. An
increased stiffness of the elastic components (e.g. endomysium) of the MTU might increase
stress on the contractile components, which may result in an increase of extracellular
inflammatory mediators and in an activation of the nociceptor of the overstretched
cytoskeleton/muscle ECM leading to elevated muscle soreness (Chapter 5). Another
functional group of SNPs associated with the acute RE intervention are related to enzymes
of the skeletal muscle catabolic and anabolic signaling pathways. The beneficial alleles
might increase the expression rate of their transcript following EIMD, potentially promoting
MTU repair in the short term. However, as the majority of these SNPs are not associated
with an increased muscle strength after chronic RE, proteins of both the elastic components
of the muscle-tendon unit (MTU) and of the catabolic signaling pathway might be less
important for chronic RE adaptation (Chapter 6).
192
There was no interaction between genetic variations and changes in strength following the
acute RE (Chapter 5). It is thought that muscle force is transmitted longitudinally as a result
of sarcomere shortening and laterally via the perimysium (surrounding muscle fascicles) to
the tendon and ultimately to the bone (Hughes et al., 2015, Ramaswamy et al., 2011). The
EIMD-intervention induced by an IKD with low-speed eccentric MVC was potentially not
able to cause substantial damage to the stiff components of the perimysium (such as to the
collagen type I fibrils), and the MVC strength loss might be more associated with damage
to structural components of the myofibrillar apparatus, particularly those involved in the
longitudinal force transmission (e.g. titin and nebulin) (Trappe et al., 2002). As no SNP,
which showed an association to myoblast:fibroblast ratio in the in vitro scratch assay,
demonstrated an interaction with strength, this gives further evidence that fibroblasts play
a less important part in muscle recovery, when the muscle ECM is not substantially
damaged. Repeated high external forces involved with high-speed (stretch-shortening)
movements, such as with IS of Chapter 3, are potentially associated with a greater risk of
damaging components of the muscle ECM/perimysium compared to EIMD-interventions
with low-speed eccentric MVCs such as in Chapter 5 (objective 2; see section 7.1.1).
Among the individual SNPs that were associated with improvements in muscle specific
force following chronic RE (Chapter 6), were predominantly linked with proteins of the stiff
part of the ECM. The association between the ECM-related SNPs and muscle specific force
lead to the suggestion that the accumulation of recurring RE might lead to a better turnover
of the proteins, and, therefore, subsequently to a stiffer perimysium of the muscle ECM with
better force transmission capabilities.
In terms of the role of the muscle ECM, several studies investigated global mRNA
expression of skeletal muscle biopsies following acute and chronic RE (Damas et al., 2018,
Phillips et al., 2013) and these investigations observed strong changes in gene expression
related to the cytoskeleton and muscle ECM. Studies of the adaptive responses of the rates
of protein synthesis to exercise have largely so far focused on myocellular fractions,
excluding collagen. However, the response of the muscle ECM to RE was confirmed in
193
some investigations on the protein level (Moore et al., 2005b, Miller et al., 2005), in an
immunohistochemical investigation (Mackey et al., 2011), and in one metabolomics study
(Fazelzadeh et al., 2016). This together with the results of this thesis indicates that strength
gains might not only associated with improvements of the myofibrillar content and of the
(patellar) tendon of the MTU, but that muscle ECM remodelling might play an important part
in terms of strength gains following chronic RE.
To conclude, we have investigated the role of genetic variations on the response to acute
and chronic strenuous exercise interventions, including assessments from the DNA to the
whole muscle-tendon complex. We believe that the findings of this thesis advance the
knowledge of exercise genetics. However, research in the area of exercise genetics is in its
infancy. Additional large cohorts, investigating the individual response to acute and chronic
RE, needs to be established so that our model can be validated in these independent
cohorts. If the polygenic profiles (e.g. TGS-C) can be validated in future, practical
recommendations can be deducted from these findings. Potentially, the responsiveness of
strength and power athletes can be estimated with one acute RE session together with a
serum sample (assessing IL-6 concentration and CK activity). This might also have valuable
information for practitioners to significantly improve prevention and rehabilitation
programmes and to optimise muscle strengthening programmes.
7.2 THESIS LIMITATIONS We acknowledge that there was a relatively small number of subjects included in the in vivo
cohorts of Chapter 5 and 6 and also from the in vitro cohort of Chapter 4. However, given
the difficulties in performing these types of intervention studies, the data presented is of
great scientific value and should be utilised as a catalyst to reliably validate and replicate
these findings.
Further, we have recruited both male and female participants in Chapter 4 and 5, and there
is some limited evidence that men and women respond differently to eccentric exercise
(Sewright et al., 2008). However, the in vitro study of Chapter 4 and the majority of previous
194
investigations attempting to address this question have shown no sex differences in in the
susceptibility to ultrastructural muscle damage (Sayers and Clarkson, 2001, Thompson et
al., 1997, Stupka et al., 2001, Wüst et al., 2008). Furthermore, although our male
participants were stronger than our female subjects in both absolute and relative (to body
mass) terms, when the change in MVC at time points POST and 48POST was reported as
a percentage change from baseline MVC, we observed no difference in strength loss
between men and women. We, therefore, used absolute strength normalised to body mass
with the covariate sex, so we were able to analyse strength differences between
genotype/allele for each SNP. Moreover, each of our three polygenic groups contained a
similar ratio of men to women, so it is highly unlikely that any sex differences influenced the
outcome of our results.
Eccentric exercise results in a delayed peak and a slower decrease of serum IL-6 during
recovery between 6 and 24 h after EIMD (Willoughby et al., 2003, Pedersen and Febbraio,
2008). Therefore, serum IL-6 expression immediately after the investigations indicates that
intense exercise occurred but it cannot be assured that this marker indicates muscle
damage in the current study. The generally low absolute value of CK activity of the in vivo
studies (Chapter 3 and 5) of this thesis might be explained by the fact that we have used a
different method involving venous blood, which will usually be conducted in in vitro
investigations (Owens et al., 2015). Therefore, further interventions are necessary to
compare CK activity assessments in vivo, and the investigations may have benefitted from
additional time points for blood analyses to acquire a more comprehensive and accurate
representation of the time course of e.g. serum IL-6 response and of additional muscle
damage biomarkers to our EIMD intervention.
Peripheral fatigue can be caused by metabolite perturbations such as the depletion of
intramuscular glycogen (Bendiksen et al., 2012). However, despite the fact that participants
were instructed to eat two hours before arrival, and to avoid strenuous exercise prior to the
testing, the two in vivo EIMD-studies (Chapter 3 and 5) did not control for diet or assessed
glycogen depletion during the intervention. Although the EIMD interventions lasted less than
195
25 min, indicating that glycogen depletion might be only a minor factor which contributed to
the impaired muscle function following the EIMD-interventions, future studies should assess
and control the glycogen content of the muscles before and after EIMD-interventions.
Recent studies suggest that fatigue alters the optimal angle during MVC in the hamstrings
but not in the quadriceps (Coratella et al., 2015). This might have influenced the results of
the isometric MVC test of the hamstring muscle group in Chapter 3. Further studies should
confirm these results with isometric MVCs at different knee joint angles. Further, we have
only measured muscle architecture and sEMG activity of the BFLH. During data collection,
several published investigations (Kellis, 2015, Schuermans et al., 2016, Schuermans et al.,
2014) indicated that the other hamstring muscles might have an impact on hamstring fatigue
and, potentially, on hamstring strain injury risk. We therefore suggest that further studies
conducting IS should also take the other hamstring muscles into consideration. Other
factors, such as skeletal muscle fibre type composition might also contribute to the
prolonged recovery process following EIMD.
We assumed that the myoblast:fibroblast ratio is similar between the vastus lateralis musle
(from which we obtained the muscle biopsy) and the BFLH, as Terry et al. (2018)
demonstrated a high similarity of transcriptome expression patterns in skeletal muscles of
rodents, when the muscles consist of similar fibre type composition and of similar
physiological functions, such as the BFLH (47.1% MHC-I, 35.5% MHC-IIA, and 17.4% MHC-
IIX) (Evangelidis et al., 2016) and the vastus lateralis (49-59% MHC-I, 26-35% MHC-IIA,
and 16-28% MHC-IIX) (Mittendorfer et al., 2005, Taylor et al., 1997). However, gene
expression patterns vary between rodents and human (Su et al., 2002), and there are is a
gap of research between the intra-individual variability of the myoblast:fibroblast ratio
between skeletal muscles. Therefore, further investigations needs to address this research
gap to confirm our findings.
Lastly, we distinguished the primary muscle cells in myoblasts (desmin-positive) and
fibroblasts (desmin negative) with a desmin antibody in the in vitro study of Chapter 4 and
5, as previous investigations have determined that the non-myoblasts fraction is highly
196
enriched in fibroblasts with up to 99 % of this fraction being fibroblasts (Agley et al., 2013,
Mathew et al., 2011). For immnunohistochemistry analysis, we have fixed the cells with a
low density of 30%, so that the cells could be easily distinguished from each other. The ICC
(3, k) of 0.83 indicates a good reliability for the characterisation and the quantification of
myoblasts and fibroblasts. However, analysing the entire well (instead of sub-sampling
random areas of each well) and additional methodical approaches, such as cell sorting by
flow cytometry, could have improved the accuracy of our myoblast:fibroblast ratio
calculation. Future studies may use additional antibodies, such as DAPI (for staining nuclei)
and TE7 (for staining fibroblasts), to validate our findings.
7.3 FUTURE DIRECTIONS
Previous investigations have identified over 200 genes, in which common genetic variants
are located, involved in the genetic predisposition to physical performance (Moran and
Pitsiladis, 2017). However, the small overlap of SNPs related to athletes/ performance and
of GWAS studies of the general population including a wide range of age and lifestyle and
behavioural exposures (Willems et al., 2017, Zillikens et al., 2017) indicating the importance
of homogenous cohorts. Presumably, SNPs, which are associated with changes in muscle
mass and strength in the normal population over different age ranges might be more
influenced by SNPs regarding muscle atrophy and motor neuron genes. In future, large-
scale studies with homogeneous (young) cohorts should be conducted as an
interdisciplinary and multi-centre project including several “omics” measurements such as
transcriptome sequencing and metabolomics together with muscle biopsies to identify the
cause and consequences of different recovery patterns of participants following acute and
chronic RE. Here, large-scale investigations including primary human muscle stem cells
derived from the same participants who performed the in vivo intervention, could shed light
on the association between the myoblast:fibroblast ratio and the genetic variations on the
response/adaptation following acute and chronic RE.
The results of this thesis lead to the assumption that strength might be linked with muscle
ECM remodelling following chronic RE. Further, the stiffness of the ECM can be seen as a
197
key sensor of external forces to appropriate respond and adapt to external stress, a process
known as mechanotransduction (Gattazzo et al., 2014). Molecular skeletal
mechanotransducers of the ECM (e.g. integrins and costameres) might be associated with
muscle ECM remodelling and, subsequently, with the increased ECM stiffness following
chronic RE. However, the investigation of the mechanoreceptors of the ECM was beyond
the scope of the current thesis. As the mechanosensory pathway seems to be independent
of the Akt/mammalian target of rapamycin/ S6K1 pathway (Eftestøl et al., 2016), and recent
investigations revealed that increased ECM stiffness is accompanied with the activity of
components (YAP/TAZ) of the Hippo Pathway (Engler et al., 2006, Piccolo et al., 2014),
further investigations should assess the association between the mechanotransduction and
muscle ECM remodelling following RE. Further, muscle strength declines during disuse at
approximately three times the rate that muscle tissue is lost (Farthing et al., 2009). Future
studies should investigate whether the loss of muscle ECM integrity plays a role of the
disproportional loss of strength compared to muscle mass during disuse and they should
replicate the SNPs of the GWAS studies regarding muscle strength (Willems et al., 2017)
and muscle mass (Zillikens et al., 2017) in hypertrophy and atrophy interventions.
There is evidence to suggest that there is a dose-response relationship for training volume
of RE and gain of muscle mass, but increases in muscle strength remain similar and seems
not to be affected by the total number of repetitions (Schoenfeld et al., 2018). Muscle
strength is further augmented by higher intensities, whereas exceeding a threshold of about
40% of 1RM is a sufficient stimulus for increasing muscle mass (Lasevicius et al., 2018).
Power athletes, usually exercising with high intensity and lower volume, demonstrate a
smaller muscle fibre CSA but a higher fibre specific tension compared to body builders
training with high volume but low/moderate intensity (Meijer et al., 2015). The investigations
of this thesis suggest that the muscle ECM might play an important role in respect to
changes in strength following acute and chronic RE. However, no studies exist about
muscle ECM training so far. Further investigations need to assess, whether the current
knowledge of tendon training (exercise regime with at least of 70% of 1-RM) (Bohm et al.,
198
2015) can be extrapolated to muscle ECM training, and whether chronic RE potentially
improve the material (remodelling) within the muscle ECM rather than a solely increase of
CSA.
Further, it is well known that a history of previous injuries is evidenced as a risk factor for
future sport-related injuries (Freckleton and Pizzari, 2013). As recent investigations have
revealed that muscle ECM is involved in the severity of muscle injuries (Balius et al., 2018),
high recurrence rate of muscle strains might be partly caused of exercising only with low or
moderate intensities during the rehabilitation exercise programmes, and, therefore, missing
the intensity threshold of at least 70 % (1-RM) to exercise the muscle ECM. RE with high
intensities might lead to a stiffer muscle ECM and to a higher ‘protection’ against structural
ECM damage. We therefore suggest that future investigations in respect to rehabilitation
exercise programmes should assess whether progressive RE, reaching high training
intensities towards the end of the programme, decrease muscle re-injuries.
7.4 FINAL CONCLUSION
This thesis has generated novel findings as to the role genetic variation plays in the
response to acute and chronic strenuous exercise. Further, by using a triangulation
approach of combining different assessments from varying research disciplines, including
genetic, cellular, physiological, and biomechanical analyses, this thesis sheds light onto the
role of the muscle ECM regarding the response/adaptation following acute and chronic RE.
There is evidence to suggest that fibroblasts have an important role in muscle remodelling,
especially within the first days following eccentric exercises induced by fast and intense
dynamic movements. The results of this thesis will help to identify individuals who are
unlikely to respond to resistance exercise, or who require longer to recover from a bout of
strenuous exercise. This may help practitioners to prescribe “personalised exercise
medicine” to their patients/athletes, thus optimising health and performance, and reducing
the risk of injury. The results will pave the way for public health services and sporting
199
organisations to effectively manage their patients/athletes personalised programmes of
prevention and rehabilitation in the future.
200
8 References
AGLEY, C. C., ROWLERSON, A. M., VELLOSO, C. P., LAZARUS, N. R. & HARRIDGE, S. D. 2013. Human skeletal muscle fibroblasts, but not myogenic cells, readily undergo adipogenic differentiation. J Cell Sci, jcs. 132563.
AHMETOV, I. I., DRUZHEVSKAYA, A. M., LYUBAEVA, E. V., POPOV, D. V., VINOGRADOVA, O. L. & WILLIAMS, A. G. 2011. The dependence of preferred competitive racing distance on muscle fibre type composition and ACTN3 genotype in speed skaters. Experimental physiology, 96, 1302-1310.
AHMETOV, I. I., NAUMOV, V. A., DONNIKOV, A. E., MACIEJEWSKA-KARŁOWSKA, A., KOSTRYUKOVA, E. S., LARIN, A. K., MAYKOVA, E. V., ALEXEEV, D. G., FEDOTOVSKAYA, O. N. & GENEROZOV, E. V. 2014. SOD2 gene polymorphism and muscle damage markers in elite athletes. Free Radical Res, 48, 948-955.
AKIMOTO, A. K., MIRANDA-VILELA, A. L., ALVES, P. C., PEREIRA, L. C., LORDELO, G. S., HIRAGI CDE, O., DA SILVA, I. C., GRISOLIA, C. K. & KLAUTAU-GUIMARAES, M. D. N. 2010. Evaluation of gene polymorphisms in exercise-induced oxidative stress and damage. Free Radical Res, 44, 322-31.
AL-SHANTI, N. & STEWART, C. E. 2009. Ca2+/calmodulin-dependent transcriptional pathways: potential mediators of skeletal muscle growth and development. Biol Rev, 84, 637-52.
ALEXANDER, R. M. 1975. The dimensions of knee and ankle muscles and the forces they exert. J. Hum. Move. Stud., 1, 115-123.
ALLEN, D. G., WHITEHEAD, N. P. & YEUNG, E. W. 2005. Mechanisms of stretch-induced muscle damage in normal and dystrophic muscle: role of ionic changes. J Physiol, 567, 723-35.
ALLEN, N. E., DAVEY, G. K., KEY, T. J., ZHANG, S. & NAROD, S. A. 2002. Serum insulin-like growth factor I (IGF-I) concentration in men is not associated with the cytosine-adenosine repeat polymorphism of the IGF-I gene. Cancer Epidemiology Biomarkers & Prevention, 11, 319-320.
ALSHARIDAH, M., LAZARUS, N. R., GEORGE, T. E., AGLEY, C. C., VELLOSO, C. P. & HARRIDGE, S. D. 2013. Primary human muscle precursor cells obtained from young and old donors produce similar proliferative, differentiation and senescent profiles in culture. Aging cell, 12, 333-344.
ALVARES, J. B. D. A. R., RODRIGUES, R., DE AZEVEDO FRANKE, R., DA SILVA, B. G. C., PINTO, R. S., VAZ, M. A. & BARONI, B. M. 2015. Inter-machine reliability of the Biodex and Cybex isokinetic dynamometers for knee flexor/extensor isometric, concentric and eccentric tests. Physical Therapy in Sport, 16, 59-65.
AMELINK, G. & BÄR, P. 1986. Exercise-induced muscle protein leakage in the rat: effects of hormonal manipulation. Journal of the neurological sciences, 76, 61-68.
ANDERSEN, H., NIELSEN, S., MOGENSEN, C. E. & JAKOBSEN, J. 2004. Muscle strength in type 2 diabetes. Diabetes, 53, 1543-1548.
ANDERSEN, M. B., PINGEL, J., KJAER, M. & LANGBERG, H. 2011. Interleukin-6: a growth factor stimulating collagen synthesis in human tendon. J Appl Physiol, 110, 1549-54.
ANDREASSEN, C. S., JAKOBSEN, J., RINGGAARD, S., EJSKJAER, N. & ANDERSEN, H. 2009. Accelerated atrophy of lower leg and foot muscles—a follow-up study of long-term diabetic polyneuropathy using magnetic resonance imaging (MRI). Diabetologia, 52, 1182-91.
201
APPELL, H.-J., SOARES, J. M. C. & DUARTE, J. A. R. 1992. Exercise, muscle damage and fatigue. Sports Med, 13, 108-115.
APPS, C., STERZING, T., O'BRIEN, T., DING, R. & LAKE, M. 2017. Biomechanical locomotion adaptations on uneven surfaces can be simulated with a randomly deforming shoe midsole. Footwear Science, 9, 65-77.
ARAI, H., MIYAMOTO, K. I., TAKETANI, Y., YAMAMOTO, H., IEMORI, Y., MORITA, K., TONAI, T., NISHISHO, T., MORI, S. & TAKEDA, E. 1997. A vitamin D receptor gene polymorphism in the translation initiation codon: effect on protein activity and relation to bone mineral density in Japanese women. Journal of Bone and Mineral Research, 12, 915-921.
ARAUJO, L. G., WATERHOUSE, J., EDWARDS, B., SANTOS, E. H. R., TUFIK, S. & TÚLIO DE MELLO, M. 2011. Twenty-four-hour rhythms of muscle strength with a consideration of some methodological problems. Biological rhythm research, 42, 473-490.
ARCHAMBAULT, J. M., JELINSKY, S. A., LAKE, S. P., HILL, A. A., GLASER, D. L. & SOSLOWSKY, L. J. 2007. Rat supraspinatus tendon expresses cartilage markers with overuse. J Orthop Res, 25, 617-24.
ARMSTRONG, R. B. 1984. Mechanisms of exercise-induced delayed onset muscular soreness: a brief review. Medicine and science in sports and exercise, 16, 529-538.
ARMSTRONG, R. B. 1990. Initial events in exercise-induced muscular injury. Medicine and science in sports and exercise, 22, 429-435.
ARMSTRONG, R. B., WARREN, G. L. & WARREN, J. A. 1991. Mechanisms of exercise-induced muscle fibre injury. Sports Medicine, 12, 184-207.
ARNOLD, L., HENRY, A., PORON, F., BABA-AMER, Y., VAN ROOIJEN, N., PLONQUET, A., GHERARDI, R. K. & CHAZAUD, B. 2007. Inflammatory monocytes recruited after skeletal muscle injury switch into antiinflammatory macrophages to support myogenesis. J Exp Med, 204, 1057-69.
ASP, S., DAUGAARD, J. R., KRISTIANSEN, S., KIENS, B. & RICHTER, E. A. 1996. Eccentric exercise decreases maximal insulin action in humans: muscle and systemic effects. The Journal of physiology, 494, 891-898.
ASP, S., DAUGAARD, J. R. & RICHTER, E. A. 1995. Eccentric exercise decreases glucose transporter GLUT4 protein in human skeletal muscle. The Journal of physiology, 482, 705-712.
AZMI, N. L., DING, Z., XU, R. & BULL, A. M. J. 2018. Activation of biceps femoris long head reduces tibiofemoral anterior shear force and tibial internal rotation torque in healthy subjects. PLoS One, 13, e0190672.
BABENKO, V., GRAVEN-NIELSEN, T., SVENSSON, P., DREWES, A. M., JENSEN, T. S. & ARENDT-NIELSEN, L. 1999. Experimental human muscle pain and muscular hyperalgesia induced by combinations of serotonin and bradykinin. Pain, 82, 1-8.
BACZYNSKA, A. M., SHAW, S., ROBERTS, H. C., COOPER, C., SAYER, A. A. & PATEL, H. P. 2016. Human Vastus Lateralis Skeletal Muscle Biopsy Using the Weil-Blakesley Conchotome. Journal of Visualized Experiments, e53075-e53075.
BAECKE, J., BUREMA, J. & FRIJTERS, J. 1982a. A short questionnaire for the measurement of habitual physical activity in epidemiological studies. The American journal of clinical nutrition, 36, 936-942.
BAECKE, J. A., BUREMA, J. & FRIJTERS, J. 1982b. A short questionnaire for the measurement of habitual physical activity in epidemiological studies. The American journal of clinical nutrition, 36, 936-942.
202
BAIRD, M. F., GRAHAM, S. M., BAKER, J. S. & BICKERSTAFF, G. F. 2012. Creatine-kinase-and exercise-related muscle damage implications for muscle performance and recovery. Journal of nutrition and metabolism, 2012, 1-13.
BALIUS, R., ALOMAR, X., PEDRET, C., BLASI, M., RODAS, G., PRUNA, R., PEÑA-AMARO, J. & FERNÁNDEZ-JAÉN, T. 2018. Role of the Extracellular Matrix in Muscle Injuries: Histoarchitectural Considerations for Muscle Injuries. Orthopaedic Journal of Sports Medicine, 6, 2325967118795863.
BALNAVE, C. & THOMPSON, M. 1993. Effect of training on eccentric exercise-induced muscle damage. Journal of Applied Physiology, 75, 1545-1551.
BALNAVE, C. D. & ALLEN, D. G. 1995. Intracellular calcium and force in single mouse muscle fibres following repeated contractions with stretch. The Journal of Physiology, 488, 25-36.
BALSOM, P., SEGER, J., SJÖDIN, B. & EKBLOM, B. 1992. Maximal-intensity intermittent exercise: effect of recovery duration. International journal of sports medicine, 13, 528-528.
BALTZOPOULOS, V. 1995. A videofluoroscopy method for optical distortion correction and measurement of knee-joint kinematics. Clinical Biomechanics, 10, 85-92.
BANG, M.-L., CENTNER, T., FORNOFF, F., GEACH, A. J., GOTTHARDT, M., MCNABB, M., WITT, C. C., LABEIT, D., GREGORIO, C. C. & GRANZIER, H. 2001. The complete gene sequence of titin, expression of an unusual≈ 700-kDa titin isoform, and its interaction with obscurin identify a novel Z-line to I-band linking system. Circulation research, 89, 1065-1072.
BANSAL, D., MIYAKE, K., VOGEL, S. S., GROH, S., CHEN, C.-C., WILLIAMSON, R., MCNEIL, P. L. & CAMPBELL, K. P. 2003. Defective membrane repair in dysferlin-deficient muscular dystrophy. Nature, 423, 168-172.
BARFIELD, W. L., UAESOONTRACHOON, K., WU, C.-S., LIN, S., CHEN, Y., WANG, P. C., KANAAN, Y., BOND, V. & HOFFMAN, E. P. 2014. Eccentric muscle challenge shows osteopontin polymorphism modulation of muscle damage. Human molecular genetics, 23, 4043-4050.
BARKER, T., HENRIKSEN, V. T., MARTINS, T. B., HILL, H. R., KJELDSBERG, C. R., SCHNEIDER, E. D., DIXON, B. M. & WEAVER, L. K. 2013. Higher serum 25-hydroxyvitamin D concentrations associate with a faster recovery of skeletal muscle strength after muscular injury. Nutrients, 5, 1253-1275.
BARR, R., MACDONALD, H., STEWART, A., MCGUIGAN, F., ROGERS, A., EASTELL, R., FELSENBERG, D., GLÜER, C., ROUX, C. & REID, D. 2010. Association between vitamin D receptor gene polymorphisms, falls, balance and muscle power: results from two independent studies (APOSS and OPUS). Osteoporosis international, 21, 457-466.
BARTON-DAVIS, E. R., SHOTURMA, D. I., MUSARO, A., ROSENTHAL, N. & SWEENEY, H. L. 1998. Viral mediated expression of insulin-like growth factor I blocks the aging-related loss of skeletal muscle function. Proceedings of the National Academy of Sciences of the United States of America, 95, 15603-15607.
BAUMERT, P., LAKE, M. J., DRUST, B., STEWART, C. & ERSKINE, R. M. 2017. TRIM63 (MuRF-1) Gene Polymorphism is Associated with Biomarkers of Exercise-Induced Muscle Damage. Physiological genomics, physiolgenomics. 00103.2017-physiolgenomics. 00103.2017.
BAUMERT, P., LAKE, M. J., STEWART, C. E., DRUST, B. & ERSKINE, R. M. 2016a. Genetic variation and exercise-induced muscle damage: implications for athletic
203
performance, injury and ageing. European journal of applied physiology, 116, 1595-1625.
BAUMERT, P., LAKE, M. J., STEWART, C. E., DRUST, B. & ERSKINE, R. M. 2016b. Inter-individual variability in the response to maximal eccentric exercise. European journal of applied physiology, 116, 2055-2056.
BAUMERT, P., LAKE, M. J., STEWART, C. E., DRUST, B. & ERSKINE, R. M. 2018. Variations of Collagen-Encoding Genes are Associated with Exercise-Induced Muscle Damage. Physiological genomics.
BEDAIR, H. S., KARTHIKEYAN, T., QUINTERO, A., LI, Y. & HUARD, J. 2008. Angiotensin II receptor blockade administered after injury improves muscle regeneration and decreases fibrosis in normal skeletal muscle. American journal of sports medicine, 36, 1548-1554.
BEELEN, A., SARGEANT, A. & WIJKHUIZEN, F. 1994. Measurement of directional force and power during human submaximal and maximal isokinetic exercise. European journal of applied physiology and occupational physiology, 68, 177-181.
BEHRENS, M., MAU-MOELLER, A., WASSERMANN, F. & BRUHN, S. 2013. Effect of fatigue on hamstring reflex responses and posterior-anterior tibial translation in men and women. PloS one, 8, e56988.
BELCASTRO, A. N., SHEWCHUK, L. D. & RAJ, D. A. 1998. Exercise-induced muscle injury: a calpain hypothesis. Mol Cell Biochem, 179, 135-45.
BELL, R. D., SHULTZ, S. J., WIDEMAN, L. & HENRICH, V. C. 2012. Collagen gene variants previously associated with anterior cruciate ligament injury risk are also associated with joint laxity. Sports Health: A Multidisciplinary Approach, 4, 312-318.
BELLEMARE, F., WOODS, J., JOHANSSON, R. & BIGLAND-RITCHIE, B. 1983. Motor-unit discharge rates in maximal voluntary contractions of three human muscles. Journal of neurophysiology, 50, 1380-1392.
BEN-ZAKEN, S., ELIAKIM, A., NEMET, D., KASSEM, E. & MECKEL, Y. 2013. Increased prevalence of MnSOD genetic polymorphism in endurance and power athletes. Free radical research, 47, 1002-1008.
BEN-ZAKEN, S., ELIAKIM, A., NEMET, D., RABINOVICH, M., KASSEM, E. & MECKEL, Y. 2015. ACTN3 Polymorphism: Comparison Between Elite Swimmers and Runners. Sports medicine-open, 1, 13.
BENDIKSEN, M., BISCHOFF, R., RANDERS, M. B., MOHR, M., ROLLO, I., SUETTA, C., BANGSBO, J. & KRUSTRUP, P. 2012. The Copenhagen Soccer Test: physiological response and fatigue development. Med Sci Sports Exerc, 44, 1595-603.
BENDJABALLAH, M., SHIRAZI-ADL, A. & ZUKOR, D. 1997. Finite element analysis of human knee joint in varus-valgus. Clinical biomechanics, 12, 139-148.
BENJAMINI, Y. & HOCHBERG, Y. 1995. Controlling the false discovery rate: a practical and powerful approach to multiple testing. Journal of the royal statistical society. Series B (Methodological), 289-300.
BENJAMINSE, A., HABU, A., SELL, T. C., ABT, J. P., FU, F. H., MYERS, J. B. & LEPHART, S. M. 2008. Fatigue alters lower extremity kinematics during a single-leg stop-jump task. Knee Surg Sports Traumatol Arthrosc, 16, 400-7.
BENNERMO, M., HELD, C., STEMME, S., ERICSSON, C. G., SILVEIRA, A., GREEN, F. & TORNVALL, P. 2004. Genetic predisposition of the interleukin-6 response to inflammation: implications for a variety of major diseases? Clin Chem, 50, 2136-40.
204
BENOIT, D. L. & DOWLING, J. J. 2006. In vivo assessment of elbow flexor work and activation during stretch-shortening cycle tasks. J Electromyogr Kinesiol, 16, 352-64.
BHAT, M. & ISMAIL, A. 2015. Vitamin D treatment protects against and reverses oxidative stress induced muscle proteolysis. J Steroid Biochem Mol Biol, 152, 171-9.
BIGLAND-RITCHIE, B., JOHANSSON, R., LIPPOLD, O. & WOODS, J. 1983. Contractile speed and EMG changes during fatigue of sustained maximal voluntary contractions. Journal of neurophysiology, 50, 313-324.
BIJUR, P. E., SILVER, W. & GALLAGHER, E. J. 2001. Reliability of the visual analog scale for measurement of acute pain. Academic emergency medicine, 8, 1153-1157.
BINDER-MACLEOD, S. A., LEE, S. C., FRITZ, A. D. & KUCHARSKI, L. J. 1998. New look at force-frequency relationship of human skeletal muscle: effects of fatigue. Journal of neurophysiology, 79, 1858-1868.
BIOLO, G., WILLIAMS, B. D., FLEMING, R. Y. & WOLFE, R. R. 1999. Insulin action on muscle protein kinetics and amino acid transport during recovery after resistance exercise. Diabetes, 48, 949-957.
BIOQUE, G., CRUSIUS, J. B. A., KOUTROUBAKIS, I., BOUMA, G., KOSTENSE, P. J., MEUWISSEN, S. G. M. & PENA, A. S. 1995. Allelic polymorphism in IL-1 beta and IL-1 receptor antagonist (IL-1Ra) genes in inflammatory bowel disease. Clin Exp Immunol, 102, 379-83.
BIRESSI, S. & RANDO, T. A. Heterogeneity in the muscle satellite cell population. Seminars in cell & developmental biology, 2010. Elsevier, 845-854.
BLANCHARD, A., OHANIAN, V. & CRITCHLEY, D. 1989. The structure and function of α-actinin. Journal of muscle research and cell motility, 10, 280-289.
BLAU, H. M. & WEBSTER, C. 1981. Isolation and characterization of human muscle cells. Proceedings of the National Academy of Sciences, 78, 5623-5627.
BODINE, S. C., LATRES, E., BAUMHUETER, S., LAI, V. K.-M., NUNEZ, L., CLARKE, B. A., POUEYMIROU, W. T., PANARO, F. J., NA, E. & DHARMARAJAN, K. 2001a. Identification of ubiquitin ligases required for skeletal muscle atrophy. Science, 294, 1704-1708.
BODINE, S. C., LATRES, E., BAUMHUETER, S., LAI, V. K.-M., NUNEZ, L., CLARKE, B. A., POUEYMIROU, W. T., PANARO, F. J., NA, E., DHARMARAJAN, K., PAN, Z. Q., VALENZUELA, D. M., DECHIARA, T. M., STITT, T. N., YANCOPOULOS, G. D. & GLASS, D. J. 2001b. Identification of ubiquitin ligases required for skeletal muscle atrophy. Science, 294, 1704-8.
BOESEN, A. P., DIDERIKSEN, K., COUPPÉ, C., MAGNUSSON, S. P., SCHJERLING, P., BOESEN, M., KJÆR, M. & LANGBERG, H. 2013. Tendon and skeletal muscle matrix gene expression and functional responses to immobilisation and rehabilitation in young males: effect of growth hormone administration. The Journal of physiology, 591, 6039-6052.
BOHM, S., MERSMANN, F. & ARAMPATZIS, A. 2015. Human tendon adaptation in response to mechanical loading: a systematic review and meta-analysis of exercise intervention studies on healthy adults. Sports medicine-open, 1, 7.
BOPPART, M. D., VOLKER, S. E., ALEXANDER, N., BURKIN, D. J. & KAUFMAN, S. J. 2008. Exercise promotes alpha7 integrin gene transcription and protection of skeletal muscle. Am J Physiol Regul Integr Comp Physiol, 295, R1623-30.
BORG, G. A. 1982. Psychophysical bases of perceived exertion. Med sci sports exerc, 14, 377-381.
205
BORINSKAYA, S. A., GUREEV, A. S., ORLOVA, A. A., SANINA, E. D., KIM, A. A., GASEMIANRODSARI, F., SHIRMANOV, V. I., BALANOVSKY, O. P., REBRIKOV, D. V., KOSHECHKIN, A. V. & YANKOVSKY, N. K. 2013. Allele frequency distributions of -174G/C polymorphism in regulatory region of interleukin 6 gene (IL6) in Russian and worldwide populations. Genetika, 49, 113-24.
BORST, S. E. 2004. The role of TNF-α in insulin resistance. Endocrine, 23, 177-182. BOSSUYT, F. M., GARCIA-PINILLOS, F., RAJA AZIDIN, R. M., VANRENTERGHEM, J. &
ROBINSON, M. A. 2016. The Utility of a High-intensity Exercise Protocol to Prospectively Assess ACL Injury Risk. Int J Sports Med, 37, 125-33.
BRADLEY, P. S., DI MASCIO, M., PEART, D., OLSEN, P. & SHELDON, B. 2010. High-intensity activity profiles of elite soccer players at different performance levels. The Journal of Strength & Conditioning Research, 24, 2343-2351.
BRADLEY, P. S., SHELDON, W., WOOSTER, B., OLSEN, P., BOANAS, P. & KRUSTRUP, P. 2009. High-intensity running in English FA Premier League soccer matches. Journal of sports sciences, 27, 159-168.
BRANCACCIO, P., MAFFULLI, N. & LIMONGELLI, F. M. 2007. Creatine kinase monitoring in sport medicine. British medical bulletin, 81, 209-230.
BRING, D. K. I., PAULSON, K., RENSTROM, P., SALO, P., HART, D. A. & ACKERMANN, P. W. 2012. Residual substance P levels after capsaicin treatment correlate with tendon repair. Wound Repair and Regeneration, 20, 50-60.
BRINK, M., PRICE, S. R., CHRAST, J., BAILEY, J. L., ANWAR, A., MITCH, W. E. & DELAFONTAINE, P. 2001. Angiotensin II induces skeletal muscle wasting through enhanced protein degradation and down-regulates autocrine insulin-like growth factor I. Endocrinology, 142, 1489-1496.
BROCKETT, C. L., MORGAN, D. L. & PROSKE, U. 2004. Predicting hamstring strain injury in elite athletes. Medicine & Science in Sports & Exercise, 36, 379-387.
BROOK, M. S., WILKINSON, D. J., SMITH, K. & ATHERTON, P. J. 2016. The metabolic and temporal basis of muscle hypertrophy in response to resistance exercise. Eur J Sport Sci, 16, 633-44.
BROOKS, J. H., FULLER, C. W., KEMP, S. P. & REDDIN, D. B. 2006. Incidence, risk, and prevention of hamstring muscle injuries in professional rugby union. The American journal of sports medicine, 34, 1297-1306.
BROOS, S., MALISOUX, L., THEISEN, D., FRANCAUX, M., DELDICQUE, L. & THOMIS, M. A. 2012. Role of alpha-actinin-3 in contractile properties of human single muscle fibers: a case series study in paraplegics. Plos One, 7, 1-6.
BROOS, S., MALISOUX, L., THEISEN, D., VAN THIENEN, R., FRANCAUX, M., THOMIS, M. A. & DELDICQUE, L. 2018. The stiffness response of type IIa fibres after eccentric exercise-induced muscle damage is dependent on ACTN3 r577X polymorphism. Eur J Sport Sci, 1-10.
BROOS, S., MALISOUX, L., THEISEN, D., VAN THIENEN, R., RAMAEKERS, M., JAMART, C., DELDICQUE, L., THOMIS, M. A. & FRANCAUX, M. 2016. Evidence for ACTN3 as a speed gene in isolated human muscle fibers. PloS one, 11, e0150594.
BROWN, A. D., CLOSE, G. L., SHARPLES, A. P. & STEWART, C. E. 2017. Murine myoblast migration: influence of replicative ageing and nutrition. Biogerontology, 18, 947-964.
BROWN, S., DAY, S. & DONNELLY, A. 1999. Indirect evidence of human skeletal muscle damage and collagen breakdown after eccentric muscle actions. Journal of sports sciences, 17, 397-402.
206
BROWN, S. J., CHILD, R. B., DAY, S. H. & DONNELLY, A. E. 1997a. Exercise-induced skeletal muscle damage and adaptation following repeated bouts of eccentric muscle contractions. Journal of sports sciences, 15, 215-222.
BROWN, S. J., CHILD, R. B., DAY, S. H. & DONNELLY, A. E. 1997b. Indices of skeletal muscle damage and connective tissue breakdown following eccentric muscle contractions. Eur J Appl Physiol Occup Physiol, 75, 369-74.
BRUKNER, P. & CONNELL, D. 2015. ‘Serious thigh muscle strains’: beware the intramuscular tendon which plays an important role in difficult hamstring and quadriceps muscle strains. British journal of sports medicine, bjsports-2015-095136.
BRUNNER, H. G., KORNELUK, R. G., COERWINKEL-DRIESSEN, M., MACKENZIE, A., SMEETS, H., LAMBERMON, H. M. M., VAN OOST, B. A., WIERINGA, B. & ROPERS, H.-H. 1989. Myotonic dystrophy is closely linked to the gene for muscle-type creatine kinase (CKMM). Human genetics, 81, 308-310.
BUCHHEIT, M. & MENDEZ-VILLANUEVA, A. 2013. Reliability and stability of anthropometric and performance measures in highly-trained young soccer players: effect of age and maturation. Journal of Sports Sciences, 31, 1332-1343.
BURDEN, A. 2010. How should we normalize electromyograms obtained from healthy participants? What we have learned from over 25 years of research. Journal of electromyography and kinesiology, 20, 1023-1035.
BUSH, M., BARNES, C., ARCHER, D. T., HOGG, B. & BRADLEY, P. S. 2015. Evolution of match performance parameters for various playing positions in the English Premier League. Human movement science, 39, 1-11.
BUTTERFIELD, T. A. 2010. Eccentric exercise in vivo: strain-induced muscle damage and adaptation in a stable system. Exercise and sport sciences reviews, 38, 51-60.
BYRNE, C., TWIST, C. & ESTON, R. 2004. Neuromuscular function after exercise-induced muscle damage. Sports medicine, 34, 49-69.
CANTINI, M., GIURISATO, E., RADU, C., TIOZZO, S., PAMPINELLA, F., SENIGAGLIA, D., ZANIOLO, G., MAZZOLENI, F. & VITIELLO, L. 2002. Macrophage-secreted myogenic factors: a promising tool for greatly enhancing the proliferative capacity of myoblasts in vitro and in vivo. Neurol Sci, 23, 189-94.
CARTEE, G. D., HEPPLE, R. T., BAMMAN, M. M. & ZIERATH, J. R. 2016. Exercise Promotes Healthy Aging of Skeletal Muscle. Cell Metab, 23, 1034-1047.
CATOIRE, M. & KERSTEN, S. 2015. The search for exercise factors in humans. The FASEB Journal, 29, 1615-1628.
CAUCI, S., DI SANTOLO, M., RYCKMAN, K. K., WILLIAMS, S. M. & BANFI, G. 2010. Variable number of tandem repeat polymorphisms of the interleukin-1 receptor antagonist gene IL-1RN: a novel association with the athlete status. BMC medical genetics, 11, 29.
CENTNER, T., YANO, J., KIMURA, E., MCELHINNY, A. S., PELIN, K., WITT, C. C., BANG, M.-L., TROMBITAS, K., GRANZIER, H. & GREGORIO, C. C. 2001. Identification of muscle specific ring finger proteins as potential regulators of the titin kinase domain1. Journal of molecular biology, 306, 717-726.
CHAMBERS, R. L. & MCDERMOTT, J. C. 1996. Molecular basis of skeletal muscle regeneration. Can J Appl Physiol, 21, 155-84.
CHAN-ROPER, M., HUNTER, I., MYRER, J. W., EGGETT, D. L. & SEELEY, M. K. 2012. Kinematic changes during a marathon for fast and slow runners. Journal of sports science & medicine, 11, 77.
207
CHAN, S., SETO, J. T., HOUWELING, P. J., YANG, N., NORTH, K. N. & HEAD, S. I. 2011. Properties of extensor digitorum longus muscle and skinned fibers from adult and aged male and female Actn3 knockout mice. Muscle Nerve, 43, 37-48.
CHEN, C.-H., YE, X., WANG, Y.-T., CHEN, Y.-S. & TSENG, W.-C. 2017. Differential Effects of Different Warm-up Protocols on Repeated Sprints-Induced Muscle Damage. The Journal of Strength & Conditioning Research.
CHEN, T. C., LIN, K.-Y., CHEN, H.-L., LIN, M.-J. & NOSAKA, K. 2011. Comparison in eccentric exercise-induced muscle damage among four limb muscles. European journal of applied physiology, 111, 211-223.
CHENG, L., ZHANG, D., ZHOU, L., ZHAO, J. & CHEN, B. 2015. Association between SLC30A8 rs13266634 Polymorphism and Type 2 Diabetes Risk: A Meta-Analysis. Medical Science Monitor, 21, 2178-2189.
CHEUNG, K., HUME, P. A. & MAXWELL, L. 2003. Delayed onset muscle soreness. Sports Medicine, 33, 145-164.
CHILDERS, M. K. & MCDONALD, K. S. 2004. Regulatory light chain phosphorylation increases eccentric contraction-induced injury in skinned fast-twitch fibers. Muscle & nerve, 29, 313-317.
CHIMIENTI, F., DEVERGNAS, S., PATTOU, F., SCHUIT, F., GARCIA-CUENCA, R., VANDEWALLE, B., KERR-CONTE, J., VAN LOMMEL, L., GRUNWALD, D., FAVIER, A. & SEVE, M. 2006. In vivo expression and functional characterization of the zinc transporter ZnT8 in glucose-induced insulin secretion. J Cell Sci, 119, 4199-206.
CHUMANOV, E. S., HEIDERSCHEIT, B. C. & THELEN, D. G. 2007. The effect of speed and influence of individual muscles on hamstring mechanics during the swing phase of sprinting. Journal of biomechanics, 40, 3555-3562.
CHUMANOV, E. S., SCHACHE, A. G., HEIDERSCHEIT, B. C. & THELEN, D. G. 2011. Hamstrings are most susceptible to injury during the late swing phase of sprinting. British journal of sports medicine, bjsports90176.
CLANSEY, A. C., HANLON, M., WALLACE, E. S. & LAKE, M. J. 2012. Effects of fatigue on running mechanics associated with tibial stress fracture risk. Medicine and science in sports and exercise, 44, 1917-1923.
CLARKE, M. & FEEBACK, D. L. 1996. Mechanical load induces sarcoplasmic wounding and FGF release in differentiated human skeletal muscle cultures. The FASEB journal, 10, 502-509.
CLARKSON, P. M., DEVANEY, J. M., GORDISH-DRESSMAN, H., THOMPSON, P. D., HUBAL, M. J., URSO, M., PRICE, T. B., ANGELOPOULOS, T. J., GORDON, P. M. & MOYNA, N. M. 2005a. ACTN3 genotype is associated with increases in muscle strength in response to resistance training in women. Journal of Applied Physiology, 99, 154-163.
CLARKSON, P. M., HOFFMAN, E. P., ZAMBRASKI, E., GORDISH-DRESSMAN, H., KEARNS, A., HUBAL, M., HARMON, B. & DEVANEY, J. M. 2005b. ACTN3 and MLCK genotype associations with exertional muscle damage. J Appl Physiol (1985), 99, 564-9.
CLARKSON, P. M. & HUBAL, M. J. 2002. Exercise-induced muscle damage in humans. American journal of physical medicine & rehabilitation, 81, S52-S69.
CLARKSON, P. M., NOSAKA, K. & BRAUN, B. 1992. Muscle function after exercise-induced muscle damage and rapid adaptation. Medicine and science in sports and exercise, 24, 512-520.
CLOSE, R. 1972. Dynamic properties of mammalian skeletal muscles. Physiological reviews, 52, 129-197.
208
COLBERG, S. R., SIGAL, R. J., FERNHALL, B., REGENSTEINER, J. G., BLISSMER, B. J., RUBIN, R. R., CHASAN-TABER, L., ALBRIGHT, A. L. & BRAUN, B. 2010. Exercise and type 2 diabetes: the American College of Sports Medicine and the American Diabetes Association: joint position statement. Diabetes care, 33, e147-e167.
COLLINS, M. & RALEIGH, S. M. 2009. Genetic risk factors for musculoskeletal soft tissue injuries. Medicine and Sport Science, 54, 136-149.
CONSORTIUM, G. P. 2012. An integrated map of genetic variation from 1,092 human genomes. Nature, 491, 56-65.
CORATELLA, G., BELLIN, G., BEATO, M. & SCHENA, F. 2015. Fatigue affects peak joint torque angle in hamstrings but not in quadriceps. Journal of sports sciences, 33, 1276-1282.
COSTA, A. M., SILVA, A. J., GARRIDO, N. D., LOURO, H., DE OLIVEIRA, R. J. & BREITENFELD, L. 2009. Association between ACE D allele and elite short distance swimming. European journal of applied physiology, 106, 785-790.
COSTILL, D. L., PASCOE, D. D., FINK, W. J., ROBERGS, R. A., BARR, S. I. & PEARSON, D. 1990. Impaired muscle glycogen resynthesis after eccentric exercise. Journal of Applied Physiology, 69, 46-50.
CRAMERI, R., AAGAARD, P., QVORTRUP, K., LANGBERG, H., OLESEN, J. & KJÆR, M. 2007. Myofibre damage in human skeletal muscle: effects of electrical stimulation versus voluntary contraction. The Journal of physiology, 583, 365-380.
CRANE, J. D., ABADI, A., HETTINGA, B. P., OGBORN, D. I., MACNEIL, L. G., STEINBERG, G. R. & TARNOPOLSKY, M. A. 2013. Elevated mitochondrial oxidative stress impairs metabolic adaptations to exercise in skeletal muscle. PloS One 8, e81879.
CREMA, M. D., JARRAYA, M., ENGEBRETSEN, L., ROEMER, F. W., HAYASHI, D., DOMINGUES, R., SKAF, A. Y. & GUERMAZI, A. 2017. Imaging-detected acute muscle injuries in athletes participating in the Rio de Janeiro 2016 Summer Olympic Games. Br J Sports Med, bjsports-2017-098247.
CROSS, T. M., GIBBS, N., HOUANG, M. T. & CAMERON, M. 2004. Acute quadriceps muscle strains: magnetic resonance imaging features and prognosis. The American journal of sports medicine, 32, 710-719.
CROWN, A., HE, X., HOLLY, J., LIGHTMAN, S. & STEWART, C. 2000. Characterisation of the IGF system in a primary adult human skeletal muscle cell model, and comparison of the effects of insulin and IGF-I on protein metabolism. Journal of endocrinology, 167, 403-415.
DA CUNHA NASCIMENTO, D., DE SOUSA, N. M. F., DE SOUSA NETO, I. V., TIBANA, R. A., DE SOUZA, V. C., VIEIRA, D. C. L., CAMARÇO, N. F., DE OLIVEIRA, S., DE ALMEIDA, J. A. & NAVALTA, J. 2015. Classification of pro-inflammatory status for interleukin-6 affects relative muscle strength in obese elderly women. Aging clinical and experimental research, 27, 791-797.
DAMAS, F., NOSAKA, K., LIBARDI, C. A., CHEN, T. C. & UGRINOWITSCH, C. 2016a. Susceptibility to Exercise-Induced Muscle Damage: a Cluster Analysis with a Large Sample. Int J Sports Med, 37, 633-40.
DAMAS, F., PHILLIPS, S. M., LIBARDI, C. A., VECHIN, F. C., LIXANDRÃO, M. E., JANNIG, P. R., COSTA, L. A., BACURAU, A. V., SNIJDERS, T. & PARISE, G. 2016b. Resistance training‐induced changes in integrated myofibrillar protein synthesis are related to hypertrophy only after attenuation of muscle damage. The Journal of physiology, 594, 5209-5222.
209
DAMAS, F., UGRINOWITSCH, C., LIBARDI, C. A., JANNIG, P. R., HECTOR, A. J., MCGLORY, C., LIXANDRÃO, M. E., VECHIN, F. C., MONTENEGRO, H. & TRICOLI, V. 2018. Resistance training in young men induces muscle transcriptome-wide changes associated with muscle structure and metabolism refining the response to exercise-induced stress. European Journal of Applied Physiology, 1-10.
DANSER, A. J., SCHALEKAMP, M. A., BAX, W. A., VAN DEN BRINK, A. M., SAXENA, P. R., RIEGGER, G. A. & SCHUNKERT, H. 1995. Angiotensin-converting enzyme in the human heart effect of the deletion/insertion polymorphism. Circulation, 92, 1387-1388.
DAVIS, M. E., GUMUCIO, J. P., SUGG, K. B., BEDI, A. & MENDIAS, C. L. 2013. MMP inhibition as a potential method to augment the healing of skeletal muscle and tendon extracellular matrix. Journal of Applied Physiology, 115, 884-891.
DE MOOR, M. H., SPECTOR, T. D., CHERKAS, L. F., FALCHI, M., HOTTENGA, J. J., BOOMSMA, D. I. & DE GEUS, E. J. 2007. Genome-wide linkage scan for athlete status in 700 British female DZ twin pairs. Twin Research and Human Genetics, 10, 812-820.
DEASY, B. M., LU, A., TEBBETS, J. C., FEDUSKA, J. M., SCHUGAR, R. C., POLLETT, J. B., SUN, B., URISH, K. L., GHARAIBEH, B. M. & CAO, B. 2007. A role for cell sex in stem cell–mediated skeletal muscle regeneration: female cells have higher muscle regeneration efficiency. The Journal of cell biology, 177, 73-86.
DEL COSO, J., SALINERO, J. J., LARA, B., GALLO-SALAZAR, C., ARECES, F., HERRERO, D. & PUENTE, C. 2017a. Polygenic Profile and Exercise-Induced Muscle Damage by a Competitive Half-Ironman. Journal of strength and conditioning research.
DEL COSO, J., VALERO, M., SALINERO, J. J., LARA, B., GALLO-SALAZAR, C. & ARECES, F. 2017b. Optimum polygenic profile to resist exertional rhabdomyolysis during a marathon. PloS one, 12, e0172965.
DELELLIS, K., INGLES, S., KOLONEL, L., MCKEAN-COWDIN, R., HENDERSON, B., STANCZYK, F. & PROBST-HENSCH, N. M. 2003. IGF1 genotype, mean plasma level and breast cancer risk in the Hawaii/Los Angeles multiethnic cohort. British journal of cancer, 88, 277-282.
DENDORFER, A., WOLFRUM, S., WAGEMANN, M., QADRI, F. & DOMINIAK, P. 2001. Pathways of bradykinin degradation in blood and plasma of normotensive and hypertensive rats. Am J Physiol Heart Circ Physiol, 280, H2182-8.
DENNIS, R. A., TRAPPE, T. A., SIMPSON, P., CARROLL, C., HUANG, B. E., NAGARAJAN, R., BEARDEN, E., GURLEY, C., DUFF, G. W. & EVANS, W. J. 2004. Interleukin-1 polymorphisms are associated with the inflammatory response in human muscle to acute resistance exercise. The Journal of physiology, 560, 617-626.
DESCHEPPER, C. F. 1994. Angiotensinogen: hormonal regulation and relative importance in the generation of angiotensin II. Kidney Int, 46, 1561-3.
DEUSTER, P. A., CONTRERAS-SESVOLD, C. L., O'CONNOR, F. G., CAMPBELL, W. W., KENNEY, K., CAPACCHIONE, J. F., LANDAU, M. E., MULDOON, S. M., RUSHING, E. J. & HELED, Y. 2013. Genetic polymorphisms associated with exertional rhabdomyolysis. Eur J Appl Physiol, 113, 1997-2004.
DEVANEY, J. M., HOFFMAN, E. P., GORDISH-DRESSMAN, H., KEARNS, A., ZAMBRASKI, E. & CLARKSON, P. M. 2007a. IGF-II gene region polymorphisms related to exertional muscle damage. J Appl Physiol (1985), 102, 1815-23.
210
DEVANEY, J. M., HOFFMAN, E. P., GORDISH-DRESSMAN, H., KEARNS, A., ZAMBRASKI, E. & CLARKSON, P. M. 2007b. IGF-II gene region polymorphisms related to exertional muscle damage. Journal of applied physiology, 102, 1815-1823.
DEWBERRY, R., HOLDEN, H., CROSSMAN, D. & FRANCIS, S. 2000. Interleukin-1 receptor antagonist expression in human endothelial cells and atherosclerosis. Arterioscler Thromb Vasc Biol, 20, 2394-400.
DI GIOVINE, F. S., TAKHSH, E., BLAKEMORE, A. I. F. & DUFF, G. W. 1992. Single base polymorphism at -511 in the human interleukin-1 beta gene (IL1 beta). Hum Mol Genet, 1, 450-450.
DIMCHEV, G. A., AL-SHANTI, N. & STEWART, C. E. 2013. Phospho-tyrosine phosphatase inhibitor Bpv (Hopic) enhances C2C12 myoblast migration in vitro. Requirement of PI3K/AKT and MAPK/ERK pathways. Journal of muscle research and cell motility, 34, 125-136.
DINARELLO, C. A. 2009. Immunological and inflammatory functions of the interleukin-1 family. Annu Rev Immunol, 27, 519-50.
DOBROWOLNY, G., GIACINTI, C., PELOSI, L., NICOLETTI, C., WINN, N., BARBERI, L., MOLINARO, M., ROSENTHAL, N. & MUSARÒ, A. 2005. Muscle expression of a local Igf-1 isoform protects motor neurons in an ALS mouse model. The Journal of cell biology, 168, 193-199.
DOESSING, S., HOLM, L., HEINEMEIER, K. M., FELDT-RASMUSSEN, U., SCHJERLING, P., QVORTRUP, K., LARSEN, J. O., NIELSEN, R. H., FLYVBJERG, A. & KJAER, M. 2010. GH and IGF1 levels are positively associated with musculotendinous collagen expression: experiments in acromegalic and GH deficiency patients. European Journal of Endocrinology, 163, 853-862.
DOUSSET, E., AVELA, J., ISHIKAWA, M., KALLIO, J., KUITUNEN, S., KYROLAINEN, H., LINNAMO, V. & KOMI, P. V. 2007. Bimodal recovery pattern in human skeletal muscle induced by exhaustive stretch-shortening cycle exercise. Medicine and science in sports and exercise, 39, 453-460.
DUAN, C., REN, H. & GAO, S. 2010. Insulin-like growth factors (IGFs), IGF receptors, and IGF-binding proteins: roles in skeletal muscle growth and differentiation. Gen Comp Endocrinol, 167, 344-51.
DUANCE, V. C., RESTALL, D. J., BEARD, H., BOURNE, F. J. & BAILEY, A. J. 1977. The location of three collagen types in skeletal muscle. FEBS letters, 79, 248-252.
DUHIG, S., SHIELD, A. J., OPAR, D., GABBETT, T. J., FERGUSON, C. & WILLIAMS, M. 2016. Effect of high-speed running on hamstring strain injury risk. Br J Sports Med, 50, 1536-1540.
DUNDON, J. M., CIRILLO, J. & SEMMLER, J. G. 2008. Low-frequency fatigue and neuromuscular performance after exercise-induced damage to elbow flexor muscles. Journal of Applied Physiology, 105, 1146-1155.
DURAND-BUSH, N. & SALMELA, J. H. 2002. The development and maintenance of expert athletic performance: Perceptions of world and Olympic champions. Journal of applied sport psychology, 14, 154-171.
DUTTO, D. J. & BRAUN, W. A. 2004. DOMS-associated changes in ankle and knee joint dynamics during running. Medicine and science in sports and exercise, 36, 560-566.
EFTESTØL, E., EGNER, I. M., LUNDE, I. G., ELLEFSEN, S., ANDERSEN, T., SJÅLAND, C., GUNDERSEN, K. & BRUUSGAARD, J. C. 2016. Increased hypertrophic response with
211
increased mechanical load in skeletal muscles receiving identical activity patterns. American Journal of Physiology-Cell Physiology, 311, C616-C629.
EIRALE, C., TOL, J., FAROOQ, A., SMILEY, F. & CHALABI, H. 2013. Low injury rate strongly correlates with team success in Qatari professional football. Br J Sports Med, 47, 807-808.
EKSTRAND, J. 2013. Keeping your top players on the pitch: the key to football medicine at a professional level. BMJ Publishing Group Ltd and British Association of Sport and Exercise Medicine.
EKSTRAND, J., HÄGGLUND, M. & WALDÉN, M. 2011. Epidemiology of muscle injuries in professional football (soccer). The American journal of sports medicine, 39, 1226-1232.
EKSTRAND, J., WALDÉN, M. & HÄGGLUND, M. 2016. Hamstring injuries have increased by 4% annually in men's professional football, since 2001: a 13-year longitudinal analysis of the UEFA Elite Club injury study. British journal of sports medicine, 50, 731-737.
ENGLER, A. J., SEN, S., SWEENEY, H. L. & DISCHER, D. E. 2006. Matrix elasticity directs stem cell lineage specification. Cell, 126, 677-689.
ERSHLER, W. B. & KELLER, E. T. 2000. Age-associated increased interleukin-6 gene expression, late-life diseases, and frailty. Annual review of medicine, 51, 245-270.
ERSKINE, R. M., FLETCHER, G. & FOLLAND, J. P. 2014a. The contribution of muscle hypertrophy to strength changes following resistance training. European journal of applied physiology, 114, 1239-1249.
ERSKINE, R. M., JONES, D. A., MAFFULLI, N., WILLIAMS, A. G., STEWART, C. E. & DEGENS, H. 2011. What causes in vivo muscle specific tension to increase following resistance training? Experimental physiology, 96, 145-155.
ERSKINE, R. M., JONES, D. A., MAGANARIS, C. N. & DEGENS, H. 2009. In vivo specific tension of the human quadriceps femoris muscle. European journal of applied physiology, 106, 827-838.
ERSKINE, R. M., JONES, D. A., WILLIAMS, A. G., STEWART, C. E. & DEGENS, H. 2010a. Inter-individual variability in the adaptation of human muscle specific tension to progressive resistance training. European journal of applied physiology, 110, 1117-1125.
ERSKINE, R. M., JONES, D. A., WILLIAMS, A. G., STEWART, C. E. & DEGENS, H. 2010b. Resistance training increases in vivo quadriceps femoris muscle specific tension in young men. Acta physiologica, 199, 83-89.
ERSKINE, R. M., WILLIAMS, A. G., JONES, D. A., STEWART, C. E. & DEGENS, H. 2012. Do PTK2 gene polymorphisms contribute to the interindividual variability in muscle strength and the response to resistance training? A preliminary report. Journal of applied physiology, 112, 1329-1334.
ERSKINE, R. M., WILLIAMS, A. G., JONES, D. A., STEWART, C. E. & DEGENS, H. 2014b. The individual and combined influence of ACE and ACTN3 genotypes on muscle phenotypes before and after strength training. Scandinavian journal of medicine & science in sports, 24, 642-648.
ESFORMES, J. I., NARICI, M. V. & MAGANARIS, C. N. 2002. Measurement of human muscle volume using ultrasonography. European journal of applied physiology, 87, 90-92.
EVANGELIDIS, P., MASSEY, G. J., FERGUSON, R. A., WHEELER, P. C., PAIN, M. T. & FOLLAND, J. P. 2016. The functional significance of hamstrings composition: is it
212
really a ‘fast’muscle group? Scandinavian journal of medicine & science in sports, 27, 1181-1189.
EVANGELIDIS, P. E., MASSEY, G. J., PAIN, M. & FOLLAND, J. P. 2014. Biceps Femoris Aponeurosis Size: A Potential Risk Factor for Strain Injury? Medicine and science in sports and exercise.
EYNON, N., HANSON, E. D., LUCIA, A., HOUWELING, P. J., GARTON, F., NORTH, K. N. & BISHOP, D. J. 2013. Genes for elite power and sprint performance: ACTN3 leads the way. Sports Medicine, 43, 803-817.
FARTHING, J. P., KRENTZ, J. R. & MAGNUS, C. R. 2009. Strength training the free limb attenuates strength loss during unilateral immobilization. J Appl Physiol (1985), 106, 830-6.
FAZELZADEH, P., HANGELBROEK, R. W., TIELAND, M., DE GROOT, L. C., VERDIJK, L. B., VAN LOON, L. J., SMILDE, A. K., ALVES, R. D., VERVOORT, J. & MULLER, M. J. J. O. P. R. 2016. The muscle metabolome differs between healthy and frail older adults. Journal of Proteome Research, 15, 499-509.
FERNÁNDEZ, A. M., DUPONT, J., FARRAR, R. P., LEE, S., STANNARD, B. & LE ROITH, D. 2002. Muscle-specific inactivation of the IGF-I receptor induces compensatory hyperplasia in skeletal muscle. Journal of Clinical Investigation, 109, 347-355.
FIELDING, R. A., MANFREDI, T. J., DING, W. E. N. J. I. N. G., FIATARONE, M. A., EVANS, W. J. & CANNON, J. G. 1993. Acute phase response in exercise. III. Neutrophil and IL-1 beta accumulation in skeletal muscle. American Journal of Physiology-Regulatory, Integrative and Comparative Physiology, 265, R166-R172.
FIELDING, R. A., MEREDITH, C. N., O'REILLY, K. P., FRONTERA, W. R., CANNON, J. G. & EVANS, W. J. 1991. Enhanced protein breakdown after eccentric exercise in young and older men. Journal of Applied Physiology, 71, 674-679.
FISCHER, C. P. 2006. Interleukin-6 in acute exercise and training: what is the biological relevance? Exerc Immunol Rev, 12, 6-33.
FISCHER, C. P., HISCOCK, N. J., PENKOWA, M., BASU, S., VESSBY, B., KALLNER, A., SJÖBERG, L. B. & PEDERSEN, B. K. 2004. Supplementation with vitamins C and E inhibits the release of interleukin-6 from contracting human skeletal muscle. The journal of physiology, 558, 633-645.
FISHMAN, D., FAULDS, G., JEFFERY, R., MOHAMED-ALI, V., YUDKIN, J. S., HUMPHRIES, S. & WOO, P. 1998. The effect of novel polymorphisms in the interleukin-6 (IL-6) gene on IL-6 transcription and plasma IL-6 levels, and an association with systemic-onset juvenile chronic arthritis. J Clin Invest, 102, 1369-76.
FITZSIMONS, M., DAWSON, B., WARD, D. & WILKINSON, A. 1993. Cycling and running tests of repeated sprint ability. Australian Journal of Science and Medicine in Sport, 25, 82-82.
FLANN, K. L., LASTAYO, P. C., MCCLAIN, D. A., HAZEL, M. & LINDSTEDT, S. L. 2011. Muscle damage and muscle remodeling: no pain, no gain? The Journal of experimental biology, 214, 674-679.
FLORINI, J. R., EWTON, D. Z. & COOLICAN, S. A. 1996. Growth hormone and the insulin-like growth factor system in myogenesis. Endocr Rev, 17, 481-517.
FLÜCK, M., CHIQUET, M., SCHMUTZ, S., MAYET-SORNAY, M.-H. & DESPLANCHES, D. 2003. Reloading of atrophied rat soleus muscle induces tenascin-C expression around damaged muscle fibers. American Journal of Physiology-Regulatory, Integrative and Comparative Physiology, 284, R792-R801.
213
FOSTER, B., MORSE, C. I., ONAMBELE-PEARSON, G., AHMETOV, I. I. & WILLIAMS, A. G. 2012. Genetic variation, protein composition and potential influences on tendon properties in humans. The open sports medicine journal, 6, 8-21.
FOULSTONE, E. J., HUSER, C., CROWN, A. L., HOLLY, J. M. & STEWART, C. E. 2004. Differential signalling mechanisms predisposing primary human skeletal muscle cells to altered proliferation and differentiation: roles of IGF-I and TNFα. Experimental cell research, 294, 223-235.
FRECKLETON, G. & PIZZARI, T. 2013. Risk factors for hamstring muscle strain injury in sport: a systematic review and meta-analysis. British journal of sports medicine, 47, 351-358.
FREITAS, S. R., MARMELEIRA, J., VALAMATOS, M. J., BLAZEVICH, A. & MIL‐HOMENS, P. 2018. Ultrasonographic Measurement of the Biceps Femoris Long‐Head Muscle Architecture. Journal of Ultrasound in Medicine, 37, 977-986.
FRIDEN, J., KJÖRELL, U. & THORNELL, L.-E. 1984. Delayed muscle soreness and cytoskeletal alterations: an immunocytological study in man. International journal of sports medicine, 5, 15-18.
FRIDEN, J. & LIEBER, R. L. 1992. Structural and mechanical basis of exercise-induced muscle injury. Med Sci Sports Exerc, 24, 521-30.
FRIDEN, J. & LIEBER, R. L. 2001. Eccentric exercise-induced injuries to contractile and cytoskeletal muscle fibre components. Acta Physiologica Scandinavica, 171, 321-326.
FRIDEN, J., SJÖSTRÖM, M. & EKBLOM, B. 1981. A morphological study of delayed muscle soreness. Experientia, 37, 506-507.
FRY, C. S., KIRBY, T. J., KOSMAC, K., MCCARTHY, J. J. & PETERSON, C. A. 2017. Myogenic progenitor cells control extracellular matrix production by fibroblasts during skeletal muscle hypertrophy. Cell stem cell, 20, 56-69.
FUJITA, S., RASMUSSEN, B. B., CADENAS, J. G., GRADY, J. J. & VOLPI, E. 2006. Effect of insulin on human skeletal muscle protein synthesis is modulated by insulin-induced changes in muscle blood flow and amino acid availability. American Journal of Physiology-Endocrinology and Metabolism, 291, E745-E754.
FUNGHETTO, S. S., PRESTES, J., SILVA ADE, O., FARIAS, D. L., TEIXEIRA, T. G., VIEIRA, D. C., SOUZA, V. C., SOUSA, N. M., NAVALTA, J. W., MELO, G. F. & KARNIKOWSKI, M. G. 2013. Interleukin-6 -174G/C gene polymorphism affects muscle damage response to acute eccentric resistance exercise in elderly obese women. Exp Gerontol, 48, 1255-9.
GABBETT, T. J., HULIN, B. T., BLANCH, P. & WHITELEY, R. 2016. High training workloads alone do not cause sports injuries: how you get there is the real issue. BMJ Publishing Group Ltd and British Association of Sport and Exercise Medicine.
GANDEVIA, S. C. 2001. Spinal and supraspinal factors in human muscle fatigue. Physiological reviews, 81, 1725-1789.
GARG, K. & BOPPART, M. D. 2016. Influence of exercise and aging on extracellular matrix composition in the skeletal muscle stem cell niche. Journal of Applied Physiology, 121, 1053-1058.
GARTON, F., SETO, J., QUINLAN, K., YANG, N., HOUWELING, P. & NORTH, K. 2013. α-Actinin-3 deficiency alters muscle adaptation in response to denervation and immobilization. Human molecular genetics, ddt580.
GARTON, F. C., HOUWELING, P. J., VUKCEVIC, D., MEEHAN, L. R., LEE, F. X., LEK, M., ROESZLER, K. N., HOGARTH, M. W., TIONG, C. F. & ZANNINO, D. 2018a. The Effect
214
of ACTN3 Gene Doping on Skeletal Muscle Performance. The American Journal of Human Genetics, 102, 845-857.
GARTON, F. C., HOUWELING, P. J., VUKCEVIC, D., MEEHAN, L. R., LEE, F. X. Z., LEK, M., ROESZLER, K. N., HOGARTH, M. W., TIONG, C. F., ZANNINO, D., YANG, N., LESLIE, S., GREGOREVIC, P., HEAD, S. I., SETO, J. T. & NORTH, K. N. 2018b. The Effect of ACTN3 Gene Doping on Skeletal Muscle Performance. Am J Hum Genet, 102, 845-857.
GATTAZZO, F., URCIUOLO, A. & BONALDO, P. 2014. Extracellular matrix: a dynamic microenvironment for stem cell niche. Biochimica et Biophysica Acta (BBA)-General Subjects, 1840, 2506-2519.
GAUTEL, M. 2011a. Cytoskeletal protein kinases: titin and its relations in mechanosensing. Pflügers Archiv-European Journal of Physiology, 462, 119-134.
GAUTEL, M. 2011b. The sarcomeric cytoskeleton: who picks up the strain? Current opinion in cell biology, 23, 39-46.
GAYAGAY, G., YU, B., HAMBLY, B., BOSTON, T., HAHN, A., CELERMAJER, D. S. & TRENT, R. J. 1998. Elite endurance athletes and the ACE I allele--the role of genes in athletic performance. Hum Genet, 103, 48-50.
GEORGIADES, E., KLISSOURAS, V., BAULCH, J., WANG, G. & PITSILADIS, Y. 2017. Why nature prevails over nurture in the making of the elite athlete. BMC genomics, 18, 835.
GIACHELLI, C. M., LOMBARDI, D., JOHNSON, R. J., MURRY, C. E. & ALMEIDA, M. 1998. Evidence for a role of osteopontin in macrophage infiltration in response to pathological stimuli in vivo. Am J Pathol, 152, 353-8.
GIACOPELLI, F., MARCIANO, R., PISTORIO, A., CATARSI, P., CANINI, S., KARSENTY, G. & RAVAZZOLO, R. 2004. Polymorphisms in the osteopontin promoter affect its transcriptional activity. Physiol Genomics, 20, 87-96.
GILLIES, A. R. & LIEBER, R. L. 2011. Structure and function of the skeletal muscle extracellular matrix. Muscle & nerve, 44, 318-331.
GILLIVER, S., DEGENS, H., RITTWEGER, J., SARGEANT, A. & JONES, D. 2009. Variation in the determinants of power of chemically skinned human muscle fibres. Experimental physiology, 94, 1070-1078.
GIRARD, O., MENDEZ-VILLANUEVA, A. & BISHOP, D. 2011. Repeated-Sprint Ability—Part I. Sports medicine, 41, 673-694.
GIRDEN, E. R. 1992. ANOVA: Repeated measures, Sage. GLAISTER, M., HOWATSON, G., PATTISON, J. R. & MCINNES, G. 2008. The reliability and
validity of fatigue measures during multiple-sprint work: an issue revisited. The Journal of Strength & Conditioning Research, 22, 1597-1601.
GLUND, S., DESHMUKH, A., LONG, Y. C., MOLLER, T., KOISTINEN, H. A., CAIDAHL, K., ZIERATH, J. R. & KROOK, A. 2007. Interleukin-6 directly increases glucose metabolism in resting human skeletal muscle. Diabetes, 56, 1630-1637.
GOETSCH, K. P., MYBURGH, K. H. & NIESLER, C. U. 2013. In vitro myoblast motility models: investigating migration dynamics for the study of skeletal muscle repair. Journal of muscle research and cell motility, 34, 333-347.
GOETSCH, K. P. & NIESLER, C. U. 2011. Optimization of the scratch assay for in vitro skeletal muscle wound healing analysis. Analytical biochemistry, 411, 158-160.
GOETSCH, S. C., HAWKE, T. J., GALLARDO, T. D., RICHARDSON, J. A. & GARRY, D. J. 2003. Transcriptional profiling and regulation of the extracellular matrix during muscle regeneration. Physiological genomics, 14, 261-271.
215
GOMEZ-CABRERA, M.-C., DOMENECH, E. & VIÑA, J. 2008. Moderate exercise is an antioxidant: upregulation of antioxidant genes by training. Free Radical Biology and Medicine, 44, 126-131.
GORDON, P. M., LIU, D., SARTOR, M. A., IGLAYREGER, H. B., PISTILLI, E. E., GUTMANN, L., NADER, G. A. & HOFFMAN, E. P. 2012. Resistance exercise training influences skeletal muscle immune activation: a microarray analysis. Journal of applied physiology, 112, 443-453.
GORDON, S. E., DAVIS, B. S., CARLSON, C. J. & BOOTH, F. W. 2001. ANG II is required for optimal overload-induced skeletal muscle hypertrophy. American Journal of Physiology-Endocrinology And Metabolism, 280, E150-E159.
GRANACHER, U., LESINSKI, M., BÜSCH, D., MUEHLBAUER, T., PRIESKE, O., PUTA, C., GOLLHOFER, A. & BEHM, D. G. 2016. Effects of resistance training in youth athletes on muscular fitness and athletic performance: a conceptual model for long-term athlete development. Frontiers in physiology, 7, 164.
GREALY, R., HERRUER, J., SMITH, C. L., HILLER, D., HASELER, L. J. & GRIFFITHS, L. R. 2015. Evaluation of a 7-Gene Genetic Profile for Athletic Endurance Phenotype in Ironman Championship Triathletes. PloS one, 10, e0145171.
GREGORY, C. M. & BICKEL, C. S. 2005. Recruitment patterns in human skeletal muscle during electrical stimulation. Physical therapy, 85, 358-364.
GRIFFIN, C. A., APPONI, L. H., LONG, K. K. & PAVLATH, G. K. 2010. Chemokine expression and control of muscle cell migration during myogenesis. Journal of cell science, 123, 3052-3060.
GROBLER, L., COLLINS, M. & LAMBERT, M. I. 2004. Remodelling of skeletal muscle following exercise-induced muscle damage: review article. International SportMed Journal, 5, 67-83.
GROHMANN, M., FOULSTONE, E., WELSH, G., HOLLY, J., SHIELD, J., CROWNE, E. & STEWART, C. 2005. Isolation and validation of human prepubertal skeletal muscle cells: maturation and metabolic effects of IGF‐I, IGFBP‐3 and TNFα. The Journal of physiology, 568, 229-242.
GROUNDS, M., SOROKIN, L. & WHITE, J. 2005. Strength at the extracellular matrix–muscle interface. Scandinavian journal of medicine & science in sports, 15, 381-391.
GRUNDBERG, E., BRANDSTROM, H., RIBOM, E. L., LJUNGGREN, O., MALLMIN, H. & KINDMARK, A. 2004. Genetic variation in the human vitamin D receptor is associated with muscle strength, fat mass and body weight in Swedish women. European Journal of Endocrinology, 150, 323-328.
GUEX, K., GOJANOVIC, B. & MILLET, G. P. 2012. Influence of hip-flexion angle on hamstrings isokinetic activity in sprinters. J Athl Train, 47, 390-5.
GUSTAFSSON, E., ASZÓDI, A., ORTEGA, N., HUNZIKER, E. B., DENKER, H. W., WERB, Z. & FÄSSLER, R. 2003. Role of collagen type II and perlecan in skeletal development. Annals of the New York Academy of Sciences, 995, 140-150.
GYSEL, T., CALDERS, P., CAMBIER, D., ROMAN DE METTELINGE, T., KAUFMAN, J., TAES, Y., ZMIERCZAK, H.-G. & GOEMAERE, S. 2014. Association between insulin resistance, lean mass and muscle torque/force in proximal versus distal body parts in healthy young men. Journal of musculoskeletal & neuronal interactions, 14, 41-49.
HÄGGLUND, M., WALDÉN, M., MAGNUSSON, H., KRISTENSON, K., BENGTSSON, H. & EKSTRAND, J. 2013. Injuries affect team performance negatively in professional football: an 11-year follow-up of the UEFA Champions League injury study. Br J Sports Med, bjsports-2013-092215.
216
HAN, Y. J., MA, S.-F., WADE, M. S., FLORES, C. & GARCIA, J. G. 2012. An intronic MYLK variant associated with inflammatory lung disease regulates promoter activity of the smooth muscle myosin light chain kinase isoform. Journal of molecular medicine, 90, 299-308.
HANGELBROEK, R. W., KNUIMAN, P., TIELAND, M. & DE GROOT, L. C. J. E. G. 2018. Attenuated strength gains during prolonged resistance exercise training in older adults with high inflammatory status. 106, 154-158.
HANSEN, M., BOESEN, A., HOLM, L., FLYVBJERG, A., LANGBERG, H. & KJÆR, M. 2013. Local administration of insulin-like growth factor-I (IGF-I) stimulates tendon collagen synthesis in humans. Scandinavian journal of medicine & science in sports, 23, 614-619.
HARA, A., SAKAI, N., FURUICHI, K., SAKAI, Y., TAKEYA, M., BUCALA, R., MUKAIDA, N., TAKUWA, Y., MATSUSHIMA, K. & KANEKO, S. 2013. CCL2/CCR2 augments the production of transforming growth factor-beta1, type 1 collagen and CCL2 by human CD45-/collagen 1-positive cells under high glucose concentrations. Clinical and experimental nephrology, 17, 793-804.
HARDY, D., BESNARD, A., LATIL, M., JOUVION, G., BRIAND, D., THÉPENIER, C., PASCAL, Q., GUGUIN, A., GAYRAUD-MOREL, B. & CAVAILLON, J.-M. 2016. Comparative study of injury models for studying muscle regeneration in mice. PloS one, 11, e0147198.
HARMON, B. T., ORKUNOGLU-SUER, E. F., ADHAM, K., LARKIN, J. S., GORDISH-DRESSMAN, H., CLARKSON, P. M., THOMPSON, P. D., ANGELOPOULOS, T. J., GORDON, P. M. & MOYNA, N. M. 2010. CCL2 and CCR2 variants are associated with skeletal muscle strength and change in strength with resistance training. Journal of applied physiology, 109, 1779-1785.
HARRIES, S. K., LUBANS, D. R. & CALLISTER, R. 2012. Resistance training to improve power and sports performance in adolescent athletes: A systematic review and meta-analysis. Journal of Science and Medicine in Sport, 15, 532-540.
HARRISON, S. & GEPPETTI, P. 2001. Substance p. The international journal of biochemistry & cell biology, 33, 555-576.
HAWKE, T. J. & GARRY, D. J. 2001. Myogenic satellite cells: physiology to molecular biology. J Appl Physiol (1985), 91, 534-51.
HE, J., CHEN, Y., LIN, Y., ZHANG, W., CAI, Y., CHEN, F., LIAO, Q., YIN, Z., WANG, Y., TAO, S., LIN, X., HUANG, P., CUI, L. & SHAO, Y. 2017. Association study of MCP-1 promoter polymorphisms with the susceptibility and progression of sepsis. PLoS One, 12, e0176781.
HEAD, S. I., CHAN, S., HOUWELING, P. J., QUINLAN, K. G. R., MURPHY, R., WAGNER, S., FRIEDRICH, O. & NORTH, K. N. 2015. Altered Ca2+ kinetics associated with α-actinin-3 deficiency may explain positive selection for ACTN3 null allele in human evolution. PLoS genetics, 11.
HELED, Y., BLOOM, M. S., WU, T. J., STEPHENS, Q. & DEUSTER, P. A. 2007. CM-MM and ACE genotypes and physiological prediction of the creatine kinase response to exercise. Journal of Applied Physiology, 103, 504-510.
HENNEMAN, E., SOMJEN, G. & CARPENTER, D. O. 1965. Functional significance of cell size in spinal motoneurons. Journal of neurophysiology, 28, 560-580.
HERMENS, H. J., FRERIKS, B., DISSELHORST-KLUG, C. & RAU, G. 2000. Development of recommendations for SEMG sensors and sensor placement procedures. Journal of electromyography and Kinesiology, 10, 361-374.
217
HERRING, B. P., DIXON, S. & GALLAGHER, P. J. 2000. Smooth muscle myosin light chain kinase expression in cardiac and skeletal muscle. American Journal of Physiology-Cell Physiology, 279, C1656-C1664.
HICKS, K. M., ONAMBELE-PEARSON, G. L., WINWOOD, K. & MORSE, C. I. 2017. Muscle-Tendon Unit Properties during Eccentric Exercise Correlate with the Creatine Kinase Response. Front Physiol, 8, 657.
HIGASHIHARA, A., ONO, T., KUBOTA, J., OKUWAKI, T. & FUKUBAYASHI, T. 2010. Functional differences in the activity of the hamstring muscles with increasing running speed. Journal of sports sciences, 28, 1085-1092.
HILL, M. & GOLDSPINK, G. 2003. Expression and Splicing of the Insulin-Like Growth Factor Gene in Rodent Muscle is Associated with Muscle Satellite (stem) Cell Activation following Local Tissue Damage. The Journal of physiology, 549, 409-418.
HIRATA, A., MASUDA, S., TAMURA, T., KAI, K., OJIMA, K., FUKASE, A., MOTOYOSHI, K., KAMAKURA, K., MIYAGOE-SUZUKI, Y. & TAKEDA, S. 2003. Expression profiling of cytokines and related genes in regenerating skeletal muscle after cardiotoxin injection: a role for osteopontin. Am J Pathol, 163, 203-15.
HOFFMAN, E. P., GORDISH-DRESSMAN, H., MCLANE, V. D., DEVANEY, J. M., THOMPSON, P. D., VISICH, P., GORDON, P. M., PESCATELLO, L. S., ZOELLER, R. F. & MOYNA, N. M. 2013. Alterations in osteopontin modify muscle size in females in both humans and mice. Medicine and science in sports and exercise, 45, 1060.
HOLMES, A. G., WATT, M. J. & FEBBRAIO, M. A. 2004. Suppressing lipolysis increases interleukin-6 at rest and during prolonged moderate-intensity exercise in humans. Journal of Applied Physiology, 97, 689-696.
HOPKINSON, N. S., LI, K. W., KEHOE, A., HUMPHRIES, S. E., ROUGHTON, M., MOXHAM, J., MONTGOMERY, H. & POLKEY, M. I. 2008. Vitamin D receptor genotypes influence quadriceps strength in chronic obstructive pulmonary disease–. The American journal of clinical nutrition, 87, 385-390.
HORNBERGER, T. A., MCLOUGHLIN, T. J., LESZCZYNSKI, J. K., ARMSTRONG, D. D., JAMESON, R. R., BOWEN, P. E., HWANG, E. S., HOU, H., MOUSTAFA, M. E., CARLSON, B. A., HATFIELD, D. L., DIAMOND, A. M. & ESSER, K. A. 2003. Selenoprotein-deficient transgenic mice exhibit enhanced exercise-induced muscle growth. J Nutr, 133, 3091-7.
HOWATSON, G. & MILAK, A. 2009. Exercise-induced muscle damage following a bout of sport specific repeated sprints. The Journal of Strength & Conditioning Research, 23, 2419-2424.
HOWATSON, G. & VAN SOMEREN, K. A. 2008. The prevention and treatment of exercise-induced muscle damage. Sports Medicine, 38, 483-503.
HUANG, P., FENG, L., OLDHAM, E. A., KEATING, M. J. & PLUNKETT, W. 2000. Superoxide dismutase as a target for the selective killing of cancer cells. Nature, 407, 390-5.
HUBAL, M. J., CHEN, T. C., THOMPSON, P. D. & CLARKSON, P. M. 2008. Inflammatory gene changes associated with the repeated-bout effect. American Journal of Physiology-Regulatory, Integrative and Comparative Physiology, 294, R1628-R1637.
HUBAL, M. J. & CLARKSON, P. M. 2009. Counterpoint: Estrogen and sex do not significantly influence post-exercise indexes of muscle damage, inflammation, and repair. Journal of applied physiology, 106, 1012-1014.
HUBAL, M. J., DEVANEY, J. M., HOFFMAN, E. P., ZAMBRASKI, E. J., GORDISH-DRESSMAN, H., KEARNS, A. K., LARKIN, J. S., ADHAM, K., PATEL, R. R. & CLARKSON, P. M. 2010.
218
CCL2 and CCR2 polymorphisms are associated with markers of exercise-induced skeletal muscle damage. Journal of Applied Physiology, 108, 1651-1658.
HUBAL, M. J., GORDISH-DRESSMAN, H., THOMPSON, P. D., PRICE, T. B., HOFFMAN, E. P., ANGELOPOULOS, T. J., GORDON, P. M., MOYNA, N. M., PESCATELLO, L. S. & VISICH, P. S. 2005. Variability in muscle size and strength gain after unilateral resistance training. Med Sci Sports Exerc, 37, 964-72.
HUCHO, T. & LEVINE, J. D. 2007. Signaling pathways in sensitization: toward a nociceptor cell biology. Neuron, 55, 365-376.
HUDSON, M. B. & PRICE, S. R. 2013. Calcineurin: a poorly understood regulator of muscle mass. The international journal of biochemistry & cell biology, 45, 2173-2178.
HUERTA-ALARDÍN, A. L., VARON, J. & MARIK, P. E. 2005. Bench-to-bedside review: rhabdomyolysis—an overview for clinicians. Crit care, 9, 158-169.
HUGHES, D. C., DAY, S. H., AHMETOV, I. I. & WILLIAMS, A. G. 2011. Genetics of muscle strength and power: polygenic profile similarity limits skeletal muscle performance. Journal of sports sciences, 29, 1425-1434.
HUGHES, D. C., WALLACE, M. A. & BAAR, K. 2015. Effects of aging, exercise and disease on force transfer in skeletal muscle. American Journal of Physiology-Endocrinology and Metabolism, 309, E1-E10.
HUGHES, S. M. & BLAU, H. M. 1990. Migration of myoblasts across basal lamina during skeletal muscle development. Nature, 345, 350-353.
HYLDAHL, R. D. & HUBAL, M. J. 2014. Lengthening our Perspective: Morphological, Cellular and Molecular Respones to Eccentric Exercise Muscle & Nerve, 49, 155-170.
HYLDAHL, R. D., NELSON, B., XIN, L., WELLING, T., GROSCOST, L., HUBAL, M. J., CHIPKIN, S., CLARKSON, P. M. & PARCELL, A. C. 2015. Extracellular matrix remodeling and its contribution to protective adaptation following lengthening contractions in human muscle. The FASEB Journal, 29, 2894-2904.
INOUE, M., TOKUYAMA, S., NAKAYAMADA, H. & UEDA, H. 1998. In vivo signal transduction of tetrodotoxin-sensitive nociceptive responses by substance P given into the planta of the mouse hind limb. Cellular and molecular neurobiology, 18, 555-561.
IWAO-KOIZUMI, K., OTA, T., HAYASHIDA, M., YONETANI, Y. & NAKATA, K. 2014. The ACTN3 Gene is a Potential Biomarker for the Risk of Non-Contact Sports Injury in Female Athletes. J Mol Biomark Diagn S, 6, 2.
JAMKRAJANG, P., ROBINSON, M. A., LIMROONGREUNGRAT, W. & VANRENTERGHEM, J. 2017. Can segmental model reductions quantify whole-body balance accurately during dynamic activities? Gait Posture, 56, 37-41.
JANI, K. & SCHÖCK, F. 2009. Molecular mechanisms of mechanosensing in muscle development. Developmental Dynamics, 238, 1526-1534.
JENKINS, N. D., HOUSH, T. J., TRAYLOR, D. A., COCHRANE, K. C., BERGSTROM, H. C., LEWIS, R. W., SCHMIDT, R. J., JOHNSON, G. O. & CRAMER, J. T. 2014. The rate of torque development: a unique, non-invasive indicator of eccentric-induced muscle damage? Int J Sports Med, 35, 1190-5.
JIAO, S., REN, H., LI, Y., ZHOU, J., DUAN, C. & LU, L. 2013. Differential regulation of IGF-I and IGF-II gene expression in skeletal muscle cells. Molecular and cellular biochemistry, 373, 107-113.
JIMÉNEZ-JIMÉNEZ, R., CUEVAS, M. J., ALMAR, M., LIMA, E., GARCÍA-LÓPEZ, D., DE PAZ, J. A. & GONZÁLEZ-GALLEGO, J. 2008. Eccentric training impairs NF-κB activation and
219
over-expression of inflammation-related genes induced by acute eccentric exercise in the elderly. Mechanisms of ageing and development, 129, 313-321.
JOE, A. W., YI, L., NATARAJAN, A., LE GRAND, F., SO, L., WANG, J., RUDNICKI, M. A. & ROSSI, F. M. 2010. Muscle injury activates resident fibro/adipogenic progenitors that facilitate myogenesis. Nature cell biology, 12, 153.
JOFFE, Y. T., COLLINS, M. & GOEDECKE, J. H. 2013. The relationship between dietary fatty acids and inflammatory genes on the obese phenotype and serum lipids. Nutrients, 5, 1672-1705.
JOHNSTON, A. P., BAKER, J., BELLAMY, L. M., MCKAY, B. R., DE LISIO, M. & PARISE, G. 2010. Regulation of muscle satellite cell activation and chemotaxis by angiotensin II. PloS one, 5, e15212.
JOHNSTON, A. P., BAKER, J., DE LISIO, M. & PARISE, G. 2011. Skeletal muscle myoblasts possess a stretch-responsive local angiotensin signalling system. Journal of the Renin-Angiotensin-Aldosterone System, 12, 75-84.
JONES, D. 1996. High- and low-frequency fatigue revisited. Acta Physiologica, 156, 265-270.
JONES, D., RUTHERFORD, O. & PARKER, D. J. Q. J. O. E. P. 1989. Physiological changes in skeletal muscle as a result of strength training. 74, 233-256.
JONES, E. J., BISHOP, P. A., WOODS, A. K. & GREEN, J. M. 2008. Cross-sectional area and muscular strength. Sports Medicine, 38, 987-994.
JÖNHAGEN, S., ERICSON, M. O., NEMETH, G. & ERIKSSON, E. 1996. Amplitude and timing of electromyographic activity during sprinting. Scandinavian journal of medicine & science in sports, 6, 15-21.
KAHLES, F., FINDEISEN, H. M. & BRUEMMER, D. 2014. Osteopontin: A novel regulator at the cross roads of inflammation, obesity and diabetes. Molecular Metabolism, 3, 384-393.
KANAMORI, A., WOO, S. L., MA, C. B., ZEMINSKI, J., RUDY, T. W., LI, G. & LIVESAY, G. A. 2000. The forces in the anterior cruciate ligament and knee kinematics during a simulated pivot shift test: a human cadaveric study using robotic technology. Arthroscopy, 16, 633-639.
KANDA, K., SUGAMA, K., HAYASHIDA, H., SAKUMA, J., KAWAKAMI, Y., MIURA, S., YOSHIOKA, H., MORI, Y. & SUZUKI, K. 2013. Eccentric exercise-induced delayed-onset muscle soreness and changes in markers of muscle damage and inflammation. Exerc. Immunol. Rev, 19, 72-85.
KARIMI, M., GOLDIE, L. C., CRUICKSHANK, M. N., MOSES, E. K. & ABRAHAM, L. J. 2009. A critical assessment of the factors affecting reporter gene assays for promoter SNP function: a reassessment of −308 TNF polymorphism function using a novel integrated reporter system. European journal of human genetics, 17, 1454-1462.
KELLER, H. L., ST PIERRE SCHNEIDER, B., EPPIHIMER, L. A. & CANNON, J. G. 1999. Association of IGF-I and IGF-II with myofiber regeneration in vivo. Muscle & nerve, 22, 347-354.
KELLIS, E. 2015. Biceps femoris and semitendinosus tendon/aponeurosis strain during passive and active (isometric) conditions. Journal of Electromyography and Kinesiology.
KELLIS, E. & BALTZOPOULOS, V. 1999. In vivo determination of the patella tendon and hamstrings moment arms in adult males using videofluoroscopy during submaximal knee extension and flexion. Clinical Biomechanics, 14, 118-124.
220
KHAPCHAEV, A. Y. & SHIRINSKY, V. 2016. Myosin light chain kinase MYLK1: Anatomy, interactions, functions, and regulation. Biochemistry (Moscow), 81, 1676-1697.
KIBLER, W. B., CHANDLER, T. J. & STRACENER, E. S. 1992. 4: Musculoskeletal Adaptations and Injuries Due to Overtraining. Exercise and sport sciences reviews, 20, 99-126.
KIRCHHOFF, K., MACHICAO, F., HAUPT, A., SCHAFER, S. A., TSCHRITTER, O., STAIGER, H., STEFAN, N., HARING, H. U. & FRITSCHE, A. 2008. Polymorphisms in the TCF7L2, CDKAL1 and SLC30A8 genes are associated with impaired proinsulin conversion. Diabetologia, 51, 597-601.
KIRK, E. A. & RICE, C. L. 2016. Contractile function and motor unit firing rates of the human hamstrings. Journal of Neurophysiology, jn. 00620.2016.
KIRWAN, J. P., BOUREY, R. E., KOHRT, W. M., STATEN, M. A. & HOLLOSZY, J. O. 1991. Effects of treadmill exercise to exhaustion on the insulin response to hyperglycemia in untrained men. Journal of applied physiology, 70, 246-250.
KJÆR, M. 2004. Role of extracellular matrix in adaptation of tendon and skeletal muscle to mechanical loading. Physiological reviews, 84, 649-698.
KNOCHEL, J. P. 1990. Catastrophic medical events with exhaustive exercise:“white collar rhabdomyolysis.”. Kidney Int, 38, 709-19.
KNOLL, R., BUYANDELGER, B. & LAB, M. 2011. The sarcomeric Z-disc and Z-discopathies. J Biomed Biotechnol, 2011, 1-12.
KOSKINEN, S. O. A., WANG, W., AHTIKOSKI, A. M., KJAER, M., HAN, X. Y., KOMULAINEN, J., KOVANEN, V. & TAKALA, T. E. S. 2001. Acute exercise induced changes in rat skeletal muscle mRNAs and proteins regulating type IV collagen content. American Journal of Physiology-Regulatory, Integrative and Comparative Physiology, 280, R1292-R1300.
KOSTEK, M. C., DEVANEY, J. M., GORDISH-DRESSMAN, H., HARRIS, T. B., THOMPSON, P. D., CLARKSON, P. M., ANGELOPOULOS, T. J., GORDON, P. M., MOYNA, N. M. & PESCATELLO, L. S. 2010. A polymorphism near IGF1 is associated with body composition and muscle function in women from the Health, Aging, and Body Composition Study. European journal of applied physiology, 110, 315-324.
KRAGSTRUP, T. W., KJAER, M. & MACKEY, A. 2011. Structural, biochemical, cellular, and functional changes in skeletal muscle extracellular matrix with aging. Scandinavian journal of medicine & science in sports, 21, 749-757.
KUIPERS, H. 1994. Exercise-induced muscle damage. International journal of sports medicine, 15, 132-135.
KUJALA, U. M., SARNA, S., KAPRIO, J., TIKKANEN, H. O. & KOSKENVUO, M. 2000. Natural selection to sports, later physical activity habits, and coronary heart disease. British journal of sports medicine, 34, 445-449.
KUROSAKA, M. & MACHIDA, S. 2012. Exercise and skeletal muscle regeneration. The Journal of Physical Fitness and Sports Medicine, 1, 537-540.
LAGUETTE, M.-J., ABRAHAMS, Y., PRINCE, S. & COLLINS, M. 2011. Sequence variants within the 3′-UTR of the COL5A1 gene alters mRNA stability: Implications for musculoskeletal soft tissue injuries. Matrix Biology, 30, 338-345.
LANGBERG, H., OLESEN, J. L., GEMMER, C. & KJÆR, M. 2002. Substantial elevation of interleukin-6 concentration in peritendinous tissue, in contrast to muscle, following prolonged exercise in humans. The Journal of physiology, 542, 985-990.
LANZA, M. B., BALSHAW, T. G., MASSEY, G. J. & FOLLAND, J. P. 2018. Does normalization of voluntary EMG amplitude to MMAX account for the influence of electrode location and adiposity? Scand J Med Sci Sports.
221
LAPPALAINEN, J. 2009. IL6 genotype and creatine kinase response to exercise. European journal of applied physiology, 106, 315-315.
LARRUSKAIN, J., LEKUE, J. A., DIAZ, N., ODRIOZOLA, A. & GIL, S. M. 2017. A comparison of injuries in elite male and female football players: A five-season prospective study. Scand J Med Sci Sports.
LASEVICIUS, T., UGRINOWITSCH, C., SCHOENFELD, B. J., ROSCHEL, H., TAVARES, L. D., DE SOUZA, E. O., LAURENTINO, G. & TRICOLI, V. 2018. Effects of different intensities of resistance training with equated volume load on muscle strength and hypertrophy. Eur J Sport Sci, 18, 772-780.
LE GRAND, F. & RUDNICKI, M. A. 2007. Skeletal muscle satellite cells and adult myogenesis. Current opinion in cell biology, 19, 628-633.
LEE, D.-M., BAJRACHARYA, P., LEE, E. J., KIM, J.-E., LEE, H.-J., CHUN, T., KIM, J., CHO, K. H., CHANG, J. & HONG, S. 2011. Effects of gender-specific adult bovine serum on myogenic satellite cell proliferation, differentiation and lipid accumulation. In Vitro Cellular & Developmental Biology-Animal, 47, 438-444.
LEE, H. J., KIM, K. J., PARK, M. H., KIMM, K., PARK, C., OH, B. & LEE, J. Y. 2005. Single-nucleotide polymorphisms and haplotype LD analysis of the 29-kb IGF2 region on chromosome 11p15.5 in the Korean population. Hum Hered, 60, 73-80.
LEMAIRE, K., RAVIER, M. A., SCHRAENEN, A., CREEMERS, J. W., VAN DE PLAS, R., GRANVIK, M., VAN LOMMEL, L., WAELKENS, E., CHIMIENTI, F., RUTTER, G. A., GILON, P., IN'T VELD, P. A. & SCHUIT, F. C. 2009. Insulin crystallization depends on zinc transporter ZnT8 expression, but is not required for normal glucose homeostasis in mice. Proc Natl Acad Sci U S A, 106, 14872-7.
LEVINSON, H., MOYER, K. E., SAGGERS, G. C. & PAUL EHRLICH, H. 2004. Calmodulin‐myosin light chain kinase inhibition changes fibroblast‐populated collagen lattice contraction, cell migration, focal adhesion formation, and wound contraction. Wound repair and regeneration, 12, 505-511.
LI, X., WANG, S.-J., TAN, S. C., CHEW, P. L., LIU, L., WANG, L., WEN, L. & MA, L. 2014. The A55T and K153R polymorphisms of MSTN gene are associated with the strength training-induced muscle hypertrophy among Han Chinese men. Journal of sports sciences, 32, 883-891.
LI, Y. P., CHEN, Y., JOHN, J., MOYLAN, J., JIN, B., MANN, D. L. & REID, M. B. 2005. TNF-alpha acts via p38 MAPK to stimulate expression of the ubiquitin ligase atrogin1/MAFbx in skeletal muscle. FASEB J, 19, 362-70.
LI, Y. P., LECKER, S. H., CHEN, Y., WADDELL, I. D., GOLDBERG, A. L. & REID, M. B. 2003. TNF-alpha increases ubiquitin-conjugating activity in skeletal muscle by up-regulating UbcH2/E220k. FASEB J, 17, 1048-57.
LIEBER, R. L. & FRIDÉN, J. 1999. Mechanisms of muscle injury after eccentric contraction. Journal of Science and Medicine in Sport, 2, 253-265.
LIN, C., ZHANG, S., WANG, Y., WANG, Y., NICE, E., GUO, C., ZHANG, E., YU, L., LI, M., LIU, C., HU, L., HAO, J., QI, W. & XU, H. 2018. Functional Role of a Novel Long Noncoding RNA TTN-AS1 in Esophageal Squamous Cell Carcinoma Progression and Metastasis. Clin Cancer Res, 24, 486-498.
LING, P. R., SCHWARTZ, J. H. & BISTRIAN, B. R. 1997. Mechanisms of host wasting induced by administration of cytokines in rats. American Journal of Physiology-Endocrinology And Metabolism, 272, E333-E339.
LISTRAT, A., LETHIAS, C., HOCQUETTE, J., RENAND, G., MENISSIER, F., GEAY, Y. & PICARD, B. 2000. Age-related changes and location of types I, III, XII and XIV collagen during
222
development of skeletal muscles from genetically different animals. The Histochemical Journal, 32, 349-356.
LLOVERA, M., GARCIA-MARTINEZ, C., LOPEZ-SORIANO, J., CARBO, N., AGELL, N., LOPEZ-SORIANO, F. J. & ARGILES, J. M. 1998. Role of TNF receptor 1 in protein turnover during cancer cachexia using gene knockout mice. Mol Cell Endocrinol, 142, 183-9.
LOSSIE, J., KÖHNCKE, C., MAHMOODZADEH, S., STEFFEN, W., CANEPARI, M., MAFFEI, M., TAUBE, M., LARCHEVÊQUE, O., BAUMERT, P., HAASE, H., BOTTINELLI, R., REGITZ-ZAGROSEK, V. & MORANO, I. 2014. Molecular mechanism regulating myosin and cardiac functions by ELC. Biochemical and Biophysical Research Communications, 450, 464-469.
LOVERING, R. M. & DE DEYNE, P. G. 2004. Contractile function, sarcolemma integrity, and the loss of dystrophin after skeletal muscle eccentric contraction-induced injury. American Journal of Physiology-Cell Physiology, 286, C230-C238.
LUCIA, A., GOMEZ-GALLEGO, F., CHICHARRO, J. L., HOYOS, J., CELAYA, K., CORDOVA, A., VILLA, G., ALONSO, J. M., BARRIOPEDRO, M., PEREZ, M. & EARNEST, C. P. 2005. Is there an association between ACE and CKMM polymorphisms and cycling performance status during 3-week races? Int J Sports Med, 26, 442-7.
LUGER, T. A. 2002. Neuromediators—a crucial component of the skin immune system. Journal of dermatological science, 30, 87-93.
MA, F., YANG, Y., LI, X., ZHOU, F., GAO, C., LI, M. & GAO, L. 2013. The association of sport performance with ACE and ACTN3 genetic polymorphisms: a systematic review and meta-analysis. PloS one, 8, e54685.
MACARTHUR, D. G. & NORTH, K. N. 2004. A gene for speed? The evolution and function of α-actinin-3. Bioessays, 26, 786-795.
MACARTHUR, D. G., SETO, J. T., CHAN, S., QUINLAN, K. G., RAFTERY, J. M., TURNER, N., NICHOLSON, M. D., KEE, A. J., HARDEMAN, E. C., GUNNING, P. W., COONEY, G. J., HEAD, S. I., YANG, N. & NORTH, K. N. 2008. An Actn3 knockout mouse provides mechanistic insights into the association between alpha-actinin-3 deficiency and human athletic performance. Hum Mol Genet, 17, 1076-86.
MACARTHUR, D. G., SETO, J. T., RAFTERY, J. M., QUINLAN, K. G., HUTTLEY, G. A., HOOK, J. W., LEMCKERT, F. A., KEE, A. J., EDWARDS, M. R. & BERMAN, Y. 2007. Loss of ACTN3 gene function alters mouse muscle metabolism and shows evidence of positive selection in humans. Nature genetics, 39, 1261-1265.
MACHIELA, M. J. & CHANOCK, S. J. 2015. LDlink: a web-based application for exploring population-specific haplotype structure and linking correlated alleles of possible functional variants. Bioinformatics, 31, 3555-3557.
MACKEY, A. L., BRANDSTETTER, S., SCHJERLING, P., BOJSEN-MOLLER, J., QVORTRUP, K., PEDERSEN, M. M., DOESSING, S., KJAER, M., MAGNUSSON, S. P. & LANGBERG, H. 2011. Sequenced response of extracellular matrix deadhesion and fibrotic regulators after muscle damage is involved in protection against future injury in human skeletal muscle. The FASEB Journal, 25, 1943-1959.
MACKEY, A. L., DONNELLY, A. E., TURPEENNIEMI-HUJANEN, T. & ROPER, H. P. 2004. Skeletal muscle collagen content in humans after high-force eccentric contractions. Journal of applied physiology, 97, 197-203.
MACKEY, A. L., MAGNAN, M., CHAZAUD, B. & KJAER, M. 2017. Human skeletal muscle fibroblasts stimulate in vitro myogenesis and in vivo muscle regeneration. J Physiol, 595, 5115-5127.
223
MAHONEY, D. J., SAFDAR, A., PARISE, G., MELOV, S., FU, M., MACNEIL, L., KACZOR, J., PAYNE, E. T. & TARNOPOLSKY, M. A. 2008. Gene expression profiling in human skeletal muscle during recovery from eccentric exercise. American Journal of Physiology-Regulatory, Integrative and Comparative Physiology, 294, R1901-R1910.
MAIWALD, C., STERZING, T., MAYER, T. & MILANI, T. 2009. Detecting foot-to-ground contact from kinematic data in running. Footwear Science, 1, 111-118.
MALM, C., NYBERG, P., ENGSTRÖM, M., SJÖDIN, B., LENKEI, R., EKBLOM, B. & LUNDBERG, I. 2000. Immunological changes in human skeletal muscle and blood after eccentric exercise and multiple biopsies. The Journal of physiology, 529, 243-262.
MALONE, S., HUGHES, B., DORAN, D. A., COLLINS, K. & GABBETT, T. J. 2018. Can the workload–injury relationship be moderated by improved strength, speed and repeated-sprint qualities? Journal of Science and Medicine in Sport.
MALONE, S., ROE, M., DORAN, D. A., GABBETT, T. J. & COLLINS, K. 2016. High chronic training loads and exposure to bouts of maximal velocity running reduce injury risk in elite Gaelic football. Journal of Science and Medicine in Sport.
MANFREDI, T. G., FIELDING, R. A., O'REILLY, K. P., MEREDITH, C. N., LEE, H. Y. & EVANS, W. J. 1991. Plasma creatine kinase activity and exercise-induced muscle damage in older men. Medicine and science in sports and exercise, 23, 1028-1034.
MANN, C. J., PERDIGUERO, E., KHARRAZ, Y., AGUILAR, S., PESSINA, P., SERRANO, A. L. & MUÑOZ-CÁNOVES, P. 2011. Aberrant repair and fibrosis development in skeletal muscle. Skeletal muscle, 1, 21.
MANN, V., HOBSON, E. E., LI, B., STEWART, T. L., GRANT, S. F., ROBINS, S. P., ASPDEN, R. M. & RALSTON, S. H. 2001. A COL1A1 Sp1 binding site polymorphism predisposes to osteoporotic fracture by affecting bone density and quality. The Journal of clinical investigation, 107, 899-907.
MANSFIELD, J. C., HOLDEN, H., TARLOW, J. K., DI GIOVINE, F. S., MCDOWELL, T. L., WILSON, A. G., HOLDSWORTH, C. D. & DUFF, G. W. 1994. Novel genetic association between ulcerative colitis and the anti-inflammatory cytokine interleukin-1 receptor antagonist. Gastroenterology, 106, 637-42.
MARSH, D. R., CRISWELL, D. S., HAMILTON, M. T. & BOOTH, F. W. 1997. Association of insulin-like growth factor mRNA expressions with muscle regeneration in young, adult, and old rats. American Journal of Physiology-Regulatory, Integrative and Comparative Physiology, 273, R353-R358.
MARSHALL, P. W., LOVELL, R., JEPPESEN, G. K., ANDERSEN, K. & SIEGLER, J. C. 2014. Hamstring muscle fatigue and central motor output during a simulated soccer match. PLoS One 10, e102753.
MARTIN, J. A., BRANDON, S. C., KEULER, E. M., HERMUS, J. R., EHLERS, A. C., SEGALMAN, D. J., ALLEN, M. S. & THELEN, D. G. 2018. Gauging force by tapping tendons. Nature communications, 9, 1592.
MARTINEZ AMAT, A., MARCHAL CORRALES, J. A., RODRIGUEZ SERRANO, F., BOULAIZ, H., PRADOS SALAZAR, J. C., HITA CONTRERAS, F., CABA PEREZ, O., CARRILLO DELGADO, E., MARTIN, I. & ARANEGA JIMENEZ, A. 2007. Role of alpha-actin in muscle damage of injured athletes in comparison with traditional markers. Br J Sports Med, 41, 442-6.
MASSIDDA, M., CORRIAS, L., BACHIS, V., CUGIA, P., PIRAS, F., SCORCU, M. & CALÒ, C. M. 2015. Vitamin D receptor gene polymorphisms and musculoskeletal injuries in
224
professional football players. Experimental and Therapeutic Medicine, 9, 1974-1978.
MATHENY, W., MERRITT, E., ZANNIKOS, S. V., FARRAR, R. P. & ADAMO, M. L. 2009. Serum IGF-I-deficiency does not prevent compensatory skeletal muscle hypertrophy in resistance exercise. Experimental Biology and Medicine, 234, 164-170.
MATHEW, S. J., HANSEN, J. M., MERRELL, A. J., MURPHY, M. M., LAWSON, J. A., HUTCHESON, D. A., HANSEN, M. S., ANGUS-HILL, M. & KARDON, G. 2011. Connective tissue fibroblasts and Tcf4 regulate myogenesis. Development, 138, 371-384.
MAYHEW, D. L., KIM, J.-S., CROSS, J. M., FERRANDO, A. A. & BAMMAN, M. M. J. J. O. A. P. 2009. Translational signaling responses preceding resistance training-mediated myofiber hypertrophy in young and old humans. 107, 1655-1662.
MCCARROLL, S. A., KURUVILLA, F. G., KORN, J. M., CAWLEY, S., NEMESH, J., WYSOKER, A., SHAPERO, M. H., DE BAKKER, P. I., MALLER, J. B. & KIRBY, A. J. N. G. 2008. Integrated detection and population-genetic analysis of SNPs and copy number variation. 40, 1166.
MCCLAY, I. & MANAL, K. 1999. Three-dimensional kinetic analysis of running: significance of secondary planes of motion. Medicine and Science in Sports and Exercise, 31, 1629-1637.
MCGINLEY, C., SHAFAT, A. & DONNELLY, A. E. 2009. Does antioxidant vitamin supplementation protect against muscle damage? Sports Medicine, 39, 1011-1032.
MCHUGH, M. P. 2003. Recent advances in the understanding of the repeated bout effect: the protective effect against muscle damage from a single bout of eccentric exercise. Scandinavian journal of medicine & science in sports, 13, 88-97.
MCKAY, B. R., DE LISIO, M., JOHNSTON, A., O'REILLY, C. E., PHILLIPS, S. M., TARNOPOLSKY, M. A. & PARISE, G. 2009. Association of interleukin-6 signalling with the muscle stem cell response following muscle-lengthening contractions in humans. PLoS one, 4, e6027-e6027.
MEIJER, J., JASPERS, R., RITTWEGER, J., SEYNNES, O. R., KAMANDULIS, S., BRAZAITIS, M., SKURVYDAS, A., PIŠOT, R., ŠIMUNIČ, B. & NARICI, M. V. 2015. Single muscle fibre contractile properties differ between body‐builders, power athletes and control subjects. Experimental physiology, 100, 1331-1341.
MENDIGUCHIA, J., ALENTORN-GELI, E., IDOATE, F. & MYER, G. D. 2013. Rectus femoris muscle injuries in football: a clinically relevant review of mechanisms of injury, risk factors and preventive strategies. Br J Sports Med, 47, 359-366.
MERCADO, M. L., AMENTA, A. R., HAGIWARA, H., RAFII, M. S., LECHNER, B. E., OWENS, R. T., MCQUILLAN, D. J., FROEHNER, S. C., FALLON, J. R. & MERCADO, M. L. 2006. Biglycan regulates the expression and sarcolemmal localization of dystrobrevin, syntrophin, and nNOS. The FASEB journal, 20, 1724-1726.
MILLAY, D. P., O’ROURKE, J. R., SUTHERLAND, L. B., BEZPROZVANNAYA, S., SHELTON, J. M., BASSEL-DUBY, R. & OLSON, E. N. 2013. Myomaker is a membrane activator of myoblast fusion and muscle formation. Nature, 499, 301-305.
MILLAY, D. P., SUTHERLAND, L. B., BASSEL-DUBY, R. & OLSON, E. N. 2014. Myomaker is essential for muscle regeneration. Genes & development, 28, 1641.
MILLER, B. F., OLESEN, J. L., HANSEN, M., DØSSING, S., CRAMERI, R. M., WELLING, R. J., LANGBERG, H., FLYVBJERG, A., KJAER, M. & BABRAJ, J. A. 2005. Coordinated
225
collagen and muscle protein synthesis in human patella tendon and quadriceps muscle after exercise. The Journal of physiology, 567, 1021-1033.
MILLS, M., YANG, N., WEINBERGER, R., VANDER WOUDE, D. L., BEGGS, A. H., EASTEAL, S. & NORTH, K. 2001. Differential expression of the actin-binding proteins, α-actinin-2 and -3, in different species: implications for the evolution of functional redundancy. Human Molecular Genetics, 10, 1335-1346.
MIRANDA-VILELA, A. L., AKIMOTO, A. K., LORDELO, G. S., PEREIRA, L. C., GRISOLIA, C. K. & DE NAZARÉ KLAUTAU-GUIMARÃES, M. 2012. Creatine kinase MM TaqI and methylenetetrahydrofolate reductase C677T and A1298C gene polymorphisms influence exercise-induced C-reactive protein levels. European journal of applied physiology, 112, 183-192.
MITTENDORFER, B., ANDERSEN, J., PLOMGAARD, P., SALTIN, B., BABRAJ, J., SMITH, K. & RENNIE, M. 2005. Protein synthesis rates in human muscles: neither anatomical location nor fibre‐type composition are major determinants. The Journal of physiology, 563, 203-211.
MIYAMOTO-MIKAMI, E., MURAKAMI, H., TSUCHIE, H., TAKAHASHI, H., OHIWA, N., MIYACHI, M., KAWAHARA, T. & FUKU, N. 2017. Lack of association between genotype score and sprint/power performance in the Japanese population. J Sci Med Sport, 20, 98-103.
MOLINA, R. & DENADAI, B. S. 2012. Dissociated time course recovery between rate of force development and peak torque after eccentric exercise. Clinical physiology and functional imaging, 32, 179-184.
MONTGOMERY, H. E., MARSHALL, R., HEMINGWAY, H., MYERSON, S., CLARKSON, P., DOLLERY, C., HAYWARD, M., HOLLIMAN, D. E., JUBB, M. & WORLD, M. 1998. Human gene for physical performance. Nature, 393, 221-222.
MOORE, B. B., KOLODSICK, J. E., THANNICKAL, V. J., COOKE, K., MOORE, T. A., HOGABOAM, C., WILKE, C. A. & TOEWS, G. B. 2005a. CCR2-mediated recruitment of fibrocytes to the alveolar space after fibrotic injury. The American journal of pathology, 166, 675-684.
MOORE, D. R., PHILLIPS, S. M., BABRAJ, J. A., SMITH, K. & RENNIE, M. J. 2005b. Myofibrillar and collagen protein synthesis in human skeletal muscle in young men after maximal shortening and lengthening contractions. American Journal of Physiology-Endocrinology and Metabolism, 288, E1153-E1159.
MORAN, C. N. & PITSILADIS, Y. P. J. J. O. S. S. 2017. Tour de France Champions born or made: where do we take the genetics of performance? 35, 1411-1419.
MORAN, C. N., YANG, N., BAILEY, M. E. S., TSIOKANOS, A., JAMURTAS, A., MACARTHUR, D. G., NORTH, K., PITSILADIS, Y. P. & WILSON, R. H. 2007. Association analysis of the ACTN3 R577X polymorphism and complex quantitative body composition and performance phenotypes in adolescent Greeks. European Journal of Human Genetics, 15, 88-93.
MORGAN, D. L. 1990. New insights into the behavior of muscle during active lengthening. Biophysical journal, 57, 209-221.
MORSE, C. I., DEGENS, H. & JONES, D. A. 2007. The validity of estimating quadriceps volume from single MRI cross-sections in young men. European journal of applied physiology, 100, 267-274.
MUELLER-WOHLFAHRT, H.-W., HAENSEL, L., MITHOEFER, K., EKSTRAND, J., ENGLISH, B., MCNALLY, S., ORCHARD, J., VAN DIJK, C. N., KERKHOFFS, G. M. & SCHAMASCH, P.
226
2012. Terminology and classification of muscle injuries in sport: a consensus statement. British journal of sports medicine, bjsports-2012-091448.
MUNAFÒ, M. R. & SMITH, G. D. 2018. Robust research needs many lines of evidence. Nature Publishing Group.
MUNZENMAIER, D. H. & GREENE, A. S. 1996. Opposing actions of angiotensin II on microvascular growth and arterial blood pressure. Hypertension, 27, 760-765.
MURASE, S., TERAZAWA, E., QUEME, F., OTA, H., MATSUDA, T., HIRATE, K., KOZAKI, Y., KATANOSAKA, K., TAGUCHI, T. & URAI, H. 2010. Bradykinin and nerve growth factor play pivotal roles in muscular mechanical hyperalgesia after exercise (delayed-onset muscle soreness). The journal of neuroscience, 30, 3752-3761.
MURPHEY, L. J., GAINER, J. V., VAUGHAN, D. E. & BROWN, N. J. 2000. Angiotensin-converting enzyme insertion/deletion polymorphism modulates the human in vivo metabolism of bradykinin. Circulation, 102, 829-32.
MURPHY, M. M., LAWSON, J. A., MATHEW, S. J., HUTCHESON, D. A. & KARDON, G. 2011. Satellite cells, connective tissue fibroblasts and their interactions are crucial for muscle regeneration. Development, 138, 3625-3637.
MURTON, A. J., CONSTANTIN, D. & GREENHAFF, P. L. 2008. The involvement of the ubiquitin proteasome system in human skeletal muscle remodelling and atrophy. Biochim Biophys Acta, 1782, 730-43.
MUSARÒ, A., MCCULLAGH, K., PAUL, A., HOUGHTON, L., DOBROWOLNY, G., MOLINARO, M., BARTON, E. R., SWEENEY, H. L. & ROSENTHAL, N. 2001. Localized Igf-1 transgene expression sustains hypertrophy and regeneration in senescent skeletal muscle. Nature genetics, 27, 195-200.
MYERSON, S., HEMINGWAY, H., BUDGET, R., MARTIN, J., HUMPHRIES, S. & MONTGOMERY, H. 1999. Human angiotensin I-converting enzyme gene and endurance performance. J Appl Physiol (1985), 87, 1313-6.
NAKAMURA, Y. N., IWAMOTO, H., ETOH, T., SHIOTSUKA, Y., YAMAGUCHI, T., ONO, Y., TABATA, S., NISHIMURA, S. & GOTOH, T. 2007. Three‐dimensional observation of connective tissue of bovine masseter muscle under concentrate‐and roughage‐fed conditions by using immunohistochemical/confocal laser‐scanning microscopic methods. Journal of food science, 72, E375-E381.
NAKANO, T., LI, X., SUNWOO, H. & SIM, J. 1997. Immunohistochemical localization of proteoglycans in bovine skeletal muscle and adipose connective tissues. Canadian Journal of Animal Science, 77, 169-172.
NAZAROV, I. B., WOODS, D. R., MONTGOMERY, H. E., SHNEIDER, O. V., KAZAKOV, V. I., TOMILIN, N. V. & ROGOZKIN, V. A. 2001. The angiotensin converting enzyme I/D polymorphism in Russian athletes. Eur J Hum Genet, 9, 797-801.
NEDELEC, M., MCCALL, A., CARLING, C., LEGALL, F., BERTHOIN, S. & DUPONT, G. 2014. The influence of soccer playing actions on the recovery kinetics after a soccer match. The Journal of Strength & Conditioning Research, 28, 1517-1523.
NEUMANN, D. A. 2010. Kinesiology of the hip: a focus on muscular actions. journal of orthopaedic & sports physical therapy, 40, 82-94.
NEWHAM, D., JONES, D. & CLARKSON, P. 1987. Repeated high-force eccentric exercise: effects on muscle pain and damage. Journal of applied physiology, 63, 1381-1386.
NEWHAM, D., JONES, D. & EDWARDS, R. 1983. Large delayed plasma creatine kinase changes after stepping exercise. Muscle & Nerve: Official Journal of the American Association of Electrodiagnostic Medicine, 6, 380-385.
227
NGUYEN, H. X. & TIDBALL, J. G. 2003. Interactions between neutrophils and macrophages promote macrophage killing of rat muscle cells in vitro. The Journal of physiology, 547, 125-132.
NICOL, C., AVELA, J. & KOMI, P. V. 2006. The stretch-shortening cycle. Sports Medicine, 36, 977-999.
NIELSEN, J., FARUP, J., RAHBEK, S. K., DE PAOLI, F. V. & VISSING, K. 2015. Enhanced Glycogen Storage of a Subcellular Hot Spot in Human Skeletal Muscle during Early Recovery from Eccentric Contractions. PloS one, 10.
NIEMAN, D. C., NEHLSEN-CANNARELLA, S. L., FAGOAGA, O. R., HENSON, D., UTTER, A., DAVIS, J. M., WILLIAMS, F. & BUTTERWORTH, D. E. 1998. Influence of mode and carbohydrate on the cytokine response to heavy exertion. Medicine and Science in Sports and Exercise, 30, 671-678.
NIEMAN, D. C., PETERS, E. M., HENSON, D. A., NEVINES, E. I. & THOMPSON, M. M. 2000. Influence of vitamin C supplementation on cytokine changes following an ultramarathon. Journal of Interferon & Cytokine Research, 20, 1029-1035.
NIEMI, A.-K. & MAJAMAA, K. 2005. Mitochondrial DNA and ACTN3 genotypes in Finnish elite endurance and sprint athletes. European Journal of Human Genetics, 13, 965-969.
NIGRO, J. M., SCHWEINFEST, C. W., RAJKOVIC, A., PAVLOVIC, J., JAMAL, S., DOTTIN, R. P., HART, J. T., KAMARCK, M. E., RAE, P. M., CARTY, M. D. & ET AL. 1987. cDNA cloning and mapping of the human creatine kinase M gene to 19q13. Am J Hum Genet, 40, 115-25.
NORTH, K. N. & BEGGS, A. H. 1996. Deficiency of a skeletal muscle isoform of α-actinin (α-actinin-3) in merosin-positive congenital muscular dystrophy. Neuromuscular Disorders, 6, 229-235.
NORTH, K. N., YANG, N., WATTANASIRICHAIGOON, D., MILLS, M., EASTEAL, S. & BEGGS, A. H. 1999. A common nonsense mutation results in α-actinin-3 deficiency in the general population. Nature genetics, 21, 353-354.
NOSAKA, K. & CLARKSON, P. M. 1996. Variability in serum creatine kinase response after eccentric exercise of the elbow flexors. Int J Sports Med, 17, 120-7.
NOSAKA, K., SAKAMOTO, K., NEWTON, M. & SACCO, P. 2001. How long does the protective effect on eccentric exercise-induced muscle damage last? Medicine and science in sports and exercise, 33, 1490-1495.
NOWAK, K. J., WATTANASIRICHAIGOON, D., GOEBEL, H. H., WILCE, M., PELIN, K., DONNER, K., JACOB, R. L., HÜBNER, C., OEXLE, K. & ANDERSON, J. R. 1999. Mutations in the skeletal muscle α-actin gene in patients with actin myopathy and nemaline myopathy. Nature genetics, 23, 208.
O'DELL, S. D. & DAY, I. N. 1998. Insulin-like growth factor II (IGF-II). Int J Biochem Cell Biol, 30, 767-71.
ONISHI, H., YAGI, R., OYAMA, M., AKASAKA, K., IHASHI, K. & HANDA, Y. 2002. EMG-angle relationship of the hamstring muscles during maximum knee flexion. Journal of Electromyography and Kinesiology, 12, 399-406.
OPAR, D. A., WILLIAMS, M. D. & SHIELD, A. J. 2012. Hamstring strain injuries. Sports Medicine, 42, 209-226.
ORCHARD, J. W. 2001. Intrinsic and Extrinsic Risk Factors for Muscle Strains in Australian Football. The American Journal of Sports Medicine, 29, 300-303.
228
OSTROWSKI, K., SCHJERLING, P. & PEDERSEN, B. K. 2000. Physical activity and plasma interleukin-6 in humans–effect of intensity of exercise. European journal of applied physiology, 83, 512-515.
OWENS, D. J., ALLISON, R. & CLOSE, G. L. 2018. Vitamin D and the Athlete: Current Perspectives and New Challenges. Sports Med, 48, 3-16.
OWENS, D. J., FRASER, W. D. & CLOSE, G. L. 2014. Vitamin D and the athlete: Emerging insights. European journal of sport science, 15, 73-84.
OWENS, D. J., SHARPLES, A. P., POLYDOROU, I., ALWAN, N., DONOVAN, T., TANG, J., FRASER, W. D., COOPER, R. G., MORTON, J. P. & STEWART, C. 2015. A systems-based investigation into vitamin D and skeletal muscle repair, regeneration, and hypertrophy. American Journal of Physiology-Endocrinology and Metabolism, 309, E1019-E1031.
PADULO, J., TILOCA, A., POWELL, D., GRANATELLI, G., BIANCO, A. & PAOLI, A. J. S. 2013. EMG amplitude of the biceps femoris during jumping compared to landing movements. 2, 520.
PAQUETTE, M. R., PEEL, S. A., SCHILLING, B. K., MELCHER, D. A. & BLOOMER, R. J. 2017. Soreness-related changes in three-dimensional running biomechanics following eccentric knee extensor exercise. European Journal of Sport Science, 1-9.
PASCHALIS, V., GIAKAS, G., BALTZOPOULOS, V., JAMURTAS, A. Z., THEOHARIS, V., KOTZAMANIDIS, C. & KOUTEDAKIS, Y. 2007. The effects of muscle damage following eccentric exercise on gait biomechanics. Gait & posture, 25, 236-242.
PASSERIEUX, E., ROSSIGNOL, R., LETELLIER, T. & DELAGE, J. P. 2007. Physical continuity of the perimysium from myofibers to tendons: involvement in lateral force transmission in skeletal muscle. J Struct Biol, 159, 19-28.
PATEL, J. A., NAIR, S., OCHOA, E. E., HUDA, R., ROBERTS JR, N. J. & CHONMAITREE, T. 2010. Interleukin-6 -174 and tumor necrosis factor α -308 polymorphisms enhance cytokine production by human macrophages exposed to respiratory viruses. Journal of Interferon & Cytokine Research, 30, 917-921.
PAUL, A. C. & ROSENTHAL, N. 2002. Different modes of hypertrophy in skeletal muscle fibers. The Journal of cell biology, 156, 751-760.
PAULSEN, G., CRAMERI, R., BENESTAD, H. B., FJELD, J. G., MØRKRID, L., HALLEN, J. & RAASTAD, T. 2010. Time course of leukocyte accumulation in human muscle after eccentric exercise. Medicine and science in sports and exercise, 42, 75-85.
PAULSEN, G., MIKKELSEN, U. R., RAASTAD, T. & PEAKE, J. M. 2012. Leucocytes, cytokines and satellite cells: what role do they play in muscle damage and regeneration following eccentric exercise. Exerc Immunol Rev, 18, 42-97.
PEAKE, J., DELLA GATTA, P., SUZUKI, K. & NIEMAN, D. 2015. Cytokine expression and secretion by skeletal muscle cells: regulatory mechanisms and exercise effects. Exercise immunology review, 21, 8-25.
PEAKE, J., NOSAKA, K. K. & SUZUKI, K. 2005. Characterization of inflammatory responses to eccentric exercise in humans. Exerc Immunol Rev, 11, 64-85.
PEAKE, J. & SUZUKI, K. 2004. Neutrophil activation, antioxidant supplements and exercise-induced oxidative stress. Exerc Immunol Rev, 10, 129-41.
PEDERSEN, B. K. 2011. Muscles and their myokines. The Journal of experimental biology, 214, 337-346.
PEDERSEN, B. K. & FEBBRAIO, M. A. 2008. Muscle as an endocrine organ: focus on muscle-derived interleukin-6. Physiological reviews, 88, 1379-1406.
229
PEDERSEN, B. K. & FISCHER, C. P. 2007. Beneficial health effects of exercise–the role of IL-6 as a myokine. Trends in pharmacological sciences, 28, 152-156.
PEDERSEN, B. K., STEENSBERG, A., FISCHER, C., KELLER, C., KELLER, P., PLOMGAARD, P., FEBBRAIO, M. & SALTIN, B. 2003. Searching for the exercise factor: is IL-6 a candidate? J Muscle Res Cell Motil, 24, 113-9.
PEGORARO, E., HOFFMAN, E. P., PIVA, L., GAVASSINI, B. F., CAGNIN, S., ERMANI, M., BELLO, L., SORARU, G., PACCHIONI, B., BONIFATI, M. D., LANFRANCHI, G., ANGELINI, C., KESARI, A., LEE, I., GORDISH-DRESSMAN, H., DEVANEY, J. M., MCDONALD, C. M. & COOPERATIVE INTERNATIONAL NEUROMUSCULAR RESEARCH, G. 2011. SPP1 genotype is a determinant of disease severity in Duchenne muscular dystrophy. Neurology, 76, 219-26.
PEREIRA, D. S., GARCIA, D. M., NARCISO, F. M. S., SANTOS, M. L. A. S., DIAS, J. M. D., QUEIROZ, B. Z., SOUZA, E. R., NOBREGA, O. T. & PEREIRA, L. S. M. 2011. Effects of 174 G/C polymorphism in the promoter region of the interleukin-6 gene on plasma IL-6 levels and muscle strength in elderly women. Brazilian journal of medical and biological research, 44, 123-129.
PEREIRA, D. S., MATEO, E. C. C., DE QUEIROZ, B. Z., ASSUMPÇÃO, A. M., MIRANDA, A. S., FELÍCIO, D. C., ROCHA, N. P., DOS ANJOS, D. M. D. C., PEREIRA, D. A. G. & TEIXEIRA, A. L. 2013. TNF-α, IL6, and IL10 polymorphisms and the effect of physical exercise on inflammatory parameters and physical performance in elderly women. Age, 35, 2455-2463.
PETERSEN, A. M. W. & PEDERSEN, B. K. 2005. The anti-inflammatory effect of exercise. Journal of applied physiology, 98, 1154-1162.
PETERSEN, J., THORBORG, K., NIELSEN, M. B., BUDTZ-JØRGENSEN, E. & HÖLMICH, P. 2011. Preventive effect of eccentric training on acute hamstring injuries in men’s soccer: a cluster-randomized controlled trial. The American journal of sports medicine, 39, 2296-2303.
PETUSHEK, E. J., SUGIMOTO, D., STOOLMILLER, M., SMITH, G. & MYER, G. D. 2018. Evidence-based best-practice guidelines for preventing anterior cruciate ligament injuries in young female athletes: a systematic review and meta-analysis. The American journal of sports medicine, 0363546518782460.
PHILIPPOU, A., MARIDAKI, M., THEOS, A. & KOUTSILIERIS, M. 2012. Cytokines in muscle damage. Advances in clinical chemistry, 58, 49.
PHILLIPS, B. E., WILLIAMS, J. P., GUSTAFSSON, T., BOUCHARD, C., RANKINEN, T., KNUDSEN, S., SMITH, K., TIMMONS, J. A. & ATHERTON, P. J. 2013. Molecular networks of human muscle adaptation to exercise and age. PLoS Genet, 9, e1003389.
PHILLIPS, M. I., SPEAKMAN, E. A. & KIMURA, B. 1993. Levels of angiotensin and molecular biology of the tissue renin angiotensin systems. Regul Pept, 43, 1-20.
PICCOLO, S., DUPONT, S. & CORDENONSI, M. 2014. The biology of YAP/TAZ: hippo signaling and beyond. Physiological reviews, 94, 1287-1312.
PIMENTA, E. M., COELHO, D. B., CRUZ, I. R., MORANDI, R. F., VENEROSO, C. E., DE AZAMBUJA PUSSIELDI, G., CARVALHO, M. R. S., SILAMI-GARCIA, E. & FERNÁNDEZ, J. A. D. P. 2012. The ACTN3 genotype in soccer players in response to acute eccentric training. European journal of applied physiology, 112, 1495-1503.
PISTILLI, E. E., DEVANEY, J. M., GORDISH-DRESSMAN, H., BRADBURY, M. K., SEIP, R. L., THOMPSON, P. D., ANGELOPOULOS, T. J., CLARKSON, P. M., MOYNA, N. M., PESCATELLO, L. S., VISICH, P. S., ZOELLER, R. F., GORDON, P. M. & HOFFMAN, E. P.
230
2008. Interleukin-15 and interleukin-15R alpha SNPs and associations with muscle, bone, and predictors of the metabolic syndrome. Cytokine, 43, 45-53.
PLEASE SEE CHAPTER III. PLEASE SEE CHAPTER IV. PLEASE SEE CHAPTER V. PLOMGAARD, P., BOUZAKRI, K., KROGH-MADSEN, R., MITTENDORFER, B., ZIERATH, J. R. &
PEDERSEN, B. K. 2005. Tumor necrosis factor-α induces skeletal muscle insulin resistance in healthy human subjects via inhibition of Akt substrate 160 phosphorylation. Diabetes, 54, 2939-2945.
PLOUTZ-SNYDER, L. L., GIAMIS, E. L., FORMIKELL, M. & ROSENBAUM, A. E. 2001. Resistance training reduces susceptibility to eccentric exercise-induced muscle dysfunction in older women. The Journals of Gerontology Series A: Biological Sciences and Medical Sciences, 56, B384-B390.
PORTER, J. D., KHANNA, S., KAMINSKI, H. J., RAO, J. S., MERRIAM, A. P., RICHMONDS, C. R., LEAHY, P., LI, J., GUO, W. & ANDRADE, F. H. 2002. A chronic inflammatory response dominates the skeletal muscle molecular signature in dystrophin-deficient mdx mice. Human molecular genetics, 11, 263-272.
POSTHUMUS, M., SCHWELLNUS, M. P. & COLLINS, M. 2011. The COL5A1 gene: a novel marker of endurance running performance. Medicine and science in sports and exercise, 43, 584-589.
POTTER, J. J., LIU, X., KOTEISH, A. & MEZEY, E. 2013. 1, 25‐dihydroxyvitamin D3 and its nuclear receptor repress human α1 (I) collagen expression and type I collagen formation. Liver International, 33, 677-686.
POWELL, P. L., ROY, R. R., KANIM, P., BELLO, M. A. & EDGERTON, V. R. 1984. Predictability of skeletal muscle tension from architectural determinations in guinea pig hindlimbs. Journal of Applied Physiology, 57, 1715-1721.
POWERS, S. K. & JACKSON, M. J. 2008. Exercise-induced oxidative stress: cellular mechanisms and impact on muscle force production. Physiological reviews, 88, 1243-1276.
PROSKE, U. & MORGAN, D. L. 2001. Muscle damage from eccentric exercise: mechanism, mechanical signs, adaptation and clinical applications. The Journal of physiology, 537, 333-345.
PRUNA, R., ARTELLS, R., RIBAS, J., MONTORO, B., COS, F., MUÑOZ, C., RODAS, G. & MAFFULLI, N. 2013. Single nucleotide polymorphisms associated with non-contact soft tissue injuries in elite professional soccer players Influence on degree of injury and recovery time. BMC musculoskeletal disorders, 14, 221.
QI, L., ZHANG, C., VAN DAM, R. M. & HU, F. B. 2007. Interleukin-6 genetic variability and adiposity: associations in two prospective cohorts and systematic review in 26,944 individuals. The Journal of Clinical Endocrinology & Metabolism, 92, 3618-3625.
QUINLAN, K. G., SETO, J. T., TURNER, N., VANDEBROUCK, A., FLOETENMEYER, M., MACARTHUR, D. G., RAFTERY, J. M., LEK, M., YANG, N. & PARTON, R. G. 2010. α-Actinin-3 deficiency results in reduced glycogen phosphorylase activity and altered calcium handling in skeletal muscle. Human molecular genetics, 19, 1335-1346.
RAASTAD, T., OWE, S. G., PAULSEN, G., ENNS, D., OVERGAARD, K., CRAMERI, R., KIIL, S., BELCASTRO, A., BERGERSEN, L. & HALLEN, J. 2010. Changes in calpain activity, muscle structure, and function after eccentric exercise. Med Sci Sports Exerc, 42, 86-95.
231
RAFEEUDDIN, R., SHARIR, R., STAES, F., DINGENEN, B., GEORGE, K., ROBINSON, M. A. & VANRENTERGHEM, J. 2016. Mapping current research trends on neuromuscular risk factors of non-contact ACL injury. Physical Therapy in Sport, 22, 101-113.
RAMASWAMY, K. S., PALMER, M. L., VAN DER MEULEN, J. H., RENOUX, A., KOSTROMINOVA, T. Y., MICHELE, D. E. & FAULKNER, J. A. 2011. Lateral transmission of force is impaired in skeletal muscles of dystrophic mice and very old rats. The Journal of physiology, 589, 1195-1208.
RAMPININI, E., BOSIO, A., FERRARESI, I., PETRUOLO, A., MORELLI, A. & SASSI, A. 2011. Match-related fatigue in soccer players. Medicine and science in sports and exercise, 43, 2161-2170.
RANKINEN, T., WOLFARTH, B., SIMONEAU, J. A., MAIER-LENZ, D., RAURAMAA, R., RIVERA, M. A., BOULAY, M. R., CHAGNON, Y. C., PERUSSE, L., KEUL, J. & BOUCHARD, C. 2000. No association between the angiotensin-converting enzyme ID polymorphism and elite endurance athlete status. J Appl Physiol (1985), 88, 1571-5.
RAWSON, E. S., CLARKSON, P. M. & TARNOPOLSKY, M. A. 2017. Perspectives on exertional rhabdomyolysis. Sports Medicine, 47, 33-49.
REEVES, N. D., NARICI, M. V. & MAGANARIS, C. N. 2004a. Effect of resistance training on skeletal muscle-specific force in elderly humans. Journal of applied physiology, 96, 885-892.
REEVES, N. D., NARICI, M. V. & MAGANARIS, C. N. 2004b. In vivo human muscle structure and function: adaptations to resistance training in old age. Experimental physiology, 89, 675-689.
REID, M. B. 2005. Response of the ubiquitin-proteasome pathway to changes in muscle activity. Am J Physiol Regul Integr Comp Physiol, 288, R1423-31.
REID, M. B. & LI, Y. P. 2001. Tumor necrosis factor-alpha and muscle wasting: a cellular perspective. Respir Res, 2, 269-72.
REILLY, T. & WILLIAMS, A. M. 2003. Science and Soccer, Routledge. REIN, T., FÖRSTER, R., KRAUSE, A., WINNACKER, E.-L. & ZORBAS, H. 1995. Organization of
the-Globin Promoter and Possible Role of Nuclear Factor I in an-Globin-inducible and in a Noninducible Cell Line. Journal of Biological Chemistry, 270, 19643-19650.
RENZI, D., PELLEGRINI, B., TONELLI, F., SURRENTI, C. & CALABRO, A. 2000. Substance P (neurokinin-1) and neurokinin A (neurokinin-2) receptor gene and protein expression in the healthy and inflamed human intestine. The American journal of pathology, 157, 1511-1522.
RIGAT, B., HUBERT, C., ALHENC-GELAS, F., CAMBIEN, F., CORVOL, P. & SOUBRIER, F. 1990. An insertion/deletion polymorphism in the angiotensin I-converting enzyme gene accounting for half the variance of serum enzyme levels. J Clin Invest, 86, 1343-6.
ROBINSON, M. A. & VANRENTERGHEM, J. 2012. An evaluation of anatomical and functional knee axis definition in the context of side-cutting. Journal of biomechanics, 45, 1941-1946.
ROBINSON, R., CARPENTER, D., SHAW, M. A., HALSALL, J. & HOPKINS, P. 2006. Mutations in RYR1 in malignant hyperthermia and central core disease. Hum Mutat, 27, 977-89.
RODAN, G. A. 1995. Osteopontin overview. Annals of the New York Academy of Sciences, 760, 1-5.
ROIG, M., O'BRIEN, K., KIRK, G., MURRAY, R., MCKINNON, P., SHADGAN, B. & REID, D. W. 2008. The effects of eccentric versus concentric resistance training on muscle
232
strength and mass in healthy adults: a systematic review with meta-analyses. British journal of sports medicine, 43, 556-568.
ROSEN, C. J., KURLAND, E. S., VEREAULT, D., ADLER, R. A., RACKOFF, P. J., CRAIG, W. Y., WITTE, S., ROGERS, J. & BILEZIKIAN, J. P. 1998. Association between serum insulin growth factor-I (IGF-I) and a simple sequence repeat in IGF-I gene: implications for genetic studies of bone mineral density. The Journal of Clinical Endocrinology & Metabolism, 83, 2286-2290.
ROTH, S. M., MARTEL, G. F., IVEY, F. M., LEMMER, J. T., TRACY, B. L., HURLBUT, D. E., METTER, E. J., HURLEY, B. F. & ROGERS, M. A. 1999. Ultrastructural muscle damage in young vs. older men after high-volume, heavy-resistance strength training. Journal of Applied Physiology, 86, 1833-1840.
ROTH, S. M., ZMUDA, J. M., CAULEY, J. A., SHEA, P. R. & FERRELL, R. E. 2004. Vitamin D receptor genotype is associated with fat-free mass and sarcopenia in elderly men. The Journals of Gerontology Series A: Biological Sciences and Medical Sciences, 59, B10-B15.
RUBINSTEIN, I., ABASSI, Z., COLEMAN, R., MILMAN, F., WINAVER, J. & BETTER, O. S. 1998. Involvement of nitric oxide system in experimental muscle crush injury. Journal of Clinical Investigation, 101, 1325.
RUIZ, J. R., ARTETA, D., BUXENS, A., ARTIEDA, M., GÓMEZ-GALLEGO, F., SANTIAGO, C., YVERT, T., MORÁN, M. & LUCIA, A. 2010a. Can we identify a power-oriented polygenic profile? Journal of Applied Physiology, 108, 561-566.
RUIZ, J. R., BUXENS, A., ARTIEDA, M., ARTETA, D., SANTIAGO, C., RODRÍGUEZ-ROMO, G., LAO, J. I., GÓMEZ-GALLEGO, F. & LUCIA, A. 2010b. The− 174 G/C polymorphism of the IL6 gene is associated with elite power performance. Journal of Science and Medicine in Sport, 13, 549-553.
RUIZ, J. R., GÓMEZ‐GALLEGO, F., SANTIAGO, C., GONZÁLEZ‐FREIRE, M., VERDE, Z., FOSTER, C. & LUCIA, A. 2009. Is there an optimum endurance polygenic profile? The Journal of physiology, 587, 1527-1534.
RUTHERFORD, O., JONES, D., NEWHAM, D. J. J. O. N., NEUROSURGERY & PSYCHIATRY 1986. Clinical and experimental application of the percutaneous twitch superimposition technique for the study of human muscle activation. 49, 1288-1291.
SACHECK, J. M., HYATT, J.-P. K., RAFFAELLO, A., JAGOE, R. T., ROY, R. R., EDGERTON, V. R., LECKER, S. H. & GOLDBERG, A. L. 2007. Rapid disuse and denervation atrophy involve transcriptional changes similar to those of muscle wasting during systemic diseases. The FASEB Journal, 21, 140-155.
SAKUMA, K. & YAMAGUCHI, A. 2010. The functional role of calcineurin in hypertrophy, regeneration, and disorders of skeletal muscle. BioMed Research International, 2010.
SANTAMARIA, L. J. & WEBSTER, K. E. 2010. The effect of fatigue on lower-limb biomechanics during single-limb landings: a systematic review. journal of orthopaedic & sports physical therapy, 40, 464-473.
SANTTILA, S., SAVINAINEN, K. & HURME, M. 1998. Presence of the IL-1RA allele 2 (IL1RN*2) is associated with enhanced IL-1beta production in vitro. Scand J Immunol, 47, 195-8.
SARGEANT, A. J., HOINVILLE, E. & YOUNG, A. J. J. O. A. P. 1981. Maximum leg force and power output during short-term dynamic exercise. 51, 1175-1182.
233
SATKUNSKIENE, D., STASIULIS, A., ZAICENKOVIENE, K., SAKALAUSKAITE, R. & RAUKTYS, D. 2015. Effect of muscle-damaging eccentric exercise on running kinematics and economy for running at different intensities. The Journal of Strength & Conditioning Research, 29, 2404-2411.
SAYERS, S. P. & CLARKSON, P. M. 2001. Force recovery after eccentric exercise in males and females. European journal of applied physiology, 84, 122-126.
SCHÄFER, R., KNAUF, U., ZWEYER, M., HÖGEMEIER, O., DE GUARRINI, F., LIU, X., EICHHORN, H. J., KOCH, F. W., MUNDEGAR, R. R. & ERZEN, I. 2006. Age dependence of the human skeletal muscle stem cell in forming muscle tissue. Artificial organs, 30, 130-140.
SCHMAIER, A. H. 2003. The kallikrein-kinin and the renin-angiotensin systems have a multilayered interaction. American Journal of Physiology-Regulatory, Integrative and Comparative Physiology, 285, R1-R13.
SCHNEIDER, B. S. P. & TIIDUS, P. M. 2007. Neutrophil Infiltration in Exercise-Injured Skeletal Muscle. Sports Medicine, 37, 837-856.
SCHOENFELD, B. J. 2010. The mechanisms of muscle hypertrophy and their application to resistance training. The Journal of Strength & Conditioning Research, 24, 2857-2872.
SCHOENFELD, B. J. 2012. Does exercise-induced muscle damage play a role in skeletal muscle hypertrophy? The Journal of Strength & Conditioning Research, 26, 1441-1453.
SCHOENFELD, B. J., CONTRERAS, B., KRIEGER, J., GRGIC, J., DELCASTILLO, K., BELLIARD, R. & ALTO, A. 2018. Resistance Training Volume Enhances Muscle Hypertrophy. Med Sci Sports Exerc.
SCHUERMANS, J., VAN TIGGELEN, D., DANNEELS, L. & WITVROUW, E. 2014. Biceps femoris and semitendinosus—teammates or competitors? New insights into hamstring injury mechanisms in male football players: a muscle functional MRI study. British journal of sports medicine, 48, 1599-1606.
SCHUERMANS, J., VAN TIGGELEN, D., DANNEELS, L. & WITVROUW, E. 2016. Susceptibility to hamstring injuries in soccer: a prospective study using muscle functional magnetic resonance imaging. The American journal of sports medicine, 44, 1276-1285.
SCHWARTZ, M. H. & ROZUMALSKI, A. 2005. A new method for estimating joint parameters from motion data. Journal of biomechanics, 38, 107-116.
SCOTT, J. & HUSKISSON, E. 1979. Vertical or horizontal visual analogue scales. Annals of the rheumatic diseases, 38, 560.
SELLWOOD, K. L., BRUKNER, P., WILLIAMS, D., NICOL, A. & HINMAN, R. 2007. Ice-water immersion and delayed-onset muscle soreness: a randomised controlled trial. British journal of sports medicine, 41, 392-397.
SETO, J. T., LEK, M., QUINLAN, K. G., HOUWELING, P. J., ZHENG, X. F., GARTON, F., MACARTHUR, D. G., RAFTERY, J. M., GARVEY, S. M. & HAUSER, M. A. 2011. Deficiency of α-actinin-3 is associated with increased susceptibility to contraction-induced damage and skeletal muscle remodeling. Human molecular genetics, 20, 2914-2927.
SETO, J. T., QUINLAN, K. G., LEK, M., ZHENG, X. F., GARTON, F., MACARTHUR, D. G., HOGARTH, M. W., HOUWELING, P. J., GREGOREVIC, P. & TURNER, N. 2013. ACTN3 genotype influences muscle performance through the regulation of calcineurin signaling. The Journal of clinical investigation, 123, 4255-4263.
234
SEWRIGHT, K. A., HUBAL, M. J., KEARNS, A., HOLBROOK, M. T. & CLARKSON, P. M. 2008. Sex differences in response to maximal eccentric exercise. Medicine and science in sports and exercise, 40, 242-251.
SEYMORE, K. D., DOMIRE, Z. J., DEVITA, P., RIDER, P. M. & KULAS, A. S. 2017. The effect of Nordic hamstring strength training on muscle architecture, stiffness, and strength. European journal of applied physiology, 117, 943-953.
SHARIR, R., RAFEEUDDIN, R., STAES, F., DINGENEN, B., GEORGE, K., VANRENTERGHEM, J. & ROBINSON, M. A. 2016. Mapping current research trends on anterior cruciate ligament injury risk against the existing evidence: in vivo biomechanical risk factors. Clinical Biomechanics, 37, 34-43.
SHARPLES, A. P., AL‐SHANTI, N., LEWIS, M. P. & STEWART, C. E. 2011. Reduction of myoblast differentiation following multiple population doublings in mouse C2C12 cells: a model to investigate ageing? Journal of cellular biochemistry, 112, 3773-3785.
SHARPLES, A. P. & STEWART, C. E. 2011. Myoblast models of skeletal muscle hypertrophy and atrophy. Current Opinion in Clinical Nutrition & Metabolic Care, 14, 230-236.
SHERWOOD, R., LAMBERT, A., NEWHAM, D., WASSIF, W. & PETERS, T. 1996. The effect of eccentric exercise on serum creatine kinase activity in different ethnic groups. Annals of clinical biochemistry, 33, 324-329.
SHIELD, A. & MURPHY, S. 2018. Preventing hamstring injuries-Part 1: Is there really an eccentric action of the hamstrings in high speed running and does it matter?
SHIMODA-MATSUBAYASHI, S., MATSUMINE, H., KOBAYASHI, T., NAKAGAWA-HATTORI, Y., SHIMIZU, Y. & MIZUNO, Y. 1996. Structural dimorphism in the mitochondrial targeting sequence in the human manganese superoxide dismutase gene. A predictive evidence for conformational change to influence mitochondrial transport and a study of allelic association in Parkinson's disease. Biochem Biophys Res Commun, 226, 561-5.
SIEMS, W., CAPUOZZO, E., LUCANO, A., SALERNO, C. & CRIFO, C. 2003. High sensitivity of plasma membrane ion transport ATPases from human neutrophils towards 4-hydroxy-2, 3-trans-nonenal. Life sciences, 73, 2583-2590.
SIM, M.-K., WONG, Y.-C., XU, X.-G. & LOKE, W.-K. 2014. Des-aspartate-angiotensin I attenuates ICAM-1 formation in hydrogen peroxide-treated L6 skeletal muscle cells and soleus muscle of mice subjected to eccentric exercise. Regulatory peptides, 188, 40-45.
SLAVOTINEK, J. P., VERRALL, G. M. & FON, G. T. 2002. Hamstring injury in athletes: using MR imaging measurements to compare extent of muscle injury with amount of time lost from competition. American Journal of Roentgenology, 179, 1621-1628.
SMITH, C., KRUGER, M. J., SMITH, R. M. & MYBURGH, K. H. 2008. The inflammatory response to skeletal muscle injury: illuminating complexities. Sports Med, 38, 947-69.
SMITH, C. K., 2ND, JANNEY, M. J. & ALLEN, R. E. 1994. Temporal expression of myogenic regulatory genes during activation, proliferation, and differentiation of rat skeletal muscle satellite cells. J Cell Physiol, 159, 379-85.
SMITH, L. L., MCCAMMON, M., SMITH, S., CHAMNESS, M., ISRAEL, R. G. & O'BRIEN, K. F. 1989. White blood cell response to uphill walking and downhill jogging at similar metabolic loads. Eur J Appl Physiol Occup Physiol, 58, 833-7.
235
SMITH, L. L., MCKUNE, A. J., SEMPLE, S. J., SIBANDA, E., STEEL, H. & ANDERSON, R. 2007. Changes in serum cytokines after repeated bouts of downhill running. Appl Physiol Nutr Metab, 32, 233-40.
SOMBOONWONG, J., TRAISAENG, S. & SAGUANRUNGSIRIKUL, S. 2015. Moderate-intensity exercise training elevates serum and pancreatic zinc levels and pancreatic ZnT8 expression in streptozotocin-induced diabetic rats. Life Sci, 139, 46-51.
SONG, Y., STÅL, P. S., YU, J.-G., LORENTZON, R., BACKMAN, C. & FORSGREN, S. 2014. Inhibitors of endopeptidase and angiotensin-converting enzyme lead to an amplification of the morphological changes and an upregulation of the substance P system in a muscle overuse model. BMC musculoskeletal disorders, 15, 126.
SPROUSE, C., GORDISH-DRESSMAN, H., ORKUNOGLU-SUER, E. F., LIPOF, J. S., MOECKEL-COLE, S., PATEL, R. R., ADHAM, K., LARKIN, J. S., HUBAL, M. J., KEARNS, A. K. & DEVANEY, J. M. 2014. SLC30A8 nonsynonymous variant is associated with recovery following exercise and skeletal muscle size and strength. Diabetes, 63, 363-368.
STAFILIDIS, S. & ARAMPATZIS, A. 2007. Muscle–tendon unit mechanical and morphological properties and sprint performance. Journal of sports sciences, 25, 1035-1046.
STAIGER, H., MACHICAO, F., STEFAN, N., TSCHRITTER, O., THAMER, C., KANTARTZIS, K., SCHAFER, S. A., KIRCHHOFF, K., FRITSCHE, A. & HARING, H. U. 2007. Polymorphisms within novel risk loci for type 2 diabetes determine beta-cell function. PLoS One, 2, e832.
STANTON, P. & PURDAM, C. 1989. Hamstring injuries in sprinting—the role of eccentric exercise. Journal of Orthopaedic & Sports Physical Therapy, 10, 343-349.
STARKIE, R., OSTROWSKI, S. R., JAUFFRED, S., FEBBRAIO, M. & PEDERSEN, B. K. 2003. Exercise and IL-6 infusion inhibit endotoxin-induced TNF-alpha production in humans. FASEB J, 17, 884-6.
STAUBER, W. T., CLARKSON, P. M., FRITZ, V. K. & EVANS, W. J. 1990. Extracellular matrix disruption and pain after eccentric muscle action. Journal of Applied Physiology, 69, 868-874.
STEENSBERG, A., FISCHER, C. P., KELLER, C., MOLLER, K. & PEDERSEN, B. K. 2003. IL-6 enhances plasma IL-1ra, IL-10, and cortisol in humans. Am J Physiol Endocrinol Metab, 285, E433-7.
STERNLICHT, M. D., LOCHTER, A., SYMPSON, C. J., HUEY, B., ROUGIER, J.-P., GRAY, J. W., PINKEL, D., BISSELL, M. J. & WERB, Z. 1999. The stromal proteinase MMP3/stromelysin-1 promotes mammary carcinogenesis. Cell, 98, 137-146.
STEWART, C. E., JAMES, P. L., FANT, M. E. & ROTWEIN, P. 1996. Overexpression of insulin-like growth factor-II induces accelerated myoblast differentiation. J Cell Physiol, 169, 23-32.
STEWART, C. E., NEWCOMB, P. V. & HOLLY, J. M. P. 2004. Multifaceted roles of TNF-α in myoblast destruction: A multitude of signal transduction pathways. Journal of cellular physiology, 198, 237-247.
STEWART, C. E. & ROTWEIN, P. 1996a. Growth, differentiation, and survival: multiple physiological functions for insulin-like growth factors. Physiol Rev, 76, 1005-26.
STEWART, C. E. & ROTWEIN, P. 1996b. Insulin-like growth factor-II is an autocrine survival factor for differentiating myoblasts. Journal of Biological Chemistry, 271, 11330-11338.
236
STEYAERT, A., BURSSENS, P., FORSYTH, R. & VANDERSTRAETEN, G. 2010. Qualitative analysis of substance P, NK1-receptor and nerve ingrowth in substance P-treated ruptured rat Achilles tendon. Acta Orthop Belg, 76, 387-95.
STRATOS, I., LI, Z., HERLYN, P., ROTTER, R., BEHRENDT, A.-K., MITTLMEIER, T. & VOLLMAR, B. 2013. Vitamin D increases cellular turnover and functionally restores the skeletal muscle after crush injury in rats. The American journal of pathology, 182, 895-904.
STUPKA, N., TARNOPOLSKY, M. A., YARDLEY, N. & PHILLIPS, S. M. 2001. Cellular adaptation to repeated eccentric exercise-induced muscle damage. Journal of Applied Physiology, 91, 1669-1678.
SU, A. I., COOKE, M. P., CHING, K. A., HAKAK, Y., WALKER, J. R., WILTSHIRE, T., ORTH, A. P., VEGA, R. G., SAPINOSO, L. M. & MOQRICH, A. 2002. Large-scale analysis of the human and mouse transcriptomes. Proceedings of the National Academy of Sciences, 99, 4465-4470.
SUZUKI, K., NAGANUMA, S., TOTSUKA, M., SUZUKI, K.-J., MOCHIZUKI, M., SHIRAISHI, M., NAKAJI, S. & SUGAWARA, K. 1996. Effects of exhaustive endurance exercise and its one-week daily repetition on neutrophil count and functional status in untrained men. International journal of sports medicine, 17, 205-212.
SUZUKI, K., NAKAJI, S., YAMADA, M., TOTSUKA, M., SATO, K. & SUGAWARA, K. 2002. Systemic inflammatory response to exhaustive exercise. Cytokine kinetics. Exerc Immunol Rev, 8, 6-48.
SUZUKI, Y. J. & FORD, G. D. 1999. Redox regulation of signal transduction in cardiac and smooth muscle. Journal of molecular and cellular cardiology, 31, 345-353.
SWEENEY, H. L., BOWMAN, B. F. & STULL, J. T. 1993. Myosin light chain phosphorylation in vertebrate striated muscle: regulation and function. American Journal of Physiology, 264, C1085-C1085.
SZCZESNA, D., ZHAO, J., JONES, M., ZHI, G., STULL, J. & POTTER, J. D. 2002. Phosphorylation of the regulatory light chains of myosin affects Ca2+ sensitivity of skeletal muscle contraction. J Appl Physiol (1985), 92, 1661-70.
TARPEY, P. S., BEHJATI, S., COOKE, S. L., VAN LOO, P., WEDGE, D. C., PILLAY, N., MARSHALL, J., O'MEARA, S., DAVIES, H., NIK-ZAINAL, S., BEARE, D., BUTLER, A., GAMBLE, J., HARDY, C., HINTON, J., JIA, M. M., JAYAKUMAR, A., JONES, D., LATIMER, C., MADDISON, M., MARTIN, S., MCLAREN, S., MENZIES, A., MUDIE, L., RAINE, K., TEAGUE, J. W., TUBIO, J. M., HALAI, D., TIRABOSCO, R., AMARY, F., CAMPBELL, P. J., STRATTON, M. R., FLANAGAN, A. M. & FUTREAL, P. A. 2013. Frequent mutation of the major cartilage collagen gene COL2A1 in chondrosarcoma. Nat Genet, 45, 923-6.
TAYLOR, A., HUMPHRIES, B., SMITH, P. & BRONKS, R. 1997. Electrophoretic separation of myosin heavy chain isoforms in the human m. vastus lateralis: references to reproducibility and relationships with force, electromechanical delay, fibre conduction velocity, endurance and electromyography. Archives of physiology and biochemistry, 105, 10-18.
TAYLOR, J., SUN, Y. V., CHU, J., MOSLEY, T. H. & KARDIA, S. L. 2008. Interactions between metallopeptidase 3 polymorphism rs679620 and BMI in predicting blood pressure in African–American women with hypertension. Journal of hypertension, 26, 2312.
TEDESCO, F. S., DELLAVALLE, A., DIAZ-MANERA, J., MESSINA, G. & COSSU, G. 2010. Repairing skeletal muscle: regenerative potential of skeletal muscle stem cells. J Clin Invest, 120, 11-9.
237
TERRY, E. E., ZHANG, X., HOFFMANN, C., HUGHES, L. D., LEWIS, S. A., LI, J., WALLACE, M. J., RILEY, L. A., DOUGLAS, C. M. & GUTIERREZ-MONREAL, M. A. 2018. Transcriptional profiling reveals extraordinary diversity among skeletal muscle tissues. eLife, 7.
THELEN, D. G., CHUMANOV, E. S., HOERTH, D. M., BEST, T. M., SWANSON, S. C., LI, L., YOUNG, M. & HEIDERSCHEIT, B. C. 2005. Hamstring muscle kinematics during treadmill sprinting. Med Sci Sports Exerc, 37, 108-114.
THIEBAUD, R. S. 2012. Exercise-induced muscle damage: is it detrimental or beneficial. J Trainol, 1, 36-44.
THOMAS, K., DENT, J., HOWATSON, G. & GOODALL, S. 2017. Etiology and Recovery of Neuromuscular Fatigue after Simulated Soccer Match Play. Medicine and science in sports and exercise, 49, 955-964.
THOMIS, M., BEUNEN, G., LEEMPUTTE, M. V., MAES, H., BLIMKIE, C., CLAESSENS, A., MARCHAL, G., WILLEMS, E. & VLIETINCK, R. 1998. Inheritance of static and dynamic arm strength and some of its determinants. Acta Physiologica Scandinavica, 163, 59-71.
THOMPSON, H. S., HYATT, J.-P., DE SOUZA, M. J. & CLARKSON, P. M. 1997. The effects of oral contraceptives on delayed onset muscle soreness following exercise. Contraception, 56, 59-65.
THOMPSON, W. R. & BINDER-MACLEOD, S. A. 2006. Association of genetic factors with selected measures of physical performance. Physical therapy, 86, 585-591.
TIAINEN, K., THINGGAARD, M., JYLHÄ, M., BLADBJERG, E., CHRISTENSEN, K. & CHRISTIANSEN, L. 2012. Associations between inflammatory markers, candidate polymorphisms and physical performance in older Danish twins. Experimental gerontology, 47, 109-115.
TIDBALL, J. G. 1991. Force transmission across muscle cell membranes. Journal of biomechanics, 24, 43-52.
TIDBALL, J. G. 2005. Inflammatory processes in muscle injury and repair. American Journal of Physiology-Regulatory, Integrative and Comparative Physiology, 288, R345-R353.
TIDBALL, J. G. 2011. Mechanisms of muscle injury, repair, and regeneration. Comprehensive Physiology, 1, 2029-2062.
TIDBALL, J. G. & VILLALTA, S. A. 2010. Regulatory interactions between muscle and the immune system during muscle regeneration. American Journal of Physiology-Regulatory, Integrative and Comparative Physiology, 298, R1173-R1187.
TIMMINS, R. G., BOURNE, M. N., SHIELD, A. J., WILLIAMS, M. D., LORENZEN, C. & OPAR, D. A. 2016. Short biceps femoris fascicles and eccentric knee flexor weakness increase the risk of hamstring injury in elite football (soccer): a prospective cohort study. Br J Sports Med, 50, 1524-1535.
TIMMINS, R. G., OPAR, D. A., WILLIAMS, M. D., SCHACHE, A. G., DEAR, N. M. & SHIELD, A. J. 2014. Reduced biceps femoris myoelectrical activity influences eccentric knee flexor weakness after repeat sprint running. Scandinavian journal of medicine & science in sports, 24, e299-e305.
TIMMINS, R. G., SHIELD, A. J., WILLIAMS, M. D., LORENZEN, C. & OPAR, D. A. 2015. Biceps femoris long head architecture: a reliability and retrospective injury study. Medicine and science in sports and exercise, 47, 905-913.
TOFT, A. D., JENSEN, L. B., BRUUNSGAARD, H., IBFELT, T., HALKJÆR-KRISTENSEN, J., FEBBRAIO, M. & PEDERSEN, B. K. 2002. Cytokine response to eccentric exercise in
238
young and elderly humans. American Journal of Physiology-Cell Physiology, 283, C289-C295.
TORRENTE, Y., EL FAHIME, E., CARON, N. J., DEL BO, R., BELICCHI, M., PISATI, F., TREMBLAY, J. P. & BRESOLIN, N. 2003. Tumor necrosis factor-alpha (TNF-alpha) stimulates chemotactic response in mouse myogenic cells. Cell Transplant, 12, 91-100.
TOTH, K. G., MCKAY, B. R., DE LISIO, M., LITTLE, J. P., TARNOPOLSKY, M. A. & PARISE, G. 2011. IL-6 induced STAT3 signalling is associated with the proliferation of human muscle satellite cells following acute muscle damage. PLoS one, 6, e17392.
TOUMI, H., F’GUYER, S. & BEST, T. M. 2006. The role of neutrophils in injury and repair following muscle stretch. Journal of anatomy, 208, 459-470.
TRAPPE, T. A., CARRITHERS, J. A., WHITE, F., LAMBERT, C. P., EVANS, W. J. & DENNIS, R. A. 2002. Titin and nebulin content in human skeletal muscle following eccentric resistance exercise. Muscle & nerve, 25, 289-292.
TSAOPOULOS, D. E., BALTZOPOULOS, V. & MAGANARIS, C. N. J. C. B. 2006. Human patellar tendon moment arm length: measurement considerations and clinical implications for joint loading assessment. 21, 657-667.
TSATALAS, T., GIAKAS, G., SPYROPOULOS, G., SIDERIS, V., LAZARIDIS, S., KOTZAMANIDIS, C. & KOUTEDAKIS, Y. 2013. The effects of eccentric exercise-induced muscle damage on running kinematics at different speeds. Journal of sports sciences, 31, 288-298.
TURRINA, A., MARTÍNEZ-GONZÁLEZ, M. A. & STECCO, C. 2013. The muscular force transmission system: role of the intramuscular connective tissue. Journal of bodywork and movement therapies, 17, 95-102.
VAESSEN, N., HEUTINK, P., JANSSEN, J. A., WITTEMAN, J. C., TESTERS, L., HOFMAN, A., LAMBERTS, S. W., OOSTRA, B. A., POLS, H. A. & VAN DUIJN, C. M. 2001. A polymorphism in the gene for IGF-I functional properties and risk for type 2 diabetes and myocardial infarction. Diabetes, 50, 637-642.
VAN DER HORST, N., SMITS, D.-W., PETERSEN, J., GOEDHART, E. A. & BACKX, F. J. 2015. The Preventive Effect of the Nordic Hamstring Exercise on Hamstring Injuries in Amateur Soccer Players A Randomized Controlled Trial. The American journal of sports medicine, 0363546515574057.
VAN DYK, N., BAHR, R., WHITELEY, R., TOL, J. L., KUMAR, B. D., HAMILTON, B., FAROOQ, A. & WITVROUW, E. 2016. Hamstring and Quadriceps Isokinetic Strength Deficits Are Weak Risk Factors for Hamstring Strain Injuries A 4-Year Cohort Study. The American journal of sports medicine, 0363546516632526.
VAN HOOREN, B. & BOSCH, F. 2018. Preventing hamstring injuries-Part 2: There is possibly an isometric action of the hamstrings in high-speed running and it does matter.
VAN POTTELBERGH, I., GOEMAERE, S., NUYTINCK, L., DE PAEPE, A. & KAUFMAN, J. 2001. Association of the type I collagen alpha1 Sp1 polymorphism, bone density and upper limb muscle strength in community-dwelling elderly men. Osteoporosis International, 12, 895-901.
VANGSTED, A. J., KLAUSEN, T. W., ABILDGAARD, N., ANDERSEN, N. F., GIMSING, P., GREGERSEN, H., NEXO, B. A. & VOGEL, U. 2011. Single nucleotide polymorphisms in the promoter region of the IL1B gene influence outcome in multiple myeloma patients treated with high-dose chemotherapy independently of relapse treatment with thalidomide and bortezomib. Ann Hematol, 90, 1173-81.
239
VAUGHAN, D., HUBER-ABEL, F. A., GRABER, F., HOPPELER, H. & FLÜCK, M. 2013. The angiotensin converting enzyme insertion/deletion polymorphism alters the response of muscle energy supply lines to exercise. European journal of applied physiology, 113, 1719-1729.
VENCKUNAS, T., SKURVYDAS, A., BRAZAITIS, M., KAMANDULIS, S., SNIECKUS, A. & MORAN, C. N. 2012. Human alpha-actinin-3 genotype association with exercise-induced muscle damage and the repeated-bout effect. Applied Physiology, Nutrition, and Metabolism, 37, 1038-1046.
VERBRUGGE, S. A. J., SCHONFELDER, M., BECKER, L., YAGHOOB NEZHAD, F., HRABE DE ANGELIS, M. & WACKERHAGE, H. 2018. Genes Whose Gain or Loss-Of-Function Increases Skeletal Muscle Mass in Mice: A Systematic Literature Review. Front Physiol, 9, 553.
VERHEUL, J., CLANSEY, A. C. & LAKE, M. J. 2017. Adjustments with running speed reveal neuromuscular adaptations during landing associated with high mileage running training. J Appl Physiol (1985), 122, 653-665.
VERMA, S., MOIZ, J., SHAREEF, M. & HUSAIN, M. 2015. Physical performance and markers of muscle damage following sports specific sprints in male collegiate soccer players: repeated bout effect. The Journal of sports medicine and physical fitness.
VINCENT, B., DE BOCK, K., RAMAEKERS, M., VAN DEN EEDE, E., VAN LEEMPUTTE, M., HESPEL, P. & THOMIS, M. A. 2007. ACTN3 (R577X) genotype is associated with fiber type distribution. Physiol Genomics, 32, 58-63.
VINCENT, B., WINDELINCKX, A., NIELENS, H., RAMAEKERS, M., VAN LEEMPUTTE, M., HESPEL, P. & THOMIS, M. A. 2010. Protective role of α-actinin-3 in the response to an acute eccentric exercise bout. Journal of Applied Physiology, 109, 564-573.
VOLAKLIS, K. A., HALLE, M. & MEISINGER, C. 2015. Muscular strength as a strong predictor of mortality: a narrative review. European journal of internal medicine, 26, 303-310.
VRIEZE, S. I., MCGUE, M., MILLER, M. B., HICKS, B. M. & IACONO, W. G. 2013. Three mutually informative ways to understand the genetic relationships among behavioral disinhibition, alcohol use, drug use, nicotine use/dependence, and their co-occurrence: twin biometry, GCTA, and genome-wide scoring. Behavior genetics, 43, 97-107.
WAHL, P., BRIXIUS, K. & BLOCH, W. 2008. Exercise-induced stem cell activation and its implication for cardiovascular and skeletal muscle regeneration. Minimally Invasive Therapy & Allied Technologies, 17, 91-99.
WALDÉN, M., HÄGGLUND, M., MAGNUSSON, H. & EKSTRAND, J. 2016. ACL injuries in men's professional football: a 15-year prospective study on time trends and return-to-play rates reveals only 65% of players still play at the top level 3 years after ACL rupture. Br J Sports Med, 50, 744-750.
WALLACE, J. L. & NORTON, K. I. 2014. Evolution of World Cup soccer final games 1966–2010: Game structure, speed and play patterns. Journal of Science and Medicine in Sport, 17, 223-228.
WALLIMANN, T., WYSS, M., BRDICZKA, D., NICOLAY, K. & EPPENBERGER, H. M. 1992. Intracellular compartmentation, structure and function of creatine kinase isoenzymes in tissues with high and fluctuating energy demands: the 'phosphocreatine circuit' for cellular energy homeostasis. Biochem J, 281 ( Pt 1), 21-40.
240
WALSH, S., LIU, D., METTER, E. J., FERRUCCI, L. & ROTH, S. M. 2008. ACTN3 genotype is associated with muscle phenotypes in women across the adult age span. Journal of applied physiology, 105, 1486-1491.
WALSTON, J., ARKING, D. E., FALLIN, D., LI, T., BEAMER, B., XUE, Q., FERRUCCI, L., FRIED, L. P. & CHAKRAVARTI, A. 2005. IL-6 gene variation is not associated with increased serum levels of IL-6, muscle, weakness, or frailty in older women. Experimental gerontology, 40, 344-352.
WANG, Y.-C., HU, Y.-W., SHA, Y.-H., GAO, J.-J., MA, X., LI, S.-F., ZHAO, J.-Y., QIU, Y.-R., LU, J.-B. & HUANG, C. 2015. Ox-LDL Upregulates IL-6 Expression by Enhancing NF-κB in an IGF2-Dependent Manner in THP-1 Macrophages. Inflammation, 38, 1-8.
WARREN, G. L., HULDERMAN, T., JENSEN, N., MCKINSTRY, M., MISHRA, M., LUSTER, M. I. & SIMEONOVA, P. P. 2002a. Physiological role of tumor necrosis factor alpha in traumatic muscle injury. FASEB J, 16, 1630-2.
WARREN, G. L., HULDERMAN, T., MISHRA, D., GAO, X., MILLECCHIA, L., O’FARRELL, L., KUZIEL, W. A. & SIMEONOVA, P. P. 2005. Chemokine receptor CCR2 involvement in skeletal muscle regeneration. The FASEB journal, 19, 413-415.
WARREN, G. L., LOWE, D. A. & ARMSTRONG, R. B. 1999. Measurement tools used in the study of eccentric contraction-induced injury. Sports Medicine, 27, 43-59.
WARREN, G. L., LOWE, D. A., HAYES, D. A., KARWOSKI, C. J., PRIOR, B. M. & ARMSTRONG, R. 1993. Excitation failure in eccentric contraction-induced injury of mouse soleus muscle. The Journal of Physiology, 468, 487-499.
WARREN, J. D., BLUMBERGS, P. C. & THOMPSON, P. D. 2002b. Rhabdomyolysis: a review. Muscle Nerve, 25, 332-47.
WATANABE, K., KOUZAKI, M. & MORITANI, T. 2016. Effect of Electrode Location on Task-Dependent Electromyography Responses Within the Human Biceps Femoris Muscle. Journal of applied biomechanics, 32.
WEBSTER, K. E. & HEWETT, T. E. 2018. Meta-analysis of meta-analyses of anterior cruciate ligament injury reduction training programs. Journal of Orthopaedic Research.
WEI, W., FAREED, M. U., EVENSON, A., MENCONI, M. J., YANG, H., PETKOVA, V. & HASSELGREN, P. O. 2005. Sepsis stimulates calpain activity in skeletal muscle by decreasing calpastatin activity but does not activate caspase-3. Am J Physiol Regul Integr Comp Physiol, 288, R580-90.
WIEWELHOVE, T., FERNANDEZ-FERNANDEZ, J., RAEDER, C., KAPPENSTEIN, J., MEYER, T., KELLMANN, M., PFEIFFER, M. & FERRAUTI, A. 2015. Acute responses and muscle damage in different high-intensity interval running protocols. The Journal of sports medicine and physical fitness.
WILLEMS, S. M., WRIGHT, D. J., DAY, F. R., TRAJANOSKA, K., JOSHI, P. K., MORRIS, J. A., MATTEINI, A. M., GARTON, F. C., GRARUP, N. & OSKOLKOV, N. 2017. Large-scale GWAS identifies multiple loci for hand grip strength providing biological insights into muscular fitness. Nature communications, 8, 16015.
WILLIAMS, A. G., DAY, S. H., FOLLAND, J. P., GOHLKE, P., DHAMRAIT, S. & MONTGOMERY, H. E. 2005. Circulating angiotensin converting enzyme activity is correlated with muscle strength. Med Sci Sports Exerc, 37, 944-948.
WILLIAMS, A. G. & FOLLAND, J. P. 2008. Similarity of polygenic profiles limits the potential for elite human physical performance. The journal of physiology, 586, 113-121.
WILLOUGHBY, D., MCFARLIN, B. & BOIS, C. 2003. Interleukin-6 expression after repeated bouts of eccentric exercise. International journal of sports medicine, 24, 15-21.
241
WILSON, A. G., SYMONS, J. A., MCDOWELL, T. L., MCDEVITT, H. O. & DUFF, G. W. 1997. Effects of a polymorphism in the human tumor necrosis factor α promoter on transcriptional activation. Proceedings of the National Academy of Sciences, 94, 3195-3199.
WILSON, E. M., HSIEH, M. M. & ROTWEIN, P. 2003. Autocrine growth factor signaling by insulin-like growth factor-II mediates MyoD-stimulated myocyte maturation. Journal of Biological Chemistry, 278, 41109-41113.
WILSON, G. J., WOOD, G. A. & ELLIOTT, B. C. 1991. Optimal stiffness of series elastic component in a stretch-shorten cycle activity. Journal of applied physiology, 70, 825-833.
WILSON, I. A., BRINDLE, K. M. & FULTON, A. 1995. Differential localization of the mRNA of the M and B isoforms of creatine kinase in myoblasts. Biochem. J, 308, 599-605.
WINDELINCKX, A., DE MARS, G., BEUNEN, G., AERSSENS, J., DELECLUSE, C., LEFEVRE, J. & THOMIS, M. 2007. Polymorphisms in the vitamin D receptor gene are associated with muscle strength in men and women. Osteoporosis International, 18, 1235-1242.
WISDOM, K. M., DELP, S. L. & KUHL, E. 2015. Use it or lose it: multiscale skeletal muscle adaptation to mechanical stimuli. Biomechanics and modeling in mechanobiology, 14, 195-215.
WOODS, C., HAWKINS, R., MALTBY, S., HULSE, M., THOMAS, A. & HODSON, A. 2004. The Football Association Medical Research Programme: an audit of injuries in professional football—analysis of hamstring injuries. British journal of sports medicine, 38, 36-41.
WOODS, D., HICKMAN, M., JAMSHIDI, Y., BRULL, D., VASSILIOU, V., JONES, A., HUMPHRIES, S. & MONTGOMERY, H. 2001. Elite swimmers and the D allele of the ACE I/D polymorphism. Hum Genet, 108, 230-2.
WOOLFSON, A. M., HEATLEY, R. V. & ALLISON, S. P. 1979. Insulin to inhibit protein catabolism after injury. New England Journal of Medicine, 300, 14-17.
WOZNIAK, A. C., KONG, J., BOCK, E., PILIPOWICZ, O. & ANDERSON, J. E. 2005. Signaling satellite‐cell activation in skeletal muscle: markers, models, stretch, and potential alternate pathways. Muscle & Nerve: Official Journal of the American Association of Electrodiagnostic Medicine, 31, 283-300.
WU, Y., ERDŐDI, F., MURÁNYI, A., NULLMEYER, K. D., LYNCH, R. M. & HARTSHORNE, D. J. 2003. Myosin phosphatase and myosin phosphorylation in differentiating C2C12 cells. Journal of Muscle Research & Cell Motility, 24, 499-511.
WÜST, R. C., MORSE, C. I., DE HAAN, A., JONES, D. A. & DEGENS, H. 2008. Sex differences in contractile properties and fatigue resistance of human skeletal muscle. Experimental physiology, 93, 843-850.
YAHIAOUI, L., GVOZDIC, D., DANIALOU, G., MACK, M. & PETROF, B. J. 2008. CC family chemokines directly regulate myoblast responses to skeletal muscle injury. J Physiol, 586, 3991-4004.
YAMIN, C. 2009. Reply to “IL6 genotype and creatine kinase response to exercise”. European journal of applied physiology, 107, 375-375.
YAMIN, C., AMIR, O., SAGIV, M., ATTIAS, E., MECKEL, Y., EYNON, N., SAGIV, M. & AMIR, R. E. 2007. ACE ID genotype affects blood creatine kinase response to eccentric exercise. Journal of Applied Physiology, 103, 2057-2061.
YAMIN, C., DUARTE, J. A. R., OLIVEIRA, J. M. F., AMIR, O., SAGIV, M., EYNON, N., SAGIV, M. & AMIR, R. E. 2008. IL6 (-174) and TNFA (-308) promoter polymorphisms are
242
associated with systemic creatine kinase response to eccentric exercise. European journal of applied physiology, 104, 579-586.
YAMIN, C., OLIVEIRA, J., MECKEL, Y., EYNON, N., SAGIV, M., AYALON, M., ALVES, A. J. & DUARTE, J. A. 2010. CK-MM gene polymorphism does not influence the blood CK activity levels after exhaustive eccentric exercise. Int J Sports Med, 31, 213-7.
YANG, J., BAKSHI, A., ZHU, Z., HEMANI, G., VINKHUYZEN, A. A., LEE, S. H., ROBINSON, M. R., PERRY, J. R., NOLTE, I. M. & VAN VLIET-OSTAPTCHOUK, J. V. 2015. Genetic variance estimation with imputed variants finds negligible missing heritability for human height and body mass index. Nature genetics.
YANG, J. & XU, X. 2012. alpha-Actinin2 is required for the lateral alignment of Z discs and ventricular chamber enlargement during zebrafish cardiogenesis. FASEB J, 26, 4230-42.
YANG, M., RAMACHANDRAN, A., YAN, H. M., WOOLBRIGHT, B. L., COPPLE, B. L., FICKERT, P., TRAUNER, M. & JAESCHKE, H. 2014. Osteopontin is an initial mediator of inflammation and liver injury during obstructive cholestasis after bile duct ligation in mice. Toxicol Lett, 224, 186-95.
YANG, N., MACARTHUR, D. G., GULBIN, J. P., HAHN, A. G., BEGGS, A. H., EASTEAL, S. & NORTH, K. 2003. ACTN3 Genotype Is Associated with Human Elite Athletic Performance. The American Journal of Human Genetics, 73, 627-631.
YANG, S. Y. & GOLDSPINK, G. 2002. Different roles of the IGF-I Ec peptide (MGF) and mature IGF-I in myoblast proliferation and differentiation. FEBS letters, 522, 156-160.
YANG, W. & HU, P. 2018. Skeletal muscle regeneration is modulated by inflammation. Journal of orthopaedic translation.
YE, S. 2006. Influence of matrix metalloproteinase genotype on cardiovascular disease susceptibility and outcome. Cardiovascular research, 69, 636-645.
YIN, H., PRICE, F. & RUDNICKI, M. A. 2013. Satellite cells and the muscle stem cell niche. Physiological reviews, 93, 23-67.
YOO, J., KIM, B.-H., KIM, S.-H., KIM, Y. & YIM, S.-V. 2016. Genetic polymorphisms to predict gains in maximal O 2 uptake and knee peak torque after a high intensity training program in humans. European journal of applied physiology, 116, 947-957.
YOSHIDA, T., HUQ, T. S. & DELAFONTAINE, P. 2014. Angiotensin type 2 receptor signaling in satellite cells potentiates skeletal muscle regeneration. Journal of Biological Chemistry, jbc. M114. 585521.
YU, Z. B. 2013. Tetanic contraction induces enhancement of fatigability and sarcomeric damage in atrophic skeletal muscle and its underlying molecular mechanisms. Zhongguo ying yong sheng li xue za zhi= Zhongguo yingyong shenglixue zazhi= Chinese journal of applied physiology, 29, 525-533.
ZALIN, R. 1972. Creatine kinase activity in cultures of differentiating myoblasts. Biochem. J, 130.
ZAMMIT, P. S. 2008. All muscle satellite cells are equal, but are some more equal than others? J Cell Sci, 121, 2975-82.
ZANOTTI, S., GIBERTINI, S., DI BLASI, C., CAPPELLETTI, C., BERNASCONI, P., MANTEGAZZA, R., MORANDI, L. & MORA, M. 2011. Osteopontin is highly expressed in severely dystrophic muscle and seems to play a role in muscle regeneration and fibrosis. Histopathology, 59, 1215-1228.
243
ZANOU, N. & GAILLY, P. 2013. Skeletal muscle hypertrophy and regeneration: interplay between the myogenic regulatory factors (MRFs) and insulin-like growth factors (IGFs) pathways. Cellular and Molecular Life Sciences, 70, 4117-4130.
ZHAN, M., JIN, B., CHEN, S.-E., REECY, J. M. & LI, Y.-P. 2007. TACE release of TNF-α mediates mechanotransduction-induced activation of p38 MAPK and myogenesis. J Cell Sci, 120, 692-701.
ZHANG, B.-T., YEUNG, S. S., ALLEN, D. G., QIN, L. & YEUNG, E. W. 2008. Role of the calcium-calpain pathway in cytoskeletal damage after eccentric contractions. Journal of Applied Physiology, 105, 352-357.
ZHANG, G., YOUNG, B., EZURA, Y., FAVATA, M., SOSLOWSKY, L., CHAKRAVARTI, S. & BIRK, D. E. 2005. Development of tendon structure and function: regulation of collagen fibrillogenesis. J Musculoskelet Neuronal Interact, 5, 5-21.
ZHAO, Z., LIU, B., LI, B., SONG, C., DIAO, H., GUO, Z., LI, Z. & ZHANG, J. 2017. Inhibition of long noncoding RNA IGF2AS promotes angiogenesis in type 2 diabetes. Biomedicine & Pharmacotherapy, 92, 445-450.
ZILLIKENS, M. C., DEMISSIE, S., HSU, Y.-H., YERGES-ARMSTRONG, L. M., CHOU, W.-C., STOLK, L., LIVSHITS, G., BROER, L., JOHNSON, T. & KOLLER, D. L. 2017. Large meta-analysis of genome-wide association studies identifies five loci for lean body mass. Nature communications, 8, 80.
Copyright © 2022 FDOKUMEN