Baburai Nagesh, Aravinda Kumar (2006) The physiological ...
294
Baburai Nagesh, Aravinda Kumar (2006) The physiological and genetic bases of water-use efficiency in winter wheat. PhD thesis, University of Nottingham. Access from the University of Nottingham repository: http://eprints.nottingham.ac.uk/11398/1/435403.pdf Copyright and reuse: The Nottingham ePrints service makes this work by researchers of the University of Nottingham available open access under the following conditions. · Copyright and all moral rights to the version of the paper presented here belong to the individual author(s) and/or other copyright owners. · To the extent reasonable and practicable the material made available in Nottingham ePrints has been checked for eligibility before being made available. · Copies of full items can be used for personal research or study, educational, or not- for-profit purposes without prior permission or charge provided that the authors, title and full bibliographic details are credited, a hyperlink and/or URL is given for the original metadata page and the content is not changed in any way. · Quotations or similar reproductions must be sufficiently acknowledged. Please see our full end user licence at: http://eprints.nottingham.ac.uk/end_user_agreement.pdf A note on versions: The version presented here may differ from the published version or from the version of record. If you wish to cite this item you are advised to consult the publisher’s version. Please see the repository url above for details on accessing the published version and note that access may require a subscription. For more information, please contact [email protected]
-
Upload
khangminh22 -
Category
Documents
-
view
0 -
download
0
Transcript of Baburai Nagesh, Aravinda Kumar (2006) The physiological ...
Baburai Nagesh, Aravinda Kumar (2006) The physiological and genetic bases of water-use efficiency in winter wheat. PhD thesis, University of Nottingham.
Access from the University of Nottingham repository: http://eprints.nottingham.ac.uk/11398/1/435403.pdf
Copyright and reuse:
The Nottingham ePrints service makes this work by researchers of the University of Nottingham available open access under the following conditions.
· Copyright and all moral rights to the version of the paper presented here belong to
the individual author(s) and/or other copyright owners.
· To the extent reasonable and practicable the material made available in Nottingham
ePrints has been checked for eligibility before being made available.
· Copies of full items can be used for personal research or study, educational, or not-
for-profit purposes without prior permission or charge provided that the authors, title and full bibliographic details are credited, a hyperlink and/or URL is given for the original metadata page and the content is not changed in any way.
· Quotations or similar reproductions must be sufficiently acknowledged.
Please see our full end user licence at: http://eprints.nottingham.ac.uk/end_user_agreement.pdf
A note on versions:
The version presented here may differ from the published version or from the version of record. If you wish to cite this item you are advised to consult the publisher’s version. Please see the repository url above for details on accessing the published version and note that access may require a subscription.
For more information, please contact [email protected]
THE PHYSIOLOGICAL AND GENETIC BASES OF
WATER-USE EFFICIENCY IN WINTER WHEAT
By
Aravinda Kumar Baburai Nagesh
B. Sc. (Agri), M. Sc. (Agronomy)
Thesis submitted to the University of Nottingham for the degree of Doctor of Philosophy
Division of Agricultural and Environmental Sciences School of Biosciences
University of Nottingham Sutton Bonington Campus
LE12 5RD Leicestershire United Kingdom
May 2006
OF NOTTINGHAM ORD LIBRARY
Dedication
I dedicate this thesis to my wife, Mamata, for all her love, support and enduring patience with me during this period of my life and for allowing me to accomplish the goals I had for my professional life. Also to my son, Amit, for continually reminding me of the joy of discovering something new.
ACKNOVMEDGEMIENTS
I would like to thank my supervisors Dr S. N. Azam-Ali and Dr M. John Foulkes for their
valuable guidance, keen interest and constructive criticism throughout the progress of my
PhD investigations and for their help in the preparation of this thesis.
The useful suggestions and help from Dr Sean Mayes, Dr Jim Craigon and Prof. Richard
Mithen are greatly appreciated.
I am equally grateful to Messrs John Alcock, Matt Tovey, Fiona Wilkinson, Jim Briggs,
David Hodson, Peter Craigon and Julietta Marquez at various stages in successful conduct
of field and glasshouse experiments for their encouragement and the kind co-operation
extended to me during the course of my investigation. I also acknowledge the useful inputs
of my colleagues Mr. Abdul Al-Ghzawi, Dr Simon Mwale, Dr. Trigo, Dr. Melanie King, Dr
Xiamin Chang, Miss Liz Lloyd, Miss Reshmi Gaju and Mr. Prince Buzwale.
Special thanks also go to Mrs Sue Golds, Emma Hooley, Sheila Northover and Mr. Chris
Mills in the Division who contributed in various ways to the successful completion of my
work.
Provision of the genetic map data jointly from JIC, Norwich, University of Nottingham and
ADAS, UK is gratefully acknowledged.
I am very grateful to the Association of Commonwealth Universities and Commonwealth
Scholarship Commission, U. K for awarding me the scholarship to undertake the studies;
and to the British Council for administrating my financial and welfare matters. I am also
thankful to the administrative authorities of University of Agricultural Sciences, Dharwad,
India for granting me study leave.
I wish to thank everyone involved, not giving names for fear of omitting anyone who has
supported or helped me.
I would also like to express my gratitude and respect to my parents and brothers, and
parents-in-law. My diction is too poor to translate the gratitude into so many words for their
endless support and patience during my absence from them.
TABLE OF CONTENTS
ABSTRACT ............................... ...........................................................
LIST OF FIGURES ..................... ............................................................ iv
..................... . LIST OF TABLES
. ........................................................ . . . vii
. . LIST OF PLATES ......................... ........................................................ .. . .... x GENERAL ABBREVIATIONS AND ACRONYMS
............................................ xi
CIMPTER 1: INTRODUCTION ................................................................. i
CIMPTER 2: REVIEW OF LITERATURE ..................................................... 5
2.1 CROP
2.1.1 Root size and morphology ............................................................... 7
2.1.2 Relationship between root length density and resource capture ..................... 11
2.2 WATER-USE EFFICIENCY ....................................................................
13
2.2.1 Definitions ...................................................................................
13 2.2.2 Determinants of WUE in crop plants ...................................................
14 2.2.2.1 Stomatal conductance and Rubisco content ... ... ... ... ... ... ... ... ... ... ... ... ... ... ... ... ... ...
14 2.2.2. La Rubisco activity in relation to drought stress ..................................................... 15
2.2.2. Lb Stornatal conductance ............................................................................... 15
2.2.2.2 Genetic variation in WUE and determinant plant and canopy processes ... ... ... ..... 16 2.2.2.3 Canopy architecture and aerodynamic resistance ... ... ... ... ... ... ... ... ... ... ... ... ... ......
18 2.2.3 The physiological basis of the relationship between carbon isotope
discrimination and TE .....................................................................
19 2.2.3.1 Carbon isotope composition in relation to the physiological behaviour ofp1ants .....
20 2.2.4 Relationship between TE and ýWE and A 13C
......................................... 21
2.2.5 Genetic correlations between A 13 C and grain yield ................................... 21
2.2.5.1 Genetic correlations ofA 13C with TE andyield under well-watered conditions ........ 22 2.2.5.2 Genetic correlations qfA 13C with TE andyield under drought
... ... ... ... ... ... ... ... ..... 24
2.2.5.3 Relationship between A 13 C, TE andyield under the influence of aerial environment. 26 2.2.6 Variation in A13C among different plant organs .......................................
28 2.3 HARVEST INDEX ..............................................................................
29 2.4 USE OF CROP SIMULATION MODELS TO IDENTIFY DROUGHT-RESISTANCE
TRAITS ...........................................................................................................
30
2.5 GENETICS OF WATER-USE EFFICIENCY ...................................................
32
2.5.1 Studies on near-isogenic lines ............................................................
33 2.5.2 Quantitative trait loci (QTLs) detection using mapping populations ...............
34 2.5.2.1 Synteny among cereals for comparative mapping of QTLs
... ... ... ... ... ... ... ... ... ... ..... 38 2.6 HYPOTHESES AND OBJECTIVES
...................................................................... 40
2.7 THESIS STRUCTURE ......................................................................................... 41
CIL4PTER 3: MATERIALS AND METHODS ........................................................... 43
3.1 GLASSHOUSE EXPERIMENTS ............................................................................ 43
3.1.1 Experimental design and treatments .................................................... 43
3.1.1.1 Moisture regime treatment .... ... ... ... ... ... ... ... ... ... ... ... ... ... ... ... ... ... ... ... ...... .....
43 3.1.1.2 Genotype treatment ... ... ... ... ... ... ... ... ... ... ... ... ... ... ... ... ... ... ... ... ... ... ... ... ...
44 3.1.2 Management of plants in soil columns .................................................
46 3.1.2.1 Sowing and transplanting
... ... ... ... ... ... ... ... ... ... ... ... ... ... ... ... ... ... ... ... ... .... 46
3.1.3 Plant measurements ........................................................................ 47
3.1.3.1 Developmental stages and growth analysis ... ... ... ... ... ... ... ... ... ... ... ... ... ..... 47
3.1.3.2 Shoot number, dry matter and green area per plant ... ... ... ... ... ... ... ... ... ...... 47
3.1.3.3 Plant height ... ... ... ... ... ... ... ... ... ... ... ... ... ... ... ... ... ... ... ... ... ... ... ... ... ... ... ....
47 3.1.3.4 Root dry matter and root length density
... ... ... ... ... ... ... ... ... ... ... ... ... ... ... ... 47
3.1.3.5 Plant water use and water-use efficiency ... ... ... ... ... ... ... ... ... ... ... ... ... ... ..... 48
3.1.3.6 Leaf relative water content (R WC) ... ... ... ... ... ... ... ... ... ... ... ... ... ... ... ... ... ....
48 3.1.3.7 SPAD measurements ... ... ... ... ... ... ... ... ... ... ... ... ... ... ... ... ... ...... ... ... ... ... .....
49 3.1.3.8 Gas-exchange measurements ... ... ... ... ... ... ... ... ... ... ... ... ... ... ... ... ... ... ... ......
49 3.1.3.9 Carbon isotope composition analysis ..... ... ... ... ... ... ... ... ... ... ... ... ... ... ... ... ... ... .....
50 3.1.4 Environmental measurements ............................................................
53 3.2 FIELD EXPERIMENTS
........................................................................................ 53
3.2.1 Experimental sites and plot management ............................................... 53
3.2.2 Experimental design and treatments ..................................................... 54
3.2.2.1 Experimental treatments .................................................................... 54
3.2.3 Crop measurements ............................................................................... 55
3.2.3.1 Crop development ..............................................................................
56 3.2.3.2 Crop 56 3.2.3.3 Shoot number, green area and crop dry matter ..........................................
56 3.2.3.4 Lodging assessment ...........................................................................
59 3.2.3.5 Combine grain yield and thousand grain weight at harvest
........................... 59
3.2.3.6 Gas-exchange measurements .............................................................. 60
3.2.3.7 Carbon isotope composition analysis .................................................. 60
3.3 DATA HANDLING AND STATISTICAL ANALYSIS .........................................
60
3.4 GENETIC 61
3.4.1 Construction of genetic map ................................................................ 61
3.4.2 QTL analysis... 62 3.4.2.1 Construction of datafiles
... ... ... ... ... ... ... ... ... ... ... ... ... ... ... ... ... ... ... ... ... ... ..... 63
3.4.2.2 Kruskal-Wallis analysisfor non-parametric mapping ... ... ... ......... ... ... ... ... ... .... 63
3.4.2.3 Interval mapping ... ... ... ... ... ... ... ... ... ... ... ... ... ... ... ... ... ... ... ... ... ... ....... ... ..... 63
3.4.2.4 MQM mapping ... ... ... ... ... ... ... ... ... ... ... ... ... ... ... ... ... ... ... ... ... ... ... ... ... ........ 65
CHAPTER 4: WATER USE AND WATER-USE EFFICIENCY OF WHEAT GENOTYPES IN GLASSHOUSE EXPERIMENTS
............................... 66
4. IRESULTS .......................................................................................
66 4.1.1 Weather
...................................................................................... 66
4.1.2 Plant development ..........................................................................
66 4.1.2.1 Shootproduction andsurvival ... ... ... ... ... ... ... ...... ... ... ... ... ... ... ... ..... ... ... ... ... ... ...
69 4.1.3 Above-ground dry matter ................................................................
72 4.1.3.1 Dry matter growth of leaves, stems and ears ... ... ... ... ... ... ... ... ........ ... ... .....
74 4.1.3.1.1 Leaf dry matter ... ... ... ... ... ... ... ... ... ... ... ... ... ... ... ... ... ... ... ... ... ... ... ... ... ... ... .........
74
4.1.3.1.2 Stem dry matter ... ... ... ... ... ... ... ... ... ... ... ... ... ... ... ... ... ... ... ... ... ... ... ... ... ... ... ... ..... 74
4.1.3.1.3 Ear dry matter ... ... ... ... ... ... ... ... ... ... ... ... ... ... ... ... ... ... ... ... ... ...... ... ... ... ... .......... /4 4.1.4 Root dry matter and root length density at harvest
.................................... 77
2 4.1.4.1 Specific root length (m g-), root diameter (mm) and surface area (cm ) ...... 81
4.1.5 Green area (cm 2 plant-) ................................................................... 82 4.1.5.1 Leaf chlorophyll concentration estimate (SPAD units) ... ... ... ... ... ... ..... ... ...
83 4.1.5.2 Leaf rolling ... ... ... ... ... ... ... ... ... ... ... ... ... ... ... ... ... ... ... ... ... ... ... ... ... ... ..... ...
85 4.1.5.3 Leaf relative water content (R WQ
... ... ... ... ... ... ... ... ... ... ... ... ... ... ........ ...... 85
4.1.6 Plant water use ............................................................................. 87 4.1.6 ]Cumulative water use ... ... ... ... ... ... ... ... ... ... ... ... ... ... ... ... ... ... ... ... ... ...........
87 4.1.7 Season-long water use efficiency (WUE) (g dry matter kg-1 H20)
................. 89
4.1.8 Grain yield, harvest biomass and harvest index ........................................
93 4.1.9 Thousand grain weight, ear number, grains ear . ......................................
94 4.1.10 Gas-exchange measurements ...........................................................
97 4.1.10.1 Photosynthetic rate (A; PM01 M-2 S-1 )
... ... ... ..... ... ... ... ... ... ... ... ... ... ... ... ..... 97
4.1.10.2 Stomatal conductance (gs; MM01 M-2S-1) ... ... ... ... ... ... ... ... ... ... ... ... ... ......... 98
4.1.10.3 Intercellular C02concentration (Cj; mmol C02 motlair) ... ... ... ... ........... 98
4.1.10.4 Carboxylation capacity (A/Cj ratio) ... ... ... ... ... ... ... ... ... ... ... ... ... ... ... ........ 99
4.1.10.5 Transpiration rate (E; MM01 M-2 s-') ... ... ... ... ... ... ... ... ... ... ... ... ... ... ... ........ 99
4.1.10.6 Instantaneous transpiration efficiency (ITE; mmol C02mol-I H20) ... ........
100
4.1.11 Carbon isotope discrimination analysis (%o; A 13C)
.................................. 103 4.2 DISCUSSION
................................................................................................... 105
4.2.1 Root growth and water use ............................................................... 105 4.2.2 Water-use efficiency and dry matter production .......................................
109 4.2.2.1 Plant growth responses ... ... ... ... ... ... ... ... ... ... ... ... ... ... ... ... ... ... ... ... ... ........
110 4.2.2.2 Yield response to water availability ... ... ... ... ... ... ... ... ... ... ... ... ... ... ... ... ... ...
112 4.2.3 Contribution of harvest index responses to drought resistance .......................
114 4.2.4 Leaf level transpiration efficiency ...................................................... 115
CIMPTER 5: WATER-USE EFFICIENCY OF WHEAT GENOTYPES IN FIELD EXPERIMENTS ........................................................................... 121
5.1 RESULTS ........................................................................................................
121 5.1.1 Weather patterns and soil moisture deficits
..................................................... 121
5.1.1.1 Experimental conditions and weather patterns ... ... ... ... ... ... ... ... ... ... ... ...... 122
5.1.2 Effects 6T irrigation and genotypes on grain yield and carbon isotope discrimination of 33 DH genotypes and 2 parents ....................................
125 5.1.2.1 Grain yield .............................................................................
125 5.1.2.1.12003
................................................................................... 125
5.1.2.1.2 2005 .....................................................................................
125 5.1.2.1.3Cross-sitelseason mean ...................................................................
125 5.1.2.2 Carbon isotope discrimination values (Delta; %q)
............................... 127
5.1.2.2.12003 .....................................................................................
127
5.1.2.2.2 2005 .....................................................................................
127
5.1.2.2.3 Cross-sitelseason mean .................................................................... 127
5.1.3 Relationship between A 13 C and grain yield ............................................... 128
5.1.4 Effects of genotypes and irrigation on yield and yield components .................... 131
5.1.4.1 Grain yield ... ... ... ... ... ... ... ... ... ... ... ... ... ... ... ... ... ... ... ... ... ... ... .................... 131 5.1.4.2 A bove-ground dry matter production (A GDM)
... ... ... ... ... ... ... ... ... ... ... ... ... 131
5.1.4.2.12003 ....................................................................................
131 5.1.4.2.2 2005
.................................................................................... 131
5.1.4.2.3 Cross-sitelseason mean ................................................................. 132
2 5.1.4.3 Ear number m.... ... ... ... ... ... ... ... ... ... ... ... ... ... ... ... ... ... ... ... ... ... ... ... ... ......
132 5.1.4.3.12003
..................................................................................... 132
5.1-4.3.2 2005 .....................................................................................
132 5.1.4.3.3 Cross-sitelseason mean ....................................................................
132 5.1.4.4 Thousand grain weight ... ... ... ... ... ... ... ... ... ... ... ... ... ... ... ... ... ... ... ... ... ... .....
132 5.1.4.4.12003
..................................................................................... 133
5.1.4.4.2 2005 ......................................................................................
133 5.1.4.4.3 Cross-sitelseason mean. .
133 5.1.4.5 Grain number ear . ... ... ... ... ... ... ... ... ... ... ... ... ... ... ... ... ... ... ... ... ... ... ... ... ...
133 5.1.4.5.12003 ......................................................................................
133 5.1.4.5.2 2005
...................................................................................... 134
5.1.4.5.3 Cross-sitelseason mean. 134 5.1.4.6 Plant height
... ... ... ... ... ... ... ... ... ... ... ... ... ... ... ... ... ... ... ... ... ... ... ... ... ... ... ..... 134
5.1.4.612003 ... ... ... ... ... ... ... ... ... ... ... ... ... ... ... ... ... ... ... ... ... ... ... ... ... ... ... ... ... ... ... ... ....
134 5.1.4.62 2005
... ... ... ... ... ... ... ... ... ... ... ... ... ... ... ... ... ... ... ... ... ... ... ... ... ... ... ... ... ... ... ... .... 134
5.1.4.6.3 Cross-sitelseason mean .... ... ... ... ... ... ... ... ... ... ... ... ... ... ... ... ... ... ... ... ... ... ... ..... 134
5.1.4.7 Carbon isotope discrimination andyield relationship in eight selected genotypes ... ... ... ... ... ... ... ... ... ... ... ... ... ... ... ... ... ... ... ... ... ... ... ... ... ... ... ... ..... 138
5.1.5 Gas-exchange measurements ........................................................................ 138
5.1.5.1 Photosynthetic rate (A; umol m -2 S-1) ... ... ... ... ... ... ... ... ... ... ... ... ... ... ... ... ..... 138
5.1.5.1.12003 .....................................................................................
138
5.1.5.1.2 2005 .....................................................................................
138
5.1.5.2 Stomatal conductance (gs'. MM01 M-2 S-1 ) ... ... ... ... ... ... ... ... ... ... ... ... ... ... ... ....
139 5.1.5.2.12003
................................................................................... 139
5.1.5.2.2 2005 .....................................................................................
139 5.1.5.3 Intercellular C02concentration (Cj; mmol C02 mol-lair) ... ... ... ... ... ... ... ...
139 5.1.5.3.12003
..................................................................................... 139
5.1.5.3.2 2005 ......................................................................................
139 5.1.6 Effects of genotypes and irrigation on growth and partitioning .....................
144 5.1.61 Date of anthesis ............................................................................
144 5.1.62 Green area index ...........................................................................
144 5.1.6 3 Flag leaf area index ..........................................................................
146 5.1.6 4 Above-ground biomass production .........................................................
147 5.1.6 5 Effects on biomass partitioning at harvest
... ... ... ... ... ... ... ... ... ... .................. 148
5.1.7 Effects of I B/ IR translocation on A 13 C and grain yield ............................... 150
5.1.8 Effects of Rht genes on A 13 C and grain yield .......................................... 150
5.2 DISCUSSION ....................................................................................................
154 5.2.1 The impact of drought and weather conditions ................................................
154 5.2.2 Relationships between A 13 C and yield ............................................................
155 5.2.3 Relationships between A 13 C and stomatal aperture traits
.................................. 157
5.2.4 Drought effects on growth processes ............................................................... 162
5.2.4.1 Evidence for post-anthesis dro ught and yie Id responses ........................... 162

5.2.4.2 Effects of IBLIIRS translocations ............................................................ 165
5.2.4.3 Effects ofRht genes ... ... ... ... ... ... ... ... ... ... ... ... ... ... ... ... ... ... ... ... ... ... ... ... ... 166
5.2.5 Relationships between A 13 C and yield traits ................................................... 166
CHAPTER 6: QUANTITATIVE GENETIC ANALYSIS .......................................... 168
6.1 RESULTS OF QTL ANALYSIS ............................................................................
168
6.1.1 Carbon isotope discrimination (A 13C) ............................................................
169 6.1.1.12003
........................................................................................................ 169
61.1.22005 .........................................................................................................
169 6.1.2 Grain yield .................................................................................................
172 6.1.2.12003
...................................................................................................... 172
6.1.2.2 2005 ......................................................................................................
174 6.1.3 Thousand grain weight .................................................................................
176 61.3.12003
...................................................................................................... 176
61.3.22005 ......................................................................................................
176 6.2 DISCUSSION
................................................................................................... 182
6.2.1 Mapping population of Beaver x Soissons ......................................................
182 6.2.2 Mapping of carbon isotope discrimination (A 13C)
.......................................... 182 6.2.3 Mapping of yield and yield components .........................................................
185 62.3.1 Grain yield .............................................................................................
185 6.2.3.2 Thousand grain weight ...........................................................................
186 6.2.4 Stability of QTLs-implications for use in breeding
................................... 187
6.2.5 Comparison of present results with previous work on BxS population ........... 188
6 2.5.1 Co-location of QTLsfor target traits in the present study ... ... ... ... ... ... ... .... 189
6.2.6 Synteny among cereals for QTLs for drought resistance ............................ 190
CHAPTER 7. - GENERAL DISCUSSION ............................................................... 196
7.1 PHYSIOLOGICAL BASIS OF GENETIC VARIATION IN DROUGHT PERFORMANCE......
7.1.1 Water use ................................................................................... 7.1.2 Water-use efficiency ...................................................................... 7.1.3 Harvest index
............................................................................... 7.1.4 Joint optimization of water use and WUE for drought resistance in the UK
environment ................................................................................ 7.2 GENETIC BASIS OF WATER-USE EFFICIENCY..
.................................................... 7.2.1 Syntenic associations of the present findings in other cereals ....................... 7.2.2 Potential use of QTLs in breeding programmes ....................................... 7.3 FUTURE WORK 7.4 CONCLUSIONS
...............................................................................................
198 198 202 207
210- 211 214 218 219 222
113-v REFERENCES ....................................................... o ....... o ...........................
224
APPENDICES ............................................................................................ 259
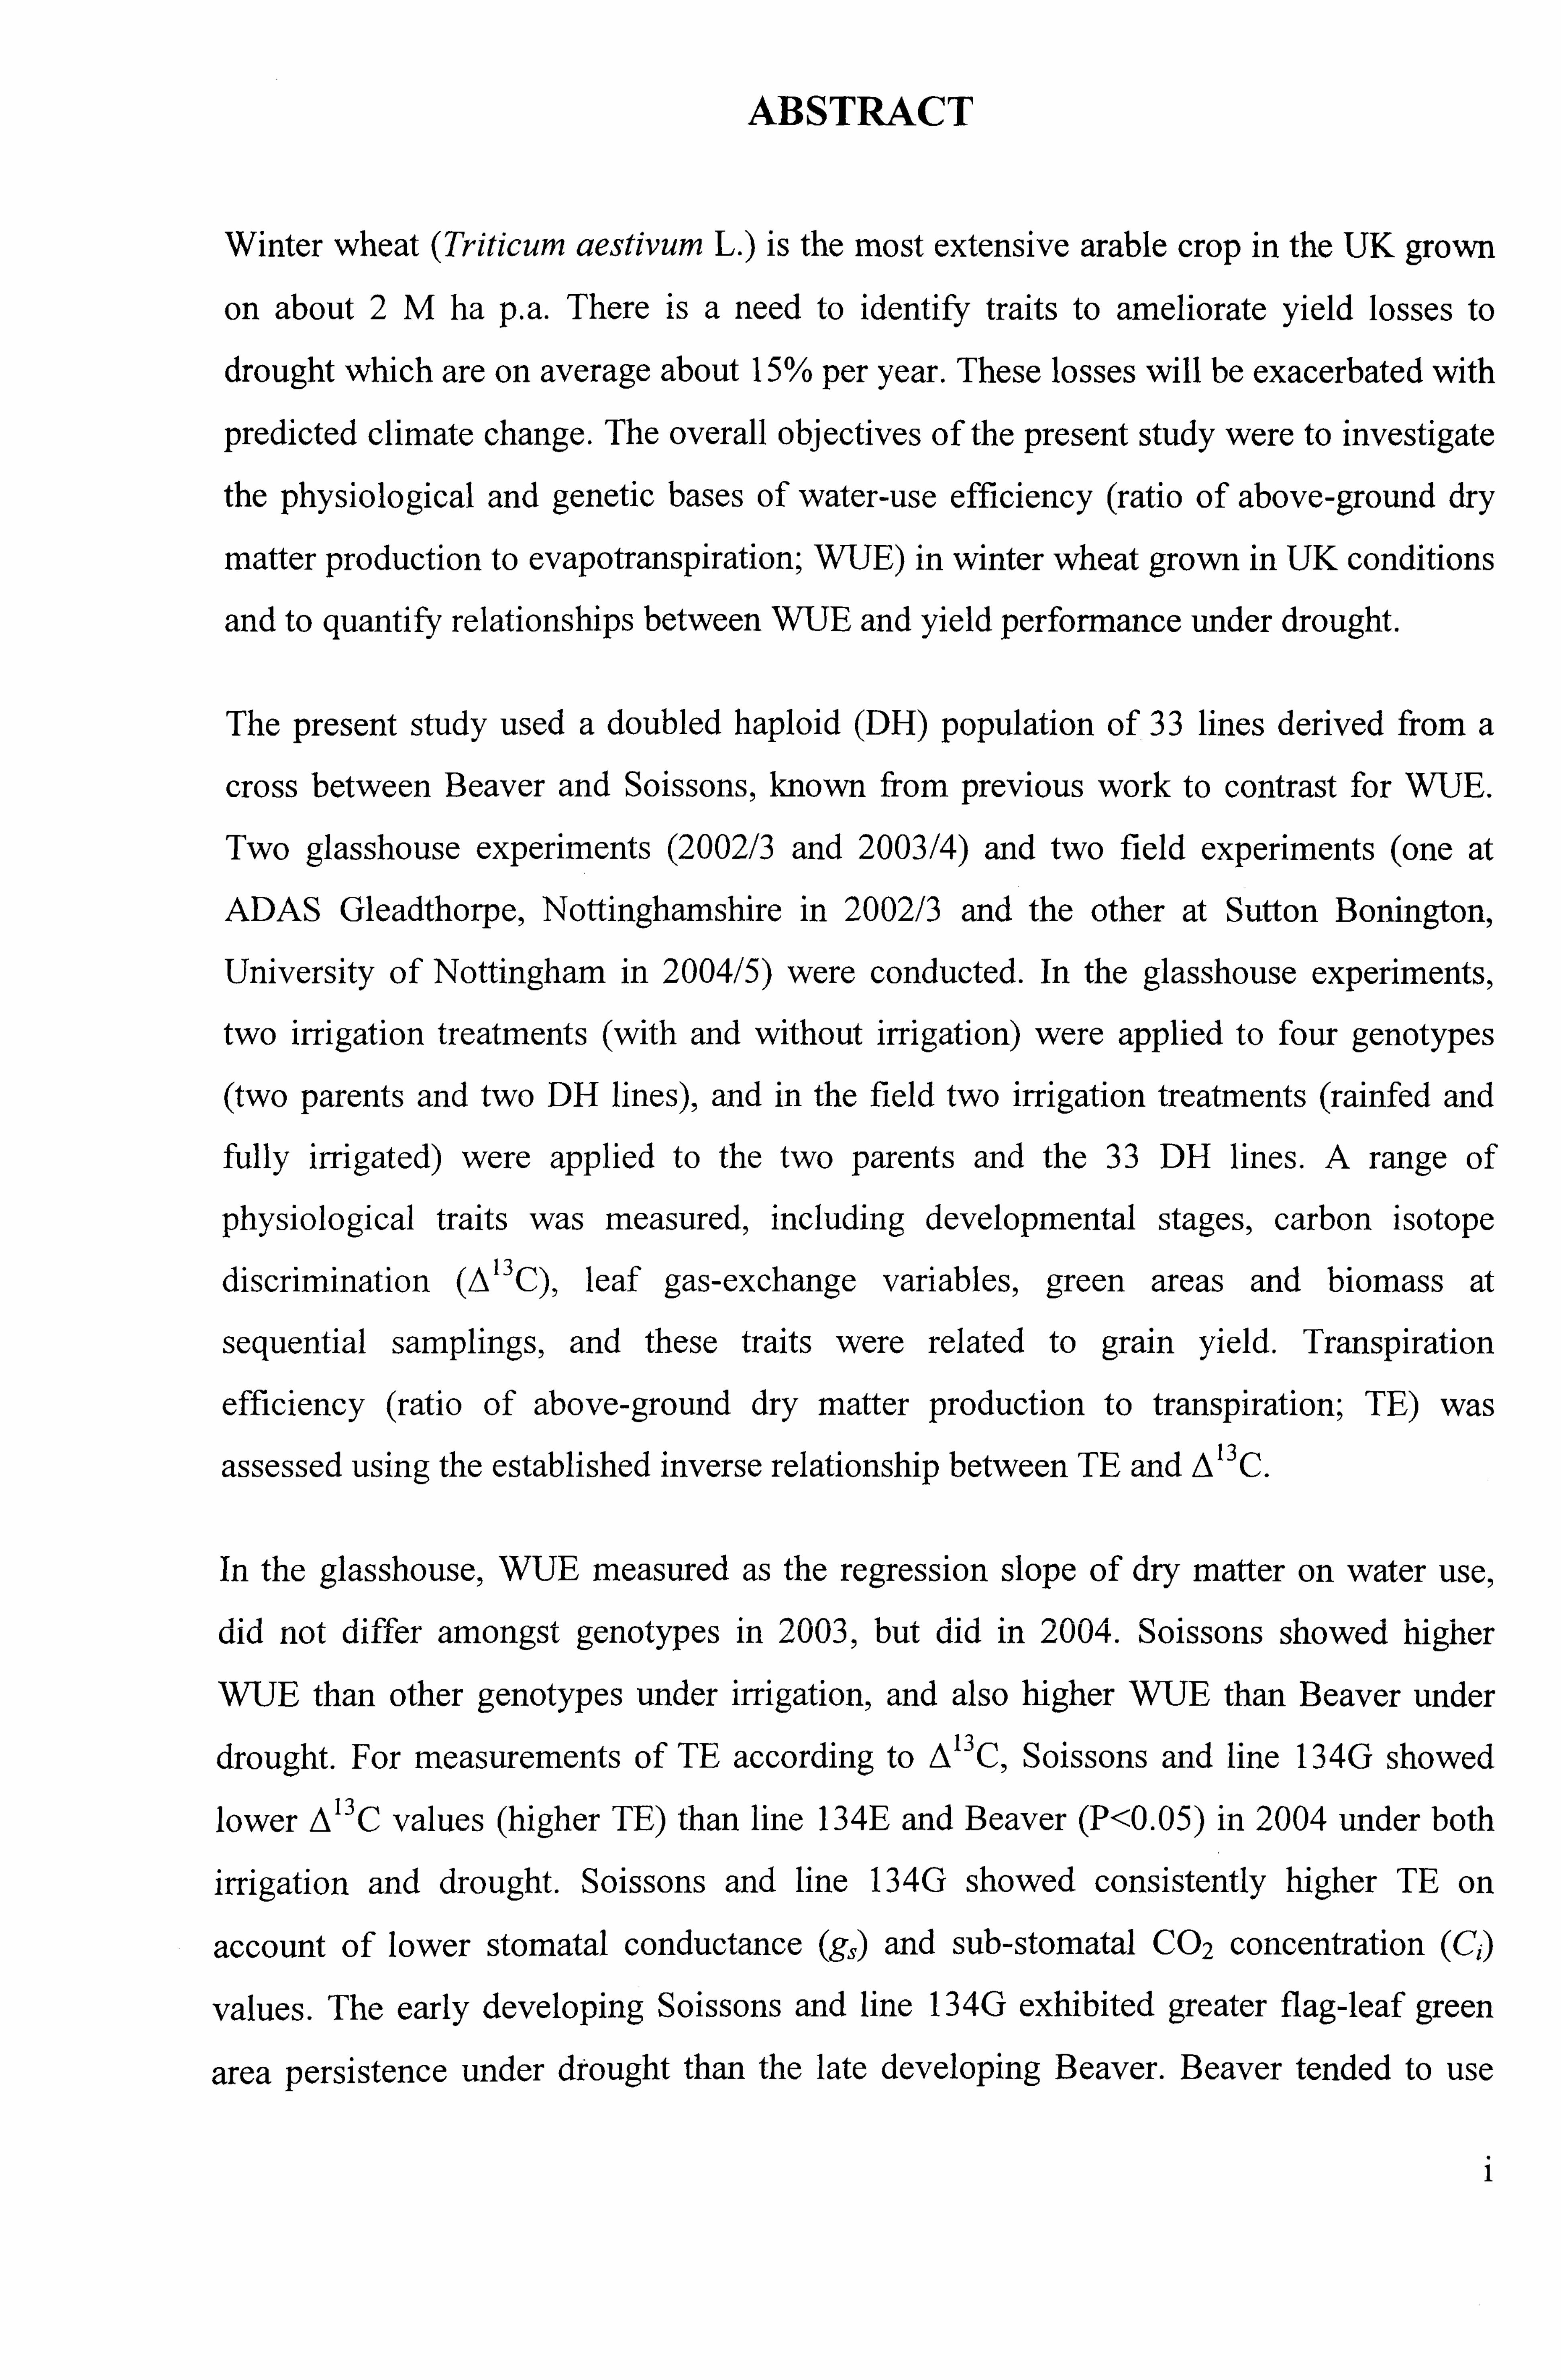
ABSTRACT
Winter wheat (Triticum aestivum L. ) is the most extensive arable crop in the UK grown
on about 2M ha p. a. There is a need to identify traits to ameliorate yield losses to
drought which are on average about 15% per year. These losses will be exacerbated with
predicted climate change. The overall objectives of the present study were to investigate
the physiological and genetic bases of water-use efficiency (ratio of above-ground dry
matter production to evapotranspiration; WUE) in winter wheat grown in UK conditions
and to quantify relationships between WUE and yield performance under drought.
The present study used a doubled haploid (DH) population of 33 lines derived from a
cross between Beaver and Soissons, known from previous work to contrast for WUE.
Two glasshouse experiments (2002/3 and 2003/4) and two field experiments (one at
ADAS Gleadthorpe, Nottinghamshire in 2002/3 and the other at Sutton Bonington,
University of Nottingham in 2004/5) were conducted. In the glasshouse experiments,
two irrigation treatments (with and without irrigation) were applied to four genotypes
(two parents and two DH lines), and in the field two irrigation treatments (rainfed and
fully irrigated) were applied to the two parents and the 33 DH lines. A range of
physiological traits was measured, including developmental stages, carbon isotope
discrimination (A13C), leaf gas-exchange variables, green areas and biomass at
sequential samplings, and these traits were related to grain yield. Transpiration
efficiency (ratio of above-ground dry matter production to transpiration; TE) was
assessed using the established inverse relationship between TE and A 13c.
In the glasshouse, WUE measured as the regression slope of dry matter on water use,
did not differ amongst genotypes in 2003, but did in 2004. Soissons showed higher
WUE than other genotypes under irrigation, and also higher WUE than Beaver under
drought. For measurements of TE according to A 13c ,
Soissons and line 134G showed
lower A' 3C values (higher TE) than line 134E and Beaver (P<0.05) in 2004 under both
irrigation and drought. Soissons and line 134G showed consistently higher TE on
account of lower stomatal conductance (g, ) and sub-stomatal C02 concentration (C)
values. The early developing Soissons and line 134G exhibited greater flag-leaf green
area persistence under drought than the late developing Beaver. Beaver tended to use
i
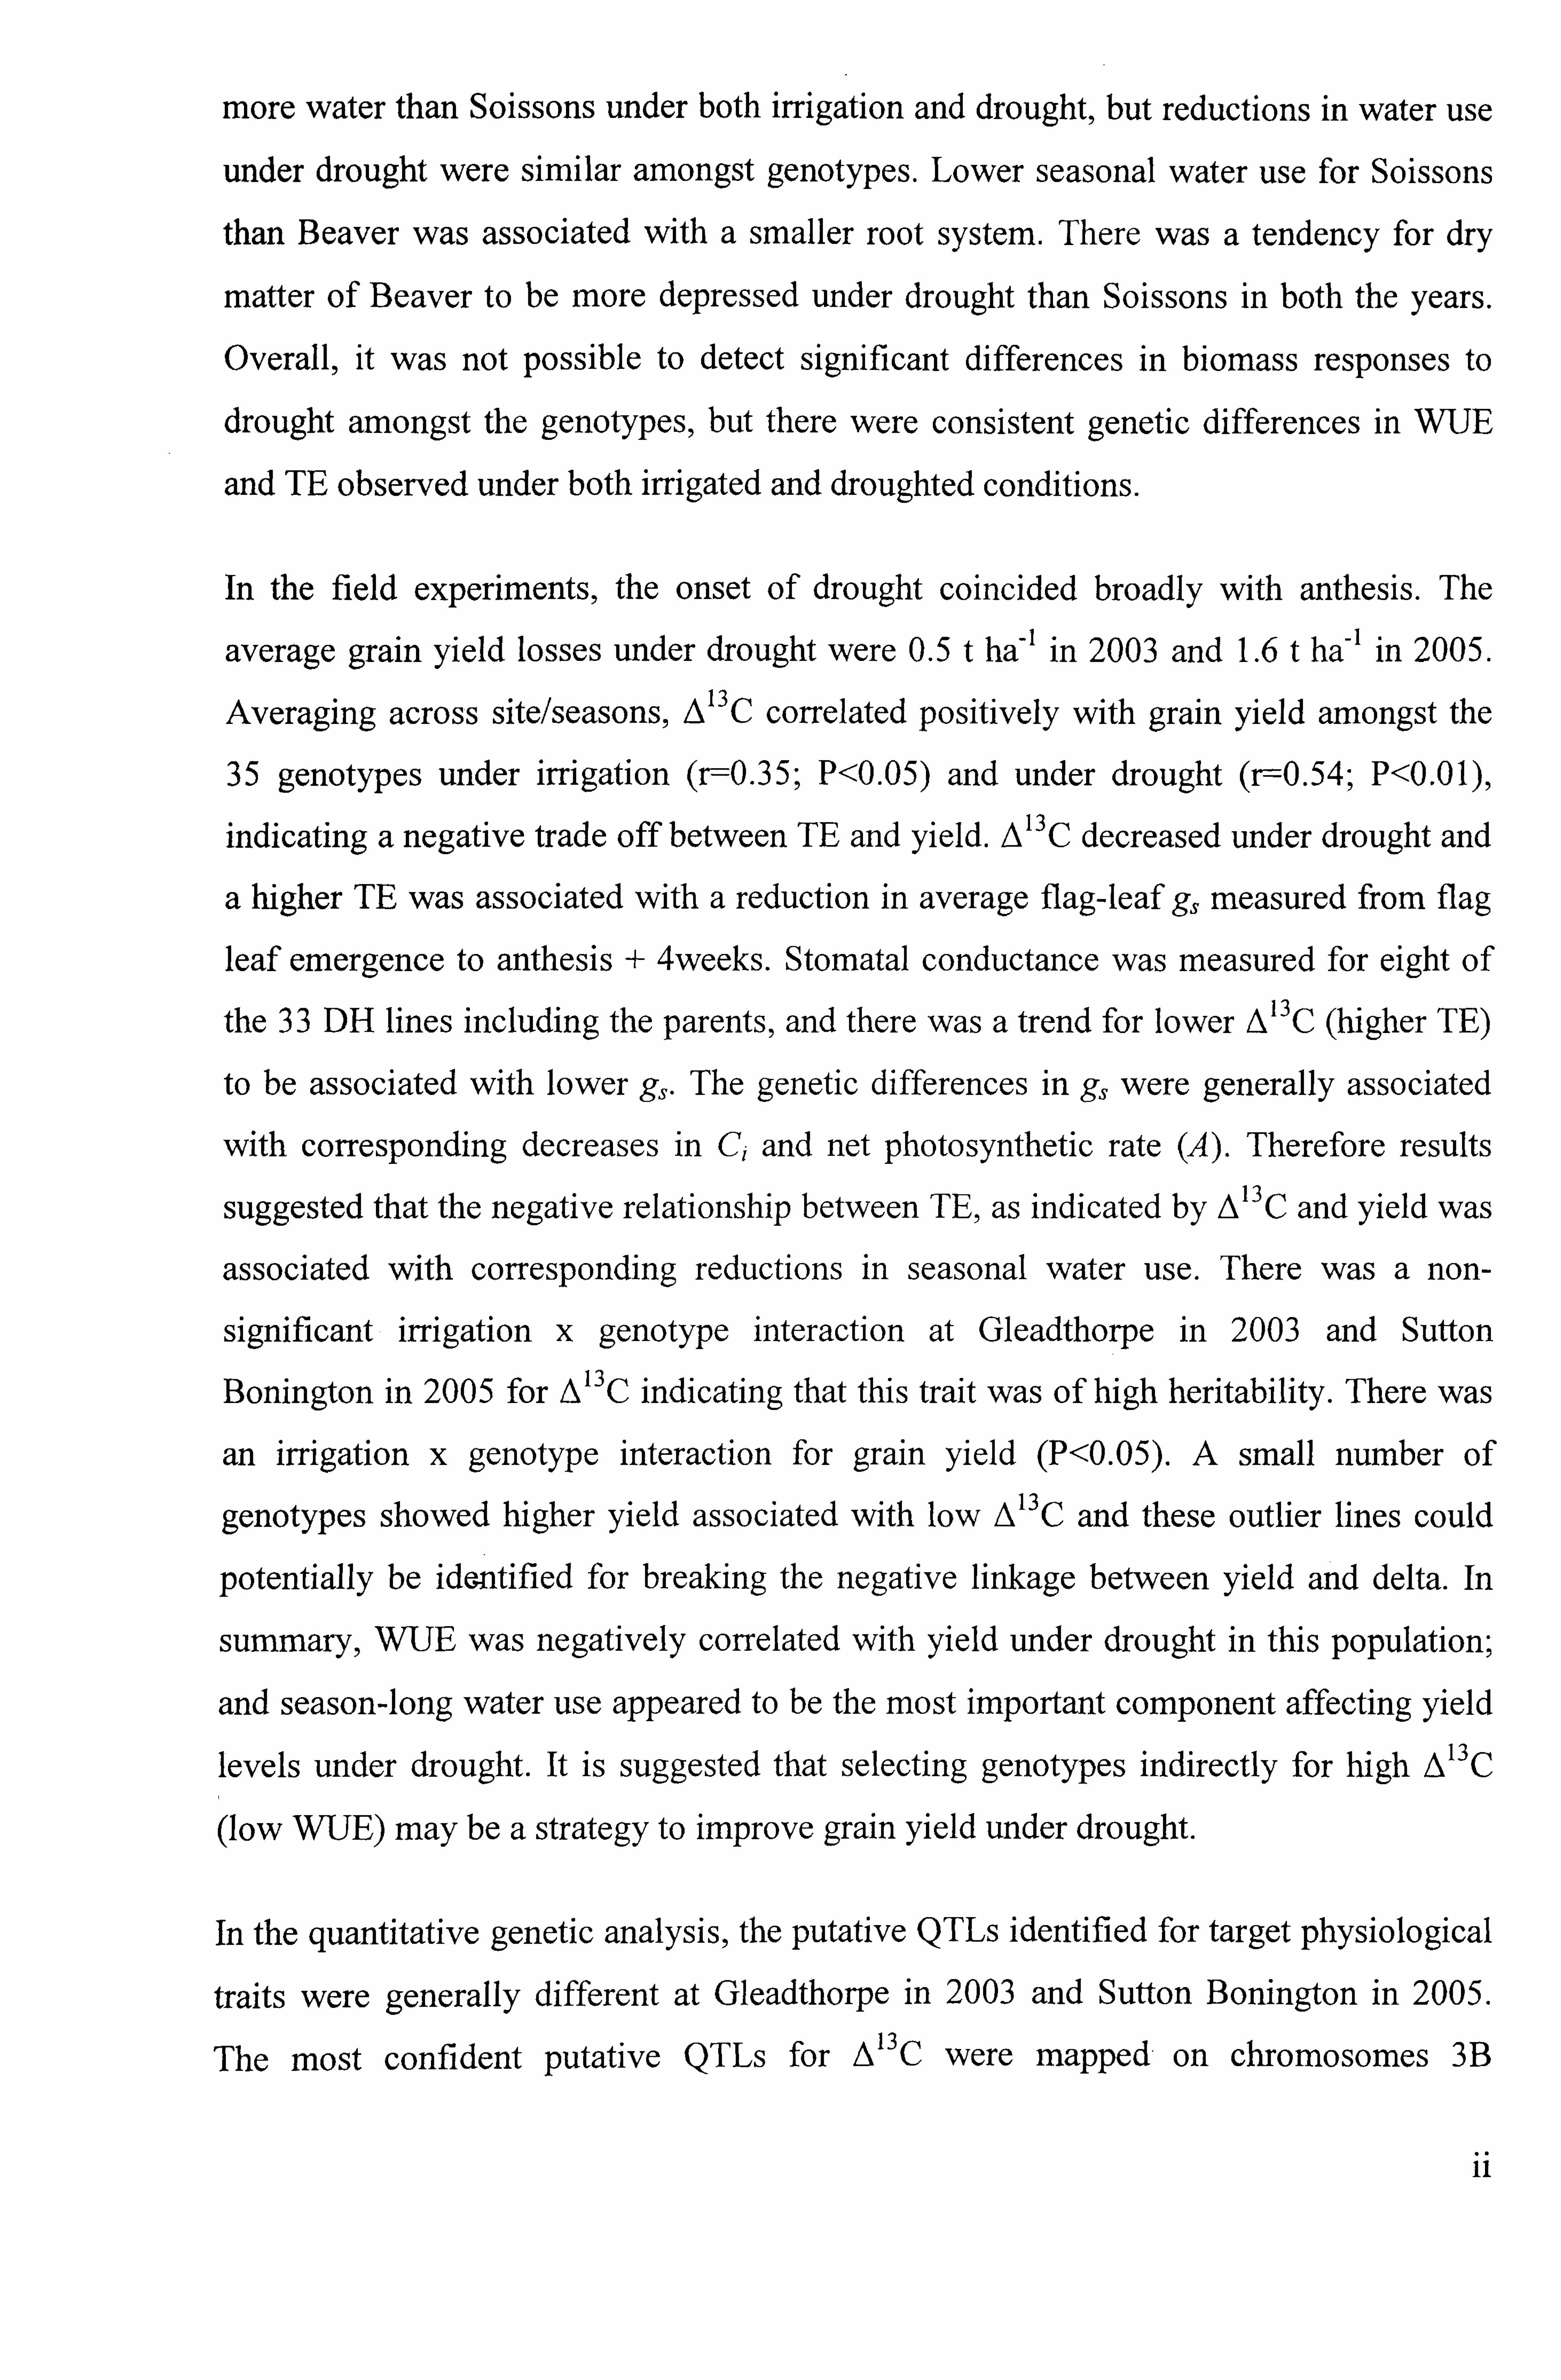
more water than Soissons under both irrigation and drought, but reductions in water use
under drought were similar amongst genotypes. Lower seasonal water use for Soissons
than Beaver was associated with a smaller root system. There was a tendency for dry
matter of Beaver to be more depressed under drought than Soissons in both the years.
Overall, it was not possible to detect significant differences in biomass responses to
drought amongst the genotypes, but there were consistent genetic differences in WUE
and TE observed under both irrigated and droughted conditions.
In the field experiments, the onset of drought coincided broadly with anthesis. The
average grain yield losses under drought were 0.5 t ha-1 in 2003 and L6 t ha-1 in 2005.
Averaging across site/seasons, A13C correlated positively with grain yield amongst the
35 genotypes under irrigation (r--0.35; P<0.05) and under drought (r--0.54; P<0.01),
indicating a negative trade off between TE and yield. A 13 C decreased under drought and
a higher TE was associated with a reduction in average flag-leaf g, measured from flag
leaf emergence to anthesis + 4weeks. Stomatal conductance was measured for eight of
the 33 DH lines including the parents, and there was a trend for lower A13C (higher TE)
to be associated with lower g, The genetic differences in g, were generally associated
with corresponding decreases in Ci and net photosynthetic rate (A). Therefore results
suggested that the negative relationship between TE, as indicated by A13C and yield was
associated with corresponding reductions in seasonal water use. There was a non-
significant irrigation x genotype interaction at Gleadthorpe in 2003 and Sutton
Bonington in 2005 for A13C indicating that this trait was of high heritability. There was
an irrigation x genotype interaction for grain yield (P<0.05). A small number of
genotypes showed higher yield associated with low A 13C and these outlier lines could
potentially be identified for breaking the negative linkage between yield and delta. In
summary, WUE was negatively correlated with yield under drought in this population;
and season-long water use appeared to be the most important component affecting yield
levels under drought. It is suggested that selecting genotypes indirectly for high A13C
(low WUE) may be a strategy to improve grain yield under drought.
In the quantitative genetic analysis, the putative QTLs identified for target physiological
traits were generally different at Gleadthorpe in 2003 and Sutton Bonington in 2005.
The most confident putative QTLs for A 13C were mapped- on chromosomes 3B
ii
(LOD=2.32) and 2D (LOD=1.43). The identification of QTLs as potential candidate
genes on these chromosomes may be associated directly with VVrUE in the Beaver x
Soissons DH mapping population. The A13C QTL on chromosome 3B was detected
commonly in both the irrigation environments and the direction of allelic effects was
consistent with the parental differences in A 13 C. This QTL may therefore represent a
novel gene for optimising WUE. It is suggested that breeders could optimise TE by
selection according to a marker for this gene involving further fine-mapping to identify
a marker tightly linked to the gene. Such a marker would also provide a target for gene
discovery in future work.
The results suggest that water use is the most important component of Passioura's yield
model for yield improvement under UK conditions. Nevertheless, ýVUE and harvest
index and their responses under drought will also likely play a role in yield improvement
through breeding in the UK targeted at drought-prone environments in future years.
iii
LIST OF FIGURES
Figure 4. La Maximum and minimum temperatures collected from (i) glasshouse experiment - 2003 (ii) Sutton Bonington meteorological station - 2003
................. 67
Figure 4. Lb Maximum and minimum temperatures collected from (i) glasshouse experiment - 2004 (ii) Sutton Bonington meteorological station - 2004
.............. 67
Figure 4.2 Fertile shoot number plant-' of four wheat genotypes in the (a) irrigated
and (b) unirrigated treatments in 2003. Error bars show the S. E. D of means (D. F=24) for the genotype x irrigation interaction effect ........................
70
Figure 4.3 Fertile shoot number plant-' of four wheat genotypes in the (a) irrigated
and (b) unirrigated treatments in 2004. Error bars show the S. E. D of means (D. F=24) for the genotype x irrigation interaction effect ........................
70
Figure 4.4 Infertile shoot number plant-' of four wheat genotypes in the (a) irrigated and (b) unirrigated treatments in 2003. Error bars show the S. E. D of means (D. F=24) for the genotype x irrigation interaction effect ........................
71
Figure 4.5 Infertile shoot number plant-' of four wheat genotypes in the (a) irrigated and (b) unirrigated treatments in 2004. Error bars show the S. E. D of means (D. F=24) for the genotype x irrigation interaction effect ................... .....
71
Figure 4.6 Above-ground dry matter accumulation plant-' of four wheat genotypes in the irrigated (closed symbols, solid lines) and unirrigated conditions (open
symbols, dotted lines). Error bars show S. E. D of mean (D. F=20) for the irrigation
x genotype interaction effect ................................................................ 73
Figure 4.7 Leaf, stem plus leaf sheath and ear dry matter (g plant-) of four wheat genotypes in irrigated (closed symbols) and unirrigated (open symbols) treatments in (a) 2003 and (b) 2004. Error bars show the S. E. D. of mean (D. F=24) for
genotype x irrigation interaction ............................................................
76
Figure 4.8 Root weight (g M-3 ) at anthesis for the (a) irrigated and (b) unirrigated treatments for four wheat genotypes measured in 0-20,40-60 and 80-100 cm depth soil horizons in 2003. Errors bars show S. E. D of mean of genotype x irrigation interaction (D. F=24). Data are square root transformed
..................... 79
Figure 4.9 Root weight (g M-3 ) at anthesis for the (a) irrigated and (b) unirrigated treatments for four wheat genotypes measured in 0-20,20-40,40-60,60-80 and 80-100 cm depth soil horizons in 2004. Errors bars show S. E. D of mean of genotype x irrigation interaction (D. F=16). Data are square root transformed ....................................................................................
79
Figure 4.10 Profiles of root length densities (CM CM-3 ) at anthesis for the (a) irrigated and (b) unirrigated treatments for four wheat genotypes measured in 0- 20ý 40-60 and 80-100 cm depth soil horizons in 2003. Errors bars show S. E. D. of
mean of genotype x irrigation interaction (D. F==24) .....................................
80
iv
Figure 4.11 Profiles of root length densities (CM CM-3 ) at harvest for the (a) irrigated and (b) unirrigated treatments for four wheat genotypes measured in 0- 20,20-40,40-60,60-80 and 80-100 cm depth soil horizons in 2004. Errors bars
show S. E. D. of mean of genotype x irrigation interaction (D. F=16) ...................
80
Figure 4.12 Green area (cm 2 plant-) of four wheat genotypes grown under irrigated (closed symbols) and unirrigated (open symbols) treatments in (a) 2003 and (b) 2004 glasshouse experiments. Error bars are S. E. D of mean (D. F=24) for
genotype x irrigation interaction effects ................................................... 84
Figure 4.13 Relative water content (RWC) of flag leaves of the main shoot of four
wheat genotypes at different growth stages in irrigated and unirrigated treatments in 2004. Errors bars show S. E. D of genotype x irrigation interaction
effect ............................................................................................ 86
Figure 4.14 Cumulative water-use (1) between samplings of four wheat genotypes in irrigated and unirrigated treatments in (a) 2003 and (b) 2004. Error bars show S. E. of mean of genotypes ...................................................................
88
Figure 4.15 Regression of above-ground dry matter (g) on cumulative water use (1) for four wheat genotypes under (a) Irrigated (Beaver y=2.76x (R2=0
. 91
2=0. (R2 = 0.99)'. Soissons y=3.23x (R 86); 134G y=2.75x 134E y=3.32x (R 0.89)) and (b) Unirrigated (Beaver y=2.60x (R 2
=0.88), - Soissons y=2.49x (R 2=0.95); 134G y=2.66x (R 2
=0.80); 134E y=3. ]8x (R2= 0.66)) treatments in
2003 (n=16) ...................................................................................
91
Figure 4.16 Regression of above-ground dry matter (g) on cumulative water use (1) for four wheat genotypes under (a) Irrigated (Beaver y=2.90x (R2=0.93), - Soissons y=3.43x (R 2=0.92); 134G y=3. ]6x (R2 =0.86), - 134E y=3. ]5x (R2 = 0.97)) and (b) Unirrigated (Beaver y=2.47x (R 2 =-0.48), - Soissonsy=2.77x (R 2=_
0.63); 134G y=2.65x (R2 =0.47), - 134E y=2.75x (R 2 =0.52)) treatments in 2004
92 (n= 16)
...........................................................................................
Figure 4.17 Carbon isotope discrimination (A 13C) for (a) leaves at anthesis in 2003 (b) mature grains in 2004 and (c) leaves at anthesis in 2004 for four wheat genotypes in the glasshouse experiments. Errors bars show S. E. (D. F=24) for
genotypes x irrigation interaction ...........................................................
104
Figure 5.1 Soil moisture deficit in irrigated and unirrigated treatments in 2002/3 (Gleadthorpe) and 2004/5 (Sutton Bonington) and daily rainfall ........................
123
Figure 5.2 Relationships between grain yield (85% DM) and carbon isotope discrimination (%o) measured in mature grains for a set of 33 doubled haploid lines in mapping population of Beaver x Soissons grown at Gleadthorpe (2003)
and Sutton Bonington (2005) in irrigated and unirrigated conditions .................. 130
V

Figure 6.1 Summary of locations of QTL for traits on the Beaver x Soissons DH
mapping population with the positions of marker loci on chromosomes of interest. TGW= thousand grain weight; DELTA= carbon isotope discrimination; YIELD = Grain yield; 03=2003; 05=2005; I=irrigated; U=unirrigated. Arrows and letter
represent the parental allele increasing expression of trait. Values of K* test and LOD scores of interval mapping for putative QTLs are given in Tables 6-2- 6.7
..................................................................................................... 179
vi
LIST OF TABLES
Table 3.1. Determinants of VVUE for which Beaver and Soissons are known to contrast from previous work ................................................................ 45
Table 3.2. Contrasting morphological traits used for selecting the eight wheat genotypes for intensive measurements ................................................... 55
Table 4.1. Dates of different growth stages recorded on four wheat genotypes in irrigated and unirrigated treatments .......................................................
68
Table 4.2. SPAD units and percent leaf rolling of four wheat genotypes in irrigated and unirrigated conditions .......................................................
85
Table 4.3. Grain yield (g plant-'), harvest biomass (g plant-) and harvest index of four wheat genotypes in irrigated and unirrigated treatments in 2003 and 2004
............................................................................................ 95
Table 4.4 Thousand grain weight, number of ears plant-' and grains ear-' of four
wheat genotypes in irrigated and unirrigated treatments in 2003 and 2004 ..........
96
Table 4.5 Mean values of net photosynthetic rate (A), stomatal conductance (g, )
and intercellular C02 concentration (C) for four wheat genotypes in irrigated and unirrigated treatments in 2003 and 2004
............................................ 101
Table 4.6 Mean values of transpiration rate (E), carboxylation capacity and instantaneous transpiration efficiency for four wheat genotypes in irrigated and uniffigated treatments in 2003 and 2004
.................................................. 102
Table 5.1 Mean monthly weather data for Gleadthorpe and Sutton Bonington in
experimental season and for the 30 year long-term mean (LTM) for Gleadthorpe (1975-2004) and Sutton Bonington (1975-2003)
......................................... 124
Table 5.2 Combine grain yield (85%DM) for 33 doubled haploid lines and 2
parents in the population derived from Beaver x Soissons in 2003 (Gleadthorpe)
and 2005 (Sutton Bonington) in irrigated and unirrigated treatments .................. 126
Table 5.3 Grain carbon isotope discrimination values (%o) for 33 doubled haploid lines and 2 parents in the population of Beaver x Soissons in 2003 (Gleadthorpe)
and 2005 (Sutton Bonington) in irrigated and unirrigated treatments .................. 129
Table 5.4 Above-ground dry matter (g m-2) and harvest index for eight wheat genotypes in irrigated and unirrigated treatments .........................................
135
Table 5.5 Thousand grain weight (g) for 33 doubled haploid lines and 2 parents in the population derived from Beaver x Soissons in 2003 (Gleadthorpe) and 2005 (Sutton Bonington) in irrigated and unirrigated treatments ..............................
136
Table 5.6 Ears M-2 , grains ear-I and plant height for six DH lines and the 2 parents of the Beaver x Soissons population in irrigated and unirrigated treatments in 2003
and 2005 ........................................................................................
137
Table 5.7 Photosynthetic rates ([tmol m-2 s-1) of eight wheat genotypes in irrigated vii
and unirrigated treatments in 2003 and 2005 .......................................................... 141
Table 5.8 Stomatal conductance (mmol m-1 s-1) of eight wheat genotypes in irrigated and unirrigated treatments in 2003 and 2005
.................................... 142
Table 5.9 Intercellular C02 concentration (mmol C02mol-1 air) of eight wheat genotypes in irrigated and unirrigated treatments in 2003 and 2005
................... 143
Table 5.10 Dates of GS61 for 33 doubled haploid lines and the 2 parents in the population of Beaver x Soissons in irrigated and unirrigated treatments ...............
145
Table 5.11 Flag leaf area index, green area index and above-ground dry matter at GS61 of four wheat genotypes in irrigated and unirrigated conditions at Sutton Bonington in 2004 and 2005
................................................................. 146
Table 5.12 Leaf lamina dry matter, stem-and-sheath dry matter and ear dry matter at GS61 of four wheat genotypes in irrigated and unirrigated treatments at Sutton Bonington in 2004 and 2005
.................................................................. 149
Table 5.13 Carbon isotope discrimination (%o) and grain yield (@ 85 % DM; t ha- 1) for groups of IBUIRS and IB doubled-haploid lines derived from Beaver x Soissons mapping population ................................................................
150
Table 5.14 Carbon isotope discrimination (%o) and grain yield (@ 85% DM; t ha-1) for groups of At], Rht2, Rht]+Rht2 and rht doubled haploid lines derived from Beaver x Soissons mapping population .....................................................
151
Table 5.15 Genetic correlation coefficients of parameters measured on the eight lines of Beaver x Soissons DH population in irrigated and unirrigated conditions in 2003
.......................................................................................... 152
Table 5.16 Genetic correlation coefficients of parameters measured on the eight lines of Beaver x Soissons DH population in irrigated and unirrigated conditions in 2005
.......................................................................................... 153
Table 6.1 Marker coverage for the Beaver x Soissons genetic map .................... 168
Table 6.2 Summary of QTL analysis for carbon isotope discrimination under irrigated and uniffigated treatments in 20103 (Gleadthorpe) using Kruskal-Wallis
non-parametric test and interval mapping ................................................ 170
Table 6.3 Summary of QTL analysis for carbon isotope discrimination under irrigated and unirrigated conditions in 2005 (Sutton Bonington) using Kruskal- Wallis (KW) non-parametric test and interval mapping .................................
171
Table 6.4 Summary of QTL analysis for grain yield under irrigated and unirrigated treatments in 2003 (Gleadthorpe) using Kruskal-Wallis (KW) non-parametric test and interval mapping ..........................................................................
173
Table 6.5 Summary of QTL analysis for grain yield under irrigated and unirrigated conditions in 2.005 (Sutton Bonington) using Kruskal-Wallis non-parametric test
viii
and interval mapping .......................................................................... 175
Table 6.6 Summary of QTL analysis for 1000-grain weight under irrigated and unirrigated conditions in 2003 (Gleadthorpe) using Kruskal-Wallis non-parametric test and interval mapping ...........................................................................
177
Table 6.7 Summary of QTL analysis for 1000-grain weight under irrigated and unirrigated conditions in 2005 (Sutton Bonington) using Kruskal-Wallis non- 178 parametric test and interval mapping ......................................................
ix
LIST OF PLATES
Plate 3.1 Experimental layout in the glasshouse in 2004 .............................
45
Plate 3.2 Wheat genotypes grown in growth rooms and later transplanted into PVC columns in glasshouse .............................................................. 46
Plate 3.3 Portable photosynthetic system CIRAS-1 (PP Systems, UK) used for
measuring leaf gas-exchange. System console and leaf chamber mounted on a stand with wheat leaf clamped into
...................................................... 50
Plate 3.4 Scanned images of (A) leaf samples and (B) grain samples used for 13 C/ 12 C analysis, taken using Nikon digital net camera Dn 100 and SMZ 1500
microscope ................................................................................... 52
Plate 3.5 An aerial view of the field experiment at Sutton Bonington in 2004/5 in mid July showing treatment differences between the irrigated and unirrigated plots ............................................................................
54
Plate 3.6 Six doubled-haploid lines and two parents selected for intensive study contrasting for their physiological and morphological features
..................... 57
x
GENERAL ABBREVIATIONS AND ACRONYMS % percent %0 parts per thousand
Vi micron
ýImol micromol 13 C/11C Carbon isotope ratio IB/IR Chromosome translocation of the short arm of rye-chromosome IR
into wheat chromosome 1B
A Photosynthetic rate ABA Abscisic acid ADAS Agricultural Development and Advisory Services
AFLP Amplified fragment length polymorphism ANOVA Analysis of variance APSIM Agricultural Production Systems slMulator Ar Aerodynamic resistance AW Available water C3 Carbon-3 C4 Carbon-4 Ca Partial pressureOf C02in air Ci IntercellularCO2concentration
CIMMYT Centro Internacional de Mejoramiento de Maiz y Trigo
cm centimetre
cm centi Morgan C02 Carbon dioxide
CSIRO Commonwealth Scientific and Industrial Research Organization
d Days
D. F Degrees of freedom
DAS Days after sowing DH Doubled-haploid lines
DNA Deoxyribo nucleic acid E Transpiration rate 9 gram
g M-2 Gram per square metre
GxE Genotype x environment interaction
GAI Green area index
gs Stornatal conductance h hours
HGCA Home Grown Cereals Authority
xi
HI Harvest index
ICARDA International Center for Agricultural Research in the Dry Areas
ITE Instantaneous transpiration efficiency ITMI International Triticeae Mapping Initiative
JIC John Innes Center
K* Kruskal-Wallis test static kg kilogram
I litre
LAI Leaf area index
LOD Logarithm of Odds
In metre MAFF Ministry of Agriculture, Fisheries and Food
mm millimeter
mmol millimol NILs Near-isogenic lines
0C degrees Celsius
P Probability
Ppd Photoperiod insensitive gene PVC Polyvinyl chloride QTL Quantitative trait loci
r Correlation coefficient R2 Coefficient of determination
Rht Semi-dwarfing genes RILs Recombinant inbred lines
RLD Root length density
Rubisco Ribulose- I 5-bisphosphate carboxylase-oxygenase RWC Relative water content RWD Root weight density
s second
s. e standard error S. E. D Standard error of difference
SLA Specific leaf area SLN Specific leaf nitrogen SPAD Soil-Plant Analysis Development system SRL Specific root length
SSR Simple sequence repeats
t ha-1 tonnes per hectare
TE Transpiration efficiency
xii

TGW Thousand grain weight TRSA Total root surface area UK United Kingdom
VPD Vapour pressure deficit
Water-use efficiency isotope composition
A or A 13C Carbon isotope discrimination value
xiii
CHAPTERI: INTRODUCTION
Wheat (Triticum aestivum L. ) is an important cereal crop of the word. Globally, more land is used to produce wheat than any other commodity (FAO, 1996; Jason, 2004).
Most countries attempt to produce enough wheat to meet internal demand, to be self-
sufficient in the world's most basic foodstuff. The world demand for wheat is growing
at approximately 2% per year (Rosegrant et al., 1995), while genetic gains in yield
potential of irrigated wheat stand at less than 1% (Sayre et al., 1997). The total area
under wheat in the world is 216 million ha producing 626 million tonnes annually (FAO,
2005) with an average productivity of 2.8 t ha-1. Wheat is produced under diverse
environmental conditions ranging from well-irrigated to water-stress situations, and
wheat yields are reduced by 50-90% of their irrigated potential by drought on at least 60
million ha in the developing world (Skovmand et al., 200 1).
Globally, CIMMYT (International Center for Maize and Wheat Improvement)
recognizes 12 distinct mega-environments where wheat is produced which range from
the Mediterranean climate of west Asia to most other parts of the globe. The
Mediterranean-type climates (southern Europe, west Asia, north Africa, South Africa,
southern Australia, and in southwest North and South America) account for about 10-
15% of world's wheat production where the period of crop growth is usually restricted
by lack of rainfall, water deficits, and high temperatures at the start and end of the
growing season (Loss and Siddique, 1994). Thus, water stress is a major limitation to
wheat growth and yield in these environments.
Winter wheat is the most widely grown arable crop in the UK accounting for over 40 per
cent of tilled land in eastern counties of England (Foulkes et al., 200 1). Of the 21
million tonnes of total cereals production in UK, wheat alone contributes 15 million
tonnes (DEFRA, 2006) and the average productivity is 8t ha-1. Of the 2 million ha of
UK wheat grown annually, about 700,000 ha are grown on drought-prone soils (Foulkes
et al., 2001). On these drought-prone soils yield loss can range between 0-4 t ha-1 in a
given year.
In the UK such water deficits can commonly limit wheat yield in some years (Foulkes
and Scott, 1998) and drought typically occurs late in the season, with onset of stress
broadly co-incident with flowering (Foulkes et al., 2001). Typically onset of drought is
post-anthesis and losses are in the region of 1-2 t ha-1 (Foulkes et al., 2002).
Extreme meteorological events, such as spells of high temperature, heavy storms, or
droughts, disrupt crop production. Frequent droughts not only reduce water supplies but
also increase the amount of water needed for plant transpiration. It is obvious that any
significant change in climate on a global scale will have a strong impact on local
agriculture, and therefore affect the world's food supply. Several uncertainties are
related to the degree of temperature increase and to the concomitant changes in the
precipitation patterns that determine the water supply to crops, and to the evaporative
demand imposed on crops by climate change. With predicted climate change (Marsh,
1996) the frequency of dry years, and therefore of droughts, will increase in eastern
counties of England where most UK wheat is grown. Climate change is predicted to lead
to drier summers. The South East of England accounts for more than half the country's
wheat area. Wassenaar et al. (1999) demonstrated in a modelling study in France that a
strong relation between soil water holding capacity and yield of wheat under climate
change in areas subject to summer droughts. When the variability of the UK climate is
taken into account in estimates of the range of water-limited yield under climate change
some studies suggest no change under currentC02 levels and increases in yields under
higher C02 levels (Harrison et al., 2000). However, such modelling studies may not
fully account for yield potential gains occurring through biomass production. In addition
there will. still be problems with regard to water availability patterns in lighter soils.
Since seasonal drought can also be a problem in favourable environments, physiological
traits to minimise effects of drought stress, e. g. improving water-use efficiency (ratio of
aerial biomass to evapotranspiration; WUE), may also influence yield in high yielding,
rainfed environments over a run of years. Similarly, improving water-use efficiency
could also be important in irrigated environments if it results in less water being used to
achieve higher yields. There is evidence that recent genetic gains in yield of wheat in the
UK are driven by above-ground biomass production, so there may be an increase in
demand for water if there is no change in WUE (Foulkes et al., 200 1).
With regard to applying irrigation water, in the UK growers give priority to crops such
as potatoes and sugar beet rather than winter wheat, as these realise better financial
2

returns to irrigation (Bailey, 1990). Choice of drought-resistant cultivars is the best way
to minimise adverse effects of uncertain droughts. So future research on physiological
traits to increase the yield per unit crop evapotranspiration under drought by genetic
means to underpin breeding is required. Early sowing may be a useful option for winter
wheat as it results in larger and deeper root systems (Barraclough and Leigh, 1984), but
problems may occur in some cases related to increased incidence of take-all disease and/
or risks of frost damage to shoot apices in the spring.
Most currently used commercial UK wheat varieties apparently have similar WUE,
although there is some evidence that WUE may have decreased with breeding. For
example, the old tall winter wheat cultivar Maris Huntsman had higher WUE than other
five semi-dwarf modem wheats (Foulkes et al., 2001). There is therefore a need to
identify sources of variation in WUE for breeders to exploit and to identify the main
determinants associated with WUE in UK environments. Improvements in WUE have
been a long-standing goal of plant scientists. If genetic improvements could be made in
the amount of dry matter produced for a given amount of water transpired,
improvements in drought resistance or irrigation efficiency would be expected (Richard,
1994). Improving WUE is generally thought to be of the most value in environments
subject to severe water limitation, but higher WUE could potentially have value over a
range of environments including those subject to more moderate water stress. There
have been relatively few experimental studies relating the physiology and genetics of
VPJE of wheat under contrasting soil moisture situations in the UK conditions or
relating WUE to stomatal aperture traits measured at the canopy or leaf level.
A combination of physiology and genetics may improve basic understanding of the
complex trait of WUE and predictions of genotype x environment interactions, offering
new avenues for optimizing WUE through breeding for specific environments.
The majority of economic traits in crop plants are quantitative in nature, each controlled
by many genes or gene complexes that are described as quantitative trait loci (QTL).
Genetic mapping of these QTL has been greatly facilitated in recent years due to two
important developments, the availability of molecular markers, and the development of
a variety of powerful and improved statistical methods. Using genetic mapping to
dissect the inheritance of different complex traits in the same segregating population can
3

be a powerful means to distinguish common heredity from casual associations between
such traits (Paterson et al., 1988).
In several cereal species, genetic maps have been used to identify chromosomal regions
controlling traits related to drought stress response. Different segregating populations from maize, sorghum, rice, wheat, barley have been studied for quantitative characters,
such as phenology, root characters, canopy architecture and growth, abscisic acid
accumulation, photosynthetic parameters, chlorophyll amount or "stay green", water
status and osmotic adjustment parameters, water-use efficiency and carbon isotope
discrimination (This et al., 1999). Carbon isotope discrimination (A 13 Q has been used
to select commercial wheat varieties recently by CSIRO (Commonwealth Scientific and Industrial Research Organisation) in Australia. The two wheat cultivars 'Drysdale' and 'Rees' have been bred and released for commercial cultivation using scientific gene
selection criteria based on A 13 C. There is a negative relationship between A 13 C and VXE (Farquhar and Richards, 1984). In this context, the present study used A 13C fo r
assessing the relationships between WUE and genotype performance.
The overall objective of the present study was to investigate the physiological and
genetic bases of water-use efficiency in winter wheat grown under UK conditions with
the aim of identifying physiological criteria and associated QTLs that can be used as
selection criteria in breeding programmes. The aim was to quantify the relationship
between WUE and grain yield under well-watered and droughted environments as well
as improved understanding of WUE.
The study was based on glasshouse and field experiments under well-watered and droughted conditions. The main objective was to identify the physiological and genetic bases of variation in )WE in winter wheat in an existing doubled-haploid mapping
population derived from a cross between Beaver and Soissons.
An extensive review on the key determinant physiological processes and the genetic
bases of WUE in relation to wheat is presented in the following chapter.
4
CHAPTER 2: REVIEW OF LITERATURE
The main aim of this literature review is to abstract and synthesize the existing
knowledge on water-use efficiency (ýWE) particularly with regard to physiological
mechanisms associated with genetic variation with potential application for breeding.
In addition, this review will provide evidence for different hypotheses to be tested in the
glasshouse and field experiments. This review has been organised into three main parts.
The first part deals with understanding the physiological basis of WUE and associated
C02 and water vapour gas exchange processes. The major focus is on the mechanisms
underlying processes associated with either carbon uptake or water loss that bring about
changes in WUE. The second part deals with the use of the well established technique of
carbon isotope discrimination (A13C) for estimating WUE, describing various
interrelationships between A13C and WUE and grain yield. Major attention has been
placed on various envirom-nental factors that are responsible for variation in A13C across
wide range of envirom-nents. The third part deals with the genetic basis of variation in
WUE and determinant traits. The aim is to review associated quantitative trait loci for
drought tolerance traits in wheat and other cereals. At the end of this chapter, a summary
of the various hypotheses to be tested in this study is presented.
Water availability is expected to be the most prominent constraint to increasing
agriculture production in the future. In many parts of the world, rainfed agriculture is
increasingly becoming unproductive due to prolonged drought. The frequency of dry
years and summer droughts is likely to increase as a result of predicted climate change
(Marsh, 1996). In one estimate, wheat yields are reduced by 50-90% of their irrigated
potential by drought on at least 60 million ha in the developing world (Skovmand et al.,
2001). On the other hand, global demand for wheat is growing at approximately 2% per
year (Rosegrant et al., 1995), while the genetic gains in yield potential of irrigated wheat
stand at slightly less than 1% (Sayre et al., 1997). Major research in this context is
focused on improving the drought-resistance traits in crop plants, wheat in particular.
Among a number of traits, improving the WUE is perhaps receiving the major attention
among the crop researchers. Breeding for specific physiological traits that are expected
to impart a yield advantage in dry environments has be en difficult and associated with
slow progress in genetic gains in yield. Increases in wheat yields in rainfed
5
environments have been achieved during most of this century through the use of
conventional empirical breeding approaches. However, the effectiveness of conventional
breeding will depend on non-genetic factors associated with the conduct of experiments
(Richards et al., 2002). In this context, physiological approaches can complement
empirical breeding. Improved understanding of the factors regulating wheat production
and precise targeting of physiological traits to reduce the impact of drought would aid
rates of genetic progress in wheat improvement. The application of physiological
approaches to breeding has been extensively reviewed by Blum (1988) for abiotic
stresses, by Evans (1993) for yield potential, by Loss and Siddique (1994) for wheat
under drought and by Chaves et al. (2002) for photosynthesis and growth in relation to
water stress in the field.
In the UK wheat is the most important arable crop grown on an area of about 2 million
ha annually. About 30% of this crop acreage is under drought-prone soils (MAFF, 1999).
In the UK water deficits can commonly limit wheat yield in some years on light soils
(Foulkes and Scott, 1998) and onset of moisture stress typically coincides with
flowering (Foulkes et al., 2001). The drought under UK conditions occurs in a less
severe form than that observed in Mediterranean or dry-land areas of the world.
However, with predicted climate change the frequency of dry years or water availability
for irrigation, and therefore of droughts, seems likely to increase. So quantification of
the effects of drought in these more marginal conditions by establishing the value of
traits for drought resistance is important (Foulkes et al., 2001).
For any trait to be included in crop improvement programmes as a selection criterion, it
should have sufficient genetic variability, _a
low genotype x environment interaction
effect and be heritable. Existence of genetic variability in water-use efficiency has been
known for almost a century (Briggs and Shantz, 1914). The framework proposed by
Passioura (1977; 1983) has proved very useful for identifying important traits
underlying yield of cereal crops growing in water-limited environments. This
framework is based on grain yield alone, and not on drought protection or on survival
under drought which were popular concepts in the past but which have been largely
unsuccessful as selection criteria (Richards et aL, 2002).
6
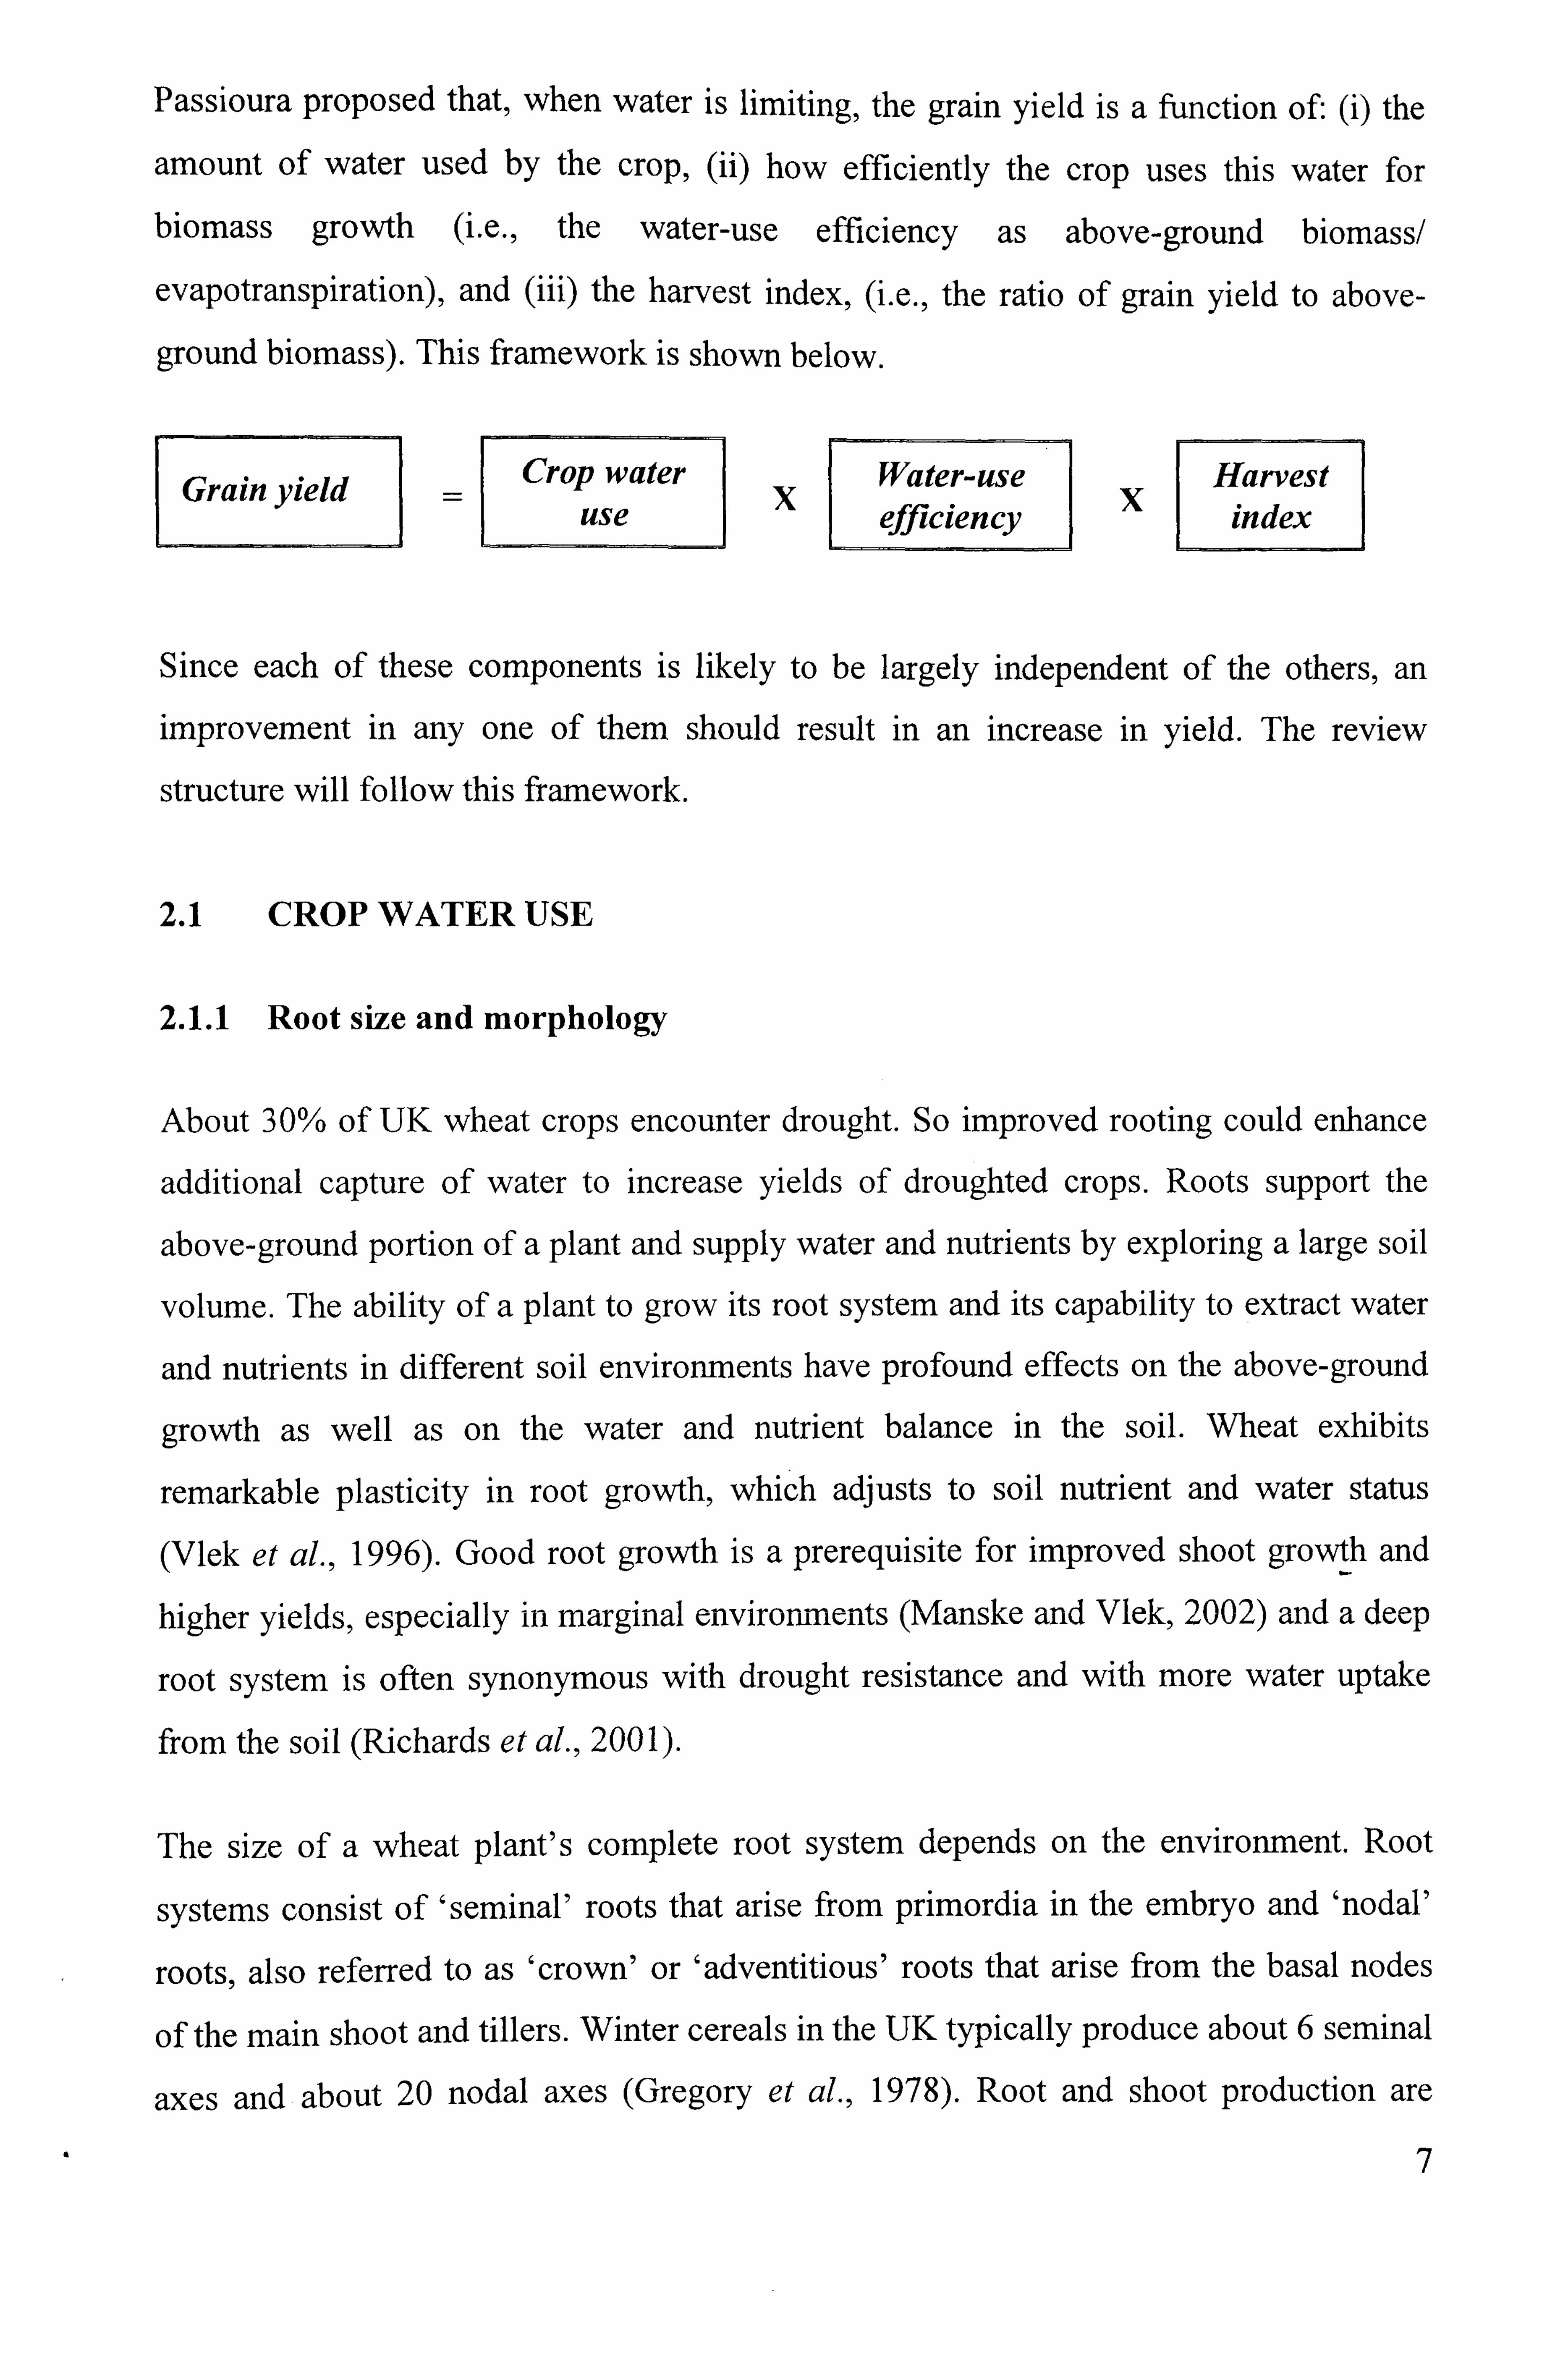
Passioura proposed that, when water is limiting, the grain yield is a function of- (i) the
amount of water used by the crop, (ii) how efficiently the crop uses this water for
biomass growth (i. e., the water-use efficiency as above-ground biomass/
evapotranspiration), and (iii) the harvest index, (i. e., the ratio of grain yield to above-
ground biomass). This framework is shown below.
Grain yield Crop water
X Water-use Harvest
use efficiency index
Since each of these components is likely to be largely independent of the others, an
improvement in any one of them should result in an increase in yield. The review
structure will follow this framework.
2.1 CROP WATER USE
2.1.1 Root size and morphology
About 30% of UK wheat crops encounter drought. So improved rooting could enhance
additional capture of water to increase yields of droughted crops. Roots support the
above-ground portion of a plant and supply water and nutrients by exploring a large soil
volume. The ability of a plant to grow its root system and its capability to extract water
and nutrients in different soil envirom-nents have profound effects on the above-ground
growth as well as on the water and nutrient balance in the soil. Wheat exhibits
remarkable plasticity in root growth, which adjusts to soil nutrient and water status
(Vlek et al., 1996). Good root growth is a prerequisite for improved shoot growth and
higher yields, especially in marginal environments (Manske and Vlek, 2002) and a deep
root system is often synonymous with drought resistance and with more water uptake
from the soil (Richards et al., 2001).
The size of a wheat plant's complete root system depends on the environment. Root
systems consist of 'seminal' roots that arise from primordia in the embryo and 'nodal'
roots, also referred to as 'crown' or 'adventitious' roots that arise from the basal nodes
of the main shoot and tillers. Winter cereals in the UK typically produce about 6 seminal
axes and about 20 nodal axes (Gregory et al., 1978). Root and shoot production are
7
synchronised, with nodal axis appearance linearly related to leaf production in wheat
(Klepper et al., 1984; Vincent and Gregory, 1989) and barley (Wahbi and Gregory,
1995). The first nodal axes typically appear when about 3 main shoot leaves have
emerged, and axes continue to be produced until stem elongation carries the nodes
above the soil surface (Klepper et al., 1984). Extension of both the seminal and nodal
roots usually continues to flowering (Belford et al., 1987).
The horizontal spread of wheat roots is usually 30-60 cm (Russell, 1977); and roots
grow to a depth of up to 200 cm (Gregory et al., 1978; Barraclough and Weir, 1988;
Ford et al., 2002). However, about 70% of total root length is found within top 0-30 cm
of soil. This is because of proliferation of lateral axes and because roots grow towards
areas of higher nutrient and water concentrations, where rooting can take place. In wheat,
root dry matter growth attains its maximum value at anthesis and net translocation of
carbon to the roots stops after anthesis (Gregory, 1994). Three root characteristics are
considered critical to moisture extraction: (i) the rate at which the root system descends
in the soil, (ii) the maximum rooting depth, and (iii) the root length density (the root
length per unit volume of soil; RLD) (Azam-Ali and Squire, 2002).
Mineral nutrients and water availability are considered together in the majority of root
studies. Experiments conducted on a silty clay loam soil at Rotharnsted revealed that
drought reduced the amount of root growth in the top soil although there was some
compensatory growth in the subsoil as long as there was available nitrogen (Barraclough
and Leigh, 1984). Roots also acquire a range of other nutrients like phosphorous which
are less mobile in the soil than N. Theoretical estimates by van Noordwijk (1983) for P
transport in soil and root uptake suggest that ten times more roots are required to capture
all the P in soil solution compared with water. So a reduction in the root length in the
surface layers is likely to have some effect on the ability of the crop to take up P.
Reductions in root length due to soil drying have been reported by Blum and Sullivan
(1997). They examined the effect of plant size (plant height and shoot biomass) on plant
performance under the effect of various agents of stress and top-root drying using Rht
(tall), Rhtl and Rht2 (semi-dwarf) and Rht3 (dwarf) isogenic lines of spring wheat cv.
Bersee. Top-soil drying resulted in decreased shoot biomass but increased total root
length. Stomatal closure was the primary response to top soil drying. The dwarf plants
8

had relatively higher grain yields under stress indicating their resistance to top-root
drying while tall plants showed no variation. Other experiments showed that barley is
able to tolerate extreme drying of the top-soil without affecting photosynthesis
providing that at least 50% of the root system is well supplied with water (i. e. soil
moisture contents close to field capacity) (Bingham and McCabe, 2003).
Most genetic comparisons of root traits have focused on differences between old long-
strawed and modem short-strawed cultivars. MacKey (1973), examining near-isogenic
lines in wheat, found a positive correlation between plant height and rooting depth.
Some cultivar comparisons support this result (Gupta and Virmani, 1973; Brown et al.,
1987) whereas the majority of reports indicate no consistent difference between semi-
dwarfs and talls (e. g., Welbank et al., 1974; Cholick et al., 1977; Bingham et al., 2002).
Other studies have even shown that semi-dwarfs have larger root systems (Siddique et
al., 1990; Haberle et al., 1995). In summary, there appears to be no effect of the semi-
dwarf genes on relationships between above- and below-ground parts of the crop that
has been consistently observed across environments.
A wide range of literature on varietal differences in rooting depth of wheat in response
to moisture stress (e. g. Hurd 1968; Gregory et al., 1978; Hoad et al., 2001) is available.
The effects of genotypic variations on root characteristics of crop plants were reviewed
by O'Toole and Bland (1987). Li et al. (2001) reported that under lower soil water
content thin roots extend greatly, but in well-watered treatments roots were short and
thicker. They showed irrigation promotes greater xylem vessel diameter development
which would promote faster and greater soil water uptake. Richards et al. (2001)
emphasized the importance of a deep root system in extracting more water from soil for
greater drought resistance. Improvements in rooting attributes can be brought about by
increasing the rooting depth and optimizing the root distribution with depth by an
increase in the duration of the vegetative period (Brown et al., 1987; Wahbi & Gregory,
1989; Siddique et al., 1990; Miralles et al., 1997). The developmental variation amongst
genotypes has a large influence on genetic variation in rooting traits. A genetic
comparison of six modem UK cultivars in the field detected a two-fold difference in
RLD at 80 cm depth, from about 1-2 CM CM-3 , with Shamrock exhibiting greater RLD
compared to the other five varieties (Ford et al., 2002). During drought, soil water
9

becomes less than required for potential transpiration by the plant. Drying of the soil
surface may inhibit normal development of the nodal root system (Gregory et al., 1978;
Gregory, 1994). Barraclough and Weir (1988) found root and shoot growth of winter
wheat were reduced by the imposition of an artificial drought even though the water use
was not affected until after anthesis. Wheat cultivars with highest rates of root growth
tend to have the lowest rates of transpiration per unit root mass and this tends to
decrease the rate of water uptake per unit root length (van den Boogaard et al., 1996). In
a study conducted at CIMMYT, most drought-tolerant semi-dwarf bread wheats formed
more roots in deeper soil layers, whereas the non-tolerant checks had fewer roots in
deep soil (Manske et al., 2000).
Improved root biomass has been associated with the I BL. I RS wheat-rye translocation in
spring wheat in California in pot-grown experiments (Ehdaie et al., 2003). However, the
effect of IBLIRS wheat-rye translocation on root dry weight was neutral in this
investigation. Genetic differences in root dry matter may result from the extent to which
genotypes differ in the degree of adjustment to the onset of nutrient stress, i. e., the
functional equilibrium between root and shoot (Brouwer, 1963; van NoordwiJk and de
Willegen, 1987). The extent of genetic diversity in this adjustment is largely unknown.
The development of synthetic hexaploid wheat, product of crossing between durum
wheat and wild (D genome) diploids has enabled new genetic diversity to be introduced
into the bread wheat gene pool (Villareal et al., 1995; CIMMYT, 1996). Wide crossing
can be used to introduce stress adaptive genes from diploid and tetraploid genomes, for
example through the production of synthetic hexaploids, i. e. by crossing modem
tetraploid durum wheats with Aegilops tauschii, the ancestral donor of the D genome in
hexaploid wheat. Wide-crossing has contributed significantly to the drought adaptation
of CIMMYT wheat germplasm (Mujeeb-Kazi et al., 1998; Reynolds et al., 2005). The
synthetic derived wheat lines have improved ability to extract water at intermediate (30-
90 cm) rooting depths (Copland et al., 2002).
The ratio between the amount of root dry mass and shoot dry mass is a measure of the
allocation of resources between different plant components (Hoad et al., 2001). When
WUE is expressed as the ratio of above-ground biomass to water used, then the
genotype that partitioned less to the roots would not only have a higher WUE but also
10

earlier canopy closure, there by reducing evaporation. This reduction in root/shoot ratio
may be very important in superficially increasing WUE in Mediterranean-type
environments (Richards, 1987). However, studies have shown that the response of wheat
plants to limitations of soil water is to allocate a greater amount of the carbon
assimilated to roots (Hamblin et al., 1990; Gregory and Atwell, 1991; Palta and Gregory,
1997). Such partitioning of assimilates between roots and shoots appears to be highly
dependent on genotype (Sadhu and Bhaduri, 1984). Some experiments showed that
reducing the carbohydrate supplies to the roots tend to decrease the rate of extension of
seminal axes and first order lateral roots (Bingham and Stevenson, 1993; Bingham et al.,
1996). On the other hand, a wheat ideotype should react positively to drought by
producing a larger root biomass under droughted compared to favourable conditions
(Ehdaie et al., 2003). Many studies have demonstrated that top-soil drying resulted in
increased root/shoot ratio in wheat (for e. g. Blum and Sullivan, 1997). Modifying root
dry matter distribution may increase plant reproductive allocations, which may be
favourable to increasing grain yields (Weiner, 1990). Hoad et al. (2001) reviewed on the
management of cereal root systems and pointed out that the genetic variation in rooting
characteristics could be taken advantage of in breeding programmes where lodging and
drought are problems.
The synthesis and accumulation of chemical signals such as abscisic acid (ABA) are a
natural drought avoidance mechanism in most plants (Turner, 1986). ABA production
by dehydrating roots is also known to cause variations in stornatal responses, whilst leaf
water status is kept constant (Gowing et al., 1990; Davis and Zhang, 1991). These
investigations provide an understanding of root-to-shoot signalling through the hormone
ABA under water stress conditions.
2.1.2 Relationship between root length density and resource capture
Greater root length density has been associated with higher water absorption from the
soil and subsequent improved performance of cereal crops (Passioura, 1983; Hamblin
and Tennant, 1987; Gregory et al., 1992; Hoad et al., 2001). In rainfed wheat, root
length densities are much higher in drier years (Hamblin et al., 1990) and wheat grown
under residual moisture depends on deeper roots to access moisture from deeper soil
layers (Jordan et al., 1983; Mian et al., 1993). Studies at Rothamsted, UK have
II
demonstrated that drought increased the depth of rooting from 140 cm to 160 cm
although the RLD was less than 0.1 CM CM-3 compared to the RLD of 5-10 CM CM-3 in
the top soil (Barraclough, 1984). In droughted conditions and with an adequate supply
of nitrogen, RLD of I CM CM-3 was found sufficient to allow all the available water to be
extracted; below 80 cm depth water uptake was limited by root growth as RLD was
below I CM CM-3 - Barraclough (1989) found that irrigated wheat used no water from
below 80 cm whereas droughted plants removed water from the entire soil profile where
roots were found. Root diameter is also important because small diameters with high
resistance may limit the rate of transport of water and solutes towards the shoot.
Calculations by McCoy et al. (1984) and Passioura (1983) for theoretical situations in
which RLD, initial water status and root diameter were varied suggested that RLD
-3 values <0.1 CM CM would require between 12 and 20 days to deplete various soils of
available water. In another study in barley, it was reported that a RLD of about 1 cm cm-
3 is required for extraction of 90% of the available water, and about 2 CM CM-3 for
complete extraction as field-based estimate (Gregory and Brown, 1989 cited in Bingham
et al., 2002). This estimate was found to be similar with that predicted from theoretical
considerations of water uptake by single roots (Van Noordwijk, 1983). Theoretically,
the RLD of cereals in surface layers of most soils are adequate to access most of the
available soil water and densities more than 1.0 CM CM-3 are associated with only small
increases in the total amount of water taken up during yield forming period (Gregory et
al., 1978; King et al. 2003).
Wang and Smith (2004) reviewed simulation modelling studies of the above-ground
growth, crop yield, below-ground root system formation, and root function for optimally
supplying water and nutrients to the plant. Modelling root growth and function has been
simplified in most crop simulation models due to limited root data. There are studies in
UK winter wheat on root-modelling for simulating the root system functionality in terms
of nutrient and water resource uptake and interaction with the above-ground organs (for
e. g. King et al., 2003; Bingham et al., 2002). In this context, King et al. (2003) working
in UK on cereal root modelling emphasized that a more uniform distribution of the roots
with depth gave a greater economic return through improved water and nutrient capture.
However, there are relatively few examples of breeders selecting for improved drought
resistance acco rding to rooting traits.
12
Since root studies are very labour-intensive most breeding programmes have largely
avoided using root traits as selection criteria. The methods used in root research are (i)
descriptive (e. g. core break method, mesh bag method, electrical capacitance method,
rhizotrons, wax layer method, root angle method or assessing root pulling strength) and
(ii) quantitative (manual sampling in the field and measuring root parameters). However,
for screening large numbers of wheat genotypes indirect and practically feasible
methods are required for use in selection programmes (Manske et al., 2001). Hence,
there is a need to develop precise, high-throughput screens for roots in future studies.
2.2 WATER-USE EFFICIENCY
2.2.1 Definitions
The tenn water-use efficiency (WUE) is generally used to express the ratio of aerial
biomass to evapotranspiration. It can be expressed as [Equation 2.1 ]:
WUE (biomass) = TE/ [1+ (E, /T)] ............................................... ...
Equation 2.1
Where TE is the transpiration efficiency (above-ground dry weight/transpiration), Es is
the water lost by evaporation from the soil surface, and T is water lost through
transpiration by the crop (Richards, 1991). An increase in transpiration efficiency and/or
a reduction in soil evaporation will increase WUE. Increasing TE and decreasing soil
evaporation can be achieved through both management and genetic improvement.
A number of selection criteria or screening tools have been developed for fast reliable
screening of TE and its determinants in breeding programmes, e. g. the 13C/12C isotope
discrimination technique (Farquhar and Richards, 1984) for estimating TE and the
viscous-flow porometer for estimating stomatal conductance (Richards et al., 2002).
In this thesis, the gravimetric calculation of above-ground biomass WUE (g dry matter
litre water-) has been standardized as the ratio of cumulative above-ground dry matter
to cumulative water use [Equation 2.2]
WUE (above-ground biomass):: -- (W2-Wl)/ (C2-Cl)
............................... Equation 2.2
Where, Wj=: total crop dry matter (g plant-') at sampling time I
13
W2=total crop dry matter (g plant-') at sampling time 2
C I= cumulative water use (1) at sampling time I
C2=cumulative water use (1) at sampling time 2
With regard to gas-exchange,
TE (instantaneous) = ITEin, = Net photosynthetic rate/ Transpiration .........
Equation 2.3
TE (intrinsic) = ITEi,, t= Net photosynthetic rate/ Stomatal conductance....... Equation 2.4
2.2.2 Determinants of WUE in crop plants
It is well known that the process of photosynthesis involves two separate steps: diffusion
or C02 input through the stomata, and carboxylation. TheC02gradient from atmosphere
to sub-stomatal cavity is mainly a function of plant biological processes affecting Ci
(partial pressure Of C02 inside the sub-stomatal cavity), since C, (partial pressure of
C02 in the air surrounding the leaf) is relatively stable. In contrast, the water gradient is
mainly a function of weather variables and leaf surface temperature. The principal
processes involved in determining Ci are carboxylation as influenced by the content and
activity of Rubisco (Ribulose-1,5-bisphosphate carboxylase/oxygenase) enzyme; and the
stomatal conductance (g, ), as regulated by stomata. There are therefore several
biochemical and physiological processes influencing Cj, hence the C02gradient from
atmosphere to sub-stomatal cavity, by wheat canopies.
2.2.2.1 Stomatal conductance and Rubisco content
The rate Of C02 uptake per unit leaf area relates directly to stomatal conductance, which,
in turn, is controlled by stomatal regulatory processes. As stomata close, Ci decreases
and TE at the level of a single leaf &uld increase. The canopy conductance should
broadly follow a similar pattern. In addition, Ci is influenced by the carboxylation
capacity of the plant, higher Rubisco concentration decreasing Ci hence increasing TE.
In cereals, there are several reports of specific leaf nitrogen content (ratio of nitrogen
(N) content to leaf area; SLN) correlating positively with TE, e. g. Borrell et al. (2000) in
sorghum, presumably through effects on Rubisco content. Genetic variation in Rubisco
content has been shown to correlate positively with C02 exchange rate in rice (Sarker et
al., 2000; Sivasankar et al., 1998; Xu et al., 1997) and wheat (Julian et al., 1998), with
light-saturated rate of photosynthesis in rice (Makino et al., 2000) and with grain yield
14
in maize (Martinez-Barajas et al., 1999). Varying the Rubisco content is suggested as a
strategy to ensure adequate N reserves for grain filling in rice (Horton and Murchie,
2000). However, there are relatively few reports of genetic variation in Rubisco content
or activity in hexaploid wheat; one recent investigation was reported by Xiao et al.
(1998).
2.2.2. La Rubisco activity in relation to drought stress
There is evidence that the decrease inC02 assimilation rates found in drought-stressed
leaves cannot be simply reversed by increasing the external C02 Supply, showing that
drought stress must also affect mesophyll metabolism (Lawlor, 1995; 2002 and Tang et
al., 2002). This mesophyll response becomes progressively more important with
increasing water deficiency (Tezara and Lawlor, 1995; Udayakumar et al., 1998).
Several studies have suggested that decreased photosynthetic capacity results from
impaired regeneration of ribulose- 1,5-bisphosphate (RuBP) (e. g. Gimenez et al., 1992).
Increased severity and duration of drought stress is known to decrease Rubisco activity
and protein content in wheat (Kicheva et al., 1994) and in some other species
(Majumdar et al., 1991). Rubisco activase expression is increased under heat stress in
wheat (Law and Crafts-Brandner, 2001). The total Rubisco activity of wheat flag leaves
was decreased when drought stress was imposed at anthesis; this decrease was
accompanied by a decrease in both soluble protein and chlorophyll (Holaday et al.,
1992; Parry et al., 2002). However, in wheat Rubisco activities were not correlated with
leaf relative water content (RWC) (Parry et al., 2002) suggesting a decrease in its
contribution to the total amount of soluble protein. Udayakumar et al. (1998)
demonstrated an inverse relationship between Rubisco content and A 13 C among
groundnut genotypes, suggesting that the variability in A 13C is dependent on mesophyll
capacity rather than g,; and that therefore mesophyll efficiency is important in
determining A 13 C andNWE.
2.2.2.1. b Stomatal conductance
Stomatal aperture density and leaf area, which are the main biological determinants of
plant transpiration, are also the main determinants of carbon accumulation by plants
because C02 flows to photosynthetic sites via the stomata. This leads to well
15

documented relationships between light interception, transpiration, photosynthesis, and
biomass production as 'water for carbon' and 'water for temperature' trade-offs
(Monteith 1993; Tardieu, 2005).
Stomatal conductance relates to how easilyC02 can be moved into the leaf and is
controlled by stomatal regulatory processes. Conductance toC02 is directly convertible
to conductance to H20 i. e. g, carbon = (g, water/ 1.6), where 1.6 is the ratio of
diffusivities of H20 andC02. H20is lighter and diffuses faster thanC02. In general, TE
of crops will be increased by low stomatal conductance. Measurement of g, can give an
insight into the transpiration of a crop canopy, which is closely related to biomass
production. The link between g, and transpiration is so close that transpiration could
reliably be estimated from measurements of g, (Azam-Ali, 1983). Besides this,
evaporative demand on the leaf is a major environmental determinant of transpiration
rate, which is most precisely measured as the vapour pressure gradient between the leaf
and the air (Monteith, 1995).
Assuming the water vapour concentration gradient (Wi- Wj is an independent
environmental variable then TE at a given site is a negative function of the ratio CIC,.
For non-stressedC3 plants, the value of C/C, is around 0.7 and is determined by the
balance between g, and photosynthetic rate (A) (Condon et al., 2002). If CI-C, ratio is
lower as a result of increased photosynthetic capacity then there will be an increase in A
per unit leaf area. However, if C/C, is lower as result of lower g, then there will be a
reduction in A.
2.2.2.2 Genetic variation in WUE and determinant plant and canopy processes
Genotypic variation in WUE determined by both photosynthetic capacity and stomatal
conductance has been reported in wheat (Condon et aL, 1990; Blum, 1990; Morgan and
Le Cain 1991; Condon and Richards, 1993; Morgan et al., 1993; Fischer et al., 1998).
Some of these studies are reviewed here.
Morgan and Le Cain (1991) in Colorado, USA investigated the genetic variation in 15
field-grown winter wheat genotypes under irrigated conditions and found greater WUE
in genotypes with leaves of lower g,. They found no significant date x cultivar
interactions for A, g, Ci and C/C, indicating that similar week-to-week variations in
16

gas exchange were experienced by most genotypes. Blum (1990) in Israel found that
high grain yield in spring wheat under drought was positively associated with theC02
assimilation rate at light saturation (A,,,,,, ) and g,; newer cultivars had significantly
higher A,,,, and g, than the older cultivars. In winter wheat, Gent and Kiyomoto (1985)
did not observe a positive relation between grain yield and canopy and leafC02
assimilation rates; and higher grain yield was related to a higher HI. Ashraf and Bashir
(2003) in Pakistan demonstrated in an irrigated pot study that higher photosynthetic
capacity, measured asC02 exchange rate, at the vegetative stage in spring wheat cv.
Inqlab-91 resulted in higher grain yield. Whereas, a higher post-anthesis assimilation
rate in cv. Barani-83 resulted in higher grain yield and WUE. Stomatal conductance was
the primary factor affecting photosynthesis in Inqlab-91 at the vegetative stage but not
in Barani-83. Thus, the cultivars appeared to have used different temporal patterns of
photosynthesis for enhanced grain production.
Ritchie et al. (1990) in Texas observed in winter wheat that the most drought-resistant
genotypes (e. g. cv. TAM W-101) had a higher photosynthetic capacity and greater g, in
water-stress conditions than the more susceptible genotypes (e. g. cv. Sturdy). TAM W-
101 tended to have higher WUE than Sturdy under moderate to severe stress conditions,
but not under well-watered conditions. High leaf RWC, A, and photosynthetic capacity
traits conferred better drought resistance in TAM W-101. These two genotypes have
been the subject of several investigations into the physiological nature of their respective
responses to water-deficit stress (Schonfeld et al., 1988; Ritchie et al., 1990; Morgan et
al., 1993). Wheat research at CSIRO, Canberra, Australia showed that a decrease in
stornatal conductance improved TE among wheat genotypes in greenhouse and field
studies (e. g. Condon et al., 1990; Condon and Richards, 1992) and the genetic variation
in stornatal conductance unassociated with ABA responses has also been reported in
spring wheat (Condon et al., 1990). On the other hand various experiments have shown
that stomatal responses are often more closely linked to soil moisture content than to
leaf water status. This suggests that stomata are responding to chemical signals such as
ABA produced by dehydrating roots even when the leaf water status is kept constant
(Gowing et al., 1990; Davis and Zhang, 1991). The regulation of gas exchange may not
be a simple response to a dose of ABA coming from the root, but that the cells of the
leaf will process information received by both the roots and the shoot. A long-distance
17
signal from the root and a locally generated signal within the leaf may both operate
within the leaf at the same time (Davis et al., 2002).
In cereals, for example rice, there are reports demonstrating genetic variation in
photosynthetic capacity (Murchie et al., 1999; Horton and Murchie, 2000) and are
related to mesophyll conductance (Price et al., 2002) as a key limitation to productivity
under irrigation. Although many studies have correlated leaf gas-exchange results with
WUE, often the relationship between short-term gas-exchange variables and the actual
water-use efficiency for the whole growing season is poor, because there are a number
of factors affecting dry matter accumulation but not leaf gas-exchange (Boyer, 1996).
For example, the biomass production of a plant is not only determined by net
photosynthesis during the day but also by respiratory losses at night. Gas exchange
determination for short times during the day does not inform on dark respiration losses,
which are influenced by temperature and the molecular composition of the dry matter.
Therefore, although rapid and convenient, gas exchange measurements may not be
totally reliable to assess differences in WUE at the whole crop level.
2.2.2.3 Canopy architecture and aerodynamic resistance
Independently of leaf and canopy conductance responses working through stomatal
conductance, the canopy affects the rate of evapotranspiration according to its
aerodynamic resistance to water vapour and heat transfer to the atmosphere (Ar)
(Monteith, 198 1). Crop height and surface roughness and the wind speed influence this.
In general, taller crops with rougher surfaces have reduced Ar hence lower WUE. Under
drought, where the green canopy area is usually small, effects of Ar on
evapotranspiration are thought to be minor compared to those of canopy conductance
(Squire, 1990). For wheat cultivars, differences in surface roughness are thought to have
relatively little impact on WUE (Sylvester-Bradley et al., 1990). The presence of Rht
semi-dwarf genes may however have an effect on canopy conductance via Ar. In this
regard, variation in crop height has been shown to influence WUE in studies on isogenic
lines, e. g. shorter stature with the Rht-D] semi-dwarf gene conferring decreases in the
region of 10% (Richards, 1992; Ehdaie and Waines, 1994; Foulkes et al., 2001).
However, this variation would not be associated with differences in Ar, since shorter
stature would increase Ar hence WUE.
18

2.2.3 The physiological basis of the relationship between carbon isotope discrimination and TE
AtmosphericC02 contains the naturally occurring carbon isotopes 12C, 13C,
and 14C
in
the proportions 98.9%, 1.1%, and 10-10%, respectively. 14CO2 is present in such small
quantities that it has no physiological relevance, but 13 C02 is different. The chemical
properties of 13 C02are identical to those of
12 C02, but because of the slight difference in
mass (2.3%) most plants assimilate less 13 C02 than 12CO2- Since 12CO2 is lighter than
13 C02, it diffuses slightly faster toward the carboxylation site within the chloroplast. For
reasons not yet understood, Rubisco has an intrinsic discrimination value of -30%o
against 13 C02 (Farquhar et al., 1989). By contrast, Phospho-enol pyruvate (PEP)
carboxylase, the primaryC02fixation enzymeOf C4plants, has a much smaller isotope
discrimination effect (about -2 to 6%o). Thus, the inherent difference between the
discrimination effects of the two carboxylating enzymes causes the different isotope
compositions observed inC3andC4plants (Farquhar et al., 1989).
Carbon isotope composition is measured by use of a mass spectrometer, which yields
the following ratio [Equation. 2.5]
[R= 13 C02 / 12 C021
.................................................................... Equation 2.5
13C/ 12 C ratio values are expressed as carbon isotope composition
(613C) values
[Equation. 2.6]. This is quantified on a "parts per mil" (= x 10-3 or %o) basis; %o is not a
unit and 8 is dimensionless (Farquhar and Lloyd, 1993)
813C (%0) = {(13C/ 12C sample
y (13CI 12C standard) -IIX
1000 ......................
Equation 2.6
The standard represents the carbon isotopes contained in the Pee D-ee limestone
formation from a fossil belemnite. Carbon isotope discrimination is calculated with
respect to the carbon isotopic ratio of air [Equation 2.7]
A13C (%0) (13C/ 12C air
(13C/ 12C plant) -IIX 1000
........................... Equation 2.7
The value of the discrimination (A13C) against 13C is calculated from 6a and 8p [Equation
2.8], where 'a' refers to air and 'p' to plant (Farquhar et al., 1989):
19
A 13C == (8" - 8p/ (I +8p) ................................................................. Equation 2.8
On the PDB scale, free atmospheric C02 has a current deviation, 613 Ca3 Of
approximately -8.0%o (Farquhar et al., 1989).
C3 plants have typical values for isotope composition (81 3C) of about -28%o; C4 Plants
have an average value of -14%o (O'Leary, 1988). The negative sign indicates that both
C3andC4plants have less 13C than the isotope standard. Since the 'per mil' calculation
involves multiplying by 1000, the actual isotope discrimination is small. Nonetheless,
A 13C can be used as a reliable indirect measurement of TE. Most importantly, it has the
capacity to integrate effects across time and across leaf layers within the canopy.
2.2.3.1 Carbon isotope composition in relation to the physiological behaviour of
plants
In C3 plants, A 13C is proportional to the partial pressure Of C02 in the intercellular air
space of leaves (C). More discrimination occurs when Ci is high, when stomata are open.
Open stomata also facilitate water loss. Thus, TE is negatively associated with
discrimination against 13C (Farquhar et al., 1989). In some circumstances the
relationship can vary and the causes of this variation will be discussed later. Despite its
apparent utility, the measurement of A 13 C has several short comings such as it provides
no information on the magnitudes of either A or T or whether variation in A 13C is being
driven by variation in g, or A. Furthermore, A 13 C reveals no information on the impact
of the vapour pressure gradient on the TE at the leaf level measured by gas-exchange.
Hence, A 13 C has limited application for comparing absolute values between experiments
in different environments. Nevertheless, within an experiment it serves to identify
relative differences between genotypes making it a potentially useful as a breeding tool
(Hall et al., 1994). Most importantly, A 13C is a lot easier and faster to measure than TE
itself Several reports confirm that A 13C of plant material is closely related to. TE
integrated over the duration of the growth period of the plant material sampled
(Farquhar and Richards, 1984; Condon et al., 1992).
20
2.2.4 Relationship between TE and WUE and A 13C
Transpiration efficiency is the preferred measure for examining potential genetic
variation in crop WUE. If the component of soil evaporation is minimised then an
increase in TE will also increase WUE (Condon et al., 2002). Information on the use of
A 13 C and stomatal aperture traits as indicators of TE under drought in the UK as whole
is not available and there are no previous studies of application of these techniques in
winter wheat in the UK climate.
TE and A 13 C are linearly negatively related and A 13C values may be used to assess VVUE
among wheat cultivars (Farquhar and Richards, 1984; Condon et al., 1987). In C3 Plants.
A 13C is largely determined by of Cj1C, which is related to the balance between g, and
carboxylation capacity. Higher A 13C may be related to a higher ratio of CIC, due to
greater g, (Condon et al., 1987; Morgan et al., 1993), which leads to higher
photosynthetic rates and, hence, higher yields even in the absence of stress.
Alternatively, higher carboxylation capacity determined by non-stomatal factors, mainly
the amount and activity of enzymes in the chloroplast (Condon et al., 1987), may lead to
a higher ratio Of Ci/Ca hence higher Al 3 C. The ratio of A to Ci is often considered for
estimating carboxylation capacity (Rebetzke et al., 2002).
2.2.5 Genetic correlations between A 13 C and grain yield
In wheat, positive correlations between yield and A 13 C have been reported (Condon et
al., 1987; Araus et al., 1993,1997; Morgan et al., 1993; Fischer et al., 1998; Rebetzke
et al., 2002). Selecting for high A 13 C at an early stage of the breeding programme under
low or high stress environments (Sayre et al., 1995) or under well watered conditions
(Morgan et al., 1993; Condon et al., 1990) has been reported. Fischer et al. (1998)
showed a positive correlation between A 13 C and yield among eight CIMMYT spring
wheat varieties in Mexico under irrigated conditions and A 13C was in the range 18.4-
19.4%o. A higher A 13C was associated with higher Ci, A and g, While, Araus et al.
(1997) reported that A 13 C ranged from 14%o under rainfed conditions to 16.7%o under
irrigated conditions for a set of 144 wheat genotypes and that the genotypic variation in
A 13C was due to variation in both g, and A, with each contributing approximately in
21
equal amounts. A similar observation was also made in other studies (Condon et al.,
1990; Condon and Richards, 1993). In another study, selecting for a low A 13 C has been
associated with high TE for genetic improvement in grain yield under low rainfall
environments in Australia (Rebetzke et al., 2002). Alternatively, several pot studies
have indicated a negative correlation between A13 C and shoot dry matter (Condon et al.,
1990; Ehdaie et al., 1991; Ehdaie and Waines, 1994; Ehdaie 1995). Similarly, a negative
correlation between A 13 C and TE has been observed (Farquhar et al., 1982; Farquhar
and Richards, 1984; Ehdaie et al., 1991; Johnson et al., 1995; Matus et al., 1996; Ehdaie
and Waines 1996; Monneveux et al., 2006) and these negative correlations were often
inconsistent across water regimes and years.
The application of A 13 C as a potential tool for wheat improvement has been practically
possible. In this direction, concerted efforts have been made to complement traditional
breeding methods with physiological selection criteria in Australian wheat improvement
programmes by CSIRO. For example, backcrossing of an old Australian wheat cv.
'Quarrion' (low A 13 C and high TE), into the cv. Hartog (Richards, 2004). Hartog
(intermediate to high A 13 C and low TE) has robust adaptation, good disease resistance
and excellent grain quality. Two backcrosses were made to Hartog following selection
for A 13C in the field (Richards, 2004). A yield advantage in wheat between 2 and 15%
of the back-cross lines with low A 13 C at yield levels from 5t ha- I to It ha- I was reported
(Rebetzke et al., 2002) when compared with high A 13C sister lines. Based on selection
for A 13C, the variety 'Drysdale' was released for southern New South Wales, Australia,
in 2002 and 'Rees' for the northern Australian cropping region in 2003. This is the first
example of the application of A 13C in selection for wheat breeding improvement.
Genetic variation for VVUE and A 13 C among semi-dwarf and dwarf modem wheat
cultivars has been reported (Siddique et al., 1990; Ehdaie et al., 1991; Ehdaie, 1995),
but the associated genetic gain in yield in these studies was relatively small.
2.2.5.1 Genetic correlations of A13C with TE andyield under well-watered conditions
The association of A 13 C with TE has been reported to be either positive or negative
depending upon the soil moisture conditions. Most experiments show grain yield of
irrigated cereals was positively associated with A 13C of the peduncle (Acevedo, 1993),
22
grain (Teulat et al., 2001) or flag leaf (Monneveux et al. 2005; Merah et al., 2002).
Monneveux et al. (2006) in France reported a negative correlation between grain A 13C
and TE (measured as CER/g, ) under rainfed conditions on account of low g,, and a
positive correlation under irrigated conditions on account of higher leafC02 exchange
rate (CER). The range of A13C was 14.6-16.1%o under rainfed conditions and 16-1-
17.6%o under irrigation. The leafC02 exchange rate was positively correlated to g,
under irrigated conditions indicated that CER was driven by stornatal limitations. They
concluded that breeding for high grain A 13C would lead, under Mediterranean drought
conditions, to higher g, lower TE and higher grain yield. Blum (1996) pointed out that
if selection for high photosynthetic capacity or higher crop productivity brings about an
increase in stornatal conductance, then a concomitant increase in A 13C or a decrease in
crop WUE is expected.
In another study, Royo et al. (2002) in Spain evaluated 25 durum wheat cultivars for
A 13C in two contrasting water regimes and found a positive genetic correlation between
A 13 C and grain yield. A 13C was higher for the irrigated regime (I 7.4%o) than the rainfed
regi me (15.4%o). They concluded that selecting genotypes for yield based on high A 13C
would be advantageous under well-watered conditions.
Condon et al. (1987) reported in a field study in Australia that under well-watered
conditions A 13C measured in the plant stem and grain was positively correlated, but
A 13 C and TE were not negatively related; biological yield was strongly influenced by g,
However, Condon et al. (1990) demonstrated in a glasshouse study a negative
relationship between flag leaf A 13 C and WUE under well-watered conditions and
suggested the use of A 13C for yield selection under well-watered conditions. In another
study, Ehdaie et al. (1991) in California reported a strong negative correlation between
A 13 C and VVUE in spring wheat cultivars in both glasshouse and field experiments. A
negative correlation was also observed between A 13 C and total dry matter (TDM); and
TDM was more strongly influenced by photosynthetic rate rather than the g, However,
such negative correlations are not always observed. For example, Morgan et al. (1993)
found a positive relationship between A 13 C and WUE in irrigated field-grown winter
wheat plants. Morgan et al. (1993) found a positive relationship between A 13 C and
VXE in the irrigated field grown winter wheat. Intrinsically high g, of high-A 13C lines
23
can apparently result in moderate leaf desiccation by mid-day, which in turn can lower
g, relative to that of low-A 13C lines. These leaf gas-exchange data did not explain the
positive relationship between A 13 C and productivity arising out of differences in g, or
CER in this study. While Matus et al. (1996) found no significant correlation between
A 13 C and TE; and an inconsistent correlation between A 13 C and above-ground dry
matter at flowering of wheat, lentil and canola.
Ehdaie et al. (199 1) observing average WUE of landraces and modem wheat genotypes
in pot and field experiments concluded that selection for high A 13C, under either wet or
dry conditions, can improve WUE in wheat. In another pot study, however, on seven
bread wheat cultivars grown under well-watered conditions, A 13C was negatively
correlated with WUE, but positively with HI (Ehdaie and Waines, 1993). Matus et al.
(1996) reported the existence of genetic variability for A 13C in spring bread wheat and
dururn wheat. The range of A 13C was large for wheat under well-watered conditions
(21.9-22.9%o) as compared to drought (20.3-21.2%o), but they found no correlation
between A 13 C and TE. They concluded A 13C cannot be used for selection for TE. Thus,
it is evident from these studies that causal relation between Al 3C and WUE may change
depending on the availability of soil water and genotypic performance. In general, under
well-watered conditions most studies have reported positive genetic correlations
between A13 C and TE, although there are several reports of neutral or negative
relationships.
2.2.5.2 Genetic correlations ofA13C with TE andyield under drought
Under drought-stressed conditions, the value of A 13C tends to be lower (Condon et al.,
1990; Morgan et al., 1993; Ehdaie, 1995). This is possibly because of a reduction in
stomatal conductance improving TE (Farquhar and Richards, 1984). In a field
experiment conducted at Montepellier, France, Merah et al. (2001) demonstrated a
positive correlation between A 13 C and yield of 144 durum wheat accessions (comprising
landraces, improved cultivars and advanced breeding lines). The drought in this study
was terminal occurring as early, mild and intermittent water stress. They reported that a
higher A 13C was related to a higher CjIC, ratio due to a greater g, leading to higher
photosynthetic rates and higher yield; and high A 13C can be used for selecting for yield
under drought.
24

Craufurd et al. (199 1) demonstrated that early maturing barley cultivars escaped drought
showing high A 13 C and yield. Alternatively, Sayre et al. (1995) reported in a CIMMYT/
ICARDA based trial that under low and high-stressed conditions, A 13C may be
potentially used to augment selection for high yield based rather than replace selection
for yield itself. This would increase the rate of genetic gain in yield of spring wheat in
water-limited environments. Thus, a high A 13C can be used for breeding programmes
during early growth stages under water-stress.
In environments where crop growth is heavily dependent on moisture stored in the soil
profile from rain that falls outside the main crop growth phase, selection for low A 13C is
likely to be effective for yield improvement. In these environments, where transpiration
makes up a high proportion of total crop water use, high TE promotes conservation of
soil water, which sustains yield determining processes in the period leading up to and
after anthesis. In stored-moisture environments, profligate high A 13C genotypes are
more likely to exhaust the soil water supply before this critical phase (Richards et aL,
2001). The value of improved TE via reduced stomatal conductance may depend on
available water (AW), e. g. higher TE is beneficial with low AW where all soil water is
still used with higher TE. However, there may be a trade-off between higher TE and
lower seasonal water use in environments where there is more AW in the soil profile
(Araus et al., 2002).
From a physiological point of view, several reasons could potentially explain a positive
relationship between A 13 C and yield. If low A is mediated by low g, plants with low
A 1,3C may not use all available soil water, particularly in the range of moderate drought
to well irrigated environments. Such an explanation is consistent with the variation in g'
rather than in intrinsic photosynthetic capacity amongst genotypes (Romagosa and
Araus, 1991; Condon et aL, 1992). The inconsistency in relationships of A 13 C and shoot
dry matter or grain yield could be due to several genotypic and environmental factors
that might have greater influence on plant growth under field than glasshouse
environments (Ehdaie and Waines, 1996).
Thus, under relatively severe drought when crop growth is entirely dependent on stored
soil moisture, a reduction in g, would lead to higher VXE and so increase the yield.
25

Araus et al. (2001) summarized the research work done under Mediterranean
envirom-nents showing that high A 13C genotypes, which sustain greater g, and
transpiration losses during grain filling, can provide higher yield in a wide range of
environinents with intermediate to low levels of drought stress. Thus the utility of A 13C
in wheat breeding is likely to vary depending on the extent to which yield is limited by
water supply. Richards et al. (2001) argue that in wheat, A 13C is a 'conservative' trait
associated with somewhat slower water use and possibly slower growth rate.
Consequently in environments where water is largely non-limiting, low A 13C (high TE)
has been associated with relatively low yield potential in wheat (Condon et al., 1987).
The implication is that selection for high A 13C in these environments may prove useful
in identifying lines with high yield potential. Selection for high A 13C may also be
effective for yield improvement in rainfed environments where crop growth to anthesis
is sustained by current rainfall or where drought is relieved well before anthesis. In these
environments high A 13C should be associated with more dry matter at maturity
(Richards et al., 2001). Blum (2005) reviewed extensively that genotypic variations in
WUE were driven mainly by variations in water use rather than by variations in plant
dry matter production. It is therefore not surprising that selection for high WUE by
using carbon isotope discrimination has tended to result in smaller or earlier flowering
plants that use less water over the growing season (e. g. Condon et al. 2002). Thus
selecting for low A 13C is beneficial under severe drought conditions. This has been
demonstrated in barley (e. g. Craufurd et al., 1991), in wheat (e. g. Rebetzke et al., 2002).
2.2.5.3 Relationship between j 13 C, TE and yield under the influence of the aerial
environment
The variations in canopy morphology, leaf size and orientation, and in stomatal.
conductance (g, ), may affect leaf energy balance and therefore the leaf-to-air vapour
pressure gradient. This in turn may alter the actual flux of water vapour corresponding
to a given value of A 13C .
Thus, even in genotypes of the same species growing in the
same environment, the relative ranking with respect to A 13C may not reflect the actual
ranking in terms of TE (Meinzer et al., 1992). Increases in leaf temperature either
because of radiation load or indirectly because of reduced water uptake may affect
relationships between A and TE. A high heat stress might reduce WUE through
deleterious effects on carboxylation/respiration and increase water use via the effects of
26
increased vapour-pressure deficit (VPD) associated with a higher temperature and leaf-
to-air temperature difference. Thus the relationships between A 13C and TE or yield are
often modified by the prevailing radiation and temperature (Bowling et al., 2002).
Kemanian et al. (2005) reviewed that carbon flux varies in response to physiological and
environmental factors. Among these factors, it is well documented that C/G decreases
as water stress increases in field-grown potatoes (Vos and Groenwold, 1989), wheat (e. g.
Whitfield, 1990), and sorghum (Williams et al., 2001). Indirect evidence of that
response to water deficit and associated decrease in stornatal conductance is the decrease
in A 13C in water stressed plants (e. g. Hubick and Farquhar, 1989; Condon et al., 1992).
A few reports evidenced that the ratio C/Ca decreases with increasing leaf-to-air VPD
(Condon et al., 1992; Kemanian et al., 2005), and this could be explained by a reduction
in the stomatal conductance at increased leaf-to-air VPD (Mott and Parkhurst, 1991).
Perhaps for this reason in many studies the correlation between A 13 C and grain yield of
wheat was not consistently positive across different envirom-nents (Ehdaie et al., 1991;
Condon et al., 1992; Matus et al., 1997). This inconsistency has been well-documented
for a large number of studies investigating cereal genotypes grown in rainfed and
irrigated environments in Australia (Condon et al., 1987,1993 and 2002; Condon and
Richards, 1993; Condon and Hall, 1997), the Mediterranean region (Voltas et al., 1999;
Merah et al., 2001; Royo et al., 2002; Araus et al., 2003) and elsewhere (Sayre et al.,
1995; Fischer et al., 1998); and the relationships reported between grain yield and Al 3c
have only infrequently been negative. Much more often these relationships have been
either 'positive' or 'neutral'. Such inconsistencies reflect that A 13C is under the
influence of plant available soil moisture and prevailing weather at a given growth stage
of the crop. The situation with positive or no correlation between A 13C and WUE could
be related to the environmental conditions such as water availability and VPD during the
sampling period and factors affecting variation in A13C such as assimilation rate and
stomatal conductance (Morgan et al., 1993; Leidi et al., 1999).
Condon and Richards (1992) demonstrated genotypic variations for A 13C in bread wheat
in a field experiment in Australia and that the GxE interaction was small in relation to
genetic variation in A 13 C and this interaction was principally due to variation in the rate
of water use among genotypes. In addition, there may have been differences in
27
genotypic rankings across environments according to the response of stomata to soil
water depletion and/or to increasing VPD. Similarly in barley (Romagosa and Araus,
199 1; Acevedo, 1993) and durum wheat (Araus et al., 1993; Monneveux et al., 2006),
A 13C was found to vary genetically but envirom-nental factors may cause even larger
changes in the value of A 13C, which could compromise the effective use of A13C in
breeding programmes.
Ehdaie and Waines (1996) opined that a higher stornatal conductance due to higher
mean temperature and relative humidity of air in the glasshouse could result in higher
A13C than in field conditions. For wheat grown under non-irrigated conditions, grain
yield is dependent largely on the plant available soil water content (Condon et al., 1992;
Sadras and Milroy 1996). The inherent variation in soil water content and soil nutrients
in the field also may cause variation in A13C (Hall et al., 1994). In addition to grain yield,
WUE is an important parameter under non-irrigated conditions since WUE is considered
a component of adaptation to water stress (Ehdaie et al., 1991; Morgan et al., 1993; van
den Boogaard et al., 1997).
2.2.6 Variation in A 13 C among different plant organs
Many studies have reported the use of various plant organs such as the flag leaf,
peduncle, stem and grain for estimation of A 13C. Condon and Richards (1992) found
variation among genotypes in A 13C of different plant parts (flag leaf, stem, peduncle,
grains and rachis) was always significant, and was typically 1.8%o. They reported that
across several envirom-nents, mean A 13 C ranged from 18%o to 21.0%o for early-formed
dry matter and from 13.4%o to 16%o for grain. The genotype ranking for A 13C changed
with different plant parts. Genotypic differences in grain A 13C were difficult to interpret
because of the likelihood of some changes in genotype ranking resulting from
differences in the degree of water stress encountered during grain filling. In addition, the
contribution of remobilized carbon to grain A 13 C may vary between envirom-nents and
genotypes. Merah et al. (200 1) studied the use of flag leaf, awns and grain for estimation
of A 13C in a field experiment conducted under rainfed conditions in Montpellier, France
which included 144 durum. wheat accessions. The range of flag leaf A 13C (18.2 -
20.3%o) was higher than for grain A 13C (15.7-18.3 %o). The higher values for flag leaf
A 13C were accompanied by favourable conditions without water stress and could be due
28
to higher photosynthetic rate, while higher stornatal limitations on transpiration during
grain yield formation led to lower A 13C. In another study, peduncle A 13C in bread wheat
showed a low GxE interaction indicating the relative ranking of genotypes remained
consistent across environments (Ehdaie et al., 1991). In summary, it is evident that grain
samples are preferable for A 13C measurements under conditions of mild water stress, as
they integrate effects over the time of grain yield formation.
2.3 HARVEST INDEX
Harvest index (ratio of grain to total above-ground dry matter at harvest; HI) is easier to
measure than water use and WUE. Genotype ranking for HI is generally relatively stable
across optimal environments (Gallagher and Biscoe, 1978). Like water use and WUE,
the genetic manipulation of HI is complex under variable rainfed environments. Traits
like early flowering, shorter height and peduncle length, tiller inhibition, stay-green and
greater utilization of stem reserves and assimilate retranslocation may increase the HI
under drought. Thus, incorporating genes that contribute to height reduction and to early
flowering is an effective way to increase HI as they result in less growth of vegetative
organs. In particular manipulating pre- and post-anthesis water use in favour of the grain
filling period is one way to increase HI under drought. If post-anthesis water use as a
proportion of total water use is large, HI will be large.
Substantial genetic variation exists in wheat for the physiological traits mentioned above
(Reynolds et al., 2001; Foulkes et al., 2004). However, making genetic gains in yield
under drought is not simple because of the unpredictability of drought and seasonal
variation. In this context, the use of physiological approaches to complement empirical
breeding is important. Several studies in winter wheat have quantified the reductions in
HI due to drought; and the differences in HI contributed to the differences in yield
responses to drought (Fischer and Wood, 1979; Innes et al., 1981 & 1984; Innes and
Blackwell, 1983; Foulkes et al., 2002).
Reynolds et al. (2005) mentioned that genes affecting a greater relative partitioning of
assimilates to the sink, resulting in a higher HI, may improve yield under drought since
this will not be at the expense of water required for generating additional biomass. In
this context, Richards et al. (2002) suggested that a high HI under drought may be either
29
constitutive (e. g. associated with Rht genes) or adaptive. The former is associated with increased WUE (where WUE is defined in terms of increased grain yield rather than
biomass). However, in this case increased HI would be considered a pleiotropic effect of
traits associated with improvement in grain-filling, such as remobilisation of stem
reserves, increased access to water, etc.
At CIMMYT research is being focussed on improving drought tolerance by
introgressing stress adaptive traits into empirically selected drought tolerant germplasm.
In this regard, Reynolds et al. (1999; 2005) proposed a conceptual model of a drought
resistant wheat cultivar, which should encompass high expression of physiological traits
such as seed size, coleoptile length, early ground cover, pre-anthesis biomass, stem
reserves/remobilization., spike photosynthesis, stomatal conductance, osmotic
adjustment, accumulation of abscisic acid, heat tolerance, leaf anatomical traits (e. g.
glaucousness, pubescence, rolling, thickness), high tiller survival, and stay-green.
Among these, Richards et al. (2001) suggested the traits such as phenology or flowering
habit, tiller initiation, xylem vessel diameter, leaf conductance, stay-green/ leaf rolling
and assimilate retranslocation are proposed to be associated with HI under drought.
Foulkes et al. (2002) demonstrated differences in six winter wheat cultivars in stem
reserve accumulation contributed to the ability to maintain HI hence grain yield under
post-anthesis drought in UK. In another field study in spring wheat a positive linear
relationship between HI and evapotranspiration was reported and this was attributed to
different sink capacities established in irrigated and unirrigated treatments during the
pre-anthesis phase coupled with greater pre-anthesis assimilate mobilization in
unirrigated plants (Aggarwal et al., 1986). This indicated that HI and season-long water
use were not completely independent. Thus, it is evident that traits that influence HI
could be genetically manipulated to some extent provided there is a clear physiological
understanding of the mechanisms involved.
2.4 USE OF CROP SIMULATION MODELS TO IDENTIFY DROUGHT- RESISTANCE TRAITS
In addition to conceptual models (e. g. Reynolds et al., 1999; 2005) crop simulation
models may be used for yield prediction in stress environments. The modelling
30
approach can help to prioritise traits in crop ideotypes and can predict GxE interaction
for optimising the trait selection in different climates.
Reports from CSIRO, Australia, indicated that an increased TE was associated with
increased yields under drought in wheat (Richards et al., 2002) in eastern Australia and
yields of wheat genotypes with high TE were up to 10% higher than those with low TE;
and in a Mediterranean-type climate increased TE did not reduce yields (Condon et al.,
2002). Simulation analysis of TE indicated benefits in a medium-rainfall of ca. 320 min
Mediterranean environment, particularly when sufficient nitrogen is supplied to the crop
(Asseng et al., 2002). In another simulation study, Asseng & van Herwaarden, (2003)
showed that increasing the ability to accumulate stem carbohydrates for later
remobilisation to the grain by 20% increased yields between 1.5 and 4t ha-1 under
moderate levels of water shortage. In favourable seasons, benefits were negligible due to
high photosynthetic rates during grain filling and in very dry seasons also negligible due
to low assimilate storage and poor sink demand.
The prediction of optimized phenological development for improving wheat yield under
drought has been reported using the SIRIUS wheat model (Jamieson et al., 1998). The
accurate prediction of phenological development and LAI is more important for grain
yield prediction than are the components of grain yield. SIRIUS model predicted the
influence of water stress on partitioning of biomass to ear during pre-anthesis ear growth
was more important in determining grain number than the effect on biomass
accumulation during the same growth stage. The development of the Agricultural
Production Systems slMulator (APSIM) model (McGown et al., 1996) for wheat and its
calibration for a Mediterranean-type climate (Asseng et al., 1998) has enabled the
management factors affecting wheat yields to be analysed more comprehensively and
for a range of soil types and historical weather records. As the model incorporates
routines for water and nitrogen movement in the soil and the influence of water-logging
events on the yield of wheat, it can be used to determine the potential yield in an
environment. The APSIM model, used to simulate shoot and root growth, grain yield,
water and nitrogen uptake, predicted final root depth and time course of root
development as the key processes that regulate water and N uptake pattern for yield gain
in Australian envirom-nents. In another study, a hypothetical genotype was simulated,
31
assuming faster and deeper root growth without requiring more assimilates from above
ground, by restructuring the root system to sacrifice shallow roots in favour of an
extended root profile. Thus increasing the root depth and water uptake could largely
reduce deep drainage losses and resulted in a grain yield advantage of 27% (Asseng et
al., 2001). In a sensitivity analysis, Asseng et al. (1997) simulated root dynamics of
wheat and predicted an advantage of larger root densities deeper in the soil profile when
water and N deficiency occurs in soil. Alternatively, increasing the specific leaf area
(ratio of leaf area to leaf weight; SLA) is most effective on low water holding sandy
soils for increased yields in Mediterranean conditions, provided soil N supply is
matched with plant N demand. However, higher SLA reduced grain yields on loamy and
clay-loamy soils (Asseng et al., 2003). On the sandy soils, the yields of genotypes with
normal vigour were often limited due to poor leaf area development and biomass
accumulation before anthesis (Asseng et al., 2001). However, on clay soils, the crops
grew more vigorously before anthesis and grain yields were restricted by the limited
water available from the shallow wetting depth (Asseng et al., 2001). Therefore,
increased SLA was more effective in increasing grain yields on the low water holding
sand than on the high water holding clay soils.
As reviewed earlier in section 2.1 , crop simulation modelling can be used to assess the
likely impact on water-use efficiency and yield of changing the expression of specific
traits, e. g. root distribution (King et al., 2003; Bingham et al., 2002). Results of such
simulations indicate that greater progress may be achieved by jointly optimising traits so
that potential negative trade-offs between individual traits are minimised.
2.5 GENETICS OF WATER-USE EFFICIENCY
For a breeding programme to be successful in improving TE in bread wheat, it requires
knowledge of the inheritance of A 13 C and associated growth characteristics. There are
two general approaches to identifying genes controlling WUE: (i) examination of near
isogenic lines (NILs) and (ii) identification of QTLs in mapping populations. In this
regard, A 13 C has been reported to be both quite variable amongst genotypes and highly
heritable evidencing strong genetic control with high broad sense heritability in bread
wheat (Condon and Richards, 1992; Ehdaie et al., 1991); in durum wheat (Araus et al.
1998; Merah et al., 2001); in peanut (Hubick et al., 1988); in alfalfa (Johnson and
32
Rumbaugh, 1995) or a narrow sense heritability of this trait in bread wheat (Ehdaie and Waines, 1994; Rebetzke et al., 2002). This indicates the possibility of using delta for
breeding for improved water-use efficiency or indirectly for ability to capture more
water.
2.5.1 Studies on near isogenic lines
Ehdaie and Waines (1996) reported in pot and field studies the dwarfing genes Rhtl,
Rht2 and Rht3 in NILs of spring wheats of Maringa and Nainari 60 to increase the
harvest index, but to have relatively smaller effects on root dry matter. The Rht2 gene
depressed WUE by 15% only in Maringa background. In another study in well-watered
field conditions, A 13C was negatively associated with grain yield and shoot dry matter in
Maringa isogenic lines (Ehdaie and Waines, 1994). The dwarfing genes, in either
genetic background in wet and dry field conditions, did not show changes in A 13C
except for Rht3 in Maringa background. In another study, Richards (1992) used NILs of
bread wheat cultivars of Kalyansona x Chenab70 and Arz x Pato Argentino backgrounds.
These NILs of spring wheat for the dwarfing genes Ad, Rht2, Rht3 and Rhtl+Rht2 as
well as tall (rht) lines were grown in dry land field environments; and in pot and
glasshouse experiments. In the field, tall wheats had a slightly higher A 13 C relating to
faster canopy growth. However, TE (above-ground dry weight/water transpired) and
WUE (above-ground dry weight/evapotranspiration) declined with plant height in both
glasshouse and field experiments. There was no evidence that tall wheats had a greater
capacity for storage and remobilization of photosynthate in the stems than shorter
wheats. The reasons for higher A 13C in tall lines were that tall lines had the faster
expanding leaf canopies, the lowest photosynthetic capacity per unit area and higher
stomatal conductances. However, Ehdaie and Waines (1996) reported the presence of
dwarfing genes did not bring about significant changes in A 13C of 'Maringa' and
'Nainari60' spring wheat background in wet and dry field conditions. The A 13 C ranged
from 16 to 21%o under well-watered and from 17.3 to 20. %o under droughted field
conditions. Many such studies using the NILs indicated that a lower TE is associated
with the short lines, and this was mainly due to lower shoot dry matter production
(Ehadaie and Waines, 1994; Ehadaie and Waines, 1996; Siddique et al., 1990; Richards,
1992).
33
Ehdaie and Waines (1994) developed F1, F2, BCI and BC2 populations from a cross
between Chinese Spring (low A 13 C) and Yecora Rojo (high A 13C) for genetic analysis of
A 13 C and found A 13C varied significantly only in well-watered treatments. In another
study, Ehdaie et al. (2003) reported the yield advantage of wheat-rye translocation lines
under droughted conditions was due to their greater WLJE or rooting ability compared to
their non-translocation counterparts. The effects of short arm translocations of rye
chromosome 1 (IRS) on root biomass, WUE and agronomic performance in spring
bread wheat cv. 'Pavon' were studied in pot experiments; total and root dry matter
increased in 1 RS. 1 AL and I RS. 1 DL translocation lines in well-watered and in 1 RS. I AL
lines in droughted conditions. The IRS translocations also exhibited increased water use
as they increased transpiration rate. In the field experiment, similar positive effects of
1 RS were found in wet and dry conditions.
Mohammady (2005) used F2 backcross reciprocal monosomic crosses between wheat
varieties Falchetto (low A 13
Q and 18 monosomic lines of Oxley (high A 13 C) to identify
chromosomal location responsible for allelic variation in A 13C.
In this pot based study,
chromosome ID from Falchetto, increased WUE and reduced A 13C
over reciprocal lines.
This suggested that the evolutionary source of the D genome (Triticum tauschii) and its
relatives are potential sources of variation in VVUE for breeding programmes.
Masle et al. (2005) reported in recombinant inbred lines (RILs) of Columbia (Col-4) and
Landsberg erecta (erl 1) cross in Arabidopsis that the ERECTA gene, a putative leucine-
rich repeat receptor-like kinase, regulates plant TE. Expression of this gene with higher
photosynthetic rate and low stomatal conductance resulted in higher WUE irrespective
of water availability. This gene was identified as a major locus for a QTL for A 13C on
chromosome 2 that explained 21-64% phenotypic variance.
2.51 Quantitative trait loci (QTLs) detection using mapping populations
Several different types of populations may be utilized for mapping within a given plant
species. F2 populations, derived from F, hybrids, and backcross (13C) populations,
derived by crossing the F, hybrid to one of the parents, are the simplest types of
mapping populations developed for self-pollinating species. Inbreeding of individual F2
plants allows the construction of RILs, which consist of a series of homozygous lines,
34

each containing a unique combination of chromosomal segments from the original
parents (Collard et al., 2005). However, for producing RI populations usually six to
eight generations are required. Doubled haploid (DH) populations may be produced by
regenerating plants by the induction of chromosome doubling from (i) pollen cells using
micro-spore culture or (ii) from haploid embryos (produced by crossing F, plants with
maize pollen) by treating with colchicine. However, the production of DH populations is
only possible in species that are amenable to tissue culture e. g. cereal species such as
rice, barley and wheat. The major advantages of RILs and DH populations are that they
produce homozygous or true-breeding lines that can be multiplied and reproduced
without genetic change occurring. This allows for the implementation of replicated trials
across different locations and years (Collard et al., 2005).
Linkage analysis with molecular genetic markers is a very powerful tool in the genetic
analysis of quantitative traits (van Ooijen, 1999) such as WUE. These traits are often
called complex traits in contrast to Mendelian traits and the relation between genotype
and phenotype cannot be observed directly. The regions within genomes that contain
genes associated with a particular quantitative trait are known as quantitative trait loci
(QTLs). QTL analysis is usually carried out using interval mapping (Lander and
Botstein, 1989). Linkage maps are constructed from the analysis of many segregating
markers. 'QTL mapping' is based on the principle that genes and markers segregate via
chromosome recombination (called crossing-over) during meiosis (i. e. sexual
reproduction), thus allowing their analysis in the progeny (Paterson, 1996). Collard et al.
(2005) reviewed the three main steps affecting construction of a linkage map: (1) Size of
the population: Population s izes generally ranging from 50-250 individuals or even
larger are required for high resolution mapping and this population must be
phenotypically evaluated for quantitative traits before QTL detection. (2) Identification
ofpolymorphism: It is critical that sufficient polymorphism (the nucleotide sequence of
genomic DNA) exists between parents in order to construct a linkage map. This involves
identification of DNA markers that reveal differences between parents followed by
screening of the entire mapping population. (3) Linkage analysis of markers: This
involves coding of data for each marker on each individual of a population and
conducting linkage analysis using computer software programs. Linkage between
markers is calculated as LOD score (logarithm of odds; likelihood ratio statistic). The
35

density of markers depends to some extent on the genome size and a higher density
would give more precisely positioned markers on a linkage map. These positions or map distances are calculated using the 'Kosambi' mapping function (Kearsey and Pooni,
1996).
Essentially statistical procedures are used to assess the correlation between phenotypic
values of different genotypes within the segregating population and the allelic
composition at each locus used to produce a marker map. Regions of the genome that
show significant LOD values are assumed to contain a QTL (van Ooijen, 1999). After
construction of a linkage map the next step is detection of QTLs. This is done by QTL
analysis using single marker analysis, simple interval mapping and composite interval
mapping (Liu, 1998; Tanksley, 1993).
Phenotyping the population for the target trait is important and the laboratory marker
data has to be correlated with the field data for QTL identification. In this regard, the
need for developing high-throughput precise phenotyping screens for the target traits is
very essential. Phenotypic correlations are commonly used to associate markers with
traits and to genetically dissect complex traits into Mendelian factors. Once markers that
are tightly linked to genes or QTLs of interest have been identified, breeders may use
these markers as diagnostic tools to identify lines carrying the genes or QTLs in a
marker-assisted selection (MAS) programme. The selected QTLs should account for the
largest proportion of the phenotypic variance for the target trait. Thus, the main aim of
QTL mapping is to produce a skeletal framework that covers all chromosomes evenly in
order to identify markers flanking those QTLs that control target trait. Sometimes the
closest markers flanking a QTL may not be tightly linked to a gene of interest, which
means that recombination can occur between a marker and QTL, thus reducing the
reliability and usefulness of the marker. So by using larger population sizes and a
greater number of markers, more tightly-linked markers can be identified in high-
resolution mapping. Therefore, high-resolution mapping of QTLs may be used to
develop reliable markers for MAS (at least <5 cM but ideally <1 cM from the gene) and
also to discriminate between a single gene and several linked genes (Michelmore, 1995;
Mohan et al., 1997).
36
The QTL analysis of quantitative traits in bread wheat has in part been hampered by its large genome size (Bennett et al., 1982; cited in Quarrie et al., 2005) with the majority
of wheat DNA being repetitive sequences. The relatively recent origin of the hexaploid
wheat (Huang et al., 2002) and low levels of polymorphism (Chao et al., 1989) makes it
difficult to achieve detailed genetic maps of the whole genome as compared to other
crop species (Quarrie et al., 2005).
In spite of the difficulties in working with the large genome size of wheat, several
studies show identification of QTLs associated with WUE and yield in wheat. Quarrie et
al. (2005) reported fewer QTLs on the D genome than the A and B genomes, owing to
the much lower density of markers obtained for the D genome of Chinese spring x SQl
cross. Group 5 chromosomes gave the largest number of yield QTLs, and the group 6
chromosomes the least. Many studies revealed that group 5 chromosomes have been
regarded to carry genes for abiotic stress resistance (Sutka and Snape, 1989; Manyowa
and Miller,, 1991; Cativelli et al., 2002; Forster et al., 1988, Mahmood and Quarrie,
1993).
Zhang and Ping (2002) mentioned in a review that a RFLP genetic linkage map of wheat
RILs derived from W7984 x Opata was used to study QTL of 33 traits associated with
WUE. The centromeric region of IA and 1B were closely linked with QTLs for
photosynthetic and root traits. The QTLs controlling WUE, plant height and growth rate
were located on the group 2 chromosomes; root traits were located on the 6A and 6B
chromosomes. A large gene cluster made up of seven QTLs controlling WUE of wheat
was found near the centromeric region of 6D chromosome.
Teulat et aL (2002) studied the map generated from 167 RILs of barley from a cross
between Tadmor and Er/Aprn in three Mediterranean field environments differing in
water availability. Ten QTLs for A 13C were identified: six of which presented main
effects across three or two environments. Seasonal rainfall and the ratio of rainfall to
evapotranspiration made large contributions to the environmental effect, but their
influence on GxE for A 13C was weak. Eight QTLs for A 13C co-located with QTLs for
physiological traits related to plant water status and/or osmotic adjustment, and/or for
agronomic traits measured on this population.
37
2.5.2.1 Synteny among cerealsfor comparative mapping of QTLs
Molecular linkage maps with several major QTLs for A 13C in rice were recently 3
published by Price et al. (2002) and Laza et al. (2006), so any QTL candidate gene
regions identified in wheat could be compared with the rice genetic map to provide
comparative information on possible homologue location in rice. Some examples of
synteny are reviewed below.
The genome size of bread wheat is much larger than for durum wheat, barley, rice,
maize and sorghum. This makes much more complex the use of molecular markers for
breeding and selection in wheat. Bread and durum wheat have a lower level of
polymorphism than barley or other cereals (Chao et al., 1989; Devos et al., 1995) and
the level of polymorphism is not consistent across genomes or crosses (Langridge et al.,
2001).
Cereal annuals are known to share some level of homology which enables one to
compare syntenic regions putatively linked to drought-tolerance traits. For example,
rice, wheat and maize share extensive homologies in a number of regions in their
genomes, e. g. chromosome 4, chromosome 2 and chromosome 2S respectively (Ahn et
al., 1993). The dwarfing alleles Rht-B] and Rht-D] in wheat are also the orthologues of
the maize allele dwarf-8.
A conserved orthologous sequence of genes within a novel colinear region in wheat
chromosome IAS and rice chromosome 5S has been reported (Guyot et al., 2004).
Morgan and Tan (1996) identified a major gene controlling osmoregulation on the
homoeologous arm in wheat (chromosome 7A), but this gene was probably at a more
distal position, corresponding by synteny to a rice chromosome 6 segment. In various
studies, group 5 chromosomes of wheat are reported to carry genes controlling a range
of abiotic stress responses such as tolerance to freezing, drought, osmotic stress, and
high temperatures (Snape et al., 200 1; Cattivelli et al., 2002).
Chromosomes of homoeologous group 2 of wheat are orthologous to chromosome F of
sorghum and chromosome 10 of maize (Gale and Devos, 1998) and chromosomes 7 and
4 of rice (Sorrells et al., 2003) where QTLs for stay green have been reported in
38
sorghum (Tuinstra et al., 1997; Kebede et al., 200 1), in maize (Bertin and Gallais, 200 1),
in rice (Jiang et al., 2004) and in wheat (Verma et al., 2004).
In barley, QTLs for A 13C on chromosomes 2H and 6H showed associations with TGW
and on chromosome 6H between A 13 C and (Teulat et al. 2002). One of the target loci on
chromosome 7H of barley, where QTLs for osmotic potential (yn), RWC and some
other traits have been collocated, was shown to be co-linear with a region of rice
chromosome 8 (Teulat et al. 1998), where a QTL for osmotic adjustment at 70% of RWC was also found by Lilley et al. (1996). The anchor probe was mapped at the same homologous region of chromosome 8 of rice and chromosome 7 of wheat, but only on
chromosome IH of barley (Teulat et al. 1998). Laza et al. (2006) in Japan studied 101
RILs derived from an indica xjaponica rice cross under flooded conditions and reported
putative QTLs for A 13C on chromosomes 2,4,8,9,11 and 12.
QTLs for traits involved in drought resistance have been reported in several crops. For
example, QTLs for osmotic adjustment were identified in rice (Lilley et al. 1996; Zhang
et al. 2001), barley (Teulat et al. 1998,2001) and wheat (Morgan and Tan 1996).
Similarly QTLs have been identified for the anthesis silking interval in maize (Ribaut et
al. 1996) and QTLs for stay green in sorghum (Tuinstra et al. 1997; Xu et al. 2000;
Kebede et al. 2001) and wheat (Verma et al. 2004). However, there are only a few
reports on QTLs for carbon isotope discrimination in crop plants. QTLs for A 13 C have
been reported in barley (Teulat et al. 2002; Forster et al. 2004), Arabidopsis (Hausmann
et al. 2004; Juenger et al. 2005; Masle et al. 2005), tomato (Martin et al. 1989), soybean
(Specht et al. 2001), rice (Price et al. 1997 and 2002; Laza et al., 2006) and brassica
(Hall et al. 2005). To date there are no reported investigations available which have
identified QTLs for A 13C in wheat.
Previous UK-based work analysed the genetic control of drought resistance utilising F,
derived double-haploid (DH) mapping populations that were produced from crosses
between Beaver (UK feed wheat variety) and Soissons (French bread wheat variety).
These two cultivars are known to contrast for expression of target traits affecting
perfon-nance under drought. Beaver (late flowering/poor canopy persistence) and
Soissons (early flowering/ good canopy persistence) and their DH populations were
utilised for further studies to quantify the associations between target drought resistance
39

traits like stem-soluble carbohydrate (SSC) reserves, flowering date, flag leaf green area (FLGA) persistence and yield response to drought (DEFRA, 2001; Verma et al., 2004).
Some of the significant findings were: (i) SSC reserves had neutral effects on absolute
yield loss to drought, (ii) early flowering had neutral effects on absolute yield loss to
drought (iii) 'Stay-green' measured as percent flag leaf remaining green at GS61+5
weeks was positively correlated with yield under drought, but not under irrigation. (iv)
new QTLs for % FLGA on chromosome 2D associated directly with stay green effects
(Verma et al., 2004). However, this study did not investigate WUE.
Thus evidence from comparative mapping among other cereal species may help in
identification of candidate genes in wheat associated directly with higher water-use
efficiency. These QTLs may represent novel sources of improved WUE for breeders to
exploit. In addition the information generated will be of value to breeders for further
fine-mapping to identify markers tightly linked to genes controlling the trait, and for
gene discovery.
2.6 HYPOTHESES AND OBJECTIVES
The present study is focused on improving understanding of the physiological
determinants of water-use efficiency and their genetic control using doubled-haploid
lines derived from a cross between winter wheat varieties Beaver (high A' 3Q and
Soissons (low A 13C), contrasting for carbon isotope discrimination and traits
hypothesized to be determinants of WUE. Lines of this population were tested under
irrigated and water-stressed regimes, in both glasshouse and field conditions.
Specific hypotheses were:
1. The genetic variation in TE in the DH population is due to differences in stomatal
conductance, net photosynthetic rate and intercellular C02 concentrations of the flag
leaf
2. A decreased stornatal conductance or an increased net photosynthetic rate will reduce
intercellularC02 concentration and increase TE.
40

3. A negative genetic correlation exists between carbon isotope discrimination and TE
or WUE in the UK enviromnent.
4. A 13C is associated with ratio intercellularC02 to airC02 (Ci Q. A
13C increases as
Ci remains high and thus they are linearly related. Plants discriminating heavily against 13 C have low WUE and able to keep a relatively high Ci.
5. Quantitative trait loci (QTLs) for carbon isotope discrimination can be identified
explaining variation in WUE in UK wheat.
6. There is a positive genetic correlation between TE or WUE and grain yield amongst
lines of DH population under drought in the UK.
To test these hypotheses, two glasshouse experiments (at Sutton Bonington) involving 2
DH lines and 2 parental lines and three field experiments (at Gleadthorpe and Sutton
Bonington, Nottinghamshire, UK) involving 33 DH lines and 2 parental lines (Beaver
and Soissons), were carried out.
The present study had the following objectives.
Firstly, to quantify the relative contributions of genotype and environment (water
availability) and to phenotypic variation in VXE in winter wheat. Secondly, to identify
the physiological determinants of genetic and environmental variation in WUE in UK
wheat with particular focus on stomatal aperture traits. Thirdly, to quantify the
physiological interrelationships between expression of WUE and grain yield under
irrigation and drought. Lastly, to identify quantitative trait loci (QTLs) for WUE and its
determinant traits by characterizing doubled haploid lines of Beaver and Soissons and
associating data with an existing micro-satellite marker map.
2.7 THESIS STRUCTURE
The materials used and methodologies adopted in the present investigation are described
in chapter 3. In the glasshouse experiments, a subset of 4 genotypes differing in morpho-
physiological traits was studied which allowed detailed observations of gravimetric
estimation of WUE, gas-exchange measurements, water use, dry matter production at
41
frequent samplings in irrigated and droughted treatments for two years. The glasshouse
experiments are described in chapter 4, The main aim was to identify processes
underlying relationships between WUE and yield. In the field experiments, 33 DH
genotypes and 2 parents were screened under irrigated and droughted treatments in the
field at Gleadthorpe (in 2003) and at Sutton Bonington (in 2005); and 8 lines were
selected for intensive study of physiological parameters. The field experiments are
described in chapter 5. The main was to identify genetic correlations between WtJE and
sub-traits and between WUE and yield under irrigation and drought. Based on the
phenotypic quantitative data collected for A 13 C and other traits, genetic analysis was
done to identify chromosomal regions and putative QTLs associated with WUE. The
genetic analysis is described in Chapter 6. The overall outcome of the present study is
discussed in chapter 7 with regard to improvement in water-use efficiency in wheat
grown in the UK. This chapter will discuss of various target traits and mechanisms; and
their relevance to physiological and genetic basis of water-use efficiency in UK winter
wheat. The implications for future wheat breeding improvement in the UK are outlined.
Some recommendations for future work and summary are set out at the end of chapter 7.
42
CHAPTER 3: MATERIALS AND METHODS
Two glasshouse experiments and two field experiments were conducted during the
course of the investigation. Experimental design and treatments, plot or soil column
management, crop or plant measurements and environmental measurements in each
experiment are described in this chapter.
3.1 GLASSHOUSE EXPERIMENTS
3.1.1 Experimental design and treatments
One PVC column experiment was conducted in each of 2003 and 2004. A completely
randomised design in 2003 and a randomised block design in 2004 were adopted. In
each experiment there were two moisture regimes (well-watered and droughted regimes) in each of which four winter wheat genotypes were examined. There were four
replicates. Within each replicate, there were six sub-replicate columns to allow for six destructive growth-analysis samplings through the growing cycle. A total of 192 PVC
columns were therefore prepared with a view to six sequential growth-analysis
samplings, with 32 columns per sampling (Plate 3.1). The PVC columns (root tubes)
which were used were 0.1 in in diameter, and filled to a depth of 1.0 in with John Innes
Compost No. 2 as growth medium. Tubes were cut longitudinally to facilitate removal
of intact root systems, and were fastened together with celluloid tape. The bottom of the
columns was covered with polythene in which 4-5 drainage holes were made.
3.1.1.1 Moisture regime treatment
Two treatments were imposed as 'well-watered' and 'droughted' and regimes when the
plants were at 50 days after sowing (DAS) in 2003; and 75 DAS in 2004. Well watered
treatments were irrigated to return columns to 90% field capacity (FC) by irrigating
approximately every 7 d. The droughted treatments received the same amounts of water
as the well watered treatment up to flag leaf emergence (GS39) (Tottman and Broad,
1987), after which genotypes in droughted columns received different quantities of
water as per gravimetric estimation approximately every 7 d. Each genotype within an
individual irrigation treatment received the same absolute amount of water throughout
the experiment. Shortly before plantlets were transplanted into soil columns, the
43
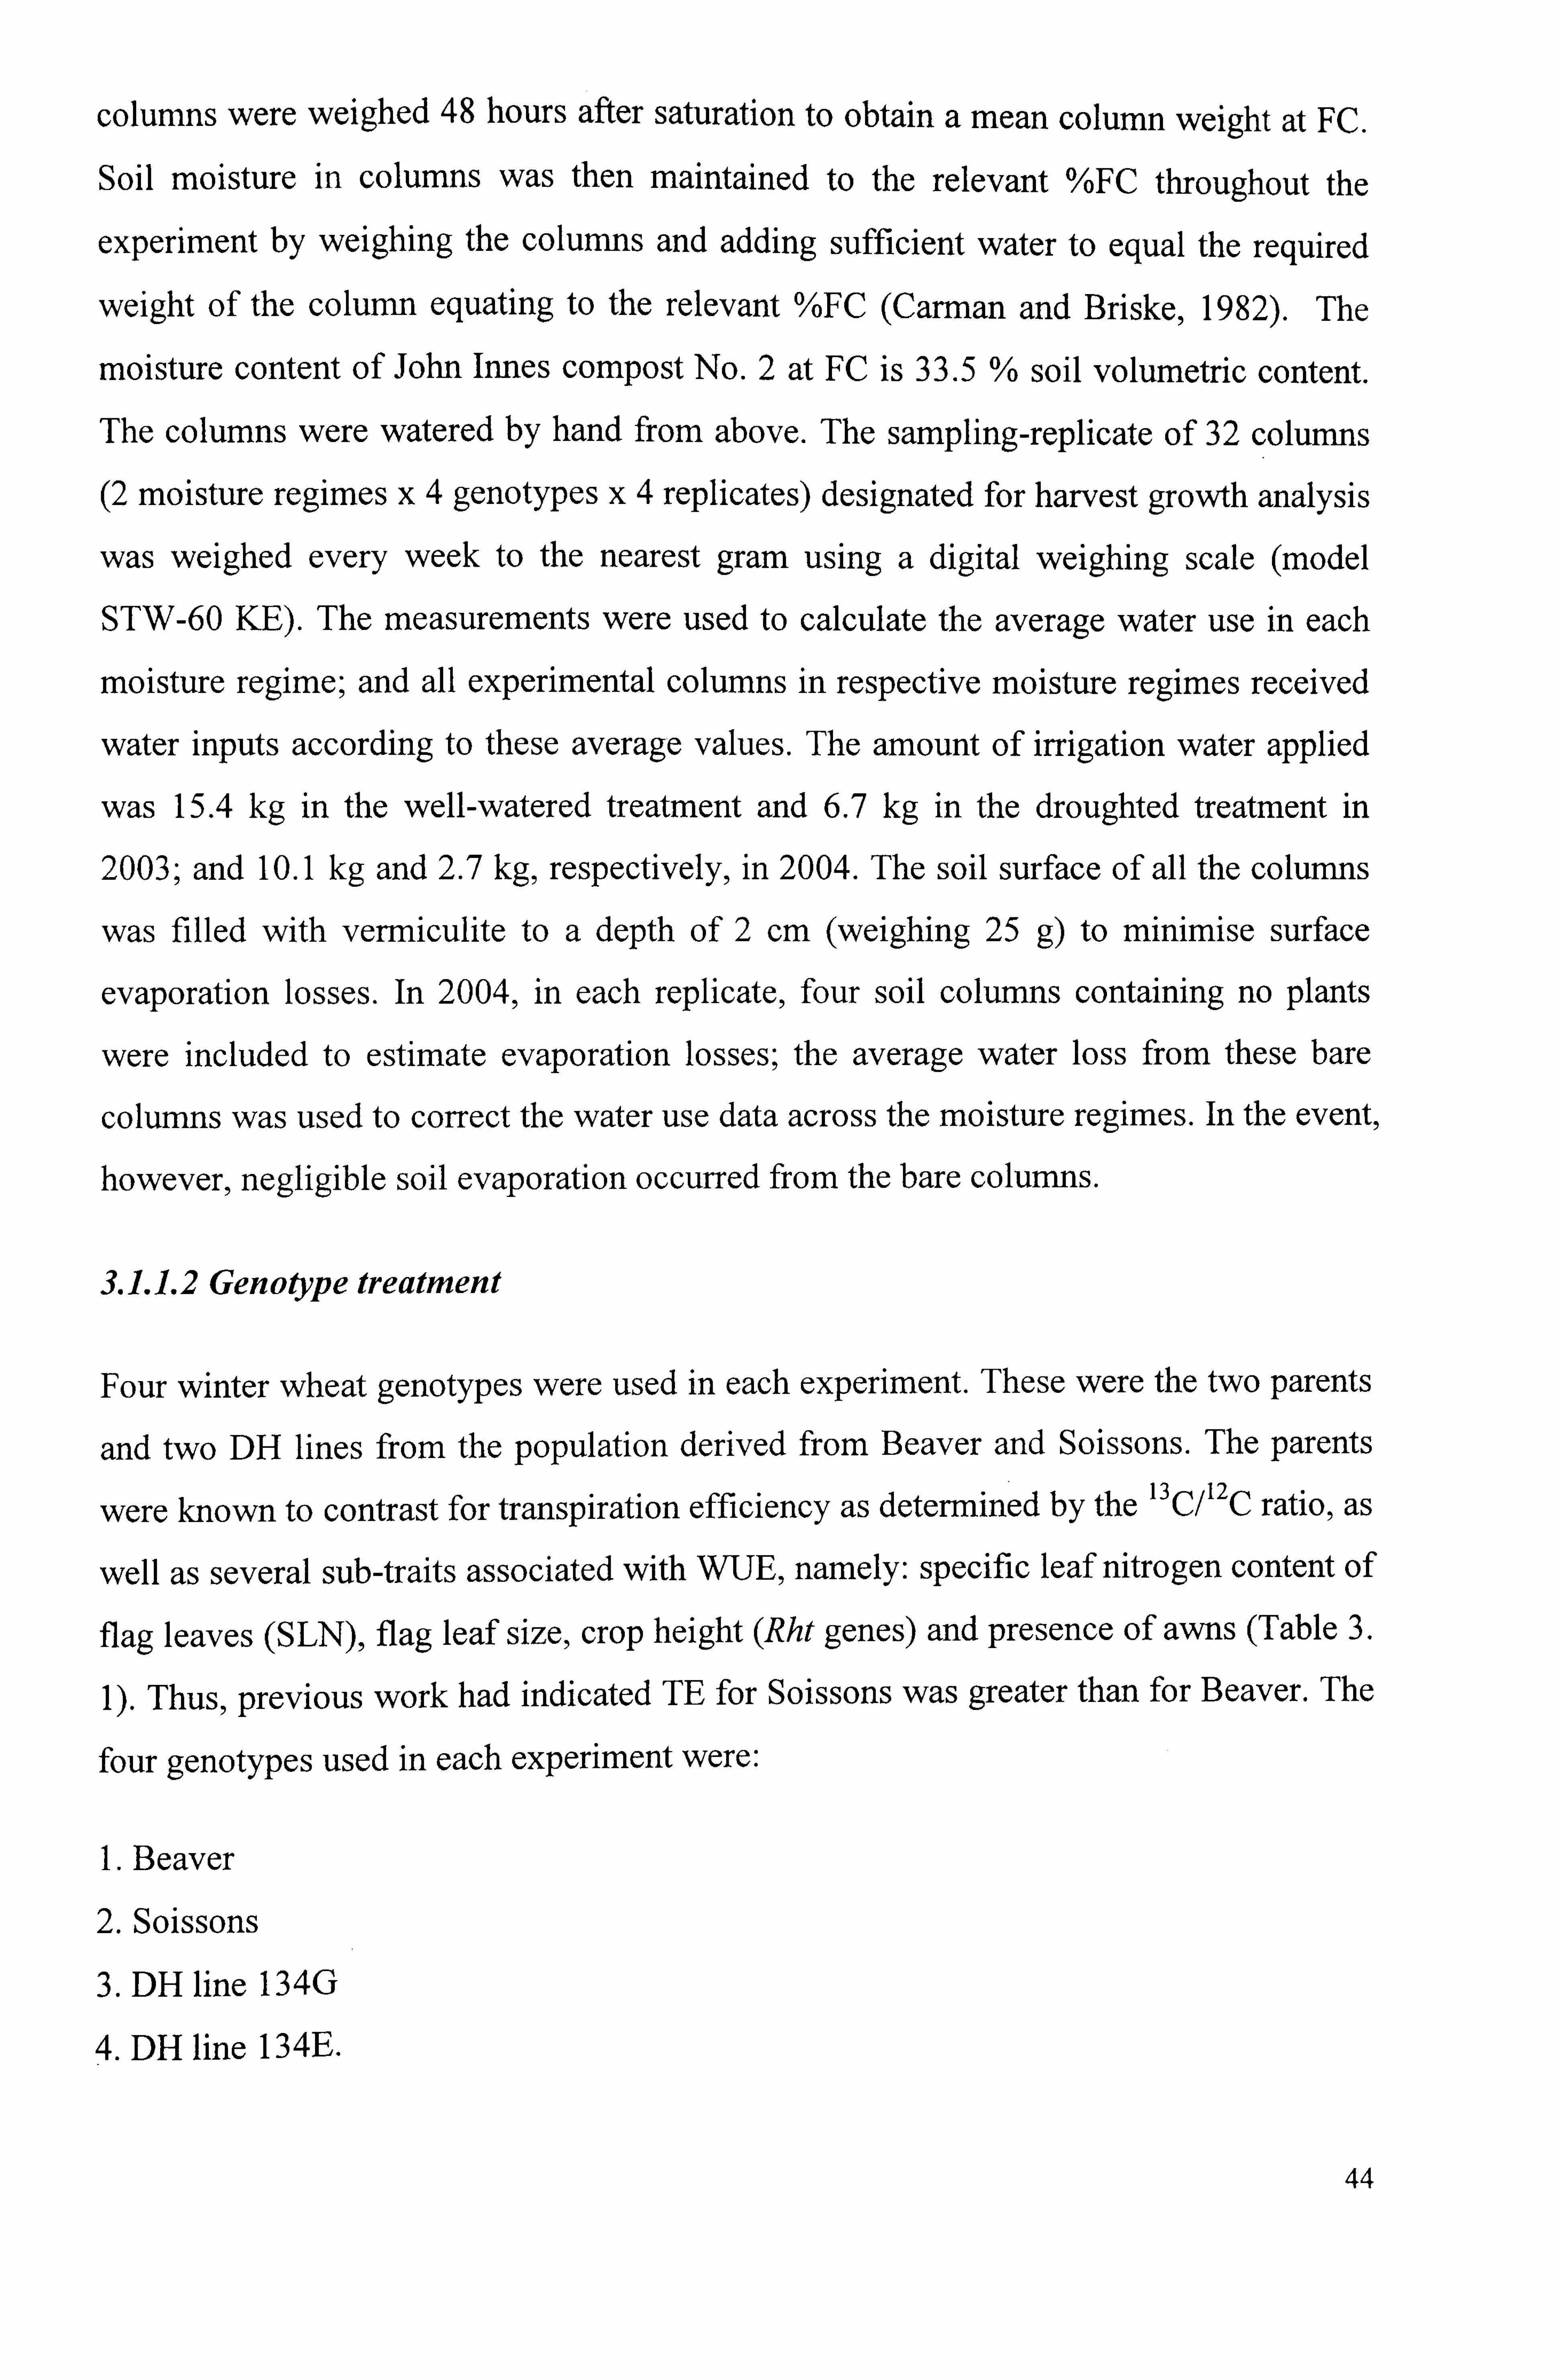
columns were weighed 48 hours after saturation to obtain a mean column weight at FC.
Soil moisture in columns was then maintained to the relevant %FC throughout the
experiment by weighing the columns and adding sufficient water to equal the required
weight of the column equating to the relevant %FC (Carman and Briske, 1982). The
moisture content of John Innes compost No. 2 at FC is 33.5 % soil volumetric content.
The columns were watered by hand from above. The sampling-replicate of 32 columns
(2 moisture regimes x4 genotypes x4 replicates) designated for harvest growth analysis
was weighed every week to the nearest gram using a digital weighing scale (model
STW-60 KE). The measurements were used to calculate the average water use in each
moisture regime; and all experimental columns in respective moisture regimes received
water inputs according to these average values. The amount of irrigation water applied
was 15.4 kg in the well-watered treatment and 6.7 kg in the droughted treatment in
2003; and 10.1 kg and 2.7 kg, respectively, in 2004. The soil surface of all the columns
was filled with vermiculite to a depth of 2 cm (weighing 25 g) to minimise surface
evaporation losses. In 2004, in each replicate, four soil columns containing no plants
were included to estimate evaporation losses; the average water loss from these bare
columns was used to correct the water use data across the moisture regimes. In the event,
however, negligible soil evaporation occurred from the bare columns.
3.1.1.2 Genotype treatment
Four winter wheat genotypes were used in each experiment. These were the two parents
and two DH lines from the population derived from Beaver and Soissons. The parents
were known to contrast for transpiration efficiency as determin ed by the 13C/12 C ratio, as
well as several sub-traits associated with WUE, namely: specific leaf nitrogen content of
flag leaves (SLN), flag leaf size, crop height (Rht genes) and presence of awns (Table 3.
1). Thus, previous work had indicated TE for Soissons was greater than for Beaver. The
four genotypes used in each experiment were:
1. Beaver
2. Soissons
3. DH line 134G
4. DH line 134E.
44
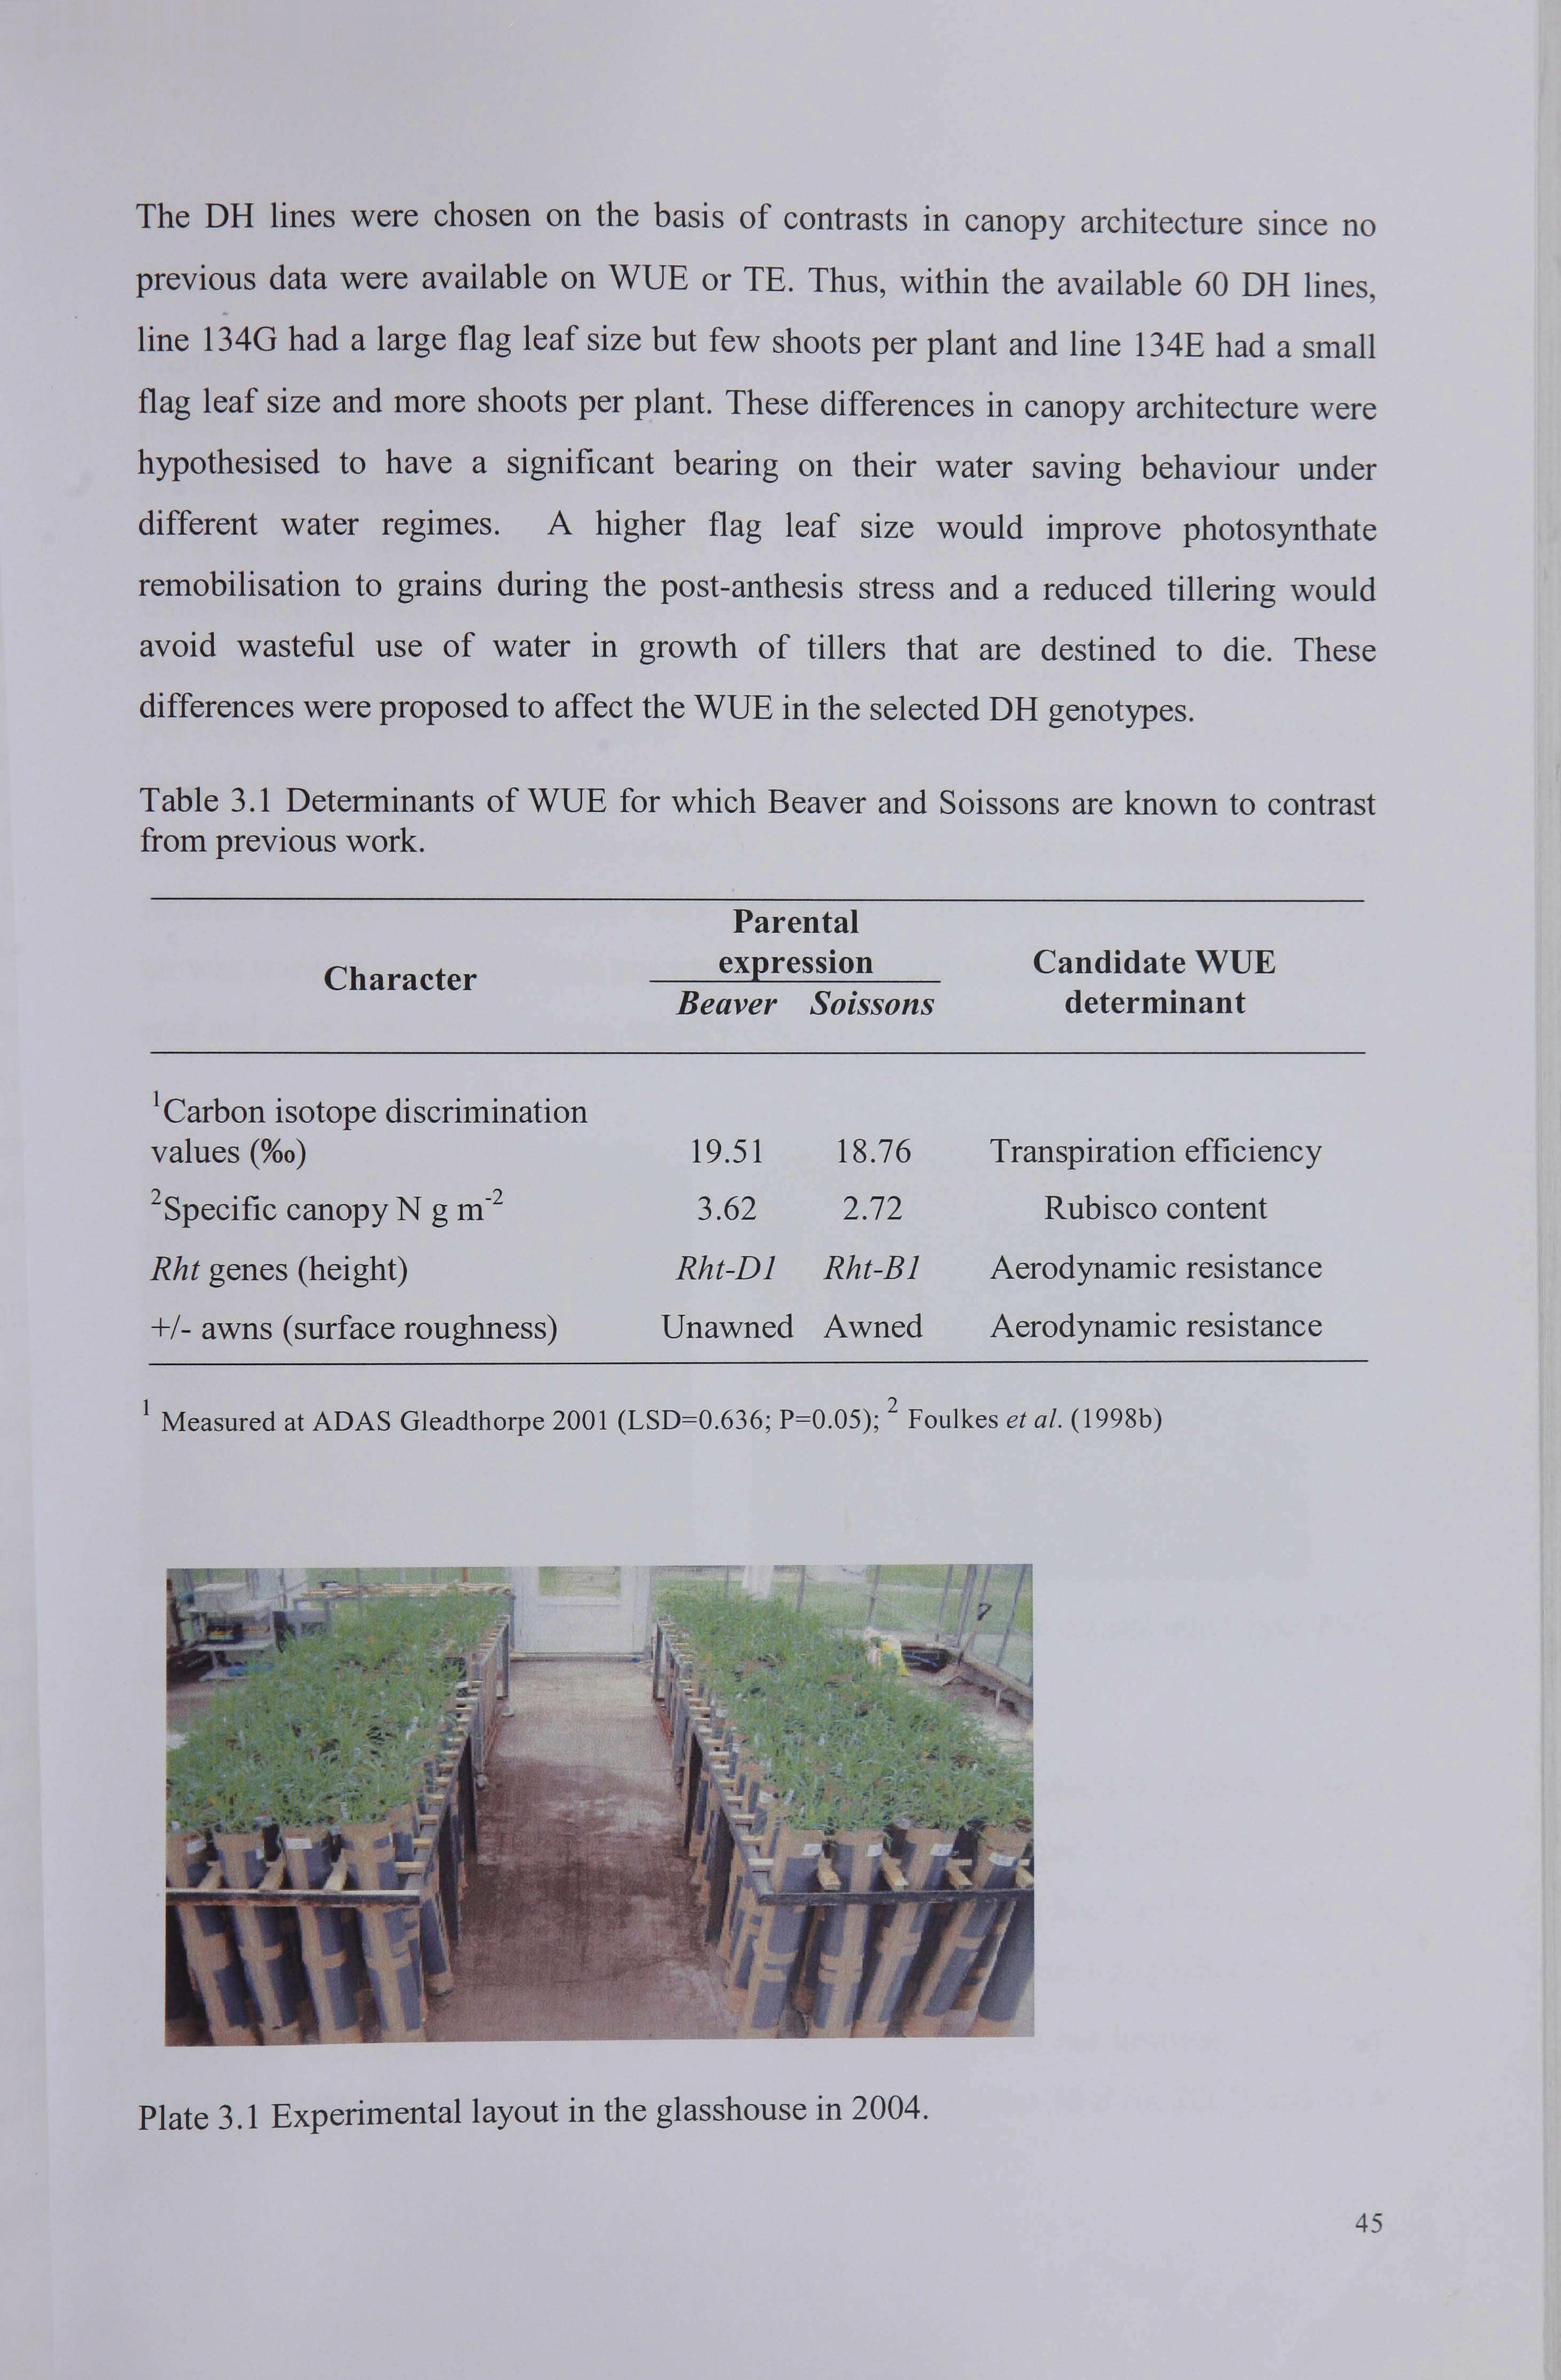
The DH lines were chosen on the basis of contrasts in canopy architecture since no
previous data were available on WUE or TE. Thus, within the available 60 DH lines,
line 134G had a large flag leaf size but few shoots per plant and line 134E had a small
flag leaf size and more shoots per plant. These differences in canopy architecture were
hypothesised to have a significant bearing on their water saving behaviour under
different water regimes. A higher flag leaf size would improve photosynthate
remobilisation to grains during the post-anthesis stress and a reduced tillering would
avoid wasteful use of water in growth of tillers that are destined to die. These
differences were proposed to affect the WUE in the selected DH genotypes.
Table 3.1 Detenninants of WUE for which Beaver and Soissons are known to contrast from previous work.
Parental
Character expression Candidate WUE Beaver Soissons determinant
'Carbon isotope discrimination
values (%o) 2 Specific canopy Ng M-2
Rht genes (height)
+/- awns (surface roughness)
19.51 18.76
3.62 2.72
Rht-D] Rht-B]
Unawned Awned
Transpiration efficiency
Rubisco content
Aerodynamic resistance
Aerodynamic resistance
I Measured at ADAS Gleadthorpe 2001 (LSD=0.636; P=0.05); 2 Foulkes et al. (1998b)
" ..
" 1" I -"
%(. k
'..
"
I A
Plate 3.1 Expenmental layout in the glasshouse in 2004.
45

3.1.2 Management of plants in soil columns
3.1.2.1 Sowing and transplanting
Plants were sown on 7 March 2003 and 19 February 2004. In each experiment, plants Q
plants per 10 em diameter plastic pot) were grown initially in a control I ed- environment
growth room under vernalising temperatures at 6T with a photoperiod of 12 hours for
35 d in 2003 and for 55 d in 2004 (Plate 3.2). Thus, the wheat seedlings were
transplanted into soil columns in the glasshouse at 35 d in the first year and at 55 d in
the second year. Plants were transplanted at 3 plants per column in 2003 and one plant
per column in 2004 in the glasshouse. The glasshouses had vents on either side of the
central ridge. An electric motor connected auto vent was operated manually to vary
temperatures in the glasshouse to avoid frost risk. The glasshouses contained heating
facilities through low pressure hot water circulated in pipes around each house and the
air was wanned by the heat from hot interior surfaces and retained in the building by the
roof and glass wall. There was no supplementary lighting during the experimentation.
Plate 3.2 Wheat genotypes grown in growth rooms and later transplanted into PVC
columns in glasshouse.
The soil columns were filled with John Innes Compost No. 2, which is a blend of loam
(7 parts), sphagnum moss peat (3 parts), coarse sand or grits (2 parts) and fertilisers. For
each in 3 of mix it also contains 0.6 kg ground lime stone, 2.4 kg hoof and horn meal, 2.4
kg super phosphate and 1.2 kg potassium sulphate. Each column was packed to a bulk
-3 density of approximately 0.97 g cm .
To ensure nitrogen was not limiting, 2gN per
column as NH4NO3 (34.5 % N) was added when the crop was 50 d (in 2003) and 67 d
46
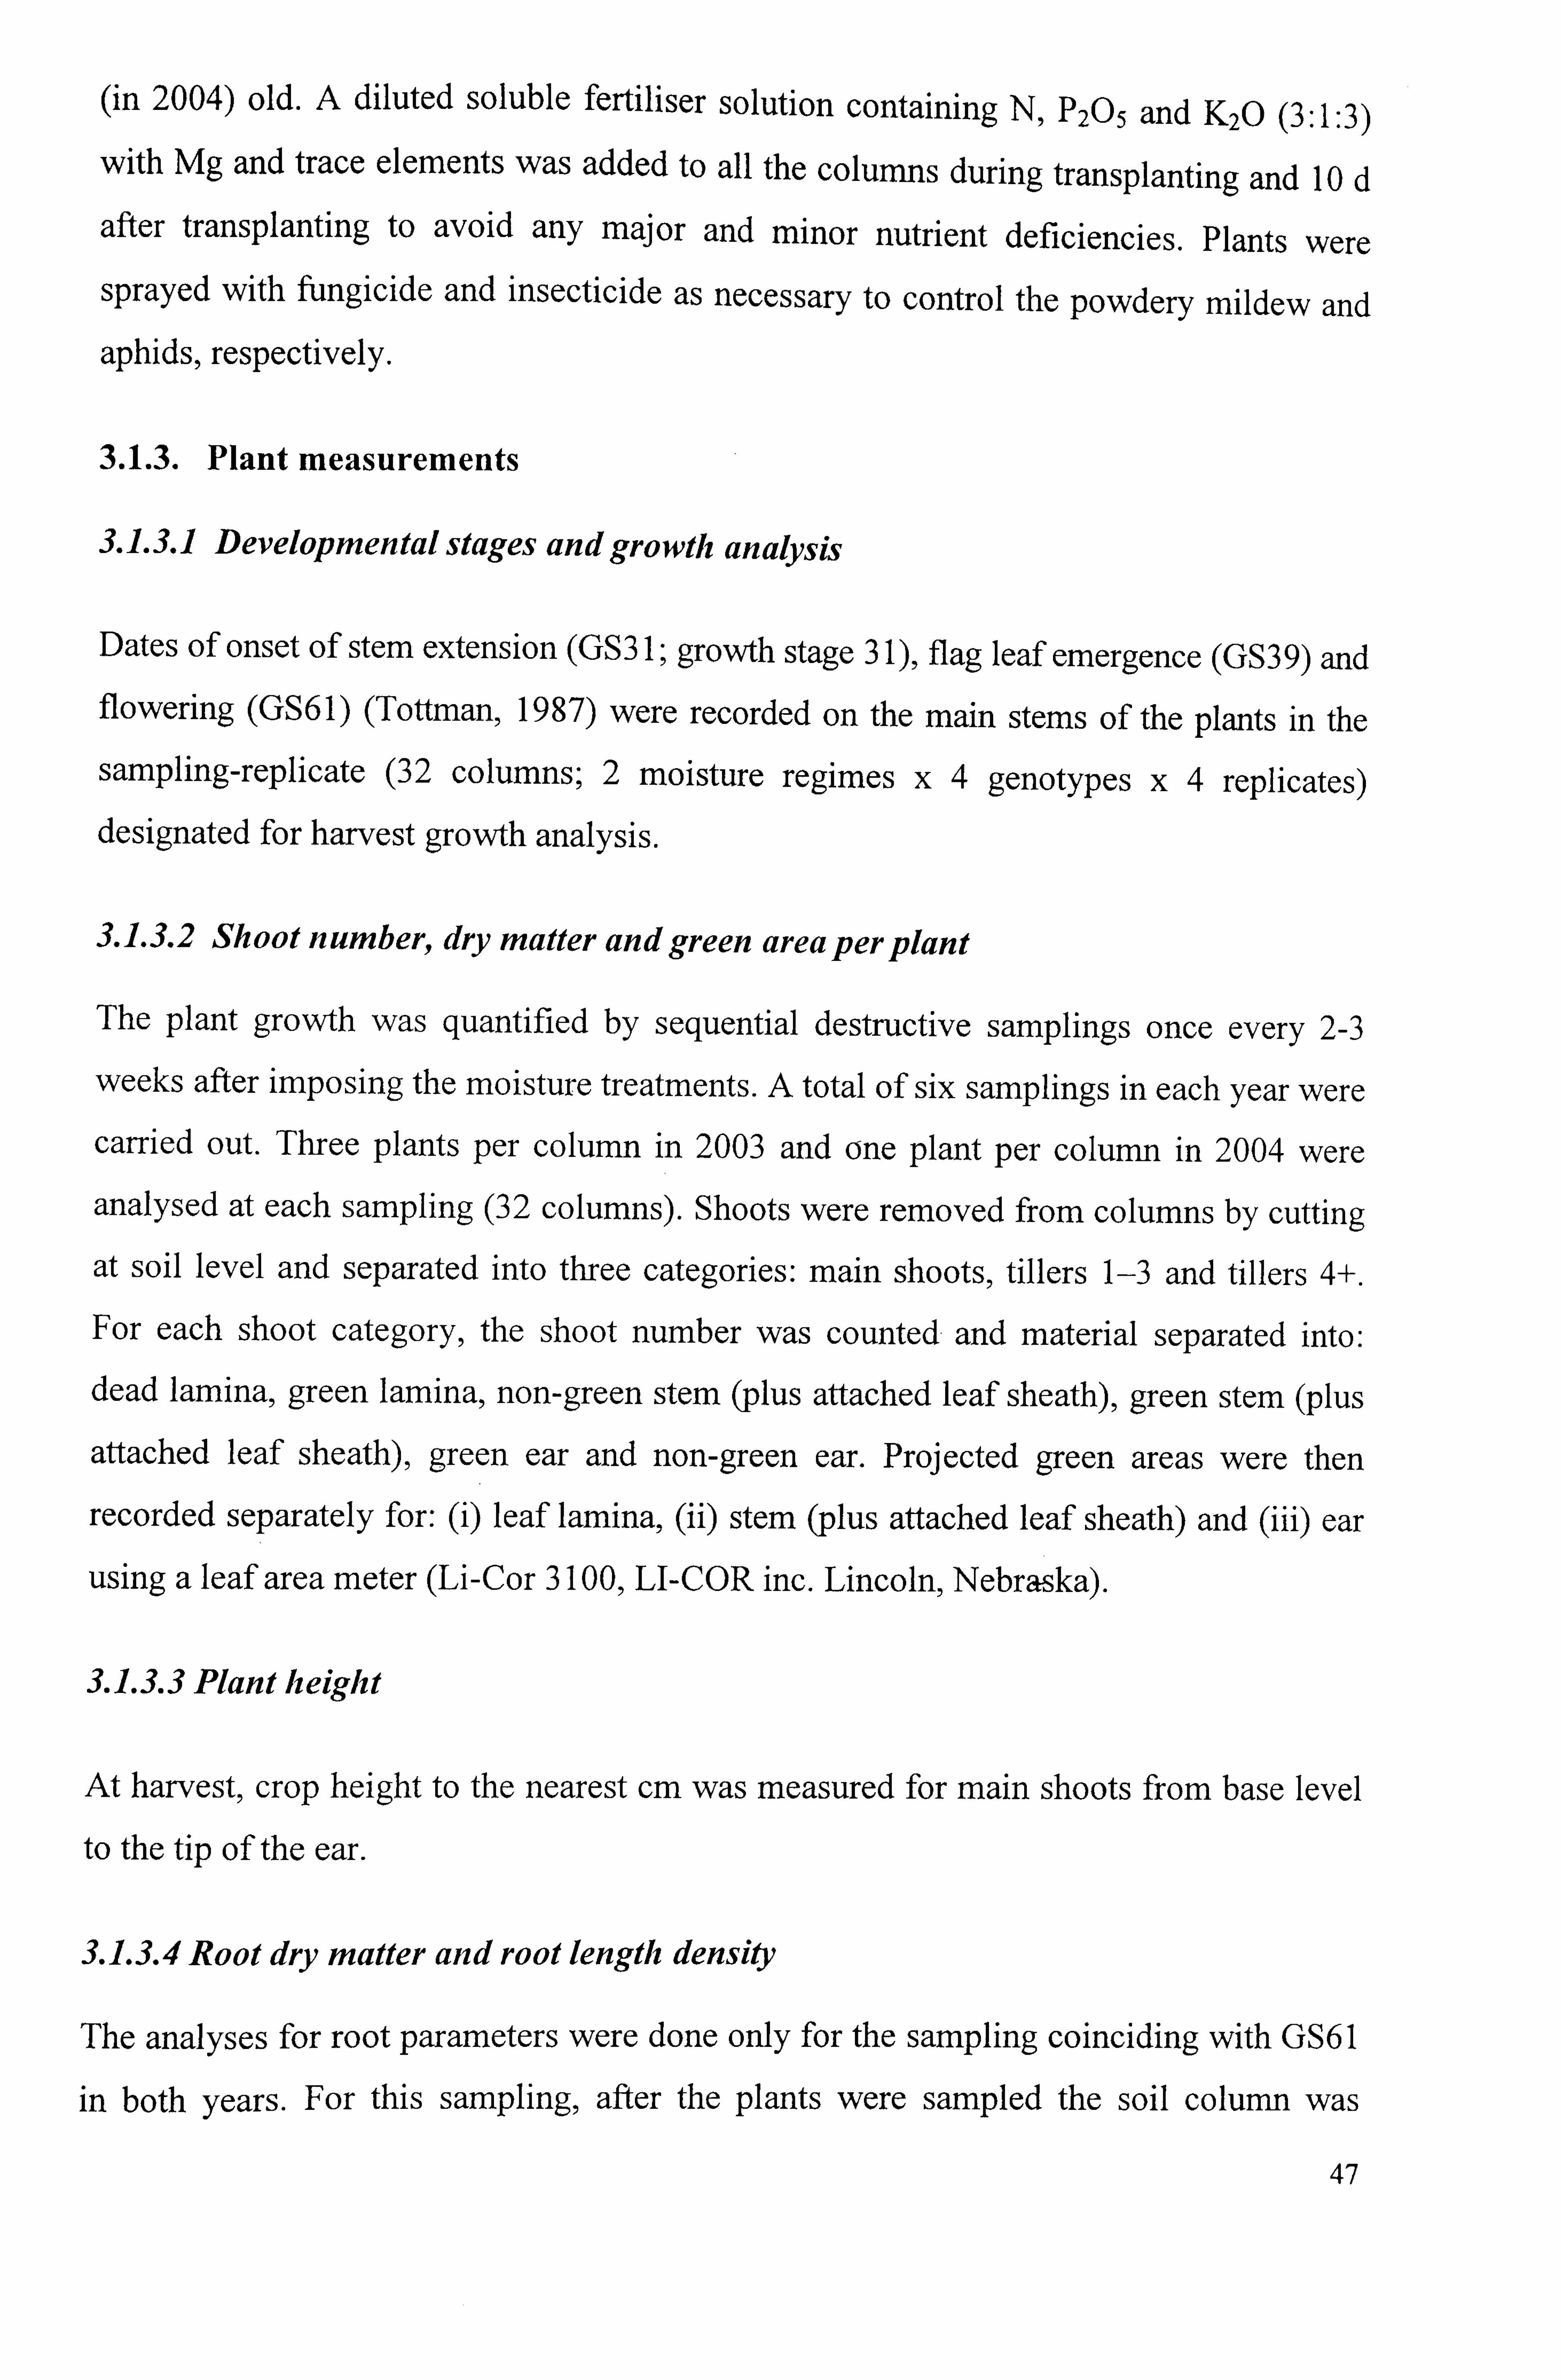
(in 2004) old. A diluted soluble fertiliser solution containing N, P205 and K20 (3: 1: 3)
with Mg and trace elements was added to all the columns during transplanting and 10 d
after transplanting to avoid any major and minor nutrient deficiencies. Plants were
sprayed with fungicide and insecticide as necessary to control the powdery mildew and aphids, respectively.
3.1.3. Plant measurements
3.1.3.1 Developmental stages and growth analysis
Dates of onset of stem extension (GS3 1; growth stage 3 1), flag leaf emergence (GS39) and flowering (GS61) (Tottman, 1987) were recorded on the main stems of the plants in the
sampling-replicate (32 columns; 2 moisture regimes x4 genotypes x4 replicates) designated for harvest growth analysis.
3.1.3.2 Shoot number, dry matter andgreen areaperplant
The plant growth was quantified by sequential destructive samplings once every 2-3
weeks after imposing the moisture treatments. A total of six samplings in each year were
carried out. Three plants per column in 2003 and one plant per column in 2004 were
analysed at each sampling (32 columns). Shoots were removed from columns by cutting
at soil level and separated into three categories: main shoots, tillers 1-3 and tillers 4+.
For each shoot category, the shoot number was counted and material separated into:
dead lamina, green lamina, non-green stem (plus attached leaf sheath), green stem (plus
attached leaf sheath), green ear and non-green ear. Projected green areas were then
recorded separately for: (1) leaf lamina, (ii) stem (plus attached leaf sheath) and (iii) ear
using a leaf area meter (Li-Cor 3 100, LI-COR inc. Lincoln, Nebraska).
3.1.3.3 Plant height
At harvest, crop height to the nearest cm was measured for main shoots from base level
to the tip of the ear.
3.1.3.4 Root dry matter and root length density
The analyses for root parameters were done only for the sampling coinciding with GS61
in both years. For this sampling, after the plants were sampled the soil column was
47

separated into 0-20,20-40,40-60,60-80 and 80-100 cm horizons. The soil samples were
stored for 3-4 weeks in a cold room at 4'C prior to root washing. For the soil from each 20 cm horizon, roots were removed by washing by hand under a water jet and the
organic debris was separated using forceps following the general procedure described by
Manske et al. (2001). The washed root samples were placed in water-containing plastic
jars and stored in cold room at 4'C until they were scanned. Before root image analysis,
washed roots were placed in scanner trays the same size as the rectangular scan area in
the root scanner computer system (Regent STD 1600+ which uses a winRHIZOTm 2002
software programme; Regent Instruments, UK). The roots were immersed in water and
spread evenly in the scanner trays. The scanner trays had a scanning area of 22 x 30 cm.
The roots were first digitized with an image acquisition device in the WinRHIZO
system with a desktop optical scanner as the image acquisition device. Root analyses to
estimate the root length density (CM CM-3) , average diameter (mm), root volume (CM),
root surface area (cm 2) ,
distribution and diameter classes were carried out. The scanned
root samples were dried at 800C for 48 h for estimation of root dry matter.
3.1.3.5 Plant water use and water-use efficiency
At each sampling, the columns were weighed to determine changes in water use through
time by gravimetric analysis. The total amount of water used was calculated as the
difference between the final and initial weight of columns taking into account the
amount of water supplied to each column. The cumulative water-use efficiency for each
irrigation x genotype treatment combination was calculated as the slope of the linear
regression of above-ground dry matter on cumulative water use when forced through the
origin. It was assumed that drainage and soil evaporation were zero from the time of the
first growth analysis through to harvest.
3.1.3.6 Leaf relative water content (R WC)
In the 2004 experiment, flag leaves from each irrigation x genotype treatment
combination (4 replications) were used for determination of RWC. The sampling was
carried out in the morning hours in the first four sampling stages. The measurements
were based on a procedure widely used in previous studies (e. g. Equiza et al., 2001).
Sampled leaves were sealed in plastic bags, placed above ice in a cool-box, and
transported immediately to the laboratory. Leaf discs of I cm diameter were bored from
48

the sampled leaves using a steel borer and the fresh weight of discs determined using a
Precisa 125A precision balance (Precisa Instruments AG, Switzerland). Leaf discs were
then floated in a Petri dish containing distilled water for 24 h at room temperature in
order to saturate them to full turgidity. The discs were then removed, blotted dry on
paper towels and their saturated weights recorded. Discs were then dried at 80 OC for 48
h and the weight recorded. The RWC was calculated as [Equation 3.1 ]:
RWC= [(fresh weight-dry weight)/ (saturated weight-dry weight)] x 100.... Equation 3.1
3.1.3.7 SPAD measurements
Chlorophyll content was determined non-destructively using a SPAD-502 meter
(Minolta, Japan). The measurements were made on the flag leaf of main shoots from
each irrigation x genotype combination in four replications, by clamping the SPAD
sensor over the leaf lamina. The veins of the leaf were avoided as they could affect the
results due to thickness and paleness. This instrument uses measurement of transmitted
radiation in the red and near infrared wavelengths to provide numerical values related to
leaf chlorophyll content. The SPAD meter normally gives values for wheat between 35
and 50 reflectance units. A close linear correlation between SPAD values and
extractable chlorophyll content has been reported for a wide range species (Marquard
and Tipton 2004; Finnan et al. 2004).
3.1.3.8 Gas exchange measurements
Leaf gas exchange was measured using a portable Infra-Red Gas Analysis (IRGA)
system (CIRAS-1, PP-Systems, UK) in conjunction with a plant leaf cuvette having an
area of 2.5 cm 2 of leaf surface (Plate 3.3). CIRAS-1 measures C02 concentration and
water vapour pressure changes in the leaf cuvette, from which calculations for various
gas-exchange parameters are performed. In both years, from stem extension (GS39) to
mid grain filling (GS61+4 weeks) gas-exchange was assessed once or twice a week on
the flag leaf of main shoots between 10.00 and 15.3 0 h. Before using the instrument the
influx0f C02 into the system was adjusted to ambientC02 concentration of 365 ppm.
After clamping the flag leaf into the leaf cuvette attached to CIRAS it was then
equilibrated forC02 exchange rate, stornatal conductance and transpiration. The steady
state of these parameters was achieved after about 15 minutes. Three measurements per
49
column were taken for each genotype x irrigation combination in each replicate; and a
total of either 96 or 72 readings were taken each time. Each measurement took about 90-
120 s for recording an equilibrated value. Gas-exchange measurements were taken on
days with sufficient sunlight and no artificial light source was used for illumination.
This provided estimates of.
1. stomatal conductance (g, ) - mmol m -2 s -1
2. assimilation rate (A) - ýtMol M-2S-I
3. sub-stomataIC02concentration (Cj) - MMOI C02mol-1 air
4. transpiration rate (E) - mol M-2 s- I
Plate 3.3: Portable photosynthetic system CIRAS-1 (PP Systems, UK) used for
measuring leaf gas-exchange variables. System console and leaf chamber mounted on a stand with wheat leaf clamped into.
3.1.3.9 Carbon isotope composition analysis
In 2003, flag leaf samples collected at anthesis (GS61) were dried for 48 h at 80'C.
These samples were then ground to a fine powder (<200 ýt particle diameter) using a
Cyclotec 1093 sample mill (Foss Tecator Co. ) for carbon isotope analysis using a mass
spectrometer. In 2004, in addition to leaf samples at GS61 mature grain samples
collected at harvest were ground to a fine powder (<250 ýt particle diameter; Plate 3.4)
after drying for 48 h at 800C, for detennination of the 12C/13C isotope ratio.
The carbon isotope discrimination analysis was performed at the British Geological
Survey (BGS) Laboratory, Keyworth, Nottinghamshire, UK. 13C/12C ratios of bulk
50
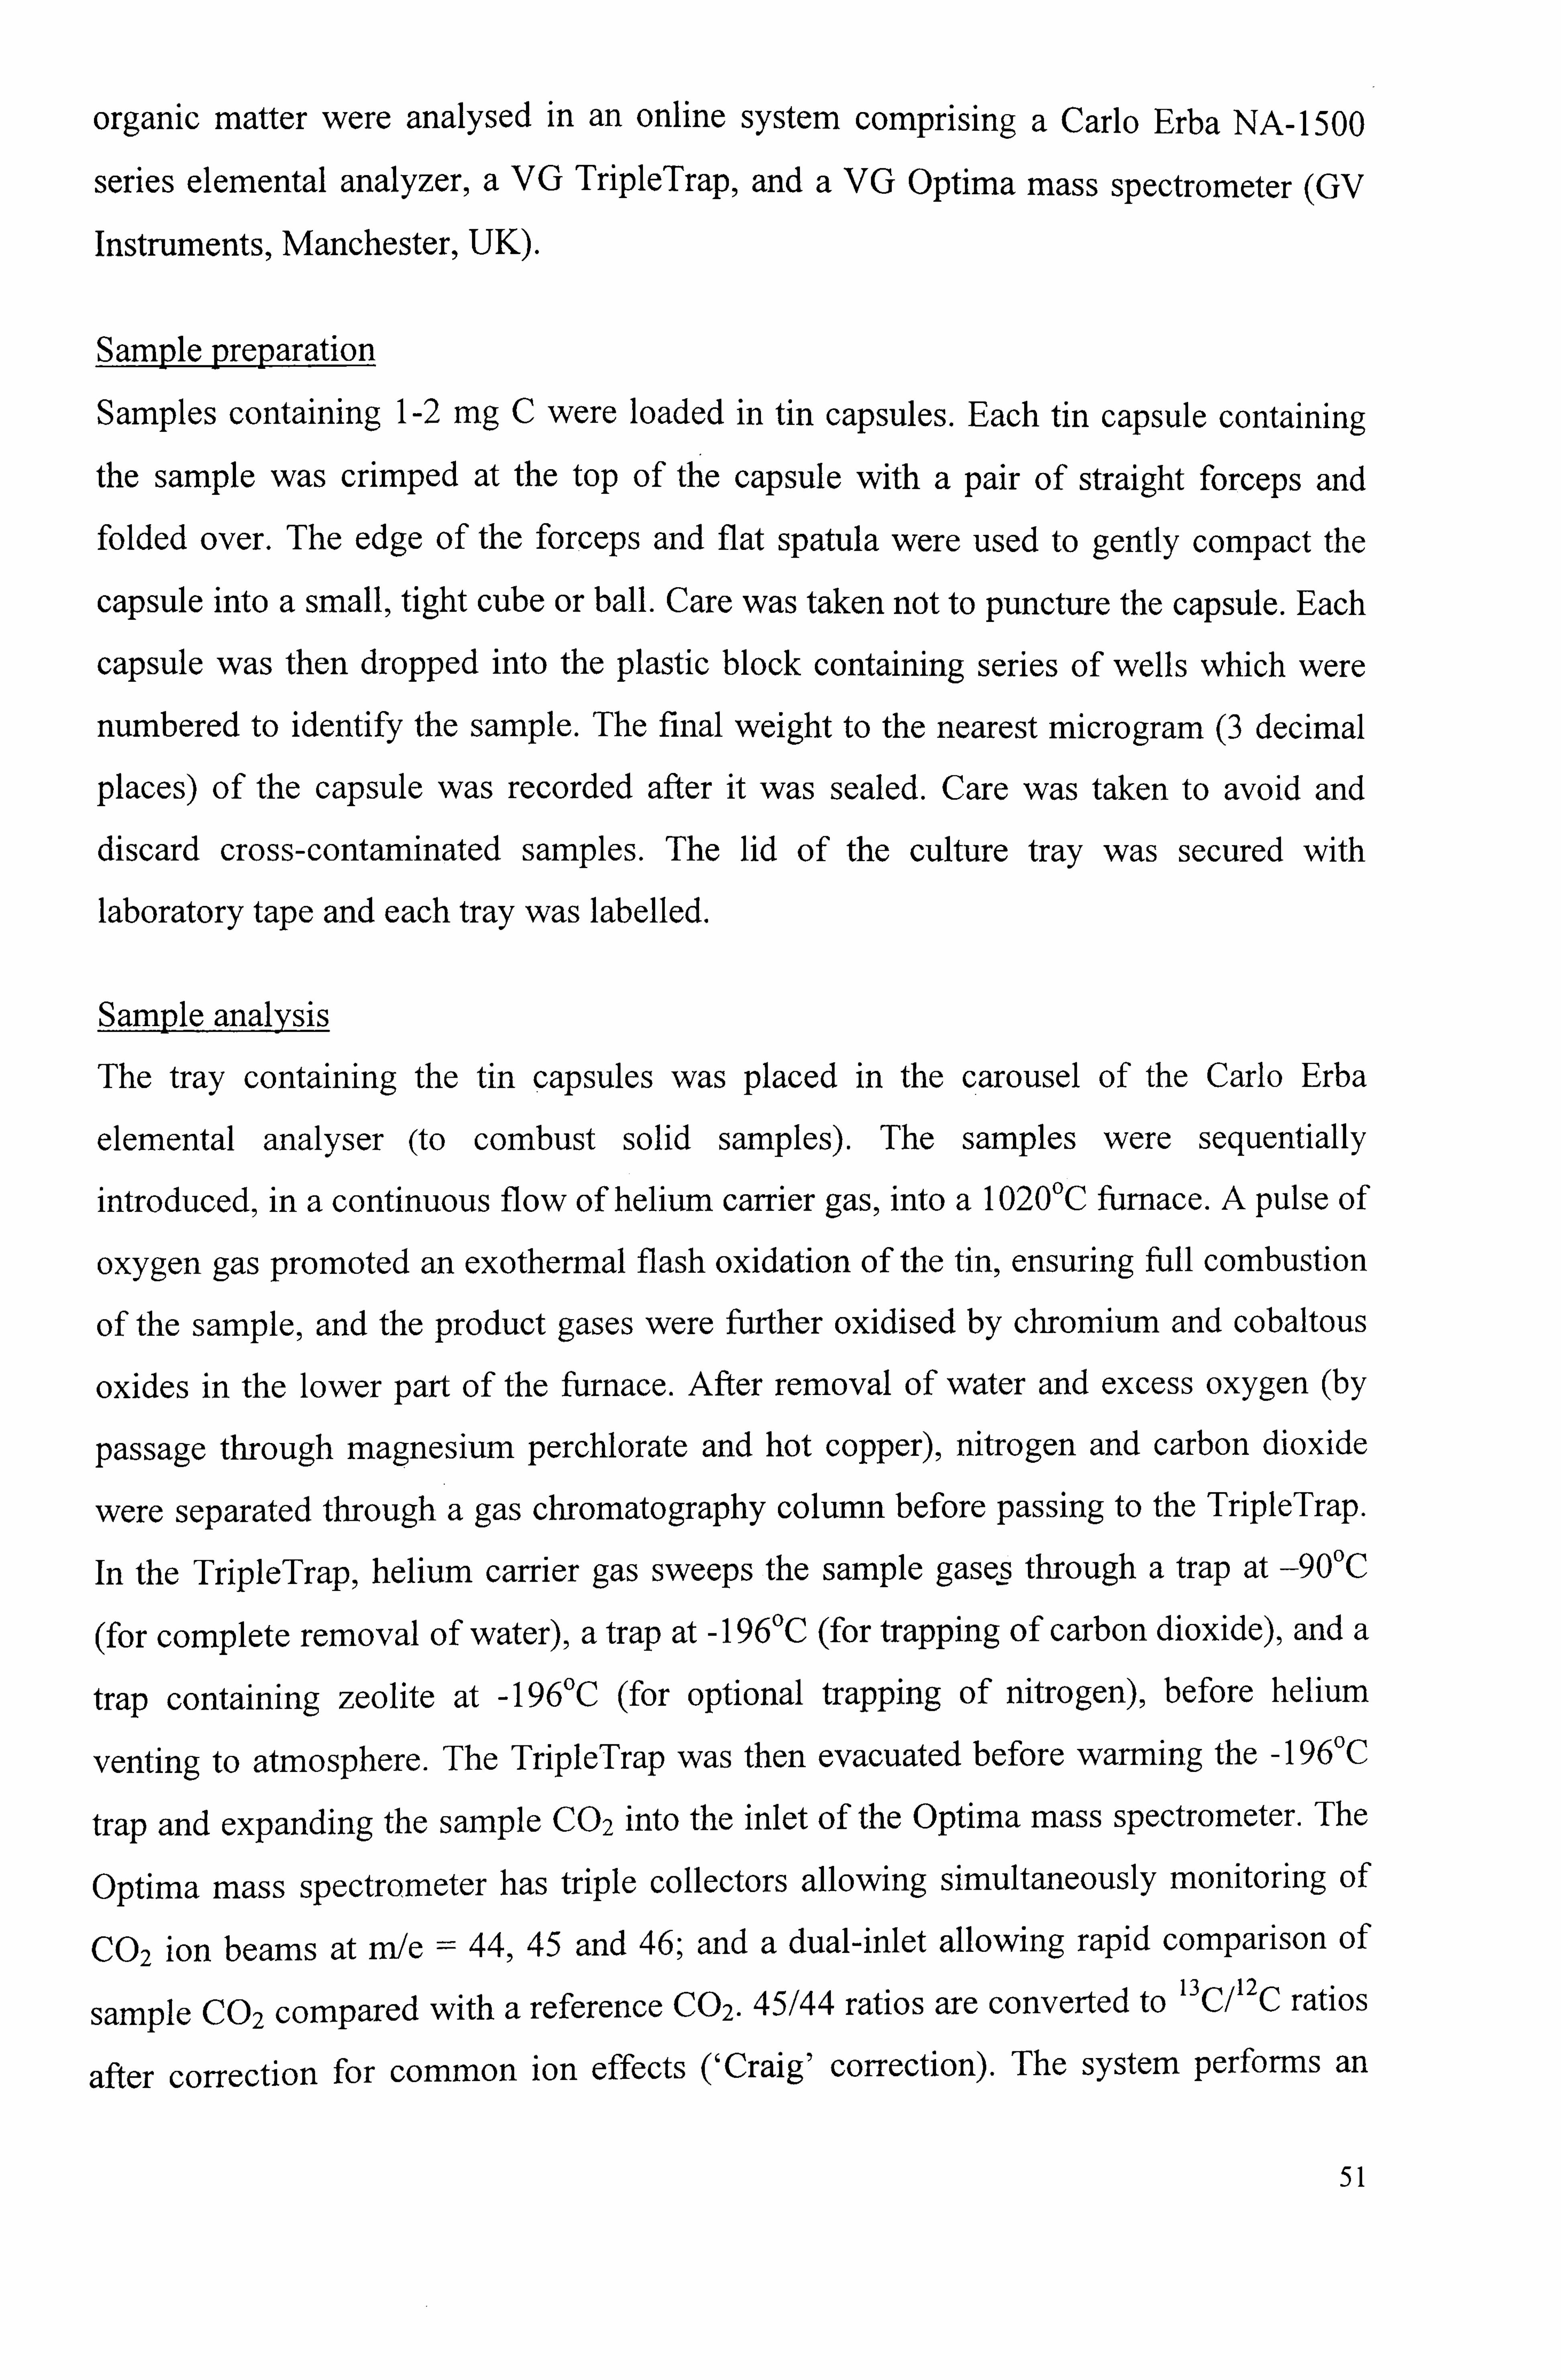
organic matter were analysed in an online system comprising a Carlo Erba NA-1500
series elemental analyzer, a VG TripleTrap, and a VG Optima mass spectrometer (GV
Instruments, Manchester, UK).
Sample preparation
Samples containing 1-2 mg C were loaded in tin capsules. Each tin capsule containing
the sample was crimped at the top of the capsule with a pair of straight forceps and
folded over. The edge of the forceps and flat spatula were used to gently compact the
capsule into a small, tight cube or ball. Care was taken not to puncture the capsule. Each
capsule was then dropped into the plastic block containing series of wells which were
numbered to identify the sample. The final weight to the nearest microgram (3 decimal
places) of the capsule was recorded after it was sealed. Care was taken to avoid and
discard cross-contaminated samples. The lid of the culture tray was secured with
laboratory tape and each tray was labelled.
Sample analysis
The tray containing the tin capsules was placed in the carousel of the Carlo Erba
elemental analyser (to combust solid samples). The samples were sequentially
introduced, in a continuous flow of helium carrier gas, into a 10200C furnace. A pulse of
oxygen gas promoted an exothermal flash oxidation of the tin, ensuring full combustion
of the sample, and the product gases were further oxidised by chromium and cobaltous
oxides in the lower part of the furnace. After removal of water and excess oxygen (by
passage through magnesium perchlorate and hot copper), nitrogen and carbon dioxide
were separated through a gas chromatography column before passing to the TripleTrap.
In the TripleTrap, helium carrier gas sweeps the sample gases through a trap at -900C
(for complete removal of water), a trap at -I 96'C (for trapping of carbon dioxide), and a
trap containing zeolite at -1960C (for optional trapping of nitrogen), before helium
venting to atmosphere. The TripleTrap was then evacuated before warming the -196'C
trap and expanding the sampleC02 into the inlet of the Optima mass spectrometer. The
Optima mass spectrometer has triple collectors allowing simultaneously monitoring of
C02 ion beams at m/e = 44,45 and 46; and a dual-inlet allowing rapid comparison of
sample C02 compared with a referenceC02.45/44 ratios are converted to 13C/12 C ratios
after correction for common ion effects ('Craig' correction). The system performs an
51
automated run on up to 50 samples at a time. In each run two samples of a laboratory
standard were analysed after every ten unknown leaf or grain samples. From knowledge
of the laboratory standard's VC value versus VPDB (Vienna Pee Dee belemnite;
derived from regular comparison with international calibration and reference materials
NBS-19 and NBS-22), the 13C/12 C ratios of the unknown samples were converted to
carbon isotope discrimination (613C) values versus VPDB (Tim Heaton, personal
communication). Standards of broccoli plant material were calibrated against National
Bureau of Standards NBS-19 and NBS-22. Replicate analysis of well-mixed samples
indicated a precision of + <0. I %o (I standard deviation). The resulting 613C values were
used to calculate carbon isotope discrimination (A 13 C), which has a negative linear
relationship with transpiration efficiency (Farquhar and Richards, 1984).
Therefore, 13
C/ 12
C ratio values were expressed as carbon isotope composition (6 13 C)
values [Equation 3.2], where
613C (%o) = [(R sample /R standard)- I] x 1000 .................................
Equation 3.2
13 12 R is the C/ C ratio. The standard for comparison was a broccoli standard calibrated
against Pee Dee belemnite (PDB) carbonate. The value of discrimination (A) against 13 C
is calculated from6aand 6p [Equation 3.3], where 'a' refers to air and 'p' to plant. The
carbon isotope composition of air was taken as -8%o (Farquhar et al., 1989):
A= (6a -6p A/ (I + 6p) ................................................................
Equation 3.3
200, u
(b)
0*' *-
*
-:
250, u
Plate 3.4 Scanned images of (a) leaf samples and (b) grain samples used for C 13/ C2
analysis, taken using Nikon digital net camera Dn 100 and SMZ 1500 microscope.
52
3.1.4 Environmental measurements
The glasshouse experiments were conducted under natural conditions without any
control of radiation levels, relative humidity and temperature. However, the minimum
temperature of the glasshouse was regulated to avoid risk of frost early in the growing
season. The daily measurements of minimum and maximum temperature were recorded by a data logger (Campbell Scientific CRIO). Only in 2004, four tube solarimeters were
placed at a height of 2m from the ground to measure the incident radiation in the
glasshouse.
3.2 FIELD EXPERIMENTS
The experimental design and plot management for the field experiments are described in
this section as well as crop measurements taken at various growth stages.
3.2.1 Experimental sites and plot management
Three field experiments were carried out. One field experiment was conducted in 2002/3
at the drought-prone site of ADAS Gleadthorpe, Nottinghamshire (55013' N, 10 6';
loamy sand to 35 cm over medium sand; Cuckney Series). The experiment was sown as
a first wheat on 19 October 2002; the previous crop was main crop potatoes. A second
field experiment was sown at University of Nottingham farm, Sutton Bonington (52'
50'N, 10 15'W; stony medium loam to 80 cm over clay; Dunnigton Heath Series) in
2004/5 (Plate 3.5). This experiment was sown as a first wheat on 8 October 2004; the
previous crop was winter oats. A third field experiment in 2003/4 had been previously
sown at University of Nottingham farm, Sutton Bonington (stony medium loam to 80
cm over clay; Dunnigton Heath Series). This experiment was sown on 30 September
2003; the previous crop was winter oats. Due to severe lodging associated with July and
August rainfall significantly above the long-term mean, however, the data from the
experiment in 2003/4 at Sutton Bonington are not discussed in the main section of this
thesis. A Summary of these results is presented in Appendices III-VI. In each
experiment, an Oyjard drill was used to sow seeds at 325 seeds M-2 into 12 rows of 12
and 13.5 cm row width at Gleadthorpe and Sutton Bonington, respectively. A
prophylactic programme of fungicides at GS31, GS39 and GS61 was applied in all
experiments, and herbicides and pesticides were applied depending on prevalent
53

problems and local conditions to control diseases, weeds and pests to minimum levels.
Nitrogen fertilizer was applied as ammonium nitrate prill to ensure that N was not limiting. No plant growth regulator (PGR) was applied at Gleadthorpe. At the more lodging-prone site of Sutton Bonington, PGR as chlon-nequat was applied at GS3 1. Full
details of crop husbandry and the calendar date of operations are presented in Appendix
1.
-
JOWý
-0o
I101 11 1ý
Aý ,i,, -, ,,, III
Plate 3.5. An aerial view of the field experiment at Sutton Bonington in 2004/5 in mid July showing treatment differences between the irrigated and unirrigated plots.
3.2.2 Experimental design and treatments
The experiments at Gleadthorpe and Sutton Bonington used a randomised split-plot
design, with three replicates. The irrigation treatments were randomised on main plots,
and within these, genotypes were fully randomised on sub-plots. Experimental plans are
given in Appendix 11.
3.2.2.1 Experimental treatments
IrriRation treatments (main plots)
Two irrigation treatments: (i) fully irrigated from onset of stem extension (GS3 1) to
harvest and (ii) unirrigated were randomised on main plots. At Gleadthorpe, water was
applied using a linear overhead irrigator and at Sutton Bonington using a trickle
irrigation system. At both sites, water was applied in the irrigated treatment to maintain
54

soil moisture deficit, calculated using the ADAS Irriguide model (Bailey and Spackman,
1996), to <50 % available water (AW) up to GS61 +4 weeks and 75 % AW thereafter.
Irrigation was discontinued completely at full canopy senescence. Unirrigated
treatments in both years did not receive any irrigation. At both sites there were 8m
discard areas between irrigation main plots.
Genotypes (sub-plots)
Thirty three DH lines and their parents, Beaver and Soissons, were randomised in sub-
plots at Sutton Bonington. At Gleadthorpe an additional 13 DH lines were included, so
46 DH lines and their parents, Beaver and Soissons were randomised on sub-plots. The
size of the sub-plot was 1.40 mx 10 in at Gleadthorpe and 1.62 x 12 m at Sutton
Bonington. Parental differences for key physiological traits are given in section 3.1.1.2.
This DH population was physiologically characterised for selected traits and yield
response to drought at ADAS Gleadthorpe in a previous investigation in 1999/2000 and
2001/2 at Gleadthorpe (Foulkes et al., 2002). Based on this information, a subset of six
DH lines and the two parents was selected for intensive study according to values for
key morphological traits (plant height, flag leaf size, presence/ absence of awns and ear
size) (Plate 3.6). The morphological traits based on which of the eight genotypes were
selected are presented in Table 3.2.
Table 3.2 Contrasting morphological traits used for selecting the eight wheat genotypes for intensive measurements.
Genotype Plant height Flag leaf size Presence of awns Ear size
134G Tall Large Awned Large
134E Tall Intermediate Awned Intermediate
21B Semi-dwarf Large Unawned Intermediate
22B Tall Large Unawned Intermediate
35A Tall Intermediate Awned Large
76A Double-dwarf Large Awned Large
Beaver Semi-dwarf Large Unawned Large
Soissons Semi-dwarf Intermediate Awned Intermediate
3.2.3 Crop measurements
Measurements taken in experiments at Gleadthorpe and Sutton Bonington are described
in this section. The experimental years in the text are designated by their harvest years:
i. e. 2002/3 is referred to as 2003.
55
3.2.3.1 Crop development
Dates of reaching different growth stages were based on the decimal code of growth
stages (GS) explained by Zadoks et al. (1974) as revised by Tottman and Broad (1987).
At Gleadthorpe, date of GS61 was assessed in all sub-plots. At Sutton Bonington, the
dates of GS30, GS31 and GS39 were assessed only in sub-plots of four genotypes in
two replicates and the date of GS61 in all sub-plots. For GS30 and GS31, five whole
plants per sub-plot were pulled up and the stage of the main shoot was recorded. For
GS39 and GS61, visual assessment of all shoots was carried out. A growth stage was
assigned when more than 50 % of the main shoots were at the particular stage. Crop
maturity was taken as the date when all the green lamina area had senesced and < 25%
of the stem area was remaining green.
3.2.3.2 Crop height
A few days prior to harvest, crop height to the nearest cm from ground level to the tip of
the ear was measured for five randomly selected fertile shoots per sub-plot.
3.2.3.3 Shoot number, green area and crop dry matter
Gleadthorpe 2003
A few days prior to harvest, approximately 100 shoots were selected at random from each
sub-plot cutting off at ground level. The outer row on either side of the sub-plot was not
sampled and samples were at least 50 cm in from the ends of plots. For the whole of the
sample, ears were cut off at the collar, counted and then threshed. The weight of the grain
and chaff was recorded after drying for 48 h at 800C. The fresh weight of the total straw
was recorded. A 20% sub-sample of straw was taken (by fresh weight) and the weight
recorded after drying at 80'C for 48 h.
Sutton Bonington 2005
At growth stages GS31 and GS61, the quadrat samples were taken for the four selected
genotypes studied in the glasshouse experiments. At harvest, the quadrat samples from 2
each sub-plot were taken for the eight selected genotypes. The quadrat size was 0.72 m
(1.2 x 0.6 m). All plant material was sampled within one quadrat per sub-plot, oriented
so that rows ran parallel with the 0.6 m sides of the quadrat. The sample size included
56
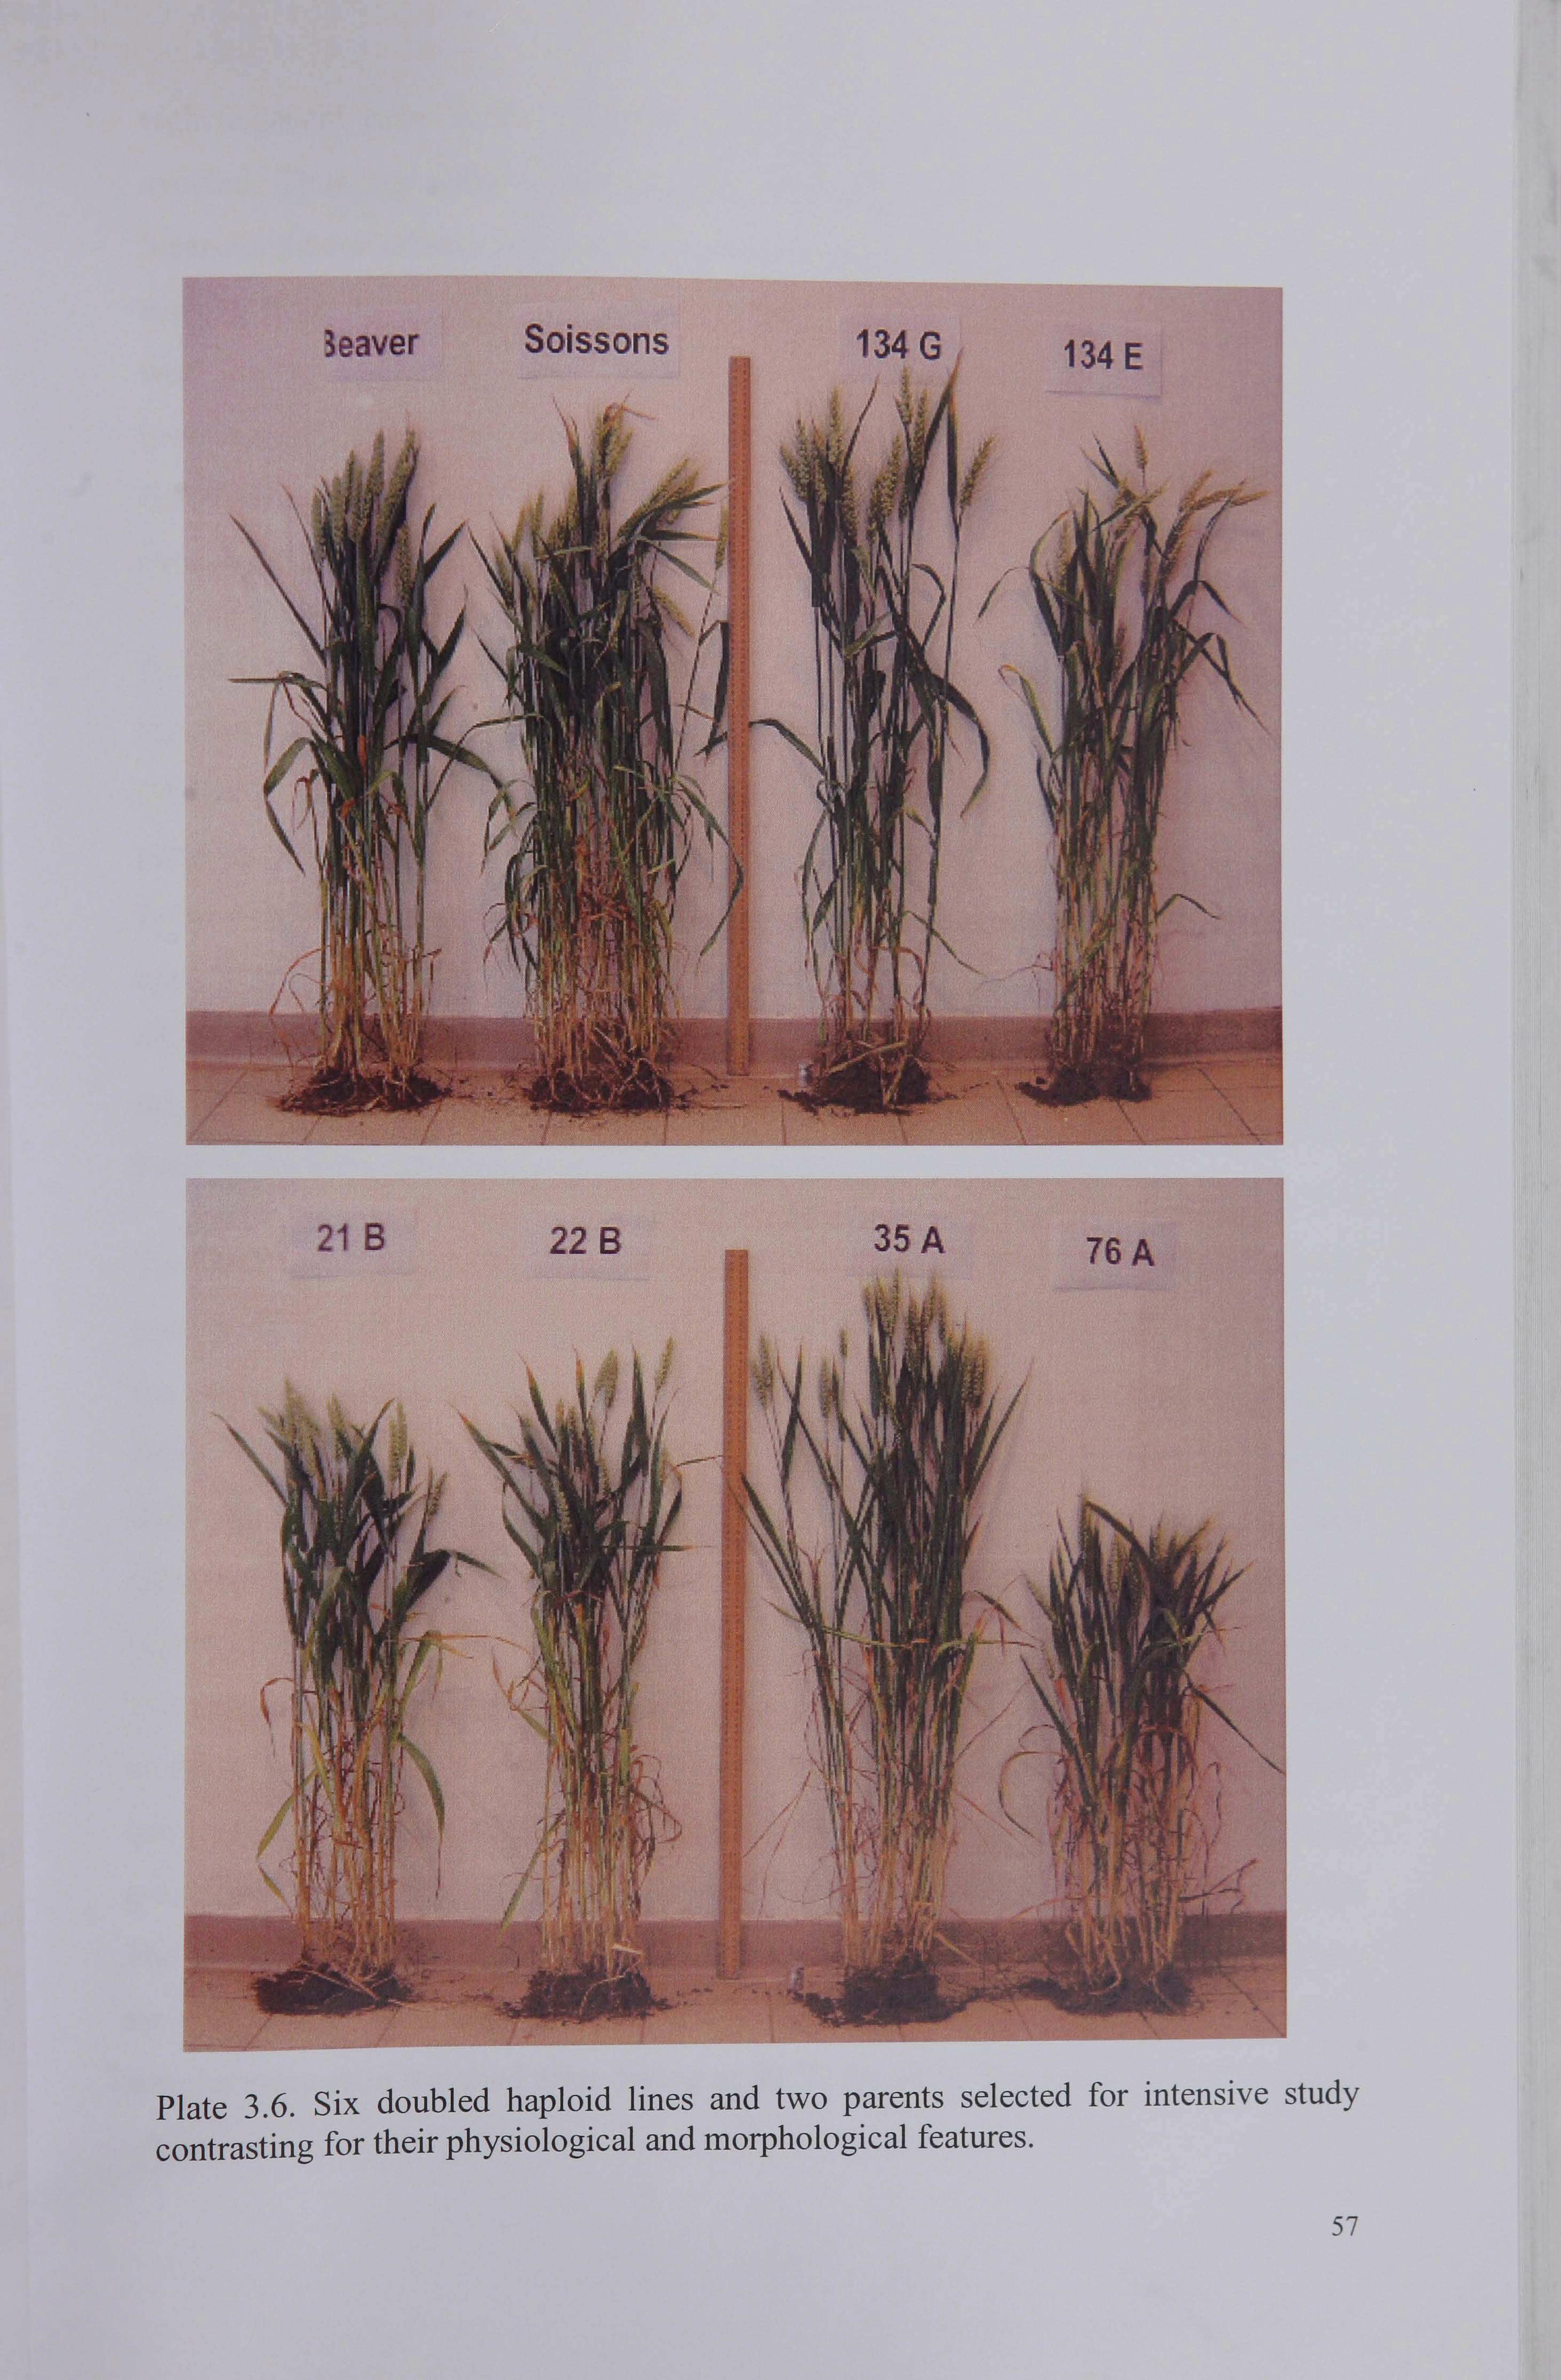
An
3eaver Soissons
21 B 22 B
134 G
35 A
134 E
76 A
57
eight adjacent rows in the sub-plot and the outer two rows of the sub-plot were avoided. Thus, the sub-plot sample size was 0.63 M2 (8 x 0.132 x 0.6). To avoid 'near-neighbour'effects, the quadrats were placed at least 0.5 m apart and at least two
rows in from the edges of the sub-plot and 0.5 m from their ends. At GS31 plants were dug up with their roots, which were later cut off in the laboratory at 'ground level' and discarded. At later growth stages, plants were cut at the ground level in the field. All the samples were stored in a cold room at 4 OC and growth analysis was carried out within 4d of sampling.
At GS31 and GS61, the total fresh weight of all the above-ground plant material was
recorded. An approximately 10% sub-samPle by fresh weight (SSI) was then
randomly taken, and kept for further analysis. At GS3 1, the weight of the remaining
plant material (90%) was recorded after drying at 80 OC for 48 hours. At GS61, a ftirther sub-samPle (SS2) in addition to the SSI sub-sample was taken as an
approximate 20 % sub-sample by fresh weight and weighed after drying at 80 T for
48 h. After the SSI and SS2 sub-samples had been taken the remainder of the
-2 original sample was discarded. Above-ground dry weight M was calculated on the basis of the 90% sub-sample at GS31 and the SS2 sub-sample at GS61.
The SSI sub-sample was split into three categories of shoots defined as: (a)
potentially fertile shoots (when the shoot showed no signs of yellowing at the tips of
the youngest leaves at GS3 1, and when the shoot had an ear at GS6 1), (b) dying
shoots (when the newest expanding leaf had begun to turn yellow at the tip), and (c)
dead shoots (when the shoot had no green material). The shoot number for each
category was recorded. The dry weight of the dying and dead shoots was recorded
separately after drying at 800C for 48 h. For the potentially fertile shoots, the material
was separated into: (a) green leaf lamina (severed at ligule), (b) green true stem with
attached leaf sheath, (c) non-green stem with attached leaf sheath, (d) dead leaf
lamina (i. e. non-green - severed at ligule), (e) green ears (cut at the collar) and non-
green ears. The dry weight of each component recorded after drying at 80 T for 48 h.
The projected areas of green lamina, green stem with attached leaf sheath and green
ear components were measured using a Li-Cor 3 100 leaf area meter; and then the
samples were then weighed after drying at 80 OC for 48 h. The green area index (GAI,
58
defined as the green canopy area per unit ground area) was calculated after summing
up the green areas of the lamina, stem and ear fractions.
At the sampling at harvest, shoots from the whole 0.63 M2 sub-plot sample were
counted in two categories: (a) fertile shoots (those with an ear), (b) infertile shoots (those without an ear). The infertile shoots were weighed after drying at 80 OC for 48
h. The ears from the fertile shoots were cut off and the fresh weight of straw was
recorded. A 25 % sub-sample by fresh weight was taken, and the material separated into (a) leaf lamina, (b) stem and leaf sheath and (c) ear. The components were
weighed after drying for 48 h at 800C. The ears were threshed and the grain and chaff
collected and weighed after drying at 80 OC for 48 h. A 40 g sub-sample of dried
grain was taken and cleaned by removing the broken grains. The grains were then
counted using a Contador seed counter (Muffer inc., Germany) and the dry weight
of the sample recorded. From this, the I 000-grain weight was recorded.
3.2.3.4 Lodging assessment
When lodging was observed, assessments of its incidence were made. A visual
assessment of the percentage area of the crop which was lodged (lodging defined as
when crop lodges between 45' and 90' from the vertical) was made of the whole sub-
plot, including its edges, by walking around the plot perimeter. Two assessments of
crop lodging were carried out, on 21 June (GS61+3 weeks) and 15 September 2004
(harvest). The results for percentage plot lodged at the time of harvest are given in
Appendix V.
3.23.5 Combine grain yield and thousand grain weight at harvest
Prior to harvesting, tram-lines were cut-out. The sub-plot lengths of the resultant
combine areas at Gleadthorpe (1.40 m by approximately 5 m) and Sutton Bonington
(1.62 m by approximately, 10 m) were recorded accurately. Combine grain yield was
measured for all sub-plots. All combined grain from each sub-plot was weighed on
the combine. Immediately after harvest, a 250 g sub-sample of grain was accurately
weighed and then reweighed after drying at 80'C for 48 h, allowing sub-plot yields to
be expressed as tonnes per hectare (t ha-1) at 85 % dry matter. A further 75 g sub-
59
sample of grain was taken from each combine sample and cleaned by removing all broken grain. The number of grains and the weight of each sample after drying at 800C for 48 h were recorded. The thousand grain weight was then calculated.
3.2.3.6 Gas-exchange measurements
In each experiment, gas-exchange measurements of photosynthetic rate, stomatal
conductance and inter-cellular C02 concentration were recorded weekly at Gleadthorpe in 2003 and twice weekly at Sutton Bonington in 2004 and 2005 (from
GS39 to GS61+ 5 weeks) on the eight selected genotypes for all sub-plots as detailed
in sub-section 3.1.7.
3.2.3.7 Carbon isotope composition analysis
In 2003 and 2005, for each sub-plot samples from grain from the combine were oven- dried for 48 h at 80 ' C. These samples were ground to a fine powder and then
submitted to analysis using the mass spectrometer for A 13 C determination as described in sub-section 3.1.3.8.
3.3 DATA HANDLING AND STATISTICAL ANALYSIS
Data were entered into EXCEL 2003 (Microsoft Corporation) spreadsheets and
analysed using GENSTAT 8.1 (Lawes Agricultural Trust, Rothamsted Experimental
Station). Standard analysis of variance procedures for a two-way ANOVA (no
blocking) or a two-way ANOVA in randomised blocks for glasshouse data and a
split-plot design in randomised blocks for field data were used to calculate treatment
means, standard errors and significant differences between treatment means.
Replications were regarded as random effects, while irrigation treatment and
genotype were fixed effects. For ANOVAs across seasons, Bartlett's test (P = 0.05)
was used to test for the homogeneity of variances, and site/seasons were regarded as
random effects. The mean square for the year or site/season effect was tested against
an error mean square representing the variation between blocks within site/seasons.
The mean square of the genotype and year or site/season x cultivar effects was tested
against an error B mean square representing residual variation. Treatment means
were compared using the least significant difference of the means of Fisher,
60
calculated from standard errors of the difference of the means using appropriate degrees of freedom, when the ANOVA indicated significant differences. In
glasshouse experiments, standard linear regression analysis was performed to determine the water-use efficiency of irrigation x genotype treatment combinations as the slopes of the respective regressions of cumulative dry matter on cumulative water use. Parallel regression analysis (simple linear regression with groups) was used to test for differences between treatment combinations in each year separately. Pooled
analysis of data across site/seasons was carried out wherever it was appropriate. Genetic correlations between traits and between respective traits and grain yield were calculated using the genotype means. The effects of presence/ absence of IBUIRS or of Rht genes were tested as a contrast between two levels of the main effects of DH lines. Treatment means for IBLARS or 113 or for the At], Rht2, Rht]+Rht2 and rht
groups of lines were compared using the variance ratio since there were only two levels
for the comparison. The classification of IBUIRS and Rht lines were done at JIC
(DEFRA, 2001).
3.4 GENETIC ANALYSIS
The target traits such as A 13C, grain yield and thousand grain weight were selected for phenotypic evaluation. The phenotype data of these target traits and genotype data
of BxS mapping population were analysed using the computer software package
MapQTL version 5 (van Ooijen, 2004). The QTL analysis was done separately for
Gleadthrope (2002/3) and Sutton Bonington (2004/5) experimental sites. The
procedures involved in the QTL analysis are presented here.
3ALI Construction of genetic map
Initial mapping work at John Innes Centre, Norwich, in collaboration with University
of Nottingham and ADAS on the original 49 lines of the Beaver x Soissons mapping
population was carried out in a DEFRA Project OC9602 'Maintaining wheat
performance through improved resistance to drought' using simple sequence repeats
(SSR), amplified fragment length polymorphisms (AFLP), storage protein (Glutenin)
loci and the major dwarfing genes Rht-B] and Rht-D] (Verma et aL, 2004). In a
further collaborative DEFRA project 'Physiological traits influencing hardness and
vitreosity in wheat grain' this skeletal map was expanded at the John Innes Centre
61
using further SSR markers to give a more comprehensive coverage (DEFRA, 2004). This included extending the SSR marker coverage to 65 lines to develop a more accurate map. For SSR analysis, the sets of Publicly available GWM (Roder et al., 1998), PSP (Bryan et al., 1997), wheat microsatellite consortium, and BARC (Somers et al., 2004) marker primer pairs were tested on the parents for
polymorphism. From this parental screen, markers were chosen for mapping which gave easily scored polymorphisms. Fragments amplified by PCR (polymerase chain reaction) for all the DH lines and parents were separated on 5% polyacrylamide gels
at 90 W for 1.5 h. The amplified fragments were visualized by silver staining.
From the characterized genotype data, map construction was carried out using JoinMap version 2.0 (Stam, 1993). The Kosambi mapping function (Kosambi, 1944)
was used to calculate the centiMorgan (cM) distances. In total, 107 SSR markers
mapped into 33 linkage groups using JoinMap and an extra 19 markers were incorporated into the map by calculating recombination distances to the nearest linked marker using consensus maps.
3.4.2 QTL Analysis
The approach used in the present work, where the population size is relatively small,
was first to search for QTLs by applying analyses of variance (ANOVA) to partition
the variation within and between genotypes for each marker in turn on each linkage
group. Thus, for each marker the population was characterized into the two
homozygous classes and an ANOVA carried out to detect the additive effect of each
locus. If a significant difference was found, then a QTL linked to the marker locus
was indicated. The ANOVA tests carried out on the target traits confirmed normal
distribution of data.
More sophisticated analyses were then carried out to more accurately locate QTLs
onto specific regions of the genome using least squares techniques for flanking
marker models. Two separate statistical procedures were applied, interval mapping
(Haley and Knott, 1992) and marker regression (Kearsey and Hyne, 1994). Only the
interval mapping results are presented on account of their accuracy over simple
marker regression analysis. For analysing the data for two environments
62
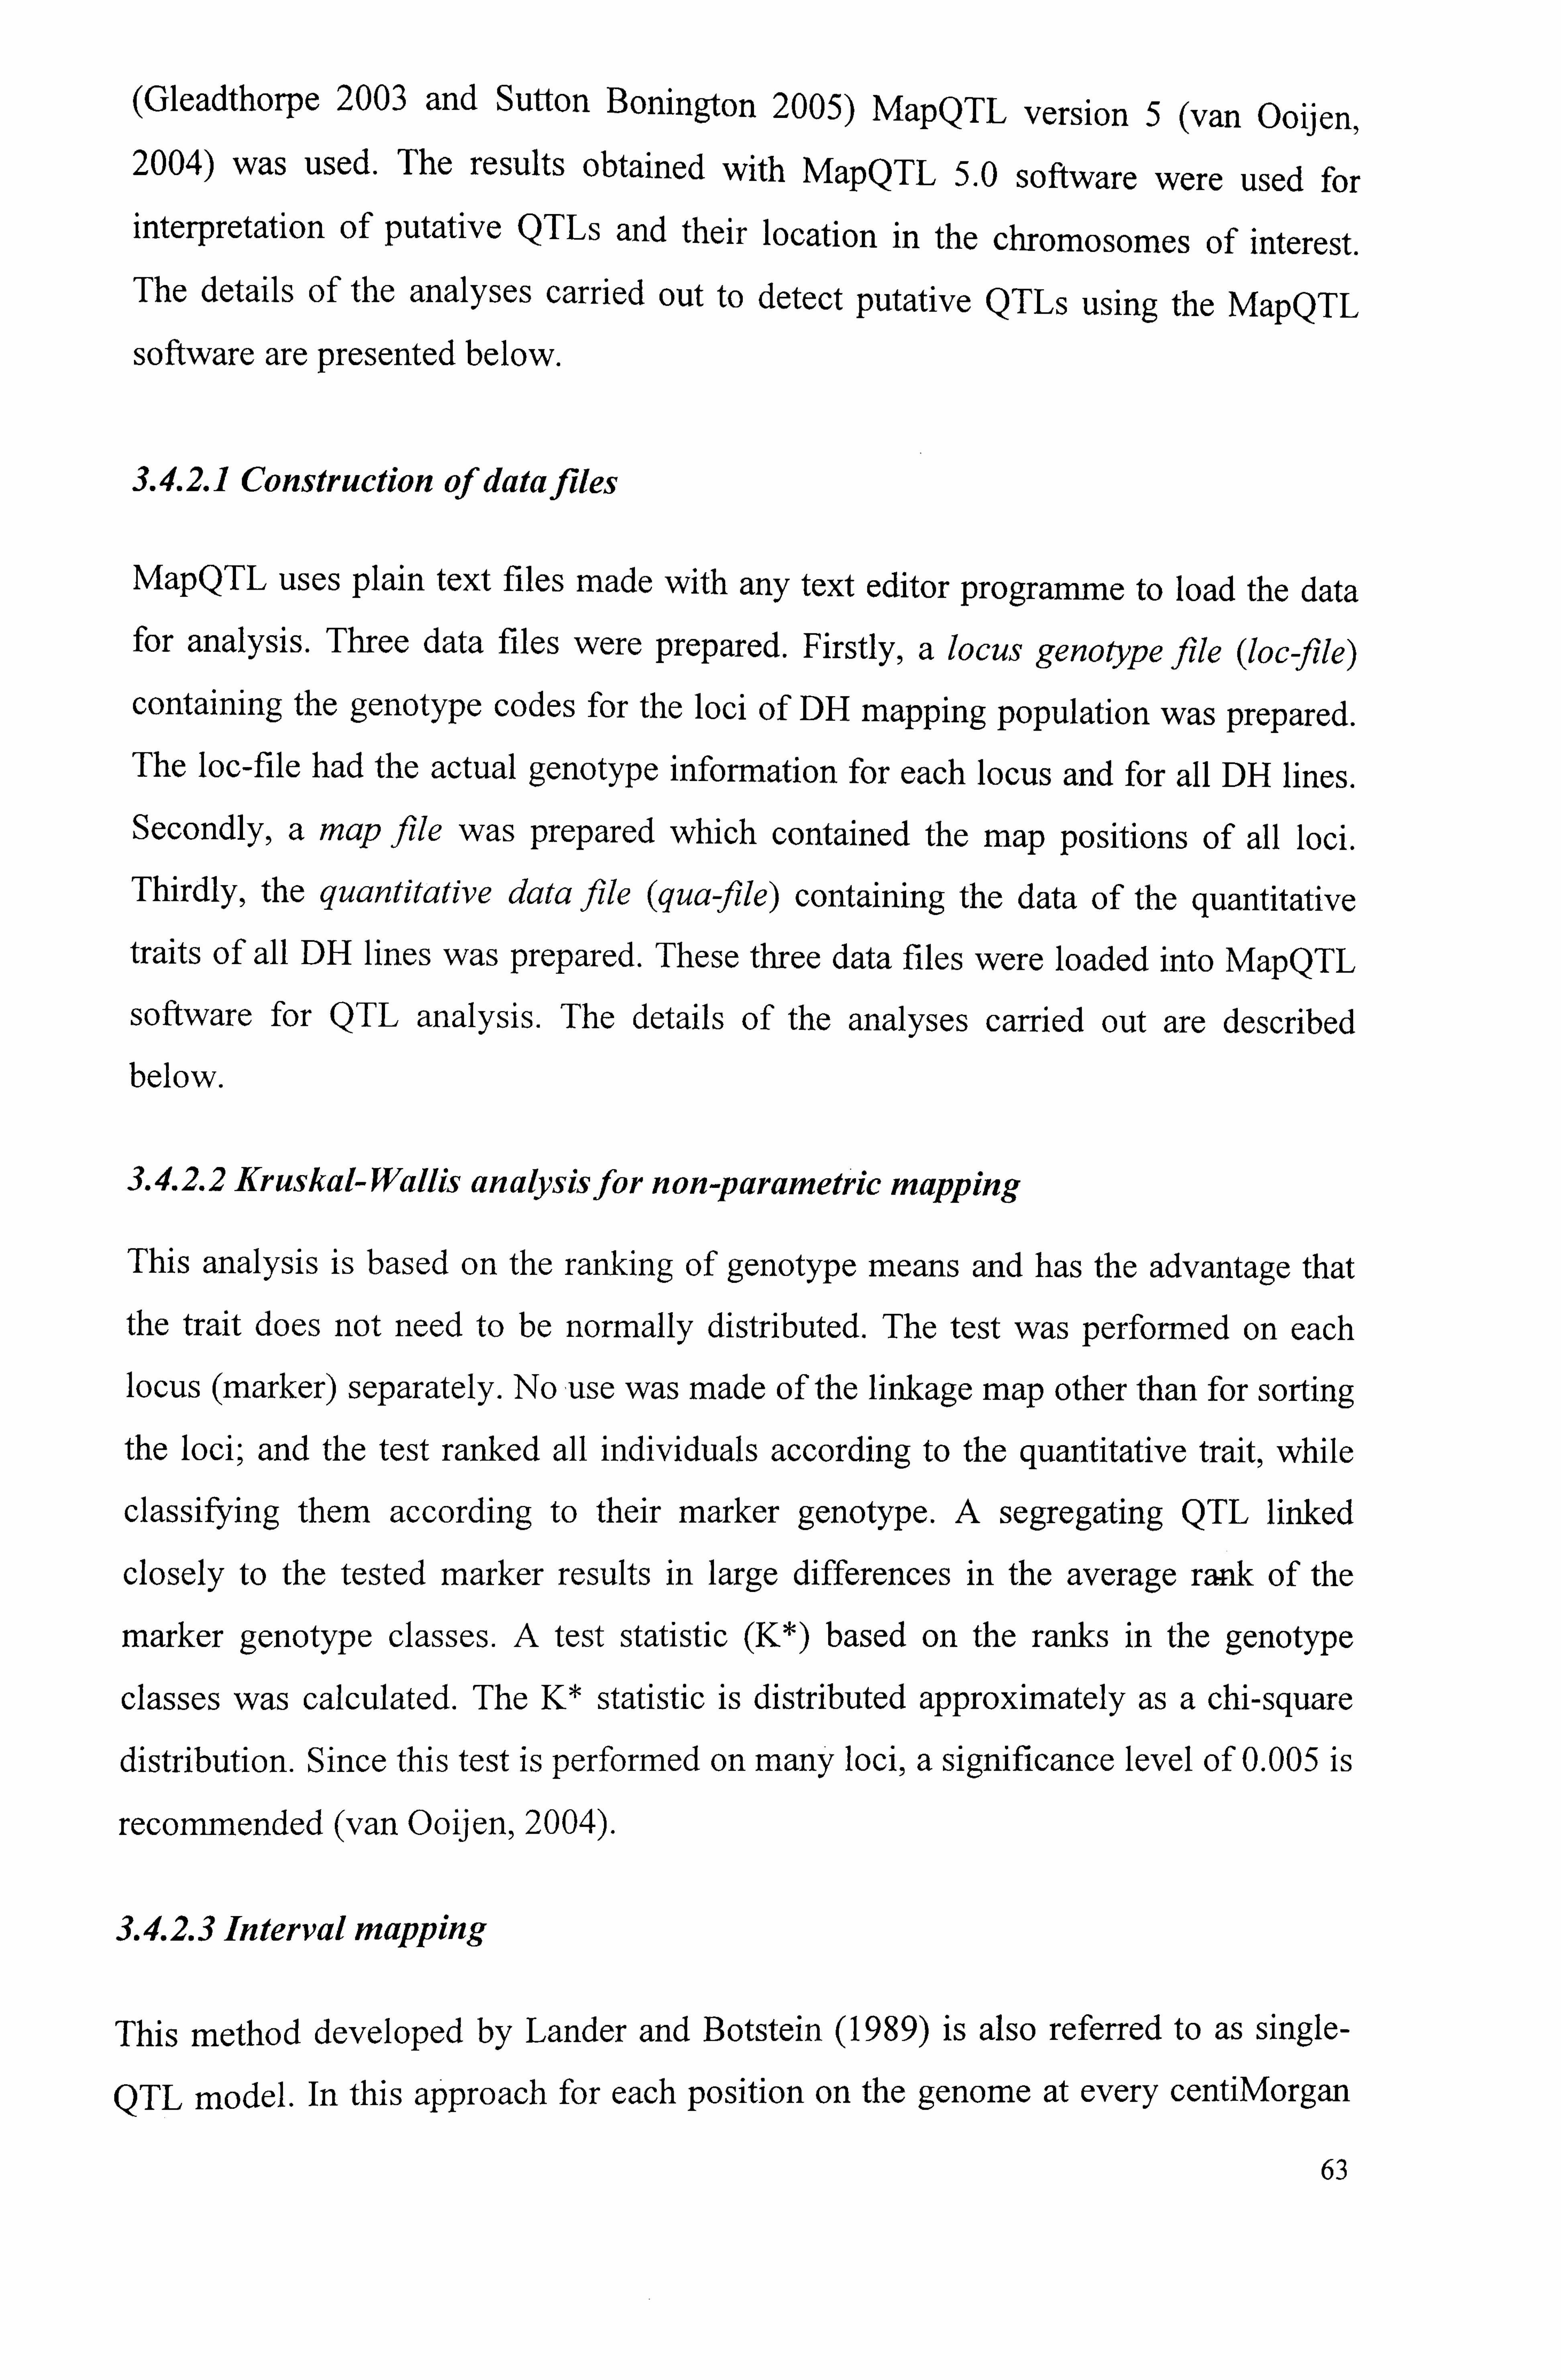
(Gleadthorpe 2003 and Sutton Bonington 2005) MapQTL version 5 (van Ooijen, 2004) was used. The results obtained with MapQTL 5.0 software were used for interpretation of putative QTLs and their location in the chromosomes of interest.
The details of the analyses carried out to detect putative QTLs using the MapQTL
software are presented below.
3.4.2.1 Construction of dataftles
MapQTL uses plain text files made with any text editor programme to load the data
for analysis. Three data files were prepared. Firstly, a locus genotype file (loc-fille)
containing the genotype codes for the loci of DH mapping population was prepared. The loc-file had the actual genotype information for each locus and for all DH lines.
Secondly, a map file was prepared which contained the map positions of all loci.
Thirdly, the quantitative data file (qua-file) containing the data of the quantitative
traits of all DH lines was prepared. These three data files were loaded into MapQTL
software for QTL analysis. The details of the analyses carried out are described
below.
3.4.2.2 Kruskal-Wallis analysisfor non-parametric mapping
This analysis is based on the ranking of genotype means and has the advantage that
the trait does not need to be normally distributed. The test was performed on each
locus (marker) separately. Nouse was made of the linkage map other than for sorting
the loci; and the test ranked all individuals according to the quantitative trait, while
classifying them according to their marker genotype. A segregating QTL linked
closely to the tested marker results in large differences in the average rank of the
marker genotype classes. A test statistic (K*) based on the ranks in the genotype
classes was calculated. The K* statistic is distributed approximately as a chi-square
distribution. Since this test is performed on many loci, a significance level of 0.005 is
recommended (van Ooijen, 2004).
3.4.2.3 Interval mapping
This method developed by Lander and Botstein (1989) is also referred to as single-
QTL model. In this approach for each position on the genome at every centiMorgan
63
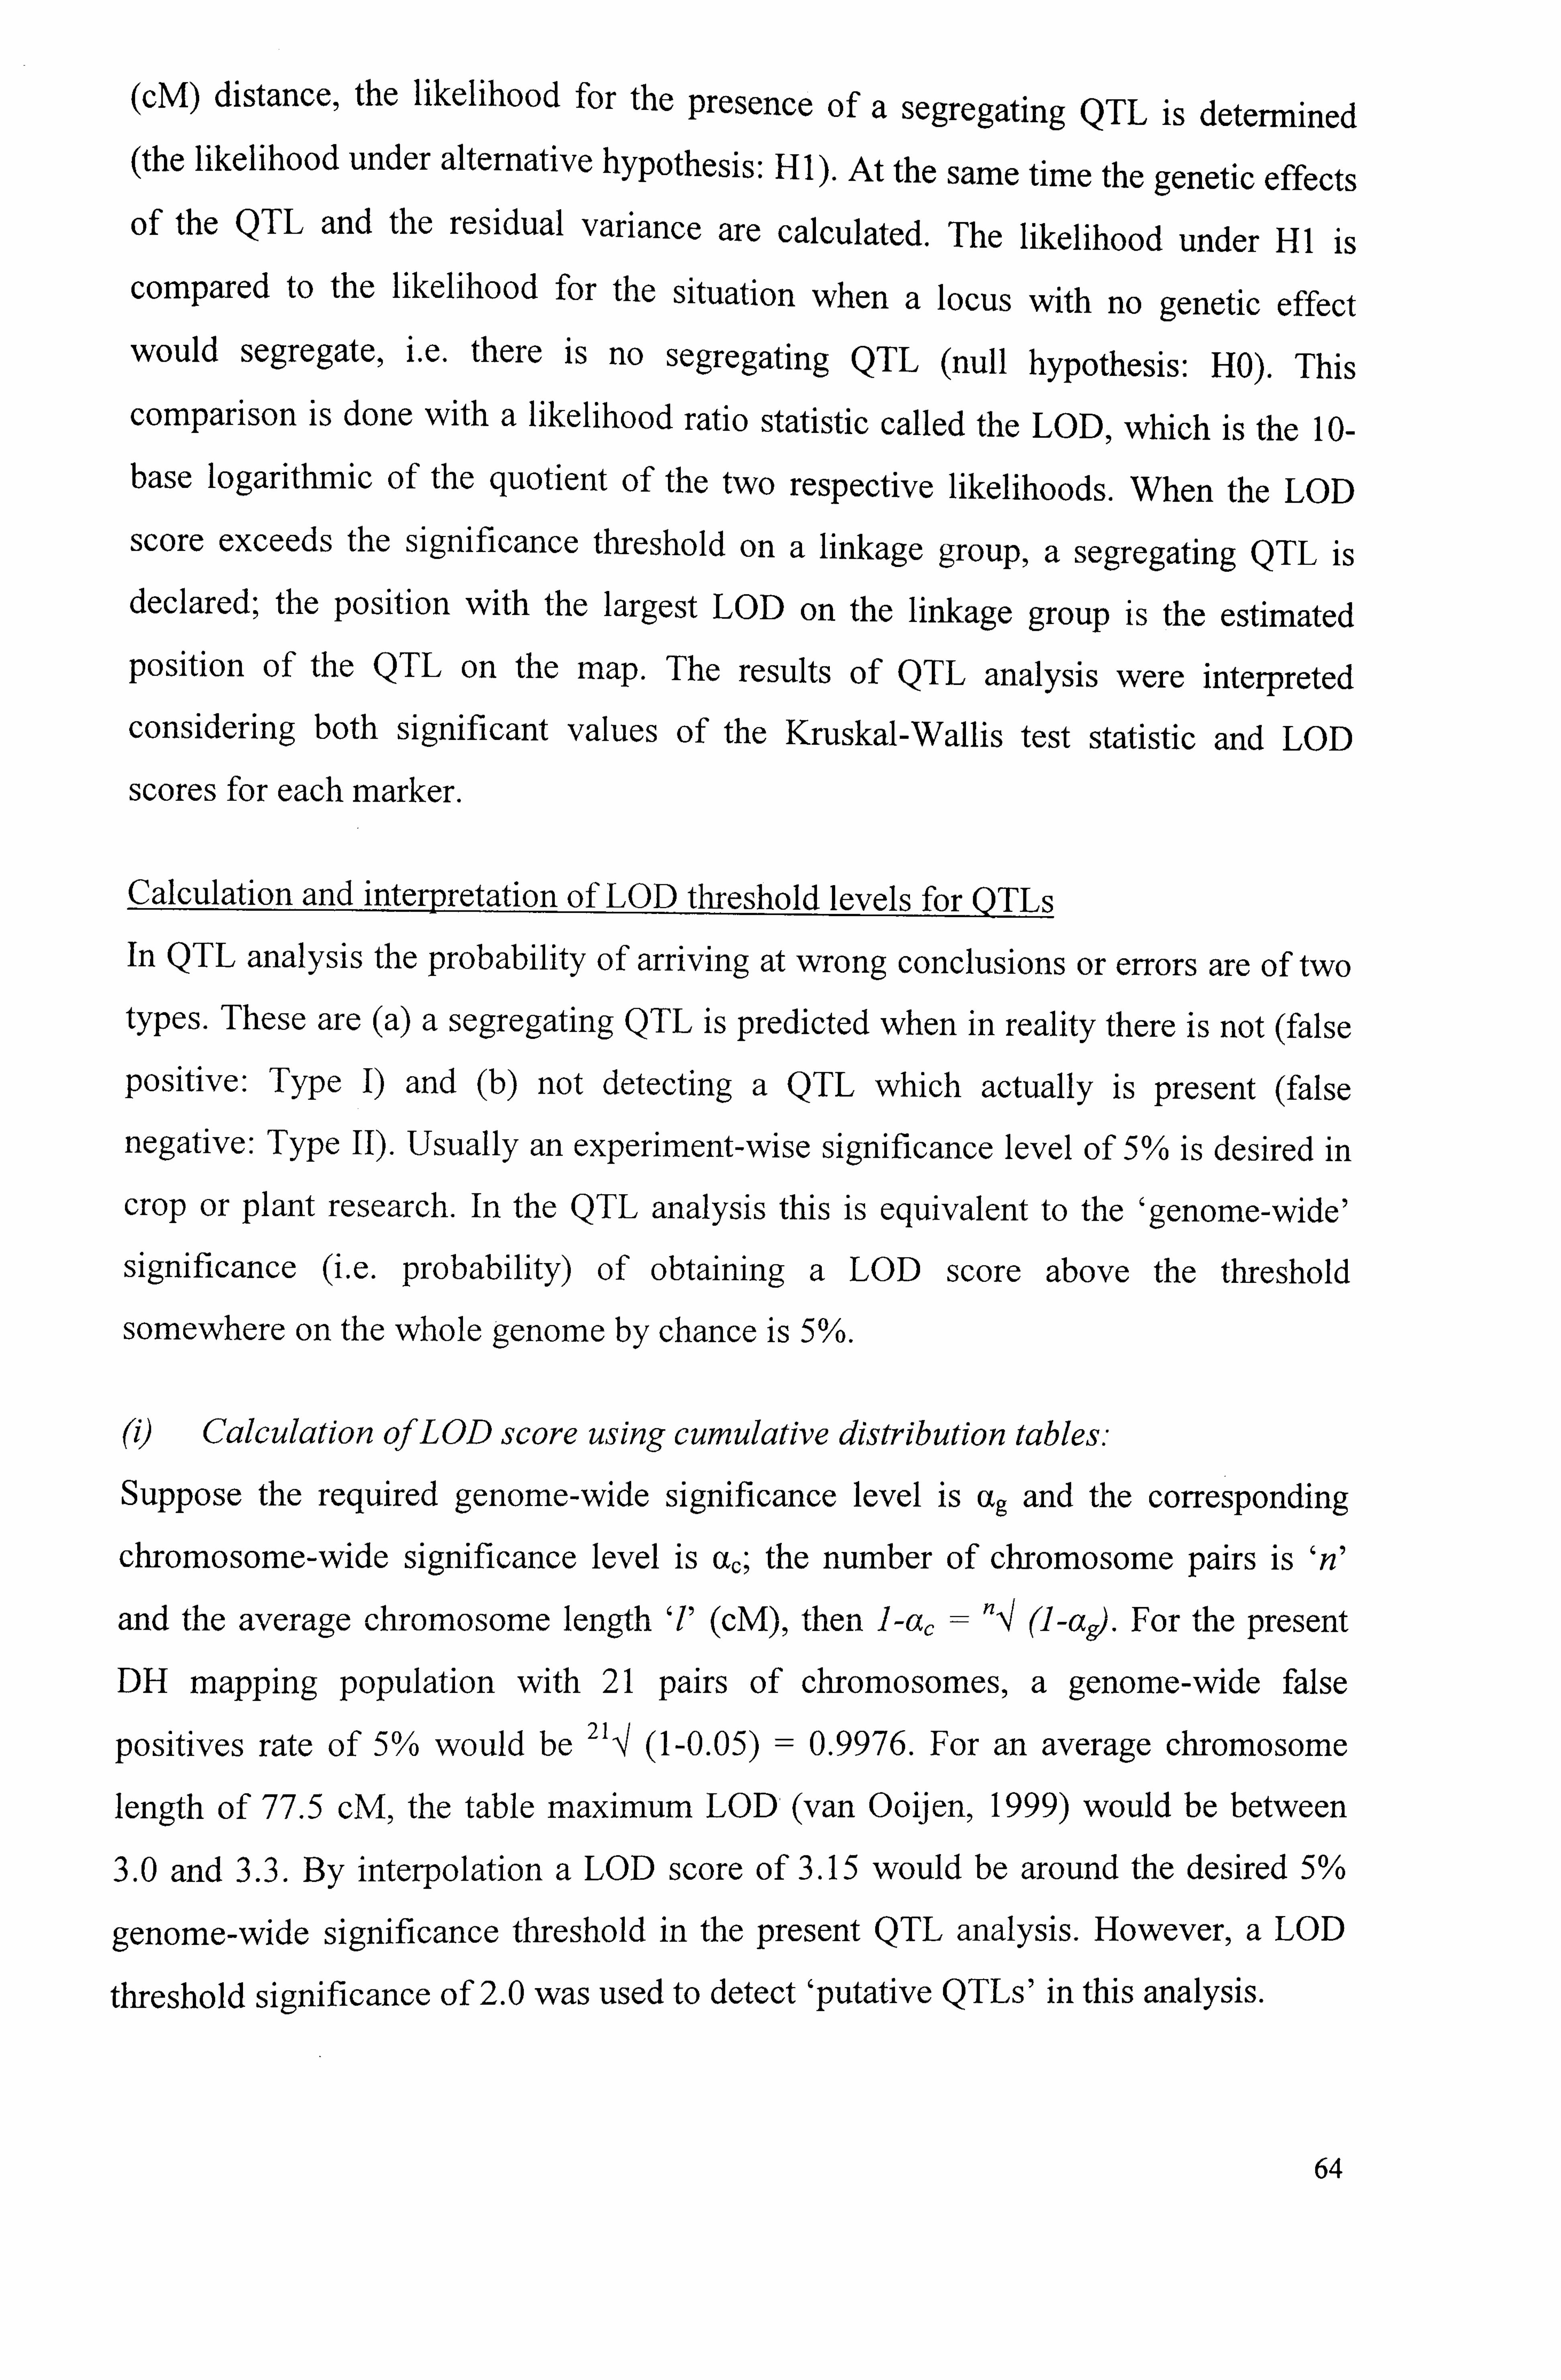
K
(cM) distance, the likelihood for the presence of a segregating QTL is determined (the likelihood under alternative hypothesis: HI). At the same time the genetic effects of the QTL and the residual variance are calculated. The likelihood under HI is
compared to the likelihood for the situation when a locus with no genetic effect would segregate, i. e. there is no segregating QTL (null hypothesis: HO). This
comparison is done with a likelihood ratio statistic called the LOD, which is the 10- base logarithmic of the quotient of the two respective likelihoods. When the LOD
score exceeds the significance threshold on a linkage group, a segregating QTL is declared; the position with the largest LOD on the linkage group is the estimated
position of the QTL on the map. The results of QTL analysis were interpreted
considering both significant values of the Kruskal-Wallis test statistic and LOD
scores for each marker.
Calculation and inteEpretation of LOD threshold levels for QTLs
In QTL analysis the probability of arriving at wrong conclusions or errors are of two
types. These are (a) a segregating QTL is predicted when in reality there is not (false
positive: Type 1) and (b) not detecting a QTL which actually is present (false
negative: Type 11). Usually an experiment-wise significance level of 5% is desired in
crop or plant research. In the QTL analysis this is equivalent to the 'genome-wide'
significance (i. e. probability) of obtaining a LOD score above the threshold
somewhere on the whole genome by chance is 5%.
(i) Calculation ofLOD score using cumulative distribution tables:
Suppose the required genome-wide significance level is ag and the corresponding
chromosome-wide significance level is a,; the number of chromosome pairs is W
and the average chromosome length T (cM), then I-a, =N (]-ad. For the present
DH mapping population with 21 pairs of chromosomes, a genome-wide false
positives rate of 5% would be 21ý (1-0.05) = 0.9976. For an average chromosome
length of 77.5 cM, the table maximum LOD (van Ooijen, 1999) would be between
3.0 and 3.3. By interpolation a LOD score of 3.15 would be around the desired 5%
genome-wide significance threshold in the present QTL analysis. However, a LOD
threshold significance of 2.0 was used to detect 'putative QTLs' in this analysis.
64

(ii) Calculation of LOD score using a permutation test:
The estimation of LOD threshold significance by the table method was refined more
accurately by permutation tests. This test was perfon-ned for interval mapping. Over a
set of permutations the frequency distribution of the maximum LOD score was determined. In each iteration, the quantitative data were permuted over the
individuals while the marker data remain fixed. Subsequently interval mapping was done on the obtained data set. The number of permutations was set to 10,000
iterations and the frequency distributions were obtained for each linkage group and
genome-wide as a whole. A threshold significance with a P-value 0.05 was used to
find the interval (as LOD score) in the results of permutation test where the 'relative
cumulative count' (cumulative count ., total number of permutations) was about I-
0.05=0.95 or the first higher value. By this method, the genome-wide significance of 5% again indicated threshold significance for LOD for different loci which ranged
from 3.1-3-4.
3.4.2.4 MQM mapping
This is based on multiple QTL models developed by Jansen (1993) and Jansen and
Stain (1994). This approach involves use of significant markers as cofactors on the
other chromosomes,, with additive and dominant gene action only. This method
utilizes approaches (i) to look for putative QTLs by interval mapping (ii) close to
detected QTLs markers are selected as cofactors to take over the role of the nearby
QTLs in the approximate multiple QTL models used in the subsequent MQM
mapping. Fitting the selected cofactors will reduce the residual variance. If a QTL
explained larger total variance, then the linked marker was used as a cofactor in
subsequent MQM mapping enhance the power of search for other segregating QTLs.
In the present analysis only for a few putative QTLs MQM mapping was applied to
sort the segregating QTLs.
65

CHAPTER 4: WATER USE AND WATER-USE EFFICIENCY OF WHEAT GENOTYPES IN GLASSHOUSE EXPERIMENTS
This chapter describes results from two glasshouse experiments conducted during 2003
and 2004. The differences between four winter wheat genotypes, contrasting for
morpho-physiologica I characteristics, on water uptake, water-use efficiency and dry
matter growth were examined.
4.1 RESULTS
4.1.1 Weather
The temperature data collected for glasshouse experiments in 2003 and 2004 are
presented in Figure 4.1 (a - b), along with development data for the wheat genotypes. In
2003, both minimum temperature and maximum temperature increased during the
season reaching maximum values of 23.4 T and 40.5 T respectively on 9 August
corresponding to the late grain filling stage. Unusually high temperatures after booting
and during grain filling phase (Figure 4.1 (a)) resulted in poor spikelet fertility and grain
filling in 2003. In 2004, the maximum temperature exceeded 30 OC one week before flag
leaf emergence and 4-5 days before anthesis. However, temperatures tended to remain
stable in the range of 20-25 OC during most of the crop cycle (Figure 4.1 (b)).
4.1.2 Plant development
Soissons was the fastest developing genotype to all stages followed by lines 134G, 134E
and then Beaver (Table 4.1). Soissons flowered 9 and 7 days earlier than Beaver in 2003
and 2004, respectively, with intermediate values for the other two lines. Similar
differences were observed earlier in the season at onset of stem extension (GS3 1). Line
134G flowered one day earlier than 134E (Table 4.1). Averaging across genotypes, the
period of stem extension from GS31 to GS61 was 46 days in 2003 and 54 in 2004. In
2003, Beaver was relatively later at all the growth stages compared to 2004 probably
owing to lack of vernalization temperatures during early growth. Irrigation delayed
flowering in the range 1-5 days in 2003 and 1-2 days in 2004.
66
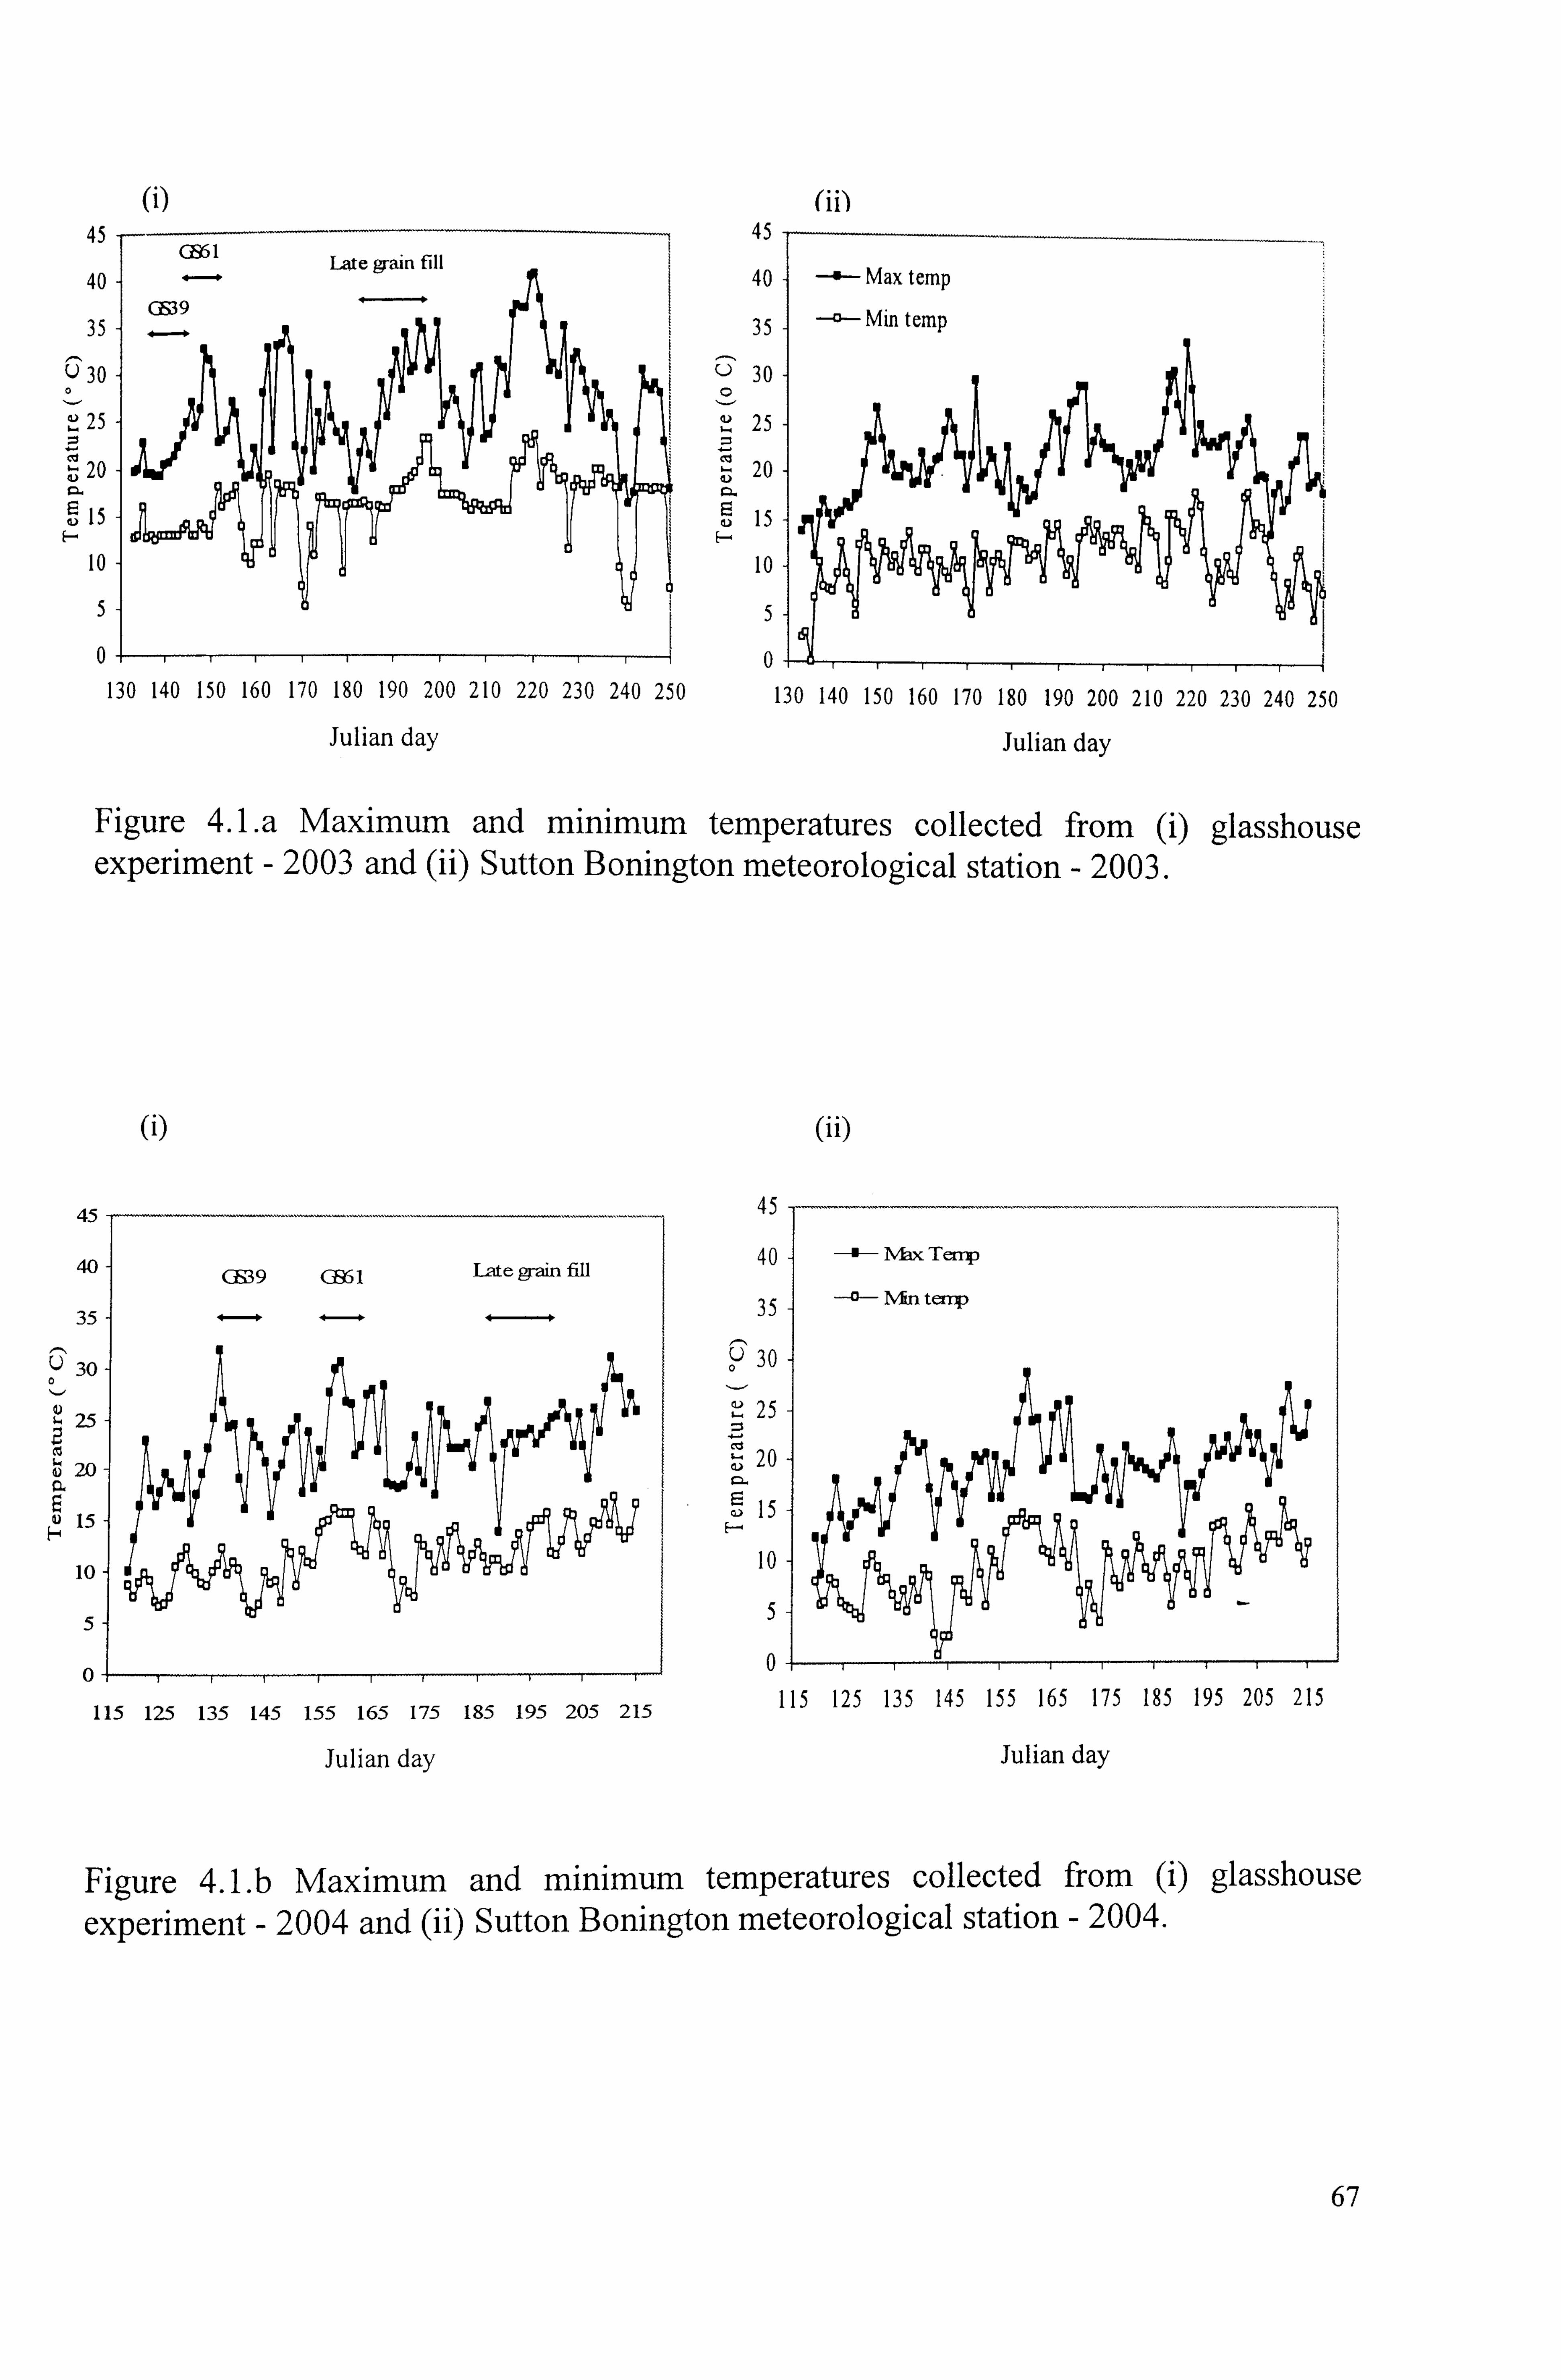
(i) 45 --
40 GS61 Late grain fill
GS39 35
U 30 0 it -a) i 25 i co
20 lu 91.
15
10
5
0
130 140 150 160 170 180 190 200 210 220 230 240 250
Julian day
(ii) 45
40 Max temp
Min temp 35
30 -
25
03 (U
20 -
15 -
10 -
5
01T
130 140 150 160 170 180 190 200 210 220 230 240 250
Julian day
Figure 4. La Maximum and minimum temperatures collected from (i) glasshouse experiment - 2003 and (ii) Sutton Bonington meteorological station - 2003.
(i)
45
40
35
1-1 U 30
25
20
15
10
5
0
C939 G%l Late grain fill
115 125 135 145 155 165 175 185 195 205 215
Julian day
(ii)
4
4'
3
U3
21
0iIIwIIIIIiI
115 125 135 145 155 165 175 185 195 205 215
Julian day
Figure 4. Lb Maximum and minimum temperatures collected from (i) glasshouse experiment - 2004 and (ii) Sutton Bonington meteorological station - 2004.
67
4 C) C)
M
03
-ci
(4-4 0
U
1-4
-0
H
P--(1
rn
rn
N
'11- z2) Zý rIlý
rn , Z2) ZD r1-1
cn
0
i)
a) >-, (1) Q) 110 r- - ct m = Itt z
Q) r- C) cz m = I* r r- C) = m ýý (=> = C=> - =
C) Z
r:: kr)
00
=S
4") C., (*, I I-- kr) r- r- r-
=3 C) = C) :: I C) =
C3 M
.! Z ct m Cýj M
C) M I- M
110 ct coo M cý ý m
a. )
kl) 00 C., C-4
ýD
, , - ý, Z. 00 cl s 00 M ý m
C-4
.! Z ý, o " C'4 ;.
, Z., ýo " _--q ;_ .q ý. -ý
$-.
M ;.. \ýc &- 00
68
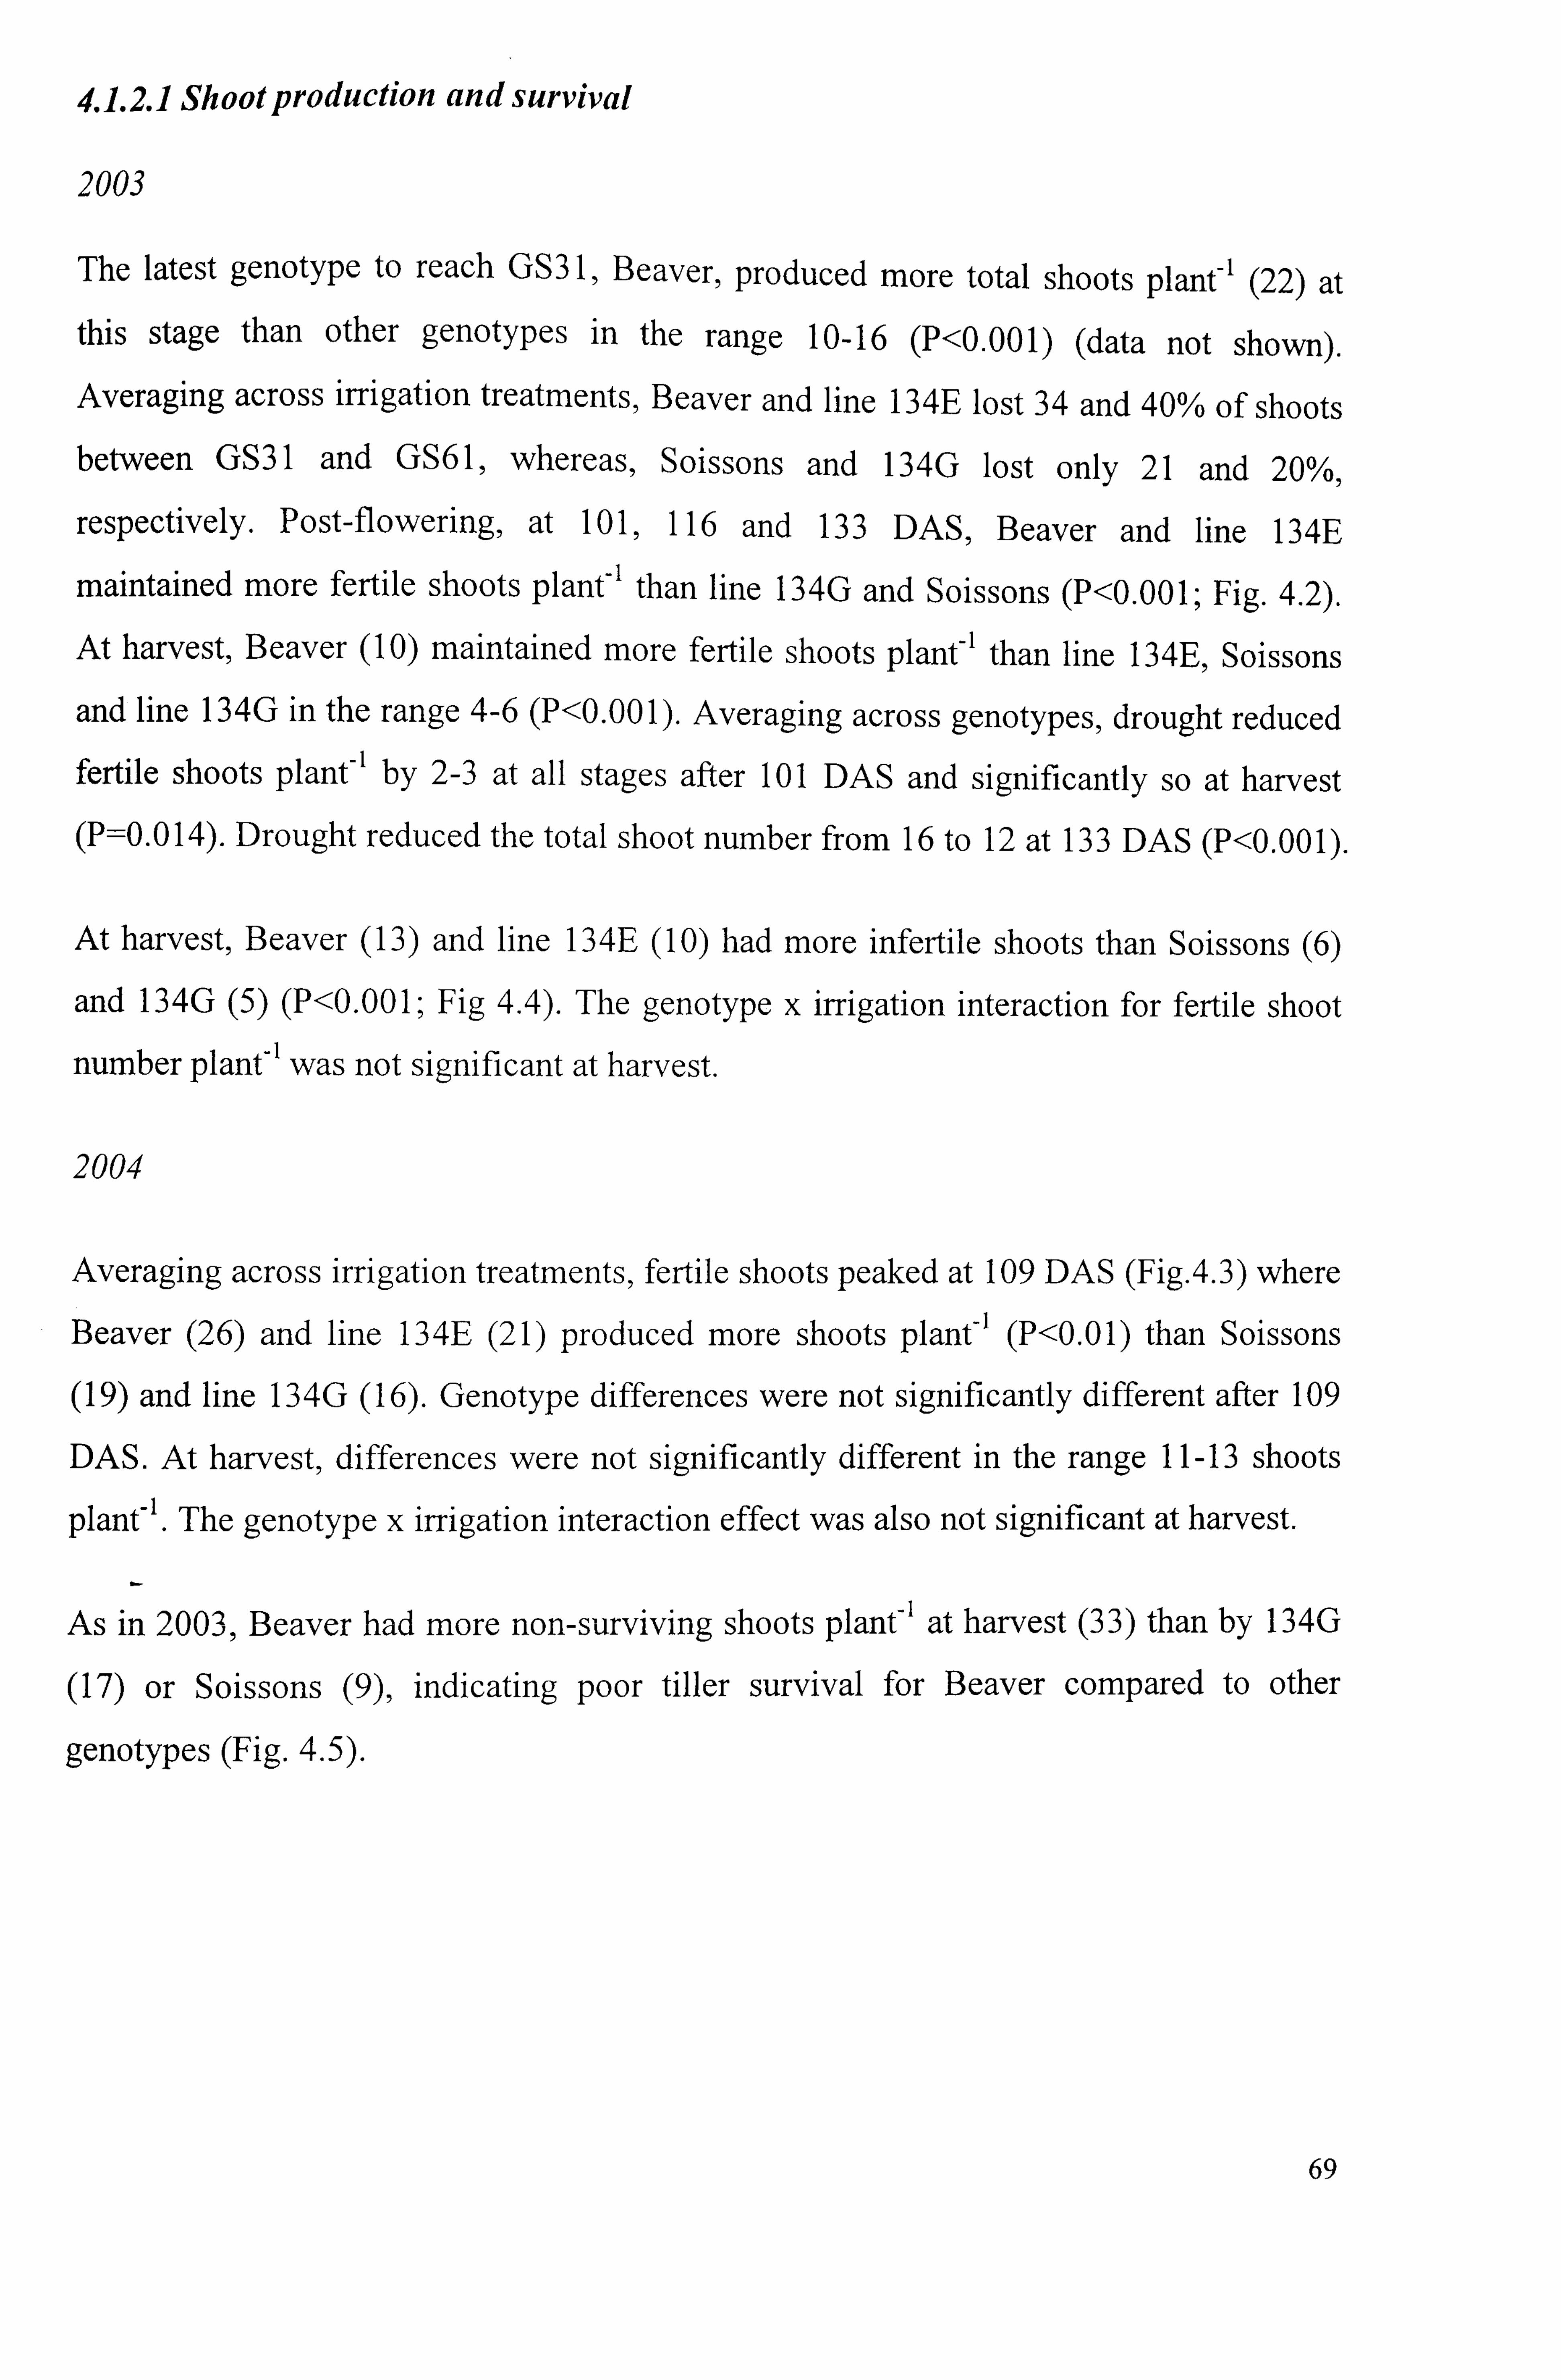
4.1.2.1 Shootproduction and survival
2003
The latest genotype to reach GS3 1, Beaver, produced more total shoots plant-' (22) at this stage than other genotypes in the range 10-16 (P<0.001) (data not shown). Averaging across irrigation treatments, Beaver and line 134E lost 34 and 40% of shoots between GS31 and GS61, whereas, Soissons and 134G lost only 21 and 20%,
respectively. Post-flowering, at 101,116 and 133 DAS, Beaver and line 134E
maintained more fertile shoots plant-' than line 134G and Soissons (P<0.001; Fig. 4.2).
At harvest, Beaver (10) maintained more fertile shoots plant-' than line 134E, Soissons
and line 134G in the range 4-6 (P<0.001). Averaging across genotypes, drought reduced fertile shoots plant-' by 2-3 at all stages after 101 DAS and significantly so at harvest
(P=0.014). Drought reduced the total shoot number from 16 to 12 at 133 DAS (P<0.001).
At harvest, Beaver (13) and line 134E (10) had more infertile shoots than Soissons (6)
and 134G (5) (P<0.001; Fig 4.4). The genotype x irrigation interaction for fertile shoot
number plant-' was not significant at harvest.
2004
Averaging across irrigation treatments, fertile shoots peaked at 109 DAS (Fig. 4.3) where
Beaver (26) and line 134E (21) produced more shoots plant-' (P<0.01) than Soissons
(19) and line 134G (16). Genotype differences were not significantly different after 109
DAS. At harvest,, differences were not significantly different in the range 11-13 shoots
plant-1. The genotype x irrigation interaction effect was also not significant at harvest.
As in 2003, Beaver had more non-surviving shoots plant-' at harvest (33) than by 134G
(17) or Soissons (9), indicating poor tiller survival for Beaver compared to other
genotypes (Fig. 4-5).
69
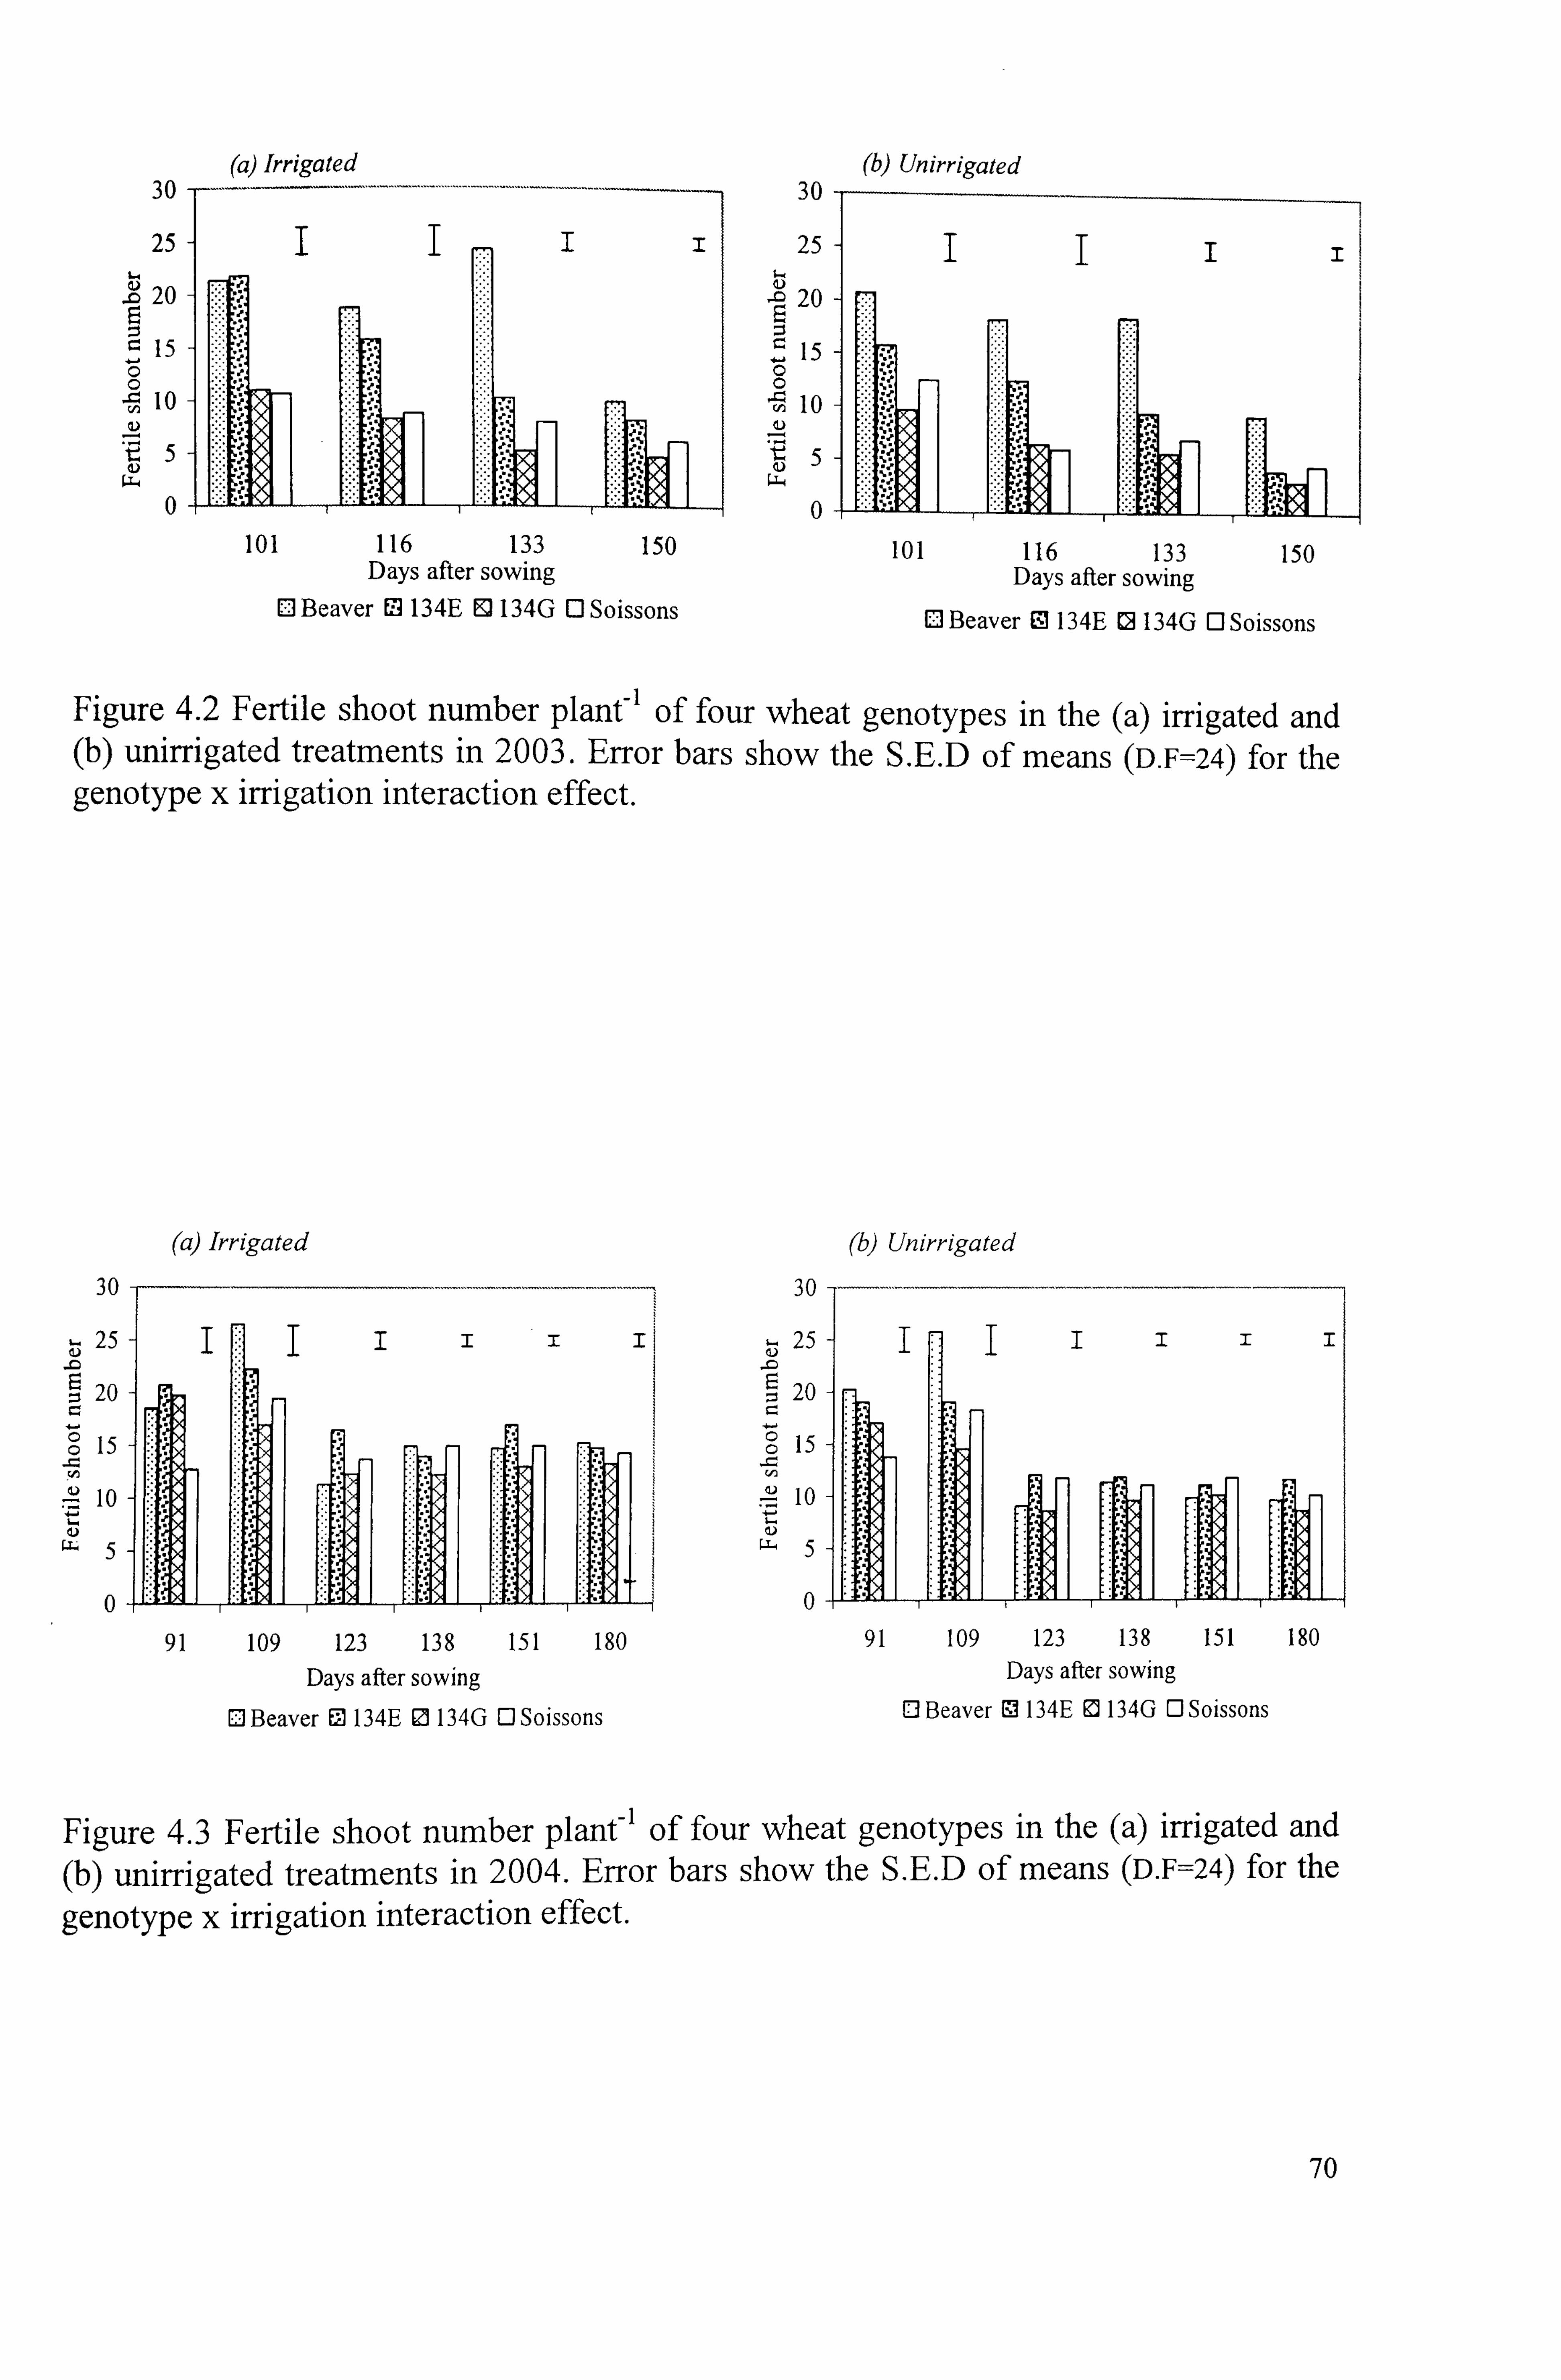
30
25
20 E
15 -I
C
-Io Q)
Q
0
(a) Irrigated 30
25
-0 20
15
lo
tý 5
0
(b) Unirrigated
I
x
101 116 133 150 Days after sowing
El Beaver El 134E 13 134G 0 Soissons
Figure 4.2 Fertile shoot number plant-' of four wheat genotypes in the (a) irrigated and (b) unirrigated treatments in 2003. Error bars show the S. E. D of means (D. F=24) for the genotype x irrigation interaction effect.
30
25
-0 Eý 20
15
10
0
(a) Irrigated
30
25
-0 20
15
10
0
(b) Unirrigated
IIIII
91 109 123 138 151 180 Days after sowing
0 Beaver M 134E ED 134G 0 Soissons
Figure 4.3 Fertile shoot number plant-' of four wheat genotypes in the (a) irrigated and (b) unirrigated treatments in 2004. Error bars show the S. E. D of means (D. F=24) for the
genotype x irrigation interaction effect.
70
101 116 133 150 Days after sowing
11 Beaver S 134E El 134G 0 Soissons
91 109 123 138 151 180
Days after sowing
El Beaver EO 134E 0 134G 0 Soissons

30
25 .0
20
15
10
5
0
(a) Irrigated - *
I
_
I I
101 116 133 150 Days after sowing
El Beaver S 134E 12 134G 0 Soissons
30
25 ýc
20
0 ,Z
15
10
5
0
'b) Unirrigated
III
101 116 133 150 Days after sowing
0 Beaver 9 134E 0 134G 0 Soissons
Figure 4.4 Infertile shoot number plant-' of four wheat genotypes in the (a) irrigated and (b) unirrigated treatments in 2003. Error bars show the S. E. D of means (D. F=24) for the genotype x irrigation interaction effect.
30 (a) Irrigated
25 -0
20 - 0 C, 15 -
10 411)
5
0
(b) Unirrigated 30 -
5 25
20
15 vi
10
5 ... ;v
0
w
Figure 4.5 Infertile shoot number plant-' of four wheat genotypes in the (a) irrigated and (b) unirrigated treatments in 2004. Error bars show the S. E. D of means (D. F=24) for the
genotype x irrigation interaction effect.
71
138 151 180
Days after sowing
Cl Beaver 0 134E El 134G 0 Soissons
138 151 180
Days after sowing
OBeaver 0 134E 13 134G 0 Soissons

4.1.3 Above-ground dry matter
2003
Averaging across irrigation treatments, dry matter plant-' differed between genotypes at 82,101 DAS and at harvest (P<0.0 1). At harvest, line 134G (9.7g), Soissons (9.1 g) and line 134E (8.9g) accumulated more dry matter than Beaver (6.8 g) (P<0.05; Fig 4.6a).
At 116 DAS, dry matter accumulation reached the maximum. Dry matter growth may have been restricted due to sink limitation associated with heat stress during the pre-
anthesis in this experiment. Averaging across genotypes, dry matter was reduced in the
unirrigated treatment (P<0.01) at all the samplings except at 82 DAS. At harvest,
drought reduced mean shoot dry matter from 10.9 to 6.3 g plant-' (P<0.01). The
reduction ranged from 3.3 to 7.0 g plant-' amongst genotypes, but the genotype x irrigation interaction effect was not significant at harvest.
2004
Averaging across the irrigation treatments, the dry matter plant- I peaked at 151 DAS
(GS61). Line 134G accumulated more dry matter than other genotypes at harvest
(P<0.05; Fig. 4.6 b). Drought reduced the dry matter accumulation between 123 DAS
(GS61+3 weeks) and harvest (P<0.001; Fig 4.5 b), with a 26.8 g plant-' reduction at
harvest (P<0.001). The genotype x irrigation interaction was significant at harvest
(P<0.05) with Soissons maintaining dry matter better than Beaver; the reductions due to
drought were 29 and 32 g plant- I, respectively. Line 134E maintained dry matter best
amongst all genotypes with a reduction of only 19 g plant-I (P<0.02), while the
reduction was 31 g plant-' in line 134G.
In summary, at a given growth stage, there was a general trend for dry matter of Beaver
to be more depressed under drought than Soissons in both the years. However, this
general trend did not usually realise statistical significance. There were 3 plants per
column in 2003 and one in 2004, so absolute values for dry matter were greater in 2004.
72
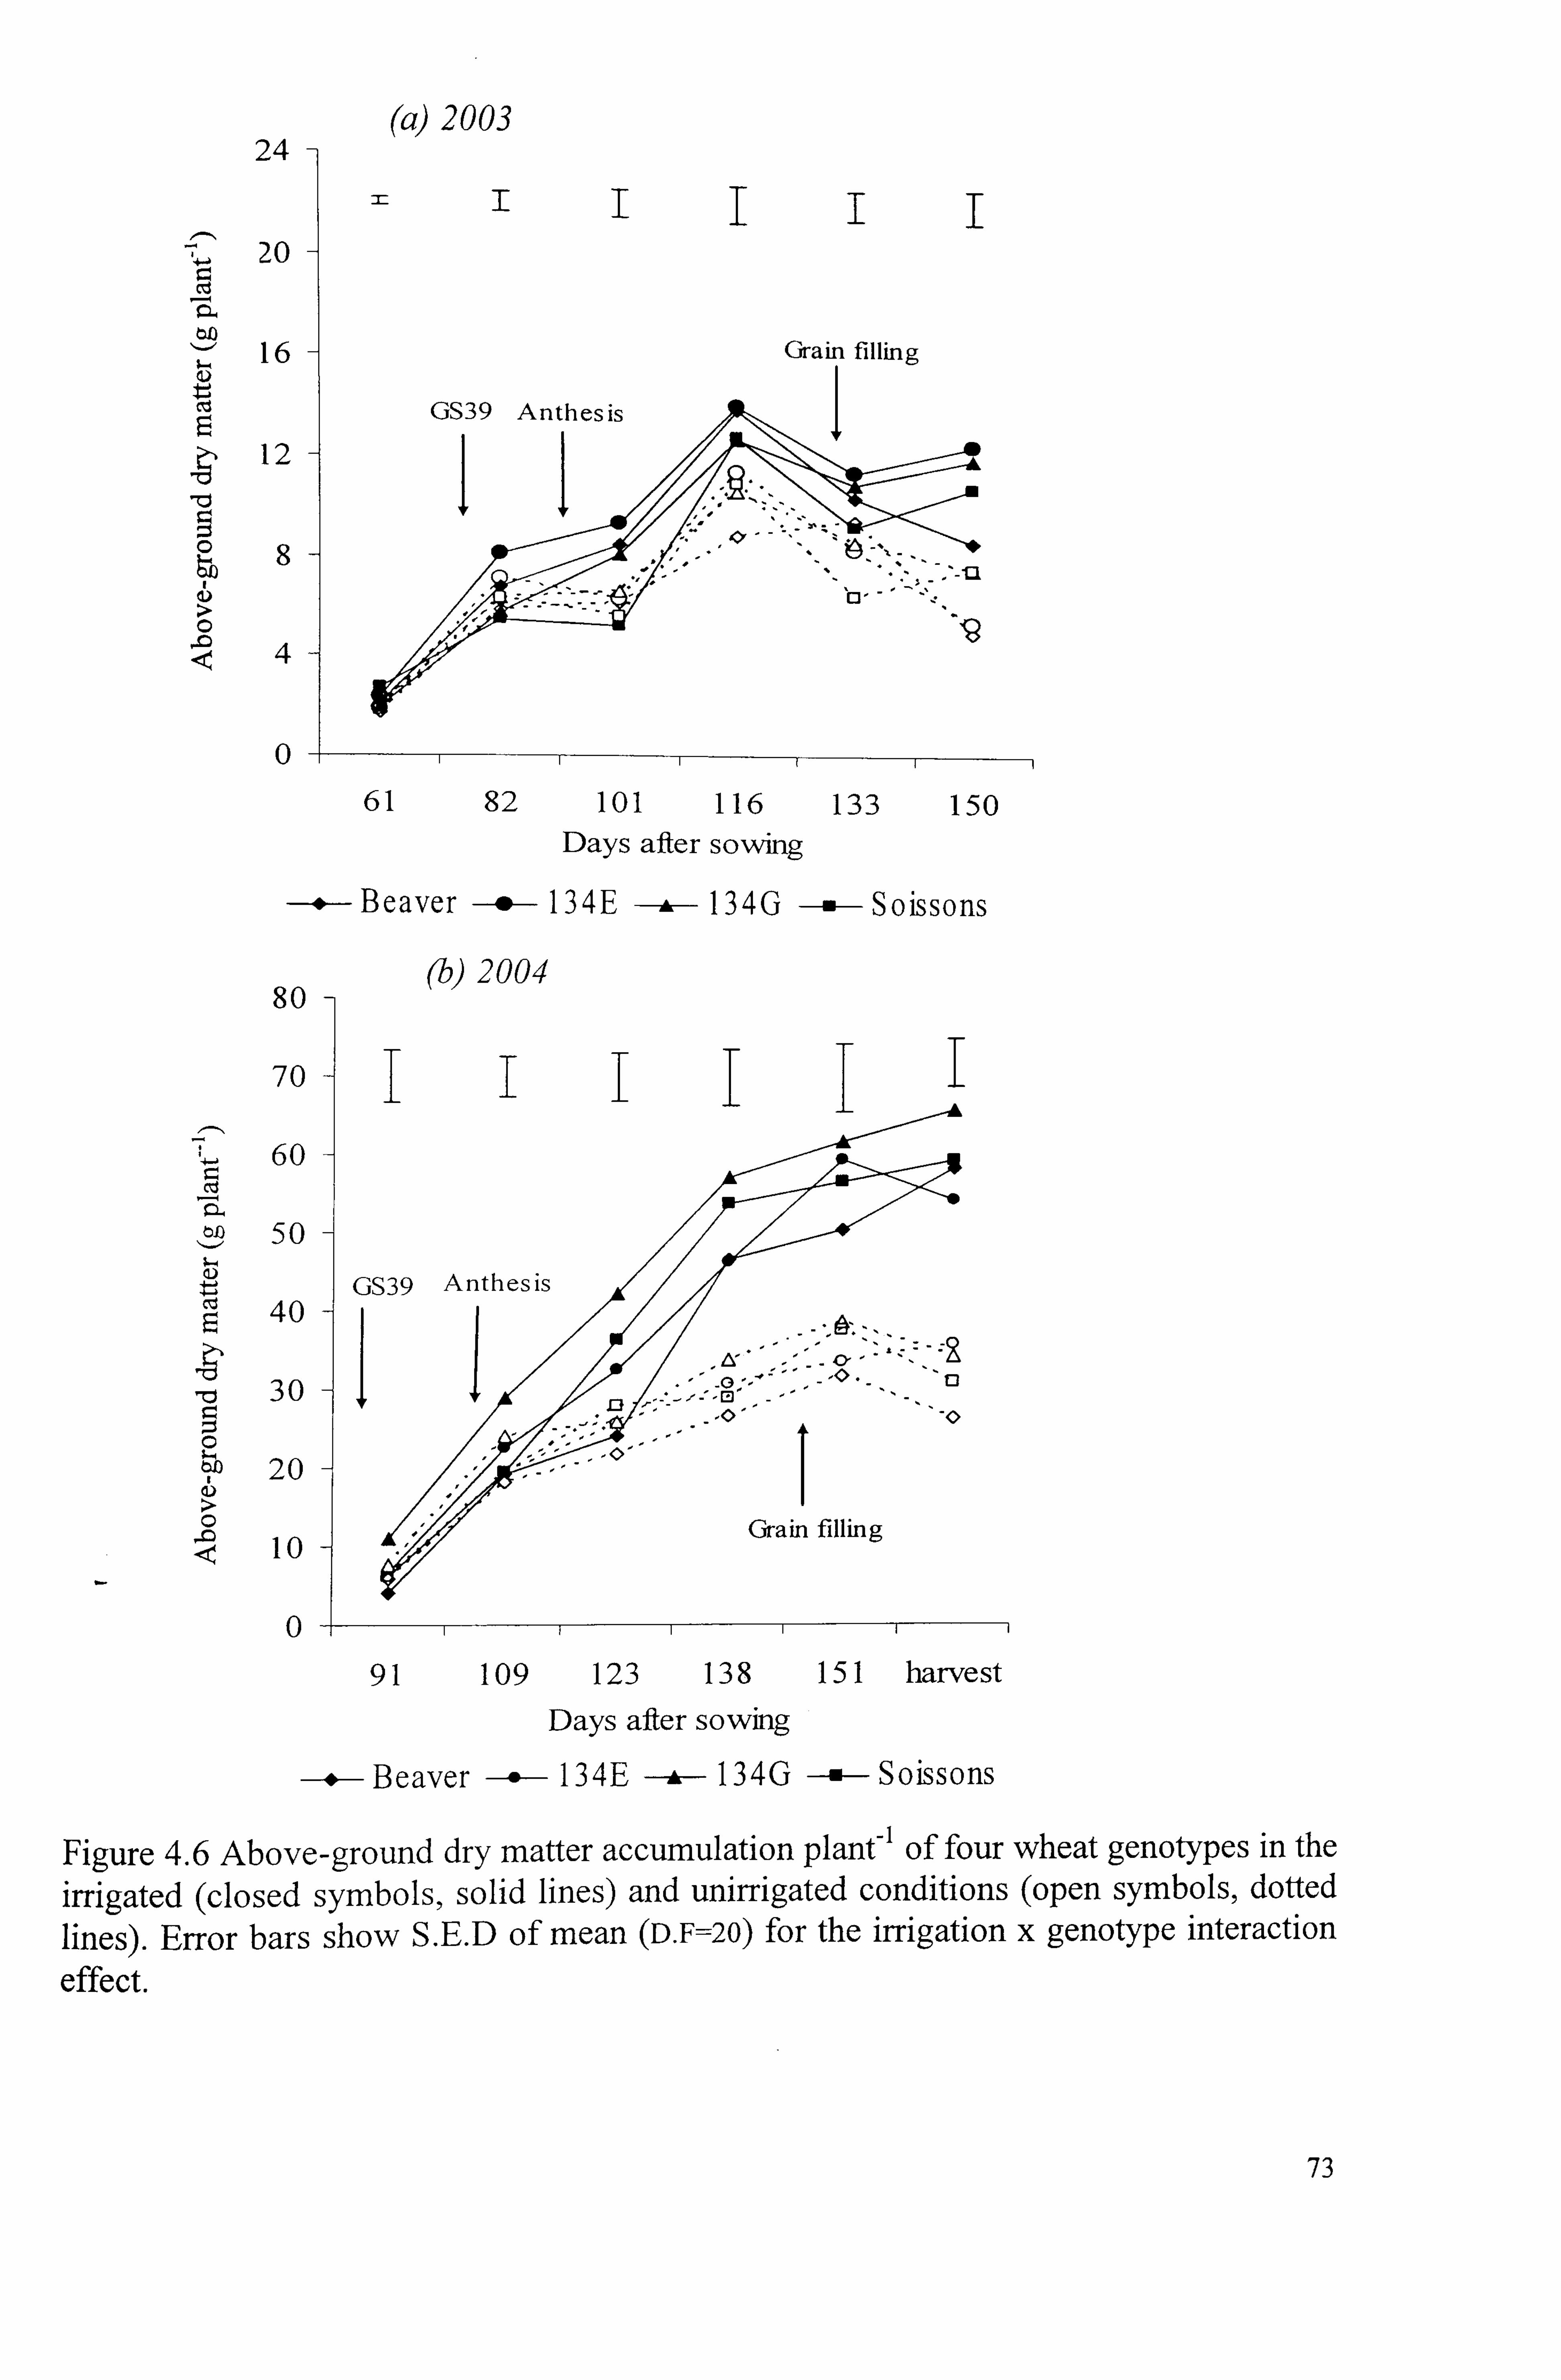
24
20
CL
16
12
7: ý
8
I
GS39 Anthesis II-
C3'
0i 1
61 82 101 116 133 150 Days after sovm'g
Beaver -*-- 1 34E A, 134G Sois sons
(b) 2004 80
70
60
50
GS39 Anthesis
40 ,.,:,.
-: -
40-
-9
7ý 30 - 0,10
D- -* - 13
, &ý
20 ,I. -, ,-,
0'
10 Grain filling
0
91 109 123 138 151 harvest
Days after sowing
Beaver 134E * 134G Soissons
Figure 4.6 Above-ground dry matter accumulation plant-' of four wheat genotypes in the
irrigated (closed symbols, solid lines) and unirrigated conditions (open symbols, dotted
lines). Error bars show S. E. D of mean (D. F=20) for the irrigation x genotype interaction
effect.
(a) 2003
Grain filling
73
4.1.3.1 Dry matter growth of leaves, stems and ears
4.1.3.1.1 Leafdrymatter
In 2003, drought decreased the dry matter accumulation in leaf laminae from 116 DAS (3 weeks after anthesis) (P<0.01). Genotypes showed differences in leaf dry matter at all the samplings (P<0.01; Fig. 4.7). Beaver had higher leaf dry matter plant-1 at all
samplings (P<0.0.1) with a higher proportion of dry matter in leaves at harvest (0.56g;
P<0.001) followed by line 134E (0.41g), and Soissons and line 134G (both 0.28g). At
harvest, leaf dry matter was higher for Beaver and line 134E (3.5 and 3.6g respectively; P<0.01) than for Soissons and line 134G (both 2.6 g). The genotype x irrigation
interaction effect was not significant.
In 2004, drought decreased leaf dry matter at harvest from 6.6 to 4.7g (P<0.01). A
similar trend was noticed at 123,138 and 151 DAS (P<0.002; Fig. 4.7). However, the
proportion of biomass in leaves at 123,151 DAS and at harvest was more under drought
(P<0.05); and was higher for Beaver than other genotypes (P<0.05) at all sampling
stages. The genotype x irrigation interaction effect was not significant.
4.1.3.1.2 Stem dry matter
In 2003, drought decreased the partitioning of dry matter to stems at 61,133 DAS and at
maturity (P<0.01; Fig. 4.7). At harvest, drought reduced stem dry matter from 4.0 to 2.4g
(P<0.001). The DH lines accumulated more stem dry matter accumulation compared to
their parents. At harvest 134E and 134G had a higher proportion of biomass as stem (0.4
each; P<0.02) than Soissons and Beaver (0.34 each).
In 2004, drought reduced stem dry matter at all growth stages except 138 and 151 DAS
(P<0.01); at harvest the reduction was from 13.5 to 9.2g (P<0.001). Lines 134E and
134G accumulated more stem dry matter than Soissons or Beaver (P<0.001; Fig. 4.7). At
151 DAS and harvest, drought reduced the proportion of biomass in the stem (P<0.05).
The interaction effect was significant at harvest, with Beaver and 134E showing a
greater reduction in stem partitioning due to drought (P=0.005).
Ear dry matter
The effects of drought on ear dry matter were diminished in 2003 due to poor overall
grain growth which was probably due to combination of a lack of vernalization of
74
seedlings in the early growth stages and heat stress during grain filling. So the ear
partitioning and ear dry matter in 2003 at harvest is not presented here on account of
poor post-anthesis ear growth (see Fig. 4-7). In 2004, drought reduced ear dry matter at
harvest (36.1 cf. 15.4 g; P<0.001). Averaging across irrigation treatments, Soissons and
134G accumulated more ear dry matter at 109,123 and 151 DAS than Beaver or 134E
(P<0.03; Fig. 4.7). At harvest, drought reduced the ear index from 0.64 to 0.50 (P<0.001).
The proportion of ear dry matter varied among genotypes from 0.63 in Soissons to 0.52
in Beaver (P<0.05). The decrease in ear index due to drought was statistically significant
in Beaver and line 134G (P<0.04), while this was not in Soissons and line 134E.
75
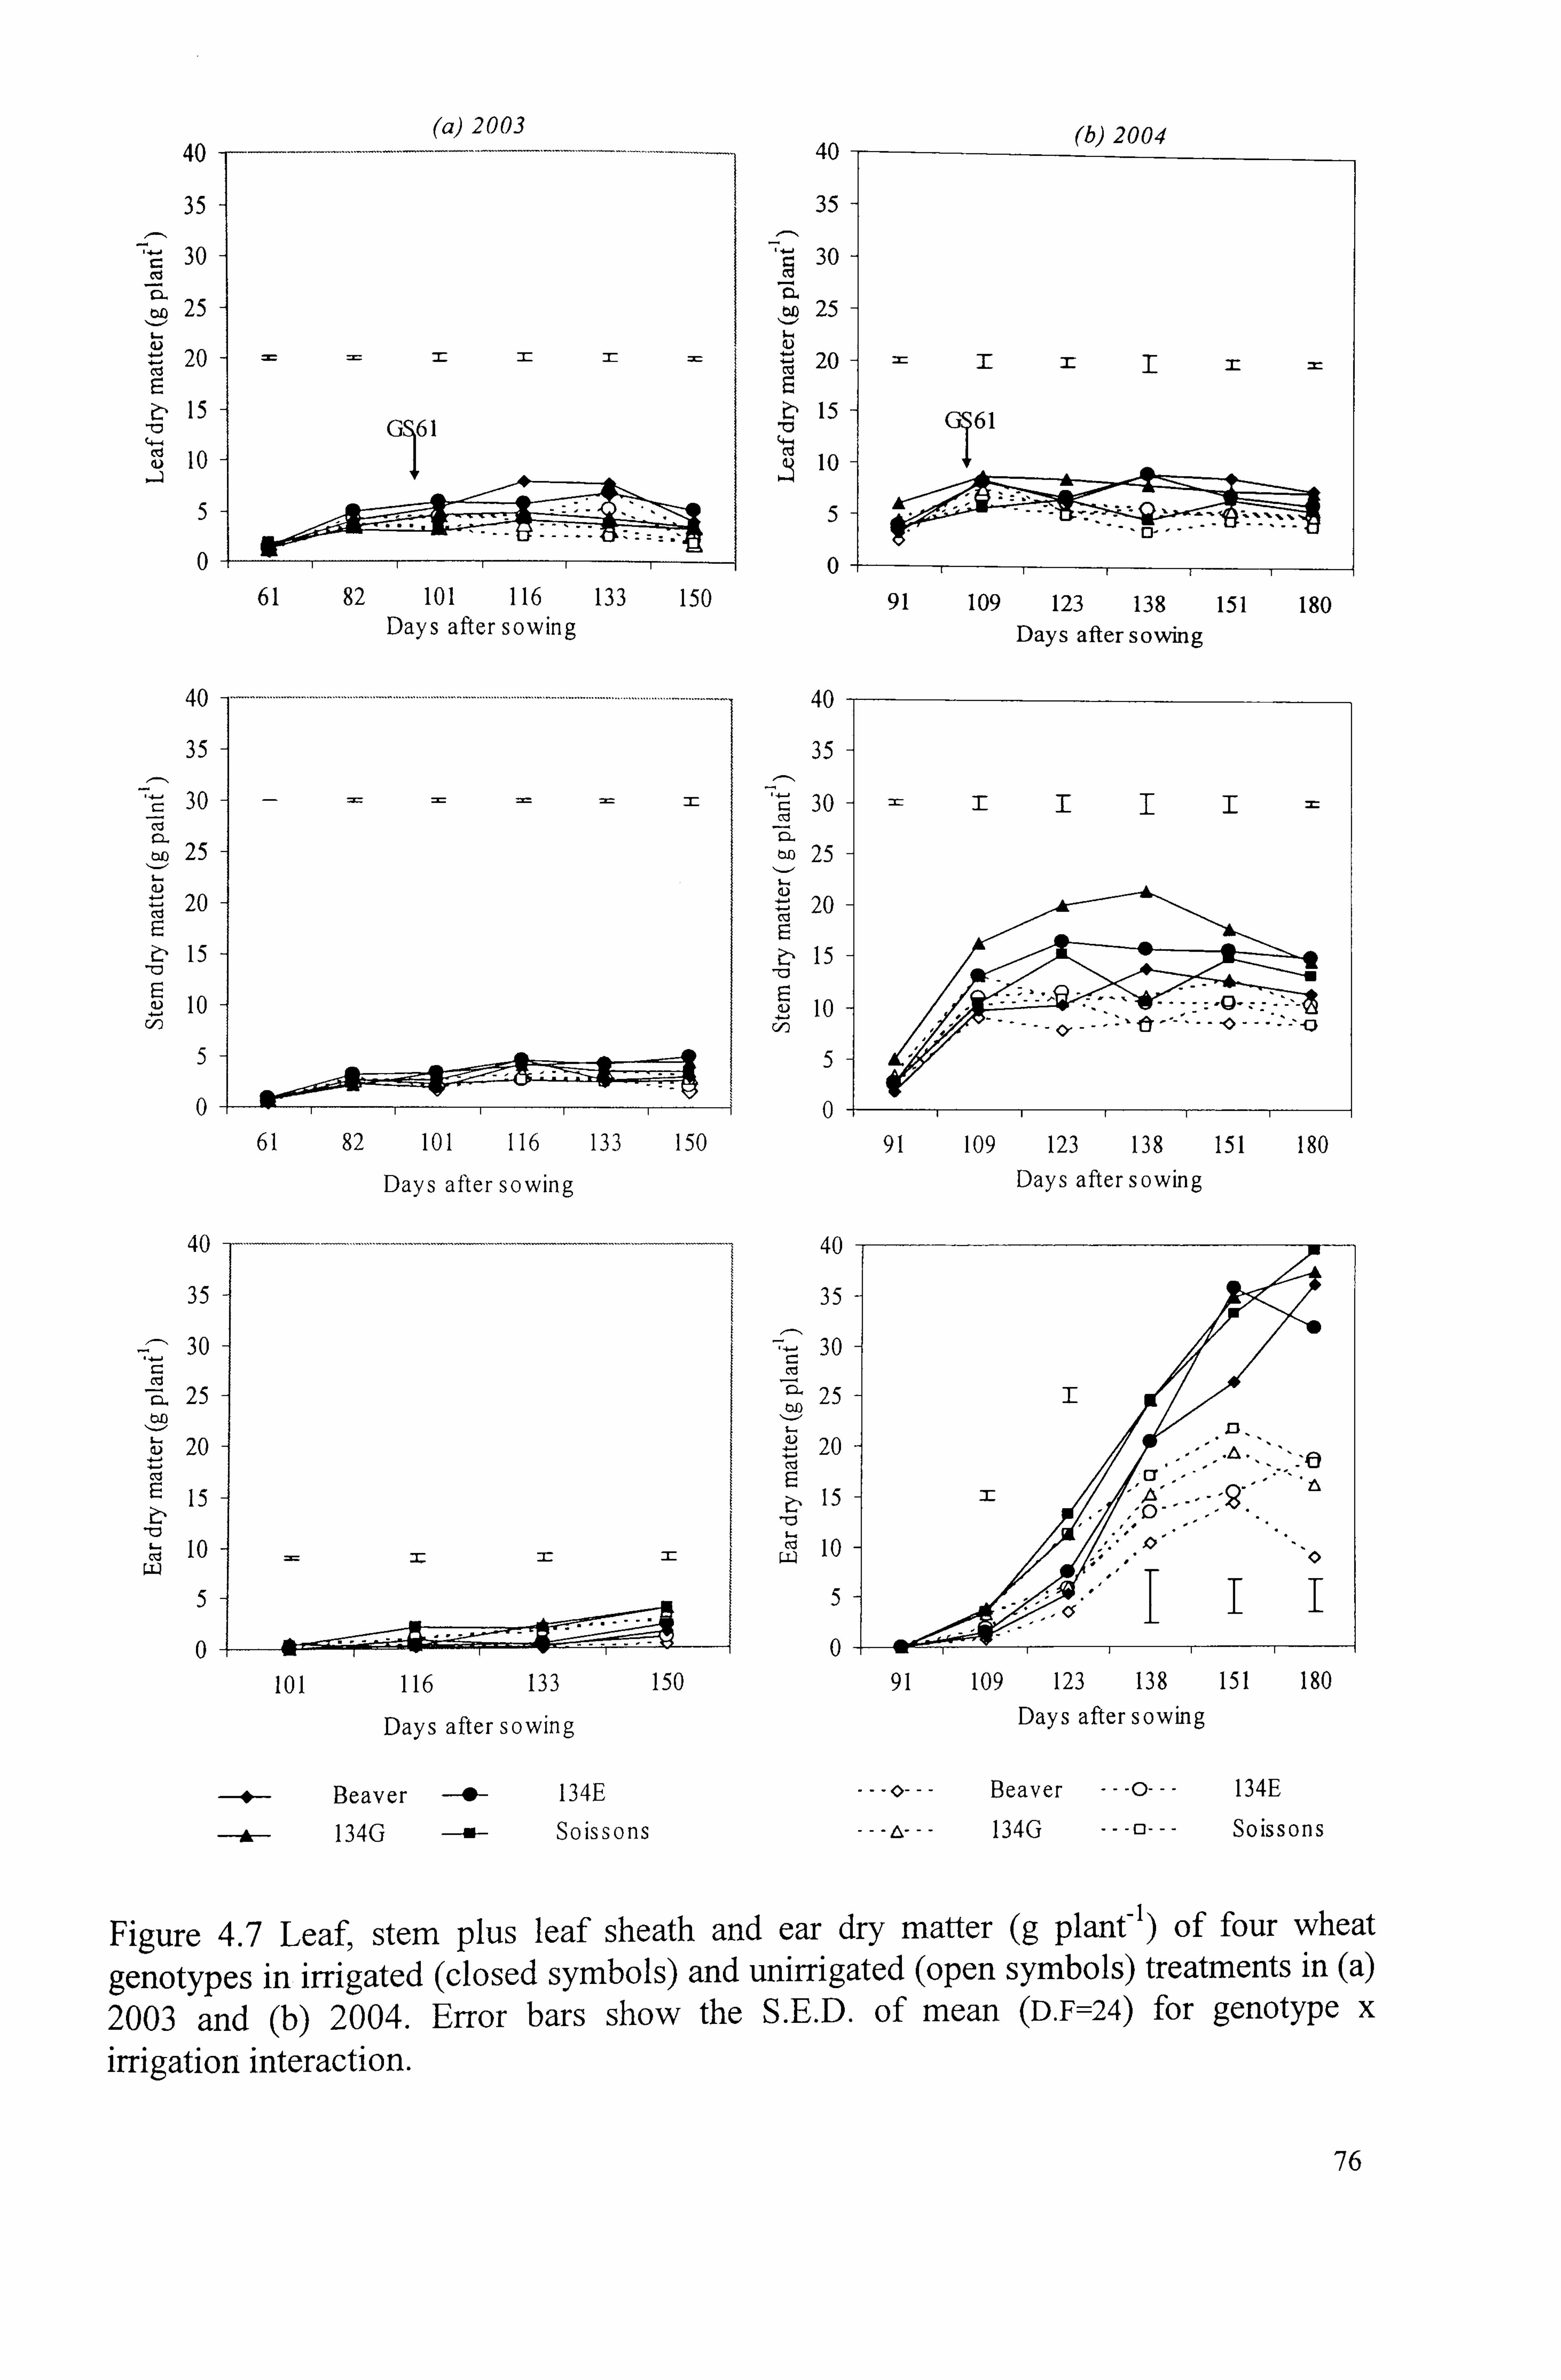
40
35
30
25
20
15
cl, lo
5
0
40
35
z- 30
25
20
i'-, 15
10
5
0
40
35
30
25
20
15
10
5
0
2003
GTI
61 82 101 116 133 150 Days after sowing
====
61 82 101 116 133 15C
Days after sowing
40
35
30
25
20
15 4,
10
5
0
40
35
30 0.
25
20 ci E
15
10
5
0
(b) 2004
T-
61
91 109 123 138 151 180 Days after sowing
I.
91 109 123 138 151 180
Days after sowing
40
35
30
25
20
15
10
5
0
101 116 133 150 91 109 123 138 151 180
Days after sowing Days after sowing
Beaver 134E --- 0 --- Beaver --- 0--- 134E
134G Soissons --- L --- 134G --- 0--- Soissons
Figure 4.7 Leaf, stem plus leaf sheath and ear dry matter (g plant-) of four wheat
genotypes in irrigated (closed symbols) and unirrigated (open symbols) treatments in (a)
2003 and (b) 2004. Error bars show the S. E. D. of mean (D. F=24) for genotype x irrigation interaction.
. 11 ,,
I -A -,,,, --a Cy
76
4.1.4 Root dry matter and root length density at harvest
2003
The root weight (root weight per unit volume; g M-3) was calculated using a square root
transformation as the data were not normally distributed. This was calculated for the 0-
205 40-60 and 80-100 cm depths. Averaging across irrigation treatments, genotypes differed in root biomass at depths to 60 cm depth (P<0.02; Fig. 4.8). Irrigation improved
root biomass in the 0-20 cm depth compared to the unirrigated treatment (P=0.09).
While drought increased root biomass at deeper depths of 80-100 cm (P=0.08). Under
irrigation, at 0-20 cm depth line 134E accumulated more root biomass 27.6g M-3
(P=0.02) and differed significantly over the other genotypes. Beaver showed a trend for
greater root dry matter than Soissons at the 0-20 and 40-60 cm depths but the
differences were not statistically significant (Figure 4.8). None of the genotype x
irrigation interactions was significant.
Root length densities (RLD; root length per unit volume; CM CM-3) were greater in the
unirrigated treatment and differences were statistically significant at the 80-100 cm
depth (P<0.01). Genotypic differences were weakly significant at 0-20 (P=0.06) and 40-
60 cm (P=0.09) depths. Under irrigation, line 134E had higher RLD than other
genotypes associated with its higher mean root weight (Fig. 4.10). At 80- 100 cm depth,
drought increased RLD (P<0.01) and genotype differences were not statistically
significant. The interaction effect was weakly significant with Soissons having a greater
increase in RLD at 80-100 cm depth than other genotypes under drought (P=0.07). The
magnitude of the increase in RLD at 80-100 cm depth was in the sequence Soissons >
Beaver > 134G > 134E.
2004
Root dry weight was higher in the irrigated treatment at all depths (P<0.01). Under
irrigation, line 134G accumulated more root dry matter than the other genotypes at all
soil depths (P<0.01) (Fig. 4.9 a& b). In addition, there was a trend for Soissons to have
lower root biomass than Beaver at all the depths. At depths 60-80 cm and 80-100 cm,
DH lines had higher root biomass compared to their parents and significantly so for line
134G. At 80- 100 cm depth, the interaction. effect was significant (P=0.02) with line
134G losing more root dry matter due to drought than line 134E, Soissons and Beaver.
77
RLD was greater under irrigation than under drought at all depths to 60 cm (P<O -0
1) and
at 80-100 cm (P=0.09). Under irrigation, RLD was greater for Beaver than for Soissons
(P<0.0 1; Fig. 4.11), except at 80-100 cm where both had similar values. Under irrigation,
line 134G showed a trend for greater RLD than 134E at most depths (Fig. 4.11). A
significant interaction was found at 80-100 cm depth, where Beaver increased RLD
under drought compared to decreases for other genotypes (P<0.04).
In summary it is evident that root biomass and RLD increased under irrigation at deeper
depths. Irrigated DH lines had greater root dry matter, e. g. 134G. Beaver had a greater RLD than Soissons in 2004 or Soissons had a greater RLD than Beaver in 2003, but
only at 80-100 cm.
78
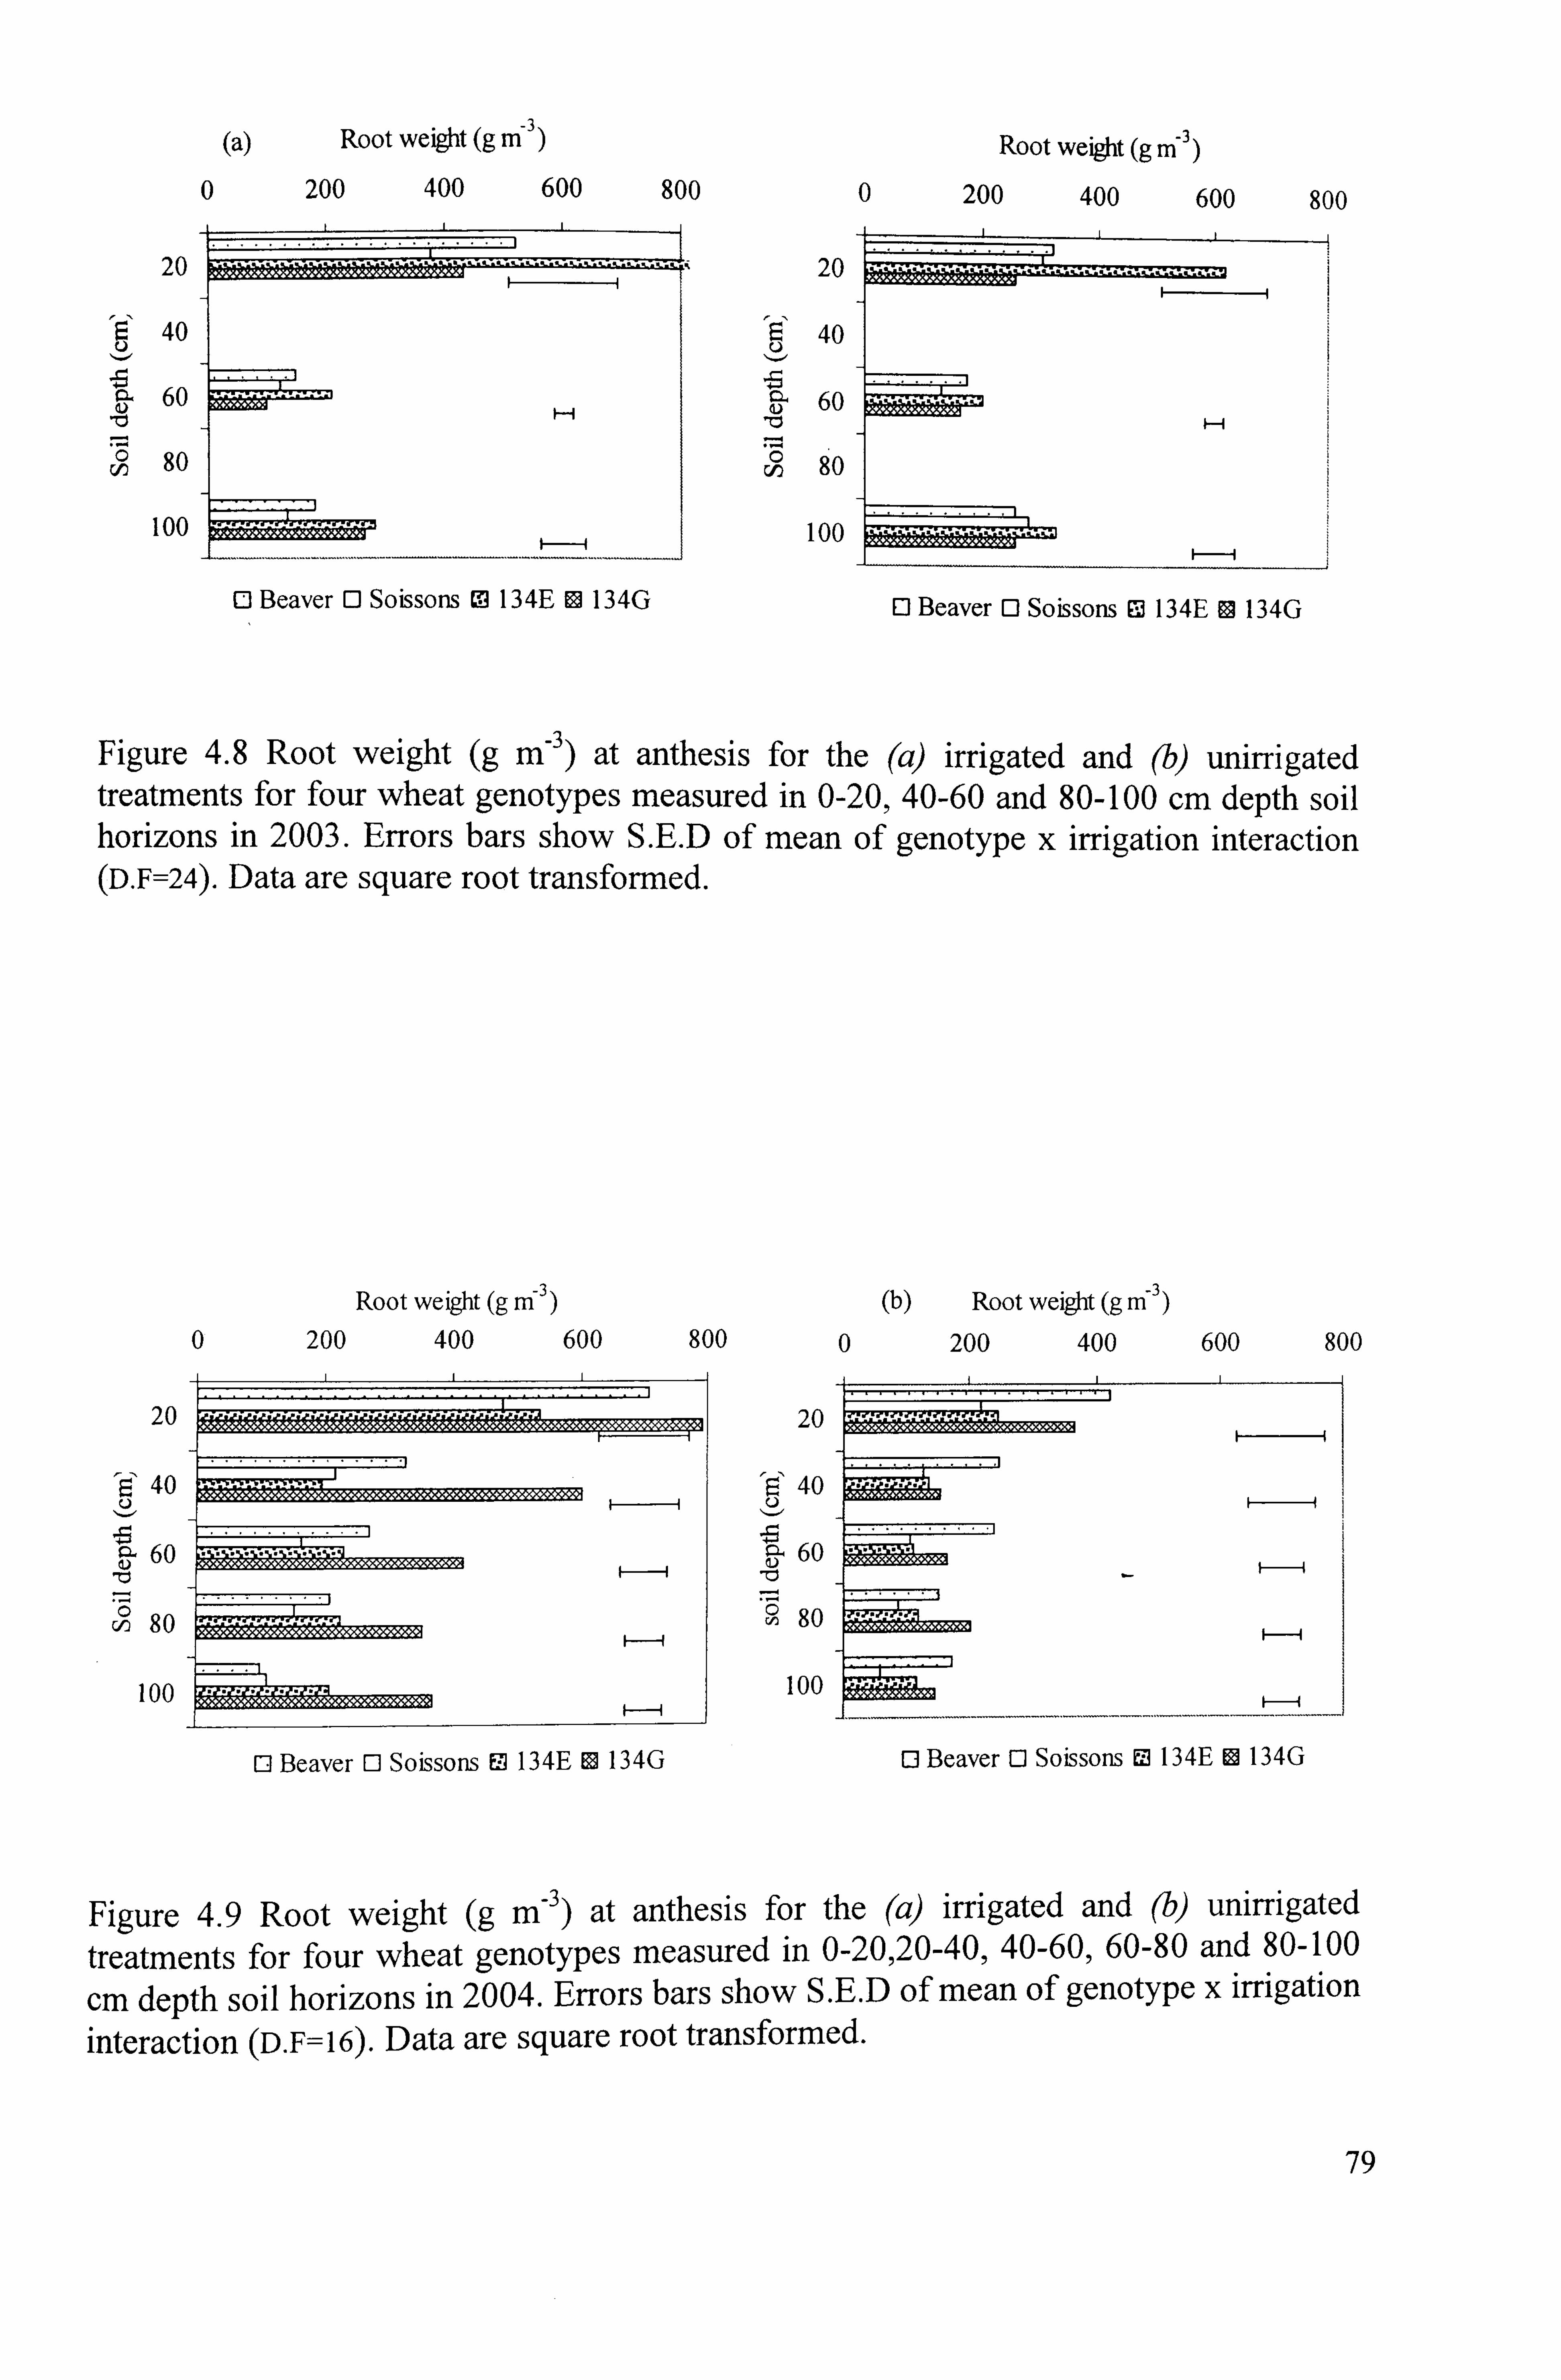
(a) Root weight (g M-3) Root weight (g m -3)
0 200 400 600 800 0 200 400 600
20
Eu 40
60
C/o 80
F-i
100
0 Beaver 0 Soissons 0 134E 91 134G
20
40
60 "ZZ
80
100
800
Figure 4.8 Root weight (g M-3) at anthesis for the (a) irrigated and (b) unirrigated treatments for four wheat genotypes measured in 0-20,40-60 and 80-100 cm depth soil horizons in 2003. Errors bars show S. E. D of mean of genotype x irrigation interaction (D. F=24). Data are square root transformed.
Root weight (gM3 )
0 200 400 600
20
40
60
80
100
8 00
20
40
60
C, 80
100
0 Beaver 11 Soissons 9 134E ES 134G 0 Beaver 0 Soissons U3 134E 0 134G
Figure 4.9 Root weight (g M-3 ) at anthesis for the (a) irrigated and (b) unirrigated treatments for four wheat genotypes measured in 0-20,20-40,40-60,60-80 and 80-100
cm depth soil horizons in 2004. Errors bars show S. E. D of mean of genotype x irrigation
interaction (D. F=16). Data are square root transformed.
(b) Root weight (g m -3)
0 200 400 600 800
79
0 Beaver 0 Soissons 0 134E 0 134G
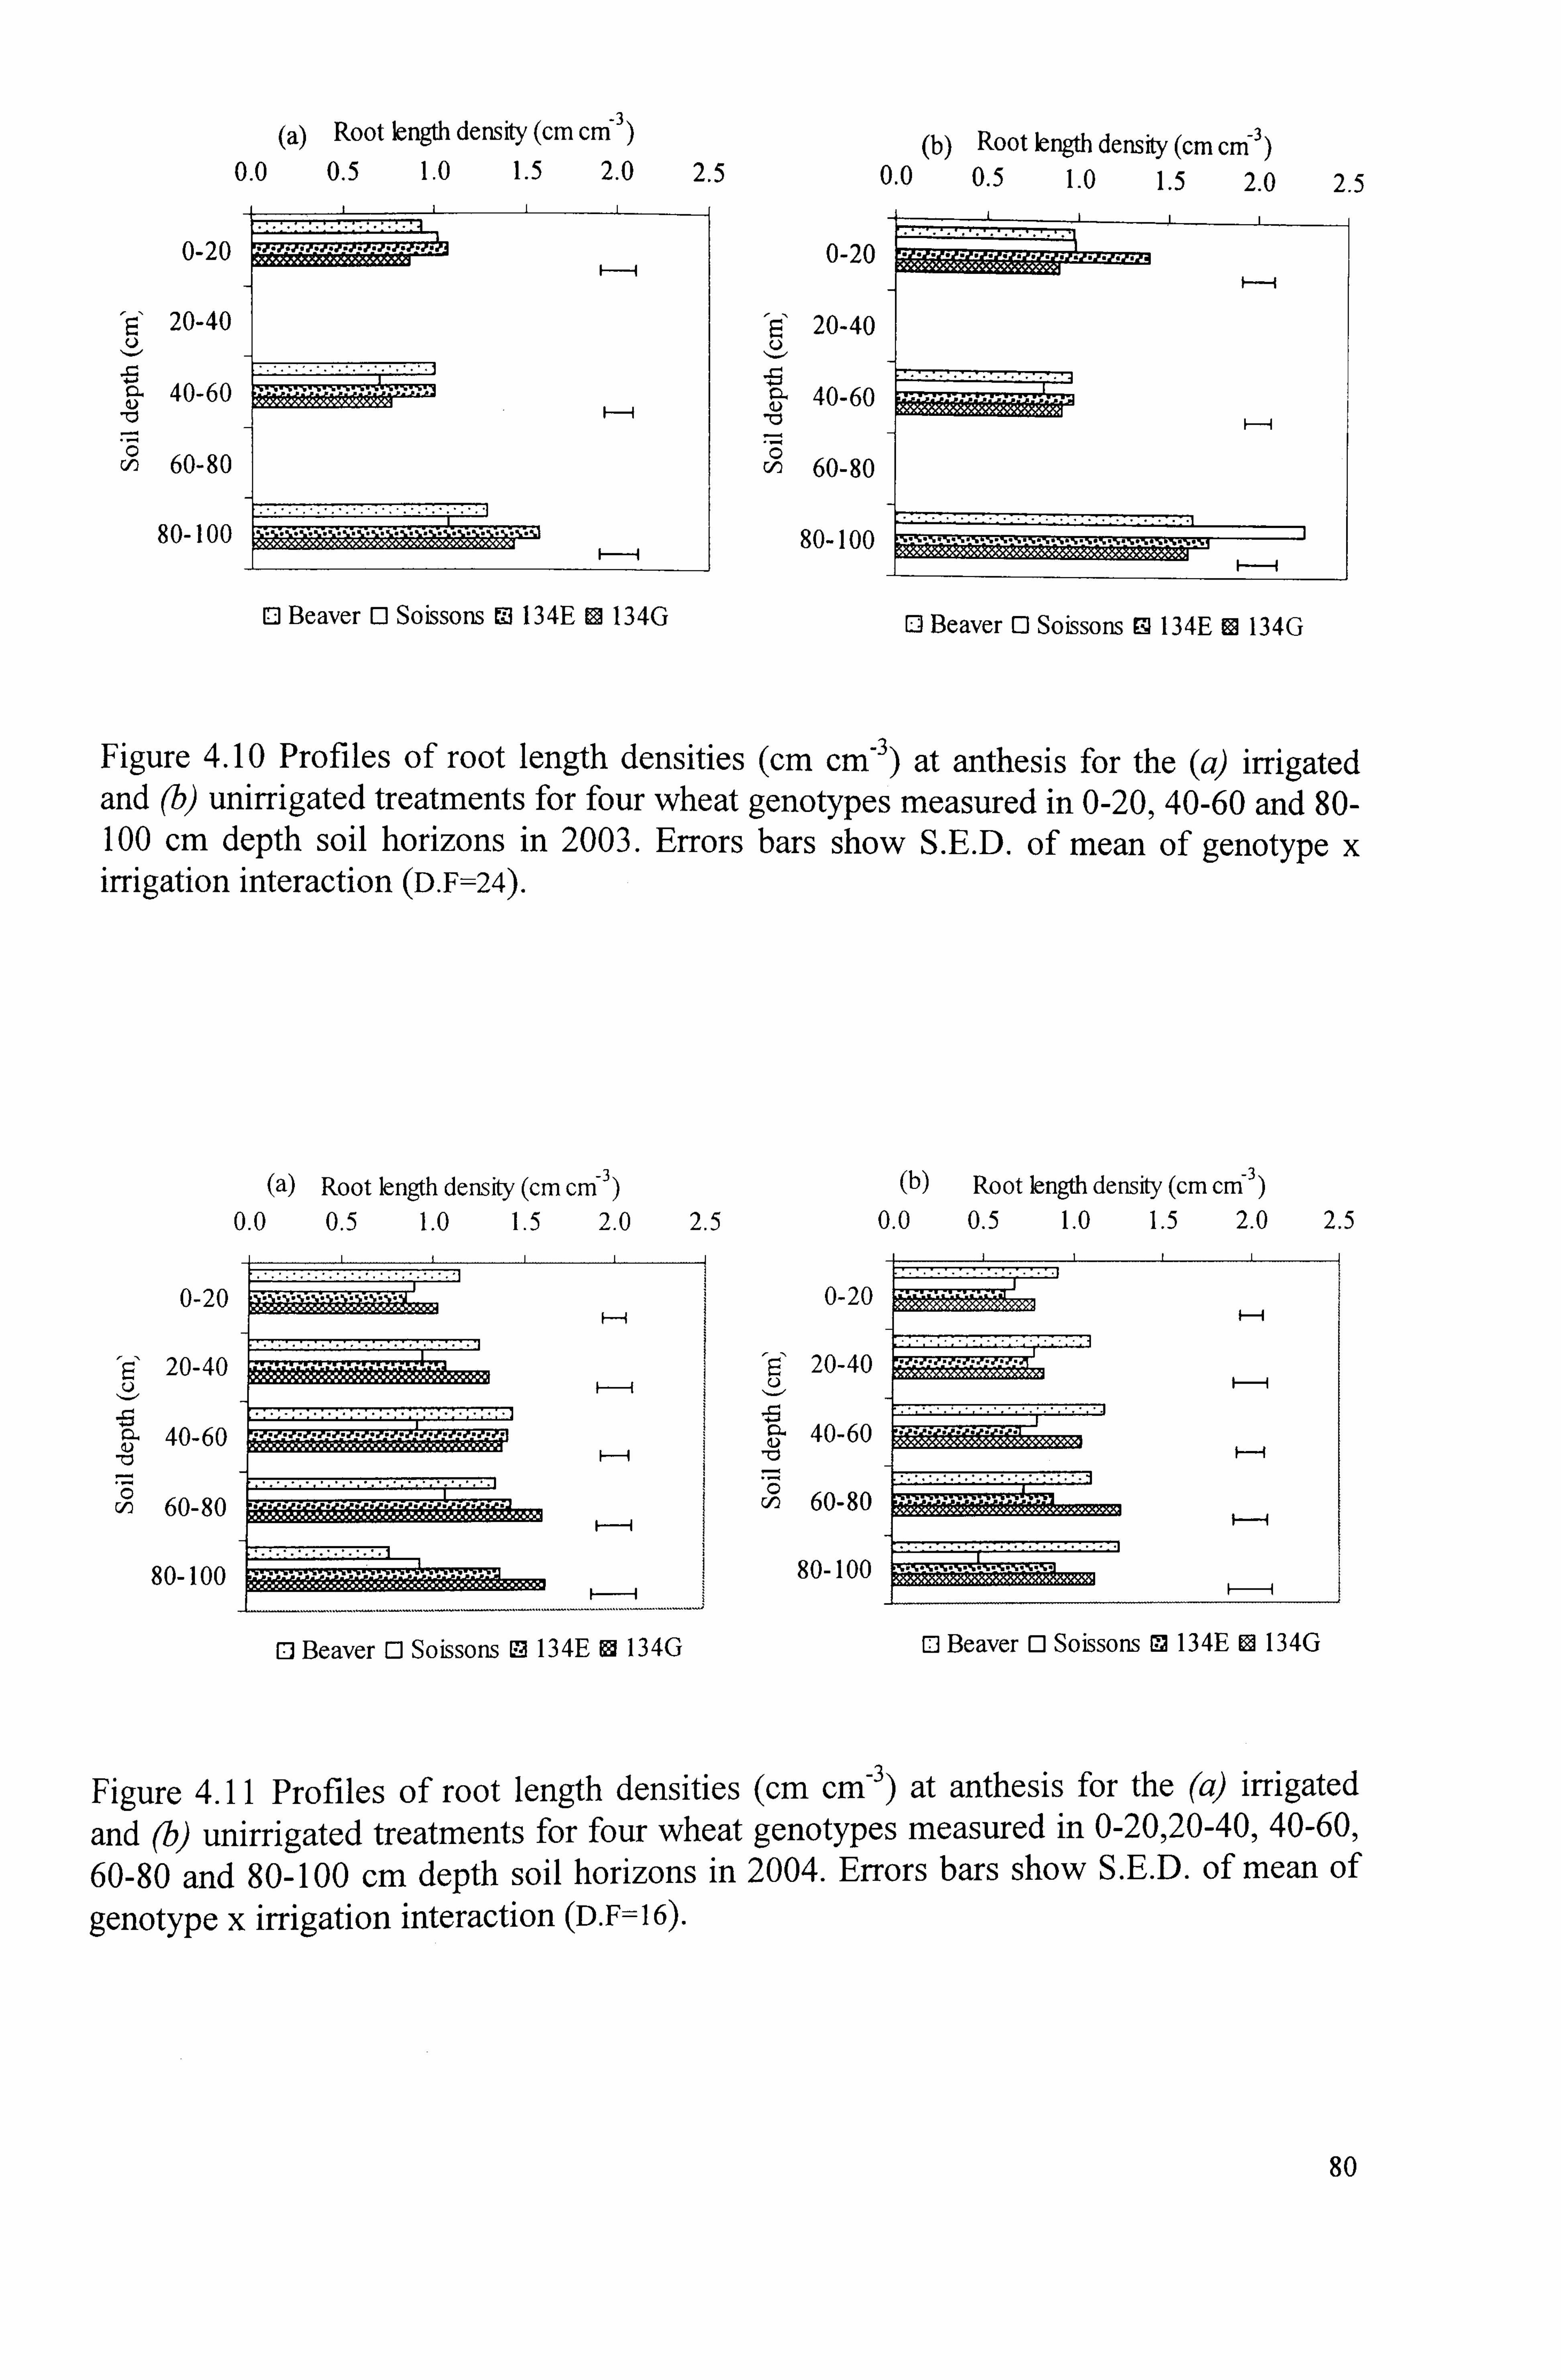
(a) Root length density (cm cm -3)
0.0 0.5 1.0 1.5 2.0
0-20
"E' 20-40 Q
-; s 40-60
0 co 1 60-80
80-100
2.5
F---ý
0 Beaver 0 Soissons 0 134E 0 134G 1: 1 Beaver 0 Soissons 0 134E 0 134G
Figure 4.10 Profiles of root length densities (CM CM-3 ) at anthesis for the (a) irrigated and (b) unirrigated treatments for four wheat genotypes measured in 0-20,40-60 and 80- 100 cm depth soil horizons in 2003. Errors bars show S. E. D. of mean of genotype x irrigation interaction (D. F=24).
(a) Root length density (cm cm -3)
0.0 0.5 1.0 1.5 2.0
0-20
20-40
40-60
60-80
80-100
�I
Cl Beaver 0 Soissons ED 134E Q 134G
Figure 4.11 Profiles of root length densities (CM CM-3 ) at anthesis for the (a) irrigated
and (b) unirrigated treatments for four wheat genotypes measured in 0-20,20-40,40-60,
60-80 and 80-100 cm depth soil horizons in 2004. Errors bars show S. E. D. of mean of
genotype x irrigation interaction (D. F=16).
(b) Root length density (CM CM 3)
2.5 0.0 0.5 1.0 1.5 2.0 2.5
0-20
20-40
40-60 "0
60-80
2.5
(b) Root length density (cm cm -3) 0.0 0.5 1.0 1.5 2.0
80-100
0-20
20-40
40-60
60-80
80-100
80
0 Beaver 0 Soissons 0 134E 0 134G
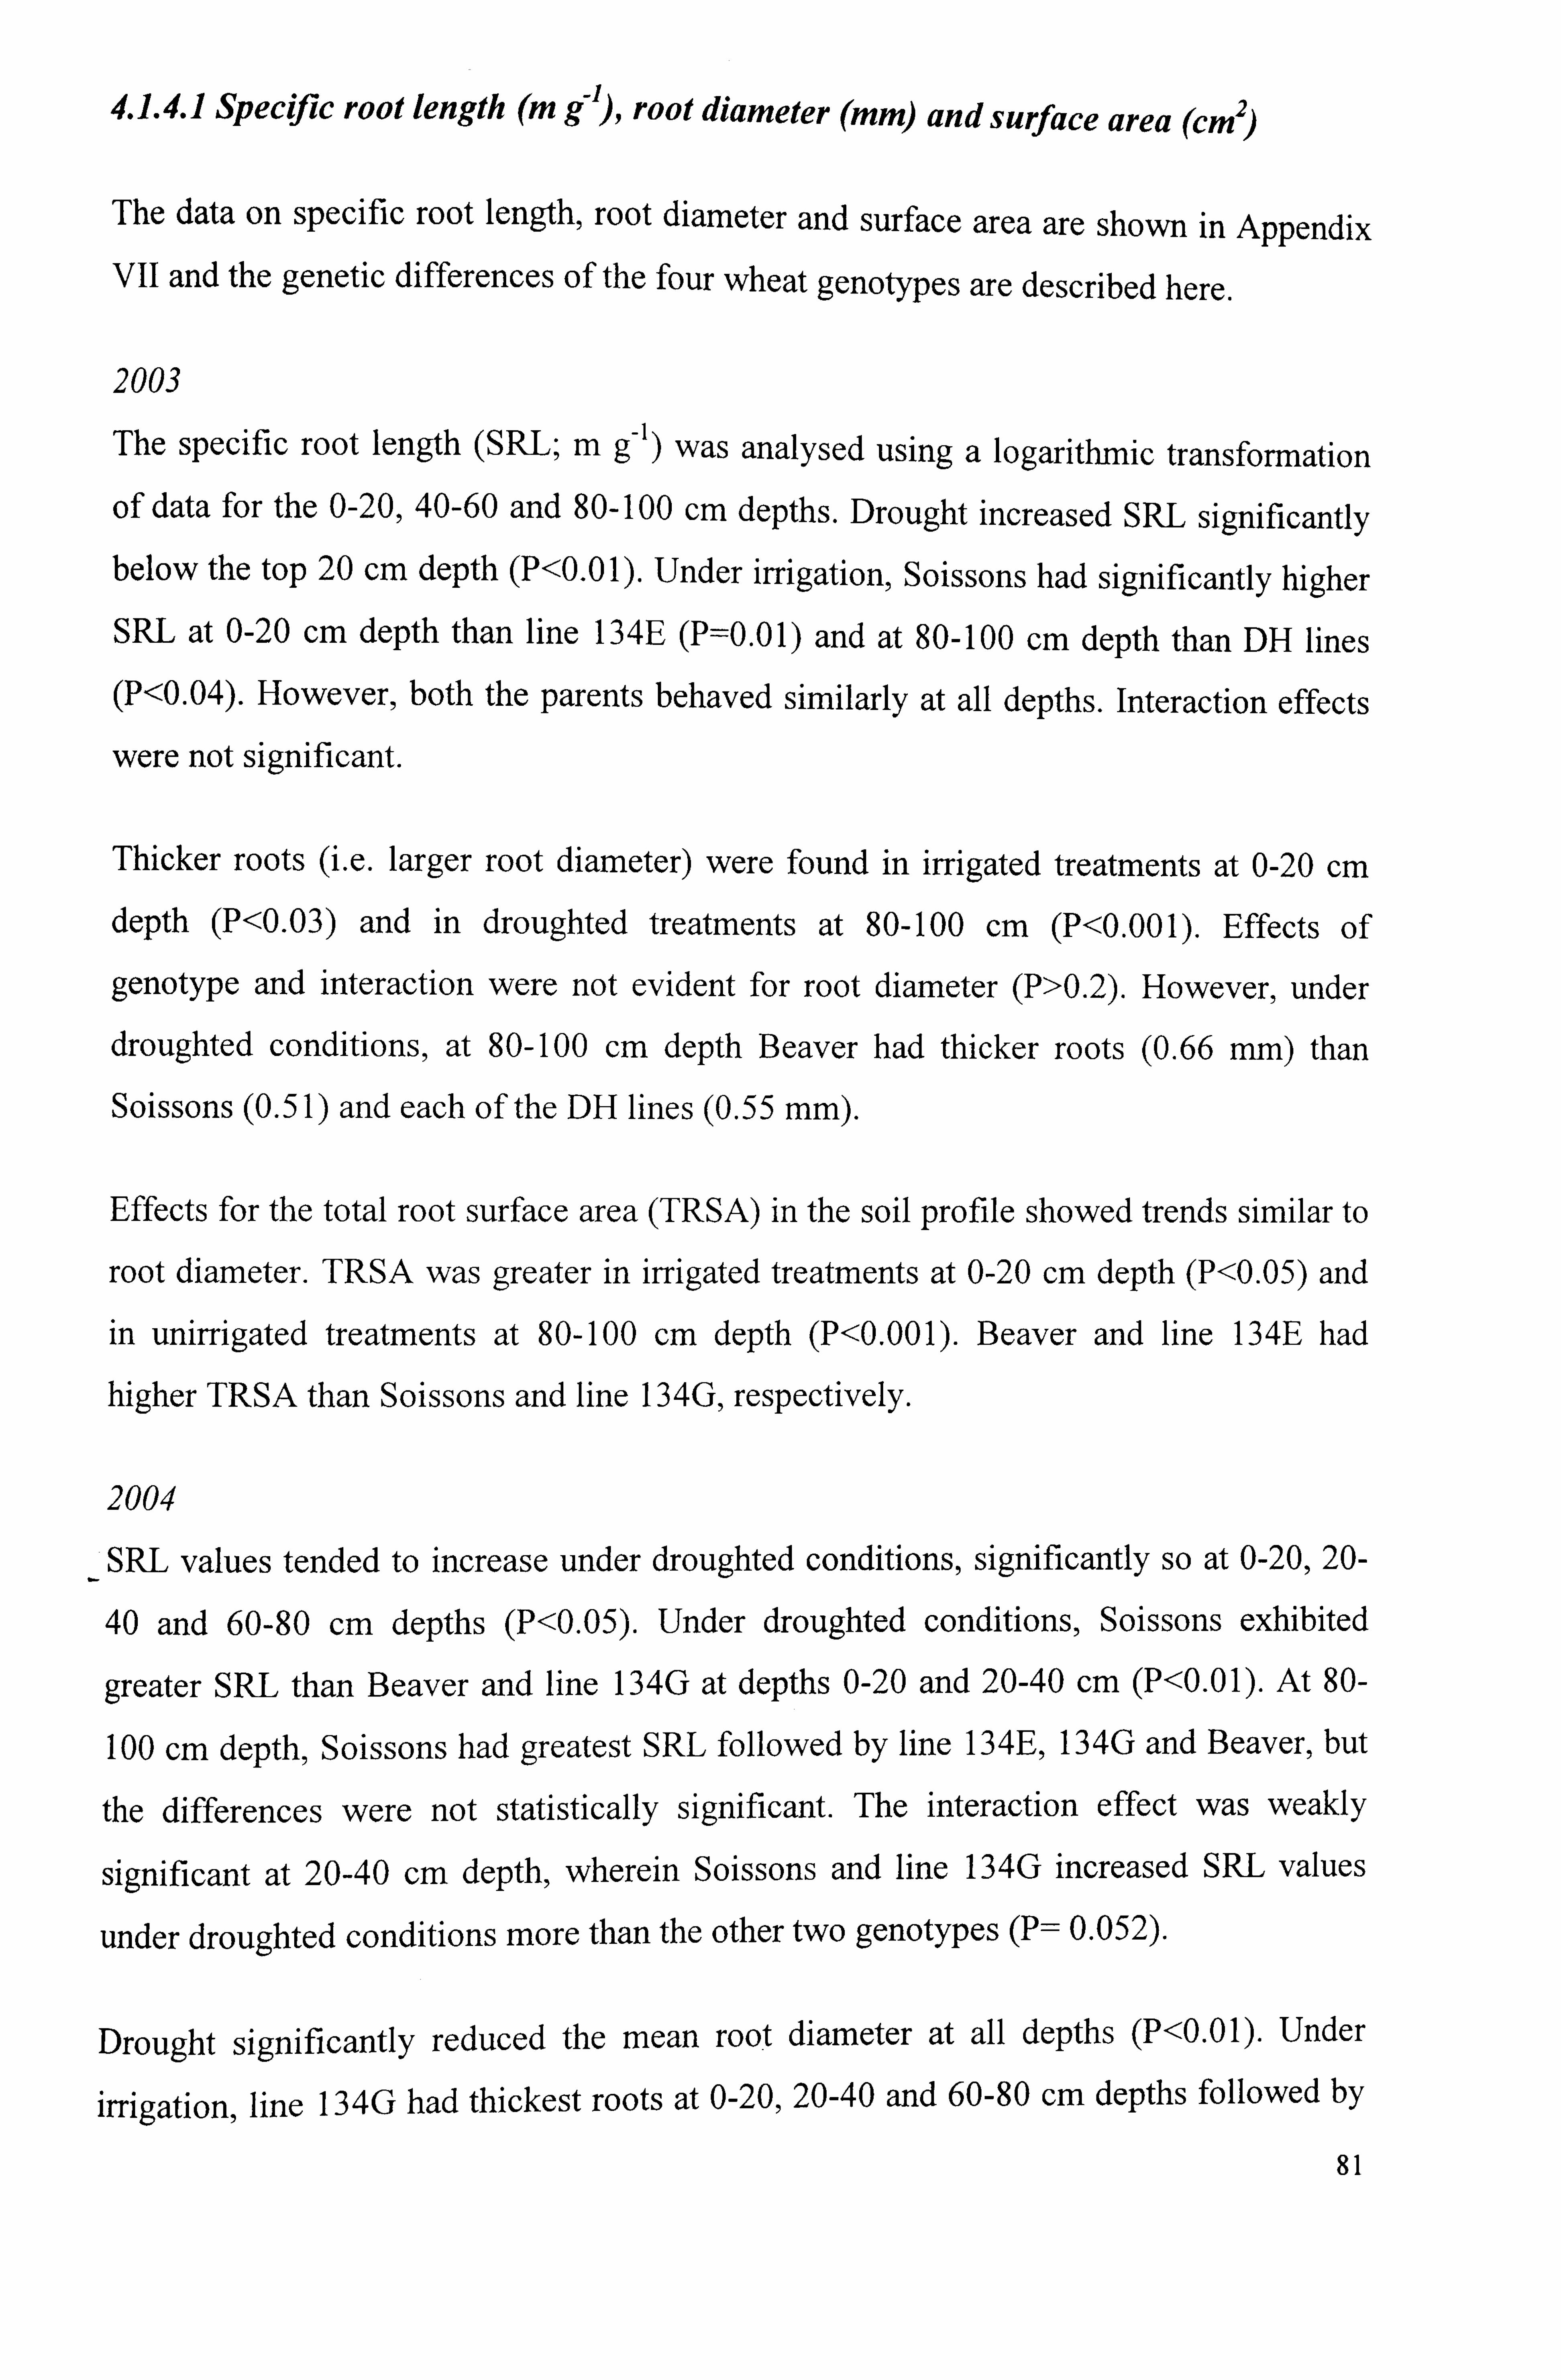
1 4.1-4.1 Specific root length (M g7), root diameter (Mm) and surface area (cm2)
The data on specific root length, root diameter and surface area are shown in Appendix
VII and the genetic differences of the four wheat genotypes are described here.
2003
The specific root length (SRL; in 9-1) was analysed using a logarithmic transformation
of data for the 0-20,40-60 and 80-100 cm depths. Drought increased SRL significantly below the top 20 cm depth (P<0.01). Under irrigation, Soissons had significantly higher
SRL at 0-20 cm depth than line 134E (P=0.01) and at 80-100 cm depth than DH lines
(P<0.04). However, both the parents behaved similarly at all depths. Interaction effects
were not significant.
Thicker roots (i. e. larger root diameter) were found in irrigated treatments at 0-20 cm
depth (P<0.03) and in droughted treatments at 80-100 cm (P<0.001). Effects of
genotype and interaction were not evident for root diameter (P>0.2). However, under
droughted conditions, at 80-100 cm depth Beaver had thicker roots (0.66 mm) than
Soissons (0.51) and each of the DH lines (0.55 mm).
Effects for the total root surface area (TRSA) in the soil profile showed trends similar to
root diameter. TRSA was greater in irrigated treatments at 0-20 cm depth (P<0.05) and
in unirrigated treatments at 80-100 cm depth (P<0.001). Beaver and line 134E had
higher TRSA than Soissons and line 134G, respectively.
2004
SRL values tended to increase under droughted conditions, significantly so at 0-20,20-
40 and 60-80 cm depths (P<0.05). Under droughted conditions, Soissons exhibited
greater SRL than Beaver and line 134G at depths 0-20 and 20-40 cm (P<0.01). At 80-
100 cm depth, Soissons had greatest SRL followed by line 134E, 134G and Beaver, but
the differences were not statistically significant. The interaction effect was weakly
significant at 20-40 cm depth, wherein Soissons and line 134G increased SRL values
under droughted conditions more than the other two genotypes (P= 0.052).
Drought significantly reduced the mean root diameter at all depths (P<0.01). Under
irrigation, line 134G had thickest roots at 0-20,20-40 and 60-80 cm depths followed by
81
Beaver and line 134E with Soissons having finer roots at all depths (P<0.03). Genotype
x irrigation interaction was weakly significant at 0-20 cm (P= 0.054) and 80-100 cm (P= 0.057) depths with line 134G having more reduced root diameter under droughted
conditions than other genotypes.
Irrigation resulted in higher TRSA at all soil depths (P< 0.03). The values were higher at 60-80 cm depth in irrigated than in unirrigated treatments (435 c. f. 267 CM2 ; P<0.001).
Under irrigation, among genotypes, 134G followed by Beaver had significantly higher
TRSA over Line 134E and Soissons above 40 cm depth (P<0.05). At 40-60 cm depth,
Soissons had significantly the least TRSA than rest of the genotypes (P=0.03). At 60-80
cm depth, 134G had significantly higher TRSA (575 CM2; P<0.001). At 80-100 cm depth, line 134G and 134E had significantly higher TRSA than Beaver and Soissons
(P=0.02). The genotype x irrigation effect was significant at the 80-100 cm depth; with line 134G showing decreased TRSA under drought (588 c. f. 297 CM2; P=0.034) than
other genotypes.
4.1.5 Green area (cm 2 plant-)
2003
Drought significantly decreased green area at all the samplings (P<0.01; Fig. 4.12a).
Under irrigation, green area was greater for Beaver than for Soissons at 133 DAS
(GS61+4wks) and at harvest (P<0.03). At 10 1 DAS, there was a trend for line 134G and
Beaver to lose more green area under drought than Soissons and line 134E (P=0.07).
Under irrigation, Soissons and line 134G produced the least green area at 133 DAS (173
and 149 cm 2 plant-', respectively); and at harvest (42 and 33 cm 2 plant-', respectively).
The differences in the development of genotypes resulted in variations in the production
of green area at a given sampling. Although, the genotype x irrigation interaction was
generally not statistically significant, there was a consistent trend for Beaver to lose
more green area under drought than other genotypes.
2004
Green area decreased after 109 DAS (one week after anthesis) due to drought (P <0.001).
Genotypic differences were significant at all the samplings (P<0.05). At 91 DAS, under
irrigation, line 134G exhibited greatest green area (1088 CM2 plant-') with other
82

genotypes in the range 610-779 cm 2 (Fig. 4.12b). At 109 DAS, 134E had maximum
green area (1743 cm 2; P=0.05) under irrigation followed by line 134G, while parents had the least. At 123 DAS, three weeks after anthesis, Beaver showed an increase in
green area over line 134G (P = 0.043), but did not differ with line 134E and Soissons.
At 138 DAS, line 134G and Beaver still showed greater green area than line 134E and Soissons (P = 0.026). However, a significant genotype x irrigation interaction was found
(P = 0.033), wherein, with line 134G and Soissons lost more green area under drought
as compared to 134E and Beaver. At 151 DAS Beaver which maintained significantly
more green area in irrigated conditions (1071 cm2; P=0.002) than other genotypes. It is
probable that genotype differences at any given sampling were partly as a result of
developmental differences. For example, fast developing Soissons reached maturity at
least ten days earlier than Beaver. Similarly, line 134G also reached maturity earlier
than line 134E.
4.1.5.1 Leaf chlorophyll concentration estimate (SPAD units)
In 2003,, the main effect of drought was not significant for leaf chlorophyll concentration.
Under irrigation, genotypes differed at 68 DAS (GS39+1week). Beaver and Soissons
exhibited higher chlorophyll content (45.59 and 44.67 units respectively) than lines
134E and 134G (41.19 and 36.52 units, respectively; P<0.001). Similar genotype
differences were observed at GS61+3 weeks (P<0.001; Table 4.2). The main effects of
irrigation and genotypes were not significantly different at GS61+4 weeks and
GS61+5weeks. The irrigation interaction effect was not significant at any sampling.
Average across all measurements, the genotype difference was weakly significant with
Beaver and Soissons showing higher SPAD values than the two DH lines (P=0.055).
In 2004, the leaf chlorophyll concentration was only measured at GS61 and
GS61+3weeks and differences among genotypes, irrigation or for their interactions were
not statistically significant.
83
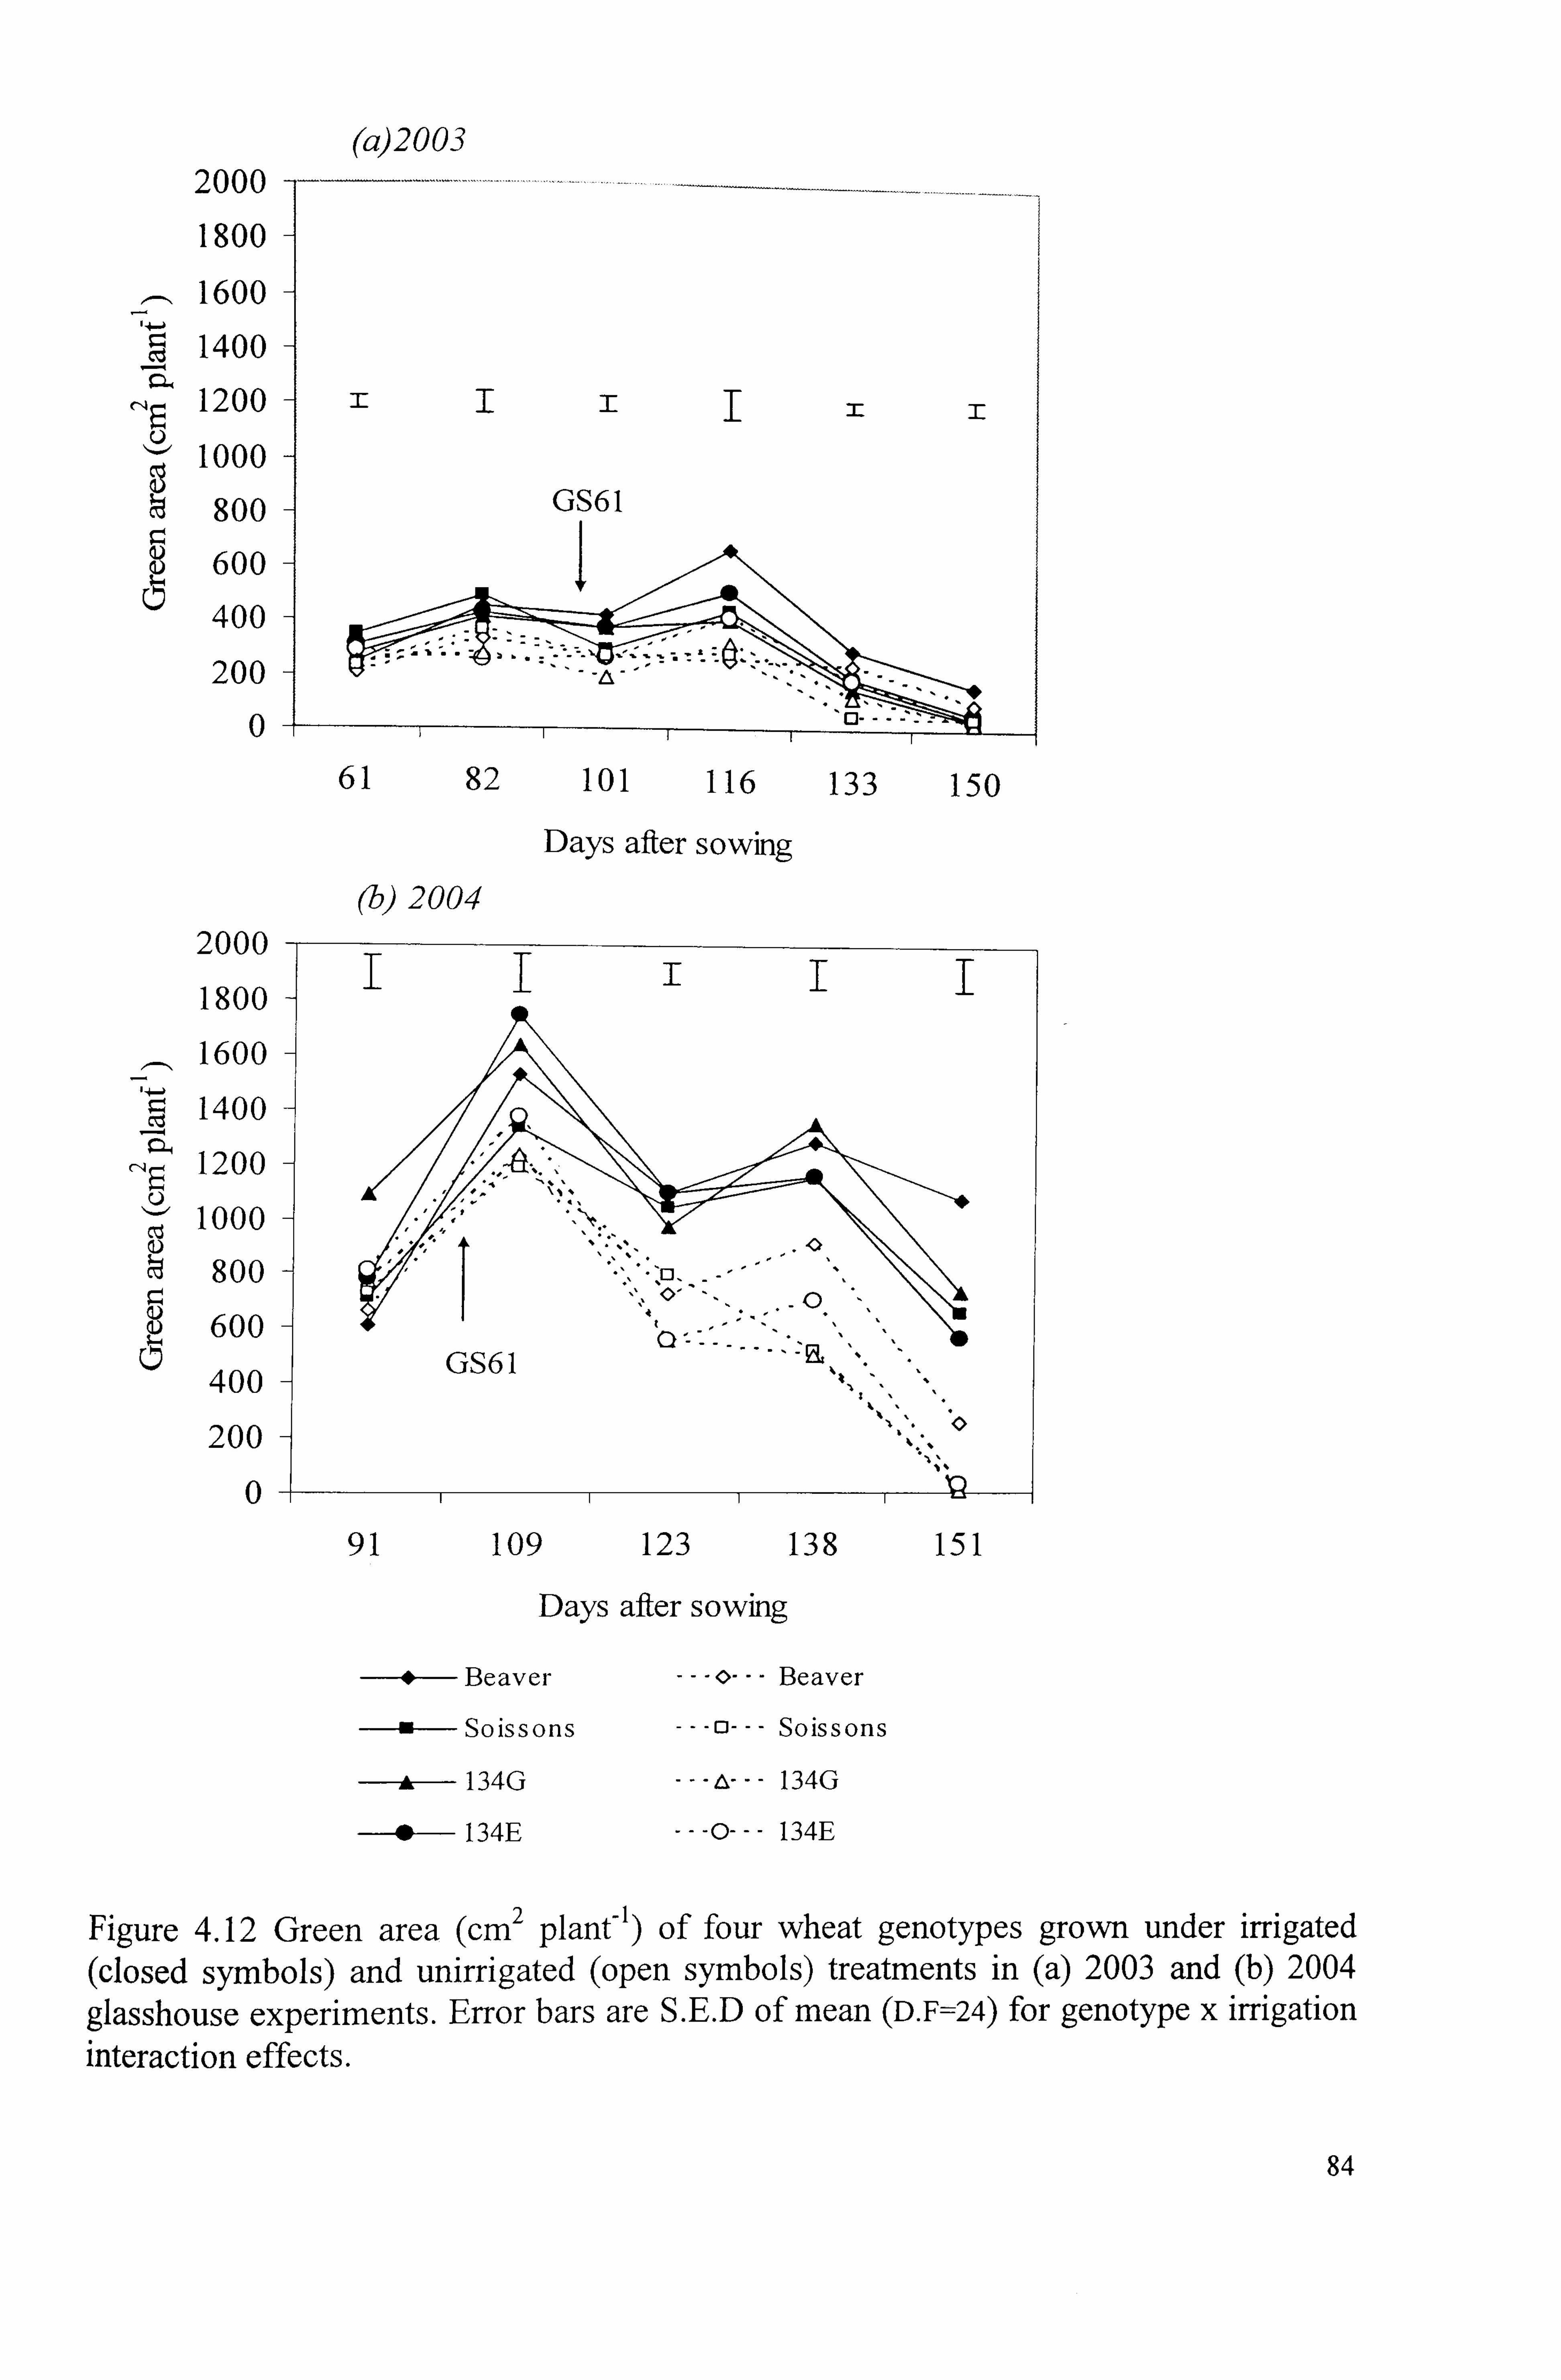
(a)2003 2000
1800
1600
1400
1000
800
600
400
200
0
Days after sowing
(b) 2004 2000
1800
1600
1400
1200
1000
800 r.
600
400
200
0
GS61
91 109 123 138 151
Days after sowing
Beaver --- * --- Beaver
Soissons --- 0 --- Soissons
134G --- A --- 134G
134E --- 0 --- 134E
Figure 4.12 Green area (cm 2 plant-) of four wheat genotypes grown under irrigated (closed symbols) and unirrigated (open symbols) treatments in (a) 2003 and (b) 2004
glasshouse experiments. Error bars are S. E. D of mean (D. F=24) for genotype x irrigation interaction effects.
84
61 82 101 116 133 150
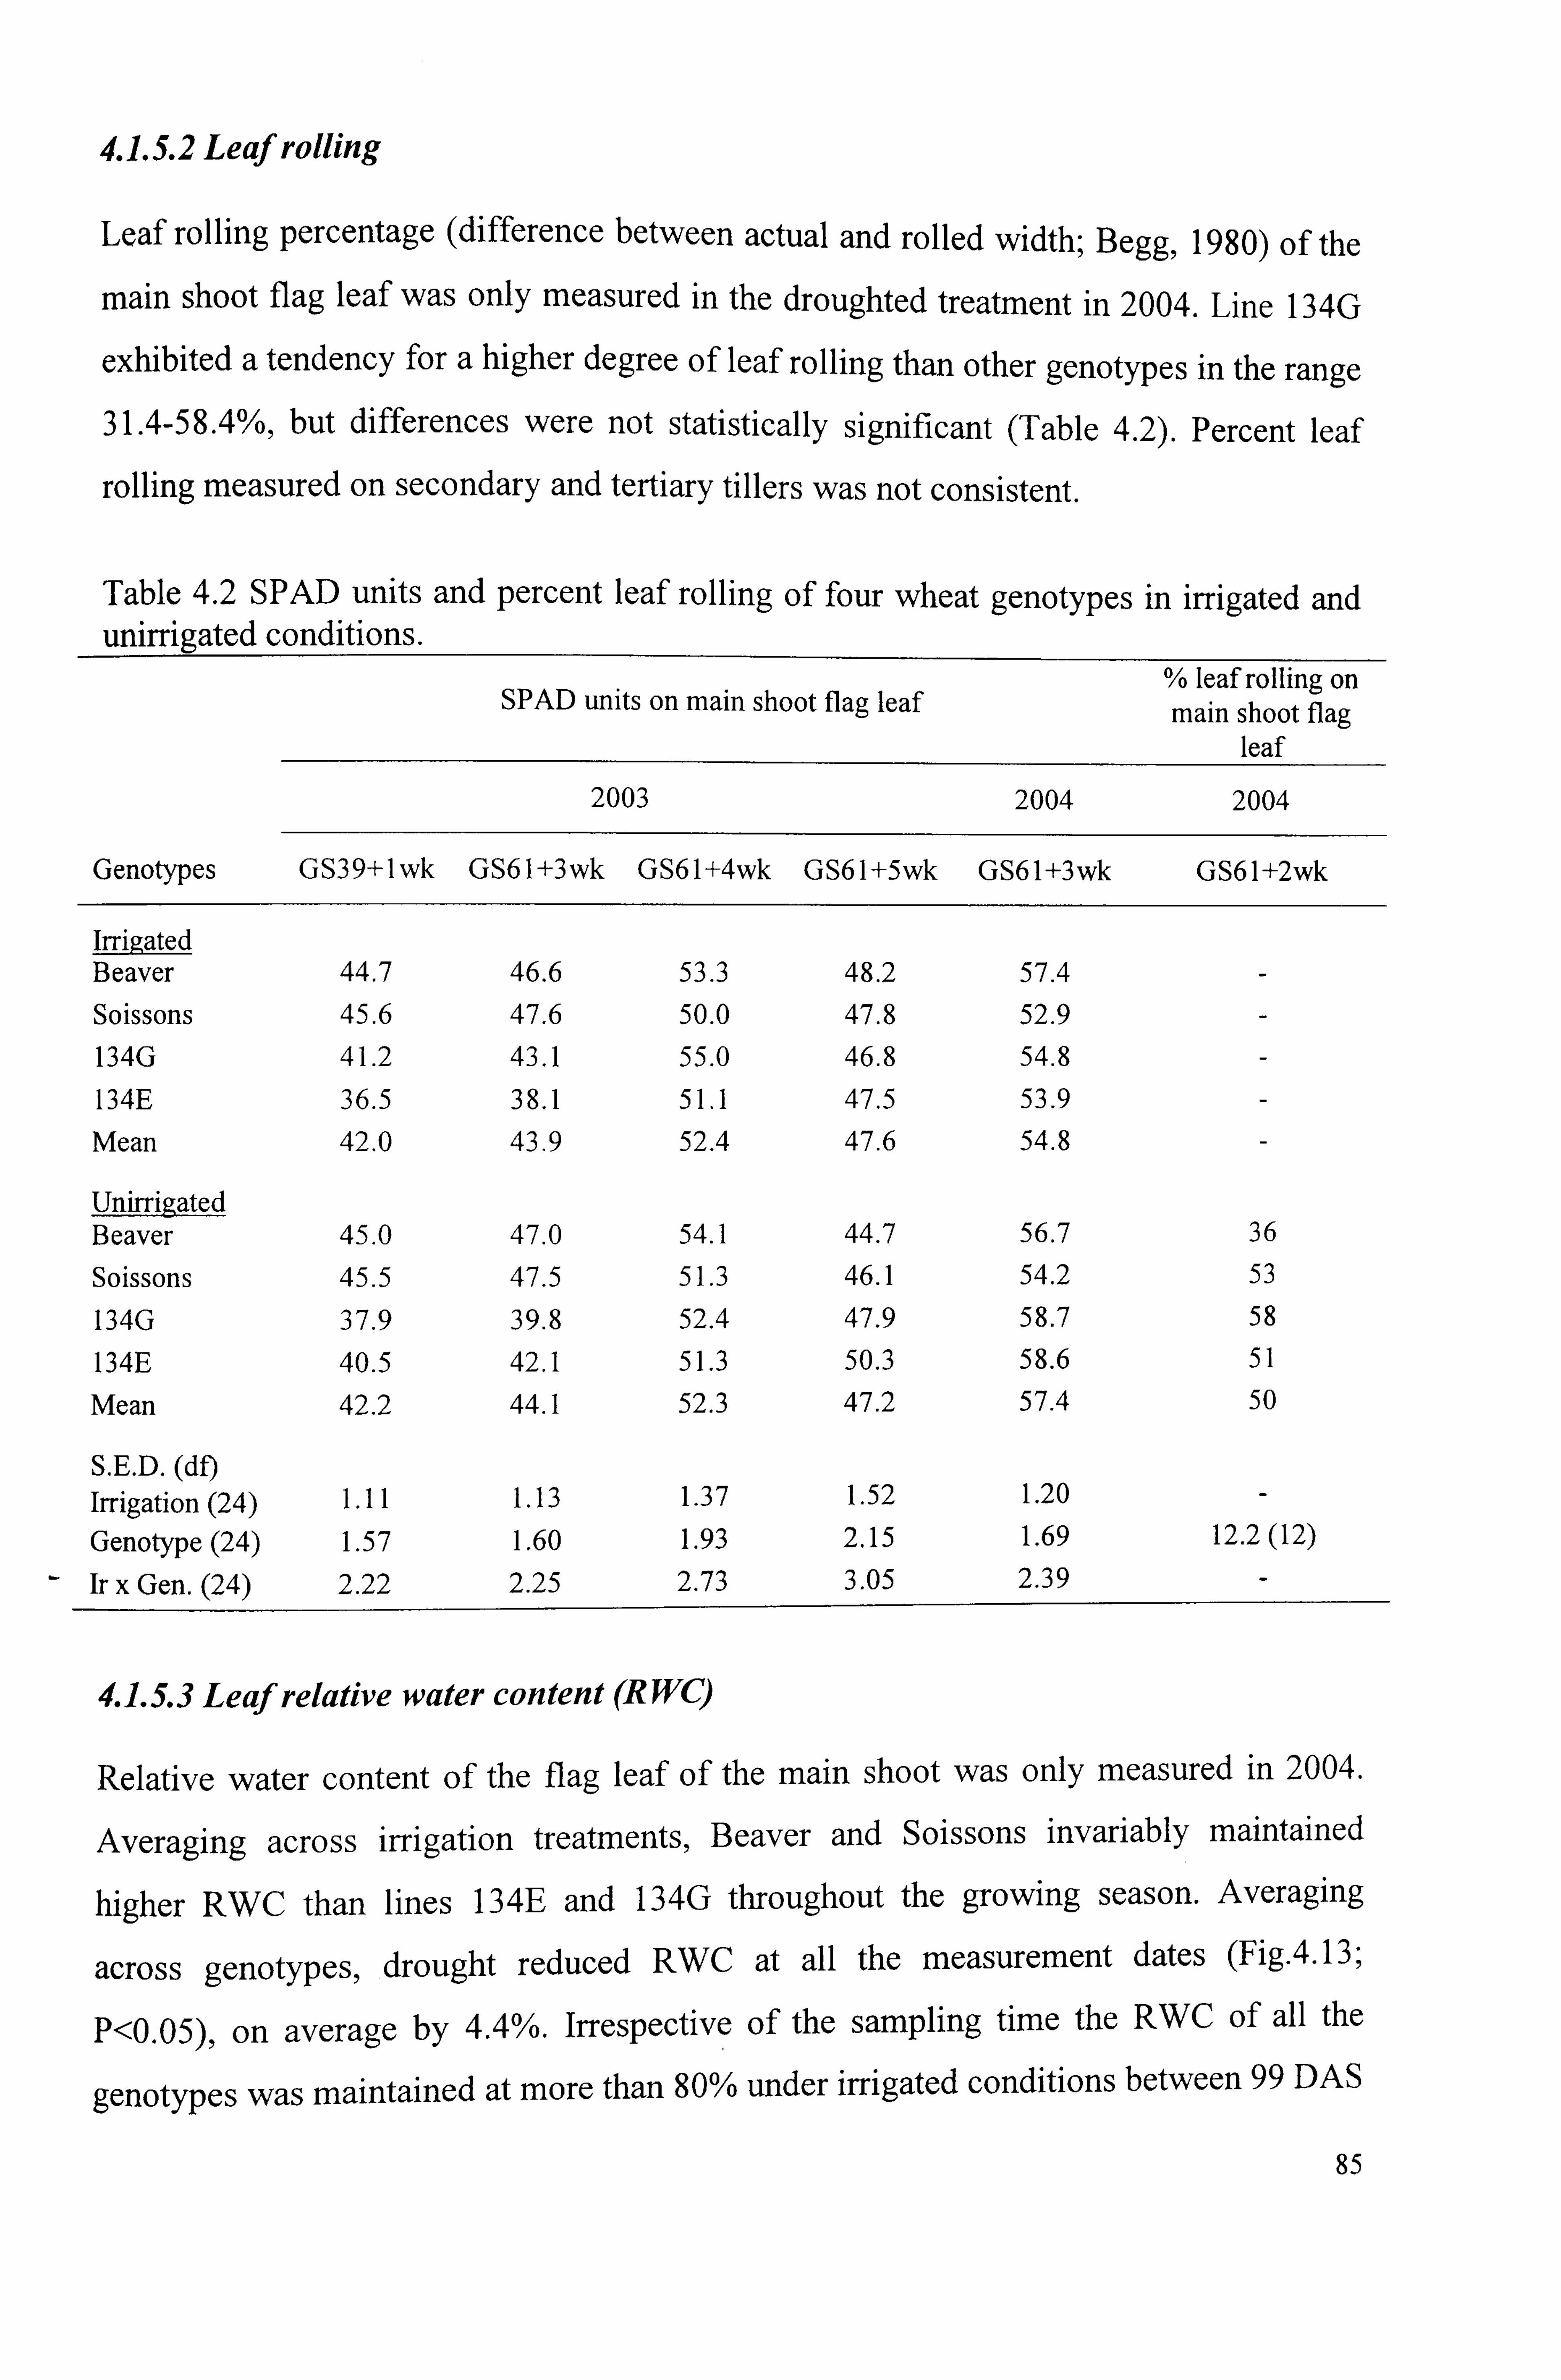
4.1.5.2 Leaf rolling
Leaf rolling percentage (difference between actual and rolled width; Begg, 1980) of the
main shoot flag leaf was only measured in the droughted treatment in 2004. Line 134G
exhibited a tendency for a higher degree of leaf rolling than other genotypes in the range 31.4-58.4%, but differences were not statistically significant (Table 4.2). Percent leaf
rolling measured on secondary and tertiary tillers was not consistent.
Table 4.2 SPAD units and percent leaf rolling of four wheat genotypes in irrigated and unirrigated conditions.
% leaf rolling on SPAD units on main shoot flag leaf main shoot flag
leaf
2003 2004 2004
Genotypes GS39+lwk GS61+3wk GS61+4wk GS61+5wk GS61+3wk GS61+2wk
Irrip, ated Beaver 44.7 46.6 53.3 48.2 57.4
Soissons 45.6 47.6 50.0 47.8 52.9
134G 41.2 43.1 55.0 46.8 54.8
134E 36.5 38.1 51.1 47.5 53.9
Mean 42.0 43.9 52.4 47.6 54.8
Unirrigated Beaver 45.0 47.0 54.1 44.7 56.7 36
Soissons 45.5 47.5 51.3 46.1 54.2 53
134G 37.9 39.8 52.4 47.9 58.7 58
134E 40.5 42.1 51.3 50.3 58.6 51
Mean 42.2 44.1 52.3 47.2 57.4 50
S. E. D. (df) Irrigation (24) 1.11 1.13 1.37 1.52 1.20
Genotype (24) 1.57 1.60 1.93 2.15 1.69 12.2
-
(12)
Ir x Gen. (24) 2.22 2.25 2.73 3.05 2.39
4.1.5.3 Lea relative water content (R WC) ff
Relative water content of the flag leaf of the main shoot was only measured in 2004.
Averaging across irrigation treatments, Beaver and Soissons invariably maintained
higher RWC than lines 134E and 134G throughout the growing season. Averaging
across genotypes, drought reduced RWC at all the measurement dates (Fig-4.13;
P<0.05), on average by 4.4%. Irrespective of the sampling time the RWC of all the
genotypes was maintained at more than 80% under irrigated conditions between 99 DAS
85

and 138 DAS. A reduction of 3-5% was observed both in irrigated and droughted
conditions after anthesis. The ranking of the genotypes varied little in both the irrigated
and unirrigated treatments. This ranking was in the order of Beaver > Soissons > 134E > 134G. The genotype x irrigation interaction was not statistically significant.
100
95
I 90
85
80 U
1: 4
75
70
Oz o '0
,, 0 Anthesis Grain filling
III --F-- - -- --I
99 109 123 138 150
Days after sowmg
wet-Beaver
wet-Soissons
A wet- 134G
0 wet- I 34E
* ---- dry-Beaver
13 ---- dry-Soissons
A ---- dry-134G
0 ---- dry-134E
Figure 4.13 Relative water content (RWC) of the flag leaf of the main shoot of four
wheat genotypes at different growth stages in irrigated and unirrigated treatments in 2004. Errors bars show S. E. D for the genotype x irrigation interaction effect.
86

4.1.6 Plant water use
4.1.6.1 Cumulative water use
The time-course changes in water use of the four genotypes in 2003 and 2004 are
presented in Figure 4.14 (a) and (b). In 2003, the amount of water applied to columns during the experiment was 6.7 1 in the unirrigated treatment and 15.4 1 in the irrigated
treatment (Fig. 4.14 a). The pattern of water use differed between genotypes and irrigation treatments (P<0.001). The water use by Soissons was smaller throughout the
growing period compared to Beaver, both in the irrigated and unirrigated treatments
(P<0.05). Line 134E used more water than 134G; these two lines were intermediate in their water use. The interaction effect for water use was not statistically significant.
In 2004, the amount of water applied to columns in the droughted and irrigated
treatments were 2.7 and 10.1 1 respectively (Fig. 4.14 b). Between the initial and final
samplings, Line 134G and Beaver used more water (both 9 1) than line 134E and Soissons (P=0.01). The season-long water use by the genotypes was related to their
development and maturity. Soissons, on account of its faster development than Beaver
used less water,, whilst line 134G used more water than 134E. The relative abilities of
genotypes to maintain water use under irrigation appear to correspond to differences in
rooting traits. Line 134G and Soissons exhibited a trend to maintain water uptake than
line 134E and Beaver.
In 2003, Beaver and line 134E had higher total root surface area and root diameter,
particularly in the droughted treatments. In addition a larger root volume was present in
these genotypes. In 2004, total root surface area of line 134G and Beaver was more in
the top 60 cm soil horizon, but at deeper profiles DH lines had higher root surface area
and root volume than the parental lines (P=0.02). Beaver and 134G had greater RLD.
On the other hand, Soissons always exhibited the smallest root diameter, root surface
area and root volume and had greater specific root length (SRL; root length/ root
weight), a measure of fineness of roots which resulted in effective capture of moisture in
the soil profile.
87
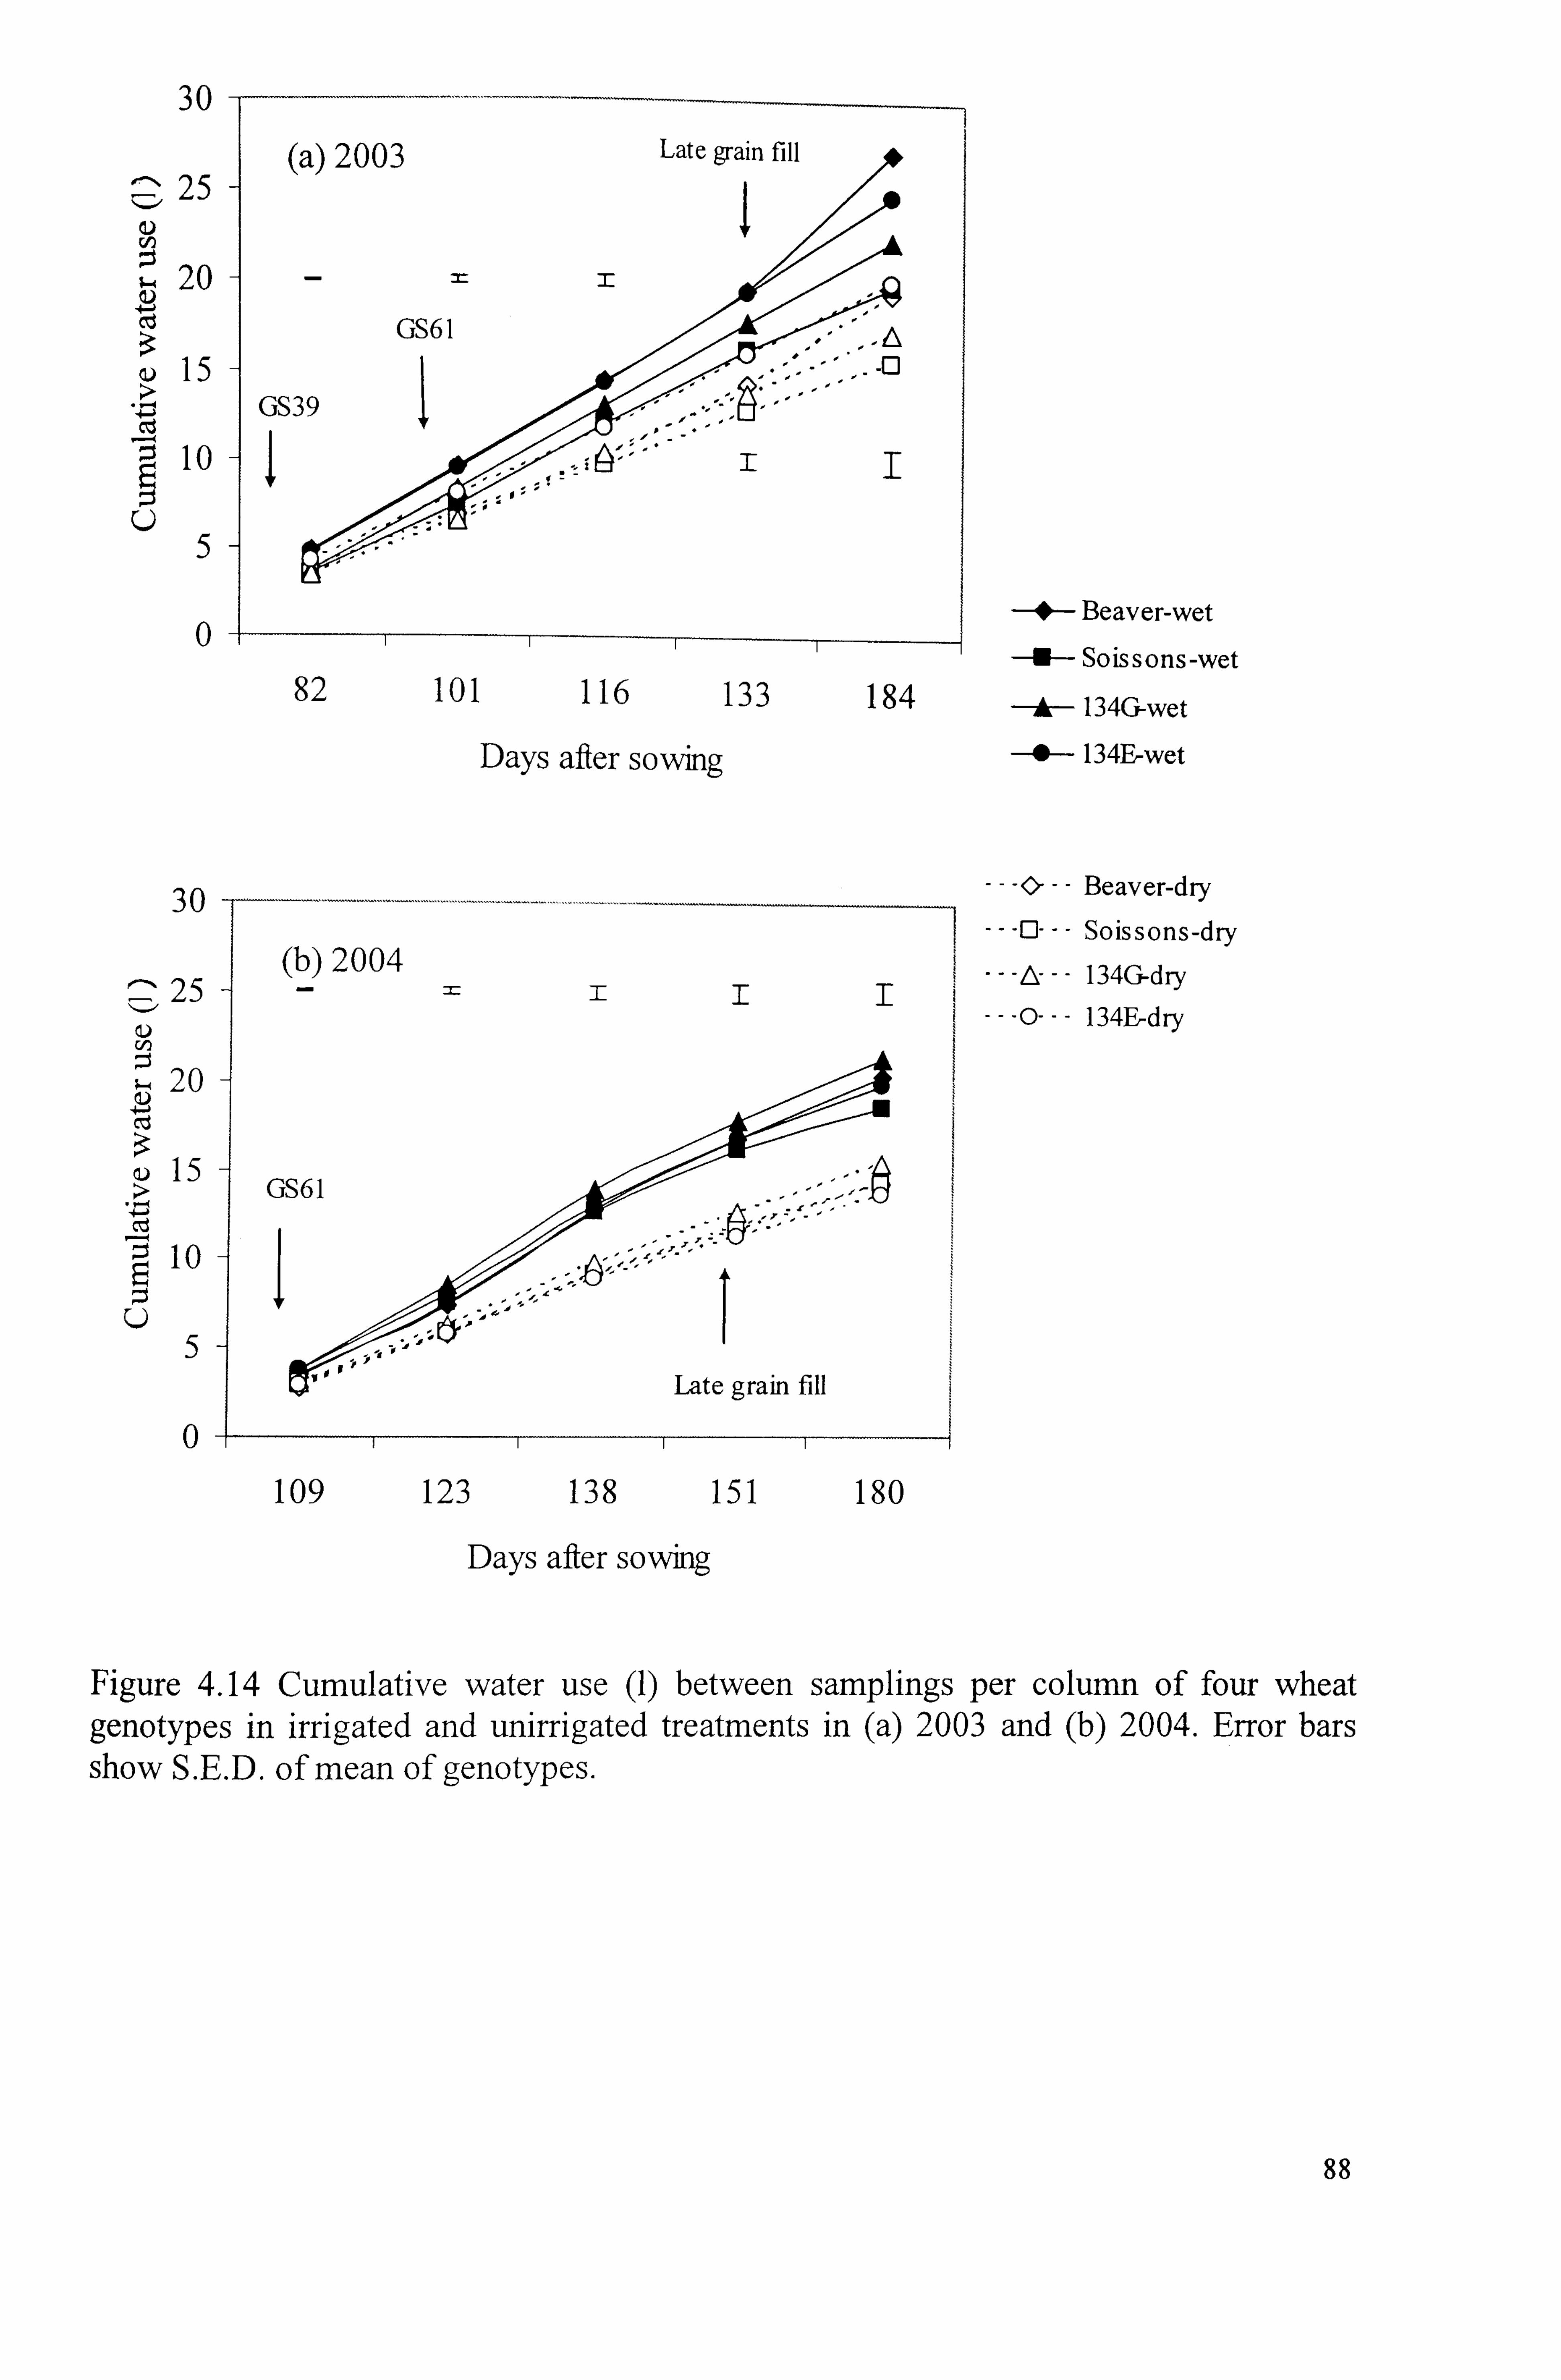
30
25
V) 20
Cd 15
10
5
0
2003 Late grain fill
I
GS61
GS39
'o ,
82 101 116 133 184
Days after soving
30
25
20
15
Z, 10 H
5
0
(b) 2004
GS61
10 1 0 Late grain fill
109 123 138 151 180
Days after sowing
,0 Beaver-wet
-NF- Soissons-wet
* 134Gwet
--0- 134E-wet
-0- -- Beaver-dry
Soissons-dry
134Gýdry
134E-dry
Figure 4.14 Cumulative water use (1) between samplings per column of four wheat genotypes in irrigated and unirrigated treatments in (a) 2003 and (b) 2004. Error bars
show S. E. D. of mean of genotypes.
88
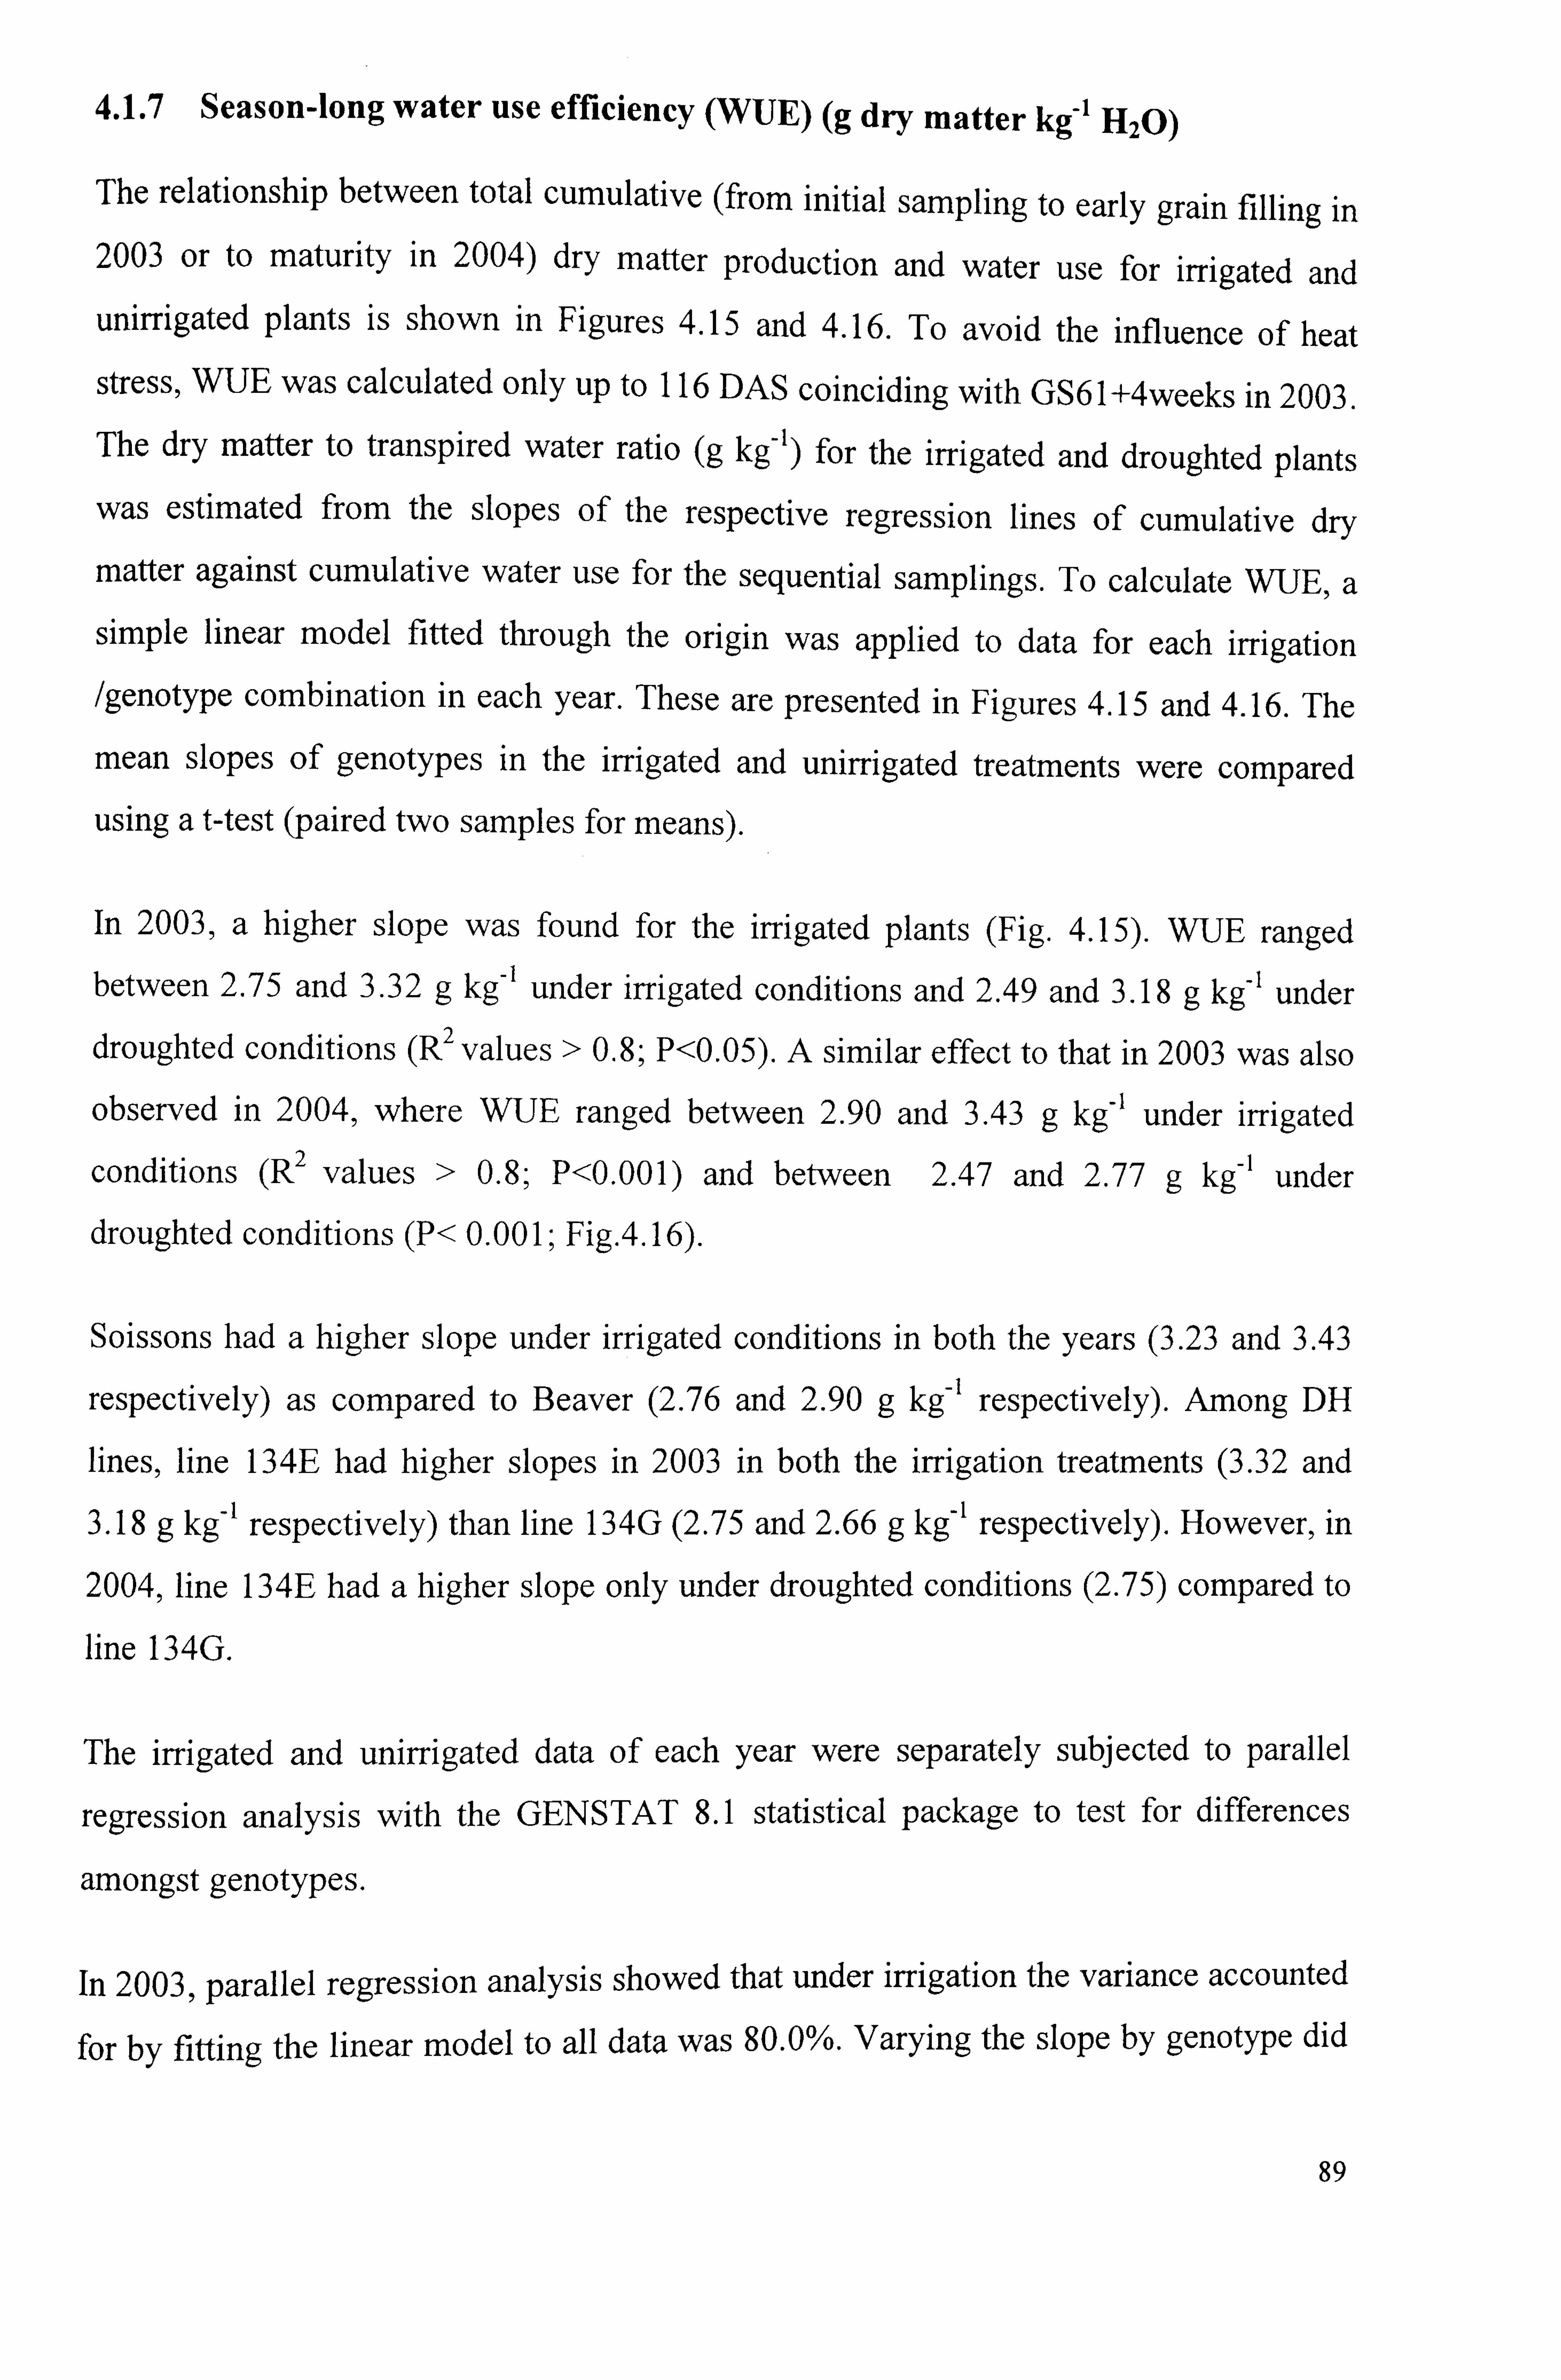
4.1.7 Season-long water use efficiency (WUE) (g dry matter kg-1 H20)
The relationship between total cumulative (from initial sampling to early grain filling in 2003 or to maturity in 2004) dry matter production and water use for irrigated and unirrigated plants is shown in Figures 4.15 and 4.16. To avoid the influence of heat
stress, WUE was calculated only up to 116 DAS coinciding with GS61+4weeks in 2003. The dry matter to transpired water ratio (g kg-1) for the irrigated and droughted plants
was estimated from the slopes of the respective regression lines of cumulative dry
matter against cumulative water use for the sequential samplings. To calculate WUE, a
simple linear model fitted through the origin was applied to data for each irrigation
/genotype combination in each year. These are presented in Figures 4.15 and 4.16. The
mean slopes of genotypes in the irrigated and unirrigated treatments were compared
using a t-test (paired two samples for means).
In 2003, a higher slope was found for the irrigated plants (Fig. 4.15). WUE ranged between 2.75 and 3.32 g kg-1 under irrigated conditions and 2.49 and 3.18 g kg-1 under
droughted conditions (R 2 values > 0.8; P<0.05). A similar effect to that in 2003 was also
observed in 2004, where WUE ranged between 2.90 and 3.43 g kg-1 under irrigated
conditions (R 2 values > 0.8; P<0.001) and between 2.47 and 2.77 g kg-1 under
droughted conditions (P< 0.001; Fig. 4.16).
Soissons had a higher slope under irrigated conditions in both the years (3.23 and 3.43
respectively) as compared to Beaver (2.76 and 2.90 g kg- I respectively). Among DH
lines, line 134E had higher slopes in 2003 in both the irrigation treatments (3.32 and
3.18 g kg-I respectively) than line 134G (2.75 and 2.66 g kg-1 respectively). However, in
2004, line 134E had a higher slope only under droughted conditions (2.75) compared to
line 134G.
The irrigated and unirrigated data of each year were separately subjected to parallel
regression analysis with the GENSTAT 8.1 statistical package to test for differences
amongst genotypes.
In 2003, parallel regression analysis showed that under irrigation the variance accounted
for by fitting the linear model to all data was 80.0%. Varying the slope by genotype did
89
not significantly improve the fit (P<0.65; accounting for 93.4% variance, estimated s. e 4.52). Similarly the slopes for genotypes under drought were not significantly different.
In 2004, genotypes within individual irrigation treatments differed (P<0.01) on the basis
of parallel regression analysis. In a separate analysis for the irrigated treatments, WUE
was greater for Soissons (P<0.01) than other genotypes. Whilst under unirrigated
conditions, a similar tend was observed. Further, pooled analysis of both irrigated and
unirrigated treatment groups showed differences between the genotypes (P<0.001)
explaining 91.2 % variance.
Applying parallel regression analysis to all data in 2003 and 2004 in irrigated and
unirrigated conditions, the variance accounted for by fitting the linear model to all data
was 89.2% (P< 0.01). Varying the slope by genotype did not significantly improve the
fit (P<0.4, s. e = 5.60). However, parallel regression analysis showed that varying the
slope by irrigation treatment did significantly improve the fit, WUE was greater under
irrigated than under unirrigated conditions.
90
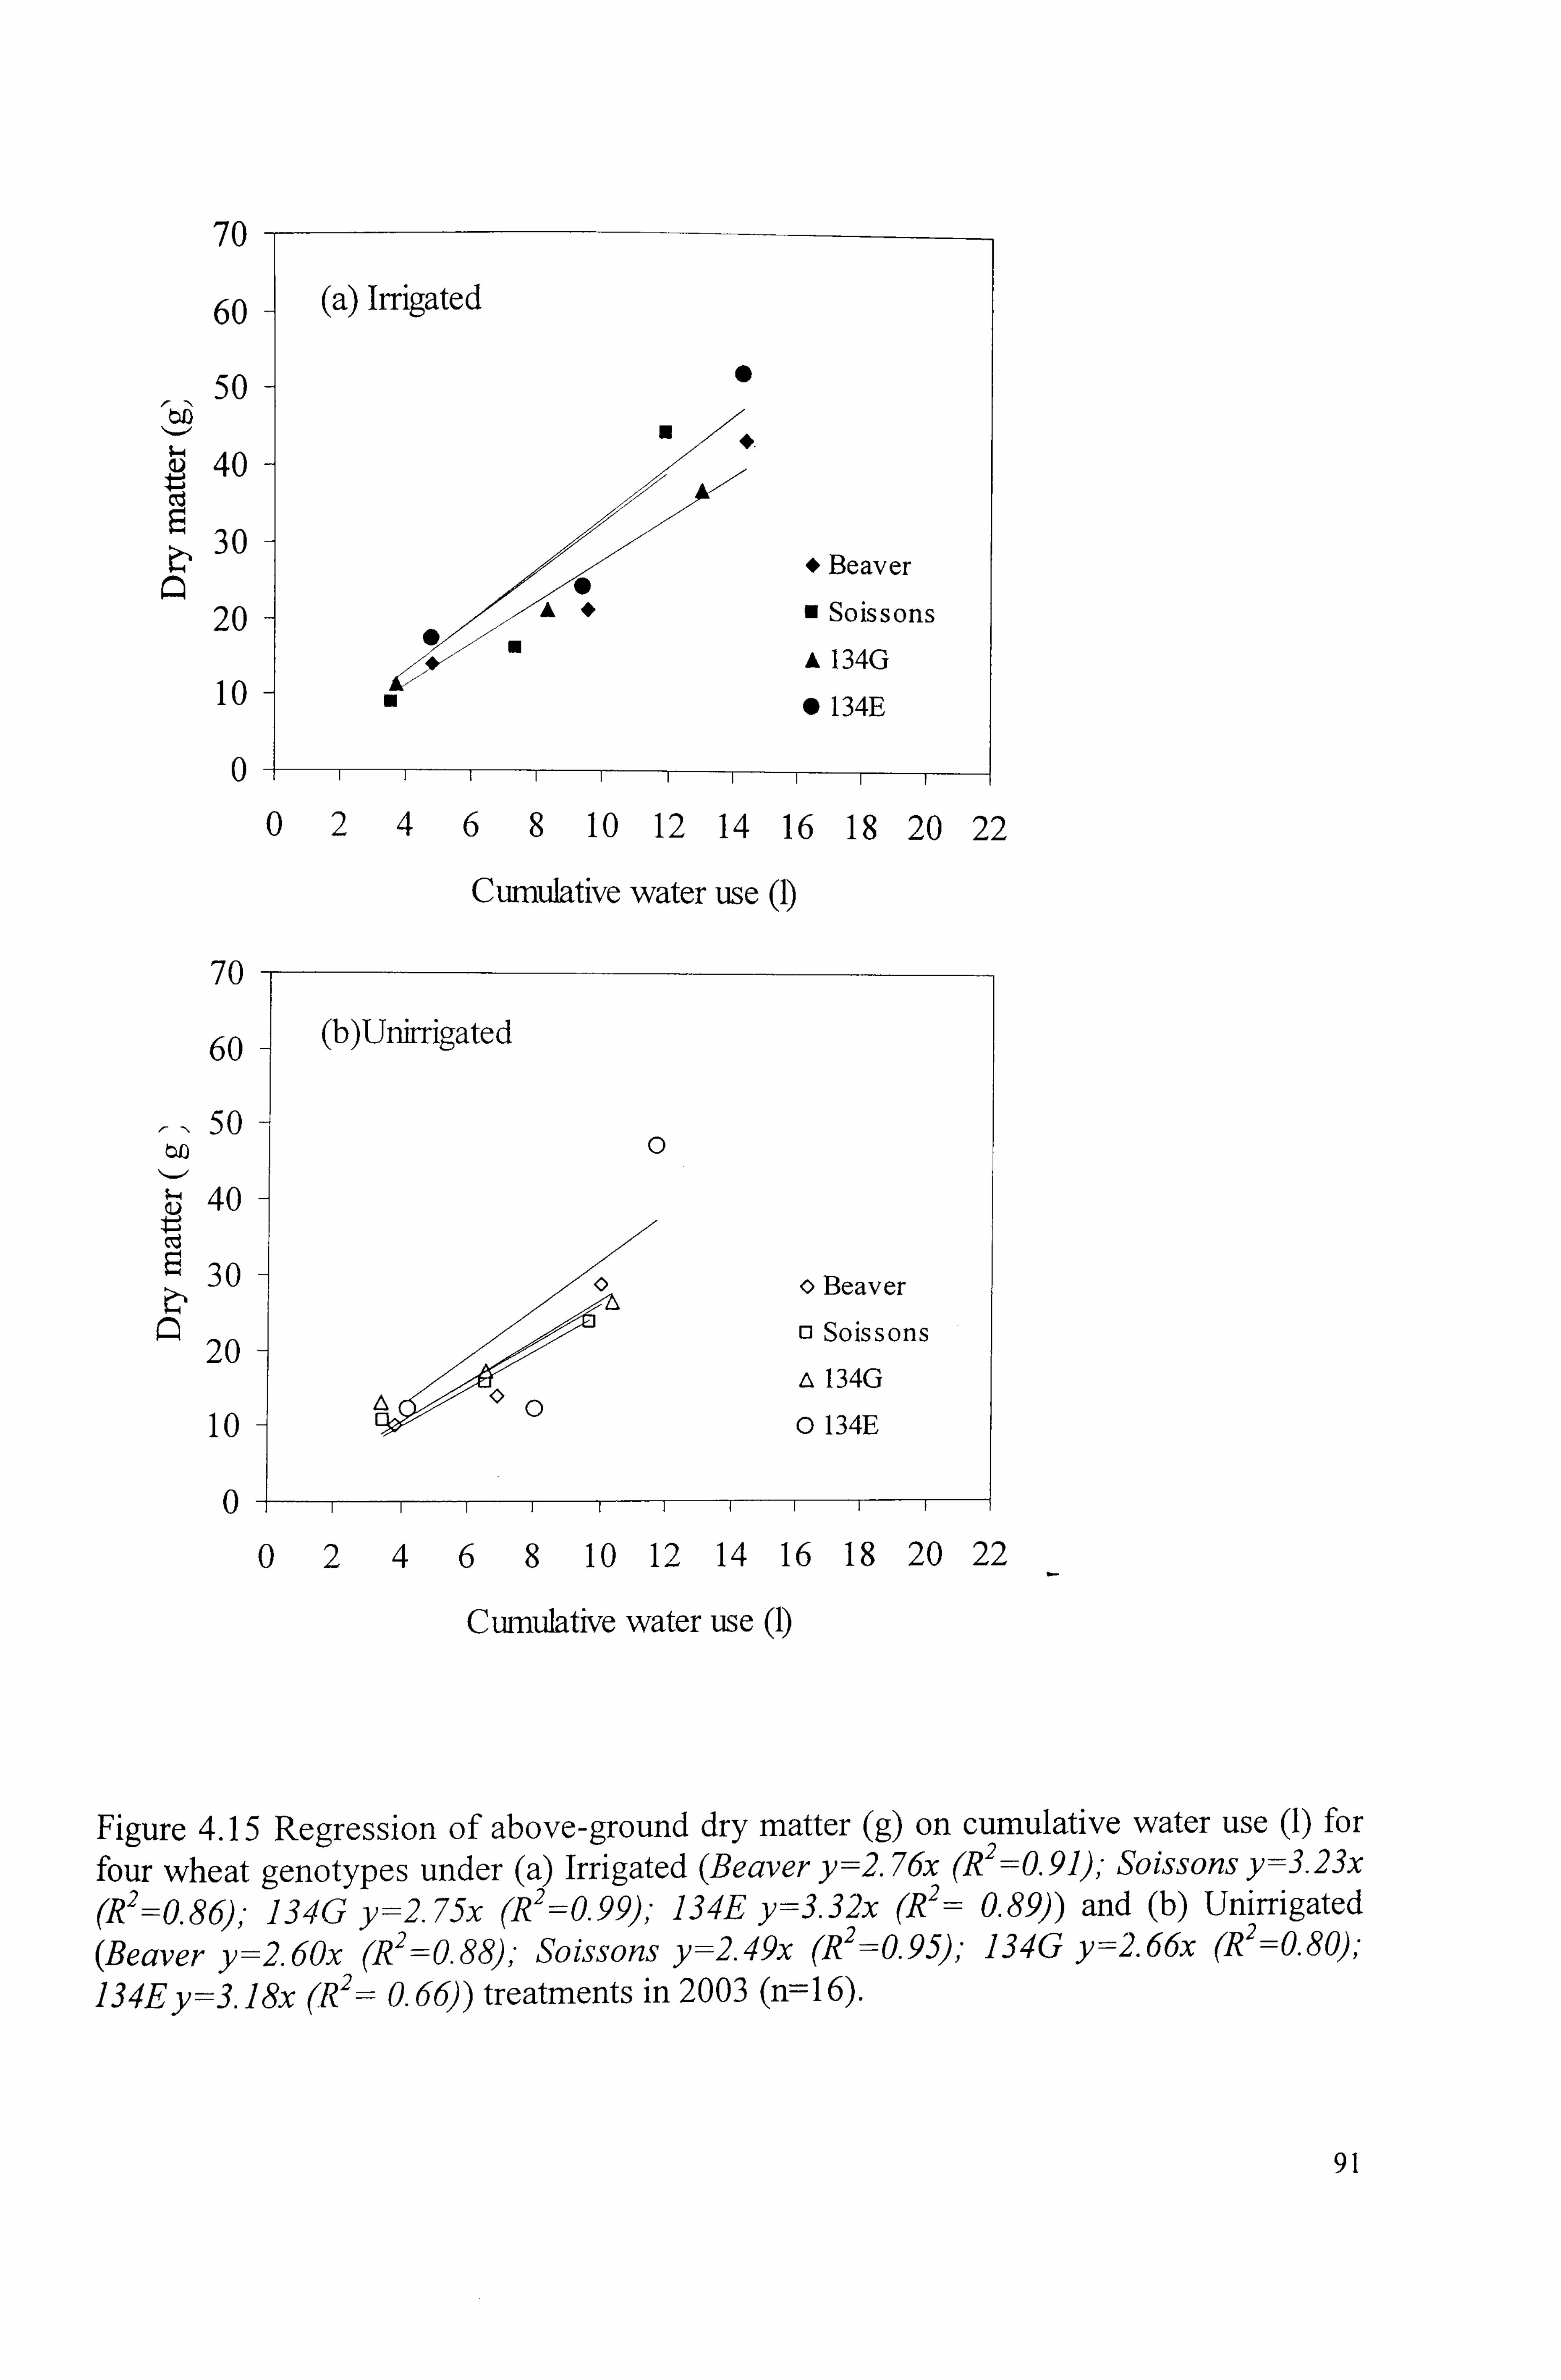
70
60
50
40 ct
30
20
10
0
70
60
50
40
30
20
10
0
(a) Irrigated
0
+
Beaver
A0 Soissons
A 134G
0 134E
02468 10 12 14 16 18 20 22
Cwnulative water use (1)
(b)Unirrigated
0
o Beaver
cl Soissons
A 134G
0 134E
02468 10 12 14 16 18 20 22
Cunulative water use (1)
Figure 4.15 Regression of above-ground dry matter (g) on cumulative water use (1) for
four wheat genotypes under (a) Irrigated (Beaver y=2.76x (R 2=0 . 91); Soissons y=3.23x
(R2=0.86), - 134G y=2.75x (R2 = 0.99)'. 134E y=3.32x (R 2= 0.89)) and (b) Unirrigated
(Beaver y=2.60x (R 2 =0.88), - Soissons y=2.49x (R2=0.95),. 134G y=2.66x (R 2
=0.80); 134Ey=3. ]8x (R2= 0.66)) treatments in 2003 (n= 16).
91
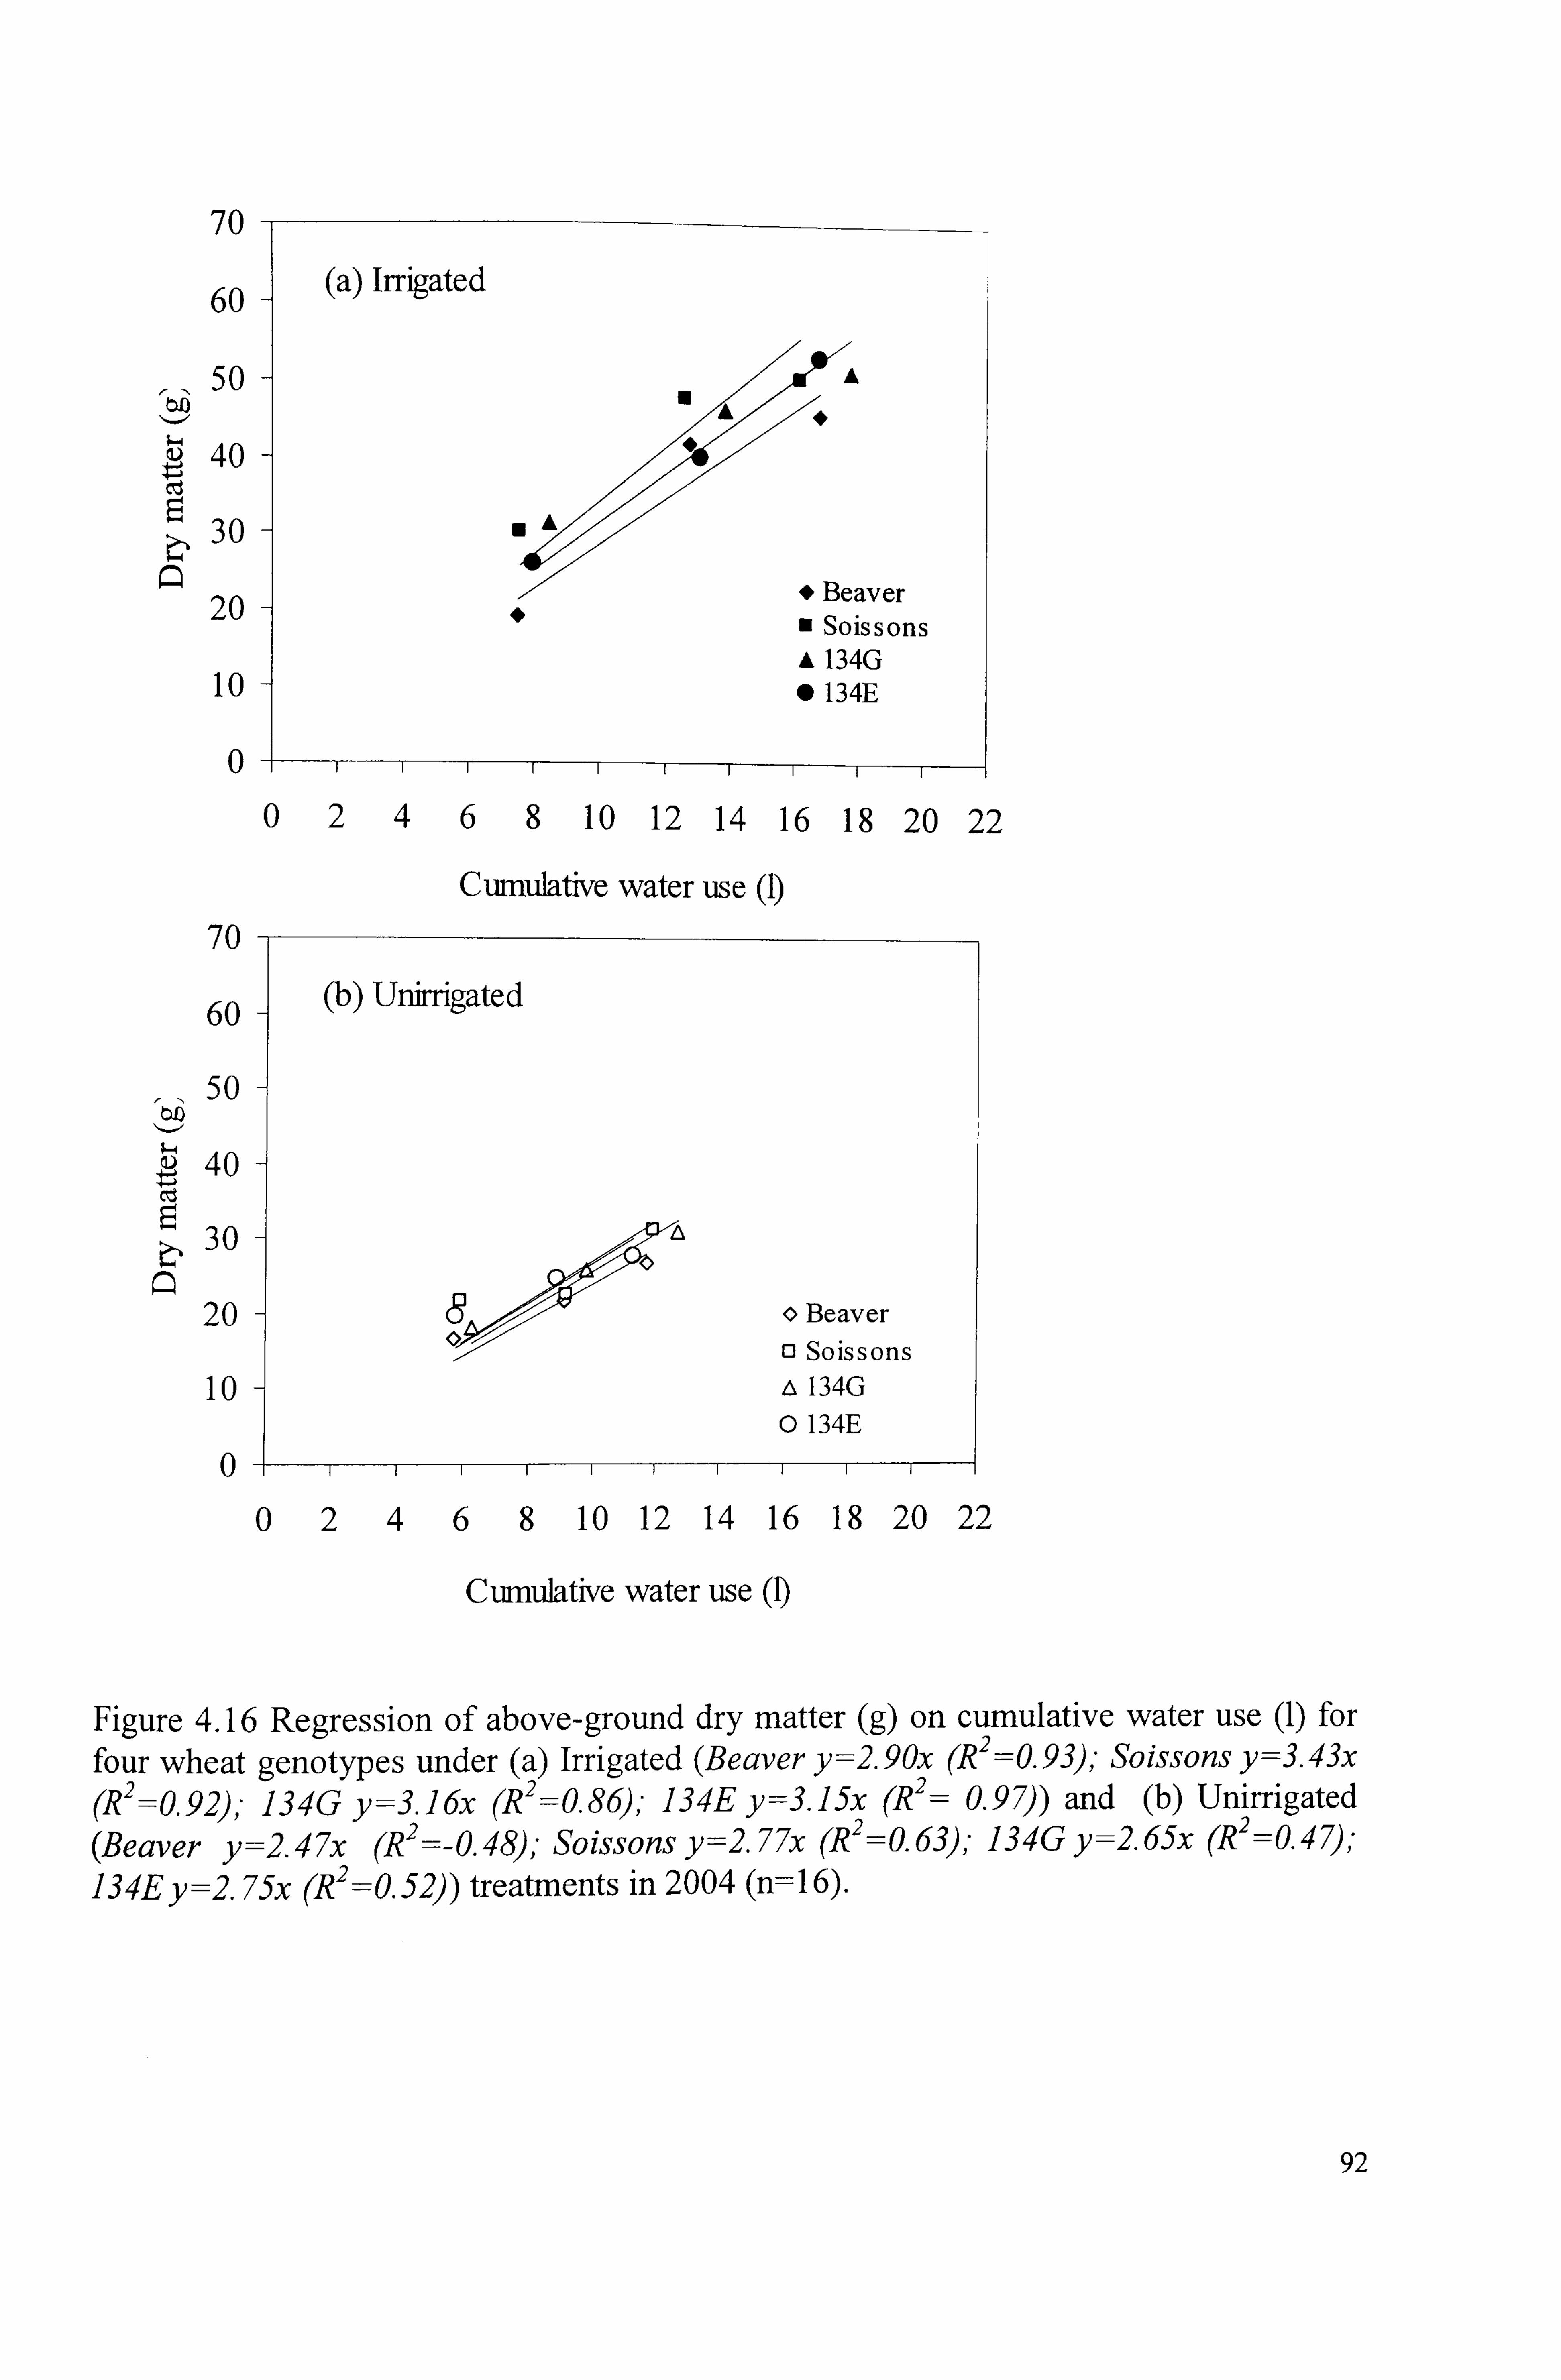
70
60
50
40
30
20
10
0
70
60
50
40
30
20
10
0
(a) ItTigated
AA
14 * Beaver
m Soissons
A 134G 0 134E
02468 10 12 14 16 18 20 22
Cumulative water use (1)
(b) Unirrigated
0 Beaver
13 Soissons
* 134G
* 134E
468 10 12 14 16 18 20 22
Cumulative water use (1)
Figure 4.16 Regression of above-ground dry matter (g) on cumulative water use (1) for
four wheat genotypes under (a) Irrigated (Beaver y=2.90x (R 2=0.93); Soissons y=3.43x (R2 =:::: 0.92)'. 134G y=3. ]6x (R2 =0.86), - 134E y=3. ]5x (R2 = 0.97)) and (b) Unirrigated
(Beaver y=2.47x (R 2 =-O. 48); Soissons y=2.77x (R2=0.63)'. 134G y=2.65x (R2 = 0.4 7);
134Ey=2.75x (R2 = 0.52)) treatments in 2004 (n= 16).
92
4.1.8 Grain yield, harvest biomass and harvest index
In 2003, the grain growth was detrimentally affected due to lack of vernalization and heat stress in the glasshouse. So the differences amongst the genotypes and their
responses to irrigation treatments for grain dry matter are of limited value. However5
these problems did not occur in 2004 and good grain growth was maintained.
In 2003, averaging across irrigation treatments, grain yield of wheat genotypes ranged from 0.82 to 1.82 g plant-' (P=0.03). These amounts of grain growth are unusually low,
e. g. as compared to potential grain growth of 1.66 g ear-' (HGCA wheat growth guide, 1998). Averaging across genotypes, drought reduced yield from 1.68 to 1.18 g plant-' (P=0.09; Table 4.3). Soissons yielded more than Beaver, on average, by 0.68 g plant- I
Soissons lost more yield (0.59 g) under drought than Beaver (0.14 g). Beaver also
maintained yield better than line 134G (0.74 g) and 134E (0.54 g) respectively.
In 2004, irrigation increased the grain dry matter plant-' by 17 g plant-' (P<0.001).
Averaged across irrigation treatments, Soissons produced a higher grain DM plant-'
(23.5 g) than Beaver (16.9 g) with intermediate values for lines 134E (19.9 g) and 134G
(19.4 g; P<0.02). Under irrigation, Soissons produced higher grain yield (32.5; P=0.02)
than Beaver (28.8g), line 134G (27.0g) or 134E (25.5g). The genotype x irrigation effect
was significant (P<0.05) with Beaver showing a mucý larger depression in yield due to
drought than other genotypes (P<0.03).
Harvest biomass decreased significantly due to drought in 2004 (P<0.001). Under
irrigation, line 134G produced highest biomass (65.8 g plant-'; P<0.02) with other
genotypes in the range 54.3-59.5 g plant-'. However, a larger reduction in biomass was
observed with Beaver and line 134G than Soissons and line 134E under droughted
conditions (P<0.03). The yield interaction though was mainly accounted for by the HI
interaction, with Beaver exhibiting a significantly larger decrease in HI under drought
than other genotypes. The two DH lines and Soissons maintained yield well in
droughted conditions therefore on account of better maintenance of HI under droughted
conditions (P<0.03; Table 4.3 )).
Drought affected the production of above-ground biomass in both the years (P<0.01).
Cross-year analysis indicated that harvest biomass decreased from 38 g to 22 g plant-'
93

under droughted conditions (P<0.001; Table 4.3). Beaver produced more harvest
biomass than Soissons under irrigated conditions but lost more of its harvest biomass
under unirrigated conditions. With respect to the DH lines, irrigated line 134G had
consistently more biomass than line 134E. Soissons had a higher value for HI than other
genotypes in both irrigated and droughted conditions in both the years (P<0.01). HI
decreased under unirrigated conditions (0.28 cf. 0.21). Soissons had greater HI under
irrigated (0.33) and unirrigated (0.28) than rest of the genotypes. The interaction effect
was significant wherein Beaver decreased HI more under drought than other genotypes
(P<0.05).
4.1.9 Thousand grain weight, ear number plant-, grains ear-'
The data for yield components for 2004 are presented in Table 4.4. Drought decreased
ear number plant-' and grains ear- I,, and thousand grain weight (TGW) (P<0.05). With
restricted water availability, TGW decreased by 7.5 g (P<0.01). Under irrigation, line
134G had significantly a higher TGW (55.3 g; P<0.02) than line 134E and Soissons (48
g each) or Beaver (45 g). The irrigation x genotype interaction was not significant for
this yield component.
Although, ear number plant-] and grains ear-' decreased due to drought (P<0.001) there
were no statistically significant differences amongst genotypes. Soissons had a trend for
more grains ear-' under irrigation than Beaver or the two DH lines (P=0.09). The
interaction effects for ear plant-I and grains ear-' were not significant.
94

bO
"C
4-j
Cd
Cd
r-)., to
cn cn
vi
+-j
CD to CD
CD CD
-0 ýý
i)
E I-
(ID (ID
U
II u
4- CIA
ct
CIA
7E
N
r- �0 t- m 00
CD
C, \ r-- - kr) 00
66 C) C)
C, 4 "4D 00
00
kn
(r) (r) \lo V') kf)
le
\IC) OC) ýn 00 cq oc rq 110 (1-1 CD
ý 110 CIA
00
06 kr) 1.6 Cý 06
" cq " cn c"I
(:: ) C71N c? ) - 00
00
00
00
CD r- ýt (211 C) c-g cý 'zý 00
le m CD -ý Cq rq rq cq
--. ( 00 kr) CD
�Z krý --, ý
cý
(N rn m tn m
Oll\ 110 clq (21) (vlý CD (n 00 -t "0
CD
kf) 00 tr)
C, 4 - tr) 00 I: t
k4l) (: ), \ cq 00
kr) tr) -
Kr) rq m CD CD
cý cý <ý
CY) C: ) 6
C) C) C) C)
C) kC)
* * ***
r-- CNI tr) C14 ý"m
00
00
C) C)
* *** ***
-
oac
00 \Z r-
00
C14 (::: > C>
-t En
0 ý
0 = C (1)
, r
> En 3 W > W (- ) oj 4ý M cn 0
cd -ýt -zl- V)
- u
m
W ': ý C , b CQ ý - V)
ý5 = - - C/ D pi lo r_ U V 4-
14-
kr)
v
v
*
P-4
CD cý
CD v
Z. 4
C
7: 3
95
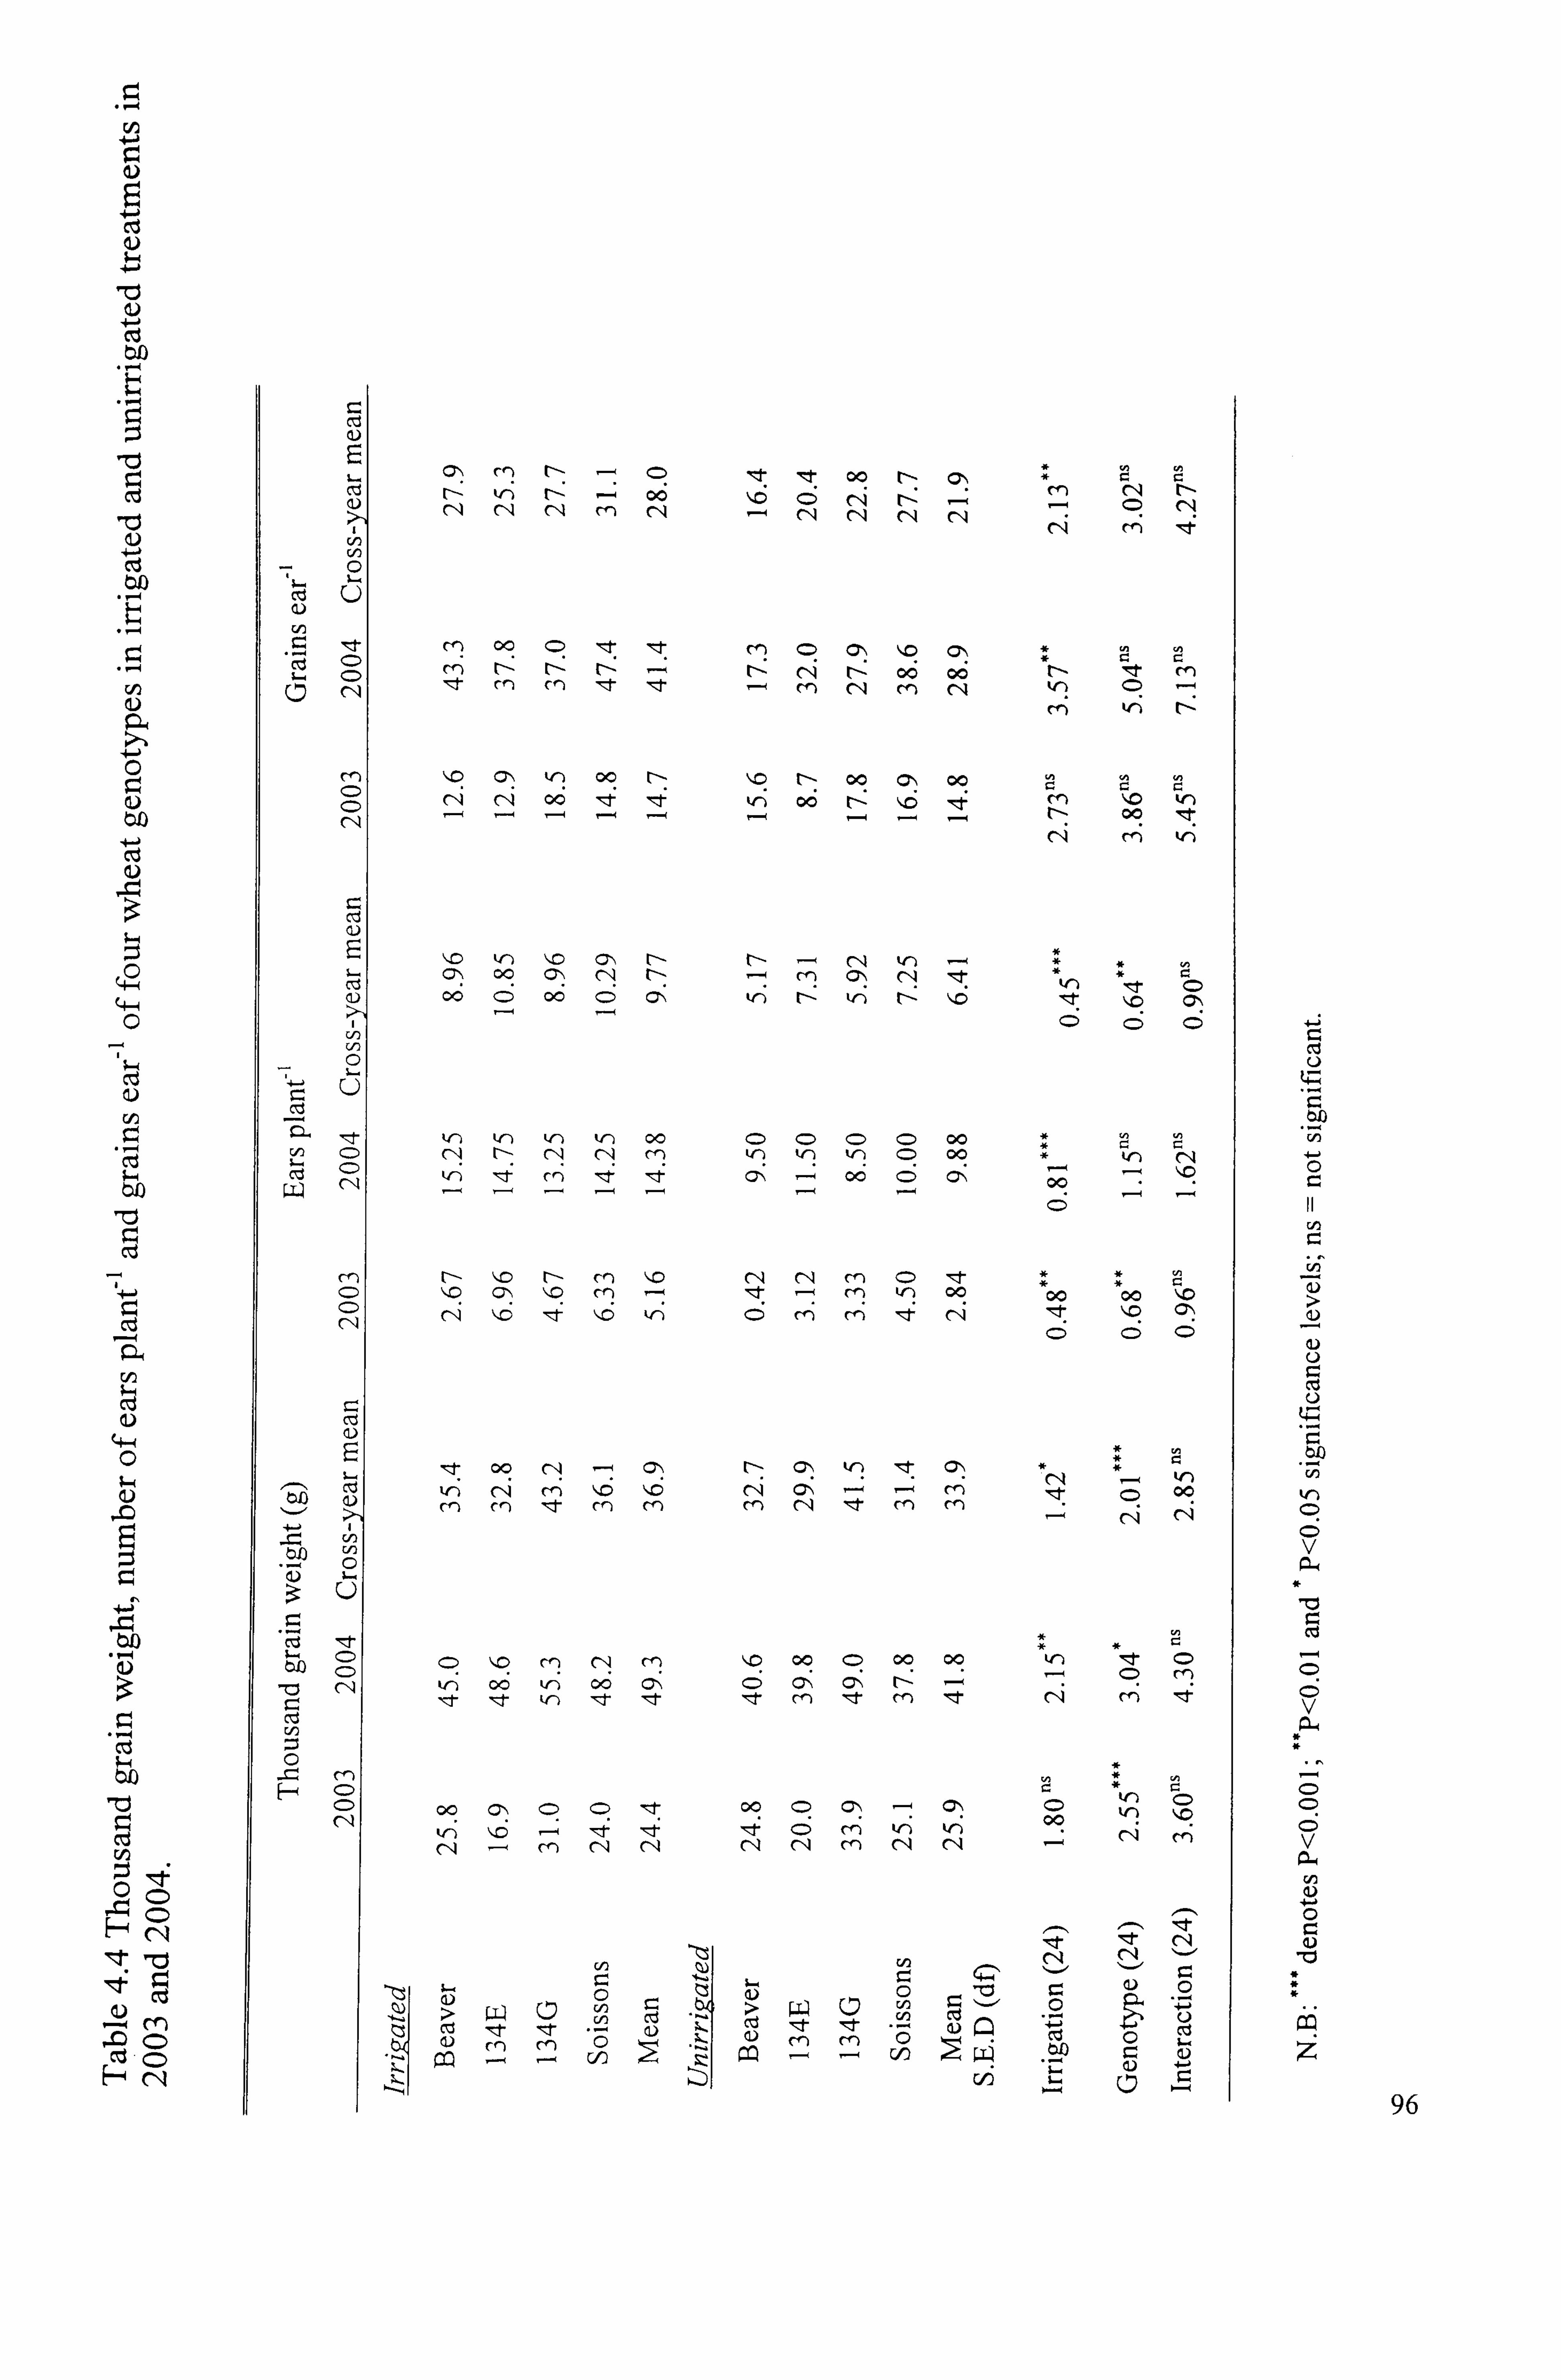
42
Cd 1--4 n4
ÖD
Cd rA
CD CD
ýý (-, l
ýc CD CD
r_ ct u
E
cn 0
(') (--I
V)
ct
Li
rn CD CD (N
r_ CZ (U
r-
CD u 9-
*ýg -e CD CD
-C5 C'A cý ce
CD irli
kr)
C-4
NNN
"0 Cl\ 41) 00 r-
rý cq oý 111: 't
, 10 k4l) \10 C-) t-- C71\ oc (01-1 (1-1 t--
06 6
00
kn kr) k4l) t-r) 00
kC)
Cf) ff) -e Cf) cn
,ee oo t-- cý, cý cq rý C-A rq C, 4 rq
cn C> C\ ýo cý
t--ý rý rý oý oý ý rn cq m clý
1,0 r- oo cý, oo
N 'r -
Ic) NNc
(::: ) C) C) C) 00 kr) kr) kr) (= 00
C7; 00 C--') Cý
rf) CD le rn kr) 00
r- Glý (n le Clý
NN -N
C14 m 19t
t- e rn
t- 00 lKt C14 m kr)
le \lo C> CD
00 00 110
QC
* *
**
-
-
ý10 00 C) 00 00 kr) C)
kr) 00 kf-) 06 c7lý 6
It Ql)
00 00 C) C*ý t1r) tn
C)
kr) llýD -4 .4 '4 (Z: ) m kr) kfý
C-4 - m cq (, ý ("I CA m CIA C14
11-1 It C14
r cl. Cý r.
I.. a) - 0 rz $..
(1) "Cl r- a) 0
> (A C: bý > clý cn
- (1) ;4 Cj (1) 0
+Cý C, . m m ýý
;4
CD v
-0
r_ ce
CD v
* Z-4
CD cý
CD v r. 4
-0
z 96
4.1.10 Gas-exchange measurements
The net photosynthetic rate (A), stomatal conductance (g), intercellular C02
concentration (C) and transpiration rate (E) were measured on the flag leaf of main shoots once or twice a week under natural sunlight from GS39 to GS61+ 4 weeks. From
these measurements carboxylation capacity and instantaneous transpiration efficiency (ITE) were calculated as the ratios between AlCi and AIE respectively. Data from a set
of four measurement dates in 2003 and five measurement dates in 2004 for the above
parameters were analysed (for all data see Appendix ); the mean values across all
measurement dates in 2003 and 2004 are presented in Tables 4.5 and 4.6, respectively.
M-2 1 4.1.10.1 Net photosynthetic rate (A;, wnol S-)
In 2003, averaging across genotypes, there was a marginal trend for irrigation to
improve A (P=0.13; Table 4.5). Averaging across irrigation treatments, line 134G (5.1
ýtrnol M-2 s-1) had higher net photosynthetic rate (P< 0.05) than line 134E (2.9 [tMol M-2S-
1). The mean values of A for Beaver and Soissons were similar (4.46 and 4.32 ýtmol m-
2 s- 1, respectively). A similar trend was observed for genotype performance under
irrigation, except Soissons showed a slight increase in A values. Under drought, line
134G and Soissons showed higher A values than Beaver and line 134E. However, the
genotypes x irrigation interaction effects were not statistically significant.
In 2004, A was much higher than in 2003 probably on account of differences in the
development as gas exchange measurements were concentrated in the active growth
phase between GS39 to GS61. In addition, there was one plant per column rather than
three. Again A was higher under irrigated than under unirrigated conditions (4.6 c. f 3.8
ýtrnol M-2S- 1), but not significantly so. Genotype differences were significant with
Soissons having greater assimilation rates than other genotypes and lines 134G and
134E having greater rates than Beaver (P=0.032). The interaction effect was not
significant.
Averaging across years, drought reduced A by 0.94 ýtMol M-2 s-1 (P <0.05; Table 4.5).
Soissons had higher A than other genotypes (P <0.0 1) and lines 134G and 134E showed
97
greater A values than Beaver. The genotype x irrigation interaction however was not
significant.
4.1.10.2 Stomatal conductance (g,; mmol m-2s-1)
In 2003, irrigation increased stomatal conductance (P<0.01). Averaging across irrigation
treatments, line 134G (137 MMO, M-2 s-1) had higher g, than 134E (73 nUnol M-2S-1; p
<0.05). Among parents, Soissons had higher g, (120 mmol M-2S-) than Beaver (112
MMOI M-2 s-1). Under irrigation, line 134G had significantly higher gs rates than other
genotypes and Soissons and Beaver had higher gs rates than line 134E (P=0.013). The
interaction effect was not significant.
The conductance values were higher in 2004 than in 2003. A higher stomatal
conductance was found under irrigation (556 MMOI M-2S-1) than under drought (377
MMOI M-2 S-I ; P=0.002). Averaging across irrigation regimes, genotypes did not differ
(P=O. 3 1). Under irrigation, Soissons had higher g, values (73 7 MMOI M-2 S-1) than other
genotypes; and 134G and 134E had higher values than Beaver. Although, the interaction
effects were not significant (P=O. 16), Soissons and line 134G showed much larger
reductions in g, than Beaver and line 134E.
Cross-year analysis indicated g, was reduced by 228 MMOI M-2S- 1
due to drought (P
<0.01; Table 4.5).
4.1.10.3 Intercellular C02 concentration (Ci; MMOI C02 mol"air)
In 2003, drought increased the mean Ci from 253 to 287 mmoIC02mol-lair (P <0.02).
Although genotype differences were not consistent across reading dates, on average line
134G and Soissons had lower Ci than line 134E or Beaver. The interaction effect was
significant, with Beaver and line 134E showing a larger increase in Ci under drought
than Soissons and line 134G (P <0.05; Table 4.5).
In 2004, drought decreased Ci values significantly from 475 to 460MMOI C02mol-lair
(P = 0.037) and genotype effects were not statistically significant in the range 460
(134E) to 480 (Beaver)MMOI C02mol-lair. The irrigation x genotype interaction effect
was, however, significant (P<0.001). Ci was reduced by drought in Beaver and line
134G, there was effect on Soissons and was increased in line 134E.
98
Cross-year analysis showed a significant irrigation x genotype interaction, with Beaver
and line 134E showing a larger increase in Ciunder drought (P<0.02; Table 4.5) while, Soissons and line 134G showed reduced Ci.
4.1.10.4 Carboxylation capacity (41Cj ratio)
The ratio of assimilation rate to intercellularC02 concentration was used to deten-nine
the carboxylation capacity (Table 4.6). In 2003, irrigation increased AlCi ratio (18.6 cf
13.9; P <0.05). Among genotypes, under irrigation, line 134G and Beaver had higher
ratios (21.7 and 21.1, respectively) than Soissons and line 134E (16.2 and 15.6,
respectively; P=: 0.08). Although, the ratio decreased under drought in general the
irrigation x genotype interaction was not statistically significant.
In 2004, the carboxylation capacity was similar under irrigated and un1rr1gated
conditions. Under irrigation, Soissons (33.3) and line 134E (27.7) had a higher AlCi ratio
than Beaver (18.8; P< 0.03). The interaction effect was significant (P< 0.05); with line
134G and Beaver increasing the ratio under drought in contrast to Soissons and line
134E which showed decreases under drought.
When averaged across the two years, a higher AlCi ratio was found under irrigation
(P<0.03), and the carboxylation capacity of Soissons . (24.8) was higher than other
genotypes in the range 21.7-19.9 (P=0.01). There was a trend for an interaction with line
134G and Beaver increasing the ratio under drought in contrast to Soissons and line
134E which showed decr eased ratios under drought.
4.1.10.5 Transpiration rate (E; mmol m -2S-1)
In 2003, drought reduced mean transpiration rates (E) from 2.1 to 1.8 mmol M-2 S-1
(P=O. 13). Averaging across irrigation regimes, E for 134G (2.4 MMOI M-2 s-1) was higher
than for 134E (1.3; P=0.012). Under irrigation, Soissons (2.3 MMOI M-2 s-1) had a higher
transpiration rate than Beaver (1.8 MM01 M-2 s- I; P<0.02). The interaction effect was not
consistent across measurement dates and the interaction effect for the mean value across
readings was not statistically significant (Table 4.6). The values in 2004 were generally
higher than in 2003. In 2004, irrigation and genotype effects and their interaction were
99
not significant. Genotypes values were similar in the range 4.46-4.79MMOI M-2 S-1.
However, there was a trend for drought to reduce transpiration rates from 5.1 to 4.2
mmol M-2S-I.
Cross-year analysis revealed the irrigated treatment had higher rates of transpiration
than the unirrigated treatment (P<0.001), but there were no significant differences
among the genotypes. The genotype x irrigation interaction was significant (P=0.014)
and showed that overall the reduction in E under drought was greater in Soissons and line 134G than in Beaver (P<0.02).
4.1.10.6 Instantaneous transpiration efficiency (ITE, - AIE; mmol C02 morl H20)
Instantaneous transpiration efficiency was calculated as the ratio between net
photosynthetic rate (A) and transpiration rate (E). In 2003, irrigation and genotype
effects and their interaction effect were not statistically significant (Table 4.6). All the
genotypes had a similar ITE in the range of 2.15-2.48. In 2004, ITE increased under
droughted conditions by 0.. ' )7 mmol mol-1 (P=O. 1). Soissons had a higher ITE (2.95) than
other genotypes in the range 2.30-2.74 mmol mol-1. There was a significant interaction
with line 134G showing a more increased ITE under droughted conditions (P=0.002)
than other genotypes. Cross-year analysis showed that ITE increased under drought
(2.64 cf. 2.32; P<0.05). Although the genotype differences were not statistically
significant, the irrigation x genotype interaction was, with ITE under drought increasing
more for line 134G than for other genotypes, and more for Soissons than for Beaver and
line 134E (P<0.05).
100

Cd
ol , ýýo
73 v
CIS
'F.; C) (D C) U C-4
ýct
Q)
4-
c7s
Cd m
Cd 03 p
o
C'/'D C\l
cd
CIZI
cd
1) +ýý -;, 5,
al
cw
cri
ýc r, 4 cd (1)
ED
00
(01*ý It
Zt (01ý \10 r- 1-0 1- C, 4 "o kr)
cq
I-- m
-I- V')
(-ý tn
1.6 ý10
Cý kr)
kfý
ff)
(: ý
(0, ý,
krý ý, c
ý. 6
tr)
r-
00
00 C14
m
00 t--
00
\C trý
ýo
00
00
ý'o
(f')
C7ý,
cf)
clq
"'t 00
C\l m rf) m t--
kr) 4 \ýo
00 kr)
c) r--
kr) V')
00 C: ) I'D ý10 t-- Q)
"D ýzt CD c) V-) t-- - " \10 ý10 *
kc) 00 -
Cý 00 00 00 k4r)
CIA
- (::: ) CD
00 CD
rl) 00
"D clq
00 I-
C) CIA
- r-
00 00
C14 m
C114 (:: ) k. -) 00
00 00 Cý\ 00 C) (6
.
kC)
(1-4
C)
C)
-I-
kr)
: I, 00
. (::: ) 00 00
00
C', "0 kr) - (r) Cý, <= 00
I'D c"I W') 00 ": T 110 , I-
> ct
03 rl) I- rz
> cis
Cd C)
C
P
"a r_
cý CD v
CD
cý CD v P. ý
z
101
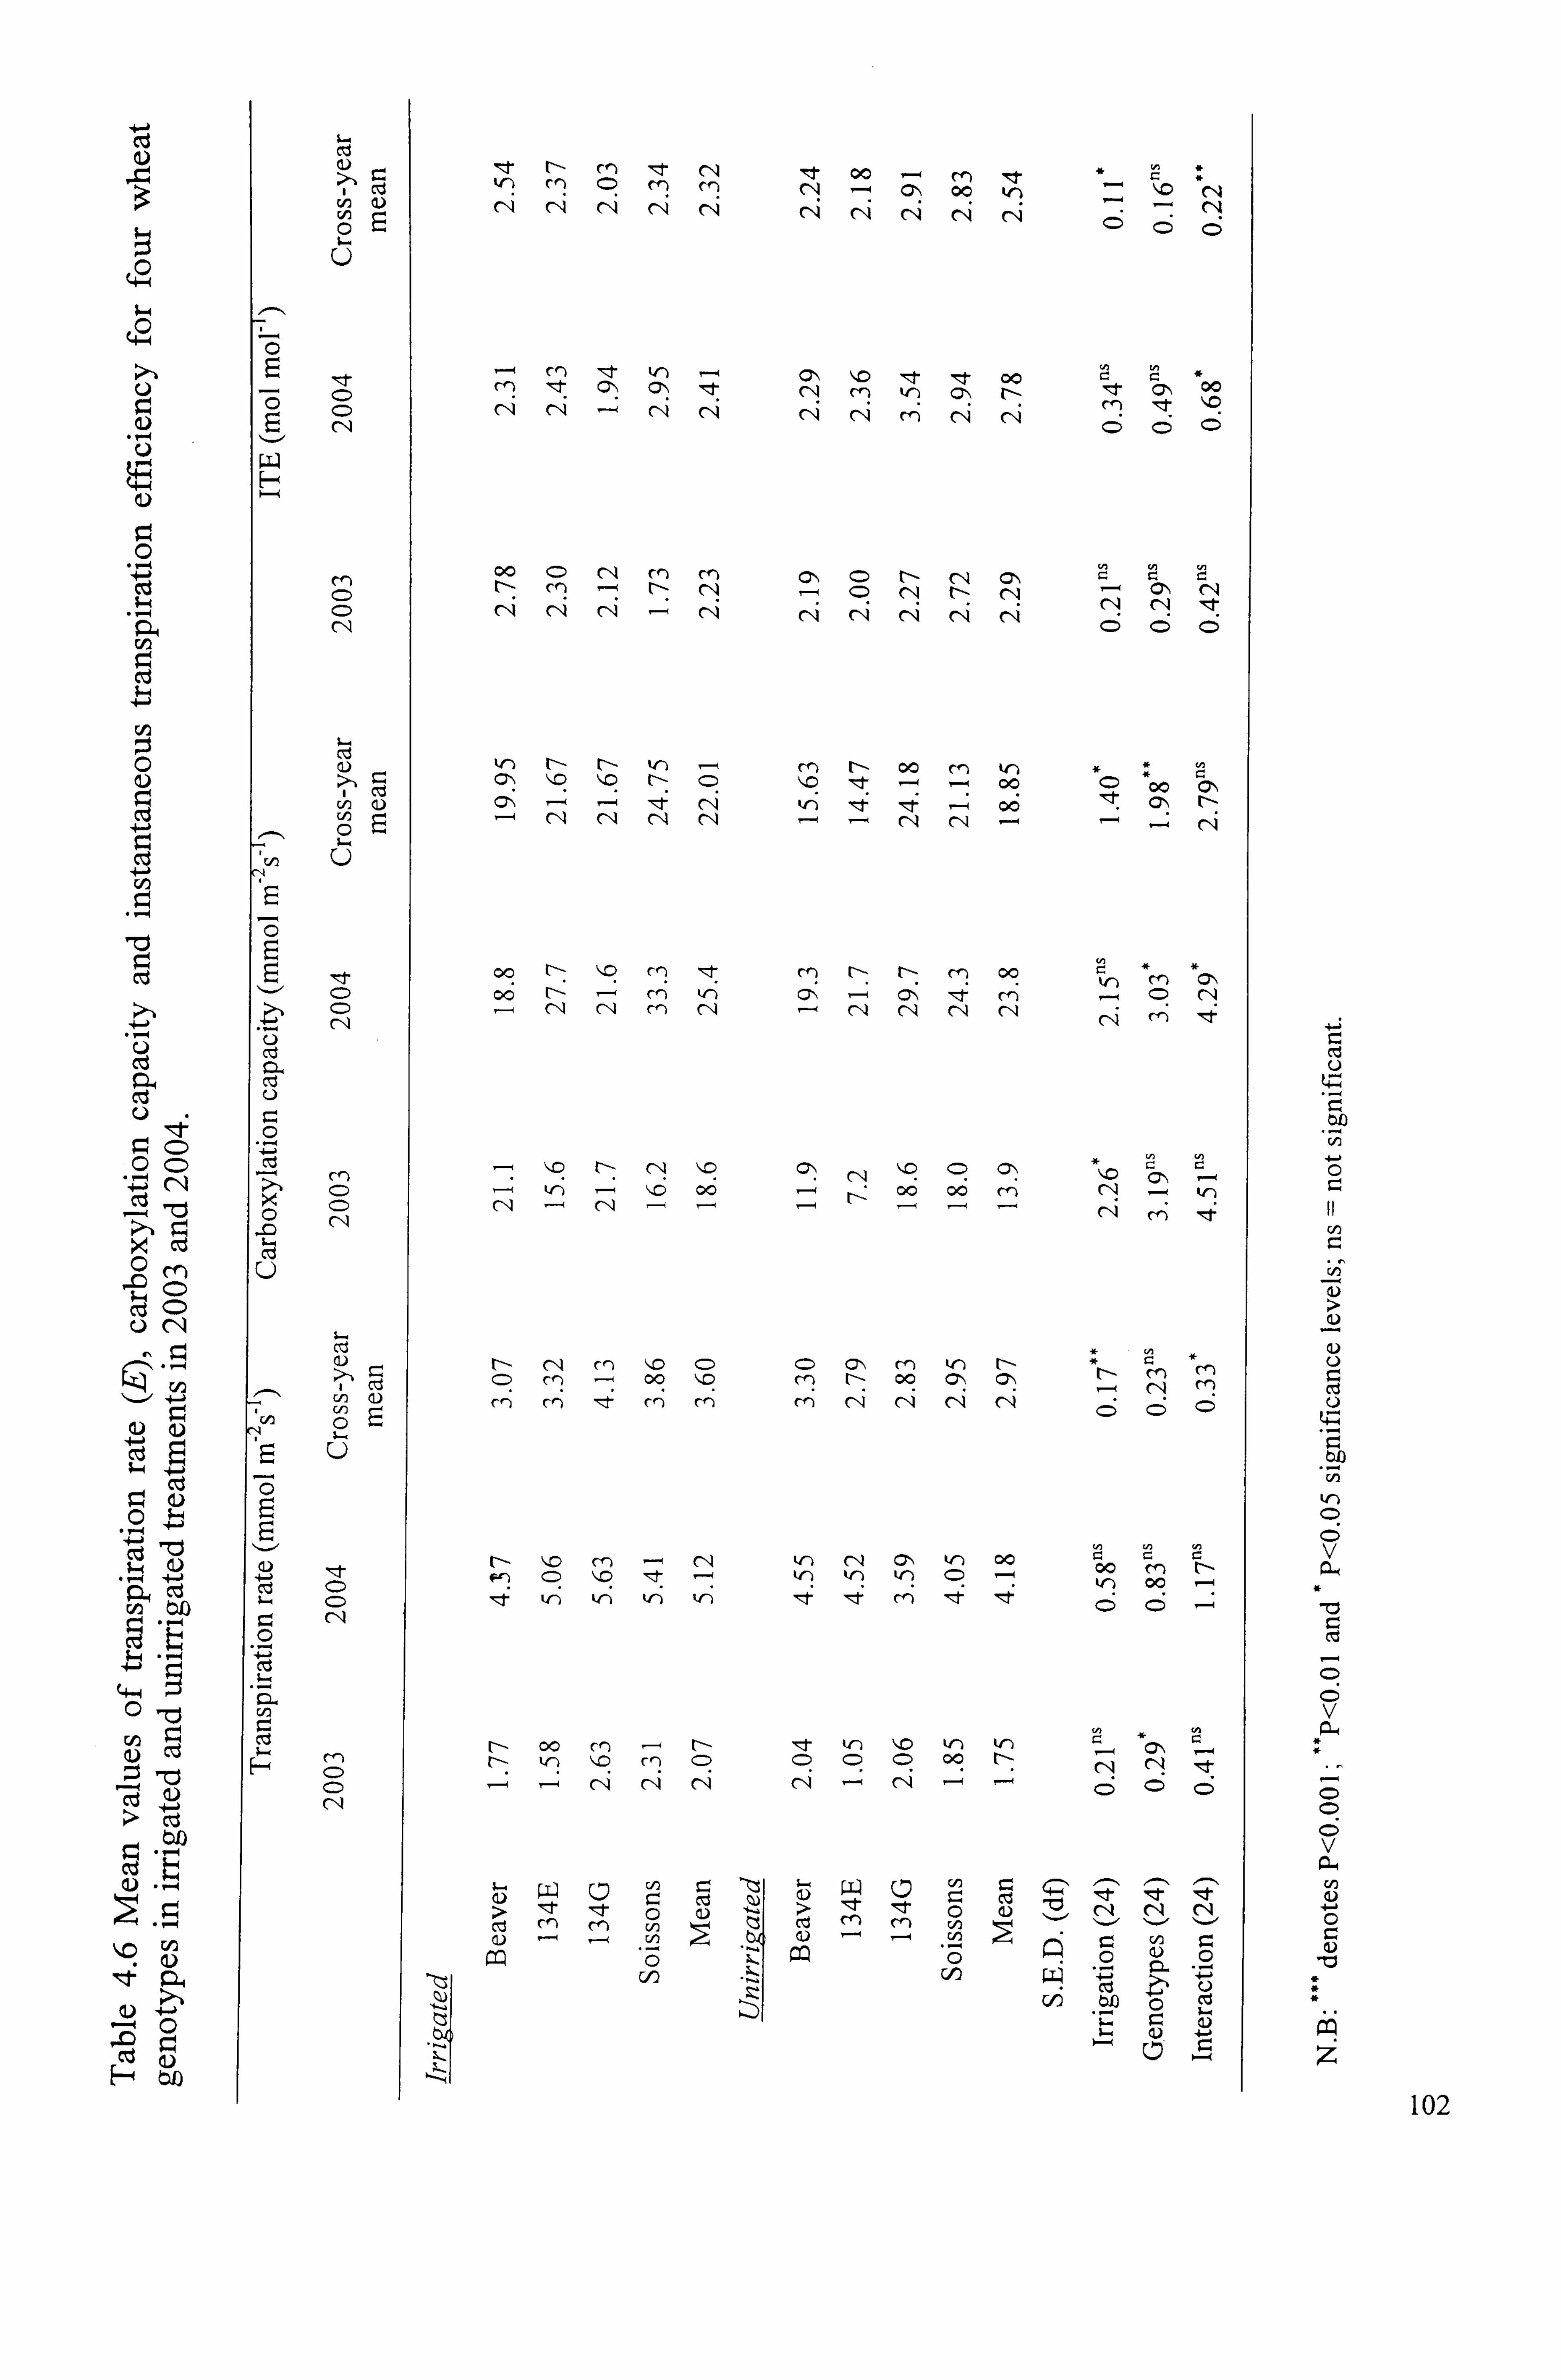
+-j Cd
' f 00 1 03
W ) C ) C) m ff-) N - C., 00 kf) - ., c (N
u 42(
It 00 CA I 0
CIA C14 Cý C'ý ff) ýt 'D
C) c) C)
00 C)
C) C) C>
En
cn ý3
os t--
1 m r-- 00 kr)
od 10 ý, c 'tt ý OC) 00 Clý
cl J) cn 11 I
clý r-
0 C 4 c"I C A rq u 4-. ) C14
E
7: 1
Cfi ý . (n 00 kr) M C*ý
(: D 00 t7, C. r) V-) Cý Cý "71- C) cn cli
0
C) fq t-- " ýo C71) " Cý C7ý 1-0 (71\ -ý kr)
'
110 00 00 00 m klý
---( 7ý 0 1 C-4 - ( ,I - , - Cý m IRt
ý-t -0 ( 4
X 0m u
Cfi r-- ý10 C: ) C: ) (7ý -
m tf) l
r- I 00 ýo m [ - 00 c ý C N
En
cn (1) rl) m
-4 C) m m (-ý (11 (-ý clý
Cl) 0
j ., -4
+-
E -+-ý
Cý$ 7ý ; -4 a) (1)
r- kn '
Cý4 Cý
' kc) 00
00 C m
4 -4 W ) kr) V ) C)
krý
kr) kn V-) kr)
4-4
r- 00 kr) V') t4l)
kr) 00
7: 1
0 C) ýs M (1)
M -
Cý)
ý V) ý5
. 1-11
- .
Cd
,c r-, Q! ) a cd 0 %, 0-4
ýq Eb
4-
4ý
r_:
kr)
C) v
v
*
a4
C> v
13-4
z 102
4.1.11 Carbon isotope discrimination analysis (%.; A13C)
2003
Leaf lamina samples at anthesis were analysed for A 13 C and indicated that effects of irrigation, genotype and their interaction were not significant. The coefficient of
variation associated with this trait was about 5%. The effects of irrigation or genotypes
and/or their interactions were not statistically significant. However, averaging across
genotypes, there was a trend for drought to reduce the A 13C values considerably. The
reductions in A 13C under drought were apparently greater for line 134G and Soissons
than the two other genotypes (Fig. 4.17 a).
2004
A 13C was analysed on mature grains. Drought in the unirrigated treatment reduced delta
by c. 1.40 %o (P<0.001; Fig. 4.17 b). The coefficient of variation was 3.2%. Averaging
across irrigation regimes, line 134G had smaller A 13C (16.25 %o) than other genotypes in
the range 16.89-17.60 %o (P<0.001). However, there was no statistically significant
difference for A 13 C between Beaver and Soissons. The interaction effect was significant
with line 134G and Beaver showing larger decreases in A 13C under drought than other
genotypes. Beaver had a higher A 13C value than Soissons under irrigated conditions
(18.04 and 17.90 %o respectively). However, the reverse was true under droughted
conditions but these differences were not statistically significant. As compared to all the
genotypes, line 134G showed lower A 13C values both in wet and dry stands (17.16 and
15.33 %o respectively; P<0.02). The magnitude of reduction in A 13C was higher in
Beaver compared to Soissons to an extent of 2.30 %o (P<0.05). Under drought, the final
grain yield of Beaver was lower and the grains were not propqrly developed compared
to other genotypes. The data was found to vary as there was aGxE interaction for the
grain A 13C. So a separate analysis for leaf A 13C was done.
In contrast to grain, leaf A 13C values at anthesis showed a trend similar to that in 2003
and indicated that drought reduced A 13C values by c. 1.39 %o (P=0.002; Fig. 4-17 c). Line
134G and Soissons showed lower A 13C (18.10 & 19.49 %o, respectively) in the
unirrigated treatment compared to line 134E and Beaver (P<0.05). This is consistent
with higher ITE observed for line 134G and Soissons in the droughted treatment
compared to Beaver and line 134E. The interaction effect was not significant indicting
103

that A 13C is highly heritable among the genotypes. The coefficient of variation was 4.4%.
20
19
18
17
15
14
11
Beaver 134E 134G Soissons
20
19
18
17
16
15
14
22
21
20
19
18
0 12. 17
-0
tn
16
15
14
I
Beaver 134E 134G Soissons
Figure 4.17 Carbon isotope discrimination (A 13C) for (a) leaves at anthesis in 2003 (b)
mature grains in 2004 and (c) leaves at anthesis in 2004 for four wheat genotypes in the
glasshouse experiments. Errors bars show S. E. D. (D. F=24) for genotypes x irrigation
interaction.
104
Beaver 134E 134G Soissons
0 ln*ted 0 Unhigated

4.2 DISCUSSION
Water-use efficiency has often been discussed in relation to plant performance when
water is limiting. Plants adapt to limited water availability through various
morphological and physiological mechanisms and this requires an understanding of the
various processes regulating the efficient use of water within a plant species. About 20%
of the UK winter wheat yield potential is lost annually to drought (Foulkes et al., 2002).
The improvement of WUE of wheat has important implications for improving yield
under drought and conserving water in the absence of drought for both economic and
environmental benefits. The present work investigated genotypes which contrasted for
several traits (flowering time, flag leaf size and presence of awns) and major agronomic
genes HBAR, -IBAR, Rht] and Rht2); The results of analyses on the physiological basis of WUE in these genotypes are discussed in this section.
The framework proposed by Passioura (1977), as outlined in chapter 2, serves as the
most appropriate way to identify traits that may limit wheat yields in water-limited
envirom-nents. According to this, yield may be increased by an increase in water use or
water-use efficiency and/or HI, provided that there would not be any significant
negative relationships among the three variables. The inter-relationships among these
variables are discussed in this section with a view to identifying mechanisms to improve
performance under drought, and quantifying their genetic variability.
4.2.1 Root growth and water use
The pattern of water use by genotypes differed over the growing period, with early
developing Soissons showing the smallest total water use and Beaver the greatest,
whereas water use by the DH lines was similar. The effects of genotypic differences in
root traits in relation to water use are discussed here.
Root traits may have a significant role to play in the development of new wheat
genotypes with improved adaptability in water-limited conditions. Root length density is
one important trait and the distribution of root length density with depth may be
important. In the present study, the plant roots from columns were sampled at anthesis.
It was observed that roots extended well below 100 cm by anthesis. Studies in the UK
(Gregory et al., 1978; Barraclough and Leigh, 1984), Australia (Hamblin et aL, 1990;
105
and Siddique et al., 1990) and elsewhere (Boehm, 1978; Kaetterer et al., 1993;
Robertson et al., 1993) have also reported a peak of root growth around anthesis, with a decline after anthesis when most assimilates are used for reproductive growth and only a
small proportion for root growth (Gregory and Atwell, 1991). In addition, the wheat
genotypes differ in depth of rooting under drought (Hurd, 1968; Gregory et al., 1978)
and differ for root dry weight with depth (Brown et al., 1987; Siddique et al., 1990;
Miralles et al., 1997).
In this study, RLD for all the genotypes across moisture regimes at all depths exceeded
0.5 cm cm-3 . It has been reported that RLD of UK winter cereals typically varies with
depth from about 5-10 CM CM-3 at 0-20 cm to 0.5-1.0 CM CM-3 at 80-100 cm
(Barraclough et al., 1989). Theoretically, the mean RLD of cereals in top layers of most
soils are adequate to access most of the available soil water since densities more than 1
-3 CM CM are associated with only small increases in the total amount of water taken up
during yield forming period (King et al. 2003). Theoretical calculations predict a critical
RLD of about 1.0 CM CM-3 for nitrate uptake in cereals, above which further increases in
RLD equate to excessive roots which do not influence N uptake (van Noordwijk, 1983).
This range concurs with the results for uptake of all available water with a RLD of about
1.0 CM CM-3 in spring barley (Gregory and Brown, 1989) and winter wheat roots
(Barraclough et al., 1989). In the present study, genotypes showed some consistency in
RLD across years. Beaver maintained a higher RLD than Soissons. However, line 134G
had low RLD compared to 134E in 2003 and vice versa in 2004. These differences were
associated with the observed genotypic differences in water uptake. The RLD values in
the present study are in general agreement with ranges reported for winter wheat
(Gregory et al., 1978; Barraclough, 1984). RLD is usually highest in upper horizons,
however, in this study root distribution with depth showed slightly higher values below
80 cm. In 2003, the pre-anthesis water use under drought was reduced by 30-50% and
the post-anthesis water use by 44-46% in all the genotypes. Later flowering cultivars,
Beaver and line 134E had a higher pre- to post-anthesis water use ratio (0.33 and 0.36
respectively) than 134G (0.30) and Soissons (0.22). Thus, post-anthesis water use was
greater in Soissons and 134G. In 2004, water use by genotypes in the droughted
treatment was reduced in the range 55-57% during the pre-anthesis period and 21-24%
during the post-anthesis period. A smaller pre- to post-anthesis water use ratio was also
106

found for Soissons (0.46) over other genotypes (0.59 each) owing to differences in development. Soissons carries the Ppd-D]a allele for the photoperiod insensitivity
which under UK conditions typically advances flowering by about 8 days (Worland et al., 1998; Foulkes et al., 2004). In this study, evaluating RLD as a factor is complicated by uncertainties about the fraction of total root length that is functional with respect to
water uptake (Passioura 1983).
The percent reduction in the total RLD across soil horizons was significant (P<0.05) at
about 25% under drought; and that of Soissons and 134G (27%) was lower in 2004 as
compared to Beaver (7%) and 134E (37%). Previous studies have demonstrated that
rooting densities of cereal crops in general are not considered a limiting factor for
moisture uptake (Gregory et al., 1978; Smucker, 1984). Water uptake is limited by the
water potential in the rooted soil volume rather than by root density. However, there can
be limitations in the soil profile due to rooting when RLD is less than I CM CM-3
(Barraclough et al., 1989). Gregory and Brown (1989), Barraclough et al. (1989) and
Robinson (1994) have shown that water uptake may be altered by RLD distribution with
depth at anthesis. On the other hand, Hamblin and Tennant (1987) studied the root
growth of wheat, lupins and peas in dryland areas of Western Australia and found no
correlation between root length density and water uptake. Siddique et al. (1990) in
Australia showed that old varieties had a higher RLD and dry matter than new cultivars
in the top 40 cm of soil, where most roots occur. The total water use by old and modem
cultivars was found to be similar.
Higher RLD for Beaver than Soissons may be attributed to a higher mean root dry
weight for Beaver. The root dry matter accumulation was gýeatest in the 0-20 cm soil
layer in all the genotypes. However, roots in the 0-20 cm horizon had high root specific
weight so RLD was not greater than in deeper soil horizons. This is different to results
of previous field investigations which reported exponential decreases in RLD with depth
(Barraclough, 1984; Gregory et al. 1992).
In the present study, root distribution with depth differed for the genotypes in the
different water regimes. Beaver and line 134G tended to use more water on account of
greater RLD and a greater root dry matter partitioning. Root dry matter is typically 10%
of total dry matter after flowering in C3 cereals in temperate regions (e. g. Gregory et al.,
107
1978), but may be as high as 30% in Mediterranean environments (Siddique et al., 1990). However, in this study the mean root partitioning was about 5% of total dry
matter irrespective of the soil water supply. Several studies showed an increment in root dry matter under drought in winter wheat (Blum et al., 1983; Barraclough, 1984; Palta
and Gregory, 1997), as opposed to the decreased root dry weight found under droughted
conditions in the present study. Genetic variation in the size of the root system of wheat
cultivars has been reported (Siddique et al., 1990; McCaig and Morgan, 1993; Miralles
et al., 1997), but the effect on growth of water stress can vary. Siddique et al. (1990)
reported the yield improvement in modem cultivars was associated with reduced root dry matter. Improved root biomass has been associated with the IBUIRS wheat-rye translocation in spring wheat (Ehdaie et al., 2003). It is interesting to note that in this
study the highest root dry matter was found in Beaver, a IB/IR translocation cultivar.
However, the genetic differences in root dry matter presently reported may result from
the extent to which genotypes differ in the degree of adjustment in root partitioning in
response equally to the onset of stress, i. e., the functional equilibrium between root and
shoot (Brouwer, 1963; van NoordwiJk and de Willegen, 1987).
Soil and climatic conditions were found to have more influence on rooting depth and
distribution than the genetic make-up of cultivars of winter wheat in England (Lupton et
al 1974; Wilhelm et al., 1982). In the present study, the smaller root system of Soissons
can be ascribed to its faster development with fewer calendar days for root growth up to
anthesis.
SRL (specific root length; m g-1) is a measure of the fineness of the root system
(Wilhelm et al., 1982). Soissons had a significantly larger SRL (thicker roots) at most
soil depths compared to Beaver in both years. DH lines showed differences only in 2003,
but in general line 134E had finer roots. RLD of Soissons was always lower on account
of developmental difference and reduced root length per soil volume, but Soissons had
SRL compared to Beaver. Line 134G had always lower SRL and higher RLD than 134E.
However, these contrasting genotypic differences in RLD in the present study do not
appear to be a major mechanism for improving water uptake because most genotypes
had their RLD exceeding 0.5 CM CM-3 by anthesis. It should be noted that with regard to
nutrient uptake theoretically higher root densities are needed to access phosphorous in
108
soil solution than those needed to capture water and nitrogen in the upper surface horizon (Van Noordwijk, 1983).
The presence of the Ppd-D] gene which confers photoperiod insensitivity and early flowering (Worland, 1996) in Soissons increased its post-anthesis water use. This is in
line with findings of Foulkes et al., (2004) who demonstrated that early flowering with Ppd-D] isogenics (photoperiod-insensitive) in Mercia decreased pre-flowering water
uptake under unirrigated conditions, but increased post-flowering uptake as compared to
ppd-D] (photoperiod- sensitive) isogenic lines.
4.2.2 Water-use efficiency and dry matter production
Many have reported about the linear relationship between water use and dry matter
production (de Wit, 1958; Hanks in Taylor et al., 1983; Condon et al., 2002; Foulkes et
al., 2002). This linearity is explained by the diffusion link between photosynthesis and
transpiration. In 2003, although a linear relationship was found between the dry matter
and the amount of water used by genotypes, parallel regression analysis revealed no
significant differences for the slopes (WUE) among genotypes both under irrigated and
unirrigated conditions. WUE was not significantly different when plants were well-
watered or stressed.
Irrigated treatments showed higher WUE in both years. In 2004, averaging across
irrigation treatments, a significant difference in slopes of genotypes was observed
through parallel regression analysis. Soissons had higher WUE than Beaver. Similarly
the two DH lines showed higher WUE than Beaver. When pooling data across seasons,
effects of genotype and the genotype x irrigation interaction were not statistically
significant. There are a few reports that drought stress decreases the dry matter to
transpired water ratio (Johnson and Henderson, 2002; Pannu and Singh, 1993; Foulkes
et al., 2001). On the other hand, most of the results based on dry matter harvests of
plants in controlled environments point to small increases in WUE with drought stress in
C3 plants (e. g. Fisher and Turner, 1978). In wheat many investigations (Aggarwal et al.,
1986; Hubick & Farquhar, 1989; Condon et al., 1990; Li et al., 2001; Foulkes et al.,
2001) have reported significant increases in VXE in response to drought. Present work
109
showed a slight decrease in WUE of some genotypes under water stress, but the irrigation x genotype interaction was not significant. One Possible reason for lower
WUE in droughted columns could be that the vermiculite was not completely effective in reducing evapo ration from the soil surface and possibly some proportion of water
might have been used to wet up the vermiculite before reaching the soil. Proportionally
more water evaporation could have occurred from the surface in the droughted treatment
than in the irrigated treatment and a greater proportion of it could have been used to wet
up the vermiculite before it reached the soil.
4.2.2.1 Plant growth responses
Parental genotypes and DH lines differed in their developmental rate. Soissons
developed faster than Beaver reaching anthesis a week earlier and line 134G 1-2 days
earlier than 134E within this range. The slower developing cultivars, Beaver and line
134E had the maximum shoot number, but had greater tiller death between GS31 and
GS61. The production of non-surviving shoots may be detrimental to crop performance
when water is limited because the carbon within dying shoots is not completely re-
distributed to fertile shoots (Donald, 1968; Thorne and Wood, 1987; Berry et al., 2003).
At maturity, slow developing Beaver and 134E had highest final ear number. This may
be partly due to their profuse tillering behaviour. Under water-limited conditions, cereal
crops with limited tillering have generally been shown to yield better than profusely
tillering crops (Jones and Kirby, 1977; Duggan, et al., 2000; Somersalo et al., 1998;
Brisson et al.,, 200 1). In addition, profuse tillering usually results in many non-surviving
tillers which transpire most water in soil without contributing effectively to yield.
The water use pattern of parents differed with Soissons using most water in the irrigated
and droughted treatments post-anthesis in both years on account of its early flowering.
There was a trend for dry matter plant-' of Beaver to be more depressed under drought
than for Soissons, although Beaver produced more shoots. Ability to maintain ear-
bearing tillers and ear dry matter partitioning was reduced under drought in the present
study as evident with Beaver having more non-surviving shoots under drought which
did not contribute to ear dry matter. Several studies have indicated that non-surviving
shoots potentially did not contribute more dry matter than they contribute from their
110

own carbon fixation (Berry et al., 2003; Simons, 1982). The proportion of shoots dying
from early stem extension to anthesis under drought ranged amongst genotypes from 21
to 25% in 2003 and from 24 to 31% in 2004 across the genotypes. Genotypes responded differently. Beaver and line 134G had more shoot death compared to Soissons and 134E.
Shorter growth duration (as indicated by early anthesis) constitutes an important
attribute of drought escape, especially with regard to late-season water stress. Drought
escape was observed with Soissons which tended to complete the sensitive tiller survival
stage of development when most water was available. This was supported by relatively fewer aborted shoots in this genotype.
Slower developing Beaver and line 134E showed later senescence relative to flowering
time in both the wet and dry moisture regimes. The loss of green area due to water stress
increased from 35 to 85% from flag leaf emergence to visible maturity (when ears
started ripening) in 2003; and from 20-90% in 2004. The response of wheat genotypes
to drought in respect of leaf area has been well documented (Condon & Richards, 1992;
Foulkes et al., 2001). In this study, under irrigation Beaver and line 134E had more
green area than Soissons and line 134G. While in 2003, genotype differences in green
area plant-1 were not consistent. Maximum green area under irrigation did not predict
pre-anthesis water use and biomass response to drought amongst genotypes in this study.
Foulkes et al. (1993 and 2001) also found that cultivar differences in maximum green
area under irrigation did not correlate well with differences in biomass response to
drought; and maximum green area index was poor guide to seasonal growth, or water
use during the growing season and a poor predictor of biomass response to drought in
the UK's temperate climate. In the present study, the reduction in green area under
drought was more for Beaver than for Soissons. In 2004-, at 138 DAS (GS61+6wks in
Soissons; GS61+5week in lines 134G and 134E; GS61+4weeks in Beaver) green area of
Soissons was maintained well under drought compared to Beaver. Since genotype
differences at any given sampling time in the present study are confounded by
development, faster development of Soissons and or 134G could have resulted in these
differences in green area responses through a 'drought escape' effect. The interaction
effect was not evident in 2003.

The drought tolerance of a crop is sometimes achieved by maintaining a higher plant water status during a period of increasing water deficit (Turner, 1979). The possible
options are (a) stornatal regulation of transpiration, (b) maintaining or increasing the
water uptake from roots, (c) reduction in evaporative canopy area surfaces, or (d)
reduction in radiation load absorbed by the canopy. It is reported that a higher flag leaf
RWC in well-watered treatments could maintain vigorous assimilation, favourable for
achieving higher grain yield (Li et al., 2001). In the present study, genotypic differences
for relative water content (RWC) under drought were not evident (P<0.3). An average
reduction of about 4% in RWC was observed under droughted conditions. Thus,
differences in RWC could not explain the differences in water uptake and crop growth
under drought observed in the present study.
Reduction in transpiring surfaces by leaf rolling is another drought-avoidance strategy in
plants (Richards et al., 2002). Leaf rolling is a concomitant response to decreasing leaf
water potential. In the present study, Soissons showed higher percent of leaf rolling
under drought over Beaver and the DH lines. This leaf characteristic might reduce
transpiration losses and improve water status.
4.2.2.2 Yield response to water availability
The effects of water stress on the yield reduction of crops have been well documented
(Turner 1986; Blum et al., 1990; Taylor et al., 1996). Grain growth was lower in 2003
than in 2004 due to lack of vernalization and/or heat stress at late booting around the
time of meiosis and which restricted grain number. High temperatures in 2003 also
occurred between anthesis and maturity which would mainly affect assimilate deposition
in the developing grain resulting in lower grain weight. Over the range of 12 OC to 26 T
grain weight is reduced at a rate of 4 to 8% per T increase (Wardlaw et al., 1980;
Wiegand and Cuellar, 1981; Acevedo et al., 1991). In the present study, the grain yield
ranged from 0.82 to 1.82 g plant-' and these amounts were unusually low. The mean
coefficient of variation for grain yield in 2003 was about 56%. Such large variations in
grain growth may be attributed to differential responses to high temperatures. Thus, data
in 2003 provide limited information on yield responses and WUE was calculated only
over the pre-anthesis period during this year. However, the yield responses depend on
the timing of drought. Plaut et al. (2003) reported water deficits did not reduce kernel
112
number, but affected I 000-kernel weight in wheat. Blum et al. 0 990) reported in spring wheat that the highest grain yield plant-' was usually from the cultivar that excelled in
I kernels ear- , even though it was lowest in potential tillering. In the present study, in 2004 Soissons, line 134E and line 134G maintained grain yield plant-' under drought better compared to Beaver. The reasons can be ascribed to better maintenance of harvest
biomass under drought in Soissons and line 134E compared to Beaver. Soissons and lines 134E or 134G maintained HI better than Beaver. The susceptibility of Beaver to drought can be linked to more restricted water uptake and lower W'UE under drought
compared to Soissons. Foulkes et al. (2002) demonstrated decreases in individual ear
weight at flowering under drought were associated with fewer grains ear-' when the
onset of drought occurred shortly before flowering. In the present study similar effects
were found on grain ear-' and this confirms floret survival is linked to assimilate supply to the ear (Slafer, 1996; Foulkes et al., 2002).
The yield responses of the four genotypes to restricted water availability in 2004
differed significantly. Both harvest biomass (R 2=0 . 86) and HI (R 2=0
. 70) were correlated
with yield responses. The faster developing Soissons maintained harvest biomass better
than Beaver; and line 134E better than line 134G. Among yield components, in 2004,
ear number plant-' decreased on average by 31% and the decrease ranged from 22-3 8%
among the genotypes. Grain yield plant-1(60%), grains ear-' (30%) and 1000-grain
weight (15%) were also decreased due to water stress. This is in line with several reports
on effects of pre-anthesis water stress on plant height, leaf area, grain number, grain
weight and grain yield of wheat (e. g. Gupta et al., 2001; Foulkes et al., 2002). In the
present study, Beaver lost more grain yield (82%) under drought as compared to
Soissons (54%). Among the DH lines, 134G suffered a reduction in grain yield by 54%
as compared to 43% for line 134E under drought. In this study, the comparative yield
response to drought for Beaver and Soissons indicated that Beaver lost more grain yield
than Soissons. The WUE of Beaver under drought was lower (2.47g DM kg-lwater;
R 2=0 . 48) compared to Soissons (2-77 g DM kg-lwater; R 2=0
. 63).
These effects perhaps reflected the extent of drought incurred by plants during the
period from ear emergence to the end of flowering, with larger deficits and reductions in
grains ear-' and ear number-' plant for the later developing genotypes. GxE interactions
for yield components were not evident, but the pattern of depression for yield
113

components among genotypes was consistent with Soissons escaping the drought early. In the present study, under irrigation Soissons (Ppd-DI) produced fewer ears plant-' but
this was compensated by more grains ear-', as was found by Worland (1996) and Foulkes et al. (2004).
4.2.3 Contribution of harvest index responses to drought resistance
Harvest index has been reported to be a relatively stable feature for a given cultivar in
the absence of severe stress (Gallagher & Biscoe, 1978), but effects are commonly
reported with drought (Innes et al., 1984; Ehdaie, 1995; Foulkes et al., 2002). In the
present study, the average decrease from 0.48 to 0.35 in 2004 under drought was
consistent with these findings. A larger reduction in HI of 0.31 for Beaver compared
with 0.09 for Soissons (P<0.05) contributed to the differences in yield responses to
drought. Significantly different reductions in harvest biomass under drought were also found with Beaver and line 134G showing larger decreases than Soissons and line 134E.
The positive effects of Ppd-D] in improving the HI have been previously reported for
UK wheat ( Foulkes et al., 2004) and in Soissons a decreased crop water use in the pre-
anthesis period compared to ppd-D] UK bred varieties (Foulkes et al., 200 1).
The grain sink size is determined progressively through sequential formation of tillers,
spikelets, florets and the grain with overlap between stages of growth. Soissons
partitioned more dry matter into ears (63%) than Beaver (52%). DH lines had about
57% ear dry matter each. Reduction in HI under drought has been reported in UK wheat
(Innes et al., 1984; Innes and Blackwell, 1983; Foulkes et al., 2002). Large reductions in
HI are common under drought, given that HI only shows conservatism with
environment under optimal growing conditions and can be reduced if a crop is grown
under resource-limited conditions (Azam-Ali and Squire, 2002). Soissons maintained HI
better compared to other genotypes associated with early flowering as described above.
Lines 134E and 134G are tall (rht) whereas Beaver (Rht-DIb, formerly Rht2) and
Soissons (Rht-B]b formerly At]) are semi-dwarfs. DH lines (taller) and Soissons
(Rht]) maintained better HI with smaller reductions under drought compared to Beaver.
Greater reduction in grain yield and associated yield components under droughted
conditions in this study could be as a result of poorer accumulation and/or translocation
114
and stem carbohydrate remobilisation during the period of water stress. It has been
shown in previous studies that UK cultivars accumulate amounts of stem-soluble
carbohydrate at flowering in the range 2-4 t ha-1 and these differences were associated
with ability to maintain HI (Foulkes et al., 1998 and 2002). However, stem soluble
carbohydrate accumulation was not measured in the present study.
4.2.4 Leaf level transpiration efficiency
A quantitative analysis at the leaf scale by gas-exchange for estimating net
photosynthetic rate (A) and transpiration (E) and stomatal conductance (g, ) would
provide a better understanding of differences in genotypic responses in contrasting water
regimes underlying WUE at the whole crop level. In this context, the analysis of gas
exchange traits is discussed here. Stomatal opening is regulated according to soil water
status (Gowing et al., 1990; Davis and Zhang, 1991; Chaves and Oliveira, 2004); and at
the cellular level stomatal regulation occurs during responses to vapour pressure deficit.
Regulation of stomatal conductance enables the plant to modify gas exchange with the
atmosphere reversibly, on a time scale of only a few minutes.
It is well established that photosynthesis is closely related to dry matter production in
most crops, and plant responses and adaptation to biotic and abiotic stresses are reflected
in changes in their photosynthetic rates (Richards et al., 2002; Chaves and Oliveira
2004). Stomatal closure or a decrease in stomatal conductance leads to a decrease in
C02 intake, decreased intercellular C02 partial pressure, and thereby decreasedC02
assimilation and net photosynthesis (Farquhar and Sharkey, 1982). Soissons and line
134G showed significantly higher photosynthetic rates (A) in general across the readings
between GS39 and GS61+4 weeks. Under well-watered conditions, Soissons and line
134G transpired more water, but they reduced transpiration (E) under water stress
conditions more than Beaver and line 134E. The differences in the development stages
of these genotypes might have also contributed to differences in their response to water
stress.
Over all there was a decrease in net photosynthesis (A) under water stress by 11%, but
the genotypes did not respond under drought significantly differently. Beaver had lower
A than Soissons under irrigated and droughted conditions. There was an interaction
115

between date of measurement and genotype (P=: 0.04), with Soissons and line 134G
having relatively higher values on 6 May (GS31+3weeks) and 7 July (GS61+3weeks) in
2004. Possibly this was due to development differences amongst genotypes.
Averaging across years, g, reduced by 46% due to drought with no significant differences amongst genotypes. However, under drought, there was a trend for a greater
reduction in g, from GS 39 to GS61+4 weeks in 134G (58%) and Soissons (51%)
compared to Beaver (38%) and 134E (7%). Lower g, values are associated with slower
crop growth rates and slower depletion of soil water from the start of stem elongation (Richards et al., 2000). Thus, Beaver showed low mean stornatal conductance under drought, at a given growth stage, consistent with its slower growth rate compared to
Soissons and line 134G. Stomatal conductance results were also consistent with a larger
depression of dry matter for Beaver under drought than for Soissons. The variability of
the gas exchange data on individual assessment dates reported here was relatively high,
in particular for stomatal conductance. Nevertheless, in the present study there was a
general trend for Soissons and line 134G to show decreased g, supporting the hypothesis
that a lower stomatal conductance would favour higher WUE of genotypes. Condon et
al. (2002) pointed out that in cereals high TE is associated with conservative water use
but also conservative growth in the absence of water stress. However, in drier 'stored-
moisture' environments, the conservative gas-exchange associated with low g, and high
TE can result in a considerable yield gain
Pooling data across years, ITEi,,, (calculated as AIE ratio) increased under drought by
14%. Line 134G and Soissons showed a trend for increased ITEj", under drought by
64% and 21% with little changes observed in Beaver and 134E. These responses could
be attributed to reduced g, under water-stress for line 134G and Soissons. This is
consistent with the previous work where greater reduction in g, under water stress
caused an increased WUE (Morgan et al., 1993; Van den Boogaard et al., 1997).
As stomata close, theC02 concentration inside the leaf initially declines with increasing
stress and then increases as drought becomes more severe (Lawlor, 1995). Line 134G
and Soissons showed 7% and 2% reductions in Ci under drought. Ci tended to decrease
initially and thereafter increased progressively as the crop suffered more severe drought.
Soissons had lower Ci values than Beaver in both the water regimes. This could have
116
contributed to higher TE in Soissons than in Beaver. A similar pattern for lower Cj
associated with higher WUE was observed in line 134G compared to 134E. The
interaction effect was significant with relatively higher Ci for Beaver under drought.
Pooled data of all dates of measurement revealed a significantly lower Ci for Soissons
than Beaver (data not shown) and is consistent with a higher ITE or )WE observed for
Soissons. There is evidence from previous studies that lower mean Ci results in increase
in transpiration efficiency (Farquhar and Richards, 1984; Condon et al., 1990).
A reduction in Cj under drought was evident from the cross-year analysis for Soissons
and line 134G (P=0.01). Genotypic variation in leaf size and stomatal distribution can
affect stomatal aperture traits in plants, and Beaver and line 134E had relatively smaller
leaf sizes. Genotypes with smaller leaf size tend to have increased stomatal. density
(Austin et al., 1982; Dunstone et al., 1973), a feature that could result in decreased
WUE. These two genotypes showed no reductions in Ci. In theory, it is expected that a
positive relationship exists between C/C, and TE under water limited conditions
(Farquhar and Richards, 1984; Richards et al., 2001; Condon et al., 2002). Thus, the
observed lower Ci values in Soissons and line 134G might have resulted in their higher
ITEi,,,. Soissons showed a greater degree of stomatal closure under droughted conditions
and maintained a relatively lower Ci relative to that in the well-watered treatment
compared to other genotypes, thus optimising carbon gain with respect to water loss
(Cowan, 1982). Similar contrasts were observed with respect to line 134G versus line
134E.
Ritchie (1974) demonstrated that, provided the soil surface is dry, once the leaf area
index decreases below 3, transpiration decreases approximately linearly with leaf area to
give zero transpiration at zero leaf area. In both years, the seasonal average value of
green area was reduced by about 35% under drought. The proportional reduction in
conductance under drought (46%) was greater than the reduction in green area.
According to Bradford and Hsiao (1982), canopy size is generally more sensitive to
water stress than stomatal conductance for many species. There was a significant
reduction in the green area (P<0.05) but only a strong trend for a reduction in g,
(P<O. 10) under water stress conditions.
117

Many researchers have demonstrated that an increase in WUE could be attributed to a
reduction in stomatal conductance and/or increased assimilation rates (Blum, 1990;
Morgan and LeCain, 1991; Van den Boogaard et al. ý 1997; Fischer et al., 1998; Lu et al.,
1998). Under drought, Soissons did differ consistently in g, compared to Beaver but also
showed significantly increased ITEi,, s on account of increased net photosynthesis. ITEi,,,
was also improved for line 134G under drought as compared to 134E and Beaver.
In several studies high yield under drought in wheat lines was associated with higher net
photosynthesis, lower stomatal conductance and lower sub-stomatal C02 concentration
(Blum 1990; Fischer et al., 1998; Lu et al., 1998; Reynolds et al., 2000). This is in
agreement with the general findings of the present study that the performance of wheat
genotypes like Soissons and line 134G was associated with higher values for net
photosynthesis and lower stomatal conductance and Ci.
Gas-exchange studies give an estimate of the instantaneous transpiration efficiency for a
specific leaf, while the isotopic (13C/12 C) discrimination methods give an integrated
value over time and leaf layers. It is rather difficult to relate instantaneous measures to
values over longer periods, as diurnal changes in stomatal conductance and
environmental conditions mean that the long-term average WUE may only loosely be
related to measured instantaneous values (Jones, 2004). Hence in the present study, the
carbon isotope discrimination technique was used to estimate the variation in intrinsic
WUE among the genotypes over time.
It is evident from the present investigation that a higher A, lower g, and Ci in both
Soissons and line 134G resulted in higher TE at the leaf scale. This was also supported
by gravimetric estimation of WUE which showed apparently higher values for these
genotypes.
Many researchers have shown the robust negative association of A 13 C and TE inC3
plants like bread wheat (Condon et al., 1990; Ehdaie et al., 1991; Condon & Richards
1992) and barley (Hubick and Farquhar, 1989). In the present study, this relationship
was not strongly evident in 2003. This may be due to the variation in the pattern of dry
matter accumulation as a result of the crop being subjected to cyclic phases of water
availability. In addition, treatment differences were difficult to quantify precisely due to
118
spatial vanation in the glasshouse associated with heat stress. However, the regression
of ITE (measured at leaf scale) versus leaf A 13C was negative and weakly significant (P
=0.13) under droughted conditions. In 2003, leaf A 13 C did not differ statistically
significantly amongst genotypes, but Soissons exhibited a lower value under irrigation
by 0.49%o compared to Beaver and by IAI %o under drought. In 2004, green lamina at
anthesis and mature grains at harvest were analysed for A13C separately. Leaf A 13 C for
Soissons was lower than Beaver (P=0.002), consistent with estimates of more efficient
water use by this cultivar. For example, lower g, and lower Ci in Soissons and also lower
WUE according to the gravimetric estimation. A non-significant GxE interaction
indicated that A13C is heritable in these genotypes. Previous studies in wheat showed the
existence of a low or non-significant GxE interaction for A13C indicating its high
heritability (Condon et al., 1987; Condon and Richards, 1992; Matus et al., 1996). The
droughted treatments had lower leaf A 13C .
Grain A 13 C also differed similarly between
the parents.
The genotypic range in A 13C in the present study (0.49%o in 2003; and 1.93%o in 2004)
is in general agreement with those reported in previous studies in wheat (1.1-2.6%o by
Condon et al., 1987; 2.8%o by Ehdaie et al., 1991; 1.1-1.8%o by Condon et al., 1992;
1.0-1.4%o by Morgan et al., 1993 and 0.32-0.62%o by Xue et al., 2002). In 2004, the
range of leaf A 13C was higher (19.3-20.7%o) than for grains A 13C (16.4-17.7%o). This is
also consistent with previous reports in wheat which showed higher mean A 13C in early-
formed dry matter than for grains (Condon and Richards, 1992; Condon et al., 1992;
Merah et al., 2001). In the present study, relatively lower g, and significantly higher
carboxylation capacity (AIC, ratio) for Soissons and 134G may have resulted in higher
TE and/or WUE in these genotypes. In 2003, leaf A 13 C at anthesis did not vary much
among the genotypes and across water regimes. Nevertheless, Soissons still expressed
lower A 13C values than Beaver. In both the years A 13C values were low under water-
limiting conditions (P<0.001).
Baker (1988) envisaged that a significant genotype-by-water regime interaction for A 13C
may be of two types: non-crossover and crossover interactions- In 2004, crossover
interactions were apparent for grain A 13C which showed different ranking for Beaver
being the highest in irrigated and lowest in droughted treatment. Differences in the rate
119
and extent of soil water extraction among wheat genotypes have been shown to be
associated with differences in A 13C Particularly if working through g, (Condon et al., 1992 and 2002). Condon and Richards (1992) suggested that for genotypic comparisons
of A 13C plants should be sampled early in development under well-watered conditions to
avoid confounding effects related to differences in mid and late season water stress
development. Based on analysis of leaf samples at anthesis, lower A13C values for
Soissons and line 134G compared to Beaver and line 134E were confirmed, consistent
with the results that lower delta values resulted in improved WUE or TE. Both
gravimetric estimation and gas-exchange measurements broadly confirmed these
responses.
In summary, it is evident that earliness could favour post-anthesis water use (e. g.
Soissons). It is also possible that genetic variation in root traits may correlate with
season-long water use, especially when onset of drought coincides with anthesis. WUE
measured as the regression slope of dry matter on water use was higher for Soissons and
the two DH lines compared to Beaver. Later developing genotypes (Beaver and line
134E) had more non-surviving tillers hence they did not partition dry matter to ears
better resulting in lower grain DM. A higher grain DM as a result of higher A rates was
realised in Soissons and line 134G. The differences in green area production under well-
watered conditions did not relate to water use amongst genotypes. However, late
developing Beaver showed greater senescence under drought compared to Soissons.
This indicated scope for improving flag-leaf green area persistence for drought
resistance. Soissons and the two DH lines maintained HI better under drought compared
to Beaver. Under non-limited water conditions Soissons and line 134G tended to use
less water, but reductions in transpiration and stomatal. conductance under drought were
smaller for these genotypes. Thus, Soissons and line 134G showed higher ITEj., on
account of lower g, and Ci values which was consistent with lower A 13C or higher WUE
for these genotypes. However, the genotype responses to measured gas-exchange
parameters need critical consideration in further studies to see whether a lower g, and Ci
results in a higher WUE in the UK grown wheat.
120
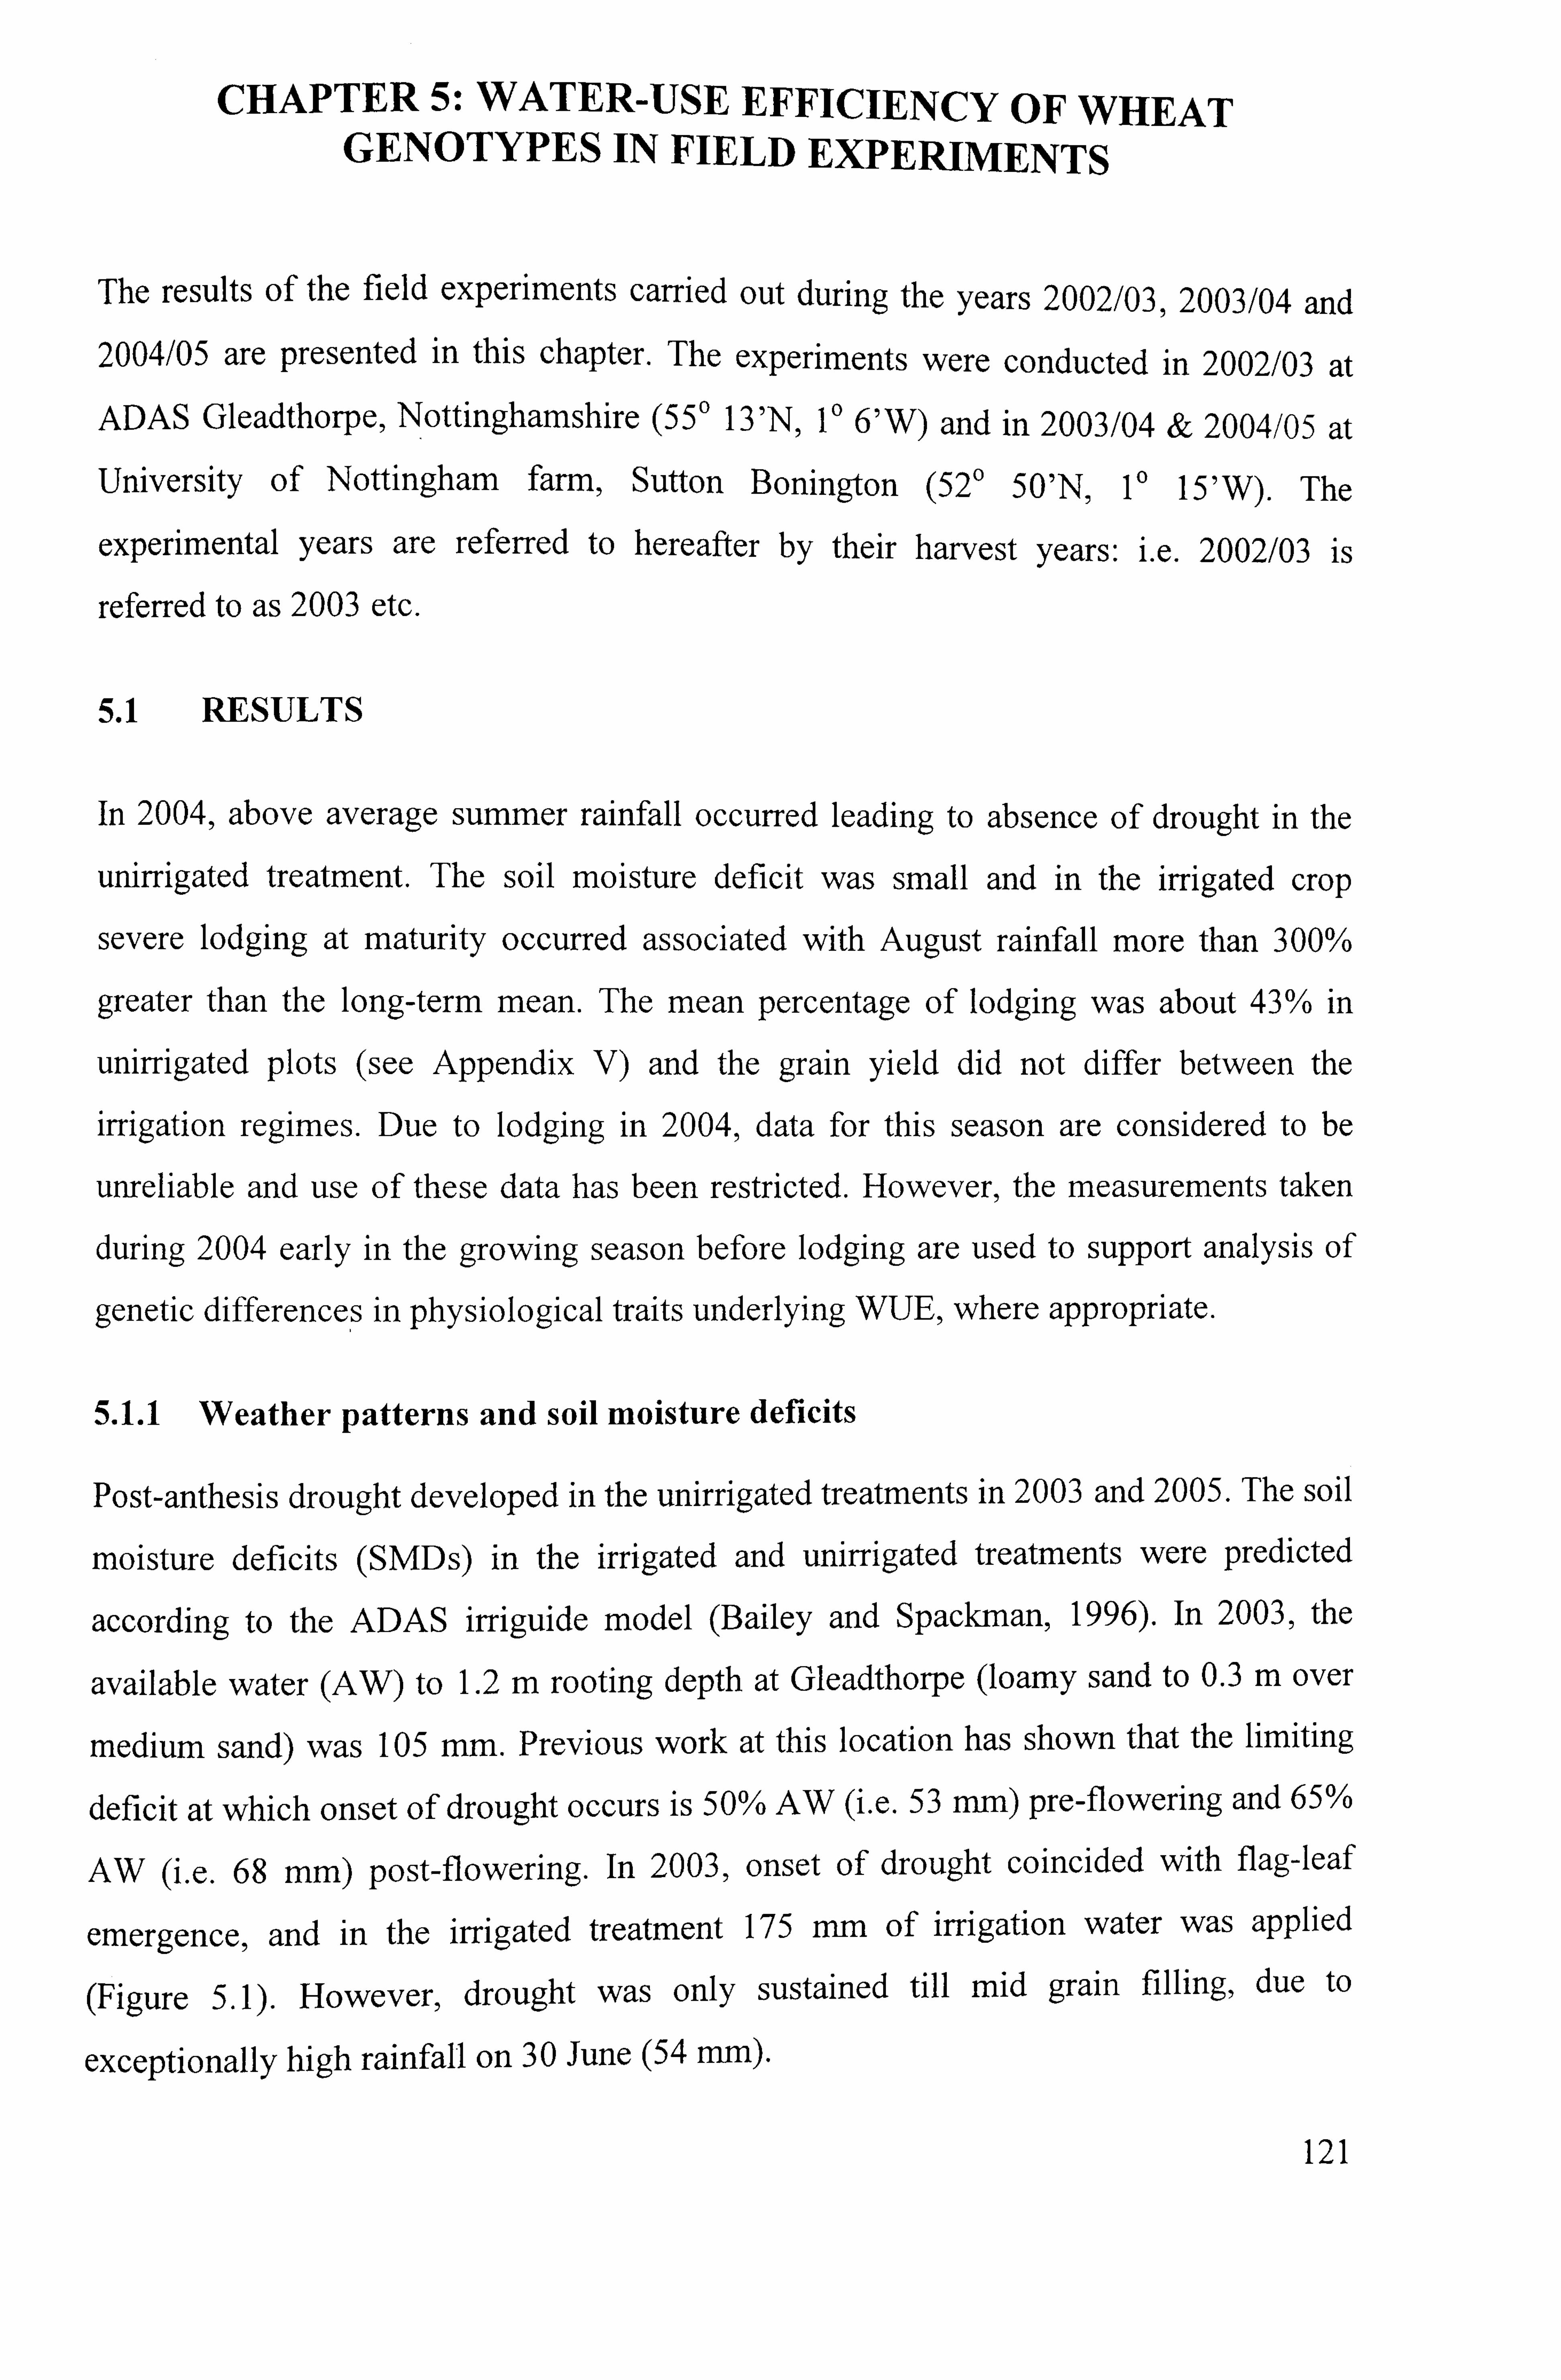
CHAPTER 5: WATER-USE EFFICIENCY OF WHEAT GENOTYPES IN FIELD EXPERIMENTS
The results of the field experiments carried out during the years 2002/03,2003/04 and 2004/05 are presented in this chapter. The experiments were conducted in 2002/03 at ADAS Gleadthorpe, Nottinghamshire (55' 13'Ný V 6'W) and in 2003/04 & 2004/05 at University of Nottingham farm, Sutton Bonington (52' 50'Ný 10 15'W). The
experimental years are referred to hereafter by their harvest years: i. e. 2002/03 is
referred to as 2003 etc.
5.1 RESULTS
In 2004, above average summer rainfall occurred leading to absence of drought in the
unirrigated treatment. The soil moisture deficit was small and in the irrigated crop
severe lodging at maturity occurred associated with August rainfall more than 300%
greater than the long-term mean. The mean percentage of lodging was about 43% in
unirrigated plots (see Appendix V) and the grain yield did not differ between the
irrigation regimes. Due to lodging in 2004, data for this season are considered to be
unreliable and use of these data has been restricted. However, the measurements taken
during 2004 early in the growing season before lodging are used to support analysis of
genetic differences in physiological traits underlying WUE, where appropriate.
5.1.1 Weather patterns and soil moisture deficits
Post-anthesis drought developed in the unirrigated treatments in 2003 and 2005. The soil
moisture deficits (SMDs) in the irrigated and unirrigated treatments were predicted
according to the ADAS irriguide model (Bailey and Spackman, 1996). In 2003, the
available water (AW) to 1.2 in rooting depth at Gleadthorpe (loamy sand to 0.3 in over
medium sand) was 105 mm. Previous work at this location has shown that the limiting
deficit at which onset of drought occurs is 50% AW (i. e. 53 mm) pre-flowering and 65%
AW (i. e. 68 mm) post-flowering. In 2003, onset of drought coincided with flag-leaf
emergence, and in the irrigated treatment 175 mm of irrigation water was applied
(Figure 5.1). However, drought was only sustained till mid grain filling, due to
exceptionally high rainfall on 30 June (54 mm).
121
In 2005, at Sutton Bonington, the AW to 1.2 m rooting depth was 186 mm. SMD
exceeded 92 mm. (50% AW) on 30 May and limiting deficits were maintained until
physiological maturity (Figure 5.1). A total 171 mm of irrigation water was applied in
the irrigated treatment.
5.1.1.1 Experimental conditions and weatherpatterns
The 2002/3 season at Gleadthorpe was characterized by a cold December and January,
followed a warm spring and then slightly above average temperatures until harvest,
(Table 5.1). Mean air temperature exceeded 16 T from June onwards. The rainfall
below long-term mean was experienced between January and April. In the 2004/5
season at Sutton Bonington average rainfall was experienced from sowing until
February. March and May were drier than average. The mean air temperature, rainfall
and radiation levels were generally similar to the long-term mean.
122
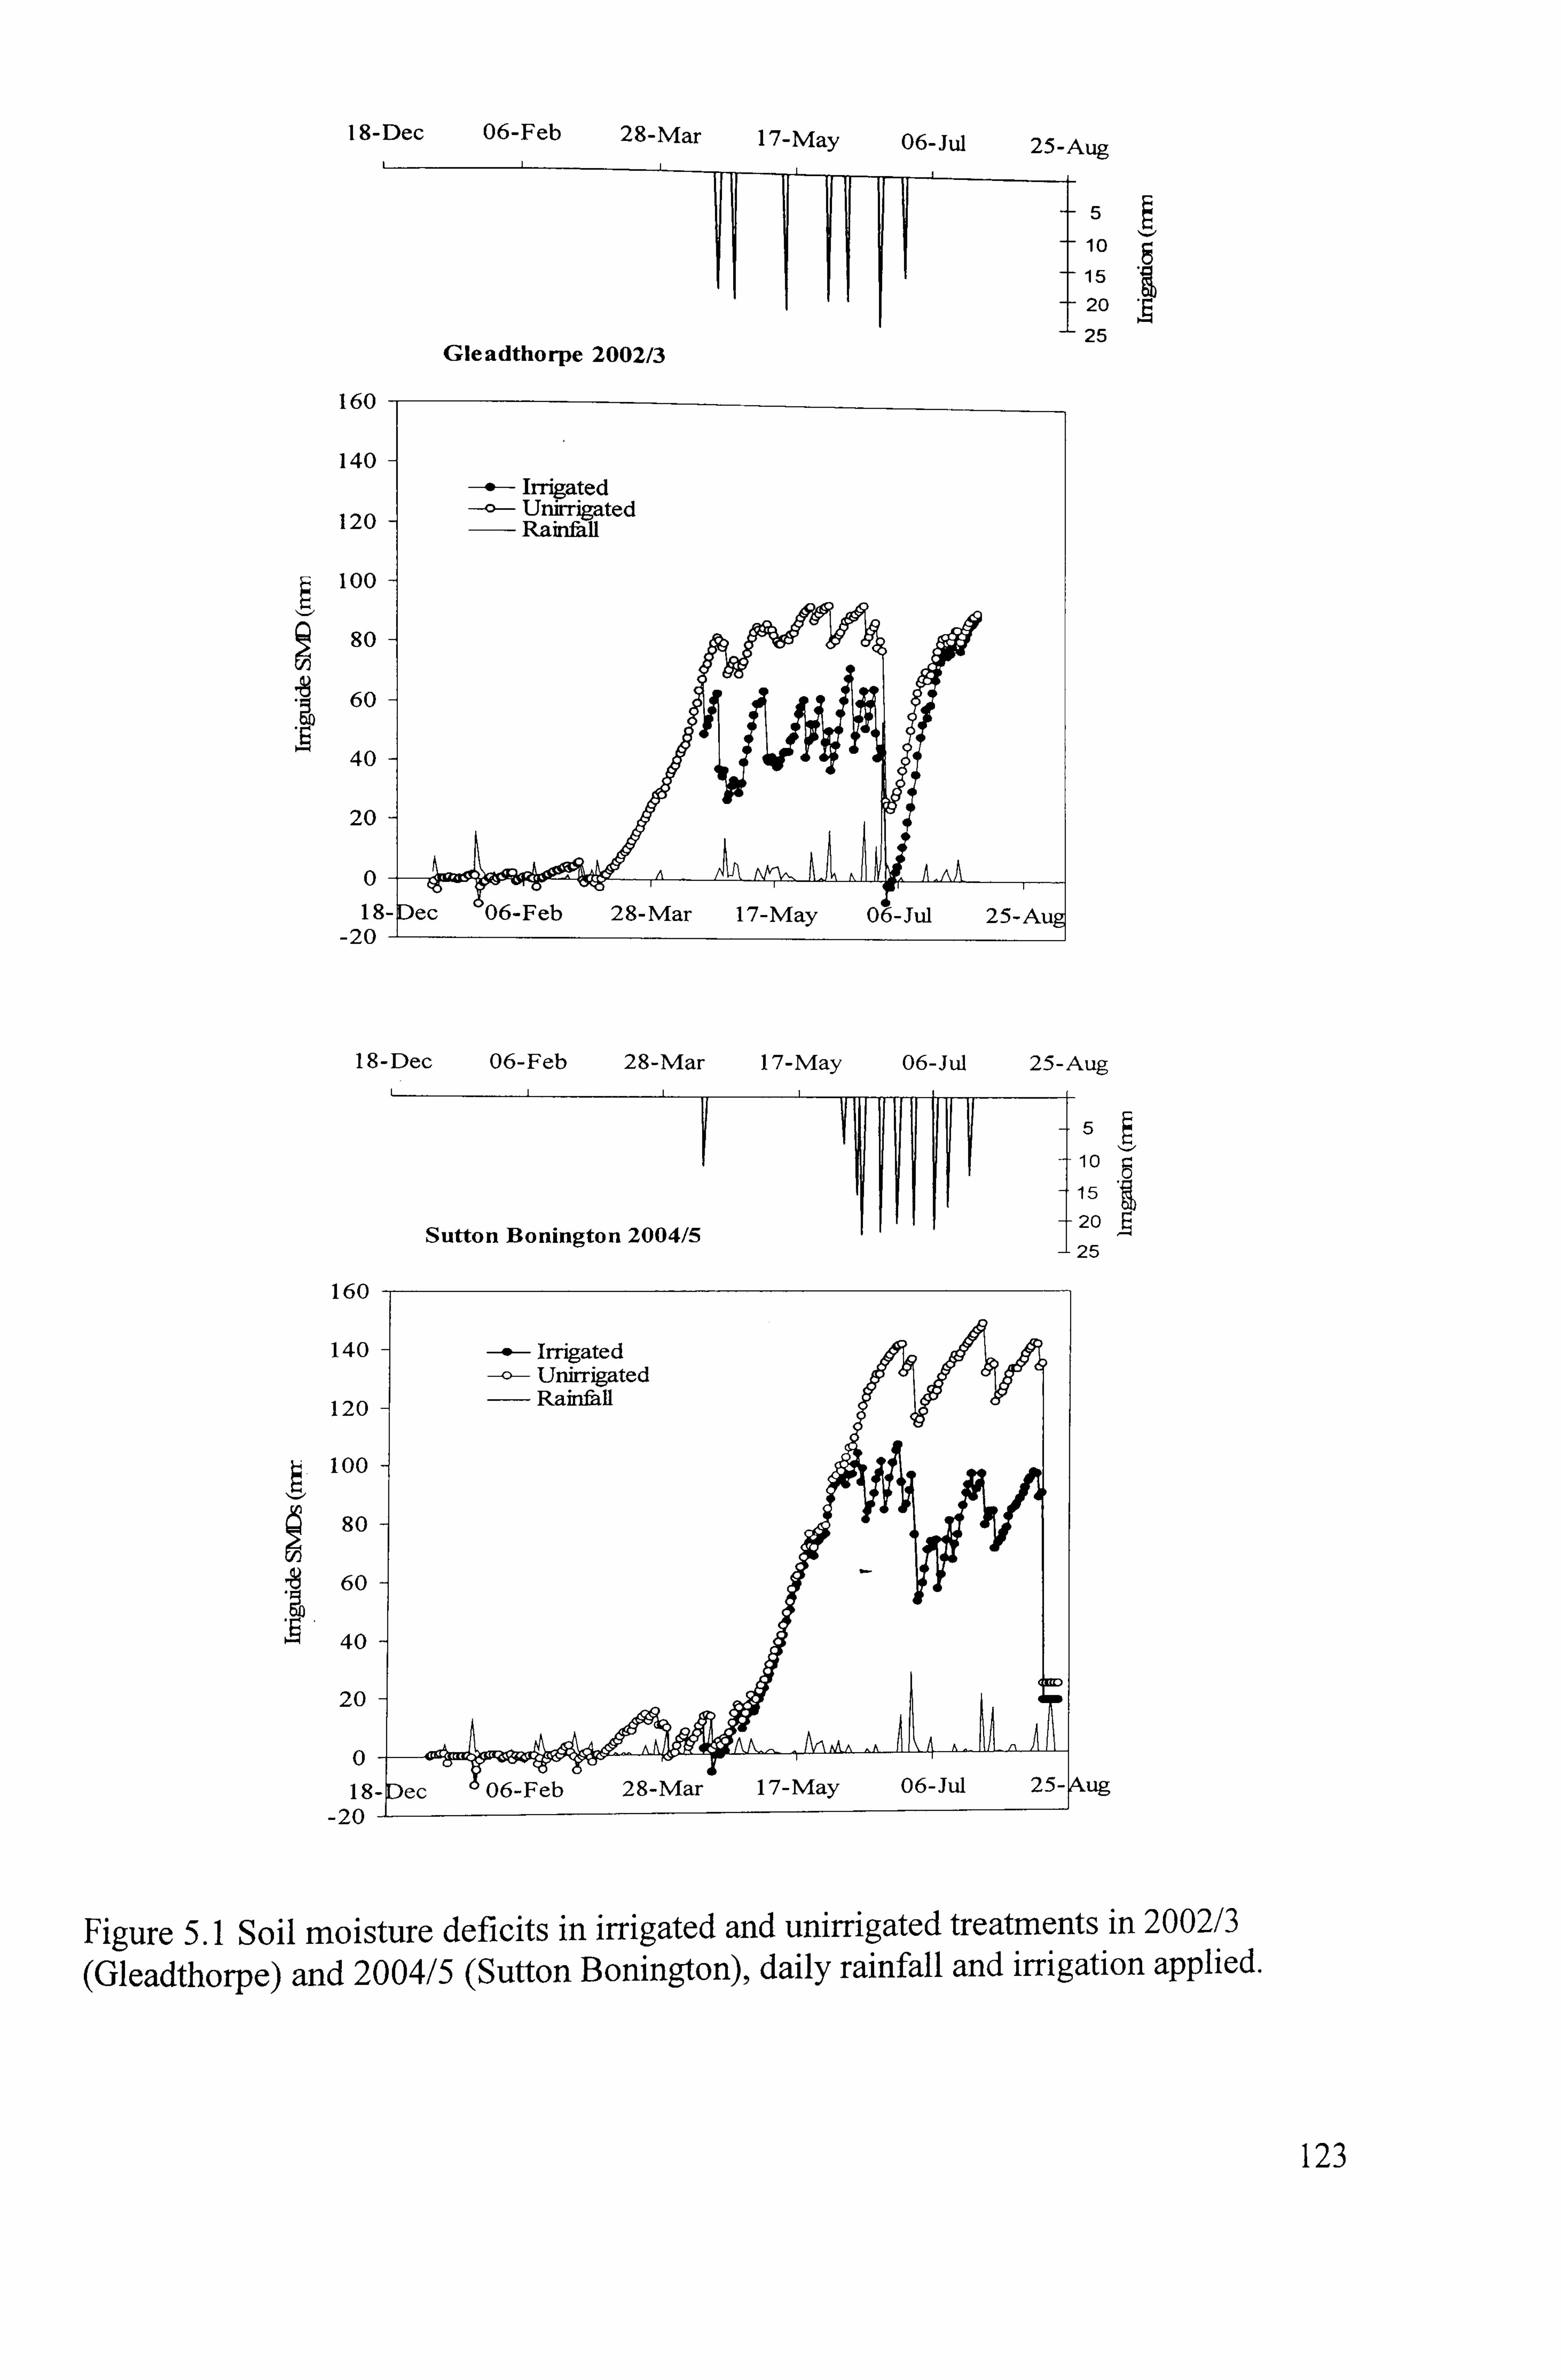
18-Dec 06-Feb 28-Mar 17-May 06-Ad
Gleadthorpe 2002/3
160
140
120
100
80
60
40
20
0
18
-20
160
140
120
100
80
60
40
20
0
I&
-20
25-Aug
5
10
--15
20
25
Irrigated Unirrigated Rain&ll
Feb 28-Mar 17-May 0; -Jul 25-
18-Dec 06-Feb 28-Mar 17-May 06-Rd 25-Aug
5
__10
- 15
Sutton Bonington 2004/5 -- 20
--25
Figure 5.1 Soil moisture deficits in irrigated and unirrigated treatments in 2002/3
(Gleadthorpe) and 2004/5 (Sutton Bonington), daily rainfall and irrigation applied.
123
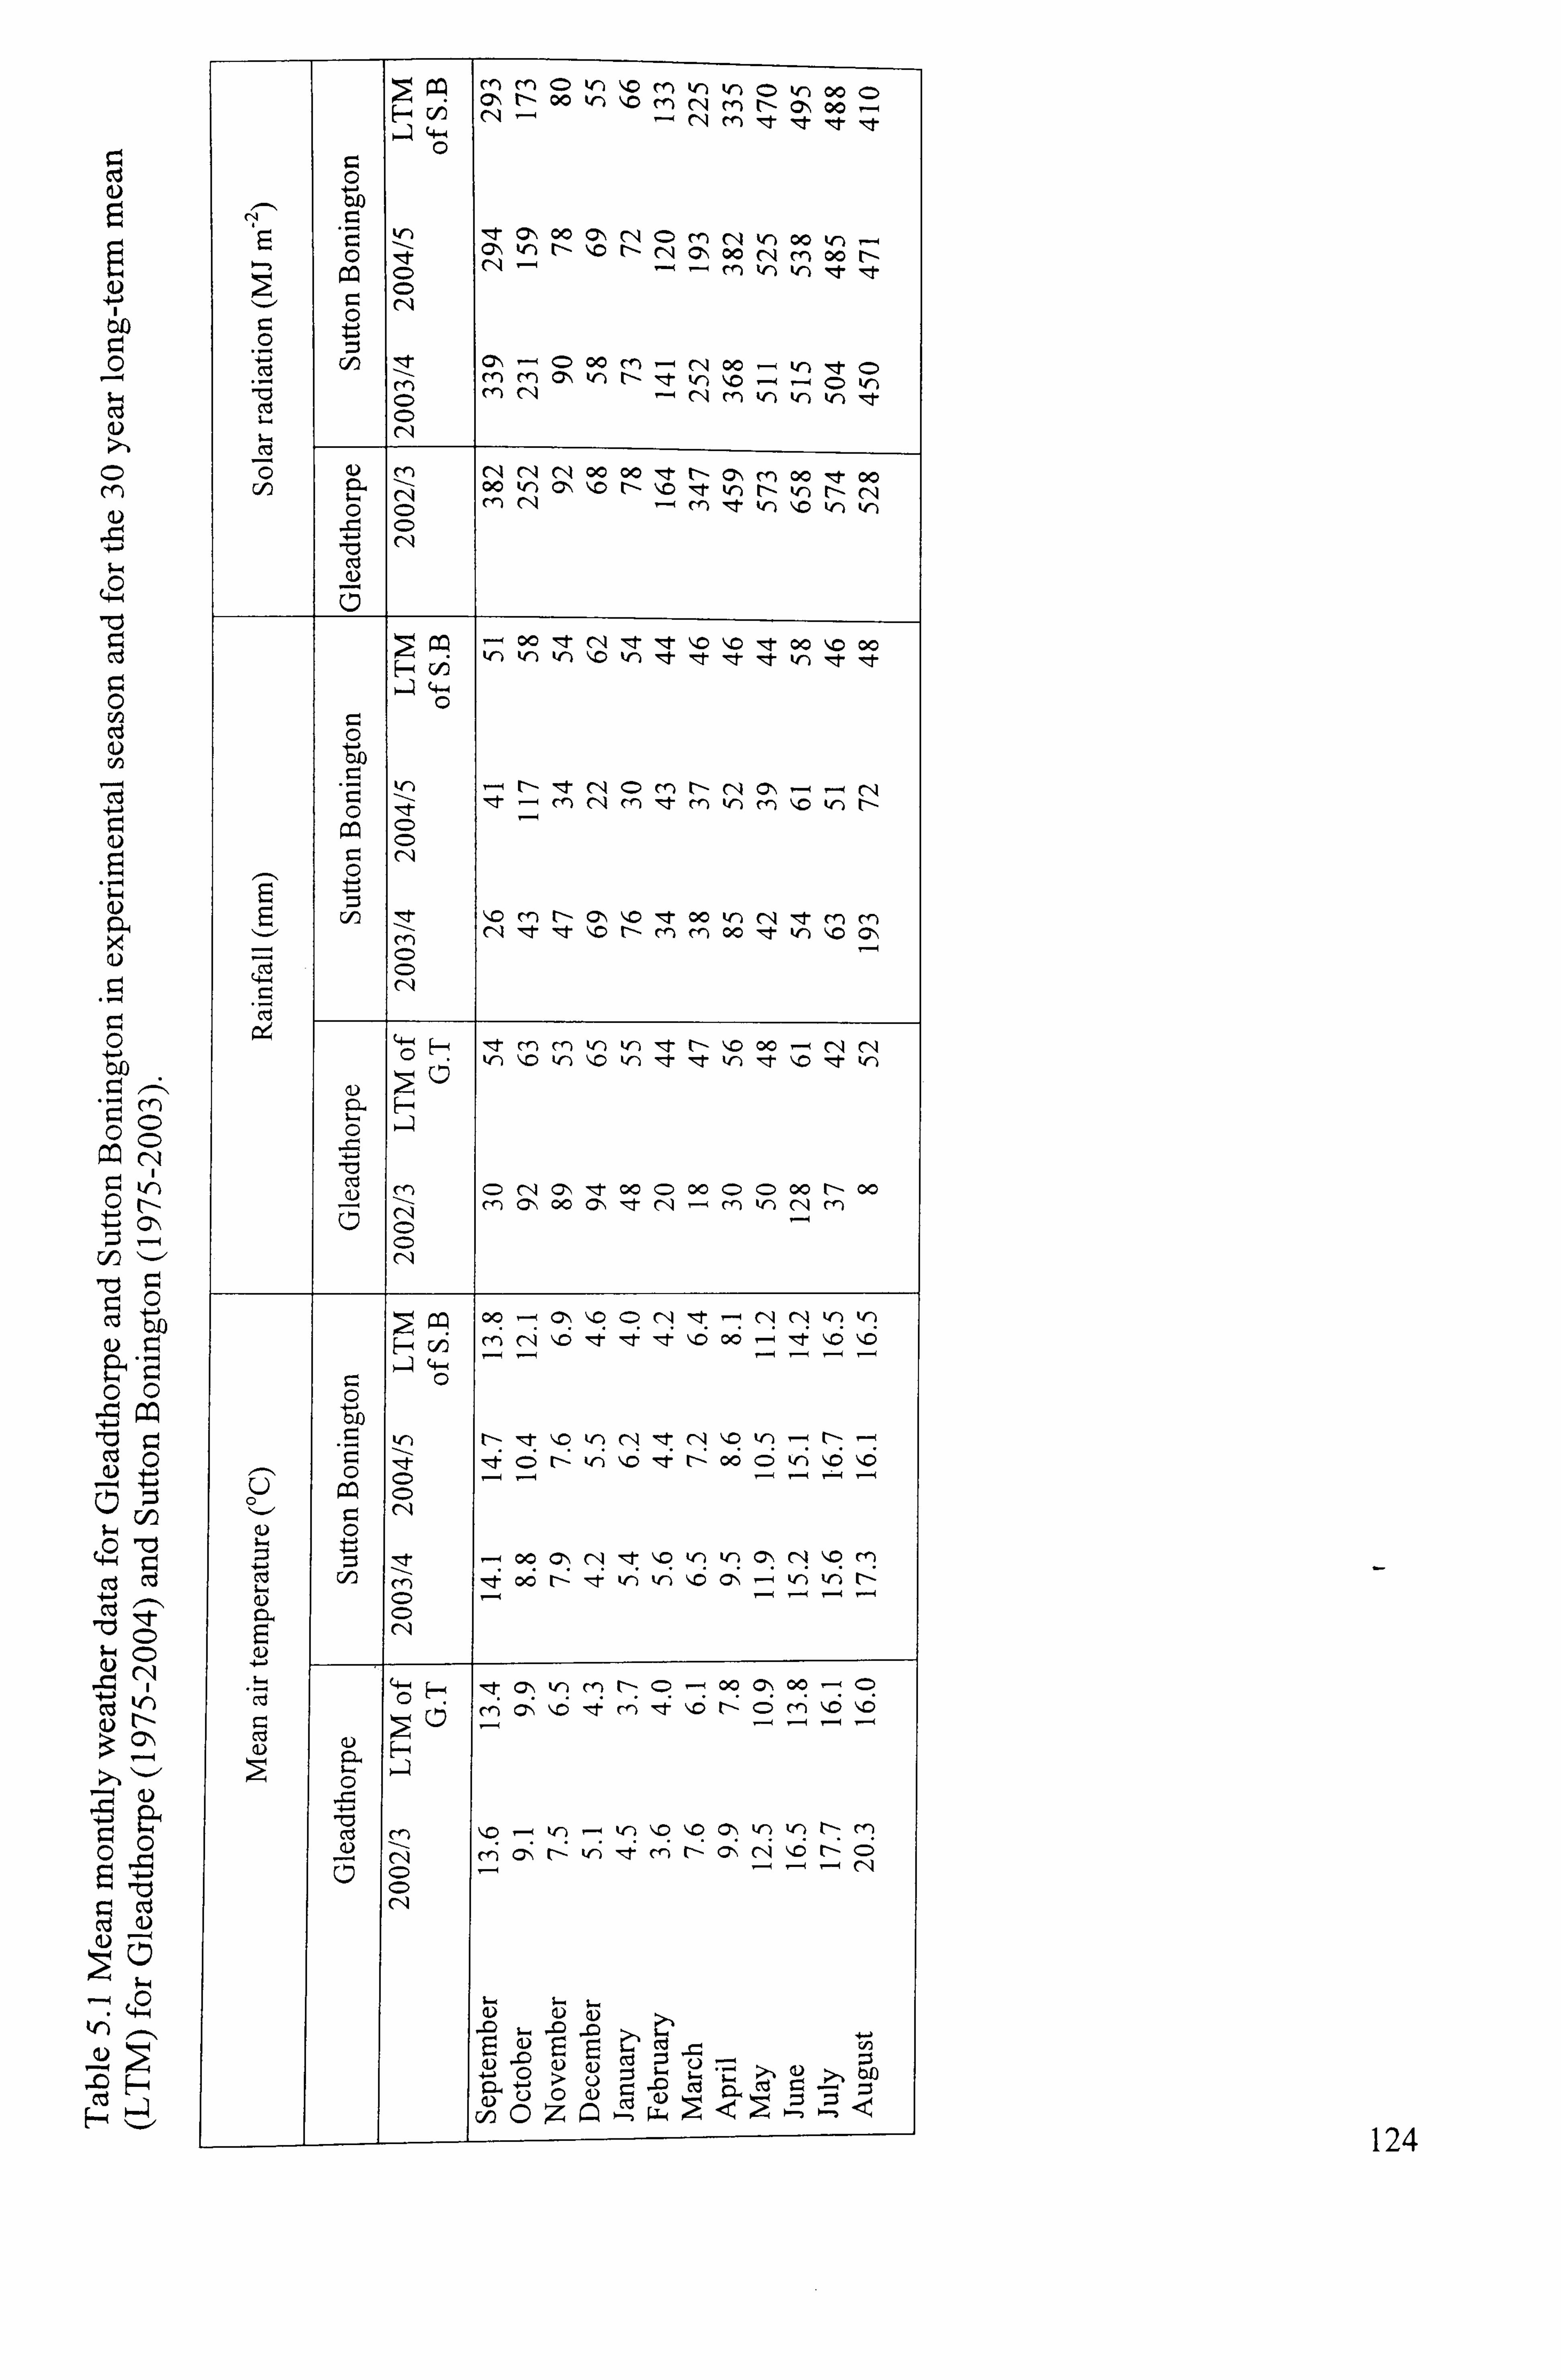
m
(42 7ý r. Cd
0 En Cd U
Cd
"C
-0 Cd ý-4
tw
-0 1: ý Cd
1-11
C)
kn rl-
+-j
lcý 03
m r- C)
00 kr)
kn
"o m ýc m
kr)
N kr) o kr) 00
- Vý CIA
m r Cý 00
4-4 N m Iýt 'Tt -t
0 lz
', I- CN 00 a, c"I C) m r4 V) 00 V) ý Cý kr) t'- 1ý0 t-- N C., 00 N cn 00 [--
C/) :! ý 00 M 00 kr)
m m m (0, \ kr) t'- IZI, kr) ý, c - - C> tr)
"a C) m cli - C14 m tn tr) W') ýI,
C)
C14 C14 00 00 IZI, tl- Cý m 00 I: t 00 00 kr) CN 1ý0 rl- 110 tr) t-- kr) r-- C14
0 C)
41. Cý 4-
7: ý
03
00 tt C, 4 "t ý: t "o ý, o "t 00 1,0 00 tr) kr) kn I'D kr) kr) Itil It
4-4 C)
a
0
k4l) C)
5 C, ) : 7ý ýc M [-- c-, ý, c zr 00 V') C14 'Iýt MM 00 -, t W-) c-,
ct
'i; I r4 - ý- E--ý -ýt m 1
c-n V-) V) , I- t'- 1.0 00 --1 C'4 C'4 kr) ,0 tr) k. -) 1r) V)
C)
'S
re) oc c) 00 C) C) 00 r'- 00 m C', oc c" zl- C'q - Cf) kr) m
C) C)
:ý co 00 - Cý "o (=) cq zt .
- .
(, A .
(", .
Ir) If) .. P C'ý m . C-q . "D . -ýt .. -: zt- -, I- -c 00 - , I- 1ý0 "D
00 C7-, (-A -o krý 'n CN
Iýc C,
E 0 - 4
4-4 09 Cý 00
CD
7:; 03
C'A CIA
C-A
-0 U. -0 -0 ýl cl -a
+ý
'I) 4ý 'D 0 (1) > a) Cd :ý
1. C
U - ,
$-. ý>-, a) >, bl) C) 0 - C, 3 r- - =S
:: 3 C) Z
124

5.1.2 Effects of irrigation and genotype on grain yield and carbon isotope discrimination of 33 DH genotypes and 2 parents.
An overview of the results obtained from. the analysis of combine grain yield and carbon
isotope discrimination values for the 33 DH lines and the two parents Beaver and Soissons, is presented in the following sub-sections.
5.1.2.1 Grain Yield
5.1.2.1.1 2003
Averaging across genotypes, drought decreased grain yield from 8.52 to 8.03 t ha-1
(P=0.39; Table 5.2). Genotypes differed significantly in the range 10.2 to 6.4 t ha-1
(P<O. 00 1). Yield losses due to drought ranged from 0.12 to 3.02 t ha- 1 amongst the lines,
and the irrigation x genotype interaction was significant (P<0.001). With regard to the
parents, Beaver yielded higher under irrigation, and apparently lost more grain yield
under drought compared to Soissons.
5.1.2.1.2 2005
Restricted water availability reduced average grain yields by 1.58 t ha-'(P=0.047).
Under irrigation, lines yielded in the range 12.38 t ha-1 to 8.97 t ha-' (P<0.001).
Reductions in grain yield under drought ranged from 0.57 to 3.84 t ha-1 (P=0.02). The
genotype x irrigation interaction effect was significant with lines 14E and 19B losing
grain yield in the range of 3.39 to 3.84 t ha-1. Beaver again yielded higher than Soissons
under irrigation and the reduction in their grain yield due to drought was greater for
Beaver (1.91 t ha-1) than Soissons (1.45 t ha-1) (P=0.02; Table 5.2).
Cross sitelseason mean
Averaging across the two site-seasons, drought reduced grain yield from 9.5 to 8.4 t ha-1
(P<0.03; Table 5.2). Genotypes differed significantly in the range 8.2 to 10.9 t ha-1. The
yield responses to drought among all DH lines ranged from 0.11 to 2.46 t ha-I (P<0.02).
High yielding Beaver lost about 1.3 t ha-1 (P=0.02) compared to 1.0 t ha-1 for Soissons.
The interaction effect for site/season x genotype was significant (P<0.001), with the
parents and 24 lines showing relatively greater yield in 2005 compared to 2003.
125
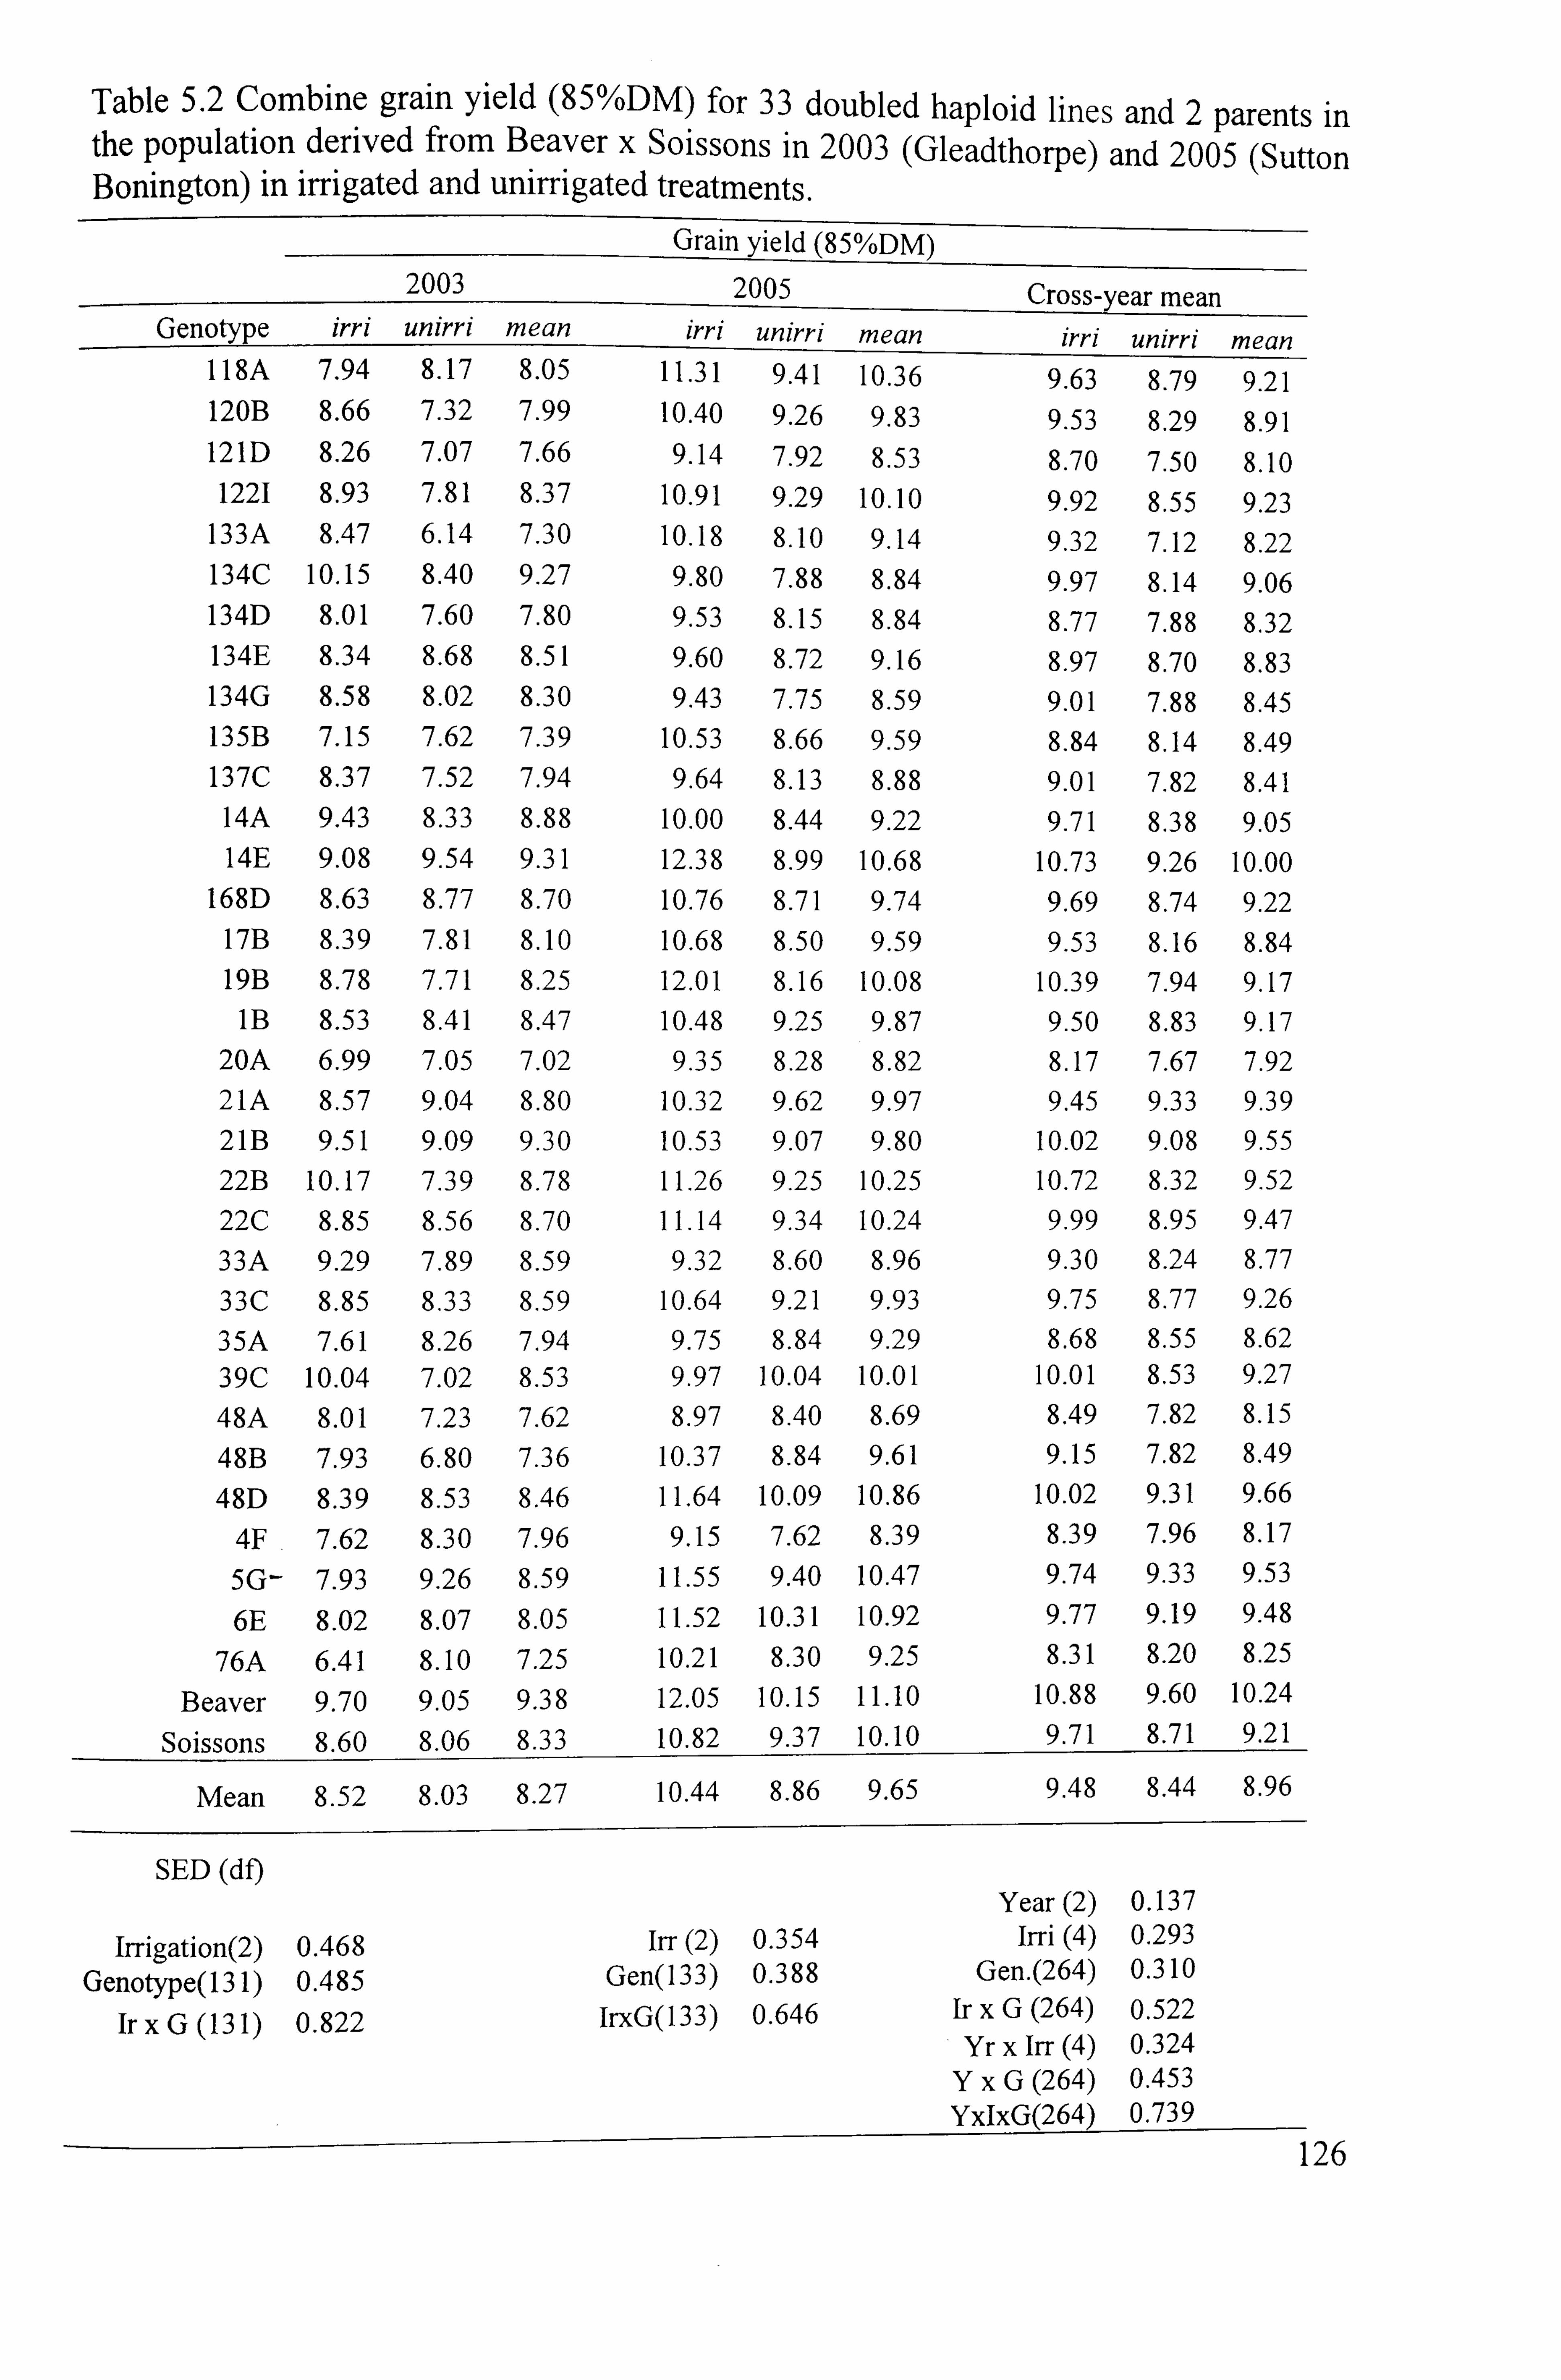
Table 5.2 Combine grain yield (85%DM) for 33 doubled haploid lines and 2 parents in the population derived from Beaver x Soissons in 2003 (Gleadthorpe) and 2005 (Sutton Bonington) in irrigated and unirrigated treatments.
Grain yield ( 85%DM)
2003 2005 Cross-year mean Genotype irri unirri mean I. rri . uni . rri mean irri unirri mean
118A 7.94 8.17 8.05 11.31 9.41 10.36 9.63 8.79 9.21 120B 8.66 7.32 7.99 10.40 9.26 9.83 9.53 8.29 8.91 121D 8.26 7.07 7.66 9.14 7.92 8.53 8.70 7.50 8.10 1221 8.93 7.81 8.37 10-91 9.29 10.10 9.92 8.55 9.23
133A 8.47 6.14 7.30 10.18 8.10 9.14 9.32 7.12 8.22 134C 10.15 8.40 9.27 9.80 7.88 8.84 9.97 8.14 9.06 134D 8.01 7.60 7.80 9.53 8.15 8.84 8.77 7.88 8.32 134E 8.34 8.68 8.51 9.60 8.72 9.16 8.97 8.70 8.83 134G 8.58 8.02 8.30 9.43 7.75 8.59 9.01 7.88 8.45 135B 7.15 7.62 7.39 10.53 8.66 9.59 8.84 8.14 8.49 137C 8.37 7.52 7.94 9.64 8.13 8.88 9.01 7.82 8.41 14A 9.43 8.33 8.88 10.00 8.44 9.22 9.71 8.38 9.05 14E 9.08 9.54 9.31 12.38 8.99 10.68 10.73 9.26 10.00
168D 8.63 8.77 8.70 10.76 8.71 9.74 9.69 8.74 9.22 17B 8.39 7.81 8.10 10.68 8.50 9.59 9.53 8.16 8.84 19B 8.78 7.71 8.25 12.01 8.16 10.08 10.39 7.94 9.17 IB 8.53 8.41 8.47 10.48 9.25 9.87 9.50 8.83 9.17
20A 6.99 7.05 7.02 9.35 8.28 8.82 8.17 7.67 7.92 21A 8.57 9.04 8.80 10.32 9.62 9.97 9.45 9.33 9.39 21B 9.51 9.09 9.30 10.53 9.07 9.80 10.02 9.08 9.55
22B 10.17 7.39 8.78 11.26 9.25 10.25 10.72 8.32 9.52
22C 8.85 8.56 8.70 11.14 9.34 10.24 9.99 8.95 9.47
33A 9.29 7.89 8.59 9.32 8.60 8.96 9.30 8.24 8.77
33C 8.85 8.33 8.59 10.64 9.21 9.93 9.75 8.77 9.26
35A 7.61 8.26 7.94 9.75 8.84 9.29 8.68 8.55 8.62
39C 10.04 7.02 8.53 9.97 10.04 10.01 10.01 8.53 9.27
48A 8.01 7.23 7.62 8.97 8.40 8.69 8.49 7.82 8.15
48B 7.93 6.80 7.36 10.37 8.84 9.61 9.15 7.82 8.49
48D 8.39 8.53 8.46 11.64 10.09 10.86 10.02 9.31 9.66
4F 7.62 8.30 7.96 9.15 7.62 8.39 8.39 7.96 8.17
5G- 7.93 9.26 8.59 11.55 9.40 10.47 9.74 9.33 9.53
6E 8.02 8.07 8.05 11.52 10.31 10.92 9.77 9.19 9.48
76A 6.41 8.10 7.25 10.21 8.30 9.25 8.31 8.20 8.25
Beaver 9.70 9.05 9.38 12.05 10.15 11-10 10.88 9.60 10.24
Soissons 8.60 8.06 8.33 10.82 9.37 10.10 9.71 8.71 9.21
Mean 8.52 8.03 8.27 10.44 8.86 9.65 9.48 8.44 8.96
SED (df) Year (2) 0.137
Irrigation(2) 0.468 Irr (2) 0.354 Irri (4) 0.293
Genotype(131) 0.485 Gen(133) 0.388 Gen. (264) 0.310
lrxG(131) 0.822 lrxG(133) 0.646 Ir xG (264) 0.522
, Yr x Irr (4) 0.324 YxG (264) 0.453 YxlxG(264) 0.739
126
5.1.2.2 Carbon isotope discrimination values (Delta; ABC; %0)
5.1.2.2.1 2003
Drought decreased the grain delta from 20.28 to 19.37 %o (P=0.09). The genotypes differed significantly and under irrigation, delta ranged from 19-54 & (line 135B) to 20.99 %o (line 22B) (P<0.001). The parents differed in A 13C with Soissons showing a lower value than Beaver both under irrigated and unirrigated conditions (P<0.001; Table 5.3). Under irrigation, the A 13C for Beaver and Soissons were 20.68 and 20.19 %o
respectively. The reduction in delta under drought ranged from 0-35 to 1.3 4 %o amongst lines, but the genotype x irrigation interaction was not significant (P=O. 12).
5.1.2.2.2 2005
Drought significantly reduced grain A13C from 20.57 %o to 19-08 %o (P<0.005; Table
5.3). Under irrigation delta ranged from 20.0 %o (line 135B) to 21.23 %o (line 22B).
Parents differed significantly with Soissons again showing lower values in both irrigated
and unirrigated conditions than Beaver (P<0.001). Under irrigated conditions, the delta
values for Beaver and Soissons were 20.91 and 20.37 %o respectively (P<0.001; Table
5.3). The irrigation x genotype interaction was not significant (P=0.1), and drought
reduced grain A 13C in the range of 1.17 to 1.97 %o amongst genotypes.
5.1.2.2.3 Cross-sitelseason mean
Averaging across the two seasons, drought reduced grain A 13 C by 1.20 %o (P=0.001).
Under irrigation, A 13 C ranged from 19.77 %o (line 135B) to 21.11%o (line 22B)
(P<0.001). The two parents differed consistently, in the two years as described above,
under unirrigated conditions in the range of 19.09 %o (Soissons) and 19.49 %o (Beaver).
The irrigation x line interaction was not significant and drought decreased A 13C in the
range 0.86 %o (line 135B) to 1.49 %o (line 133A) (P=0.054; Table 5.3). The lack of a
significant interaction is consistent with the literature demonstrating that A 13 C appears
to be highly heritable among the genotypes in the BxS population. Neither of the
interaction effects was significant for site/season x irrigation (P=O. 13) and site/season x
irrigation x line (P=0.15). However, the site/season x line interaction was significant
(P<0.001) indicated that the performance of genotypes was different in each site/season.
127
Averaging across 2003 and 2005, mean A 13 C ranged from 19.34 %o (line 135B) to 20.46 %o (line 22B). Of the eight genotypes most intensively studied, lines 134G and 22B had
minimum and maximum A13C values (19.42 and 20.46 %o respectively). The ranking of the genotypes was in the order of 134G <Soissons <21B <35A <76A <Beaver <134E <22B. Under unirrigated conditions, in both years, line 134G and Soissons always had low delta values indicating high WUE. Whereas, lines 134E, 22B and Beaver always had high delta values indicating low WUE.
5.1.3 Relationship between A 13 C and grain yield
Carbon isotope discrimination was measured on grains of all 35 genotypes obtained from combine harvest in 2003 and 2005. The grain A 13C was positively correlated with
grain yield in each of the two site/seasons (Figure 5.2)
In 2003, A 13C showed a positive linear relationship with yield amongst genotypes (R 2=0.17; P=0.013) under drought. Under irrigation, the relationship was not significant (P=0.87). A similar positive linear relationship was observed in 2005 under drought
(R 2=0.17; P=1 0.0 15) with no significant relationship under irrigated conditions (P=O. 12).
For individual irrigation treatments, mean values over two years showed a significant
positive relationship between A 13 C and grain yield (P<0.05). Coefficients of
determination (R 2) were 0.29 under drought (P<0.001) and 0.12 under irrigation
(P<0.04). The genotype x irrigation interaction effect just failed to realise significance
(P=0.054). Thus, the genotype performance was apparently stable in each of the
experiments.
In theory, carbon isotope discrimination values are negatively correlated with TE
(Farquhar and Richards, 1984). Since WUE was not measured directly in the field, TE
and A 13 C are not always negatively correlated. So the present results indicate a negative
relationship between TE and grain yield. More detailed measurements of growth and
gas-exchange parameters were carried out in each year to examine processes underlying
the differences in A 13C for eight selected genotypes. The following sections describe the
growth and yield performance of the six DH lines and their parents for these stomatal
aperture traits.
128

Table 5.3 Grain carbon isotope discrimination values (%o) for 33 doubled haploid lines and 2 parents in population derived from Beaver x Soissons in 2003 (Gleadthorpe) and 2005 (Sutton Bonington) in irrigated and unirrigated treatments.
2003 Grain delta (%o)
2005 Cros Genotype irri unirri mean irri unirri mean irri
s unirri
-year mean 118A 20.67 19.33 20.00 20.89 19.49 20.19 20.78 19.41 20.09
120B 19.80 19.32 19.56 20.03 18.70 19.36 19.92 19.01 19.46 121D 20.63 19.46 20.04 20.77 19.19 19.98 20.70 19.32 20.01 1221 20.07 19.31 19.69 20.61 18.89 19.75 20.34 19.10 19.72
133A 20.25 19-10 19.68 20.70 18.86 19.78 20.47 18.98 19.73 134C 20.12 18.85 19.48 20.35 18.83 19.59 20.23 18.84 19.54 134D 19.85 19.23 19.54 20.51 19-03 19.77 20.18 19.13 19.66 134E 20.55 19.81 20.18 20.85 19.64 20.24 20.70 19.72 20.21 134G 20.14 19.02 19.58 20.07 18.44 19.25 20.11 18.73 19.42 135B 19.54 19.02 19.28 20.00 18.80 19.40 19.77 18.91 19.34 137C 19.93 18.90 19.41 20.50 19.24 19.87 20.21 19.07 19.64 14A 20.04 19.29 19.67 20.73 19.26 20.00 20.39 19.28 19.83 14E 20.69 19.64 20.17 20.74 19.37 20.06 20.72 19.51 20.11
168D 19.88 18.88 19.38 20.29 18.44 19.36 20.08 18.66 19.37 17B 19.99 19.14 19.57 20.11 18.93 19.52 20.05 19.04 19.54 19B 20.74 19.46 20.10 20.63 19.00 19.82 20.68 19.23 19.96 IB 20.35 19.36 19.85 20.72 19.37 20.05 20.53 19.37 19.95
20A 19.66 18.50 19.08 20.67 18.87 19.77 20.17 18.69 19.43 21A 20.78 19.73 20.26 21.10 19.75 20.42 20.94 19.74 20.34 21B 20.18 19.71 19.95 20.76 18.79 19.77 20.47 19.25 19.86 22B 20.99 19.92 20.46 21.23 19.69 20.46 21.11 19.80 20.46 22C 20.51 19.64 20.07 20.59 19.38 19.98 20.55 19.51 20.03 33A 20.04 18.82 19.43 20.07 18.78 19.42 20.06 18.80 19.43 33C 19.98 19.30 19.64 20.38 18.90 19.64 20.18 19.10 19.64 35A 20.40 19.76 20.08 20.27 19.10 19.68 20.33 19.43 19.88 39C 20.12 19.39 19.76 20.64 19.04 19.84 20.38 19.21 19.80 48A 20.05 19.08 19.57 20.73 18.85 19.79 20.39 18.96 19.68 48B 20.40 19.67 20.04 20.71 19.14 19.92 20.56 19.40 19.98 48D 20.23 19.58 19.91 20.37 19.18 19.77 20.30 19.38 19.84
4F 20.49 19.30 19-90 20.45 19.02 19.74 20.47 19.16 19.82
5G 20.59 20.24 20.42 21.04 19.39 20.21 20.81 1_9.8 1 20.31 6E 20.52 19.51 20-01 20.67 19.27 19.97 20.59 19.39 19-99
76A 20.61 19.89 20.25 20.60 18.97 19.78 20.60 19.43 20.02
Beaver 20.68 19.77 20.22 20.91 19.21 20.06 20.79 19.49 20.14
Soissons 20-19 19.08 19.64 20.37 19-10 19.74 20.28 19.09 19.69
Mean 20.28 19.37 19.82 20.57 19.08 19.83 20.42 19.23 19.83
SED (df) Year (2) 0.0652
Irrigation (2) 0.293 Irri (2) 0.090 Irri (4) 0.1530
Genotype (132) 0.162 Geno. (130) 0.133 Gen. (262) 0.1048
Ir xG (132) 0.369 Irx G (130) 0.206 Ir xG (262) 0.2116
Yr x Irr (4) 0.1663
Yr xG (262) 0.1600
YxIrxG(262) 0.2653
129
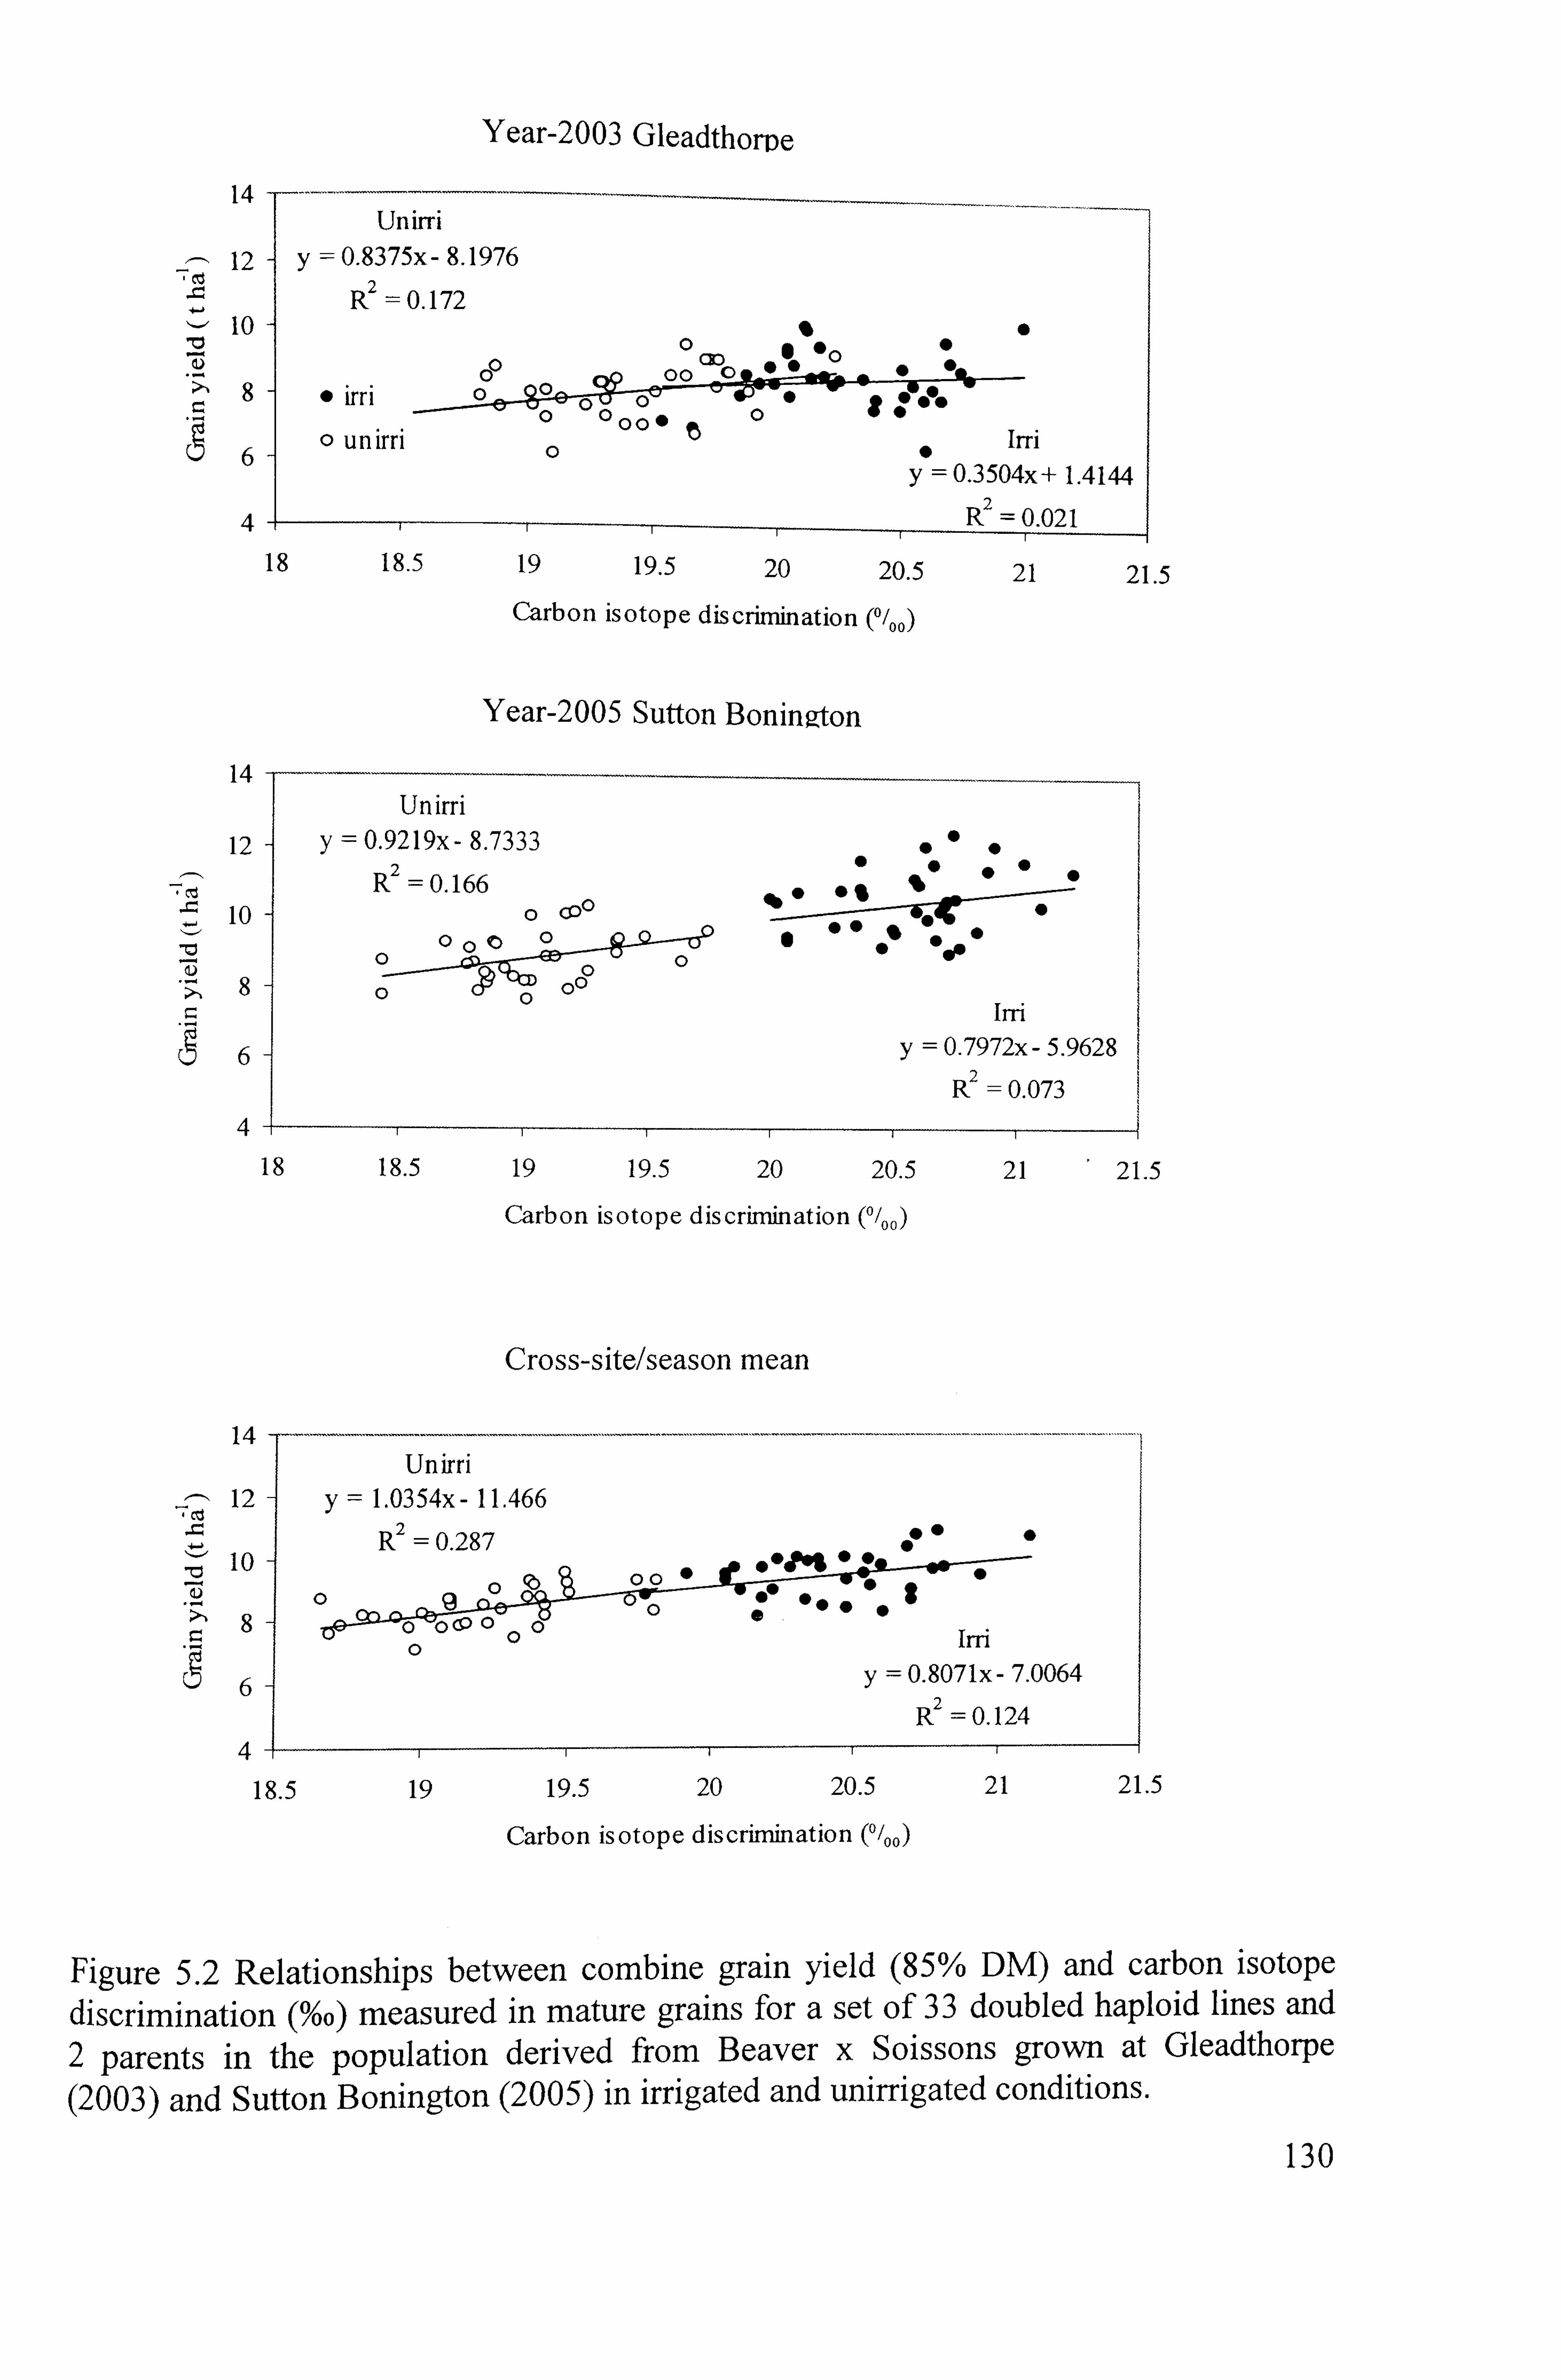
Year-2003 Gleadthome
14 - Unirri
12 -y=0.8375x- 8.1976
Rý = 0.172 1-1 10
-00
"0 0000 73 cX) 0
0 0* 0 *0 00 00 w 8 irri 000 eo - '12' e- --00 10 0
100 219
6o unirri 0 009 Irri
y 0.3 504x + 1.4144
4- Rý = 0.021
18 18.5 19 19.5 20 20.5 21 21.5
Carbon isotope discrirnination C/,, ))
Year-2005 Sutton Boninaton
14
12
lo "I,
Unirri y=0.9219x- 8.7333
2 R=0.166
0 (300 000 0
0- 0e,
zo 'i ýo00) 0
lý 0 0,4 %
0- 0 00060 00
0
irri
y=0.7972x - 5.9628
Rý = 0.073
4 4-
18 21 1 21.5
Cross-site/season mean
14
18.5 19 19.5 20 20.5
Carbon isotope discrirnination
Un irri y 1.0354x- 11.466
2 R=0.287
0 00 0
0 CP 0 0
30 0
0 --4
--ýIo-
0
12
10
8
6
00 008
irri
y=0.8071x- 7.0064 W=0.124
4-
18.5 19 19.5 20 20.5
Carbon isotope discritnination (0/,, 0)
21 21.5
Figure 5.2 Relationships between combine grain yield (85% DM) and carbon isotope
discrimination (%o) measured in mature grains for a set of 33 doubled haploid lines and 2 parents in the population derived from Beaver x Soissons grown at Gleadthorpe
(2003) and Sutton Bonington (2005) in irrigated and unirrigated conditions.
130
5.1.4 Effects of genotypes and irrigation on yield and yield components
The responses to irrigation of eight wheat genotypes contrasting for morpho- physiological characteristics were examined. The contrasting differences for the basis of selection of these genotypes are presented in Table 3.2 and described in chapter 3. These
genotypes differed for the key morphological traits like plant height, flag leaf size,
presence/ absence of awns and ear size.
5.1.4.1 Grain yield
The grain yield responses to drought are shown in Table 5.2. In summary, averaging
across the two years and across the 8 genotypes, drought reduced grain yield from 9.48
to 8.44 t ha-1 (P<0.03). Averaging across years, line 22B and Beaver produced highest
grain yields under irrigation in the range 10.7-10.9 t ha-1 (P<0.001; Table 5.2). The
interaction showing larger decreases of irrigation x genotype was significant (P<0.02)
with line 22B (2.4 t ha-1) and Beaver (1.3 t ha-1), lines 134G and Soissons showing
losses of about 1.0 t ha-1, and lines 76A, 35A and 134E showed smallest reductions in
grain yield in the range 0.1-0.3 t ha-1 due to drought (Table 5.2).
5.1.4.2 Above-ground dry matter production (A GDM)
5.1.4.2.1 2003
Drought reduced AGDM from 1811 g M-2 to 1699 g M-2 , but not significantly so. Under
irrigation, the genotypes differed significantly in the range 1305-2118 g m-' (P<0.001;
Table 5.4). The genotype x irrigation interaction was weakly significant with line 22B
and Beaver losing more AGDM due to drought than other genotypes (P=0.07) in the
range 191-408 g m-2 .
5.1.4.2.2 2005
Drought reduced AGDM by about 209 g M-2 , but not significantly so. Genotype
differences were evident with lines Beaver, 22B and 35A producing more AGDM under
irrigation (P<O. 00 1) than other genotypes. The interaction effect was not significant.
131
5.1.4.2.3 Cross-sitelseason mean
The reduction in AGDM was on average 161 g M-2 (P-0.12). Genotypic differences
were significant with line 22B and Beaver producing more AGDM under irrigation
(2210 and 2134 g M-2 , respectively; P<0.001) than other genotypes in the range 1614 to 2088 g M-2 .
Lowest AGDM was observed for line 76A. The genotype x irrigation interaction was not significant (P=0.08). However, there was a trend for line 22B (382 g
M-2) to lose more biomass under drought than line 76A (20g M-2).
-2 5.1.4.3 Ear number M
5.1.4.3.1 2003
Restricted water availability decreased ear number M-2 by 74 (P=0.032). Lines 22B, 35A
and 134E produced more ears under irrigation than line 134G (P<0.001; Table 5.6). The
interaction effect was not significant.
5.1.4.3.2 2005
The effect of drought was not significant (P=0.07). Under irrigation, Soissons (617 M-2)
and lines 134E and 35A (both 593 ears M-2) produced more ears M-2 than line 134G (394
m-2 ) (P<0.001). The irrigation x genotype interaction effect was not significant.
5.1.4.3.3 Cross-sitelseason mean
Drought resulted in fewer ears (P=0.07). Under irrigation, lines 22B, 35A and 134E had
more ears than other genotypes in the range 615-443 M-2 (p.,: ý0.001). Soissons differed
significantly compared to Beaver (590 c. f 540; P<0.001). The irrigation x genotype
interaction was not significant.
5.1.4.4 Thousand grain weight
Thousand grain weight (TGW) was measured on all 35 genotypes in contrast to the
other yield components that were only measured on the eight selected genotypes.
132
5.1.4.4.1 2003
Unirrigated treatments showed larger differences (P<0.01; Table 5.5) on account of more grain weight. Under irrigation line 134G had a higher TGW (49.8 g; P<0.001)
than 11 other genotypes in the range of 44.6-47.8g. Beaver and Soissons differed
significantly in grain weight under irrigation (P<0.001). The interaction effect was significant with line 76A showing greater grain weight increase (P<0.001) under drought than lines 35A, 6E, 135B, Soissons and 4F.
5.1.4.4.2 2005
Drought decreased TGW significantly by 3.42 9 (P=0.005). Lines 134G, 76A and Beaver had the greatest grain weight in the range of 46.5-51.1 g (P<0.001) under irrigation, but these lines lost most grain weight under drought (P<0.001). Soissons had
the smallest grain weight (41 g; P<0.001) under irrigation. The largest reduction was found for line 76A (9g) followed by Beaver and 134E (4g each). Overall 28 lines of the
35 showed significant reductions in TGW due to drought (P<0.001).
5.1.4.4.3 Cross-sitelseason mean
Averaging across years drought reduced TGW from 43.9 to 42.7 (P<0.02; Table 5.5).
Under irrigation, line 134G had a larger TGW (50.5 g; P<0.001) than other lines in the
range of 49.3-38.9 g. Beaver differed significantly compared to Soissons, with greater
TGW under irrigation (43.52 c. f. 40.44g; P<0.001). The irrigation x genotype
interaction effect was significant with 12 lines showing a significant decrease in TGW
due to drought (P<0.001). However, the response of parents was not significantly
different.
5.1.4.5 Grain number eaf 1
5.1.4.5.1 2003
The reductions in grain number due to drought was weakly significant (P=: 0.053). In
irrigated conditions, it ranged from 28 to 43 grains ear-. Lines 76A, and 134G had
significantly more grains (P<0.001; Table 5.6). The response of lines to drought was not
significantly different.
133
5.1.4.5.2 2005
Drought reduced grains ear-' by 3.1 (P==0.053). Lines differed significantly under irrigation with 76A and Beaver having more fertile ears than line 134E in the range 38.7-23.7 grains ear-' (25; P<0.001). The irrigation x genotype interaction was not significant.
5.1.4.5.3 Cross-sitelseason mean
Overall drought apparently reduced number of grains ear-' by 0.3. Genotypes differed
with lines 76A and 21B producing more grains ear-' (38-41) under irrigation (P<0.001)
than lines 35A and 134E (about 28) (P<0.001; Table 5.6). The irrigation x genotype interaction effect was not significant.
5.1.4.6 Plant height
5.1.4.61 2003
Drought did not reduce the plant height (Table 5.6). However, genotypes differed
significantly with in the range of 94-58 cm (P<0.001). Soissons was slightly taller than
Beaver (83 cm c. f. 78 cm; P<0.001). The irrigation x genotype interaction was not
significant.
5.1.4.62 2005
Drought reduced height by 3 cm (P<0.013; Table 5.6). Under irrigation, line 134G (87
cm; P<0.02) was taller than other genotypes in the range 62-85 cm. The genotype x
irrigation interaction was significant with Beaver and lines 21B, 35A and 76A showing
greater reductions in plant height under drought than other genotypes (P<0.023).
5.1.4.63 Cross-sitelseason mean
Drought decreased plant height from 80 cm to 77 cm (P<0.01; Table 5.6). Under
irrigation genotypes differed from 90 to 59 cm (P<0.01), but Beaver and Soissons were
similar of about 80 cm. The irrigation x genotype interaction effect was not significant.
However, there was a trend for Beaver to reduce plant height by about 5 cm more under
drought than Soissons.
134
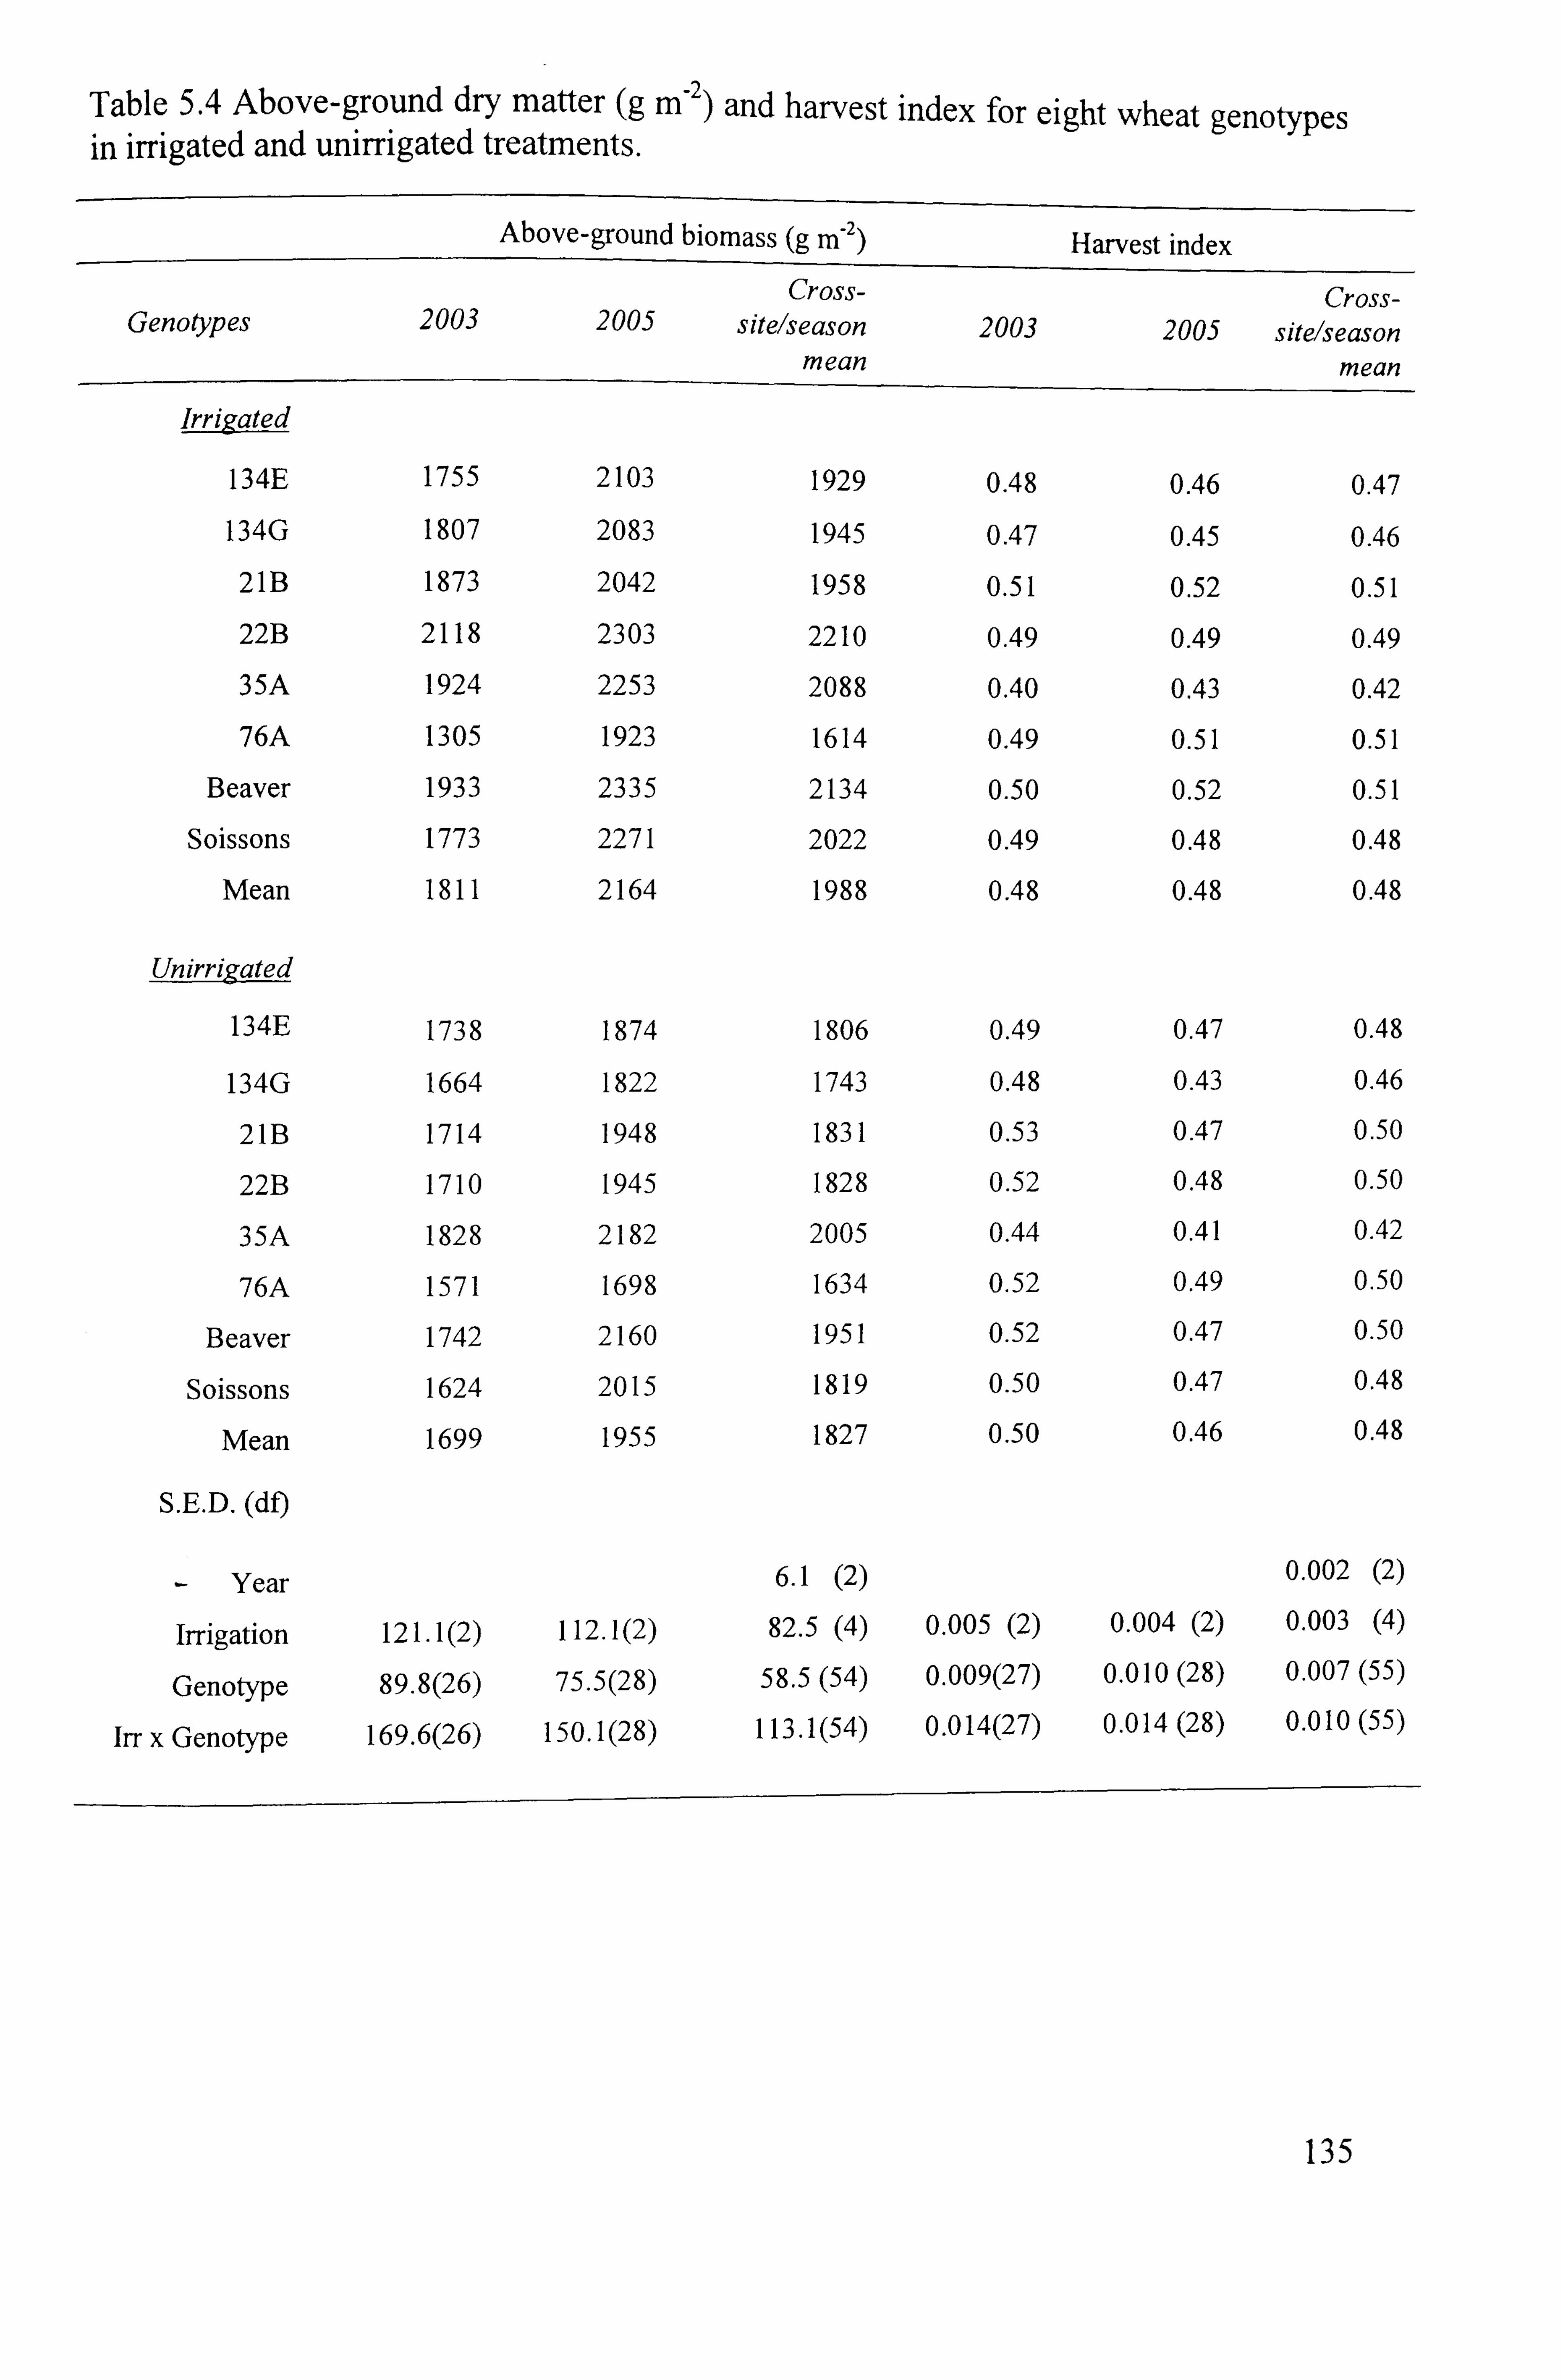
Table 5.4 Above-ground dry matter (g M-2 ) and harvest index for eight wheat genotypes in irrigated and unirrigated treatments.
Above-ground biomass (g M-2) Harvest index
Cross- Cross- Genotypes 2003 2005 sitelseason 2003 2005 sitelseason
mean mean
Irrigated
134E 1755 2103 1929 0.48 0.46 0.47
134G 1807 2083 1945 0.47 0.45 0.46
21B 1873 2042 1958 0.51 0.52 0.51
22B 2118 2303 2210 0.49 0.49 0.49
35A 1924 2253 2088 0.40 0.43 0.42
76A 1305 1923 1614 0.49 0.51 0.51
Beaver 1933 2335 2134 0.50 0.52 0.51
Soissons 1773 2271 2022 0.49 0.48 0.48
Mean 1811 2164 1988 0.48 0.48 0.48
Unirrýgated
134E 1738 1874 1806 0.49 0.47 0.48
134G 1664 1822 1743 0.48 0.43 0.46
21B 1714 1948 1831 0.53 0.47 0.50
22B 1710 1945 1828 0.52 0.48 0.50
35A 1828 2182 2005 0.44 0.41 0.42
76A 1571 1698 1634 0.52 0.49 0.50
Beaver 1742 2160 1951 0.52 0.47 0.50
Soissons 1624 2015 1819 0.50 0.47 0.48
Mean 1699 1955 1827 0.50 0.46 0.48
S. E. D. (df)
- Year 6.1 (2) 0.002 (2)
irrigation 121.1(2) 112.1(2) 82.5 (4) 0.005 (2) 0.004 (2) 0.003 (4)
Genotype 89.8(26) 75.5(28) 58.5(54) 0.009(27) 0.010(28) 0.007(55)
Irr x Genotype 169.6(26) 150.1(28) 113.1(54) 0.014(27) 0.014(28) 0.010(55)
135
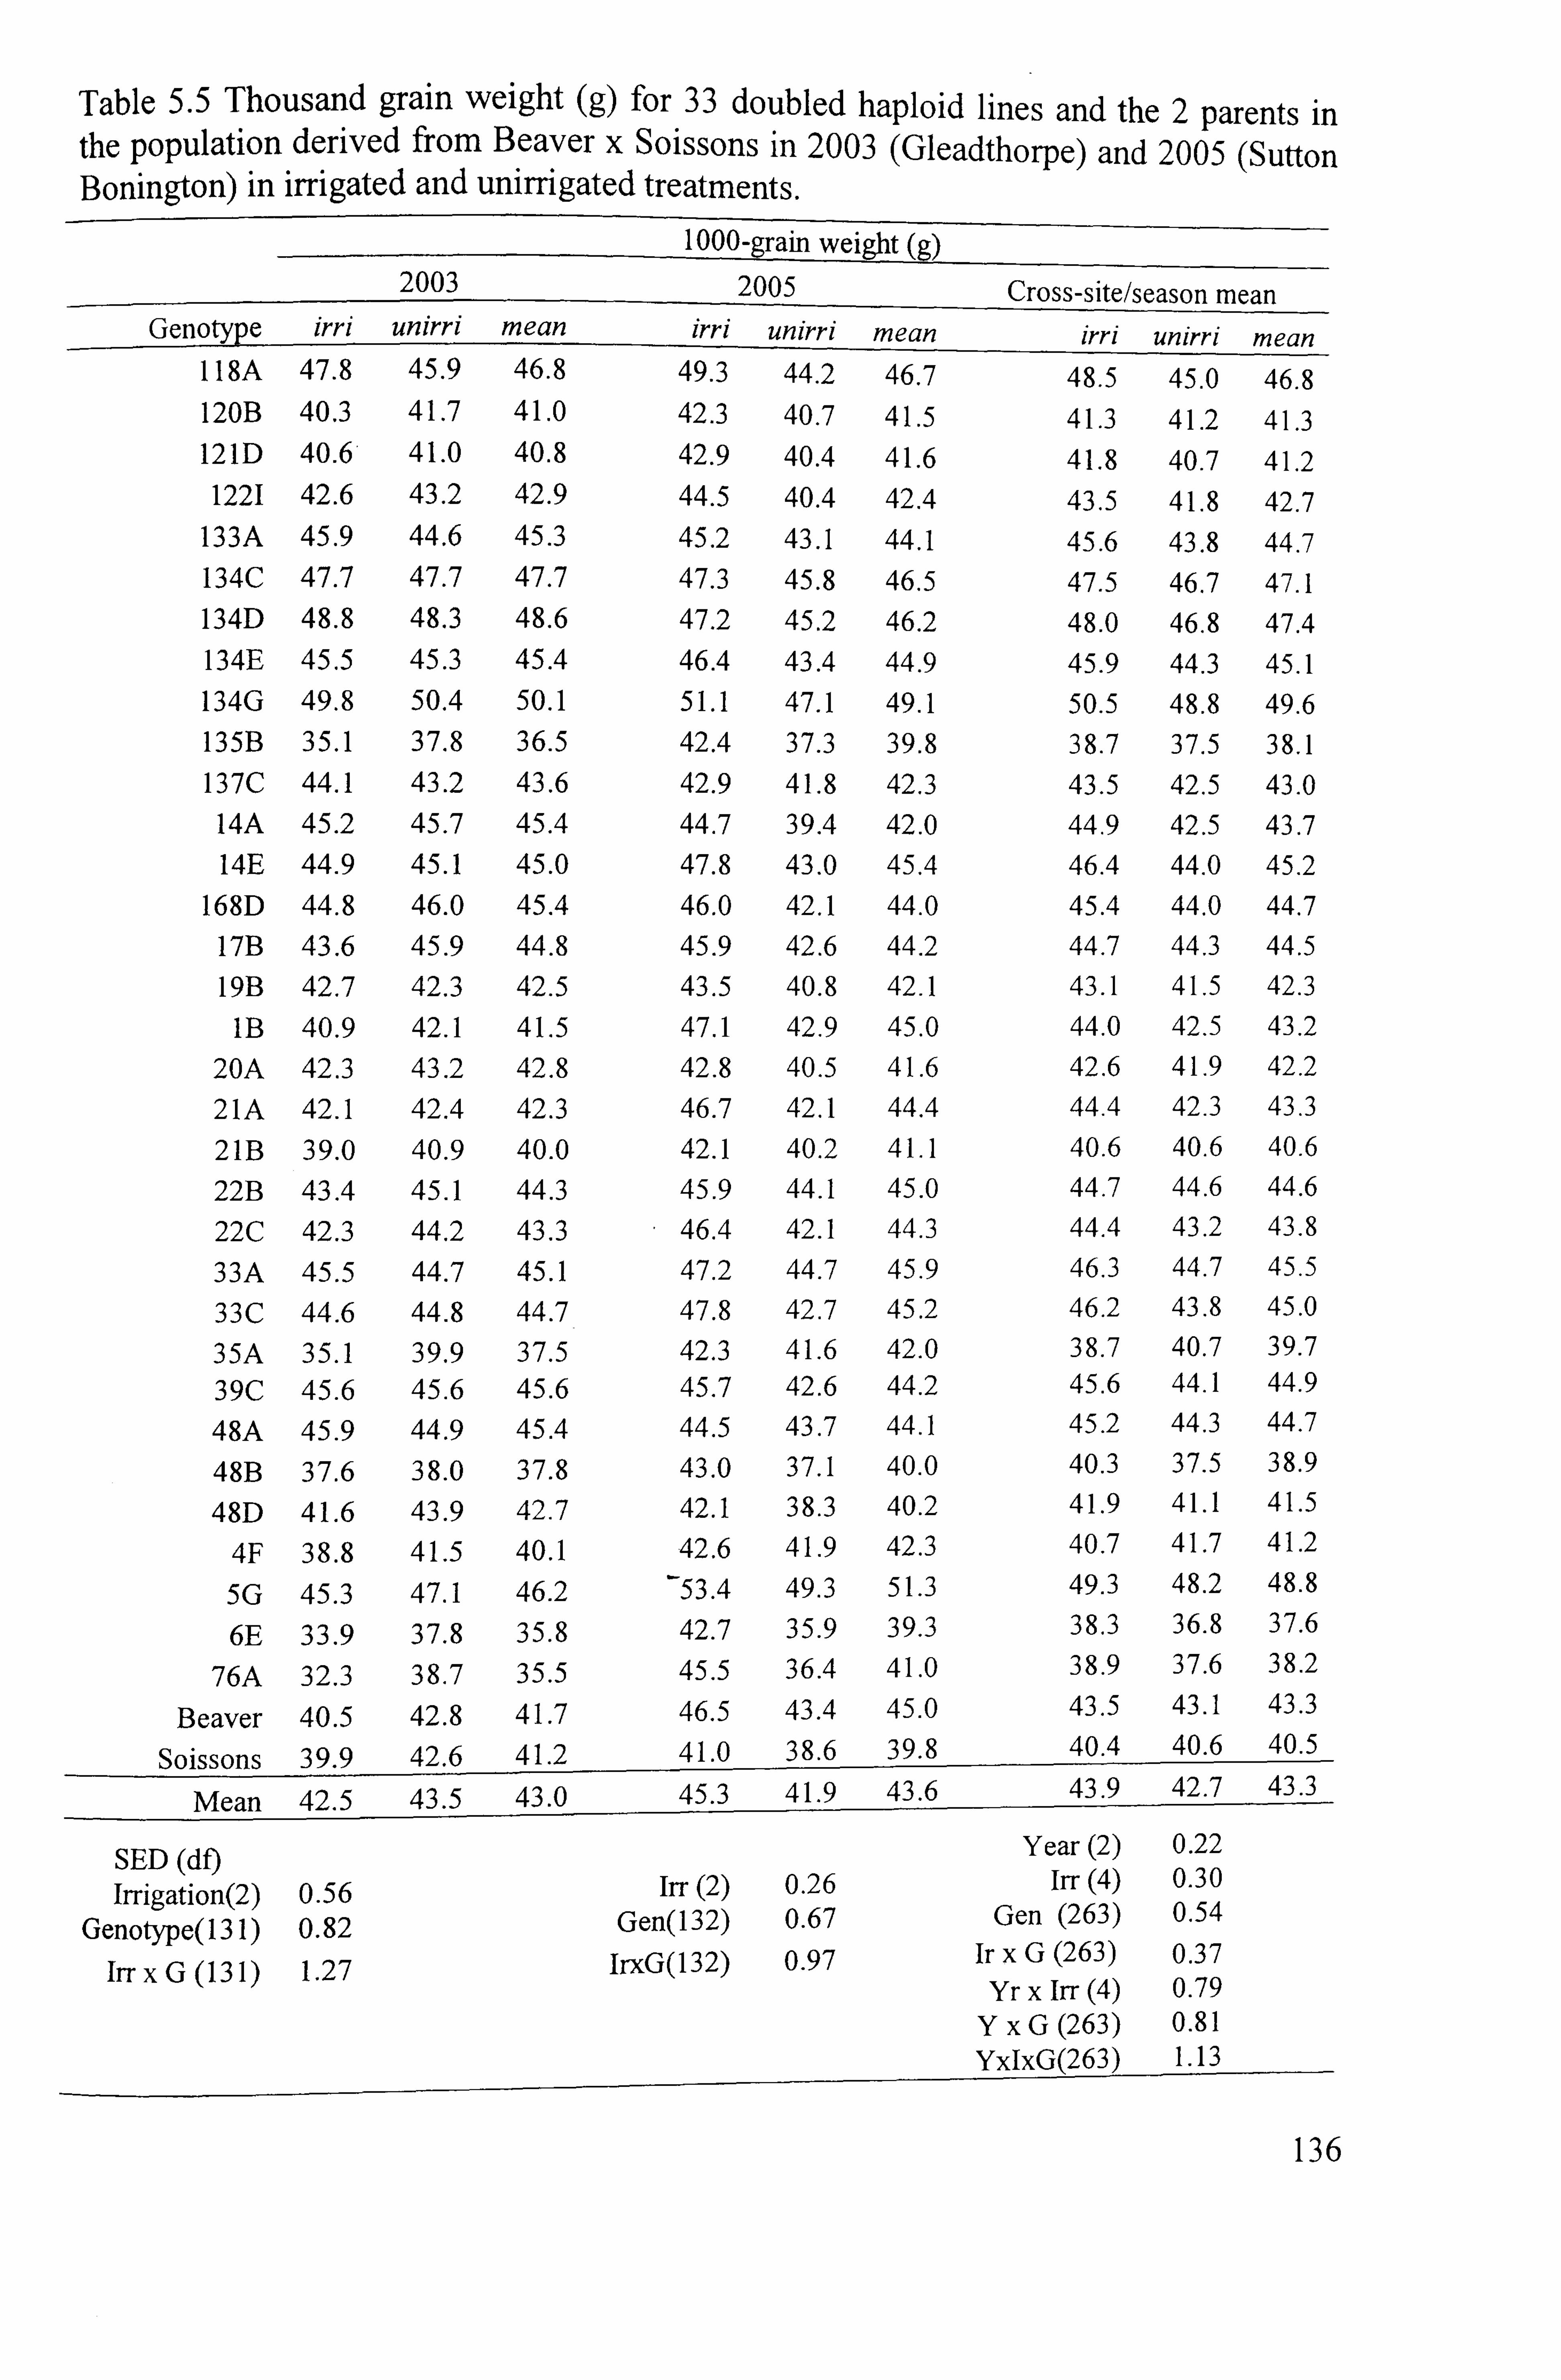
Table 5.5 Thousand grain weight (g) for 33 doubled haploid lines and the 2 parents in the population derived from Beaver x Soissons in 2003 (Gleadthorpe) and 2005 (Sutton Bonington) in irrigated and unirrigated treatments.
I 000-grain ight (g) 2003 2005 Cross -s ite/s eason mean
Genotype irri unirri mean irri unirri mean irri unirri mean 118A 47.8 45.9 46.8 49.3 44.2 46.7 48.5 45.0 46.8 120B 40.3 41.7 41.0 42.3 40.7 41.5 41.3 41.2 41.3 121D 40.6 41.0 40.8 42.9 40.4 41.6 41.8 40.7 41.2 1221 42.6 43.2 42.9 44.5 40.4 42.4 43.5 41.8 42.7
133A 45.9 44.6 45.3 45.2 43.1 44.1 45.6 43.8 44.7 134C 47.7 47.7 47.7 47.3 45.8 46.5 47.5 46.7 47.1 134D 48.8 48.3 48.6 47.2 45.2 46.2 48.0 46.8 47.4 134E 45.5 45.3 45.4 46.4 43.4 44.9 45.9 44.3 45.1 134G 49.8 50.4 50.1 51.1 47.1 49.1 50.5 48.8 49.6 135B 35.1 37.8 36.5 42.4 37.3 39.8 38.7 37.5 38.1 137C 44.1 43.2 43.6 42.9 41.8 42.3 43.5 42.5 43.0 14A 45.2 45.7 45.4 44.7 39.4 42.0 44.9 42.5 43.7
14E 44.9 45.1 45.0 47.8 43.0 45.4 46.4 44.0 45.2
168D 44.8 46.0 45.4 46.0 42.1 44.0 45.4 44.0 44.7
17B 43.6 45.9 44.8 45.9 42.6 44.2 44.7 44.3 44.5
19B 42.7 42.3 42.5 43.5 40.8 42.1 43.1 41.5 42.3
IB 40.9 42.1 41.5 47.1 42.9 45.0 44.0 42.5 43.2
20A 42.3 43.2 42.8 42.8 40.5 41.6 42.6 41.9 42.2
21A 42.1 42.4 42.3 46.7 42.1 44.4 44.4 42.3 43.3
21B 39.0 40.9 40.0 42.1 40.2 41.1 40.6 40.6 40.6
22B 43.4 45.1 44.3 45.9 44.1 45.0 44.7 44.6 44.6
22C 42.3 44.2 43.3 46.4 42.1 44.3 44.4 43.2 43.8
33A 45.5 44.7 45.1 47.2 44.7 45.9 46.3 44.7 45.5
33C 44.6 44.8 44.7 47.8 42.7 45.2 46.2 43.8 45.0
35A 35.1 39.9 37.5 42.3 41.6 42.0 38.7 40.7 39.7
39C 45.6 45.6 45.6 45.7 42.6 44.2 45.6 44.1 44.9
48A 45.9 44.9 45.4 44.5 43.7 44.1 45.2 44.3 44.7
48B 37.6 38.0 37.8 43.0 37.1 40.0 40.3 37.5 38.9
48D 41.6 43.9 42.7 42.1 38.3 40.2 41.9 41.1 41.5
4F 38.8 41.5 40.1 42.6 41.9 42.3 40.7 41.7 41.2
5G 45.3 47.1 46.2 53.4 49.3 51.3 49.3 48.2 48.8
6E 33.9 37.8 35.8 42.7 35.9 39.3 38.3 36.8 37.6
76A 32.3 38.7 35.5 45.5 36.4 41.0 38.9 37.6 38.2
Beaver 40.5 42.8 41.7 46.5 43.4 45.0 43.5 43.1 43.3
Soissons 39.9 42.6 41.2 41.0 38.6 39.8 40.4 40.6 40.5
Mean 42.5 43.5 43.0 _45.3
41.9 43.6 43.9 42.7 43.3
SED (df) Year (2) 0.22
Irrigation(2) 0.56 Irr (2) 0.26 Irr (4) 0.30
Genotype(l 3 1) 0.82 Gen(132) 0.67 Gen (263) 0.54
Irr xG (13 1) 1.27 lrxG(132) 0.97 Ir xG (263) 0.37 Yr x Irr (4) 0.79
YxG (263) 0.81 YxIxG(263) 1.13
136
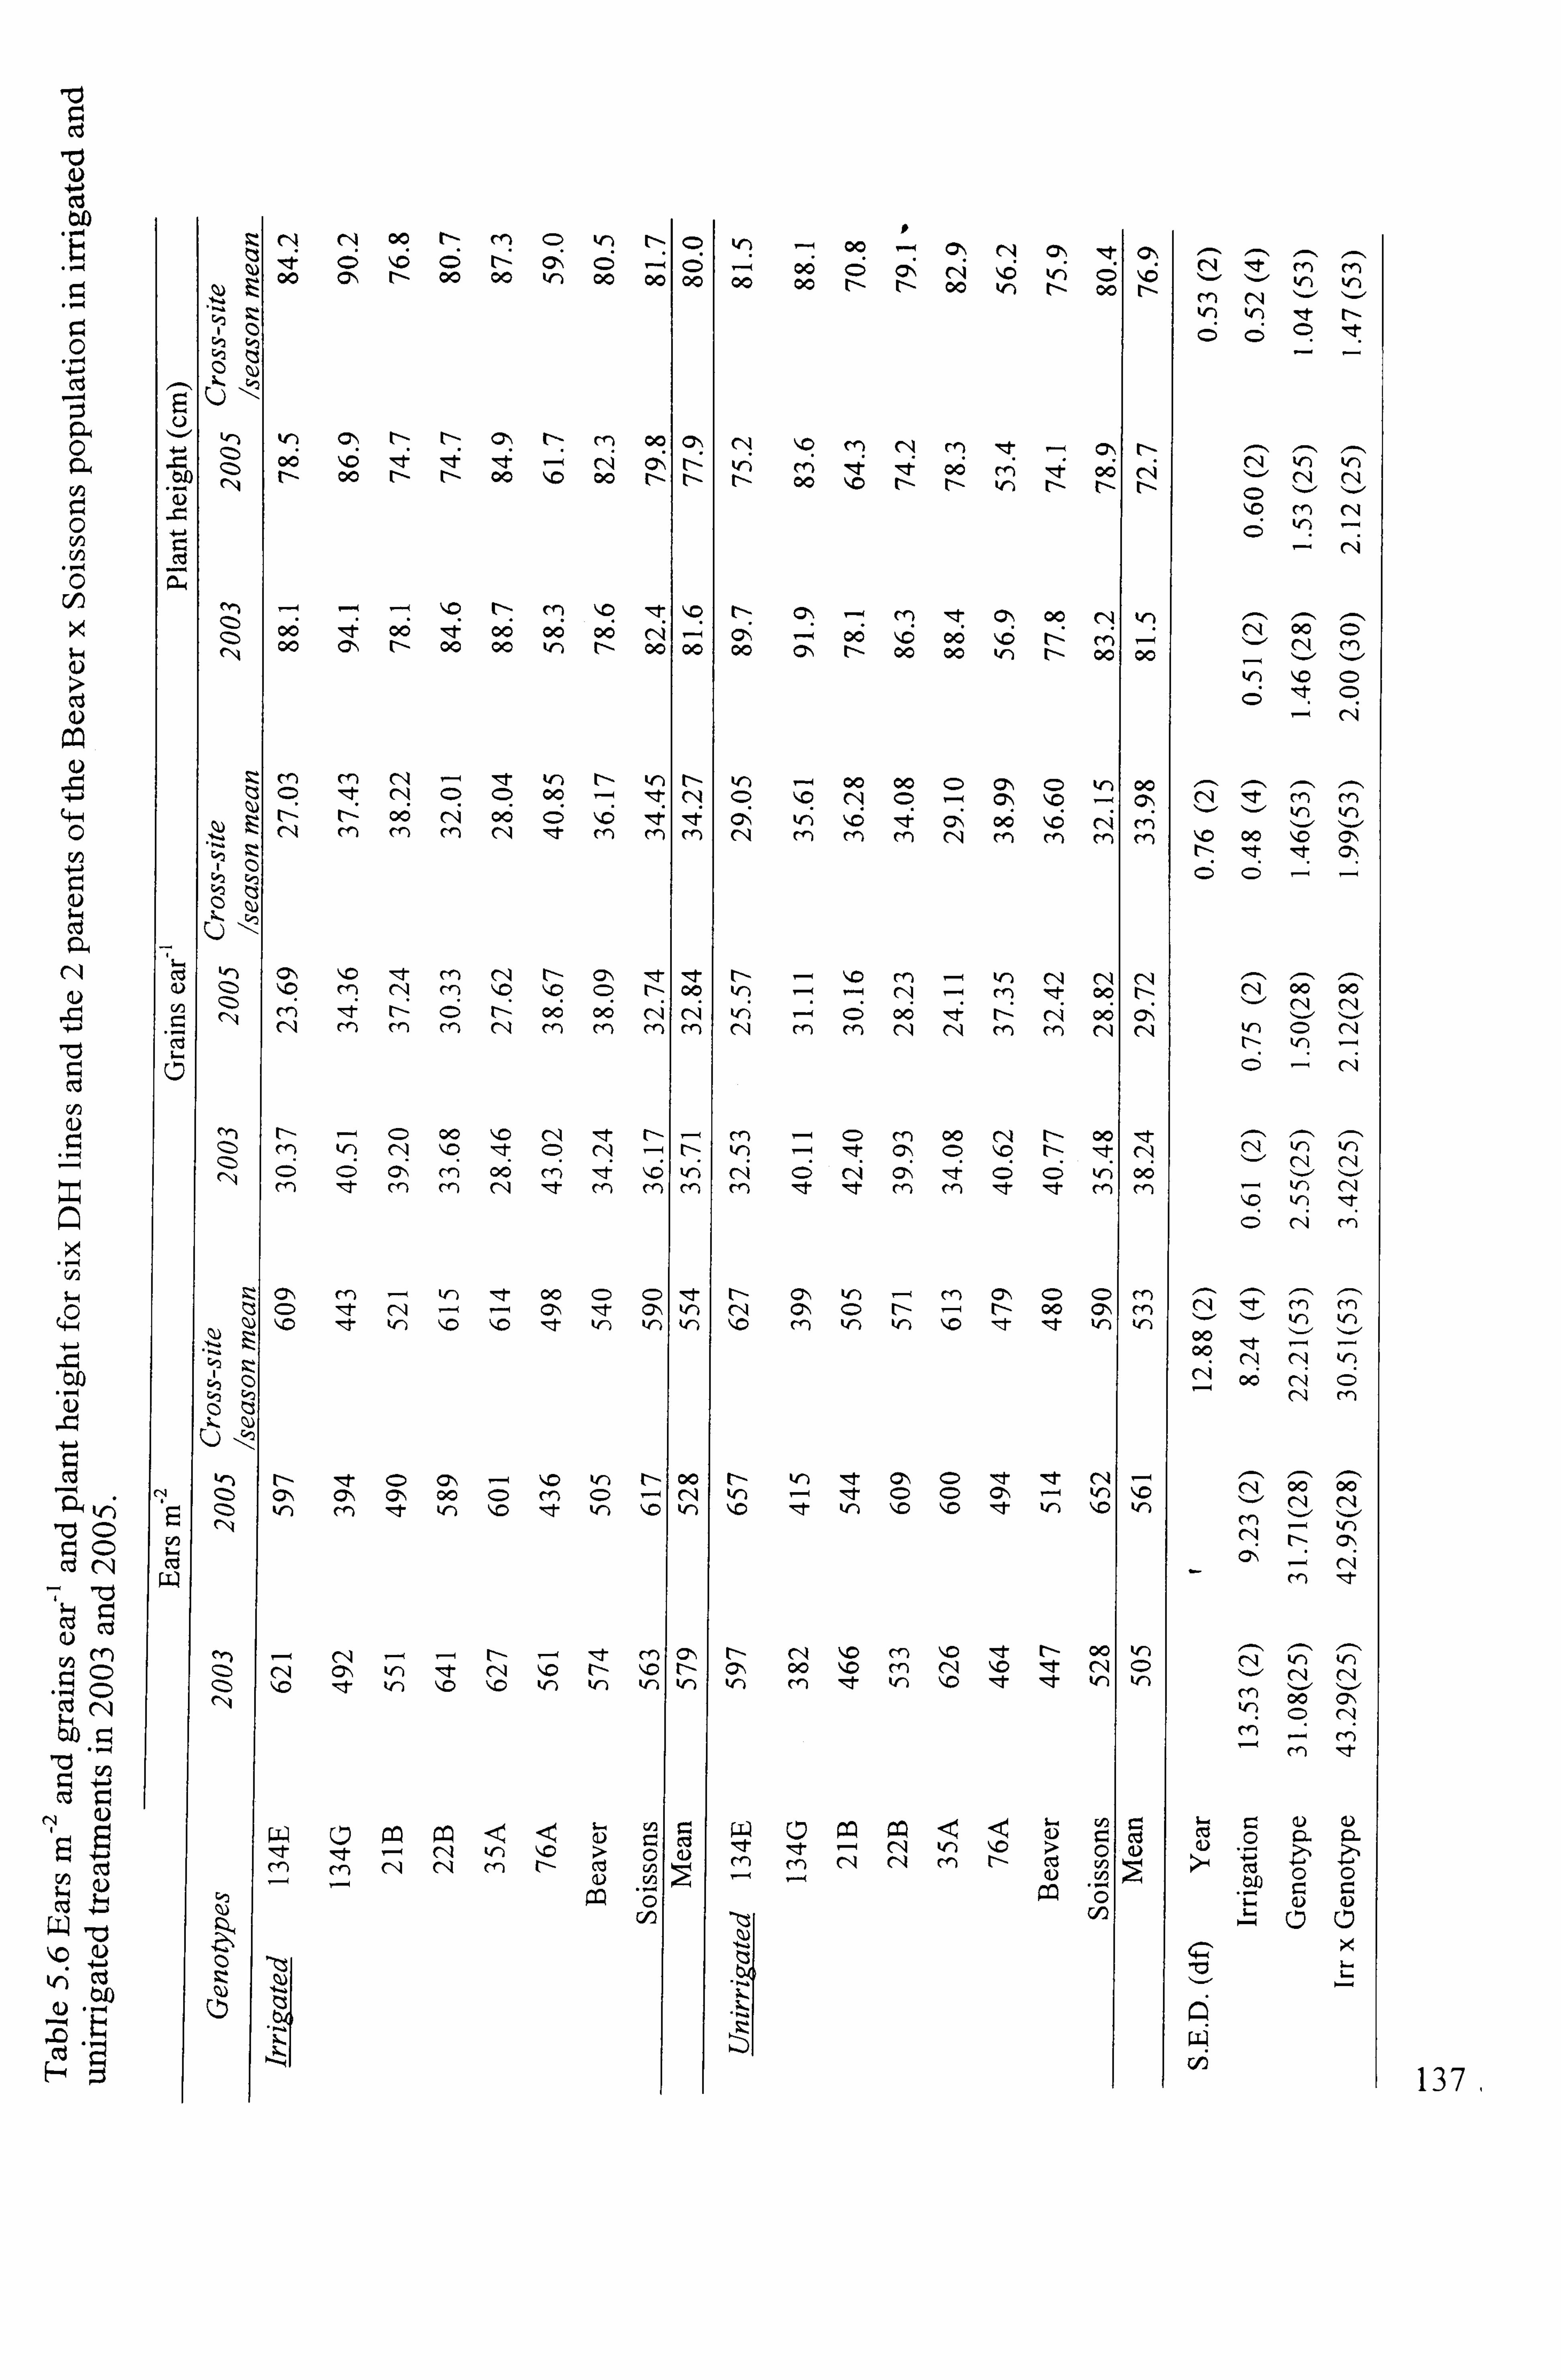
"0
0 rA cn
X
Cd
Cd
a)
Ici lcý
7ý C I: i 0 CI N
,;, 2 m CD rq
ý +J
Z Cd 4 Q) ce 4
, 4. -4
I P-4
cn r-
ct
(-I)
N
z N " 00 t- m C: ) kr)
1: 3 4 00 c; ,6 r-
6 00 r-ý 00 Cý kr)
6 00 oc
Lel) kr) C, m oc
Q'I 06 r- \16 00 4 r-
4 r-
4 00 I'D Cý 00 0ý
rn ,Z (Z2)
--ý -, ý --ý llý rl: m I-Cý lzý 00 ýt 00 ýt 00 00 00 C-4 00 Cý r'- 00 00 kr) t- oc
Z m m " - ZT In t-- kr)
'ýt C'4 C> C) 00
06 rlý 00 C5
(Zý
CIA
N
con
01) "o , I- m cli (-- (=*ý -, I- I'D m (14 m ý, o I'D (::: ) r--
r--ý 06 C-6
- C) 00 1- r-
Cý m 00 Cn m C'A
C-1 00 C: ) C)
kf) ý. C) 11C : I- kr) kr)
r-- 't C) C, ý - ,c kr) t--
Clý Cýl Ols 00 C) m C>
kr) M It kr) ', 0 Itt kr)
kf) V') W') kr) tr)
w Iýt m
(D t
m
= - (-I
= C14 C, 4
-ý tr) m
-ý 1-0 t-
(, I, )
Cld cn
00
N N
100
r-
lzt 09 rq ým
h
, 'I- k4')
00 N kr)
N
i)
0 09 Cý
00 <=) (7N 00 00 rl- r'- 00 00
c'! lscý cn (14 rf) t- Cý\ kr) m -4 4 06 rý 4 o6 t- 00 110 r-- r-- kr) r- rl-
r-ý Cý --ý m -: t c-, 00 Cý 00
,6 06 ý6 r-ý
00 r-- 00 00 tr) r--
cool
en 00 00 CD C> CD v) CD -0 cý CD - cý\ \z -
cý Irý lz; Z,: cý oý 116 rý ý ri rn rn m cq rn rn rn
r- - kr) (14 N m zt 0c)
00 Cý 00 C14 (If) m cq CIA m m C14
m C: ) m C* " t-- 00
trý -Zý cý C: ) "C r-ý -ZI:
CN C)
("I C', C) t-- - t-- 00 (0ý, 110 m kr) kr) 110 "It I- tr)
r- k4) ', 1- (7-% (=) 'Itt 'Rt tr) -,: t C) C) Cý - kf)
110 -Zl- kr) \ýC ý, o -Zt kd-) ý, C
t-- " \ýc m 110 't r- 00 Cý m" 110 't " tri kf) IC :tI: t tr) ý
'1- r1
-
r1 - N
N N
V) c1
O t
- - L) ri)
C/D
N
h N N
00
00
m
re) m t. 1)
ý, 0 kr)
ý
C> kr) 'n ý
1)
kr) tr)
110 m"
C*q 00 0
', I: Cý
kf) tn
ý'c 00 ýlc CN
clq 00 00
(, A
kr) kr)
V-) k4r)
kr) kr)
00
CA 00
00 00 cq C14
m ý-. / --ý
00 CN
m -ý m m It
t8 r- vu CL Q-
137 ,

5.1.4.7 Carbon isotope discrimination andyield relationship in eight selected genotypes
As Previously described a significantly Positive relationship was observed between A13 C
and grain yield for the 33 DH lines and 2 parents in both the years of the study. The
range of A 13C values for the eight selected genotypes was representative of 33 DH lines
and the 2 parents. Averaged across the 2 site/seasons when analysed on eight genotypes
separately, positive genetic correlation between A 13 C and grain yield was only weakly significant under drought (r=0.29) but was significant under irrigation (r--0.55; P<0.05).
To explain the variations in carbon isotope discrimination values among genotypes detailed measurements of gas-exchange were carried on these eight genotypes, and the details of the various stomatal aperture traits measured are presented in the following
section.
5.1.5 Gas-exchange measurements
The gas-exchange parameters (as described in the section 3.2.3.6) for eight genotypes
were assessed under natural day-light on calendar dates approximately coinciding with
flag leaf emergence, GS61 and GS61+1 week in 2003. In 2005, measurements were
carried out on four dates approximately coinciding with GS39, GS39+2 weeks, GS61
and GS61+4 weeks. The measurements made in each of the growth stages and their
means are presented in this section.
5.1.5.1 Photosynthetic rate (A; 'UMOI M-2 S-')
5.1.5.1.1 2003
Averaging over readings net photosynthetic rate declined from 13.4 to 12.0 ýLrnol M-2 s- I
under drought. The genotypic difference was weakly significant (P=: 0.052) with line
22B showing higher A values (16.53) under irrigation. The interaction responses were
not statistically significant (P=0.12), although lines 134G and Soissons showed a trend
for a greater reduction under drought (Table 5.7).
5.1.5.1.2 2005
As expected, drought on average reduced A from 20.9 to 14.1 [tMol M-2 S-1 (P<0.001).
Genotypes differed in the range 18.1 to 23.1, with lines 76A and 134G showing higher A
138
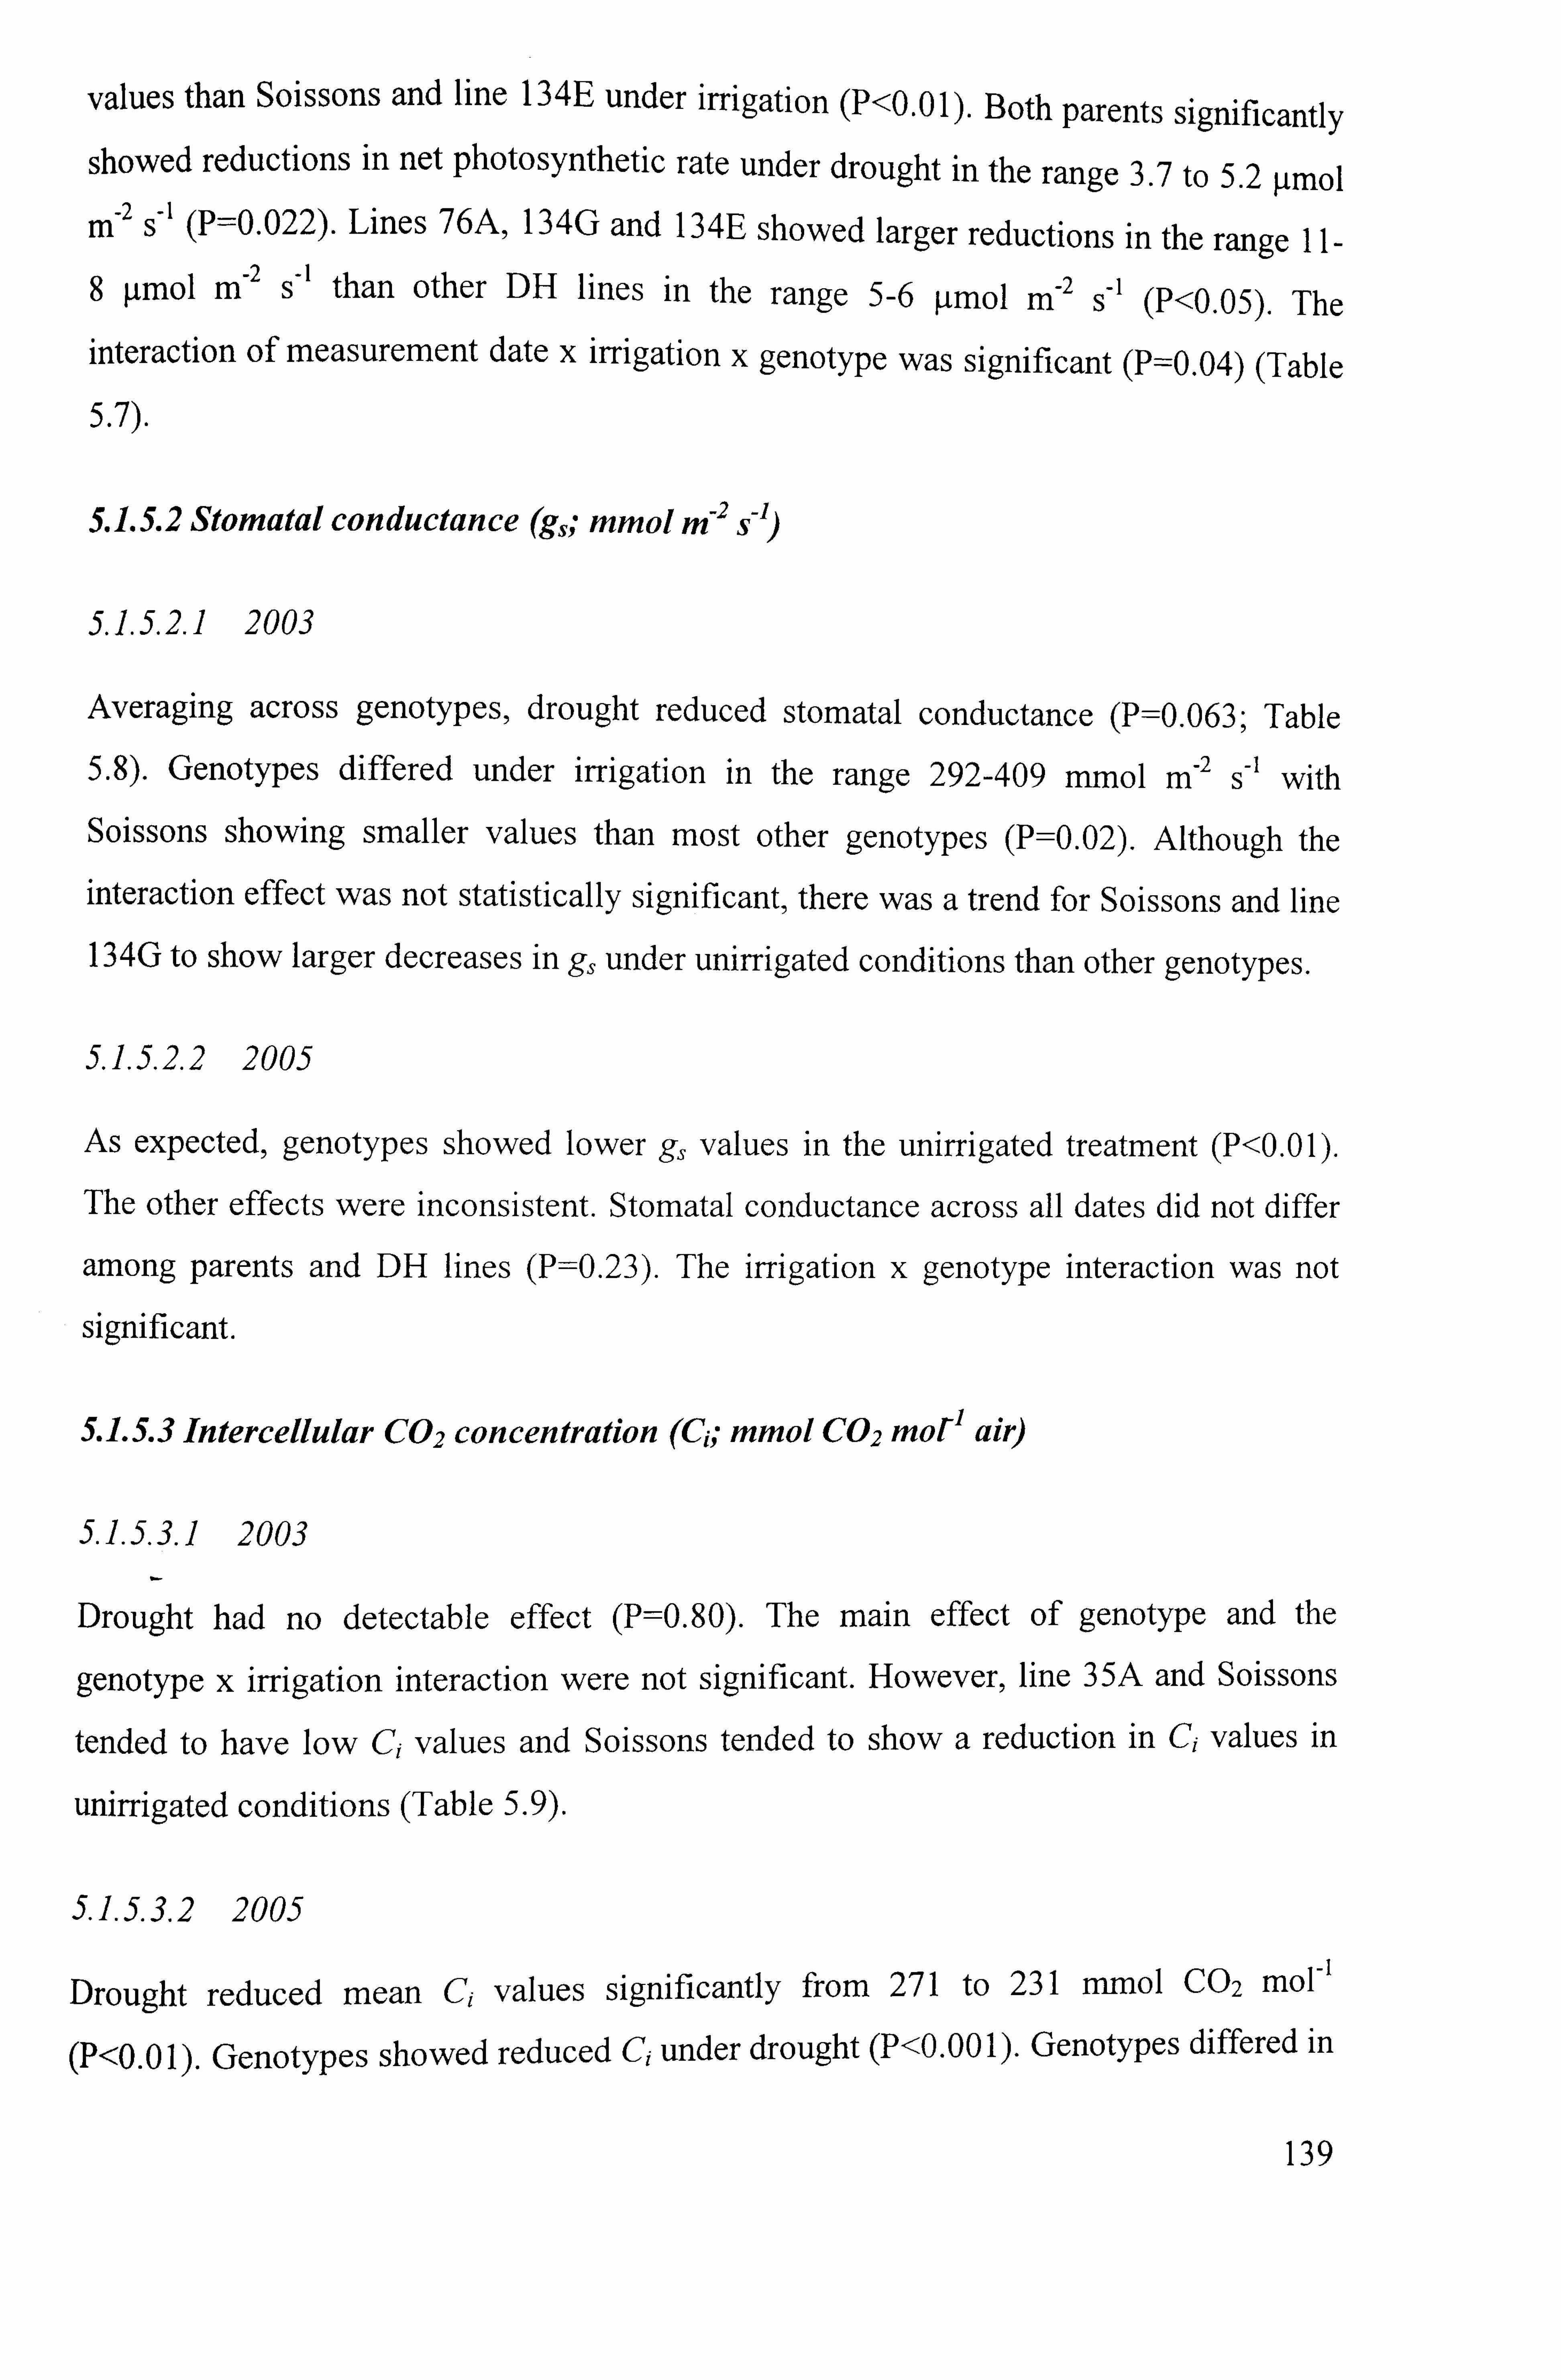
values than Soissons and line 134E under irrigation (P<0.01). Both parents significantly
showed reductions in net photosynthetic rate under drought in the range 3.7 to 5.2 Pmol
M-2 s-1 (P=0.022). Lines 76A, 134G and 134E showed larger reductions in the range I I-
8 PMO, M-2 s- I than other DH lines in the range 5-6 ýtrnol M-2 S-1 (P<0.05). The
interaction of measurement date x irrigation x genotype was significant (P=0.04) (Table
5.7).
5.1.5.2 Stomatal conductance (g,; mmol in -2 S-1)
2003
Averaging across genotypes, drought reduced stomatal conductance (P=0.063; Table
5.8). Genotypes differed under irrigation in the range 292-409 MMOI M-2 S-1 with
Soissons showing smaller values than most other genotypes (P=0.02). Although the
interaction effect was not statistically significant, there was a trend for Soissons and line
134G to show larger decreases in g, under unirrigated conditions than other genotypes.
5.1.5.2.2 2005
As expected, genotypes showed lower g, values in the unirrigated treatment (P<0.01)
The other effects were inconsistent. Stomatal conductance across all dates did not differ
among parents and DH lines (P=0.23). The irrigation x genotype interaction was not
significant.
5.1-5.3 Intercellular C02concentration (Ci; MMOI C02 mor I air)
5.1.5.3.1 2003
Drought had no detectable effect (P=0.80). The main effect of genotype and the
genotype x irrigation interaction were not significant. However, line 35A and Soissons
tended to have low Ci values and Soissons tended to show a reduction in Ci values in
unirrigated conditions (Table 5.9).
5.1.5.3.2 2005
Drought reduced mean Ci values significantly from 271 to 231 MMOI C02 MOI-I
(P<0.0 1). Genotypes showed reduced Ci under drought (P<0.00 1). Genotypes differed in
139
the range 211.3-327.6MMOI C02mol-1, air with line 76A showing higher Ci than most
other genotypes (P<0.001). Overall the irrigation x genotype interaction indicated
Soissons and line 76A showed a larger reduction in Ci under drought than other
genotypes (P=0.06). Significant interactions were found with Ci decreasing more under
drought on date3 (P=0.04) than other measurement dates. Line 76A showed a relatively
greater decrease in Ci than other genotypes on date2 (GS39+2wk).
140
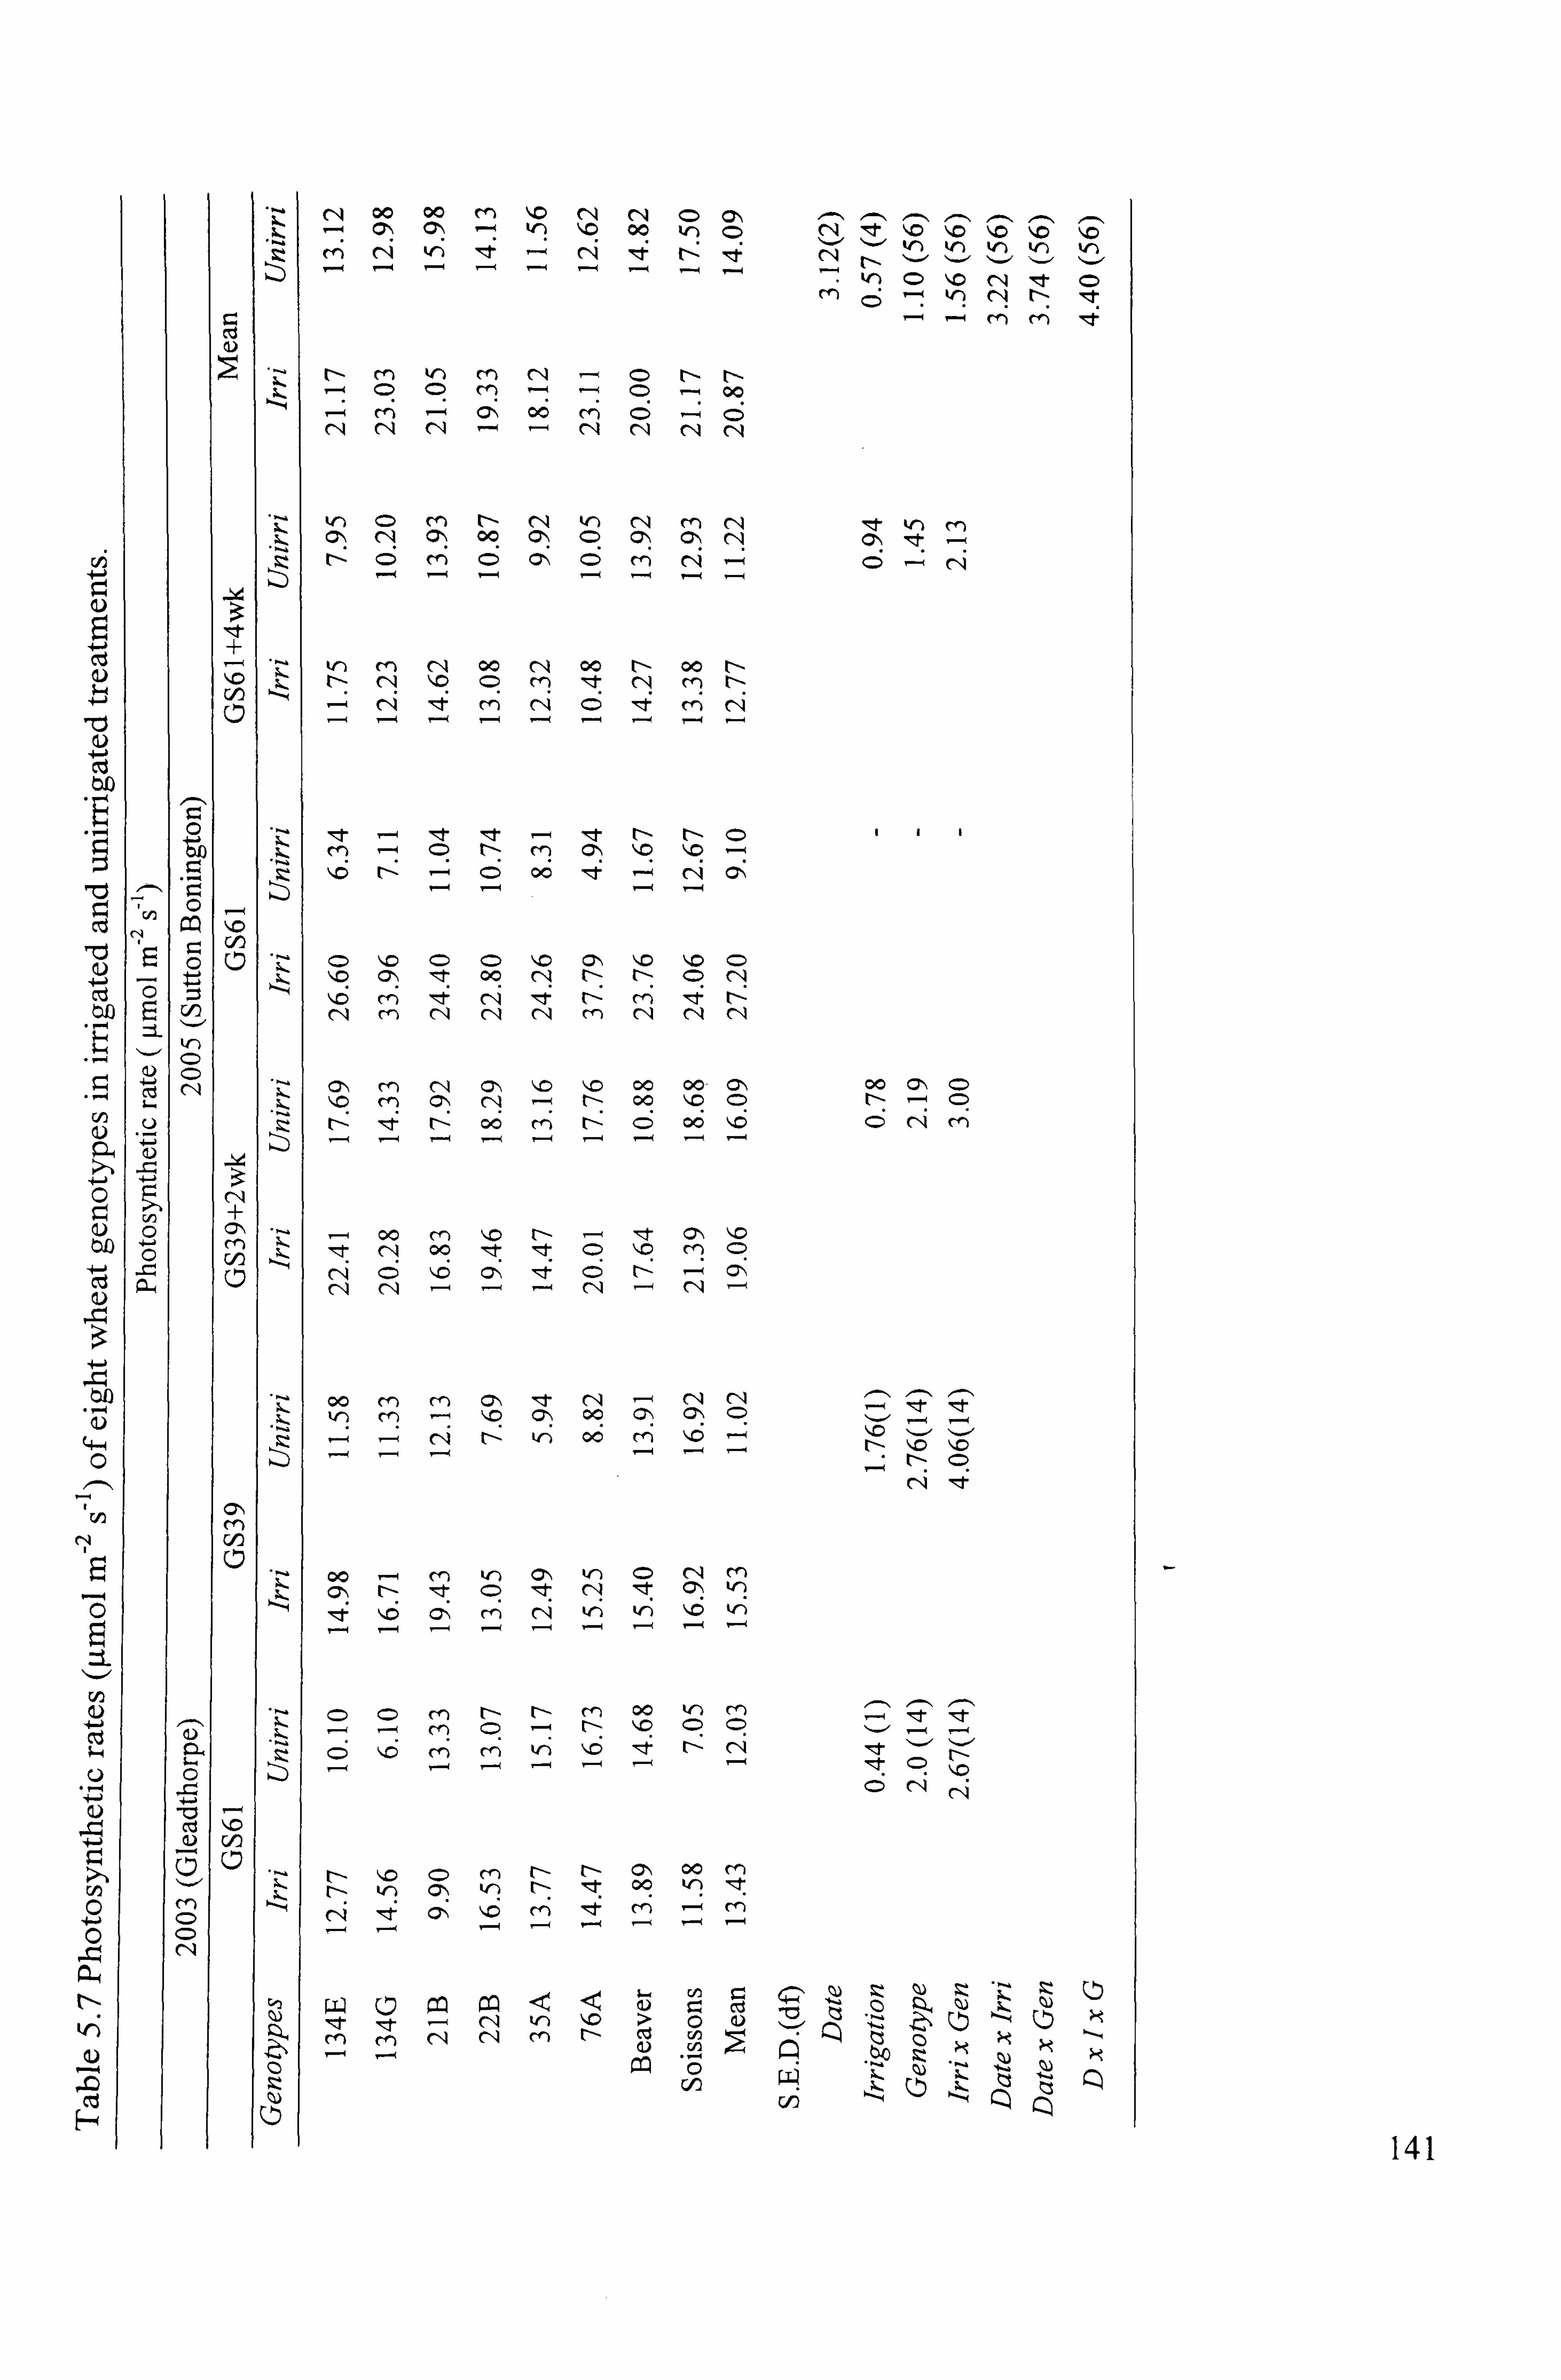
71
+-4 0
, ýi
CIS ; --4
C. )
0-4
I--
4
ý--4
N
C
E
U
I
$z
-0
cn
C)
C, 4
oo 00 rn r, ý c> c>
. V) CD e kr)
rq mt C>
r. 1--4 rn c") lIzt
CD CD CD 00
ý rý -ý r9 cý c"1 (', l 2 r9
k. cý, CD C, 4
cn (> 00
c"1 0, ý
(r) C)
C"l C>
rn a', ý
clý N 0, ý e -
c>
00 00
fn _A (Z) t- m C> �o ý, 0 ---4
Z \, O t-- - C> 00 ýe - rý cý
c>D - C: ) ý, 0 CD CD 1,0 (2, \ ý. m ý, 0 CD Z, \ýo (> le 00 (N t- t- CD rq
rn rn -0 t- oo 00 oo 'Z <> CD 00 C> CD
Z r- le r--: 00 m t- CD oo ý. c CD clý rn
2
C> rn
. - e
oo
Cq rn 00
1,0 e
t-- Mt
- C>
-e \, O
C> rn
�o CD
cq CD
CN
op jr) rn r-) rn -
C> "ýD (2ý 00 vý CN cý 1--, -ý --(
vý
clý rn
00 c7,
, r-
rn -e
kr) cý
0-, -e
W) C-ý
CD e
C'4 Cý
M 'f)
(ZD CD rn r-
CD r- tn
r- 00 kn rn
CD -ý le 't
Z CD ý, 0 0-ý (Y) ýr) �c; rý rý le -e CD t-
cý rý
cn
(D . - ý, 0 (Z M t- t-- C> 00 lrr)
to2 U z ri -
141

m C: ) C) CIA
IWO 4-J
(4-4
0
00
kr;
riD
0 E
0i 4-
0 0
7;
E 0 4-
C/)
0
It
kr) C)
03 p
Cf)
+
riD Clý
"0
N +
cl)
Cl)
06 r-
C, \
00
00
00
00 00 00 kr) kr) kf) tr)
r- 00
00 00 00
m (14 - ý r- N m Cf) m
41 C> m (-4 C) C) 00 m m I--,
olý rfý kr)
Ln
r- m clý
110 C)
tt
00
m Clf) t
C) m m Rt -1- It
C) Nt It Ln
Nt
- 00 00 C) - kr) C) olý t - "t
00 Cý
Cl\ m
-Z t "I- tr) 110 110 m m 00 (14 (= "t C)
00 ýo kf) kn 00 tr)
V) OC
kr) 00
C7ý
(:;, \ (14 kr) t-- kr)
r- C) M
-
kr)
(=>
kr)
C: )
00
(7ý
m
Cý
(::: ) C, ý cq CA
00 00
Oý
00
If
C)
m I'D m ýlc (14 C-4 N - -o
m
00 m 00
00 M
k4-) - cq
(71,
-4
m cq
m C\j
C)
M
00
(=) kf) (0. )
m , I-
-ý m C--j m (0, \
00
C*ý tr) 14 C)
00
00 C) C) r-
kf') (=)
Itt ": t
m m (14 N m .! I- m m m
Ln ý4) ýt Zt C'A %f) 110
(1) >
9. " c)
03 -(:; (1)
./ zz .
Q)
c ý Iý
(_ý ýl m m C-'l C-4 m r- ct U)
- Cý : zs l ýý 1-4
142
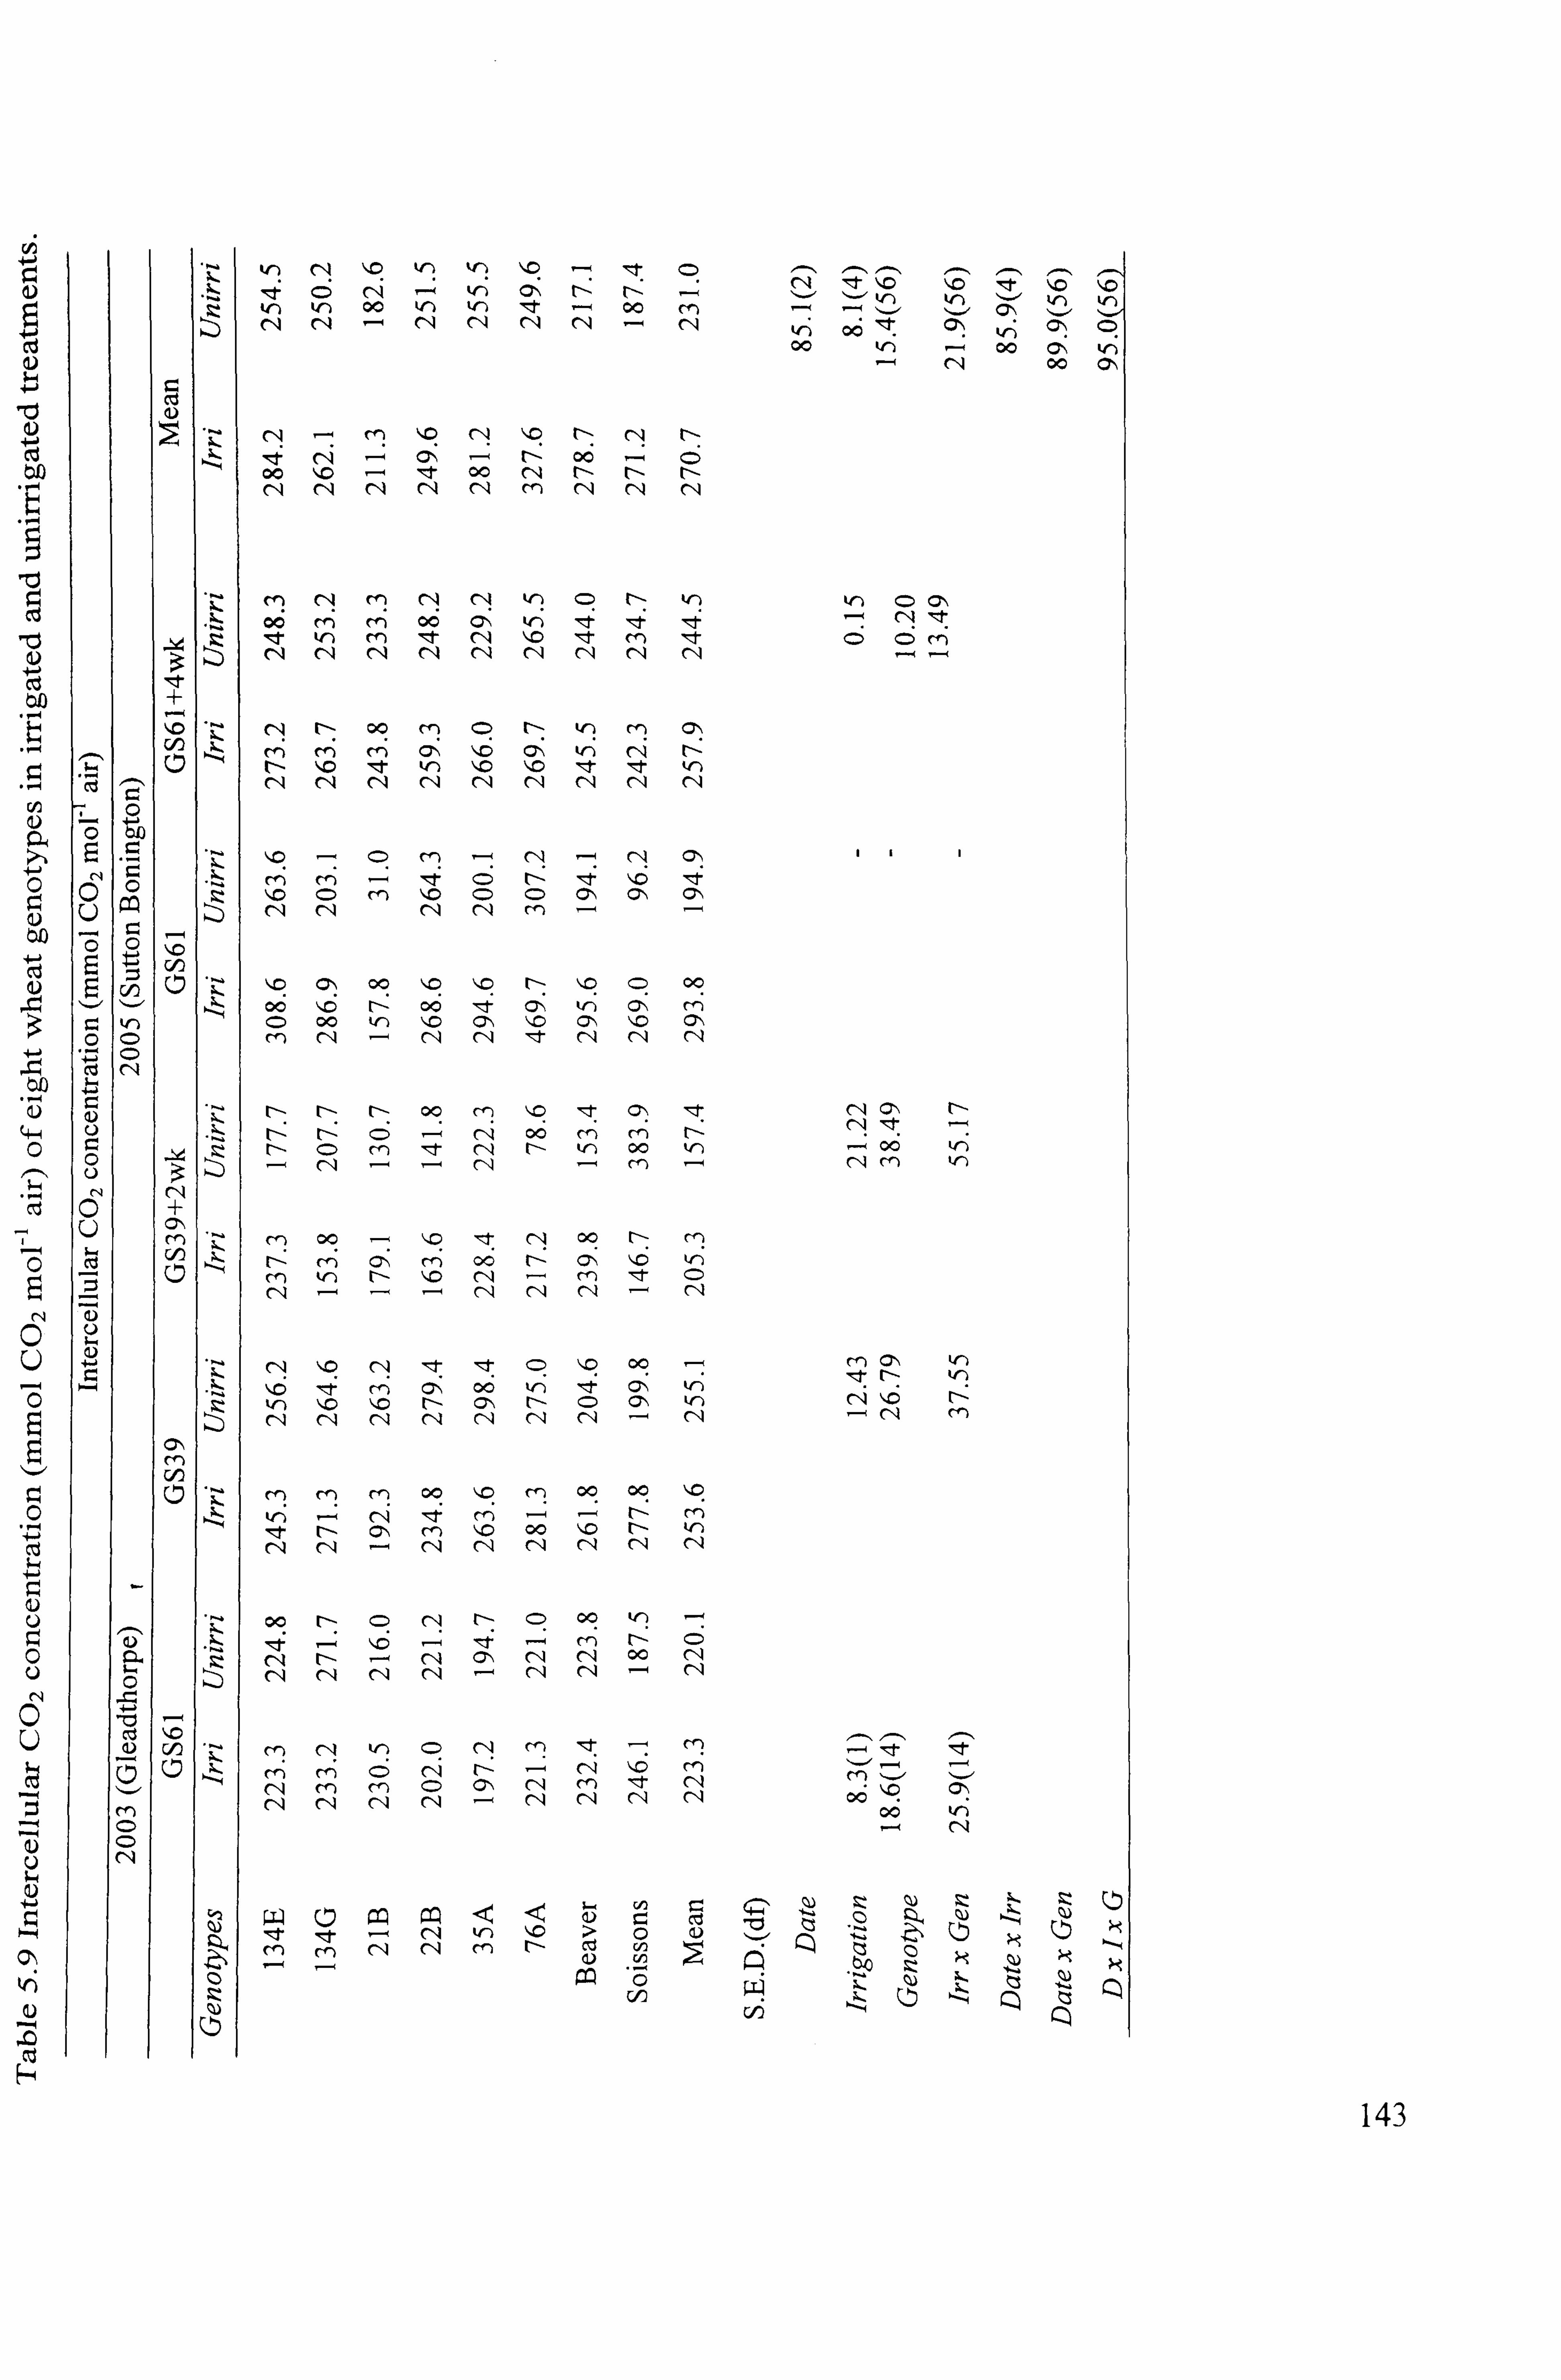
"o
tdo
*E
ct
0
r, 4 C
u
0
0
.,. I -4-J
+-j
0
0
u
u
4
H:: C
0
(ID
m
C> cz: ) N
1)
+
C/D
rn vý
Qý
ON, m
C, )
L
L L
'Z
I
Cj It
t, r) kr) 00 kr) W') lql- - 00 m
c"I "- Cq C'I C14 N-N
CA llýt 110 1-0 Iýt ýc ýo W') kn
tr) 06 00 tr) 00 C*,
00
06 00 I'D - ", 1- 00 (14 t- r- rl- C-I r14 4711 (Iq cl-I m cli "N
M"M C14 " kC) <=) t- k4)
06 Cý lfý 44 qzl- mt
cli r1l clq
r-- 00 m c) r- tr) rf) (71\ kr)
110 Iýt \C \C 171- ýt
cf) m- -4 6 t--: 4 110 -4 ýlc C) m ýo C) C: ) (7ý Cý Cý (11 C14 r, ý C,, ) m-
Cý 00 110 r- IC C) 00 00 Ic r-- 00 "zi- kn C71) m
00 tr) IZ) CN 110 Cý cl,
00 (01ý It
00 mmr C) kn 00 tf) CIA cn -
C-ý coý ---ý ýý ":: ý C'-l 00 r- (")
r- fn C7-1 m Oct-: Clý 11C krý Cf) kr) r- ý, o CNI -m -Izi- (::: ) (14 - C, 4 " ('4 -
1: t Zt C) ý10 00 kr)
tr) \10 tl- Cl\ r- C) (7ý kr)
(,, I CA (14 cq - CA
kfý
Iýt I, - Clý CC) 110 00 I'D r-- 1r) " C14 - (-4 (11 (1-4 C14
00 r- C) C-I 00 tf)
o" 00 r-I C-4 - CA
kf) Cl\
IaI
06
CIA m kr)
m C, \ kr)
kr)
ý C-4 m
kn
M / --ý CIA m m C) (01ý (, A m -It " -
06 llý Cý
00
cn sz =1 m (: ý-, ý
Z2 z (4) (ý Zý, z
rl) - z ýA)
,: t , I- ý (11 -
tr) 110 r--
> m
0 (1) J: j 11-1 rz Cý . - ; -ý C-ý u) M M (14 C 4 cn cn
143
5.1.6 Effects of genotypes and irrigation on growth and partitioning
In the experiments located at Sutton Bonington, detailed growth analysis was carried out on four genotypes contrasting for differences in morphological and physiological characteristics which included two parents, Beaver and Soissons, and two DH lines: 134G and 134E. Samplings for these genotypes were taken at GS31 and GS61 in years 2004 and 2005; and at GS39 in 2004. The results obtained on these genotypes are presented in this section.
5.1-6.1 Date of anthesis
Drought advanced flowering date on average by I day in each year. Averaging across irrigation treatments, genotypes ranged in flowering from 28 May to 7 June In 2003,
from 31 May to 9 June in 2004 and from 7 to 15 June in 2005,, with Soissons reaching
anthesis about a week earlier than Beaver (Table 5.10).
5.1.6.2 Green area index
From the sequential growth analysis it was evident that the maximum green area index
was reached at GS39 in 2004 (see Appendix III for pre-anthesis growth analysis). The
results of analyses at GS61 are presented here. In 2004, genotypic differences were
significant with Beaver showing the largest GAI of 9.52 under irrigation compared to
other genotypes in the range 6.3-7.7 (P<0.01; Table 5.11). The main effects of irrigation
and the interaction with genotype were not statistically significant.
In 2005, genotypes behaved similarly with Beaver again producing the largest green
area index of 9.33 (P<0.06) compared to other genotypes in the range 6.3-6.6 under
irrigation. The irrigation x genotype interaction was significant with Beaver showing a
greater reduction in green area index from 9.33 to 4.58 under drought than other
genotypes (P<0.002). Soissons maintained green area index better (Table 5.11).
144
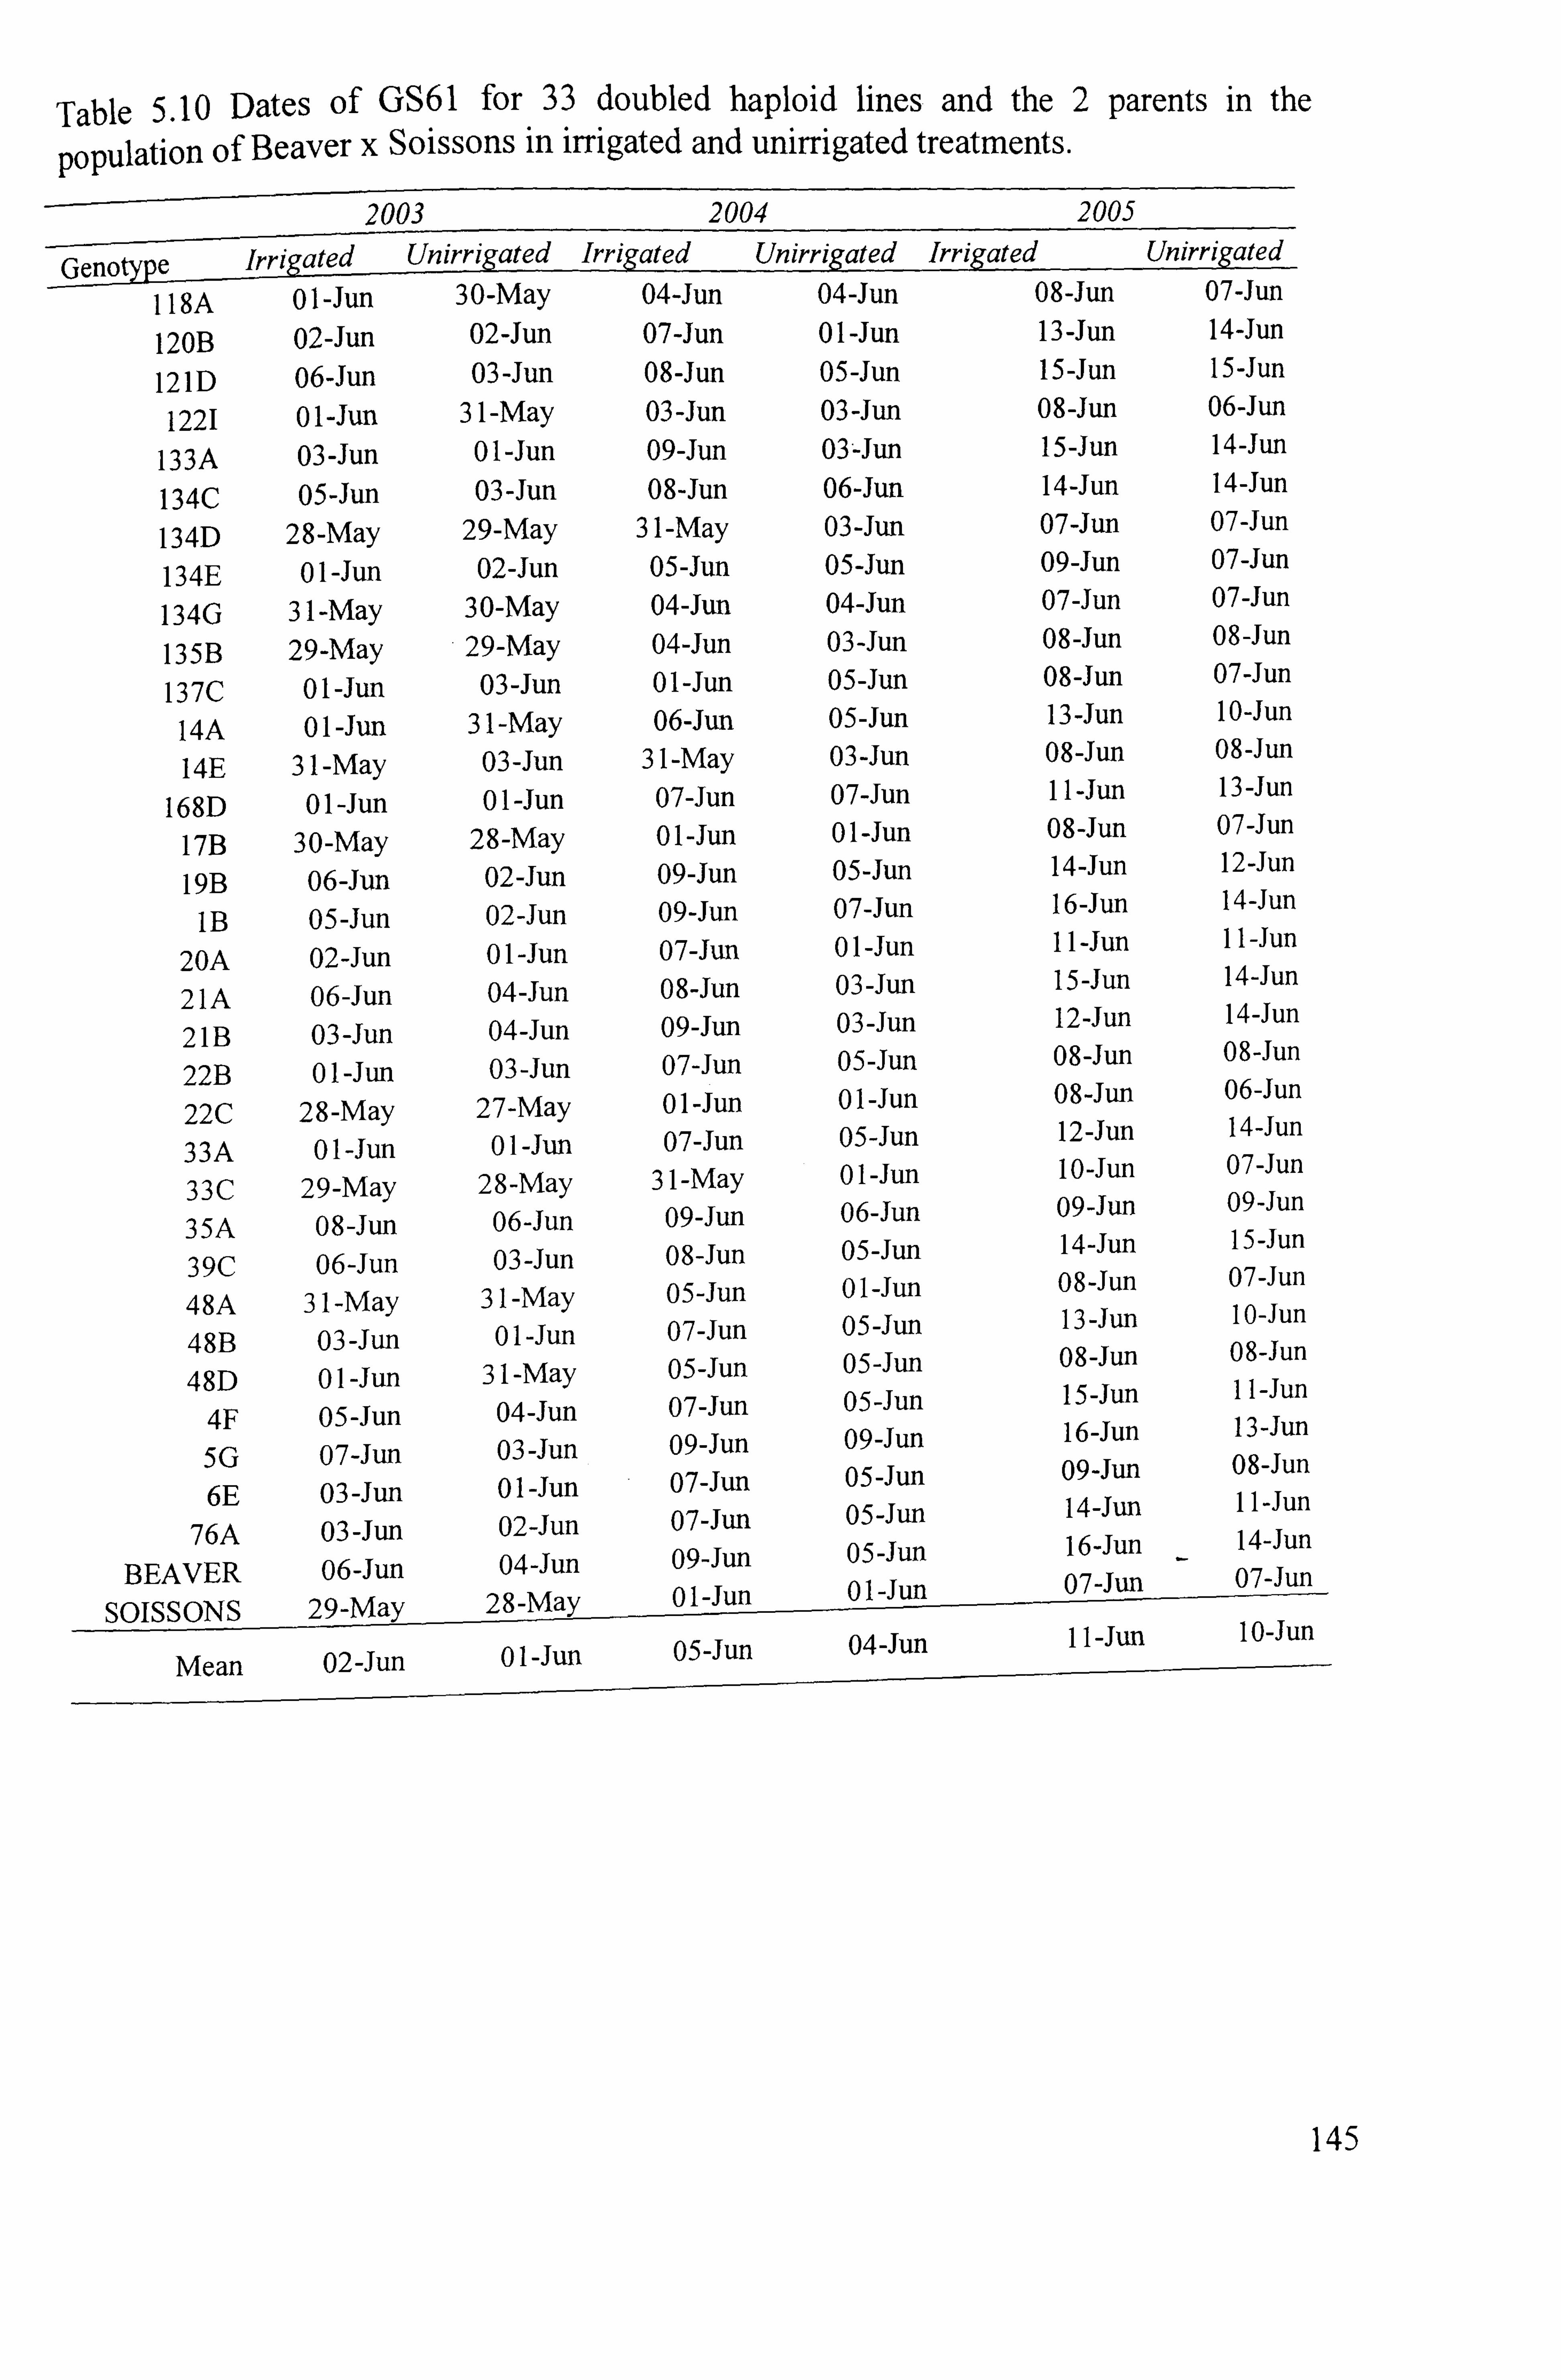
Table 5.10 Dates of GS61 for 33 doubled haploid lines and the 2 parents in the
population of Beaver x Soissons in irrigated and unirrigated treatments.
2003 2004 2005
Genotype Irrigated uUnirrigated Irri _L
r" gated Unirrigated Irrig ated -
Unirrigated
. 118A 01 -Jun 30-May 04-Jun 04-Jun 08-Jun 07-Jun
120B 02-Jun 02-Jun 07-Jun 01 -Jun 13 -Jun 14-Jun
121D 06-Jun 03-Jun 08-Jun 05-Jun 15-Jun 15-Jun
1221 01 -Jun 31 -May 03 -Jun 03 -Jun 08-Jun 06-Jun
133A 03 -Jun 01 -Jun 09-Jun 03--Jun 15-Jun 14-Jun
134C 05-Jun 03-Jun 08-Jun 06-Jun. 14-Jun 14-Jun
134D 28-May 29-May 31 -May 03-Jun 07-Jun 07-Jun
134E 01 -Jun 02-Jun 05-Jun 05-Jun 09-Jun 07-Jun
134G 31 -May 30-May 04-Jun 04-Jun 07-Jun 07-Jun
135B 29-May 29-May 04-Jun 03-Jun 08-Jun 08-Jun
137C 01 -Jun 03-Jun 01 -Jun 05-Jun 08-Jun 07-Jun
14A 01 -Jun 31 -May 06-Jun 05-Jun 13-Jun 10 -Jun
14E 31 -May 03-Jun 31 -May 03-Jun 08-Jun 08-Jun
168D 01 -Jun 01 -Jun 07-Jun 07-Jun II -Jun 13-Jun
17B 30-May 28-May 01 -Jun 01 -Jun 08-Jun 07-Jun
19B 06-Jun 02-Jun 09-Jun 05-Jun 14-Jun 12-Jun
IB 05-Jun 02-Jun 09-Jun 07-Jun 16-Jun 14-Jun
20A 02-Jun 01 -Jun 07-Jun 01 -Jun II -Jun II -Jun
21A 06-Jun 04-Jun 08-Jun 03-Jun 15-Jun 14-Jun
21B 03 -Jun 04-Jun 09-Jun 03-Jun 12-Jun 14-Jun
22B 01 -Jun 03-Jun 07-Jun 05-Jun 08-Jun 08-Jun
22C 28-May 27-May 01 -Jun 01 -Jun 08-Jun 06-Jun
33A 01 -Jun 01 -Jun 07-Jun 05-Jun 12-Jun 14-Jun
33C 29-May 28-May 31 -May 01 -Jun
10 -Jun 07-Jun
35A 08-Jun 06-Jun 09-Jun 06-Jun 09-Jun 09-Jun
39C 06-Jun 03-Jun 08-Jun 05-Jun 14-Jun 15-Jun
48A 31 -May 31 -May 05-Jun 01 -Jun
08-Jun 07-Jun
48B 03 -Jun 01 -Jun 07-Jun 05-Jun 13 -Jun I O-Jun
48D 01 -Jun 31 -May 05-Jun 05-Jun 08-Jun 08-Jun
4F 05-Jun 04-Jun 07-Jun 05-Jun 15-Jun II -Jun
5G 07-Jun 03 -Jun 09-Jun 09-Jun 16-Jun 13-Jun
6E 03-Jun 01 -Jun 07-Jun 05-Jun 09-Jun 08-Jun
76A 03 -Jun 02-Jun 07-Jun. 05-Jun 14-Jun II -Jun
14-Jun BEAVER 06-Jun 04-Jun 09-Jun 05-Jun 16-Jun
07-Jun 07-Jun SOISSONS 29-May 28-May 01 -Jun
01 -Jun
Mean 02-Jun 01 -Jun 05-Jun 04-Jun II -Jun
I O-Jun
145

5.1.6.3 Flag leaf area index
Flag leaf area index showed an apparent reduction under drought in 2005, but not in 2004. In 2004, Beaver had a higher flag leaf area index than Soissons (2.22 c. f. 1.84;
P<0.01), while lines 134E and 134G recorded 1.44 and 1.30, respectively (Table 5.11).
In 2005, although, the main effects of genotype and irrigation were not significant, the
interaction was significant and drought reduced flag leaf area index of Beaver from 1.94
to 0.89 (P<0.01); whereas the other genotypes did not show any significant reductions in
flag leaf green area.
Table 5.11 Flag leaf area index, green area index and above-ground dry matter at GS61
of four wheat genotypes in irrigated and unirrigated conditions at Sutton Bonington in 2004 and 2005.
Flag leaf area index
Green area Index Above-ground DM
(g M-2)
2004 2005 2004 2005 2004 2005
Irrigated
134E 1.44 1.37 6.27 6.64 1307 1375
134G 1.29 1.36 6.35 6.33 1170 1314
Beaver 2.22 1.94 9.52 9.33 1593 1717
Soissons 1.84 1.38 7.65 6.25 1296 1445
Mean 1.70 1.51 7.45 7.14 1341 1463
Unirrigated
134E 1.42 1.38 4.88 5.71 1345 1310
134G 1.31 1.10 5.87 4.89 1275 1247
Beaver 2.07 0.89 8.26 4.58 1551 1607
Soissons 1.87 1.34 10.71 5.69 1564 1410
Mean 1.67 1.18 7.43 5.22 1434 1394
S. E. D (df)
Irrigation (2) 0.08 0.17 0.55 0.84 14.3 7.4
Genotype (12) 0.22 0.13 1.05 0.45 75.6 50.9
Irr x Gen. (12) 0.28 0.23 1.39 0.98 93.7 62.7
146
5.1.6.4 Above-ground biomass production
The integrated effects of growth and development occurring in the pre- and post- flowering phases were ultimately expressed as the harvest biomass and the harvest index. In 2004, as previously described some of the sub-plots were lodged at anthesis. The unirrigated treatments showed higher biomass probably on account of greater incidence of lodging in the irrigated than in the unirrigated sub-plots. However,
genotypes differed significantly in irrigated conditions with biomass production at
anthesis ranging from 1170 g M-2 (linel34G) to 1593 g M-2 (Beaver) (P<0.01; Table
5.11).
A similar trend was observed in 2005 under irrigated conditions, in the range of 1314 to 1717 gm -2 for linel34G and Beaver, respectively (P<0.001) and drought decreased
biomass on average by 69 gM (P<0.01). The irrigation x genotype interaction was not
significant and genotypes ranked similarly with or without irrigation. Nevertheless, the
reduction in biomass was more with Beaver and least in Soissons following the pattern
of reductions in GAL
-2 Drought decreased leaf lamina dry weight from 199 to 175 gM (P=0.17) in 2005.
Under irrigated conditions significantly higher leaf lamina weight was found with -2 Beaver in 2004 (264 gM; P<0.001), but in 2005 the genotype differences were not
-2 statistically significant (269 gM; P=0.10). The interaction effect was not significant
(Table 5.12).
In both years, restricted water availability did not reduce stem-and-sheath dry matter (P
=0.15). The effect of genotype and the interaction with irrigation were also not
significant (Table 5.12).
In 2005, drought decreased stem partitioning from 0.61 to 0.57 (P=0.02) and stem-and-
sheath biomass at anthesis from 808 to 676 gm -2 (P=O. 11; Table 5.12). Stem dry matter
was depressed most in Beaver (208 g M-2 ) and least in Soissons (20 g M-2) .A similar
trend was found for leaf lamina dry matter production.
The ear partitioning did not vary much between irrigation treatments and remained
constant (P=0.2). However, Beaver partitioned a higher proportion of biomass to the ear
in both years (P<0.001) than Soissons, with intermediate values for lines 134G and
134E (Table 5.12).
147
5.1.6.5 Effects on biomass partitioning at harvest
The effect of drought on biomass growth was evident at GS61 in 2005 for four lines.
With more prolonged drought in this season drought decreased biomass by 69 g M-2 (P=0.0 1; Table 5.11). There were consistent differences among genotypes in both the
years in crop dry weight at harvest (P<0.01), with values averaged over two
site/seasons, ranging from 1614 g M-2 (line 76A) to 2210 g M-2 (line 22B). The biomass
depression was more for line 22B (382 g M-2 ) than for line 134G (202 g M-2) (P=0.08).
Thus, the grain yield sensitivity of line 22B to drought derived, in part, from a
sensitivity of above-ground biomass to drought (P=0.06). The yield response of Beaver
and Soissons to drought was 1.3 and 1.0 t ha-1 respectively. Averaged over the
site/seasons, there was no change in HI in the irrigation regimes (Table 5.4). However,
HI decreased with restricted water supply in 2005 from 0.48 to 0.46 (P=0.022). HI also differed averaged across site/seasons amongst the genotypes from 0.42 (line 35A) to
0.51 (line 76A) (P<0.001; Table 5.4). Higher HI in line 76A did not translate into a higher yield because of its low biomass production (163 4g M-2) ,
but it maintained yield
better under drought than other genotypes. The converse was the case for line 22B and
Beaver which did not maintain grain yield well under unirrigated conditions on account
of pronounced reductions in biomass growth. Averaging across sites/seasons, line 21B
and Soissons maintained HI better than other genotypes (Table 5.4).
148
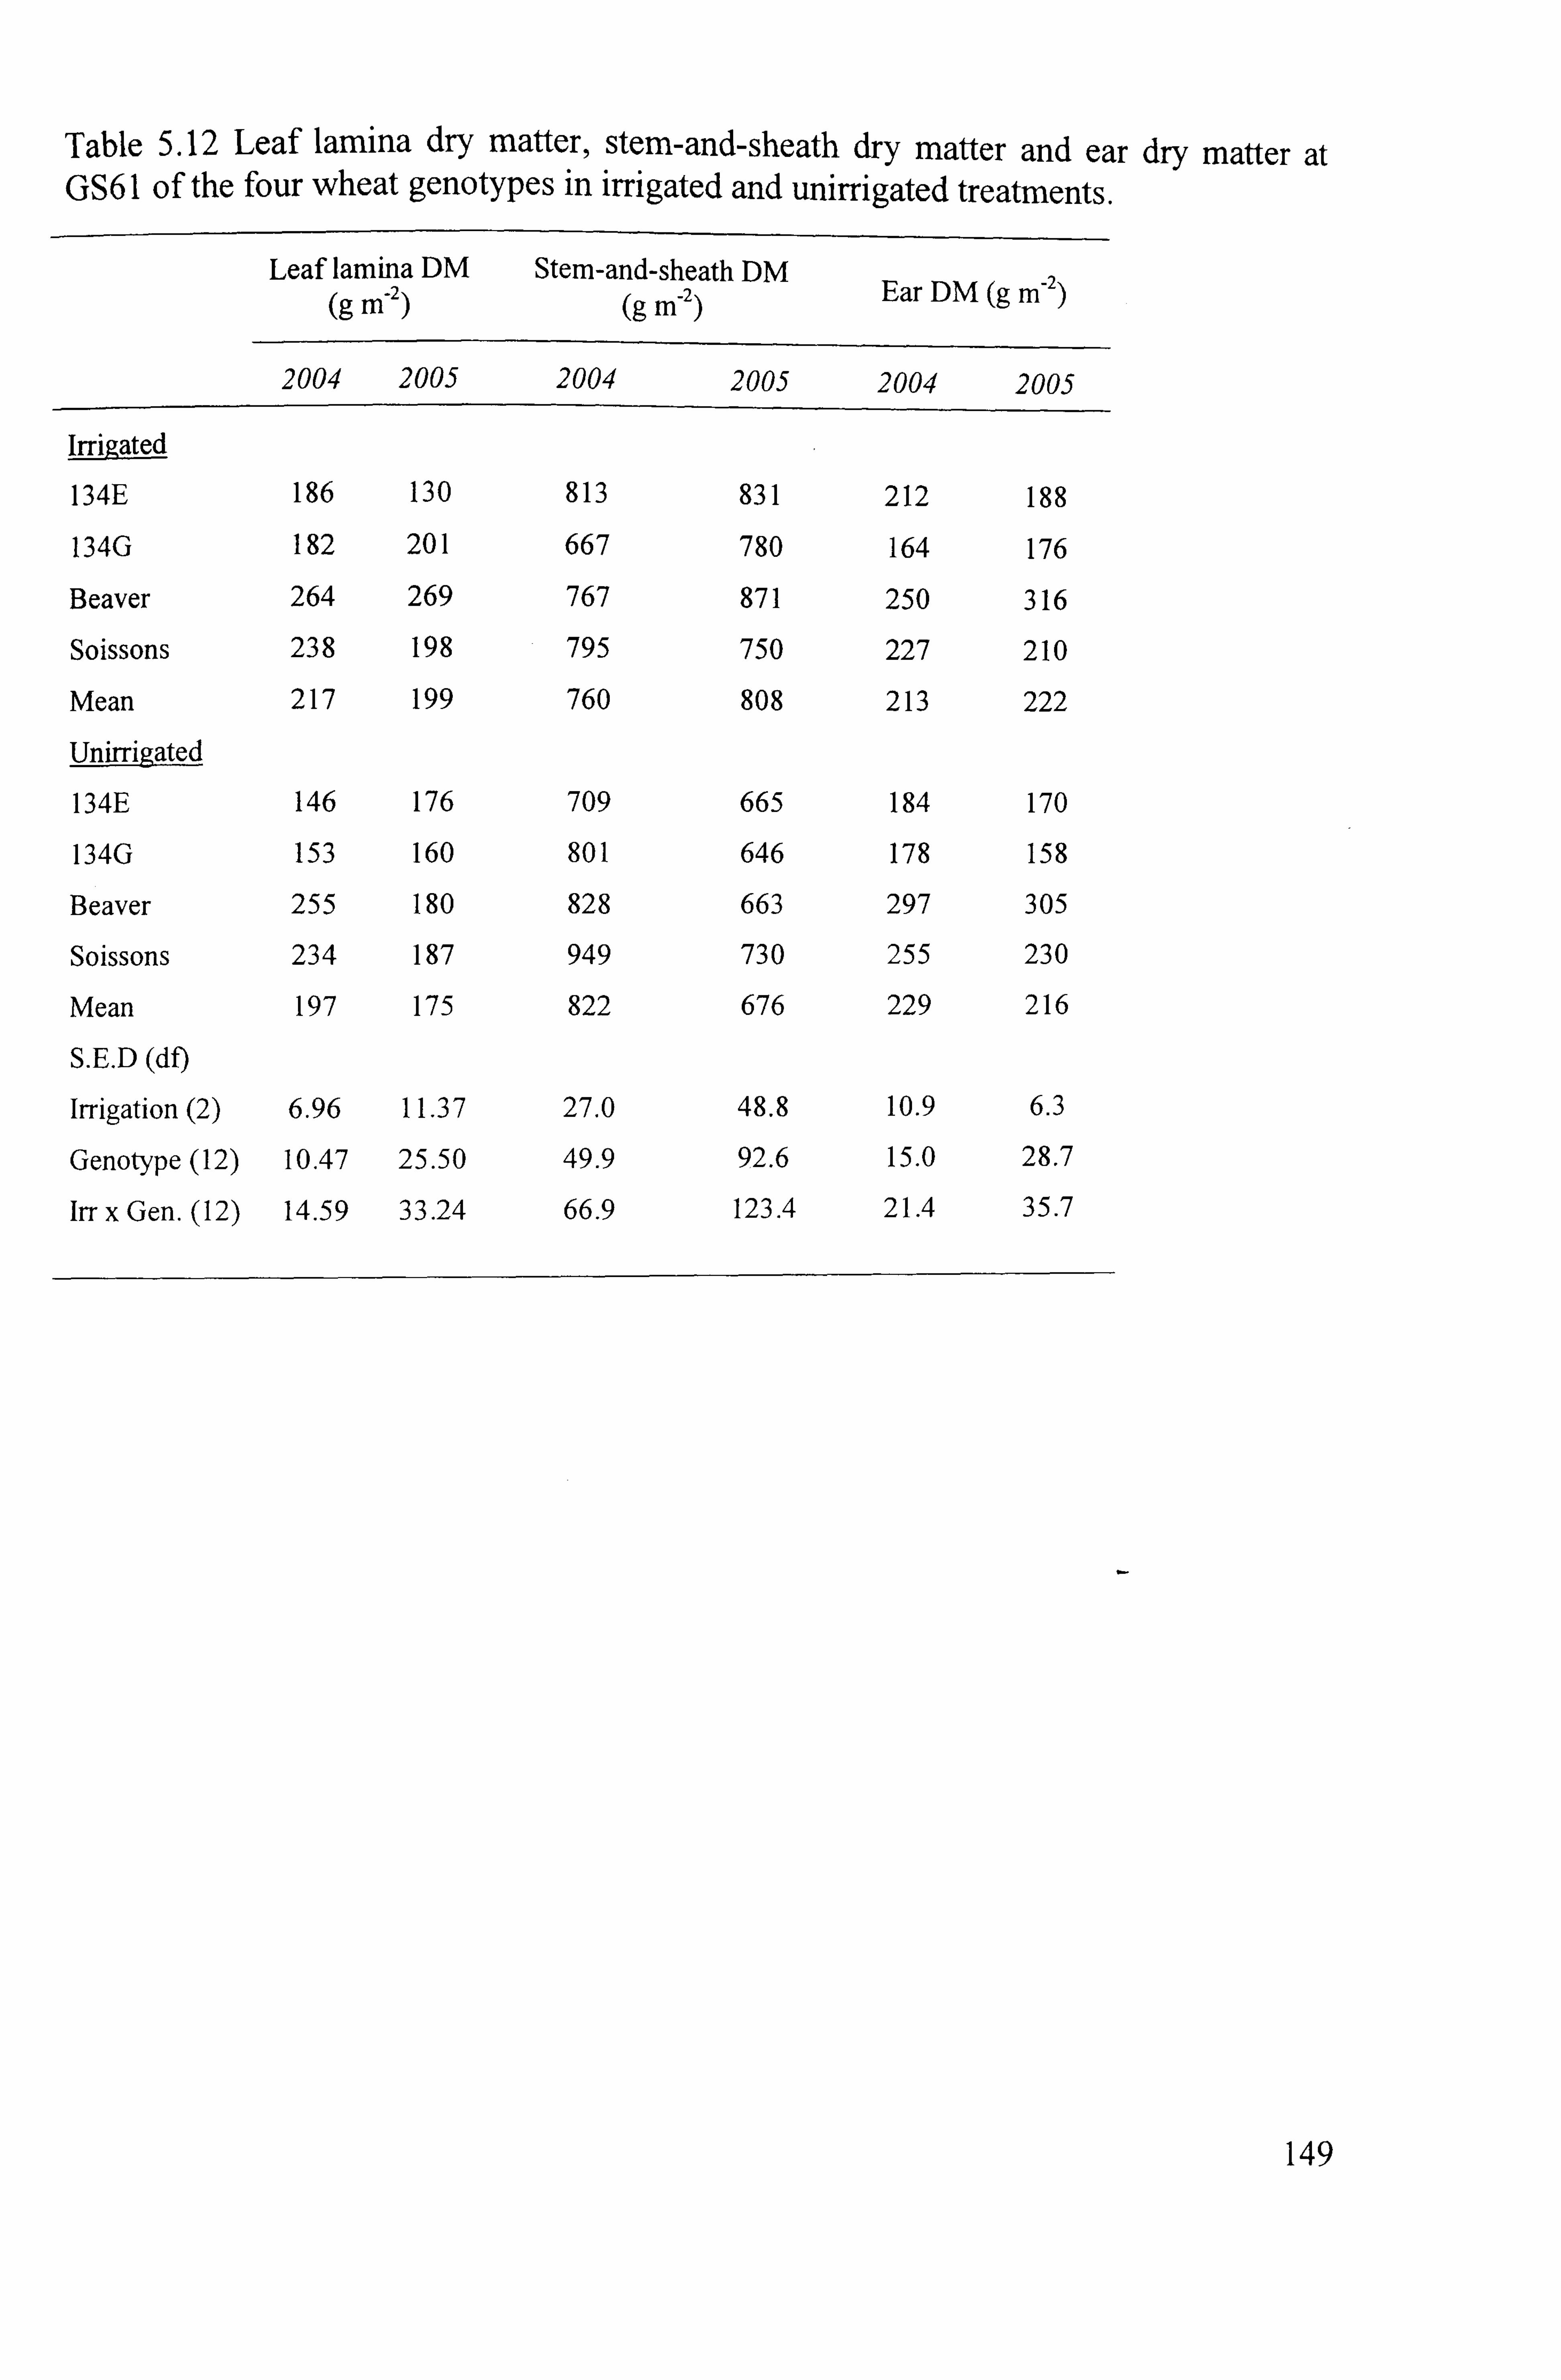
Table 5.12 Leaf lamina dry matter, stem-and-sheath dry matter and ear dry matter at GS61 of the four wheat genotypes in irrigated and unirrigated treatments.
Leaf lamina DM Stem-and-sheath DM (g M-2) (g M-2)
Ear DM (g M-2)
2004 2005 2004 2005 2004 2005
Irrigated
134E 186 130
134G 182 201
Beaver 264 269
Soissons 238 198
Mean 217 199
Unirrigated
134E 146 176
134G 153 160
Beaver 255 180
Soissons 234 187
Mean 197 175
S. E. D (df)
Irrigation (2) 6.96 11.37
Genotype (12) 10.47 25.50
Irr x Gen. (12) 14.59 33.24
813 831 212 188
667 780 164 176
767 871 250 316
795 750 227 210
760 808 213 222
709 665 184 170
801 646 178 158
828 663 297 305
949 730 255 230
822 676 229 216
27.0 48.8 10.9 6.3
49.9 92.6 15.0 28.7
66.9 123.4 21.4 35.7
149
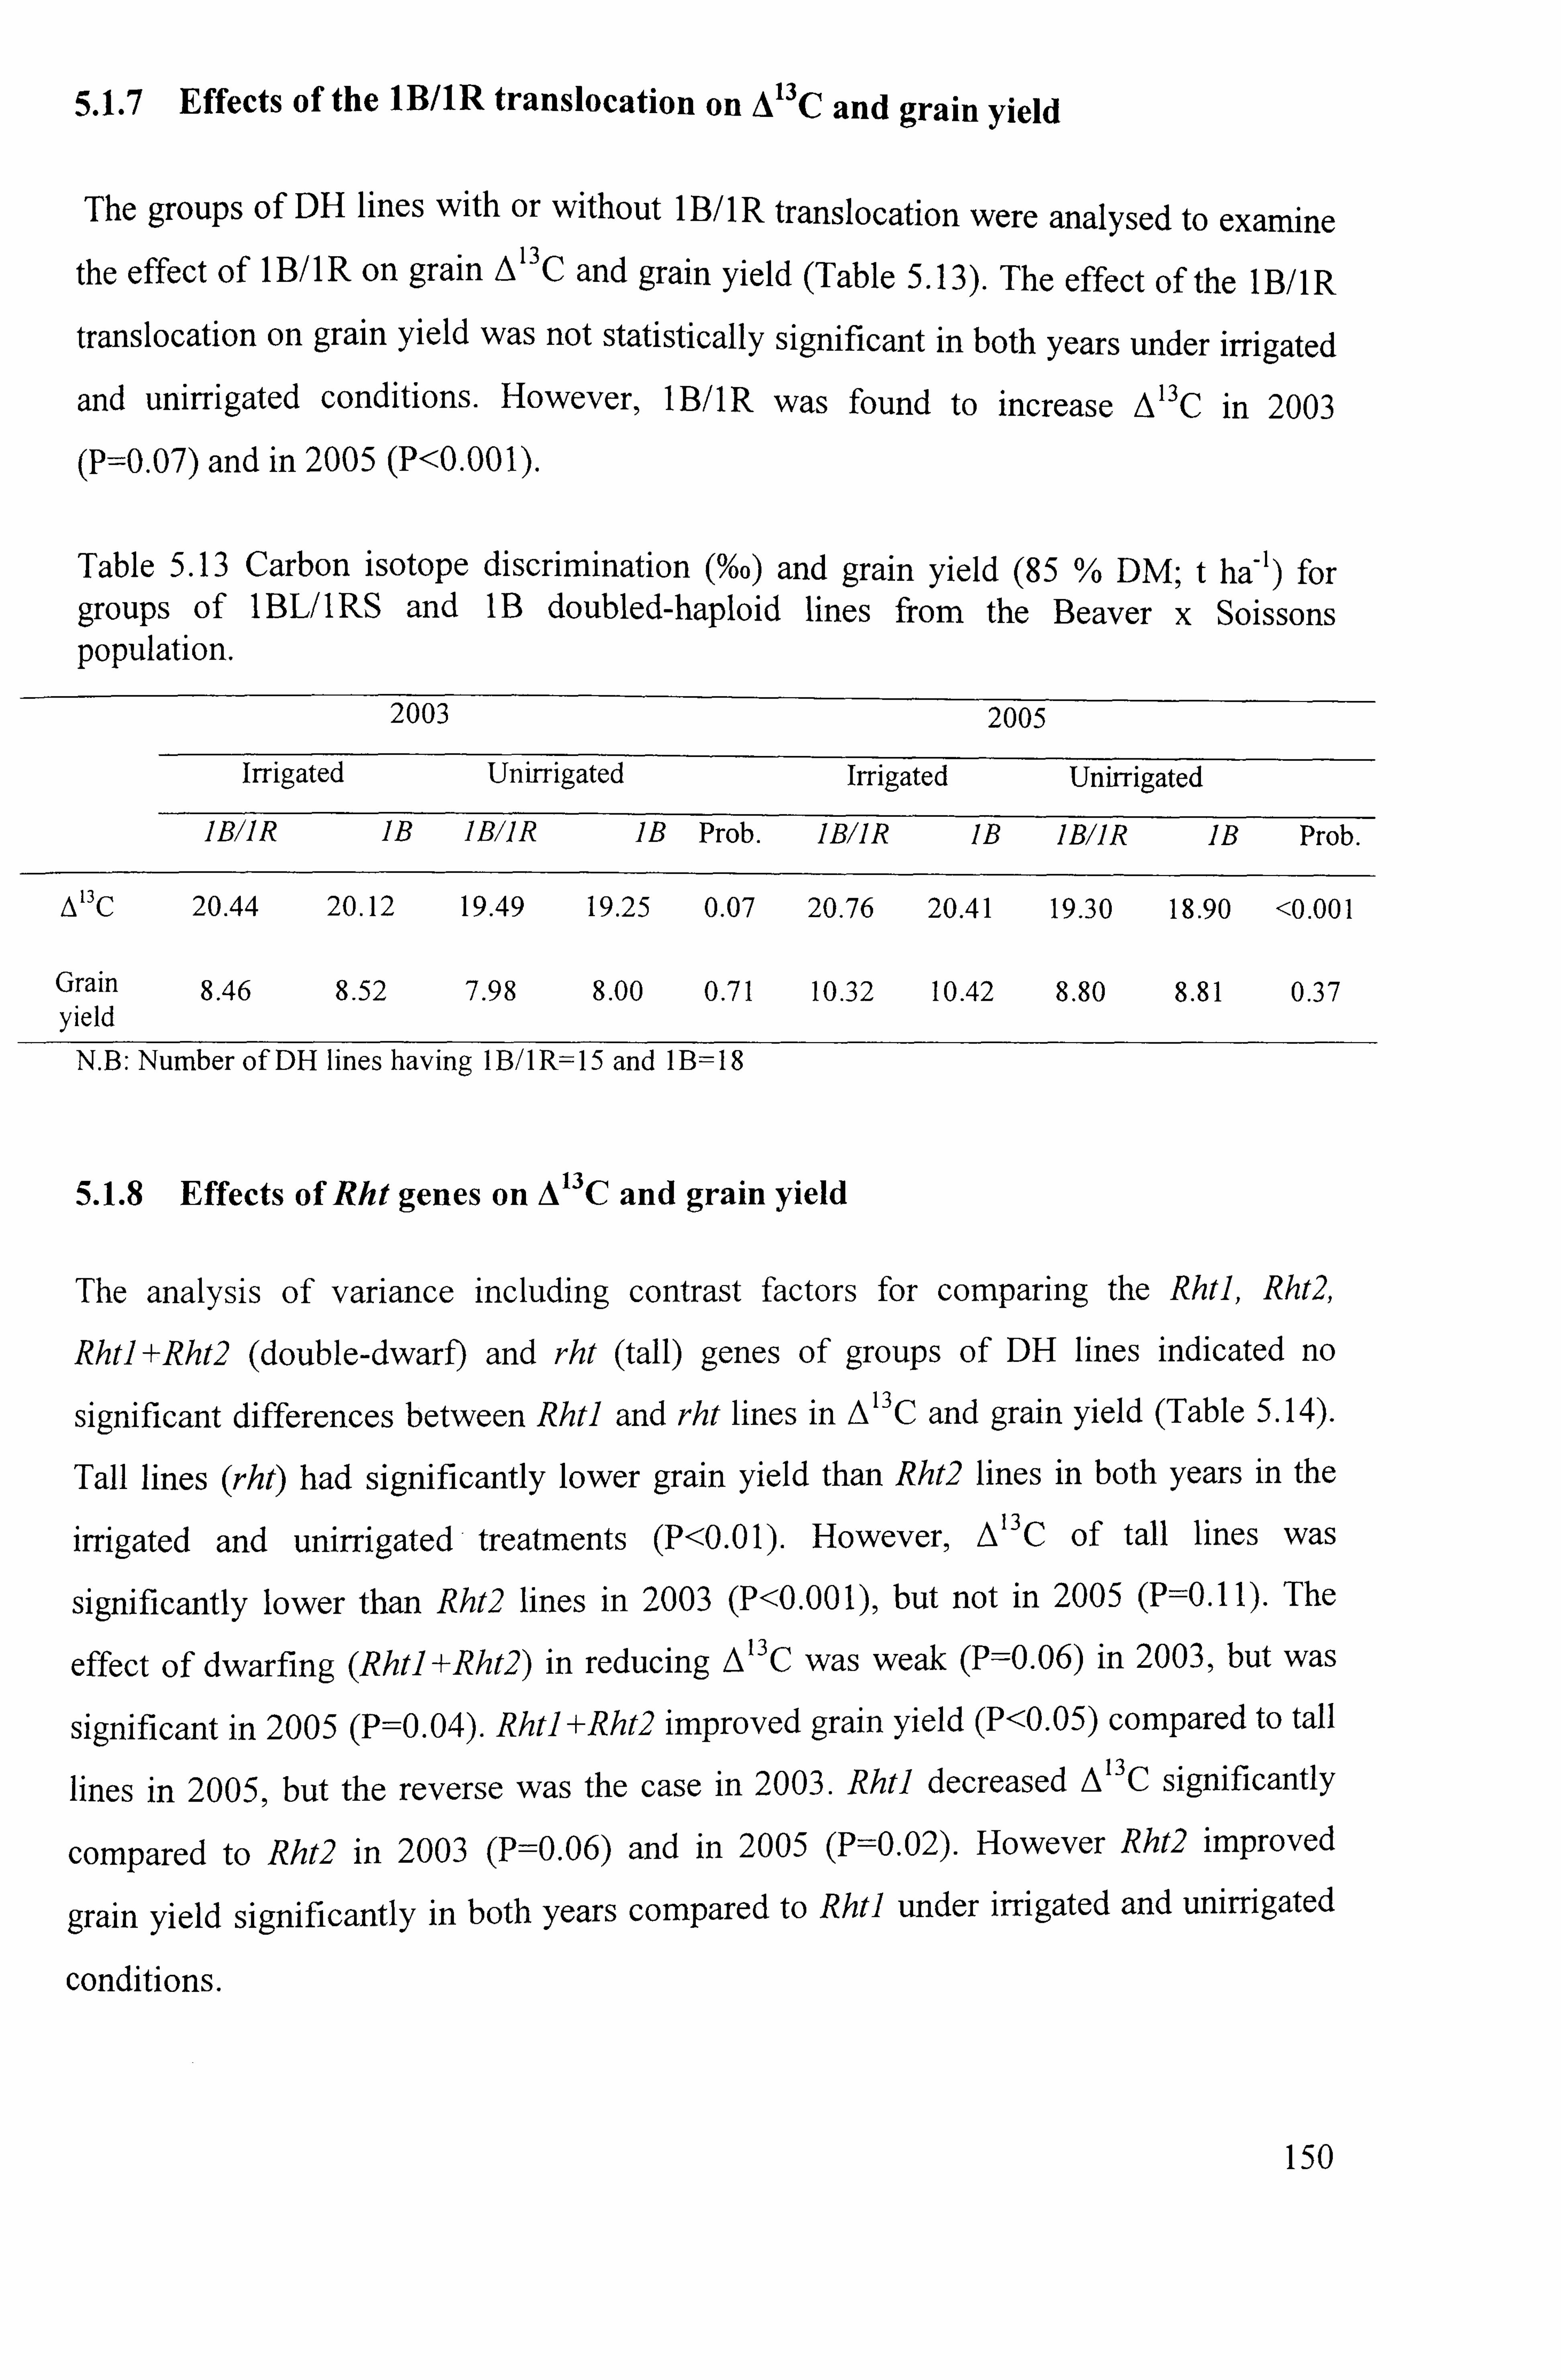
5.1.7 Effects of the IB/IR translocation on A 13 C and grain yield
The groups of DH lines with or without IB/IR translocation were analysed to examine
the effect of I B/ IR on grain A 13 C and grain yield (Table 5.13). The effect of the IBAR
translocation on grain yield was not statistically significant in both years under irrigated
and unirrigated conditions. However, IB/IR was found to increase A 13C in 2003
(P=0.07) and in 2005 (P<0.001).
Table 5.13 Carbon isotope discrimination (%o) and grain yield (85 % DM; t ha-1) for groups of IBUIRS and IB doubled-haploid lines from the Beaver x Soissons population.
2003
Irrigated Unirrigated
2005
Irrigated Unirrigated
JBIIR IB IB1IR IB Prob. IB1IR IB IB1IR IB Prob.
A13c 20.44 20.12 19.49 19.25 0.07 20.76 20.41 19.30 18-90 <0.001
Grain 8.46 8.52 7.98 8.00 0.71 10.32 10.42 8.80 8.81 0.37 yield
N. B: Number of DH lines having I B/I R= 15 and I B= 18
5.1.8 Effects of Rht genes on A 13 C and grain yield
The analysis of variance including contrast factors for comparing the Rht], Rht2,
At] +Rht2 (double-dwarf) and rht (tall) genes of groups of DH lines indicated no
significant differences between Rht] and rht lines in A 13 C and grain yield (Table 5.14).
Tall lines (rht) had significantly lower grain yield than Rht2 lines in both years in the
irrigated and unirrigated treatments (P<0.01). However, A"C of tall lines was
significantly lower than Rht2 lines in 2003 (P<0.001), but not in 2005 (P=0.11). The
effect of dwarfing (Rht] +Rht2) in reducing A13C was weak (P= 0.06) in 2003, but was
significant in 2005 (P=0.04). Rht]+Rht2 improved grain yield (P<0.05) compared to tall
lines in 2005, but the reverse was the case in 2003. Rht] decreased A 13C significantly
compared to Rht2 in 2003 (P=0.06) and in 2005 (P=0.02). However Rht2 improved
grain yield significantly in both years compared to Rhtl under irrigated and unirrigated
conditions.
150
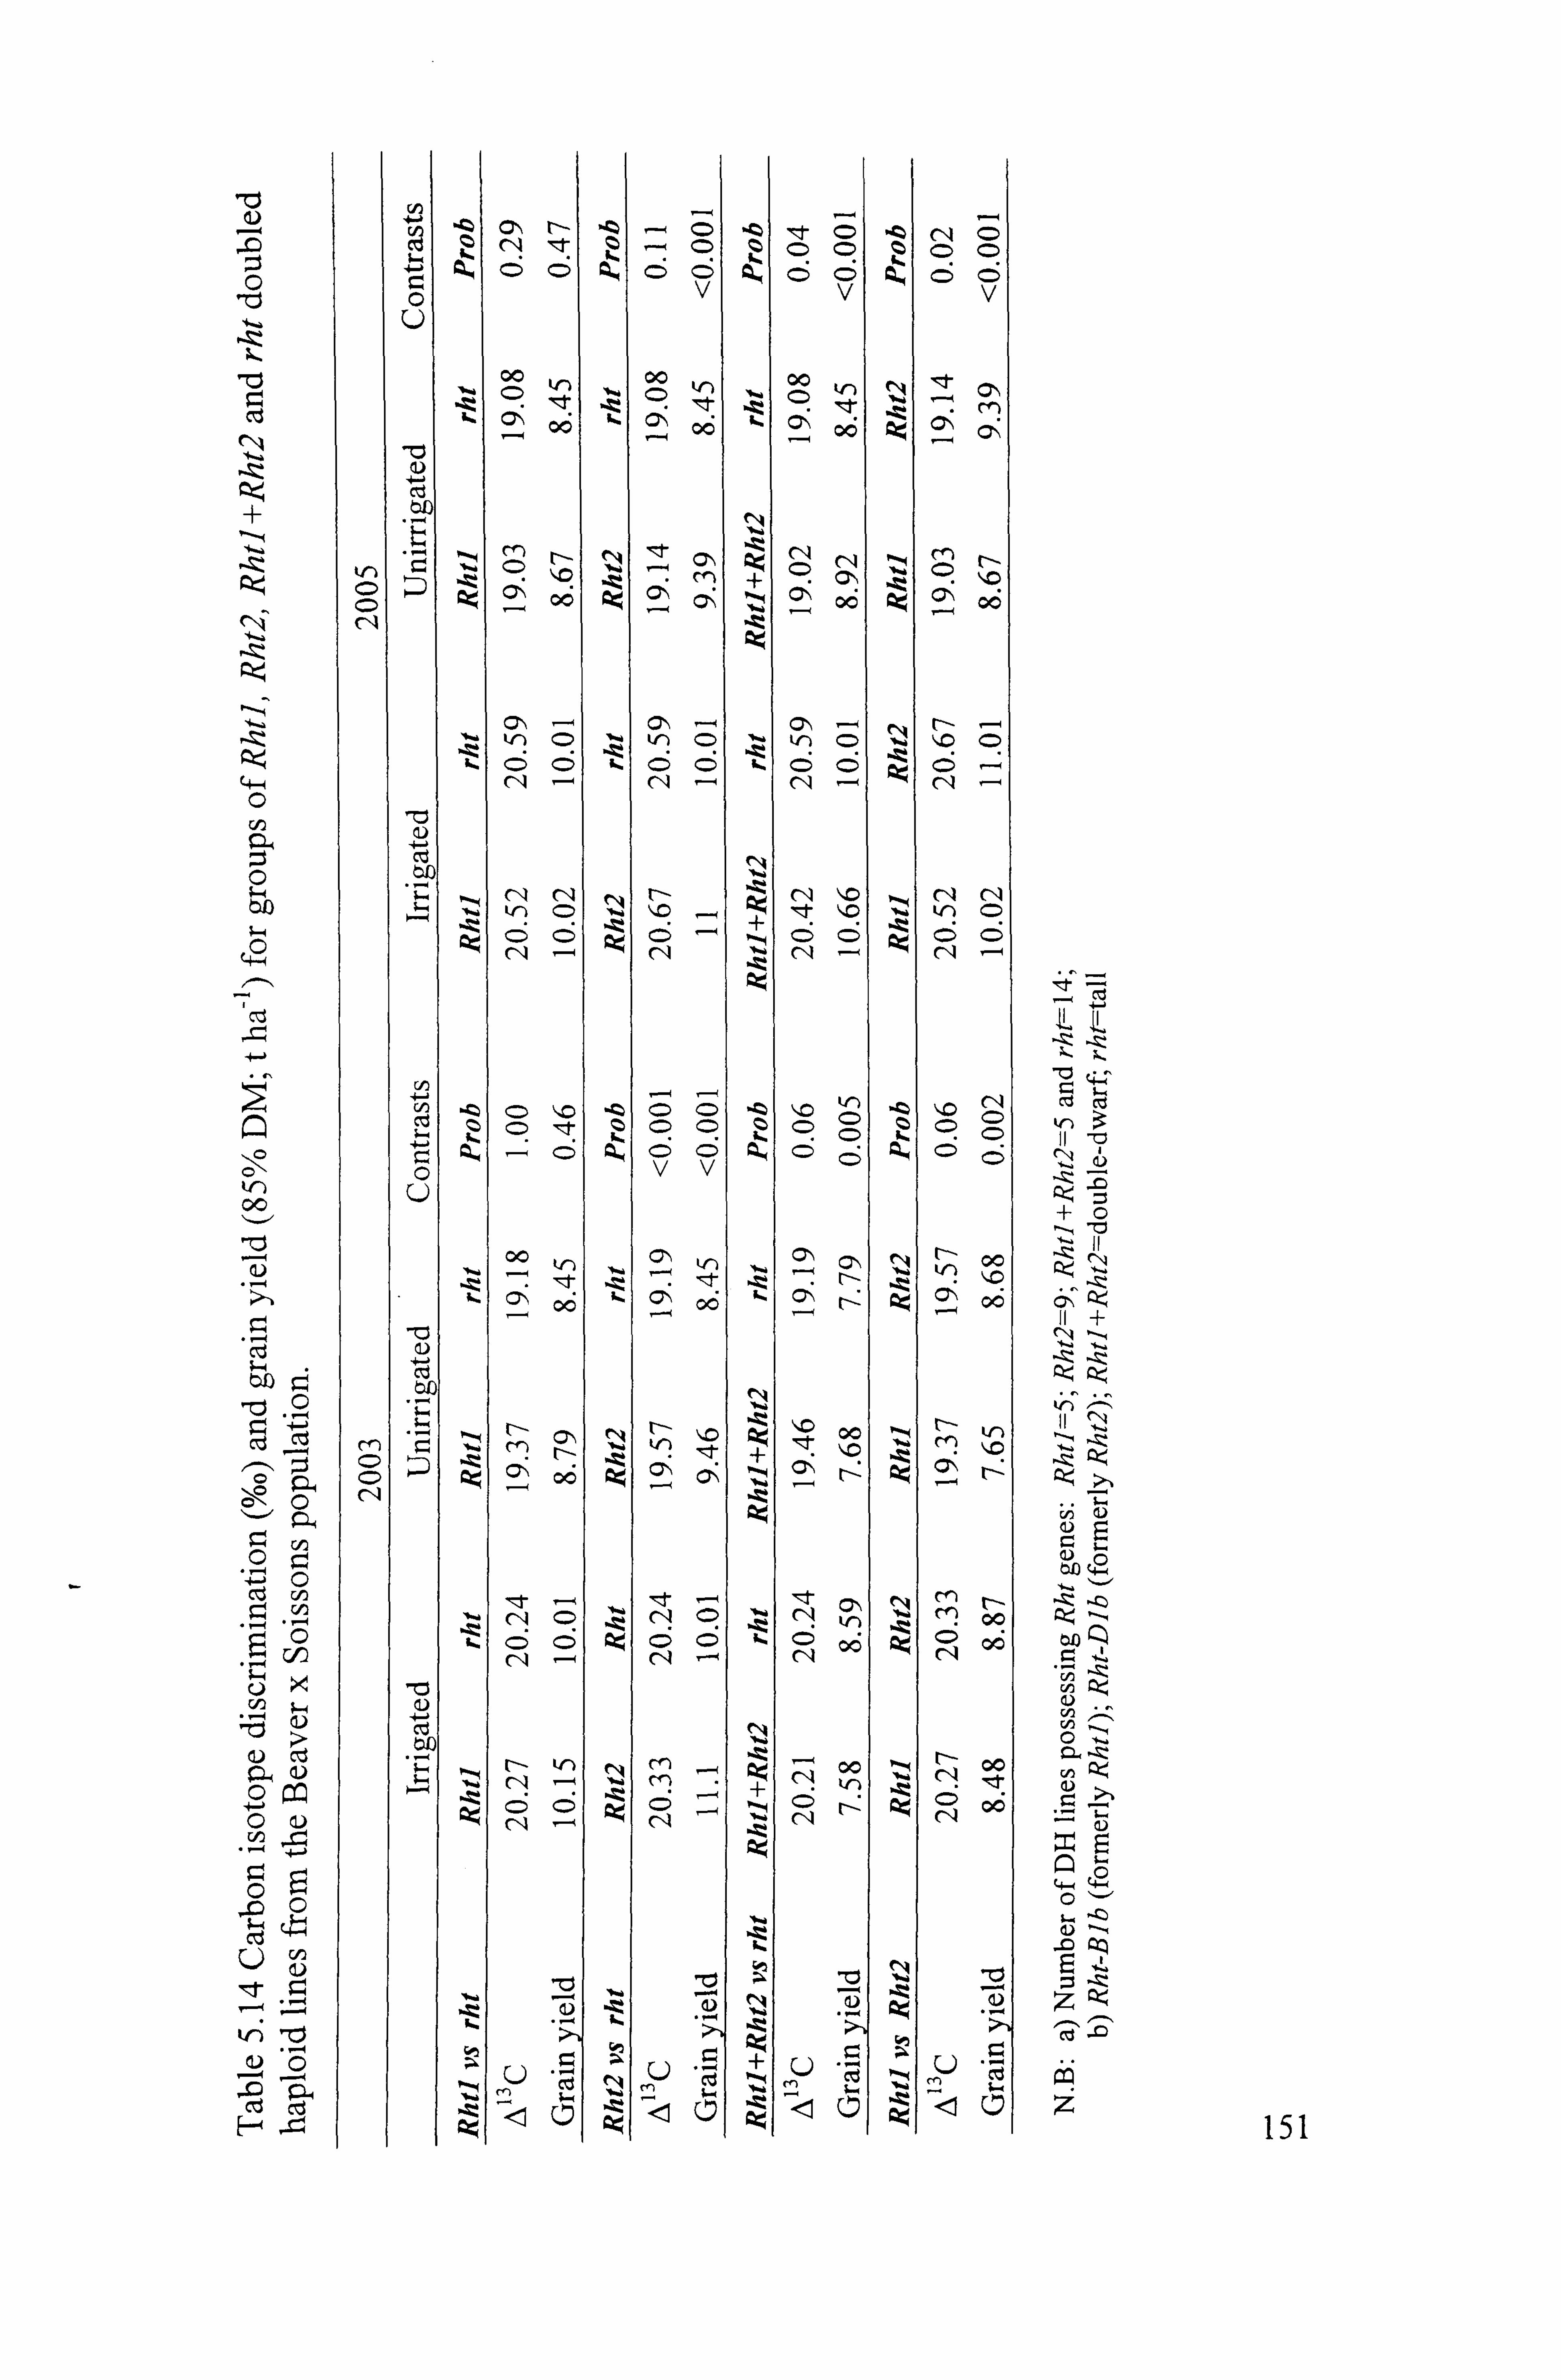
10
9.1 m
sz
C*0
b. 0
kr)
0i ; -4
cn
ct cn cn
cn
-0 C)
E- -Cý
(n C>
C) C) C) C)
v v
00 00 00
C ý
. "z 06 06 JZ4 (7ý Cý
." W-4
--- M t- C>
N
'.., 'ý-
(7ý -. 4
-tt
C4 C14
" (= !Z C') r- (= ý:, -t-5.,
ýlc
( :ýc-6 "ZS" m
:ý Cý ( + !Z (=*ý
Cý C-6 'it
C4 ý ý, c
c-, C, 6 , , : t: ý _--q C4
Cý, ý C-ý -4 cr) ---( r- ---4 '
, Iýc C>
E
(= Cý z c; 6 z =ý =ý - z 6 -4 7ý
czý (:: 5 C5 C) 6 C5 C'4 N (14 C, 4
-4--1 cn -4 --4
kr) Q ý, o " C. " iý m ct
vv u Qý 5 +
00 Cý
Lr) 00
00 Ct,
+
--Iz
$ý r- zt
"'o 00 t--
Ln II NI-
-z: -z
V td
C " =ý , "k "ý 00 " ý
C) C> Z:
C4 (= C) 'E r)
C) C16 ,t
C4 Cl
cn ; Z,
1- 1, 00
c cl , 1 " -. 4 6
'. m l, ý, 'Tt
06 a)
'$Q " -Q
-Cý "C; ý2 -Cý "Q, -0 = 41,
*E , a) C4 Z C4
-
- -%: >-. -., I- , 0
ý2
I= -4 ý2 = U- -4
C4 + u u
C; j -
!Z u
Cl)
- -,
('
&. 4 -t
m
2 ;.. -t
m
&ý
( ")
ao
.t < Qý -Z C
<(ý C4 < (-ý C4 -< - C4 4 151

ci A-) I Cd 00
00
C) C)
(Z C) Rt ýo ýlc kr) 0
c, Cý
rq 0ý 110 110
IE tt) c, c) c:, 666
CIS
00 kr) C'ý
(20 "tt t- tf)
q) c? C; C) C; C') o3
;>
r- 00
(4-4
0 0-ý :t. c, 110 C) C11 It M
c, C> C) C) C: ) C)
cn
00 0ý, C, \ C> ý V) C'4 ý, c
4 0-ý
17ý 6 --ý (-I C, .. 6*6
I= I= C.,
-0 c: * C) 66 C) c)
C7., -c - ýo C-, C; -, 00 -ri- CA t- C14 tr) Ic 00 IIR mm" -t c) m zt C) G- t- -M 4r) "
6 c) <ý 88cc> C) C) C)
0mm- C'4 en 00 00 "D C', C*ý - r- C',
(: ý --ý --ý -ý In - In C> 'ZI, C) C: ) c, (ZD c) (=, c) (q) c: ý C> c)
Cd
00 CD c" m 00 m 4-4 c" 0ý (= t-- C'I (=) ---( C, ý Cý -zt kr) tr) 00 , 1- "o C)
0 ýý t-: t-ý in crý W-) t-ý Cl ('4 66*C; ,6 C5 V) C>
m t- ýt V') 00 C, 4 cq kr) C: ) kr) m I'D NN
66,6 C> I? C) 91 C> c) 0
Q
0 kr) \0 C) r, 4
-4 0
kf) ý, c C7ý C> tr) cq C', 4 "D CA m c) cq cq 6 c; c; C) C>
u r4 Cý -ý ýQ (7ý, kn n* r" m oo t- C> 00 C'4 C'4 C, ý
0u 0ý oý oý Cý c, rfý Cr! 1,4 'tt .,.. I
(= C= (= (=> C: ) C: ) C) C) C: ) 6. J
CZ5 r Z!
tjo -- (: Zý -1 C/) C-G
q
.9 to W P., < 2:
k1r) Cý
C)
9L(
C. «
u
(L)
-0 r_
(ID
z 152
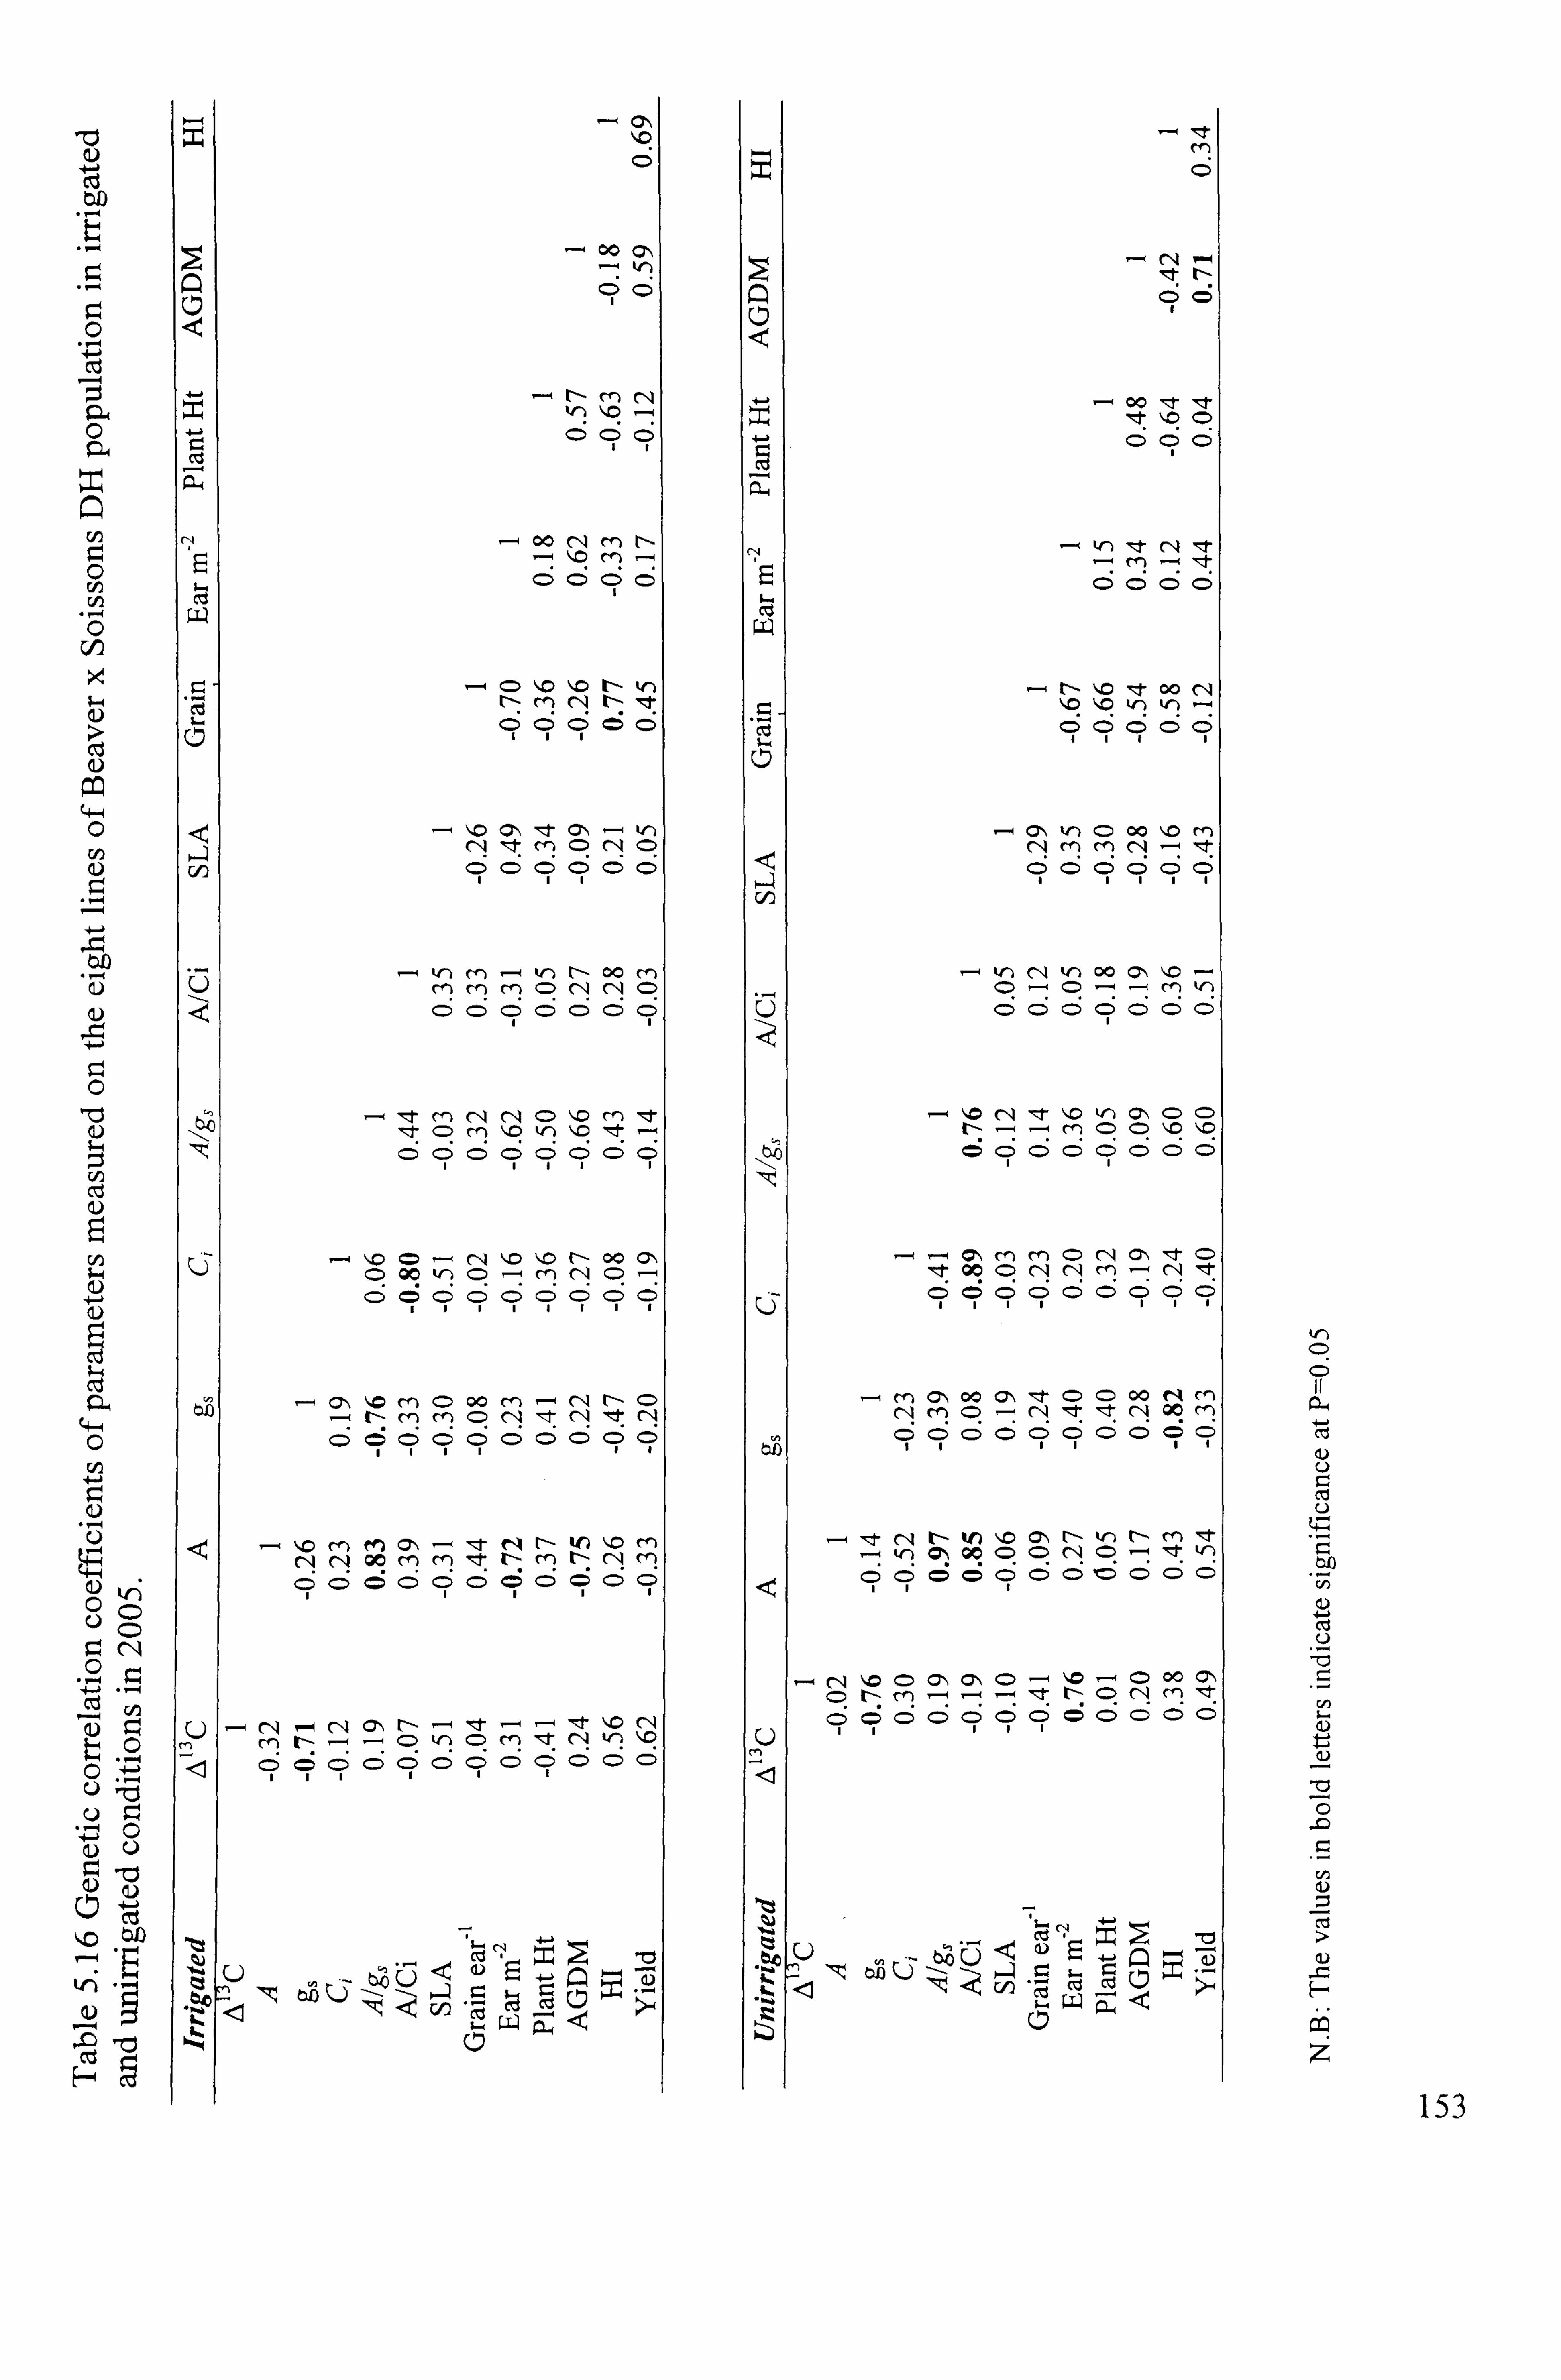
00 (7"
00
IZ4 z tr) "o -. 4 ý5. 'Itt 110 C) 0 +ý
V) - 00 (1-1 m r- cq - tr) "t " , I- 0- "o mýI- cf) ý 'Zt
03
t- ýD 00 C14 14ý llý W) Wý
C) C) C) C) C) C> Cý
I'D C*) a', W) C) 00 ý, o m
V) C14 ýt m C) C', 4 C) C14 mm CA - "t 6 C) 66c::, ) cl C) 6 C) C?
tr) m- kr) t'- 00 M kr) Cýl tn 00 C, ý "o
0m Cf) CD C-1 C114 C) <: D ý (=) -ý cf) V-)
6666666 (6) (6 C) u
M
C) C) 6 CD C) 6) 6
cn - "o 4= - C'4 "D "o t-- 00 C'ý -- Cý mm C) N C, ý -, I- C) C) 00 kn C) m r, ý C) 00 C) C14 Nm cq 't
C; al C) 66 C) 91
r-). 4 - Cý, 1,0 m C) 00 m- (14 r- C=> -ý m C71\ 00 C'ý rl, C) C) 00 "m
t- m cf) c) cl zt C14 -t N (14 m C) -N 'tt Itt " 00 m ................... <ý C: ý (: D c) C: ) c) :: ) c) = CD
+-j
uý
"o rn en Cý - , I- " t-- kn 1ý0 M ---I -zl- C'4 t- kn ý. c (7, ý r- kr) t- M ', T 00 mm "zi- Ir- m t- kn (: ý 00 C) C> C"i <= - I: t
C, C; C, Cý cl C, C) 6 C; c; 66c, CD 6 C) C)
tf)
. r-4 r-4 ýN ýo C> Cý, Cý C) - "D - C) 00 ON
ý4 -, (= t-- m -4 ýý "t t- C> Nm', zl- 4 -4 U)
C) Cý C) 6666 Cý C) 6 C) CD a) 04 U Itt -ý - ýt "C NIIIII
tý 0mm t- --q - C) kr) C: ) Cf) 'It C'4 W') ,c
r-I -Cý
cfj ltý ý-. N 4ý ýý tl
(0
, -I *E m-Z -C)
-! ý E
4- a!
C, 3
C's
bio
.2
-0
rA
cz
z 153
5.2 DISCUSSION
The results of the field study are discussed in this chapter through an analysis of various yield-forming traits and estimates of water-use efficiency to explain the relative performance of genotypes under irrigated and unirrigated field conditions. The issues
pertaining to gas-exchange measurements and their relationships with carbon isotope discrimination will be dealt with in detail to elucidate the physiological mechanisms and their genetic variation regulating water-use efficiency in UK wheat cultivars. The
present study used a doubled-haploid mapping population derived from a cross between
Beaver (UK-bred, photoperiod sensitive) and Soissons (French-bred, photoperiod insensitive). These parents also contrast for several morpho-physiological traits which
are detailed in section 3.2.2.1.
5.2.1 The impact of drought and weather conditions
For any crop, moisture availability is, principally, a function of the rainfall and the
available water capacity (AWC) of the soil within the rooting zone. The major variation
in AWC is due to soil texture and depth. However, there are also effects of soil
structural condition and whether a soil is a topsoil or subsoil (Bailey, 1990). Lighter
soils with poor structure and shallow topsoils have less AW. In the UK, AWC for winter
wheat ranges from about 120 mm on light sandy soils to more than 250 mm on some
deep silty clay loam soils, assuming a rooting depth of 1.5 in (Foulkes et al., 1994).
In 2003, at Gleadthorpe, the onset of drought coincided with flag leaf emergence, and
the irrigated treatment received 175 mm of water. In this year, soil moisture deficit
(SMD; the depletion of the available water below field capacity) exceeded 80 mm for
the period between 8 May and 29 June although the drought was only sustained till mid
grain filling due to exceptionally high rainfall on 30 June (54 mm). In 2005, at Sutton
Bonington the onset of drought coincided with ear emergence and the irrigated treatment
received 171 mm of water. SMD exceeded 100 mm. post-anthesis under unirrigated
conditions after 4 June and the drought was sustained until physiological maturity with
SMD raising to 135 mm. Thus, the post-anthesis drought was relatively severe in Sutton
Bonington in 2005 as compared to Gleadthorpe in 2003.
154
In 2003, the available water of the loam medium sand (Cuckney soil series) at ADAS Gleadthorpe was 108 mm, of which the limiting deficit (LD) was 50% (54 mm) (Foulkes et al., 2002). SMD up to 80 mm was sustained till 29 June. The sandy loam
soil (Dunnington Heath series) at Sutton Bonington had an AW of 186 Min (Reeves, 1975), and yield-limiting SMI)s were therefore those greater than 93 min (50% AW, Bailey, 1990). Thus, limiting SMI)s exceeded 100 mm. from the beginning of anthesis to
complete canopy senescence.
In this study to relate the effects of limited water availability on WUE for lines of Beaver x Soissons mapping population the popular technique of carbon isotope
discrimination has been used. Carbon isotope discrimination (delta; A 13 C) reflects a
measure of the extent to which photosynthesis (A) is maintained while stomatal
conductance (g, ) decreases. During the photosynthetic processes, C3plants discriminate
against the heavier carbon isotope 13C .
Transpiration efficiency as a process is
dependent on the ratio of intercellular to atmospheric C02 partial pressure, a higher
A 13 C resulting from higher C/C, for example, due to higher stomatal conductance.
Thus, TE (net photo synthesis/transpiration) is negatively associated with both CIC, and
A13C (Farquhar & Richards, 1984; Ehleringer, 1990).
5.2.2 Relationships between A 13 C and yield
As per 'Passioura's yield model', yield may be increased by an increase in water use,
water-use efficiency or harvest index. Here an attempt has been made to explain the
variations in WUE of wheat genotypes based on A 13 C and to interpret this within the
framework proposed by Passioura (1977; 1996). It is well established that among
several approaches, carbon isotope discrimination (A 13C) is the best-suited technique for
rapid and precise assessment of the genetic variability in WUE (Farquhar & Richards,
1984; Condon et al., 1987; Ehleringer, 1990; Ebdon et al., 1998 and Richards et al.,
2002) and as a predictor of yield performance under drought (Acevedo, 1993; Morgan et
al., 1993; Merah et al., 1999). As predicted by 13C theory, TE and A 13 C are inversely
related (Farquhar et al., 1989) and such a relationship has been confirmed in several
crop plants including cereals and legumes (Condon & Richards, 1993; Wright et al.,
1988). Thus, WUE is negatively associated with lower A 13C. In the present study,
regression analysis revealed that A 13C was positively correlated with grain yield under
155
unirrigated conditions amongst genotypes (P <0.02) in both years. The analysis of data
pooled across two site/seasons also revealed a positive association in irrigated (P<0.05)
and unirrigated conditions (P<0.001) amongst genotypes. Such a positive association of A"C with grain yield has been reported for a rangeOf C3 cereals including bread wheat (Condon et al., 1987; Ehdaie et al., 1991; Morgan et al., 1993; Ehdaie & Waines, 1996), durum wheat (Kirda et al., 1992; Merah et al., 2001; Monneveux et al., 2006) and barley (Craufurd et al., 1991; Acevedo, 1993). Similar associations have been reported for biomass production and A 13C (Condon et al., 1987; Ehdaie, 1991; Condon & Richards, 1993; Condon et al., 1993). These studies were conducted in Mediterranean or similar environments in which the crop depended on seasonal rainfall or stored moisture. The extent of drought stress in these studies was usually observed as relatively
mild to severe terminal stress imposed at around flowering. On the other handý several
pot studies have also reported a negative correlation between A 13 C and grain yield and
above-ground dry matter in wheat (Condon et al., 1990; Ehdaie et al., 199 1; Ehdaie and Waines, 1994; Ehdaie, 1995), in groundnut (Hubick et al., 1988) or no correlation in
spring wheat (Matus et al., 1996).
In this study, a highly significant difference of 1.43%o in A 13C was observed between the
site/seasons. Such difference in A 13C may be attributable to the water regimes. In the
unirrigated treatment, A 13C values were lower by 0.91%o in 2003 (P=0.09) and 1.49%o in
2005 (P<0.05) compared to the irrigated treatment. This clearly indicated a greater
impact of post-anthesis drought in reducing A 13C values in 2005 than in 2003. Several
studies have reported a significant decrease in A 13C with a decrease in soil water
availability and/ or an increase in vapour pressure deficit (Condon et al., 1987; Acevedo,
1993; Merah et al., 1999; Merah-et al., 2001). In the present study, the mean vapour
pressure deficit (VPD) during the crop season was about 0.5 kPa at Sutton Bonington
and <0.30 kPa at Gleadthorpe in 2003. So the larger differences in A 13 C at Sutton
Bonington were mainly attributed to the differences in VPD compared to Gleadthorpe.
The A 13C of genotypes in the droughted treatment ranged from 18.5-20.2%o in 2003,
18.4-19.8%o in 2005 and 18.5-20.0%o across site/seasons, while in the irrigated
treatments A 13C was significantly higher. This is in agreement with previous reports
156

indicating a reduction in A 13C under water-limited conditions (e. g. Farquhar & Richards, 1984; Condon et al., 1987; Richards et al., 2002).
Averaging across both irrigation treatments, genotypes differed in their mean A13C in the range of 19.0-20.6%o in 2003,19.2-20.5%o in 2005, and 19.2-20.6%o across site/seasons. These genetic ranges are in general agreement with previous studies in
wheat (Condon & Richards, 1992; Morgan et al., 1993; Merah et al., 2001). Ehdaie et al. (1991) reported A13 C ranges of up to 2.8 %o among wheat genotypes although much of the variability was associated with considerable genotypic differences in development. Similarly variation in A 13C in the range of up to 3.7%o for 144 accessions
of durum wheat has been reported (Merah et al., 2001). Previous work reported that differences in the rate and extent of soil water extraction among wheat genotypes were
associated with differences in A 13C (Condon et al., 1992). In the present study, the
positive association between A 13 C and grain yield indicated higher WUE was associated
with lower grain yield. The physiological basis of this association was examined further
at the leaf-scale by gas-exchange measurements for interpreting the field results of TE.
5.2.3 Relationships between A 13 C and stomatal aperture traits
It is reported that the positive correlation between A13 C and grain yield suggests the
dependence of genetic variation in A 13C on stomatal conductance (Condon et al., 1987;
Ehleringer, 1990; Acevedo, 1993; Morgan et al., 1993; Merah et al., 1999; Merah et al.,
2001). This is in general agreement with the observed positive relationship between
A 13 C and yield arising out of decreased stornatal conductance in the present study.
Stomatal conductance values were decreased by 35% in 2003 (at GS61) and 22% in
2005 (between GS39 and GS61+4 weeks) due to water stress. Soissons exhibited higher
g, values than Beaver in the pre-anthesis period, perhaps on account of its faster
development. However, at or after anthesis g, values for Soissons were apparently lower
than for Beaver in both years. The six DH lines also showed a trend for reduction in g,
values under drought. A significant interaction of genotypes with measurement date for
g, in 2005 showed some variability in the response of genotypes and that g, ranking was
certainly under the influence of the prevailing environmental conditions when the gas-
exchange was measured. However, the reduction in g, was weak for correlating the
differences amongst the genotypes and the formulated hypothesis that decreased g,
157
would favour an increase in TE was not supported in the present study. Further studies are required to examine whether reductions in gs favour increase in TE in the UK
environment.
The genetic correlation of g, with intrinsic TE (calculated as Alg, ratio) in 2003 was negative under irrigated (r---0.63) conditions with no significant correlation under drought. A similar trend was also observed in 2005 under irrigated (r---0.76; P<0.05)
and unirrigated (r=-O. 3 9) conditions. Photosynthetic capacity (calculated as a ratio of net photosynthetic rate to intercellularC02 concentration; AIQ is another important gas- exchange trait to quantify the relationships between yield and A 13C. If genotypic differences in A 13C were due to variation in photosynthetic capacity, then the
relationships between A 13 C and dry matter production would be expected to be negative,
not Positive (Condon et al., 1987). In the present study, the small number of gas-
exchange measurement dates makes it difficult to identify consistent relationships between leaf photosynthetic capacity and A 13C
. However, the correlation of AlCi with
A 13C was significant in irrigated (r--0.74; P<0.05) and unirrigated (r=0.81; P<0.05)
treatments in 2003. This implies that higher photosynthetic capacity was associated with lower TE, which does not seem logical. These effects were not confirmed to be
statistically significant in 2005. Soissons had a consistently higher AlCi ratio than
Beaver in 2005. Farquhar and Sharkey (1982) argued that internalC02 response curves
are needed to separate stomatal from non-stomatal (mesophyll) effects in leaf
photosynthesis in comparisons where genotypic differences in leaf conductance are
evident. It is possible that in this study such effects, acting on leaf photosynthesis or else
phenological differences, were associated with the differences observed among the
genotypes.
When parental lines were examined, Beaver and Soissons showed significant
differences (P<0.05) in their mean A 13C values across irrigation treatments in 2003 (20.2
and 19.6%o, respectively) and in 2005 (20.1 and 19.7%o, respectively). Both parents also
showed consistent decreases in A 13C under drought. The greater reduction in A 13C in
Soissons can be possibly related to effects of stomatal conductance. Soissons despite
having higher g, in the pre-anthesis Period showed greater reduction in g, under
droughted conditions in the post-anthesis period compared to Beaver in both years. This
158
could possibly in part explain differences in A13C of Soissons and Beaver arising out of variations in g, However, this needs further examination to see whether g, and TE are negatively correlated in field crops in the UK environment.
Previous studies in winter wheat showed existence of a significant positive correlation betweenC02 exchange rate (CER or A) and g, (Johnson et al., 1987; Morgan et al., 1990; Morgan & Le Cain, 1991; Monneveux et al., 2006). This positive correlation between g, and C02 exchange rate (A) precludes the establishment of simple
relationships between TE and either g, or CER because a higher g, with higher A would
certainly lead to a loss of water from the canopy resulting into a reduced TE. In the
present study, such a positive relationship between g, and A was observed for gas
exchange in 2003 (measured at GS61), but was not statistically significant. A negative
non-significant relationship between CER (or A) and g, was found in 2005 (measured
from GS39 to GS61+4weeks). This negative association between A and g, might have
resulted in a highly significant (P<0.05) positive correlations between A and ITE (ratio
of Alg, ) in the irrigated (r--0.83) and unirrigated (r=0.97) treatments in 2005, implying
that under the conditions when gas-exchange was measured a higher A with lower g' favoured higher TE in general. The relationship between g, and ITE (Alg, ratio) is
straight forward as they are inversely related. In this study, in general a greater WUE
was realized in leaves with lower g, in both years, but more significantly so in the
irrigated treatment in 2005 (r=-0.76) than in other environments.
The correlation of A 13C with Ci under unirrigated conditions, appeared negative in 2003
(r=-0.25) and positive in 2005 (r--0.30), but these effects were not statistically
significant. In theory, it is expected that a positive relationship exists between CI-C, and
A 13C under water limited conditions (Farquhar and Richards, 1984; Richards et al.,
2001; Condon et al., 2002). For the eight selected genotypes for intensive study of
stomatal aperture traits, there was a general trend in reduction for A, g, and Ci under
drought in both years. However, the hypothesis that the genetic variation in TE in the
DH population is due to differences in g, A and Ci of the flag leaf was partially
supported in the present study owing to the variability of stomatal aperture traits on
specific measurement dates (Tables 5.7-5.9). The genotype x irrigation interaction
effects were not significant in 2003, but were in 2005. For example, Soissons under
159
drought showed larger reductions for these gas-exchange parameters compared to Beaver.
Different genetic rankings for these stomatal aperture traits on sequential measurement dates was evident and the interaction of measurement date x genotype was significant. So on specific dates these relationships showed variable genetic behaviour despite the
positive correlation between A and TE. Thus i instantaneous ý it is difficult to relate *
measurements of gas-exchange to TE with certainty. Difficulty in relating variable
measurements of leaf gas-exchange to genotype differences in A 13C was evident in the
present study. This is possibly because of significant interactions found for measurement date x genotype in 2005. However, failure of gas-exchange data to clearly explain
positive association between A 13 C and grain yield, i. e. through detecting a positive
relationship between gs and A, may also indicate that the relationship was influenced by
a combination of factors in most of the genotypes, e. g. gs and A, plus the confounding
effects of developmental differences amongst the genotypes.
Stomatal responses to environment vary within stands of a single species; measurements
made over few days on a small part of a canopy are likely to be subject to confounding
effects as found in the present study. Atmospheric factors like relative humidity,
radiation, temperature or rainfall are likely to influence the values of gas exchange traits
(Squire, 1990). There are also diurnal fluctuations in these atmospheric factors to
consider. In addition, boundary layer effects need consideration when scaling from the
effect of stomata operating at the leaf level to canopy gas exchange, because the leaf-to-
air vapour pressure difference is likely to have an influence on leaves used in the gas-
exchange cuvette. Thus, the 'scaling up' problem is associated with impacts of unstirred
boundary layers around both the leaves and canopy as a whole (Jones, 1976; Cowan,
1988; Farquhar et al., 1988). The vapour pressure deficit during the crop season at
Sutton Bonington peaked in August at 0.48 kPa. However, there were large daily
fluctuations. A vapour pressure deficit of c. 1.02 kPa was observed on 22 June in this
year. The experimental site at ADAS Gleadthorpe is about 40 miles within the radius of
Nottinghamshire, UK and the VPD calculated for crop season at Sutton Bonington in
2003 was assumed to have similar effects in this site. However, the VPD was below
160
0.30 kPa during the crop season and increased only later in the season in August
coinciding with grain filling.
Richards et al. (2002) indicated that measuring A 13 C Provides no information on the magnitude of either A or transpiration (7) or whether variation in A 13C is being driven by variation in stornatal conductance or photosynthetic capacity. Both seasonal and diurnal variation in the water vapour gradient may have more influence on VýUE at the
crop scale than genetic variation in TE (Tanner & Sinclair, 1983). Genotype responses may also vary in different environments. Condon et al. (2002) reported that the lower g, of cultivar 'Quarrion', in two environments Wagga Wagga and Condobolin in eastern Australia, was associated with slower crop growth rates and slower soil water depletion
during the middle part of the growing season from about the start of stem elongation. They also reported that this cultivar, despite having higher TE and low gs behaved
differently at sites with respect to biomass production and grain yield being higher at Condobolin and lower in Wagga Wagga. However, in the present study, such variation for TE between the sites/seasons among genotypes was not evident. The cross-
site/season ANOVA indicated that the GxE interaction (P=0.054) for Al 3C just failed
to realise significance supporting the conclusion that A 13C was highly heritable in this
population. This is in agreement with previous reports that either a small or non-
significant GxE interaction effects indicates high heritability of A 13C in wheat (Condon
et al., 1987; Condon and Richards, 1992; Matus et al., 1996) and in peanut (Hubick et
al., 1988; Wright et al., 1988).
Wild diploid wheat species have higher photosynthetic rates than cultivated types
(Evans and Dunstone, 1970) and the highest photosynthetic rates tend to occur in small
leaved primitive diploid species (Dunstone et al., 1973). Thus, an increase in leaf
photosynthetic capacity is most often achieved in cereals by the concentration of leaf
nitrogen into smaller leaves with low specific leaf area (SLA; CM2 g-1) resulting from
reduction in the rate of leaf area expansion during early crop growth. This results in less
light interception, lower canopy photosynthesis and slower dry matter production
(Condon et al., 1993; Lopez-Casteneda et al., 1995). Thus, if low A 13C is due to greater
photosynthetic capacity per unit leaf and full light interception is maintained for only a
relatively short period, the outcome may be a negative association between leaf level A
161

and crop biomass, and a positive association between biomass production and A 13C.
This could theoretically explain why in the present study a negative association of A and AGDM was found in the irrigated treatments in 2005 (r---0.75; P<0.05).
It has been previously reported in sorghum that a negative relationship exists between TE and SLA with a tendency for specific leaf nitrogen (SLN; ratio of leaf nitrogen content to leaf area) to increase as SLA decreases (Hammer et al., 1997). This suggests that regulation of conductance rather than assimilation capacity may be responsible for
genetic variation observed in TE. In the present study, SLA decreased under drought in 2003. Soissons had a significantly higher SLA at GS61 than Beaver in both years. SLN
showed a positive correlation with A 13C only under unirrigated conditions (r--0.40;
P<0.05) for the 35 genotypes in 2003. Thus, present results did not confirm the
published negative relationship of SLA and TE. In cereals, previous reports indicated
that SLN correlates positively with ýWE, e. g., in sorghum Borrell et al. 2000; Hammer
et al. 1997), presumably through effects on Rubisco content. Genetic variation in
Rubisco content (Julian et al. 1998) and Rubisco activity (Xiao et al. 1998) has been
shown to correlate positively with photosynthesis rate in wheat.
Several studies have reported that the percent increase in WUE of wheat in dry
compared to wet environments ranges 17-32 (Kimball et al., 1995) or 40-46 (Chaudhuri
et al., 1990). Such a large variation depends on the method of calculation of WLJE either
based on grain mass or gas exchange. In the present study, at anthesis (GS61) intrinsic
WUE (calculated as ratio of Alg, ) at leaf level showed a37% (in 2003) and I I% (in
2005) increase in WUE in unirrigated treatment.
5.2.4 Drought effects on growth processes
The extensive information collected on selected DH lines allows, the effects of drought
on growth processes and associated component traits to be analysed to explain the
physiological basis for WUE in the Beaver x Soissons population.
5. Z4.1 Evidenceforpost-anthesis drought andyield responses
In the UK drought typically occurs post-anthesis. Several UK studies related genotypic
response to drought for season-long water uptake, harvest biomass and grain yield using
162
isogenic lines differing in traits such as crop height (Innes et al., 1985), ear population (Innes et al., 1981), date of ear emergence (Innes et al, 1985), leaf posture (Innes & Blackwell, 1983), other investigations examined canopy characteristics such as maximum GAI and stem soluble reserves or flowering time and their relationship with grain yield under drought for sets of cultivars (Foulkes et al., 1993,2001 & 2002). Al 3C
as a candidate selection tool to quantify drought resistance in genotypes has been
evaluated here. The yield response to irrigation in 2003 and 2005 ranged from 0.5 to 1.6
t ha-1 and was smaller than those reported previously for UK wheat of about 2t ha-I (Innes et al., 1985; Bailey, 1990; Foulkes et al., 2002). The range of yield differences
among the genotypes was also higher on account of a strong GxE interaction observed. The range of flowering date of genotypes was wide at about 9 days, with regard to French-bred photoperiod insensitive bread wheat Soissons (Worland et al., 1994;
Foulkes et al., 2002) and the late developing photoperiod sensitive UK-bred feed wheat Beaver. These differences in flowering date can be related to effects in water use
pattern. Foulkes et al. (1993) suggested that under irrigated conditions, early flowering
would lead to early maturity and hence to smaller biomass; while under drought
conditions, there would be less time for growth hence less reduction in biomass.
However, in a further study, Foulkes et aL (2004) examined the effects of the Ppd-D]
allele in near-isogenic lines of Mercia and Cappelle-Desprez winter wheats and found
no differences in yield responses to drought for early and late flowering cultivars. The
effects of Ppd-D] on drought resistance traits such as early flowering, high stem
reserves, deep rooting and WUE were found overall to be neutral on late-season drought
resistance in the UK (Foulkes et al. 2004). In the present study, the regression of
flowering date on the grain yield of genotypes was not statistically significant in each of
the irrigation treatments. This was also the case for harvest biomass. However, fast
developing Soissons produced small biomass at harvest with or without irrigation. These
findings are in general agreement with the findings of Foulkes et al. (2001; 2004) in
relation to flowering and drought resistance.
The variation in the range of flowering date of BxS mapping population may be
associated with the Ppd-D] or ppd-D] alleles on chromosome 2D controlling
photoPeriod response (Verma et al., 2004). However, regression of flowering date on (1)
irrigated yield (ii) unirrigated yield and yield loss under drought were all non significant
163

in both years (r<0.2). This indicates that early flowering did not lead to better
maintenance of yield under drought amongst lines of Beaver x Soissons population in
the present study. It is possible that the extended period of flowering may favour the development of a larger root more extensive system in photoperiod sensitive genotypes,
allowing the crop to maintain water uptake during grain filling despite their water
consumption earlier in the season (Foulkes et al., 2002). In the present study, the high
yielding genotypes tended to lose more grain yield under drought consistent with reports
of a positive association between yield potential and absolute yield loss under drought,
e. g. Fischer and Maurer (1978).
The maximum GAI at GS61 ranged from 6.3-9.5 under irrigation for the genotypes and
was broadly representative of the range for maximum GAI present in UK wheat
cultivars (Austin et al., 1980; Foulkes et al., 2001). To link maximum GAI with biomass
production response of cultivars to drought, Foulkes et al. (1993) reported that the
genetic variation in maximum GAI must be independent of variation in seasonal
fractional interception of radiation (which depends on LAI and extinction coefficient k).
However, such responses were not found on account of differences in thickness and
transmissivity of leaves in canopies (Foulkes et al. 2001); and indicated that GAI was a
poor guide to seasonal growth, or water use during the growing season and poor
predictor of biomass response to drought in the UK's temperate climate. Similar effects
could account for the lack of a correlation between maximum GAI and yield response to
drought in the present study.
In the present study, the decreases in HI under drought was about 0.0 1 which is far less
than those reported in previous UK studies (Innes et al., 198 1; 1984; Innes & Blackwell,
1983; Fischer & Wood, 1979; Foulkes et al., 2002). The HI of lines 134E, 134G and
35A was generally above the range of mean HI for parents. The improvement of HI
through UK breeding has been well documented (Austin et al., 1989; Foulkes et al.,
2002) which mainly lies with the inclusion of semi-dwarf Rht genes. In the present
study, the selected genotypes Beaver, Soissons, line 21B and 76A possessed Rhtj or
Rht2 semi-dwarfing genes while lines 134G, 134E, 35A, 22B had rht genes. Under
irrigated conditions, Beaver and line 21B had higher yields on account of having more
grains ear-'. Both these genotypes have the Rht2 gene and this is in agreement with the
164
previous reports of improved spikelet fertility conferred by the Rht2 gene (Gale & Yousefflan, 1985). However, lower grains ear-' was observed with line 76A, a double- dwarf genotype possessing Rhtl +Rht2 genes, compared to the tall lines.
Most genotypes, including Beaver, did not maintain grain yield under drought mainly because of reduction in biomass growth. The exception to this was observed in line 21B
and Soissons which maintained HI better with or without irrigation.
5.2.4.2 Effects of the IBLIIRS translocations
The IBUIRS wheat (Triticum aestivum L. ) - rye (Secale cereale L. ) centric translocation, involving the short arm of rye chromosome I Rý has been extensively used in wheat breeding programmes worldwide in recent decades (Lukaszewski, 1990; Rajaram et al., 1990). These translocations have been reported to improve yield
potential, stress tolerance and adaptation in bread wheat (Rajaram et al., 1983; Villareal
et al., 1998; Ehdaie et al., 2003). The presence of IBLARS in some hard red winter
wheats was associated with higher grain yield, aerial biomass, grain weight, and spikelet fertility (Carver and Rayburn, 1994; Foulkes et al., 2001). However, the reported effects
are generally either positive or neutral on grain yield (DEFRA, 2004). In the present
study, the above-ground biomass at harvest was raised by IBUIRS in both years, but
this was not realised as an increase in grain yield or as a reduction in yield loss under drought. Interestingly, the IBUIRS translocation was associated with higher Al 3C in
2003 (P=0.07) and in 2005 (P<0.001). Lines with IBLARS increased A 13 C both under
irrigated and unirrigated field conditions compared to their non-translocation
counterparts. Thus, it is evident that modem wheat yield improvement in UK associated
with the introduction of the IBL/IRS translocation is more linked to greater biomass at
harvest than to water-use efficiency. Previous reports of IBL/IRS conferring greater
biomass in modem wheat UK genotypes (Foulkes et al., 2001; Shearman et al., 2005)
indicated that achieving greater yield potential in modem UK wheats may be associated
with a decrease in WUE. This was also observed in the present study in that A 13 C and
grain yield of all 35 genotypes showed positive correlations under irrigated and
unirrigated field conditions, indicating that genotypes with lower delta or higher WUE
had reduced grain yields (Fig. 5.2).
165

5.2.4.3 Effects of Rh t genes
The Norin-10 dwarfing genes Rhtl and Rht2 are located at homoeologous positions on the short arms of chromosome 4B and 41), respectively. In addition to their primary effect in reduction in plant height, these genes have been associated with lodging
resistance and greater response to nitrogen than the tall cultivars (Donald, 1968). An
association of drought susceptibility and effects of Rht genes have been reported (Fischer and Wood, 1979; Duwayri, 1984; Ehdaie and Waines, 1996). In the present study, paired contrasts for comparing At], Rht2, Rhtl +Rht2 and rht genes in groups of the 33 DH lines indicated no significant differences between Rht] and rht lines in A13C
and grain yield. Tall lines (rht) had significantly lower A 13C (higher WUE) and lower
grain yield compared to Rht2 lines in both years in irrigated and unirrigated treatments (P<0.01). This is in agreement with the findings of previously reported pot experiments that tall wheats had greater total dry matter and TE than semi-dwarf and dwarf wheats (Ehdaie et al., 1991; Ehdaie and Waines, 1993). Richards (1992) in Australia and Ehdaie and Waines (1994) in California working on near isogenic lines of bread wheat for Rht], Rht2 and Rht3 have also found that TE or WUE for total dry matter declined
with plant height. The effects of double-dwarf genotypes (Rht] +Rht2) were inconsistent
in 2003, but in 2005 they showed lower A 13 C and higher grain yield (P<0.05) over tall
lines. The differences between Rhtl and Rht2 were also significant for Al 3C and grain
yield. Genotypes with Rht] showed lower A 13 C and lower grain yields in both years
under irrigated and unirrigated treatments compared to Rht2 genotypes. Thus, in the
present study it seems that lower A 13 C associated with Rht] under UK conditions may
not be associated with yield improvement.
5.2.5 Relationships between A 13 C and yield traits
In 2003, flowering time of 35 genotypes was positively correlated with A 13C under
irrigated (r=0.40; P<0.05) and unirrigated (r--0.42; P<0.05) conditions. This implied that
early flowering may lead to higher WUE. This can be ascribed to the effects of Ppd-D]
allele in advancing flowering time of genotypes thus leading to drought escape.
However, such effects were not confirmed in 2005 where A 13C correlated weakly with
flowering time only under irrigated conditions (r=0.32; P<0.10) with no consistent
effects under drought. These results are in agreement with a previous report on selection
166
for low A 13C to be associated with earlier anthesis date (Rebetzke et al., 2002). However, previous findings in wheat showed strong negative associations between A 13C
and days to heading or anthesis in Mediterranean cereals under terminal drought, with low A 13C genotypes flowering many days later than high A13C genotypes (Ehdaie et al., 1991; Craufurd et al., 1991; Acevedo, 1993; Sayre et al., 1995) while in some studies there has been little variation in flowering date (Condon et al., 1987; Morgan et al., 1993; Acevedo, 1993).
A negative correlation between A 13C and crop height was found in both years in (r--- 0.40) but these associations were not statistically significant. Howeverý tall lines
generally had lower delta. There are also reports indicating no correlation between lower delta and increased height (Donovan and Ehleringer, 1994; Rebetzke et al., 2002). The
association between A 13 C and AGDM was positive but weakly correlated. There are
studies which reported either positive or neutral effects between Al 3C and biomass
production in wheat (Condon et al., 1987; Ehdaie, 1991; Condon & Richards, 1993;
Condon et al., 1993; Richards, 1994). The factors influencing positive or negative
genetic correlations between A 13 C and yield will be discussed in more detail in chapters 6 and 7.
In summary, it is evident that under UK conditions the ability to maintain yield under
drought is mainly associated with improvement in water use rather than WUE, i. e. it
seems that the present wheat population may require ability to capture more water to
fulfill their yield potential. The formulated hypothesis that there is a positive genetic
correlation between TE or WUE and grain yield amongst lines of DH population under
drought in the UK environment needs further consideration as some genotypes showed a
trend for higher grain yield with higher A 13C ( lower TE). There is apparently a trade-off
between TE and seasonal water use in the UK environment. So further studies related to
rooting in relation to effective water capture in new cultivars seem justified. The use of
carbon isotope discrimination could serve the purpose of identifying genotypes with
improved drought resistance but perhaps only as an indirect indicator of season-long
water use.
167
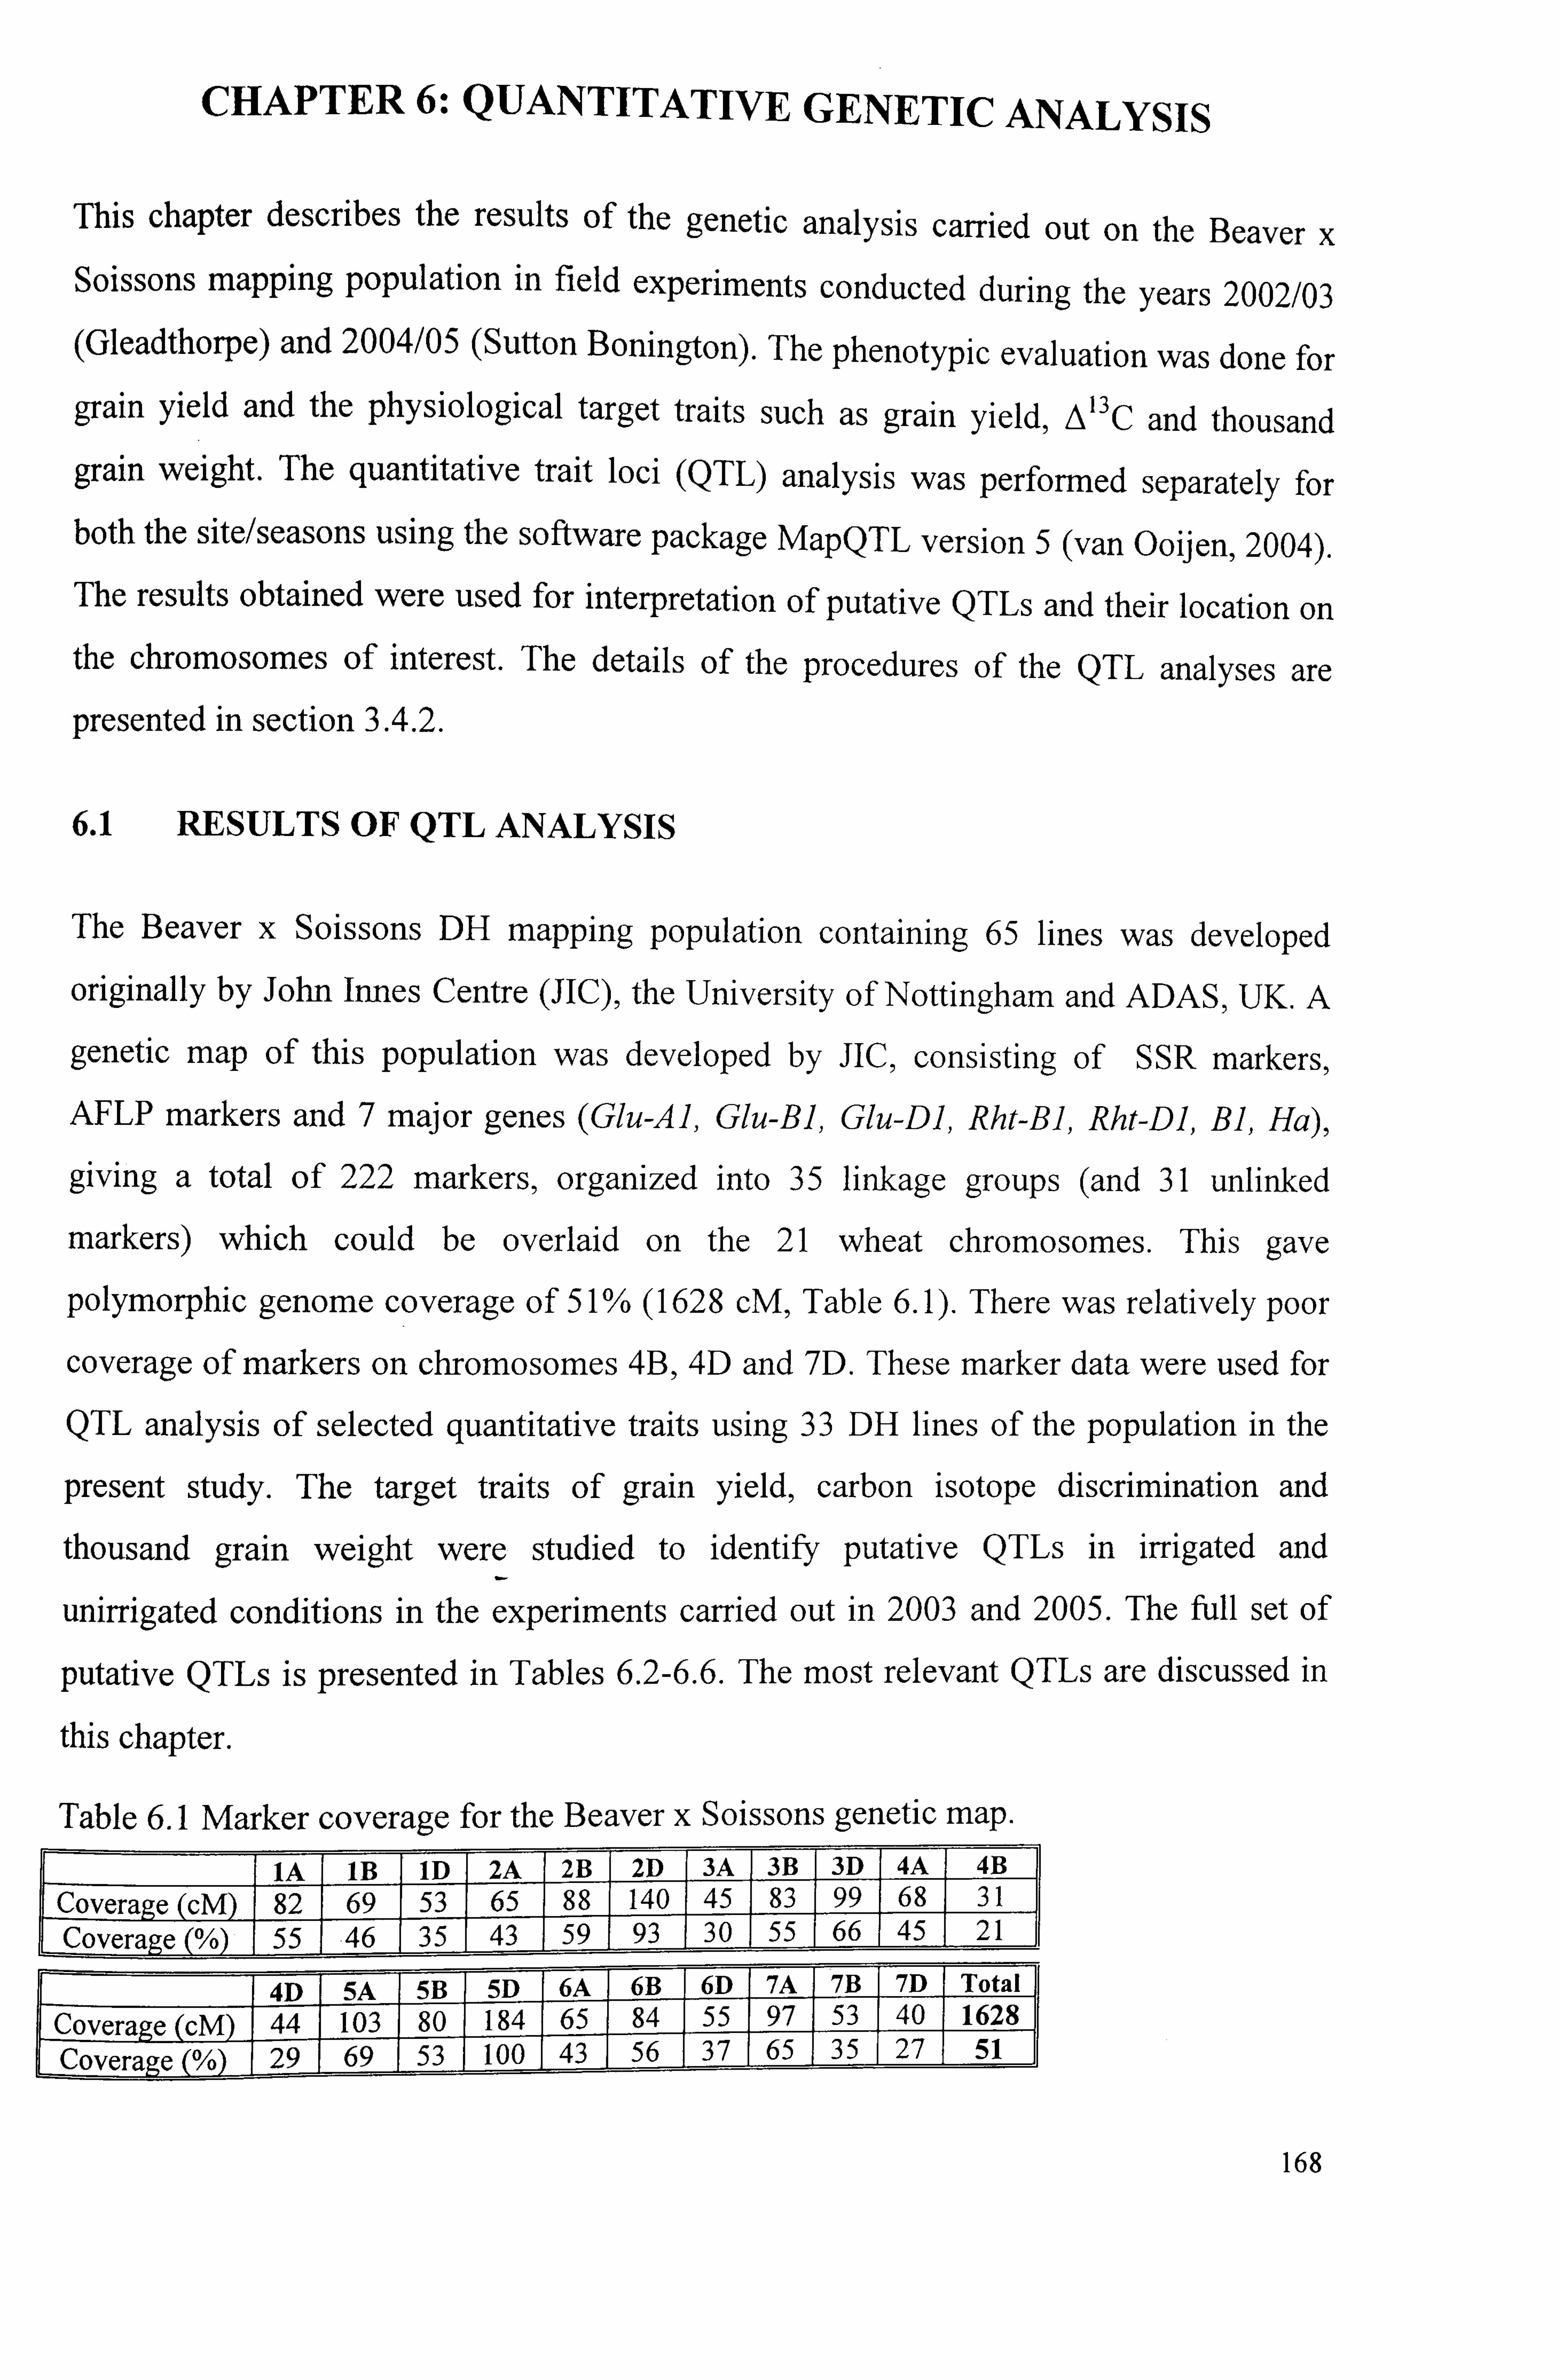
CHAPTER 6: QUANTITATIVE GENETIC ANALYSIS
This chapter describes the results of the genetic analysis carried out on the Beaver x Soissons mapping population in field experiments conducted during the years 2002/03
(Gleadthorpe) and 2004/05 (Sutton Bonington). The phenotypic evaluation was done for
grain yield and the physiological target traits such as grain yield, A"C and thousand
grain weight. The quantitative trait loci (QTL) analysis was performed separately for
both the site/seasons using the software package MapQTL version 5 (van Ooijen, 2004).
The results obtained were used for interpretation of putative QTLs and their location on the chromosomes of interest. The details of the procedures of the QTL analyses are
presented in section 3.4.2.
6.1 RESULTS OF QTL ANALYSIS
The Beaver x Soissons DH mapping population containing 65 lines was developed
originally by John Innes Centre (JIC), the University of Nottingham and ADAS, UK. A
genetic map of this population was developed by JIC, consisting of SSR markers,
AFLP markers and 7 major genes (Glu-Al, Glu-Bl, Glu-D], Rht-Bl, Rht-DI, Bl, Ha),
giving a total of 222 markers, organized into 35 linkage groups (and 31 unlinked
markers) which could be overlaid on the 21 wheat chromosomes. This gave
polymorphic genome coverage of 51% (1628 cM, Table 6.1). There was relatively poor
coverage of markers on chromosomes 4B, 4D and 7D. These marker data were used for
QTL analysis of selected quantitative traits using 33 DH lines of the population in the
present study. The target traits of grain yield, carbon isotope discrimination and
thousand grain weight were studied to identify putative QTLs in irrigated and
unirrigated conditions in the experiments carried out in 2003 and 2005. The full set of
putative QTLs is presented in Tables 6.2-6.6. The most relevant QTLs are discussed in
this chapter.
Table 6.1 Marker coverage for the Beaver x Soissons genetic map.
IA 1B 1D 2A 2B 2p 3A 3-B 3D 4A 4B E[overa e cM c 82 69 53 6- tO 45 & 8
L
3 31 31 cow Coverage (0/ý) -, qq r, 3 30 5: 5 21 2 21
4D 5A 5B 5D 6A 6B 6D 7A 7B 7D Total
Covera e 44 103 80 184 65 84 55 97 53 40 1628
Covera e 29 69 53 100 43 56 37 65 35 27 51
168
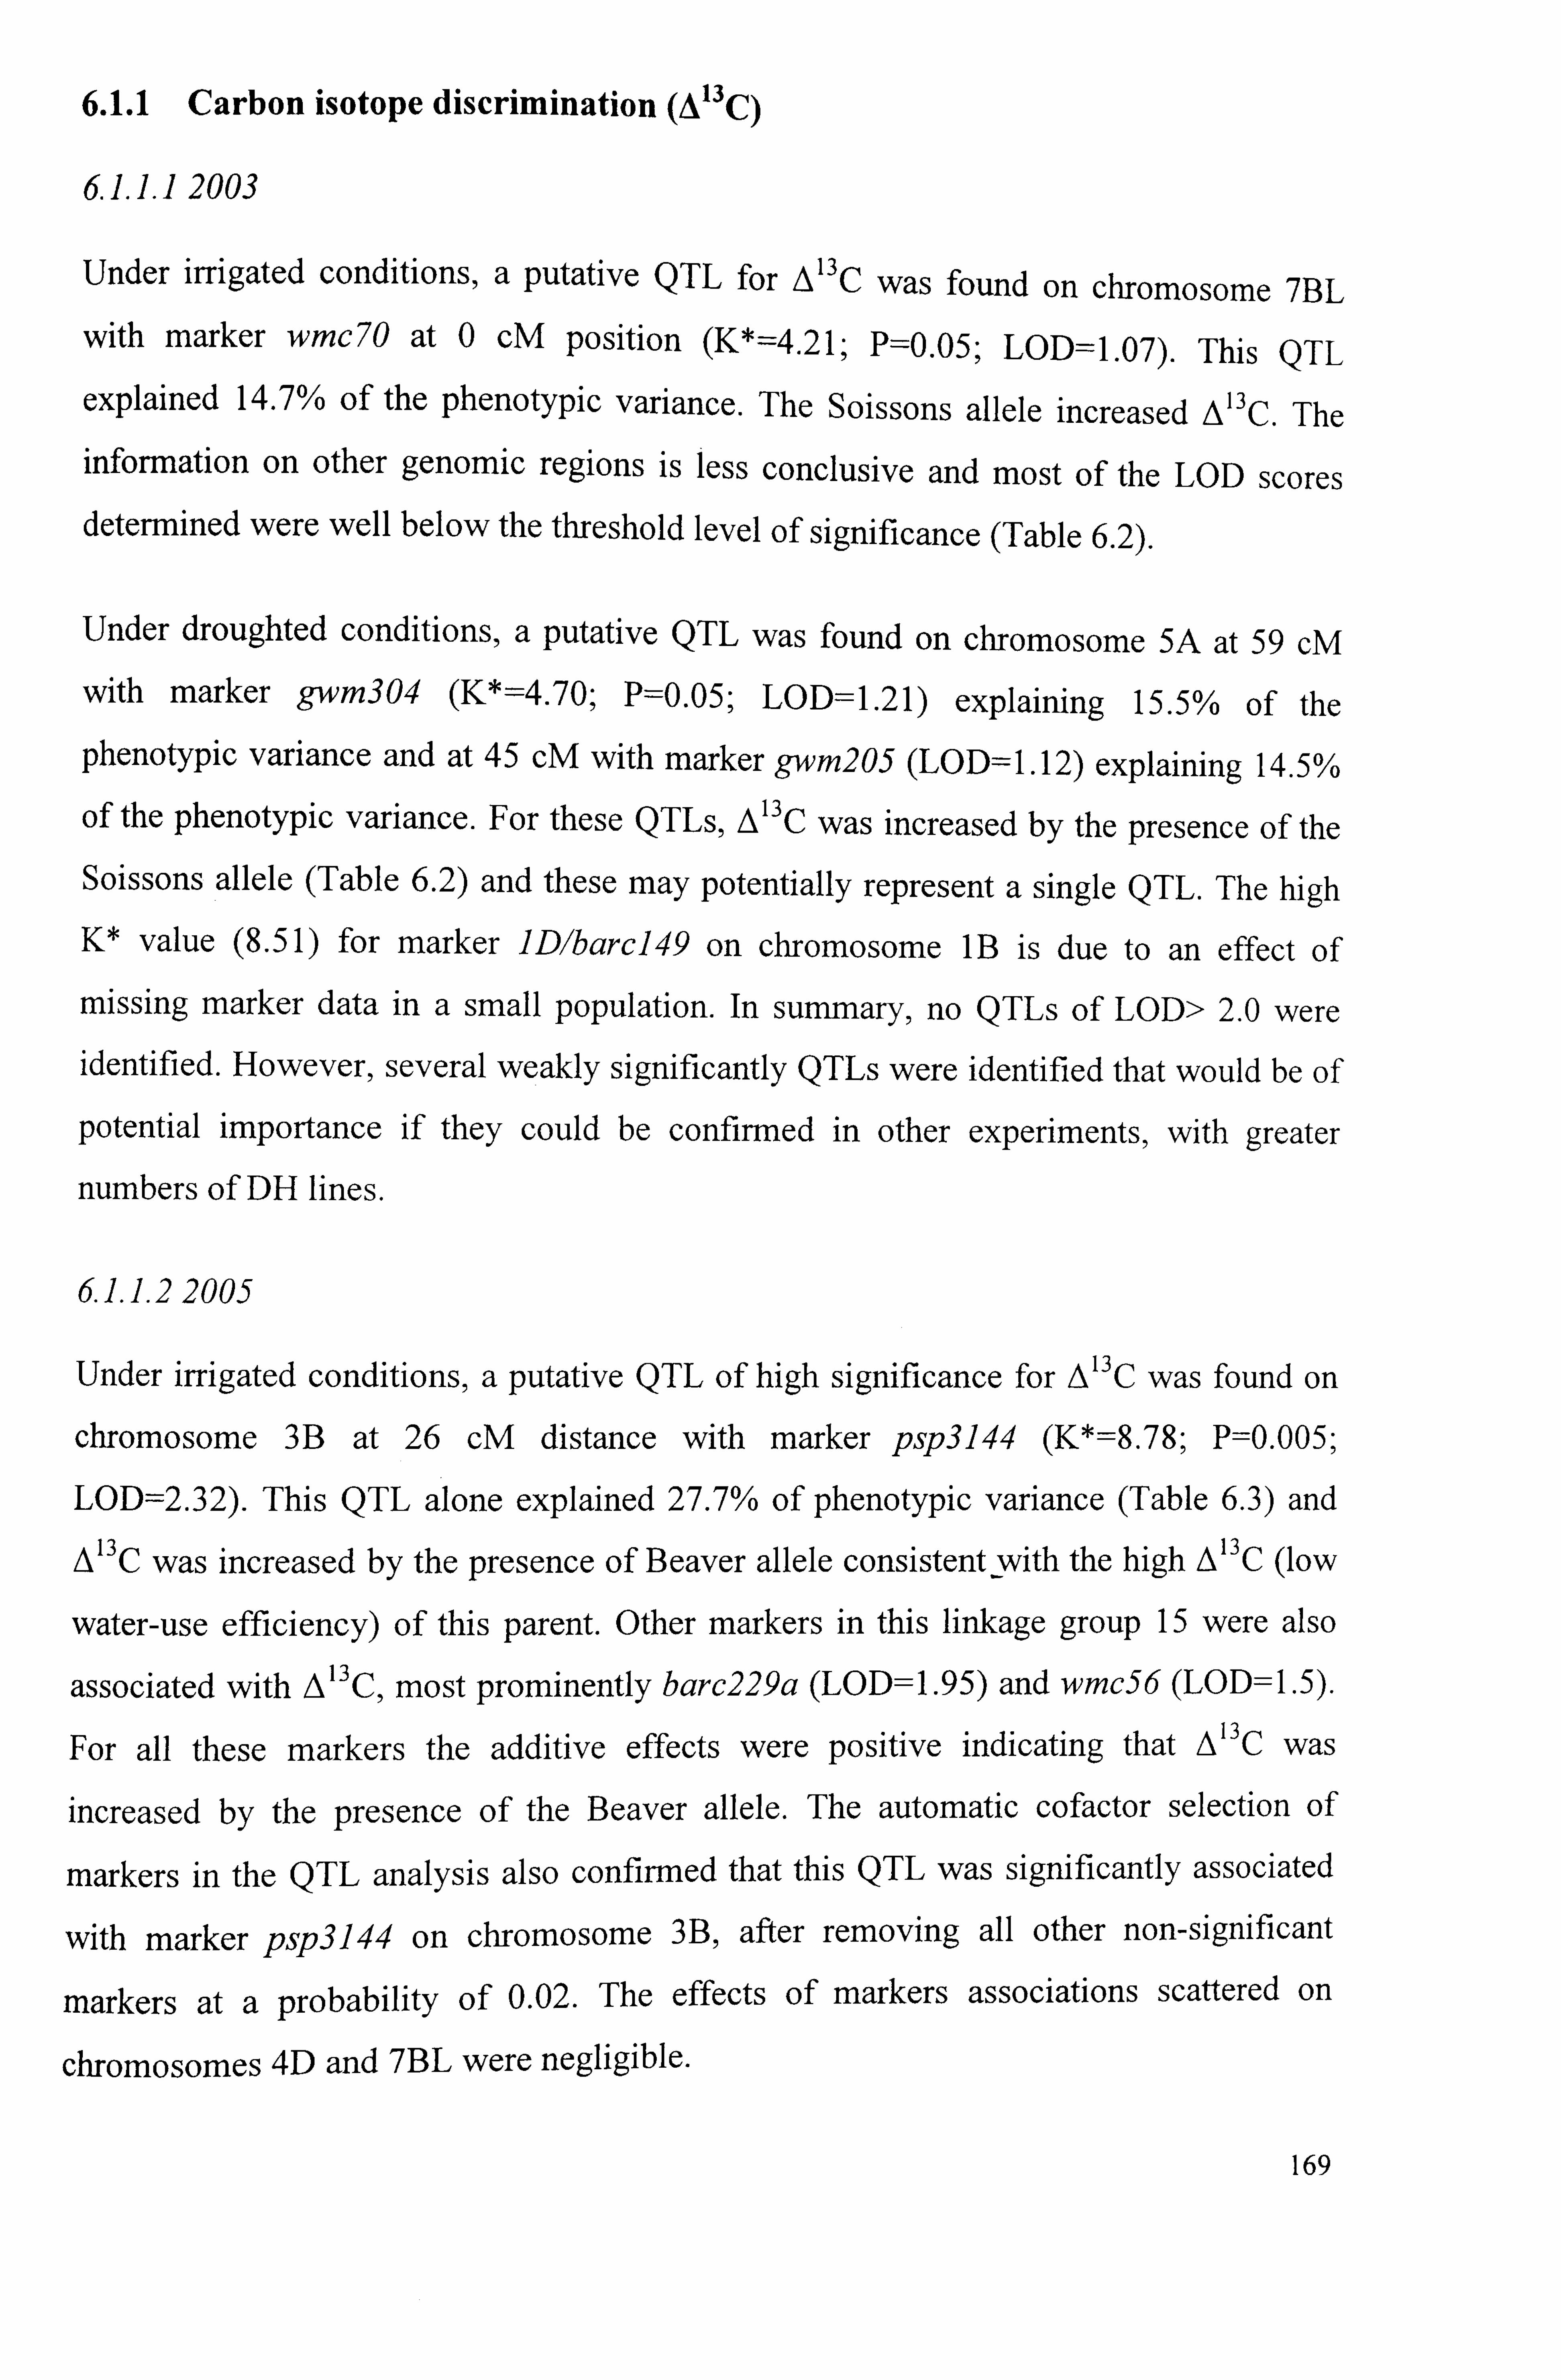
6.1.1 Carbon isotope discrimination (A 13 C)
61.1.12003
Under irrigated conditions, a putative QTL for A13C was found on chromosome 7BL
with marker wmc70 at 0 CM position (K*=4.21; P=0.05; LOD=1.07). This QTL
explained 14.7% of the phenotypic variance. The Soissons allele increased A 13C .
The information on other genomic regions is less conclusive and most of the LOD scores determined were well below the threshold level of significance (Table 6.2).
Under droughted conditions, a putative QTL was found on chromosome 5A at 59 cM
with marker gwm304 (K*=: 4.70; P=0.05; LOD:: =1.21) explaining 15.5% of the
phenotypic variance and at 45 cM with marker gwm205 (LOD=1.12) explaining 14.5%
of the phenotypic variance. For these QTLs, A13C was increased by the presence of the Soissons allele (Table 6.2) and these may potentially represent a single QTL. The high
K* value (8.51) for marker ]Dlbarc]49 on chromosome 113 is due to an effect of
missing marker data in a small population. In summary, no QTLs of LOD> 2.0 were identified. However, several weakly significantly QTLs were identified that would be of
potential importance if they could be confirmed in other experiments, with greater
numbers of DH lines.
61.1.22005
Under irrigated conditions, a putative QTL of high significance for A 13C was found on
chromosome 3B at 26 cM distance with marker psp3144 (K*=8.78; P=0.005;
LOD=2.32). This QTL alone explained 27.7% of phenotypic variance (Table 6.3) and
A 13C was increased by the presence of Beaver allele consistent with the high A 13C (low
water-use efficiency) of this parent. Other markers in this linkage group 15 were also
associated with A 13C , most prominently barc229a (LOD=1.95) and wmc56 (LOD=1.5).
For all these markers the additive effects were positive indicating that A' 3C was
increased by the presence of the Beaver allele. The automatic cofactor selection of
markers in the QTL analysis also confirmed that this QTL was significantly associated
with marker psp3]44 on chromosome 3B, after removing all other non-significant
markers at a probability of 0.02. The effects of markers associations scattered on
chromosomes 4D and 7BL were negligible.
169
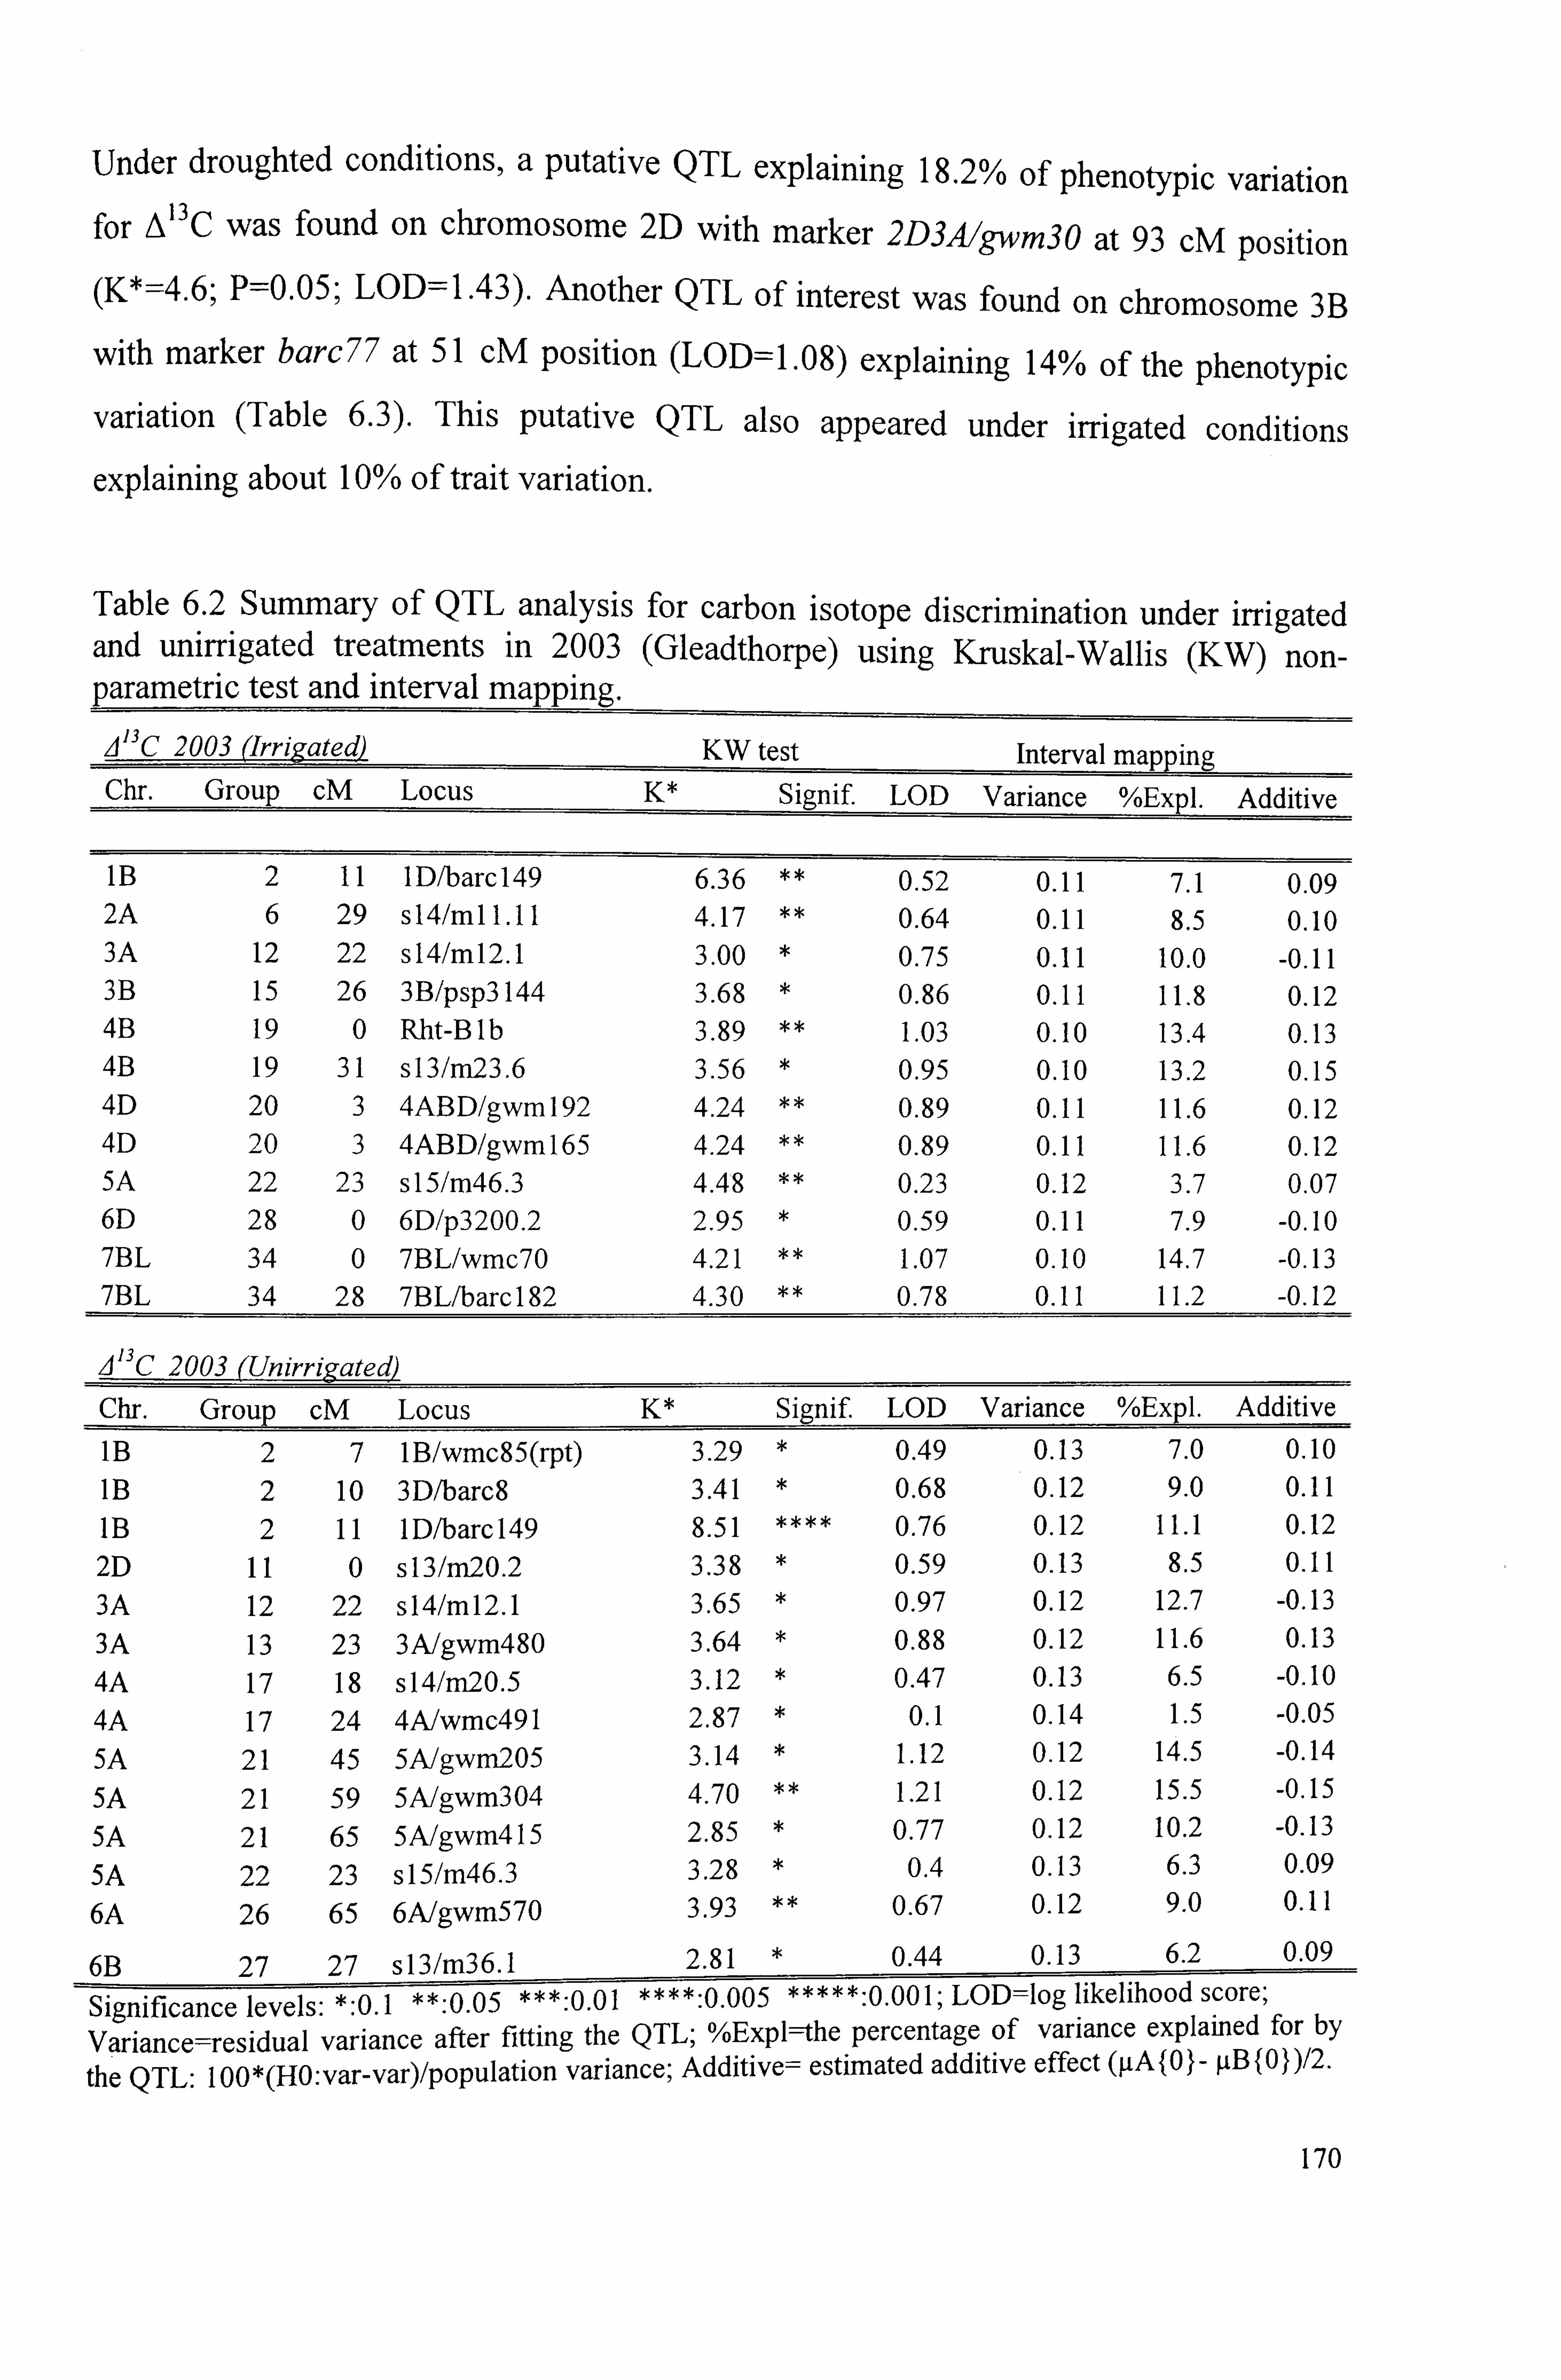
Under droughted conditions, a Putative QTL explaining 18.2% of phenotypic variation for A 13C was found on chromosome 2D with marker 2D3AIkwm3O at 93 CM position (K*=4.6; P=0.05; LOD=1.43). Another QTL of interest was found on chromosome 3B
with marker barc77 at 51 cM position (LOD=1.08) explaining 14% of the phenotypic
variation (Table 6.3). This putative QTL also appeared under irrigated conditions
explaining about 10% of trait variation.
Table 6.2 Summary of QTL analysis for carbon isotope discrimination under irrigated and unirrigated treatments in 2003 (Gleadthorpe) using Kruskal-Wallis (KW) non- parametric test and interval mapping. A13 C 2003 (LrLrigated KW test Interval mapping Chr. Group cM Locus K* Signif. LOD Variance %Expl. Additive
1B 2 11 1 D/barc 149 6.36 ** 0.52 0.11 7.1 0.09 2A 6 29 s 14/ml 1.11 4.17 ** 0.64 0.11 8.5 0.10 3A 12 22 sl4/ml2.1 3.00 0.75 0.11 10.0 -0.11 3B 15 26 3B/psp3l44 3.68 0.86 0.11 11.8 0.12 4B 19 0 Rht-B Ib 3.89 * 1.03 0.10 13.4 0.13 4B 19 31 sl3/m23.6 3.56 0.95 0.10 13.2 0.15 4D 20 3 4ABD/gwm 192 4.24 * 0.89 0.11 11.6 0.12 4D 20 3 4ABD/gwml65 4.24 * 0.89 0.11 11.6 0.12 5A 22 23 sI 5/m46.3 4.48 * 0.23 0.12 3.7 0.07 6D 28 0 6D/p3200.2 2.95 0.59 0.11 7.9 -0.10 7BL 34 0 7BL/wmc7O 4.21 * 1.07 0.10 14.7 -0.13 7BL 34 28 7BL/barc 182 4.30 * 0.78 0.11 11.2 -0.12
j 13 C 2003 (Unirrigated
Chr. Group CM Locus K* Signif LOD Variance %Expl. Additive
1B 2 7 IB/wmc85(rpt) 3.29 0.49 0.13 7.0 0.10
1B 2 10 3D/barc8 3.41 0.68 0.12 9.0 0.11
1B 2 11 1 D/barc 149 8.51 0.76 0.12 11.1 0.12
2D I1 0 s 13/m2O. 2 3.38 0.59 0.13 8.5 0.11
3A 12 22 sl4/ml2.1 3.65 0.97 0.12 12.7 -0.13 3A 13 23 3A/gwm480 3.64 0.88 0.12 11.6 0.13
4A 17 18 s 14/m2O. 5 3.12 0.47 0.13 6.5 -0.10 4A 17 24 4A/wmc491 2.87 0.1 0.14 1.5 -0.05 5A 21 45 5A/gwm2O5 3.14 1.12 0.12 14.5 -0.14 5A 21 59 5A/gwm3O4 4.70 1.21 0.12 15.5 -0.15 5A 21 65 5A/gwm4l5 2.85 0.77 0.12 10.2 -0.13 5A 22 23 s 15/m46.3 3.28 0.4 0.13 6.3 0.09
6A 26 65 6A/gwm570 3.93 0.67 0.12 9.0 0.11
6B 27 27 sl3/m36.1 2.81 0.44 0.13 6.2 0.09
Significance levels: *: 0-1 **: 0.05 ***: 0.01 ****: 0.005 *****: 0.001; LOD=Iog likelihood score;
Variance=residual variance after fitting the QTL; %Expl--the percentage of variance explained for by
the QTL: 100*(HO: var-var)/population variance; Additive= estimated additive effect (gAI01- ýffl(O))/2.
170
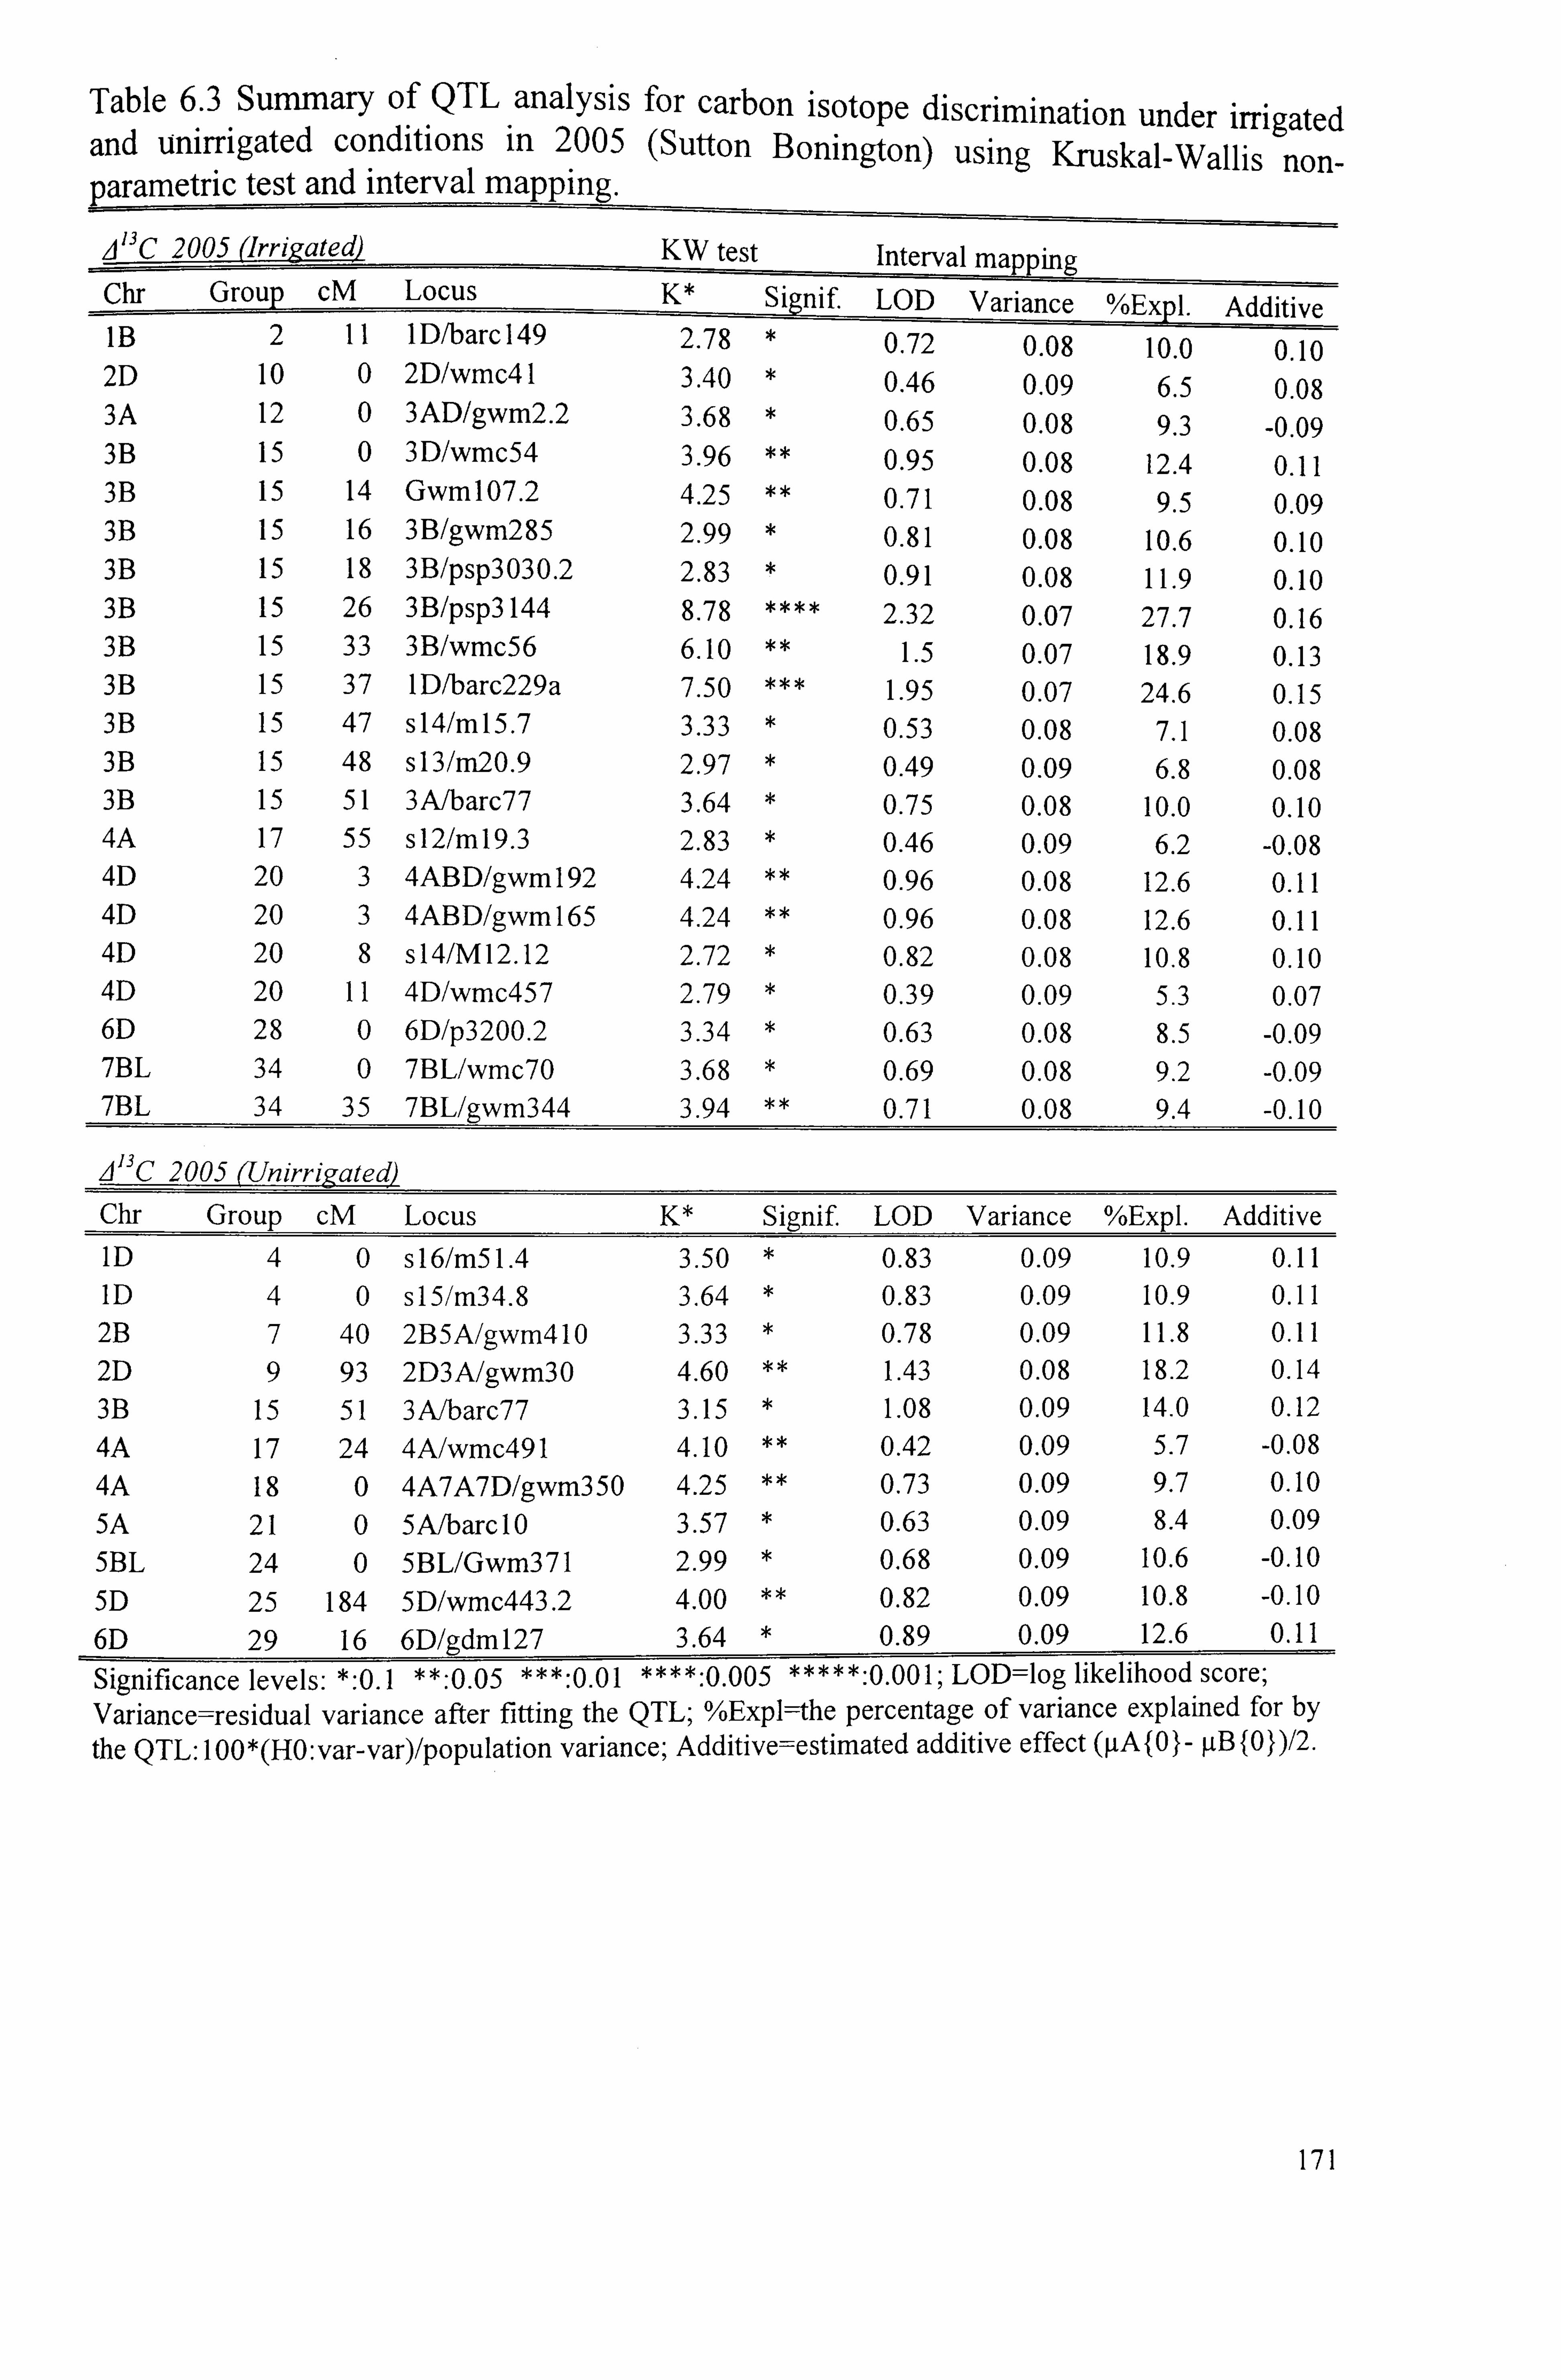
Table 6.3 Summary of QTL analysis for carbon isotope discrimination under irrigated and unirrigated conditions in 2005 (Sutton Bonington) using Kruskal-Wallis non- parametric test and interval mapping.
j 13 C 2005 (Lrrig ated KW test Interval mapping
Chr Group CM Locus K* Signif LOD Variance %Expl. Additive IB 2 11 1 D/barc 149 2.78 0.72 0.08 10.0 0.10 2D 10 0 2D/wmc4l 3.40 0.46 0.09 6.5 0.08 3A 12 0 3AD/gwm2.2 3.68 0.65 0.08 9.3 -0.09 3B 15 0 3D/wmc54 3.96 ** 0.95 0.08 12.4 0.11 3B 15 14 Gwm107.2 4.25 ** 0.71 0.08 9.5 0.09 3B 15 16 3B/gwm285 2.99 0.81 0.08 10.6 0.10 3B 15 18 3B/psp3O3O. 2 2.83 0.91 0.08 11.9 0.10 3B 15 26 3B/psp3l44 8.78 2.32 0.07 27.7 0.16 3B 15 33 3B/wmc56 6.10 1.5 0.07 18.9 0.13 3B 15 37 1 D/barc229a 7.50 1.95 0.07 24.6 0.15 3B 15 47 s 14/m 15.7 3.33 0.53 0.08 7.1 0.08 3B 15 48 sl3/m2O. 9 2.97 0.49 0.09 6.8 0.08 3B 15 51 3A/barc77 3.64 0.75 0.08 10.0 0.10 4A 17 55 s 12/m 19.3 2.83 0.46 0.09 6.2 -0.08 4D 20 3 4ABD/gwml92 4.24 ** 0.96 0.08 12.6 0.11 4D 20 3 4ABD/gwml65 4.24 ** 0.96 0.08 12.6 0.11 4D 20 8 s 14/M 12.12 2.72 0.82 0.08 10.8 0.10 4D 20 11 4D/wmc457 2.79 0.39 0.09 5.3 0.07 6D 28 0 6D/p3200.2 3.34 0.63 0.08 8.5 -0.09 7BL 34 0 7BL/wmc7O 3.68 0.69 0.08 9.2 -0.09 713L 34 35 7BL/gwm344 3.94 0.71 0.08 9.4 -0.10
j 13 C 2005 (Unirrigated
Chr Group CM Locus K* Signif LOD Variance %Expl. Additive_ ID 4 0 s 16/m51.4 3.50 0.83 0.09 10.9 0.11
ID 4 0 sl5/m34.8 3.64 0.83 0.09 10.9 0.11
2B 7 40 2B5A/gwm4lO 3.33 0.78 0.09 11.8 0.11
2D 9 93 2D3A/gwm3O 4.60 1.43 0.08 18.2 0.14
3B 15 51 3A/barc77 3.15 1.08 0.09 14.0 0.12
4A 17 24 4A/wmc491 4.10 0.42 0.09 5.7 -0.08 4A 18 0 4A7A7D/gwm350 4.25 0.73 0.09 9.7 0.10
5A 21 0 5A/barclO 3.57 0.63 0.09 8.4 0.09
5BL 24 0 5BL/Gwm371 2.99 0.68 0.09 10.6 -0.10 5D 25 184 5D/wmc443.2 4.00 0.82 0.09 10.8 -0.10 6D 29 16 6D/gdml27 3.64 0.89 0.09 12.6 0.11
Significance levels: *: 0.1 * *: 0.05 ***: 0.0 1****: 0.005 *****: 0.00 1; LOD=Iog likelihood score; Variance=residual variance after fitting the QTLý %Expl--the percentage of variance explained for by
the QTL: I 00*(HO: var-var)/population variance; Additive=estimated additive effect (pA 10 1- [tB {0))/2.
171
6.1.2 Grain yield
61.2.12003
Under irrigated conditions in 2003, putative QTLs for grain yield were found on chromosome 6B with LOD scores ranging from 1.09 to 1.68. The K* statistic using the Kruskal-Wallis (KW) test indicated significant values (P< 0. ol) for the markers
sl2lmll. 6 at 62 cM (K*=7.23; LOD=1.68) and Gwm816 at 66 cM (K*=7.55;
LOD=1.57). The percentage phenotypic variance explained by the putative QTL on 6B
amounted to 21.4%. Presence of QTLs of greater effects were also noticed on
chromosome 3B with markers wmc56 and barc229a at 33 cM (K*=6.10; LOD=1.65)
and 37 cM (K*=3.86; LOD=1.18), respectively, explained a maximum of about 21% of the variance in grain yield. The positive additive effects revealed that yield was increased by the presence of the Beaver allele for these QTLs. Minor effects for other
markers on chromosomes 4A, 2D and 7D were apparent but did not realize statistical
significance accepted in this study (Table 6.4).
Under unirrigated conditions in 2003, the QTL effects were different with a putative QTL on chromosome 3A located at 22cM with marker sl4lm]2.1 (K*=8.02; P=0.005;
LOD=2.15). This alone explained 26.5% of the phenotypic variation for grain yield
under drought. Another putative QTL of lesser significance was found on chromosome
2A at 33 cM with marker 2AIgwm3]2 (k*=5.3 1; P=0.005; LOD= 1.97), which explained
24.5% of the phenotypic variation for the grain yield. The presence of the Soissons
allele improved grain yield (Table 6.4).
172
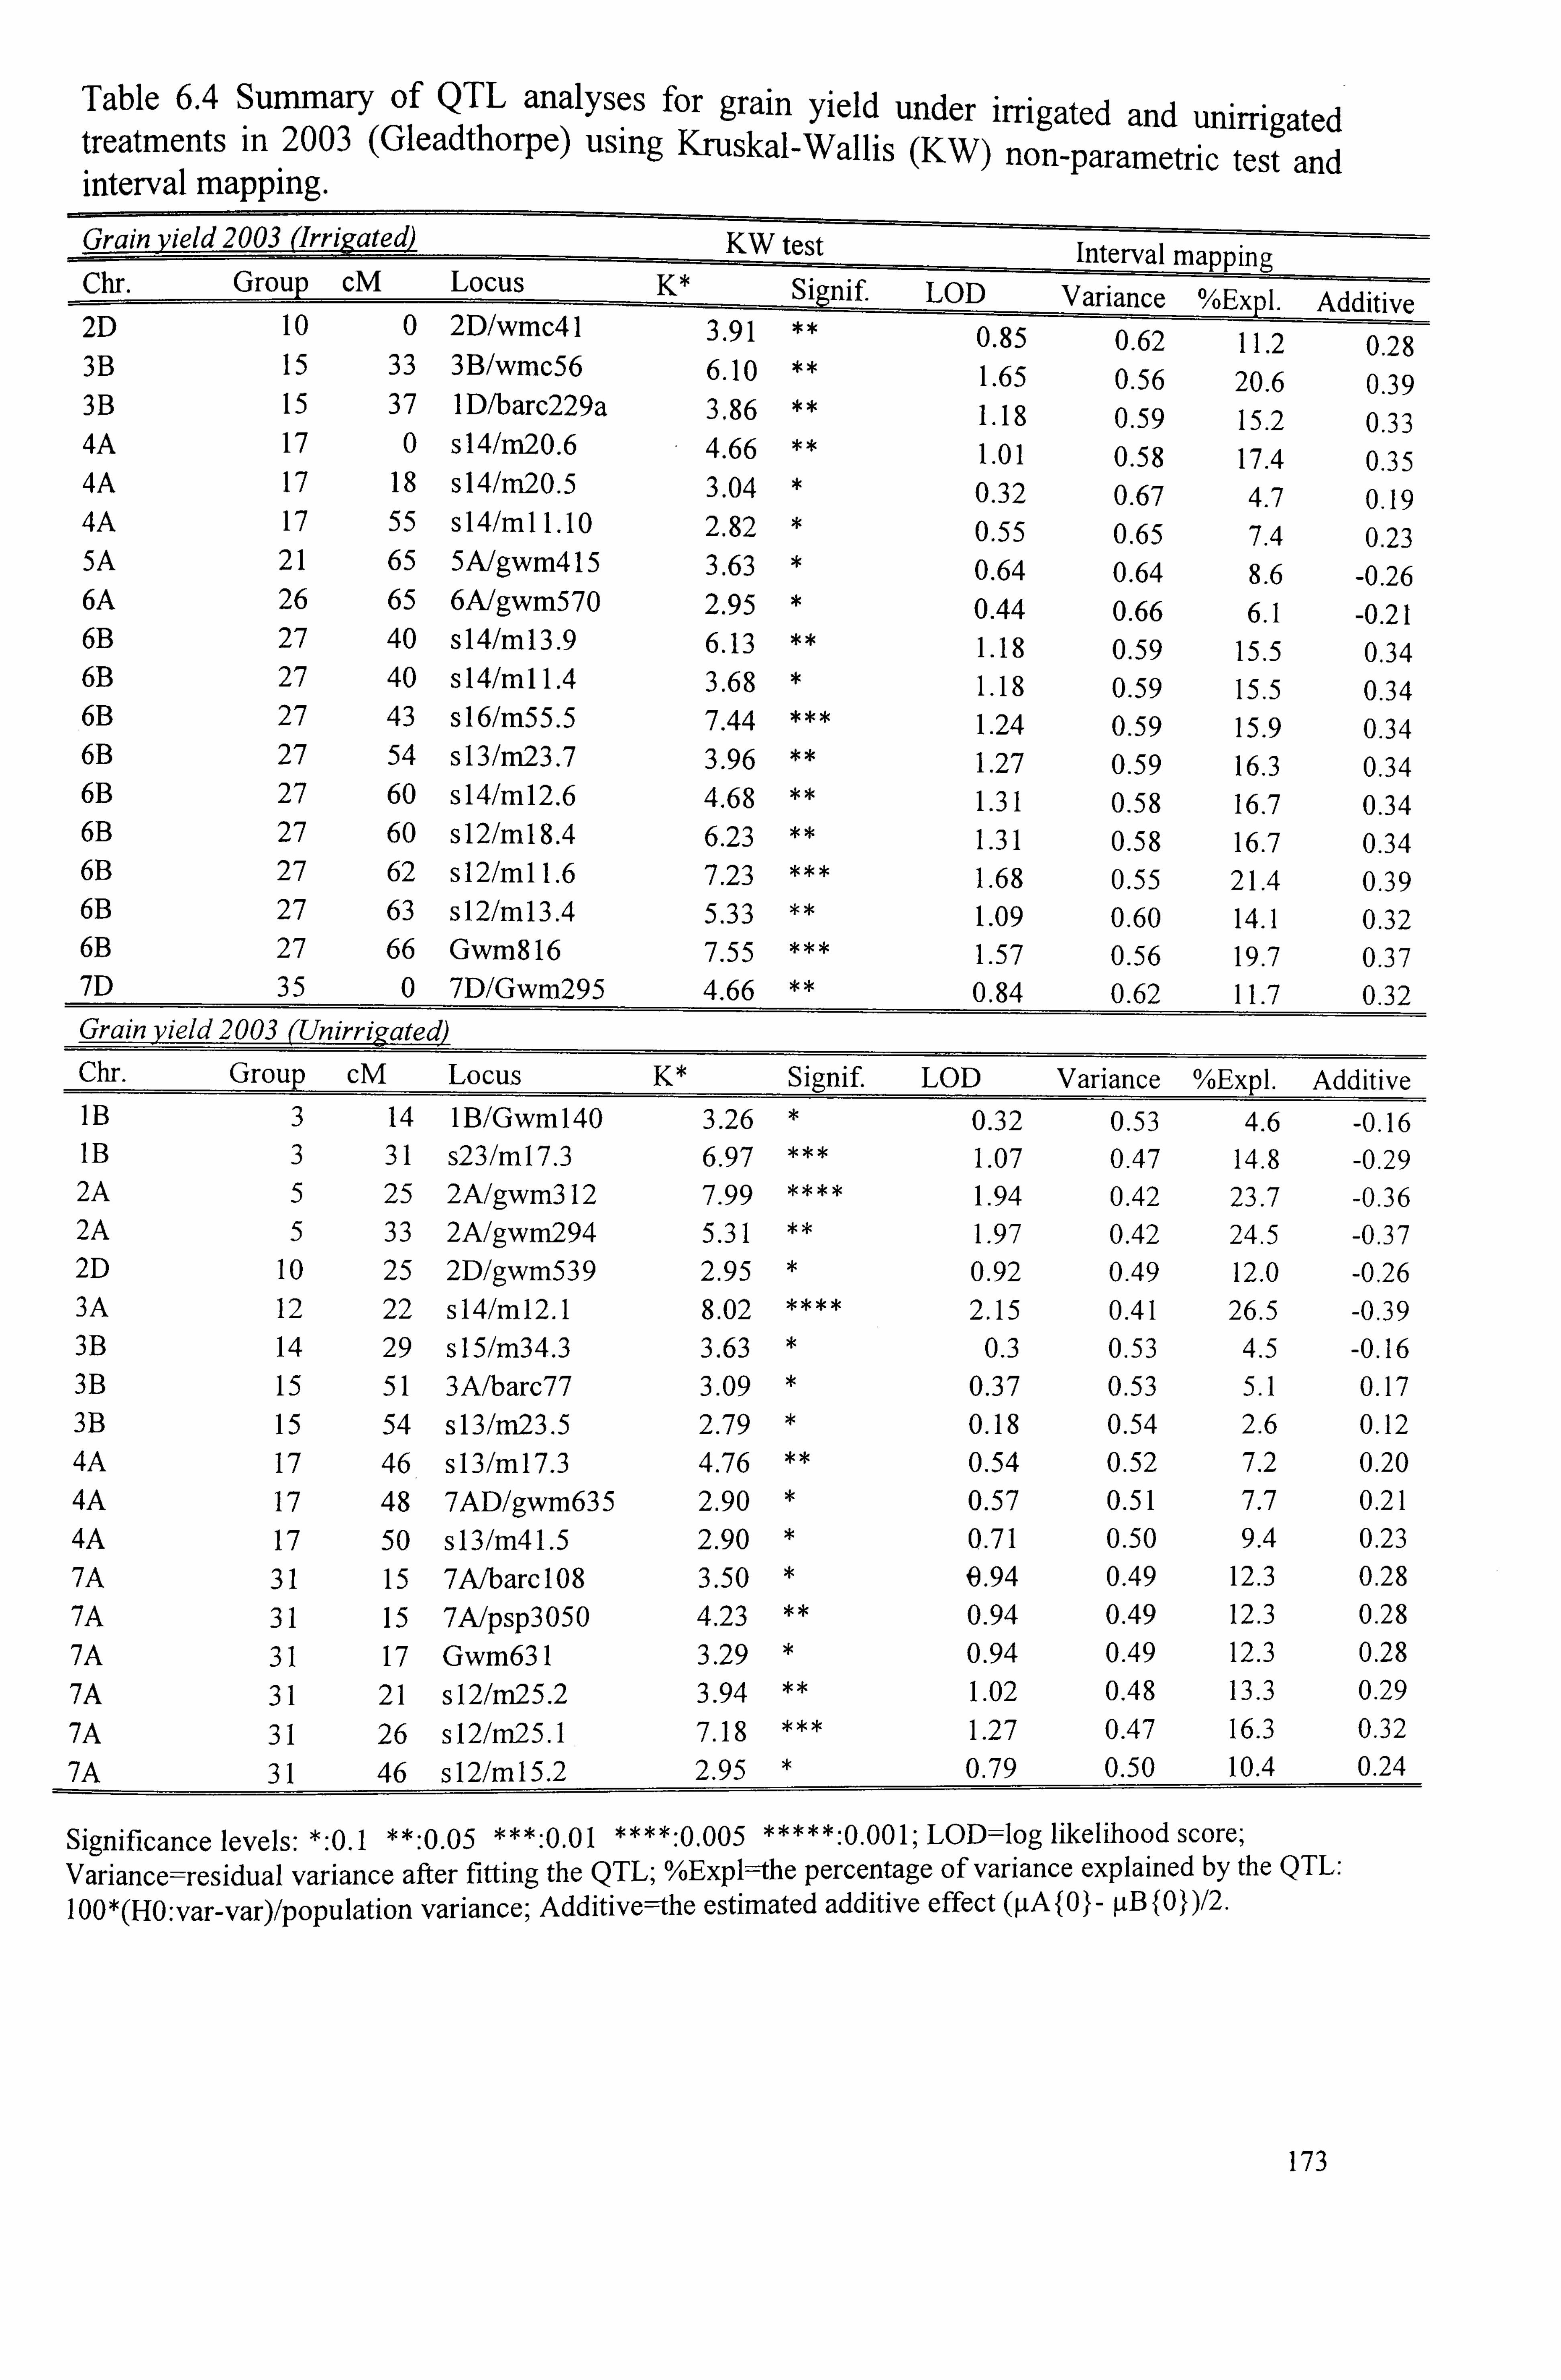
Table 6.4 Summary of QTL analyses for grain yield under irrigated and unirrigated treatments in 2003 (Gleadthorpe) using Kruskal-Wallis (KW) non-parametric test and interval mapping. Grain vield 2003 6 "rri ated) KW test interval maomna Chr. Group CM Locus
===. K* Signif LOD Variance %Expl. Additive
2D to 0 2D/wmc4l 3.91 0.85 0.62 11.2 0.28 3B 15 33 3B/wmc56 6.10 1.65 0.56 20.6 0.39 3B 15 37 1 D/barc229a 3.86 ** 1.18 0.59 15.2 0.33 4A 17 0 s 14/m2O. 6 4.66 ** 1.01 0.58 17.4 0.35 4A 17 18 s 14/m2O. 5 3.04 0.32 0.67 4.7 0.19 4A 17 55 s 14/m 11.10 2.82 0.55 0.65 7.4 0.23 5A 21 65 5A/gwm4l5 3.63 0.64 0.64 8.6 -0.26 6A 26 65 6A/gwm570 2.95 0.44 0.66 6.1 -0.21 6B 27 40 s 14/m 13.9 6.13 1.18 0.59 15.5 0.34 6B 27 40 s 14/m 11.4 3.68 1.18 0.59 15.5 0.34 6B 27 43 sI 6/m5 5.5 7.44 1.24 0.59 15.9 0.34 6B 27 54 s 13 /ni2 3.7 3.96 1.27 0.59 16.3 0.34 6B 27 60 s 14/m 12.6 4.68 1.31 0.58 16.7 0.34 6B 27 60 s 12/m 18.4 6.23 1.31 0.58 16.7 0.34 6B 27 62 s 12/m 11.6 7.23 1.68 0.55 21.4 0.39 6B 27 63 s 12/m 13.4 5.33 1.09 0.60 14.1 0.32 6B 27 66 Gwm8l6 7.55 1.57 0.56 19.7 0.37 7D 35 0 7D/Gwm295 4.66 0.84 0.62 11.7 0.32 Grain yield 2003 aLnirrýgated)
Chr. Group CM Locus K* Signif LOD Variance %Expl. Additive IB 3 14 IB/Gwml4O 3.26 0.32 0.53 4.6 -0.16 IB 3 31 s23/mI7.3 6.97 1.07 0.47 14.8 -0.29 2A 5 25 2A/gwm3l2 7.99 1.94 0.42 23.7 -0.36 2A 5 33 2A/gwm294 5.31 1.97 0.42 24.5 -0.37 2D 10 25 2D/gwm539 2.95 0.92 0.49 12.0 -0.26 3A 12 22 s 14/m 12.1 8.02 2.15 0.41 26.5 -0.39 3B 14 29 s 15/m34.3 3.63 0.3 0.53 4.5 -0.16 3B 15 51 3A/barc77 3.09 0.37 0.53 5.1 0.17 3B 15 54 s 13 /m2 3.5 2.79 0.18 0.54 2.6 0.12 4A 17 46 s13/mI7.3 4.76 0.54 0.52 7.2 0.20 4A 17 48 7AD/gwm635 2.90 0.57 0.51 7.7 0.21 4A 17 50 sl3/m4l. 5 2.90 0.71 0.50 9.4 0.23 7A 31 15 7AjbarcIO8 3.50 0.94 0.49 12.3 0.28
7A 31 15 7A/psp3O5O 4.23 0.94 0.49 12.3 0.28
7A 31 17 Gwm631 3.29 0.94 0.49 12.3 0.28
7A 31 21 s 12/m2 5.2 3.94 1.02 0.48 13.3 0.29
7A 31 26 s 12/m25.1 7.18 1.27 0.47 16.3 0.32
7A 31 46 s 12/m 15.2 2.95 0.79 0.50 10.4 0.24
Significance levels: *: 0.1 **: 0.05 ***: 0.01 ****: 0.005 *****: 0.001; LOD=Iog likelihood score; Variance=residual variance after fitting the QTL; %Expl----the percentage of variance explained by the QTL:
I 00*(HO: var-var)/population variance; Additive-the estimated additive effect (ýtA f 01 - [tB f 0))/2.
173
6.1.2.2 2005
In the irrigated environment, a Putative QTL was found on chromosome 7A (linkage
group 30) with marker gwm60 at 42 cM (K8*=8.41; P=0.005; LOD=2.18). This QTL
explained 26.2 % of phenotypic variance for grain yield. Another putative QTL was found on 5D (linkage group 25) at 184 cM with marker wmc443.2 (k*=: 9.05; P=0.005;
LOD=2.07) explaining 25.1% of phenotypic variation (Fig. 6.1). It was interesting to
note that for these QTLs on ch-romosomes 7A and 5D yield was being increased by the
presence of the Soissons allele. However, other putative QTLs of lesser significance
were found on chromosome 3A with marker gwm480 (K*=7.17; LOD=1.88) and 1B
with barc]49 (K*=8.00; LOD=1.79) where the Beaver allele, explaining 23.2 and 22.9
% phenotypic variance, respectively, increased yield (Table 6.5).
In the droughted environment, a putative QTL for yield was found on chromosome 3A
(linkage group 13) with marker gwm480 at 23cM distance (K*=10.14; P=0.005;
LOD=2.5 1). For this marker the presence of the Beaver allele improved yield. Another
QTL on 5D was found with marker wmc443.2 at 25 cM (K*5.07; P=0.05; LOD=1.12)
explaining 14.5% of the phenotypic variance. This QTL under the influence of Soissons
allele interestingly also improved the yield under irrigated conditions at the same marker
locus explaining 25% of the phenotypic variance. The effects of markers barc]49 (chr
113), 2ABDGwm382 (chr 2A), for which the Beaver allele increased yield, and gwrn304
(chr 5A), for which the Soissons allele increased yield, were found in both irrigated and
unirrigated conditions, although the effects in one of the two treatments were low.
174
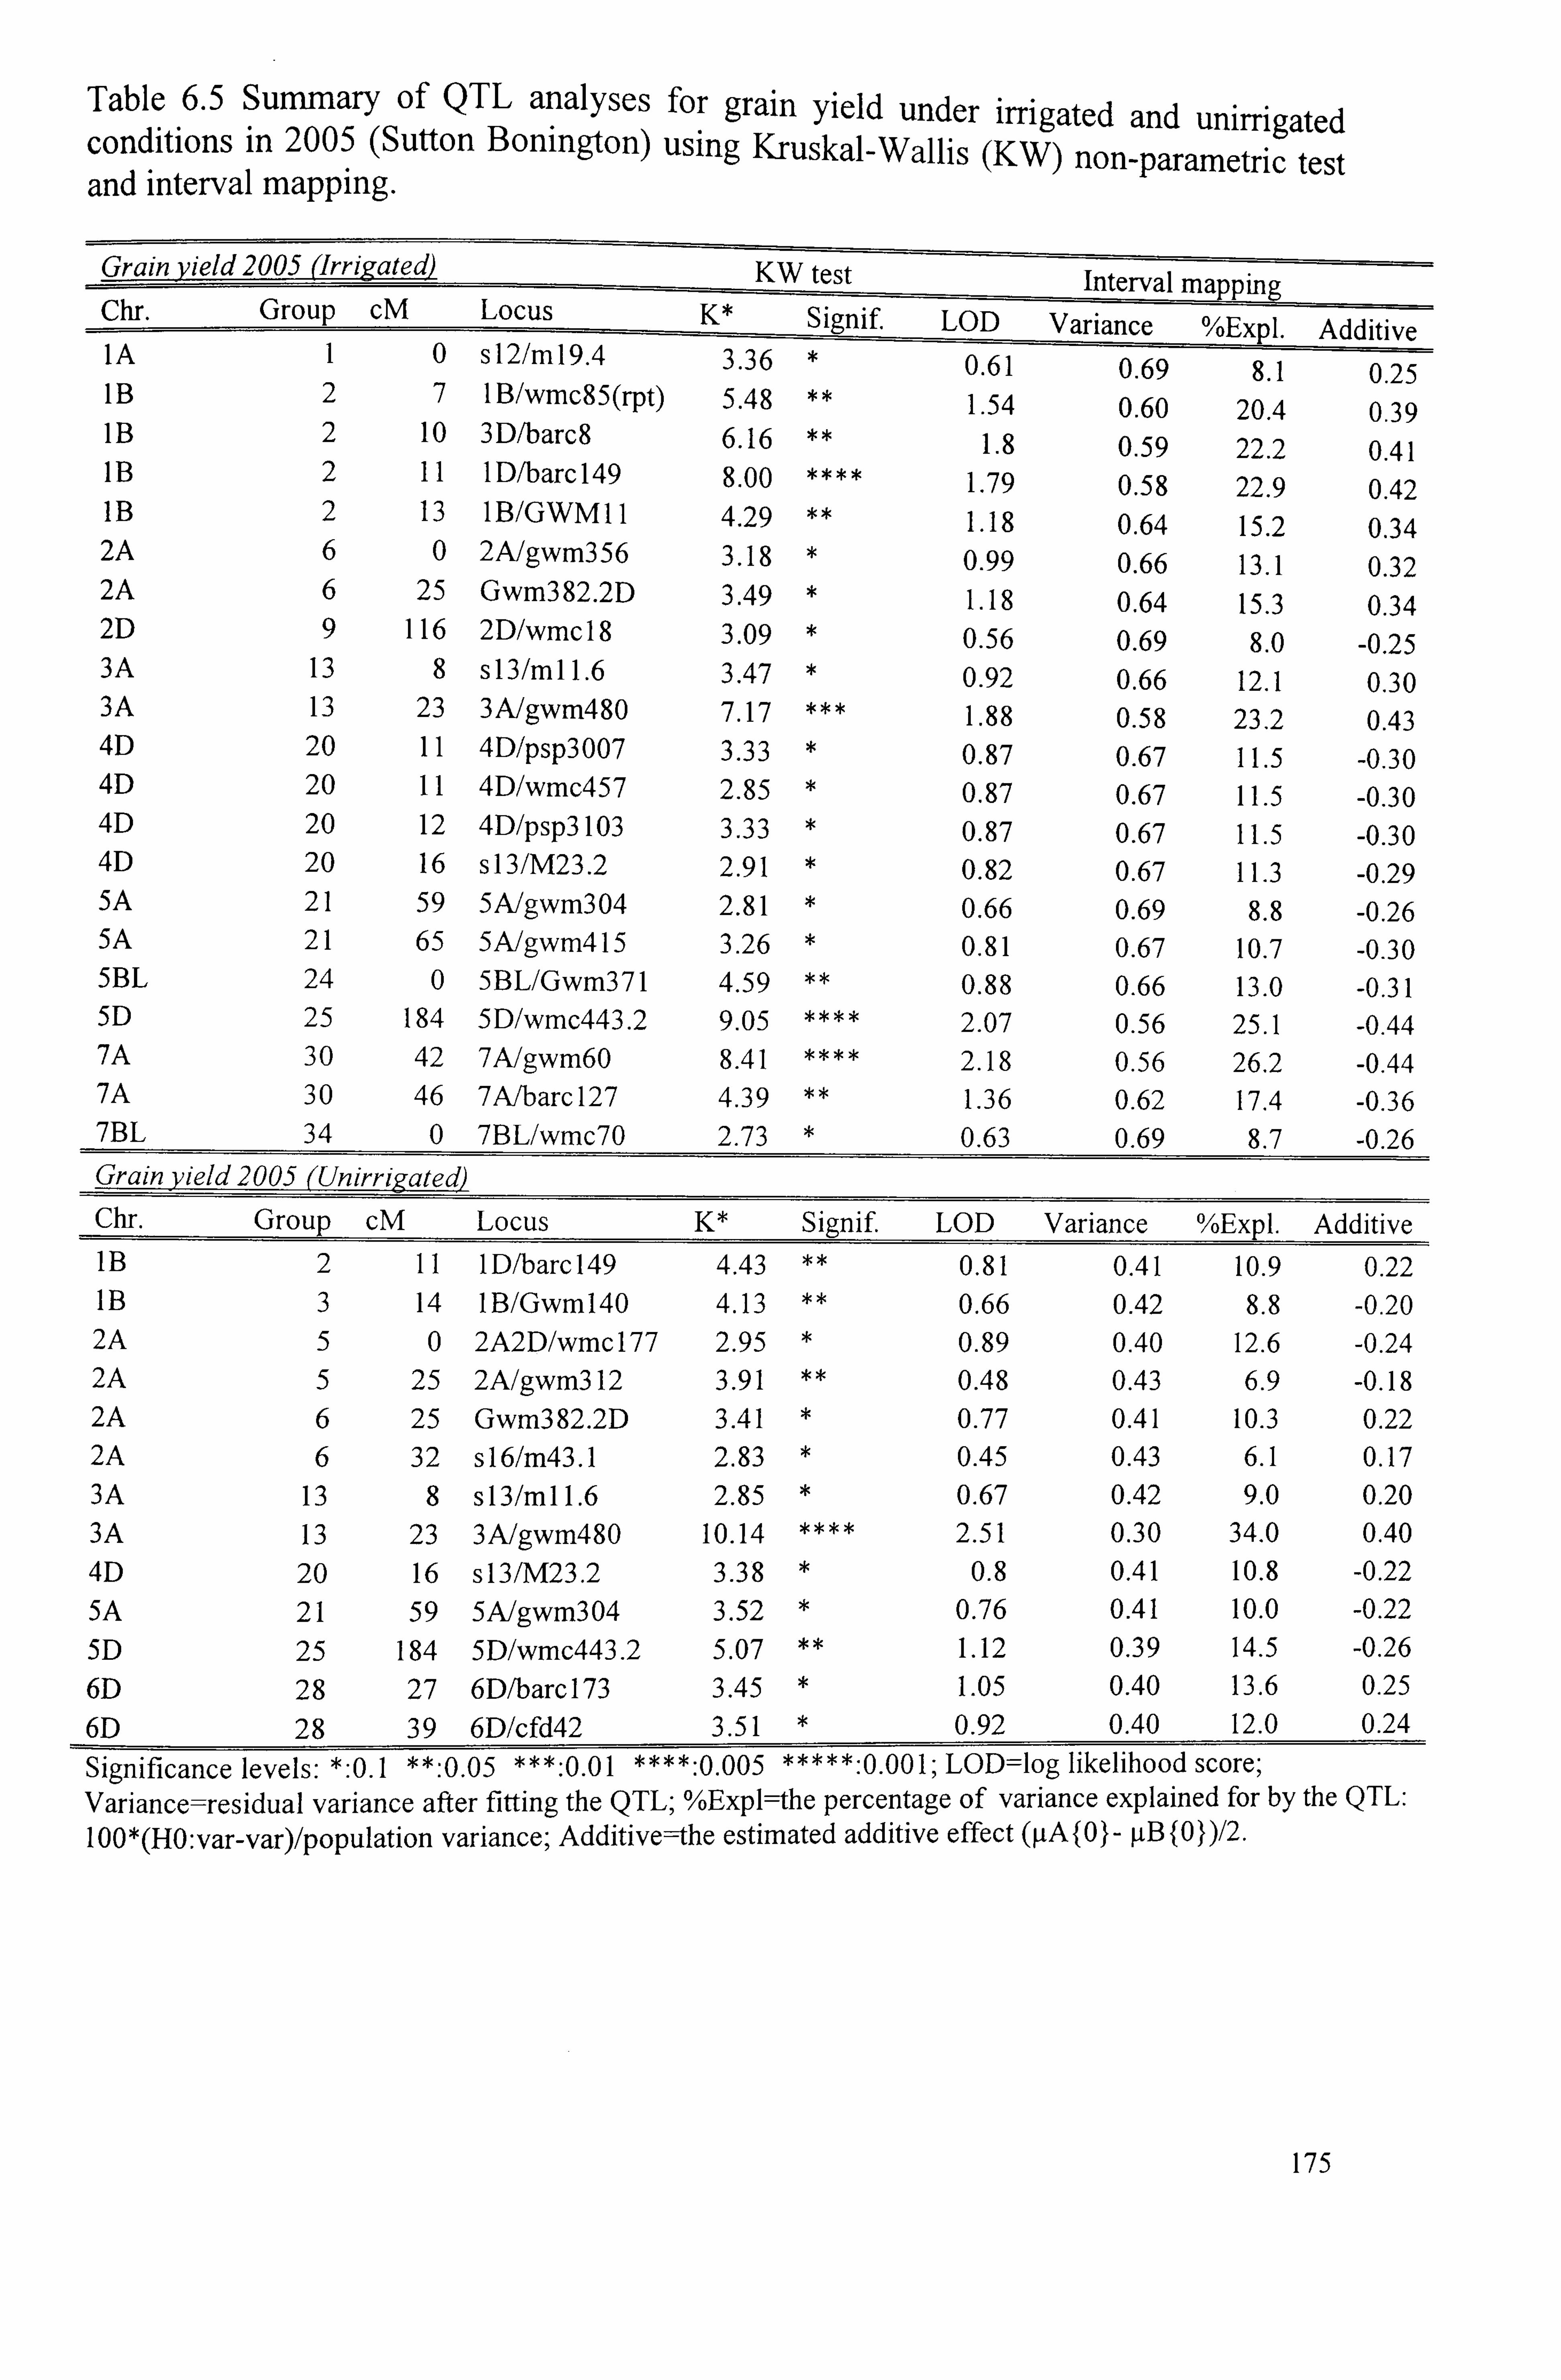
Table 6.5 Summary of QTL analyses for grain yield under irrigated and unirrigated conditions in 2005 (Sutton Bonington) using Kruskal-Wallis (KW) non-parametric test and interval mapping.
Grain vield 2005 (Irrý gateddj KW test Interval mappin g Chr. Group cm- Locus
-- K* Signif LOD Variance %Expl. Additive
IA 1 0 s 12/m 19.4 3.36 0.61 0.69 8.1 0.25 1B 2 7 IB/wmc85(rpt) 5.48 ** 1.54 0.60 20.4 0.39 1B 2 10 3 D/b arc 8 6.16 ** 1.8 0.59 22.2 0.41 1B 2 11 1 D/barc 149 8.00 1.79 0.58 22.9 0.42 1B 2 13 1 B/GWM 11 4.29 1.18 0.64 15.2 0.34 2A 6 0 2A/gwm356 3.18 0.99 0.66 13.1 0.32 2A 6 25 Gwm382.2D 3.49 1.18 0.64 15.3 0.34 2D 9 116 2D/wmc 18 3.09 0.56 0.69 8.0 -0.25 3A 13 8 s 13/m 11.6 3.47 0.92 0.66 12.1 0.30 3A 13 23 3A/gwm480 7.17 1.88 0.58 23.2 0.43 4D 20 11 4D/psp3OO7 3.33 0.87 0.67 11.5 -0.30 4D 20 11 4D/wmc457 2.85 0.87 0.67 11.5 -0.30 4D 20 12 4D/psp3lO3 3.33 0.87 0.67 11.5 -0.30 4D 20 16 sI 3/M23.2 2.91 0.82 0.67 11.3 -0.29 5A 21 59 5A/gwm3O4 2.81 0.66 0.69 8.8 -0.26 5A 21 65 5A/gwm4l5 3.26 0.81 0.67 10.7 -0.30 5BL 24 0 5BL/Gwm371 4.59 0.88 0.66 13.0 -0.31 5D 25 184 5D/wmc443.2 9.05 2.07 0.56 25.1 -0.44 7A 30 42 7A/gwm6O 8.41 2.18 0.56 26.2 -0.44 7A 30 46 7A/barc 127 4.39 1.36 0.62 17.4 -0.36 7BL 34 0 7BL/wmc7O 2.73 0.63 0.69 8.7 -0.26 Grain yield 2005 (Unirrigate! j)
chr. Group CM Locus K* Signif LOD Variance %Expl. Additive IB 2 11 1 D/barc 149 4.43 ** 0.81 0.41 10.9 0.22 1B 3 14 1B/Gwm140 4.13 ** 0.66 0.42 8.8 -0.20 2A 5 0 2A2D/wmcl77 2.95 0.89 0.40 12.6 -0.24 2A 5 25 2A/gwm3l2 3.91 * 0.48 0.43 6.9 -0.18 2A 6 25 Gwm382.2D 3.41 0.77 0.41 10.3 0.22 2A 6 32 sI 6/m43.1 2.83 0.45 0.43 6.1 0.17 3A 13 8 s 13/m 11.6 2.85 0.67 0.42 9.0 0.20 3A 13 23 3A/gwm480 10.14 2.51 0.30 34.0 0.40 4D 20 16 s 13/M23.2 3.38 0.8 0.41 10.8 -0.22 5A 21 59 5A/gwm3O4 3.52 0.76 0.41 10.0 -0.22 5D 25 184 5D/wmc443.2 5.07 1.12 0.39 14.5 -0.26 6D 28 27 6Dibarc 173 3.45 1.05 0.40 13.6 0.25
6D 28 39 6D/cfd42 3.51 0.92 0.40 12.0 0.24
Significance levels: *: 0.1 **: 0.05 ***: 0.0 1 ****: 0.005 *****: 0.00 1; LOD=Iog likelihood score; Variance=residual variance after fitting the QTL; %Expl--the percentage of variance explained for by the QTL:
100 * (HO: var-var)/population variance; Additive--the estimated additive effect ([tA {O I- [tB f0 J)/2.
175
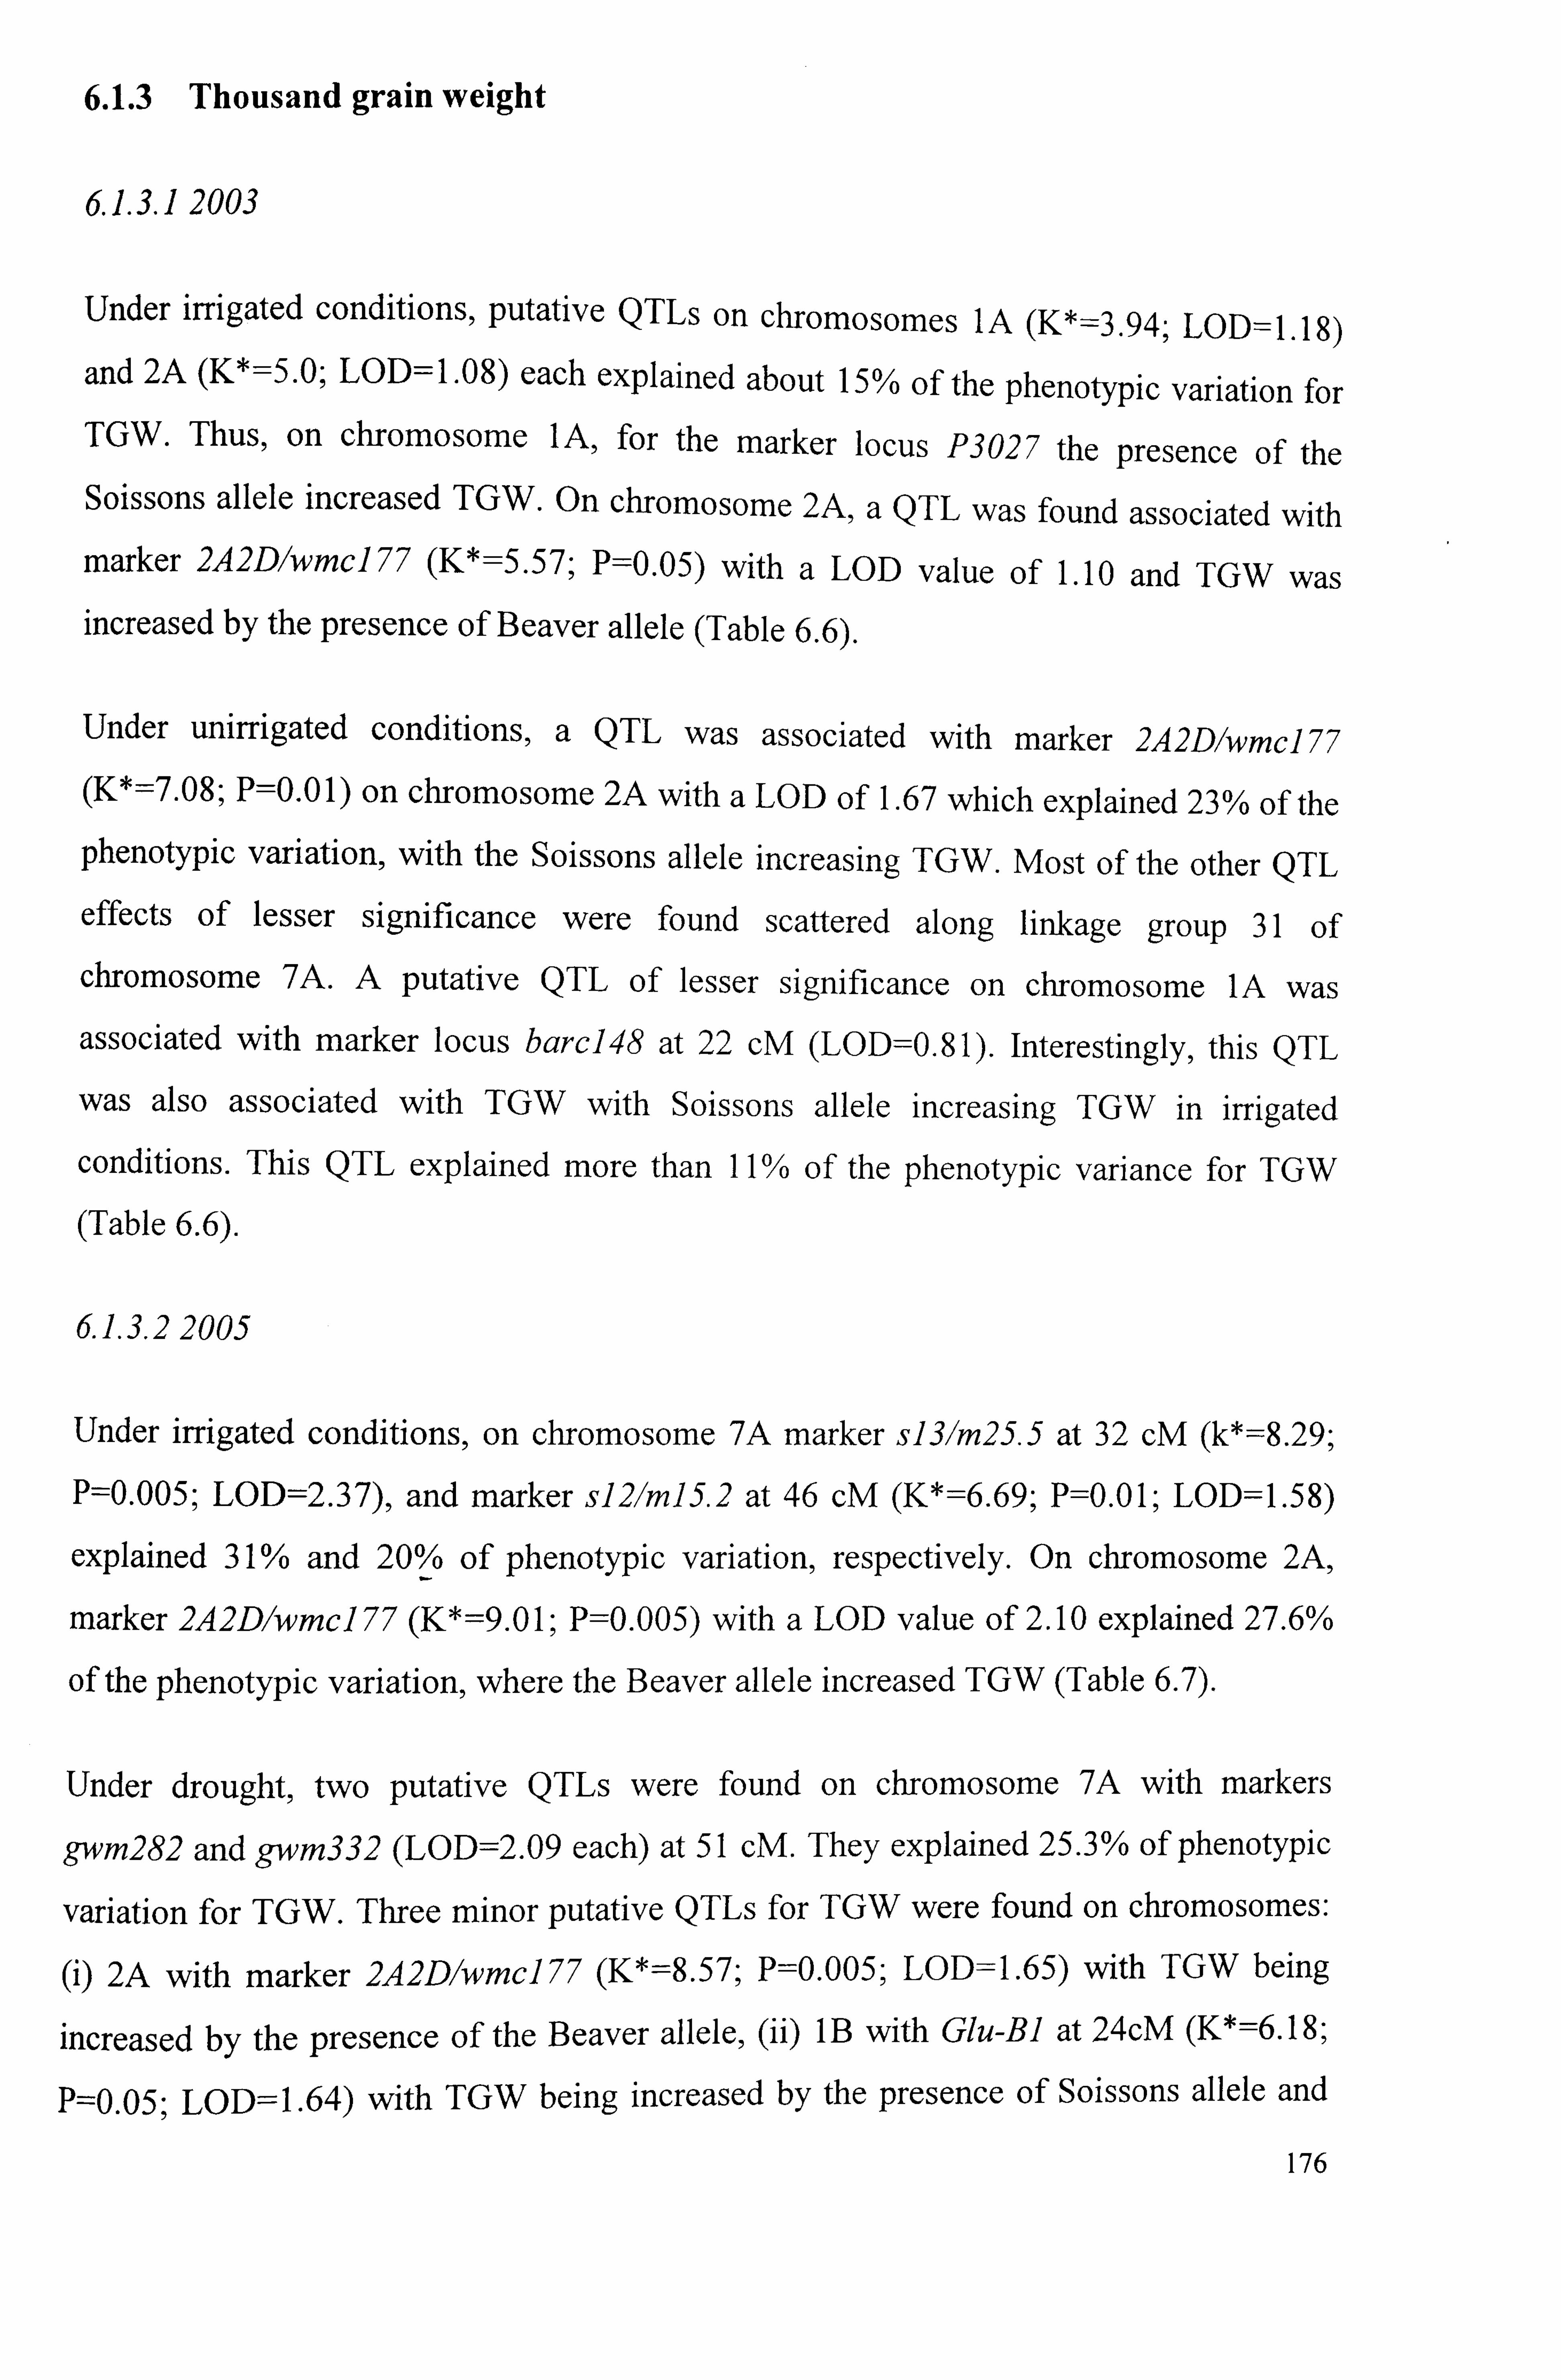
6.1.3 Thousand grain weight
61.3.12003
Under irrigated conditions, putative QTLs on chromosomes IA (K*==3.94; LOD=1.18)
and 2A (K*==5.0; LOD= 1 . 08) each explained about 15% of the phenotypic variation for
TGW. Thus, on chromosome IA, for the marker locus P3027 the presence of the Soissons allele increased TGW- On chromosome 2A, a QTL was found associated with marker 2A2DIwmc]77 (K*=5.57; P=0.05) with a LOD value of 1.10 and TGW was increased by the presence of Beaver allele (Table 6.6)
Under unirrigated conditions, a QTL was associated with marker 2A2D1wmc] 77 (K*=7.08; P=0.01) on chromosome 2A with a LOD of 1.67 which explained 23% of the
phenotypic variation, with the Soissons allele increasing TGW. Most of the other QTL
effects of lesser significance were found scattered along linkage group 31 of
chromosome 7A. A putative QTL of lesser significance on chromosome 1A was
associated with marker locus barc]48 at 22 cM (LOD=0.81). Interestingly, this QTL
was also associated with TGW with Soissons allele increasing TGW in irrigated
conditions. This QTL explained more than I I% of the phenotypic variance for TGW
(Table 6.6).
61.3,22005
Under irrigated conditions, on chromosome 7A marker s131M25.5 at 32 cM (k*=8.29;
P=0.005; LOD=2.37), and marker sI21mI5.2 at 46 cM (K*=6.69; P=0.01; LOD=1.58)
explained 31% and 20% of phenotypic variation, respectively. On chromosome 2A,
marker 2A2D1wmcI 77 (K*=9.0 1; P=0.005) with a LOD value of 2.10 explained 27.6%
of the phenotypic variation, where the Beaver allele increased TGW (Table 6.7).
Under drought, two putative QTLs were found on chromosome 7A with markers
gwm282 and gwm332 (LOD=2.09 each) at 51 cM. They explained 25.3% of phenotypic
variation for TGW. Three minor putative QTLs for TGW were found on chromosomes:
(i) 2A with marker 2A2DIwmc]77 (K*=8.57; P=0.005; LOD=1.65) with TGW being
increased by the presence of the Beaver allele, (ii) 1B with Glu-B] at 24cM (K*=6.18;
P=0.05; LOD=1.64) with TGW being increased by the presence of Soissons allele and
176
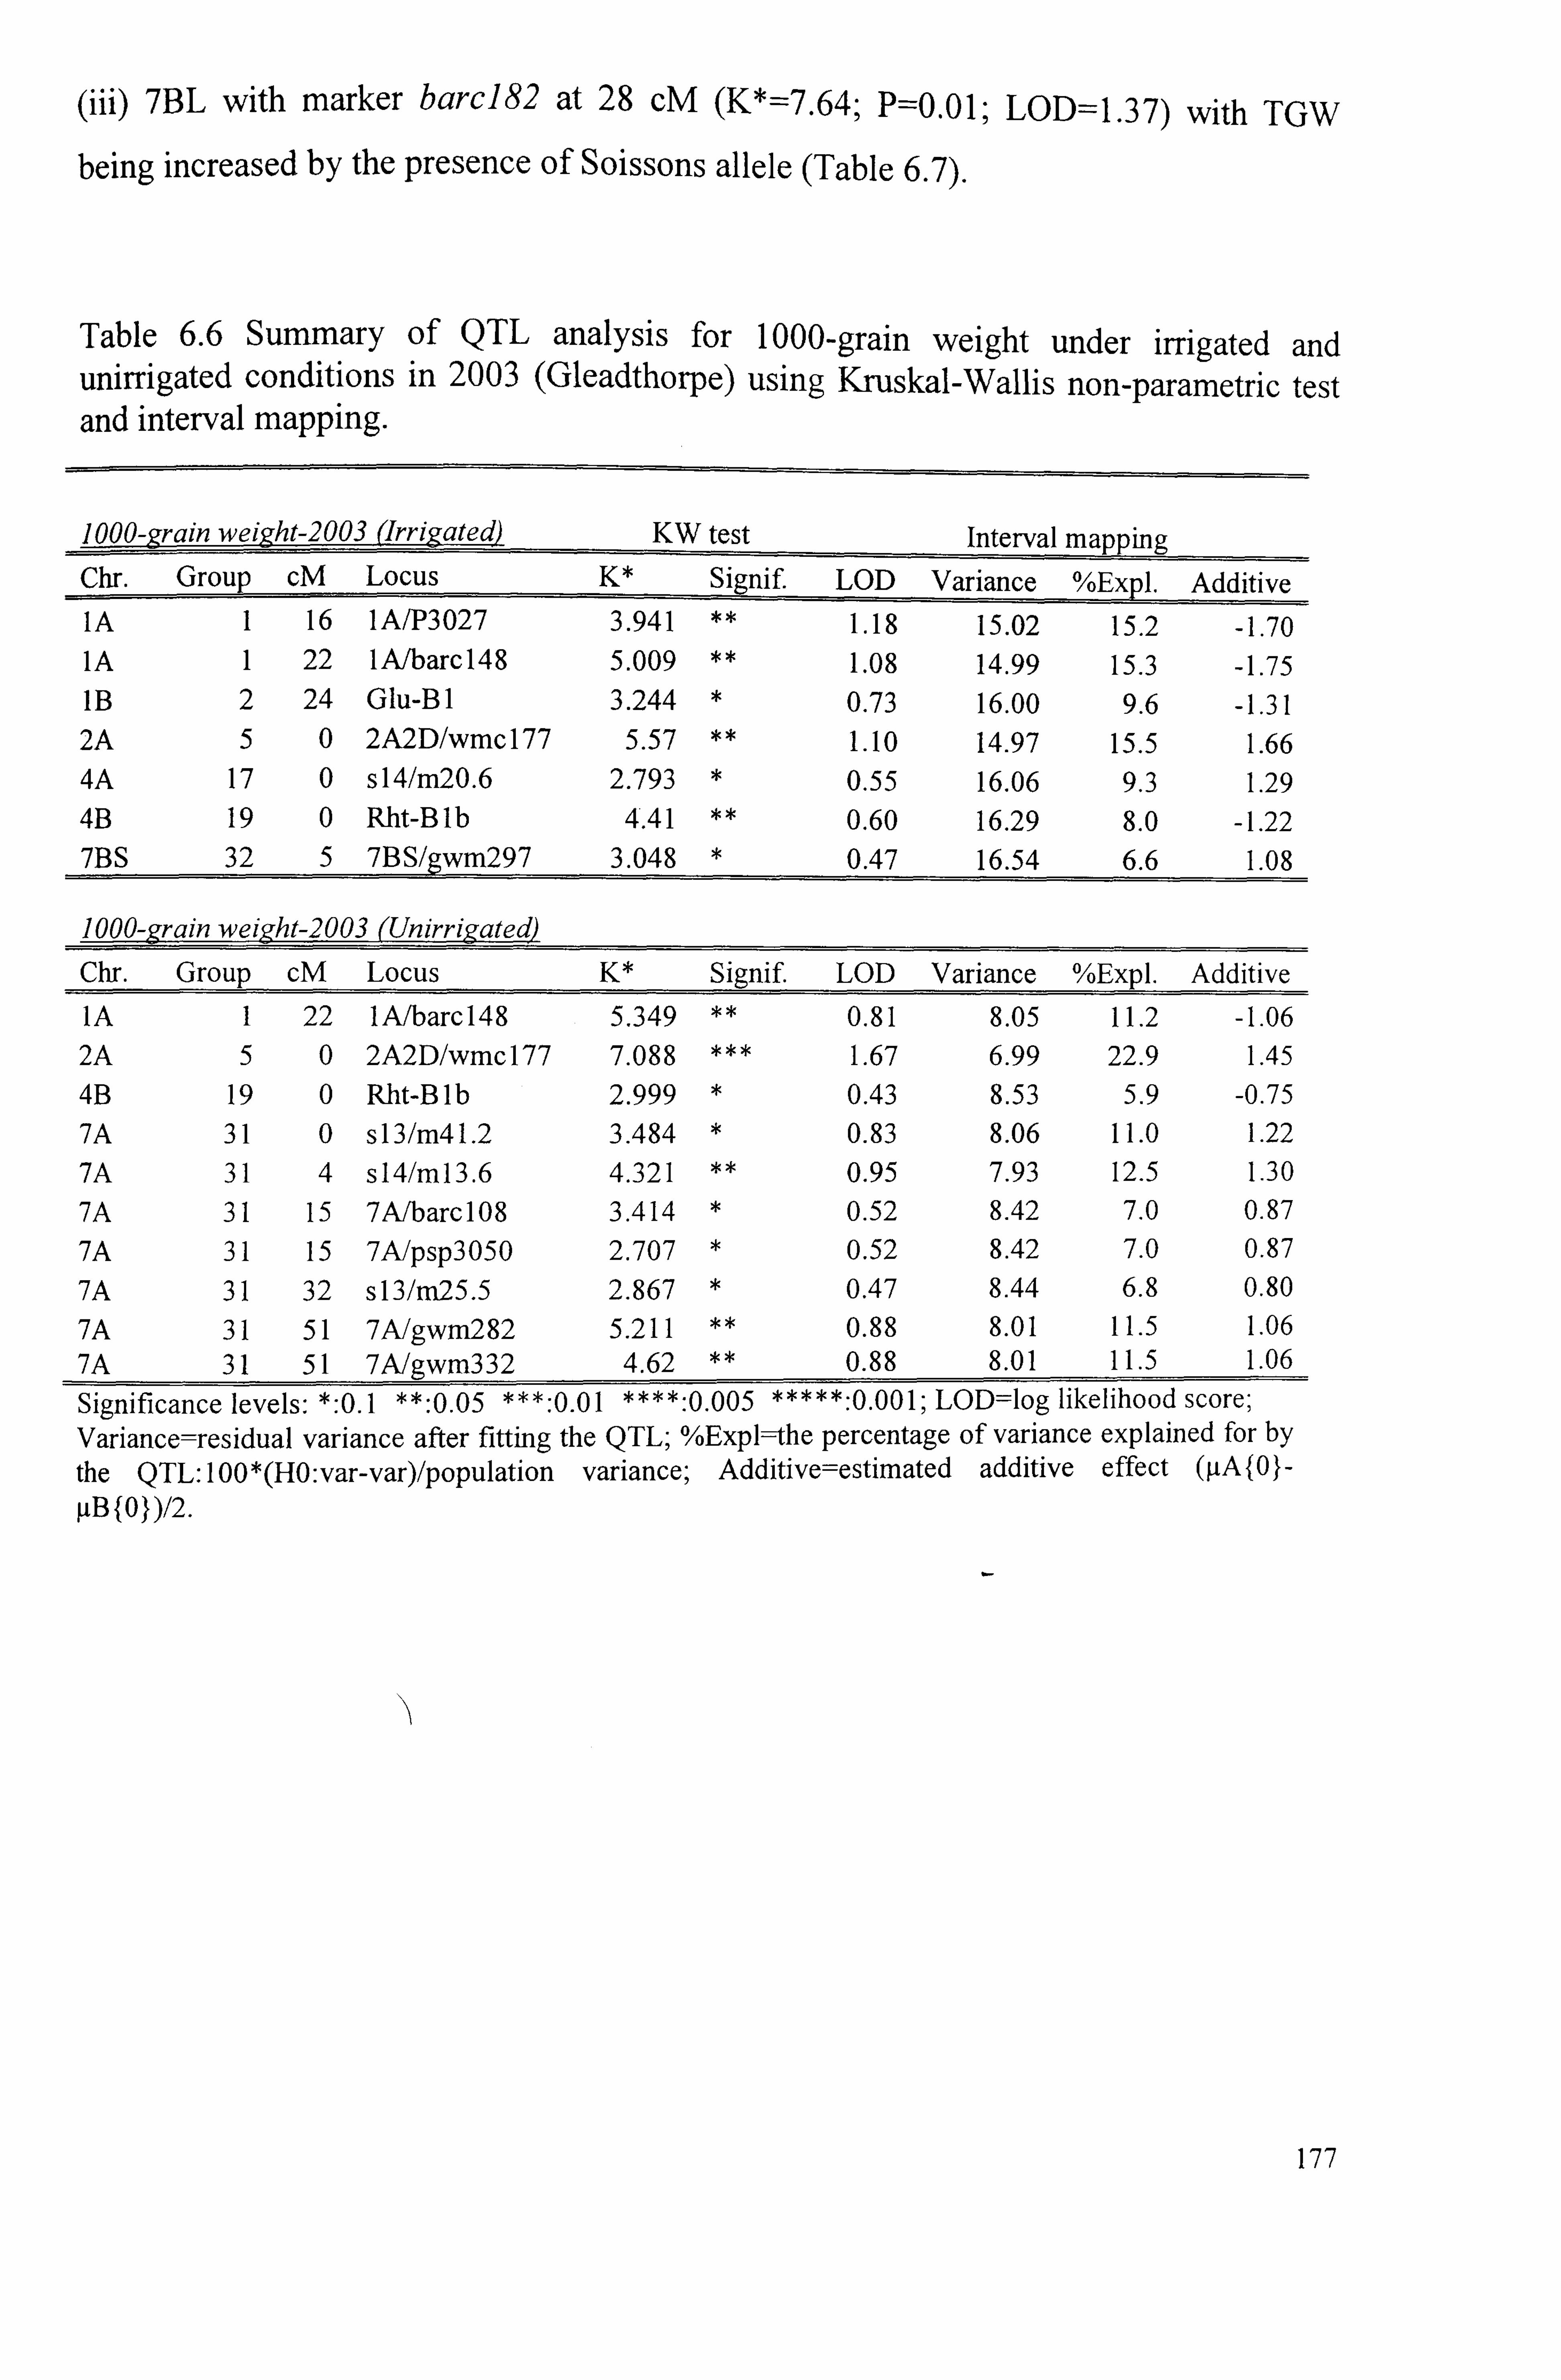
(iii) 7BL with marker barcJ82 at 28 cM (K*=7.64; P=0.01; LOD=1.37) with TGW
being increased by the presence of Soissons allele (Table 6.7).
Table 6.6 Summary of QTL analysis for I 000-grain weight under irrigated and unirrigated conditions in 2003 (Gleadthorpe) using Kruskal-Wallis non-parametric test and interval mapping.
1000- grain wei ght-2003 (Lrri ated __
Z- =KW
test Interval mapping Chr. Group CM Locus K*
_ Signif LOD Variance %Expl. Additive
IA 1 16 1 A/P3 027 3.941 ** 1.18 15.02 15.2 -1.70 1A 1 22 1 A/barc 14 8 5.009 ** 1.08 14.99 15.3 -1.75 1B 2 24 Glu-B 1 3.244 0.73 16.00 9.6 -1.31 2A 5 0 2A2D/wmcl77 5.57 * 1.10 14.97 15.5 1.66 4A 17 0 s 14/m2O. 6 2.793 0.55 16.06 9.3 1.29 4B 19 0 Rht-B Ib 4.41 * 0.60 16.29 8.0 -1.22 7BS 32 5 7BS/gwm297 3.048 0.47 16.54 6.6 1.08
1000-Lyrain weiv-ht-2003 (Unirrit-ated
Chr. Group CM Locus K* Signif LOD Variance %Expl. Additive
IA 1 22 1 A/barc 14 8 5.349 0.81 8.05 11.2 -1.06 2A 5 0 2A2D/wmcl77 7.088 1.67 6.99 22.9 1.45 4B 19 0 Rht-B Ib 2.999 0.43 8.53 5.9 -0.75 7A 31 0 sl3/m4l. 2 3.484 0.83 8.06 11.0 1.22
7A 31 4 s 14/m 13.6 4.321 0.95 7.93 12.5 1.30
7A 31 15 7A/barcIO8 3.414 0.52 8.42 7.0 0.87
7A 31 15 7A/psp3O5O 2.707 0.52 8.42 7.0 0.87
7A 31 32 s13/m25.5 2.867 0.47 8.44 6.8 0.80
7A 31 51 7A/gwm282 5.211 ** 0.88 8.01 11.5 1.06 7A 31 51 7A/gwm332 4.62 ** 0.88 8.01 11.5 1.06
Significance levels: *: 0.1 **: 0.05 ***: 0.01 ****: 0.005 *****: 0.001; LOD=Iog likelihood score; Variance=residual variance after fitting the QTL; %Expl--the percentage of variance explained for by
the QTL: 100*(HO: var-var)/population variance; Additive=estimated additive effect (PtAýOj-
IjB{O))/2.
177
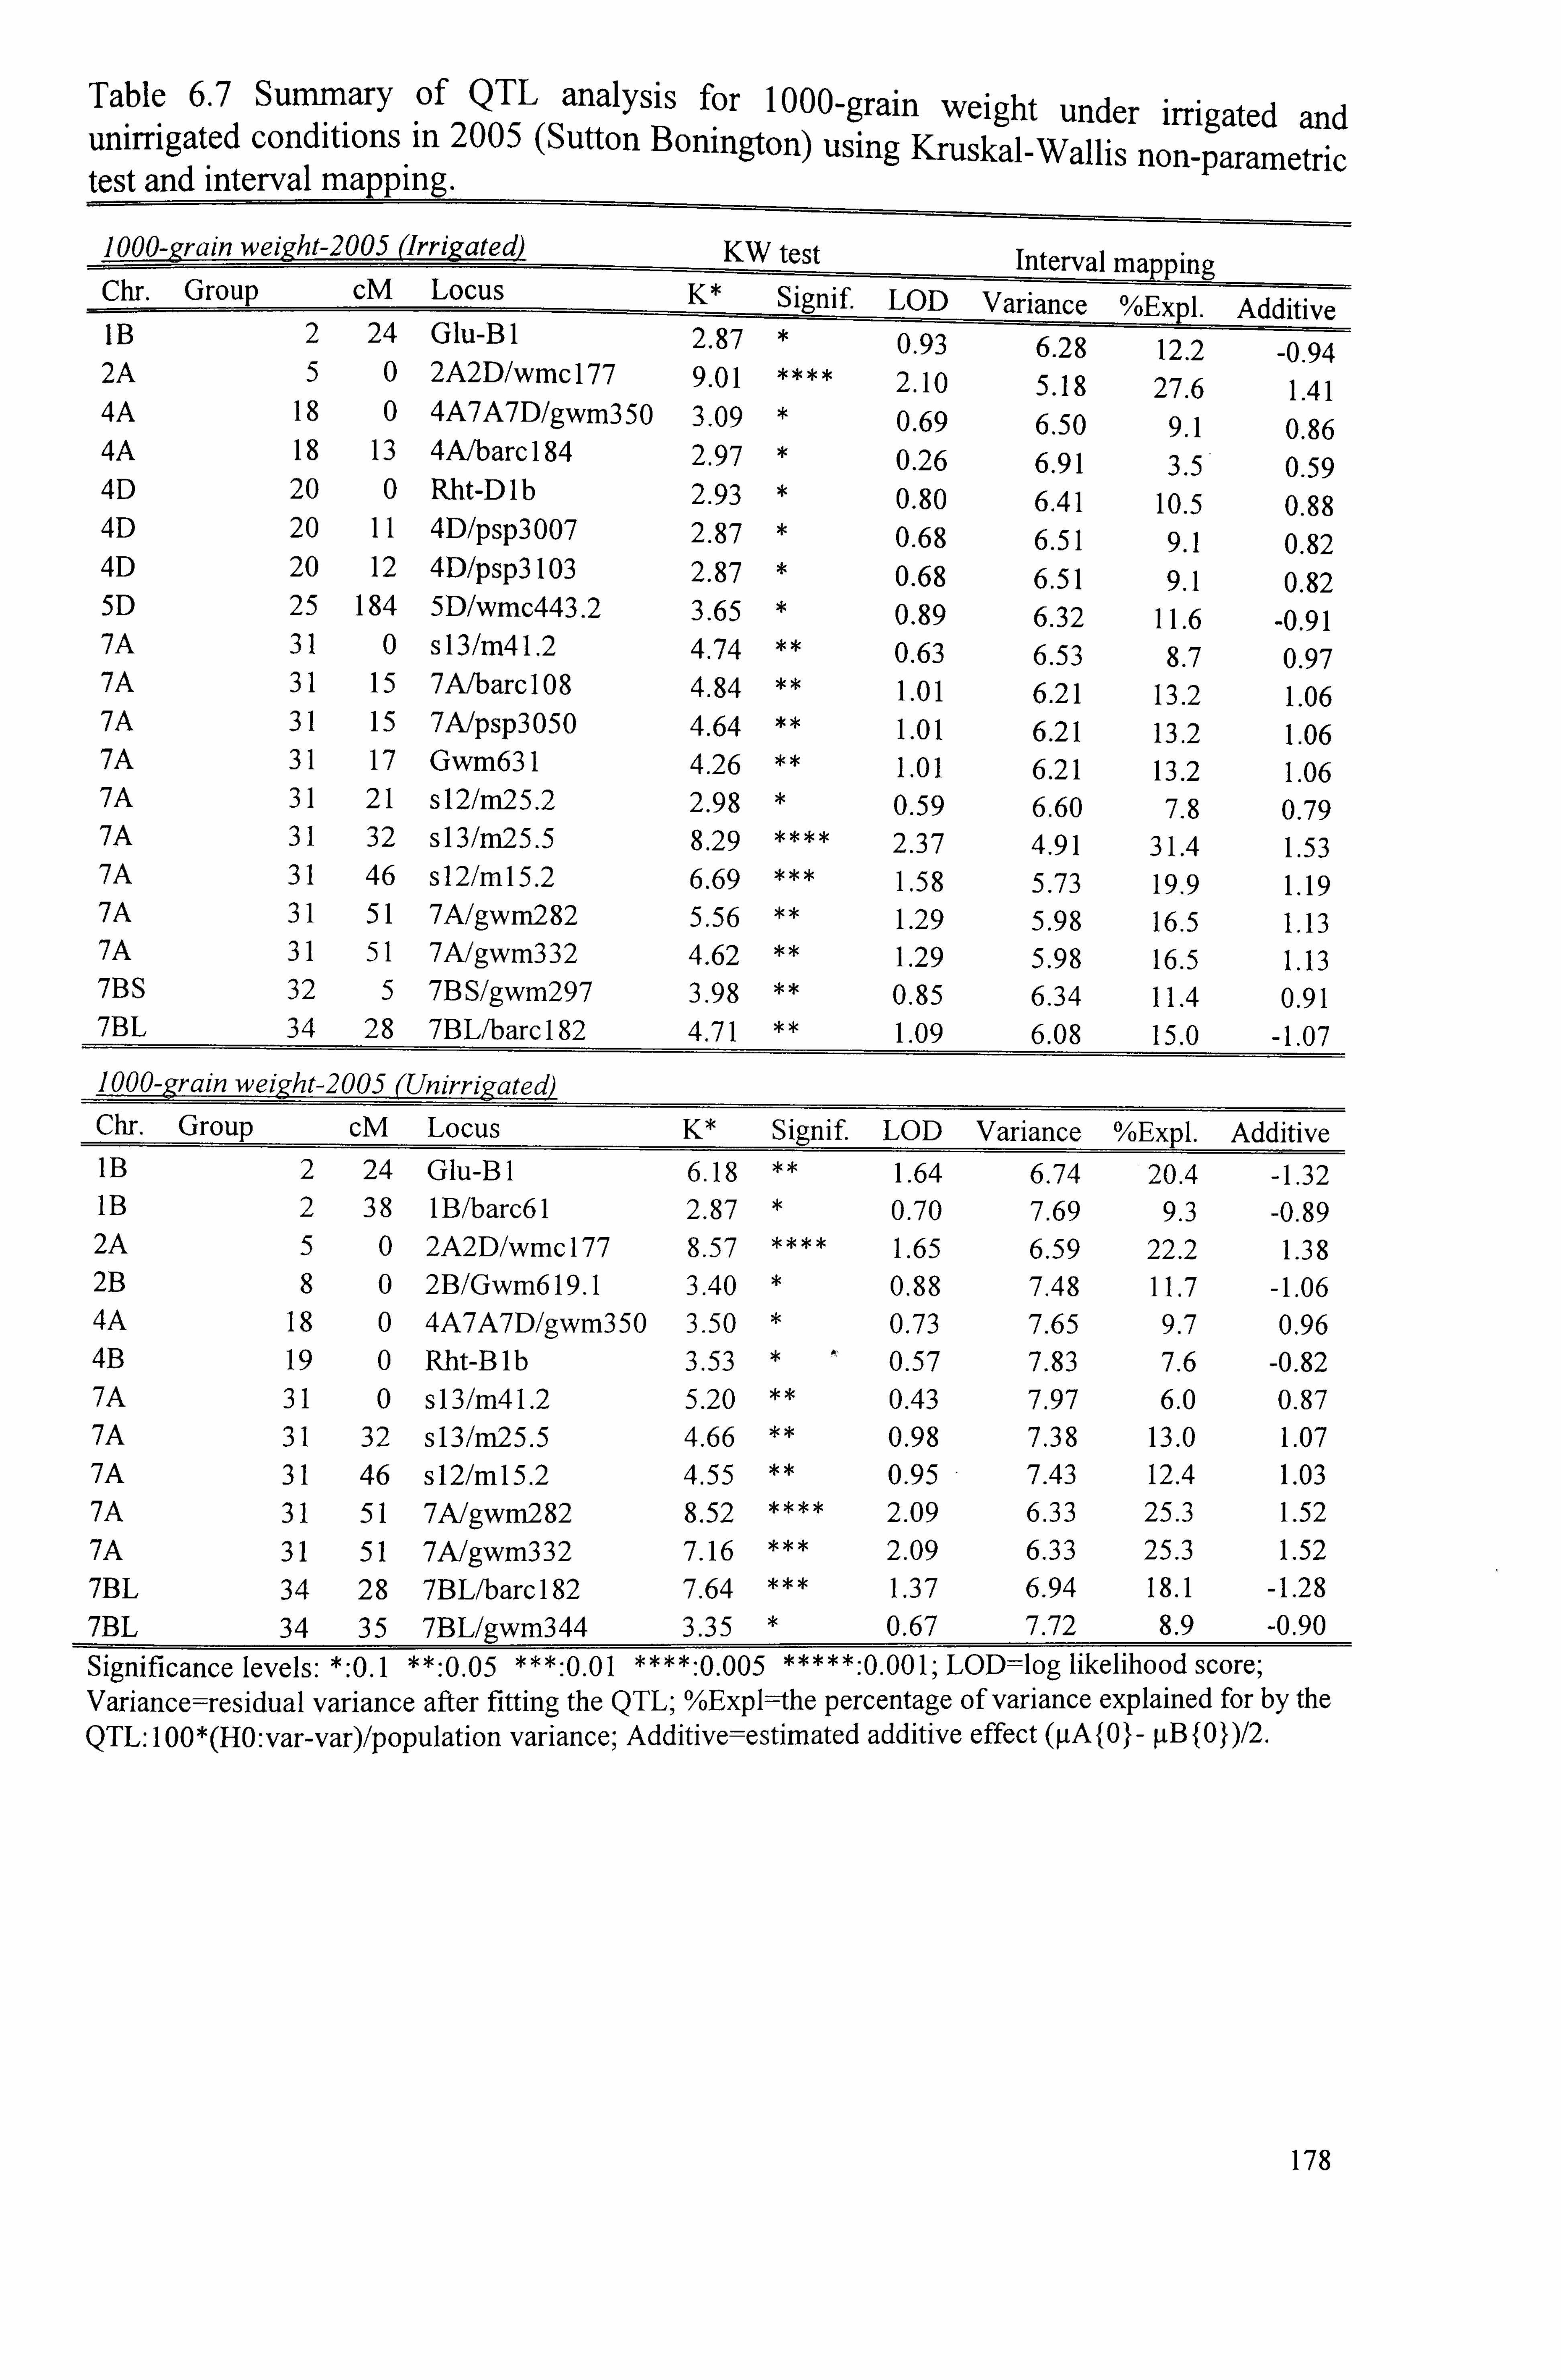
Table 6.7 Summary of QTL analysis for 1000-grain weight under irrigated and unirrigated conditions in 2005 (Sutton Bonington) using Kruskal-Wallis non-parametric test and interval mapping.
1000-grain weight-2005 (Lrrigated) KW test Interval ma Chr. Group cm Locus K* Signif. Variance %Expl. Additive IB 2 24 Glu-B 1 2.87 0.93 6.28 12.2 -0.94 2A 5 0 2A2D/wmc 177 9.01 2.10 5.18 27.6 1.41 4A 18 0 4A7A7D/gwm350 3.09 0.69 6.50 9.1 0.86 4A 18 13 4A/barc 184 2.97 0.26 6.91 3.5 0.59 4D 20 0 Rht-D Ib 2.93 0.80 6.41 10.5 0.88 4D 20 11 4D/psp3OO7 2.87 0.68 6.51 9.1 0.82 4D 20 12 4D/psp3lO3 2.87 0.68 6.51 9.1 0.82 5D 25 184 5D/wmc443.2 3.65 0.89 6.32 11.6 -0.91 7A 31 0 s 13/m4l. 2 4.74 ** 0.63 6.53 8.7 0.97 7A 31 15 7A/barcIO8 4.84 ** 1.01 6.21 13.2 1.06 7A 31 15 7A/psp3O5O 4.64 ** 1.01 6.21 13.2 1.06 7A 31 17 Gwm631 4.26 ** 1.01 6.21 13.2 1.06 7A 31 21 sl2/m25-2 2.98 0.59 6.60 7.8 0.79 7A 31 32 sl3/m25.5 8.29 2.37 4.91 31.4 1.53 7A 31 46 s 12/m 15.2 6.69 1.58 5.73 19.9 1.19 7A 31 51 7A/gwm282 5.56 1.29 5.98 16.5 1.13 7A 31 51 7A/gwm332 4.62 1.29 5.98 16.5 1.13 7BS 32 5 7BS/gwm297 3.98 0.85 6.34 11.4 0.91 7BL 34 28 7BL/barc 182 4.71 1.09 6.08 15.0 -1.07 1000-ý-, rain weizht-2005 (Unirrigated
Chr. Group cm Locus K* Signif LOD Variance %Expl. Additive 1B 2 24 Glu-B 1 6.18 1.64 6.74 20.4 _
-1.32 1B 2 38 1 B/barc6l 2.87 0.70 7.69 9.3 -0.89 2A 5 0 2A2D/wmc 177 8.57 1.65 6.59 22.2 1.38 2B 8 0 2B/Gwm6l9.1 3.40 0.88 7.48 11.7 -1.06 4A 18 0 4A7A7D/gwm350 3.50 0.73 7.65 9.7 0.96 4B 19 0 Rht-B Ib 3.53 0.57 7.83 7.6 -0.82 7A 31 0 sI 3/m4l. 2 5.20 ** 0.43 7.97 6.0 0.87 7A 31 32 sl3/m25.5 4.66 ** 0.98 7.38 13.0 1.07 7A 31 46 s 12/m 15.2 4.55 ** 0.95 7.43 12.4 1.03
7A 31 51 7A/gwm282 8.52 2.09 6.33 25.3 1.52
7A 31 51 7A/gwm332 7.16 2.09 6.33 25.3 1.52
7BL 34 28 7BL/barc 182 7.64 1.37 6.94 18.1 -1.28 7BL 34 35 7BL/gwm344 3.35 0.67 7.72 8.9 -0.90 Significance levels: *: 0.1 **: 0.05 ***: 0.01 ****: 0.005 *****: 0.001; LOD=log likelihood score; Variance=residual variance after fitting the QTL; %Expl=the percentage of variance explained for by the QTL: 100*(HO: var-var)/population variance; Additive=estimated additive effect ([tAf 01- IM f 01)/2.
178

4__
000
X
9z I v I 1 4_4 m
Lf) (Y)
co
IT
0 Cl)
E
00 - ýt
C)
1 ) Cl) U)
rl- 14 (D 6
C'!
- C. 4
0u
$_4 U) rl Q
'a 0) E 3: EE 0 E co MCI) 0 E E
3. . "4 -, U) CD (3) -4 cl)
C)
. - ý+ 4-)
ý 1: ý
4- A_ 4 1)ý t-
Z Z -4 -4
4- I-4 l- en en 0m
ey) Vý , Z) ýZ5
cz cz C'd
th -T--T-'FT
ell rl- - Cl)
CD (0 Lf) Cl)
Q -__
N7 r_ý C_j
rl-ý sm. It
r-L4 0 a) -. 4 E E E
0) E CO EE
Cl)
CIO
ýn -0 0 ý--4
C, 3 bD
kn fn
cz kf)
u >
1-4 44 ý
Z Z
"0 -T,
CýU) 8 co
co 0) 't 2 - co
.
CD
! ý? q
,t Ci
r-
ct Uý tý t
- ý C) s - -`E00 E Cl a E 3:
0 ca
ca - co CL E- E - E b mu
.ý cn 3: cc Zý4 CL cm m (n
CL 3: -
m ýj C\l
4-
-+D
ýi rn ,, m
+
A - ". q I Iw I 1
Iq 7 7 4-4 $.. 4 W-) v 1. ) -ý
-, 0 j-
rl- 00 04
LO Cl) C'i c) w- LO
C,
L6
0) C) E tO
r-- 04 +_
>,, r, C) * CIA c) cl) C)_
- E ftftm E C-4 D_ E 0) E
gE 04
E4 E izý
(n CL
3. 0)
3: ý: C-4 cn
EE
\, C) ch 'S.,
179
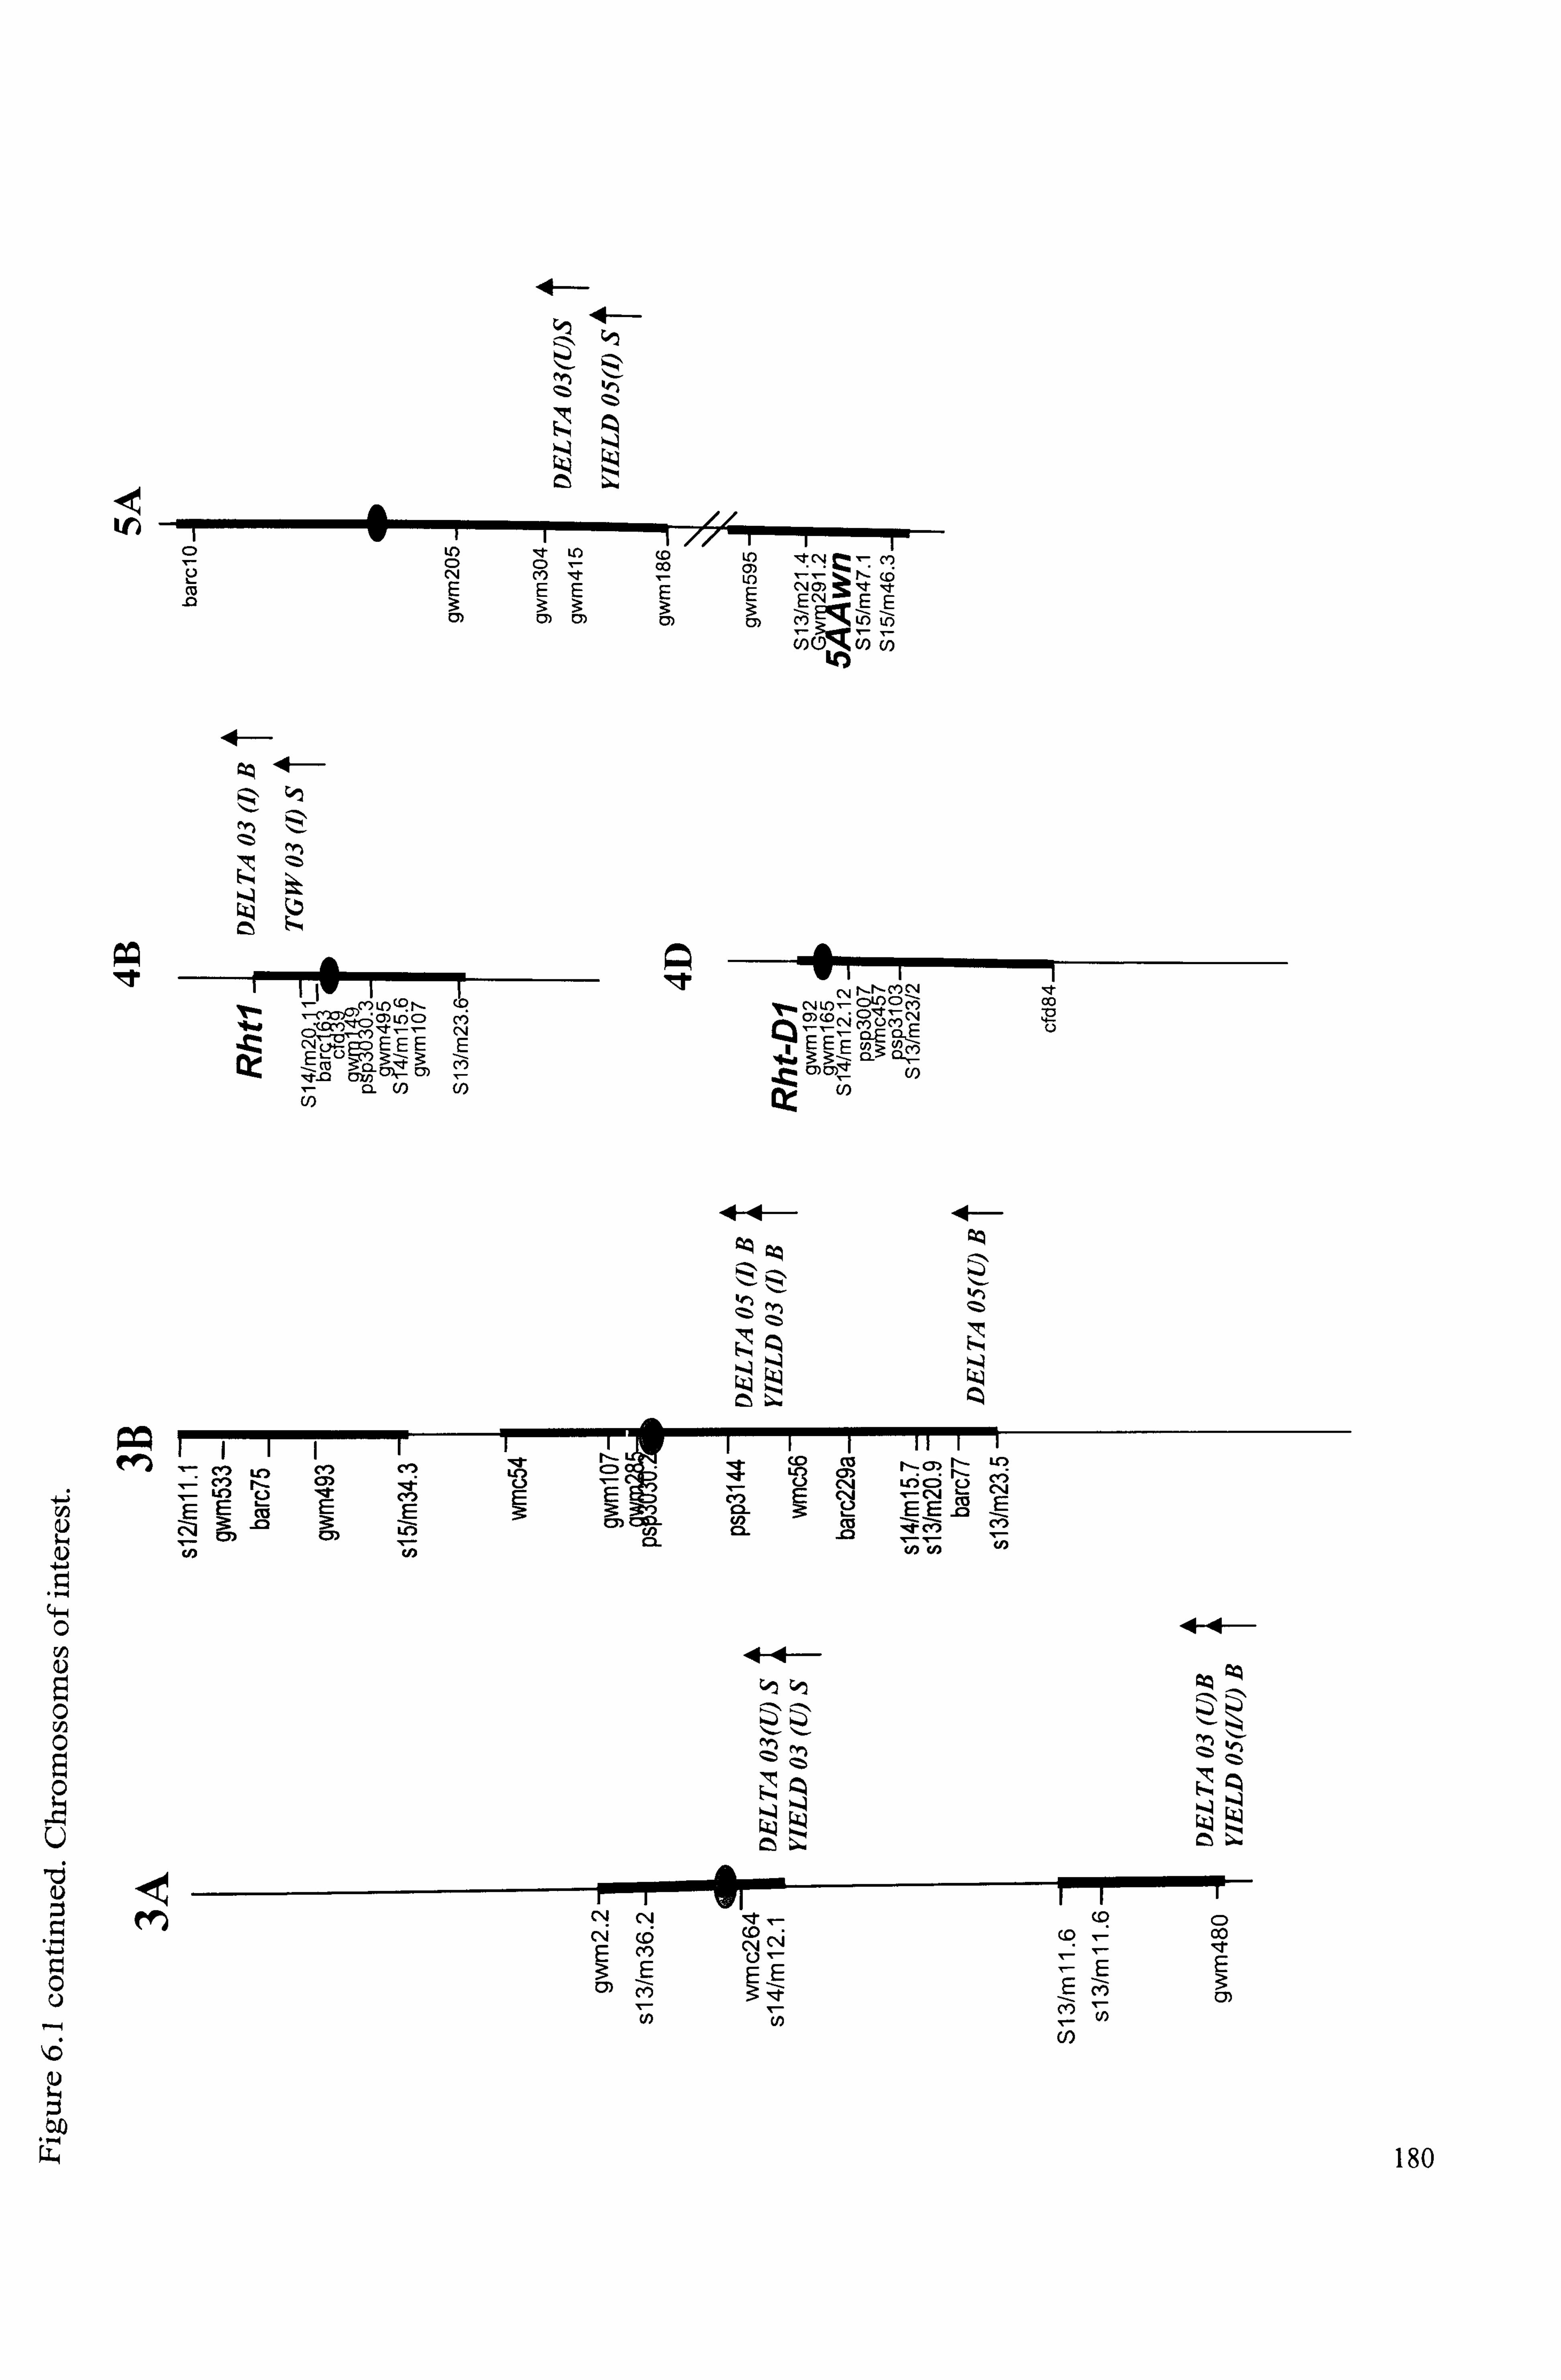
4z
C) U) C) It LO C) - co Lf) 0) 't (, I c? 2 c
CN
E CY) It
EE - LO - ý; k I-t "o
c o E E E c4 ,EE
U)
<: Z> rn
IV I LO r- (n L6 CD cli
r- C') CJ LO S! q 1,2 CCO co
N oc') C) E - CIE 'ýý EEE cL 4 E" r -Co
E EE , E u)?: Inco CY) C'm C, ) 0) :, ! , C, U) U) (D
ct
elf) cl)
I)
0
99
ýz> fý, ) (Z>
Zb 'm
CD C»
cý:
-e: CD
ýB - 42
c"i c» cz; ,
EE Co ýzr E CI) E C-')
Co 'ý4) 4 C*4 C
EE Co
-- 3: m 2; ý c3) cm (n c2
c2. Co c, >
Co - Co
2 Z> (Z> Z>
ýz cý
lz M C, 4
cý ý 1-9 CD 00
E ý:
c
E E ýt E
u C» Elt
E -
'c 1 3r 0)
m
180
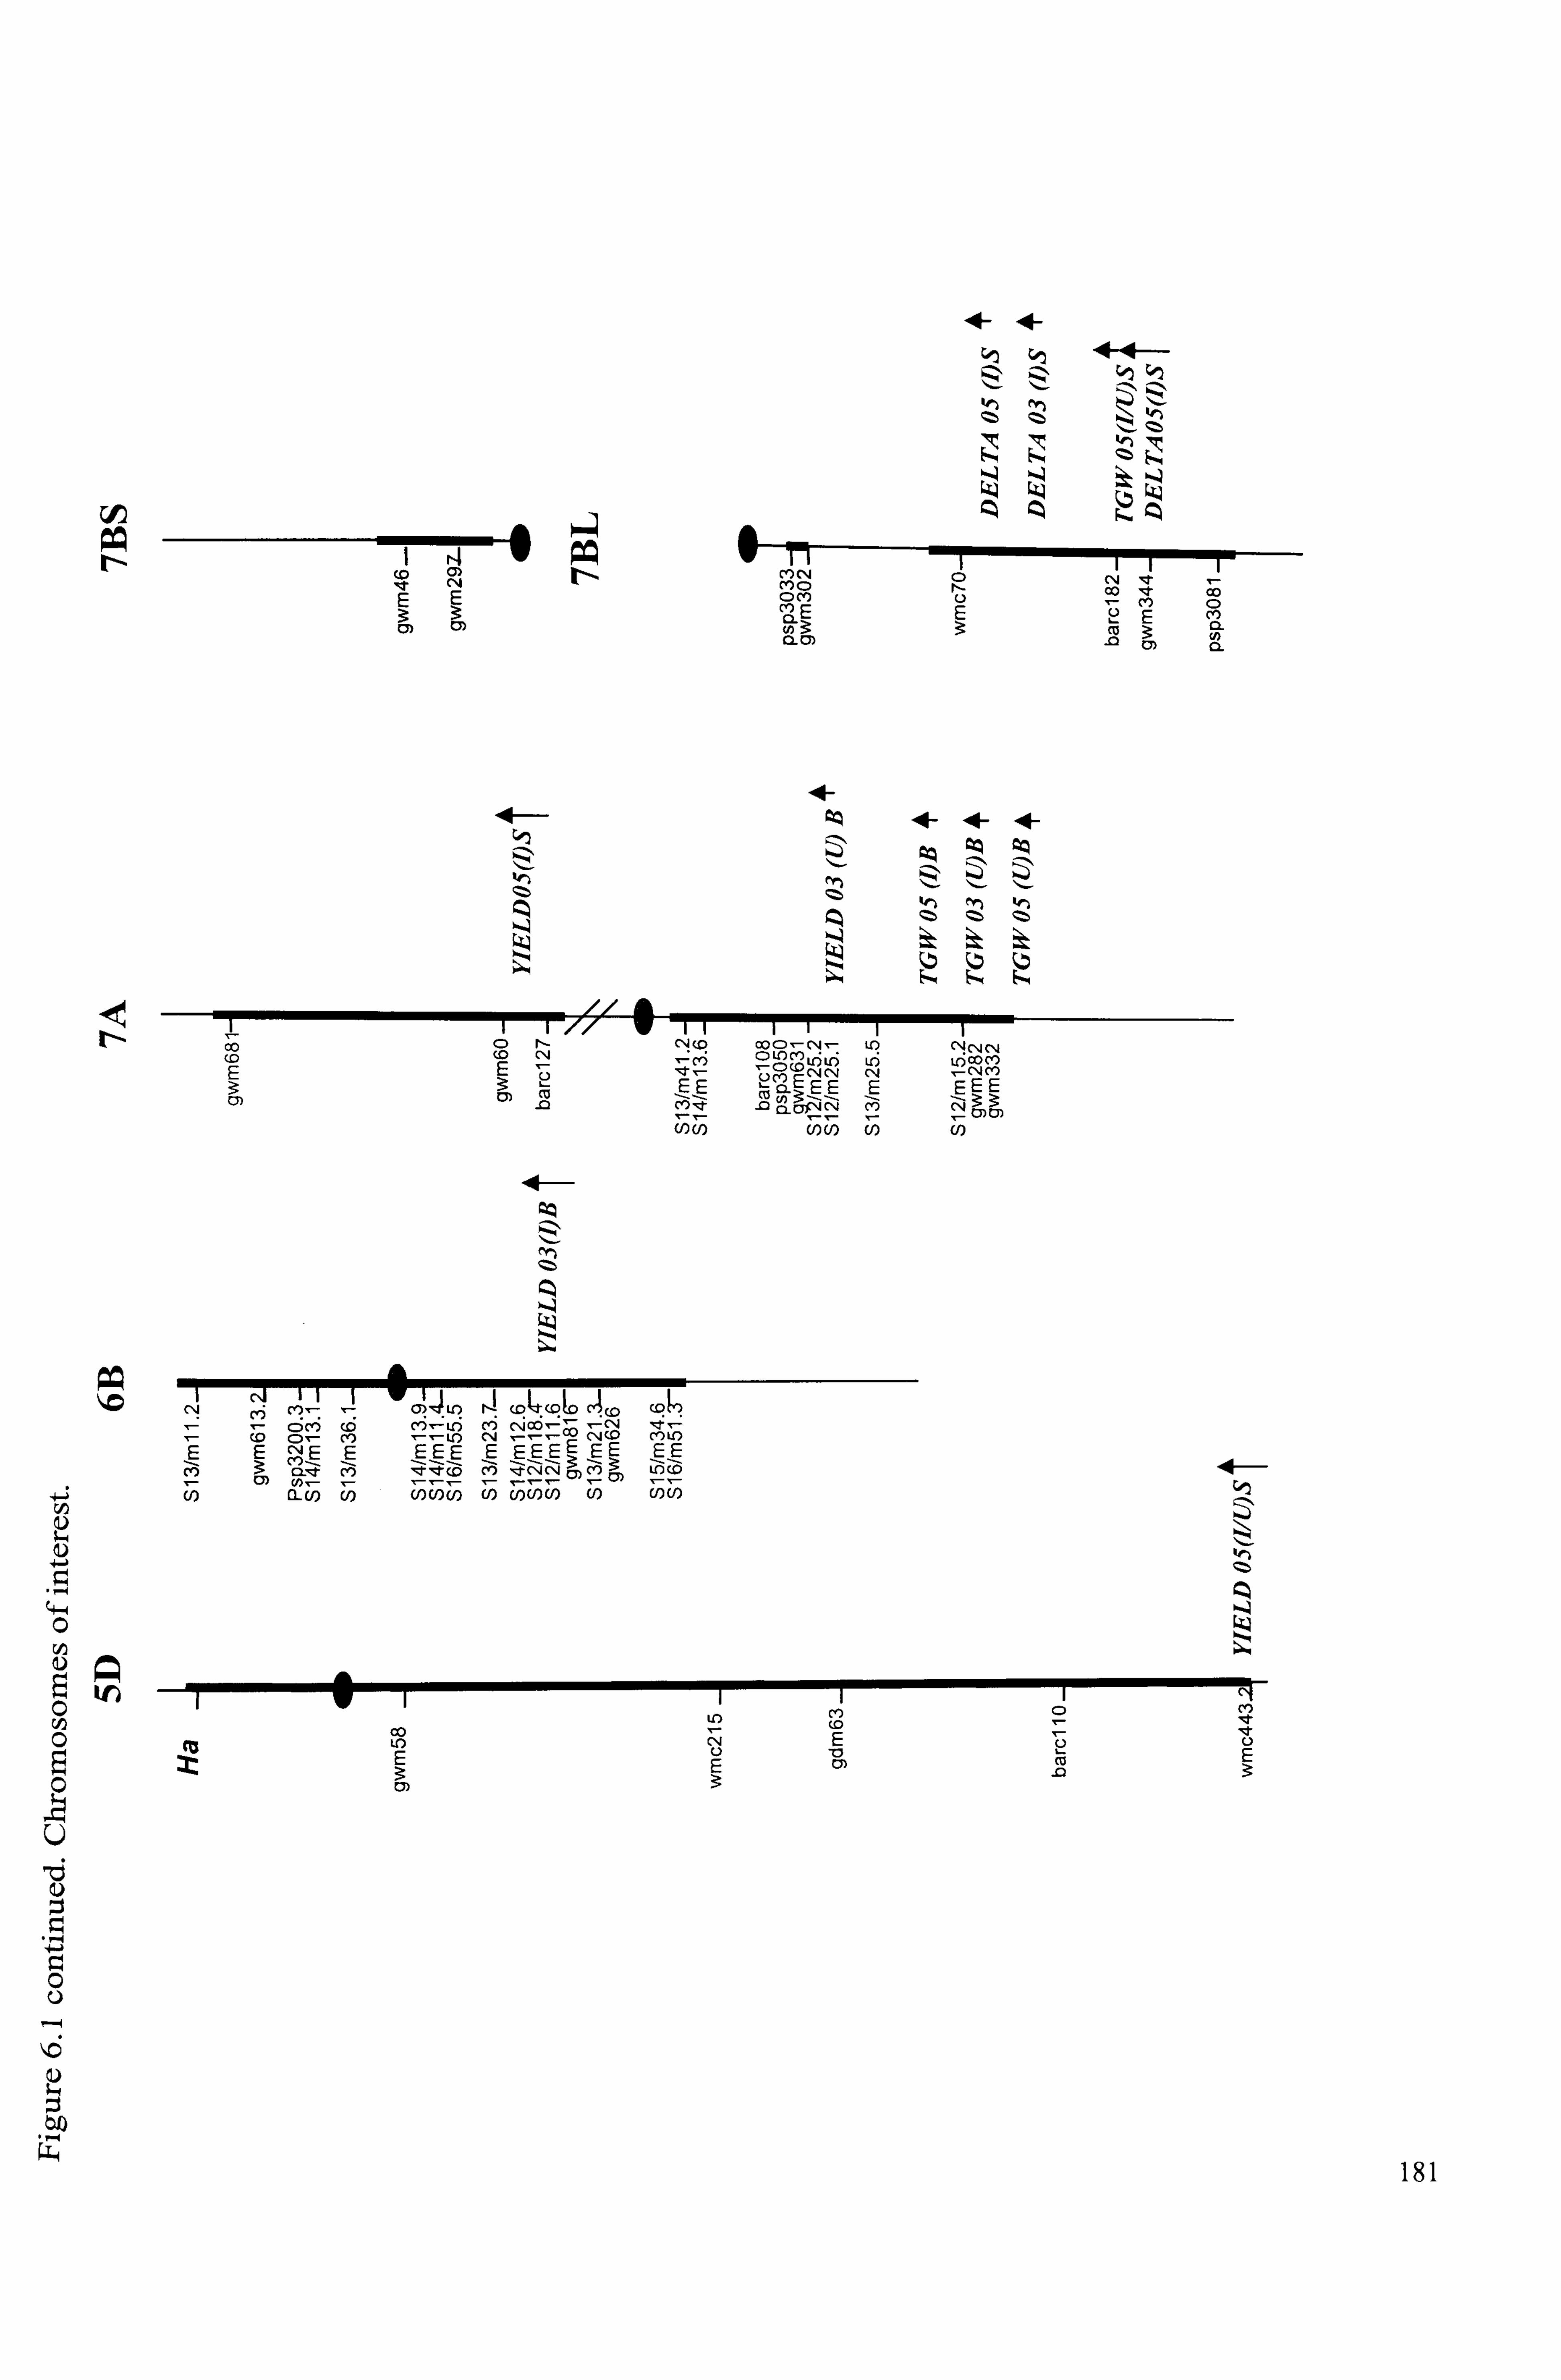
(Z (D cli
E
14
(Z> krý ey) 41ý
1 F-ZZ W -i 1 11 1 C) r, - CJ (i) CO CD N
1 C, 4 ci C, 4
(0 cli E -: cli
It- CD
cg) 5
- r CN C'J CN 1, ý OD n
- C, 4 M ý: - EE e ) c2»E EE E EEE -C4
MM Zý
19
92>
rA
A... ) z 0
C) - ,Z (0ý ', ý Lfý 1'ý (qlzt(. qto CI(O (q C; C-5 (6 ý2 ;: LI) "I C4 00 7 ý; ýý C\l f
E C
E C: ) - "E
Cl) E
U) EEE
C4 -- (D
tEE EE EE CO LO EE
3: CO- 0 t M Ce) N c)
cm -7 - 17) - - =- U) 11 ý; C, )U)U) ý; U )( /)U) U)U)
A MCD (D (n
11- u 00 't 00
CD ME CL E cn CL C3)
o»
94
41ý zz
g: z s4
u-) CI) CD
OD (D
cu LO
181

6.2 DISCUSSION
Most of the agriculturally important traits such as grain yield, yield components and quality are controlled by many genes and are known as 'quantitative' traits. The regions within genomes that contain genes associated with a particular quantitative trait are known as quantitative trait loci (QTL). Identification of these QTLs by conventional
phenotypic evaluation, generating a genetic linkage map and applying QTL analysis for
identifying chromosomal regions offers valuable scope for identifying markers for use in marker-assisted selection in breeding. In the present study, an attempt was made to investigate the genetic basis of water-use efficiency by identifying QTLs for carbon
isotope discrimination (A 13 Q and quantifying co-linearity with QTLs for grain yield and thousand grain weight in the DH mapping population of Beaver x Soissons.
6.2.1 Mapping population of Beaver x Soissons
Population sizes used in genetic mapping studies generally range from 50 to 250
individuals (Young 1994; Mohan et al. 1997). However, larger populations are required
for high-resolution mapping. The entire mapping population must be evaluated
phenotypically for quantitative traits. Although the Beaver x Soissons mapping
population contained 65 DH lines, the present study utilized only 33 lines because of
difficulty in labour availability and the high cost of isotope analysis. The traits were
phenotyped in three replicates, so the precision of measurements to some extent
compensated for fewer DH lines. In addition, replication in each site/season ensured the
analysis was sufficiently powerful to identify putative QTLs for target traits. The target
traits were evaluated for all 33 DH lines and the two parents for QTL mapping for
identification of associated chromosome regions. The results of QTL analysis are
discussed here.
6.2.2 Mapping of carbon isotope discrimination (A 13C)
QTLs for traits involved in drought resistance have been reported in several crops. For
example, QTLs for osmotic adjustment were identified in rice (Lilley et al. 1996; Zhang
et al. 2001), barley (Teulat et al. 1998,2001) and wheat (Morgan and Tan, 1996).
Similarly QTLs have been identified for the anthesis silking interval in maize (Ribaut et
182

al., 1996) as well as QTLs for stay green in sorghum (Tuinstra et al., 1997; Xu et al., 2000; Kebede et al., 200 1) and wheat (Verma et al., 2004).
However, there are only a few reports on QTLs for carbon isotope discrimination in crop plants. QTLs for A 13 C have been reported in barley (Teulat et al., 2002; Forster et al. ,
2004), Arabidopsis (Hausmann et al. , 2004; Juenger et al., 2005; Masle et al., 2005),
tomato (Martin et al., 1989), soybean (Specht et al., 2001), rice (Price et al., 1997 and 2002; Laza et al., 2006) and brassica (Hall et al., 2005). To date there are no reported investigations available which have identified QTLs for A 13C in wheat, although research is underway in CSIRO, Australia (R. A. Richards, personal communication. ).
In the present study, the putative QTLs for A 13C obtained on the basis of interval
mapping and the Kruskal-Wallis non-parametric test are discussed here. At Sutton
Bonington in 2005, one putative QTL of higher significance for A 13C was found on the
chromosome 313 (irrigated in 2005), A 13 C being increased (or WUE decreased) by the
Beaver allele which explained about 28% of the phenotypic variance for A 13C. Other
QTLs for delta under unirrigated conditions were also found on chromosome 2D and 3B
(in 2005) which explained 18.2% and 14% of phenotypic variance, respectively, A 13C
again being increased by the Beaver allele. Thus, in this study the presence of putative QTL for A 13C was evident on chromosome 3B. At Gleadthorpe in 2003, two putative
QTLs for A 13C were found on chromosomes 713L and 4B explaining more than 13% of
the phenotypic variance (irrigated in 2003). The influence of parental alleles for these
QTLs for the expression of A 13C was, however, different. The Soissons allele on 713L
increased A 13 C and the Beaver allele on chromosome 4B decreased A 13 C. The putative
QTLs found on chromosome 5A and 3A (unirrigated in 2003) explained more than 13%
of the phenotypic variance and for these QTLs, A 13C was increased by the Soissons
allele. The QTL analysis for Gleadthorpe data did not show QTLs of LOD> 2.0.
Nevertheless, several putative QTLs identified in this study would be of potential
importance if they could be confirmed in other experiments.
Thus, in this study a range of variation was found in the expression of A 13C under the
influence of either of the parental alleles. This can be due to differences in genotypic
performances specific to the environment. However, the putative QTL detected on 3B
was of higher significance and this agrees with the parental characterization for delta.
183
There are only a few studies that relate genetic analysis of A' 3C in the mapping
population of plant species. In Arabidopsis Juenger et al. (2005) found significant
genetic variation for 6 13C in the Landsberg erecta (Ler) x Cape Verde Islands (Cvi)
mapping population across 10 genomic regions. Both the parental ecotypes contained
plus and minus alleles for 6 13C which explained the observed transgressive segregation in the RIL population. Similar genetic effects were also evident in the current Beaver x Soissons DH population with Beaver and Soissons possessing plus and minus alleles for
variation in A 13C.
Masle et al. (2005) assessed the phenotype of a population of RILs derived from a cross between Columbia (Col-4) and Landsberg erecta (erl 1) ecotypes of Arabidopsis for
variation in transpiration efficiency and identified a significant QTL for A 13C on
chromosome 2, which explained 21-64% of the total phenotypic variation in A 13 C. They
reported the isolation of a gene that regulates transpiration efficiency, ERECTA, a
putative leucine-rich repeat receptor-like kinase (LRR-RLK) known for its effects on
inflorescence development. This is proposed as a major contributor to the locus for A 13C
on Arabidopsis chromosome 2. Teulat et al. (2002) reported 10 QTLs for A 13C in barley
with major QTLs on chromosome 2H and 4H and these were co-localised with other
drought tolerant traits such as osmotic potential and relative water content.
Previous research investigated the genetic variation in A 13 C between two wheat varieties
Oxley (high A 13 C) and Falchetto (low A 13C) (Mohammady-D, 2005). F2 backcross
reciprocal monosomic crosses between Falchetto and 18 monosomic lines of Oxley
were used to identify chromosomal locations of the genes responsible for variation in
A 13 C. Allelic variations were found on chromosome ID for WUE and A 13C suggesting
that the evolutionary source of the D genome (Triticum tauschii) and its relatives are
potential variation sources for breeding programmes (Mohammady-D, 2005). In this
pot-based study water stress was imposed by withholding water for 7 days at the meiosis
stage of development and reciprocal families belonging to chromosome ID were
assessed for WUE at the F3 generation stage. Chromosome ID of Falchetto decreased
A 13C. In the present study, one putative QTL for A 13C was found on chromosome 2D
under unirrigated conditions in 2005. So the importance of D genome as indicated by
184

the presence of a putative QTL for A 13C in the present study would relate to the importance of D genome from Triticum tauschii in ftirther breeding programmes.
A QTL of lesser significance on chromosomes 4B near the Rht-B] locus (irrigated
treatment in 2003) explained 13% phenotypic variance, with A 13C increased by the
presence of Beaver semi-dwarf allele (decreasing WUE). Rht genes present on
chromosome 4 modulate the morphology and physiology of wheat in a manner that
involves compensation among several physiological processes. For instance, Rht genes decrease leaf area, but photosynthesis per unit leaf area increases (e. g. Richards et al. 2002). Although Rht genes increase leaf permeability to water vapour, plant water status
changes in compensation to minimize differences in WUE. The results of previous work
on near isogenic lines of spring wheat are contradictory. One study in Australia
indicated that WUE declined with plant height and tall lines had a significantly higher
A 13C (Richards, 1991), while another in California indicated the dwarfing genes
depressed WUE by 15% and A 13C was negatively associated with total dry matter
(Ehdaie and Waines, 1996). In winter wheat, a previous UK field study on cv. Mercia
Rht NILs found that the Rht-D]b semi-dwarf allele decreased WUE compared to the tall
control (Foulkes et al., 2001) and therefore supported the present findings. In general,
previous investigations therefore suggest that semi-dwarfing has decreased WUE
consistent with the present findings for A 13C.
6.2.3 Mapping of yield and yield components
6.2.3.1 Grain yield
Putative QTLs for grain yield were found on chromosome 6B and 3B (irrigated in
2003), 3A (unirrigated in 2003; irrigated & unirrigated in 2005), 2A (unirrigated in
2003), 7A (unirrigated in 2003 and irrigated in 2005) and on 5D (irrigated and
unirrigated 2005). The QTLs on 5D explained 25.1% and 14.5% of the phenotypic
variance for grain yield under irrigated and unirrigated treatments in 2005, respectively.
Some of these QTLs coincided with yield or yield-related QTLs previously identified in
wheat. Chromosome 5D is homoeologous with other group 5 chromosomes which are
known to carry genes for abiotic stress resistance (Sutka and Snape, 1989; Manyowa
and Miller, 1991; Cattivelli et al., 2002; Quarrie et al., 2005). In addition, QTLs for
185

yield also have previously been identified on chromosome 5B of bread wheat (Byrne et
al., 2002).
The putative QTL for yield found on chromosome 6B in the present study was in a homoelogous position to a yield QTL region identified in previous work in spring wheat (Blanco et al., 2002; Quarrie et al., 2005). The putative yield QTL on chromosome 6B
explained 21.4 % of the phenotypic variance (irrigated in 2003) and is co-linear with the
QTL for yield in the centromeric region of 6B in the ITMI (International Triticeae
Mapping Initiative) population (Ayala et al. 2002).
The putative yield QTL clusters found on chromosome 3B and 7A in this study matched
the yield QTL clusters found on these chromosomes for the Chinese Spring x SQI
population (Quarrie et al., 2005). QTLs on 3B explained 35.8 % of the phenotypic
variance for yield and on 7A explained 43.6% (irrigated in 2005) and 16.3 %
(unirrigated 2003) of the phenotypic variance for yield. Therefore several yield QTLs in
the present study were relatively close to those reported in the previous literature.
6.2.3.2 Thousand grain weight(TGUg
Putative QTLs for TGW were found on chromosomes 7A (unirrigated in 2003; irrigated
and unirrigated in 2005), 2A (irrigated and unirrigated in 2003 and 2005), IA (irrigated
and unirrigated in 2003) and the long arm of 7B (irrigated and unirrigated in 2005). The
QTL on chromosome 2A is consistent with previous mapping work under irrigated
conditions in 2002 at Gleadthorpe on the Beaver x Soissons population (DEFRA, 2004).
In the present study, yield QTLs were coincident with TGW QTLs on chromosome 7A
in the irrigated treatment in 2005. Earlier work on an ITMI population found a QTL on
7AL for spikelets per ear (Li et al., 2002), and it is possible that the present QTL for
TGW may represent a pleiotropic effect of a QTL for grains per ear. In other field
studies, yield QTL clusters were coincident with significant effects for grains per ear
and TGW on a Chinese spring x SQI wheat cross examined in a wide range of
geographical locations (Quarrie et al., 2005). Effects for TGW have also been associated
with the 7DL. 7Ag translocation in a study using near isogenic lines (Singh et al., 1998).
186
6.2.4 Stability of QTLs - implications for use in breeding
A 13C provides an integrative measure of transpiration efficiency, mainly regulated by
stomatal-aperture traits (Morgan et al. 1993; Reynolds et al. 2000); strong variations in
climatic conditions are expected to have a significant influence on A 13C values (Merah
et al. 2001). The effect of post-anthesis drought on A 13 C at Sutton BonIngton in 2005
was more severe than the mild drought at Gleadthorpe in 2003. The statistically non
significant genotype x irrigation interaction found for A 13C from the cross site/season
analysis of variance revealed a stable performance of genotypes across irrigation
regimes.
The positive correlation between A 13 C and grain yield suggested that the physiological
basis of genetic differences in A 13 C depended on stomatal conductance (Condon et al.,
1987; Acevedo, 1993; Morgan et al., 1993; Merah et al., 2001). Thus, gas exchange
measurements at or after anthesis showed that gs values for Soissons (low A 13C) were
apparently lower than for Beaver (high A 13C) in both years.
The putative QTLs identified in irrigated and unirrigated envirom-nents were generally
different, and also differed for a given irrigation treatment across site/seasons. This
revealed that QTLs for A 13C were apparently not stable and were under the influence of
prevailing environmental conditions. For instance, in 2003 (Gleadthrope), 13% and 15%
phenotypic variance was accounted for by the A 13C QTLs on chromosomes 4B and 7BL
under irrigation, respectively, while variation was mainly accounted for by QTLs on
chromosomes 5A (15%) and 3A (13%) under drought. On the other hand, in 2005
(Sutton Bonington), 28% (irrigated) and 14% (unirrigated) of the total phenotypic
variance was accounted for by the QTLs on chromosome 3B; and 18.2% for the QTL on
chromosome 2D under drought.
Evidence of a non significant genotype x environment interaction for A13C in each year
or across years (P=0.06) in the general analysis of variance (as discussed in chapter 5)
suggests that A 13C is heritable. However, the significant genotype x environment
interaction for grain yield indicated the absolute yield loss under drought differed
amongst genotypes. This was also supported by a significantly positive genetic
correlation between delta and grain yield which suggested that selecting a genotype with
187
low A (higher WUE) may result in lower grain yield under drought. Nevertheless, the QTLs accounting for higher phenotypic variance identified in both environments may
potentially serve as selection criteria for use in wheat breeding programmes. However,
some of these QTLs may not be useful as they are not stable across seasons, but the
QTL on 3B at 26 cM (marker psp 3144) could be of use as its detection was confirmed
under irrigation in two site/seasons (although only weakly significant in 2005).
In addition, the present results as discussed in Chapter 5 suggest that water use rather
than WUE is the main driver of genetic perfon-nance under mild UK droughts as
compared to severe droughts in drier Mediterranean-type environments. The positive
association between grain yield and A 13C found in both wet and dry environments can
be linked to an existence of a trade-off between higher WUE (via lower stornatal
conductance) and lower season-long water use and hence yield. It follows that QTLs for
low A 13C (or high WUE) may be used as an indirect way of selecting for greater
seasonal water use under post-anthesis drought in the UK
In this study, the putative QTLs for A 13C were not confidently co-located with any of
the chromosomal regions for the putative QTLs detected for grain yield and TGW. It is
apparent in this study that there is a genetic basis for inheritance of A 13C , which may not
be related to yield improvement in the UK conditions; further studies to determine
whether genetic improvement in grain yield and higher WUE in winter wheat are
independent in the UK needs to be ascertained.
In the following section, the associations of these QTLs for A 13 C are compared with
QTLs for drought resistance traits found in previous studies involving the BxS DH
population in the UK.
6.2.5 Comparison of present results with previous work on BxS population
Initial QTL studies Verma et al. (2004) evaluated 49 lines of this Beaver x Soissons DH
population at the Gleadthorpe site in 2000 and 2001 and identified a strong QTL for
9 stay green' (% green flag leaf area remaining green at GS61+35d) on chromosome 2B
under irrigation and on long arm of chromosome 2D under drought. The QTL for stay
green on 2D was associated with a positive effect of the Soissons allele. In the present
188

work, a major putative QTL for A13C was found at gwm30 locus on the long arm of
chromosome 2D (unirrigated. in 2005) and explained about 18% of phenotypic variance, but the location was different to the QTL for 'stay-green' described in previous work on
chromosome 2D.
The significance of the photo -insensitivity genes for early flowering has been reported
in previous studies, wherein Soissons is known to carry a dominant Ppd-D]a allele for
photoperiod insensitivity on the short arm of chromosome 2D (Verma et al., 2004;
Foulkes et al., 2004). This genetic effect in Soissons was evidenced in its early
flowering behaviour as compared to Beaver. A putative QTL was also identified on
chromosome 2D for A 13C with the Soissons allele increasing A 13 C and it can be
speculated that Ppd-DIa conferring early flowering was associate with higher A 13C in
the present study. This could also be related to a possible association between early
flowering and low A 13C, for improved WUE in the UK environment.
It is also interesting to note that some of the QTLs for A 13 C detected in this study appear
to be co-located to QTLs for drought resistance traits identified in previous work
(DEFRA, 2004). This may include the QTL on chromosome 4B (irrigated in 2003) close
to the centromeric position which is apparently co-located with a QTL for stem water
soluble carbohydrates (irrigated and unirrigated in 2002) and percent flag leaf green area
(irrigated in 2002) within 10 cM on linkage group 19 (DEFRA, 2004). Both these
effects may be pleiotropic effects of the semi-dwarfing gene Rht-Dlb. The positional
correspondence in terms of markers appearing within 15 cM may imply the conserved
organization of the genes in the genome and also the functions of the genes underlying
the drought resistance traits. However, further genetic and physiological understanding
is necessary for making use of these traits.
6.2.5.1 Co-location of QTLsfor target traits in the present study
In this study, only at the Gleadthorpe site were QTLs for delta and grain yield found to
be associated with the same marker s141MJ2.1 at 22 cM on chromosome 3A, with the
Soissons allele increasing the expression of these traits under drought. However, the co-
localisation of putative QTLs for delta, grain yield and TGW were different for different
markers and linkage groups.
189
6.2.6 Synteny among cereals for QTLs for drought resistance
Although no formal syntenic analyses were carried out in this study, it was possible to
make broad comparisons with other cereal species. The genome size of bread wheat is
much larger (16.5 Gb) than for durum wheat (13 Gb), barley (4.5 Gb), rice (400 Mb),
maize (2.5 Gb) and sorghum (730 Mb) making the identification and use of molecular
markers for breeding and selection in wheat more complex. Bread and durum wheat
have a lower level of polymorphism than barley or other cereals (Chao et al., 1989;
Devos et al., 1995) and the level of polymorphism is not consistent across genomes or
crosses (Langridge et al., 2001).
The first grass consensus map aligning the genomes of seven different grass species
using rice as a reference genome was published by Moore et al. (1995), and modified as
4concentric circle diagram' by Gale and Devos (1998) who suggested that the syntenic
relationships among cereal annuals will be useful for predicting the loci of homologous
major genes. This concept can be extended to a large number of QTL analyses for
detecting the QTL shared among cereals as they share some level of homology. For
example rice, wheat and maize share extensive homoelogies in a number of regions in
their genomes, e. g. chromosome 4 in rice compared with chromosomes 2 and 2S in
wheat and maize, respectively (Ahn et al., 1993; Sorrells et al., 2003). The dwarfing
alleles Rht-BI and Rht-D] in wheat are also the orthologues of the maize dwarf-8 gene
and Arabidopsis gibberellin insensitive genes (Peng et al., 1999).
A conserved orthologous sequence of genes within a novel colinear region in wheat
chromosome 1AS and rice chromosome 5S has been reported (Sorrells et al., 2003;
Guyot et aL 2004). Morgan and Tan (1996) identified a ma or QTL controlling
osmoregulation on the homoeologous arm in wheat (chromosome 7A), but this was
probably at a more distal position on the chromosome, corresponding by synteny to a
rice chromosome 6 segment. In the present study, a grain yield QTL was identified
under drought (in 2003) on the same long arm of chromosome 7A, and it may be worth
further study to see if any QTLs for osmoregulation are co-linear with this QTL.
Homoeologous group 5 chromosome of wheat is reported to carry genes controlling a
range of abiotic stress responses such as tolerance to freezing, drought, osmotic stress,
190
and high temperatures (Snape et al., 200 1; Cattivelli et al., 2002). QTL clusters for plant height, tiller number, spikelet number on chromosome 5A (Snape et al., 1985), yield
components (Araki et al., 1999) and for grain yield (Kato et al., 2000) have been
reported. The accumulation of hormone abscisic acid (ABA) by plants in response to
drought, and many other stresses is well known. In wheat, a highly significant QTL for
ABA accumulation in droughted leaves was found on the long arm of chromosome 5A,
coincident for the RFLP marker Xpsr575 with the major vernalization responsive gene
Vrn] (Quarrie et al., 1994). The significance of chromosome 5A is in concurrence with
the present findings that a putative QTL for delta was detected on the long arm of 5A in
2003 under drought (LOD=1.21). However, the association of marker gwm304 on
chromosome 5AL in the present study with ABA accumulation needs confin-nation in
further investigation.
Chromosomes of homoelogous group 2 of wheat are orthologous to chromosome F of
sorghum, chromosome 10 of maize (Gale and Devos, 1998) and chromosomes 7 and 4
of rice (Sorrells et al., 2003) where QTLs for stay green have been reported in sorghum
(Tuinstra et al., 1997; Kebede et al., 2001), in maize (Bertin and Gallais, 2001), in rice
(Jiang et al., 2004) and in wheat (Verma et al., 2004). In the present study, a putative
QTL for A 13C was found on the long arm of chromosome 2D (LOD=1.43) with the
presence of the Soissons allele decreasing A 13C (or increasing WUE). In maize, genomic
regions significantly affecting tolerance to drought were found on chromosomes 1,3,5,6,
and 8. For yield, a total of 50% of the phenotypic variance was explained by five
putative QTLs (Agrama and Moussa, 1996). Group 3 chromosome of maize is
orthologous to group 3 chromosome of wheat (as per map alignment from Gale and
Devos, 1998). In this study, therefore potential synteny with maize was noticed by the
presence of the putative QTL (LOD==2.32) for A 13C on chromosome 3B (irrigated in
2005), where Soissons allele increased WUE.
By synteny chromosome 2 of wheat is orthologous to chromosome 7 and 4 of rice
(Sorrells et al., 2003). QTLs for A 13C on chromosomes 2 and 7 were identified in rice
(Price et al., 2002; Laza et al., 2006). So the QTL on group 7 of rice could potentially be
syntenous with the QTL for delta in the present study on 2D. However, this may need
further consideration because this QTL was not detected at Gleadthorpe in 2005. Price et
191
al. (2002) reported differential expression of QTLs for A 13C in upland rice experiments
conducted at WARDA and IRRI. Such instability of QTLs in this study is in agreement
where QTLs for A 13C were generally different at Gleadthorpe and Sutton Bonington.
There are studies in barley that can be easily extended to wheat. Barley like wild and
cultivated wheat and rye possesses the basic seven chromosomes of the Triticeae.
Hexaploid wheat (Triticum aestivum L. ) contains the A, B, and D genomes and barley
(Hordeum vulgare L. ) contains the H genome (Campbell and Close, 1997). In crop
plants, dehydrin proteins are produced in response to environmental stimuli with a
dehydrative component, including drought, low temperature and salinity. Dehydrin loci
located within QTL intervals are known to control important phenotypic traits including
winter hardiness in barley (Hordeum vulgare L. ) and anthesis-silking interval in maize
(Zea mays L. ). Map positions of some dehydrin genes in barley and wheat have been
reported (Campbell and Close, 1997). Loci detected by dhn] and dhn2 on linkage group
5H of barley were within position of a QTL contributing to winter-hardiness,
photoperiod response, and heading date in a number of studies (Pan et al., 1994). This
region of the group 5 chromosomes also houses the barley Sh2 locus, which is a
determinant of winter or spring growth habit, and the homoalleles of Sh2, Vrn] of wheat
(chromosome 5A) and SpI of rye (Galiba et al., 1995; Fowler et al., 1996). It is possible
that the dehydrin loci on groups 5 of barley may be related to a Al 3C QTL cluster, found
in the present study, on chromosome 5A which explained 15% of the phenotypic
variance (unirrigated in 2003).
In barley, QTLs for A 13C on chromosomes 2H and 6H showed associations with TGW
and on chromosome 6H between A and several yield components, including TGW,
relative water content (RWC), osmotic potential (yn), and osmotic potential at full
turgor as well as several water soluble carbohydrates under drought (Teulat et aL 2002);
One of the target loci on chromosome 714, where QTLs for xV7r, RWC and some other
traits have been co-located, was shown to be co-linear with a region of rice chromosome
8 (Teulat et aL 1998), where a QTL for osmotic adjustment at 70% of RWC was also
found by Lilley et aL (1996). These drought tolerance traits can potentially be related to
those QTLs found for A on chromosomes 7131, and 2D and for TGW on 7A and 2A in
this study and further work seems justified to see whether this is the case.
192

Present results showed the detection of a total of nine Putative QTLs for A13C: on chromosomes 7BL and 4B (irrigated in 2003), 5A, 3A, IB (unirrigated in 2003), 3B and 4D (irrigated in 2005); and 2D and 3B (unirrigated in 2005) indicating a complex
mechanism controlling expression of this trait. Hence, with the exception of the A 13 C QTL on 3B in irrigated (LOD=2.32) and unirrigated (LOD=1.08) conditions at Sutton
Bonington, QTLs found in the present study could be specific to one environment and
were different between the two water treatments in each environment.
In summary, the putative QTLs of highest statistical significance were mapped on
chromosomes 3B (LOD=2.32) and 2D (LOD=1.43). There is some evidence from
comparative mapping in other species that may support the identification of QTLs on
these chromosomes in wheat associated directly with water-use efficiency. Thus the
hypothesis formulated for identification of QTLs for A 13C was supported by the present
findings (Tables 6.2 & 6.3). These QTLs may therefore represent novel sources for
improving WUE, for breeders to exploit. This information will be of value to breeders
for further fine-mapping to identify markers tightly linked to genes controlling the trait,
and for gene discovery.
The theory underpinning quantitative trait loci hypothesizes that specific chromosomal
regions contain genes which would make a significant contribution to the expression of
a complex trait. Identification of QTLs by comparing the linkage of polymorphic
molecular markers and phenotypic trait measurements aid in the dissection of complex
traits. This potentially enables the identification of the actual genes involved in the trait
and understanding of the cellular roles and functions of these genes. Hence, the accuracy
and precision of locating QTLs depends, in part, on the density of the linkage map
created. The higher the density of the map, the more precise will be the location of the
putative QTL. However, the most limiting factor for accurate location is number of
meiotic break points. The density of the genetic map with a total of 222 markers was
sufficient to carryout the QTL mapping in this study. These QTLs by other methods,
such as positional cloning, can be used effectively to isolate specific genes. QTLs often
interact in complex ways and their expression may be influenced by non-genetic factors.
For example, QTLs for A"C may be related to stomatal aperture traits and may be
environmental specific as evidenced by specific detection either at Gleadthorpe or
193
Sutton Bonington, but much more data across a range of environments may be needed in
future to relate these functions. In this study the QTLs for A 13C , grain yield and TGW
were different in both site/seasons. Some QTLs detected for grain yield and TGW were
on the different linkage groups of the chromosome, e. g. 2A and 7A. Nevertheless,
identification and functional analysis of genes affecting the phenotype offers great scope for developing markers for application in breeding programmes. If a known gene
corresponds to the same region as a QTL for a quantitative trait, it is a candidate gene for that trait, although the phenotypic plasticity may often affect quantitative traits that
are expressed differently in different environments (e. g. Kearsey and Pooni, 1996;
Collard et al., 2005). Thus further studies may be worth considering for relating
genotypic plasticity and the genotype x environment interaction.
Improvements in abiotic stress tolerance such as drought can be achieved by genetic
engineering. Transcription factors (proteins that bind to regulatory regions and control
gene expression) have been shown to produce multiple phenotypic alterations, many of
which are involved in stress responses. Research work at CIMMYT utilised DREBI-A, a
transcription factor that recognizes dehydration response elements has been shown in
Arabidopsis thaliana to play a crucial role in promoting the expression of drought-
tolerance genes. Dehydration-Responsive Element Binding gene 1 (DREBI) and DREB2
are transcription factors that bind to the promoter of genes such as rd29A, thereby
inducing expression in response to drought, salt, and cold. The A. thaliana DREBIA
gene with a stress-inducible promoter from the rd29A gene (stress-induced genes, such
as rd29A in A. thaliana, are induced through the ABA-independent pathway) was
transferred via biolistic transformation into bread wheat. Expression of the DREBIA
gene in wheat demonstrated substantial resistance to water stress in comparison with -
checks under experimental greenhouse conditions, manifested by a 10-day delay in
wilting when water was withheld (Pellegrineschi et al., 2004). Therefore, if the genetic
systems based on transgenes can be demonstrated to be effective, they will provide an
attractive and complementary option for improving a plant's performance under stress
conditions. CIMMYT is considering testing the DREBIA gene in the drought-tolerant
wheat, to see if the resulting plants can use water even more efficiently. This may have
major implications for its use in other cereal crops, such as rice, maize, and barley.
194
Nonetheless, if candidate genes for the putative QTLs in the present study are identified
through further fine mapping, and if their function is proved through deletion 'knock
out' techniques, then it may enable their transfer into other cereal species through
transformation methods. Besides this, sequencing the gene and developing perfect
markers offers a greater scope for combining marker assisted breeding into transgenic
breeding for development of new cultivars not only in UK but across the wheat growing
areas in the world.
195

CHAPTER 7: GENERAL DISCUSSION
In most areas and years in the UK the soil is returned to field capacity by rainfall during
the autumn and winter. The replenishment to field capacity depends upon the maximum
soil moisture deficit reached in the summer which in turn depends on the crop, soil and the summer rainfall pattern. In the UK, for winter wheat production there is a shortfall
of about 130 mm between average rainfall and average evapotranspiration during spring
and summer (Jones and Thomasson, 1985). Deep soils of fine texture usually hold
ample moisture to meet the crop's demand for water after accounting for this shortfall (Gales and Wilson, 1981). Of the 2 million ha of wheat grown annually, 250 000 ha are
on shallow soils and 220,000 ha are on sandy soils (MAFF, 1999), so a significant
acreage of wheat land is likely to encounter drought in an average year (Innes et al., 1985; Bailey 1990). Much of the UK wheat production area on these soil types can
potentially suffer yield reductions due to droughts under present climatic conditions (Weir, 1988). Currently the wheat and arable area is concentrated in the South and East
of England (MAFF, 2002); and soil moisture deficit in East Anglia, the East Midlands
and the South-East parts of UK is the biggest current threat to production and these
regions account in total for more than half the country's wheat area.
In the UK typically drought occurs late in the season, with onset of stress broadly co-
incident with flowering (Foulkes et al., 2001) and yield losses are in the region of 1-2 t
ha-1 (Foulkes et al., 2002). However, on drought-prone soils yield loss in wheat can
range between 0-4 t ha-1 in a given year, (i. e. if onset of drought occurs earlier than
flowering). Water availability could thus limit yield potential even on soil of moderate
to high water availability in future years because of climate change. Climate change
predicts greater frequency of drier summers in the south and east of England. Thus,
there is considerable interest in increasing WUE to conserve soil water and improve
yield under drought. Modem UK wheat cultivars have larger harvest above-ground
biomass than their predecessors (Shearman et al., 2005), so may have greater demand
for water. Most currently commercial varieties apparently have similar WUE (Foulkes et
al., 2001) and WUE may even have decreased with breeding. There is evidence that
changes in breeding in recent decades may have increased the demand of wheat crops
for water in non-droughted environments. For example, the Rht2 semi-dwarf gene
196
introduced in the mid 1970's has been found to be associated with lower WUE (Foulkes
et al., 1998a) and a higher WUE of an old tall cv. Maris Huntsman compared to five
modem semi-dwarf cultivars was reported (Foulkes et al., 2001). The IBL/IRS
translocation introduced in the mid 1980's associated with greater biomass production at harvest was also associated with greater requirement for water (Foulkes et al., 1998b).
These studies have provided possible opportunities for exploiting genetic diversity in
modem wheat cultivars for an improved understanding of mechanisms originating either through WUE or enhanced water uptake for realising the attainable yield under drought.
Hence, this study was aimed at identifying and quantifying sources of genetic variation in WUE for breeders to exploit and identifying the main determinants of this variation in
WUE and understanding any genotype x environment interactions for WUE in the UK
environment. In addition, identification of sub-traits for maintenance of crop production
under drought is also important as these sub-traits can potentially be used as selection
criteria in breeding programmes. Previous studies have targeted selection methods for
drought-resistant traits, specifically: early flowering date, greater accumulation of stem
carbohydrate reserves and better canopy persistence (DEFRA, 2002). Apart from
identifying the target physiological traits underlying WUE and water use, the present
study also investigated inter-relationships between water use and WUE and HI in
relation to final yield performance.
The project was focussed on improving understanding of the physiological determinants
of water-use efficiency and their genetic control using doubled-haploid lines derived
from a cross between UK-grown winter wheats Beaver (UK feed wheat) and Soissons
(French bread wheat). Previous evidence showed that the parents contrasted for Rht and
Ppd geues and the presence or absence of thelBL/IRS translocation, and also differed
for A13C values (Foulkes, M. J., Personal communication). Lines of this population and
the two parents were examined under irrigated and unirrigated conditions, in both
glasshouse and field experiments. This chapter deals with how the present study was
able to provide improved understanding of the physiological and genetic bases of WUE
in UK winter wheat. The findings discussed are described in three broad sections. The
first section deals with the physiological understanding of genetic variation with regard
to water use, WUE and biomass partitioning to grains. The second section deals with the
197
genetic basis of drought resistance through identification Of putative QTLs. The third
section deals with the proposed direction of future work and overall conclusions.
7.1 PHYSIOLOGICAL BASIS OF GENETIC VARIATION IN DROUGHT PERFORMANCE
There should be significant genetic variation for a target physiological trait and the trait
should be of high heritability for breeding to achieve results more quickly and
efficiently than selecting progeny for yield performance alone. The genetic progress in
yield in drought environments has been quite limited in most crop improvement
programmes (Reynolds et al., 2001; Slafer et al., 2005). This may be in part because
physiological studies that have focussed on plant responses to water stresses have in
general occurred in parallel to breeding and largely the two have existed in separate
arenas.
The magnitude of the yield reductions under UK drought has been reported to be about
2t ha-1 (Innes et al., 1985; Foulkes et al., 2002). However, in this study, the yield
reductions under drought ranged from 0.5 t ha-1 (in 2003; P=0.40) to 1.6 t ha-I (in 2005;
P<0.05) and the yielding ability of genotypes was strongly influenced by the GxE
interaction (P<0.03). So this indicated genetic variation in yielding ability under drought
existed and could potentially be related to the performance of physiological traits. Traits
putatively related to yield under drought conditions must positively affect water use,
WUE or biomass partitioning to the grain (Passioura, 1977,1996; Richards, 1996,2000;
Araus et al., 2002).
Water use
The phenology of the crop has been considered to be one of the most important
attributes for conferring the ability to perform better under stressful conditions in
Australia (e. g. Passioura, 1996,2002; Richards, 1996) and Spain (Villegas et al., 2000).
The impact and extent of droughts in these Mediterranean regions are more severe than
in the UK. However, drought occurring during a particular growth stage of the crop
cycle may result in severe yield reductions. So any changes in phenology should allow
the crop to escape water stress by avoiding the coincidence of water stress during critical
stages of development. Thus traits related to improved water use such as flowering time
198
become relevant when crops do not completely use the water potentially available for
growth. The inclusion of the photoperiod insensitive, early-flowering cv. Soissons and a
photoperiod sensitive, late-flowering cv. Beaver as parents resulted in differences in
days-to-flowering of about 9 d. In the present field studies, flowering time did not
correlate with yielding ability of genotypes under drought (r--0.2), indicating that early flowering did not lead to a better maintenance of grain yield under drought and the
effect of flowering date on grain yield was neutral. Howeve r, in the glasshouse studies,
there was a trend for the early flowering genotypes (for e. g. Soissons) to express 'drought escape' on account of relatively greater post-anthesis water use, but they had a lower overall water uptake. With regard to the field results, it is possible that later
flowering might have favoured development of larger root system allowing the crop to
maintain water uptake during grain filling, despite using more water in the pre-flowering
period. More generally, photoperiod insensitivity in genotypes may theoretically have
drought escape of more severe pre- and post-anthesis droughts than encountered in the
present study. However, selection for early flowering especially from early sowings (i. e.
sowing before late September) might lead to an increased risk of frost. Thus, selection
for time of anthesis may need a careful consideration by combining frost tolerance into
these genotypes to make potential use of available soil moisture later in the crop season.
The traits related to W`UE and partitioning become more important when available water
is already depleted in a given environment (see Slafer et al., 2005). The breeding
strategies may differ depending upon the climatic conditions, e. g. Mediterranean-type
environments compared to the less severe droughts occurring in UK environments. In
Mediterranean conditions, terminal drought develops increasingly throughout the late
vegetative and grain filling phases (Loss and Siddique, 1994), while in UK drought
coincides with post-anthesis development of crops and physiological maturity is only
advanced by about 4-7 days (Foulkes et al., 2002). In Mediterranean regions, like
Western Australia or Spain, time to anthesis has tended to be reduced systematically as
new cultivars have been released (e. g. Siddique et al., 1989; Slafer et al., 2005). So
when the drought is expected to be terminal, selection for earliness increases 'drought
escape' and improves the partitioning of the total water use by the crop to the grain
filling period. In this study, flowering time (GS61) of the genotypes was not associated
with the absolute grain yield loss of the genotypes under drought (r--0.33) which is in
199

support of previous studies in the UK (Foulkes et al., 2001). However, a positive correlation between flowering date and yield under both irrigated and droughted
conditions indicated higher yield is associated with late flowering, e. g. yield for Beaver
was higher than Soissons in the field studies. Nevertheless, such differences were not evident in the glasshouse studies, possibly on account of a smaller number of
comparisons amongst genotypes and that fact that the measurements were based on
single plants. However, there was a correlation between flowering time and A13C in one
of the two field experiments, at Gleadthorpe in 2003, where earlier flowering was
associated with higher grain A13C (P<0.05). This suggests that a low A (high WUE) in
early-flowering genotypes could possibly be due to a drought-escape effect during the
grain-filling period. Alternatively early flowering with Ppd-D] may be associated with
smaller leaves of higher specific leaf weight and net photosynthesis rate.
On the other hand the association of flowering time and grain A 13 C was not confirmed
statistically at Sutton Bonington in 2005 although the post-anthesis drought was even
more severe. So the observed effect of 'drought escape' cannot be taken as certain with
regard to A 13C. Moreover, the non-significant regression of flowering date on grain
yield in both site/seasons showed that early flowering did not lead to better maintenance
of grain yield under drought. Thus, earliness is probably not very relevant as a major
prospective trait according to results in this population for future breeding. On the other
hand, 'drought escape' in the glasshouse experiments was observed in early flowering
genotypes. That is, Soissons showed least seasonal-water use and relatively higher post-
anthesis water use compared to Beaver, while DH lines 134G and 134E were
intermediate in their responses. However, these contrasts did not provide evidence for
large differences in post-anthesis water uptake, so there may be a trade-off between
earlier flowering and the development of a less extensive rooting system in these early
genotypes. It should be noted that net root growth normally ceases at anthesis.
Roots traits relating to a deeper and more extensive root system confer the ability to the
crop canopy for capturing more water. Although they are difficult to measure, they are
important to characterise as they are determinants of whether genotypes extract all the
available soil water in a season under drought. A deep root system allows the crop to
access water in deeper soil layers, and deeper rooting may be associated with higher
200
stomatal conductance under drought (Blum, 1993,1996). In this study, root traits were measured in the glasshouse experiments on four genotypes. The differences in RLD for
these genotypes indicated the existence of genetic variation for root distribution with depth in UK-adapted winter wheat. Beaver had greater RLD in each depth and total RLD across all depths. Regardless of RLD, higher root weight across all depths was
evident in Beaver and line 134G. These observed genetic differences in root dry weight
may be due to differences in the degree of functional equilibrium between root and
shoot (Brouwer, 1963, van Noordwijk and de Willegen, 1987).
RLD was greater than the critical RLD of about 1.0 CM CM-3 for effective water capture (Barraclough et al., 1989) at anthesis in Beaver and line 134G at depths below 40 cm in
2004, while in 2003 the RLD of all the four genotypes exceeded 1.0 CM CM-3 below 80
cm depth. The genotypic differences in absolute water use in the post-anthesis period
were evident with early flowering cultivars using most water during this period.
However, the genetic variation in root dry matter of genotypes relating to the observed
differences in RLD for effective water uptake could not be linked to season-long water-
use under drought in the glasshouse study. This needs to be further characterised along
with post-anthesis water use in other early and late flowering genotypes. The concept of
decreased root partitioning with breeding in recent decades in UK wheats has been
suggested (Foulkes et al., 1998; Shearman, 2001). But introduction of IBL/IRS
translocation may increase root biomass (Ehdaie et al., 2003). In the glasshouse study,
the drought susceptibility of Beaver in terms of its inability to maintain harvest biomass
under drought was evident on account of restricted water uptake especially at later
stages of development. This was evident by a significant GxE interaction (P<0.03).
Soissons maintained biomass and yield better under drought. As this study quantified
differences for only four genotypes for root traits, it is possible that an evaluation over a
wider range of genotypes of root traits would reveal more useful variation in root traits
in terms of their related differences in maintenance of biomass under drought. In any
case, the incorporation of root traits into UK varieties will require the allocation of
significant resources and a specific breeding effort including the development of high
throughput, precise phenotyping root screens (Bingham and McCabe, 2004).
201
Baseline physiological studies have been carried out (Foulkes et al., 2001; Shearman et al., 2005) on set of historic UK varieties to establish which physiological traits are likely to be
contributing to changes in variety performance over years. For example, such experiments have shown that harvest index is approaching its theoretical maximum of about 0.60, so
that future gains in yield may increasingly depend upon achieving greater harvest
biomass, whilst maintaining HI. This implies that future genetic gains in yield under UK
drought conditions may require increases in both source and sink related traits. It is
considered that the rate of photosynthesis during grain filling, the amount of assimilates
available for remobilisation, root: shoot partitioning and the flag leaf area persistence
during grain filling are key above-ground traits. In addition, genetic differences in the
pattern of RLD distribution with depth and specific root weight may be key below-
ground traits for increasing season-long water capture to underpin increases in biomass.
7.1.2 Water-use efficiency
Carbon isotope discrimination (A 13C) is a promising trait for assessing genetic variation
in VvrUE (Farquhar and Richards, 1984; Richards et al., 2002) and also provides an
indirect indication of water extracted by different genotypes. As previously discussed
(chapters 4& 5), the physiological basis of variation in A 13C inC3 species is related to
variation in Ci, i. e. when Ci is lower, A is lower and WUE (TE) is higher (Farquhar and
Richards, 1984; Condon et al., 1987). As A 13C correlates positively with g, it indicates
the water status of the plant, especially under water-limited conditions. For example,
higher delta may indicate an improved ability to access water due to differences in
rooting ability. A lower delta relates to higher Alg, i. e. TE as measured by gas-exchange
at the leaf level. Higher TE (lower delta) can result from either lower g, or higher A
associated with higher photosynthetic capacity. In this study, genetic differences in delta
were found in the field of up to 1.14 % (droughted) and 1.34 %o (irrigated) averaged
across site/seasons (P<0.05) while, in the glasshouse study, genotypes differed by 1.93
%o (in 2004; P<0.01). In both of these experiments no GxE interaction was found. This
is consistent with observed trends in TE measured by gas-exchange in this study in the
field and glasshouse experiments. There was a general trend for a negative genetic
correlation between A 13 C and gas-exchange TE and a positive genetic correlation with
Ci in both glasshouse and field conditions. Since a higher TE amongst genotypes was
202
associated with generally lower A and lower g, it is possible that selection for a higher
TE could lead to lower dry matter production under drought in the UK environment, i. e.
the reduction in g, was relatively more than the reduction in A. The observations that the
genetic correlation between yield and A"C was always positive (P <0.02) in the present
study suggesting decreased biomass productivity with higher WUE in the BxS DH
population. Nevertheless, the positive correlation of delta and grain yield confirmed the
theoretical physiological basis (Farquhar and Richards, 1984) for variation in A 13C to
account for genetic differences in WUE in BxS mapping population. The reduction in
A 13C in droughted compared to irrigated treatments both in glasshouse and field
experiments reflected a decrease in Ci as result of reduced stomatal conductance in
water-stressed plants. Similar effects of drought have been commonly observed in C3
cereals worldwide (Evans et al., 1986; Richards et al., 2001; Condon et al., 2002). Small
changes in A13C under drought suggest poor stomatal control and profligate water use;
conversely, large changes in A13C suggested tight stomatal control and conservative
water use. However,, the hypothesis [(I) section 2.6; P40] that the genetic variation in
TE in the DH population is due to differences in g, or A or Ci of the flag leaf could not
be confirmed by the gas-exchange measurements on account of a high variability
associated with stomatal aperture traits across the measurement dates (Tables 5.7-5.9).
With regard to genetic differences, a larger A 13 C in Beaver and 134E than Soissons and
134G may imply less tight stomatal control of water loss for these genotypes i. e. higher
g, The relatively lower g, values associated with a conservative water use in Soissons
and line 134G were confirmed in both glasshouse and field studies. In the present study,
there were associated difficulties with gas-exchange measurements in the field which
did not show statistically significant associations with grain A 13C . There was no control
over temperature or light in the field during gas-exchange measurement. Besides this the
measurements were a series of spot readings made on single leaves hence the
convincing evidence of a link between carboxylation capacity or stomatal conductance
and A 13C was not found (Tables 5.15 & 5.16). So it is not possible to conclude
unequivocally from these data the underlying cause of the variation in A 13C is stomatal
conductance. However, from this study there was an indirect evidence of a link between
g, and A 13C since there was a positive genetic correlation between A 13 C and yield. If
A 13C was correlated with gs, then A 13C would provide an indirect measure of water use
of the genotypes integrated over the growing period of the particular organ sampled.
203

Further work seems justified to test whether this is the case. The possible application of
these findings in UK breeding programmes would be to select indirectly for delta (i. e. high A13C, low WUE) presumably associated with greater water use under drought in
the UK.
The present study could not establish a clear negative relationship between A 13 C and WUE on account of associated difficulties in relating the gas-exchange measurements
obtained as a series of spot readings made on single leaves to A 13C (an indicator of
transpiration efficiency integrated over leaf layers and time). The genotypic differences
were apparent in the gas-exchange data, but data did not show a significant positive
genetic correlation between gs and A 13 C. Therefore, further work would be needed first
to establish that there is a negative relationship between TE and A 13C in field crops in
the UK environment, before A 13C could be used for infori-ning on water extraction
amongst genotypes.
The ongoing breeding programmes in Australia have incorporated selection of
genotypes based on A 13C. 'Drysdale' and 'Rees' were the first commercial wheat
varieties bred using A 13 C as selection criteria. These varieties have a yield advantage in
dry situations for crops growing on stored soil water. At CIMMYT also attempts are
underway to improve drought tolerance by introgressing stress adaptive traits into
empirically selected drought tolerant germplasm. CIMMYT's germplasm collection is
being screened for high expression of many of the physiological traits that encompasses
the conceptual model of a drought resistant wheat cultivar (Richards et al., 2001;
Skovmand et al., 2001). Currently CIMMYT are considering use of Al 3C but only in the
same sense as in the present study, since high A 13 C has been associated with high yield
in both their irrigated and droughted mega-environments (Matthew Reynolds, personal
communication). However, the use of delta for selection of varieties in UK
environments needs some further careful consideration. Interestingly, in this study some
of the lines showed a trend for low delta (high ýVUE) to be associated with higher grain
yield. This was confirmed by the outlier lines for the relationship between delta and
grain yield calculated at 95 % confidence interval across years. The values for delta and
grain yield appearing above or below the threshold mean indicated that for some
genotypes (e. g. 1221,168D, 33C, Soissons, 39C and 48D) a higher grain yield was
associated with lower delta or higher VXE- So the hypothesis [(3) section 2.6; P401 that
204
a negative genetic correlation exists between A 13 C and TE was indirectly confirmed by a
positive correlation between A 13 C and grain yield in some of the genotypes. However,
this requires further intensive physiological investigations in these genotypes to
ascertain what mechanisms may be responsible for this apparent breakage of the
negative linkage between WUE and grain yield.
Genetic variation in stomatal conductance partly explained the genetic variation in TE in
the present study. Although genetic correlations were generally not statistically
significant on individual assessment dates, there was a general trend in reductions in g'
across all data. Despite the variability in the gas-exchange data over the dates of
measurement in this study, there was a general trend for reductions in g, A and Ci to be
associated with higher TE and lower delta amongst genotypes under drought. The
experimental variability may in part be an artefact of the temporal variation arising out
of phenological differences among genotypes. Increased A could apparently not explain
or provide a possible mechanism for an increased TE amongst genotypes in this study.
So the hypothesis [(2) section 2.6; P40] that a decreased stomatal conductance or an
increased net photosynthetic rate would reduce Ci and increase TE could not be
confirmed by the present findings owing to the difficulties associated with environment
conditions under which gas-exchange measurements were done and also in scaling up
the data from the single leaf to the canopy scale. Further work involving more frequent
gas-exchange measurements made using supplementary light to standardize the light
environment are required to test this hypothesis. Nevertheless, there was some indirect
evidence of a link between g, and TE through the negative relationship between A 13C
and yield. The hypothesis [(4) section 2.6; P41] that A 13C increases as Ci remains high
could not be confirmed for the same reasons as mentioned above. In summary, it is more
evident that minimising g, favoured higher TE. However,, this may not be a realistic
breeding policy because in UK drought over years is not predictable, so a drought
resistant variety must also perform well in the absence of drought. Thus there is a need
to search for new sources of genetic variation in photosynthetic traits to increase WUE
via increases in A.
This study focussed only on one mapping population derived from a Beaver x Soissons
cross and it is possible that it may not be a representative of responses in other UK
205

germplasm. In this regard there is a need to search for novel sources of variation in
WUE in germplasm, unadapted to the UK environments. It is often found that
photosynthetic rate per unit area is similar, or possibly less, in modem high yielding
cereals than in their predecessors. This is certainly true of cultivated bread wheat
compared with its wild diploid ancestors. The wild diploid wheats have a higher light
saturated photosynthetic rate (Austin, 1988). Evans (1980) and Austin (1985) confirmed
that hexaploid bread wheat has leaves of larger size and greater persistence than its
ancestor, but 25-30% lower light-saturated photosynthesis rate (Austin et al., 1987;
Austin, 1988). This reflects on the scope for improvement in photosynthetic machinery in bread wheat genotypes introgressing genes from wild diploids, although it will be
important to take account of any negative trade-offs with leaf size hence seasonal
radiation interception.
Based on the resistance analogue for C02 and H20 vapour fluxes into and out of
individual leaves exposed to saturating light intensity, WUE is maximal when the rate of
net Photosynthesis is less than half its unstressed rate. For crop canopies the rate of A at
which WUE is maximum is influenced by additional factors which may be susceptible
to genetic modification. The resistance of the crop boundary layer to CO 2 and H20
vapour transport affects transpiration more than assimilation and may vary with leaf size,
leaf position and canopy architecture. Increases in this resistance will tend to increase
WUE (Austin, 1987). However, these effects are likely to be small compared with
effects of gas-exchange traits operating at the leaf level particularly in the UK
conditions where drought is usually not very severe.
Hammer et al. (1997) demonstrated in sorghum a negative relationship between TE and
specific leaf area, thus a higher SLA would relate to lower ýNUE. This study showed no
relationship between SLA and TE. Indeed the SLA of Beaver was lower as a
consequence of thicker leaves. The reason why a high SLA in Soissons resulted in a
high WUE (low A 13 Q needs to be investigated further. Flag-leaf rolling under water
stress indicates plant water status which is more often linked to deeper rooting as an
adaptive feature to avoid leaf senescence and maintain green area (Reynolds et al.,
2001). Greater flag-leaf rolling was evident in Soissons which demonstrated a greater
persistence of flag leaf area under drought as compared to Beaver. Soissons and
206
line 13 4G sustained green area or leaf production during drought even under more severe
water stress and possessed lower A 13 C as consequence. This could possibly explain in
part differences amongst genotypes in VVUE arising out of differences in this self- defence strategy.
In this study, interestingly IBUIRS lines showed higher A 13 C. For example, Beaver
possessing this translocation had higher A 13C .
This is possibly because of a positive
association between A 13 C and grain yield, with the higher yield being associated with higher g,.
7.1.3 Harvest index
Most yield improvements in drought environments have come by increasing the
transpirational component of season-long evapotranspiration through management and
breeding, and by increasing HI through breeding in wheat. The genetic gains in yield in
modem UK winter wheat cultivars have been mostly attributed to an increase in HI, but
since the late 1980I)s there is evidence of increases in the above-ground biomass, in
addition to the increase in HI. Austin (1980) predicted a theoretical limit to HI of 0.62
for winter wheat grown in NW Europe due to the biomass needed for physical support
of reproductive structures and assimilate production. Shearman et al. (2005) reported
that since about 1985 most yield genetic gains have been associated with increases in
biomass, but still stated there was some scope for further increases in HI in UK wheat
varieties in future years. An increase in HI with the semi-dwarf wheats introduced
worldwide in the 1960s and 1970s has been associated with increased partitioning to the
ear in the pre-anthesis period (Fischer, 1983). In the present study HI ranged from 0.45
to 0.53 amongst the DH lines under drought, and the genotype x drought interaction for
yield was explained most by reduction in biomass. This was evident in Beaver which
did not maintain grain yield under drought because of reduction in biomass growth. In
contrast, line 76A which despite having maintained HI well under drought did not yield
better because of poor biomass growth. Soissons which sustained yield under drought
maintained both above-ground biomass and HI. Thus, the genetic differences in ability
to maintain HI under water stress were associated with genetic differences in ability to
maintain yield. Hence, it is evident in this study that improvement in HI under drought
through breeding can be achieved to realise the attainable yield under drought. One
207
possible way to alleviate source limitation under drought stress lies in improved post-
anthesis stem reserve mobilisation into grains. Higher HI under post-anthesis stress can be realised by improvement in late-season water use of these genotypes under droughted
conditions, e. g. through better rooting or maintaining green leaf area under drought
through 'stay-green' traits.
The 'stay-green' trait could be associated with favourable moisture acquisition since it
may be related to deeper rooting and may indicate the ability of the green area of
genotypes to persist green area for additional water extraction (Reynolds et al., 2001;
Verma et al., 2004). In this study, Soissons (early developing) showed greater
persistence of canopy under drought as compared to Beaver. A greater reduction in
green area index of Beaver (late developing) under drought was found. Thus, these
results showed that early flowering might have helped redistribute water uptake more
favourably towards the grain filling phase. This indicates the ability of early genotypes
(e. g. Soissons) to possibly acquire water use from deeper soil horizons even during later
stages of grain filling. However, this needs to be characterised in further studies, and the
trade-offs between flowering date and rooting need to be quantified.
In the glasshouse study, drought developed progressively from flag leaf emergence
(GS39) and was sustained until full canopy senescence. This study showed evidence for
genetic variation in maintenance of yield under drought which may reflect on the
translocation of stem reserves to grain during grain filling effectively in genotypes, e. g.
better maintenance of yield for Soissons and 134G, although stem reserves were not
measured in this study. It would be desirable to increase biomass production
concurrently with HI in order to further increase yield under drought, as direct selection
for HI alone has been shown in some cases to result in a reduction in total biomass with
no associated increase in yield (Sharma and Smith, 1986; Austin, 1994). Innes et al.
(1984) showed in spring wheat that HI for high ABA genotypes (0.49) was marginally
greater compared to low ABA genotypes (0.48), under early drought (water withheld for
4 weeks preceding anthesis) and ranged from 0.46 to 0.44 under late drought (no water
between anthesis and maturity) conditions. The greater WUE of high ABA lines under
late drought was associated with maintenance of biomass and reduced water use.
208
The effect of the I BL/ I RS translocation on grain yield and A 13 C examined in this study
revealed that I B/ IR translocation lines showed increase in A 13C in 2003 (P=0.07) and in
2005 (P<0.001), but not in grain yield as compared to non-translocation lines. Although
there was a trend for increased harvest biomass with theIBLARS translocation in the
2003 field experiment. Austin (1999) and Foulkes et al. (1998) showed that IBL/IRS
rye translocation lines yielded more than their near contemporaries which do not carry
translocation. TheIBL/IRS translocation was associated with greater accumulation of
stem reserves and conferring greater biomass at harvest in modem adapted UK wheat
genotypes (Foulkes et al., 2001; DEFRA, 2004).
The tall lines (rht) possessed low A 13C (high WUE) and had decreased grain yield under
drought compared with Rht2 lines, more significantly so in 2003 (P<0.001) than in 2005
(P<O. 10). A low grain yield was observed in tall lines due to low HI. The observation of
higher A13C in tall lines has been reported in earlier studies by Richards (1992) and
Ehdaie and Waines (1994). The current findings broadly agreed with these reports. Rht
genes decrease available stem sink and hence anthesis biomass, but Rht genes as a
consequence, increase ear fertility and HI. The increase in HI is proportionately greater
than the decrease in harvest biomass (DEFRA, 2004). A higher biomass production in
tall lines did not result in higher grain yields due to lower HI. So this overall suggests
that breeding may have inadvertently decreased WUE. Thus the implications for greater
'water demand' of modern cultivars for yield improvement under drought needs to be
reconsidered by improving assimilate remobilisation in the grain filling period. The
positive association between HI and A' 3C indicates as WUE increased partitioning of
dry matter to grain decreased. This antagonism between HI and A 13C could make
fealising increases in grain yield difficult when selecting for high WUE. On the other
hand, low WUE during the grain filling period or a higher water use might improve
grain yield associated with a higher HI as observed in this study.
The principle constraint lies in the successful use of A 13 C as a candidate character will
still depend on determining those circumstances and crops in which A is lowered for a
higher WUE without compromising grain yields. The high WUE of Soissons observed
in this study may be ascribed to its inherently rapid development with production of
most of biomass before drought becomes severe coinciding with post-anthesis. The
209

observed drought escape associated with higher WE of Soissons could be ascribed to
effective use of water during sensitive stages of development. Besides it may be more
profligate in water use in the post-anthesis period thus be able to escape drought effects before grain filling.
7.1.4 Joint optimization of water use and WUE for drought resistance in the UK environment
For temperate cereals, including wheat, the utility of A 13C in breeding is likely to vary depending on the extent to which yield is limited by water supply and also at what stage
of the crop cycle water stress occurs (Richards et al., 2001). In wheat, A 13C is a
conservative trait associated with somewhat slower water use and possibly slower
growth rate. Consequently in environments subject to terminal (late-season) water stress
(like in UK), it is not surprising that low A 13C (high WUE) was associated with
relatively low yield potential in wheat. The implication is that selection for high A 13C in
these environments may prove successful in identifying lines with high attainable yield
under post-anthesis drought. Thus, reasons for why some genotypes with low A 13C
showed a trend for high grain yield under drought, i. e. breaking the positive association
between A 13 C and yield, needs to be considered in further studies. So the hypothesis [(6)
section 2.6; P41] that there is a positive genetic correlation between TE and grain yield
under drought was indirectly disproved in the present study because of the positive
genetic correlation between A 13 C and grain yield (Fig. 5.2). Further studies to examine
the apparent negative linkage between TE and grain yield in the UK environment are
required. In environments where crop growth is heavily dependent on moisture stored in
the soil profile from rain that falls outside the main crop growth phase, selection for low
A 13C is likely to be effective for yield improvement, e. g. New South Wales (Condon et
al., 1987). Profligate high A13C genotypes are more likely to exhaust the soil water
supply before the critical grain filling phase (Richards et al., 2002). This seems unlikely
in the UK environment. Thus, it can be concluded from the observed relations under
field conditions that: firstly, a strong negative relation exists between WUE and A 13 C;
secondly, a strong positive relationship exists between A 13 C and yield. The possible
options of potentially breaking this negative linkage between lower WUE and higher
yield in the UK include improving photosynthetic traits. Substantial genetic gains in
yield may be achieved if breeders are able to produce cultivars with faster growth rates
210
and greater biomass at harvest. For example, Austin (1999) and Reynolds et al. (1999)
suggested that modifying beneficially theC02fixing photosynthetic enzyme Rubisco by
reducing its oxygenase activity for improved biomass growth.
7.2 GENETIC BASIS OF WATER-USE EFFICIENCY
Breeding for productivity improvement needs to be more efficient than has been in the
past. World demand for wheat is growing at approximately 2% per annurn (Rosegrant et
al., 1995). The increasing world demand for food by population pressure and the risks
associated with future climate change prompts for urgent need for research break-
throughs, particularly targeted at drought resistance. Contributions from molecular
biology for improved yield potential and drought resistance seem to depend upon an
improved knowledge of yield and resource-use efficiency physiology and the ability to
phenotype precisely for key target traits. Hence for a successful marker-assisted
selection (MAS, selection based on the presence of a few genes or quantitative trait loci)
programme, the value of a physiological trait in terms of its heritability and correlation
with grain yield needs to be established first and then it may be useful to determine its
genetic basis, such as the number and location of genes/ QTLs involved in its expression.
In this context, phenotyping of physiological traits and further application in MAS for
productivity improvement under water limited environment remains challenging for the
crop scientists.
A combination of the application of physiology and genetics may improve basic
understanding of complex genotype x environment interactions, such as plant response
to drought conditions, offering new avenues for crop improvement. Using genetic
mapping to dissect the inheritance of different complex traits in the same segregating
population can be a powerful means to distinguish common heredity from casual
associations between such traits (Paterson et al. 1988).
As carbon isotope discrimination provides an integrative measure of photosynthetic
activity, mainly influenced by stomatal aperture opening (Morgan et al., 1993; Reynolds
et al., 2000), variations in prevailing climatic conditions are likely to have a significant
influence on A 13C values (Merah et al., 2001). This can be related to the present study
where drought was more severe in Sutton Bonington compared to Gleadthorpe; and the
211

drought at Gleadthorpe was sustained only up to mid-grain filling. This difference
between these two site/seasons influenced the QTLs detected in each case. So it is
important to consider the influence of climatic factors on A 13C under UK drought in
further research to attribute correctly the causes of genetic variation in expression of
A 13c.
In this study, expression of A 13C under the influence of either of the parental alleles
varied, and explained that genetic expression of A 13C may be specific to the
environment. At Sutton Bonington in 2005, a putative QTL for A 13C on chromosome 3B
in the irrigated environment explained 27.7% of the phenotypic variance. A QTL on
chromosome 3B under drought was also identified which explained 14% of the
phenotypic variance. Another putative QTL found on chromosome 2D also explained
18.2% of the phenotypic variance under drought. At Gleadthorpe in 2003, a putative
QTL on 4B in the irrigated environment explained 13.4% phenotypic variance and on
713L explained 14.7% variance; and under drought a putative QTL on chromosome 5A
explained about 15.5% variance for A 13C.
The importance and potential of chromosome 3B in carrying the allelic variation for
delta was encouraging in this study as the expression of QTL was common to both water
conditions with higher LOD scores in the irrigated (2.32) and unirrigated (1.08)
conditions at Sutton Bonington. Importantly the alleles, which were responsible for
decreased A 13C, were from Soissons.
There is no reported evidence of QTLs for A 13C in bread wheat, although work on
identifying QTLs in different spring wheat mapping populations is ongoing at CSIRO,
Australia (Richards, R. A. Personal communication); and the present finding of putative
QTL for delta on chromosome 3B is original in its context. Thus, the potential of the B
genome needs a critical consideration in UK wheat breeding programmes for
introgressing traits like A 13 C and/or its association with other physiological traits related
to drought resistance. The QTLs for other physiological traits such as plant water status
or osmotic adjustment and/or yield components potentially co-localising with the QTL
on chromosome 3B need further investigation to provide a strong physiological and
genetic basis to this trait-marker association.
212
The importance and potential of the D genome in carrying allelic variation for A 13C in
wheat has been reported (Mohammady, 2005). In this study, a putative QTL for A 13C
was found on chromosome 2D with a high LOD score of 1.43 under unirrigated
conditions. In a previous study on the Beaver x Soissons mapping population a QTL for
stay green on the long arm of chromosome 2D was detected by Verma et al. (2004), but
this was not linked to the QTL detected at the marker position of 2D in this study. Nevertheless, the evolutionary source of D genome- Triticum tauschii and its relatives -
may provide a potential source for delta in order to improve WUE in the wheat cultivars.
The possible association of this chromosome in influencing drought resistant traits such
as expression of low A 13C or stay green needs further consideration in future breeding
programmes.
For high resolution mapping generally larger populations comprising 50 to 250
individuals are required (Mohan et al., 1997). In this study the number of DH genotypes
used was low being 33. In addition, the power of detecting a' QTL depends on the
number of markers and the genome size of a species (see review by Collard et al.,
2005). Preliminary genetic mapping studies generally require 100 to 200 markers
(Mohan et al., 1997) and the power of detecting a QTL could be virtually the same for a
marker spacing of 10 cM as for an infinite number of markers, and may slightly
decrease for marker spacing of 20 or even 50 cM (Darvasi et al., 1993). In this study,
the detection of putative QTLs using genotype data with 222 molecular markers was
able to provide information on the genetic basis of allelic variation among the target
traits measured. The relatively higher percentage of variance associated with the QTL
detected for A 13C on chromosome 3B suggests it would be reasonable to consider
backcrossing followed by fine mapping in this case potentially to develop a marker for
use in future breeding programmes.
A 13 C results indicated stable ranking of genotypes across irrigation regimes as revealed
by a statistically non-significant genotype x irrigation interaction. The physiological
basis of genetic differences in A 13C appeared to depend on stomatal conductance. This
was indicated by a positive correlation between A13 C and grain yield; similar findings
were also reported in several previous studies in Mediterranean-type environments
(Condon et al., 1987; Acevedo, 1993; Mo rgan et al., 1993; Merah et al., 2001).
213

Associated reductions in stomatal conductance lead to a conservative water use, as indicated by apparently lower g, values for Soissons (low A 13C) than for Beaver (high
A 13C) in both years. On the other hand, yielding ability of genotypes differed across
water regimes was evident by a significant genotype x environment interaction for grain
yield. The positive correlation of delta and grain yield suggested that selecting a
genotype with low A (higher ýVUE) may result in lower grain yield of wheat in UK
environment. Nevertheless, the QTLs for delta accounting for a higher percentage of
phenotypic variance identified in both environments may potentially serve as candidates for the development of markers for use in selection programmes. In addition, it seems
that water use rather than WUE is the main driver of performance under mild UK
droughts as compared to more severe droughts in 'stored water' environments. Thus,
using QTLs for low A 13C (or high WUE) may serve as an indirect way of selecting for
greater seasonal water use hence yield under drought in the UK.
7.2.1 Syntenic associations of the present findings in other cereals
Assessment of genetic diversity, new gene discovery, genetic dissection of complex
traits and MAS of useful traits are some key areas of wheat improvement. The
understanding about expression and inheritance of complex traits is progressing rapidly
through positional cloning of QTL. Technological breakthroughs in genomics promise
to provide a comprehensive picture of the various plant growth and developmental
responses to ensure real gains in improving and stabilizing crop productivity. High-
throughput genomics tools, coupled with innovative bioinformatics techniques, offer
new avenues to exploit model systems to make rapid advances.
Hexaploid wheat consists of three closely related genomes designated A, B and D which
are derived from three progenitor species. Gene redundancy is therefore the norm, with
at least a triplicate homoeoallelic set for most of the genes. Unlike the smaller genome
size of 130-140 Mb in Arabidopsis thaliana (model experimental plant) or 400 Mb for
rice (model cereal), wheat has a large genome size estimated at 16,000 Mb
(Arumuganathan and Earle, 1991). However, there seems to be a limitation in using
information from rice genomics where information related to bread making and pasta
quality, winter hardiness, vernalization etc. is required in wheat (Lagudah et al., 2001).
A high level of intra- and inter-chromosomal gene duplication in wheat maps compared
214
to rice maps (Dubcovsky et al., 1996) on account of differences in their evolutionary divergence may lead to hybridisation in non-colinear regions in wheat and rice. Nevertheless, the use of rice genomics for positional cloning in wheat is still promising. Wheat being a hexaploid species tolerates chromosome deletion and aneuploidy better
than any diploid crop species like rice. Despite these facts any syntenous relationship between rice and wheat (e. g. QTLs for A 13C)
, especially for drought, would provide a basis for understanding the physiological and genetic mechanisms underlying this trait.
Moore et al. (1995) suggested that the syntenic relationships among cereals will be
useful for predicting the loci of homologous major genes. This concept can be extended
to the QTL shared among cereals. A large number of QTL analyses will provide many
instances of homologous QTLs among crop plants. Furthermore, most wheat
chromosomes were shown to be syntenic with their rice (Kurata et al., 1994) and maize
counterparts (Ahn et al., 1993). Linkage maps in wheat have confirmed evolutionary
chromosomal translocation rearrangements involving chromosomes 2B, 4A, 5A, 6B and
7B. which were based on cytological evidence, and have established synteny among
closely related grass species such as rice, maize, oats and wheat (Ahn et al., 1993;
Devos et al., 1994; Borner et al., 1998).
Laza et al. (2006) reported putative QTLs for 613C for RILs of flooded rice (indica x
japonica cross) on chromosomes 2,4,8,9,11 and 12 across plant parts, growth stages
and seasons. Chromosomes 2 and 9 decreased WUE (low 6 13 Q. They indicated that
differential expression of QTL for 613C was attributed to differential function of each
QTL. These QTLs were associated with a few co-located QTLs for leaf traits like leaf N
and leaf thickness informing on their physiological and genetic associations with leaf
traits. In upland rice genotypes, QTLs for A 13C were found on chromosomes 1,2,3,4,
61 7ý 10 and 12 (Price et al., 2002), but these were different in each year at two locations
tested at IRRI and WARDA. Nevertheless, the possible syntenic association of rice
chromosomes 2,4 and 12 with wheat requires further studies.
In maizeý five putative QTLs significantly affecting tolerance to drought were found on
chromosomes 1,3,5,6 and 8 (Agrama and Moussa, 1996). As per map alignment (Gale
and Devos, 1998) group 3 chromosome of maize is orthologous to group 3 chromosome
215

of wheat. In this study, a potential synteny with maize was evident by a putative QTL (LOD=2.32) for A 13C on chromosome 3B for WUE.
In this study several putative QTLs for grain yield were found on chromosomes 3B, 51)ý 6B and 7A under irrigation which each explained more than 20% of the phenotypic
variance. QTLs on chromosomes 2A, 3A, 5D and 7A each explained more than 14% of the phenotypic variance under drought. Occurrence of yield QTLs on chromosomes 3A,
5D and 7A were common in both the irrigation treatments. The putative yield QTL
clusters found on chromosome 3B and 7A in this study are in agreement with the yield QTL clusters found on these chromosomes for the Chinese spring x SQ1 population (Quarrie et al., 2005). The yield QTL found on chromosomes 3A under drought was
also in agreement with the previous work in Beaver x Soissons mapping population (DEFRA, 2004).
The importance of group 5 chromosomes to carry genes for abiotic stress resistance is
well known (Forster et al., 1988; Sutka and Snape, 1989; Cattivelli et al., 2002; Quarrie
et al., 2005). The QTL identified on 5D in this study explained more than 14.0% of the
phenotypic variance for grain yield under drought and coincided with yield or yield
components QTLs previously identified in wheat (Snape et al., 2001).
The putative QTL for yield found on chromosome 6B in the present study was also in a
homoeologous position to a yield QTL region identified in previous work (Blanco et al.,
2002; Quarrie et al., 2005). The putative yield QTL on chromosome 6B explained
21.4% of the phenotypic variance (irrigated in 2003) in the present study and is
coincident with the QTL for yield in the centromeric region of 6B in the ITMI
(International Triticeae Mapping Initiative) population (Ayala et al. 2002).
The putative QTL for TGW detected on chromosomes 2A was common to both the
site/seasons under different irrigation regimes and explained phenotypic variance of
greater than 15% in 2003 and 20% in 2005. This is in agreement with previous findings
in this mapping population wherein a QTL for TGW on chromosome 2A appeared
common to both the irrigation regimes in 2002 (DEFRA, 2004). Other QTLs on
chromosomes IA (in 2003) under irrigated conditions explained about 15% of the
216
phenotypic variance; and on 7A (in 2005), common to both irrigation regimes, explained
more than 25% of the phenotypic variance for TGW.
In this study, a yield QTL was coincident with a QTL for TGW on chromosome 7A in
the irrigated treatment in 2005. Research on an ITMI population showed that the long
arm of 7A also harbours QTLs for spikelets per ear (Li et al., 2002). The pleiotropic
effect of other traits like grains/ear may be associated with QTLs for TGW and yield. So
research focused on fine mapping for other physiological traits in this mapping
population needs further attention. In other field studies, yield QTL clusters were
coincident with significant effects for grains/ear and TGW on wheat crosses examined
world wide (Quarrie et al., 2005) and positive effects for yield and TGW were
associated with the 7DL. 7Ag translocation (Singh et al., 1998). In this study, it was also
observed that co-localisation of putative QTLs for yield and TGW was within 25 cM
distance on chromosome 7A in 2003. At present the available information on co-
localization of QTLs for traits in a specific mapping population and their synteny with
other cereal crops is limited. However, from the information generated in the present
findings, it seems that alleles for QTLs that increase water-use efficiency (decrease
A13 Q are not likely to improve grain yield in the UK environment. This provided a
strong genetic basis for inheritance of A 13C suggesting a negative genetic correlation
with yield in UK conditions. In the event if these two trait expressions are mutually
exclusive then future breeding strategies should aim at breeding cultivars with high
attainable yield under drought through maintaining the water use.
The present identification of a putative QTL for A 13C on chromosome 3B in wheat may
be associated with water-use efficiency in UK wheats. This supports the hypothesis [(5)
section 2.6; P4 I] that QTLs for A 13C can be identified for explaining the genetic
variation in WUE in UK winter wheat (Tables 6.2 & 6.3). This QTL may represent a
means of identifying novel sources of alleles for improving WUE for breeders world
wide to exploit and the information derived from this study will be of value to breeders
in countries with more severe droughts than in the UK for further fine-mapping to
identify markers tightly linked to genes controlling the trait, and for gene discovery.
The cost of phenotyping for delta in breeding programmes is probably prohibitive;
hence there is a need to identify markers. Although the success of use of delta in
217
developing new wheat cultivars has been demonstrated in Australia with the release of cultivars 'Drysdale' and 'Rees' the need for selecting wheat varieties under UK
conditions based on carbon isotope signature still needs further consideration because a variety selected for drought must also perform as well as contemporary varleties under optimal conditions.
7.2.2 Potential use of QTLs in breeding programmes
Research on developing molecular markers for traits associated with drought tolerance in wheat is underway at CIMMYT. RILs populations are being used to identify genomic
regions associated with a range of physiological parameters controlling drought
tolerance (Ribaut et al., 2001). Molecular markers can be used for tracing a favourable
allele across generations and for identifying the most suitable line among the progeny. It
is very important to have molecular markers linking with genes of interest for tracing
favourable alleles. So developing a molecular marker within genes that are sequenced
would aid in tracing favourable alleles. Microsatellite sequences can be identified within
the gene, and primers to amplify the microsatellites can be designed. So if a marker is
located within the gene sequence itself, it co-segregates with the target gene, and
therefore the favourable alleles can be exactly traced. However, for polygenic traits,
target genes have not been characterized at the molecular level. The selected genomic
regions involved in a MAS experiment are chromosomal segments or QTLs. When a
QTL represents a large chromosome segment of more than 10 cM, there should be a
marker within the QTL to eliminate genotypes presenting a double recombination
between the two flanking markers. A favourable allele can be introgressed using the
marker in target germplasm throuýh backcrossing or can be selected in a segregating
population.
The MAS step, conducted only once, is based on the use of reliable PCR-based markers
on large segregating populations derived from crosses between elite parental lines,
which contrast for the target trait and allelic complementarity. So any inforination
generated in tracing favourable alleles should be relevant for pyramiding favourable
alleles at cloned genes or major QTLs in new germplasm.
218
Due to cost of the utilizing several QTLs, only markers that are tightly linked to no more than three QTLs are typically used (See review by Collard et al., 2005). These QTLs for
target traits can be linked directly to conceptual physiological models provided there is
adequate genotyping and phenotyping data. Besides this, the development of mapping
software and the use of more powerful statistical methods for an optimised MAS
approach needs consideration. New developments and improvements in marker
technology, integration of functional genomics (e. g. use of express sequence tag, single
nucleotide polymorphisms and micro-array analysis to develop markers from genes as
ccandidate genes') with QTL mapping and the availability of more saturated maps in
future would improve efficiency of MAS. The development of high resolution maps will
also facilitate the isolation of actual genes via 'positional cloning'. Positional cloning
involves the use of tightly linked markers to isolate target genes by using the markers as
a probe. The knowledge of the DNA sequence of the gene enables the design of perfect
markers which are located within the actual gene sequence, thus eliminating the
possibility of recombination between marker and gene (Ellis et al., 2002).
7.3 FUTURE WORK
The main finding of this study showed that water use emerges as an important
component of genotype performance under drought in the UK environment. A 13C
provides a useful indirect measure of water use. Further studies are needed to identify
genetic differences in root length density and root: shoot ratios of the genotypes for
water uptake. Measurements of root traits across sampling stages were beyond the scope
of the present study, as other above-ground traits were intensively assessed in the
glasshouse and field experiments across samplings. There is a need Uo develop faster
root screens for measurements of roots which remain time consuming and challenging
for physiologists. Since water-use may be the most important component underlying
yield response to drought in the UK, studies on identifying genetic diversity in rooting
traits and QTLs for root traits would be worthy of further investigation.
Methodological considerations in imposing drought treatments in the glasshouse and in
the field need to be revisited. This study highlighted the difficulty in relating
measurements in the glasshouse on single plants to the field 'plot' scale on account of
the variable influence of environmental conditions. Although, the gravimetric estimation
219

of water uptake in soil columns used in this study could provide an appropriate measure
of WE, it is very important that the growing conditions and timing of drought are
properly defined because any small variation in these conditions would increase the
residual variance and result in lower experimental precision. The main control of duration of water stress is the size of columns relative to plant size and this might
sometimes lead to difficulty in achieving drought stress when the growth stage of the
plants is advanced at transplantation. This study used plants which were grown in the
growth rooms to undergo vernalization and later transplanted to the columns. So
estimation of WUE or water use from the start of experiment could not be quantified.
Ideally plant growth and water use would be monitored right from the beginning of
germination in soil columns. Furthermore, use of rain-out shelters in the field
experiments would provide an improved estimate of the influence of drought on crop
performance because in the UK rainfall is not predictable; and the occurrence of
summer rains may limit the water stress which can be imposed on the crop in drought
research. Also droughts can be tailored to specific phenophases with the use of rain-out
shelters.
Gas-exchange measurements for experiments involving a large number of genotypes is
time consuming and difficult to measure. There is a need to develop faster screening
methods to estimate stomatal conductance when phenotyping for larger populations.
This is important to see whether there is a negative relationship between A' 3C and TE in
winter wheat grown in the UK. Some progress has been made with the development of
the viscous-flow porometer at CSIRO, Australia in recent years. Although
measurements of canopy temperature depression (CTD) provide an estimate of stomatal
conductance, its use in UK environment is limited because of cooler climate condition
and the temperature differences will be meagre and cumbersome even to detect small
differences.
There is evidence that Soissons has higher flag leaf area persistence and maintains green
area better under water stress conditions. Further investigations seem justified to identify
QTLs associated with this stay-green mechanism. It seems that there is a negative trade-
off between VXE and seasonal-water use in this study as indicated by a positive
correlation between A"C and grain yield. On the other hand, some genotypes with low
220
A13 C also showed a trend for high grain yield under drought. The reasons for this
response need to be investigated further. Identification of fast, reliable and low-cost
physiological surrogates in place of carbon isotope discrimination to screen large
numbers of genotypes seems justified. It is also important to consider the influence of
climatic factors on A' 3C under UK drought in further research to attribute the causes of
phenotypic variation in expression of A 13C.
The possible association of the 3B chromosome in influencing expression of low A 13C
was evident in this study. Hence the potential of the B genome needs a critical
consideration in UK wheat breeding programmes for introgressing traits like A 13C
and/or its association with other physiological traits related to drought resistance. The
putative QTLs for delta of higher phenotypic variance identified in irrigated and droughted environments may serve potentially as candidates for the development of
markers for wheat breeders to use in future selection programmes. Besides this the
possible syntenic association of other cereal chromosomes with wheat with regard to
A 13 C needs further studies. Further fine mapping of the QTL for A 13C identified on
chromosome 3B seems justified.
The recent international conference on drought (Interdrought-11: 2005, Rome, Italy)
made several recommendations to address the future challenges in drought research. The
findings of the present study would be in agreement with the following of these
recommendations. (1) Plant biotechnology research aimed at enhancing plant production
under limited water supply should assure effective collaboration with whole plant and
field research. (ii) The seriousness of the problem, i. e. water scarcity, which is often
used to justify biotechnology research, cannot allow biotechnology research to be
continued within its own domain. (iii) Marker-assisted selection offers a great potential
for plant breeding under water-limited conditions. (iv) Accurate phenotyping at the
initial molecular mapping exercise is the most important prerequisite for success when
complex, low heritable traits are to be mapped. (v) Considerable effort is needed
towards understanding better the physiological processes that determine yield in any
stress environment and their genetic control.
Thus, the present study provided improved understanding to integrate the physiology
and genetic domains of research for underpinning various mechanisms explaining the
221

genetic variation in yield under water-limiting situations, particularly with regard to
post-anthesis drought in the UK environment.
7.4 CONCLUSIONS
Post-anthesis drought under UK conditions is likely to have a ma . or threat on winter
wheat production as result of climate change. The frequency of dry years and droughts
will increase with predicted climate change (Marsh, 1996). According to the results of
climate change models, there is a strong relationship between soil water availability and
yield of wheat in areas subject to summer droughts (Wassenaar et al., 1999). Thus, most
of the wheat hectarage in the UK under drought-prone soils (Foulkes & Scott, 1998)
may suffer from significant yield losses in future years. Some of these effects may be
offset by the introduction of new cultivars by suitable genetic intervention strategies, so
additional research and investment in genetics, physiology and breeding is critical to
future. In this context, any improvement in the performance of a crop under water
shortage can arise from identifying target physiological traits and making genetic
changes to the crop that enable it to perform better in drought-prone environments
(Turner, 1997; Richards et al., 2002). The present study investigated the physiological
and genetic bases of variation in WUE in UK winter wheat. Based on the results of this
study, the following conclusions can be drawn:
1) Genotypic differences found in the field for A 13C were generally in agreement with
measured transpiration efficiency.
2) Carbon isotope discrimination analysis revealed Soissons and line 134G had low
A 13C values (high WUE) b6th in the glasshouse as well as in the field experiments
compared to Beaver.
3) Delta (A 13C) correlated positively with grain yield of field-grown wheat genotypes
under drought and frequent gas-exchange measurements are needed to explain the
variation associated with differences in stomatal conductance and Ci.
4) WUE can be improved by selecting lines for target traits like grain A 13 C. However,
there may be an inverse relationship between WUE and grain yield in the UK
222

environment. Nevertheless, A 13C can be used as an indirect indicator of yield under drought.
5) The IBLARS translocation increased A"C both under irrigated and unirrigated
conditions. Thus, a higher A 13C in IBL/IRS lines was associated with reduced WUE.
So yield improvement in UK IBL/IRS wheats arises from greater water use
associated with greater biomass production rather than improved water-use
efficiency. In general, present results indicated in the UK conditions water use
appears to be the major component underpinning yield improvement under drought.
6) There was a neutral effect of flowering on yield responses to drought. Early
flowering may be linked with smaller biomass at flowering which would potentially
favour post-flowering growth and hence maintenance of HI under drought. However,
there may be a trade-off between early flowering and the development of a smaller
less extensive root system in photoperiod insensitive genotypes, largely cancelling
out the benefit of their smaller water consumption earlier in the season. So that post-
flowering water uptake is only marginally increased in early flowering types.
7) The most confident putative QTLs were identified for A 13C on chromosomes 3B (in
irrigated) and 2D (in unirrigated) in 2005. For the QTL on chromosome 313, the
Beaver allele increased A 13C consistent with the observed parental differences. If
this trait-marker association could be confirmed in further work, fine mapping would
be justified for marker development for this QTL -
8) There was a significant irrigation x genotype for grain yield but not for A 13C in the
field experiments. The yield interaction was explained by -differential ability
amongst the genotypes to maintain water use, hence biomass, and HI. Of the
components of Passioura's framework for yield improvement, in the UK the
capacity of genotypes to maintain water use under drought seems to be the most
important for maintenance of grain yield under drought amongst modem UK
genotypes.
223
REFERENCES
ACEVEDO, E. (1993) Potential of 13 C discrimination as a selection in barley breeding. Pp. 399-417. Academic Press, USA.
ACEVEDO, E., NACHIT, M. and ORTIZ-FERRARA, G. (1991) Effects of heat stress on wheat and possible selection tools for use in breeding for tolerance. In D. A Saunders, ed. Wheatfor the nontraditional warm areas, p. 401-42 1. Mexico, DF, CIMMYT.
AGGARWAL, P. K., SINGH, A. K., CHATURVEDI, G. S. and SINHA, S. K. (1986) Performance of wheat and triticale cultivars in a variable soil-water enviror-unent 11. Evapotranspiration, water use efficiency, harvest index and grain yield. Field Crops Research, 13,301-315.
AGRAMA , H. A. S. and MOUSSA, M. E. (1996) Mapping QTLs in breeding for drought
tolerance in maize (Zea mays L. ). Euphytica 91,89 - 97.
AHN, S. N., BOLLICH, C. N., McCLUNG, A. M. and TANKSLEY, S. D. (1993) RFLP
analysis of genomic regions associated with cooked-kemel elongation in rice. Theoretical and Applied Genetics 87,27-3 2.
ARAKI, E., MIURA, H. and SAWADA, S. (1999) Identification of genetic loci
affecting amylose content and agronomic traits on chromosome 4A of wheat. Theoretical and Applied Genetics 98,977-984.
ARAUS, J. L., REYNOLDS, M. P. and ACEVEDO, E. (1993) Leaf posture, grain yield,
growth, leaf structure, and carbon isotope discrimination in wheat. Crop Science,
33ý 1273-1279.
ARAUS, J. L., BROWN, H. R, FEBRERO, A, BORT, J., and SERRET, M. D. (1993)
Ear photosynthesis, carbon isotope discrimination and the contribution of
respiratory C02 to differences in grain mass in durum. wheat. Plant, Cell and
Environment 16,383-392.
ARAUS, J. L., AMARO, T., ZUHAIR, Y. and NACHIT, M. M. (1997) Effect of leaf
structure and water status on carbon isotope discrimination in field-grown durum
wheat. Plant Cell and Environment, 20,1484-1494.
ARAUS, J. L., AMARO, T., CASADESUS, J., ASBATI, A., and NACHIT, M.
M. (1998) Relationships between ash content, carbon isotope discrimination and
yield in durum wheat. Australian Journal o Plant Physiology 25,835-842. )f
ARAUS, J. L., CASADESUS, J., ASBATI, A. and NACHIT, M. M. (2001) Basis of the
relationship between ash content in the flag leaf and carbon isotope
discrimination in kernels of durum wheat. Photosynthetica, 39,591-596.
ARAUS, U., CASADESUS, J. and BORT, J. (2001) Recent tools for the screening of
physiological traits determining yield. In: Application of Physiology in wheat
224
breeding; Reynolds, M. P., Ortiz-Monasterio, J-1. and McNab, A., (Eds. ). CIMMYT, Mexico, D. F. pp. 59-77.
ARAUS, J-L., SLAFER, G. A., REYNOLDS, M. P. and ROYO, C. (2002) Plant breeding and drought in C3 cereals: What should we breed for? Annals of Botany, 89, 925-940.
ARAUS, J. L., VILLEGAS,, D., APARICIO, N., GARCIA DEL MORAL, L. F, EL HANI, S, RHARRABTI, Y., FERRIO, J. P and ROYO, C. (2003) Environmental Factors Determining Carbon Isotope Discrimination and Yield in Durum Wheat under Mediterranean Conditions. Crop Science 43,170-180.
ARUMUGANATHAN, K. and EARLE, E. D. (1991) Nuclear DNA content of some important plant species, Plant Molecular Biology Reports 9,208-218.
ASHRAF, M and BASHIR, A. (2003) Relationship of photosynthetic capacity at the vegetative stage and during grain development with grain yield of two hexaploid wheat (Triticum aestivum L. ) cultivars differing in yield. European Journal of Agronomy 19,277-287.
ASSENG, S, KEATING, B, FILLERY, 1. R. P, GREGORY, P. J.,, BOWDEN, J. Wý TURNER, N. C.
, PALTA, J. A, and ARBRECHT, D. G. (1998) Performance of
the APSIM-wheat model in Western Australia. Field Crops Research 57,179.
ASSENG, S., RICHTER, C. and WESSOLEK, G. (1997) Modelling root growth of wheat as the linkage between crop and soil. Plant and Soil 190,267-277.
ASSENG, S, TURNER, N. C., BOTWRIGHT, T. L., and CONDON, A. G. (2003) Evaluating the impact of a trait for increased specific leaf area on wheat yields using a crop simulation model. Agronomy Journal 95,19.
ASSENG,, S, TURNER, N. C., and KEATING, B. (2001) Analysis of water and nitrogen-use efficiency of wheat in a Mediterranean climate. Plant and Soil 233,
127-143.
ASSENG, S., TURNER, N. C., RAY, J. D., and KEATING, B. A. (2002) A simulation
analysis that predicts the influence of physiological traits on the potential yield of
wheat. European Journal ofAgronomy 17: 123-141.
ASSENG, S and Van HERWAARDEN, A. F. (2003) Analysis of the benefits to wheat
yield from assimilates stored prior to grain filling in a range of environments.
Plant and Soil 256,229.
AUSTIN, R. B. (1980). Physiological limitations to cereals yields and ways of reducing
them by breeding. p. 3-19. In: Opportunities for increasing crop yields: R. G.
Hurd et al. (Ed. ). Association of Applied Biology, Pitman, Boston.
AUSTIN, R. B. (1985) Grain and straw yields of old and new wheat varieties. In: Plant
Breeding Institute Annual report for 1984, Cambridge. Pp. 131-132.
225
AUSTIN, R. B. (1987) Some crop characteristics of wheat and their influence on yield and water use. In: Drought Tolerance in Winter Cereals. J-P. Srivastava (Ed. ) Wiley, New York, pp. 321-336.
AUSTIN, R. B. (1988) A different ideotype for each environment? In: Cereal breeding related to integrated cereal production. M. L. Joma and L. A. T. Slootmaker (Eds. ). Pudoc, Wageningen. Pp. 47-60.
AUSTIN, R. B. (1994) Crop breeding opportunities, In: Physiology and determination of crop yield K. J. Boote et al. (Eds. ) ASA, CSA and SSA. Madison, WI, USA. Pp. 567-586.
AUSTIN, R. B. (1999) Yield of wheat in the United Kingdom: Recent advances and prospects. Crop Science 39,1604-1610.
AUSTIN, R. B., FORD, M. A., MILLER, T. E., MORGAN, C. L. and PARRY, M. A. J. (1987) Variation in photosynthetic characteristics among Triticum species and attempts to exploit it in breeding. Photosynthetic Research 4,361-368.
AUSTIN, R. B., FORD,, M. A. and MORGAN, C. L (1989) Genetic improvement in the field of winter barley: A further evaluation. Journal of Agricultural Science (Cambridge) 112,295-301.
AUSTIN, R. B., MORGAN, C. L.,, FORD,, M. A. and BHAGWAT, S. C. (1982) Flag leaf
photosynthesis of Triticurn aestivurn and related diploid and tetraplold species. Annals ofBotany 49,127-132.
AYALA, L., HENRY, M., Van GINKEL, M., SINGH., R., KELLER, B., HAIRALLAH,
M. (2002) Identification of QTLs for BYDY tolerance in bread wheat. Euphytica
128ý 249-259.
AZAM-ALI, S. N (1983) Seasonal estimates of transpiration from a millet crop using a
porometer. Agricultural Meteorology 30,13 -24.
AZAM-ALI, S. N. and SQUIRE, G. R. (2002) Principles of Tropical Agronomy.,
Wallingford, UK: CAB International.
BAILEY, R. J. (1990) Irrigated crops and their management. Farming Press, Ipswich.
BAILEY, R. J. and SPACKMAN, E. (1996) A model for estimating soil moisture
changes as an aid to irrigation scheduling and crop water-use studies: 1.
Operational details and description. Soil Use and Management 12,122-128.
BAKER, N. R. (1996) Photosynthesis and the environment. Kluwer Publications,
Dordrecht, Netherlands.
226
BAKER, R. J. (1988) Test for crossover genotype-environment interaction. Canadian Journal ofPlant Science 68,405-410.
BARRACLOUGH, P. B. (1984) The growth and activity of wInter wheat roots in the field-root-growth of high yielding crops in relation to shoot growth. Journal of Agricultural Science, Cambridge 103,439-442.
BARRACLOUGH, P. B and LEIGH, R. A. (1984) The growth and activity of winter wheat roots in the field: the effect of sowing date and soil type on root growth of high yielding crops. Journal ofAgricultural Science, Cambridge 103,59-74.
BARRACLOUGH, P. B. (1989) Root-growth, macro-nutrient uptake dynamics and soil fertility requirements of a high yielding winter oilseed rape crop. Plant and Soil 119ý 59-70.
BARRACLOUGH, P. B., KUHLMANN, H. and WEIR, A. H. (1989) The effects of prolonged drought and nitrogen-fertilizer on root and shoot growth and water uptake by winter-wheat. Journal ofAgronomy and Crop Science- Zeitschrift Fur Acker Und Pfanzenbau 163,3 52-3 60.
BARRACLOUGH,, P. B. and WEIR, A. H. (1988) Effects of compacted subsoil layer on root and shoot growth, water use and nutrient uptake of winter wheat. Journal of Agricultural Science, Cambridge 110,207-216.
BEGG, J. E. (1980) In: Adaptation of plants to water and temperature stress, N. C. Turner
and P. J. Kramer (Eds. ) pp. 33-42. Wiley, New York.
BELFORD, R, KLEPPER, B and RICKMAN, R (1987) Studies on intact shoot root systems of field-grown winter wheat 11. Root and shoot development patterns as related to nitrogen fertilizer. Agronomy Journal 79,310-319.
BENNETT, M. D., SMITH, J. B. and HESLOP-HARRISON, J. S. (1982) Nuclear DNA
amounts in angiospenns. Proceedings ofRoyal Society London Series B, 216,179-199.
BERRY, P. M., SPfNK, J. H., FOULKES, M. J. and WADE, A. (2003) Quantifying the
contributions and losses of dry matter from non-surviving shoots in four cultivars
of winter wheat. Field Crops Research 80,111-121.
BERTIN, P. and GALLAIS , A. (200 1). Genetic variation for nitrogen use efficiency in a set
of recombinant inbred lines. II-QTL detection and coincidences. Maydica 46,53-68.
BINGHAM, I. J., FOULKES, M. J., GAY, A. P., GREGORY, P. J., KING, J. A.,
ROBINSON, D. and SYLVESTER-BRADLEY, R. (2002) 'Balancing' root and
canopy growth. In: Agronomic intelligence. - the basis for profitable production.
Home-Grown Cereals Authority, R&D Conference, 2002,6.1-6.14.
BINGHAM, I. J. and McCABE V. B. (2003) Investigating the scope for managing the
root system of spring barley crops to improve performance on drought-prone
soils. Project Report No. 316. HGCA, London.
227
BINGHAM, I. J. and McCABE, V. B. (2004) Maximising production potential through understanding crop root systems. In: Managing soil and roots for profitable production HGCA conference- UK 2004 2.1-2.12.
BINGHAM, I. J., PANICO, A. and STEVENSON, E. A. (1996) Extension rate and respiratory activity in the growth zone of wheat roots: time-course for adjustments after defoliation. Physiologia Plantarum 98,201-209.
BINGHAM, I. J. and STEVENSON, E. A. (1993) Control of root growth-effects of carbohydrates on the extension, branching and rate of respiration of different fractions of wheat roots. Physiologia Plantarum 88,149-158.
BLANCO, A., PASQUALONE, A., TROCCOLI, A., DI FONZO, N. AND SIMEONE, R. (2002) Detection of grain protein content QTLs across environiments in tetraploid wheats. Plant molecular Biology. 48,615-623.
BLUM, A. (1988) Plant breeding for stress enviromnents. CRC Press, Boca Raton, Florida, USA. Pp. 1-223.
BLUM, A. (1990) Variation among wheat cultivars in the response of leaf gas- exchange to light. Journal ofAgricultural Science, Cambridge 115,305-311.
BLUM, A. (1993) Selection for sustained production in water-deficit environments. In: International Crop Science. I. D. R. Buxton, R. Shibles, R. A. Forsberg, B. L. Blad, K. H. Asay, G. M. Paulsen, and R. F. Wilson (Eds. ) Crop Science Society of America, Madison. Pp. 343-347.
BLUM, A. (1996) Yield potential and drought resistance: are they mutually exclusive?. In: Increasing yield potential in wheat. - Breaking the barriers. M. P. Reynolds,
S. Rajaram, and A. McNab. (Eds. ) Mexico, D. F, CIMMYT pp. 76-89.
BLUM, A. (2005) Drought resistance, water-use efficiency, and yield potential-are they
compatible, dissonant, or mutually exclusive? Australian Journal ofAgricultural Research, 56,1159-1168.
BLUM, A., POIARKOVA, H., GOLAN, G. and MAYER, J. (1983) Chemical dessication
of wheat plants as a simulator of post-anthesis stress 1. Effects on translocation and
kernel growth. Field Crops Research 6,51-58.
BLUM, A., RAMAIAH, S., KANEMASU, E. T. and PAULSEN, G. M. (1990) Wheat
recovery from drought stress at the tillering stage of development. Field Crops
Research 24,67-85.
BLUM, A. and SULLIVAN, C- Y. (1997) The effect of plant size on wheat response to
agents of drought stress. 1. Root drying. Australian Journal of Plant Physiology
24ý 1-35.
BOEHM, W. (1978) Investigations on root development in winter wheat. Zeitschriftfur
Acker- undPflanzenbau 147,264-269.
228
BORNER, A., KORZLTN, V. and WORLAND, A. J. (1998) Comparative genetic mapping of loci affecting plant height and development in cereals. Euphytica 100: 245-248.
BORRELL, A. K., HAMMER, G. L., and DOUGLAS, A. C. (2000) Does maintaining green leaf area in sorghum improve yield under drought? 1. Leaf growth and senescence. Crop Science 40,1026-1037.
BOWLING, D. R., MCDOWELL, N. G., BOND, B. J. LAW, BE and EHLERINGER 13C JR. (2002) content of ecosystem respiration is linked to precipitation and
vapor pressure deficit. Oecologia 131,113-124.
BOYER, J. S. (1996) Advances in drought tolerance in plants. Advances in Agronomy, 565 187-218.
BRADFORD, K. J. and HSIAO, T. C. (1982) Physiological responses to moderate water stress. In: Physiological Plant Ecology - Water relations and Carbon assimilation, Encyclopedia of Plant Physiology. 11 New Series. O. L. Lange (Ed. ) Springer-Verlag, New York, Vol. 12B pp. 264-324.
BRIGGS, L. J., and SHANTZ, H. L. (1914) Relative water requirement of plants. Journal
ofAgricultural Research 3,1-64.
BRISSON N., GUEVARA, E., MEIRA, S., MATURANO, M. and COCA,, G. (2001) Response of five wheat cultivars to early drought in the Pampas. Agronomy Journal 21,483-495.
BROWN) S. C. , KEAUNGE, J. D. H.,, GREGORY, P. J., and COOPER, P. J. M. (1987).
Effects of fertillser, variety and location on barley production under rainfed
conditions in northern Syria. 1. Root and shoot growth. Field Crops Research 16,
53-66.
BROUWER, R. (1963) Some aspects of the equilibrium between over-ground and
underground plant parts. Jaarboek IBS, Wageningen, 31-3 9.
BRYAN, G. J., COLLINS, A. J., STEPHENSON, P., ORRY, A., SMITH, J. B. and
GALE, M. D. (1997) Isolation and characterization of microsatellites from
hexapl old bread wheat. Theoretical and Applied Genetics 94,557-563.
BYRNE, P. F., BUTLER, J. D., ANDERSON, G. R. and HALEY, S. D. (2002) QTLS for
agronomic and morphological traits in spring wheat population derived from a
cross of heat tolerant and heat sensitive lines. In: Plant, Animal and Microbe
Genomes X conference. San Diego, CA, USA.
CALVET, J. C. (2000) Investigating soil and atmospheric plant water stress using
physiological and micrometeorological data. Agricultural and Forest
Meteorology 103,229-247.
229
CAMPBELL, S. A. and CLOSE, T. J. (1997) Dehydrins: genes, proteins, and associations with phenotypic traits. The New Phytologist 137,61-74.
CARMAN, J. G. and BR1SKE, D. D. (1982) Root initiation and root and leaf elongation of dependent little bluestem tillers following defoliation. Agronomy Journal 74,432-435.
CARVER, B. F. and RAYBURN, A. L. (1994) Comparison of related wheat stocks possessing 1B or IRS. IBL chromosomes: Agronomic performance. Crop Science 34,1505-1510.
CATTIVELLI, L., BALDI, P., CROSATTI, C., FONZO, N.,, FACCIOLI, P., GROSSI,, M., MASTRANGELO, A. M., PECCHIONI, N., and STANCA, A. M. (2002) Chromosome regions and stress-related sequences involved in resistance to abiotic stress in Triticeae. Plant Molecular Biology 48,649-665.
CHAUDHURI, U. N., KIRKHAM, M. B. and KANEMASU, E. T. (1990) Carbon dioxide and water level effects on yield and water use of winter wheat. Agronomy Journal 82, 637-641.
CHAVES, M. M. and OLIVEIRA, M. M. (2004) Mechanisms underlying plant resilience to water deficits: Prospects for water-saving agriculture. Journal of Experimental Botany, (Water-Saving in Agriculture Special Issue) 55, 2365-2384.
CHAVES, M. M., PEREIRA, J. S., MAROCOJ., RODRIGUES, M. L., RICARDO, C. P. P., OSORIO. M. L., CARVALHOJ, FARIAJ. and PfNHEIRO, C. (2002) How Plants Cope with Water Stress in the Field? Photosynthesis and Growth. Annals
ofBotany, 89,907-916.
CHAVO, S., SHARP, P. J., WORLAND, A. J., WARHAM, E. J., KOEBNER, R. M. D.
and GALE, M. D. (1989) RFLP based genetic maps of wheat homoeologous
group 7 chromosomes. Theoretical andApplied Genetics 78,495-504.
CHOLICK, F. A., WELSHý R. J. and COLE, C. V. (1977) Rooting patterns of sen-ý-dwarf
and tall winter wheat cultivars under dryland field conditions. Crop Science 17,
637-639.
CIMMYT (1996) CIMMYT 1995/96 World wheat facts and trends: Understanding
global trends in the use of wheat diversity and international flows of wheat
genetic resources. CIMMYT, Mexico, D. F.
COLLARD, B. C. Y., JAHUFER, M. Z. Z., BROUWER, J. B. AND PANG, E. C. K. (2005)
An introduction to markers, quantitative loci (QTL) mapping and
marker-assisted selection for crop improvement: The basic concepts. Euphytica
142ý 169-196.
CONDON, A. G., RICHARDS, R. A. and FARQUHAR, G. D. (1987) Carbon isotope
discrimination is positively correlated with grain-yield and dry-matter
production in field-grown wheat. Crop Science 2 7,996-100 1.
230
CONDON, A. G. and RICHARDS, R. A. (1992) Broad Sense Heritability and Genotype x Environment Interaction for Carbon Isotope Discrimination in Field-Grown Wheat. Australian Journal ofAgricultural Research 43,921-934.
CONDON, A. G., FARQUHAR, G. D. and RICHARDS. R. A. (1990). Genotypic variation in carbon isotope discrimination and transpiration efficiency in wheat: Leaf gas exchange and whole plant studies. Australian Journal of Plant Physiology 17,9-22.
CONDON, A. G., RICHARDS, R. A. and FARQUHAR, G. D. (1992) The effect of variation in soil-water availability, vapor- pressure deficit and nitrogen nutrition on carbon isotope discrimination in wheat. Australian Journal of Agricultural Research 43,935-947.
CONDON, A. G. and RICHARDS, R. A. (1992) Exploiting genetic variation in transpiration efficiency in wheat- an agronomic view. In: Perspectives on carbon and water relationsfrom stable isotopes; Ehleringer, J. R., Farquhar, G. D., Hall, A. E. and Ting, 1. (Eds. ), Academic Press, New York.
CONDON, A. G., RICHARDS, R. A. and FARQUHAR, G. D. (1993) Relationships between carbon-isotope discrimination, water-use efficiency and transpiration
efficiency for dryland wheat. Australian Journal of Agricultural Research 44, 1693-1711.
CONDON, A. G. and RICHARDS, R. A. (1993) Exploiting genetic variation in
transpiration efficiency in wheat: An Agronomic view. In: Stable Isotopes and
plant carbon-water relations; Ehleringer, J. R., Hall, A. E. and Farquhar, G. D.
(Eds. ), Academic Press, USA. pp. 535-550.
CONDON, A. G. and HALL, A. E. (1997) Adaptation to diverse environments: Genotypic variation in water-use efficiency within crop species. In: Agricultural
Ecology (Ed. Jackson, L. E. ), Academic Press, San Diego, CA. pp. 79-116.
CONDON, A. G., RICHARDS, R. A., REBETZKE, G. J. and FARQUHAR, G. D. (2002)
Improving intrinsic water-use efficiency and crop yield. Crop Science
425122-131.
COPLAND, S., REYNOLDS, M. P., TRETHOWAN, R., DAVIES, W. P., and
GOODING, M. J. (2002) Moisture stress resistance of wheat lines derived from
synthetic hexaploids. Proceedings of the conference "Genotype to Phenotype. -
Narrowing the Gap ", December 16-18th. Royal Agricultural College,
Cirencester, UK. Association ofApplied Biologists.
COWAN, 1. R. (1982) Regulation of water use in relation to carbon gain in higher plants.
In: Physiological Plant Ecology - Water relations and Carbon assimilation,
Encyclopedia of Plant Physiology-11 New Series. O. L. Lange (Ed. )
Springer-Verlag, New York, Vol. 12B pp. 569-613.
231
COWAN, I. R. (198 8) Stomatal physiology and gas exchange in the field. In: 'Flow and Transport in the Natural Environment: Advances and Applications'. SteffenX L. and. Denmead, O. T. (Eds. ) Springer-Verlag, New York. pp. 160-172.
CRAUFURDI, P. Q., AUSTIN, R. B., ACEVEDO, E. and HALL, M. A. (1991) Carbon isotope discrimination and grain yield in barley Field Crops Research 27, 301-313.
DARVASI, A., WEfNREB, A., MfNKE, V., WELLER, JI and SOLLER, M. (1993) Detecting marker-QTL linkage and estimating QTL gene effect and map location using a saturated genetic map. Genetics 134,943 -95 1.
DAVIES, W. J., WILKINSON, S and LOVEYS, B. (2002) Stomatal control by chemical signalling and the exploitation of this mechanism to increase water use efficiency in agriculture. New Phytologist 153 (3)5 449-460.
DAVIES, W. J. and MANG, J. (1991) Root signals and the regulation of growth and development in drying soil. Annual Review ofPlant Physiology 42,55-76.
DEFRA (2001) Department for Environment, Food and Rural Affairs: Final Project Report OC9602 Maintaining wheat performance through improved resistance to drought. pp. 20.
DEFRA (2002) Department for Environment, Food and Rural Affairs: Final Project Report CE0370 Maintaining wheat performance through improved exploitation of drought resistance traits. pp. 23.
DEFRA (2004) Department for Environment, Food and Rural Affairs: Final Project Report AR0908 Physiological traits influencing hardness and vitreosity in wheat
grain. 22 pp.
DEFRA (2006) Department for Environment, Food and Rural Affairs: Final estimates of
cereal production in UK 2005. www. defra. gov. uk and www. statistics. gov. uk.
DEVOS, K. M., ATKINSONý M. D., CHINOY, C. N., FRANCIS, H. A., HARCOURT,
R. L., KOEBNER, R. M. D., LIU, C. J., MASOJC, P., XIE, DX and GALE, M. D.
(1993) Chromosomal rearrangements in the rye genome relative to that of wheat.
Theoretical andApplied Genetics 85,673-680.
DEVOS, K. M., CHAO, S., LI, Q. Y., SIMONETT15 M. C. and GALE, M. D. (1994)
Relationship between chromosome 9 of maize and wheat homeologous group 7
chromosomes. Genetics 138,1287-1292.
DEVOS, K. M., DUBCOVSKYý J., DVORAK, J., CHINOY, C. N. and GALE, M. D.
(1995) Structural evolution of wheat chromosomes 4A, 5A, and 7B and its
impact on recombination. Theoretical andApplied Genetics 91,282-288.
De WIT, C. T., (1958) Transpiration and crop yields. In: Trersl. Landbouwk Onderz., 64,
1-88.. Institute of Biological and Chemical Research on Field crops and Herbage,
Wageningen, The Netherlands.
232
DONALD, C. A. (1968) The breeding of crop ideotypes. Euphytica 17,3 85-403.
DONOVAN, L. A. and EHLERINGER, J. R. (1994) Carbon isotope discrimination, water-use efficiency, growth, and mortality in a natural shrub population. Oecologia 100,347-354.
DUBCOVSKY, J., LUO, M. C., ZHONG, G. Y., BRANSTEITTER, R., DESAI, A., KILIAN, A., KLEINHOFS, A. and DVORAK J. (1996) Genetic map of diploid wheat, Triticum monococcum L., and its comparison with maps of Hordeum vulgare L., Genetics 143,983-999.
DUGGAN, B. L., DOMITRUK, D. R. and FOWLER, D. B. (2000) Yield component variation in winter wheat grown under drought stress. Canadian Journal of Plant Science 80,739-745.
DUNSTONE, R. L., GIFFORD, M., and EVANS, L. T. (1973) Photosynthetic
characteristics of modern and primitive wheat species in relation to ontogeny and adaptation to light. Australian Journal o Biological Sciences 26,295-307. ýf
DUWAYRI, M. (1984) Comparison of wheat cultivars grown in the field under different levels of moisture. Cereal Research Communication 12,27-34.
EBDON, J. S., PETROVIC, A. M. and DAWSON, T. E. (1998) Relationship between
carbon isotope discrimination, water use efficiency, and evapotranspiration in
Kentucky bluegrass. Crop Science 38,157-162.
EHDAIE,, B.,, HALL,, A. E. ý
FARQUHAR, G. D., NGUYEN, H. T. and WAfNES, J. G.
(1991) Water-use efficiency and carbon isotope discrimination in wheat. Crop
Science,, 31,, 1282-1288.
EHDAIE, B. (1995) Variation in water-use efficiency and its components in wheat: 11.
Pot and field experiments. Crop Science 35,1617-1626.
EHDAIE, B. and WAINES, J. G. (1993) Variation in water-use efficiency and its
components in wheat: 1. Well-watered pot experiment. Crop Science 33,
294-299.
EHDAIE, B. and WAINES, J. G. (1994) Genetic analysis of carbon isotope
discrimination and agronomic characters in a bread wheat cross. Theoretical and
Applied Genetics 88,1023-1028.
EHDAIE,, B. and WAWESý I G. (1996) Genetic variation for contribution of
preanthesis assimilates to grain yield in spring wheat. Journal of Genetics and
Breeding 50,47-56.
EHDAIE, B., WHITKUS, R. W. and WAINES, J. G. (2003) Root biomass, water-use
efficiency, and performance of wheat-rye translocations of chromosomes I and 2
in spring bread wheat'Pavon'. Crop Science 43,710-717.
233
EHLERINGER, J. R., WHITE, J. W., JOHNSON, D. A. and BRICK, M. (1990) Carbon isotope discrimination, photosynthetic gas exchange and water-use efficiency in common bean and range grasses. Acta Oecologia 11,611-625.
ELLIS, M. H., SPIEMEYER, W., GALE, K. R., REBETZKE, G. J. and RICHARDS, R. A. (2002) "Perfect" markers for the Rht-B]b and Rht-D]b dwarfing genes in wheat Theoretical and Applied Genetics 105,103 8-1042.
EQUIZA, M. A., MIRAVE, J. P. and TOGNETTI, J. A. (2001) Morphological, anatomical and physiological responses related to differential shoot vs. root growth inhibition at low temperature in spring and winter wheat. Annals of Botany 87,67-76.
EVANS J. R. (1993) Photosynthetic acclimation and nitrogen partitioning within a lucerne canopy: Stability through time and comparison with a theoretical optimum? Australian Journal of Plant Physiology 20,69-82.
EVANS, J. R., SHARKEY, T. D., BERRY, J. A. and FARQUHAR, G. D. (1986) Carbon isotope discrimination measured concurrently with gas-exchange to investigate C02 diffusion in leaves of higher plants. Australian Journal ofPlant Physiology, 135 281-292.
EVANS, L. T. and DUNSTONE, R. L. (I 970) Some physiological aspects of evolution in
wheat. Australian Journal Biological Science 23,725-74 1.
EVANS, L. T. (1980) The natural history of crop yield. American Scientist 68,3 88-397.
FAO (1996) Production year book 1995. Vol. 49, FAO statistical series no. 13 0. Rome:
Food and Agriculture Organisation of the United Nations)
FAO (2005) FAO Statistics Database. Rome: Food and Agriculture Organisation of the
United Nations). Available at http: //apps. fao. org.
FARQUHAR, G. D. and SHARKEY, T. D. (1982) Stomatal conductance and
photosynthesis. Annual Review of Plant Physiology and Plant Molecular
Biology 33,317-3ý5-
FARQUHAR, G. D., OLEARY, M. H. and BERRY, J. A. (1982) On the relationship
between carbon isotope discrimination and the inter-cellular carbon-dioxide
concentration in leaves. Australian Journal of Plant Physiology 9,121-13 7.
FARQUHAR, G. D. and RICHARDS, R. A. (1984) Isotopic composition of plant carbon
correlates with water-use efficiency of wheat genotypes. Australian Journal of
Plant Physiology 11,539-552.
FARQUHAR, G. D., HUBICK, K. T., CONDON, A. G. and RICHARDS, R. A. (1988).
Carbon isoto e fractionation and plant water-use efficiency. In: 'Applications o p
?f
234

Stable Isotope Ratios to Ecological Research'. Rundel, P. W., Ehleringer, J. R. and Nagy, K. A (Eds. ) Springer-Verlag, New York, pp. 21-40.
FARQUHAR, G. D., EHLERINGER, J. R. and HUBICK, K. T. (1989) Carbon Isotope Discrimination and Photosynthesis. Annual Review of Plant Physiology and Plant Molecular Biology 40,503-537.
FARQUHAR, G. D. and LLOYD, J. (1993) Carbon and oxygen effects in the exchange of carbon dioxide between terrestrial plants and the atmosphere. In: Stable Isotopes and plant carbon-water relations; Ehleringer, J. R., Hall, A. E. and Farquhar, G. D. (Eds. ), Academic Press, USA. pp. 47-69.
FINNAN, J. M, BURKE, J. 1. and JONES, M. B. (2004) A time concentrations study of the effects of ozone on spring wheat (Triticum aestivum L., cv. Promessa). 3. Effects on leaf area and flag leaf senescence. " Agriculture, Ecosystems and Environment 69 27-35.
FISCHER, R. A. (1983) Growth and yield of wheat. In: Potential productivity offield crops under different environments. IRRI, Los Ban'os, Philippines. pp. 129-154.
FISCHER, R. A. and MAURER, R. (1978) Drought resistance in spring wheat cultivars. 1. Grain yield responses. Australian Journal of Agricultural Research 29, 897-912.
FISCHER, R. A, REES, D, SAYRE, K. D., LU, Z, CONDON, A. G., and LARQUE- SAAVEDRA, A. (1998) Wheat yield progress associated with higher
stornatal conductance and photosynthetic rate, and cooler canopies. Crop Science 38ý 1467-1475.
FISCHER, R. A. and TURNER, N. C. (1978) Plant productivity in the arid and semi-arid zones. Annual Review ofPlant Physiology, 29,277-317.
FISCHER, R. A. and WOOD, J. T. (1979) Drought resistance in spring wheat cultivars: III. Yield associations with morpho-physiological traits. Australian Journal of Agricultural Research 30,1001-1020.
FORD, K. E., GREGORY, P. J., GOODING, M. J. and PEPLER, S. (2002) Root length
density variation in modem winter wheat cereals. In: Proceedings of VII
Congress of the European Society of Agronomy. F. J. Villalobos, and L. Testi
(Eds. ) Consejeria de Agricultura y Pesca, Cordoba. Pp 3 61-3 62.
FORSTER, B. P., MILLER, T. E. AND LAW, C. N. (1988) Salt tolerance of two wheat-
Agropyronjunceum disomic addition lines. Genome 30,559-564.
FORSTER, J. W., JONES, E. S., BATLEY. J. and SMITH, K. F. (2004) Molecular
marker-based genetic analysis of pasture and turf grasses. In: Molecular
breeding offorage and turf Hopkins A, Wang ZY, Mean R, Sledge M, Barker
RE (Eds. ) Kluwer, Dordrecht, pp 197-238.
235

FOULKES, M. J., SCOTT, R. K., SYLVESTER-BRADLEY, R., CLARE, R. W., EVANS, E. J., FROST, D. L., KETTLEWELL, P. S. RAMSBOTTOM, J. E. and WHITE, E. (1994) Suitabilities, of UK winter wheat (Triticum aestivum L. ) varieties to soil and husbandry conditions. Plant Varieties and Seeds 7,161-18 1.
FOULKES, M. j., SYLVESTER-BRADLEY, R., SCOTT, R. K. and RAMSBOTTOM, J. E. (1993) A search for varietal traits that may influence performance of winter wheat during droughts in England. Aspects ofApplied Biology 34,279-288.
FOULKES, M. J.,, SYLVESTER-BRADLEY, R. and SCOTT, R. K. (1998a) Evidence for differences between winter wheat cultivars in acquisition of soil mineral nitrogen and uptake and utilization of applied fertilizer nitrogen. Journal of Agricultural Science, Cambridge 130,29-44.
FOULKES, MJ., SPINK, J. H., SCOTT, R. K. and CLARE, R. W (1998b). Varietal typing trials and NIAB additional character assessments. Home-Grown Cereals Authority Final Project Report No. 174, Vol. V. HGCA, London.
FOULKES, M. J. and SCOTT, R. K. (1998c) Exploitation of varieties for UK cereal production. Vol-11. Part 1. Varietal responses to drought. In: HGCA re ort no P 174 HGCA, London.
FOULKES, M. J., SCOTT, R. K. and SYLVESTER-BRADLEY, R. (2001) The ability of wheat cultivars to withstand drought in UK conditions: resource capture. Journal
ofAgricultural Science, Cambridge 137,1-16.
FOULKES, M. J., SCOTT, R. K. and SYLVESTER-BRADLEY, R. (2002) The ability of
wheat cultivars to withstand drought in UK conditions: formation of grain yield. Journal ofAgricultural Science, Cambridge 138,153-169.
FOULKES, M. J., SYLVESTER-BRADLEY, R., WORLAND, A. J. and SNAPE, JW.
(2004) Effects of a photoperiod-response gene Ppd-D] on yield potential and drought resistance in UK winter wheat. Euphytica 135,63-73.
FOWLER, D. B., CHAUVIN, L-P., LIMIN, A. E. and SARHAN, F. (1996) The
regulatory role of vernalization in the expression of low temperature-induced
genes in wheat and rye. Theoretical andApplied Genetics 93,554-559.
GALE, M. D. and DEVOS, K. M. (1998) Plant comparative genetics after 10years.
Science, 282,656-659.
GALE, M. D. and YOUSEFFIAN, S. (1985) Dwarfing genes in wheat. In: Progress in
plant breeding. Russell, G. E (Ed. ). Butterworths, London. p. 1-35.
GALES, K. and WILSON, N. J. (1981) Effect of water shortage on the yield of winter
wheat. Annals ofApplied Biology 99,323-334.
GALLAGHER, J. N. and BISCOE, P. V- (1978) Radiation absorption, growth and yield
of cereals. Journal ofAgricultural Science, Cambridge 91,47-60.
236
GALIBA, G., QUARRIE, S. A., SUTKA, J., MORGOUNON, A. and SNAPE, J. W. (1995) RFLP mapping of the vernalization (Vrnl) and frost resistance (FrI) genes on chromosome 5A of wheat. Theoretical and Applied Genetics 90, 1174-1179.
GENT MRN and KIYOMOTO, R. K. (1985) Comparison of canopy and flag leaf net carbon dioxide exchange of 1920 and 1977 New York winter wheats. Crop Science 25,81-86.
GIMENEZ, C., MITCHELL, VJ AND LAWLOR, D. W. (1992) Regulation of Photosynthetic Rate of Two Sunflower Hybrids under Water Stress Plant Physiology. 98,516-524.
GOWING, D. J. G., DAVIES,, W. J. and JONES, H. G. (1990) A positive root-source signal as an indicator of soil drying in apple Malus domestica. Journal of Experimental Botany 41,1535-1540.
GREGORY, P. J. and ATWELL, B. J. (1991) The fate of carbon in pulse-labelled crops of barley and wheat. Plant and Soil 136,205-213.
GREGORY, P. J. and BRO WN 5 S. C. (19 8 9) Root growth, water use and yield of crops in
dry environments: what characteristics are desirable? Aspects ofApplied Biology 22ý 235-243.
GREGORY, P. J.., MCGOWAN, M., BISCOE, P. V. and HUNTER, B. (1978a) Water
relations of winter wheat. 1. Growth of the root system. Journal ofAgricultural Science, Cambridge 91,91-102.
GREGORY, P. J., MCGOWAN, M. and BISCOE, P. V. (1978b) Water relations of
winter wheat. 2. Soil water relations. Journal of Agricultural Science,
Cambridge, 91,103-116.
GREGORY, P. J. (1994) Resource capture by root networks. In: Resource capture by
crops; Monteith,, J. L.,, Scott, R. K. and Unsworth, M. H., (Eds. ) Nottingham:
Nottingham University Press pp. 77-97.
GREGORY, P. J.,, TENNANT, D., and BELFORD, R. K. (1992) Root and shoot growth,
and water and light-use efficiency of barley and wheat crops grown on a shallow
duplex soil in a Mediterranean-type environment. Australian Journal of
Agricultural Research 43,555-573.
GUPTA, A. P. and VIRMANI, S. M. (1973) Note on the rooting pattern of
three- gene-dwarf wheats. Indian Journal ofAgricultural Science 43,971-973.
GUPTA, N. K., GUPTA, S- and KUMAR, A. (2001) Effect of water stress on
physiological attributes and their relationship with growth and yield of wheat
cultivars at different stages. Journal ofAgronomy and Crop Science, 186,55-62.
237
GUPTA, P-K., VARSHNEY, R. K., SHARMA, P. C. and RAMESH, B. (1999) Review on molecular markers and their applications in wheat breeding. Plant Breeding, 118, 369-390,
GUTIERREZ-RODRIGUEZ, M., REYNOLDS, M. P. and LARQUE-SAAVEDRA, A. (2000) Photosynthesis of wheat in a warm, irrigated enviromuent - 11. Traits associated with genetic gains in yield. Field Crops Research 66,51-62.
GUYOT, R., YAHIAOUI,, N., FEUILLET, C. and KELLER B. (2004) In silico comparative analysis reveals a mosaic conservation of genes within a novel colinear region in wheat chromosome I AS and rice chromosome 5S. Functional and Integrative Genomics 4,47-58.
HABERLE, J., SVOBODA, P. and BLAHA, L. (1995). The comparison of shoot and root production in old and new cultivars of winter cereals. Roshnna Vyroba 41: 511-516.
HALEY, C. S. and KNOTT, S. A. (1992). A simple regression method for mapping quantitative trait loci in line crosses using flanking markers. Theoretical and Applied Genetics 103,601-606.
HALL, N. M., 1 GRIFFITHS
, H., CORLETT
, J. A., JONES
, H. G., LYNN, J. and KING,
G. J. (2005) Relationships between water-use traits and photosynthesis in Brassica oleracea resolved by quantitative genetic analysis. Plant Breeding 124, 557-564.
HALL, A. E., RICHARDS, R. A., CONDON, A. G., WRIGHT, G. C. AND FARQUHAR, G. D. (1994) Carbon isotope discrimination and plant breeding. Plant Breeding
Reviews 12,81-113.
HAMBLIN, A. P. and TENNANT, D. (1987) Root length density and water uptake in
cereals and grain legumes; how well are they correlated? Australian Journal of Agricultural Research 38,513-527.
HAMBLIN, A. P., TENNANT, D., and PERRY, M. W. (1990) The cost of stress: Dry
matter partitioning changes with seasonal supply of water and nitrogen to
dryland wheat. Plant and Soil 122,47-5 8.
HAMMERý G. L., FARQUHAR, G. D. and BROAD, I. J. (1997) On the extent of genetic
variation for transpiration efficiency in sorghum. Australian Journal of
Agricultural Research 48: 649-655.
HANKSý R. J. (1983) Yield and water-use relationships: an overview. In: Limitations to
efficient water use in crop production, Taylor, H. M (Ed. ) Madison, USA. Pp.
393-411.
HARRISON, P. A, BUTTERFIELD, R. E, and ORR, J. L. (2000) Modelling climate
change impacts on wheat, potato and grapevine in Europe. In: Climate change,
climatic variability and agriculture in Europe; Harrison PA, Butterfield RE and
238
Lonsdale KG (Eds. ), Research Report no 21. Environmental Change Institute, University of Oxford., pp. 367-390.
HAUSMANN, N., JUENGER, T. E., SEN, S., STOWE, K., DAWSON T. E. and SIMMS E. L. (2004) Quantitative trait loci (QTL) affecting 613 C and response to differential water availability in Arabidopsis thaliana. Evolution 59,81-96.
HENDERSON, S., VON CAEMMERER, S., FARQUHAR, G. D., WADE, L. and HAMMER, G. (1998) Correlation between carbon isotope discrimination and transpiration efficiency in lines of the C4 species Sorghum bicolor in the glasshouse and the field. Australian Journal o Plant Physiology, 25,111-123. ?f
HGCA (1998) The wheat growth guide to improve husbandry decisions. Home Grown Cereals Authority Publication Series. London Pp. 3 1.
HOAD, S. P., RUSSELL, G., LUCAS, M. E. and BINGHAM, I. J. (2001) The management of wheat, barley, and oat root systems. In: Advances in Agronomy. 193 - 246. Academic Press.
HOLADAY, A. S., MARTINDALE, W., ALRED, R., BROOKS, A. L. AND. LEEGOOD, R. C. (1992) Changes in Activities of Enzymes of Carbon Metabolism in Leaves during Exposure of Plants to Low Temperature. Plant Physiology, 98,1105-1114.
HORTON, P. and MURCHIE, E. H. (2000)C4photosynthesis in rice: some lessons from
studiesOf C3photosynthesis in field-grown rice. In: Redesigning photosynthesis to increase yield. Sheehy, J. E., Mitchell, P. L. & Hardy B. (Eds. ) Elsevier Science BV!
ý 127-144.
HUANG, S., SIRIKHACHORNKIT, A., SU, X., FARIS, J. and GILL B. et al., 2002 Genes encoding plastid acetyl-CoA carboxylase and 3-phosphoglycerate
kinase of the Triticum/Aegilops complex and the evolutionary history of
polyploid wheat. Proceedings of the National Academy of Science. USA 99,
8133-8138.
HUBICK, K. T. and FARQUHAR, G. D. (1989) Carbon isotope discrimination and the
ratio of carbon gained to water lost in barley cultivars. Plant Cell and Environment
12,795-804.
HUBICK, K. T., SHORTER, T. R. and FARQUHAR, G. D. (1989) Heritability and
genotype x environment interactions of carbon isotope discrimination and
transpiration efficiency in peanut (Arachis hypogaea L. ) Australian Journal of
Plant Physiology 15,799-813.
HURD, E. A. (1968) Growth of roots of seven varieties of spring wheat at high and low
moisture levels. Agronomy Journal 60,201-205.
239
MESý P. and BLACKWELL, R. D. (1983) Some effects of leaf posture on the yield and water economy of winter wheat. Journal ofAgricultural Science, Cambridge 101,367-376.
INNES, P. BLACKWELL, R. D., AUSTIN, R. B. and FORD, M. A. (1981) The effects of selection for numbers of ears on the yield and water economy of winter wheat. Journal ofAgricultural Science, Cambridge 97,523-532.
INNES, P. BLACKWELL, R. D. and QUARRIE, S. A. (1984) Some effects of genetic variation in drought-induced abscisic acid accumulation on the yield and water use of winter wheat Journal ofAgricultural Science, Cambridge 102,341-3 5 1.
INNES, P., HOOGENDORN, J. and BLACKWELL, R. D. (1985) Effects of differences in date of ear emergence and height on yield of winter wheat. Journal of Agricultural Science, Cambridge 105,543-549.
IQBAL, M. M., AKHTER, J., MOHAMMAD, W., SHAH, S. M., NAWAZ, H. and MAHMOOD, K. (2005) Effect of tillage and fertilizer levels on wheat yield, nitrogen uptake and their correlation with carbon isotope discrimination under rainfed conditions in north-west Pakistan. Soil and Tillage Research, 80,47-57.
JAMIESON, P. D., PORTER, R. J, GOUDRIAN, J., RITCHIE, J. T., KEULEN, VAN, H.
and STOL, W. (1998) A comparison of the models AFRCWHEAT2, CERES-Wheat, SIRIUS, SUCROS2 and SWHEAT with measurements from
wheat grown under drought. Field Crops Research 55,23-44.
JASON, CM. (2004) World agriculture and the environment: A
commo dity-by- commodity guide to impacts and practices. Washington, D. C.,
Island Press. pp. 367-386.
JIANG, G. H., HE, Y. Q., XU, C. G., LI, X. H. and MANG, Q. (2004) The genetic basis of stay-green in rice analyzed in a population of doubled haploid lines
derived from an indica x japonica cross Theoretical and Applied Genetics
108,688 - 698.
JOHNSON, B. L. and HENDERSON, T. L. (2002) Water use patterns of grain amaranth in Northern Great Plains. Agronomy Journal 94,1437-1443.
JOHNSON, R. C., KEBEDE, H., MORNHINWEG, D. W., CARVER, B. F., RAYBURN,
A. L. and NGUYEN, H. T. (1987) Photosynthetic differences among Triticurn
accessions at tillering. Crop Science 27,1046-1050.
JOHNSON, D. A. and RUMBAUGH, M. D. (1995) Genetic variation and inheritance
characteristics for carbon isotope discrimination in alfalfa. Journal of Range
Management 48,126-13 1.
JONES, H. G. (1976) Crop characteristics and the ratio between assimilation and
transpiration. Journal ofApplied Ecology 13,605-622.
240
JONES H. G. (2004) What is water use efficiency? In: Water use efficiency in plant biology; Mark A Bacon (Ed. ), Blackwell publishing Ltd, Oxford, UK pp. 27-41.
JONES, R. J. A and THOMASSON, A-J. (1985) An agroclimatic databank for England and Wales. Soil Survey Technical Monograph No. 16. Dorking: Adlard & Son Ltd.
JONES, H. G., and. KIRBY, E. J. M. (1977) Effects of manipulation of number of tillers and water supply on grain yield in barley. Journal of Agricultural Science, Cambridge 88,391-397.
JORDAN , W. R. (19 8 3) Whole plant response to water deficits: an overview. In: Taylor
H. M., Jordan, W. R. and Sinclair TR (Eds. ) Limitations to efficient water use in crop production. Madison, USA: American Society of Agronomy pp. 289-317.
JULIAN, C., THEOBALD, J. C., MITCHELL, R. A. C., PARRY, M. A. J., and LAWLOR, D. W. (1998) Estimating the excess investment in ribulose-1,5-bisphosphate carboxylase /oxygenase in leaves of spring wheat grown under elevatedC02. Plant Physiology 118,945-955.
JUENGER, T. E., MCKAY, J. K., HAUSMANN, N., KEURENTJESI J. B., SEN, S., STOWE,, K. A., DAWSON, T. E., SIMMS, E. L. and RICHARDS, J. H. (2005) Identification and characterization of QTL underlying whole-plant physiology in Arabidopsis thaliana: 13c
, stornatal conductance and transpiration efficiency. Plant, Cell and Environment 28,697-708.
KAETTERER, T., HANSSON, A. C. and ANDREN, 0. (1993) Wheat root biomass and
nitrogen dynamics - Effects of daily irrigation and fertilisation. Plant and Soil
151,21-30.
KATO, K., MIURA, H. and SAWADA, S. (2000) Mapping QTLs controlling grain
yield and its components on chromosome 5A of wheat. Theoretical and Applied
Genetics 101,1114 - 1121.
KEARSEY, M. J. and HYNE, V. (1994) QTL analysis: a simple marker-regression
approach. Theoretical and Applied Genetics 89,698-702.
KEARSEY, M. J. and POONI, H. (1996) The genetic analysis of quantitative traits.
Chapman and Hall, London.
KEBEDE, H., SUBUDHI, P. K., ROSENOW and NGUYEN, H. T. (2001) Quantitative
trait loci influencing drought tolerance in grain sorghum (Sorghum biclor L.
Moench). Theoretical and Applied Genetics 103,266-276.
KEMANIAN, A. R., STOCKLE, C. O. and HUGGINS, D. R. (2005) Transpiration-use
efficiency of barley. Agricultural and Forest Meteorology 130,1 -11.
241
KICHEVA, M-1, TSONEV, T. D. and POPOVA, L. P. (1994) Stomatal and non stomatal limitations to photosynthesis in two wheat cultivars subjected to water stress. Photosynthetica 30,107-116.
KIMBALL B. A., PfNTER P. J., GARCIA R. L., LAMORTE R. L., WALL G. W., HLNSAKER D. J., WECHSLNG G., WECHSUNG F. and KARTSCHALL T. (1995) Productivity and water-use of wheat under free-air C02 enrichment. Global Change Biology 1,429-442.
KING, J., GAY, A., SYLVESTER-BRADLEY, R., BINGHAM, I. J., FOULKES, MJ, GREGORY, P. J. and ROBINSON, D. (2003) Modelling cereal root systems for water and nitrogen capture: Towards an economic optimum. Annals ofBotany 91, 383-390.
KIRDA, C., MOHAMED, A. R. A. G., KUMARASINGHE) K. S., MONTENEGRO, A., and ZAPATA, F. (1992) Carbon isotope discrimination at vegetative stage as an indicator of yield and water use efficiency of spring wheat (Triticum turgidum L. var. durum). Plant and Soil 7,217-223.
KLEPPER, B., BELFORD, R. K. and RICKMAN, R. W. (1984) Root and shoot development in winter wheat. Agronomy Journal 76,117-122.
KOSAMBI, D. D. (1944) The estimation of map distances from recombination values. Annals of Eugenetics 12,172-175.
KURATA, N., MOORE, G., NAGAMURA, Y., FOOTE, T., YANO, M., MINOBE, Y.
and GALE, M. D. (1994) Conservation of genome structure between rice and wheat. Biotechnology 12,276-278.
LAGUDAHA, E. S., DUBCOVSKY, J. and POWELL, W. (2001) Wheat genomics. Plant Physiology and Biochemistry 39,3 3 5-344.
LANDER, E. S. and BOTSTEIN, D. (1989) Mapping Mendelian factors underlying
quantitative traits using RFLP linkage maps. Genetics 121,185-199.
LANGRIDGE, P., LAGUDAH, E., HOLTON, T., APPELS, R., SHARP, P. AND
CHALMERS, K. (2001) Trends in genetic and genomic analyses in wheat: A
review. Australian Journal ofAgricultural Research 52,1043-1077.
LAW, R. D. and CRAFTS -BRANDNER, S. J. (2001) High temperature stress increases
the expression of wheat leaf ribulose-1,5-bisphosphate carboxylase/oxygenase
activase protein. Archives of Biochemistry and Biophysics 386,261-267.
LAWLOR, D. W. (1995) The effects of water deficit on photosynthesis. In: Environment
and Plant metabolism; N. Smirnoff (Ed. ), Bios Science publishers, Oxford. pp.
129-160
LAWLOR, D. W. (2002) Limitation to photosynthesis in water-stressed leaves: stomata
vs. metabolism and the role of ATP. Annals ofBotany (London) 89,871-885.
242
LAZA, Ma-R., KONDO, M., IDETA, 0., BARLAAN, E. and IMBE, T. (2006) Identification of quantitative trait loci for 613 C and productivity in irrigated lowland rice. Crop Science 46,763-773.
LEIDI, E. O.,, LOPEZ, M., GORIJAM, J. and GUTIERREZ, J. C. (1999) Variation in carbon isotope discrimination and other traits related to drought tolerance in upland cotton cultivars under dryland conditions. Field Crops Research 61, 109-123.
Llý F. M-, LIU, X. L. and LI, S. Q. (200 1) Effects of early soil water distribution on the dry matter partition between roots and shoots of winter wheat. Agricultural Water Management 49,163 -17 1.
LI) W. L., NELSON, J. C., CHU, C. Y., SHI, L. H., HUANG, S. H., LIU, D. J. (2002) Chromosomal locations and genetic relationships of tiller and spike characters in wheat. Euphytica 125,357-366.
LILLEY, J. M., LUDLOW, M. M., McCOUCH, S. R. and O'TOOLE, J. C. (1996) Locating QTL for osmotic adjustment and dehydration tolerance in rice. Journal
of Experimental Botany 47,1427-143 6.
LIU5 B. (1998) Statistical genomics: Linkage, mapping and QTL analysis. CRC Press, Boca Raton.
LOPEZ-CASTANEDA, C., RICHARDS, R. A. and FARQUHAR, G. D. (1995) Variation in early vigour between wheat and barley. Crop Science 35,472-479.
LOSS, S. P and SIDDIQUE, K. H. M., (1994) Morphological and physiological traits
associated with wheat yield increases in Mediterranean environments. Advances
in Agronomy 52,229-276.
LU) Z, PERCY,, R. G, QUALSET, C. 0, and ZEIGER, E. (1998) Stomatal conductance
predicts yield in irrigated pima cotton and bread wheat grown at high
temperatures. Journal ofExperimental Botany 49,453-460.1998.
LUKASZEWSKI, A. J. (1990). Frequency IRSAAL and IRS/IBL translocations in
United States wheats. Crop Science 30,1151-1153.
LUPTON, F. G. H., OLIVER, R. H., ELLIS, F. B., BARNES, B. T, HOWSE, K. R.,
WELBANK, P. J. and TAYLOR, P. J. (1974) Root and shoot growth of
semi-dwarf and tall winter wheats. Annals ofApplied Biology 77,129-144.
MACKEY, J (1973) The wheat root. In proceedings, Fourth International Wheat
Genetics Symposium, Columbia, Missouri, August 1973, pp. 893-937. Ed by
E. R. Sears & L. M. S. Sears. University of Missouri, USA.
MAHMOOD, A. and QUARRIE, S. A. (1993) Effects of salinity on growt , ionic
relations and physiological traits of wheat, disomic addition lines from
Thinopyrum bessarabicum and two amphiploids. Plant Breeding 110,265-276.
243
MAJUMDAR, S., GHOSH, S., GLICK, B. R., and DUMBROFF, E. B. (1991) Activities of chlorophyllase, phosphoenolpyruvate carboxylase and ribulose-1, 5-bisphosphate carboxylase in the primary leaves of soybean during senescence and drought. Physiologia Plantarum 81,473-480.
MAKINO, A., NAKANO, H., MAE, T., SHIMADA, T. and YAMAMOTO, N. (2000) Photosynthesis, plant growth and N allocation in transgenic rice plants with decreased Rubisco under C02 enrichrnent. Journal of Experimental Botany 51, 383-389.
MANSKE, G. G. B., ORTIZ-MONASTERIO JI, VAN GINKEL, M., GONZALEZ, R. M., RAJARAM, S., MOLINA, E. and VLEK, P. L. G. (2000) Traits associated with improved P-uptake efficiency in CIMMYT's semidwarf spring bread wheat grown on an acid Andisol in Mexico. Plant and Soil 221,189-204.
MANSKE, G. G. B., ORTIZ-MONASTERIO, J. 1. and VLEK, P. L. G. (2001) Techniques for measuring genetic diversity in roots. In: Application o hysiology in wheat ýfp breeding; Reynolds, M. P., Ortiz-Monasterio, J. 1 and McNab, A. (Eds. ), CIMMYT, Mexico,, D. F. pp. 208-218.
MANSKE, G. G. B. and VLEK, P. L. G. (2002) Root architecture: Wheat as a model plant. In: Plant Roots: The Hidden Half 3 rd edition. Waisel, A. Eshel, A. and Kafkafi, U. (Eds. ) New York: Marcel Dekker Inc. pp. 249-259.
MANYOWA,, N. M. and MILLER, T. E. (1991) The genetics of tolerance to high mineral concentrations in the tribe Triticeae-a review and update. Euphytica 57,175-185.
MARQUARD, R. D. and TIPTON, J. L. (2004) Relationship between extractable
chlorophyll and an in situ method to estimate leaf greenness. Horticulture
Science 22: 1327.
MARSH, T. J. (1996) The 1995 UK drought-A signal of climatic instability?
Proceedings of the Institution of Civil Engineers- Water Maritinie and Energy
118ý 189-195.
MARTIN, B., TAUER C. G, and KIN R. K. (1999) Carbon-isotope discrimination as a
tool to improve water-use efficiency in tomato. Crop Science 39,1775-1783.
MARTINEZ-BARAJAS, E., MOLINA GALAN, J. and de JIMENEZ, E. S. (1997)
Regulation of Rubisco activity during grain-fill in maize: role of Rubisco
activase. Journal ofAgricultural Science Cambridge 128,155-16 1.
MASLE, J., GILMORE, S. R. and FARQUHAR, G. D. (2005) The ERECTA gene
regulates plant transpiration efficiency in Arabidopsis. Nature 436,866-870.
MATUS, A, SLINKARD, A. E, and VAN KESSEL, C. (1996) carbon isotope
discrimination and indirect selection for transpiration efficiency in lentil (Lens
culinaris Medikus), spring bread wheat (Triticum aestivum L. ) durum wheat
(T turgidium L. ) and canola (Brassica napus L. ). Euphytica 87,141-15 1.
244

MATUS, A, SLINKARD, A. E, and VAN KESSEL, C. (1997) Genotype x Environment interaction for carbon isotope discrimination in spring wheat. Crop Science 37, 97-102.
McCAIG, T. N. and MORGAN, J. A. (1993) Root and shoot dry matter partitioning in near-isogenic wheat lines differing in height. Canadian Journal of Plant Sciences 73,679-689.
McCOY, E. L., BOERSMA, L., UNGS, M. L., and AKRATANAKUL, S. (1984) Towards understanding soil water uptake by plant roots. Soil Science 137,69-77.
McGOWAN R L, HARGREAVES JNG, HAMMER G L, HOLZWORTH D P, and FREEBAIRN., D. M. (1996) APSIM: A novel software system for model development, model testing and simulation in agricultural systems research. Agricultural Systems 50,255-271.
MEfNZER, F. C., SALIENDRA, N. Z. and CRISOSTO, C. H. (1992) Carbon isotope discrimination and gas exchange in coffea arabica during adjustment to different
soil moisture regimes. Australian Journal of Plant Physiology 19,171-184.
MERAH, 0., DELEENS, E. and MONNEVEUX, P. (1999) Grain yield, carbon isotope discrimination and carbon, mineral and silicon content in leaf and mature kernels
of durum wheat under contrasted water regimes. Physiologia Plantarum 107, 387-394.
MERAH, O., DELEENS,, E.,, TEULAT, B. and MONNEVEUX,, P. (2002) Association between yield and carbon isotope discrimination value in different organs of durum wheat under drought. Journal of Agronomy and Crop Science 188,
426-434.
MERAH, 0. (200 1) Carbon isotope discrimination and mineral composition of three
organs in durum wheat genotypes grown under Mediterranean conditions. Comptes Rendus de VA cadem ie des Sciences - Series III - Sciences de la Vie, 324,
355-363.
MERAH, 0., MONNEVEUX, P. and DELEENS, E. (2001) Relationships between flag
leaf carbon isotope discrimination and several morpho-physiological traits in
dururn wheat genotypes under Mediterranean conditions. Environmental and
Experimental Botany 45,63 -7 1.
MERAH, 0., DELEENS, E. and MONNEVEUX, P. (2001) Relationships between
carbon isotope discrimination, dry matter production, and harvest index in durum
wheat. Journal ofPlant Physiology 158,723-729.
MIAN, M. A. R., NAFZIGER, E. D., KOLB, F. L. AND TEYKER, R. H. (1993) Root
growth of wheat genotypes in hydroponic culture and in the greenhouse under
different soil moisture regimes. Crop Science 33,129-138.
MICHELMORE, R. (1995) Molecular approaches to manipulation of disease resistance
genes. Annual Review ofPhytopathology 33,393-427.
245

MINISTRY OF AGRICULTURE, FISHERIES AND FOOD (MAFF), (1999) CAP Reform: Potential for effects of environmental impact on farming (SA0111), Reportfor AIMFF (ACD) by ADAS and CSL 22 January 1999.
MINISTRY OF AGRICULTURE, FISHERIES AND FOOD (MAFF) (2002). Identifying and costing agricultural responses under climate change scenarios (ICARUS), Report CC0537 for MAFF by Hossell, J., ADAS Wolverhampton. p .46.
MIRALLES, D. J. and SLAFER, G. A. (1997) Radiation interception and radiation use efficiency of near-isogenic wheat lines with different height. Euphytica 97, 201-208.
MOHAMMADY-D, S. (2005) Chromosome 1D as possible location of a gene (s) controlling variation between wheat (Triticum aestivum L. ) varieties for carbon isotope discrimination (A) under water-stress conditions. Euphytica 146, 143-148.
MOHAN, M., NAIR, S., BHAGWAT, A., KRISHNA, T. G., YANO, M., BHATIA, C. R.
and SASAKI, T. (1997) Genome mapping, molecular markers and marker-assisted selection in crop plants. Molecular Breeding 3,87-103.
MONNEVEUX, P., REKIKA, D., ACEVEDO,, E. and MERAH, O. (2006) Effect of drought on leaf gas exchange, carbon isotope discrimination, transpiration
efficiency and productivity in field grown durum wheat genotypes. Plant Science 1701 867-872.
MONNEVEUX, P., REYNOLDS, M. P., TRETHOWAN, R., GONZALEZ- SANTOY0,
H., PENA, R. J. and ZAPATA, F. (2005) Relationship between grain yield and
carbon isotope ýdiscrimination in bread wheat under four water regimes. European Journal ofAgronomy 22,231-242.
MONTEITH J. L. (1981) Evaporation and surface temperature. Quarterly Journal of Royal Meteorological Society 107,1-27.
MONTEITH, J. L. (1993) The exchange of water and carbon by crops in a Mediterranean
climate. Irrigation Science 14,85-91.
MONTEITH, J. L. (1995) A Reinterpretation of Stomatal Responses to Humidity. Plant
Cell and Environment, 18,3 5 7-3 64.
MOORE, G., DEVOS, K. M., WANG, Z. and GALE, M. D. (1995) Grasses, line up and
form a circle. Current Biology 5: 737-739.
MORGAN, J. A and Le CAIN, D. R. (199 1) Leaf gas exchange and related traits among
15 winter wheat genotypes. Crop Science 31,443-448.
MORGAN, J. A, Le CAIN, D. R, MCCAIG, T. N, AND QUICK, J. S. (1993) Gas
exchange, carbon isotope discrimination, and productivity in winter wheat. Crop
Science 33,178-186.1993.
246
MORGAN, J. M. and TAN, M. K. (1996) Chromosomal location of a wheat osmoregulation gene using RFLP analysis. Australian Journal of Plant Physiology 23,803-806.
MOTT, K. A. and PARKHURST, D. F. (199 1) Stomatal response to humidity in air and helox. Plant Cell and Environment 14,509-515.
MUJEEB-KAZI, A., GILCHRIST, L. I., FUENTES-DAVILA, G., DELGADO, R. (1998) Production and utilization of D genome synthetic hexaploids in wheat improvement. In Triticeae III, pp. 369-374. A. A. Jaradat (Ed). Enfield, NH: Science Publishers.
MURCHIE, E. H., CHEN, Y-Z., HUBBART, S., PENG, S. and HORTON, P. (1999) Interactions between senescence and leaf orientation determine in situ patterns of photosynthesis and photo-inhibition in field-grown rice. Plant Physiology 119, 553-564.
NARANJO, T., ROCA, A., GOICOECHEA, P. G. and GIRALDEZ, R. (1987) Arm homoelogy of wheat and rye chromosomes. Genome 29,873-882.
OTEARY, M. H. (1988) Carbon isotope in photosynthesis. Bioscience 38,328-336.
O'TOOLE,, J. C. and BLAND, W. L. (1987) Genotypic variation in crop plant root systems. Advances in Agronomy 41,91-145.
PALTA, J. A. and GREGORY, P. J. (1997) Drought affects the fluxes of carbon to roots and soil in 13C pulse-labeled plants of wheat. Soil Biology and Biochemistry 29, 1395-1403.
PAN, A., HAYES, P. M., CHEN,, F., CHEN, T. H. H., BLAKE, T.,, WRIGHT, S.,
KARSAI, 1. and BEDO, Z. (1994) Genetic analysis of the components of winter hardiness in barley (Hordeum vulgare L. ) Theoretical and Applied Genetics 89,
900-910.
PANNU, R. K. and SINGH, D. P. (1993) Effect of irrigation on water use, water-use
efficiency, growth and yield of mungbean. Field Crops Research 31,8 7-100.
PARRY M. A. J., ANDROLOJC, PJ, KHAN, S., LEA, P. J. and KEYS, A. J. (2002)
Rubisco activity: Effects of drought stress. Annals of Botany 89,833-839.
PAS SIOURA, J. B. (1977) Grain yield, harvest index and water use of wheat. Journal of
Australian Institute ofAgricultural Science 43,117-120.
PASSIOURA, J. B. (1983) Roots and drought resistance. Agricultural Water
Management, 7,265-280.
PASSIOURA J. B. (1996) Drought and drought tolerance. Plant Growth Regulation 20,
79-83.
PASSIOURA, J. B. (2002) Environmental biology and crop improvement. Functional
Plant Biology 29: 537-546.
247
PATERSON3 A. H. (1996) Mapping genes responsible for differences in phenotype. In: Genome mapping in plants. Paterson, A. H. (Ed. ). R. G. Landes Company, San Diego, California, Academic Press, Austin, Texas. Pp. 41-54.
PATERSON, A. H., LANDER, E. S., HEWITT, J. D., PETERSON, S., LINCOLN, S. E. and TANKSLEY, S. D. (1988) Resolution of quantitative traits into Mendelian factors by using a complete linkage map of restriction fragment length polymorphisms. Nature 335,721-726.
PELLEGRINESCHI A, REYNOLDS M, PACHECO M, BRITO RM, ALMERAYA R,, YAMAGUCHI- SHINOZAKI, K, HOISINGTON D. (2004) Stress-induced expression in wheat of the Arabidopsis thaliana DREBIA gene delays water stress symptoms under greenhouse conditions. Genome 47,493-500.
PENG, J., RICHARDS,, D. E., HARTLEY, N. M., MURPHY, G. P., DEVOS, K. M., FLINTHAM, J. E,, BEALES, J., FISH, L. J., WORLAND, A. J., PELICA, F., SUDHAKAR, D., CHRISTOU, P., SNAPE, J. W., GALE, M. D. and HARBERD, N. P. (1999) 'Green revolution' genes encode mutant gibberellin response modulators. Nature 400,256-261.
PLAUT, Z., BUTOW, B. J, BLUMENTHAL, C. S and WRIGLEY, C. W. 2004. Transport of dry matter into developing wheat kernels and its contribution to
grain yield under post-anthesis water deficit and elevated temperature. Field Crops Research 86,185-198.
PRICE,, A. H., CAIRNS, J. E., HORTON, P., JONES, H. G. and GRIFFITHS, H. (2002)
Linking drought-resistance mechanisms to drought avoidance in upland rice
using a QTL approach: progress and new opportunities to integrate stomatal and
mesophyll responses Journal of Experimental Botany 53,989-1004.
PRICE, A. H., YOUNG, E. M. and TOMOS, A. D. (1997) Quantitative trait loci
associated with stomatal conductance, leaf rolling and heading date mapped in
upland rice (Oryza sativa). New Phytologist 137,83 -9 1.
PRICEAH., STEELE, K. A., GORHAM, J., BRIDGES, J. M., MOORE, B. J.,
EVANS, J. L., RICHARDSON, P. and JONES, R. G. W. (2002) Upland rice grown
in soil-filled chambers and exposed to contrasting water-deficit regimes: 1. Root
distribution, water use and plant water status. Field Crops Research 76,11-24.
PRICE, A. H., STEELE, K. A., MOORE, B. J. and JONES, R. G. W. (2002) Upland rice
grown in soil-filled chambers and exposed to contrasting water-deficit regimes:
11. Mapping quantitative trait loci for root morphology and distribution. Field
Crops Research, 76,25-43.
QUARRIE, S. A, GULLI, M, CALESTANI, C., and STEED, A. (1994) Location of gene
regulating drought-induced abscisic acid production on the long arm of
chromosome 5A of wheat. Theoretical andApplied Genetics 89,794-800.
248
QUARRIE, S. A., STEED, A., CALESTAN13C., SEMIKHODSKII, A. 3
LEBRETON, C., CHINOY, C., STEELE, N., PLJEVLJAKUSI-(ý, D.
3 WATERMAN, E.,
WEYENJ., SCHONDELMAIERJ., HABASH, D. Z., FARMERY., SAKER, L., CLARKSON,, D. T., ABUGALIEVA, A., YESSIMBEKOVA, M., TURUSPEKOV, Y., ABUGALIEVA, S.
3 TUBEROSA, R., SANGUINETI, M. C.,
HOLUNGTON, P. A., ARAGUES, R., ROYO, A. and DODIG, D. (2005) A high-density genetic map of hexaploid wheat (Triticum aestivum L. ) from the cross Chinese Spring X SQ I and its use to compare QTLs for grain yield across a range of environments. Theoretical andApplied Genetics 110,865-880.
RAJARAM, S, Van GINKEL, M, and FISCHER, R. A. (1995) CIMMYT's wheat breeding mega-environments (ME). In: Proceedings of the 8th International Wheat Genetics Symposium. Beijing, China.
RAJARAM, S. , VILLAREAL, R. and MUJEEB-KAZI, A. (1990) The global impact of
I B/ IR spring wheat. Agronomy Abstracts. ASA, Madison, Wisconsin p. 10 5.
RAJARAM, S., MANN, Ch. E., ORTIZ-FERRARA, G. and MUJEEB-KAZI, A. (1983) Adaptation, stability and high yield potential of certain 1 B/ 1R CIMMYT wheats - P. 613-621. In: Proceedings of 6 th International Wheat Genetics Symposium. Sakarnoto, S. (Ed. ) Kyoto, Japan 28 Nov- 3 Dec. 1983.
RAO, R. C. N., UDAYKUMARIM. ý
FARQUHAR, G. D., TALWAR, H. S. and PRASAD, T. G. (1995) Variation in carbon-isotope discrimination and its
relationship to specific leaf-area and Ribulose-1,5-Bisphosphate Carboxylase
content in groundnut genotypes. Australian Journal of Plant Physiology 22, 545-551.
REBETZKE, G. J., CONDON, A. G., RICHARDS, R. A. and READ, J. J. (2001)
Phenotypic variation and sampling for leaf conductance in wheat (Triticum
aestivum L. ) breeding populations. Euphytica 121,335-341.
REBETZKE, G. J., CONDONý A. G., RICHARDS, R. A. and FARQUHAR, G. D' (2002)
Selection for reduced carbon isotope discrimination increases aerial biomass and
grain yield of rainfed bread wheat. Crop Science 42,739-745.
REEVES, M. J. (1975) Soil Survey Record No. 2 7: Soils in Derbyshire II. Adlard & Son
Ltd., Dorking. UK-
REYNOLDS, M. P., DELGADO, M. I. B., GUTIERREZ-RODRIGUEZ, M. and
LARQUE-SAAVEDRA, A. (2000) Photosynthesis of wheat in a warm, irrigated
environment. 1: genetic diversity for photosynthesis and its relation to
productivity. Field Crops Research, 66,37-50.
REYNOLDS, M. P., TRETHOWAN, R., VAN GINKEL, M. and RAJARAM, S. (2001)
Application ofphysiology in Wheat Breeding. CIMMYT, Mexico, D. F.
REYNOLDS, M. P., TRETHOWAN, R., CROSSAJ., VARGAS, M. and SAYRE, K. D.
(2002) Physiological -factors associated with genotype by enviromuent
interaction in wheat. Field Crops Research, 75,139-160.
249
REYNOLDSýM. P. ý
RAJARAM, S. and SAYRE, K. D. (1999) Physiological and genetic changes of irrigated wheat in the post-green revolution period and approaches for meeting projected global demand. Crop Science 39,1611-1621.
REYNOLDS, M. P. )
MUJEEB-KAZI, A. and SAWKINS, M. (2005) Prospects for utilising plant-adaptive mechanisms to improve wheat and other crops in drought- and salinity-prone environments. Annals of Applied Biology, 146, 239-259.
RIBAUT, J. M., HOISINGTON, D., DEUTSH, J. A., JIANG, C. and GONZALES -de-LEON, D. (1996) Identification of quantitative trait loci under drought conditions in tropical maize. 1. Flowering parameters and the anthesis silking interval. Theoretical andApplied Genetics 92,905-914.
RIBAUT, J. M., WILLIAM, H. M. KHAIRALLAH, M. WORLAND, A. J. and HOISINGTON, D. (2001) Genetic basis of physiological traits. In: Application
of Physiology in neat Breeding. - M. P. Reynolds, M. P., Ortiz-Monasterio, J. 1.
and McNab, A. (Eds. ), CIMMYT, Mexico, D. F. pp. 88-100.
RICHARD, C. J. (1994). Genetic variation and physiological mechanisms for water-use efficiency in temperate grasses and legume germplasm. In: Efficiency of water use in crop systems. Heath M. C et al. (Eds. ). Aspects of applied Biology, 38, 71-78.
RICHARDS, R. A., (1987) Physiology and the breeding of winter-grown cereals for dry
areas. In: Drought Tolerance in Winter Cereals. Srivastava, J. P., Porceddu, E.,
Acevedo, E., Varma, S. (Eds. ), Wiley, New York, pp. 133-150.
RICHARDS, R. A. (1991) Crop improvement for temperate Australia: Future
opportunities. Field Crops Research 26,141-169.
RICHARDS, R. A. (1992) The effect of dwarfing genes in spring wheat in dry
environments . 2. Growth, water-use and water-use efficiency. Australian
Journal ofAgricultural Research 43,529-539.
RICHARDS, R. A. (1996) Defining selection criteria to improve yield under drought.
Plant Growth Regulation 20,157-166.
RICHARDS, R. A. (2000) Selectable traits to increase crop photosynthesis and yield of
grain crops. Journal of Experimental Botany 51,447-45 8.
RICHARDS, R. A., CONDON, A. G. and REBETZKE, G. J. (2001) Traits to improve
yield in dry environments. In: Application ofPhysiology in Wheat Breeding. - M. P.
Reynolds, M. P., Ortiz-Monasterio, J. 1. and McNab, A. (Eds. ), CIMMYT,
Mexico, D. F. pp. 88-100.
RICHARDS, R. A. (2004) Physiological traits used in the breeding of new cultivars for
water-scarce environments. In: New directionsfor a diverse planet- Proceedings
250
of the 4th International Crop Science Congress, 26 Sep -I Oct 2004, Brisbane. Australia.
RICHARDS, R. A., REBETZKIE, G. J., CONDON, A. G. and VAN HERWAARDEN, A. F. (2002) Breeding opportunities for increasing the efficiency of water use and crop yield in temperate cereals. Crop Science 42,111-12 1.
RITCHIE, J. T. (1974) Atmospheric and soil water influences on the plant water balance. Agricultural Meteorology 14,1.83-198.
RITCHIE, S. W; NGUYEN, H. T. and HOLADAY, A. S. (1990) Leaf Water Content and Gas-Exchange Parameters of Two Wheat Genotypes Differing in Drought Resistance. Crop Science 30,105-111.
ROBINSON, D. (1994) The responses of plants to non-uniform supplies of nutrients. New Phytologist 127,635-674.
ROBERTSON, MJ., FUKAI, S., LUDLOW, M. M. and HAMMER, G. L. (1993) Water extraction by grain sorghum in a sub-humid environment. 2: Extraction in
relation to root growth. Field Crops Research 33,99-112.
RODER, M. S., KORZUN, V., WENDEHAKE, K., PLASCKE, J., TIMER, M. H., LEROY, P. and GANAL, M. W. (1998) A microsatellite map of wheat. Genetics 149,2007-2023.
ROMAGOSA, 1. and ARAUS, J. L. (1991) Genotype-environment interaction for grain yield 13 C discrimination in barley. Barley Genetics VI, 563-567.
ROSEGRANT, M. W, AGCAOILI-SOMBILLA, M, and PEREZ, N. D. (1995) Global food projections to 2020: Implications for investment. Washington, D. C., IFPRI.
ROYO, C., VILLEGAS, D., DEL MORAL, L. F. G., ELHANI, S., APARICIO, N.,
RHARRABTI, Y. and ARAUS, J. L. (2002) Comparative performance of carbon isotope discrimination and canopy temperature depression as predictors of
genotype differences in durum wheat yield in Spain. Australian Journal of Agricultural Research 53,561-569.
RUSSELL, R. S. (1977) Plant root systems: Their function dhid interaction with the soil.
McGrow-Hill Book Company, UK.
SADHU, D. and BHADURI, P. N. (1984) Variable traits of roots and shoots of wheat. Z.
Acker-und Pflanzenbau 153-216.
SADRAS, V. O. and MILROY, S. P. (1996) Soil-water thresholds for the responses of
leaf expansion and gas exchange: A review. Field Crops Research 47,253-266.
SARKER, M. A. Z., MURAYAMA, S-, ISHIMINE, Y. and TSUZUKI, E. (2001)
Physio-morphological characters of F, hybrids of rice (Oryza sativa L. ) in
Japonica-indica crosses - Plant Production Science 4,196-20 1.
251

SAYRE,, K. D., ACEVEDO, E. and AUSTIN, R. B. (1995) Carbon isotope discrimination and grain yield for three bread wheat germplasm groups grown at different levels of water stress. Field Crops Research, 41,45-54.
SAYRE, K. D. , RAJARAM, S, and FISCHER, R. A. (1997) Yield potential progress in
short bread wheats in northwest Mexico. Crop Science 37,36-42.
SCHONFELD, M. A, JOHNSON, R. C, CARVER, B. F. and MORNHINWEG, D. W. (1988) Water relations in winter wheat as drought resistance indicators. Crop Science 28,526-53 1.
SHARMA, R. C. and SMITH, E. L. (1986) Selection for high and low harvest index in 3 winter-wheat populations. Crop Science 26,1147-1150.
SHEARMAN, V. J. (2001) Changes in the yield-limiting processes associated with genetic improvement in wheat. PhD thesis, University of Nottingham, UK, 238
pp.
SHEARMAN, V. J., SYLVESTER-BRADLEY, R, SCOTT, R. K. and FOULKES, M. J. (2005) Physiological Processes Associated with Wheat Yield Progress in the UK. Crop Science 45,175-185.
SIDDIQUE, K. H. M. ý
BELFORD, R. K., PERRY, M. W. and TENNANT, D. (1989) Growth, development and light interception of old and modem wheat cultivars in
a Mediterranean environment. Australian Journal of Agricultural Research 40, 473-487.
SIDDIQUE, K. H. M. ý BELFORD, R. K. and TENNANT, D. (1990) Root: shoot ratios of
old and modern, tall and semi-dwarf wheats in a Mediterranean environment. Plant and Soil 121
ý 89-98.
SIMONS, R. G. (1982) Tiller and ear production of winter wheat. Field Crop Abstracts
35ý 857-870.
SINGH, R. P., HUERTA-ESPINO, S., RAJARAM, S. and CROSSA, J. (1998)
Agronomic effects of from chromosomal translocations 7DL. 7Ag and I BL. IRS
in spring wheat. Crop Science 38,27-33.
SIVASANKAR, A., LAKKINENI, K. C., JAIN, V., KUMAR, P. A. and ABROL, Y. P.
(1998) Differential response of two wheat genotypes to nitrogen supply. 1.
Ontogenic changes in laminae growth and photosynthesis. Journal ofAgronomy
and Crop Science 181,21-27.
SKOVAMAND, B., REYNOLDS, M. P. and DELACY, I. H. (2001) Searching Genetic
Resources for physiological traits with potential for increasing yield. In:
Application of Physiology in Wheat Breeding. - M. P. Reynolds, M. P.,
Ortiz-Monasterio, JI and McNab, A. (Eds. ), CIMMYT, Mexico, D. F. pp. 17-28.
252

SLAFER, G. A. (1996) Differences in phasic development rate amongst wheat cultivars independent of responses to photoperiod and vernalization. A viewpoint of the intrinsic earliness hypothesis Journal ofAgricultural Science 126,403-419.
SLAFER, G. A., ARAUS, U., ROYO, C. and MORAL, L. F. G. (2005) Promising eco-physio logical traits for genetic improvement of cereal yields in Mediterranean envirom-nents. Annals ofApplied Biology 146,61-70.
SMUCKER,, AJ. M. (1984) Carbon utilization and losses by plant root systems. In: Roots, Nutrient and water influx, and Plant Growth. Pp 27-46. A. S. A. Publication No. 49. SSSA-CSSA-ASA Madison, WI.
SNAPE, J. W., LAW, C. N., PARKER, B. B. and WORLAND, A. J. (1985) Genetical analysis of chromosome 5A of wheat and its influence on important agronomic characters Theoretical and Applied Genetics 71,518 - 526.
SNAPE, J. W.,, SARMA, R., QUARRIE, S. A., FISH, L., GALIBA, G. and SUTKA, J. (2001) Mapping genes for flowering time and frost tolerance in cereals using precise genetic stocks. Euphytica 120,309-315.
SOMERS, D. J., ISAAC, P. and EDWARDS, K. (2004) A high density microsatellite consensus map for bread wheat (Triticum aestivum L. ). Theoretical and Applied Genetics 109,, 1105-1114.
SOMERSALO,, S., MAKELA, P., RAJALA, A., NEVO, E. and PELTONEN-SAINIO, P. (1998) Morpho-physi o logical traits characterizing environmental adaptation of Avena barbata. Euphytica 99,213-220.
SORRELLS, M. E., ROTA, M. L., KANDIANIS, C. E., GREENE, R. A., KANTETY, R., MUNKVOLD, J. D., MIFTAHUDIN., MAHMOUD, A., MA, X.,
GUSTAFSON, P. J., et al. (2003) Comparative DNA Sequence Analysis of Wheat and Rice Genomes Genome Research 13,1818-1827.
SPECHT, J. E., CHASE, K., MACRANDER, M., GRAEF, G. L., CHUNG, J.,
MARKWELL, J. P., GERMANN, M., ORF, J. H. and LARK, K. G. (2001)
Soybean response to water a QTL analysis of drought tolerance. Crop Science 41,
493-509.
SQUIRE, G. R. (1990) The Physiology of Tropical Crop Production, Wallingford, UK.;
C. A. B. International.
STAM, P. (1993) Construction of integrated genetic linkage maps by means of a new
computer package: Joinmap. Plant Journal, 3,739-749.
SUTKA, J. and SNAPE, J. W. (1989) Location of a gene for frost resistance on
chromosome 5A of wheat. Euphytica 42,41-44.
SYLVESTER-BRADLEY, R., SCOTT, R. K. and WRIGHT, C. E. (1990) Physiology in
the production and improvement of cereals. Home-Grown Cereals Authority,
Research Review No. 18,156 pp.
253
TANQ, A. C.!, KAWAMITSU, Y., KANECHI, M. and BOYER, J. S. (2002) Photosynthetic oxygen evolution at low water potential in leaf discs lacking an epidermis. Annals of Botany 89,861-870.
TANKSLEY, S. D. (1993) Mapping polygenes . Annual Review of Genetics 27,205-23 3.
TANNER, C. B and SINCLAIR, T. R. (1983) Efficient water use in crop production: research or re-search ? In: Limitations to Efficient Water Use. - Taylor, H. M et al. (Eds. ) American Society of Agronomy, Madison, Wisconsin, USA, pp. 1-28.
TARDIEU, F. (2005) Plant tolerance to water deficit: physical limIts and possibilities for progress. Comptes Rendus Geosciences 337,57-67.
TAYLOR, H. M., JORDON, W. R. and SINCLAIR, T. R. (1983) Limitations to efficient water use in crop production. American Society of Agronomy, Madison, Wl.
TENHUNEN, J. D., PEARCY, R. W. and LANGE, O. L. (1987) Diurnal variation in leaf conductance and gas exchange in natural environments. In: Stomatal function, Zeiger, E., Farquhar, G. D and Cowan, I. R. (Eds. ) Stanford University Press, Stanford. Pp. 323-351.
TEULAT, B., MONNEVEUX, P, WERY, J., BORRIES, C., SOUYRIS, L, CHARRIER, A., and THIS, D. (1998) Relationship between relative water content and growth parameters under water stress in barley: A QTL study. New Phytologist 137, 99-107.
TEULAT, B., MERAH, 0. and THIS, D. (2001) Carbon isotope discrimination and productivity in field-grown barley genotypes. Journal of Agronomy and Crop Science 187,33-39.
TEULAT, B.,, MERAH, 0., SIRAULT, X., BORRIES, C., WAUGH, R. and THIS, D.
(2002) QTLs for grain carbon isotope discrimination in field-grown barley.
Theoretical and Applied Genetics, 106,118-126.
TEULATI, B., THIS, D., KHAIRALLAH, M., BORRIES, C., RAGOT C., SOURDILLE,
P., LEROY P., MONNEVEUX P., and CHARRIER, A. (1998) Several QTLs
involved in osmotic adjustment trait variation in barley (Hordeum vulgare L. ).
Theoretical and Applied Genetics 96,688-698.
TEZARA,, W. and LAWLOR, D. W. (1995) Effects of water stress on the biochemistry
and physiology of photosynthesis in sunflower. In: Photo synthesis-from light to
biosphere. Mathias, P (Ed. ) Vol. IV. Kluwer Academic Publishers, The Hague,
pp. 625-628.
THIS, D., KNEZEVIC, D., JAVORNIK, B., TEULATI B., MONNEVEUX, P. and
JANJIC, V. (1999) Genetic Markers and Their Use in Cereal Breeding.
Monography for the International Symposium 'Breeding of Small Grains'.
Kragujevac, 24-27 Dec. 1998.
254
THORNE, G. N. and WOOD, D. W. (1987) Effects of radiation and temperature on tiller survival, grain number and grain yield in winter wheat. Annals of Botany 59, 413-426.
TOTTNIAN, D. R. and BROAD, H. (1987) The decimal code for growth stages of cereals. Annals qfAppliedffiology 110,441-454.
TUINSTRA, M. R., GROTE, E. M., GOLDSBROUGH, R. B. and EJETA, G. (1997) Genetic analysis of drought. tolerance and components of grain development in Sorghum bicolor (L. ). Molecular Breeding, 3,439-448.
TUINSTRA, M. R., E. M. GROTE, P. B. GOLD SBROUGH, and G. EJETA. (1997) Genetic analysis of post-flowering drought tolerance and components of grain development in Sorghum bicolor (L. ) Moench. Molecular Breeding 3,439-448.
TURNER, N. C. (1979) Drought resistance and adaptation to water deficits in crop plants. In: Stress physiology of crop plants, H. Mussell and R. C. Staples (Eds. ), Wiley Interscience, New York, pp. 343-372.
TURNER, N. C. (1986) Crop water deficits: A decade of progress. Advances in Agronomy 39,1-5 1.
TURNER, N. C. (1997) Further progress in crop water relations. Advances in Agronomy 58ý 293-338.
UDAYAKUMAR, M., SHESHSHAYEE, M. S., NATARAY, K. N., BINDU MADHAVA, H., DEVENDRA, R.,, AFTAB HUSSAIN, I. S., and PRASAD., T. G. (1998) Why has breeding for water-use efficiency not been successful? An
analysis and alternate approach to exploit this trait for crop improvement.
Current Science 74,994-1000.
D F% Van den BOOGAARD, R, de BOER, R. M., VENEKLAAS, E. J. and LAMBERS, H.
(1996) Relative growth rate, biomass allocation pattern and water-use efficiency
of three wheat cultivars during early ontogeny as dependent on water availability. Physiologia Plantarum 98,493-504.
Van den BOOGAARD, R, ALEWUNSE, D, and VENEKLAAS, E. J. (1997) Growth
and water-use efficiency of 10 Triticum aestivum cultivars at different water
availability in relation to allocation of biomass. Plant Cell and Environ'Ment 20,
200-210.
Van NOORDWIJK M. (1983) Functional interpretation of root densities in the field for
nutrient and water uptake. In: Wurzelokologie und ihre Nutzanwendung. Bohm,
W., Kutshera, L and Lichtenegger, E. (Eds. ) Bundesanstalt ffir alpenlandische
Landwirtschaft, Irdning, Austria. pp. 207-226.
Van NOORDWIJK, M. and De WILLIGEN, P. (1987) Agricultural concepts of roots
from morphogenetic to functional equilibrium between root and shoot growth.
Netherlands Journal of, 4gricultural Science 35,487-496.
255
Van OOjjEN, j. W. (1999) LOD significance thresholds for QTL analysis in experimental populations of diploid species. Heredity 83,613-624.
Van OOIJEN, J. W. (2004) MapQTLO 5, software for the mapping of quantitative trait loci in experimental populations, Kyazma B. V., Wageningen, Netherlands.
VERMA V, FOULKES M. J, WORLAND AJý SYLVESTER-BRADLEY R, CALIGARI P. D. S, and SNAPE J. W. (2004) Mapping quantitative trait loci for flag leaf senescence as a yield determinant in winter wheat under optimal and drought- stressed environments. Euphytica 135,255-263.
VILLAREAL, R. L., DAVILA, G. F. AND MUJEEB KAZI, A. (1995) Synthetic hexaploids x Triticum aestivum advanced derivatives resistant to Karnal Bunt (Tilletia indica Mitra ) Cereal Research Communication 27,127-132.
VILLAREAL, R. L., BANUELOS, 0., MUJEEB-KAZI, A. and RAJARAM, S. (1998) Agronomic performance of chromosomes IB and I BL. IRS near isolines in the spring bread wheat Seri M82. Euphytica 103: 195-202.
VILLEGAS D., APARICIO, N., NACHIT, M. M., ARAUS, J. L. and. ROYO, C. (2000) Photosynthetic and developmental traits associate
'd with genotypic differences in
durum wheat yield across the Mediterranean basin Australian Journal of Agricultural Research, 51,891-90 1.
VINCENT, C. D. and GREGORY, P. J. (1989) Effects of temperature on the development and growth of winter wheat roots. Plant and Soil 119,87-97.
VLEK, P. L. G., LUTTGER, A. B. AND MANSKE, G. G. B. (1996) The potential contribution of arbuscular mycorrhiza to the development of nutrient and water efficient wheat. In: The ninth regional wheat workshopfor eastern, central and southern Africa. Tanner, D. G., Payne, T. S. and Abdalla, 0. S. (Eds. ) Addis Abba, Ethiopia: CIMMYT. Pp. 28-46.
VOLTAS,, I,, ROMAGOSA, I., LAFARGA, A., ARMESTO, A. P., SOMBRERO, A.
and ARAUS, J. L. (1999) Genotype by environment interaction for grain yield
and carbon isotope discrimination of barley in Mediterranean Spain. Australian
Journal ofAgricultural Research 50,1263 -127 1.
VM J. and GROENWOLD, J. (1989) Characterstics of photosynthesis and
conductance of potato canopies and the effects of cultivar and transient drought.
Field Crops Research 20,237-250.
WAHBI, A., and GREGORY, P. J. (1989) Genotypic differences in root and shoot
growth of barley hordeum-vulgare 1. Glasshouse studies of young plants and
effects of rooting medium. Experimental Agriculture 25,375-388.
WAHBI, A., and GREGORY, P. J. (1995) Growth and development of young roots of
barley (Hordeum vulgare L-) genotypes. Annals of Botany 75,533-539.
256
WANG, E. and SMITH, C. J. (2004) Modelling the growth and water uptake function of plant root systems: a review. Australian Journal of Agricultural Research 55., 501-523.
WARDLAW, I. F. 5
SOFIELD, 1. and CARTWRIGHT, P. M. (1980) Factors limiting the rate of dry matter accumulation in the grain of wheat grown at high temperature. Australian Journal of Plant Physiology 7,87-400.
WASSENAAR, T,, LAGACHERIEý P., LEGROS, J-P, and ROUNSEVELL, M. D. A. (I 999) Modelling wheat yield responses to soil and climate variability at the regional scale. Climate Research 11,220.
WEIR, A. H. (198 8) Estimating losses in the yield of winter wheat as a result of drought, in England and Wales. Soil Use and Management 4,3 3- 40.
WEINER, J. (1990) Plant population ecology in agriculture. In: Agroecology. Ronald, C. (Eds. ) McGrow-Hill, New York, pp. 235-261.
WELBANK, P. J., GIBB, M. J., TAYLOR, P. J. and WILLIAMS, E. D. (1974) Root growth of cereal crops. Rothamsted Experimental Station Report for 1973, Part 2ý 26-66.
WHITFIELD, D. M. (1990) Canopy conductance, carbon assimilation and water use in
wheat. Agricultural and Forest Meteorology 53,1-18.
WIEGAND, C. L. and CUELLAR, J. A. (1981) Duration of grain filling and kernel
weight of wheat as affected by temperature. Crop Science 21,95-101.
WILHELM, W. W. . MIELKE, L. N., and FENSTER, C. R. (1982) Root development of
winter wheat as related to tillage practice in Western Nebraska. Agronomy Journal 74,85-88.
WILLIAMS, D. G., GEMPKO, V., FRAVOLINI, A., LEAVITT, S. W., WALL, G. W.,
KIMBALL, B. A., PINTER, P. J., LAMORTE, R. and OTTMAN, M. (2001)
Carbon isotope discrimination by Sorghum bicolor under C02 enrichment and drought. New Phytologist, 150,285-293.
WORLAND, A. J. (1996) The influence of flowering time genes on environmental
adaptability in European wheats Euphytica 89,49-57.
WORLAND, A. J., APPENDINO, M. L. AND SAYERS, E. J. (1994) The Distribution in
European winter wheats, of genes that influence ecoclimatic adaptability whilst
detrmining photoperiodic insensitivity and plant height. Euphytica 80,219-228.
WORLAND, A. J., KORZLTN, V., RODER, M. S., GANAL, M. W. and LAW, C. N.
(1998) Genetic analysis of the dwarfing gene Rht8 in wheat. Part 11. The
distribution and adaptive significance of allelic variants at the Rht8 locus of
wheat as revealed by microsatellite screening. Theoretical and Applied Genetics
96,1110-1120.
257

WRIGHT, G. C., HUBICK, K. T. and FARQUHAR, G. D. (1988) Discrimination in
carbon isotopes of leaves correlates with water-use efficiency of field-grown
peanut cultivars. Australian Journal ofPlant Physiology 15,815-825.
XIAO, K., ZHANGý R., ZOU, D. H. and QlAN, W. P. (1998) Studies on RuBisCO traits during flag leaf ageing in wheat. Acta Botanica Sinica 40,343-348.
XU, Y., ZHU, J. L., XIAO, J., HUANG, N. and McCOUCH, S. R. (1997) Chromosomal
regions associated with segregation distortion of molecular markers in F2, backcross, doubled haploid, and recombinant inbred populations in rice (Oryza
sativa L. ) Molecular and General Genetics 253,535-545.
XU, W. W., SUBUDHI, P. K., CRASTA, O. R., ROSENOW, D. T., MULLET, J. E. and NGUYEN, H. T. (2000) Molecular mapping of QTLs conferring stay-green in
grain sorghum (sorghum bicolor L. Moench) Genome 43,461-469.
XUE, Q., SOUNDARARAJAN, M., WEISS, A., ARKEBAUER, T. J. and STEPHEN BAENZIGER. P. (2002) Genotypic variation of gas exchange parameters and carbon isotope discrimination in winter wheat. Journal ofPlant Physiology 159, 891-898.
YOUNG, N. D. (1994) Constructing a plant genetic linkage map with DNA markers, P. 39-57. In: DNA-based markers in plants. Kluwer, Dordrech/Boston/London.
ZADOKS, J. C., CHANG, T. T. and KONSAK, C. F. (1974) A decimal code for the
growth stages of cereals. Weed Research 14,415-42 1.
ZHANG ,
J., ZHENG, H. G., AARTI, A., PANTUWAN ,
G., NGUYEN, T. T.,
TRIPATHY ,
J. N., SARIAL, A. K., ROBIN, S., BABU, R. C. I.
NGUYEN,
BAY D., SARKARUNG, S., BLUM, A. and NGUYEN, H. T. (200 1) Locating
genornic regions associated with components of drought resistance in rice:
comparative mapping within and across species Theoretical and Applied
Genetics 103,19-29.
MANG, Z. B. and XU, PING. (2002) [Reviewed on wheat genome] Chinese. Hereditas
(Beying). 24,389-394.
258

APPENDIXI
. Experiment 2002/03 Gleadthorpe Field Name YA0603 ýieýd
ajl: t: ituýdýe- Soil texture &series Cuckney Series, loam medium sand to 35 cm over medium sand Drainage Good Previous crop Potato Cultivations Chisel Ploughed 11/09/02
Spring tined 28/09/02 Ploughed and furrow pressed 02/10/02 Tined and rolled 18/10/02
Sowing 19/10/02 Seed rate 250-seeds m-2 Drill type & width Oyjard, 2m Row width 13.20 cm Plot length 12 rn Plot width 1.6 1m Drilled / 2.00m centre to centre Fertiliser 216 kg ha-1 Triple Super Phosphate (GS22) 06/02/03
164 kg ha- I Muriate of Potash (GS 22/23) 13/02/03 135 kg ha-1 Ammonium Sulphate as Sulphur Gold (20/02/03) 5 kg Manganese Sulphate (GS22/23) 27/02/03 145 kg ha-1 Ammonium Nitrate (19/03/03) 237 kg ha-1 Ammonium Nitrate (14/04/03) 150 kg ha-1 Ammonium Nitrate (12/05/03)
Herbicide 1.25 1 ha-1 Fenpath lpex (difluefenican+isoproturan) 19/02/02 20 g ha-1 Ally (metsulfuron-methyl)23/04/03 1.75 1 ha-1 lsoproturon 19/12/02 0.80 1 ha-1 Starane 2 (fluroxypyr)23/04/03
Fungicide 0.4 1 ha-1 Corbel 24/04/03 0.15 1 ha-1 Fortress 24/04/03 0.75 1 ha-1 Opus + 0.6 kg ha-1 Unix 02/05/03
1.50 1 ha-1 Ecl iPse 10/05/03
1.00 1 ha-' Silvacur 03/06/03 -
Insecticide 0.251 ypermethrin 19/12/02
1.50 1 ha-1 Dursban 24/01/03
Harvest date 14/08/2003
259
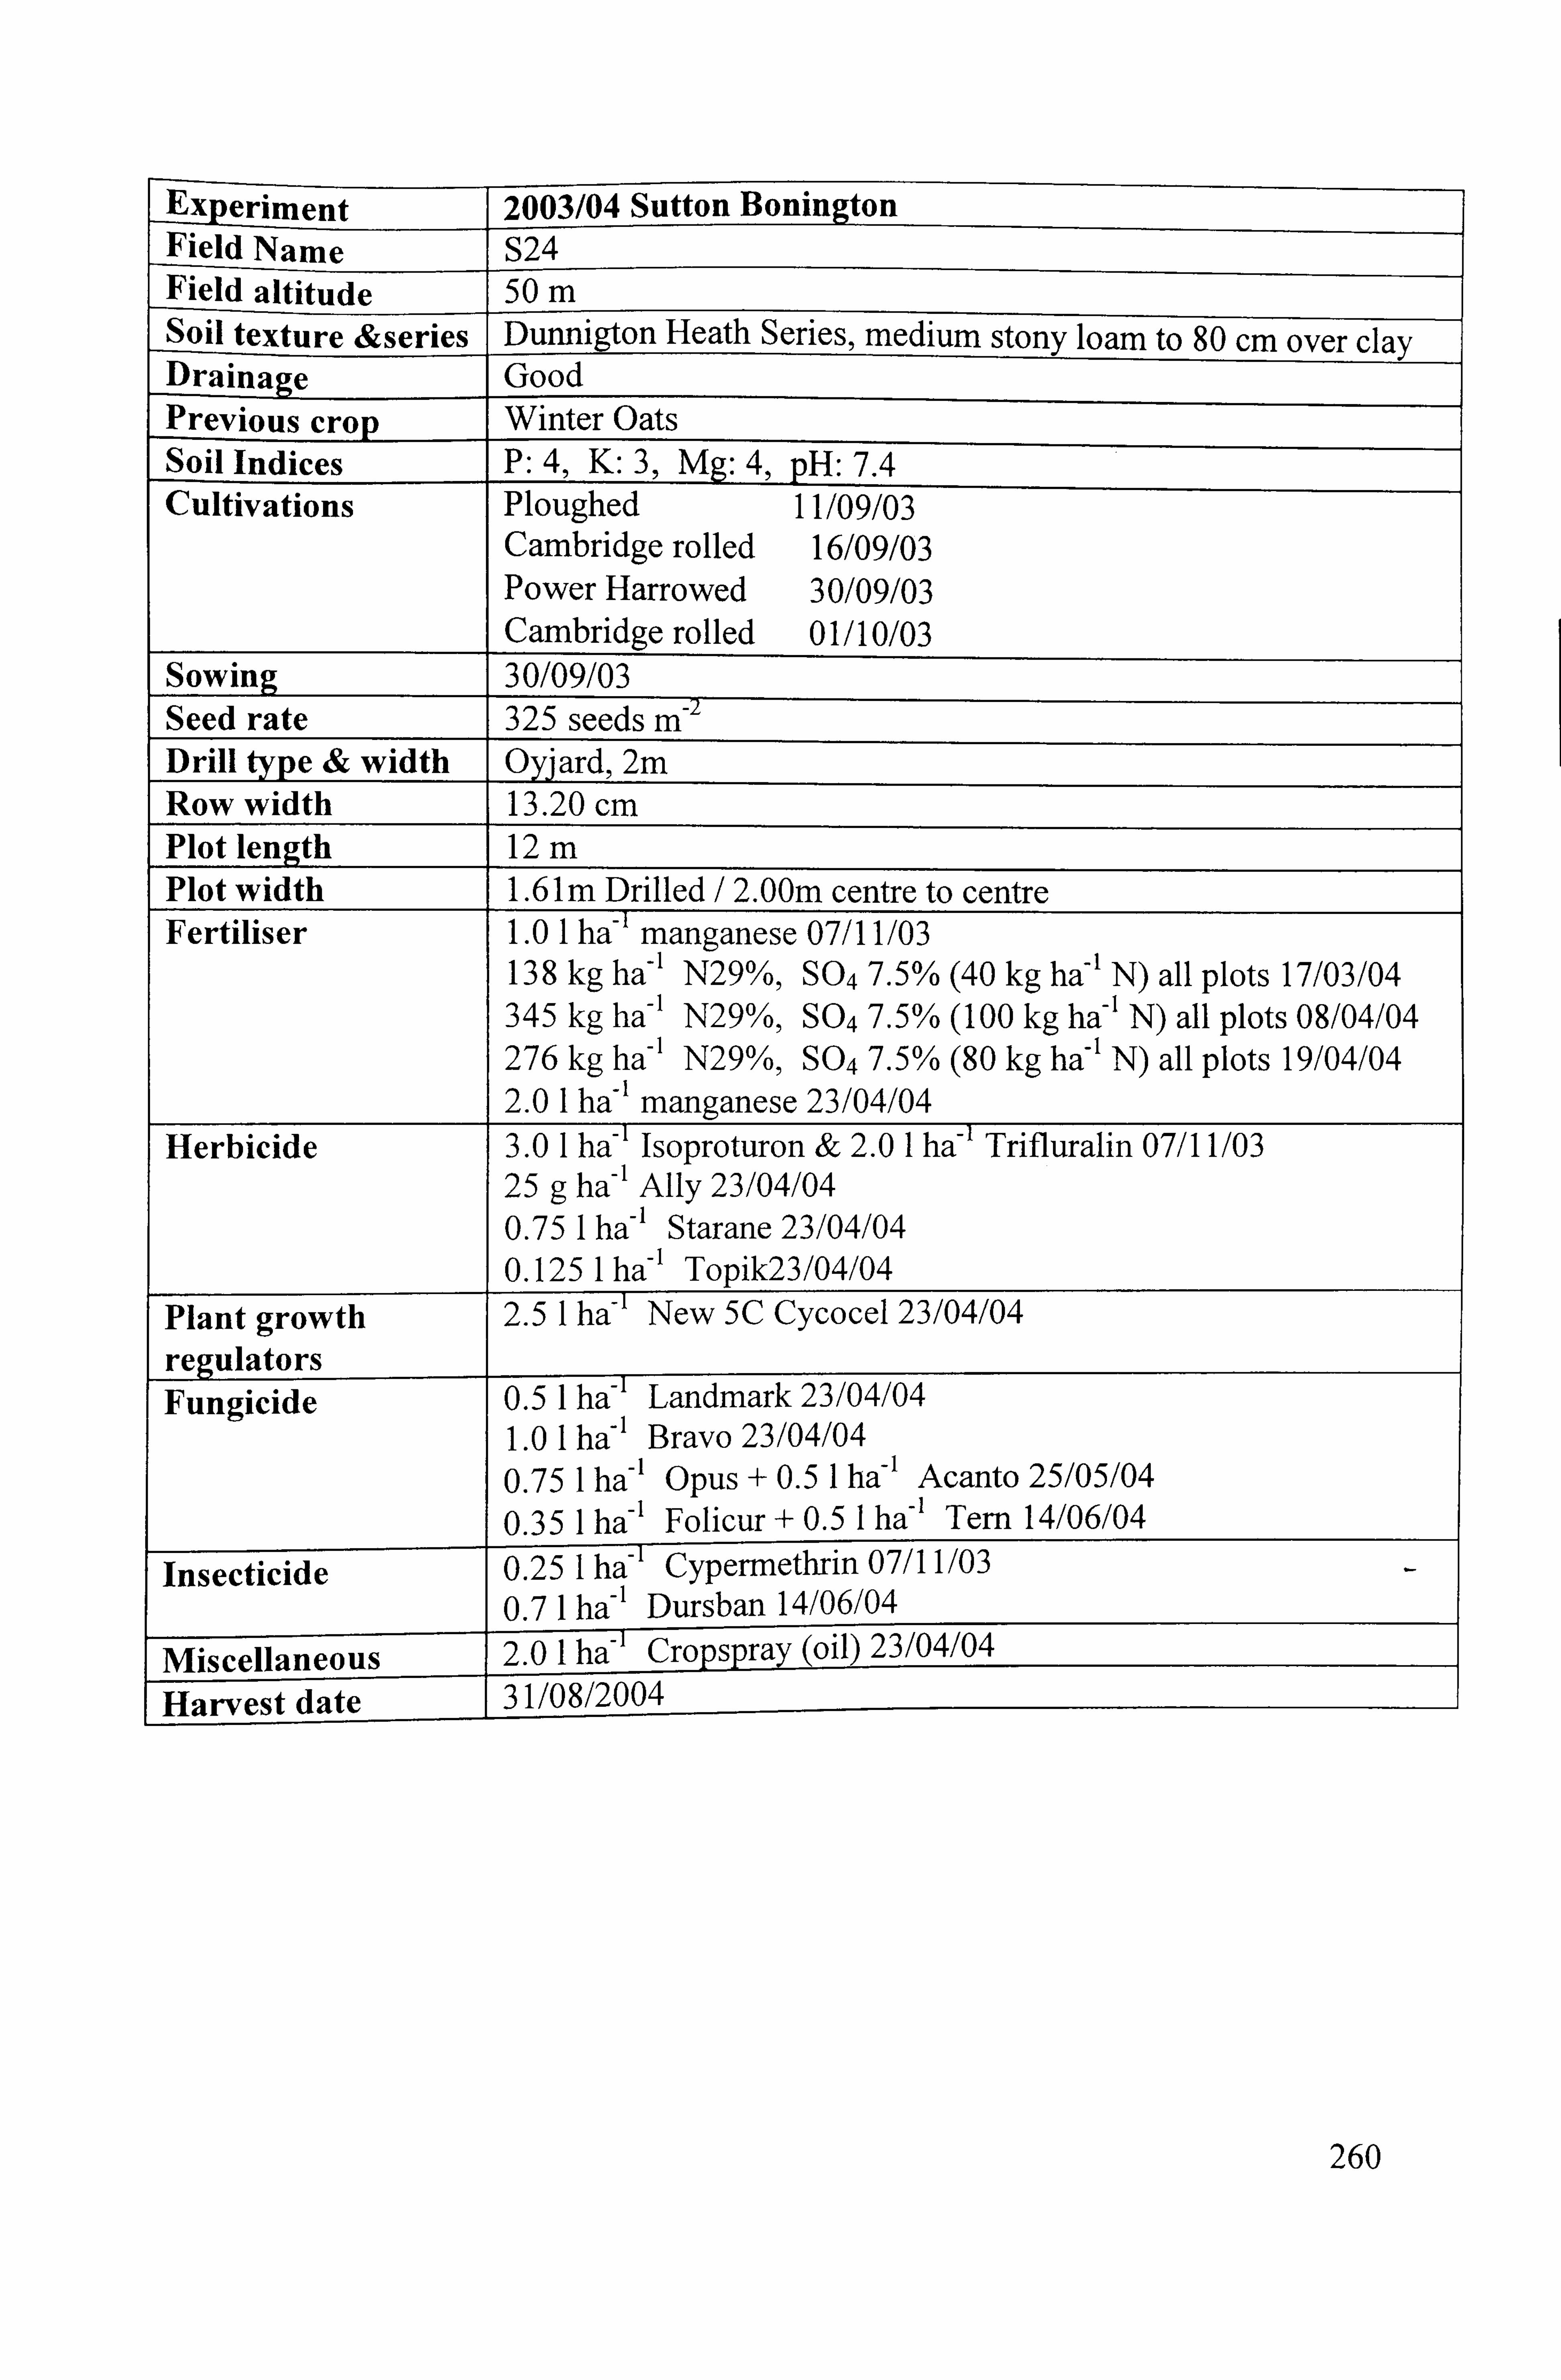
Ex eriment 2003/04 Sutton Bonington Field Name S24 Field altitude 50 m Soil texture &series Dunnigton Heath Series, medium stony loam to 80 cm over clay Drainage Good Previous crop Winter Oats Soil Indices P: 4, K: 3, Mg: 4, pH: 7.4 Cultivations Ploughed 11/09/03
Cambridge rolled 16/09/03 Power Harrowed 30/09/03 Cambridge rolled 01/10/03
Sowing 30/09/03 Seed rate 325 seeds m-' Drill type & width ard, 2m Row width 13.20 cm Plot length 12 m Plot width 1.61m Drilled / 2.00m centre to centre Fertiliser 1.0 1 ha-' manganese 07/11/03
138 kg ha-1 N29%, S047.5% (40 kg ha- N) all plots 17/03/04 345 kg ha-1 N29%, S047.5% (100 kg ha-1 N) all plots 08/04/04 276 kg ha-1 N29%, S047.5% (80 kg ha-1 N) all plots 19/04/04 2.0 1 ha-1 manganese 23/04/04
Herbicide 3.0 1 ha-1 lsoproturon & 2.0 1 ha-1 Trifluralin 07/11/03 25 g ha-1 Ally 23/04/04 0.75 1 ha-1 Starane 23/04/04 0.125 1 ha-1 Topik23/04/04
Plant growth 2.5 1 ha-1 New 5C Cycocel 23/04/04
regulators Fungicide 0.5 1 ha-1 Landmark 23/04/04
1.0 1 ha-1 Bravo 23/04/04
0.75 1 ha-1 Opus + 0.5 1 ha-1 Acanto 25/05/04
0.35 1 ha-1 Folicur + 0.5 1 ha-1 Tern 14/06/04
Insecticide 0.25 1 ha-1 Cypermethrin 07/11/03
0.7 1 ha-1 Dursban 14/06/04
Miscellaneous 2.0 1 ha-T-Cr 04
Harvest date 31/08/2004
260
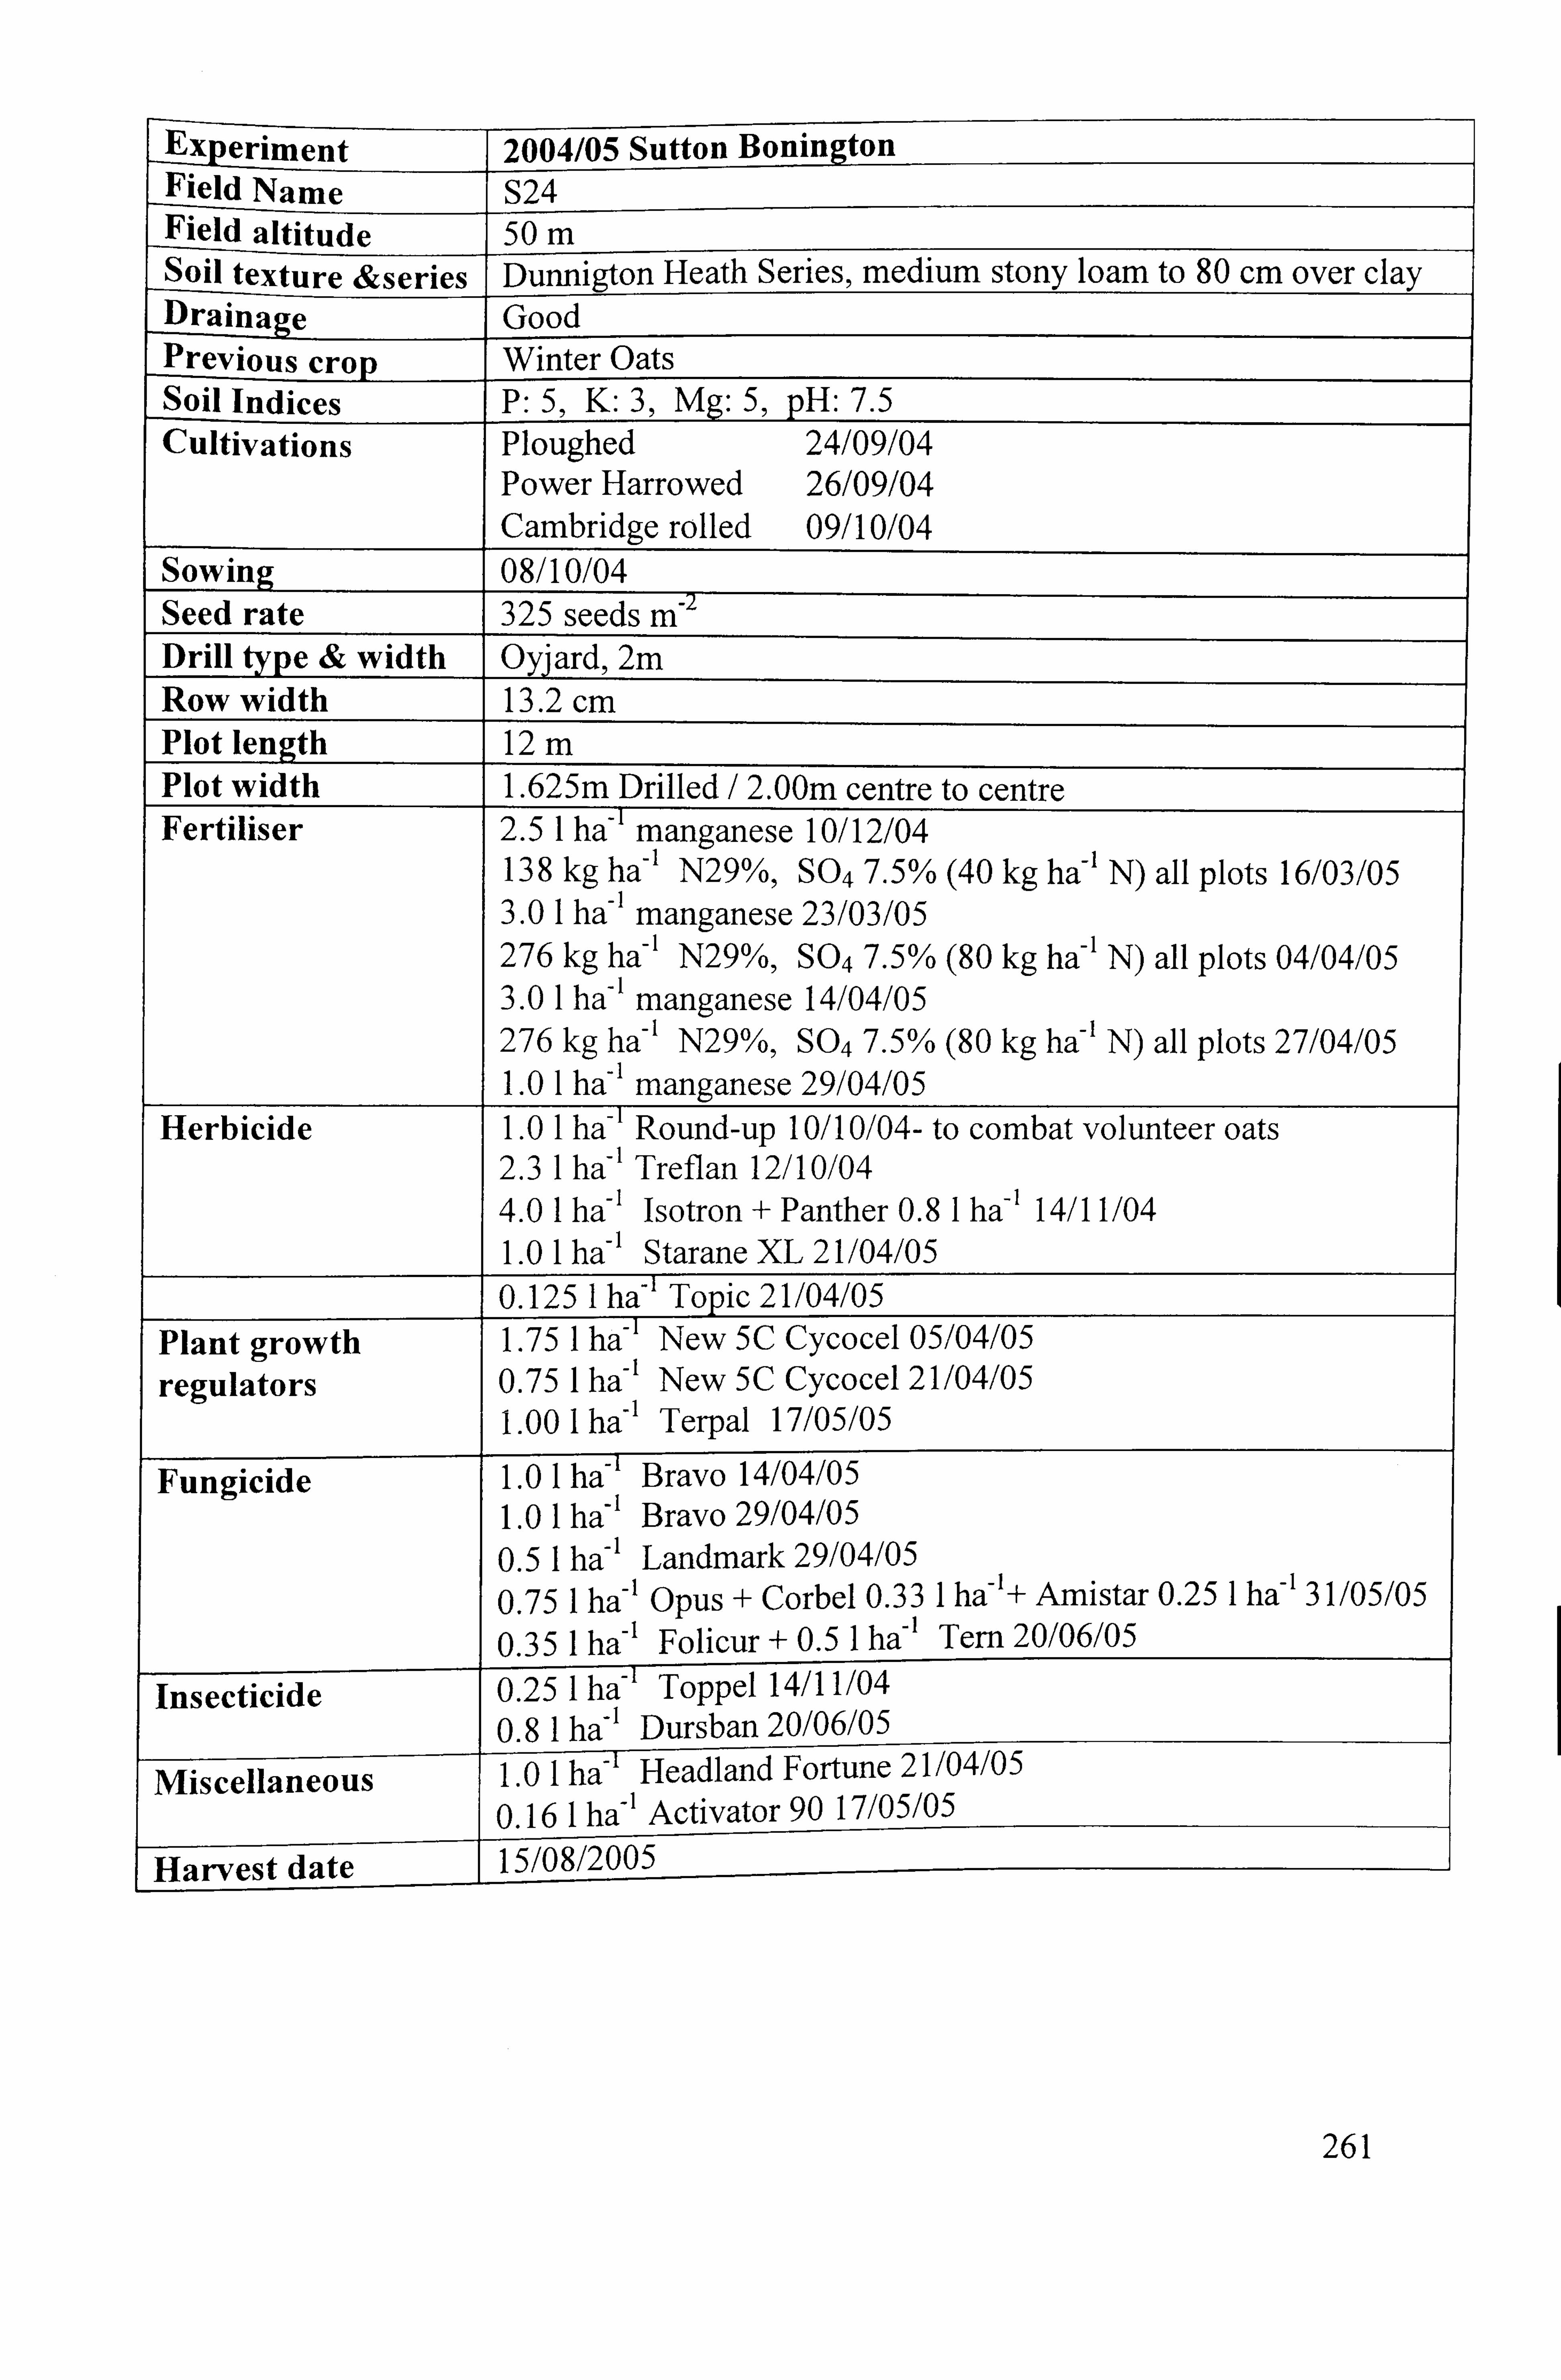
-Experiment 2004/05 Sutton Bonington
Field Name S24 Field altitude 50 m Soil texture &series Dunnigton Heath Series, medium stony loam to 80 cm over clay Draina e ý9
Good Previous crop Winter Oats Soil Indices P: 5ý K: 3) Mg: 5, pH: 7.5 Cultivations Ploughed 24/09/04
Power Harrowed 26/09/04 Cambridge rolled 09/10/04
Sowin 08/10/04 Seed rate 325 seeds m-' Drill type & width Oyjard, 2m Row width 13.2 cm Plot length 12 rn Plot width 1.625m Drilled / 2.00m centre to centre Fertiliser 2.5 1 ha-' manganese 10/12/04
138 kg ha-1 N29%, S047.5% (40 kg ha-1 N) all plots 16/03/05 3.0 1 ha-1 manganese 23/03/05 276 kg ha-1 N29%,, S047.5% (80 kg ha-'N) all plots 04/04/05 3.0 1 ha-1 manganese 14/04/05 276 kg ha-1 N29%, S047.5% (80 kg ha-1 N) all plots 27/04/05 1.0 1 ha-1 manganese 29/04/05
Herbicide 1.0 1 ha-1 Round-up 10/10/04- to combat volunteer oats 2.3 1 ha-1 Treflan 12/10/04 4.0 1 ha-1 Isotron + Panther 0.8 1 ha-1 14/11/04 1.0 1 ha-1 Starane XL 21/04/05
0.125 1 ha-' Topic 21/04/05
Plant growth 1.75 1 ha-' New 5C Cycocel 05/04/05
regulators 0.75 1 ha-1 New 5C Cycocel 21/04/05 1.00 1 ha-1 Terpal 17/05/05
Fungicide 1.0 1 ha-1 Bravo 14/04/05 1.0 1 ha-1 Bravo 29/04/05
0.5 1 ha-1 Landmark 29/04/05
0.75 1 ha-1 Opus + Corbel 0.33 1 ha-'+ Amistar 0.25 1 ha-1 31/05/05
0.35 1 ha-1 Folicur + 0.5 1 ha-1 Tern 20/06/05
Insecticide 0.25 1 ha-T Toppel 14/11/04
0.8 1 ha-1 Dursban 20/06/05 - -
Miscellaneous ne21/04/05 ortu 1.0 1 ha-F-H-eadl-and F
0.16 1 ha-1 Activator 90 17/05/05
est date
261

z
z
po
TA 0 T 11 10 C. 4 r, 10 C., 4 Cý C4
C4 " cq
C', ri c eq C, m 'o
CA m 00 11 'IT C', m C4 'r
C) ol r4 1 10
C14 C', eq
C14
C4 Ir r-- CA
C-4 - 00 C. 4
r4 C14
C, I C14 r4
C4 14 10 C, 4 1 C> m
1.4 m r4 C-4 00 r4 m
10 m C14
CD (-4 M
C, 4 C4 w C',
q '0 CD m
m m 10 1-4 1 00 A C m
00 w 10 '
w C,
Cl
C ,
r4 N
r- C4 10 10 w
(-4- I
CC",
-. t 0 (71 m
10 IT
10 ýo C, 4 11 (A
m 00 4 CA 'I C4 C'4
, C 4 CA
\0 r- It 10 11 10
4 10 14
C, 10 C. 4 w '
q C, (71 C-4 cq C C C 4 C',
C4 00 C,
10 C, 4
C, t- 11
" Cý, C, CA
I ("I C-4 10
I cl CIA \0 t'-
14 t- C, 1A cq C-4 - C4
C14 C'4 r- t-
C7, 1-4 I
E-
10
C) C14
10
c4 00 C, CD 14 "T CD
v- cý "t r4 01 'T Ol C7, I C), Cl
11 \0
C-4 "t 10
m ?
-0
C, Cl '. 4
00 CD 10 Ol
C', 'o 10 C,
00 1- C,
Cl 2
r4 - C,
w CIA 4 rq
C>
cq
10 7 C4 w C) Cý4
11
-, t r,
CD
S2 C,
f C,
n, r-
N C>
10 w zr
-
C)
10 10 , C,
C, 0 ý-, I ,--I , ýý ýý
-- r- "'
C4
"t ýE C14 - ýE (7, w IT
11 C) It cq .0
Cý 10 C>
2
ý2 n -= C, C,
-IT 'o 1 00
(71 CA (71
C, 'I 10
;r cq 'IT "t C4 0
zr C, 4
'D
w 10 10 C, ýr 'o rq r-
r- C,
0 G C14 r- C7, 0 m C'4
00 Cý
C-4 'IT 'D C-1
N
C, cq ON C, CA r4
00 "4 r4 00 r4
C, CD
cq
r- C4 cli r- 00
CD 'D
c r4 m ('4 mr
j (-4 00 m 00
cq C14 c: >
'D Cq
c, 4 r4 C4 r4 m 00 00
'4 C14 (
rq oo 'T
A "10 r, It 10
cl 00 C. 4,
r4
C, m w 0, C, 4
Cl m 'o
I- 2- 1
-
N
O
:2
0 0 C:
10 r 6 6
06 6 rl r- o ci '
0- a .-t6 -
ci 6
z t: o Azý
00 4) - Z
bo 4) . Z
CO 0 t5Z Ej z w 00
E r- 0 6 ý;
- r 0 E .E - E - ýý Fl: -j CL, Z - ý ,- ýý ri : ý , i: -j 4 ýý ý
L)
m
IS. 0:
0
I- I..
4)
C-4
- (_
F-
il>, 01 0 :ý. c: Co .
12 e
C4 en W) 10 r- 00 ON 0
mm en 11) en In In It
u
t ;ýr, 4 fm le V) 10 r- =ý=
i f4 f4 "" r4 m"-ý
v uw< cQ M
r r- v- m- c> m co <U 0.0 0-
it:
4) ex Z, 0 C C14 4) LLý
!2
Ci - e4 ný ýn c r- = 0,2
262
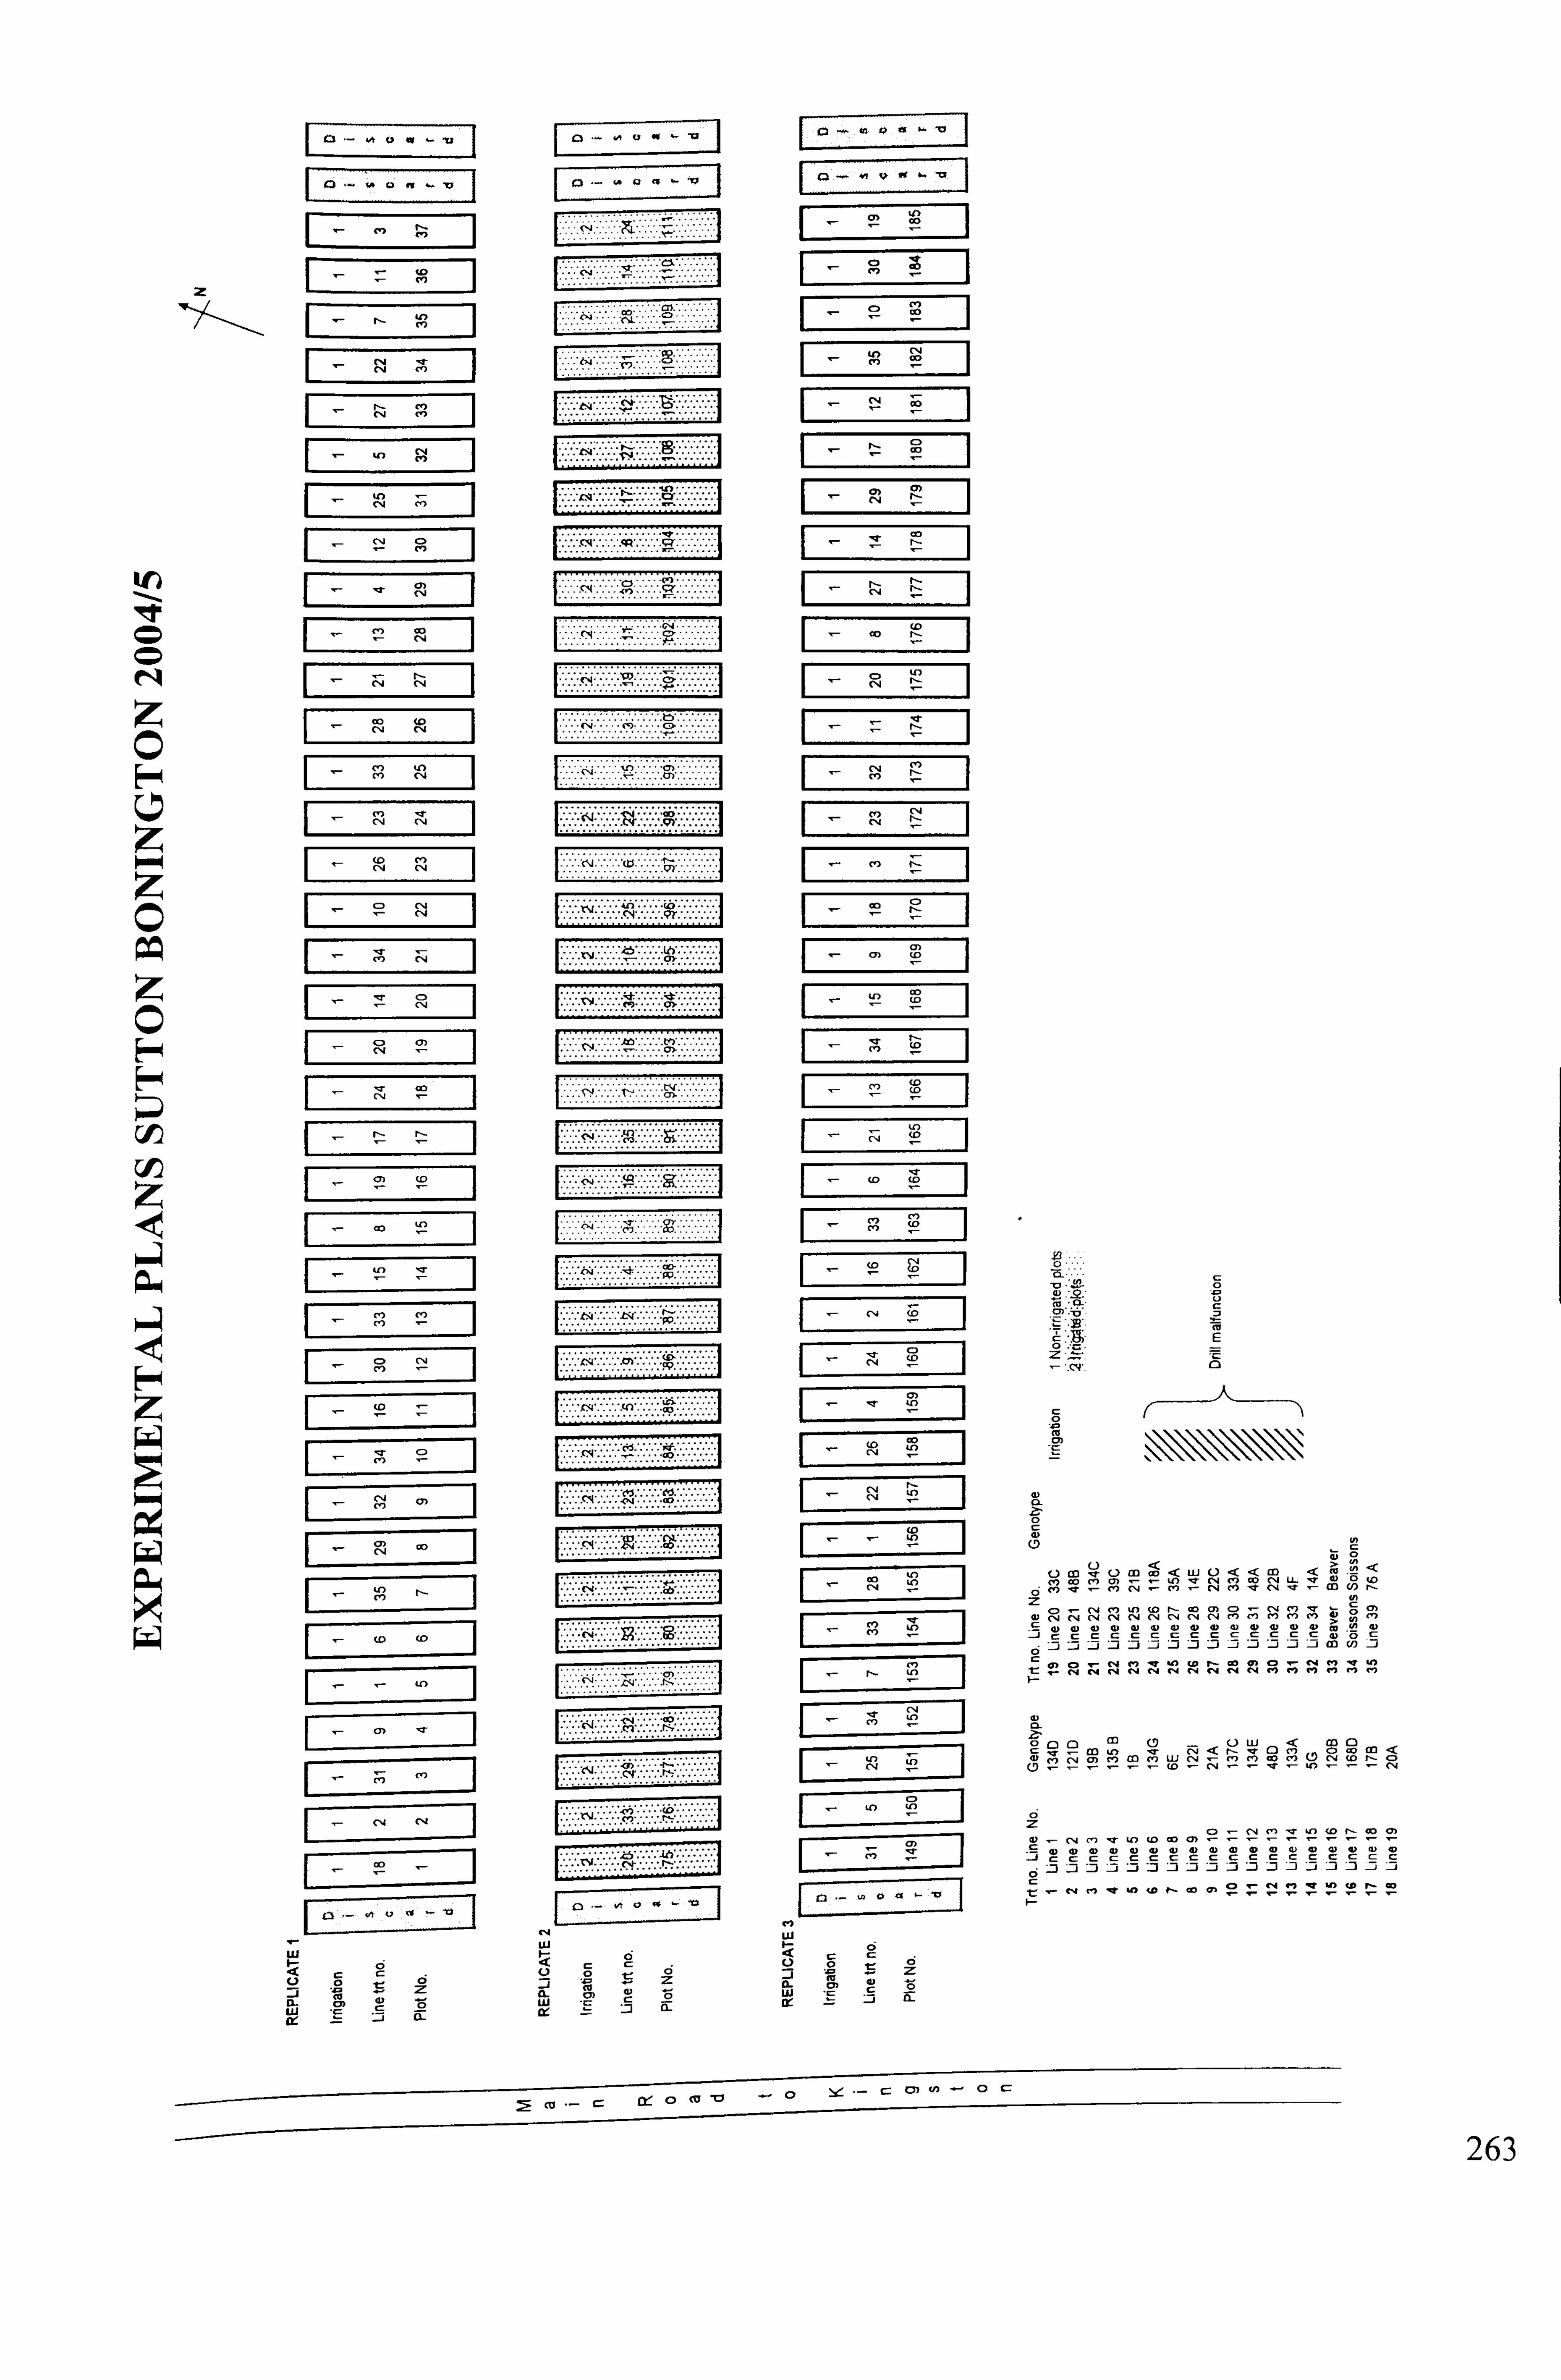
z C
z z C
z C
z
z
ui
2E (U .-CW0 cu -ci
ui
CL
- C, ý, _ ': C" ý-C:
49
a
C) co m<< LLJ 0<<< mmw, 5,0
cn u)
0 uj
12 ;E 12
:3 13 1D -3 13 -D 13 -3 1D -3 D ý5 13 13
263

C3 Ca
1-71
ýol
C, -ýý. -V
T-1
I- -- ýV-O--]
I- zr; ý=2
F7 [- -ý2 V F77
E -- ý-T-v E==
, EE==
ui 0 .5z CL mw
ui IL
. 4.1.1.1.
ý'M' 0
0
0 C) co
C) << r) co LLI C) <<m<L
ci m co m-výý---- LL
CO (/) ý mw0
z C) ",..... CN
00Mw00w000 41
_j _j _j __j DD cn U) -j
if In i-
w a- 0 in 0m (D LLJ CC) 0m
m 'o mA ui ýl - ý2 ý2
--1 24
C-4 M 10 0) ý2 S2 ý2 ý2
_j _j _j __j
264
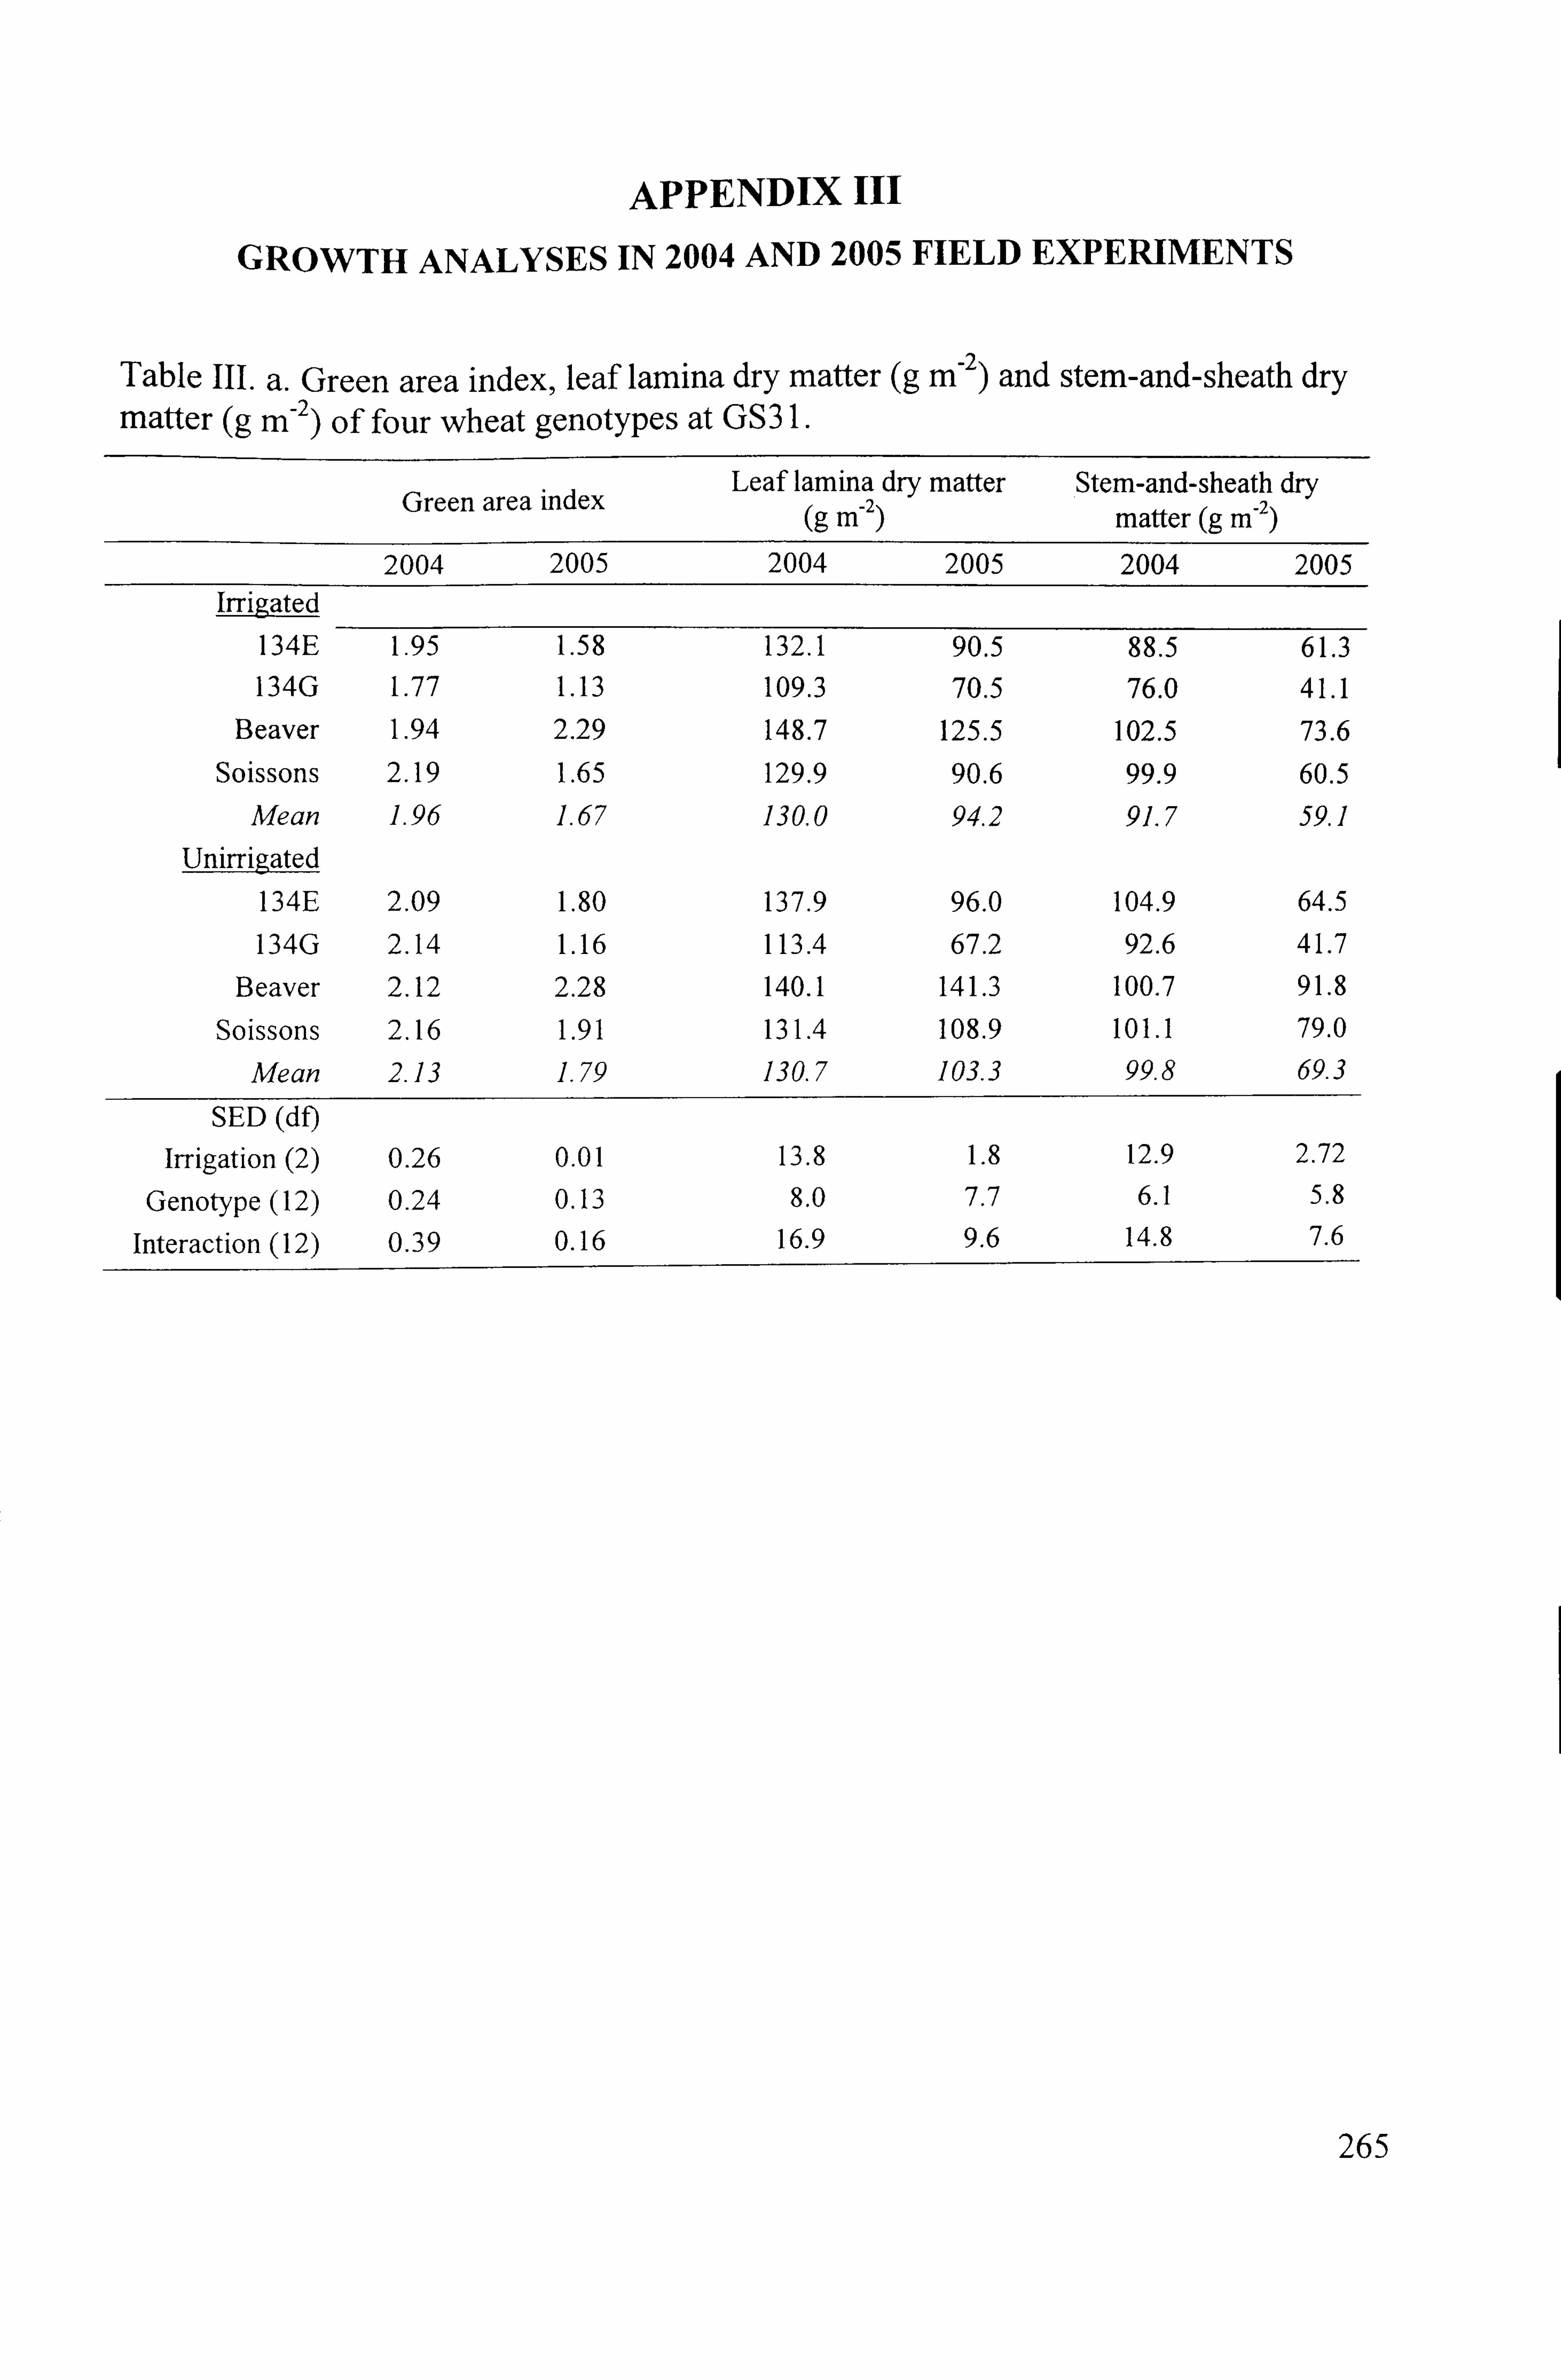
APPENDIX III
GROWTH ANALYSES IN 2004 AND 2005 FIELD EXPERIMENTS
Table III. a. Green area index, leaf lamina dry matter (g M-2 ) and stem-and-sheath dry
matter (g M-2) of four wheat genotypes at GS3 L
Leaf lamina dry matter Stem-and-sheath dry Green area index (g M-) matter (g M-2)
2004 2005 2004 2005 2004 2005 Irrigated
134E 1.95 1.58 132.1 90.5 88.5 61.3
134G 1.77 1.13 109.3 70.5 76.0 41.1
Beaver 1.94 2.29 148.7 125.5 102.5 73.6
Soissons 2.19 1.65 129.9 90.6 99.9 60.5
Mean 1.96 1.67 130.0 94.2 91.7 59.1
Unirrigated
134E 2.09 1.80 137.9 96.0 104.9 64.5
134G 2.14 1.16 113.4 67.2 92.6 41.7
Beaver 2.12 2.28 140.1 141.3 100.7 91.8
Soissons 2.16 1.91 131.4 108.9 101.1 79.0
Mean 2.13 1.79 130.7 103.3 99.8 69.3
SED (df)
Irrigation (2) 0.26 0.01 13.8 1.8 12.9 2.72
Genotype (12) 0.24 0.13 8.0 7.7 6.1 5.8
Interaction ( 12) 0.39 0.16 16.9 9.6 14.8 7.6
265
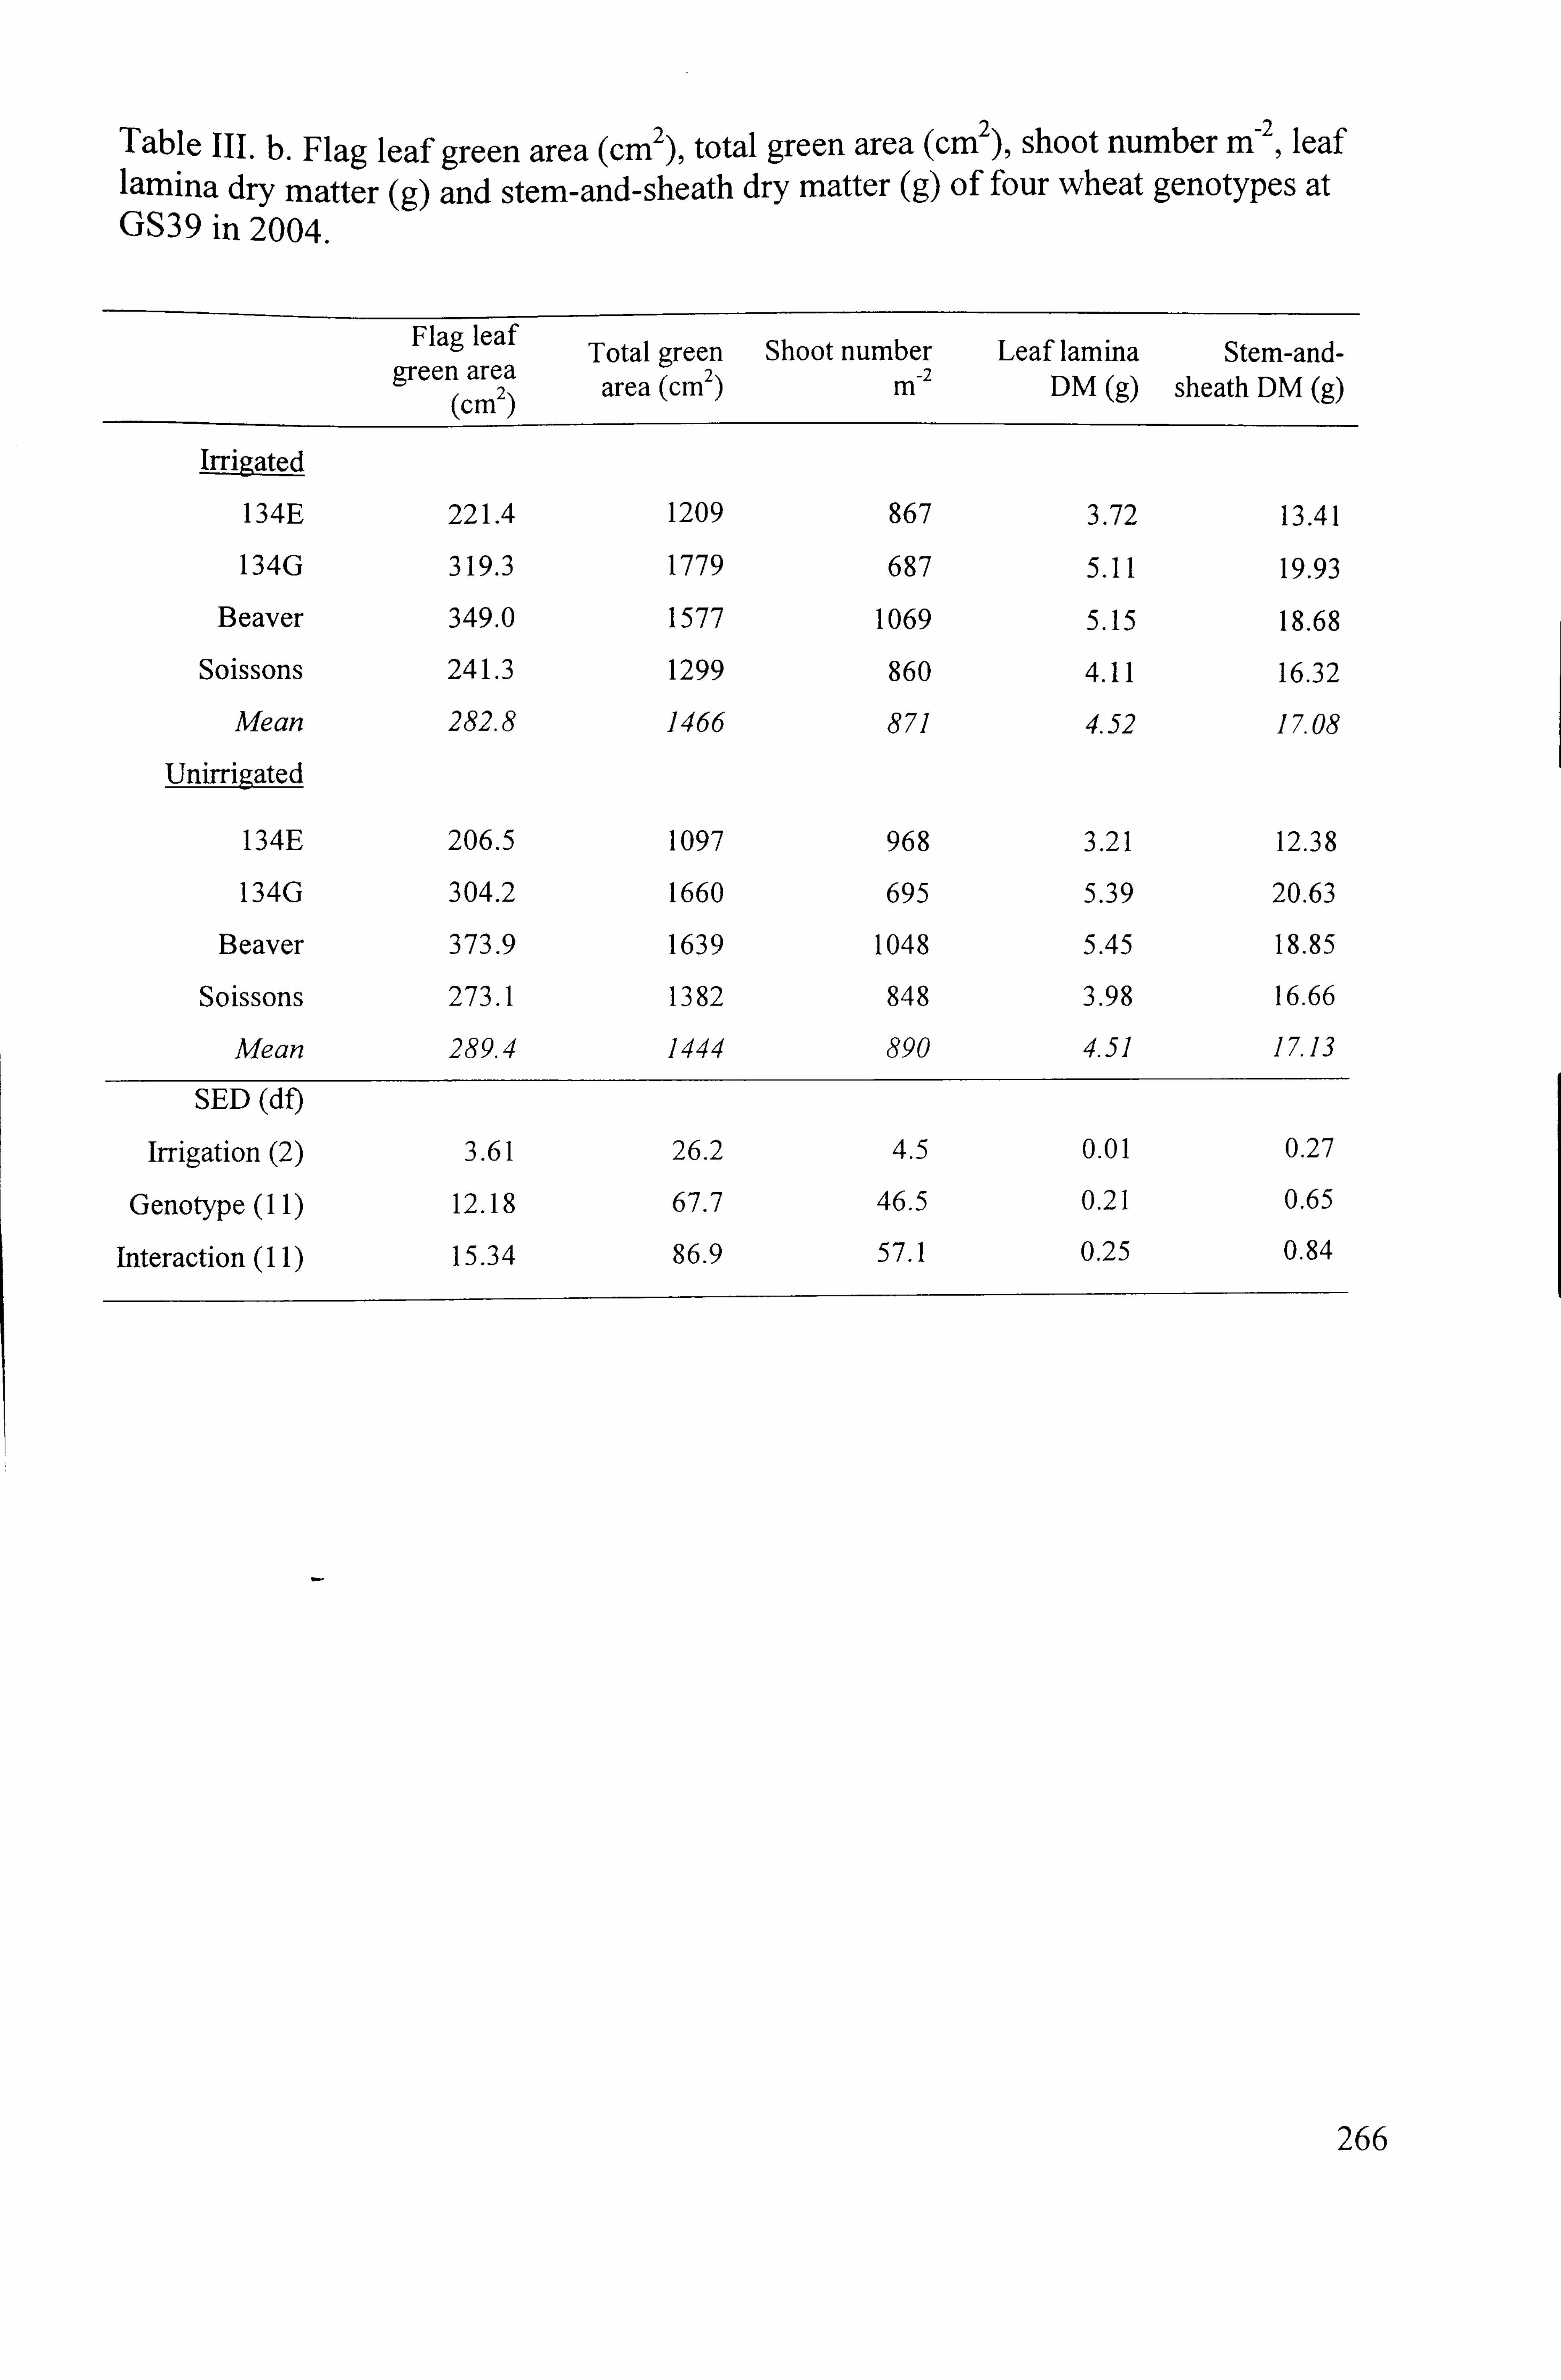
Table III. b. Flag leaf green area (CM2), total green area (cm), shoot number M-2, leaf
lamina dry matter (g) and stem-and-sheath dry matter (g) of four wheat genotypes at GS39 in 2004.
Flag leaf Total green Shoot number Leaf lamina Stem-and-
p, Teen area (CM2) -2 (CM2) area m DM (g) sheath DM (g)
Irrigated
134E 221.4 1209 867 3.72 13.41
134G 319.3 1779 687 5.11 19.93
Beaver 349.0 1577 1069 5.15 18.68
Soissons 241.3 1299 860 4.11 16.32
Mean 282.8 1466 871 4.52 17.08
Unirrigated
134E 206.5 1097 968 3.21 12.38
134G 304.2 1660 695 5.39 20.63
Beaver 373.9 1639 1048 5.45 18.85
Soissons 273.1 1382 848 3.98 16.66
Mean 289.4 1444 890 4.51 17.13
SED (df)
Irrigation (2) 3.61 26.2 4.5 0.01 0.27
Genotype (11) 12.18 67.7 46.5 0.21 0.65
Interaction (11) 15.34 86.9 57.1 0.25 0.84
266

-z
L)
(': 2
7ý
Cd q. )
E U)
+-i C) lz u
41.1
. ". -4
lý
Q)
7: ý rl C u
0i 'tý
0
-4 ; -. 4
'o v
C) :T c) C-4 Cý rj Cý C; c; 't Itt Nt C> ýt
cn C) Q5 . - 00 a, r- kfý (6 o6
U -, '.. C'4 C> m - C114 C> Cý C'ý - =- ýý 00 u Eý C4 c) CA
UU 4. tr) r- - C) 00 --( m I-
6 06 kr) C14 00 ýlc ý, c tn W) tr)
V) C) C-ý m 00 r- C-1 \, o m (7\ Q! ) . - m -4 o6 06 -4 11- 00 Cý Cý ; ý-
! V-ý tr) C) t, - t-- -tt 00 - 00 , ý 1r) 1r) r- W) kn tr) tr) ý, o kn
't ýt r- C) r-
C'i C-ý o6 110 C'i r" z CA N tn C, 4 r'- - N m M -
0 110 m C14 ýc rl- r- C: ) Cý 00
u ý C'4 C'I (14 C-) 1-0 r-- - ýý Irý ,
1,6 06 ýi 110 00 Ic kf) Itt kr)
7G
kn
m 0" r 4-
kn CýN r-- 01ý W) - ýý rý (14 CIA C-1 - - (-A rA
rID
E C
C)
0
C)
IS
C C
-
3 +
tJD ( D,
I'D C/)
C)
I
I cl, (: )'-, t-- - t- r- N -I- kr) oo
116 Vý clý 44
-, t r- CN 00 r- 00
\ýo 00
C14 kr) ýt :tC: ) C-- tf) C, 4 00 I'D
06
alý wý CD CD (ý) CD (N (n
rn (N clq CD
rý (-� (-q Cq Cq CN
w
ýD Z pz 9 Gn
mt
rn e
rn -4 rý
rý N
kn
rn ý, 0
r- m v Z
GO rA
cn
00
N
N
t'- -m rn 00 C> C> C> 't rý r-: IZI' r1) M tn (f) r- 090
CD - rn rn
C_ý ff) rn
r- (n rn 1,0 - "0 le (1) 00 rn all \Z
rn rn le
ru
267
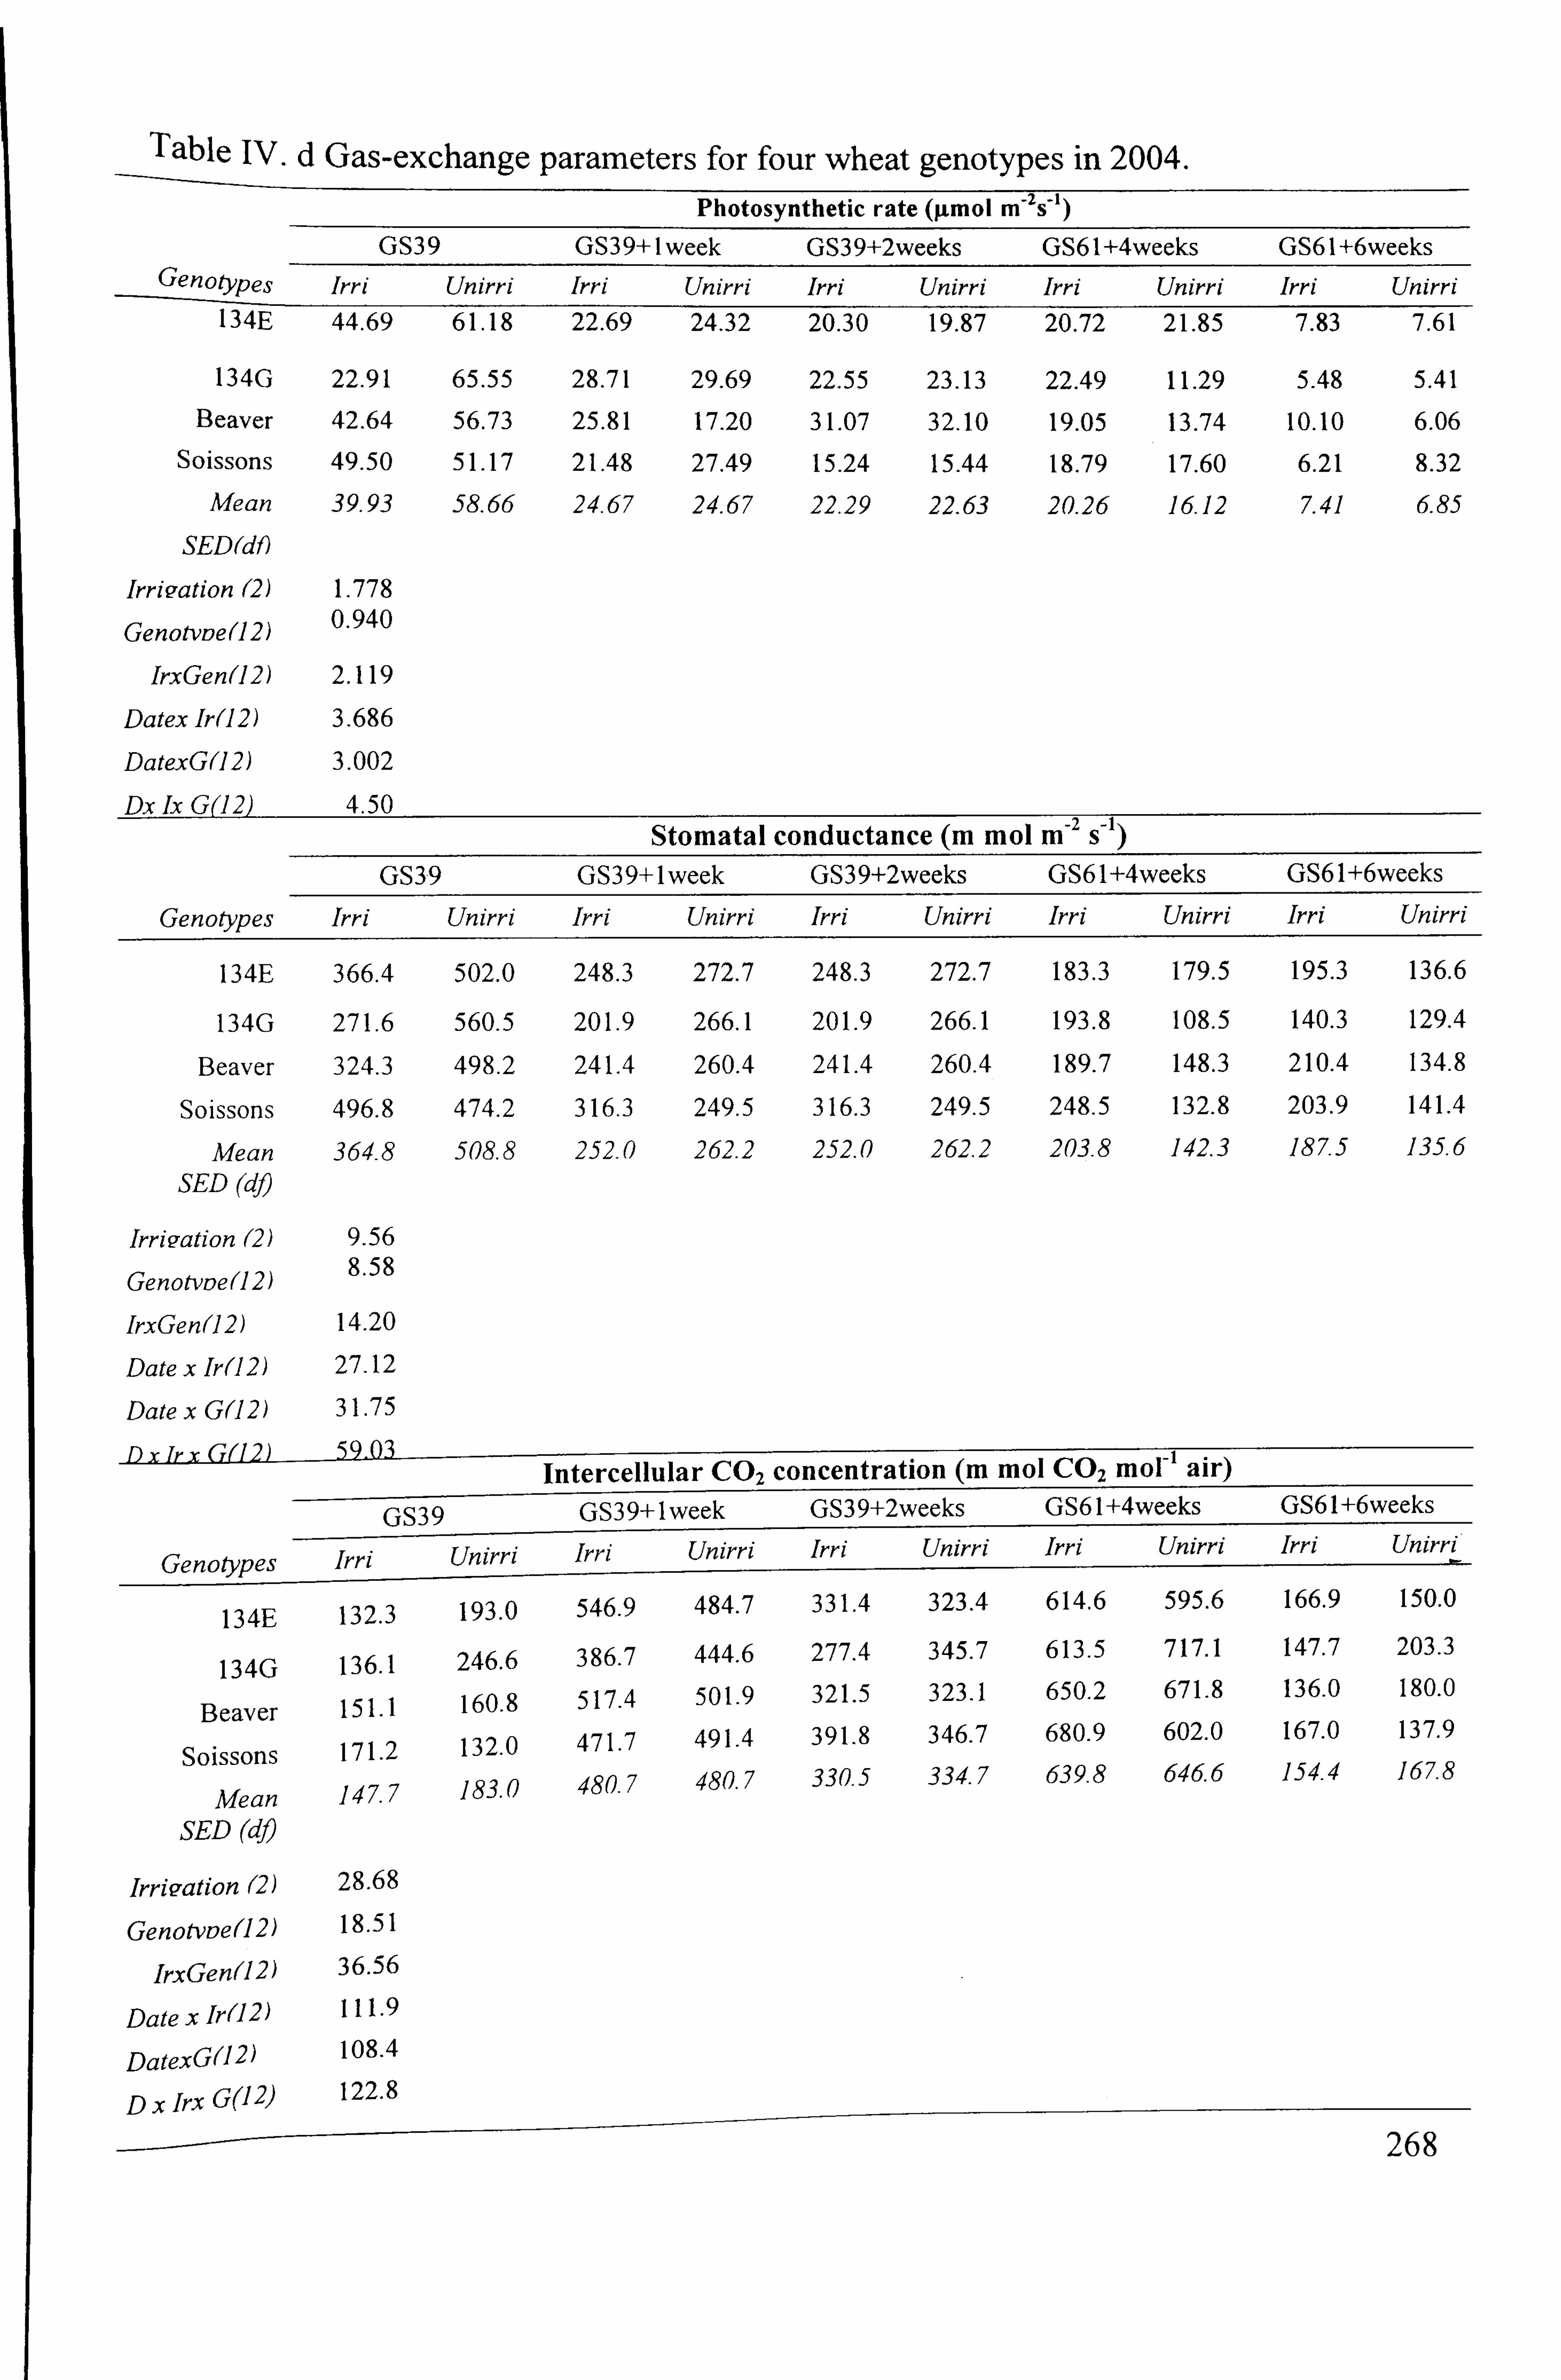
Table IV. d Gas-exchange parameters for four wheat genotypes in 2004. Photosynthetic rate (gmol m -2s-)
GS39 GS39+lweek GS39+2weeks GS61+4weeks GS61+6weeks Genotypes Irri Unirri Irri Unirri Irri Unirri Irri Unirri Irri Unirri
134E 44.69 61.18 22.69 24.32 20.30 19.87 20.72 21.85 7.83 7.61
134G 22.91 65.55 28.71 29.69 22.55 23.13 22.49 11.29 5.48 5.41
Beaver 42.64 56.73 25.81 17.20 31.07 32.10 19.05 13.74 10.10 6.06
Soissons 49.50 51.17 21.48 27.49 15.24 15.44 18.79 17.60 6.21 8.32
Mean 39.93 58.66 24.67 24.67 22.29 22.63 20.26 16 12 7.41 6.85
SED(dl)
Irrivation (2) 1.778
GenOtVDe(12) 0.940
IrxGen(12) 2.119
Datex Ir(12) 3.686
DatexG(12) 3.002
Dx Ix G(12) 4.50
Stomatal conductance (m Mo l M-2 S-)
GS39 GS39+lweek GS39+2weeks GS61+4weeks GS61+6weeks
Genotypes Irri Unirri Irri Unirri Irri Unirri Irri Unirri Im Unim
134E 366.4 502.0 248.3 272.7 248.3 272.7 183.3 179.5 195.3 136.6
134G 271.6 560.5 201.9 266.1 201.9 266.1 193.8 108.5 140.3 129.4
Beaver 324.3 498.2 241.4 260.4 241.4 260.4 189.7 148.3 210.4 134.8
Solssons 496.8 474.2 316.3 249.5 316.3 249.5 248.5 132.8 203.9 141.4
Alfean 364.8 508.8 252.0 262.2 252.0 262.2 203.8 142.3 187.5 135.6
SED (dj)
Irrigation (2) 9.56
GenOtVDe(12) 8.58
lrxGen(12) 14.20
Date x lr(12) 27.12
Date x G(12) 31.75
03 59 Dx [r x Cr(l 2) . Intercellular C02 concentration (m MOI C02 mol-1 air)
GS39 GS39+lweek GS39+2weeks GS61+4weeks GS61+6weeks
C""nt-v"'Os irri Unirri Irri Unirri Irri Unirri irri Unirri Irri Unirri
134E 132.3 193.0 546.9 484.7 331.4 323.4 614.6 595.6 166.9 150.0
134G
Beaver
Soissons
Mean
136.1
151.1
171.2
147,7
246.6
160.8
132.0
183.0
386.7
517.4
471.7
480.7
444.6
501.9
491.4
480.7
277.4
321.5
391.8
330.5
345.7
323.1
346.7
334.7
613.5
650.2
680.9
639.8
717.1
671.8
602.0
6466
147.7
136.0
167.0
154.4
203.3
180.0
137.9
167.8
SED (dfi
Irrigation (2) 28.68
Genotvoe(12) 18.51
IrxGen(12) 36.56
Date x Ir(12) 111.9
DatexG(12) 108.4
Dx Jrx G(12) 122.8
268
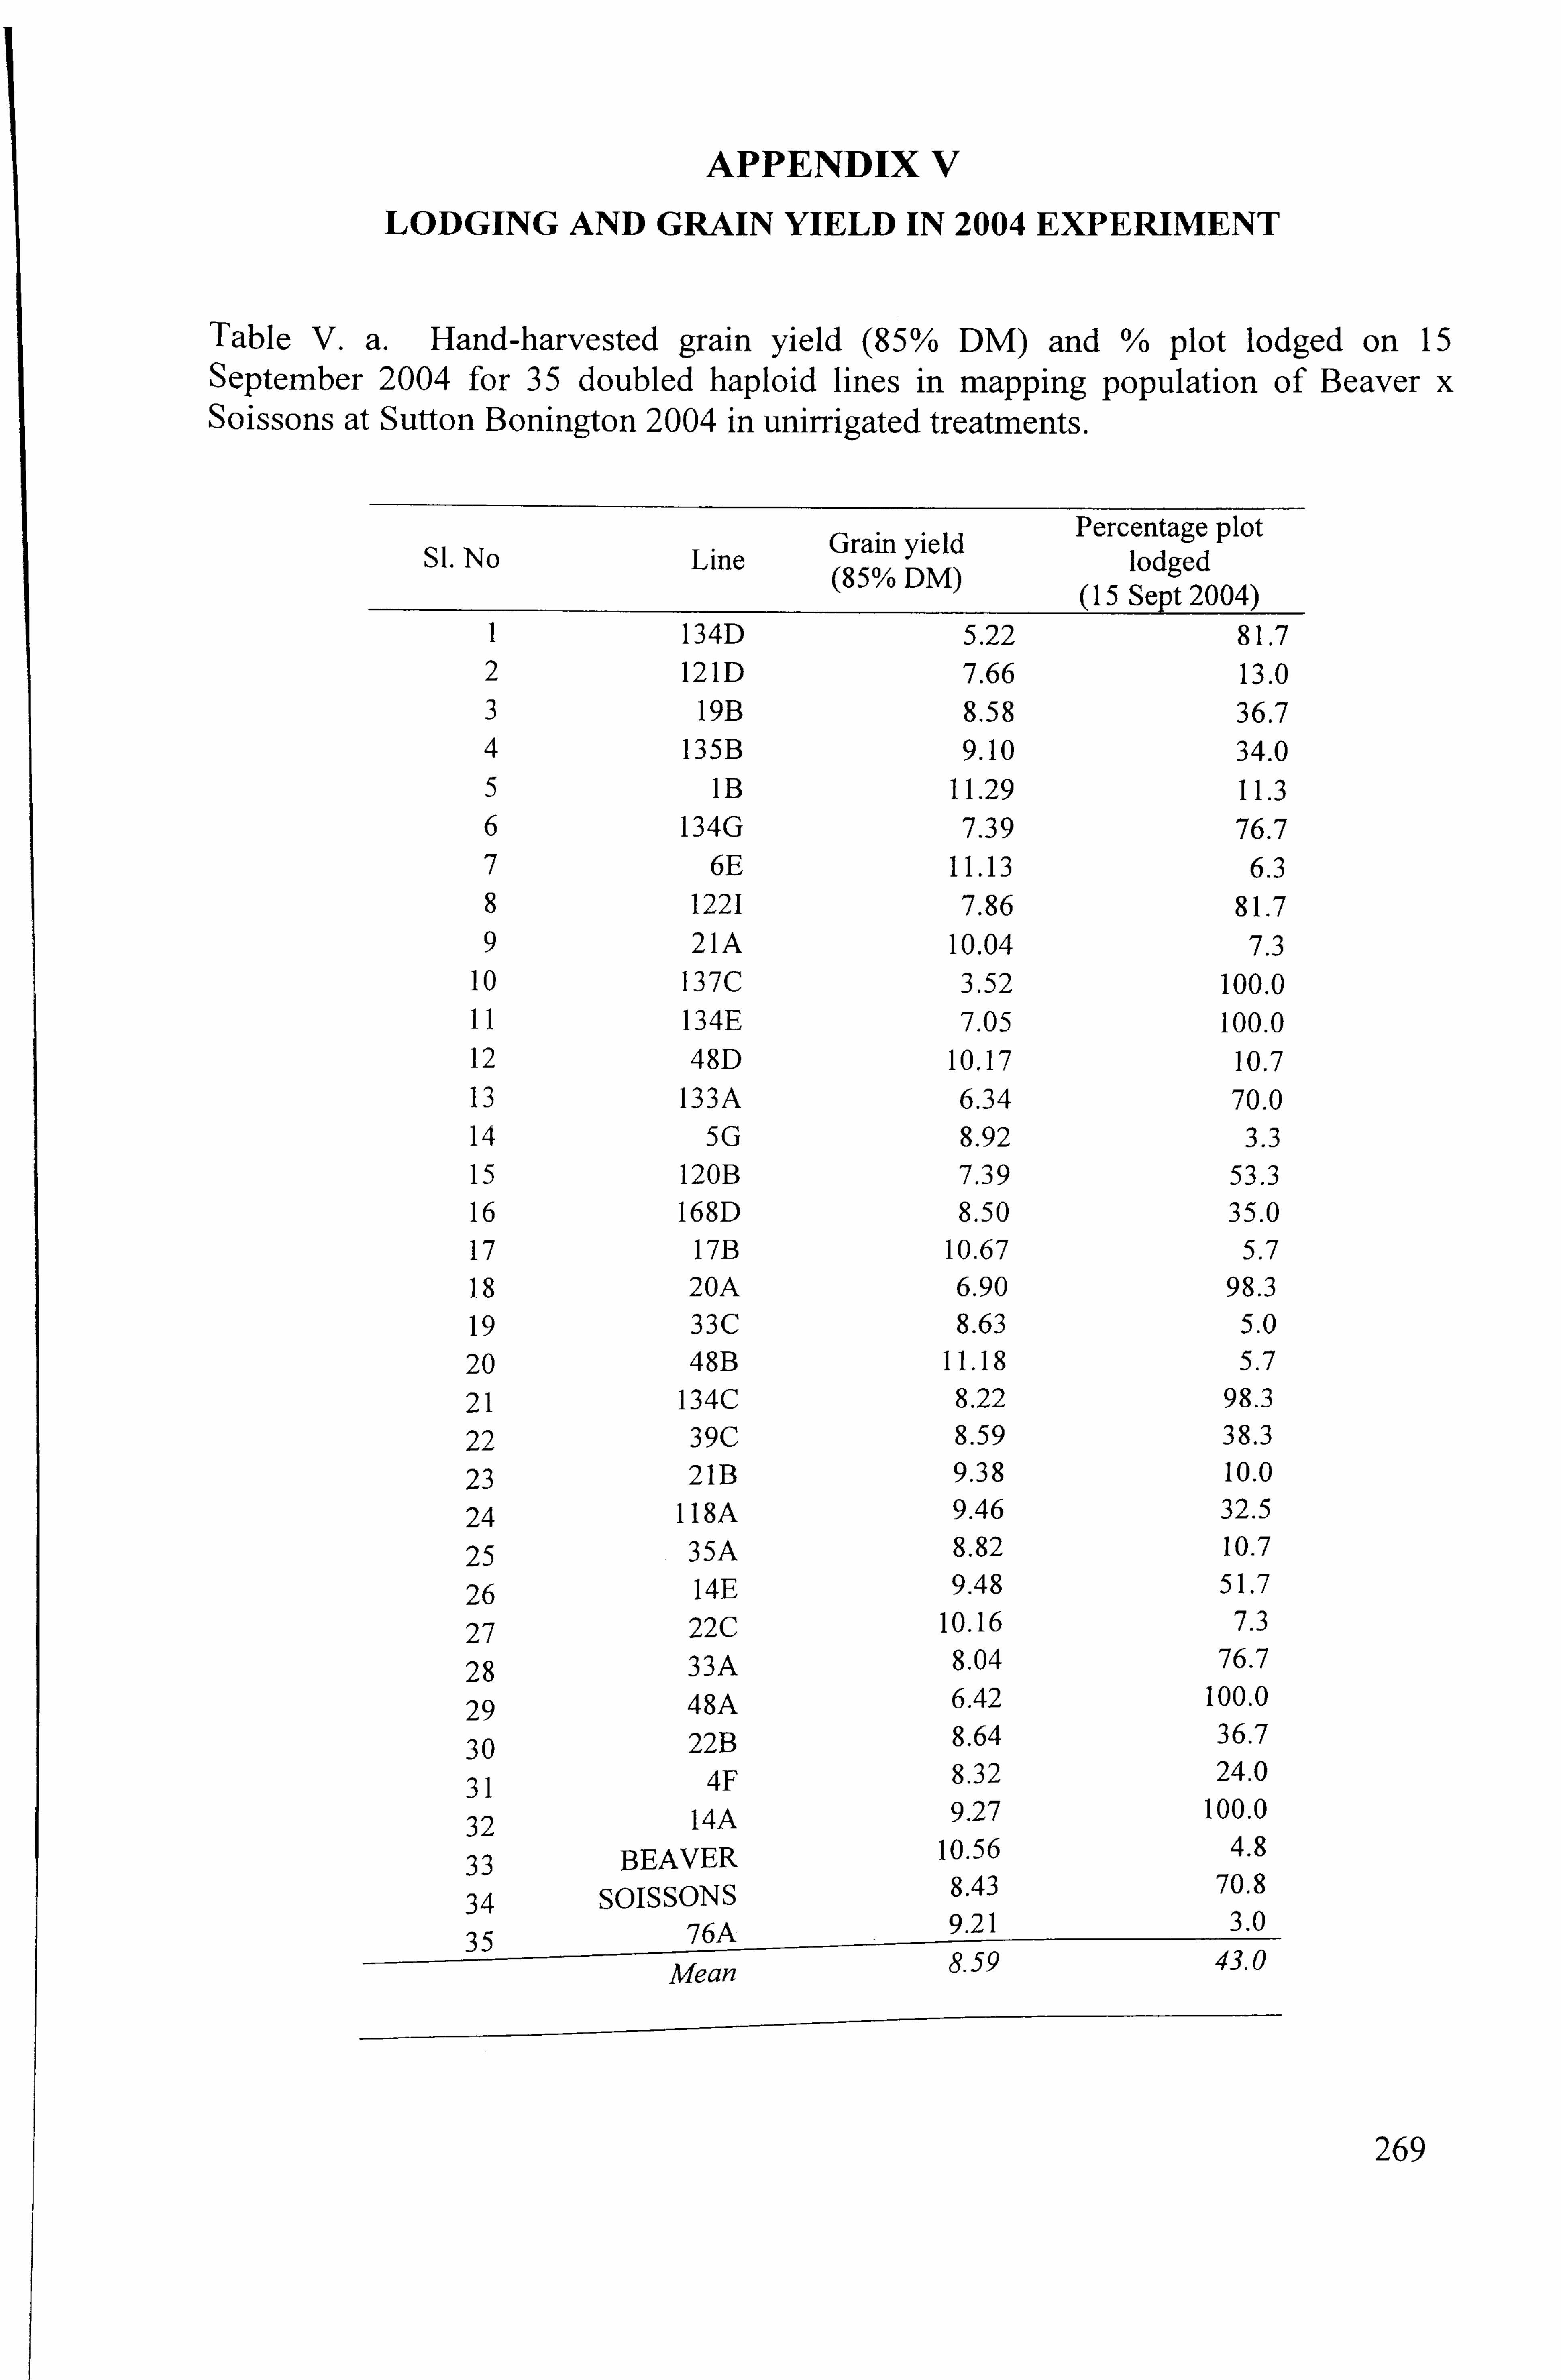
APPENDIX V
LODGING AND GRAIN YIELD IN 2004 EXPERIMENT
Table V. a. Hand-harvested grain yield (85% DM) and % plot lodged on 15 September 2004 for 35 doubled haploid lines in mapping population of Beaver x Soissons at Sutton Bonington 2004 in unirrigated treatments.
SI. No Line Grain yield (85% DM)
Percentage plot lodged
(15 Sept 2004) 1 134D 5.22 81.7 2 121D 7.66 13.0 3 19B 8.58 36.7 4 135B 9.10 34.0 5 1B 11.29 11.3 6 134G 7.39 76.7 7 6E 11.13 6.3 8 1221 7.86 81.7 9 21A 10.04 7.3
10 137C 3.52 100.0 II 134E 7.05 100.0 12 48D 10.17 10.7 13 133A 6.34 70.0 14 5G 8.92 3.3 15 120B 7.39 53.3 16 168D 8.50 35.0 17 17B 10.67 5.7 18 20A 6.90 98.3 19 33C 8.63 5.0
20 48B 11.18 5.7
21 134C 8.22 98.3
22 39C 8.59 38.3
23 21B 9.38 10.0
24 118A 9.46 32.5
25 35A 8.82 10.7
26 14E 9.48 51.7
27 22C 10.16 7.3
28 33A 8.04 76.7
29 48A 6.42 100.0
30 22B 8.64 36.7
31 4F 8.32 24.0
32 14A 9.27 100.0
33 BEAVER 10.56 4.8
34 SOISSONS 8.43 70.8
35 76A 9.21 3.0
Mean 8.59 43.0
269

APPENDIX VI
CARBON ISOTOPE DISCRIMINATION (%o) IN 2004
Figure VI. a Carbon isotope discrimination values of eight wheat genotypes under unirrigated conditions at Sutton Bonington 2004. Error bars show S. E. D of means of genotypes.
20.6
20.4
20.2
20.0
19.8
u 19.6
19.4 r-I 0 19.2
U 19.0
18.8 134G Soissons 21B 35A 76A Beaver 22B 134E
270
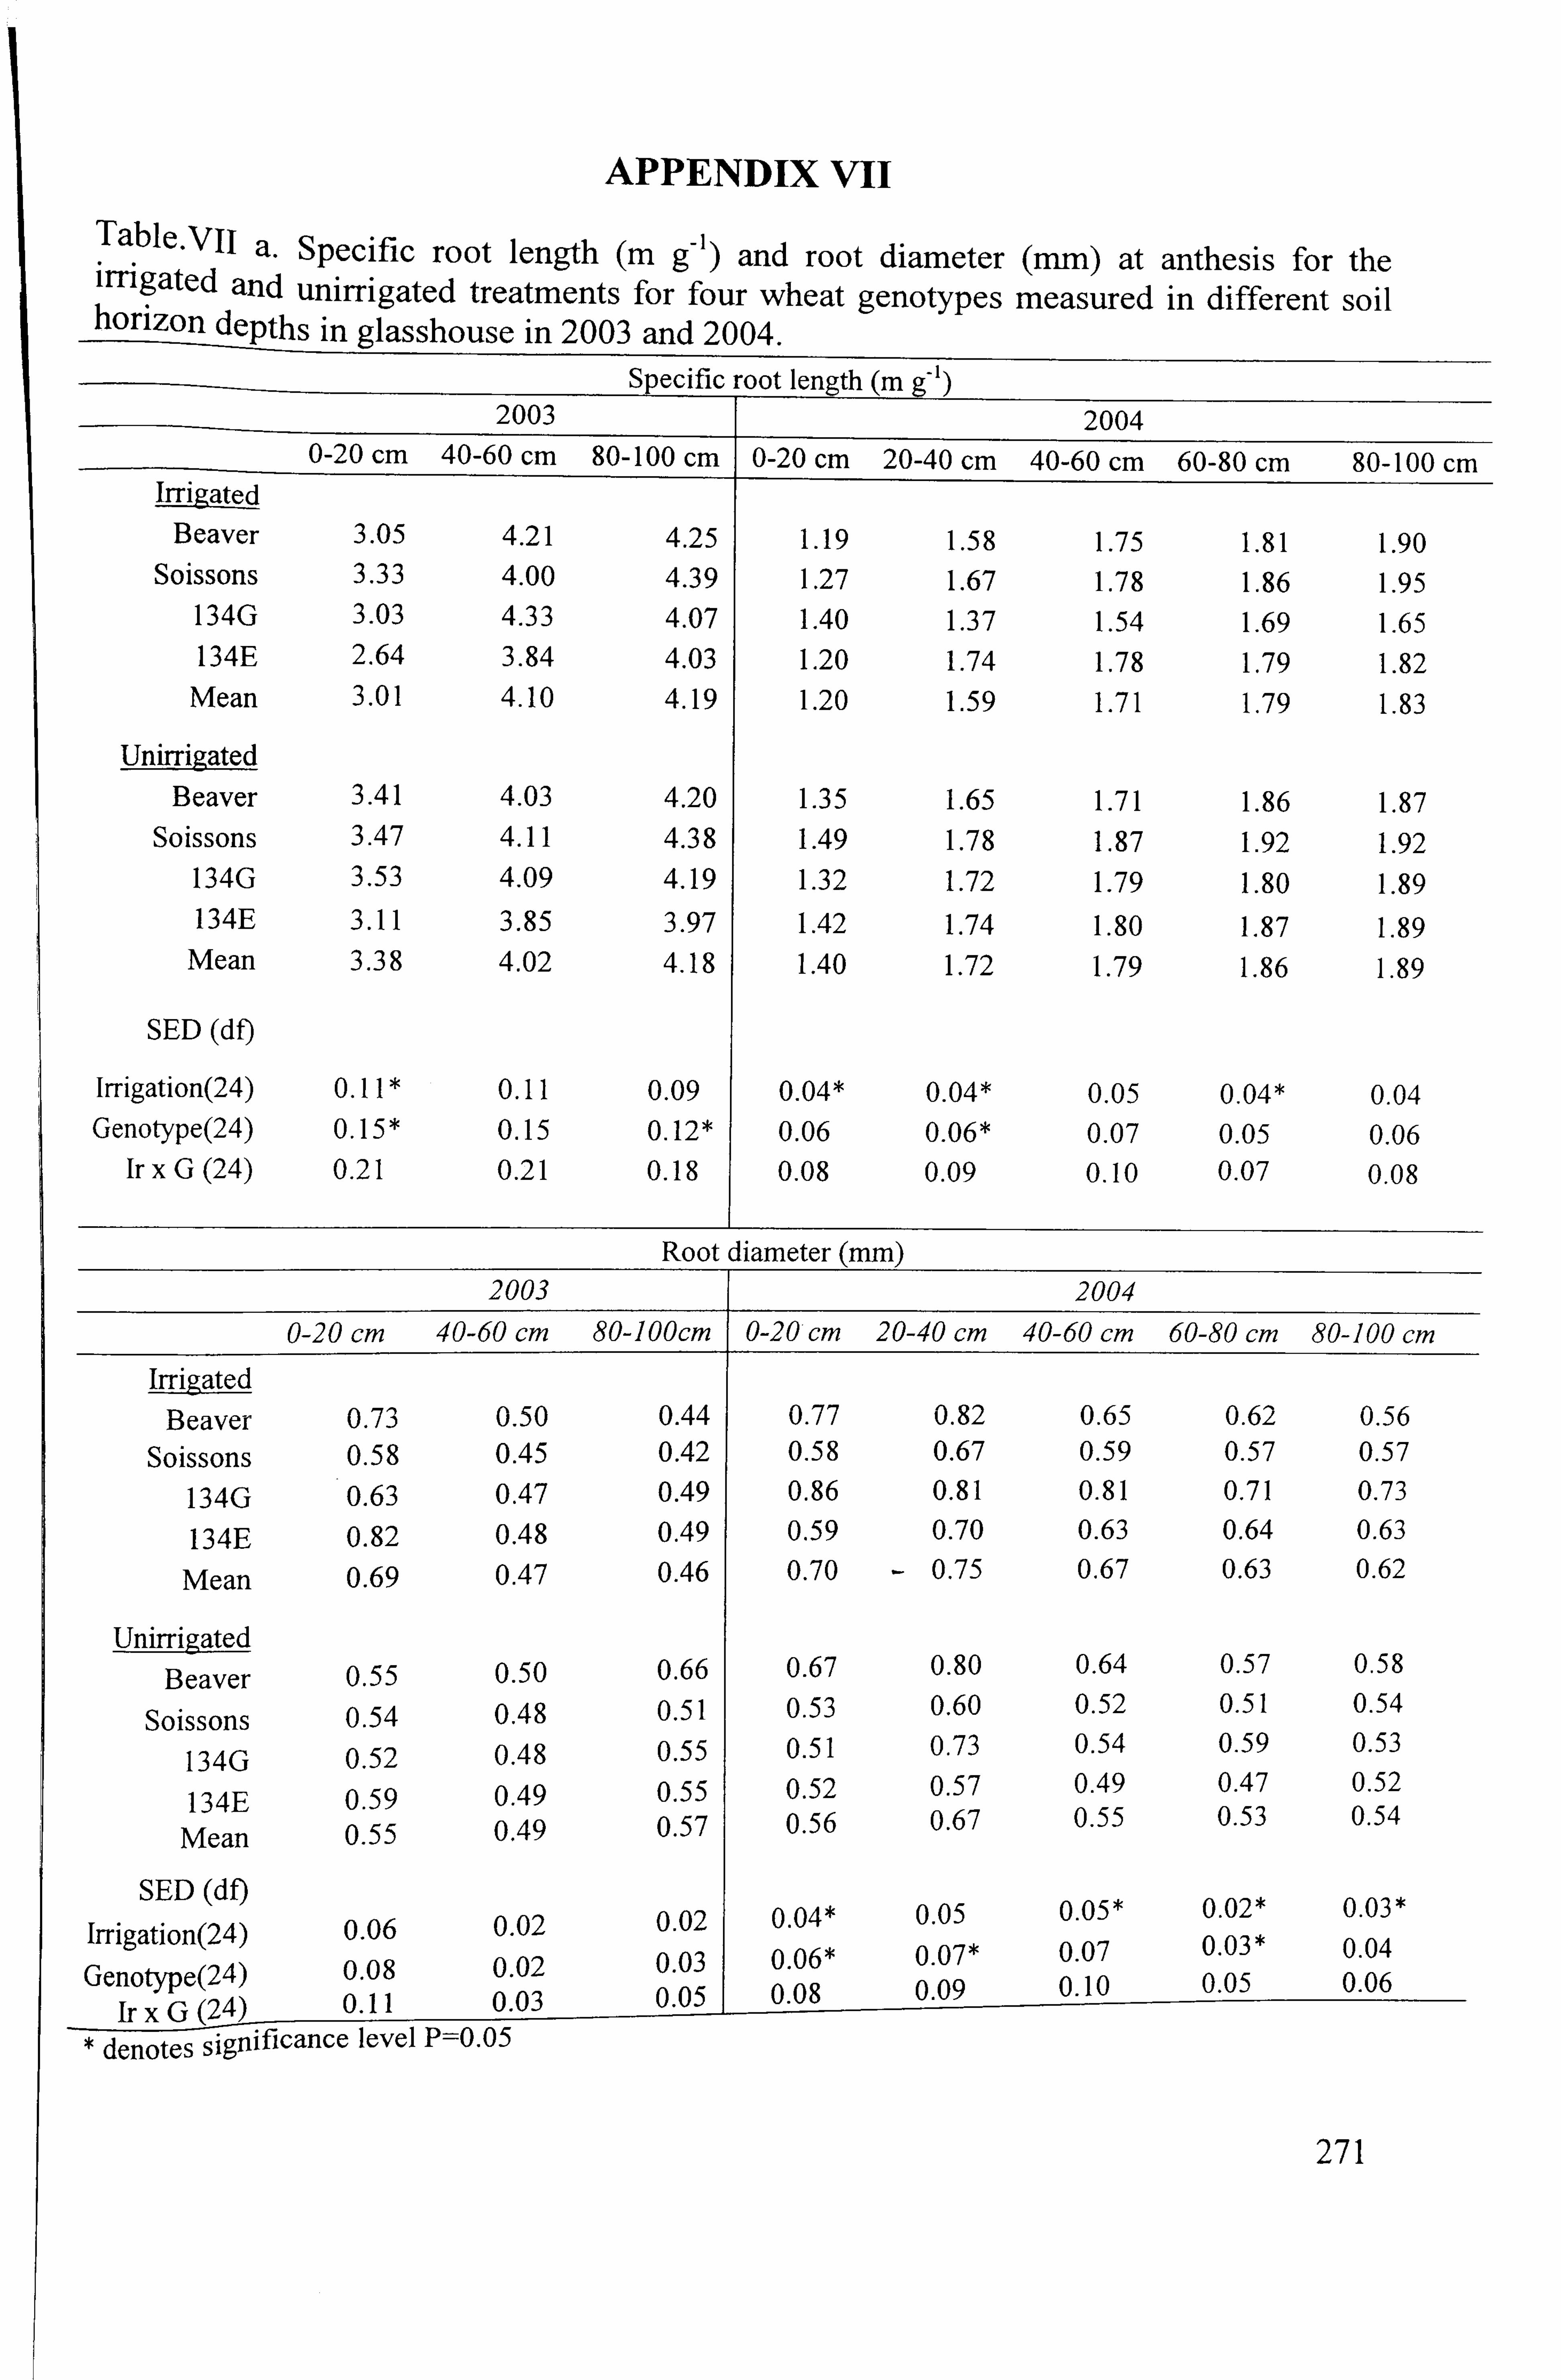
APPENDIX VII
Table-VII a. Specific root length (in g-1) and root diameter (mm) at anthesis for the irrigated and unirrigated treatments for four wheat genotypes measured in different soil horizon depths in glasshouse in 2003 and 2004.
Specific root len2th (m a-1) 2003 2004
0-20 cm 40-60 cm 80- 100 cm 10-20
cm 20-40 cm 40-60 cm 60-80 cm 80-100 cm Irrigated
Beaver 3.05 4.21 4.25 Soissons 3.33 4.00 4.39
134G 3.03 4.33 4.07 134E 2.64 3.84 4.03 Mean 3.01 4.10 4.19
Unirrigated
Beaver 3.41 4.03 4.20
Soissons 3.47 4.11 4.38
134G 3.53 4.09 4.19
134E 3.11 3.85 3.97 Mean 3.38 4.02 4.18
SED (df)
Irrigation(24) 0.11 0.11 0.09 Genotype(24) 0.15* 0.15 0.12*
Ir xG (24) 0.21 0.21 0.18
1.19 1.58 1.75 1.81 1.90 1.27 1.67 1.78 1.86 1.95
1.40 1.37 1.54 1.69 1.65 1.20 1.74 1.78 1.79 1.82
1.20 1.59 1.71 1.79 1.83
1.35 1.65 1.71 1.86 1.87
1.49 1.78 1.87 1.92 1.92
1.32 1.72 1.79 1.80 1.89
1.42 1.74 1.80 1.87 1.89 1.40 1.72 1.79 1.86 1.89
0.04* 0.04* 0.05 0.04* 0.04
0.06 0.06* 0.07 0.05 0.06
0.08 0.09 0.10 0.07 0.08
Root diameter (mm 2003 1 2004
0-20 cm 40-60 cm 80-100cm 0-20 cm 20-40 cm 40-60 cm 60-80 cm 80-100 cm
Irrigated Beaver 0.73 0.50 0.44 0.77 0.82 0.65 0.62 0.56
Soissons 0.58 0.45 0.42 0.58 0.67 0.59 0.57 0.57
134G 0.63 0.47 0.49 0.86 0.81 0.81 0.71 0.73
134E 0.82 0.48 0.49 0.59 0.70 0.63 0.64 0.63
Mean 0.69 0.47 0.46 0.70 - 0.75 0.67 0.63 0.62
Unirrigate
Beaver 0.55 0.50 0.66 0.67 0.80 0.64 0.57 0.58
Soissons 0.54 0.48 0.51 0.53 0.60 0.52 0.51 0.54
134G 0.52 0.48 0.55 0.51 0.73 0.54 0.59 0.53
134E 0.59 0.49 0.55 0.52 0.57 0.49 0.47 0.52
Mean 0.55 0.49 0.57 0.56 0.67 0.55 0.53 0.54
SED (df)
Irrigation(24) 0.06 0.02 0.02 0.04* 0.05 0.05* 0.02* *
0.03*
Genotype(24) 0.08 0.02 0.03 0.06* 0.07* 0.07 0.03 0 05
0.04 06 0
Ir xG (24) 0.11 0.03 0.05 0.08 0.09 0.10 . .
denotes significance level P=0.05
271

Table-VII b. Total root surface area (cm) at anthesis for the irrigated and unirrigated treatments for four wheat genotypes measured in different soil horizon depths in glasshouse in 2003 and 2004.
Total root surface area (cm
2003 2004
0-20 cm 40-60 cm 80-100 cm 0-20 cm 20-40 cm 40-60 cm 60-80 cm 80-100 cm
Irrigated Beaver 269 132 139 468 481 470 411 216
Soissons 147 79 120 296 294 278 304 264
134G 188 87 179 423 564 544 575 588
134E 347 129 176 296 309 432 449 439
Mean 237 107 153 371 412 431 435 377
Unirrigated
Beaver 114 90 351 371 360 372 312 365
Soissons 138 93 287 201 203 206 182 128
134G 116 81 271 283 211 284 367 297
134E 200 127 273 178 193 171 208 235
Mean 142 98 295 258 242 258 267 256
SED (df)
Irrigation(24) 42* 13 29* 44* 49* 44* 39* 50*
Genotype(24) 60 19 41 62* 70* 62* 55* 70*
Ir xG (24) 84 27 59 87 98 88 78 99*
denotes significance level P =0.05
272