From CIE 2006 physiological model to improved age-dependent and average colorimetric observers
40
1 From CIE 2006 Physiological Model to Improved Age- Dependent and Average Colorimetric Observers Abhijit Sarkar, 1, 2, * Florent Autrusseau, 2 Françoise Viénot, 3 Patrick Le Callet, 2 Laurent Blondé 1 1 Technicolor Research & Innovation, 1 av Belle Fontaine – CS 17616, 35576 Cesson-Sévigné Cedex, France 2 LUNAM Université, Polytech’Nantes, IRCCyN UMR CNRS 6597 (Institut de Recherche en Communications et Cybernétique de Nantes), Rue Christian Pauc, BP50609, 44306, Nantes 3 (Muséum national d’histoire naturelle, Centre national de la recherche scientifique, Ministère de la Culture et de la Communication) CRCC, USR3224, 36 rue Geoffroy-Saint-Hilaire, 75005 *Corresponding author: [email protected] Abstract: In the context of color perception on modern wide-gamut displays with narrow-band spectral primaries, we performed a theoretical analysis on various aspects of physiological observers proposed by CIE TC 1-36 (CIEPO06). We allowed certain physiological factors to vary, which was not considered in the CIEPO06 framework. For example, we analyzed that the long wave-sensitive (LWS) or medium wave-sensitive (MWS) peak-wavelength shift in the photopigment absorption spectra, a factor not modeled in CIEPO06, contributed more toward observer variability than some of the factors considered in the model. Further, we compared the color-matching functions derived from the CIEPO06 model and the CIE 10° standard colorimetric observer to the average observer data from three distinct subgroups of Stiles-Burch observers, formed on the basis of observer ages (22-23 years, 27-29 years and 49-50 years). The errors in predicting the ) (λ x and ) (λ y color- matching functions of the intra-group average observers in the long-wave and in the medium-wave range respectively were generally more in case of the CIEPO06 model compared to the 10° standard colorimetric observer, and manifested both in spectral and chromaticity space. In contrast, the short-wave sensitive ) ( 10 λ z function of the 10° standard colorimetric observer performed poorly compared to the CIEPO06 model for all three subgroups. Finally, a constrained nonlinear optimization on the CIEPO06 model outputs showed that a peak-wavelength shift of photopigment density alone could not improve the model prediction errors at higher wavelengths. As an
-
Upload
independent -
Category
Documents
-
view
3 -
download
0
Transcript of From CIE 2006 physiological model to improved age-dependent and average colorimetric observers

1
From CIE 2006 Physiological Model to Improved Age-
Dependent and Average Colorimetric Observers
Abhijit Sarkar, 1, 2, * Florent Autrusseau, 2 Françoise Viénot, 3 Patrick Le Callet, 2 Laurent
Blondé 1
1Technicolor Research & Innovation, 1 av Belle Fontaine – CS 17616, 35576 Cesson-Sévigné
Cedex, France
2LUNAM Université, Polytech’Nantes, IRCCyN UMR CNRS 6597 (Institut de Recherche en
Communications et Cybernétique de Nantes), Rue Christian Pauc, BP50609, 44306, Nantes
3(Muséum national d’histoire naturelle, Centre national de la recherche scientifique, Ministère
de la Culture et de la Communication) CRCC, USR3224, 36 rue Geoffroy-Saint-Hilaire, 75005
*Corresponding author: [email protected]
Abstract:
In the context of color perception on modern wide-gamut displays with narrow-band spectral
primaries, we performed a theoretical analysis on various aspects of physiological observers
proposed by CIE TC 1-36 (CIEPO06). We allowed certain physiological factors to vary, which was
not considered in the CIEPO06 framework. For example, we analyzed that the long wave-sensitive
(LWS) or medium wave-sensitive (MWS) peak-wavelength shift in the photopigment absorption
spectra, a factor not modeled in CIEPO06, contributed more toward observer variability than some
of the factors considered in the model. Further, we compared the color-matching functions derived
from the CIEPO06 model and the CIE 10° standard colorimetric observer to the average observer
data from three distinct subgroups of Stiles-Burch observers, formed on the basis of observer ages
(22-23 years, 27-29 years and 49-50 years). The errors in predicting the )(λx and )(λy color-
matching functions of the intra-group average observers in the long-wave and in the medium-wave
range respectively were generally more in case of the CIEPO06 model compared to the 10°
standard colorimetric observer, and manifested both in spectral and chromaticity space. In contrast,
the short-wave sensitive )(10 λz function of the 10° standard colorimetric observer performed
poorly compared to the CIEPO06 model for all three subgroups. Finally, a constrained nonlinear
optimization on the CIEPO06 model outputs showed that a peak-wavelength shift of photopigment
density alone could not improve the model prediction errors at higher wavelengths. As an

2
alternative, two optimized weighting functions for each of LWS and MWS cone photopigment
densities led to significant improvement in the prediction of intra-age group average data for both
22-23 years and 49-50 years age-groups. We hypothesize that the assumption in the CIEPO06
model that the peak optical density of visual pigments does not vary with age is false, and is the
source of these prediction errors at higher wavelengths. Correcting these errors in the model can
lead to an improved age-dependent observer, and can also help update the current CIE 10° standard
colorimetric observer. Accordingly, it would reduce the discrepancies between color-matches with
broadband spectral primaries and color matches with narrowband spectral primaries.
OCIS codes: 330.0330, 330.1715, 330.1720, 330.1730, 330.5310, 120.2040.
1. Introduction
The most fundamental aspect of applied colorimetry is the trichromacy of our visual system, which allows
us to represent any color in terms of its tristimulus values. Computing tristimulus values for any object
color requires the use of the spectral reflectance of the object color, the spectral power distribution of the
scene illuminant, and the spectral characteristics of a colorimetric observer. For the color imaging
community, it is of interest to investigate which is a better representation of real observer data, CMFs
derived from CIE 2006 physiologically-based observer model, or the CIE 10° standard colorimetric
observer. This issue has been explored through a theoretical analysis performed in the context of display
colorimetry.
1.A. CIE 2° and 10° Standard Colorimetric Observers
In 1931, the CIE (Commission Internationale de l’Éclairage) defined a standard observer for colorimetry,
based on Wright’s [1] and Guild’s [2] 2° color matching data. However, the basic datasets were
transformed to incorporate V(λ), the luminous efficiency function of the CIE standard photometric
observer [3], into the standard colorimetric observer. Incorporating both photometric and colorimetric
characteristics was motivated by a need to simplify hardware computations [4], but this has been a major
source of criticism of CIE 1931 standard colorimetric observer, since the CIE standard photometric
observer was based on an entirely different set of psychophysical task than color matching [5]. CIE 1931
standard colorimetric observer led to spectral estimation error caused by the underestimation of
luminosity at short wavelengths with the CIE standard photometric observer. Revisions of the CIE
standard photometric observer V(λ) function below 460 nm were proposed by Judd [6] in 1951, and

3
further revision below 410 nm was proposed by Vos [7] in 1978. The former was widely accepted in the
vision science community, and the latter resulted in a CIE recommendation in 1988 in the form of a
supplementary observer VM(λ) for photometry [8], but the color imaging industry continued to use the
original CIE 1931 standard colorimetric observer derived from 2° color matching data, applicable to small
fields.
In 1964, CIE recommended a large-field standard colorimetric observer based on the work of Stiles and
Burch [9] and Speranskaya [10]. Stiles and Burch maintained high photopic luminance of the matching
fields and incorporated mathematical corrections to exclude the effect of rod intrusion in long-wavelength
color matches. The color-matching function )(λy represents the relative spectral luminous efficiency
function of the CIE 10° standard colorimetric observer, but the photometric standard still uses )(2 λy from
the CIE 2° standard colorimetric observer to define luminance, even for large-field stimuli.
For many practical industrial applications, the use of the 2° standard colorimetric observer is
questionable, as the field-of-view is typically much larger than 2°. Indeed, many industrial engineers have
chosen to use )(10 λy in colorimetric applications. However, because of the absence of rod contribution,
and more importantly, because of individual differences in the visual system, it has been observed that
even the CIE 10° standard colorimetric observer does not always correspond to real observer matches for
large fields.
1.B. CIE 2006 Physiologically-Based Observer (CIEPO06)
In 2006, CIE’s technical committee TC 1-36 published a report [11] (described hereafter as CIEPO06, an
abbreviated form of CIE 2006 physiological observer) on the choice of a set of Color-matching functions
(CMFs) and estimates of cone fundamentals for the color-normal observer. The CIEPO06 model is
largely based on the work of Stockman and Sharpe [12]. Starting from 10° CMFs of 47 Stiles-Burch
observers [9], the model defines 2° and 10° fundamental observers and provides a convenient framework
for calculating average cone fundamentals for any field size between 1° and 10° and for an age between
20 and 80.
1.C. Individual cone fundamentals
In its approach to construct a fundamental observer, technical committee CIE TC 1-36 has ignored
individual variability [11] [13]. A few studies have dealt with individual variations of color-matching
functions, analyzing the data collected by Stiles and Burch using 10° fields [14], examining the
differences between the CMFs of the CIE 1931 standard colorimetric observer, the Judd’s revision of this
set and the set of 2° CMFs collected by Stiles and Burch [15], comparing inter-individual and intra-

4
individual variability of experimental CMFs [16]. Wyszecki and Stiles [17] (page 348) produced a global
statistical analysis of the dispersion of the data collected by Stiles and Burch using 10° fields. In the last
ten years, a few sets of matching results have been generated at low or moderate luminance levels to
investigate intra- and inter-observer variability [18][19] and test additivity and transformability of color
matches [20] [21]. One study of nine observers’ color-matching functions concluded that a main cause of
the individual difference was the difference of individual spectral lens density [22]. Individual variations
of Rayleigh matches have also been examined experimentally [23] [24] [25] [26] or theoretically [27].
Although these studies strived to relate the variation of color matches to underlying physiological factors,
they failed to model individual effects of these factors in a practical manner that could be implemented in
industrial applications.
In this paper, we take advantage of the framework developed in CIEPO06 to examine through theoretical
analysis the effect of age on the CMFs of individual observers and on individual color matches as viewed
on displays.
1.D. General colorimetric transforms
Each set of CIEPO06 cone fundamentals can be converted to CMFs through a linear transformation. At
the time of this work, the final 3x3 transformation matrix for such conversion was not yet made available
by CIE TC 1-36. Two approaches could yield a proper linear transformation. We computed an
approximate 3x3 LMS-to-XYZ transformation matrix from the available CIE 1964 10° )(10 λx ,
)(10 λy , )(10 λz standard colorimetric observer functions and the average )(10 λN
SBl , )(10 λN
SBm , )(10 λN
SBs
cone fundamentals of 47 Stiles-Burch observers each normalized to unity. The transformation matrix is
given below:
=
)(
)(
)(
2.0735820.0404530.024300-
0.013360-0.3330430.698648
0.4195121.321620-1.905378
)(
)(
)(
10
10
10
10
10
10
λ
λ
λ
λ
λ
λ
N
SB
N
SB
N
SB
s
m
l
z
y
x
(1)
The above matrix was used at all times for converting any normalized L, M, S cone fundamentals from
Stiles-Burch dataset into CIE XYZ like CMFs similar to 10° )(10 λx , )(10 λy , )(10 λz functions. It is
reasonably close to the matrix published earlier by other researchers [28]. Note that in [28], a negative
sign was accidentally omitted in the 1st row, 2nd column of the transformation matrix (Eq. 1).
We computed another approximate 3x3 LMS-to-XYZ transformation matrix from the CIE 10° standard
colorimetric observer functions and the CIEPO06 model cone fundamentals )(1006 λCIEl , )(1006 λCIEm ,

5
)(1006 λCIEs applicable for an age of 32 and 10° field size without any normalization of the cone
fundamentals.
=
)(
)(
)(
0.0274320.0001670.000089-
0.000181-0.0013580.002520
0.0055500.005386-0.006873
)(
)(
)(
10
10
10
06
06
06
10
10
10
λ
λ
λ
λ
λ
λ
CIE
CIE
CIE
s
m
l
z
y
x
(2)
This transformation matrix was used in the analysis of the effect of various physiological factors on
CIEPO06 cone fundamentals, where normalization is not desirable. If normalized CIEPO06 cone
fundamentals are used, the resulting transformation matrix is very close to that of Eq. (1).
1.E. The CIEPO06 model
The CIEPO06 model is a convenient and effective mathematical tool for understanding how various
physiological factors affect the cone fundamentals, and thus the CMFs. A brief review of the model will
be helpful in better understanding the analysis that follows.
CIEPO06 framework [11], shown in Fig. 1, involves two parameters, namely, the field-size, varying
between 1° and 10°, and the observer age, varying between 20 and 80. Three physiological factors have
been incorporated in the CIEPO06 model, in the form of spectral optical density functions for: a) lens and
other ocular media absorption, b) macular pigment absorption, and c) visual pigments in the outer
segments of photoreceptors. Out of these, the ocular media optical density function has an age-dependent
and an age-independent component. The macular pigment optical density function consists of a peak
function and a relative function, where only the peak function varies with the field size. Similarly, the
visual pigment optical density has two components, the peak as a function of the field size, and the low-
density spectral absorbance that is independent of any parameters.
The CIEPO06 cone fundamentals can be written in a simplified form as in Eq. (3) [11]. Al(λ), Am(λ), As(λ)
are the low-optical density spectral absorbance for long-, medium- and short-wave sensitive cones
respectively. Dvis,l, Dvis,m and Dvis,s are peak optical densities of the visual pigments for three cones. Dmac(λ)
and Docul(λ) are the optical densities of the macular pigment and the ocular media (including the lens)
respectively, with the optical density (or absorbance) being the log10 function of the inversed transmission
of the media: )/1(log10 TD =
[ ][ ][ ] )()()(.
)()()(.
)()()(.
1010101)(
1010101)(
1010101)(
,
,
,
λλλ
λλλ
λλλ
λ
λ
λ
oculmacssvis
oculmacmmvis
oculmacllvis
DDAD
DDAD
DDAD
s
m
l
−−−
−−−
−−−
⋅⋅−=
⋅⋅−=
⋅⋅−=
(3)

6
While these three physiological factors are important contributors to observer variability, there is another
important but more complex source of variability that has not been included in the CIEPO06 model. A
number of studies have suggested that individual differences in the color vision are partly due to the
variations in the peak wavelength (λmax) of the cone photopigment [29]. These differences can be due to
individual variability, but can also be due to a variation in genetic composition or polymorphism, for
example, a single amino-acid substitution (Alanine for Serine) at position 180 of the long-wave sensitive
(LWS) photopigment opsin genes [30].
The rest of the paper is organized as follows. In the next section, a theoretical analysis investigating the
relative importance of various physiological factors on display color perception is presented. In Section 3,
the average Stiles-Burch observer data from three different age-groups are compared with the
corresponding CIEPO06 model predictions and the CIE 10° standard colorimetric observer. The
perceptual effect of the prediction errors in these two cases are then explored in the context of display
colorimetry in Section 4. Next, Section 5 presents a constrained nonlinear optimization of the CIEPO06
model, performed in an attempt to improve the prediction errors for various age-groups. We conclude by
summarizing the results obtained from these theoretical analyses in Section 6. An exploratory analysis of
the display results has been presented at a conference [31].
2. Effect of various physiological factors on display color perception
Individual variation in color perception depends on the spectral characteristics of the stimuli. As Smith
and Pokorny [32] have observed: “With the generally broadband spectra of reflective materials, factors
such as lens transmission or macular pigment density provide correlated changes in the spectral
distribution of light arriving at the retina from different samples. Thus there may be a translation of color
axes but little rotation…Specification based on narrow-band trichromatic primaries may be more or less
subject to individual variation, depending on the relation between the spectra of the biological variables
and the spectra of the colorimetric primaries”. In view of this observation, two questions arise: i) how do
various physiological factors described in the previous section affect the color perception on a given
display? And, ii) how do these effects vary between a display with broadband primaries and another with
narrow-band primaries? The purpose of the analysis described in this section was to investigate these two
issues.
2.A. Displays used in the analysis
We compared the effect of various factors in terms of color perception on two displays with different
spectral characteristics. The first was a Sony BVM32 Cathode Ray Tube (CRT) display widely used as a

7
reference studio display (hereafter referred to as Ref-CRT). The second was a Hewlett-Packard
DreamColor LP2480zx professional 30-bit Wide-Gamut Liquid Crystal Display (LCD) with LED
backlight (hereafter referred to as WG-LCD).
The spectral power distributions of the primaries of the two displays are shown in Fig. 2. There is a
significant difference in the spectral characteristics between the two displays. WG-LCD is representative
of modern wide-gamut displays with peaky primaries, and Ref-CRT is representative of a typical CRT
display, and of HDTV broadcasting standard references. 3x3 primary tristimulus matrices of the two
displays were computed, which represented the linear relationship between the XYZ tristimulus values
and the RGB channel values. Note that normally the digital counts first need to be corrected (linearized)
for the display nonlinearity (gamma correction) before computing the primary tristimulus matrix.
However, since this analysis is strictly theoretical, and since gamma correction does not affect rest of the
computations, display nonlinearity has been ignored in this work. Thus, using the primary tristimulus
matrix of a given display, any set of XYZ values could be converted into the corresponding set of RGB
channel values and vice versa.
2.B. Method of analysis
In this work, the relative importance of the four physiological factors described earlier on the cone
fundamentals were explored within the framework of CIEPO06. Cone fundamentals for 10° field size and
an observer age of 32 were computed by independently modifying the contribution of individual factors.
In the first analysis published previously [31], we completely removed the contribution of various factors
one at a time, by setting the optical density term to zero in case of ocular media and macular pigment
absorption, by setting the peak optical density to unity in case of low-density absorption spectra
(signifying very high absorption taking place in the outer segments of visual pigments), and by shifting
the peak wavelength of the LWS photopigment optical density by 250 cm-1 toward shorter wavelengths in
case of peak wavelength shift. In the second analysis presented in this paper, we independently modified
the contributions of various physiological factors as follows:
i) mean optical density of ocular media varied by ±25%
ii) peak optical density of macular pigment varied by ±25%
iii) peak optical density term for low-density photopigment relative absorption spectra varied by
±25% (0.38 is nominal)
iv) peak wavelength shift of the cone photopigment optical density in the outer segment of the
photoreceptor: a) LWS peak shift by -4 nm (toward shorter wavelength), b) medium wave-
sensitive (MWS) peak shift by +4 nm (toward longer wavelength)

8
Such modifications of optical densities by the same percentage allow us to compare the effect of various
factors. For cases (i) and (iv), the modifications are the same as those reported by Smith and Pokorny
[32]. A high optical density in case (iii) signifies higher photoreceptor self-screening, resulting in the
broadening of the photopigment relative absorption spectra [33] (page 65-66), while case (iv) signifies
LWS and MWS polymorphism described earlier. For case (iv), the peak wavelength λ was first shifted in
the wavenumber scale (ν = 107/ λ, where ν is in cm-1 and λ is in nm), the cone absorptance spectra were
re-sampled, modified cone fundamentals were computed and converted from the quanta to energy units,
and finally were renormalized. Note that case (iv) considers LWS and MWS peak wavelength shifts
independently.
For each planned variation of these four factors, a set of modified CIEPO06 cone fundamentals was
computed, and were compared to corresponding CIEPO06 cone fundamentals under normal conditions.
The difference between the two sets of functions indicates the contribution of a given physiological
factor. The difference was computed in terms of Euclidean distance in the cone fundamental space. Note
also that we use CIEPO06 10° cone fundamentals, unlike Smith and Pokorny 2° cone fundamentals as in
[32].
In order to simulate the effect of various physiological factors when viewing color stimuli on different
displays, chromaticities of these stimuli for a given display and a given set of modified CIEPO06 cone
fundamentals must be computed. In this analysis, seven test stimuli were selected from various parts of
the common gamut of the CRT and the LCD. These stimuli were chosen such that they covered the whole
common display gamut in the CIE 1976 (u', v') coordinate system (Fig. 3). The chromaticity of the
seventh stimulus was close to that of display white. These coordinates were converted to XYZ
colorimetric system through a straightforward transformation, as shown in Eq. (4) below. The
chromaticity coordinates are listed in Table 1.
Yy
zZY
y
xX
vu
vy
vu
ux
==
+−=
+−=
;
;12'16'6
'4;
12'16'6
'9
(4)
Smith and Pokorny [32] investigated the effects of different physiological factors on two sets of
chromaticities at a nominal luminance of 8 cd/m², varying along the horizontal and vertical lines in the
cone-troland chromaticity diagram. This luminance level is rather low for most industrial applications,
thus we used a constant luminance of 25 cd/m² for seven distinct chromaticities described in the next
section. For our application context (content production for the film industry), we considered this an
appropriate luminance level for the displays.

9
From tristimulus values (X10, Y10, Z10) of the test stimuli, the RGB channel values (R, G, B) required to
produce these colors on the two displays were computed using the display primary tristimulus matrices,
as shown in Eq. (5). The primary tristimulus matrix for a display is formed by the tristimulus values of
peak primaries.
∗
=
−
10
10
10
1
max,max,max,
max,max,max,
max,max,max,
Z
Y
X
ZZZ
YYY
XXX
B
G
R
bgr
bgr
bgr
(5)
The product of the RGB values for each channel and the spectral data of the corresponding display
primaries [Ppri-R(λ), Ppri-G (λ), Ppri-B(λ)], when added for all three channels, gave the spectral power
distribution of the test stimuli for a given display, as per Eq. (6). These spectral data were used to
compute tristimulus values in the subsequent step, described next. In computing the spectral power
distribution of the test stimuli, we assume the displays have perfect additivity and proportionality, and
also stable primaries.
[ ]
∗=
−
−
−
)(
)(
)(
)(
λ
λ
λ
λ
Bpri
Gpri
Rpri
stim
P
P
P
BGRP (6)
2.C. Derivation of cone troland coordinates from a given set of display channel values
The derivation of cone troland coordinates from Smith-Pokorny 2° cone fundamentals has been described
in detail elsewhere [34][35] [36]. The method used in this study for deriving the cone troland coordinates
corresponding to a given set of display channel values and the CIEPO06 10° cone fundamentals is
described now.
MacLeod and Boynton [36] proposed a chromaticity diagram (lMB, sMB) [see Eq. (7)], where the projective
plane is an equiluminant chromaticity plane. A basic assumption in forming the MacLeod-Boynton
chromaticity diagram is that short-wavelength sensitive cone fundamental )(λs does not contribute to
luminance. In this diagram, the abscissa lMB = L/(L+M) represents the equal and opposite change in LWS
and MWS cone excitations, i.e. an increase in the LWS luminance is counterbalanced by an equal
decrease in MWS luminance, but the sum is unity. The ordinate sMB = S/(L+M) denotes the level of short-
wave sensitive (SWS) cone excitation.
ML
Ss
ML
Ll MBMB +
=+
= ; (7)
10
In order to scale the ordinate axis, the concept of cone trolands has been introduced. Since the troland is a
unit used to express a quantity proportional to retinal illuminance, the amount of L-cone trolands and M-
cone trolands indicates the respective contribution of LWS and MWS cone excitations to the retinal
illuminance. Since SWS cones do not contribute to luminance, S-cone troland must be appropriately
defined. In the representation proposed by Boynton and Kambe [37], one troland of the equal energy
spectrum amounts to one S-cone troland.
In case of CIEPO06 cone fundamentals which are the same as Stockman-Sharpe 10° cone fundamentals
each scaled to unity peak, the luminous efficiency function is given by Eq. (8) [38]. However, as our
analysis involves comparing normal and modified cone fundamentals, any normalization must be avoided
since it can unduly shift the peak wavelength of modified cone fundamentals, making it difficult to infer
whether such shift is due to a physiological factor or because of normalization.
When cone fundamentals are not normalized to unity peak, luminous efficiency function can be obtained
by adding LWS and MWS cone fundamentals in 1.98:1 ratio [same ratio as in Eq. (8)], thus LWS cone
fundamentals were scaled by 1.98 to begin with [Eq. (9)]. No scaling was used for SWS cone
fundamentals. Next, the product of scaled cone fundamentals and the test stimulus spectral power
distribution [Pstim(λ)] obtained from Eq. (6) was computed for each wavelength and summed over the
whole wavelength range, resulting in LMS tristimulus values in the cone fundamental space [Eq. (10)].
The resulting tristimulus values were specific to a given display and a given set of modified cone
fundamentals, computed from various normal and modified CIEPO06 10° cone fundamentals. Macleod-
Boynton chromaticity coordinates (lMB, sMB) were then obtained from LMS tristimulus values as described
before [Eq. (7)].
)(349676.0)(692839.0)(10, λλλ mlVSS += (8)
98.1)()( ∗= λλ llSC (9)
)(
)(
)(
)(
λ
λ
λ
λ
stim
SC
P
s
m
l
S
M
L
∗
=
(10)
Again, to comply with the definition of S-cone trolands, Macleod-Boynton s-coordinates (sMB) were
scaled such that s-coordinate of equal energy white would be equal to unity. In case of CIEPO06 10° cone
fundamentals, the computed scale factor was 21.7209.
The luminance values [Ystim] of the test stimuli were obtained by vectorially adding the peak primary
luminance values [YRmax, YGmax, YBmax] scaled by the respective channel values, as shown in Eq. (11).

11
[ ]
∗=
max
max
max
B
G
R
stim
Y
Y
Y
BGRY (11)
Using the above method, relative cone trolands were computed for the seven test stimuli and are plotted in
Fig. 4.
Using an observer model different from the 10° standard colorimetric observer is likely to distort the
uniformity of u'v'Y color space, the extent of which depends on the specific observer model used.
However, in our analysis we hypothesize that in a small region of three-dimensional space around a given
color, the Euclidean distances for various observer CMFs can be compared. Because of this issue, use of
more complex color space like CIELAB and color difference equations was avoided as they could
possibly amplify uniformity distortions. u'v'Y was chosen over xyY because of better visual uniformity.
2.D. Results
In Fig. 5 the (u', v') chromaticity shifts of the seven test stimuli are shown, depicting the effects of
modified cone fundamentals on color perception on the CRT (green symbols) and the LCD (red symbols).
The squares represent a 25% increase in the optical density of the ocular media (Fig. 5a), of the macular
pigment (Fig. 5b) and of the cone photopigment (Fig. 5c), and in Fig. 5d, a shift of the peak LWS cone
wavelength by 4 nm toward shorter wavelengths (see Section 3B). The triangles represent a 25% decrease
in the optical density of the ocular media (Fig. 5a), of the macular pigment (Fig. 5b) and of the cone
photopigment (Fig. 5c), and in Fig. 5d, a shift of the peak MWS cone wavelength by 4 nm toward longer
wavelengths. Fig. 6 shows the same chromaticity shifts in the cone troland chromaticity diagram. Table 2
represents the root-mean-square (RMS) of the (u', v') coordinate shifts of seven displayed stimuli due to
each of the four factors (scaled by 1000). Mean and maximum RMS differences are shown for both
displays.
All four factors do not affect the target specification to the same extent. Out of all four factors,
photopigment peak optical density affects the observer color perception the most, as evident from Table
2. In case of ocular media and macular pigment absorption, the change in color perception occurs along
the same direction: toward yellow-green when the optical density is increased and toward blue when it is
decreased (Figs. 5a and 5b). This is true even for the test stimulus close to the display white. These
directions of change are in line with Wyszecki and Stiles’ results [17] (pp 352). However, the effect of
macular pigment absorption is significantly less than ocular media absorption, in fact it is the least
significant physiological factor when compared to the others, as per Table 2. The change due to macular
pigment absorption is marginally larger for LCD as compared to the CRT, and is the opposite in case of

12
ocular media absorption. That ocular media optical density plays a dominant role in observer variability,
even within the same age-group, has been reported by several vision researchers. Pokorny et al [39]
observe that “studies which include a large number of observers of similar age indicate that there is
considerable variability in estimated lens density at any given age. For example, van Norren and Vos
noted that the difference between the five highest and five lowest of Crawford's 12 observers was greater
than one log unit at 400 nm. This variation may be even more pronounced in an older group of subjects”.
Note that in terms of cone excitation, largest change due to modification of ocular media and macular
pigment absorption occurs for the blue color (test stimulus 6).
Finally, in case of CRT, the effect of photopigment peak wavelength shift is as large as that of ocular
media absorption, particularly the LWS cone shift. In case of LCD, the LWS cone peak wavelength shift
is by far the second most important factor in influencing display color perception, after photopigment
peak optical density.
2.E. Analysis of results
Interestingly, the direction of change due to the modification of the photopigment peak optical density is
different for the CRT and the LCD, both in terms of (u', v') chromaticity coordinates (Fig. 5c) and relative
cone trolands (Fig. 6c). This difference is more apparent in green-red region of color space and reduces as
we go toward blue. We can assume that relative position of display primaries with respect to the cone
fundamentals has an influence on such difference in directional effects between the two displays.
However, other physiological factors do not show such trend. Another observation is that for the reddish-
yellow (test stimulus #2), red (test stimulus #3) and magenta (test stimulus #5), the directions of change
due to LWS and MWS peak wavelength shifts (Figs. 5d and 6d) are the same. An explanation of this
observation is that the LWS and MWS peaks move toward each other. For other stimuli, the effect of
peak wavelength shifts is not significant
Since the photopigment peak optical density has the strongest influence in display color perception
compared to other factors, and since largest chromaticity shift due to this factor occurs in blue, we can
assume that individual variations in the color vision of a large population of real observers will have a
significant impact on the perception of blue.
This analysis also shows that the photopigment peak wavelength shift is an important physiological factor
affecting display color perception, particularly in case of modern displays with narrow-band primaries
(Table 2). The difficulty in modeling this factor imposes serious limitation on the age-dependent
observers of CIEPO06. Observer variability within a given age-group due to such factors cannot be

13
predicted, even though this variability can be more significant than the effects of some of the factors
already included in the model.
This analysis has some inevitable constraints. It is difficult to predict the extent to which various
physiological factors affect the color perception of an individual observer. It is also difficult to ascertain
what amount of peak wavelength shift should physiologically correspond to a 25% change in peak optical
densities. We chose a peak wavelength shift of 4 nm since this is the largest shift observed due to the
serine-alanine amino acid substitution at position 180 of the photopigment opsin genes, a common form
of polymorphism [30]. We hypothesize that the conditions analyzed here all represent extreme changes in
four physiological factors, and thus are reasonable to compare. In spite of the above constraint, this
analysis highlights the relative importance of various factors in affecting color perception on displays.
3. Intra-age group average observer prediction with CIEPO06 model and
the CIE 10° standard colorimetric observer
As already suggested in the past, question arises whether it could be worthwhile to explore if the observed
inter-subject differences in color matches could be predicted by adjustment of more of the CIEPO06
parameters. In this study, experimental data from the 1959 Stiles-Burch study [9] involving 47 observers
were re-examined, since this is the most comprehensive visual dataset for color vision available to date.
3.A. CIEPO06 Age Parameters for Real Observers
The age parameter was introduced in the CIEPO06 model to take into account the difference in absorption
in the ocular media, in particular the lens, between the aged and the young observers. At this time, the age
dependencies of the absorption by the macular pigment as well as the densities of the visual pigments
were considered of minor influence. The two-component age function of the CIEPO06 model originated
from several experimental bases which were thought to be representative of large groups of observer [39].
Thus, the CIEPO06 age parameter does not necessarily correspond to the age of the real Stiles-Burch
observers. In other words, predicted model functions that best match the real observer data may not
always be obtained using real observer ages. This may happen because of random observer variability,
and/or because of the exclusion of one or more physiological factors from the CIEPO06 model. These
factors could be age-independent, like the peak wavelength shift of the LWS or MWS cone photopigment
as discussed earlier, or these could be age-dependent physiological factors not considered in CIEPO06.
CIE committee TC 1-36 also recognized this restriction by pointing out that CIEPO06 fundamental
observer was a theoretical construct [11]. In this analysis, we determined the CIEPO06 age parameters
that resulted in the best predictions of each individual Stiles-Burch observer cone fundamental data. For

14
each individual Stiles-Burch observer, three CIEPO06 age parameters were derived so as to fit as closely
as possible the three cone fundamentals, respectively. Two different methods were used. In the first
method, we computed the correlation coefficients between the normalized cone fundamentals for each
Stiles-Burch observer, using Eq. (1) as explained in Section 1D, and those corresponding to all possible
CIEPO06 age parameter values between 20 and 80 (a total of 61). The corresponding CIEPO06 age was
the one yielding the highest correlation coefficient for a given cone fundamental. This process was
repeated for all three cone fundamentals and for all 47 Stiles-Burch observers. In the second method,
corresponding CIEPO06 age for each Stiles-Burch observer was predicted by minimizing the RMS errors
between the normalized cone fundamentals for each Stiles-Burch observer, and those corresponding to all
possible CIEPO06 age parameter values between 20 and 80.
3.B. Comparison of CIEPO06 predicted and real ages of Stiles-Burch observers
In Fig. 7, the CIEPO06 predicted ages obtained using the correlation coefficient (CORR) method have
been plotted against the actual ages of 47 Stiles-Burch observers. The second method (RMSE) produced
very similar results. No direct correspondence was found between the real and predicted ages.
The gain offered by the adjusted CIEPO06 age over the real age could be validated by examining the
prediction of matches of equal-energy white. Fig. 8 shows (x, y) chromaticity of equal-energy white
computed with CMFs derived from CIEPO06 cone fundamentals for each Stiles-Burch observer.
CIEPO06 cone fundamentals were obtained by using corresponding ages from both methods (CORR and
RMSE) as well as by using actual observer ages. Matches obtained with real observer cone fundamentals
are also plotted. While CIEPO06 with age correspondence (with either method) yields greater observer
variability than CIEPO06 with actual observer ages, it fails to explain all the variability in the real
observer data, particularly along the ordinate.
The mean standard deviations of the CIEPO06 cone fundamentals from the 47 Stiles-Burch observer data
averaged over all observers are plotted in Fig. 9. The LWS, MWS and SWS cone fundamentals
obtained by using corresponding ages from the two methods (CORR and RMSE) and by using actual
observer ages are shown. Mean (central mark), as well as the 25th and 75th percentiles (dotted bars) of
standard deviations are higher when real observer ages are used in the model. The error is higher for LWS
and MWS cone fundamentals than for SWS cone fundamental. This further shows that by adjusting the
age parameter, the CIEPO06 prediction of real Stiles-Burch observer data is improved.
3.C. Grouping Stiles-Burch Observers with respect to age
To conform to the age-dependent observer model of CIEPO06, three dominant age-groups among the
Stiles-Burch observers were identified. The groups were formed in such a way that the age difference

15
between observers within any group was not more than two years. This constraint allowed grouping of
only 22 out of 47 observers. Six observers with ages between 22 and 23 formed Group-1, ten observers
with ages between 27 and 29 consisted Group-2 and another six observers with ages between 49 and 50
were placed in Group-3. In the rest of the analysis, these three observer groups are used. For each group,
CIEPO06 age correspondence for the average data was established using the correlation coefficient
method for the average Stiles-Burch cone fundamentals for the group and CIEPO06 cone fundamentals
for all possible ages. In the following sections, we obtained two sets of CIEPO06 CMFs for each observer
group, CIEPO06 CMFs obtained by using adjusted age parameter values given by the correlation
coefficient method, and CIEPO06 CMFs obtained by using actual average observer ages.
3.D. Comparing CIEPO06 Model Prediction and 10° Standard Colorimetric Observer with
Intra-Group Average
Once three groups of observers were identified, the variability of CMFs was examined within each group.
The examination put more emphasis on the regions of the spectrum where )(10 λx , )(10 λy , )(10 λz peak.
In Fig. 10, intra-group minimum, maximum and average CMF values are shown along with the 10°
standard colorimetric observer CMFs, the CIEPO06 model predictions, with age correspondence and with
real ages. Table 3 lists the results of a statistical comparison of the Stiles-Burch observer CMFs, 10°
standard colorimetric observer and CIEPO06 model predictions with age correspondence and with real
ages. Values corresponding to )(10 λx , )(10 λy , )(10 λz functions, in the corresponding long-, medium-
and short- wavelength ranges for each group are shown. The 3rd column in Table 3 shows the intra-group
standard deviation of the Stiles-Burch data (note that standard deviation has the same units as the data),
signifying intra-group observer variability. Following three columns list absolute difference of various
functions from the intra-group mean, averaged over all wavelengths. The three functions considered here
are i) 10° standard colorimetric observer, ii) CIEPO06 with real observer ages as input, and iii) adjusted
CIEPO06 ages with age correspondence as input. The absolute differences of the functions were
multiplied by three weighting functions (for LWS, MWS and SWS respectively) before averaging over all
wavelengths. The weighting functions were computed by dividing the three intra-group average Stiles-
Burch observer CMFs by their respective sum over all wavelengths. The role of the weighting functions
was to assign more weights to the values around the peak than those in the lower end of the ordinate,
while ensuring the weights were proportional to original observer data. Note that since the )(10 λx ,
)(10 λy , )(10 λz CMFs do not have the same ordinate scale, the rows should not be compared as such.
As shown in Fig. 10 and Table 3, in case of x-CMFs for Group-1 and -3, both original CIEPO06 model
predictions with real ages and 10° standard colorimetric observer deviate from the intra-group average.

16
CIEPO06 model with real observer ages generally performs similar to or worse than the 10° standard
colorimetric observer )(10 λx and )(10 λy CMFs. For Group-1 and -3, the age correspondence method
mostly improves CIEPO06 predictions, and is mostly better than the standard colorimetric observer. For
Group-2, the prediction error is relatively low even without age correspondence, indicating CIEPO06
model’s age parameter works well for the age group of 27-29. This is not surprising since the average
observer age in the Stiles-Burch study, on which CIEPO06 is based, was 32. For Group-3 concerning
aged observers, CIEPO06 performs worse than the standard colorimetric observer for )(10 λx and
)(10 λy CMFs. The errors in the original model prediction are comparable to the intra-group standard
deviation, indicating that the prediction errors are statistically significant.
As far as the )(10 λz CMF is concerned, the CIEPO06 model produces markedly better results compared
to the CIE 10° standard colorimetric observer, even without age correspondence. On an average, the
reduction in mean absolute difference is more than 50%. )(10 λz CMF also shows high standard deviation
compared to )(10 λx and )(10 λy , indicating that the high prediction error of the standard colorimetric
observer is, at least partially, due to observers having short wavelength cone sensitivity significantly
different from the average. As explained in Section 2D, there is high variability in ocular media optical
density among observers, which is more pronounced among higher age-group observers [39].
Presumably, this variability will manifest more significantly in the blue region of color space. It is logical
to hypothesize that in the process of averaging over whole population of all ages, observers significantly
different from the majority unduly affect the average. Within the constraints of current analysis, CIEPO06
seems to offer an improvement over the 10° standard colorimetric observer in predicting intra-age group
average z-functions.
4. Display colorimetry: comparison of CIEPO06 CMFs and the CIE 10°
standard colorimetric observer
Any statistical method used to compare the model predictions with real observer data is incomplete
without an analysis of the perceptual effect of the prediction errors. Thus, an additional analysis was
performed to simulate the effect of the deviations of CIEPO06 model predictions and the CIE 10°
standard colorimetric observer from the average intra-group observer data on display color perception.
The same method of computation of (u', v') tristimulus values for the seven test stimuli was followed as
was used for analyzing the effect of various psychological factors, described earlier. The only difference
in this case is in the last step. The spectral power distributions of the test stimuli, obtained from the

17
channel values and the spectral data of the display primaries, were integrated with either the CIEPO06
CMFs with age correspondence, or the CIEPO06 CMFs with real ages, or the CIE 10° standard
colorimetric observer to obtain the (u', v') specification. (u', v') RMS distances were computed between
coordinates corresponding to Stiles-Burch intra-group average (u'av,SB, v'av,SB) and those corresponding to
various model predictions (u'pred, v'pred), as shown in Eq. (12). In this equation, the distances are
normalized by (u'av,SB, v'av,SB), the coordinates for Stiles-Burch intra-group average data. Such
normalization allows us a comparison of relative magnitudes of various distances.
2
,
,
2
,
,
'
''
'
''100
−+
−⋅=
SBav
SBavpred
SBav
SBavpred
v
vv
u
uurms (12)
Table 4 lists these normalized distances computed for the LCD. For the CRT, the RMS distance
differences between chromaticities predicted by the CIE 10° standard colorimetric observer and CIEPO06
model were less apparent and are not shown. Note that all these distances are computational color
differences between actual and model-predicted chromaticities, and simply help us compare model
prediction errors in a perceptual space. The distances in different parts of the color space are not
comparable since the (u', v') space is not perceptually uniform, but small distances corresponding to
various CMFs can be compared. So the values in the Table 4 should be compared row-wise, and not
column-wise.
The shaded entries in Table 4 represent the cases where the original CIEPO06 model with real ages
predicted the intra-group averages better than those of the CIE 10° standard colorimetric observer (lighter
shade), as well as cases where CIEPO06 model with age correspondence predicted the intra-group
averages better than the original CIEPO06 model (darker shade). While for Group -1 and -3, original
CIEPO06 model predictions are generally better than the CIE 10° standard colorimetric observer, the
model mostly performs worse in case of Group-2. Applying the age correspondence generally improves
the model prediction in case of Group-1 and -2. For Group-3 however, age correspondence mostly
degrades the original model prediction quite significantly. This shows reducing overall RMS error in the
cone fundamental or tristimulus space does not necessarily result in improved prediction of color
perception in a chromaticity space. Another possible explanation is that the observer variability in higher
age-group observers is not well modeled in CIEPO06 (see Fig. 10), thus intra-group average prediction is
adversely affected by the poor prediction of color matches for observers significantly different from the
average.
Now, how could we correlate the observations from Table 3 (see Section 3D) and Table 4? Note that
Table 3 lists scaled prediction errors around the peak regions of individual x-, y- and z- CMFs, while

18
Table 4 lists normalized RMS distances in predicting several test stimuli reproduced on the LCD in two-
dimensional (u', v') chromaticity space. Although it is not surprising that the observations are not always
congruent with each other, two inferences can be drawn by taking into account results from both analyses.
Overall, the CIEPO06 model in its original form does not always offer an improvement over the 10°
standard colorimetric observer in predicting intra-age group average observer data. Using values different
from actual observer ages in CIEPO06 model can achieve better overall correlation between actual and
model predicted CMFs in the tristimulus or cone fundamental space, but does not necessarily result in
improved prediction of individual color matches, particularly when the stimuli do not have a flat spectral
characteristics. While the short wavelength CIEPO06 CMFs consistently perform better than the 10°
standard colorimetric observer for all three age-groups, the model’s prediction errors in medium and long
wavelengths are significantly higher for Group-3. Why the model does not work well for higher age-
group Stiles-Burch observers at longer wavelengths? This issue is further investigated in the next section.
5. Optimized CIEPO06 cone fundamentals for Stiles-Burch observer groups
As discussed in the preceding sections, CIEPO06 model does not satisfactorily predict the intra-group
Stiles-Burch average observer color-matching functions )(10 λx and )(10 λy in the long- and medium-
wavelength range, particularly for higher age-group observers. These observations thus raise the question:
can we improve the model performance in the longer wavelengths? If so, how can we achieve that?
This prediction error can result from many potential sources. For example, it could be due to individual
observer’s LWS or MWS photopigment peak wavelength shift resulting from genetic polymorphism (as
discussed in Section 2), or it could be due to poor modeling of cone absorptance spectra in longer
wavelengths. As far as the prediction error at higher wavelengths is concerned, we can rule out the role of
ocular media and macular pigment optical density factors, since their influences are insignificant beyond
550 nm. Note that ocular media optical density is the only physiological factor in CIEPO06 model that
changes with age. To probe possible ways to improve the CIEPO06 model prediction at higher
wavelengths, a constrained nonlinear optimization was performed under two different conditions.
5.A. Method of optimization
In the first case, only the peak wavelength shifts of the LWS or MWS photopigments were allowed to
vary, keeping all other parameters constant. In the second case, a weighting function for the low-optical
density absorption spectra was introduced, which was then optimized. In both cases, the original
CIEPO06 functions at the short-wavelengths were not altered.
19
The equations for CIEPO06 cone fundamentals were introduced in Eq. (3). In the first optimization, only
the peak wavelength shifts of Al(λ) and Am(λ) functions were allowed to vary, keeping all other parameters
constant. The optimized cone fundamentals can thus be represented by Eq. (13):
[ ][ ] )()()(.
)()()(.
1010101)(
1010101)(,,
,,
λλλ
λλλ
λ
λoculmacmshiftedmvis
oculmaclshiftedlvis
DDADopt
DDADopt
m
l
−−−
−−−
⋅⋅−=
⋅⋅−= (13)
Here, [Dvis,lAshifted,l(λ)] and [Dvis,mAshifted,m(λ)] terms are mathematical representation of the peak wavelength
shift due to polymorphism. In the actual implementation of the optimization method, the peak wavelength
λ was first shifted in the wavenumber scale (ν = 107/ λ, where ν is in cm-1 and λ is in nm) independently
for LWS and MWS photopigment, next the cone absorptance spectra were re-sampled, then modified
cone fundamentals were computed and converted from the quanta to energy units, and finally were
renormalized. In the objective function, the Root Mean Square Error (RMSE) over the whole wavelength
range was computed between the modified CIEPO06 cone fundamentals and Stiles-Burch intra-group
average cone fundamentals, and was minimized iteratively by changing the amount of peak λ shift. This
shift was constrained between +250 and -250 cm-1, with a starting value of 100 cm-1. Thus, the
optimization process left the contributions of macular pigment and ocular media unaltered; only the
contributions of LWS and MWS cone absorption spectra were changed. The SWS cone fundamental was
not modified. The optimization was terminated after 10000 iterations, or below an error of 10-6,
whichever was earlier.
In the second optimization, weighting functions wl(λ) and wm(λ) for the low-optical density spectral
absorbance terms Al(λ) and Am(λ) respectively were introduced beyond 550 nm [Eq. (14)]. As before, the
SWS cone fundamental was unaltered.
[ ][ ] )()()()(.
)()()()(
1010101)(
1010101)(,
,
λλλλ
λλλλ
λ
λoculmacmmmvis
oculmaclllvis
DDwADopt
DDwADopt
m
l
−−⋅−
−−⋅⋅−
⋅⋅−=
⋅⋅−= (14)
While some authors have already questioned the CIEPO06 SWS cone fundamental at short wavelengths
[40], for our work, there are two reasons for restricting optimization above 550 nm. Firstly, we are
primarily interested in reducing prediction errors at higher wavelengths. Secondly, the ocular media and
macular pigment optical densities have significant contributions to the cone fundamentals below 550 nm.
Thus, even if we introduce a weighting function below 550 nm and obtain better results, it is difficult to
isolate a single physiological factor as the source of prediction error.

20
As in the first optimization, the Root Mean Square Error (RMSE) between the modified CIEPO06 cone
fundamentals and Stiles-Burch intra-group average cone fundamentals were minimized in the objective
function.
5.B. Results
As a result of the first optimization, the peak wavelengths of Al(λ) and Am(λ) functions were shifted
differently for different groups. For Group-1, LWS and MWS peak wavelength shifts were 3.6 nm and
1.3nm respectively, both toward shorter wavelengths. For Group-2, only the LWS function was shifted by
0.1 nm toward shorter wavelengths. For Group-3 on the other hand, the shifts were toward longer
wavelengths, 4.1 nm and 0.3 nm for respectively LWS and MWS functions.
The second optimization resulted in different LWS and MWS weighting functions for the three groups.
These functions are shown in Fig. 11. The optimized function is obtained by multiplying the original
CIEPO06 model function by the respective weighting function. Thus a weighting of unity does not affect
the original model function. As shown in Fig. 11, the LWS weighting functions have higher values than
those of MWS cones. What is interesting is that for both LWS and MWS, the weighting functions for
Group-1 and -3 are somewhat symmetrical around the unity weights. To remind the reader, these two
groups consist of younger (22-23 years) and older (49-50 years) observers respectively, while Group-2
observers have average age in the middle (27-29 years). For higher age group observers, peak optical
density is reduced by the optimization process, and is increased for the lower-age group.
Results of both optimization processes are incorporated in Table 5, introduced earlier in Section 3D (see
Table 3). Both )(λx and )(λy intra-age group average color-matching functions of Stiles-Burch
observers of Group-1 and -3 are better predicted by the optimized model.
The improvement in model performance is also substantiated in Table 6. The shaded entries in Table 6
represent the cases where the original CIEPO06 model with real ages predicted the intra-group average
data better than those of the CIE 10° standard colorimetric observer (lighter shade), as well as cases
where the optimized CIEPO06 model predicted the intra-group averages better than the original CIEPO06
model as well as the CIE 10° standard colorimetric observer (darker shade). These values were computed
in the same way as described in Section 4. Overall, the peak wavelength shift optimization did not lead to
better prediction of average data. An effect of polymorphism on the average data is not apparent in any of
the three groups. This supports Webster’s conclusion [29] that no polymorphism effect among the Stiles-
Burch observers could be confirmed. However, this depends on the observer group involved in the study.
Viénot [25] showed that a shift in the wavelength of peak sensitivity of the cone photopigments could
account for the variability in multiple Rayleigh matches from color normal observers.

21
In our analysis, significant improvement was achieved by optimizing the low-density photopigment
spectral absorbance functions for Group-1 and -3. On an average, for Group-1, the average RMS
prediction error for the seven stimuli reduced by more than 70% as compared to the CIE 10° standard
colorimetric observer, while for Group-3, the improvement was around 45%. Only exception is the blue
test color (TS-6) for group-3, which in any case does not have significant spectral power in the
wavelengths beyond 550 nm. In general in case of Group-2, the optimization did not improve the results.
5.C. Discussion
Foregoing discussion leads to a hypothesis that a major source of the CIEPO06 model prediction errors at
higher wavelengths is in the model’s cone absorptance spectra, which has two components, photopigment
low-density spectral absorbance function and the peak optical density of visual pigment. Fig. 11 indicates
that cone absorptance spectra should have an age-dependent component, which would cause the cone
absorptance spectra to reduce as the age is increased. This component should have different values in the
long- and medium- wavelength range.
What could be the physiological explanation for such a component, which is missing from the model? As
explained in section 5.8 of the CIE TC 1-36 report [11], there are some indications that the peak optical
density of the visual pigment decreases gradually as a function of age. However, because of insufficient
or contradictory data to support this hypothesis [41] [42] [43], such dependence has been ignored in the
model. A logical argument would be that the age dependence of this factor has a significant effect on cone
fundamentals and color matches, and that its exclusion from the CIEPO06 model leads to prediction
errors of intra-age group average at higher wavelengths. This argument appears to contradict Webster and
Macleod’s [44] observation that none of the factors extracted through a factor analysis of the Stiles-Burch
10° data corresponded to differences in photopigment density, and only a weak role of density differences
was suggested by the fits to the correlation matrix. They concluded the peak wavelength shift of
photopigment density was a more salient determinant of individual differences in the matches. A key
difference between that study and our analysis is that Webster and Macleod were investigating individual
variability without regard to age groups, while we focused on intra-age group average prediction. For the
latter, differences in photopigment optical density does seem to be an important factor.
It should be emphasized that the optimization method described in this section is purely mathematical.
Deriving a physiologically-based correction function was beyond the scope of current study. However,
we believe this analysis isolates the likely source of a major flaw in the CIEPO06 model, correcting
which can lead to a significant improvement in model performance, particularly for observers in higher
age-groups compared to the Stiles-Burch observers’ average age of 32.

22
6. Conclusions
In this paper, we presented a theoretical analysis on various aspects of the physiologically-based observer
model proposed by CIE TC 1-36 (CIEPO06). In the context of color perception on modern narrow-band
displays, we evaluated the performance of the CIEPO06 model in predicting the average data for three
different age-groups of Stiles-Burch observers and compared the results with the CIE 10° standard
colorimetric observer. Our goal was to determine if an age-dependent observer provides an advantage
over a single average observer. Several conclusions can be drawn from our study as listed below:
i) The photopigment peak optical density has the strongest influence in display color perception compared
to other physiological factors. This finding assumes further significance in light of Smith et al.’s [45]
observation that a variation of ±0.2 unit of photopigment optical density from the mean could account for
99% of the individual variance in the Stiles-Burch pilot data [9]. Photopigment peak wavelength shift is
another factor having significant contribution to observer variability, but is not within the scope of the
CIEPO06 model. ii) Using real observer ages in the model leads to large errors in intra-age group average
observer CMF prediction, making it difficult to apply this model directly in practical applications. iii) CIE
10° standard colorimetric observer z-function has a large error with respect to intra-age group average z-
functions of all three Stiles-Burch age-groups studied, namely 6, 10 and 6 observers in age range 22-23,
27-29 and 49-50 years respectively; in all three cases, CIEPO06 model provides significant improvement,
iv) x- and y- CMFs derived from the CIEPO06 model for the observer age group of 49-50 years show
high deviation from the intra-group average, the error being comparable to intra-group standard deviation.
v) In terms of predicting average color perception for different age-groups on a display with narrow-band
primaries, the CIEPO06 model in its original form does not always offer an improvement over the 10°
standard colorimetric observer. This limitation is particularly apparent for higher age-group observers in
the red-green part of the color space. vi) A constrained nonlinear optimization of the CIEPO06 model
shows that only peak wavelength shifts of the LWS and MWS photopigment density fails to improve
intra-age group average prediction, while weighting functions for the photopigment density functions
above 550 nm significantly improves this prediction both in the spectral domain and chromaticity space,
for both age groups of 22-23 and 49-50 years. This weighting function is different for different age-
groups and also different for LWS and MWS cone photopigment densities. We propose that the peak
optical density of visual pigments should be an age-dependent function in the CIEPO06 model and should
be defined independently for LWS and MWS cone photopigments.

23
References
1. W. D. Wright, “A re-determination of the trichromatic coefficients of the spectral colors”, Trans.
Opt. Soc. 30, 141-164 (1929).
2. J. Guild, “The colorimetric properties of the spectrum”, Philosophical Trans. Royal Soc. London
A 230, 149-187 (1931).
3. CIE, Sixième Session, Genève, Juillet, 1924, Recueil des travaux et compte rendu de séances
(Cambridge University Press, Cambridge 1926), pp 67-69.
4. R. S. Berns, Billmeyer and Saltzman’s principles of color technology, 3rd Ed. (John Wiley &
Sons, New York, 2000).
5. V. C. Smith and J. Pokorny, “Color matching and color discrimination”, in The Science of Color,
2nd Ed, S.K. Shevell, ed. (Elsevier, Oxford, 2003), pp. 110.
6. D. B. Judd, “Colorimery and artificial daylight”, in Technical Committee No. 7 Report of
Secretariat United States Commission, International Commission on Illumination, 12th Session,
Stockholm, 1- 60 (1951).
7. J. J. Vos, “Colorimetric and photometric properties of a 2° fundamental observer”, Color Res.
App. 3,125-128 (1978).
8. CIE 86-1990, CIE 1988 2° spectral luminous efficiency function for photopic vision (Commission
Internationale de l’éclairage, Vienna, Austria, 1990).
9. W. S. Stiles and J. M. Burch, “N.P.L. Colour-matching investigation: final report”, Optica Acta
6, 1-26 (1959).
10. N. I. Speranskaya, “Determination of spectral color co-ordinates for twenty-seven normal
observers”, Optics and Spectroscopy 7, 424-428 (1959).
11. CIE, “Fundamental Chromaticity Diagram with Physiological Axes – Part I”, CIE Technical
Report, 170-1 (2006).
12. A. Stockman and L. T. Sharpe, “The spectral sensitivities of the middle- and long- wavelength-
sensitive cones derived from measurements in observers of known genotype”, Vision Res. 40,
1711-1737 (2000).
13. A. Stockman, D. I. A. Macleod and N. E. Johnson, “Spectral sensitivities of human cones”, J.
Opt. Soc. Am. A 10(12), 2491-2521 (1993)
14. D. I. A. Macleod and M. A. Webster, "Factors influencing the color matches of normal
observers," in Colour Vision: Physiology and Psychophysics, J. D. Mollon and L. T. Sharpe, eds.
(Academic, London, 1983), pp. 81-92.

24
15. V. C. Smith, J. Pokorny and Q. Zaidi, “How do sets of Color-Matching Functions differ?”, in
Colour Vision: Physiology and Psychophysics, J. D. Mollon and L. T. Sharpe, eds. (Academic,
London 1983).
16. F. Viénot, “Relations between inter- and intra-individual variability of color matching functions.
Experimental results”, J. Opt. Soc. Am. A 70(12), 1476-1483 (1980).
17. G. Wyszecki and W. S. Stiles, Color science: concepts and methods, quantitative data and
formulae, 2nd Ed. (John Wiley & Sons, 1982)
18. A. North and M. Fairchild, Measuring color-matching functions. Part I, Color Research
& Application 18, 155–162 (1993).
19. A. North and M. Fairchild, Measuring color-matching functions. Part II. New data for
assessing observer metamerism, Color Research & Application 18, 163–170 (1993).
20. B. Oicherman, M. R. Luo, B. Rigg, A. R. Robertson, “Effect of observer metamerism on colour
matching of display and durface colours”, Color Res. App. 33(5), 346-359 (2008).
21. C. Oleari and M. Pavesi, “Grassmann's laws and individual color-matching functions for non-
spectral primaries evaluated by maximum saturation technique in foveal vision”, Color Res. App.
33(4): 271–281 (2008).
22. Y. Nakano, Y. Nakayasu, H. Morita, K. Suehara, J. Kohda and T. Yano, “Individual difference of
color matching functions and its cause”, ISCC Jubilee (2006).
23. J. Neitz and G. H. Jacobs, “Polymorphism in normal human color vision and its mechanism”,
Vision Res. 30(4), 621-636 (1990).
24. J. C. He and S. K. Shevell, “Individual differences in cone photopigments of normal trichromats
measured by dual Raleigh-type color matches”, Vision Res. 34(3), 367-376 (1994).
25. F. Viénot, L. Serreault and P. P. Fernandez, “Convergence of experimental multiple Rayleigh
matches to peak L- and M-photopigment sensitivity estimates”, Visual Neuroscience 23, 1–8
(2006).
26. J. L. Barbur, M. Rodriguez-Carmona, J. A. Harlow, K. Mancuso, J. Neitz and M. Neitz, “A study
of unusual Rayleigh matches in deutan deficiency”, Visual Neuroscience 25, 507–516 (2008).
27. P.B.M. Thomas and J.D. Mollon, “Modelling the Rayleigh match”, Visual Neuroscience 21,
477–482 (2004).
28. P. Csuti and J. Schanda, “Colour matching experiments with RGB-LEDs”, Color Res. App.
33(2), 108-112 (2008).
29. M. A. Webster, “Reanalysis of λmax variations in the Stiles-Burch 10-degrees color-matching
functions”, J. Opt. Soc. Am. A 9, 1419-1421 (1992).

25
30. L. T. Sharpe, A. Stockman, H. Jägle and J. Nathans, “Opsin genes, cone photopigments, color
vision, and color blindness”, in Color Vision: From Genes to Perception, 1st Ed., K. R.
Gegenfurtner, L. T. Sharpe and B. B. Boycott, eds. (Cambridge University Press, Cambridge,
2001), pp. 3-52.
31. A. Sarkar, L. Blondé, P. L. Callet, F. Autrusseau, J. Stauder, and P. Morvan, “Study of observer
variability in modern display colorimetry: an analysis of CIE 2006 model,” in Proceedings of the
11th Congress of the International Colour Association (AIC), edited by Dianne Smith, Paul
Green-Armytage, Margaret A. Pope and Nick Harkness. CD. (Colour Society of Australia,
Sydney, 2009).
32. V. C. Smith, J. Pokorny, “Chromatic-discrimination axes, CRT phosphor spectra and individual
variation in color vision”, J. Opt. Soc. Am. A 12, 27-35 (1995).
33. O. Packer and D. R. Williams, “Light, the retinal image and photoreceptors”, in The Science of
Color, 2nd Ed, S.K. Shevell, ed. (Elsevier, Oxford, 2003), pp. 41-102.
34. V. C. Smith and J. Pokorny, “The design and use of a cone-chromaticity space”, Color Res. App.
21(5), 375-383 (1996).
35. E. Miyahara, V. C. Smith and J. Pokorny, “How surrounds affect chromatic discrimination”, J.
Opt. Soc. Am. A 10, 545-553 (1993).
36. D. I. A. Macleod and R. M. Boynton, “Chromaticity diagram showing cone excitation by stimuli
of equal luminance”, J. Opt. Soc. Am. A 69, 1183-1185 (1979).
37. R. M. Boynton and N. Kambe, "Chromatic difference steps of moderate size measured along
theoretically critical axes," Color Res. App. 5, 13-23 (1980).
38. A. Stockman, “Colour & Vision Research Laboratory website”, http://www.cvrl.org/
39. J. Pokorny, V. C. Smith and M. Lutze, “Aging of the human lens”, Applied Optics 26(8), 1437-
1440 (1987)
40. P. Csuti and J. Schanda, “A better description of metameric experience of LED clusters”, in
Proceedings of Light and Lighting Conference with Special Emphasis on LEDs and Solid State
Lighting, Budapest, Hungary May 27-29 2009.
41. A.E. Elsner, L. Berk, S.A. Burns and P.R.Rosenberg, “Aging and human cone photopigments”, J.
Opt. Soc. Am. A 5, 2106-2112 (1988).
42. W. H. Swanson and G. E. Fish, “Age-related changes in the colour-match-area effect”, Vision
Res. 36, 2079-2085 (1996).
43. A. B. Renner, H. Knau, M. Neitz, J. Neitz and J. S. Werner, “Photopigment optical density of the
human foveola and a paradoxical senescent increase outside the fovea”, Visual Neuroscience 21,
827–834 (2004).

26
44. M. A. Webster and D. I. A. MacLeod, “Factors underlying individual-differences in the color
matches of normal observers”, J. Opt. Soc. Am. A 5, 1722-1735 (1988).
45. V. C. Smith, J. Pokorny, S. J. Starr, “Variability of color mixture data - I. Interobserver
variability in the unit coordinates”, Vision Res. 16, 1087-1094 (1976).

27
List of Figures
1 A block diagram of the CIEPO06 framework 5
2 Spectral Power Distributions of the two displays used in the analysis 7
3 Seven test stimuli in (u', v') chromaticity diagram 8
4 Seven test stimuli in Boynton-Kambe relative cone troland coordinates based on
CIEPO06 10° cone fundamentals 11
5 Simulated chromaticity shift for seven test stimuli due to modified cone fundamentals in
(u',v') chromaticity diagram. Squares: increase in peak optical density by 25% for ocular
media (a), for macular pigment (b) and for photopigment peak optical density (c).Peak
wavelength shift of LWS cone photopigment by 4 nm toward shorter wavelengths in (d).
Triangles: decrease in peak optical density by 25% for ocular media (a), for macular
pigment (b) and for photopigment peak optical density (c). Peakwavelength shift of MWS
cone photopigment by 4 nm toward longer wavelengths in (d). Green symbols correspond
to the CRT and red symbols to LCD.
11
6 Simulated chromaticity shift for seven test stimuli due to modified cone fundamentals in
relative cone troland space. Squares: increase in peak optical density by 25% for ocular
media (a), for macular pigment (b) and for photopigment peak optical density (c). Peak
wavelength shift of LWS cone photopigment by 4 nm toward shorter wavelengths in (d).
Triangles: decrease in peak optical density by 25% for ocular media (a), for macular
pigment (b) and for photopigment peak optical density (c). Peak wavelength shift of
MWS cone photopigment by 4 nm toward longer wavelengths in (d). Green symbols
correspond to the CRT and red symbols to LCD.
11
7 Age correspondence between CIEPO06 model’s best prediction and 47 Stiles-Burch
observers 14
8 Chromaticities of matches of equal-energy white, computed using cone fundamentals
from the 47 Stiles-Burch observer data and CIEPO06 predictions, with two adjustment
methods for age (CORR and RMSE) as well as with actual observer age
14
9 Mean standard deviation of CIEPO06 cone fundamentals from the 47 Stiles-Burch
observer data, with two adjustment methods for age (CORR and RMSE) as well as with
actual observer age. On each box, the central mark is the median, the edges of the box are
the 25th and 75th percentiles, the whiskers extend to the most extreme data points that are
not considered outliers, while outliers are plotted individually as small circles.
14

28
10 CMFs for the Stiles-Burch intra-group average observer (green line with squares),
CIEPO06 model predictions (blue triangles), CIEPO06 model predictions with age
correspondence (red filled circles) and CIE 10° standard colorimetric observer (black
star) for Group-1 (top row), -2 (middle row) and -3 (bottom row). Stiles-Burch
Observers’ intra-group minimum (black line) and maximum (black line with circles) are
also shown. Each plot shows the CMFs around the peak only.
15
11 Weighting functions for the optimizing the LWS (left) and MWS (right) low density
spectral absorbance. Optimization was performed above 550 nm. 20

29
List of Tables
1 CIE 1964 xy and CIE 1976 (u', v') chromaticity coordinates for seven test stimuli and the
display whites 8
2 (u', v') RMS distance (x1000) from average cone fundamental 11
3 Deviations of CMF data from intra-group average Stiles-Burch observer, 10° standard
colorimetric observer and CIEPO06 model predictions with age correspondence and with
real ages
15
4 (u', v') normalized RMS distances (x100) of predicted chromaticity values from Stiles-
Burch intra-group average CMFs, computed for seven test stimuli as viewed on the LCD.
Predicted chromaticity values were obtained using CIE 10° standard colorimetric observer
CMFs, CIEPO06 model CMFs with real ages and CIEPO06 model CMFs with age
correspondence. Shaded values indicate improvement in the prediction of chromaticities
corresponding to intra-group average CMFs, either by the CIEPO06 original model
compared to the CIE 10° standard colorimetric observer (lighter shade), or by the
CIEPO06 model with age correspondence compared to the original CIEPO06 model
(darker shade).
17
5 Comparison of deviations of CMF data from intra-group average Stiles-Burch observer,
10° standard colorimetric observer, CIEPO06 original model predictions and optimized
CIEPO06 model with modified low density absorbance spectra
20
6 (u', v') normalized RMS distances (x100) from Stiles-Burch intra-group average
chromaticities computed for seven test stimuli as viewed on the LCD. Results are shown
for the CIE 10° standard colorimetric observer, original CIEPO06 model predictions and
optimized model prediction through peak wavelength shift and weighted low-density
photopigment spectral absorbance. Shaded values indicate improvement in the prediction
of chromaticities corresponding to intra-group average CMFs, either by the CIEPO06
original model compared to the CIE 10° standard colorimetric observer (lighter shade), or
by the optimized CIEPO06 model compared to both original CIEPO06 model and CIE
10° standard colorimetric observer (darker shade).
20
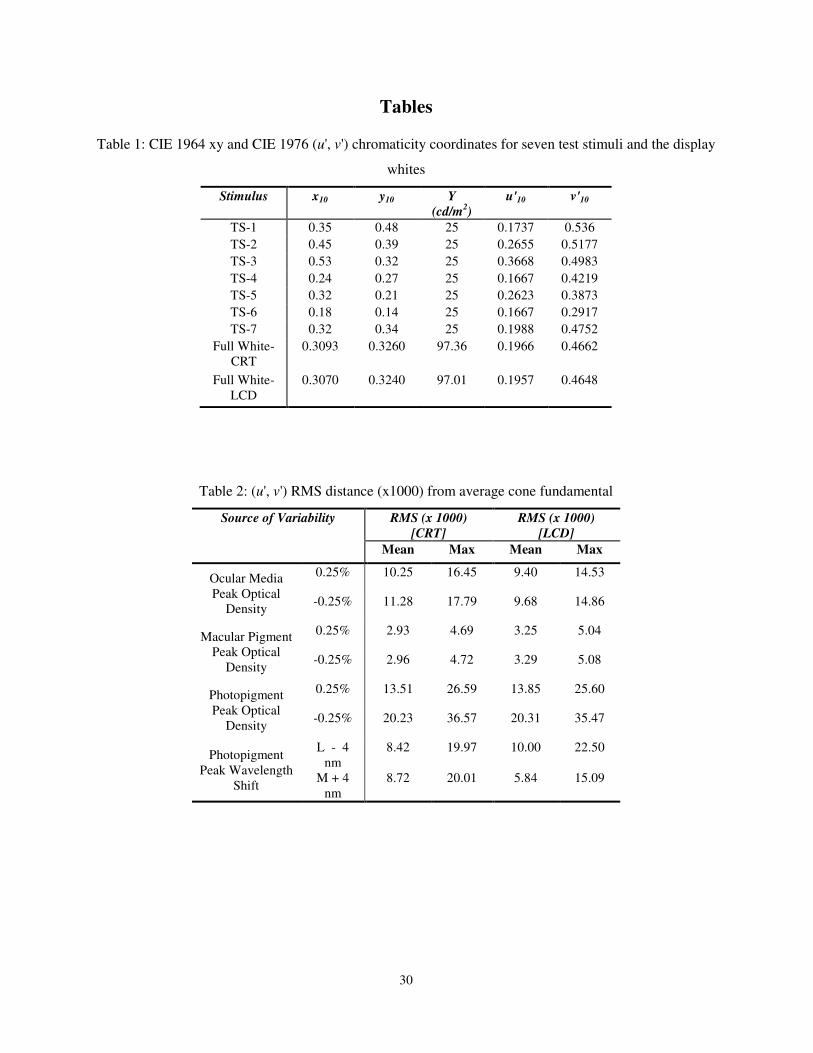
30
Tables
Table 1: CIE 1964 xy and CIE 1976 (u', v') chromaticity coordinates for seven test stimuli and the display
whites
Stimulus x10 y10 Y
(cd/m2)
u'10 v'10
TS-1 0.35 0.48 25 0.1737 0.536 TS-2 0.45 0.39 25 0.2655 0.5177 TS-3 0.53 0.32 25 0.3668 0.4983 TS-4 0.24 0.27 25 0.1667 0.4219 TS-5 0.32 0.21 25 0.2623 0.3873 TS-6 0.18 0.14 25 0.1667 0.2917 TS-7 0.32 0.34 25 0.1988 0.4752
Full White-CRT
0.3093 0.3260 97.36 0.1966 0.4662
Full White-LCD
0.3070 0.3240 97.01 0.1957 0.4648
Table 2: (u', v') RMS distance (x1000) from average cone fundamental
Source of Variability RMS (x 1000)
[CRT]
RMS (x 1000)
[LCD]
Mean Max Mean Max
Ocular Media Peak Optical
Density
0.25% 10.25 16.45 9.40 14.53
-0.25% 11.28 17.79 9.68 14.86
Macular Pigment Peak Optical
Density
0.25% 2.93 4.69 3.25 5.04
-0.25% 2.96 4.72 3.29 5.08
Photopigment Peak Optical
Density
0.25% 13.51 26.59 13.85 25.60
-0.25% 20.23 36.57 20.31 35.47
Photopigment Peak Wavelength
Shift
L - 4 nm
8.42 19.97 10.00 22.50
M + 4 nm
8.72 20.01 5.84 15.09

31
Table 3. Deviations of CMF data from intra-group average Stiles-Burch observer, 10° standard
colorimetric observer and CIEPO06 model predictions with age correspondence and with real ages
CMF Grp.
No.
Mean Intra-
group
Stiles-Burch
Std. Dev.
Mean Scaled Abs. Diff. From Mean
Intra-group Stiles-Burch Data
CIE 10° Std. Col.
Obs.
CIEPO06
Model with Real Ages
Model with Age
Corres.
)(λx 1 10.11 5.68 6.53 2.51 2 11.28 2.54 1.74 1.99 3 9.12 9.93 10.58 6.06
)(λy 1 6.02 2.81 4.73 1.13 2 6.68 2.28 2.42 2.43 3 5.41 2.12 4.21 2.5
)(λz 1 22.7 19.25 8.22 7.55 2 25.54 10.88 6.2 6.17 3 21.43 11.71 5.21 3.99
Table 4. (u', v') normalized RMS distances (x100) of predicted chromaticity values from Stiles-Burch
intra-group average CMFs, computed for seven test stimuli as viewed on the LCD. Predicted
chromaticity values were obtained using CIE 10° standard colorimetric observer CMFs, CIEPO06 model
CMFs with real ages and CIEPO06 model CMFs with age correspondence. Shaded values indicate
improvement in the prediction of chromaticities corresponding to intra-group average CMFs, either by
the CIEPO06 original model compared to the CIE 10° standard colorimetric observer (lighter shade), or
by the CIEPO06 model with age correspondence compared to the original CIEPO06 model (darker
shade).
Test Stim.
Group-1 Group-2 Group-3
CIE 10° Std
Col. Obs
CIEPO06 with real
ages
CIEPO06 With Age Corres.
CIE 10° Std
Col. Obs
CIEPO06 with real
ages
CIEPO06 With Age Corres.
CIE 10° Std
Col. Obs
CIEPO06 with real
ages
CIEPO06 With Age Corres.
TS-1 4.52 5.23 2.00 2.89 2.80 2.43 1.79 0.41 3.70
TS-2 2.36 1.85 1.90 1.47 1.84 1.74 1.77 1.79 1.83
TS-3 1.11 0.49 1.40 0.82 1.16 1.22 1.46 1.89 0.79
TS-4 4.19 4.34 0.61 2.68 2.72 1.84 0.81 0.63 4.62
TS-5 1.97 0.81 0.92 1.29 1.91 1.42 1.30 2.15 2.59
TS-6 3.54 3.13 1.15 2.27 2.64 1.23 1.80 1.47 5.42
TS-7 3.51 3.35 1.48 2.22 2.43 1.96 1.37 0.68 3.35

32
Table 5. Comparison of deviations of CMF data from intra-group average Stiles-Burch observer, 10°
standard colorimetric observer, CIEPO06 original model predictions and optimized CIEPO06 model with
modified low density absorbance spectra
CMF Group
No.
Mean
Intra-
group
Stiles-
Burch
Std.
Dev.
Mean Scaled Abs. Diff. From Mean
Intra-group Stiles-Burch Data
CIE 10° Std. Obs.
CIEPO06 Model
Original Optimized
(Low Density Abs. Spectra)
)(λx 1 10.11 5.68 6.53 2.01
2 11.28 2.54 1.74 2.17
3 9.12 9.93 10.58 2.01
)(λy 1 6.02 2.81 4.73 1.34
2 6.68 2.28 2.42 1.4
3 5.41 2.12 4.21 1.12
Table 6. (u', v') normalized RMS distances (x100) from Stiles-Burch intra-group average chromaticities
computed for seven test stimuli as viewed on the LCD. Results are shown for the CIE 10° standard
colorimetric observer, original CIEPO06 model predictions and optimized model prediction through peak
wavelength shift and weighted low-density photopigment spectral absorbance. Shaded values indicate
improvement in the prediction of chromaticities corresponding to intra-group average CMFs, either by
the CIEPO06 original model compared to the CIE 10° standard colorimetric observer (lighter shade), or
by the optimized CIEPO06 model compared to both original CIEPO06 model and CIE 10° standard
colorimetric observer (darker shade).
Tes
t S
tim
.
Group-1 Group-2 Group-3
CIE
10
° S
td.
Co
l.
Ob
s.
CIE
PO
06
CIE
PO
06
Op
tim
.
(Pea
k λ
Sh
ift)
CIE
PO
06
Op
tim
.
(LD
Ab
s S
pec
tra
)
CIE
10
° S
td.
Co
l.
Ob
s.
CIE
PO
06
CIE
PO
06
Op
tim
.
(Pea
k λ
Sh
ift)
CIE
PO
06
Op
tim
.
(LD
Ab
s S
pec
tra
)
CIE
10
° S
td.
Co
l.
Ob
s.
CIE
PO
06
CIE
PO
06
Op
tim
.
(Pea
k λ
Sh
ift)
CIE
PO
06
Op
tim
.
(LD
Ab
s S
pec
tra
)
TS-1 4.52 5.23 5.21 0.58 2.89 2.80 3.54 2.96 1.79 0.41 2.18 0.11
TS-2 2.36 1.85 3.88 0.25 1.47 1.84 2.23 1.12 1.77 1.79 2.23 0.26
TS-3 1.11 0.49 2.86 0.72 0.82 1.16 1.08 0.11 1.46 1.89 1.60 0.46
TS-4 4.19 4.34 3.99 0.86 2.68 2.72 3.06 2.84 0.81 0.63 0.97 0.73
TS-5 1.97 0.81 2.70 0.77 1.29 1.91 2.25 1.30 1.30 2.15 1.78 1.10
TS-6 3.54 3.13 2.47 0.86 2.27 2.64 2.36 2.43 1.80 1.47 2.16 2.36
TS-7 3.51 3.35 4.18 0.52 2.22 2.43 2.95 2.23 1.37 0.68 1.76 0.36
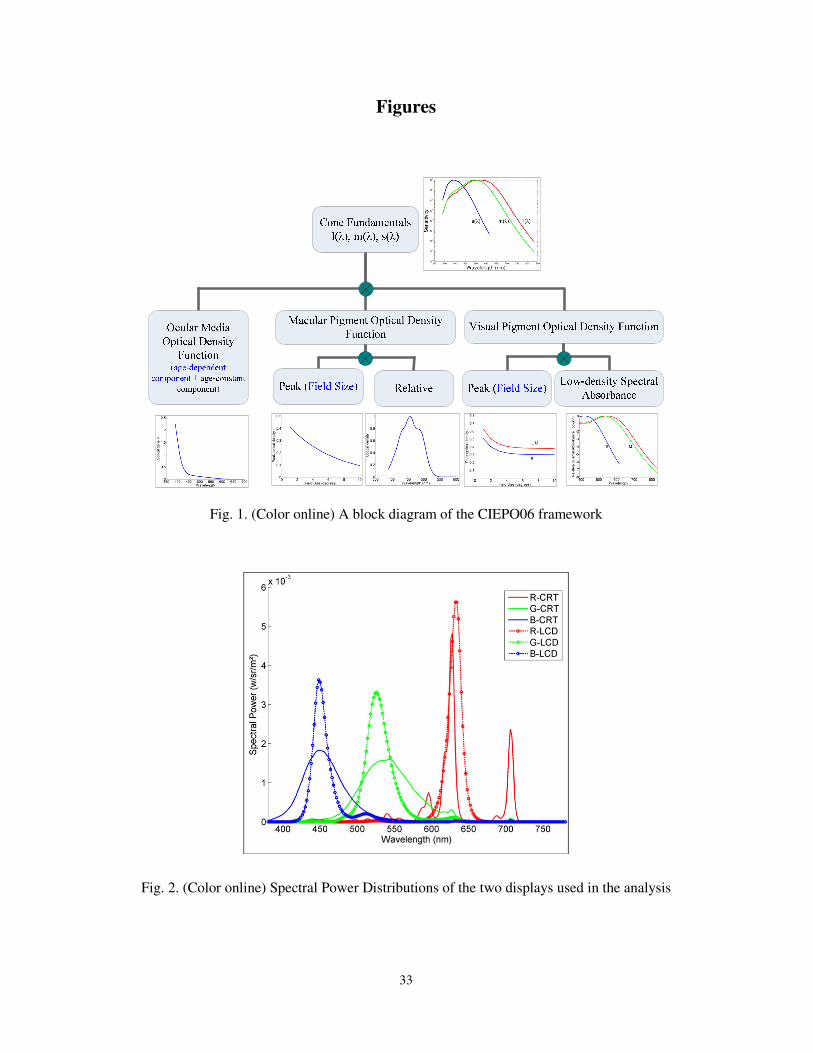
33
Figures
Fig. 1. (Color online) A block diagram of the CIEPO06 framework
Fig. 2. (Color online) Spectral Power Distributions of the two displays used in the analysis

34
Fig. 3. (Color online) Seven test stimuli in (u', v') chromaticity diagram
Fig. 4. (Color online) Seven test stimuli in Boynton-Kambe relative cone troland coordinates based on
CIEPO06 10° cone fundamentals

35
Fig. 5 (Color online) (Note: figure should not be reduced). Simulated chromaticity shift for seven test
stimuli due to modified cone fundamentals in (u',v') chromaticity diagram. The circles show the original
chromaticities of the stimuli. Increase (squares) and decrease (triangles) of the peak optical density by
25% are shown for ocular media (a), for macular pigment (b) and for photopigment peak optical density
(c). Peak wavelength shift of LWS cone photopigment by 4 nm toward shorter wavelengths (squares) and
of MWS cone photopigment by 4 nm toward longer wavelengths (triangles) are shown in (d). Green
symbols correspond to the CRT and red symbols to LCD.

36
Fig. 6 (Color online) (Note: figure should not be reduced). Simulated chromaticity shift for seven test
stimuli due to modified cone fundamentals in relative cone troland space. The circles show the original
chromaticities of the stimuli. Increase (squares) and decrease (triangles) of the peak optical density by
25% are shown for ocular media (a), for macular pigment (b) and for photopigment peak optical density
(c). Peak wavelength shift of LWS cone photopigment by 4 nm toward shorter wavelengths (squares) and
of MWS cone photopigment by 4 nm toward longer wavelengths (triangles) are shown in (d). Green
symbols correspond to the CRT and red symbols to LCD.

37
Fig. 7. (Color online) Age correspondence between CIEPO06 model’s best prediction and 47 Stiles-
Burch observers
Fig. 8. (Color online) Chromaticities of matches of equal-energy white, computed using cone
fundamentals from the 47 Stiles-Burch observer data and CIEPO06 predictions, with two adjustment
methods for age (CORR and RMSE) as well as with actual observer age

38
Fig. 9. (Color online) Mean standard deviation of CIEPO06 cone fundamentals from the 47 Stiles-Burch
observer data, with two adjustment methods for age (CORR and RMSE) as well as with actual observer
age. On each box, the central mark is the median, the edges of the box are the 25th and 75th percentiles,
the whiskers extend to the most extreme data points that are not considered outliers, while outliers are
plotted individually as small circles.

39
Fig. 10 (Color online) (Note: figure should not be reduced). CMFs for the Stiles-Burch intra-group
average observer (green line with squares), CIEPO06 model predictions (blue triangles), CIEPO06 model
predictions with age correspondence (red filled circles) and CIE 10° standard colorimetric observer
(black star) for Group-1 (top row), -2 (middle row) and -3 (bottom row). Stiles-Burch Observers’ intra-
group minimum (black line) and maximum (black line with circles) are also shown. Each plot shows the
CMFs around the peak only.

40
Fig. 11. (Color online) Weighting functions for the optimizing the LWS (left) and MWS (right) low
density spectral absorbance. Optimization was performed above 550 nm.