
Opacity with Orwellian Observers and Intransitive Non-Interference
Upload
khangminh22Category
view
0download
0
1
NC DAQ Source Test Observers Checklist - Reference Method CEM TestingEPA Methods 3a, 6c, 7e, 10 (40 CFR 60 Appendix A)
Line by line explanation and references.
This checklist is not intended to replace familiarity with the reference test methods. It is intended to point outprocedures that can be easily checked and will help ensure an accurate, and valid test.
Some items can be filled out prior to the test observation, such as the permit #, source tested, applicableregulation, process data and production rates. This information can be essential in answering questions on-site and determining if enough applicable data is being recorded.
Facility Name / Location: - Self explanatory
Facility Contact / Phone #: - Aids SSCB when contacting facility
Testing Firm / Contact: - Aids Regional Office and SSCB when contacting testing firm
Permit # / Source Tested: - A quick reference for the regions and SSCB
Applicable Regulation / Limit:Reviewing the applicable regulation (state or NSPS) will aid in the determination of the correctsampling train conditions, the correct process conditions, and the correct operational data.
Process Data / Production Rate: Process Data: It is absolutely imperative for the facility to record the pertinent data during the test sothat the measured emissions can be correlated to a production rate and compared to the permit limit.The test will be unacceptable without production data. A review of the applicable regulation and thepermit conditions will aid in determining the correct process rate and the pertinent parameters(throughput, heat input, firing rates, etc.)
Sample Date / Time:Record the time and the run number(s) when you were present. This data will aid in determining ifa DAQ representative was present at specific times / runs. For instance, if a test company states ina report that they had to void run number 2 due to a failed calibration, the regional office or SSCB canreview the checklist to confirm the events.
Ask for an explanation to any question answered "No" and attach comments to thisform.
The checklist has been created in a “yes or no” format. For most of the questions, ‘yes’ is the correctanswer. Therefore, if the test company responds ‘no,’ you should request a clarification. It may bea simple mis-understanding on either side or it may be a major error. There are some questions thatdo not require a ‘yes or no’ answer. There are other questions that are correctly answered with a ‘no’and do not require further explanation.

2
This page was intentionally left blank.

0
10
20
30
40
50
2 3 4 5 6 7 8 9 10
0.5 1.0 1.5 2.0 2.5
8 or 9
12 16
20
24 or 25
Higher Number is for Rectangular Stacks or Ducts
a
a
a* From Point of Any Type ofDisturbance (Bend, Expansion, Contraction, etc.)
Stack Diameter = 0.30 to 0.61 m (12-24 in.)
Duct Diameters Downstream from Flow Disturbance* (Distance B)
Duct Diameters Upstream from Flow Disturbance* (Distance A)
Stack Diameter > 0.61 m (24 in.)
Disturbance
MeasurementSite
Disturbance
A
B
0
10
20
30
40
50
2 3 4 5 6 7 8 9 10
0.5 1.0 1.5 2.0 2.5
8 or 9
12
Higher Number is for Rectangular Stacks or Ducts a
a* From Point of Any Type ofDisturbance (Bend, Expansion, Contraction, etc.)
Duct Diameters Downstream from Flow Disturbance* (Distance B)
Duct Diameters Upstream from Flow Disturbance* (Distance A)
Stack Diameter > 0.61 m (24 in.)
Disturbance
MeasurementSite
Disturbance
A
B
16
Stack Diameter = 0.30 to 0.61 m (12-24 in.)
3
Figure 1-1. Minimum number of traverse points for particulatetraverses.
Figure 1-2. Minimum number of traverse points for velocity (nonparticulate)traverses.
Method 1 - Sample and Velocity Traverses for Stationary SourcesMethod 1 is used to determine if a source’s stack meets the correct criteria for testing. The points tobe tested within the stack for velocity measurements are also determined using Method 1.
1.1) Method 1 calculated correctly (see reverse side)?Method 1: If stack is between 4" - 12" then Method 1a must be employed. If duct is <4" thenalternative methods must be used. (Contact SSCB with any test questions)Stack Diameter?_______ Measured on site?Port distance from upstream disturbance (A)_______ Upstream Diameters (A)______ Port distance from downstream disturbance (B)_____ Downstream Diameters(B)____# of Sampling Points?_____ (Draw a line vertically from the "Distance A" axis down to thestep chart, and from the "Distance B" axis up to the step chart. The maximum # of pointsmarked on the chart yields the minimum # of points to be sampled.)
Method 1 can be found in 40 CFR 60 Appendix A. When the data from the preceding questions iscombined with the following charts, the number of sampling points necessary can be determined. The‘Upstream Diameters (A)’ value is calculated by dividing the distance from a flow disturbance to theupstream sampling location by the diameter of the stack. The ‘Downstream Diameters (B)’ value isdetermined in a similar fashion. If you get confused about the “upstream” and “downstream”definitions, just follow the labeling on the charts. Once you have determined the upstream /downstream diameters, you can transfer those values to the horizontal axis on the charts below.Draw a line vertically from the "Distance A" axis down to the step chart, and from the "Distance B"axis up to the step chart. The maximum # of points marked on the chart yields the minimum # ofpoints that shall be sampled.Method 1 - stacks with diameters > 12 inches
Particulate traverses - Method 1, section 2.2.1Velocity traverses - Method 1, section 2.2.2
Method 1A - stacks with diameters between 4-12 inches.Stacks smaller than 4 inches will require alternative methodology.
12
3
45
6
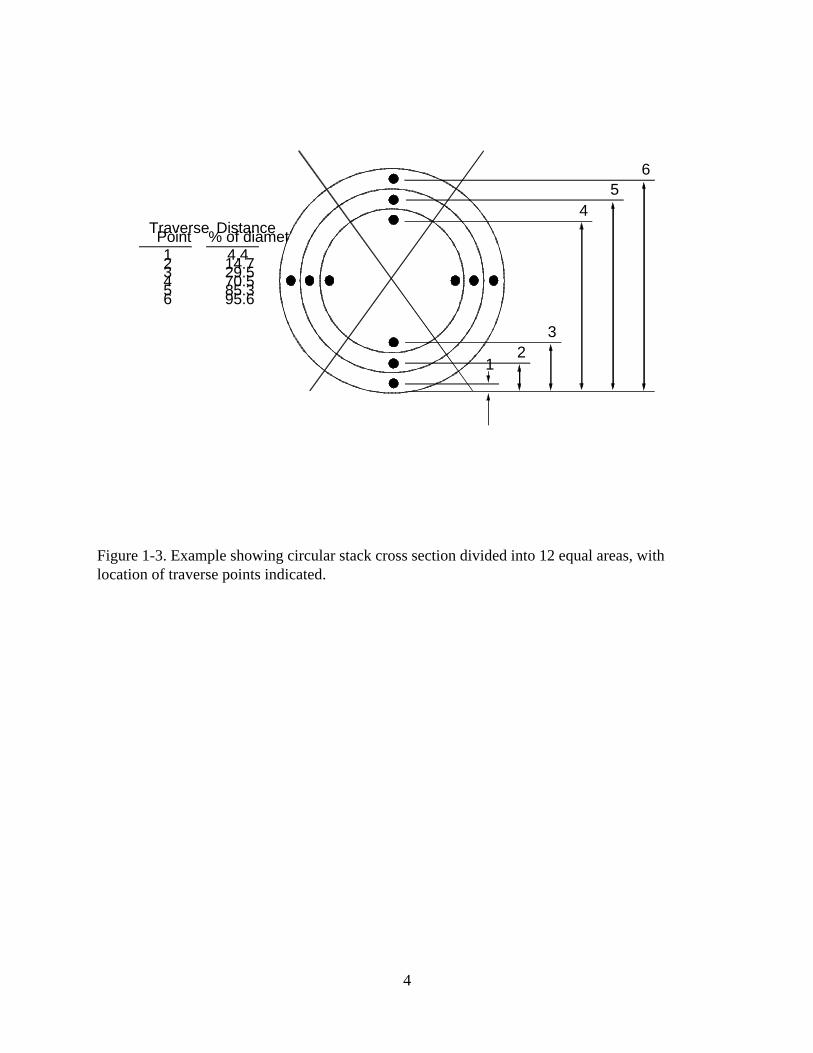
Traverse Point123456
Distance % of diameter
4.414.729.570.585.395.6
4
Figure 1-3. Example showing circular stack cross section divided into 12 equal areas, withlocation of traverse points indicated.

5
TABLE 1-2 LOCATION OF TRAVERSE POINTS IN CIRCULAR STACKS(Percent of stack diameter from insidewall to traverse point)
Traverse Point Number of traverse points on a diameterNumber on aDiameter 2 4 6 8 10 12 14 16 18 20 22 24
1 . . . . . . . . . . . 14.6 6.7 4.4 3.2 2.6 2.1 1.8 1.6 1.4 1.3 1.1 1.1
2 . . . . . . . . . . . 85.4 25.0 14.6 10.5 8.2 6.7 5.7 4.9 4.4 3.9 3.5 3.2
3 . . . . . . . . . . . 75.0 29.6 19.4 14.6 11.8 9.9 8.5 7.5 6.7 6.0 5.5
4 . . . . . . . . . . . 93.3 70.4 32.3 22.6 17.7 14.6 12.5 10.9 9.7 8.7 7.9
5 . . . . . . . . . . . 85.4 67.7 34.2 25.0 20.1 16.9 14.6 12.9 11.6 10.5
6 . . . . . . . . . . . 95.6 80.6 65.8 35.6 26.9 22.0 18.8 16.5 14.6 13.2
7 . . . . . . . . . . . 89.5 77.4 64.4 36.6 28.3 23.6 20.4 18.0 16.1
8 . . . . . . . . . . . 96.8 85.4 75.0 63.4 37.5 29.6 25.0 21.8 19.4
9 . . . . . . . . . . . 91.8 82.3 73.1 62.5 38.2 30.6 26.2 23.0
10 . . . . . . . . . . 97.4 88.2 79.9 71.7 61.8 38.8 31.5 27.2
11 . . . . . . . . . . 93.3 85.4 78.0 70.4 61.2 39.3 32.3
12 . . . . . . . . . . 97.9 90.1 83.1 76.4 69.4 60.7 39.8
13 . . . . . . . . . . 94.3 87.5 81.2 75.0 68.5 60.2
14 . . . . . . . . . . 98.2 91.5 85.4 79.6 73.8 67.7
15 . . . . . . . . . . 95.1 89.1 83.5 78.2 72.8
16 . . . . . . . . . . 98.4 92.5 87.1 82.0 77.0
17 . . . . . . . . . . 95.6 90.3 85.4 80.6
18 . . . . . . . . . . 98.6 93.3 88.4 83.9
19 . . . . . . . . . . 96.1 91.3 86.8
20 . . . . . . . . . . 98.7 94.0 89.5
21 . . . . . . . . . . 96.5 92.1
22 . . . . . . . . . . 98.9 94.5
23 . . . . . . . . . . 96.8
24 . . . . . . . . . . 98.9

De'2LW
(L % W)
6
Figure 1-4. Example showing rectangular stack cross section divided into 12 equal areas,with a traverse point at centroid of each area.
For rectangular ducts, the same process is used to determine how many points need to besampled. However, the method requires a calculation of an equivalent diameter based onthe dimensions of the duct. That equivalent diameter is then divided into the upstream /downstream distances. The number of points is chosen in the same manner as above.
Table 1-1. CROSS-SECTION LAYOUT FOR RECTANGULAR STACKS——————————————————————————————————————————Number of traverse points Matrix layout ——————————————————————————————————————————
9 ................... 3x3 12 ................... 4x3 16 ................... 4x4 20 ................... 5x4 25 ................... 5x5 30 ................... 6x5 36 ................... 6x6 42 ................... 7x6 49 ................... 7x7
——————————————————————————————————————————
Review Method 1 to determine the placement of the points once the number of points have beendetermined.
1.2) Cyclonic flow check completed? (Average of absolute value of all angles <20degrees?)

7
Method 1, section 2.4.The effluent within a stack does not always travel linearly. The introduction of the gas stream into astack at a tangential angle can create an effluent cyclone within the stack. The presence of cyclonicflow is not desirable for testing emissions from the stack. Essentially, most of the sampling equipmentwas not designed to take measurements in non-linear flow. Combined with the characteristics ofparticle motion, flow and pollutant stratification, cyclonic flow is undesirable for a sampling location.How linear must the flow be? Method 1 has states that the flow must be less than 20 degrees, onaverage, from the axis of the flue. In other words, the angle of non-axial flow (axial would be perfectlyvertical flow in a vertical stack and perfectly horizontal in a horizontal duct) must be measured at eachpoint, prior to beginning the test. The average of each individual angle shall be less than 20degrees.A pitot tube, which is used in Method 2 to measure the flow rate, and an angle finder areused to determine the angle of the effluent, relative to the flue walls, at each sampling point.

8
This page was intentionally left blank.

A B
FaceOpeningPlanes(a)
TransverseTube Axis
ABPAPB
Note:1.05 D < P < 1.50 Dt tP = PBA
LongitudinalTube Axis
B-Side Plane
A-Side Plane
Dt
(b)
(c)
A or B
(a) end view; face opening planes perpendicular to transverse axis;(b) top view; face opening planes parallel to longitudinal axis;(c) side view; both legs of equal length and centerlines coincident, when viewed from both sides. Baseline coefficient values of 0.84 may be assigned to pitot tubes con- structed this way
9
Figure 2-2. Properly constructed Type S pitot tube.
Method 2 - Determination of Stack Gas Velocity and Volumetric Flow Rate2.1) Pitot tube leak check completed after each run?
The pitot tube is inserted in the stack and the flow stream impacts on one side of the pitot head. Thetwo sides of the pitot tube are connected by two lines (typically called a pitot umbilical) to the twosides of a sealed manometer. The effluent gas stream does not pass from one side of the pitot,through the manometer and out the other side of the pitot. The effluent creates a pressure differential(delta p) between the two pitot heads. The magnitude of the differential pressure is measured on themanometer. Therefore, it is imperative to ensure a leak free system. A pitot tube leak check shouldbe performed after each run. If the leak check fails, the runs between the failed leak check and theprevious passed leak check should be invalidated.
40CFR60 M2, section 3.1: “It is recommended, but not required, that a pretestleak-check be conducted, as follows: (1) blow through the pitot impact opening untilat least 7.6 cm (3 in.) H2O velocity pressure registers on the manometer; then, closeoff the impact opening. The pressure shall remain stable for at least 15 seconds; (2)do the same for the static pressure side, except using suction to obtain the minimumof 7.6 cm (3 in.) H2O. Other leak-check procedures, subject to the approval of theAdministrator, may be used.” ... “Conduct a post-test leak-check (mandatory), asdescribed in Section 3.1 above, to validate the traverse run.”
Other procedures may include closing off both sides of the pitot tube at once through a single pieceof tubing. This procedure will create a loop out of the entire system. Keep in mind that the entire pitottube system, assembled for testing, must be leak checked. The fluid within the manometer is aviscous oil and will therefore run down the walls of the manometer tube. This may appear to be a leaksince the level of the oil will be increasing, but eventually the oil level will become steady. There havebeen questions about what “stable” means - how much deviation is allowed? Ideally, no leaks, andtherefore no change in manometer fluid level should occur.
2.2) Visual check of pitot tube heads - good condition?40CFR60 M2, section 2.1 & figures 2-1, 2-2, and 2-3.The type S pitot head is assigned a coefficient of 0.84, which will be used in velocity calculations, ifthe pitot tube meets certain dimensional limits. Since the pitot tube is not required to be calibrated,

(a)
TransverseTube Axis B
(f)
A
1
(b)
1 2
A BA
FlowBA
$1(-)(c)
FlowBA
$1(+)(d)
(e)
BA $1(+ or -)
$2(+ or -)
LongitudinalTube Axis
B
Z
(g)
A WB
10
it is important for the pitot tube to remain in good condition. Comparing the pitot heads to the figuresin the CFR will determine if the pitot tube is acceptable. Look for damaged, crushed, or flattenedheads as well as any other mis configuration. This procedure can be performed prior to the beginningof the test run or after the run is complete.
2.3) Manometer level and zeroed correctly?40CFR60 M2, section 3.2Since the manometer measures the differential pressure of the pitot tube heads, it is imperative thatthe manometer is level and the fluid has been adjusted to read zero before the test run. In order toget a “differential pressure” we must know the “original” pressure and then subtract it from the“measured” pressure. If we set the “original” pressure to zero, the “measured” pressure will be thevalue indicated by the fluid level on the manometer scale. Similarly, since the manometer scale wasdefined with a level reference, if the scale is slanted, the fluid’s position on the scale will not indicatean accurate delta P. Prior to each run, the level and the zero should be checked. The test team mayalso want to check the level and zero between port changes especially when the manometer mustbe moved. The leveling should occur first so that the zero reading is not biased. There should bea leveling bubble built into the body of the manometer. The manometer can be adjusted on onecorner until the bubble indicates a level position. The manometer reading is made by aligning thebottom of the fluid meniscus with the reflection of the meniscus on the mirrored background. The zeroreading is taken while the pitot heads are covered so that there is no impaction from the wind. Theadjustment for the zero level is made by adjusting the fluid level in a reservoir built into themanometer. The procedure may need to be performed multiple times on days with great temperaturefluctuations, due to the expansion / contraction of the manometer fluid.

11
2.4) Static pressure measured during the test day?40CFR60 M2, section 3.4The static pressure basically measures the difference in absolute pressure from the ambientatmosphere to the gases within the stack. The static pressure value is used in the calculation of gasvelocity and volumetric flow rate. The measurement is made with the same pitot tube used forvelocity measurements. During velocity measurements, the pitot tube is oriented such that the planeof the pitot head opening is perpendicular to the flue’s longitudinal axis so that the gas stream willimpact on the opening. When the static pressure is measured, the pitot tube heads are rotated untilthere is a null (zero) reading on the manometer. A null reading indicates that the plane of the pitothead openings is parallel to the direction of the flow and therefore, effluent is not impacting on thepitot head creating a differential pressure reading on the manometer. Once the manometer yieldsa null reading, one side of the manometer is disconnected from the pitot tube. The pressure of theambient atmosphere will be applied to one side of the manometer and the pressure of the effluentgases will be applied to the other side. The difference in the two pressures is termed the staticpressure. A positive static pressure occurs when the effluent gas pressure is greater than theatmospheric pressure. A negative pressure occurs when the ambient pressure is greater than thestack gas pressure. A physical inspection of the sampling port can aid in determining whether thestatic pressure is positive or negative. If effluent is blowing out at the sampling port, the staticpressure is probably positive. If ambient air is being drawn into the port opening, then the staticpressure is probably negative. If the gases at the port ‘puff’ in and out, then the static pressure maybe negligible. In all cases, the static pressure shall be measured.
2.5) Barometric pressure recorded and adjusted for elevation? (see reverse side)40CFR60 M2, section 2.5
“Barometric pressure must be adjusted minus 0.1" per 100ft elevation increase orvice versa for elevation decrease. (Elevation at which barometric pressure ismeasured compared to the elevation at the test platform.)”
An accurate value for barometric pressure is important for the velocity and volumetric flow ratecalculation. Barometric pressure will change due to altitude by the relationship given above. Testingfirms may have equipment to measure barometric pressure at the sampling location. Others may relyon the data generated at a control room, air port, or National Weather Service station. If samplingis occurring at a 300 foot location and the barometric pressure was measured at an airport 100 feetlower than the source’s elevation, a correction of (0.1*3+0.1*1=0.4) minus 0.4 inches must be appliedto the measured barometric pressure.
2.6) Pitot tube heads oriented to axis of flue? / Pitot tube perpendicular to axis of stack?The pitot tube performs it’s designed function when the effluent impacts the pitot head opening in aperpendicular direction. Therefore, the pitot heads must be aligned to the axis of the flue so that thepitot head opening plane is perpendicular to the direction of flow and perpendicular to the stack walls.This assumes that the direction of the effluent and the axis of the flue are parallel. EPA has set forthan acceptable deviation for the direction of flow (20 degrees) as was addressed in the discussion ofcyclonic flow. In order to ensure standardized, reproducible result, the pitot heads shall be orientedto the axis of the flue. The pitot tube should be inserted in the flue and remain at a perpendicularangle to the flue. For example, if the testing is occurring at a vertical stack, the pitot tube should beparallel to the ground, and the pitot must be perpendicular to the stack. The pitot tube must a beperpendicular to the stack so that the path of travel for the pitot is across a diameter of the crosssection.

7.62 cm (3 in.)* Temperature Sensor
1.90 - 2.54 cm*(0.75 - 1.0 in.)
Type S Pitot TubeLeak-Free ConnectionsManometer
* Suggested (Interference Free) Pitot tube/Thermocouple Spacing
12
Figure 2-1. Type S pitot tube manometer assembly.
2.7) Temperature recorded at each sampling point?40CFR60 M2, section 3.3As the pitot tube traverses the cross section of the stack, the differential pressure (delta p) and thetemperature shall be measured at each sampling point determined in Method 1. A thermocoupleshould be attached to the pitot tube and an average temperature for the effluent can be determined.The temperature read out at each point should be allowed to stabilize prior to recording the data.

Probe
Filter(Glass Wool) Flexible Tubing
Squeeze Bulb
To Analyzer
Valve
Air-TightPump
Probe
Rate Meter
Air-CooledCondenser
Surge Tank
Bag
QuickDisconnect
Rigid Container
Filter(Glass Wool)
Valve
13
Figure 3-1. Grab-Sampling Train.
Figure 3-2. Integrated gas-sampling train.
Method 3 - Gas Analysis for O , CO , and Dry Molecular Weight2 2
Skip this section if O2 & CO2 concentrations are determined via analyzers.If a flow rate determination is necessary, but the testing company does not use analyzers for the O2and CO2 measurements, then the molecular weight (MW) determinations are produced through theoriginal Method 3 utilizing an Orsat wet-chemical analyzer. MW is determined by the ratios of O2,CO2, and CO in the following equation:
M = Dry Molecular weight of the gas streamd
Md= 0.440(%CO ) + 0.320(%O ) + 0.280(%N + %CO)2 2 2
%N = 100 - (%CO + %O )2 2 2
Typically, carbon monoxide is not measured for MW determinations since it is multiplied by the samefactor as N2. Therefore, once the O2 and CO2 concentrations are measured, the remainder of thegases with percentage concentrations are assumed to be N2.
3.1) Orsat or Fyrites used? (circle)The O2 & CO2 determinations are performed using an Orsat (O2 & CO2) or a Fyrite (for CO2 only).The analysis is performed by introducing a sample of the effluent (typically collected in a bag) to theOrsat of Fyrite equipment. There is one reagent used to absorb O2 and a different reagent used to

14
absorb CO2. Due to the gas absorption, there will be a difference in gas volume within the analyzerthat can be measured on a scale. The Orsat is the preferred wet chemistry method for O2 and CO2determinations. The Fyrite may be used for CO2 but is not allowed for O2 by the NCAC .0501regulation. The measured O2 concentration is an important variable in the lb/mmBtu calculation; asmall error in the O2 measurement can create a large error in the emission calculation that mayeffect the compliance status of a source.
3.2) Orsat performed in triplicate? Analysis consistent?40CFR60 M3, section 3.4The analysis shall be performed on one sample per test run. When the Orsat analysis is performed,the test company should make three separate measurements on each run’s sample. The threeanalysis, on the same sample, should not differ greatly.
“3.4 Repeat the sampling, analysis, and calculation procedures until the dry molecularweights of any three grab samples differ from their mean by no more than 0.3 g/g-mole (0.3lb/lb-mole). Average these three molecular weights, and report the results to the nearest 0.1g/g-mole (0.1 lb/lb-mole).”

15
Method 4 - Determination of Moisture Content in Stack Gases4.1) Impingers used or some other type of condenser? Multi point sample?
40CFR60 M4, section 2.1.2 & 2.2.1The most common moisture determination system is the impinger train that is used on the back sideof a Method 5 sampling train. The impinger train is the Method 4 part of the Method 1-5 samplingtrain. The impinger train can be used by itself, when particulate determinations are not necessary,to determine the moisture content.
2.1.2. ...“Alternatively, any system may be used (subject to the approval of theAdministrator) that cools the sample gas stream and allows measurement of both the waterthat has been condensed and the moisture leaving the condenser, each to within 1 ml or 1 g.”
A traverse of the flue should occur in order to ensure representativeness of the moisturedetermination:
“2.2.1 Unless otherwise specified by the Administrator, a minimum of eight traverse pointsshall be used for circular stacks having diameters less than 0.61 m (24 in.), a minimum ofnine points shall be used for rectangular stacks having equivalent diameters less than 0.61m (24 in.), and a minimum of twelve traverse points shall be used in all other cases. Thetraverse points shall be located according to Method 1. The use of fewer points is subject tothe approval of the Administrator.”
4.2) H O in first 2 impingers, 3rd impinger empty, silica gel in 4th impinger?240CFR60 M4, section 2.1.2“2.1.2 Condenser. The condenser consists of four impingers connected in series with groundglass, leak-free fittings or any similarly leak-free non-contaminating fittings..... The first twoimpingers shall contain known volumes of water, the third shall be empty, and the fourthshall contain a known weight of 6- to 16-mesh indicating type silica gel, or equivalentdesiccant.”
4.3) Temperature at the exit of impingers / condenser <68F? (see reverse side)40CFR60 M4, section 2.2.5
“2.2.5 To begin sampling, position the probe tip at the first traverse point. Immediately startthe pump and adjust the flow to the desired rate. Traverse the cross section, sampling at eachtraverse point for an equal length of time. Add more ice and, if necessary, salt to maintaina temperature of less 20 C (68 F) at the silica gel outlet.”
The outlet temperature of less than 68 degrees ensures that the sample is relatively dry before exitingthe train, and it approximates the “standard” temperature used for calculations.
“Exit Temperature: The temperature of the dry gas leaving the impingers/condenser mustbe below 68F. When the ambient temperature is above 68F it may take approximately 5minutes for the thermal effects of the ice bath to cool the exit thermometer below 68F.”
4.4) Silica gel in good condition? - Blue-new, Pink-spent (unable to absorb more H O)2

16
Most silica gel used for moisture determinations is the “indicating” type. Dark colored (blue, purple)silica gel can absorb water from the gas stream. Light colored silica gel (pink, white) has lost mostof it’s absorptive capacity. As the test run is performed, the silica gel will absorb more and moremoisture from he effluent. The gas contacts the silica gel at the bottom of the impinger first, since thegas enters through the impinger stem (like a straw). Silica gel at the bottom of the impinger willchange color first. If all of the silica gel has turned a pale color by the end of the run, some moisturemay be passing through the train. The sampling team should use new silica gel and may choose touse more silica gel.

17
CEM Methods: Method 3A-O /CO , M6C-SO , M7E-NO , M10-CO2 2 2 xThe CEM methods for O2 / CO2 / Nox / and SO2 are very similar and are all based on the proceduresin Method 6c. Method 10 for carbon monoxide uses the same principles, but the methodology isslightly different. Typically, companies will perform CO testing using the Method 6c procedures.
5.1) System leak check performed during test day? (not required per method but goodQ.A.)
Although not required, some test companies will perform a leak check on the CEM sampling systemprior to sampling (a procedure with which we will not argue). The leak check is a good indicator ofloose connections and the location of a leak. Once the system is assembled and in place, the testteam member at the sampling location will plug the end of the CEM probe, thus sealing the system.The team member in the CEM mobile trailer will then observe a rotameter, or other flow indicator,while the sampling pump is operating. If the sampling pump can pull ambient air in through a leak inthe system, the rotameter will continue to give a reading or the ball within the rotameter will bounce,indicating a leak. If the ball sits still or has minimal movement (contributed to the diaphragm actionof the pump), then the negative pressure side of the system should be leak free. It may take a littletime to perform the leak check since the entire sampling system, from the truck to the stack location,is being evacuated. The sample pump is located in the sampling trailer and pulls gas from the stack location and thenpumps it through the manifold board and the analyzers. A leak that will intake ambient air can occurat any point including the probe, the valve, filter, condenser, sample lines, and the intake of the pump(including the pump). This occurance is termed a negative pressure leak. A positive pressure leakwill expel effluent from the sample system to the ambient surroundings. When the pump pushes thegas to the analyzers, a positive pressure leak can occur from the pump outlet through the labplumbing, manifold board, analyzer connections and ambient dump (the sample gas is eventuallyexpelled from the truck and ducted away from the surroundings). A negative pressure leak will makeit impossible to perform calibrations or compile good data (dilution due to ambient air). A positivepressure leak concentrated in a mobile trailer can make you very sick.
5.2) Sample point w/in centroid of stack (compliance test)?The tip of the gas sample probe shall be placed in the center of the stack and a single point gassample may be taken during the run. If the gas test is a Relative Accuracy Test Audit (RATA), thenthe sampling points must conform to 40 CFR 60 Appendix B, Performance Specification 2 (16.7, 50,83.3 percent of the stack diameter)
5.3) Sample conditioner / dryer used?40CFR60 M6c, section 5.1.5 & 5.1.6The analyzers for these methods measure the pollutant concentration on a ‘dry’ basis. The particulatematter and moisture within the effluent must be removed so that the analyzers will function properly.A ‘dirty’ or wet gas stream will influence the concentration readings and may damage the electronics.An in- stack filter, which may consist of a plug of glass wool, and an out of stack filter are typicallyused. The conditioning equipment can be defined as that part of the system that removes the moisture andparticulate from the gas sample. The sample conditioner is typically a condenser that may be assimple as a spiral of Teflon tubing immersed in an ice water bath. As the effluent travels through thespiral, the cool temperature condenses the moisture which is then captured in traps and expelled.Other condensers include more expensive equipment like a Perma-pure dryer. Testers must be usedto ensure that with either the particulate removal or the moisture removal, the concentration of the gaspollutant is not altered. A condenser can quickly become a pollutant scrubber if the collected moistureis not expelled.
5.4) Heated sample line used prior to sample conditioner?

18
As the sample is extracted from the stack, it will typically travel through several pieces of equipment:a probe, sample valve, filter, sample line, condenser, and then more sample line to the test trailer.The condenser is the piece of equipment to dry the gas. To ensure the moisture does not condenseprior to the condensor, the pre-condensor equipment shall be heated. Therefore, the probe, valve,filter and intermediate sample line shall be heated to prevent condensation.
5.5) Moisture visible in the sample line? (Do not explain a "No")If moisture is visible in the sample line prior to the conditioning system, the preceding equipment maynot be heated enough. The primary concern is to prevent the pooling of water which will scrub theeffluent. If there is minimal water entering the condenser, this may be acceptable. If the moisture isvisible exiting the condenser, or at any point between the condenser and the analyzers, then theconditioning system is not working properly. The result may effect the performance of the system ordestroy the analyzers.
5.6) Filter used: "In stack" or "heated out of stack"40CFR60 M6c, section 5.1.6A simple check to ensure that a filter is being used as part of the conditioning system.
5.7) Sample system flow rates within 10% of calibration flowrates?40CFR60 M6c, section 7.3Some analyzers may be influenced by the rate the sample is introduced into the analyzer. Therefore,the system flow rate must be measured during the calibrations. The measurement can be madethrough a rotameter that gauges the pump flow rate and the flow rate to the individual analyzers.Once the sampling of effluent begins, the flow rate to the analyzer should be within 10% of thecalibration flow rate. This procedure further validates the calibration.
5.8) All concentration measurements below the span value for that pollutant?40CFR60 M6c, section 2.1The span is defined as the maximum concentration that has been calibrated ( if you calibrate aconcentration of 0-100, then the span is 100; if you calibrate a concentration of 0-200, then the spanis 200; etc.). The calibration span is a function of the pollutant concentration while the instrumentrange is a function of the analyzer.
“2.1 Analytical Range. The analytical range is determined by the instrumental design. Forthis method, a portion of the analytical range is selected by choosing the span of themonitoring system. The span of the monitoring system shall be selected such that thepollutant gas concentration equivalent to the emission standard is not less than 30 percentof the span. If at any time during a run the measured gas concentration exceeds the span, therun shall be considered invalid.”
5.9) Data Recorder: Digital / Strip chart / Manual / other__________ (circle one)40CFR60 M6c, section 3.1.3A simple check to ensure that a the data is being recorded ;-)
“3.1.3 Data Recorder. A strip chart recorder, analog computer, or digital recorder forrecording measurement data from the analyzer output.”
5.10) NO monitoring: NO to NO convertor operating? Total NO being analyzed?x x240CFR60 M7e, sections 3.1.2 & 5.1.2 & 6.4That portion of the analyzer that converts NO to NO so that “Total NO ” will be measured. The last2 x
19
convertor efficiency check should have been performed within the past year.
5.11) Calibration Error Check performed for all analyzers and within specifications(2% of span)?
40CFR60 M6c, sections 3.4, 4.1, and 6.3The calibration error check is a “direct” calibration of the analyzer. The calibration gas is directedstraight from the cylinder to the analyzer without leaving the sample trailer. This is primarily acalibration to ensure that the analyzer has a linear response. Once the span has been chosen fora pollutant, the analyzer is challenged by several gases:
For Methods 3A, 6C, and 7E: a 0 (zero) gas, a 40-60% of span gas, and a 80-100% of spangas shall be used.For Method 10: a 0, 30% 60% and 90% of span gas shall challenge the analyzer.
The difference between the calibration gas value and the response provided by the analyzer shall bewithin 2% of the span. If this requirement is not met, the calibration error check must be performedagain until the analyzer can pass the test. There shall be no adjustments made to the analyzers afterthe start of the Calibration Error test. If an adjustment is made, then the calibration error test mustbegin again.
5.12) System Bias Check performed for each analyzer before the first run, between eachrun, and after the last run?
40CFR60 M6c, sections 3.5, 4.2 and 6.4Once the analyzer has been calibrated in the Calibration Error Check, the integrity of the samplingsystem must be determined. The system bias check is performed by sending the calibration gases,one at a time, up to the sampling location, through as much of the probe as possible, through all ofthe conditioning equipment, down through the sampling line to the trailer, and is then injected to theanalyzers. If there are any leaks in the system, any puddled water, or any contaminated parts of thesystem, then the system bias check may fail. The system check is performed by injecting the zerogas and one of the upscale gases (the mid or high gas, whichever most approximates the effluentconcentration). For the system bias check, the difference between the calibration gas value and theresponse provided by the analyzer shall be within 5% of the span.
5.13) Test team monitoring analyzer zero drift and calibration drift between each run?40CFR60 M6c, sections 3.6, 3.7, 4.3, 4.4, and 7.4The test company shall keep track of the differences of the sampling system bias check from run torun.
“The sampling team shall calculate and report the calibration drift for each analyzerbetween each calibration. The zero drift and calibration drift are limited to 3% of the spanover the period of each run. The calculation for drift is: (Final system cal. - Initial systemcal) / span *100. All calibration gases shall be used for the calibration error test. Only thezero and one span gas are required for the system calibrations.”
20
The following page (front/back) should be completed to the extent possible. The datamay be transferred from print outs provided by the tester. Preferably, the calibrationsshould be viewed at the time they are performed to assure monitor stability and correctflowrates for each calibration gas.
Process Data: It is absolutely imperative for the facility to record the pertinent dataduring the test so that the measured emissions can be correlated to a production rateand compared to the permit limit. The test will be unacceptable without productiondata.
Method 1: If stack is between 4" - 12" then Method 1a must be employed. If duct is<4" then alternative methods must be used. (Contact SSCB with any test questions)Stack Diameter?_______ Measured on site?
Port distance from upstream disturbance (A)_______ Upstream Diameters(A)______
Port distance from downstream disturbance (B)_____ DownstreamDiameters(B)____
# of Sampling Points?_____ (Draw a line vertically from the "Distance A" axisdown to the step chart, and from the "Distance B" axis up to the step chart. Themaximum # of points marked on the chart yields the minimum # of points to besampled.)
Min. number of traverse points for velocity (non-particulate) traverses
Points correctly marked on the pitot tube? Port length accounted for incalculations?
Remarks: Barometric Pressure: Barometric pressure must be adjusted minus 0.1" per 100ftelevation increase or vice versa for elevation decrease. (Elevation at which barometricpressure is measured compared to the elevation at the test platform.)
Exit Temperature: The temperature of the dry gas leaving the impingers/condensermust be below 68F. When the ambient temperature is above 68F it may takeapproximately 5 minutes for the thermal effects of the ice bath to cool the exitthermometer below 68F.

21
CEM Methods:There shall be no adjustments made to the analyzers after the start of the CalibrationError test. If an adjustment is made, reject all data since the last completed systemcalibration. The Calibration Error test shall be re-performed and any subsequentsystem calibrations that are necessary. The calibration and sample gas flow rates canand should be adjusted to within 10% of the flowrate during the calibration error test.The mid range or high range gas can be used for the system bias test; however, it ispreferred to use the upscale calibration gas closest to the effluent concentration. It isalso possible to use more than the required number of gases as long as the minimumgases were used. Single point gas sampling is acceptable for compliance testing. Thegas sample should be extracted from the center of the stack. The span of the analyzersshall be selected such that the gas concentration equivalent to the emission standard isnot less than 30% of the span. If at any time during a run the measured gasconcentration exceeds the span, the run shall be considered invalid.
Remarks:
22
CEMPage 2/2
Cal. Gas Values (A)40CFR60 M6c, section 5.3The calibration gas values shall be within the ranges discussed earlier: (0, 40-60%, and 60-80% ofthe span) The calibration gases shall be Protocol 1 gases. These gases have successfully passedan independent calibration procedure. Record the gas values as listed on the cylinder or thecertification sheet.
Direct Cal. Response (B)40CFR60 M6c, section 6.3The response that the analyzer produces once the calibration gas is introduced during the calibrationerror check.All calibration recorded values shall be taken once the analyzers read-out has become steady andis not increasing or decreasing.
Cal. Error %40CFR60 M6c, sections 3.4 and 4.1The calibration error percentage must be less than 2% of span for all of the calibration gases ascalculated by the following equation: [(A-B)/C]*100
Where: A=Calibration gas valueB=Direct Calibration ResponseC= Analyzer span
System Cal.40CFR60 M6c, section 6.4The system shall be calibrated to determine any system errors.
Response Pre-Run 1 (R1)
The analyzer response to the system calibration.
System Bias %[(R1-B)/C]*100(<5%)
The percentage of bias associated with the calibration, the calculation, and the limit.
O / CO / SO / No / CO2 2 2 xSpan: ©
Record the chosen span of each pollutant analyzer.
Calibration Error value shall be equal to or less than 2%. System Calibration Biasshall be equal to or less than 5%. The sampling team shall calculate and report thecalibration drift for each analyzer between each calibration. The zero drift andcalibration drift are limited to 3% of the span over the period of each run. Thecalculation for drift is: (Final system cal. - Initial system cal) / span *100. All

23
calibration gases shall be used for the calibration error test. Only the zero and onespan gas are required for the system calibrations.
Run 1 Maximum Conc. / Run 1 Average Conc.Record the maximum concentration and average concentration reported by each analyzer during therun.

24
CEMPage ½%
The required percentage that the calibration gases shall be within (as calculated from the span value).
Calibration Gas RangesThe allowable range that a chosen gas cylinder concentration must be within.
Calibration Gas ValuesThe actual value of the gas cylinder concentration.
Gas Manufacturer & Cylinder #Record the manufactured of the gas and the cylinder number of the gas used. This will aid invalidating the calibrations.
Protocol 1 gas?40CFR60 M6c, section 6.1Check to ensure that the gas is certified via Protocol 1
Expiration Date OK?All calibration gases are certified for a specific time period and have an expiration date. Ensure thatthe gas has not “expired”.
N or other non - O gas2 2For a ‘zero’ gas, nitrogen can be used. It is also acceptable to use a gas that does not contain thepollutant whose analyzer is being zeroed. For example: As the high calibration gas for Nox is beinginjected, the SO2, O2, and CO monitors can all be zeroed since the upscale Nox gas should notinclude the other gases.
To calculate cylinder gas range, multiply span by corresponding percentage (0.4* span,0.6* span). The calibration gas to be used shall fall within these values. CO gases donot need to be exactly 30%, 60%, and span, but should approximate the percentages.For CO testing, the "Span" gas value can be considered 80-100% of the calibratedspan. Method 10 for carbon monoxide has slight variations from method 6c, but mosttest companies perform CO testing to method 6c requirements.
Copyright © 2022 FDOKUMEN