Feedback amplifier configurations - Circuits, Devices and ...
nNucleic Acids Research, Vol. 20, No. 8 1933-1941
The pH dependent configurations of the C.A mispair inDNA
Y.Boulard, J.A.H.Cognet1, J.Gabarro-Arpa1, M.Le Bret1, L.C.Sowers2 and G.V.Fazakerley*Service de Biochimie et de Genetique Moleculaire, Departement de Biologie Cellulaire et Moleculaire,Centre d'Etudes de Saclay, 91191 Gif-sur-Yvette Cedex, 1Laboratoire de PhysicochimieMacromoleculaire, Institut Gustave Roussy, F-94800 Villejuif, France and 2Division of Pediatrics,City of Hope National Medical Center, Duarte, CA 91010, USA
Received January 20, 1992; Revised and Accepted March 20, 1992
ABSTRACTThe structure of the cytosine-adenine mispair in a 7base pair duplex has been investigated by proton NMRspectroscopy. At low pH, the predominant structure isprotonated on the A residue and assumes a wobbleconformation consistent with previous findings. The Cresidue of the mispair is found in a C2'- C3' endoeqilibrium. This is confirmed by molecular dynamicscalculations which suggest that the conformation of theprotonated wobble is flexible and not as rigid as anormal base pair. As the solution pH is raised, astructural transition is observed with an apparent pKof 7.54 at 230C. At higher pH the predominant structureis one in which both the C and A residues areintrahelical. Evidence is presented that this structurecorresponds to a reverse wobble in which the twobases are held together by one hydrogen bond. Thisstructure is much less stable than the protonated formand even at low temperature single strands areobserved in slow exchange with the neutral duplexform.
INTRODUCTIONThe adenosine-cytosine mispair, when formed in DNA, wouldserve as an intermediate in establishing transition mutations invivo. Over the years, many studies have been conducted toidentify the structure if the C.A mispair. Although a variety oftechniques have been employed, elucidation of the C.A structurehas proven difficult, elusive and controversial.
Originally, it was proposed that the C.A mispair could formin Watson-Crick geometry if either A or C formed a raretautomeric structure (1,2). The tautomer model historically hasbeen preferred, however, few experimental studies havesupported this model. Since 1959, a total of at least nine otherstructural alternatives have been suggested.
Patel et al. (3) were the first to examine the C.A mispair inDNA using high field NMR spectroscopy. Their results, for themispair studied at low pH, were inconsistent with imino tautomers
in Watson -Crick geometry, however, there was not sufficientinformation to unambiguously define the structure. Hunter et al.(4) established that the C.A mispair in a DNA duplex crystalobtained at acidic pH was in a wobble geometry. Crystallographycould not, however, determine whether the structure wasprotonated or involved tautomeric forms.We have been interested in the phenomena of ionized base pairs
due to the lower energy required for ionization versus tautomerformation at physiological pH (5,6). We demonstrated thationization and tautomer formation induced changes in protonchemical shifts of similar magnitude but opposite direction. Usingthis information, we examined the C.A data of Patel et al. Ourresults were consistent with protonation of the A residue andinconsistent with formation of imino tautomeric forms by eitherthe A or C residues. Recently, protonation of the A residue inan C.A mispair at acidic pH has been unambiguously confirmed(7) by NMR spectroscopy of N-15 enriched oligonucleotides.The presence of ionized bases in mispairs implies that the
structure of the mispair may vary as a function of solvent pH.Transitions between structurally distinct base pair configurations,induced by changes in solvent pH, have been demonstrated forfluorouracil-guanine (8), bromouracil-guanine (9) and guanine-adenine (10,11) base mispairs. It has been shown foroligonucleotides containing C.A mispairs that the meltingtransition temperature is highly pH dependent (12) and the N-15NMR study (7) indicated that the protonated C.A mispair loosesa proton with increasing solvent pH. There have been no reportedstudies on the nature of the C.A mispair under neutral or alkalineconditions.
In order to provide a more complete understanding of the C.Amispair, we have conducted NMR studies on a model DNAduplex containing an C.A mispair as a function of pH.
MATERIALS AND METHODSThe duplex studied here was formed from the oligonucleotides5'd(C1 A2 G3 C4 G5 G6 C7).(G8 C9 C1O A11 C12 T13 G14).The duplex was 4mM in strand concentration in 10 mMphosphate buffer, 150 mM NaCl and 0.2 mM EDTA.
* To whom correspondence should be addressed
l. 1992 Oxford University Press
1934 Nucleic Acids Research, Vol. 20, No. 8
NMR spectra were recorded on either AMX500 or AMX600Bruker spectrometers. Details of the NMR experiments and datatreatment have been given previously (13).
Molecular mechanics calculations. Energy minimizations andmolecular dynamics were carried out using the program AMBER(14-16) on IBM 530 RISC 6000 computers. The parameters usedare as described previously (13). The charges for the protonatedadenosine base were calculated on a VAX 8530 with the programQUEST of the AMBER package (15 - 19) in accordance with theAMBER database. Comparison between the NMR data and modeldata, function F, is as described previously (13).
Molecular dynamics (MD). The molecular dynamicscomputations were all performed as described previously (20).The preparation procedure was developed for a system with avery sensitive dynamic probe. NMR distance measurements wereused as restraints in the MD. The force constant used was 10kcal/mol.A2 (MDI). In a second run, MDII, the restraint wassolely on the torsion angle 6 of all residues except C4 and A 1.These were restrained to 60 = 1440. The force constant usedwas 10 kcal/mol. These two MD runs are compared. Kinetic,potential and total energy of the molecule remained at equilibriumvalues during the entire 200 ps runs without drifting.The molecular structures were displayed on a Silicon Graphics
IRIS 4D70GT using the programs, MORCAD and OCL (21,22).
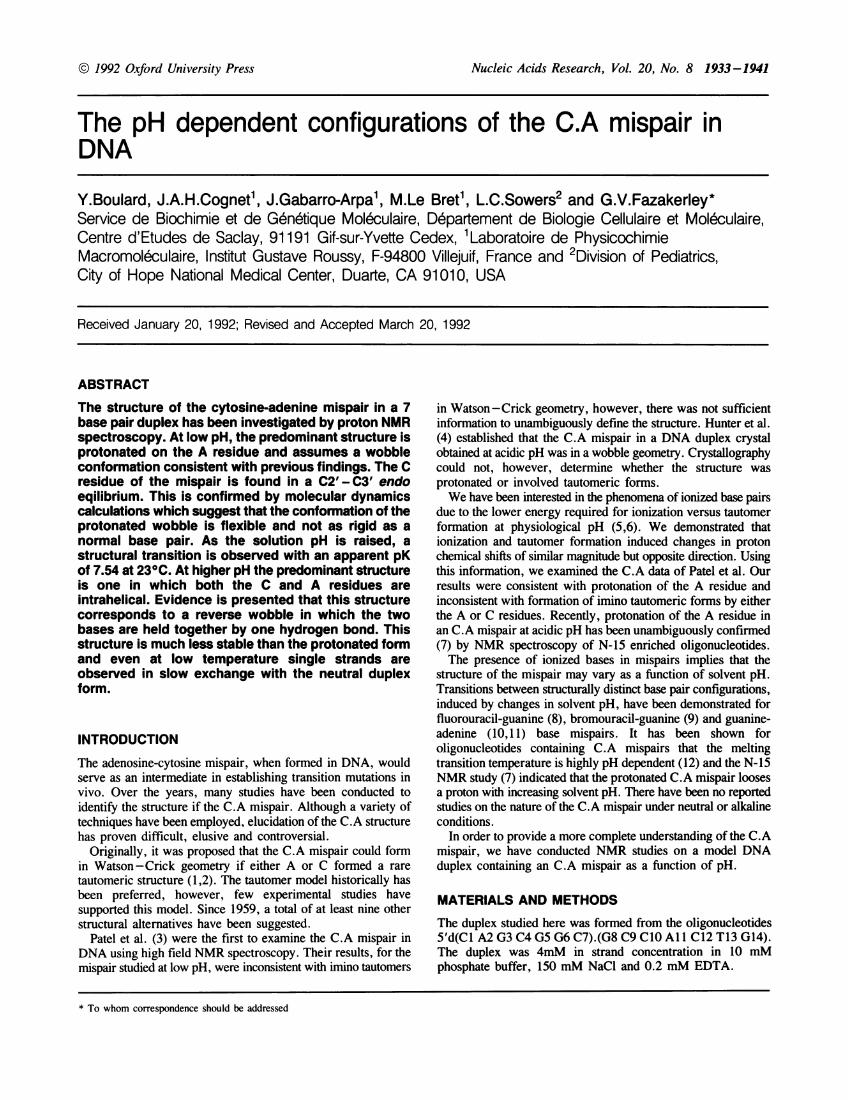
multiplied by a sine bell shifted by 7r/2 before Fouriertransformation this cross peak has an intensity similar to all othersuch intraresidue cross peaks, Figure 1 (top).Four interbase cross peaks, A- D, are observed corresponding
to H8/H6-CH5 interactions for G6-C7, G8-C9, C9-CIO andA 1-C 12 respectively. A fifth one might be expected betweenthe G3-C4 residues but this overlaps with the G6 H8-G5 H1'cross peak. A resonance at 7.75 ppm gives two overlapping crosspeaks with the HI' resonances of A2 and G3, peak E, and anotherwith that of G14, peak F, identifying this resonance as A2 H2.Similarly a resonance at 8.10 ppm gives cross peaks with theHI' resonances of A1l, C12 and G5, peaks H-J, and thus canbe assigned to All H2.The above assignments are confirmed by analysis of the
H8/H6-H2'/H2"/CH3 region (not shown). The interactionsobserved in both regions show that the C and A residues of themismatch stack into the helix and that the duplex adopts a globallyB DNA structure. Although the interactions are stronglyinfluenced by spin diffusion it is apparrent that no major deviationfrom a B form structure takes place at the mismatch site.Assignment of the H3' and H4' resonances was obtained fromanalysis of TOCSY (80-ms mixing time) and phase sensitiveCOSY spectra (not shown). In order to probe in more detail thestructure of the duplex, NOESY spectra were recorded withmixing times of 40, 50, 60 and 80-ms. The initial build up rates
RESULTS AND DISCUSSIONIn the ID spectrum of the oligonucleotide at pH 7 certain of thearomatic resonances displayed large line widths indicating thepresence of an exchange phenomenon. Spectra were thusrecorded as a function of pH and subsequently of temperatureto determine the optimum experimental conditions. As the pHwas progressively lowered the broad resonances became sharperand others showed changes in their chemical shift. Below pH5.8 no further changes were observed in the spectrum. On raisingthe pH, at 23°C, certain resonances in the aromatic region, forwhich exchange was in the fast exchange region, could becontinuously followed. For example, the resonance subsequentlyidentified as All H2, showed a normal titration curve and anapparent pK of 7.54. While at pH 5.8 the spectrum indicatesthe presence of only one species this was not the case at pH 8.9where at least two species were observed. the relativeconcentration of the second species could be followed byintegration of a well resolved resonance at 7.08 ppm. Thechemical shifts show that this second species is not the low pHspecies. We observed that the relative concentration of the secondspecies is strongly temperature dependent, decreasing to ca. 10%at 1°C.By following the proton chemical shifts as a function of tem-
perature at pH 5.8 we observe a Tm of ca. 390C for the duplex.
B~~~~~(
7y-
*X;"0
NOESY spectra in D20, pH 5.8 at 23°C. Assignment of thenonexchangeable proton resonancesTo assign the base, Hl', H2', H2" and H3' protons a NOESYspectrum was recorded with a 400-ms mixing time. One regionof this spectrum is shown in Figure 1. The sequentialconnectivities can be followed for both strands, no break isobserved at the mismatch site. The cross peak corresponding tothe intraresidue interaction C10 H6-H1' appears weak and notwell aligned but this is an artefact introduced by the sine bellfiltering to improve the resolution which produces negative wingson the H5-H6 cross peak of this residue. When the data are
4
Figure 1. Part of the NOESY spectrum recorded with a 400 ms mixing timeat 23°C and pH 5.8.
Nucleic Acids Research, Vol. 20, No. 8 1935
of the NOEs were measured and converted into interprotondistances (23) for model building studies. From the magnitudeof the H8/H6-H 1' NOEs all residues must be in an anticonformation. These spectra also gave the relative assignmentof the H2'/H2" resonances and were used to determine the majorsugar puckering from the base proton-H2'/H3' NOEs (24). Theseresults were confirmed by analysis of the phase sensitive COSYspectra. Excepting the terminal residues and C4 all sugars showinteractions corresponding to a predominantly C2' endo con-formation. For C4 we observe NOEs of similar intensity for theinteractions C4 H6-H2' and H3' indicating approximately equalpopulations of C2' and C3' endo conformations. This is con-firmed by the measurement of the sum ofJH1 '-H2' and JHl '-H2"found to be 11.8 Hz, significantly lower than for all other non-terminal residues.
B
A
1'4 112 110 Tppm
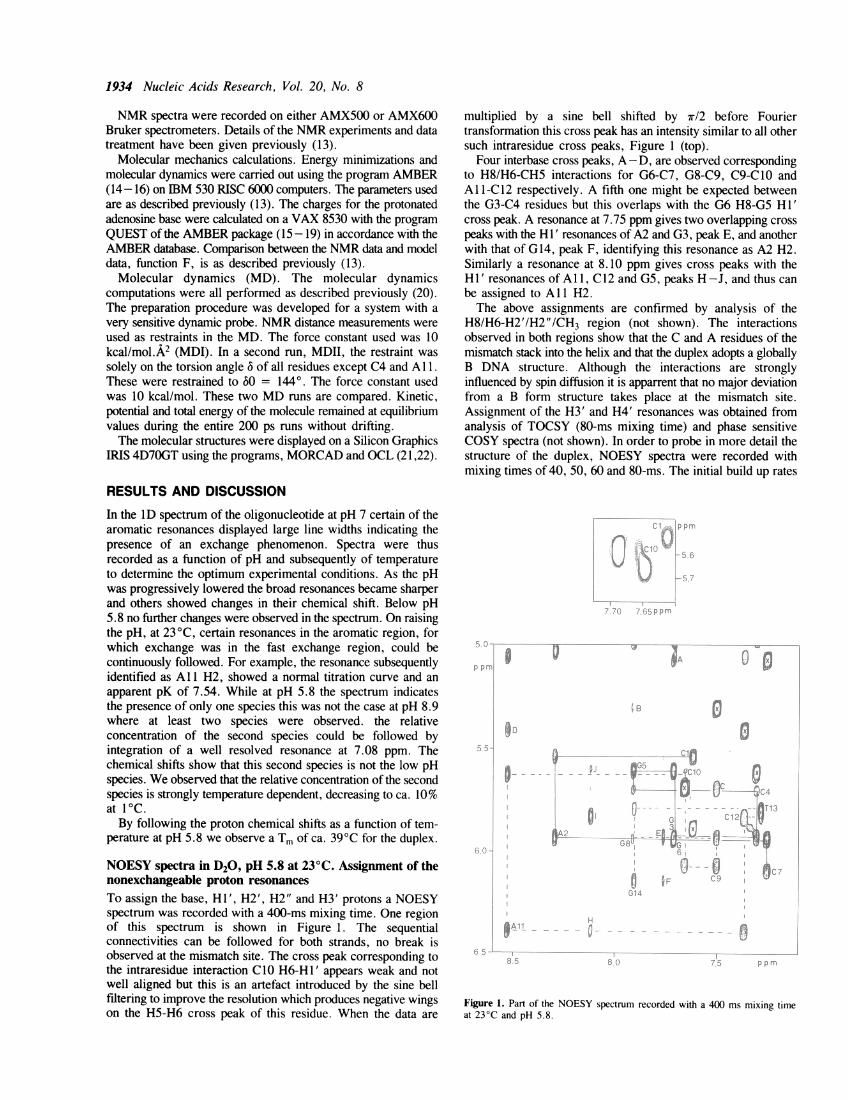
1D and NOESY spectra in H20Part of the ID spectrum of the duplex recorded at 1 C is shownin Figure 2A. We observe five resonances in the region for Gimino protons and one resonance corresponding to a T iminoproton. Additionally we observe a broad resonance around 9.5ppm. Lowering the pH to 5 has no effect upon the linewidth ofthe resonance at 9.5 ppm indicating that it is not broadened byexchange with the solvent. When the temperature is lowered thisresonance broadens into the base line, on the other hand itnarrows as the temperature is raised. Its linewidth is ca. 400 Hzat 15°C, 270 Hz at 20°C and 180 Hz at 30°C. The spectrumat 30°C is shown if Figure 2B. Integration of this peak relativeto that at 8.75 ppm (which corresponds to one proton, see below)shows that it corresponds to two protons.A NOESY spectrum was recorded at 1 'C. Two regions of this
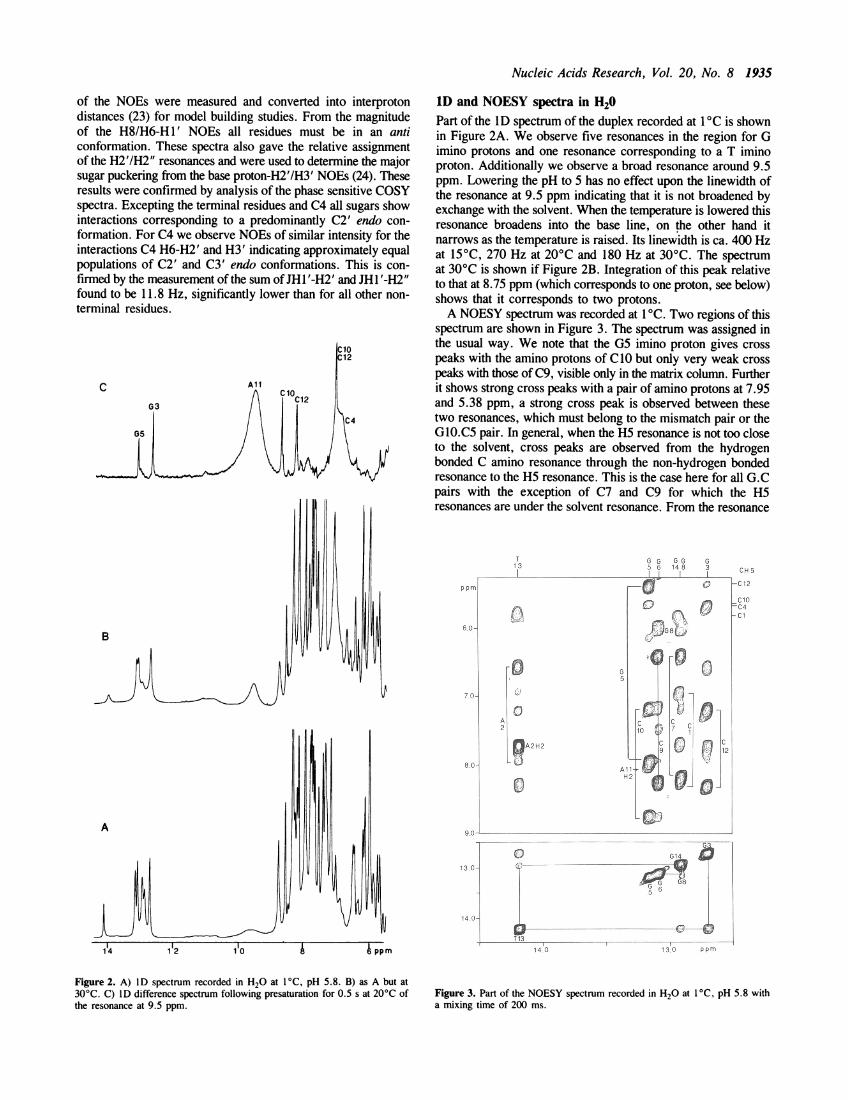
spectrum are shown in Figure 3. The spectrum was assigned inthe usual way. We note that the G5 imino proton gives crosspeaks with the amino protons of C10 but only very weak crosspeaks with those of C9, visible only in the matrix column. Furtherit shows strong cross peaks with a pair of amino protons at 7.95and 5.38 ppm, a strong cross peak is observed between thesetwo resonances, which must belong to the mismatch pair or theG1O.C5 pair. In general, when the H5 resonance is not too closeto the solvent, cross peaks are observed from the hydrogenbonded C amino resonance through the non-hydrogen bondedresonance to the H5 resonance. This is the case here for all G.Cpairs with the exception of C7 and C9 for which the H5resonances are under the solvent resonance. From the resonance
13
ppm
60-
7 0
8 0-
G G G G G5 6 148 3
F[.-I
A2
qA2 H2
LC
C1
G5
A1Al'H,
"I-G 8'
ci i'o
0
Ci
12oj;)
CH 5
-C12
cio-C4- C1
130- ___._.:~~~~~~:G6
14~~~~ ~~~~~~~~~~1
14 0-
0- T13 _ _ Ts.14 0 13 0 ppm
Figure 2. A) ID spectrum recorded in H20 at 1°C, pH 5.8. B) as A but at30°C. C) ID difference spectrum following presaturation for 0.5 s at 20°C ofthe resonance at 9.5 ppm.
Figure 3. Part of the NOESY spectrum recorded in H20 at 1 °C, pH 5.8 witha mixing time of 200 ms.
1936 Nucleic Acids Research, Vol. 20, No. 8
at 7.95 ppm we do not observe a cross peak with a CH5 resonanceexcluding that this pair of protons arises from C4, for which theH5 resonance is well removed from the solvent frequency. Theymust therefore arise from the amino group of G5 or A1l. Atthis stage of the assignment three observations suggest that theseresonances arise from the amino group of G5. The intensity ofthe NOEs from the imino proton of G5 are similar to thoseobserved between imino protons and the C amino protons of thesame base pair thus showing spatial proximity to the imino protonof G5. Secondly, we might expect to observe the same pair ofNOEs from the imino proton of G3 if these resonances arise fromA1l, which, at least for the resonance at 5.38 ppm, we do not.Thirdly, the chemical shift of this resonance at 5.38 ppm, wouldbe very unusual for an A residue. While the G amino protonsof non-terminal G.C base pairs normally give rise to very broadand unobservable resonances at low temperature this is notnecessarily the case for base pairs adjacent to a mismatch site(25) where, for reasons of steric hindrance, amino group rotationcan be slowed down into the slow exchange region.
All the amino protons other than those of the G residues (excepttentatively G5), C4 and ofAll have been identified as indicatedin Figure 3. Two other cross peaks in Figure 3 with a resonanceat 6.00 ppm can be assigned to the pair of amino protons of G8which, via fraying, are in rapid rotation on a proton time scaleas previously observed (25).The 9.5 ppm resonance is far too broad to give any interactions
in NOESY spectra at any temperature. We have carried out aID difference spectrum with presaturation for 0.5 s at 20°C,Figure 2C. A very large NOE is observed at 6.90 ppm, the
Table 1. Chemical shifts of non-exchangeable protons at 23°C and of exchangeableprotons at 1 'C. The second line (b) for the central dinucleotide gives the chemicalshifts observed for the duplex at pH 8.9 and 12°C.
HS/H2H8/H6 CH3 HI' H2' H2" H3' NH NH2
C1 7.60 5.87 5.52 1.85 2.42 4.67 8.30,6.95A2 8.28 7.75 5.92 2.79 2.86 5.02 7.95,6.60G3 7.69 5.91 2.47 2.71 4.96 12.69G3b 7.74 5.71 2.50 2.52 4.92C4 7.29 5.60 5.69 1.51 2.15 4.75 6.90C4b 7.28 5.20 6.02 2.01 2.46 4.81G5 7.89 5.59 2.72 2.74 4.98 13.15 7.95,5.38G5b 7.81 5.52 2.55 2.64 4.80G6 7.69 5.92 2.49 2.66 4.96 13.08C7 7.24 5.06 6.08 2.19 2.19 4.48 8.15,6.40G8 7.89 5.92 2.63 2.73 4.78 12.89 6.00C9 7.48 5.29 6.05 2.18 2.52 4.86 8.37,6.41ClO 7.64 5.67 5.61 2.29 2.44 4.88 8.75,7.16ClOb 7.35 5.58 5.46 1.70 2.13 4.77All 8.51 8.10 6.38 2.66 3.00 5.04 9.50Al lb 8.31 8.05 6.19 2.71 2.84C12 7.35 5.40 5.81 1.85 2.43 5.04 8.32,7.20C12b 7.41 5.37 5.79 1.95 2.41 4.62T13 7.27 1.67 5.76 1.84 2.31 4.85 14.18G14 7.89 6.12 2.37 2.63 4.68 12.91
Table 2. NMR fit, F, for different sugar pucker combinations of C4 and theprotonated A 1.
conformations All C3' endo All C2' endo
C4 C3' endo 0.5 1.1C4 C2' endo 1.7 2.4
intensity of which indicates close spatial proximity of theseprotons. NOEs are observed to the hydrogen bonded andcoincident non-hydrogen bonded amino protons of C10 and C 12and to the imino protons of G3 and G5. When the 1D differencespectrum was recorded at 30°C (not shown) we observe that the6.9 ppm resonance, like that at 9.5 ppm sharpens with increasingtemperature.This suggests that the protons corresponding to boththese resonances undergo a similar proton exchange phenomenonwhich influences their linewidths. Although we cannot integratethe resonance at 6.9 ppm it is very probable that it correspondsto two protons. We have attempted to carry out difference spectraupon preirradiation of the resonance at 6.9 ppm. We observeNOEs (not shown) to the CH5 protons of C12, C4 and CIO.As selective presaturation is not possible these results cannot beunambiguously interpreted.The observation of a structural change occurring as a function
of pH for a duplex containing only normal bases indicates thatprotonation is occurring at low pH. In a different sequencecontaining a G.A mismatch we have been able to observe, at16 ppm, the additional proton in the structure G. +A, protonatedon Nl at pH 5 (11). We have titrated the C.A duplex down topH 4 but we do not observe a resonance corresponding to anadditional proton. This may be due to greater solvent accessibilityor more frequent base pair opening in the case of a purine-pyrimidine mismatch relative to a purine-purine mismatch.
/2\3
(X)C)o t
$/ \3 2.0 H
(T) 2.0
40 NA2.
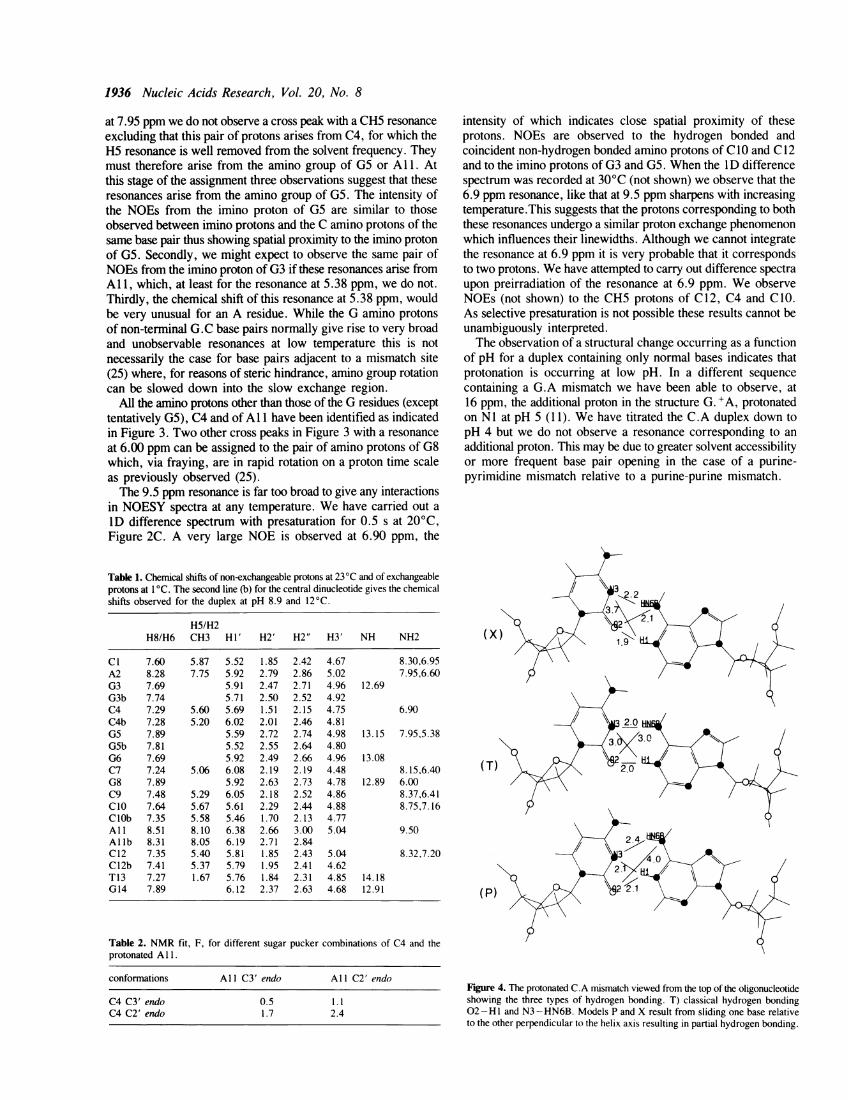
Figure 4. The protonated C.A mismatch viewed from the top of the oligonucleotideshowing the three types of hydrogen bonding. T) classical hydrogen bonding02-HI and N3 -HN6B. Models P and X result from sliding one base relativeto the other perpendicular to the helix axis resulting in partial hydrogen bonding.
Nucleic Acids Research, Vol. 20, No. 8 1937
We observe one amino group at 9.5 ppm and very probablyanother amino pair at 6.9 ppm. This latter conclusion is basedupon the temperature dependence of the line width and that, frompresaturation at 9.5 ppm we do not observe, by spin diffussion,an NOE to another exchangeable proton. It could, however, beunder the solvent resonance. We have previously shown (5) thatprotonation on N I of adenosine shifts the H8 proton significantlydownfield. The chemical shift observed here relative to the neutralspecies (see below) is entirely consistent with protonation of Ain the C.A mismatch. It has also been observed (26) that baseprotonation results in large downfield shifts for the amino protonsof both AMP and CMP. Similar results have been observed forthe amino protons of protonated bases in triple stranded structures(27-30). This leads to the conclusion that the 9.5 ppm resonance
corresponds to the amino group of A1l. This is further supportedby comparison of spectra of an C.A and A.04meT mismatch(31). The 6.9 ppm resonance must therefore be assigned to theC4 amino protons. In the structure of a protonated C.A mismatchthe C amino protons are not engaged in hydrogen bonding. Whilein G.C base pairs the amino protons are not broadened by rotationabout the C-N bond at 30°C (32) this is not the case for CMP(33) where at this temperature the two resonances are collapsed.On the other hand we have generally been able to observe separateresonances for A amino protons at low temperature. That rotationabout the C-N bond is faster, now being in the intermediateexchange region, could be due either to weakening of the C-Nbond because of base protonation or due to the structure of thebase pair or both. The proton chemical shifts are given in Table 1.
Molecular modellingThe starting models were constructed from canonical B-DNA,with the minimum number of changes necessary to accomodatethe protonated C.A base pair in the double helix. Four variantsof this molecular model were examined. These were the fourpermutations of C2' endo and C3' endo sugar conformations forthe central base pair. The fit to the NMR data, F values, afterenergy minimization when these conformations were fixed isshown in Table 2. When any other sugar puckers were forcedto C3' endo the fit is poorer. The model with C4 in C3' endo,Al 1 C2' endo , hereafter called model A, appears to fit best.However, the NMR data indicate that there is a conformationalequilibrium for the C4 deoxyribose.The C.AH + mismatch is characterized by the presence of two
hydrogen bond acceptors on C4 and two hydrogen bond donorson AH +. This explains why we observe during the energy
minimization runs that the C.AH+ base pairing oscillatesbetween three patterns of hydrogen bonding as shown if Figure 4thereby generating a large number of base pairing conformations.These can be described as P) partial hydrogen bonding A HI -C02 and N3, also A HN6B-C N3. T) normal hydrogen bondingA HI -C 02 and A HN6B-C N3. X) partial hydrogen bondingA HI-C 02 and also A HN6B-C N3 and C 02. Energyminimization tends to prefer conformation P but the NMR datado not distinguish well among the three. This base oscillationis much more weakly observed for the Watson Crick base pairs.Model A with standard hydrogen bonding was used as the
starting structure for the MD runs. The first MD run (MD1) was
Table 3. Interproton distances determined by NOE measurements and from the 200 ps run MDII. The first entryis from the NMR data and the second is the % difference between the model distance and the NMR data,(model-NMR)/NMR.
H8/H6 Hi 'intra Hi 'inter H2'intra H2"inter H5inter CH3 H3'intra H2'interbase i i i-I i i-i i+l i+l i i-I
C 1 3.6 3 2.3 1A 2 3.6 8 3.7 -6 2.2 6 2.4 1G3 2.4 -1 2.37C 4 4.1 -j10* 3.6 -3* 2.7 -2* 2.1 10* 3.0 -13*G 5 3.8 3 2.2 8 2.8 -9* 2.5 -5*G 6 3.6 9 3.1 9 2.2 11 2.2 6 3.8 -1C 7 3.6 3 3.2 0 2.3 2 2.1 10G 8 2.3 7C 9 3.8 -2 3.5 -1 2.2 2 2.4 -5 3.8 -2CIO 3.7 -10 2.3 -3 2.3 0All 4.1 -5 3.2 6 2.6 -8 2.8 -15 3.8 -4C12 3.8 -2 3.4 2 2.2 2 2.1 12 3.5 -2T13 3.9 -4 3.6 3 2.1 8 2.2 5G14 2.3 9
Table 4. Torsion angles and standard deviations for the 200 ps MDI run with all NMR distance constraints exceptthose involving C4 (marked with * in Table 3).
Pucker Amp. ca ( 6 E X
G3 142 13 43 5 -69 12 176 10 57 9 131 10 -178 8 -95 11 -114 10C4 79 37 41 6 -74 13 169 10 61 9 94 20 -176 9 -84 18 -139 13G5 149 15 42 5 -69 12 176 10 61 10 135 10 -179 11 -114 15 -108 9CIO 147 12 44 5 -71 12 178 10 57 9 137 9 -164 26 -133 26 -110 10All 150 18 40 6 -74 18 172 13 58 10 136 11 179 8 -98 11 -116 9C12 135 13 42 5 -69 11 177 9 58 9 126 10 -178 12 -103 14 -121 9
Averages and standard deviations over all bases except the terminal and central bases.
143 14 42 5 -69 12 176 10 58 9 132 10 -176 11 -105 15 -116 10
1938 Nucleic Acids Research, Vol. 20, No. 8
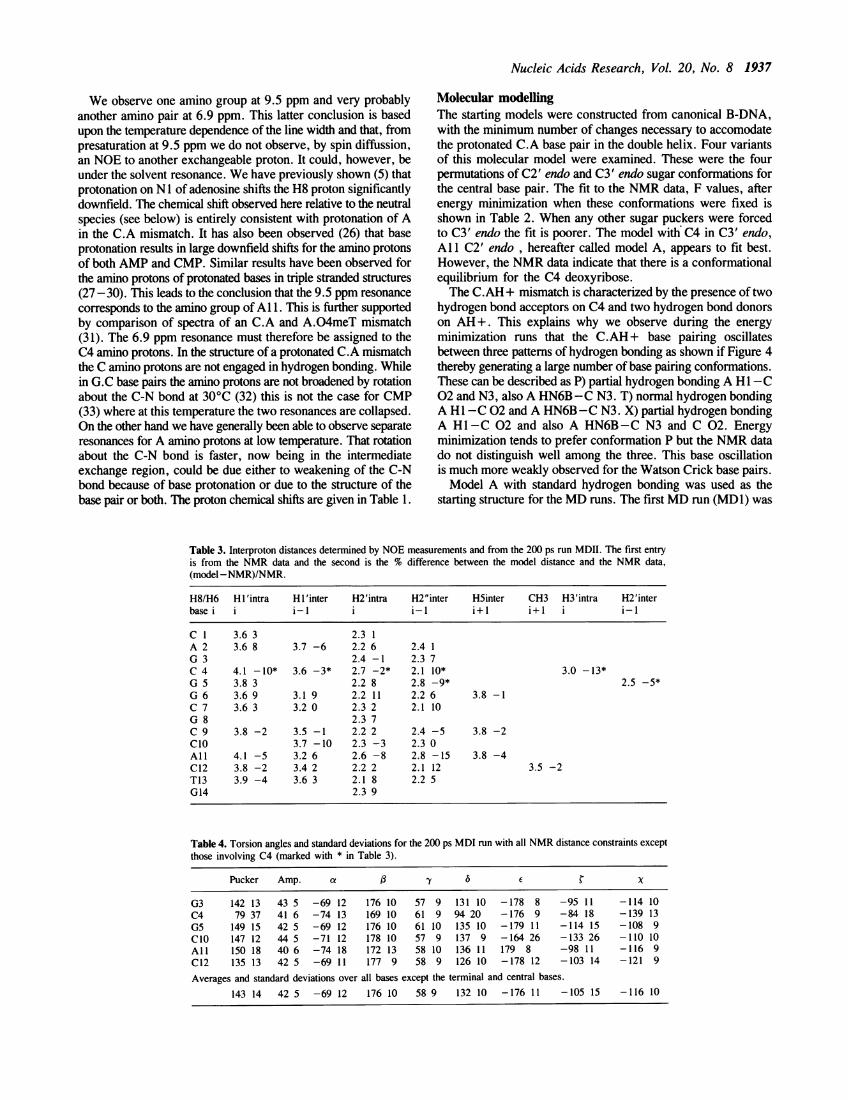
performed with all NMR distance restraints given in Table 3except those involving C4 (marked with an asterisk) in order toallow conformational flexibility for this residue. The resultingstructure is described in Table 4 in terms of average torsionangles. All sugar puckers are found in the C2' endo conformationexcept that of C4 which oscillates between C3' and C2' endo.This is clearly seen in terms of the interproton distances and 6torsion angle for C4 in Figure 5, A-C. All remains close toC2' endo but this residue has the distance constraints included.A second MD run (MD2) was carried out with solely a mild
constraint on the the torsion angles 6 for all sugars except C4and Al 1 (see Materials and Methods). In this run we observe,Figure 5, D - F, from the interproton distances and torsion angle6 for Al that it rarely departs from a C2' endo conformation.The results obtained from MD1 and MD2 show no significantdifferences in terms of interproton distances and torsion angles.Al remains C2' endo and C4 oscillates. The agreement withthe NMR data is shown in Table 3.The lengths of the hydrogen bonds 02- H1 and N3 - HN6B
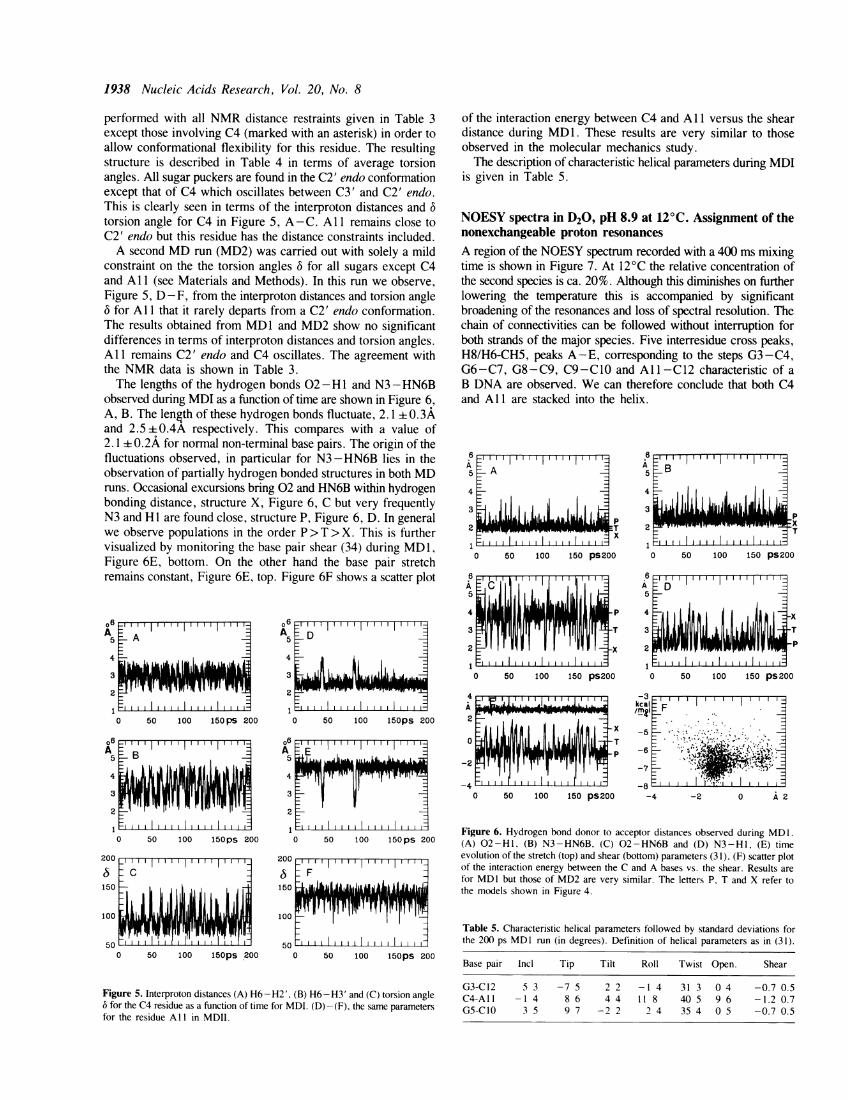
observed during MDI as a function of time are shown in Figure 6,A, B. The length of these hydrogen bonds fluctuate, 2.1 0.3Aand 2.5 -0.4A respectively. This compares with a value of2. 1 0.2A for normal non-terminal base pairs. The origin of thefluctuations observed, in particular for N3 -HN6B lies in theobservation of partially hydrogen bonded structures in both MDruns. Occasional excursions bring 02 and HN6B within hydrogenbonding distance, structure X, Figure 6, C but very frequentlyN3 and HI are found close, structure P, Figure 6, D. In generalwe observe populations in the order P > T > X. This is furthervisualized by monitoring the base pair shear (34) during MD1,
Figure 6E, bottom. On the other hand the base pair stretchremains constant, Figure 6E, top. Figure 6F shows a scatter plot
201
0 50 100 150 pS 20
6 _1 1 1 1 1_5 B
4
3
2
0 50 100 150ps 20
10
u-
A5
4
3
2
)o
_ D
z II0 50 100 150ps 20C
56 1 1_1115
4
23 t0 50 100 isOPS 20C
DO
)O
150
500 50 100 150pS .200
150
100
500 50 100 150pS 200
Figure 5. Interproton distances (A) H6-H2'. (B) H6-H3' and (C) torsion angle6 for the C4 residue as a function of time for MDI. (D) - (F), the same parametersfor the residue Al I in MDII.
of the interaction energy between C4 and A 11 versus the sheardistance during MD 1. These results are very similar to thoseobserved in the molecular mechanics study.The description of characteristic helical parameters during MDI
is given in Table 5.
NOESY spectra in D20, pH 8.9 at 12°C. Assignment of thenonexchangeable proton resonances
A region of the NOESY spectrum recorded with a 400 ms mixingtime is shown in Figure 7. At 12°C the relative concentration ofthe second species is ca. 20%. Although this diminishes on furtherlowering the temperature this is accompanied by significantbroadening of the resonances and loss of spectral resolution. Thechain of connectivities can be followed without interruption forboth strands of the major species. Five interresidue cross peaks,H8/H6-CH5, peaks A-E, corresponding to the steps G3 -C4,G6-C7, G8-C9, C9-CO0 and All-C12 characteristic of aB DNA are observed. We can therefore conclude that both C4and All are stacked into the helix.
6A5
4
3
2
'I II 1-
0 50 100 150 PS2'00
0 50 100 150 pS200
6
5
4
I
If Id 1
Li Li[ i ,I,ihi^.iI h1L15hP
2 _V9 -Xql1 _ I 10 50 100 150 pS200
A _Z _
3 T
2
1_Il_0 50 100 150 PS200
_3,kcal/Tg1-5
-6
-7
0 50 100 150 pS200 -4 -2 0 A2
Figure 6. Hydrogen bond donor to acceptor distances observed during MD 1.
(A) 02-Hi, (B) N3-HN6B, (C) 02-HN6B and (D) N3-Hl, (E) timeevolution of the stretch (top) and shear (bottom) parameters (31), (F) scatter plotof the interaction energy between the C and A bases vs. the shear. Results arefor MD1 but those of MD2 are very similar. The letters P, T and X refer tothe models shown in Figure 4.
Table 5. Characteristic helical parameters followed by standard deviations forthe 200 ps MDI run (in degrees). Definition of helical parameters as in (31).
Base pair Incl Tip Tilt Roll Twist Open. Shear
G3-C12 5 3 -7 5 2 2 -1 4 31 3 0 4 -0.7 0.5C4-All -1 4 8 6 4 4 11 8 40 5 9 6 -1.2 0.7G5-CIO 3 5 9 7 -2 2 2 4 35 4 0 5 -0.7 0.5
_l iI
- A_~~~~~~~~~
i 1 L
W'Tbi.TlJ_ ;r~~~~~~~
x5 :~A_4 -
2
1
_1 l;_F_
IMAIIjub_17
c
r-i
r-
r
-
I
I
0A
cI
~2(

Nucleic Acids Research, Vol. 20, No. 8 1939
We are able to follow another set of connectivities for the minorspecies. For the first strand we observe different chemical shiftsfor the base H8/H6 protons for all the residues. On the otherstrand separate resonances are only observed for C12. Theirassignment is confirmed by exchange cross peaks observedaround the aromatic region of the ROESY spectrum (not shown).As we are able to follow the connectivities through C4 and Al 1
for the second species we can exclude the possibility of anextrahelical structure.The neutral C.A mismatch can exist in three structures (see
below) but it would be suprising that a change of conformationfor the central base pair would strongly influence the chemicalshift of the terminal base protons. Rather, the temperaturedependence of the concentration of the second species couldsuggest that it corresponds to single strands. However exchangebetween a duplex in the presence of an excess of one strand isgenerally in the fast proton exchange region. We have recordedNOESY spectra on the first strand under otherwise identicalconditions. We are able to follow the connectivities for the singlestrand exactly as for the duplex (not shown). This single strandmust have a right handed helical structure. The formation of asuch a structure for a single strand has previously been observed(35). All the observed chemical shifts correspond exactly withthose of the minor species. The two strands were titrated againsteach other until integrations of resolved resonances of each strandwere equal to better than 5%. The observed resonances of thefirst strand in the single stranded form do not arise from an excessof this strand. It is not clear why there is an apparent differencein the behaviour of the two single strands. Strand 1 may havea more defined structure than strand 2 or the difference inchemical shifts between the single and double stranded form forstrand 2 could be smaller resulting in fast exchange except forC12 H6. Clearly, on raising the pH we have significantlydestabilized the duplex. Following the T13 H6 resonance as afunction of temperature we observe a Tm for the duplex of ca.
29°C or ca. 10°C below that of the low pH structure. We did
ppm
5.0
5.4
58
6.2-
G5-A2IGS C7' C12' GS'I D
I,I ID
C1 C4
a0. D
Qc 0. 0
0*I@-A e- ---B 0.,I
I t-|~G4 ICC482 74 ppm
Figure 7. Part of the NEOSY spectrum recorded at pH 8.9, 12°C with a 400ms mixing time. On the top axis are marked the chemical shifts of the identifiedsingle strand species.
not observe separate resonances for the double and single strandspecies when measuring the Tm of the low pH species.We observe significant chemical shift changes for the
mismatched pair between the low and high pH structures. Onraising the pH we find upfield shifts for All H8, Al 1 HI' andC4 H6 of 0.18, 0.2 and 0.4 ppm respectively. The C4 HI'resonance moves 0.33 ppm downfield. The residues in the 5',but much less so in the 3' direction are also influenced. The G3HI' and CIO H6 resonances show large upfield shifts.The region of the NOESY spectrum corresponding to the
interactions H8/H6-H2'/H2"/CH3 confirms the assignmentsgiven above and that the C.A bases are intrahelical.
Short mixing time NOESY spectra have also been recorded.These provide the relative assignment of the H2' and H2"protons. The intensities of the H8/6-H ' cross peaks show thatall the bases, except that of C4, are in a normal anti conformation.These cross peaks are ca. 10% of the volume of the CH6-H5cross peaks. For C4 the cross peak is ca. 50% of that of theaverage CH6-H5 cross peak volumes. This is considerablysmaller than that which would be observed for a syn structureand indicates rather a high anti conformation for this residue.Whereas the C4 sugar showed a significant contribution froma C3' endo conformation at low pH we find at high pH it revertsto a normal C2' endo conformation.We have not attempted to determine interproton distances from
the NOE build up curves. For certain protons the exchangebetween single strand and double strand is in the fast exchangeregion and for others it is in the slow exchange region and thisexchange may affect the cross peak volumes.We have attempted to record spectra in H2O but at this high
pH the imino protons are very broad due to exchange with thesolvent. We have not been able to obtain any structuralinformation from these spectra.
DISCUSSIONLow pH structureThe data from this, as well as other studies, establish that belowphysiological pH, the adenine-cytosine mispair is in a wobbleconformation. Two hydrogen bonds are formed due toprotonation of the adenine residue.
In the system studied here, the interproton connectivitiesestablish that the A and C residues are intrahelical. At low pH,the All H8 proton is 0.20 ppm downfield of the All H8 protonof an A.T pair in the same sequence (25). The chemical shiftof the C4 H6 proton is essentially the same as the C4 H6 protonof a C.G pair within the same sequence (25). These data areconsistent with protonation of the A residue as discussedpreviously (5).
Table 6. Chemical shifts of pyrimidine H5 protons in different environments.A6 refers to the difference between the monomer chemical shift and the chemicalshift of the H5 proton in the indicated base pair. The indicated base pair is thecentral base pair in the 7 base pair oligonucleotide duplex studied in the paper.
6 ppm A6 6 ppm Ab
U monomer 5.89 C monomer 6.05U.A 5.08 0.81 C.G 5.25 0.80U.G 5.44 0.45 C.AH+ 5.60 0.45
C.A 5.20 0.85
1940 Nucleic Acids Research, Vol. 20, No. 8
In order to form the protonated wobble pair, the C residuemoves towards the major groove and the A residue towards theminor groove. Table 6 lists proton chemical shifts for pyrimidineH5 resonances in several different environments. Chemical shiftsof the CH5 of the C.A mispair are compared to the U.A andU.G pairs. Upon formation of a U.A base pair, the chemicalshift of the UH5 proton moves upfield by 0.81 ppm. In the U.Gwobble pair, the magnitude of the stacking induced upfield shiftfor the H5 proton is reduced to 0.45 ppm.
In the same neighbouring sequence, the CH5 of the C.G pairexperiences a stacking induced shift of 0.80 ppm. In the C.Amispair at low pH, the CH5 proton resonates 0.45 ppm upfieldfrom the corresponding chemical shift of the monomer. Thesedata suggest that the geometry and position of the C in theprotonated C.A pair is very similar to the position of the U inthe U.G wobble pair.However, the NMR and MD results show that the protonated
structure does not correspond to a unique conformation. TheNMR data show clealy a conformational equilibrium for thedeoxyribose of C4. This is very well reproduced in the MDcalculations, as we have previously seen in other studies (20,24).Agreement between the NMR data and computations with solerestraints on the torsion angles 6, except at the mismatch site,are excellent. This lead us to investigate the hydrogen bondingpattern at the mismatch site during these MD runs. The hydrogenbonding situation is unusual in that there are two donors on one
base and two acceptors on the other (with another potentialhydrogen bond donor but without any possibility to participatein hydrogen bonding). The NMR data suggest close proximitybetween the amino groups of Al1 and C4 but this cannot bequantified. However, in both MD runs this is the preferredorientation of the mismatched bases, that is structure P is mostfrequently formed.
2. Structural transition with increase in solvent pH. Structuraltransitions have been observed previously for duplexoligonucleotides containing the C.A mispair. Recently Jones etal. (7) measured an apparent pK of 6.6 for a 12 base pair duplexcontaining two C.A mispairs. In this study, we have one C.Amispair in a seven base pair duplex and measured an apparentpK of 7.54 at 23°C. The appearance of a pH dependent structural
1-H+
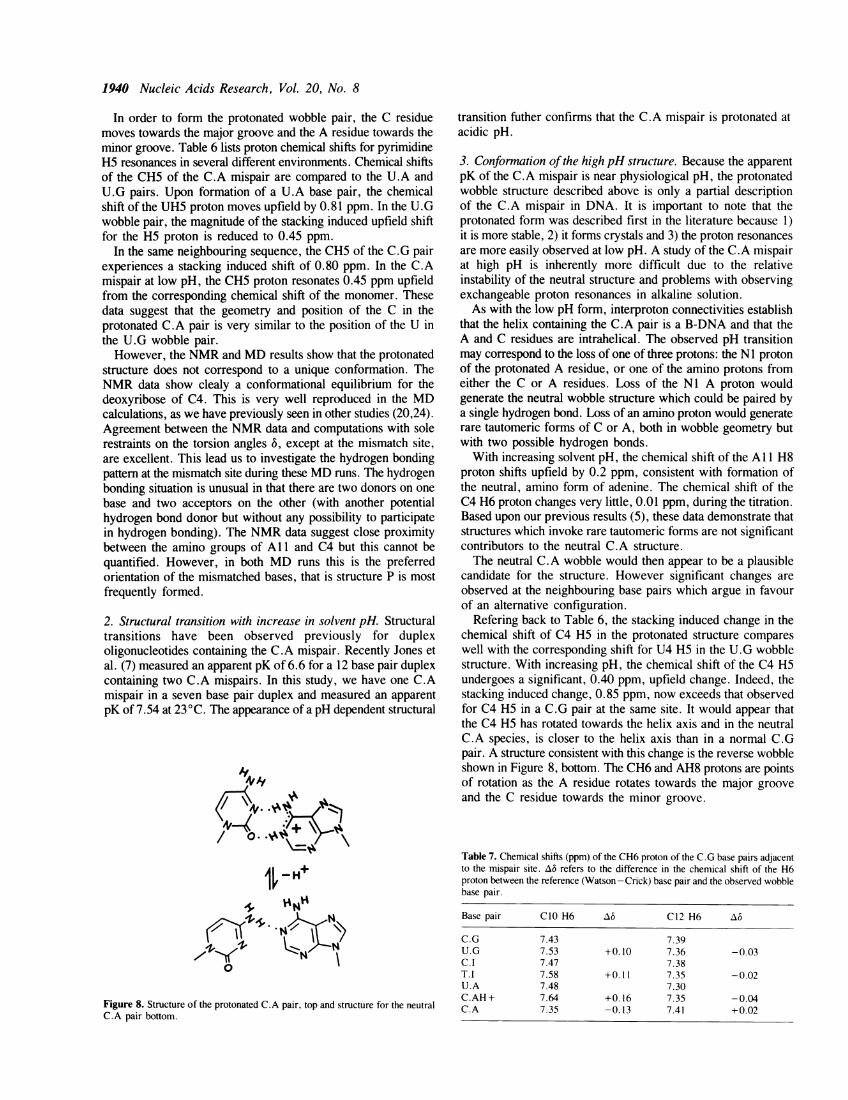
Figure 8. Structure of the protonated C.A pair, top and structure for the neutralC.A pair bottom.
transition futher confirms that the C.A mispair is protonated atacidic pH.
3. Conformation ofthe high pH structure. Because the apparentpK of the C.A mispair is near physiological pH, the protonatedwobble structure described above is only a partial descriptionof the C.A mispair in DNA. It is important to note that theprotonated form was described first in the literature because 1)it is more stable, 2) it forms crystals and 3) the proton resonancesare more easily observed at low pH. A study of the C.A mispairat high pH is inherently more difficult due to the relativeinstability of the neutral structure and problems with observingexchangeable proton resonances in alkaline solution.As with the low pH form, interproton connectivities establish
that the helix containing the C.A pair is a B-DNA and that theA and C residues are intrahelical. The observed pH transitionmay correspond to the loss of one of three protons: the N I protonof the protonated A residue, or one of the amino protons fromeither the C or A residues. Loss of the NI A proton wouldgenerate the neutral wobble structure which could be paired bya single hydrogen bond. Loss of an amino proton would generaterare tautomeric forms of C or A, both in wobble geometry butwith two possible hydrogen bonds.With increasing solvent pH, the chemical shift of the All H8
proton shifts upfield by 0.2 ppm, consistent with formation ofthe neutral, amino form of adenine. The chemical shift of theC4 H6 proton changes very little, 0.01 ppm, during the titration.Based upon our previous results (5), these data demonstrate thatstructures which invoke rare tautomeric forms are not significantcontributors to the neutral C.A structure.The neutral C.A wobble would then appear to be a plausible
candidate for the structure. However significant changes areobserved at the neighbouring base pairs which argue in favourof an alternative configuration.
Refering back to Table 6, the stacking induced change in thechemical shift of C4 H5 in the protonated structure compareswell with the corresponding shift for U4 H5 in the U.G wobblestructure. With increasing pH, the chemical shift of the C4 H5undergoes a significant, 0.40 ppm, upfield change. Indeed, thestacking induced change, 0.85 ppm, now exceeds that observedfor C4 H5 in a C.G pair at the same site. It would appear thatthe C4 H5 has rotated towards the helix axis and in the neutralC.A species, is closer to the helix axis than in a normal C.Gpair. A structure consistent with this change is the reverse wobbleshown in Figure 8, bottom. The CH6 and AH8 protons are pointsof rotation as the A residue rotates towards the major grooveand the C residue towards the minor groove.
Table 7. Chemical shifts (ppm) of the CH6 proton of the C.G base pairs adjacentto the mispair site. A6 refers to the difference in the chemical shift of the H6proton between the reference (Watson -Crick) base pair and the observed wobblebase pair.
Base pair CIO H6 z6 C12 H6 A6
C.G 7.43 7.39U.G 7.53 +0.10 7.36 -0.03C.l 7.47 7.38T.l 7.58 +0.11 7.35 -0.02U.A 7.48 7.30C.AH+ 7.64 +0. 16 7.35 -0.04C.A 7.35 -0.13 7.41 +0.02

Nucleic Acids Research, Vol. 20, No. 8 1941
Additional support for the reverse wobble comes from thechemical shifts of the C residues above and below the mispairedA residue in the helix. Previously, we have studied guanine andinosine wobble pairs in the same sequence. We found that theH6 protons of ClO and C 12 are sensitive to changes in the centralbase pair of the helix. When comparing the C.G versus U.Gwobble and C.I versus T.I wobble, the chemical shift of ClOH6 is observed to move downfield 0.10 and 0.11 ppmrespectively and the C12 H6 moves upfield 0.03 and 0.02 ppmrespectively, Table 7. In this sequence, the purine in a wobbleconfiguration moves towards the minor groove and the centreof the purine ring moves closer to C 12 H6 and further from C10H6.The relative position of the A residue of the C.A pair may
then be examined by comparing the relative chemical shifts ofC10 H6 and C12 H6 with the sequence containing a central U.Apair. As shown in Table 7, in the protonated C.A structure, CIOH6 has moved downfield 0.16 ppm and the C12 H6 upfield, 0.04ppm, consistent with movement of the A residue towards theminor groove with formation of the protonated C.A wobble.With increasing pH, significant changes are observed in the
chemical shifts of the neighbouring ClO H6 and C12 H6resonances. Relative to U.A, the changes in the proton chemicalshifts are -0.13 and +0.02 ppm respectively for the neutral C.Apair. The magnitude of these changes are similar to thoseobserved when comparing U.A with the protonated C.A but areof opposite sign. These changes are consistent with movementof the A residue towards the major groove for the neutral structurewith formation of the reversed wobble structure. We concludethat the configuration of a C.A mismatch in DNA may bedescribed best as a composite of structures, the most predominantof which are the protonated wobble and the neutral reversewobble. The relative contributions of each would be stronglydependent upon temperature, pH and base sequence. Theimplications of the equilibrium configurations described here forthe fidelity of DNA replication or mismatch repair are as yetunknown.
ACKNOWLEDGEMENTS
10. Gao, X. and Patel, D.J. (1988) J. Am. Chem. Soc.,110, 5178-5182.11. Carbonnaux, C., van der Marel, G.A., van Boom, J.H., Guschlbauer, W.
and Fazakerley, G.V. (1991) Biochemistry, 30, 5449-5458.12. Brown, T., Leonard, G.A., Booth, E.D. and Kneale, G. (1990) J. Mol.
Biol., 212, 437-440.13. Boulard, Y., Gabarro-Arpa, J. Cognet, J.A.H., Le Bret, M., Guy, A., Teoule,
R, Guschlbauer, W. and Fazakerley, G.V. (1991) Nucl. Acids Res. 19,5159-5167.
14. Weiner, P. and Kollman, P.A., J. (1981) J. Comp. Chem., 2, 287-303.15. Weiner, S.J., Koilman, P.A., Nguyen, D.T. and Case, D.A. (1986) J. Comp.
Chem., 7, 230-252.16. Singh, U.C., Weiner, P.K., Caldwell, J.W. and K6llman, P.A., (1986)
AMBER 3.0 University of California, San Fransisco.17. Singh, U.C. and Kollman, P.A. (1984) J. Comp. Chem., 5, 129-145.18. Weiner, S.J., Kollman, P.A., Case, D.A., Singh, U.C., Ghio, C., Alagona,
G. and Weiner, P. (1984) J. Am. Chem. Soc. 106, 765-784.19. Bestler, B.H., Merz, K.M. and Kollman, P.A. (1990) J. Comp. Chem. 7,
431-439.20. Cognet, J.A.H., Gabarro-Arpa, J., Cuniasse, Ph., Fazakerley, G.V. and
Le Bret, M. (1990) J. Biomol. Str. Dynam., 7, 1095-1115.21. Gabarro-Arpa, J., Cognet, J.A.H. and Le Bret, M. J. Mol. Graphics, (in
press).22. Le Bret, M., Gabarro-Arpa, J., Gilbert, J.Ch. and Lemarechal, Cl. J. Chim.
Phys. Phys-Chim. Biol. (in press).23. Cuniasse, P., Sowers, L.C., Eritja, R., Kaplan, B., Goodman, M.F., Cognet,
J.A.H., Le Bret, M., Guschlbauer, W. and Fazakerley, G.V. (1987) NucleicAcids Res., 15, 8003 -8022.
24. Cuniasse, P., Sowers, L.C., Eritja, R., Kaplan, B., Goodman, M.F., Cognet,J.A.H., Le Bret, M., Guschlbauer, W. and Fazakerley, G.V. (1989)Biochemistry, 28, 2018-2026.
25. Carbonnaux, C., Fazakerley, G.V. and Sowers, L.C. (1990) Nucleic AcidsRes. 18, 4075-4081.
26. Raszka, M. (1974) Biochemistry 13, 4616-4622.27. Rajagopal, P. and Feigon, J. (1989) Nature 339, 637-640.28. de los Santos, C., Rosen, M. and Patel, D. (1989) Biochemistry 28,
7282-7289.29. Sklenar, V. and Feigon, J. (1990) Nature 345, 836-838.30. Mooren, M.M.W., Pulleyblank, D.E., Wijmenga, S.S., Bloomers, J.J. and
Hilbers, C.W. (1990) Nucleic Acids Res., 18, 6523-6529.31. Kalnik, M.W., Kouchakdjian, M., Li, B.F.L., Swann, P.F. and Patel, D.J.
(1988) Biochemistry, 27, 100-108.32. Fazakerley, G.V., van der Marel, G.A., van Boom, J.H. and Guschlbauer,
W. (1984) Nucleic Acids Res., 12, 8269-8279.33. McConnell, B. and Seawell, P.C. (1973) Biochemistry 12, 4426-4434.34. EMBO Workshop on DNA Curvature and Bending, Churchill College,
Cambridge, UK. Sept. 10-15, 1988. Sarma, R.H. (1988) J. Biomol. Str.Dyn. 6,391-395; (1989) EMBO J. 8, 1-4.
35. Clore, G.M. and Gronenborn, A.M. (1984) Eur. Biophys. J. 11, 95- 102.
We are most grateful to M. Leminor (INSERM) for access tothe VAX 8530 computor. M. L. B. is a recipient of grants fromthe Ligue Nationale contre le Cancer, l'Association pour laRecherche contre le Cancer and from l'Universite Pierre et MarieCurie. L.C.S. acknowledges grant GM41336 from the NationalInstitutes of Health.
REFERENCES1. Freese, E. (1959) J. Mol. Biol., 1, 87-105.2. Topal, M.D. and Fresco, J.R. (1976) Nature (London) 263, 289-293.3. Patel, D.J., Kozlowski, S.A., Ikuta, S. and Itakura, K. (1984) Biochemistry,
23, 3218-3226.4. Hunter, W.N., Brown, T., Anand, N.N. and Kennard, 0. (1986) Nature
(London), 320, 552-555.5. Sowers, L.C., Fazakerley, G.V., Kim, H., Dalton, L. and Goodman, M.F.
(1986) Biochemistry, 25, 3983-3988.6. Sowers, L.C., Shaw, B.R., Veigl, M.L. and Sedwick, W.D. (1987) Mutat.
Res. 177, 201-218.7. Wang, C., Gao, H., Gaffney, B.L. and Jones, R.A. (1991) J. Amer. Chem.
Soc., 113, 5486-5488.8. Sowers, L.C., Goodman, M.F., Eritja, R., Kaplan, B. and Fazakerley, G.V.
(1989) J. Mol. Biol., 205, 437-447.9. Sowers, L.C., Eritja, R., Kaplan, B., Goodman, M.F. and Fazakerley, G.V.
(1988) J. Biol. Chem., 263, 14794-14801.
Copyright © 2022 FDOKUMEN