The relationship between trust, attachment, and antisocial work behaviors
Developmental Psychology Copyright 2000 by the American Psychological Association, Inc. 2000, Vol. 36, No. 1, 14-24 0012-1649/00/$5.00 DOt: 10.1037//0012-1649.36.1.14
Heterogeneity of Popular Boys: Antisocial and Prosocial Configurations
Philip C. Rodkin Duke University
Thomas W. Farmer University of North Carolina at Chapel Hill
Ruth Pearl and Richard Van Acker University of Illinois at Chicago
This study examined subtypes of popular 4th-6th grade boys (N = 452). Popular-prosocial (model) and popular-antisocial (tough) configurations were identified by means of teacher ratings and compared with peer and self-assessments and social centrality measures. Peers perceived model boys as cool, athletic, leaders, cooperative, studious, not shy, and nonaggressive. Peers perceived tough boys as cool, athletic, and antisocial. Model boys saw themselves as nonaggressive and academically competent. Tough boys saw themselves as popular, aggressive, and physically competent. Tough boys were disproportionately African American, particularly when African Americans were a minority in their classrooms. Model and tough boys were overrepresented at nuclear social centrality levels. These findings suggest that highly aggressive boys can be among the most popular and socially connected children in elementary classrooms.
The move from conceptualizing unpopular children as a uniform group to recognizing distinct configurations of unpopular children has been a key area of progress in the study of children's peer relationships (Rubin, Bukowski, & Parker, 1998). Some unpopular (e.g., peer rejected) children are highly aggressive, others are extremely withdrawn, still others are both aggressive and with- drawn, and others still resist classification along externalizing or internalizing dimensions (Cillessen, van IJzendoorn, van Lieshout, & Hartup, 1992; Coie & Koeppl, 1990; French, 1988; Rubin, LeMare, & Lollis, 1990). Different configurations of unpopular children vary in their self-perceptions and in the quality of their interpersonal relationships (Bierman, Smoot, & Aumiller, 1993; Boivin & B6gin, 1989; Hartup & Stevens, 1997; Hymel, Bowker, & Woody, 1993; Patterson, Kupersmidt, & Griesler, 1990). For example, Bierman et al. found that aggressive-rejected boys were more argumentative and disruptive but less shy, awkward, and socially insensitive than rejected boys who were not aggressive.
Philip C. Rodkin, Department of Psychology: Social & Health Sciences, Duke University; Thomas W. Farmer, Center for Developmental Science, University of North Carolina at Chapel Hill; Ruth Pearl and Richard Van Acker, College of Education, University of Illinois at Chicago.
Financial support (Grant H023A50033) was provided by the Office of Special Education Programs, U.S. Department of Education, and in part by National Institute of Mental Health Grant MH52429. The views expressed in this article are ours and do not represent the granting agencies.
We thank the students, teachers, and administrators who participated in this research. We also thank Molly Coe, Brett Cushman, Betsy Farmer, Sharon Grant, Wanda Henley, and Paul Kirschten for their help. Karla Fischer deserves special recognition for her comments and advice at every stage of manuscript preparation.
Correspondence concerning this article should be addressed to Philip C. Rodkin, 246 Sociology-Psychology Building, Department of Psychology: Social & Health Sciences, Box 90085, Duke University, Flowers Drive, Durham, North Carolina 27708-0085. Electronic mail may be sent to rodkin @ duke.edu.
14
Hymel et al. found that aggressive-unpopular and aggressive- withdrawn-unpopular children overestimated their social compe- tencies, but nonaggressive-withdrawn-unpopular children accu- rately detailed their social problems (see also Boivin & Hymel, 1997; Zakriski & Coie, 1996). Longitudinal studies indicate that rejected-aggressive boys, relative to nonaggressive-rejected and aggressive-nonrejected boys, follow a distinct developmental tra- jectory leading to increased risk for later adjustment difficulties (Bierman & Wargo, 1995; Coie, Terry, Lenox, Lochman, & Hy- man, 1995). In helping researchers clarify the meaning of unpop- ularity and in tailoring interventions to the distinctive profiles and needs of different children, the recognition of heterogeneity has been critical.
Studies of heterogeneity tend not to examine children who are popular with their peers. Perhaps knowledge of heterogeneity among popular children is of little practical use to the preventionist if all popular children can be aptly characterized as prosocial, or if some popular children excel academically while others are attrac- tive, athletic, and friendly. However, if some popular children are also antisocial, they may be overlooked in programs (focused mainly on unpopular children) that assist children toward positive developmental outcomes, and they also may have a large and negative influence on their peers. Documenting the presence and social characteristics of heterogeneous types of popular children is thus an important conceptual and preventative task.
Relatively little is known about the behavioral profiles of dif- ferent kinds of popular children. Children with popular sociometric status are viewed as cooperative, sociable, assertive, friendly, sensitive, helpful, and constructive (Rubin et al., 1998). Contro- versial status children are similar in some ways to popular status children. Both are nominated by a high percentage of their peers as "liked most," but controversials are also frequently nominated as "liked least" and have antisocial tendencies along with some prosocial qualities. The combination of prosocial and antisocial characteristics in controversial children is intriguing, but contro-

HETEROGENEITY OF POPULAR BOYS 15
versial children have been understudied (Rubin et al., 1998), and the controversial classification has relatively poor psychometric properties (Newcomb & Bukowski, 1984). Nonetheless, recent findings in sociology and developmental psychology suggest that a substantial proportion of preadolescent boys are very popular and very antisocial.
Some sociologists of education view popular boys in elementary (Adler & Adler, 1998) and middle school (Eder, Evans, & Parker, 1995) as rebellious and somewhat ruthless and Machiavellian in establishing and maintaining their high social positions. Adler and Adler reported that popular boys in elementary school have at least some of the following characteristics: (a) athletic ability, (b) "cool- ness" (e.g., fashionable sneakers, jeans, and hairstyles; trendy possessions; in-vogue dress styles, such as not entirely tucking in their shirts), (c) toughness (e.g., belligerence, physical intimida- tion, ridicule of others, defiance of authority, many detentions and suspensions), (d) "savoir faire" (i.e., sophisticated interpersonal skills, successful exploitation of others), and (e) moderate to moderately low academic competence (see also Coleman, 1961). Conversely, boys who were "trice," boys who strove for academic success, or boys who were overly sensitive to the needs of others were often tagged as effeminate or gay and as a result risked losing or not achieving popular status (Adler & Adler, 1998; Eder et al., 1995). Clearly, popularity has a different meaning in the sociolog- ical tradition than in sociometric studies of popular status.
In part, sociometric and sociological studies draw different conclusions because they have different definitions and methods of studying popularity. Sociological studies focus on children's social constructions of who and what is popular, and popularity is based on the relative status of children's clique and their status within their clique. Popularity is assessed through qualitative analyses of observational and narrative data. In sociometric studies, the focus is on likability rather than on prominence. Popular status is defined as being liked by many peers and disliked by few peers. Popular status and its associated characteristics are quantitatively deter- mined through the use of rating scales, peer nominations, and behavioral observations.
Recent empirical studies in developmental psychology converge with sociological ethnographies to suggest that many popular children are not prosocial. Luthar and McMahon (1996) cluster analyzed peer nominations from the Revised Class Play (Masten, Morison, & Pellegrini, 1985) and determined that 24% of inner- city ninth graders fell into a prosocial-popular configuration, and 20% fell into an aggressive-popular configuration. Parkhurst and Hopmeyer (1998) found that most eighth and ninth graders who were sociometrically popular were not perceived to be popular by peers, and most students who were perceived as popular were not popular sociometfically. Eighth and ninth graders who were per- ceived as being very popular tended to have controversial status. LaFontana and Cillessen (1998) used hypothetical vignettes to assess how fourth and fifth graders explained the actions of pop- ular, unpopular, and neutral-popular protagonists. Relative to their attributions about neutral-popular protagonists, children attributed to popular protagonists more hostile intent for their negative ac- tions but not more prosocial intent for their positive actions.
How might these differing views of popular children, seen from one perspective as prosocial but from another as antisocial, be resolved? This question is similar to the questions asked by French (1988) and Cillessen et al. (1992) regarding the heterogeneity of rejected children. The main purpose of this study was to build upon
findings that suggest the presence of popular-prosocial and popular-antisocial subtypes (e.g., Luthar & McMahon, 1996; Parkhurst & Hopmeyer, 1998) by examining heterogeneity among popular children. A second aim was to analyze children's mem- bership in popular subtypes as a function of their ethnicity and the ethnic makeup of their classrooms, In addition, we compared the social centrality of boys in different configurations. Social central- ity is a quantitative measure of salience that resembles sociological indices of children's prominence within cliques of varying social status (Cairns & Calms, 1994). This study contributes to the existing literature on heterogeneity among popular children by (a) focusing on younger children in the fourth to sixth grades, (b) recruiting a diverse sample that included European American and African American children from urban, suburban, and rural com- munities, (c) obtaining multiple reports of social behavior from teachers, peers, and the children themselves, and (d) including social centrality measures to assess clique membership and prom- inence. All analyses were performed separately by sex. Research suggests that there are different correlates of popularity (Adler & Adler, 1998) and different social values for antisocial behavior (Coie & Dodge, 1998) for boys and girls. Boys are the focus in this article.
Issues of heterogeneity have often been addressed by using cluster analysis (Boivin & B6gin, 1989; Cairns, Cairns, & Neck- erman, 1989; Cillessen et al., 1992; French, 1988, 1990; Luthar & McMahon, 1996). Cluster analysis, when used to discover homo- geneous subsets of people, is an example of a person- rather than a variable-oriented approach (Bergman & Magnusson, 1997; Block, 1971; Cairns, Cairns, Rodkin, & Xie, 1998; Magnusson, 1998). The conceptual roots of person-oriented approaches lie with theorists such as Lewin (1931) and Allport (t937), who stressed the importance of understanding the confluence of forces acting within and upon an individual rather than "mythical" or "general- ized" average trends (Allport, 1937, p. 5). The essential difference between a person- and a variable-oriented approach is whether the analysis focuses on determining relations among variables within a sample of persons or on uncovering groups of similar people across variables. This difference can be illustrated with an exam- ple: Consider a sample that is measured on popularity, aggression, and other characteristics. A multiple regression conducted on this sample shows that popularity and aggression are not significantly related. In this case, or if popularity and aggression had a modest but significant negative beta, scores on popularity and aggression could both be high for any given participant. Cluster analysis will indicate the presence of such popular-aggressive persons if they are not too rare and if they are similar on the other variables. This example suggests (and Allport also indicated) that person- and variable-oriented analyses are complements. Researchers who have used both strategies in the same study find that together the two yield common information along with unique insights not easily available to the other (e.g., Luthar & McMahon, 1996).
A secondary goal of this study was to extend the knowledge base on the ethnic composition of popular subtypes. Some evi- dence suggests that African American boys may be more likely than European American boys to be popular and antisocial. Luthar and McMahon (1996) reported that African Americans were dis- proportionately represented in their popular-aggressive cluster rel- ative to European Americans. Graham, Taylor, and Hudley (1998) found that compared with minority (African American and Latina) girls and European American children, boys of minority groups

16 RODKIN, FARMER, PEARL, AND VAN ACKER
nominated low academic achievers as their most admired and respected male peers. Low achievers were perceived as disobeying rules, putting little effort into school, and being good at sports.
The nature of the classroom environment can influence how popularity and problem behavior are related (Stormshak, Bierman, Bruschi, Dodge, & Coie, 1999). We examined whether one aspect of classroom environments--namely, the ethnic composition of children's c lassrooms--was associated with the ethnic composi- tion of popular subtypes. Following Ogbu 's (1990) framework, we suspected that African Americans might be more likely to encour- age oppositional behavior and devalue prosocial behavior when their classrooms were dominated by European Americans. Accord- ingly, we asked whether popular African Americans were more likely than popular European Americans to have antisocial char- acteristics when African Americans were in mostly European American versus 100% African American classrooms.
Our analytic strategy relied on a combination of person- and variable-oriented approaches. We performed a cluster analysis on boys who were rated by their teachers on popularity, aggression, physical and academic competence, affiliation, shyness, and inter- nalizing behavior. The goal was to determine whether or not configurations of popular-prosocial and popular-antisocial boys emerged. Using variable-oriented analyses, we then compared configurations, with interest directed toward comparisons between popular configurations. First, we compared the configural solution across peer raters and self-raters. We reasoned that the configural analysis would have more validity if the unique characteristics of each configuration were reflected in independent peer and self- reports of behavioral characteristics (Aldenderfer & Blashfield, 1984). Second, we examined the ethnic background of boys in different configurations. We expected that proportionately more African American than European American boys would be popular and antisocial, particularly when the ethnic makeup of classrooms was mostly European American. Finally, we compared configura- tions on social centrality. Previous research suggests that children representing both prosocial and antisocial types can have nuclear centrality (Cairns, Cairns, Neckerman, Gest, & Garitpy, 1988; Farmer & Rodkin, 1996). We expected that both popular-prosocial and popular-antisocial boys would be nuclear members of cliques in which they enjoyed high levels of prominence.
M e t h o d
Participants
This study is part of a broader investigation examining the social integration of students with mild disabilities in general education elemen- tary school classrooms (see also Farmer, Rodkin, Pearl, & Van Acker, 1999; Pearl et al., 1998). Children in fourth-, fifth-, and sixth-grade classrooms were recruited from schools in Chicago and North Carolina. In Chicago the schools ranged from being in inner-city to suburban settings. In North Carolina the schools were in a rural county and a small city. Recruitment focused on identifying classrooms that included students with disabilities. A total of 59 classrooms participated in the study (31 in Chicago and 28 in North Carolina), resulting in a sample of 948 children. In this report the focus was on the boys in the sample (n = 452). In the Chicago area there were 271 boys, and in North Carolina there were 181 boys. Fifty-four percent of children were European American, 40% were African American, and 6% were Hispanic.
We obtained active consent from parents and children. A parental consent form was distributed to the parents of all children. Consent forms briefly explained the purpose of the study and the types of measures that
were used. Parents were asked to indicate whether they gave permission for their child to participate in the study and to have their child return the form to his or her teacher. At the time of the survey, children who had parental permission were told that participation was voluntary and that even though their parents had given them permission to participate, they could choose not to participate. Overall, 1,022 (66%) students returned forms indicating parental consent. Of students with parental consent, 74 (7.2%) were absent on the date of data collection or had missing data on teacher or self-reports.
We compared participants and nonparticipants on demographic vari- ables. The ratio of participants to nonparticipants did not differ across study locations, X2(1, N -- 1,538) = 0.003. However, girls were more likely to participate than boys, )(2(1, N = 1,538) = 12.2, p < .001, and European American children were more likely to participate than minority (African American and Latina/Latino) children, X2(2, N = 1,538) = 25.8, p < .0001.
Measures
Interpersonal Competence Scale--Teacher (ICS-T). The ICS-T is an 18-item bidirectional questionnaire (including 2 distracter items) consisting of 7-point Likert scales that teachers completed for each participant in their class. The ICS-T scale anchors (after reversing negative items) were 1 (never, not, or no), the midpoint 4 (sometimes, so-so, or some), and 7 (always, very, or lots). The ICS-T yields composite scores on Popularity (POP, comprising "popular with boys," "popular with girls," and "lots of friends"), Olympian/Physical Competence (OLY, comprising "good at sports," "good looking," and "wins a lot"), Affiliative (AFF, comprising "always smiles" and "always friendly"), Academic (ACA, comprising "good at math" and "good at spelling"), Aggressive (AGG, comprising "always argues," "gets in trouble," and "always fights"), and Internalizing (INT, comprising "always sad," "always worries," and "shy").
Reliability coefficients were typical of similar teacher ratings on the assessed factors. Three-week test-retest reliability coefficients on fourth- and seventh-grade samples were moderately high (the median correlations across the factors were .81 for girls and .87 for boys), and 1-year stability coefficients were moderately strong (median correlations of .43 for girls and .42 for boys). The ICS-T has convergent validity with direct obser- vation and peer nomination measures and it has predictive validity over an 8-year period in predictions of adult adjustment, early school drop out, and teenage parenthood (cf. Cairns, Leung, Gest, & Cairns, 1995, for a detailed presentation of the psychometric properties of the ICS). The factor struc- ture found by Cairns, Leung, Gest, et al. (1995) was replicated in the present sample by means of principal-components analyses performed separately for each grade and for boys and girls. The only exception was that "shy" did not load with "always sad" and "always worries" on the INT factor. Therefore, SHY was retained as a single-item factor and INT was computed by combining "always sad" and "always worried."
Interpersonal Competence Scale---Self (ICS-S). The ICS-S is a 21- item bidirectional questionnaire consisting of the same 18 items and scale anchors as the ICS-T plus 3 additional distracters. Like the ICS-T, it uses 7-point Likert scales that yield composite scores on Popularity (POP), Olympian/Physical competence (OLY), Affiliative (AFF), Academic (ACA), Aggressive (AGG), and Internalizing (INT). The factorial struc- ture, test-retest reliability, and concurrent and predictive validity for the ICS-S parallel those of the ICS-T (Cairns & Cairns, 1994). The ICS factor structure reported in Cairns, Leung, Gest, et al. (1995) was replicated in our sample by means of principal-components analyses performed separately for each grade and for boys and girls. However, SHY was retained as a single-item factor, and INT was computed by combining "always sad" and "always worded" to preserve comparability between the ICS-T and ICS-S.
Peer interpersonal assessments. Children were asked to nominate three peers in their classroom who best fit descriptors for nine items. Nominations were obtained from both boys and girls, and children could nominate same- or cross-sex peers. Children were told that they could nominate themselves and that they could nominate the same person for more than one item. The items were described as follows:

HETEROGENEITY OF POPULAR BOYS 17
(a) Cooperative. Here is someone who is really good to have as part of your group, because this person is agreeable and cooperates-- pitches in, shares, and gives everyone a turn. (b) Disruptive. This person has a way of upsetting everything when he or she gets into a group---doesn't share and tries to get everyone to do things their way. (c) Acts shy. This person acts very shy with other kids. It 's hard to get to know this person. (d) Starts fights. This person starts fights. This person says mean things to other kids or pushes them, or hits them. (e) Leader. This person gets chosen by the others as the leader. Other people like to have this person in charge. (I) Athletic. This person is very good at many outdoor games and sports. (g) Gets in trouble. This person doesn't follow the rules, doesn't pay attention, and talks back to the teacher. (h) Good student. This person makes good grades, usually knows the fight answer, and works hard in class. (i) Cool. This person is really cool. Just about everybody in school knows this person.
These items were identical with or similar to peer-assessment procedures used by other investigators (e.g., Coie, Dodge, & Coppotelli, 1982; Masten et al., 1985; Newcomb & Bukowski, 1984). Scores for peer assessments were calculated from the quotient of the number of nominations received by a child for an item over the number of classmates nominating at least one peer for that item. A log transformation (with a small constant added to remove zero values) was applied to the peer scores to satisfy normality, and then the peer scores were standardized by sex. For the items in the current study, we examined 3-week test-retest stability in five classrooms (n = 65), and test-retest correlations ranged from .72 to .93. Nominations for "starts fights," "disruptive," and "gets in trouble" were highly corre- lated (rs = .70-.75) and combined into an overall Antisocial factor.
Social Cognitive Maps (SCM). To assess social networks, we asked the children two questions. The first question was, Are there some kids in your classroom who hang around together a lot? If children answered "yes," we then asked, Who are they? Children were instructed to list as many groups as they could think of in their class. For each classroom, children's responses to the question were aggregated to identify distinct peer groups. Children whose profiles were significantly correlated with at least 50% of the members of a group were considered to be in the group (see Cairns & Cairns, 1994; Farmer & Hollowell, 1994, for a more detailed explanation of SCM procedures and social centrality calculations).
SCM procedures have been used in a wide variety of investigations (Cairns & Calms, 1994). Three-week test-retest reliability coefficients indicate high stability (rs = .74-.84; Cairns, Leung, Buchanan, & Cairns, 1995). Validity has been established through observational and survey data demonstrating more frequent interaction among children with members of their own group, overlap between self-reported friendships and group membership (Cairns, Leung, Buchanan, et al., 1995), up to 96% consensus among children in their reports of group membership, and homogeneity in the behavioral and demographic features of group members (Cairns et al., 1988).
Social centrality was determined by combining a child's within-group centrality (Cw) with the centrality of his group (Cg). Within-group central- it-y, C~, was the quotient of the number of nominations a child received from all classroom respondents (ni) over the average of nominations received by the two most frequently nominated members of his group (ns). Within-group centrality was high if C w -- .7, average if .7 > Cw > .3, and low if Cw --< .3. Between-group centrality, Cg, was the quotient of ng over the nominations received by the most frequently nominated group in the classroom (ngMAX)- Between-group centrality was high if Cg -- .7, average if .7 > Cg > .3, and low if Cg ~ .3. Social centrality levels were labeled as follows: (a) nuclear children were high on both Cw and Cg; (b) second- ary children either had average Cw and high Cg or average-to-high C,,, and average Cg; (c) peripheral children were low on either C w or Cg; and (d) isolated children were not identified as belonging to a peer group.
Procedure
Data were collected in the fall. In Chicago, surveys were administered by two advanced doctoral students. In North Carolina, surveys were administered by one of the investigators (Thomas W. Farmer) and a research assistant with classroom teaching experience. Data collection took approximately 40 min per classroom. Children were assured that their answers would be kept confidential, and they were asked to cover their responses. In addition, children were asked not to talk and were told that they could stop participating at any time. During the survey, one admin- istrator read the instructions and questions aloud to the class while scan- ning the room to check for potential problems. The second administrator generally provided mobile monitoring and assisted children as needed. During the administration of the survey, teachers remained in the class- room and completed the ICS-T for each participant. Measures to protect the confidentiality of participants and all classroom members were ap- proved by the internal review boards of two universities and the research review boards of several school districts. All surveys were identified and distributed in a manner that concealed the identity of the participants.
R e s u l t s
Results are discussed in four sections. In the first section, we present the configural analysis that involved teachers ' assessments o f boys ' social characteristics. In the second section, we examine the degree o f correspondence be tween the configural solution and the v iews o f peers and the self. In the third section, we examine how configuration membersh ip is related to ethnic background and minority status in the classroom. In the fourth section, we relate configurat ion membersh ip to chi ldren ' s centrality in the c lassroom social structure.
Derivation o f Configurations From Teacher Ratings
We performed a configural analysis to determine whether teach- ers perceived distinct profiles o f prosocial and antisocial popular boys. We determined configurations through Ward ' s (1963) clus- tering algori thm on the seven ICS-T factors (POP, OLY, AFF, ACA, AGG, SHY, INT), s tandardized by c lassroom and sex. The similarity be tween boys ' I C S - T profiles was measured by squared Euclidean differences. Ward ' s method accounted for 39.2% o f the variance in the I C S - T factors. The number of configurations to retain was decided by examining a scree plot o f distance coeffi-
cients as a function o f the number o f configurations at each agglomerat ive step (Aldenderfer & Blashfield, 1984). Six config- urations were retained because the scree plot indicated that the presence o f additional configurat ions (more than six) did not reduce distance coeff icients more than a minimal amount.
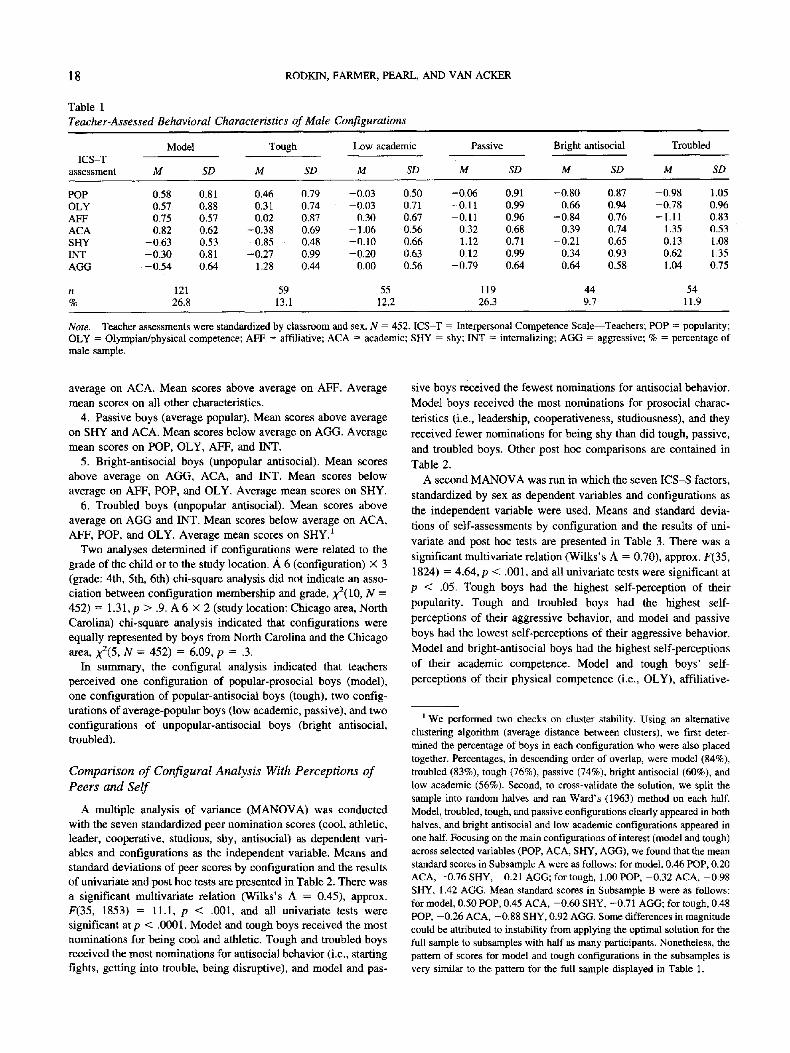
The outcome o f the configural analysis is presented in Table 1. Table 1 gives the number and percentage o f boys in each config- uration, along with mean I C S - T profiles, standard deviations, and semant ic labels for the configurations. Configurat ions are l isted in descending order on the Popularity factor. For descript ive pur- poses, ---0.30 was used as a cutoff to dist inguish above and be low average mean scores. The configurations were as follows:
1. Model boys (popular prosocial). Mean scores above average on ACA, AFF, POP, and OLY. Mean scores be low average on SHY, AGG, and INT.
2. Tough boys (popular antisocial). Mean scores above average on AGG, POP, and OLY. Mean scores be low average on SHY and ACA. Average mean scores on A F F and INT,
3. Low-academic boys (average popular), Mean scores be low
18 RODKIN, FARMER, PEARL, AND VAN ACKER
Table 1 Teacher-Assessed Behavioral Characteristics of Male Configurations
Model Tough Low academic Passive Bright antisocial Troubled ICS-T
assessment M SD M SD M SD M SD M SD M SD
POP 0.58 0.81 0.46 0.79 -0.03 0.50 -0.06 0.91 -0.80 0.87 -0.98 1.05 OLY 0.57 0.88 0.31 0.74 -0.03 0.71 -0.11 0.99 -0.66 0.94 -0.78 0.96 AFF 0.75 0.57 0.02 0.87 0.30 0.67 -0.11 0.96 -0.84 0.76 - 1.11 0.83 ACA 0.82 0.62 -0.38 0.69 - 1.06 0.56 0.32 0.68 0.39 0.74 - 1.35 0.53 SHY -0.63 0.53 -0.85 0.48 -0.10 0.66 1.12 0.71 -0.21 0.65 0.13 1.08 INT -0.30 0.81 -0.27 0.99 -0.20 0.63 0.12 0.99 0.34 0.93 0.62 1.35 AGG -0.54 0.64 1.28 0.44 0.00 0.56 -0.79 0.64 0.64 0.58 1.04 0.75
n 121 59 55 119 44 54 % 26.8 13.1 12.2 26.3 9.7 11.9
Note. Teacher assessments were standardized by classroom and sex. N = 452. ICS-T = Interpersonal Competence Scale--Teachers; POP = popularity; OLY = Olympian/physical competence; AFF = affiliative; ACA = academic; SHY = shy; INT = internalizing; AGG = aggressive; % = percentage of male sample.
average on ACA. Mean scores above average on AFF. Average mean scores on all other characteristics.
4. Passive boys (average popular). Mean scores above average on SHY and ACA. Mean scores below average on AGG. Average mean scores on POP, OLY, AFF, and INT.
5. Bright-antisocial boys (unpopular antisocial). Mean scores above average on AGG, ACA, and INT. Mean scores below average on AFF, POP, and OLY. Average mean scores on SHY.
6. Troubled boys (unpopular antisocial). Mean scores above average on AGG and INT. Mean scores below average on ACA, AFF, POP, and OLY. Average mean scores on S H Y /
Two analyses determined if configurations were related to the grade of the child or to the study location. A 6 (configuration) × 3 (grade: 4th, 5th, 6th) chi-square analysis did not indicate an asso- ciation between configuration membership and grade, )(2(10, N = 452) = 1.31,p > .9. A 6 × 2 (study location: Chicago area, North Carolina) chi-square analysis indicated that configurations were equally represented by boys from North Carolina and the Chicago area, 9(2(5, N = 452) = 6.09, p = .3.
In summary, the configural analysis indicated that teachers perceived one configuration of popular-prosocial boys (model), one configuration of popular-antisocial boys (tough), two config- urations of average-popular boys (low academic, passive), and two configurations of unpopular-antisocial boys (bright antisocial, troubled).
Comparison o f Configural Analysis With Perceptions o f Peers and Sel f
A multiple analysis of variance (MANOVA) was conducted with the seven standardized peer nomination scores (cool, athletic, leader, cooperative, studious, shy, antisocial) as dependent vari- ables and configurations as the independent variable. Means and standard deviations of peer scores by configuration and the results of univariate and post hoc tests are presented in Table 2. There was a significant multivariate relation (Wilks's A = 0.45), approx. F(35, 1853) = 11.1, p < .001, and all univariate tests were significant at p < .0001. Model and tough boys received the most nominations for being cool and athletic. Tough and troubled boys received the most nominations for antisocial behavior (i.e., starting fights, getting into trouble, being disruptive), and model and pas-
sive boys received the fewest nominations for antisocial behavior.
Model boys received the most nominations for prosocial charac-
teristics (i.e., leadership, cooperativeness, studiousness), and they
received fewer nominations for being shy than did tough, passive,
and troubled boys. Other post hoc comparisons are contained in
Table 2.
A second MANOVA was run in which the seven ICS-S factors,
standardized by sex as dependent variables and configurations as
the independent variable were used. Means and standard devia-
tions of self-assessments by configuration and the results of uni-
variate and post hoc tests are presented in Table 3. There was a
significant multivariate relation (Wilks 's A = 0.70), approx. F(35,
1824) = 4.64, p < .001, and all univariate tests were significant at
p < .05. Tough boys had the highest self-perception of their
popularity. Tough and troubled boys had the highest self-
perceptions of their aggressive behavior, and model and passive boys had the lowest self-perceptions of their aggressive behavior.
Model and bright-antisocial boys had the highest self-perceptions
of their academic competence. Model and tough boys' self-
perceptions of their physical competence (i.e., OLY), affiliative-
We performed two checks on cluster stability. Using an alternative clustering algorithm (average distance between clusters), we first deter- mined the percentage of boys in each configuration who were also placed together. Percentages, in descending order of overlap, were model (84%), troubled (83%), tough (76%), passive (74%), bright antisocial (60%), and low academic (56%). Second, to cross-validate the solution, we split the sample into random halves and ran Ward's (1963) method on each half. Model, troubled, tough, and passive configurations clearly appeared in both halves, and bright antisocial and low academic configurations appeared in one half. Focusing on the main configurations of interest (model and tough) across selected variables (POP, ACA, SHY, AGG), we found that the mean standard scores in Subsample A were as follows: for model, 0.46 POP, 0.20 ACA, -0.76 SHY, -0.21 AGG; for tough, 1.00 POP, -0.32 ACA, -0.98 SHY, 1.42 AGG. Mean standard scores in Subsample B were as follows: for model, 0.50 POP, 0.45 ACA, -0.60 SHY, -0.71 AGG; for tough, 0.48 POP, -0.26 ACA, -0.88 SHY, 0.92 AGG. Some differences in magnitude could be attributed to instability from applying the optimal solution for the full sample to subsamples with half as many participants. Nonetheless, the pattern of scores for model and tough configurations in the subsamples is very similar to the pattern for the full sample displayed in Table 1.

HETEROGENEITY OF POPULAR BOYS
Table 2
Means and Standard Deviations of Peer Nominations and Univariate Tests by Configuration
19
Bright Model Tough Low academic Passive antisocial Troubled
Peer nominations M SD M SD M SD M SD M SD M SD F(5, 446)
Cool 0.26 a 1.09 0 .46 a 1.00 -0.16 b 0.87 - -0 .27 b 0.96 -0.25 b 0.94 - -0 .28 b 0.92 7.7*** Athletic 0.28 a 1.08 0.47 a 0.80 - -0 .06 b 0 .95 - -0 .32 b 0 .95 - - 0 . 2 4 b 0 .85 - -0 .15 b 0.93 8.4*** Leader 0.56a 1.05 -0.11b. c 0.89 --0.18b. c 0.81 - -0 .06 b 1.01 --0.38b, c 0.77 -0.46c 0 . 7 4 12.6"** Cooperative 0.50 a 0.95 -0.28 c 0.92 -0.32 c 0.87 0.09 b 1.02 -0.40c 0.98 -0.39~ 0.85 13.5"** Studious 0.65 a 1.07 -0.40c. d 0.59 -0.39~.~ 0.71 0.10 b 1.03 --0.12b. c 0.79 --0.58d 0.49 22.6*** Shy -0.32¢ 0.67 0.02~. b 0.95 --0.04b, c 0.91 0.27a, b 1.19 --0.05a. ~ 0.84 0.36a 1.05 6.1"** Antisocial -0.40 d 0.52 0.79~ 0.90 -0.09¢ 0.78 -0.51 d 0.46 0.43 b 0.89 0.85~ 1.00 53.4***
n 121 59 55 119 44 54 % 26.8 13.1 12.2 26.3 9.7 11.9
Note. Peer nominations are in standard scores. N = 452. Within rows, means with different subscripts differ significantly at p < .05 in Duncan's multiple-range post hoc tests. % = percentage of male sample. ***p < .0001.
ness, shyness, and internalizing behavior did not differ from one another. Other post hoc comparisons are contained in Table 3.
These results indicate that there is a strong correspondence between the configural analysis derived from teacher assessments and the perceptions of peers and the self. Model boys were frequently nominated by their peers as being cool, athletic, leaders, cooperative, and studious, and they were rarely nominated as shy or aggressive. Compared with the views of their peers, model boys were modest in assessing their own characteristics. However, model boys did see themselves as highly affiliative, academically competent, and nonaggressive. Tough boys were perceived simi- larly by peers and themselves. Tough boys were frequently nom- inated by peers as cool, athletic, and antisocial, and tough boys viewed themselves as extremely popular, physically competent, and aggressive. Peer and self-views of tough boys were average to below average on the other assessed characteristics.
Configuration Membership by Ethnic Background and Minority Status
The next analysis determined whether European American and African American boys were proportionately represented across popular-prosocial and popular-antisocial configurations. The per- centages and numbers of European American and African Amer- ican boys in each of the six configurations are presented in Ta- ble 4. 2 As indicated in Table 4, 28.9% of European Americans but only 23.8% of African Americans were model boys, and 18.6% of African Americans but only 9.3% of European Americans were tough boys. Configuration membership and ethnic background were marginally associated with one another according to the results of a 6 (configuration) × 2 (European American, African American) chi-square test, X2(5, N = 418) = 10.1, p < .08. This association rose to statistical significance when analysis was re- stricted to comparing the model and tough configurations, )(2(1, N = 167) = 6.98, p < .01. It is important to note that for both European Americans and African Americans, the proportion of model boys exceeded the proportion of tough boys.
African American boys were distinguished according to their enrollment in either 100% African American or plurality European American classrooms. Of the 59 classrooms sampled, 15 class-
rooms were 100% African American, 35 were plurality European
American, and 9 had no African American male participants. The
average ethnic composition of plurality European American class-
rooms was 68.8% European American (SD = 19.4%), 17.6%
African American (SD = 12.4%), and 13.6% Latino/Latina
(SD = 16.9%). 3 Unfortunately, we could not examine European
Americans who were ethnic minorities in their classrooms because
all European American children were in plurality European Amer-
ican classrooms.
The proportions of European Americans, African Americans from 100% African American classrooms, and African Americans
from plurality European American classrooms who were i n the
model and tough configurations are displayed in Figure 1. A 2 5< 3
log-linear analysis indicated a significant interaction between con-
figuration membership and children's ethnic status within their
classrooms, 9(2(2, N = 167) = 9.23, p < .01. This analysis was
followed with a simple contrast on the ethnicity/minority status
factor to compare European Americans with African Americans in
2 There were 34 Latino boys who were not included in the ethnicity analyses due to sample-size constraints. Of the 34, 9 (26.5%) were model, 4 (11.8%) were tough, 3 (8.9%) were low academic, 13 (38.2%) were passive, 1 (2.9%) was bright antisocial, and 4 (11.8%) were troubled. Latinos tended to be overrepresented among passive boys and underrep- resented among bright-antisocial boys, but these differences were not significant.
3 Our initial system for classifying classroom ethnic composition differ- entiated between 23 classrooms that were over 60% European American and 12 multiethnic classrooms in which at least 40% of children were ethnic minorities. The average ethnic composition of majority European American classrooms was 79.2% European American (SD = 8.6%), 13.0% African American (SD = 8.0%), and 7.8% Latino/Latina (SD = 6.2%). For multiethnic classrooms, averages were 44.5% European American (SD = 15.3%), 28.5% African American (SD = 14.4%), and 27.0% Latino/Latina (SD = 25.3%). There were 9 popular African American boys in majority European American classrooms (4 model, 5 tough) and 8 popular African American boys in multiethnic classrooms (3 model, 5 tough). Majority European American and multiethnic classrooms were combined into the plurality European American classification because of the low sample sizes and similar patterns of configural distributions.

20 RODKIN, FARMER, PEARL, AND VAN ACKER
Table 3 Means and Standard Deviations of Self-Assessed Social Characteristics and Univariate Tests by Configuration
Model Tough Low academic Passive Bright antisocial Troubled ICS-S
assessment M SD M SD M SD M SD M SD M SD F ~
POP 0.07 b 0.96 0.44 a 0.90 0.06 b 1.01 -0 .16 b 0.97 -0 .19 b 1.09 -0.19b 1.05 3.9** OLY 0.08a.b 0.92 0.32a 0.89 0.09a. b 0.89 --0.10 b 1.03 --0.16 b 1.10 --0.26 b 1.14 2.7* AFF 0.20~ 0.96 0.05 a 0.89 0.01~ 1.27 -0.01 a 0.89 -0.02a 0.95 -0.47 b 1.06 3.6** ACA 0.42~ 0.82 -0 .04 b 0.97 -0 .40 c 1.03 0.02 b 0.97 0.15a. b 0.83 -0 .66 c 1.09 12.3'** SHY -0,04 b 0.92 -0 .20 b 0.91 --0.15b 0.99 0.27a 1.12 --0.05a. b 0.97 --0-09b 0.94 2.6* INT --0.08b.c 0.94 0.04a. c 0.96 --0.32c 0.98 0.02~, b 1.05 0.1 lax 1.01 0.32~ 0.99 2.6* AGG -0.39d 0.94 0.72a 0.94 0.09b, ¢ 0.91 -0.22c, d 0.91 0.09bx 0.99 0.41~. b 0.93 14.7"**
n 121 59 55 119 44 54 % 26.8 13.1 12.2 26.3 9.7 11.9
Note. Self-assessments are in standard scores. N = 452. Within rows, means with different subscripts differ significantly at p < .05 in Duncan's multiple-range post hoc tests. ICS-S = Interpersonal Competence Scale--Self; POP = popularity; OLY = Olympian/physical competence; APT = affiliative; ACA = academic; SHY = shy; INT = internalizing; AGG = aggressive; % = percentage of male sample. a For INT and AGG, df = 5, 446; for POP, OLY, and ACA, df = 5, 445; for AFF, df = 5, 444; for SHY, df = 5, 441. * p < .05 . * * p < . 0 1 . ***p <.001.
100% African American and plurality European American class- rooms (i.e., European Amer ican was the default parameter). Com- pared with European Americans, African Americans in 100% African American classrooms were marginally overrepresented as tough (z = 1.90, p < .1), but African Americans in plurality European Amer ican classrooms were strongly overrepresented as tough (z = 2.71, p < .01), Indeed, Figure 1 illustrates that popular African Amer icans in plurality European American classrooms were more likely to be tough boys than model boys. Taken together, these results indicate that popular African American boys were disproportionately in the tough configuration, but this effect was concentrated in c lassrooms in which African Americans were a numerical minority.
Configuration Membership and Social Centrality
Social centrality levels indicate the social salience of individuals embedded within their peer group. "Nuclear" boys are prominent (i.e., often named) members o f prominent c lassroom peer groups. "Secondary" boys are named to prominent groups less often than nuclear boys, or they are named to groups with moderate levels o f
Table 4
Percentages and Number of European American and African American Boys by Configuration
Behavioral configuration of boys % n %
prominence. "Peripheral" boys are infrequently named to class- room peer groups, and isolated boys are not named to any peer group. The percentages and number of boys at each centrality level by configuration are presented in Table 5.
There was a significant relation be tween configurations and centrality according to a 6 x 4 chi-square analysis, >(2(15, N =
.30
.28
.26
.24
.22
.20 rr~
.18 O
"~ .16
~ .14
.12
.10
[] European American
• A-A from 100% A-A Classrooms
.08
European African .06 American American
.04
Model 28.9 71 23.8 41 Tough 9.3 23 18.6 32 Low academic 11.0 27 14.5 25 Passive 27.6 68 22.1 38 Bright antisocial 10.6 26 9.9 17 Troubled 12.6 31 11.1 19
Total 58.9 246 41.1 172
Note. The percentages in each column sum to 100%.
.02
.00 Model Boys Tough Boys
Behavioral configuration
Figure 1. Proportions of European American (E-A) boys (n = 94), African American (A-A) boys from 100% A-A classrooms (n = 56), and A-A boys from plurality E-A classrooms (n = 17) in popular-prosocial (model) and popular-antisocial (tough) configurations.

HETEROGENEITY OF POPULAR BOYS
Table 5 Percentages and Number of Boys at Each Social Centrality Level by Configuration
21
Isolated Peripheral Secondary Nuclear Behavioral
configuration of boys % n X 2 % n g 2 % n )(2 % n X 2
Model 4.1 5 0.84 6.6 8 0.19 27.3 33 2.27 62.0 75 3.00* Tough 1.7 1 1.94 5.1 3 0.53 28.8 17 0.75 64.4 38 2.12" Low academic 5.5 3 0.05 5.5 3 0.36 36.4 20 0.01 52.7 29 0.04 Passive 6.7 8 0.05 10.l 12 0.88 40.3 48 0.83 42.9 51 1.42 Bright antisocial 6.8 3 0.03 4.5 2 0.56 52.3 23 3.60 36.4 16 1.74 Troubled 14.8 8 6.52** 13.0 7 1.97 35.2 19 0.00 37.0 20 t.94
Total 6.2 28 7.7 35 35.4 160 50.7 229
Note. The percentages in each row sum to 100%. Significant configurations were overrepresented at higher (model, tough) or lower (troubled) centrality levels according to a Configuration × Centrality log-linear analysis using a 1 degree-of-freedom linear contrast to assess social centrality. The chi-square columns show the con~bution of each Configuration × Centrality cell to the overall chi-square. The sum of the 24 (6 × 4) contributions is equal to the overall X2(15) value of 31.6. *p <.05. **p <.01.
452) = 31.6, p < .01. To help focus on the configurations that most contributed to the overall chi-square, we performed a log- linear analysis in which we used a linear contrast on the centrality factor (with isolated, peripheral, secondary, and nuclear as ordered levels). Examination of the Configuration × Centrality parameters indicated that both model (z = 2.02, p < .05) and tough (z = 2.37, p < .05) boys were overrepresented at higher centrality levels. Compared with a baseline rate of 50.7% across configura- tions, 62.0% of model boys and 64.4% of tough boys had nuclear centrality (see Table 5). Conversely, troubled boys were dispro- portionately at lower centrality levels (z = -3.14, p < .01). Low-academic, passive, and bright-antisocial boys were propor- tionately distributed across centrality levels (zs < 1.4).
Discuss ion
The results of this study show that popular boys are a hetero- geneous group. Model boys had prosocial characteristics that are similar to the characteristics associated with popular sociometric status. Tough boys had antisocial characteristics that resemble sociological findings on popular children. Model and tough boys were overrepresented at nuclear centrality, indicating that they were central members of prominent classroom cliques. In identi- fying the characteristics of popular-antisocial boys in middle child- hood, this study extends research suggesting that some early ado- lescents are both popular and antisocial (Luthar & McMahon, 1996; Parkhurst & Hopmeyer, 1998). Moreover, we found that tough boys were not only viewed as popular and antisocial by their peers but also by their teachers and themselves.
There was substantial agreement between teacher, peer, and self-reports on the characteristics of model and tough boys. Teach- ers viewed model boys as popular, physically and academically competent, friendly, and neither shy, internalizing, nor aggressive. Peers nominated model boys as cool, athletic, leaders, cooperative, and studious, and rarely nominated them as shy or antisocial. Model boys saw themselves as nonaggressive and academically competent. In contrast, teachers viewed tough boys as being pop- ular, extremely aggressive, physically competent, and average to below average on friendliness, academic competence, shyness, and internalizing behavior. Peers nominated tough boys as cool, ath- letic, getting into fights, causing trouble, and being disruptive.
Tough boys saw themselves as very popular, aggressive and phys- ically competent.
Although we focused on the characteristics of popular config- urations, average-popular and unpopular configurations were also of interest. Two configurations were average in popularity and widely distributed across social centrality levels. According to their teachers, low-academic boys were very low on academic competence and moderately high on friendliness. Passive boys were shy, nonaggressive, and moderately high on academic com- petence. Peer and self-perceptions were in line with teacher per- ceptions. Low-academic boys were rarely nominated as studious. Passive boys were frequently nominated as studious, shy, and cooperative and rarely nominated as antisocial. Low-academic boys saw themselves as very low on academic competence, and passive boys saw themselves as very shy. The convergence be- tween the views of peers, self, and teachers for low-academic and passive boys provides additional evidence that the configural so- lution held up well when compared with peer and self-assessments.
There were two unpopular-antisocial configurations. Teachers viewed bright-antisocial boys as unpopular, not physically com- petent, unfriendly, internalizing, aggressive, but moderately high on academic competence. Relative to bright-antisocial boys, trou- bled boys were rated even lower by teachers on popularity, phys- ical competence, and friendliness, much lower on academic com- petence, and higher on internalizing and aggressive behavior. Peers rarely nominated bright-antisocial or troubled boys for being cool, athletic, leaders, or cooperative. However, they nominated more bright-antisocial than troubled boys for studiousness and more troubled than bright-antisocial boys for antisocial behavior. Bright-antisocial boys saw themselves as moderately high on academic competence (but not aggression), and troubled boys saw themselves as unfriendly, low on academic competence, and high on internalizing and aggressive behavior. Bright-antisocial boys were proportionately distributed across centrality levels, but trou- bled boys were overrepresented at lower centrality levels.
An important aspect of this study was its use of person-oriented strategies. Person-oriented approaches encourage the researcher to consider the multiple ways that antisocial behavior may interact or be conjoined with other characteristics possessed by an individual. In this regard, we followed Magnusson (1998, p. 66), who com-

22 RODKIN, FARMER, PEARL, AND VAN ACKER
mented that "aggressiveness does not have a significance of its own independent of the context of other factors simultaneously working in the individual. It obtains its significance from its context." The findings bear out this point: When antisocial behav- ior was conjoined with high levels of athleticism and/or physical attractiveness, or when antisocial behavior was n o t in the presence of high levels of shyness or extremely low levels of friendliness, academic competence, or internalizing behavior, antisocial boys were popular. Otherwise, antisocial boys were unpopular.
A purely variable-oriented approach would have drawn atten- tion to the unique effects of antisocial behavior apart from or controlling for other characteristics with which antisocial behavior is generally associated. This choice of analytic strategy--person oriented or variable oriented--can influence the findings one obtains and the interpretation one formulates. For example, in a preliminary analysis on the teacher assessments, we regressed POP onto OLY, AFF, ACA, INT, SHY, and AGG. The results were that OLY and AFF were positively associated with POP, INT was negatively associated with POP, and AGG and SHY showed nonsignificant negative trends. Why does the positive relation between aggression and popularity seen among tough boys disap- pear? The answer is that the positive association between popu- larity and aggression for tough boys is overwhelmed by the neg- ative association between these variables for popular-prosocial (model) and unpopular-antisocial (bright antisocial, troubled) boys. Unless numerous interaction terms are added, it is difficult to detect tough boys. The key point is that the combination in a minority of children of high levels of popularity and antisocial behavior can have very important effects on the adjustment of those children and on the overall classroom social dynamic, even if the relationship between popularity and antisocial behavior across all children is small and therefore easy to overlook.
There were similarities and differences in the typical behavioral profiles of popular African American and European American boys. Most popular boys in both ethnic groups were model boys. However, proportionately more popular African Americans were tough, and proportionately more popular European Americans were model. This finding adds to research indicating that some of the characteristics associated with popularity and status vary across contexts and may reflect the values of particular peer cultures (Boivin, Dodge, & Coie, 1995; Lippitt, Polansky, Redl, & Rosen, 1952; Stormshak et al., 1999; Wright, Giammarino, & Parad, 1986). The peer cultures of minority and European Amer- ican boys may differ in important ways (e.g., Graham et al., 1998). For instance, Ogbu (1990) stated that some African Americans tend to value behaviors such as academic disengagement and disobedience of school disciplinary rules that are in opposition to dominant societal preferences. High popularity, in conjunction with these oppositional behaviors, captures well the salient char- acteristics of tough boys. An alternative interpretation, compatible with Ogbu's notion of oppositional identity, is that aggression may be functional for African American children who are socialized in low-income and higher risk communities (Luthar & McMahon, 1996).
The ethnic composition of elementary school classrooms was associated with the relative frequencies of tough and model Afri- can American boys. In plurality European American classrooms, popular African American boys were strongly overrepresented as tough relative to popular European Americans. However, popular African American boys in 100% African American classrooms
were only marginally more likely than popular European Ameri- cans to be in the tough configuration. The high proportion of tough African Americans in plurality European American classrooms is troubling because it implies that African Americans and European Americans may have somewhat segregated social roles in the multiethnic elementary classroom. We interpret this result as sug- gesting that the classroom environment is related to whether and how African American boys express oppositional values. Possibly, the visible presence and social expectations of European American children make it hard for African American boys to be highly popular, academically competent, behaviorally prosocial model boys without, in Ogbu's (1990, p. 27) words, "acting white." Research indicates that negative majority group stereotypes about the academic competence of African Americans may contribute to their disengagement from (Steele, 1997) and devaluation of aca- demic pursuits (cf. Graham et al., 1998). Likewise, in mostly European American classrooms, negative stereotypes regarding the antisocial characteristics of minority children might lead some African American boys to devalue prosocial behavior as a viable means of obtaining social status. The small sample size involved in this analysis, however, invites caution and replication. Future research that explores relations between academic disengagement and antisocial behavior and that investigates how differing class- room contexts influence the developing beliefs and values of minority children could profitably extend the findings reported here.
There was a strong relationship between the popularity of a configuration and its social centrality. This suggests that social centrality assessments may correspond to teachers' and children's notions of who is popular more closely than sociometric status classifications (cf. Parkhurst & Hopmeyer, 1998). This might be the case because social centrality is distinctive among social status measures in that it is based on prominence instead of preference (Cairns & Cairns, 1994) and aims at identifying microsocial struc- tures (i.e., peer groups or cliques) nested within a macrosocial structure (i.e., an entire classroom). The presence of multiple, distinct peer groups may provide children with a variety of social niches through which popularity in the classroom can be achieved and maintained.
These niches may be particularly consequential for boys with high levels of antisocial behavior. Aggressive and antisocial chil- dren form peer groups with other aggressive and antisocial chil- dren (Cairns et al., 1988). Like all friendships, those between antisocial children provide social and emotional support (Hartup & Stevens, 1997) but also have distinctive characteristics. Antisocial peer groups provide validation to its members for oppositional behavior. A large body of evidence, including interactional anal- yses of aggressive friendship dyads (Dishion, Andrews, & Crosby, 1995), observational analyses of play groups with aggressive chil- dren (Boivin et al., 1995; DeRosier, Cillessen, Coie, & Dodge, 1994; Wright et al., 1986), and surveys of children's normative beliefs about aggression (Huesmann & Guerra, 1997), indicates that social contexts can make problem behavior desirable. Func- tional support for antisocial behavior may be enhanced by popular, aggressive, socially prominent children like the tough boys, whose influence on less popular antisocial boys and on the classroom as a whole could be disproportionate to their numbers. For instance, bright-antisocial boys were an exception to the overall relation between the popularity of a configuration and its centrality: They were unpopular but also well-integrated in the classroom social

HETEROGENEITY OF POPULAR BOYS 23
network. It is possible that many bright-antisocial boys are sec- ondary members of groups dominated by tough boys, who may value bright-antisocial boys' intellectual prowess and support their antisocial behavior.
Along these lines, Salmivalli, Huttunen, and Lagerspetz (1997) found that peer victimization was often perpetrated by role- differentiated groups of aggressive children, including bullies, those who assist bullies, and those who provide bullies with positive feedback (see Hodges, Malone, & Perry, 1997, for the importance of social networks for potential victims). But although the support of a group may influence how and why antisocial behavior is expressed, antisocial behavior does not require social support. Troubled boys had high levels of antisocial behavior even though they tended to be peripheral to or isolated from the class- room social structure. As an area of future research, it is important to understand the unique motivations and consequences of antiso- cial behavior for children with different levels of social support and status. For some boys, antisocial behavior may occur because they lack peer relationships in the classroom, whereas for others, antisocial behavior may be facilitated by their social status.
Research on the heterogeneity of unpopular children stems in no small part from French's (1988) cross-sectional analysis of re- jected boys. Like French's study, our analysis leaves many unan- swered questions. One set of questions concerns the developmental trajectories of popular-antisocial boys. Is popularity an antecedent to or a consequence of antisocial behavior? Under what circum- stances might tough boys become more or less aggressive, or more or less popular, across the elementary school years and into ado- lescence? One issue of particular importance is whether high popularity buffers tough boys from future adjustment difficulties. For instance, popular-antisocial boys may escape many of the risk factors predicted by peer rejection (Bierman & Wargo, 1995; Coie et al., 1995). Conversely, popular-antisocial children might be particularly resistant to making necessary lifestyle changes in adolescence if their oppositional behavior has generally been as- sociated with social status and prestige. These unresolved ques- tions point to the need for longitudinal tracking of popular- antisocial children.
A second set of questions concerns heterogeneity among pop- ular girls. Our impression is that there are substantial differences between configurations of popular girls and popular boys. French (1990) found that configurations of rejected girls and boys were generally nonequivalent. Considerable evidence suggests that the correlates of popularity (Adler & Adler, 1998) and the form and value of antisocial behavior (Cole & Dodge, 1998) differ in gender-specific ways. The broader issue to which these findings point is the cultural context in which social behaviors unfold. Preadolescent boys and girls, even when educated in the same classrooms, are embedded in segregated cultures that have aptly been described as "separate worlds" (Thorne, 1986). As Rubin et al. (1998, p. 682) suggested, "not much is known about the possibility that the peer culture can play different functions for boys and girls." These perspectives suggest that researchers should pay close attention to gender-specific processes of preadolescent social development and carefully consider the benefits of aggre- gating social data over gender for the sake of statistical power or ease of interpretation.
The combination of a person-oriented approach to individual functioning together with social centrality measures encourages a view of individuals as having multiple behavioral features with
multiple opportunities to integrate into their social environment. This study showed that both prosocial and antisocial elementary school boys can be popular and prominent in the social structure of their classrooms depending on their overall configuration of be- havioral characteristics. Important extensions of this work include tracking longitudinally the developmental trajectories of antisocial children in different configurations, examining closely the effects of gender, ethnic background, and classroom social context, and triangulating social centrality measures with qualitative methodol- ogies for mapping group processes. These kinds of steps will foster a more complete understanding of the dynamic relationship be- tween the characteristics of children and their peer groups from middle childhood to adolescence. They should also inform profes- sional educators on how to manage classroom social dynamics in order to build more constructive classroom environments and facilitate positive outcomes for a wide variety of individual children.
References
Adler, P. A., & Adler, P. (1998). Peer power." Preadolescent culture and identity. New Brunswick, NJ: Rutgers University Press.
Aldenderfer, M. S., & Blashfield, R. K. (1984). Cluster analysis. Newbury Park, CA: Sage.
Allport, G. A. (1937). Personality: A psychological interpretation. New York: Holt.
Bergman, L. R., & Magnusson, D. (1997). A person-oriented approach in research on developmental psychology. Development and Psychopathol- ogy, 9, 291-319.
Bierman, K. L., Smoot, D. L., & Aumiller, K. (1993). Characteristics of aggressive-rejected, aggressive (nonrejected), and rejected (nonaggres- sive) boys. Child Development, 64, 139-151.
Bierman, K. L., & Wargo, J. B. (1995). Predicting the longitudinal course associated with aggressive-rejected, aggressive (nortrejected), and re- jected (nonaggressive) status. Development and Psychopathology, 7, 669-682.
Block, J. (1971). Lives through time. Berkeley, CA: Bancroft. Boivin, M., & B6gin, G. (1989). Peer status and self-perception among
early elementary school children: The case of the rejected children. Child Development, 60, 591-596.
Boivin, M., Dodge, K. A., & Coie, J. D. (1995). Individual-group behav- ioral similarity and peer status in experimental play groups of boys: The social misfit revisited. Journal of Personality and Social Psychology, 69, 269 -279.
Boivin, M., & Hymel, S. (1997). Peer experiences and social self-percep- tions: A sequential model. Developmental Psychology, 33, 135-145.
Calms, R. B., & Cairns, B. D. (1994). Lifelines and risks: Pathways of youth in our time. New York: Harvester Wheatsheaf.
Calms, R. B., Cairns, B. D., & Neckerman, H. J. (1989). Early school dropout: Configurations and determinants. Child Development, 60, 1437-1452.
Calms, R. B., Cairns, B. D., Neckerman, H. J,, Gest, S., & Gari6py, J-L. (1988). Social networks and aggressive behavior: Peer support or peer rejection? Developmental Psychology, 24, 813-823,
Cairns, R. B., Cairns, B. D., Rodkin, P. C., & Xie, H-L. (1998). New directions in developmental research: Models and methods. In R. Jessor (Ed.), New perspectives on adolescent risk behavior (pp. 13-40). New York: Cambridge University Press.
Cairns, R. B., Leung, M-C., Buchanan, L., & Cairns, B. D. (1995). Friendships and social networks in childhood and adolescence: Fluidity, reliability, and interrelations. Child Development, 66, 1330-1345.
Cairns, R. B., Leung, M-C., Gest, S. D., & Cairns, B. D. (1995). A brief method for assessing social development: Structure, reliability, stability,

24 RODKIN, FARMER, PEARL, AND VAN ACKER
and developmental validity of the Interpersonal Competence Scale. Behavioral Research and Therapy, 33, 725-736.
Cillessen, A. H. N., van IJzendoorn, H. W., van Lieshout, C. F. M., & Hartup, W. W. (1992). Heterogeneity among peer-rejected boys: Sub- types and stabilities. Child Development, 63, 893-905.
Coie, J. D., & Dodge, K. A. (1998). Aggression and antisocial behavior. In W. Damon (Series Ed.) & N. Eisenberg (Vol. Ed.), Handbook of child psychology: Vol. 3~ Social emotional, and personality development (5th ed., pp. 779-862). New York: Wiley.
Coie, J. D., Dodge, K. A., & Coppotelli, H. (1982). Dimensions and types of social status: A cross-age perspective. Developmental Psychology, 18, 557-570.
Coie, J. D., & Koeppl, G. K. (1990). Expanding the framework of inter- vention with rejected children. In S. R. Asher & J. D. Coie (Eds.), Peer rejection in childhood (pp. 309-337). New York: Cambridge University Press.
Coie, J. D., Terry, R., Lenox, K., Loch~an, J., & Hyman, C. (1995). Childhood peer rejection and aggression as predictors of stable patterns of adolescent disorder. Development and Psychopathology, 7, 697-713.
Coleman, J. (1961). The adolescent society. Glencoe, IL: Free Press. DeRosier, M. E., Cillessen, A. H. N., Coie, J. D., & Dodge, K. A. (1994).
Group social context and children's aggressive behavior. Child Devel- opment, 65, 1068-1079.
Dishion, T. J., Andrews, D. W., & Crosby, L. (1995). Antisocial boys and their friends in early adolescence: Relationship characteristics, quality, and interactional process. Child Development, 66, 139-151.
Eder, D., Evans, C. C., & Parker, S. (1995). School talk: Gender and adolescent culture. New Brunswick, NJ: Rutgers University Press.
Farmer, T. W., & Hollowell, J. H. (1994). Social networks in mainstream classrooms: Social affiliations and behavioral characteristics of students with emotional and behavioral disorders. Journal of Emotional and Behavioral Disorders, 2, 143-155.
Farmer, T. W., & Rodkin, P. C. (1996). Antisocial and prosocial correlates of classroom social positions: The social network centrality perspective. Social Development, 5, 174-188.
Farmer, T. W., Rodkin, P. C., Pearl, R., & Van Acker, R. (1999). Teacher- assessed behavioral configurations, peer-assessments, and self-concepts of elementary students with mild disabilities. Journal of Special Edu- cation, 33, 66-80.
French, D. C. (1988). Heterogeneity of peer-rejected boys: Aggressive and nonaggressive subtypes. Child Development, 59, 976-985.
French, D. C. (1990). Heterogeneity of peer-rejected girls. Child Develop- ment, 59, 2028-2031.
Graham, S., Taylor, A. Z., & Hudley, C. (1998). Exploring achievement values among ethnic minority early adolescents. Journal of Educational Psychology, 90,606-620.
Hartup, W. W., & Stevens, N. (1997). Friendships and adaptation in the life course. Psychological Bulletin, 121, 355-370.
Hodges, E. V. E., Malone, M. J., & Perry, D. G. (1997). Individual risk and social risk as interacting determinants of victimization in the peer groups. Developmental Psychology, 33, 1032-1039.
Huesmann, L. R., & Guerra, N. G. (1997). Children's normative beliefs about aggression and aggressive behavior. Journal of Personality and Social Psychology, 72, 408-419.
Hymel, S., Bowker, A., & Woody, E. (1993). Aggressive versus withdrawn unpopular children: Variations in peer and self-perceptions in multiple domains. Child Development, 64, 879-896.
LaFontana, K. M., & Cillessen, A. H. N. (1998). The nature of children's stereotypes of popularity. Social Development, 7, 301-320.
Lewin, K. (1931). The conflict between Aristotelian and Galilean models of thought in contemporary psychology. Journal of General Psychol- ogy, 5, 147-177.
Lippitt, R., Polansky, N., Redl, F., & Rosen, S. (1952). The dynamics of power: A field study of social influence in groups of children. In G. E. Swanson, T. M. Newcomb, & E. L. Hartley (Eds.), Readings in social psychology (Rev. ed., pp. 623-636). New York: Holt.
Luthar, S. S., & McMahon, T. J. (1996). Peer reputation among inner-city adolescents: Structure and correlates. Journal of Research on Adoles- cence, 6, 581-603.
Magnusson, D. (1998). The logic and implications of a person-oriented approach. In R. B. Cairns, L. R. Bergman, & J. Kagan (Eds.), Methods and models for studying the individual (pp. 33-64). Thousand Oaks, CA: Sage.
Masten, A., Morison, P., & Pellegrini, D. (1985). A Revised Class Play method of peer assessment. Developmental Psychology, 17, 344-350.
Newcomb, A. F., & Bukowski, W. M. (1984). A longitudinal study of the utility of social preference and social impact sociometric classification schemes. Child Development, 55, 1434-1447.
Ogbu, J. U. (1990). Racial stratification and education. In G. E. Thomas (Ed.), U. S. race relations in the 1980s and 7990s: Challenges and alternatives (pp. 3-34). New York: Hemisphere.
Parkhurst, J. T., & Hopmeyer, A. (1998). Sociometric popularity and peer-perceived popularity: Two distinct dimensions of peer status. Jour- nal of Early Adolescence, 18, 125-144.
Patterson, C. J., Kupersmidt, J. B., & Griesler, P. C. (1990). Children's perceptions of self and of relationships with others as a function of sociometric status. Child Development, 61, 1335-1349.
Pearl, R., Farmer, T. W., Van Acker, R., Rodkin, P. C., Bost, K. K., Coe, M., & Henley, W. (1998). The social integration of students with mild disabilities in general education classrooms: Peer group membership and peer-assessed social behavior. Elementary School Journal 99, 167-185.
Rubin, K. H, Bukowski, W. M., & Parker, J. G. (1998). Peer interactions, relationships, and groups. In W. Damon (Series Ed.) & N. Eisenberg (Vol. Ed.), Handbook of child psychology: Vol. 3. Social emotional and personality development (5th ed., pp. 619-700). New York: Wiley.
Rubin, K. H., LeMare, L., & Lollis, S. (1990). Social withdrawal in childhood: Developmental pathways to peer rejection. In S. R. Asher & J. D. Coie (Eds.), Peer rejection in childhood (pp. 217-252). New York: Cambridge University Press.
Salmivalli, C., Huttunen, A., & Lagerspetz, K. M. J. (1997). Peer networks and bullying in schools. Scandinavian Journal of Psychology, 38, 305- 312.
Steele, C. (1997). A threat in the air: How stereotypes shape intellectual identity and performance. American Psychologist, 52, 613-629.
Stormshak, E. A., Bierman, K. L., Bruschi, C., Dodge, K. A., & Coie, J. D. (1999). The relation between behavior problems and peer preference in different classroom contexts. Child Development, 70, 169-182.
Thorne, B. (1986). Girls and boys together.., but mostly apart: Gender arrangements in elementary school. In W. W. Hartup & Z. Rubin (Eds.), Relationships and development (pp. 167-184). Hillsdale, NJ: Erlbaum.
Ward, J. (1963). Hierarchical grouping to optimize an objective function. Journal of the American Statistical Association, 58, 236-244.
Wright, J. C., Giammarino, M., & Parad, H. W. (1986). Social status in small groups: Individual-group similarity and the social "misfit." Jour- nal of Personality and Social Psychology, 50, 523-536.
Zakriski, A. L., & Coie, J. D. (1996). A comparison of aggressive-rejected and nonaggressive-rejected children's interpretations of self-directed and other-directed rejection. Child Development, 67, 1048-1070.
Received July 29, 1998 Revision received July 1, 1999
Accepted July 2, 1999 •
Copyright © 2022 FDOKUMEN