Integrating business strategy, organizational configurations and ...
22
Management Accounting Research 15 (2004) 179–200 Integrating business strategy, organizational configurations and management accounting systems with business unit effectiveness: a fitness landscape approach Johnny Jermias a,∗,1 , Lindawati Gani b a Faculty of Business Administration, Simon Fraser University, 8888 University Drive, Burnaby, BC, Canada V5A 1S6 b Master of Accounting Program, Faculty of Economics, University of Indonesia, Jakarta, Indonesia Received 27 November 2003; accepted 10 March 2004 Abstract This study adopts a fitness landscape approach to test contingency hypotheses about the relationship between business strategy, organizational configurations, management accounting systems, and business unit effectiveness. Central to this approach is the notion of contingent fit between strategic priorities and its contextual variables. Building on Kauffman’s N-locus, two-state additive fitness model, this study predicts that the degree of contingent fit, defined as the weighted sum of independent fitness contributions of each contextual variables, will have a positive association with business unit effectiveness. Based on a mail survey and personal interviews of 106 business unit managers of publicly held companies listed under consumer goods industry, this study indicates that the degree of contingent fit has a positive association with business unit effectiveness. Further analysis reveals that strategic priorities affect the types of controls and management accounting systems used by the business units. © 2004 Elsevier Ltd. All rights reserved. Keywords: Fitness landscape approach; Effectiveness; Management accounting systems; Business strategy; Contingency theory 1. Introduction In today’s business environment, companies need to take every advantage they can to remain com- petitive. Global competition, rapid innovation, entrepreneurial competitors, and increasingly demand- ing customers have altered the nature of competition in the marketplace. This new competitive en- ∗ Corresponding author. Tel.: +1-604-291-4257; fax: +1-604-291-4290. E-mail addresses: [email protected] (J. Jermias), [email protected] (L. Gani). 1 The survey instrument and data are available upon request from the first author. 1044-5005/$ – see front matter © 2004 Elsevier Ltd. All rights reserved. doi:10.1016/j.mar.2004.03.002
-
Upload
khangminh22 -
Category
Documents
-
view
0 -
download
0
Transcript of Integrating business strategy, organizational configurations and ...

Management Accounting Research 15 (2004) 179–200
Integrating business strategy, organizational configurations andmanagement accounting systems with business unit effectiveness:
a fitness landscape approach
Johnny Jermiasa,∗,1 , Lindawati Ganib
a Faculty of Business Administration, Simon Fraser University, 8888 University Drive, Burnaby, BC, Canada V5A 1S6b Master of Accounting Program, Faculty of Economics, University of Indonesia, Jakarta, Indonesia
Received 27 November 2003; accepted 10 March 2004
Abstract
This study adopts a fitness landscape approach to test contingency hypotheses about the relationship betweenbusiness strategy, organizational configurations, management accounting systems, and business unit effectiveness.Central to this approach is the notion of contingent fit between strategic priorities and its contextual variables.Building on Kauffman’sN-locus, two-state additive fitness model, this study predicts that the degree of contingentfit, defined as the weighted sum of independent fitness contributions of each contextual variables, will have a positiveassociation with business unit effectiveness.
Based on a mail survey and personal interviews of 106 business unit managers of publicly held companies listedunder consumer goods industry, this study indicates that the degree of contingent fit has a positive associationwith business unit effectiveness. Further analysis reveals that strategic priorities affect the types of controls andmanagement accounting systems used by the business units.© 2004 Elsevier Ltd. All rights reserved.
Keywords: Fitness landscape approach; Effectiveness; Management accounting systems; Business strategy; Contingency theory
1. Introduction
In today’s business environment, companies need to take every advantage they can to remain com-petitive. Global competition, rapid innovation, entrepreneurial competitors, and increasingly demand-ing customers have altered the nature of competition in the marketplace. This new competitive en-
∗ Corresponding author. Tel.:+1-604-291-4257; fax:+1-604-291-4290.E-mail addresses: [email protected] (J. Jermias), [email protected] (L. Gani).1 The survey instrument and data are available upon request from the first author.
1044-5005/$ – see front matter © 2004 Elsevier Ltd. All rights reserved.doi:10.1016/j.mar.2004.03.002

180 J. Jermias, L. Gani / Management Accounting Research 15 (2004) 179–200
vironment requires companies’ ability to create value for their customers and to differentiate them-selves from their competitors through the formulation of a clear business strategy (Simon, 2000; Porter,1985). Other researchers, however, argue that to achieve competitive advantages and to ensure highperformance, a clear business strategy is a necessary but not a sufficient condition. Business strat-egy must be supported by appropriate organizational factors such as effective manufacturing process,organizational design and accounting information systems (e.g.,Jermias and Armitage, 2000;Waterhouse and Svendsen, 1998; Shank and Govindarajan, 1993; Johnson and Kaplan,1987).
Researchers have attempted to explain how accounting systems might be affected by the fit be-tween environmental, organizational, and decision-making style factors.Bruns and Waterhouse (1975)were among the first to address the contingent nature of environment, technology, organizational struc-ture, and management control systems by hypothesizing that there is no universally appropriate ac-counting system which applies equally to all organizations in all circumstances. Rather, they sug-gest that appropriate accounting systems depend upon organizational contextual variables (see alsoOtley, 1980; Waterhouse and Tiessen, 1978; Gordon and Miller, 1976). Otley (1980), for example,proposes the need to identify specific aspects of an accounting system that are associated with cer-tain defined circumstances and demonstrate an appropriate matching. More recent researchers thatemploy contingency theory have incorporated strategy as an important contingent variable (Chenhalland Langfield-Smith, 1988; Samson et al., 1991; Dent, 1990; Gupta, 1987; Gupta and Govindarajan,1984).
Central to the contingency approach in examining the relationships between strategic priorities, or-ganizational configurations, and management accounting systems is the notion of contingent fit. Thisapproach asserts that neither the type of strategy, nor the organizational configuration will directly affectperformance. Rather, this approach suggests that the most important determinant of performance is thecontingent fit between the chosen strategy and its contextual variables.
While previous studies have added to our understanding of the interrelationship between contextualvariables and organizational design, few, if any contingency studies have successfully developed andmeasured the construct of “appropriate match” or fit between strategic priorities and its contextual vari-ables. In addition, previous studies tend to underutilize performance measures as dependent variables(notable exceptions includeGovindarajan and Gupta, 1985; Govindarajan and Fisher, 1990; Chenhalland Langfield-Smith, 1988), even though these variables are considered by many as key components ofa system-based contingency approach (e.g.,Ginsberg and Venkatraman, 1985; Govindarajan and Gupta,1985; Selto et al., 1995; Garg et al., 2003). Researchers argue that ignoring performance variables notonly impedes the development of a true contingency theory (Otley, 1980) but also indicates the lack ofconsideration that organizational researchers have for the concerns of practitioners (Sussman and Evered,1978).
The objective of this paper is to contribute to the limited body of knowledge in this area by attempting todevelop and measure the contingent fit between strategic priorities and its contextual variables using fitnesslandscape approach and investigate the association between the level of contingent fit and effectivenessat business unit levels.
A mail survey and personal interviews are used to collect quantitative information from business unitmanagers of publicly held companies listed under consumer goods industry. Consistent with the mainprediction, the level of contingent fit has a significant positive association with business unit effectiveness.Further analysis reveals that strategic priorities do not affect the relationship between the level of con-

J. Jermias, L. Gani / Management Accounting Research 15 (2004) 179–200 181
tingent fit and business unit effectiveness. Although the association between contingent fit and businessunit effectiveness is stronger for low cost business units as compared to that of product differentiationbusiness units, the difference is not statistically significant.2
Examining these issues is important for both theoretical and practical reasons. From a theoreticalperspective, this study provides insights into the development of the contingent fit construct to representan appropriate matching between strategic priorities and its contextual variables and how to measure thisconstruct. From a practical perspective, the findings of this study can help to increase understanding ofhow different strategic priorities may require different organizational configurations to positively affectperformance.
The rest of the paper is organized as follows. The next section contains the background theory, a reviewof the related literature, the conceptual model used, and hypotheses tested. The research method is thendescribed followed by the results. The final section presents a discussion of the major findings, limitations,and implications for future research and practice.
2. Theoretical background, related literature and hypotheses
The conceptual appeal of contingency approach to study the complex relationship between strate-gic priorities, organizational design, management accounting systems and its impact on organizationalperformance has attracted the attention of numerous researchers to investigate this issue. Contingencyapproach in management accounting is based on the premise that there is no universally appropriate man-agement accounting system that applies equally well to all organizations in all circumstances (Bruns andWaterhouse, 1975; Waterhouse and Tiessen, 1978). To be effective, strategic priorities need to demon-strate an appropriate fit with its contextual variables. Although the notion of contingent fit is crucial tounderstand the contingent relationship, researchers have yet to agree on the conceptual as well as themeasurement of the contingent fit.
Several methods have been used in the contingency literature to define contingent fit. Among thosemethods are selections, interactions, and cluster analyses using Eucledian distances. Most early studiesemploying contingency approach use the selection or interaction approach for defining contingent fit.These two approaches, however, have been criticised for their inability to measure the fit of the wholesystem (Selto et al., 1995; Van de Ven and Drazin, 1985). Cluster analysis with Eucledian distancesuses a system approach and employs two steps to define fit. First, it develops the “ideal” models basedon data from high performing firms. Second, it compares the “test” firms to the ideal models usingEucledian distance formula3 by calculating the absolute value of the differences between the test firmsand the ideal models along the structural dimensions of the contingency variables. There are three mainconcerns associated with this approach. First, the formulation of the ideal models is based on the struc-
2 To examine whether the correlation in product differentiation differs from that in low cost business units, we conducted az-test using the following formula:
z = zrlc − zrpd√1/(nlc − 3) + (npd − 3)
as suggested byChen and Popovich (2002). The observedz-value of 0.440 is smaller than the critical value at any conventionalα′-levels indicating that the correlation in product differentiation is not significantly different from that in low cost business units.
3 The following formula is used to calculate the Eucledian distance:

182 J. Jermias, L. Gani / Management Accounting Research 15 (2004) 179–200
tural dimensions of high performing firms. Since different high performing firms often employ differentstructural dimensions, the ideal models depend on the data used and the criteria selected to define thehigh performing firms. Second, the causal relationship between outcome variables and contingent vari-ables is not well defined. Since the ideal models are developed based on the outcome variables (highperformance), it is not clear whether performance affects the selection of contingent variables or viceversa. Third, the definition of fit (in this case misfit) is based on the absolute score deviations from theideal models. Any deviations from the ideal models increase the degree of misfit of the company. Sincethe ideal models are those used by the high performing firms, what is considered fit by this approachmight be contradictory to the predicted relationship hypothesized by the contingency theory. For exam-ple, if the high performing firms adopt product differentiation strategy and used a medium degree ofcentralization, then any product differentiation companies that used either high or low degrees of central-ization would be considered misfits. This is inconsistent with the hypothesized relationship proposed bycontingency-based theory which predicts that product differentiation companies should use high degree ofdecentralization.
This study employs the fitness landscape theory to define the contingent fit between strategic prioritiesand its contextual variables. This theory has obtained recognition from organizational and managementscientists as an appropriate approach to investigate the fitness between strategic priorities and its contextualvariables and the relationship between fitness and organizational performance (McCarthy, 2002; Dooleyand Van de Ven, 1999; Beinhocker, 1999; Levinthal, 1997; Kauffman, 1993).
According to this theory, there are four steps to test the relationship between contingent fit and per-formance. First, the hypothesized pattern of relationships among the contingent variables should bedeveloped theoretically. Second, the range of possible scores of each contextual variable and the scoreof the ideal configuration should be determined. Third, the observed pattern of relationship from thesampled firms can be evaluated relative to the ideal configuration to determine the level of contingent fitfor each business unit using the following formula:4
Fj = 1
N
N∑i−1
Xij, ∀j = 1, . . . , J,
whereFj is the total fitness value of companyj, Xi is the fitness contribution of contextual variableX forcompanyj, N is the number of contextual variables in the model, andJ is the number of companies.
Finally, the association between contingent fit and performance can be examined using correlation anal-ysis. This theory predicts that higher contingent fit scores indicate a better chance of survival representedby higher performance.
Distij =√√√√ N∑
s=1
(Xis − Xjs)2
where Distij = the Eucledian distance of thejth firm from the ideal;Xis = score of the ideal firm on thesth structural dimension;andXjs = score of thejth firm on thesth structural dimension. (For a more detail explanation about this model, please consultVan de Ven and Drazin, 1985.)
4 Notice that the development of the fit construct is based on the hypothesized pattern of relationship and is independent ofperformance. Therefore, it is crucial that the pattern of relationships is developed theoretically. The Eucledian distance approach,in contrast, determines the fit construct based on data from what are considered high performing firms.

J. Jermias, L. Gani / Management Accounting Research 15 (2004) 179–200 183
The original theory was used in biological science to measure the degree of fitness among sub-systems and how fitness affects the ability of an evolving system to survive and produce offspring(Kauffman, 1993; Kauffman and Weinberger, 1989). Organizational and management scientists thatuse this model have argued that since organizational systems do not sexually reproduce, fitness re-veals itself in terms of the ability of organizations to survive which are often measured by their per-formance (see, e.g.,McCarthy, 2002; Dooley and Van de Ven, 1999; Beinhocker, 1999; Ruef,1997).
Fitness landscape theory offers a useful insight on how to measure fitness contribution of each vari-able in a complex system and provides discerning and testable hypotheses of the relationship betweenfitness level and performance. A critical issue to the fitness landscape theory is the definition of fitnessand how we assign fitness value to each combination. This theory asserts that fitness contributes posi-tively to the level of survival of an evolving system. One specific model of the fitness landscape theorythat has attracted a wide attention is the NK model proposed by Kauffman in the field of biologicalscience. TheN represents number of variables or subsystems of the evolving system. Each variablemay have a number of alternative forms or states denoted byA and makes a fitness contribution whichdepends on that variable and interconnectedness with other variables denoted byK. K range from 0to N − 1 where 0 indicates no inter-connection between variables andN − 1 indicate the maximumpossible interconnection among variables that may exist. In general, the number of combinations of asystem withN variables,K interconnectedness andA alternative states isAN . For example, ifN = 3,K = 2, andA = 2 (the simplest case represented by a binary code where 1 is the presence of a certainsub-system and 0 is the absence of a certain sub-system) the number of combinations of the system is2N = 23 = 8. Table 1illustrates the number of combinations of this example with its respective fitnesscontribution.
Fitness is defined as a proper match among the subsystems within the evolving system. Each subsystemis assigned a fitness score based on its existing state as compared to the hypothesized state. The closer asubsystem to its ideal state, the higher will be its fitness contribution to the system. In the original model,the fitness contribution of each subsystem was randomly assigned between 0 and 1 (values close to 0indicate poor fitness and values close to 1 indicate good fitness).
The total fitness value represents the ability of the evolving system to survive. Higher fitness valuesindicate a better chance of survival. Throughout its lifecycle, the system engages in a process of moving
Table 1Kauffman’s NK model
Combination System 1(fitness contribution)
System 2(fitness contribution)
System 3(fitness contribution)
Total fitnessvalue
000 Absent (0.2) Absent (0.1) Absent (0.1) 0.13001 Absent (0.3) Absent (0.2) Present (0.6) 0.37010 Absent (0.2) Present (0.7) Absent (0.1) 0.33100 Present (0.8) Absent (0.3) Absent (0.4) 0.50110 Present (0.9) Present (0.8) Absent (0.3) 0.67101 Present (0.6) Absent (0.4) Present (0.5) 0.50011 Absent (0.4) Present (0.6) Present (0.7) 0.57111 Present (0.7) Present (0.8) Present (0.9) 0.80

184 J. Jermias, L. Gani / Management Accounting Research 15 (2004) 179–200
Low Cost
Decen-tralized
OutputControl
MASType I
ProductDifferentia-
tion
Behavio-ral
Control
MASType II
Business UnitEffctiveness
Centra-lized
Degree ofCentralization
Types ofControl
StrategicChoice
Organizational Design Management Acct.Systems
Performance
Fig. 1. The hypothetical relationship between competitive strategy, organizational design, management accounting systems andbusiness unit performance.
from one combination to another in search of an improved fitness until it reaches the global optimum. (InTable 1, it is the 111 combination with total fitness value of 0.80.)
The most idealized NK model assumes that each variable contributes to the overall fitness valueindependently5 of all the other variables. Therefore, given the fitness contribution of the variable ateach cell, the fitness of the system is just the sum of the N independent fitness contributions from eachvariable divided by N, hence the average of those contributions. Kauffman calls this model a two-stateadditive fitness model.
The link between fitness landscape theory and contingency approach in management accounting re-search focuses on the concept of contingent fit. Researchers have argued that the contingent fit betweena chosen strategy and its contextual variables contributes to increased performance. However, there hasbeen a lack of conceptual approach to develop the construct of contingent fitness and how to measureit. In addition, not until recently that contingency researchers have tried to investigate the relationshipbetween the contingent fit and performance.
Fitness landscape theory predicts that fitness makes positive contributions to the level of survival ofan evolving system. Relating this to contingency research in management accounting, it is hypothesizedthat the degree of contingent fit between a chosen strategy and its contextual variables has a positivecorrelation with organizational performance (i.e., the ability of the organization to survive in the marketplace).
In this study, we develop the contingent fit construct based on a match between a chosen strategy(Product Differentiation or Low Cost) and its contextual variables (see Fig. 1 for the predicted match).There are three contextual variables for each strategy: decentralization, types of control and types ofmanagement accounting systems. Each contextual variable has seven possible states representing thelevel of intensity of each variable used by a business unit and we assume that each contextual variable is
5 The assumption that each variable contributes to overall fitness independently of all other variables is clearly an idealization.In a system with N contextual variables, the fitness contribution of one variable may often depend upon the other N −1 remainingvariables. One method to deal with the dependency among variables is by multiplying their fitness contributions. In general,however, we almost have no idea what might be the mutual influences on overall fitness and if the mutual contributions areaffected by a large number of variables, the interacting variables are mostly unknown.

J. Jermias, L. Gani / Management Accounting Research 15 (2004) 179–200 185
Table 2Example of possible combination, fitness contribution of each contextual variable, and total contingent fit value
Combination Degree of centralization(fitness contribution)
Type of control(fitness contribution)
Type of MAS(fitness contribution)
Total fit value1
N
N∑i=1
Xij
111 Extremely low (0.1) Extremely low (0.1) Extremely low (0.1) 0.10526 Moderately high (0.7) Low (0.3) High (0.9) 0.63143 Extremely low (0.1) Average (0.6) Moderately low (0.5) 0.40714 Extremely High (1.0) Extremely low (0.1) Average (0.6) 0.57676 Extremely high (0.9) Extremely high (1.0) Extremely high (0.9) 0.93
independent of all the other variables and therefore no accumulative effects to the overall fitness valueamong the contextual variables.6
Relating to Kauffman’s NK model, this study has the following properties: N = 3, A = 7, and K = 0.Therefore, the total possible combination for this study is AN = 73 = 343. Table 2 provides examplesof five out of 343 possible combinations of a company that adopts a product differentiation strategy.Notice that the fitness contributions of each contextual variable in this study are drawn from a definedrange associated with the level of intensity of each variable used by a business unit (i.e., 1–7, where1 = extremely low intensity; and 7 = extremely high intensity).7
At a particular point in time, a company may exist in any of the combination (states). To be optimal, acompany must engage in a process of moving from one combination to another in search of an improvedfit. The global optimum is reached when all the contextual variables match with the chosen strategy at thehighest fit value. Contingent Fit, however, is a relative concept. It is constantly changing in response to thechanges in its context (e.g., due to innovation in technology, new approach in management accounting,or new development in organizational design).
2.1. The model
Porter (1985) develops a framework for considering the nature of strategic priorities for companies tocompete effectively. He argues that a company must derive its sustainable competitive advantages eitherby becoming the lowest-cost producer in its industry (low cost strategy) or by providing products to suitcustomers’ specific needs related to quality, physical characteristics, or product-related services (productdifferentiation strategy).
Porter argues that a company must choose between competing on either low cost or product differentia-tion to be successful in the market place. Recent studies in management accounting, however, have foundthat the formulation of a clear strategic priority is a necessary but not sufficient condition to achievecompetitive advantages and to ensure high organizational performance. Strategic priorities should be
6 As the dependency among contextual variables increases (K increases from 0 to a maximum of N − 1), the contribution ofeach contextual variable to the overall fitness value depends on the level of intensity of a contextual variable along with the levelof intensity of the other contextual variables.
7 To be consistent with Kauffman’s NK model, the fitness contribution of each contextual variable is divided by the highestpossible contribution. For example, if the level of intensity of a particular contextual variable is two, the fitness contributionfrom this variable toward the overall fitness value is 0.3 (two divided by seven).

186 J. Jermias, L. Gani / Management Accounting Research 15 (2004) 179–200
supported by appropriate control system, organizational structure, and management information systems(Chenhall and Langfield-Smith, 1988; Shank and Govindarajan, 1993; Johnson and Kaplan, 1987).
Contingency theories of accounting provide discerning and testable hypotheses of why there is noone universal system of accounting that is optimal for every environment and context in which thesesystems operate. This theory posits that there is a contingent relationship between competitive strategy,organizational design, and management accounting systems. Achieving a proper match between strate-gies, organizational design and management accounting systems is predicted to enhance organizationalperformance. Several empirical studies have tested these propositions and found proper match betweena particular competitive strategy and its contextual variables (Moores and Yuen, 2001; Chenhall andLangfield-Smith, 1988; Miller, 1981).
Fig. 1 depicts the hypothetical relationship between competitive strategies, organizational design, man-agement accounting systems and organizational performance (outcome variable). The model shows thata company must choose a particular strategic (either low cost or product differentiation) to achieve sus-tainable competitive advantages. To be optimal, however, the chosen strategy should be supported byappropriate organizational designs (i.e., degree of centralization and type of control) and managementaccounting systems. The dashed lines represent a mismatched while the solid lines represent a matchbetween strategy and the respected variable. When a company has a pattern consist of all solid lines, thenit is said that the company has a match between its strategy and its contextual variables.
Fig. 1 indicates that product differentiation companies will benefit more from using a more decentralizedorganizational structure (Govindarajan, 1986; Tushman and Nadler, 1978; Galbraith, 1973; Laurence andLorsch, 1967; Burns and Stalker, 1961), put more emphasis on behavioural control (Govindarajan andFisher, 1990;8 Ouchi, 1977), and use more management accounting systems that enhance companies’ability to differentiate their products and to satisfy their customers (MAS type I) (Hoque and James, 2000;Chenhall and Langfield-Smith, 1988; Ittner and Larker, 1997; Atkinson et al., 1997; Kaplan and Norton,1996).
On the other hand, low cost strategies will benefit more from using a more centralized organizationalstructure (Merchant, 1985; Govindarajan and Gupta, 1985; Porter, 1980), emphasizing more on outputcontrol (Govindarajan and Fisher, 1990; Ouchi, 1977), and using more management accounting systemsthat enhance companies’ ability to control costs (MAS type II) (Chenhall and Langfield-Smith, 1988;Johnson and Kaplan, 1987).
Therefore, for business units that adopt a product differentiation strategy, higher fit value is characterizedby a more decentralized structure, and a more intensive application of behavioural control and MAS typeI. For business units that adopt a low cost strategy, higher fit value is characterized by a more centralizedstructure, and a more intensive application of output control and MAS type II. The appropriate matchbetween strategic priorities and its contextual variables will be reflected in business units’ ability to surviveas measured by their performance.
2.2. Hypotheses
Based on contingency research reviewed in the previous section, we investigate the extent to whichthe degree of contingent fit between competitive strategy and its contextual variables affects business
8 Although this study does not provide main effects of control systems on performance, these authors argue that productdifferentiation companies will benefit more from using behavioural control due to low knowledge of means and ends, low taskprogrammability, and low outcome observability.

J. Jermias, L. Gani / Management Accounting Research 15 (2004) 179–200 187
unit effectiveness. We are also interested in investigating the likelihood of companies adopting differentcompetitive strategies and how they support their chosen strategy with appropriate organizational de-sign and management accounting systems. To investigate these issues, the following hypotheses will beexamined.
2.2.1. Contingent fit and performanceContingency theory posits that achieving a proper match between strategic choice, organizational
design, and management accounting systems enhance organizational performance. This argument leadsto the following hypothesis:
H1. The degree of contingent fit between competitive strategy and its contextual variables is positivelyassociated with business unit effectiveness regardless of the strategic choice.
Contingency theory also predicts that the most important determinant of performance is the fit betweenstrategic choice and its contextual variable and not the type of strategies. Therefore, we expect thatthe positive association between degree of contingent fit and effectiveness will be revealed in productdifferentiation and low cost units. More specifically, we predict:
H2. There is a positive association between degree of contingent fit and effectiveness for business unitsthat adopt product differentiation strategy.
H3. There is a positive association between degree of contingent fit and effectiveness for business unitsthat adopt low cost strategy.
2.2.2. Degree of centralizationBusiness units that adopt product differentiation strategies tend to face a higher degree of uncertainty
since the companies obtain their competitive advantages by trying to satisfy the ever changing demandof their customers in terms of superior quality, more flexible and better designed products. Researchersargue that high a degree of autonomy is an appropriate response to increased uncertainty. On the otherhand, low cost companies focus on achieving low cost relative to their competitors through productivityand efficiency improvements, elimination of waste, and tight cost control (Horngren et al., 2000). Porter(1985) characterizes low cost companies as those that emphasise on cost reduction, employ highly skilledpeople, maximize economies of scale, use routine tasks, and produce standard products. With these char-acteristics, low cost companies tend to use a more centralized structure by creating highly specializedwork roles, formalized job descriptions, and standardized operating procedures (particularly when out-come observability is high but behaviour observability is low). This discussion leads to the followinghypothesis:
H4. Product differentiation units tend to use more decentralized structure as compared to that of low costunits.
2.2.3. Type of controlThe primary objective of product differentiation companies is to differentiate their products and to
satisfy their customers by producing unique products or by entering new markets. The tasks involved

188 J. Jermias, L. Gani / Management Accounting Research 15 (2004) 179–200
in producing and marketing unique products tend to be unstructured and more uncertain. Furthermore,Porter (1980) argues that product differentiation companies invest more heavily in basic research and newproduct development which makes short-term output measurement for control purposes inappropriate.Govindarajan and Fisher (1990) argue that when task programmability and outcome observability arelow, companies will benefit more from employing behavioural control.
On the contrary, the primary objective of low cost companies is to control cost by producing standard,undifferentiated products. Tasks involved in producing standard products tend to be routine and highlyprogrammable and the knowledge of ends and means is relatively high. Govindarajan and Fisher (1990)argue that since the outcome is highly observable, low cost companies tend not to incur expenses to makebehaviour observable. Therefore, low cost companies will benefit more from using output control. Thepreceding discussion can be summarized with the following hypotheses:
H5. Product differentiation units tend to use behavioural control more intensively than low cost units.
H6. Product differentiation units tend to use output control less intensively than that of low cost units.
2.2.4. Management accounting systemResearchers argue that management accounting systems that provide measures of customer satis-
faction, timely and reliable delivery, measures of key production activities, quality, benchmarking,employee-based measures and strategic planning (MAS type I) enhance companies ability to differ-entiate their products and to satisfy their customers. However, it has been suggested in the managementaccounting literature that budgetary performance measures, variance analysis and activity-based cost-ing are suitable for companies that adopt low cost strategy (Chenhall and Langfield-Smith, 1988). Thisargument leads to the following hypotheses:
H7. Product differentiation units tend to use MAS type I more intensively than that of low cost units.
H8. Product differentiation units tend to use MAS type II less intensively than that of low cost units.
3. Research method
To test the hypotheses developed in the previous section, a single industry was selected to minimize theeffect of environmental heterogeneity (Moores and Yuen, 2001; Dess and Davis, 1984). Companies listedon the Jakarta Stock Exchange under the consumer goods industry were selected as the research samplesince this industry has multi strategic business units and multi products or brands which are expectedto employ different types of organizational design, control mechanism, and management accountingsystems. Data were collected from general managers, controllers or management accountants through amail survey and personal interviews.9 Initial contact was made with all companies in the target industry.After obtaining approval from senior management, a contact in the top management was asked to nominate
9 Two pilot studies were conducted. The first study used two business unit managers to investigate the degree of understandingof the questionnaires. As a result, some clarification and simplifications were made to the questionnaires. The second study usedfour business unit managers to obtain preliminary results related to the hypotheses develop in this study and to investigate anychanges necessary before the final survey and interviews were conducted.

J. Jermias, L. Gani / Management Accounting Research 15 (2004) 179–200 189
business units and contact person to be surveyed. We suggested that the contact person should be amanager responsible for a particular product or group of products that adopt similar strategy, a controlleror a management accountant who had been in their current position for at least 1 year prior to this study.This was considered necessary to ensure that the respondents have an understanding of the market inwhich their business unit operates, as well as the strategic and operating decisions they make.
The initial contact resulted in 115 business units from 26 companies interested in this study. Each of therespondents was sent the following materials: a letter explaining the purpose of the study, the question-naires, and a self addressed, stamped return envelope. Each questionnaire consists of six sections. The firstsection asks for demographic information about the respondent. The second to the fifth sections requestsinformation about competitive strategy, degree of centralization, type of control, management accountingsystems, and level of effectiveness of the strategic business unit. The last section asks respondents if theyare interested in having a copy of the final report.
3.1. Variable measurement
This study consists of two stages. The first stage investigates the relationship between the degree ofcontingent fit level and business unit effectiveness. In the second stage, this study evaluates the degree ofcentralization, type of control, and type of management accounting systems used by product differentiationand low cost units. There are six variables used to test the hypotheses outlined in the previous section.The measurement of each of these variables is presented below.
3.1.1. Business unit effectivenessEffectiveness of a business unit is measured by a multiplication of nine performance dimensions with
their respective relative importance for the business unit. This approach is considered appropriate forthis study since different competitive strategy imply quite a different set of priorities (Govindarajan andGupta, 1985; Steers, 1975).
Respondents were asked to indicate their business unit performance relative to their company’s standardand to position their products relative to leading competitors. The instrument has nine items and responseswere given on a 7-point Likert-type scale10 (1 = significantly below average; and 7 = significantly aboveaverage) in terms of return on investment, profit, cash flow from operation, cost control, development ofnew products, sales volume, market share, market development, and personnel development. In addition,respondents were also asked to indicate the degree of importance their superior attached to the nineperformance indicators mentioned above. Responses to those statements were combined into one constructto represent business unit effectiveness.
3.2. Contingent fit
The contingent fit scale was obtained by calculating the weighted sum of the fitness contribution ofeach contextual variable to the overall fitness value for each business unit. Following fitness landscapeapproach, the contribution of each variable was transformed into the value between zero and one bydividing each contribution with the highest possible value. One complicating factor was the coexistence
10 All the scales used in this study are developed based on the principle of semantic differences described in Osgood et al.(1957).

190 J. Jermias, L. Gani / Management Accounting Research 15 (2004) 179–200
of variables that both match and mismatch the chosen strategy. All respondents use both output andbehavioural control, and management accounting systems that both support low cost as well as productdifferentiation strategy at different level of intensity. To overcome this problem, we reverse coded variablesthat are inconsistent with the chosen strategy. Therefore, to calculate the fitness value for companies thatadopt product differentiation strategy, output control and MAS type II were reverse coded. For companiesthat adopt low cost strategy, the degree of centralization, behavioural control, and MAS type I were reversecoded. These procedures are necessary to ensure that a higher score represents a better match betweenthe chosen strategy and its contextual variables.
3.2.1. Competitive strategyCompetitive strategy is measured by asking respondents to position their products relative to leading
competitors on a 7-point Likert-type scale (1 = significantly lower; and 7 = significantly higher) in termsof product selling price, percent of sales spent on research and development, product quality, productfeatures, brand image, introduction of new products, changes in design, fast and delivery, and post salessupport. The questions were intended to signify the strategic choice of the business unit where a higherscore indicates product differentiation and lower score indicates low cost strategies. The strategy measurewas derived as follows. If the average score from the above questions is higher than the mean, the businessunit adopts a product differentiation strategy. If the average score is below the mean, the business unitadopts a low cost strategy. If the average score equals the mean (i.e., the average total score = 4), thebusiness units do not have a clear strategic choice and therefore are excluded from further analysis. Fig. 2shows the measurement of the strategic choice.
3.2.2. Degree of centralizationDegree of centralization is measured by asking respondents the typical influence they have in affecting
the outcome of each operating decisions that could affect their business unit performance. The instru-ment has four items and responses were given on a 7-point Likert-type scale (1 = no influence; and7 = total autonomy). Therefore, a higher score is associated with a more decentralized business unit.
SC
SC1
SC4
SC3
SC2
SC5
SC10
SC9
SC8
SC7
SC6
Low Cost (LC) Strategy
Product Differentiation (PD) Strategy
Strategic Choices (SC)
Fig. 2. The measurement of strategic choice.

J. Jermias, L. Gani / Management Accounting Research 15 (2004) 179–200 191
Responses to these four statements were collapsed across statements to represent the degree of central-ization construct.
3.2.3. Type of controlType of control was assessed by asking respondents to indicate their superior approach to managing their
business unit on a 7-point Likert-type scale (1 = no influence; and 7 = total control). The instrument hassix items. The first three items concern about the attainment of sales targets, expense targets, and marketshare targets. The last three items ask about the procedures, the decisions taken, and the implementation ofthe decisions to achieve the targets. Responses to these six questions were combined into two constructs:output control (based on responses to the first three questions) and behavioural control (based on responsesto the last three questions).
Type ofControl
DC1*
DC4*
DC3*
DC2*
TC1
TC6*
TC5*
TC4*
TC3
TC2
Degre ofCentralization
MAS1
MAS2
MAS3
MAS4
MAS5
MAS6
MAS7
MAS8*
MAS9*
MAS10*
MAS11*
MAS12*
MAS13*
MAS14*
ManagementAccounting
System
FIT EF
EF1
EF9
EF8
EF7
EF6
EF5
EF4
EF3
EF2
For Low Cost business units
Fig. 3. The measurement of contextual variables and contingent fit for LC and PD business units and its relationship with businessunit effectiveness. ∗Reverse coding is used to measure the contingent fit value.

192 J. Jermias, L. Gani / Management Accounting Research 15 (2004) 179–200
Type ofControl
DC1
DC4
DC3
DC2
TC1*
TC6
TC5
TC4
TC3*
TC2*
Degree ofCentralization
MAS1*
MAS2*
MAS3*
MAS4*
MAS5*
MAS6*
MAS7*
MAS8
MAS9
MAS10
MAS11
MAS12
MAS13
MAS14
ManagementAccounting
System
FIT EF
EF1
EF9
EF8
EF7
EF6
EF5
EF4
EF3
EF2
For Poduct Differentiation business units
Fig. 3. (Continued ).
3.2.4. Type of management accounting systemsType of management accounting systems used by the business unit was assessed by asking respondents
to indicate whether they use a particular management accounting systems and to rate the degree ofimportance attached to each system used on a 7-point Likert-type scale (1 = negligence; and 7 =significantly very important). There are 14 items in this instrument and responses obtained from thesequestions were combined into two constructs: MAS type I (based on responses to management accountingsystems that support product differentiation strategy) and MAS type II (based on responses to management

J. Jermias, L. Gani / Management Accounting Research 15 (2004) 179–200 193
accounting systems that support low cost strategy). Fig. 3 shows the measurement of the contextualvariables used in this study and the development of contingent fit for product differentiation and low costbusiness units and the hypothesized relationship with business unit effectiveness.
The questionnaire items related to competitive strategy, degree of centralization, type of controls andmanagement accounting systems were derived from instruments used by previous researchers (Jermiasand Armitage, 2000; Chenhall and Langfield-Smith, 1988; Innes and Mitchell, 1995). The questionnaireitems for business unit effectiveness were derived from instrument proposed by Govindarajan and Fisher(1990). The fitness construct was derived from the contribution of each contextual variable toward thetotal fitness value based on the approach suggested by the fitness landscape theory.
The six constructs and their inter-item reliability were as follows:
Constructs Cronbach alpha
Business unit effectiveness 0.93Contingent fit 0.87Strategic choice 0.93Degree of centralization 0.86
Type of controlOutput control 0.81Behavioural control 0.90
Management accounting systemsType I 0.78Type II 0.94
These results indicate that the reliability of the constructs is within the acceptable range (Nunnally,1967).
4. Data analysis and results
A total of 10611 useable responses to questionnaires distributed by mail survey and interviews were re-ceived. This represents a response rate of 92%. Because of the high response rate, no test for non-responsebias was considered necessary. To test the hypotheses outlined in the previous section, three main stepswere used to analyse the data. First, we classify respondents into product differentiation and low costcompanies by analysing their scores on the 10 items under competitive strategy. Companies that scoregreater than the mean of the 10 items were classified as product differentiation, while those that scorelower than the mean were classified as low cost companies. Second, we determine the contingent fit valuefor each company by calculating the weighted sum of the fitness contribution of each contextual variableusing the formula derived from the fitness landscape theory discussed in the previous section. The totalcontingent fit value is then correlated with the business unit effectiveness. Finally, we compare the degree
11 Nine respondents were excluded from further analysis either because they do not have a clear strategic preference (threerespondents with mean score for strategic choice equals four) or they are considered as outliers based on Boxplot data validationanalysis (six respondents).

194 J. Jermias, L. Gani / Management Accounting Research 15 (2004) 179–200
Table 3Descriptive statistics: meana (standard deviation) by strategic priorities
Variables All sample (n = 106) PD (n = 75) LC (n = 31)
Business unit effectiveness 3.83 (1.22) 4.13 (1.15) 3.11 (1.07)Contingent fit 0.57 (0.06) 0.58 (0.06) 0.57 (0.07)Degree of centralization 3.97 (1.40) 3.87 (1.27) 4.22 (1.66)
Type of controlBehavioural 4.68 (1.44) 4.92 (1.40) 4.10 (1.39)Output 5.36 (1.14) 5.50 (1.03) 5.01 (1.32)
Type of management accounting systemsMAS type I 5.87 (0.82) 6.00 (0.80) 5.54 (0.78)MAS type II 4.94 (0.73) 4.93 (0.73) 4.94 (0.75)
a All scores are based on raw scores except for the contingent fit variable in which some reverse coding was performed.
of centralization, types of controls and types of management accounting systems used by companiesadopting different business strategy.
4.1. Descriptive statistics
Table 3 provides the descriptive statistics for all the variables used to test the hypotheses outlined in theprevious section. All scores are based on raw scores except for the contingent fit variable for which somereverse coding was performed (see Fig. 3 for the list of items that were reverse coded). The means of totalcontingent fit value are quite similar for product differentiation and low cost units (Mfitpd = 0.58 andMfitlc = 0.57). Product differentiation units, however, show a higher mean of business unit effectivenessthan that of low cost units (Meffpd = 4.13 and Mefflc = 3.11). As expected, product differentiation unitsuse more behavioural control (Mbehpd = 4.92 and Mbehlc = 4.10) and more MAS type I (Mms1pd = 6.00and Mms1lc = 5.54) and less MAS type II (Mms2pd = 4.93 and Mms2lc = 4.94) than those of low cost units.Contrary to our prediction, however, product differentiation units also use less decentralized structure(Mdecpd = 3.87 and Mdeclc = 4.22) and more output control than those of low cost units (Moutpd = 5.01and Moutlc = 5.50).
4.2. Hypothesis testing
The first hypothesis predicted that contingent fit would have a positive correlation with business uniteffectiveness regardless of the strategic choice. Panel A of Table 4 reports the correlation analysis for thefull sample without separating for strategic choice. Contingent fit is significantly positive, suggesting thatthe higher the fitness value, the better the performance of the business unit. This result was consistentwith H1.
The second hypothesis expected that there would be a positive correlation between contingent fit andeffectiveness for product differentiation units and low cost units. Panel B of Table 4 shows the results ofthe statistical test. The results indicate that the correlation between contingent fit and effectiveness forproduct differentiation and low cost units are both significantly positive. The results are consistent withH2 and H3.

J. Jermias, L. Gani / Management Accounting Research 15 (2004) 179–200 195
Table 4Spearman’s rho correlation between contingent fit and business unit effectiveness test of H1–H3 (P-values in parentheses)
Prediction Results
Panel A: total sample of 106 companies + 0.214 (0.014)∗
Panel B: partition by strategic prioritiesProduct differentiation (n = 75) + 0.221 (0.028)∗
Low cost (n = 31) + 0.312(0.044)∗
∗ Denote significance levels of 0.05. The significance tests are one tailed since the tests are for directional hypotheses.
Table 5Comparisons between the level of usage of the contextual variables: PD vs. LC test of H4–H8 (P-values in parentheses)
Variables Prediction t-test
Degree of decentralization + −1.18 (0.120)
Types of controlBehavioural control + 2.75 (0.003)∗∗
Output control − 2.04 (0.022)∗
Types of management accounting systemsMAS type I + 2.72 (0.004)∗∗
MAS type II − −0.07 (0.471)
The symbols (∗ and ∗∗) denote significance levels of 0.05 and 0.01, respectively. The significance tests are one tailed since thetests are for directional hypotheses.
To test H4–H8, we compare the scores from the questions that asked about the degree of decentralization,types of controls and types of management accounting systems. Table 5 shows the results of the statisticaltests.
The fourth hypothesis expected that product differentiation units will use a more decentralized or-ganizational structure as compared to that of low cost units. The results show that although low costbusiness units use a more decentralized structure, the difference is not statistically significant. Thereforeit is difficult to interpret this result.
The fifth hypothesis states that product differentiation units tend to use behavioural control moreintensively than that of low cost units. The results indicate a significant positive difference in the level ofintensity of behavioural control between product differentiation and low cost units. The result is consistentwith H5.
The sixth hypothesis postulates that product differentiation units tend to use output control less inten-sively than that of low cost units. The result indicates a significant negative difference in the level ofintensity of output control between product differentiation and low cost units. The result contradicts H6.
The seventh hypothesis predicts that product differentiation units tend to use MAS type I more inten-sively than that of low cost units. The result reveals a significant positive difference in the use of MAStype I by product differentiation units as compared to that of low cost units. The result is consistent withH6.
The eighth hypothesis expects that product differentiation will tend to use MAS type II less intensivelythan that of low cost units. The results show that although product differentiation units use MAS type

196 J. Jermias, L. Gani / Management Accounting Research 15 (2004) 179–200
II less intensively, the difference is not statistically significant. Therefore it is difficult to interpret thisresult.
5. Discussion
Conceptually, this study relies on the proposition that contingent fit between chosen strategy and itscontextual variables is positively associated with business unit effectiveness. The findings from this studyindicate that contingent fit has a significant positive relationship with business unit effectiveness regardlessof the strategic choice. This is consistent with the proposition from contingency theory that no systems areuniversally appropriate to all organization and to all circumstances. Instead, a particular strategic choicemust be associated with a certain organizational configuration and management accounting systems anddemonstrate an appropriate matching to positively affect performance.
Previous research has found that product differentiation units tend to use a more decentralized structure,more intensive behavioural control, and more intensive management accounting systems that supportbusiness units’ ability to differentiate their products and to satisfy their customers. Low cost units tendto be organized with a more centralized structure, use more intensive behavioural control, and moreintensive management accounting systems that promote efficiency.
The results of this study indicate that product differentiation units tend to use more behavioural controland management accounting systems that support companies’ ability to differentiate their product and tosatisfy their customers. These results are consistent with those of previous research. One contradictoryresult was observed when comparing the level of intensity of output control used by product differentiationand low cost units. While we predict that product differentiation units will tend to use output control lessintensively as compared to low cost units, the results show the opposite. Further analysis indicates thatthere is a strong correlation between output control and behavioural control indicating that businessunits in this industry use both behavioural and output controls simultaneously, but product differentiationcompanies use both types of controls more intensively.
We also performed an alternative test to compare the total control and relative control levels (definedas percentage of behavioural or output control to total control) used by product differentiation and lowcost business units. Tables 6 and 7 present the descriptive statistics and the t-test results. The resultsindicate that as a percentage of total control, product differentiation business units use more behaviouralcontrol and less output control as compared to low cost business units (46.72% versus 44.82% and53.28% versus 55.18%). These results are consistent with H5 and H6 although the differences are notstatistically significant. It is interesting to note that both product differentiation and low cost businessunits use more output control than behavioural control. It might be that business units in this industryrely more on output control than behavioural control because of high outcome observability. Another
Table 6Descriptive statistics: mean (standard deviation) by strategic priorities
Variables PD (n = 75) LC (n = 31)
Total control 5.21 (0.63) 4.55 (0.87)Behavioural control/total control (%) 46.72 (11.23) 44.82 (11.65)Output control/total control (%) 53.28 (11.24) 55.18 (11.66)
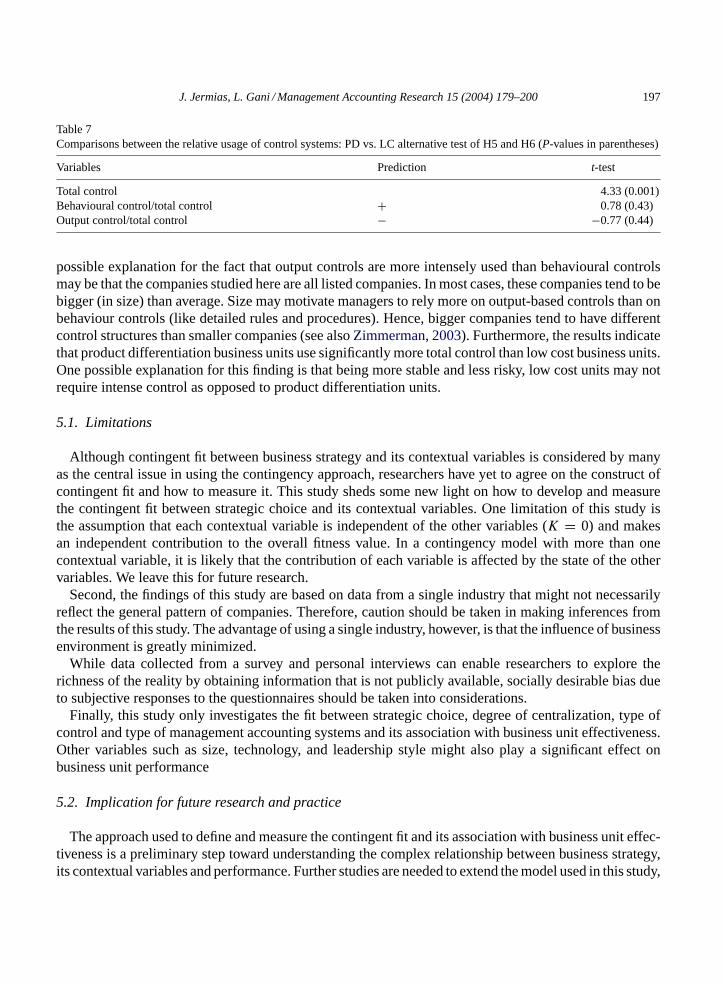
J. Jermias, L. Gani / Management Accounting Research 15 (2004) 179–200 197
Table 7Comparisons between the relative usage of control systems: PD vs. LC alternative test of H5 and H6 (P-values in parentheses)
Variables Prediction t-test
Total control 4.33 (0.001)Behavioural control/total control + 0.78 (0.43)Output control/total control − −0.77 (0.44)
possible explanation for the fact that output controls are more intensely used than behavioural controlsmay be that the companies studied here are all listed companies. In most cases, these companies tend to bebigger (in size) than average. Size may motivate managers to rely more on output-based controls than onbehaviour controls (like detailed rules and procedures). Hence, bigger companies tend to have differentcontrol structures than smaller companies (see also Zimmerman, 2003). Furthermore, the results indicatethat product differentiation business units use significantly more total control than low cost business units.One possible explanation for this finding is that being more stable and less risky, low cost units may notrequire intense control as opposed to product differentiation units.
5.1. Limitations
Although contingent fit between business strategy and its contextual variables is considered by manyas the central issue in using the contingency approach, researchers have yet to agree on the construct ofcontingent fit and how to measure it. This study sheds some new light on how to develop and measurethe contingent fit between strategic choice and its contextual variables. One limitation of this study isthe assumption that each contextual variable is independent of the other variables (K = 0) and makesan independent contribution to the overall fitness value. In a contingency model with more than onecontextual variable, it is likely that the contribution of each variable is affected by the state of the othervariables. We leave this for future research.
Second, the findings of this study are based on data from a single industry that might not necessarilyreflect the general pattern of companies. Therefore, caution should be taken in making inferences fromthe results of this study. The advantage of using a single industry, however, is that the influence of businessenvironment is greatly minimized.
While data collected from a survey and personal interviews can enable researchers to explore therichness of the reality by obtaining information that is not publicly available, socially desirable bias dueto subjective responses to the questionnaires should be taken into considerations.
Finally, this study only investigates the fit between strategic choice, degree of centralization, type ofcontrol and type of management accounting systems and its association with business unit effectiveness.Other variables such as size, technology, and leadership style might also play a significant effect onbusiness unit performance
5.2. Implication for future research and practice
The approach used to define and measure the contingent fit and its association with business unit effec-tiveness is a preliminary step toward understanding the complex relationship between business strategy,its contextual variables and performance. Further studies are needed to extend the model used in this study,

198 J. Jermias, L. Gani / Management Accounting Research 15 (2004) 179–200
for example, by relaxing the assumption that each contextual variable makes an independent contributiontoward the overall fitness value. To do this, one needs to find the interdependency among contextualvariables and their cumulative effect on fitness value to affect performance. Future research might alsouse cross-industry data to investigate the impact of fitness on business units as well as organizational levelperformance.
From a practical perspective this study is relevant to executives responsible for the design and imple-mentation of organizational structure, control and management accounting systems. The results of thisstudy provide insights into the need to align strategic priorities, organizational design and managementaccounting systems since the appropriate match between business strategy and its contextual variables islikely to affect performance.
Acknowledgements
We gratefully acknowledge the valuable comments and suggestions made by Theresa Libby, WahjudiPrakarsa and I.G.N. Agung on the early development of this paper. We would also like to thank Wa-giono Ismangil, Binsar Simanjuntak, and Sidharta Utama for their useful comments, as well the variouscompanies and their representatives for their generosity to provide data used in this study. The paper hasfurther benefited from comments and suggestions of the anonymous reviewers of this journal and fromthe views of participants at Simon Fraser University accounting seminar, the 2003 Certified Manage-ment Accountant-Simon Fraser University research meeting, and the 2002 Asian Academic AccountingAssociation Third Annual Conference, Nagoya, Japan.
References
Atkinson, A.A., Waterhouse, J.H., Wells, R.B., 1997, A stakeholder approach to strategic performance measurement. SloanManage. Rev. 38 (3).
Beinhocker, E.D., 1999. Robust adaptive strategies. Sloan Manage. Rev. 40 (3), 95–106.Bruns, W.J., Waterhouse, J.H., 1975. Budgetary control and organization structure. J. Acc. Res. 13, 177–203.Burns, T., Stalker, G.M., 1961. The Management of Innovation. Tavistock, London.Chen, P.Y., Popovich, P.M., 2002. Correlation: Parametric and Non-parametric Measures. Sage Publications, Thousand Oaks.Chenhall, R.H., Langfield-Smith, K., 1988. The relationship between strategic priorities, management techniques, and manage-
ment accounting: an empirical investigation using a system approach. Organ. Society 23 (3), 243–264.Dent, J.F., 1990. Strategy, organization and control: some possibilities for accounting research. Acc. Organ. Society 3–24.Dess, G.G., Davis, P.S., 1984. Porter’s 1980 generic strategies as determinant of strategic group membership and organizational
performance. Acad. Manage. J. 27, 467–488.Dooley, K., Van de Ven, A., 1999. Explaining complex organizational dynamics. Organ. Sci. 10 (3), 358–372.Galbraith, J.R., 1973. Designing Complex Organization. Addison Wiley, Reading, MA.Garg, V.K., Walters, B.A., Priem, R.L., 2003. Chief executive scanning emphases, environmental dynamism and manufacturing
firm performance. Strategic Manage. J. 24, 725–744.Ginsberg, A., Venkatraman, N., 1985. Contingency perspectives of organizational strategy: a critical review of the empirical
research. Acad. Manage. Rev. 10 (3), 421–434.Gordon, L.A., Miller, D., 1976. A contingency framework for the design of accounting information systems. Acc. Organ. Society
1, 59–69.Govindarajan, V., 1986. Decentralization, strategy and effectiveness of strategic business units in multi-business organizations.
Acad. Manage. Rev. 11, 844–856.

J. Jermias, L. Gani / Management Accounting Research 15 (2004) 179–200 199
Govindarajan, V., Fisher, J., 1990, Strategy, control systems, and resource sharing: effects on business unit performance. Acad.Manage. J. 259–285.
Govindarajan, V., Gupta, A.K., 1985. Linking control systems to business units strategy: impact on performance. Acc. Organ.Society 51–66.
Gupta, A.K., 1987. SBU strategies, corporate-SBU, and SBU effectiveness in strategy implementation. Acad. Manage. J.477–500.
Gupta, A.K., Govindarajan, V., 1984. Business unit strategy, managerial characteristics, and business unit effectiveness at strategyimplementation. Acad. Manage. J. 25–41.
Horngren, C.T., Foster, G., Datar., S.M., Teall, H.D., 2000. Cost Accounting: A Managerial Emphasis. Prentice Hall CanadaInc., Scarborough, Ontario.
Hoque, Z., James, W., 2000. Linking balanced scorecard measures to size and market factors: impact on organizational perfor-mance. J. Manage. Acc. Res. 12, 1–17.
Innes, J., Mitchell, F., 1995. A survey of activity-based costing in the UK’s largest companies. Manage. Acc. Res. (June),137–153.
Ittner, C.D., Larker, D.F., 1997. Quality strategy, strategic control systems, and organizational performance. Acc. Organ. Society22 (3/4), 293–314.
Jermias, J., Armitage, H.M., 2000. Management accounting in Indonesia: analysis of current systems, potential for change andforces behind innovation. Int. J. Acc. Bus. Society 8 (1), 36–57.
Johnson, H.T., Kaplan, R.S., 1987. Relevance Lost: The Rise and Fall of Management Accounting. Harvard Business SchoolPress, Boston, MA.
Kaplan, R.S., Norton, D.P., 1996. Using the Balanced Scorecard Measures that Drive Performance. Harvard Bus. Rev. (Jan-uary/February), 71–79.
Kauffman, S.A., 1993, The Origins of Order: Self Organization and Selection in Evolution. Oxford University Press, New York.Kauffman, S.A., Weinberger, E.D., 1989. The NK model of rugged fitness landscapes and its application to maturation of the
immune-response. J. Theoretical Biology 141 (2), 211–245.Laurence, P.R., Lorsch, J.W., 1967. Organization and Environment. Division of Research, Harvard Graduate School of Business
Administration, Boston.Levinthal, D.A., 1997. Adaptation on rugged landscapes. Manage. Sci. 43 (7), 934–950.McCarthy, I., 2002. Technology Management—A Complex Adaptive Systems Approach. Working Paper, University of Warwick,
Coventry, UK.Merchant, K.A., 1985. Organizational Controls and Discretionary Program Decision Making: A Field Study. Acc. Organ. Society
67–85.Miller, D., 1981. Towards a new contingency approach: the search for organizational gestalts. J. of Manage. Stud. 18 (1), 1–26.Moores, K., Yuen, S., 2001. Management accounting systems and organizational configuration: a life-cycle perspective. Acc.
Organ. Society 26, 351–389.Nunnally, J.E., 1967. Psychometric Theory. McGraw-Hill, New York.Osgood, C.E., Suci, G.J., Tannenbaum, P.H., 1957. The Measurement of Meaning. University of Illinois Press, Urbana, IL.Otley, D.T., 1980. The contingency theory of management accounting: achievement and prognosis. Acc. Organ. Society 5,
413–428.Ouchi, W., 1977. The relationship between organizational structure and organizational control. Admin. Sci. Quart. 22, 95–112.Porter, M.E., 1980. Competitive Strategy. Free Press, New York.Porter, M.E., 1985. Competitive Advantage. Free Press, New York.Ruef, M., 1997. Assessing organizational fitness on a dynamic landscape: an empirical test of the relative inertia thesis. Strategic
Manage. J. 18 (11), 837–853.Samson, D.A., Langfield-Smith, K.M., McBride, P.M., 1991. The alignment of management accounting with manufacturing
priorities: a strategic perspective. Australian Acc. Rev. 29–40.Selto, F.H., Renner, C.J., Young, S.M., 1995. Assessing the organizational fit of a just-in-time manufacturing systems: testing,
selection, interaction and systems models of contingency theory. Acc. Organ. Society 20, 665–684.Shank, J., Govindarajan, V., 1993. Strategic Cost Management: The New Tool for Competitive Advantage. The Free Press, New
York.Simon, R., 2000. Performance Measurement and Control Systems for Implementing Strategy: Text and Cases. Prentice-Hall,
Upper Saddle River, NJ.

200 J. Jermias, L. Gani / Management Accounting Research 15 (2004) 179–200
Steers, R.M., 1975. Problems in the measurement of organizational effectiveness. Admin. Sci. Quart. 20, 546–558.Sussman, G.I., Evered, R.D., 1978. An assessment of the scientific merits of action research. Admin. Sci. Quart. 23, 582–603.Tushman, M.L., Nadler, D.A., 1978. Information processing as an integrating concept in organizational design. Acad. Manage.
Rev. 3, 613–624.Van de Ven, A.H., Drazin, R., 1985. The concept of fit in contingency theory. In: Straw, B.M., Cummings, L.L. (Eds.), Research
in Organizational Behaviour. JAI Press, Greenwich, CT, pp. 333–365.Waterhouse, J., Svendsen, A., 1998. Strategic Performance Monitoring and Management: Using Non-financial Measures to
Improve Corporate Governance. The Canadian Institute of Chartered Accountants, Toronto, Ont.Waterhouse, J.H., Tiessen, P., 1978. A contingency framework for management accounting systems research. Acc. Organ. Society
3, 65–76.Zimmerman, J.L., 2003. Accounting for Decision Making and Control, 4th ed. McGraw-Hill, Irwin.