The pace of Holocene vegetation change – testing for synchronous developments
11
This article appeared in a journal published by Elsevier. The attached copy is furnished to the author for internal non-commercial research and education use, including for instruction at the authors institution and sharing with colleagues. Other uses, including reproduction and distribution, or selling or licensing copies, or posting to personal, institutional or third party websites are prohibited. In most cases authors are permitted to post their version of the article (e.g. in Word or Tex form) to their personal website or institutional repository. Authors requiring further information regarding Elsevier’s archiving and manuscript policies are encouraged to visit: http://www.elsevier.com/copyright
-
Upload
independent -
Category
Documents
-
view
0 -
download
0
Transcript of The pace of Holocene vegetation change – testing for synchronous developments

This article appeared in a journal published by Elsevier. The attachedcopy is furnished to the author for internal non-commercial researchand education use, including for instruction at the authors institution
and sharing with colleagues.
Other uses, including reproduction and distribution, or selling orlicensing copies, or posting to personal, institutional or third party
websites are prohibited.
In most cases authors are permitted to post their version of thearticle (e.g. in Word or Tex form) to their personal website orinstitutional repository. Authors requiring further information
regarding Elsevier’s archiving and manuscript policies areencouraged to visit:
http://www.elsevier.com/copyright

Author's personal copy
The pace of Holocene vegetation change e testing for synchronous developments
Thomas Giesecke a,*, K.D. Bennett b,c, H. John B. Birks d,e, f,g, Anne E. Bjune g, Elisaveta Bozilova h,Angelica Feurdean i, Walter Finsinger j, Cynthia Froyd k, Petr Pokorný l, Manfred Röschm, Heikki Seppä n,Spasimir Tonkov h, Verushka Valsecchi o, Steffen Wolters p
aDepartment of Palynology and Climate Dynamics, Albrecht-von-Haller-Institute for Plant Sciences, University of Göttingen, Untere Karspüle 2, 37073 Göttingen, Germanyb School of Geography, Archaeology and Palaeoecology, Queen’s University Belfast, Belfast BT7 1NN, Northern Ireland, UKcDepartment of Earth Sciences, Uppsala University, Villav. 16, SE-752 36 Uppsala, SwedendDepartment of Biology, University of Bergen, Thormøhlensgate 53A, N-5006 Bergen, Norwaye Environmental Change Research Centre, University College London, London WC1E 6BT, UKf School of Geography and Environment, University of Oxford, Oxford OX1 3QY, UKgUni Bjerknes Centre and Bjerknes Centre for Climate Research, Allégaten 55, N-5007 Bergen, Norwayh Sofia University St. Kliment Ohridski, Faculty of Biology, Department of Botany, Laboratory of Palynology, 8 Dragan Tzankov blvd., Sofia 1164, BulgariaiBiodiversity and Climate Research Centre (BiK-F), Senckenberganlage 25, 60325 Frankfurt, GermanyjCentre for Bio-Archaeology and Ecology (UMR 5059 CNRS), 163 Rue A. Broussonnet, F-34090 Montpellier, FrancekDepartment of Geography, College of Science, Swansea University, Swansea SA2 8PP, UKlCenter for Theoretical Study, Charles University in Prague and the Academy of Sciences of the Czech Republic, Jilská 1, 110 00 Praha, Czech Republicm Landesamt für Denkmalpflege im Regierungspräsidium Stuttgart, Fischersteig 9, 78343 Gaienhofen-Hemmenhofen, GermanynDepartment of Geosciences and Geography, University of Helsinki, P.O. Box 64, FI 00014, Finlando Institut des Sciences de l’Evolution CC 061, UMR CNRS 5554, Université de Montpellier, Place Eugéne Bataillon, 34095 Montpellier Cedex 05, Francep Lower Saxony Institute for Historical Coastal Research, Viktoriastr, 26/28, 26382 Wilhelmshaven, Germany
a r t i c l e i n f o
Article history:Received 24 January 2011Received in revised form13 June 2011Accepted 20 June 2011Available online 18 July 2011
Keywords:Synchronous changeVegetation dynamicsClimate changeHoloceneSpecies invasionPollen
a b s t r a c t
Mid to high latitude forest ecosystems have undergone several major compositional changes during theHolocene. The temporal and spatial patterns of these vegetation changes hold potential information totheir causes and triggers. Here we test the hypothesis that the timing of vegetation change wassynchronous on a sub-continental scale, which implies a common trigger or a step-like change in climateparameters. Pollen diagrams from selected European regions were statistically divided into assemblagezones and the temporal pattern of the zone boundaries analysed. The results show that the temporalpattern of vegetation change was significantly different from random. Times of change cluster around8.2, 4.8, 3.7, and 1.2 ka, while times of higher than average stability were found around 2.1 and 5.1 ka.Compositional changes linked to the expansion of Corylus avellana and Alnus glutinosa centre around 10.6and 9.5 ka, respectively. A climatic trigger initiating these changes may have occurred 0.5 to 1 ka earlier,respectively. The synchronous expansion of C. avellana and A. glutinosa exemplify that dispersal is notnecessarily followed by population expansion. The partly synchronous, partly random expansion ofA. glutinosa in adjacent European regions exemplifies that sudden synchronous population expansionsare not species specific traits but vary regionally.
� 2011 Elsevier Ltd. All rights reserved.
1. Introduction
Pollen diagrams testify to the changes in vegetation compositionover long periods and can give insights to past vegetationdynamics. However, they depict the result of a process, but littleinformation of its cause. It is therefore not surprising that palae-oecologists have been arguing about the reasons for vegetation
change since the development of the subject. The comparison ofpollen diagrams in space and through time offers some insights,and thus Rudolph (1930) suggested that the general succession ofmajor forest elements in central Europe occurred synchronously.His summary of possible causes for Holocene changes in forestcomposition has changed little over the last 80 years and can besummarized as follows: I) an autogenous succession, controlled bycompetition and interactionwith soil development; II) the distanceto suitable Glacial maximum refugia with the delayed spread out ofthese areas; and III) climate change, which would determine theexpansion of different species at different times. By rejecting the
* Corresponding author. Tel.: þ49 551 39 10675; fax: þ49 551 39 8449.E-mail address: [email protected] (T. Giesecke).
Contents lists available at ScienceDirect
Quaternary Science Reviews
journal homepage: www.elsevier .com/locate/quascirev
0277-3791/$ e see front matter � 2011 Elsevier Ltd. All rights reserved.doi:10.1016/j.quascirev.2011.06.014
Quaternary Science Reviews 30 (2011) 2805e2814

Author's personal copy
first two, Rudolph (1930) favoured the climate hypothesis. Heassumed that all major forest species would have spread from theirGlacial refugia during the Late Glacial and early Holocene before thetime of the Corylus expansion (approximately 10.6 ka).With respectto Picea, Fagus and Carpinus similar ideas were already put forwardby von Post (1924), who like Rudolph (1930) interpreted theexpansion of different species as the result of a change in climate.Several other pioneers in the subject of vegetation history followedthese ideas. For example Godwin (1975) argued that species may bepresent at abundances too low to be detected by pollen analysis,but may expand once the climate would become suitable. Incontrast, Rudolph’s pupil Firbas (1949) stressed that seed dispersaland distance to Glacial maximum plant refugia can explain thegeneral pattern in Holocene vegetation development. At the sametime Firbas (1949) also acknowledged the importance of climateand hence followed Rudolph’s notion that the general succession isbroadly synchronous, and provided an even more detailed schemeof it, which he advocated could be used for dating. In North AmericaDavis (1976) showed how species spread during the Holocene andsubstantiated the hypothesis that life cycle, dispersal biology anddistance to full Glacial refugia could explain the observed vegeta-tion history. Prentice et al. (1991) condensed the three hypothesesinto two, the disequilibrium and the dynamic equilibriumhypothesis with respect to climate as a variable factor, and showedthat spatial patterns interpreted as range expansion of specieslimited by dispersal, could also be explained by directional changesin climate. Principally all climate reconstructions from pollendiagrams are based on the validity of the climate equilibriumhypothesis (Prentice et al., 1991). However, from the early simpli-fication of climatic periods that are characterised by distinctclimates with shifts in between them, like the BlytteSernanderclimate classification, these modern numerical reconstructionsportray a general scenario of gradually changing climateparameters.
Forests are rather stable systems, as trees are generally longlived, producing abundant seeds so that a gap in the canopy isimmediately filled with a descendant of one of the surroundingindividuals making it difficult for newcomers to establish. Thisinertia is broken in major disturbance events like extensive fires,which facilitate vegetation change (Green, 1982, 2006). Bradshawand Hannon (1992) used this concept of disturbance to interpreta shift in vegetation composition from one stable state to another.Tinner and Lotter (2001, 2006) showed that the climate excursionaround 8.2 ka could have acted just like a major disturbance event.By stressing the established tree populations during the climatereversal the inertia of the resident population is lowered allowingnew arrivals to get established. Tinner and Lotter (2006) alsomentioned that the climate excursion might have marked a shift inthe moisture regime in the region and thus led to a persistent shiftin vegetation composition.
Many spatio-temporal patterns in pollen data-sets are oftengradual in space and time and may be explained by the invasion ofa species, a gradual change in climate or slowly increasing humanactivity. These patterns can be easily distinguished from synchro-nous changes in vegetation composition between distant sites.Such shifts can involve different species in different regions orconstitute parallel developments in the abundance of the samespecies over vast areas. Synchronous vegetation change docu-mented inmany pollen diagrams from a large regionmay be causedby step-like changes in climate parameters or short climateexcursions like the 8.2 ka event that would trigger synchronousshifts in vegetation composition. Through land-use change, humanactivity could also have brought about synchronous or asynchro-nous changes in vegetation composition, depending on howquickly a new technology or idea spread.
The aim of this paper is to test whether synchronicity in Holo-cene vegetation change was significant for European forest devel-opment, and thus evaluate the importance of abrupt climatechange for forest ecosystems during the Holocene.
2. Methods
2.1. Data compilation
We selected pollen analytical results from 59 sites throughoutEurope (Fig.1) in twoways: Data-sets that are continuous over 9000years or more with at least six radiocarbon dates or varve chro-nology were extracted from the European Pollen Database (EPD). Inparallel, palynologists were approached directly and invited tocontribute their data to this study. In the latter case restrictions onthe number of radiocarbon dates per sequence were relaxed if theavailable dates and sedimentation history indicated a near linearageedepth relationship. In some occasions the authors provided anageedepth model based on calibrated radiocarbon dates or varvechronology, and this information was used in the analysis. In mostcases a new ageedepth model was constructed through calibratingthe original radiocarbon dates using Bcal or Calib with the IntCal04(Reimer et al., 2004) curve. Depths to age relationships were con-structed using the mode or weighted average of the probabilitydistribution for the calibrated age. Agemodels chosen depended onthe amount of available radiocarbon dates and the complexity of thesedimentation history and range from linear interpolations andlinear regression models to polynomials and smoothing splines aswell as combinations of models for different sections of thesequence. Ageedepth models were fitted using psimpoll (Bennett,2007) and MatLab. Pollen percentages were calculated from thecount data and based on the sum of all terrestrial pollen and sporesexcluding Sphagnum spores. In a few cases the authors providedpollen percentage data based on the above sum.
2.2. Zonation and analysis
The zonation of stratigraphical data can be carried out in anagglomerative way e.g. using constrained cluster analysis (CONISS;Grimm, 1987) or divisively by splitting the sequence into smallerand smaller sections using binary or optimal techniques (Gordonand Birks, 1972). Binary splitting first finds the point where a divi-sion reduces the overall variance most and then looks for furthersplits within the new sections. Optimal splitting always considersthe full sequence at once irrespectively how many divisions arecarried out. Bennett (1996) showed that the broken-stick model(MacArthur, 1957) can be used to determine the number of zonesthat are statistically significant. Themodel is conceptually similar tothe binary splitting approach, and is also applicable to optimalsplitting and CONISS (Bennett, 1996). Gordon and Birks (1972)argued that divisive techniques may be better suited to detectgradual but stratigraphically consistent changes and the analysispresented here was therefore restricted to the two divisive tech-niques binary and optimal splitting. The splitting techniquesrequire a measure of variance that is additive, however the choiceinfluences the result of the analysis. Here we used both the infor-mation content criterion and the sum of squared deviations(Gordon and Birks, 1972). Combining the two splitting techniqueswith the twomeasures of variance we carried out the resulting fourcombinations on all square root transformed data-sets including allterrestrial taxa that exceeded one percent in any one sample. Thenumber of significant zones was evaluated using the broken-stickmodel and the ages for the significant splits were collated. Thisanalysis was carried out using psimpoll (Bennett, 2007).
T. Giesecke et al. / Quaternary Science Reviews 30 (2011) 2805e28142806

Author's personal copy
The resulting ages for the time of the split are associated withlarge uncertainties of two main sources. They carry all the uncer-tainty of the age model. In addition they represent the age of themidpoint between two samples, while there is no way of knowingwhen this change actually occurred, and thus this uncertaintyincreases with decreasing sample resolution. To take these uncer-tainties into account the results were handled in twoways: the ageswere collected into bins of 200 years width and the frequency ofthese bins was further analysed. Secondly, the ages were uniformlytreated as the mean of a Gaussian distribution with a variance of100 years. The probabilities of all events were added, combining theresults from the four analyses. The timing of splits were consideredfor the time up until 13 ka, as few data-sets reached far into the LateGlacial and their age control was seldom well constrained. Single,dominant changes like the shift from the Late Glacial to the Holo-cene can affect the overall variance of a data-set and thus influencethis analysis. Therefore, all pollen data was subsequently restrictedto 11 ka and 9 ka and the splitting techniques were run on theserestricted data. The resulting frequencies and probabilities wereadjusted by the number of available sequences by division of theavailable by the maximum number of sequences. The chance thata large number of randomly occurring events would fall into one ofthe 65 bins can be described by the Poisson distribution. Using a Chisquare test this theoretical distribution was compared to thedistribution of frequencies in the individual data-sets. This testevaluates the likelihood that for example two bins were selectedmore than 10 times, which would be unlikely in a random process,while the 10 times selection of only one bin may occur by chance. Arigorous statistical test of significance for the selection of individualbins is not straightforward, as the 59 diagrams span different time
intervals and were divided into different numbers of zones, witha low probability of two zones from the same diagram falling intothe same bin.
3. Results
The highest frequency of pollen zone boundaries is seen in theearly Holocene before 9 ka, regardless of the splitting technique andthe variance measure. Using the sum of squares variance criterion,32% and 28% of all available pollen data-sets show a boundarybetween 11.4 and 11.6 ka, corresponding to the beginning of theHolocene. Splitting procedures using the information contentcriterion selected zone boundaries coinciding with the onset of theHolocene less frequently. They found splits around 10.7 ka and thisbin was selected by the binary splitting procedure in 25% of avail-able data-sets (Fig. 2). However, including all splits the corre-sponding peak in accumulated probabilities shifted towardsa younger age of 10.55 ka (Fig. 3). A distinct peak at 9.54 ka in theaccumulated probabilities (Fig. 3) is clearly visible in the histogramsfor binary splitting with information content and optimal splittingwith sum of squares (Fig. 2). A broad peak in the accumulatedprobabilities (Fig. 3) centres at 8.28 ka, though the histogramsindicate that the frequency of splits with this approximate agevaries between techniques. Also all other peaks younger than 8 kararely show parallels between the four histograms. The comparisonwith the accumulated probabilities of the restricted data-sets(Fig. 4) shows that most of these peaks remain fixed even whenthe overall variance of the data-set was reduced. Only one broadnew peak emerged in the 9 ka restricted data-set spanning7.2e7.5 ka, while the peak at 6 ka became more important (Fig. 4).
40°E30°E
20°E
20°E
10°E
10°E
0°
0°10°W20°W
60°N 60°N
50°N 50°N
40°N 40°N
1 23
4 5 6
7
89
10
1112
1314
15161718
19
20 21
2223
24
25
26
27
2829 3031 3233
34
35
36
3738
39
40 41
4243
444546
4748
49 5051
5253
54
5556
5758
59
Fig. 1. Map indicating the location of 59 pollen diagrams used in the analysis. Numbers are linked to sites and references in the online Appendix.
T. Giesecke et al. / Quaternary Science Reviews 30 (2011) 2805e2814 2807
Author's personal copy
Thenumber of zoneboundaries fallingwithin each200-yearwidebin were expressed as frequency distributions and compared toPoisson distributions, which describe random encounters for thesame number of observations as splits were found. The differencebetween the two distributions was evaluated by a Chi square test(Table 1). The observed distributions are often characterised by lowand high frequency bins that occur more often than at random. Thehigh frequency for some bins would be expected for cases where anunderlying cause like the onset of the Holocene controlled a vegeta-tion shift in many pollen diagrams. The case that average frequencybins occur more often in the observations compared to a random
process, may be caused by the fact that pollen diagrams tend to havezone boundaries more or less evenly spread over the Holocene after9 ka. However, cases with more than expected low frequency binsindicate that vegetation composition remained stable over particularperiods. The different measures of variance show a larger influenceon the absolute number of zones compared to the different splittingtechniques. The original 59 pollen data-sets yielded a total of 225 and228 splitswhen information contentwasused and 260 and264 splitswith sums of squares. The resulting average of five significant zonesper data-set varies between three and ten zones (Appendix).
Approximately one in three pollen diagrams depicts clearchanges at the Younger Dryas/Holocene transition that was pickedup by the zonation techniques. It is interesting to see that this peak incoinciding zone boundaries is well defined in time and not spread
Fig. 3. Accumulated probability for the time of pollen zone boundaries, combining allresults from the different techniques and variance measures. The solid line shows theoriginal data; the dashed line is adjusted with respect to the number of pollendiagrams available; the grey line marks the proportion of diagrams covering a givenpoint in time.
0 2000 4000 6000 8000 10000 120000
0.02
0.04
0.06
0.08
0.1
0.12
0.14
0.16
0.18
8.387.57.2
64.83.7
3.21.21
Age in years
Accu
mul
ated
pro
babi
lity
Fig. 4. Accumulated probability for the time of pollen zone boundaries as in Fig. 3.(solid line) compared to the results of the restriction to the last 11 ka (short dashes)and to the last 9 ka (long dashes). The age of the peaks is given in thousands of years.
Fig. 2. Frequency of the timing in pollen zone boundaries collected into 200-year wide bins (light shaded); (dark shaded) show the relative frequency adjusted by the number ofavailable pollen diagrams for each period.
T. Giesecke et al. / Quaternary Science Reviews 30 (2011) 2805e28142808

Author's personal copy
out over several hundred years, as could have been expected due tothe varying dating control. This sets a benchmark for the evaluationof coinciding younger zone boundaries. Alsoworth noting is that thiszone boundary was never the first split, indicating that thiscompositional change is statistically not the most important. Onboth sides of the Younger Dryas/Holocene boundary pollen spectraare often dominated by pine and birch pollen and this importantclimate change is therefore often not picked up by the statisticalsplitting of pollen diagrams from different European regions.
3.1. Synchronous changes involving different species
Pollen zone boundaries falling into the bin around 8.3 ka and3.7 kawere frequently selected (9 and 11 times, respectively) by theoptimal splitting technique using the sum of squaremeasure.Whenshifting the bins slightly eight diagrams show splits between 8.1 kaand 8.3 ka and another eight between 8.3 ka and 8.5 ka. Of the firsteight diagrams four come from the British Isles while three of thesplits around 8.4 ka are from Germany and two from northernFinland. The diagrams from Scotland and northern Finland showa rise of Pinus at this time, although that started somewhat earlier.We observed shifts of various pollen curves in several diagrams, butthe onset of the continuous curve of a taxon (e.g. Tilia at HockhamMere) was rare to coincide with zone boundaries around this time.Frequently diagrams show pronounced, short declines in somepollen curves (especially Corylus) dating to 8.2 ka as described byTinner and Lotter (2001), but in many diagrams the curves quicklyreturn to pervious values and in these cases no pollen zoneboundary was set.
Zone boundaries around 3.7 ka characterise a decline in Betulaand Alnus in northern Norway, a decline in Pinus in northernFinland and declining Corylus curves with rising Carpinus and/orFagus curves in Poland and Germany. While the peak around 8.3 kais smeared over a wider time interval the peak at 3.7 is narrow andindicated mainly by the optimal splitting technique using the sumof square measure. In a back of the envelope calculation the chanceof hitting a predefined 200-year wide bin between 0 and 10 ka maybe compared to rolling the dice 200 times (number of splits foroptimal splitting with sum of squares in this interval) yieldinga probability of hitting it 9 or more times of 2%. This probability isa conservative estimate as diagrams with two zone boundaries per200-year period are rare. Thus, while there are no parallel changesin vegetation composition around 8.3 and 3.7 ka, it is unlikely thatthe frequent occurrence of these particular zone boundaries wasbrought about solely by chance.
3.2. Parallel patterns in pollen diagrams
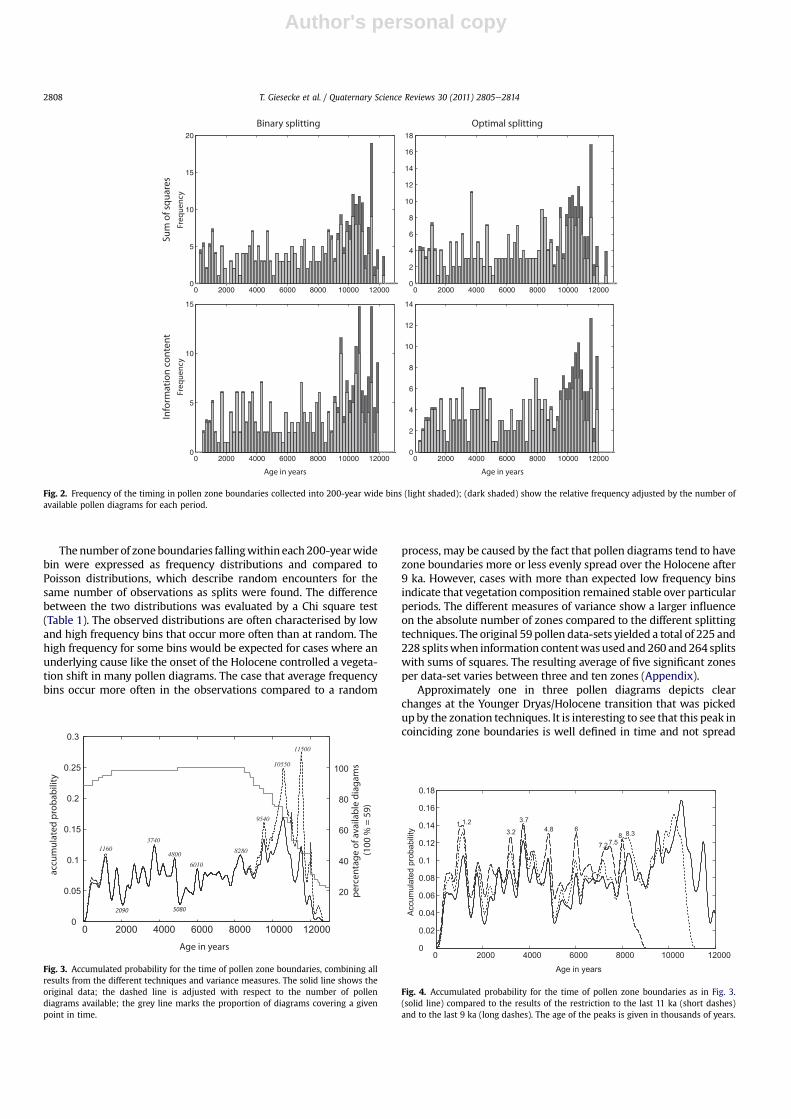
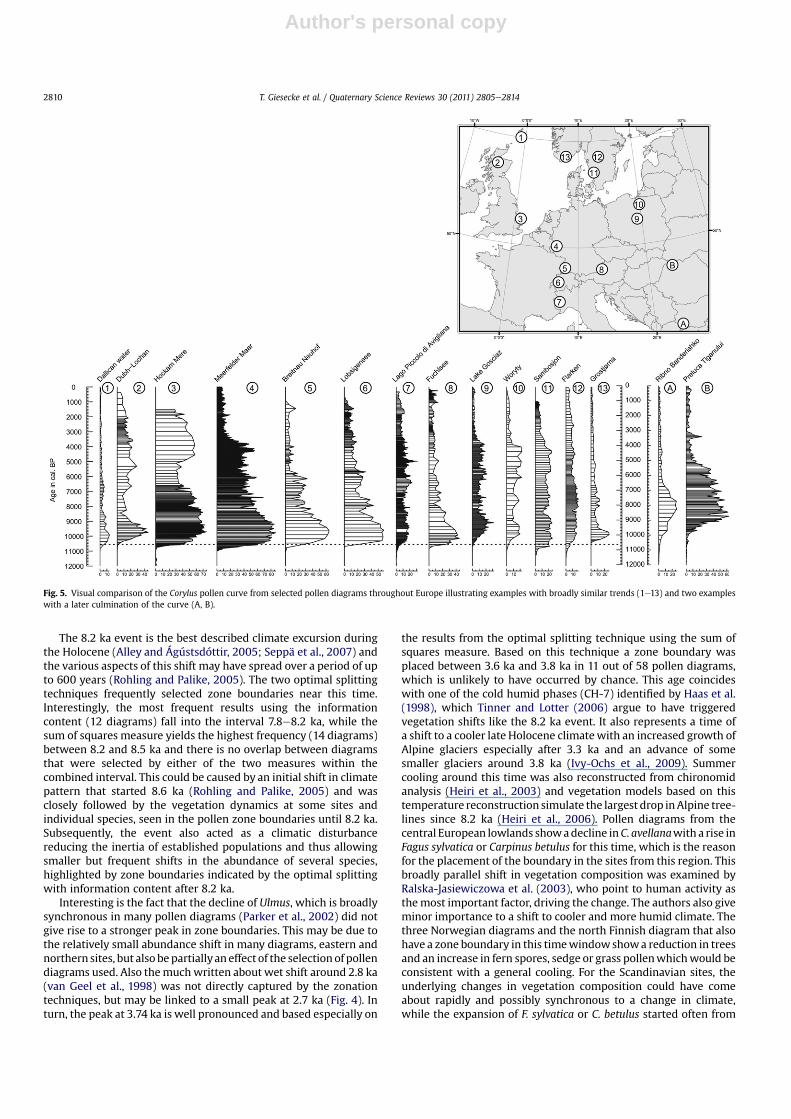
The individual pollendiagramswere scanned to explorewhich ofthe peaks in the timing of zone boundariesmarks a similar change invegetation composition across sites. The rise of the pollen curves ofCorylus (Fig. 5) and Alnus (Fig. 6) could be associated to the peaks of10.55 ka and 9.54 ka in the accumulated probability plot (Fig. 3). Theparallel rise in the Corylus curvewas found inmany pollen diagramsespecially from Western Europe. Noteworthy is the diagram fromDallicanWater on Shetland (Bennett et al., 1992), where the Coryluscurve runs parallel with several diagrams from continental Europe,even though the nearest point of the island is more than 150 kmaway from the Scottishmainland. The dynamics of the rising Coryluscurve as well as the timing of its rise varied between sites and thelatter may have been affected by the dating control. At some sites,however, the different timing for the rise of the Corylus curve couldnot be explained by uncertainties in the dating control. For exampleat �Svarcenberk in the Czech Republic (Pokorný, 2002) the rise of theCorylus curve coincides approximately with the beginning of theHolocene. On the other hand, at sites in the mountains of Romaniaand Bulgaria the rise of Corylus displayed an altogether differentpattern compared to North-West Europe (Fig. 5). Here the curvesstart at the same time as in diagrams towards the north-west, butthe major rise and culmination date to younger ages. For all sitesused in this study it can be assumed that the bulk of Corylus pollenoriginated from Corylus avellana. Corylus colurna occurs in Bulgariaas a rare species at elevations below 1200 m and may havecontributed small and hence insignificant amounts of pollen to thetwoBulgarian sites, so that also here the pollen typewas interpretedto represent mainly C. avellana (Tonkov et al., 2002).
The fast rise of the Alnus curve at 9.5 ka is synchronous in pollendiagrams around the Baltic Sea, while diagrams to the west andsouth are characterised by Alnus pollen curves that increase atdifferent times and with varying slopes. Interesting to note is therapid rise in the diagram from Lago Piccolo di Avigliana (Finsingerand Tinner, 2006) that almost coincides in time with that in thenorth-eastern diagrams, while the site is situated at the south-eastern limit of the Alps. Also the Alnus curve from MeerfelderMaar (Kubitz, 2000) rises quickly, but only at 6 ka with the declineof Ulmus. In contrast many other diagrams show a gradual increase.
4. Discussion
4.1. Synchronous changes
A large number of Holocene climate shifts or short-lived excur-sions are reported in the literature so that it seems almost possible tofind one within the uncertainty of any standard radiocarbon date.However, tree-ring series can convincingly show that the Holocenehad periods during which trees in specific habitats were stressedand others where growth was complacent (Leuschner et al., 2002).There are several external forcing mechanisms that work withdifferent frequencies as well as resonating atmosphereeoceaninteractions, which in concert caused climate to constantly change(Wanner et al., 2008). Trees are long lived, produce abundant seedsand some are able to reproduce vegetative (e.g. Tilia). Thereforea high amplitude or long-lasting shift in climate parameters wouldbe necessary to change the species composition of such a system.Onthe otherhand, the effect of a small climatic excursion, like a numberof dry years, could be amplified through the outbreak of a pathogen.Thus the peaks in the combined probability plot (Fig. 3) may holdsome information on periods of change. In this respect the twotroughs around 2.1 ka and 5.1 ka represent times that were consis-tently avoided by the placement of zone boundaries, indicatingperiods of vegetation stability.
Table 1Results of the Chi square test for the randomness of the frequency distribution forzone boundaries falling into a 200-year bin and the critical value for 95%. Test resultsexceeding the critical value are marked with an asterisk. The variance measureswere abbreviated: sum of squares¼ s.q., information content¼ info.; adjusted refersto the frequency distribution adjusted by the availability of sites; restricted refers tothe analysis of pollen data-sets restricted to the last 11 ka and 9 ka.
Splitting technique Unrestricted 11 karestricted
9 ka restricted
Chi Criticalvalue
Chi Criticalvalue
Chi Criticalvalue
Binary s.q. 5.0 15.5 14.2 16.9 6.5 15.5Binary s.q. adjusted 5392.0* 28.9 34.3* 22.4 7.1 16.9Binary info. 22.2* 16.9 10.9 14.1 26.1* 15.5Binary info. adjusted 525.1* 23.7 11.0 16.9 24.3* 14.1Optimal s.q. 20.8* 18.3 20.8* 19.7 25.8* 18.3Optimal s.q. adjusted 437.0* 26.3 37.4* 21.0 26.2* 19.7Optimal info. 3.4 12.6 4.3 14.1 9.6 14.1Optimal info. adjusted 20.6 21.0 2.9 18.3 10.5 15.5
T. Giesecke et al. / Quaternary Science Reviews 30 (2011) 2805e2814 2809
Author's personal copy
The 8.2 ka event is the best described climate excursion duringthe Holocene (Alley and Ágústsdóttir, 2005; Seppä et al., 2007) andthe various aspects of this shift may have spread over a period of upto 600 years (Rohling and Palike, 2005). The two optimal splittingtechniques frequently selected zone boundaries near this time.Interestingly, the most frequent results using the informationcontent (12 diagrams) fall into the interval 7.8e8.2 ka, while thesum of squares measure yields the highest frequency (14 diagrams)between 8.2 and 8.5 ka and there is no overlap between diagramsthat were selected by either of the two measures within thecombined interval. This could be caused by an initial shift in climatepattern that started 8.6 ka (Rohling and Palike, 2005) and wasclosely followed by the vegetation dynamics at some sites andindividual species, seen in the pollen zone boundaries until 8.2 ka.Subsequently, the event also acted as a climatic disturbancereducing the inertia of established populations and thus allowingsmaller but frequent shifts in the abundance of several species,highlighted by zone boundaries indicated by the optimal splittingwith information content after 8.2 ka.
Interesting is the fact that the decline of Ulmus, which is broadlysynchronous in many pollen diagrams (Parker et al., 2002) did notgive rise to a stronger peak in zone boundaries. This may be due tothe relatively small abundance shift in many diagrams, eastern andnorthern sites, but also bepartiallyaneffect of the selectionof pollendiagrams used. Also themuchwritten about wet shift around 2.8 ka(van Geel et al., 1998) was not directly captured by the zonationtechniques, but may be linked to a small peak at 2.7 ka (Fig. 4). Inturn, the peak at 3.74 ka is well pronounced and based especially on
the results from the optimal splitting technique using the sum ofsquares measure. Based on this technique a zone boundary wasplaced between 3.6 ka and 3.8 ka in 11 out of 58 pollen diagrams,which is unlikely to have occurred by chance. This age coincideswith one of the cold humid phases (CH-7) identified by Haas et al.(1998), which Tinner and Lotter (2006) argue to have triggeredvegetation shifts like the 8.2 ka event. It also represents a time ofa shift to a cooler late Holocene climatewith an increased growth ofAlpine glaciers especially after 3.3 ka and an advance of somesmaller glaciers around 3.8 ka (Ivy-Ochs et al., 2009). Summercooling around this time was also reconstructed from chironomidanalysis (Heiri et al., 2003) and vegetation models based on thistemperature reconstruction simulate the largest drop inAlpine tree-lines since 8.2 ka (Heiri et al., 2006). Pollen diagrams from thecentral European lowlands showadecline inC. avellanawith a rise inFagus sylvatica or Carpinus betulus for this time, which is the reasonfor the placement of the boundary in the sites from this region. Thisbroadly parallel shift in vegetation composition was examined byRalska-Jasiewiczowa et al. (2003), who point to human activity asthemost important factor, driving the change. The authors also giveminor importance to a shift to cooler and more humid climate. Thethree Norwegian diagrams and the north Finnish diagram that alsohave a zone boundary in this timewindowshowa reduction in treesand an increase in fern spores, sedge or grass pollenwhichwould beconsistent with a general cooling. For the Scandinavian sites, theunderlying changes in vegetation composition could have comeabout rapidly and possibly synchronous to a change in climate,while the expansion of F. sylvatica or C. betulus started often from
Fig. 5. Visual comparison of the Corylus pollen curve from selected pollen diagrams throughout Europe illustrating examples with broadly similar trends (1e13) and two exampleswith a later culmination of the curve (A, B).
T. Giesecke et al. / Quaternary Science Reviews 30 (2011) 2805e28142810

Author's personal copy
small populations and thus a delay between cause and effect mayhave to be anticipated here. However, this delay may not be as longas during the early Holocene when populations started to developfrom single individuals. During the late Holocene pollen ofF. sylvatica and C. betulus are frequently found several hundred orthousand years before the curves rise distinctly and here the changein the slope of population increase should be the time to investigatewhen looking for causes of this expansion (Giesecke et al., 2007).The here reviewed data are inconclusivewith respect to the cause ofthe change, but the coincidence of zone boundaries at this time isintriguing and should stimulate further ideas and studies.
4.2. Parallel changes
The most widespread parallel shift in Holocene vegetationcomposition was the expansion of C. avellana populations, whichoccurred broadly synchronous at far apart sites regardless of theirdistance to possible LGM refugia, ice cover during the glacial orseparation by water (Fig. 5; Tallantire, 2002; Finsinger et al., 2006).The trigger for the expansion of the populationsmust have operatedon a large scale and is thus likely to have been climatic. A short-termfluctuation in climate influencing the competitive balance is nota possible mechanism. At the northern sites populations of the lightdemanding C. avellana expanded in an open forest dominated byPinus sylvestris andBetula species (Firbas,1949; Tallantire, 2002) andthus interspecies competition was probably of little importance.Therefore, a continued shift in climate parameters or patterns mayhave been the trigger for the synchronous expansion of C. avellana atfar apart sites inwestern Europe. In his review of the hypothesis for
the rapid early Holocene spread of C. avellana Huntley (1993)concluded that the unique combinations of climate parametersfavoured the rapid expansion. However, he did not address thesynchronous population increase at far apart sites and pointed toplateaux in the radiocarbon timescale that in his view lead to theimpression of spuriously rapid migration rates. Unlike Huntley(1993), Tallantire (2002) came to the conclusion that C. avellanamust have been widespread in Europe before the rise of the pollencurve, but he argued that the populations were already large andtheir flowering suppressed under early Holocene climate. Although,C. avellana has been reported to reproduce by layering in marginalsituations (Persson et al., 2004) propagation through seed isnecessary for populations to expand and the pollen produced in theprocess should be visible in sediments from that time. However, thespread of this large pollen producer is not apparent palynologicallyand thus most likely occurred at low population density, possiblyincluding frequent long distance dispersal (Giesecke, 2005c).Assuming that the rapid increase in pollen curves represents theincrease of populations (Bennett, 1983, 1988) these populationsmust have started their growth before it is visible in the pollendiagrams (Bennett, 1988). Based on pollen accumulation rate esti-mates from Hockham Mere, Bennett (1983) estimated a doublingtime for C. avellana populations between 32 and 53 years. Extrap-olating the exponential population increase at HockhamMere backin time would yield a supposed initial growth of the first scatteredindividuals to have started at about 11.2 ka, while the data fromMeerfelderMaar point to a somewhat earlier initiation of growth. Intime this corresponds to the end of the Preboreal oscillation at11.25 ka and a proposed shift tomore humid andwarmer conditions
Fig. 6. Visual comparison of the Alnus pollen curve from selected eight pollen diagrams around the Baltic Sea (1e8) with selected diagrams from central and western Europe (AeF).
T. Giesecke et al. / Quaternary Science Reviews 30 (2011) 2805e2814 2811

Author's personal copy
(Bos et al., 2007; Magny et al., 2007) could have favoured if nottriggered the expansion of C. avellana over a wide area. Consideringthe uncertainties of dating and early growth rates, it may not benecessary to invoke a climatic shift at the end of the Preborealoscillation, but it could also be argued that the onset of theHoloceneitself set the start for the expansion of C. avellana populationsthroughout north-western Europe.
The timing of the rise in Alnus at sites around the Baltic Seaappears more confined compared to the C. avellana rise, but wasspatially more restricted (Fig. 6). Although this expansion of Alnuscan be ascribed mainly to Alnus glutinosa, Alnus incana probablyplayed a part in this population expansion, at least at some sites(Giesecke, 2005a). In this respect it is interesting that the synchro-nous population expansion occurred largely in the area where bothspecies are present today and hybridisation between the twospecies could have influenced the pattern. For example the hybridA. incana � glutinosa grows faster than A. glutinosa (Mejnartowicz,1999) and the different preference of A. incana for climate andsoils could have assisted in the spread of A. glutinosa. While thisgives room for speculation it does not explain the synchronousexpansion as such. Moreover, the regional synchronicity of thespecies expansion in one region is contrasted by the clear individualand site-specific development in the west, which has been shownfor the British Isles (Bennett and Birks, 1990). As in the case ofC. avellana, if climate was a trigger for this expansion, then thischange must have preceded the rapid rise in the curve by a fewhundred years. The central Swedish sites Holtjärnen and Abbort-järnen (Giesecke, 2005a,b) show doubling times for pollen accu-mulation rates between 80 and 130 years and the increase can beextrapolated backwards to about 10.3 ka (Bond event 7, Bond et al.,1997).
C. avellana and Alnus are not the only two species for whicha parallel increase in population between distant sites has beenreconstructed. Also, for example, the Quercus curves show a parallelincrease in many pollen diagrams, but with a lower rate, which isnot giving rise to large changes in the pollen composition of adja-cent samples. Apart from 10.6 ka and 9.5 ka all other peaks in zoneboundaries are mainly caused by shifts in frequencies of pollentypes that were present long before and after the change. These donot necessarily involve a long time lag as underlying changes inplant abundance are often smaller than a factor of two and cantherefore take place within decades. However, where the change inpollen composition was brought about by the expansion of a pop-ulationwith a slow intrinsic growth rate (e.g. Fagus, Bradshaw et al.,2010) the trigger for the shift in vegetation composition may befound several hundred or a thousand years earlier.
4.3. Implications and open questions
This study highlights that shifts in Holocene vegetation compo-sition have often occurred at the same time, which corroborates theearlier notion by Tinner and Lotter (2006) that climate events likethat at 8.2 ka triggered the expansion of F. sylvatica in differentEuropean regions. A climate trigger coincides with changes invegetation composition around 8.2 ka, while the causes for some ofthe other periods of change identified here are less certain andwarrant further investigation. The synchronous population peaks ofPopulus in North America bracketing the Younger Dryas cold phasewere reactions to the effects that the changing climate had on itscompetitors (Peros et al., 2008). In contrast, the synchronousexpansions of C. avellana and A. glutinosa, highlighted in this study,are direct responses to climate change. This is especially interestingin the case of C. avellana. Here we either have to assume extremelyfast rates of immigration, in the order of 2000 m yr�1, or a spreadduring the Late Glacial with survival during the Younger Dryas cold
event. The latter would be in line with Rudolph’s (1930) ideas andmay be important for some other tree species as well. Thesynchronous expansion of C. avallana populations also suggests thata climatic threshold for the species was reached at the same timefrom Scotland to the Alps and at more continental sites in the East. Aclimatically controlled population expansion is exemplified by theparallel shape of the curves from north-western Italy (Finsinger andTinner, 2006) and Shetland (Bennett et al., 1992).
The example of A. glutinosa shows that the same species canshow a different behaviour with respect to its regional expansion.The synchronous expansion in formally glaciated areas around theBaltic Sea shows that dispersal cannot have been limiting here andits spatially erratic expansion in the west is likely to reflect sitespecific developments (Bennett and Birks, 1990).
This study has made use of statistical zonation techniques toidentify the timing of significant vegetation change in differentEuropean regions. This composite record can be compared to therate of change analysis of 18 North-East American pollen diagramsby Grimm and Jacobson (1992). Despite the differentmethods used,the general trends of both analyses are similar, as both highlight thebeginning of the Holocene as a period of pronounced and frequentchange in vegetation composition. Vescovi et al. (2007) showedthat statistical zonation is a useful tool evaluating climaticallyinduced parallel vegetation changes in several diagrams from thesame region. Already the comparison of two pollen diagrams maybe assisted by statistical zonation of pollen diagrams (e.g. Giesecke,2005b). These statistically defined zone boundaries often differfrom visually defined zones and thus the results of this analysisdiffer from Gajewski et al. (2006), who analysed the temporaldistribution of pollen zone boundaries summarized by Berglundet al. (1996). The latter analysis had the additional problem thatnot all diagrams included in the book edited by Berglund et al.(1996) were well dated by independent means and ages for zoneboundaries were often derived by correlation to distant diagramswith some independent dating, assuming that changes in vegeta-tion pattern were synchronous.
5. Conclusion
This analysis shows that tree-dominated vegetation in Europehas often changed synchronously over the last 11 500 years. Theonly driver that can synchronize vegetation change on a sub-continental scale is climate, both as abrupt step-like change, butalso as climate excursions that work like large-scale disturbanceevents. The parallel population expansions of C. avellana andA. glutinosa represent a special case of synchronous developments.In both cases populations built up from palynologically undetect-able occurrences of these large pollen producers. This implies thatthe species werewidespread at low abundances prior to populationexpansions and a climate trigger initiated the growth of thesepopulations over awide area. The case of A. glutinosa is of particularinterest as the species shows a synchronous expansion only aroundthe Baltic Sea but a site specific, erratic behaviour in WesternEurope. For both species the palynologically visible time ofexpansion does not hold any information to the time of their spreador even rates of spread. What is true for these two species may alsoplay a role for many other trees that spread early without leavingevidence of their presence and only expanded when the climatebecame suitable (Rudolph, 1930; Godwin, 1975).
Acknowledgements
Wewish to thank Anneli Poska and Ricarda Voigt for making theirdata available and commenting on the manuscript. Thanks are due toJudy Allen, Brigitta Ammann, Gunnar Digerfeldt, Hans Göransson,
T. Giesecke et al. / Quaternary Science Reviews 30 (2011) 2805e28142812
Author's personal copy
Beate Kubitz, Andy Lotter, Andrzej Obidowicz, the late Winifred Pen-nington, Reet Pirrus, Magdalena Ralska-Jasiewiczowa, Gra _zynaMiotk-Szpiganowicz, Alan Smith, Kazimierz Tobolski, Irmeli Vuorela andClare Watson, who submitted their data to the European pollendatabase and thus made this meta-analysis possible. We are alsograteful to Willy Tinner and Simon Brewer for providing constructivecomments on an earlier version of the manuscript. T. Gieseckeacknowledges funding fromtheGermanResearchFoundation througha personal grant GI 732/1-1. K.D. Bennett gratefully acknowledgesa Royal Society e Wolfson Merit Award. Pollen data from the CzechRepublic resulted from the project IAAX00020701. This is publicationno. A337 from the Bjerknes Centre for Climate Research.
Appendix. Supplementary material
Supplementary material associated with this article can befound, in the online version, at doi:10.1016/j.quascirev.2011.06.014.
References
Alley, R.B., Ágústsdóttir, A.M., 2005. The 8 k event: cause and consequences ofa major Holocene abrupt climate change. Quaternary Science Reviews 24,1123e1149.
Bennett, K.D., 1983. Postglacial population expansion of forest trees in Norfolk, UK.Nature 303, 164e167.
Bennett, K.D., 1988. Holocene geographic spread and population expansion of Fagusgrandifolia in Ontario, Canada. Journal of Ecology 76, 547e557.
Bennett, K.D., 1996. Determination of the number of zones in a biostratigraphicalsequence. New Phytologist 132, 155e170.
Bennett, K.D., 2007. Psimpoll and Pscomb Programs for Plotting and Analysis. http://www.chrono.qub.ac.uk/psimpoll/psimpoll.html.
Bennett, K.D., Birks, H.J.B., 1990. Postglacial history of alder (Alnus glutinosa (L.)Gaertn.) in the British Isles. Journal of Quaternary Science 5, 123e133.
Bennett, K.D., Boreham, S., Sharp, M.J., Switsur, V.R., 1992. Holocene history ofenvironment, vegetation and human settlement on Catta Ness, Lunnasting,Shetland. Journal of Ecology 80, 241e273.
Berglund, B.E., Birks, H.J.B., Ralska-Jasiewiczowa, M., Wright, H.E. (Eds.), 1996.Palaeoecological Events during the Last 15 000 Years. J Wiley, Chichester,p. 764.
Bond, G., Showers, W., Cheseby, M., Lotti, R., Almasi, P., de Menocal, P., Priore, P.,Cullen, H., Hajdas, I., Bonani, G., 1997. A pervasive millennial-scale cycle in NorthAtlantic Holocene and glacial climates. Science 278, 1257e1266.
Bos, J.A.A., van Geel, B., van der Plicht, J., Bohncke, S.J.P., 2007. Preboreal climateoscillations in Europe: wiggle-match dating and synthesis of Dutch high-resolution multi-proxy records. Quaternary Science Reviews 26, 1927e1950.
Bradshaw, R., Hannon, G., 1992. Climatic-change, human influence and disturbanceregime in the control of vegetation dynamics within Fiby forest, Sweden.Journal of Ecology 80, 625e632.
Bradshaw, R.H.W., Kito, N., Giesecke, T., 2010. Factors influencing the Holocenehistory of Fagus. Forest Ecology and Management 259, 2204e2212.
Davis, M.B., 1976. Pleistocene biogeography of temperate deciduous forests. Geo-science and Man 13, 13e26.
Finsinger, W., Tinner, W., 2006. Holocene vegetation and land-use changes inresponse to climatic changes in the forelands of the southwestern Alps, Italy.Journal of Quaternary Science 21, 243e258.
Finsinger, W., Tinner, W., van der Knaap, W.O., Ammann, B., 2006. The expansionof hazel (Corylus avellana L.) in the southern Alps: a key for understanding itsearly Holocene history in Europe? Quaternary Science Reviews 25, 612e631.
Firbas, F., 1949. Spät- und nacheiszeitliche Waldgeschichte Mitteleuropas nördlichder Alpen, Allgemeine Waldgeschichte. Gustav Fischer, Jena.
Gajewski, K., Viau, A.E., Sawada, M., Atkinson, D.E., Fines, P., 2006. Synchronicity inclimate and vegetation transitions between Europe and North America duringthe Holocene. Climatic Change 78, 341e361.
Giesecke, T., 2005a. Holocene forest development in the central Scandes Mountains,Sweden. Vegetation History and Archaeobotany 14, 133e147.
Giesecke, T., 2005b. Holocene dynamics of the southern boreal forest in Sweden.Holocene 15, 858e872.
Giesecke, T., 2005c. Moving front or population expansion: how did Picea abies (L.)Karst. become frequent in central Sweden? Quaternary Science Reviews 24,2495e2509.
Giesecke, T., Hickler, T., Kunkel, T., Sykes, M.T., Bradshaw, R.H.W., 2007. Towards anunderstanding of the Holocene distribution of Fagus sylvatica L. Journal ofBiogeography 34, 118e131.
Godwin, H., 1975. History of the British Flora. Cambridge University Press,Cambridge.
Gordon, A.D., Birks, H.J.B., 1972. Numerical methods in Quaternary palaeoecology. I.Zonation of pollen diagrams. New Phytologist 71, 961e979.
Green, D.G., 1982. Fire and stability in the postglacial forests of southwest NovaScotia. Journal of Biogeography 9, 29e40.
Grimm, E.C., 1987. CONISS: a FORTRAN 77 program for stratigraphically constrainedcluster analysis by the method of incremental sum of squares. Computers andGeosciences 13, 13e35.
Grimm, E.C., Jacobson, G.L., 1992. Fossil-pollen evidence for abrupt climate changesduring the past 18 000 years in eastern North America. Climate Dynamics 6,179e184.
Haas, J.N., Richoz, I., Tinner, W., Wick, L., 1998. Synchronous Holocene climaticoscillations recorded on the Swiss Plateau and at Timberline in the Alps. TheHolocene 8, 301e309.
Heiri, O., Lotter, A.F., Hausmann, S., Kienast, F., 2003. A chironomid-based Holocenesummer air temperature reconstruction from the Swiss Alps. Holocene 13,477e484.
Heiri, C., Bugmann, H., Tinner, W., Heiri, O., Lischke, H., 2006. A model-basedreconstruction of Holocene treeline dynamics in the Central Swiss Alps. Journalof Ecology 94, 206e216.
Huntley, B., 1993. Rapid early Holocene migration and highabundance of hazel(Corylus avellana L.): alternative hypotheses. In: Chambers, F.M. (Ed.), ClimateChange and Human Impact on the Landscape. Chapman & Hall, London.
Ivy-Ochs, S., Kerschner, H., Maisch, M., Christl, M., Kubik, P.W., Schluchter, C., 2009.Latest Pleistocene and Holocene glacier variations in the European Alps.Quaternary Science Reviews 28, 2137e2149.
Kubitz, B., 2000. Die holozäne Vegetations- und Siedlungsgeschichte in der West-eifel am Beispiel eines hochauflösenden Pollendiagrammes aus demMeerfelderMaar. Dissertationes Botanicae 339, 1e106.
Leuschner, H.H., Sass-Klaassen, U., Jansma, E., Baillie, M.G.L., Spurk, M., 2002.Subfossil European bog oaks: population dynamics and long-term growthdepressions as indicators of changes in the Holocene hydro-regime and climate.Holocene 12, 695e706.
MacArthur, R.H., 1957. On the Relative Abundance of Bird Species. In: Proceedings ofthe National Academy of Sciences of the United States of America, 43 293e295.
Magny, M., Vanniere, B., de Beaulieu, J.L., Begeot, C., Heiri, O., Millet, L., Peyron, O.,Walter-Simonnet, A.V., 2007. Early-Holocene climatic oscillations recorded bylake-level fluctuations in west-central Europe and in central Italy. QuaternaryScience Reviews 26, 1951e1964.
Mejnartowicz, L., 1999. Evidence for long-term heterosis phenomenon in the Alnusincana � glutinosa F-1 hybrids. Silvae Genetica 48, 100e103.
Parker, A.G., Goudie, A.S., Anderson, D.E., Robinson, M.A., Bonsall, C., 2002. A reviewof the mid-Holocene elm decline in the British Isles. Progress in PhysicalGeography 26, 1e45.
Peros, M.C., Gajewski, K., Viau, A.E., 2008. Continental-scale tree populationresponse to rapid climate change, competition and disturbance. Global Ecologyand Biogeography 17, 658e669.
Persson, H., Widen, B., Andersson, S., Svensson, L., 2004. Allozyme diversity andgenetic structure of marginal and central populations of Corylus avellana L.(Betulaceae) in Europe. Plant Systematics and Evolution 244, 157e179.
Pokorný, P., 2002. A high-resolution record of Late-Glacial and Early-Holoceneclimatic and environmental change in the Czech Republic. Quaternary Inter-national 91, 101e122.
Prentice, I.C., Bartlein, P.J., Webb, T., 1991. Vegetation and climate change in easternNorth-America since the Last Glacial Maximum. Ecology 72, 2038e2056.
Ralska-Jasiewiczowa, M., Nalepka, D., Goslar, T., 2003. Some problems of foresttransformation at the transition to the oligocratic/Homo sapiens phase of theHolocene interglacial in northern lowlands of central Europe. VegetationHistory and Archaeobotany 12, 233e247.
Reimer, P.J., Baillie, M.G.L., Bard, E., Bayliss, A., Beck, J.W., Bertrand, C.J.H.,Blackwell, P.G., Buck, C.E., Burr, G.S., Cutler, K.B., Damon, P.E., Edwards, R.L.,Fairbanks, R.G., Friedrich, M., Guilderson, T.P., Hogg, A.G., Hughen, K.A.,Kromer, B., McCormac, G., Manning, S., Ramsey, C.B., Reimer, R.W., Remmele, S.,Southon, J.R., Stuiver, M., Talamo, S., Taylor, F.W., van der Plicht, J.,Weyhenmeyer, C.E., 2004. IntCal04 terrestrial radiocarbon age calibration,0e26 cal kyr BP. Radiocarbon 46, 1029e1058.
Rohling, E.J., Palike, H., 2005. Centennial-scale climate cooling with a sudden coldevent around 8,200 years ago. Nature 434, 975e979.
Rudolph, K., 1930. Grundzüge der nacheiszeitlichen Waldgeschichte Mitteleuropas.Beihefte Botanisches Centralblatt 47, 11e176.
Seppä, H., Birks, H.J.B., Giesecke, T., Hammarlund, D., Alenius, T., Antonsson, K.,Bjune, A.E., Heikkila, M., MacDonald, G.M., Ojala, A.E.K., Telford, R.J., Veski, S.,2007. Spatial structure of the 8200 cal yr BP event in northern Europe. Climateof the Past 3, 225e236.
Tallantire, P.A., 2002. The early-Holocene spread of hazel (Corylus avellana L.) inEuropenorth andwest of the Alps: an ecological hypothesis. Holocene 12, 81e96.
Tinner, W., Lotter, A.F., 2001. Central European vegetation response to abruptclimate change at 8.2 ka. Geology 29, 551e554.
Tinner, W., Lotter, A.F., 2006. Holocene expansions of Fagus silvatica and Abies albain Central Europe: where are we after eight decades of debate? QuaternaryScience Reviews 25, 526e549.
Tonkov, S., Panovska, H., Possnert, G., Bozilova, E., 2002. The Holocene vegetationhistory of Northern Pirin Mountain, southwestern Bulgaria: pollen analysis andradiocarbon dating of a core from Lake Ribno Banderishko. Holocene 12, 201e210.
van Geel, B., Van der Plicht, J., Kilian, M.R., Klaver, E.R., Kouwenberg, J.H.M.,Renssen, H., Reynaud-Farrera, I., Waterbolk, H.T., 1998. The sharp rise of Delta C-14 ca. 800 cal BC: possible causes, related climatic teleconnections and theimpact on human environments. Radiocarbon 40, 535e550.
Vescovi, E., Ravazzi, C., Arpenti, E., Finsinger, W., Pini, R., Valsecchi, V., Wick, L.,Ammann, B., Tinner,W., 2007. Interactions between climate and vegetation during
T. Giesecke et al. / Quaternary Science Reviews 30 (2011) 2805e2814 2813

Author's personal copy
the Lateglacial period as recorded by lake andmire sediment archives in NorthernItaly and Southern Switzerland. Quaternary Science Reviews 26, 1650e1669.
von Post, L., 1924. Ur de sydsvenska skogarnas regionala historia under postarktisktid. Geologiska Föreningen Förhandlingar 46, 83e128.
Wanner, H., Beer, J., Butikofer, J., Crowley, T.J., Cubasch, U., Fluckiger, J., Goosse, H.,Grosjean, M., Joos, F., Kaplan, J.O., Kuttel, M., Muller, S.A., Prentice, I.C.,Solomina, O., Stocker, T.F., Tarasov, P., Wagner, M., Widmann, M., 2008. Mid- toLate Holocene climate change: an overview. Quaternary Science Reviews 27,1791e1828.
Further reading1
Allen, J.R.M., Huntley, B., Watts, W.A., 1996. The vegetation and climate of northwestIberia over the last 14,000 years. Journal of Quaternary Science 11, 125e147.
Ammann, B., 1985. Lobsingensee e Late Glacial and Holocene environments ofa lake on the central Swiss plateau. Dissertationes Botanicae 87, 127e134.
Bigler, C., Larocque, I., Peglar, S.M., Birks, H.J.B., Hall, R.I., 2002. Quantitative mul-tiproxy assessment of long-term patterns of Holocene environmental changefrom a small lake near Abisko, northern Sweden. Holocene 12, 481e496.
Birks, H.H., Birks, H.J.B., 2003. Reconstructing Holocene climates from pollen andplant macrofossils. In: Mackay, A., Battarbee, R.W., Birks, H.J.B., Oldfield, F.(Eds.), Global Change in the Holocene. Arnold, London, pp. 342e357.
Bjune, A.E., Birks, H.J.B., Seppä, H., 2004. Holocene vegetation and climate history ona continentaleoceanic transect in northern Fennoscandia based on pollen andplant macrofossils. Boreas 33, 211e223.
Bjune, A.E., 2005. Holocene vegetation history and tree-line changes on a north-south transect crossing major climate gradients in southern Norway eevidence from pollen and plant macrofossils in lake sediments. Review ofPalaeobotany and Palynology 133, 249e275.
Bozilova, E., Tonkov, S., 2000. Pollen from Lake Sedmo Rilsko reveals southeastEuropean postglacial vegetation in the highest mountain area of the Balkans.New Phytologist 148, 315e325.
Digerfeldt, G., 1977. The Flandrian Development of Lake Flarken. Regional Vegeta-tion History and Palaeoclimatology. University of Lund Department of Quater-nary Geology, Report 13, 101 pp.
Digerfeldt, G., 1982. The Holocene development of Lake Sambosjon. 1. The regionalvegetation history. Lundqua Report 23, 1e24.
Eide, W., Birks, H.H., Bigelow, N.H., Peglar, S.M., Birks, H.J.B., 2006. Holocene forestdevelopment along the Setesdal valley, southern Norway, reconstructed frommacrofossil and pollen evidence. Vegetation History and Archaeobotany 15,65e85.
Feurdean, A., 2005. Holocene forest dynamics in northwestern Romania. Holocene15, 435e446.
Froyd, C.A., 2005. Fossil stomata, reveal early pine presence in Scotland: implica-tions for postglacial colonization analyses. Ecology 86, 579e586.
Froyd, C.A., 2006. Holocene fire in the Scottish Highlands: evidence from macro-scopic’ charcoalrecords. Holocene 16, 235e249.
Giesecke, T., 2001. Pollenanalytische und sedimentchemische Untersuchungen zurnatürlichen und anthropogenen Geschichte im Schlaubetal. In: Sitzungsber-ichte der Gesellschaft Naturforschender Freunde zu Berlin, 39 89e112.
Göransson, H., 1991. Vegetation and Man Around Lake Bjärsjöholmssjön duringPrehistoric Time, Lundqua Report 31, 44 pp.
Heikkila, M., Seppä, H., 2003. A 11,000 yr palaeotemperature reconstruction fromthe southern boreal zone in Finland. Quaternary Science Reviews 22, 541e554.
Heinrichs, M.L., Peglar, S.M., Bigler, C., Birks, H.J.B., 2005. A multi-proxy palae-oecological study of Alanen Laanijarvi, a boreal-forest lake in Swedish Lapland.Boreas 34, 192e206.
Lotter, A.F., 1988. Paläoökologische und paläolimnologische Studie des Rotsees beiLuzern. Pollen-, grossrest-, diatomeen- und sedimentanalytische Untersu-chungen. Dissertationes Botanicae 124, 187.
Miotk-Szpiganowicz, G., 1992. The history of vegetation of Bory Tucholskie and therole of man in the lighht of palynological investigations. Acta Palaeobotanica 32,39e122.
Obidowicz, A., 1989. Type region P-a: inner West Carpathians e Nowy Targ Basin.Acta Palaeobotanica 29, 11e15.
Pawlikowski, M., Ralska-Jasiewiczowa, M., Schönborn, W., Stupnicka, E.,Szeroczynska, K., 1982. Woryty near Gietrzwald, Olsztyn Lake District, NEPoland e vegetational history and lake development during the last 12,000years. Acta Palaeobotanica 22, 85e116.
Pennington, W., 1975. A chronostratigraphic comparison of late Weichselian andlate Devensian subdivisions illustrated by two radiocarbon dated profiles fromwestern Britain. Boreas 4, 157e171.
Pennington, W., Haworth, E.Y., Bonny, A.P., Lishman, J.P., 1972. Lake sediments innorthern Scotland. Philosophical Transactions of the Royal Society B 264,191e294.
Pirrus, R., Róuk, A.-M., Liiva, A., 1987. Geology and stratigraphy of the reference siteof lake Raigastvere in Saadjärv drumlin field. In: Raukas, A.S., Saarse, L. (Eds.),Palaeohydrology of the Temperate Zone II, Lakes. Valgus, Tallinn, pp. 101e122.
Pokorný, P., 2005. Role of man in the development of Holocene vegetation inCentral Bohemia. Preslia 77, 113e128.
Poska, A., Saarse, L., 2002. Biostratigraphy and C-14 dating of a lake sedimentsequence on the north-west Estonian carbonaceous plateau, interpreted interms of human impact in the surroundings. Vegetation History and Archae-obotany 11, 191e200.
Ralska-Jasiewiczowa, M., Goslar, T., Madeyska, T., Starkel, L., 1998. Lake Gosciaz,Central Poland. A Monographic Study. Szafer Institute of Botany, Kraków.
Rankama, T., Vuorela, I., 1988. Between inland and coast in Metal Age Finland ehuman impact on the premeval forests of Southern Häme during the Iron Age.Memoranda Societatis Pro Fauna et Flora Fennica 64, 25e34.
Rösch, M., 1989. Pollenprofil Breitnau-Neuhof: Zum zeitlichen Verlauf der hol-ozänen Vegetationsentwicklung im südlichen Schwarzwald. Carolinea 47,15e24.
Rösch, M., 2000. Long-term human impact as registered in an upland pollen profilefrom the southern Black Forest, south-western Germany. Vegetation Historyand Archaeobotany 9, 205e218.
Saarse, L., Poska, A., Kaup, E., Heinsalu, A., 1998. Holocene environmental events inthe Viitna area, north Estonia. Proceedings of the Estonian Academy of Sciences,Geology 47, 31e44.
Seppä, H., Weckström, J., 1999. Holocene vegetational and limnological changes inthe Fennoscandian tree-line area as documented by pollen and diatom recordsfrom Lake Tsuolbmajavri, Finland. Ecoscience 6, 621e635.
Seppä, H., Nyman, M., Korhola, A., Weckstrom, J., 2002. Changes of treelines andalpine vegetation in relation to post-glacial climate dynamics in northernFennoscandia based on pollen and chironomid records. Journal of QuaternaryScience 17, 287e301.
Smith, A.G., Gobbard, I.C., 1991. A 12500 years record of vegetational history atSluggan Bog, County Antrim, Northern Ireland (incorporating a pollen zonescheme for the non-specalist). New Phytologist 118, 167e187.
Tobolski, K., 1990. Paläoökologische Untersuchungen des Siedlungsgebietes imLednica Landschaftspark (Nordwestpolen). Offa 47, 109e131.
Valsecchi, V., Finsinger, W., Tinner, W., Ammann, B., 2008. Testing the influence ofclimate, human impact and fire on the Holocene population expansion of Fagussylvatica in the southern Prealps (Italy). Holocene 18, 603e614.
Velle, G., Larsen, J., Eide, W., Peglar, S.M., Birks, H.J.B., 2005. Holocene environmentalhistory and climate of Ratasjoen, a low-alpine lake in south-central Norway.Journal of Paleolimnology 33, 129e153.
Voigt, R., 1996. Paläolimnologische und vegetationsgeschichtliche Untersuchungen anSedimenten aus Fuschlsee und Chiemsee. Dissertationes Botanicae 270, 1e303.
Voigt, R., 2006. Settlement history as reflection of climate change: the case study ofLake Jues (Harz Mountains, Germany). Geografiska Annaler Series A-PhysicalGeography 88, 97e105.
Watson, C.S., 1996. The vegetational history of the northern Apennines, Italy:information from three new sequences and a review of regional vegetationalchange. Journal of Biogeography 23, 805e841.
Wolters, S., 2002. Vegetationsgeschichtliche Untersuchungen zur spätglazialen undholozänen Landschaftsentwicklung in der Döberitzer Heide (Brandenburg).Dissertationes Botanicae 366, 1e157.
1 References to pollen diagrams cited only in Supplementary Information.
T. Giesecke et al. / Quaternary Science Reviews 30 (2011) 2805e28142814