The Overlap Detectors - CERN Document Server
12
Basic Considerations on the Overlap Detectors of the ATLAS ALFA system C. Joram a , H. Stenzel b and A. Braem a a CERN, PH department, Geneva, Switzerland b II. Physikalisches Institut, Justus-Liebig-Universität Giessen, Germany 30 June 2006 Abstract We discuss the motivation and possible implementation of Overlap Detectors for the relative alignment of the two halves of the ATLAS Roman Pot detectors. We propose a system design and a set of prototype detectors for a proof of principle in a test beam experiment. 1. Introduction The luminosity determination for the ATLAS experiment at LHC IP1 requires an absolute knowledge of the t-value of the scattered protons on an event-by-event basis. The scattering angle and consequently the t-value are derived from the x-y coordinate measured with ALFA. The position of the LHC beam spot at the location of the ALFA tracking stations is a priori unknown and can vary from fill to fill by up to a couple of mm. It is therefore necessary to position the upper and lower ALFA detectors symmetric to the beam spot before a meaningful measurement can start. Asymmetric vertical positioning of the two detector halves relative to the beam spot (case B in Fig. 1) would show up in the data as asymmetric occupancy distributions and could be in principle corrected for offline. Similarly a horizontal relative displacement of the two halves (case C) becomes evident in the data and can be corrected. A symmetric vertical displacement of the upper and lower ALFA detectors relative to their default position (case D) can however not be derived from the data. The precision with which the distance between the two detectors is known has a direct consequence on the uncertainty of the luminosity. If the upper and lower detectors approach the beam to a distance of 1.5 mm, a systematic shift of ∆y = 15 µm represents a positioning error ∆y/y of 1%, and consequently an angular error ∆θ/θ of 1%. ATL-LUM-PUB-2007-002 12 March 2007
-
Upload
khangminh22 -
Category
Documents
-
view
0 -
download
0
Transcript of The Overlap Detectors - CERN Document Server
Basic Considerations on the Overlap Detectors of the
ATLAS ALFA system
C. Jorama, H. Stenzelb and A. Braema
a CERN, PH department, Geneva, Switzerland b II. Physikalisches Institut, Justus-Liebig-Universität Giessen, Germany
30 June 2006
Abstract
We discuss the motivation and possible implementation of Overlap Detectors for the relative alignment of the two halves of the ATLAS Roman Pot detectors. We propose a system design and a set of prototype detectors for a proof of principle in a test beam experiment.
1. Introduction The luminosity determination for the ATLAS experiment at LHC IP1 requires an absolute knowledge of the t-value of the scattered protons on an event-by-event basis. The scattering angle and consequently the t-value are derived from the x-y coordinate measured with ALFA. The position of the LHC beam spot at the location of the ALFA tracking stations is a priori unknown and can vary from fill to fill by up to a couple of mm. It is therefore necessary to position the upper and lower ALFA detectors symmetric to the beam spot before a meaningful measurement can start. Asymmetric vertical positioning of the two detector halves relative to the beam spot (case B in Fig. 1) would show up in the data as asymmetric occupancy distributions and could be in principle corrected for offline. Similarly a horizontal relative displacement of the two halves (case C) becomes evident in the data and can be corrected. A symmetric vertical displacement of the upper and lower ALFA detectors relative to their default position (case D) can however not be derived from the data. The precision with which the distance between the two detectors is known has a direct consequence on the uncertainty of the luminosity. If the upper and lower detectors approach the beam to a distance of 1.5 mm, a systematic shift of ∆y = 15 µm represents a positioning error ∆y/y of 1%, and consequently an angular error ∆θ/θ of 1%.
AT
L-L
UM
-PU
B-2
007-
002
12 M
arch
200
7

A B C D
z
y
x Fig. 1: Schematic representation of the relative positioning of the two detector halves. A: correct alignment, B: vertically asymmetric, C: horizontally asymmetric, D: vertically symmetric shift.
The impact of a vertical misalignment of 15 µm on the reconstructed t-value was estimated as follows. Protons resulting from an elastic interaction were generated with PYTHIA in the relevant range of t. The scattered protons were tracked through the optical lattice to the detection plane at the Roman Pots with the MADX program, using the dedicated high β* optics. The detectors are placed at a vertical distance of 1.5 mm from the nominal orbit.
The distance between the two detectors was assumed to be vertically shifted by 15 µm in the reconstruction algorithm, which yields subsequently a slightly shifted value of t, toffs. The amount of this shift expressed in terms of the normalized pull, (t-toffs)/t, is shown in Fig. 2 (lower plot) as function of log(-t). At the smallest detectable t-values of 3·10-4 the resulting error on the t-scale amounts to 2% and then rapidly decreases with 1/√t to a negligible level of 2.5 per mil at –t =10-2 GeV2. The luminosity is most sensitive to the small values of t in the Coulomb-Nuclear interference region, depending on the fit range the uncertainty on the t-scale may propagate at the same level of 2 % into the luminosity.
In addition to the systematic shift in the t-scale the misalignment entails also a contribution to the resolution of t, since t is reconstructed out of the y and x coordinate, the latter being not misaligned. As a consequence a certain distribution (t-toffs)/t is observed and its width (RMS) is shown in the upper part of Fig. 2.
This resolution contribution is rather small, at most 1.5 per mil at –t = 10-3 GeV2, compared to other sources like the beam divergence.
We conclude that vertical the distance between the two ALFA half detectors must be known with a precision of about 10 µm.

RM
S
yoffs=15 µm
contribution to resolution
RMS((t-toffs)/t)
log10(-t) [GeV2]
mea
n
systematic t-shiftmean((t-toffs)/t)
00.020.040.060.08
0.10.120.140.16
x 10-2
-4 -3.5 -3 -2.5 -2 -1.5 -1 -0.5 0
-0.02-0.0175
-0.015-0.0125
-0.01-0.0075
-0.005-0.0025
0
-4 -3.5 -3 -2.5 -2 -1.5 -1 -0.5 0
Fig. 2: Results of the simulation with a vertical detector shift of 15 µm. Upper plot: contribution to t-resolution (RMS). Lower plot: systematic t-shift (t-toffs)/t
2. Approach There are two approaches to determine the distance between the two detector halves:
1. The distance can be measure by means of an electronic (LVDT = Linear Variable Differential Transformer) or an optical ruler. One or two rulers must be mounted at the outside of the two pots (see Fig. 3). One can either try to measure the distance between two reference points on the two pots or the position of each of the pots relative to some reference points on the RP chassis. The absolute distance of the two ALFA detectors needs to be derived from these measurements. Good precision can only be achieved by calibrating this measurement in the metrology lab with a precise

CMM1. Apart from the intrinsic precision (repeatability) achievable with a LVDT in a non-ideal environment (presence of RF and magnetic fields), there may be additional uncertainties related to temperature variations, transport, installation etc. To achieve a precision of 10 µm is definitely a challenge.
2. The vertical distance between the two detectors can be determined by means of so-called overlap detectors. The overlap detectors (ODs) are particle detectors which need to measure only the vertical coordinate. Two ODs are mounted below (and above) the actual detector planes (see Fig. 4). They move with the detector planes and their relative position to those is fixed and well known. The ODs detect particles in the beam halo region. The active areas of the ODs begin to overlap when the detector halves approach each other. The distance of the detector halves can be calculated from the measurement of particles which traverse both ODs.
(1) ( )∑=
−=Ni
ii yyd,1
21
The required measurement precision is obtained by recording a sufficiently large number of tracks and calculating their average deviation in the two ODs. The achievable precision depends on three factors: 1) the intrinsic spatial resolution of the OD, 2) the statistics of particles detected with the OD, and 3) the alignment uncertainty between the ODs and the detector halves. Details will be discussed below.
LVD
T
Fig. 3: Schematic representation of the distance measurement with a LVDT.
1 CMM = Coordinate Measurement Machine

particle
Fig. 4: Schematic representation of the principle of overlap detectors. In the figure just one pair of overlap detectors is used to measure the vertical distance between the two detector halves.
3. The LHC beam halo The LHC beam is collimated by a complex system of primary, secondary and tertiary collimators. The precise composition and intensity of the beam halo depends on the beam optics and will not be known before LHC start-up.
Ideally the overlap measurements are made with 7 TeV protons which are transported parallel to the primary beam. Therefore the overlap detectors should be included inside the aperture of the beam tube with a diameter of 50 mm, ideally within the aperture of the beam screens [1]. The beam screens are of cylindrical shape, however they have two flats, either in the horizontal or vertical plane, depending on the location. In the close-by quadruple Q6 the beam screens have an aperture diameter of 45.1 mm and 35.3 mm between the vertical flats. The preceding quads Q1-Q5 are also equipped with beam screens with slightly different apertures and with vertical and horizontal flats. The composition of the halo may be influenced by shower particles originating from hadronic interactions of the beam with collimators and structural components.
The divergence of the beam has little impact on the measurement as long as in the vertical plane it is symmetric to the beam axis. Any systematic shift must be small compared to the desired resolution divided by the z-distance of the two overlap detectors, i.e. σy’ < 10 µm / 30 mm ~ 0.3 mrad.
Asymmetric halo particles can in principle be identified by means of the overlap detectors in the second Roman Pot which is 3.5 m downstream. Assuming that the two pots are vertically aligned to a precision of 100 µm, the angular selection of this arrangement σy’ < 100 µm / 3.5 m ~ 0.03 mrad is largely sufficient to identify and eliminate an asymmetric halo component.

4. Design of the overlap detectors The overlap detectors consist of horizontally mounted scintillating fibres of the same type and size as the main detector. They cover an active area of 6 × 15 mm. An OD comprises 3 planes of 30 fibres. The three planes are vertically staggered by 166 and 333 µm, respectively, such that a detector with an effective pitch of 166 µm is formed. The horizontal fibres are bent by 90º and routed upwards to the MAPMTs. In order to maximize the bending radii of the fibres, the 30 fibres are split into two layers of 15 fibres each which are mounted on the front and the back side, respectively, of a ceramic support plate. A fourth ceramic support carries two 3 mm thick plastic scintillators of 15 × 6 mm size which act as trigger counters for the overlap detectors. Front and top view of the overlap detectors integrated with the main detectors is shown in Fig. 5 and Fig. 6.
The two ODs are mounted symmetrically on both sides of the main detector and are housed in two special extrusions of the Roman Pot envelope (see Fig. 7). The design of the ODs is a compromise in order to satisfy the manifold physics and technical constraints. In the horizontal plane the distance between OD edge and the beam axis is 19 mm which means that about 2/3 of the active surface is inside the beam tube radius of 25 mm. The longitudinal distance between the two OD sets is 46 mm.
The ODs start to overlap when the two pots have a distance of 8.5 mm from the beam axis. The maximum vertical overlap is 15 mm.
The overlap detectors provide the coordinate information in discrete steps of 500 µm / 3 = 166.6 µm. The difference of the hits in the two detectors can also be measured only in discrete steps of 166.6 µm. Differences smaller than 166.6 µm are derived by averaging the measured discrete differences over a sample of events with sufficiently large statistics (see eqn. 1). The achievable precision of such a measurement is discussed below.
The design has the unwanted feature that the second overlap detector is located vertically on the same level as the bottom face of the first Roman Pot. This means a fraction of the protons which traverse the second overlap detector had a chance to interact in up to ~20 mm of stainless steel. The material budget corresponds to approximately 10% of a nuclear interaction length (λI(iron) = 19.7 cm). The probability of a proton interaction is therefore P = 1 – e -2 / 19.7 ~ 0.1. In first approximation the secondary particles have low transverse momenta (~GeV/c) and are distributed symmetrically to the original proton trajectory. Particles with sizable transverse momentum can be eliminated by the angular selection discussed above. The design feature is therefore not expected to lead to significant performance degradation.

Fig. 5: Front view of the full detector assembly with the overlap detectors. The spot and the circle in the centre represent the beam axis and the beam tube (diameter 50 mm). Not shown are the beam screens which have in the close-by quadruple Q6 a free aperture of 44 mm.
Fig. 6: Top view of the detector assembly. The first three planes (from the bottom) belong to the overlap detectors. The overlap triggers are also shown (without support plane).

Fig. 7: Roman Pot with extrusions f or the overlap detectors.
5. Precision of the distance measurement In the following we estimate the precision in the distance measurement which can be achieved with the detector arrangement described above.
dp
m
Fig. 8: Illustration of displacement calculation
Fig. 8 illustrates how the displacement d of the two overlap counters with identical pitch p can be derived from the number of hits n and m. The number of hits in a given cell of the first detector is denoted as n. The numbers of hits in the two affected cells of the second detector are n and n-m, respectively. It follows
(2) pnmd ⋅= /
On average the ratio of m to n is given by
n-mn

(3) pdnm // =
By error propagation the precision of d is computed as (⊕ means quadratic sum)
(4)
.
.
syst
syst
dpnm
nd
npd
dppdn
ndm
mdd
∆⊕∆⊕⊕⋅
=
∆⊕∆∂∂
⊕∆∂∂
⊕∆∂∂
=∆
The precision of the d measurement is driven by the size of the sample n used for the measurement. The pitch of the detector is not a determining parameter as a larger pitch can be compensated by a larger sample. The third term m/n·∆p in eqn. 4 can be written as d·∆p/p, i.e. it can be considered as relative pitch error scaled with the displacement d of the two detectors. The last term accounts for any systematic shift between the overlap detector and the actual fibre detector. The third and fourth terms dominate the precision once the sample statistics exceeds a few thousands of counts. To keep these terms small requires knowing the position of every fibre to a precision of about 5 µm. This can be achieved by means of an optical survey. Similarly here we aim for a precision of 5 µm for the alignment of fibre and overlap detectors such that the overall precision remains within the 10 µm limit discussed in the introduction.
0
0.005
0.01
0.015
0.02
0 2000 4000 6000 8000
total number of hits
RM
S re
solu
tion
(mm
)
p = 0.166, ∆p = 0.005, d = 0.01
p = 0.166, ∆ p = 0.005, d = 0.16
Fig. 9: Resolution band for overlap detectors with an effective pitch of 166 µm.

Fig. 9 visualizes the resolution band calculated according to eqn. 4 for the parameters p = 0.166 mm, ∆p = 0.005 mm. The band corresponds to values of d ranging from 0.01 to 0.16 mm.
6. Strategy for the alignment of the overlap detectors As discussed above the achievable precision of the distance measurement is dominated by the systematic uncertainties of the positions of the individual overlap fibres and the overall alignment of the OD w.r.t. the main fibre detector.
Optical metrology of the individual overlap fibres can be performed once the fibres are glued on the ceramic support plates. At this stage both the front and the back sides of the plates are accessible. The vertical positions of all fibres relative to fix reference points on the ceramic substrates are recorded in a database and are used later during the normal operation when the distance is measured with beam, hit by hit. The precision of such an optical measurement can realistically achieve ±5 µm. Care must be taken that the fibres be arranged horizontally within ±0.5 mrad.
Optical metrology approaches its limits once the three OD planes are mounted together with the main detector. Only the front side of the first OD plane and the backside of the last main detector plane are visible when all detector planes are stacked up to a full ALFA detector module.
Fig. 10: Principle of the alignment procedure with a particle beam.
It is in these conditions that one needs to know the relative alignment of OD w.r.t. the main detector. One possibility is to perform measurements with the CMM every time a new plane is added to the stack. In this way the position of a reference point on each of the planes (main detector and OD) can be determined in the coordinate system which is defined by the two alignment pins of the support arm. The precision of this method is difficult to estimate as relatively long lever arms (>100 mm) are involved.
An alternative and complementary approach is the use of a particle beam combined with a beam telescope of reasonably high spatial resolution. The principle is sketched in Fig. 10.
A fully assembled ALFA detector module is exposed to a high energy particle beam (preferably with low beam divergence). The beam telescope, e.g. a Silicon microstrip or a pixel telescope, is mounted rigidly and as close as possible to the ALFA module. The Si-telescope covers the overlap detector and also a good part of the ALFA active area. Measurements are performed of the track-by-track coordinate differences ∆yOS = yOD – ySi and ∆yOS = yALFA – ySi. The two measurements allow linking the positions of the OD and the main fibre detector via the beam telescope. The relative misalignment of ALFA and OD is ∆yOS - ∆yAS. With high statistics samples and centre-of-gravity methods the achievable uncertainly is expected to be well below 10 µm. The method relies on two assumptions: (1) The pitch of the Si-detector is precisely known and does not vary over the active surface. (2) The telescope is aligned such that its strips are parallel to the OD fibres. Depending on the active area of the beam telescope the measurement is performed separately for the right and left OD detectors.
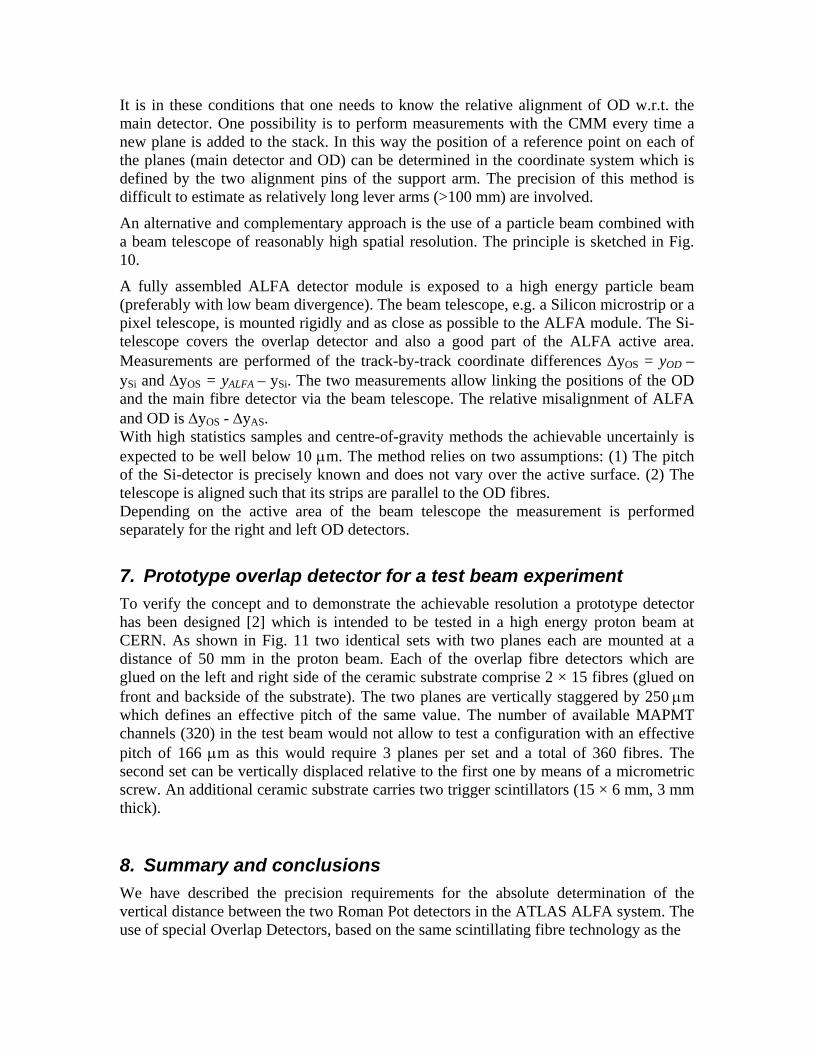
7. Prototype overlap detector for a test beam experiment To verify the concept and to demonstrate the achievable resolution a prototype detector has been designed [2] which is intended to be tested in a high energy proton beam at CERN. As shown in Fig. 11 two identical sets with two planes each are mounted at a distance of 50 mm in the proton beam. Each of the overlap fibre detectors which are glued on the left and right side of the ceramic substrate comprise 2 × 15 fibres (glued on front and backside of the substrate). The two planes are vertically staggered by 250 µm which defines an effective pitch of the same value. The number of available MAPMT channels (320) in the test beam would not allow to test a configuration with an effective pitch of 166 µm as this would require 3 planes per set and a total of 360 fibres. The second set can be vertically displaced relative to the first one by means of a micrometric screw. An additional ceramic substrate carries two trigger scintillators (15 × 6 mm, 3 mm thick).
8. Summary and conclusions We have described the precision requirements for the absolute determination of the vertical distance between the two Roman Pot detectors in the ATLAS ALFA system. The use of special Overlap Detectors, based on the same scintillating fibre technology as the
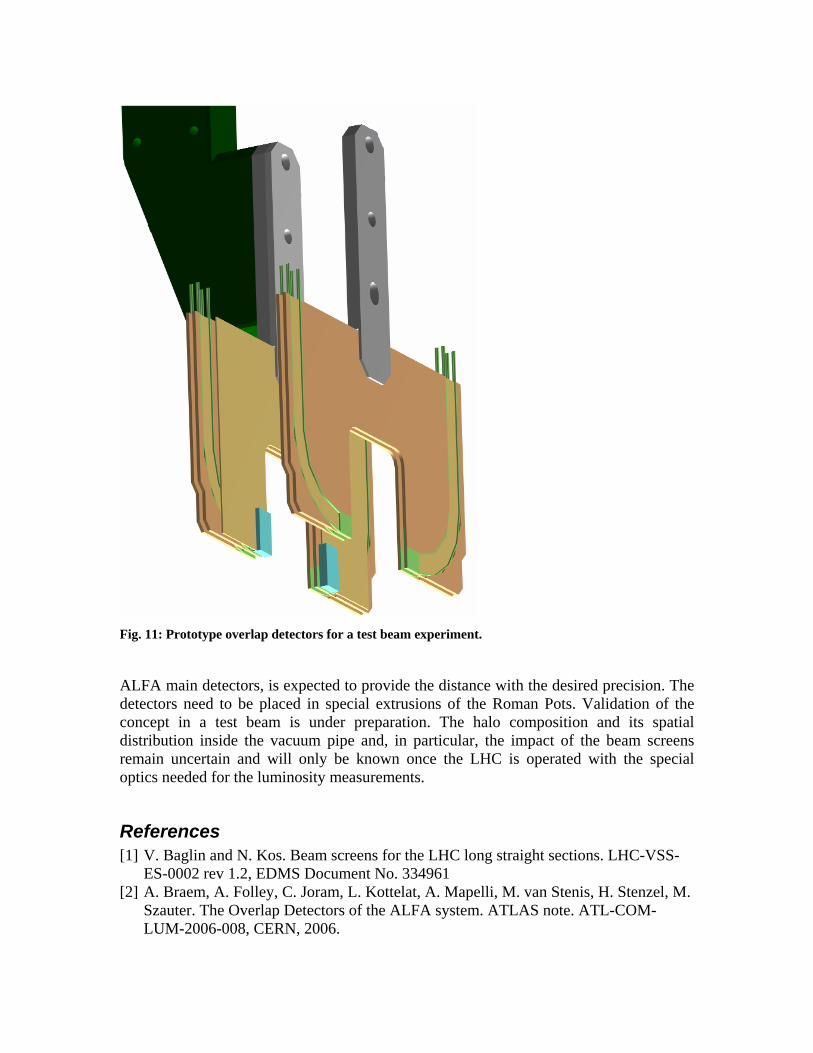
Fig. 11: Prototype overlap detectors for a test beam experiment.
ALFA main detectors, is expected to provide the distance with the desired precision. The detectors need to be placed in special extrusions of the Roman Pots. Validation of the concept in a test beam is under preparation. The halo composition and its spatial distribution inside the vacuum pipe and, in particular, the impact of the beam screens remain uncertain and will only be known once the LHC is operated with the special optics needed for the luminosity measurements.
References [1] V. Baglin and N. Kos. Beam screens for the LHC long straight sections. LHC-VSS-
ES-0002 rev 1.2, EDMS Document No. 334961 [2] A. Braem, A. Folley, C. Joram, L. Kottelat, A. Mapelli, M. van Stenis, H. Stenzel, M.
Szauter. The Overlap Detectors of the ALFA system. ATLAS note. ATL-COM-LUM-2006-008, CERN, 2006.