
Consumer Awareness, Attitudes and Behaviours to Fortified ...
Upload
khangminh22Category
view
1download
0
The nutritional quality of turmeric fortified zobo (Hibiscus sabdariffa)
Bsc thesis Food Technology Ellen Koopman 991001464050 Food Quality and Design (FQD)
Supervisors: Folake Idowu-Adebayo Anita Linnemann Wednesday, 03 July 2019

ii
1. Abstract Zobo is a traditional Nigerian street-vended beverage, made of the calyces of the flower Hibiscus sabdariffa. Malnutrition is a major concern in countries such as Nigeria. Addition of turmeric to zobo might improve the nutritional quality of the drink. Two different addition methods of turmeric in two concentrations were tested for nutrient composition.
The proximate analysis, which comprises the moisture, ash, protein, fat and carbohydrate fraction, of fortified zobo was determined. Also, the pH and specific gravity were measured. With HPLC, the vitamins A (beta-carotene), B (folic acid) and C (ascorbic acid) were analysed, as well as minerals iron and zinc.
It was found that zobo has a very high moisture content of 96% and low concentrations of carbohydrates, ash, protein and fat. The drink has a low pH of around 2.4, which increases upon addition of turmeric. The specific gravity is around 1 for all samples. No beta-carotene was detected. Folic acid was detected, but the concentration could not be determined. Ascorbic acid was found in the samples, ranging from 500-800 μg/100 mL. The concentration of iron and zinc ranged from 10-14 and 2-3 mg/L, respectively.
The daily recommended amount of vitamin C for children the age 2-5 is 30 mg, the recommended amount of the minerals are 8 mg for iron and 6 mg for zinc. To reach these amounts, one must consume around 4 litres of zobo. The daily requirements of nutrients thus cannot be met by consumption of (fortified) zobo. However, it can contribute to meet the requirements.
The addition of turmeric to zobo might improve the nutrient composition of zobo, although it is yet to be proven with significance. The consumption of turmeric fortified zobo could potentially be beneficial to health and relieve malnutrition.
Keywords: Zobo, Hibiscus sabdariffa, malnutrition, nutritional composition, proximate analysis

iii
Table of Contents 1. Abstract ............................................................................................................................................... ii
2. Introduction ........................................................................................................................................ 1
3. Materials and methods ....................................................................................................................... 3
3.1 Preparation of turmeric fortified zobo ............................................................................................... 3
3.2 Measurement of pH and specific gravity ............................................................................................ 4
3.3 Proximate analysis .............................................................................................................................. 4
3.4 Vitamin determinations ...................................................................................................................... 5
3.5 Mineral determination ....................................................................................................................... 6
3.6 Data analysis ....................................................................................................................................... 7
4. Results and discussion ........................................................................................................................ 8
4.1 pH and specific gravity ........................................................................................................................ 8
4.2 Proximate analysis .............................................................................................................................. 9
4.3 Vitamin contents ............................................................................................................................... 13
4.4 Mineral content ................................................................................................................................ 18
5 Conclusion ............................................................................................................................................... 21
6 Recommendations .................................................................................................................................. 22
7 References .............................................................................................................................................. 23
8 Appendix ............................................................................................................................................... - 1 -
8.1 Protocols ......................................................................................................................................... - 1 -
8.2 Proximate analysis ........................................................................................................................ - 15 -
8.3 Vitamin content ............................................................................................................................ - 18 -
8.4 Mineral content ............................................................................................................................ - 19 -
8.5 pH and specific gravity .................................................................................................................. - 20 -
8.6 Ethiek ............................................................................................................................................ - 22 -

1 | P a g e
2. Introduction Malnutrition is a major concern in developing countries in sub-Saharan Africa (Müller & Krawinkel, 2005). According to the World Health Organization (WHO), more than two billion people worldwide are affected by vitamin and mineral deficiencies, with tragic consequences. Micronutrient intake is insufficient, as well as consumption of macronutrients, e.g. protein and fat. This undernourishment results in stunting (low height for age) and wasting (low weight for height), especially in children under the age of five. Of all children under five years old in the world in 2017, 22.2% is stunted and 7.5% is wasted (World Health Organization, 2018). The numbers have declined over the past decades, but improvement must be made.
Of the macronutrients, especially the protein intake is insufficient and important to prevent protein-energy malnutrition. Of the micronutrients, certain crucial vitamins and minerals are not consumed enough. One of these is vitamin A, which is essential for the functioning of the eyes and immune system. Folate, a generic term for the B vitamins, is deficient as well. It is involved in DNA synthesis, stability and repair. The minerals iron and zinc are most necessary, together with the trace element iodine. Iron has numerous functions in the human body, but most importantly, it is necessary for oxygen transport. Zinc is crucial for a normal cellular metabolism. Iodine is needed for optimal foetal and postnatal central nervous system growth and development (Abeywickrama et al., 2018; Bailey, West Jr, & Black, 2015; Müller & Krawinkel, 2005; Tulchinsky, 2010).
The WHO has set up guidelines for treatment for health workers to battle macro- and micronutrient deficiency (World Health Organization, 1999). However, prevention of malnutrition is preferred. Increasing the diversity of foods consumed helps to ingest more of the essential nutrients, or providing supplements loaded with these. Another solution would be fortifying the locally consumed foods with substances high in essential nutrients (Dary & Hurrell, 2006). A food suitable for fortification is zobo.
Zobo is a refreshing, non-alcoholic beverage sold and produced in Nigeria. It is made by boiling water with the calyces of the Roselle flower (Hibiscus sabdariffa). After subsequent filtration, an extract with a dark red colour and sour taste is obtained. This can be flavoured with sugar, spices such as garlic and ginger, or fruits (Adelekan, Arisa, Alamu, Adebayo, & Popoola, 2014; Omemu, Edema, Atayese, & Obadina, 2006). The drink is a good source of vitamins and minerals (Adesokan, Abiola, Adigun, & Anifowose, 2013; Davidson, 2011). Often produced by local women and sold as a low-cost beverage, zobo generates income and alleviates poverty (Adelekan et al., 2014; Adeniji, 2017). Even though the drink is cheap and nutritious, it is not produced on a large scale due to its poor shelf life (Omemu et al., 2006).
In this research, turmeric (Curcuma longa) paste and root are added to the zobo drink in various concentrations. This root, indigenous to India, is currently gaining attention in the farming systems and research in Nigeria (Akpan, Muoneke, & Okpara, 2012; Akter, Hossain, Takara, Islam, & Hou, 2019). It is used as food additive, preservative and colorant. This yellow colour of turmeric is caused by curcumin, which also has many other properties. It has antibacterial, antioxidant and even anticarcinogenic activities (Akter et al., 2019; Ramadan, Al-Kahtani, & El-Sayed, 2011). Besides curcumin (3-4%), turmeric also contains protein (6.3%), fat (5.1%), minerals (3.5%), carbohydrates (69.4%) and moisture (13.1%) (Chattopadhyay, Biswas, Bandyopadhyay, & Banerjee, 2004). Iron and zinc naturally occur in turmeric (Singh & Garg, 2006; Trinidad, Sagum, Leon, Mallillin, & Borlagdan, 2010), as well as folate. Turmeric does, unfortunately, not contain any iodine (United States Department of Agriculture, 2018). This research studies to which extent the addition of this spice can improve the nutritional quality of zobo.

2 | P a g e
RESEARCH QUESTIONS
Does addition of turmeric increase the concentration of the important nutrients (protein, vitamin A, folate, zinc and iron)?
o Does the method of preparation of zobo have an effect on the concentration of the important nutrients?
o Does a higher concentration of added turmeric equal a linear increase in nutrient content?
What is the proximate and physicochemical composition of turmeric fortified zobo?

3 | P a g e
3. Materials and methods Protocols mentioned in this paper can be found in the appendix, section 8.1.
3.1 Preparation of turmeric fortified zobo Ingredients
Zobo (Hibiscus sabdariffa) calyces were purchased, dried, from Dutse market, Nigeria. Turmeric (Curcuma longa) roots from Omuooke-Ekiti market, Nigeria. Sucrose (table sugar) purchased from supermarket chain Jumbo, ‘kristalsuiker’ of brand Van
Gilse, Wageningen, the Netherlands.
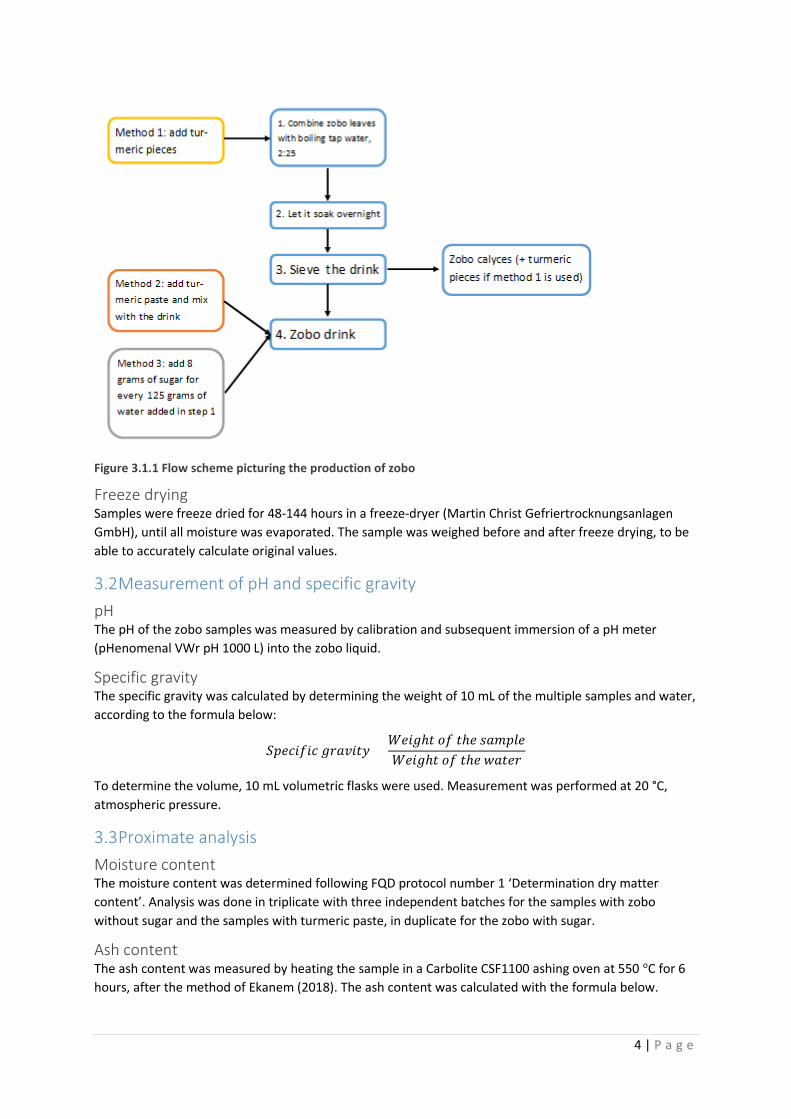
Preparation The fortified zobo was prepared by two different methods and two different concentrations, i.e. 2% and 6% turmeric added on basis of weight of the product in the specific addition step. Five different samples were attained: zobo control, zobo with boiled turmeric 2%, zobo with boiled turmeric 6%, zobo with turmeric paste 2% and zobo with turmeric paste 6%. An overview of production steps, as adapted from a previous FQD bachelor student, can be seen in figure 3.1.1 (Potkamp, 2018).
Zobo calyces and water were combined in a ratio of 2:25, thus 2 grams of zobo calyces for every 25 grams of water. The water is boiling when the calyces are added and is kept boiling on a heat source. After 5 minutes, the pan is removed from the heat and left to soak overnight.
At first, all samples were made with the addition of sugar (method 3) included. Later, it was changed and no sugar was added anymore. This was done because of interference of the sugar with some measurements. In the report, samples made with inclusion of method 3 will be referred to as ‘zobo with sugar’. When not specified, no sugar was added to the zobo.
The zobo control was made without added method 1 or 2, the zobo with boiled turmeric was made with method 1 and the zobo with turmeric paste was made with method 2.
Method 1 The turmeric pieces added in method 1 were finely chopped pieces from the entire turmeric roots, roughly 2x2 mm. The turmeric was added together with the calyces as either 2 or 6 percent of the weight of the water and calyces in the first step of zobo production.
Method 2 The turmeric added in method 2 was produced by combining 40 g chopped turmeric with 80 mL water and blended together in a Waring commercial laboratory blender until a fine paste was obtained. This paste was added as either 2 or 6 percent of the sieved liquid.
Method 3 In method 3, an additional 8 grams of sucrose (table sugar) was added for every 125 grams of water added in the first production step.
4 | P a g e
Figure 3.1.1 Flow scheme picturing the production of zobo
Freeze drying Samples were freeze dried for 48-144 hours in a freeze-dryer (Martin Christ Gefriertrocknungsanlagen GmbH), until all moisture was evaporated. The sample was weighed before and after freeze drying, to be able to accurately calculate original values.
3.2 Measurement of pH and specific gravity pH The pH of the zobo samples was measured by calibration and subsequent immersion of a pH meter (pHenomenal VWr pH 1000 L) into the zobo liquid.
Specific gravity The specific gravity was calculated by determining the weight of 10 mL of the multiple samples and water, according to the formula below:
𝑆𝑆𝑆𝑆𝑆𝑆𝑆𝑆𝑆𝑆𝑆𝑆𝑆𝑆𝑆𝑆 𝑔𝑔𝑔𝑔𝑔𝑔𝑔𝑔𝑆𝑆𝑔𝑔𝑔𝑔 =𝑊𝑊𝑆𝑆𝑆𝑆𝑔𝑔ℎ𝑔𝑔 𝑜𝑜𝑆𝑆 𝑔𝑔ℎ𝑆𝑆 𝑠𝑠𝑔𝑔𝑠𝑠𝑆𝑆𝑠𝑠𝑆𝑆𝑊𝑊𝑆𝑆𝑆𝑆𝑔𝑔ℎ𝑔𝑔 𝑜𝑜𝑆𝑆 𝑔𝑔ℎ𝑆𝑆 𝑤𝑤𝑔𝑔𝑔𝑔𝑆𝑆𝑔𝑔
To determine the volume, 10 mL volumetric flasks were used. Measurement was performed at 20 °C, atmospheric pressure.
3.3 Proximate analysis Moisture content The moisture content was determined following FQD protocol number 1 ‘Determination dry matter content’. Analysis was done in triplicate with three independent batches for the samples with zobo without sugar and the samples with turmeric paste, in duplicate for the zobo with sugar.
Ash content The ash content was measured by heating the sample in a Carbolite CSF1100 ashing oven at 550 °C for 6 hours, after the method of Ekanem (2018). The ash content was calculated with the formula below.

5 | P a g e
𝐴𝐴𝑠𝑠ℎ 𝑆𝑆𝑜𝑜𝑐𝑐𝑔𝑔𝑆𝑆𝑐𝑐𝑔𝑔 =𝑊𝑊𝑆𝑆𝑆𝑆𝑔𝑔ℎ𝑔𝑔 𝑜𝑜𝑆𝑆 𝑔𝑔ℎ𝑆𝑆 𝑠𝑠𝑔𝑔𝑠𝑠𝑆𝑆𝑠𝑠𝑆𝑆 𝑔𝑔𝑆𝑆𝑔𝑔𝑆𝑆𝑔𝑔 𝑔𝑔𝑠𝑠ℎ𝑆𝑆𝑐𝑐𝑔𝑔
𝑊𝑊𝑆𝑆𝑆𝑆𝑔𝑔ℎ𝑔𝑔 𝑜𝑜𝑆𝑆 𝑔𝑔ℎ𝑆𝑆 𝑠𝑠𝑔𝑔𝑠𝑠𝑆𝑆𝑠𝑠𝑆𝑆 𝑔𝑔𝑔𝑔𝑔𝑔𝑐𝑐𝑠𝑠𝑆𝑆𝑆𝑆𝑔𝑔𝑔𝑔𝑆𝑆𝑡𝑡 𝑏𝑏𝑆𝑆𝑆𝑆𝑜𝑜𝑔𝑔𝑆𝑆 𝑔𝑔𝑠𝑠ℎ𝑆𝑆𝑐𝑐𝑔𝑔 × 100%
Analysis was done in triplicate with three independent batches.
Fat content The fat content was determined by a Soxhlet fat extraction. FQD protocol 38 ‘The Soxhlet extraction’ was followed. Freeze dried zobo material was used for extraction. Extraction was done for four hours to ensure extraction of all lipids. Analysis was done in duplicate with two independent batches.
Crude protein content The protein fraction was determined by the DUMAS method, coupled with a protein analyser. Protocol number 39 by FQD ‘Use Dumas at Chemistry Group’ was used, with the method described for wet samples. Because of a low expected protein concentration, a small adjustment to the protocol was made. The sample was pipetted in tin cups (200 μL), dried overnight, and then more sample was added (200 μL) and dried. The standard nitrogen to protein conversion factor, 6.25, was used to calculate the protein concentration (Sáyago-Ayerdi, Arranz, Serrano, & Goñi, 2007). Analysis was done in triplicate with three independent batches.
Carbohydrate content As all food fractions should add up to 100%, the carbohydrate content was calculated by the formula below (Ekanem, 2018):
𝐶𝐶𝑔𝑔𝑔𝑔𝑏𝑏𝑜𝑜ℎ𝑔𝑔𝑡𝑡𝑔𝑔𝑔𝑔𝑔𝑔𝑆𝑆 𝑆𝑆𝑜𝑜𝑐𝑐𝑔𝑔𝑆𝑆𝑐𝑐𝑔𝑔= 100% −𝑠𝑠𝑜𝑜𝑆𝑆𝑠𝑠𝑔𝑔𝑚𝑚𝑔𝑔𝑆𝑆 𝑆𝑆𝑜𝑜𝑐𝑐𝑔𝑔𝑆𝑆𝑐𝑐𝑔𝑔 − 𝑔𝑔𝑠𝑠ℎ 𝑆𝑆𝑜𝑜𝑐𝑐𝑔𝑔𝑆𝑆𝑐𝑐𝑔𝑔 − 𝑆𝑆𝑔𝑔𝑔𝑔 𝑆𝑆𝑜𝑜𝑐𝑐𝑔𝑔𝑆𝑆𝑐𝑐𝑔𝑔− 𝑆𝑆𝑔𝑔𝑚𝑚𝑡𝑡𝑆𝑆 𝑆𝑆𝑔𝑔𝑜𝑜𝑔𝑔𝑆𝑆𝑆𝑆𝑐𝑐 𝑆𝑆𝑜𝑜𝑐𝑐𝑔𝑔𝑆𝑆𝑐𝑐𝑔𝑔
3.4 Vitamin determinations Vitamin A (beta-carotene) The concentration of vitamin A was estimated by measuring the beta-carotene concentration, which is a pro-vitamin A compound (Grune et al., 2010). The other pro-vitamin A carotenoids (beta-cryptoxanthin and alfa-carotene) contribute much less to the dietary intake, thus these are not measured (Toti, Chen, Palmery, Villaño Valencia, & Peluso, 2018). HPLC settings of FQD protocol number 20E ‘Extraction and characterisation of carotenoids combi method’ were used.
However, because the zobo is liquid, different extraction methods were used. First, extraction was tried with liquid samples. This was found to be ineffective and induced gel formation, hindering extraction. To obtain a higher concentration, freeze dried material was used for extraction. Two different extraction liquids were used: hexane and an ‘extraction mixture’ (hexane:acetone:ethanol + 0.01% butylated hydroxytoluene (BHT), 2:1:1). Extraction was performed by combining 1 g of freeze dried sample with 4 mL of either extraction liquid. After vortexing for 3 minutes, phase separation was allowed. The clear upper supernatant was collected. To get a full extraction, 2 mL of the extraction liquid was added to the freeze dried sample. Again, it was vortexed for 3 minutes and the supernatant was collected. This last procedure was repeated one more time to get a triple extraction. The collected supernatant was concentrated by evaporation in a Büchi rotovapor R-200/R-210/R-215, vacuum controller V-800/V-850 and heating bath B-490/-491 at 40 degrees Celsius, 270 mbar. The concentrate was collected and dissolved in methanol:tetrahydrofuran (THF) + 0.01% BHT, 1:1, to a total volume of 4 mL. This was filtered through a 0.2 µm RC filter with syringe and transferred to an amber HPLC vial.
Standards were prepared according to FQD protocol number 20_1 ‘Preparation control samples’.

6 | P a g e
Vitamin B (folic acid) To determine the amount of folic acid present in zobo, a HPLC was run on a Thermo Scientific Ultimate 3000 HPLC machine with RS diode array detector.
Chemicals used:
Potassiumdihydrogenphosphate (KH2PO4) for analysis, Merck KGaA (Darmstadt, Germany) Dipotassiumhydrogenphosphate (K2HPO4) anhydrous for analysis, Merck KGaA (Darmstadt, Germany) Acetonitrile (ACN) ULC-MS, Actu-All chemicals (Oss, the Netherlands) Ortho-phosphoric acid 85% for analysis, Merck KGaA (Darmstadt, Germany) Folic acid analytical standard, Sigma Aldrich (St. Louis, Missouri, USA)
The settings of PhD student Furahisha were used as a guide, but with a slightly adapted buffer and UV-detection (Miraji, 2019). Column Prevail C18, 5μm 250 x 4.6mm was used. The mobile phase was a 25 mM pH3 KH2PO4 solution:acetonitrile, 90:10. The elution was isocratic with a flow rate of 1.0 ml/min. Detection was done at 245, 283 and 356 nm (Gazzali et al., 2016).
As eluent and buffer, KH2PO4 solution:acetonitrile, 90:10, was used. The potassium dihydrogen phosphate was dissolved in water to 25 mM and brought to pH 3 by adding a few drops of ortho-phosphoric acid. A higher ratio of ACN was used to make sure the peaks would appear in the HPLC graph early enough.
Solutions of vitamin B1 (thiamine), B3 (nicotinic acid), B3’ (nicotinamide) were added to the run to provide an external control.
The samples were centrifuged at 4000 rpm for 7 minutes from the start of run, then measured undiluted and two times diluted with the buffer in amber HPLC flasks.
The control was measured by first making a stock solution of folic acid, 1 mg/mL. Folic acid was dissolved in 100 mM, pH 8-9 K2HPO4 (Hurtado, Rocha, Torres, & Torres, 2016). For the dilutions, the folic acid was dissolved in the potassium dihydrogen phosphate buffer.
Vitamin C (ascorbic acid) To determine the concentration of ascorbic acid, HPLC was used. Preparation of control and running of samples was done according to FQD protocol 35A1 ‘Determination of AA and DHA using HPLC’. Only total ascorbic acid (TAA) concentration was determined. The mango control samples were not run along, as these comprise a very different food matrix.
The samples were prepared by centrifugation at 4000 rpm for 7 minutes from the start of the run. The supernatant was diluted two times. This is defined by the protocol as ‘filtrate homogenate’, and was treated accordingly.
Calculation of the concentration of vitamin C was done according to the previously mentioned protocol.
Analysis was performed in duplicate with independent batches for the zobo with sugar samples, and once for the zobo without sugar.
3.5 Mineral determination Samples were sent to the Chemisch Biologisch Laboratorium Bodem (CBLB) lab (Wageningen, the Netherlands) for analysis. Samples were destructed with HNO3-HCl (aqua regia) and measured with the ICP-AES method for iron and zinc. Twelve samples were sent for analysis: two independent batches of zobo were sent, consisting of five samples each. Two samples with water were also sent to determine the influence of the tap water and processing methods. One of the samples contained tap water, straight from the tap. The other water sample comprised tap water, which was treated as if it were zobo. Thus, it was boiled in a pot, soaked overnight and filtered through a sieve.

7 | P a g e
Besides, samples with turmeric and water were sent as well. Two independent batches with four samples were sent: 2% and 6% boiled turmeric, and 2% and 6% turmeric paste dissolved in water, totalling to eight samples.
To investigate the inter-sample variation, the sample which showed the largest variation was resent. This sample was measured in triplicate.
3.6 Data analysis Data was analysed using Microsoft Office 2016, Chromeleon 7 and IBM SPSS Statistics.
Statistical analysis with SPSS To determine if data was normally distributed, the test of Shapiro-Wilk was used with p<0.05, where H0=data is normally distributed and Ha=data is not normally distributed.
To find significant differences, data was tested with a paired samples t-test, p<0.05 proving a significant difference between samples.

8 | P a g e
4. Results and discussion
4.1 pH and specific gravity Tables and graphs of statistical analysis can be found in the appendix, section 8.5.
pH The pH of the zobo was measured to get an indication of the amount of acid present in the zobo, which influences vitamin stability and measurements. Low pH values between 2.4-2.6 were measured. The pH of zobo seemed to increase with increasing turmeric concentration. This was confirmed by significance. In table 4.1.1, samples with a different superscript are significantly different. Not only did addition of turmeric increase the pH, addition of a higher concentration of paste also increased the pH more.
Table 4.1.1 pH of zobo
pH batch 6
pH batch 7
pH batch 8
Average pH
Relative standard deviation (in %)
Zobo control 2.43 2.44 2.42 2.43B 0.3 Zobo with boiled turmeric 2%
2.40 2.46 2.47 2.44ABC 1.4
Zobo with boiled turmeric 6%
2.58 2.54 2.53 2.55AC 0.9
Zobo with turmeric paste 2%
2.45 2.44 2.43 2.44C 0.3
Zobo with turmeric paste 6%
2.47 2.49 2.46 2.48A 0.6
Significant differences (p<0.05) are indicated with different superscripts.
Ekanem (2018) found a higher pH, 3.6. However, a different method of preparation was used: a lower hibiscus calyces:water ratio was maintained, 1,5:25. Besides, the zobo was boiled for a much longer time, 40 minutes, but it was not soaked overnight. This could influence the compounds extracted, thus the pH.
Adesokan et al. (2013) reported an even higher pH, 3.94. Nonetheless, a different preparation method was used as well. A ratio of 14.6:25, much higher than the ratio used in this research, was maintained. Also, the calyces were added to boiling water and only allowed to soak for 15 minutes.
The higher pH in literature might have to do with the shorter time the zobo calyces are in contact with the water. Letting the zobo soak overnight allows for a longer extraction time, in which more acids might be dissolved, thus resulting in a lower pH.
The slight increase in pH upon incorporation of turmeric into zobo will probably not influence product properties very much.
Specific gravity The specific gravity of zobo was determined with water as reference. Zobo had almost the same density as water, it seems to be slightly less dense, table 4.1.2. However, this cannot be said with certainty, as no significant differences between samples were found.

9 | P a g e
Table 4.1.2 Specific gravity of zobo
Specific gravity batch F
Specific gravity batch G
Specific gravity batch H
Average specific gravity
Relative standard deviation (in %)
Zobo control 1.010 1.014 1.008 1.011 0.3 Zobo with boiled turmeric 2%
1.011 1.008 1.006 1.008 0.2
Zobo with boiled turmeric 6%
1.011 1.002 1.005 1.006 0.5
Zobo with turmeric paste 2%
1.008 1.012 1.015 1.012 0.3
Zobo with turmeric paste 6%
1.007 1.009 1.013 1.010 0.3
4.2 Proximate analysis Tables and graphs of statistical analysis can be found in the appendix, section 8.2.
Moisture content A decreasing moisture trend was observed with an increasing turmeric concentration. This is confirmed by a significant difference between the zobo control and the zobo with turmeric paste 6% for the zobo without sugar. This decrease in moisture content can be explained by the moisture content of turmeric paste that was added, i.e. roughly 90%, about 5 percentage point lower than that of the zobo control. The moisture content of zobo without sugar can be found in table 4.2.1 and that of turmeric paste in table 4.2.2.
Table 4.2.1 Moisture content of zobo without sugar
Moisture content batch 6 (in %)
Moisture content batch 7 (in %)
Moisture content batch 8 (in %)
Average moisture content (in %)
Relative standard deviation (in %)
Zobo control 96.1 96.5 96.0 96.2A 0.30 Zobo with boiled turmeric 2%
95.5 95.7 96.4 95.9AB 0.47
Zobo with boiled turmeric 6%
96.0 95.7 95.8 95.8AB 0.19
Zobo with turmeric paste 2%
96.1 95.9 95.8 95.9AB 0.16
Zobo with turmeric paste 6%
95.7 96.0 95.6 95.8B 0.25
Significant differences (p<0.05) are indicated with different superscripts.

10 | P a g e
Table 4.2.2 Moisture content of turmeric paste
Turmeric paste 1 (in %)
Turmeric paste 2 (in %)
Turmeric paste 3 (in %)
Average moisture content (in %)
Relative standard deviation (in %)
Moisture content
90.6 90.8 90.6 90.6 0.17
The moisture content of the zobo control is in accordance with values found earlier by Adeniji (2017), who measured the moisture content of commercial (95.1% moisture) and locally prepared (94.5% moisture) zobo. However, other authors reported lower moisture contents, in the range of 82-88% (Adelekan et al., 2014; Adeniji, 2017; Ekanem, 2018). The higher dry matter content they found could also be due to the addition of flavourings, such as ginger and fruits, or sugar.
Ash content As zobo only contains about 4% dry matter, low values for the fractions other than moisture were expected. This is true for the ash content, which is around 0.5% of the total weight for most samples, table 4.2.3. Because the zobo with turmeric paste 6% has a lower moisture and thus a higher dry matter content, a higher ash content was expected. Nonetheless, this is not observed in these samples. It shows a similar ash content to the zobo control. The zobo with boiled turmeric 6% seems to have a higher ash content than the zobo control, although this difference was shown not to be significant. No significant differences between zobo samples were found.
Table 4.2.3 Ash content of zobo
Ash content batch 9 (in %)
Ash content batch 10 (in %)
Ash content batch 6 (in %)
Average ash content (in %)
Relative standard deviation (in %)
Zobo control 0.50 0.49 0.43 0.47 7.2 Zobo with boiled turmeric 2%
0.58 0.46 0.58 0.54 12.0
Zobo with boiled turmeric 6%
0.62 0.51 0.61 0.58 10.8
Zobo with turmeric paste 2%
0.49 0.41 0.43 0.45 9.2
Zobo with turmeric paste 6%
0.52 0.49 0.42 0.47 11.0
In literature, values of between 0.6-1.8% ash were found (Adelekan et al., 2014; Adeniji, 2017; Ekanem, 2018; Ezearigo, Adeniji, & Ayoade, 2014). The ash content measured in this study is slightly lower than this range.
However, this can be explained by the moisture content of the zobo. In literature, the moisture content is lower and this zobo thus contains more dry matter. As the ash content is a representation of the total inorganic matter, and water is not included in this fraction, a higher ash content is to be expected with a higher dry matter content (Akpanyung, 2005).
Fat content An extremely low fat percentage was expected. Fat is a nonpolar compound, which does not dissolve well in water without the addition of an emulsifier (Sakiyan, Sumnu, Sahin, & Bayram, 2004). As the zobo

11 | P a g e
leaves contain only around 3% fat before preparation and the fat does not dissolve well in the water in which the leaves are boiled, not much fat is to be expected in the finished zobo (Babalola, Babalola, & Aworh, 2001). The results of the Soxhlet extraction were in line with these expectations. All samples showed an extremely low fat percentage, close to zero. Data analysis showed that the values found for batch 7 were not normally distributed and thus could not be analysed for significance with a paired sample t-test. The average fat content can be found in table 4.2.4.
Table 4.2.4 Fat content of zobo
Fat content batch 6 (in %)
Fat content batch 7 (in %)
Average fat content (in %)
Relative standard deviation (in %)
Zobo control 0.003 0.003 0.003 9.9 Zobo with boiled turmeric 2%
0.004 0.003 0.003 29.9
Zobo with boiled turmeric 6%
0.006 0.003 0.004 50.7
Zobo with turmeric paste 2%
0.005 0.002 0.003 51.3
Zobo with turmeric paste 6%
0.007 0.008 0.008 6.8
Crude protein content A low protein content was found, table 4.2.5. However, addition of turmeric seemed to increase protein content. Turmeric contains 6.3% protein (Chattopadhyay et al., 2004), which is much higher than the amount of protein found in the zobo control. This is reflected in the zobo with boiled turmeric samples, which both contain significantly more protein than the zobo control.
Table 4.2.5 Crude protein content of zobo
Protein content batch 6 (in %)
Protein content batch 7 (in %)
Protein content batch 8 (in %)
Average protein content (in %)
Relative standard deviation (in %)
Zobo control 0.18 0.16 0.18 0.18B 5.9 Zobo with boiled turmeric 2%
0.23 0.24 0.22 0.23A 3.4
Zobo with boiled turmeric 6%
0.23 0.20 0.22 0.22A 5.0
Zobo with turmeric paste 2%
0.19 0.15 0.20 0.18AB 14.5
Zobo with turmeric paste 6%
0.19 0.16 0.24 0.20AB 21.3
Significant differences (p<0.05) are indicated with different superscripts.
Carbohydrate content The carbohydrate content was calculated from the other fractions and can be seen in table 4.2.6 below. Besides the moisture, the carbohydrates seem to be the biggest constituent of zobo. However, this value was calculated and not measured, so it serves as an indication for carbohydrate content.
12 | P a g e
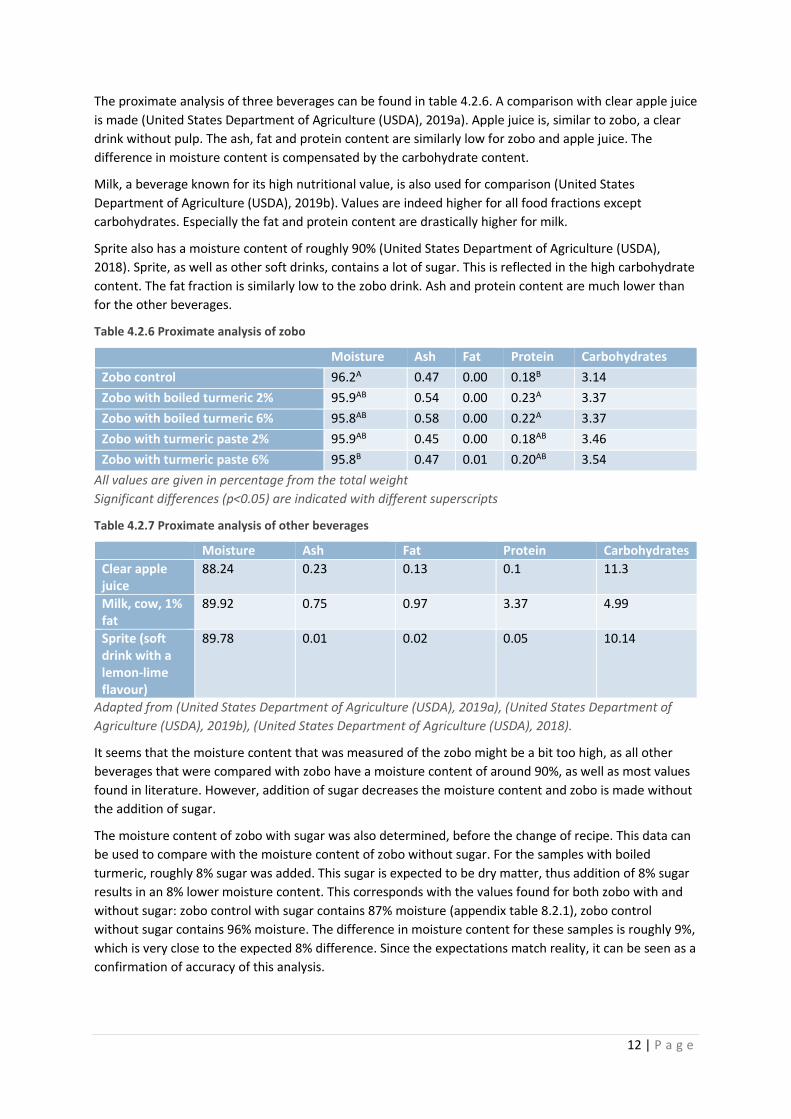
The proximate analysis of three beverages can be found in table 4.2.6. A comparison with clear apple juice is made (United States Department of Agriculture (USDA), 2019a). Apple juice is, similar to zobo, a clear drink without pulp. The ash, fat and protein content are similarly low for zobo and apple juice. The difference in moisture content is compensated by the carbohydrate content.
Milk, a beverage known for its high nutritional value, is also used for comparison (United States Department of Agriculture (USDA), 2019b). Values are indeed higher for all food fractions except carbohydrates. Especially the fat and protein content are drastically higher for milk.
Sprite also has a moisture content of roughly 90% (United States Department of Agriculture (USDA), 2018). Sprite, as well as other soft drinks, contains a lot of sugar. This is reflected in the high carbohydrate content. The fat fraction is similarly low to the zobo drink. Ash and protein content are much lower than for the other beverages.
Table 4.2.6 Proximate analysis of zobo
Moisture Ash Fat Protein Carbohydrates Zobo control 96.2A 0.47 0.00 0.18B 3.14 Zobo with boiled turmeric 2% 95.9AB 0.54 0.00 0.23A 3.37 Zobo with boiled turmeric 6% 95.8AB 0.58 0.00 0.22A 3.37 Zobo with turmeric paste 2% 95.9AB 0.45 0.00 0.18AB 3.46 Zobo with turmeric paste 6% 95.8B 0.47 0.01 0.20AB 3.54
All values are given in percentage from the total weight Significant differences (p<0.05) are indicated with different superscripts
Table 4.2.7 Proximate analysis of other beverages
Moisture Ash Fat Protein Carbohydrates Clear apple juice
88.24 0.23 0.13 0.1 11.3
Milk, cow, 1% fat
89.92 0.75 0.97 3.37 4.99
Sprite (soft drink with a lemon-lime flavour)
89.78 0.01 0.02 0.05 10.14
Adapted from (United States Department of Agriculture (USDA), 2019a), (United States Department of Agriculture (USDA), 2019b), (United States Department of Agriculture (USDA), 2018).
It seems that the moisture content that was measured of the zobo might be a bit too high, as all other beverages that were compared with zobo have a moisture content of around 90%, as well as most values found in literature. However, addition of sugar decreases the moisture content and zobo is made without the addition of sugar.
The moisture content of zobo with sugar was also determined, before the change of recipe. This data can be used to compare with the moisture content of zobo without sugar. For the samples with boiled turmeric, roughly 8% sugar was added. This sugar is expected to be dry matter, thus addition of 8% sugar results in an 8% lower moisture content. This corresponds with the values found for both zobo with and without sugar: zobo control with sugar contains 87% moisture (appendix table 8.2.1), zobo control without sugar contains 96% moisture. The difference in moisture content for these samples is roughly 9%, which is very close to the expected 8% difference. Since the expectations match reality, it can be seen as a confirmation of accuracy of this analysis.

13 | P a g e
4.3 Vitamin contents Tables and graphs of statistical analysis and HPLC outputs can be found in the appendix, section 8.3.
Vitamin A (beta-carotene) Turmeric (Curcuma longa) contains about 2 μg/100 g beta-carotene (Trinidad et al., 2010). Nevertheless, the concentration of beta-carotene in zobo could not be determined. None of the tried extraction methods resulted in peaks in the HPLC chromatogram.
However, when freeze dried material was used for extraction, a different compound was extracted, figure 4.3.1. It seems to be lutein, a yellow carotenoid. It is structurally very similar to beta carotene, but has one hydroxyl group attached to every cyclic end, see figure 8.3.1 in appendix (Siems, Sommerburg, & Van Kuijk, 1999). It is therefore a more polar compound than beta-carotene, which does not contain any polar hydroxyl groups (figure 8.3.2 in appendix) (Liaaen-Jensen & Jensen, 1971). As the liquid in which the zobo calyces are boiled is water, lutein will dissolve better than beta-carotene. This is also the case for the extraction liquids. Lutein dissolves better in hexane and in the extraction mixture (hexane:acetone:ethanol + 0.01% BHT, 2:1:1) than beta-carotene (Craft & Soares, 1992). The calyces of Hibiscus sabdariffa contain both beta-carotene and lutein, but lutein in a concentration about two times higher than that of all beta-carotene (Piovesana, Rodrigues, & Noreña, 2019).
Lutein could also improve the nutritional value of zobo, as it potentially aids in prevention of macular degeneration, plays a role in the development of the visual and nervous systems of foetuses, and has antioxidant properties (Steiner, McClements, & Davidov-Pardo, 2018)
Lutein has a strong yellow colour (Abdel-Aal, Akhtar, Zaheer, & Ali, 2013). During extraction, a bright yellow colour was observed, more so in the samples extracted with the extraction mixture. Figure 4.3.2 shows the colour of the supernatant of the samples after extraction. The more saturated colour, thus higher concentration of yellow compounds, is reflected in higher peak areas of the extraction mixture samples in the HPLC graph, figure 4.3.3.
Figure 4.3.1 HPLC output of the beta-carotene run with left supposedly lutein and right, in pink, the beta-carotene control

14 | P a g e
Figure 4.3.2 Supernatant after extraction
Figure 4.3.3 HPLC run with two lutein peaks. The small peak originates from a sample extracted with hexane, the high peak from a sample extracted with the extraction mixture
No beta-carotene was found. Where the control samples gave peaks with a retention time of 4.96 minutes, no peaks were found around that specific retention time in the tested sample. An explanation could be the nonpolar character of beta-carotene, low solubility in water and thus low presence in the

15 | P a g e
zobo. Alternatively, there is a possibility that the concentration of beta-carotene is too low to be detected by the HPLC, even after extraction with concentrated material.
Vitamin B (folic acid) Folic acid was detected in the zobo samples, figure 4.3.4. The suspected folic acid in the samples corresponded with the retention time of the control samples. Also, the UV-VIS spectrum of the folic acid peak in the sample (figure 4.3.5) shows a large peak at 285 nm, which is close to the expected 283 nm.
Figure 4.3.4 HPLC graph of folic acid, with the folic acid peak in pink
Figure 4.3.5 UV-VIS spectrum of the folic acid peak
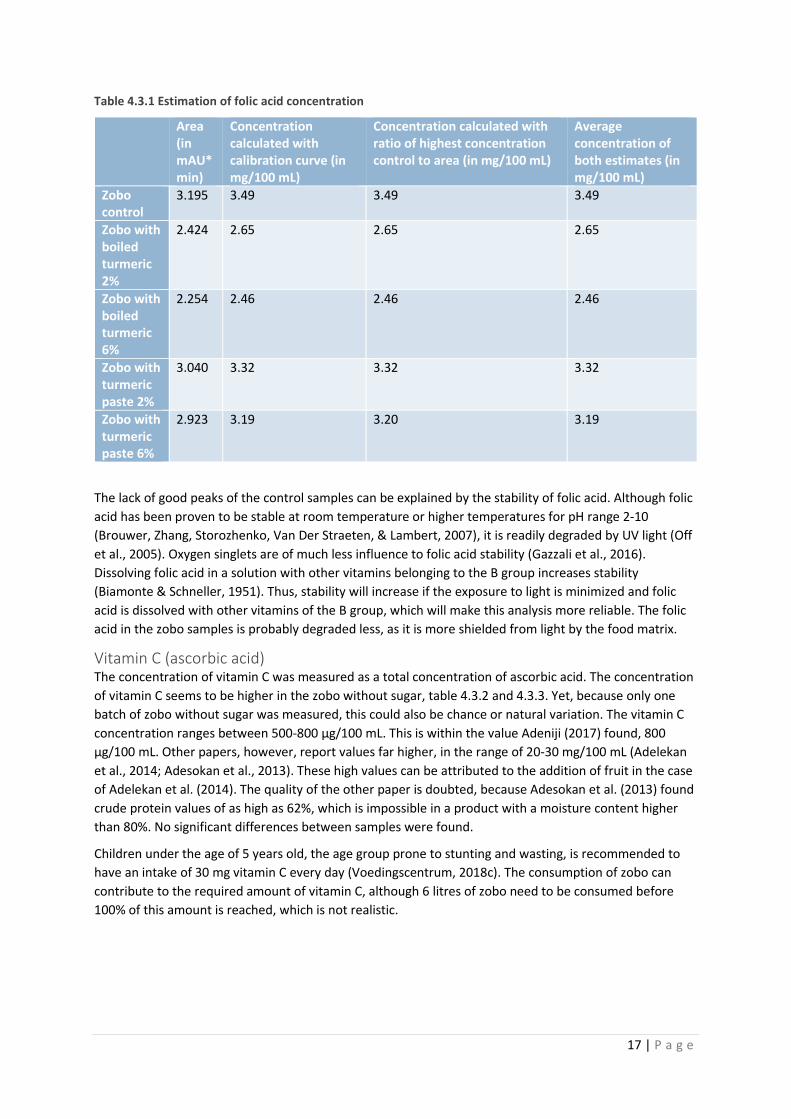
Accurate numbers for the concentration, however, could not be determined. The control series did not give sufficient convertible peaks. Thus, transformation from peak area to concentration was not possible. Yet, rough estimations were made. A calibration curve was made with the two adequate control peaks and the trend line was forced to intercept at (0,0), as the area should be 0 at a concentration of 0. This calibration curve, including coefficient of determination and slope, can be found in figure 4.3.6. This slope was used to calculate an estimate of the folic acid concentration.
Another way to estimate the concentration was by comparing the ratio of area to concentration of the best peak. The ratio area:concentration for the best control peak, the control with the highest

16 | P a g e
concentration folic acid, was found to be 0.091. This number was used to estimate the concentration of folic acid in the samples. The result of both estimations can be found in table 4.3.1. This is in no way an accurate measure of the folic acid concentration, it only serves as an indication of the folic acid concentration in zobo.
The real concentration of folic acid in zobo will probably be lower, as the folic acid was degraded in the control samples and subsequently gives a lower area. If the starting concentration of the control sample is used for calculation, however, this results in higher concentrations than is true in reality. The measurement must be repeated with stable control samples to obtain accurate results.
If the estimated values will be close to the real concentration of folic acid in zobo, it could be a major contributor to folic acid intake in the daily diet. Folic acid is especially important for pregnant and lactating women, who need 400 μg of folic acid daily (Voedingscentrum, 2018a). As little as 15 mL of the zobo drink would suffice to get this daily amount. Yet, the real concentration of folic acid in zobo is likely lower than the estimation.
Figure 4.3.6 Calibration curve of folic acid
y = 0.0915xR² = 1
02468
101214161820
0 50 100 150 200 250
Area
(mAU
*min
)
Concentration of folic acid (μg/mL)
Folic acid calibration curve
Concentration in μg/mL
Linear (Concentration in μg/mL)
17 | P a g e
Table 4.3.1 Estimation of folic acid concentration
Area (in mAU*min)
Concentration calculated with calibration curve (in mg/100 mL)
Concentration calculated with ratio of highest concentration control to area (in mg/100 mL)
Average concentration of both estimates (in mg/100 mL)
Zobo control
3.195 3.49 3.49 3.49
Zobo with boiled turmeric 2%
2.424 2.65 2.65 2.65
Zobo with boiled turmeric 6%
2.254 2.46 2.46 2.46
Zobo with turmeric paste 2%
3.040 3.32 3.32 3.32
Zobo with turmeric paste 6%
2.923 3.19 3.20 3.19
The lack of good peaks of the control samples can be explained by the stability of folic acid. Although folic acid has been proven to be stable at room temperature or higher temperatures for pH range 2-10 (Brouwer, Zhang, Storozhenko, Van Der Straeten, & Lambert, 2007), it is readily degraded by UV light (Off et al., 2005). Oxygen singlets are of much less influence to folic acid stability (Gazzali et al., 2016). Dissolving folic acid in a solution with other vitamins belonging to the B group increases stability (Biamonte & Schneller, 1951). Thus, stability will increase if the exposure to light is minimized and folic acid is dissolved with other vitamins of the B group, which will make this analysis more reliable. The folic acid in the zobo samples is probably degraded less, as it is more shielded from light by the food matrix.
Vitamin C (ascorbic acid) The concentration of vitamin C was measured as a total concentration of ascorbic acid. The concentration of vitamin C seems to be higher in the zobo without sugar, table 4.3.2 and 4.3.3. Yet, because only one batch of zobo without sugar was measured, this could also be chance or natural variation. The vitamin C concentration ranges between 500-800 μg/100 mL. This is within the value Adeniji (2017) found, 800 μg/100 mL. Other papers, however, report values far higher, in the range of 20-30 mg/100 mL (Adelekan et al., 2014; Adesokan et al., 2013). These high values can be attributed to the addition of fruit in the case of Adelekan et al. (2014). The quality of the other paper is doubted, because Adesokan et al. (2013) found crude protein values of as high as 62%, which is impossible in a product with a moisture content higher than 80%. No significant differences between samples were found.
Children under the age of 5 years old, the age group prone to stunting and wasting, is recommended to have an intake of 30 mg vitamin C every day (Voedingscentrum, 2018c). The consumption of zobo can contribute to the required amount of vitamin C, although 6 litres of zobo need to be consumed before 100% of this amount is reached, which is not realistic.

18 | P a g e
Table 4.3.2 Vitamin C content of zobo with sugar
Concentration vitamin C batch 4 (in μg/100 mL)
Concentration vitamin C batch 5 (in μg/100 mL)
Average concentration (in μg/100 mL)
Relative standard deviation (in %)
Zobo control 560 449 504 16 Zobo with boiled turmeric 2%
582 488 535 12
Zobo with boiled turmeric 6%
534 526 530 1
Zobo with turmeric paste 2%
546 472 509 10
Zobo with turmeric paste 6%
651 498 574 19
Table 4.3.3 Vitamin C content of zobo without sugar
Concentration vitamin C batch 8 (in μg/100 mL) Zobo control 694 Zobo with boiled turmeric 2% 769 Zobo with boiled turmeric 6% 735 Zobo with turmeric paste 2% 701 Zobo with turmeric paste 6% 716
4.4 Mineral content Tables and graphs of statistical analysis and HPLC outputs can be found in the appendix, section 8.4.
Control samples Control samples with tap water and processed water were measured to determine the influence of the water that was used in the zobo preparation on final mineral content. As can be seen in table 4.4.1 below, the concentration iron and zinc in the water samples is negligible. It can thus be assumed that the concentration of iron and zinc found in the zobo stems from the hibiscus flowers and turmeric.
Table 4.4.1 Control samples with water for mineral content determination
Control samples Iron (in mg/L) Zinc (in mg/L) Processed water -0.01 0.02 Untouched tap water -0.01 0.07
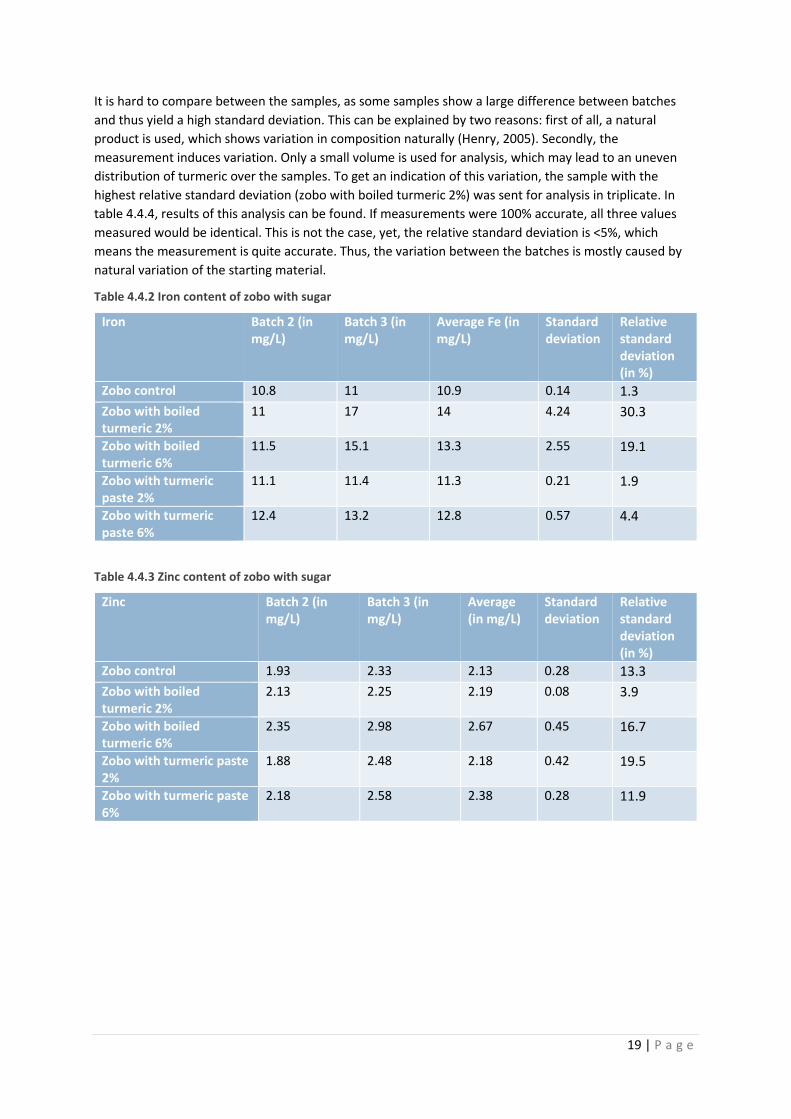
Iron and zinc Zobo made with sugar was sent for the first analysis. Yet, sugar is not expected to have an influence on mineral content, as sucrose does not contain minerals. The average concentration of iron ranges between 10-14 mg/L, the concentration of zinc between 2.1-7.7 mg/L (table 4.4.2 and 4.4.3).
The daily recommended amount of iron is 8mg, of zinc 6 mg, both for children in the age 2-5 (Voedingscentrum, 2018b, 2018d). Drinking zobo would contribute greatly towards the required amount of iron. Consumption of 800 mL of zobo would exceed the required amount of iron. To reach the recommended amount of zinc, however, would take almost 3 litres of zobo.
19 | P a g e
It is hard to compare between the samples, as some samples show a large difference between batches and thus yield a high standard deviation. This can be explained by two reasons: first of all, a natural product is used, which shows variation in composition naturally (Henry, 2005). Secondly, the measurement induces variation. Only a small volume is used for analysis, which may lead to an uneven distribution of turmeric over the samples. To get an indication of this variation, the sample with the highest relative standard deviation (zobo with boiled turmeric 2%) was sent for analysis in triplicate. In table 4.4.4, results of this analysis can be found. If measurements were 100% accurate, all three values measured would be identical. This is not the case, yet, the relative standard deviation is <5%, which means the measurement is quite accurate. Thus, the variation between the batches is mostly caused by natural variation of the starting material.
Table 4.4.2 Iron content of zobo with sugar
Iron Batch 2 (in mg/L)
Batch 3 (in mg/L)
Average Fe (in mg/L)
Standard deviation
Relative standard deviation (in %)
Zobo control 10.8 11 10.9 0.14 1.3 Zobo with boiled turmeric 2%
11 17 14 4.24 30.3
Zobo with boiled turmeric 6%
11.5 15.1 13.3 2.55 19.1
Zobo with turmeric paste 2%
11.1 11.4 11.3 0.21 1.9
Zobo with turmeric paste 6%
12.4 13.2 12.8 0.57 4.4
Table 4.4.3 Zinc content of zobo with sugar
Zinc Batch 2 (in mg/L)
Batch 3 (in mg/L)
Average (in mg/L)
Standard deviation
Relative standard deviation (in %)
Zobo control 1.93 2.33 2.13 0.28 13.3 Zobo with boiled turmeric 2%
2.13 2.25 2.19 0.08 3.9
Zobo with boiled turmeric 6%
2.35 2.98 2.67 0.45 16.7
Zobo with turmeric paste 2%
1.88 2.48 2.18 0.42 19.5
Zobo with turmeric paste 6%
2.18 2.58 2.38 0.28 11.9

20 | P a g e
Table 4.4.4 Determination of variation between measurements, the sample ‘zobo with boiled turmeric 2%’ was measured three times
Measurement 1 Measurement 2 Measurement 3 Average Standard
deviation Relative standard deviation (in %)
Iron (mg/L) 8.91 9.04 8.31 8.75 0.39 4.43 Zinc (mg/L) 2.29 2.34 2.19 2.27 0.08 3.36
No significant differences were found between the zobo control and the samples of zobo with turmeric.

21 | P a g e
5 Conclusion Upon addition of turmeric, the pH increased significantly from around 2.4 to 2.5, more so when 6% of turmeric paste was added when compared to 2% turmeric paste. This small increase in pH will probably not affect product properties very much. The specific gravity of the zobo was found to be roughly 1 for all samples, which means that the density of zobo is close to the density of water.
The proximate analysis of zobo revealed an extraordinarily high moisture content of zobo of roughly 96%. Adding 6% turmeric paste resulted in a significant decrease in moisture content. The zobo contained virtually no fat and only little protein, ash and carbohydrates. These carbohydrates were, with a weight percentage of a little over 3%, the biggest fraction besides the moisture. A significant increase in protein was found for both samples with boiled turmeric. However, an increase from 0.18% to 0.22-0.23% of protein will not make a real contribution to the nutritional value of zobo.
No beta-carotene was found in the samples. It is suspected it is not present, or in amounts too low to detect by HPLC. However, lutein was likely detected. Folic acid was detected in all of the samples. Concentration of folic acid could not yet be determined, but is estimated to be around 2.5-3.5 mg/100 mL. If the real concentration would be anywhere close to this, consumption of zobo could majorly contribute to the required daily folic acid intake. The vitamin C concentration of zobo was found to be between 500-800 μg/100 mL.
The concentration of iron and zinc in fortified zobo is 10-14 and 2-3 mg/L, respectively. The concentration of the minerals seems to increase with the addition of turmeric, but this was not proven by significance, likely due to high standard deviations.
The daily recommended amount of vitamin C for children the age 2-5 is 30 mg, the recommended amount of the minerals are 8 mg for iron and 6 mg for zinc. To reach these amounts, one must consume around 4 litres of zobo. The daily requirements of nutrients thus cannot be met by consumption of (fortified) zobo. However, it can contribute to meet the nutrient requirements.
In conclusion, the addition of turmeric to zobo increases protein content and has the potential to increase mineral and vitamin concentration, thus improving the nutritional quality of zobo. The consumption of turmeric fortified zobo could be beneficial to health and relieve malnutrition.

22 | P a g e
6 Recommendations To be able to measure the concentration of folic acid in zobo, a calibration curve must be made to convert peak areas to concentrations. This can only be done with a series of stable control samples. It was not yet accomplished to get a stable control series of folic acid, due to its chemical instability. It is therefore recommended to increase the stability of the folic acid control samples and perform analysis of folic acid again. Stability can be increased by reducing exposure to light, for example by packing the folic acid stock solution in aluminium foil and working in the light reduced lab (Off et al., 2005). Another way to increase stability is by adding other vitamins of the B-complex to the folic acid stock solution and control samples (Biamonte & Schneller, 1951). For example, stock solutions of vitamins B1 and B3 previously prepared by PhD student Furahisha could be added to the stock solution of folic acid to increase its stability (Miraji, 2019).
Accuracy of the Soxhlet fat extraction can be improved. Due to the low fat content, only little fat is extracted from the zobo. So little (around 4 mg), that it cannot be accurately measured (the analytical balance used is accurate from 100 mg). The inaccuracy of this analysis can be solved by extracting more fat or by using a more accurate balance. To extract more fat, bigger glassware could be used, with a higher loading capacity of the zobo material.
Zobo not only contains minerals and vitamins, but it also contains other health-promoting compounds. For example lutein, which potentially aids in prevention of macular degeneration, plays a role in the development of the visual and nervous systems of foetuses, and has antioxidant properties (Steiner et al., 2018). Zobo contains a very high concentration of anthocyanidins, which also may exert health benefits through its antioxidant capacity (Khoo, Azlan, Tang, & Lim, 2017). It is recommended to measure the concentration of these and other healthy component, to get a more complete overview of the nutritional quality of the zobo.
No significant differences were found in the mineral analysis of zobo. However, when looking at the data, it seems turmeric could increase the mineral content. It is therefore advised to take more measurements for the mineral content of zobo with turmeric. One way to do this would be by sending samples with turmeric, boiled in water 2% and 6%, and turmeric paste dissolved in water 2% and 6% to the CBLB lab (Wageningen, the Netherlands). This way, the influence of turmeric on the zobo can be investigated more clearly. Another way to obtain significant results would be to repeat the analysis, so results in triplicate are obtained instead of duplicate.
The analysis of vitamin C in zobo could be repeated. No significant differences were found yet, partially due to the small sizes of batches analysed (n=2 and n=1 for zobo with and without sugar, respectively). If more measurements are done, especially with zobo without sugar, there is a chance to find significant differences between samples and treatments.
Lastly, a combination of turmeric and other compounds could be investigated to see if the nutrient improvement can be optimized. E.g., (Adelekan et al., 2014) added different fruits to zobo to enhance the product. A combination of fruits and spices like turmeric might lead to a nice flavour and optimal nutritional properties.

23 | P a g e
7 References
Abdel-Aal, E.-S. M., Akhtar, H., Zaheer, K., & Ali, R. (2013). Dietary sources of lutein and zeaxanthin carotenoids and their role in eye health. Nutrients, 5(4), 1169-1185. doi: 10.3390/nu5041169
Abeywickrama, H., Koyama, Y., Uchiyama, M., Shimizu, U., Iwasa, Y., Yamada, E., . . . Mitobe, Y. (2018). Micronutrient status in Sri Lanka: A review. Nutrients, 10(11), 1583.
Adelekan, Arisa, Alamu, A., Adebayo, Y., & Popoola, G. (2014). Production and acceptability of fruits enhanced zobo drink. Food Science and Technology Letters, 5(1), 46.
Adeniji, P. (2017). Nutritional, Sensory and Microbiological Quality Assessment of fortified Zobo Drink: A Home-Prepared Traditional Nigerian Beverage.
Adesokan, I. A., Abiola, O. P., Adigun, M. O., & Anifowose, O. A. (2013). Analysis of quality attributes of Hibiscus sabdariffa (zobo) drinks blended with aqueous extract of ginger and garlic (Vol. 7).
Akpan, I., Muoneke, C., & Okpara, D. (2012). Effect of Egusi Planting Density on Productivity of Egusi/Turmeric Intercrops in Southeastern Nigeria. Asian Journal of Crop Science, 5(1), 41-47.
Akpanyung, E. (2005). Proximate and mineral element composition of bouillon cubes produced in Nigeria. Pakistan Journal of Nutrition, 4(5), 327-329.
Akter, J., Hossain, M. A., Takara, K., Islam, M. Z., & Hou, D. X. (2019). Antioxidant activity of different species and varieties of turmeric (Curcuma spp): Isolation of active compounds. Comparative Biochemistry and Physiology Part - C: Toxicology and Pharmacology, 215, 9-17. doi: 10.1016/j.cbpc.2018.09.002
Babalola, S., Babalola, A., & Aworh, O. (2001). Compositional attributes of the calyces of roselle (Hibiscus sabdariffa L.).
Bailey, R. L., West Jr, K. P., & Black, R. E. (2015). The Epidemiology of Global Micronutrient Deficiencies. Annals of Nutrition and Metabolism, 66(suppl 2)(Suppl. 2), 22-33. doi: 10.1159/000371618
Belt, H. v. d. (2016). Introduction to Ethics: three varieties of moral reasoning. Internal publication. Wageningen University. Philosophy.
Biamonte, & Schneller. (1951). A study of folic acid stability in solutions of the B complex vitamins. Journal of the American Pharmaceutical Association (Scientific ed.), 40(7), 313-320.
Brouwer, V. d., Zhang, G. F., Storozhenko, S., Van Der Straeten, D., & Lambert, W. E. (2007). pH stability of individual folates during critical sample preparation steps in prevision of the analysis of plant folates. Phytochemical Analysis: An International Journal of Plant Chemical and Biochemical Techniques, 18(6), 496-508.
Chattopadhyay, I., Biswas, K., Bandyopadhyay, U., & Banerjee, R. K. (2004). Turmeric and curcumin: Biological actions and medicinal applications. Current Science, 87(1), 44-53.
Craft, N. E., & Soares, J. H. (1992). Relative solubility, stability, and absorptivity of lutein and. beta.-carotene in organic solvents. Journal of Agricultural and Food Chemistry, 40(3), 431-434.
Dary, O., & Hurrell, R. (2006). Guidelines on food fortification with micronutrients. Geneva, Switzerland World Health Organization, Food and Agricultural Organization of the United Nations.
Davidson, G. I. (2011). Nutrient content and sensory evaluation of hawked and home-made Roselle (Zobo) drink. Journal of Home Economics Research, 15, 209-218.
Ekanem, J. O. (2018). Microbial, Sensory and Nutritional Properties of Laboratory Prepared Sorrel (Zobo) Drinks Fortified with Spices and Sugar (Vol. Volume 7, Number 8).
Ezearigo, Adeniji, P., & Ayoade, F. (2014). Screening of natural spices for improving the microbiological, nutritional and organoleptic qualities of the Zobo drink. Journal of Applied Biosciences, 76(1), 6397–6410.
Gazzali, Lobry, M., Colombeau, L., Acherar, S., Azaïs, H., Mordon, S., . . . Frochot, C. (2016). Stability of folic acid under several parameters. European Journal of Pharmaceutical Sciences, 93, 419-430.
Grune, T., Lietz, G., Palou, A., Ross, A. C., Stahl, W., Tang, G., . . . Biesalski, H. K. (2010). β-Carotene is an important vitamin A source for humans. The Journal of nutrition, 140(12), 2268S-2285S.
Henry, R. (2005). Plant diversity and evolution: genotypic and phenotypic variation in higher plants: Cabi Publishing.
Hurtado, A., Rocha, N., Torres, N., & Torres, L. (2016). Determination of Folic Acid in Fortified Cereals by High Performance Liquid Chromatography with Diode Array Detection. SMGroup.
Khoo, H. E., Azlan, A., Tang, S. T., & Lim, S. M. (2017). Anthocyanidins and anthocyanins: colored pigments as food, pharmaceutical ingredients, and the potential health benefits. Food & nutrition research, 61(1), 1361779-1361779. doi: 10.1080/16546628.2017.1361779
Krol, L. (2019). [Peerreview ethisch dilemma]. Liaaen-Jensen, S., & Jensen, A. (1971). [56] Quantitative determination of carotenoids in photosynthetic
tissues Methods in Enzymology (Vol. 23, pp. 586-602): Academic Press. Mepham, B. (2013). Ethical principles and the ethical matrix. Practical Ethics for Food Professionals: Ethics in
Research, Education and the Workplace, 52. Miraji, K. (2019). [Communication about buffer and stock solution]. Müller, O., & Krawinkel, M. (2005). Malnutrition and health in developing countries. Cmaj, 173(3), 279-286. Nijeboer, A. (2009). Waarom ontwikkelingshulp niet werkt en hoe Afrika zich wel kan ontwikkelen. Lcoomotie. Off, M. K., Steindal, A. E., Porojnicu, A. C., Juzeniene, A., Vorobey, A., Johnsson, A., & Moan, J. (2005).
Ultraviolet photodegradation of folic acid. Journal of Photochemistry and Photobiology B: Biology, 80(1), 47-55.
Omemu, A., Edema, M., Atayese, A., & Obadina, A. (2006). A survey of the microflora of Hibiscus sabdariffa (Roselle) and the resulting “Zobo” juice. African Journal of Biotechnology, 5(3), 254-259.
24 | P a g e
Piovesana, A., Rodrigues, E., & Noreña, C. P. Z. (2019). Composition analysis of carotenoids and phenolic compounds and antioxidant activity from hibiscus calyces (Hibiscus sabdariffa L.) by HPLC-DAD-MS/MS. Phytochemical Analysis, 30(2), 208-217. doi: 10.1002/pca.2806
Potkamp, S. (2018). The effect of turmeric on the growth of Escherichia coli in street vended zobo beverage (Hibiscus sabdariffa).
Ramadan, G., Al-Kahtani, M. A., & El-Sayed, W. M. (2011). Anti-inflammatory and Anti-oxidant Properties of Curcuma longa (Turmeric) Versus Zingiber officinale (Ginger) Rhizomes in Rat Adjuvant-Induced Arthritis. Inflammation, 34(4), 291-301. doi: 10.1007/s10753-010-9278-0
Sakiyan, O., Sumnu, G., Sahin, S., & Bayram, G. (2004). Influence of fat content and emulsifier type on the rheological properties of cake batter. European Food Research and Technology, 219(6), 635-638. doi: 10.1007/s00217-004-1020-4
Sáyago-Ayerdi, S. G., Arranz, S., Serrano, J., & Goñi, I. (2007). Dietary fiber content and associated antioxidant compounds in roselle flower (Hibiscus sabdariffa L.) beverage. J. of Agricultural and Food Chemistry, 55(19), 7886-7890.
Siems, W. G., Sommerburg, O., & Van Kuijk, F. J. (1999). Lycopene and β‐carotene decompose more rapidly than lutein and zeaxanthin upon exposure to various pro‐oxidants in vitro. Biofactors, 10(2‐3), 105-113.
Singh, V., & Garg, A. N. (2006). Availability of essential trace elements in Indian cereals, vegetables and spices using INAA and the contribution of spices to daily dietary intake. Food Chemistry, 94(1), 81-89. doi: https://doi.org/10.1016/j.foodchem.2004.10.053
Steiner, B. M., McClements, D. J., & Davidov-Pardo, G. (2018). Encapsulation systems for lutein: A review. Trends in Food Science & Technology, 82, 71-81. doi: https://doi.org/10.1016/j.tifs.2018.10.003
Toti, E., Chen, C. Y. O., Palmery, M., Villaño Valencia, D., & Peluso, I. (2018). Non-Provitamin A and Provitamin A Carotenoids as Immunomodulators: Recommended Dietary Allowance, Therapeutic Index, or Personalized Nutrition? Oxidative medicine and cellular longevity, 2018, 4637861-4637861. doi: 10.1155/2018/4637861
Trinidad, T., Sagum, R., Leon, M. p. d., Mallillin, A., & Borlagdan, M. (2010). Zingiber Officinale and Curcuma Longa as Potential Functional Foods/Ingredients.
Tulchinsky, T. H. (2010). Micronutrient Deficiency Conditions: Global Health Issues. Public Health Reviews, 32(1), 243-255. doi: 10.1007/bf03391600
United States Department of Agriculture. (2018). Retrieved from https://ndb.nal.usda.gov/ndb/foods/show/02043?fgcd=&manu=&format=&count=&max=25&offset=&sort=default&order=asc&qlookup=02043&ds=&qt=&qp=&qa=&qn=&q=&ing=
SPRITE, lemon-lime, without caffeine, (2018). United States Department of Agriculture (USDA). (2019a). Apple juice, canned or bottled, unsweetened,
without added ascorbic acid. (173933). Retrieved from https://fdc.nal.usda.gov/fdc-app.html#/food-details/173933/nutrients.
United States Department of Agriculture (USDA). (2019b). Milk, fluid, 1% fat, without added vitamin A and vitamin D. (173441). Retrieved from https://fdc.nal.usda.gov/fdc-app.html#/food-details/173441/nutrients.
Voedingscentrum. (2018a). Foliumzuur (vitamine B11). Retrieved from https://www.voedingscentrum.nl/encyclopedie/foliumzuur.aspx.
Voedingscentrum. (2018b). IJzer. Retrieved from https://www.voedingscentrum.nl/encyclopedie/ijzer.aspx. Voedingscentrum. (2018c). Vitamine C (ascorbinezuur). Retrieved from
https://www.voedingscentrum.nl/encyclopedie/vitamine-c.aspx. Voedingscentrum. (2018d). Zink. Retrieved from https://www.voedingscentrum.nl/encyclopedie/zink.aspx. Vos, C. (2019). Zolang landen hun eigen honger stillen ten koste van Afrika, verandert er niks. de Volkskrant.
Retrieved from https://www.volkskrant.nl/kijkverder/2018/voedselzaak/artikelen/afrika-zou-zich-een-stuk-beter-ontwikkelen-als-we-ons-er-minder-mee-zouden-bemoeien/
World Health Organization. (1999). Management of severe malnutrition: a manual for physicians and other senior health workers.
World Health Organization. (2018). The nutrition challenge: food system solutions: World Health Organization.

- 1 -
8 Appendix
8.1 Protocols Protocol 1 Dry matter content 1. Introduction Dry matter content is measured in order to express the concentration of an compound of certain material in gram per dry matter . Dry matter/ moisture can play a role in the shelf life of products. For some products the commodities requires a minimum dry matter content. By heating the sample, water is evaporating. Sea sand is used when the product is relatively wet to prevent the forming of a film. 2. Reagents Sea Sand Firma: Merckx no: DATV 107712 storage; FQD.L2-11.VCC &2.11 3. Equipment Analytical balance Excicator Numbered aluminium boxes with covers storage; FQD L 2.10 cupboard 27 Metal tray for transport Glass spatula Oven 100 °C and 80 °C 4. Method Wet material:
• Heat the aluminium boxes at least 30 minutes or during the night at 100 C. Cool to room temperature with the cover closed in the excitator, during 20 minutes at least.
An other possibility is drying the boxes during a longer period of time in the excitator.
• Number the boxes. • Add 1 gram of sea sand and the glass spatula. • Weight the boxes. • Weights 0,5 –1 gram of your sample of interest. Mix the material using the spatula. • Dry the sample (don’t remove the spatula)without cover during the night at 80 °C,
followed by 3 hours at 100 °C and 1 hour in the excitator. • Weight the boxes using the analytical balance. • Calculate the dry matter content.
Dry material:
• Heat the aluminium boxes at least 30 minutes or during the night at 100 C. Cool to room temperature with the cover closed in the excitator, during 20 minutes at least.
An other possibility is drying the boxes during a longer period of time in the excitator
• Number the boxes. • Weight the boxes • Weights 0,5 –1 gram of you’re sample of interest. • Dry the sample without cover during the night at 100 C, followed by 1 hour in the
excitator • Weight the boxes using the analytical balance.
- 2 -
• Calculate the dry matter content Remarks
• Weighting accuracy 0,1 mg • Dry matter content diary product see notes of practical course • Meat product take 5-10 gram cut in peaces, use blender 1 minute speed 3 • Instead of drying overnight, you can dry for 3 hours in total. Cool to room temperature
after 2 hours of drying. Determine the weight. Dry for another hour, cool to room temperature, determine the weight. Repeat this procedure until the difference in weight is less than 0,5 mg. Using the last measurement for you’re calculation.
6. Literature. 7. Calculation % ds = weight after drying- weight box before drying)/ weight of the sample * 100 %. Or % water = ((weight box + weight product)-weight box after drying)/ weight of sample *100% % ds= 1- % water.
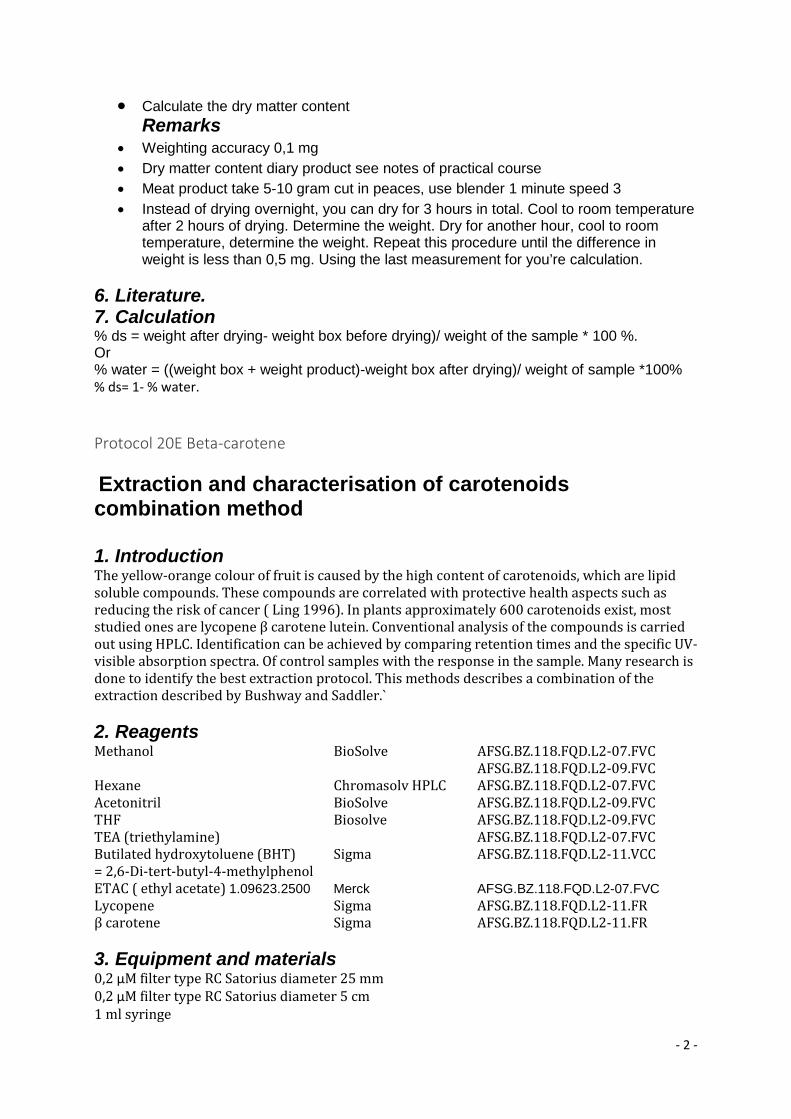
Protocol 20E Beta-carotene Extraction and characterisation of carotenoids combination method 1. Introduction The yellow-orange colour of fruit is caused by the high content of carotenoids, which are lipid soluble compounds. These compounds are correlated with protective health aspects such as reducing the risk of cancer ( Ling 1996). In plants approximately 600 carotenoids exist, most studied ones are lycopene β carotene lutein. Conventional analysis of the compounds is carried out using HPLC. Identification can be achieved by comparing retention times and the specific UV-visible absorption spectra. Of control samples with the response in the sample. Many research is done to identify the best extraction protocol. This methods describes a combination of the extraction described by Bushway and Saddler.` 2. Reagents Methanol BioSolve AFSG.BZ.118.FQD.L2-07.FVC
AFSG.BZ.118.FQD.L2-09.FVC Hexane Chromasolv HPLC AFSG.BZ.118.FQD.L2-07.FVC Acetonitril BioSolve AFSG.BZ.118.FQD.L2-09.FVC THF Biosolve AFSG.BZ.118.FQD.L2-09.FVC TEA (triethylamine) AFSG.BZ.118.FQD.L2-07.FVC Butilated hydroxytoluene (BHT) Sigma AFSG.BZ.118.FQD.L2-11.VCC = 2,6-Di-tert-butyl-4-methylphenol ETAC ( ethyl acetate) 1.09623.2500 Merck AFSG.BZ.118.FQD.L2-07.FVC Lycopene Sigma AFSG.BZ.118.FQD.L2-11.FR β carotene Sigma AFSG.BZ.118.FQD.L2-11.FR 3. Equipment and materials 0,2 μM filter type RC Satorius diameter 25 mm 0,2 μM filter type RC Satorius diameter 5 cm 1 ml syringe

- 3 -
HPLC amber flask and cover Alltech Disposable centrifuge tubes 50 ml Greiner Disposable centrifuge tubes 15 ml Greiner Hereaus Multifuge x3R location 2.10 HPLC system 4 /5 location 2.08 Ultra turrax without air vent location 2.09 Solutions filter device location 2.08 Evaporator location 2.09 Monolytic column Onyx C18 Phenomenx ( 100x 4.6 mm) cat no; CHO-7643 4. Method Pre-treatment material; Prepare samples according to protocol .... Sample preparation: Carotenoid extraction is performed out under subdued light and the extracts stored at a dark place to prevent exposure of carotenes to the ultraviolet light.( lab 2.09) For samples containing water ( like watermelon) follow procedure A. Other fruit or vegetables follow procedure B. A: Execute triplicate extraction. Weigh 1.25 gram of sample in 15 ml centrifuge tube. Use 5 gram when juices are used. Add 10 ml of hexane. Vortex during 10 minutes and centrifuge 5 minutes for 3000 rpm. Discard the supernatant in new 50 ml centrifuge tube. Repeat the procedure for at least 2 times until the flesh of the fruit appears colourless. Execute the third extraction using THF instead of hexane. Water confined within collected supernatant is eliminated by freezing for 30 minutes at -20 °C Remove the upper coloured part (hexane, THF and extracted carotenes) and collect in new tube. Evaporate the extract using vacuum evaporator (40 0C and 270 mbar vacuum protocol no25). Dissolve the extracted carotenes in sample buffer. Filter the 1 ml of sample on 0.20 μm filters, and pour into amber vials to be analysed. B: Execute triplicate extraction if possible. Weigh 2 gram of fresh fruit of vegetable. Add 3 volumes of miili Q water and 10 ml of hexane. Homogenize the sample using an ultra turrax at 10.000 rpm for 1 minute. Vortex the sample another 5 minutes and centrifuge 3000 rpm for 5 minutes. Discard the supernatant in an new 50 ml tube and add 10 ml of THF. Repeat this procedure for 3 times until the pellet appears colourless after centrifugation. Water confined within collected supernatant is eliminated by freezing for 30 minutes at -20 °C Remove the upper coloured part (hexane, THF and extracted carotenes) and collect in new tube. Evaporate the extract using vacuum evaporator (40 0C and 270 mbar vacuum protocol no 25). Extracted carotenes were then dissolved in sample buffer. Filter the 1 ml of sample on 0.20 μm filters, and pour into amber vials to be analysed. Samples are analysed on Phenomenex Onyx C18 column. For most detailed results the YM 30 column is used.( consult your supervisor) and see remarks. Solutions; Sample buffer; MeOH-THF 1:1 + 0.01% BHT. HPLC solutions; Analyses α and β carotene; ACN:MeOH:ETAC 60:30:10 + 0.1% TEA, sonicate 20 minutes before use Analyses xanthophyls; Aceto : MeOH 95: 5 + 0.05% TEA, sonicate 20 minutes before use Analyses carotenoids and xanthopyls; A Aceto : MeOH 95: 5 + 0.05% TEA, sonicate 20 minutes before use
- 4 -
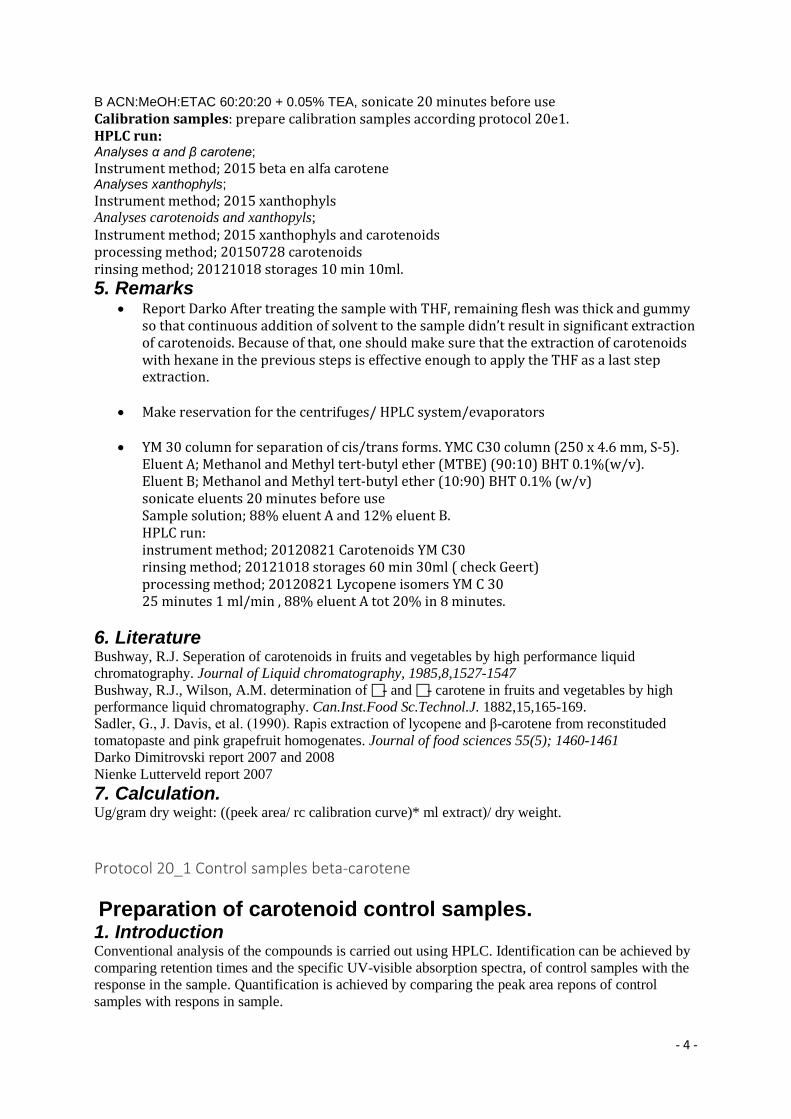
B ACN:MeOH:ETAC 60:20:20 + 0.05% TEA, sonicate 20 minutes before use Calibration samples: prepare calibration samples according protocol 20e1. HPLC run: Analyses α and β carotene; Instrument method; 2015 beta en alfa carotene Analyses xanthophyls; Instrument method; 2015 xanthophyls Analyses carotenoids and xanthopyls; Instrument method; 2015 xanthophyls and carotenoids processing method; 20150728 carotenoids rinsing method; 20121018 storages 10 min 10ml. 5. Remarks
• Report Darko After treating the sample with THF, remaining flesh was thick and gummy so that continuous addition of solvent to the sample didn’t result in significant extraction of carotenoids. Because of that, one should make sure that the extraction of carotenoids with hexane in the previous steps is effective enough to apply the THF as a last step extraction.
• Make reservation for the centrifuges/ HPLC system/evaporators
• YM 30 column for separation of cis/trans forms. YMC C30 column (250 x 4.6 mm, S-5).
Eluent A; Methanol and Methyl tert-butyl ether (MTBE) (90:10) BHT 0.1%(w/v). Eluent B; Methanol and Methyl tert-butyl ether (10:90) BHT 0.1% (w/v) sonicate eluents 20 minutes before use Sample solution; 88% eluent A and 12% eluent B. HPLC run: instrument method; 20120821 Carotenoids YM C30 rinsing method; 20121018 storages 60 min 30ml ( check Geert) processing method; 20120821 Lycopene isomers YM C 30 25 minutes 1 ml/min , 88% eluent A tot 20% in 8 minutes.
6. Literature Bushway, R.J. Seperation of carotenoids in fruits and vegetables by high performance liquid chromatography. Journal of Liquid chromatography, 1985,8,1527-1547 Bushway, R.J., Wilson, A.M. determination of - and - carotene in fruits and vegetables by high performance liquid chromatography. Can.Inst.Food Sc.Technol.J. 1882,15,165-169. Sadler, G., J. Davis, et al. (1990). Rapis extraction of lycopene and β-carotene from reconstituded tomatopaste and pink grapefruit homogenates. Journal of food sciences 55(5); 1460-1461 Darko Dimitrovski report 2007 and 2008 Nienke Lutterveld report 2007 7. Calculation. Ug/gram dry weight: ((peek area/ rc calibration curve)* ml extract)/ dry weight.
Protocol 20_1 Control samples beta-carotene Preparation of carotenoid control samples. 1. Introduction Conventional analysis of the compounds is carried out using HPLC. Identification can be achieved by comparing retention times and the specific UV-visible absorption spectra, of control samples with the response in the sample. Quantification is achieved by comparing the peak area repons of control samples with respons in sample.

- 5 -
This methods describes the procedure to prepare stock solutions and to measure the concentration of control samples. 2. Reagents Ethanol BioSolve AFSG.BZ.118.FQD.L2-09.FVC Hexane Chromasolv HPLC AFSG.BZ.118.FQD.L2-07.FVC THF Biosolve AFSG.BZ.118.FQD.L2-09.FVC BHT Butilated hydroxytoluene Sigma AFSG.BZ.118.FQD.L2-11.VCC = 2,6-Di-tert-butyl-4-methylphenol Lycopene L9879 Sigma AFSG.BZ.118.FQD.L2-11.FR β carotene C9750 Sigma AFSG.BZ.118.FQD.L2-11.FR Lutein= Xanthophyll Fluka 95507 Zeaxanthin CaroteNature? Asthaxanthin CaroteNature? 3. Equipment and materials 0,2 μM filter type RC Satorius diameter 25 mm 1 ml syringe 0,2 μM filter type RC Satorius diameter 5 cm HPLC amber flask and cover Alltech Cryogene vial lab 2.10?? Volumetric flasks 10 ml Kimax Tube Glass pipet (Pasteurse pipet) Evaporator location 2.09 Cary 50 spectrometer location 2.09 Solutions filter device location 2.08
4. Method Sample solutions; MeOH – THF 1:1 0.01 % BHT. Filter solution using 0.2 um RC filter. Stock solution preparation; Each carotenoid has its specific solvent solution, see table1. Work under Nitrogen. Prepare stocksolutions of β carotene; weigh the amount as described in table 1 in Kimax tube and add THF. Prepare stocksolutions of lycopene; open ampul add 250 ul THF transfer into Kimax tube. Rinse ampul 3* 250 ul with THF. Prepare stocksolutions of Lutein/Zeaxanthin/ Astaxanthine; transfer the content of an ampul quantitatively into 10 ml volumetric flask, under nitrogen. Add a small amount of ethanol/THF into the amplul. Use a glass pipet (Pasteur) to dissolve.
• Transfer the solution to volumetric flask using a second one. • Repeat the procedure 3 times. Check if the solution is clear. • Adjust the volumetric flask to the mark • Transfer the solution to a labelled Kimac tube • Divide 1 ml portion into cryogene vial, flush with nitrogen and store -40ºC at Q3
Diluted stock solution
• Diluted stock solutions are used to measure the concentration. Find additional information in table 2.
• Execute duplicate dilutions in kimax tubes. Total amount needed for spectrophotometer 1.5 ml.
• Measure the absorption against solvent as blank. • Calculate the concentration in stock solution.
Work solutions The stock solutions are used for preparation of 4 point calibration curve in range 0.125/ 0.25/ 0.5 and 1 ug/ml in sample solution according to table 3A and 3B.

- 6 -
The pre-dilutions are stored at -20°C in amber vials, after flushing with nitrogene and filtering using 0.2 um filter. Every sequence contains fresh diluted calibration curve. 5. Remarks The preparation of the control samples is executed in lab 2.09 because of the light and oxidative sensitivity of the material. Connect a funnel to the nitrogen supply and work underneath it during dissolving the samples. Stability stock solutions; 6-8 weeks at -40°C. Stability work solutions; 6-8 weeks at -40°C. Purity control samples; notify supervisor if purity is less than 95%.Correct concentration if necesaary. 6. Literature. Based on Human Nutrition Protocol Pieter Versloot 2005
7. Calculation. Conc control ug/ml= (E/ spec abs)* 104* dilution * % purity % Purity = (area component/ sum area total peaks)*100
Table 1 Control sample and dilution buffer
Table 2 Diluted stocksolutions
Table 3A Calibration curve pre-dilutions
Table 3B Calibration curve dilutions

- 7 -
Protocol 35A1 Vitamin C Determination of L- Ascorbic Acid(AA) and L-dehydroascorbic Acid(DHA) using HPLC in Fruit Juices. 1. Introduction L-Ascorbic Acid(AA) is the main active form of Vitamin C. Ascorbic acid can be easily oxidised to L-Dehydroascorbic Acid (DHA) which as well exhibit biological activity. Humans cannot synthesise ascorbate, thus their main source of Vitamin C are fruits, vegetables and sub products. This Vitamin is calling attention due to its antioxidant properties which had been related with the prevention of some diseases. This analytical method determines the concentration of Ascorbic Acid and the concentration of Total Ascorbic Acid by the reduction reaction of DHA to AA. The concentration of DHA is calculated by subtracting the initial AA content from the total AA content after conversion. 2. Reagents Ethanol, 100% (ETOH) Merck 100983 AFSG.BZ.118.FQD.L2-07.FVC
AFSG.BZ.118.FQD.L2-09.FVC Metaphosphoric Acid (MPA) Merck 100546 AFSG.BZ.118.FQD.L2-11.VCC Orthophosphoric Acid Merck 100573 AFSG.BZ.118.FQD.L2-06.FVA Tris-2-carboxyethyl phosphine Sigma C4706-10G AFSG.BZ.118.FQD.L2-11.REF (TCEP) L-Ascorbic Acid Sigma 95210-250G AFSG.BZ.118.FQD.L2-11.VCC tert-Butylhydroquinone Fluka 19986 AFSG.BZ.118.FQD.L2-11.VCC (=THBQ) 3. Equipment and materials Analytical balance location 2.11 Waring blender location 2.07 Ultra Turrax T25 & small Turrax tube location 2.09 Hereaus Multifuge x3R location 2.10
Eppendorf 5430R centrifuge l ocation 2.09 5 ml rotor HPLC system 1 location 2.08 Varian Polaris C18a (4.6*150mm 5 m) location 2.08 Guard column 0.2μm HPLC filter (Sartorius, CA 0.45μm, 15 mm) 2 ml syringes HPLC amber vials and covers 1000 ml glass bottle 2000 ml glass beaker 5 ml eppendorf tube( order number 0030 119 401) 2-10 cupboard 8 15 ml Greiner tubes with marks. 50 ml Greiner tubes with marks. 4.Solutions 1M THBQ 166,2 mg/ml ETOH 3% MPA, 1 mM THBQ in Milli-Q water: weigh 30 gram of MPA and add 1.0 ml of 1 M THBQ solution to 1000 ml milli Q water. Pass through a 0.2μm CA filter. Store this solution in a refrigerator. 1M TCEP (M=286,65) in Milli-Q water; prepare a solution of 1.4333g/5ml in milli Q water. Pass through a 0.2μm CA filter and keep it cool in a refrigerator and during use in a bucket with ice. Orthophosphoric Acid 0.2% in milli Q water; weigh 4 grams and dissolve in 2 liter milli Q water. sonicate 20 minutes before use. Rinsing solution; 80% H20 20% MeOH, sonicate 20 minutes before use

- 8 -
5.Method Pre Sample preparation fresh fruit juice: Press the fresh homogenates directly after cutting, using a hydraulic press and a combination of a synthetic towel and a cheese towel.
• Pre-wet both towels. • Place first the synthetic cloth into a plastic container. • Add the cheese cloth (is thus the inner one) and add the pulp, wrap tightly and transfer to the
press. • Bring the pressure gradually up to 100 bar (first go slowly to 150 bar resulting in pressure
drop between 100 and 150 bar) • Hold on pressure till no juice is released • The fresh fruit juices are stored on ice or -20˚C till further preparations.
Every sample is pressed with the same synthetic cloth, but a new cheese cloth. Rinse the synthetic cloth after pressing. Ascorbic acid extraction (AA) Prevent the Ascorbic acid from oxidation, read remarks. Samples are handled in triplicate; so weigh your samples 3 times
• Thawing of frozen fruit juice is done overnight in a refrigerator. • Mix the fresh juice and pipette 10.0 ml in a 15 ml Greiner tube. • Centrifuge for 10 min at 3000 rpm at 4˚C. • Deposit 2x 5.0 ml supernatant in 5.0 ml Greiner tubes • Centrifuge for 10 min at 10.500 rpm at 4˚C. • Filter the juice using 0.2 μm CA filters. • Dilute your samples in 3% MPA, THBQ if the concentration exceeds 200μg /ml Vit.C • 2 ml is used for AA measurements; prepare 1 HPLC vials with 2 ml • 2 ml is used for TAA measurements.
. Depending on the research question you can decide to estimate the recovery of Ascorbic Acid from the fibers:
• Weigh new 15 ml Greiner tube. • Add 10.0 ml juice and weigh again. • Centrifuge for 5 minutes at 3000 rpm at 4˚C. • Collect supernatant in pre-weight tube • Suspend pellet in 3.5 ml of 3%MPA, THBQ solution • Mix well • Repeat centrifugation and combine supernatants • Treat pellets 3 times and note total weight.
Total ascorbic acid determination (TAA) using TCEP solution: Use 2 ml of the filtrate homogenate described above.
• Pipet 15 μL of TCEP solution into an amber HPLC vial • add 1.485 ml of the prepared extract as described above. • Shake well. • Incubate 20 minutes at room temperature. • The samples are then ready for HPLC analysis.
Calibration standard serie:

- 9 -
• Prepare 10 mg/ml Ascorbic acid stock d solution in MPA THBQ • Filtered through a 0,2 μm CA filter. • Dilute the stock solution, 50x 100x 200x 400x 800x 1600x 3200x 6400x ( range 200
μg/ml- 1.56 μg/ml). • Transfer t 2 mL of the dilutions in amber HPLC files.
Prepare blank HPLC vials:
• 3% MPA THBQ solution, • 0.2% Orthophosphoric Acid solution. • 1mM TCEP in 3%MPA THBQ solution.
HPLC run: Elution Buffer: is Orthophosphoric Acid 0.2% in milli Q water Run time: 5,5 minutes Flow: 1ml/min 245 nm Sample injected: 20μl instrument method; 20121114 vit C Polaris HPLC1 rinsing method; 20121114 vit C Polaris HPLC 1 processing method; 20120802 vit C Polaris 2010 nov Sample dilutions: Pine apple juice: 4 times diluted Marula juice: 8 times diluted 6.Remarks Prepare Ascorbic Acid stock solutions fresh every day (store in ice during preparation) Always include control mango sample in the test. Preparation of samples, extracts, stock solutions and standards are done under reduced light (safety fume hood lab.209) and at 4˚C (cold centrifugation and storage in ice bucket with ice). Try to avoid freezing of starting material. When concentrations are too high dilute with 3% MPA 1mM THBQ solution. HPLC analysis are first performed on Blanks, then on AA samples and TAA samples and at last on the standard series. After each 10 samples a blank of the eluent should be run . Rinse system and column at least 30 minutes with 80% H20 20% MeOH According to results Teresa; standard deviation should not exceed 10% for duplicate samples 7.Literature. Hernandez, Y., Lobo, M. G. &Gonzalez, M. (2006). Determination of vitamin C in tropical fruits: a comparative evaluation of methods. Food Chemistry 96(4): 654-664. Wechtersbach, L., Cigic, B. (2007). Reduction of dehydroascorbic acid at low Ph. J.Biochem. Biophys, Methods 70: 767-772. 8.Calculation. 1. Construct calibration curve. Regression should be at least 0.98. The rc should fit in range 0.8 till 1.5. 2. Check the integration and determine the area’s. 3. Determine the exact weight of pellets, extraction volumes etc. 4. Calculate the amount of vit.C in samples and express in mg/100 g fresh weight. Using the calculated concentration by the Chromeleon software
Protocol 38 Fat content The Soxhlet extraction. 1. Introduction

- 10 -
Soxhlet is used for total fat determination in food. In principle fat will be extracted out of a food product, using petroleum ether 40-60˚C, special glassware, sample thimbles and a heating block, for at least 3 hours. It is used for solid food samples containing less than 10% water. If moisture content is higher pre-drying of samples is necessary. Samples should also be homogeneous. 2. Reagents Petroleum ether 40-60˚C; Merck 1.01774.2500 (P.E.) 2-07 FVC Cleaning solutions: Acetone for rinsing; VWR PROL20063.695 2-07 FVC Industrial soap: Mix of 500 ml K500 soap, 250 ml 33% NaOH and 2000 ml of demi-water or use “RECA Teepol soap” ask Frans Demineralized water Chemicals and solutions: Sea sand; Merck 1.07711.1000 2-11VCC Hydrochloric acid, concentrated, Merck 1.00314.2500 2-06 AAC Hydrochloric acid, 4M; Add 400 ml of demineralized water in a 1 Litre glass beaker and add slowly 200 ml concentrated hydrochloric acid while stirring. 3. Equipment and materials Reservation: subscription in office agenda in fume hood in lab.2-06 (full name, data and number of samples) Fume Hood lab. 2-06 Heating blocks: Labotech LT-6 heating blocks for 6 positions each (2 blocks available)= 12 positions and/or Gerhardt EV16 heating blocks for 6 positions each (2 blocks available)= 12 positions. In total 24 positions. Special glassware: Coolers Extractors (150 ml); Lenz Laborglasinstruments art.nr. 5395143 Location; storage room FQD “ bordes”. Extraction thimbles (Whatman nr. 603; 33*118 mm) Lab 2.06/6-2
Flatbottomflasks, 250 ml Lab 2.09/9-13 Fat free cotton wool Boiling chips Dispenser, 50 ml with tubing, for adding petroleum ether Rotation Evaporator(s) of Büchi; Reservation by Outlook digital agenda Analytical balance (accuracy 0.1 mg) Whatman 595 ½ filter discs, 150 mm (only for meat sample hydrolysis) pH paper 0-14 (for meat sample hydrolysis) Measuring cylinder, glass, 500 ml (for meat sample hydrolysis) Watch glasses (for meat sample hydrolysis) Glass beaker, 250 ml (for meat sample hydrolysis) Glass beaker, 100 ml (for thimbles to weigh samples) Glass beaker, 1 Litre (for making 4M HCl) Glass beaker, 2 Litre (for evaporation of P.E. out of thimbles) 50 ml Measuring cylinder (for adding hydrolysis solution) Glass funnels (only for meat sample hydrolysis) 4. Method Sample preparation:

- 11 -
• Be sure samples are homogeneous and contain no more than 10% moisture. If so, pre-dry samples overnight in an oven at 102˚C.
• For meat samples first hydrolysis of samples should be carried out described below (“Hydrolysis of meat samples”)
• Weigh in extraction thimbles 1-5 grams of sample (amount depending on expected fat percentage: the higher fat % the lower the weight. Use a glass beaker of 100 ml ,to put thimbles in, and an analytical balance. If weight of sample is less than 5 grams, mix sample with Sea sand to total weight of 5 grams.
• Add a code to the thimbles with a pencil (not a pen!!) and close the extraction thimbles with a piece of cotton wool and bring it in extractors.
• Add some boiling chips to the flat bottom flasks and weigh them on an analytical balance.
• Add, using the dispenser, at least 200 ml petroleum ether 40-60˚C (but not more than 225 ml) in the flat bottom flasks with boiling chips.
Hydrolysis of meat samples:
• Weigh 3 to 5 grams of homogenised sample in a 300 ml Erlenmeyer flask. Add 50 ml 4M HCl and some boiling chips. Close the erlenmeijer flask with a watch glass and boil gently for 1 hour. Add 150 ml hot demineralized water and filter over a Whatman 595 1/2 , 150 mm, filter. Wash the erlenmeijer flask 3 times with hot water and filter. Wash the filter with hot water until the filtrate is neutral (check with pH paper). Spread the filter on a watch glass and dry it for at least 1 hour in an oven at 105˚C. Place the filter in a Soxhlet thimble and proceed as described below.
Extraction procedure:
Before use: Use the Soxhlet device set-up and place it in a fume hood. Connect the coolers to each other within one heating assembly and turn the cold water tap open (slowly and not too far: check outlet of last cooler).
• Connect the flat bottom flasks to the extractors and both to the coolers and place everything on a heating block.
• Turn on the heating block (Labotech blocks position “75%’” and Gerhardt position “2”). • Wait till the petroleum ether boils and refluxes in the extractor • Extraction should be done for at least 3 hours. • After extraction time stop heating, but leave the cooling on. After boiling and refluxing of
Petroleum ether stopped wait for half an hour to cool down. Close the water tap. • Disconnect the flat bottom flasks from the extractors and the extractors from the
coolers. Rinse all P.E into the flat bottom flasks (use closed side of extractor for pouring!!). Take out the thimbles and bring them in a glass beaker. Keep this beaker in the fume hood one night for evaporation of P.E. inside the thimbles.
• Rinse the extractors with small amounts of P.E. (5ml) and collect the liquid in the flat bottom flasks.
Evaporation of P.E.:
• Evaporate the P.E. in the flat bottom flasks using Rotation Evaporators of Büchi (lab.246) under vacuum (protocol 37).
• Leave the flat bottom flasks, after evaporating all P.E., overnight in a fume-hood to get rid of the last bit of P.E.
• Weigh the flat bottom flasks with boiling stones and fat on the same analytical balance as in the beginning of this experiment.
Cleaning:

- 12 -
• Clean the flat bottom flasks well with warm water and the industrial soap solution and leave them to dry on a drying rack. Throw the dried thimbles with sample waste in a waste basket or collect your dried samples for further analysis and throw the thimbles away.
• Clean the extractors 3 times with acetone and leave them to dry in the fume-hood. Acetone waste is collected in waste can 3 (halogen poor organic waste).
5. Picture of an Soxhlet assembly
6. Literature: Practicumhandleiding, Inleiding Levensmiddelenchemie en –analyse, H.A. Schols, H.L. Kaastra, E.J. Bakx, H. Gruppen, december 1999. Practical Manual Meat Science , J.P.H. Linssen et al. (PDQ-32806 manual). 7. Contact persons:
• Frans Lettink room 2.24 Tel : 0317-483231 E: [email protected] • Erik Meulenbroeks room 2.25
Protocol 39 Protein content
Working with the Flash EA 1112 Protein analyser 1. Equipment, tools and chemicals Flash EA 1112 Protein analyser (“DUMAS”) AFSG.BZ.118.FCH.L1-01. sample tray with 32 positions Eager 200 software

- 13 -
Stove 60˚C (for drying liquid samples) AFSG.BZ.118.FCH.L1-01. Microbalance (Mettler-Toledo XA105 AFSG.BZ.118.FCH.L1-01. Tin Cups (Interscience; in box with transparent cover) Sample rack for tin cups Spatula (small) Pipet 200 microliter and tips (for liquid samples) Tweezer Tin Cup closing device with pestle (Interscience) for standard series D-Methionine 99+% ACROS Organics227210250 AFSG.BZ.118.FCH.L1-01.
CAS 348-67-4 for blank samples Cellulose Aldrich 310697-50g AFSG.BZ.118.FCH.L1-01.
powder 20 μm; 2. Method Reservation; Ask Frans or Erik for booking in digital agenda of device. Principle of DUMAS: Dried or pre-dried homogeneous samples containing protein, methionine standards and blank (cellulose) samples are weight in tin cups and oxidised in the DUMAS in a metal column filled with oxidation chemicals at high temperature using pure oxygen and gases released are transported with helium as carrier gas through reduction, carbon dioxide and water filters onto a separation column on which nitrogen is separated and after that detected. A conversion factor is used to calculate nitrogen content into protein content. The results are good comparable to results obtained by the Kjeldahl method.
Sample preparation
Before every measurement it is necessary to clean the weighing tools thoroughly with ethanol. Samples for measurement should be homogeneous (dry samples milled and wet samples mixed well), because this is a microanalysis. Dry samples: Tare tin cup, weigh maximum 15 mg in the tin cup, make note of the weight and close with closing device and tweezer. Then, wearing gloves, make small tin balls by rubbing the closed tin cups between your thumb and pointing finger. Next place tin cups in sample rack (add to this rack your name and FQD on a tape). Wet samples: Tare tin cup, pipet 200 microliter in the tin cup, make note of the weight and place it in a sample rack. Add a tape with your name to this rack. Place the rack with tin cups in the 60˚C stove nearby the DUMAS. Dry overnight. Next day close the tin cups carefully with a tweezer and use the closing device and, wearing gloves, make small tin balls by rubbing the closed tin cups between thumb and pointing finger. Put the samples back in the sample rack. Only one sample tray on the system should be used (position 0 to 31= total 32 positions) so refill the sample tray when you have more than 32 samples (blanks+ standards+ own samples). Blank samples: weigh 10 to 15 mg of cellulose in tin cups, make note of the weight and close them as mentioned for dry and wet samples. Standard samples: weigh approximately 2.5, 5.0, 7.5, 10.0,12.5 and 15.0 mg of D-Methionine in tin cups, make note of their weight and close them as mentioned for dry and wet samples.

- 14 -
Order of analysis: 1 Blank sample, 6 standard samples, 1 Blank sample, 10 samples of your own, 1 Blank sample, 10 samples of your own, 1 Blank sample etc. In the end of your series add a methionine sample (as Unknown) and the last sample should be a Blank sample. Analyse your own samples at least in duplicate. Instrument maintenance
For maintenance ask: FQD - Frans Lettink, Erik Meulenbroeks (FCH - Emma Teuling, Peter de Gijsel) Starting up system
Select ‘Edit Elemental Analyser Parameters’ . Uncheck ‘Set instrument to Standby’, than select ‘SEND’ and ‘OK’. Perform a leak check (already possible without temperatures ready); Open the window ‘View
Elemental Analyser Status’ with the icon, and choos the tab ‘special functions’. Choose ‘leak check’. After 300 to 400 seconds carrier flow should be smaller than 5 ml/min and reference flow should be smaller than 10 ml/min. Check temperatures in toolbars caption ‘View, ‘View Elemental Analyser Status’ . The system is ready to use when ‘ready led’ on the system lights up. This takes about 30 minutes. Preparation measurement For every new sequence, a new folder ‘yymmdd’ should be made in your own folder. Copy the Method ‘Template N measurement’ in this folder from the ‘Method’ folder and adjust the sequence table of the method and save it in your folder with the new name. Fill in the sample names , the file name, the weights and your conversion factor. Always fill in a file name otherwise after measurement you can’t find your chromatograms! Opening your sample table can be done using Edit--> Sample Table. When having less than 62 samples, always end with a standard methionine. Actual (Act) should be checked in the row of your first sample in the Sample Table. This should be a Blank sample. When having less than 62 samples (maximum for a morning performance), always end with a blank sample (as Unknown) and then a methionine (as Unknown). Saving your method--> File-> Save method Starting measurement
Start the system with the icon and click “force to standby” before starting the sequence. Check if the first blank has a zero value and standard series have a R square of at least 0.99 (View--> Calibration curve) If so, continue with the analysis, otherwise ask the responsible technician of FQD Group (see maintenance list) to have a look at the instrument conditions. Looking at results: Recalculation--> Summary results

- 15 -
Important remark: Don’t leave the sample table and the Summary results screens open during measurement of your samples, because the DUMAS won’t go on with sampling your samples!!!!!
Finalize measurement Fill in the Excel file on the desktop on the PC It is important to have this data, so please fill in Copy your own data to Excel (File-Export-) and give this file the same name as your DUMAS file. Copy your Excel file to a USB stick for further data management. 3. Remarks as a result of visit of Interscience company (Only for supervisors) a) Re-introduce users with above-mentioned rules b) Do not use double cups anymore c) We tested the Oxygen supply and downgraded it. This results in less maintenance on Cupper column. d) When bringing system to standby position for maintenance, wait 2 minutes before disconnecting anything e) Be careful with replacing the catalyst tube. The inside coating of the oven is broken, so it is possible you hit the inside heating coil f) Remove ash after each measuring series, a new metal ash catcher has been introduced
8.2 Proximate analysis
Table 8.2.1 Moisture content of zobo with sugar
Moisture content batch 1 (in %)
Moisture content batch 2 (in %)
Average moisture content (in %)
Relative standard deviation (in %)
Zobo control 85.8 87.7 86.7 1.53 Zobo with boiled turmeric 2%
86.8 87.6 87.2 0.65
Zobo with boiled turmeric 6%
87.1 87.9 87.5 0.62
Zobo with turmeric paste 2%
86.3 88.8 87.5 2.02
Zobo with turmeric paste 6%
87.3 88.1 87.7 0.61
Table 8.2.2 Normality test for moisture content of zobo without sugar
Tests of Normality
Kolmogorov-Smirnova Shapiro-Wilk
Statistic df Sig. Statistic df Sig. Mois_cont_F 0.273 5 .200* 0.852 5 0.201 Mois_cont_G 0.252 5 .200* 0.845 5 0.179 Mois_cont_H 0.254 5 .200* 0.914 5 0.492 *. This is a lower bound of the true significance.
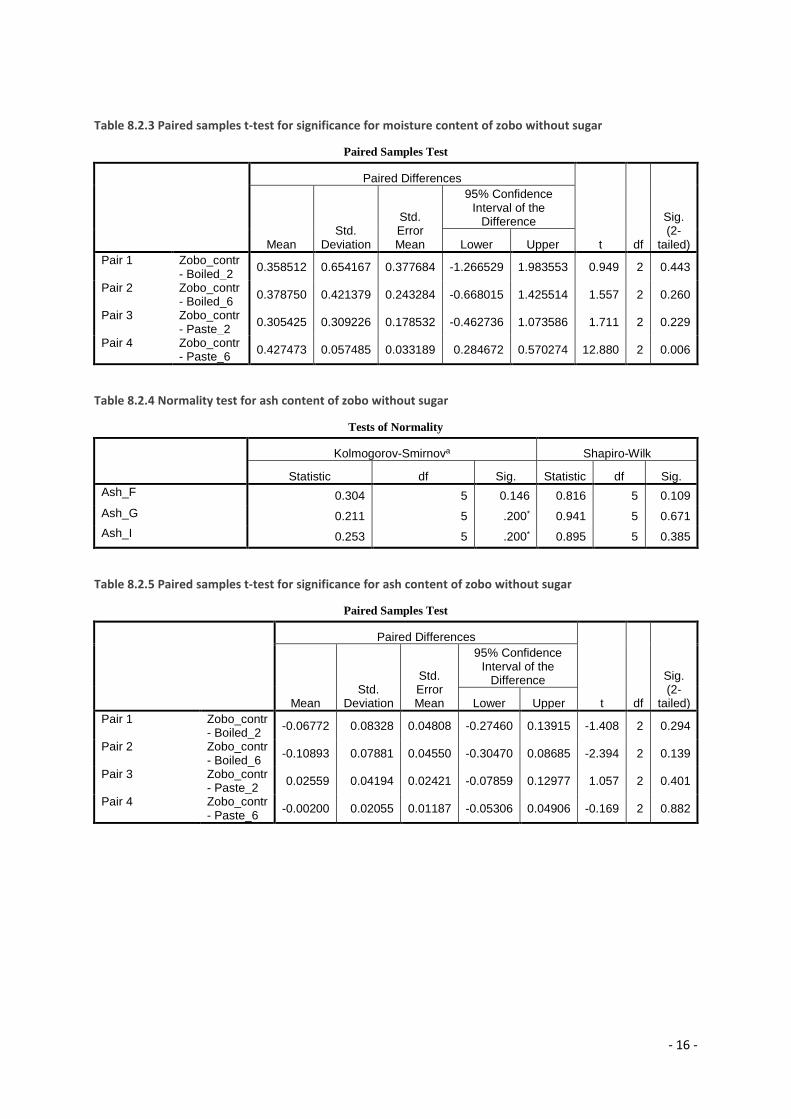
- 16 -
Table 8.2.3 Paired samples t-test for significance for moisture content of zobo without sugar
Paired Samples Test
Paired Differences
t df
Sig. (2-
tailed) Mean Std.
Deviation
Std. Error Mean
95% Confidence Interval of the
Difference
Lower Upper Pair 1 Zobo_contr
- Boiled_2 0.358512 0.654167 0.377684 -1.266529 1.983553 0.949 2 0.443
Pair 2 Zobo_contr - Boiled_6 0.378750 0.421379 0.243284 -0.668015 1.425514 1.557 2 0.260
Pair 3 Zobo_contr - Paste_2 0.305425 0.309226 0.178532 -0.462736 1.073586 1.711 2 0.229
Pair 4 Zobo_contr - Paste_6 0.427473 0.057485 0.033189 0.284672 0.570274 12.880 2 0.006
Table 8.2.4 Normality test for ash content of zobo without sugar
Tests of Normality
Kolmogorov-Smirnova Shapiro-Wilk
Statistic df Sig. Statistic df Sig. Ash_F 0.304 5 0.146 0.816 5 0.109 Ash_G 0.211 5 .200* 0.941 5 0.671 Ash_I 0.253 5 .200* 0.895 5 0.385
Table 8.2.5 Paired samples t-test for significance for ash content of zobo without sugar
Paired Samples Test
Paired Differences
t df
Sig. (2-
tailed) Mean Std.
Deviation
Std. Error Mean
95% Confidence Interval of the
Difference
Lower Upper Pair 1 Zobo_contr
- Boiled_2 -0.06772 0.08328 0.04808 -0.27460 0.13915 -1.408 2 0.294
Pair 2 Zobo_contr - Boiled_6 -0.10893 0.07881 0.04550 -0.30470 0.08685 -2.394 2 0.139
Pair 3 Zobo_contr - Paste_2 0.02559 0.04194 0.02421 -0.07859 0.12977 1.057 2 0.401
Pair 4 Zobo_contr - Paste_6 -0.00200 0.02055 0.01187 -0.05306 0.04906 -0.169 2 0.882

- 17 -
Table 8.2.6 Normality test for protein content of zobo without sugar
Tests of Normality
Kolmogorov-Smirnova Shapiro-Wilk
Statistic df Sig. Statistic df Sig. Fat_F 0.136 5 .200* 0.987 5 0.967 Fat_G 0.431 5 0.003 0.697 5 0.009 *. This is a lower bound of the true significance.
a. Lilliefors Significance Correction
Table 8.2.7 Normality test for protein content of zobo without sugar
Tests of Normality
Kolmogorov-Smirnova Shapiro-Wilk
Statistic df Sig. Statistic df Sig. Protein_F 0.319 5 0.105 0.793 5 0.071 Protein_G 0.320 5 0.103 0.850 5 0.194 Protein_H 0.237 5 .200* 0.961 5 0.814 *. This is a lower bound of the true significance.
a. Lilliefors Significance Correction
Table 8.2.8 Paired samples t-test for significance for protein content of zobo without sugar
Paired Samples Test
Paired Differences
t df
Sig. (2-
tailed) Mean Std.
Deviation
Std. Error Mean
95% Confidence Interval of the
Difference
Lower Upper Pair 1 Zobo_contr
- Boiled_2 -0.055130 0.017869 0.010316 -0.099518 -0.010742 -5.344 2 0.033 Pair 2 Zobo_contr
- Boiled_6 -0.039939 0.008220 0.004746 -0.060358 -0.019520 -8.416 2 0.014 Pair 3 Zobo_contr
- Paste_2 -0.008433 0.016500 0.009527 -0.049422 0.032557 -0.885 2 0.469
Pair 4 Zobo_contr - Paste_6 -0.021384 0.033265 0.019206 -0.104019 0.061250 -1.113 2 0.381
Pair 5 Boiled_2 - Boiled_6 0.015191 0.015816 0.009131 -0.024098 0.054480 1.664 2 0.238
Pair 6 Paste_2 - Paste_6 -0.012951 0.024550 0.014174 -0.073936 0.048033 -0.914 2 0.457

- 18 -
8.3 Vitamin content
Figure 8.3.1 Chemical structure of beta-carotene (Siems et al., 1999)
Figure 8.3.2 Chemical structure of lutein (Liaaen-Jensen & Jensen, 1971)
Figure 8.3.3 Example of a calibration curve used to calculate the vitamin C concentration
Table 8.3.1 Normality test for vitamin C content of zobo with sugar
Tests of Normality
Kolmogorov-Smirnova Shapiro-Wilk
Statistic df Sig. Statistic df Sig. Vit_C_D 0.236 5 .200* 0.872 5 0.275 Vit_C_E 0.146 5 .200* 0.997 5 0.997 *. This is a lower bound of the true significance.
a. Lilliefors Significance Correction
y = 0.7083xR² = 1
0
20
40
60
80
100
120
140
160
0 50 100 150 200 250
Peak
are
a (m
AU*m
in)
Concentration control sample (μg/mL)
Area versus concentration of control sample
Area
Linear (Area)

- 19 -
Table 8.3.2 Paired samples t-test for significance for vitamin C content of zobo with sugar
Paired Samples Test
Paired Differences
t df
Sig. (2-
tailed) Mean Std.
Deviation
Std. Error Mean
95% Confidence Interval of the Difference
Lower Upper Pair 1 Zobo_contr
- Boiled_2 -30.69606 12.12376 8.57279 -139.62369 78.23158 -3.581 1 0.173
Pair 2 Zobo_contr - Boiled_6 -25.58049 72.74037 51.43521 -679.12679 627.96580 -0.497 1 0.706
Pair 3 Zobo_contr - Paste_2 -4.63850 26.66940 18.85811 -244.25356 234.97656 -0.246 1 0.846
Pair 4 Zobo_contr - Paste_6 -70.05474 29.89544 21.13927 -338.65461 198.54514 -3.314 1 0.187
8.4 Mineral content Table 8.4.1 Normality test for iron content of zobo with sugar
Tests of Normality
Kolmogorov-Smirnova Shapiro-Wilk
Statistic df Sig. Statistic df Sig. Iron_B 0.259 5 .200* 0.870 5 0.266 Iron_C 0.201 5 .200* 0.932 5 0.612 *. This is a lower bound of the true significance.
a. Lilliefors Significance Correction
Table 8.4.2 Paired samples t-test for significance for iron content of zobo with sugar
Paired Samples Test
Paired Differences
t df Sig. (2-tailed) Mean
Std. Deviatio
n
Std. Error Mean
95% Confidence Interval of the
Difference
Lower Upper Pair 1
Zobo_contr - Boiled_2
-3.100
0 4.1012 2.900
0
-39.948
0
33.7480
-1.06
9 1 0.479
Pair 2
Zobo_contr - Boiled_6
-2.400
0 2.4042 1.700
0
-24.000
5
19.2005
-1.41
2 1 0.392
Pair 3
Zobo_contr - Paste_2
-0.350
0 0.0707 0.050
0 -
0.9853 0.2853 -
7.000
1 0.090
Pair 4
Zobo_contr - Paste_6
-1.900
0 0.4243 0.300
0 -
5.7119 1.9119 -
6.333
1 0.100

- 20 -
Table 8.4.3 Normality test for zinc content of zobo
Tests of Normality
Kolmogorov-Smirnova Shapiro-Wilk
Statistic df Sig. Statistic df Sig. Zinc_B 0.204 5 .200* 0.946 5 0.705 Zinc_C 0.222 5 .200* 0.914 5 0.490 *. This is a lower bound of the true significance.
a. Lilliefors Significance Correction
Table 8.4.4 Paired samples t-test for significance for zinc content of zobo with sugar
Paired Samples Test
Paired Differences
t df Sig. (2-tailed) Mean
Std. Deviatio
n
Std. Error Mean
95% Confidence Interval of the
Difference
Lower Upper Pair 1
Zobo_contr - Boiled_2
-0.0600
0 0.19799 0.1400
0
-1.8388
7
1.71887
-0.42
9 1 0.742
Pair 2
Zobo_contr - Boiled_6
-0.5350
0 0.16263 0.1150
0
-1.9962
1
0.92621
-4.65
2 1 0.135
Pair 3
Zobo_contr - Paste_2
-0.0500
0 0.14142 0.1000
0
-1.3206
2
1.22062
-0.50
0 1 0.705
8.5 pH and specific gravity Table 8.5.1 Normality test for pH of zobo
Tests of Normality
Kolmogorov-Smirnova Shapiro-Wilk
Statistic df Sig. Statistic df Sig. pH_F 0.256 5 .200* 0.880 5 0.312 pH_G 0.239 5 .200* 0.904 5 0.430 pH_H 0.266 5 .200* 0.903 5 0.428 *. This is a lower bound of the true significance.
a. Lilliefors Significance Correction

- 21 -
Table 8.5.2 Paired samples t-test for significance for pH of zobo
Paired Samples Test
Paired Differences
t df Sig. (2-tailed) Mean
Std. Deviati
on
Std. Error Mean
95% Confidence Interval of the
Difference
Lower Upper Pair 1
Zobo_contr - Boiled_2
-0.0146
67
0.037207
0.021481
-0.1070
93
0.077760
-0.68
3 2 0.565
Pair 2
Zobo_contr - Boiled_6
-0.1210
00
0.024269
0.014012
-0.1812
88
-0.0607
12
-8.63
6 2 0.013
Pair 3
Zobo_contr - Paste_2
-0.0126
67
0.004509
0.002603
-0.0238
68
-0.0014
65
-4.86
5 2 0.040
Pair 4
Zobo_contr - Paste_6
-0.0476
67
0.008145
0.004702
-0.0678
99
-0.0274
35
-10.1
37 2 0.010
Pair 5
Paste_2 - Paste_6
-0.0350
00
0.012166
0.007024
-0.0652
21
-0.0047
79
-4.98
3 2 0.038
Pair 6
Boiled_6 - Paste_6
0.073333
0.030022
0.017333
-0.0012
46
0.147913
4.231 2 0.052
Pair 7
Boiled_2 - Boiled_6
-0.1063
33
0.058859
0.033982
-0.2525
46
0.039880
-3.12
9 2 0.089
Table 8.5.3 Normality test for specific gravity of zobo
Tests of Normality
Kolmogorov-Smirnova Shapiro-Wilk
Statistic df Sig. Statistic df Sig. Spec_grav_F 0.229 5 .200* 0.867 5 0.254 Spec_grav_G 0.214 5 .200* 0.952 5 0.749 Spec_grav_H 0.225 5 .200* 0.900 5 0.410 *. This is a lower bound of the true significance.
a. Lilliefors Significance Correction
Table 8.5.4 Paired samples t-test for significance for specific gravity of zobo
Paired Samples Test
Paired Differences
t df
Sig. (2-
tailed) Mean Std.
Deviation
Std. Error Mean
95% Confidence Interval of the
Difference
Lower Upper Pair 1 Zobo_contr
- Boiled_2 0.002459 0.003790 0.002188 -0.006955 0.011873 1.124 2 0.378
Pair 2 Zobo_contr - Boiled_6 0.005028 0.007039 0.004064 -0.012457 0.022513 1.237 2 0.342
Pair 3 Zobo_contr - Paste_2 -0.001082 0.005450 0.003147 -0.014621 0.012457 -0.344 2 0.764
Pair 4 Zobo_contr - Paste_6 0.000848 0.005245 0.003028 -0.012180 0.013877 0.280 2 0.806

- 22 -
8.6 Ethiek Groepsopdracht
BSc Thesis Ethiek Studenten:
• Ellen ter Beest • Mette Hamers • Gertine Hoefnagel • Ellen Koopman • Berdet van Kraats • Laurine Krol
Titel thesis: De nutritionele kwaliteit van door kurkuma versterkte Zobo (Hibiscus sabdariffa) Naam thesisstudent: Ellen Koopman Naam begeleider: Anita Linnemann, Folake Idowu-Adebayo Checklist
1. Er mag geen fraude gepleegd worden (Lab integrity) 2. De wetenschapper moet kritisch zijn 3. Het onderzoek moet objectief zijn (De groene Amsterdammer) 4. Er mag geen plagiaat gepleegd worden (Lab integrity) 5. De dataset moet groot genoeg zijn om betrouwbare conclusies te trekken 6. De wetenschapper moet open staan voor weerlegging van zijn hypothese (Popper) 7. Er mag geen sprake zijn van belangenverstrengeling 8. Het onderzoek moet reproduceerbaar zijn 9. De wetenschapper moet transparant zijn 10. Het onderzoek moet relevant zijn
Checklist toegepast De checklist zal worden toegepast op de thesis van Ellen Koopman. 1. Ellen gaat integer met haar resultaten om en zal een belofte doen om geen fraude te plegen. 2. In haar research proposal geeft Ellen aan kritisch naar haar methodes, resultaten en literatuur te kijken, zodat haar thesis met een kritische blik wordt geschreven. 3. Er is geen sprake van belangenverstrengeling, dus het onderzoek is objectief. 4. Ellen pleegt geen plagiaat en zal op correcte wijze de bronnen vermelden. 5. Ellen geeft aan dat zij gebruik gaat maken van 2 onafhankelijke replica’s per behandeling, wat maakt dat de dataset groot genoeg is om betrouwbare conclusies te trekken 6. Ellen geeft aan dat ze ook open staat voor data die juist niet haar hypothese bevestigt. 7. Ellen heeft in geen enkele zin belangen bij de uitkomst van het onderzoek. 8. Doordat de materialen en methodes duidelijk beschreven zijn, is dit onderzoek reproduceerbaar. 9. De methode, data en referenties zijn duidelijk, zichtbaar, toegankelijk voor anderen, dus Ellen is transparant. 10. Het doel van Ellen haar onderzoek is om de Zobo te verrijken met vitaminen en mineralen, om ziekte en zelfs sterfte te verminderen in Nigeria. Het onderzoek kan grote gevolgen hebben voor de gezondheid in Nigeria en is dus zeker relevant. Vragen interview Welk criterium uit de lijst is het belangrijkst? Punt 1, want voordoen alsof je serieus onderzoek uitvoert terwijl je het hebt verzonnen is een groot misdrijf.

- 23 -
Mist u nog een criterium? Verantwoordelijkheid nemen als onderzoeker is ook belangrijk. Bijvoorbeeld op het gebied van duurzaamheid. Of bij het werken met mensen is het krijgen van toestemming cruciaal. Wetenschappers moeten ook altijd hun impact op hun omgeving meewegen in hun onderzoek. Hoe staat u tegenover de uitspraak van Popper: “Sta open voor dat ene verschijnsel dat je theorie kan weerleggen”. Mee eens, uitschieters, kloppen die wel of niet? In de wetenschap hebben we soms valse bevestiging van onze hypothese, de zogenaamde ‘false positives’. Dit komt door de significantie van 5% die standaard gehanteerd wordt. In 5 procent van de gevallen wordt dus onterecht een conclusie getrokken. Zo ook bij de zaak van Lucia de B. Zij werd als verpleegkundige verdacht van het vermoorden van meerdere mensen, die waren gestorven onder rare omstandigheden met haar in de buurt. Ze werd uiteindelijk levenslang opgesloten, onder andere door het argument dat al die doden slecht met kans van 1 op 7 miljard door toeval konden komen. Uiteindelijk is ze toch vrijgesproken. Dus met kansberekening achterhaal je niet altijd de waarheid. Werkt u/PhD’ers die u begeleidt samen met een bedrijf, en zo ja, hoe zorgt u er voor dat er geen sprake is van invloed van het bedrijf op het onderzoek of de resultaten? Het vak Product and Process Design waar ik nu lesgeef werkt samen met bedrijven. Ze betalen een kleine som geld voor de samenwerking. Van tevoren vertel ik ze dat de educatie voorop staat. Als bedrijven proberen de studenten te veel bezig te laten zijn met onderzoek voor hen, grijp ik in. Wat zou u doen als u het vermoeden zou hebben dat een van uw collega’s fraude heeft gepleegd? Je moet eerst zorgen dat je het zeker weet. Ik zou de persoon confronteren en met hem/haar praten. Als ik tevreden ben met het antwoord, verontschuldig ik mezelf tegenover die persoon en laat ik het vallen. Zo niet, dan praat ik erover met Vincenzo (hoofd van de afdeling) in vertrouwen. Het is uiteindelijk zijn verantwoordelijkheid om dit soort zaken op te lossen.
Individuele opdracht Van de regen in de drup?
Ellen Koopman, 991001464050
Title of the thesis: ‘The nutritional quality of turmeric fortified Zobo (Hibiscus sabdariffa)’
Woorden: 954
Mijn ethische dagorde
Laatst las ik een artikel over ‘cultural appropriation’, oftewel culturele toe-eigening. Dit fenomeen wordt beschreven als ‘de overname of het gebruik van elementen van een bepaalde cultuur door een andere cultuur’. Een voorbeeld hiervan is het dragen van de Japanse kimono door mensen die verder geen begrip hebben van de culturele waarde en gebruiken die hieraan verbonden zijn. Ik moet eerlijk toegeven dat ik mij wel eens schuldig heb gemaakt aan cultural appropriation, vooral voortkomend uit onwetendheid. Dit zette mij verder aan het denken. Zijn er nog andere momenten waarop ik, of mijn Westerse voorvaderen, andere culturen niet genoeg gerespecteerd hebben? Een duidelijk voorbeeld hiervan is het imperialisme en kolonialisme van de Europese grootmachten in de 15e eeuw. In deze tijd breidden de rijke en wetenschappelijk ontwikkelde landen snel hun territorium uit overzees. Nederland had koloniën in onder andere Indonesië, Zuid-Amerika en Afrika, waaronder Slavenkust, wat gebied van het huidige Nigeria omvat. De Nederlandse heerschappij had vaak desastreuze gevolgen voor de plaatselijke bevolking. Slavenhandel en onderdrukking waren tijdens heerschappij de orde van de dag. Echter, na bevrijding van de westerse macht, werden de landen veelal achtergelaten met een corrupte overheid en armoede. Dit deed me denken aan mijn thesis, welke over zobo gaat. Zobo is een Nigeriaanse drank, gemaakt van

- 24 -
gekookte hibiscusbloemen. Na filtreren en het toevoegen van smaakstoffen krijg je een verfrissende, non-alcoholische drank. Deze drank wordt vaak langs de weg verkocht door arme, lokale vrouwen, om zo een inkomstenbron te generen. Wat we gaan onderzoeken is of de toevoeging van het specerij kurkuma invloed heeft op de nutritionele samenstelling van de zobo. We willen met name kijken of de vitaminen en mineralen die tekort komen in Afrika, zoals vitamine A en ijzer, in concentratie toenemen. Bij een tekort aan deze voedingsstoffen kan ziekte ontstaan en uiteindelijk zelfs sterfte. Het is dan ook belangrijk om meer van deze stoffen in het dagelijkse dieet te nuttigen. Dit betekent echter wel weer dat wij als Nederlanders ons bemoeien met de gang van zaken in Afrika. Mogen wij ons mengen in dit continent, of zal dit leiden tot een te grote invloed van het Westen op Afrika?
Ethisch dilemma
Als de kurkuma verrijkte Zobo onderzocht en eventueel in Nigeria gebruikt gaat worden, kan dit leiden tot invloed van de Westerse wereld op Nigeria. Dit is eerder niet gunstig is gebleken voor de plaatselijke bevolking. Echter, als de verrijkte Zobo niet in Nigeria geconsumeerd gaat worden, blijft er sprake van vitamine en mineralentekort, wat leidt tot ziekte en zelfs sterfte.
Het bijltjesmoment
Er moet hier gekozen worden tussen twee kwaden: het mogelijk negatief beïnvloeden van een andere cultuur, of mensen ziekte laten lijden. Mijn collega, mevrouw Krol, heeft een interessant alternatief aangeboord. Zij zei: ‘Wanneer ze (de lokale bevolking) geen invloeden willen van de Westerse wereld, kunnen ze het product weigeren’ (Krol, 2019). Hoewel ik dit een interessante insteek vind, denk ik niet dat mensen snel een innovatief product zullen weigeren. Daarnaast blijkt de (negatieve) invloed van het Westen op Afrika een terugkerend thema (Nijeboer, 2009). Het dilemma blijft daarom bestaan. De keuze die gemaakt wordt aan de hand van de dilemma, zal invloed hebben op vier partijen: mensen met een voedingsstoffentekort in Nigeria, de algehele bevolking van Nigeria, de mensen die Zobo verkopen en natuurlijk wij als onderzoekers.
Mensen met een voedingsstoffentekort zullen gebaat zijn bij een verrijkte Zobo, aangezien dit hun gezondheid en dus levensduur- en kwaliteit zal verbeteren. De algehele bevolking van Nigeria, echter, zit misschien niet op dit product te wachten. In een artikel in de Volkskrant staat het volgende: “illustreert de ergernis onder de bevolking over de onophoudelijke bemoeienis met het continent. Alsof de koloniale overheersing nooit ten einde is gekomen.” (Vos, 2019). Oftewel, ze zijn niet zo gesteld op de Westerse bemoeienis met Afrika. Daarentegen is de verkoop van zobo een extra inkomstenbron voor arme mensen in Nigeria. Als de verkoopcijfers toenemen doordat mensen het meer consumeren, zal ook hun inkomen stijgen. Tenslotte, wij als onderzoekers willen graag artikelen publiceren, dus wij zijn erbij gebaat om dit onderzoek uit te voeren.
Er zijn twee ethische perspectieven om naar dit dilemma te kijken: utilitaristisch en deontologisch. Utilitarisme gaat uit van het meeste geluk voor de meeste mensen, waar de deontologie uitgaat van de normen van de mens, die niet overschreden mogen worden (Belt, 2016; Mepham, 2013).
Als er wordt gekeken vanuit een utilitaristisch perspectief, is het onderzoeken van verrijkte Zobo de betere optie. Drie van de belanghebbende partijen, alle behalve de algemene bevolking van Nigeria, zijn hier blijer mee. De bevolking van Nigeria is weliswaar een groter aantal mensen dan de andere groepen bij elkaar, maar de geluksverandering in de groep die lijdt aan een voedingsstoffentekort, is vele malen groter dan die van de algehele bevolking. De gezondheid van een mens heeft een veel grotere invloed op geluk dan de relatief kleine ergernis veroorzaakt door Westerse bemoeienis.
Echter, als er wordt gekeken vanuit een deontologisch perspectief, weegt de algehele bevolking van Nigeria zwaarder mee. Een van de normen, autonomie, mag namelijk niet geschonden worden. Dit gebeurt wel met het verrijken van zobo. De zelfstandigheid van de individuen in de bevolking wordt aangetast door de inmenging van ons als onderzoekers. Daarentegen druist het onnodig laten lijden van

- 25 -
zieken ook tegen onze normen in. Als we vanuit de leer van de deontologie naar dit dilemma kijken, stuiten we op tegenstrijdigheden.
Ookal is er geen goed of fout, geen absolute waarheid, toch zal er een keuze gemaakt moeten worden. Persoonlijk kies ik voor het onderzoeken van de verrijkte Zobo. Ik vind dat het belang van de zieke mensen zwaarder weegt dan de hinder die de bevolking ondervindt van Westerse invloed.
Toevoeging:
In de wetenschap wordt ook wel gezegd: één meting is geen meting. Het is daarom interessant, zoals ethiekdocente Jacobs mij heeft getipt, om ook aan anderen te vragen hoe zij dit dilemma zouden benaderen. In het schema hieronder staat de mening van 10 anderen.
Wat ik heel interessant vind om te zien, is dan 9/10 mensen hetzelfde besluit nemen als ik: wel de zobo onderzoeken. Iedereen heeft echter een ander argument om hun besluit te ondersteunen. Erg leuk om ook hun argumenten te horen en te kijken hoe zij tegen dit dilemma aankijken. Ik hoop dat mijn collega’s, vrienden en familie zich nu ook iets bewuster zijn van de problematiek rond Afrika en de invloed van het Westen hierop.
Naam Relatie ten opzichte van auteur Ellen
Wel of niet de zobo onderzoeken en argumenten
Christien Westerbos Thesis collega Wel onderzoeken, omdat mensenlevens verbeteren het belangrijkst is.
Rosanne Vroomen Thesis collega Niet onderzoeken, omdat wij als het westen niet te veel moeten inmengen met Afrika.
Willemein Hoving Thesis collega Wel onderzoeken, want de negatieve invloed van vroeger was niet op het gebied van voeding, en dit onderzoek gaat wel over voeding.
Milou Kolkman Thesis collega Wel onderzoeken, het paper wordt toch niet gepubliceerd. Dus dan zijn de onderzoekers tevreden, maar wordt Afrika niet negatief beïnvloed.
Fleur de Haas Vriendin Wel onderzoeken. De invloed van het Westen is vooral negatief gebleken doordat het bieden van hulp werd gedaan zonder genoeg begrip van de omgeving en cultuur. Hier gaat het echter om een traditioneel Afrikaans product, wat dus wel past bij de cultuur en een betere achtergrond geeft om het probleem op te lossen. Een voorwaarde is verder wel dat de lokale bevolking profiteert van het innovatieve product, en niet Westerse grote bedrijven als Unilever met de winst aan de haal gaan en zo geld uit het continent weghalen in plaats van stimuleren.
Marije Heerma Vriendin Wel onderzoeken. Die mensen daar hebben net zoveel recht op een gezond leven als wij in Europa. In Europa zijn we bevoorrecht doordat wij niet kampen met dit probleem, dus heb je de plicht om hen te helpen. Als jij in hun schoenen
- 26 -
had gestaan had je ook op hulp uit de rijke westerse landen gehoopt. Echter is dit dan met een maatschappelijke insteek en moet er wel naar het verdienmodel gekeken worden om niet de Nigeriaanse bevolking uit te buiten.
Renee Rooijakkers Vriendin Wel onderzoeken, we hebben de plicht om mensen te helpen die dat nodig hebben.
Karin Koopman Moeder Wel onderzoeken, de invloed van het westen is er toch al (met name in medicijnen, ontwikkelingshulp, techniek, de paus etc.). Daarbij, meten is weten.
Max Koopman Broer Wel onderzoeken, als ze geen invloed van het westen willen, kunnen ze het product ook weigeren
Geert-Jan Koopman Vader Wel onderzoeken, het onderzoek an sich kan geen kwaad. Wat er dan met de resultaten gedaan wordt echter wel.
Copyright © 2022 FDOKUMEN


![Fortified Palaces in Early Modern Europe, 1400-1700 [EAHN 2014]](https://static.fdokumen.com/doc/165x107/6332577f576b626f850d5fce/fortified-palaces-in-early-modern-europe-1400-1700-eahn-2014.jpg)