The NeurIPS 2020 Education Challenge - Proceedings of ...
15
Proceedings of Machine Learning Research 133:191–205, 2021 NeurIPS 2020 Competition and Demonstration Track Results and Insights from Diagnostic Questions: The NeurIPS 2020 Education Challenge Zichao Wang *† [email protected] Angus Lamb *‡ [email protected] Evgeny Saveliev § [email protected] Pashmina Cameron ‡ [email protected] Yordan Zaykov ‡ [email protected] Jos´ e Miguel Hern´ andez-Lobato § [email protected] Richard E. Turner § [email protected] Richard G. Baraniuk † [email protected] Craig Barton ¶ [email protected] Simon Peyton Jones ‡ [email protected] Simon Woodhead ¶ [email protected] Cheng Zhang ‡ [email protected] Editors: Hugo Jair Escalante and Katja Hofmann Abstract This competition concerns educational diagnostic questions, which are pedagogically effec- tive, multiple-choice questions (MCQs) whose distractors embody misconceptions. With a large and ever-increasing number of such questions, it becomes overwhelming for teachers to know which questions are the best ones to use for their students. We thus seek to answer the following question: how can we use data on hundreds of millions of answers to MCQs to drive automatic personalized learning in large-scale learning scenarios where manual personalization is infeasible? Success in using MCQ data at scale helps build more intelli- gent, personalized learning platforms that ultimately improve the quality of education en masse. To this end, we introduce a new, large-scale, real-world dataset and formulate 4 data mining tasks on MCQs that mimic real learning scenarios and target various aspects of the above question in a competition setting at NeurIPS 2020. We report on our NeurIPS competition in which nearly 400 teams submitted approximately 4000 submissions, with encouragingly diverse and effective approaches to each of our tasks. Keywords Personalized education, Diagnostic questions, Question analytics, Unsupervised learning, Matrix completion, Missing value prediction, Active learning * Equal Contribution. † Rice University ‡ Microsoft Research Cambridge § University of Cambridge ¶ Eedi Corresponding to Simon Woodhead and Cheng Zhang. c 2021 Z. Wang et al.
-
Upload
khangminh22 -
Category
Documents
-
view
1 -
download
0
Transcript of The NeurIPS 2020 Education Challenge - Proceedings of ...
Proceedings of Machine Learning Research 133:191–205, 2021 NeurIPS 2020 Competition and Demonstration Track
Results and Insights from Diagnostic Questions:The NeurIPS 2020 Education Challenge
Zichao Wang∗†
Angus Lamb∗‡
Evgeny Saveliev§
Pashmina Cameron‡
Yordan Zaykov‡
Jose Miguel Hernandez-Lobato§
Richard E. Turner§
Richard G. Baraniuk†
Craig Barton¶
Simon Peyton Jones‡
Simon Woodhead¶
Cheng Zhang‡
Editors: Hugo Jair Escalante and Katja Hofmann
Abstract
This competition concerns educational diagnostic questions, which are pedagogically effec-tive, multiple-choice questions (MCQs) whose distractors embody misconceptions. With alarge and ever-increasing number of such questions, it becomes overwhelming for teachersto know which questions are the best ones to use for their students. We thus seek to answerthe following question: how can we use data on hundreds of millions of answers to MCQsto drive automatic personalized learning in large-scale learning scenarios where manualpersonalization is infeasible? Success in using MCQ data at scale helps build more intelli-gent, personalized learning platforms that ultimately improve the quality of education enmasse. To this end, we introduce a new, large-scale, real-world dataset and formulate 4data mining tasks on MCQs that mimic real learning scenarios and target various aspectsof the above question in a competition setting at NeurIPS 2020. We report on our NeurIPScompetition in which nearly 400 teams submitted approximately 4000 submissions, withencouragingly diverse and effective approaches to each of our tasks.
Keywords
Personalized education, Diagnostic questions, Question analytics, Unsupervised learning,Matrix completion, Missing value prediction, Active learning
∗ Equal Contribution.† Rice University‡ Microsoft Research Cambridge§ University of Cambridge¶ EediCorresponding to Simon Woodhead and Cheng Zhang.
c© 2021 Z. Wang et al.
Wang et al.
1. Introduction
Recent years have seen an increasing proliferation of large-scale, online learning platformsthat provide expertly produced materials and instructions at a low cost. These platformsare revolutionizing current education practices by lowering access to professional learningresources bringing high-quality learning experiences to the mass. One of the core enablingtechnologies of these platforms is personalized learning algorithms that automatically tai-lor instructions and pedagogical activities to each student considering their backgrounds,interests, and learning objectives. However, personalization remains a central challenge forthese learning platforms and is still an active research area. This is because every studentis unique and different, which requires individualized learning pathways that best suit eachstudent. While teachers, paying individual attention to each student, naturally adapt theirpedagogy to the needs of that student, algorithms are less adaptable compared to expertteachers.
An over-arching question, then, is how to personalize an online learning platform, sothat it adapts to the needs of a particular student. That question is too big and vague, soin this paper, we focus on a small sub-problem: personalizing the choice of multiple-choicediagnostic questions. We chose this focus carefully. First, there is ample research thatshows that well-crafted multiple-choice questions are educationally effective (?). Second,multiple-choice questions make it easy to gather copious data in a very well-structured form:students, questions, and the answers students gave to some of those questions. Third, we hadan active partnership with a live, deployed platform (Eedi) that had hundreds of thousandsof users, so we could gather a lot of data to feed today’s data-hungry machine-learningalgorithms.
In this paper we describe a NeurIPS competition in which we supplied a large datasetof answers to such multiple-choice diagnostic questions and invited participants to engagein several tasks, all of which were directed towards the ultimate goal of identifying whichquestions would be most suitable for a particular student, at a particular point in theirlearning journey. More specifically, our contributions are as follows:
• We organized a competition at NeurIPS 2020 on Multiple-Choice diagnostic Questions,which we identify as a fertile application domain for machine learning in education.Not only are these diagnostic questions educationally sound, but their format is alsoextremely well-suited to a range of machine learning methods.
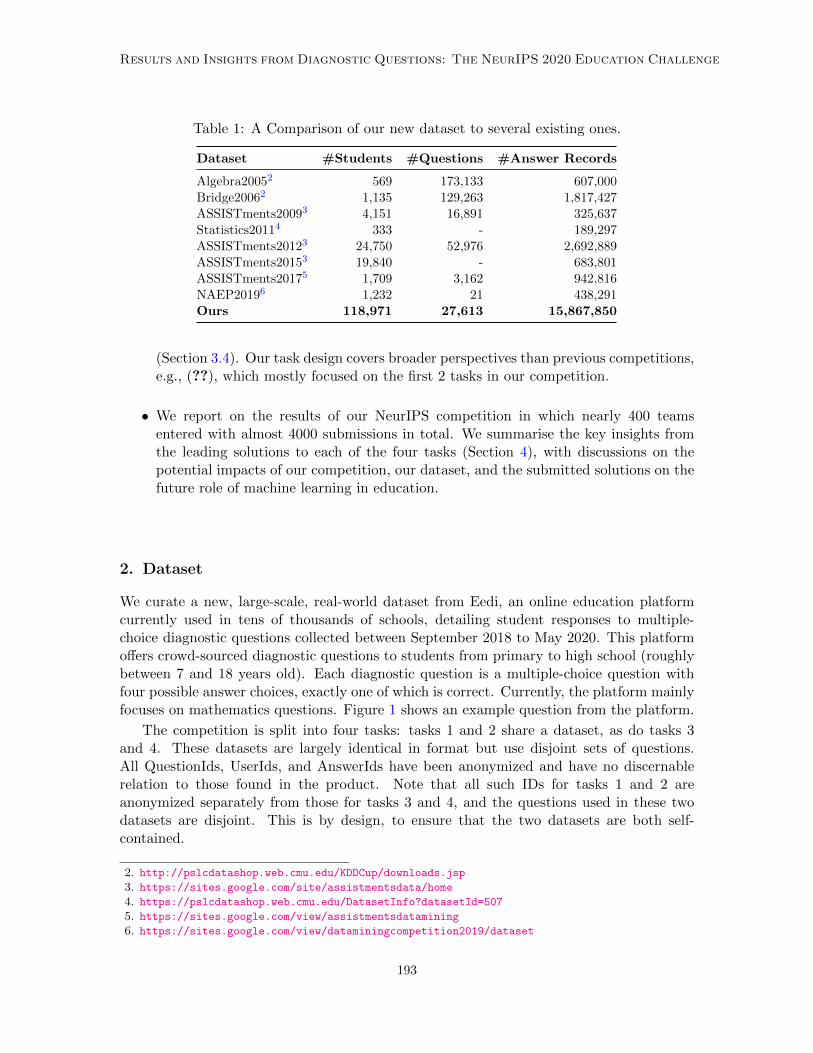
• We introduce a massive dataset of answers to diagnostic questions, now publicly avail-able (Section 2).1 This is by far one of the biggest datasets in the educational domain;see Table 1 for a comparison. Our dataset also has the potential to help advance educa-tional and machine learning research beyond the scope of our competition (Section 6).
• We introduce four different competition tasks that aim to address challenges relatingto diagnostic questions. We include 2 common educational data mining tasks thatour dataset enables, aiming at accurately predicting students’ answers to questions(Sections 3.1 and 3.2). More importantly, we also introduce a new task on automaticquestion quality assessment (Section 3.3) and a task on personalized question selection
1. https://eedi.com/projects/neurips-education-challenge
192
Results and Insights from Diagnostic Questions: The NeurIPS 2020 Education Challenge
Table 1: A Comparison of our new dataset to several existing ones.
Dataset #Students #Questions #Answer Records
Algebra20052 569 173,133 607,000Bridge20062 1,135 129,263 1,817,427ASSISTments20093 4,151 16,891 325,637Statistics20114 333 - 189,297ASSISTments20123 24,750 52,976 2,692,889ASSISTments20153 19,840 - 683,801ASSISTments20175 1,709 3,162 942,816NAEP20196 1,232 21 438,291Ours 118,971 27,613 15,867,850
(Section 3.4). Our task design covers broader perspectives than previous competitions,e.g., (??), which mostly focused on the first 2 tasks in our competition.
• We report on the results of our NeurIPS competition in which nearly 400 teamsentered with almost 4000 submissions in total. We summarise the key insights fromthe leading solutions to each of the four tasks (Section 4), with discussions on thepotential impacts of our competition, our dataset, and the submitted solutions on thefuture role of machine learning in education.
2. Dataset
We curate a new, large-scale, real-world dataset from Eedi, an online education platformcurrently used in tens of thousands of schools, detailing student responses to multiple-choice diagnostic questions collected between September 2018 to May 2020. This platformoffers crowd-sourced diagnostic questions to students from primary to high school (roughlybetween 7 and 18 years old). Each diagnostic question is a multiple-choice question withfour possible answer choices, exactly one of which is correct. Currently, the platform mainlyfocuses on mathematics questions. Figure 1 shows an example question from the platform.
The competition is split into four tasks: tasks 1 and 2 share a dataset, as do tasks 3and 4. These datasets are largely identical in format but use disjoint sets of questions.All QuestionIds, UserIds, and AnswerIds have been anonymized and have no discernablerelation to those found in the product. Note that all such IDs for tasks 1 and 2 areanonymized separately from those for tasks 3 and 4, and the questions used in these twodatasets are disjoint. This is by design, to ensure that the two datasets are both self-contained.
2. http://pslcdatashop.web.cmu.edu/KDDCup/downloads.jsp3. https://sites.google.com/site/assistmentsdata/home4. https://pslcdatashop.web.cmu.edu/DatasetInfo?datasetId=5075. https://sites.google.com/view/assistmentsdatamining6. https://sites.google.com/view/dataminingcompetition2019/dataset
193

Wang et al.
Figure 1: An example question in our dataset.
2.1. Primary Data
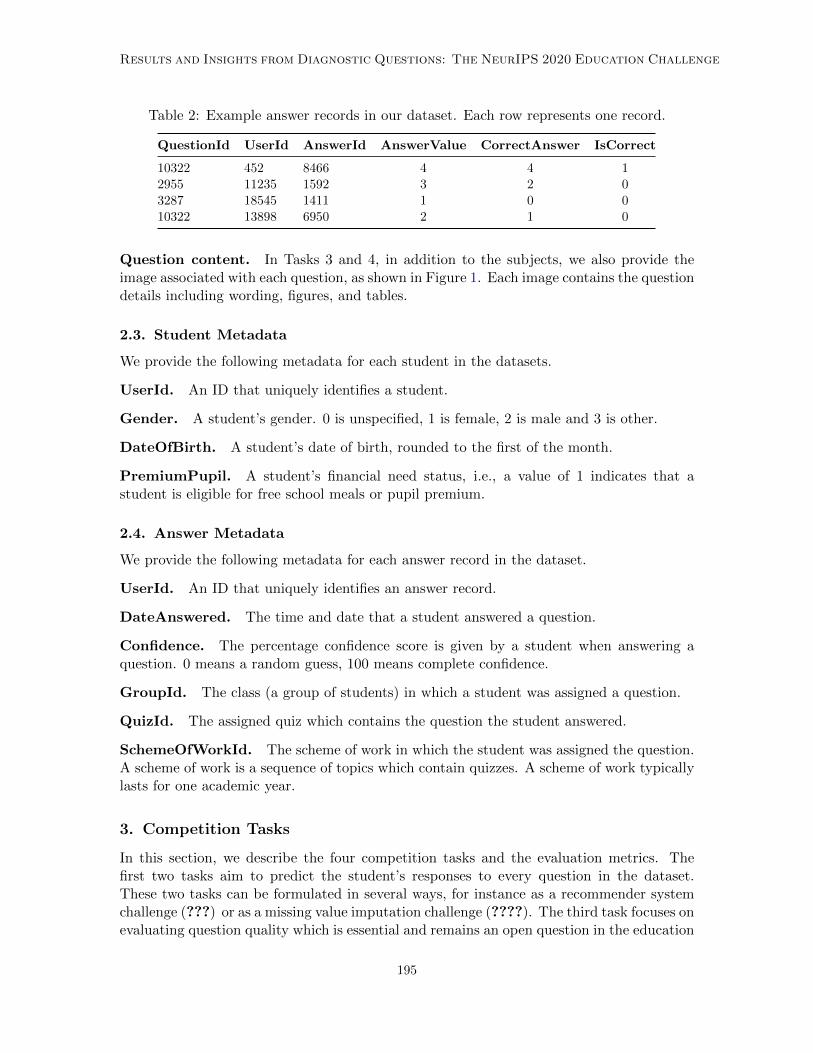
The primary training data for the tasks consists of records of answers that students re-sponded to multiple-choice diagnostic questions. Table 2 illustrates the format of some datapoints in our dataset. Because each student has typically answered only a small fractionof all possible questions, some students and questions are associated with too few answerrecords. Therefore, for tasks 1 and 2, we remove questions that have received fewer than50 answers and students who have answered fewer than 50 questions. Similarly, for tasks 3and 4, where we are interested in a fixed set of questions, we remove all students who hadanswered fewer than 50 of these questions. When a student has submitted multiple answersto the same question, we use the latest answer record. The data can be transformed intomatrix form, where each row represents a student and each column represents a question.Figure 2 illustrates such a representation of our dataset.
For tasks 1 and 2, we randomly split the answer records into 80%/10%/10% train-ing/public test/private test sets. Similarly, for tasks 3 and 4, we randomly split the UserIdsinto 80%/10%/10% training/public test/private test sets. These pre-processing steps leadto training datasets of the following sizes:
• Tasks 1 and 2: 27,613 questions, 11,8971 students, 15,867,850 answers
• Tasks 3 and 4: 948 questions, 4,918 students, 1,382,727 answers
The total number of answer records in these training sets exceeds 17 million, renderingmanual analysis impractical and necessitating an automated, data-driven approach.
2.2. Question Metadata
We provide the following metadata for each question in the datasets.
SubjectId For each question, we provide a list of subjects associated with the question.Each subject covers an area of mathematics, at varying degrees of granularity. Examplesubjects include “Algebra”, “Data and Statistics”, and “Geometry and Measure”. Thesesubjects are arranged in a tree structure, i.e., the subject “Factorising” is the parent subjectof “Factorising into a Single Bracket”.
194
Results and Insights from Diagnostic Questions: The NeurIPS 2020 Education Challenge
Table 2: Example answer records in our dataset. Each row represents one record.
QuestionId UserId AnswerId AnswerValue CorrectAnswer IsCorrect
10322 452 8466 4 4 12955 11235 1592 3 2 03287 18545 1411 1 0 010322 13898 6950 2 1 0
Question content. In Tasks 3 and 4, in addition to the subjects, we also provide theimage associated with each question, as shown in Figure 1. Each image contains the questiondetails including wording, figures, and tables.
2.3. Student Metadata
We provide the following metadata for each student in the datasets.
UserId. An ID that uniquely identifies a student.
Gender. A student’s gender. 0 is unspecified, 1 is female, 2 is male and 3 is other.
DateOfBirth. A student’s date of birth, rounded to the first of the month.
PremiumPupil. A student’s financial need status, i.e., a value of 1 indicates that astudent is eligible for free school meals or pupil premium.
2.4. Answer Metadata
We provide the following metadata for each answer record in the dataset.
UserId. An ID that uniquely identifies an answer record.
DateAnswered. The time and date that a student answered a question.
Confidence. The percentage confidence score is given by a student when answering aquestion. 0 means a random guess, 100 means complete confidence.
GroupId. The class (a group of students) in which a student was assigned a question.
QuizId. The assigned quiz which contains the question the student answered.
SchemeOfWorkId. The scheme of work in which the student was assigned the question.A scheme of work is a sequence of topics which contain quizzes. A scheme of work typicallylasts for one academic year.
3. Competition Tasks
In this section, we describe the four competition tasks and the evaluation metrics. Thefirst two tasks aim to predict the student’s responses to every question in the dataset.These two tasks can be formulated in several ways, for instance as a recommender systemchallenge (???) or as a missing value imputation challenge (????). The third task focuses onevaluating question quality which is essential and remains an open question in the education
195
Wang et al.
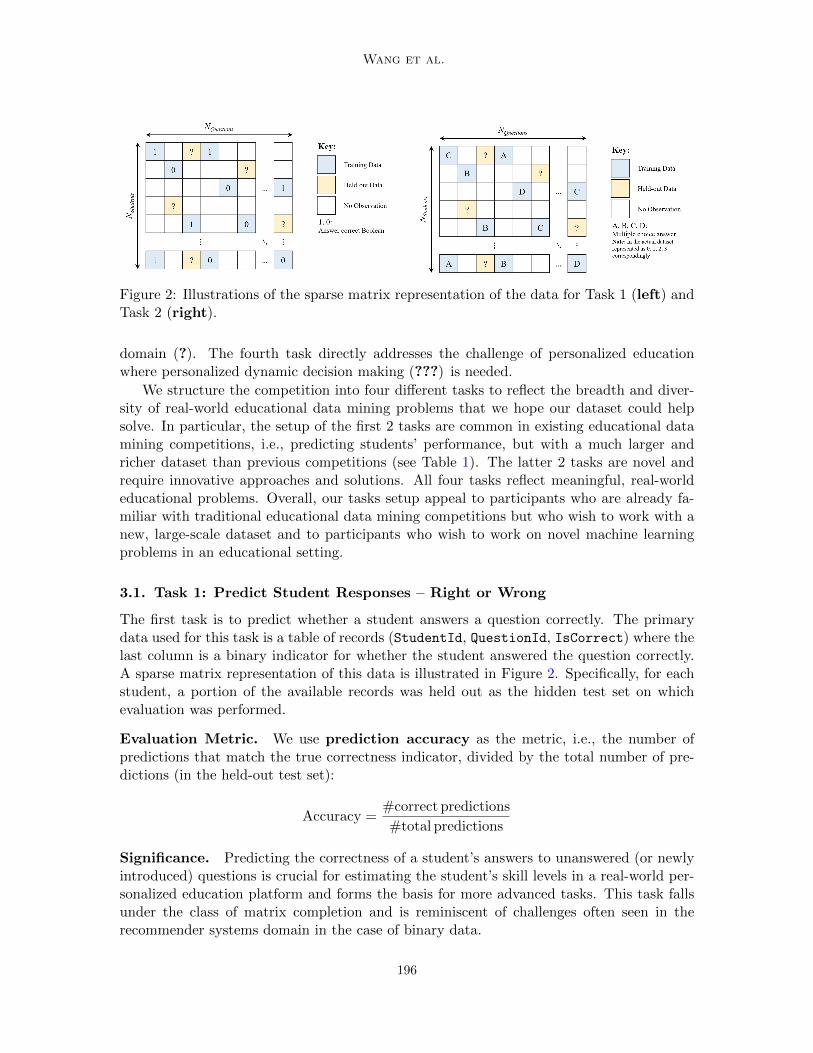
Figure 2: Illustrations of the sparse matrix representation of the data for Task 1 (left) andTask 2 (right).
domain (?). The fourth task directly addresses the challenge of personalized educationwhere personalized dynamic decision making (???) is needed.
We structure the competition into four different tasks to reflect the breadth and diver-sity of real-world educational data mining problems that we hope our dataset could helpsolve. In particular, the setup of the first 2 tasks are common in existing educational datamining competitions, i.e., predicting students’ performance, but with a much larger andricher dataset than previous competitions (see Table 1). The latter 2 tasks are novel andrequire innovative approaches and solutions. All four tasks reflect meaningful, real-worldeducational problems. Overall, our tasks setup appeal to participants who are already fa-miliar with traditional educational data mining competitions but who wish to work with anew, large-scale dataset and to participants who wish to work on novel machine learningproblems in an educational setting.
3.1. Task 1: Predict Student Responses – Right or Wrong
The first task is to predict whether a student answers a question correctly. The primarydata used for this task is a table of records (StudentId, QuestionId, IsCorrect) where thelast column is a binary indicator for whether the student answered the question correctly.A sparse matrix representation of this data is illustrated in Figure 2. Specifically, for eachstudent, a portion of the available records was held out as the hidden test set on whichevaluation was performed.
Evaluation Metric. We use prediction accuracy as the metric, i.e., the number ofpredictions that match the true correctness indicator, divided by the total number of pre-dictions (in the held-out test set):
Accuracy =#correct predictions
#total predictions
Significance. Predicting the correctness of a student’s answers to unanswered (or newlyintroduced) questions is crucial for estimating the student’s skill levels in a real-world per-sonalized education platform and forms the basis for more advanced tasks. This task fallsunder the class of matrix completion and is reminiscent of challenges often seen in therecommender systems domain in the case of binary data.
196
Results and Insights from Diagnostic Questions: The NeurIPS 2020 Education Challenge
3.2. Task 2: Predict Student Responses – Answer Prediction:
The second task is to predict which answer a student responds to a particular question. Theprimary data used for this task is a table of records (StudentId, QuestionId, AnswerValue,CorrectAnswer) where the last 2 columns are categorical taking values in [1, 2, 3, 4] (corre-sponding respectively to multiple-choice answer options A, B, C and D). The sparse matrixrepresentation is illustrated in Figure 2 (right). Because the questions in our dataset areall multiple-choice, each with four potential choices and one correct choice, we treat thistask as a multi-class prediction problem in a matrix completion formulation. This problemformulation is similar to that in Task 1 but with unordered categorical data, i.e., students’actual choices, instead of binary data, i.e., students’ correct/incorrect answer indicators.We note that such unordered, categorical data is rare in the recommender systems domain,where responses will typically be binary or ordinal (e.g. 1-5 stars).
Evaluation Metric. We use the same metric prediction accuracy as in Task 1, exceptthat the true answers are now categorical instead of binary.
Significance. Predicting the actual multiple-choice option for a student’s answer allowsanalysis of likely common misconceptions that a student may hold on a topic. For ex-ample, clusters of question-answer pairs that are highly correlated may indicate that theycorrespond to the same, or related misconceptions. Understanding the relationships amongmisconceptions is a crucial problem to solve for curriculum development, which could informthe way a topic is taught and the sequencing of topics.
3.3. Task 3: Global Question Quality Assessment
The third task is to predict the “quality” of a question, as defined by a panel of domainexperts (experienced teachers), based on the information learned from the students’ answerrecords. Because how expert teachers judge question quality is unknown and difficult toquantify, this task requires defining and developing a metric for evaluating the questionquality that mimics the experts’ judgment of question quality. This task can be viewed asan unsupervised learning task because there is no explicit supervision label available forquestion quality.
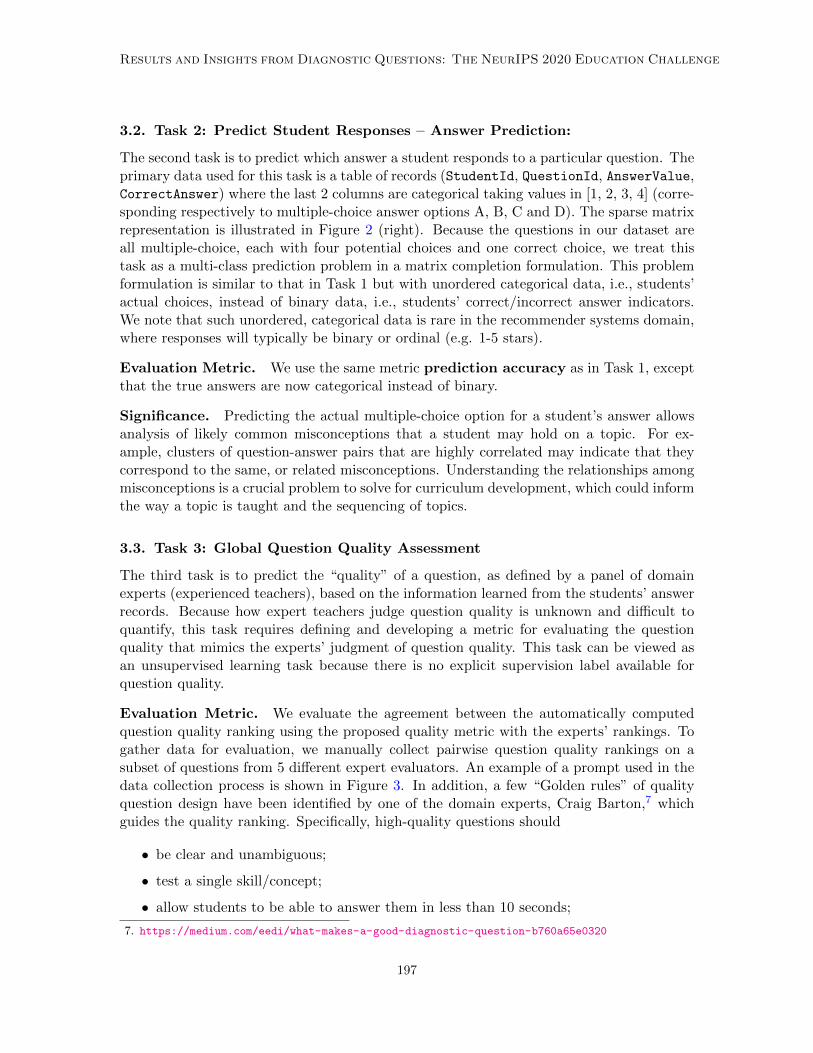
Evaluation Metric. We evaluate the agreement between the automatically computedquestion quality ranking using the proposed quality metric with the experts’ rankings. Togather data for evaluation, we manually collect pairwise question quality rankings on asubset of questions from 5 different expert evaluators. An example of a prompt used in thedata collection process is shown in Figure 3. In addition, a few “Golden rules” of qualityquestion design have been identified by one of the domain experts, Craig Barton,7 whichguides the quality ranking. Specifically, high-quality questions should
• be clear and unambiguous;
• test a single skill/concept;
• allow students to be able to answer them in less than 10 seconds;
7. https://medium.com/eedi/what-makes-a-good-diagnostic-question-b760a65e0320
197
Wang et al.
Figure 3: Example of a prompt used in collecting experts’ judgement of pairwise relativequestion quality. In addition to this, the experts receive the following instructions: On eachof the following slides, you will see 2 questions, one on the left and one on the right. Pleasedecide which question is of higher quality; ties are not allowed.
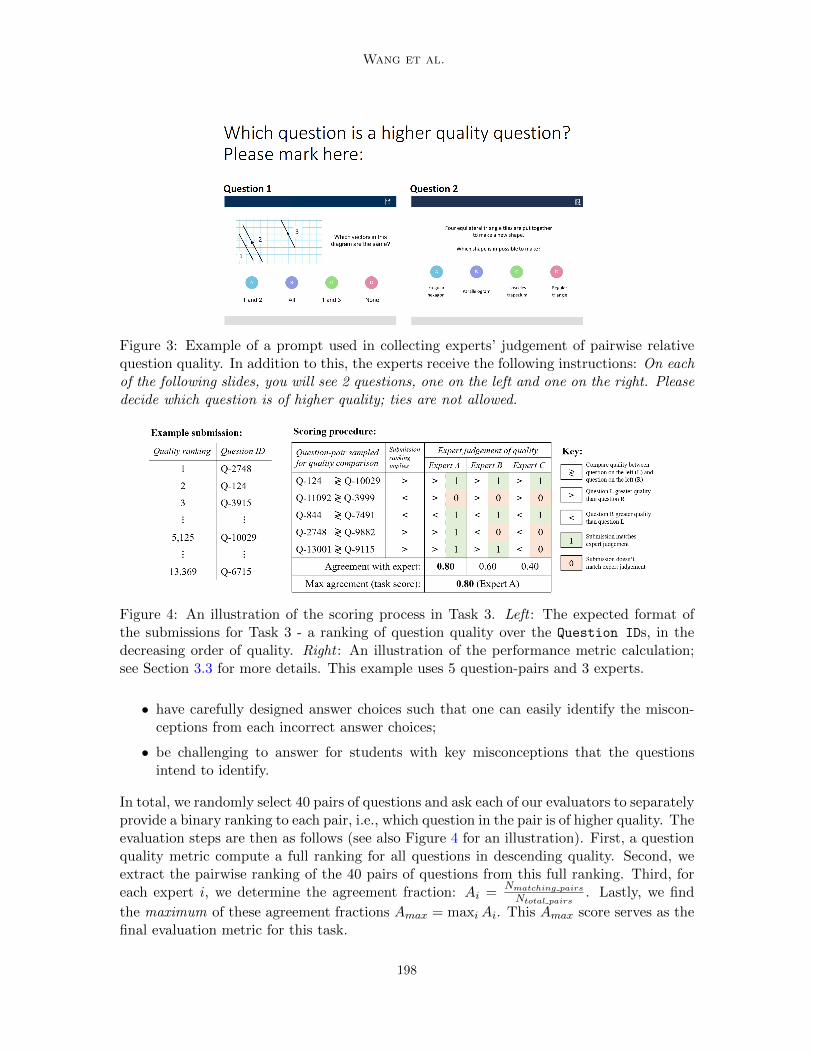
Figure 4: An illustration of the scoring process in Task 3. Left : The expected format ofthe submissions for Task 3 - a ranking of question quality over the Question IDs, in thedecreasing order of quality. Right : An illustration of the performance metric calculation;see Section 3.3 for more details. This example uses 5 question-pairs and 3 experts.
• have carefully designed answer choices such that one can easily identify the miscon-ceptions from each incorrect answer choices;
• be challenging to answer for students with key misconceptions that the questionsintend to identify.
In total, we randomly select 40 pairs of questions and ask each of our evaluators to separatelyprovide a binary ranking to each pair, i.e., which question in the pair is of higher quality. Theevaluation steps are then as follows (see also Figure 4 for an illustration). First, a questionquality metric compute a full ranking for all questions in descending quality. Second, weextract the pairwise ranking of the 40 pairs of questions from this full ranking. Third, foreach expert i, we determine the agreement fraction: Ai =
Nmatching pairs
Ntotal pairs. Lastly, we find
the maximum of these agreement fractions Amax = maxiAi. This Amax score serves as thefinal evaluation metric for this task.
198
Results and Insights from Diagnostic Questions: The NeurIPS 2020 Education Challenge
We were looking for metrics that can approximate any expert’s judgment really well,hence we used the maximum of the agreement fractions, rather than a mean of the agreementfractions over all experts. The reasoning for this approach is that the quality metrics ofthe experts are in themselves subjective, and it is interesting to find whether a particularexpert’s approach can be approximated especially well by the use of machine learning.
Significance of Task 3. A scalable, evidence-based mechanism that produced reliablemeasures of question quality remains an open challenge because question quality is oftenregarded as a subjective measure, i.e., different people might have varying definitions ofquestion quality. Thus, having one unified, an objective metric is challenging. Furthermore,even experts sometimes write questions that seem good at first glance but turn out to beof poor quality. In situations where questions are crowd-sourced, the question quantity islarge but the quality is likely to vary significantly, rendering manual inspection challengingand desiring automated techniques to identify high-quality questions. Automatic questionquality judgment can also be a valuable guide for the teachers, i.e., to help them authorhigher quality questions.
3.4. Task 4: Personalized Questions
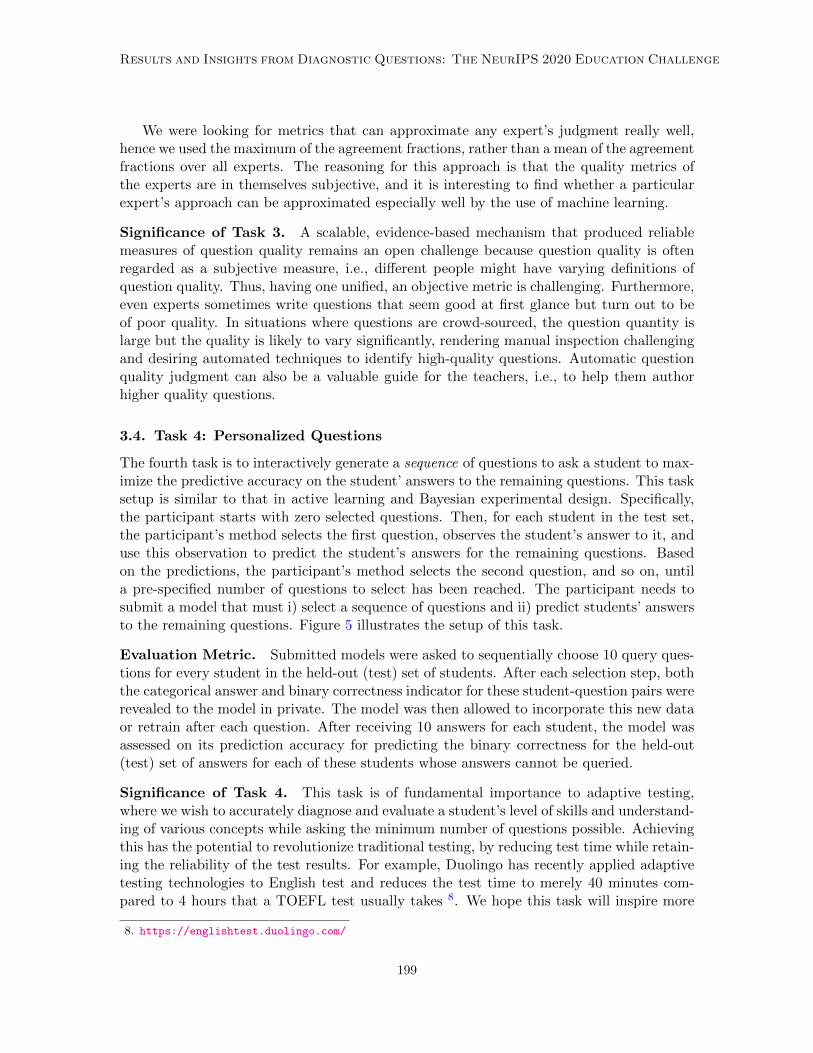
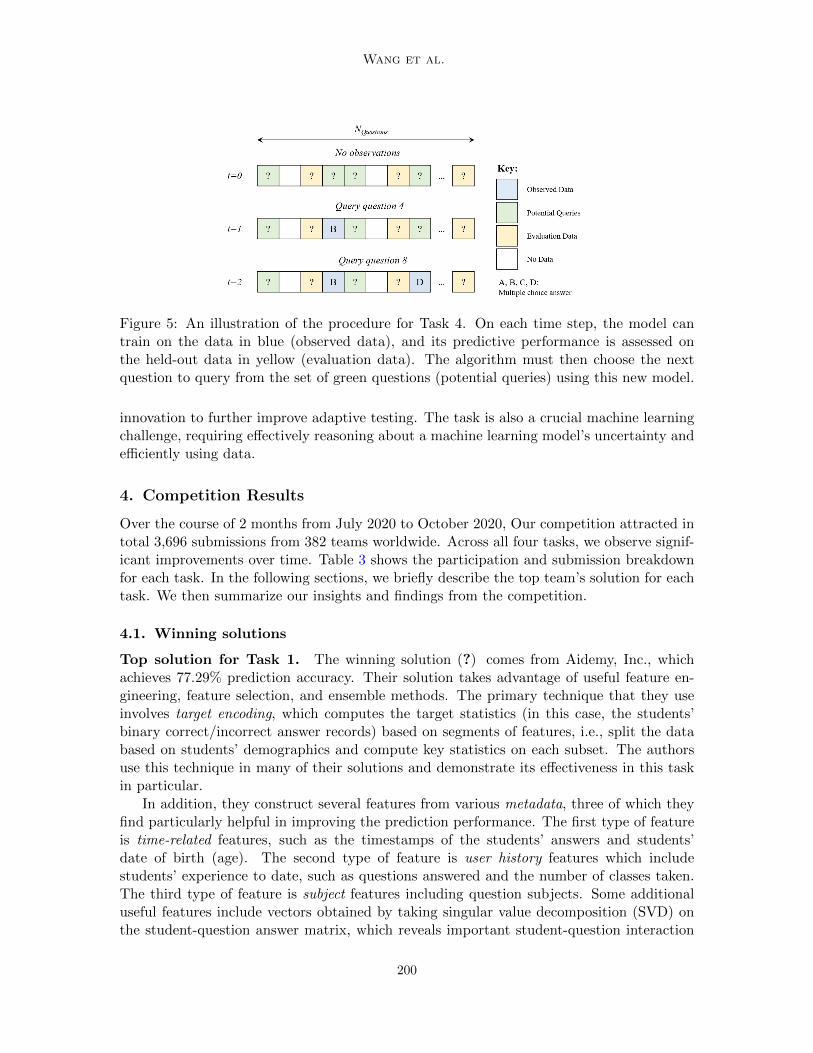
The fourth task is to interactively generate a sequence of questions to ask a student to max-imize the predictive accuracy on the student’ answers to the remaining questions. This tasksetup is similar to that in active learning and Bayesian experimental design. Specifically,the participant starts with zero selected questions. Then, for each student in the test set,the participant’s method selects the first question, observes the student’s answer to it, anduse this observation to predict the student’s answers for the remaining questions. Basedon the predictions, the participant’s method selects the second question, and so on, untila pre-specified number of questions to select has been reached. The participant needs tosubmit a model that must i) select a sequence of questions and ii) predict students’ answersto the remaining questions. Figure 5 illustrates the setup of this task.
Evaluation Metric. Submitted models were asked to sequentially choose 10 query ques-tions for every student in the held-out (test) set of students. After each selection step, boththe categorical answer and binary correctness indicator for these student-question pairs wererevealed to the model in private. The model was then allowed to incorporate this new dataor retrain after each question. After receiving 10 answers for each student, the model wasassessed on its prediction accuracy for predicting the binary correctness for the held-out(test) set of answers for each of these students whose answers cannot be queried.
Significance of Task 4. This task is of fundamental importance to adaptive testing,where we wish to accurately diagnose and evaluate a student’s level of skills and understand-ing of various concepts while asking the minimum number of questions possible. Achievingthis has the potential to revolutionize traditional testing, by reducing test time while retain-ing the reliability of the test results. For example, Duolingo has recently applied adaptivetesting technologies to English test and reduces the test time to merely 40 minutes com-pared to 4 hours that a TOEFL test usually takes 8. We hope this task will inspire more
8. https://englishtest.duolingo.com/
199
Wang et al.
Figure 5: An illustration of the procedure for Task 4. On each time step, the model cantrain on the data in blue (observed data), and its predictive performance is assessed onthe held-out data in yellow (evaluation data). The algorithm must then choose the nextquestion to query from the set of green questions (potential queries) using this new model.
innovation to further improve adaptive testing. The task is also a crucial machine learningchallenge, requiring effectively reasoning about a machine learning model’s uncertainty andefficiently using data.
4. Competition Results
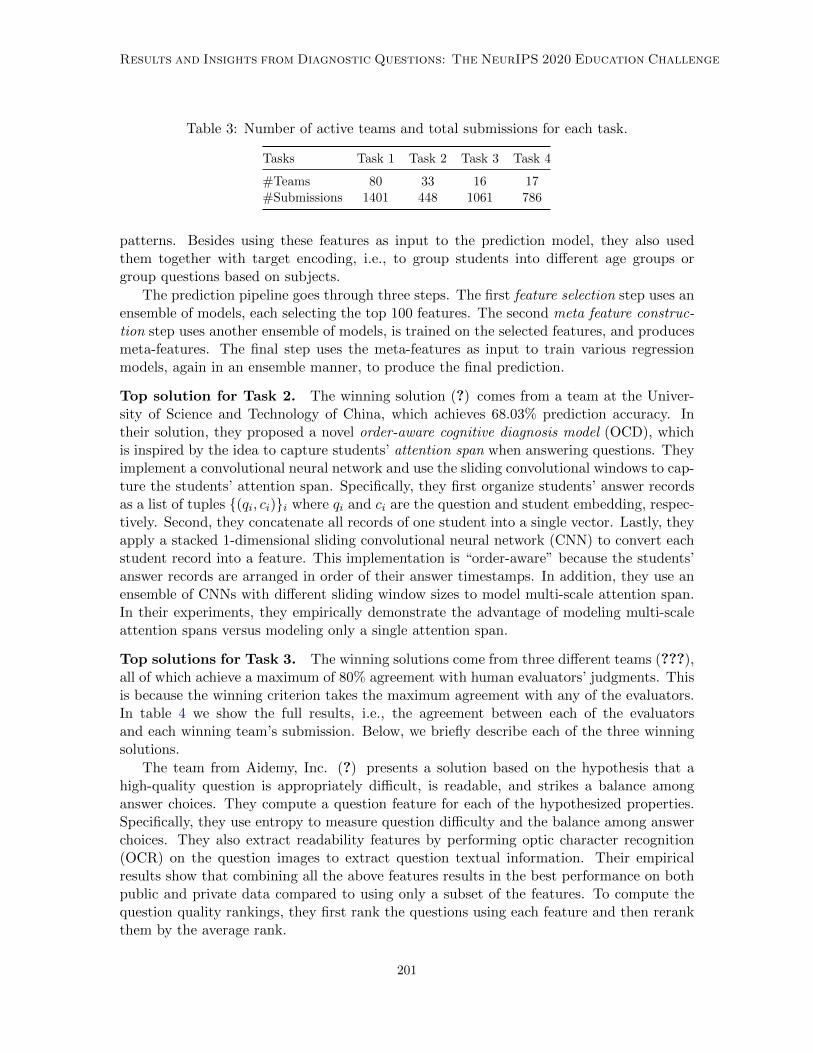
Over the course of 2 months from July 2020 to October 2020, Our competition attracted intotal 3,696 submissions from 382 teams worldwide. Across all four tasks, we observe signif-icant improvements over time. Table 3 shows the participation and submission breakdownfor each task. In the following sections, we briefly describe the top team’s solution for eachtask. We then summarize our insights and findings from the competition.
4.1. Winning solutions
Top solution for Task 1. The winning solution (?) comes from Aidemy, Inc., whichachieves 77.29% prediction accuracy. Their solution takes advantage of useful feature en-gineering, feature selection, and ensemble methods. The primary technique that they useinvolves target encoding, which computes the target statistics (in this case, the students’binary correct/incorrect answer records) based on segments of features, i.e., split the databased on students’ demographics and compute key statistics on each subset. The authorsuse this technique in many of their solutions and demonstrate its effectiveness in this taskin particular.
In addition, they construct several features from various metadata, three of which theyfind particularly helpful in improving the prediction performance. The first type of featureis time-related features, such as the timestamps of the students’ answers and students’date of birth (age). The second type of feature is user history features which includestudents’ experience to date, such as questions answered and the number of classes taken.The third type of feature is subject features including question subjects. Some additionaluseful features include vectors obtained by taking singular value decomposition (SVD) onthe student-question answer matrix, which reveals important student-question interaction
200
Results and Insights from Diagnostic Questions: The NeurIPS 2020 Education Challenge
Table 3: Number of active teams and total submissions for each task.
Tasks Task 1 Task 2 Task 3 Task 4
#Teams 80 33 16 17#Submissions 1401 448 1061 786
patterns. Besides using these features as input to the prediction model, they also usedthem together with target encoding, i.e., to group students into different age groups orgroup questions based on subjects.
The prediction pipeline goes through three steps. The first feature selection step uses anensemble of models, each selecting the top 100 features. The second meta feature construc-tion step uses another ensemble of models, is trained on the selected features, and producesmeta-features. The final step uses the meta-features as input to train various regressionmodels, again in an ensemble manner, to produce the final prediction.
Top solution for Task 2. The winning solution (?) comes from a team at the Univer-sity of Science and Technology of China, which achieves 68.03% prediction accuracy. Intheir solution, they proposed a novel order-aware cognitive diagnosis model (OCD), whichis inspired by the idea to capture students’ attention span when answering questions. Theyimplement a convolutional neural network and use the sliding convolutional windows to cap-ture the students’ attention span. Specifically, they first organize students’ answer recordsas a list of tuples {(qi, ci)}i where qi and ci are the question and student embedding, respec-tively. Second, they concatenate all records of one student into a single vector. Lastly, theyapply a stacked 1-dimensional sliding convolutional neural network (CNN) to convert eachstudent record into a feature. This implementation is “order-aware” because the students’answer records are arranged in order of their answer timestamps. In addition, they use anensemble of CNNs with different sliding window sizes to model multi-scale attention span.In their experiments, they empirically demonstrate the advantage of modeling multi-scaleattention spans versus modeling only a single attention span.
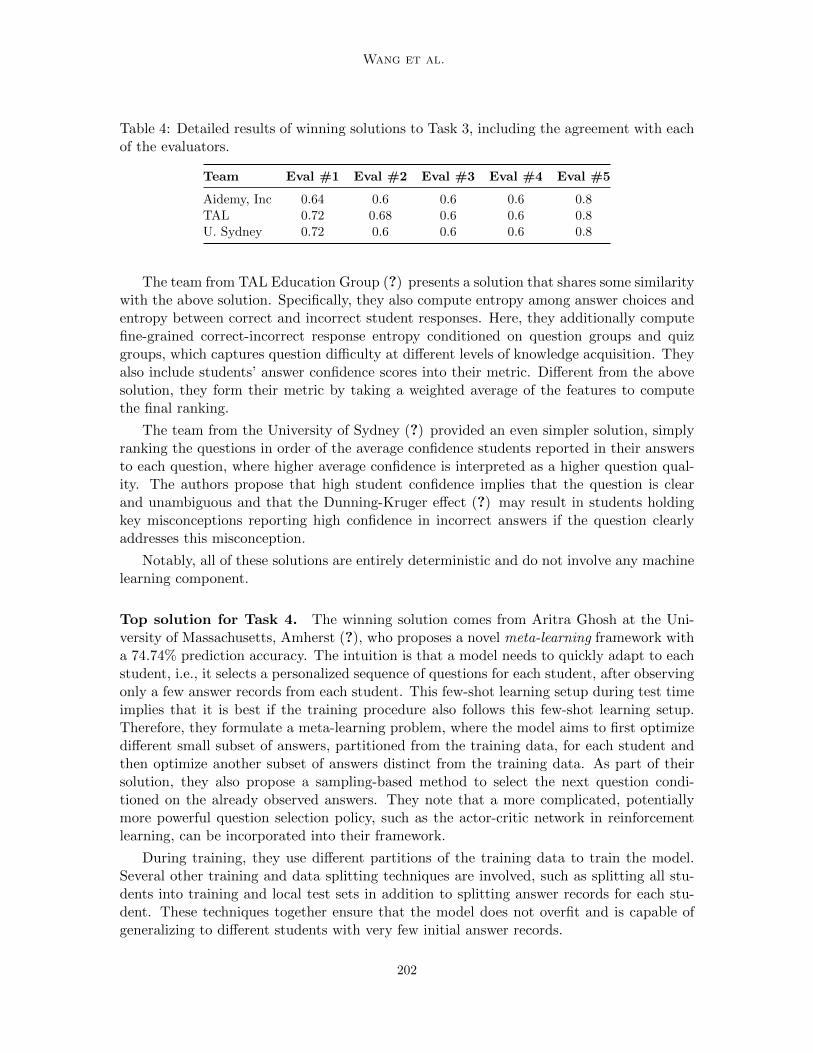
Top solutions for Task 3. The winning solutions come from three different teams (???),all of which achieve a maximum of 80% agreement with human evaluators’ judgments. Thisis because the winning criterion takes the maximum agreement with any of the evaluators.In table 4 we show the full results, i.e., the agreement between each of the evaluatorsand each winning team’s submission. Below, we briefly describe each of the three winningsolutions.
The team from Aidemy, Inc. (?) presents a solution based on the hypothesis that ahigh-quality question is appropriately difficult, is readable, and strikes a balance amonganswer choices. They compute a question feature for each of the hypothesized properties.Specifically, they use entropy to measure question difficulty and the balance among answerchoices. They also extract readability features by performing optic character recognition(OCR) on the question images to extract question textual information. Their empiricalresults show that combining all the above features results in the best performance on bothpublic and private data compared to using only a subset of the features. To compute thequestion quality rankings, they first rank the questions using each feature and then rerankthem by the average rank.
201
Wang et al.
Table 4: Detailed results of winning solutions to Task 3, including the agreement with eachof the evaluators.
Team Eval #1 Eval #2 Eval #3 Eval #4 Eval #5
Aidemy, Inc 0.64 0.6 0.6 0.6 0.8TAL 0.72 0.68 0.6 0.6 0.8U. Sydney 0.72 0.6 0.6 0.6 0.8
The team from TAL Education Group (?) presents a solution that shares some similaritywith the above solution. Specifically, they also compute entropy among answer choices andentropy between correct and incorrect student responses. Here, they additionally computefine-grained correct-incorrect response entropy conditioned on question groups and quizgroups, which captures question difficulty at different levels of knowledge acquisition. Theyalso include students’ answer confidence scores into their metric. Different from the abovesolution, they form their metric by taking a weighted average of the features to computethe final ranking.
The team from the University of Sydney (?) provided an even simpler solution, simplyranking the questions in order of the average confidence students reported in their answersto each question, where higher average confidence is interpreted as a higher question qual-ity. The authors propose that high student confidence implies that the question is clearand unambiguous and that the Dunning-Kruger effect (?) may result in students holdingkey misconceptions reporting high confidence in incorrect answers if the question clearlyaddresses this misconception.
Notably, all of these solutions are entirely deterministic and do not involve any machinelearning component.
Top solution for Task 4. The winning solution comes from Aritra Ghosh at the Uni-versity of Massachusetts, Amherst (?), who proposes a novel meta-learning framework witha 74.74% prediction accuracy. The intuition is that a model needs to quickly adapt to eachstudent, i.e., it selects a personalized sequence of questions for each student, after observingonly a few answer records from each student. This few-shot learning setup during test timeimplies that it is best if the training procedure also follows this few-shot learning setup.Therefore, they formulate a meta-learning problem, where the model aims to first optimizedifferent small subset of answers, partitioned from the training data, for each student andthen optimize another subset of answers distinct from the training data. As part of theirsolution, they also propose a sampling-based method to select the next question condi-tioned on the already observed answers. They note that a more complicated, potentiallymore powerful question selection policy, such as the actor-critic network in reinforcementlearning, can be incorporated into their framework.
During training, they use different partitions of the training data to train the model.Several other training and data splitting techniques are involved, such as splitting all stu-dents into training and local test sets in addition to splitting answer records for each stu-dent. These techniques together ensure that the model does not overfit and is capable ofgeneralizing to different students with very few initial answer records.
202
Results and Insights from Diagnostic Questions: The NeurIPS 2020 Education Challenge
5. Observations and Insights
The importance of educational domain knowledge. The successful solutions in alltasks demonstrate the importance of educational domain knowledge. For example, the bestsolution for task 1 leverages several related metadata about students and questions and com-bines them with feature selection and ensemble methods. This observation suggests thatto build successful predictive and analytical models, it is important to creatively and clev-erly incorporate educational domain knowledge into potentially black-box machine learningmethods, in addition to simply building more powerful models. Empirically, we observe thatmethods that purely rely on state-of-the-art models such as deep learning perform sub-parwith those that take advantage of educational domain knowledge and intuitions. Modelswith domain knowledge built-in also have the potential to provide us valuable insights intowhich features are useful for the predictive task, which can then help guide and optimizethe data collection process.
The potential utility of entropy-based question quality metrics. Many of thetop-performing solutions leverage entropy as a way to measure question quality. Entropyis an appropriate measure of balance among a question’s answer choices and between thecorrect and incorrect students’ responses. As some submitted solutions’ intuition indicates,questions that strike such balance tend to be moderately difficult (not too easy or toodifficult) and can distinguish students that have or do not have a mastery of knowledge.Those questions thus should be of high quality.
The above observations yield two interesting insights. First, the aforementioned intu-itions closely align with the expert human evaluators’ judgment criteria, because questionquality ranked by metrics based on those intuitions achieve substantial agreements withthat ranked by expert human evaluators. Second, entropy is a suitable way to quantifythe above intuition. Our insights suggest that entropy-based metrics are a promising direc-tion to explore for objectively quantifying question quality, a property that we traditionallyconsider as overly subjective and unlikely to be computed.
The promise of emerging ML techniques for education. Across all submissions, wehave seen many creative applications of the latest machine learning methods. For example,the winning solution in task 4 develops a meta-learning framework that also leveragestechniques such as reinforcement learning, few-shot learning, and bi-level optimization.Although these novel methods sometimes fall behind traditionally successful methods indata science competitions such as boosting methods and ensembles, they bring in new ideasto modeling educational data and have the potential to contribute to other practical datascience problems beyond education.
6. Competition Impacts
In this section, we describe the potential impacts that our competition has on AI for edu-cation. We also discuss other educational and broader impacts.
Impact on AI for Education. As described in Section 3, each of the competition tasksis rooted in a genuine, real-world educational problem. Successful solutions to tasks 1 and 2will lead to more accurate student analytics and misconception identification, respectively.
203
Wang et al.
These improvements could better assist teachers and personalized learning algorithms inknowing how the students are learning, leading to more effective personalized learning.Successful solutions to task 3 provide novel ideas to quantify question quality. These ideaswill spark new research in question quality quantification and provide preliminary ways todo so. Finally, successful solutions to task 4 will lead to more effective question sequence se-lection. This will potentially improve performance for adaptive testing algorithms, improveefficiency for online assessment, and save teachers’ time in manually selecting questions.
Our competition may potentially benefit AI for education beyond the tasks that weintroduced. Our dataset, which is large in size and rich in metadata, will contribute tomany other research problems in AI for education. For example, our dataset contains thetimestamps of the answers, which fits perfectly in the setting of knowledge tracing (????),one of the fundamental problems in educational data mining that tracks students’ progressover time. Our dataset also contains the topics/skills that each question intends to test,which can be used for fine-grained misconception identification and analysis (?????). Fi-nally, our dataset contains question images, which include the question text. These textsand images could enable research on multi-modal data integration, i.e., images and naturallanguage, to improve modeling performance on a variety of educational data mining tasks.
Broader Impacts. Our competition also has broader impact beyond education becauseour competition involves multiple fundamental machine learning challenges that need to beaddressed. For example, the solutions for the first two tasks show that both deep-learningbased methods and ensemble-based methods using extensive feature engineering are viablesolutions. These observations could inspire future development that better leverage theadvantages of both methods for matrix completion and recommender system design, bothof which are generalizations of the problems in task 1 and task 2 of our competition. Thesolutions for task 3 could be useful as a novel entropy-based ranking method for a varietyof applications that involve ranking, such as information retrieval. The solutions for task4 invites new methodologies, such as meta-learning and bi-level optimization, for activelearning and Bayesian experimental design in general. Overall, all our tasks are technicallychallenging and interesting and we are excited to observe the impact that the inspiringsubmissions to our competition will have in the future to the NeurIPS community andbeyond.
7. Conclusions
We present the NeurIPS 2020 Education Challenge, a comprehensive challenge focusingspecifically on the applications of AI in education. We introduce four different tasks, allof which represent practical and pressing problems that large-scale online educational plat-forms are facing today. We curate one of the largest educational datasets available to datewith rich metadata on both students and questions. The competition has attracted wideattention from participants worldwide, whose solutions bring fresh ideas to large-scale edu-cational data mining and suggest promising future research directions for each of the tasks.Finally, we note that our large, real-world dataset has much broader applications in both AIfor education and machine learning than those tasks that we designate in our competition.
Our competition deliberately pinpoints a focused target: student responses to multiple-choice diagnostic questions. But education is extremely complicated, and there are many,
204
Results and Insights from Diagnostic Questions: The NeurIPS 2020 Education Challenge
many other important problems. For example, it is difficult to define and quantify stu-dents’ learning outcomes. In our current setting, students’ objective is to correctly answerall questions assigned to them. This may not be a poor approximation of the real learningoutcome that teachers care about. Also, currently, we can only analyze students’ perfor-mance after we collect their data. It is highly desirable, but challenging, to perform analysis,and even intervention during students’ learning process, but this may yield ethical issues.Besides, many other types of learning activity data such as collaboration, emotional state,and confidence, which potentially have a high impact on learning, are difficult to collect.Finally, it is an ongoing research problem to determine how best to collect and save largeeducational data for AI applications while preserving students’ and teachers’ privacy. Weare continuing to work on these challenging issues and we believe that our dataset and theinsights drawn from the competition will have a positive long-term impact on educationalpractitioners and diverse research communities.
Acknowledgements
We thank the Codalab team for their technical support throughout the competition andall competition participants who contributed. ZW and RGB are supported by NSF grants1842378 and 1937134 and by ONR grant N0014-20-1-2534.
205