The MIMOSE Approach to Support Sustainable Forest ... - MDPI
16
sustainability Article The MIMOSE Approach to Support Sustainable Forest Management Planning at Regional Scale in Mediterranean Contexts Matteo Vizzarri 1 , Lorenzo Sallustio 1, *, Davide Travaglini 2 , Francesca Bottalico 2 , Gherardo Chirici 2 , Vittorio Garfì 1 , Raffaele Lafortezza 3,4 , Donato Salvatore La Mela Veca 5 , Fabio Lombardi 6 , Federico Maetzke 5 and Marco Marchetti 1 1 Research Centre for Inner Areas and Apennines (ArIA), Dipartimento di Bioscienze e Territorio, Università degli Studi del Molise, Contrada Fonte Lappone, 86090 Pesche (IS), Italy; [email protected] (M.V.); vittorio.garfi@unimol.it (V.G.); [email protected] (M.M.) 2 Dipartimento di Gestione dei Sistemi Agrari, Alimentari e Forestali, University of Florence, via San Bonaventura 13, 50145 Firenze, Italy; davide.travaglini@unifi.it (D.T.); francesca.bottalico@unifi.it (F.B.); gherardo.chirici@unifi.it (G.C.) 3 Dipartimento di Scienze Agro-Ambientali e Territoriali, University of Bari, Via G. Amendola 165/a, 70126 Bari, Italy; [email protected] 4 Center for Global Change and Earth Observations (CGCEO), Michigan State University, East Lansing, MI 48823, USA 5 Dipartimento di Scienze Agrarie e Forestali, Università degli Studi di Palermo, Viale delle Scienze, Ed. 4, 90128 Palermo, Italy; [email protected] (D.S.L.M.V.); [email protected] (F.M.) 6 Dipartimento di Agraria, Università Mediterranea di Reggio Calabria, Contrada Melissari, Loc. Feo di Vito, 89122 Reggio Calabria, Italy; [email protected] * Correspondence: [email protected]; Tel.: +39-87-440-4171 Academic Editor: Jose G. Borges Received: 19 December 2016; Accepted: 16 February 2017; Published: 21 February 2017 Abstract: In recent decades, Mediterranean landscapes have been affected by human-induced drivers, such as land use and climate change. Forest ecosystems and landscapes have been particularly affected in mountainous regions due to limited management and stewardship, especially in remote areas. Therefore, there is a need to set up new strategies to enhance ecosystem services in forested areas which, in turn, will benefit local communities and economies. In this study, we implemented a new approach—Multiscale Mapping of Ecosystem Services (MIMOSE)—to assess ecosystem services in Mediterranean forests located in a mountainous region of Italy. We spatially assessed timber provision and carbon sequestration according to three forest management strategies: business-as-usual, maximizing economic values, and prioritizing conservation. Sustainable strategies for forest planning were identified at the landscape scale. We found that (i) timber provision is a conflicting service, especially when adaptation strategies are promoted; (ii) the most balanced set of forest ecosystem services is achieved through prioritizing conservation; and (iii) the ecosystem services availability is enhanced by optimizing the spatial allocation of different management strategies. Our approach is suitable to support landscape planning for balancing forest ecosystem potentialities while respecting local community needs and promoting sustainable development goals in the Mediterranean area. Keywords: carbon storage and sequestration; forest ecosystem services; forest management planning; MIMOSE; total ecosystem services value; wood production Sustainability 2017, 9, 316; doi:10.3390/su9020316 www.mdpi.com/journal/sustainability
-
Upload
khangminh22 -
Category
Documents
-
view
0 -
download
0
Transcript of The MIMOSE Approach to Support Sustainable Forest ... - MDPI
sustainability
Article
The MIMOSE Approach to Support SustainableForest Management Planning at Regional Scale inMediterranean Contexts
Matteo Vizzarri 1, Lorenzo Sallustio 1,*, Davide Travaglini 2, Francesca Bottalico 2,Gherardo Chirici 2, Vittorio Garfì 1, Raffaele Lafortezza 3,4, Donato Salvatore La Mela Veca 5,Fabio Lombardi 6, Federico Maetzke 5 and Marco Marchetti 1
1 Research Centre for Inner Areas and Apennines (ArIA), Dipartimento di Bioscienze e Territorio,Università degli Studi del Molise, Contrada Fonte Lappone, 86090 Pesche (IS), Italy;[email protected] (M.V.); [email protected] (V.G.); [email protected] (M.M.)
2 Dipartimento di Gestione dei Sistemi Agrari, Alimentari e Forestali, University of Florence,via San Bonaventura 13, 50145 Firenze, Italy; [email protected] (D.T.);[email protected] (F.B.); [email protected] (G.C.)
3 Dipartimento di Scienze Agro-Ambientali e Territoriali, University of Bari, Via G. Amendola 165/a,70126 Bari, Italy; [email protected]
4 Center for Global Change and Earth Observations (CGCEO), Michigan State University, East Lansing,MI 48823, USA
5 Dipartimento di Scienze Agrarie e Forestali, Università degli Studi di Palermo, Viale delle Scienze, Ed. 4,90128 Palermo, Italy; [email protected] (D.S.L.M.V.); [email protected] (F.M.)
6 Dipartimento di Agraria, Università Mediterranea di Reggio Calabria, Contrada Melissari, Loc. Feo di Vito,89122 Reggio Calabria, Italy; [email protected]
* Correspondence: [email protected]; Tel.: +39-87-440-4171
Academic Editor: Jose G. BorgesReceived: 19 December 2016; Accepted: 16 February 2017; Published: 21 February 2017
Abstract: In recent decades, Mediterranean landscapes have been affected by human-induced drivers,such as land use and climate change. Forest ecosystems and landscapes have been particularlyaffected in mountainous regions due to limited management and stewardship, especially inremote areas. Therefore, there is a need to set up new strategies to enhance ecosystem servicesin forested areas which, in turn, will benefit local communities and economies. In this study,we implemented a new approach—Multiscale Mapping of Ecosystem Services (MIMOSE)—to assessecosystem services in Mediterranean forests located in a mountainous region of Italy. We spatiallyassessed timber provision and carbon sequestration according to three forest management strategies:business-as-usual, maximizing economic values, and prioritizing conservation. Sustainable strategiesfor forest planning were identified at the landscape scale. We found that (i) timber provision isa conflicting service, especially when adaptation strategies are promoted; (ii) the most balanced set offorest ecosystem services is achieved through prioritizing conservation; and (iii) the ecosystemservices availability is enhanced by optimizing the spatial allocation of different managementstrategies. Our approach is suitable to support landscape planning for balancing forest ecosystempotentialities while respecting local community needs and promoting sustainable development goalsin the Mediterranean area.
Keywords: carbon storage and sequestration; forest ecosystem services; forest management planning;MIMOSE; total ecosystem services value; wood production
Sustainability 2017, 9, 316; doi:10.3390/su9020316 www.mdpi.com/journal/sustainability

Sustainability 2017, 9, 316 2 of 16
1. Introduction
Forest ecosystems provide a large set of goods and services (hereafter referred to as forestecosystem services, FES) from the global to the local scale, such as timber and non-timber products,habitats for wildlife, sinks to regulate and mitigate chemical and hydrological regimes, and culturaland historical heritages [1,2]. In recent decades, FES have been formally recognized in some countries(e.g., UK; [3]), and their associated benefits to communities have increased [4]. FES availabilitydepends on the resilience, health, and stability of forest ecosystems [5]. However, the most recentchanges in land use and climate have strongly altered the capacity of forest ecosystems to guaranteefuture human well-being, especially in partly degraded and fragmented landscapes, such as thosein the Mediterranean region [6]. The forest ecosystems in the Mediterranean region have sufferedthe abandonment of traditional silvicultural practices, localized overexploitation and, consequently,a reduction in stand productivity [7]. Considering these challenges, forest management and planningare called to balance FES availability with ecological and socio-economic aspects at the local scalein European forests [8,9]. In the spatial and temporal distribution and allocation of managementinterventions across the forest area, forest management planning needs to be primarily orientedtowards sustainability at a broader scale (e.g., the landscape or regional levels). In other words, forestmanagement planning should enhance the social and economic well-being of local communities byconsidering the anthropogenic effects on FES flows, such as land use change or forestry interventions.As a consequence, assessing the impact of alternative forest management strategies on the capacityof forests to provide FES is increasingly required to better direct decision-making processes towardsimproving the resilience of integrated ecological and socio-economic systems, especially at thelandscape scale [10].
The acquisition of more detailed data on forest structure and soil, and their integration withadditional information (e.g., remotely-sensed) may support forest management planning in betterdetecting changes in forest ecosystems and related services at both the spatial and temporal scale.In recent decades, very few models/systems have been adopted or implemented in Mediterraneanforest landscapes as decision support tools, for example, to evaluate trade-offs and flows oftimber and cork and pinecone supplies, and carbon stocks in Portugal [11–13], to address thejoint production of timber and mushrooms in Turkey [14], and to facilitate predictions on wildfiremanagement [15,16]. The role of the available models and decision-support systems to operationalizethe concept of ecosystem services at local and regional scales is largely debated [13,17]. For instance,regional differences in terms of FES provision at EU scale were recently assessed by combiningdecision support systems with scenario-building processes [18]. However, the implementation oftargeted policies (e.g., the EU Biodiversity Strategy to 2020; COM(2011)244), as well as a multi-sectorialperspective in assessing ecosystem services, are still required in spatial planning [17]. On the contrary,the so-called “model suites” have been shown to provide multiple approaches to decision-makingissues [17]. For example, the “Integrated Valuation of Ecosystem Services and Trade-offs” (InVEST) and“Artificial Intelligence for Ecosystem Services” (ARIES) models have been proven effective in severalcases [19,20]. Outside of Europe, the InVEST model was shown to be flexible in estimating, in a spatiallyexplicit way, both the biophysical and economic values of ecosystem services at the landscape orwatershed scale, and for forest management planning purposes [21]. In the Mediterranean region,the InVEST model was adopted to analyze the sediment dynamics and habitat quality in two forestedwatersheds in Spain [22,23]. Nevertheless, to our knowledge, very few studies have examined theimplications of forest management planning on FES provision. For example, the Multiscale Mapping ofEcosystem Services (MIMOSE) approach was adopted to simulate the effects of management strategieson FES in Central Italy [24].
In Italy, the weak integration between the information made available by the national forestinventory and the current management and socio-economic conditions, as well as the overlap ofresponsibilities in forest planning have limited the long-term functionality and resilience of forestlandscapes [25]. Similarly, the implementation of scenario-based solutions (i.e., models and tools) at
Sustainability 2017, 9, 316 3 of 16
the operational scale for maximizing FES provision in forest management planning contexts is stilllacking in many parts of Italy. Although several studies have attempted to combine decision supportsystems with participatory processes (Basilicata region; [26]) and addressed the multi-functionalityof forest landscapes (Molise region; [27]), many more efforts are still needed to consider FES ina spatially-explicit way and their related trade-offs in forest management planning in Italy.
To address these challenges, our study aims to: (i) implement the MIMOSE approach inSouthern Italy to highlight the potentialities and constraints of assessing FES for forest planningin both biophysical and economic terms; (ii) propose alternative spatially-explicit strategies forimproving sustainable forest management planning; and (iii) assess the implications of differentforest management strategies on the total ecosystem services value, as well as their effects onincomes and social well-being. Firstly, timber provision and carbon sequestration were assessed andmapped over a 20-year simulation period (2015–2035) according to three forest management strategies;Secondly, the FES obtained were then used to compare the implications of the three alternativemanagement strategies; Lastly, an optimized forest management plan was hypothesized by mergingthe three alternative management strategies in order to maximize the total ecosystem services value atthe landscape scale and ultimately support sustainable large-scale forest management planning.
2. Materials and Methods
2.1. Study Area and Data
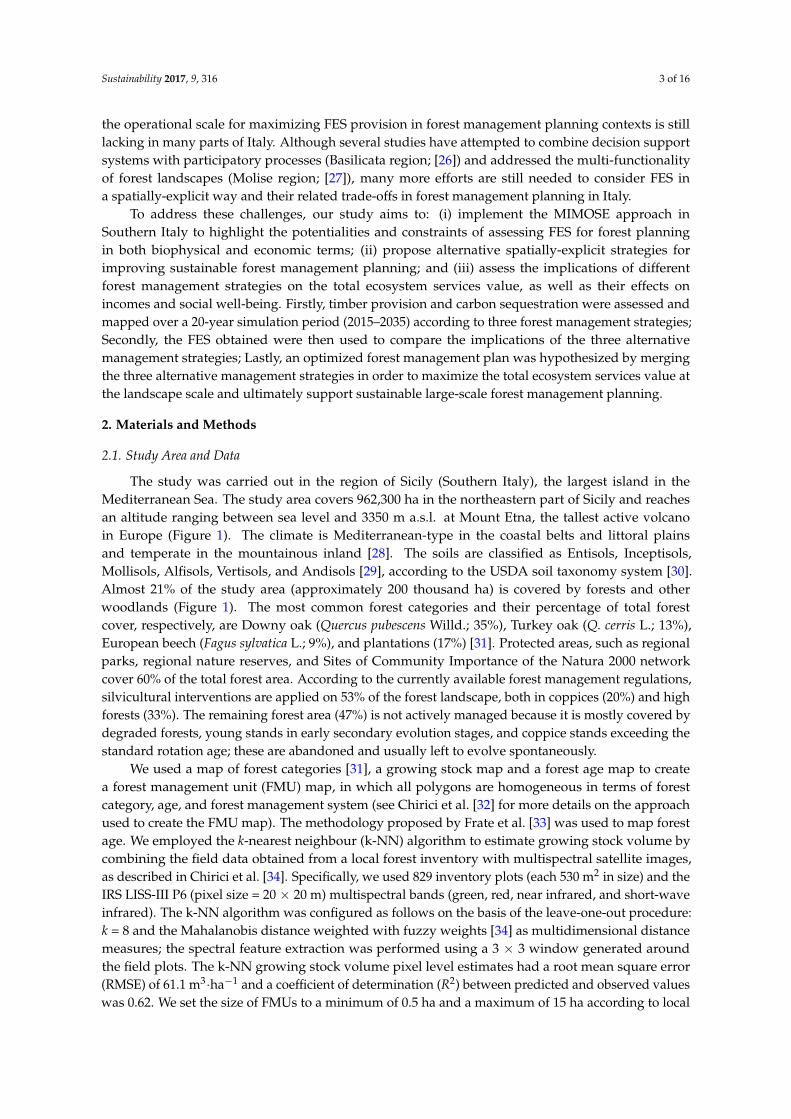
The study was carried out in the region of Sicily (Southern Italy), the largest island in theMediterranean Sea. The study area covers 962,300 ha in the northeastern part of Sicily and reachesan altitude ranging between sea level and 3350 m a.s.l. at Mount Etna, the tallest active volcanoin Europe (Figure 1). The climate is Mediterranean-type in the coastal belts and littoral plainsand temperate in the mountainous inland [28]. The soils are classified as Entisols, Inceptisols,Mollisols, Alfisols, Vertisols, and Andisols [29], according to the USDA soil taxonomy system [30].Almost 21% of the study area (approximately 200 thousand ha) is covered by forests and otherwoodlands (Figure 1). The most common forest categories and their percentage of total forestcover, respectively, are Downy oak (Quercus pubescens Willd.; 35%), Turkey oak (Q. cerris L.; 13%),European beech (Fagus sylvatica L.; 9%), and plantations (17%) [31]. Protected areas, such as regionalparks, regional nature reserves, and Sites of Community Importance of the Natura 2000 networkcover 60% of the total forest area. According to the currently available forest management regulations,silvicultural interventions are applied on 53% of the forest landscape, both in coppices (20%) and highforests (33%). The remaining forest area (47%) is not actively managed because it is mostly covered bydegraded forests, young stands in early secondary evolution stages, and coppice stands exceeding thestandard rotation age; these are abandoned and usually left to evolve spontaneously.
We used a map of forest categories [31], a growing stock map and a forest age map to createa forest management unit (FMU) map, in which all polygons are homogeneous in terms of forestcategory, age, and forest management system (see Chirici et al. [32] for more details on the approachused to create the FMU map). The methodology proposed by Frate et al. [33] was used to map forestage. We employed the k-nearest neighbour (k-NN) algorithm to estimate growing stock volume bycombining the field data obtained from a local forest inventory with multispectral satellite images,as described in Chirici et al. [34]. Specifically, we used 829 inventory plots (each 530 m2 in size) and theIRS LISS-III P6 (pixel size = 20 × 20 m) multispectral bands (green, red, near infrared, and short-waveinfrared). The k-NN algorithm was configured as follows on the basis of the leave-one-out procedure:k = 8 and the Mahalanobis distance weighted with fuzzy weights [34] as multidimensional distancemeasures; the spectral feature extraction was performed using a 3 × 3 window generated aroundthe field plots. The k-NN growing stock volume pixel level estimates had a root mean square error(RMSE) of 61.1 m3·ha−1 and a coefficient of determination (R2) between predicted and observed valueswas 0.62. We set the size of FMUs to a minimum of 0.5 ha and a maximum of 15 ha according to local

Sustainability 2017, 9, 316 4 of 16
forest regulations. The FMU map contains 44,467 FMUs, with an average size of 4.5 ha (SD ± 3.5).Table 1 summarizes the main forest variables available for each FMU.Sustainability 2017, 9, 316 4 of 16
Figure 1. Map of Italy (bottom right) and study area highlighted in black. The close-up of the study area shows the forest cover differentiated according to the most common forest categories (labelled in the legend).
Table 1. The main quantitative variables available for each forest management unit.
Forest Variable Measurement Unit Average Value (±SD) Altitude m·a.s.l. 788 (±403)
Slope % 34 (±17) Age years 18 (±12)
Standing volume m3·ha−1 87.6 (±51.5) Above-ground biomass Mg·ha−1 73.7 (±41.9)
2.2. The MIMOSE Approach
MIMOSE is a spatially-explicit approach that is useful to assess, in both biophysical and economic terms, different FES and their related trade-offs (i.e., timber harvesting versus carbon sequestration) under various management strategies [24]. In the present work, we implemented this approach following three steps, as proposed by Olander et al. [35]: (i) alternative forest management strategies (i.e., business-as-usual, BaU; nature conservation, NC; and wood production, WP) were applied at the FMU level in the study area; (ii) the InVEST model was applied to assess and map timber production and carbon sequestration over a 20-year time period (from 2015 to 2035) under different management strategies; and (iii) a large-scale forest management plan was hypothesized to maximize the total ecosystem services value at the regional scale.
2.2.1. Forest Management Strategies
We considered three alternative forest management strategies, hereafter named BaU, NC, and WP. BaU (business-as-usual) represents the current forest management approach required by local forest regulations. NC and WC were designed to represent management strategies directed more towards nature conservation or wood production, respectively, compared to BaU. We assumed that all forests were managed as even-aged systems in BaU and WP, and that high forests were managed
Figure 1. Map of Italy (bottom right) and study area highlighted in black. The close-up of the studyarea shows the forest cover differentiated according to the most common forest categories (labelled inthe legend).
Table 1. The main quantitative variables available for each forest management unit.
Forest Variable Measurement Unit Average Value (±SD)
Altitude m a.s.l. 788 (±403)Slope % 34 (±17)Age years 18 (±12)
Standing volume m3·ha−1 87.6 (±51.5)Above-ground biomass Mg·ha−1 73.7 (±41.9)
2.2. The MIMOSE Approach
MIMOSE is a spatially-explicit approach that is useful to assess, in both biophysical and economicterms, different FES and their related trade-offs (i.e., timber harvesting versus carbon sequestration)under various management strategies [24]. In the present work, we implemented this approachfollowing three steps, as proposed by Olander et al. [35]: (i) alternative forest management strategies(i.e., business-as-usual, BaU; nature conservation, NC; and wood production, WP) were applied at theFMU level in the study area; (ii) the InVEST model was applied to assess and map timber productionand carbon sequestration over a 20-year time period (from 2015 to 2035) under different managementstrategies; and (iii) a large-scale forest management plan was hypothesized to maximize the totalecosystem services value at the regional scale.
2.2.1. Forest Management Strategies
We considered three alternative forest management strategies, hereafter named BaU, NC, and WP.BaU (business-as-usual) represents the current forest management approach required by local forestregulations. NC and WC were designed to represent management strategies directed more towards

Sustainability 2017, 9, 316 5 of 16
nature conservation or wood production, respectively, compared to BaU. We assumed that allforests were managed as even-aged systems in BaU and WP, and that high forests were managedwith the aim of transitioning towards uneven-aged systems in NC. For each forest managementstrategy, the following three management systems were considered: coppice (including simplecoppice forests and coppice forests with standards) [36], coppice in conversion to high forest [37],and high forest. Clearcutting was used as a silvicultural practice for coppices in BaU, NC, and WP,and for high forests (conifer species) in BaU and WP. The shelterwood practice [38] was used forboth high forests (broadleaved species) and coppices in conversion to high forests in BaU and WP.The selection cut system was used in NC for both high forests and coppices in conversion to highforests (additional information regarding, e.g., rotation age and the limitations set in the diverseforest management strategies depending on terrain slope, presence of protected areas, and maximumsize of clearcutting areas can be found in Bottalico et al. [24]). Table 2 reports harvesting intensity,expressed as the percentage of total growing stock adopted for BaU, NC, and WP, which was setbased on the national literature [39–41] and in cooperation with local forest managers. Forest residueswere estimated taking into account that approximately 77% of wood volume (m3) is available forwood supply and the remaining as residuals [42]. The share of removed residues was set at 75%and 90% of the total residues for BaU and WP, respectively. For NC, the share of removed residuesvaried from 0% to 75% depending on terrain slope [43]. The forest management strategies wereimplemented at the FMU scale over a 20-year period (2015–2035) using the area control method andthe current annual increment of wood volume (m3·ha−1·year−1) for the different forest categories [44].Thinning operations were performed twice during the simulation period, once every 10 years,depending on the forest management strategy employed.
Table 2. Harvesting intensity (percentage of total growing stock) for the forest management strategies.BaU, business-as-usual; NC, nature conservation; WP, wood production.
Management Strategy BaU NC WP
Simple coppice 100% - 100%
Coppice with standards 60%–70%, depending onforest categories
40%–65%, depending on forestcategories
70%–80%, depending onforest categories
Coppice in conversionto high forest
Thinning: 50% for the first,then 20%Seed cut: 30%Removal cuts: 30%
Thinning: 50% for the first,then 15%Selection cut: 10%–30% basedon the concept of theminimum growing stock [41]
Thinning: 50% for thefirst, then 25%Seed cut: 30%Removal cuts: 30%
High forest
Thinning: 20%Broadleaved species-Seed cut: 30%Removal cuts: 30%Conifer species-Clear cut: 100% (max 3 ha)
Thinning: 15%Selection cut: 10%–30% basedon the concept of theminimum growing stock [41]
Thinning: 25%Broadleaved species-Seed cut: 30%Removal cuts: 30%Conifer species-Clear cut: 100%
2.2.2. Ecosystem Services Assessment
The InVEST model [45] was used to assess and map the effects of the three forest managementstrategies on two FES, namely carbon storage and sequestration, and wood production. These effectswere evaluated in both biophysical and economic terms. The amount of wood harvested from2015 to 2035 was simulated using the InVEST Managed Timber Production model. This toolallowed considering different harvest intensities and frequencies, according to the three alternativemanagement strategies. The InVEST Managed Timber Production model was applied at the FMUlevel, assuming that the total amount of timber harvested is used as firewood [46]. The economicoutputs of the model are provided as net present value (NPV). NPV represents the net economic valueat the starting point (2015 in our case) of timber production, according to all forestry interventions,as planned for the entire simulation period (i.e., 20 years). NPV (€·ha−1) was calculated for each FMU

Sustainability 2017, 9, 316 6 of 16
as a function of the amount of timber harvested, as well as its price (divided into hardwood andsoftwood) and harvesting costs. These values were then discounted in 2015 by adopting a discountrate of 3% [24]. The InVEST Carbon Storage and Sequestration model was implemented to assessforest carbon sequestration from 2015 to 2035 at the FMU level. In biophysical terms, carbon storagein 2035 was estimated by subtracting the simulated wood removals (i.e., harvested biomass) andadding the current annual increment of wood volume during the 20-year simulation period, as alsosuggested by the Italian national forest inventory [44] for forest growth simulation. The amountof carbon was not only estimated for the above-ground living biomass compartment, but also forother carbon pools: below-ground biomass, dead organic matter, including dead wood and litter,and soil organic matter (see also the IPCC Good Practice Guidance for Land Use, Land Use Changeand Forestry—GPG-LULUCF) [47]. Carbon sequestration was finally estimated by subtracting carbonstorage in 2035 from carbon storage in 2015. The biophysical value was then converted into economicterms using the social cost of carbon (SCC) [48], considering a single SCC value of 109 €·Mg−1 and7% as the discount rate (see Bottalico et al. [24] for further details). It is important to highlightthat because SCC represents the total value of the incremental damage due to a small increase incarbon dioxide emissions [49], it can be considered more as a social than a pure market value and is,therefore, suitable to evaluate the social impacts of certain climate change policies and strategies [48].NPVs and SCCs related to FMUs were finally aggregated for the whole study area to evaluate the totalnet present value (TNPV) and total social cost of carbon (TSCC), respectively.
2.2.3. Spatially-Explicit Analysis
The total ecosystem services value (TESV) is calculated as the sum of TNPV and TSCC,and represents the capacity of a given area to provide multiple services [50]. TESV can be equalto zero if no added benefits to society are provided through a specific activity, or negative if thecosts of the activity are higher than the incomes (i.e., SCC is higher than NPV), or positive in theopposite case. Unlike Bottalico et al. [24], the primary aim of our study was not to investigate therelationships between the two FES, but to develop a forest management plan that maximizes TESVat the regional scale. Although a relatively higher TESV could be achieved through one of the threeproposed management strategies (BaU, NC, and WP), perhaps the best result might be reachedby mixing and merging them within the same forest management plan, according to the specificFMU characteristics (forest type, age, slope, etc.). To test this hypothesis and create the so-calledoptimized forest management plan (OFMP), we performed an FMU-based analysis to select thatmanagement strategy that maximizes TESV within each FMU. Accordingly, each FMU was assignedto a specific management strategy and then aggregated into a forest compartment (CMP), which ishomogenous from the management perspective. Three CMPs were created and named according tothe original forest management strategy (BaU, NC and WP). These three CMPs were finally mergedinto a single OFMP. The implications in terms of TESV, and the relationships between the two FESconsidered, were then analyzed, particularly accounting for their effects on private and social benefitsand, consequently, on related sustainability.
3. Results and Discussion
3.1. Forest Ecosystem Services
In the case of timber production, TNPV was 140.6 M €, 70.4 M €, and 236 M €, equivalent to8.8 M m3, 4.7 million m3, and 12.9 million m3 of wood harvestable under the BaU, NC, and WPmanagement strategies, respectively. On average, NPV was 707.6 €·ha−1, 354.4 €·ha−1, and 1187.3 €·ha−1,equivalent to 44.2 m3·ha−1, 23.7 m3·ha−1, and 64.7 m3·ha−1 for the three management strategies,respectively. For carbon sequestration, TSCC was 83.8 M €, 306.1 M €, and −167.2 M €, corresponding toa total carbon removal of approximately 1.4 million Mg, 5 million Mg, and −2.7 million Mg for the BaU,NC, and WP management strategies, respectively. Carbon sequestration values were negative when
Sustainability 2017, 9, 316 7 of 16
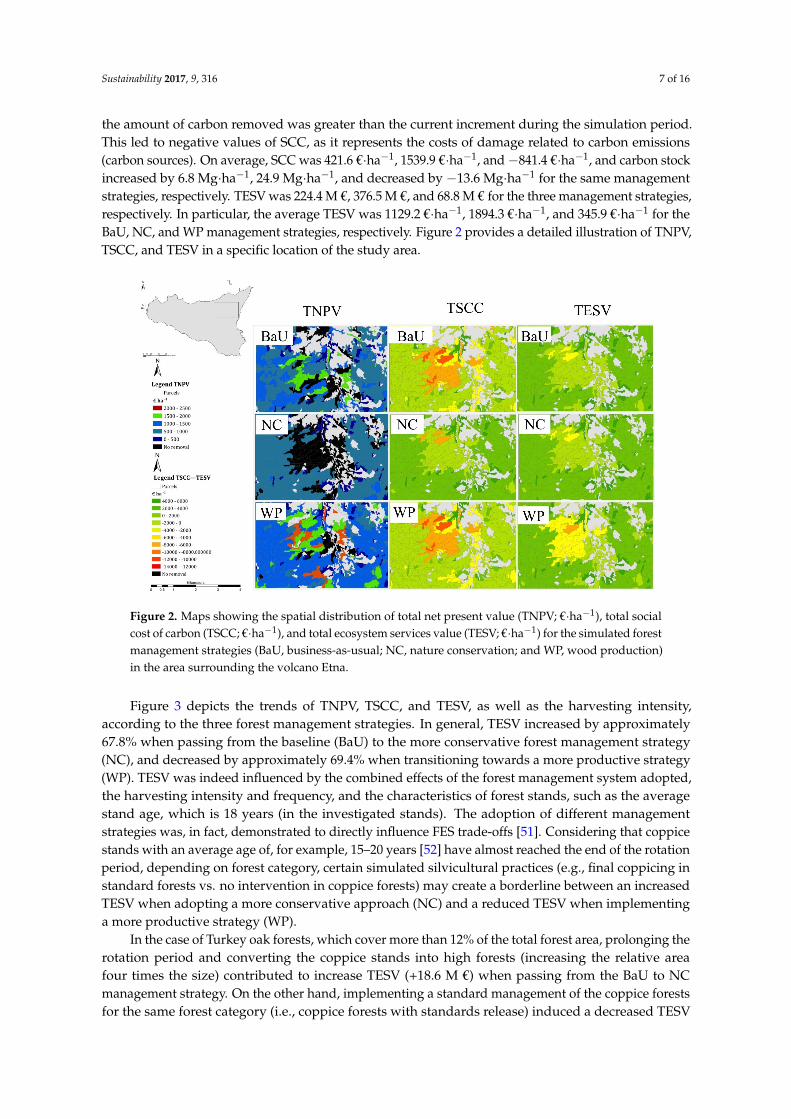
the amount of carbon removed was greater than the current increment during the simulation period.This led to negative values of SCC, as it represents the costs of damage related to carbon emissions(carbon sources). On average, SCC was 421.6 €·ha−1, 1539.9 €·ha−1, and −841.4 €·ha−1, and carbon stockincreased by 6.8 Mg·ha−1, 24.9 Mg·ha−1, and decreased by −13.6 Mg·ha−1 for the same managementstrategies, respectively. TESV was 224.4 M €, 376.5 M €, and 68.8 M € for the three management strategies,respectively. In particular, the average TESV was 1129.2 €·ha−1, 1894.3 €·ha−1, and 345.9 €·ha−1 for theBaU, NC, and WP management strategies, respectively. Figure 2 provides a detailed illustration of TNPV,TSCC, and TESV in a specific location of the study area.
Sustainability 2017, 9, 316 7 of 16
management strategies, respectively. TESV was 224.4 M €, 376.5 M €, and 68.8 M € for the three management strategies, respectively. In particular, the average TESV was 1129.2 €·ha−1, 1894.3 €·ha−1, and 345.9 €·ha−1 for the BaU, NC, and WP management strategies, respectively. Figure 2 provides a detailed illustration of TNPV, TSCC, and TESV in a specific location of the study area.
Figure 2. Maps showing the spatial distribution of total net present value (TNPV; €·ha−1), total social cost of carbon (TSCC; €·ha−1), and total ecosystem services value (TESV; €·ha−1) for the simulated forest management strategies (BaU, business-as-usual; NC, nature conservation; and WP, wood production) in the area surrounding the volcano Etna.
Figure 3 depicts the trends of TNPV, TSCC, and TESV, as well as the harvesting intensity, according to the three forest management strategies. In general, TESV increased by approximately 67.8% when passing from the baseline (BaU) to the more conservative forest management strategy (NC), and decreased by approximately 69.4% when transitioning towards a more productive strategy (WP). TESV was indeed influenced by the combined effects of the forest management system adopted, the harvesting intensity and frequency, and the characteristics of forest stands, such as the average stand age, which is 18 years (in the investigated stands). The adoption of different management strategies was, in fact, demonstrated to directly influence FES trade-offs [51]. Considering that coppice stands with an average age of, for example, 15–20 years [52] have almost reached the end of the rotation period, depending on forest category, certain simulated silvicultural practices (e.g., final coppicing in standard forests vs. no intervention in coppice forests) may create a borderline between an increased TESV when adopting a more conservative approach (NC) and a reduced TESV when implementing a more productive strategy (WP).
In the case of Turkey oak forests, which cover more than 12% of the total forest area, prolonging the rotation period and converting the coppice stands into high forests (increasing the relative area four times the size) contributed to increase TESV (+18.6 M €) when passing from the BaU to NC management strategy. On the other hand, implementing a standard management of the coppice forests for the same forest category (i.e., coppice forests with standards release) induced a decreased TESV (−19.8 M €) when passing from the BaU to WP management strategy. Indeed, prolonging the rotation length, as in the case of the NC strategy, was found to lower the incomes from wood production (cf. [53]). Moreover, in the total forest area, the reduction of the coppice forest area subjected to the final cut, with standard release (−40.4%), resulted in an increased TESV (+15.9 M €) when passing from the BaU to NC management strategy. On the contrary, increasing the area of
Figure 2. Maps showing the spatial distribution of total net present value (TNPV; €·ha−1), total socialcost of carbon (TSCC; €·ha−1), and total ecosystem services value (TESV; €·ha−1) for the simulated forestmanagement strategies (BaU, business-as-usual; NC, nature conservation; and WP, wood production)in the area surrounding the volcano Etna.
Figure 3 depicts the trends of TNPV, TSCC, and TESV, as well as the harvesting intensity,according to the three forest management strategies. In general, TESV increased by approximately67.8% when passing from the baseline (BaU) to the more conservative forest management strategy(NC), and decreased by approximately 69.4% when transitioning towards a more productive strategy(WP). TESV was indeed influenced by the combined effects of the forest management system adopted,the harvesting intensity and frequency, and the characteristics of forest stands, such as the averagestand age, which is 18 years (in the investigated stands). The adoption of different managementstrategies was, in fact, demonstrated to directly influence FES trade-offs [51]. Considering that coppicestands with an average age of, for example, 15–20 years [52] have almost reached the end of the rotationperiod, depending on forest category, certain simulated silvicultural practices (e.g., final coppicing instandard forests vs. no intervention in coppice forests) may create a borderline between an increasedTESV when adopting a more conservative approach (NC) and a reduced TESV when implementinga more productive strategy (WP).
In the case of Turkey oak forests, which cover more than 12% of the total forest area, prolonging therotation period and converting the coppice stands into high forests (increasing the relative areafour times the size) contributed to increase TESV (+18.6 M €) when passing from the BaU to NCmanagement strategy. On the other hand, implementing a standard management of the coppice forestsfor the same forest category (i.e., coppice forests with standards release) induced a decreased TESV
Sustainability 2017, 9, 316 8 of 16
(−19.8 M €) when passing from the BaU to WP management strategy. Indeed, prolonging the rotationlength, as in the case of the NC strategy, was found to lower the incomes from wood production(cf. [53]). Moreover, in the total forest area, the reduction of the coppice forest area subjected to thefinal cut, with standard release (−40.4%), resulted in an increased TESV (+15.9 M €) when passingfrom the BaU to NC management strategy. On the contrary, increasing the area of coppice forestswith standard release (+8.1%) for the same forest category resulted in a dramatic reduction of TESV(−56.2 M €) when passing from the BaU to WP management strategy. This discrepancy is due tothe allocation of a large portion of the downy oak forest area (~40%) converted from coppice to highforest, and left to natural evolution, in the case of the NC management strategy for the time periodunder study. In this way, future carbon accumulation is facilitated (cf. [54]). Concerning the Europeanbeech forests (9% of the total forest area), the simulated forest interventions resulted in a decreasedTESV (−25.7 M €) when passing from the BaU to WP management strategy. This may be due to thefact that the increase in TNPV still remained lower in comparison with the decrease in TSCC whenpassing from the BaU to WP management strategy, though most of the European beech coppice forestswith standard release are actively managed (i.e., harvested). Accordingly, the period chosen for thesimulations (i.e., 20 years) seems to be short to effectively understand the future development of foreststands and, in turn, assess the implications of some silvicultural interventions on TESV, such as naturalevolution, conversion of coppice forests to high forests, and so forth.
These results are similar to those obtained in Bottalico et al. [24] for the Molise region(South-central Italy). The average TESV ha−1 was higher in the Molise region for the NC managementstrategy than in the Sicilian case study (+314 €·ha−1), while it was lower for the WP strategy(−136 €·ha−1). This was mainly due to the presence of younger stands and the adoption of lessintensive forestry interventions when comparing the Sicily and Molise region studies. In the case ofthe NC management strategy, the harvesting rates during the simulation period were lower for theSicilian forests compared with those of the Molise region (55% vs. 62%). Conversely, in the case ofthe WP management strategy, the harvesting rates were higher for Sicilian forests when comparedwith those for the Molise (88% vs. 83%). This may be due to the fact that the European beech forests inthe Sicilian case study are mostly located at higher elevations and within protected areas and, thus,less intensive forestry interventions for these stands were implemented during the simulation in thecase of the NC management strategy.
Sustainability 2017, 9, 316 8 of 16
coppice forests with standard release (+8.1%) for the same forest category resulted in a dramatic reduction of TESV (−56.2 M €) when passing from the BaU to WP management strategy. This discrepancy is due to the allocation of a large portion of the downy oak forest area (~40%) converted from coppice to high forest, and left to natural evolution, in the case of the NC management strategy for the time period under study. In this way, future carbon accumulation is facilitated (cf. [54]). Concerning the European beech forests (9% of the total forest area), the simulated forest interventions resulted in a decreased TESV (−25.7 M €) when passing from the BaU to WP management strategy. This may be due to the fact that the increase in TNPV still remained lower in comparison with the decrease in TSCC when passing from the BaU to WP management strategy, though most of the European beech coppice forests with standard release are actively managed (i.e., harvested). Accordingly, the period chosen for the simulations (i.e., 20 years) seems to be short to effectively understand the future development of forest stands and, in turn, assess the implications of some silvicultural interventions on TESV, such as natural evolution, conversion of coppice forests to high forests, and so forth.
These results are similar to those obtained in Bottalico et al. [24] for the Molise region (South-central Italy). The average TESV ha−1 was higher in the Molise region for the NC management strategy than in the Sicilian case study (+314 €·ha−1), while it was lower for the WP strategy (−136 €·ha−1). This was mainly due to the presence of younger stands and the adoption of less intensive forestry interventions when comparing the Sicily and Molise region studies. In the case of the NC management strategy, the harvesting rates during the simulation period were lower for the Sicilian forests compared with those of the Molise region (55% vs. 62%). Conversely, in the case of the WP management strategy, the harvesting rates were higher for Sicilian forests when compared with those for the Molise (88% vs. 83%). This may be due to the fact that the European beech forests in the Sicilian case study are mostly located at higher elevations and within protected areas and, thus, less intensive forestry interventions for these stands were implemented during the simulation in the case of the NC management strategy.
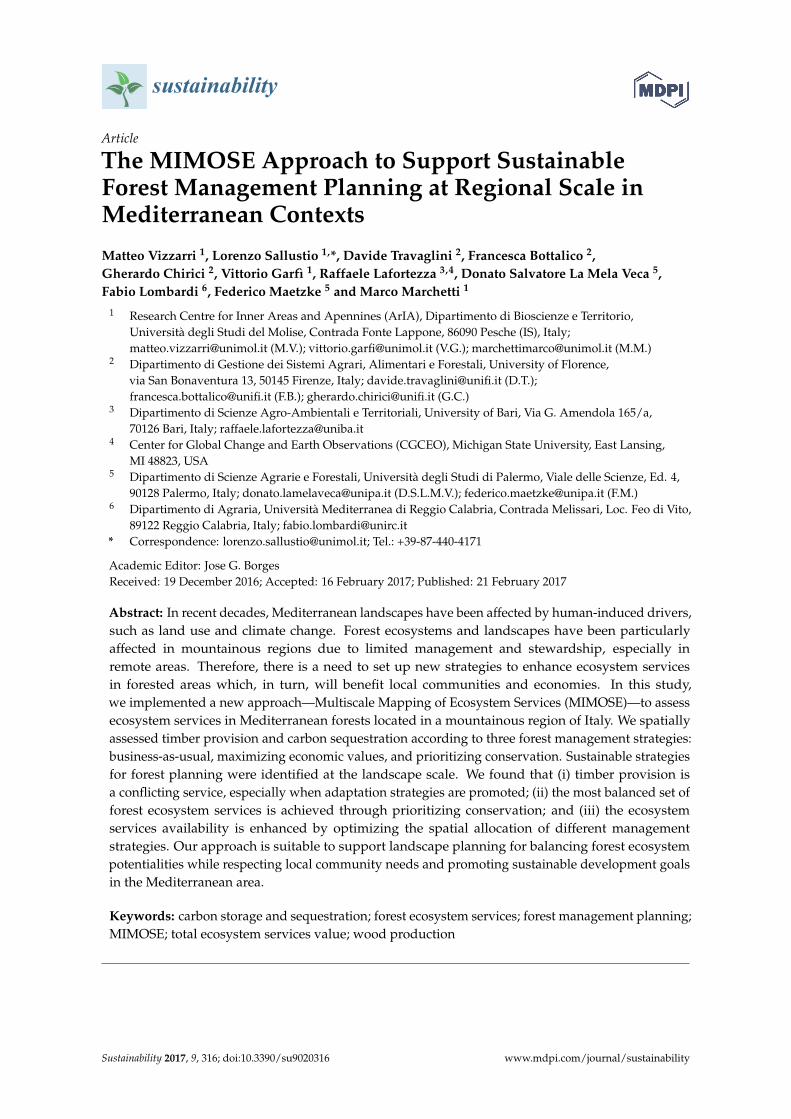
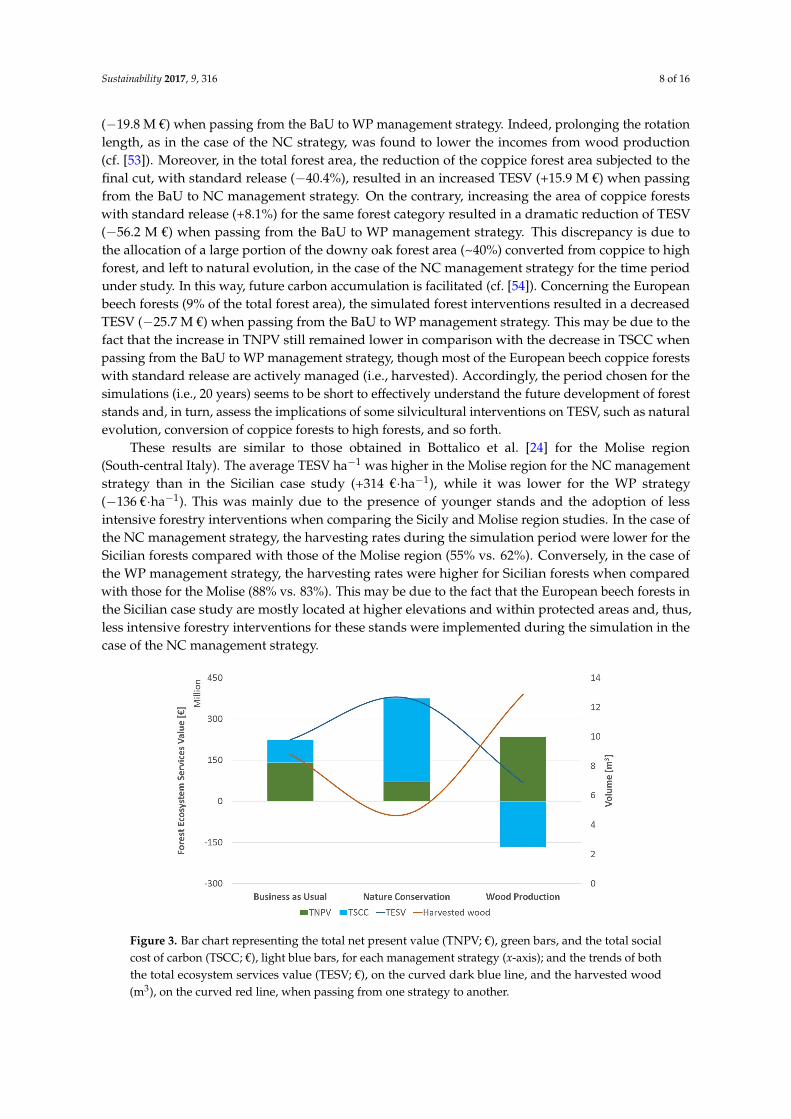
Figure 3. Bar chart representing the total net present value (TNPV; €), green bars, and the total social cost of carbon (TSCC; €), light blue bars, for each management strategy (x-axis); and the trends of both the total ecosystem services value (TESV; €), on the curved dark blue line, and the harvested wood (m3), on the curved red line, when passing from one strategy to another.
The results mainly show that overall timber provision and carbon sequestration are conflicting services. Biomass removal yields high timber revenues (TNPV) and low carbon stock (TSCC), at least in the short-term. This indicates that simulations should be extended for more than 20 years to further understand the development of forest stands over time. Forestry interventions must be implemented by considering their effects on the biophysical properties of the forest stands and the
Figure 3. Bar chart representing the total net present value (TNPV; €), green bars, and the total socialcost of carbon (TSCC; €), light blue bars, for each management strategy (x-axis); and the trends of boththe total ecosystem services value (TESV; €), on the curved dark blue line, and the harvested wood(m3), on the curved red line, when passing from one strategy to another.

Sustainability 2017, 9, 316 9 of 16
The results mainly show that overall timber provision and carbon sequestration are conflictingservices. Biomass removal yields high timber revenues (TNPV) and low carbon stock (TSCC), at leastin the short-term. This indicates that simulations should be extended for more than 20 years to furtherunderstand the development of forest stands over time. Forestry interventions must be implementedby considering their effects on the biophysical properties of the forest stands and the objectives tobe reached [55]. In this way, a deeper understanding of the spatial patterns and implications offorest management intensity and frequency on FES and their trade-offs are extremely important [56].For example, increasing harvesting intensity may lead to a strong reduction of the total biomass and,subsequently, of carbon stock over the short run, particularly in younger and more intensively managedforest stands (see also [57]). Especially in forest landscapes in the Mediterranean region, which are oftenabandoned or degraded [58], forest management and planning must balance incomes with increasedecosystem resilience and stability [59]. This is the case for the Mediterranean and mountainousconiferous plantations in the investigated area, where TESV increased by approximately 32 M €,especially due to the adoption of thinning practices in previously unmanaged forest stands whenpassing from the BaU to NC management strategy. The implementation of active forest managementmay also reduce the negative impacts of external disturbances (e.g., wildfires) on FES provision andensure the stability of forest stands for long periods [60].
3.2. Balancing Forest Ecosystem Services for Sustainable Planning Purposes
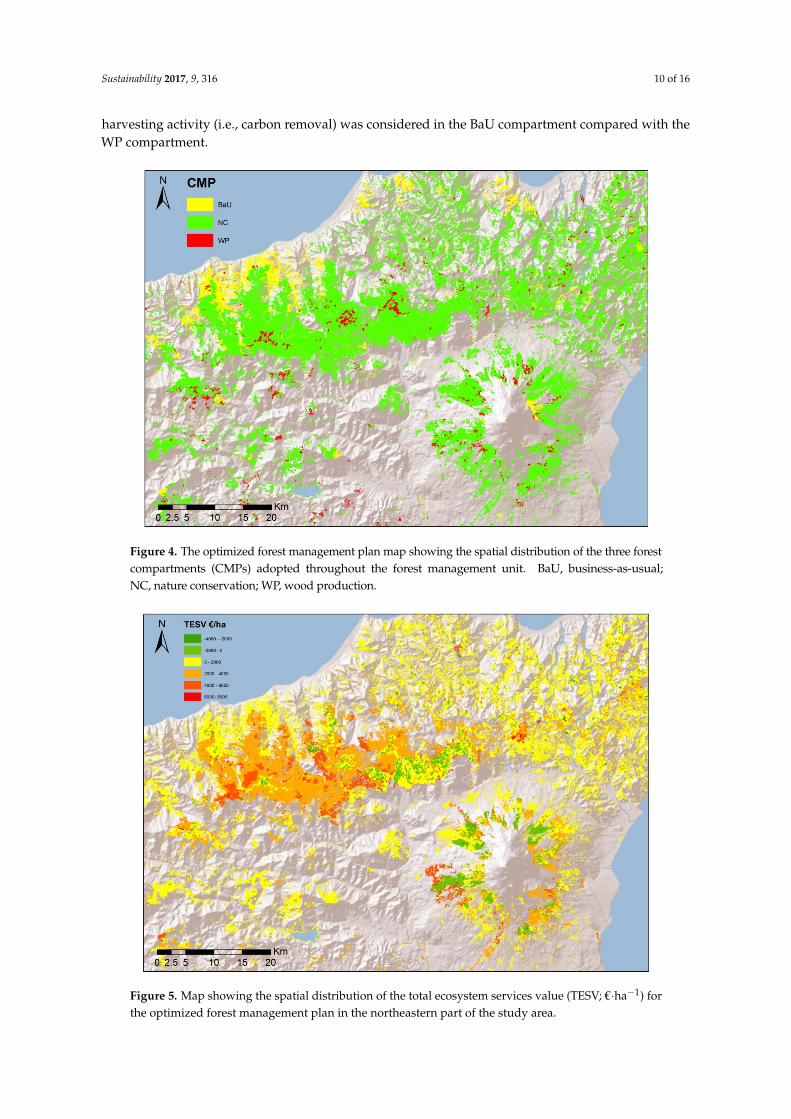
The most effective forest management strategy was selected and adopted to maximize TESVwithin each FMU (see the Materials and Methods section); the resulting OFMP map is depicted inFigure 4 and the relative TESVs are shown in Figure 5. The OFMP was largely dominated by FMUs,which were managed using a more conservative approach (NC management strategy; 83% of the forestarea), while the more productive plan was limited to a few highly-productive FMUs (WP managementstrategy; 5% of the forest area). The remaining 12% of the forest area was managed by applyingthe current forest management strategy (BaU). In this case, no changes in the FMUs’ TESV wereobserved when passing from the BaU to the more conservative or productive strategies. These FMUsare, indeed, those where interventions were neither considered nor planned for the future becauseof existing legal (i.e., protected areas) and morphological (i.e., high steepness) constraints. Moreover,these FMUs are characterized by cork oak and other broadleaved mixed forests comprising almost80% of the forest CMP area, and refer to young stands in early secondary evolution stages that areneglected due to low market potentialities and average stand age, respectively. Conversely, the WPcompartment is largely dominated by Mediterranean and mountainous pine forests (52% of the forestCMP), and is characterized by high growing stock volumes and limited harvesting restrictions. Finally,the NC compartment is dominated by mixed deciduous oak forests (holm oak and Turkey oak),which represent almost 60% of its forest area.
The TESV of the OFMP is 380 M € and proportionally distributed among the three forest CMPsbased on their coverage (Figure 6). Almost 79% of the TESV is related to carbon sequestration (TSCC),while only 21% is related to timber harvesting (TNPV). Timber harvesting is mainly concentrated inthe WP compartment, where the average harvesting rate is 16% of the total compartment’s growingstock and decreased to approximately 8% in the NC compartment. Nevertheless, only a limited partof the regional TNPV (almost 19%) was derived from the WP compartment, while the remainingportion is related to the NC compartment owing to its larger area. It is important to highlight thateven if covering only 5% of the whole forest area, the WP compartment contributes almost 20% to theTNPV (Figure 6), thus, substantially increasing private benefits for local populations, whereas the BaUcompartment yields no contribution in terms of TNPV. According to the OFMP, the net carbon storedin the study area is 4.9 million Mg, corresponding to a TSCC of 301.6 M €. In this case, the contributionof the BaU compartment in terms of TSCC is more than proportional to its size (16%), while the WPcompartment’s contribution was drastically reduced (1%). This is quite obvious considering that no
Sustainability 2017, 9, 316 10 of 16
harvesting activity (i.e., carbon removal) was considered in the BaU compartment compared with theWP compartment.Sustainability 2017, 9, 316 10 of 16
Figure 4. The optimized forest management plan map showing the spatial distribution of the three forest compartments (CMPs) adopted throughout the forest management unit. BaU, business-as-usual; NC, nature conservation; WP, wood production.
Figure 5. Map showing the spatial distribution of the total ecosystem services value (TESV; €·ha−1) for the optimized forest management plan in the northeastern part of the study area.
Figure 4. The optimized forest management plan map showing the spatial distribution of the three forestcompartments (CMPs) adopted throughout the forest management unit. BaU, business-as-usual;NC, nature conservation; WP, wood production.
Sustainability 2017, 9, 316 10 of 16
Figure 4. The optimized forest management plan map showing the spatial distribution of the three forest compartments (CMPs) adopted throughout the forest management unit. BaU, business-as-usual; NC, nature conservation; WP, wood production.
Figure 5. Map showing the spatial distribution of the total ecosystem services value (TESV; €·ha−1) for the optimized forest management plan in the northeastern part of the study area.
Figure 5. Map showing the spatial distribution of the total ecosystem services value (TESV; €·ha−1) forthe optimized forest management plan in the northeastern part of the study area.

Sustainability 2017, 9, 316 11 of 16
Sustainability 2017, 9, 316 11 of 16
Figure 6. Relative contribution (%) of the three forest compartments (CMPs) in terms of surface, total ecosystem services value (TESV), total net present value (TNPV) and total social cost of carbon (TSCC). BaU, Business-as-Usual; NC, nature conservation; WP, wood production.
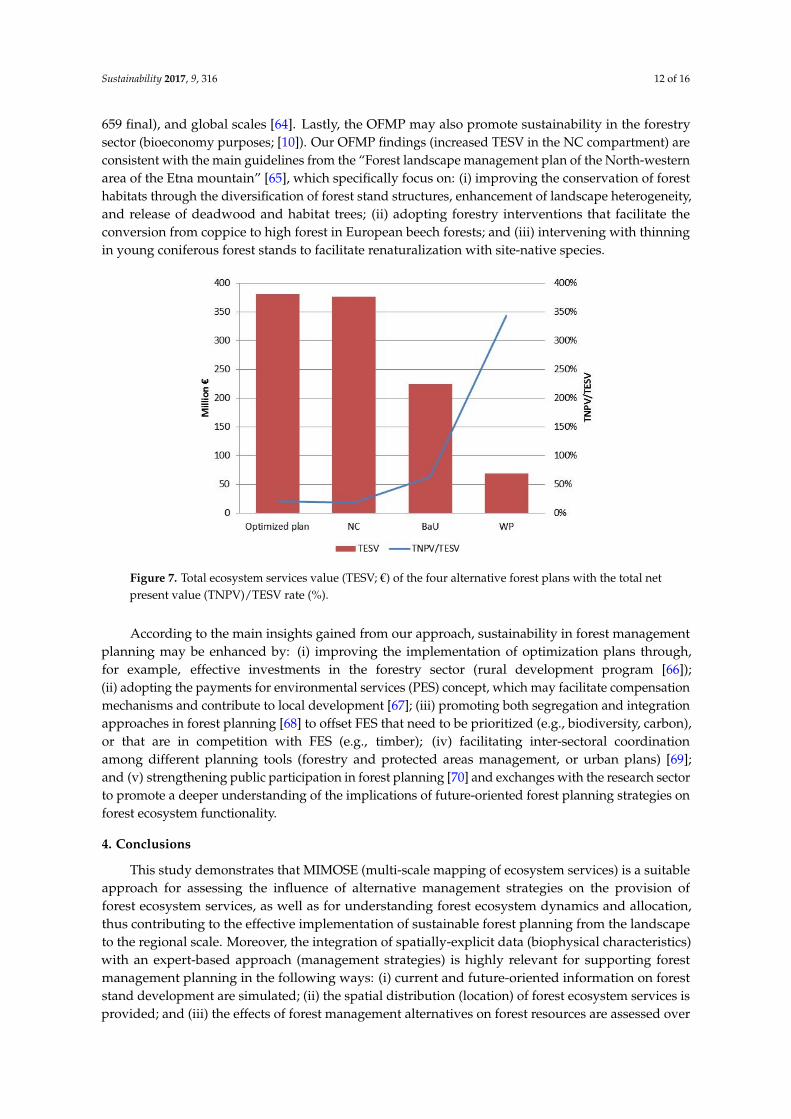
By comparing the OFMP with the three management strategies previously simulated, we observed that the former contributes to an increased TESV of about 4.2 M € compared to the NC management strategy (Figure 7). Considering both the BaU and WP management strategies, the net increase rose to 156.2 and 311.9 M €, respectively. Considering the wall-to-wall application of the NC management strategy, in the OFMP the TNPV increased by 8.6 M €, while the TSCC decreased only by 4.4 M €. Accordingly, the balance between TNPV and TSCC slightly increased in the OFMP compared to the NC management strategy (21% and 19%, respectively) (Figure 6). Even if the difference is very little, the increase in TNPV and, consequently, the increase in the TNPV/TSCC ratio, probably represents the most important achievement of the OFMP. In fact, in addition to the net increase of the regional TESV, the OFMP demonstrated to significantly increase the private benefits deriving from timber harvesting with low impacts on the social benefits, which decreased by lessening climate mitigation (i.e., TSCC). This contributes to balancing both private-economic and socio-environmental needs and, consequently, the sustainability goals in forest management planning. On the other hand, the substantial imbalance between TNPV and TSCC, corresponding to the wall-to-wall application of the BaU management strategy and even more to that of the WP strategy (63% and 343%, respectively), led to a significant decrease in regional TESVs. In these two cases, the significant private benefits have strong negative influences on the social benefits, thus leading to possible unsustainable and conflictual situations for the near future. Considering the NC management strategy, the relative increase of TNPV (11%) was higher than the relative increase of timber harvested (3%). This finding can be explained by considering that timber harvesting is more concentrated in suitable and profitable (maximized cost-benefit share) stands.
Considering the main outcomes, this study contributes to supporting sustainable forest management planning. FES mapping and trade-off assessments are extremely useful to identify priority areas for implementing specific planning strategies and distributing forestry interventions across the landscape, according to forest stand characteristics and economic revenues. In this way, our approach may help to bridge the gap between decision-making processes and local social and economic needs [61]; it may also contribute to the current state of forest stands in order to better adapt them to external disturbances or extreme events [62]. From the landscape to the regional scale, the OFMP may facilitate the implementation of forest planning guidelines of other plans at a higher hierarchical level (e.g., regional forest plan of the region of Sicily [63]) or of FES-related strategies, which are already available at the national, European (EU Forestry Strategy; COM(2013) 659 final), and global scales [64]. Lastly, the OFMP may also promote sustainability in the forestry sector (bioeconomy purposes; [10]). Our OFMP findings (increased TESV in the NC compartment) are
Figure 6. Relative contribution (%) of the three forest compartments (CMPs) in terms of surface, totalecosystem services value (TESV), total net present value (TNPV) and total social cost of carbon (TSCC).BaU, Business-as-Usual; NC, nature conservation; WP, wood production.
By comparing the OFMP with the three management strategies previously simulated, we observedthat the former contributes to an increased TESV of about 4.2 M € compared to the NC managementstrategy (Figure 7). Considering both the BaU and WP management strategies, the net increase rose to156.2 and 311.9 M €, respectively. Considering the wall-to-wall application of the NC managementstrategy, in the OFMP the TNPV increased by 8.6 M €, while the TSCC decreased only by 4.4 M €.Accordingly, the balance between TNPV and TSCC slightly increased in the OFMP compared to theNC management strategy (21% and 19%, respectively) (Figure 6). Even if the difference is very little,the increase in TNPV and, consequently, the increase in the TNPV/TSCC ratio, probably represents themost important achievement of the OFMP. In fact, in addition to the net increase of the regional TESV,the OFMP demonstrated to significantly increase the private benefits deriving from timber harvestingwith low impacts on the social benefits, which decreased by lessening climate mitigation (i.e., TSCC).This contributes to balancing both private-economic and socio-environmental needs and, consequently,the sustainability goals in forest management planning. On the other hand, the substantial imbalancebetween TNPV and TSCC, corresponding to the wall-to-wall application of the BaU managementstrategy and even more to that of the WP strategy (63% and 343%, respectively), led to a significantdecrease in regional TESVs. In these two cases, the significant private benefits have strong negativeinfluences on the social benefits, thus leading to possible unsustainable and conflictual situations for thenear future. Considering the NC management strategy, the relative increase of TNPV (11%) was higherthan the relative increase of timber harvested (3%). This finding can be explained by considering thattimber harvesting is more concentrated in suitable and profitable (maximized cost-benefit share) stands.
Considering the main outcomes, this study contributes to supporting sustainable forestmanagement planning. FES mapping and trade-off assessments are extremely useful to identifypriority areas for implementing specific planning strategies and distributing forestry interventionsacross the landscape, according to forest stand characteristics and economic revenues. In this way,our approach may help to bridge the gap between decision-making processes and local social andeconomic needs [61]; it may also contribute to the current state of forest stands in order to betteradapt them to external disturbances or extreme events [62]. From the landscape to the regionalscale, the OFMP may facilitate the implementation of forest planning guidelines of other plans ata higher hierarchical level (e.g., regional forest plan of the region of Sicily [63]) or of FES-relatedstrategies, which are already available at the national, European (EU Forestry Strategy; COM(2013)
Sustainability 2017, 9, 316 12 of 16
659 final), and global scales [64]. Lastly, the OFMP may also promote sustainability in the forestrysector (bioeconomy purposes; [10]). Our OFMP findings (increased TESV in the NC compartment) areconsistent with the main guidelines from the “Forest landscape management plan of the North-westernarea of the Etna mountain” [65], which specifically focus on: (i) improving the conservation of foresthabitats through the diversification of forest stand structures, enhancement of landscape heterogeneity,and release of deadwood and habitat trees; (ii) adopting forestry interventions that facilitate theconversion from coppice to high forest in European beech forests; and (iii) intervening with thinningin young coniferous forest stands to facilitate renaturalization with site-native species.
Sustainability 2017, 9, 316 12 of 16
consistent with the main guidelines from the “Forest landscape management plan of the North-western area of the Etna mountain” [65], which specifically focus on: (i) improving the conservation of forest habitats through the diversification of forest stand structures, enhancement of landscape heterogeneity, and release of deadwood and habitat trees; (ii) adopting forestry interventions that facilitate the conversion from coppice to high forest in European beech forests; and (iii) intervening with thinning in young coniferous forest stands to facilitate renaturalization with site-native species.
Figure 7. Total ecosystem services value (TESV; €) of the four alternative forest plans with the total net present value (TNPV)/TESV rate (%).
According to the main insights gained from our approach, sustainability in forest management planning may be enhanced by: (i) improving the implementation of optimization plans through, for example, effective investments in the forestry sector (rural development program [66]); (ii) adopting the payments for environmental services (PES) concept, which may facilitate compensation mechanisms and contribute to local development [67]; (iii) promoting both segregation and integration approaches in forest planning [68] to offset FES that need to be prioritized (e.g., biodiversity, carbon), or that are in competition with FES (e.g., timber); (iv) facilitating inter-sectoral coordination among different planning tools (forestry and protected areas management, or urban plans) [69]; and (v) strengthening public participation in forest planning [70] and exchanges with the research sector to promote a deeper understanding of the implications of future-oriented forest planning strategies on forest ecosystem functionality.
4. Conclusions
This study demonstrates that MIMOSE (multi-scale mapping of ecosystem services) is a suitable approach for assessing the influence of alternative management strategies on the provision of forest ecosystem services, as well as for understanding forest ecosystem dynamics and allocation, thus contributing to the effective implementation of sustainable forest planning from the landscape to the regional scale. Moreover, the integration of spatially-explicit data (biophysical characteristics) with an expert-based approach (management strategies) is highly relevant for supporting forest management planning in the following ways: (i) current and future-oriented information on forest stand development are simulated; (ii) the spatial distribution (location) of forest ecosystem services is provided; and (iii) the effects of forest management alternatives on forest resources are assessed over time and space. In addition, MIMOSE may be used to support the preparation of specific guidelines to balance ecosystem functionality and local socio-economic needs (through an optimized forest management plan). Hence, the MIMOSE approach may be replicated in other contexts with
Figure 7. Total ecosystem services value (TESV; €) of the four alternative forest plans with the total netpresent value (TNPV)/TESV rate (%).
According to the main insights gained from our approach, sustainability in forest managementplanning may be enhanced by: (i) improving the implementation of optimization plans through,for example, effective investments in the forestry sector (rural development program [66]);(ii) adopting the payments for environmental services (PES) concept, which may facilitate compensationmechanisms and contribute to local development [67]; (iii) promoting both segregation and integrationapproaches in forest planning [68] to offset FES that need to be prioritized (e.g., biodiversity, carbon),or that are in competition with FES (e.g., timber); (iv) facilitating inter-sectoral coordinationamong different planning tools (forestry and protected areas management, or urban plans) [69];and (v) strengthening public participation in forest planning [70] and exchanges with the research sectorto promote a deeper understanding of the implications of future-oriented forest planning strategies onforest ecosystem functionality.
4. Conclusions
This study demonstrates that MIMOSE (multi-scale mapping of ecosystem services) is a suitableapproach for assessing the influence of alternative management strategies on the provision offorest ecosystem services, as well as for understanding forest ecosystem dynamics and allocation,thus contributing to the effective implementation of sustainable forest planning from the landscapeto the regional scale. Moreover, the integration of spatially-explicit data (biophysical characteristics)with an expert-based approach (management strategies) is highly relevant for supporting forestmanagement planning in the following ways: (i) current and future-oriented information on foreststand development are simulated; (ii) the spatial distribution (location) of forest ecosystem services isprovided; and (iii) the effects of forest management alternatives on forest resources are assessed over
Sustainability 2017, 9, 316 13 of 16
time and space. In addition, MIMOSE may be used to support the preparation of specific guidelinesto balance ecosystem functionality and local socio-economic needs (through an optimized forestmanagement plan). Hence, the MIMOSE approach may be replicated in other contexts with relativelylow costs, since it is an effective tool for supporting decisions aimed at implementing more sustainablestrategies in the forestry sector. This is crucial to promote and implement sustainable developmentgoals, especially in the Mediterranean region (e.g., www.planbleu.org).
Acknowledgments: We thank Anna Barbati, Piermaria Corona, Leonardo Antonello, Vincenzo Giannico,Susanna Nocentini, Lucia Pesola, and Francesco Riccioli, who contributed to an early version of this manuscript.The authors also wish to acknowledge Yole De Bellis for contributing to the English editing of this work. This workwas carried out under the research project “Development of innovative models for multiscale monitoring ofecosystem services indicators in Mediterranean forests (MIMOSE)”, funded by the FIRB2012 program of theItalian Ministry of Education, Universities and Research (Grant: RBFR121TWX, project coordinator: F. Lombardi).
Author Contributions: Matteo Vizzarri was responsible for drafting the paper; Lorenzo Sallustio mainlyperformed the analyses; Davide Travaglini and Francesca Bottalico prepared the input data and contributed tothe discussion of the results. Vittorio Garfì prepared the input data and contributed to review the main contents.Gherardo Chirici, Raffaele Lafortezza, Donato Salvatore La Mela Veca, Fabio Lombardi, Federico Maetzke,and Marco Marchetti contributed to review the main contents and discuss the results.
Conflicts of Interest: The authors declare no conflict of interest.
References
1. Shvidenko, A.; Barber, C.V.; Persson, R. Forest and woodland systems. In Millennium Ecosystem Assessment.Ecosystems and Human Well-Being: Current State and Trends; Hassan, R.M., Scholes, R., Ash, N., Eds.;Island Press: Washington, DC, USA, 2005; Volume 1, pp. 586–621.
2. Vizzarri, M.; Tognetti, R.; Marchetti, M. Forest Ecosystem Services: Issues and Challenges for Biodiversity,Conservation, and Management in Italy. Forests 2015, 6, 1810–1838. [CrossRef]
3. UK National Ecosystem Assesment. UK National Ecosystem Assessment: Synthesis of the Key Findings;UK National Ecosystem Assesment: Cambridge, UK, 2011.
4. Costanza, R.; de Groot, R.; Sutton, P.; van der Ploeg, S.; Anderson, S.J.; Kubiszewski, I.; Farber, S.; Turner, R.K.Changes in the global value of ecosystem services. Glob. Environ. Chang. 2014, 26, 152–158. [CrossRef]
5. Proença, V.; Pereira, H.M.; Vicente, L. Resistance to wildfire and early regeneration in natural broadleavedforest and pine plantation. Acta Oecol. 2010, 36, 626–633. [CrossRef]
6. La Mela Veca, D.S.; Cullotta, S.; Sferlazza, S.; Maetzke, F. Anthropogenic Influences in Land Use/Land CoverChanges in Mediterranean Forest Landscapes in Sicily. Land 2016, 5, 3. [CrossRef]
7. Nocentini, S.; Coll, H. Mediterranean forests: human use and complex adaptive systems. In Managing Forestsas Complex Adaptive Systems: Building Resilience to the Challenge of Global Change; Messier, C., Puettmann, K.,Coates, K., Eds.; Earthscan: London, UK, 2013; pp. 214–243.
8. Fares, S.; Mugnozza, G.S.; Corona, P.; Palahi, M. Five steps for managing Europe’s forests. Nature 2015, 519,7–9. [CrossRef] [PubMed]
9. Lafortezza, R.; Sanesi, G.; Chen, J. Large-scale effects of forest management in Mediterranean landscapes ofEurope. iForest 2013, 6, 342–346. [CrossRef]
10. Marchetti, M.; Vizzarri, M.; Lasserre, B.; Sallustio, L.; Tavone, A. Natural capital and bioeconomy:Challenges and opportunities for forestry. Ann. Silvic. Res. 2014, 38, 62–73. [CrossRef]
11. Borges, J.G.; Garcia-Gonzalo, J.; Bushenkov, V.; McDill, M.E.; Marques, S.; Oliveira, M.M.Addressing Multicriteria Forest Management With Pareto Frontier Methods: An Application in Portugal.For. Sci. 2014, 60, 63–72. [CrossRef]
12. Garcia-Gonzalo, J.; Bushenkov, V.; McDill, M.E.; Borges, J.G. A decision support system for assessingtrade-offs between ecosystem management goals: An application in portugal. Forests 2015, 6, 65–87.[CrossRef]
13. Borges, J.G.; Marques, S.; Garcia-Gonzalo, J.; Rahman, A.U.; Bushenkov, V.; Sottomayor, M.; Carvalho, P.O.;Nordström, E.-M. A Multiple Criteria Approach for Negotiating Ecosystem Services Supply Targets andForest Owners’ Programs. For. Sci. 2017, 63, 49–61. [CrossRef]

Sustainability 2017, 9, 316 14 of 16
14. Mumcu Küçüker, D.; Baskent, E.Z. Sustaining the Joint Production of Timber and Lactarius Mushroom:A Case Study of a Forest Management Planning Unit in Northwestern Turkey. Sustainability 2017, 9, 92.[CrossRef]
15. Pacheco, A.P.; Claro, J.; Fernandes, P.M.; de Neufville, R.; Oliveira, T.M.; Borges, J.G.; Rodrigues, J.C.Cohesive fire management within an uncertain environment: A review of risk handling and decision supportsystems. For. Ecol. Manag. 2015, 347, 1–17. [CrossRef]
16. Foresta, M.; Carranza, M.L.; Garfì, V.; Di Febbraro, M.; Marchetti, M.; Loy, A. A systematic conservationplanning approach to fire risk management in Natura 2000 sites. J. Environ. Manag. 2016, 181, 574–581.[CrossRef] [PubMed]
17. Grêt-Regamey, A.; Sirén, E.; Brunner, S.H.; Weibel, B. Review of decision support tools to operationalize theecosystem services concept. Ecosyst. Serv. 2016. [CrossRef]
18. Biber, P.; Borges, J.; Moshammer, R.; Barreiro, S.; Botequim, B.; Brodrechtová, Y.; Brukas, V.; Chirici, G.;Cordero-Debets, R.; Corrigan, E.; et al. How Sensitive Are Ecosystem Services in European Forest Landscapesto Silvicultural Treatment? Forests 2015, 6, 1666–1695. [CrossRef]
19. Posner, S.; Verutes, G.; Koh, I.; Denu, D.; Ricketts, T. Global use of ecosystem service models. Ecosyst. Serv.2016, 17, 131–141. [CrossRef]
20. Villa, F.; Bagstad, K.J.; Voigt, B.; Johnson, G.W.; Portela, R.; Honzák, M.; Batker, D. A methodology foradaptable and robust ecosystem services assessment. PLoS ONE 2014, 9, e91001. [CrossRef] [PubMed]
21. Delphin, S.; Escobedo, F.J.; Abd-Elrahman, A.; Adams, A.E.; Martin, J.; Cademus, R. Stewardship EcosystemServices Study Series: Assessing Forest Water Yield and Purification Ecosystem Services in the Lower Suwannee RiverWatershed, Florida; UF/IFAS Extension Service: Gainesville, FL, USA, 2014.
22. Sánchez-Canales, M.; López-Benito, A.; Acuña, V.; Ziv, G.; Hamel, P.; Chaplin-Kramer, R.; Elorza, F.J.Sensitivity analysis of a sediment dynamics model applied in a Mediterranean river basin: Global changeand management implications. Sci. Total Environ. 2015, 502, 602–610. [CrossRef] [PubMed]
23. Terrado, M.; Momblanch, A.; Bardina, M.; Boithias, L.; Munné, A.; Sabater, S.; Solera, A.; Acuña, V.Integrating ecosystem services in river basin management plans. J. Appl. Ecol. 2016, 865–875. [CrossRef]
24. Bottalico, F.; Pesola, L.; Vizzarri, M.; Antonello, L.; Barbati, A.; Chirici, G.; Corona, P.; Cullotta, S.; Garfì, V.;Giannico, V.; et al. Modeling the influence of alternative forest management scenarios on wood productionand carbon storage: A case study in the Mediterranean region. Environ. Res. 2016, 144, 72–87. [CrossRef][PubMed]
25. Maetzke, F.G.; Cullotta, S. Environmental and Forest Planning in Italy: Conflicts and Opportunities.Agric. Agric. Sci. Procedia 2016, 8, 332–338. [CrossRef]
26. De Meo, I.; Ferretti, F.; Hujala, T.; Kangas, A. The usefulness of Decision Support Systems in participatoryforest planning: A comparison between Finland and Italy. For. Syst. 2013, 22, 304–319. [CrossRef]
27. Vizzarri, M.; Chiavetta, U.; Santopuoli, G.; Tonti, D.; Marchetti, M. Mapping forest ecosystem functions forlandscape planning in a mountain Natura2000 site, Central Italy. J. Environ. Plan. Manag. 2015, 58, 1454–1478.[CrossRef]
28. Rivas-Martinez, S. Bioclimatic Map of Europe: Bioclimates, Scale 1:16; University of León: León, Spain, 2004.29. Fierotti, G. The Soils of the Sicily Region. With Elements of Soil Genesis, Classification, Mapping, and Evaluation;
Flaccovio Dario: Palermo, Italy, 1997.30. U.S. Department of Agriculture (USDA). Soil Taxonomy. A Basic System of Soil Classification for Making and
Interpreting Soil Surveys; Government Printing Office: Washington, DC, USA, 1975; p. 754.31. Cullotta, S.; Marchetti, M. Forest types for biodiversity assessment at regional level: The case study of Sicily
(Italy). Eur. J. For. Res. 2007, 126, 431–447. [CrossRef]32. Chirici, G.; Sallustio, L.; Vizzarri, M.; Marchetti, M.; Barbati, A.; Corona, P.; Travaglini, D.; Cullotta, S.;
Lafortezza, R.; Lombardi, F. Advanced earth observation approach for multiscale forest ecosystem servicesmodeling and mapping (mimose). Ann. Bot. 2014, 4, 27–34.
33. Frate, L.; Carranza, M.L.; Garfì, V.; Di Febbraro, M.; Tonti, D.; Marchetti, M.; Ottaviano, M.; Santopuoli, G.;Chirici, G. Spatially explicit estimation of forest age by integrating remotely sensed data and inverse yieldmodeling techniques. iForest 2016, 9, 63–71. [CrossRef]
34. Chirici, G.; Barbati, A.; Corona, P.; Marchetti, M.; Travaglini, D.; Maselli, F.; Bertini, R. Non-parametric andparametric methods using satellite images for estimating growing stock volume in alpine and Mediterraneanforest ecosystems. Remote Sens. Environ. 2008, 112, 2686–2700. [CrossRef]

Sustainability 2017, 9, 316 15 of 16
35. Olander, L.; Johnston, R.J.; Tallis, H.; Kagan, J.; Maguire, L.; Polasky, S.; Urban, D.; Boyd, J.; Wainger, L.;Palmer, M. Best Practices for Integrating Ecosystem Services into Federal Decision Making; University of Maryland:College Park, MD, USA, 2015; Volume 48.
36. Ciancio, O.; Nocentini, S. The coppice forest; Silviculture, regulation, management. In Il Bosco Ceduo:Selvicoltura, Assestamento, Gestione; Accademia Scienze Forestali: Firenze, Italy, 2004; pp. 679–701.
37. Ciancio, O.; Corona, P.; Lamonaca, A.; Portoghesi, L.; Travaglini, D. Conversion of clearcut beech coppicesinto high forests with continuous cover: A case study in central Italy. For. Ecol. Manag. 2006, 224, 235–240.[CrossRef]
38. Smith, D.M.; Larson, B.C.; Kelty, M.J.; Ashton, M.S. The Practice of Silviculture: Applied Forest Ecology; Wiley andSons: New York, NY, USA, 1997.
39. Piussi, P. Selvicoltura Generale; Unione Tipografico-Editrice Torinese (UTET): Milano, Italy, 1994.40. Ciancio, O. Forest Management Plan 2006–2025 of the Vallombrosa National Nature Reserve; Corpo Forestale
dello Stato; Ufficio Territoriale per la Biodiversità di Vallombrosa: Reggello, Firenze, 2009.41. Ciancio, O. Systemic silviculture: Philosophical, epistemological and methodological aspects. L’Ital. For.
Mont. 2011, 66, 181–190. [CrossRef]42. Bernetti, I.; Fagarazzi, C. GIS Based Methodology for a Sustainable and Efficient Exploitation of Biomass for Energy
Use; ETA: Florence, Italy, 2003.43. European Environment Agency (EEA). How Much Bioenergy Can Europe Produce Without Harming the
Environment? EEA: Luxembourg, 2006.44. Gasparini, P.; Tabacchi, G. L’Inventario Nazionale delle Foreste e dei serbatoi forestali di Carbonio (INFC)
2005—Secondo Inventario Forestale Nazionale Italiano. Metodi e Risultati; Edagricole-Il Sole 24 Ore: Bologna,Italy, 2011; p. 653. (In Italian)
45. Sharp, R.; Tallis, H.T.; Ricketts, T.; Guerry, A.D.; Wood, S.A.; Chaplin-Kramer, R.; Nelson, E.; Ennaanay, D.;Wolny, S.; Olwero, N.; et al. InVEST 3.3.1 User’s Guide; The Natural Capital Project: Palo Alto, CA, USA, 2016.
46. ISTAT. Crops, Forests and Hunting–Year 2000; ISTAT: Rome, Italy, 2003.47. Intergovernmental Panel on Climate Change (IPCC). Good Practice Guidance for Land Use, Land-Use Change
and Forestry; Institute for Global Environmental Strategies: Kanagawa, Japan, 2003.48. Sallustio, L.; Geneletti, D. Assessing land take by urban development and its impact on carbon storage:
Findings from two case studies in Italy. Environ. Impact Assess. Rev. 2015, 54, 80–90. [CrossRef]49. Tol, R.S.J. The economic effects of climate change. J. Econ. Perspect. 2009, 23, 29–51. [CrossRef]50. Maes, J.; Paracchini, M.L.; Zulian, G.; Dunbar, M.B.; Alkemade, R. Synergies and trade-offs between
ecosystem service supply, biodiversiyt, and habitat conservation status in Europe. Biol. Conserv. 2012, 155,1–12. [CrossRef]
51. Duncker, P.S.; Raulund-Rasmussen, K.; Gundersen, P.; Katzensteiner, K.; de Jong, J.; Ravn, H.P.; Smith, M.;Eckmüllner, O.; Spiecker, H. How forest management affects ecosystem services, including timber productionand economic return: Synergies and trade-offs. Ecol. Soc. 2012, 17, 50. [CrossRef]
52. Rey, A.; Pegoraro, E.; Tedeschi, V.; de Parri, I.; Jarvis, P.G.; Valentini, R. Annual variation in soil respirationand its components in a coppice oak forest in Central Italy. Glob. Chang. Biol. 2002, 8, 851–866. [CrossRef]
53. Roberge, J.M.; Laudon, H.; Björkman, C.; Ranius, T.; Sandström, C.; Felton, A.; Sténs, A.; Nordin, A.;Granström, A.; Widemo, F.; et al. Socio-ecological implications of modifying rotation lengths in forestry.Ambio 2016, 45, 109–123. [CrossRef] [PubMed]
54. Luyssaert, S.; Schulze, E.-D.; Börner, A.; Knohl, A.; Hessenmöller, D.; Law, B.E.; Ciais, P.; Grace, J.; Börner, A.;Hessenmöller, D.; et al. Law Old-growth forests as global carbon sinks. Nature 2008, 455, 213–215. [CrossRef][PubMed]
55. Rist, L.; Felton, A.; Samuelsson, L.; Sandstrom, C.; Rosvall, O. A New Paradigm for Adaptive Management.Ecol. Soc. 2013, 18, 63. [CrossRef]
56. Levers, C.; Verkerk, P.J.; Müller, D.; Verburg, P.H.; Butsic, V.; Leitão, P.J.; Lindner, M.; Kuemmerle, T. Drivers offorest harvesting intensity patterns in Europe. For. Ecol. Manag. 2014, 315, 160–172. [CrossRef]
57. Schwenk, W.S.; Donovan, T.M.; Keeton, W.S.; Nunery, J.S. Carbon storage, timber production,and biodiversity: Comparing ecosystem services with multi-criteria decision analysis. Ecol. Appl. 2012, 22,1612–1627. [CrossRef] [PubMed]
58. Scarascia-Mugnozza, G.; Oswald, H.; Piussi, P.; Radoglou, K. Forests of the Mediterranean region: Gaps inknowledge and research needs. For. Ecol. Manag. 2000, 132, 97–109. [CrossRef]
Sustainability 2017, 9, 316 16 of 16
59. Vizzarri, M.; Sallustio, L.; Tognetti, R.; Paganini, E.; Garfì, V.; La Mela Veca, D.S.; Munafò, M.; Santopuoli, G.;Marchetti, M. Adaptive forest governance to face land use change impacts in Italy: A review. L’Ital. For. Mont.2015, 70, 237–256. [CrossRef]
60. Vacchiano, G.; Garbarino, M.; Lingua, E.; Motta, R. Forest dynamics and disturbance regimes in the ItalianApennines. For. Ecol. Manag. 2016. [CrossRef]
61. De Groot, R.S.; Alkemade, R.; Braat, L.; Hein, L.; Willemen, L. Challenges in integrating the concept ofecosystem services and values in landscape planning, management and decision making. Ecol. Complex.2010, 7, 260–272. [CrossRef]
62. Vacchiano, G.; Maggioni, M.; Perseghin, G.; Motta, R. Effect of avalanche frequency on forest ecosystemservices in a spruce-fir mountain forest. Cold Reg. Sci. Technol. 2015, 115, 9–21. [CrossRef]
63. Regione Siciliana. Proposal for the Regional Forest Plan 2009–2013; Regione Siciliana: Caltanissetta, Italy, 2012.64. United Nations (UN). Transforming Our World: The 2030 Agenda for Sustainable Development; UN: New York,
NY, USA, 2015; pp. 1–5.65. Regione Siciliana; Accademia Italiana di Scienze Forestali. Forest Landscape Management Plan of the
North-western area of the Etna mountain; Accademia Italiana di Scienze Forestali: Firenze, Italy, 2008.66. European Court of Auditors (ECA). Special Report No. 8/2013—Support the Improvement of the Economic Value of
Forests from the European Agricultural Fund for Rural Development; Publications Office of the European Union:Luxembourg, 2013.
67. Marino, D.; Gaglioppa, P.; Schirpke, U.; Guadagno, R.; Marucci, A.; Palmieri, M.; Pellegrino, D.;Gusmerotti, N. Assessment and governance of Ecosystem Services for improving management effectivenessof Natura 2000 sites. Bio-Based Appl. Econ. 2014, 3, 229–247.
68. Bollmann, K.; Braunisch, V. To integrate or to segregate: Balancing commodity production and biodiversityconservation in European forests. In Integrative Approaches as an Opportunity for the Conservation of ForestBiodiversity; Taylor & Francis: Abingdon, UK, 2013; pp. 18–31.
69. Cullotta, S.; Boncina, A.; Carvalho-Ribeiro, S.M.; Chauvin, C.; Farcy, C.; Kurttila, M.; Maetzke, F.G. Forestplanning across Europe: The spatial scale, tools, and inter-sectoral integration in land-use planning. J. Environ.Plan. Manag. 2015, 58, 1384–1411. [CrossRef]
70. Aretano, R.; Petrosillo, I.; Zaccarelli, N.; Semeraro, T.; Zurlini, G. People perception of landscape changeeffects on ecosystem services in small Mediterranean Islands: A combination of subjective and objectiveassessments. Landsc. Urban Plan. 2013, 112, 63–73. [CrossRef]
© 2017 by the authors. Licensee MDPI, Basel, Switzerland. This article is an open accessarticle distributed under the terms and conditions of the Creative Commons Attribution(CC BY) license (http://creativecommons.org/licenses/by/4.0/).