Forest Operations for Sustainable - cofe.org
189
PROCEEDINGS Forest Operations for Sustainable Forests and Healthy Economies Council On Forest Engineering (COF 20th Annual Meeting July 28-July 31,1997 Rapid City, South Dakota, USA USDA Forest Service • South Dakota State University
-
Upload
khangminh22 -
Category
Documents
-
view
2 -
download
0
Transcript of Forest Operations for Sustainable - cofe.org
PROCEEDINGS
Forest Operations for SustainableForests and Healthy Economies
Council On Forest Engineering (COF
20th Annual MeetingJuly 28-July 31,1997Rapid City, South Dakota, USA
USDA Forest Service • South Dakota State University
1997 COFE Meeting Sponsors
Black Hills Forest Resource Assocation
Danzco
Neiman Sawmills, DBA Devils Tower Forest Products
Pope & Talbot, Inc.
Resource Roundup
Timbco Hydraulics, Inc.
Stihl,Inc.
Wheeler Lumber
Rapid City Chamber of Commerce
South Dakota Department of Agriculture,Forestry & Natural Resource Management Division
South DakotaState University,. Department of Horticulture, Forestry, Landscape & Parks
USDA Forest Service, Black Hills National Forest
USDA Forest Service, Regional Office, Denver, Colo.
PROCEEDINGS
Forest Operationsfor Sustainable Forestsand Healthy Economies
Council On Forest Engineering (COFE)
20th Annual MeetingJuly 28-July 31,1997Rapid City, South Dakota, USA
Hosted byUSDA /Forest Service
South Dakota State University
Editors: John J. Ball and Lawson W. Starnes

FOREWORD
TheCouncil of Forest Engineering (COFE) isa professional organization basedinNorth America interested in matters related toforest engineering. Throughanannual meeting with technical sessions, field sessions, and publication of aproceedings and through regional activities, COFE encourages the exchange ofinformation and technologies relating to forest operations.
The theme for thisyear's meeting is "Forest Operations forSustainable Forestsand Healthy Economies." The meeting is composed of four technicial sessionsthatcoversustainable management, forest operations andtheenvironment, efficiencies in forest operations, and mapping and visual assessment offorest operations. Theall-day field tour highlights sustainable forest operations in theBlack Hills.
We would like to thank the sponsors of this meeting: Danzco; Pope &Talbot,Inc.; Neiman Sawmill, DBA Devils Tower Forest Products; Timbco Hydraulics,Inc.; Stihl, Inc.; Wheeler Lumber, Black Hills Forest Resource Association;Rapid CityChamber of Commerce; Resource Roundup: South DakotaDepartment ofAgriculture; Forestry &Natural Resource ManagementDivision; South Dakota State University, Department ofHorticulture, Forestry,Landscape & Parks;and USDA Forest Service. Wewould also like to thankMs. Mary Brashier of the South Dakota State University AgriculturalCommunication Department for herassistance in the production of thisproceedings.
John J. Ball Lawson W. StarnesSouth DakotaState University USDAForestService

Contents
Session 1: Sustainable management
Forestry operations in the next century, Daniel Y. Guimier IWetland harvesting systems: developing alternatives for sustainable operation,
Bob Rummer, Bryce Stokes, Alvin Schilling 7Logging technology for managing northern hardwoods, Neil K. Huyier, Chris B. LeDoux 12Stand, harvest, and equipment interactions caused by harvesting prescriptions,
Jingzin Wang, W. Dale Greene j7Forest restoration in southwestern Colorado,
Dennis L Lynch, Lawson W. Stames, Catherine S. Jones 31An investigation offactors influencing returns on investment in the southern logging industry,
W. Dale Greene, F. Christian Zinkhan 36Anew harvest operation cost model toevaluate forest harvest layout alternatives,
42
Integrated approach for determining the size ofgroup-selection openings, Chris B. LeDoux 48Production functions for cut-to-length harvesting inbunched and unbunched material,
Peter C. Schroder, Leonard R. Johnson 52
Session 2: Forest operations and the environment
Methods used toevaluate the effects of forest operations on the remaining vegetation and soil:a review and recommendations, Michael A. Thompson, James A. Mattson, Joseph B. Slums 62
Comparison ofdamage characteristics to young Douglas fir stands from commercial thinningusing four timber harvesting systems, Han-Sup Han, Loren D. Kellogg 76
Evaluating theeffectiveness of timber harvesting BMPs on stream sedimentationin the Virginia Coastal Plain, Robert M. Shaffer, Saied Mostaghimi 86
Maintaining logyard stormwater quality at minimal cost,
Cornells F. de Hoop, Kyoung S. Ro, David A. Einsel, Mark D. Gibson, George A. Grozdits 89Thinning alternatives in pole-size northern hardwoods, James A. Mattson 93
Session 3: Efficiencies in forest operations
Cable logging with contoured reserves — "wiener" logging, Stephen Aulerich 102Skyline grapple yarding, Ervin J. Brooks, Stephen O'Brien 105Hurricane Fran helicopter salvage casestudy. Hank Sloan, Jim Sherar 107Automatic foam fire suppression for mobile equipment,
Stan Worsley, Monty Armstrong, Bruce Edwards 114Theplastic road, Jeffry £. Moll, Reky Hiramoto 118Anearthwork calculator program for your personal computer,
Stephen D. Shaffer, Thomas A. Walbridge, Jr., W. Michael Aust 132

Laser surveying, Jeffry E. Moll I3gSurveying for National Forest boundaries in the Rocky Mountain Region,
Carl W. Simpler 143
Collecting and using site-specific vegetation and terrain data of varying accuracyfor use in landscape visualizations of harvesting options,Stephen E. Reutebuch, Scott D. Bergen, James L Fridley 148
Techniques forvisualizing theappearance of timber harvest operations,Robert J. McGaughey 156
Visual quality assessment of alternative silvicultural practices in
upland hardwood management, 77m McDonald, Bryce Stokes 165
COFE regional reports
Northeast U.S. and easternCanada,Stephen M. Wteder 170
Southern region, Bryce J. Stokes 172
Lake states andcentral Canada, Michael A. Thompson 175Inland west, Leonard R. Johnson 178Western U.S., Loren D. Kellogg 180
SDSU
The papers in this proceedings have received minimal editing. The content and views
expressed in the papers are the responsibility of the individual authors, and their publication
should not be taken as an official endorsement by South Dakota State University or the USDAForest Service.
The useoftrade, firm, or corporation names in this publication is for the information and con
venience of the reader. Such use does not constitute an official endorsement or approval by
the U.S. Department ofAgriculture or any ofits agencies ofany product or service tothe
exclusion ofothers that may be suitable.
Published in accordance with anact passed in 1881 by the 14th Legislative Assembly, Dakota Territory, establishingthe Dakota Agricultural College and with the act ofre-organization passed in 1887 bythe 17th Legislative Assembly,which established the Agricultural Experiment Station at South Dakota State University. SDSUis anAffirmativeAction/Equal Opportunity Employer (Male/Female) and offers all benefits, services, education, and employment opportunities without regard for ancestry, age, race, citizenship, color, creed, religion, gender, disability, national origin, sexual preference, orVietnam Era veteran status. 126copes printed at SDSU Printing Laboratory at no cost to the state.
Forestry Operations in the Next Century
Daniel Y. Guimier, Eng., Manager-Eastern DivisionForest Engineering Research Institute of Canada (FERIC)
580boul. Saint-Jean, Pointe-Claire, Quebec H9R 3J9Tel.: (514) 694-1140 • Fax: (514) 694-4351
e-mail: [email protected]
ABSTRACT: What will future forestry operations resemble? In what context will workers, technicians and forest engineers work?Arecent analysis of the technical, social and economic factors the forest industry faces can help us predict how operations willhave to change to adapt to future demands. In this context the presentation focuses on outlining what forestry operations maybe like inthenext century.
Keywords: forestry operations, predictions, driving forces, trends, advanced technologies
INTRODUCTION
Weare livingin an age whenchange is acceleratingand the only thing that we can really predict is thattomorrow will be differentfrom today. Even though theunderlyingnatural rhythms of the forest's evolution aredictated by Mother Nature, andremain unchanged andlargely invisible even to forestry experts, forestry activitiesare undergoing a revolution. In this light, whatwill future forestry operations resemble in the next century? In what context will workers, technicians andforestry managers work? It would be presumptuoustoattemptto predictthis with any certainty, but an analysis of the technical, social, and economic factors theforest industry currently faces can nonetheless help usto predicthow operations will have to changeto adaptto future demands.The beauty of predicting the futureis that nobody today can prove that we're wrong;itwill be interestingto reread this text in 5 or 10 years tocompare our predictions with reality!
In this context,my presentation will focuson outliningwhat forestry operations will be like in the year 2000and beyond, based on the factors that are drivingchange ("driving forces") that we can perceive today. Iwill start with a definition of those factors that are evi
dent at local and international scales, from both a technical and an economical view and in a human context,after which I will discuss how forestry activities andequipment must adapt to these changes.
This presentation is based on a strategic "orientation"exercise that FERIC recently completed on behalf ofIndustry Canada with the assistance of our members.This exercise, entitled 'Technology Road Map forForest Operations in Canada," had the goal of formu
latingrecommendations for governments, the forestindustry, equipment manufacturers, research groups,and others involved in the forestry sector and wasintended to focusaction on the sector's future priorities. To do so, an exhaustive review of current trendswas carriedout throughgroup discussions, a literaturereview, and interviews with key personnel in the sector.The most promising emergingtechnologies were identified, and the identification of technological or organisational gaps subsequently helped define the road orroadsalong whichthe "road map" would lead to prosperous forest operations in the next century.
DRIVING FORCES
We identified ninegroups of factors that, together, affectand will continue to affect future forestry operations:1. The delivered cost of fiber.
2. Environmental issues.
3. Resource availability.4. The profile of the operations and operators.5. Government involvement.
6. Public pressures.7. Worker needs.
8. Market demands.
9. Technological innovations.
Most of these factors are interrelated and act together;for example, publicpressures influence governmentinvolvement, and environmental issueshavean impacton market demands.
Some of these factors act in concert whereas othersconflict; for example,environmental issuescan imposefinancial constraints that act against the need to reduce

costs so as to remain competitive. No matter their relative importance and how theyact, the following drivingforces are generally recognized as primary elements ofchange and will significantly affect forestry operationsof the future.
Cost of fiber delivered to mills
The delivered cost of fiberis oftenthe main componentof a product's total cost. Thus, costs must be maintainedat the lowestpossible level for the industry toretain or regain its competitiveness against international competition that will only increase in the future.Technological and operational changes in harvesting,silviculture, and transportation are thus often largelydriven by the need to reduce costs.
Environmental issues
We are all aware of ourcollective responsibility to conduct forestryoperations that respect the environmentwithin the contextof sustainable management. Whetherfrom the point of view of water quality, wildlife preservation, biodiversity, or esthetics, future forestry operations must evolve inresponse to society's growingexpectations. Planning, forestry practices, and equipment must be modified as a result.
Resource availability
Our forests are a renewable but not inexhaustiblesource of raw material. Healthy management practicesand pressures from other users of the forest, specifically the general public, require that losses and wastefulpractices be eliminated and that gooduse be madeofall theavailable fiber. Insome areas, wearealreadyexperiencing shortages of fiber incertain quality classes, and thishas ledto changes in our forestry practicestoward techniques that further favor therecovery anduseof species that wereformerly considered noncommercial; in addition, increasing attention is beingdevoted toward making theprocessing phases contribute as much as possible to quality, and thus to thevalue of the endproduct.
Profile of operations
The structure of the forest industry itselfgreatly influences the nature of forestry operations. Forexample, atrend, thatbegan a few years agoand is common today,toward contractor-based operations rather thancompany-owned equipment imposes certainpractices adaptedto the needs of contractors. The need for direct andconstant communication and monitoring at all levels ofoperations also determines the appropriate equipmentand organizational structures.
Government involvement
Governments playa major role in directing forestrypractices, whether throughforest practicesstandardsand regulations, land tenureand harvesting policies,environmental laws, or other legislation (or lack thereof), and theywill continueto play this role in thefuture. Whether they fulfill this role via incentivesorcoersion, the policies by whichthey act will have adecisive influence on the equipment and operationaltechniques used in the forest. Workers and forest managersmust, morethan ever, understand and apply theseincreasinglycomplicated laws.
Public pressures
The public comprises anincreasingly important drivingforce. Not only does thepublic participate in publicconsultations in specific cases (as in the case ofClayoquot Sound), but there is alsoan increasing andunremitting role indaily decision-making andtheplanning of forestry operations. Whether in terms of questions suchas clearcutting, monocultures, prescribedburning, roads, pesticides, or roadside debris, the publichasthepower to shape future practices.
Worker needs
There isalready an anticipated scarcity of qualified forest workers, and this trend cannot be reversed unlessforestry jobsof thefuture offer attractive working conditions; moreover, some form of modified educationmustbe provided to train operators to deal with thedemands of increasingly complex machinery and operatingconditions. Even thoughoperators have someability to adapt to technological changes, technologyitselfmustalso be adapted to meet the needsof theavailable workers.
Market demands
Globalization of markets and fierce competition forraw materials have motivated the industry to seek markets for new, morespecialized products. Just as markets dictate the nature of theproducts thatthe industrymanufactures, so too do the products dictate the natureand the quality of the raw material that is required.Market demands thus determine the nature of operations in the forest to some extent.
Technological innovations
The arrivalof new, innovative technologies is anothersource of change. If it is true that the factors I've previously cited are the engines of technological evolution,it is also true that the availability of the technology
itself will lead to changes in forestry operations. Forexample, global positioning systems (GPS) were notinvented to address a specific forestry need, but theyhave revolutionized some of our operating techniques. It is certain that other technological innovations outside the forestry sector will change our wayof working in the future.
TRENDS IN VARIOUS SYSTEMS
Harvesting systems
Gingras (1992) studied the evolution in eastern Canadaof the three main harvestingsystems, namely full-treeharvestingwith roadside delimbing, tree-length harvesting withdelimbing at the stump,and shortwoodharvesting using cut-to-length machines with multifunctionalheads. The current trend suggests thatmachines with multifunctional heads will continue toreplace full-tree systemsover the next 5 years.Many ofthe previously discussed factors that are drivingchanges, such as fiber recovery and quality, reducedenvironmental impacts, and increasedoperational flexibility, explain this trend.
Another trend is becoming apparent in the form ofincreased harvest volumes from partial cutting. Arecent survey indicated that 25% of FERIC's membercompanies are already performing commercial thinning, at least in the form of operational trials, and anadditional 34% expect to do so over the next 5 years.There is no doubt that partial-cutting techniques will berefined in the Canadian context and applied on a widerscale in the next century.
Silvicultural systems
A growing trend towards protecting and promotingadvance regeneration will dominate in the next century.In general, silvicultural systems will tend to encouragethe natural evolution of the forest rather than impose anartificial approach. The areas to be planted will continue to decrease.
Herbicides and pesticides will become increasinglyunacceptable means of intervention, even where theyare not actually prohibited. Other means of interventionwill be developed.
The demand for fiber and the need to protect investments will allow companies to justify stand-tendingoperations, especially for stands near mills.Precommercial thinning operations will increase inpopularity.
Transportation systems
It may be a lackof vision, but it is hard to imagine thattransportation from the forest to the mill will beperformed byanymeans other thantrucking overthenextdecade. One can imagine an increased use of rail transportation, aerial systems (balloons), pipelines forchips,or a modernized form of water transportation, but theseare relatively improbable solutions. In contrast, thesemi-trailer system will continue to evolve to increaseits efficiency and safety. Importantgains can resultfrom increasing payload while respecting regulationson total or axle weights, as well as from using moreefficient motors thatprovide substantial fuel savings.
It is perhaps at the level of forest road construction andmaintenance thatthe evolution has been most striking.In effect, we are approaching a situation in which theroad network is already fairly well developed and thepriorities will change to focus on maintenance andmanagement of the established network rather than onits establishment. It is also obvious that the design andconstruction of roads must be integratedwith reliablesystems of preventingerosion and the consequent sedimentation of streams.
ADVANCED TECHNOLOGIES
Now let us move on to examine various technologiesthat could increasingly be applied in forest operationsor equipment. FERIC has identified ten technologiesthat, in our opinion, will be a significant part of the lifeof a forestry worker in the next century:
1. Machine-control systems.2. Operator aids/robotics.3. Lightweight components.4. Positioning systems.5. Computerized decision-support systems.6. Training simulators.7. Machine vision.
8. Environmentally friendly fluids.9. Environmental technologies for soil protection.10. Communications.
Machine-control systems
The machines of the future will be equipped with"intelligent" control systems that let them adapt to theenvironment in which they are working; by using various sensors, the machine will "know" when it is on a
slope, when it is on wet ground, or when its wheels areslipping. It can thus adapt to these conditions in a waythat optimizes its performance and reduces its impact
on its environment; forexample,controlling wheel slipwill reduce soil damage, cabs can automatically adjustthemselvesto account forslopes, an understanding ofground firmness would let a planting machine adjustplantingdepth for seedlings, and a machine could evenprovide its operator withdiagnostics on its operatingcondition, thusreducing downtime forrepairs.
Operator aids/robotics
As a result of automating a machine's functions, operatorscouldconcentrate theirenergy andresources onmaking strategic decisions rather than onroutine operating tasks. After aninitial learning phase, the machinewould manage systematic and repetitive actions byitself; these could include placing logs in piles, grabbinga tree fordelimbing, or movingin a straight line.Current efforts in thisarea focus largely on thedevelopmentof a boom-control system based on coordinatedmotion control; thissystemletstheoperator control theimplement (e.g., a felling head) by using a mini-joystick without having to worry about the operation ofthe hydraulic cylinders. In such a system, theoperatorsimply points the control lever in the desired directionand theonboard computer controls thenecessaryhydraulic valves. Moving from this point to a fullyautonomous robot in the forest represents an unlikelystep; even if certain activities will be highlyautomated,the operator will retain an important role for the foreseeable future.
Lightweight components
There are two main reasons to reduce the weight of thecomponents of forestry machines: to increase their pay-load orcapacity and to reduce ground pressure as muchas possible, thus reducing impact on the soil. The systems used in forestry operations have traditionallymade little use of lightweight materials developed inother sectors such as the aerospace industry.Aluminum, Kevlar, carbon fiber, and other materialspermit the construction of very strong, light components, and will be widely used in forestry equipment inthe next century. Several examples are currently underdevelopment
In sensitive areas such as riparian zones, wheretravelby forestry machinery must be avoided, operators ofcable skidders can use synthetic-fiber cables rather thansteel. These cables are as strong assteel, but weighmuch less, which lets operators haul out the cablesmuch farther from the machine and thus reduce theneed for on-site travel.
To maximize the protection of regeneration and soils,harvesting equipment will need tohave the greatest
possible boom reach to let operators maximize thespacing between skid trails. Telescoping orunusuallylongboomsare beginning to appear, and the use ofcomposite materials may permit even greater lengths.
Positioning systems
Global positioning systems (GPS) technology now letsusers rapidly update maps andother forestry data andefficiently perform on-site surveys, which formerlyrequired considerable time and resources.
The machines of theyear 2000 and beyond may beequipped with navigation systems basedon GPS technology to facilitate theconduct and monitoring of harvesting and stand-tending operations. The operator cannavigate usinga map displayed on a screen in the cab.Navigationsystems will eliminate several costs relatedto the demarcation of blocks, reserves, streams, androads.
However, this assumes that ourbasemaps have therequired degree of precision and thus that thecomputerized spatial reference information will be reliable,which is not currently the case. In this context, bettersurvey data and remote sensing will play a key role.
Computerized decision-support systems
Taking increasingly strict standards and alternative values into account, the industry faces an increasinglycomplex planning process for its forest interventions.In addition, aconsiderable quantity of biophysical, ecological, and social data will have to be available forintegration into the planning process.
This data is ruled by complex interrelations that will bebetter understood and better integrated withinmoreprecise, but notyet perfect, models. Geographic information systems (GIS) are already operational toolsthatgreatly facilitate themanagement of large quantities ofinformation. In contrast, managers have relatively fewdecision-support tools available to help them select anoptimum harvesting and silviculturescenario. FERICiscurrently working to develop acomputerized modelcalled "Interface" that will let managers simulate various harvestingand regeneration scenariosand calculatetheir total cost
Similar decision-support tools will be available in thefuture for optimizing forestry operations in terms ofenvironmental, ecological, social, wildlife, and otherparameters. Forestry managers will still make the finaldecisions, but formulating the elements of a solutionwill begreatly simplified by the useof such computerized tools.

Training simulators
The need for training machine operatorswill onlyincrease with increasing constraints and operationaldemands in the forest and with increasing complexityof forestry equipment Because of the highcostof suchequipment, the risks involved in using an inexperiencedoperatorin the field, and the complexity of theconcepts to be taught, training will rely moreand moreon simulators. FERIC,along with our partners in theATREF (application of robotics technologies to forestrymachines) project, is already working on the development of a simulatorthat will help operators learn to usea harvester's boom.
Machine vision
Most futureequipment will incorporate some formofmachine vision that will let it evaluate the objects itmust handle (trees, logs, chips, etc.) and respondappropriately. For example, FERIC foresees the development of a camera system for measuring logs ondelimbers or processors. Analyzing an object, as indetermining tree diameter, will help to optimizeslashing. The same technology will be developed for measuring logs (while accounting for various deductionsfor rot, etc.), and the analysisand sortingof pulp chips.Finally, if we hope to automate certain forestry operations (e.g., through robotics), the machine must "visualize" its environment, for example, to be capable of"seeing" a tree before it can grab it. Such machinevision systems are already well implementedin facilities such as sawmills, but will have to be adapted to theconstraints of the forest environment.
Environmentally friendly fluids
Forestry equipment should never be a source of contamination of the water table or the atmosphere.Hydraulic, cooling, and combustion systems should bevery "tight" and should incorporate some mechanismfor handling spills. Exhaust gases must meet strict standards, and fluids (oils, liquid coolants, fuels) will needto be biodegradable.
We are already seeing the emergence of some of theseproducts on the market. For example, vegetable oilscan now replace mineral oils for lubricating the chainsaws of multifunctional heads (Makkonen 1994). Soon,this type of oil will also be able to replace thehydraulic oils in forest machines.
Environmental technologies for protecting soils
Over the next decade, we will see the introduction ofmany innovations in existing or new traction systems
intended to reduce the impact of machinery on soils.One technology that is currently well developed—oversized tires and tracks—contributes to reducing soilcompaction and rutting and improves the flotation offorestry machines. We will also see wider use of central tire inflation (CTT) on most forestry equipment.This technology is already well developed in the truckingsector. Thetechnology involved in "walkingmachines" is stillat an embryonic stage, but may onedayreplace wheels and tracks, which are responsiblefor most soil disturbance.
The development of each of these systemsrelies on abetter understanding of the terramechanicsof forestsoils (i.e., the interaction between wheels and the soil),a sciencethat is still largely unknowntoday.
Communications
In the year 2000 and beyond, our current means ofcommunication will appear archaic to us; for example,the Internetis only beginningto show its potential.Oral communication and the transfer of large amountsof data and imagesbetween the forestry worker, thesite foreman, and the mill and its clients will be easyand free fromobstacles. The efficiencyof an operationwill rest, to a large degree, on good communicationbetween the various parties involved in the forest. Forexample, it is highly likely that a client in Copenhagenwill be able to send an order for sawlogs to a mill inThunder Bay, which will relay the species and sizespecifications to an operator in the forest, who can program his onboard computer to accommodate the order.
The foreman could also check the status of distant
equipment and know, for example, the position of atruck, the fuel level in a harvester, or the area treatedby a scarifier.
Some foresters from the British Columbia governmentalready use a portable office that gives them accessfrom their trucks, via modem, to information such asdigitized maps of a region, databases, and the text ofapplicable forestry practices codes.
Modernization of our means of communication will
surely rely on the development and use of a network ofsatellites such as MSAT and the development of standard data-exchange protocols.
CONCLUSIONS
The important pressures and trends that will shapeforestry operations in the next century are already in

place. The challenges thatthey represent will be partiallysolved by theuseof modern technologies appliedto our tools and our management and communicationmethods. But thesetechnologies will provide only asupport on which the worker and the forest managercanlean to accomplish theirwork according to the"rulesof the art" The forest manager of the next century will have to be capable of makingdecisions thatextend beyond a strictly forestry context.
Significant changes are thus expected in forestry operations, andthese changes will to a large extentbeimposed by necessity. It is,however, urgent that theforest sector readies itself to recognize thisneedtoevolve andensures thatthe necessary research anddevelopment efforts are undertaken.
REFERENCES
FERIC. 1996. Technology Road Map for forest operations in Canada. For Eng Res Inst Can(FERIC),Pointe-Claire, Que. Special Report SR-117.15 p.
Gingras, J.-F.; Ryans, M. 1992. Future woodlandsequipment needs in eastern Canada: 1992-2001. ForEng Res Inst Can (FERIC), Pointe-Claire, Que. Tech.NoteTN-193.12 p.
Gingras, J.-F. 1996. AmCnagement forestier: lesdCveloppements technological actuels sont-ils6 lahauteur des besoins? Conference descooperativesforestiSres, 11 avril 1996. For Eng Res Inst Can(FERIC), Pointe-Claire, Que.
Makkonen, 1.1994. Environmentally compatible oils.For Eng Res Inst Can (FERIC), Pointe-Claire, Que.Field Note No General-39. 2 p.
Wetland Harvesting Systems-
Developing Alternatives for Sustainable Operation
BobRummer, USDA Forest ServiceAuburn, Alabama
Bryce J.Stokes, USDA Forest ServiceAuburn, Alabama
and
Alvin Schilling, International Paper Co.Hattiesburg, Mississippi
ABSTRACT: Wetland forests represent some of the most productive forest lands in the southeast. They are also an environ-mentallysensitive ecotype which presents unique problems for forest operations. Sustaining active management in these areaswill require systems which can operate on weak soil conditions without adversely affecting soil properties or stand regeneration.The systems must also operate economically. This paper reviews current investigations of alternative systems including large-capacity forwarders, clambunk skidders, and the skidder/shovel logger system in the southeastern U.S. The systems are compared in terms ofproduction, cost, and potential site impacts.
Key Words: wetland harvesting, forwarders, site impacts
INTRODUCTION
Forested wetlands are an important natural resource inthe southern United States. McWilliams and Faulkner(1991) estimate that bottomland hardwood forestscover 10 million hectares of the southern coastalplain.These forested sites providesignificant ecological values in modifying hydrology, improving waterquality,and life support. The unique hydrology and soils ofwetland forests also make them highly productive interms of wildlife, aquatichabitat,and plant communities. McWilliams and Faulkner (1991) note that bottomlands contain over half the hardwood timber
resource in the south-central United States.
The ecological value and productive potential of bottomland hardwood forests reveal two constraints. Firstthe economic incentive to maintain these areas in forestcover depends on cost-effective forest operations.Secondly, however, productive use must not compromise the ecological functions of these sites.
The soft soils of typical wetland sites make it difficultto achieve eitherobjective. Low-bearing-capacitysoils impede access and extraction and increase harvesting costs. Soft soils are also more sensitive to disruption, magnifying the impacts of ground operations.
In 1986, an industry taskforce conducted a survey ofsoutheastern wetland loggers (Stokes 1988). The mostcommon system configuration averaged six workersand had one tracked feller-buncher and two rubber-
tiredskidders. Production averaged 350 cordsperweek. A survey of Mississippi Delta loggers (Jackson1990) found 98% using rubber-tired skidders forextraction. Wide tires and dual tires werecommonlyapplied to enhance trafficability.
While rubber-tired skidders are common, many of theproblemsin wetland logging are tied to this extractionfunction. Rubber-tired skidders cancause rutting andpuddling of soils. Aust et al. (1993) also foundchanges in subsurfacehydrology associated with theimpacts of skidtrailson wet pine flats. Skidders operating in theseconditions typically have lower productivity and higher operating costs than similar machinesworking on dry sites. The combination of reducedproductivity and the limitedload capacity of the skiddingfunction establishes the economical skid distance. Thisin turndetermines roadand landing spacing.
Several papers (Jackson and Stokes 1990, Reisingerand Aust 1990) briefly reviewed alternative technologies for wetland operations. They describeda range ofequipment including tracked skidders, large-capacity
forwarders, cable systems, and helicopters. However,their reportdid not address systemconfigurations.
Thecontractor working on wetsites faces thechallengeof developing an integrated system ofequipment andmethods that will (1) operate effectively on wetsoils,(2) minimize ecological impacu which include rutting,soildisturbance, and hydrologic alterations, and(3)provide a reasonable economic return. With increasingmarket demands in the South for hardwood fiber, forestoperationsare extending into more adverse sites.Under today's social pressures to protect sites andensure sustainability, it is more difficult to harvest suchareas costeffectively. It is alsoapparent thatconventional harvesting systems do notadequately address theneedsof the wetland logger.
This paper isa review ofsome currently operating andevolving hardwood, wetsiteharvesting systems: (1)conventional grapple skidding, (2) clambunk skidding,(3) high-capacity forwarding, and (4) shovel logging.Helicopter and cable systems are briefly described.
WETLAND LOGGING EQUIPMENT
A wetland logging system has to perform the functionsof felling, limbing and topping, primary transport, andloading. Suchequipment is oftenconventional forestmachinery with special adaptations toenhance oper-ability in wet terrain.
Feller-bunchers
Felling trees on wet sites requires moving a fellingmachine to the tree, making the cut and directing theplacement ofthe fallen tree. These tasks are complicated inwetlands bysoft soils and large trees withextreme butt swell. Within the last few years, manyoperators have replaced chainsaws or rubber-tired,drive-to-tree feller-bunchers with tracked, swing-to-treefeller-bunchers. Swing feller-bunchers may reduce sitedisturbance bylimiting travel and bythe use of wideflotation tracks. On extremely wet sites, swing feller-bunchers mayeven use felled treesor constructed matsfor support. By bunching felled trees, swing machineshelp increase extraction productivity and reduce theamount of traffic on the site.
Swing feller-bunchers have higher initial and operatingcosts than rubber-tired equipment Historically, thisoption was the least preferred because ofthese highcosts. However, increasing emphasis onreducing sitedisturbance and the cost ofworkman's compensationare offsetting the additional capital costs ofswingmachines.
Grapple Skidders
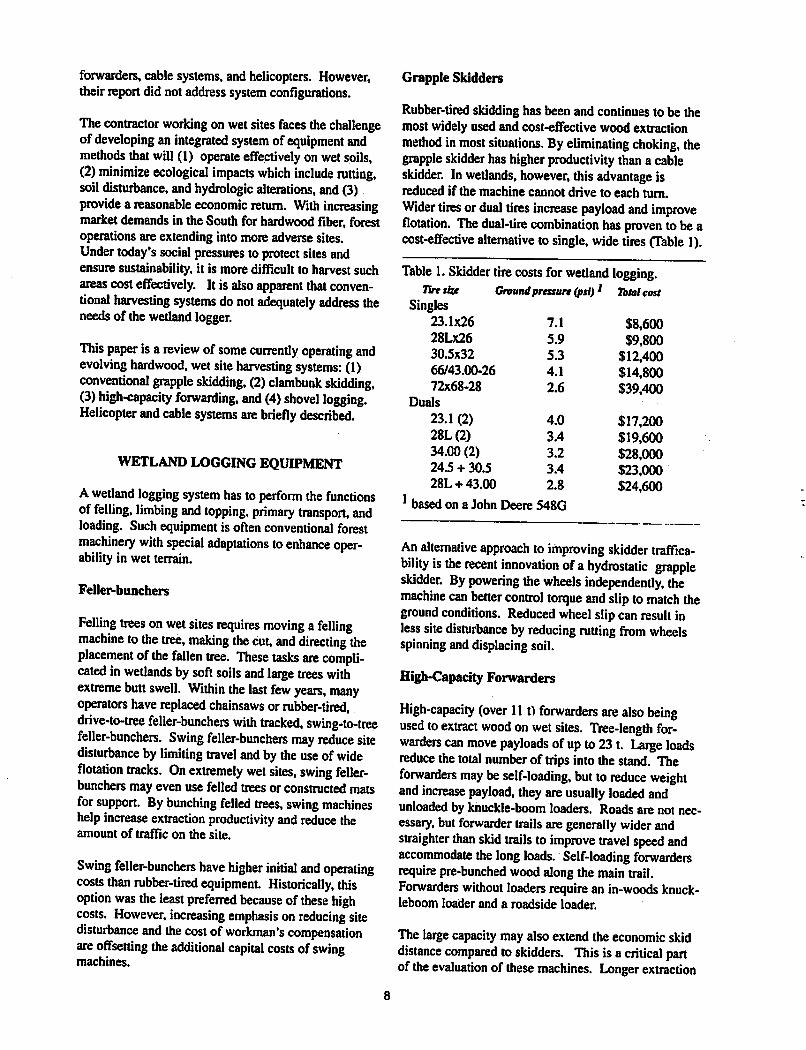
Rubber-tired skiddinghas been and continues to be themost widely used and cost-effective wood extractionmethod inmost situations. Byeliminating choking, thegrapple skidder has higher productivity than a cableskidder. Inwetlands, however, this advantage isreduced if the machine cannot drive to each turn.Wider tires or dual tires increase payload and improveflotation. The dual-tire combination has proven to beacost-effective alternative to single, wide tires (Table 1).
Table 1. Skidder tire costs for wetland logging.Tire she Ground pressure (pit)' total cost
Singles23.1x26 7.1 $8,60028Lx26 5.9 $9,80030.5x32 5.3 $12,40066/43.00-26 4.1 $14,80072x68-28 2.6 $39,400
Duals
23.1 (2) 4.0 $17,20028L(2) 3.4 $19,60034.00 (2) 3.2 $28,00024.5 + 30J 3.4 $23,00028L +43.00 2.8 $24,600
1based on a John Deere 548G
An alternative approach to improving skidder traffica-bility is the recent innovation ofa hydrostatic grappleskidder. By powering the wheels independently, themachine can better control torque and slip to match theground conditions. Reduced wheel slipcanresult inless site disturbance byreducing rutting from wheelsspinning anddisplacing soil.
High-CapacityForwarders
High-capacity (over 111) forwarders are also beingused to extract wood on wet sites. Tree-length forwarders can move payloads ofupto23 t. Large loadsreduce thetotal number of trips into the stand. Theforwarders may be self-loading, but to reduce weightand increase payload, they are usually loaded andunloaded by knuckle-boom loaders. Roads are not necessary, butforwarder trails aregenerally wider andstraighter than skid trails to improve travel speed andaccommodate the long loads. Self-loading forwardersrequire pre-bunched woodalong the main trail.Forwarders without loaders require an in-wcods knuck-leboom loader and a roadside loader.
The largecapacity may also extend the economic skiddistance compared toskidders. This isa critical partof the evaluation of these machines. Longer extraction
distance reduces roadbuilding costs. Fewer roads alsoreduce the overall site disturbance. Systems using tree-lengthforwarders may also be less sensitive to wetweather since highway haul trucks arenotoperating onunimproved woods roads. High capacity forwarderscanwork at very longdistances; one study observedextraction at 8 km.
Clambunk Skidders
Clambunk skidders are another alternative to conventionalskidders. Like tree-length forwarders, clambunks extend extraction distance and reduce travel byhaving a larger payload. Six-and eight-wheel driveclambunks have been manufactured by various companies fora long time but have notbeen widely accepteddue to theiroverall large sizeandhigh price. Thelargesize makes them difficult to move over the road to different locations. Asmaller, lessexpensive four-wheel-drive clambunk capable of skidding 15-ton loads wasintroduced in 1993 (Schilling 1993).
Clambunks generally are self-loading. However, withlimited maneuverability as the load accumulates, clambunks need to work from pre-bunched material along amain trail. Effective extraction distance lies betweenconventional skidders and tree-length forwarders.
Shovel Loaders
Shovel loaders are hydraulic knuckleboom loadersadapted to heavy swing applications. Shovel loadershave been used in the Pacific Northwest (Anderssonand Jukes 1995,McNeel and Andersson 1993) toextractwoodshort distances to roadside. Typically, thetree-length stems or logsare picked up, swung 180degrees toward thedeck or roadside, perpendicular tothe direction of travel of the shovel. In effect, thewood is moved two lengths of the boom; this distanceis increased by grappling longer stems near the end.
On wet sites in thesouthern U.S., theprocedure is significantly different. Shovel loaders are used to pilefelled trees in a "road" of stems. The trees are laiddown end-to-end which provides a continuous mat tosupport skidders. The shovel machine builds the mat,pre-bunches stems to load skidders, and loads out the"road" as it works from the back of the corridor out ofthe stand. With long reach and wide tracks, shovelloaders minimize site disturbance. Corridor spacingcan be two to three times the boom reach.
Aerial
Cable systems and helicoptershave also been used inwetlands on a limited basis. The primary advantage of
thesesystems is a reduction in site disturbance and theability to extract wood inareas which will not supportground systems. Such systems are also employed toprovide woodflow during wet winter months.
Murray (1996) describes a cable system operating inGeorgia which uses mobile intermediate supports for amulti-span standingskyline. A tracked feller-bunchercuts the timber which is forwarded 100 mtothe skyline corridor by a shovel loader. The Christy yardercarries enough skyline to reach 760 m.
Helicopters are used more frequently on wet sites butrequire larger tree sizes and short distances to be economical. This system causes the least disturbanceexcept for the building of decks and roads.
Both cable and helicopter systems require large capitalinvestments and well-trained, skilled crews. These systemsmust also maintainhigh production to achieveprofitability. For these reasons, aerial systems tendtobe associated withlargecontractors closely associatedwith major wood consumers.
Equipment Costs
While initial cost is only one component of a machinerate, it is directly related to hourly operating costsandcapitalization requirements for the operation. Table 2summarizes some current price data (Brinker 1997).
SYSTEM CONFIGURATIONS
A comprehensive evaluation of wetland logging alternatives must lookat a range of combinations of equipment. To compare amongalternatives, system production rates were estimated using theAuburn HarvestingAnalyzer, a spreadsheet template that combines standinformation, production equations, and cost information. Four systems weremodeled: (1) swing feller-buncher withgrapple skidder; (2) swing feller-buncher,grapple skidder,clambunk; (3) swing feller-buncher,grapple skidder, tree-length forwarder; and (4) swingfeller-buncher, shovel loader, grapple skidder. All systems included manual toppingwith chainsaws.
Production functions were developed for a clambunkskidder, shovel loader, and swing-to-tree feller-bunchers using standard production and time study methods.Regression analysis related productivity to variousstand parameters. Previous studies of tree-length forwarders, grapple skidders were used as estimators forthose functions. Machinecosts were estimatedusingthe machine rate approach and current price data. A

Table 2. Costs of representative wetland logging equipment.
Machine ' Make/Model Tires Purchase PriceCable skidder Franklin 405 23.1x26 duals $95,600Grapple skidder Timberjack 450C 28Lx26 duals $138,915Grapple skidder Timberjack 480C 28Lx26 duals $181,218Clambunk skidder Franklin 170 24.5x32 duals $162,500Clambunk skidder Timberjack 933C 20.5x25 $417,502Clambunk skidder Ardco "N" 6x6 66/43.00-25 $460,000Swing feller-buncher TimbcoT425-B tracks $238,641Swing feller-buncher Timberjack 608 tracks $248,623Swing feller-buncher Tigercat 860 tracks $319,000Drive-to-tree feller-buncher John Deere 643D 28Lx26 $153,975Drive-to-tree feller-buncher Franklin C5000 28Lx26 $173,500Tree-length forwarder Ardco "K" 6x6 66743.00-25 $233,933Shovel loader Timberjack 735 tracks $255,000
stand table was constructed from cruise plot data of anactual bottomland stand (Table 3). The stand had 344trees per ha with a quadratic mean DBH of 28 cm.Stand volume averaged 2921 perha.
Table 3. Bottomland hardwood stand for analyses.DBH (cm) Trees/ha Tons/ha
15 86 9.720 69 18.625 42 21.1
30 37 29.935 35 40.040 27 42.745 20 41.650 10 27.455 10 31.960 5 21.1
65 0.5 2.070 1.2 7.2
Using thecommon stand table and production functions, each system was modeled at the actual observedextraction distances.
The summary data in Table 4 is based on verydifferentextraction distances and tract configurations. The lateral distance refers to the average distance from thestump to the main trail (pre-bunch distance). Theexternal distance is theone-way distance of primaryextractiontransport The extraction distances are considered representative for each specific system.
SUMMARY
The wetland forest resource challenges forest operations from both an environmental and an operationalperspective. The operatingconditions in these standspush the limits of equipment capabilities. Variability inoperating conditions also means that there isno singlebest operational approach for working in wetlands.Wet pine flats in Louisiana are very different from alluvial Delta islands and Carolina pocosins.
Resource managers and logging contractors need thecapability toanalyze system performance for varyingconditions to minimize production costs. Theapproach
Table 4. Wetland logging system estimated production summary.
System
Feller-buncher, grapple skidderFeller-buncher, grapple skidder, clambunkFeller-buncher, grapple skidder, forwarderFeller-buncher, shovel,grapple skidder
Lateral External System Ratedistance (m) distance (m) (t/SMH)
0
107
107
10
213
366
1676
274
10
29.7
32.1
29.4
40.8
System Cost(S/SMH)
$171.77
$219.98
$213.93
$237.38
Unit Cost
(S/0
$5.78
$6.85
$7.28
$5.82
demonstrated in this report isa simple technique foraddressing such questions. For example, the systemspreadsheetscan be iterated over distances to determine breakeven extraction distances which separatesystems. Changes in stand volumes or diameter distribution can also be studied to estimate the impact ofselective harvesting strategies on unitcost.
Increasing fiber demands in the South mean there willbea continuing search for better ways to work in wetlands. New equipment developments, new systemcombinations, and better methods ofanalyzing andunderstanding system performance will be the key tofinding solutions.
LITERATURE CITED
Andersson, BjSrn; Jukes, Warren. 1995. Harvestingcoastal second-growth forests: two case studies. TechNoteTN-232. PointeClaire, Quebec: ForestEngineering Res Institute of Canada. 13 p.
Aust W.M.; Reisinger, T.W.; Burger, J.A.; Stokes, B.J.1993. Soilphysical and hydrological changes associated with logging a wet pine flat with wide-tired skidders. Southern J Applied Forestry. 17(1): 22-25.
Brinker, R. 1997. Personal communication.Jackson, B. 1990. Final report: factors affecting har
vesting cost on alluvial floodplain forest environments. School of Forestry, Wildlife, and Fisheries.Baton Rouge: Louisiana State University. 34 p.
McNeel, Joe; Andersson, Bj6m. 1993. Shovel loggingwith different retrieval patterns. In: Proc, 16th annualCOFE meeting; Savannah, GA. Corvallis, OR:Council onForest Engineering: 14 p.
McWilliams, W.H.; Faulkner, J.L. 1991. Bottomlandhardwood timber resource of the coastal plainprovince inthe south central USA. Report 91-A-ll.Washington, DC: American Pulpwood Association.46 p.
Murray, Herb. 1996. Western cable yarding andGeorgia swamp harvesting. Tech Release 96-R-13.Washington, DC: American Pulpwood Association. 2 p.
Reisinger, Thomas W.; Aust, W. Michael. 1990.Specialized equipment and techniques for loggingwetlands. Paper 90-7570. American Society ofAgricultural Engineers. 11 p.
Schilling, Alvin. 1993. Franklin's clambunk skidder.Tech Release 93-R-67. Washington, DC: AmericanPulpwood Association. 2 p.
Stokes, Bryce J. 1988. Wetland logger survey summaryand production and costs of selected wetland loggingsystems.Report 88-A-10. Washington, DC: AmericanPulpwood Association. 26 p.
11

Logging Technology for Managing Northern Hardwoods
Neil K. HuylerUSDAForest Service
Northeastern Forest Experiment Station705Spear St., P.O. Box 968
Burlington, VT 05402
and
Chris B. LeDouxUSDA Forest Service
Northeastern Forest Experiment Station180 Canfield Street
Morgantom, WV 26505-3101
ABSTRACT: Logging is a key activity in the rural communities of the Northeast. For these communities to remain viable in aglobal wood market, forestland owners need to integrate new forest harvesting technology with the concept of sustainableforestry. Major issues affecting the selection of new logging technology are costs, production goals, silvicultural treatments,environmental impacts, and sustainable forest goals. Addressing these issues in the treatment ofnorthern hardwood standsrequires the use of alternative logging technology. Forest planners, managers, and loggers need to know what type of toggingtechnologies are available and their limitations for treating these hardwood stands. We compared three logging technologiesthat are applicable in hardwood stands: a small cable yarder, aconventional ground-based tractor, and a cut-to-length (CTL) andforwarding system. The results suggest that the impact of piece size on the cost for the cable yarder is a major factor. However,it isnot quite sopronounced for the ground-based and CTL systems.
Keywords: cable logging, ground-base skidding, cut-tc-length harvesting, thinning, cost, production, break-even comparison.
INTRODUCTION
Increasing concern with the impactof logging systemson the forest site has led managers to consider alternative harvesting technologies. Although rubber-tiredskidders have long been the standardfor extractingtimber from hardwood sites, loggers are beginning touse other harvesting systems to minimize adverseimpacts on the harvest site.
A way of life in many of the rural communities in theNortheast, logging is not only the economic base butalso a major part of the social structure within thesecommunities. Logging represents the starting point formuchof the market activity in the forest productssector and is the focal point for multiple use and die different values placed on the forest. Woodland ownersand forest managers are trying to understand ecosystem management objectives and the practices that willmeet those objectives.
For these and other reasons related to multiple use, thesilvicultural practices and logging technology available
forharvesting are important factors inachieving cost-effective yetenvironmentally sensitive operations.
A series of time and motion studies has documentedproduction rates and costs of small tractors, a smallcable yarder (Huyler and LeDoux 1997), and a smallcut-to-length (CTL)and forwarding system(Huylerand LeDoux 1996). Field studies of small tractors(Huyler and LeDoux 1989) have shown that thesemachines are well suited for removing timber fromhardwood sites. The time studies were conducted oncommercial timbersales in the Northeast. In this paperwe used thesetime-study data, a stump-to-mill costingmodel (LeDoux 1985), and ECOST version 3.0(LeDoux 1997)to compare production rates and costsof a small tractor, small cable yarder, and small CTLforwarding system.
METHODS
The stand prescription for all systems studiedwas primarily thinning to reduce the stand basal area.
12
Typically, the long-range plans for these stands were togrow high-quality hardwoods while providing forotherforest uses. The harvesting technologies were classedas small systems and selected on the basis of two criteria: that they be less than 60 hp, and that ground-based systems have4-wheel-drive capability.
The conventional ground-based systemused in theanalysis was an A60F Holder tractor. An articulated48-hp diesel tractor manufactured inWest Germany, itwas equipped with an Igland-Jones3000 double-drumwinch with a ratedpulling capacity of 6.600lb. Thecableyarding system was a Roller R-300yarder. Thisis a trailer- or tractor-mounted uphill yarder used mostly for commercial thinningand small-wood harvesting. Manufactured inAustria, it has a minimum powersource of 40 hp,a 23-ft (7-m) tower, and a payloadcapacity of 3,500 lb. TheCTL harvester/processor wasa single-grip Peninsula design roller processing saw-head model RP1600. Themaximum cutting diameteris 14.0 inches; the minimum-maximum limb diameteris 1/2 to9 inches, respectively. The single-grip headwas mounted on a modified 988 John Deere, 70-tracked excavator platform. The 55-hp machine hasa48-gal/min hydraulic pumpsystem. Included in theCTL system was a Valmet model 524 forwarder. Thisbidirectional 4-wheel-drive machine was equipped witha small clam loader and an 8-ft logbunk.
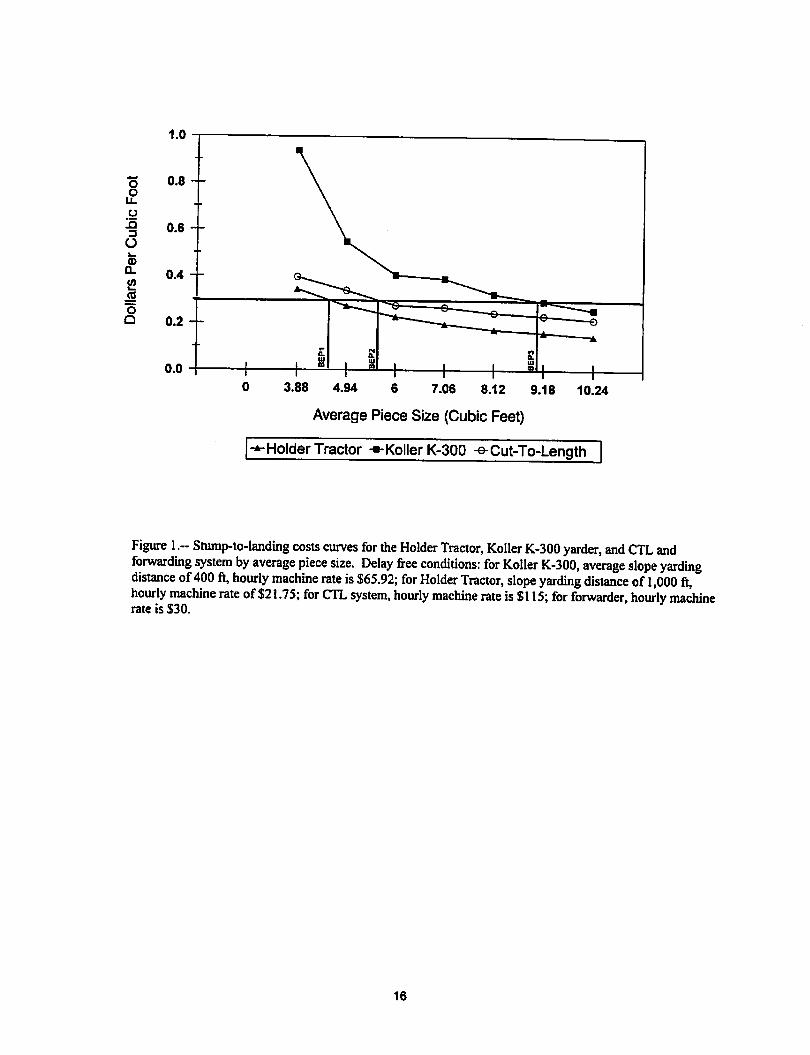
RESULTS
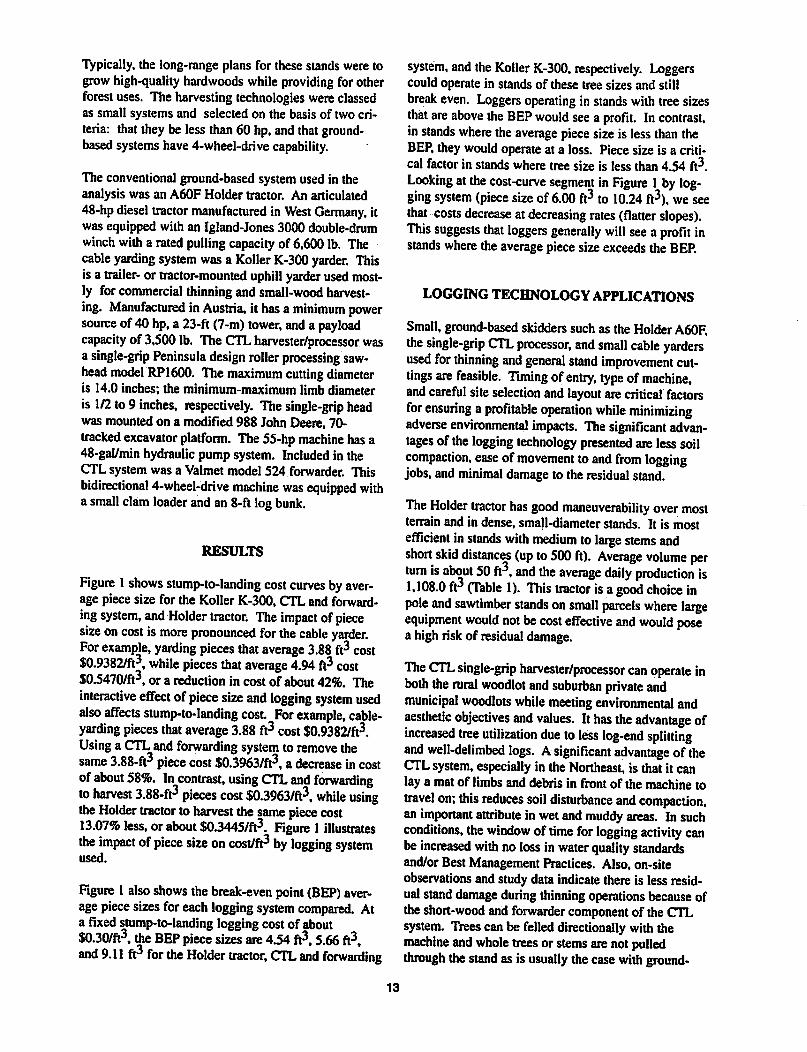
Figure 1shows stump-to-landing cost curves by average piece size for the Roller R-300, CTL and forwarding system, and Holder tractor. The impact ofpiecesize on cost is more pronounced for the cable yarder.For example, yarding pieces that average 3.88 ft3 cost$0.9382/ft3, while pieces that average 4.94 ft3 cost$0.5470/ft3, or a reduction in cost ofabout 42%. Theinteractive effect ofpiece size and logging system usedalso affects stump-to-landing cost. For example, cable-yarding pieces that average 3.88 ft3 cost $0.9382/ft3.Using a CTL and forwarding system to remove thesame 3.88-ft3 piece cost $0.3963/ft3, adecrease in costofabout 58%. In contrast, using CTL and forwardingto harvest 3.88-ft3 pieces cost $0.3963/ft3, while usingthe Holder tractor to harvest the same piece cost13.07% less, orabout $0.3445/ft3. Figure 1illustratesthe impact ofpiece size on cost/ft3 by logging systemused.
Figure 1alsoshows the break-even point(BEP) averagepiece sizes foreach logging system compared. Ata fixed stump-to-landing logging cost of about$0.30/ft3, the BEP piece sizes are 4.54 ft3,5.66 ft3,and 9.11 ft3 for the Holder tractor, CTL and forwarding
system, and theRoller R-300. respectively. Loggerscould operate in stands of these tree sizes and stillbreak even. Loggers operating instands with tree sizesthat are above the BEP would see a profit. In contrast,instands where the average piece size is less than theBEP, they wouldoperate at a loss. Piecesize is a critical factor in stands where tree size is less than 4.54 ft3.Looking at the cost-curve segment in Figure 1by logging system (piece size of6.00 ft3 to 10.24 ft3), we seethat costs decrease atdecreasing rates (flatter slopes).This suggests that loggers generally will see a profit instands where the average piece sizeexceeds the BEP.
LOGGING TECHNOLOGY APPLICATIONS
Small, ground-based skidders such as theHolder A60F,the single-grip CTL processor, and small cable yardersused for thinning and general stand improvement cuttings are feasible. Timing ofentry, type of machine,andcareful siteselection andlayout arecritical factorsfor ensuring a profitable operation while minimizingadverse environmental impacts. The significant advantages of the logging technology presented are less soilcompaction, ease of movement toand from loggingjobs,and minimal damage to the residual stand.
The Holder tractor has good maneuverability over mostterrainand in dense, small-diameterstands. It is mostefficient instands with medium to large stems andshort skid distances (up to500 ft). Average volume perturn is about 50 ft3, and the average daily production is1,108.0 ft3 (Table 1). This tractor is agood choice inpole and sawtimber stands on small parcels where largeequipment would not becost effective and would posea high riskof residual damage.
The CTL single-grip harvester/processor can operate inboth the rural woodlot and suburban private andmunicipal woodlots while meeting environmental andaesthetic objectives and values. It has the advantage ofincreased tree utilization due to less log-end splittingand well-delimbed logs. Asignificant advantage of theCTLsystem, especially in the Northeast, is that it canlay a mat of limbs and debris in front of the machine totravel on; this reduces soil disturbance and compaction,an important attribute in wetand muddy areas. In suchconditions, the window of time for logging activity canbe increased with noloss in water quality standardsand/or Best Management Practices. Also, on-siteobservations and study data indicate there is less residualstand damage during thinning operations because oftheshort-wood andforwarder component of the CTLsystem. Treescan be felleddirectionally with themachine andwhole trees or stems are notpulledthrough thestand as is usually thecase with ground-
13
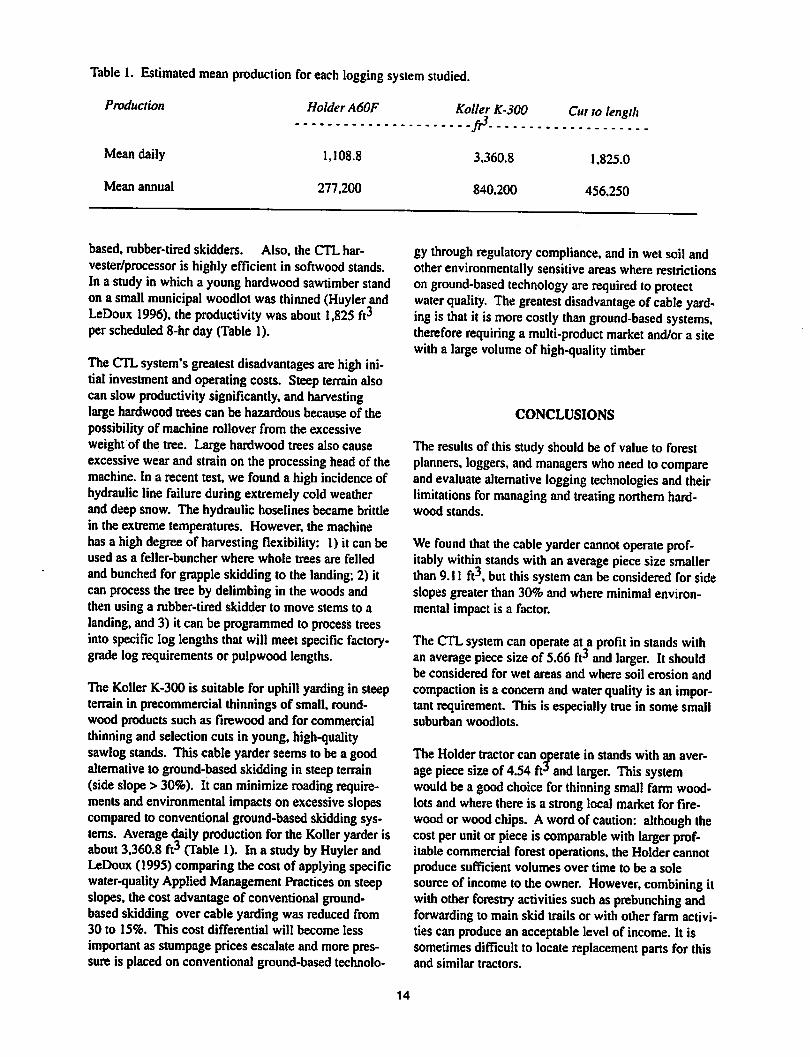
Table 1. Estimated mean production for each logging system studied.
Production
Mean daily
Mean annual
Holder A60F
1,108.8
277.200
based, rubber-tired skidders. Also, the CTL harvester/processor is highly efficient in softwood stands.In a study in which a young hardwood sawtimber standon a small municipal woodlot was thinned (Huyler andLeDoux 1996), the productivity was about 1,825 ft3perscheduled 8-hr day (Table 1).
The CTL system's greatest disadvantages are high initial investment andoperating costs. Steep terrain alsocanslow productivity significantly, andharvestinglarge hardwood trees can be hazardous because of thepossibility of machine rollover from the excessiveweight of the tree. Large hardwood trees also causeexcessive wearandstrain on the processing head of themachine. In a recenttest, we found a high incidence ofhydraulic line failure during extremely cold weatherand deep snow. The hydraulic hoselines became brittlein the extreme temperatures. However, the machinehas a high degreeof harvesting flexibility: 1) it can beused as a feller-buncher where whole trees are felled
andbunched for grapple skidding to the landing; 2) itcan processthe tree by delimbing in the woods andthen using a rubber-tired skidder to move stems to alanding, and3) it can be programmed to process treesintospecific log lengths that will meet specific factory-grade log requirements or pulpwood lengths.
The Roller R-300 is suitable foruphill yarding in steepterrain in precommercial thinnings of small, round-wood products such as firewood and for commercialthinning and selection cuts in young, high-qualitysawlog stands. This cable yarder seems to be a goodalternative to ground-based skidding in steepterrain(side slope> 30%). It can minimize reading requirements and environmental impacts on excessive slopescompared to conventional ground-based skidding systems. Average daily production for the Roller yarderisabout 3360.8 ft3 (Table 1). In astudy by Huyler andLeDoux (1995) comparing the cost of applyingspecificwater-quality Applied Management Practices on steepslopes, the cost advantage of conventional ground-basedskidding over cable yarding was reduced from30 to 15%. This cost differential will become less
important as stumpage pricesescalateand more pressure is placed on conventional ground-based technolo
Koller K-300
•--fi3
3,360.8
840,200
Cut to length
1.825.0
456.250
gy through regulatory compliance, andin wet soil andotherenvironmentally sensitive areas where restrictionson ground-based technology are required to protectwater quality. The greatest disadvantage of cable yarding is that it is more costly than ground-based systems,therefore requiring a multi-product market and/or a sitewitha large volume of high-quality timber
CONCLUSIONS
The results of this study should be of value to forestplanners, loggers, and managers who need to compareandevaluate alternative logging technologies and theirlimitations for managing and treating northern hardwood stands.
We found that thecable yarder cannot operate profitablywithin stands with an average piece size smallerthan 9.11 ft3, but this system can be considered for sideslopes greater than 30% and where minimal environmental impact is a factor.
The CTL system canoperate at a profit in stands withan average piece size of5.66 ft3 and larger. It shouldbe considered for wet areas and where soil erosion andcompaction is a concern and water quality is an important requirement. This is especially true in some smallsuburban woodlots.
The Holder tractorcan operate in stands with an average piece size of4.54 ft3 and larger. This systemwouldbe a goodchoice for thinning small farm wood-lots and where there is a strong local market for firewood or wood chips. A word of caution: although thecost perunit or piece is comparable with larger profitablecommercial forest operations, the Holder cannotproduce sufficient volumes over time to be a solesource of income to the owner. However, combining itwithother forestry activities such as prebunching andforwarding to main skid trails or with other farm activities can produce an acceptable level of income. It issometimes difficult to locate replacement parts for thisand similar tractors.
14
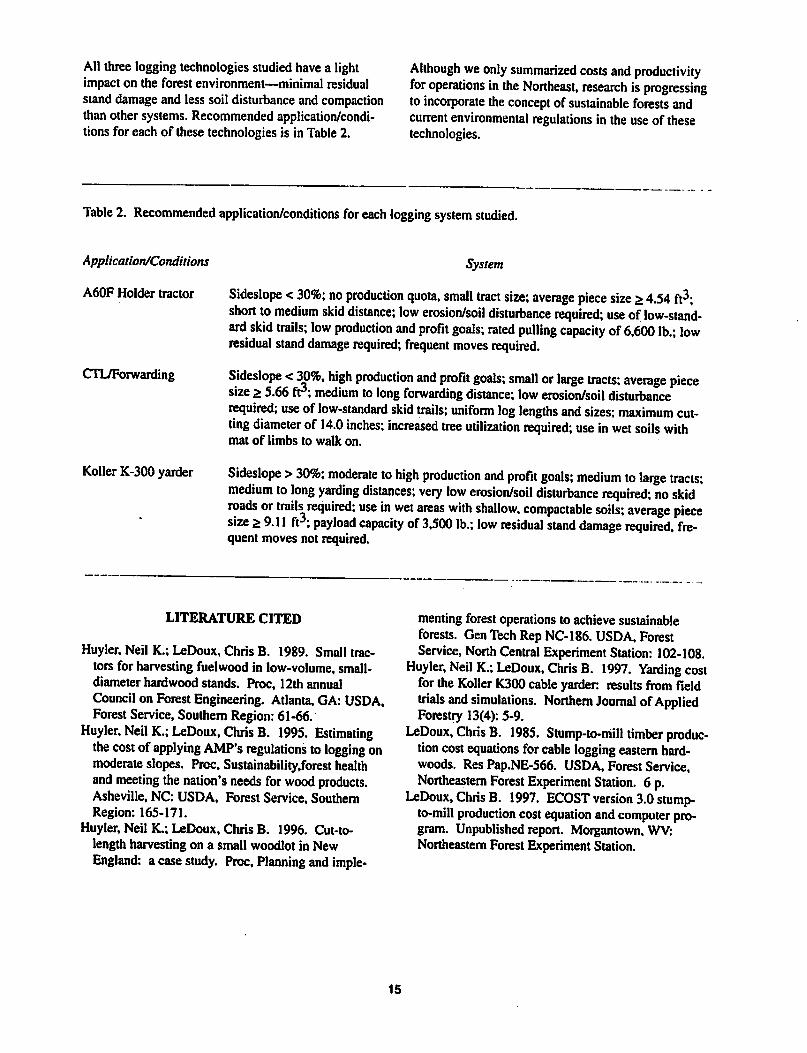
All three logging technologies studiedhavea lightimpact on the forest environment—minimal residualstand damage and less soil disturbance and compactionthanothersystems. Recommended application/conditions for each of these technologies is in Table 2.
Although we only summarized costs and productivityfor operations in the Northeast, research is progressingto incorporate theconcept of sustainable forests andcurrent environmental regulations in the use of thesetechnologies.
Table 2. Recommended application/conditions for each logging system studied.
Application/Conditions
A60F Holder tractor
CTL/Forwarding
Roller R-300 yarder
System
Sideslope <30%; no production quota, small tract size; average piece size >4.54 ft3;short tomedium skid distance; low erosion/soil disturbance required; use of low-standard skid trails; low production and profit goals; rated pulling capacity of6.600 lb.; lowresidual stand damage required; frequent moves required.
Sideslope <30%, high production and profit goals; small or large tracts; average piecesize s 5.66 ft3; medium to long forwarding distance; low erosion/soil disturbancerequired; use of low-standard skid trails; uniform log lengths and sizes; maximum cutting diameter of 14.0 inches; increased tree utilization required; use in wet soils withmat of limbs to walk on.
Sideslope >30%; moderate to high production and profit goals; medium to large tracts;medium to long yarding distances; very low erosion/soil disturbance required; no skidroads or trails required; use in wet areas with shallow, compactable soils; average piecesize 29.11 ft3; payload capacity of 3,500 lb.; low residual stand damage required, frequent moves not required.
LITERATURE CITED
Huyler. Neil R.; LeDoux, Chris B. 1989. Small tractors for harvesting fuelwood in low-volume, small-diameter hardwood stands. Proc, 12th annualCouncil on ForestEngineering. Atlanta, GA: USDA,Forest Service, Southern Region: 61-66.
Huyler, Neil R.; LeDoux, Chris B. 1995. Estimatingthe cost ofapplying AMP's regulations tologging onmoderate slopes. Proc, Sustainability.forest healthand meeting the nation's needs for wood products.Asheville, NC: USDA, Forest Service, SouthernRegion: 165-171.
Huyler, Neil R.; LeDoux. Chris B. 1996. Cut-to-length harvesting on a small woodlot in NewEngland: a case study. Proc, Planning andimple
menting forest operations to achieve sustainableforests. GenTech Rep NC-186. USDA, ForestService, North Central Experiment Station: 102-108.
Huyler, Neil R.; LeDoux, Chris B. 1997. Yarding costfor the RollerR300cableyarder results from fieldtrials and simulations. Northern Journal ofAppliedForestry 13(4): 5-9.
LeDoux, Chris B. 1985. Stump-to-mill timber production costequations forcable logging eastern hardwoods. ResPap.NE-566. USDA, ForestService,Northeastern Forest Experiment Station. 6 p.
LeDoux, Chris B. 1997. ECOST version 3.0 stump-to-mill production costequation andcomputer program. Unpublished report. Morgantown, WV:Northeastern ForestExperiment Station.
15
o
£g
o
<DQ.
W&_
JO
Oa
3.88 4.94 6 7.06 8.12 9.18
Average Piece Size (Cubic Feet)
10.24
-Holder Tractor -»-Koller K-300 -o-Cut-To-Length~1
Figure 1.-- Stump-to-landing costs curves for the Holder Tractor, Roller R-300 yarder, and CTL andforwarding system by average piece size. Delay free conditions: for Roller R-300, average slope yardingdistance of400 ft, hourly machine rate is $65.92; for Holder Tractor, slope yarding distance of 1,000 ft,hourly machine rate of$21.75; for CTL system, hourly machine rate is $115; for forwarder, hourly machinerate is $30.
16
Stand, Harvest, and Equipment Interactions
Caused by Harvesting Prescriptions
Jingxin Wang andW. Dale GreeneWamell Schoolof Forest Resources
University ofGeorgiaAthens, GA 30602-2152
ABSTRACT: Partial cutting is increasingly used as aharvesting method to address public concerns about timber harvesting.Such operations, however, increase the difficulty of felling and harvesting trees since less volume is removed and the residualstand must be protected. The interactions of stand types, harvesting methods, and different equipment were evaluated in anexperiment using interactive simulation. Three felling methods (chainsaw, feller-buncher, harvester) and two extraction methods(grapple skidder and forwarder) were examined performing clearcuts, shelterwood cuts, and single-tree selection cuts in a naturalstand and a planted stand. Elemental times, distances traveled, travel intensity, and productivity estimates were obtained foreach combination of stand, harvest, and equipment Results indicate the relative efficiency and feasibility of using partial cuttinginstead ofclearcutting.
Key Words: partial cutting, timber harvesting, interactive simulation
INTRODUCTION
Partial cuts increase the difficulty of harvestingandpotentially have greater negative environmentalimpacts. Studying the interactions of stand, harvest,and machine factors and selecting an effective harvesting system are becoming prime concerns to forest managers. Several factors affect the operation of a harvesting system. Tree size, stand density, harvestingprescription, and machine each affect the production andcost (Greene et al. 1987a).
The productivity and profitability of individual harvesting machines have been addressed by many researchers(Lanford and Sirois 1983. Tufts et al. 1988, Greene andStokes 1988, Greene and McNeel 1991, Tufts andBrinker 1993a and 1993b). Many of these previousstudies examined a single harvest method. A few, however, reported on comparisons and interactions of harvesting systems (Rluender and Stokes 1994, Lanfordand Stokes 1995 and 1996, Rluender et al. 1996).These side-by-side field comparisons identified differences in harvesting systems.
Field studies, however, are handicapped by the cost ofreplicating experiments over a variety of conditions. Inaddition, some influencing factors such as bunch sizeare not easy to control in the woods. Interactive computer simulation combined with a limited amount offield data overcomes many of these shortcomings.
Many harvesting simulation programs have been developed during last three decades. Goulet et al. (1979,1980a, 1980b) summarized the models availablethrough 1980. Most of the models were deterministic,numerical simulation programs (Martin 1975, Webster1975, Bare et al. 1976, Bradley et al. 1976). The activities of a machine in partial cuts were not simulatedwell by these models since machine restrictions due tostand density, spatial patterns, and harvest prescriptionswere not modeled.
Since 1980, more harvesting simulation studies havebeen reported. Garbini et al. (1984) used numericalsimulation with graphical animation to illustrate material movement and machine activities in continuous
simulation of a log merchandiser. In another decisionsimulator application, graphical animation and numerical data were used to make log bucking decisions(Lembersky and Chi, 1984). Fridley et al. (1982.1985)and Fridley and Jorgensen (1983) reported theuse of graphical interactive simulation for studying thedesign of swing-to-tree feller-bunchers used for thinning. The program was used to identify the effect ofvariousdesign parameters on feller-buncher performance during thinning (Fridley et al. 1988). An interactive simulation program for modeling feller-buncherswas developed by Greene and Lanford (1984, 1986).Working with this simulation program, Greene et al.(1987a) examined the effects of stand and operatingfactors on the productivity of a small feller-buncher in
17
second thinning operations and concluded that variability between simulation operators existed but did notappear to affect the usefulness of interactive simulation(Greeneet al. 1987b). Blockand Fridley(1990)described a three-dimensional,color, interactive, realtime, computer graphics simulation of a feller-buncher.Theprogram allowed the userto vary physical parametersof the feller-buncher thatwould affect its performance in the woods. Baumgras etal. (1993) presenteda simulation model to estimate-stump-to-truck production ratesand multiproduct yields for conventionalground-based timber harvesting systems inAppalachianhardwood stands. Amethod of estimating tree damagewasalso addressed in conjunction withan interactivemachine simulation program that could model harvestingperformance ina variety of silvicultural operations(Bragg et al. 1994). Some of the models since 1980adopted interactive graphics-based simulation techniques which offer a better method to model the activities ofharvesting machines. These programs mainlymodeled and simulated the feller-bunchers.
OBJECTIVES
Thisstudy used interactive computer simulation toidentify and evaluate the interactions of stand conditions, harvest prescriptions, and harvesting machineswith a designed experiment. More specifically, thestudy examined:
1. distance traveled per harvested tree, time per tree,and felling productivity as affected by mean DBHremoved, volume per hectare removed, harvestmethod, and felling machine type;
2. mean extraction distance, mean turn size, cycletime, and extraction productivity asaffected bybunch size, volume per hectare extracted, harvestmethod, andfelling andskidding machine; and
3. travel intensity ona logging site asaffected bystand, harvest, and machine.
METHODS AND MATERIALS
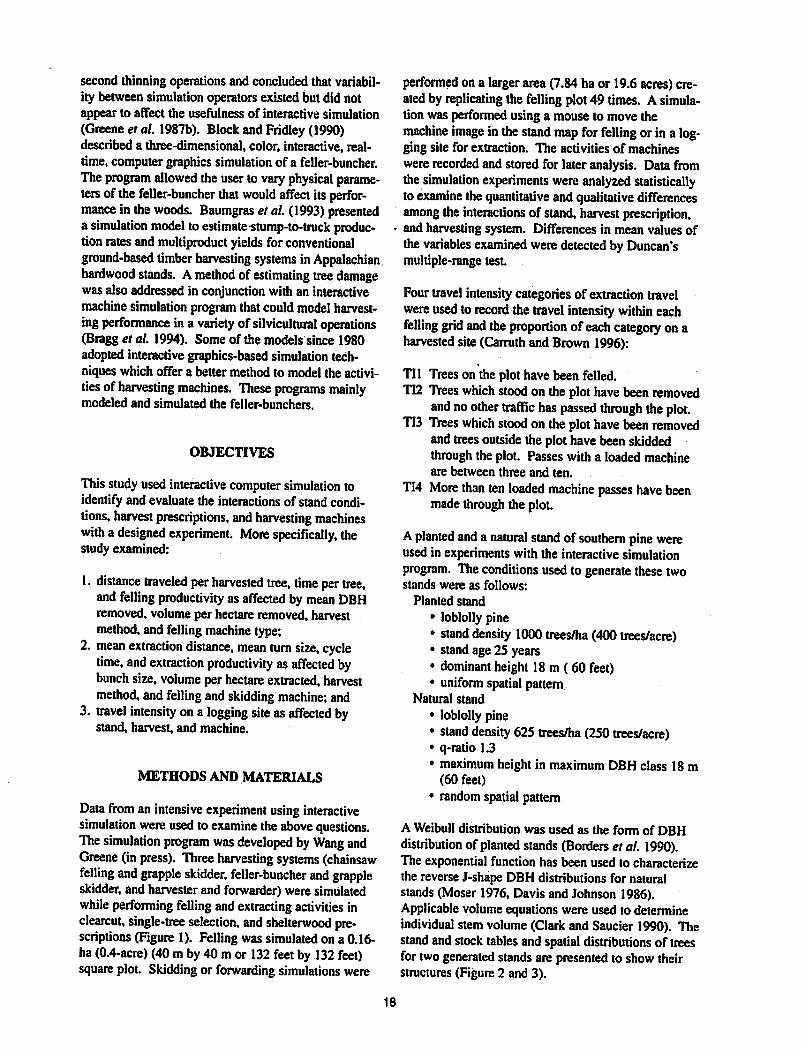
Data from an intensive experiment using interactivesimulation were used toexamine the above questions.The simulation program was developed by Wang andGreene (in press). Three harvesting systems (chainsawfelling and grapple skidder, feller-buncher and grappleskidder, and harvester and forwarder) were simulatedwhile performing felling and extracting activities inclearcut, single-tree selection, and shelterwood prescriptions (Figure 1). Fellingwassimulated on a 0.16-ha(0.4-acre) (40mby40 m or 132 feet by 132 feet)squareplot. Skidding or forwarding simulations were
performed on a largerarea (7.84 ha or 19.6acres)createdby replicating the fellingplot 49 times. A simulation was performed using a mouse to move themachine image in the stand map for felling or in a logging site for extraction. The activities of machineswererecorded and stored for later analysis. Data fromthesimulation experiments were analyzed statisticallyto examine thequantitative and qualitative differencesamong the interactions of stand, harvest prescription,
- and harvesting system. Differences in mean values ofthevariables examined were detected by Duncan'smultiple-range test.
Four travelintensity categoriesof extraction travelwere used to record thetravel intensity within eachfelling grid and theproportion of each category onaharvested site(Camithand Brown 1996):
Til Treeson the plot have been felled.TI2 Trees which stood on the plot havebeenremoved
and no other traffic has passed through the plot.TI3 Trees which stood on theplothave been removed
and treesoutsidethe plot have been skiddedthrough the plot. Passes with a loaded machineare between three and ten.
TI4 More than ten loaded machine passes have beenmadethrough the plot.
Aplanted and a natural stand of southern pine wereused in experiments with the interactive simulationprogram. The conditions used to generate these twostands were as follows:
Planted stand
• loblolly pine• stand density 1000trees/ha (400trees/acre)• stand age 25 years• dominant height 18m ( 60 feet)• uniform spatial pattern
Natural stand
• loblolly pine• stand density 625 trees/ha (250trees/acre)• q-ratio 1.3
• maximum height in maximum DBH class 18 m(60 feet)
• random spatialpattern
A Weibull distribution was used as the form of DBHdistribution of planted stands (Borders etal. 1990).The exponential function has been used to characterizethe reverse J-shape DBH distributions for naturalstands(Moser 1976,Davis and Johnson 1986).Applicable volume equations were used to determineindividual stemvolume (Clark and Saucier 1990). Thestandand stocktablesand spatialdistributions of treesfor twogenerated stands are presented to showtheirstructures (Figure 2 and 3).
18
Grapple skidder
Whole trees
Chainsaw
Feller-buncher
Whole treeg
Tree-length
Tree-length On-boord
truck
Hauling
—•
Grapple skidder
Harvester
Forwarder
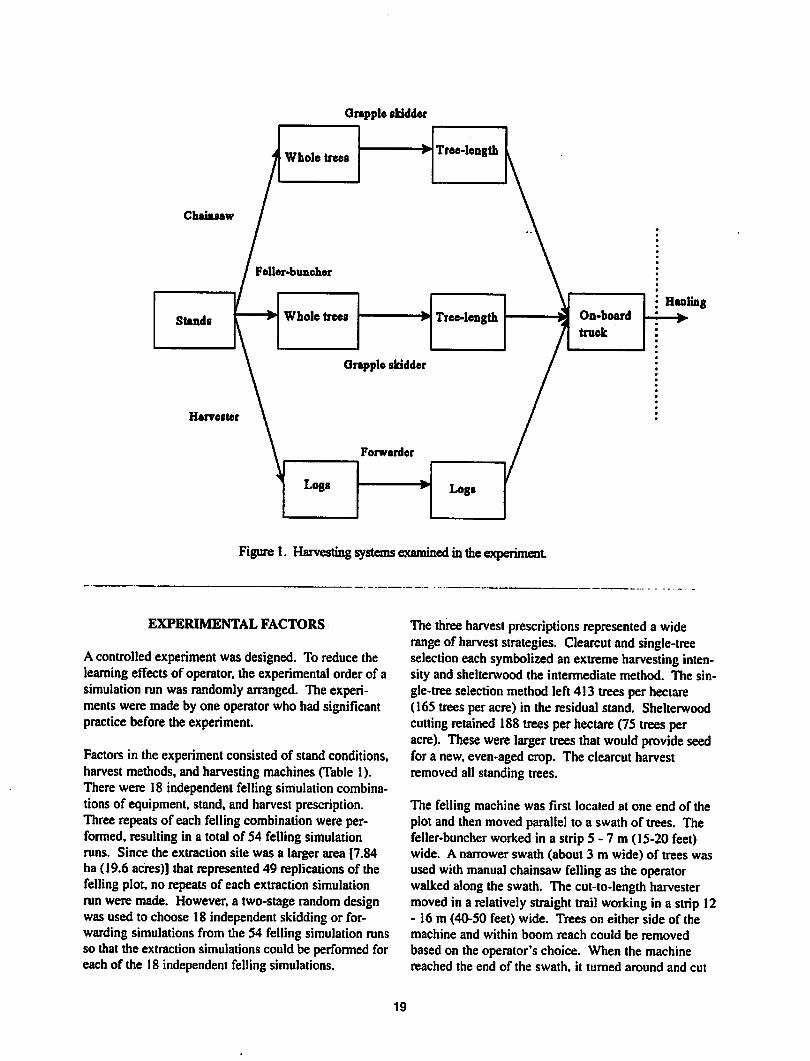
Figure 1. Harvesting systems examined intheexperiment
EXPERIMENTAL FACTORS
A controlled experiment was designed. To reduce thelearningeffects of operator, the experimental order of asimulation run was randomly arranged. The experiments were made by one operatorwho had significantpractice before the experiment.
Factors in the experiment consisted of stand conditions,harvest methods, and harvesting machines (Table 1).There were 18 independent felling simulation combinationsof equipment, stand, andharvest prescription.Three repeatsof each felling combination were performed, resulting in a total of 54 felling simulationruns. Since the extraction site was a larger area [7.84ha (19.6 acres)] that represented49 replicationsof thefelling plot, no repeats of each extraction simulationrun were made. However, a two-stage random designwas used to choose 18 independent skidding or forwarding simulations from the 54 felling simulation runsso that the extraction simulations could be performed foreach of the 18 independent felling simulations.
The three harvest prescriptions represented a widerange of harvest strategies. Clearcut and single-treeselection eachsymbolized an extreme harvesting intensity and shelterwood the intermediate method. The single-tree selection method left 413 trees perhectare(165 trees per acre) in the residual stand. Shelterwoodcutting retained 188trees perhectare (75 trees peracre). These were larger trees that would provide seedfor a new,even-aged crop. The clearcut harvestremoved all standing trees.
The felling machine was first located at one end of theplot and then moved parallel to a swath of trees. Thefeller-buncher worked in a strip 5 - 7 m (15-20 feet)wide. A narrower swath (about 3 m wide) of trees wasused with manual chainsaw felling as the operatorwalked along the swath. The cut-to-length harvestermoved in a relatively straight trail working in a strip 12-16 m (40-50 feet) wide. Trees on either side of themachine and within boom reach could be removed
based on the operator's choice. When the machinereached the end of the swath, it turned around and cut
19
i H FOREST HARVESTING SIMULATfin H~ !P,I*J'-•>::•'::>•.:«•
mnnSSs :•:•»:-:••:•>:•.•-.•::• :•*•::«•>":• >:•:•:•>:•>:•:%•:•:•
"
4
#
• •
•
*
*
•
•
♦
4 :
** ft •
*
•
♦ • *•
*
•
♦ ♦n
•
•
* ♦•
• «
*
* ftat ft
• t
* *
4 «• •
••
• ,
••
'
**
#
»
»
1 •
•
«
*•
4
•
•
•
1 »•
*•
**
•
* * «
*
•
•
4
4
4
I:\ * «
*
1 •
4 •
**
•*
i * »• •
•
♦
•
«
•
*•
4
.«
*
ft •
3 ** ,.,,,,*,., * *
DBH
_(cm]_Trees/Ha Total Height
(S)
BA/Ha
(m'/Ha)Volume/Ha
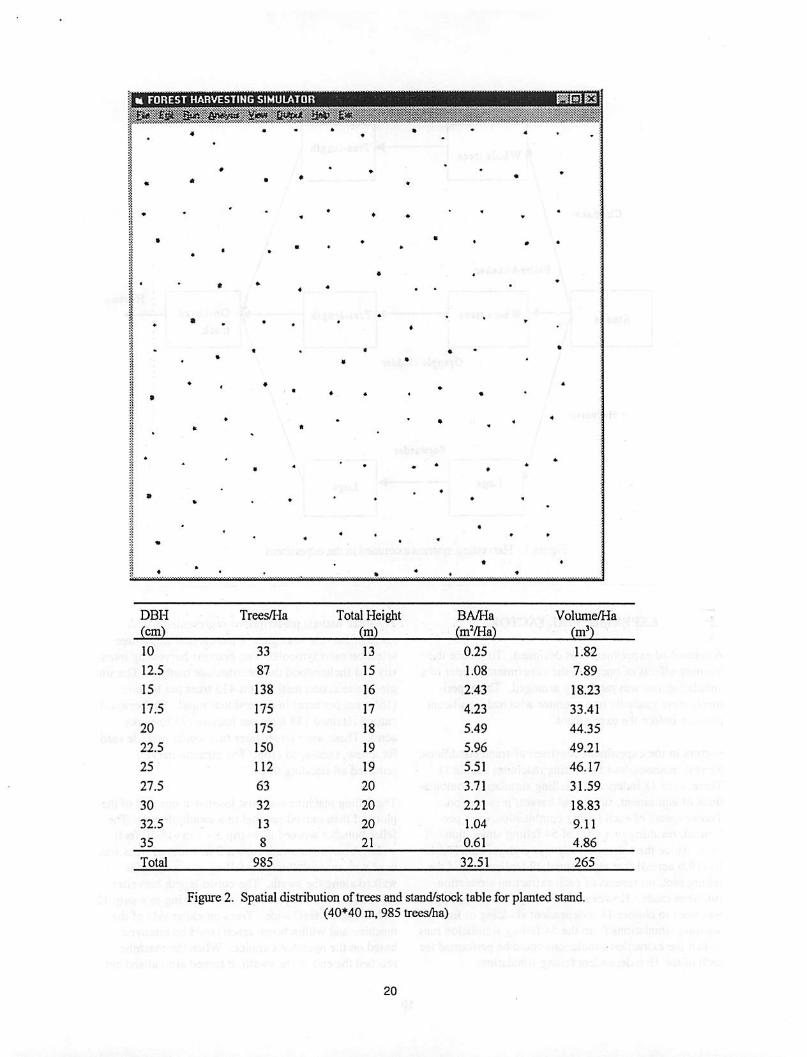
10 33 13 0.25 1.82
12.5 87 15 1.08 7.89
15 138 16 2.43 18.23
17.5 175 17 4.23 33.41
20 175 18 5.49 44.35
22.5 150 19 5.96 49.21
25 112 19 5.51 46.17
27.5 63 20 3.71 31.59
30 32 20 2.21 18.83
32.5 13 20 1.04 9.11
35 8 21 0.61 4.86
Total 985 32.51 265
Figure 2. Spatial distribution of trees and stand/stock table for planted stand.(40*40 m, 985 trees/ha)
20
v.v.v.v.v.Y.v.v.y.v-v.v.-....-
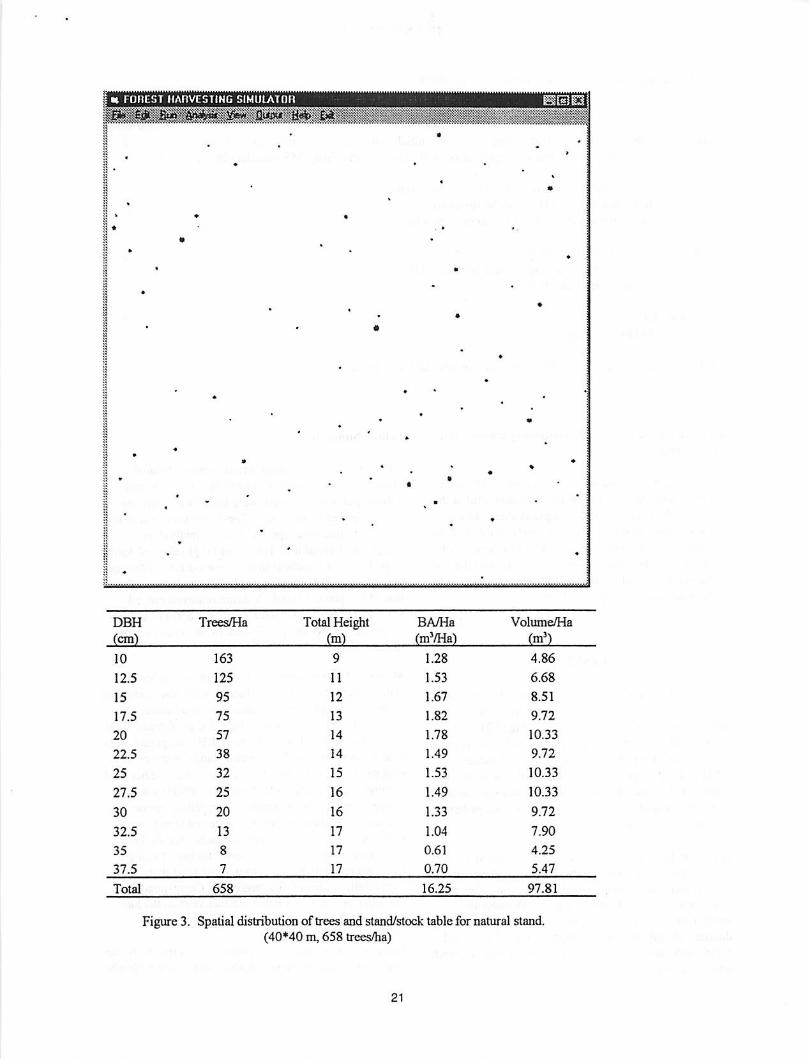
DBH Trees/Ha
10 163
12.5 125
15 95
17.5 75
20 57
22.5 38
25 32
27.5 25
30 20
32.5 13
35 8
37.5 7
Total 658
Total Height(m)
BA/Ha
(mVHa)Volume/Ha
(m3)
9 1.28 4.86
11 1.53 6.68
12 1.67 8.51
13 1.82 9.72
14 1.78 10.33
14 1.49 9.72
15 1.53 10.33
16 1.49 10.33
16 1.33 9.72
17 1.04 7.90
17 0.61 4.25
17 0.70 5.47
16.25 97.81
Figure 3. Spatial distribution of trees and stand/stocktable for natural stand.(40*40 m, 658 trees/ha)
21
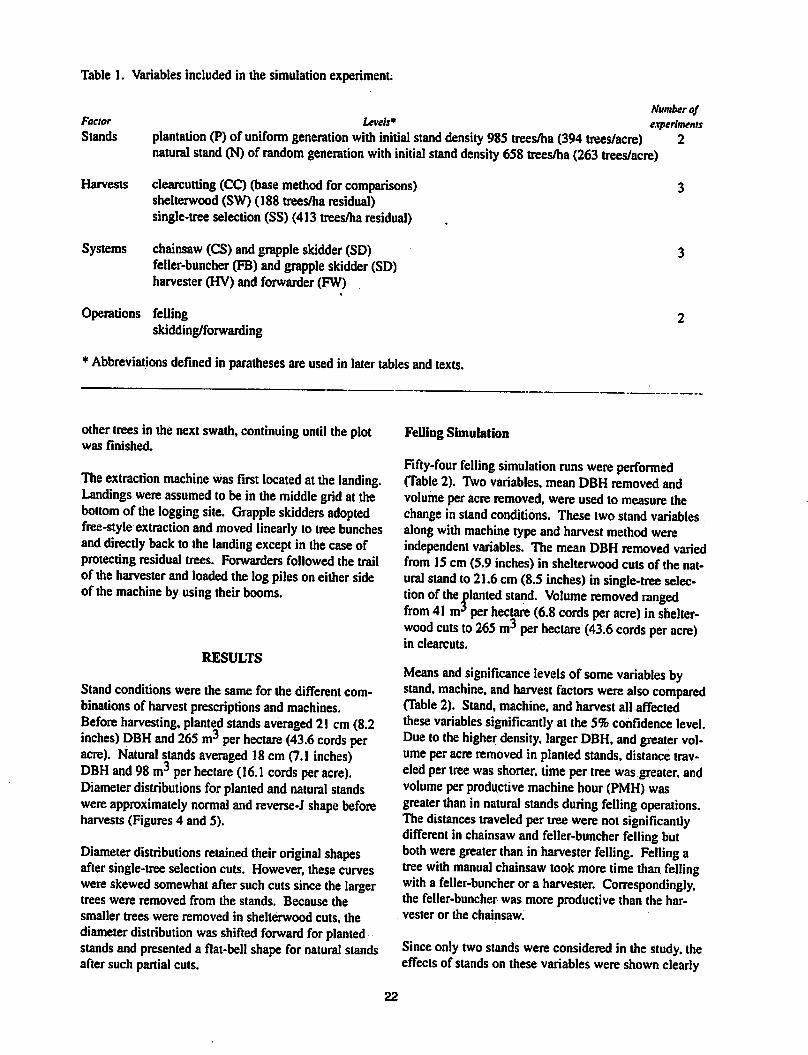
Table 1. Variables included in the simulation experiment.
NumberofFactor Levels* experimentsStands plantation (P) of uniform generation with initial stand density 985 trees/ha (394trees/acre) 2
natural stand (N) of random generation with initial stand density 658trees/ha (263 trees/acre)
Harvests clearcutting(CC) (base method for comparisons) 3shelterwood (SW) (188 trees/ha residual)single-tree selection (SS) (413 trees/ha residual)
Systems chainsaw (CS) and grapple skidder (SD) 3feller-buncher (FB) andgrapple skidder (SD)harvester (HV) and forwarder (FW)
Operations felling 2skidding/forwarding
* Abbreviations defined in paratheses are used in latertablesand texts.
other trees in the next swath, continuing until theplotwas finished.
The extraction machine was first located at the landing.Landings were assumed to be in themiddle grid at thebottom of the logging site. Grapple skidders adoptedfree-style extraction and moved linearly to treebunchesanddirectly back to the landing except in thecaseofprotecting residual trees. Forwarders followed the trailof theharvester and loaded the logpiles oneither sideof the machine by using theirbooms.
RESULTS
Stand conditions were the same for the different combinations of harvest prescriptions and machines.Before harvesting, planted stands averaged 21 cm(8.2inches) DBH and 265 m3 per hectare (43.6 cords peracre). Natural stands averaged 18 cm (7.1 inches)DBH and 98 m3 per hectare (16.1 cords per acre).Diameter distributions for planted and natural standswere approximately normal andreverse-J shape beforeharvests (Figures 4 and 5).
Diameter distributions retained their original shapesafter single-tree selection cuts. However, these curveswere skewed somewhat aftersuchcuts since the largertrees were removed from the stands. Because the
smaller trees were removed in shelterwood cuts, thediameter distribution wasshifted forward forplantedstandsand presented a flat-bell shape for natural standsafter such partial cuts.
Felling Simulation
Fifty-four felling simulation runs were performed(Table2). Two variables, mean DBH removed andvolume per acre removed, were used to measure thechange in stand conditions. These two stand variablesalong with machine type and harvest method wereindependent variables. The mean DBH removed variedfrom 15cm (5.9 inches) in shelterwood cuts of the natural stand to 21.6 cm(8.5 inches) insingle-tree selection of the planted stand. Volume removed rangedfrom 41 m3 per hectare (6.8 cords per acre) in shelter-wood cuts to 265 m3 per hectare (43.6 cords per acre)in clearcuts.
Means and significance levels ofsome variables bystand, machine, and harvest factors were also compared(Table 2). Stand, machine, and harvest all affectedthesevariables significantly at the 5% confidence level.Due to the higher density, larger DBH, and greater volume per acre removed in planted stands, distance traveled pertree was shorter, time pertree was greater, andvolume per productive machine hour (PMH) wasgreater than in natural stands during felling operations.The distances traveled pertree were not significantlydifferent inchainsaw andfeller-buncher felling butboth were greater than in harvester felling. Felling atree with manual chainsaw took more time than fellingwith a feller-buncher or a harvester. Correspondingly,the feller-buncher was more productive than the harvester or the chainsaw.
Since only two stands were considered in the study, theeffects of stands on these variables were shown clearly
22
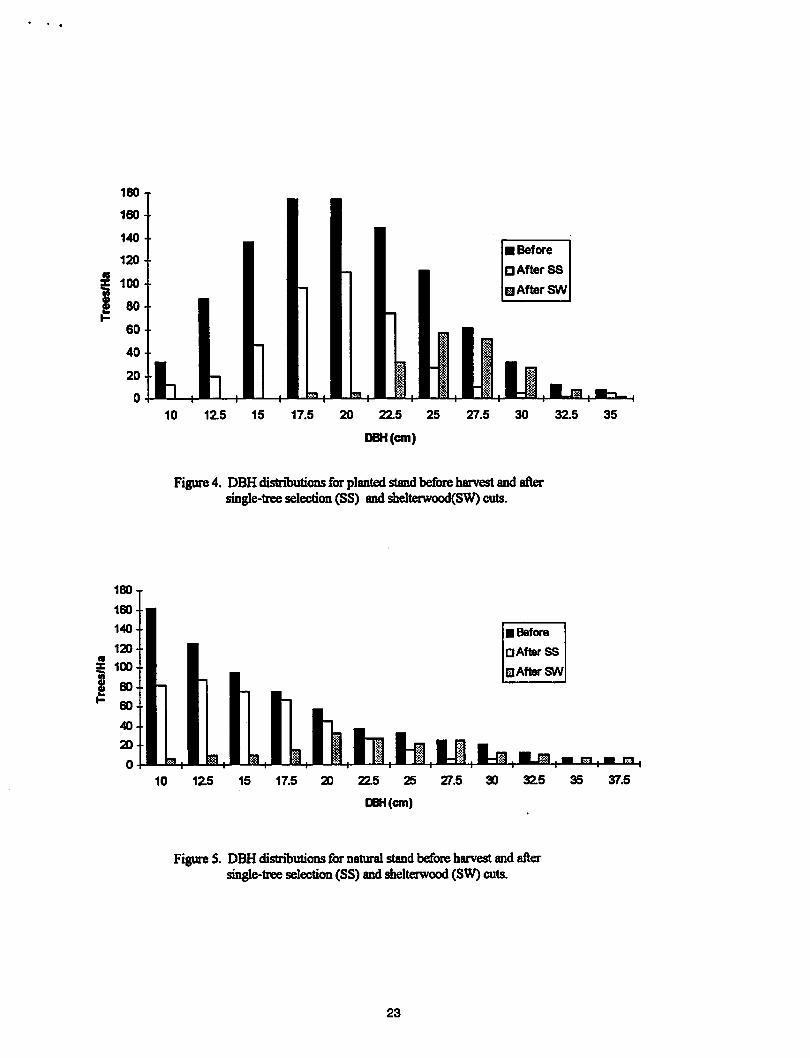
180 j160-
140-
120-
100-
80
60 -
40 -
20
£3-
• Before
D After SS
E After SW
10 12.5 15 17.5 20 22.5 25 27.5 30 32.5 35
DBH (cm)
Figure 4. DBH distributions for plantedstandbeforeharvestand aftersingle-treeselection(SS) and shelterwood(SW)cuts.
D After SS
m After SW
Figure 5. DBHdistributions for natural stand beforeharvest andaftersingle-treeselection(SS) andshelterwood (SW) cuts.
23
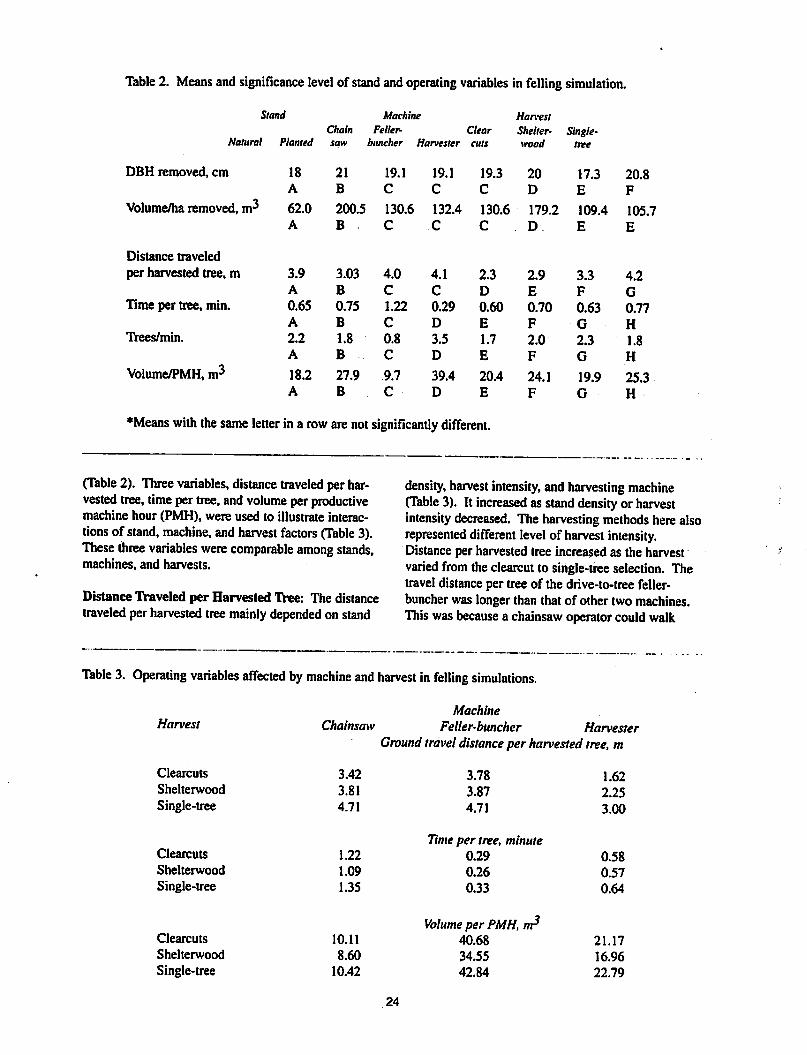
Table 2. Means and significance level of stand andoperating variables in felling simulation.
Stand Machine Harvest
Chain Feller- Clear Shelter- SingleNatural Planted saw buncher Harvester cuts wood tree
DBH removed, cm 18 21 19.1 19.1 19.3 20 17.3 20.8A B C C C D E F
Volume/ha removed, m3 62.0 200.5 130.6 132.4 130.6 179.2 109.4 105.7A B C C C D E E
Distance traveled
per harvested tree, m 3.9 3.03 4.0 4.1 2.3 2.9 3.3 4.2A B C C D E F G
Time per tree, min. 0.65 0.75 1.22 0.29 0.60 0.70 0.63 0.77A B C D E F G H
Trees/min. 2.2 1.8 0.8 3.5 1.7 2.0 2.3 1.8A B C D E F G H
Volume/PMH, m3 18.2 27.9 9.7 39.4 20.4 24.1 19.9 25.3A B C D E F G H
♦Means with the same letter ina row are not significantly different.
(Table 2). Three variables, distance traveled perharvested tree, time per tree, andvolume perproductivemachine hour (PMH), were used to illustrate interactionsof stand, machine, and harvest factors (Table 3).These three variables were comparable among stands,machines, and harvests.
Distance Traveled per Harvested Tree: The distancetraveled perharvested treemainly depended on stand
density, harvest intensity, and harvesting machine(Table 3). It increased as stand densityor harvestintensity decreased. The harvesting methods here alsorepresented different level of harvest intensity.Distance per harvested tree increased as the harvestvaried from the clearcutto single-tree selection. Thetravel distance per tree of the drive-to-tree feller-buncherwas longer than that of other two machines.Thiswas because a chainsaw operator couldwalk
Table 3. Operating variables affected by machine and harvest in felling simulations.
Harvest
Clearcuts
Shelterwood
Single-tree
Clearcuts
Shelterwood
Single-tree
Clearcuts
Shelterwood
Single-tree
MachineChainsaw Feller-buncher Harvester
Ground travel distance per harvestedrtree, m
3.42 3.78 1.623.81 3.87 2.254.71 4.71
Time per tree, minute
3.00
1.22 0.29 0.58
1.09 0.26 0.57
1.35 0.33
Volume per PMH, m^
0.64
10.11 40.68 21.17
8.60 34.55 16.96
10.42 42.84 22.79
24
directlyfrom one tree to another tree to be felledandthe harvester could select and cut a tree by swingingthe boom. Distance traveled per tree with chainsawfelling varied from 3.42 to4.7 m(11.4 to 15.7 feet).Harvester felling gave the least ground travel distanceperharvested tree, ranging from 1.6to 3.0m (5.4to10.0 feet).
Time per Tree: Stand,machine, and harvest factors allaffected the time pertree significantly (Table 3). Timeper tree was directly related to the mean DBH of thetree removed and inversely related to the harvest intensity. Since the quadratic mean DBH removed in thesingle-tree selection method was larger than that in theclearcut, time per tree was correspondingly greater thanthat with clearcutting. Similarly, time pertree in theshelterwood was less than in clearcuts since smallertrees were removed.
Chainsaw felling needed much moretime (1.09 to 1.35minutes) to cut one treecompared to the two harvesting machines. The feller-buncher took between 0.26and 0.33 minutes to fell a tree. Because the harvesterperformed both felling andprocessing, its time pertreewas nearly double that of thefeller-buncher and rangedfrom 0.58 to 0.64 minutes per tree.
Ifconsidered as trees perminute (the reciprocal of timeper tree), the samefactors wereimportant butgaveinverse trends. Obviously, the smaller the tree, themore trees per minute could be cut. Due to this effect,trees per minute in the shelterwood method was higherthan inclearcutting or single-tree selection. Trees perminute in single-tree selection was the lowest. Treesper minuteof chainsaw felling ranged from 0.75 in single-tree selection to 0.94 in the shelterwood method.The feller-buncher produced 2.99 to 3.48 trees perminute, and theharvester 1.55 to 1.79 trees perminute,depending on harvesting methods and stand characteristics.
Volume per Productive Machine Hour: Volume perPMH was affected by stand, machine, and harvest atthe 5% significance level (Table 3). In addition, volume per PMH was also directly related to tree size tobeharvested, bunch size, andharvesting intensity. Theproductivity of chainsaw fellingwas the lowestandvaried from 8.4 m3 (3.45 cords) per PMH in shelter-wood cuts to 11.2 m3 (4.29 cords) per PMH in singletree selection. Again, since the cut-to-length harvesteralso processed trees, its productivity of 17.0 to 22.8 m3(6.98 to 9.38cords) per PMH was lower than the feller-buncher. Thefeller-buncher presented the highest productivity among these three felling machines, rangingfrom 34.6 to 42.8 m3 (14.22 to 17.63 cords) per PMH.Productivity was verysensitive to the tree size harvest
ed. Therefore, single-tree selection was the more productive method among the three cutting methodsbecause oflarger trees removed. The productivity ofclearcut method was very close tothat insingle-treeselection, and the shelterwood method presented thelowestproductivity.
Skidding/Forwarding Simulation
The same volume felled and bunched during fellingwas extracted to the landing during skidding or forwarding operations. For thesakeof operational feasibilityand efficiency of simulation,the numberof treesina bunch size forextraction following chainsaw orharvester felling was six, while for extraction following the feller-buncher it was three piles. Bunch sizefor extracting ranged from 0.51 m3 (0.21 cords) inthe shelterwood method of natural stand to 1.75 m3(0.72 cords) in single-tree selection of planted stands(Table 4).
Volume per acre removed and bunch volume were usedas additional independent variables forcomparisonsamong interactions. Nosignificant difference in volume per acre extracted existed among the three harvesting systems. This value, however, did vary by theharvest method and stand. Bunch size was not significantly different among the three harvesting systems.
Volume per turn is another control variable in extraction. Stand and harvest could affect the volume perturn of the machine. Volume per turn, however, mainlydepended on themachine's capacity. Dueto residualstands and the bunch location, the skidder or forwardermight bedriven back to landing without reaching itsfull capacity. Thevolume per turn of grapple skidderwas controlled between 1.58 and 1.77 m^ (0.65 and0.73 cords) perturn. The loads of forwarder perturnwere 9.43 to 9.94 m3 (3.88 to 4.09 cords). The largepayload of the forwarder meant that it needed fewerpassesover the loggingsite to move logs to the roadside deck.
Volume per PMH in clearcuts and single-tree selectionwere also not significantlydifferent due to the similarbunch size. Similarly, the effects of stands on thesevariables were clearly expressed. Average skiddingdistance, loads per turn, cycle time, volume per PMH,and proportion of skidder or forwarder travel intensitycategory by machine and harvest wereanalyzed furtherto illustrate the skidding or forwarding operations andtheir interactions.
Average SkiddingDistance: Average skidding distance was affected by stand, machine, and harvest,especially, by machine holding capacity (Table 5).
25

Table 4. Means and significance level of operating variables in extractionsimulation.
Sla,
Natural
nd
Planted
Felling machineChain- Feller-
saw buncher Harvester Clearcut
Harvest
Shelter-
wood
Singletree
Extraction machineGrappleskidder Forwarder
Volume/acre removed,
cords 25.71
A
76.86
B
51.0
C
51.61
C
51.39
C
70.54
D
42.28
E
41.04
E
51.22
F
51.39
F
Bunch size, m3 0.97
A
1.51
B
1.31
C
1.14
C
1.26
C
1.26
D
0.97
E
1.46
D
1.24
F
1.26
F
Volume/turn, m3 4.16
A
4.50
B
1.68
C
1.68
D
9.60
E
4.28
F
4.25
G
4.47
H
1.68
I
9.60
J
Average skiddingdistance, m 206
A
176
B
145
C
151
D
278
E
182
F
203
G
188
H
148
I
278
J
Cycle time, min. 13.97
A
11.47
B
7.63
C
7.18
D
23.35
E
12.12
F
14.11
G
11.92
H
7.40
I
23.35
J
Volume/PMH, m3 15.28
A
20.46
B
13.66
C
15.02
D
24.98
E
18.49
F
15.84
G
19.29
F
14.34
H
24.98
I
Travel intensity2,% 33
A
23
B
32
C
31
C
21
D
25
E
33
F
26
E
31
G
21
H
Travel intensity3,% 29
A
17
B
8
C
13
D
47
E
20
F
21
G
27
H
11
I
47
J
Travel intensity4,% 38
A
60
B
60
C
56
D
32
E
55
F
46
G
47
H
58
I
32
J
♦Means with the same letter in a row are notsignificantly different
Within the specified logging site in the study, the average skidding distance under chainsaw felling was 138to 148 m (459 to 487 feet). In the feller-buncherfelling plot, theaverage skidding distance was a littlebit longer than that with chainsaw, from 149 to 157 m(498 to 524 feet). This was mainly due to the differentbunch size in such felling plots. Since the forwardingpattern and payloadwere very different from the skidding used in thesimulation, theaverage forwardingdistance varied from 253 to 303 m (843 to 1009 feet)andwas longer than the average skiddingdistances inthe logging sites with chainsaw and feller-buncherfelling. The average skidding distance was also verysensitive to harvest methodsandharvest intensity.
The shelterwood method removed relatively smallertrees and resulted in smaller bunch size. Consequently,the skidder or forwarder needed to move forward andpick upmore smaller bunches to meet itscapacity andresulted in a longer skidding/forwarding distance. Thesingle-tree selection method with lower harvest intensity could have longer distances between bunches andsometimes resulted in a longerskiddingdistance thanthat in clearcuts.
Cycle Time: The cycle timeof skidding or forwardingwas summarized by machine and harvest (Table 5).The skidding cycle time in the chainsaw felling plotwas6.95 to 8.53 minutes. The cycle time of skidding
26
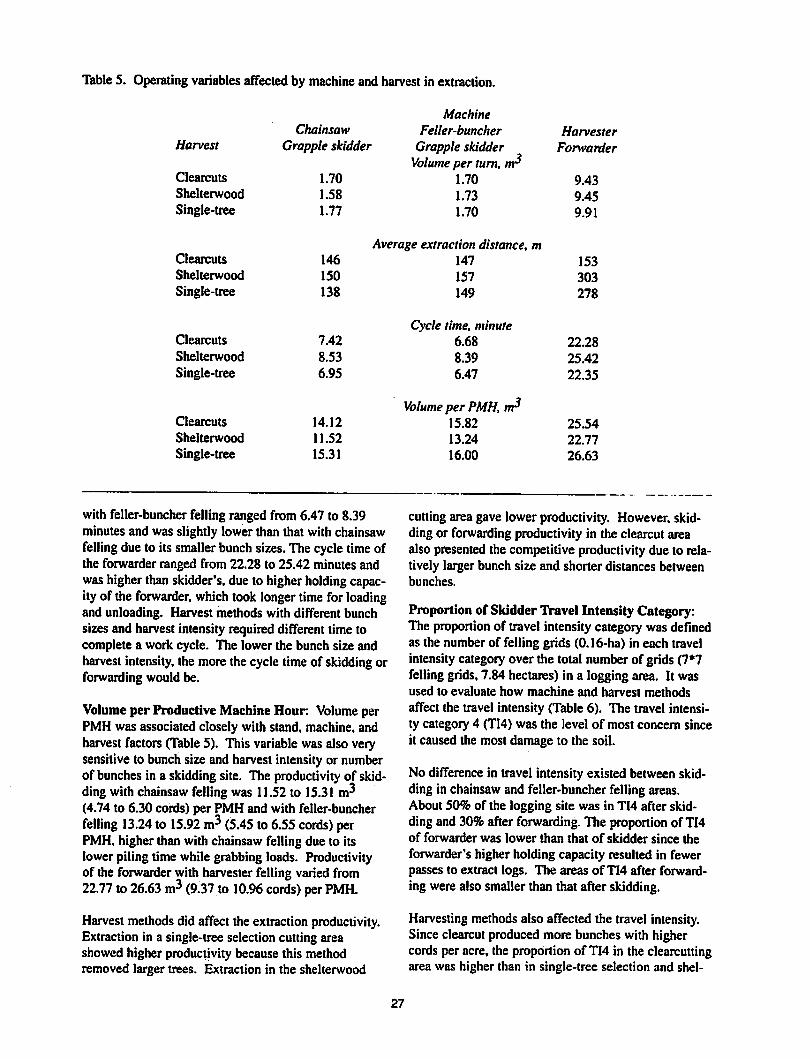
Table 5. Operating variables affected by machine and harvest in extraction.
Machine
Chainsaw Feller-buncher HarvesterHarvest Grapple skidder Grapple skidder Forwarder
Volume per turn, nrClearcuts 1.70 1.70 9.43Shelterwood 1.58 1.73 9.45Single-tree 1.77 1.70
Average extraction distance, m
9.91
Clearcuts 146 147 153Shelterwood 150 157 303Single-tree 138 149
Cycle time, minute
278
Clearcuts 7.42 6.68 22.28Shelterwood 8.53 8.39 25.42Single-tree 6.95 6.47
Volume per PMH, m*
22.35
Clearcuts 14.12 15.82 25.54
Shelterwood 11.52 13.24 22.77
Single-tree 15.31 16.00 26.63
with feller-buncher fellingranged from 6.47 to 8.39minutes and was slightly lower than that with chainsawfelling due to its smallerbunch sizes.The cycle time ofthe forwarder ranged from 22.28 to 25.42 minutes andwas higher thanskidder's, due to higherholding capacity of the forwarder, whichtook longer time for loadingand unloading. Harvest methods with different bunchsizes and harvest intensity required different time tocomplete a work cycle. The lower the bunch size andharvest intensity, the more the cycle time of skidding orforwarding would be.
Volume per Productive Machine Hour: Volume perPMH was associated closely with stand, machine, andharvest factors (Table5). This variable was also verysensitive to bunchsize and harvest intensity or numberof bunches in a skidding site. The productivityof skidding with chainsaw felling was 11.52 to 15.31 m3(4.74 to 6.30 cords) per PMH and with feller-buncherfelling 13.24 to 15.92 m3 (5.45 to 6.55 cords) perPMH, higher than with chainsaw felling due to itslower piling time while grabbing loads. Productivityof the forwarder with harvester felling varied from22.77 to 26.63 m3 (9.37 to 10.96 cords) per PMH.
Harvest methods did affect the extraction productivity.Extraction in a single-tree selection cutting areashowed higher productivity because this methodremoved larger trees. Extraction in the shelterwood
cutting area gave lower productivity. However, skidding or forwarding productivity in the clearcut areaalso presented the competitiveproductivity due to relatively larger bunch size and shorter distances betweenbunches.
Proportion of Skidder Travel Intensity Category:The proportionof travel intensity category was definedas the number of felling grids (0.16-ha) in each travelintensity category over the total numberof grids (7*7felling grids.7.84 hectares) in a loggingarea. It wasused to evaluate how machine and harvest methodsaffect the travel intensity (Table 6). The travel intensity category 4 (TI4) was the level of most concern sinceit caused the most damage to the soil.
No difference in travel intensity existed between skidding in chainsaw and feller-buncher fellingareas.About 50% of the logging site was in TI4 after skidding and 30% after forwarding. The proportion of TI4of forwarder was lower than that of skidder since theforwarder's higher holding capacity resulted in fewerpasses to extract logs. The areas ofTI4 after forwarding werealso smaller than that after skidding.
Harvesting methods also affected the travel intensity.Since clearcut produced more bunches with highercords per acre, the proportion of TI4 in the clearcuttingarea was higher than in single-tree selection and shel-
27
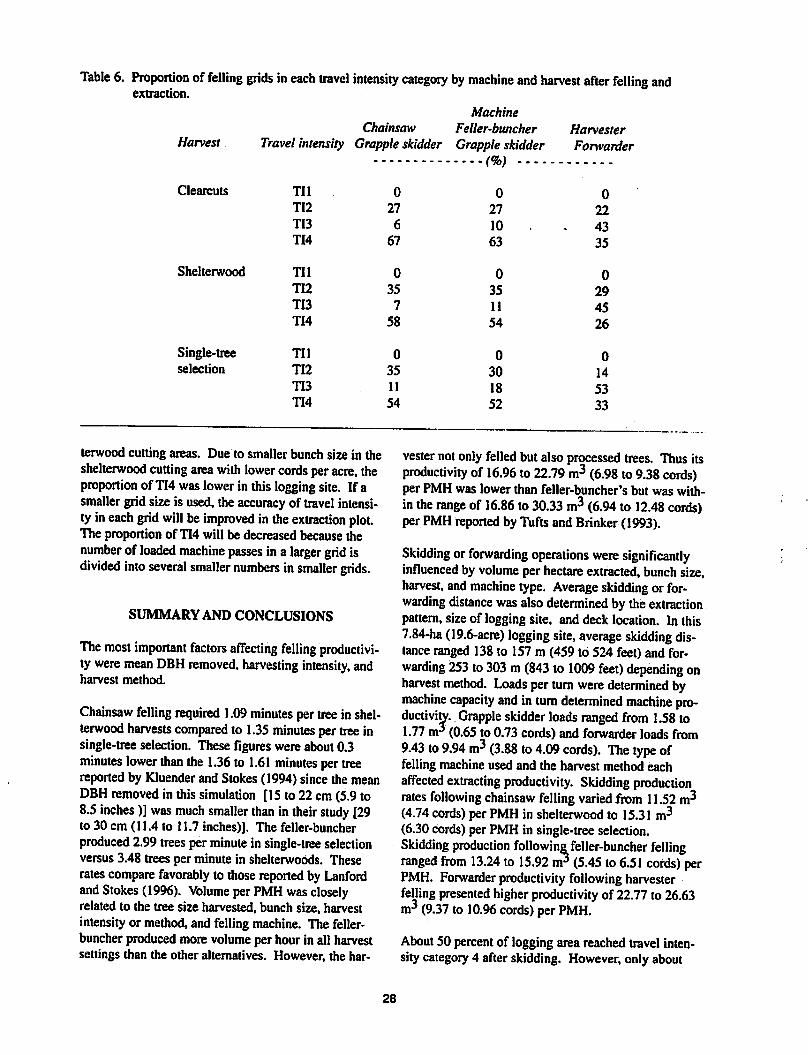
Table 6. Proportion of felling grids in each travel intensity category by machine and harvest after felling andextraction.
Harvest
Machine
Chainsaw Feller-buncher HarvesterTravel intensity Grapple skidder Grapple skidder Forwarder
Clearcuts Til 0 0 0TI2 27 27 22
TI3 6 10 43TI4 67 63 35
Shelterwood Til 0 0 0TI2 35 35 29TI3 7 11 45TI4 58 54 26
Single-tree Til 0 0 0selection TI2 35 30 14
TI3 11 18 53TI4 54 52 33
terwood cutting areas. Due to smaller bunch size in theshelterwood cutting area with lower cords per acre, theproportion of TI4 waslower in this logging site. If asmaller grid size is used, the accuracy of travel intensity ineach grid will beimproved inthe extraction plot.The proportion ofTI4 will be decreased because thenumber of loaded machine passes in a larger grid isdivided into several smaller numbers in smaller grids.
SUMMARY AND CONCLUSIONS
The most important factors affecting felling productivity were mean DBH removed, harvesting intensity, andharvest method.
Chainsaw felling required 1.09 minutes per tree inshelterwood harvests compared to 1.35 minutes per tree insingle-tree selection. These figures wereabout 0.3minutes lower than the 1.36 to 1.61 minutes per treereported by Kluender and Stokes (1994) since the meanDBH removed in this simulation [15 to 22cm (5.9 to8.5 inches)] was much smaller than in their study [29to 30 cm (11.4 to 11.7 inches)]. The feller-buncherproduced 2.99 trees per minute in single-tree selectionversus 3.48 trees per minute in shelterwobds. Theserates compare favorably to those reported by Lanfordand Stokes (1996). Volume per PMH was closelyrelated to the tree size harvested,bunch size, harvestintensity or method, and felling machine. The feller-buncher produced more volume per hour in all harvestsettings than the other alternatives. However, the har
vesternot only felled but also processed trees. Thus itsproductivity of 16.96 to 22.79 m3 (6.98 to 9.38 cords)per PMH was lower than feller-buncher's but was within the range of16.86 to 30.33 m3 (6.94 to 12.48 cords)per PMHreported by Tufts and Brinker (1993).
Skidding or forwarding operations were significantlyinfluenced by volume perhectare extracted, bunch size,harvest, and machine type. Average skidding or forwarding distance was also determined by theextractionpattern, size of logging site, and deck location. In this7.84-ha (19.6-acre) logging site, average skidding distance ranged 138to 157 m (459 to 524 feet) and forwarding 253 to 303 m (843 to 1009 feet) depending onharvest method. Loads per turn were determined bymachine capacity and inturn determined machine productivity. Grapple skidder loads ranged from 1.58 to1.77 m3 (0.65 to 0.73 cords) and forwarder loads from9.43 to 9.94 m3 (3.88 to 4.09 cords). The type offelling machine used and the harvest method eachaffected extracting productivity. Skidding productionrates following chainsaw felling varied from 11.52 m3(4.74 cords) per PMH in shelterwood to 15.31 m3(6.30cords) perPMH in single-tree selection.Skidding production following feller-buncher fellingranged from 13.24 to 15.92 m3 (5.45 to 6.51 cords) perPMH. Forwarder productivity following harvesterfelling presented higher productivity of 22.77 to 26.63m3 (9.37 to 10.96 cords) per PMH.
About50 percent of logging area reached travel intensitycategory 4 after skidding. However, only about
28

30%of this area reached travel intensitycategory 4after forwarding. From this point of view, the harvesterand forwarder system could have less impact on logging sitesand residual trees than the other two systems.
Effects of stand, harvest, and machine factors on system cost and production are also under examination butwerenot ready for inclusion in this paper. Other factors that should be considered in future studies includethe effect of deck location and alternative machine,operating patterns.
REFERENCES
Bare, B. B., B. A. Jayne, and B. F.Anholt 1976.Simulated-based approach for evaluating loggingresidue handling systems. General Technical ReportPNW-45. USDA Forest Service, Portland, OR.
Baumgras, J. E., C. C. Hassler. and C. B. LeDoux.1993. Estimating and validating harvesting systemproduction throughcomputer simulation. ForestProducts Journal 43(11/12): 65-71.
Block, W. A. andJ. L. Fridley. 1990. Simulation offorest harvesting usingcomputeranimation. TransASAE 33(3): 967-974.
Borders, B. E., W. M. Harrison, D. E. Adams, R. L.Bailey, and L.V. Pienaar. 1990. Yield predictionand growth projection for site-prepared loblolly pineplantations in theCarolinas, Georgia, Florida, andAlabama. PMRC Technical Report 1990-2. Schoolof Forest Resources, University of Georgia, Athens.
Bradley, D. P., R. E. Biltonen, and S. A. Winsauer.1976. Computer simulation of full-tree field chipping and trucking. Research Paper NC-129. NorthCentral Forest Experiment Station, USDA ForestService, St. Paul, Minnesota.
Bragg, W. C, W. D. Ostrofsky, and B. F. Hoffman, Jr.1994. Residual tree damage estimates from partialcuttingsimulation. Forest Products Journal 44(7/8):19-22.
Carruth, J. S. and J. C. Brown. 1996. Predicting theoperability of South Carolina coastal plain soils foralternative harvesting systems. General TechnicalReport NC-186. USDA Forest Service, St. Paul,MN. p 47-53.
Clark III, A. and J. R. Saucier. 1990. Tables for estimating total-tree weights, stemweights, and volumes of planted and natural southern pine in thesoutheast. Georgia Forest Research Paper 79,Research Division, Georgia Forestry Commission.
Davis, L. S. and K. N. Johnson. 1986. ForestManagement (3rd ed). McGraw-Hill Book Co.
Fridley, J. L., J. L. Garbini, and J. E. Jorgensen. 1982.Interactive simulation of forest thinning systemconcepts. ASAE Paper 82-1603.
Fridley, J. Land J. E. Jorgensen. 1983. Geometricmodeling to predict thinning system performance.Trans ASAE 26(4): 976-982.
Fridley, J. L, J. L. Garbini, J. E. Jorgensen, and P. A.Peters. 1985. Interactive simulation for studyingthedesign of feller-bunchers for forest thinning.-Trans ASAE 28(3): 680-686.
Fridley, J. L, J. E. Jorgensen, and J. L. Garbini. 1988.Rational approach to feller-bunchers design forsteep slopethinning. Forest Products J 38(6): 31-37.
Garbini, J. L., M. R. Lembersky, U. H. Chi, andM.T.Hehnen. 1984. Merchandiser design using simulation with graphical animation. Forest Products34(4): 61-68.
Goulet, D. V., R. H. Iff, and D. L. Sirois. 1979. Tree-to-mill forest harvesting simulation models:Whereare we? Forest Products J 29(10): 50-55.
Goulet, D. V., R. H. Iff. and D. L. Sirois. 1980a. Fiveforest harvesting simulation models - Part I:Modeling characteristics. Forest Products J 30(7):17-20.
Goulet. D. V.. R. H. Iff. and D. L. Sirois. 1980b. Fiveforest harvesting simulation models - Part II: Paths,pitfalls, and other considerations. Forest Products J30(8): 18-22.
Greene,W. D. and B. L. Lanford. 1984. Geometricsimulation of feller-bunchers in southern pine plantation thinning. ASAE Paper 84-1612.
Greene.W. D. and B. L. Lanford. 1986. Interactivesimulation program to model feller-bunchers.Alabama Ag Experiment Station Bull 576.
Greene, W. D., B. L. Lanford., and E. F. Mykytka.1987a. Stand andoperating effects on feller-buncher productivity in second thinnings of southern pine.Forest ProductsJ 37(3): 27-34.
Greene. W. D., J. L. Fridley. and B. L. Lanford. 1987b.Operator variability in interactive simulations offeller-bunchers. Trans ASAE 30(4): 918-922.
Greene. W. D. and B. J. Stokes. 1988. Performanceofsmall grapple skidders in plantation thinnings applications. Southern J of Appl For 12(4): 243-246.
Greene, W. D. and J. F. McNeel. 1991. Productivityand cost of sawhead feller-bunchers in the South.Forest products J 41(3): 21-26.
Kluender, R. A. and B. J. Stokes. 1994. Productivityandcosts of three harvesting methods. Southern Jof Appl For 18(4): 168-174.
Kluender. R.. D. Lortz, W. McCoy, B. Stokes, and J.Klepac. 1996. Effects of removal intensity and treesize on harvesting costs and profitability. Unpubms. School of Forest Resources, University ofArkansas at Monticello.
29

Lanford, B. L. and D. L. Sirois. 1983. Drive-to-tree,rubber-tired feller-buncher production studies.General Technical Report SO-45. USDA ForestService, New Orleans, LA.
Lanford, B. L. and B. J. Stokes. 1995. Comparison oftwo thinning systems. Part 1. Stand and siteimpacts. ForestProductsJ 45(5): 74-79.
Lanford, B. L. and B. J. Stokes. 1996. Comparison oftwo thinning systems. Part 2. Productivity andcosts. Forest Products J 46(11/12): 47-53.
Lembersky, M. R. and U. H. Chi. 1984. "Decisionsimulators" speed implementation andimproveoperations. Interfaces 14(4): 1-15.
Martin, A. J. 1975. Timber harvesting and transportsimulator (THATS): with subroutine forAppalachian logging. Research Paper NE-316.Northeastern Forest ExperimentStation,USDAForestService, Upper Darby, Pa.
Miyata,E. S. 1980. Determining fixed and operatingcosts of logging equipment General TechnicalReport NC-55. USDA Forest Service, St. Paul, MN.
Moser Jr.. J. W. 1976. Specification of density for theinverse J-shapeddiameter distribution. ForestScience 22(2): 177-184.
Tufts, R. A., B. J. Stokes, and B. L. Lanford. 1988.Productivity of grapple skidders insouthern pine.Forest Products J. 38(10): 24-30.
Tufts, R. A. andR. W. Brinker. 1993a. Valmet'swoodstar series harvesting system: a case study.Southern J of Appl For 17(2): 69-74.
Tufts, R.A. and R.W. Brinker. 1993b. Productivity ofa Scandinavian cut-to-length system while secondthinning pine plantations. Forest Products J43(11/12): 24-32.
Wang, J. and W. D. Greene. (In press). Interactivesimulation system for modeling stands,harvests,and machines. School of Forest Resources,University ofGeorgia,Athens.
Webster, D. B. 1975. Development of a flexible timber harvestingsimulation model. Forest ProductsJ25(l):40-45.
30
Forest Restoration in Southwestern Colorado
Dennis L LynchDepartment ofForest Sciences, Colorado State University
Lawson W. Stames
Timber SalesGroup, Region 2, USForest Service
Catherine S. JonesDepartment ofForest Sciences, Colorado State University
ABSTRACT: The Ponderosa Pine Forest Partnership in southwestern Colorado is investigating the feasibility of restoring apondeiosa pine forest ecosystem to an 1870s pre-settlement condition and reintroducing fire aspart of the ecosystem processon the San Juan National Forest The Partnership is acooperative effort of federal agencies, state and local government, theColorado State University system, and the Colorado Timber Industry Association. The project involves both economic and environmental studies. This paper describes the economic and policy portions of the study of harvesting efficiencies and attemptsat development ofmarkets for small-diameter pine.
Keywords: forest restoration, timber harvesting, ponderosa pine
Introduction
In 1993, the Ponderosa PineForestPartnership wasformed in response to problems associated with pineforests andrural development in Montezuma County,Colorado. Members include Montezuma County, theSan Juan National Forest, Renewable Resources Staff,Region 2 USFS, Colorado State Forest Service, Ft.LewisCollege,Colorado State University ExtensionService, the College of Natural Resources, and theColorado Timber Industry Association. These groupsare working together to develop a forest restorationproject that will improve the ecology of a ponderosapine (Pinus ponderosa) forest and create viable economicdevelopment in Montezuma County.
At the turn of the century, the original, natural forest inMontezuma County was railroad logged. The loggedarea was left to naturally regenerate and shortly thereafterwas included in the National Forest system byPresidential proclamation. The forest was protectedfrom fire, logging, insects,diseases, and other disturbances.Attemptsat forest managementwere limited.
Over the years, the forest regenerated, becamequitedense, and many of the trees became deformed. Thequality of the trees was so poor and their size so smallthat no significant markets existed for use of the wood.This became a concern to the county, which sought toencourage rural development and jobs for its citizens.Insects, disease, andespecially wildfire became significant forest management problems.
During the 1990s, Dr. William Romme of Ft. LewisCollege began conducting fireecology research on theSanJuan National Forest, determining that fire hadbeen an integral part of theoriginal forest ecosystemwhich existed prior to the 1870s. In the area describedin this paper, he found that from 1729 to 1879 therehad been a median fire frequency of 10 years witharange from 2 to 31 years. He also found that there hadnot been a fire in this specific area in the last 100years, a significant change from the fire frequency ofthe previous 300 years.
Hisresearch further determined that the original forestwasstructurally much different than the present forest.The original forest consisted of small groups of large,old growth ponderosa pines surrounded byopenings ofgrass and forbs. Unlike the present, very little oak-brush (Quercus gambelli) existed in theunderstory(Romme 1996). His findings stimulated interest inrestoring the forest to its pre-settlement condition. Butmany of the small diameter, deformed trees in the forest would have to be removed.
Thus theSanJuanNational Forest, as are many otherNational Forests in the West, was at a crossroads.Forest health issues related to wildfire and insect epidemics are endangering forest ecosystems. Rural communities arestruggling because of the changes in theavailability of timber supply. In thiscase, the pine-oakforests in Southwest Colorado are overstocked compared to historic stand conditions, but this translates tolow value, small diameter material for which there is
31

little market demand. In addition, thedeclining forestindustry of the area is primarily geared to utilize largediameter pine. These concerns, coupled with the risinginterest in forest restoration associated with Dr.Romme's work, appeared to present anopportunity totrya newforest management strategy.
The Ponderosa PineForest Partnership wasformed.Previous timbersales incorporating small-diametermaterial had been rejected-as too risky by the forestindustry and typically had gone no bid. Therefore,Montezuma County purchased an administrative timbersale from the U.S. Forest Service. The sale containedfive units and was offered as a research and demonstration study saleat reduced stumpage rates to determinethe potential for forest restoration and its contributionto the rural economy.
Study Sale Objectives
Layout and preparation of the studysale was underthedirection of Forester Phil Kemp of the Dolores Districtof theSanJuan National Forest. Incooperation withDr. Romme,Mr Kempinstructed the timber markersintheecological prescription suggested byRomme'sresearch. The larger, older trees were marked for retention ingroups. All trees 5 inches dbh andupoutsidethegroups were leftfor removal. Regional oversightand assistance in timbersale appraisal and contractdevelopment came from Lawson Starnes, ProgramManager forTimberSale Preparation in Region 2 ofthe Forest Service, USDA.
The objectives for this study sale are stated in the contract between Montezuma County and the U.S.ForestService. These objectives, as providedto theresearchers in this study, are as follows:
Researchand Demonstration ProjectRequirements: Purchaser shall conduct the followingstudies and shall be responsible for allincurred costs of the studies including any costsrelated to wood chipping, transportation, datagathering,materialsand supplies,and finalreport preparation:LoggingProduction Analysis: The purchasershall establish fall, buck and skid productionrates, and costs for large sawtimber, small saw-timber, and products other than logscategories.Separate production rates shall also be compiledfor each equipment type used in the administrative study, e.g. feller buncher, shears, conventional logging methods.Product Sorting: The purchaser shall sort at thelanding logged materials into the followingproduct categories: sawlogs, posts and poles,chips to be utilized in other value-addedprod
ucts, residual biomass to be used forenergyproduction.Purchaser shall estimate the time and cost ofproduct sorting and the total volume of materialsderived by product category, by harvest unit.Purchaser shall also document the destinationand quantity of log flows to manufacturingfacilities. (Special Contract Provision, R2-CT6.69-8/95).
In addition, thestudywas to analyze policy barriers toforest ecosystem restoration on federally managed landin southwestern Colorado.
Study Designand Analysis Procedures
The Department of Forest Sciences, Colorado StateUniversity, was asked by Montezuma County, theForest Service, and theColorado Timber IndustryAssociation to assist in the development of a timberharvesting study for thesale to examine products, markets, harvesting efficiency and costs. Theprincipalresearchers forthestudy areDr. Dennis L. Lynch, .professor, and Catherine Jones, research associate. Fielddata collection and observations were conducted fromAugust 1995 to December 1996. Data analysisis stillunderway at thetime of submission of this paper. Unit1 of the sale, containing 125 acres, was considered atrial unit to develop an understanding of study variables andharvesting methods. The scope and intensityof the studywas limitedby the budgetand resulted inthe employment of only one field observer.
An actual count by diameter class of all trees felledwas made by the cutters doing the felling. Skidderoperators also made an actual count by diameter classof logs per turn and thenumber of turns perday.Thesedata werecollected each day, field checked, andrecorded in a spread sheet by the field observer. Inaddition, cycle timeswerecollectedrandomly to checkfelling, limbing, andbucking times as well as skiddingturn times. The loader operator kept a record of thenumber of logsper load and loads per day from thesale.Truckspassedover a certified scale, and the gross,tare and net weights for each truck were recorded.Samplesof trees were taken from the deck prior toloading to determine cubic foot volume and weightrelationships.(Markstrom et al. 1982) These were usedto convert truck weights into cubic foot volumes forUnit 1. In subsequent units, a certified Forest Servicescaler scaled loads of POL and sawlogs to determineweight-volume relationships.
Costs for harvestingand transportation activities werebased on actual costs experienced by the operator.Thus, actual counts, weights, costs, and product values
32

were utilized as a basis for the study. Comparisonswere made between product values, logging costs, andmeasurements to determine the relationship of datafrom this unit with similar situations in other areas.Duringthe analysis, manydifferentrelationships ofdatawereexamined to determine harvesting efficiency,potential alternatives, the effects of estimates versusactual amounts, and profit (loss) results.
Logging System Operation . .
Unit 1 was purchased from Montezuma County andloggingwas accomplished by Ragland & SonsLogging, a familyownedand operatedbusiness locatedin Dolores, Colo. Since Unit 1 wasthe keydemonstration unit forthesale, felling was accomplished usingchainsaws to insure thatno damage occurred to theresidual stand and that a proper fuel bedwas developedforprescribed burning of theslash. Typically, three tofour saws were operated, and trees were directionallyfelled to avoid damageto the residual stand. The cutters were very aware that this was a demonstration unitand thatappearance of thearea wasimportant, sostumpswere flush cut with the surfaceof the ground.Limbing and bucking were doneat the stump withchainsaws. Slash was scattered tocreate a relativelyuniform fuel bed.
Skidding was done by a Cat 518 and JD 540 rubbertired skidders that were equipped with swinging grapples. Usually bothskidders were in operation. Skidderoperators had to search for logs lying in the slash, andtheskidder operator would have to make a turn bymoving logs together. Logs were not sorted, and theskidder would bringin whatever comprised a turnregardlessof whether it was sawlogs or small diametermaterial. Skidding distances were typically about 200to 250 ft to a spur road that had been constructedthrough the unit by a road grader. Unit road construction simply consisted of bladinga clear area over thesurface of relatively flat ground. Decks were built perpendicularly to the roads. The skidder would place aturn in thedeck and then use its blade to push logs upinto the deck. A knot bumperworked at the deck, takingoff limbs thatwere notcutduring limbing in thewoods and bucking any material broken in theprocessof skidding and decking.
Loading was conducted by a hydraulic knuckle boomloaderon a truck chassis. Conventional log truckswould park on the unit spur road, and the loader wouldswing logs on to them from the deck. The loader sorted the logs by product, which in this unit consisted ofwaferwood foran oriented strand board plant, pineexcelsior logs, andsawlogs. If there were notenoughwaferwood logs in a deck to make a load, the truck and
the loader would move forward to the next deck andthe load would be completed there. Two or threemoveswere necessary in some cases to complete aload. Thus, trucks were delayed until this was completed. Waferwood and excelsior loads consisted of 5-to 11.9-inch material plus any 12+ inch material thatwas toodeformed to make efficient sawlogs.
Hauling was to the Louisiana Pacific waferboard plant• in Olathe, to Western Excelsior in Mancos, or to the
Stonertop sawmill near Dolores. All trucks wereweighed and logs per load were counted.
Comparison of Logging Costs with Other Studies
One of the concerns in this study relates to the justification of logging efficiency in Unit 1. To analyze logging costs, comparisons were made with other studiesand data from USFS cost collection.
Three other studies were utilized. One was from theMescalero Apache Reservation in New Mexico whereponderosa pine was harvestedfor chips for the linerboard plant in Snowflake, Ariz (Watson and Stokesundated). Another study from eastern Oregon involvedtheproduction of biomass forpowergeneration fromtwo stands and the production of sawlogs from a thirdstand (Hemphill 1989). A third study by the NEOSCorporation for the Fort Apache Timber Company inArizona considered costs in biomass production(NEOS Corporation, McTague 1994).
When comparing to costs in those studies, the loggingcosts forwaferwood were found to be typically higher.However, logging costs for the sawlogmaterial in Unit1 appearedquite competitive with costs in the studies.Thus, the logging costs experienced in Unit 1 wereconsidered to be at an acceptable level, given the technology used.
Comparison of Stump to TruckLogging Costswith Regional Average Costs
Costs compiled by the U.S. Forest Service in Region 2for the Central Rocky Zone and listed in the TimberAppraisal Handbook (FS Handbook 2409.22 1995)indicated a total average regional logging costof$60.35 perCCF for felling, bucking, limbing, lopping,skidding, loading, and overhead. Total actual wafer-wood costs for the same production elements in Unit 1were S59.94/CCF ($16.70/ton). while total sawlogcosts were $55.52/CCF($15.47/ton). Thus, Unit 1costs were less than the average costs experienced inthe Region, supporting the beliefthat the logging costsfor this Unit were reasonable but could be reducedeven more.
33

Revenues, Costs, and Profit (Loss)by Product and Destination
Three types of products were realized from the treescut in Unit 1. Thesewerewaferwood, pineexcelsior,and sawlogs. Both waferwood and excelsior were trialmarkets, sinceponderosa pinehadnotbeenpreviouslyusedby eitherof the manufacturing plants. The following is a summaryof the profit and loss for theseproducts.
Waferwood:
Revenue: $31.00 per tonTotalCosts (stumpto mill): $34.36per ton
(Loss): $-3.36 per tonTotal Amount Cut: 2,322.75 tonsLoss for this product: $-7,804.44
Excelsior
Revenue: $17.00per tonTotalCosts (stumpto mill): $26.65 per ton
(Loss): $-9.65 per tonTotal Amount Cut: 145 tons
Loss for this product: $-1,399.25
Sawlogs:(Since the logger also owned and operated the sawmill,the sawlogsdelivered to the mill were valuedby use oftransaction evidence from other mills. Sawmills from
Espanola, N.M., to Grand Junction, Colo., that utilizeponderosa pine were contacted and their price informationanalyzed. On the basisof that study, the followingrevenue and cost information emerged.)
Estimated Revenue: $32.69 per tonTotalCosts (stumpto mill): $28.10 per tonProfit: $4.59 per tonTotal Amount Cut: 1,232.76 tonsProfit for this product: $5,658.37
Note that this is an estimate of the potentialvalueandprofit that could have been realized if the logs had beensoldfor fair marketvalue to a buyerat the Stonertopmill location. It is a "paper profit" estimate and not arecordof an actual transaction. Since two existingmarkets for sawn material were lost, the logs were notmilled untilalmost a year later and the ownerreportedthat the market declined during that time.
It was, of course, disappointing that the first unit wasnot economically profitable. However, this was notunexpected. All parties knew that there were substantial risks in harvesting the small diameter, deformedtrees and developing a market for them.
We now are completing the analysis of costs and revenues on four other units in the sale. Preliminary fig
ures indicate that a profit wasonlyachieved in oneunitand that losses were substantial in the other three units.On the other hand, there were several aspects of theexperience thatcouldbe counted as progress towardunderstanding the problems associated with southwestpine forest restoration.
Policy Barriers to Forest Restoration
•Understanding existing-federal landpolicy is keytodeveloping viable newapproaches to forest management. Current ForestServicepolicy favors"tree measurement" sales with payment based on cruise estimates rather than log scaling.
Risk to purchasers is higher with this method becauseof the potential that a sale may cut out short of the estimated volume. This risk is further accentuated in forest restoration sales where the coefficient of variationcan be exceptionally high due to the diverse nature ofthe material to be removed. Tree measurement salesalsoare more expensive for the ForestService to prepare than scaled sales. Given the low value nature ofthe material removed, the risks of volume estimates,and the expense incurred with such sales, this study isassessing the useof total weightscaling to reducecostsand risk. At this point, the results have been sufficiently encouraging to result in a change in policy to allowweight scaling in low-value forest restoration sales.
The National ForestManagement Act of 1976requiresthatdesignation, marking when necessary, and supervisionof harvesting be conducted by personsemployedby the Secretary of Agriculture who have no personalinterest in the purchase or harvestof products. Cut orleave trees are normally marked with paint above andbelowstump height in IndividuallyTree Marked (ITM)units.
While this is a long-established practice in partial cutsituations, it is also results in significant preparationcosts for the Forest Service. In forest restoration projects the designation of low-value material using paintcan becomevery expensive. Thus, designation by prescription may be a more appropriate and cost effectivemethod for many forest restoration projects whereweight scaling is used and where silvicultural objectives are simple and clear.
Recent Forest Service policy requires the valuation oftimber using transaction evidence procedures instead ofthe residual value method. The shift to transaction evi
dence eliminated the requirement to conduct expensivelogging cost collection and mill recovery studies.However, this study points out the need to have accurate logging cost and value recovery data when design-
34

ing forest restoration projects where market data forsmall diameter and multi-product materials lack well-developed markets.
Another concern related to forest restoration projects isthat Forest Service timber sale program accomplishment is measured by volume offered instead of volumesold or area treated. Measuring volume sold or thearea of forest restored to a desired ecological conditionwould provide additional incentive to develop viablerestoration projects and avoid "no-bid" situations.Forest restoration projects have to be carefullydesigned to achieve break-even results.
Reduced federal budgets make conventional servicecontracts that pay for thinning unfeasible. Commercialtimber sales, where appropriate, can help improve costeffectiveness but restoration projects typically lackquality sawlog material. Where sawlog material is limited and small diameter material dominates, particularcare must be given to developing sales which balancehigher value material against low-value material.Thus, sales of sawlog material in areas in need of forestrestoration may achieve accomplishment targets butdiminish the prospects for future restoration of the area.
Appraisals must also recognize the higher logging costsassociated with small material, especially where additional sorting and long hauls to multiple destinationsare necessary.
CONCLUSIONS
While final data analysis is not fully complete at thewriting of this paper, some conclusions can be offered.
Forest restoration projects must be based on sound ecological information. It is clear to everyone involved inthe Pines Partnership that public support for this forestrestoration project would have been weak or nonexistent without the research results and credibility of Dr.Romme. Additionally, collaborative efforts by themembers of the Ponderosa Pine Partnership have fostered understanding, trust, and commitment to thevision of forest restoration for this forest.
Small-diameter material in southwestern Colorado is
expensive to log, process, and market. Hauling is amajor cost.
Accurate logging cost and revenue data is critical torealistic stumpage pricing and sale design. Pricingstructures used with larger diameter sawlog sales frequently result in no bids when applied to forest restoration sales. Application of research findings has led toadjustments in pricing structure which resulted in successful bids for two FY 1997 timber sales that are keyto the pine-oak restoration in southwest Colorado.
Local market development for 5- to 8-inch dbh pinematerial is critical for future long-term restoration projects. Effective utilization of 8- to 11.9-inch materialfor higher value products is essential to profitability.
Federal policies and procedures associated with standard timber sales can be a barrier to restoration projects. There is some room for policy adjustmentwithinexisting laws and regulations.
References
Timber Sale Appraisal Handbook. FSH 2409.22 ForestService, USDA.
Hemphill, Dallas. 1989. Economics of forest residuerecovery systems in an eastern Oregon logging operation. Unpublished paper.
Markstrom, Donald C. et.al. 1982. Cord, volume, andweight relationships for small ponderosapine trees inthe Black Hills. Research Paper RM-234. USDA,Forest Service.
NEOS Corporation and JP McTague. 1994. FortApacheTimber Company wood fuel supply assessment. NEOS Task Number. 10-45. Unpublishedpaper.
Romme, WilliamH. 1996. Pre-1870fire history on theSan Juan National Forest. Work in progress.
TimberSale Contract 2400-6T. 1995.Pines Projectsale. USDA, Forest Service.
Watson,W.F. and B.J. Stokes. n.d. Final report of theMescalero flail/chipper production study. MississippiState University and USDA, Forest Service.
35
An investigation of Factors Influencing Returns on Investment
in the Southern Logging Industry
W. Dale GreeneAssociate Professor
F.Christian Zinkhan
Associate Professor
D.B. Wamell School of ForestResourcesUniversity ofGeorgia
Athens, GA 30605-2152USA
ABSTRACT: The logging industry is capital intensive. Managers need to be attentive to financial as well as operational measures of performance. Through a revised version of the Auburn Harvesting Analyzer, this paper illustrates the sensitivity of thefinancial performance of a logging enterprise to both external and internal factors. Results are displayed through model incomestatements, DuPont analysis, andleverage measures.
Keywords: logging, profitability, returns oninvestment
INTRODUCTION
Logging is a capital intensive, commodity-orientedbusiness. This has traditionally focusedthe attention oflogging contractors, managers, and researchers on thecost per unit of production (Lanford and Stokes 1996,Keegan etaL 1995). Financial measures commonlyused in other industries have been used less often. Thispaper reviews financial measures and financial planning models widely used in business andprovidesexamples of each in a logging context
PROFILE OF THE LOGGING INDUSTRY
Dun and Bradstreet (1993) surveyed a broad range oflogging enterprises to collect financial ratio information. The distribution of total assets of the entities wasas follows: less than $100,000,6%; $100,000-$250,000,15%;$250,000-$500,000,24%; $500,000-$1,000,000,25%;$1,000,000-$5,000,000,27%; andgreater than $5,000,000,3%. With a median netprofitmargin (net profit relative to sales) of 2.6%, the overallsampleachieveda return on assets (net profit relativeto total assets) of 4.5% and a return on equity (netprofit relative to shareholderequity) of 12.1%. Almost onehalf (46.9%) of the firms' total assets were financedwith debt
Forhissurvey of 24 independent logging businesses inthe southeastern USA, Loving (1991) divided costs
into sixcomponents: consumable supplies, labor,equipment, insurance, contract hauling, andadministrative overhead. Consumable supplies included repairand maintenance supplies, parts, fuel, oil, tires, tubes,and saw expenditures. Without contract hauling payments (revenue) included, the breakdown of costs wasfound to be as follows: consumables (27%), labor(29%),equipment (27%), insurance(5%), contracthauling (10%), and administrative overhead (2%).
FINANCIAL PLANNING MODELS
Financial planning models are used by managers toimprove their evaluation of alternative growth plans,financing and investment choices, and expense controloptions. Two techniques, leverage analysis andthe DuPontsystem of analysis, can be incorporated into financialplanning models to improve the utility of theiroutput. In thissection, the twotechniques will bereviewedand critiqued. In the next section, the techniques will beapplied toexamples from the loggingindustry in the southern U.S.
Leverage Analysis
Managers can increase the sensitivity of their firm'searnings per share (EPS) (or, for entities other than corporations, profitsper ownership unit) to revenues intwo generalfashions: by orienting theircost structuretoward fixedcosts (oftenresulting from increased use
36
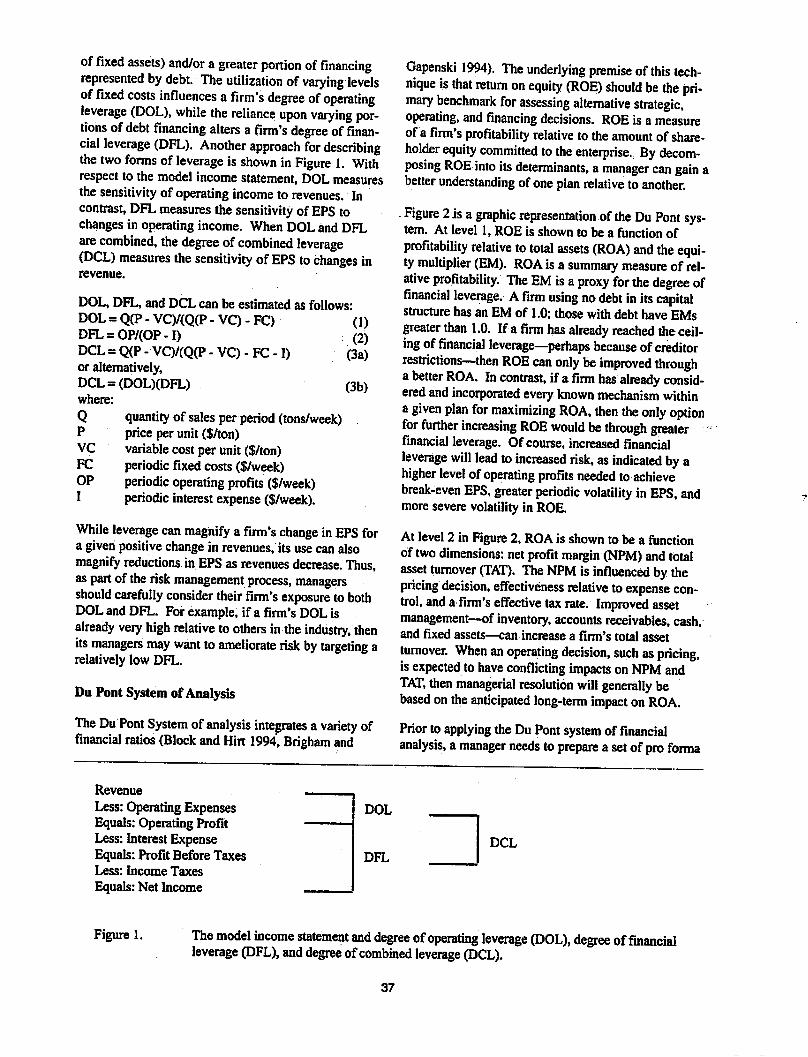
offixed assets) and/or a greater portion offinancingrepresented by debt. The utilization ofvarying levelsoffixed costs influences a firm's degree ofoperatingleverage (DOL), while the reliance upon varying portions ofdebt financing alters a firm's degree offinancial leverage (DFL). Another approach for describingthe two forms of leverage is shown inFigure 1. Withrespect to the model income statement, DOL measuresthe sensitivity of operating income to revenues. Incontrast DFLmeasures the sensitivity of EPS tochanges in operating income. When DOLand DFLare combined, the degree ofcombined leverage(DCL) measures the sensitivity ofEPS to changes inrevenue.
DOL, DFL, and DCL can be estimated as follows:DOL = Q(P - VC)/(Q(P - VC) - FC) (1)DFL =OP/(OP-I) (2)DCL = Q(P-VC)/(Q(P-VC)-FC-I) (3a)or alternatively,DCL = (DOL)(DFL) (3b)where:
quantity of salesper period (tons/week)price per unit ($/ton)variable cost per unit ($/ton)periodic fixed costs ($/week)periodicoperatingprofits ($/week)periodic interest expense($/week).
QP
VC
FC
OP
I
While leverage canmagnify a firm's change inEPS fora givenpositivechangein revenues, its usecan alsomagnify reductions in EPS as revenues decrease. Thus,aspart of the risk management process, managersshould carefully consider their firm's exposure tobothDOLand DFL. For example, if a firm's DOLisalready very high relative toothers in the industry, thenits managers may want toameliorate risk by targeting arelatively low DFL.
Du Pont Systemof Analysis
The Du Pont System ofanalysis integrates a variety offinancial ratios (Block and Hirt 1994, Brigham and
Gapenski 1994). The underlying premise ofthis technique is that return on equity (ROE) should be the primary benchmark for assessing alternative strategic,operating, andfinancing decisions. ROE is a measureof a firm's profitability relative to the amount of shareholder equity committed to the enterprise. By decomposing ROE into its determinants, a manager can gain abetter understanding ofone plan relative toanother.
Figure 2isagraphic representation ofthe Du Pont system. At level 1, ROE is shown to be a function ofprofitability relative to total assets (ROA) and the equitymultiplier (EM). ROA isa summary measure of relative profitability. The EM isa proxy for the degree offinancial leverage. Afirm using no debt in its capitalstructure has an EM of 1.0; thosewithdebt have EMsgreater than 1.0. If a firm has already reached the ceiling of financial leverage—perhaps because ofcreditorrestrictions—then ROE can only be improved througha better ROA. In contrast, ifa firm has already consideredandincorporated every known mechanism withinagiven plan for maximizing ROA, then the only optionfor further increasing ROE would be through greaterfinancial leverage. Of course, increased financialleverage will lead to increased risk, as indicated by ahigher level of operating profits needed to achievebreak-even EPS, greater periodic volatility inEPS, andmore severe volatility in ROE.
At level 2 in Figure 2, ROA is shown to be a functionof two dimensions: net profit margin (NPM) and totalasset turnover (TAT). The NPM is influenced by thepricing decision, effectiveness relative toexpense control, and a firm's effective tax rate. Improved assetmanagement—of inventory, accounts receivables, cash,and fixed assets—can increase a firm's total assetturnover. When anoperating decision, such aspricing,isexpected to have conflicting impacts onNPM andTAT, then managerial resolution will generally bebased on the anticipated long-term impact on ROA.
Prior to applying the DuPont system of financialanalysis, a manager needs toprepare a setofpro forma
Revenue
Less:Operating ExpensesEquals: Operating ProfitLess: Interest ExpenseEquals: Profit Before TaxesLess: Income Taxes
Equals: Net Income
DOL
DCL
DFL
Figure 1. The model income statement and degree ofoperating leverage (DOL), degree offinancialleverage (DFL), and degree ofcombined leverage (DCL).
37

Level I:
Level 2:
ROE = NI/SE
IROA = NI/A X EM = A/SE
INPM = NI/R X TAT = R/A
Return on EquityShareholders' EquityAssets
Net Profit MarginTotal Asset Turnover
NI Net IncomeROA Return on AssetsEM EquityMultiplierR Revenues
ROE
SE
A
NPM
TAT
Figure 2. TheDuPontsystem of financial analysis.
financial statements for eachcompeting plan. Aftercomparing theexpected ROEs foreachplan, themanagershould thendecompose this summary measure offinancial performance intoits determinants. Not onlywill this step help identify the major reason(s) for anydivergence from expected ROE, but also it can serve asa reality check. Absolutemagnitudes of the criticaldeterminants should be carefully compared to historicallevels as well as industry averages togain a better perspective of the plan's feasibility. A high favorable variance associated with the critical determinant should bescrutinizedwith respect to its likely achievement.
Negative net profits were obtained in three alternativescenarios—off-road diesel fuel prices at$1.25 pergallon, capital investment increasing to $1,000,000, andcontract rates of $11 per ton. Higher diesel pricesincreased operating expenses, higher capital investmentincreased interest, and lowerprices reduced sales.
Inanother example that drastically reduced profitability, weekly production of 60 loadsper week, insteadofthe base65 loads, reduced annual profits from $36,530tojust$4,957. Profits rose dramatically as fuel prices,interest rates, capital investment, or debt financing fellor as production or contract rates increased.
SENSITIVITY OFFINANCIAL PERFORMANCE Leverage Analysis
The Auburn Harvesting Analyzer(Tuftset al. 1985,Greene and Lanford 1997) is a widely used spreadsheetforestimating logging costs. It wasextensively modified to incorporate the above financial performancemeasures. Profitor loss was estimatedby inclusion ofa contract rate. Weekly production was varied anddetermined cost per ton and profit/loss per ton for theweek. Base-case assumptions were representative oftypical logging operations in Georgia andmarket pricesin early 1997 (Table 1). Forthisanalysis, consumablesupplies and contracthauling were assumed to be variable costs. All other costs were considered to be fixed.By incorporating the base-case assumptions into theAuburn Harvesting Analyzer, all model income statement items, DuPont analyses, and leverage analyseswere estimated.
Model Income Statements
With base-case assumptions, the operation yielded netprofitsof $36,530on sales of $1,022,385 (Table 2).Interest expensewas $36,148 for financing 80%ofequipment investment of $800,000 at 10% annualinterest.
At a production levelof 1,704 tons per week (65 loadsperweek at 26.215 tons per load), theoperating profitper weekand the net income per week wereestimatedto be$1,582 and$731, respectively. Thisproductionlevel is about 207 tons (8 loads) beyond the operatingprofit break-even level:
BEVOP = FC/(P- VC) (4)= $11.435/($12.00-$4.36)= 1,497 tons per week
where:
BEVOP = break-even volume, foroperating profit toequal zero.
The base-case production level is only about 113 tons(4 loads) greater than the net profit break-even level:BEVNI = (FC + I)/(P-VC) (5)
= ($11,435 + $723)/($12.00 - $4.36)= 1,591 tons per week
where:
BEVNI = break-even volume, fornet income to equalzero.
With production relatively close to the operating breakeven volume, the DOL is fairly high: 8.32. Thus, if
38
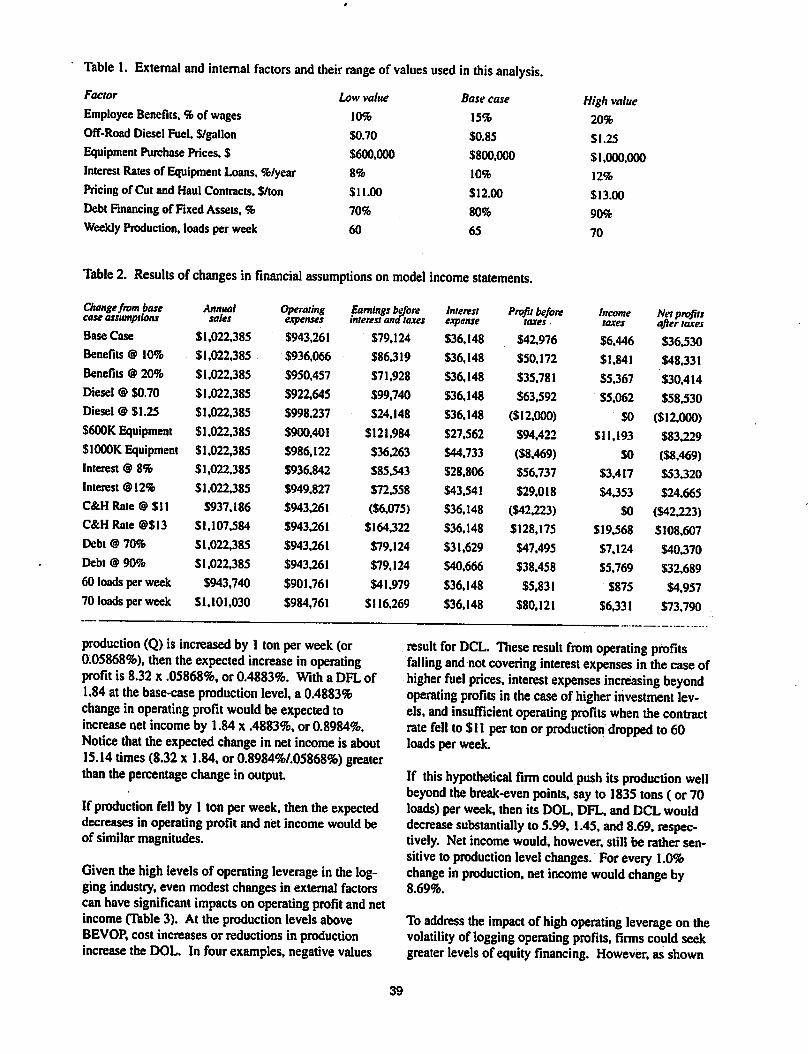
Table 1. External and internal factors and their range ofvalues used in this analysis.
Factor
Employee Benefits, % of wages
Off-RoadDiesel Fuel. S/gallon
Equipment Purchase Prices, $
Interest Rates of Equipment Loans, %/year
Pricing of Cut and Haul Contracts. S/ton
Debt Financing of Fixed Assets, %
Weekly Production, loads perweek
Low value Base case High value10% 15% 20%
$0.70 S0.85 S1.25
S600.000 $800,000 SI.000,000
8% 10% 12%
SI 1.00 SI 2.00 $13.00
70% 80% 90%
60 65 70
Table 2. Results of changes in financial assumptions onmodel income statements.
Change from basecase assumptions
Annualsales
Operatingexpenses
Earningsbeforeinterest and taxes
Interestexpense
Profit beforetaxes
Incometaxes
Net profitsafter taxes
Base Case $1,022,385 $943,261 $79,124 $36,148 $42,976 $6,446 $36,530Benefits @ 10% $1,022,385 $936,066 $86,319 $36,148 S50.172 $1,841 $48,331Benefits @ 20% $1,022,385 $950,457 $71,928 $36,148 $35,781 $5,367 $30,414Diesel @ $0.70 SI.022.385 $922,645 $99,740 536,148 $63,592 $5,062 $58,530Diesel ©51.25 $1,022,385 $998,237 $24,148 536,148 ($12,000) $0 ($12,000)S600K Equipment Sl.022.385 $900,401 $121,984 $27,562 $94,422 $11,193 $83,229S1000K Equipment Sl.022,385 $986,122 $36,263 $44,733 ($8,469) $0 ($8,469)Interest @ 8% $1,022,385 $936,842 $85,543 $28,806 $56,737 $3,417 $53320Interest @ 12% $1,022,385 $949,827 $72,558 $43,541 $29,018 $4,353 $24,665C&HRate@SU $937,186 $943,261 ($6,075) $36,148 ($42,223) $0 ($42,223)C&H Rate @$13 $1,107,584 $943,261 $164322 S36.148 $128,175 $19,568 $108,607Debt @ 70% SI,022,385 $943,261 $79,124 $31,629 $47,495 $7,124 $40370Debt® 90% Sl.022,385 $943,261 $79,124 $40,666 $38,458 $5,769 $32,68960 loads perweek $943,740 $901,761 $41,979 $36,148 $5,831 $875 $4,95770 loads per week $1,101,030 $984,761 $116,269 S36.148 $80,121 $6,331 $73,790
production (Q) is increased by 1 ton per week(or0.05868%), then theexpected increase in operatingprofit is 8.32 x .05868%, or 0.4883%. With a DFL of1.84 at the base-case production level, a 0.4883%change in operating profit would be expected toincrease net income by 1.84x .4883%.or 0.8984%.Notice thatthe expectedchangein net incomeis about15.14 times (8.32 x 1.84, or0.8984%/.05868%) greaterthanthe percentage changein output.
If production fell by 1ton per week, thenthe expecteddecreases in operating profit and net income would beof similar magnitudes.
Given the high levels of operating leverage in the logging industry, even modest changesin external factorscan have significant impactson operating profitandnetincome (Table 3). At the productionlevels aboveBEVOP, cost increases or reductions in productionincrease the DOL. In fourexamples, negativevalues
result for DCL. These result from operating profitsfalling and notcovering interest expenses in the caseofhigher fuel prices, interest expenses increasing beyondoperating profits in the caseof higher investment levels, and insufficient operating profits when the contractrate fell to$11 per tonor production dropped to 60loads per week.
If thishypothetical firm couldpush its production wellbeyond the break-even points, say to 1835 tons (or 70loads) per week, then its DOL, DFL, and DCL woulddecrease substantially to 5.99,1.45,and 8.69, respectively. Net income would, however, still be rather sensitive to production level changes. For every 1.0%change in production, net income would change by8.69%.
To address the impact of highoperating leverage on thevolatilityof logging operating profits, firms could seekgreater levels of equity financing. However, as shown
39
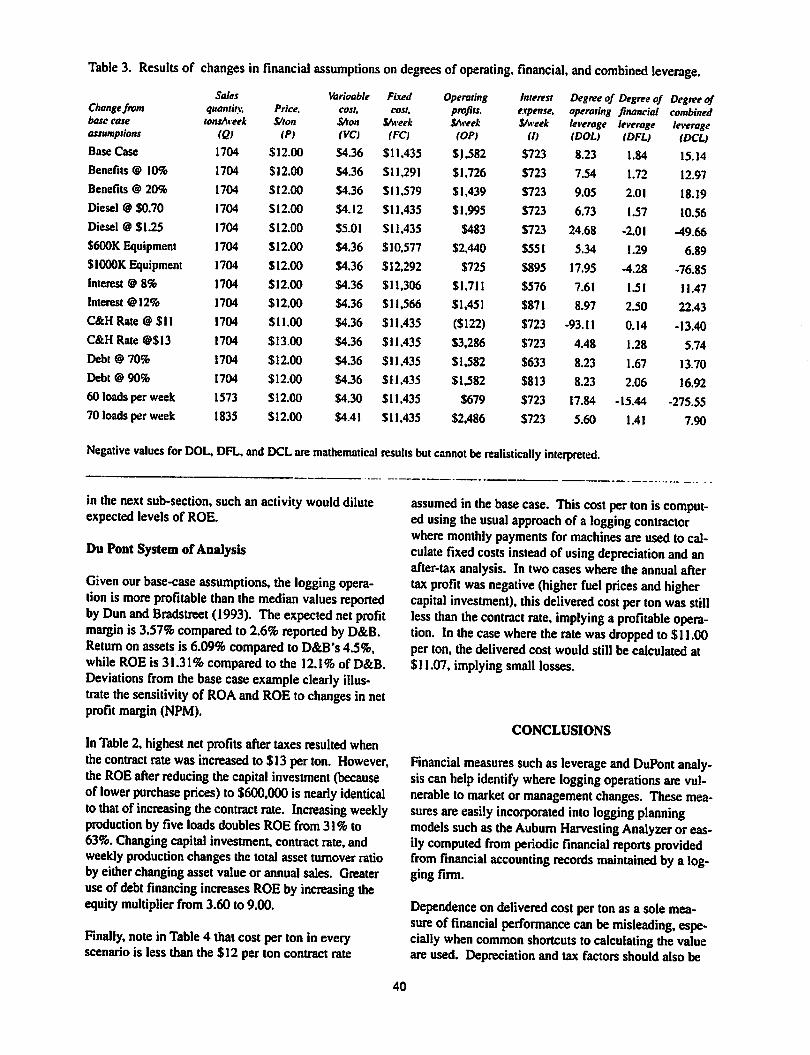
Table 3. Results of changes in financial assumptions on degrees ofoperating, financial, and combined leverage.
Changefrombase case
assumptions
Sales
quantity,tonsAreek
(QI
Price.
S/ton
(P)
Varioable
cost.
S/lon
(VC)
Fixed
cost,
SAveek
(FC)
Operatingprofits.SAveek
(OP)
Interest
expense,
SAveek
(I)
Degree of Degree of Degree ofoperating financial combinedleverage leverage leverage(DOL) (DFL) (DCL)
Base Case 1704 $12.00 S4.36 $11,435 $J382 $723 8.23 1.84 15.14
Benefits ® 10% 1704 $12.00 $4.36 $11,291 $1,726 $723 7.54 1.72 12.97
Benefits @ 20% 1704 $12.00 $4.36 $11,579 $1,439 $723 9.05 2.01 18.19
Diesel @ $0.70 1704 SI 2.00 $4.12 SI 1.435 $1,995 $723 6.73 1.57 10.56
Diesel @ $1.25 1704 512.00 $5.01 SI 1.435 S483 $723 24.68 -2.01 ^*9.66
S600K Equipment 1704 $12.00 54.36 $10,577 $2,440 $551 5.34 1.29 6.89
SI000K Equipment 1704 $12.00 $4.36 $12,292 $725 $895 17.95 -4.28 -76.85Interest @ 8% 1704 $12.00 S4.36 $11,306 $1,711 $576 7.61 1.51 11.47
Interest @ 12% 1704 $12.00 $4.36 $11,566 $1,451 $871 8.97 2.50 22.43
C&HRate@$ll 1704 $11.00 $4.36 $11,435 ($122) $723 -93.11 0.14 -13.40
C&H Rate @$13 1704 $13.00 $4.36 $11,435 $3,286 $723 4.48 1.28 5.74
Debt @ 70% 1704 $12.00 54.36 $11,435 $1,582 $633 8.23 1.67 13.70Debt @ 90% 1704 $12.00 $4.36 $11,435 $1,582 $813 8.23 2.06 16.92
60 loads per week 1573 512.00 $4.30 $11,435 $679 $723 17.84 -15.44 -275.5570 loads per week 1835 $12.00 $4.41 $11,435 52,486 $723 5.60 1.41 7.90
Negative values for DOL, DFL. and DCL are mathematical results but cannot be realistically interpreted.
in the next sub-section, suchan activity would diluteexpected levels of ROE.
Du Pont System ofAnalysis
Given ourbase-case assumptions, the logging operation is more profitable than themedian values reportedby Dun andBradstreet (1993). Theexpected netprofitmargin is 3.57% compared to 2.6%reported by D&B.Return on assets is 6.09% comparedto D&B's 4.5%,while ROE is 31.31% compared to the 12.1% of D&B.Deviations from thebasecaseexample clearly illustrate thesensitivity of ROA and ROE to changes in netprofit margin (NPM).
InTable 2, highest net profitsafter taxesresulted whenthecontract rate was increased to $13per ton. However,the ROEafter reducing the capital investment (becauseof lower purchase prices) to $600,000 is nearly identicalto that of increasing tiie contract rate. Increasing weeklyproduction by five loads doubles ROE from 31% to63%. Changingcapital investment contract rate, andweekly production changes the total asset turnover ratioby either changing asset value or annua] sales. Greateruse of debt financing increases ROE by increasing theequity multiplierfrom 3.60 to 9.00.
Finally, notein Table 4 that cost per ton in everyscenario is less than the $12 per ton contract rate
assumed in thebasecase. Thiscostperton is computed using the usual approach of a logging contractorwhere monthly payments for machines are used to calculate fixed costs instead of using depreciation andanafter-tax analysis. In two cases where the annual aftertaxprofit was negative (higher fuel prices andhighercapital investment), thisdelivered costper tonwasstillless than thecontract rate, implying a profitable operation. In thecase where the ratewas dropped to $11.00per ton, the delivered cost would still be calculated at$11.07, implyingsmall losses.
CONCLUSIONS
Financial measures such as leverage and DuPont analysiscan help identify where logging operations are vulnerable to market or management changes. These measures areeasily incorporated into logging planningmodels such as the Aubum Harvesting Analyzeror easilycomputed from periodic financial reports providedfrom financial accounting records maintained bya logging firm.
Dependence on delivered cost per ton as a sole measure of financial performance canbe misleading, especiallywhen common shortcuts to calculating the valueare used. Depreciation and tax factors should also be
40
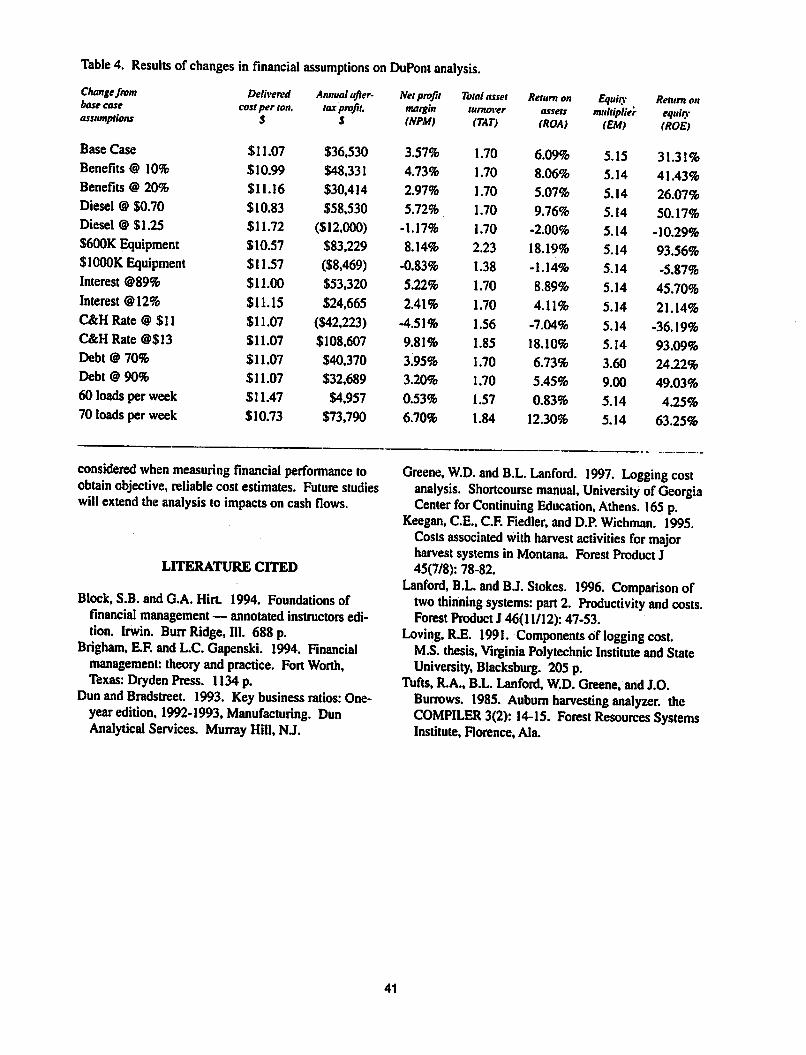
Table 4. Results ofchanges infinancial assumptions on DuPont analysis.
Changefrom Delivered Annualafter Net profit Total asset Return on Equity Return onbase case cost per ton. tax profit. margin turnover assets multiplier equityassumptions S S (NPM) (TAT) (ROA) (EM) (ROE)
Base Case $11.07 $36,530 3.57% 1.70 6.09% 5.15 31.31%Benefits @ 10% $10.99 $48,331 4.73% 1.70 8.06% 5.14 41.43%Benefits @ 20% $11.16 $30,414 2.97% 1.70 5.07% 5.14 26.07%Diesel @ $0.70 $10.83 $58,530 5.72% 1.70 9.76% 5.14 50.17%Diesel @ $1.25 $11.72 ($12,000) -1.17% 1.70 -2.00% 5.14 -10.29%S600K Equipment $10.57 $83,229 8.14% 2.23 18.19% 5.14 93.56%$1000KEquipment $11.57 ($8,469) -0.83% 1.38 -1.14% 5.14 -5.87%Interest @89% $11.00 $53,320 5.22% 1.70 8.89% 5.14 45.70%Interest @ 12% $11.15 $24,665 2.41% 1.70 4.11% 5.14 21.14%C&HRate@$ll $11.07 ($42,223) -4.51% 1.56 -7.04% 5.14 -36.19%C&H Rate @$13 $11.07 $108,607 9.81% 1.85 18.10% 5.14 93.09%Debt @ 70% $11.07 $40,370 3.95% 1.70 6.73% 3.60 24.22%Debt® 90% $11.07 $32,689 3.20% 1.70 5.45% 9.00 49.03%60 loads per week $11.47 $4,957 0.53% 1.57 0.83% 5.14 4.25%70 loads per week $10.73 $73,790 6.70% 1.84 12.30% 5.14 63.25%
considered when measuring financial performance toobtain objective, reliable cost estimates. Future studieswill extendthe analysis to impactson cash flows.
LITERATURE CITED
Block, S.B. and G.A. Hirt. 1994. Foundations offinancial management— annotated instructors edition. Irwin. BurrRidge, 111. 688 p.
Brigham, E.F. and L.C. Gapenski. 1994. Financialmanagement: theory and practice. Fort Worth,Texas: Dryden Press. 1134 p.
Dun and Bradstreet 1993. Key businessratios: One-yearedition, 1992-1993, Manufacturing. DunAnalytical Services. MurrayHill, NJ.
Greene, W.D. and B.L. Lanford. 1997. Logging costanalysis. Shortcourse manual, University ofGeorgiaCenter for Continuing Education, Athens. 165 p.
Keegan, C.E., C.F. Fiedler, and D.P. Wichman. 1995.Costs associated with harvest activities for majorharvest systems in Montana. Forest Product J45(7/8): 78-82.
Lanford, B.L. and B.J. Stokes. 1996. Comparison oftwo thinning systems: part2. Productivity andcosts.Forest Product J 46(11/12): 47-53.
Loving, R.E. 1991. Components of logging costM.S. thesis,VirginiaPolytechnicInstitute and StateUniversity, Blacksburg. 205 p.
Tufts, R.A.. B.L. Lanford, W.D. Greene, and J.O.Burrows. 1985. Auburn harvesting analyzer, theCOMPILER 3(2): 14-15. Forest Resources SystemsInstitute, Florence, Ala.
41
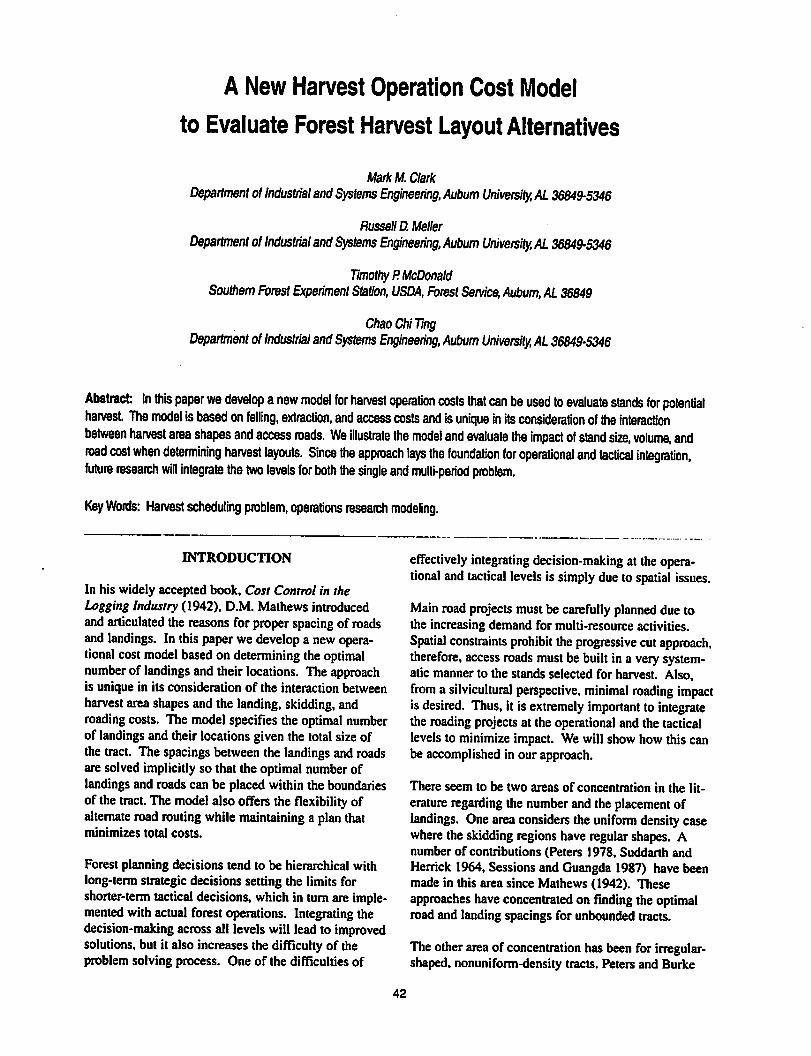
A New Harvest Operation Cost Model
to Evaluate Forest Harvest Layout Alternatives
Mark M.Clark
Department of Industrial and Systems Engineering, Auburn University, AL 36849-5346
Russell D. Metier
Department of Industrial and Systems Engineering, Auburn University, AL 36849-5346
Timothy RMcDonaldSouthern Forest Experiment Station, USDA, Forest Service, Auburn, AL 36849
Chao Chi TingDepartment ofIndustrial and Systems Engineering, Auburn University, AL 36849-5346
Abstract: In this paper we develop a new model for harvest operation costs that can be used to evaluate stands for potentialharvest. The model isbased on felling, extraction, and access costs and isunique in its consideration of the interactionbetween harvest area shapes and access roads. We illustrate the model and evaluate the impact of stand size, volume, androad cost when determining harvest layouts. Since the approach lays the foundation for operational and tactical integration,future research will integrate the two levels for both the single and mulli-period problem.
Key Words: Harvest scheduling problem, operations research modeling.
INTRODUCTION
In his widely accepted book. Cost Controlin theLogging Industry(1942), D.M. Mathews introducedandarticulated the reasons for properspacing of roadsand landings. In thispaperwe develop a new operational costmodel based on determining theoptimalnumber of landings and their locations. The approachis unique in its consideration of the interaction betweenharvest areashapes and the landing, skidding, androading costs. The modelspecifies the optimal numberof landings and their locations given the total size ofthe tract. The spacings betweenthe landings and roadsare solved implicitly so that the optimal numberoflandings and roads can be placed within the boundariesof the tract.The model also offers the flexibility ofalternate road routing while maintaining a plan thatminimizes total costs.
Forest planning decisions tend to be hierarchical withlong-term strategic decisionssetting the limitsforshorter-term tactical decisions, which in turnare implemented withactual forest operations. Integrating thedecision-making across all levels will lead to improvedsolutions, but it also increases the difficulty of theproblem solving process. One of the difficulties of
effectively integrating decision-making at theoperational and tactical levels is simply due to spatial issues.
Main road projects mustbe carefully planned due tothe increasing demand for multi-resource activities.Spatial constraints prohibit theprogressive cutapproach,therefore, access roads must be built in a very systematic manner to the stands selected for harvest. Also,from a silvicultural perspective, minimal roading impactisdesired. Thus, it is extremely important to integratethe roading projects at the operational and the tacticallevels to minimize impact. We will show how this canbe accomplished in our approach.
There seem to be two areas of concentration in the literature regarding the numberand the placement oflandings. Oneareaconsiders the uniform density casewhere the skidding regions have regular shapes. Anumber of contributions (Peters 1978, Suddarth andHerrick 1964, Sessions and Guangda 1987) have beenmade in this area since Mathews (1942). Theseapproaches haveconcentrated on finding the optimalroad and landing spacings for unbounded tracts.
The other area of concentration has been for irregular-shaped, nonuniform-density tracts. Peters and Burke
42
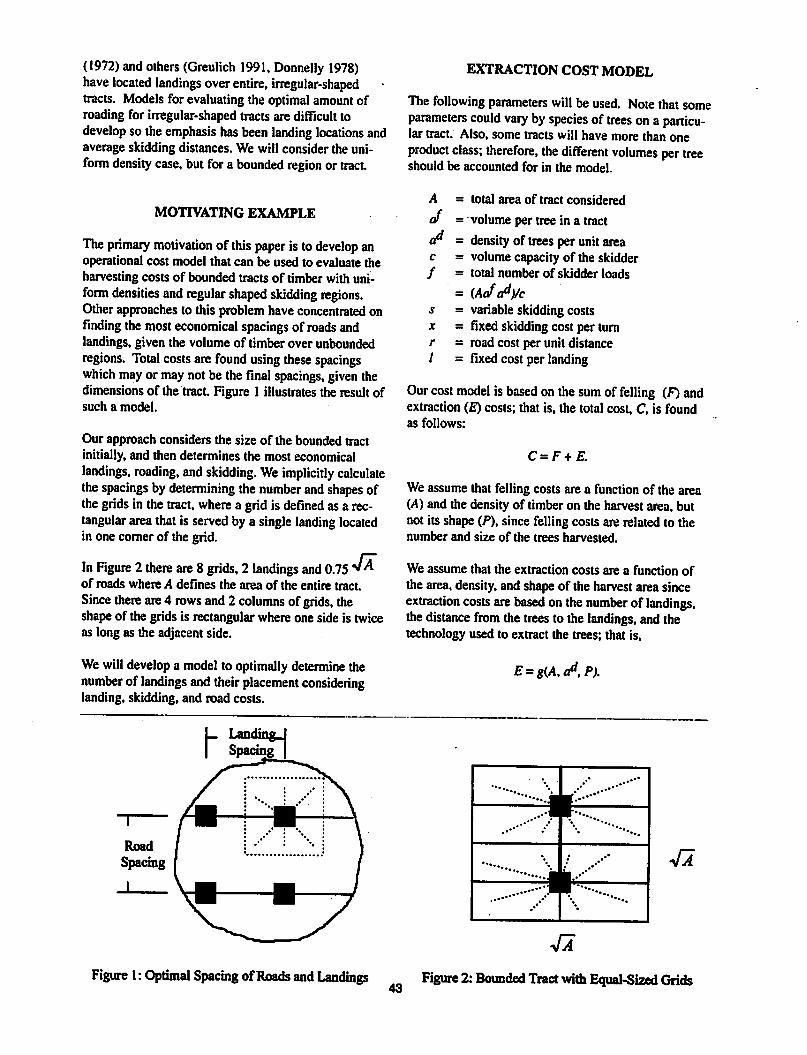
(1972) and others (Greulich 1991, Donnelly 1978)have located landings over entire, irregular-shapedtracts. Models for evaluating the optimal amount ofroading for irregular-shaped tracts are difficult todevelop so theemphasis hasbeen landing locations andaverage skidding distances. We will consider the uniform density case, but fora bounded region or tract
MOTIVATING EXAMPLE
The primary motivation of this paper is todevelop anoperational cost model that can be used to evaluate theharvesting costs of bounded tracts of timber with uniform densities and regular shaped skidding regions.Otherapproaches to this problem have concentrated onfinding the most economical spacings of roads andlandings, given the volume of timber over unboundedregions. Total costs are found using these spacingswhich may or may not be the final spacings, given thedimensions of the tract Figure 1 illustrates the resultofsuch a model.
Our approach considers the size of the bounded tractinitially, and then determines the most economicallandings, roading, and skidding. We implicitly calculatethe spacings bydetermining the number and shapes ofthe grids in the tract, wherea grid is defined as a rectangular areathat is served by a single landing locatedin one cornerof the grid.
In Figure 2there are 8grids, 2landings and 0.75 VAof roads where A defines the area of the entire tract.Since there are4 rows and 2 columns of grids, theshape of the grids is rectangularwhere one side is twiceas long as the adjacent side.
Wewill develop a model to optimally determine thenumber of landings andtheirplacement consideringlanding, skidding, and road costs.
hLandingJSpacingj
EXTRACTION COST MODEL
The following parameters will be used. Note that someparameters could vary by species of trees ona particular tract Also, some tracts will have more than oneproduct class; therefore, the different volumes per treeshould be accounted for in the model.
A
Jadc
f
s
X
r
I
= total area of tract considered
= volume per tree in a tract
= density of trees per unit area= volume capacity of the skidder= total number of skidder loads
= (Aafadf/c= variable skidding costs= fixed skidding cost per turn= road cost per unit distance= fixedcost per landing
Our cost model isbased on the sum of felling (F) andextraction (E) costs; that is, the total cost, C, is foundas follows:
C=F+E.
Weassume that fellingcosts are a function of the area(A) and the density of timber on the harvest area, butnot its shape (P), since fellingcosts are related to thenumber and size of the trees harvested.
We assume that the extraction costs are a function ofthe area,density, and shape of the harvest area sinceextraction costs arebased on thenumber of landings,thedistance from the trees to the landings, and thetechnology used to extract the trees; that is,
£ =g(AV,P).
£
».VI
Figure 1: Optimal Spacing ofRoads and Landings43
Figure 2: Bounded Tractwith Equal-Sized Grids

Wedefine total extraction costs to equal the sum of thelandings costs, L,and the skidding costs, 5, and theroad costs, R; i.e.,
E = L + S + R.
As we noted earlier, £ is a function ofA,ad, and P. Inparticular, P is a function of the following two decisionvariables:g (the number of grids) and n (the number oflandings), where a grid defines"an area that is harvestedfrom onelanding. Note thata tract is typically partitioned into multiple grids where up to fourgrids can beharvested from one landing.
Assumptions
In the following model we assume:1. grids are rectangular;2. skid distances are proportional to rectilinear
distances (or canbe adjusted with some proportionality constant, as suggested by Greulich (1991));
3. there will only be one means-of-egress to a stand;4. all roads are orthogonal to the x and y axes;5. thecapacity of the skidderis fixed a priori.
Approximate Extraction Cost Model
Aftersplitting the area into g grids, we then need tochoose our n landing locations. Thus, we construct amodel to determine both the optimalg and n for agiven area. Note thatsincen is a function of g, we willuse n(g) to denote this.
Mathews (1942) explained in detail the economic differences of placing a landing onthe boundary of a tractversus building a road and placing the landing on theinterior of a tract So it is reasonable to say ifg is lessthan orequal to 2 then there would beone landinglocated on the boundary of the tract that served each ofthe twogrids. Alternatively, as longas g > 2, it seemsreasonable to approximate n(g) as:
(1)
L = n(8) = g/4.
This indicates that the tract will besplit into multiplesof 4 withone landing serving4 grids.
If wedivide the tract area.A, intoequal-area grids, wecan determine the numberof skidderloadsper grid.Since the grids arenot always square, we must modifytheequation to allow for rectangular shaped grids.Thus,
S=sf(-+k-rfxa b (2)
where a andb represent the number of grid rows andcolumns. Although a andb could be interchanged torepresent the rows or thecolumns in this equationwithout changing the resulting valueof S, we will showlater that a>b must always hold.
Generally, the amount of roading required is that whichprovides access to each of the landing locations. Wecanconstruct a table thatshows theamount of roadingrequired based on the size of the tract and the numberof grids. For every harvest pattern we can calculate aconstant value that can simply be multiplied by thelength of oneside of the square areato get the totalamount of roading required. Table 1 shows the resultsof a number of different harvest patterns.
We approximate the total costof roading, /?, with thefollowing equation:
*«r(^<fl-2)i+l)+^a,-2))a 2 b (3)
where a and b represent the number of columns androwsof grids. Note that (3) requires that a > b andb> 2. Aswe will show later, theharvest pattern couldrotate, thus, a could represent the rows or the columnsand likewise forb. So,a does notnecessarily representthe columns or the rows but the greaterof the two,unless thecolumns and rows are equal. It follows thenthat g = ab.
The costof roading is approximated well by (3). Infact (3) appears toprovide the exact amount ofroadingcosts as long as b is even and > 2. Notice that inTable 1 all of the possible b's are even or one. This isdue to there not being a feasible solution where b isboth oddand greater than one when there areg 14 landings. Note from the Roading columnin Table 1 that for
Table 1. Grid, road,and landingcombinations.
Pattern Grids Col. Rows Landings Roading
1 2 1 2 1 02 4 2 2 1 0.5003 8 2 4 2 0.7504 12 2 6 3 0.8305 16 2 8 4 0.875
6 20 2 10 5 0.9007 24 2 12 6 0.9168 16 4 4 4 1.750
9 24 4 6 6 2.00010 32 4 8 8 2.12511 40 4 10 10 2.200
44
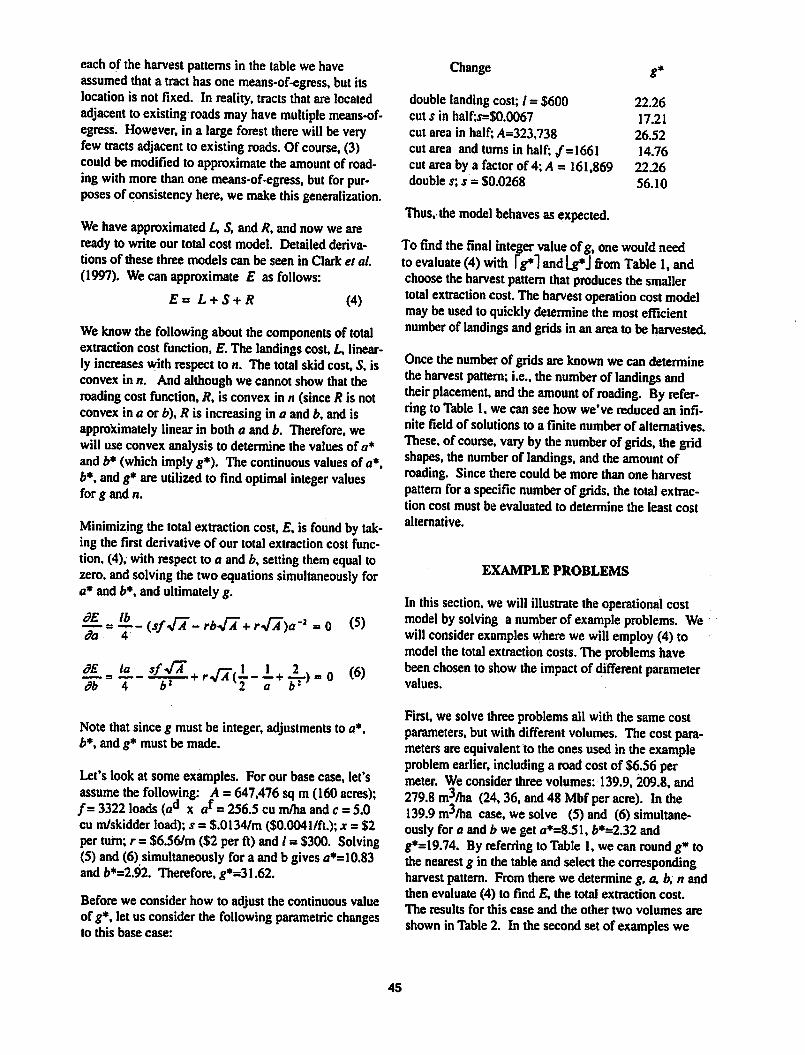
eachof the harvestpatterns in the table we haveassumed that a tract has one means-of-egress, but itslocation is not fixed. In reality, tracts thatare locatedadjacent toexisting roads mayhave multiple means-of-egress. However, in a large forest there willbe veryfew tracts adjacent to existingroads. Of course, (3)could be modified to approximate the amount of roading with more than onemeans-of-egress, but for purposes of consistency here, we makethis generalization.
We have approximated L, S, and R, and now we areready to write our total cost model. Detailed derivations of these three models can be seen in Clark et al.(1997). We can approximate £ as follows:
£= L + S + R (4)
We know the following aboutthe components of totalextraction cost function, £. The landings cost, L, linearly increaseswith respect to n. The total skid cost S, isconvex in n. And although we cannot show that theroading cost function, R, is convex in n (since R is notconvex in a or b), R is increasing in a andb, andisapproximately linear in both a and b. Therefore, wewill use convex analysis to determine the values of a*and b* (which imply g*). The continuous values of a*,b*,and g* are utilized to find optimal integer valuesfor g and n.
Minimizing the total extraction cost, £, is found by taking the first derivative of our total extraction cost function, (4), with respect to a and b, setting themequal tozero,and solving the two equations simultaneously fora* and b*, and ultimately g.
HL^IL-fsfjA-rbjA+r^a-1 =0da 4
db 4 A2 v2 a b!'
(5)
(6)
Note that since g must be integer, adjustments to a*.b*, and g* must be made.
Let's look at some examples. For our base case, let'sassume the following: A = 647,476 sq m (160 acres);/= 3322 loads (ad x a{=256.5 cu m/ha and c=5.0cu m/skidder load); s = $.0134/m ($0.0041/ft); x = $2per tum; r = $6.56/m ($2 per ft) and / = $300. Solving(5) and (6) simultaneously for a and b gives a*=10.83andfc*=2.92. Therefore, g*=31.62.
Before we consider how to adjust the continuous valueofg*, let us considerthe following parametric changesto this base case:
Change g*
double landing cost; / = $600 22.26cut s in half;j=$0.0067 17.21cut areain half; A=323,738 26.52cut area and turns in half; /=1661 14.76cut area by a factor of 4; A = 161,869 22.26double s; s = $0.0268 56.10
Thus,-the model behaves asexpected.
To find the final integer value ofg, one would needto evaluate (4) with [g*] and Lg*J from Table 1, andchoose the harvest pattern that produces the smallertotal extraction cost. The harvest operation costmodelmay be used to quickly determine the most efficientnumberof landings and grids in an area to be harvested.
Oncethe numberof grids are known we candeterminethe harvest pattern; i.e.. thenumber of landings andtheir placement and the amount of roading. By referring to Table 1, we can see how we've reduced an infinite field of solutions to a finite number of alternatives.These, of course, vary by thenumber of grids, the gridshapes, the number of landings, andthe amountofroading. Since there could be more than one harvestpattern for a specificnumberof grids, the total extraction cost must be evaluated to determine the least costalternative.
EXAMPLE PROBLEMS
In this section, we will illustrate the operational costmodelby solving a numberof example problems. Wewillconsider examples where we will employ (4) tomodelthe total extraction costs.The problems havebeen chosen to show the impact of different parametervalues.
First, we solve three problems all with the same costparameters, but with differentvolumes. The cost parameters are equivalent to the ones used in the exampleproblem earlier, including a road cost of $6.56 permeter. We consider three volumes: 139.9,209.8, and279.8 m3/ha (24,36. and 48 Mbf per acre). In the139.9 m^/ha case, we solve (5) and (6) simultaneously for a and b we get a*=8.51, b*=2.32 andg*=19.74. By referring to Table 1, we can round g* tothe nearest g in the table andselect the correspondingharvest pattern. Fromthere we determineg, a, b, n andthen evaluate (4) to find £, the total extraction cost.The results for this case and the other two volumes are
shown in Table2. In the second set of examples we
45
increased the variable skidding cost by25% to$0.01675 per meter. The resultsare shown in Table 3.Note that with the increased skid cost the shapes of thegrids change to compensate for the increased cost.
INTEGRATION OF OPERATIONALAND TACTICAL PLANS
The operational plan, as we've defined it, considersonly thecost for harvesting a specific stand. The tactical plan specifies where andwhen to harvest specifictracts. Thetwomust be integrated at some point inorder todevelop theoverall harvesting plan. Sinceroading is a majordecision variableat both levels, itcould bea means by which the two levels areintegrated. This integration could lead to multiple stands sharing the same roads. After the most economical landing and road placements areknown at the operationallevel this integration could be enhanced.
Another reason for multiple roading alternatives is toprovide a basis forthe integration of these operationalplans with the tactical plan. Forexample, consider aforest with nine stands with anaccess road runningalong the northern boundary and we select threeofthose stands forharvest in thefirst period. Furthermore,assume that the harvest patterns are similar to those inFigure 4(a), then wehave the flexibility to manipulatethe harvest patterns while maintaining minimum harvesting costs. Also, we might beable toshare haulingroads in an effort to minimize the total amount of roading. If wecan't share the roading, the result to the tactical planmight resemble Figure4(b). But withsharedroading, the result might resemble Figure 4(c). It isclear that some additional costs must be incurred toupgrade the roads for additional capacity, but thiscostmight be incurred in any plan.
h h r
h h u1
(a) (b) (c)
Figure 4. Integration of roading
CONCLUSIONSAND FUTURE RESEARCH
In this paper wehave developed a model of timber harvest costs that enables us tofind the minimum operational costs. Themodel was developed such that thesize ofthe tract isconsidered sothat the harvest patterncould be found to minimize the cost ofthe harvestingoperations. We showed how these operational harvestpatterns can beused as a foundation forthe integrationof the operational and tactical plans.
Future research will cover two related areas. First, wewill look at tracts that are not square. Obviously, withthe increasing use of GIS, more and more informationmay be used to define tract boundaries in an effort tomake better harvesting decisions. Topography, soilconditions, existing roads, streamlocations, etc., willall have an impact on the tract shape.
The second area of future research is todevelop analgorithm for efficiently solving the tactical level problem while considering the integration of the operationalplan. Theresults in Nelson and Brodie (1990) andO'Hara et al. (1989) indicate that in order to solve larger problems theuse of a heuristic-search algorithm willbe required.
Table 2. Results of three example problems
Volume (m139.9
209.8
279.8
Vha.) a*
8.51
9.52
10.11
A*
2.32
2.95
3.43
8*19.74
27.43
34.67
Grids (g)20
24
32
Columns Rows
2 10
2 12
4 8
Landings £($)5 18,0316 23,8198 28,343
Table 3. Results of three example problems with increased skidcost
Volume (m3/ha.) a* b* g* Grids (g) Columns Rows Landings E ($)139.9 8.86 2.65 23.47 24 2 12 6 20,884209.8 9.90 3.31 32.81 32 4 8 8 27,354279.8 10.85 3.82 41.45 40 4 10 10 31,707
46
REFERENCES
Clark, M.M.; Meller. R.D.; McDonald. T.P.; Ting, C.C.1997. New harvest operational cost model. TechReport 97-01: Department of Industrial and SystemsEngineering, Auburn University, AL, 36849.
Donnelly, D. M. 1978. Computing average skiddingdistance for logging areas with irregular boundariesand variable log density. GenTech Report RM-58.Fort Collins: USDA, Forest Service.
Greulich, Francis E. 1991. Optimal landing location onflat uniform terrain. Canadian J of Forest Research21:573-584.
Mathews, D. M. 1942. Cost Control in the LoggingIndustry. McGraw-Hill.
Nelson, J.; Brodie, J.D. 1990. Comparison of a randomsearch algorithm and mixed integerprogrammingfor solving area-based forest plans. Canadian J ofForest Research 20: 934-942.
O'Hara, AJ.; Faaland, B.H.; Bare, B.B. 1989. Spatiallyconstrained timber harvest scheduling. Canadian Jof Forest Research 19: 715-724.
Olsen, Eldon D. 1983. Avoiding twoerrors in estimating logging costs. Trans ASAE 26(5): 1424-1426.
Peters, P. A. 1978. Spacing of roads and landings tominimize timber harvestcost. Forest Science24(2):209-217.
Peters. P.A.; Burke, J.D. 1972. Average yarding distance on irregularly shaped timber harvest settings.Research Note PNW-178, Portland OR: USDA.Forest Service, Pacific Northwest Research Station.
-Sessions, John; Guangda, Li. 1987. Deriving optimalroad and landing spacing with microcomputer programs. Western J of Applied Forestry 2(3):94-98.
Suddarth, S.K.; Herrick, A.M. 1964. Average skiddingdistance for theoretical analysis of logging costs.Research Bull 789Purdue University AgExperimentStation.
Thompson, M.A. 1988. Optimizing spur road spacingon the basisof profit potential. Forest Products J38(5):53-57.
47
Integrated Approach for Determining the Size
of Group-Selection Openings
Chris B. LeDouxSupervisory Industrial Engineer
USDAForest ServiceMorgantown, West Virginia USA
ABSTRACT: The use of group-selection methods is becoming more widespread as landowners and forest managers attemptto respond to public pressure to reduce the size of clearcut blocks. Several studies have shown that harvesting timber in smallergroups or clumps increases the cost of operations for both cable and ground-based logging systems. Recent regenerationstudies have shown that the number of stems, numbers of shade-tolerant and intolerant species, basal area, and volume areaffected by the size of opening created. Size of opening and resulting vegetation also affects the wildlife species that use thesesmall openings. We integrated the results from several cable and ground-based logging studies with those from several regeneration studies to determine the most effective size of group-selection openings. Managers can avoid serious economic lossesby using groups of 1.25 acres or larger. These results should be valuable to managers, loggers, and planners consideringgroup-selection methods.
Key Words: group-selection, break-even, logging systems, integration, economics
INTRODUCTION
Publicconcern about clearcutting has resulted in theincreased useof group-selection methods by landownersand forest managers. The small openings created bythese techniques allow the harvestingof timber withoutimpairing the visual quality of the site. Yet managersinterested in keepingloggingcosts undercontrol areconcerned about the potential loss of production andprofit in choosing group-selection over conventionalforms of clearcutting.
Group-selection entailsharvesting smallgroups orclumpsof trees in a somewhatrandom pattern across astand to capture mortality and insect and disease infestations, regenerate stands, and harvest financiallymature trees. Group-selection has certainadvantagesover single-tree selection: 1) Older mature trees can beharvested more economically and with less damage tothe residual stand; 2) managers are afforded greaterflexibility in creating environmental conditions thatfavorsuccessful reproduction; and 3) reproductiondevelops in well-defined, even-aged aggregations. Thelatter is a substantial advantage over single-tree selection in developing goodtree form, particularly in hardwoods (Smith 1986).
Group-selection cuttings alsocreate openings or gapsin the forest canopy that can increase the area of desir
able habitat for wildlife. Manyspeciesof wildlife benefit from the combination of environmental conditionsexisting within and along the boundaries between theyoung reproduction and older adjacent trees. A widearray of protective cover is available in proximity tovarious food plants that maybe created by the broadspectrum of microclimatic conditions existing betweentheedges and thecenters of theyoung groups.
Harvesting studies of group-selection in eastern hardwoods have shown that the economic success of suchharvests relies heavily onproduct markets, tree speciesand quality, and logging costs (Bell 1989, Boucher andHall 1989, LeDoux etal. 1991, Brummel 1992,Erickson et al. 1992, LeDoux etal. 1993). Other studies have attempted to define group-selection harvestsand when theycan be used(Roach 1974). In general,harvesting costs increase rapidly as sizeof openingdecreases. Results suggest that costs may be prohibitivefor groups smaller than 1/2acre (LeDoux etal. 1991).
Regeneration studies have shown thatspecies composition can be affected by group-selection treatments(Walters and Nyland 1989, Dale et al. 1995). Smallclearcuts alsohave a largerproportion of their totalareainfluenced by thesurrounding forest than largerclearcuts (Marquis 1965). The increased competitionfor water and nutrients due to theseedgeeffects influences tree growth (Minckler et aL 1973, Smith 1981,
48
Dale et al. 1995). Reductions intotal height and merchantable height growth of newregeneration werereported near the opening edge for 10 to30 years followingsmall group-selection cuts (Minckler andWoerheide 1965.Sanderand Clark 1971, Willison1981, Hilt 1985, Dale et al. 1995).
We integrated harvesting data available from LeDouxet al. (1991, 1993) with those from Dale et al. (1995)to determine the most effective sizeof group-selectionopenings. The results presented here combine the mostrecent data available on logging costs and regenerationresponses for group-selection treatments.
METHODS
Dale et al. (1995) reported 30-year regeneration resultsfrom 89group-selection plots located inWest Virginia,Illinois, Ohio, and Kentucky. The units ranged insizefrom 0.04 to 1.61 acres. Because the stand characteristics were so highly correlated withopening size. Daleet al. pooled the data from all regenerated plots andused non-linear regression techniques todevelop equations for estimating numberof trees, basal area, totalcubic-foot volume, and merchantable volume as a functionof opening size. Using theseequations and data,we reconstructed the 30-year-old individual-tree standsfor 1/4-, 1/2-, 1-, and 1 1/2-acre groups (Table 1).
Data on individual-tree stands by unit size was put intothe MANAGE simulation model(LeDoux 1986). Acomputer program written in FORTRAN V, MANAGEintegrates harvesting technology, silvicultural treatments, market price, and economic concerns over thelife of a stand. The simulation is a combination of discrete and stochastic subroutines. Individual subrou
tines model harvesting activities, silvicultural treatments, growth projections, market prices,and discounted present networth (PNW) economic analysis.
MANAGE was calibrated to produce stand attributesthat are identical to those calculated from data in Daleetal. (1995) for the initial 30-year-old stands. Thegrowth and products development of each stand wasthen projected to arotation age of90 years for comparison. The delivered log prices used in this integrationby speciesand grade are shown in Table 2.The criterion used was the PNW atage 30. The simulated PNW by unit size is shown in Table 3.
RESULTS
The results in Table 3 show that larger groups arecheaper to harvest than smaller ones, i.e„ larger groupsstart out with moreand larger trees/acre than smallerones. The interactive effectof larger groups, largertrees, and more trees/acreresults in increased revenueassizeof opening increases. Thiseffectintegratedwith harvesting efficiencies results in greater PNWyields per acre atage 90 for larger units.
Forexample, units of 1.5 acresreturn$37.86/acre inPNW. By contrast, units of 0.25 acrereturn$10.73/acrein PNW, a72% reduction in financial yields overa 60-year period. This equates to net loss in PNW of$0.45/acre/year.
When PNW is graphed by size of opening (Figure 1),PNW yields/acre level off with units of 1.25 acres orgreater.
These results match initial results of Dale etal. (1995)and LeDoux et al. (1991.1993) for cable and ground-based logging of group-selection units. Ledoux et al.found that production rates and yarding costs for unitsof 1.0 acre were similar to those for large clearcuts.However. Ledoux et at. found that total logging andlayout costs for 1.0acre groups were fourto six timesmoreexpensive than those for large clearcuts. Dale et
Table 1. Attributes of reconstructed stands atage 30, by opening size (from Dale et al. 1995)
Number
Size of of Basal Total Merchantable Quadraticopening trees area volume volume stand diameterAcres ft2 Inches0.25 330 38.97 980.51 270.70 4.650.50 388 54.88 1460.05 451.84 5.091.00 440 71.66 1931.86 651.27 5.461.50 457 78.56 2107.87 738.76 5.61
aSpecies composition: hickory, black oak, white oak, chestnut oak, scarlet oak, northern red oak, yellow-poplar, redmaple, black cherry, ash,blacklocust birch, beech, elm, dogwood, holly, magnolia, redbud, and sassafras.
49
Table 2. Delivered log prices by species and grade, in dollar/Mbf, international 1/4-inchrule (from Worthington et al. 1996).
Species group Grade 1
Hickory 210
Black Oak 450
White Oak 450
Chestnut Oak 450
Scarlet Oak 450
Northern Red Oak 561
Yellow Poplar 268
Red Maple 200
Black Cherry 571
Ash 420
Birch 107
Beech 106
Elm 76
Other Hardwoods 76
In dollars/cord
Grade 2 Grade 3 Pulpwood*
160 100 40
250 100 40
250 100 40
250 100 40
250 100 40
397 138 40
174 98 40
125 50 40
400 259 40
297 169 40
86 85 40
91 86 40
76 76 40
76 76 40
Table 3. Simulated PNWand stand attributes for reconstructed stands atage 90,by size of opening.
Size of . Total Averageopening volume stand dhb PNW* CashflowAcres fr/acre Inches • — Dollars/acre
0.25 2507.37 10.02 10.73 63.22
0.50 3134.22 10.87 16.92 99.69
1.00 4123.97 11.57 33.58 197.84
1.50 4259.74 11.75 37.86 223.06
*PNW at age 90; real discount rate = 3%
al. (1995) found that regeneration in blocks of 1.0acreor larger was similar to that in large clearcuts.
Although size of opening and resulting vegetationalso affect wildlife species that use these small openings, we did not analyze the relationship between sizeof opening and wildlife impacts. This is best evaluated in the field by managers familiar with actual conditions. For example, several small openings locatedclose to each other among different types of forestcover will be used differently by wildlife than onelargeopening surrounded by a single type of forestcover.
CONCLUSIONS
Logging costs decrease and the numberof regeneratedtrees/acre increases with increasing group size. Thequadratic mean dbh of regenerated trees increases withincreasing groupsize. More and larger trees/acre resultin more merchantable volume/acre.
The results of this investigation suggest that group-selection units should be 1.25 acres or larger to takeadvantageof the interactive effect of logging costs andregeneration efficiencies and thus avoid serious economic losses.
50
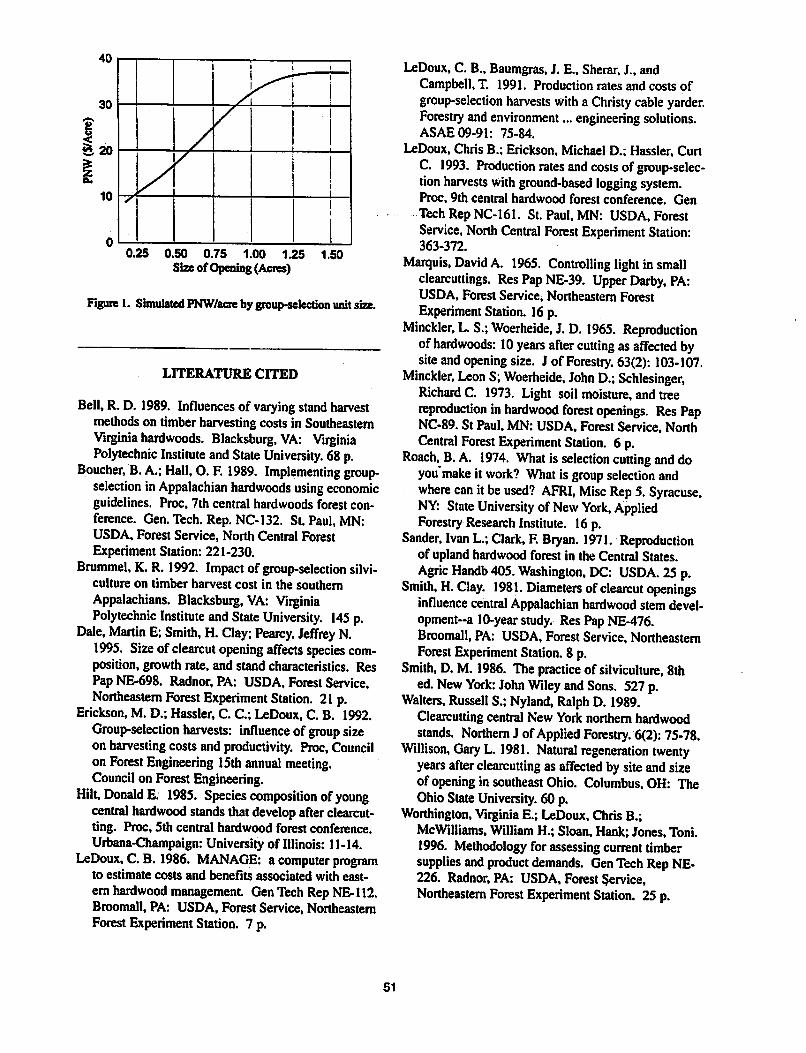
40
30
* 20
10
0.25 0.50 0.75 1.00 1.25 1.50Size ofOpening (Acres)
Figure 1. Simulated PNW/acre by group-selection unitsize.
LITERATURE CITED
Bell, R. D. 1989. Influences of varying stand harvestmethodson timber harvesting costs in SoutheasternVirginia hardwoods. Blacksburg, VA: VirginiaPolytechnic Institute and State University. 68 p.
Boucher, B. A.; Hall, O. F. 1989. Implementing group-selection inAppalachian hardwoods using economicguidelines. Proc, 7th central hardwoods forest conference. Gen.Tech. Rep. NC-132. St. Paul, MN:USDA, Forest Service, North Central ForestExperiment Station: 221-230.
Brummel, K. R. 1992. Impact of group-selection silviculture on timber harvest cost in the southernAppalachians. Blacksburg, VA: VirginiaPolytechnic Institute and State University. 145 p.
Dale, Martin E;Smith, H. Clay; Pearcy, Jeffrey N.1995. Size ofclearcut opening affects species composition, growth rate, and stand characteristics. ResPapNE-698. Radnor, PA: USDA, Forest Service,Northeastern Forest Experiment Station. 21 p.
Erickson,M. D.; Hassler, C. C; LeDoux, C. B. 1992.Group-selection harvests: influence ofgroup sizeon harvesting costs and productivity. Proc, CouncilonForest Engineering 15th annual meeting.Council on Forest Engineering.
Hilt, Donald E. 1985. Species composition ofyoungcentral hardwood standsthat develop afterclearcutting. Proc, 5th central hardwood forest conference.Urbana-Champaign: University of Illinois: 11-14.
LeDoux, C. B. 1986. MANAGE: a computer programto estimate costs and benefits associated with eastern hardwood management GenTech Rep NE-112.Broomall, PA: USDA, Forest Service, NortheasternForestExperiment Station. 7 p.
LeDoux, C. B., Baumgras. J. E, Sherar, J., andCampbell, T. 1991. Production rates and costs ofgroup-selection harvests With a Christy cable yarder.Forestry and environment... engineering solutions.ASAE 09-91: 75-84.
LeDoux, Chris B.; Erickson, Michael D.; Hassler, CurtC. 1993. Production rates and costs ofgroup-selection harvests with ground-based logging system.Proc, 9th central hardwood forest conference. GenTechRepNC-161. St. Paul, MN: USDA. ForestService. North Central Forest Experiment Station:363-372.
Marquis, David A. 1965. Controlling light in smallclearcuttings. ResPapNE-39. Upper Darby, PA:USDA, Forest Service, Northeastern ForestExperiment Station. 16p.
Minckler, L.S.; Woerheide, J. D. 1965. Reproductionofhardwoods: 10 years after cutting asaffected bysiteandopening size. J of Forestry. 63(2): 103-107.
Minckler, Leon S;Woerheide, John D.; Schlesinger,Richard C. 1973. Light soil moisture, and treereproduction inhardwood forest openings. Res PapNC-89. St Paul,MN: USDA, ForestService, NorthCentral Forest Experiment Station. 6 p.
Roach, B. A. 1974. What is selection cutting and doyou'make itwork? What isgroup selection andwhere can it beused? AFRI, Misc Rep 5. Syracuse,NY: State University of New York, AppliedForestry Research Institute. 16p.
Sander, Ivan L.; Clark, F. Bryan. 1971. Reproductionof upland hardwood forest in the Central States.Agric Handb 405. Washington. DC: USDA. 25 p.
Smith, H. Clay. 1981. Diameters ofclearcut openingsinfluence central Appalachian hardwood stem devel-opment-a 10-year study. Res Pap NE-476.Broomall, PA: USDA, Forest Service, NortheasternForest Experiment Station. 8 p.
Smith, D. M. 1986. The practice of silviculture, 8thed. New York: John Wiley and Sons. 527p.
Walters, Russell S.; Nyland, Ralph D. 1989.Clearcuttingcentral New York northern hardwoodstands. Northern J ofApplied Forestry. 6(2): 75-78.
Willison, Gary L. 1981. Natural regeneration twentyyears afterclearcutting as affected by siteandsizeof opening in southeastOhio. Columbus,OH: TheOhio State University. 60 p.
Worthington, VirginiaE.; LeDoux, Chris B.;McWilliams,William H.; Sloan, Hank; Jones, Toni.1996. Methodology for assessing currenttimbersupplies and product demands. Gen Tech Rep NE-226. Radnor, PA: USDA, Forest Service,Northeastern Forest Experiment Station. 25 p.
51
Production Functions for Cut-to-Length Harvesting
in Bunched and Unbunched Material
Peter C. SchroderUniversity of Idaho, Moscow, Idaho
and
Leonard R. Johnson
University ofIdaho, Moscow, Idaho
ABSTRACT: Three different harvest / processor configurations and asingle forwarding configuration were analyzed. Eachmachine and each operating format was evaluated for its productivity through detailed time and production studies. Data fromthe time studies were used to develop predictive models of the individual work cycles of each machine. In the conventionalthinning format, the highest percent productive time was realized by the Timbco T425/Pika 600 at 877%. Based on a limitednumber of observed cycles, pre-bunching had a dramatic effect on the percent productive time of bolh the Hitachi EX 150/Keto500 and the Komatsu PC95/Hahn HSG 140, raising their percent productive time from 81.2% to 99.5% and 62.1% to 94.7%respectively. On a cost per piece basis, the Komatsu PC 95 / Hahn HSG 140 proved to be the lowest cost alternative for boththe conventional thinning format and pre-bunched processing format at $0.74 and $0.48/piece respectively.
INTRODUCTION
Cut-to-length/forwarder harvest systems havebecomeincreasingly important in the Pacific Northwest. Theseharvest systems have gained popularity for their productivity advantage over conventional systems, in thinningsmalltimber, and for their ability to meetsilvicultural goals that include retention of nutrients on the siteand minimization of soil impactsand residual standdamage.
Generally, cut-to-length/forwarder systems employ twoexpensive and complex machines, the harvester/processor and the forwarder. Working together, thesemachine havea highcapacity for producing timberproducts from overstocked, smaller diameter stands.The challenge for the operators of these machines is tofully utilize theproduction capacity of thesystemwhile still maintaining the silvicultural objectives forthe site.
The first two harvest/processors, a Hitachi EX150 withKeto model 500 processing head and a Komatsu PC95with HahnHSG140processinghead, were observedworking in a conventional thinningformatas wellasprocessing material from pre-bunched piles. The thirdsystem, a TimbcoT425 with Pika Model600 processing head, was only observed ina conventional thinningformat. While eachof the harvest / processors perform
similar functions, they operated in unique ways, hadoperators of varying skill levels and were studied individually. Detailed time andmotion studies provideddataon the production elements anddelayfactors forthe individual machines.
SITE CONDITIONS
Harvest operations were observed in three separatelocations. Site 1 was located in northern Idaho on auniversity-managed experimental forest. Site 2 andSite3 were located on industrial private lands in northwestern Montana.
The harvest / processoroperation on Site 1 wasobserved working on a north facing slope of approximately 5 acres. Slopes ranged from 10% to 25% andaveraged 20%. The harvest/ processor thinned thestand from approximately 450stems peracre, averaginga buttdiameter of 8.3 inches, to 150stems peracre. Thissitealsocontained pre-bunched tree lengthmaterial consisting primarily of Abies grondis (grandfir) with an average butt diameter of 11.8 inches.
Site2 involved harvesting and forwarding in bothconventional thinning and pre-bunched processing formats.Slopes on the5-acre site faced southwest and rangedfrom 0% to 40%,withan average of 25%.
52
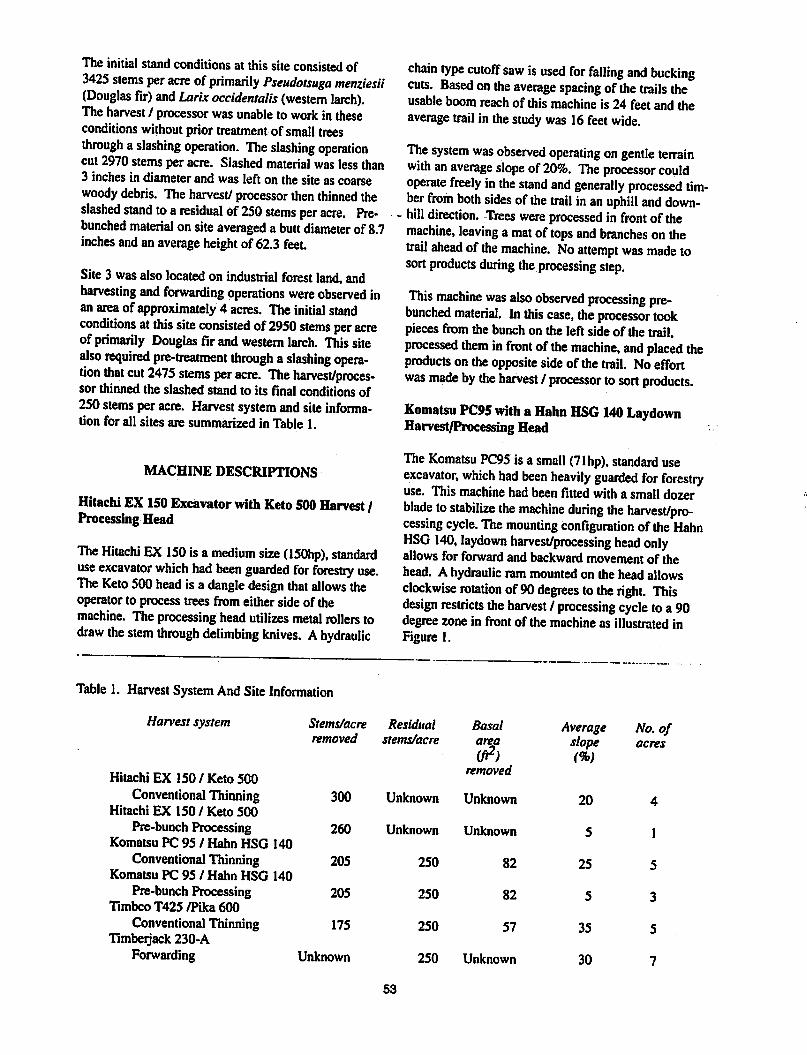
Theinitial stand conditions at thissiteconsisted of3425 stems per acre ofprimarily Pseudotsuga menziesii(Douglas fir) and Larix occidentals (western larch).The harvest / processor was unable to work in theseconditions withoutprior treatment of small treesthrough a slashing operation. The slashing operationcut 2970stems per acre. Slashedmaterial wasless than3 inches in diameter and was left on thesite as coarsewoody debris. The harvest/ processor then thinned theslashed stand toa residual of250 stems per acre. Pre-bunched material on siteaveraged a butt diameter of 8.7inches and an average height of 62.3 feet
Site 3 was also located on industrial forest land, andharvesting and forwarding operations were observed inan areaof approximately 4 acres. The initial standconditions at this site consisted of2950 stems per acreof primarily Douglas fir andwestern larch. Thissitealso required pre-treatment through a slashing operation that cut 2475 stems per acre. The harvest/processor thinned the slashedstand to its final conditions of250 stems peracre. Harvest system and site information for all sites are summarized in Table 1.
chain type cutoff saw is used for falling and buckingcuts. Based onthe average spacing ofthe trails theusable boom reach of thismachine is 24 feet and theaverage trail in the study was 16feet wide.
The system was observed operating on gentle terrainwith an average slope of20%. The processor couldoperate freely inthe stand and generally processed timber from both sides ofthe trail in an uphill and down-
- hill direction. Trees were processed in front of themachine, leaving a mat of tops and branches on thetrail ahead ofthe machine. No attempt was made tosort products during the processing step.
This machine was also observed processing pre-bunched material. In this case, the processor tookpieces from the bunch onthe left side of the trail,processed them infront ofthe machine, and placed theproducts on the opposite side of the trail. No effortwas made by the harvest / processor tosort products.
Komatsu PC95 with a Hahn HSG 140 LaydownHarvest/Processing Head
The Komatsu PC95 is a small (71hp), standard useexcavator, which had been heavily guarded for forestryuse. This machine had been fitted witha small dozerblade to stabilize the machine during the harvest/processing cycle. Themounting configuration of theHahnHSG 140, laydown harvest/processing head onlyallowsfor forward and backward movement of thehead. A hydraulic ram mounted on the headallowsclockwise rotation of90degrees to the right. Thisdesign restricts the harvest / processing cycle toa 90degree zonein frontof the machine as illustrated inFigure 1.
MACHINE DESCRIPTIONS
Hitachi EX 150 Excavator with Keto 500 Harvest /Processing Head
The Hitachi EX 150 isa medium size (150hp), standarduse excavator which hadbeen guarded for forestry use.The Keto 500 head isa dangle design that allows theoperator to process trees from either side of themachine. The processing head utilizes metal rollers todraw the stem through delimbing knives. Ahydraulic
Table 1. HarvestSystemAnd Site Information
Harvest system
Hitachi EX 150 / Keto 500
Conventional ThinningHitachi EX 150/Keto500
Pre-bunch ProcessingKomatsu PC 95 / Hahn HSG 140
Conventional ThinningKomatsu PC 95 / Hahn HSG 140
Pre-bunch ProcessingTimbco T425 /Pika 600
Conventional ThinningTimberjack 230-A
Forwarding
Stems/acreremoved
Residualstems/acre
Basal
area
(ft2)removed
Averageslope<%)
No. ofacres
300 Unknown Unknown 20 4
260 Unknown Unknown 5 1
205 250 82 25 5
205 250 82 5 3
175 250 57 35 5
nknown 250 Unknown 30 7
53

Twometal drums with teeth draw the stem through thedelimbing knives. A hydraulic chain-type cut off sawis used for falling and bucking cuts. Based on theaverage distance between trails this machine has ausableboom reach of 21 feet. The average trail in thestudy was 15 feet wide.
The machine was observed on variable terrain withslopesof 0% to 40% and an average slope of 25%.Processing was done in both-an uphill and downhill -direction, perpendicular to the slope. The steepest sectionswereprocessed in a downhill direction, using thedozerbladefor added stability. The configuration ofthisprocessing headallowed trees to be processed onlyin a 90- degree arc in frontof the machine, leavingproduct sorts on the left side of the machine. A concertedeffortwas made to sort three producttypesandto concentrate volumefor the forwarding phaseduringthe processingoperation. The three product sorts weresaw logs, stud logs, and pulp logs.
This machine was also observed processing pre-bunched timber on flat terrain. Pre-bunching of treelengths had been done by a small crawler tractor with ashearing head mounted on the front Bunches consisted of 2 to 12 stems. Due to the operatingcharacteristics of the harvest/ processor, the ideal presentation ofthe bunched material was either directlyaheadof themachine, or up to 45 degrees to the right of the harvest/ processor path. The operator also noted that 5 to 8
Falling & Processing Zone
Product
DeckingZone
Figure 1. OperationalConfiguration of the KomatsuPC95 with Hahn HSG 140 Harvester Head
stems per bunch was ideal. Space forproduct sortswas also necessary on the left side of the harvest /processor path. The tops and limbs wereplaced in thetrail ahead of the machine.
Timbco T425 with Pika 600 Harvest/ProcessingHead
The Timbco T425 (171hp) is a purpose built machine-for-forestry applications. It is self leveling to certainlimits and has the ability to operate on slopes upto50%. This machine had a snorkel type boom that provided for additional reach into standing trees. The Pika600head is a dangle design, allowing trees to beprocessed from either side of the machine. The heademploys two metal drums with teeth to draw the stemthrough the delimbing knives. Ahydraulic chain-typecutoffsawis used for falling andbucking cuts. Themachine has a usable boom reach of 26 feet, and, basedon observations, the average trail was 15 feet wide.
The system was observed onsteep terrain, with slopesranging from 10% to 50%and an average of 35%.While this machine configuration allows for processingfrom both sides of the machine, theoperator preferredto process trees from theleftside of thetrail, leavingtheproduct logs to the right sideof the machine. Topsand limbs were left on the trail ahead of the machine.Processing wasdone in an uphill direction only, andthe machine was backed down the slope before startingup the next trail. No attempt wasmade to sort productsduringthe harvest /processing operation.
Timberjack 230-A four wheeled forwarder.
TheTimberjack 230-A is a purpose built, logforwarding machine. It is a four-wheel-drive, articulated forwarder with an 8 ton capacity. It utilizes a Logliftbrandgrapple loader forloading, unloading, and sorting.
Theforwarder was observed operating in many conditions, with slopes ranging from 0% to 45% and anaverage slopeof 35%. The forwarder operatedon harvest/processor trails that were oriented perpendicular totheslope. The machine wasbacked to theupper endofthe trail and was loaded as it traveled downhill towardthe deck. Loadinggenerally occurred from one side ofthe machine. Productsortingtook placeboth in thewoodsand at the deckingarea. Forwarding turns included up to three products in various combinations. Forexample, there might be a single product in the bunk,therecouldbe two products separated in the bunk, twoproducts mixed in the bunk, or three products mixed inthe bunks. The degreeof sorting by the processorandtheforwarder had a significant effect on theproductivity of the machine.
54

PRODUCTION RESULTS
The production statistics for each machine and operationformat are presented inTable 2. Harvest / processingand forwarding cycles were recorded as separatetimes so forwarding production does not match that ofthe processors.
The low percent productivity for the Komatsu / HahnHSG 140 compared to the other machines can beattributed to some uniquedelay elementsencounteredby this system. For example, due to the smallerstemcapacityof the harvest / processing head, the machineoperatorstoppedthe harvest/ processing operation tohand fall and partially process oversizedstems. Thistooka significant amountof time. A seconddelay element unique to this operation was the time spent moving up hills. The combination of increased slope andslashed material on the ground created some movementdifficulties for this machine. In some cases, the boomhad to be used to either push or pull the machine to thenext processing location. The two other machines didnot encounter these difficulties due to the larger stemcapacity of their harvest / processing heads and muchhigherhorsepower. If these delays are ignored, allthree machineshave productive cycle times which arecomparatively close.
Table 2 also shows the productive and scheduled timein pre-bunched processing. Based on a limited numberof observations, both the productiveand scheduledcycle time decreased compared to conventional thinningoperations. The decrease in productive and sched
Table 2. Harvest/Processing And Forwarding
uled cycle time is most significant for the Komatsu PC95 / Hahn HSG 140. The high productive and scheduled cycle times for the Hitachi EX 150 / Keto 500 canbepartially attributed to the large stem sizes in thisoperation. These tested the capacity of the Keto headand slowed the operation.
Another factor contributing to highcycletimeswas thewell-worn drive rollerswhichgrippedthe tree and fedthe stem through the delimbing knives. In conventional thinning this was less of a problem, as the operatorused the momentum of the falling tree to aid in delimbing. This technique could not beapplied in thepre-bunched processing role. Thus, delimbing was slowedby the feed rateof the processing head.
The forwarding cycle was dominated by theloadingelement, representing 41%of the total scheduled cycletime. This elementwas highlydependent on the number of moves required to fill the bunk. The amount ofsorting required wasalsoa factor. Three product sortswere taken from the study sites. Full bunks of threemixed products resulted in verylong unloading times.Full bunks of a single product resulted in long loadingtimes due to thehigh number of moves required to fillthe bunk. Partial loads of single productswere fastbut did not fully utilize the capacity of the forwarder.
Asolution to these problems rests in the ability to loadmore than oneproduct at each loading stopandto keepthe products separated in the bunk of the forwarder. Anumber of turnswere observed in this configurationand they proved to have someof the lowest cycle times.
Harvest sytstem No. of No. of Ave. Productive Scheduled Percent
cycles pieces vol/piece cycle time cycle time /rroductiv
(ft3) (min) (min) time
Hitachi EX 150/Keto500
Conventional Thinning 221 559 ♦4.9 1.17 1.44 81.2%
Hitachi EX 150/Keto500
Pre- Bunched Processing 79 236 *9.5 1.20 1.20 99.5%Komatsu PC95 / Hahn HSG 140
Conventional Thinning 503 1516 •3.5 1.01 1.64 62.1%Komatsu PC95 / Hahn HSG 140
Pre- Bunched Processing 211 624 *3.5 0.89 0.94 94.7%Timbco T425/Pika 600
Conventional Thinning 441 963 *3.2 0.94 1.07 87.7%
Timberjack 230-AForwarding 51 3998 ♦3.5 31.28 32.07 97.8%
* Calculated using Smailien's volume formula♦♦Calculated using an average of 44 green lbs/ft3 (Caterpillar Performance Handbook)
55
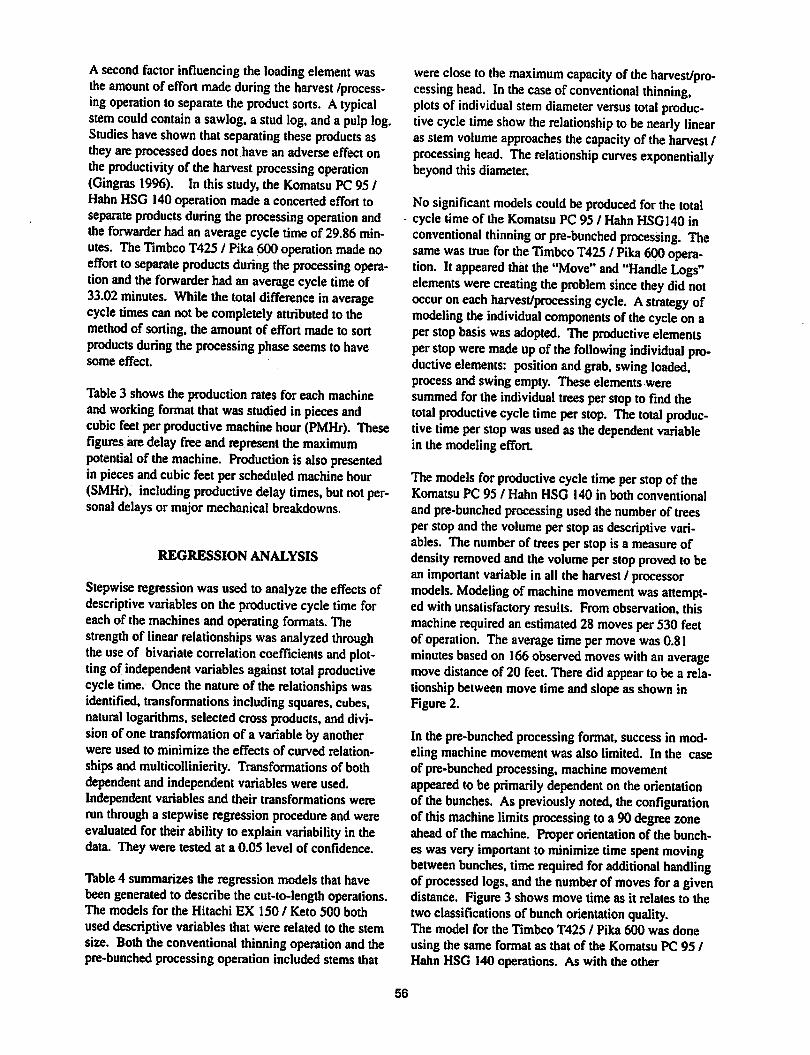
A second factor influencing the loadingelementwasthe amount of effort made during the harvest /processing operation toseparate the product sorts. Atypicalstem could contain a sawlog, a stud log. and a pulp log.Studies have shown thatseparating these products asthey are processed does not have an adverse effect onthe productivity of the harvest processing operation(Gingras 1996). In this study, the Komatsu PC95/Hahn HSG 140 operation made a concerted effort toseparate products during the processing operation andthe forwarder had an averagecycle time of 29.86minutes. TheTimbco T425/ Pika600 operation made noeffort toseparate products during the processing operation and theforwarder hadan average cycle time of33.02 minutes. While thetotal difference inaveragecycle timescan not be completely attributed to themethodof sorting, the amount of effort made to sortproducts during the processing phase seems to havesome effect
Table 3 shows the production rates for each machineand working format thatwasstudied in pieces andcubic feetper productive machine hour (PMHr). Thesefigures aredelay free and represent the maximumpotential of themachine. Production is also presentedin pieces and cubic feet per scheduledmachine hour(SMHr), including productive delay times, but not personal delays or major mechanical breakdowns.
REGRESSION ANALYSIS
Stepwise regression was used to analyze the effects ofdescriptive variables on the productive cycle time foreachof the machines and operating formats. Thestrength of linear relationships wasanalyzed throughthe use of bivariate correlation coefficients and plotting of independent variables against total productivecycle time. Once the nature of the relationships wasidentified, transformations including squares, cubes,natural logarithms, selectedcross products, and division of one transformation of a variable by anotherwere used to minimize the effects of curved relationships and multicollinierity. Transformations of bothdependentand independent variables were used.Independent variables and their transformations wererun through a stepwise regression procedure and wereevaluated for theirability to explain variability in thedata. They were tested at a 0.05 level of confidence.
Table 4 summarizes the regression models that havebeengenerated to describe the cut-to-length operations.The models for the Hitachi EX 150 / Keto 500 bothused descriptive variables that were related to the stemsize. Both the conventional thinningoperation and thepre-bunched processing operation included stems that
were close to the maximum capacity of the harvest/processing head. Inthe case ofconventional thinning,plots of individual stem diameter versus total productive cycle time show the relationship tobenearly linearas stem volume approaches the capacity of the harvest /processing head. The relationship curves exponentiallybeyond this diameter.
No significant models could be produced for the totalcycle time of the Komatsu PC 95 / Hahn HSG140 inconventional thinning orpre-bunched processing. Thesame was true forthe Timbco T425 / Pika 600 operation. It appeared that the "Move" and "Handle Logs"elements were creating the problem since they did notoccur oneach harvest/processing cycle. Astrategy ofmodeling the individual components of thecycle on aper stop basis wasadopted. The productive elementsperstop were made upof the following individual productive elements: position and grab, swing loaded,process and swing empty. These elements weresummed for the individual trees perstopto find thetotal productive cycle time perstop. The total productive time perstopwas used as thedependent variablein the modeling effort
The models forproductive cycle time perstop of theKomatsu PC 95 / Hahn HSG 140 in both conventionaland pre-bunched processing used the numberof treesper stop and the volume per stop as descriptive variables. The numberof trees per stop is a measure ofdensity removed and the volume perstop proved to bean important variable in all the harvest / processormodels. Modeling of machine movement was attempted with unsatisfactory results. From observation, thismachine required an estimated 28 movesper 530 feetof operation. The averagetime per move was 0.81minutes based on 166 observed moves with anaveragemovedistance of 20 feet. There did appear to be a relationshipbetween move time and slope as shown inFigure 2.
In the pre-bunched processing format, success in modeling machine movement was also limited. In the caseof pre-bunched processing, machine movementappeared to be primarilydependenton the orientationof the bunches. As previously noted, the configurationof thismachine limits processing to a 90 degree zoneahead of the machine. Proper orientationof the bunches was very important to minimize timespent movingbetween bunches, time required foradditional handlingof processed logs, and the number of moves for a givendistance. Figure 3 shows move time as it relates to thetwo classifications of bunchorientation quality.The model for the Timbco T425 / Pika 600 was doneusing the same format as that of the Komatsu PC 95 /Hahn HSG 140 operations. As with the other
56
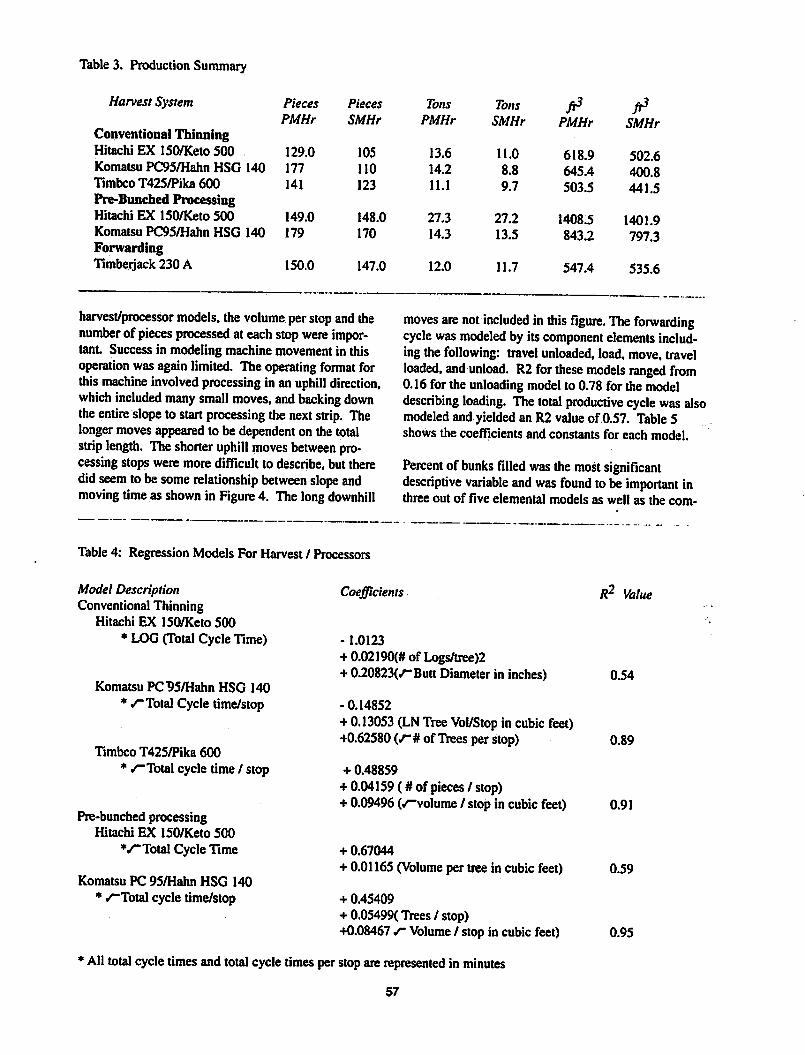
Table 3. Production Summary
Harvest System Pieces Pieces Tons Tons ft3 ft3PMHr SMHr PMHr SMHr PMHr SMHr
ConventionalThinningHitachi EX 150/Keto 500 129.0 105 13.6 11.0 618.9 502.6Komatsu PC95/Hahn HSG 140 177 110 14.2 8.8 645.4 400.8Timbco T425/Pika 600 141 123 11.1 9.7 503.5 441.5Pre-Bunched ProcessingHitachi EX 150/Keto 500 149.0 148.0 27.3 27.2 1408.5 1401.9Komatsu PC95/Hahn HSG 140 179 170 14.3 13.5 843.2 797.3ForwardingTimberjack 230 A 150.0 147.0 12.0 11.7 547.4 535.6
harvest/processor models, the volume perstop and thenumber of pieces processed at each stop were important Success in modeling machine movement in thisoperation wasagain limited. Theoperating format forthismachine involved processing in an uphill direction,which included many small moves, andbacking downthe entire slope to start processing the next strip. Thelonger moves appeared to be dependent on the totalstrip length. Theshorter uphill moves between processing stops were more difficult to describe,but theredid seem tobesome relationship between slope andmoving time as shown in Figure 4. The long downhill
moves are not included inthis figure. The forwardingcyclewasmodeled by its component elements including the following: travel unloaded, load, move, travelloaded, and unload. R2 forthese models ranged from0.16 for the unloading model to 0.78 for the modeldescribing loading. Thetotal productive cycle was alsomodeled and yielded an R2 value of 0.57. Table 5shows the coefficients and constants for each model.
Percent of bunks filled was the most significantdescriptive variable and was found tobe important inthree out of five elemental models as well as the corn-
Table 4: Regression Models For Harvest / Processors
Model DescriptionConventional Thinning
Hitachi EX 150/Keto 500
* LOG (Total Cycle Time)
Komatsu PC95/Hahn HSG 140* •"Total Cycle time/stop
Timbco T425/Pika 600* •"Totalcycle time / stop
Pre-bunched processingHitachi EX 150/Keto 500
VTotal Cycle Time
Komatsu PC 95/Hahn HSG 140
* /"Total cycle time/stop
Coefficients R? Value
-1.0123
+ 0.02190(# of Logs/tree)2+ 0.20823(/~Butt Diameterin inches) 0.54
-0.14852
+ 0.13053 (LNTreeVol/Stop in cubic feet)+0.62580 (7-# of Trees per stop) 0.89
+ 0.48859
+ 0.04159 (# of pieces / stop)+ 0.09496 (/-volume / stop in cubic feet) 0.91
+ 0.67044
+ 0.01165 (Volume per tree in cubic feet) 0.59
+ 0.45409
+ 0.05499(Trees / stop)+0.084677"Volume / stop in cubic feet) 0.95
*All total cycletimes and total cycletimes perstop arerepresented in minutes
57
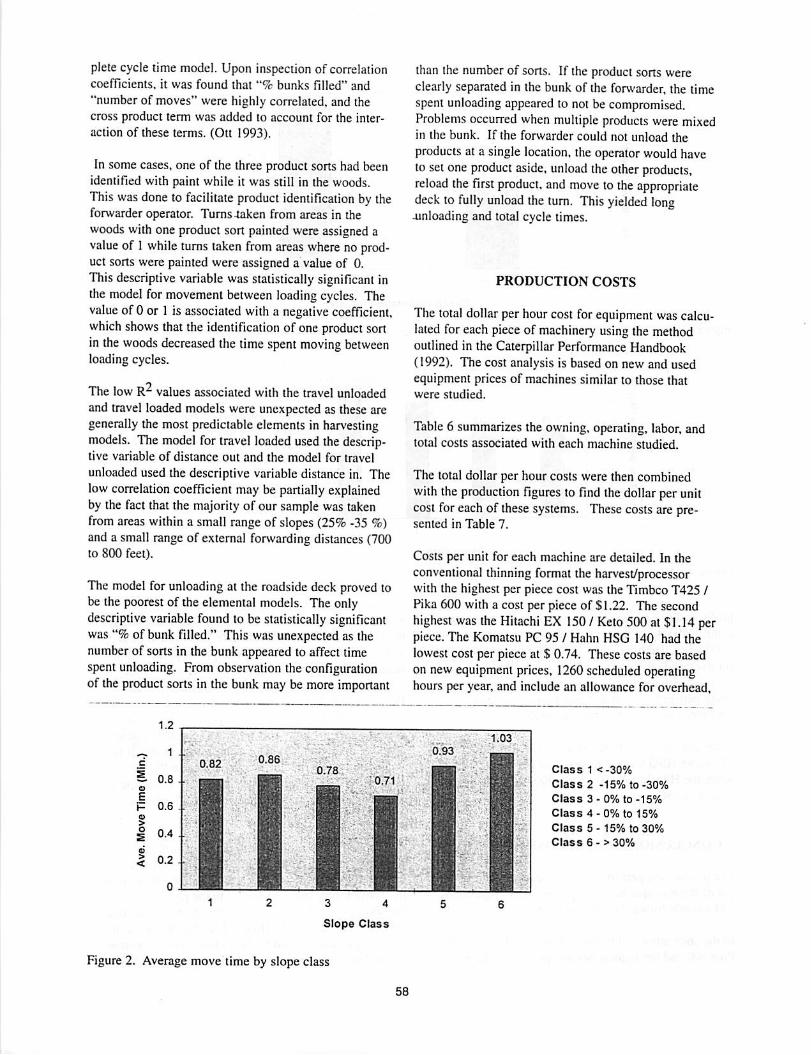
pletecycle time model. Upon inspection of correlationcoefficients, it was found that "% bunks filled" and"number of moves" were highly correlated, and thecross product term was added to account for the interaction of these terms. (Ott 1993).
In some cases, one of the three product sorts had beenidentified with paint while it was still in the woods.This was done to facilitate product identification by theforwarder operator. Turns.taken from areas in thewoods with one product sort painted were assigned avalue of 1 while turns taken from areas where no product sorts were painted were assigned a value of 0.Thisdescriptive variable was statistically significant inthe model for movement between loading cycles. Thevalueof 0 or 1 is associated with a negativecoefficient,which shows that the identification of one product sortin the woods decreased the time spent moving betweenloading cycles.
The low R- values associated with the travel unloadedand travel loaded models were unexpectedas thesearegenerally the most predictable elements in harvestingmodels. The model for travel loaded used the descriptive variable of distance out and the model for travelunloaded used the descriptive variable distance in. Thelow correlation coefficient may be partially explainedby the fact that the majority of our sample was takenfrom areas within a small range of slopes (25% -35 %)and a small range of external forwarding distances (700to 800 feet).
The model for unloading at the roadside deck proved tobe the poorest of the elemental models. The onlydescriptive variable found to be statistically significantwas "% of bunk filled." This was unexpected as thenumberof sorts in the bunk appeared to affect timespent unloading. From observation the configurationof the product sorts in the bunk may be more important
Figure 2. Average move time by slope class
than (he numberof sorts. If the product sorts wereclearly separated in the bunk of the forwarder, the timespent unloading appeared to not be compromised.Problems occurred when multiple products were mixedin the bunk. If the forwarder could not unload theproducts at a single location, the operator would haveto set one product aside, unload theotherproducts,reload the first product, and move to the appropriatedeck to fully unload the turn. This yielded long.unloading and total cycle times.
PRODUCTION COSTS
The total dollarperhourcost for equipment was calculated for each piece of machinery usingthe methodoutlined in the Caterpillar Performance Handbook(1992). The cost analysis is based on new and usedequipment prices of machines similar to those thatwere studied.
Table 6 summarizes the owning,operating, labor, andtotal costs associated with each machine studied.
The total dollar per hour costs were then combinedwith the production Figures to find the dollar perunitcost for eachof these systems. These costs are presented in Table 7.
Costs per unit for each machine are detailed. In theconventional thinning format the harvest/processorwith the highest per piece cost was the Timbco T425 /Pika600 with a cost per piece of SI.22. The secondhighest was the Hitachi EX 150 / Keto 500at SI.14 perpiece. The Komatsu PC 95 / Hahn HSG 140 had thelowest cost per piece at $ 0.74. These costs are basedon new equipment prices. 1260 scheduled operatinghours per year, and include an allowance for overhead.
Class 1 <-30%
Class 2 -15% to-30%
Class 3-0% to-15%
Class 4-0% to 15%
Class 5- 15% to 30%
Class 6 - > 30%
58
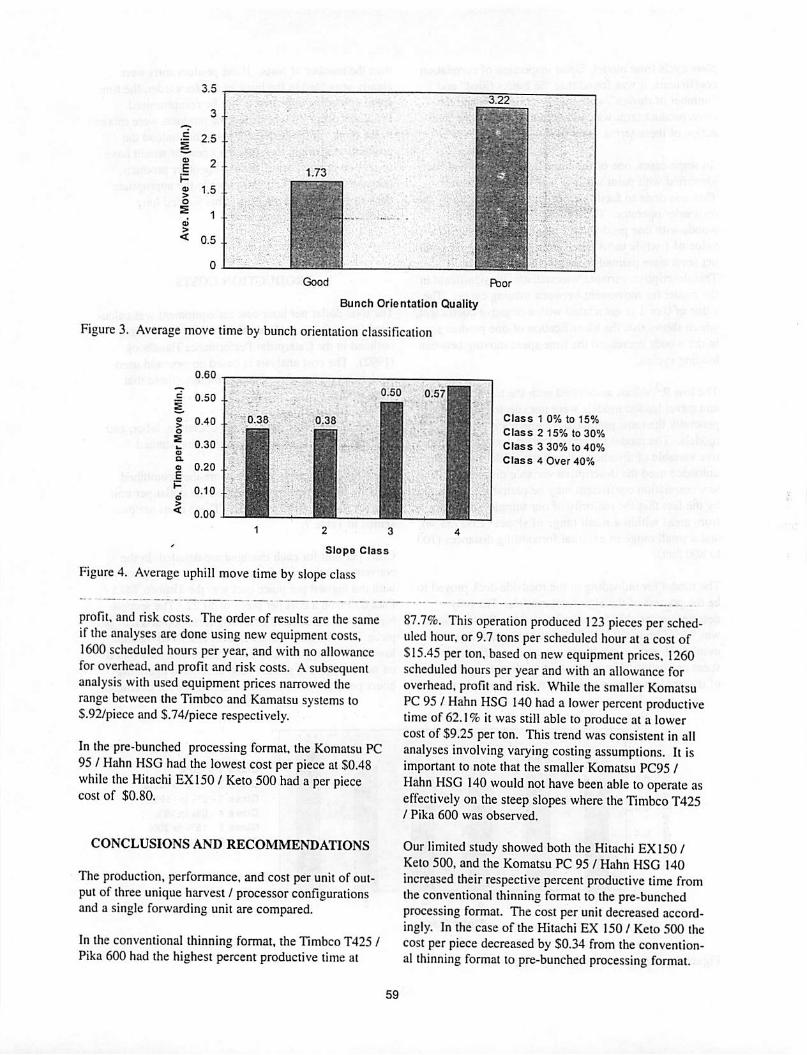
Good Fbor
Bunch Orientation Quality
Figure3. Average move time by bunch orientation classification
0.60
d 0.50 ->
> 0.40 .o
0.30 .o
u.
o
r
0.20 .
H0.10 .
O
< 0.00
Class 1 0% to 15%
Class 2 15% to 30%
Class 3 30% to 40%
Class 4 Over 40%
2 3
Slope Class
Figure 4. Average uphill move time by slope class
profit, and risk costs. The order of results are the sameif the analyses aredone using new equipment costs,1600scheduled hours per year, and with no allowancefor overhead, and profit and risk costs. Asubsequentanalysis with used equipment prices narrowed therange between the Timbco and Kamatsusystems toS.92/piece andS.74/piece respectively.
In the pre-bunched processing format, the Komatsu PC95 / Hahn HSG had the lowest cost perpiece at $0.48while the Hitachi EX 150 / Keto 500had a per piececost of $0.80.
CONCLUSIONS AND RECOMMENDATIONS
The production, performance, and cost per unit of output of three unique harvest / processor configurationsand a single forwarding unit are compared.
In the conventional thinning format, the Timbco T425 /Pika 600 had the highest percent productive time at
87.7%. This operation produced 123 pieces per scheduled hour, or 9.7 tons per scheduled hour at a cost ofSI5.45 per ton, based on new equipment prices. 1260scheduled hours per year and with an allowance foroverhead, profit and risk. While the smaller KomatsuPC95 / Hahn HSG 140 hada lower percent productivetime of 62.1 % it was still able to produce at a lowercost of $9.25 per ton. This trend was consistent in allanalyses involving varying costing assumptions. It isimportant to note that the smaller Komatsu PC95 /Hahn HSG 140 would not have been able to operate aseffectively on the steep slopes where the TimbcoT425/ Pika 600 was observed.
Our limited study showed both the Hitachi EX150 /Keto 500, and the Komatsu PC 95 / Hahn HSG 140increased theirrespective percent productive time fromthe conventional thinning format to the pre-bunchedprocessing format. The cost per unit decreased accordingly. In the case of the Hitachi EX 150 / Keto 500 thecost per piece decreased by S0.34 from the conventional thinning format to pre-bunched processing format.
59
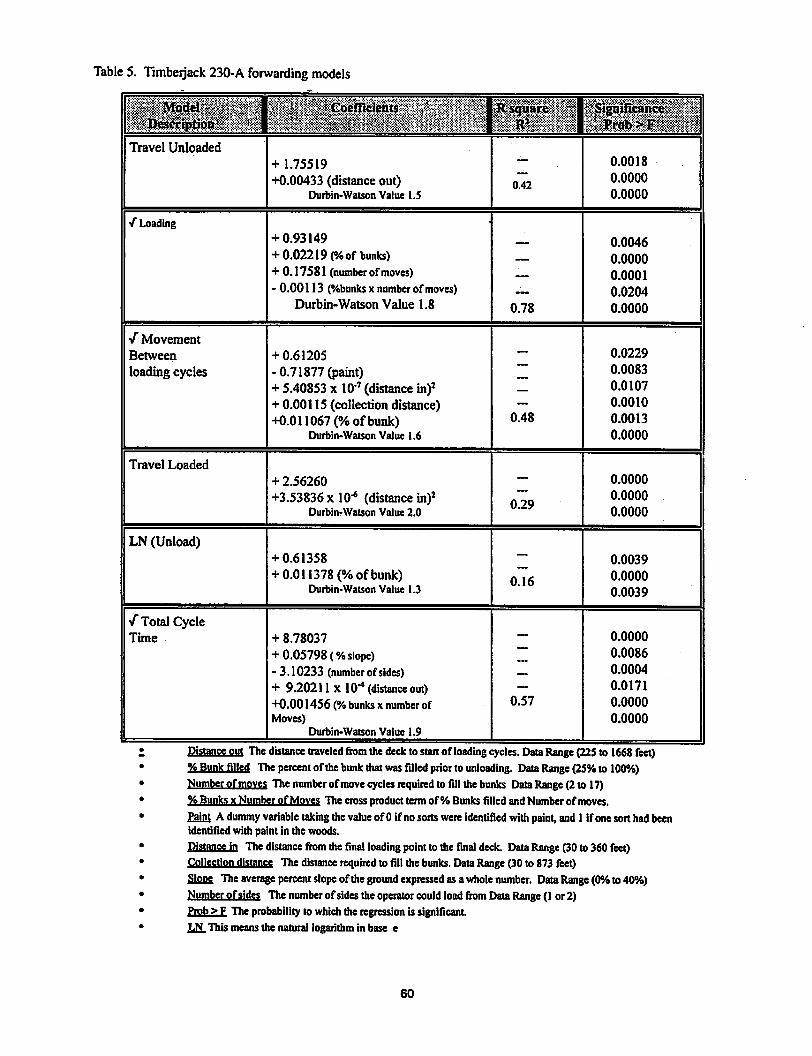
Table 5. Timberjack 230-A forwarding models
Travel Unloaded
V" Loading
+1.75519
+0.00433 (distance out)Durbin-Watson Value 1.5
+ 0.93149
+ 0.02219 (%of bunks)+ 0.17581 (number ofmoves)- 0.00113 (%bunks x number ofmoves)
Durbin-Watson Value 1.8
0.42
0.78
0.0018
0.0000
0.0000
0.0046
0.0000
0.0001
0.0204
0.0000
/MovementBetween
loading cycles+ 0.61205
-0.71877 (paint)+ 5.40853 x 10*7 (distance in)1+ 0.00115 (collection distance)+0.011067 (% ofbunk)
Durbin-Watson Value 1.6
0.0229
0.0083
0.0107
0.0010
0.0013
0.0000
Travel Loaded
LN (Unload)
•/"Total CycleTime
+ 2.56260
+3.53836 x 10"* (distance in)2Durbin-Watson Value 2.0
+ 0.61358
+ 0.011378 (% ofbunk)Durbin-Watson Value 1.3
+ 8.78037
+ 0.05798 (% slope)- 3.10233 (number of sides)+ 9.20211 x 10"4 (distance out)+0.001456 (%bunksx number ofMoves)
Durbin-Watson Value 1.9
0.48
0.29
0.16
0.57
0.0000
0.0000
0.0000
0.0039
0.0000
0.0039
0.0000
0.0086
0.0004
0.0171
0.0000
0.0000
Distance out The distance traveled from thedeckto start ofloading cycles. Data Range (225 to 1668 feet)% Bunk filled The percent ofthebunkthatwas filled prior to unloading. Data Range (25%to 100%)Number of moves The number of movecycles required to fill thebunks Data Range (2to 17)% Bunks x NumberofMoves The crossproduct termof% Bunks filledandNumberofmoves.
Paint A dummyvariable takingthevalueof0 if nosorts wereidentified with paint, and1ifonesorthadbeenidentified with paint in the woods.
Distance in The distance from the final loading pointto the final deck. DataRange(30to 360 feet)Collectiondistance The distance required to till the bunks. DataRange(30 to 873 feet)
Slone Theaverage percent slope of theground expressed asawhole number. Data Range (0%to 40%)Number ofsides The numberofsidesthe operator couldloadfrom Data Range(1 or2)Prob>F The probability to whichthe regression is significant.LCLThis means the natural logarithm in base e
60
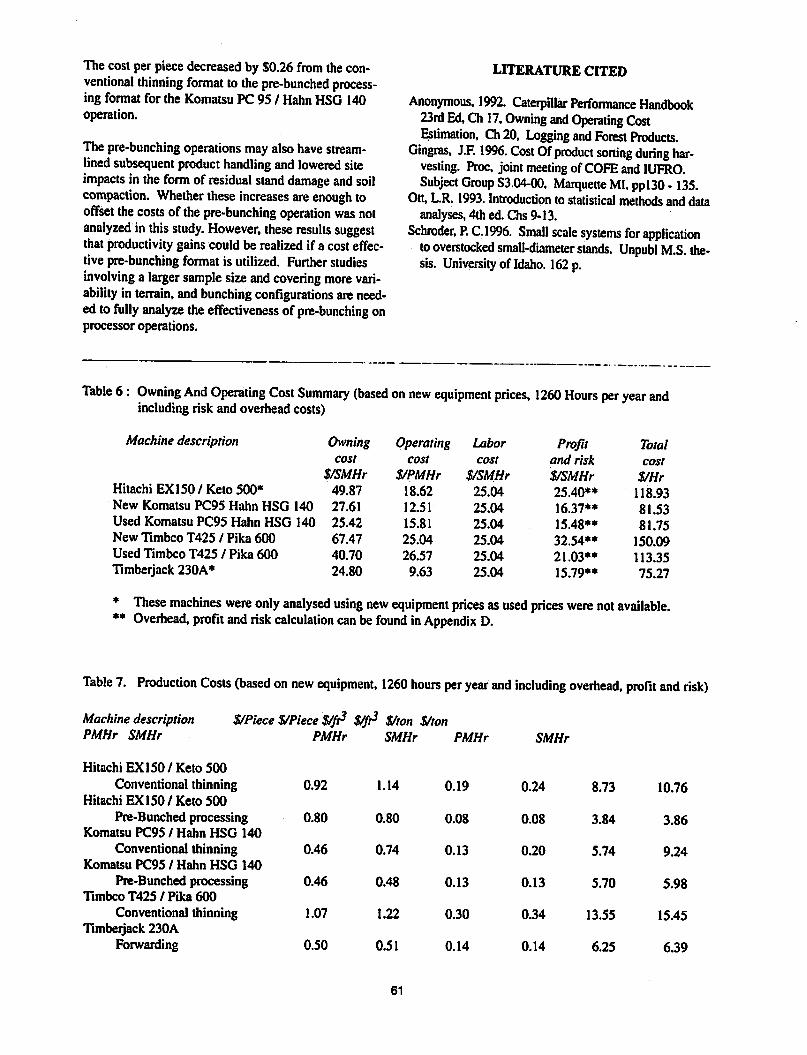
Thecostper piece decreased by $0.26 from theconventional thinning format to the pre-bunched processing format for the Komatsu PC 95 / Hahn HSG 140operation.
The pre-bunching operations may also havestreamlinedsubsequent producthandling and lowered siteimpacts in theform of residual stand damage and soilcompaction. Whether these increases areenough tooffset the costs of thepre-bunching operation was notanalyzed in this study. However, these results suggestthat productivity gains could be realized if a cost effective pre-bunching format is utilized. Furtherstudiesinvolving a larger sample size and covering more variability in terrain, andbunching configurations are needed to fully analyze theeffectiveness of pre-bunching onprocessor operations.
LITERATURE CITED
Anonymous, 1992. Caterpillar Performance Handbook23rd Ed, Ch 17, Owning and Operating CostEstimation, Ch20, Logging and Forest Products.
Gingras, J.F. 1996. Cost Of product sorting during harvesting. Proc, jointmeeting ofCOFE and IUFRO.Subject Group S3.04-00, Marquette MI, ppl30 -135.
Ott,L.R. 1993. Introduction to statistical methods and dataanalyses, 4th ed. Chs 9-13.
Schroder, P. C.1996. Small scale systems for applicationtooverstocked small-diameter stands. Unpubl M.S. thesis. University of Idaho. 162 p.
Table 6 Owning And Operating Cost Summary (based on new equipment prices, 1260 Hours per year andincluding risk and overhead costs)
Machine description
Hitachi EX150/Keto 500*New Komatsu PC95 Hahn HSG 140Used Komatsu PC95 Hahn HSG 140New Timbco T425 / Pika 600Used Timbco T425 / Pika 600
Timberjack 230A*
* These machines were only analysed using new equipment prices asused prices were not available.** Overhead, profit and risk calculation can befound inAppendix D.
Owning Operating Labor Profit Totalcost cost cost and risk cost
$/SMHr VPMHr $/SMHr $/SMHr S/Hr49.87 18.62 25.04 25.40** 118.9327.61 12.51 25.04 16.37** 81.5325.42 15.81 25.04 15.48** 81.7567.47 25.04 25.04 32.54** 150.0940.70 26.57 25.04 21.03** 113.3524.80 9.63 25.04 15.79** 75.27
Table 7. Production Costs (based on new equipment, 1260 hours per year and including overhead, profit and risk)
Machine descriptionPMHr SMHr
VPieceVPieceVft3 ifft3 Vton VtonPMHr SMHr PMHr SMHr
Hitachi EX150/ Keto 500
Conventional thinningHitachi EX150/ Keto 500
Pre-Bunched processingKomatsu PC95 / Hahn HSG 140
Conventional thinningKomatsu PC95 / Hahn HSG 140
Pre-Bunched processingTimbco T425/Pika 600
Conventional thinningTimberjack 230A
Forwarding
0.92 1.14 0.19 0.24 8.73 10.76
0.80 0.80 0.08 0.08 3.84 3.86
0.46 0.74 0.13 0.20 5.74 9.24
0.46 0.48 0.13 0.13 5.70 5.98
1.07 1.22 0.30 0.34 13.55 15.45
0.50 0.51 0.14 0.14 6.25 6.39
61

Methods Used to Evaluate the Effects ofForest Operations on the Remaining
Vegetation and Soil: Review and Recommendations
Michael A. ThompsonJamesAMattson
andJoseph B. Sturos
USDA Forest ServiceHoughton, Ml, USA
Abstract: The effects of forest operations on the physical attributes and ecology of aforest site are of great concern tolandowners, forest managers, equipment operators, and the environmental community. Consistent, accurate, and economicmethods for evaluating effects are needed. In this paper, we will review methods from the literature that are being used to evaluate the physical effects of forest operations on the remaining vegetation and soil. These will include methods to evaluateresidual tree damages, damage to understory plants and seedlings, degree of soil displacement, and degree of soil compaction.From this review, we will recommend specific methods for evaluating these effects.
Keywords: forest operations, evaluation methods, tree damage, site disturbance, soil compaction
INTRODUCTION
Forest operations, such as timber harvesting, roadbuilding, sitepreparation, andmechanical planting,canaffectthe physical attributes and ecologyofaforest site. Typical effects include physical damage toremaining trees and plants, displacement and mixingofsoil layers, andcompaction ofsurface soil layers.
These effects can be either intended or unintended inthe particular operation beingconducted. They canalso be considered desirable or undesirable relative tothe management objectives forthe site. Mostoperationsresult in some combination of intended/desirable,unintended/desirable, and unintended/undesirable effects. Although a fourth category exists,namely intended/undesirable, we don't believe anyoneintentionally creates undesirable effects in forestoperations.
Examplesofintended/desirable effects includeremovingvegetationand organic soil from a roadright-of-way, clearing thecompeting vegetation andhumus inaspot scalping operation, oropening aslitinthesoilto accept seedlings ina planting operation.Examples ofunintended/desirable effects mightinclude the soil scarification and associated seedbedpreparation that often occurs in logskidding, thepossible improvement indrainage efficiencyassociated withroad construction operations,
62
the possible increase in nutrient availability associatedwith site preparation operations, or the reduction incompetition ofundesirable vegetation with plantedseedlings as a resultofphysical damage from theprimemover in plantingoperations.
The categoryofeffects that is ofmost concern inforest operations is that considered unintended/undesirable. This includes unwanted damage toremaining treesandplants, unwanted displacementandmixingofsoil layers, unwanted compaction ofsurface soil layers, damage to archeological resources,contamination ofsoiland water by oiland gas spills,andrelease of pollutants intotheatmosphere. Theseeffects sometimes lead to further undesirable effects,such assoilerosion, stream siltation, poorwaterquality, reductions in wildlife populations, increasesin insect ordisease populations, reductions in treegrowth rates, increased treemortality, changes in lowplant communities, and a decrease inaesthetic qualityofthe site.
Knowledge ofthemagnitude and prevalence oftheseunintended/undesirable effects is important inorder tominimize future impacts andmaintain a healthy forestenvironment A good methodology for measuringthese effectsis critical to properly assessing theirextentandimportance. A good evaluation systemormethod has the followingattributes:
Accurate - The system should provide anaccuratedescription of thephysical effects that actuallyoccurred asaresult ofthe forest operation.
Consistent - Measurements should be objective sothat theycan beconsistently and repeatably appliedby different observers.
Easyto apply - It should be reasonably fast and easyto apply to minimizethe costofdata gathering.
Provide usefulinformation- It should provide usefulandappropriate information for developing a clearpicture ofdirect andpossible indirect effects.
Statisticallyvalid - It shouldprovidemethodsandmeasurementsthat are statisticallyvalid.
The purpose ofthis report is to reviewpastand currentmethods being used to evaluatethe effects of forestoperations on the remaining vegetation andsoil. Fromthis review, we will recommend assessment methodswe feel areappropriate forgeneral use,as well ashighlight research needs in this area.
DAMAGE TO RESIDUAL TREES AND PLANTS
Damage to residual treesandplants in forestoperations can take many forms. Scuffsare scrapesthatdamage or removea portion ofthe outerand/orinner bark from the bole, roots, or branches ofa tree.Thesewounds cancause discoloration ofthe adjacentwood, affecting productvalue at the time ofharvest(Ohman 1970). They alsoprovide a pathway forinsects,disease, and decay to infect and furtherdamage orkill the treeovertime (Shigo 1979).
Gouges are scrapes or punctures thatextendthroughthe bark layers into the wood. These wounds arepresumed to have a similar but more serious effect ondiscoloration, decay,and insect and diseaseattackthanscuffwounds(Bruhn 1986). Cuts arelike gougesexcept they aredone with a sharpened tool, such as achainsaw, circular saw, disc saw, or pruningsaw.Cuts and gougeshave similareffects on the tree.
Otherdamages that can occur includepinned, leaning,broken,and uprooted trees and plants. Pinnedtreesarebent over with the leaderpinnedto or nearto theground. Leaning treeshavebeenpushed partially overso they arestandingat a different angle than before.Brokentreesor plantshave hadtheir top brokenoffatsome pointalongthe stem. Uprooted treesor plantshavebeencompletely uprooted from the soil. Except
63
for leaning trees, these damages generally destroy thegrowth and future value potential of the tree orplant.
Broken branches are acommon form of crown damagein forest operations. This type of injury can result ineffectssimilar to scuff wounds, aswell asdecrease theoverall vigor and current growth potential of thetree(Nyland 1994). Frayed branch stubs in the tree crownare more likely to result in rot because theytend totrap and retain moisture (Anderson 1994). Brokenbranches may beinconsequential if only a few smallbranches are broken, orvery serious totree orplanthealth if manylarger branches are broken.
Severed or crushed roots are common forms ofrootdamage in forest operations. These injuries can resultin effects similar to that ofbroken branches. Woundsincontact with soil are more susceptible todecaybecause themoisture provides a good environmentfor infection (Dey 1994). Discoloration and decayinitiated inroots often extend into the buttlog of thetree (Benzie etal. 1963). Rootdamage can occurwithout any visible disruption of the soil (Shepperd1993), making assessment ofactual root damagedifficult Severe rootdamage oftenoccurs inconjunction withsoilrutting. The partial protectionprovided bysoil overtheroots is lost when ruttingoccurs, leaving theroots vulnerable to damage.
Damage to residual treesandplants in forestoperations canoccur in several ways. A machineoperating in thestand can damage vegetation directlyby rubbing upagainst them,by running overthem, orby swinging moveableparts against them. A machine..can also indirectly damage vegetation by pushing ordragging othermaterials (such astrees, logs, rocks,anddirt)up against or pastthem.
A large portion ofdamage to residual trees and plantscomes from unintended interaction with cut trees andlogs. This occurs in felling as the tree falls, inextraction asthetree or logismovedfrom the stumpto the landing orroadside, in decking asthe treeor logis piled, andin loading as the treeor log is loaded.
Although thecauses andeffectsofdamage to lowplantsand seedlings aresimilarto those ofresidualtrees,the methods used to assessdamagesto eacharesomewhat different Reasons for differences includethe smallersize and greater abundance oflowvegetation, alongwith differences in the typesofdamagesthey normally sustain. Therefore,we willdiscuss the methodology associated with eachseparately.

Assessment of residual tree damage
Residual treedamage asa result of forest operationscanbe assessed in several ways. One is to evaluatedamages as they occur(e.g.,Wendel and Kochenderfer1978; Kelloggand Hargrove 1985). This methodprovides exact knowledgeofhow the damageoccurred, which can then be used to minimize futuredamages. More commonly, however, damage isevaluated afterthe operations ofinterest are complete(e.g., Lamson et al. 1985). Associatingdamages withtheircause(i.e., felling, skidding, etc.) using thisapproach requires that the damage assessmentberepeated aftereach individual operation is complete.
If the measurement area ofinterest is smallenough, a100%surveyofall residual trees can be done (e.g.,SidleandLaurent 1986; Howard 1996). For largerareas, a samplingpartemmust be employed. Sampleplotscanbe laidout in a completely random pattern(e.g.,Kelley 1983); a systematic pattern, suchas plotswith fixedspacings on lineswith fixed spacings (e.g.,McNeel and Ballard 1992); or some combination ofrandom and systematic,such as plots with fixedspacings on randomlylocated lines (e.g., Baumgras etal. 1995), randomlyspacedplots on lines with fixedspacings (e.g.,Ostrofsky et al. 1986),or randomlyselectedpointson a fixed grid(e.g., McLaughlin andPulkki 1992).
Sample plots can be circularor rectangular. Circularplots can be fixed radius or variable radius. For fixedradius circular and rectangular plots, all trees largerthansome minimum specified size falling within theplot boundaries areevaluated fordamage(e.g.,Ficklinet al. 1997). Forvariableradiusplots, all trees largerthanthe minimum specified size identified as being inwith a prism areassessed for damages(e.g., Meyer etal. 1966; Fairweather 1991).
A line transect can also be used to define fixed and
variable width sampleplots. A fixed width plot isformed when all trees within a given perpendiculardistance from the transect line are measured (e.g.,Nichols etal. 1993;Biltonen et al. 1976). Availablewidth plot is formed when a prismis used to definesample trees on either side ofthe transect line(e.g., Cline etal. 1991).
Pilkertonet al. (1996) compared four differentsampling patterns for evaluating residual standdamage: fixed radius circular plots with fixed line andplot spacings,randomly located fixed radiuscircularplots, fixedwidth to eithersideofevenly spaced linetransects, and fixed width blocks laid out
64
perpendicular to the skyline road. Theyconcludedthat the sampling pattern using fixed radius circularplots with fixed line and plot spacings was themostefficient to install and provided an acceptable estimateof residual stand damage.
Plot sizes (inacres) used for fixed-area plots include0.0125 (e.g., McLaughlin andPulkki 1992), 0.025(e.g., Lanford and Stokes 1995), 0.05 (e.g., Nichols etal. 1993), 0.1 (e.g., Bettinger and Kellogg 1993), 0.2(e.g., Reisinger and Pope 1991), 0.5(e.g., Miller et al.1984; Meadows 1993), 125 (e.g., Schmid and Mata1993), and on up to the full harvested area for 100%surveys (e.g.,Bruhn 1986; Howard 1996). Severaldamage surveys employing variable plotboundariesused a basal area factor (BAF) 10 (square feet) prism(Fairweather 1991; Meyer et al. 1966; Thompson et al.1995), whereas one useda BAF 75 prism(Clineet al.1991).
Theminimum sizetree (diameter atbreast height -dbh)evaluated for damages varies considerablybetween studies. Minimum treesizes(dbhin inches)used have included0.5 (e.g.,Nichols et al. 1993), 1.0(e.g., Wendel andKochenderfer 1978), 1.5 (e.g.,Thompson et al. 1995), 1.6(e.g., Herrick andDeitschman 1956), 2.0(e.g., Kelley 1983), 2.5(e.g.,Lanfordand Stokes 1995),3.0 (e.g.,Cline 1991),4.0(e.g., Davisand Vollmer 1993),4.6 (e.g., Fairweather1991),5.0 (e.g., Huyleret al. 1994),6.0 (e.g.,ReisingerandPope 1991),and 8.0 (e.g.,Nyland et al.1976).
The numberor percentoftreesdamaged is a commonstatistic reported in damage studiesandwill varyconsiderably if smalltreesareincluded. Althoughthere are some very good reasonsnot to assessdamages to small trees in some silvicultural systems,to ensure comparability ofresults, minimum tree sizeor size groupings shouldbe kept consistent fromonedamagestudy to the next
Common attributesrecorded for damaged treesinclude tree species, tree dbh, distance from the tree tothe nearest trail, distance downthe trail to the landing,locationofthe damage (root, root collar, bole, orcrown),whetheror not it is a potential crop tree,andtype ofdamage (outerbarkscuff, exposedsapwoodscuff, gouge, cut, pinned leader, leaning bole, brokenbole, uprooted bole, broken branches, and broken orcrushedroots). Ifthe damage is a scuff, gouge,or cutmeasurementstaken include the length,width, area,anddepth ofthe damage, the heightto the baseofthedamage, andthe quadrant that the damageis locatedinrelativeto the nearesttrail and landing.
Pinned,leaning,brokenand uprootedtrees are notedas such,with the angleof lean and heightto brokentop noted. The height to and size of broken branchesare noted, while the size ofand distance from the rootcollar for severed or crushed roots are noted. Otherfactorsthat are assessed to help explain the observeddamage rates include the number and size of the treesremoved, the numberand size ofthe trees remaining,the lengths ofthe productsbeingremoved, theoperationalsystemsused, the experienceand carelevelofthe operator,the terrain, the season of harvest,and otherpossible influencingfactors. Differentevaluation systems usedto quantify residual standdamagevary considerablyin relation to thesemeasured attributes.
Recommended tree damage evaluation methods
There is a needto standardize themethodology usedto assess residual treedamages resulting from forestoperations (Bruhn 1986). A standard methodologywillhelpprovide for meaningful and unbiasedcomparisonsbetweenalternativesystems,as well asensure consistency in impact monitoring programs.As a startingpoint in this effort,we recommend thefollowing:
Sample uniformly - Thesampling pattern usedshouldbe uniform across the area ofconcern. Residual treedamages areoften more prevalent along mainextraction routes andclose tothelanding. Samplingthe area uniformly will ensure thesample representsthe entire area. Plot ortransect lines should beevenlyspacedand run perpendicularto the trails andcorridors to lessen therisk ofoversampling near oraway from these extraction routes (Young 1994).Also, uniform sampling patterns are easierto installand at least asaccurate asotherpossible samplingschemes (Pilkerton et al. 1996).
Sample intensively • Sample as intensively aspossible to achieve a reasonable level ofconfidence inthedata. Samples costmoney, but incorrectconclusions could cost a lot more. Schreuder et al.(1993) discuss this in detail.
Use variable radius plots - Variable radius plotsincrease measurement efficiency by lowering thenumber oftrees mat must evaluated with no loss inaccuracy (Dilworth and Bell 1977). McNeeletal.(1996) recommend that damage assessment beanextension ofcurrent inventory procedures. Variableradius plots arecommonly used inforest inventory,making damage assessment byprism a naturalextensionofcurrentpractice.
65
Use a common mimimum tree size - The minimumtreesize surveyed fordamages will affect observeddamage rates. The main effect will be due to adifference inthenumber of trees perunitareaincluded inthe survey. Asecondary effect willbedueto possible differences indamage rates basedon treesize. Forthisreason, it is important to havea commonminimum tree size orcommon size groupings betweendamage studies if they are tobecompared. Werecommend grouping trees bysize into saplings (dbhfrom 1.0 to4.0 inches) and larger trees (dbh greaterthanor equalto 4.0 inches).
Relatedamageto a singleoperation- Eachforestoperation has unique factors that affect stand damagerates. Lumping the damagesfrommorethan oneoperation together makes it impossible todistinguishthe damages associated with each particular operation,potentially biasing comparisons between equipmentand operational methods. This can bedone bywatching the damages asthey areoccurring orsurveying for damages after each individual operation.
Measure all pertinent data - Data we feel should bemeasured includes the following:
Tree speciesTreediameter at breastheight •
Saplings> 1.0 and < 4.0 inchesLarger stems > 4.0 inches
Potentialcrop tree - yes or noDistance to the nearest trailDistance along trail to the landingDamage location - root,rootcollar, bole,or crownDamagetype
Outer bark scuff- length, width, height, quadrantExposedsapwoodscuff- same as aboveGouge - same asabove, also maximum depthCut- sameas gougePinned leader
Leaning bole- approximate angle of leanBrokenbole- heightto break,diameterat breakUprooted boleBroken branches - heightand sizeofeach
broken branch > 2 inches diameter at breakSevered or crushed roots - size, quadrant, and
distance from the root collar for each rootOther pertinent information
Species, number, and size ofthe trees removedSpecies, number, andsize ofthetrees remainingType and lengths ofproducts removedOperational systems used in the harvestExperience andcarelevel of theoperatorLocal terrainand groundconditionsSeason ofharvest
Level of harvest planning andoversight
Damage to low plants and seedlings
Assessingdamage to low plantsand seedlingsas aresultof forest operationsshould not be confused witha regeneration survey,althoughsimilarmethods areused. The purpose ofa regeneration survey is toassessthe adequacy oftree seedlingstocking andcomposition, alongwith a measureofthe competingvegetation present(Brand et al. 1991). Thisinformation can then be used to decide if furthertreatmentor plantingofthe areais needed.
The purposeofa damage assessment is to determinehowa particular operation impacted low vegetation.A distinction is often made between desirable treeregeneration andotherlow vegetation, with only theformer beingassessed in manycases (e.g., Gingras1994). Insomecases, the effect ofoperational damageis evaluated usingchanges in seedlingstockingandcomposition as an indicator with no direct assessmentofactual damages (e.g., Mclnnis andRoberts 1994).This approach blurs the linebetween damageassessmentand regeneration surveys.
Damage to lowvegetation is normally assessed usingfixed-area plots ofa much smaller size than that usedto assessresidual tree damage. This can be attributedtothelarger number ofspecies and individual plantsgenerally present Plotsizes (in square meters)thathavebeenusedinclude 3.1 (e.g., Teschet al. 1990),4.0 (e.g., Gingras et al. 1991), 5.0 (e.g.,MclnnisandRoberts 1994), 102 (e.g., Sauder 1992), and 162 (e.g.,Gottfried 1987). In some cases, onlyonetree seedlingin eachsampleplot is identifiedand evaluated fordamage (e.g., Tesch et al. 1990). Continuous transectbands havealsobeenused(e.g., Youngblood 1990).
Sample plots can be located using anyofthepatternsdiscussed previously to sample residual tree damage.Themostcommon pattern used isevenly spaced plotsonevenly spaced parallel transect lines runningperpendicular to themain extraction trails (e.g.,Gingras 1990; Mclnnis andRoberts 1994). If transectbands are used, theyare usually evenly spaced,parallel, and running perpendicular to trails oryardingcorridors (e.g., Youngblood 1990).
All recognized vegetation within the plotboundariesisevaluated. Tree seedlings orother woody plants areoftenseparated intoheightclasses (e.g., Gottfried1987). Damages to theseplants are oftencategorizedinto oneofseveral classes, such asuninjured, injured,and destroyed (Sauder 1992) orundamaged, slightiydamaged, moderately damaged, and severely damaged(Tesch etal. 1990).
66
Recommendedevaluationmethods for low plants
The damage assessment system used willdepend ontheinformational needs ofthestudy (as defined by theobjectives), aswell asonsite characteristics, budgetpersonnel, and other factors. We recommend usingthesame guidelines asoutlined for assessing residualtree damages, except for the following:
Use fixed-area plots- Variable radius plotscannot beused for low vegetation due to the small size. Werecommend circular plots5.0 square meters (radius of1.26meters) in size.
Integrate with tree inventory procedures - Definesizeand diameter limits ofrecognized vegetationrelative tothelimits used inthetree inventory phase(e.g. if aone-inch tree istheminimum sizerecognizedin the tree inventory plots,just underone inchwouldbe the largest treerecognized in thisassessment).
Measure all pertinent data - Data we feel should bemeasured include the following:
SpeciesHeightDamage class
Uninjured - No apparent injuryInjured - Obvious injury, but good chance of
survival andsubsequent growthDestroyed - Obvious injurywith littleor no
chanceofsurvivalandgrowthOther pertinent information related to thestudy
objectives and operational system
SOIL DISTURBANCE
Soildisturbance in forest operations canbe defined asan abrupt change in thechemical, biological, orphysical characteristicsofthe soil as a direct result ofthesystem operating onthesite (Standish et al. 1988).Mechanical displacement ofthesoil bymovingmachinery, trees, andlogsis themainmodeofdisturbance. Displacement ofsoilcanresultin aloosening and mixing of soil layers orthecompactingofsurfacesoils (Froehlich 1973).
Most forest operations rely ontheuseof heavyequipment, whichnearly always results in some formofdisturbance (Beets etal. 1994). Some is intendedand desirable, such aswhen clearing theright-of-wayand compacting the subgrade inroadbuilding, whenpreparing the surfaces oflandings andaccesstrails,andwhencreating anopening in the soil fortreeplanting.
Much ofthe soil disturbance that occurs in forestoperations, however, is unintended and undesirable.Thepassage ofloaded orunloaded equipment over thesoil generally causes some movement, mixing, andcompaction. The morepasses made,themoreseverethedisturbance. Rutting results when soilispushedoutfrom under thetires ortracks. Trees orlogs beingremoved from the forest can also result in disturbanceof soil bydirect contact withtheground.
Moving, mixing, and compacting thesoil layers canaffect site quality and plant community dynamics.Moving soilanddamaging the vegetation thatholdsittogether can sometimes cause further movement ofsoil by erosion. Erosion ofthe soil can furtherdeteriorate sitequality andlead to sedimentation ofadjacent water resources, affecting water quality andfish habitat.
Compaction ofthe soil candirectly affectsoilporosity, vegetation growth, soilbiota,andwaterinfiltration rate (Reisinger etal. 1988). Recovery ofcompactedsoils to original densitiescan be slow(Froehlich et al. 1985). Therefore, it is important tominimize the unintended/undesirable disturbance ofsoil in forest operations.
Krag et al.(1986) emphasize the importance ofidentifying thesources ofsoildisturbance to properlyassess its significance, aswellascategorizing thedepths of disturbances to better assess severity.Roads, landings, andextraction trails (withtrailssometimes broken down into primary and secondary)are the normal sources ofdisturbance that have beenidentifiedin paststudies. With newermechanizedharvesting systems, disturbance created by feller-bunchers or harvesters should also be considered as acategory.
Bockheim et al. (1975) observed that evaluating themerits ofsoil disturbance iscomplicated by the factthatthe nature anddegree ofsoil disturbance areneither uniform norrandomly distributed across aharvested area. The non-random character ofthedistribution precludes evaluation ofimpacts byrandom sampling ofsoilsbeforeandafterharvesting.They thensuggest a strategy for assessing the effectsoftimberharvestingon soils, summarizedas follows:
Classifythe nature and intensityofsoildisturbanceby criteria distinguishable in the field.
Determine the physical andchemical properties ofthe soils by samplingwithin the stratificationsdetermined by disturbance categories.
Interpret changesin soil properties in terms ofbeneficial and detrimental effects.
67
Determinethe areadistributionofthe variousdisturbance classes.
Summarize the effects forthe entireharvested area.
The systems used toclassify disturbance resultingfrom forest operations are many and varied. Dymess(1965) used the following four categories:
Undisturbed - Litter in place, nocompaction.Slightlydisturbed - Three conditions fit this class:
a. Litter removed and undisturbed mineral soilexposed;
b. Mineral soil and litter intimately mixed, withabout50 percentofeach;
c. Pure mineral soil deposited ontopoflitterandslash to a depth ofat least 2 inches.
Deeply disturbed • Surface soil removed and thesubsoil exposed; thesoil surface is veryseldomcoveredby litteror slash.
Compacted - Obvious compaction due to passageofa log ormobile equipment
A number ofother researchershave either used thisscheme orexpanded on it slightly. Bockheimet al.(1975), Miller andSirois(1986), SidleandLaurent(1986), Reisinger etal. (1992), and Austet al. (1993a)all generally followed these categories. Martin (1988)expanded theclassification to 10categories as follows:
Undisturbed • No visual disturbance ofanytype.Depressed - Forest floor notdisturbed laterally, but
depressed byequipment orbya falling tree.Organic scarification - Forest floordisturbed
laterally, butnoevidence ofcompression bywheels,tracks, or railing trees.
Mineral scarification - Removal ofthe organichorizons butno disruption ofthemineral soil.
Organic mounds - Mounds of soil, still covered byorganicmaterial.
Mineral mounds - Mounds ofmineral ororganicsoilcovered by mineral soildeposits.
Organicruts - Shallow wheel or track ruts withintheorganic horizons ordeep compression rutsstill lined with organic soil.
Mineral ruts • Wheel or track ruts in mineral soil.Dead wood - Stumps or logsin contactwith the
soil or slash too dense to allow for evaluation.Rock - Bare rocks larger than 10cm.
Turcotteetal. (1991) used a fairly similarscheme ofnine categories, but grouped them into4 consolidatedcategoriesas follows:
Slash
Intact forest floorUndisturbed
Organic moundOrganic rut

Bare mineral soil
Mineral scarified
Mineral muted
Mineral mound
Mixed side rut
Mineral ruts
McMahon (1995a) used one ofthe most detailedclassification schemes, distinguishing between 15disturbance types grouped into five classes:
Undisturbed
Shallow disturbance
Litterin placeLitterremoved, topsoil intactLitterandtopsoil removedTopsoil depositedon litter
Deep disturbanceTopsoil removed, subsoil exposedErosion feature
Subsoil puddlingRut 5 to 15 cm deepRut 16to 30 cm deepRut >30cm deepSubsoil/baserock deposit
Slash cover
10to 30 cm deep>30cm deep
Non-soil
Two clarifying codesof C for compacted andM formineral/subsoil were used with these classifications.
The classification systems presented here illustrate theamount of variation that existsbetween systems incommonuse. The system used to classifydisturbancewill ultimatelydeterminewhetheror not the resultsarecomparable to otherresults. Therefore, to ensurecomparability, a standard classification systemshouldbe used when documentingsoil disturbances.
Recommendeddisturbance classification system
We recommend a disturbance classification systemsimilar to thatusedby Martin (1988)as follows:
Undisturbed - No visual evidence ofdisturbance.Depressed • Someevidenceofcompaction, butno
lateral movement ofsoil and litter still intactCovered - All original soil layers intact and
undisturbed, butcovered by looseadjacent soil.Scarified, Organic - Forest floor disturbed laterally
exposing organicsoil with no evidence ofcompression by wheels, tracks,lop, or trees.
Scarified, Mineral - Forest floor andorganic soildisturbed laterally exposingmineral soilwithnoevidence of compression bywheels, tracks, logs,or trees.
68
Mounded, Organic - Forest floor and organic soildisplaced laterally and possibly mixed formingmounds with no disturbance to the mineral soil.
Mounded, Mineral - Forest floor, organic soil,andmineral soil displaced laterally and possiblymixed formingmounds with no evidence ofcompression by wheels, tracks, logs, ortrees.
Rutted, Organic - Forest floor and organic soilmixed andcompacted by wheelsor tracksleaving a rut, no disturbance ofmineral soilother than compaction.
Rutted, Mineral - Forest floor, organic soil,andmineral soil mixed and compacted by wheels ortracksleavinga rut in the mineral soil.
Muck - Organic ormineral muck inruts precludingevaluation ofdepth andseverity.
Wood - Stumps orother tree parts covering thesoil.Rock • Rocks larger than 15cm on the surface.
We feel this system is sufficientlydetailed to beinformative, without sacrificing reproducibility byincludingtoo much detail.
Soil disturbance sampling
Because forest sitesare usually too large to determineand map specific soil disturbances atevery point, asampling method is needed. Methods in use arebasedonclassifying singlepoints (e.g., Dymess 1965; Sidleand Laurent 1986); thesmall area around a point (e.g.,McMahon 1995a; Meek 1994; Reisinger etal. 1992;Gingras 1994); thelength of intersecting line segments(e.g., Howes et al. 1983; Hatchell et al. 1970); ortheintersecting area a fixed distance to both sidesofatransect (McNeel and Ballard 1992).
For theclassification of disturbance atdiscrete pointsorover smallareas, sampling pointscanbe locatedacross thearea ofconcern randomly (e.g., Li andChaplin 1995), along straight lines (e.g., Bockheimetal. 1975), along zigzag lines (e.g., Krag et al.1986;Hall 1996), or in clusters (e.g., Kleinn 1994). Themostcommon method usedis to locate samplingpoints along straight transect lines.
Thetransect lines used to locate sampling points ortoevaluate disturbance continuously can originate fromrandom starting points (e.g., Turcotte et al. 1991) orfrom fixed starting points(e.g.,Lanford and Stokes1995; Baumgras et al. 1995). Transectlines canrun ineither random directions (e.g., Martin 1988) orinfixed directions, such asparallel (e.g., Aust et al.1993a), parallel but perpendicular to the maintransect(e.g., Miller and Sirois 1986), orcrossing to form adiamond partem (e.g., Thompson etal. 1995).
McMahon (1995b) tested two sampling patterns whileusing thesmall area around a pointmethod ofassessing site disturbance. These patterns are asfollows:
Point transect - Sampling points are evenly spacedalongparallel, evenly spaced linetransects thatare laid outperpendicular to the predominantdirection oftravel.
Grid point intercept -A grid system withpredefined line spacing is randomly oriented over astudysite. At each intercept, four transects arerun to form across, starting with a randombearing. Sampling pointsare then located atpredetermined spacings along each transect
Three pointtransect spacings (30,50, and80m) andonegrid spacing (60x60 m) were compared. Samplepoints weretakenevery 1 m along transects. Gridpointtransects were30 m long. An intensive 1x1 msurvey was used as the actual to which the othermethods werecompared. McMahon (1995b)concluded thatthe point transect method gave themost accurate and consistent estimate ofdisturbancein the samplearea.
Recommendeddisturbance sampling method
We concurwith Bockheim et al. (1975) that due to thenon-random nature ofdisturbances from forestoperations, sampling systems shouldbe uniformacross thesiteto provide anunbiased representation ofeffects that existacross theentire area. Also,plot ortransect lines should be oriented generallyperpendicular to major features, such as roads,landings, access trails, andyarding corridors.
Although McMahon(1995b) considersthe linetransect method (measuring disturbances continuouslyalong thetransect) too subjective, we intuitively feelthis is thebestmethodfor assessing sitedisturbance.We feel it is the least data intensive method availableto achieve a givenlevelofaccuracy. We havenoscientific information supporting thisconclusion,however. Several researchers have used this methodwithnomention ofit being toosubjective (e.g.,Howeset al. 1983; Martin 1988; Hatchell et al. 1970;Aust et al. 1993a; Turcotte et al. 1991;LanfordandStokes 1995).
We also feel thatthe surveyshould beginas soonafterthe operationas feasible before actual effects arechanged orcovered upbywind, precipitation, fallingleaves, low plant growth, etc. Disturbances due todifferent operations (i.e., felling, skidding, etc.)shouldbe assessed separately wheneverpossible.
69
Soil compaction
Following the recommendations ofBockheim et al.(1975), thephysical properties of the soil are assessedwithin the stratifications outlined in the disturbancesurvey. One of themain properties of interest is soilcompaction due tothe influence ithas on root growthand development, and theabsorption of water into thesoil (Adams and Froelich 1981).
Soil compaction isusually determined indirectly bymeasuring thechange in soil properties that areinfluenced bycompaction. Soil bulk density andporosity are themostdirect quantitative measurementsofsoil compaction and are frequently used toexpresschanges in soil properties dueto machine traffic(Reisinger et al. 1988). Bulkdensity ismostcommonly determined byextracting core samples ofthesoil under study, determining volume and oven-dry weight of thesample, and calculating avalue forbulkdensity (Blake and Hartge 1986).
Determination of bulk density from core samples isusually done inconjunction with laboratory analysis ofother keysoil properties, such asporosity andhydraulic conductivity (e.g., Austetal. 1993b). Coresampling can beveryphysically demanding work,particularly inheavy clay soils. Rockysoils and soilswith significantamountsofrootsarealsodifficult tosample with acoresampler. Errors canoccurwithcore samples dueto accidental compaction ofthethesoil inthecore resulting from incorrect samplingtechniques (Raper and Erbach 1985).
The nuclear-gamma radiation gauge isanalternatemethod for determining soilbulkdensity andmoisturecontent Several researchers have used thistechnology when studying the effectof forestequipment on soilproperties (e.g., Froelich et al.1980; Donnelly et al. 1991; Davis 1992). The nuclear-gamma radiation gauge is operated in a nondestructive sampling mode, allowing resampling ofthesoil in-piace before and after theoperation. Thisapproach (i.e., sampling the same soil in-place),minimizes the error associated with natural soilvariation.
Murosky and Hassan (1991), inastudyofthe impactoftracked and rubber-tired skidder traffic on a wetlandsitein Mississippi, usedbothcore sampling and anuclear-gamma radiation gauge to determine drybulkdensity and moisture content ofthe soil. The nucleargamma radiation gauge was found to giveconsistentlylowervalues forbulk density thanthe soil cores. Aregression analysisofthe resultsobtainedwith the two

methods produced anR2 value of0.908, indicatingthat the resultsobtainedwith the nuclear-gammaradiation gaugecould be correctedto soil core resultswith confidence. A potential problemwith nondestructive sampling methods is thatthe presense offoreign objects such as large rocks or roots in thesampling areamay not be detected.
A thirdalternative formeasuring soil bulk densityrelieson manualexcavation ofthe soil (BradfordandGrossman 1982). This method uses a lower resilientring of foam plastic, which is moldedto the shape ofthe soil surfaceby an upperrigidringofacrylicplastic. The cavity formedby these rings is linedwithplasticand filledwith water to determine the basevolume. A samplepit is then dugwithin the confinesofthecavity, the excavated pit is linedwith plasticand filled with water, and a volume for the excavatedsampleis determined by subtraction ofthe watervolumes. The weightofthe excavated sample andtheexcavated volumeare used to calculate bulkdensity.
Shetron et al.(1988) usedthis technique in a studyofthe effect ofmultiple machine passeson surface bulkdensity forthreereasons: it was easyto obtain the 0- to5-cmlayer ofthe wheeltrack; coarse fragments couldberemoved from the sample to calculate soilmatrixdensity andporosity; and it was possible to sample alarger area ofthewheeltrack to include both lugdepression andspace between the lugs.
Where conditions suchas large numbers ofrocks androotsprohibitthe effective use of other methods, amethod utilizingplastic-coated clods can sometimesbeemployed(Blake andHartge 1986). The methodconsists ofcollecting a natural clod from the faceofanexcavation, applying a coatofplastic lacquer to seal it,and determining the massand volumeof thesample inthe laboratory for a calculation ofbulk density. Thistechnique is labor intensiveandrequires extensivelaboratory work,increasing the cost The method hasbeenusedin several studies, however(e.g., Cullen etal. 1991; Thompson et al. 1995).
Soil compaction is also directlyrelated to theresistance to penetration ofthe soil. The mostcommon method for assessing soilpenetrability ofaforest soil inthe field is with a cone penetrometer. Acone penetrometer is a device that measures theamountof force required to push a rod with astandard-size cone point into the soil at a constant rateofspeed(Bradford 1986). The penetration force databy soil depth provides a relative measureoftheamount ofsoilcompaction mathasoccurred (e.g.,McDonald et al. 1995;Van Miegroetet al. 1994).
Soilcompaction is often measured during studies ofthe impacts of equipment on forest sites as aconsequence ofharvesting orother forest operations.Sampling in thesestudies generally concentrates onimpacted and immediately adjacent non-impactedareas. Thenormal guidelines ofexperimental designapply tothese studies. The high natural variabilityfound in forest soils generally requires that largenumbers of samples be taken to ensure that treatmenteffects can be identified.
This high natural variability alsomakes it difficult toextrapolatethe results obtained from a finite numberofsamples to larger areaswith confidence. This isparticularly important ifmanagement decisionsarebeingbased on evaluations ofsoilproperties fromsamples, such asadecision to suspend operationswhen a threshold level ofsoil moisture content isreached. The datasupportingthat decision need tohave been obtained in astatistically valid anddefensible manner.
Howes et al.(1983) havedeveloped initial guidelinesforsamplingphysical conditionsofsurface soils andfor properly extrapolating the sample results to standlevel values. It is important that these techniques befurther developed and used inmanagement practicesanddecisionmaking.
Very little is yet known aboutthe long-term effects ofsoilcompaction on forest productivity, partly duetothe complexnature ofthe problem, andpartly duetoan inadequate level ofresearch effort. Consistentdatacollection methods are needed so thatlarge-scale,long-term studies ofthe effectof forest operations onproductivitycan be conductedefficiently, and in amanner thatwill lead to widelyapplicable results.Studies comparing thevarious methods for analyzingsoilcompaction are needed asa first steptowarddeveloping consistent datacollectionmethods in thisarea.
Recommended soil compaction sampling methods
Soil compaction assessment should be intimately tiedto thedisturbance classes present on a siteandtheassociated areas in theseclasses. Exceptforundisturbed (control) areas, onlythedisturbed areaswherecompaction is likely to be presentneed to beassessed. Assessment should occur as soon after theoperation as feasible. An effort should be made toseparate the effects ofcompactiondue to differentoperations (e.g., telling, skidding). Soilmoistureduring the operation should beassessed ifpossibledueto theinfluence ofthisvariable on compaction.
70
Because of the highnatural variability in forest soils,non-destructive testingmethods, such as the nucleargamma radiation gauge, thatcanre-sample the samesoilrepeatedly (before andafteroperations) areverydesirable forstudies where treatment effects arebeingmonitored over time. These instruments are accurate,buttime-consuming andexpensive to use, favoring theuseofother methods inmostcases (Smith 1987).
Measurements takenwitha conepenetrometer, on theother hand, arequick and easy, butquite variable.Thisrequires thata large number ofpointsbesampled. Laboratory analysis ofclodsamples is alsoexpensive, andtheresulting bulkdensities often quitevariable. Forthesereasons, we haveconcluded that,forsimplebulkdensitymeasurements, eitherthe coresampleror excavationmethodswork best. The coresamplerworkswell in reasonably uniform soils,whiletheexcavation method workswell in rocky soils.
DISCUSSION
The methods used to assess the effects offorestoperations on theremaining vegetation andsoilwilldepend on theparticular needsandobjectives of eachindividual study ormonitoring program. Properplanning is essential to ensurethatall necessary dataarebeingcollected andall unnecessary dataarenotForstudies with several objectives, locating samplepoints, lines,or plots in association withothermeasurements can simplifyand integrate datacollection efforts, lowering costs and increasing thevalue ofthe data.
Research is needed to evaluate the methods used toassess theeffects of forest operations ontheremainingvegetation andsite. This is especially trueforthesamplingpatternsused in these assessments. This willhelpidentify the mostaccurate, consistent, easytoapply,useful,andstatistically valid methods. Thiswork should beconducted incooperation withscientists from other disciplines andon-the-groundmanagers to beof highest valueinthe management ofecosystems.
Werecognize that assessment techniqueswill varyforgood reason. However, the recommendations we havemade inthispapercanserveasa starting pointforplanning residual treedamage assessments, lowplantand seedlingdamagesurveys,site disturbanceevaluations,and soil compactionstudies. Increaseduseofstandard assessment techniques will improvethe comparability and usefulness ofinformation on theoperational effectsofforestequipment
71
LITERATURE CITED
Adams, Paul W.; Froehlich, Henry A. 1981.Compaction of forest soils. USDA Forest ServiceExtension Publication PNW 217,13p.
Anderson, Harvey W. 1994. Some implications oflogging damagein the toleranthardwoodforests ofOntario. In: Rice, JA. ed.Logging damage: Theproblemsand practicalsolutions.ForestResearchInformation PaperNo. 117. Saulte Ste. Marie,Ontario, Canada: Ministry ofNatural Resources,Ontario Forest Research Institute: 3-27.
Aust, W.M.; Reisinger, T.W.; Burger, J.A.; Stokes,B.J. 1993a. Soil physical and hydrological changesassociated with logging a wetpineflatandwidetired skidders.SJAF 17(1):22-25.
Aust, W.M.; Reisinger, T.W.; Stokes, BJ.; Burger,JA 1993b.Tire performance as a funtionofwidthand number ofpasses onsoil bulk density porosityin a minorstream bottom. In:Brissette, J.C.,ed.Proc. ofthe Seventh Biennial Southern Silv. Res.Conf.; 1992November 17-19;Mobile,AL Gen.Tech. Rep. SO-93.New Orleans,LA: USDAForestService, Southern For. Exp.Sta.: 137-141.
Baumgras, John E; Sherar,JamesR; LeDoux,Chris B.1995. Environmental impacts from skyline yardingpartial cuts inan Appalachian hardwood stand: acase study. In: Proc.18th Annual Council On ForestEngineering Mtng; 1995 June5-8;Cashiers, NC.[Corvallis, OR:Oregon StateUniversity]: 87-96.
Beets, P.N.; Terry, T.A.; Manz, J. 1994. Managementsystems forsustainable productivity. In: Impacts offorest harvesting onlong-term siteproductivity.London: Chapmanand Hall:219-246.
Benzie, J.W.; Hesterberg, G.; Ohman, J.H. 1963.Pathological effects of logging damage four yearsafterselective cutting in old-growth northernhardwoods. Jour. For. 61(10):786-792.
Bettinger,P.; Kellogg LJD. 1993.Residual standdamage fromcut-to-length thinningofsecond-growthtimber in the CascadeRangeofwesternOregon. ForestProd. J. 43(11/12):59-64.
Biltonen, F.E.;Hillstrom, WA; Steinhilb, H.M;Godman, HM. 1976. Mechanized thinning ofnorthernhardwoodpole stands:methodsandeconomics.Res. Pap. NC-137. St. Paul, MN:USDAForestService, North CentralFor.Exp. Sta. 17 p.
Blake, G.R; Hartge, K.H. 1986.Bulk density. In:Klute,Arthured. Methods of soil analysis, part 1:Physicaland mineralogicalmethods. 2nd ed. Madison, WI:Am. Soc. Agron.,; Soil Sci. Soc. Am.: 363-382.
Bockheim, J.G.; Ballard, T.M.; Willington, R.P. 1975.Soil disturbance associated with timberharvestingin southwestern British Columbia. Can. J. For. Res.5:285-290.
Bradford, J.M. 1986.Penetrability. In: Klute, Arthur,ed. Methodsofsoil analysis, Part1:Physical andmineralogicalmethods. 2nd ed. Madison, WI:Am. Soc. Agron.; Soil Sci. Soc. Am.: 463-478.
Bradford, J.M.; Grossman, RB. 1982. In-situmeasurement ofnear-surface soil strength by thefall-cone device. Soil Sci. Soc. Am. J. 46:685-688.
Brand, David G.;Leckie, Donald G.;Cloney,EdwardE. 1991.Forest regeneration surveys:design,datacollection, and analysis. The Forestry Chronicle67(6): 463-657.
Bruhn,Johann N. 1986.Damageto the residual standresulting frommechanized thinning ofnorthernhardwoods. In: Sturos, J.A., comp. Hardwoodthinningopportunities in the lake states;Proc.ofasymp.; 1984April 20; Houghton, MI, Gen. Tech.Rep. NC-113. St Paul, MN: USDA ForestService,North Central For. Exp. Sta.:74-84.
Cline, Michael L.;Hoffman, Benjamin F; Cyr,Michael; Bragg, William. 1991. Stand damagefollowing whole-tree partial cuttingin northernforests. NJAF 8(2): 72-76.
Cullen, Stephen J.; Montagne, Cliff;Ferguson,Hayden. 1991. Timber harvest trafficking and soilcompaction in western Montana. Soil Sci. Soc. Am.Jour. 55:1416-1421
Davis, Craig J.; Vollmer, Craig A. 1993.Residualdamage underuneven-age silviculturalprescriptions. In: Environmentally sensitive forestengineering: 16th annual meetingofthe Council onFor. Eng.; 1993 August 8-11; Savannah, GA. 10 p.
Davis, Scott 1992. Bulk densitychanges in twocentral Oregon soils following tractor logging andslashpiling.WJAF 7(3): 86-88.
Dey,Dan. 1994. Careful logging, partial cutting, andthe protection ofterrestrial andaquatic habitats. InLogging damage: The problems and practical
72
solutions,Ontario MinistryofNatural Resources,For. Res. Inf. Paper No. 117, p. 53-69.
Dilworth, JJL; Bell, J.F. 1977. Variable probabilitysampling - Variable plotandthree-P Corvallis, OR:Oregon State University Book Stores. 130 p.
Donnelly, John R.; Shane, John B.;Yawney, Harry W.1991. Harvesting causes onlyminor changes inphysical properties ofanupland Vermont soil.NJAF 8(1): 33-36.
Dyrness, C.T. 1965. Soil surface condition followingtractor and high-lead logging in theOregonCascades. Jour.For. 8(1): 15-17.
Fairweather, Stephen E. 1991. Damage to residualtreesaftercable loggingin northern hardwoods.NJAF 8(1): 15-17.
Ficklin, Robert I.; Dwyer, JohnP. Cutter,Bruce E.;Draper, Tom. 1997. Residual tree damage duringselection cuts usingtwo skiddingsystems in theMissouri Ozarks. In: Proceedings, 11th CentralHardwood Forest Conference; 1997March 23-26;Columbia, MO: Gen.Tech.Rep.NC-188. St Paul,MN: USDA Forest Service, North Central For. Exp.Sta.: 36-46.
Froehlich, Henry A. 1973. The impact ofeven-ageforest management on physical properties ofsoils.In: Herman, RK.; Lavender, D.P. eds.Even-agemanagement symposiumproceedings, 1972Aug. 1;Corvallis, OR: Oregon State University: 199-220.
Froelich, HA.; Miles, D.W.R.,; Robbins, R.W. 1985.Soilbulkdensity recovery on compacted skid trailsin Central Idaho. Soil Sci Soc Am J. 49:1015-1017.
Froehlich, HenryA.; Azevedo, J.; Cafferata, Peter;Lysne, Dave. 1980. Predicting soilcompaction onforested land. No. 7100-Engineering 8171 2204.Missoula, MT: USDA Forest Service, MissoulaEquipment Development Center. 120 p.
Gingras, J.-F. 1994. A comparison of full-tree versuscut-to-lengthsystems in the ManitobaModelForest SR-92. PointeClaire, Quebec, Canada:Forest Engineering Res. Inst ofCanada. 16p.
Gingras, J.-F.; Cormier, D.;Ruel,J.-C.; Pin,D. 1991.Comparative study oftheimpact ofthree skiddingmethods on advanceregeneration. TN-163. PointeClaire, Quebec, Canada: Forest EngineeringResearch Institute ofCanada. 12p.
Gingras, J.-F. 1990. Harvesting methods favouring theprotection ofadvance regeneration: Quebecexperience.TN-144. PointeClaire, Quebec,Canada: Forest Eng. Res. Inst ofCanada. 8 p.
Gottfried, Gerald J. 1987. Effects of modified skiddingrules on mixedconfier advance regeneration inArizona. RM-479. FortCollins,CO:USDA ForestService, Rocky Mtn. For. and Range Exp. Sta. 8 p.
Hall, Peter. 1996. Cutover waste assessment - Acomparison ofsampling techniques andintensities.TN-27. Rotorua, NZ:Logging Ind. Res. Org. 2 p.
Hatchell, G.E.;Ralston,C.W.; Foil,R.R. 1970.Soildisturbances in logging. Jour. For. 68:772-775.
Herrick, David E.;Deitschman,Glenn H. 1956.Effectoftractor logging uponhardwood stands. ForestProd. J. 6(10): 403-408.
Howard, Andrew F. 1996. Damage to residual treesfrom cable yarding when partial cutting second-growth stands in coastal British Columbia.Can. J. For. Res. 26:1392-1396.
Howes, Steve; Hazard, John; Geist, J. Michael. 1983.Guidelines for sampling somephysical conditionsof surface soils. [Portland, OR]: USDAForestService, Pacific Northwest Region. 34 p.
Huyler, Neil K.;Aiken, George D.; LeDoux,Chris B.1994. Residual stand damage survey for three smalltractors usedin harvesting northern hardwoods. In:Sessions, J.; Kellogg, L.,eds. Proc. ofthemtgonadvanced technology in forest operations: appliedecology inaction; 1994 July 24-29; Portland, OR.[Corvallis, OR:Oregon State Univ.]: 173-183.
Kelley, Ronald S. 1983. Stand damage from whole-tree harvestingin Vermont hardwoods.Jour. For.81(2): 95-96.
Kellogg, L.; Hargrave, M. 1985. Harvesting costand stand damage comparisons ofcable thinningtechniques: Herringbone strip thinning versusconventional thinning. In: Forest operations inpolitically andenvironmentally sensitive area: Proc.8thannual Council OnForest Engineering; 1985August 18-22;Tahoe City, CA.: 84-90.
Kleinn, Christoph. 1994.Comparison oftheperformance oflinesampling to otherforms ofcluster sampling. For. Ecol. andMgmt68:365-373.
73
Krag, R; Higginbotham, K.; Rothwell, R 1986.Loggingand soil disturbance in southeast BritishColumbia.Can. J. For. Res. 16:1345-1354.
Lamson, Neil I; Smith, H. Clay; Miller, Gary W. 1985.Logging damage using anindividual-tree selectionpractice in Appalachian hardwood stands. NJAF 2:117-120.
Lanford, Bobby L; Stokes, Bryce J. 1995. Comparisonoftwo thinning systems.Part 1:Stand andsiteimpacts. Forest Prod. J. 45(5): 74-79.
Li,F.; Chaplin, J. 1995. Analysis ofrandom andsystematic sampling methods forresidue covermeasurement. Trans, oftheAm. Soc. ofAgric.Eng. 38(5): 1353-1361.
Martin, C. Wayne. 1988. Soil disturbance bylogginginNewEngland - review and managementrecommendations. NJAF 5:30-34.
McDonald, T.P.; Stokes, BJ.; Aust, W.M. 1995. Soilphysical property changes afterskiddertrafficwithvarying tire widths. Jour. For. Eng. 6(2): 41-50.
Mclnnis, BryceG;Roberts, MarkR; 1994.Theeffects of full-tree and tree-length harvests onnatural regeneration. NJAF 11(4): 131-137.
McLaughlin, John A.; Pulkki, Reino E. 1992.Assessment ofwounding attwocommerciallythinned jackpine sites. NJAF 9(2): 43-46.
McMahon, Shane. 1995a. A survey method forassessing sitedisturbance. Project Report P.R 54.Rotorua, NewZealand: NewZealand LoggingIndustry Research Organization. 16 p.
McMahon, Shane. 1995b. Accuracy oftwo groundsurveymethods forassessing sitedisturbance.Jour. For. Eng.6(2):27-33.
McNeel, Joseph B.;Briggs, David; Petersen, Brent;Holmes, Michael. 1996. Damage to residual treesduring partial harvests- measurement, analysis andimplications. In: Blinn, GR.; Thompson, M.A,eds.Planning and implementing forest operations toachieve sustainable forests: Proc. ofthejoint mtg.ofthe Council On For. Eng.andInt Union ofFor.Res.Org.; 1996 July 29-August 1; Marquette, MLSt Paul, MN: USDA Forest Service,North CentralForest Experiment Station:73-81.

McNeel, J.F.; Ballard,T.M. 1992.Analysis ofsitestandimpacts from thinning with a harvester-forwarder system. Jour. For. Eng. 4(1): 23-29.
Meadows, JamesS. 1993.Loggingdamage to residualtrees following partialcutting in a green ash-sugarberry stand in the Mississippi delta. In:Gillespie,AJL; Parker, G.R.; Pope, P.E.; Rink, G.;eds. Proc., 9th Central Hardwood For. Conf.; 1993March 8-10;West Lafayette, IN. Gen. Tech. Rep.NC-161. St Paul, MN: USDA Forest Service, NorthCentral Forest Experiment Station:248-260.
Meek, Philippe. 1994.Thinning in streamsideprotection strips with the Valmet 901. FieldNoteNo.: Felling-22J>ointe Claire,Quebec, Canada:For. Eng.Res. List ofCanada, Eastern Div. 2 p.
Meyer, Gene; Ohman, John H.; Oettel, Russell. 1966.Skidding hardwoods - Articulated rubber-tiredskidders versus crawlertractors. Jour. For. 64(3):191,194-196.
Miller, Gary W.; Lamson, Neil I.; Brock, Samuel M.1984. Loggingdamage associated with thinningcentralAppalachian hardwood stands with awheeled skidder. In proc. Mtn.Logging Symp.;1984 June 5-7; Morgantown, WV: 125-131.
Miller, James H.; Sirois, Donald L. 1986. Soildisturbance by skylineyarding vs. skidding in aloamy hill forest Soil Sci. Soc. Am. J.50:1579-1583.
Murosky, D.L.; Hassan, A.E. 1991. Impact oftrackedand rubber-tired skidders traffic on a wedand site inMississippi. Trans, ofthe Am. Soc.ofAgric. Eng.34(1): 322-327.
Nichols, MX; Lemin,R.C., Jr.; Ostrofsky, W.D.1993. The impactoftwo harvesting systemsonresidual stems in a partially cut standofnorthernhardwoods. Can. J. For. Res. 24:350-357.
Nyland, Ralph D. 1994. Careful logging in northernhardwoods. In: Logging damage:The problems andpractical solutions. Ontario Ministry ofNaturalResources, For. Res. Info.Paper No. 117, p. 29-51.
Nyland, RJ).; Craul, PJ.; Behrend, D.F.; Echelberger,RE.; Gabriel, WJ.; Nissen, RL. Jr.; Uebler, R;Zarnetske, J. 1976. Logging and its effect innorthern hardwwods. State Univ. ofNY AppliedFor. Res. Inst, Res. Rep. No. 31,134 p.
74
Ohman, John H. 1970. Value loss from skiddingwounds in sugar mapleandyellow birch.Jour. For.68(4)226-230.
Ostrofsky, W.D.; Seymour, R.S.;Lemin,R.C., Jr.1986. Damageto northern hardwoods fromthinning using whole-tree harvesting technology.Can. J. For. Res. 16:1238-1244.
Pilkerton, Stephen J.; Han, Han-Sup; Kellog, Loren D.1996. Quantifying residual stand damage in partialharvest operations. In: Blinn, C.R; Thompson,MA., eds.Planning andimplementing forestoperations to achieve sustainable forests: Proc.ofthe Joint MtgofCouncil OnFor. Eng.andIntUnion ofFor. Res. Org.; 1996 July29-August 1;Marquette, MI. StPaul, MN: USDA Forest Service,North Central For. Exp. Sta: 62-72.
Raper, Randy L.; Erbach, Donald C. 1985. Accuratebulkdensity measurements usingacoresampler.Am. Soc.ofAgric.Eng.Paper No. 85-1542.St Joseph,MI: 23p.
Reisinger, Thomas W.; Pope, Phillip E.; Hammond,Sheldon C. 1992. Natural recovery ofcompactedsoils in an uplandhardwood forest in Indiana.NJAF 9(4): 138-141.
Reisinger, Thomas W.; Pope, Phillip E. 1991. Impactoftimber harvestingon residual trees in a centralhardwood forest in Indiana. In: McCormick,L.H.;Gottschalk, K.W. eds. Proc. 8th Central HardwoodFor. Conf.; 1991 March 4-6;University Park, PA.Gen. Tech. Rep. NE-148. Radnor,PA: USDAForest Service, Northeastern For. Exp. Sta.: 82-91.
Reisinger, Thomas W.; Simmons, Gerry L.;Pope,Phillip E. 1988. The impact oftimber harvestingon soilproperties andseedling growth in the south.SJAF 12(1):58-67.
Sauder, E.A. 1992. Timber-harvesting techniques thatprotectconifer understoryin mixed wood stands:casestudies. Canada-Alberta partnershipagreement in forestry, joint publication. 72 p.
Schmid, JJvl; Mata, SA. 1993. Frequency ofexternaldefect and skiddingdamage in lodgepolepinestands in Colorado andWyoming.Res. NoteRM-525. Fort Collins, CO:USDA Forest Service,Rocky Mountain Forest andRange ExperimentStation.5 p.
Schreuder, Hans T.; Gregoire, TimothyG.;Wood,Geoffrey, B. 1993. Sampling methods formultiresource forest inventory. New York:John WileyandSons.446 p.
Shepperd, Wayne D. 1993. Theeffectofharvestingactivities on soilcompaction, rootdamage, andsuckering in Colorado aspen. WJAF8(2)62-66.
Shetron, Stephen G.; Sturos, John A.;Padley, Eunice;Trettin, Carl. 1988. Forest soil compaction: effectofmultiple passes and loadings onwheel tracksurface soilbulkdensity. NJAF 5(2): 120-123.
Shigo, Alex L. 1979. Tree decay: An expandedconcept Agric. Info.Bull.No. 419.WashingtonDC: USDAForest Service. 73 p.
Sidle, Roy C; Laurent, Thomas H. 1986. Shedamagefrom mechanized thinning in southeast Alaska.NJAF 3:94-97.
Smith, D.L.0.1987. Measurement, interpretation andmodelling ofsoil compaction. SoilUseandManagement 3(3): 87-93.
Standish, J.T.; Commandeur, PJL;Smith,RB. 1988.Impacts of forest harvesting on physical propertiesofsoils with reference to increased biomassrecovery - areview. Information Report BC-X-301.Victoria, BC, Canada: Can.For. Serv., Pac. For.Centre.24 p.
Tesch, StevenD.; Crawford, Michael S.; Baker-Katz,Kathryn; Mann, John W.. 1990. Recovery ofDouglas-fir seedlings from logging damage insouthwestern Oregon: preliminary evidence.Northwest Science 64(3): 131-139.
Thompson, MichaelA.; Sturos, John A.;Christopherson,Nels S.; Sturos, Joseph B. 1995.Performance and impacts of extracting logs ondesignated trails in anall-age hardwood stand. In:Kellog, L.; Milota, G., eds.: Proc.ofthe Int UnionofFor. Res. Org. XX World Congress; 1995 August6-12; Tampere, Finland. Corvallis, OR: OregonState University: 197-213.
Turcotte, David E.; Smith, C. Tattersall. 1991. Soildisturbance following whole-tree harvesting innorth-central Maine. NJAF 8:68-72.
75
VanMiegroet, H.; Zabowski; Smith, C.T.; Lundkvist,H. 1994. Review of measurement techniques in siteproductivity studies. In: Impacts of forestharvesting on long-term siteproductivity. London:Chapmanand Hall: 287-362.
Wendel, G.W.; Kochenderfer, J.N. 1978. Damage toresidual hardwood stands caused bycable yardingwitha standing skyline. SJAF 2:121-125.
Young, Eric. 1994. Residual stand damage assessmentfollowing commercial thinnings. NewfoundlandForest Service, Forest Products and DevelopmentDivision Internal Report #11,11 p.
Youngblood, Andrew P. 1990.Effect ofshelterwoodremoval methods onestablished regeneration inanAlaskawhitespruce stand. Can. J. For. Res. 20:1378-1381.

Comparison of Damage Characteristics to
Young Douglas Fir Stands from Commercial Thinning
Using Four Timber Harvesting Systems
Han-Sup Han
and
Loren D. Kellogg
Oregon State University
Corvallis, Oregon, USA
ABSTRACT: Each harvesting system leaves its own type of damage to crop trees during thinning operations. Understanding theimpact of different harvesting systems helps forest managers to achieve management objectives associated with sustainabtlityand quality control. Damage to residual trees from commercial thinning was characterized and compared with four common harvesting systems in western Oregon: tractor, cut-to-length, skyline and helicopter. This study was conducted in six young (30 -50years old) Douglas-fir {Pseudotsuga menziesilj stands having various residual densities. Scarring by ground-based systemswas more severe: scar sizes were bigger, and gouge and root damage was more prevalent than that caused by skyline and helicopter systems. Crown removal and broken-top damage was more common with skyline and helicopter logging. The damagelevels varied among different thinning treatments and logging systems. The levels were heavily influenced by many compounding factors. In the cut-to-length system, the harvester caused more wounding to crop trees than the forwarder, but forwarderscars were larger and sustained severe gouge damages.
KEY WORDS: logging damage, commercial thinning, harvesting systems
INTRODUCTION
Intensiveforest management practices in westernOregon increasingly require the useof thinning prescriptions for both private and public land. Sessionsetal. (1991) surveyed the use of thinning practices inwestern Oregon. Managers responsible for industrialforests indicated that within 25 years, current management intensities would require thinning on abouttwothirds of their forest lands. For public lands in the samesurvey, the Forest Service and Bureau of LandManagement (BLM)planed to implement intensivemanagementon virtually all of their forested acres allocatedto timber production in western Oregon. Undertheir 10-decade management plan which began in1991, the area to be thinned was projected to increaseby five timesover the 10-decade period.
These trends are the same in Washington State.McNeel et al. (1996)surveyed forest land managers inwestern Washington and found that public land owners
have increased theacreage thinned ontheir managedlandsby almost200% in the past 5 years.
During fiscal year 1995, the Oregon Department ofForestry estimated that 627,668 acres of forest land hadmerchantable logs removed from them. Partial cut andclear cut areas were 524,701 acres (84%) and 102,967acres (16%) respectively. Partial cuts include shelter-wood, seed tree, selective, preparation, intermediate,improvement, and salvage cuts.
Since any type ofdamage to remaining trees is a byproductof thinningoperations, it is of interest to forestmanagers andresearchers. The understanding of logging impacts to residual stands is more important thanever to ensure the sustainablity and quality control offuture stands.
Lanford and Stokes (1995) compared two thinning systemson logging damage to 18-year-old loblolly pinetrees. They reported that the feller-buncher/ skidder
76
system scarred significantly more trees, 62 trees perha(tph, 25 trees per acre (tpa)) than did the cut-to-lengthsystem, 25tph (10 tpa). Compared to the cut-to-lengthsystem, theskidder system had 10times larger scarsand 24 times more scararea peracre.
Aresidual stand damage study ofa cut-to-length system inthe Pacific Northwest was conducted byBettinger andKellogg (1993). They found 39.8% ofDouglas-fir trees sustained some damage with only0.8% oftrees sustaining major damage. The majorityof logging damage was relatively small. Total scar areaper acre was 1.2 m2 (12.85 ft2), which was far greaterthan Lanford and Stokes's observation, 0.046 m2 (0.5ft2). They also noted that most of the damage occurredwithin 4.6 m(15 ft) ofa trail centeriine and originatedwithin 0.9m (3 ft) of the ground line.
Aho etal. (1983) compared the amount ofdamagefrom commercially thinned, young-growth stands oftrue fir, Douglas-fir, and ponderosa pine with two logging methods: conventional logging practices and logging procedures designed toreduce damage toresidualtrees. Inthe five conventionally thinned young-growthstands surveyed in northern California, 22% to 50% ofthe residual trees were wounded. The level ofdamagein four stands that were thinned using techniquesdesigned to reduce logging skidding injuries were substantially lower, ranging from only5% to 14%.
Damage to leave trees is less severe with skyline thinning than with conventional skidding or tractor-basedoperations(Aulerich et al. 1976,Carvell 1984,Fairweather 1991). Aulerich etal. (1976) reported that11 %of trees aftertractor thinning hadwounds over46cm2 (7.1 in2), and 7% of the stems following skylinethinning had wounds of this size. In the tractor thinnedunit 58% of the scars were either on roots or the lower30cm (11.8 in) of the tree trunks. Ninety-eight percentof skyline thinning wounds were over30cm(11.8 in)above ground, and 22% of these scars were more than1.52 m(4.6 ft) above ground. Ina skyline loggingstudy, Kellogg etal. (1986) reported that most yardingdamage (66.6% of total scar area) occurred within 6 m(20feet) of theskyline corridor centeriine. They alsonoted that selective thinning causedgreaterresidualstand damage thana herringbone thinning.
Ina commercial thinning using a small helicopter witha payload capacity of 1,133 kg (2,500pounds). Flatten(1991) found thatdamage to a young Douglas-fir standappeared to be far less than typically found with skyline systems.
The questions of a maximum acceptable damage leveland what constitutes a damaged tree arise whenever
penalties for damage are an issue. Government agencies and private industry have answered these questionsin their policies, but they arenot consistent. Some of -the rules are written with ambiguous language resultingindifferent interpretation. Theminimum scar size toconstitute damage varies from agency to agency, ranging from 6.5 cm2 (1 in2) to 464 cm 2(72 in2) or nowritten definition. Amaximum acceptable damagelevel consisting ofscarring, crown and root damage isalso not consistent: 3%, 5% oftotal damaged tree oraninspector's decision.
Damage to residual trees is related to several factorsbesides the logging system, including thinning intensity, planning and layout season ofharvest species,felling patterns, yarder size, skyline deflection, tree distance from skid trails, tree size, tree length being harvested andsiteconditions (slope, soil texture, rocki-ness. etc.).However, researchers agree that the mostcritical factor affecting the damage level is a worker'sskill and efforts (McLaughlin and Pulkki 1992, Hoffman1990; Cline et al. 1991; Ostrofsky et al. 1986; Kelloggetal. 1986).
The results ofthe first halfofthis project were presentedat the annual Council on Forest Engineering(COFE) meeting last year (Pilkerton etal. 1996),which included skyline and helicopter thinning units.In thispaper, wecompare the characteristics of standdamage inrelation to various thinning treatments andto four logging systems including the results from lastyear (helicopterlogging).We also discuss the harvesting variables affecting damage level.
METHODS
Study SitesandThinning Prescriptions
Data for this study were collected oncommerciallythinned young stands in the central Cascade Mountainsof Oregon. Table 1 describes the characteristics ofstands andthinning systems used forthestudy areas.Forthe purpose of standdamage comparison, onecable(3 units), one cut-to-length (3 units), and two tractorsales (5 units) were selected on the Willamette NationalForest totaling 210ha (521 acre). Thestudy areaswere administrated by three different Forest ServiceRanger Stations. Thesesecond-growth standsareaswere previously clearcut between theearly 1940s and1950s, broadcast burned soon afterward and allowed 2-4 years to regenerate naturally before being interplant-ed with Douglas fir. Stands were dominated byDouglas fir with two layers of scattered western hemlockand individual or clumpsof big leaf maple (Acermacrophyllum).
77
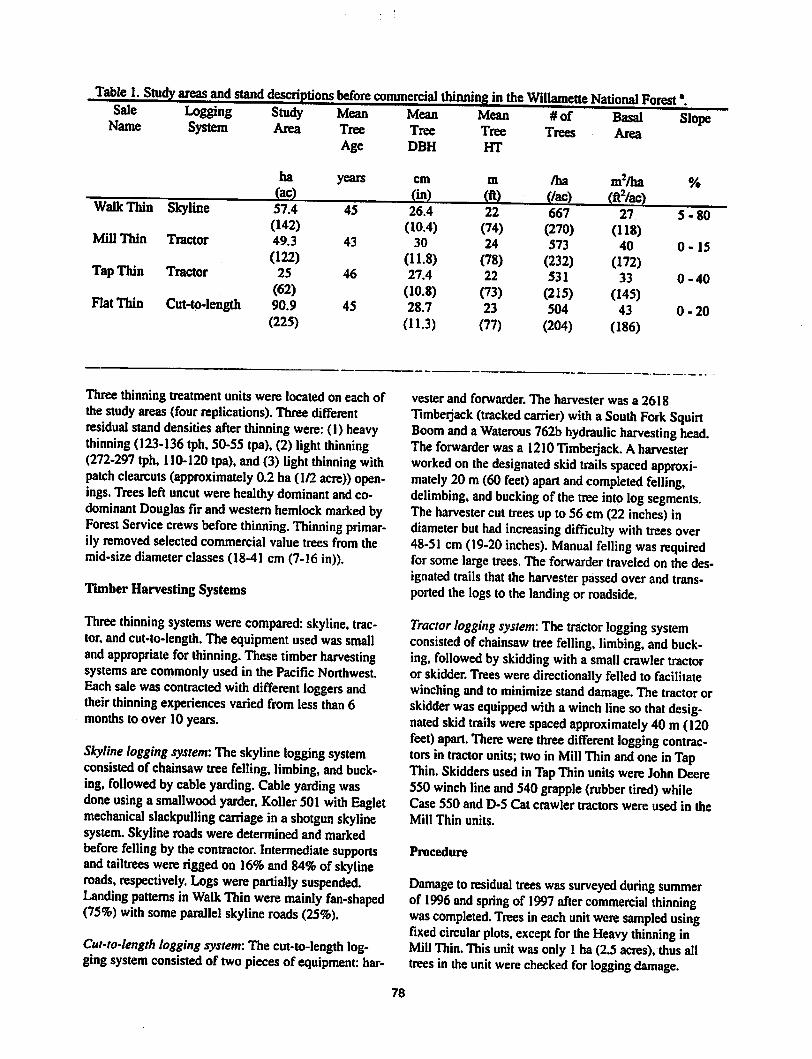
Table 1. Study areas and stand descriptions before commercial thinning in the Willamette National Forest'.Sale Logging Study Mean Mean Mean #of Basal Slope
Name System Area Tree Tree TreeAge DBH HT
Trees Area
ha years cm m /ha m2/ha %(ac)
45
(in)
26.4
(ft)22
(/ac) (ftVac)Walk Thin Skyline 57.4 667 27 5-80
(142) (10.4) (74) (270) (118)Mill Thin Tractor 49.3 43 30 24 573 40 0-15
(122) (118) (78) (232) (172)Tap Thin Tractor 25 46 27.4 22 531 33 0-40
(62) (10.8) (73) (215) (145)Flat Thin Cut-to-length 90.9 45 28.7 23 504 43 0-20
(225) (11.3) (77) (204) (186)
Three thinning treatment units were located on each ofthe study areas (four replications). Three differentresidual stand densities after thinning were: (1) heavythinning (123-136 tph, 50-55 tpa), (2) light thinning(272-297 tph, 110-120 tpa), and (3) light thinning withpatch clearcuts (approximately 0.2ha(1/2 acre)) openings. Trees left uncut were healthy dominant and co-dominant Douglas fir and western hemlock marked byForest Service crews before thinning. Thinning primarily removed selected commercial value trees from themid-size diameter classes (18-41 cm (7-16 in)).
Timber Harvesting Systems
Three thinning systems were compared: skyline, tractor, andcut-to-length. The equipment used was smalland appropriate for thinning. These timber harvestingsystems are commonly used in the Pacific Northwest.Each sale was contracted withdifferent loggers andtheir thinning experiences varied from less than 6months to over 10 years.
Skyline logging system: The skyline logging systemconsisted of chainsaw tree felling, limbing, and bucking, followed by cable yarding. Cable yarding wasdone using asmallwood yarder, Koller 501 with Eagletmechanical slackpulling carriage in a shotgun skylinesystem. Skyline roads were determined and markedbefore felling by the contractor. Intermediate supportsand tailtrees were rigged on 16% and 84% of skylineroads, respectively. Logs were partially suspended.Landing patterns inWalk Thin were mainly fan-shaped(75%) with some parallel skyline roads (25%).
Cut-to-length logging system: The cut-to-length logging system consisted of two pieces of equipment: har
vester and forwarder. The harvester was a 2618Timberjack (tracked carrier) with a South Fork SquirtBoom and aWaterous 762b hydraulic harvesting head.The forwarder was a 1210 Timberjack. A harvesterworked onthe designated skid trails spaced approximately 20m (60 feet) apart and completed felling,delimbing, and bucking of the tree into log segments.The harvester cut trees up to 56 cm (22 inches) indiameter buthad increasing difficulty withtrees over48-51 cm (19-20 inches). Manual felling was requiredfor some large trees. The forwarder traveled on the designated trails that the harvester passed overand transported the logsto the landing or roadside.
Tractor logging system: The tractor logging systemconsisted of chainsaw tree felling, limbing, and bucking, followed by skidding with a small crawler tractoror skidder. Trees were directionally felled to facilitatewinching and to minimize stand damage. The tractor orskidder was equipped with awinch line sothat designated skidtrails were spaced approximately 40 m (120feet) apart. There were three different logging contractors in tractor units; two inMill Thin and one in TapThin. Skiddersused inTapThin units wereJohn Deere550 winch line and540 grapple (rubber tired)whileCase 550 and D-5 Cat crawler tractors were used in theMill Thin units.
Procedure
Damage toresidual trees was surveyed during summerof 1996 and spring of 1997 after commercial thinningwas completed. Trees ineach unit were sampled usingfixed circular plots, except for the Heavy thinning inMill Thin.This unitwasonly 1ha(2.5 acres), thus alltrees in the unit were checked for logging damage.
78

The sampling pattern was a systematic grid having thesample units, with a constant distance between sampling unitswithinrows equally spaced. These rowswere perpendicular to the primary direction of yardingor skidding to landings. If this was impossible due tofan-shape yarding orskidding patterns, we stratified theunit to avoid locating therows parallel to skyline roadsor skidtrails. Plot sizeswere 0.04 ha(1/10 acre) forLight thinning treatments or0.08 ha(1/5 acre) forHeavy thinning treatments. The sample sizeof eachunitwascalculated using(Thompson 1995):
"o =N*p(l-P)
(N-l<a +P(l-P)
ffftSample size =
t*p*s
n0- number ofdamaged trees required insampleN= total numberoftreesin the unitp =estimate of percentage damaged trees inuriit</= allowable sampling error, 10% was used.z = 1.96 for95%probabilityt = numberoftrees perunit, ha or acres =plot size, 0.04 ha (0. lac) or0.08 ha (0.2ac)
Once the sample size wascalculated, plots were uniformly distributed through the unit.The numberofplots ranged from 20 to 27, sampling 2.1% to 34.7% ofthe area of each unit. In surveying tree damage, wenumbered all damaged trees and marked undamagedtrees ineach plot using paint. This avoided countingthe same tree twice or missing trees and facilitatedremeasurement if needed.
If a tree was damaged, such as scarring, root and/orcrown damage, we measured DBH and collected thedata related to tree damage. For scarring damage, scarlength, width, andheight from the ground level weremeasured. A scar was defined as removal of the barkandcambial layer, exposing the sapwood. Each scarwastraced ontoregular paper andthese tracings weremeasured for scar area using a planimeter. If a scarwas bigger than the paper size, the scar was tracedonto several pieces of paper, measuredby.piece,andthen summed for a total scar area. The scars thatcould not be reached by hand were measured withBettinger and Kellogg's method (1993) that uses acamera equipped with a 70 - 210 mm zoom lens. Apicture of the scar included a scale, which was mounted on a level rod. Scars were numbered if there weremore than one scar per tree.
Scar locations on the bole were noted by four quadrants: (1) quadrant #1 facing the landing, (2) quadrant#2 facing the corridor, (3) quadrant #3 facing the tail-tree or tailhold, (4) quadrant #4 opposite toquadrant 2.Each scar waschecked to see if the wood fibers wereremoved, called gouge damage. If ascar had gougedamage, the gouge area and the gouge depth were categorized by three levels: (1) <25% and < 1cm, (2) 25%to 50% and 1 cm - 2 cm, (3) > 50% and >2 cm. Thedistance from the corridor centerline and landing (skyline unitsonly) forevery damaged treewas recorded.
If the tree top was removed, it was recorded as a broken-top. Crowndamage described when half or moreof the crown was removed from the base of the livecrown to thetop. Any visual scar or severing of theroot system was defined as root damage.
To study the wounding caused by theharvester or theforwarder, 3.9 ha (9.7 acres) of the Light thinning unit inthe FlatThin sale was selected. The areaincluded onelanding and 5 equipment trails ranging from 365 m(1200 feet) to 669 m (2200 feet) in length. All of thetrees in thearea were observed for damage after the harvester passed andbeforethe forwarder operation. Paintwas sprayed on the wounded area to differentiate thedamage created by the forwarder. Every tree inthe studyarea was checked again after the forwarder operation.
RESULTS
Damage Level and Scar Size
The most typical typeof damage to thecrop trees inevery logging system unit was scarring, accounting formore than 90% of thetotal damage. Crown damagewas more prevalent in skyline logging units than inground based loggingsystems. Crownremoval andbroken-tops werecaused by lateral excursion of theskyline during lateral inhaul. Ground based systemscreated more severe root damage than skyline. Rootsystems below the ground linewere easily damaged byrepeated passes of equipment and logsbeing dragged.Skidder blading to level the surface of skid trails alsosevered root systems. These three typesof damage constituted the damage related to thinning operations inthis study.
Highest incidence of damage to residual trees was41.3% in theLightthinning unitof thecut-to-lengthsystem (Table 2). The units thinned by the harvesterand forwarder sustained higher damage levels (over30%) than units thinned using a tractor(7.5% to25.4%) or a skyline system (13.5 to 20.2%). The twolowestdamage levels were measured at the Heavy
79
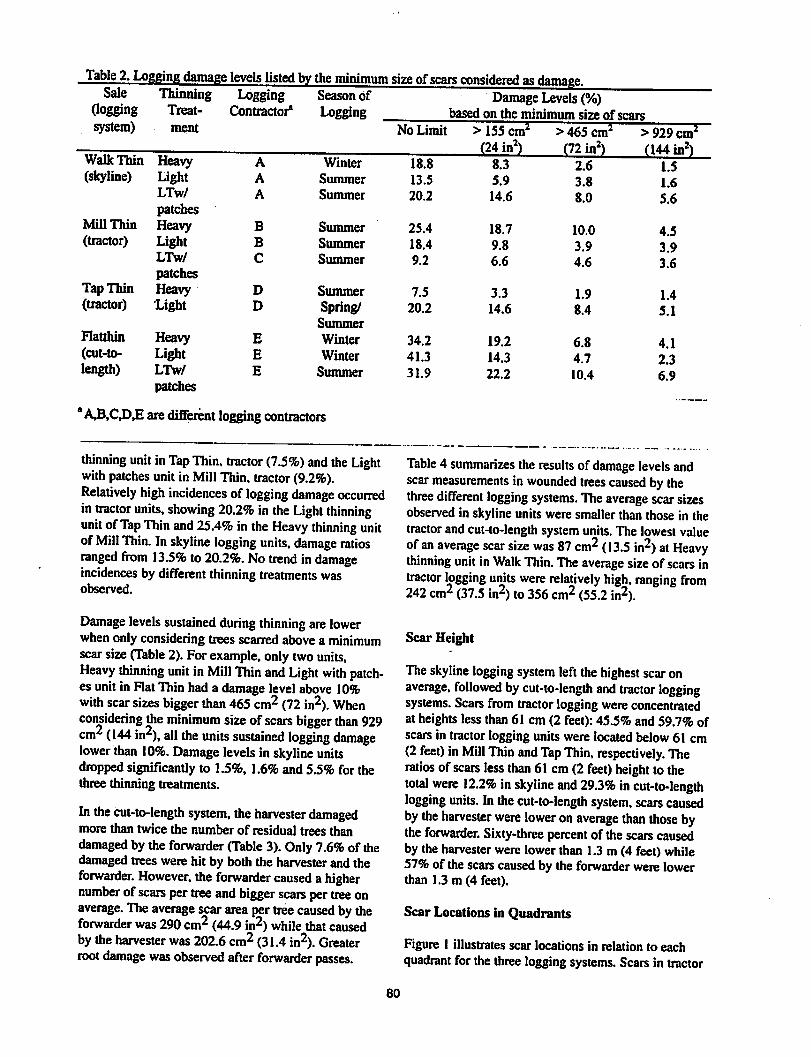
Table 2. Logging damage levels listed by the minimum size ofscars considered as damage.Sale Thinning Logging Season of Damage Levels (%)
Cogging Treat- Contractor* Logging based on the minimum size ofscarssystem) ment No Limit > 155 cm2
(24 in2)> 465 cm2
(72 in2)2.6
> 929 cm2(144 in2)
1.5Walk Thin Heavy A Winter 18.8 8.3(skyline) Light A Summer 13.5 5.9 3.8 1.6
LTw/ A Summer 20.2 14.6 8.0 5.6patches
Mill Thin Heavy B Summer 25.4 18.7 10.0 4.5(tractor) Light B Summer 18.4 9.8 3.9 3.9
LTw/ C Summer 9.2 6.6 4.6 3.6patches
Tap Thin Heavy D Summer 7.5 3.3 1.9 1.4(tractor) Light D Spring/
Summer
20.2 14.6 8.4 5.1
Flatthin Heavy E Winter 34.2 19.2 6.8 4.1(cut-to- Light E Winter 41.3 14.3 4.7 2.3length) LTw/
patchesE Summer 31.9 22.2 10.4 6.9
•A3,C,D,E aredifferent logging contractors
thinning unit inTap Thin, tractor (7.5%) and the Lightwith patches unit in Mill Thin, tractor (9.2%).Relatively high incidences of logging damage occurredintractor units, showing 20.2% in the Light thinningunit ofTap Thin and 25.4% in the Heavy thinning unitof Mill Thin. In skyline logging units, damage ratiosranged from 13.5% to 20.2%. No trend indamageincidences by different thinning treatments wasobserved.
Damage levels sustained during thinning are lowerwhen only considering trees scarred above a minimumscar size (Table 2). For example, only two units,Heavy thinning unit inMill Thin and Light with patches unit in Flat Thin hada damage level above 10%with scar sizes bigger than 465 cm2 (72 in2). Whenconsidering theminimum sizeof scars bigger than 929cm2 (144 in2), all the units sustained logging damagelower than 10%. Damage levels in skylineunitsdropped significantly to 1.5%, 1.6% and 5.5% for thethree thinning treatments.
In the cut-to-length system, the harvester damagedmore than twice the number of residual trees thandamaged by the forwarder (Table 3). Only7.6% of thedamaged trees were hit by both the harvester andtheforwarder. However, the forwarder caused ahighernumber of scars per tree and bigger scars per tree onaverage. Theaverage scar area per tree caused by theforwarder was 290 cm2 (44.9 in2) while that causedbythe harvester was 202.6 cm2 (31.4 in2). Greaterroot damage was observed after forwarder passes.
Table 4 summarizes the results of damage levels andscar measurements in wounded trees caused by thethree different logging systems. The average scar sizesobserved in skyline units were smallerthan those in thetractor and cut-to-length system units. The lowest valueofan average scar size was 87 cm2 (13.5 in2) at Heavythinning unit inWalk Thin. The average sizeof scars intractor logging units were relatively high, ranging from242 cm2 (37.5 in2) to 356 cm2 (55.2 in2).
Scar Height
The skyline logging system left thehighest scar onaverage, followed bycut-to-length and tractor loggingsystems.Scars from tractor loggingwereconcentratedat heights less than 61 cm (2 feet): 45.5% and59.7%ofscars in tractor logging units were located below 61 cm(2 feet) in Mill Thin and Tap Thin, respectively. Theratios of scars less than 61 cm (2 feet) height to thetotal were 12.2% inskyline and 29.3% incut-to-lengthlogging units. Inthecut-to-length system, scars causedby the harvester were lower on average than those bythe forwarder. Sixty-three percent of the scars causedby the harvester were lowerthan 1.3 m (4 feet) while57% of the scars causedby the forwarder were lowerthan 1.3 m (4 feet).
Scar Locations in Quadrants
Figure 1 illustrates scar locations in relation to eachquadrant for the threeloggingsystems. Scars in tractor
80
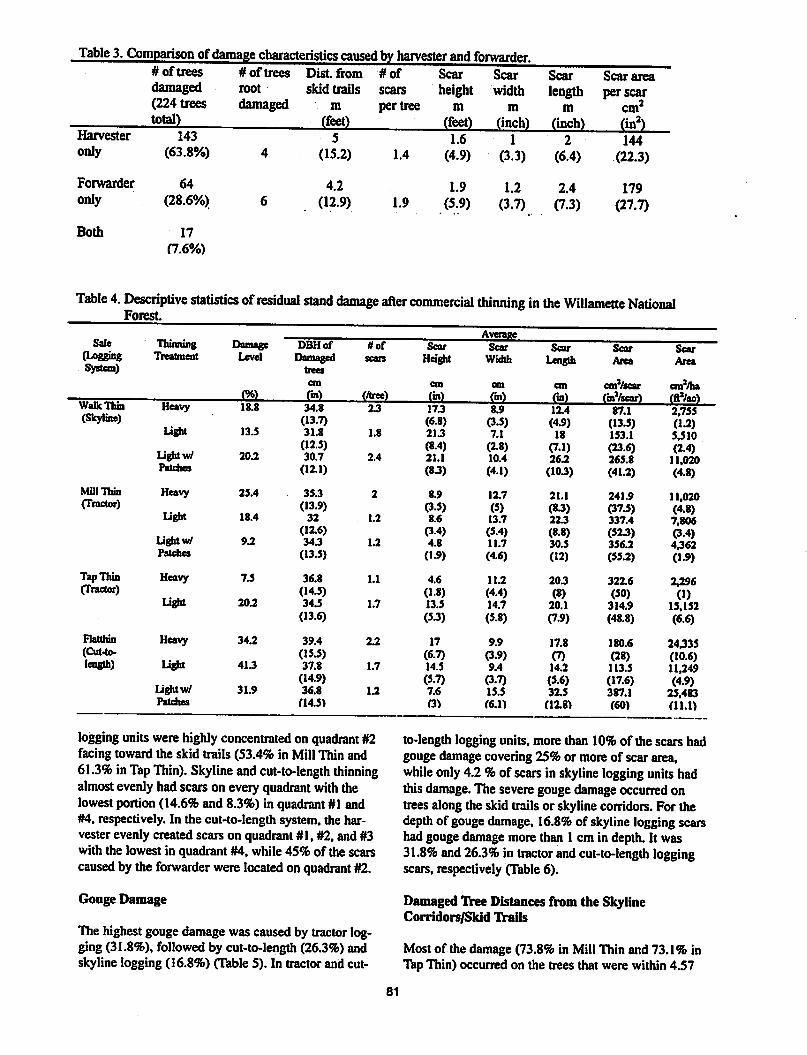
Table 3. Comparison of damage characteristics caused by harvester and forwarder.# oftrees # of trees Dist. from #of Scar Scardamaged root skid trails scars height width(224 trees damaged m per tree m mtotal) (feet) (feet) (inch)
Scar
lengthm
(inch)
Scar area
per scar
cm2
(i»2)144
(22.3)
Harvester
only
Forwarder
only
Both
143
(63.8%)
64
(28.6%)
17
(7.6%)
5
(15.2)
4.2
(12.9)
1.4
1.9
1.6
(4.9)
1.9
(5.9)
1
(3.3)
1.2
(3.7)
2
(6.4)
2.4
(7.3)179
(27.7)
Table 4. Descriptive statistics ofresidual stand damage after commercial thinning in the Willamette NationalForest
Thinning DamageAverage
Sale DBHof IK of Scar Scar Scar Scar Scar(Logging Treatment Level Damaged scars Height Width Length Area AreaSystem) trees
cm cm cm cm cmVscar cmVha<%) fin) (/tree) (in) fin) (in) (inVscar)
87.1
flrVac)2,755
Walk Tfam Heavy 18.8 34.8 23 17.3 8.9 12.4(Skyline) (13.7) (6.8) (3.5) (45) (13.5) (1.2)
Light 13.5 31.8 1.8 213 7.1 18 153.1 5,51002.3) (8.4) (2.8) (7.1) (23.6) (24)
Light w/ 20.2 30.7 2.4 21.1 10.4 26.2 265.8 11,020Patches (12.1) (83) (4.1) (103) (41.2) (4.8)
Mill Thin Heavy 25.4 35.3 2 8.9 1X7 21.1 241.9 11.020(Tractor) (13.9) (3.5) (5) (83) (37.5) (4.8)
Light 18.4 32 1.2 8.6 13.7 223 337.4 7,806(12.6) (3-4) (5.4) (8.8) (523) (3.4)
Light w/ 9J2 343 1.2 4.8 11.7 30.5 356.2 4362Patches (13.5) (1.9) (46) (12) (55.2) (1.9)
Tap Thin Heavy 7.5 36.8 1.1 4.6 11.2 203 32X6 2296(Tractor) (14.5) (1.8) (4.4) (8) (50) (1)
Light 20.2 34.5 1.7 13.5 14.7 20.1 314.9 15.152(13.6) (53) (5.8) (7.9) (48.8) (6.6)
Flattbin Heavy 34.2 39.4 22 17 9.9 17.8 180.6 24335(Cut-to- (15.5) (6-7) (3.9) 0) (28) (10.6)length) Light 413 37.8 1.7 14.5 9.4 14.2 113.5 11,249
(14.9) (5.7) (3.7) (5.6) (17.6) (45)Lightw/ 315 36.8 1.2 7.6 15.5 32.5 387.1 25,483Patches (14.5) (3) (6.1) (1X8) (60) (11.1)
logging uniu were highlyconcentrated on quadrant #2facing toward the skid trails (53.4% in Mill Thin and61.3% inTap Thin). Skyline and cut-to-length thinningalmost evenlyhadscars on everyquadrant withthelowest portion (14.6% and 8.3%) in quadrant #1 and#4, respectively. In the cut-to-length system, the harvester evenly created scars on quadrant#1, #2, and #3with the lowest in quadrant #4, while 45% of the scarscaused by the forwarder were located on quadrant #2.
Gouge Damage
The highestgougedamagewas causedby tractor logging (31.8%), followed by cut-to-length (26.3%) andskyline logging (16.8%) (Table 5). In tractor and cut-
to-length logging units, more than 10% of the scars hadgouge damage covering 25% or more of scar area,while only4.2 % of scars in skylinelogging units hadthisdamage. The severe gouge damage occurred ontrees along the skid trails or skyline corridors. For thedepthof gougedamage, 16.8% of skyline loggingscarshadgougedamage more than 1cm in depth. It was31.8% and 26.3% in tractor and cut-to-length loggingscars, respectively (Table 6).
Damaged Tree Distances from the SkylineCorridors/Skid Trails
Most of the damage (73.8% in Mill Thin and 73.1% inTap Thin) occurred on the trees that were within 4.57
81
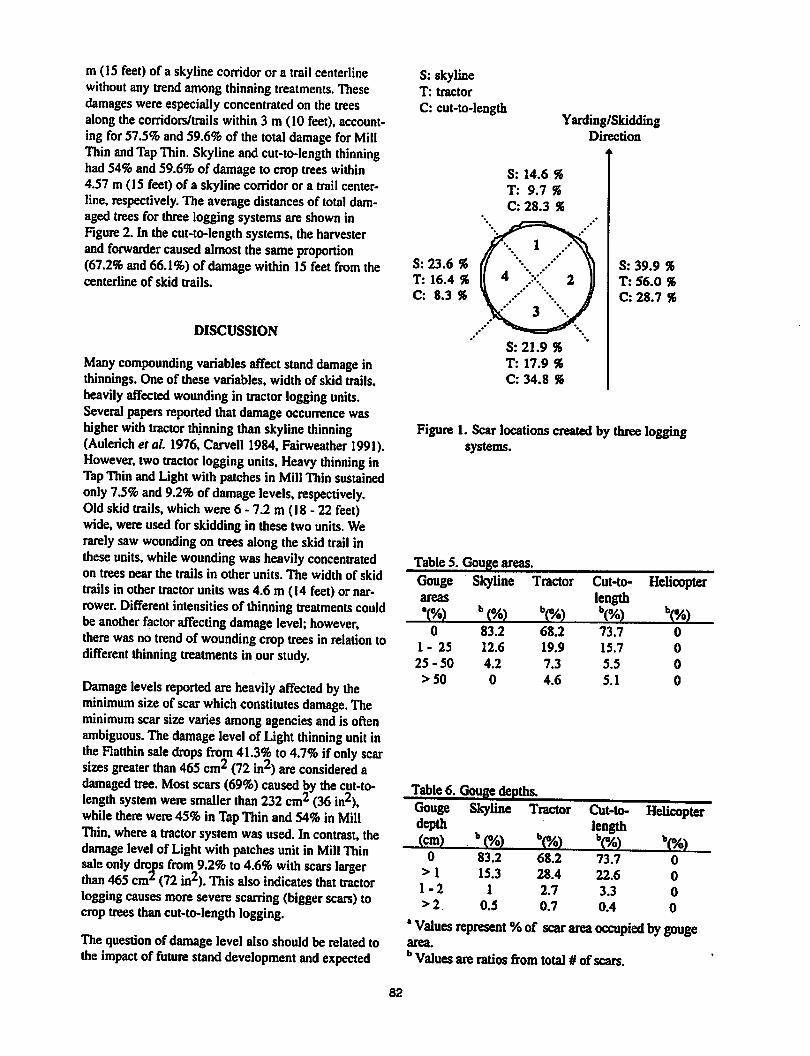
m (15 feet) of a skyline corridor or a trail centerlinewithout any trendamong thinning treatments. Thesedamages wereespecially concentrated on the treesalong the corridors/trails within 3 m (10 feet), accounting for57.5% and59.6% of the total damage forMillThin and Tap Thin. Skyline andcut-to-length thinninghad 54% and 59.6% of damage to crop trees within4.57 m (15 feet) of a skyline corridor or a trail center-line, respectively. The averagedistances of total damaged trees for three logging systems are shown inFigure 2. In the cut-to-length systems, the harvesterandforwarder caused almost thesame proportion(67.2% and66.1%) of damage within 15feet from thecenterline of skid trails.
DISCUSSION
Many compounding variables affect stand damage inthinnings. One of these variables, width of skid trails,heavily affected wounding in tractor logging units.Severalpapersreported that damage occurrence washigher with tractor thinning than skyline thinning(Aulerich etal. 1976, Carvell 1984,Fairweather 1991).However, two tractor logging units, Heavy thinning inTapThin and Light with patches in Mill Thin sustainedonly 7.5% and 9.2% of damage levels, respectively.Oldskidtrails, which were6 - 7.2 m (18- 22 feet)wide,wereused for skiddingin these two units. Werarelysaw wounding on trees along the skid trail inthese units, while wounding washeavily concentratedon trees near the trails in other units. The width of skidtrails in othertractor uniu was4.6 m (14 feet) or narrower. Different intensities of thinning treatments couldbe anotherfactoraffectingdamage level;however,there was no trend of wounding crop trees in relation todifferent thinning treatments in our study.
Damage levels reported are heavily affected by theminimum size of scar which constitutes damage. Theminimum scarsize varies among agencies and is oftenambiguous. The damage level ofLight thinning unit inthe Flatthin sale drops from 41.3% to 4.7% if only scarsizes greater than 465 cm2 (72 in2) are considered adamaged tree. Most scars(69%) caused by thecut-to-length system were smaller than 232 cm2 (36 in2),while there were 45%in Tap Thinand54% in MillThin,where a tractor system was used. In contrast, thedamage level of Light with patches unit in Mill Thinsale only drops from 9.2% to 4.6% with scars largerthan 465 cm2 (72 in2). This also indicates that tractorlogging causes more severe scarring (bigger scars) tocrop trees thancut-to-length logging.
The questionof damage level also should be related tothe impact of future stand development and expected
S: skylineT: tractor
C: cut-to-lengthYarding/Skidding
Direction
S: 23.6 %
T: 16.4 %
C: 8.3 %
S: 14.6 %
T: 9.7 %
C: 28.3 %
S: 21.9 %T: 17.9 %
C: 34.8 %
S: 39.9 %
T: 56.0 %
C: 28.7 %
Figure 1. Scar locations created by three loggingsystems.
Table 5. Gouge areas
Gouge Skyline Tractor Cut-to- Helicopterareas length*(%) b(%) b(%) b(%) b(%)
0 83.2 68.2 73.7 0
1- 25 12.6 19.9 15.7 0
25-50 4.2 7.3 5.5 0
>50 0 4.6 5.1 0
Table 6. Gouge depths,Gouge Skyline Tractor Cut-to- Helicopterdepth length(cm) b(%) b(%) b(%)
73.7
b(%)00 83.2 68.2
>1 15.3 28.4 22.6 01-2 1 2.7 3.3 0>2 0.5 0.7 0.4 0
•Values represent %of scar area occupied by gougearea.
bValues are ratios from total # ofscars.
82
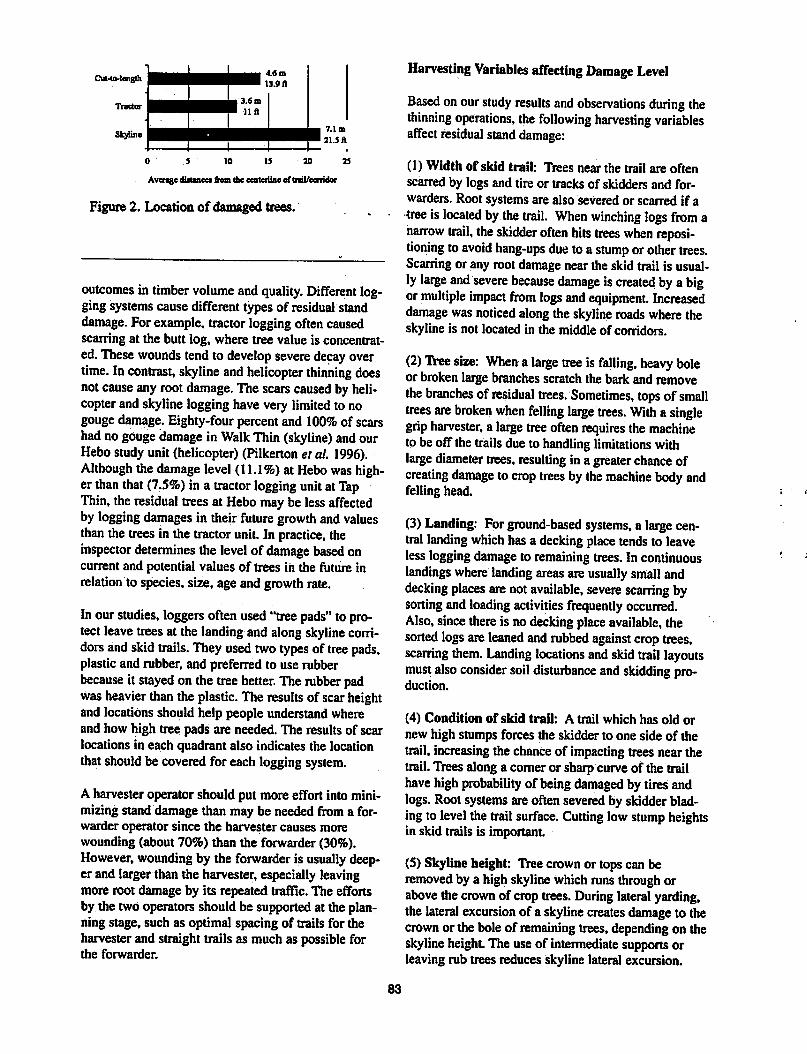
0 5 10 15 20 25
Avenge distance* from ihe centerline oftral/corridor
Figure 2. Location ofdamaged trees.
outcomes in timber volume and quality. Different loggingsystems causedifferent typesof residual standdamage. For example, tractor logging often causedscarring at the butt log, where tree value is concentrated. These wounds tend to develop severe decay overtime. In contrast, skyline and helicopter thinning doesnot cause any root damage. The scars caused by helicopter and skyline logging have very limited to nogouge damage.Eighty-four percent and 100% of scarshad no gouge damage in Walk Thin (skyline) andourHebo study unit (helicopter) (Pilkerton etal. 1996).Although the damage level (11.1%) at Hebo was higher than that (7.5%) in a tractor logging unit at TapThin, the residual treesat Hebomaybe lessaffectedby logging damages in their futuregrowth and valuesthanthe trees in the tractorunit. In practice, theinspector determines the level of damage based oncurrent and potential values of trees in the future inrelationto species, size, age and growth rate.
Inour studies, loggers often used "treepads" to protect leave trees at the landing and along skylinecorridorsand skidtrails. They usedtwo types of treepads,plastic and rubber, and preferred to use rubberbecause it stayedon the tree better. The rubber padwasheavier thanthe plastic. The results of scarheightand locationsshould help people understandwhereand how high tree pads are needed. The results of scarlocations in each quadrant also indicates the locationthatshould be covered for each logging system.
A harvester operator should put more effort into minimizing stand damage than may be needed from a forwarder operator since the harvester causes morewounding (about 70%) than the forwarder (30%).However, woundingby the forwarder is usually deeper and larger than the harvester, especially leavingmore root damage by its repeated traffic. The effortsby the two operators should be supportedat the planning stage, such as optimal spacing of trails for theharvester and straight trails as much as possible forthe forwarder.
Harvesting Variables affecting Damage Level
Based on our study results and observations during thethinning operations, the following harvesting variablesaffect residual stand damage:
(1) Width of skid trail: Trees near the trail are oftenscarred by logs and tire or tracks of skidders and forwarders. Root systems are also severed or scarred if atree is located by the trail. When winching logs from anarrow trail, the skidder often hiu trees when repositioning toavoid hang-ups due toa stump orother trees.Scarring or anyrootdamage neartheskidtrail is usuallylarge and severe because damage iscreated by a bigor multiple impact from logs andequipment Increaseddamage was noticed along the skyline roads where theskyline is not located in the middle of corridors.
(2) Tree size: When a large tree isfalling, heavy boleor broken large branches scratch the bark and removethe branches of residual trees. Sometimes, tops of smallfrees are broken when felling large trees. With a singlegripharvester, a large treeoften requires the machineto beoff the trails due to handling limitations withlarge diameter trees, resulting in a greater chance ofcreating damage tocrop trees bythe machine body andfelling head.
(3)Landing: Forground-based systems, a large central landing which has a decking placetendsto leaveless logging damage to remaining trees. In continuouslandings where landing areas are usually small anddecking places arenot available, severe scarring bysorting and loading activities frequently occurred.Also, since there is no decking place available, thesorted logsareleaned andrubbed against crop trees,scarring them. Landing locations andskid trail layoutsmust alsoconsider soildisturbance and skidding production.
(4) Condition of skid trail: A trail which has old ornew high stumps forces the skidder to one side of thetrail, increasing the chance of impacting trees near thetrail. Trees along a corneror sharpcurveof the trailhave high probability of being damaged by tiresandlogs. Root systems areoftensevered by skidder blading to level the trail surface. Cutting low stumpheighuin skid trails is important.
(5) Skyline height: Tree crownor tops can beremoved by a high skylinewhich runs throughorabove the crownof crop trees.During lateralyarding,the lateral excursion of a skyline creates damage to thecrownor the bole of remaining trees,depending on theskyline height. The use of intermediate supports orleaving rub trees reduces skyline lateral excursion.
83
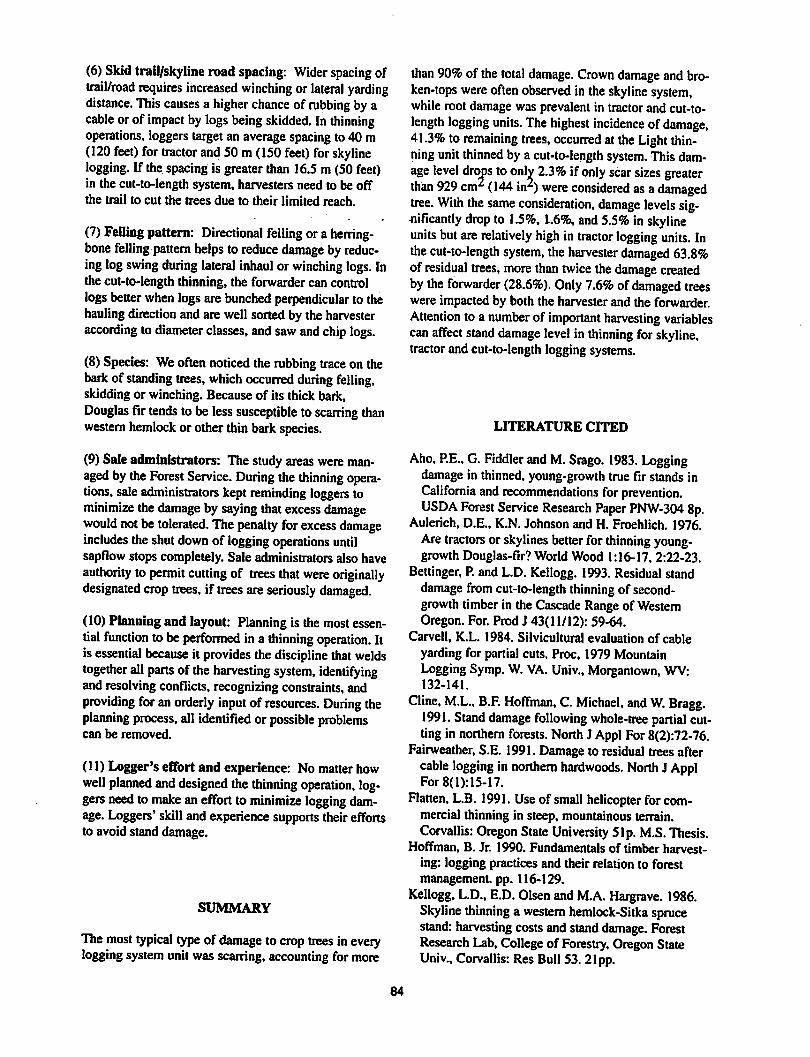
(6) Skid trail/skyline road spacing: Wider spacing oftrail/road requires increased winching or lateral yardingdistance. This causes a higher chance of rubbing byacable or of impact by logs being skidded. In thinningoperations, loggers target an average spacing to 40 m(120 feet) for tractor and50 m (150 feet) forskylinelogging. If the spacingis greater than 16.5m (50 feet)in the cut-to-length system, harvesters need to be offthe trail to cut the trees due to their limited reach.
(7) Felling pattern: Directional felling or a herringbone felling pattern helps to reduce damage byreducing log swing during lateral inhaul or winching logs. Inthe cut-to-length thinning, the forwarder can controllogsbetterwhen logs are bunched perpendicular to thehauling direction and are well sorted by the harvesteraccording to diameter classes, andsawandchip logs.
(8)Species: We often noticed the rubbing trace on thebark of standing trees, which occurred during felling,skidding or winching. Because of iu thick bark,Douglas fir tends to be lesssusceptible to scarring thanwestern hemlockor other thin bark species.
(9)Saleadministrators: Thestudy areas were managed bythe Forest Service. During the thinning operations, saleadministrators kept reminding loggers tominimize thedamage by saying thatexcess damagewould not be tolerated. Thepenalty forexcess damageincludes theshutdown of logging operations untilsapflow stops completely. Sale administrators also haveauthority to permit cutting of trees that were originallydesignated crop trees, if trees are seriously damaged.
(10) Planning and layout: Planning is themost essential function to beperformed in a thinning operation. Itis essential because it provides thediscipline that weldstogether all parts of theharvesting system, identifyingand resolving conflicts,recognizing constraints, andproviding foranorderly input of resources. During theplanning process, all identified or possible problemscan be removed.
(11) Logger's effort and experience: No matterhowwell planned and designed thethinning operation, loggersneed to make an effort to minimize logging damage. Loggers' skilland experience supports theireffortsto avoid stand damage.
SUMMARY
Themost typical type of damage to croptrees ineverylogging systemunit was scarring,accounting for more
than 90% of the total damage. Crown damage and broken-tops were often observed in the skyline system,while root damage was prevalentin tractorand cut-to-length logging units. The highest incidence of damage,41.3% to remaining trees, occurred at the Light thinning unit thinned by a cut-to-length system. This damage level drops toonly 2.3% if only scar sizes greaterthan 929 cm2 (144 in2) were considered as adamagedtree. With the same consideration, damage levels significantly drop to 1.5%, 1.6%, and 5.5% inskylineunits butare relatively high in tractor logging uniu. Inthe cut-to-length system, the harvester damaged 63.8%of residual trees, more than twice the damage createdby the forwarder (28.6%). Only 7.6% ofdamaged treeswere impacted by both the harvester and the forwarder.Attention to a number of important harvesting variablescan affect stand damage level in thinning for skyline,tractorand cut-to-length loggingsystems.
LITERATURE CITED
Aho, P.E., G.Fiddler and M. Srago. 1983. Loggingdamage in thinned, young-growth true fir stands inCalifornia and recommendations for prevention.USDA Forest Service Research Paper PNW-304 8p.
Aulerich, D.E., K.N. Johnson and H. Froehlich. 1976.Are tractors or skylines better for thinning young-growth Douglas-fir? World Wood 1:16-17,2:22-23.
Bellinger, P. and L.D. Kellogg. 1993. Residual standdamage from cut-to-length thinning of second-growth timber in the Cascade Range of WesternOregon. For. Prod J 43(11/12): 59-64.
Carvell, K.L. 1984. Silvicultural evaluation of cableyarding for partial cuts. Proc, 1979 MountainLogging Symp.W. VA. Univ., Morgantown, WV:132-141.
Cline. M.L., B.F. Hoffman, C.Michael, and W. Bragg.1991. Stand damage following whole-tree partial cutting in northern foresu. North J Appl For8(2):72-76.
Fairweather, S.E. 1991. Damage to residual trees aftercable logging in northern hardwoods. North J ApplFor 8(1):15-17.
Flatten, L.B. 1991. Use of small helicopter forcommercial thinning in steep, mountainous terrain.Corvallis: Oregon State University 51p. M.S. Thesis.
Hoffman, B. Jr. 1990. Fundamentals of timber harvesting: logging practices and their relation to forestmanagement, pp. 116-129.
Kellogg, L.D., E.D. Olsen andM.A. Hargrave. 1986.Skyline thinning a western hemlock-Sitka sprucestand: harvesting costs and stand damage. ForestResearch Lab, College of Forestry, Oregon StateUniv., Corvallis: Res Bull 53. 21pp.
84

Lanford, B.L. and B.J. Stokes. 1995. Comparison oftwo thinning systems: Part 1. stand and site impacts.Forest Prod. J. 45(5):74-79.
MacLaughlin J.A. and R.E. Pulkki. 1992. Assessmentof wounding attwocommercially thinned Jack pinesites. North J Appl For 9(2):43-46.
McNeel,J.F., D. Briggs,and B. Petersen. 1996.Damage to residual trees during partial harvest- measurement, analysis, and implications. Proc, 1996Annual COFE meeting. Marquette: University ofMichigan Press: 73-81.
Ostrofsky, W.D., R.S. Seymour, and R.C. Lemin, Jr.1986. Damage tonorthern hardwoods from thinningusing whole-tree harvesting technology. Can J ForRes 16:1238-1244.
Pilkerton, SJ., H.S. Han. and L.D. Kellogg. 1996.Quantifying residual stand damage in partial harvestoperations. Proc, 1996 Annual COFE meeting.Marquette: University of Michigan Press: 62-72.
Sessions. J., K.N. Johnson, J. Beuter, B. Greber. and G.Lettman. 1991. Timber for Oregon's tomorrow, 1989update. Forest Research Lab,Oregon State,Corvallis.
85

Evaluating the Effectiveness ofTimber Harvesting BMPs on
Stream Sedimentation in the Virginia Coastal Plain
RobertM.Shaffer
Department ofForestry
and
Saied MostaghimiDepartment ofBiological Sysyems Engineering
Virginia Tech
ABSTRACT: Three small watersheds in the Virginia coastal plain were monitored to evaluate the effectiveness of BMPs onstream sedimentation. One watershed was harvested with BMPs; one was harvested without BMPs; the third remained uncut,asacontrol. Pre- and post-harvesting water quality data were compared using the minimum detectable change (MDC) statistic.Harvesting without BMPs significantly increased concentrations and loadings of total suspended solids, while harvesting withBMPs did not, indicating that BMPs were effective in minimizing stream sedimentation.
Key Words: BMPs, timber harvesting, water quality
INTRODUCTION
Timberharvesting "Best Management Practices"(BMPs) (VDOF 1994) are operational techniquesdesigned to protect stream water quality during andafter logging operations. Their effectiveness has beendocumented in several studies in the southernAppalachian mountain region but by few in the southern coastal plain region. Since progress in forest waterquality protection is often measured by thepercentageof harvested sites implementing BMPs, it is critical toevaluate and document the effectiveness of these recommended techniques. Thus, the objective of this studywas to evaluate the effectiveness of BMPs on the protection of stream waterqualityduring and after timberharvesting in the Virginia coastal plain.
STUDY METHODS
Three small adjacent forested sub-watersheds locatedwithin the Nomini Creek watershed in WestmorelandCounty, Virginia, were chosen for thestudy (Figure 1).Slopes in the sub-watersheds range from 2-3% overmost of theareato 30%along the deeply incisedstreamchannels. Soils are sandy loams. Timberconsisted of loblolly pine (Pinus taeda L.), with mixedhardwoods along the stream bottoms.
InAugust, 1991, stream monitoring stations (weirs)were installed at the outlets of the three sub-watersheds. Basedow and stormflow water quality sampleswerecollected by automatic water samplers at each station. Thesamples were analyzed at Virginia Tech fortotal suspended solids (TSS), as well as other waterquality parameters.
During theperiod between January 31 - February 4,1994, after 27 months of pre-harvest data collection,two of the sub-watersheds were simultaneously harvested. QN4 (8.5 ha)wasclearcut with BMPs; QN3(7.9 ha) was clearcut without BMPs; andQN5 (9.8 ha)remained undisturbed, as a control. Similar loggingequipment and operating procedures wereused on bothharvesu (rubber-tired feller-buncher/ grapple skiddersystems). Manual chainsaw felling wasemployed inthe steep streamside areas.
BMPsimplemented on sub-watershed QN4 included:1. Aformal pre-harvest plan was developed and fol
lowed.
2. A streamside management zone (SMZ) 50 feet wideon eithersideof the stream was flagged.Approximately one-third of the basal area, primarilyin largerdiameter trees,was carefully removed withminimum grounddisturbance, leavingtwo-thirds ofthe trees remaining uncut within the SMZ.
86

Figure 1. NorniniCreekforestedsub-watersheds
NomioiCrecIc*~^j^/''>n
j\^s--' Virginia j3 If
Road yyWatershed Boundary
N. QNS
V;
QN4
|«>-StreiniMonitoringStiUca | >\ vy. \
Stream Channel
1N
SO 100 1501ratten |
\ Strtuntlde Area
3. Water-bars were installed immediately after harveston all primary skid trails.
4. Thelanding wasseeded with grass.
Post-harvest water quality data was recorded throughApril 1995. The impacts of timber harvesting onwaterquality wasevaluated using the minimum detectablechange (MDC) statistic (Spooner et al. 1987). Thecomparison of means test was performed for the threesub-watersheds. If the percent difference in mean sub-watershed response between thepre-harvest and post-harvest periods measured fora particular water qualityparameter was greater than the percent MDC for thatparameter, it wasconcluded thata significant changehad occurred for that parameter. If the test determinedthatthecontrol sub-watershed (QN5) had notchangedsignificantly from the pre-harvest to thepost-harvestperiod, however, then a change in theresponse fromthe harvested sub-watersheds could be attributed to thetreatment applied(harvesting with or without BMPs).
RESULTS AND DISCUSSION
The post-harvest mean weekly total suspended solids(TSS)concentration from the "no-BMPs"(QN3) sub-watershed was 116% greater than the pre-harvest concentration (Table 1). The MDC for TSS on QN3 was78%, so the differencebetween pre- and post-harvestmeans was statistically significant. The sediment con
centrations from QN4, the sub-watershed harvestedwith BMPs, were not significantly impacted by harvesting. Since sediment concentrations in the controlsub-watershed (QN5) didnot change significantly fromthepre-to thepost-harvesting period, thedifference inresponse between the harvested sub-watersheds can bedirectly attributed to BMPs.
Cumulative TSS loadings were similarfor the BMPsub-watershed (QN4) and the control sub-watershed(QN5) throughout thestudy. Loadings from the no-BMPsub-watershed (QN3)began to increase dramatically during thefall of 1993, a few months priorto harvest, and continued to increase afterharvest, particularly fromApril to August 1994.On-site observationoftheweir forQN3 provided a possible explanation forthis. When the weir was installed in 1991, the base ofthe flume was slightly above the bottom of the streamchannel. This allowed a small amount ofponding todevelop immediately behind the weir. This pondingmay have trapped sediment, thus reducingTSS measurements at the start of the project Later in the pre-harvest period, when the ponded area behind the weirfilled up with sediment, the sediment suspended in thestreamflowwas readilypassed through the weir,asindicated by the larger sediment losses from QN3.
Nevertheless, a statisticallysignificant increase in sediment loading occurred from the pre- to the post-harvestperiod for sub-watershed QN3, harvested without
87
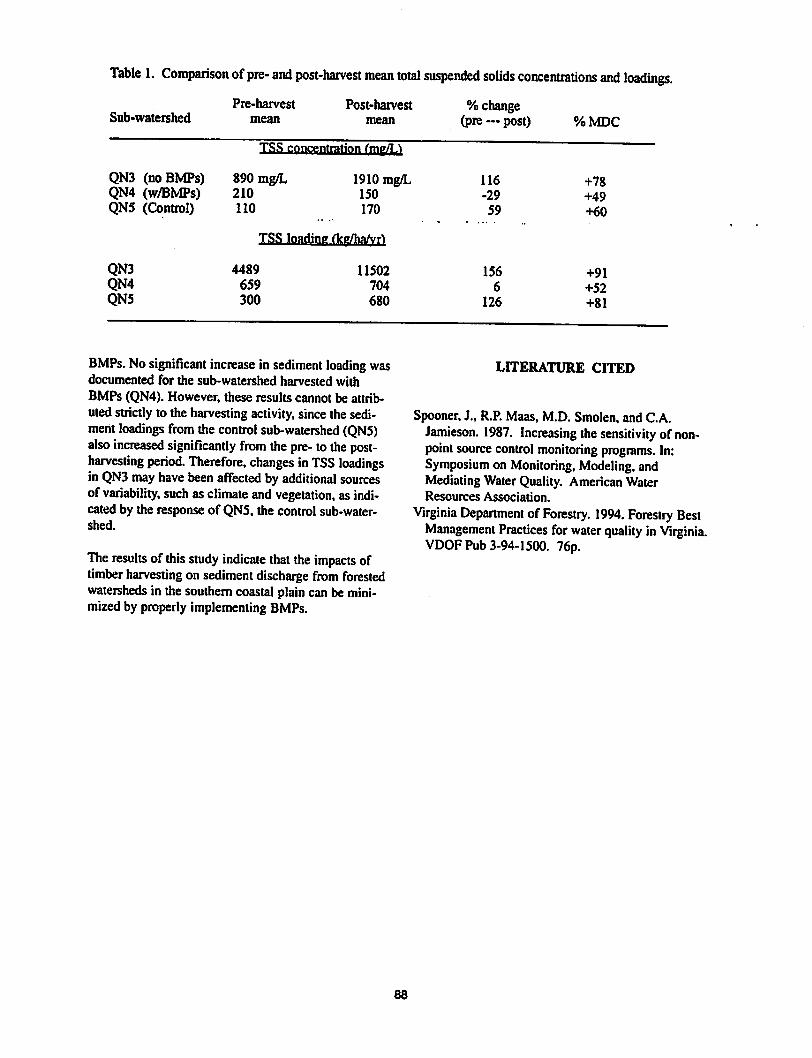
Table 1. Comparison of pre- and post-harvest mean total suspended solids concentrations and loadings.
Sub-watershedPre-harvest
mean
Post-harvestmean
% change(pre — post) %MDC
TSS concentration <mg/i:>
QN3 (no BMPs)QN4 (w/BMPs)QN5 (Control)
890mg/L210
110
1910 mg/L150
170
116
-29
59
+78
+49
+60
QN3QN4QN5
TSS loading ilcgVha/vrt
4489
659
300
11502
704
680
BMPs. No significant increase in sediment loading wasdocumented for the sub-watershed harvested withBMPs (QN4). However, these resulu cannot be attributed strictly to the harvesting activity, since the sediment loadings from the control sub-watershed (QN5)also increased significantly from thepre- to the post-harvesting period. Therefore, changes inTSS loadingsin QN3may have been affectedby additional sourcesof variability, such as climate and vegetation, as indicated by the response of QN5, the control sub-watershed.
The resulu of this study indicate that the impacts oftimber harvesting on sediment discharge from forestedwatersheds in the southerncoastal plaincan be minimized by properly implementing BMPs.
156
6
126
+91
+52
+81
LITERATURE CITED
Spooner, J., R.P.Maas, M.D. Smolen, and C.A.Jamieson. 1987. Increasing the sensitivity of non-point source control monitoring programs. In:Symposium on Monitoring, Modeling, andMediating Water Quality. American WaterResources Association.
Virginia Department of Forestry. 1994. Forestry BestManagement Practices for water quality inVirginia.VDOFPub 3-94-1500. 76p.
88
Maintaining Logyard Stormwater Quality at Minimal Cost
Cornells F.de Hoop, Assistant Professor
Louisiana Forest Products Lab, Louisiana State UniversityAg Center, Baton Rouge, LA
Kyoung S. Ro, Assistant Professor
Dept. of Civil &Environmental Engineering, Louisiana State University
DavidA Einsel, former Graduate Assistant
Dept of Civil &Environmental Engineering, Louisiana State University
Mark D. Gibson, Professor
Louisiana Forest Products Lab, Louisiana Tech University, Ruston, LA
George A Grozdits, Research Associate
Louisiana Forest Products Lab, Louisiana Tech University
ABSTRACT: The build up of bark on log storage and handling facilities can cause water quality problems. The stormwaterrunoffs from several yards in Louisiana were analyzed for pollutant content. Pollutants of major concern were chemical and biochemical oxygen demand (COD, BOD) and total suspended solids (TSS). Several low-cost treatments were tried and analyzed.The results of the project will generate an initial data base for reference in developing regulations and recommended measuresfor pollution control from log storage facilities.
Key Words: stormwater, runoff, log yards, water pollution
INTRODUCTION
Forests cover nearly half of the land area withinLouisiana, making trees the number one"crop" in thestate. Although forested areas contain essentially thesametree trunks and bark as log yards, the high concentration of material (especially bark) in log yardsmaycause undesirable concentrations of pollutants inwaters draining from them. Since most log yardsarealready required to be permitted by a state agency forstormwater runoff, both industryrepresentatives andregulators needto knowwhat typeof pollutants canbeexpected from these facilities, what concentrations toexpect, and how pollutants can be minimized.
OBJECTIVE
Whereasa large percentage of the activities associatedwith forestry-related activities fall within the traditionaldefinition of nonpoint source pollution, log sorting and
log storage facilities are operations within the forestindustry which have not been thoroughly investigated.
The Louisiana Forest Products Laboratory of the LSUAg Center initiated a research project sponsored by theStateof Louisiana Department of EnvironmentalQuality (DEQ) and the US Environmental ProtectionAgency (EPA). DEQ states as its objective:
The Louisiana Department of EnvironmentalQuality, in cooperation with the LouisianaOffice ofForestry and the Louisiana ForestryAssociation, proposes an investigation to identifythe typeand volume of pollutanu foundwithin wastewaters from log storage andforest products manufacturing facilities in orderto createa general permit for this type ofoperation. Recommended control measurescanalsobe evaluated to determine if theyareeffective in reducing identified pollutanu.Thosecontrol measures can be incorporatedinto the permit requirement as minimum
89
measures of treatment required. In addition toproducing a general permit, this wastewaterand control measures information will also beincorporated into Louisiana's existing forestryeducational program.
METHODOLOGY
Toprovide a credible, overall "picture" of thelogyardsegment of the forest producu industry, a survey of theindustry was conducted toascertain sizes of yards, volumes handled, volumes stored, etc. (deHoop etal.1997).
Six sites (three in northern Louisiana and three insoutheastern Louisiana) were selected forstudy. Allhandle southern pinealmost exclusively. Pollutantparameters were studied for about 6 months. Thensome low-cost treatmenu were tested. Two sitesalready had treatment facilities in place, simplifyingtesting. The types of mitigating treatmenu include:bark settling/oil skimming device, oil-absorbing boom,metal grate, metal grate with bark as filter,aerationpond, and long vegetated ditch.
It was hoped that some pollution parameters might becontrolled effectively through the use of best management practices (BMPs), in thiscasea clean yardvs.adirty yard, butattempts to setupthis type of experiment failed.
All sites and mitigation methods were tested for thefollowing parameters (priority pollutanu):
Biochemical Oxygen Demand (BOD5)ChemicalOxygen Demand (COD)Total Suspended Solids (TSS)Total Dissolved Solids (TDS)pHTemperature
Most sites were also tested onceeachforheavy metals(Sb, As,Be,Cd,Cr,Cu, Pb, Hg,Ni,Se,Ag,TL Zn,cyanide, andphenol), volatile compounds (31 compounds; EPA test 624), semi-volatile compounds (56compounds; EPA test 625), and pesticides (25compounds; EPA test608). The priority pollutant parameter teste were performed on campus, while the otherteste were contracted out to private laboratories.
Water samples from sprinkler recirculation ponds wereobtained manually at the researchers' convenience.Some stormwater samples wereobtained manually during storm evenu, but this proved to be a difficult andillusory task. Automatic stormwatersamplecollectorswere installed at runoff discharge sites that couldcol
lect up to 24one-liter samples upon the commencementof threshold waterflow levels. Flowmeters wereattached to the samplers to monitorwaterflow levelsand estimate runoff volumes. The samplers were programmed to pick up eight samples at 15-minute intervals, catching the first 95 minutes of each stormevent.This seemed appropriate, as fewstormevents lastedmuch longer than this.
Toestimate total pollutant discharge, total water flowhadto be estimated; so some type of weir or flume hadto be constructed at two of the sites. One,a V-notchweir, was constructed on a 4* x8' sheet ofplywood,transported to site by pickuptruckand installed in twohours. The other flume was constructed of two piecesof30-cm (12-inch) diameter pvc pipe installed side-by-side into vertical pieces of plywood. Both devicessuffered from problems caused bydebris accumulation.
RESULTS
There are an estimated 90 yards inthe state. Seventy-two percent report having a stormwater pollution prevention plan in place.
All of the volatiles, semi-volatiles, and pesticide testsconcluded that if these compounds were present, theywere below detectable levels. AH of the heavy metalstesu indicated normal background levels, even in therecirculation ponds, with most numbers being close toor below detection limits.
Water temperatures werenear normal for thisclimate,and pH levelswereconsistently between 5.9 and 8.1.
Total dissolved solids (TDS) values ranged from 62 to1353 milligrams per liter, with typical values of 200 to1100. Thehigher numbers tend to occur during thedriertimes of theyear. Water from logsprinkler recirculation ponds showed levels within this same range.Since dissolved solidsare extremely difficult toremove, the rest of this paper will concentrate on theremaining parameters of interest - Biochemical OxygenDemand over 5 days (BOD5), Chemical OxygenDemand (COD) andTotal Suspended Solids(TSS).
Untreated water
Onlyonesite presented the opportunity to obtainstormwater runofffroman activeyard withdry logstorage and no treatment or mitigation to the runoff ofany sort. The ranges of resulu are:
BOD 6 to 48 mg/LCOD 0 to 14,724mg/LTSS 7 to 52,316 mg/L.
90
The last number occurred during a trace rainfall. Thesecond highest number for TSS is 3,302. All of thehigher numbersoccurred during the initial samplesofeach storm event.
There were two log sprinkler recirculation ponds fromwhich grab samples were taken directly. The ranges ofresulu were:
BOD 6 to 10 mg/LCOD 0 to 298 mg/LTSS 6 to 37 mg/L.
Throughout all the sampling at all locations, BOD wasconsistently low, indicating that COD and TSS areprobably much more important. A question remains,however, whether the standard BOD test is appropriatefor this type of water, as the microbes used to test BODoriginate from municipal waste streams. It is unlikelythat thesemicrobes can digest bark and wood particlesefficiently.
Thehighest levels of COD andTSSweregenerallyfound in the earliest samples in each storm event.
Treated water
Bark as filter. As stormwater gathers into dischargepoints, it oftencarries bark with it. By installing ametal grate near the discharge point, most of this barkwill screen outand be deposited in front of the grate.While theholes in the grateare necessarily toolarge toact as a filter, this bark accumulates and becomes, ineffect, a filter for subsequent stormwater evenU. Thequestion then becomes whether the barkfilter actuallyimproves water quality or aggravates the problem. Oneyard had a metal grate with 200 feet of bark-filled ditchupstream from thegrate, lending an opportunity to testthe effect of a bark filter.
BOD levels appeared to increase (2% to 13%) as aresult of the bark filter, while COD levels decreased.8% to 32% and TSS decreased 32% to 36%. SinceBOD levels were lowanyway (74 to 129 mg/L), itseems reasonable to conclude that using bark to filterstormwater runoff has a desirable effect.
Bark removal/oil skimming device. One sawmill hadinstalled a concrete-lined bark removal device followedby an oil skimming device that was simpleyetappeared to be effective. The bark removal deviceconsisted of a concrete channel builtso thatthe largerpieces of debris had time to settle to the bottom. Aramp was constructed on one side so that a front-endloader could scoop out the debris as needed. The oilskimming deviceconsistedof a rubber hose loop that
floated on the water. Any oil on the wateradhered tothe hose. An electric motor slowly circulated the hoseover the water surface. Near the motor, the oil waswiped off of the hose and collected into a barrel.
Thisdevice turned out to be quite effective. It reducedBOD levels by 8%to 41%, COD levels by 31% to71% and TSS levels by 13% to 89%.
The effectiveness of this device has led the researchersto take a closer look at theeffect of anoil-absorbingboom. It is possible that the boom may improve TSSandCODas well as oil andgrease parameters.
Detention pond. The same sawmill that installed thebark removal/oil skimming devicedescribed above followed up this device with a well-constructed detentionpond. The detention pond was the most effective treatmentof those tested. BODremovals rangedfrom73%to 92%. COD removals ranged from 43% to 99.8%.TSS removals ranged from 57% to 97%.
Ratios
There appears to be a strong correlation between BODand COD. On individual samples, BOD levels were1%to 13%that of COD levels. Average ratios at eachyard ranged from 4% to 7%.
Although less precisely defined, there was a strong correlation between COD and TSS duringsome rainstorms. TSS levels were usually a little higher thanCOD levels.
CONCLUSIONS
1. The CODandTSS levels were consistently higherthan those of BOD in logstorage yards and in log processing yards.
2. Nocorrelation was found to existbetween theparameter levels and the rainfall totals in both storage andprocessing yards.
3. Anaverage BOD/COD ratio of approximately 0.04- 0.07 was discovered forbothstorage andprocessingyards.
4. The COD andTSS parameters closely mimic eachother in log storage yards.
5. A definite hierarchy of BOD. COD, and TSSremoval efficiencies was discovered for the controlmeasures. Ranked in terms of their decreasing removal
91
efficiencies for BOD, COD, and TSS, the control measures were the detention pond, combined barkremoval/oil skimming device, combined screen andaccumulated bark filter, and the individual screen.
RECOMMENDATIONS
1. Variables suspected of affecting the BOD, COD,and TSS parameter-levels and mass emissions shouldbe investigated. Some possible ones include yard traffic, rainfall intensity, time duration of rainfall, rainfalltotal, logyard size, number of logs present, andageoflogs being stored.
2. Samples should be collected from all four seasonsto ensure that there are no significantdifferencesbetween the parameter levels for different seasons.
3. Several detention pondswithvarying retentiontimes should be investigated to seehow significantlythe retention time would affect the removal efficienciesof BOD, COD, andTSS. There is most likely a pointat which it becomes uneconomical to build a largerpond (i.e. one with a larger retention time).
4. The effect of a dirty vs. a clean bark removal/oilskimming device on the removal percentages of BOD,TSS, andespecially CODshould be investigated. Thelengthof time between cleanings should be varied to
check whether a clean device contributes tohigher orlower removal efficiencies.
5. Because the bark removal/oil skimming device wasfairly effective in removing the BOD, COD, andTSS,anoilboom should be investigated as a possible control measure.
6. The TSS and COD removal percentages for thescreen with an accumulated bark filter should be furtherstudied by modifying the length, depth, and widthof the associated bark filter, the contact time betweenthe water and bark filter, the size and porosity of thebark particles, and the type of tree species from whichthe bark filteroriginated.
ONGOING ACTIVITIES
The researchers in this project arecurrently investigating theeffecuof an oil-absorbing boom and theeffecuof a long, vegetated ditch.
LITERATURE CITED
de Hoop, Niels., Shulin Chen and Bruce C. Alt. 1997.Overview of log yards in Louisiana. AmericanPulpwood Assoc Tech Release 97-R-11. 2p.
92

Thinning Alternatives in Pole-Size Northern Hardwoods
James A. MattsonMechanical Engineer
North-Central Forest Experiment Staffer)USDA Forest Service
Forestry Sciences laboratoryHoughton, Michigan
ABSTRACT: From a silviculture! standpoint, individual-tree selection is the most desirable method of thinning, but economics,equipment, or site impact considerations may require a departure from the ideal. Thinning alternatives—strip-thinning and twostrip-with-selection-between-the-strips patterns—were compared to individual-tree selection in a typical pole-size northern hardwood stand. Strip thinning, blind to the size and quality of the trees being removed, retained the average tree size and distribution of the original stand. As the spacing between the strips increased, the structure of the thinned stand became more like thedesired selection cut Total growth in the thinned stands was similar, but more of the growth occurred on crop trees asthe thinning approached the individual-tree selection pattern. These results can help to develop optimal combinations of equipmentsystems, thinning patterns, economics, and silviculture! objectives.
Keywords: crop trees, thinning patterns, site impacts, improvement cuts, stand damage
INTRODUCTION
There are more than 10.9 million acres of
commercial forest land in the maple-birchtypein theLake States. Spencer (1986) estimated that 1.3million ofthose acres need thinning, particularly inunmanaged, second-growthforests. Previouslyunmanaged, even-aged, second-growth, pole-sizestands (5- to 9-inch diameter-at-breast-height(Ab.h.)) with a site indexof 55 or greater at age 50can be managedfor high-quality sugar maple (Acersaccharum Marsh.Vyellow birch (getaJaaflephanjensis), and red maple (Acer nibrumTisawlogs and veneer (Erdmarm 1986). However,beforethese stands can be brought undermanagement, an initial improvement cut is neededto release the best quality dominant and co-dominanttrees of desired species for accelerated growth.
Improvement cuteare performed to createthe qualitysawtimber stands of the future. The best resulu with
veryshade tolerant specieslike sugar maple areachieved with uneven-agemanagement. An idealuneven-age stand would have high quality treesdistributed through all size classes. This distributionwould allow cutting about 2,000 to 3,000 board feet
93
of sawlogsevery 10 to 15years. If moderatelyshade-tolerant species like red oak (Onerous rubra)or yellow birch are preferred, even-agemanagementwould be used, and an ideal even-age stand wouldhaveseedlingsof desirable speciesthat are wellestablished when the overstory is ready for harvest.With either management system,it is important tohavequalityseedsourcesto geneticallyimprovethestand. The leave trees in thinnings should beselected based on species, stem quality, d.b.h.,spacing, and the desired residual basal area andcrowncover. If the stand is high-graded (only thelargest and best trees cut) as so often happens, treequality will deteriorate over time.
Although initial improvement cuts are necessaryfroma silviculturalpoint of view, they are timeconsuming, marking is expensive, and the producuremoved from the stand are typically oflow value.These economic factors make the use of mechanizedharvestingsystems, with their high levelsofproductivity, an economicnecessity. Becausethemanagement objective for northern hardwood forestsgenerally is to optimizethe productionofqualityhardwood sawtimber, the condition of the residualstand after a thinning is ofutmost concern.

Particularly with mechanized harvesting anditsinherent potential for residual stand damage,thinningmethods areneeded thatcanaccomplishthe silvicultural objectives without excessive damageto the residual stand.
Individual-tree selection is the most desirablemethodof thinning forun-evenagednorthernhardwoods from a silvicultural standpoint, buteconomic factors andharvesting equipmentconstrairiUmayliimttriefeasunlityofthumemod.Compromises between thedesire to implement ansihdculturauy idealthinning and the needto maketheharvesting operation economically efficient mayneed to be made. Numerous studies have evaluatedthe economics of thinningoperations (Biltonen et al.1976, Mattson 1993), but the effects ofless thanideal thinningtreatments onsilvicultural objectiveshave not been studied
The impact ofthe passage of harvesting equipmentover forest soils is also a matter ofconcern for forestmanagers. The relationship betweenmachinetrafficandsoilstructure andquality has been the subject ofnumerousstudies (Reisingeret al. 1988,Martin1988). It is commonly agreed thatthe passage ofharvesting equipment, under improper conditions,cannegatively impact forest soils. Restricting thetravel of harvesting equipment to trails designated bythe forest manager hasbeen studied asa possiblemeans of minimizing theimpact of harvestingequipment on the site. Thompson etal. (1995), in astudy ofskidding andforwarding bothwithandwithout the use ofdesignated trails, foundthatcompromises will have to be made betweenproductivity, cost, leave treedamage, andsoilimpacts. Concentrating thepassage ofharvestingequipment to designatedtrailsin the standcould alsocreate a less thanideal thinningsituation from asilvicultural standpoint. Effectively, strip-thinningor strip-thinning with selection-thinning between thestrips would be done, which is a departure from theideal individual-tree selection-thinning.
Thispaper summarizes theresults of a three phasestudy to evaluate the silvicultural effects ofalternative thinningpatterns in typical second-growth, northern hardwood polestands in needofimprovement cms. In the first phase, stand datawerecollected fora computeranalysis ofthe effect ofalternative thinning patternson silviculturalobjectives. Field trials were conducted in the secondphase to compare, ona silvicultural basis, thinningpatterns thatmaybe commercially acceptable
94
compromises. The third phasemeasuredthe effecuof alternative thinning patterns ontree growth after10 growing seasons.
PHASE I—SIMULATED THINNING
A typical stand ofeven-aged, second-growth,northern hardwood poletimber, located in HoughtonCounty of theUpper Peninsula of Michigan, wasselected for study. The stand hasrelatively flatterrain, suitable formechanized harvesting. Thestand iscomprised of about 85 percent sugar mapleand 10percent redmaple. Yellow birch,blackcherry fPraims fiemtinaV imrrwnnri qTjftrgyjigjnjana), American elm fllhmw ameri«ina\ andbigtooth aspen fPnpiiliis grandjjderffltta) main. »Ttfc,remaining basalarea. The stand,nearan areaknown locally as the CoveredRoad, is on landowned by the Mead Paper Company, Inc. Beforeexperimental plotswere identified, the entire standwas marked for a commercial thinning withtypicalmarking guidelines used in the area.
Fivesquare, 1-acre plou wereestablished in thestand. Location, species, and diameter ofall trees 2inchesdb.h. and largerwererecorded. Potentialcroptreeswereidentifiedon eachplotbasedon treequality, species, db.h., crown class, andspacing.Totalheight, crownratio, crownclass,and treequality were also recorded for anaverage of58croptrees per acre. Sonderman's (1979) relative tree-quality index was used to monitortreequality andtocompare treequalitybetween plots (Table 1)
For each 1-acre plot, a thinning prescription wascomputer generated and field checked on a tree-by-tree basis, tomeet the guidelines recommended byTubbs(1977). This individual-tree selection wasassumed to represent the silviculturalry idealthinning for this stand and was used as the basis ofcomparisons amongtreatments. The criteria usedforthinning were:
1. Releasecroptrees for growth,2. Remove high-risk trees, culls, and
undesirablespecies,3. Thin from belowto leavea well-spaced
stand ofdominant and codominant
trees of the desired basal area.
Table 2 presenu the characteristics ofthe standbefore andafter the simulated silviculturally idealthinning, averaged forall plou. In addition, the
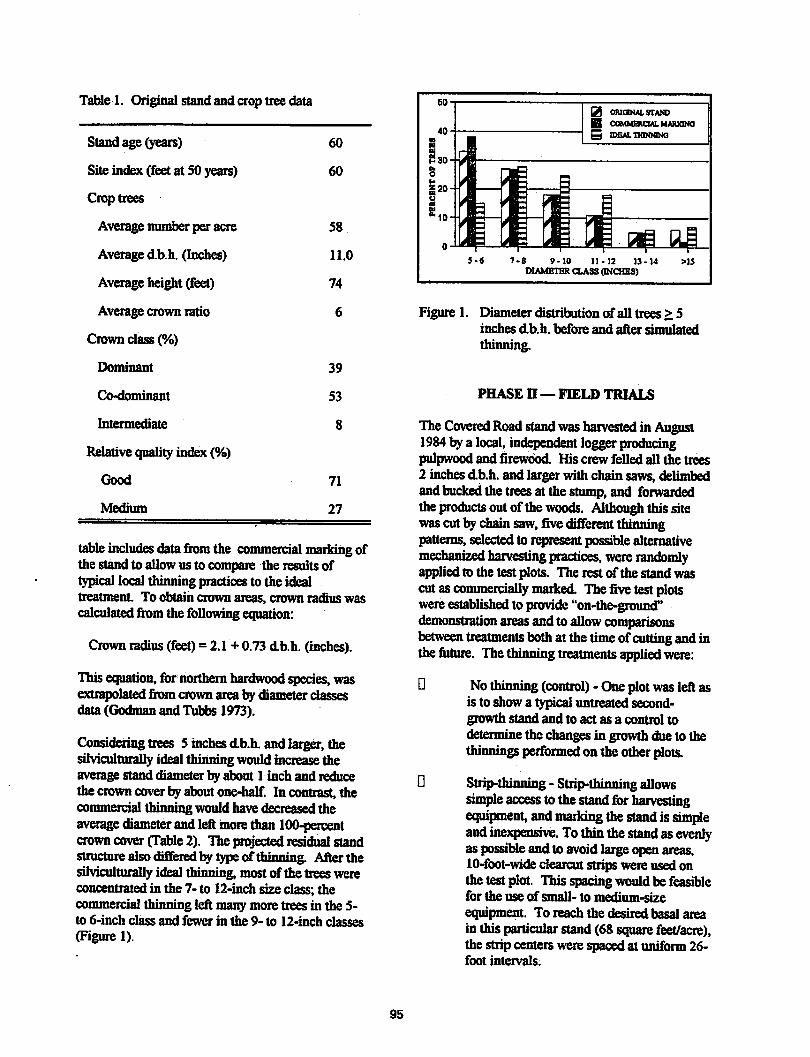
Table 1. Original stand and crop tree data
Stand age (years) 60
Site index (feet at SO years) 60
Crop trees
Average number per acre 58
Average db.h. (Inches) 11.0
Average height (feet) 74
Average crown ratio 6
Crown class (%)
Dominant 39
Co-dominant 53
Intermediate 8
Relative quality index (%)
Good 71
Medium 27
tableincludes datafrom the commercial marking ofthe stand to allowus to compare the resultsoftypical local thinning practices to the idealtreatment. To obtain crown areas, crown radius wascalculatedfrom the following equation:
Crownradius (feet)= 2.1 + 0.73 db.h. (inches).
This equation,for northernhardwoodspecies, wasextrapolatedfrom crownarea by diameter classesdata (Godman and Tubbs 1973).
Considering trees 5 inchesdb.h. and larger, thesirviculturallyideal thinning would increase theaverage stand diameter by about 1 inch and reducethe crowncoverby aboutone-half. In contrast, thecommercial thinning would have decreased theaverage diameter and leftmore than 100-percentcrown cover (Table 2). The projected residual standstructure also differedby type ofthinning. After thesUviculturally ideal thinning, most ofthe trees wereconcentrated in the 7- to 12-inch size class; thecommercial thinning left many more trees in the 5-to 6-inch class and fewer in the 9- to 12-inch classes(Figure 1).
95
50
S-6
12 MUOJML STANDB COMMERCIAL MARKDW5 IDEAL TWNNINa
ap R|1-8 9-10 11.12 13-14
DIAMETER CLASS (INCHES)>1S
Figure 1. Diameter distribution ofall trees > 5inches db.h. before and after simulatedthinning.
PHASE II — FIELD TRIALS
The Covered Roadstandwasharvested in August1984 bya local, independent loggerproducingpulpwood and firewood. His crew felled all the trees2 inches db.h. and larger with chain saws, delimbedand buckedthe trees at the stump, and forwardedtheproducts outof the woods. Although this sitewas cutbychainsaw, fivedifferent thinningpatterns,selectedto representpossiblealternativemechanized harvesting practices, were randomlyapplied to the test plots. The rest ofthe stand wascut as commercially marked. The five test plotswereestablishedto provide"on-the-ground"demonstration areasand to allowcomparisonsbetween treatments bothat the timeof cuttingand inthefuture. Thethinningtreatments appliedwere:
• No thinning (control) - One plot was left asis to show a typical untreated second-growth stand and to act as a control todeterminethe changes in growth due to thethinningsperformed on the otherplots.
0 Strip-tliinning - Strip-thinning allowssimple access to the standfor harvestingequipment, and marking the standis simpleand inexpensive. Tothin the standas evenlyas possibleand to avoid large open areas,10-foot-wide ciearcut strips were used onthe test plot. This spacingwouldbe feasiblefor the use of small- to medium-sizeequipment. To reach the desired basal areain this particular stand (68 square feet/acre),the strip centers were spaced at uniform 26-foot intervals.
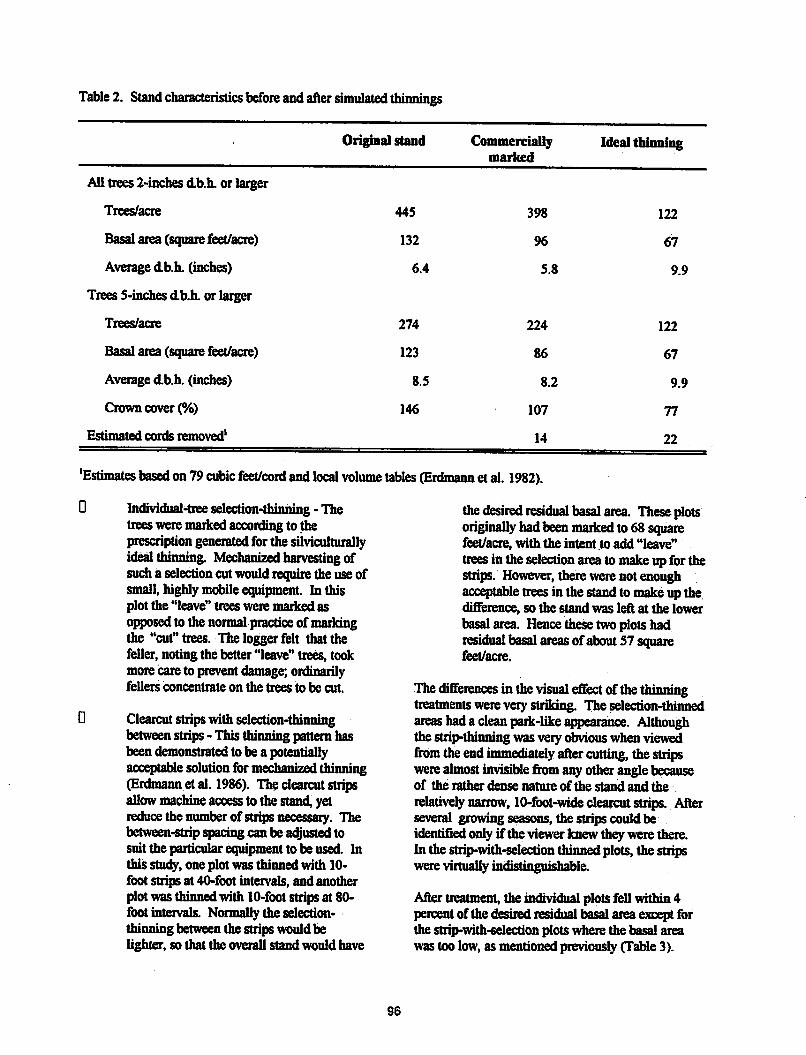
Table 2. Stand characteristics before andafter simulated thinnings
Original stand Commerciallymarked
Ideal thinning
All trees 2-inches db.h. or larger
Trees/acre 445 398 122
Basal area (square feet/acre) 132 96 67
Average db.h. (inches) 6.4 5.8 9.9
Trees 5-inches db.h. or larger
Trees/acre 274 224 122
Basal area (square feet/acre) 123 86 67
Average db.h. (inches) 8.S 8.2 9.9
Crown cover (%) 146 107 77
Estimated cords removed' 14 22
'Estimates based on 79 cubic feet/cord and local volume tables (Erdmann etal. 1982).
D Individual-tree sdection-trdiuiing -Thetreeswere marked according to theprescription generated for the silviculturallyidealthinning. Mechanized harvesting ofsucha selection cut would require the use ofsmall,highly mobileequipment. In thisplot the "leave" trees were marked asopposed to the normal practice of markingthe "cut" trees. The logger felt that thefeller, noting the better "leave" trees, tookmore careto preventdamage; ordinarilyfellers concentrate on the trees to be cut.
0 Clearcut strips with selection-thinningbetweenstrips- This thinning pattern hasbeendemonstrated to be a potentiallyacceptable solutionformechanizedthinning(Erdmann et al. 1986). The clearcut stripsallowmachine access to the stand, yetreduce the number of strips necessary. Thebetween-strip spacing can be adjustedtosuit the particular equipment to be used Inthis study, one plot was thinned with 10-foot strips at 40-foot intervals, and anotherplotwasthinnedwith 10-foot stripsat 80-foot intervals. Normally the selection-thinning between the strips would belighter, so that the overall stand would have
96
thedesired residual basal area. Theseplotsoriginally hadbeenmarkedto 68 squarefeet/acre, with the intent to add "leave"treesin the selection areato make up forthestrips. However, there werenotenoughacceptable treesin the stand to make up thedifference, so the stand was left at the lowerbasalarea. Hencethese two plots hadresidual basal areas of about57 squarefeet/acre.
The differences in thevisual effect of thethinningtreatments were very striking. The selection-thinnedareas hadaclean park-like appearance. Althoughthe strip-thinningwas very obviouswhen viewedfrom theendimmediately after cutting, the stripswerealmost invisible fromany otheranglebecauseof the rather dense nature of the stand and therelatively narrow, 10-foot-wide clearcut strips. Afterseveral growing seasons, the strips could beidentified only ifthe viewer knew they were there.In the strip-with-selection thinned plots, the stripswere virtually indistinguishable.
After treatment,the individual plots fell within 4percentofthe desired residual basalareaexcept forthe strip-with-6electionplots where the basal areawas too low, as mentioned previously (Table 3).

Table 3. Field trials - plot data before and after thinning
Trees/acre - before
-after
BA (square feet/acre)—before
-after
D.b.h. (Inches) -before
-after
Crop trees/acre—before
— after
Crown cover (%)—before
-after
Est. Volume (cubic feet/acre)—before
-after
Cords removed1
Control Individual-
tree
selection
Stripthinning
Stripselection
40-foot
intervals
Stripselection
80-foot
intervals
294 272 290 241 274
109 176 81 95
128 138 110 117 121
70 68 55 57
8.3 9.1 7.8 8.7 8.4
10.6 8.0 10.5 9.8
60 63 53 57 56
63 35 45 45
153 161 137 137 145
78 84 60 64
3890 4280 3300 3630 3710
2200 2030 1760 1780
26 16 24 24
'Estimates based on79cubic feet/cord and local volume tables (Erdmann etal. 1982).
After several growing seasons, there was an increasein brush, mostly woody shrubs, on the plots. Onecornerofthe selection-thinned plot showeda largenumber ofaspen suckers.
A majorconcernwith strip-thinningis the loss ofpotential croptrees in the machine-access strips.Although croptreeswould not be specificallyidentified, the number ofcrop trees per acre in ourstudy corresponds to the number of potential high-quality sawtimber trees in the stand The strip-thinning cut 34 percentofthe available croptrees; inthe strip-with-selectioncuts, 20 percentwere cutTheoretically, in the individual-tree selectionthinning, no crop trees should have been cut, but 1 to2 percent were cut accidentally.
Crown release and crown closure are critical motors
in the growthand qualitydevelopmentof croptrees.Studies have shown significant increases in db.h.growth of pole-size hardwoods after crown release
97
forup to 15years(Erdmann and Oberg 1973,Erdmann and Peterson 1972, Erdmann et al. 1985,Stone 1977). A reduction in percentof crowncoverfor all treatments parallelsthe reduction in basalarea. However, in the strip-thinnedplot, theopenings in the canopy benefited only the treesclosest to the strip edges.
Becausethe strip-thinning was blind to the size andqualityoftreesremoved,both the average treediameter and size distributionofthe strip-thinnedplot, like the control plot, remained almost identicalto the originalstand As the spacingbetween thestrips became widerin the strip-with-selectiontreatments, the distribution became more like thedesired selection cut, with most of the trees in the 7-to 12-inch size classes (Figure 2).
In a relatedstudy, various competition measureswere calculatedfor the crop trees to determine theextentof release accomplished by each thinning
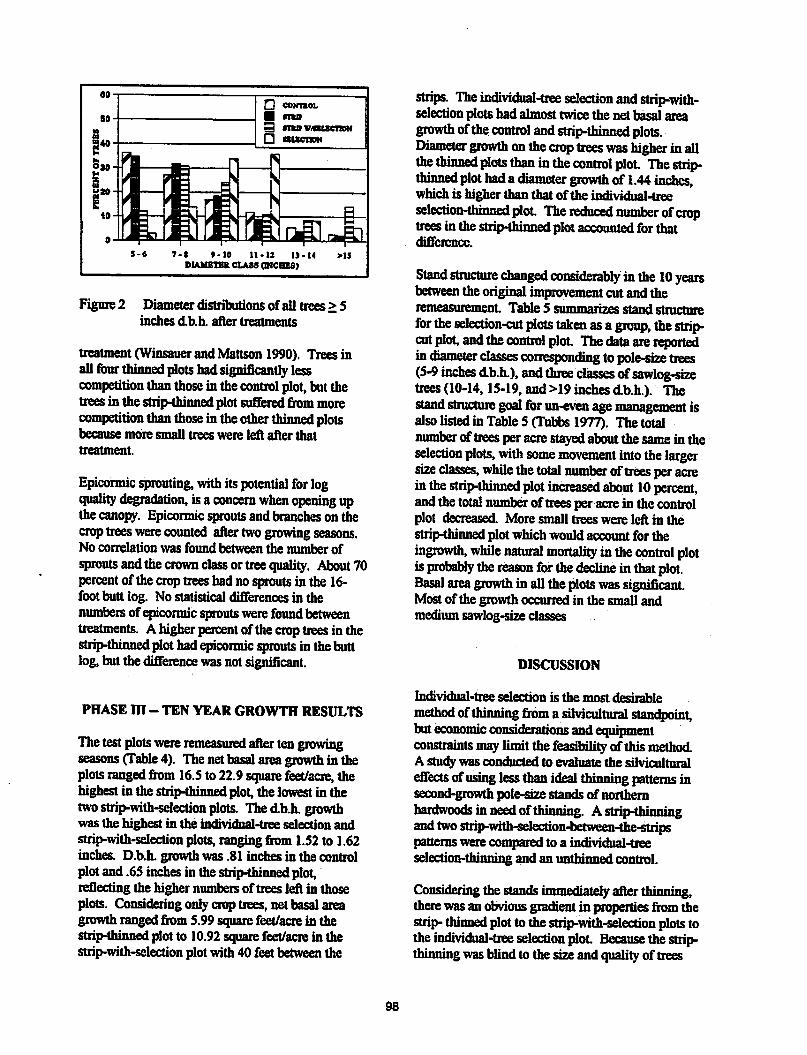
s-«
• CONT10L• maB mswjnucnoN• nucimt
7-1 *-10 11-11 13.MDIAMBTHK CLASS (INCHES)
>1S
Figure2 Diameter distributionsofall trees > 5inches db.h. after treatments
treatment (Winsauerand Mattson 1990). Trees inall four thinnedplots hadsignificantly lesscompetition thanthose in thecontrol plot, butthetrees in the strip-thinned plotsuffered from morecompetition thanthose in theother thinned plotsbecause more small trees were left after thattreatment
Epiconnic sprouting, withitspotential for logquality degradation, isaconcern when opening upthe canopy. Epiconnicsprouts andbranches on thecroptreeswerecounted aftertwo growing seasons.No correlation was found between the number ofsprouts andthe crown class ortreequality. About 70percent of the croptrees hadno sprouts in the 16-foot butt log. No statistical differences in thenumbers ofepicormicsproutswere foundbetweentreatments. A higher percent ofthe croptreesin thestrip-thinned plothadepicormic sprouts in thebuttlog,but the difference wasnot significant.
PHASE m - TEN YEAR GROWTH RESULTS
Thetest plots were remeasured after tengrowingseasons (Table 4). The netbasal area growth in theplots ranged from 16.5 to 22.9square feet/acre, thehighestin the strip-thinned plot the lowestin thetwostrip-with-selection plots. The db.h. growthwas the highest in the individual-tree selection andstrip-with-selection plots, rangingfrom 1.52 to 1.62inches. D.b.h. growthwas .81 inches in the controlplotand.65inches in the strip-thinned plot,reflecting the higher numbers oftrees left in thoseplots. Consideringonly croptrees,net basalareagrowthranged from 5.99square feet/acre in thestrip-thinned plot to 10.92 square feet/acre in thestrip-with-selection plotwith 40 feet betweenthe
98
strips. The individual-tree selection and strip-with-selection plotshadalmosttwicethe net basal areagrowth ofthecontrol andstrip-thinned plots.Diameter growth onthecrop trees was higher in allthe thinned plots than inthecontrol plot Thestrip-thinned plot hadadiameter growth of 1.44 inches,which is higher than that ofthe individual-treeselection-thinned plot The reduced number ofcroptreesin the strip-thinnedplot accounted forthatdifference.
Stand structure changed considerably in the 10 yearsbetween the original improvement cut andtheremeasurement. Table 5 summarizes stand structurefor theselection-cut plots taken asa group, thestrip-cutplot, and thecontrol plot Thedata are reportedin diameter classes corresponding to pole-size trees(5-9 inches db.h.), and three classes of sawlog-sizetrees (10-14,15-19, and>19inchesdb.h.). Thestand structure goal for un-even agemanagement isalso listed in Table 5 (Tubbs 1977). The totalnumber of treesperacrestayedabout the samein theselection plots, with some movement into thelargersize classes, while thetotal number of trees per acrein thestrip-thinned plot increased about 10 percentandthetotal number oftrees peracre in the controlplot decreased More small trees were left in thestrip-thinned plot which would account for theingrowth, while natural mortality in thecontrol plotis probably thereason for thedecline in that plot.Basal area growth in allthe plots was significantMost ofthe growth occurred in the small andmedium sawlog-size classes
DISCUSSION
Individual-tree selection is the most desirablemethod ofthinning from asiMcultural standpointbuteconomic considerations andequipmentconstraints may limit the feasibility ofthis methodA study was conducted to evaluate the stfvicultnraleffects of usinglessthanideal thinning patterns insecond-growth pole-size stands ofnorthernhardwoods in needofthinning. A strip-thinningandtwostrip-with-selection-between-the-stripspatterns were compared to a individual-treeselection-thinning and an iintbinned control.
Considering the stands immediately after thinning,there wasanobvious gradient in properties from thestrip- thinnedplotto the strip-with-selection plotstothe individual-tree selection plot Because the strip-thinningwasblind to the size andqualityof trees
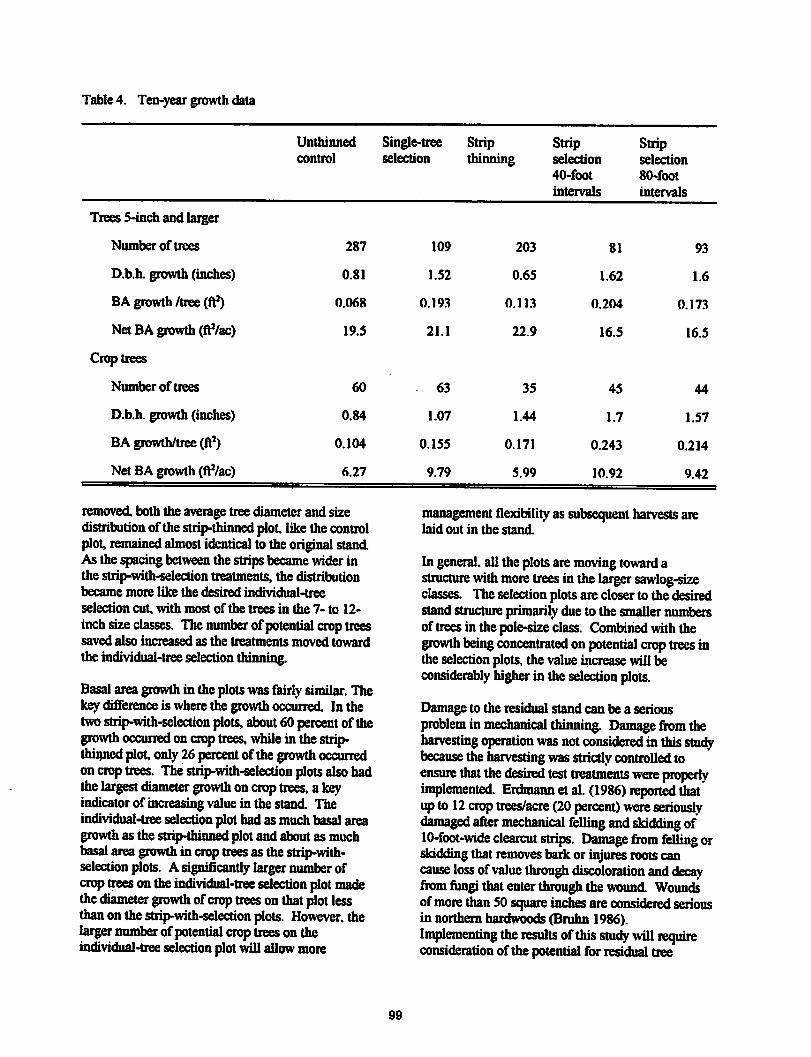
Table 4. Ten-year growth data
Unthinned
control
Single-treeselection
Stripthinning
Stripselection
40-foot
intervals
Stripselection
80-foot
intervals
Trees 5-inch and larger
Number of trees 287 109 203 81 93
D.b.h. growth (inches) 0.81 1.52 0.65 1.62 1.6
BA growth /tree (ft2) 0.068 0.193 0.113 0.204 0.173
Net BA growth(fV/ac) 19.5 21.1 22.9 16.5 16.5
Croptrees
Number oftrees 60 63 35 45 44
D.b.h. growth (inches) 0.84 1.07 1.44 1.7 1.57
BA growth/tree (ft1) 0.104 0.155 0.171 0.243 0.214
Net BA growth (ftVac) 6.27 9.79 5.99 10.92 9.42
removed boththe average treediameter and sizedistribution of the strip-thinned plot like thecontrolplot remained almost identical to theoriginal standAs the spacing between the strips became widerinthe strip-with-selection treatments, the distributionbecame more like the desired individual-tree
selection cut with most ofthe trees in the 7- to 12-
inch sizeclasses. The number of potential crop treessaved also increased as the treatments moved towardthe individual-tree selection thinning.
Basal area growth in theplots was fairly similar. Thekey difference is where the growthoccurred In thetwo strip-with-selection plots, about 60 percent of thegrowth occurred oncrop trees, while in the strip-thinned plot only26percent of the growth occurredon crop trees. The strip-with-selection plots also hadthelargest diameter growth oncrop trees, akeyindicator of increasing value in the stand Theindividual-tree selection plot had asmuchbasal areagrowth asthe strip-thinned plotandabout asmuchbasal area growth in crop trees as the strip-with-selection plots. A significantly larger number ofcrop trees onthe individual-tree selection plot madethediameter growth of crop trees onthat plot lessthan onthestrip-with-selection plots. However, thelarger number of potential crop trees on theindividual-tree selection plot willallow more
99
management flexibilityas subsequent harvestsarelaid out in the stand
In general, all the plotsaremovingtoward astructure withmore trees in the larger sawlog-sizeclasses. The selection plotsarecloser to the desiredstand structure primarily dueto the smaller numbersof trees in the pole-size class. Combined with thegrowth being concentrated on potential crop trees inthe selection plots, the valueincrease will beconsiderably higher in the selection plots.
Damage to the residual standcan be a seriousproblem in mechanical thinning. Damage from theharvesting operation was not considered in this studybecause theharvesting was strictly controlled toensure that the desired test treatments were properlyimplemented Erdmann et al. (1986) reported thatupto 12 crop trees/acre (20 percent) were seriouslydamaged after mechanical felling and skidding of10-foot-wide clearcut strips. Damage from felling orskidding thatremoves barkor injures roots cancause loss ofvalue through discoloration and decayfrom fungi thatenter through the wound Woundsof more than 50 squareinches are considered seriousin northernhardwoods(Bruhn 1986).Implementing the results of this studywill requireconsideration of the potential forresidual tree
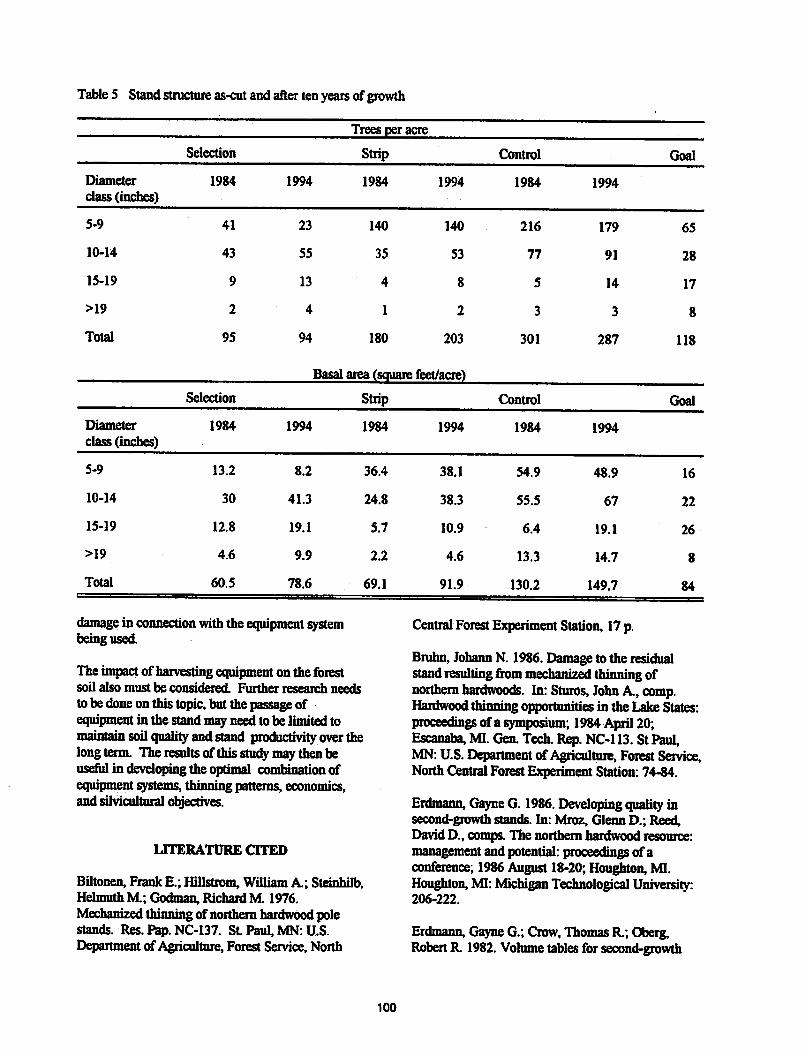
Table 5 Standstructure as-cut andafter tenyears ofgrowth
Trees per acre
Selection Strip Control
1994
Goal
Diameter
class (inches)1984 1994 1984 1994 1984
5-9 41 23 140 140 216 179 65
10-14 43 55 35 53 77 91 28
15-19 9 13 4 8 5 14 17
>19 2 4 1 2 3 3 8
Total 95 94 180 203 301 287 118
Basal area (square feet/acre)
Selection Strip Control Goal
Diameter
class (inches)1984 1994 1984 1994 1984 1994
5-9 13.2 8.2 36.4 38.1 54.9 48.9 16
10-14 30 41.3 24.8 38.3 55.5 67 22
15-19 12.8 19.1 5.7 10.9 6.4 19.1 26
>19 4.6 9.9 2.2 4.6 13.3 14.7 8
Total 60.5 78.6 69.1 91.9 130.2 149.7 84
damage in connection with thebeing used
equipment system Central Forest Experiment Station, 17p.
Theimpactof harvesting equipment on the forestsoil also must be considered Further research needsto bedone on this topic,but the passageofequipmentin the stand may need to be limited tomaintain soilquality and stand productivity overthelongterm. The results of this study maythenbeuseful in developing the optimal combination ofequipmentsystems, thinning patterns, economics,and sirviculturalobjectives.
LITERATURE CITED
Biltonen, Frank E.; Hillstrom, William A.; Steinbilb,HelimithM.;Godman, Richard M. 1976.Mechanized thinningof northernhardwood polestands. Res. Pap. NC-137. St PauL MN: U.S.Department of Agriculture, ForestService, North
100
Bruhn, JohannN. 1986.Damageto the residualstandresulting frommechanized thinningofnorthern hardwoods. In: Sturos, JohnA.,comp.Hardwoodthinning opportunities in the Lake States:proceedings ofa symposium; 1984 April20;Escanaba, MI. Gen. Tech.Rep. NC-113. St Paul,MN:U.S.Department of Agriculture, Forest Service,North Central Forest Experiment Station: 74-84.
Erdmann, Gayne G. 1986. Developing qualityinsecond-growth stands. In: Mroz, Glenn D.; ReedDavid D., comps. The northern hardwood resource:managementand potential: proceedingsof aconference; 1986August18-20;Houghton, MI.Houghton, MI:Michigan Technological University:206-222.
Erdmann, GayneG.; Crow,Thomas R.; Oberg,Robert R. 1982. Volume tables forsecond-growth

northern hardwood forests in northeastern
Wisconsin. Res. Pap. NC-222, St Paul, MN: U.S.Department of Agriculture, Forest Service, NorthCentral Forest Experiment Station, 5 p.
Erdmann, Gayne G.; Mattson, James A.; Oberg,Robert R. 1986. A 9-year evaluation of mechanizedthinning in northern hardwoods. In: Sturos, JohnA, comp. Hardwood thinning opportunities in theLake States: proceedings of a symposium; 1984April 20;Escanaba, MI. Gen. Tech. Rep. NC-113. StPaul, MN: U.S. Departmentof Agriculture, ForestService, North Central Forest Experiment Station:54-68.
Erdmann,Gayne G.; Oberg, Robert R. 1973.Fifteen-year results from six cutting methods in second-growth northern hardwoods. Res. Pap. NC-100. St.Paul, MN:U.S. Department of Agriculture,ForestService, North Central Forest Experiment Station. 12P
Erdmann, GayneG.; Peterson, Ralph M., Jr. 1972.Crown release increases diameter growth andbolesprouting of pole-size yellow birch. Res. Note NC-130. St. Paul, MN: U.S. Department of Agriculture,Forest Service, NorthCentral Forest ExperimentStation. 4 p.
Erdmann, Gayne G.; Peterson, Ralph M., Jr.; Oberg,Robert R 1985. Crown releasing of redmaplepolesto shorten high-qualitysawlog rotations. CanadianJournal of Forest Research 15: 694-700.
Godman, Richard M.; Tubbs, Carl H. 1973.Establishing even-agenorthernhardwoodregenerationby the shelterwood method-apreliminary guide. Res. Pap. NC-99. St. Paul, MN:U.S. Department ofAgriculture,Forest Service,North Central Forest Experiment Station. 9 p.
Martin, C. Wayne. 1988. Soildisturbance by loggingin NewEngland—review andmanagementrecommendations. Northern Journal of AppliedForestry 5: 30-34.
Mattson, James A. 1993. Tree-section harvesting ofnorthern hardwood thinnings. Res. Pap. NC-312. St.PauL MN: U.S. Departmentof Agriculture,ForestService, North Central Forest Experiment Station. 16P-
Reisinger, Thomas W.; Simmons, Gerry L.; Pope,Phillip E. 1988. The impact of timber harvesting on
101
soil properties and seedling growth in the South.Southern Journal of Applied Forestry 12: 58-67.
Sonderman, David L. 1979. Guide to themeasurement oftree characteristics importantto thequality classification system for young hardwoodtrees. Gen. Tech. Rep. NE-54. Radnor, PA: U.S.Department ofAgriculture, Forest Service,NortheasternForestExperiment Station. 12 p.
Spencer, John S., Jr. 1986.The Lake States'hardwood resource. In: Sturos, John A., comp.Hardwoodthinning opportunities in the Lake States:proceedings ofa symposium; 1984 April 20;Escanaba, MI. Gen. Tech. Rep. NC-113. St Paul,MN:U.S. Department of Agriculture, Forest Service,North Central Forest ExperimentStation: 6-25.
Stone, Douglas M. 1977. Fertilizing andthinningnorthern hardwoods in the Lake States. Res. Pap.NC-141. St Paul, MN: U.S. Department ofAgriculture, Forest Service, North Central ForestExperiment Station. 7 p.
Thompson, Michael A.; Sturos, John A.;Christopherson, Nels S.; Sturos, Joseph B. 1995.Performance and impacts of extracting logsondesignated trailsin an all-age hardwood stand In:Kellog, Loren; Milota, Ginger, eds. The way aheadwithharvesting andtransportation technology:Proceedings of the International Union of ForestryResearch Organization XX World Congress; 1995August 6-12;Tampere, Finland Corvallis, OR:OregonStateUniversity: 197-213.
Tubbs, Carl H. 1977. Manager's handbook fornorthern hardwoods in the North Central States.Gen. Tech. Rep. NC-39. St. Paul, MN: U.S.Department of Agriculture, Forest Service, NorthCentral Forest Experiment Station. 29 p.
Winsauer, Sharon A.; Mattson, James A. 1992.Calculating competitionin thinned northernhardwood Res. Pap. NC-306. St. Paul, MN: U.S.Department ofAgriculture,Forest Service, NorthCentral Forest Experiment Station. 10p.

Cable Logging With Contoured Reserves —"Wiener" Logging
Stephen Aulerich, Vice Resident
Forest Engineering Inc.
620 SW 4th Street
Corvallis, Oregon 97333 USA
ABSTRACT: Author presents experiences of implementing new technologies in cable harvesting utilizing apattern of narrowalternating contoured clearcuts.
Keywords: Cable Logging, visual Concerns, Strategic and Tactical Planning
INTRODUCTION
British Columbia's beautiful scenery andrustic atmosphere draw visitors from all over the world. Much ofBritish Columbia's forest landis on steepmountainousterrain, which is highly visible from the highways andwaterways. The steep slopes, coupled with the attention they receive, make harvestingactivitiesa challenge. Ninety-five percent of the forest land base ismanaged as Crown land with strict environmentalguidelines. Protecting water, soil, wildlife, and otherresource values is critical to successfully operating onthese lands.
British Columbia's interior hasitsown setofchallenging conditions. Timber volumes arerelatively low.Typical stands have a volume of around 350 cubicmeters per hectare. The trees are also fairly smallwithstanddiameters at breast heightaround 30-60centimeters. Roadsand landingsare expensiveto buildandmaintain due to the steepslopes, presence of rock, andnumerous water crossings. Deflection is hard to findwith the long continuous slopes.
Quality forestengineering layoutand innovative harvesting techniques are required to maintain economicallyviable operations whileminimizing environmental impacts (Aulerich 1992). Forthe past several yearsForest Engineering Inc. hasbeenworking with theVavenby Division of Weyerhaeuser Canada in thedevelopment and implementation of detailed strategicand tactical plans onmany oftheir sensitive operatingareas. This planning effort has clearly identified theneed to introduce new harvesting technologies toaddress a variety of physical, economic, silvicultural,and environmental issues related to harvesting operations on these lands.
CONCEPT
One of these innovative harvesting techniques is theconcept of narrow-contoured openings and reservesplaced horizontally along the contour of the steep hillsides. The name "Wiener" logging comes from theshape of the narrow stacked openings (Figure 1). Thelong, narrow-contoured clearcuts are evenly spaced upand down the hill. Generally, the contoured openingsand associated reserve areas are in the range of 25-50meters wide and 200-400 meters in length.Approximately50% of the stand will be harvested on agiven skyline road. Depending onhow many entriesaredesigned, thismay only be a quarter, third, or halfof the surrounding stand. Long narrow strips of timberare left in between the contoured clearcuts. Thesereserves will be harvested oncethere is a young standof timber established in the narrow openings. Logs areharvested out of the narrow openings and yardedthrough corridors in thereserve strips.
There areseveral benefits to using this concept overtraditional methods:
1. The narrow openings arescreened from view bythe reserve areas, allowing harvesting to take place inareasonce avoideddue to steepslopesand high visualconcerns. The reserve areas act as a screen to reducethe visibility of the narrow clearcut openings.Depending upon the steepness of theground and therelative locations of theviewpoints, varying widths ofboth the openings and the reserves can be utilized toachieve the desiredscreening.
2. A clearcut system can be utilized for the narrowopenings being harvested. Compared topartial cuttingsystems,clearcuts offer the advantagesof reduced har-
102
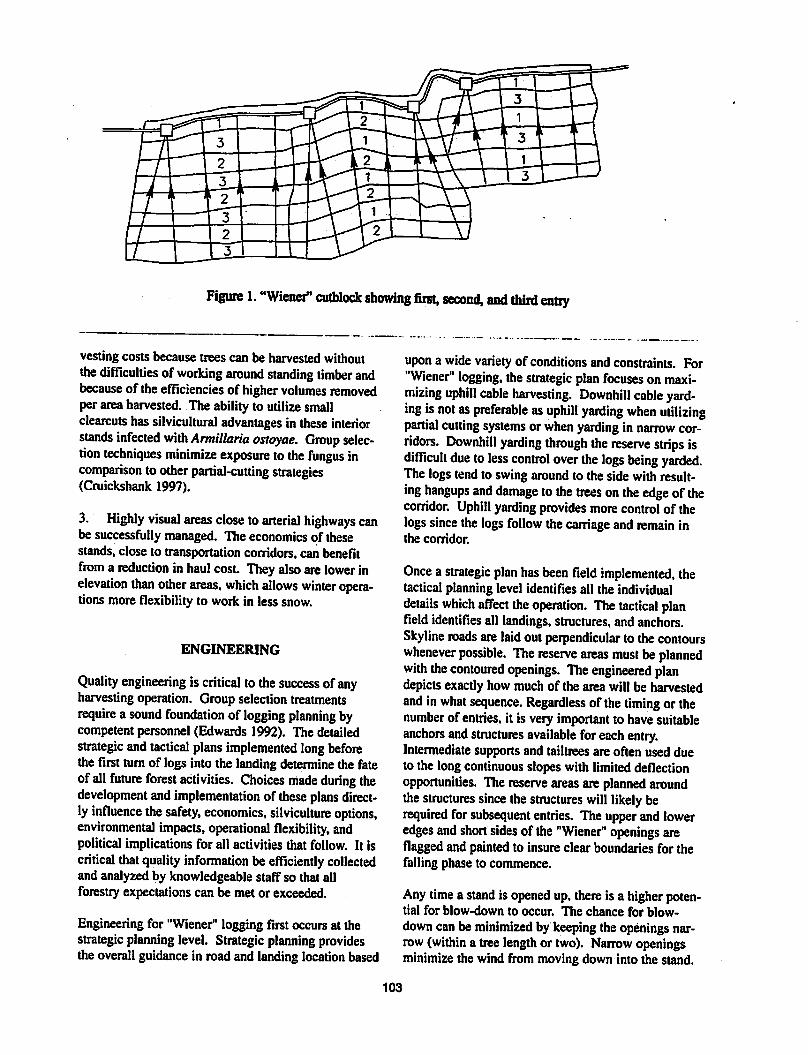
Figure 1. "Wiener*' cutblock showing first, second, and thud entry
vesting costs because trees can be harvested withoutthe difficulties ofworking around standing timber andbecause of the efficiencies of higher volumes removedper area harvested. The ability to utilizesmallclearcuts hassilvicultural advantages in these interiorstands infected with Armillaria ostoyae. Group selection techniques minimize exposure to the fungus incomparison to other partial-cutting strategies(Cruickshank 1997).
3. Highly visual areas close toarterial highways canbe successfully managed. The economics of thesestands, close to transportation corridors, can benefitfrom a reduction in haul cost They alsoare lower inelevation than other areas, which allows winter operations more flexibility to work in less snow.
ENGINEERING
Quality engineering iscritical tothe success ofanyharvesting operation. Groupselection treatmentsrequire a sound foundation of logging planning bycompetent personnel (Edwards 1992). The detailedstrategic and tactical plans implemented long beforethe first turn of logs into the landingdetermine the fateofallfuture forest activities. Choices made during thedevelopment andimplementation of these plans directly influence thesafety, economics, silviculture options,environmental impacts, operational flexibility, andpolitical implications for all activities that follow. It iscritical thatquality information be efficiently collectedand analyzed by knowledgeable staff so that allforestry expectations can be met or exceeded.
Engineering for "Wiener" loggingfirst occursat thestrategic planning level. Strategic planning providesthe overall guidance in road and landinglocation based
upon a wide varietyof conditions and constraints. For"Wiener" logging, thestrategic plan focuses on maximizing uphill cable harvesting. Downhill cable yarding isnot as preferable as uphill yarding when utilizingpartial cutting systems or when yarding in narrow corridors. Downhill yarding through the reserve strips isdifficult due toless control over the logs being yarded.The logstendto swing around to theside withresulting hangups and damage to the trees on the edge of thecorridor. Uphill yarding provides more control of thelogs since the logs follow the carriage and remain inthe corridor.
Once a strategic plan has been field implemented, thetactical planning level identifies all the individualdetails which affect the operation. The tactical planfield identifies all landings, structures, and anchors.Skyline roads are laidout perpendicular to the contourswhenever possible. The reserve areas must be plannedwith the contoured openings. The engineered plandepictsexactly how much of the area will be harvestedand inwhat sequence. Regardless of the timing or thenumber of entries, it is very important to havesuitableanchors andstructures available foreach entry.Intermediate supportsand tailtreesare often used dueto the longcontinuous slopeswith limiteddeflectionopportunities. Thereserve areas are planned aroundthe structures since the structures will likely berequired forsubsequent entries. The upper and loweredges andshort sides of the "Wiener" openings areflagged and painted to insure clear boundaries for thefalling phase to commence.
Any time a stand is opened up, there is a higher potential for blow-down to occur. The chance for blow-down canbe minimized bykeeping the openings narrow (within a treelength or two). Narrow openingsminimize the wind from movingdown into the stand.
103

Wind-firm edges are selected at the ends of the narrowstrips to reduce the chance of blow-down in these areas.If a blow-down event does occur, the entire area willhave been engineered with the roads located appropriately for the timberto be successfully salvaged.
HARVESTING
After the area is engineered and laid out, the fallingcrew falls the timber across thehill, keeping the timberwithin the narrow openings, similar to falling a roadright-of-way. Lead is across thehill,within theopenings, forthe lateral yarding carriages employed.Corridor trees are felled down the hill within the narrow three- to four-meter-wide corridor. Aslight wideningof thecorridor nearthe upper edgeof thecontouredopenings allows the turn of logsto swing into thecorridor. Thisslight widening alsoprovides room tochangethe direction of the felled timber from down the hill inthe corridor toacross thehill in the contoured openings. Trees along theupper edge of the "Wiener" openingcan be felled slightly downhill, away from theupperedge, to help the turns to swing into the corridor.Timber is bucked or left tree-length depending uponavailable landing space anddesired loads for the equipment being used.
Pre-rigging of structures ahead of yarding is necessary,sincethere is more setup time per volume of timberyarded per skyline road. If the structures are neededforsubsequent passes, theycan be protected with treeplates,or new corridors may need to be selected to lineup other structure combinations when the reserve areasare harvested.
Various yarders and carriagescan be utilized with thistechnique. Carriages which have lateral yarding capabilities are required to yard sideways between thecorridors. Radio-controlled, motorized slackpulling carriages capable ofgoing overan intermediate supportare often used. Choker setting production is similartoclearcut harvesting since logs are stillbeing yardedfroma clearcut. The main production loss is related toa larger proportion of timeassociated with setup.Quality engineering and layout, along with a hardworkingand trained logging crew, have keptproduction atacceptable levels.
TRAINING
Successful implementation of new techniques requiresan understanding of the concepts as well as supportfrom management. Engineering technologies need tobe transferred to the people implementing the layout.Harvesting technologies needto be developed withinthe logging contractor community to perform the sub
sequent harvesting. Management needs to weigh thecosts and benefits of the new technologies and providetime and resources to implement any necessarychanges.
Weyerhaeuser Vavenby has invested in the training oftheir forestry staff and logging contractors. Companymanagement hasseen the tangible and intangible benefits of the new technologies and understands the effortto train both forestry and logging staff in new harvesting and engineering technologies. "Wiener" logging isjust one of many techniques being introduced andimplemented. The forestry staffandlogging contractors have received classroom training andhands-ontraining in the field. The training hasallowed theforestry staff todevelop a wide variety of importantengineering skills necessary toimplement operationallyfeasible strategic and tactical plans incorporating thenew techniques. Logging contractor training has provided the knowledge for the contractor to harvest theareas efficiently and safely.
SUMMARY
Within a fairly short time of3 years the Vavenbyforestry staffhas successfully field-implementeddetailed engineering plans in highly visible, steep,mountainous terrain utilizing the "Wiener" loggingconcept. Some of the areas engineered in the field arecurrently being harvested by contract loggers embracing thenew technologies. "Wiener" logging maintainsmany of theadvantages of harvesting within a clearcutwhile providing a screen to reduce visual impacts. Theability to operate successfully on steep, mountainousslopes is based upon thedetailed, operationally focusedengineering being done. The new technologies beingapplied allow areas which were avoided in thepast tobeconsidered economically and environmentally feasible.
LITERATURE CITED
Aulerich, Stephen; Gardiner, Bruce. 1992.Technology transferof skylinesystems to the interiorof British Columbia. Proc, International mountainlogging and pacific northwest skyline symp;Bellevue, WA: 60-68.
Cruickshank, M.; Morrison, D. 1997. Fungal rootdisease starts at the stump. Canadian SilvicultureMagazine 5(1): 26-29.
Edwards, R.;Kellogg, L.; Bettinger, P.. 1992. Skylinelogging planning and harvest cost in five alternativegroup selection systems. Proc, International mountain logging and pacific northwest skyline symp;Bellevue, WA: 121-133.
104
Skyline Grapple Yarding
Ervin J. Brooks
USDA Forest ServiceClearwater National Forest
and
Stephen O'BrienUSDAForest Service
Helena National Forest
ABSTRACT: Alogging contractor and equipment manufacturer in northem Idaho have teamed up to develop a fully mechanized skyline logging system. The felling is completed with asteep-slope feller/buncher. The yarding is accomplished using askyline yarder with at least two drums and a prototype radio-controlled, hydraulic grapple carriage. Once the trees reach thelanding astroke-boom processor is utilized to limb, top, and buck the logs. On moderately steep ground (35-55%) this systempromises toincrease the economic feasibility of harvesting small wood.
KEYWORDS: skyline, logging, grapple, carriage, steep-slope, mechanized
INTRODUCTION
As the size of trees available to logging contractorsdecreases, the efficiency inherent with mechanizedequipment has kept operationseconomically feasible.This trendhas been limited primarilyto ground-basedoperations and practiced on moregentle terrain (0-35%). Twoequipment developments have allowed anorthern Idaho logging contractor to use mechanizationto fell, process, and load trees up to 55.9 cm (22 inches) in diameter on steep slopes.
Thismechanized skyline system consists of a steep-slopefeller/buncher, skylineyarder equipped witharecentlydevelopedgrapple carriage, a stroke boomdelimber, and a log loader.
Acomplete description of theentiresystem is presented in thispaper. However, it is recommended yourfocus beon the recent skyline carriage developmentand how it provides the opportunity to merge othermechanized developments into a physical and economically feasible mechanized skyline yarding alternative.
SYSTEM DESCRIPTION
Felling
In preparation foruseof thegrapple carriage, felling oftimberis completed using a steep-slope feller/buncher.
This track-mounted machine mechanically fells alltrees within a skyline corridorby beginning at the roadand working down to the unit boundary. Trees felled inthe downhill pass are placedalong one side of the corridor. Once at the bottom of the unit, the feller/buncherbegins its return to the landing by felling treesto eithersideof thecorridor and placing them behind themachine. This in effect prebunches an area 15-17meters (50-56 feet) in width by the length of the skylinecorridor. Within this total felling width, felled timber is concentrated in a strip 3-3.5 meters (10-12 feet)in preparation for the yarding phase. Treesare felledand bunched as a whole-tree operation.
Yarding
This phase of theoperation is completed through useofa skyline yarder equipped with at least two drums. Alive skyline configuration is utilized to support theweight of thecarriage and turn while allowing thecarriage to be raised andlowered when necessary. Amainline is attached to thegrapple carriage andservesto return the carriage to the landing.
A complete cycle of this skyline yarding system wouldbe describedas: 1) carriage outhaul under the controlof the yarder engineer, 2) grasping (hook) of a turnthroughradio controls operated by a person in thewoods. This person has a set of joy sticks for controlling the grapple arm and grapple, 3) inhaul of the turn,where control of the carriage has been returned to the
105
yarder engineer, and 4) release (unhooking) of the logsat the landing, where the yarderengineerhas control ofthe grapple carriage.
Processing
Once the trees have been yarded to the roadside, astroke boom delimber is utilized to limb, top, and buckmaterial into desired log lengths. Slash generated bythis operation is thus retained in a pile at the roadsidefor later disposal. Logs are decked along theroadsideby the delimber for later loading.
CARRIAGE
The prototype carriage utilized by this system wasdesigned and built by Bill Maki of Maki Carriages, andSteve Henderson of Henderson Logging. It isequippedwith a hydraulic armand grapple. The armis mounted on thebottom of thecarriage, can be remotelyswiveled to assist in placement of thegrapple, and hasa reachof 1.83 meters (6 feet) to either side of the carriage. The grapple is mounted on the end of theboomarm and canbe opened to a widthof 1.83 meters (72inches).
The carriage rides ona skyline cable under gravity duringtheyarding operation. Once the person in thecutting unit signals die yarder engineer to stop the carriage, control of the carriage is turned over to that person. This individual is outfitted with twojoy stickremote controls mounted on a belt and worn around thewaist. These joysticks control thegrapple arm and thegrapple from a safe distance during theprocess ofacquiring a turn. Once a turn has been secured in thegrapple that person signals the yarder engineer tobeginthe inhaul phase. At die landing, the yarder engineerreleases the turn from the grapple andreturns the carriage to the cutting unit.
Turn time is much faster with this carriage incomparison to a carriage equipped with chokers. This is dueto a shift from laborintensive cycle elements,hook and
unhook, to an operation that is fully mechanized. Thespeeds of cycle times are more dependent upon linespeed capabilityof the yarderthan before. Use ofyarders which areequippedwith two or more drumsthat can achieve high line speeds is a good match forthis carriage.
DISCUSSION
The use of this system has several advantages to theequipment owner. First, crew size and workman'scompensationcosts can be reduced. These reductionsresult from moving the felling operation from a manual, high manpower work force to that of asingle individualoperating inside an enclosedcab. These costsare further reduced byan operation that requires onlyone person in the cutting unit during theyarding operation. The owner can seea potential workforce reduction of 3-5 people with these changes.
Total yarding time can be reduced per cutting unit byprebunching whole trees into corridors. This eliminatesthe lateral yarding element of the cycle time. By eliminating this element, maximum efficiency ofagrapplecarriage overachoker setting system can be realized.The ability torelease logs at the landing without havingto remove chokers further reduces cycle time.
Previous studies on skyline yarding established thatlateral yarding consumes approximately 50% of the cycletime. In addition, unhooking time consumes another20-25% of the cycle time. By investing in a machinetocomplete the felling and prebunching, yarding timecan be cut approximately in half. Utilizing this grapplecarriage can further reduce cycle times.
Utilizing aprocess of mechanized felling to prebunchtrees can result in turns that more closely approximatedesired skyline loads. As silvicultural prescriptions areimplemented that direct industry toward everdecreasing wood size, this aspect will allow the equipmentowneranopportunity to reduce yarding costs in smaller timber.
106
Hurricane Fran Helicopter Salvage Case Study
Hank Sloan
Roanoke, VA
and
JimSherar
Asheville, NC
ABSTRACT: Three harvesting alternatives were considered to salvage Appalachian hardwoods blown down by Hurricane Fran9/96. Helicopter logging was the chosen alternative, being the least costly, least impacting, and allowing salvage of the mosttimber. Acase study of the KMAX helicopter production and costs for the project indicate a production average 10.7 mbf/hr atacost of $209/mbf International. Comparison of case study results to estimates by HELIPACE, a PC program to simulate helicopter production and costs, indicates estimates for the KMAX may need refining.
Keywords: helicopter, logging, Helipace, KMAX
INTRODUCTION
On September 6, 1996, Hurricane Fran impacted theDismal Mountain area on the Pedlar Ranger Districtapproximately 5 miles west of Lowesville, Va. Thedamage to the forest consisted mainly of blown downtrees and broken tops in a variety of intensities rangingfrom scattered individual trees to areas of completecollapse of the dominantforest. This paper looksat thealternative methods of harvest which were considered,presents a case study of helicopter logging, and reviewsthe effectiveness of the computer program Helipace(Aerial ForestManagement Foundation 1996) to predict costs based upon the case study results.
ALTERNATIVES CONSIDERED
The sawtimber that blew down was subject to rapiddeterioration in the 1997 growing season due to staining. Species composition was 80% yellow poplar, 20%northern red oak. The damaged sawtimber componentwould be characterized as high quality in a marketwhere industrial demand is outstripping available supply (Sloan 1995). The damaged small roundwoodcomponent of this timber is very common in the market area and of little economic value, either in terms ofstumpage receipts or in meeting industrial demands forforest products. Available supply of small roundwoodexceeds industrial demand (Sloan 1995). The focus ofthis salvage effort was thus on the sawtimber.
The salvage area terrain is characterized as rocky withextensive steep slopes, >35%. The soils are shallow
with bedrock surface exposure in several areas. Theownership pattern was such that some salvage areascould not be accessed by ground due to a lack of easement. These factors restrict the operability of loggingsystems.
Three harvesting alternatives for salvage of the blowndown timber were considered: 1) conventional cableskidderwith forwarder swing,2) downhill skylinewithcable skidderbunching, and 3) helicopter logging.
Alt. 1: conventional loggingwith forwarder swing
Due to the steep ground, an extensive network of skidroads would be required in this alternative. Given theshallow soils and bedrock exposures, this alternativealso presented some risk associated with the ability tobuild skid roads without blasting. These same factorsalso limit the ability to build truck road in the area. Inlieu of building truck road, a forwarder road was considered more feasible, utilizing forwarding to a full service landing at an existing truck road. The forwarderroad wouldrequirethe construction of a temporarybridge to cross KingsCreek,a trout fishery.
This logging system alternative is the closest match tothe area's conventional systems and, being common,wouldtheoreticallygive the timber sale offeringthegreatest market exposure. However, the difficult terrainand the availability of forwarders would limit significantly this alternative's marketability. The timberthat was blocked by lack of easement would not be salvaged. This alternative's projected sale volume was621 mbf (International 1/4-inch). Given the midwinter
107

sale date, it is likely that harvestoperations underthisalternative would bedelayed until early spring andproduction would be limited by the forwarding swing tothe truck road.
Given the average skid of 800 ft combined with a 2400ft average forward, the logging system production isestimated at 9-10 mbf/day. At this rate of logging production the harvest would conclude in late
summer/early fall of 1997. The stainingof thesawtimberwould begin to occur in latespring and by harvestend would be quite heavy. The value loss due to staindegrade would be high.
Alt 2: downhill skyline with cable skidderbunching
To reduce ground impacts and risks associatedwithroad building, an alternative using a downhill skylinesystem was developed. In areas where there was insufficient deflection for skylining, a cableskidder wouldbe used to bunch the timber under a skyline corridor.The timber that was blocked by lack of easementwould not be salvaged. Approximately halfof theestimated 621 mbf in this alternative would need to bebothskidded and yarded. The cable skidderwouldneed to have a system of roads built, although thisalternative would reduce the roading required byapproximately 40%. Harvesting could begin withoutdelay in thehalfof theareato be yarded directly,delaying skid road building until seasonal weather permitted.
The loggingsystem production for this alternative isestimated to be 12-15 mbf/day. At thisrate of logging the harvest would conclude in mid summer, andbyharvest endvalue lossdue to stain degradewould be moderate.
Alt. 3: helicopter
Given the rough terrain, the trout fisheries, inaccessibletimber, and the fairly intense amount of developmentrequired in the first twoalternatives a helicopter alternative was planned. The timber that was land lockedto ground based systems could be harvested, and thisalternative's projected sale volume was 925 mbf.Estimated volumes of removal in the 10+ mbf/ac rangeprovided the opportunity to hook full turns and minimize helicopter costs.
Initially, it was thought that an optimalnumberandspacing of landings could be selected to minimize helicoptercosts. The environmentalanalysis process,however eliminated all landing opportunities exceptone, due to cultural resource protection or LandManagement Planning allocations. Fortunately this
landing location was fairly central to the timber to besalvaged.
Production for this alternative was estimated to be 80-100 mbf/day. and logging production could begin withoutdelay. At this rateof logging the harvest wouldconclude in late winter, priorto any lossdue to staindegrade. See Figure 1. for a mapof thisalternative.
DECISION FOR HELICOPTER LOGGING
The decision to use the helicopter alternative wasbasedupon these factors:
1. It salvaged the most timber.2. It was estimated to be the most cost effective.3. It wasestimated to have the least soil,water,
fisheries, and visual impacts.4. It minimized the riskof developments in
rugged terrain.5. It minimized loss in value due tostain degrade.
Helicopter logging is normally thought of as themostexpensive logging method. This is not always thecase.There areno"rules of thumb" which can beapplied tologging system selections. Acomparison of typicalunit rates for logging systems is not sufficient toportray enough information to base a reliable decision.Each alternative must bedeveloped insufficient projectdetail to allow for specific cost estimates, environmental impacts, and risk assessment.
It is possible to identify when helicopter loggingshould be considered as an alternative. These factorsare when:
1. Conventional logging costs arehigher thannormal and particularly whenswingsystemsare needed.
2. When conventional logging systems can notaccess all timber, either through operabilitylimitations or ROW easement limitations.
3. Whenenvironmental impacts fromconventionalloggingare heavy or unlawful. This includestimber with BMP restrictions such that it eithereliminatesharvest conventionally or forces BMPvariance to harvest conventionally.
4. When road costs are higher than normal, orwhen permanent access is not needed for futuremanagement.
5. When quick salvage is necessary overlargeareasdue to substantia] risk of degrade, particularlyduring weather related inoperable seasons.
108
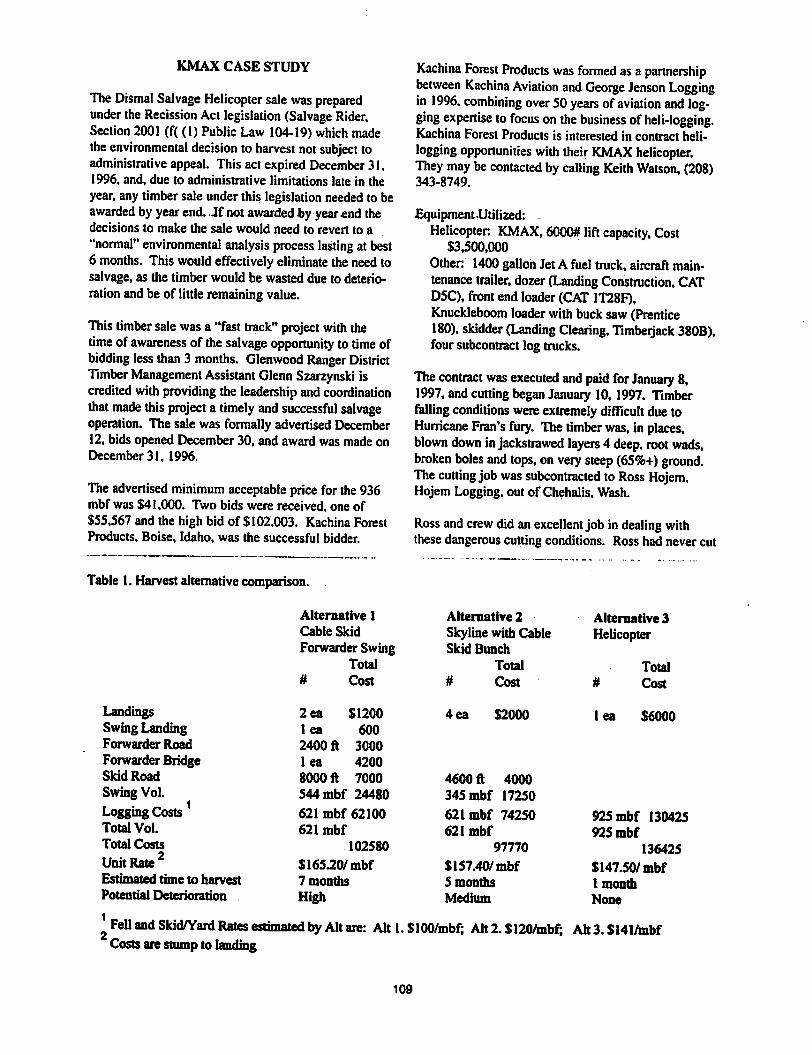
KMAX CASE STUDY
The Dismal Salvage Helicopter salewas preparedunder theRecission Act legislation (Salvage Rider,Section 2001 (f( (1) Public Law 104-19) which madethe environmental decision to harvest notsubject toadministrative appeal. Thisact expired December 31,1996, and, due to administrative limitations late in theyear, any timbersale under this legislation needed to beawarded by yearend. Jf notawarded by year end thedecisions to make the sale would need to revert to a"normal" environmental analysis process lasting at best6 months. This would effectively eliminate the need tosalvage, as the timber would be wasted due to deterioration and be of little remaining value.
This timber sale wasa "fast track"project with thetime of awareness of the salvage opportunity to time ofbidding lessthan 3 months. Glenwood Ranger DistrictTimber Management Assistant Glenn Szarzynski iscredited with providing the leadership andcoordinationthat made this project a timely and successful salvageoperation. The sale was formally advertised December12, bids opened December 30, and award was made onDecember 31, 1996.
Theadvertised minimum acceptable price for the936mbf was $41,000. Two bids were received, one of$55,567 and the high bid of $102,003. Kachina ForestProducts, Boise, Idaho, was the successful bidder.
Kachina Forest Products was formed asa partnershipbetween Kachina Aviation and George Jenson Loggingin 1996, combining over 50years ofaviation and logging expertise tofocus on the business ofheli-logging.Kachina Forest Products is interested in contract heli-logging opportunities with their KMAX helicopter.They may be contacted by calling Keith Watson, (208)343-8749.
Equipment .Utilized:Helicopter KMAX, 6000# liftcapacity. Cost
$3,500,000Other: 1400gallonJet A fuel truck, aircraftmaintenance trailer, dozer (Landing Construction, CATD5C), front end loader(CAT 1T28F),Knuckleboom loaderwithbuck saw (Prentice180), skidder (Landing Clearing, Timberjack 380B).four subcontract log trucks.
The contract was executed and paid forJanuary 8,1997, andcutting began January 10,1997. Timberfalling conditions were extremely difficult due toHurricane Fran's fury. The timber was, in places,blown down injackstrawed layers 4 deep, root wads,broken boles and tops, on very steep (65%+) ground.Thecutting job wassubcontracted to Ross Hojem,Hojem Logging, out of Chehalis, Wash.
Ross and crew didanexcellent job indealing withthese dangerous cutting conditions. Ross had never cut
Table 1.Harvest alternative comparison.
Alternative 1 Alternative 2 Alternative3Cable Skid Skyline with Cable HelicopterForwarder Swing Skid Bunch
Total Total Total# Cost # Cost # Cost
Landings 2 ea S1200 4ea $2000 lea $6000Swing Landing lea 600Forwarder Road 2400 ft 3000Forwarder Bridge 1 ea 4200Skid Road 8000 ft 7000 4600 ft 4000Swing Vol. 544mbf 24480 345mbf 17250
Logging Costs 621 mbf 62100 621mbf 74250 925mbf 13042Total Vol. 621 mbf 621 mbf 925 mbfTotal Costs
Unit Rate2102580 97770 136425
$165.20/ mbf $157.40/mbf $147.50/mbfEstimated time to harvest 7 months 5 months 1 monthPotential Deterioration High Medium None
F̂ell and Skid/Yard Rates estimated by Alt are: Alt 1. $100/mbf; Ah 2. $120/mbf; Alt 3. $141/mbf' Costs are stumpto landing
109
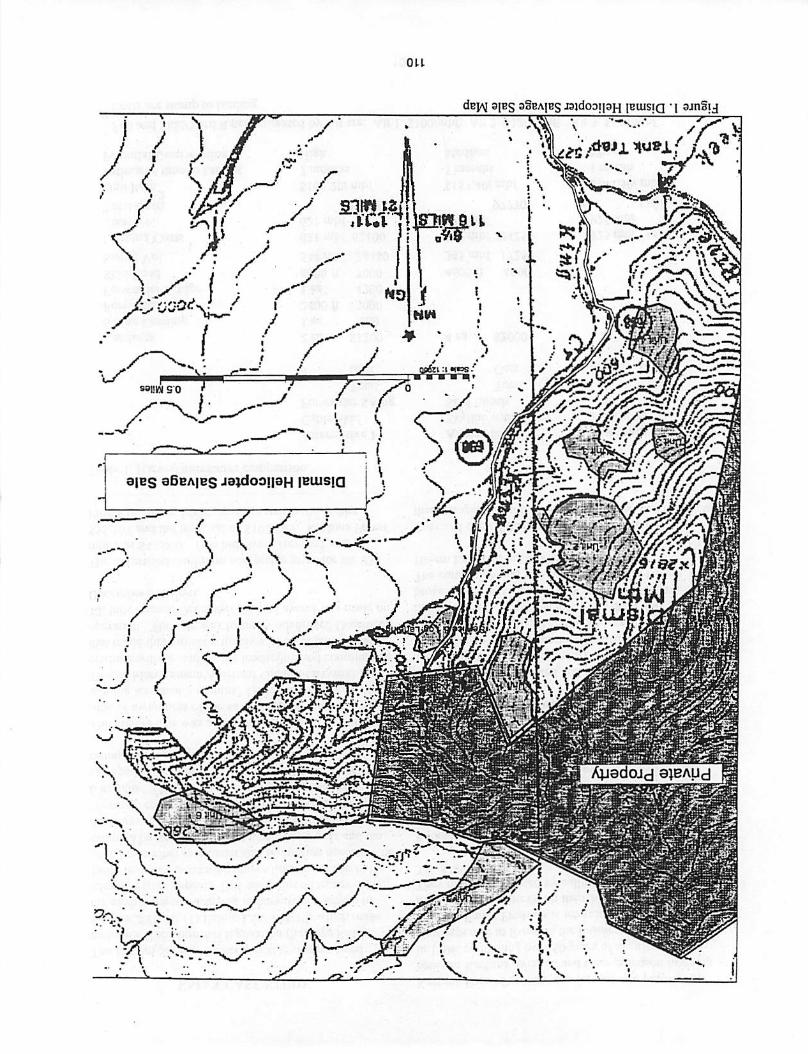
Figure1.DismalHelicopterSalvageSaleMap
110

for ahelicopter job, but hehas worked extensively witha wide range of logging systems onsteep ground. Healso had valuable experience cutting AppalachianHardwoods (Sloan 1992), something that KachinaForest Products lacked.
Timber cutting production average lOmbf/man-day,and was done with safety inoperations as first priority.No cutting occurred on windy days, length of work daywas controlled to.minimize. fatigue, andxommunica- .tion was maintained between the cutting crew members. The cutting contract ratewas $22/mbfInternational.
Both theservice and log landing construction wasaccomplished witha rented Caterpillar D5C dozer.Along with some minor road widening, the landingclearing and construction process took a full week. Inorderto armor the landing for winter season work,400tonsof Va#2 stone (3-47dia) was placed. The cost ofthese landings were$2100 DSC, $4800stone, $1500labor for a total cost of $8400.
Flying of the timber began on January 23 witha schedule of working Monday through Saturday when notlimited byvisibility orwind (>35mph). Table 2 represents a summary of the production data recordedduring the project.
Total timber sale cruised volume to be flown was 925mbf International broken down as follows:
SpeciesGroupYellow PoplarRed Oak
Misc HWD
MBF International743
174
8
Based upon the cruised volume and the actual flightrecords, production for the KMAX was 10.7 mbf/hrInternational.
-Total.timber.sale delivered volume as recorded frommill receipts was 754 mbf Doyle broken down as follows:
MBF Doyle595
109
27
SpeciesYellow PoplarRed Oak
Chestnut Oak
Ash
HickoryHard MapleBasswood
Soft MapleMisc
7
6
3
3
2
2
Based upon the delivered volume and the actual flightrecords, production for the KMAX was 8.73 mbf/hrDoyle.
One of the most critical factors indetermining aircraftcosts is the utilization rate of the aircraft. Annual utilization can beprojected from this project, based upontheavailability of the aircraft to fly with weather
Table 2. KMAX productiondatarecord
Date Total Total Aborts Flights Turns/ Pounds/Pounds Turns # Hours Hour Turn
1/23/97 382380 81 4 3.6 22.5 4721
tbl 1™,9J 333590 70 6 3.6 19.4 4766'Ui 1/27/97 699890 146 7 6.5 22.5 4794
1/29/97 706750 151 12 6.9 21.9 46801/30/97 778390 172 6 6.9 24.9 45261/31/97 748690 164 7 7.0 23.4 45652/1/97 699010 156 5 6.6 23.6 44812/3/97 826420 189 6.7 28.2 43732/4/97 751200 162 6.3 25.7 46372/5/97 867500 193 6.3 30.6 44952/7/97 795200 186 5.5 33.8 42752/10/97 152360 37 12 30.8 41182/11/97 461720 104 3.6 28.9 44402/15/97 609620 140 4.9 28.6 43542/18/97 897310 198 73 27.1 45322/19/97 402070 94 3.5 26.9 4277
Totals 10112100 2243 47 86.4 26.0 4508
111
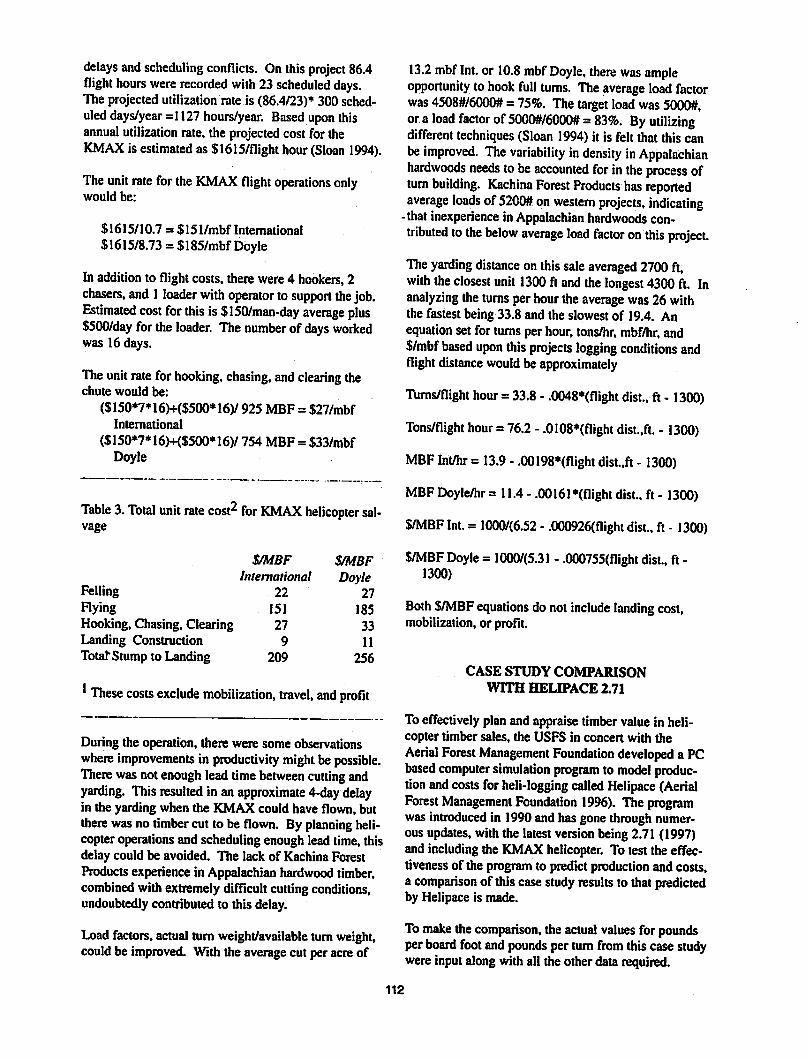
delays and scheduling conflicts. Onthis project 86.4flight hours were recorded with 23scheduled days.The projected utilization rate is (86.4/23)* 300 scheduled days/year =1127 hours/year. Based upon thisannual utilization rate, the projected cost for theKMAX is estimated as $1615/flight hour(Sloan 1994).
The unit rate for the KMAX flight operations onlywould be:
$1615/10.7 = $151/mbf International$1615/8.73 = $185/mbfDoyle
In addition to flight costs, therewere4 hookers, 2chasers, and I loader with operator tosupport the job.Estimated cost for this is $150/man-day average plus$500/day forthe loader. Thenumber of days workedwas 16 days.
The unit rate forhooking, chasing, and clearing thechute would be:
($150*7*16H$500*16)/ 925 MBF = $27/mbfInternational
($150*7*16)+($500*16)/ 754 MBF = $33/mbfDoyle
Table 3. Total unit rate cost2 for KMAX helicopter salvage
FellingFlyingHooking, Chasing, ClearingLanding ConstructionTotal"Stump to Landing
$/MBF S/MBFInternational Doyle
22 27
151 185
27 33
9 11
209 256
These costs exclude mobilization, travel, and profit
During the operation, there were some observationswhere improvements in productivity might bepossible.There was not enough lead time between cutting andyarding. This resulted inanapproximate 4-day delayin the yarding when the KMAX could have flown, buttherewas no timbercut to be flown. By planning helicopteroperations and scheduling enough lead time, thisdelay could be avoided. The lack of Kachina ForestProductsexperiencein Appalachian hardwood timber,combinedwith extremely difficult cutting conditions,undoubtedlycontributed to this delay.
Load factors, actual turn weight/available turn weight,could be improved. With the average cut per acre of
13.2 mbf Int. or 10.8 mbfDoyle, there was ampleopportunity to hook full turns. The average load factorwas 4508#/6000# = 75%. Thetarget load was 5000#,ora load factor of5000#/6000# = 83%; By utilizingdifferent techniques (Sloan 1994)it is felt that this canbe improved. The variability indensity in Appalachianhardwoods needs tobe accounted for in the process ofturn building. Kachina Forest Products has reportedaverage loads of5200# on western projects, indicating
-that inexperience in Appalachian hardwoods contributed tothe below average load factor onthis project.
The yarding distance onthis sale averaged 2700 ft,with the closest unit 1300 ft and the longest 4300 ft. Inanalyzing the turns perhour the average was 26 withthe fastest being33.8 and the slowest of 19.4. Anequation set for turns per hour, tons/hr, mbf/hr, and$/mbf based upon this projects logging conditions andflight distance would beapproximately
Turns/flight hour = 33.8 - .0048*(flight dist., ft -1300)
Tons/flight hour = 76.2 - .0108*(flight dist.ft. -1300)
MBF Int/hr = 13.9 - .00198*(flight dist.,ft -1300)
MBF Doyle/hr = 11.4 - .00161 *(flight dist.. ft - 1300)
$/MBF Int. = 1000/(6.52 - .000926(flight dist., ft - 1300)
$/MBF Doyle = 1000/(5.31 - .000755(flight dist., ft -1300)
Both S/MBF equations do notinclude landing cost,mobilization, or profit.
CASE STUDY COMPARISONWITH HELIPACE 2.71
Toeffectively plan and appraise timbervalue in helicopter timber sales, the USFS in concert with theAerial Forest Management Foundation developed a PCbased computer simulation program to model production andcosts forheli-logging called Helipace (AerialForest Management Foundation 1996). The programwas introduced in 1990and has gone through numerous updates, with the latest version being2.71 (1997)and including the KMAX helicopter. To test the effectiveness of the program to predictproduction and costs,a comparison of this case studyresults to that predictedby Helipace is made.
Tomake thecomparison, the actual values forpoundsperboard foot andpounds per turn from thiscasestudywere inputalongwith all the otherdata required.
112
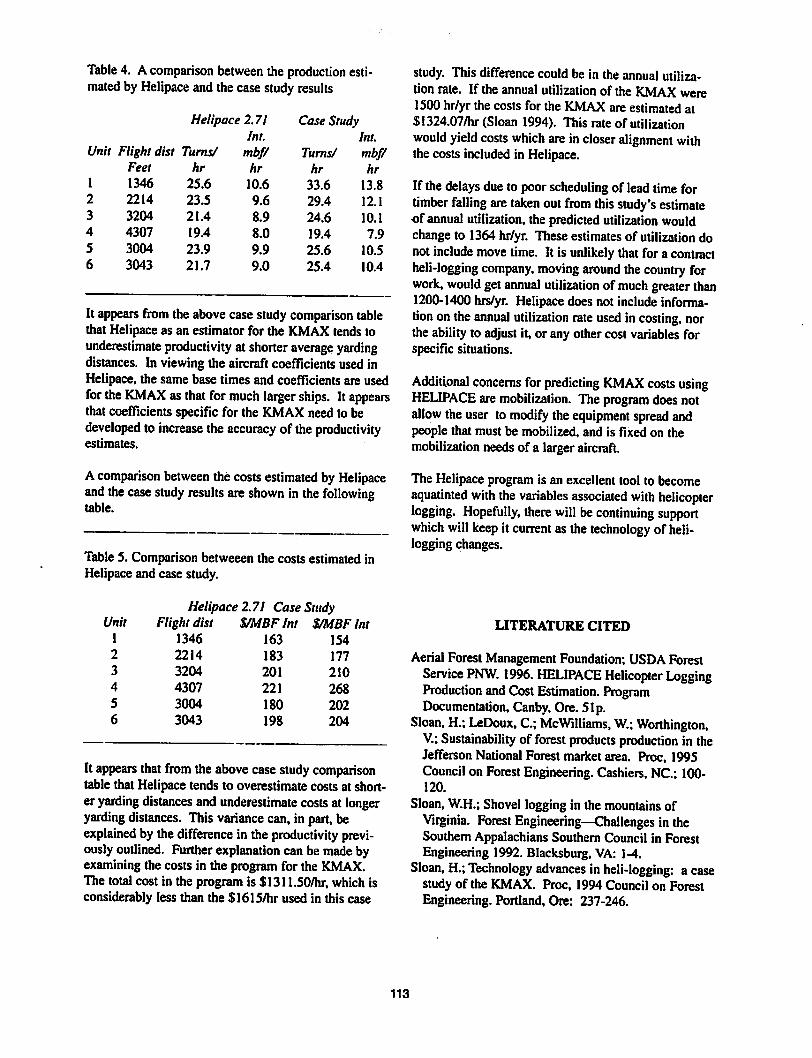
Table 4. Acomparison between the production estimated by Helipace and the case studyresults
Helipace 2.71 Case StudyInt. Int.
Unit Flight dist Turns/ mbf/ Turns/ mbf/Feet hr hr hr hr
1 1346 25.6 10.6 33.6 13.8
2 2214 23.5 9.6 29.4 12.1
3 3204 21.4 8.9 24.6 10.1
4 4307 19.4 8.0 19.4 7.95 3004 23.9 9.9 25.6 10.5
6 3043 21.7 9.0 25.4 10.4
It appears from the above casestudy comparison tablethat Helipace as an estimator for the KMAX tends tounderestimate productivity at shorter average yardingdistances. In viewing the aircraft coefficients used inHelipace, the same base times and coefficients are usedfor the KMAX as thatformuch larger ships. It appearsthat coefficients specific for the KMAX need to bedeveloped to increase theaccuracy of theproductivityestimates.
Acomparison between the costsestimated by Helipaceand the case study results areshown in the followingtable.
Table 5. Comparison betweeen the costs estimated inHelipace and case study.
Helipace 2.71 Case StudyUnit Flight dist S/MBF Int S/MBFInt
1 1346 163 154
2 2214 183 177
3 3204 201 2104 4307 221 2685 3004 180 202
6 3043 198 204
It appears that from theabove case study comparisontable that Helipace tends to overestimate costs at shorter yarding distances and underestimate costsat longeryarding distances. This variance can, in part, beexplained by thedifference in the productivity previouslyoutlined. Furtherexplanationcan be madebyexaminingthe costs in the program for the KMAX.The total cost in the program is $1311.50/hr, which isconsiderably less than the $1615/hr used in this case
study. Thisdifference could be in theannual utilization rate. If the annual utilization of the KMAX were1500 hr/yr the costs for the KMAX are estimated at$1324.07/hr (Sloan 1994). This rate of utilizationwould yield costs which are in closer alignment withthe costs included in Helipace.
If thedelays due to poorscheduling of lead time fortimber falling are taken out from thisstudy's estimateof annual utilization, the predicted utilization wouldchange to 1364 hr/yr. These estimates of utilization donot includemovetime. It is unlikely that for a contractheli-logging company, moving around the country forwork, would get annual utilization of much greater than1200-1400 hrs/yr. Helipace does not include information ontheannual utilization rate used incosting, northe ability to adjust it, or any other cost variables forspecific situations.
Additional concerns for predicting KMAX costs usingHELIPACE are mobilization. The program does notallow the user to modify the equipment spread andpeople that must be mobilized, and is fixed on themobilization needs of a larger aircraft.
The Helipace program is an excellent tool to becomeaquatinted with the variables associated with helicopterlogging. Hopefully, there will be continuing supportwhich will keep it current as thetechnology of heli-logging changes.
LITERATURE CITED
Aerial Forest Management Foundation; USDA ForestService PNW. 1996. HELIPACE Helicopter LoggingProduction and CostEstimation. ProgramDocumentation, Canby, Ore. 51p.
Sloan, H.; LeDoux, C; McWilliams, W.; Worthington,V.; Sustainability of forest products production in theJefferson National Forest marketarea. Proc, 1995Council on ForestEngineering. Cashiers, NC; 100-120.
Sloan,W.H.; Shovel loggingin the mountains ofVirginia. Forest Engineering—Challenges in theSouthern Appalachians Southern Council in ForestEngineering 1992. Blacksburg, VA: 1-4.
Sloan, H.; Technology advances inheli-logging: a casestudy of the KMAX. Proc, 1994 Council on ForestEngineering. Portland, Ore: 237-246.
113
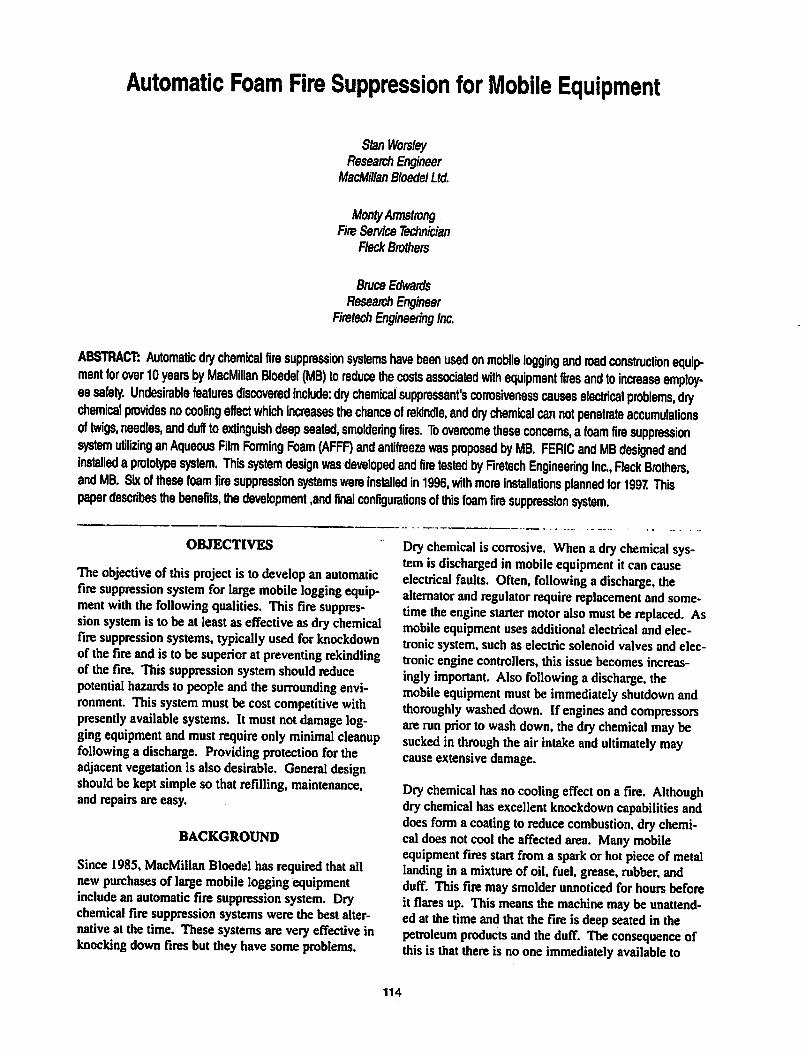
Automatic Foam Fire Suppression for Mobile Equipment
Stan WorsleyResearch Engineer
MacMillan Bloedel Ltd.
Monty ArmstrongFireService Technician
Fleck Brothers
Bruce EdwardsResearch Engineer
Firetech Engineering Inc.
ABSTRACT: Automatic dry chemical fire suppression systems have been used on mobile logging and road construction equipment for over 10 years by MacMillan Bloedel (MB) to reduce the costs associated with equipment fires and to increase employee safety. Undesirable features discovered include: dry chemical suppressant's corrosiveness causes electrical problems, drychemical provides no cooling effect which increases the chance of rekindle, and dry chemical can not penetrate accumulationsof twigs, needles, and duff to extinguish deep seated, smoldering fires. To overcome these concerns, afoam fire suppressionsystem utilizing an Aqueous Rim Forming Foam (AFFF) and antifreeze was proposed by MB. FERIC and MB designed andinstalled aprototype system. This system design was developed and fire tested by Firetech Engineering Inc., Fleck Brothers,and MB. Six of these foam fire suppression systems were installed in 1996, with more installations planned for 1997 Thispaper describes the benefits, the development ,and final configurations of this foam fire suppression system.
OBJECTIVES
The objective of this project is to develop an automaticfire suppression system for large mobile logging equipment with the following qualities. This fire suppressionsystem is to be at leastas effective as dry chemicalfire suppression systems, typicallyused for knockdownof the fire andis to be superior at preventing rekindlingof the fire. This suppression systemshouldreducepotential hazards to people and the surrounding environment. This systemmust be cost competitive withpresently available systems. It must notdamage logging equipment and must require only minimal cleanupfollowing a discharge. Providing protection for theadjacent vegetation is alsodesirable. General designshouldbe kept simple so that refilling, maintenance,and repairs are easy.
BACKGROUND
Since 1985, MacMillan Bloedelhas required that allnew purchases of large mobile loggingequipmentinclude an automatic fire suppression system. Drychemical fire suppression systems were the best alternative at the time. These systemsare very effective inknocking down fires but they havesomeproblems.
Dry chemical is corrosive. When a dry chemical systemis discharged in mobile equipment it can causeelectrical faults. Often, following a discharge, thealternator andregulator require replacement andsometime the engine starter motor also must be replaced. Asmobile equipment uses additional electrical and electronic system, such as electric solenoid valves and electronic engine controllers, this issue becomes increasingly important. Also following a discharge, themobile equipment must be immediately shutdown andthoroughly washed down. If engines and compressorsarerunpriorto wash down, thedrychemical may besucked in through the air intake and ultimately maycause extensive damage.
Dry chemical has nocooling effect ona fire. Althoughdrychemical hasexcellent knockdown capabilities anddoes form a coating to reduce combustion, drychemical does not cool the affected area. Manymobileequipment fires start froma sparkor hot pieceof metallanding in a mixture of oil, fuel, grease, rubber, andduff. This fire may smolder unnoticedfor hours beforeit flares up. This means the machine may be unattended at the time and that the fire is deep seated in thepetroleum products and theduff. Theconsequence ofthis is that there is no one immediately available to
114

mop up after the fire has been knocked down and thatthe fire may continue to smolder after the dry chemicalsuppression system has knocked the fire down.Following detection of the fire and discharge ofthe drychemical suppressant, fires have rekindled on mobileequipment, causing extensive damage and costlyrepairsor equipment replacement.
Dry chemical does not flow after application. Generally,dry chemical suppressant will remain where it has beenapplied. Although thissounds positive at first, whenconsidering the complex shapes onmobile equipment,this can bea disadvantage. Designing a system todirect suppressant at all possiblefire hazards would beextremelycostly to design, build, install, and maintain.It also wouldrequiremany machine, model, and evenoptionspecificdesigns. Furthermore, if the fire hasinitiated from below the equipment or has carried ondown tobelow the equipment, automatic dry chemicalsuppression systems are unlikely toextinguish any significant fire. Reignition is possible.
In 1989, MacMillan Bloedel decided that an automaticfire suppression system that utilized an AFFF (aqueousfluid forming foam) foam could bedeveloped toreduceor eliminate these problems. Adevelopment teamincluding Fleck Brothers, Firetech Engineering, FERIC(Forest Engineering Research Institute of Canada), andMacMillan Bloedel was formed todesign anautomaticfoam firesuppression system.
INITIAL PROTOTYPE
In 1990, FERIC developed anexperimental foam firesuppression system. FERIC investigated potential firesuppressants which confirmed foam to be the bestchoice of suppressant. Factors in this choice includedheat absorption, ability to penetrate, blanket formingability, andpostdischarge cleanup. Class AandBfoams were compared, and Class B foam was found tobesuperior in forming and maintaining a blanket ofsuppressant to sealthe surface of petroleum products.With no significant benefitusing ClassAfoam, ClassB foam was chosen.
Initially FERIC constructed a small single nozzle system for bench tests. This system assisted indefiningthe optimal operating pressures and hose sizesconsidering other design constraints. Small test fires wereused to compare class A and B foams. A class B foam,Petroseal, waschosenas the superiorfoamin thisapplication as a result of its rekindle or burn back resistance on hydrocarbons. Petroseal is an FFFP (filmforming fluoro protein) foam that also performs as anAFFF but with reduced corrosive and environmental
impacts. Thistestsystem was alsoused toensure thatadding a nontoxic antifreeze to thefoam solutionwould not reduce fire suppressing effects.
Having chosen foam as the suppressant, other designobjectives were reviewed. These objectives includedquick response, effective coverage, minimal dependence on other machine systems, effective operationthrough expected ambient and operating temperatures,both manual and automatic actuation, and, asimpledesign to facilitate installation and simplify cleanup.
Following the above bench tests. FERIC designed anexperimental foam suppression system forMacMillanBloedel's Kelsey Bay Division on a Thunderbird1146B hydraulic log loader. This prototype included anitrogen cylinder, a regulator, a 60US gal foam solution tank, four Angus K40 foam nozzles, a Ropec R777control system, threeFenwall heatdetectors, a 1 1/2-inch normally closed (NC) zero leak solenoid valve,andsome hardware andwiring.
The nitrogen cylinder, through theregulator, maintainspressure in the solution tank and the solenoid valvemounted to the bottom of the solution tank keeps thesolution in the tank until the valve isopened by themonitor. The monitor may be set into alarm by eitherthe fenwall detectors (automatically) or a switch on themonitor (manual). The monitor will keep the solenoidvalve open even if neither the detectors nor the manualswitch remain closed toprevent partial discharges. Areset button is used to override this function and closethe solenoid valve.
The monitor includes an auto shut down 15 secondsafterthe monitor receives signal of a fire. There is alsoa button tooverride this function and provide the operator more time to safely shut down the machine ifrequired.
Installation and testing of this foam suppression systemwerecompleted in early 1991. Testing included a wettest, that is discharging the system as it would occur incaseof a fire. The test results appeared favorable witha total discharge time of 55 seconds. Excess foamflowed through themachine and onto the groundbelow, providing protection for the surrounding vegetation. Although thissystem appeared to operate effectively, no full scale burn tests hadbeen performed tothis date.
POTENTIAL IMPROVEMENTS
The main concern with this prototype wasthat it hadnot been tested in full-scale fire conditions. There was
115
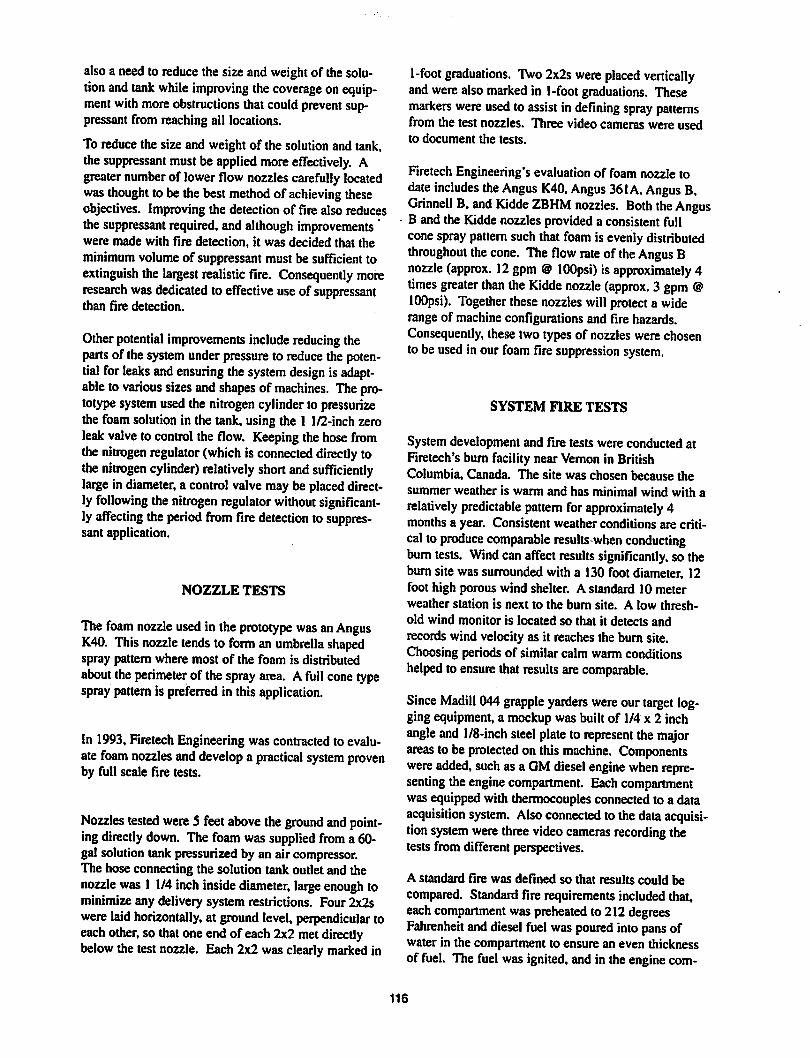
also a need to reduce the size and weightof the solution and tank while improving the coverage onequipment with more obstructions thatcould prevent suppressant from reaching all locations.
To reduce the size and weight of the solutionand tank,thesuppressant must be applied more effectively. Agreaternumberof lower flow nozzles carefully locatedwasthought to be the best method of achieving theseobjectives. Improving the detection of fire also reducesthesuppressant required, and although improvementswere made with fire detection, it was decided that theminimum volume of suppressant must be sufficient toextinguish the largest realistic fire. Consequently moreresearch wasdedicated to effective useof suppressantthan fire detection.
Other potential improvements include reducing theparts of the system under pressure to reduce the potential for leaks andensuring the system design is adaptableto various sizes and shapes of machines. Theprototypesystemused the nitrogen cylinder to pressurizethe foamsolution in the tank, using the 1 1/2-inch zeroleak valveto control the flow. Keepingthe hose fromthe nitrogen regulator (which is connected directly tothe nitrogen cylinder) relatively short and sufficientlylarge in diameter, a control valve may be placeddirectly following the nitrogen regulator without significantly affecting theperiod from fire detection to suppressant application.
NOZZLE TESTS
Thefoam nozzle used in theprototype was anAngusK40. Thisnozzle tends to form an umbrella shapedspray pattern where most of the foam is distributedabout theperimeter of the spray area. Afull cone typespray pattern is preferredin this application.
In 1993, Firetech Engineering was contracted to evaluate foam nozzles anddevelop a practical system provenby full scale fire tests.
Nozzles tested were 5 feet above theground and pointingdirectly down. The foam was supplied from a 60-gal solution tank pressurized by an air compressor.The hose connecting the solution tank outlet and thenozzle was 1 1/4 inch inside diameter, large enough tominimizeany delivery system restrictions. Four 2x2swere laid horizontally, at ground level, perpendicular toeachother, so thatone end of each2x2 metdirectlybelowthe test nozzle. Each 2x2 was clearly marked in
1-foot graduations. Two 2x2s were placed verticallyand werealso marked in 1-foot graduations. Thesemarkers were used to assist indefining spray patternsfrom the test nozzles. Three video cameras were usedto document the tests.
Firetech Engineering's evaluation of foam nozzle todate includes the Angus K40, Angus 361A.Angus B,Grinnell B.and Kidde ZBHM nozzles. Both the AngusB and the Kidde nozzles provided a consistent fullcone spray pattern such that foam is evenly distributedthroughout the cone. The flow rate of the Angus Bnozzle (approx. 12 gpm @ lOOpsi) isapproximately 4times greater than the Kidde nozzle (approx. 3 gpm @lOOpsi). Together these nozzles will protect a widerange of machine configurations and fire hazards.Consequently, these two types of nozzles werechosento be used inour foam fire suppression system.
SYSTEM FIRE TESTS
System development and fire tests were conducted atFiretech's burn facility near Vernon in BritishColumbia, Canada. The site was chosen because thesummer weather is warm and has minimal wind with arelatively predictable pattern forapproximately 4months a year. Consistent weather conditions are critical to produce comparable results when conductingburn tests. Wind canaffect results significantly, so theburn site was surroundedwith a 130 foot diameter, 12foot high porous wind shelter. A standard 10 meterweather station is next to the burn site. A low threshold wind monitor is located so that it detects andrecords wind velocity as it reaches the burn site.Choosing periods of similar calm warm conditionshelped to ensure that results are comparable.
Since Madill 044 grapple yarders were ourtarget loggingequipment, a mockup was builtof 1/4x 2 inchangle and 1/8-inch steel plate to represent the majorareas to be protected on this machine. Componentswere added, such as a GM diesel engine when representing theengine compartment. Each compartmentwas equippedwith thermocouples connected to a dataacquisition system. Also connected tothedata acquisition system were three video cameras recording thetests from different perspectives.
A standard fire was defined so that results could becompared. Standard fire requirementsincludedthat,each compartment waspreheated to 212degreesFahrenheit anddiesel fuel was poured intopans ofwater in the compartment to ensure an even thicknessof fuel. The fuel was ignited, and in the engine com-
116
partment two jets of diesel fuel were also ignited tosimulate a broken hydraulic hose. The fuel wasallowed to burnfor 30 seconds before suppressant wasapplied to the fire. This produced a large fire whichrepresented the largest fire thesuppression systemcouldreasonably be expected to extinguish.
Approximately 25 standard test fires were conducted totest various nozzle locations and to estimate theoptimum flow rateof suppressant. A drychemical systemwas installed by FleckBrothers as directed by the manufacturer and applied to the standardfire to evaluatethe performance of thefoam system compared todrychemical.
TEST RESULTS
The test criteria was to achieve fire knockdown in 2seconds or less, without rekindle. In the standard fire,optimal flow rates were determined for each of the following compartments of a Madill 044grapple yarder,the engine, the brakes, the clutches, and the drums.Optimal nozzle locations were determined. Dry chemical suppressant was also tested in the standard fire tocompare it to foam suppressant.
The optimal flow rate for the engine compartment is 73gpm at 160 psi, for the brake compartment 35gpm at160 psi, for the clutch compartment 32 gpmat 160 psi,andfor thedrum compartment 40 gpmat 160 psi. Sixnozzles are located in the engine compartment, seven 'are in the brake compartment, four are in the clutchcompartment, and eight are in the drumcompartment.
Firetech Engineering found that locating thenozzles sothat the incoming combustion air is entrained withfoam provides an effective suppression system. Thishelps draw the foam into the areas where the fire islocated. Firetech also found that opposing nozzles canreduce the speed of the foam and create a foam that ismore easily entrained into the combustion air. Thesebenefits have been implemented. However, cautionmustbe taken to ensure that non-opposing nozzles donot createair turbulence that may fan the fire byincreasing the combustion air.
Validation tests were also conducted in the enginecompartment for demonstration purposes. In addition to
the fuel loading of thestandard fire, rubber was addedtosimulate the effect ofpneumatic and hydraulichoses. In each dry chemical test, 21 pounds ofdrychemical suppressant was used, whereas in foam teststheflow rate was 1gallon per second with the foamsuppressant flow beingshut off as soon as knockdownwas realized.
The time to knockdown fordry chemical was 2 to 8seconds and for thefoam suppressant 1 to 4 seconds.No rekindle occurred when using foam suppressant;however, rekindle of the rubber occurred after 6 minutes during a dry chemical test.
IMPLEMENTATION
In 1996, six foam systems were installed byFleckBrothers and in 1997 two more were installed. Thefirst system was installed in February ona Madill 044grapple yarder. The second system was installed inMarch on a Hitachi EX400 excavator. The third foamsuppression system was installed on a Linkbelt 5800Quantum Road Builder inJune. InSeptember thefourth and fifth systems were installed on a TMM850line loader; one on the loader and one on the carrier.The sixth system was installed ona Kobelco 350 logloader. In February of 1997 foam systems wereinstalled on two 4300 Linkbelt machines—a hydrauliclog loader and anexcavator. Installation time andsystem cost for a foam suppressionsystem are similar to adry chemical system of comparablesize.
CONCLUSIONS
This foam system is believed to besuperior to drychemical systems typically used on mobile forestryequipment and willcontinue to be implemented in ourequipment.
For fireknockdown, this foam suppression system is atleast aseffective asa dry chemical system. Foam suppressantprovidessignificantcooling to reduce rekindlewhereas drychemical suppressant doesnot Foam suppressant is moreenvironmentally friendly and less corrosive thandrychemical suppressant. Cleanup is easy,and recharging this foam system can be easilyachievedin the field, minimizing equipment down time.
117

The Plastic Road
JeffryE.Moll,RE.,Senior Project Leader
San Dimas Technology &Development Center
Reky Hiramoto, EngineeringAssistantSan Dimas Technology &Development Center
ABSTRACT: The Plastic Road was designed for short-term access of vehicles and equipment over environmentally sensitivesites or soils with low bearing capacity.The system is lightweight, portable, inexpensive, easily constructed of readily availablematerials, and temporary. Material lists and tools, plus step-by-step instructions are included in this report The road was testedontheOsceola Ranger District in Florida.
Keywords: environment; low bearing capacity soils; plastic road; geotextile; portable crossing
INTRODUCTION
Many forest activities require short-term access forvehiclesand equipment over sensitive sites or soilswith low bearing capacity. Likewise, many projects inthe forest benefit from work schedule extensions orseasonal adjustments that allow increased sensitivity towildlife. Temporary access overenvironmentally sensitive sites is facilitated by effective crossing systemsthat are economical as well as easily installed, movedwithin project, andremoved. The plastic road is onesuch system (Figure 1).
This system is lightweight, portable, reusable, inexpensive, andeasily constructed of readily available materials. The plastic road was conceived with use on temporary roads in mind.
This report describes site conditions and operationalrequirements under which the plastic road may be usedforshort-term access into the forest. System limitationsarediscussed, as areareas for improvement. Using,moving, disassembling, and transporting are alsodescribed. Materials and tools required to fabricatethe plastic road are listed, andstep-by-step instructionsforassembly and installation of thesystem are included.
THE PLASTIC ROAD FOR SHORT-TERMACCESS
The plastic road spreads wheel loads over an increasedsubgrade area, reducingruttingand disturbance to soilsand vegetation (Figure2). This helps reduce waterconcentrations, channeling, erosion, and the potential for
damage to fish and wildlife habitat. Ageotextile under-layment (Figure 3) to the plastic road further increasesenvironmental sensitivity byseparating the crossingfrom soiland allows water to filter through. Geotextilehelps spread load, may increase soil bearing capacity,and facilitates removal of thecrossing after use.Removal is quick andeasy compared to thatof conventional techniques for crossing softspotsandcan aid inclosureand obliteration of the temporary road.
The plastic road is lightweight, portable, reusable, andinexpensive when amortized over system life. Itslengthis tailored to site conditions in 10foot (3 meter) increments. Plastic road panels and required accessories for40 linear feet (12 linear meters) ofcrossing may betransported ina 3/4ton pickup and assembled ona typical site bya two-person crew (Figure 4) inapproximately 1 hour. Thislength of plastic road may bemoved from siteto sitebychaining-to andtowing witha pickup truck or logging equipment. Worn or brokenPVC pipe members are easily replaced, facilitatingmaintenance and reuseof the system. Materials costincluding geotextile andtransition mats (Figure 1) forthis length of plastic road is approximately $2000.Adding labor to fabricate increases the cost toapproximately $2500. Materials are readily available throughmajor hardware distributors.
Transition Mats
Transition mats composed of successively larger pipe(2-inch to 3-inch upto the4-inch standard panel pipesize) easethe transition of tires from the approach ontothe plastic road. Making the first 2-inch pipein the mat
118

to support wheel loads of Schedule 80 increases matdurability. The transition mats increase environmentalsensitivity by eliminating the need for ramping up tothe plastic road with soil, which usually has tobeborrowed from somewhere (Figure5). Transition mats alsoreduce the forces applied to the plastic roadas tiresrollonto it. Longitudinal forces tend todisplace the plasticroad in the direction the vehicle is moving, discouraging it from gaining a set in the soil.Absence of this setcan lead tosoil kneading and increased rutting as theplastic road creeps and point loads from individual pipevary in location onthe soil. Forces abruptly applied bytires to the4-inch pipe as in useof theplastic roadwithout ramping ortransition mats can result inpipeshattering, especially in very coldenvironments.
Use of The Plastic Road
Vehicles negotiating the plastic roadshould travel at aconstant 5 mph (8 kph); sudden acceleration or deceleration may cause loss of traction, especially if the plastic is wet The system has successfully supported 18-wheel on-highway (80,000lbs GVW, or36,400 kg)log trucks (and other forest traffic and logging equipment) on straight alignments withgrades up to 4%withno cross-slope.Steeper grades or the existenceofcross-slope or horizontal curvature mayalsoresultinlossof traction. Traction loss mayoccurbetween tiresand the PVC,or slippagemay occur between the PVCand the soilor geotextile, causing it to work outof thesoil ramp if so installed (Figure6). In these lattercasesa wave may form in the crossingsystem which canlead to failure if the system folds over on itself.
Experimentation with tractive surfaces applied to thePVCpipewasconducted in an attempt to reduce thepotential for traction problems. Epoxy andsandwastried, as wasattaching sheetgrating with machine-screws to individual pipeand to a series of pipes. Theepoxy/sand application did notexhibit required durability, as the sand grains rolled out or were sheared out ofthe epoxy when subjected to wheel loads. Attachinggrating was labor- and time-intensive and did notappear to greatly increase traction; the coefficient offriction between rubber andsteel is low, causing areliance on interlock between tire tread andgratingopenings for any traction increase. Successfullyincreasing tractionbetweentires and plasticwithoutanchoring the plastic road may result in displacementof thesystem or in a wavebuildup.
Plastic Road Field Tests
A PVC pipe mat used and removed at scores of sites onthe Osceola Ranger District in Florida remains service
able afterseveral hundred log truck passes and otherheavy and light vehicle traffic. Aprototype plastic roadinstallation tested by San Dimas Technology andDevelopment Centerhas supported over 400 loaded18-wheel log truck passes at two sites. Testing includedseveral relatively high-speed passes (in excess of 10mph, or 16km/h), thenegotiation of several passeswith driver and trailer tires only partially on the plasticroad,and hard braking. Several passes weremade with
. the plastic road located ona dry, hard, rocky subgrade,which resulted inpoint-loading and breakage of several4-inch pipe.
Areas for Improvement
Areas forimprovement and further testing includeanchoring systems, alternative transition mats,alternative materials to resist pipe breakage (use of Schedule80 PVC orABS, for example), use on grades steeperthan 4% oroncross slope, further investigation intotractive surfaces, and use on curves.
Use oncurves may require anchoring, tractive surfaces,and a wider plastic road tocompensate for off-trackingand curve widening. Adesign conforming panels tocurvatureand specific configurations for inside andoutside panels mayalsobe required.
Use ofthe plastic road toprovide access across gulliesor drainages merits experimentation. Loose or bundledpipe placed in the low spots might possibly provide thesmooth subgrade required forsubsequent installation ofthe plastic road. Investigation into useon skid trails aswell as long term use is also warranted.
MOVING AND DISASSEMBLY
Up to40 linear feet (12 linear meters) of plastic roadcan bemoved from site tositebyattaching a chain tothe transition matcable loops (Figure 1)or around thepanel spacer. Washers anddouble clipsare installed onthe loops to provide strength expressly for this purpose.Apickup truck or logging equipment may be usedtodrag the plastic road to the new site. Care should betaken in tugging theplastic road outof its set,especially if it is deeply sunk into the soil and/or if soil hasmigrated into the pipe ends. Well-set plastic roadinstallations may require disassembly prior to movingto prevent damage or breakage. The distance and surface overwhich the plastic roadis dragged should alsobeevaluated to avoid excessive wearor breakage.
Disassemblyof the plastic road after use or for transportto another site is easily accomplished by pulling
119
quick pins in the panel connectors. This reduces theassembly into its component parts: panels, panel connectors, and transition mats.Forty linear feet (12 linearmeters) of plasticroad components fit into a 3/4 tonpickup truck or on a flatbed. Thegeotextile material isremoved unless a biodegradable type was usedallowing it to remain in place. Shaping of the sitemay berequired if the set resulted in depressions which mightlead to channelingor concentration of water.
CONCLUSIONS
The plastic road is available to aid short term accessforvehicles andequipment into forest. This system islightweight, portable, reusable, inexpensive, andconstructed of readily available materials. The plastic roadreduces rutdepth and hasprovided satisfactory serviceoversensitive sitesand soilsof lowbearing capacity onrelatively flat road grades free of crossslope and horizontalcurvature. Testing usage outside theseconstraints and further development effort tooptimize performance is warranted.
MATERIALS AND TOOLS REQUIREDFOR THE PLASTIC ROAD
Plastic road fabrication requires thefollowing parts(Figure 7):
4-inch PVC Schedule 40, four foot lengths3-inch PVC Schedule 40, four and three foot
lengths2-inch PVC Schedule 40, four foot lengths1-inch PVC Schedule 80,tenfoot lengths1-inch PVCSchedule 80,eight inch lengths3/8-inch diameterquick pins3/8-inchcable Cable clips for 3/8-inchcable3/8-inch washers
Nonwoven, needle-punched polypropylene or HDPEgeotextile materials of low(3ozVsq. yd,or 100 gm/sq.meter) to mediumweight (6 ozVsq. yd, or 200gm/sq. meter) have performed adequately, as havebiodegradable poly-jute materials. To fabricate theplastic road you will need the following tools:
Drill press13/32-inch drill bit
1 3/8-inch drill bit
Powersaw (abrasive, table, or radial arm)Hammer
Pry-bar to fit 13/32-inch holeSander
Use of geotextile is optional and dependent on the soiland site conditions.
FABRICATION OF THE PLASTIC ROAD
To produce parts A.B.C.D.E, and F, cut PVC stock intothespecified lengths anddrill appropriate hole sizesinto the pipe as specified in Table 1. Bevel ends ofparts E and F toenable easy installation into part A.
Assembly of Panels(2 eachrequired per 10 LF of plastic road)
Materials needed foreach panel:27 A
2E
4 Quick PinsSreps:1. Lay 2 Esparallel toeach other, approximately 42"apart.
2. Slip-fit anAonto the two Es, seefigure 8(a).3. Repeat step 2 until 27 As are on the 2 Es,
see figure 8(b).4. Arrange the As oneach end such that the E pro
trudes only halfway through as shownin figure 8(c).
5. Insert quick pins in the holes in the ends ofeach E as shown in figure 8(c). Thisrequiressticking your hand into each end A. and results inan open holeto accept the F partof panel connector(Figure 9). The Es have extra holes at 108-incheson center for prying, if required.
6. Repeat steps 1 through 5 for theotherpanel.
Assemblyof Panel Connectors (2each required)
Materials neededfor each panelconnector2A
ID
4F
8 quick pins
Steps:1. Arrange theparts AandD sidebyside, A-D-A as
shown in figure 10(a).2. Slide the end of D into the end of an A.3. Line up the holes and slide an F into the holes to
secure the pipes in place.4. Quick pin the stubbies in place.5. Repeat steps 3 & 4 for theopposite endof D and
the remaining A.6. Repeat steps 1through 5 forthe other panel
connector.
120

Assemblyof Transition Mats (4 required)
Materials needed for each transition mat:1A*
5B
6C
2H
81
4J
Steps:1. Form a 4-inch loop in the end of the cable
andsecure with 2 cableclips.2. Slide a washer on the cable.
3. Insert the free end of the cable into the 13/32-inchholein theA from the inside (see figure 11(a) andpull tight.Repeat steps 1-3 for the other cable.Slidethe Bs onto the cables, see figure 11 (b).Slide the Cs ontothe cables**,see figure 11(b)Slide a washer on each of the two cables.Form loops in each cable end(removing slack in thecable in the process) andsecure with21, see figureU(c).
Repeat steps 1 through 8 for the other three mats.
Assembly of 10 LF of Plastic Road with TransitionMats
Materials needed:
2 panels2 panel connectors4 transition mats
Steps:1 Arrange thetwo panels atthe needed crossing loca
tion with agap of approximately 2 feet, see figure12(a).
2. Place the 2 panel connectors as shown in figure12(a). Remove thequick pins, allowing the stubbiesto fit intothecorresponding holes in the As in thepanel ends.
3. Quick pin the panel connectors in place. Thisrequires you to stick your handinto the lastA at theend of each panel.Watch out for snakes!!
4. Arrange the transition mats as shown in figure 12(a)and quick pin asdescribed above for the panels.
The length of plastic road can beeasily increased by 10foot increments. Required parts for each 10 footincrement are shown inTable 3.Two panels and 1panel connector are installed for each additional 10 LFincrement as described in the Section entitled"Assembly of 10 LF of Plastic Road with TransitionMats." Transition mats are installed at each end of theplastic road as described in the same Section.
Table J. Pads Specification*
Part Name Description O.D. Length Drilled
Hole Dia.
X-Xon
CenterA Panel Member 4" PVC Sch. 40 4.5" 48"(-) 1.375" 42"B Mat Member 3" PVC Sch. 40 3.5" 48"(-) 13/32" 32"C Mat Member 2" PVC Sch. 40 2.375" 48"(-) 13/32" 32"D Panel Spacer 3" PVC Sch. 40 3.5" 36" 1.375" 30"£ Stringer 1" PVC Sch. 80 1.315" 120" (-) 13/32" 108,117"F Stubbie 1" PVC Sch. 80 1.315" 8" 13/32" 5.5"G Quick Pin Steel Pins 3/8" 3" .. _
H Cable Cable 3/8" 5' .. »„
I Cable Clip Cable Clip •• _ _ „
J Washer Washer ~ -. _ _
K Geotextile Geotextile — _ _ H
(-) indicaltes true length will >eless than that tal julated due to saw bla le width los s
hole location:
The number of parts and stock items necessary for 10 LFofplastic road withtransition matsaredisplayed in table 2.
121
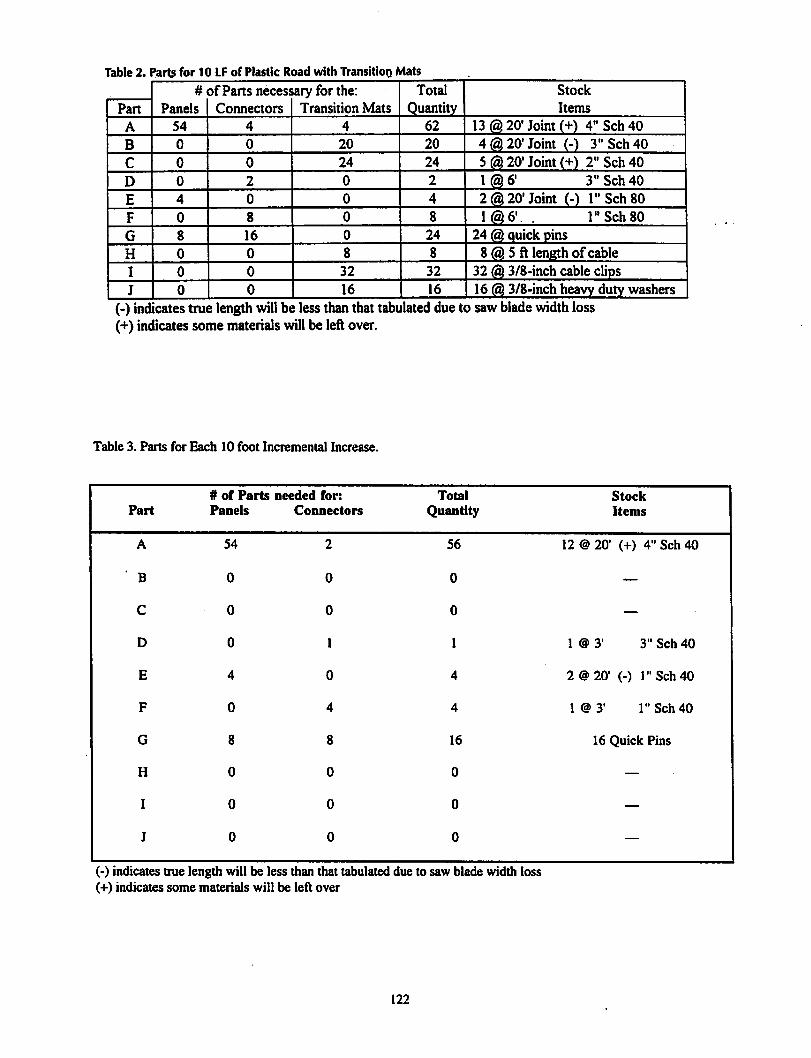
Table 2. Parts for 10 LFof Plastic Road with Transition Mats
# ofParts necessary for the: Total
QuantityStock
ItemsPart Panels Connectors Transition Mats
A 54 4 4 62 13® 20'Joint (+) 4" Sch 40
B 0 0 20 20 4 @ 20' Joint (-) 3" Sch 40
C 0 0 24 24 5 @ 20' Joint (+) 2" Sch 40
D 0 2 0 2 1 @ 61 3" Sch 40
E 4 0 0 4 2® 20' Joint (-) 1" Sch 80
F 0 8 0 8 I® 6' . 1" Sch 80
G 8 16 0 24 24 @ quick pins
H 0 0 8 8 8 @ 5 ft length ofcable
I 0 0 32 32 32 @ 3/8-inch cable clips
J 0 0 16 16 16 (5) 3/8-inch heavy duty washers
(-) indicates true length will be less thanthat tabulated due to saw blade width loss(+) indicates some materials will be left over.
Table 3. Parts for Each 10 foot Incremental Increase.
# of Parts needed for: Total StockPart Panels Connectors Quantity Items
A 54 2 56 12 @ 20' (+) 4" Sch 40
B 0 0 0 —
C 0 0 0 —
D 0 1 1 1 @ 3' 3" Sch 40
E 4 0 4 2@20" (-) 1" Sch 40
F 0 4 4 1@3' 1" Sch 40
G 8 8 16 16 Quick Pins
H 0 0 0 —
I 0 0 0 —
J 0 0 0 —
(-) indicates true length will be less than that tabulated due to saw blade width loss(+) indicates some materials will be left over
122
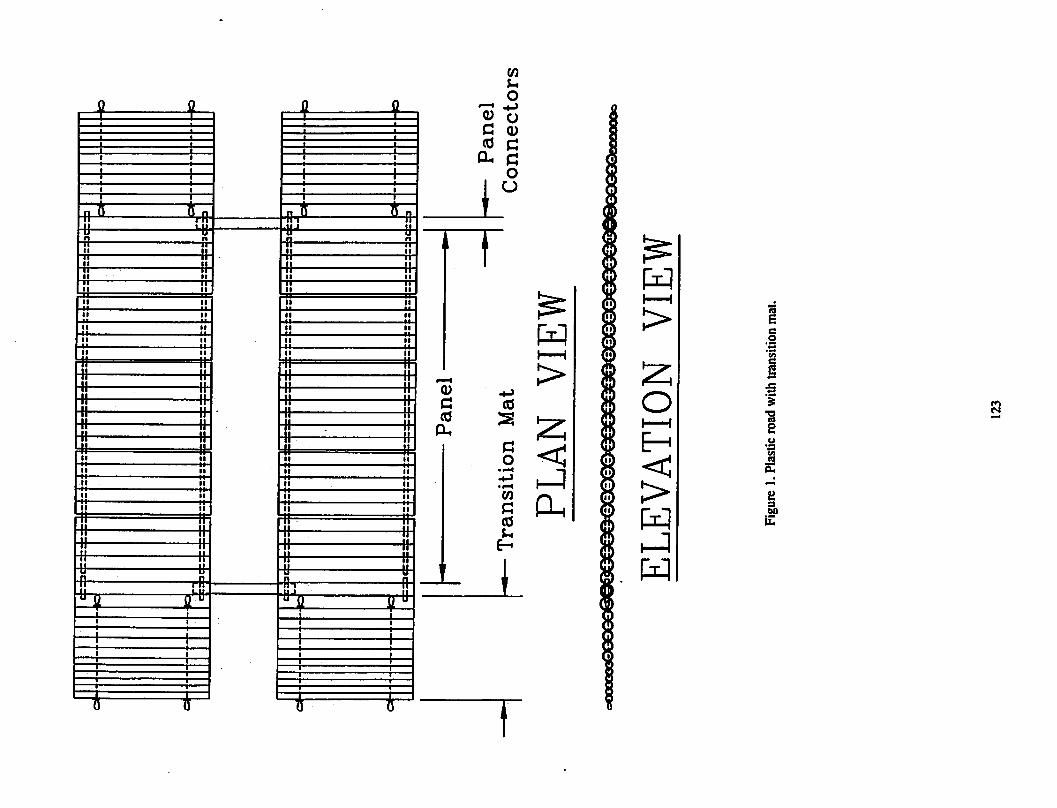
•IC Id
a-
—e |Q
..-
-.t.
.|fT
Pan
el
Tra
nsit
ion
Mat
PL
AN
VIE
W
~*
ca
--1
ac::
a
at::
a a a
•-o
•-o to
•-o
—P
an
el
Co
nn
ecto
rs
EL
EV
AT
ION
VIE
W
Figu
re1.
Plas
ticro
adw
ithtr
ansi
tion
mat
.
12
3
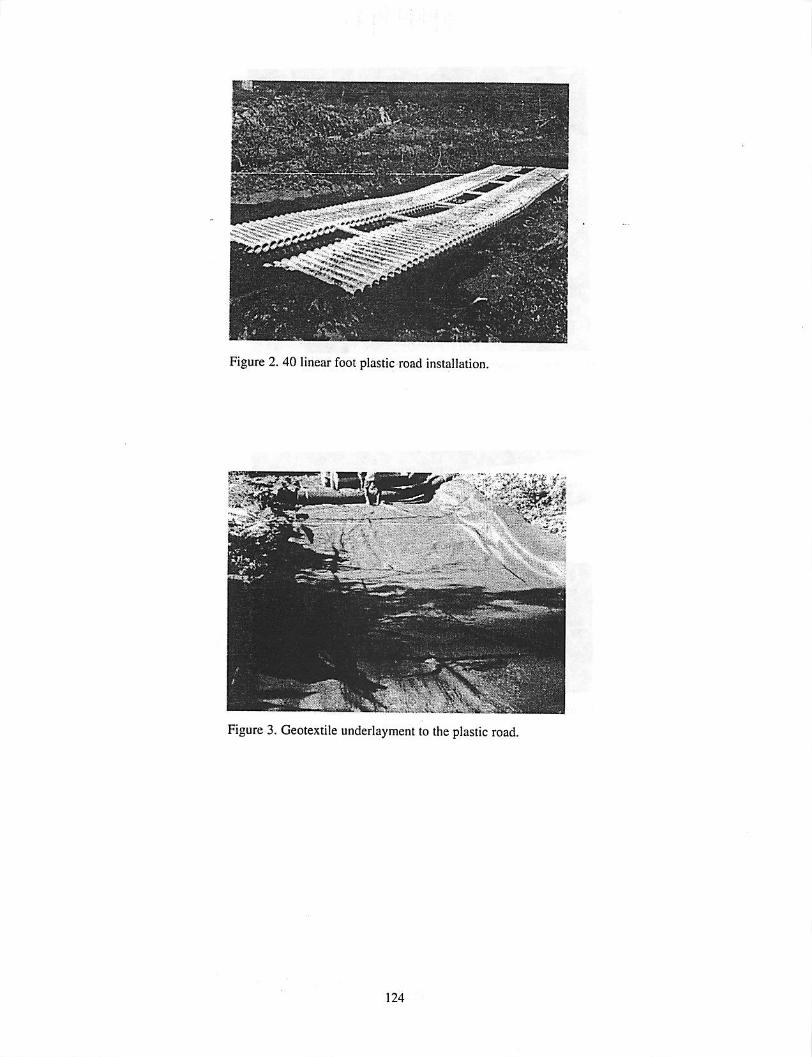
Figure 2. 40 linear foot plastic road installation.
Figure 3. Geotextile underlayment to the plastic road.
124
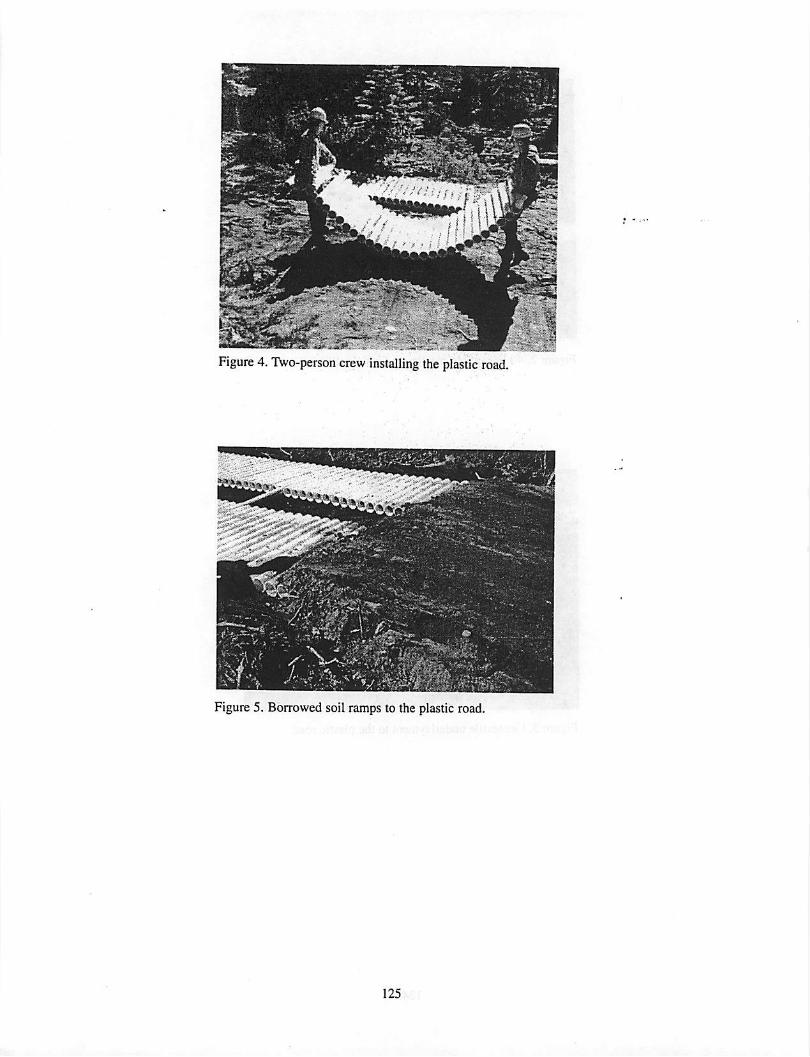
Figure 4. Two-person crew installing the plastic road.
Figure 5. Borrowedsoil ramps to the plastic road.
125
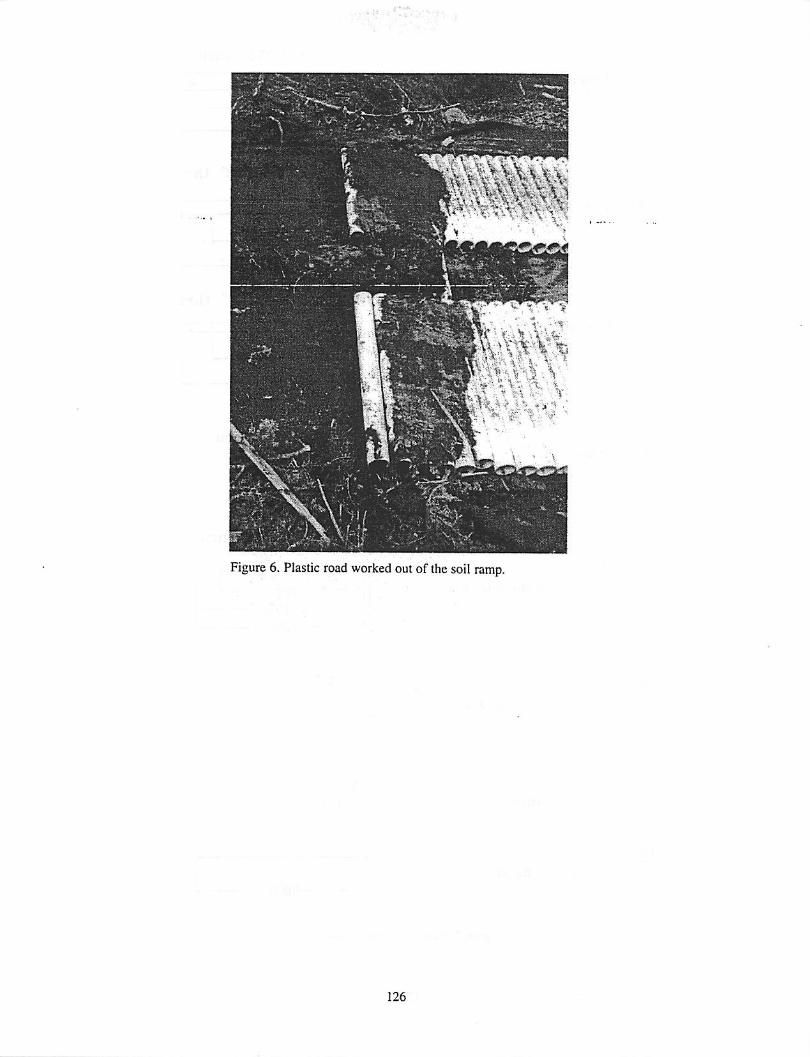
ri*vj ;- "'
v ~i
•V ti
-X, \ \ •v •w- * . t~v>S'i • *>
%J \ fe* *-r >-M» ', V 1,* • '. •: <•' V
Figure 6. Plastic road worked outof the soil ramp.
126
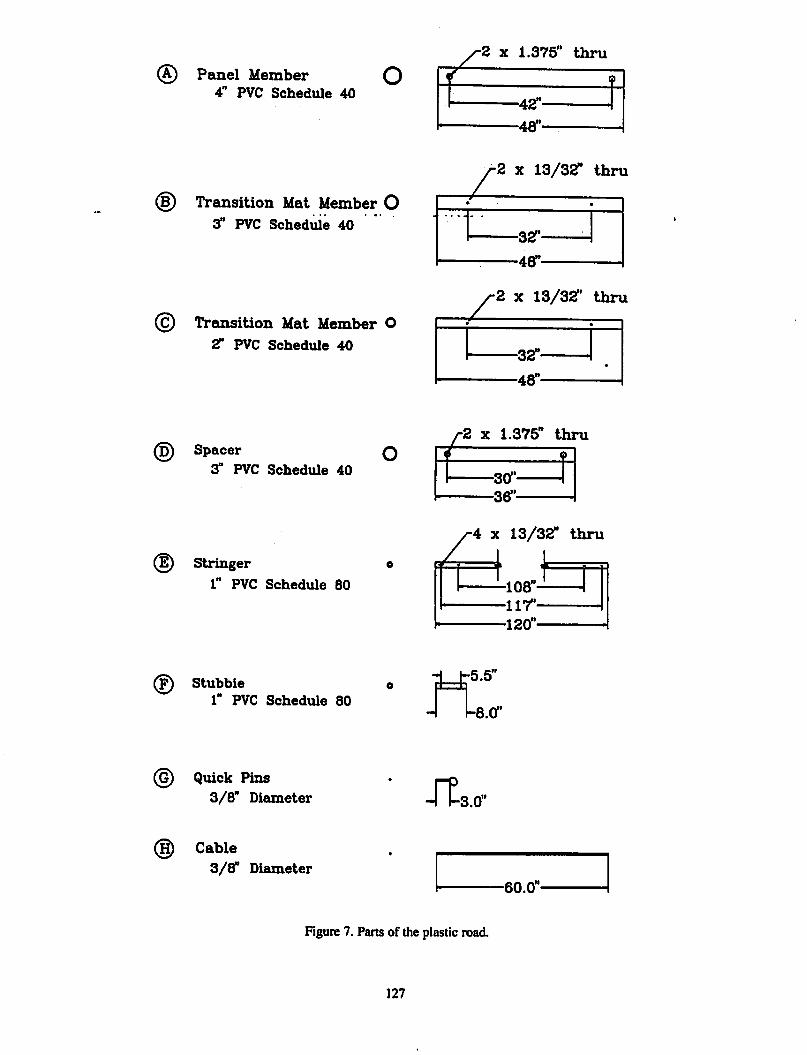
® Panel Member O4" PVC Schedule 40
(D Transition Mat Member O3" PVC Schedule 40 *
(§) Transition Mat Member O2" PVC Schedule 40
(jj) Spacer3" PVC Schedule 40
E) Stringer1" PVC Schedule 80
(F) Stubbie o1" PVC Schedule 80
G) Quick Pins3/8" Diameter
(g) Cable3/8" Diameter
2 x 1.375" thru£.
-42"-
-48"-
t
2 x 13/32" thru
2 x 13/32" thru
2 x 1.375" thru
/-30"-
-36"-
-4 x 13/32" thru
—108"-!——117"
—120"
-I L-8.0"
-I f-3.0"
-60.0"-
Figure 7. Parts of the plastic road.
127
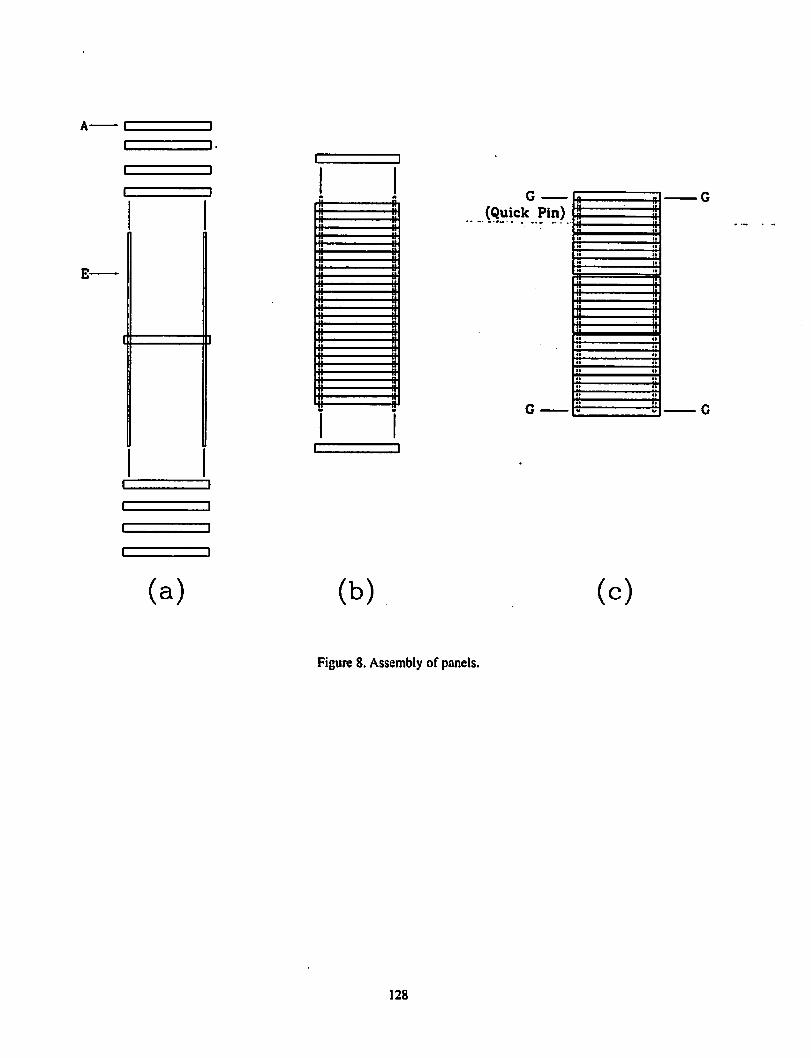
(Quick Pin)
(a) (b) (c)
Figure 8. Assembly of panels.
128
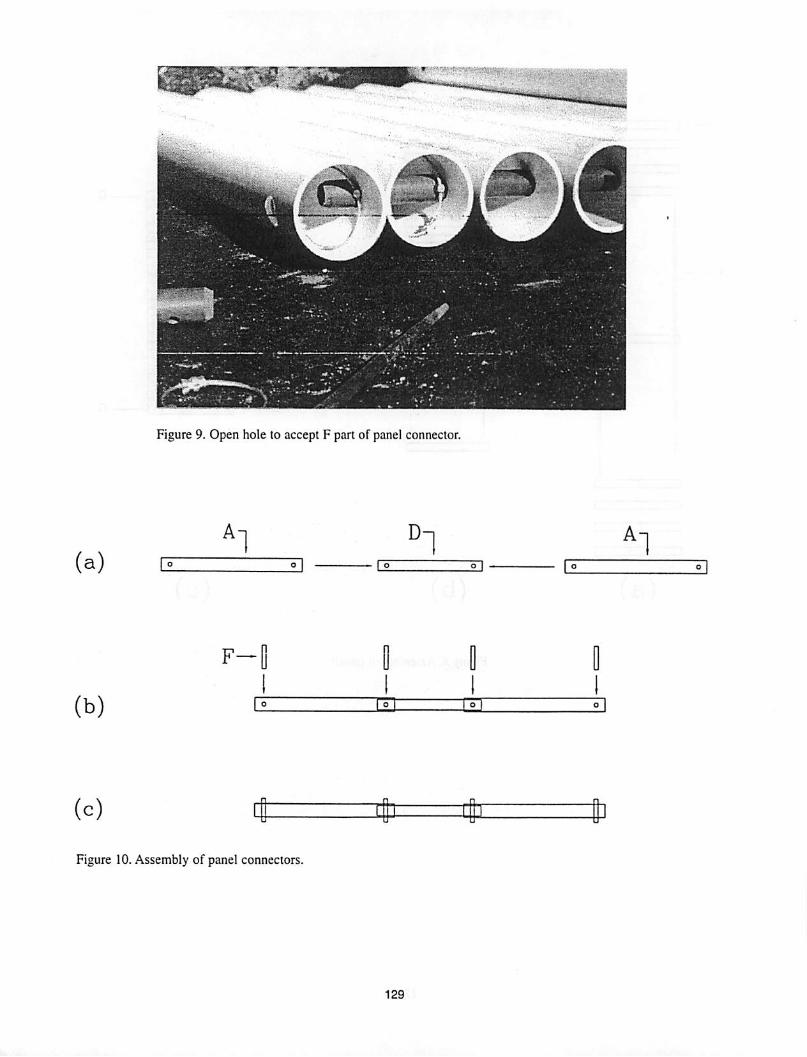
"•"
•
•
Figure 9. Open hole to accept F part of panel connector.
(a)
A1
D1 '1
F—
(b)
(c)
Figure 10.Assembly of panel connectors.
129
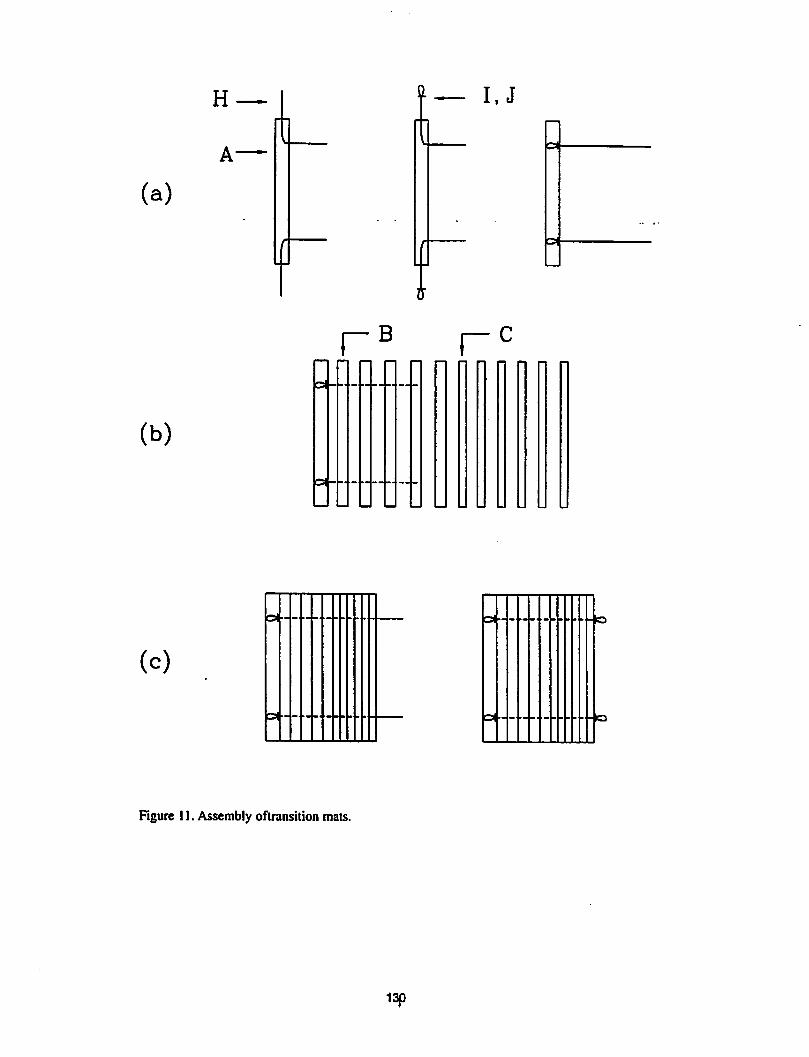
(a)
(b)
(c)
H —
A—
&•-
a-
T— I.J
rB r
&--
a--
Figure 11.Assembly oflransition mau.
130
•-to
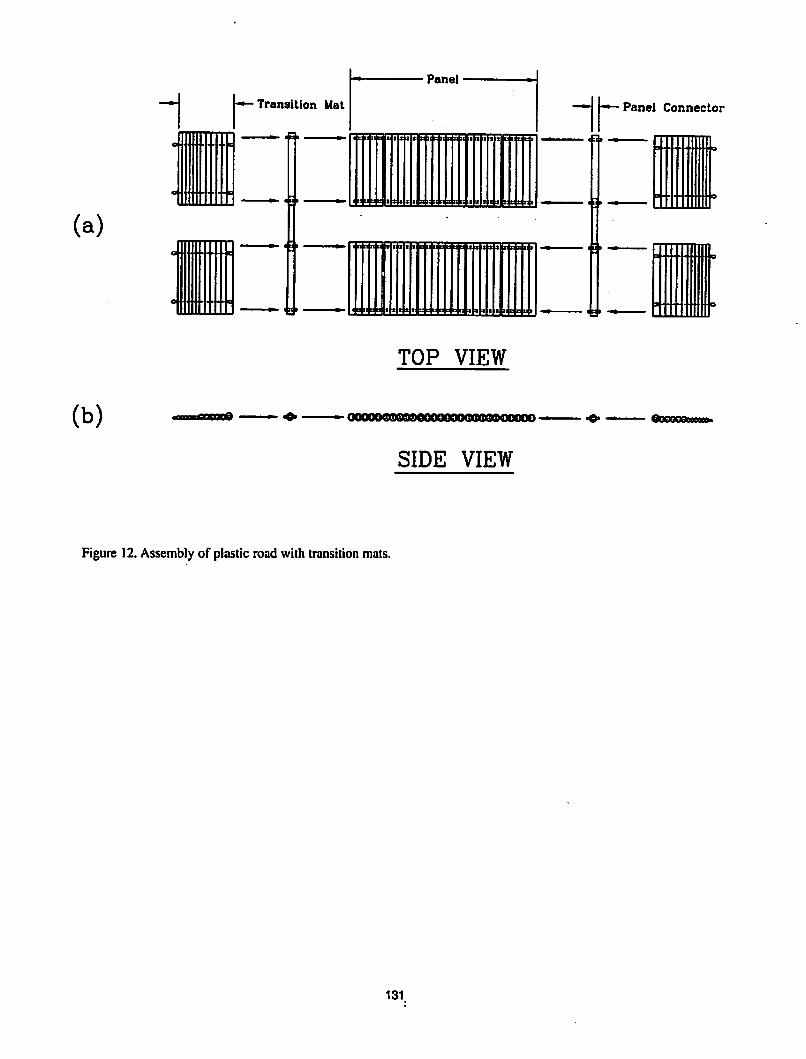
Panel
-—Transition Mat Panel Connector
* I! El t! tall I S t I tl II tl E! El I! U Itltl I!
(a)
tltt
TOP VIEW
(b) •minflOmoO • oooooeeo80oooooooQ0eeeooooo • VeUOUvUbboQeQe^
SIDE VIEW
Figure 12. Assembly of plastic road with transition mats.
131
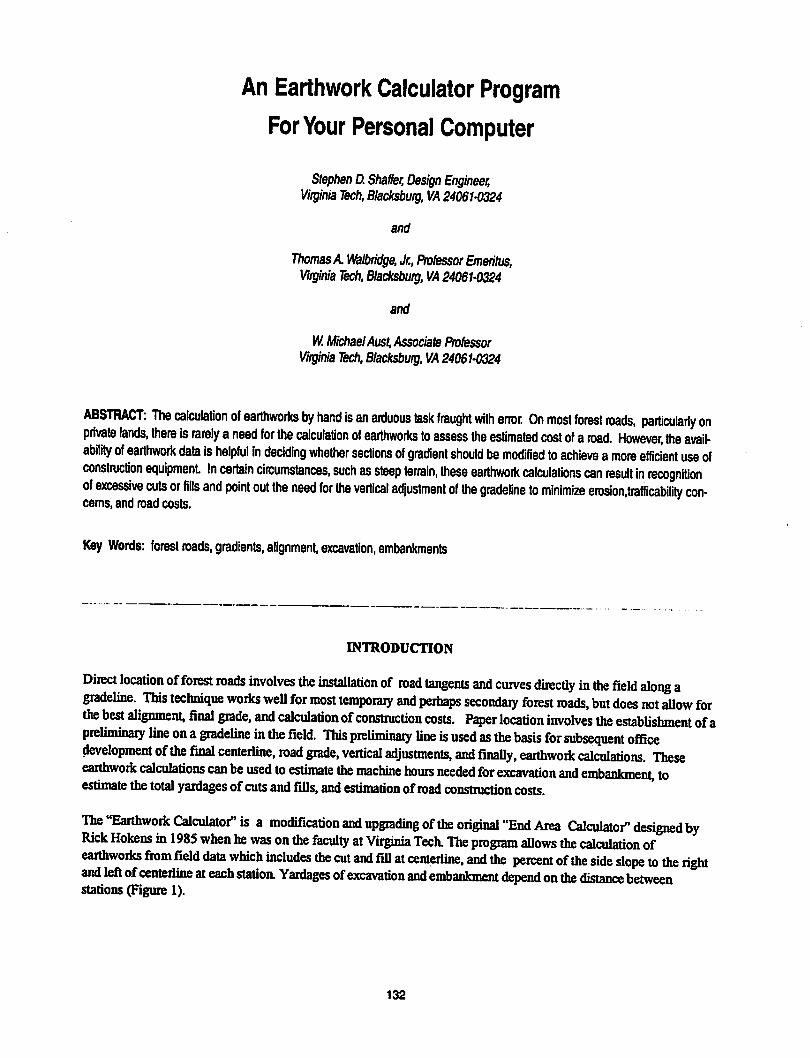
An Earthwork Calculator Program
For Your Personal Computer
Stephen D. Shaffer, Design Engineer,Virginia Tech, Blacksburg, VA 24061-0324
and
Thomas A Walbridge, Jr., Professor Emeritus,Virginia Tech, Blacksburg, VA 24061-0324
and
W. MichaelAust, Associate ProfessorVirginia Tech, Blacksburg, VA 24061-0324
ABSTRACT: The calculation of earthworks by hand is an arduous task fraught with error. On most forest roads, particularly onprivate lands, there is rarely aneed for the calculation of earthworks to assess the estimated cost of a road. However, the availability of earthwork data is helpful in deciding whether sections of gradient should be modified to achieve amore efficient use ofconstruction equipment. In certain circumstances, such as steep terrain, these earthwork calculations can result in recognitionof excessive cuts or fills and point out the need for the vertical adjustment of the gradeline to minimize erosion.trafficability concerns, and road costs.
Key Words: forest roads, gradients, alignment, excavation, embankments
INTRODUCTION
Direct location of forest roads involves the installation of road tangents and curves directly in the field along agradeline. This technique works well for most temporary and perhaps secondary forest roads, but does not allow fortie best alignment, final grade, and calculation ofconstruction costs. Paper location involves the establishment ofapreliminary line on agradeline in the field. This preuminary Une is used as the basis for subsequent officedevelopment ofthe final centerline, road grade, vertical adjustments, and finally, earthwork calculations. Theseearthwork calculations can be used to estimate the machine hours needed for excavation and embankment, toestimate the total yardages of cuts and fills, and estimation of road construction costs.
The "Earthwork Calculator" is a modification and upgrading ofthe original "End Area Calculator" designed byRick Hokens in 1985 when he was on the faculty at Virginia Tech The program allows the calculation ofearthworks from field data which includes the cut and fill at centerline, and the percent of the side slope to the rightand left ofcenterline at each station. Yardages ofexcavation and embankment depend on the distance betweenstations (Figure 1).
132
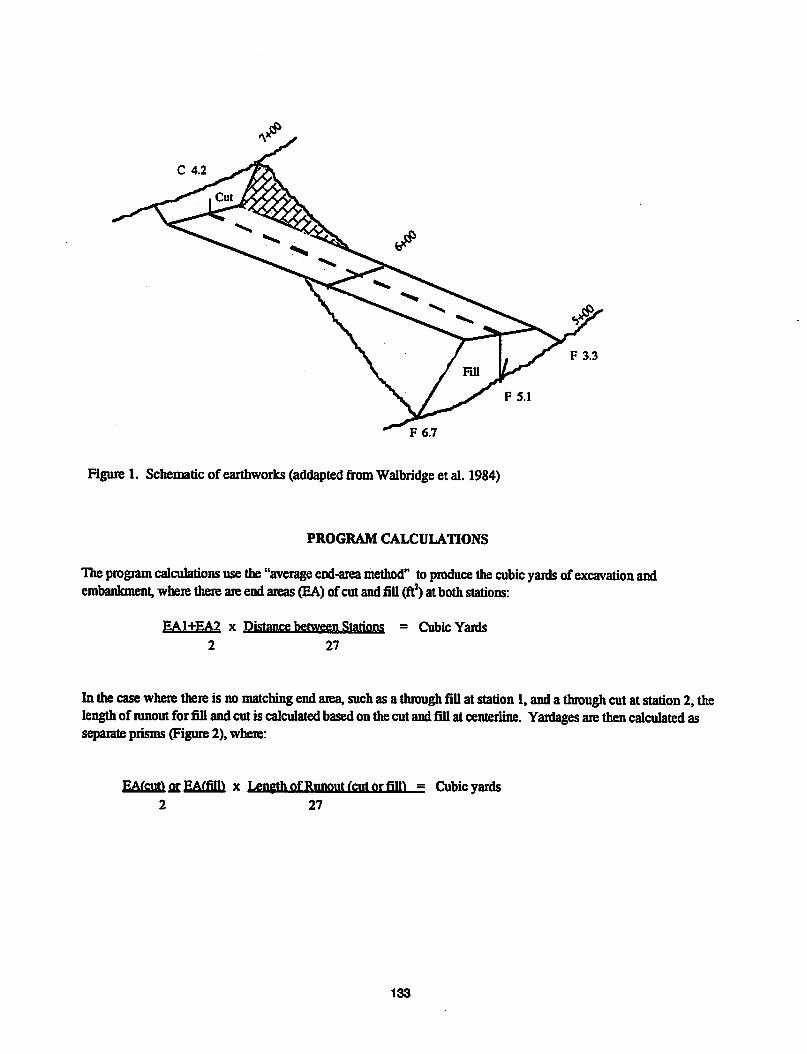
C 4.2
F6.7
Figure 1. Schematic of earthworks(addapted fromWalbridgeet al. 1984)
PROGRAM CALCULATIONS
The program calculations use the"average end-area method" to produce thecubic yards of excavation andembankment, where there are endareas (EA) ofcutand fill (ft2) atbothstations:
EA1+EA2 x Distance between Stations = Cubic Yards
2 27
Inthecase where there is nomatching endarea, such asathrough fill atstation 1, and a through cutatstation 2, thelength ofrunout for fillandcutis calculated based onthecutandfillatcenterline. Yardages are thencalculated asseparate prisms (Figure 2), where:
EAfcnftorEAffim x Length ofRunoutrentor fiin = Cubicyards2 27
133

t t t
For Cut Volume For Fill Volume For Cut Volume
(EAl+EA2)/2 xz/27 =yd3 (EAl+EA2)/2 x z/27 =yd3 (EACl+EAC2)/2 xz/27 =yd 3For Fill Volume
(EAF1+EAF2£) x z/27 = yd 3Through Cut to Through Fill to Sideslope toThrough Cut Through Fill Sideslope
Figure 2. Examples of earthwork calculations with matching end areas (adapted from Walbridge, 1991).
When the end area of stationone is a through cut or a through fill, andthe end area of station two is a sidehillsection with cutand fill, the length of runout iscalculated based onthe height atthe shoulder of the road (Figure 3).Yardages arethen calculated as separate pyramids, where:
EAftniftorEAffill) x Length ofRunout fait or filft = Cubic yards3 27
134
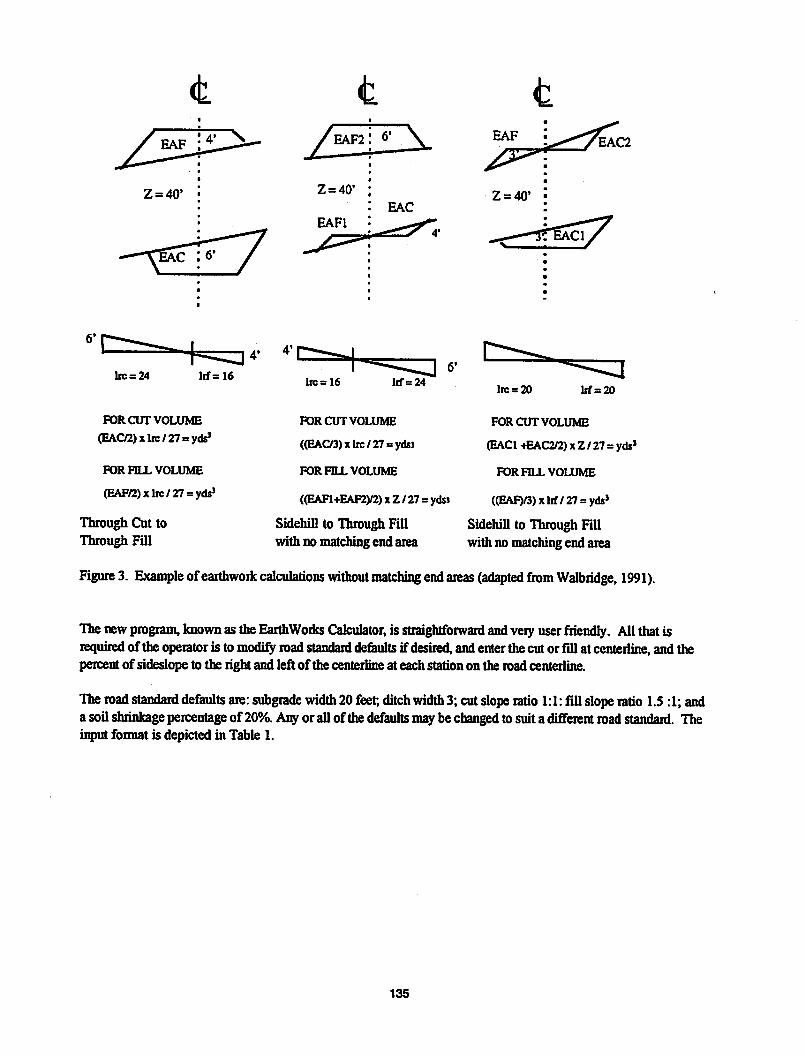
<t
Z = 40'
lrc = 24 lrf=16
POR CUT VOLUME
(EA02)x lrc/27:1yds3
FOR FILL VOLUME
(EAF/2)xlrc/27 =yds}
Through Cut toThrough Fill
£
lies 16 lrf=24
eac2
Z = 40'
lrc = 20 lrf=20
FOR CUT VOLUME
(EAC1 +EAC2/2) x Z / 27= yds'
FOR FILL VOLUME
((EAFV3)xlrf/27 = ydsJ
Sidehill to Through Fill
FOR CUT VOLUME
((EAC/3)xlrc/27 = yds3
FOR FILL VOLUME
((EAFl+EAF2)/2) x Z / 27 = ydsJ
SidehUl to Through Fillwith no matching end area with no matching end area
Figure 3. Example of earthwork calculations without matching end areas (adapted from Walbridge, 1991).
The newprogram, knownastheEarthworks Calculator, is straightforward and veryuser friendly. All thatisrequired ofthe operator is to modify road standaid defaults ifdesired, andenterthe cutor fillatcenterline, andthepercentof sideslope to the right and left ofthe centerlineat each stationon the roadcenterline.
Theroad standard defaults are: subgrade width 20 feet; ditch width 3; cutslope ratio 1:1: fill slope ratio 1.5 :1; anda soilshrinkage percentage of 20%. Any orallof thedefaults maybe changed to suitadifferent road standaid. Theinput format is depicted in Table 1.
135
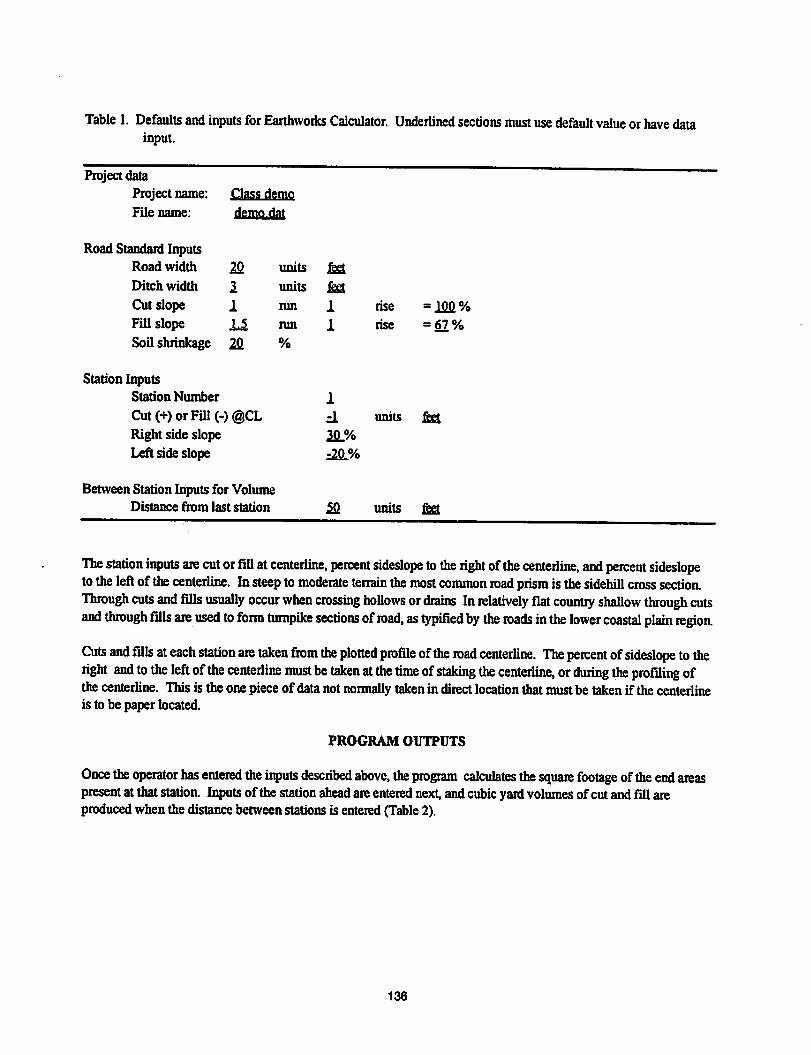
Table 1. Defaults and inputs forEarthworks Calculator. Underlined sections must use default value orhave datainput.
Project dataProject name: Class demo
File name: dejnojjal
Road Standaid InputsRoad width 20 units feet
Ditch width 1 units &SLCut slope 1 run 1 rise = JM%Fill slope 1A run 1 rise = 62%
Soil shrinkage 24 %
Station InputsStation Number 1
Cut(+)orFill(-)@CL J. units feet
Right side slope 3JL%Left side slope r2P_%
Between Station Inputs for VolumeDistance from last station SO. units fe£
The station inputs are cut orfill atcenterline, percent sideslope to the right ofthe centerline, and percent sideslopetotheleftof the centerline. In steep to moderate terrain the most common road prism is thesidehill cross section.Through cuts and fills usually occur when crossing hollows ordrains Inrelatively flat country shallow through cutsand through fills are used to form turnpike sections ofroad, as typified by the roads inthe lower coastal plain region.
Cuts and fills ateach station arc taken from the plotted profile ofthe road centerhne. The percent ofsideslope totheright and to the left ofthe centerline must be taken atthe time ofstaking the centerline, orduring the profiling ofthe centerhne. This is the one pieceof datanot nonnally takenin directlocation that mustbe takenif the centerlineis to be paper located.
PROGRAM OUTPUTS
Once the operator has entered the inputs described above, the program calculates the square footage ofthe end areaspresent at thatstation Inputs of the station ahead areentered next, andcubic yardvolumes ofcutandfill areproduced whenthe distancebetweenstationsis entered (Table 2).
136
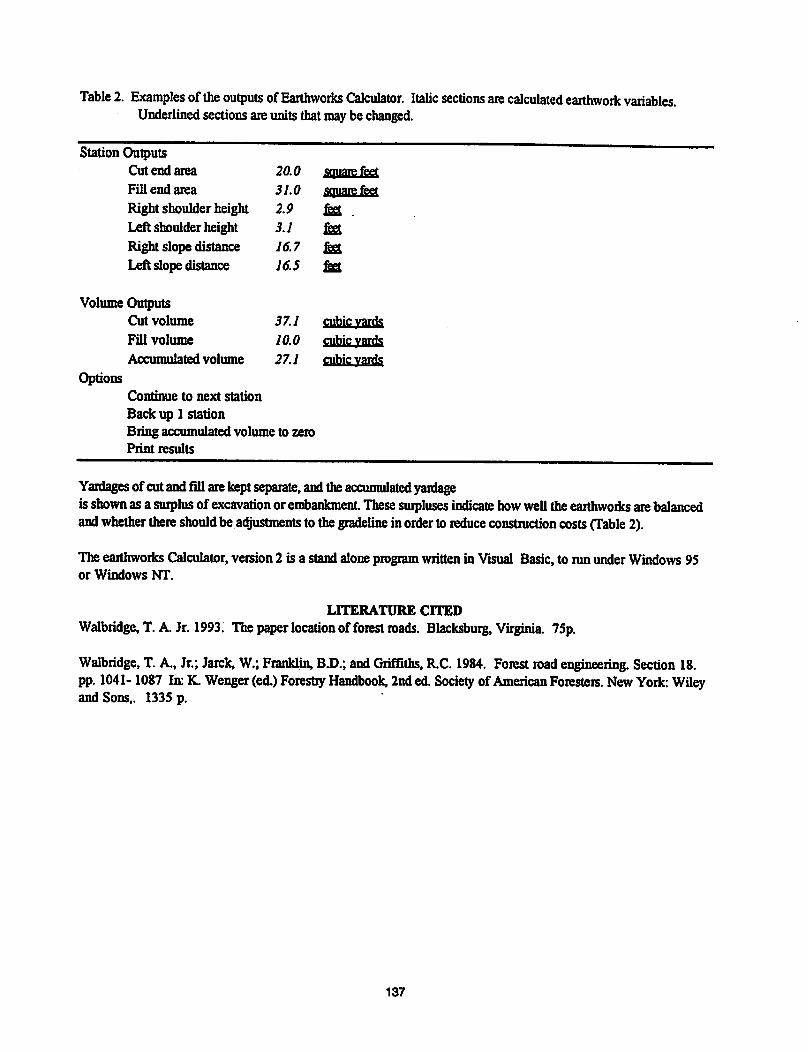
Table 2. Examples of theoutputs ofEarthworks Calculator. Italic sections arecalculated earthwork variables.Underlinedsectionsare units that maybe changed.
Station OutputsCut end area 20.0 square feet
Fill end area 31.0 sjuarejget
Right shoulder height 2.9 feet
Left shoulder height 3.1 feet
Right slope distance 16.7 feet
Left slope distance 16.5 feet
Volume OutputsCut volume 37.1 cubic vards
Fill volume 10.0 cubic vards
Accumulated volume 27.1 cubic vards
OptionsContinue to next station
Back up 1 stationBring accumulated volume to zeroi
Print results
Yardages ofcutandfill arekeptseparate, andtheaccumulated yardageis shown as a surplus of excavation or embankment. These surpluses indicate howwelltheearthworks arebalancedandwhether there should beadjustments tothegradeline inorder to reduce construction costs (Table 2).
The earthworks Calculator, version 2 is a standaloneprogram writtenin Visual Basic,to run under Windows 95or Windows NT.
LITERATURE CITED
Walbridge, T. A. Jr. 1993. Thepaperlocation of forest roads. Blacksburg, Virginia. 75p.
Walbridge, T. A., Jr.; Jarck, W.; Franklin, B.D.; andGriffiths, R.C. 1984. Forest roadengineering. Section 18.pp. 1041-1087 In: K. Wenger (ed.) Forestiy Handbook, 2nd ed. Society ofAmerican Foresters. New York: Wileyand Sons,. 1335 p.
137

Laser Surveying
JeffryE.MoH,P.E.Senior Project Leader
San Dimas Technology and Development Center
ABSTRACT: The Laser Technology, Inc., Criterion 400 laser instrument makes and downloads 3-dimensional survey measurements in afew seconds and is eye safe. Accuracy for slope distance measurements is plus-or-minus 0.1 meter; for verticalinclination, plus-or-minus 0.2 degree; and for azimuth, plus-or-minus 0.5 degree. Survey management software, called LASER-SOFT, compatible with PCs, laptops, pen computers, and many MS-DOS data recorders, is available from LTI. Standard traverse and cross section surveys are managed by LASERSOFT, as are repeating radial type surveys. Repeating radials are performed by surveying in abaseline traverse as in the standard, but allow side shots to be taken to any point of interest in anydirection. Turning points can be used on any string of side shots. LASERSOFT converts survey data into input files for LUMBERJACK, FLRDS, RDS-PC, HANS-ON. Eaglepoint, and AUTOCAD, and contains afile transfer utility.
KEY WORDS: surverying, laser, design, traverse, side shot
INTRODUCTION
LASERSOFT and the LaserTechnology, Inc. (LTI)Criterion 400 survey laser instrument constitute a virtual revolution in pre-design activities for many projectsrequiring field survey in the Forest Service. Theinstrument makes and downloads survey measurementsin a couple of seconds; LASERSOFT is MS-DOS compatible software thatprovides a user-friendly platformfor survey management and data conversion into formats required by several widely-used PC-based roadandsitedesign software systems. Thisarticle providesinformation specific to LASERSOFT V1.0 usage, inaddition to briefoverviews of laserinstrument capabilities and and plannedsurvey routines. "Reflectorassemblies" and rods usedduring a lasersurvey aredescribed, as are control and test surveys conducted todate. Step-by-step instructions fora simple survey areavailable from theSan Dimas Technology and Development Center, including "quickkey" helpmenus andoptions made possible by the LASERSOFT system.
LASERSOFT is an evolution of ROADSOFT, createdby LTI software engineersprimarilyfor low-volumeroad surveying anddataconversion for import intoLUMBERJACK and FLRDS roaddesign systems.Incorporation of a conversion for ASCII three-dimensional coordinate files followed, as did conversions forRDSPC and ROADCALC, capable of performinghigher-standard and geometricdesign. The 3-D information may be tailoredfor import not only to roaddesign systems, but terrain modeling, sitedesign, andCAD type software, making possible a hostof survey
applications useful in most resource areas of the ForestService. Indeed, the name was changed sospecialistsin all disciplines would realize thesystem is notrestricted to road-related or engineering surveys.LASERSOFT operates on several MS-DOS compatibledata recorders and the PC.
LASERSOFT is much more sophisticated than previous laser survey management systems discussed by thisauthor, although one—MC-TRAVERSE. which runs onthe Corvallis Microtechnology, Inc. MC-V datarecorder—has been refined by the Malheur NationalForest andis being used by Forests in Region 6.
THE LTI CRITERION 400
SURVEY LASER INSTRUMENT
The instrument uses an infrared semi-conductor laserdiode for slope distance (SD) measurement. A verticaltilt-sensing encoder provides vertical inclination (VI),while a fluxgate electronic compass measures magneticazimuth (AZ),completing the data required to establisha point's three-dimensional location inspace.
Manufacturer specifications givethe instrument a slopedistance measurement range of 1.5 to 9,150 meters (5to 30,000 feet) when sighted on a retrodirective prism,andfrom 1.5 to 450meters (5 to 1500 feet) when sighted on a "non-cooperative" target, such as a tree or theground. A common 7.5 centimeter (3 inch) diameterplastic automotive reflector—with hundreds of tinyprisms—carried by a rodperson, is used in conjunction
138

with a filter on the instrument to ensure measurementonly to the desired point. With filter and reflector, theinstrument will measure through heavy vegetation,reducing the amount of clearing required compared toexisting survey methods.
Accuracy specified by LTI for slope distance measurements is plus-or-minus 0.1 meter (0.3 foot); for verticalinclination, plus-or-minus0.2 degree (0.35 percentslope); and for azimuth, plus-or-minus 0.5 degree.Results of controlled tests performed by SDTDC showaverage error to be within these values.
Eye safety for the instrument meets FDA Class 1, (CFR21), which means no measurable eye damage resultsafter 3 hours of constant exposure to the laser beam.The laserbeam contains only 5% of the energy of theaverage TV remote control. See Figure 1 for the surveylaser field hardware configuration.
LASER
LASER
STAFF
BATTERY
Figure 1.Survey laserfield hardware configuration
SURVEYING ROUTINES
LASERSOFT duplicates standard traverse and crosssectioning and makes possible an economical, efficient"repealing radial." Standard methodology is potentiallyreplaced, as the repeating radial makes full use of lasersystem utility in providing quick datacollection to anypoint of interest. Gone are the instrument constraintsthat defined development of the standard method.
A traverse is simply a string of points—called Points-of-Intersection, or Pis—connected by survey measurements that establish each Pi's 3-D location. Cross sections are also strings of points, referred to as side shotsand associated with a particular PI. Thus, the traversemay be considered a base line, while side shots aremade from the base line to points of interest. The crosssection is generally made along the angle bisect in thetraverse, allowing the assumption of horizontal angle;the surveyor need make only distance and vertical control measurements to determine the 3-D location of aside shot. PI #1 in Figure 2 shows a standard crosssection, the horizontal angle in this case perpendicularto the traverse link between PI #1 and PI #2.
Radial side shots require collectionof 3-D information,as they may be made in any direction. PI #2 showssimple radial side shots, while radial side shots associated with PI#3 illustrate use of turning points. Theinstrument must be set up on the turning point for measurement to subsequent side shots, generally due to alack of sight distance to the side shot from the PI.
Multiple radial shots may be made from a turning pointsideshotas well as from a PI, and multiple side shot
O Point ol Intersection (PI)
• Sid* Shot
Figure 2. Plan view of traverse and side shots
139
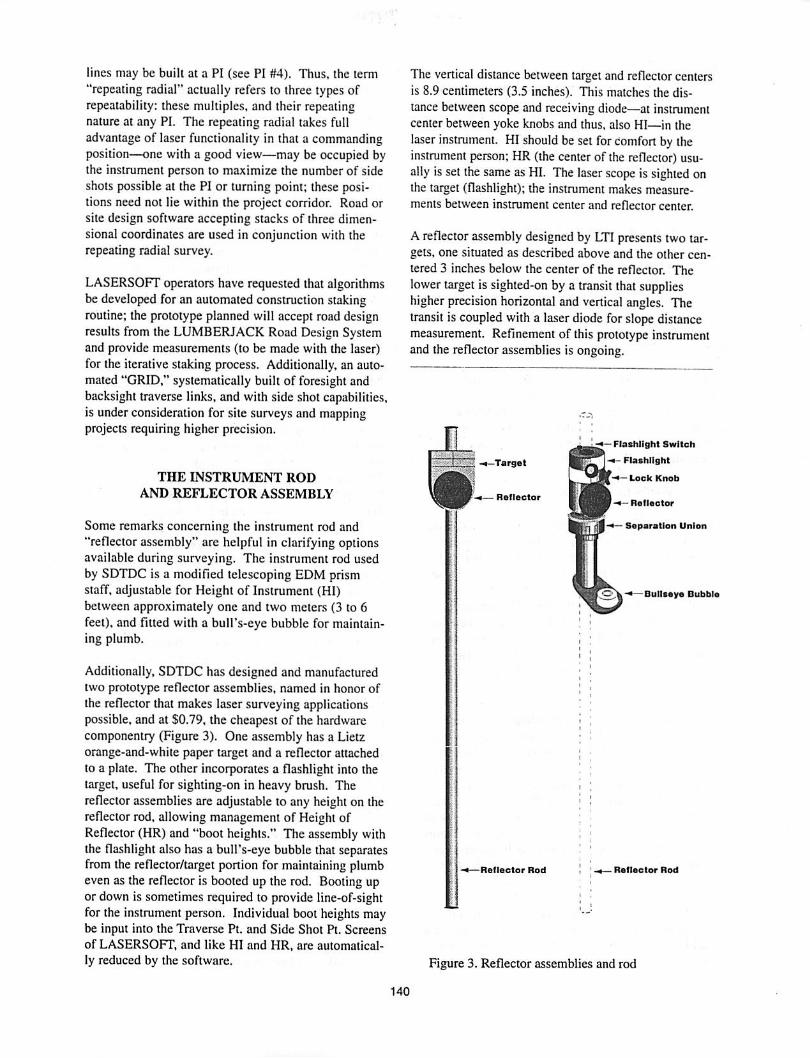
lines may be built at a PI (see PI #4). Thus, the term"repeating radial" actually refers to three types ofrepeatability: these multiples, and their repeatingnature at any PI. The repeating radial takes fulladvantage of laser functionality in that a commandingposition—one with a good view—may be occupied bythe instrument person to maximize the number of sideshots possible at the PI or turning point; these positions need not lie within the project corridor. Road orsite design software accepting stacks of three dimensional coordinates are used in conjunction with therepeating radial survey.
LASERSOFT operators have requested that algorithmsbe developed for an automated constructionstakingroutine; the prototypeplanned will accept road designresults from the LUMBERJACK Road Design Systemand provide measurements (to be made with the laser)for the iterative staking process. Additionally, an automated "GRID," systematically built of foresight andbacksight traverse links, and with side shot capabilities,is underconsideration for site surveys and mappingprojects requiring higher precision.
THE INSTRUMENT ROD
AND REFLECTOR ASSEMBLY
Some remarks concerning the instrument rod and"reflector assembly" are helpful in clarifying optionsavailable during surveying. The instrument rod usedby SDTDC is a modified telescoping EDM prismstaff, adjustable for Height of Instrument (HI)between approximately one and two meters (3 to 6feet), and fitted with a bull's-eye bubble for maintaining plumb.
Additionally, SDTDC has designed and manufacturedtwo prototype reflector assemblies, named in honor ofthe reflector that makes laser surveying applicationspossible, and at S0.79, the cheapest of the hardwarecomponentry (Figure 3). One assembly has a Lietzorange-and-white paper target and a reflector attachedto a plate. The other incorporates a flashlight into thetarget, useful for sighting-on in heavy brush. Thereflector assemblies are adjustable to any height on thereflector rod, allowing management of Height ofReflector (HR) and "boot heights." The assembly withthe flashlight also has a bull's-eye bubble that separatesfrom the reflector/target portion for maintaining plumbeven as the reflector is booted up the rod. Booting upor down is sometimes required to provide line-of-sightfor the instrument person. Individual boot heights maybe input into the Traverse Pt. and Side Shot Pt. Screensof LASERSOFT. and like HI and HR, are automatically reduced by the software.
The vertical distance between target and reflector centersis 8.9 centimeters (3.5 inches). This matches the distance between scope and receiving diode—at instrumentcenter between yoke knobs and thus, also HI—in thelaser instrument. HIshould be set for comfort by theinstrument person; HR (the centerof the reflector) usually isset thesame as HI. The laserscope is sighted onthe target (flashlight); the instrument makes measurements between instrument center and reflector center.
A reflector assembly designed by LTI presents two targets, one situated as described above and the other centered 3 inches below the center of the reflector. Thelower target is sighted-on by a transit that supplieshigher precision horizontal and vertical angles. Thetransit is coupled with a laser diode for slope distancemeasurement. Refinement of this prototype instrumentand the reflector assemblies is ongoing.
-•-Target
• Reflector
-Rolloctor Rod
- Flashlight Switch
«*- Flashlight
'-•—Lock Knob
-Rellector
Separation Union
OJV-«—Bullseye Bubble
- Rellector Rod
Figure 3. Reflector assemblies and rod
140

The horizontal distance(in inches)between the centerof the reflector rod and the reflector surface is referredto as Prism Offset, and should be measured andinput—along with HI and HR—into the Inst/TargHeight screen of LASERSOFT. These values remainin effect for all measurements until different values arekeyed in; only one setof values may be input for a particular traverse point and the associated side shots.
CONTROL AND TEST SURVEYS
Several control and test surveys havebeenconductedtodate. These include control surveys for investigationintoinstrument accuracy andprecision, andvarious testsurveys fortroubleshooting survey management software, investigating instrument utility, and predictingeconomic benefits.
Asnoted above, control surveys indicate average sensor error is within LTI system specifications. Instrument precision is described in terms of the 95% erroras follows: E95 for slope distance is 1.8centimeters(0.06 foot); for vertical inclination, 0.05 degree (0.08percent slope); andazimuth, 0.11 degree.
Test surveys thus far conducted include:
1) Duplication of a standard traverse and cross-sectionlow-volume road survey performed by a five-personcrew using a 100-foot clothtape, 75-foot retractablelogger's tapes, and hand clinometers and compasses.A two-person laser crew performed the same workonthe ground in 80% of the time. Neither surveyrequired clearing. Manually keypunching standarddata into the LUMBERJACK Road Design Systemrequired 83 minutes, while electronic laser datatransfer and related activities with LASERSOFTrequires between 5 and 15 minutes.
2)Afour-person laser crew performing low-volumeroadsurveysin brushy, mountainous terrainon theGunnison National Forest of Region 2 produced atthe rate of one station, 30.5 meters (100 feet) every2 minutes. The averagedistancebetween Pis was15 meters (50 feet). Thus, one PI stake was pounded perminute on the average. Approximately 3% ofshots required clearing. Data conversion and importinto LUMBERJACK took less than 10 minutes perroad. Average road length was 1200meters (4000feet).
3) The North Zone of the Black Hills NationalForest,also in Region 2, hosted a test survey consisting of a12PI traverse withcrosssections averaging 6 sideshots each. The survey was performed by the stan
dardmethod andduplicated first with an EDM forcontrol, and then with the laser instrument. Manydeviations from control by the standard are apparentwhen comparing traverse, profile, and cross sectionplots. Inspection reveals causes including low resolution of standard instruments, andhuman errorinreading standard instruments and in recording andkeypunching standard data. Comparisons of laser-derived versus EDM plots shows almost perfectoverlay: only a couple of cross section plots areoffby as much asthe width ofa plotted line. Heavyoak brush was manually pushed out ofthe way toprovide sight distance onapproximately 36shotsduring the standard and EDM surveys. Similarclearing was required ononly four shots during thelaser survey.
4) Road obliteration surveys on theSix Rivers NationalForest inRegion 5 were performed by a four-personlaser crew inwhich 4.5 meter (15 foot) deep by 30meter (100 foot) embankments over 76 centimeter(30 inch) CMP were tobe removed. Repeating radi-als were employed requiring an average of45minutes per site. An average of60shots—only a few ofwhich needed clearing—were made at each site.The data were electronically imported into DesignCad software forcontour map development.Templates can befabricated in field design to modelre-contouring, andearthwork quantities andconstruction staking notes can be generated after surveycompletion ona laptop computer at thesite. Thus,all field work supporting preconstruction activitiesmay be completed in a single trip.
5)A"GRID" prototype has been tested for higher precision survey requirements, with the points in thegridestablished by foresight/backsight traverselinks. This routine allows data averaging, and thusincreased accuracy; the duplication alsofeeds errortracking and correction algorithms. Results for a 20point grid indicate raw closure ranges of 1:500 to1:5000horizontally and between 1:50and 1:500vertically, depending on site conditions. This particulargrid was performed with the laseron a staff;tighter closures are possible when tripod-mountingthe instrument.
6) Numerous other surveys have been conducted bySDTDC totest LASERSOFT algorithm outputs forthe following options:
* Foresight/backsight averaging;* Reduction of turning points on side shots;* Reduction of bootheight and HIandHRinputs;* Reduction of side shot data to coordinates for
extra side shot lines at a PI.
141

Step-by-step instructions for asimple survey, including Additional information on the LTI Criterion 400 surveyquick key help menus and options made possible by laser and LASERSOFT program may be obtained fromLASERSOFT, are available by contacting J.Moll:w07a LTI at(303) 649-1000.or (909) 599-1267x246.
142
Surveying for National Forest Boundaries
in the
Rocky Mountain Region, USDA Forest Service
Carl W. Sumpter, Forest Land SurveyorMedicine Bow-Routt National Forest
2468 Jackson St.
Laramie, Wyoming 82070
Abstract: This paper discusses procedures for conducting an "Official U.S. Governmenf cadastral survey and the integration ofthe Global Positioning System (GPS) in delineating National Forest boundaries in the Rocky Mountain Region, USDA ForestService. GPS technology is rapidly becoming one of the most important "tools" surveyors have in their "tool box."
INTRODUCTION
In the Rocky Mountain Region there are over 44,000miles of property boundary lineand many more countless miles of rights-of-ways and other landsurveyswhich needto be surveyed. Property boundary linesmust be marked and posted to show the forest landmanager and the general public where National ForestSystem lands are located.
Historically, National ForestSystem landswereestablished by proclamation based on "aliquot parts" conforming to the U.S. Rectangular Survey System, akaPublicLand SurveySystem (PLSS),or by metesandbounds descriptions.
The process of delineating property boundary linesusually requires the lines to be resurveyed or retracedto establish the lines on the ground. The resurvey orretracement of these lines is done in two ways: 1) inaccordance with the rulesand procedures set forth bythe USDIBureauof Land Management (BLM) for thesurvey of public lands and, 2) by state licensed surveyors in accordance with individual state regulations, forthe resurvey or retracement of "reacquired lands" (private lands returned to federal ownership).The modern U.S. government cadastral surveyor mustfollow in the"footsteps of the original surveyor."
This is accomplished by the following ouUined (BLM1991) procedure:
The need for a survey is determined
An official land survey is required for land actionsinvolving U.S. Forest Service administered lands.
Surveys are sometimes necessary to insure proper management of certainResource Management actions.
These may include:Delineating areas of federal lands where, by law,
stipulations on use are limited.Preventing and detecting trespass/encroachmentsDefining lease or resource boundariesLand exchanges and small tracts act
A request for survey is issued
Request for surveys are usually submitted by ForestService land managers or privatecitizens.
Requests can also originate from other various sources:Congressional ordersCourt andexecutive orders
Special and Congressional actsCooperative surveys
Requests include the following information:Purpose and scope of the surveyDetailedspecial requirementsSource of funding and method of payment
The request is receivedand acted upon
The ForestLandSurveyorreceives the request, whichtriggers some internal actions, including:
Research of official public land recordsResearch of other federal Agencies (BLM), state and
local governments, and variousnongovernmentalsources
143
Evaluation of the information obtained to extractwhat is pertinent to thesurvey andusing that information to prepare a plan of survey.
This step initiates the gathering and evaluation of evidence portion of the survey which continues until thesurvey is completed.
Asurveyer is assigned to the project
Survey instructions are prepared and issued to the project surveyor. If BLM Special Instruc-tionsarerequired, thenthese are prepared by the BLM andissued to the Forest Service Land Surveyor. Theseinstructions are multi-functional and are essential documents.
Assignment of survey instructions include writtenauthorization for the surveyor toexecute and expendmoney to complete the survey.
Survey instructions include:Historical information relevant to the surveyProper authorization for thesurveyLimits and character of work forthe surveyMethod and order of procedure to be utilizedSupporting field data
Field notes
Plats
ReportsMaster title plat/status
Additional records research is doneand field work is started
Once assigned to the survey project, the surveyor willperform additional research for sources of documentary, testimonial, and physical evidence by:
Contacting private landowners forpermission tocross to private property
Interviewing local residentsContacting absentee and former landownersVisiting local county andprivate professional sur
veyors
Checking other common sources of information
Surveyevidence includesany information that tendstoproveor disprove the positionof a property cornerorline.
Tfhe field survey is started
The objectof the resurveyis two parts.Adequate protection of existing "BonaFide" rightsProper marking of the boundaries of theremaining
Forest Service lands.
Proper execution of a resurvey is to"follow in thefootsteps0 ofthe previous survey. Locating the footsteps is an art not easily mastered, and involves:
Knowledge and proficiencyInterpretation ofrecorded field notes and plats for
essential information
Gathering of evidence, corner searchDiplomatic interviewing skills
. -Keen observations of manmade physicalchanges which were intended for the purpose oflocation orpreserving the position ofthe propertyline.
Field work for the measurement ofangles and distances to determine cornerlocation may be accomplished by conventional traversing techniques (totalstation) and/or GPS.
Confident andlogical interpretation of facts anddataobtained assist in the determination orperpetuation ofthe property line.
Corner monumentation andthe property lineare marked and posted
The final step of the field work is corner monumentation and marking and posting of the property line,which is intended to :
Establish a permanent marking of the property linesFix comer positions to locate thesurveyed landsPerpetuate found or identified corners.
As an aid to permanence, monuments constructed ofdurable material (aluminum or brass capsand steelposts) are utilized.
Accessories to thecorner areestablished (bearing treesand reference monuments).
To perpetuate the property line, the line is blazed,cleared, marked with signs and/or red paint, with aluminum, steel, or carsonite posts with signs placed inter-visible along the line.
A geodeticGPS control survey is performed
The land (cadastral) surveyis connected to theNational Geodetic Control Network or the HighAccuracy Reference Network (HARN), allowing adirect relationship toother surveys, mapping programs,and Geographic Information Systems (GIS) or LandInformation Systems (LIS).
The data to be included in GIS/LIS consists of:
144

Coordinates ofevery public land survey system(PLSS) corner that has been established
Physical description of the monumentHistorical information
Other data pertinent to the cornerLand ownership and status
Ageodetic GPS control survey is normally done priorto the field work or at the same time to provide controlforconventional traversing techniques and forGPSpositioning.
GPS positioning fordetermining cornerlocations isnormally done bystatic, fast-static, kinematic (post-process or real-time) and is tied to the GPS control network.
Field notes,plats, and records are prepared
The ForestServicesurveyorcreates the official (BLM)survey record by transcribing field data into the officialsurvey record format This includes both field notesand the true line plat.
Fieldnotes represent the survey in text form containing thewritten record describing the survey(monuments found or set and related information),andalsothe reporting of direction and length oflines
True line platsorstate statue platsrepresents thesurvey in pictorial form, accurately depicting theboundaries surveyed indirection and length
State monument recordsdescribing monumentsfound or set along with accessories.
Notes and plats are revied
The field notes, plats and records are examined andreviewed byother experienced land surveyors toensurethe survey, plats, field notes, and records meet all legal,technical, and state requirements.
The official record contains a complete description ofwork performed and monuments established.
The review process provides:Assurance of accurate, official recordsDetailed documentation of the surveyA basis for decisions made to establish or reestab
lish boundary linesVerified measurements (plats versus field notes),
proportions and/or adjustments, acreageand closures
Thorough, accurate recordation of evidence found orrecovered
Assurance of proper methods and procedures utilized
Accurate transcription of field data bythe surveyorAthorough, independent check by an another expe
rienced landsurveyor
The survey is approved
The authority to approve land (cadastral) surveys hasbeen granted to the Forest Land Surveyor under statelicensing authority for surveys doneunderthe ForestService Surveyors State License. In some cases theauthority toapprove (to accept) land surveys isdone bythe Forest Supervisor or Forest Engineer.
If thesurvey wasdone under Special Instructionsissued bythe BLM to the Forest Service Surveyor,then the authority toapprove surveys has been delegated to the ChiefCadastral Surveyor forthe BLM at theState Office.
Plats and field notesare officially filed
Until theplat is filed in theofficial public records(county courthouse and/or BLM state office), the survey is not considered official or legal.
The United States Supreme Court in Cox vs Hart, Cal.1922.43 S.Ct. 154, stated:
The running of lines in the field and the layingout and platting of townships, sections andlegalsubdivisions, are not alone sufficient to constitutea survey, and until all conditions as to filing intheproper land office, andall requirements as toapproval have been complied with, the lands areto regarded as unsurveyed, andnotsubject to disposal as surveyed lands.
Once the survey has been accepted, the acceptance andfiling notice is advertised in the Federal Register and inthe local newspaper. This is onlytrueif this was aBLM special instruction survey, it does not apply tosurveys done under state license.
Oncefiled, the surveysbecome public record.
The survey becomes a permanentpublic land record
This completes theprocess forexecuting a land (cadastral) survey, in compliance with all federal and staterequirements, from receiving authorization, to executing a survey, to filing the field notes and plats.
145
A permanent recordnow exists servingas a basis forlegal descriptions, thereby establishing a directrelationship of ownership on the ground with ownership inthe records.
This continues a process that has been in existence forover 200 years and is considered the best in the world.
GPS SURVEYING
With terrain ranging from high mountains with heavytimber andrugged slopesto prairie grasslands, GPSsurveying technology is rapidly becoming thesurveyingmethod of choice for performing resurveys andretracements.
Although GPS does not perform in all situations, whencombined with conventional surveying techniques, significantcost and time savingscan be realized. It hasbeen proven to be a 25%-75% reduction in time andcosts when conducting field measurements and formarking and postingof property line.
GPS surveying technology is comprised of thefollowing techniques:
Static —
Observation times of 1 hour or longer dependingupon length of baseline (1000 km.+)
Positional accuracy is: 5 mm Hz, 1 cm Vert.Receiver type Trimble 4000 L1/L2 and LI
Used forestablishing primary control and secondarycontrol. Thepreferred technique when tree canopy ispresent requires increased observation times.
Fast Static —
Observation times of 5 to 20 minutes dependingupon length of baseline (<20 km).
Positional accuracy is: 1 cm Hz, 2 cm Vert.Receiver type Trimble 4000 L1/L2
Usedforestablishing secondary control and forcornercontrol.
Kinematic —
Post processed - observation times as little as 1 second
Real time - observation times same as post-processed
Positional accuracy is: 1 cm Hz, 2 cm Vert.Receiver type Trimble 4000 L1/L2, Radio transmit
ter and receiverfor Real-time correction required.
The following procedures are done usingone or moreof the GPS surveying techniques when performing acadastral survey.
A primary highaccuracy static control network isestablished outside of theproject area. This network istied to the High Accuracy Reference Network (HARN).
A secondary highaccuracy static control network isestablished within the projectarea. This controlnetwork is usedas reference to providedifferential corrections for all subsequent GPS survey. The resultingbaselines are usually shorter inlength, thus requiringshorter observation times. Specifically 'Township" corners are used and selected control stations are established for use with conventional surveying methodsand to provide a "verification" of the correct calculation whenusing state planecoordinates.
Onceall of the control is establishedGPS observationsaredone on"found" corners or "temporarymove/azimuth points." These are normally done byfast-static or kinematic techniques.
However, a thorough corner search and evidence evaluation must be done before GPS control is done. Thisis done by using (Y)code receivers (restricted use, federal agencies only). These receivers are not subject tothe effect ofselective availability, thus allowing navigation and positioning for corner search toa positionalaccuracy of <10 meters.
When all of the corners have been found and the cornerGPScontrol is done,anotherprocedure is followed.This includes data processing, data evaluation, networkadjustments, and coordinate/datum transformations.When the final GPS data iscorrect, it is then ready foruse indetermining corner locations by theproceduresspecified by theBLM for resurveys and retracementsof public lands.
During thisprocedure, evaluation of original records,subsequent resurveys, and thecurrent GPS survey areevaluated regarding bearingand distancemeasurementdifference and/or errors. At this time, selection ofcoordinate system and datum is critical.
The procedure theUSFS Rocky Mountain Region follows is to use state plane coordinates, NAD83 datumwith conversion to othercoordinate systems as a finalstep. Combined scale factor is determined and conver-gency is accounted for to bring the GPS data (coordinates) up to theground. This is necessary for performing the subsequent sub-division calculations and for thesmooth integration into conventional (total station) surveying techniques.
Afterall the necessary calculations have been performed, theresulting coordinates (Northing andEastings) are loaded into a total station data collector
146
with Tripod Data Systems software forpoint locationusingconventional techniques or into theTrimble datacollector (TDC-1) forpoint location using Real-timeKinematic (RTK) surveying techniques.
Fieldsurveymethods for GPS surveys include the normal "checks" for redundancy, measurement of calculated and measuredpositions for corners, and correct "initialization" for RTK surveys.
All GPSsurveysperformedby the USDAForestService are done in accordance with the current BLM"Standards forGPS surveys done under SpecialInstructions in Wyoming and Nebraska." Thesestandards require a maximum of 5 cm Network adjusted"point positional error" be achieved for all corner locations used for control and for corners to be set.
Once allof the comers areset, thecadastral survey follows the standard procedures as outlined in the beginning of this paper.
SUMMARY
The use of GPS surveying techniques is rapidly changing the way the U.S. governmentconducts "official"boundary surveys. GPS technology allows for largeland areas to be surveyed in a very costand time effective manner, and can be integrated with conventionalsurveying methods.
With all of the "new technology", the U.S. government surveyor must still walk in the original surveyor's footsteps, otherwise the best survey process inthe world will be lost.
It can only besaid of the modern U.S. government surveyor, "You drive the technology, do not let the technology drive you".
REFERENCE
Cadastral Survey. 1991. Bureau of Land Management.
147

Collecting and Using Site-Specific Vegetationand Terrain Data of Varying Accuracy for Use inLandscape Visualizations of Harvesting Options
Stephen E. ReutebuchScott D. BergenJames L Fridtey
Cooperative for Forest-Systems EngineeringUniversity ofWashington, Seattle, Washington
Abstract Although the visual impact of a harvesting operation is often of great concern to forest owners, it is difficult to assessvisual changes prior to completion of operations. In many situations, owners have several harvesting options that can be implemented that would result in very different visual effects. In this paper the authors present two case studies in which landscapevisualizations of alternatives were generated. The paper discusses varying accuracy levels for vegetation and terrain datarequired to develop credible images for visual impact assessments. The authors also present a photogrammetric method forcollecting thesedataina cost-effective manner.
Keywords: landscape visualization, harvesting, aerial photographs, photogrammetry
INTRODUCTION
Over the past 30 years, public interest in the visualimpact ofharvesting activities has steadily increased.Concurrently, landscape visualization technology hasincreased insophistication while becoming morewidelyavailable to harvest planners. In the 1970sand 1980svisual displays ofproposed harvest unitswere limited to: 1) abstract,perspective line-drawings with "stick-figure" details plotted ontogriddedterrain models(Nickerson 1979);2) planimetricmaps ofareas of inter-visibility(Travis et al. 1975);or 3) artistically altered imagesof landscape photo-graphs (Zube et al. 1987). McGaughey (1997) providesan overview of various landscape- and stand-levelvisualization techniquesin these proceedings.
In the 1990sseveralpowerful landscape visualizationtechniques that rely on geometric models ofthelandscape have becomeavailableto produceshaded-reliefrenderings of terrainsurfaces. Thesesystemsproduce more realistic images oftrees, shrubs, roads,and other landscape features. Bergen et al. (1996)describethe Vantage Point package; Orland (1997)describes the SmartForest system;and McGaugheyand Ager (1996) present the UTOOLS/UVIEW
package. Allof these systems utilize digital terrainmodels (DTM) anddetailed vegetation inventoryinformation toproduce highly detailed, perspective-view renderings of forested landscapes. In this paperwediscuss twocasestudies completed using theVantage Point system. However, the outlined datacollection methods can be used with most visualizationsystems that require digital terrain dataandvegetation measurements to simulate landscapeviews.
DATA REQUIREMENTS
The Vantage Point system requires thefollowingcategories ofdata: a digitalrepresentation oftheground surface, boundaries of different landscapefeatures, information describing vegetation distributionand size,boundaries ofproposedharvestunits,intensityofproposed harvest activities, and viewpoint locations.
Digital Ground Surface Data
The most common source ofthree-dimensional terrain data usedfor landscape visualization is thedigital elevation model (DEM) produced bytheUSDI Geological Survey (USGS). There are several
Presented atthe meeting of theCouncil On Forest Engineering, Rapid City, SD, July 28-July 31,1997.
148
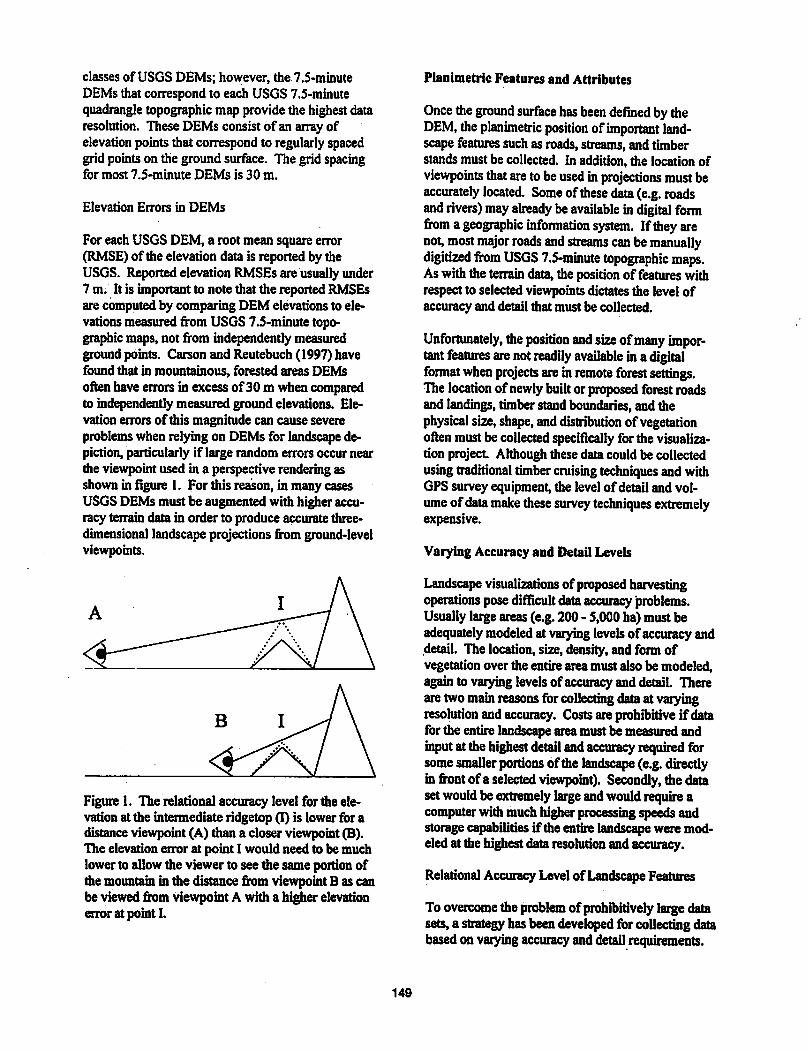
classes ofUSGS DEMs; however, the 7.5-minuteDEMs that correspond to each USGS 7.5-minutequadrangle topographic map provide the highest dataresolution. These DEMs consist ofan array ofelevation pointsthat correspond to regularly spacedgridpoints on the groundsurface. The gridspacingfor most 7.5-minute DEMs is 30 m.
Elevation Errors in DEMs
ForeachUSGS DEM, a root mean squareerror(RMSE) ofthe elevation data is reported by theUSGS. Reported elevation RMSEs areusuallyunder7 m. It is important to note that the reported RMSEsare computed by comparing DEM elevations to elevations measured from USGS 7.5-minute topographic maps, not from independently measuredground points. Carson and Reutebuch (1997) havefound that in mountainous, forested areas DEMsoftenhave errors in excess of30 m when comparedto independently measured ground elevations. Elevation errorsofthis magnitude can cause severeproblemswhen relying on DEMs for landscape depiction, particularly if large random errorsoccur nearthe viewpointused in a perspective rendering asshownin figure 1. Forthis reason, in many casesUSGS DEMs must be augmented with higheraccuracy terrain data in order to produce accuratethree-dimensional landscape projections from ground-levelviewpoints.
Figure 1. The relational accuracylevel forthe elevation at the intermediate ridgetop (I) is lower for adistanceviewpoint (A) than a closer viewpoint (B).The elevation errorat point I would need to be muchlowerto allowthe viewer to see the same portion ofthe mountain in the distance from viewpoint B as canbe viewed from viewpoint A with a higher elevationerrorat point I.
149
Planimetric Features and Attributes
Once theground surface has been defined by theDEM, the planimetric position of important landscapefeatures suchasroads, streams, andtimberstands must be collected. In addition, the location ofviewpoints that are tobeused in projections mustbeaccurately located. Some of these data (e.g. roadsand rivers) mayalready beavailable indigital formfrom ageographic information system. If theyarenot, most major roads and streams can bemanuallydigitized from USGS 7.5-minute topographic maps.As with the terrain data, the position of features withrespect to selected viewpointsdictates the level ofaccuracy and detail that must be collected.
Unfortunately, theposition and sizeof many important features are notreadily available inadigitalformat when projects are inremote forest settings.The location ofnewly builtor proposed forest roadsand landings, timberstandboundaries, andthephysical size,shape, anddistribution ofvegetationoften must becollected specifically forthe visualization project Althoughthesedata couldbe collectedusingtraditional timber cruising techniques andwithGPS survey equipment,the level ofdetailand volumeofdata makethese survey techniques extremelyexpensive.
Varying Accuracy and Detail Levels
Landscape visualizations ofproposed harvestingoperations pose difficult data accuracy problems.Usuallylarge areas (e.g. 200 - 5,000ha)must beadequately modeledat varyinglevelsofaccuracy anddetail. The location, size, density,and form ofvegetation over the entire areamust also be modeled,again to varyinglevelsofaccuracy anddetail. Thereare two mainreasons forcollecting data at varyingresolution andaccuracy. Costs are prohibitive ifdataforthe entirelandscape area must be measuredandinput atthehighest detail and accuracy required forsomesmaller portions ofthe landscape (e.g.directlyin front ofa selected viewpoint). Secondly, die datasetwouldbe extremely large andwouldrequire acomputerwith much higherprocessing speedsandstorage capabilities if the entirelandscape were modeled at the highestdata resolution andaccuracy.
Relational AccuracyLevel ofLandscape Features
To overcome the problem ofprohibitively large datasets,a strategy hasbeen developed for collectingdatabasedon varyingaccuracy anddetail requirements.
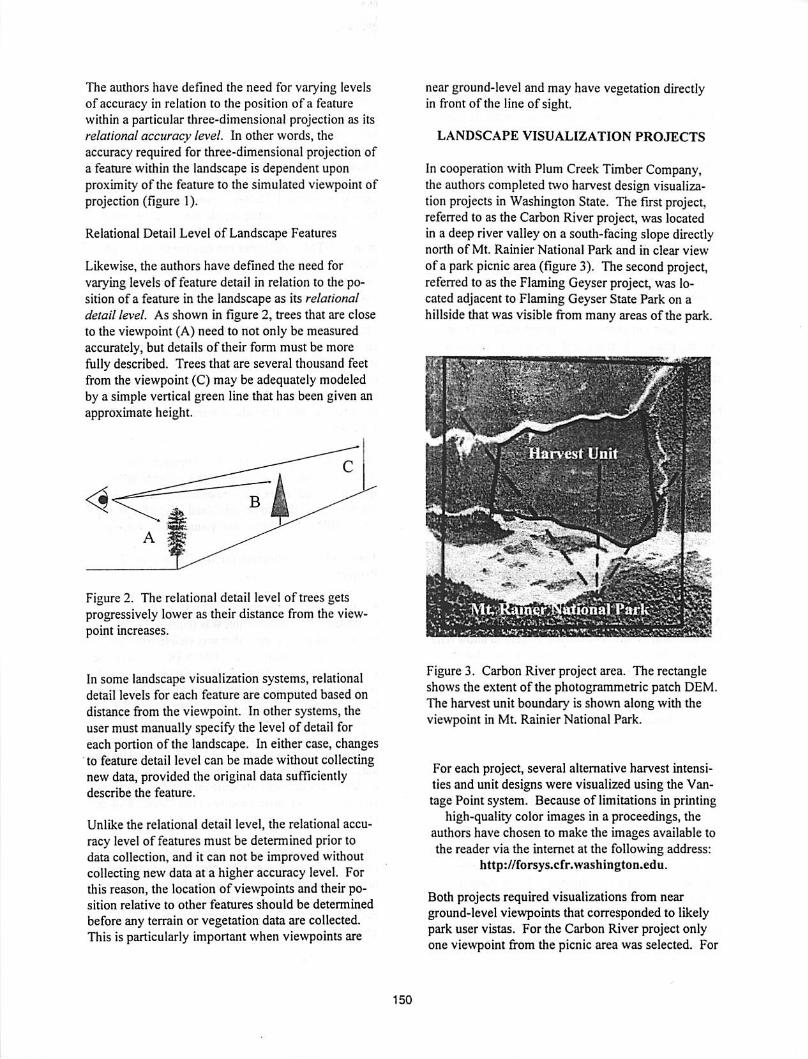
The authors have defined the need for varying levelsof accuracy in relation to the position of a featurewithin a particular three-dimensional projection as itsrelational accuracy level. In other words, theaccuracy required for three-dimensional projection ofa feature within the landscape is dependent uponproximity of the feature to the simulated viewpoint ofprojection (figure 1).
Relational Detail Level of Landscape Features
Likewise, the authors have defined the need for
varying levels of feature detail in relation to the position of a feature in the landscape as its relationaldetail level. As shown in figure 2, trees that are closeto the viewpoint (A) need to not only be measuredaccurately, but details of their form must be morefully described. Trees that are several thousand feetfrom the viewpoint (C) may be adequately modeledby a simple vertical green line that has been given anapproximate height.
Figure 2. The relational detail level of trees getsprogressively lower as their distance from the viewpoint increases.
In some landscape visualization systems, relationaldetail levels for each feature are computed based ondistance from the viewpoint. In other systems, theusermust manually specify the level of detail foreach portion of the landscape. In either case, changesto feature detail level can be made without collectingnew data, provided the original data sufficientlydescribe the feature.
Unlike the relational detail level, the relational accuracy level of features must be determined prior todata collection, and it can not be improved withoutcollecting new data at a higher accuracy level. Forthis reason, the location of viewpoints and their position relative to other features should be determined
before any terrain or vegetation data are collected.This is particularly important when viewpoints are
150
near ground-level and may have vegetation directlyin front of the line ofsight.
LANDSCAPE VISUALIZATION PROJECTS
In cooperation with Plum Creek Timber Company,the authors completed two harvest design visualization projects in Washington State. The first project,referred to as the Carbon River project, was locatedin a deep river valley on a south-facingslope directlynorth of Mt. Rainier National Park and in clear viewof a park picnic area (figure 3). The second project,referred to as the Flaming Geyser project, was located adjacent to Flaming Geyser State Park on ahillside that was visible from many areas of the park.
Figure 3. Carbon River project area. The rectangleshows the extent of the photogrammetric patch DEM.The harvest unit boundary is shown along with theviewpoint in Mt. Rainier National Park.
For each project, several alternative harvest intensities and unit designs were visualized using the Vantage Point system. Because of limitations in printing
high-quality color images in a proceedings, theauthors have chosen to make the images available tothe reader via the internet at the following address:
http://forsys.cfr.washington.edu.
Both projects required visualizations from nearground-level viewpoints that corresponded to likelypark user vistas. For the Carbon River project onlyone viewpoint from the picnic area was selected. For
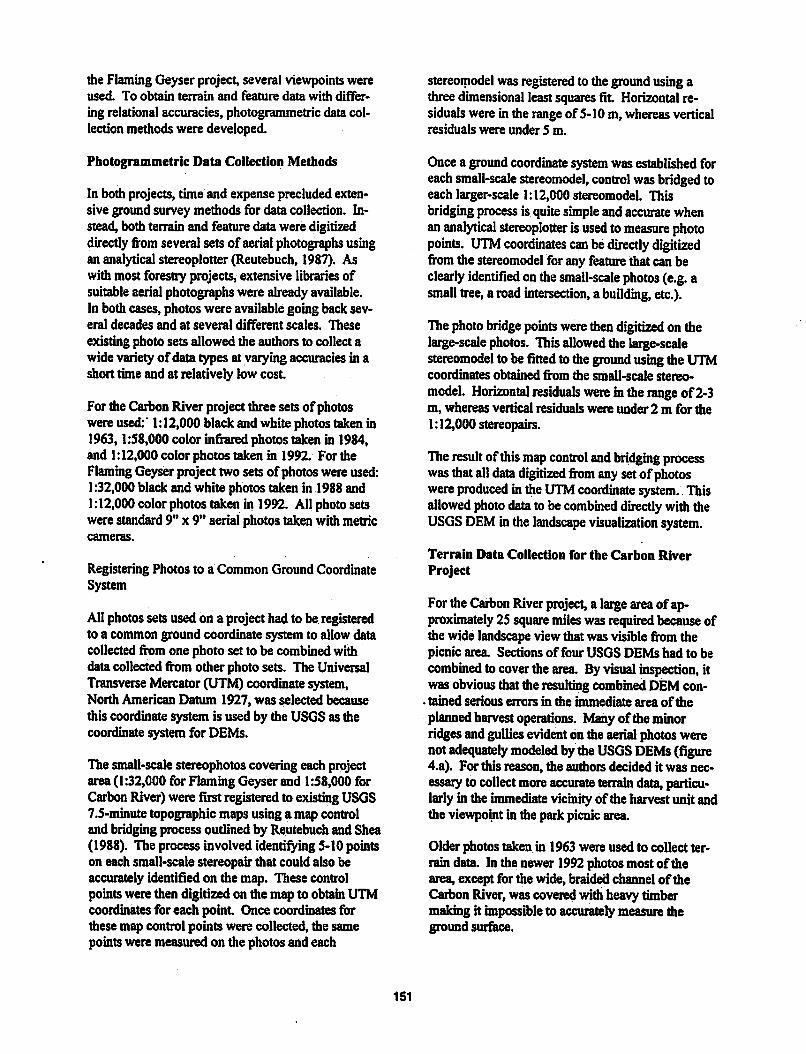
the FlamingGeyser project, several viewpoints wereused. To obtain terrain and feature data with differ
ing relational accuracies, photogrammetric datacollection methods were developed.
Photogrammetric Data Collection Methods
In both projects, time and expense precluded extensive ground survey methods for data collection. Instead, both terrainand feature data were digitizeddirectly from several sets of aerial photographs usingan analyticalstereoplotter (Reutebuch, 1987). Aswith most forestry projects, extensive libraries ofsuitableaerial photographswere alreadyavailable.In both cases, photos were availablegoing backseveral decades and at several different scales. These
existing photo sets allowed the authorsto collectawide varietyofdatatypes at varying accuracies in ashort time and at relatively low cost
For the Carbon River projectthree sets ofphotoswereused:' 1:12,000 black andwhite photostaken in1963,1:58,000 color infrared photos taken in 1984,and 1:12,000color photos taken in 1992. FortheFlaming Geyser projecttwo sets ofphotoswereused:1:32,000 black and white photos taken in 1988and1:12,000 colorphotostaken in 1992. All photo setswerestandard 9" x 9" aerial photostakenwith metriccameras.
Registering Photos to a Common Ground CoordinateSystem
All photos setsusedon a project hadto beregisteredto a common ground coordinate system to allow datacollected from one photo set to be combined withdatacollected from other photo sets. The UniversalTransverse Mercator(UTM) coordinate system,North American Datum 1927, was selected becausethis coordinate system is used by die USGS asthecoordinatesystem for DEMs.
The small-scale stereophotoscovering each projectarea(1:32,000 for Flaming Geyser and 1:58,000 forCarbon River)were firstregistered to existingUSGS7.5-minute topographicmaps using a map controland bridging process outlined by Reutebuch and Shea(1988). The process involved identifying5-10pointson each small-scale stereopair that could also beaccurately identified on the map. These controlpoints were then digitized on the map to obtainUTMcoordinatesfor each point Once coordinates forthese map control points were collected, the samepoints were measured on the photos and each
151
stereomodel wasregistered to the ground usingathreedimensional leastsquares fit Horizontal residuals were in the range of5-10 m, whereas verticalresiduals were under 5 m.
Once a groundcoordinate system was established foreach small-scale stereomodel, control wasbridged toeach larger-scale 1:12,000stereomodel. Thisbridging process is quitesimpleandaccurate whenan analytical stereoplotter is used to measure photopoints. UTM coordinates can bedirectly digitizedfrom the stereomodel forany feature thatcanbeclearly identified onthesmall-scale photos (e.g. asmall tree, aroad intersection, abuilding, etc.).
The photo bridge points were thendigitized on thelarge-scale photos. This allowed the large-scalestereomodel to be fitted to the ground usingthe UTMcoordinates obtained from the small-scale stereomodel. Horizontal residuals were inthe range of2-3m, whereas vertical residuals were under 2 m for the1:12,000stereopairs.
The result ofthismapcontrol andbridging processwasthatalldata digitized from anysetofphotoswere produced in the UTM coordinate system. Thisallowed photo data tobe combined directly with theUSGSDEM inthe landscape visualization system.
Terrain Data Collection for the Carbon RiverProject
For theCarbon River project, a large area of approximately 25 square mileswasrequired because ofthe wide landscape view thatwasvisible fromthepicnic area. Sections of four USGS DEMs had to becombined to cover the area. By visual inspection, itwas obviousmat the resulting combinedDEM con-
•tained serious errors in the immediate area oftheplanned harvest operations. Manyofthe minorridges andgulliesevidenton the aerial photos werenot adequately modeledby the USGS DEMs(figure4.a). For this reason, the authors decided it was necessary to collect moreaccurate terrain data, particularlyin the immediate vicinity ofthe harvestunit andthe viewpoint in the park picnicarea.
Older photostaken in 1963were used to collect terrain data. In the newer 1992 photosmost ofthearea, except for the wide, braidedchannel oftheCarbon River, was coveredwith heavy timbermaking it impossible to accurately measure theground surface.
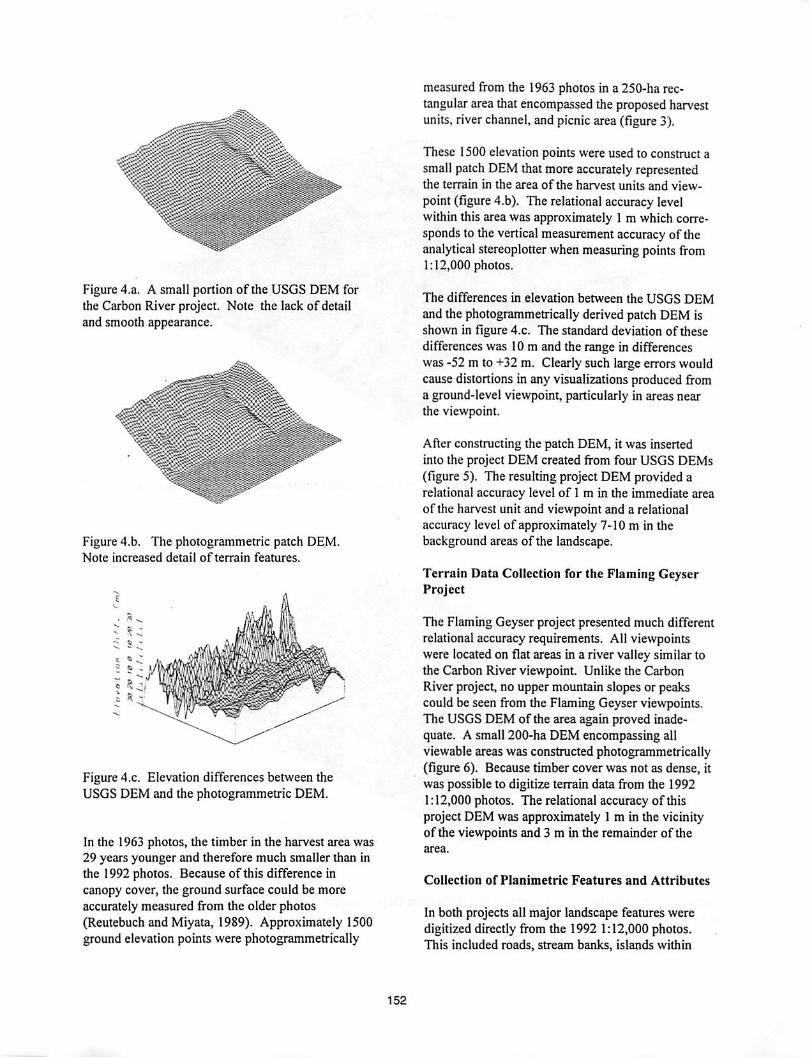
• :'•':';. •••}
Figure 4.a. A small portion of the USGS DEM forthe Carbon River project. Note the lack of detailand smooth appearance.
""'£:^H-^>: :=S=;::::::;:;:i;:;Sr:E^:::::::::^::"l:---:;;=?-==::-"S=:!"^ni^!•:S:::-:5|!:
Figure 4.b. The photogrammetric patch DEM.Note increased detail of terrain features.
Figure 4.c. Elevation differences between theUSGS DEM and the photogrammetric DEM.
In the 1963 photos, the timber in the harvest area was29 years younger and therefore much smaller than inthe 1992 photos. Because of this difference incanopy cover, the ground surface could be moreaccurately measured from the older photos(Reutebuch and Miyata, 1989). Approximately 1500ground elevation points were photogrammetrically
152
measured from the 1963 photos in a 250-ha rectangular area that encompassed the proposed harvestunits, river channel, and picnic area (figure 3).
These 1500 elevation points were used to construct asmall patch DEM that more accurately representedthe terrain in the area of the harvest units and viewpoint (figure 4.b). The relational accuracy levelwithin this area was approximately 1 m which corresponds to the vertical measurementaccuracy of theanalytical stereoplotter when measuring points from1:12,000 photos.
The differences in elevation between the USGS DEMand the photogrammetrically derived patch DEM isshown in figure 4.c. The standard deviation of thesedifferences was 10m and the range in differenceswas -52 m to +32 m. Clearly such large errors wouldcause distortions in any visualizations produced froma ground-level viewpoint, particularly in areas nearthe viewpoint.
After constructing the patch DEM, it was insertedinto the project DEM created from four USGS DEMs(figure 5). The resulting project DEM provided arelational accuracy level of 1 m in the immediate areaof the harvest unit and viewpoint and a relationalaccuracy level of approximately 7-10 m in thebackground areas of the landscape.
Terrain Data Collection for the Flaming GeyserProject
The Flaming Geyser project presented much differentrelational accuracy requirements. All viewpointswere located on flat areas in a river valley similar tothe Carbon River viewpoint. Unlike the CarbonRiver project, no upper mountain slopes or peakscould be seen from the Flaming Geyser viewpoints.The USGS DEM of the area again proved inadequate. A small 200-ha DEM encompassing allviewable areas was constructed photogrammetrically(figure 6). Because timber cover was not as dense, itwas possible to digitize terrain data from the 19921:12,000 photos. The relational accuracy of thisproject DEM was approximately 1 m in the vicinityof the viewpoints and 3 m in the remainder of thearea.
Collection of Planimetric Features and Attributes
In both projects all major landscape features weredigitized directly from the 1992 1:12,000 photos.This included roads, stream banks, islands within
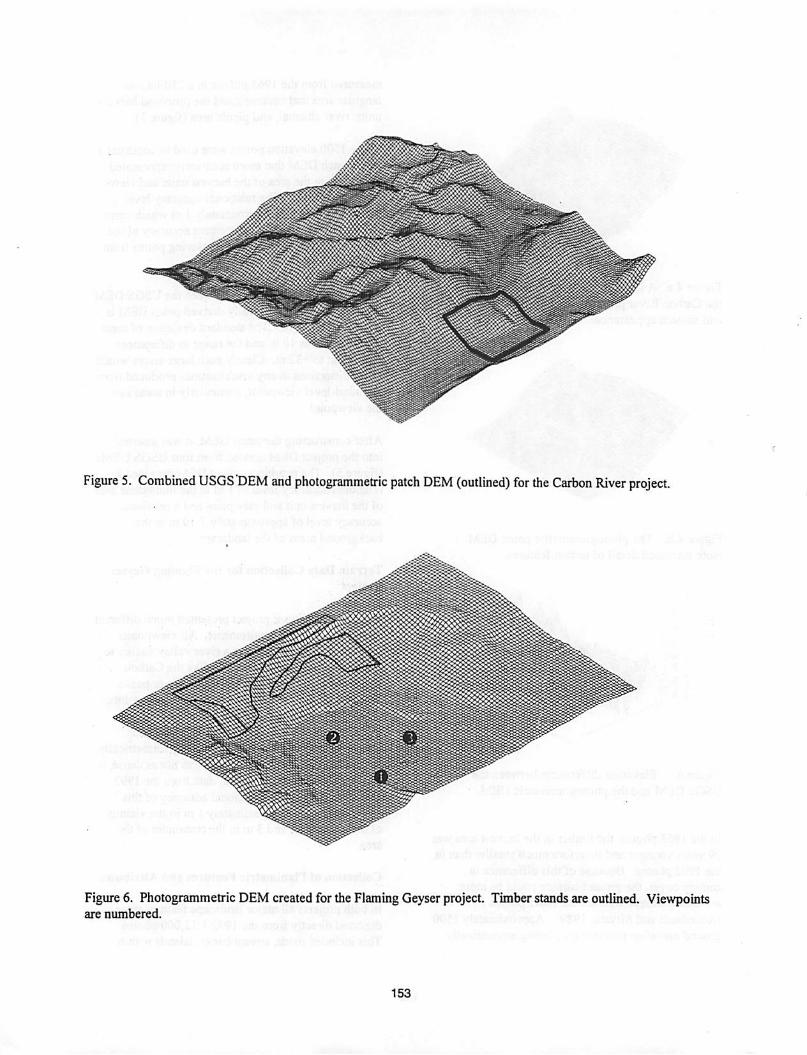
Figure 5. Combined USGS'DEM and photogrammetric patch DEM (outlined) for the Carbon River project.
Figure6. PhotogrammetricDEM created for the FlamingGeyser project. Timber stands are outlined. Viewpointsare numbered.
153
streams,gravel bars, timber stand boundaries, openfields, and viewpoints. In addition, a sample of treeheights and crown diameters in each timber polygonwas measured from the photos. Tree type, whetherconifer or hardwood, was also recorded. Each polygon was coded by its ground cover type and was assigned a relational detail level based on its proximityto the viewpoints.
These feature data were combined with the projectDEMs and alternative harvest options were designed.It should be noted that the project DEMs can also beused with the Preliminary Logging Analysis System(McGaughey, 1991) to assist with the harvest designprocess.
Simulated Harvest Alternatives
Once all required data were collected and input intothe Vantage Point system, landscape visualizations ofharvest alternatives were produced.
Carbon River Harvest Alternatives
For the Carbon River project a landscape visualization showing the area in its pre-harvest condition wasfirst produced. This image was compared withphotographs taken from the picnic area in the park toinsure that the photogrammetric data set provided aaccurate approximation of the area. Next, fourharvest options were simulated. These included: 1)a traditional clearcut with required stream bufferstrips; 2) a mixture of thinning in highly visibleareas and clearcuts in more obscured areas; 3) a stripthinning that would facilitate logging in more visibleareas and clearcuts in less visible areas; and 4) aclearcut with larger leave areas. All images areavailable for viewing on the internet. After reviewing the images, Plum Creek chose to implement thethird option which greatly reduced the visual impactwhile allowing for an efficient harvest operation.
Flaming Geyser Harvest Alternatives
For the Flaming Geyser project, only pre-harvestconditions and two harvest options were simulated:1) a traditional clearcut with required stream bufferstrips; and 2) a clearcut with larger leave strips inhighly visible areas. After reviewing the images,Plum Creek chose to implement the second optionwhich greatly reduced the visual impact.
154
CONCLUSIONS
In many harvesting situations planners must considerthe visualimpactofproposed operations. Severallandscape visualization systems are now availablethat can produce perspective view imagesof forestedareaswith vegetation cover. Unfortunately, in manycases, existing terrain and feature dataare inadequatefor producing credibleimagesthat truly modeltheareaof interest, particularly in the immediate vicinityofselected viewpoints. The authors have addressedthis problemby developing the concepts ofrelationalaccuracy and detail levelsand by developingphotogrammetric data collection techniques.
The photogrammetric.data techniques allowplannersto collectboth terrainand feature data very rapidlyfrom existing aerial photos with little to no field datacollection. The resulting landscapevisualizationsrepresent the actual ground much better than visualsbased on USGS DEMs and stand boundaries from
traditional timber inventories. In the projectsdescribed above, photogrammetric data collectiontook less than two days for each project; however,several weeks were required to order and acquireaerial photos from various companies and agencies.The landscape visualization process requiredapproximately two weeks per project.
In both project areas presented above, the visualizations allowed forest engineers to better design andevaluate alternatives in sensitive areas that greatlyreduced visual impact
LITERATURE CITED
Bergen, S. D.; McGaughey, R. J.; Fridley, J. L. 1996.Aspects ofaccuracy in the Vantage Point landscapevisualization tool. 1996 ASAE Annual International
Meeting, Phoenix, AZ. ASAE Paper No. 965014.ASAE, St. Joseph, MI. 11 p.
Carson, W. W.; Reutebuch, S. E. 1997. A rigoroustest of the accuracy ofUSGS digital elevation modelsin forested areas ofOregon and Washington. In:1997 ACSM-ASPRS technical papers: 1997 ACSM-ASPRS annual convention. 1997 April 7-10.Seattle, WA. Bethesda, Maryland: AmericanSociety for Photogrammetry and Remote Sensing:133-143.
McGaughey, R. J. 1991. Timber harvest planninggoesdigital: PLANS—preliminary logging analysissystem. Compiler 9(3): 10-17.
McGaughey, R. J. 1997. Techniques for visualizingthe appearance of timber harvestoperations. In:Forestoperation for sustainable forests and healtheconomies. 20th annual meeting ofthe Council OnForest Engineering, 1997 July 28-31, RapidCity, SD10 p. (In this volume).
Nickerson,D.B. 1979. SIGHTLINE,PERSPECTIVE PLOT, SLOPE-three desktopcomputer programs for forest landscape design. JournalofForestry 77(1): 14-17.
Reutebuch, S. E. 1987. PC-based analytical stereoplotter for use in Forest Service field offices. In:ASPRS technical paper: 1987ASPRS-ACSM fallconvention. 1987 October 4-9. Reno.NV. FallsChurch, VI: American Society for Photogrammetryand Remote Sensing: 222-232.
Reutebuch, S. E.; Miyata, E. S. 1989. Cable thinningunit layout usinghistorical aerial photography.In: Implementing techniques for successful forest
155
operations. 12* annual meeting of the Council onForest Engineering, 1989 August27-30,Coeurd'Alene,ID: 71-76.
Reutebuch, S. E.; Shea, R. D. 1988. A method tocontrol large-scale aerial photos whensurveyedground control is unavailable. In Greer,J. D., ed.Remotesensing forresource inventory, planning, andmonitoring: Proceedings ofthe 2Bd Forest Serviceremote sensing applications conference. 1988 April11-15. Slidell, LA. FallsChurch,VI: AmericanSociety for Photogrammetry andRemote Sensing:231-236.
Travis, M. R.; Eisner, G. H.; Iverson, W. D.;Johnson, C. G. 1975. VIEW1T: computation ofseenareas, slope, andaspect forland-use planning.Gen. Tech. Rep. PSW-11. Berkeley, CA: USDAForest Service, Pacific Southwest Forest andRangeExperiment Station. 70 p.
Zube, E. H.; Simcox, D. E.; Law, C. S. 1987. Perceptual landscape simulations: historyand prospect.LandscapeJournal6(1): 62-80.
Techniques for Visualizing the Appearance of
Timber Harvest Operations
Robert J. McGaugheyUSDA Forest Service, Pacific Northwest Research Station
University ofWashington, PO Box 352100Seattle, WA 98195-2100
email: mcgoyQu.viashington.edu
ABSTRACT: The appearance of landscapes and individual stands after harvest operations is critical to public acceptance oftimber haivest practices. This paper reviews four visualization techniques suitable for visualizing the appearance of timber harvest operations: geometric modeling, video imaging, ahybrid technique combining geometric modeling and video imaging, andimage draping. Techniques are reviewed for application to plot-, stand-, and landscape-scale project areas. Specific visualization software, both public domain and commercial applications, are identified. World wide web site addresses are given for mostsoftware packages.
Keywords: visualization, video imaging, timber haivest, visual simulation
INTRODUCTION
The appearance of landscapes and individual standsafter harvest operations is critical to public acceptanceof timber harvest practices. Thorough planning,detailed site-specific analysis, and careful monitoringof harvest activities will not result in truly successfuloperations if the public views theresulting landscapeas an eyesore.
Attempts to mitigate the visual impactof harvestsinclude modifying unit boundaries to conform totopography andothernatural stand openings, prescribingsilvicultural treatments thatretain higher numbersof standing trees orgroups of trees, and attempting to"hide" or"screen" harvest units from sight. These mitigation efforts can be successful.
However, foresters charged with designing harvest unitshapes and silvicultural treatments often find it difficulttodevelop visually acceptable solutions by working inthe field or with planimetric maps. The ability to visualize theappearance of a treatment or harvest operationbefore implementation can provide needed visual feedback during the design process.
People exhibit varying abilities to visualize the effectof harvest patterns and silvicultural treatments. Someindividuals can lookat maps and diagrams showingharvest unit boundaries andread descriptions of the silvicultural prescriptions to make a judgment of the
appearance of the resulting operation, but othersrequire more picture-like visualizations. The proliferation of newtechnology such as geographic informationsystems and high-resolution satellite imagery haveenabled forest managers to provide detailed maps andimages showing a variety of resource characteristics.
These traditional products, however, do not necessarilyprovide realistic representations of theappearance offorested areas before and after harvest operations. Inaddition, these products do not provide sufficientvisualfeedback to forest engineers and other resource specialists. Such feedback isessential if they are todesignoperations that produce a satisfactory visualcondition.
Foresters, engineers, and other resource specialists canuse computer visualization techniques to create imagesdepicting the appearance of forested landscapes beforeand after harvest activities. Images depicting a varietyof harvest unit designs help them preview the visualappearance of proposed activities. Visualization products, ranging from three-dimensional drawings to highly realistic rendered images, provide feedback whiledesigning harvest units and silvicultural prescriptions.Such products also facilitate communication betweenthedesigner, other resource specialists, and the public.
This paperwill present an overview of visualizationtechniques suitable for usein timber harvest planning,discuss their relative strengthsand weaknesses,andprovide guidelines for selecting an appropriate visual-
156
ization technique given the terrain, stand, operationalconditions, and the intended use of the visualizationproduct.
OVERVIEW OFVISUALIZATION TECHNIQUES
Forestry professionals have used visualization techniques toaddress a variety of forest management problems. Prior to the advent of computerized methods,they used "artists' renditions" to communicate theeffectsof land management activities. Such visual andphysical models, produced using artistic techniquessuchas perspective sketching, watercolors, air brush,and scale models, continue to communicate thespatialarrangement and extent of management activities to thelay public.
However, the current trendin forest management istowardmoredetaileddesigns involving small treatmentareas scattered over a larger landscape and the removalor modification of specific stand components.Alternative treatments utilize different mechanicalmethods, vary the spatial arrangement of treatmentunits, and specify different levels of modification within individual treatment units. With such treatments, thetraditional "artists' rendition" cannot be made specificenough to represent the subtle differences betweenalternative treatments.
Computerized visualization methods range from simplediagrams to complete virtual realities. Four methodsare suitablefor producing visual representations of forest operations:
• geometric modeling,• video imaging,• geometricvideo imaging,• image draping.
Geometric Modeling
Forestry professionals have used geometric modelingtechniques to depict landscapeconditionssince 1976(Myklestad andWager 1976). Geometric modelingmethods build geometric models of individual components (groundsurface, trees and other plants). The individual component models are then assembled to createa forest stand or landscape model. Scenes depicting thecomplete model are then rendered froma variety ofviewpoints. In its simplestform, this technique can beusedto generate perspective drawings showing typicalGIS data coverages such as roads, streams, and polygondataoverlaid ontotheground surface. Morecomplexapplications build very detailed models of individualtrees that include small branches and leaves for use inrenderingscenes or special effects for motion pictures.
Geometric modeling systems specifically aimed at producing visualizations of forestry activities have beenpresented by several authors(Bonnicksen 1993. Burkand Nguyen 1992, Hanu. 1995, Kuehne 1993. Fridleyetal. 1991, Larson 1994. McGaughey 1997,McGaughey and Ager 1996, McGaughey and Twito1988, Orland 1997). These systems use perspective ororthographic drawing techniques to render stand andlandscape images for land areas ranging insize from
-less than one acre-to-several thousand acres. Some systems are interfaced to stand projection models to showboth thecapabilities of theprojection model andstandconditions resulting from modeled stand growth andsilvicultural treatments over time. Some systems relyon commercial computer aided design programs suchasAutocad to render images of the geometric modelswhile others directly employ two-andthree-dimensional drawing techniques to render images.
Video Imaging
Video imaging is a computer technique that usescomputer programsto "cut-and-paste"or "paint" onscanned full-color video or photographic images to represent changes to the standand landscape conditions.Video imaging produces television-quality (orbetter),full-color visual representations that depict current andfuture conditions. Orland (1988. 1993) reports theuseof images created using video imaging techniques forboth internal reviews of proposed management activities and for public information and participation.
Digital editing capabilities typically usea library ofimages representing different forest conditions toreplace portions of anoriginal image or to literallyoverlay objects or vegetation patterns onto anoriginalimage. To simulate the appearance of damage causedby defoliating insects, Orland etal. (1990) used imageprocessing techniques to analyze thecolor changesassociated with insect damage in forests. They thenapplied similar color changes to new landscape imagestosimulate new damage. Larson etal. (1988) reportusing similar techniques to simulate the effects ofatmospheric pollution on thequality of photographicimages and scenic views.
Geometric Video Imaging
A hybrid approach, called geometric video imaging inthis paper, combines geometric modeling and videoimaging techniques to produce very realistic imagesthat accurately represent data describing the effectsofforest management activities. Operators use geometricmodeling techniques to produce scenes used to determine the location, arrangement, andscale of proposedlandscape changes. Video imaging techniques are then
157
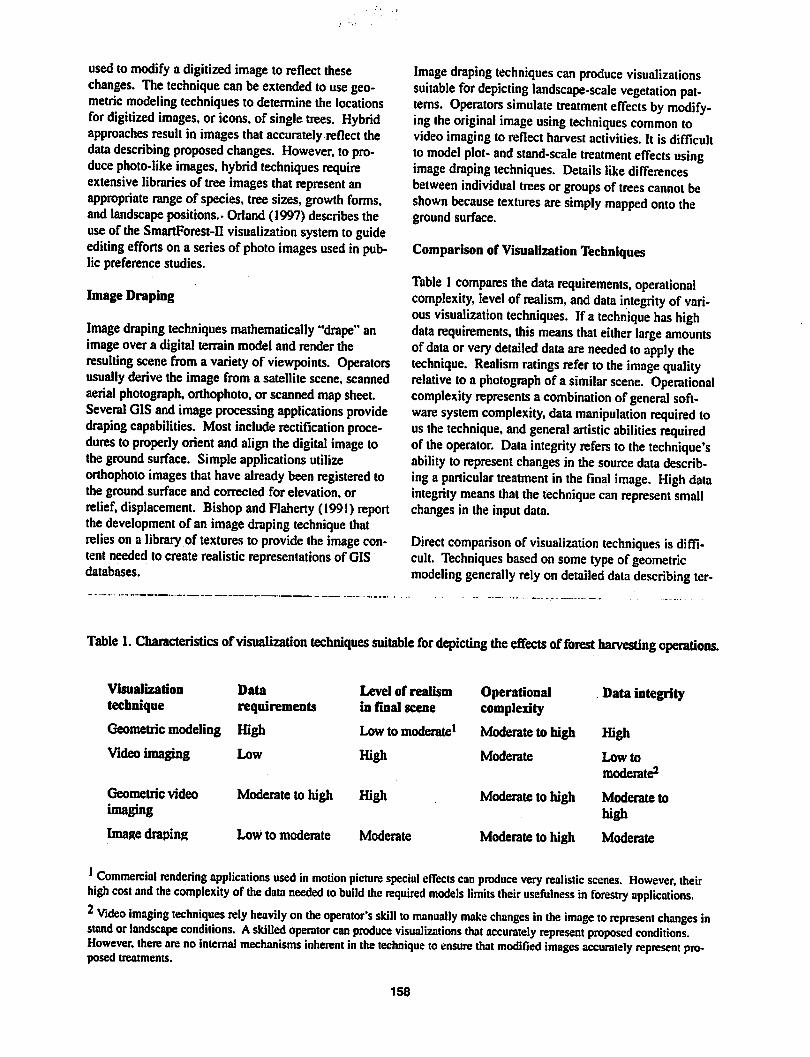
used to modify a digitizedimage to reflect thesechanges. The technique can beextended to use geometric modeling techniques to determine the locationsfor digitized images, or icons, of single trees. Hybridapproaches result in images that accurately reflect thedatadescribing proposed changes. However, to produce photo-like images, hybrid techniques requireextensive libraries of tree images thatrepresent anappropriate range of species, tree sizes,growthforms,and landscapepositions.- Orland (1997) describes theuse of the SmartForest-II visualization system toguideediting efforts on a series of photo images used in public preference studies.
Image Draping
Image draping techniques mathematically "drape" animage over a digital terrain model and render theresulting scene from a variety of viewpoints. Operatorsusually derive the image from a satellite scene, scannedaerial photograph, orthophoto, or scanned map sheet.Several GISand image processing applications providedraping capabilities. Most include rectification procedures to properly orient and align thedigital image tothe ground surface. Simple applications utilizeorthophoto images thathave already been registered tothe ground surface and corrected for elevation, orrelief, displacement. Bishop andFlaherty (1991) reportthedevelopment of an image draping technique thatrelies on a library of textures to provide the image content needed to create realistic representations of GISdatabases.
Image draping techniques can produce visualizationssuitable for depicting landscape-scale vegetation patterns. Operators simulate treatment effects by modifying theoriginal image using techniques common tovideoimaging to reflectharvestactivities. It is difficultto model plot- and stand-scale treatment effects usingimagedraping techniques. Details like differencesbetween individual trees or groups of trees cannot beshown because textures aresimply mapped onto theground surface.
Comparison ofVisualization Techniques
Table 1compares the data requirements, operationalcomplexity, level of realism, and data integrity of various visualization techniques. Ifa technique has highdata requirements, this means that either large amountsofdata orvery detailed data are needed toapply thetechnique. Realism ratings refer to the image qualityrelative toa photograph of a similar scene. Operationalcomplexity represents a combination of general software system complexity, datamanipulation required tous the technique, andgeneral artistic abilities requiredof the operator. Data integrity refers to the technique'sability to representchanges in the source data describing a particular treatment inthe final image. High dataintegrity means that the technique can represent smallchanges in the input data.
Direct comparison of visualization techniques is difficult. Techniques basedon sometypeof geometricmodeling generally rely ondetailed data describing ter-
Table 1. Characteristics ofvisualization techniques suitable for depicting the effects offorest harvesting operations.
Visualization Data
technique requirements
Geometric modeling High
Video imaging Low
Geometric video Moderate to highimaging
Image draping Low to moderate
Level of realism
in final sceneOperationalcomplexity
Data integrity
Low to moderate1 Moderate to high High
High Moderate Low to
moderate2
High Moderate to high Moderate to
high
Moderate Moderate to high Moderate
Commercial rendering applications used in motion picture special effects can produce very realistic scenes. However, theirhigh cost and the complexity ofthe data needed to build the required models limits their usefulness in forestry applications.*Video imaging techniques rely heavily on the operator's skill to manually make changes in the image to represent changes instand orlandscape conditions. Askilled operator can produce visualizations that accurately represent proposed conditions.However, there are no internal mechanisms inherent in the technique to ensure that modified images accurately represent proposed treatments.
158
rain and stand conditions to create an image representing those data. Video imaging and image draping techniquesstart with an image andattempt to modify theimage to correctly represent proposed changes. All ofthe techniques mentionedare suitable for forestry visualization. However, inherent limitations in the techniques, data requirements, orquality of the final imageproducts make sometechniques better suited to particularapplications in forestry.
Operators cannot apply geometric modeling applications embedded into or that relyon a forest growthmodel to a broad range of visualization projects.Growth models represent specific forest types and geographic regions and cannot be easily applied to otherareas or forest types. Applications that rely on commercial CAD packages may be difficult for some individuals to apply. In most cases, the operator isassumed to have accessto and be proficient with theCAD application. Operators not familiar with the CADapplication must learn to use its features and the procedures to convert the forest or landscape data into aproperly formatted geometric model.
Video imaging techniques, usually applied to landscape-scale projects, canbe used to represent standtreatments. However, it is difficult to represent smallscale, subtlechanges affecting individual treesandsmall groups of trees. Video imaging relies heavily ontheoperator's skill to visualize the effect of a proposedtreatment and make the necessary changes to an imageto accurately reflect the treatment. Operators must befamiliar with the operations and forest conditionsbefore they can make image modifications thataccurately and consistently reflect changes in the underlying data. Simply painting a new texture over a portionof a stand maynotadequately communicate changes instandattributes such as tree spacing andcrownclosure.
Video imaging techniques lack accurate methods fortransferring planimetricinformation such as treatmentunit locations and roads onto the perspective scene represented by theoriginal photograph. Most often, operators manually transfer such features from topographicmaps. This can lead to significanterrors. The consequences of such errors canbe as simple asa misplacedharvest unit. However, incorrectly placed treatment unitboundaries canhave a significant impact on the appearance of the unit from specific viewpoints. For example,the position and shape of theunit boundary significantlyaffect the portionseen from a roadside. Positional errorscanresult in final images thatsignificantly misrepresentthe visual effect of a proposed treatment
Image draping techniques show unit locations andoverall vegetation patterns. Because image draping
techniques apply image texture to theground surfaceonly, they represent very littleheight detail for trees.For example, the edge of aclearcut usually provides asharp contrast between the height of an adjacent standand the bare ground of the clearcut area. Image draping techniques cannot display thisheight difference.Image draping isalso prone toerrors when attemptingto model theeffectof a light source shining ontotheterrain surface. Aerial images used tocolor the ground-surface-already represent theeffectof a light source:the sun. Additional attempts to further shade the terrain surface based on another light source or a differentsunangle cancreate optically confusing scenes.Simply using the intensity of the aerial image willresult in a scene with some lighting effects. However,images will often be of lowcontrast and appear "flat"because aerial photographs are often taken during midday to minimize shadows. This lighting problem alsomakes it difficult to modifyanaerial image to reflecttheeffectof treatments. Areas of an image used toprovide textures for a treatment area must have thesame orientation oraspect asareas being replaced inthe original image. The lighting effects and conflictingshadows in final image will beconfusing to viewers ifthe orientations are not similar.
Bycombining geometric modeling and video imagingtechniques, geometric video imaging can produce data-driven images that exhibit a high degree of realism. Askilled operator is still needed to modify digital images.Large libraries of images are needed to provide the richpalette of vegetation types, sizes, orientations, andcolors needed to make final image modificationsrealistic.Nonetheless, thistechnique is theonly visualizationtechnique currently available that can produce photographic quality images that reflect small changes tostand and landscape data.
All four methods can use databases describing standconditions before and after proposed changes to providea data-driven solution. The degree to whichchanges in thedatabase are visible inthe final imagedepends on the technique and the operator's skill.Systems must have well-designed databases and linkages between the database and the visualization technique. Such systems allow users to respond quickly todesign changes and shifts in management strategies andto provide consistent results for a variety of treatmentalternatives. In general, geometric modeling techniques, including geometric video imaging, are considered the most "data-driven." They provide for a one-to-one relationship betweendata describing a treatmentandobjectsin the final scene. Video imaging andimagedraping techniques do not providesuch a relationship but instead rely on the skill of the operator toaccurately reflect database elements in the final scene.
159
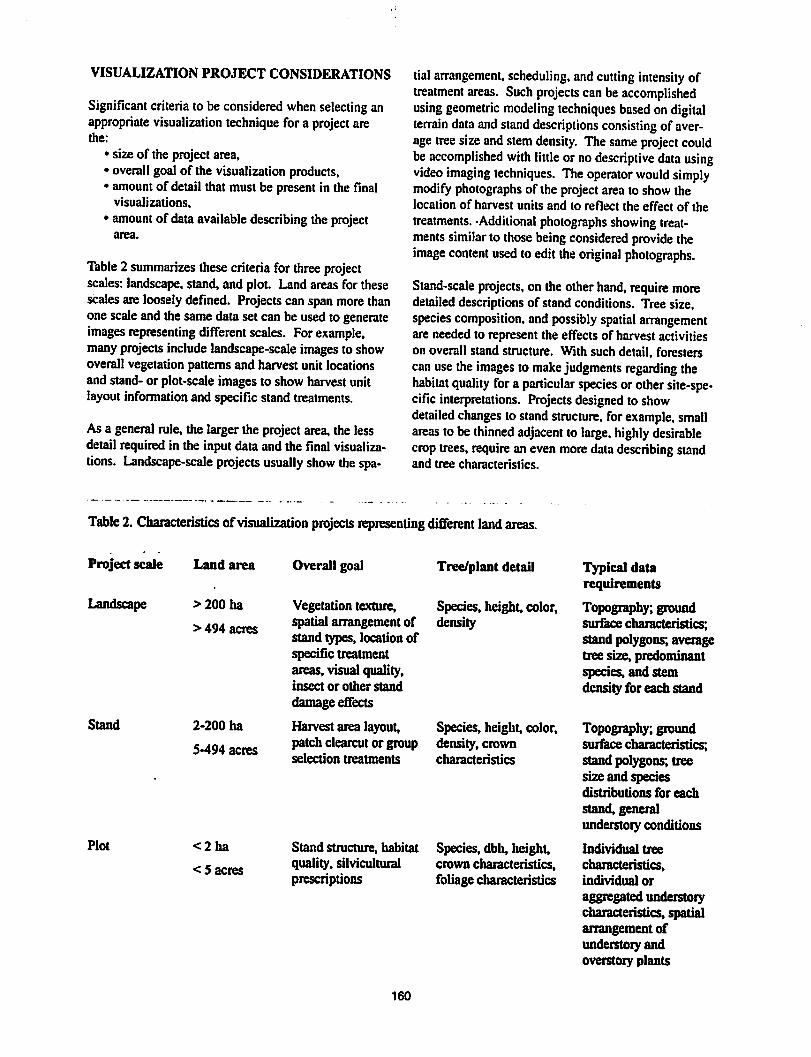
VISUALIZATION PROJECT CONSIDERATIONS
Significant criteria to be considered when selecting anappropriate visualization technique for a project arethe:
• size of the project area,• overall goal of the visualization products,• amount of detail that must be present in the final
visualizations.
• amount of data available describingthe projectarea.
Table 2 summarizes these criteria for three projectscales: landscape, stand, and plot. Land areas for thesescalesare looselydefined. Projectscan span morethanone scaleand the same data set can be used to generateimages representing different scales. Forexample,manyprojectsinclude landscape-scale images to showoverall vegetation patterns and harvest unit locationsand stand-or plot-scale imagesto show harvest unitlayout information and specific stand treatments.
As a general rule, the larger the project area, the lessdetail required in the inputdata and the final visualizations. Landscape-scale projects usually show the spa
tial arrangement, scheduling, and cutting intensity oftreatment areas. Such projects can be accomplishedusing geometric modeling techniques based ondigitalterrain dataandstand descriptions consisting of average tree sizeandstem density. Thesame project couldbe accomplished with little orno descriptive data usingvideo imaging techniques. The operator would simplymodify photographs of the projectarea to showthelocation of harvest units and to reflect the effect of thetreatments. -Additional photographs showing treatments similar to those being considered provide theimage content used to edit the original photographs.
Stand-scale projects, on theotherhand, require moredetaileddescriptions of stand conditions. Tree size,species composition, and possibly spatial arrangementare needed to represent the effects of harvest activitieson overall stand structure. With such detail, foresterscan use the images to make judgments regarding thehabitat quality for a particular species or other site-specific interpretations. Projects designed to showdetailed changes to stand structure, forexample, smallareas to be thinned adjacent to large, highly desirablecrop trees, require an even moredata describing standand tree characteristics.
Table 2. Characteristics of visualization projects representing different land areas.
Project scale Land area
Landscape
Stand
Plot
> 200 ha
> 494 acres
2-200 ha
5-494 acres
<2ha
< 5 acres
Overall goal
Vegetation texture,spatial arrangement ofstand types, location ofspecific treatmentareas,visual quality,insect or other stand
damage effects
Harvest area layout, Species, height, color,patchclearcutor group density, crownselection treatments characteristics
Stand structure, habitatquality, silviculturalprescriptions
160
Tree/plant detail
Species, height, color,density
Species, dbh, height,crown characteristics,foliage characteristics
Typical datarequirements
Topography; groundsurface characteristics;stand polygons;averagetree size, predominantspecies, and stemdensity for each stand
Topography; groundsurface characteristics;stand polygons; treesize and speciesdistributions for each
stand, generalunderstory conditions
Individual tree
characteristics,individual or
aggregated understorycharacteristics,spatialarrangement ofunderstory andoverstory plants
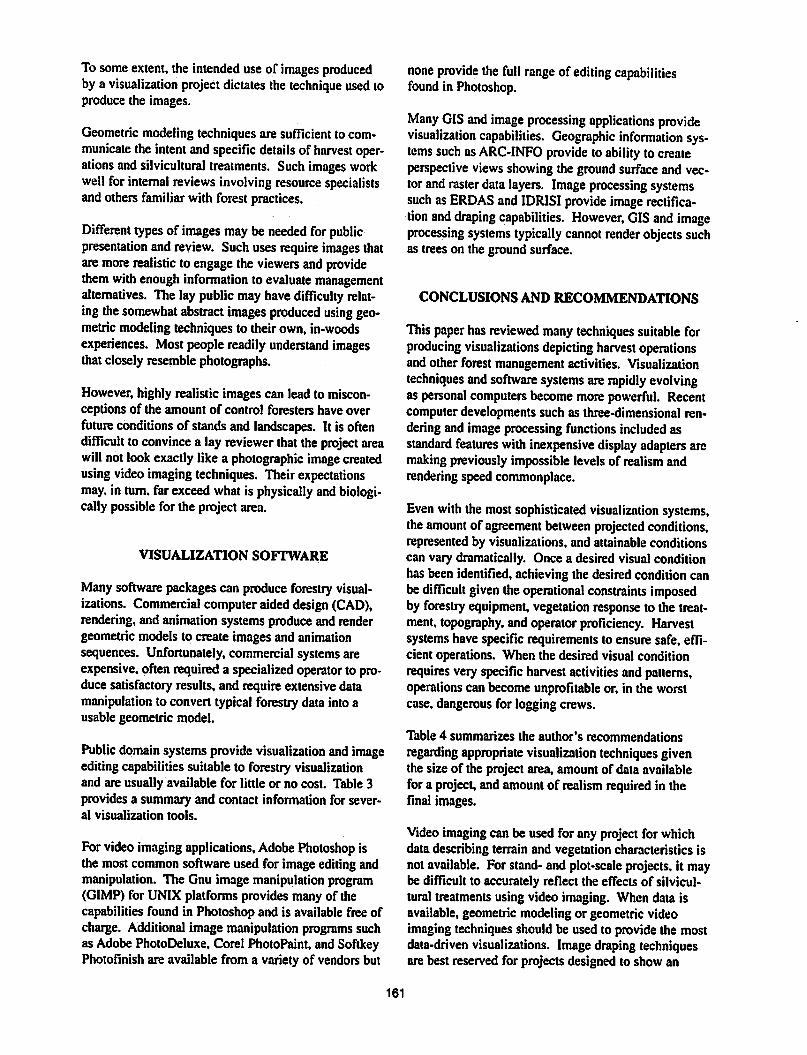
Tosome extent, the intended useof images producedby a visualization project dictates the technique used toproduce the images.
Geometric modeling techniques are sufficient to communicate the intent and specific details of harvest operations and silvicultural treatments. Such images workwell forinternal reviews involving resource specialistsand others familiarwith forest practices.
Different types of images maybe needed forpublicpresentation and review. Such uses requireimages thatare more realistic to engage the viewers andprovidethem with enough information to evaluate managementalternatives. The lay publicmayhavedifficulty relatingthesomewhat abstract images produced using geometric modeling techniques to their own, in-woodsexperiences. Mostpeople readily understand imagesthat closely resemblephotographs.
However, highly realistic images can lead to misconceptions of the amount of control foresters have overfuture conditions of stands and landscapes. It is oftendifficult to convince a lay reviewer that the project areawillnot lookexactly like a photographic image createdusing video imaging techniques. Theirexpectationsmay. in turn, far exceed what is physically andbiologically possible for the project area.
VISUALIZATION SOFTWARE
Many software packagescan produceforestry visualizations. Commercial computeraided design(CAD),rendering,and animation systems produce and rendergeometricmodels to create images and animationsequences. Unfortunately, commercial systemsareexpensive, often required a specialized operator to produce satisfactoryresults, and require extensivedatamanipulation to convert typical forestry data intoausable geometric model.
Public domain systems provide visualization andimageeditingcapabilities suitable to forestry visualizationand are usually available for little or no cost. Table 3provides a summary and contact information for several visualization tools.
For videoimaging applications, Adobe Photoshop isthe most common software used for image editing andmanipulation. The Gnu image manipulation program(GIMP) for UNIX platforms provides many of thecapabilities found in Photoshop and is available free ofcharge. Additional image manipulationprograms suchas Adobe PhotoDeluxe, Corel PhotoPaint, and SoftkeyPhotofinish are available from a variety of vendors but
none provide the full range ofediting capabilitiesfound in Photoshop.
Many GIS and image processing applications providevisualization capabilities. Geographic information systems suchas ARC-INFO provide to ability to createperspective views showingthe groundsurface and vector and rasterdata layers. Image processing systemssuch as ERDAS andIDRISI provide image rectification and draping capabilities. However, GIS and imageprocessing systems typically cannot render objects suchas trees on the ground surface.
CONCLUSIONS AND RECOMMENDATIONS
Thispaper has reviewed many techniques suitable forproducing visualizations depicting harvest operationsand other forest management activities. Visualizationtechniques andsoftware systems are rapidly evolvingas personal computers becomemore powerful. Recentcomputer developments such as three-dimensional rendering and imageprocessing functions included asstandard features with inexpensive display adapters arcmaking previously impossible levels of realism andrendering speedcommonplace.
Even with the most sophisticated visualization systems,the amount of agreement between projected conditions,represented by visualizations, and attainable conditionscan vary dramatically. Once a desired visual conditionhas been identified, achieving the desired condition canbe difficult given theoperational constraints imposedby forestry equipment, vegetation response to the treatment, topography, and operator proficiency. Harvestsystemshave specific requirementsto ensure safe, efficient operations. When the desired visual conditionrequires very specific harvest activities and patterns,operationscan become unprofitable or, in the worstcase, dangerous for logging crews.
Table 4 summarizes the author's recommendationsregarding appropriate visualization techniques giventhe size of the project area, amount of data availablefora project, andamount of realism required in thefinal images.
Videoimagingcan be used for any project for whichdata describing terrain and vegetation characteristics isnotavailable. For stand- and plot-scale projects, it maybe difficult to accurately reflect the effects of silvicultural treatments using video imaging. When data isavailable, geometric modelingor geometricvideoimagingtechniques should be used to provide the mostdata-driven visualizations. Image draping techniquesare best reserved for projects designed to show an
161
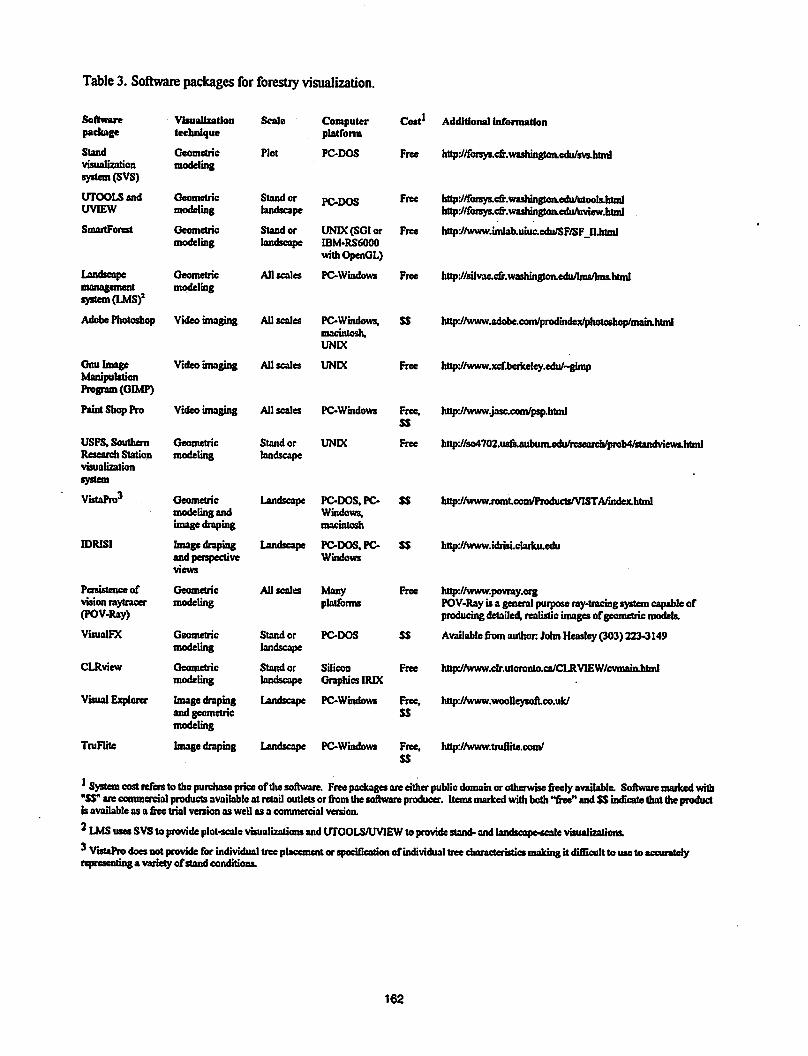
Table 3. Software packages for forestry visualization.
Software
package
Stand
visualizationsystem (SVS)
UTOOLSandUVIEW
SmartForest
Landscapemanagementsystem (LMS)1
Visualizationtechnique
Geometric
modeling
Geometric
modeling
Geometric
modeling
Geometric
modeling
AdobePhotoshop Video imaging
Scale Computer Cost' Additional Informationplatform
Plot PC-DOS
Stand or pc-DOSlandscape
Free http^/foreys.cfr.washingtoaedu/svs.html
Free httpy/foisys.cfr.washJngloaeduAitoolsJttmlhttpy/foisys.cfr.wasrungtoaeduAiviewJilnil
Standor UNIX (SGI or Free bttpyAvww.tmlab.uiuc.edii/SF/SF Il.htmllandscape IBM-RS6000
whhOpenGL)
All scales PC-Windows Free hQp^/silvae.cfr.washingtoitedu/lms/lms.hlml
Allscales PC-Windows, SS http^/www.adobe.coin/prodindex^photoshop/main.htmlmacintosh,UNIX
Gnu ImageManipulationProgram(GIMP)
Paint ShopPro Video imaging
Video imaging All scales UNIX Free rtttpy/www.xcf.bericeley.cdu/--gimp
USPS, SouthernResearch Station
visualization
system
VistaPro3
IDR1SI
Persistence of
vision raylracer(POV-Ray)
VisualFX
CLRview
Visual Explorer
TruFlite
Geometric
modeling
Geometricmodeling andimagedraping
Imagedrapingand perspectiveviews
Geometric
modeling
Geometric
modeling
Geometric
modeling
Imagedrapingand geometricmodeling
Imagedraping
All scales PC-Windows Free, httpyAvww.jasc.com/psp.htmlSS
Stand or UNIX
landscapeFree htu>^/so4702.usfeaubum.edu/rescan^pnib4/standviews.html
Landscape PC-DOS, PC- $S rmp^Avww.nmtccm'ProductsAaSTA/index.htiiilWindows,macintosh
Landscape PC-DOS, PC- $$ httpyAvvm.idrisi.ctarku.eduWindows
All scales Manyplatforms
Stand or PC-DOS
landscape
Stand or Silicon
landscape Graphics IRIX
Landscape PC-Windows Free, http://www.woolleyMn.co.uk/SS
Free htrpyAvww.povray.orgPOV-Rayis a general purpose ray-tracing system capable ofproducing detailed, realistic imagesofgeometric models.
SS Available from author John Heastey (303)223-3149
Free httpyAvww.clr.utorwto.ca/CUtVTEW/cvmain.html
Landscape PC-Windows Free, httpyAvww.tniflite.com/SS
1System cost refers to the purchase price ofthe software. Free packages are either public domain or otherwise freely available. Software marked with"SS" are commercial products available atretail outlets orfrom thesoftware producer. Items marked withboth "free" and SSindicate thattheproductb available as a free trial venion as well as a commercial version.
3LMS uses SVS to provide plot-scale visualizations and UTOOLS/UVIEW to provide stand- and landscape-scale visualizations.3VistaPro does not provide for individual tree placement or specification ofuulividual tree characteristics making hdifficult touse toaccuratelyrepresenting a variety ofstand conditions.
162
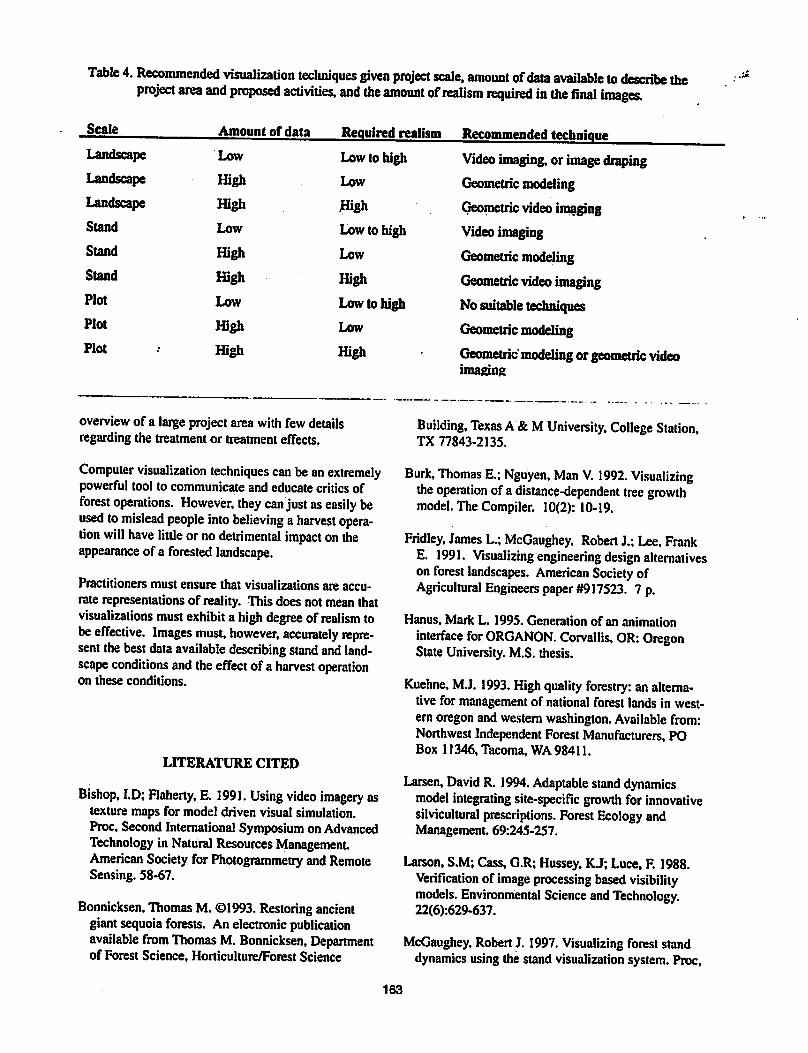
Table 4. Recommended visualization techniques given project scale, amount ofdata available to describe theproject area and proposed activities, and the amount ofrealism required in the final images.
Scale Amount of data Required realism Recommended technique
Landscape Low Low to high Video imaging, orimage drapingLandscape High Low Geometric modelingLandscape High High Geometric videoimagingStand Low Low to high Video imagingStand High Low Geometric modelingStand High High Geometric video imagingPlot Low Low to high No suitable techniquesPlot High Low Geometric modelingPlot High High Geometric modeling orgeometric video
imaging
overview of a largeproject area with few detailsregarding the treatment or treatment effects.
Computer visualization techniques can be an extremelypowerful tool to communicate and educate critics offorest operations. However, they can justaseasily beused tomislead people into believing a harvest operation will have little or nodetrimental impact ontheappearance of a forested landscape.
Practitioners must ensure that visualizations are accurate representations of reality. This does not mean thatvisualizations must exhibit a high degree of realism tobe effective. Images must, however, accurately represent thebest dataavailable describing stand and landscape conditions and theeffect of a harvest operationon these conditions.
LITERATURE CITED
Bishop, I.D; Flaherty, E. 1991. Using video imagery astexture maps for model driven visual simulation.Proc,SecondInternational Symposium on AdvancedTechnology in Natural Resources ManagementAmerican Society for Photogrammetry andRemoteSensing. 58-67.
Bonnicksen. Thomas M. ©1993. Restoring ancientgiantsequoia forests. An electronic publicationavailable from Thomas M. Bonnicksen, Departmentof Forest Science, Horticulture/Forest Science
Building, Texas A& MUniversity, College Station,TX 77843-2135.
Burk, Thomas E.; Nguyen, Man V. 1992. Visualizingthe operation ofa distance-dependent tree growthmodel. The Compiler. 10(2): 10-19.
Fridley, James L.;McGaughey. Robert J.; Lee, FrankE. 1991. Visualizing engineering design alternativesonforest landscapes. American Society ofAgricultural Engineers paper #917523. 7 p.
Hanus, Mark L. 1995. Generation of an animationinterface forORGANON. Corvallis, OR: OregonState University. M.S. thesis.
Kuehne, MJ. 1993. High quality forestry: analternative for management of national forest lands in western Oregon and westernWashington. Availablefrom:Northwest Independent ForestManufacturers, POBox 11346, Tacoma, WA 98411.
Larsen, David R. 1994. Adaptable stand dynamicsmodel integrating site-specific growth for innovativesilvicultural prescriptions. Forest Ecology andManagement. 69:245-257.
Larson, S.M;Cass, G.R;Hussey, KJ; Luce,F. 1988.Verification of image processing based visibilitymodels. Environmental Science andTechnology.22(6):629-637.
McGaughey, Robert J. 1997. Visualizing forest standdynamics using the standvisualization system. Proc,
163
1997 ACSM/ASPRS Annual Convention andExposition. American Society for Photogrammetryand Remote Sensing 4:248-257.
McGaughey, Robert J.;Twito, Roger H. 1988.VISUAL and SLOPE: perspective andquantitative representation of digital terrain models. GenTech RepPNW-GTR-214. Portland, OR: USDA, ForestService. Pacific Northwest Research Station. 26 p.
McGaughey, Robert J.; Ager, Alan A. 1996. UTOOLSand UVIEW: analysis and visualization software.Proc, sixth biennial USDA Forest Service remote
sensing application conference. American Society ofPhotogrammetry and Remote Sensing. 319-329.
Myklestad, E.; Wager, J.A. 1976. PREVIEW: computerassistance for visual management of forested landscapes. Res PapNE-355. Morgantown, WV: USDA.Forest Service, Northeastern Forest ExperimentStations. 12p.
Orland, Brian. 1988. Video-imaging: a powerful toolfor visualization and analysis. LandscapeArchitecture. 78: 78-88.
Orland, Brian. 1993. Synthetic landscapes: a review ofvideo-imaging applications inenvironmental perception research, planning, anddesign. In: Marans,Robert W. and Daniel Stokols, eds. Environmentalsimulation: research and policy issues. New York.:Plenum Press. 213-252.
Orland, Brian. 1997. Forest visual modeling for planners and managers. Proc, 1997ACSM/ASPRSAnnualConvention and Exposition. AmericanSociety for Photogrammetry and Remote Sensing.4:193-203.
Orland, Brian; Daniel. Terry C; LaFontaine. Jeanine;Goldberg, C. 1990. Visual effects of insect damagein western mixed coniferous forests. Final Report.Cooperative Research Project. USDA Forest Service,Rocky Mountain Forest and Range ExperimentStation, Research Work Unit 4501. Imaging SystemsLaboratory, Department of Landscape Architecture,University of Illinois, Urbana. 33 p.
Virtual RealityLaboratories. Inc.©1993. Vistapro userguide (IBM DOS Version 3.0). San Luis Obispo, CA:Virtual Reality Laboratories. Inc. [paged by individual chapters].
164
Visual Quality Assessment ofAlternative Silvicultural Practices in
Upland Hardwood Management
Tim McDonald
USDA Forest ServiceAuburn, Ala.
and
Bryce StokesUSDA Forest Service
Auburn, Ala.
Abstract: Visual impacts of forest operations are of increasing concern to forest managers. Tools are available for evaluating,and potentially avoiding, problems in visual quality resulting from poorly designed haivest unit boundaries. One of these visualization tools is applied in comparing various harvest unit shape alternatives in an upland hardwood stand on steeply slopingground. Visualization tools were found to be most suited to placing small leave strips within larger clearcuts for obscuring someareas from view and giving the impression of a series of smaller cutting units.
Keywords: visualization rendering, visual impacts, quality aesthetics
INTRODUCTION
Forest management in the South hasnothistoricallybeenconstrained by visualqualityconcerns.Although management practices are routinelyemployed to mitigate visual impacts of harvesting,greater care in design and layout of forest harvestunits may become necessary if public sensitivity toappearance increases as it has in other partsof thecountry.
Visual simulation is one technique available tomanagers forestimatingthe severity of, andperhapsavoiding,negative visual impactsof forestharvesting. These techniques have not been usedwidely in the South,but could be of great benefit toforest managers if applied in highly visually sensitiveareas.This paper reports on an applicationof visualsimulation inevaluating the changein appearance ofa hillslope whenharvestedusingdifferentcut unitboundaries. Various types ofdesignrecommendations havebeenpublished givingmanagerssome guidance in how to alter a particularharvest block to minimize visual impacts. This paperwill reporton a particularapplication ofsomeofthese recommendations, report on how they changed
165
cut unitsize, andshowhoweffective theywereinaltering the visual impact of harvesting.
METHODS
There are twomain approaches to implementingvisual simulation: retouching photos (e.g. Orland1988; Johnson and others 1994; Palmer and others1993) and a 'virtual reality' method where the sceneisconstructed using computer rendering techniquesbased ona model of landscape features (e.g. Bergenand others 1992; Fridleyand others 1991). Bothmethods have their advantages. Photo retouchingtends to be themostrealistic, but is constrained bythequality andview point of theoriginal image. Italso requires at least a minimal level ofartistic skillto perform, andconsiderable ground workto collecta photo library of appropriatetexturesand colors foruse in retouching the images. It has been usedsuccessfully in developing a strategyfor harvestsinvisually sensitive areas(Palmer andothers 1993), andseems to be used quite effectively, and often, in thePacific Northwest region (Taylor 1994). The 'virtualreality', or computermodelling, approach has beenused less frequently inpractice. This seems mainly

related to issuesofqualityof the images producedand the computer power necessary to generate them.This approach requires generating a 3-dimensionalmodel of the landscape, completewith trees andother features, andthen simulating computationallyhow lightwould interact with it. It requires largeamounts ofdata and a sophisticated rendering systemto implement. Because ofthe intensity ofthecomputations required, it-can also take a long time togenerate an image. The advantages ofthe approach,however, make it a viableoption.Althoughcostsofcomputerhardware might be higherup front, costsper picturewill probablybe lower because no fieldwork is needed to generate an image. There is alsoconsiderable flexibility with the approach. Any foresttype at any stage ofdevelopment can be simulated onthe same landscape, making it possible to seechangesover time, something very difficult to dowith photo editing. Another disadvantage ofthephoto editingmethod is locating a particular spotonthe ground within a photo. In the modellingapproach, any location can be specifiedexactlywithin the image.This is especiallyeasy if therenderingsystem is coupled with a GIS.
Either ofthesetoolswouldbe useful in evaluatingvisual impacts typical ofsouthern silviculturalpractices and landscape conditions. Our particularapplication wasto examine the suitability of stripclearcuttingin upland hardwood management. Atleast two studies (Schweitzer and others 1976; Danieland Boster 1976) haveshownthatleave strips canincrease the scenicacceptability of large clearcuts.Strip clearcutting ofhardwoods onsteeply slopingsitescouldalsopotentially decrease soil losses byproviding filter strips withinthe stand. Despite thesepotential advantages, anumber of concerns persistovercosts and silvicultural effects of implementingstripclearcutting in uplandhardwoods.
In 1996 ourresearch unit, along with ChampionInternational, National Forestsof Alabama, AlabamaA&M University, andAuburnUniversity, installed astudyto investigate three harvest systemsin uplandhardwoods: clearcut, stripclearcut, and defermentcut. Variables measured included estimates of harvestcosts and productivity, site impact, soil movement,and regeneration, for each alternative.
Also of interestwas the perceived scenic beauty ofeach harvest alternative. However, because ofthestudy design, it was not possibleto implement eachtreatment on an operational scale. The study wasinstalled on a hillslope in northern Alabama, near the
166
confluenceofThompson and West Flint creeks inLawrence County. The area available for the studytotaled about 20 ha (50 acres), and to have aminimum number ofreplicates, treatmentblockswere limited to 4 acres in size. Itwaspossible tosatisfactorily measure economic, silvicultural, andenvironmental effects on blocks this size, but visualquality wasanother matter. As analternative, acomputer visualization systemwasdeveloped toproduce images ofthetreatments implemented arosstheentire hillslopee. This paper reports on theuse ofthat system in evaluating the silvicultural treatmentsinstalled intheupland hardwood management study,aswell as someobservations on thevalidity ofimages produced, thedrawbacks/problems associatedwith this type ofapproach, and some observationsonthe useof harvest unit boundaries and leave patchesto mitigate visual impact.
A number of simulations were made usingthevisualization system. Presented inthis paper areviews of the uncut hillslope, plus aclearcut and stripclearcut version, and a larger clearcut on the samehillwithSMZsand visual screens. All images weremade using topography dataobtained from USGSand imported into a GIS. The GIS was used to createfictitious cut unit boundaries, as well as to measureareas of treated blocks.
Figure 1shows atopographic mapwith the stripclearcut boundaries superimposed. Scale is notshown,but is approximately 8mm perkm (1/2 inchper mile). Strips wereapproximately 46 m (150')wide, with 46 m intervals between. Total area was18.2 ha(45 ac) for the threestripcuts. Theseboundaries in figure 1 served as the basis forsimulating thestrip clearcut, and theouter boundaryofthe three strips was used for the clearcut. Totalarea of the clearcut polygon was 31 ha (76 ac).
A view point is also indicated on the map. Thisview point was about600 m (2000 ft) from themiddle of thehillslope across a narrow valley. It washigherthan the surrounding ground and both clearedoftrees and accessible. Photos were taken from theview point for comparison with simulated images.This point was also used as the viewer location for allsimulated images.
Figure 2a shows topography of the same areawith asomewhat larger clearcut boundary superimposed.Within the clearcut arethreebuffer zones coveringthe bottom ofdrainsrunning downhill. This areawasused as a potential realization ofa large-scale

clearcut thatmight be applied on the hill. Totalareaof theclearcut was 48 ha(119 ac) excluding thebuffer zones. Figure 2b isthe same clearcut plus aseriesofsmall screensand patchesused to bothobscure parts of the clearcut and give theappearanceof the larger area being composedof several smallerareas. These are standard options for mitigatingvisual impact ofclearcuts.
Figure 3 is a scanned imageofa photoofthehillslope taken from the view point in figure 1. Thephotowas taken using a standard 50 mm lens andrecorded on slide film.
Simulated images were made using the systemdescribed in McDonald (In Press). This visualizationsystem is built around a general-purpose raytracingTenderer. The Tenderer provides very flexible controlover the ' camera' used to createthe images. Thesimulated imageswere made using a wide-angleexposure in order to show a greater length ofthehillslope for comparison among treatment options.This is in contrast to the photo in figure 3 and shouldbe kept in mind in making comparisonsto the actualview.
RESULTS AND DISCUSSION
Figure 4 shows simulated versions of the hillslopeinan uncut state, and with the clearcut and stripclearcuttreatments imposed. Comparison of the uncutsimulated imagewith the photo from figure 3 showsthat there were some obvious differences between
the two. The most striking was the amount ofreliefseen in the simulated ridgetop compared to the realone. The photo from figure 3 shows only a smallsection ofthe simulated hill slope in figure4 andcould, therefore, not be truly comparable. But, basedon experience with other simulations, it was likelythat the use of the USGS digital elevation model(DEM) to generatethe topography led to errors.There is variability inherent in the DEM itself, aswell as in the conversion from the 30 m grid used inthe DEM to the triangularirregular network thatservesas the groundsurface in the simulated images.
Another obvious difference between the images infigures 3 and 4 were the textural characteristics of thevegetation. The simulated trees seemed somewhat'smoother1 in appearancethan the real. Thedifference was more pronounced in the color versionsofthe images. The simulated trees were modeledusing images of trees painted onto transparent boxes.
The tree images used in this process were drawingsinstead of actual tree photos. The use of photosmight have led to more realistic simulations.Although nodirect comparison is possible fromfigure 3, it is likely that the cutover areas of figure 4would have shown qualitativedifferences with actualphotosof slashand bare ground.
Despite someinconsistencies with reality, the imagesproducedusing the system were useful forcomparison between treatments. There was adramatic difference inthe amount ofvisible groundsurface between the two cutting patterns. It appearedfrom these results that theuseofstrip clearcuttingshould reduce the potential for negative publicreaction to the harvest. No dataareavailable,however,thatmight indicate the degree ofbenefitfrom implementing this silvicultural practice.Without this type of information it would be difficultto determinewhether a 40 percentreduction inharvested volume, plusthe added expense formarking, would be justified.
Stripclearcutting is a screening technique used toobscure the view ofa harvested area. Some have
charged(Wood 1988 for example) that this deceivesthe public concerning the nature of forestmanagement and is counterproductive in the longterm. Mitigating the visual impact ofa harvest, onthe otherhand, is considered a prudent approach togaining, orat least maintaining, public acceptancefor the practice of forestry.
Mitigation techniquesaremore difficult to implementthan simplescreening. Calculating anaverage stripwidth to screen a harvest as in the aboveexamplecould easily be done given data on slope and treeheight. A rendering system for this situation isprobably not necessary.
Placing cut unit boundaries for reducing visualimpacts, however, is a more subtle process thatbenefits from the useofa design tool. Relativelysmallshifts in placement of screens, forexample, orsmall patches of leavetrees,canhave fairly dramaticeffects on the appearance ofa harvest.
Figure 5 shows the hillslope ofthe previous exampleswith a42.5 ha(105 ac)clearcut (46.1 ha boundedbycut unit, 3.6 ha in buffer strips). Although the bufferstrips helpbreak up the size ofthe unit visually, theclearcut still dominates the hillside visually. Addingtwo small, thinned strips anda coupleof leavepatches (see figure 2), however, seems to reduce the
167
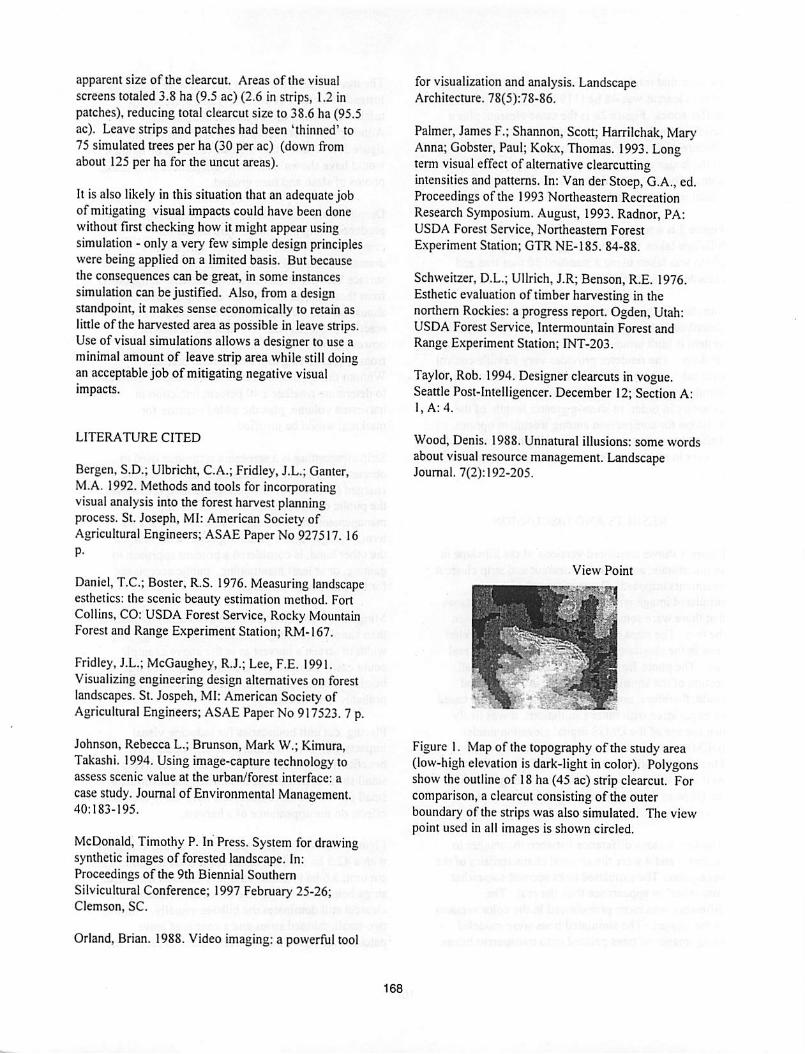
apparent size of the clearcut. Areas of the visualscreens totaled 3.8 ha (9.5 ac) (2.6 in strips, 1.2inpatches), reducing total clearcut size to 38.6 ha (95.5ac). Leave strips and patches had been 'thinned' to75 simulated trees per ha (30 per ac) (down fromabout 125 per ha for the uncut areas).
It is also likely in thissituation that an adequate jobof mitigating visual impacts could have been donewithout first checking how it might appear usingsimulation - only a very few simple design principleswere being applied on a limited basis. But becausethe consequences can be great, in some instancessimulation can bejustified. Also, from a designstandpoint, it makessense economicallyto retain aslittle of the harvested areaas possible in leave strips.Use of visual simulations allows a designer to use aminimal amount of leave striparea while stilldoingan acceptable job of mitigating negative visualimpacts.
LITERATURE CITED
Bergen. S.D.; Ulbricht, C.A.; Fridley, J.L.; Gamer,M.A. 1992. Methods and tools for incorporatingvisual analysis into the forest harvest planningprocess. St. Joseph, MI: American Society ofAgricultural Engineers; ASAE Paper No 927517. 16P-
Daniel, T.C; Boster. R.S. 1976. Measuring landscapeesthetics: the scenic beauty estimation method. FortCollins, CO: USDA ForestService, Rocky MountainForest and Range Experiment Station; RM-167.
Fridley, J.L.; McGaughey, R.J.; Lee, F.E. 1991.Visualizing engineering design alternatives on forestlandscapes. St. Jospeh, MI: American Society ofAgricultural Engineers; ASAE PaperNo 917523. 7 p.
Johnson, Rebecca L.; Brunson, Mark W.; Kimura,Takashi. 1994. Using image-capture technology toassess scenic value at the urban/forest interface: a
casestudy. Journal of Environmental Management.40:183-195.
McDonald, Timothy P. In Press. System for drawingsynthetic images of forested landscape. In:Proceedings of the 9th Biennial SouthernSilvicultural Conference; 1997 February 25-26;Clemson, SC.
Orland, Brian. 1988. Video imaging: a powerful tool
for visualization and analysis. LandscapeArchitecture. 78(5):78-86.
Palmer, James F.; Shannon, Scott; Harrilchak, MaryAnna; Gobster, Paul; Kokx, Thomas. 1993. Longterm visual effect of alternative clearcuttingintensities and patterns. In: Van der Stoep, G.A., ed.Proceedings of the 1993 Northeastern RecreationResearch Symposium. August, 1993. Radnor, PA:USDA Forest Service, Northeastern ForestExperiment Station; GTRNE-185. 84-88.
Schweitzer, D.L.; Ullrich, J.R; Benson, R.E. 1976.Esthetic evaluation of timber harvesting in thenorthern Rockies: a progress report. Ogden, Utah:USDA Forest Service, Intermountain Forest andRange Experiment Station; INT-203.
Taylor, Rob. 1994. Designer clearcuts in vogue.Seattle Post-Intelligencer. December 12; Section A:1,A:4.
Wood, Denis. 1988. Unnatural illusions: some wordsabout visual resource management. LandscapeJournal. 7(2): 192-205.
View Point
Figure 1. Mapof the topographyof the study area(low-high elevation is dark-light in color). Polygonsshow the outlineof 18ha (45 ac) strip clearcut. Forcomparison, a clearcut consistingof the outerboundary of the strips was also simulated. The viewpoint used in all images is shown circled.
168

a)
b)
Figure 2. Two elevation maps showing the hillsidewith a large clearcut boundary. Streamside buffersare included in 2a. The addition of some small
patches of leave trees is shown in 2b.
Figure 3. A photo showing how the hillside actuallyappeared from the view point.
(b)dtUCUt
i
(c)mip eleven
Figure 4. Simulated image as seen from the viewpoint that compares the hillslope in an uncut,clearcut, and strip clearcut state.
:--••. .v„%... ... ..
(i)clcarml
, -. -j^w.^.J.'ji.iT.' -.v.-.-
(b)ele»mjt*uhSMZi
-.-....,- a£
(c)*i Ihvuul| KXMM
Figure5. The same hillside with a larger clearcut,with SMZs added, and with additional visualscreening patches.
169
COUNCIL ON FOREST ENGINEERING REPORT
NORTHEAST U.S. AND EASTERN CANADA
JUNE 1997
Stephen M. WiederUnit Forester
St. John Unit
PO Drawer YAshland, ME 04732
The New England Regional Council On ForestEngineering is alive andwell. NERCOFE currentlyhas 14 eastern Canada members and 52 northeasternU.S. members.
On March 3-4, 1997 NERCOFE held a conference atthe University of Maine, Orono. Topics were on lowimpact logging equipment andMaine forestry laws,regulations, and guidelines. This conference receivedmany positive comments from the 127 attendees.
At the annual business meeting NERCOFE membersvoted to donate $2,000 to the Tom Cocoran
Scholarship Fund. This moneygoes into a trust fundwhere scholarships are given out using interest or dividends and not the capital.
MAINE
Of particular interest wasthe Green Party Referendumthatwasproposed to ban clearcutting and greatlyrestrict other forestry practices in the state of Maine.To gain support against the referendum Maine'sGovernorKing and the forest industry asked environmental groups suchas the Maine Audubon Society, theNatural Resources Council of Maine, and theSportsman Alliance of Maine what forest industrycould do to gain their support.
After much negotiating andconsensus, these groupsagreed to propose an alternativeto the Green PartyReferendum called The Compact. Therefore, therewere three choices on the November 1996 ballot, 2AThe Green Party's "Ban Clearcutting Referendum," 2BThe Compact for Maine's Forest, and 2CAgainst bothmeasures. Industry and Compact supporters were hoping to get 51%of the vote to enact the Compact andpossibly be done with the issue.
At the polls, 2A got29.6 %, 2B got 47.7%, and 2Cgot22.7%. It is a dead issue for now and will be voted onin 1997.
This whole issue is a verysensitive one. There aremany small landowners who don't want any furtherrestrictions on forest practices. Most of the 13 largelandowners in the state have already adopted theCompact on a voluntary basis into their operations.The Green Party supporters will probably vote againstthe Compact and try to get more restrictive forestrypractices including a ban on clearcutting. Polls showthat if it was voted today, the outcome wouldbe 50/50.The forest industry will be working hard to gain theundecided voters support for theCompact in thiscoming November election.
Jonathan Carter, who spearheaded Maine's ban clear-cut initiative, isnow executive director of the newlyformed Forestry Ecology Network (FEN), a non-profit,anti-forestry group committed to regulating forestrypractices on all lands in Maine. FEN is supporting twoforestry related bills in the 118th Legislature whicharesponsored by Rep. Paul Volenik (D-Sedgwick). Thefirst is a statewide banon clearcutting. Thesecond is arequirement that landownersreceivingbenefits underthe Tree Growth Tax law retain minimum volumes oftrees after harvest.
NEW HAMPSHIRE
Boise Cascade Corp., Champion International Corp.,Crown Vantage Inc., International Paper, John HancockMutual LifeInsurance Co.'sTimber Resource Group,Wagner ForestManagement and Fred Foss signedandnegotiated a voluntary "Memorandum of Understanding for High-Elevation Forest Management," toset standards for harvesting timberon environmentally
170

sensitive lands above 2,700 feet. The agreement cov- VERMONTers harvest limits, restrictions on road building, andprotection ofwildlife habitat on more than 33,000 The State Senate passed by20 to 10 avote to enact aacres. The Appalachian Mountain Club helped draft moratorium on the application ofherbicide spray as aand negotiate the pact because it believes voluntary forest practice. The State House must now debate andagreements "can often accomplish more than legisla- decide whether to support moratorium. Governor Deantion" supports the moratorium.
171
SOUTHERN REGIONAL REPORT
Bryce J. StokesUSDA Forest Service
Devall Drive
Auburn, AL36849
INTRODUCTION
It appears as if many in woodprocurement, forest management, operations, manufacturing, and sales in thesouthern U.S. aresimultaneously biting thebullet andshowing signs of guarded optimism for the future.
On the one hand, during last year, purchasing costswere high, selling prices werelow, quotas ruled,machine purchases sagged, and everyone's favorite discussion topic was "SFI." However, there is continuedcommitment to training, investments in timberland andfacilities in the South, new technology implementation,and a common hope that forestry will survive and prosper in the South. As the South becomes the wood basket for the nation, many see opportunities and thepotential for a better future. The questions are "howcan we afford to get whereour industry needs to be"and "who will pay." These questions will needto beaddressed in the near future.
HARVESTING TASK FORCE
In 1996,the American Pulpwood Association Southeastern Technical Committee formed a Harvesting TaskForce. The purpose of theTask Force is toencouragethe development and improvement of systems for economically harvesting trees with reduced levels of soildisturbance on wet sites. Objectives are to:
(1) identify andclarify opportunities for improvementof wet site harvesting,
(2) identifyshared perspectiveson how to harvesttrees on wet sites witha focus on moving treesfrom the stump to roadside or deck,
(3) provide a framework for testing alternativeapproaches and sharing results,
(4) provideloggers a forum for input to thisprocess, and
(5) providea forum for supplying information toequipment andengineering firms fordevelopmentof alternativeconcepts.
TheTaskForce is composedof representatives fromfive forest industrycompanies, two universities, theForest Service, APA, and two logging contractors.
To date, the Task Force has:
(1) identified a protocol for measuring soil surfacedisturbance,
(2) established some selected machine and systemattributes that minimize soildisturbance, and
(3) sponsored logging equipment manufacturers/loggers forum to discuss more innovative methods of reducing site impactson wet sites.
The forum hadexcellent participation with commonrecognition and concern for the problem ofsite impactson wet sites, and strong desire to continue such dialogue. There was excellent discussion concerning thatsome solutions were already available butexpensive,the market will not bear the cost of developing newtechnologies, technologies were not the only answer(an example was a need for training), and a concern asto who has to pay thecostassociated with doing whatit takes to reduce site impacts. The TaskForce willcontinue to provide mechanisms foraddressing theseconcerns and looking at solutions.
ROLE OF THE SOUTH
The Southern U.S. hasbecome a major supplier ofwood and wood products for the nation. It has overone third of the production forestlands in the U.S.. andforestry is the number-one industry in mostof theSouthern states. In the pastyear, land andproductionfacilities transactions in the South are an indication ofthe current and projected role that the South has in timber production.
Two examples are theadditional acquisition of over240,000 acres of commercial forestlands in the SouthbyWeyerhaeuser Company, and the purchase of over500,000 acres of timberlands intheSouth by PlumCreek Timber, a Northwest company.
There isalso increased interest in the development offast-growing hardwood plantations by the larger pulpand papercompanies. Several companies are doingpilot studies andare in theprocess of developing largeplantation systems, some using irrigated systems thatprovide supplemental water and controlled nutrient
172

delivery systems to individual trees. The SouthernResearch Station of the Forest Service has initiated amulti-disciplinary research cooperative to look at siteproductivity, environmental concerns, and efficientmanagement systems for such plantations. The proposed coopinvolves the Department of Energy'sSavannah RiverSite and Oak Ridge NationalLaboratory, three universities, and several forest industry companies.
INNOVATIONS
There have been new, or at leastreuse or expanded use,of innovative techniques in forest harvesting.
More companies have implemented orexpanded pineplantation thinning. Many are using cut-to-length systems, and several contractors areusing small swing-tracked harvesters. Aninnovation on the tree-lengthsystem in thinnings is to use the trees in the cut corridors as matting to protect the ground, especially byusing swing, tracked feller-bunchers. Many bottomland and swamp loggers areusing swing, trackedfeller-bunchers to reduce site damage and to improvethe efficiency of their system bybuilding strategicallylarger bundles, and by working withshovels to thetree-lengthmaterial to improve skidder access.
Clambunk skidders and large capacity forwarders arebeing introduced on wetsitesto improve productionand reduce site damage by eliminating high-traffickedareas. Large shovels and use of cableyarders on flatsites with intermediate supports arealso being tried.
Satellite and in-woods flail delimbing and debarkinghave become commonplace, especially in first thinnings of pine plantations. An innovation by onecompany is the delimbing/debarking of trees at roadside byflail systems into "barkless" tree-length wood tobesent todrum debarkers at the mill for improved chipquality, almost zero percent bark content whenchipped. Thesystem increases thepercent of usablefiber per truck load and leaves more of the waste onsite to be used for replacing nutrients.
A manufacturer has developed a hydrostatic drivenskidder with variable speed control to reduce slipandimprove traction while operatingon wet sites. It hasshownsome potential in reducingsite disturbance andimproving production. Also, a major skiddermanufacturerhasannounced the construction of a skidder plantin Georgia.
Loggertraining is still a majorconcern,especially inresponse to theAF&PA's Sustainable Forestry Initiative
(SFI). Almost every state has a logger training program. International Paper Company announced a planthat will require all loggers who supply fiber to theircompany to support this initiative, complete an education program, and adhere toSFI's harvesting criteria.
Champion Internationa] has initiated a PreferredSuppliers Program (PSP) which is anexpansion of SFIand itsown Stewardship and Sustainability Initiative.
-•It's being pilot tested in the Alabama Region. Itrequires that loggers exceed many state standards forwater quality protection, worker safety, provide forprotection ofendangered species, and meet wood quality standards.
CURRENT RESEARCH ANDEXTENSION EFFORTS
TheUSDA Forest Service Engineering Research Unitat Auburn, Ala., is completing extensive evaluation ofsite productivity, water quality, system efficiency,regeneration, and visual quality for upland hardwoods.Other studies include evaluating harvesting systems forbottomland hardwoods, assessing impacts of road construction onside slopes, predicting water quality andsoil impacts from different site prep and harvestingtreatments, andimproving forest worker safety andhealth.
Auburn University has anactive Professional LoggingManagement Course, having trained over 900 loggersto date. Two video conferences were conducted lastyean
(1) The Sustainable Forestry Initiative and ItsImpact on Loggers, and
(2) Worker's Compensation Issues and the Logger.
There has been a high demand for workshops such asLogging Cost Analysis, ThinningMethods, andHarvest Planning and Layout. Research has continuedon evaluating cut-to-length systemsin first and secondthinnings and clearcuts.
Other research has included evaluating the spreading ofpoultry litterandsludge on thinned pine plantations.Researchers have beeninvestigating the prevalence andoperating characteristics of animal logging operationsin Alabama. Theyconducted a surveywhich identifiedover50 animal loggers currently working in Alabama.A video conference on horse and mule logging wasbroadcast to several states and British Columbia inApril 1997.
Ongoing forestry operations research at Virginia Techincludes theevaluation of BMPs, logging capacity uti-
173

lization andcost, soil and site impacts from timberharvesting, chipquality, andlogger training. Newresearch is on theeffectiveness of logging safety programs and the establishment of SMZs in disturbed wetlands. Extension efforts at VirginiaTech have been thedevelopment of logger education programs onsafety,business management, andharvest planning forVirginia's Sustainable Forestry Initiative. Over 1,600logging personnel were trained in these programs in1996. Incooperation with theAmerican PulpwoodAssociation's Southwide Safety Committee, a"Knuckleboom Loader Safety" videotape was produced.
TheVirginia General Assembly passed a"right to practice forestry" law in 1997 that prohibits local governments from passing ordinances thatunduly restrict alandowner's right to practice forestry or harvest timber.Timber harvest levels haveincreased dramatically insome areas of Virginia overthe past 2-3 years, causingconcern among state forestry officials and forest industry leaders. The issue is being studied.
A prominent researcher atMississippi State University,Dr. William F. Watson, retired after a long and distinguished career to partake in the fruits of working for aforest industry company. Research andextension,especially in logging training, will continue, if notflourish in his absence.
The University of Georgia is formally establishing acenter for forestry business and is adding five new faculty positions. Current research and extension in forestoperations are focusing on labor issues, labor productivity, and SFI training. Computer simulation modelingis being used toevaluate arange of systems working invarious silvicultural treatments. New research has beeninitiated toevaluate the productivity and quality fordelimbing and processing.
There isother excellent research and extension beingcompleted at other universities and institutions acrossthe South. Unfortunately, the author hadinsufficienttime to contact everyone and regrets theirexclusionfrom this report.
174
Regional Report:
Lake States and Central Canada
Michael A. Thompson
USDA Forest ServiceNorth Central Forest Experiment Station
Houghton, Ml, USA
ABSTRACT: Forestry and forest operations in the Lake States and Central Canada appear to be doing reasonably well. Thenew reality is "sustainable forestry" as dictated by anumber of initiatives and regulations. Many individuals and organizationsare continuing to struggle with how to practice sustainable forestry on the ground. Management improvements are being madedaily as technology improves, better guidance develops, and information sharing occurs. This report provides aquick overviewof the issues, the industry, and related things of interest in the forests of the Lake States and Ontario.
Key Words: forestry, forest operations, forest industry, forest engineering
INTRODUCTION
Forestry and forest operations in the Lake States andCentral Canada appear to be doing reasonably well.Thebig issues in the Lake States region, as in mostotherregions, are theSustainable Forestry Initiative,Best Management Practices, logger certification, andlandowner certification programs. Issues in Ontariocontinue to be the Class Timber EnvironmentalAssessment and the Crown Forest Act.
Implementing theAF&PA's Sustainable ForestryInitiative (SFI)has been a major issue in the LakeStates. Thereare many questions anddisagreementsonhow to satisfy thebasic tenets of thisprogram.There arealsoquestions about whois responsible forwhatand who should pay the costs associated withcompliance. This has increased tension between woodbuyers and suppliers. TheAPA initiative to help provide on-the-ground guidance for SFIand mill/loggerrelationships (Tankersley 1997)has the potential toalleviate much of the current controversy.
The implementation of voluntary BestManagementPractices (BMPs) in each state is a somewhat less contentious issue. The major efforts being undertaken currently are: 1) surveying harvested sites to determinecompliance with BMP guidelines, 2) educating loggers,landowners, andforesters about BMPs, 3) providingtechnical assistance, and 4) conductingresearch on better ways to protect water resources (Hausler 1996).
In Ontario, the Environmental Assessment Board hasreleased its ruling on the Class Environmental
Assessment for Timber Management on Crown Lands(Kaiser 1996). The ruling provides a timber management planning process with extensive public participation and clear lines of responsibility and accountability.Although timber management is the main objective, byopening up the planning process, the Board has laid thegroundwork for progress in integrated resource management.
Another majorissueaffecting forestry in Ontario is theCrown Forest Sustainibility Act whose purpose is toensureCrownforests are managed to meetsocial,economic, andenvironmental needs of present and futuregenerations (Kaiser 1996). Key features are that it legislates forest, not timber, management; it introduces anew forest management licensing regime: it significantly increases Ministerial power; andit provides forstiffenforcement provisions. Of particular concern to theforest industry is the uncertainty in wood supply andfines for infractionspossible under this Act.
FOREST RESOURCES AND MANAGEMENT
Forest resources in the Lake States were assessedrecently by the Lake States Forestry Alliance (1995).Timber volume is increasing with growth exceedingharvest by about 90%. The forests are diverse andhealthy, with eachmeasure increasing as better management practices are used. Insect and disease threatsto forest health are generally localized, with droughtbeing theonly potential hazard likely to affect largeareas.
175
Forest areahas increased in the last 15 years byseveralmillion acres. Nonindustrial privateand state andcounty forests constitute 80% of the productive forestin the region. Thisownership pattern cancreate difficulties in applying good management practices acrossthe landscape. Management in this region tends to beless intensive than inseveral other regions. Management will have to become more intensive in the futureto achieve sustainableproductionof the forestresources in the Lake States.
Severalguiding principles for the environmental management of Lake States forests are included in the LakeStatesForestry Alliance report(1995). Theseincludethe following:
The diversity of Lake States forests canbe safeguardedand enhanced through management. Techniques areavailable to influence stand structure and biologicalcomposition to mimic the structure anddynamics ofnatural stands.
Human activities, such as forest management, industrialdevelopment, and recreational use, can be structured tominimize adverse effects onwater quality and quantity.
Areas ofconcentrated tourism require careful design tomaintain their attractiveness and to minimize negativeeffects on water and other natural resource values.
Practical andeffective strategies areneeded to mitigateenvironmental effects due to human use if forests are tobe sustained.
Interactions among resource uses and values rangefrom complimentary tocompatible tocompetitive.Except forsome especially incompatible uses, specificmitigating measures can be used to minimize conflict.
FOREST INDUSTRY
Forest industry in the region is in reasonably goodshape, even though pulp and paper production is Hearing the bottomof a down cycle (Johnson 1997). Thelumber sector is doing wellowing to continued strongdemand for housing and the imposition of a tariffonCanadian softwood imports.
Caterpillar is acquiring the majorityof assetsofSkogsjan AB, a Swedish cut-to-length equipment manufacturer. The companymanufactures forwarders, harvesters, and harvesterheads. This equipment is expected to fill a gap in Caterpillar's currentproductline.
Forest operations in many areas of the region are moving increasingly toward cut-to-length systems, duemainly to environmental benefits, as well as good person-day productivity insmaller trees. Highly mechanized systems are the norm in some areas, particularlyMinnesota where aspen clearcutting isprevalent. Theunderwater salvage logging operation at the bottomofLake Superior near Ashland, Wise, isexpected to continue for many years.
Several pieces of equipment have been introducedrecently from the Lake States region. Fabtek recentlydebuted its new 16-ton, 8-wheel forwarder. Timbcohas developed a 16-ton, 8-wheel forwarder tobepairedwith theirnewsingle-grip harvester, which usestheirwell-known carrier. SISU Valmet has revamped its single-grip, 6-wheel 911C harvester to address the needsof North American loggers, which includes a localparts supply. Forest Technology hasdeveloped astroke processor head with updated hydraulic andelectronic controls.
Prentice has introduced two new tracked feller bunch-ers (the 620 and 720) that feature automatic leveling,allowing them to work onslopes upto55%. Tigercathas introduced a tracked feller buncher featuring extraground clearance, low ground pressure, and generousliftcapacity. Timberjack has added many newfeaturesin their tracked feller bunchers, including more groundclearance, fuel capacity, swing torque, and tractiveeffort. Deere has added more power and a hydrostaticdrive to their 843G wheeled feller buncher. Blount hasintroduced the Hydro-Ax Tri-Wheel feller buncher featuring good stability, maneuverability, andcontrol.
Caterpillar has introduced their new purpose-built,527GR tracked skidder featuring anelevated sprocketdrive system, added power, reduced ground pressure,and better ground clearance. Hahn has introduced atracked, roll/stroke delimber (the HSW 110/T)designed to delimb in the woods behind a feller buncher. Timberline has introduced the SDL2a stroke delimber featuring a computerized measurement and controlsystem andoptional four-way leveling. Timberjack iscurrently developing a walking machine that theyexpectto have operating in the woodsby year 2005.
FOREST SHORTS
A ban on logging white pine in Minnesota had beenproposed due to greatly reduced inventories from historical levels. A compromisewas reachedwith theDNR to provideadvancednotice of sales involvingwhite pine.
176

Menominee TribalEnterprises in northern Wisconsin isunique in North America in that it has become the onlycompany with dual certification from both theScientific Certification Systems (Green Cross) and theInternational Rain ForestAlliance (Smart Wood).
The extremely low-frequency communications networkinstalled bythe U.S. Navy in upper Michigan hascausedthe adjacent trees to grow faster than normal -up to 50% diameter increase for aspen.
An eastern red cedar tree growing in northernWisconsin hasbeen estimated to be 1290 years old.
Farm groups inWisconsin support the legalizing andgrowing of industrial hemp, mainly as a supply of fiberto thepulp and paper industry. One acreof hemp provides as much fiber as 4 acres of trees.
ANative American tribe in Wisconsin is raisingEuropean red deer to supplement income from gambling. The meat isvaluable, with all parts of the animals being used.
Plans for the Lake States Wood Consortium, a collaboration between industry andresearch, arebeginning totake shape in the region.
Several automatic weather stations are being set upalong roadways in Wisconsin to monitor road conditions. The information collected will help determineroad maintenance needs, weight restriction timing, androad closures.
A University of Minnesota study shows thatmythsabound aboutforest healthand management issues.Continued effortsto educate the public are critical.
A University of Wisconsin study claims that habitatprotection doesnot hurt logging jobs.
Other sources of information about the current statusand important issues in the Lake States and Ontario canbe found in Brock (1996), Dahlman (1996), and Sturos(1995).
RESEARCH
One of the more significant research studiesassociatedwith forest operations being implemented in the regionis a study inMinnesota looking at the ecologicaleffects ofmanaging riparian forest areas. The study isa cooperative effort between the Minnesota Departmentof Natural Resources, the University of Minnesota, theNatural Resources Research Institute, and the USDAForest Service.
The purpose of the study is to assess the degree towhich several riparian forest prescriptions areeffectivein meeting ecological, downstream, timber, economic,and cultural resource objectives. Severalsilviculturaland harvesting treatments will be applied in riparianareas under both summer and winter conditions, withresponses being monitored. Thestudy is expected tocontinue through 1998.
LITERATURE CITED
Brock, Robert H. 1996. Spotlight on forest operations:Northeast/North Central Region. Forest ProductsJournal 46(7/8): 22-24.
Dahlman, Rick. 1996. The Western Great LakesRegion: Issues andtrends in timber harvesting andforest management. Proc, 19th Council On ForestEngineering, Marquette, MI. p. 188-193.
Hausler, Rich. 1996. Forestry best managementpractices and thesite audit program. MichiganForests 17(3):11. 16.
Johnson, Eric. 1997. Trends '97.TheNorthern LoggerAnd Timber Processor 45(7): 22,23, 26.
Kaiser, Martin. 1996. Ontario's new reality: TheTimber E.A. and the Crown Forest Act. CanadianForest Industries, March issue:33,34,36, 39.
LakeStates Forestry Alliance. 1995. Forest resourcetrends and opportunities in the Lake States: Acontinuing renaissance. Hayward, WI. 39 p.
Sturos, John A. 1995. Lake States regional report.Proc, 18th Council OnForest Engineering,Cashiers, NC. p. 12-14.
Tankersley, Mike. 1997. Wood tick trail: Taming themonster? TimberHarvesting 45(5): 11-12.
177
Inland West Regional Report
LeonardR.JohnsonUniversity ofIdaho
Moscow, Idaho
ABSTRACT: Forest industry conditions in the inland west continue to be affected by the supply of wood from federal lands.The use of cut-tc-length systems continues to grow throughout the northern part ofthe region and helicopter logging is frequently specified for harvests on federal lands. Future harvest activity on federal lands will likely emphasize thinning andrestoration harvest prescriptions.
Keywords: forest industry, timber harvesting, logging, mechanization
INTRODUCTION
The"inland west" is defined for this report to includeMontana, Idaho, Utah, Wyoming,Colorado, NewMexico, Arizona, Nevada, and South Dakota. Forestindustry issues in all states areaffected by thehigh percentage of commercial forest lands thatare managedby federal agencies, namely the U.S. ForestServiceand Bureau of Land Management.
The industry of the region has been dominated by primary lumber producers. Manufacturing of pulp andpaper,plywood and other composite productsoccurs inthe region, but not at the level of lumber. The secondarymanufacturing continues to grow. In 1991 theregion supplied about29% ofthe United States' production of softwood lumber. In 1995, that share wasreduced to 22%of U.S. production (Random Lengths1996). Many of the state, industrial and non-industrialprivate forest landsare being managed more intensively in an effort to offset some of the reductions in harvest volumes from federal lands.
Two majorenvironmental reports, the InteriorColumbia BasinStudy and relatedUpperColumbiaBasis Study, haverecently beencompleted (USDA1996). These will form a basis for management planson federal lands in the northern part of the inland west.The report recommends a decreased level of timberharvest activity on these lands, but also calls for thinningand other work to make stands less susceptible tostand-replacement wildfires. If the recommendationsare translated into land management plans, much of theharvest activity on federal landswill involve harvestingand handling smallertrees. An essentialpart of thatstrategy will be the availability of viable markets forproducts that can be manufactured from smaller trees.
SHORT ROTATION INTENSIVE CULTURE
At least two major corporations in the inland west haveprograms involving intensively grown, short rotationcrops. Thesefiberfarms will produce fiber initially forpulpand papermills within the region but have thepotential to produce fiber forothercomposite products.Oneof thecompanies began harvesting its firstrotationthispastyear. The second company will begin harvesting in 1999. Rotation age of the crops is between 5and 7 years.
Harvesting methods currently involve conventionalfeller-bunchers, forwarding with skidders or front endloaders,and processing through chain-flail delimber-debarkers. Additional enhancements in the harvestingsystems for these fiber plantations areanticipated in thefuture.
TIMBER HARVESTING SYSTEMS
The balance of timberharvesting systemshave notchanged dramatically from those reported by Starneslastyear (Starnes 1996). Conventional tractorsystems(wheeled skidder or crawler) with motor-manual fellingare still the mostcommon single system in the region.
There has been significant growth, however, in thenumberof cut-to-length systemsused in parts of theregion. These systems have operated predominantly onindustrial ownerships in a first commercial thinning ofpreviously regenerated stands. Some operations occuron non-industrial, private lands where the landownerwants to emphasize a relatively low removal intensityand high levels of site protection. The increase in unitsoperating in the regionhas led to a wider variety of
178

available systems with mostmanufacturers currentlyrepresented in the region.
Cable systems continue to be used on steeper slopes.Several manufacturers areoffering new yarder modelsappropriately sized for inland conditions. Yarderswiththecapability to swing the logs into a deck arestillthemostcommon. Neweryarders oftenallow riggingoptions that include standing, running, and live skylineconfigurations. With thedecreased activity on federallands, long lineyarding systems with distance capabilities beyond 600 meters (2000 feet) are less common.
Off-road jammers have been used extensively insouthernIdaho. Theiruseis beginning to spread tootherparts ofthe region. Thesystem utilizes a high speedwinch mounted on the boom of a tracked carrier thatcantravel offhaul roads. Carriers for steep slopefeller-bunchers are often used as the base for the system. The boom onthe carrier is used to"throw" tongsdown-slope sothat logs can be prebunched toridge-topskidtrails. Prebunched trees or logsare then forwardedto the landing forprocessing and loading.
Useof helicopter systems has been common in recentsalvage operations onfederal lands, especially salvageoperations following wildfires. Several helicopteroperations have utilized the newer K-max model helicopter.
Several harvesting research projects in the regioninvolve equipment and systemsto handlesmall treeswith accompanying studies onthe impacts of these systems.
EDUCATION / TRAINING
Efforts in logger education continue through partnerships between industry associations, stateuniversities.
andtheirassociated extension organizations. Thesearegenerally directed at the education elements recommended in theAmerican Forest and PaperAssociation's Sustainable Forestry Initiative. Elementsofthe training include ecology andsilviculture, waterquality, safety, first aid, and business management.
Thetimber harvesting option in theForest ProductsDepartment at the University of Idaho was recentlyaccredited by the Society of Wood Science andTechnology. It was accredited along with theotherforest products options in the department.
ENVmONMENTAL CONCERNS
The northern part of the region has received higherthan normal moisture thepast2 years. Record snows,record fall moisture levels, rain on snowevents, andsaturated soils have resulted in flooding and a highamount oflandslide activity. Atask force iscurrentlyinvestigating causes ofslides inparts ofthe region andthe U.S. Forest Service hasbegun road obliterationprograms on a number of forests.
LITERATURE CITED
Random Lengths. 1997. 1996 Yearbook. RandomLengths Publications. Eugene, Oregon. 250p.
Starnes, Lawson W. 1996. Inland West RegionalReport. Planning andImplementing ForestOperations to Achieve SustainableForests, GeneralTechnical Report NC-186. USDA Forest Service.NorthCentral ExperimentStation: 194-197.
USDA Forest Service. 1996. Status of the InteriorColumbia Basin: Summary ofScientific Findings.General Technical Report PNW-GTR-385. Portland,Oregon. 144p.
179
Western United States Regional Report
Loren D. KelloggProfessor
Department ofForest EngineeringOregon State University
Corvallis, Oregon
ABSTRACT: Some key issues in the western U.S. region in 1996/97 are forest management practices related to stream habitatand salmon, landslides following severe wet weather, and forest health and restoration. Timber harvest levels have remainedapproximately the same as the previous year. There has been an increasing emphasis on thinning and small wood handling.Land management activities on federal land are directed at forest structure based objectives and increasing emphasis onuneven aged silvicultural strategies. An increasing number of short rotation hybrid poplar plantations are being harvested. TheSustainable Forestry Initiative™ of the American Forest and Faper Association has stimulated increased efforts in logger education in several western states. Considering the issues and challenges continually facing forest operations, the demand for professionally trained forest engineers in expected tocontinue.
Keywords: Western U.S., harvesting, legislation, forest industry, forest engineering.
INTRODUCTION
The current trend in forest management in the westernregion ofthe United States is toward more intensiveand diverse management regimes, and this trend isexpected to continue into the 21st century. Intensivemanagement involves practices such as multiple thinnings, fertilizations, and pruning. This report highlights several key issues that developed in 1996797 thatwill have long-term effects on the forest industry. Inaddition, an overview of forest management/timberharvesting operations and forest engineering education/logger training is presented.
SALMON ISSUE LEADS TO
INNOVATIVE PLAN IN OREGON
Declining numbers of wildcohosalmon recentlyprompted the National Marine Fisheries Service to considerlisting some coastalOregon populations as threatened species. A listingcould have given the federalgovernment authority to significantly restrict management practices on private lands to maintain criticalstream habitat for the fish.
As an alternative, Oregon's governor led an effort todevelop a detailed voluntary plan to notonly maintainexisting stream habitat for coho, but also conduct widespread habitat andwatershed improvement projects.Both the Oregon legislature and the forest industryagreed to help fund the plan to a total of about $30 mil
lion. The success of the plan will befollowed closelyoverthenext few years, as it represents a unique stateand local approach for dealing with bothenvironmentaland private landconcerns as they relate to theEndangered Species Act, and could serve as a modelfor addressing other specieslistings.
LANDSLIDES ARE FOCUS OF STUDffiSAND POLICY DECISIONS
Thewet weather of 1996 and 1997 ledto a large number of landslides onforest lands inOregon, includingonethat killed four people. Theslides ignited publicconcern about possible effects of timber harvesting andlogging roads,and prompted agency and political interest in both studiesof theseeffectsand potentialchanges in forest practices to reduce landslide problems. Oregon's forest industry alsotook thesignificantstep of voluntarily suspending logging on unstableareas until furtherstudiesof the problem could be completed.
Initial studies have included new analyses bythe OregonSuite University Forest Engineering Department andthe Oregon Department of Forestry. Both efforts confirmed that harvesting and roadscan play a role insome landslide events, but that management and policyresponses are not necessarily clear or simple.Especially challenging is the issue of clearcutting andlandslides, because of the variable effects observed aswell as difficulties indeveloping andadministering
180
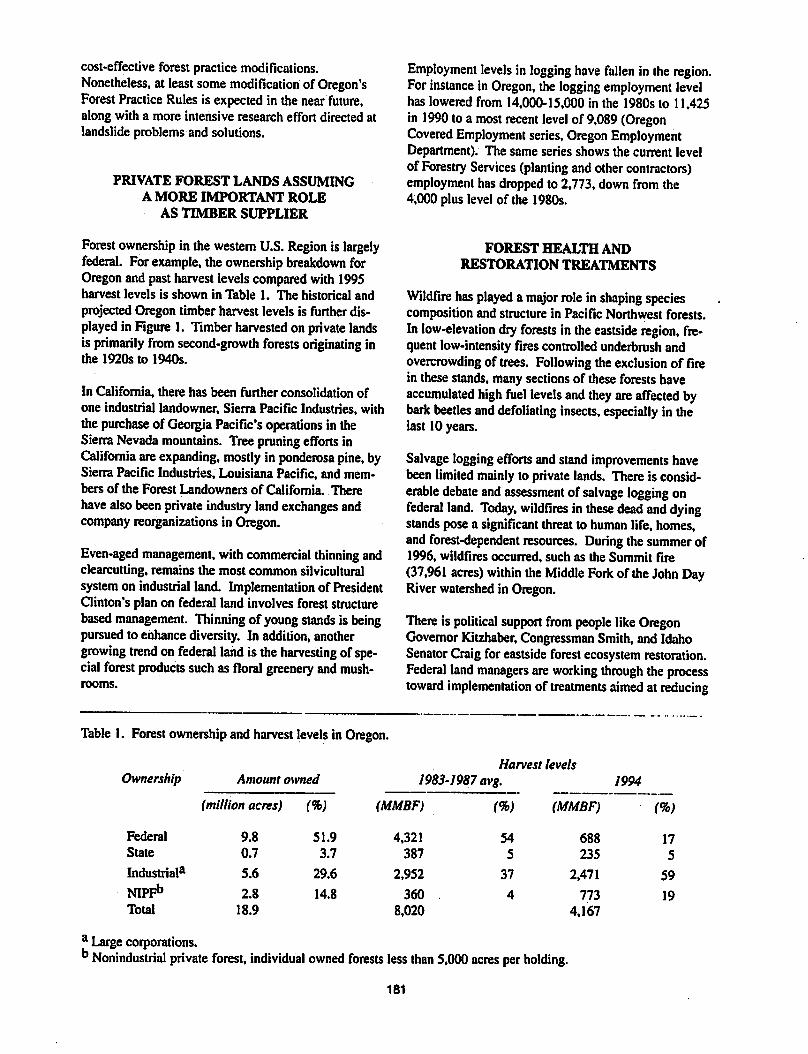
cost-effective forest practice modifications.Nonetheless, at leastsomemodification of Oregon'sForestPractice Rules is expected in the nearfuture,along with a more intensive research effort directed atlandslide problems and solutions.
PRIVATE FOREST LANDS ASSUMING
A MORE IMPORTANT ROLE
AS TIMBER SUPPLIER
Forest ownership in the western U.S. Region is largelyfederal. Forexample, the ownership breakdown forOregon and past harvest levels compared with 1995harvest levels is shown in Table 1. The historical and
projected Oregon timber harvest levels is further displayedin Figure 1. Timber harvested on private landsis primarily from second-growth forests originating inthe 1920s to 1940s.
In California, there has been further consolidation ofone industrial landowner. Sierra Pacific Industries, withthe purchase of GeorgiaPacific's operations in theSierraNevada mountains. Treepruning efforts inCalifornia areexpanding, mostly in ponderosa pine, bySierra Pacific Industries, Louisiana Pacific, and members of the Forest Landowners of California. Therehave alsobeen private industry landexchanges andcompanyreorganizations in Oregon.
Even-aged management, withcommercial thinning andclearcutting. remains the most common silviculturalsystemon industrial land. Implementation of PresidentClinton's plan on federal land involves forest structurebased management. Thinning of young stands is beingpursued to enhance diversity. In addition, anothergrowing trend on federal land is the harvesting of special forest products suchas floral greenery and mushrooms.
Employment levels in logging have fallen in the region.Forinstance in Oregon, the logging employment levelhas lowered from 14,000-15,000in the 1980s to 11.425in 1990 toa most recent level of9,089 (OregonCovered Employment series, Oregon EmploymentDepartment). The same series shows the current levelof Forestry Services (planting andothercontractors)employment has dropped to 2,773,down from the4,000 plus level ofthe 1980s.
FOREST HEALTH AND
RESTORATION TREATMENTS
Wildfire has played a major role inshaping speciescomposition and structure in Pacific Northwest forests.In low-elevation dry forests in the eastside region, frequent low-intensity fires controlled underbrush andovercrowding of trees. Following the exclusion of firein thesestands, manysections of these forests haveaccumulated high fuel levels andthey areaffected bybark beetles anddefoliating insects, especially in thelast 10 years.
Salvage logging efforts andstand improvements havebeen limited mainly to private lands. There is considerable debate and assessment of salvage logging onfederal land. Today, wildfires in these dead and dyingstands pose a significant threat to human life, homes,and forest-dependent resources. During the summerof1996, wildfires occurred, such as the Summit fire(37,961 acres) within the Middle Fork ofthe John DayRiverwatershed in Oregon.
There is political support from people likeOregonGovernor Kitzhaber, Congressman Smith, and IdahoSenator Craig foreastside forest ecosystem restoration.Federal land managers are working through the processtoward implementation of treatments aimed at reducing
Table 1. Forest ownership and harvest levels in Oregon.
Harvest levelsOwnership Amount owned 1983-1987 avg. 1994
{million acres) (%) (MMBF) <%) (MMBF) <%)
Federal 9.8 51.9 4,321 54 688 17State 0.7 3.7 387 5 235 5
Industrial8 5.6 29.6 2,952 37 2,471 59
NIPFb 2.8 14.8 360 4 773 19Total 18.9 8,020 4,167
a Large corporations.0 Nonindustrial private forest, individual owned forests less than 5,000 acres per holding.
181
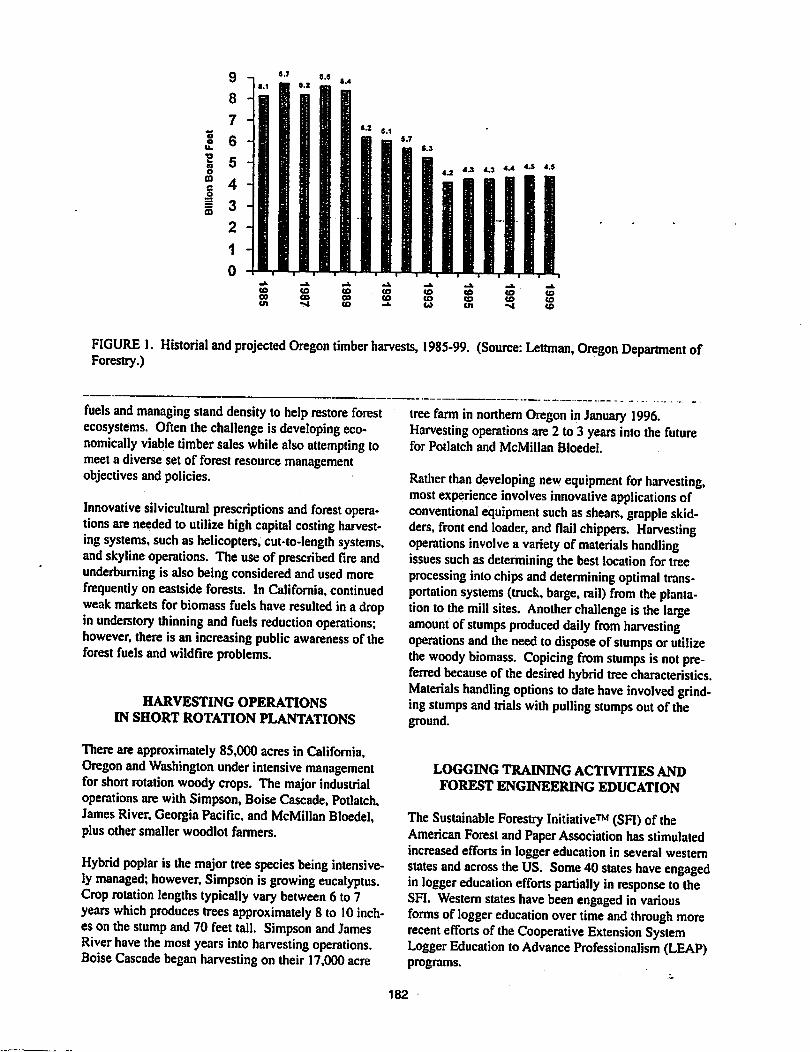
FIGURE 1. Historial and projected Oregon timber harvests, 1985-99. (Source: Lettman, Oregon Department ofForestry.)
fuels and managing stand density to help restore forestecosystems. Often the challenge is developing economically viable timber sales while also attempting tomeet a diverse set of forest resource managementobjectives and policies.
Innovative silvicultural prescriptions and forest operations areneeded to utilize high capital costing harvesting systems, such as helicopters, cut-to-length systems,and skyline operations. The useof prescribed fire andunderburning is also being considered and used morefrequently on eastside forests. In California, continuedweak markets for biomass fuels have resulted ina dropinunderstory thinning and fuels reduction operations;however, there is an increasing public awareness of theforest fuelsand wildfire problems.
HARVESTING OPERATIONSIN SHORT ROTATION PLANTATIONS
There are approximately85,000 acres in California,Oregon and Washington under intensive managementforshort rotation woody crops. The major industrialoperationsare with Simpson, Boise Cascade, Potlatch,JamesRiver, GeorgiaPacific, and McMillan Bloedel,plus other smaller woodlot farmers.
Hybrid poplar is themajor tree species being intensively managed; however, Simpson is growing eucalyptus.Croprotation lengths typically vary between 6 to 7years which produces trees approximately 8 to 10inches on the stump and 70 feet tall. Simpson and JamesRiver have the most years into harvesting operations.Boise Cascade began harvesting on their 17,000 acre
treefarm in northern Oregon in January 1996.Harvesting operations are 2 to 3 years into the futurefor Potlatch and McMillan Bloedel.
Rather than developing new equipment for harvesting,most experience involves innovative applications ofconventional equipment suchas shears, grapple skid-ders, front end loader, and flail chippers. Harvestingoperations involve a variety of materials handlingissues suchas determining thebest location for treeprocessing intochipsanddetermining optimal transportation systems (truck, barge, rail) from the plantation to the mill sites. Another challenge is the largeamount of stumps produced daily from harvestingoperations and theneed to dispose of stumps or utilizethe woody biomass. Copicing from stumps is not preferred because ofthe desired hybridtree characteristics.Materials handling options todate have involved grinding stumps and trials with pulling stumps outof theground.
LOGGING TRAINING ACTIVITIES ANDFOREST ENGINEERING EDUCATION
The Sustainable Forestry Initiative™ (SFI)of theAmerican Forestand PaperAssociation has stimulatedincreased efforts in logger education in several westernstates and across theUS. Some 40 states have engagedin logger education efforts partially inresponse to theSFI. Western states have been engaged in variousforms of logger education over time and through morerecent efforts of theCooperative Extension SystemLogger Education toAdvance Professionalism (LEAP)programs.
182

The logging associations often recognize logger education efforts through programs such asthe WashingtonContract Logger Accredited Logging Professional program orAssociated Oregon Loggers' PRO-LOGGERprogram. In California, over200loggers have receivedsome training with over 50completing all the "requiredcore" of 17 units and at least 3 units of electives. Effortsare needed to make logger education a sustainable activity insupport ofsustainable forestry operations.
Two efforts areunderway to help loggers and othersbetter understand logging costs and bidding practices."Cruise Control" isa logging estimation programoffered through the Washington Contract LoggersAssociation. Arecent (Oregon State University) LEAPprogram on"Understanding Logging Costs &BiddingPractices" used anExcel™ spreadsheet program calledLOGGER BUDGET96 which is now available throughtheOSU Forest Engineering Department with anaccompanying manual.
Inthe recent years, there has been an increasingdemand forprofessional forest engineering practitioners in the west coast region of NorthAmerica.Considering the issues and challenges continuallyfocusing onforest operations, the demand for professionally trained forest engineers is expected tocontinue. Characteristics ofthe three main forest engineeringor forest operations programs in the region are summarized inTable 2. In 1997, the UofWforest engineeringprogram wasaccredited by theAccreditation Board
TABLE 2. Characteristics of university programs.
for Engineering and Technology. In April 1997, OSUbroke ground for the Forest Ecosystem ResearchLaboratory (FERL). The new building will abut thecorner of existing Peavy Hall and it will consolidateForest Science and Forest Products faculty to improvemanagement, communication, andintra-departmentalcooperation in the College of Forestry.
The 9th Pacific Northwest Skyline Symposium was•held in May 1-996 in Campbell River, B.C. Canada.The Forest Engineering Research Institute of Canada(FERIC) and the University ofBritish Columbia sponsored thejoint symposium with the IUFRO 3.06Research Group. The next Skyline Symposium isscheduled forMarch 1999 to be held in Corvallis, Ore.,sponsored by the Department ofForest Engineering,Oregon State University.
ACKNOWLEDGMENTS
The following peopleprovided information for thisreport. Their help is greatlyappreciated.
Paul Adams, Forest Engineering Department OSUJohn Garland, Forest Engineering Department. OSUGary Lettman, Oregon Department ofForestryJohn Miles, University of California,DavisPatrick Moore, Potlatch Corporation, OregonSteve Tesch, Forest Engineering Department, OSU
Program Characteristic
Baccalaureate Degree
Program Length (years)
Approx. Number of StudentsEnrolled (1996-97)
Number of Faculty1
Oregon State Univ.(OSU)
BS.FEBS, FE/CE
4,FE5, FE/CE
65 in FE
40 in FE/CE
Univ. of Washington(UofW)
BS.FE
25V
Univ. Of BC, Canada(UBQ
BSF1
50-60
8«
1UBC offers a BSF program with amajor in forest operations.2Juniors and seniors only; freshmen and sophomores are in the pre-engineering pool ofstudents.1Full-time faculty (9-12 month appointments) with forest engineering teaching responsibilities.4Twoadditional faculty in FEextension.
183