Impact of community forest management on biomass carbon stocks in the Uatumã Sustainable...
48
This article was downloaded by: [André Luiz Menezes Vianna] On: 09 January 2014, At: 04:52 Publisher: Taylor & Francis Informa Ltd Registered in England and Wales Registered Number: 1072954 Registered office: Mortimer House, 37-41 Mortimer Street, London W1T 3JH, UK Journal of Sustainable Forestry Publication details, including instructions for authors and subscription information: http://www.tandfonline.com/loi/wjsf20 Impact of community forest management on biomass carbon stocks in the Uatumã Sustainable Development Reserve, Amazonas, Brazil André Luiz Menezes Vianna a & Philip Martin Fearnside b a Instituto de Conservação e Desenvolvimento Sustentável do Amazonas (IDESAM) , R. Barão de Solimões, 12, Conjunto Parque das Laranjeiras – Flores, CEP: 69058-250, Manaus , Amazonas , Brazil b Instituto Nacional de Pesquisas da Amazônia (INPA) , Av. André Araújo, 2936, Petrópolis, CEP: 69060-001, Manaus , Amazonas , Brazil Accepted author version posted online: 05 Dec 2013.Published online: 05 Dec 2013. To cite this article: Journal of Sustainable Forestry (2013): Impact of community forest management on biomass carbon stocks in the Uatumã Sustainable Development Reserve, Amazonas, Brazil, Journal of Sustainable Forestry, DOI: 10.1080/10549811.2013.836717 To link to this article: http://dx.doi.org/10.1080/10549811.2013.836717 Disclaimer: This is a version of an unedited manuscript that has been accepted for publication. As a service to authors and researchers we are providing this version of the accepted manuscript (AM). Copyediting, typesetting, and review of the resulting proof will be undertaken on this manuscript before final publication of the Version of Record (VoR). During production and pre-press, errors may be discovered which could affect the content, and all legal disclaimers that apply to the journal relate to this version also. PLEASE SCROLL DOWN FOR ARTICLE Taylor & Francis makes every effort to ensure the accuracy of all the information (the “Content”) contained in the publications on our platform. However, Taylor & Francis, our agents, and our licensors make no representations or warranties whatsoever as to the accuracy, completeness, or suitability for any purpose of the Content. Any opinions and views expressed in this publication are the opinions and views of the authors, and are not the views of or endorsed by Taylor & Francis. The accuracy of the Content should not be relied upon and should be independently verified with primary sources of information. Taylor and Francis shall not be liable for any losses, actions, claims, proceedings, demands, costs, expenses, damages, and other liabilities whatsoever or howsoever caused arising directly or indirectly in connection with, in relation to or arising out of the use of the Content. This article may be used for research, teaching, and private study purposes. Any substantial or systematic reproduction, redistribution, reselling, loan, sub-licensing, systematic supply, or distribution in any form to anyone is expressly forbidden. Terms & Conditions of access and use can be found at http:// www.tandfonline.com/page/terms-and-conditions
-
Upload
independent -
Category
Documents
-
view
0 -
download
0
Transcript of Impact of community forest management on biomass carbon stocks in the Uatumã Sustainable...

This article was downloaded by: [André Luiz Menezes Vianna]On: 09 January 2014, At: 04:52Publisher: Taylor & FrancisInforma Ltd Registered in England and Wales Registered Number: 1072954 Registered office: Mortimer House,37-41 Mortimer Street, London W1T 3JH, UK
Journal of Sustainable ForestryPublication details, including instructions for authors and subscription information:http://www.tandfonline.com/loi/wjsf20
Impact of community forest management on biomasscarbon stocks in the Uatumã Sustainable DevelopmentReserve, Amazonas, BrazilAndré Luiz Menezes Vianna a & Philip Martin Fearnside ba Instituto de Conservação e Desenvolvimento Sustentável do Amazonas (IDESAM) , R.Barão de Solimões, 12, Conjunto Parque das Laranjeiras – Flores, CEP: 69058-250, Manaus ,Amazonas , Brazilb Instituto Nacional de Pesquisas da Amazônia (INPA) , Av. André Araújo, 2936, Petrópolis,CEP: 69060-001, Manaus , Amazonas , BrazilAccepted author version posted online: 05 Dec 2013.Published online: 05 Dec 2013.
To cite this article: Journal of Sustainable Forestry (2013): Impact of community forest management on biomasscarbon stocks in the Uatumã Sustainable Development Reserve, Amazonas, Brazil, Journal of Sustainable Forestry, DOI:10.1080/10549811.2013.836717
To link to this article: http://dx.doi.org/10.1080/10549811.2013.836717
Disclaimer: This is a version of an unedited manuscript that has been accepted for publication. As a serviceto authors and researchers we are providing this version of the accepted manuscript (AM). Copyediting,typesetting, and review of the resulting proof will be undertaken on this manuscript before final publication ofthe Version of Record (VoR). During production and pre-press, errors may be discovered which could affect thecontent, and all legal disclaimers that apply to the journal relate to this version also.
PLEASE SCROLL DOWN FOR ARTICLE
Taylor & Francis makes every effort to ensure the accuracy of all the information (the “Content”) containedin the publications on our platform. However, Taylor & Francis, our agents, and our licensors make norepresentations or warranties whatsoever as to the accuracy, completeness, or suitability for any purpose of theContent. Any opinions and views expressed in this publication are the opinions and views of the authors, andare not the views of or endorsed by Taylor & Francis. The accuracy of the Content should not be relied upon andshould be independently verified with primary sources of information. Taylor and Francis shall not be liable forany losses, actions, claims, proceedings, demands, costs, expenses, damages, and other liabilities whatsoeveror howsoever caused arising directly or indirectly in connection with, in relation to or arising out of the use ofthe Content.
This article may be used for research, teaching, and private study purposes. Any substantial or systematicreproduction, redistribution, reselling, loan, sub-licensing, systematic supply, or distribution in anyform to anyone is expressly forbidden. Terms & Conditions of access and use can be found at http://www.tandfonline.com/page/terms-and-conditions

ACCEPTED MANUSCRIPT
ACCEPTED MANUSCRIPT 1
Impact of community forest management on biomass carbon stocks in the Uatumã Sustainable Development Reserve, Amazonas, Brazil Running head
Impact of community forest management, Brazil.
André Luiz Menezes Vianna1; Philip Martin Fearnside2
1Instituto de Conservação e Desenvolvimento Sustentável do Amazonas (IDESAM). R. Barão de Solimões, 12, Conjunto Parque das Laranjeiras – Flores, CEP: 69058-250, Manaus, Amazonas, Brazil. Tel.: + 55 (92) 3308-7360. E-mail: [email protected]
2Instituto Nacional de Pesquisas da Amazônia (INPA). Av. André Araújo, 2936, Petrópolis, CEP: 69060-001, Manaus, Amazonas, Brazil. Tel.: +55 (92) 3643-1822. E-mail: [email protected]
Forest management can result in net losses of carbon stock. To quantify the impact of the
management it is important to assess losses or gains of carbon, as well as the sustainability of the
management system. This study quantified the impact management under a Small-Scale
Sustainable Forest Management Plan, which is a recently created category of authorized
management for small managers in the state of Amazonas, Brazil. Impact was quantified on the
number of individuals, the biomass of natural regeneration and the damage to the remaining trees
two months after logging. The impact of these changes on carbon stock was estimated. The study
was carried out in the Uatumã Sustainable Development Reserve, Amazonas, Brazil, where two
areas of small-scale forest management and one control were evaluated. Average total carbon
stock previous to logging was estimated at 161.25 ± 9.66 MgC ha-1. Two months after logging,
reductions were found of 3% in one managed area (MA1) and 8.3% in the other (MA3),
including the carbon stock from the harvested timber. For each harvested tree, the logging caused
Dow
nloa
ded
by [
And
ré L
uiz
Men
ezes
Via
nna]
at 0
4:52
09
Janu
ary
2014

ACCEPTED MANUSCRIPT
ACCEPTED MANUSCRIPT 2
damage to 12 trees in MA1 and four trees in MA3. The reductions in carbon stock and number of
trees damaged per harvested tree were less than the reductions found for higher-impact forest
management and other experiences in community forest management. No significant alteration
was found in the carbon stock of natural regeneration. However, there was an increase in the
number of individuals, both in the logged areas and in their respective control areas.
Keywords. Biomass, logging, emissions reduction, REDD, global warming, conservation units.
1. Introduction
In Brazilian Amazonia 0.08 Gt (Gigatons = 109 tons) of carbon are emitted per year by logging
(Asner et al., 2005). Emissions from forest management can result in net losses or benefits that
will be different depending on which alternative one compares it to: unlogged forest,
unsustainable logging or deforestation. In comparison to unlogged forest, sustainable forest
management represents a net loss of carbon; in comparison with the other two alternatives, forest
management would result in net gains (Fearnside, 1995). Carbon losses and benefits resulting
from forest management, in addition to varying as a function of the alternative to which it is
compared, also will depend on the biomass of the forest. The losses also vary depending on the
methods and techniques used in carrying out the forest management.
Forest biomass is a function of the number of individuals, the basal area and the wood density of
the species. In the Amazon Basin these three variables are influenced by soil type, solar radiation
and precipitation (Nogueira et al. 2008; Malhi et al., 2006). Wood density varies inversely with
soil fertility, the frequency of natural disturbances, the availability of light in the understory and
Dow
nloa
ded
by [
And
ré L
uiz
Men
ezes
Via
nna]
at 0
4:52
09
Janu
ary
2014

ACCEPTED MANUSCRIPT
ACCEPTED MANUSCRIPT 3
the humidity. In the southern and the southwestern portions of Brazilian Amazonia forest
biomass is lower than that in other parts of the region. Forests that are open or naturally disturbed
tend to have a greater number of fast-growing trees with less-dense wood and a lower number of
individuals per hectare. Since the canopy is more open, there is greater penetration of light as
compared to dense forest. In these forests, the annual precipitation is lower and the dry period is
longer than that in the central and western portions of Amazonia. In the coastal portions of
Brazilian Amazonia such as Amapá, and in the Guianas, there is high forest biomass as a result
of the high basal area and high wood density due to low soil fertility (Malhi et al., 2006). The
Amazon Basin has a forest area of 5.76 × 10⁶ km² with dry above-ground live biomass generally
between 250 and 350 Mg per hectare (Malhi et al., 2006).
Management can reduce above-ground live biomass and the carbon stock of the forest by 20%
after logging (Gerwing and Vidal, 2002), and increase necromass by 200%, which increases the
risk of forest fires (Veríssimo et al., 1992). Reducing emissions from forest management requires
adopting lower-impact techniques. Reduced Impact Logging (RIL) can reduce emissions by 32%
per hectare managed as compared to conventional logging. Note, however, that emission
reduction per m3 harvested under RIL would be less than the per-hectare reduction. Even with
RIL, the initial carbon stock may not be recovered by the end of a 30-year cycle. A study in the
state of Pará found a 6% decrease in the maximum stock in one cycle (Putz et al., 2008: Table
S2).
The future stock of biomass can be jeopardized if the impacts on natural regeneration and
damage to the remaining individuals are greater than the regenerative capacity of the forest. In
Dow
nloa
ded
by [
And
ré L
uiz
Men
ezes
Via
nna]
at 0
4:52
09
Janu
ary
2014

ACCEPTED MANUSCRIPT
ACCEPTED MANUSCRIPT 4
areas managed under a high-impact regime where machines are used for dragging logs there
tends to be a reduction in the number of individuals of natural regeneration in the first years after
logging, with the number of individuals increasing later until the initial number is re-established
(Carneiro, 2010). The number of remaining trees damaged per harvested tree can be between 20
and 27 individuals in areas managed with the use of machines (Johns et al., 1996; Veríssimo et
al., 2002a, b).
In Brazil, studies on the impact of the forest management have mostly been done in experimental
areas or in areas of logging with the use of machines. Very few studies have been done in areas
under management without use of machines, and no study has been done on the impact on the
forest in areas managed under the norms of the Small-Scale Sustainable Forest Management
Plans (PMFSPE), a newly created category for low-intensity management in the state of
Amazonas. This category of management plan accounted for 85% of the permitted management
plans in Amazonas in 2009/2010 (Amazonas, SDS, 2010). Discussions are underway to make the
plans more consistent with the reality of the small managers the plans are intended to serve.
The objective of this study is to quantify the impact of community management of timber under
the norms of the PMFSPE in terms of the carbon stock of the vegetation in the Uatumã
Sustainable Development Reserve. More specifically, this study quantified: the alterations
caused by logging in the carbon stock of the vegetation of the Forest Management Areas, the
alterations in the biomass and in the number of individuals of natural regeneration, and the
damage caused by logging.
Dow
nloa
ded
by [
And
ré L
uiz
Men
ezes
Via
nna]
at 0
4:52
09
Janu
ary
2014

ACCEPTED MANUSCRIPT
ACCEPTED MANUSCRIPT 5
2. Material and Methods
2.1. Study area
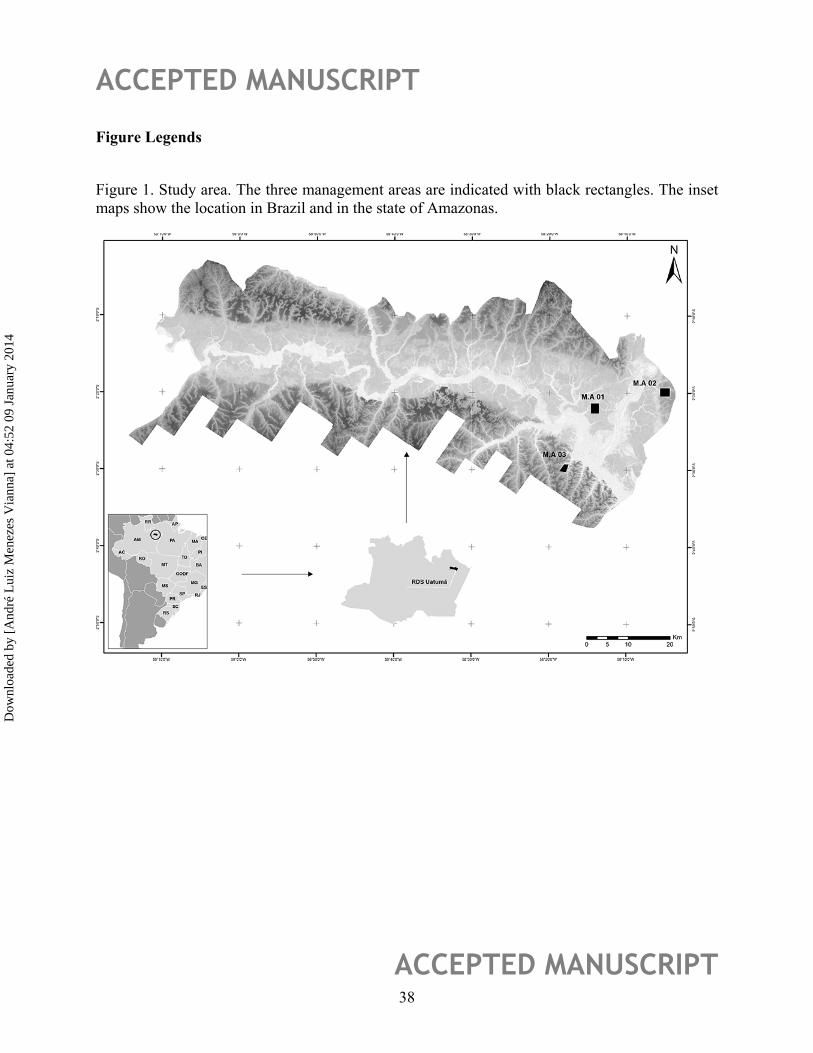
The study was carried out in the Uatumã Sustainable Development Reserve (RDS), which was
created in June 2004 with 424,430 ha located 250 km to the northeast of the city of Manaus in
the municipalities of Itapiranga and São Sebastião do Uatumã (2º 27’ to 2º 4` S; 59º 10’ to 58º 4’
W). Approximately 250 families distributed in 20 communities inhabit in the reserve. The
residents obtain income from agriculture, extractivist production and fishing.
The climate is tropical (AmW, Köppen classification), with temperature varying from 20º C to
38º C. The average annual precipitation is 2077 mm, with standard error of 438.3 mm
(Amazonas, SDS, 2009). The RDS is situated in two major units of relief: Low plateaus of
Amazonia and Amazonian Plain, where the predominant soil orders are: Latosols (in higher
areas); argisols (on the slopes); spodosols (in areas with sandy profiles) and neosols and gleys (in
the floodplains of the Uatumã River and its tributaries) (Amazonas, SDS, 2009; Brazil, Projeto
RADAMBRASIl, 1978). The forest types present are: dense ombrophilous forest on terra firme
(unflooded uplands), igapó (blackwater swamp forest), and floodplain; in addition to
campinarana and campina (oligotrophic woody vegetation) (Amazonas, SDS, 2009; Veloso et
al., 1991). The present study was carried out in Dense Ombrophilous Forest on terra firme
(unflooded uplands).
Dow
nloa
ded
by [
And
ré L
uiz
Men
ezes
Via
nna]
at 0
4:52
09
Janu
ary
2014

ACCEPTED MANUSCRIPT
ACCEPTED MANUSCRIPT 6
2.2. Forest Management System of the Uatumã RDS
In the Uatumã RDS there are seven permitted forest management plans in seven different
communities. The plans were drafted in accordance with the state norm that regulates Small-
Scale Sustainable Forest Management Plans, or PMFSPEs (Normative Instruction SDS 002 of
2008); these are the first such plans in terra firme in a conservation unit in Amazonas. Each
PMFSPE has a management area of around 500 ha and a logging intensity of 1 m³ ha-1 year-1.
Logging intensity is calculated based on the “Area of Effective Management,” which is
calculated by subtracting the “Area of Permanent Preservation” (APP) [legally protected areas on
steep slopes, hilltops and stream banks] from the Total Area of Management. Thus, as an
example, an Area of Management of 500 ha with 100 ha of APP has an Area of Effective
Management of 400 ha, with the maximum limit of annual logging of 400 m ³ (1 m³ ha-1 year-1
multiplied by 400 ha) and a logging limit of 25 m³ per inventoried area per management cycle.
As a condition for harvesting an individual the tree must have DBH (diameter at breast height:
1.3 m above the ground or above any buttresses) over 50 cm and the area must have two other
trees of same species with DBH between 20 and 50 cm. In June 2011 the Amazonas State
Council on the Environment approved a resolution regulating PMFSPEs; this resolution
modified the intensity of logging to 0.86 m³ ha-1 year-1 and increased from two to three the
number of remaining trees necessary to allow a tree to be harvested.
The bucking (cutting into rough planks) of the harvested trees is done in the field using
chainsaws and a portable sawmill. The planks are transported in a cart pulled by an ox or by a
small agricultural tractor (jerico) to the edge of a narrow river or stream, where transport to the
Dow
nloa
ded
by [
And
ré L
uiz
Men
ezes
Via
nna]
at 0
4:52
09
Janu
ary
2014
ACCEPTED MANUSCRIPT
ACCEPTED MANUSCRIPT 7
community proceeds by boat. No logging decks (clearings for stockpiling logs) are opened in
the management area and the trails cut for the inventory are used as paths for transporting the
planks to streams; it is only necessary to widen the trails, and there is no need to damage or to
remove larger-diameter individuals.
In this study three forest management areas were studied that have the characteristics presented
in Table 1.
The wood from this harvest was sold to the company that won the bidding held by
INCRA (National Institute for Colonization and Agrarian Reform). The managed wood is for
building houses for the inhabitants of the conservation unit and thus will remain in the reserve.
2.3. Initial carbon stock and alterations as a result of logging
Carbon stock was estimated for live above-ground biomass (which encompasses the arboreal
components, lianas and palms), for biomass of coarse roots ( ≥ 2 mm diameter), and for
necromass, which corresponds to dead trees both standing and fallen.
To quantify alterations in the carbon stock of the managed vegetation two measurements were
made: one in October 2009, prior to logging (Time 1 or T1) and the other in March 2011, two
months after the logging (Time 2 or T2). The studied alterations were based on the differences
found between the two inventories, as well as in comparison to an unharvested (control)
management area (MA2), which was also inventoried in the two periods. All inventoried trees
were numbered and marked; the location of the measurement was painted on the trunk so that
both measurements were made in the same place. Given that at the time of the forest inventory
Dow
nloa
ded
by [
And
ré L
uiz
Men
ezes
Via
nna]
at 0
4:52
09
Janu
ary
2014

ACCEPTED MANUSCRIPT
ACCEPTED MANUSCRIPT 8
after logging the trees were still present in the management areas, any alteration in the carbon
stock is the result of the opening of trails, cutting lianas and felling trees.
Censuses were carried out in three annual operation units in three different management areas.
The units have areas of five hectares (200 × 250 m), where all individuals with DBH over 30 cm
were measured. Data collected on this DBH class were denominated as “Level I.”
In each studied unit three plots of 10 × 250 m were installed, each distant 85 m from the next
plot. All individuals with DBH ≥10 cm were measured (denominated “Level II”). In each 10 ×
250-m plot three sub-plots of 10 ×10 m were installed where all individuals with DBH > 5 cm
were measured (“Level III”). All measured individuals were botanically identified and grouped
by life form: tree, palm and liana.
2.5 Quantification of the carbon stock
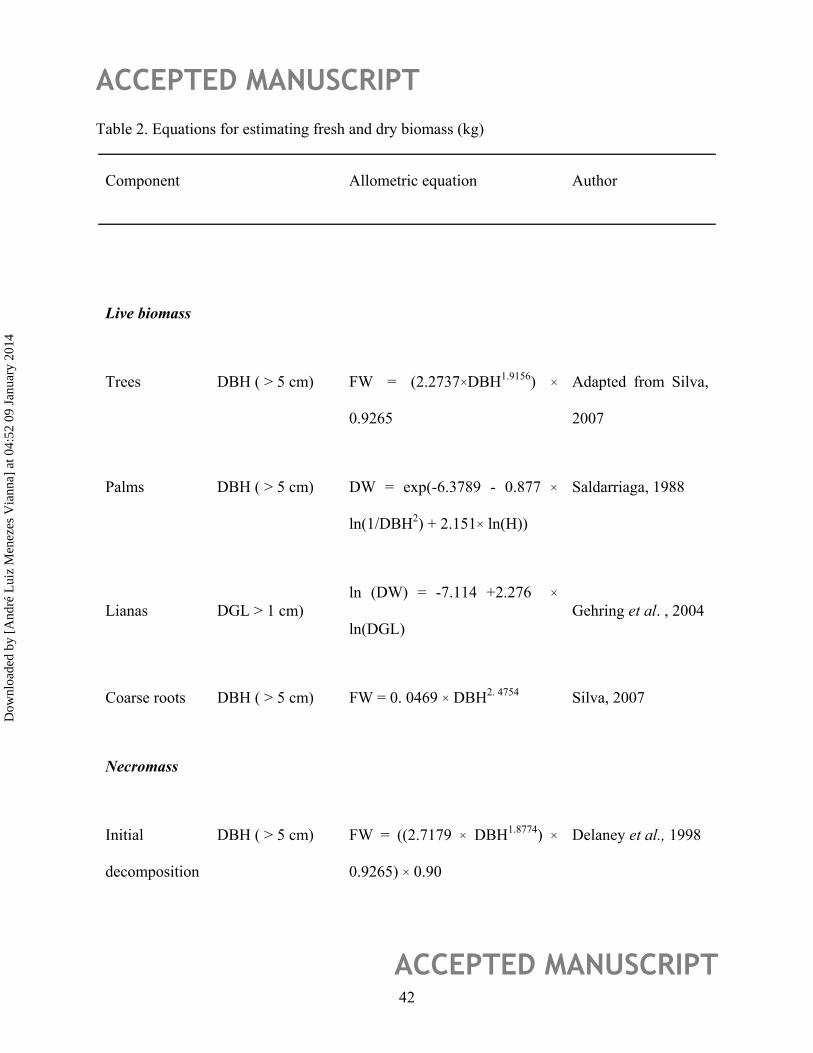
The biomass for each component was estimated from the equations presented in Table 2.
The equation for arboreal individuals DBH > 5 cm was adapted from the study by Silva (2007),
in accordance with the advice of Niro Higuchi (Personal communication, 2010).
The equation was multiplied by a factor of 0.9265, which resulted from dividing the dominant
height obtained in the field in the Uatumã RDS by measuring fallen trees (26.5 m) by the height
found at the study site of Silva (2007) (28.6 m). This correction was carried out to prevent the
estimate of carbon stock from being either under- or overestimated, had the heights of the trees at
Dow
nloa
ded
by [
And
ré L
uiz
Men
ezes
Via
nna]
at 0
4:52
09
Janu
ary
2014

ACCEPTED MANUSCRIPT
ACCEPTED MANUSCRIPT 9
the study site been different from the heights at the location where the equation we used was
developed.
Dry biomass for each individual was obtained by correcting for the water content of the fresh
biomass: 41.6% in accordance with Silva (2007). The estimate of the dry biomass of each
individual was multiplied by the carbon concentration of 48.5% for primary forest in central
Amazonia (Silva, 2007). The fresh biomass of roots was obtained using the equation of Silva
(2007) and this was converted to dry biomass using the 44.5% water content measured by Silva
(2007), after which the carbon stock was estimated using 47% as the carbon concentration (Silva,
2007).
Necromass was estimated for dead trees either standing or fallen. The estimate of necromass in
standing dead trees in initial state of decomposition was obtained using the equation for live
above-ground biomass with a reduction of the values by10% to compensate for the losses of
leaves and twigs (Delaney et al., 1998). The carbon content used was 48.5% (Silva, 2007).
2.4. Alterations in natural regeneration as a result of logging
The term “natural regeneration” has a wide variety of definitions, with important implications for
understanding the regeneration process as a whole. However, with regard to the forest stock it is
defined by Rollet (1974) as the juvenile phases of the species, for example as plants with DBH <
5 cm. It therefore refers to the initial phases of establishment and growth of the plants, since a
favorable environment will permit formation of the forest (Narvaes et al., 2005). In the present
Dow
nloa
ded
by [
And
ré L
uiz
Men
ezes
Via
nna]
at 0
4:52
09
Janu
ary
2014

ACCEPTED MANUSCRIPT
ACCEPTED MANUSCRIPT 10
study the term “natural regeneration” refers to individuals with circumference at ground level
below 15 cm, independent of height.
The alterations in natural regeneration were quantified based on the change in the number of
individuals and in the carbon stock between the measurements before and after logging (T2 -
T1), for the three management areas (MA1, MA2 and MA3), as well as for their respective
control areas (C1, C2 and C3).
2.4.1 Quantification of carbon stock and analysis of data
For each of the three management areas, 18 plots of natural regeneration were installed, nine of
which were inside and the other nine (as control plots) outside of the management area, totaling
54 plots of natural regeneration. The plots had dimensions of 5 × 5 m. The height (H) and the
circumference at ground level (CGL) and for palms the circumference at breast height were
measured for all individuals with CGL between 3 and 15 cm.
The following equations were used to quantify the dry weight (DW) of the individuals:
for pioneer and non-pioneer trees:
DW = 0.178269 × DGL 2.528425 (Ribeiro, 2010);
for palms:
DW = exp(-6.3789 - 0.877 × ln (1/DBH2) +2.151× ln(H)) (Saldarriaga, 1988);
for lianas:
Dow
nloa
ded
by [
And
ré L
uiz
Men
ezes
Via
nna]
at 0
4:52
09
Janu
ary
2014

ACCEPTED MANUSCRIPT
ACCEPTED MANUSCRIPT 11
ln(DW) = -7.114 + 2,276 × ln(DGL) (Gehring et al., 2004),
where: DW=dry weight, DBH=diameter at breast height, H=height, DGL = diameter at ground
level.
The carbon stock in each individual of natural regeneration was obtained from the dry weight by
multiplying by a factor of 0.458, which is the average carbon concentration for natural
regeneration (Ribeiro, 2010).
Alterations in the number of individuals and the carbon stock were evaluated by comparing the
alterations in the plots in each management area as compared to the alterations in their respective
control areas. The t test was used to establish differences between the control plots and the plots
submitted to logging. Each t test used 18 plots of natural regeneration, nine of which were inside
and the other nine (as control plots) outside of the management area.
2.5 Evaluation of damage
As a part of the evaluation of the impact of logging, evaluation of the un-harvested individuals
was carried out by observing damage and the state of forest health, in accordance with the
methodology of Holmes et al. (2002) and Johns et al. (1996). Each individual in the evaluated
plots remaining after logging was categorized in accordance with the following codes and
criteria: Code 0 for no damage to the trunk or the crown, Code 1 for light damage to the trunk
and damage to up to 1/3 of the crown, Code 2 for moderate damage to the trunk and damage to
up to 2/3 of the crown, and Code 3 for heavy damage to the trunk and the crown destroyed.
Dow
nloa
ded
by [
And
ré L
uiz
Men
ezes
Via
nna]
at 0
4:52
09
Janu
ary
2014

ACCEPTED MANUSCRIPT
ACCEPTED MANUSCRIPT 12
The data were analyzed by quantifying the number of individuals damaged under each damage
criterion. This was related to the number of harvested individuals and to the reduction in basal
area and carbon stock.
3. Results
3.1. Carbon stock and alterations due to logging
Previous to logging the forest, the three areas had an average carbon stock of 161.25 ± 9.66 MgC
ha-1 in above-ground live biomass of individuals with DBH > 5 cm and 24.51 ± 1.25 MgC ha-1 in
coarse roots, or 185.80 ± 10.7 MgC ha-1 for the total carbon stock.
Considering the average of the three managed areas, trees were responsible for almost all of the
carbon stock. The highest percent found for palms was for individuals with DBH between 5 and
10 cm and represented only 0.26% of the stock. Lianas did not occur in these DBH classes, only
being represented by individuals with DBH < 5 cm.
Table 3 presents the results of the carbon stock for the first measurement (Time 1). With the
objective of allowing comparison of the results of this study with those of other studies, we
calculated the totals and their respective confidence intervals (Tables 3 and 4). The confidence
intervals relate to the value obtained for trees with DBH > 30 cm in the censused areas, with the
upper (and lower) limits adjusted by adding (or subtracting) the maximum (and minimum)
values of the confidence intervals of the 10 to 30 cm and 5 to10 cm DBH classes. The level of
significance used was of 95%.
Dow
nloa
ded
by [
And
ré L
uiz
Men
ezes
Via
nna]
at 0
4:52
09
Janu
ary
2014

ACCEPTED MANUSCRIPT
ACCEPTED MANUSCRIPT 13
After logging reductions in the total live carbon stock were found of 6.78 ± 1.48 MgC ha-1, or
3.0% for MA1, and 15.95 ± 4.15 MgC ha-1, or 8.27% for MA3, considering individuals with
DBH > 5 cm. These reductions consider the total of harvested and dead trees in the management
areas after the logging. Natural causes were responsible for a reduction of 0.98 MgC ha-1 in MA1
and 0.10 MgC ha-1 in MA3.
The natural increment in the carbon stock was added to the decrease caused by the logging. The
natural increment was found in all of the three areas studied during the 18-month, period
between the evaluations. For MA2 (an unharvested area), the increment was 1.13 ± 1.46 MgC
ha-1 or 0.59% of the total carbon stock. In the harvested areas the increments in the period
between the evaluations were 1.56 MgC ha-1 or 0.89% for MA1 and 0.03 MgC ha-1 or 0.01% for
MA3. Table 4 presents the results of the impact of logging on the carbon stock (which includes
the natural increment and the decrease caused by the logging).
Of the total carbon stock in dead individuals, which includes harvested and dead trees, the
carbon in harvested trees was 9.62 MgC for MA1 (1.93 MgC ha-1) and 26.87 MgC for MA3
(5.38 MgC ha-1). Since the harvested trees will be used to construct houses inside the reserve,
part of this carbon will be fixed as wood. Considering that the sawn planks represent only 34%
of the wood that is bucked in the field using chainsaws and a portable sawmill (Koury, 2007), the
total amounts of carbon that will be fixed are 2.94 MgC for MA1 (0.59 MgC ha-1) and 8.22 MgC
for MA3 (1.64 MgC ha-1). Therefore, the totals for carbon in dead wood in the management
areas, discounting the wood that will be fixed, were 6.19 MgC ha-1 for MA1 and 14.31 MgC ha-1
for MA3.
Dow
nloa
ded
by [
And
ré L
uiz
Men
ezes
Via
nna]
at 0
4:52
09
Janu
ary
2014

ACCEPTED MANUSCRIPT
ACCEPTED MANUSCRIPT 14
3.2. Natural regeneration
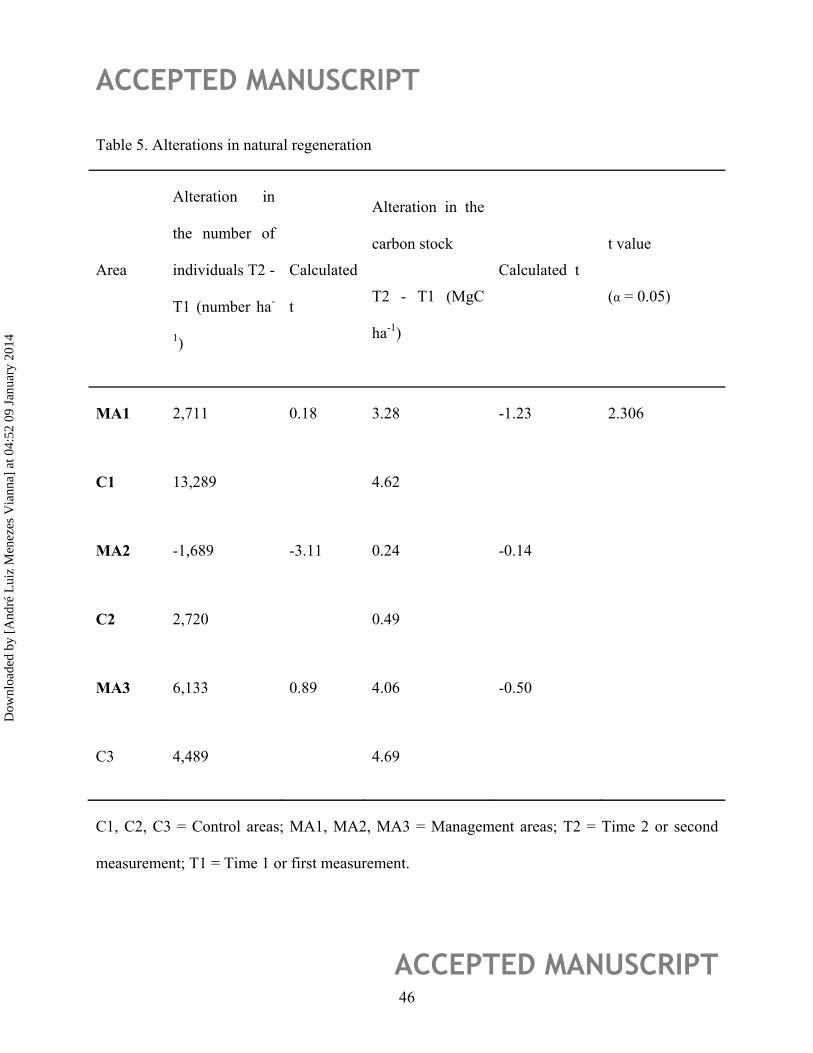
Increases in the number of individuals (DBH < 5 cm) per hectare were found in all of the areas
studied, except for Management Area 2 (MA2). For the carbon stock, increases were found for
the following areas: Management Area 1 (MA1), paired control for Management Area 1 (C1)
and paired control for Management Area 3 (C3). Reductions were found in the carbon stock of
natural regeneration in Management Area 2 (MA2), paired control for Management Area 2 (C2)
and Management Area 3 (MA3). Table 5 presents the results for natural regeneration.
The alterations in the number of individuals in the management areas when compared to the
alterations in the control areas were statistically significant at the 5% level for MA1 and MA2.
For carbon stock, the alterations in the three areas were not significant.
In Appendix A, the results of the alterations in the number of individuals and the carbon stock of
natural regeneration are discriminated by life form: pioneer, non-pioneer, palm and liana.
3.3. Evaluation of damage
The evaluation of damage was carried out for MA1 and MA3, where four and 16 trees had been
harvested, respectively. In MA1, 24 individuals had only sustained damage to the trunk and five
only to the crown, which resulted in 46 damaged individuals or 12 individuals damaged per
harvested tree. In MA3, 43 individuals only sustained damage to the trunk and five only to the
crown, which resulted in 65 damaged individuals or four individuals damaged per harvested tree.
Dow
nloa
ded
by [
And
ré L
uiz
Men
ezes
Via
nna]
at 0
4:52
09
Janu
ary
2014

ACCEPTED MANUSCRIPT
ACCEPTED MANUSCRIPT 15
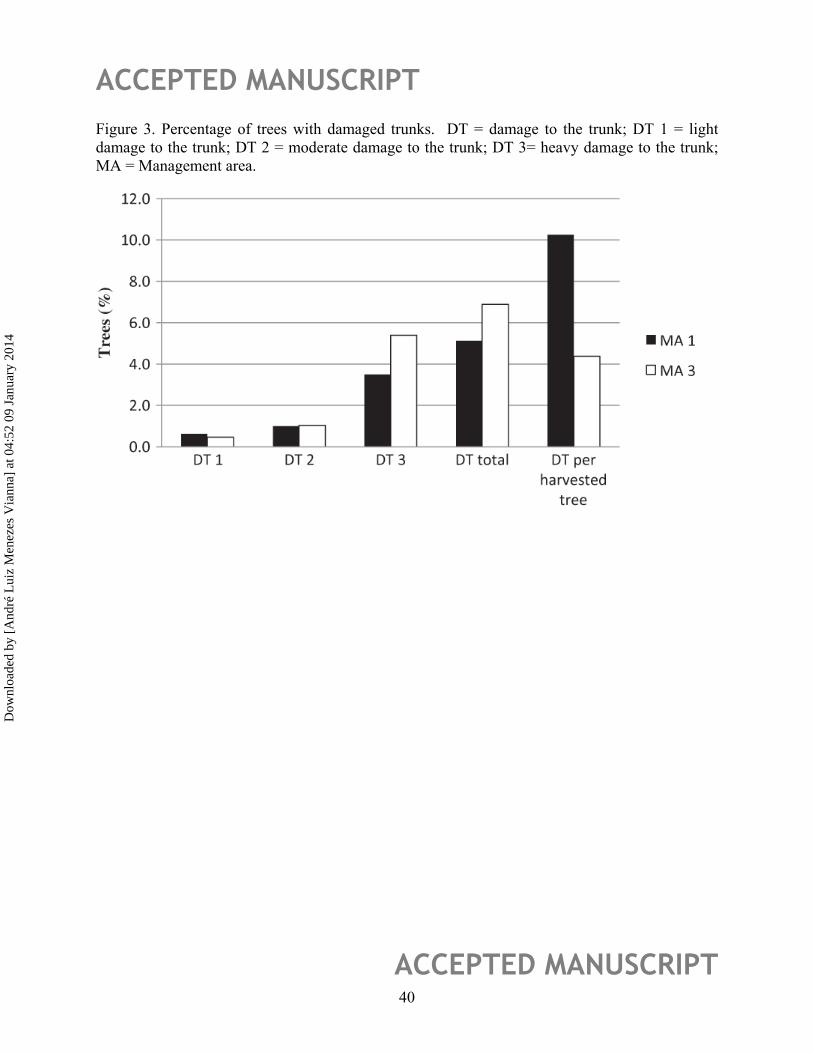
Figures 2 and 3 show the damages in percentage by category and per harvested tree, considering
the three levels of damage. Type-three damage to the trunk is characterized as lethal to the tree,
while the other damage categories are considered non-lethal.
Other factors identified were: reduction of basal area and reduction of the carbon stock as a result
of lethal damage (DT3). The lethal damage caused a reduction of 1.9 m² ha-1 of basal area in
MA1 or 6.3% and a reduction of 2.25 m² ha-1 or 8.4% in MA3.
Lethal damage (DT 3) caused a reduction on the carbon stock of 1.5 MgC ha-1 for individuals
with DBH ≥ 30 cm and from 0.68 to 1.34 MgC ha-1 for individuals with DBH 10 to 30 cm in
MA1. For MA3 the reduction in carbon stock was 4.10 MgC ha-1 for individuals with DBH ≥ 30
cm and from 0.86 to 1.65 MgC ha-1 for individuals with DBH 10 to 30 cm. The reduction of
carbon stock by lethal damage considered only damaged trees; the harvested trees were not
accounted for this result.
For damage classes DT1 and DT2 (which are considered non-lethal), in cases where the
damaged individuals later died the reduction in the carbon stock was 3.99 MgC ha-1 for
individuals with DBH > 30 cm and from 0.73 to 0.81 MgC ha-1 for individuals with DBH 10 to
30 cm in MA1. For MA3 the reduction in carbon stock was 5.00 MgC ha-1 for individuals with
DBH ≥ 30 cm and from 1.01 to 1.21 MgC ha-1 for individuals with DBH 10 to 30 cm.
In Appendix B the results for total damage and for damage to the trunk and to the crown are
presented by DBH class.
Dow
nloa
ded
by [
And
ré L
uiz
Men
ezes
Via
nna]
at 0
4:52
09
Janu
ary
2014

ACCEPTED MANUSCRIPT
ACCEPTED MANUSCRIPT 16
4.1. Discussion
4.2. Carbon stock and alterations due to logging
The results obtained for live above-ground carbon stock before logging for DBH > 10 cm
(136.42 ± 5.67 MgC ha-1 for MA1, 146.84 ± 7.78 MgC ha-1 for MA2 and 150.03 ± 7.79 MgC ha-
1 for MA3) are similar to other biomass findings found for the Manaus region: 157.69 MgC ha-1
(Nascimento and Laurance, 2002) and 148.45 MgC ha-1 (Castilho et al., 2006).
For the three studied areas, the above-ground carbon stock is concentrated in the > 30-cm DBH
class. On average, the distribution of the carbon stock was: 50% for DBH > 30 cm, 40% for
DBH 10 to 30 cm and 10% for DBH 5 to 10 cm. Therefore, estimates for these areas that
consider only DBH > 10 cm would not be reporting 10% of the above-ground carbon stock. The
value obtained in the present study was higher than those found in other studies in the Manaus
region, such as the values obtained by Nascimento and Laurance (2002) of 6% and by Silva
(2007) of 3%.
The results for carbon stocks in palms and lianas were lower than those in other studies in the
Manaus region, which found stocks of 2.5% for lianas and 0.4 to 1.8% for palms (Nascimento
and Laurance, 2002; Castilho et al., 2006; Silva, 2007). In the present study, the above-ground
carbon stock of these life forms represented less than 0.05% of the total.
Dow
nloa
ded
by [
And
ré L
uiz
Men
ezes
Via
nna]
at 0
4:52
09
Janu
ary
2014

ACCEPTED MANUSCRIPT
ACCEPTED MANUSCRIPT 17
The reductions reported in this study were smaller than those reported in studies in areas that
were logged at higher intensity and with the use of machines. After the logging 97% (MA1) and
91.7% (MA3) of the initial stocks remained. In a study by Gerwing and Vidal (2002) in
Paragominas, Pará, 80% of the initial biomass remained five years after logging where the
intensity was 30 m³ ha-1. Another study in Paragominas, Pará (also with a logging intensity of 30
m³ ha-1), indicated that 94% of the initial stock is recovered after 30 years (Putz et al., 2008).
We found necromass increases of 98% for MA1 and 99% for the MA3 after logging. Initially the
totals for the three areas were: 0.09 ± 0.17 MgC ha-1 or 0.18 Mg ha-1 of dry biomass (MA1); 0.77
± 1.25 MgC ha-1 or 0.16 Mg. ha-1 of dry biomass (MA2) and 0.07 ± 0.13 MgC ha-1 or 0.14 Mg
ha-1 of dry biomass (MA3). The increase obtained in the studied areas was less than that obtained
by Veríssimo et al. (1992) in Paragominas, Pará, where necromass increased by 200% after
logging in an area managed with the use of machines. Considering the decomposition constant
for necromass of 0.17 per year estimated by Chambers et al. (2000), one can expect emissions of
1.05 MgC ha-1 year-1 in MA1 and 2.43 MgC ha-1 year-1 in MA3. These emissions are lower than
the values in Pará for conventional logging estimated by Keller et al. (2004), who calculated an
emission of 4.5 MgC ha-1 year-1; however, they are higher than the emissions for reduced-impact
logging, which were estimated by these authors at 1.5 MgC ha-1 year-1 with a logging intensity of
25 m³ ha-1.
Based on the increments in carbon stock obtained for the three studied areas the increments in
biomass were: 2.14 Mg ha-1 year-1 (MA1); 1.55 Mg ha-1 year-1 (MA2) and 0.03 Mg ha-1 year-1
(MA3). These increments are smaller than those obtained in primary forest and in forests
Dow
nloa
ded
by [
And
ré L
uiz
Men
ezes
Via
nna]
at 0
4:52
09
Janu
ary
2014

ACCEPTED MANUSCRIPT
ACCEPTED MANUSCRIPT 18
managed experimentally under different logging intensities (low, medium and high), which,
according to Higuchi et al. (1997), are: 2.4 Mg ha-1 year-1, 3.1 Mg ha-1 year-1, 4.6 Mg ha-1 year-1
and 4.9 Mg ha-1 year-1. The data for increment refer to a single measurement interval. The
extreme drought during the study could have decreased the increments in carbon stock, making it
necessary to continue monitoring the studied areas to perfect the increment estimates.
4.3. Natural regeneration
In comparing the MA2 and C2 areas, significant alterations in the number of individuals were
found. Since MA2 was not logged, differences in seedling dynamics between the areas are not
only the result of logging. Therefore, the methodology did not demonstrate the effect of logging
by itself. Factors preventing the method from quantifying the effect of logging on natural
regeneration were: the variability in growth and in the response of natural regeneration to
logging, the short period between the logging and the measurements and the fact that the
measurements were done in different seasons of the year (the first during the dry season and the
second during the rainy season).
A reduction was expected in the number of individuals of natural regeneration soon after
logging, as in the study in Manaus by Vieira (1989), which found 3% fewer individuals as
compared to the control area one year after logging; however, the logging intensity (49 m³ ha-1)
was higher than in our case (4.8 – 10.7 m³ ha-1). Carneiro (2010) studied areas under forest
management in Itacoatiara, Amazonas, with logging intensities of 10 to 20 m³ ha-1, at different
periods after logging. At the site where logging had occurred five years previously, the number
of individuals with DBH < 5 cm was 5% less than in an unmanaged area; at the site measured
Dow
nloa
ded
by [
And
ré L
uiz
Men
ezes
Via
nna]
at 0
4:52
09
Janu
ary
2014

ACCEPTED MANUSCRIPT
ACCEPTED MANUSCRIPT 19
nine years after logging there were 43% more individuals, and at the site measured 13 years after
logging there were 16% fewer individuals. For larger, better-established individuals in areas of
experimental logging, Magnusson et al. (1999) found a significant increase in the density of
natural regeneration for individuals with DBH ≤ 10 cm and height ≥ 2 m, in comparison with the
control plot, when measured three, seven and eight years after logging.
Lower levels of precipitation and humidity cause a greater number of trees to bud and fruit
(Alencar et al., 1979). The first measurement in the present study was carried out in October
2009 and second in March of 2011, after a period of extreme drought in 2010. The question
therefore arises as to whether the larger number of individuals reported occurred as a result of the
timing of the measurements. This would be case independent of whether the difference occurs
normally as a function of the time of the year or if it was intensified by extreme drought; in this
case the greater budding and fruiting would generate a larger number of seedlings.
Despite the increase in the number of individuals, reduction was found in the carbon stock,
except for C1. This would indicate that the larger individuals were compensating for a larger
number of seedlings with small CGL (circumference at ground level). However, the reduction in
the carbon stock was not significant at the 95% level as compared to the control areas (t test).
4.4. Evaluation of damage
A greater number of cases of damage to the trunk was found in MA3 as compared to MA1,
mainly as a result of the larger number of cases of lethal damage (DT3). This result was expected
due to higher intensity of logging in MA3. However, with respect to damage to the crown, there
Dow
nloa
ded
by [
And
ré L
uiz
Men
ezes
Via
nna]
at 0
4:52
09
Janu
ary
2014

ACCEPTED MANUSCRIPT
ACCEPTED MANUSCRIPT 20
was a greater number of cases of damage in MA1, while most of the damage in MA3 was of type
DT3, which knocks down the tree completely and precludes finding any damage to the crown.
The number of trees damaged per harvested tree was greater in MA1 (12 cases) than in MA3 (4
cases). This result was not expected; however, it was found that in MA1, out of four harvested
trees a single individual accounted for 39% of the damage caused (damage to 18 trees) due to the
greater biomass of its crown. It was visually apparent that this individual had a much greater
crown biomass than any of the other trees harvested in the two managed areas.
Table 6 presents comparisons between the damage found in the present study and results in the
literature. Damage in the Uatumã RDS management areas was lower than in areas logged with
machines. Damage in the Uatumã RDS was comparable to that found in other areas logged
without the use of machines. For the relation between wood volume damaged per unit of volume
extracted, we found that MA3 did not follow the trend to having a higher value of damage per m3
harvested in the areas with higher logging intensity.
When one compares the average number of trees damaged in the present study (eight individuals
damaged per harvested tree, at an intensity of two individuals harvested per hectare) with three
studies cited in Table 6 (Johns et al., 1996; Veríssimo et al., 2002a, b), one observes that a
greater number of individuals harvested per hectare resulted in a proportionally greater number
of damaged individuals. This trend was not found in other studies relating damage to the volume
harvested, and therefore agrees with Jonkers (1988) and Veríssimo et al. (2002a) that the
increase in the damage to unharvested trees is not proportional to the increase in the volume
harvested.
Dow
nloa
ded
by [
And
ré L
uiz
Men
ezes
Via
nna]
at 0
4:52
09
Janu
ary
2014

ACCEPTED MANUSCRIPT
ACCEPTED MANUSCRIPT 21
With respect to the carbon stock, for individuals with DBH > 10 cm lethal damage caused by
logging reduced the carbon stock by 1.6% in MA1 and by 3.3% in MA3. When we consider all
levels of damage (both lethal and non-lethal), these values are 3.4% for MA1 and 4.0% for MA3
assuming that all damaged individuals later die.
In addition to the intensity of the logging, another important factor to be considered in evaluating
the impact of logging is the opening of roads and logging decks. Veríssimo et al. (2002b) found
that 46% of the damage to trees is caused by the opening of roads and 54% from felling the trees.
This means that damage to the managed forest is reduced when the wood is processed in the
field, as is done in the Uatumã RDS in order to facilitate transport without the opening of roads
and logging decks in the management area.
5. Conclusion
The reductions in the carbon stock, the basal area and the number of trees damaged per harvested
tree were lower than those for forest management with the use of machines and are consistent
with the findings of other studies in areas logged without the use of machines. The carbon stock
two months after logging was similar to the stock found after 30 years of recovery in forests
under management with the use of machines. The losses were less than those reported in other
situations, mainly due to the lack of roads and logging decks that are used in the categories of
management plans that include the use of machines.
Therefore, it was possible to quantify the impact of forest management in the Uatumã RDS, and
the activity in the reserve can be characterized as having low impact on the carbon stock of the
Dow
nloa
ded
by [
And
ré L
uiz
Men
ezes
Via
nna]
at 0
4:52
09
Janu
ary
2014

ACCEPTED MANUSCRIPT
ACCEPTED MANUSCRIPT 22
managed vegetation. These results will be useful for future projects, such as REDD+ initiatives
associated with small-scale forest management plans (PMFSPE).
Acknowledgements
This study received financial support from the Ecological Corridors Project of the Ministry of the
Environment through IDESAM (Institute for Conservation and Sustainable Development of
Amazonas), from the National Institute for Research in Amazonia (INPA) and from the National
Council for Scientific and Technological Development (CNPq). The manuscript benefited from
helpful reviewer comments.
Dow
nloa
ded
by [
And
ré L
uiz
Men
ezes
Via
nna]
at 0
4:52
09
Janu
ary
2014

ACCEPTED MANUSCRIPT
ACCEPTED MANUSCRIPT 23
APPENDIX A- Detailed results by life form for alterations in natural regeneration
Table 7. Number of individuals per hectare at Time 1 (T1) in absolute numbers and percentage alterations as compared to Time 2 (T2)
Ar
ea
T1 Alterations (T1 - T2)
L NP P Palm Total L N
P P
Pal
m
To
tal
-----------------------------------------------------n. ind.ha-1-----------
----------------------------
-----------------%------------
----
M
A1
57
8
±74
2
8.22
2
±2.2
96 - -
44
4
±47
4
9.24
4
±2.6
67 -38 27 0 40 29
C1 1.6
00
±1.4
65
3.82
2
±1.4
74 - -
57
8
±72
6
6.00
0
±2.1
11 -31
35
0 0 46 221
M
A2
97
8
±77
4
10.3
11
±3.4
27
22
2
±3
13
80
0
±53
5
12.3
11
±3.6
46 -27 -9 40 -72 -14
C2 36
0
±37
0
6.92
0
±2.6
56
28
0
±4
84
1.2
00
±1.2
26
10.1
60
±2.3
75 22 61 -29 110 27
Dow
nloa
ded
by [
And
ré L
uiz
Men
ezes
Via
nna]
at 0
4:52
09
Janu
ary
2014

ACCEPTED MANUSCRIPT
ACCEPTED MANUSCRIPT 24
M
A3
1.2
44
±42
1
7.06
7
±3.0
33
13
3
±1
54
80
0
±1.1
86
9.24
4
±2.5
95 -25 87
30
0 -17 66
C3 1.2
89
±68
7
7.64
4
±2.9
47 44
±1
03
31
1
±33
7
8.48
9
±3.9
38 -45 58 0 -43 72
C = Control area; L = Liana; MA = Measurement area; NP = Non-pioneer; P = Pioneer; T1 =
Time 1 or first measurement; T2 = Time 2 or second measurement.
Dow
nloa
ded
by [
And
ré L
uiz
Men
ezes
Via
nna]
at 0
4:52
09
Janu
ary
2014

ACCEPTED MANUSCRIPT
ACCEPTED MANUSCRIPT 25
Table 8. Carbon stock at Time 1 (T1) in Mg per hectare and percentage alterations as compared to Time 2 (T2)
Ar
ea
T1 Alterations (T1 - T2)
L NP P Palm Total L NP P Palm
To
tal
--------------------------------------MgC ha-1-----------------
--------------------------
--------------------------%-------------
----------------
M
A1
0.0
02
±0.0
02
0.
76
±0.
33 - -
0.2
02
±0.
1
0.9
61
±0.
3
10,0
21.1
275.
2 0.0
408.
6 341.6
C1 0.0
04
±0.0
02
0.
32
±0.
06 - -
0.2
76
±0.
2
0.6
01
±0.
2
19,2
83.2
1.14
8.2 0.0 61.6 768.5
M
A2
0.5
65
±0.3
12
4.
45
±1.
07
0.1
82
±0.
2
1.1
59
±0.
5
6.3
56
±1.
4 17.9 21.9
-
62.5
-
62.63.7
C2 0.0
03
±0.0
02
1.
05
±0.
22
0.0
16
±0.
0
0.5
94
±0.
3
1.6
60
±0.
4
397.
8 21.5
-
24.7 11.7 18.2
Dow
nloa
ded
by [
And
ré L
uiz
Men
ezes
Via
nna]
at 0
4:52
09
Janu
ary
2014

ACCEPTED MANUSCRIPT
ACCEPTED MANUSCRIPT 26
M
A3
0.0
04
±0.0
01
0.
94
±0.
20
0.0
10
±0.
0
0.3
93
±0.
3
1.3
51
±0.
3
4,00
4.3
368.
1
1,95
8.3 53.9 300.2
C3 0.0
05
±0.0
02
0.
72
±0.
19
0.0
00
±0.
0
0.1
54
±0.
1
0.8
78
±0.
2
7,81
2.0
618.
1
142.
8
-
60.4534.2
C = Control area; L - Liana; MA = Management area; NP = Non-pioneer; P = Pioneer; T1 =
Time 1 or first measurement; T2 = Time 2 or second measurement.
Dow
nloa
ded
by [
And
ré L
uiz
Men
ezes
Via
nna]
at 0
4:52
09
Janu
ary
2014

ACCEPTED MANUSCRIPT
ACCEPTED MANUSCRIPT 27
APPENDIX B - Detailed results by DBH class for evaluation of logging damage
Table 9. Number of damaged trees in absolute numbers and as a function of the number of harvested trees
Area Level
Only
DT
Only
DC
Total trees
damaged
Total trees
damaged per harvested tree
MA1
I 11 3 23 6
II 8 2 18 5
III 5 0 5 1
Total 24 5 46 12
MA3
I 17 5 37 2
II 20 0 22 1
III 6 0 6 0
Total 43 5 65 4
Dow
nloa
ded
by [
And
ré L
uiz
Men
ezes
Via
nna]
at 0
4:52
09
Janu
ary
2014

ACCEPTED MANUSCRIPT
ACCEPTED MANUSCRIPT 28
DC = Damage to the crown; DT = Damage to the trunk; Level I = DBH > 30 cm; Level II =
DBH 10 - 30 cm; Level III = DBH 5 - 10 cm; MA = Management area
Dow
nloa
ded
by [
And
ré L
uiz
Men
ezes
Via
nna]
at 0
4:52
09
Janu
ary
2014

ACCEPTED MANUSCRIPT
ACCEPTED MANUSCRIPT 29
Table 10, Evaluation of damage to the trunk as percentages in relation to the total number of measured individuals (absolute numbers in parentheses)
Area Level
DT 1 DT 2 DT 3 Total DT DTPHT
% (Absolute number) [Absolute
number)]
MA1
I 0,8 (3) 1,7 (6) 3,0 (11) 2,8 (20) 5
II 0,5 (2) 0,5 (2) 3,2 (12) 2,1 (16) 3
III 0,0 (0) 0,0 (0) 8,5 (5) 8,5 (5) 1
Total 0,6 (5) 1,0 (8) 3,5 (28) 4,5 (41) 9
MA3
I 0,7 (3) 2,0 (9) 4,4 (20) 7,0 (32) 3
II 0,3 (1) 0,0 (0) 5,9 (21) 6,2 (22) 1
III 0,0 (0) 0,0 (0) 10,3 (6) 10,3 (6) 0
Total 0,5 (4) 1,0 (9) 6,9 (47) 6,9 (70) 4
Dow
nloa
ded
by [
And
ré L
uiz
Men
ezes
Via
nna]
at 0
4:52
09
Janu
ary
2014
ACCEPTED MANUSCRIPT
ACCEPTED MANUSCRIPT 30
DT = Damage to the trunk; DTPHC = Damage to the trunk per harvested tree; Level I = DBH >
30 cm; Level II = DBH 10 - 30 cm; Level III = DBH 5 - 10 cm; MA = Management area
Dow
nloa
ded
by [
And
ré L
uiz
Men
ezes
Via
nna]
at 0
4:52
09
Janu
ary
2014

ACCEPTED MANUSCRIPT
ACCEPTED MANUSCRIPT 31
Table 11. Evaluation of l damage to the crown, percentage in relation to the total number of individuals measured (absolute number in parentheses)
Area Level
DC 1 DC 2 DC 3 Total DC DCPHT
% (Absolute number) [Absolute
number]
MA1
I 0.3 (1) 2.5 (9) 0.0 (0) 2.8 (10) 3
II 0.0 (0) 2.4 (9) 0.3 (1) 2.6 (10) 3
III 0.0 (0) 0.0(0) 0.0 (0) 0.0 (0) 0
Total 0.1 (1) 2.3 (18) 0.1 (1) 2.5 (20) 6
MA3
I 1.1 (5) 2.0 (9) 0.0 (0) 3.1 (14) 1
II 0.0 (0) 0.3 (3) 0.6 (2) 0.8 (5) 0
III 0.0 (0) 0.0 (0) 0.0 (0) 0.0 (0) 0
Total 0.6 (5) 1.1 (12) 0.2 (2) 2.0 (19) 1
Dow
nloa
ded
by [
And
ré L
uiz
Men
ezes
Via
nna]
at 0
4:52
09
Janu
ary
2014
ACCEPTED MANUSCRIPT
ACCEPTED MANUSCRIPT 32
DC = Damage to the crown; DCPHC = Damage to the crown per harvested tree; Level I = DBH
> 30 cm; Level II = DBH 10 - 30 cm; Level III = DBH 5 - 10 cm; MA = Management area
References
Alencar, J.C., Almeida, R.A., Fernandes, N.P., 1979. Fenologia de espécies florestais em floresta
tropical úmida de terra firme na Amazônia Central. Acta Amazonica 9(1), 163–198.
Amazonas, SDS (Secretaria de Estado do Meio Ambiente e Desenvolvimento Sustentável),
2010. A Situação Atual e Perspectivas para a Governança Florestal no Amazonas. Presentation at
the Seminário de Governança Florestal do Amazonas: Cenários para a Consolidação do Manejo
Florestal do Amazonas. 18-19 November 2011, Manaus, Amazonas, Brazil.
Amazonas. SDS (Secretaria de Estado do Meio Ambiente e Desenvolvimento Sustentável).
2009. Série Técnica Planos de Gestão: Reserva de Desenvolvimento Sustentável do Uatumã.
Vols. 1 & 2. Governo do Estado do Amazonas. Itapiranga e São Sebastião do Uatumã, SDS,
Manaus, Amazonas, Brazil.
Asner, G.P., Knapp, D.E., Broadbent, E.N., Oliveira, P.J.C., Keller, M., Silva, J.N., 2005.
Selective Logging in the Brazilian Amazon. Science 310, 480-482.
Brazil, Projeto RADAMBRASIL, 1978. Levantamento dos Recursos Naturais, Ministério das
Minas e Energia, Departamento Nacional da Produção Mineral. Folha SA-20 Manaus.
DNPM/Projeto RADAMBRASIL, Rio de Janeiro, Rio de Janeiro, Brazil.
Dow
nloa
ded
by [
And
ré L
uiz
Men
ezes
Via
nna]
at 0
4:52
09
Janu
ary
2014

ACCEPTED MANUSCRIPT
ACCEPTED MANUSCRIPT 33
Carneiro, V.M.C., 2010. Composição Florística e Estrutural da Regeneração Natural em uma
Floresta Manejada no Município de Itacoatiara (AM). PhD thesis, Instituto Nacional de
Pesquisas da Amazônia (INPA) and Universidade Federal do Amazonas (UFAM), Manaus,
Amazonas, Brazil. 160 pp.
Castilho, C.V., Magnusson, W.E., Araújo, R.N.O., Luizão, R.C.C., Luizão, F.J., Lima, A.P.,
Higuchi, N., 2006. Variation in aboveground tree live biomass in a central Amazonian Forest:
Effects of soil and topography. Forest Ecology and Management, 234, 85-96.
Chambers J.Q., Higuchi, N., Schimel, J.P., 2000. Decomposition and carbon cycling of dead
trees in tropical forests of the central Amazon. Oecologia, 122, 380–388.
Cummings, D.L., 1998. Total aboveground biomass and structure of tropical forest delineated by
Projeto RABAMBRASIL in northern Rondônia, Brazil. M.Sc. Thesis. Oregon State University,
Corvallis, Oregon, U.S.A.
Delaney, M., Brown, S., Lugo, A.E., Torres-Lezama, A., Quintero, N.B., 1998. The quantity and
turnover of dead wood in permanent forest plots in six life zones of Venezuela. Biotropica 30, 2–
11.
d’Oliveira, M.V.N., Braz, E.M., 2006. Estudo da dinâmica da floresta manejada no projeto de
manejo florestal comunitário do PC Pedro Peixoto na Amazônia Ocidental. Acta Amazonica
36(2), 177–182.
Fearnside, P.M., 1995. Global warming response options in Brazil's forest sector: Comparison of
project-level costs and benefits. Biomass and Bioenergy 8(5), 309-322.
Dow
nloa
ded
by [
And
ré L
uiz
Men
ezes
Via
nna]
at 0
4:52
09
Janu
ary
2014

ACCEPTED MANUSCRIPT
ACCEPTED MANUSCRIPT 34
Gehring, C., Park, S., Denich, M., 2004. Liana allometric biomass equations for Amazonian
primary and secondary forest. Forest Ecology and Management 195, 69-83.
Gerwing, J. , Vidal, E., 2002. Degradação de Florestas pela Exploração Madeireira e Fogo na
Amazônia. Série Amazônia N° 20, Instituto do Homem e Meio Ambiente da Amazônia
(Imazon), Belém, Pará, Brazil. 26 pp.
Higuchi, N., Santos, J., Ribeiro, R.J., Freitas, J.V., Vieira, G., Coic, A., Minette, L.J., 1997.
Crescimento e incremento de uma floresta amazônica de terra-firme manejada
experimentalmente, in: Higuchi, N., Ferraz, J.B.S., Antony, L., Luizão, F., Luizão, R., Biot, Y.,
Hunter, I., Proctor, J., Ross, S. (Eds.), BIONTE: Biomassa e Nutrientes,d Relatório Final.
Instituto Nacional de Pesquisas da Amazônia (INPA), Manaus, Amazonas, Brazil. pp. 87-132.
Holmes, T.P., Blate, G.M., Zweede, J.C., Pereira Junior, R., Barreto, P., Boltz, F., 2002. Custos e
benefícios financeiros da exploração de impacto reduzido em comparação à exploração florestal
convencional na Amazônia Oriental. Fundação Floresta Tropical, Belém, Pará, Brazil. 66 pp.
Johns, J., Barreto, P., Uhl, C., 1996. Logging damage during planned and unplanned logging
Operations in the eastern Amazon. Forest Ecology and Management 89, 59-77.
Jonkers, W.B.J., 1998. Vegetation Structure, Logging Damage, and Silviculture in Tropical Rain
Forest in Suriname. Wageningen Agricultural University, Wageningen, the Netherlands.
Keller, M., Palace, M., Asner, G.P., Pereira Jr., R., Silva, J.N., 2004. Coarse woody debris in
undisturbed and logged forests in the eastern Brazilian Amazon. Global Change Biology 10,
784–795.
Dow
nloa
ded
by [
And
ré L
uiz
Men
ezes
Via
nna]
at 0
4:52
09
Janu
ary
2014

ACCEPTED MANUSCRIPT
ACCEPTED MANUSCRIPT 35
Koury, C.G., 2007. Manejo Florestal Comunitário em Terra-firme no Baixo Amazonas: Custos e
Entraves da Produção Madeireira. Masters dissertation, Instituto Nacional de Pesquisas da
Amazônia (INPA) and Universidade Federal do Amazonas (UFAM), Manaus, Amazonas, Brazil.
129 pp.
Magnusson, W.E., Lima, O.P., Reis, F.Q., Higuchi, N., Ramos, J.F., 1999. Logging activity and
tree regeneration in an Amazonian forest. Forest Ecology and Management 113, 67–74.
Malhi, Y., Wood, D., Baker, T.R., Wright, J., Phillips, O.L., Cochrane, T., Meir, P., Chave, J.,
Almeida, S., Arroyo, L., Higuchi, N., Killeen, T., Laurance, S.G., Laurance, W.F., Lewis, S.L.,
Monteagudo, A., Neill, D.A., Vargas, P.N., Pitman, N.C.A., Quesada, C.A., Salomão, R., Silva,
J.N.M., Lezama, A.T., Terborgh, J., Martínez, R.V., Vinceti, B., 2006. The regional variation of
aboveground live biomass in old-growth Amazonian forests. Global Change Biology 12, 1107-
1138.
Narvaes, I.S., Brena, D.A., Longhi, S.J., 2005. Estrutura da Regeneração Natural em Floresta
Ombrófila Mista na Floresta Nacional de São Francisco de Paula, RS. Ciência Florestal 15(4),
331-342.
Nascimento, H.E.M., Laurance, W.L., 2002 Total aboveground biomass in central Amazonian
rainforests: a landscape-scale study. Forest Ecology and Management 168, 311–321.
Nogueira, E.M., P.M. Fearnside, B.W. Nelson, R.I. Barbosa & E.W.H. Keizer, 2008. Estimates
of forest biomass in the Brazilian Amazon: New allometric equations and adjustments to
biomass from wood-volume inventories. Forest Ecology and Management 256(11), 1853-1857.
Dow
nloa
ded
by [
And
ré L
uiz
Men
ezes
Via
nna]
at 0
4:52
09
Janu
ary
2014

ACCEPTED MANUSCRIPT
ACCEPTED MANUSCRIPT 36
Putz, F.E., Zuidema, P.A., Pinard, M.A., Boot, R.G.A., Sayer, J.A., Sheil, D., Sist, P., Elias,
Vanclay, J.K., 2008. Improved tropical forest management for carbon retention. PLoS Biology
6(7), e166, 1368-1369.
Ribeiro, G.H.P. de M., 2010. Desenvolvimento de modelos alométricos para estimar biomassa e
carbono de mudas de espécies arbóreas, em áreas atingidas por tempestades de vento em Manaus
(AM). Masters dissertation, Instituto Nacional de Pesquisas da Amazônia/Fundação
Universidade do Amazonas, Manaus, Amazonas, Brazil. 75 pp.
Rollet, B., 1974. L’architecture de forêts denses humides sempervirens de plaine. Centre
Technique Forestier Tropical, Norgent sur Marne, France. 297 pp.
Saldarriaga, J.G., West, D.C., Tharp, M.L., Uhl, C., 1988. Long-term chronosequence of forest
succession in the upper Rio Negro of Colombia and Venezuela. Journal of Ecology 76, 938-958.
Silva, R.P., 2007. Alometria, estoque e dinâmica da biomassa de florestas primárias e
secundárias na região de Manaus (AM), Ph.D. thesis, Instituto Nacional de Pesquisas da
Amazônia/Fundação Universidade do Amazonas, Manaus, Amazonas, Brazil. 152 pp.
Veríssimo, A., Barreto, P., Mattos, M., Tarifa, R., Uhl, C.,1992. Logging impacts and prospects
for sustainable forest management in an old Amazonian frontier: the case of Paragominas. Forest
Ecology and Management 55, 169-199.
Veríssimo, A., Barreto, P., Mattos, M., Tarifa, R., Uhl, C., 2002a. Impactos da Atividade
Madeireira e Perspectivas para o Manejo Sustentável da Floresta numa Velha Fronteira da
Amazônia: O Caso de Paragominas. In: Barros, A.C., Veríssimo, A., (Eds.), A expansão da
atividade madeireira na Amazônia: Impactos e perspectivas para o desenvolvimento do setor
Dow
nloa
ded
by [
And
ré L
uiz
Men
ezes
Via
nna]
at 0
4:52
09
Janu
ary
2014

ACCEPTED MANUSCRIPT
ACCEPTED MANUSCRIPT 37
florestal no Pará. Instituto do Homem e Meio Ambiente da Amazônia (IMAZON), Belém, Pará,
Brazil. pp. 41-74.
Veríssimo, A., Uhl, C., Mattos, M., 2002b. Impactos sociais, econômicos e ecológicos da
exploração seletiva de madeiras numa região de fronteira na Amazônia Oriental: o caso da
Tailândia, in: Barros, A.C., Veríssimo, A., (Eds.), A expansão da atividade madeireira na
Amazônia: Impactos e perspectivas para o desenvolvimento do setor florestal no Pará. Instituto
do Homem e Meio Ambiente da Amazônia (IMAZON), Belém, Pará, Brazil. pp. 9-39.
Vieira, G., Hosokawa, R.T., 1989. Composição florística da regeneração natural 1 ano após
diferentes níveis de exploração de uma floresta tropical úmida. Acta Amazonica 19, 401-413.
Dow
nloa
ded
by [
And
ré L
uiz
Men
ezes
Via
nna]
at 0
4:52
09
Janu
ary
2014
ACCEPTED MANUSCRIPT
ACCEPTED MANUSCRIPT 38
Figure Legends
Figure 1. Study area. The three management areas are indicated with black rectangles. The inset maps show the location in Brazil and in the state of Amazonas.
Dow
nloa
ded
by [
And
ré L
uiz
Men
ezes
Via
nna]
at 0
4:52
09
Janu
ary
2014

ACCEPTED MANUSCRIPT
ACCEPTED MANUSCRIPT 39
Figure 2. Percentage of trees with damaged crowns. DC = damage to the crown; DC 1 = damage to up to 1/3 of the crown; DC 2: damage to up to 2/3 of the crown; DC 3 = crown destroyed; MA = Management area.
Dow
nloa
ded
by [
And
ré L
uiz
Men
ezes
Via
nna]
at 0
4:52
09
Janu
ary
2014
ACCEPTED MANUSCRIPT
ACCEPTED MANUSCRIPT 40
Figure 3. Percentage of trees with damaged trunks. DT = damage to the trunk; DT 1 = light damage to the trunk; DT 2 = moderate damage to the trunk; DT 3= heavy damage to the trunk; MA = Management area.
Dow
nloa
ded
by [
And
ré L
uiz
Men
ezes
Via
nna]
at 0
4:52
09
Janu
ary
2014

ACCEPTED MANUSCRIPT
ACCEPTED MANUSCRIPT 41
Table 1. Characteristics of the forest management areas studied.
Community Identification
Area
of the
Plan
(ha)
Area
inventoried
(ha)
Volume
suitable
for
harvest
(m³)
Volume
harvested
(m³)
Logging
intensity
(m³ ha-1)
Number
of
harvested
trees
Nossa
Senhora do
Livramento
MA1 497.55 5 115.26 24.12 4.82 4
Santa Luzia
do
Jacarequara
MA2 280.91 5 117.05 0 0 0
Monte Sião
Leandro
Grande
MA3 500.00 5 120.91 53.29 10.65 16
MA = Management area.
Dow
nloa
ded
by [
And
ré L
uiz
Men
ezes
Via
nna]
at 0
4:52
09
Janu
ary
2014
ACCEPTED MANUSCRIPT
ACCEPTED MANUSCRIPT 42
Table 2. Equations for estimating fresh and dry biomass (kg)
Component Allometric equation Author
Live biomass
Trees DBH ( > 5 cm) FW = (2.2737×DBH1.9156) ×
0.9265
Adapted from Silva,
2007
Palms DBH ( > 5 cm) DW = exp(-6.3789 - 0.877 ×
ln(1/DBH2) + 2.151× ln(H))
Saldarriaga, 1988
Lianas DGL > 1 cm) ln (DW) = -7.114 +2.276 ×
ln(DGL) Gehring et al. , 2004
Coarse roots DBH ( > 5 cm) FW = 0. 0469 × DBH2. 4754 Silva, 2007
Necromass
Initial
decomposition
DBH ( > 5 cm) FW = ((2.7179 × DBH1.8774) ×
0.9265) × 0.90
Delaney et al., 1998
Dow
nloa
ded
by [
And
ré L
uiz
Men
ezes
Via
nna]
at 0
4:52
09
Janu
ary
2014

ACCEPTED MANUSCRIPT
ACCEPTED MANUSCRIPT 43
Final
decomposition
DBH ( > 10 cm) DW = BA × H × 0.78 × 0.34
Cummings, 1998
DBH (5 - 10 cm) DW = BA × H × 0.78 × 0.41
BA = Basal area; DBH = Diameter at breast height; DGL = Diameter at ground level; DW =
Dry weight; FW = Fresh weight; H = Height
Dow
nloa
ded
by [
And
ré L
uiz
Men
ezes
Via
nna]
at 0
4:52
09
Janu
ary
2014

ACCEPTED MANUSCRIPT
ACCEPTED MANUSCRIPT 44
Table 3. Quantification of carbon stock at Time 1 or first measurement.
Area Level ------------------------ Above ground live biomass ------- Total
(AGLB + CR) Necromass Tree Palm Liana Total Coarse roots
------------------------------------------------------------- MgC ha-1----------------------------------------------------------------------
MA1 I 78.63 0.00 0.00 78.63 15.96 94.59 0.00
II 57.77 ±5.28 0.02 ±0.02 0.00 57.79 ±5.30 6.56 ±0.58 64.35 ±5.86 0.09 ±0.17
III 14.61 ±2.15 0.04 ±0.02 0.00 14.65 ±2.17 0.95 ±0.16 15.60 ±2.30 0.00 ±0.00
Total 151.01 ±7.43 0.06 ±0.04 0.00 151.07 ±7.47 23.48 ±0.74 174.55 ±8.2 0.09 ±0.17
MA2 I 77.71 0.00 0.00 77.71 14.94 92.65 0.10
II 69.12 ±9.39 0.02 ±0.01 0.00 69.14 ±6.90 8.17 ±1.22 77.30 ±10.61 0.66 ±1.25
III 19.12 ±1.78 0.02 ±0.02 0.00 19.14 ±1.80 1.21 ±0.17 20.35 ±2.96 0.00 ±0.00
Total 165.95 ±12.78 0.04 ±0.03 0.00 165.99 ±8.70 24.32 ±1.39 190.30 ±13.5 0.76 ±1.25
MA3 I 86.99 0.00 0.00 86.99 17.35 104.34 0.00
II 63.04 ±12.79 0.00 ±0 0.00 63.04 ±7.79 7.31 ±1.77 70.34 14.57 0.07 ±0.13
III 16.76 ±4.31 0.00 ±0 0.00 16.76 ±1.31 1.09 ±0.28 17.85 4.59 0.00 ±0.00
Total 166.79 ±17.10 0.00 ±0.00 0.00 166.79 ±9.10 25.75 ±2.0 192.54 ±19.16 0.07 ±0.13
I 81.11 ±5.57 0.00 ±0.00 0.00 81.11 ±5.57 16.08 ±1.32 97.19 ±6.82 0.03 ±0.06
Mean II 63.31 ±6.18 0.01 ±0.01 0.00 63.32 ±6.18 7.35 ±0.87 70.67 ±7.06 0.27 ±0.36
III 16.83 ±2.46 0.02 ±0.02 0.00 16.85 ±2.45 1.09 ±0.14 17.93 ±2.58 0.00 ±0.00
Total 161.25 ±9.66 0.03 ±0.03 0.00 161.28 ±9.64 24.51 ±1.25 185.80 ±10.7 0.31 ±0.43
Level I = DBH > 30 cm; Level II = DBH 10 - 30 cm; Level III = DBH 5 - 10 cm; AGLB = Above-ground live biomass; CR = Coarse roots; Values preceded by ± refer to the standard error of the estimate. The confidence intervals for the totals relate to the value obtained for trees with DBH > 30 cm in the censused areas, plus or minus the upper and lower limits of the confidence interval estimates for the 10 to 30 cm and 5 to10 cm DBH classes.
Dow
nloa
ded
by [
And
ré L
uiz
Men
ezes
Via
nna]
at 0
4:52
09
Janu
ary
2014

ACCEPTED MANUSCRIPT
ACCEPTED MANUSCRIPT 45
Table 4. Impact of logging on the carbon stock, difference between estimate of initial carbon stock and estimate after logging (T1 - T2)
Area Level ---------------------------Above ground live biomass----------------------
Coarse roots Total (AGLB+ CR) Necromass
Tree Palm Liana Total
-------------------------------------------------------------------------- MgC ha-1 ------------------------------------------------------
I 1.75 0.000 0 1.76 0.36 2.12 -3.31
MA1 II 2.19 ±4.58 0.0013 ±0 0 ±0 2.19 ±4.57 0.63 ±0.51 2.82 ±5.08 -2.38 ±2.89
III 0.25 ±0.41 -0.0010 ±0 0 ±0 0.66 ±0.41 0.03 ±0.04 0.28 ±0.45 -1.08 ±1.41
Total 4.20 ±4.16 0.0003 ±0 0 ±0 4.20 ±4.16 1.02 ±0.47 5.22 ±4.64 -6.78 ±1.48
I -0.40 -0.0002 -0.0004 -0.40 -0.21 -0.60 -0.02
MA2 II -0.37 ±1.56 -0.0030 ±0 -0.0001 ±0 -0.37 ±1.56 -0.54 ±0.03 -0.16 ±1.59 0.00 ±0.00
III -0.67 ±0.13 -0.0010 ±0 -0.0070 ±0.01 -0.67 ±0.13 -0.02 ±0.00 -0.69 ±0.13 0.00 ±0.00
Total -1.43 ±1.43 -0.0044 ±0 -0.0072 ±0.01 -1.45 ±1.43 -0.31 ±0.03 -1.13 ±1.46 -0.02 ±0.00
I 8.69 0.0005 0 8.69 1.86 10.55 -6.69
MA3 II 3.28 ±2.30 0.0000 ±0 0 ±0 3.28 ±2.30 0.75 ±0.61 4.02 ±2.91 -7.88 ±2.65
III 1.22 ±0.15 0.0000 ±0 0 ±0 1.22 ±0.15 0.12 ±0.00 1.35 ±0.15 -1.38 ±1.50
Total 13.19 ±2.15 0.0005 ±0 0 ±0 13.19 ±2.15 2.73 ±0.62 15.92 ±2.77 -15.9 ±4.15
Level I = DBH > 30 cm; Level II = DBH 10 - 30 cm; Level III = DBH 5 - 10 cm; AGLB = Above-ground live biomass; CR = Coarse roots; Values preceded by ± refer to the standard error of the estimate; T1 = Time 1 or first measurement; T2 = Time 2 or second measurement. Level I – census (therefore there is no confidence interval). The confidence intervals for the totals relate to the value obtained for trees with DBH > 30 cm in the censused areas, plus or minus the upper and lower limits of the confidence interval estimates for the 10 to 30 cm and 5 to10 cm DBH classes.
Dow
nloa
ded
by [
And
ré L
uiz
Men
ezes
Via
nna]
at 0
4:52
09
Janu
ary
2014
ACCEPTED MANUSCRIPT
ACCEPTED MANUSCRIPT 46
Table 5. Alterations in natural regeneration
Area
Alteration in
the number of
individuals T2 -
T1 (number ha-
1)
Calculated
t
Alteration in the
carbon stock
T2 - T1 (MgC
ha-1)
Calculated t
t value
(α = 0.05)
MA1 2,711 0.18 3.28 -1.23 2.306
C1 13,289
4.62
MA2 -1,689 -3.11 0.24 -0.14
C2 2,720
0.49
MA3 6,133 0.89 4.06 -0.50
C3 4,489
4.69
C1, C2, C3 = Control areas; MA1, MA2, MA3 = Management areas; T2 = Time 2 or second
measurement; T1 = Time 1 or first measurement.
Dow
nloa
ded
by [
And
ré L
uiz
Men
ezes
Via
nna]
at 0
4:52
09
Janu
ary
2014

ACCEPTED MANUSCRIPT
ACCEPTED MANUSCRIPT 47
Table 6. Comparisons between the results of the present study and other studies on logging
Summary of results
Study location MA1 Uatumã RDS
MA3 Uatumã RDS
Acre Paragominas, Pará
Paragominas, Pará
Paragominas, Pará
Tailândia, Pará
Logging intensity (m³ ha-1)
4.82 10.65 5-10 18 37 37 16
Trees harvested per hectare
0.8 1.6 4.5 6.4 2
Trees damaged per harvested tree
12 4 20.5 27 13
Volume damaged per volume harvested
1.85 0.64 1.68 1.16
Reduction in basal area (%)
6.3 8.4 7.4 20
Author
de Oliveira & Braz (2006)
Veríssimo et al. (2002b)
Johns et al. (1996)
Veríssimo et al. (2002a)
Veríssimo et al. (2002b)
Dow
nloa
ded
by [
And
ré L
uiz
Men
ezes
Via
nna]
at 0
4:52
09
Janu
ary
2014